Embed Size (px)
Citation preview

Ganganalyse til børn med CP
– Delresultater fra kliniske forskningsprojekter
Helle Mätzke RasmussenDepartment of Clinical Research
Faculty of Health Sciences University of Southern Denmark
Orthopaedic Research Unit Department of Orthopaedic Surgery and Traumatology
Odense University Hospital
CPOP DAG 2016

2
Afhandling og artikler
The use of instrumented gait analysis
in interdisciplinary interventions for
children with cerebral palsy
Print Print & Sign, Syddansk Universitet
Frontpage Frida Danielsson (model) - Heidi Lundsgaard (photo)
PhD Thesis (2018) The use of instrum
ented gait analysis in interdisciplinary interventions for children with cerebral palsy
Helle Mätzke Rasmussen
Department of Clinical Research Orthopaedic Research Unit
Faculty of Health Sciences Department of Orthopaedic Surgery and Traumatology
University of Southern Denmark Odense University Hospital
I Rasmussen HM, Nielsen DB, Pedersen NW, Overgaard S, Holsgaard-Larsen A. Gait Deviation Index, Gait Profile Score and Gait Variable Score in children with spastic cerebral pal-sy: Intra-rater reliability and agreement across two repeated sessions. Gait & Posture. 2015;42(2):133-7.
IIa Rasmussen HM, Pedersen NW, Overgaard S, Hansen LK, Dunkhase-Heinl U, Petkov Y, Engell V, Baker R, and Hols-gaard-Larsen A. The use of instrumented gait analysis for in-dividually tailored interdisciplinary interventions in children with cerebral palsy: a randomised controlled trial protocol. BMC Pediatrics. 2015;15(1):202.
IIb Rasmussen HM, Pedersen NW, Overgaard S, Hansen LK, Dunkhase-Heinl U, Petkov Y, Engell V and Holsgaard-Larsen A. The use of instrumented gait analysis for individually tail-ored interdisciplinary interventions in children with cerebral palsy: a randomised controlled trial. [Re-submitted to Dev Med Child Neurol, Feb 2018].
III Rasmussen HM, Svensson J, Christensen MT, Pedersen NW, Overgaard S, Holsgaard-Larsen A. Threshold values of ank-le dorsiflexion and gross motor function in 60 children with cerebral palsy – a cross-sectional study [Acta Orthop, 2018 Mar 28:1-6 Epub ahead of print].

3
Population
GMFCS E & R mellem 6 og 12 år: Beskrivelser og illustrationer
GMFCS niveau V Børnene transporteres i en manuel kørestol i alle omgivelser. Børnene er begrænsede i evnen til at holde hovedet og kroppens stillinger oppe imod tyngden og de er begrænsede i styringen af bevægelserne i ben og arme.
GMFCS niveau IVBørnene bevæger sig omkring i de fleste omgivelser ved hjælp af fysisk støtte eller ved brug af el-kørestol. De kan måske gå omkring på korte distancer i hjemmet når de får fysisk støtte, når de er placeret i kropsstøttende gangredskab eller de bruger el-kørestol. I skolen, udenfor og i nærmiljøet transporteres børnene i en manuel kørestol eller de anvender en el-kørestol.
GMFCS niveau IIIBørnene går ved brug af håndholdt gangredskab i de fleste indendørs omgivelser. De kan måske gå på trapper, når de holder ved gelænder, med supervision eller støtte. Børnene bruger kørestol på længere distancer og kan måske selv køre manuel kørestol på kortere distancer.
GMFCS niveau IIBørnene kan gå i de fleste omgivelser og kan gå på trapper når de holder ved gelænder. De vil måske have vanskeligheder når de går lange distancer og når de går i ujævnt terræn, på stigninger, og når der er begrænset plads og når der er mange mennesker tæt på. Børnene vil måske gå med fysisk støtte, med et håndholdt gangredskab eller bruge en kørestol på længere distancer. Børnene har begrænsede evner til at udføre grovmotoriske aktiviteter som løb og hop.
GMFCS niveau IBørnene går i hjemmet, i skolen, udendørs og i nærmiljøet. De kan gå på trapper uden støtte ved gelænder. Børnene udfører grovmotoriske aktiviteter som at løbe og hoppe, men tempo, balance og koordination er begrænset.
GMFCS descriptors: Palisano et al. (1997) Dev Med Child Neurol 39:214–23 CanChild: www.canchild.ca
Illustrations Version 2 © Bill Reid, Kate Willoughby, Adrienne Harvey and Kerr Graham, The Royal Children’s Hospital Melbourne ERC151050
Translation to Danish: Kirsten Nordbye-Nielsen, [email protected] Aarhus University Hospital, Denmark. May 2017
I II
Rosenbaum PL at al (2008) www.canchild.ca60% of childen with CP
Rodby-Bousquet & Hägglund (2012)
Children with spastic cerebral palsyGMFCS level I and II
5-8 years of age

4
Rasmussen et al (2016)
The Danish Cerebral Palsy Follow-up Program (CPOP)National clinical quality database & Follow-up program
Standardized examinations Gross motor function
Muscle tone Passive range of motion
Orthotics and assistive devices
www.cpguiden.dk

5
Planning of interventions
Local teams
Interdisciplinary consultations
Examinations Gross motor function
Gait pattern
InterventionsRasmussen (2016)
www.cpguiden.dk

6
Gait analysis
- Movements (kinematic)- Forces (kinetics) Gage (1994)
- Diagnose and monitor progressBaker (2016)

9
Gait analysis
- 40-70% Changes in treatment plansLofterod (2007), Cook (2003), Kay (2000), Deluca (1997) - 77-97% ComplianceWren TA (2013), Lofterod (2007), Wren TA (2005)
- Effectiveness of interventionsFranki (2014), Van den Broeck (2010), Wren (2013)

7
Data from gait analysis
Clinical practise
Impairment focused interpretation (Baker 2009)
- History- Orientation: Gait indices- Video- Evidence and interpretation- Kinematic / kinetic graphs- Physical examination- Patient reported outcome measures
Example: Ankle dorsi flexion
d Too little right dorsiflexion in stancee too little dorsiflexion in swing.
Test
Team A
Retest
Laboratory Team B
Team C
+
+
+
Ganganalyse rapport
Kinematic / kinetic graphs
Projekt ID ViTo2008 / ID223
Dato 14-‐10-‐2015
The report is based on a clinical gait analysis, that have been performed as part of a research project, that is conducted at the Gait Analysis Laboratory by physiotherapist Helle Mätzke Rasmussen. HMR / 2014-‐09-‐01 / Based on a template by Baker, McGinley and Thomason (2010) 7
Gait data
Pelvic Tilt Pelvic Obliquity Pelvic Rotation
Hip Flexion Hip Adduction Hip rotation
Knee Flexion
Dorsiflexion
Foot Progression
b
a
c
d
d
e

8
Data from gait analysis
Research: Gait indices
Gait Deviation IndexSchwartz (2008)
Gait Profile Score Baker (2009)
Gait Variable Score Movement Analysis Profile
Subjects
Pelvis Ant/PstHip Flx/Ext
Knee Flx/ExtAnkle Dor/PlaPelvic Up/DnHip Add/AbdPelvic Int/Ext
Hip Int/ExtFoot Int/Ext
GPS
Controls
Pelvis Ant/PstHip Flx/Ext
Knee Flx/ExtAnkle Dor/PlaPelvic Up/DnHip Add/AbdPelvic Int/Ext
Hip Int/ExtFoot Int/Ext
GPS
0
5
10
15
20
Med
ianan
dIQRRM
Sdiffe
rencefrom
con
trolm
ean(degrees)
MovementAnalysisProfile
Le( Right Overall
0
5
10
15
20
MovementAnalysisProfile
I suggest you use a screen dump to copy this graphic as it is actully two graphs laid on top of each other to get the overlay effect. Press <alt+prtscr> to copy to clipboard, paste and then crop to rdisplay just the graph.

10
Combining the CPOP with the use of gait analysis
Motivation for the studies

11
Study aimThis study aimed to determine if indivi-dually tailored interdisciplinary interventions with gait analysis lead to greater improvements than individu-ally tailored interdisciplinary intervention without gait analysis in overall gait pathology, walking perfor-mance and patient-reported outcome measures of function, disability and health-related quality of life.
Protocol article:Rasmussen HM, edersen NW, Overgaard S, Hansen LK, Dunkhase-Heinl U, Petkov Y, Engell V, Baker R, Holsgaard-Larsen, A BMC Pediatrics (2015)
Article IIb - resubmitted
Study aim
STUDY PROTOCOL
Open AccessThe use of instrumented gait analysis forindividually tailored interdisciplinaryinterventions in children with cerebralpalsy: a randomised controlled trialprotocolHelle Mätzke Rasmussen1,2*, Niels Wisbech Pedersen1,2, Søren Overgaard1,2, Lars Kjaersgaard Hansen3,
Ulrike Dunkhase-Heinl4,5, Yanko Petkov6, Vilhelm Engell1,2, Richard Baker7 and Anders Holsgaard-Larsen1,2Abstract
Background: Children with cerebral palsy (CP) often have an altered gait. Orthopaedic surgery, spasticity management,
physical therapy and orthotics are used to improve the gait. Interventions are individually tailored and are
planned on the basis of clinical examinations and standardised measurements to assess walking (‘care as usual’).
However, these measurements do not describe features in the gait that reflect underlying neuro-musculoskeletal
impairments. This can be done with 3-dimensional instrumented gait analysis (IGA). The aim of this study is to test the
hypothesis that improvements in gait following individually tailored interventions when IGA is used are superior to
those following ‘care as usual’.Methods/Design: A prospective, single blind, randomised, parallel group study will be conducted. Children aged 5
to 8 years with spastic CP, classified at Gross Motor Function Classification System levels I or II, will be included. The
interventions under investigation are: 1) individually tailored interdisciplinary interventions based on the use of IGA, and
2) ‘care as usual’. The primary outcome is gait measured by the Gait Deviation Index. Secondary outcome measures are:
walking performance (1-min walk test) and patient-reported outcomes of functional mobility (Pediatric Evaluation of
Disability Inventory), health-related quality of life (The Pediatric Quality of Life Inventory Cerebral Palsy Module) and
overall health, pain and participation (The Pediatric Outcome Data Collection Instrument). The primary endpoint for
assessing the outcome of the two interventions will be 52 weeks after start of intervention. A follow up will also be
performed at 26 weeks; however, exclusively for the patient-reported outcomes.Discussion: To our knowledge, this is the first randomised controlled trial comparing the effects of an individually
tailored interdisciplinary intervention based on the use of IGA versus ‘care as usual’ in children with CP. Consequently,
the study will provide novel evidence for the use of IGA.Trial registration: Trial registration: ClinicalTrials.gov NCT02160457. Registered June 2, 2014.
Keywords: Gait analysis, Cerebral Palsy, Gait Deviation Index, Study protocol
* Correspondence: [email protected] of Orthopaedic Surgery and Traumatology, Odense University
Hospital, Odense, Denmark2Institute of Clinical Research, University of Southern Denmark, Odense,DenmarkFull list of author information is available at the end of the article
© 2015 Rasmussen et al. Open Access This article is distributed under the terms of the Creative Commons Attribution 4.0
International License (http://creativecommons.org/licenses/by/4.0/), which permits unrestricted use, distribution, and
reproduction in any medium, provided you give appropriate credit to the original author(s) and the source, provide a link to
the Creative Commons license, and indicate if changes were made. The Creative Commons Public Domain Dedication waiver
(http://creativecommons.org/publicdomain/zero/1.0/) applies to the data made available in this article, unless otherwise stated.
Rasmussen et al. BMC Pediatrics (2015) 15:202 DOI 10.1186/s12887-015-0520-7

13
Interventions
Orthopaedic surgery
Control interventionswithout gait analysis report
Local healthcare teamsIndividually tailored interventions
Spasticity management
Physical therapy
Orthotics
Experimental interventionswith gait analysis report
Example: Ankle dorsi flexion
d Too little right dorsiflexion in stance
e too little dorsiflexion in swing.
Test Team A
Retest
Laboratory Team B
Team C
+
+
+
Ganganalyse rapport

14
ResultsRCTmanuscript–DevelopmentalMedicine&ChildNeurology
Lastupdated:18February2018
Figure 1 – Flow diagram of participants in the study
Enr
olm
ent
160 Letters of invitation were sent to eligible children by mail 48 Did not answer
29 Not interested in the study 83 screened by telephone 7 Not interested after screening
16 Not eligible after screening: Orthopaedic surgery (n=5), planned moving (n=3),
diagnosis had changed (n=6) and did not understand Danish (n=2)
60 Baseline assessments
Instrumented gait analysis (n=60), 1-min walk test (n=57) and questionnaires (n=58)
Allo
cati
on
60 Randomised Two participants (one from each group) were randomised with another participant.
30 Allocated to experimental group
30 received individually tailored interdisciplinary intervention with Instrumented gait analysis
provided by 29 different combinations of local healthcare teams.
30 Allocated to control group 30 received individually tailored interdisciplinary intervention without Instrumented gait analysis provided by 29 different combinations of local
healthcare teams.
Fol
low
-up
26 Follow up assessmentsa (26 weeks)
24 participants completed all subscales in the questionnaires
25 Follow up assessmentsa (26 weeks)
24 participants completed all subscales in the questionnaires
29 Post intervention assessmentsb
(52 weeks – primary follow-up)
IGA (n=28), 1-min walk test (n=24) and all subscales in the questionnaires (n=27)
29 Post intervention assessmentsb (52 weeks – primary follow-up)
IGA (n=27), 1-min walk test (n=23) and all subscales in the questionnaires (n=27)
Ana
lysi
s
30 Included in the ITT analysis
1-min walk test (n=28) and all subscales of the patient reported outcome (n=29).
30 Included in the ITT analysis
1-min walk test (n=29) and all subscales of the patient reported outcome (n=29).
Explanations:
Flow chart

15
ResultsRCTmanuscript–DevelopmentalMedicine&ChildNeurology
Lastupdated:18February2018
Figure 1 – Flow diagram of participants in the study
Enr
olm
ent
160 Letters of invitation were sent to eligible children by mail 48 Did not answer
29 Not interested in the study 83 screened by telephone 7 Not interested after screening
16 Not eligible after screening: Orthopaedic surgery (n=5), planned moving (n=3),
diagnosis had changed (n=6) and did not understand Danish (n=2)
60 Baseline assessments
Instrumented gait analysis (n=60), 1-min walk test (n=57) and questionnaires (n=58)
Allo
cati
on
60 Randomised Two participants (one from each group) were randomised with another participant.
30 Allocated to experimental group
30 received individually tailored interdisciplinary intervention with Instrumented gait analysis
provided by 29 different combinations of local healthcare teams.
30 Allocated to control group 30 received individually tailored interdisciplinary intervention without Instrumented gait analysis provided by 29 different combinations of local
healthcare teams.
Fol
low
-up
26 Follow up assessmentsa (26 weeks)
24 participants completed all subscales in the questionnaires
25 Follow up assessmentsa (26 weeks)
24 participants completed all subscales in the questionnaires
29 Post intervention assessmentsb
(52 weeks – primary follow-up)
IGA (n=28), 1-min walk test (n=24) and all subscales in the questionnaires (n=27)
29 Post intervention assessmentsb (52 weeks – primary follow-up)
IGA (n=27), 1-min walk test (n=23) and all subscales in the questionnaires (n=27)
Ana
lysi
s
30 Included in the ITT analysis
1-min walk test (n=28) and all subscales of the patient reported outcome (n=29).
30 Included in the ITT analysis
1-min walk test (n=29) and all subscales of the patient reported outcome (n=29).
Explanations:
Flow chart: Enrollment
160
83
60
16
48
29
7

16
ResultsRCTmanuscript–DevelopmentalMedicine&ChildNeurology
Lastupdated:18February2018
Figure 1 – Flow diagram of participants in the study
Enr
olm
ent
160 Letters of invitation were sent to eligible children by mail 48 Did not answer
29 Not interested in the study 83 screened by telephone 7 Not interested after screening
16 Not eligible after screening: Orthopaedic surgery (n=5), planned moving (n=3),
diagnosis had changed (n=6) and did not understand Danish (n=2)
60 Baseline assessments
Instrumented gait analysis (n=60), 1-min walk test (n=57) and questionnaires (n=58)
Allo
cati
on
60 Randomised Two participants (one from each group) were randomised with another participant.
30 Allocated to experimental group
30 received individually tailored interdisciplinary intervention with Instrumented gait analysis
provided by 29 different combinations of local healthcare teams.
30 Allocated to control group 30 received individually tailored interdisciplinary intervention without Instrumented gait analysis provided by 29 different combinations of local
healthcare teams.
Fol
low
-up
26 Follow up assessmentsa (26 weeks)
24 participants completed all subscales in the questionnaires
25 Follow up assessmentsa (26 weeks)
24 participants completed all subscales in the questionnaires
29 Post intervention assessmentsb
(52 weeks – primary follow-up)
IGA (n=28), 1-min walk test (n=24) and all subscales in the questionnaires (n=27)
29 Post intervention assessmentsb (52 weeks – primary follow-up)
IGA (n=27), 1-min walk test (n=23) and all subscales in the questionnaires (n=27)
Ana
lysi
s
30 Included in the ITT analysis
1-min walk test (n=28) and all subscales of the patient reported outcome (n=29).
30 Included in the ITT analysis
1-min walk test (n=29) and all subscales of the patient reported outcome (n=29).
Explanations:
Flow chart: Allocation
60
30 30

17
ResultsRCTmanuscript–DevelopmentalMedicine&ChildNeurology
Lastupdated:18February2018
Figure 1 – Flow diagram of participants in the study
Enr
olm
ent
160 Letters of invitation were sent to eligible children by mail 48 Did not answer
29 Not interested in the study 83 screened by telephone 7 Not interested after screening
16 Not eligible after screening: Orthopaedic surgery (n=5), planned moving (n=3),
diagnosis had changed (n=6) and did not understand Danish (n=2)
60 Baseline assessments
Instrumented gait analysis (n=60), 1-min walk test (n=57) and questionnaires (n=58)
Allo
cati
on
60 Randomised Two participants (one from each group) were randomised with another participant.
30 Allocated to experimental group
30 received individually tailored interdisciplinary intervention with Instrumented gait analysis
provided by 29 different combinations of local healthcare teams.
30 Allocated to control group 30 received individually tailored interdisciplinary intervention without Instrumented gait analysis provided by 29 different combinations of local
healthcare teams.
Fol
low
-up
26 Follow up assessmentsa (26 weeks)
24 participants completed all subscales in the questionnaires
25 Follow up assessmentsa (26 weeks)
24 participants completed all subscales in the questionnaires
29 Post intervention assessmentsb
(52 weeks – primary follow-up)
IGA (n=28), 1-min walk test (n=24) and all subscales in the questionnaires (n=27)
29 Post intervention assessmentsb (52 weeks – primary follow-up)
IGA (n=27), 1-min walk test (n=23) and all subscales in the questionnaires (n=27)
Ana
lysi
s
30 Included in the ITT analysis
1-min walk test (n=28) and all subscales of the patient reported outcome (n=29).
30 Included in the ITT analysis
1-min walk test (n=29) and all subscales of the patient reported outcome (n=29).
Explanations:
Flow chart: Allocation
60
30 30
Participants Study II-III
Number, n 60
Age, mean (SD) 6 y 10 m (1 y 3 m)
Sex, girls/boys, n (%) 21/39 (35/65)
CP subtype, UL/BL, n (%) 43/17 (72/28)
GMFCS I / II, n (%) 42/18 (70/30)

18
52 weeks
26 weeks
ResultsRCTmanuscript–DevelopmentalMedicine&ChildNeurology
Lastupdated:18February2018
Figure 1 – Flow diagram of participants in the study
Enr
olm
ent
160 Letters of invitation were sent to eligible children by mail 48 Did not answer
29 Not interested in the study 83 screened by telephone 7 Not interested after screening
16 Not eligible after screening: Orthopaedic surgery (n=5), planned moving (n=3),
diagnosis had changed (n=6) and did not understand Danish (n=2)
60 Baseline assessments
Instrumented gait analysis (n=60), 1-min walk test (n=57) and questionnaires (n=58)
Allo
cati
on
60 Randomised Two participants (one from each group) were randomised with another participant.
30 Allocated to experimental group
30 received individually tailored interdisciplinary intervention with Instrumented gait analysis
provided by 29 different combinations of local healthcare teams.
30 Allocated to control group 30 received individually tailored interdisciplinary intervention without Instrumented gait analysis provided by 29 different combinations of local
healthcare teams.
Fol
low
-up
26 Follow up assessmentsa (26 weeks)
24 participants completed all subscales in the questionnaires
25 Follow up assessmentsa (26 weeks)
24 participants completed all subscales in the questionnaires
29 Post intervention assessmentsb
(52 weeks – primary follow-up)
IGA (n=28), 1-min walk test (n=24) and all subscales in the questionnaires (n=27)
29 Post intervention assessmentsb (52 weeks – primary follow-up)
IGA (n=27), 1-min walk test (n=23) and all subscales in the questionnaires (n=27)
Ana
lysi
s
30 Included in the ITT analysis
1-min walk test (n=28) and all subscales of the patient reported outcome (n=29).
30 Included in the ITT analysis
1-min walk test (n=29) and all subscales of the patient reported outcome (n=29).
Explanations:
Flow chart: Follow-up & analysis
26 25
29
30
29
30
2728

19
ResultsBetween-group differences
In favor of Control In favor of Experimental
Rate Change CIlower CIupper Positivt Negativ Pos Neg- - -0.59 [-3.8-2.6] 1 -0,59 -3,8 2,6 -3,21 3,19 3 3 GaitDeviationIndex(GDI) 3 3- - 03.02 [-2.9-8.9] 2 3,2 -2,9 8,9 -6,1 5,7 6 6 1-minutewalktest(metre) 6 6
00.15 [-3.0-3.3] 01.37 [-2.4-5.1] 3 1,37 -2,4 5,1 -3,77 3,73 4 4 PEDI,Functionalskills 4 4-0.57 [-3.8-2.7] -0.93 [-5.5-3.6] 4 -0,93 -5,5 3,6 -4,57 4,53 5 5 PEDI,Caregiverassistance 5 50,175 [-0.8-8.2] 03.26 [-1.9-8.4] 5 3,26 -1,9 8,4 -5,16 5,14 5 5 PedsQL,DailyActivities 5 5-4.41 [-14.3-5.5] 01.12 [-8.7-10.9] 6 1,12 -8,7 10,9 -9,82 9,78 10 10 PedsQL,SchoolActivities 10 10-1.05 [-9.9-7.8] -1.19 [-9.4-7.0] 7 -1,19 -9,4 7 -8,21 8,19 8 8 PedsQL,MovementandBalance 8 8
0,25625 [-0.22-11.6] -7.13 [-15.6-1.3] 8 -7,13 -15,6 1,3 -8,47 8,43 8 8 PedsQL,PainandHurt 8 8-2.47 [-10.6-5.7] -3.41 [-12.5-5.7] 9 -3,41 -12,5 5,7 -9,09 9,11 9 9 PedsQL,Fatigue 9 9-1.81 [-6.9-3.3] 0,134027778 [-4.5-9.9] 10 2,73 -4,5 9,9 -7,23 7,17 7 7 PedsQL,EatingActivities 7 7-0.28 [-4.8-4.2] -2.64 [-8.8-3.5] 11 -2,64 -8,8 3,5 -6,16 6,14 6 6 PedsQL,SpeechandCommunication 6 602.15 [-1.2-5.5] 00.58 [-3.1-4.2] 12 0,58 -3,1 4,2 -3,68 3,62 4 4 PODCI,Globalfunctioningscale 4 401.25 [-3.7-6.2] 04.31 [-0.6-9.2] 13 4,31 -0,6 9,2 -4,91 4,89 5 5 PODCI,Upperextremityfunction 5 501.31 [-1.9-4.6] 0,085416667 [-0.6-3.9] 14 1,63 -0,6 3,9 -2,23 2,27 2 2 PODCI,Transferandbasicmobility 2 2
0,095833333 [-3.1-6.7] 01.52 [-4.7-7.7] 15 1,52 -4,7 7,7 -6,22 6,18 6 6 PODCI,Sportsandphysicalfunctioning 6 603.22 [-4.8-11.2] -5.3 [-14.0-3.4] 16 -5,3 -14 3,4 -8,7 8,7 9 9 PODCI,Pain/ComfortScale 9 902.11 [-5.7-9.9] -3.89 [-13.0-5.2] 17 -3,89 -13 5,2 -9,11 9,09 9 9 PODCI,HappinessScale 9 9
-20 -15 -10 -5 0 5 10 15 20
Gait Deviation Index (GDI) 1-minute walk test (metre) PEDI, Functional skills PEDI, Caregiver assistance PedsQL, Daily Activities PedsQL, School Activities PedsQL, Movement and Balance PedsQL, Pain and Hurt PedsQL, Fatigue PedsQL, Eating Activities PedsQL, Speech and Communication PODCI, Global functioning scale PODCI, Upper extremity function PODCI, Transfer and basic mobility PODCI, Sports and physical functioning PODCI, Pain/Comfort Scale PODCI, Happiness Scale

20
ResultsApplied interventions & compliance
Compliance + Rec + app + Rec
Physiotherapy 24 28
Orthotics 6 10
Spasticity management 5 14
Orthopedic surgery 0 1
Applied interventions Exp CON
Physiotherapy 24 24
Orthotics 8 12
Spasticity management 7 10
Orthopedic surgery 0 1n = 28/29, p = > 0.05

21
ConclusionStudy aimThis study aimed to determine if indivi-dually tailored interdisciplinary interventions with gait analysis lead to greater improvements than individually tailored interdisciplinary intervention without gait analysis in overall gait pat-hology, walking performance and patient-reported outcome measures of function, disability and health-related quality of life.
ConclusionThis study could not confirm the hypo-thesis that improvement in the overall gait pathology, walking performance and patient-reported outcomes following individually tailored interventions when gait analysis is used are superior to those following ‘usual care’ in a case-mix of all children with cerebral palsy at GMFCS levels I and II, at an early age.

Subgroup analysisBetween-group differences
In favor of Control In favor of Experimental
Rate Change CIlower CIupper Positivt Negativ Pos Neg- - -0.59 [-3.8-2.6] 1 GMFCSI- - 03.02 [-2.9-8.9] 2 -0,2 -4,31 3,91 -4,11 4,11 4 5 GaitDeviationIndex(GDI) 4 -5
00.15 [-3.0-3.3] 01.37 [-2.4-5.1] 3 2,69 -3,53 8,91 -6,22 6,22 6 6 1-minutewalk(meter) 6 6-0.57 [-3.8-2.7] -0.93 [-5.5-3.6] 4 0,06 -4,89 5,02 -4,95 4,96 5 5 PEDI,Functionalskills 5 50,175 [-0.8-8.2] 03.26 [-1.9-8.4] 5 1,66 -4,84 8,16 -6,5 6,5 7 7 PEDI,Caregiverassistance 7 7-4.41 [-14.3-5.5] 01.12 [-8.7-10.9] 6-1.05 [-9.9-7.8] -1.19 [-9.4-7.0] 7 GMFCSII
0,25625 [-0.22-11.6] -7.13 [-15.6-1.3] 8 1,24 -6,66 4,2 -7,9 2,96 5 5 GaitDeviationIndex(GDI) 5 -5-2.47 [-10.6-5.7] -3.41 [-12.5-5.7] 9 -3,11 -9,44 15,66 -6,33 18,77 13 13 1-minutewalk(meter) 13 -13-1.81 [-6.9-3.3] 0,134027778 [-4.5-9.9] 10 -2,74 -1,27 6,74 1,47 9,48 4 4 PEDI,Functionalskills 4 -4-0.28 [-4.8-4.2] -2.64 [-8.8-3.5] 11 0,58 -4,2 3,1 -4,78 2,52 4 4 PEDI,Caregiverassistance 4 -402.15 [-1.2-5.5] 00.58 [-3.1-4.2] 1201.25 [-3.7-6.2] 04.31 [-0.6-9.2] 1301.31 [-1.9-4.6] 0,085416667 [-0.6-3.9] 14 0 0
0,095833333 [-3.1-6.7] 01.52 [-4.7-7.7] 15 0 003.22 [-4.8-11.2] -5.3 [-14.0-3.4] 16 0 002.11 [-5.7-9.9] -3.89 [-13.0-5.2] 17 0 0
-3,91-8,91 PEDI,Functionalskills-5,02 PEDI,Caregiverassistance-8,16
-4,2-15,66-6,74-3,1
-20 -15 -10 -5 0 5 10 15 20
GMFCS I Gait Deviation Index (GDI) 1-minute walk (meter) PEDI, Functional skills PEDI, Caregiver assistance
GMFCS II Gait Deviation Index (GDI) 1-minute walk (meter) PEDI, Functional skills PEDI, Caregiver assistance
GMFCS E & R mellem 6 og 12 år: Beskrivelser og illustrationer
GMFCS niveau V Børnene transporteres i en manuel kørestol i alle omgivelser. Børnene er begrænsede i evnen til at holde hovedet og kroppens stillinger oppe imod tyngden og de er begrænsede i styringen af bevægelserne i ben og arme.
GMFCS niveau IVBørnene bevæger sig omkring i de fleste omgivelser ved hjælp af fysisk støtte eller ved brug af el-kørestol. De kan måske gå omkring på korte distancer i hjemmet når de får fysisk støtte, når de er placeret i kropsstøttende gangredskab eller de bruger el-kørestol. I skolen, udenfor og i nærmiljøet transporteres børnene i en manuel kørestol eller de anvender en el-kørestol.
GMFCS niveau IIIBørnene går ved brug af håndholdt gangredskab i de fleste indendørs omgivelser. De kan måske gå på trapper, når de holder ved gelænder, med supervision eller støtte. Børnene bruger kørestol på længere distancer og kan måske selv køre manuel kørestol på kortere distancer.
GMFCS niveau IIBørnene kan gå i de fleste omgivelser og kan gå på trapper når de holder ved gelænder. De vil måske have vanskeligheder når de går lange distancer og når de går i ujævnt terræn, på stigninger, og når der er begrænset plads og når der er mange mennesker tæt på. Børnene vil måske gå med fysisk støtte, med et håndholdt gangredskab eller bruge en kørestol på længere distancer. Børnene har begrænsede evner til at udføre grovmotoriske aktiviteter som løb og hop.
GMFCS niveau IBørnene går i hjemmet, i skolen, udendørs og i nærmiljøet. De kan gå på trapper uden støtte ved gelænder. Børnene udfører grovmotoriske aktiviteter som at løbe og hoppe, men tempo, balance og koordination er begrænset.
GMFCS descriptors: Palisano et al. (1997) Dev Med Child Neurol 39:214–23 CanChild: www.canchild.ca
Illustrations Version 2 © Bill Reid, Kate Willoughby, Adrienne Harvey and Kerr Graham, The Royal Children’s Hospital Melbourne ERC151050
Translation to Danish: Kirsten Nordbye-Nielsen, [email protected] Aarhus University Hospital, Denmark. May 2017
I
II
Age (< vs. > 7 years)CP Subtype (Unilat spastic CP vs. - Bilat spastic CP )

’Responder’Girl - 5.5 years - GMFCS I - FMS: 6-6-6
Baseline 52 weeks
Recommendations
(Control group)
Interventions
- Physiotherapy 1-3 / week- Botulinum toxin

’Non-responder’Boy - 9 years - GMFCS I - FMS: 6-6-6
Baseline 52 weeks
Recommendations
- Follow-up on ROM in ankle- Consider serial casting (if decreasing)
- Physiotherapy
Interventions
- Physiotherapy 2 / week
Height: 132 vs. 140 cm
22
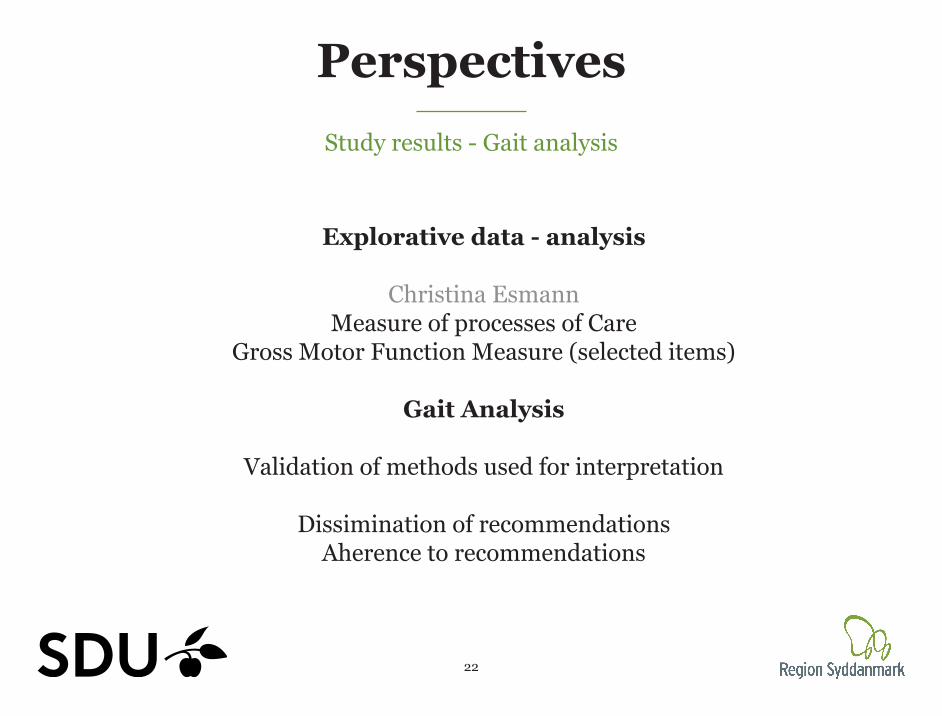
PerspectivesStudy results - Gait analysis
Explorative data - analysis
Christina EsmannMeasure of processes of Care
Gross Motor Function Measure (selected items)
Gait Analysis
Validation of methods used for interpretation
Dissimination of recommendationsAherence to recommendations

44
Study aimThe aim of this study was to investigate the threshold values used by the CPUP by testing the hypothesis that passive range of motion in ankle dorsiflexion is associa-ted with gross motor function and that gross motor function differs between the groups of participants in each category.
Study IIIThresholdvaluesofankledorsiflexionandgrossmotorfunctioninchildrenwithcerebralpalsy–acrosssectionalstudy
1
Title
Thresholdvaluesofankledorsiflexionandgrossmotorfunctioninchildrenwithcerebralpalsy–across-sectionalstudy
HelleMRasmussen1,2,JoachimSvensson2,MariaThorning1,NielsWPedersen1,2,SørenOvergaard1,2,AndersHolsgaard-Larsen1,2.
1DepartmentofOrthopedicSurgeryandTraumatology,OdenseUniversityHospital,Denmark2DepartmentofClinicalResearch,UniversityofSouthernDenmark,Odense,Denmark
Correspondingauthor:HelleMätzkeRasmussen,[email protected]:ActaOrthopedica:http://www.actaorthop.org
Wordcount:3182.
Abstractwordcount:245.
Spelling:AmericanEnglish
Range of motion and clinical cut-off points in ankle dorsiflexion are not correlated with
motor function in children with cerebral palsy – a cross sectional study
H.M. Rasmussen, J. Svensson, M. Thorning, N.W. Pedersen, S. Overgaard, A. Holsgaard-Larsen. Department of Orthopaedic Surgery and Traumatology Odense University Hospital, Odense, Denmark and
Institute of Clinical Research University of Southern Denmark, Odense, Denmark
”Clear” - no indication of deterioration was noted during the examination”.
”Vigilant observation, modified treatment or initiation of treatment is necessary”.
‘‘Alert - treatment is urgently needed, assuming no specific contraindications are present”.
Reference: www.cpup.se
Figure 1 Ankle Dorsiflexion Clinical cut-off points and clinical inter-pretation for the three categories of passi-ve range of motion i ankle dorsiflexion with flexed and extended knee.
Flexed knee
≥20° ≥10
Extended knee
>10° - <20° >0° - <10°
≤10° ≤0°
The Cerebral Palsy follow-up program (CPOP) uses cut-off points (traffic light signals) to categorize passive range of motion (ROM) in: green, yellow and red in order to guide clinical decisions (figure 1).
The cut-off points are not evidence based and potential relationships with gross mo-tor capacity and patient-reported gross motor performance have never been esta-blished.
To investigate passive ROM and the traf-fic light categories for ankle dorsi- flexion and their relationships with gross motor capacity and patient-reported gross motor performance in children with cerebral palsy (CP) by testing the hypo-thesis that:- associations between ankle dorsiflexi-on and gross motor capacity/performance exist in children with cerebral palsy.- gross motor capacity/performance differs according to the traffic light categories using passive ankle dorsiflexion.
Material and methods We conducted a cross-sectional study of 60 children with spastic CP at GMFCS levels I-II, aged 5-9 years.
Passive ROM were measured as maximal ankle dorsiflexion with flexed and extended knee using goniometry and the categories applied using the cut-off points provided by CPOP. Furthermore 1-min walking distan-ce (1-min walk), Gross Motor Function Me-asure (GMFM) and Pediatric Quality of Life Inventory Cerebral Palsy Module: move-ment and balance subscale (Pedsql) were collected.
Associations were investigated with Pearson correlation coefficients. Differen-ces in the three groups based on the traffic light categories were investigated with one-way ANOVA.
Results Opposed to our hypothesis no significant correlation (r2 < 0.2, p>0.05) were docu-mented between ROM versus 1-min walk, GMFM and Pedsql (table 1). Furthermore, the group mean values of the outcome measures in the three categories according to ROM did not differ (table 2).
Passive ROM in ankle dorsiflexion is not correlated with gross motor capaci-ty/performance, why the cut-off points used in CPOP are of limited clinical va-lue in relation to gross motor capacity and patient-reported gross motor perfor-mance. As a consequence passive ROM and gross motor capacity/performance may be considered as separate constructs, which may have impact on the decision-making of treatment for the patient group.
Background Aim of study Conclusion
Table 1. Pearson correlation coefficients
Dorsiflexion (knee 90o) r r2 p-value1-min walk test 0.11 0.01 0.41GMFM 0.09 0.01 0.50Pedsql -0.01 0.00 0.96
Dorsiflexion (knee 0o)1-min walk test 0.17 0.03 0.21GMFM 0.09 0.01 0.50Pedsql 0.06 0.03 0.68
Abbriviations: Gross Motor Function Measure (GMFM), Pediatric Quality of Life Inventory Cerebral Palsy Module: movement and balance subscale (Pedsql).
OUH - Odense University Hospital
Table 2. Mean scores (SD) of the three groups and results of the ANOVA.
Dorsiflexion (knee 90o) Green Yellow Red p-valueParticipants n=40 n=6 n=141-min walk test 80 (13) 78 (15) 76 (18) 0.674GMFM 82 (8) 82 (11) 8 (8) 0.975Pedsql 74 (19) 73 (19) 78 (22) 0.744
Dorsiflexion (knee 0o) Green Yellow RedParticipants n=49 n=5 n=61-min walk test 80 (12) 80 (14) 73 (28) 0.529GMFM 82 (8) 82 (11) 83 (8) 0.975Pedsql 74 (20) 84 (20) 70 (16) 0.489
Abbriviations: Gross Motor Function Measure (GMFM), Pediatric Quality of Life Inventory Cerebral Palsy Module: movement and balance subscale (Pedsql).

9
Passive Range of Motion
Alriksson-Schmidt AI et al (2016)Dorsiflexion with extended knee

11
CPOP - Traffic light
Alriksson-Schmidt AI et al (2016)
”Clear and that no indication of deterioration was noted during
assessment”.
>10o
”Yellow indicates that vigilant observation or potentially
treatment is recommended”.
0-10o
“Alert” and that treatment is urgently needed
(assuming no specific ontraindications)”.
<0o
Dorsiflexion with extended knee

10
Interpretation
”For children on GMFCS levels I to III, the threshold values of passive range of motion are set to ensure that the patient is able to dorsiflex adequately in the stance and swing of walking.”
Threshold values
Cerebral Parese Oppfølgingsprogram (CPOP)Alarmverdier for passive bevegeutslag 2014

15
ResultsRange of Motion i ankle dorsiflexion
(Extended knee)
010
2030
40G
ait V
aria
ble
Scor
e an
kle
-20 -10 0 10 20 30 40 50 60Dorsalflexion with extended knee (degree)
Gait variable score
r = -0.3795% CI [-0.57 - -0.13]
4060
8010
012
0G
ait D
evia
tion
Inde
x
-20 -10 0 10 20 30 40 50 60Dorsalflexion with extended knee (degree)
Gait Deviation Index
r = 0.0595% CI [-0.21 - 0.30]

16
4060
80100
120
GDI
Green Yellow Red
ResultsThreshold values - ankle dorsiflexion
(Extended knee)
Gait variable score
010
2030
40gv
s_an
kle
(deg
ree)
Green Yellow Red
Gait Deviation Index
n = 49 n = 5 n = 6 n = 49 n = 5 n = 6
p = 0.02p = 0.6

17
ResultsPassive Range of Motion in ankle dorsiflexion
(Extended knee & Flexion knee)
NO associatio and NO differenceGait Deviation Index
1-minute walkGross Motor Function Measure (selected items)
The Pediatric Quality of Life Inventory CP ModulePediatric Outcome Data Collection Instrument
Association and difference betweenGait Variable Score, ankle
Peak dorsiflexion during gait

19
Study III - ConclusionStudy aimThe aim of this study was to investigate the threshold values used by the CPUP by testing the hypothesis that passive range of motion in ankle dorsiflexion is associa-ted with gross motor function and that gross motor function differs between the groups of participants in each category.
ConclusionPassive range of motion in ankle dor-siflexion is moderately associated with ankle-specific measures of gross motor function, and the mean scores of the ankle-specific measures were different in the three categorical groups. In contrast to our hypothesis, we did not find an important relationship between passive range of motion in ankle dor-siflexion or the three related categories and overall measures of gross motor capacity or the use of gross motor skills in everyday life.

64
Examples - ”traffic light”
High GDI - red valuesGDI: 88.8 Dorsiflexion: 50 / 00
Low GDI - green valuesGDI: 48.9 - GVS: 33.50
Dorsiflexion: 200 / 150

55
Discussion - Perspective
Interpretation of examinations- gait analysis- ROM surveillance Example:Hip surveillance and CPUP hip score- inter- and intra-rater reliability- odds ratio for hip displacement- risk score for hip displacement
27
Thanks!
Participants and their parentsThe local teams and helathcare professionalsResarch assistants & colleguesAcademic advisors and co-authors
University of Southern Denmark, Odense University Hospital Research grant, Region of Southern Denmark Research grant and PhD grant, The Physiotherapy Practice Foundation, The Ludvig and Sara Elsass Foundation, The Linex Foundation and The Danish Physiotherapy Research Fund.
Test Team A
Retest
Laboratory Team B
Team C
+
+
+
Test Team A
Retest
Laboratory Team B
Team C
+
+
+