Embed Size (px)
Citation preview

July 2015
A.T. Kearney Energy Transition Institute
Introduction to Smart Grids
Beyond smart meters

Smart Grids 1
Compiled by the A.T. Kearney Energy Transition Institute
Acknowledgements
A.T. Kearney Energy Transition Institute wishes to acknowledge for their review of this FactBook: Dr. Mohamed A. El-Sayed, Professor Electrical Department at College of Engineering and Petroleum, Kuwait University; Professor Anna Creti, UniversitéParis Dauphine, Senior Research Fellow at Ecole Polytechnique, Visiting Research Fellow at University of California Berkeley; Jacqueline Chia, Senior Assistant Director Energy Division (Energy Market) at Ministry of Trade & Industry, Singapore. The Institute also wishes to thank the authors of this FactBook for their contribution: Bruno Lajoie, Romain Debarre, Yann Fayet and Gautier Dreyfus.
About the “Smart Grids Series”
The “Smart Grids Series” is a series of publicly available studies on smart grids conducted by the A.T. Kearney Energy Transition Institute that aim to provide a comprehensive overview of the current and future electricity landscape, and the keys to understanding its principal challenges and developments through a technological prism.
About the FactBook - Introduction to Smart Grids
This FactBook summarizes the innovations that are collectively known as smart-grid technologies. It highlights the challenges faced by traditional grid designs; identifies key smart-grid technologies and categorizes them into three main applications; assesses the net economic and environmental benefits of smart grid roll-outs; highlights the technological and financial status of smartgrid deployment; and analyzes the historical and political context in order to identify selected policies for successful adoption.
About the A.T. Kearney Energy Transition InstituteThe A.T. Kearney Energy Transition Institute is a nonprofit organization. It provides leading insights on global trends in energy transition, technologies, and strategic implications for private sector businesses and public sector institutions. The Institute is dedicated to combining objective technological insights with economical perspectives to define the consequences and opportunities for decision makers in a rapidly changing energy landscape. The independence of the Institute fosters unbiased primary insights and the ability to co-create new ideas with interested sponsors and relevant stakeholders.
Introduction to Smart Grids

Smart Grids 2
Electricity grids need to be modernized to meet growing demand and integrate new applications
Power grids, which bring electricity to 85% of the world’s population, are arguably one of the most important engineering achievements ofthe 20th century. Today’s grids, century-old by design, were built to accommodate centralized generators, unidirectional electricity transportthrough high-voltage transmission lines, dispatch to consumer via lower-voltage distribution lines, and centralized control centers collectinginformation from a limited number of network hubs called substations.
The goal of a power grid is to optimize, for a given combination of generation capacity and demand patterns, the reliability of power supply(the frequency and extent of outages), the quality of power supplied (in terms of voltage signal shape, frequency and phase angle), and itsaffordability.
Today’s grids are facing four principal problems and these are growing in severity. First, global electricity demand is rising faster thandemand for any other final energy source; in addition, the electrification of the economy intensifies end-user demand around peak hours,stressing grids and making rapid expansion a necessity. Second, aging infrastructure tends to compromise reliability of power supply andexacerbate energy losses to the detriment of economies undergoing rapid electrification. Third, as the share of Variable RenewableEnergy (VRE) in the energy mix grows, the power grid will need to become more flexible to match supply and demand in real time. Finally,as the penetration of Distributed Generation (DG) rises to very high levels in some areas, issues relating to power quality and bi-directionalelectricity flows arise that cannot be properly managed by traditional grids.
Simplified view of the smart grid
High voltage
transmission
Voltage: 120-800 kV
Distribution networkTransmission networkCentralized power generation
Distribution primary
feeder
Voltage: < 50 kV
Distribution secondary feeder
Voltage: >110 V
Transmission control center Distribution control center
Substation
Data flow
Electricity flow Medium voltage
power generation
Voltage: 10-30 kV
Unidirectional flow of power
Limited data flowManual reading/No automation
Executive summary (1/5)

Smart Grids 3
A smart grid refers to a modernized electricity network that monitors, protects, and optimizes the operation of its interconnected elements
The notion of grid modernization differs from country to country, depending on the smartness of the existing system. However,notwithstanding such differences, smart grids are generally characterized by the use of digital information and communications technologiesto manage both the bi-directional flow of data between end-users and system operators, and the bi-directional flow of power betweencentralized and decentralized generation.
The goal of such a modernized network is to address grid challenges at a minimal cost. It should be able to accommodate all generation andstorage options, optimize energy efficiency and asset utilization, improve power quality for end-user devices, self-heal, resist physical andcyber attacks, and enable new business solutions in a more open-access electricity market, such as demand-response programs and virtualpower plants.
Beyond incremental changes in traditional grids, smart grids facilitate the expansion of independent micro-grids that are capable of“islanding” themselves from the main grid during power-system disruptions and blackouts. The modular nature of micro-grids may allow fortheir independence, interconnection and, ultimately, the construction of a new type of super-reliable grid infrastructure.
Simplified view of the traditional grid
Executive summary (2/5)
Smart centralized generation Smart consumptionSmart transmission Smart distribution
Bi-Directional flow of data
Bi-directional flow of power

Smart Grids 4
Smart-grid technologies can be segmented into three main applications for addressing grid challenges
The transition to a smart grid requires the deployment of new power infrastructure, along with various kinds of devices, such as electronic sensors and computer systems, throughout the electricity network and their interconnection via high-speed communications networks using standardized protocols. This FactBook covers the most important smart-grid technology solutions, which can only achieve their intended benefits – the three main smart-grid applications – when integrated together.
The first application involves the optimization of grid monitoring and control, with advanced sensors and IT solutions interconnected via modern communications networks in Wide-Area Monitoring & Control (WAMC) or Distribution Automation (DA) systems. Such systems enhance control over dispatchable power plants; improve routing of electricity flows; anticipate demand patterns or grid weaknesses by virtue of predictive algorithms and condition-based maintenance; react automatically to incidents threatening the reliability of power supply with the use of smart reclosers, which enable distribution grids to be self-healing.
The second purpose of smart grids is to enable consumers to contribute to grid management through the medium of intelligent end-user devices. Combining advanced metering infrastructure with smart appliances makes dynamic demand-response programs possible. Thesecan contribute to system flexibility (in addition to peaking power plants or electricity storage) to compensate for fluctuations in VRE output or to flatten out aggregated peak loads. Bi-directional smart meters enable net metering and vehicle-to-grid programs that incentivize individual customers to become local suppliers of power and storage capacity. In addition, automated meter readings reduce the operating costs of distribution-system operators and provide greater visibility into pilferage.
The third principal aim of smart-grid technology is to enhance the physical capacity of the network. Ultra-high voltage lines, direct-current underground cables or superconductors transport more power with lower energy losses and a smaller visual footprint than conventional power lines. These new technologies could be especially effective in connecting remote offshore wind farms to distribution grids or interconnecting asynchronous grids. Finally, it would also be possible to adjust dynamically the maximum admissible power throughput of transmission lines by installing special temperature sensors along them. This would allow the deferral of expensive and sometimes-controversial grid-extension plans.
Executive summary (3/5)

Smart Grids 5
Key smart-grid technologies segmented by main application
Executive summary (4/5)
Smart centralized generationSmart
transmissionSmart distribution
Smart appliances
reduce consumptions
Demand-Response
“Decrease peak load”
Smart Appliances
“Programmable devices”
HVDC
“Direct Current”
Vehicles-to-Grid
“Plug in to the grid”
CVR
“Conserve voltage,
save energy”
Distribution
Automation
“Self-healing”
Smart Meters
“Bidirectional & real time”
GW
Fault Current Limiter
“Absorb electric shock”
Dynamic Line Rating
“Adapt to the weather”
Superconductors
“0 resistance - 0 losses”
Wide-Area
Monitoring & Control
FACTS, VVC, SVC
“Maintain power quality”
Super-Grid
“Interconnected
micro-grids”
Net Metering
“Sell your surplus”
AC DC
Predictive Algorithms
“Forecast demand,
prevent failure”
PMU
“Synchronized sensor”
Smart consumption
Enhance physical network capacity
via new line type and power electronics
Optimize grid monitoring and control
via ICT systems, sensors and power electronics
Enable active customer
contribution
via end-user devices

Smart Grids 6
Smart grids promise numerous economic and environmental benefits, provided social acceptance and cybersecurity issues are thoroughly addressed
It is estimated that a smart-grid roll-out would generate net economic and environmental benefits in all regions where studies have taken place, although impacts are difficult to quantify. The U.S.’ Electric Power Research Institute (EPRI) estimates that the benefits for U.S. society as a whole would outweigh its costs by a factor of between 2.7 and 6. Restricting the scope to electricity-grid stakeholders, the International Energy Agency (IEA) estimates the ratio to be between 2 and 4 in OECD countries, and between 3 and 4.5 in China.
Although environmental sustainability is not the primary driver behind the adoption of smart grids, they help limit greenhouse gas emissions both directly (through energy savings) and indirectly (by encouraging the development of electric vehicles and renewables). The IEA estimates that smart grids could contribute to 4% of cumulated CO2 emissions-reduction efforts until 2030 in the lowest-cost pathway towards the 2°C target.
The concept of a smart grid relies to a large extent on active consumer participation and, for this reason, requires social acceptance. As future electricity grids will collect, communicate and store operational and private data, the issues of cybersecurity, data protection and data sharing must be carefully addressed.
Smart-grid technologies are attracting investor interest, but proper regulation and collaboration in standardization and best practices are vital to successful deployment
Global annual investments in electricity grids amounted to $218 billion in 2014 and are growing by 4% a year. Smart-grid technologies currently represent 20% of these investments ($44 billion), or $16 billion if the scope is restricted to digital energy technologies. Smart-grid investments are expected to grow by 5% a year until 2020, led by digital energy (9% a year), due in particular to rapid smart-meter roll-out: 100 million units were installed in 2014, and the penetration rate globally is set to increase from 22% to 40% in 2020.
In addition to technology deployment, private investors' interests in smart-grid RD&D intensified after 2008, following announcements of support from the U.S. DOE ($4.5 billion committed), and EU (€3 billion already allocated). Although raised funds have stabilized since 2011, venture capitalists remain highly interested in digital-energy technologies, which comprise one of the most coveted clean energy investments – only just behind solar PV – in terms of numbers of deals (35) and funds raised ($200 million) in 2014.
If smart-grid investments are mostly borne by system operators, benefits are spread among many parties (including customers and all citizens, if environmental benefits are taken into account). Yet as electricity markets evolve, with the unbundling of monopolies, the design of smart-grid business models is becoming more complex. Therefore, carefully planned regulation is required to encourage smart-grid roll-outs. Finally, standards covering interoperability, compatibility and industry best practice are among the most crucial prerequisites for smart-grid deployment, in avoiding the premature obsolescence of smart-grid devices.
Executive summary (5/5)
Smart Grids 7
Executive summary............................................................................................................................................................................................................. 2
1. Challenges in existing electricity grids...................................................................................................................................................................... 8
2. Smart-grid concepts and solutions ........................................................................................................................................................................... 20
2.1 Smart-grid concepts ................................................................................................................................................................................................. 22
2.2 Smart-grid solutions….............................................................................................................................................................................................. 29
3. Benefits and challenges of smart-grid roll-out.......................................................................................................................................................... 35
3.1 Economic and environmental benefits….................................................................................................................................................................. 37
3.2 Social acceptance and cybersecurity....................................................................................................................................................................... 44
4. Status of smart-grid deployment................................................................................................................................................................................ 47
4.1 Private investments…............................................................................................................................................................................................... 49
4.2 Public initiatives........................................................................................................................................................................................................ 56
4.3 RD&D landscape...................................................................................................................................................................................................... 62
5. Regulation and policy……………………….................................................................................................................................................................. 64
5.1 Evolution of grid regulations...................................................................................................................................................................................... 66
5.2 Best practices………………………………………………………………………………………………………………………………………………….... 71
6. Appendix: Smart-grid technologies insights............................................................................................................................................................. 75
6.1 Enhance physical network capacity………………….…............................................................................................................................................. 76
6.2 Optimize grid monitoring and control…………………………………………………………………………………………............................................. 85
6.3 Enable active customer contribution……….............................................................................................................................................................. 93
7. Acronyms & bibliography……..................................................................................................................................................................................... 100
Table of contents
Executive summary (5/5)

Smart Grids 8
Executive summary (5/5)
1. Challenges in existing electricity grids

Smart Grids 9
Main findings
Challenges in existing electricity grids
• Sometime century-old by design, existing grids face four main challenges globally:
– Electricity demand is rising faster than any other final-energy source (2% per year until 2040), and intensifying around peak times because of the progressive shift in consumption from steady industrial baseload to variable household and commercial demand. As a result, networks are being both reinforced to increase existing capacity, and extended to reach larger customer bases;
– Existing grid infrastructure is aging, because of very long return-on-investment cycles. In the U.S., the aging transmission network is causing a decline in power reliability. In some developing economies, such as India, theft and technical losses ininadequate distribution networks result in 20% of transmitted electricity being lost. The global financial impact of such grid issues is growing, as economies are ever-more reliant on electricity;
– As wind and solar capacity increase, the penetration of Variable Renewable Energy (VRE) in some regions is reaching levels that are creating difficulties in the balancing of supply and demand at a reasonable cost;
– Distributed Generation (DG) annual capacity addition is set to double in the next 10 years. Yet, in most cases so far, distributed capacity is either off-grid or merely connected to the grid, but not properly integrated into grid operation. As a result, bi-directional electricity flows and power-quality issues arise where the penetration of DG becomes critically high.
• In response to these challenges, investments in electricity grids are increasing by 4% a year globally, a growing share of whichis directed towards smart-grid technologies (20% in 2014).
• Overall, the goal of a power grid is to co-optimize, for a given set of generation capacity and demand patterns:
– Power reliability (frequency and extent of outages);
– Power quality (voltage signal shape, frequency and phase angle); and
– Power affordability for consumers.
Challenges in existing electricity grids

Smart Grids 10
Electricity networks will face four main challenges in the coming decades
Challenges in existing electricity grids
Four main challenges for the electricity networks
• Electricity losses (from inefficiencies or theft) are a growing weight on the economy of developing countries
• Aging infrastructure increasingly raises concerns about power reliability (blackouts), an issue that also affects some developed Western countries
• Rising demand in developing economies requires rapid extension of grid capacity
• Intensifying demand around peak hours puts specific strains on the grid
• Increasing need for flexibility sources to compensate for variability of supply
• Long distance between offshore wind farms and main demand centers
• Potential power-quality issue and backflow of electricity into the transmission grid
• Uncontrolled charging or discharging of electric vehicles needs to be anticipated
Rising and
intensifying
electricity demand
Aging grid
infrastructure
Increasing
share of Variable
Renewables (VRE)
Increasing
share of Distributed
Generation (DG) &
electric vehicles
1
2
3
4
Source: A.T. Kearney Energy Transition Institite analysis, adapted from IEA (2011), “Technology Roadmap: Smart Grids”. Picture credits (from top to bottom): Foolcdn.com; National Geographic; H2heuro.org; Forbesimg.com

Smart Grids 11
Electricity-demand growth is outpacing that of all other final energy carriers, and will be increasingly supplied by variable renewables (VRE)
Challenges in existing electricity grids
Global final1 energy consumption by type of energy carrierTWh, %
1. Final consumption exclude all production and transport losses. Discrepancy between electricity consumption and electricity production is due to electricity T&D losses 2 Direct heat from electricity co-generation, solar thermal, or geothermal; 3 VRE: Marine, CSP, Solar PV and Wind; 4 The New Policies Scenario is IEA’s best case forecast given enacted and proposed government policies as of 2014.
Source: IEA (2014), “World Energy Outlook 2014”
Global Electricity Production1 By Primary Energy SourceTWh, %
+1.2%
2040
18%
18%10%
3%
23%
2012
104,01012%
8%
41%
15%
13%
145,226
36%
3%
CAGR
2012-2040
+0.4%
+1.8%
+0.9%
+0.7%
CAGR
2012-2040
2.7%
+2.0%
2012
23.7%
1.2%
15.5%
12.6%
22,721
22.5%
40,104
5.0%
1.9%
0.3%
3.9%
16.2%
2040
10.8%
40.5%
11.6%
30.5%
0.9%
+1.8%
+1.8%
+8.8%
+2.6%
+1.6%
+2.1%
+1.6%
+0.5%
Coal
Gas
Hydro
Geothermal
Nuclear
Oil
VRE3
Bioenergy
+1.8%
Oil
Electricity
Gas
Bioenergy
Coal
Heat2
+2.1%
(IEA New Policies Scenario4) (IEA New Policies Scenario4)
Rising demand1

Smart Grids 12
Electricity networks are being extended around the world to reach larger customer bases and isolated power sources
Challenges in existing electricity grids
Length of global transmission networksThousands km
Source: NRG Expert (2013), “Electricity T&D white paper”; Fairley (2015), “Germany takes the lead in HVDC”, IEEE; Picture Credits: Bryan Christie Design
German Transmission-enhancement plan
+2.1%
2016e
5,245
2015e
5,140
2013
4,955 5,045
2012 2014e
4,8744,721
2011
Africa N. America AsiaEuropeS. America
Rising demand1
• Transmission lines are being extended by 2.1% per year globally, with most growth occurring in Asia (+2.5%), to meet growth in electricity demand.
• Distribution lines – more than 10 times longer than transmission lines – are also being added to a rate of 1.3% a year, especially in Africa, to reach an increasingly dispersed customer base.
• In developed economies, grid extensions are being undertaken to improve interconnections between power grids and connect remote renewable power plants.
• In Germany, for instance, a €10 billion transmission-enhancement project is already under way to ship power from northern wind turbines to the south, which used to be more reliant on nuclear energy (picture above).

Smart Grids 13
As developing economies reach an increasingly scattered customer base, the economic impact of electricity losses is worsening
Challenges in existing electricity grids
Source: The World Bank, Electric power transmission and distribution losses, 2011 dataset ; Northeast Group (2014), "India Smart Grid: Market Forecast 2015 – 2025"
Aging grid2Annual Electricity consumption per capita and Electricity T&D losses in 2011
9
15
7
77
6
10
21
33
45
6
2
1113
35
6
12
0% 10% 20% 30% 40% 50%
OECDArab world
8World average
UK
28
46
Germany
IsraelKorea
FranceUSA
CambodiaCongo, Rep.
Chile
Mexico
China
9
South Africa 8
Brazil
Russia
16
India
Indonesia
Qatar
Saudi Arabia
Oman
27Yemen, Rep.Iraq
8
BahrainUnited Arab Emirates
Egypt, Arab Rep.
9Spain
814 6 212 1016 4 0
0
1
3
1
0
35
22
4
7
5
13
10
77
109
28
6
16
23
1
9
6
0
• Transmission and Distribution (T&D) losses average 8% globally, but vary extensively around the globe, largely falling in the 3-20% range, but reaching up to 50% in some regions.
• Globally, about 75% of T&D losses occur in distribution grids. This is the result of technical factors (lower voltage and longer length) and theft (mostly in developing economies):
• In India alone, about two-thirds of T&D losses are non-technical. In some regions, up to half of the electricity put into the grid is stolen. While only accounting for 4% of global electricity demand, India accounts for 18% of global revenue losses from theft – estimated at $90 billion annually2;
• By comparison, in developed economies, non-technical losses are estimated to be below 1% of all losses incurred.
• As networks expand to reach larger and more widely dispersed customer bases in developing economies, losses are expected to continue to increase.
• Overall, the inefficiency of dilapidated or underdeveloped T&D systems incur economic losses that have an impact far beyond the power industry. These economic losses are often under-estimated.
MWh per capita % losses

Smart Grids 14
Aging transmission infrastructure in some Western economies poses a growing threat to reliability of power supply
Challenges in existing electricity grids
Source: A.T. Kearney Energy Transition Institite analysis; Amin (2011), “Turning the Tide on Outages”; U.S. DOE, “The Smart Grid - An introduction”; U.S. DOE, energy.gov database; International Business Time (July 17, 2014), “Aging US Power Grid Blacks Out More Than Any Other Developed Nation”; Picture Credits: NASA
Aging grid2U.S. August 2003 blackoutNASA satellite image
• Power reliability measures power outages, also called “blackouts”
– The three most common reliability indexes focus on the frequency (F) or duration (D) of blackouts, from the point of view of the grid system (S) or for a random customer (C): SAIDI (System Average Interruption Duration Index), CAIDI and CAIFI.
• Power reliability is declining in some Western economies, particularly in the U.S., where blackouts are causing significant economic disruption
– According to U.S. federal data, blackouts are costing at least $150 billion each year ($500 per person). Grid blackouts are approximately three times more frequent today than in 1981, and last between 92 and 214 minutes per year, depending on the state, compared with four minutes per year in Japan.
• If the direct causes of blackouts are weather, mechanical failure or human-related (attacks, mistakes), the main root cause in the U.S. is aging power infrastructure
– “The power grid, which could be considered the largest machine on Earth, was built after World War II from designs dating back to Thomas Edison, using technology that primarily dates back to the '60s and '70s” (IBT, July 17 2014).
• An aging grids is poorly adapted to:
– Extreme weather events, such as storms and floods;
– Intensifying demand: growth in U.S. peak demand for electricity since 1982 has exceeded transmission-capacity growth by almost 25% a year.

Smart Grids 15
The fundamental requirement of an electricity system is to ensure real-time balancing between supply and demand, at a minimal cost
Challenges in existing electricity grids
Source: A.T. Kearney Energy Transition Institite analysis, based on Réseau de Transport d’Electricité website dataset (www.rte-france.com/fr/developpement-durable/eco2mix) and on A.T. Kearney Energy Transition Institite (2013), “Electricity Storage FactBook”
Variable renewables3Electrical Power generated and consumed in France (December 7, 2014) GW
Production
70
Consumption
70
= Consumption (68)
Exports (1)
Storage (1)
10
30
50
70
80
40
20
0
60
Base load
Flexible generation
Midnight Midnight
Oil RenewablesNuclearHydroGas Coal
Renewables
Noon
Zoom at 12:30 PM
• As a just-in-time process, electrical consumption must be balanced with adequate production at all time.
• Each power-generation source has a different degree of flexibility, which expresses “the extent to which a power system can modify electricity production or consumption to variability, expected or otherwise” (IEA).
• However, economic considerations mean it is necessary to prioritize the use of production capacity by order of increasing operating costs (merit order):
1. VRE have virtually no operating costs and almost always supply 100% of the electricity they are generating at any given moment to the grid;
2. Baseload power plants (e.g. nuclear, coal) are highly inflexible, and usually produce the majority of electricity at low operating cost;
3. More flexible power sources (e.g. gas turbines, hydro) are used to balance electricity supply when required;
4. In addition to flexibility of supply, storage (usually expensive) and imports/exports (not always available) can be called upon.

Smart Grids 16
As the penetration of variable renewables (VRE) increases, additional flexibility sources will be needed to compensate for their unreliability
Challenges in existing electricity grids
Source: 50Hertz data archive (Wind and Solar Actual In Feed 2012, Control Load 2012); Adapted from IEA (2011), “Harnessing Variable Renewables”
Variable renewables3
Wind and solar PV output exampleMW
Concept of flexibility management
0
2000
4000
6000
8000
10000
12000
14000
PV Wind Demand
Dec 1st 2014 Dec 31st 2014
Flexibility Needs Flexibility SourcesRegional transmission grid operated by 50Hertz in Germany
Dispatchable
power plants
Demand
response(smart grid enabled)
Electricity
storage
Connections
with adjacent
markets(smart grid enhanced)
Demand
variability &
uncertainty
Variable
renewables
Power plants &
grid
contingencies
Power market
System operations
Grid hardware
Links

Smart Grids 17
The other requirement of an electricity network is to ensure power quality is adapted to each consumer
Challenges in existing electricity grids
Distributed generation4Illustrative AC signal perturbations
• Power quality measures small disturbances in the voltage signal1
(unlike power reliability, which measures complete loss of signal).
• Ideally, in a synchronous AC grid, a voltage signal consists of a pure sinusoid waveform that has:
1. Constant amplitude over time, which depends on location (e.g.220V for domestic appliances, more for industrial customers…);
2. Fixed frequency throughout the whole grid (e.g. 50 Hz in Europe);
3. No phase angle2 between locations.
• Deviations from these conditions may cause inefficiencies in end-user devices, which are generally optimized for a nominal voltage signal2.
– Small deviations from nominal voltage are unavoidable but provide insightful operating data: a local drop in voltage indicates oversupply in the vicinity; the frequency of the whole grid decreases when total load exceeds total supply; and a phase angle appears when one part of the grid is undersupplied compared with another;
– Larger deviations can lead to power failure and black-outs.
• Power quality must therefore be monitored and controlled dynamically to ensure both energy efficiency and power reliability.
Perturbed amplitudeVoltage (V)
-300
-100
100
300
0 20 40 60 80 100 120
Perturbed
Reference
220V
Time (ms)
130V 220V
1
1. Refer to appendix 6.1 slide 84 for details on voltage control; 2 The phase angle measures, between -180° and 180°, the difference in synchronization of two sinusoidal signals measured simultaneously at two locations in the grid. At 0°, signals peak or cancel at the same time. At ±180°, they are symmetrically opposite.
Source: A.T. Kearney Energy Transition Institite analysis
Perturbed frequency
-300
-100
100
300
0 20 40 60 80 100 120
Perturbed
Reference
50Hz 49HzFrequency decreasing
Time (ms)
Voltage (V)
2
Presence of a phase angle2
-300
-100
100
300
0 10 20 30 40 50 60
Voltage A
Voltage B
Voltage (V)
Time (ms)
Phase angle of 18° between locations A and B
A
B
3
• Not all customers require the same power quality: The higher the power quality requested, the higher the price charged
Smart Grids 18
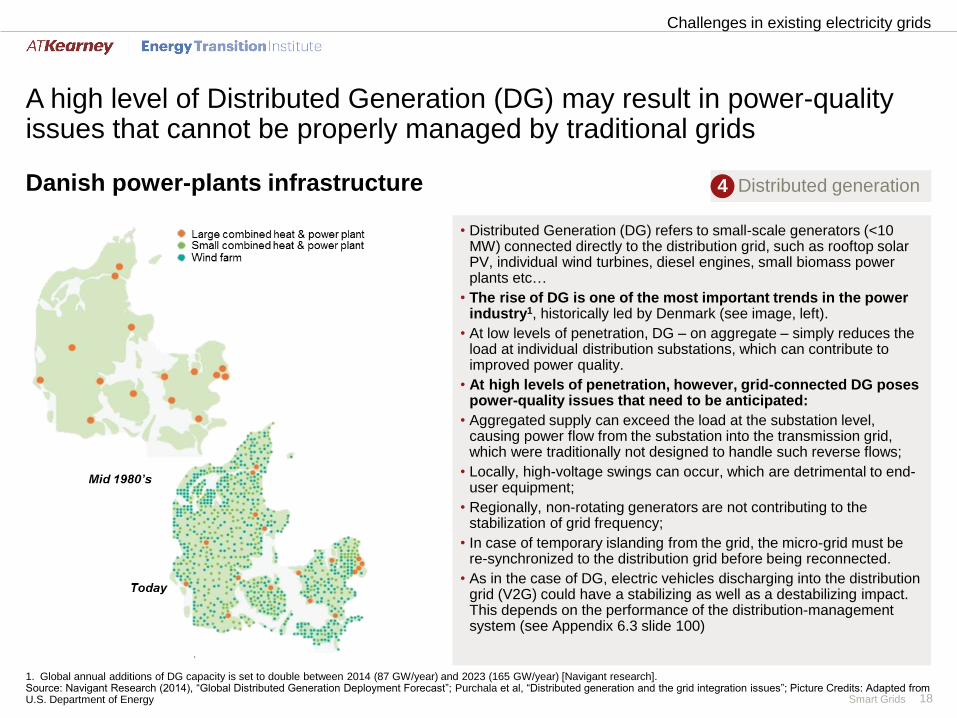
A high level of Distributed Generation (DG) may result in power-quality issues that cannot be properly managed by traditional grids
Challenges in existing electricity grids
Distributed generation4Danish power-plants infrastructure
• Distributed Generation (DG) refers to small-scale generators (<10 MW) connected directly to the distribution grid, such as rooftop solar PV, individual wind turbines, diesel engines, small biomass power plants etc…
• The rise of DG is one of the most important trends in the power industry1, historically led by Denmark (see image, left).
• At low levels of penetration, DG – on aggregate – simply reduces the load at individual distribution substations, which can contribute to improved power quality.
• At high levels of penetration, however, grid-connected DG poses power-quality issues that need to be anticipated:
• Aggregated supply can exceed the load at the substation level, causing power flow from the substation into the transmission grid, which were traditionally not designed to handle such reverse flows;
• Locally, high-voltage swings can occur, which are detrimental to end-user equipment;
• Regionally, non-rotating generators are not contributing to the stabilization of grid frequency;
• In case of temporary islanding from the grid, the micro-grid must be re-synchronized to the distribution grid before being reconnected.
• As in the case of DG, electric vehicles discharging into the distribution grid (V2G) could have a stabilizing as well as a destabilizing impact. This depends on the performance of the distribution-management system (see Appendix 6.3 slide 100)
1. Global annual additions of DG capacity is set to double between 2014 (87 GW/year) and 2023 (165 GW/year) [Navigant research].Source: Navigant Research (2014), “Global Distributed Generation Deployment Forecast”; Purchala et al, “Distributed generation and the grid integration issues”; Picture Credits: Adapted from U.S. Department of Energy

Smart Grids 19
226224218
206195
0
50
100
150
200
250
2016e2015e
CAGR1:+3.8%
2014e
$ billion
2012 2013
Power-grid investments are rising, with a growing share of investment directed towards smart-grid technologies
Challenges in existing electricity grids
Annual investments in Electricity networks globally(2012-2016)
• Annual investments in electricity grids amount to 45% of all investments in the power sector (including generation), and 17% of investments in the entire energy system.
• Grid investments are projected to increase strongly in the coming decade:
– 3.8% CAGR1 between 2012 and 2016 (see graph);
– A 44% increase from the annual average of the 2000-13 period to the annual average of the 2014-20 period.
• About 75% of these investments concern the distribution network, which represents 90% of the overall length of Transmission and Distribution (T&D) networks.
• Asia is driving most of the growth, as countries across the region extend the length of their grids to accommodate rapid increases in demand for power.
• Smart-grid technologies accounted for 20% of all electricity-grid investments in 2014 and annual investments in smart-grid technologies now amounts to an estimated $44 billion.
• The expected growth of smart-grid investments should outpace that of traditional grid components in the coming decade, with 5% CAGR1
expected between 2014 and 2023 (rising from $44 to over $70 billion).
55554445
33
0
50
100
150
200
250
CAGR1:+13.4%
Strictly speaking, smart grid investments should be a share of total grid investments. However, figures come from two different sources, which may have slightly different scope and classification; 1 CAGR: Compound annual growth rateSource: NRG Expert (2013), “Electricity T&D White Paper” for T&D Investments; Navigant Research (2013), “Executive Summary, Smart Grid Technologies, Global Market Analysis and Forecasts” for Smart Grid Investments; IEA (2014), “World Energy Investment Outlook”; Navigant Research (2014), “Executive Summary: Smart Grid Technologies“
Smart grid investments (Navigant Research 2014)
Total grid investments (NRG Expert 2013)

Smart Grids 20
2. Smart-grid concepts and solutions

Smart Grids 21
Main findings
2.1 Smart grid concepts
• A traditional electricity grid is characterized by centralized power generation, a high-voltage transmission network and a low-voltage distribution network.
• The development of variable renewables, distributed generation and storage require the reconfiguring of grid architecture and control systems into smarter arrangements.
• A smart grid is a modernized electricity network that monitors, protects, and optimizes the operation of its interconnected elements. The transition to a smart grid may require the construction of new power infrastructure, along with the deployment of various kinds of devices, such as electronic sensors and computer systems, throughout the electricity network and their interconnection via high-speed communications networks using standardized protocols. This FactBookcovers 20 of the most important technology solutions (detailed descriptions are in the Appendix).
2.2 Smart grid solutions
• Smart grids have three main applications:
1. They enable active consumer contribution to grid management by virtue of end-user technologies. This is a particularly effective way to accommodate the rising share of variable and distributed generation (net metering, demand response, smart meters);
2. They enhance the physical capacity of networks with new types of cable and power electronics that increase maximal line throughput and minimize transport losses (High Voltage Direct Current, Dynamic Line Rating);
3. They optimize the monitoring and control of electricity flows, improving power quality and reliability within the existing grid (Wide-Area Monitoring & Control (WAMC) and Distribution Automation (DA) technologies).
• These applications address existing grid challenges, but are most effective when integrated altogether.
• Looking further ahead, the modular nature of micro-grids allows for their interconnection and, ultimately, the construction of a “super grid” on which “smart cities” function.
2. Smart-grid concepts and solutions

Smart Grids 22
A smart grid is a modernized electricity network that monitors, protects, and optimizes the operation of its interconnected elements
2.1 Smart-grid concepts and solutions – concepts
Traditional GridMain characteristics of traditional grids
Smart GridMain characteristics of smart grid
Source: IEA (2011), “Technology Roadmap, Smart Grids”; A.T. Kearney Energy Transition Institite analysis;EPRI (2011), “Estimating the Costs and Benefits of the Smart Grid”; Fang et al. (2012), “Smart Grid – The new and improved power grid: a survey”
Unidirectional flow of power
Limited data flowManual reading
Bi-directional flow of power
Generation Transmission ConsumptionDistributionSmart generation
Smart consumption
Smart distribution
Smart transmission
Bi-directional flow of data
• Manages the unidirectional flow of power, from centralized power generation to end users.
• Requires that electricity be consumed as it is produced (lacking the ability to store electricity).
• Lacks monitoring tools, precluding the tracking of short-term consumption trends and making utilities unable to react quickly to supply outages.
• Accommodates all generation and storage options, with a simplified interconnection process (“plug-and-play”).
• Enables active consumer participation: Access to up-to-date information on electricity usage and pricing influences purchasing behavior.
• Enables new business solutions in a more open-access electricity market, such as demand-response programs, virtual power plants, or storage capacities allocated optimally via market forces.
• Optimizes costs: Operates efficiently through condition-based maintenance and maximizes asset utilization with advanced routing and operation algorithms.
• Provides power quality for 21st century needs, as reflected by strengthened standards for end-user electronic devices ever-more sensitive to power quality.
• Self-heals: Continuous self-assessments to detect, analyze, respond to, and restore grid components or network sections.
• Resists attacks: Reduces physical and cyber vulnerabilities, from natural as well as human causes.
Key differences between traditional and smart gridsArea Traditional grid Smart grid
Communi-cation
Electromechanical Digital
One-way Two-way
Power Centralized Centralized and distributed
Monitoring and control
Few sensors Sensors throughout
Manual monitoring Self-monitoring
Manual restoration Self-healing
Failures and blackouts Adaptive and islanding
Limited control Pervasive control
Market Few customer choices Many customer choices

Smart Grids 23
A traditional electricity grid is characterized by a centralized generation delivering a large and controllable electricity flow through transmission and distribution networks
2.1 Smart-grid concepts and solutions – concepts
Simplified view of the traditional grid
1. Substations are composed of different devices. Principally, transformers to step up or down voltage, switches (fuses, breakers, reclosers) that open or close to re-route electricity flows or activate capacitors or inductors, and sensors to measure voltage, current, frequency, power.
Source: A.T. Kearney Energy Transition Institite analysis
Centralized power generation Distribution networkTransmission network
High-voltage transmission cable Voltage: 120-800 kVLength: 10-1,000 km
Power plants
Hydraulic (storage)
Industrial/commercial customer
Residential customer
Distribution primary feederVoltage: < 50 kVLength: 1-10 km
Distribution secondary feederVoltage: >110 VLinear network topology
Transmission control center
Substation1
Data flow
Electricity
flow
Medium-voltage power generationVoltage: 10-30 kV
Distribution control center

Smart Grids 24
The introduction of renewables and distributed capacity requires the modernization of the grid such that it can handle variable and bidirectional electricity flows
2.1 Smart-grid concepts and solutions – concepts
Simplified view of the traditional grid with local sources of supply and storage
Centralized power generation Distribution networkTransmission network
Substation1
Data flow
Electricity
flow
1. Substations are composed of different devices. Principally, transformers to step up or down voltage, switches (fuses, breakers, reclosers) that open or close to re-route electricity flows or activate capacitors or inductors, and sensors to measure voltage, current, frequency, power.
Source: A.T. Kearney Energy Transition Institite analysis
Power plants
Hydraulic (storage)
Industrial/commercial customer
Residential customer
Transmission control center Distribution control center
Renewables

Smart Grids 25
Smart Grids have three main applications: enabling active consumer contribution, enhancing physical networks, and optimizing grid monitoring and control
2.1 Smart-grid concepts and solutions – concepts
Three main applications of the Smart Grid
Centralized power generation Distribution networkTransmission network
Source: A.T. Kearney Energy Transition Institite analysis
Power plants
Hydraulic (storage)
Industrial/commercial customer
Residential customer
Transmission control center Distribution control center
Renewables
Optimize grid monitoring and control
via ICT systems, sensors and power electronics:Wide-Area Monitoring & Control (WAMC)
Distribution Automation (DA)Phasor Measurement Units (PMU)…
Enable active customer
contribution
via end-user devices:Smart meters
Demand responseNet metering
...
Enhance physical network capacity
via new line type and power electronics:High Voltage Direct Current (HVDC)
Superconductors (HTSC)Dynamic Line Rating (DLR)
Volt/VAR Control (VVC)….

Smart Grids 26
Key smart grid technologies can be classified by application and type of device
2.1 Smart-grid concepts and solutions – concepts
Smart Grid technologies BY application and device typeClick on each box to navigate to the associated FactCard in Appendix
Note: Numerous technologies have been deliberately excluded from the scope of this report for the purposes of simplification. Segmentation by application is only indicative. Overlaps exist, and smart-grid technologies only offer maximal benefits when integrated together.Source: A.T. Kearney Energy Transition Institite analysis
Generation ConsumptionDistributionTransmission
Transmission System Operator (TSO)
Distribution System Operator (DSO)
End-users (residential, industrial…)
Utilities, cooperatives, end-users..
Main stakeholders
Electronic
devices and
sensors
Type of
device
Electric-power
infrastructure
Communication networks
Systems and
processes
Micro-Grids and Smart Cities Micro-Grids and Smart Cities
Home Area Network (HAN)Field Area Network (FAN)Wide Area Network (WAN)
(no transmission)
High Voltage Direct Current (HVDC), Superconductors
Flexible AC Transmission Systems (FACTS)
Fault Current Limiters (FCL)
Smart Switches
Capacitor Banks
Vehicle-to-Grid (V2G)
Smart Inverters
Dynamic Line Rating (DLR)
Smart Appliances and In-Home Display (IHD)
Phasor Measurement Unit (PMU)
Advanced Metering Infrastructure (AMI, Smart meters, MDMS…)
Wide-Area Measurement System (WAMS)Wide-Area Monitoring & Control (WAMC)
Supervisory Control and Acquisition Data (SCADA)
Volt/VAR Control (VVC), Conservation Voltage Reduction (CVR)
Smart Protection: Predictive (Failure Prediction Algorithms) orReactive (Fault Detection, Isolation and Restoration, FDIR)
Building and Home Energy Management Systems (HEMS)
Distribution Management System (DMS), Distribution Automation (DA)
Net Metering
Virtual Power Plant (VPP)
Demand Forecasting
Demand Response (DR)
Technology application: Optimize grid monitoring and controlEnhance physical network capacity Enable active customer contributionA B C

Smart Grids 27
Smart-grid devices are intended to be deployed throughout electricity networks
2.1 Smart-grid concepts and solutions – concepts
Selected smart-grid devices along the T&D value chainClick on each icon to navigate to the associated FactCard in the Appendix
Note: Refer to the next few slides and to the Appendix for a more detailed analysis of each smart-grid device; FACTS: Flexible AC Transmission System; CVR: Conservation Voltage Reduction; PMU: Phasor Measurement Units; DLR: Dynamic Line Rating; AMI: Advanced Metering infrastructure.Source: A.T. Kearney Energy Transition Institite analysis
Bi-directional flow of data
Bi-directional flow of power
AMI
Power Infrastructure
Sensor & data acquisition (PMU, DLR…)
Electronic Devices and Sensors Data systems and processes
Supervisory Control & Acquisition Data
(SCADA)
Power management Systems:
GMS: Generation Management System
WAMS: Wide-Area Measurement System
DMS: Distribution Management System
HEMS: Home energy management system
Variable renewables and
conventional power plant
Storage and electrical vehicle
Smart switch (reclosers)
Substation transformerCapacitor banks for FACTS or CVR
Smart appliances
Advanced transmission cables
Data Electricity
Centralized generation Home electricity gridDistribution gridTransmission grid
WAMSGMSHEMS
DMS
Smart Grids 28
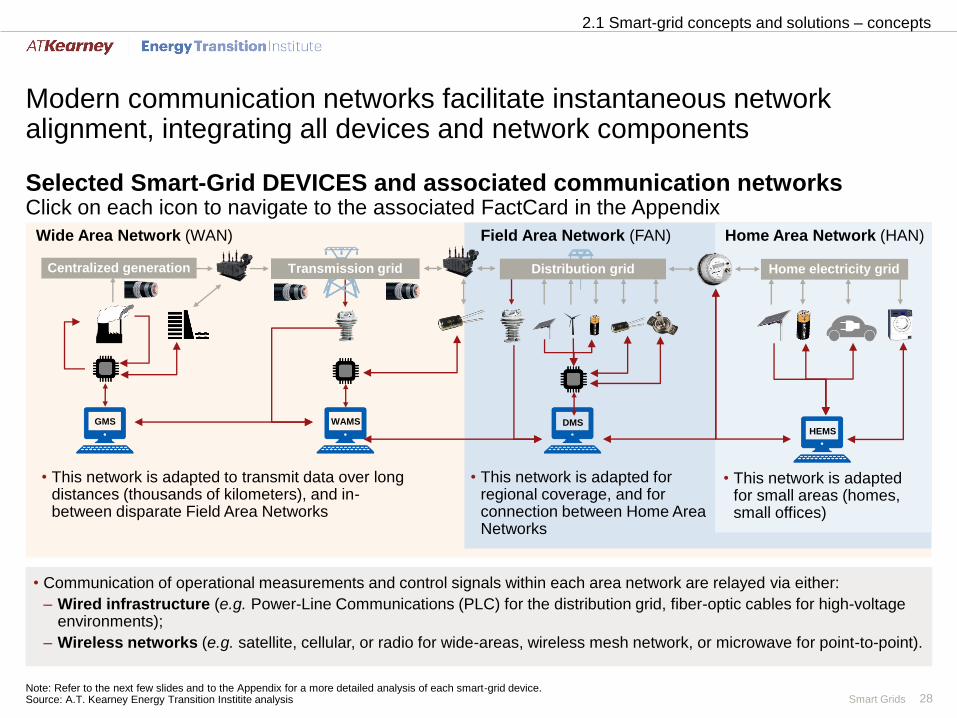
Modern communication networks facilitate instantaneous network alignment, integrating all devices and network components
2.1 Smart-grid concepts and solutions – concepts
Selected Smart-Grid DEVICES and associated communication networksClick on each icon to navigate to the associated FactCard in the Appendix
Centralized generation Home electricity gridDistribution gridTransmission grid
WAMSGMSHEMS
DMS
Wide Area Network (WAN) Field Area Network (FAN) Home Area Network (HAN)
• Communication of operational measurements and control signals within each area network are relayed via either:
– Wired infrastructure (e.g. Power-Line Communications (PLC) for the distribution grid, fiber-optic cables for high-voltage environments);
– Wireless networks (e.g. satellite, cellular, or radio for wide-areas, wireless mesh network, or microwave for point-to-point).
• This network is adapted for regional coverage, and for connection between Home Area Networks
• This network is adapted for small areas (homes, small offices)
• This network is adapted to transmit data over long distances (thousands of kilometers), and in-between disparate Field Area Networks
Note: Refer to the next few slides and to the Appendix for a more detailed analysis of each smart-grid device.Source: A.T. Kearney Energy Transition Institite analysis

Smart Grids 29
Smart-grid technologies address current grid challenges
2.2 Smart-grid concepts and solutions – solutions
Smart-Grid benefits by technology application and related grid challenges
Existing grid challenges
Smart-grid technology applications
Enhance physicalnetwork
Optimize grid monitoring and control
Enable active customer contribution
Rising and intensifying electricity demand
• Increase power-line capacity via electronic devices and sensors installed along the lines (DLR, FCL, FACTS, CVR…)
• Predict and optimize electricity flow via new sensors and algorithms of higher spatial and temporal granularity, and Wide-Area Monitoring & Control (WAMC, PMU…)
• Flatten aggregated peak demandvia dynamic demand-response programs
Aging grid infrastructure(losses & unreliability)
• Reduce transport losses by using more efficient cables (HVDC, superconductors…)
• Improve power reliability via smart protection systems, both in anticipation (failure prediction algorithms and condition-based maintenance), and in reaction (distribution automation, self-healing grid, FDIR)
• Track down thefts via advanced metering infrastructure
Increasing share of Variable Renewable (VRE)
• Connect offshore wind-farms via subsea HVDC cables.
• Smooth variability of VRE output by enlarging grid interconnections via Wide-Area Monitoring & Control
• Provide additional flexibility means by pooling of customers into virtual power plants that can store or supply large amounts of electricity in a dispatchable manner
Increasing share of Distributed Generation(DG) & Electric Vehicles (EV)
• Achieve customer energy savings by stabilizing voltage delivered to end-users as closely as possible above nominal values, optimizing appliance efficiency (CVR)
• Preserve power quality by absorbing voltage instability caused by back-flows of electricity or re-synchronization of islanded micro-grids thanks to voltage control (VVC, capacitor banks, PMU…)
• Incentivize DG and EV deployment via net metering programs and vehicle-to-grid technologies, which turn individual customers into local suppliers of electricity
A B C
1
2
3
4
Source: A.T. Kearney Energy Transition Institite analysis

Smart Grids 30
Enhancing physical network with new types of cable and power electronics increases maximal grid throughput and minimizes transport losses
2.2 Smart-grid concepts and solutions – solutions
Maximum power through transmission lineEnhance physical network capacityA
1. Disturbances can be caused by any unexpected external action (e.g. lightning strikes, storms, and loss of transmission lines or generation capacity), creating an imbalance between the mechanical power input to the generator and its electrical power output. As a result, the generator’s rotation speed will be affected, leading to changes in voltage frequency.
Source: MIT (2011), “The future of Electric Grid”; Brown and Sedano (2004), “A primer on electric transmission”, National Council on Electric Policy; Taylor (2008), “Voltage Stability for undergraduates”, University of Minnesota Power Group; Vittal (2003), “Transient Stability and control of large scale power system”, Iowa State University
> 320 km
(80-320) km
< 80 km
Length of Line
Transient stability refers to the ability of a transmission line to accept a transient increase in power flow exceeding the maximum safe voltage angle between two ends of the line
Voltage stability refers to the ability of a power system to maintain steady voltage after a disturbance (e.g. lightning)1
Thermal constraints refers to heat losses dissipated along the cable in proportion to power throughput. When overheating, cables loosen, touch the ground and break
Long lines
limited by
transient stability
Medium lines
limited by
voltage stability
Short lines
limited by
thermal constraint
Power
Voltage stability Transient stabilityThermal constraint
• Electricity lines have limited power throughput, which decreases with line length, because of three main constraints: Thermal, Voltage and Transient stability (see figure).
• Power-line capacity-enhancement technologies alleviate one of these constraints, raising max. throughput per cable:
– Higher voltage technologies (HVDC and superconductors) alleviate thermal constraints by reducing thermal transmission losses;
– Direct current (DC) transmission removes transient-stability constraints;
– Dynamic Line Rating (DLR) measures weather conditions to allow real-time modulation of maximal thermal constraints;
– Fault Current Limiter (FCL) actively absorbs current faults to improve voltage stability;
– Volt/VAR Control improve transient stability of AC transmission (via FACTS) and distribution lines (via CVR).
• Benefits:
– Increase power-line capacity;
– Reduce T&D losses;
– Connect remote supply.Limiting factors:

Smart Grids 31
Grid monitoring and control technologies optimize the routing of electricity flows and power quality within existing grid infrastructure
2.2 Smart-grid concepts and solutions – solutions
Simplified grid monitoring and control processes and associated Smart-Grid devices
Optimize grid monitoring and controlB
• Definition: Advanced grid monitoring and control refers to the improvement in the chain of command needed to operate the grid (left picture). It can be segmented along the T&D value chain:
– Wide Area Monitoring & Control (WAMC) refers to a real-time country-scale vision and control of the transmission grid;
– Distribution Automation (DA) refers to intelligent and partially automated distribution management.
• Benefits:
– Utilization of existing lines is maximized: Smart routing of electricity allows power to flow up to a line's dynamic limit instead of its worst-case limit2;
– Power quality is improved via Volt/VAR control, especially in the presence of VRE and DG;
– Power reliability is improved via automated healing and predictive algorithms;
– Losses can be precisely tracked down via advanced field sensors and visualization software.
Grid status measurement
Field devices such as sensors (PMU, AMI...) and circuit switches1
Data transmission
Via area networks (WAN, FAN) and associated communication protocols
Data gathering, processing and visualization
(SCADA, WAMS, DMS)
Control commands decision
Human-assisted or automated decision making
Commands transmission
Via area networks (WAN, FAN) and associated communication protocols
ActionsControl generator throttle;
Re-route electricity flow via smart switches1; Control voltage quality via
FACTS & CVR
1. Throughout this report, “switch” refers to any electric power device that can be open or closed (breakers, reclosers, fuses, jumpers, line cut), as opposed to potentiometers that can be gradually adjusted between an “on” and “off” position; 2. Refers to appendix 6.1 slide 8
Source: A.T. Kearney Energy Transition Institite analysis

Smart Grids 32
19
18
17
16
15
14
13
12
0
MidnightMidnight
24
20
21
23
22
Customer contribution to supply/demand balancing is enabled by Demand-Response (DR) programs
2.2 Smart-grid concepts and solutions – solutions
Aggregate demand from a regional grid(illustrative grid)
Enable active customer contributionC
• Definition of demand-response by the Federal Energy Regulatory Commission (FERC): “Changes in electric use by demand-side resources from their normal consumption patterns in response to changes in the price of electricity, or to incentive payments designed to induce lower electricity use at times of high wholesale market prices or when system reliability is jeopardized”.
• Key smart-grid technologies involved: Unlike demand-side management – a mature technology that forces targeted load reductions at participating industrial end-users – DR has only become available recently. It is made possible by the use of smart meters and smart appliances, but they can only have a meaningful impact when a large number of them are aggregated (see Appendix 6.3, slide 96).
• DR’s main benefits are:
– For end-users: lower bills and electricity consumption, the capability to participate in capacity-reserve markets;
– For DSO: improved control over electricity demand (which reduces the need for flexibility sources such as peaking plants and centralized storage systems), flattened peak loads aggregated at substation level, improved demand predictability and consumption data.
1. Peak-demand period: As standards of living reach higher levels, countries generally experience faster growth in daily peak demand than in daily average demand, as house size increases, as well as the use of heating, air-conditioning, TVs, computers and EV-charging, often at the same time of the day; refers to Appendix 6.3.
Source: Illustrative example adapted from EIA (US Energy Information Administration), Example ISO-NE electric lad, June 24, 2010; MIT (2011) “The Future of Electric Grids”; FERC, “Assessment of Demand Response and Advanced Metering”; Paul L. Joskow et al. (2012) “Dynamic Pricing of Electricity”
With Demand-ResponseWithout Demand-Response
Consumption potentially increases during low-demand period
Period with DR signal
DR incentive signal starts in period of peak demand1
Home smart appliances automatically reduce their consumptions if not overrruledby end-user (e.g. electric water heaters, central air conditioners…)
Incentive signal stops
Noon
GW

Smart Grids 33
Customer contribution to decentralized power generation can be incentivized by Net Metering programs
2.2 Smart-grid concepts and solutions – solutions
Enable active customer contributionCHow net metering works
• Definition: Net-metering refers to an incentive program that allows residential and commercial customers who generate their own electricity to be only charged for net power withdrawn from the grid, and to feed their excess electricity back into the grid, in return for financial or electricity credits (see slide 98).
• Applications: Distributed generation (see picture) vehicles-to-grid (V2G).
• Benefits:
– For end-users: allows local power producers to become local suppliers;
– For grid operators: integrates DG and EV as a source of flexible generation capacity, operated as virtual power plants (see slide 99).
• Unintended economic consequences may arise if the feed-in tariff given to the local producer includes the cost of grid services (theguarantee that producers will be able to withdraw or supply power at any time). For instance, if feed-in-tariffs equal end-user electricityprices, T&D costs will increasingly be borne by grid users not enrolled in net-metering programs
• Technical issues arise when the penetration of grid-connected DG reaches sufficiently high levels to affect voltage quality (slide 19).
• Key smart-grid technologies involved:
– To enable net-metering accounting: AMI, Smart meters and DMS;
– To maintain power quality in case of high DG penetration: PMU and smart switches in the distribution grid to re-connect in asynchronous manner a portion of the grid that has been islanded; Volt/VAR control in the distribution grid, and smart invertersconnected to the distributed generator to automatically and progressively reduce output in cases of over-voltage or over-frequency.
Source: NERA (2014) “Self-Consumption and Net Balancing: Issues and solutions”; Hidayatullah et al. (2011), “Impact of Distributed Generation on Smart Grid Transient Stability”; Sexauer et al. (2013), “Phasor Measurement Units for the Distribution Grid: Necessity and Benefits”; Picture Credits: http://www.ourpowercampaign.org/net-metering-toolkit/

Smart Grids 34
Looking further ahead, the modular nature of micro-grids allows for their interconnection and, ultimately, the construction of smart cities and super-grids
2.2 Smart-grid concepts and solutions – solutions
Micro-Grids, Smart Cities and super-grids
• A super-grid is a regional power system consisting of several micro-grids connected via transmission networks. These are virtually unaffected by severe supply shortfalls because individual micro-grids are able to disconnect from the grid.
• A micro-grid is a localized and autonomous energy system, consisting of distributed energy resources, consumers and, ideally, storage capacity.
• It has the capability to isolate itself from the main grid during power-system disruptions and blackouts, referred to as “islanding”. The grid connection is a back-up solution for situations in which one or more on-site generators have to be disconnected.
• Micro-grids also offer the prospects of stable electricity supply to communities in the developing world that do not currently have it.
• A smart city is a wider community composed of autonomous but interconnected micro-grid systems that use information and communication technologies to integrate a number of civic services. The main aims are to optimize the efficiency of power supply and maximize integration of renewable resources for sustainable living.
• A new kind of governance, incorporating genuine citizen involvement, is required to integrate various civic services, such as administration, education, healthcare, public safety, real estate, transportation, and power utilities/energy utilization.
Source: Siemens (2011), “Microgrid white paper”; Picture Credits: (left): cleanskies.org; (center): prcee.org; (right): sustainablecitynetwork.com

Smart Grids 35
3. Benefits and challenges of smart-grid roll-out

Smart Grids 36
Main findings
3.1 Economics and Environmental Benefits
■ Although impacts are difficult to quantify, a smart-grid roll-out is believed to provide net economic and environmental benefits in all regions where studies have been undertaken.
■ For U.S. society as a whole, the direct and indirect benefits of a full roll-out outweigh their costs by a factor of between 2.7 and 6. Restricting the scope to electricity-grid stakeholders, the direct benefits/cost factor is between 2 and 4 in OECD countries, and 3 and 4.5 in China.
■ However, if smart-grid investments are mostly borne by the system operators, the benefits are spread among many groups: producers, T&D operators, customers, and the public at large, as a result of environmental benefits.
■ Although environmental sustainability is not the primary driver of smart-grid adoption, smart grids contribute to limiting greenhouse gases emission both directly (through energy savings) and indirectly (by encouraging the development of electric vehicles and renewables). Overall, smart grids could contribute to 4% of cumulated CO2-emissions reduction efforts until 2030 in the lowest-cost pathway towards limiting to 2°C any rise in the average global atmospheric temperature.
3.2 Social Acceptance and Cybersecurity
■ Social acceptance of smart grids is a prerequisite for active consumer participation in grid management.
■ Clarity in relation to data privacy, sharing and protection will be essential in securing consumer acceptance and grid security. Cybersecurity must be developed to protect technology, processes and people from deliberate attacks and accidents.
3. Benefits and challenges of smart-grid roll-out

Smart Grids 37Source: EPRI (2011), “Estimating the Costs and Benefits of the Smart Grid”; European Commission Joint Research Centre (2012),“Guidelines for conducting a cost-benefit analysis of Smart Grid projects”
• Technological diversity
• Large-scale of technology
• Market size and number of market participants
• Integration of variable renewables and distributed generation.
• Diversity of smart appliances at the consumer.
• New power generation technology.
Costs and benefits related to smart grids are difficult to quantify
Uncertain costs
• Digital technologies have inherent weaknesses and have a limited
life expectancy.
• Difficulties in determining obsolescence of technology:
– Estimates of reasonable replacement costs;
– Projections of technological evolution and progress.
• Forecasts in cost savings:
– Cost of electrical components is decreasing;
– Marginal costs are decreasing because of growth in production;
– Indirect efficiency gains or lack of compatibility can greatly alter
cost recovery.
Uncertain benefits
• Benefits are often long-term:
– High upfront capital costs;
– Long lead times can face changes in exogenous variables
during construction (e.g. input costs, regulation).
• Different types of functions or technology may generate individual
benefits, while others provide benefits that mutually reinforce those
of related technologies (e.g. HVDC and FACTS).
• The role played by consumers in the market is still uncertain:
– Detailed consumption data still not ubiquitous;
– The extent to which customers are willing to participate is
uncertain.
?
Potential costs and potential benefits of smart-grid roll-out
How to monetize a physical technology?(three main challenges)
How to define boundaries: What do costs include?
3.1 Benefits and challenges of smart-grid roll-out – economics and environmental benefits

Smart Grids 38
NET PRESENT VALUE ($) = [Condition]A - [Condition]B
Net economic benefits are calculated as the difference between the business-as-usual scenario and one in which significant smart-grid technologies are deployed
• The objective is to define the baselinescenario (A) against which various smartgrid roll-out scenarios (B) are compared.
• Assumptions regarding external factorsnot related to smart grids, such aspopulation growth, regulatory frameworkand evolutions of costs must bestandardized for both scenarios.
• Several variants of scenario B can thenbe analyzed relative to scenario A, withvariations in terms of the technologies tobe implemented, and the extent of theirdeployment (full or partial roll-out).
• The net present value must be estimatedfor any given scope:
– For the purposes of the calculations of grid stakeholders, the private-sector discount rate is generally preferred.
– For the purposes of government calculations, a discount rate tied to government bonds is generally preferred.
Scenario A“Business as usual”: describes the system if no grid-
modernization occurs
Discounted over the project’s
duration
Grid-system impacts Customer impacts Societal impacts
• Net capital-cost
change
• Net O&M cost change
• Service-quality
improvement
• Customer equipment
costs
• Electricity bills
• Environmental
impacts
• Indirect economic
impacts
Societal point of view
Grid stakeholder point of view
Definition of cost/benefit analysis
Source: A.T. Kearney Energy Transition Institite analysis; European Commission Joint Research Centre (2012), “Guidelines for conducting a cost-benefit analysis of Smart Grid projects”
Scenario B Smart-grid scenario Technologies to implement
Depth of deployment
Scope of cost/benefit analysis
3.1 Benefits and challenges of smart-grid roll-out – economics and environmental benefits

Smart Grids 39
The IEA estimates that, from the viewpoint of grid stakeholders, the direct benefits of smart grids outweigh their costs in all regions studied
Advanced metering
Consumer
Transmission
Distribution
Smart-grids costs
Smart-grids benefits
Transmission
Generation
Retailer
Distribution
Overhead benefits2
min max min max min max min max min max
OECD Americas OECD Europe OECD Asia
Oceania
China India
-7.68
0.82
-1.84
0.96 0.77 0.910.30 0.35
1.36 1.71
0.72 0.91
-3.91
-1.63
-3.41
-0.60-1.36
-4.11
-1.41
-3.06
-8
-6
-4
-2
0
2
US
D t
rilli
on
• Investment costs are entirely borne by system operators, who may raise electricity prices to achieve an acceptable return oninvestment, especially after demand optimization and reduction. Technical solutions and regulatory changes are needed toaddress this barrier (e.g. who should pay for smart meters?).
• It is more difficult to place a monetary value on benefits than on costs. While some benefits specifically apply to a singlestakeholder (e.g. a reduced need for physical meter-reading because of smart meters), the largest benefits are sharedamong all grid stakeholders, shown as “overhead benefits” (e.g. overall reduction in electricity demand leading to deferredgrid extension plans).
• Finally, smart grids also facilitate the use of other technologies (e.g. electric vehicles, distributed generation). Such indirectbenefits, along with environmental ones, are not included in this analysis, even though they may be important.
3.1 Benefits and challenges of smart-grid roll-out – economics and environmental benefits
Cost and benefits of smart-grid roll-out up to 2050, in IEA 2DS scenario1
1. The 2DS Scenario is IEA’s lowest-cost pathway for mitigating greenhouse gas emissions and limiting the average increase in global temperature to below 2°C. The smart grid roll-out plan includes the full participation of residential customers in generation and demand-side flexibility services, and technology options that increase existing power-line capacities to alleviate congestion and enable maximum utilization of existing and new systems; 2. Overall direct benefits spread between all grid stakeholders.
Source: IEA (2012), “ETP 2012”

Smart Grids 40
U.S. Case (1/2): EPRI estimated the costs and benefits of a complete modernization of the U.S. Grid by 2030, from a societal point of view1
3.1 Benefits and challenges of smart-grid roll-out – economics and environmental benefits
Quantification of the costs and benefits for a complete modernization of the U.S. Grid
Distribution Customers
• Upgrade the existing system
• Embed smart-grid functionality while accommodating load growth
• Embed smart-grid functionality while accommodating large-scale renewables
• Upgrade the existing system
• Embed smart-grid functionality while accommodating load growth
• Consumer energy management
• Storage and back-up
• Other: integrated PV inverter, in-home displays, grid-ready appliances, V2G power converter, communications upgrades for building automation
Transmission & substations
Ben
efi
ts (
$ b
illio
ns)
Co
sts
($ b
illio
ns)
90
67249
165
339
232
Low EstimationsHigh Estimations
0
200
400
600
17
683
75 82
91
12
31
11 24
4611
10
4
Reliability EnvironmentCapacity Power QualityCost of Energy
OtherSecurity
• Increase power flow
• New and automated infrastructure
• Demand response
• Reduce frequency and duration of outages
• Reduce GHG emissions
• Reduce power-plant emissions
• Lower O&M costs
• Capital costs of assets
• Less T&D loss and congestion
• Enhanced Security
• Grid capable of rapid restoration after disruption
• Improve power quality
• Enhance operating window
• Productivity
• Safety
• Quality of life
299 330 281152 1020
200
400
600 475393 390
86
42
152
444
8888
Low EstimationsHigh Estimations
1. The scope of this analysis extends to U.S. society in its entirety, including externalities such as environmental impacts. Indirect benefits of smart grids are also taken into account (e.g. V2G). Returns on investments are discounted, with societal rates of return closer to those of U.S. Treasury bonds than of private-sector investments.
Source: Adapted from Electric Power Research Institute - EPRI (2011), “Estimating the costs and the benefits of the Smart Grid”

Smart Grids 41
U.S. Case (2/2): Overall, the benefits of a smarter grid are 2.7 to 6 times greater than the associated costs of modernization
3.1 Benefits and challenges of smart-grid roll-out – economics and environmental benefits
Total costs and benefits from the U.S. case (2010-2030)$ billions
Source: Adapted from Electric Power Research Institute - EPRI (2011), “Estimating the costs and the benefits of the Smart Grid”
338
476
Low Estimate
High Estimate
1,294
2,028
Low Estimate
High Estimate
Total estimated
benefits
Total estimated
costs
• The benefit/cost ratio is estimated to be between 2.7 and 6 in the U.S. for the 2010-2030 period.
• Deployment of smart-grid technologies can provide direct and indirect benefits by avoiding new investments in generation infrastructure:
– For example, EPRI estimated the potential benefits from energy efficiency and demand response at $192-242 billion in the U.S. in the 2010-2030 period.

Smart Grids 42
Smart grids contribute to limiting greenhouse gas emissions directly (via energy savings) and indirectly (enabling clean practices)
3.1 Benefits and challenges of smart-grid roll-out – economics and environmental benefits
Smart Grid fulfills Needs for emissionReduction targets
EU and U.S. climate policies
• Direct reductions from smart grids come from energy savings derived from reduced T&D losses, reduced electricity consumption, and reduced utilization of peaking plants, which are generally carbon-intensive. The size of these energy savings depends on the relative composition of supply sources and their average emissions levels.
• Indirect reductions enabled by smart grid are:
– Greater penetration of variable renewables, supported by various smart-grid technologies;
– Increased distributed generation, which is generally clean, and may reduce the average power-transmission distance, potentially curbing T&D losses;
– Reduced fuel and emissions arising from smart charging of additional electric vehicles.
Direct reductions
Support EVsSupport renewables
Energy savings1: 2%-9%
Enabled reductions1: 0.5%-3%
Enabled reductions1:
1%-12%
1. A.T. Kearney Energy Transition Institite reclassification and range compilation from EPRI, Hlekik, ClimateGroup and U.S. DOE; 2. % reduction compared with EU 1990 levels; 3. % reduction compared with U.S. 2005 levels.
Source: Pratt et al. (2010), “The Smart Grid: An Estimation of the Energy and CO2 Benefits”. PNNL, U.S. Department Of Energy; European Commission (2013), "Green Paper, A 2030 framework for climate and energy policies";
EU policy 2030 target 2050 target
GHG emissions-reduction target2
40% 80-95%
Renewable energy
(% of total energy production)
30% -
Energy savings
(% of primary energy)
20% -
U.S. Policy 2020 target 2050 target
GHG emissions-reduction target3
17% 83%
Renewable energy
(% of total energy production)
20% -
Energy savings
(% of primary energy)
5% -

Smart Grids 43
Smart grids should ideally contribute to 4% our cumulated CO2
emissions-reduction efforts in the lowest-cost pathway towards climate stabilization
3.1 Benefits and challenges of smart-grid roll-out – economics and environmental benefits
ESTIMATED ANNUAL CO2 emissions reductions from Smart-Grid deploymentGigatonne (Gt), in IEA’s lowest-cost pathway towards 2°C limit
• Although electricity consumption only represents 17% of final energy use today, it accounts for 40% of global CO2 emissions, largely because almost 70% of electricity is produced from thermal power plants with limited energy-conversion efficiency.
• The IEA estimated in 2011 that smart grids offered the potential to achieve net annual emissions reductions of 1.2 Gt of CO2
by 2015 and reductions of up to 2.9 Gt in 2050. In 2014, it estimated that smart-grid contributions should ultimately represent 4% of cumulated abatement efforts by 2050.
OECD North America OECD Europe
China
India
0.5
0.0
1.0 Gt
0.2
2030e
0.5
2015e 2050e
0.3
Enabled Reductions1 Direct Reductions2
1.0 Gt
0.5
0.00.1
2050e
0.1
2030e
0.1
2015e
1.0 Gt
0.5
0.0
2050e
0.6
2030e
0.4
2015e
0.2
0.5
0.0
1.0 Gt
2050e
0.3
2030e
0.1
2015e
0.0
1. Enabled reduction refers to a greater integration of renewables and facilitation of electric vehicles deployment; 2. Direct reduction refers to energy savings from peak-load management, continuous commissioning of service-sector loads, accelerated deployment of energy-efficiency programs, and reduced transmission losses.
Source: IEA (2011), “Technology Roadmap, Smart Grids”; IEA (2012), “ETP 2012”; The World Bank, Statistical Database, extracted June 2013
Total world
2
4 Gt
0
1.8
2030e
2.9
2050e2015e
1.2

Smart Grids 44
Social acceptance is a prerequisite for grid-extension plans and active consumer contribution to grid management
3.2 Benefits and challenges of smart-grid roll-out – social acceptance and cybersecurity
Protests against new overhead Transmission lines
Electro-magnetic fields created by transmission linesmicro Tesla (Y), meter (X)
• Smart-grid technologies will strongly impact the consumer’s day-to-day behavior. Lack of public awareness limits public support.
• Of energy and utilities chief executives interviewed in 2012, 67% identified the customer as the most critical area for investment.
• There are, for example, growing public objections to overhead power lines, particularly in Europe.
• Underground cabling, which today represents 4% of the total transmission network in Europe, is becoming an increasingly compelling alternative, mainly for environmental and political reasons.
• There are some concerns about the impact on health of long-term exposure to Electro-Magnetic Fields (EMF) caused by high-voltage power lines. Underground cables restrict EMF to the close vicinity of power lines and avoids the exposure of people to EMF.
Note: Picture Credits: The Hindu (newspaper, online); Wikipedia (online).Source: EMFs Info, High-voltage Underground Power Cables; NRG Expert (2013), “Electricity T&D white paper”; 2012 IBM Global CEO Study; EMFs.infos (online)

Smart Grids 45
Data-protection and -sharing issues will arise as the future electricity grid collects, communicates and stores operational and private consumer data
3.2 Benefits and challenges of smart-grid roll-out – social acceptance and cybersecurity
About data privacy Consumer electric usage data flow
• Grid operational data are information concerning
electricity generation, transmission and distribution, which
can be aggregated from, but are not available at, the
individual customer level. The protection of grid information
is treated as a security issue (competitive harms, and
physical or cyberattacks).
• Privacy and security of consumers’ data raise many
questions:
– Which data are we concerned about?
– Who should access these data?
– How do we balance privacy concerns with the business
and societal benefits of making these data available?
• Electricity customers will demand, and should have,
significant control over access to data about their electricity
usage.• Because data flow across the whole electricity-grid
communication network, access and ownership are issues that need to be controlled and monitored:
– The European Commission is establishing a smart-grid task force on regulatory recommendations for data safety, handling and protection (since 2009, expert group 2);
– The Office of Gas and Electricity Market (Ofgem, UK) has recently created an independent organization to safeguard against abuses of its privileged position: The Data Communication Company (DCC, open in 2013).
Data Privacy Survey
• 46% of customers believe it is “very important” that their
electricity usage be kept confidential.
• 29% believe it is “somewhat important”.
• 79% believe only customers and utilities should have
access to smart-meter information.
Note:The MIT study only assesses the U.S.Source: Edison Electric Institute (2010), "RE: Addressing Policy and Logistical Challenges to Smart Grid Implementation"; MIT (2011), “The Future of the Electric Grid”; Wright (2012), “Ofgem’s response to DECC’s Consultation on the Draft DCC Licence and Licence Application Regulations”, Ofgem
Utilityback-office systems
Utility central office
Local data collector
Smart meter
Home
Third-party services
Govt. agencies
Public
network
Private
network
Private or commercial
broadband microwave
Public
network
Public network
Wi-Fi,
ethernet
on home
wiring
Ethernet on power line,
private or commercial
cellular or broadband
Public
network
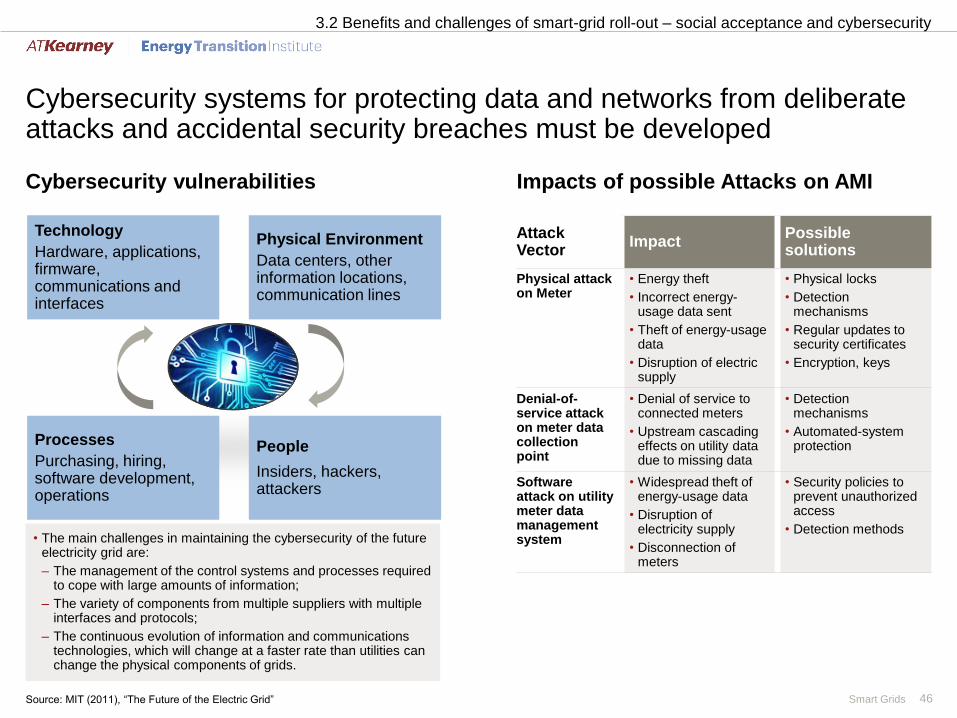
Smart Grids 46
Cybersecurity systems for protecting data and networks from deliberate attacks and accidental security breaches must be developed
3.2 Benefits and challenges of smart-grid roll-out – social acceptance and cybersecurity
Cybersecurity vulnerabilities Impacts of possible Attacks on AMI
Attack Vector
ImpactPossible solutions
Physical attack on Meter
• Energy theft
• Incorrect energy-usage data sent
• Theft of energy-usage data
• Disruption of electric supply
• Physical locks
• Detection mechanisms
• Regular updates to security certificates
• Encryption, keys
Denial-of-service attack on meter data collection point
• Denial of service to connected meters
• Upstream cascading effects on utility data due to missing data
• Detection mechanisms
• Automated-system protection
Software attack on utility meter data management system
• Widespread theft of energy-usage data
• Disruption of electricity supply
• Disconnection of meters
• Security policies to prevent unauthorized access
• Detection methods
Technology
Hardware, applications, firmware, communications and interfaces
Processes
Purchasing, hiring, software development, operations
Physical Environment
Data centers, other information locations, communication lines
People
Insiders, hackers, attackers
• The main challenges in maintaining the cybersecurity of the future electricity grid are:
– The management of the control systems and processes required to cope with large amounts of information;
– The variety of components from multiple suppliers with multiple interfaces and protocols;
– The continuous evolution of information and communications technologies, which will change at a faster rate than utilities can change the physical components of grids.
Source: MIT (2011), “The Future of the Electric Grid”

Smart Grids 47
4. Status of smart-grid deployment
Smart Grids 48
Main findings
4.1 Private investments
• The smart-grid market is sizeable: investment amounted to $44 billion in 2014, with $16 billion in digital-energy technologies alone.
• Government support kick-started investment in 2009, resulting in a flurry of investment. Since 2011, growth rates have stabilized, and investment has focused on smart meters and distribution automation.
• In the next five years, a forecast annual investment growth rate of 5% (10% in digital-energy) will be fueled by the roll-out of smart meters: 100 million were installed in 2014, and the global penetration rate is due to increase from 22% to 40% in 2020.
• Solid funding from venture capital and private equity highlight the emergence of smart grids as an essential area of clean technology.
• Major smart-grid companies are located in the U.S. and Europe.
4.2 Public initiatives
• The U.S kick-started smart-grid investments in 2009 with $4.5 billion of public-funding commitments.
• In Europe, €3 billion of public funds have been allocated since 2006 to help companies invest in smart-grid projects.
• Smart-grid initiatives continue to expand globally, with increasing momentum all around the world.
4.3 RD&D landscape
• The number of smart-grid patents filed increased by 17% a year between 2000 and 2010.
• Most smart-grid technologies are in the demonstration and deployment stages, further highlighting the dynamism of this growing sector.
4. Status of Smart-Grid Deployment

Smart Grids 49
Global smart-grid revenue is estimated to grow by 5.3% a year until 2023
4.1 Status of smart-grid deployment – private investments
Smart-Grid Revenue by region, world markets$ billion
56
63
2019e 2020e
57
2016e 2023e2014
55
44
2013
68
2017e 2022e2021e2018e2015e
64
70
55
64
33
45
2012
CAGR:+5.3%
Asia North AmericaEuropeMiddle East and Africa Latin America
+5%
+3%
+6%
+12%
+8%
CAGR
2014-2023
• Global smart-grid revenue1 is expected to rise from $44 billion in 2014 to an expected $70 billion in 2023, with average annual growth of 5.3% over this nine-year period.
• Africa as a whole, and many nations in other parts of the world with populations exceeding 100 million, will be virtually absentfrom the market until 2020.
• According to Navigant Research, the market is likely to maintain robust growth beyond 2020.
1. Smart-grid revenue includes sales from: transmission upgrades, substation automation, distribution automation, smart-grid information and communication technology, smart metering.
Source: Navigant Research (2014), “Executive Summary: Smart Grid Technologies”

Smart Grids 50
Digital energy is seeing the fastest growth, despite false starts and cost overruns in demonstration projects
Digital Energy Annual Asset finance by sector
1. Advanced smart grid refers to cross-sector projects; EMEA: Europe, Middle East and Africa; AMER: North, South Americas; APAC: Asia and Pacific. Source: BNEF, Committed funding, database extraction (may 2015); BNEF (2015), “Q1 2015 Global Digital Energy Outlook”; IEA (2015), “Energy Technology Perspectives”
Digital Energy Annual Asset finance by region
• Digital energy represents a sub-segment of the overall scope of smart grids as defined in this FactBook. It excludes capital-intensive power infrastructure for transmission-network enhancements, such as new HVDC lines and FACTS, etc..).
• The 2009 American Recovery Act in the U.S. kick-started asset finance. A smart-metering roll-out program in China has rapidly caught up, while Europe is expected to step up digital energy investments in the second half of the decade.
• According to IEA (2015), “Despite false starts and cost overruns deployment of some sub-categories of smart-grid technologies has grown quickly in early adopter markets. However, regulatory bottlenecks, and unrealistic expectations are preventing smart-grid technologies from reaching the required levels. (…) Overall, evidence that some expectations were unrealistic has tempered initial enthusiasm surrounding smart grids – and yet benefits have been realised from advanced metering infrastructure and distribution automation.”
0
5
10
15
20
25
30
2010
35
2008
11
31%
2827
2018e
$ billion(2008-2020)
2020e
1315
2012
14
2016e
20
16
19
2014
2624
Smart meteringDistribution automationAdvanced smart grid1
0
5
10
15
20
25
30
2008
11
15
2014
35
2010 2012
14
19
13
20
16
$ billion(2008-2020)
9%
2020e
27
2018e
2624
2016e
28
EMEA APACAMER
CAGR1
2014-2020
+2%
+9%
+24%
CAGR1
2008-2014
+37%
+24%
+40%
4.1 Status of smart-grid deployment – private investments

Smart Grids 51
One-third of existing electricity meters should be smart by end-2018, representing over 800 million devices
Annual deployment of Smart Meters
Source: Bloomberg New Energy Finance, Committed funding, database extraction (2015); IEA (2015), “Energy Technology Perspective”
Smart-meter Penetration 2013-2023
• The U.S. pioneered deployment of smart meters – motivated by the individual economic choices of regional utilities, with half of consumers equipped with smart meters in 2015, compared with 26% globally.
• Since 2010, Asia-Pacific countries, especially China, have shown particular interest in this technology and installed more than75 million units per year between 2010 and 2014.
• Europe is set to catch up by the end of the decade in order to comply with the European mandate on smart-meter penetration.
• By 2018, more than one meter out of three should be smart globally, representing almost 800 million devices, mainly deployed in China, the U.S. and Europe.
0
20
40
60
80
100
120
0
100
200
300
400
500
600
700
800
20122010 2014 2017e2013
# million
2009 2011 2016e2015e 2018e
73
82
66
113
69
103
54
119
16
85
Cumulated (right axis)EMEAAPAC Amer
0
10
20
30
40
50
60
70
80
2021e2019e2015e 2020e20162014 2018e2017e2013 2022e 2023e
%
North America
Latin America
Europe
World
Asia Pacific
Middle East and Africa
4.1 Status of smart-grid deployment – private investments

Smart Grids 52
The interest of private investors in digital-energy technologies intensified after 2008 but have eased since 2011
Private sector deals in digital energy1 technologies during 2008-2014
1. VC: Venture Capital; PE: Private Equity; M&A: Merger and Acquisition; 1 Digital energy includes: demand response, home energy management, micro-grid, smart grid, smart metering, smart T&D and software; 2 M&A funding was not included in the left-hand graph for improved readability; 3 Undisclosed figures were calculated as the sum of products of undisclosed deals by the average price of a deal over the seven-year period.
Source: Bloomberg New Energy Finance database (April 2015)
• Early money raised by venture capitalists and private equity funds for new digital-energy technologies intensified after 2008, principally in the U.S., in parallel with the announcement by the U.S. Department of Energy of a $4.5 billion commitment to smart grids. Since 2011, however, committed funds and numbers of deals seem to have returned to pre-2009 levels.
• By contrast, new equity raised through public markets in the later stages of development has grown more steadily, which is indicative of a maturing technology trend.
• The increase in mergers and acquisition deals since 2010 is evidence of the private sector’s dynamism in digital energy.
$ million (2008 – 2014) # deals (2008 – 2014)
4242
6365
54
42
27
84
752
18
11
2822
28
89
2008 20122010 201420132009 2011
1312
294
511
382
1,140
322409
1,308
849
564639
523
757
323
488 469
Undisclosed3M&A2VC/PE Public Markets
Switz-erland
Other
USChina
2008-2014 cumulated VC, PE, PM deals:
$6.9 billion2009: The U.S. DOE
awards smart grids $4.5
billion from Recovery Act
(see slide 57)
2008 2009 2010 2011 2012 2013 2014
4.1 Status of smart-grid deployment – private investments

Smart Grids 53
Venture capitalists remain highly interested in digital-energy technologies, which are among the hottest clean-energy investments
Funds raised via venture capital and private equity for clean technologies in 2014
1. Digital energy includes: demand response, home-energy management, micro-grids, smart grids, smart metering, smart T&D and software.Source: Bloomberg New Energy Finance, Committed funding, database extraction (2015)
• Solar and wind are mature technologies, with much bigger markets than the other technologies listed above. The considerable involvement of private-equity funding in these two segments of the renewable-energy business further underlines their maturity.
• Venture-capital funding, by contrast, tends to indicate emerging technologies and start-ups in emerging business areas.
• Digital energy1 accounts for the second-highest number of venture-capital deals and the third-largest amount raised, of all new energy technologies. When energy storage is also considered, these two grid-related technologies comprised the hottest clean-energy start-up investments in 2014.
$ million (2014) # deals (2014)
655
150
Biofuels
Solar
Digital energy1
2,096
Wind 3,119
Small hydro
Electrified transport
294
244
Biomass and waste
556Energy storage
339
33
Small hydro
Electrified transport
Energy storage
11
4
Wind 26
Biomass and waste
27
Biofuels
Solar
35
Digital energy1 42
94
Private equity (PE)Venture capital (VC)
High PE for
mature tech
High VC for
deploying tech
4.1 Status of smart-grid deployment – private investments

Smart Grids 54
The smart-grid market is currently dominated by American and European companies
Main players in Smart-Grid monitoring and control
Source: Bloomberg New Energy Finance (BNEF) database (2015)
Alstom Grid SAS/OLD Ember Corp Landis + Gyr SAS Alstom Grid SAS/OLD Landis + Gyr SAS Alstom Grid SAS/OLD
Smart Grid SolutionsLtd
Advanced Digitaldesign SA
Utilitywise PlcAdvanced Digitaldesign SA
EngageNetworks Inc
Engage Networks Inc
Current Group
LLCElster Medicao de Energia Ltda
Smart Grid SolutionsLtd
BPL Global Ltd Landis & Gyr Holdings Pty LtdUtility IntegrationSolutions Inc
ZIV aplicaciones y technologias SL
CURRENT Group LLC
GE Fuji Electric MeterCo Ltd
BPL Global Ltd Metor A S
Itron Inc
EMH Metering GmbH& Co KG
Electralink Ltd
Wasion GroupHoldings Ltd
Silver Spring Networks Inc
Nuri TelecomCo Ltd
Prime Alliance
Ambient Corp Ecologic Analytics LLC
Tantalus Systems Corp Lodestar Corp
Power PlusCommunications AgG
eMeter Corp
SmartSynch Inc
Grid automationSmart metering components
Smart meters Communications Data managementSmart-gridsoftware
Installationand system integration
4.1 Status of smart-grid deployment – private investments

Smart Grids 55
American companies are especially dominant in end-user solutions
4.1 Status of smart-grid deployment – private investments
Main players in demand response and Home Energy Management
Source: Bloomberg New Energy Finance (BNEF) database (2015)
EnteliosUtility Integration
Solution Inc
Constellation Energy Powerit Solutions LLC
EnergyConnect Inc BPL Global Ltd
EnerNOC Inc Cooper Power Systems LLC
Comverge Inc EnergyICT NV
Flexitricity Ltd
Groom energy
solutions LLC
Honeywell Building
SolutionsGmbH
Schneider Electric SE
Applied Energy Group
Global Energy Partners LLC
Service providers Technology providers Smart appliances In-home displaysCommunicationscomponents
Demand response Home energy management
Comverge Inc Intamac Systems Ltd Coronis SAS
EcoFactor Inc Passiv Systems Ltd Zensys
Energate Inc ZigBee Alliance
EnergyHub Inc Ember Corp
Tendril Networks Inc Watteco SAS
Comverge Inc EnOcean GmbH
Green Energy Option Ltdaa
Advanced Telemetry LLCa
AlertMe Ltd
Onzo Ltd
Blue Line innovations Inca

Smart Grids 56
Large public-funding commitments kick-started smart-grid investments in 2009
American Recovery and Reinvestment Act
Source: U.S. Department of Energy (2013), “Economic Impact of Recovery Act Investments in the Smart Grid”; U.S. Department of Energy: Recovery act (2009)
• The American Recovery and Reinvestment Act of 2009 (ARRA) created an economic stimulus package that aimed to generate jobs through investments in infrastructure ($105 billion), education ($100 billion), health ($155 billion), energy efficiency and renewable energy research ($27 billion).
• Of the $105 billion investment in infrastructure, $21 billion are dedicated to energy infrastructure:
• The $4.5 billion U.S. fund for smart grids includes two key programs:
– Smart Grid Demonstration Program (SGDP), designed to encourage smart-grid R&D ($600 million, 32 R&D projects);
– Smart Grid Investment Grant (SGIG), designed to support commercial-scale smart-grid projects ($3.5 billion, 99 projects);
– A further $400 million has been set aside for projects such as workforce development and interconnection transmission planning.
Radioactive waste
Smart gridEnergy
efficiency in federal buildings
Power transmission system upgrades for the Bonneville and
Western Area Power
Administrations
$6bn $6bn
$4.5bn
$4.5bn
4.2 Status of smart-grid deployment – public initiatives
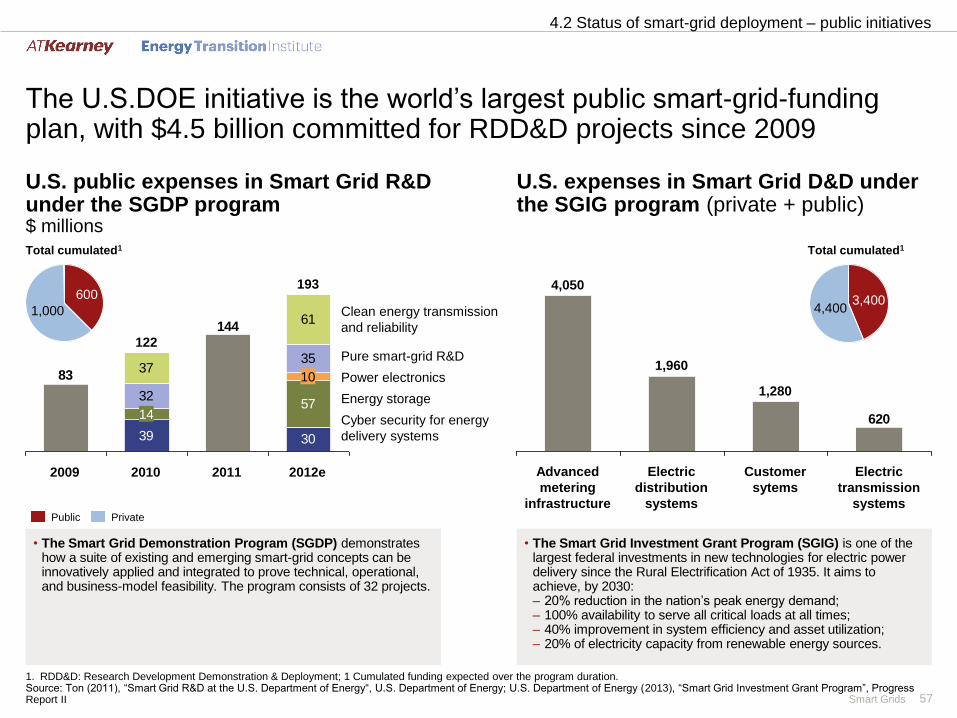
Smart Grids 57
The U.S.DOE initiative is the world’s largest public smart-grid-funding plan, with $4.5 billion committed for RDD&D projects since 2009
1. RDD&D: Research Development Demonstration & Deployment; 1 Cumulated funding expected over the program duration.Source: Ton (2011), “Smart Grid R&D at the U.S. Department of Energy“, U.S. Department of Energy; U.S. Department of Energy (2013), “Smart Grid Investment Grant Program”, Progress Report II
• The Smart Grid Demonstration Program (SGDP) demonstrates how a suite of existing and emerging smart-grid concepts can be innovatively applied and integrated to prove technical, operational, and business-model feasibility. The program consists of 32 projects.
U.S. public expenses in Smart Grid R&Dunder the SGDP program$ millions
U.S. expenses in Smart Grid D&D under the SGIG program (private + public)
39 30
32
3537
61144
83
57
Pure smart-grid R&D
Energy storage
Cyber security for energy
delivery systems
Power electronics
2012e
193
10
Clean energy transmission
and reliability
2010
14
122
20112009
620
Electric
distribution
systems
Electric
transmission
systems
Customer
sytems
1,960
4,050
1,280
Advanced
metering
infrastructure
600
1,000 4,4003,400
PrivatePublic
Total cumulated1 Total cumulated1
• The Smart Grid Investment Grant Program (SGIG) is one of the largest federal investments in new technologies for electric power delivery since the Rural Electrification Act of 1935. It aims to achieve, by 2030: – 20% reduction in the nation’s peak energy demand;– 100% availability to serve all critical loads at all times;– 40% improvement in system efficiency and asset utilization;– 20% of electricity capacity from renewable energy sources.
4.2 Status of smart-grid deployment – public initiatives
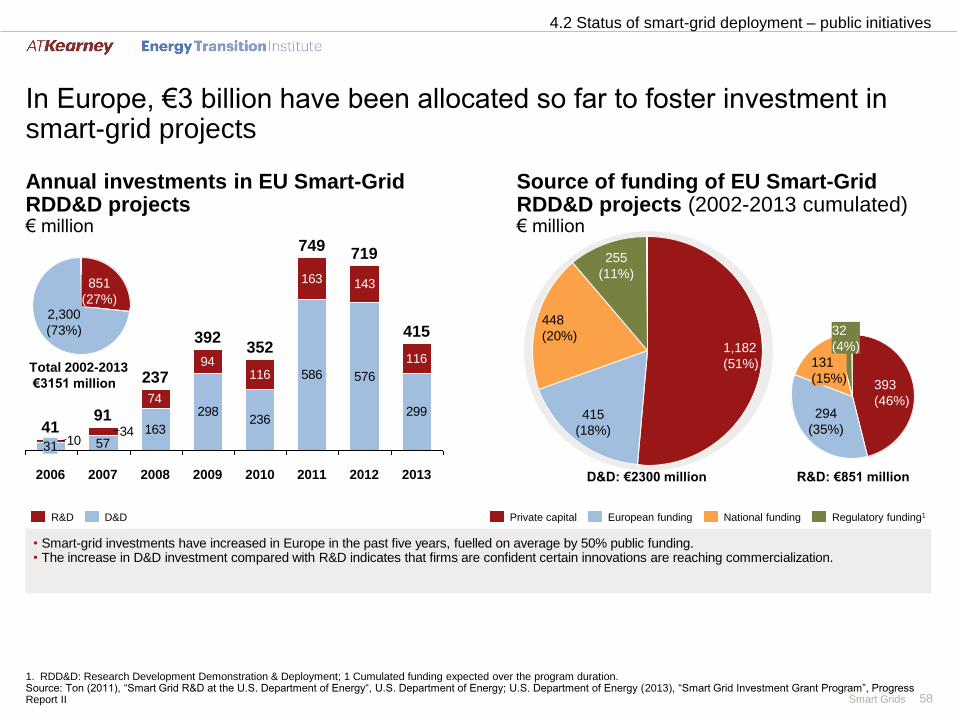
Smart Grids 58
Source of funding of EU Smart-Grid RDD&D projects (2002-2013 cumulated)€ million
In Europe, €3 billion have been allocated so far to foster investment in smart-grid projects
1. RDD&D: Research Development Demonstration & Deployment; 1 Cumulated funding expected over the program duration.Source: Ton (2011), “Smart Grid R&D at the U.S. Department of Energy“, U.S. Department of Energy; U.S. Department of Energy (2013), “Smart Grid Investment Grant Program”, Progress Report II
• Smart-grid investments have increased in Europe in the past five years, fuelled on average by 50% public funding.• The increase in D&D investment compared with R&D indicates that firms are confident certain innovations are reaching commercialization.
Annual investments in EU Smart-Grid RDD&D projects€ million
163
298236
586 576
29974
94116
163 143
116
5734
10
2011 20132012
749
415
719
2010
352
2009
237
392
2007 20082006
31
4191
R&D D&D
2,300
(73%)
851
(27%)
Total 2002-2013
€3151 million 393
(46%)294
(35%)
32
(4%)
131
(15%)
Private capital European funding Regulatory funding1National funding
R&D: €851 millionD&D: €2300 million
415
(18%)
1,182
(51%)
255
(11%)
448
(20%)
4.2 Status of smart-grid deployment – public initiatives

Smart Grids 59
Technology choice for EU Smart-Grid RDD&D (2002-2013 cumulated)€ million
European RDD&D provides a test bed for cross-border research initiatives that will prove integral in the selection of successful smart-grid technologies
Source: European Commission Joint Research Centre (2014), "Smart Grid Projects Outlook 2014"
Origin of funding for smart-grid rdd&d, top-10 EU countries (2002-2014 cumulated)€ million
0 100 200 300 400 500 600 700 800 900
Large scale variable
renewable
Electric vehicles
Smart home
Smart network
management
Smart meter
Demand response
Distributed energy
0 100 200 300 400 500 600
BE
NL
ES
UK
DE
FR
AT
IT
SE
DK
R&DD&D
• RDD&D investments in Europe are concentrated in the EU15 nations, which are those with electricity grids in the greatest need of renovation.
• Network-management systems, aiming at improving the operational flexibility of the large, interconnected European electricity grid receive the most investment.
• The forecast roll-out of nearly 200 million smart meters by 2020 should also drive very large investments in the near future.
Local pilot only. National roll-out plans are
excluded from this analysis, and estimated at
€20 billion by 2020
4.2 Status of smart-grid deployment – public initiatives
D&D R&D

Smart Grids 60
The expansion of smart-grid initiatives globally is continuing and gathering momentum
1. Adapted from Bloomberg New Energy Finance (2013).Source: Bloomberg New Energy Finance (2013), “Smart Grid Projects” (planned or commissioned); IEA (2011), “Technology Roadmap, Smart Grids”
Selected Smart-Grid Initiatives
Canada
• Smart metering in British Columbia, Ontario, Quebec, Saskatchewan
• Smart-grid pilot projects in Ontario and Quebec
U.S.
• $4.5 billion was allocated to grid modernization in 2009 through ARRA
Brazil
• Proposed universal smart metering mandate
• Large-scale pilots
EU
• Following the success of the Telegestore project in Italy (2011), $200 million has been allocated for grid modernization
• Spain has decided to replace all existing meters with smart meters by 2015
• In France, 300,000 smart meters are being deployed in pilot projects
• UK, France and Germany plan 100% smart meter penetration by 2020
China
• State Grid Corporation outlined plans for pilot programs in 2010 that map out deployment through 2030
• Smart-grids investments should reach $100 billion by 2020
Japan
• Government investments in excess of $100 million
• National smart-metering initiative
• Smart-grid projects on numerous islands in Okinawa prefecture
Australia
• Smart metering in Victoria
• Newcastle smart grid, smart city project
Singapore
• Smart-metering pilot 2011-2012
South Korea
• Jeju Island project
• Nationwide smart grid by 2030
GCC
• GCC Grid Integration, advanced AC and DC transmission interconnection between all six national grids, and establishment of monitoring and control installations
4.2 Status of smart-grid deployment – public initiatives
0-10
>10-30
>30-100
>100
# of indexed projects1

Smart Grids 61
ISGAN network has listed 98 smart-grid demonstration projects globally, mostly targeting end-user technologies
1. Some projects have more than one application. For example, Italy has two projects but they relate to three different applications: each contribution, therefore, is calculated as one-third of two; 2 Enhance physical network capacity: integration of large scale VRE; 3 Optimize grid monitoring and control: smart network management; 4 Enable active customer contribution: smart metering, integration of DG, smart customer/home, demand response, virtual power plant, electrical vehicle (EV), vehicle to grid (V2G).
Source: ISGAN (2013), “Smart Grid project catalogue: part 2, by contribution to policy goal”; IEA (2015), “ETP 2015”
Smart-grid demonstration projects by country and categoryNumber of Projects1
55
1
2
3
5
3
2
4
2
6
8
101010
11 11
57%33%
11%
Optimize grid monitoring and control3Enhance physical network capacity2 Enable active customer contribution4
• The Implementing Agreement for a Cooperative Program on Smart Grids resulted in the creation of the International Smart Grid Action Network (ISGAN) at the first Clean Energy Ministerial, in 2010. ISGAN was set up in order to establish a platform for thecoordination and collaboration of projects in smart-grid technologies.
Projects: 98
4.2 Status of smart-grid deployment – public initiatives

Smart Grids 62
The number of patents covering smart grid innovations has grown precipitously since 2000, with filings predominantly located in the U.S.
4.3 Status of smart-grid deployment – RD&D landscape
Smart-Grid patents filed by yearThousands of documents per year1
Patent filing locationCumulative patent filing registered2 (1994-2012)
0
1
2
3
4
5
6
7
+17%
2010200520001995
11%
15%
17%
3%
6%
43%
5%
BRICS Others
CanadaEurope
International
JapanUSA
• Since 2000, the number of filed patents has grown by approximately 17% annually.
• Over 60,000 patents for smart-grid technologies have been filed.
• The most common patent types involve transmission and distribution components, and information systems.
1. Post-2010 applications have not yet been published in their entirety; 2. Cumulative applications and grants per location of filing: International represents the World Intellectual Property Organization (WIPO), a United Nations agency; European filing location: European Patent Office & UK Intellectual Property Office.
Source: Relecura (2013), "Smart Grid Patent Analysis"

Smart Grids 63
Smart-grid technologies display highly variable levels of maturity
4.3 Status of smart-grid deployment – RD&D landscape
Smart-Grid Technology maturity curveClick on each icon to navigate to the associated FactCard in Appendix
Cap
ital re
qu
ire
me
nt
* Te
ch
no
log
y r
isk
Maturity
Research Development Demonstration Deployment Mature Technology
Lab work Bench scale Pilot Scale
Large/commercial-scale projects
with ongoing optimization Widely deployed commercial-scale projects
Note: DMS: Distribution Management System.Source: A.T. Kearney Energy Transition Institite analysis
Fault-Current Limiter (FCL)
Dynamic Line Rating (DLR)
Vehicle-to-Grid (V2G)
Superconducting cableDynamic Demand-Response (DR)
High Voltage Direct Current (HVDC)
Fault Detection, Isolation & Restoration (FDIR)
Supervisory Control & Acquisition Data (SCADA)
Flexible AC Transmission System (FACTS)
Advanced Metering Infrastructure (AMI) and smart meter
Electrical Vehicle (EV)
Rule-based Conservation Voltage Reduction (CVR)
Smart switch (recloser)
Smart appliance
Phasor Measurement Units (PMU) for transmission grids
Virtual Power Plant (VPP)
Dynamic-pricing net metering
Volt/VAR Control (VVC)
DMS-controlled CVR
PMU for distribution grids
Electronic devices and sensors
Systems and processes
Enhance physical network capacityElectric power infrastructure
Enable active customer contribution
Optimize grid monitoring and control

Smart Grids 64
5. Regulation and policy

Smart Grids 65
Main findings
5.1 Evolution of grid regulations
• Grid regulation is moving away from the traditional natural monopoly and vertically integrated structure, and new entrants are transforming the competitive landscape.
• Electricity markets are starting to unbundle, making smart-grid business models more complex to design.
• T&D utilities’ profit margins are still regulated locally, so smart-grid business models must be tailored to each country’s regulatory framework. Remuneration models, regulation incentives, revenue structures for utilities might differ from one country to another, depending on national regulations.
5.2 Best practices
• Governance and international institutions have an essential role in limiting certain types of risks in the financing of smart-grid projects. For instance, Public Finance Mechanisms (PFMs) support stakeholders, investors and the viability of energy projects.
• Collaboration among industries, regions and technologies in standardization and best practices are vital to smart-grid deployment.
5. Regulation and policy

Smart Grids 66
The history of the 20th century electricity grid has resulted in a market dominated by the concept of the “natural monopoly” and increasing economies of scale
Market structure and the traditional electricity grid in Europe and in the U.SNatural monopoly theory in practice
• The capital requirements of the expansion of the electricity industry were substantial. However:
– Economies of scale were significant: a continued trend saw costs drop from $5 per kWh to $0.05 per kWh between the 1880s and the 1970s;
– The customer base was expanding exponentially;
– Electrification of various domestic and professional devices only intensified demand growth.
• Executives persuaded law-makers and regulators that allowing competition would create redundancies and drive electricity prices below the level needed to cover long-term costs, arguing in favour of a “natural monopoly”.
• Without competition eroding revenue, vertically integrated utilities could now set rates that would guarantee the recuperation of costs and establish a profit margin, which created a cycle of lower costs to lower prices to higher demand.
5.1 Regulation and policy – evolution of grid regulations
Source: Collier (2013), “The Evolution of the Smart Grid”, IEEE
Natural monopoly
Economies of scale
Customer base expansion
Electrification of modern life
Vertical integrationLower retail
price
Increasedsales
revenue
Decliningper unit
costBenefits of monopolistic
market structure

Smart Grids 67
2009
Networks have become more regulated and complex, as domestic grids become interconnected internally and externally
1980
1935 1986
19671950
Federal Power Act
France/Germany/Switzerland
connected
Voltage uniformization (400 kV)
• « War of
currents »
• AC vs DC
• AC commonly used for long-distance
transmissions
• Frequency harmonization
(50 Hz Europe / 60 Hz U.S.)• Harmonization and regulation
of networks
1880
1890
Tesla transformer’s invention
Birth of Alternative Current (AC)
New York’s first electricity grid(a few houses with Edison’s light bulband generators)
• Discovery of
Direct Current
(DC)
EnergySecurity Act
France/UK connected1
2007
2005
1992
Energy Policy Act
Energy Independence and
Security Act
American Recovery and
Reinvestment Act
1996
EnergyPolicy Act
2003
Creation of State Electricity
Regulatory Commission
China’s Electricity
Power Law
1. First cross channel link completed in 1961 but decommissioned in 1984 (160 MW), 2GW since 1986 and still today.Source: Institute for energy research - IER, (online), “History of electricity”; Official governments announcements (online)
A short history of electricity networks
5.1 Regulation and policy – evolution of grid regulations

Smart Grids 68
As electricity markets are unbundling, competition puts downward pressure on prices, but makes smart-grid business models more complex to design
Allows for an optimalallocation amongvarious gridstakeholders of thecosts and benefitsassociated with gridupgrades.
Does not providecompetitive tariffs.
Opening up the generation and retailmarkets to competition has placedconsistent downward pressure on prices.
“Unbundling makes it difficult to captureboth costs and benefits of varioustechnology deployments on a system-wide basis – especially with respect tosmart grids”1 (IEA).
Regulated
framework
Competitive
market
Competitive
market
Vertically integrated market
• The utility in charge of the power generation and supply ownsthe transmission lines.
Independent Transmission Operator (ITO):
• Previous monopolies retain ownership of the transmissionnetwork, but legally independent transmission subsidiariesare created to open up transport networks to competition.
Ownership unbundling:
• Total separation between the supply/generation andtransmission owner.
• One of the key aims of the EU’s “3rd Energy Package”(legislative package to open up the gas and electricitymarkets in the EU, adopted in 2009) is to ensure thattransmission is unbundled or independent from generation,production and supply interests and that this is certified ashaving been done. Thus the aim of the European Commissionis to increase the numbers of competing generation andretailing firms in each national market and to reduce themarket shares of former monopoly incumbents
Transmission
Distribution
G2 GnG1
R2 RnR1
Transmission
Distribution
GnG1
R2 RnR1
Evolution of the electricity market structure
1. “Smart-grid investments are likely to be deployed more rapidly in vertically integrated utilities where the business case can more easily be made. In the many areas where this is not possible, more strategic co-operation between distribution-system operators and transmission-system operators is needed. The unbundling of electricity markets has introduced benefits and complexity to the electricity sector.” (IEA).
Source: IEA (2013), “Tracking Clean Energy Progress”; CEER, Smart Grids and smart regulation help implement climate-change objectives
1
2
3
Power
generation
Transmission
Distribution
Retail
G2
1 2 3
+
-
+
-
5.1 Regulation and policy – evolution of grid regulations

Smart Grids 69
New players are entering electricity-grid businesses, as the market's structure changes, integrating more digital-technology providers
Generation
Transmission
Distribution
Consumption
TransmissionSystem operators
DistributionSystemoperators
Power
producers
End-users
Power systemregulator
Public authorities New energy
providers
Technologicalstartups and patentsowners
Energy management service providers
Telecommunication operators
Equipmentmanufacturers
New entrants
ICT industry
Incumbents
ELECTRICITY VALUE-CHAIN STAKEHOLDERS: INCUMBENTS AND NEW ENTRANTS
Source: A.T. Kearney Energy Transition Institite analysis
• There are new collaborations between the ICT industry and T&D system operators: Partnership are important for the development of demonstration scale projects and technology deployment.
• New energy providers compete with traditional power producers, through decentralized power generation or Virtual Power Plants (VPP, see Appendix 6.3 slide 99).
5.1 Regulation and policy – evolution of grid regulations

Smart Grids 70
As T&D utilities’ profit margins remain regulated, smart grid business models has to be tailored to each local regulation
5.1 Regulation and policy – evolution of grid regulations
Regulatory frameworks and objectives in four states/countries
France Japan California (U.S.) UK
Remunerationmodel
Rate-Of-Return (ROR) model
• Regulator defines the operator’s estimated tariff income for the period under consideration, based on a business plan submitted by the operator
• During periodic regulatory reviews, the regulator examines the utility’s base rate, cost of capital, operating expenses, and overall depreciation. Expenditures that are deemed appropriate by the regulator are added to the base rate in order to estimate the total revenue needed for the firm to cover its expenses fully
• Rate of return is set by using conventional cost-of-service methodology (Weighted Average Cost of Capital)
RPI-X revenue model (Performance-Based Rate: PBR)
• Regulatory method based on price caps and periodic reviews (both set every five years by a regulator)
• The utility can fix a price at a maximum amount decided by the regulator
• Rates are back-calculated from a revenue target
Regulation incentives
• Under consideration by the regulator body
Yardstick incentive
• This involves comparing the utility with its own past performance and benchmarking the efficiency and performances of the three other utilities
Incentive for quality service based on penalties and rewards
• The regulator sets up quality standards that the utility can be rewarded for achieving or penalized for failing to achieve
• International survey of 15 transmission utilities
• Comparison and benchmarking of in order to set price caps
Utilities revenue structure
• RR = O + T + D + r(RB)
• Set rate of return at 7.25%,
• Variable bonuses are added according to the operator’s performance, evaluated in relation to regulator-set indicators: level of investment for interconnection for the European electricity system and for R&D, including smart grids; incentives for quality of supply
RR = O + T + D + r(RB)
• Set return rate fixed at 4.4%
RR = O + T + D + r(RB)
• Rates are set by allocating a share of revenue to each customer class and determining the structure of rates required to recover that revenue.
• The price cap for each year is set according to the Retail Price Index (RPI) and an efficiency factor, X.
• Prices remain fixed for the rate period and the utility keeps or shares the cost savings achieved.
• Revenue is the variable regulated
• Revenue reward of +/-1%, enhancing performance and quality improvement
Benefits Reward over investment
Protect the consumer by preventing overcharging
Encourage operator to improve its performance and service quality
Improve the efficiency of the distribution system and the quality of utility investments
Price mechanism restricts revenue, not profit, so it encourages efficiency
No quantity risk
Note : RR: Revenue Required ; O: OPEX ; T: Taxes; D: Depreciation ; r: Rate of Return ; RB: Rate Base.Source: National Grid, “Annual Report and Accounts 2010/11”; Jamasb and Pollitt (2000), “Benchmarking and Regulation Of Electricity Transmission and Distribution Utilities Lessons from International Experience”; Deliberation of the French Energy Regulatory Commission of 3 April 2013 deciding on the tariffs for the use of a high-voltage public electricity grid; OECD, Japan -Regulatory Reform in Electricity; Fenrick et al. “Performance Based Regulation for Electric and Gas Distributors”
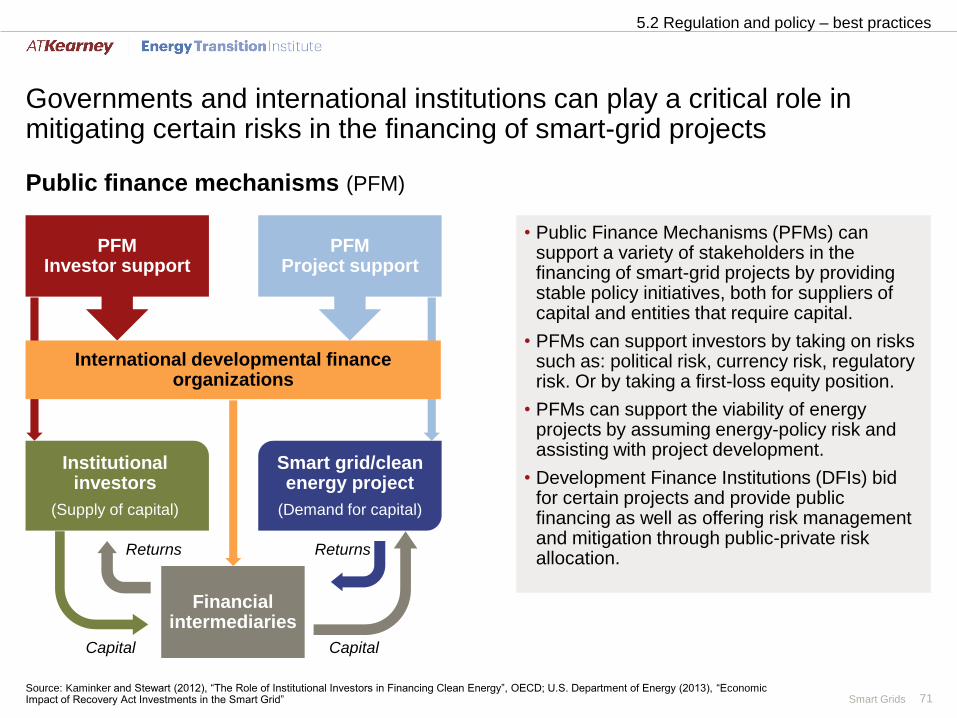
Smart Grids 71
Governments and international institutions can play a critical role in mitigating certain risks in the financing of smart-grid projects
5.2 Regulation and policy – best practices
Public finance mechanisms (PFM)
• Public Finance Mechanisms (PFMs) can support a variety of stakeholders in the financing of smart-grid projects by providing stable policy initiatives, both for suppliers of capital and entities that require capital.
• PFMs can support investors by taking on risks such as: political risk, currency risk, regulatory risk. Or by taking a first-loss equity position.
• PFMs can support the viability of energy projects by assuming energy-policy risk and assisting with project development.
• Development Finance Institutions (DFIs) bid for certain projects and provide public financing as well as offering risk management and mitigation through public-private risk allocation.
Institutional investors
(Supply of capital)
Smart grid/clean energy project
(Demand for capital)
International developmental finance organizations
PFMInvestor support
PFMProject support
Financial intermediaries
ReturnsReturns
CapitalCapital
Source: Kaminker and Stewart (2012), “The Role of Institutional Investors in Financing Clean Energy”, OECD; U.S. Department of Energy (2013), “Economic Impact of Recovery Act Investments in the Smart Grid”

Smart Grids 72
Regulators in the United Kingdom and Italy are at the forefront of innovative financing mechanisms, especially for supporting R,D&D
5.2 Regulation and policy – best practices
Office of Gas and Electricity Markets
Autorità per l'energia elettricae il gas
• The Innovation Funding Incentive (IFI) promotes general technical innovation by allowing up to 0.5% of annual revenue to be spent on innovation.
• The Registered Power Zones (RPZ) instrument was focused on encouraging innovative ways of connecting distributed generation.
• Allowances to recover RD&D expenditures for distribution network operators (DNOs) have been provided:– Regulatory allowances to recover demonstration
expenditure via tariffs;– Funding awards to help fund a small number of
flagship projects by up to £500 million ($790 million); – Discretionary rewards for successful project
completion and exceptional projects.• DNOs are required to disseminate the learning that
the projects generate, as a learning-by-doing mechanism.
• Temporarily enhanced return on revenue for capital-intensive demonstration projects:– Additional 2% extra on Weighted Average Cost of
Capital (WACC1) remuneration for a period of 12 years;
– Only covers capital expenditure and not operative costs.
• Supports pilot projects aimed at testing different market models for electric vehicle charging services. Five new pilot projects have been allowed, according to three market models:– Distribution model;– Competitive-service provider model;– Sole-service provider model.
1. WACC is a calculation of a firm’s cost of capital in which each category of capital is proportionately weighted.Source: World Energy Council (2012), “Smart Grids best practices fundamentals for a modern energy system”; Eurelectric (2011), “Regulation for Smart Grids”
RIIO: “Revenue = Incentives + Innovation + Outputs” • RIIO is an output-based regulation set in the UK,
offering the possibility of including expenditure for technical and commercial innovation projects in business plans
Regulatory Asset Base (RAB)• Several EU member states do not recognize smart-grid
investments in the RAB of European DSOs.• Therefore, DSOs may be reluctant to invest in smarter
grids: they replace the grids, but do not upgrade them
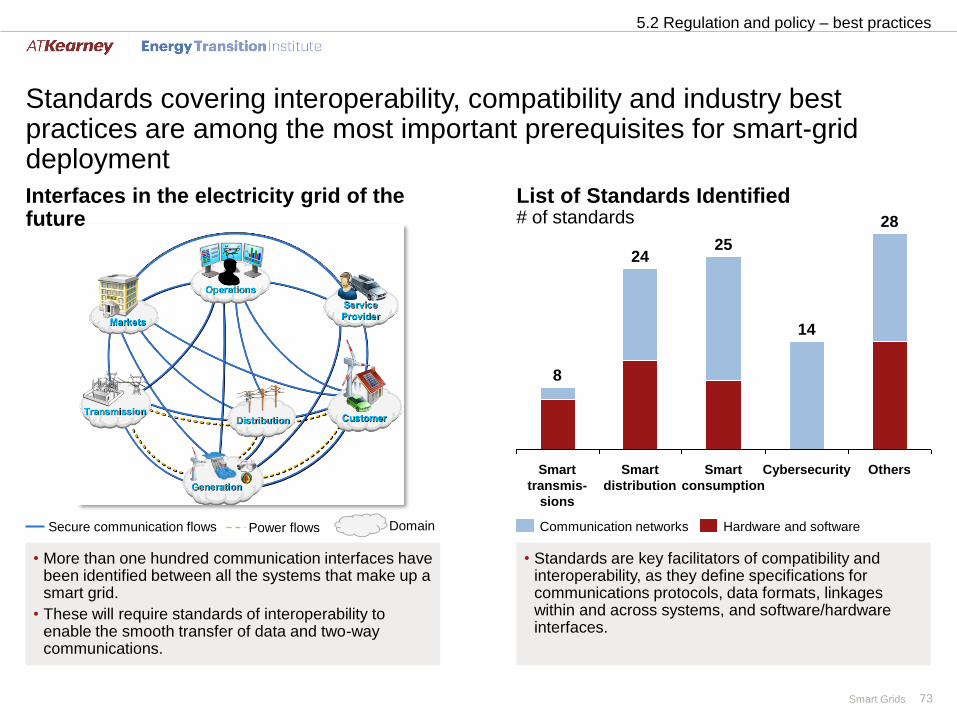
Smart Grids 73
Standards covering interoperability, compatibility and industry best practices are among the most important prerequisites for smart-grid deployment
5.2 Regulation and policy – best practices
Interfaces in the electricity grid of the future
List of Standards Identified# of standards
25
Others
14
28
Smart
consumption
CybersecuritySmart
distribution
24
8
Smart
transmis-
sions
Hardware and softwareCommunication networks
• More than one hundred communication interfaces have been identified between all the systems that make up a smart grid.
• These will require standards of interoperability to enable the smooth transfer of data and two-way communications.
• Standards are key facilitators of compatibility and interoperability, as they define specifications for communications protocols, data formats, linkages within and across systems, and software/hardware interfaces.
Secure communication flows Power flows Domain

Smart Grids 74
Standardization and best practices would avoid the premature obsolescence of future smart-grid devices
5.2 Regulation and policy – best practices
Main Levers for a systematic approach to smart-grid standardization
• Demand response and demand-side management
• Expanded digital monitoring and automation capabilities
• Energy storage
• Electric transportation
• Network communications
• Advanced metering infrastructure
• Distribution management
• Cybersecurity
Priority areas
• Standardization and best practices requires collaboration between industries, regions and technologies.
• In the absence of standards, there is a risk that smart-grid technologies will become prematurely obsolete or implemented without adequate security measures.
• These reliability risks cause regulators to reject deployment, increasing the likelihood of slow technological adoption.
Technical
Basic connectivity
Network interoperability
Syntactic interoperability
• Platform to establish physical and functional links between systems
• Mechanism to exchange messages between multiple systems across a variety of networks
• Comprehension of data structure in messages exchanged between systems
Source: NIST (2012), “Framework and Roadmap for Smart Grid Interoperability Standards”, release 2.0
Semantic understanding
Business context
• Understanding of the concepts contained in the message data structure
• Awareness of contextual aspects of specific interactions as they relate to the market
Informational
Business procedures
Business objectives
Economic/regulatory policy
• Alignment between operational business processes and procedures
• Strategic and tactical objectives shared between businesses
• Political and economic objectives embodied in policy and regulation
Organizational

Smart Grids 75
Appendix: smart-grid technology insights
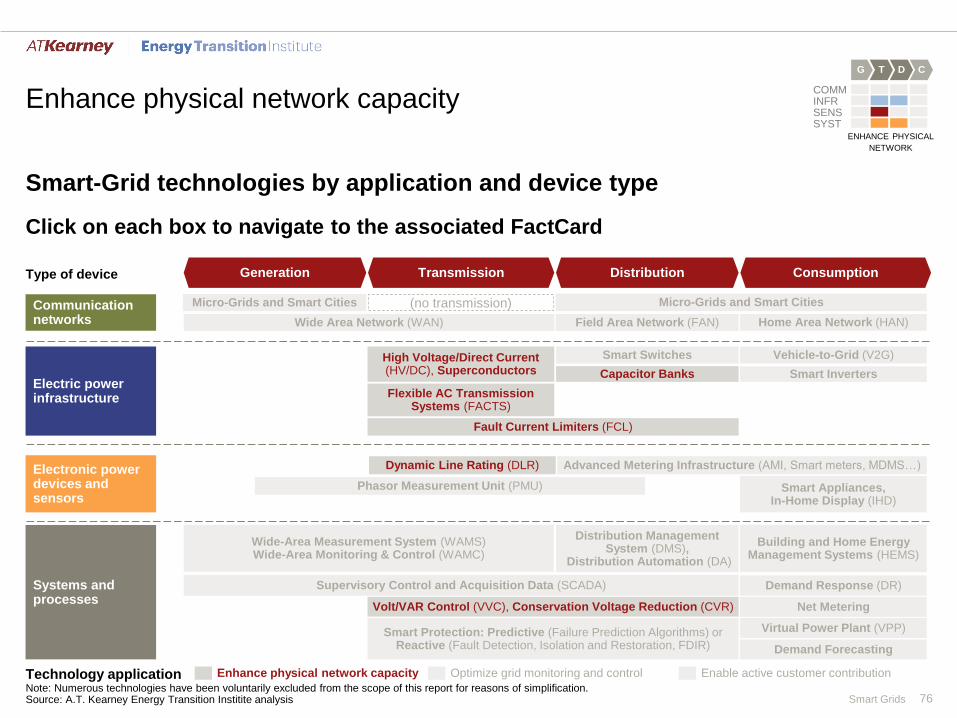
Smart Grids 76
Enhance physical network capacity
Note: Numerous technologies have been voluntarily excluded from the scope of this report for reasons of simplification.Source: A.T. Kearney Energy Transition Institite analysis
Click on each box to navigate to the associated FactCard
Technology application
Micro-Grids and Smart Cities Micro-Grids and Smart Cities
Home Area Network (HAN)Field Area Network (FAN)Wide Area Network (WAN)
Building and Home Energy Management Systems (HEMS)
Supervisory Control and Acquisition Data (SCADA)
High Voltage/Direct Current (HV/DC), Superconductors
Smart Appliances,In-Home Display (IHD)
Smart Switches
Flexible AC Transmission Systems (FACTS)
Fault Current Limiters (FCL)
Vehicle-to-Grid (V2G)
ConsumptionDistributionTransmissionGeneration
Advanced Metering Infrastructure (AMI, Smart meters, MDMS…)
Phasor Measurement Unit (PMU)
Dynamic Line Rating (DLR)
Demand Response (DR)
Volt/VAR Control (VVC), Conservation Voltage Reduction (CVR) Net Metering
Capacitor Banks
Type of device
Electric powerinfrastructure
Electronic powerdevices and sensors
Systems and processes
Communication networks
Smart Inverters
Smart Protection: Predictive (Failure Prediction Algorithms) orReactive (Fault Detection, Isolation and Restoration, FDIR)
Virtual Power Plant (VPP)
Demand Forecasting
Distribution Management System (DMS),
Distribution Automation (DA)
Wide-Area Measurement System (WAMS)Wide-Area Monitoring & Control (WAMC)
Optimize grid monitoring and control Enable active customer contributionEnhance physical network capacity
(no transmission)
Smart-Grid technologies by application and device type
D CG T
COMMINFRSENSSYST
ENHANCE PHYSICAL
NETWORK

Smart Grids 77
FactCard: AC vs. DC principles
Source: Laudani and Mitcheson, “Comparison of cost and efficiency of DC versus AC in office buildings”, Imperial College London; Diffen(online available), “AC vs. DC (Alternating Current vs. Direct Current)”
Design Overview of AC current Overview of DC current
PROS
• Alternators are the most common method of producing electricity
• In a synchronous grid, frequency can be monitored in real time, and reflects overall supply/demand balance.
• Efficient increase in voltage through transformers• Safer over longer distance
• Reduced land footprint (only two conductor cables)• Less transmission loss (2/3 that of AC)
• Used for interconnection (asynchronous/fault-level)• Used for offshore subsea cables (>30 km)• Used for small power appliances (computing)
CONS
• Power transport capacity decreases with distance• Charging and skin effects: electron tendency to flow
only at the surface of the conductor cable, requiring larger cable than in DC for the same transfer power capacity
• Point-to-point transport only unless HVDC circuit-breakers are commercialized
• High cost of equipment (converter stations)
• Transformers cannot be used to change voltage• No frequency regulation mechanism to manage
supply/demand
Frequency • Variable (50 or 60Hz) • 0 Hz
Source • Alternators • PV cells and batteries
Direction • Reverses at every cycle • Flows in one direction
Types • Sinusoidal • Pure, pulsating
Transformers • Cost-effective transformers • Expensive transformers
Cost effectiveness
• Cables < 50-100 km• Lines < 600-800 km
• Cables > 50-100 km• Lines > 600-800 km
Switchand reset
• Easy to reset or switch on/off (voltage zeros every time current reverses direction ~100 time/sec at 50 Hz)
• Hard to switch on/off and further development needed (DC current never zeros, which leads to electric arcs at high voltage when circuit breakers open or close)
D CG T
COMMINFRSENSSYST
ENHANCE PHYSICAL
NETWORK

Smart Grids 78
AC-to-DC conversion diagram
FactCard: High Voltage Direct Current (HVDC)
Note: Picture Credits: left: ABB, HVDC light cable cross section; right: Siemens, HVDC power transformer on the Australia – Tasmania cable.Source: MIT (2011), “The Future of the Electric Grid”; ABB, “The Classic HVDC Transmission”; Larruskain et al. “Transmission and Distribution Networks: AC versus DC”; Hamerly (2010), “Direct Current Transmission Lines”, Stanford university.
• Technology: Power infrastructure - Overhead or undergroundcable
• Grid integration: Point-to-point
• Maturity: HVDC (Deployment), related electronics (R,D&D)
• Potential benefits:
– Small transmission losses
– Power-stability improvements
– Mitigation of cascading supply disruptions
• Barriers:
– Cost of AC-to-DC converters
– Cost of HVDC circuit breaker and control equipment
Deployment
Maturity
• High Voltage is an electricity-transmission method that results in reduced thermal losses. Indeed, the thermal losses associated with a given power flow are proportional to the inverse of the square of the voltage
• High Voltage Direct Current (HVDC) refers to power lines transporting DC current at a high voltage
• HVDC is principally used as an asynchronous bi-directional linkage to stabilize non-synchronous AC areas (e.g. between incompatible frequency areas) and to connect large and remote variable renewables such as offshore wind farms to the main grid (e.g. subsea HVDC cables, since AC dissipates quickly underwater)
• However, converting AC-to-DC (also known as rectification) is very expensive. (DC-to-AC is called inversion)
AC to DC conversion
Filter Regulator Filter
DC power Load
Three phaseAC powerinput
DC poweroutput
D CG T
COMMINFRSENSSYST
ENHANCE PHYSICAL
NETWORK

Smart Grids 79
• Technology:
Power infrastructure – Underground cables
• Maturity:
– Longest line installed: 1 km (Germany, 2014)
• Grid integration:
– Cables linked to the conventional network at a substation
– Cooling stations needed every 1-5 km
• Potential benefits:
– Large transmission capacity in compact dimensions
– Small transmission losses
– Underground location precludes certain types of disruption
Early demo
Maturity
FactCard: Superconductivity andHigh Temperature Superconducting Cables (HTSC)
Note: Note that Tc (°C) for all superconductors is currently negative and < -140°C (133 K).Source: Picture credit (Top right): ORNL 2000-1499C EFG; Furukawa Electric Company, U.S. Department of Energy, Office of Electricity Delivery and Energy Reliability, Nexans, Superconducting Cable System
Technology
Ri
𝑢r = Va − Vb = 𝑅 𝑖
Thermal dissipation, PR=Ui2a b
R = 0i
𝑢r = Va − Vb = 0
No Thermal dissipation, PR=0
a b
Resis
tance
Temperature0 K Tc
Superconductor
“Classic” Conductor
273 K = 0°C
• Superconductivity is the phenomenon of no electrical resistance, which occurs in certain materials (e.g. metals, alloys), below a characteristic temperature Tc
• High Temperature Superconducting Cables (HTSC) operate at around Tc ~ -195°C (usually cooled with liquid nitrogen)
• There are numerous benefits to HTS technology, including:– Three-to-five times greater current density;
– Significant reductions in transmission losses;– Less space required for deployment, as it is installed
underground rather than needing large transmission towers;– Use of more environmentally sustainable liquid nitrogen rather
than the dielectric oil used in traditional high-voltage transmission
D CG T
COMMINFRSENSSYST
ENHANCE PHYSICAL
NETWORK

Smart Grids 80
• Technology: Electronic sensor
• Grid integration:
– Deployed at transmission buses
– Every 1-10 km1
• Communication protocol:
– Send data to SCADA or WAMS by fiber or microwave
• Potential benefits (after software treatment):
– Enhance power capacity of existing power line
– Better dimensioning of new power lines
– Synergies in case of wind power transmission
Deployment
Maturity
FactCard: Dynamic Line Rating (DLR)
1. The device can be installed along the cable or on top of its insulation.Source: The Valley Group, Aivaliotis S.K. (2010), “Dynamic Line Ratings for Optimal and Reliable Power Flow”; Dombek (2014), “Energy Storage, Dynamic Line Ratings Yield More Efficient Grid”; Picture credits: PACWorld & Ceati
• Stating line rating, a common practice, refers to the evaluation of the capacity that can effectively flow through a power line.
• Dynamic Line Rating (widely understood since 1984) measures the changing weather conditions that affect the temperature of the power cable in order to increase its maximum allowed capacity in low-risk situations, such as cold, windy, and cloudy winter days, when the power cable has a lower risk of overheating
• The DLR takes the form of sensors deployed at transmission buses to gauge wind speed, solar radiation and ambient temperature and communicates near-in-time measurements to management systems, which dynamically optimize power flow
0
50
100
150
200
250
Cap
ac
ity (
MV
A)
0 20 40 60 80 100
cool,windy,cloudy
hot,calm,sunny
Static Rating:Assumes constant weather conditions
static rating based on the most unfavor-able conditions at all times
Dynamic Line Rating:Consider changing weather conditions
operated at safe design isotherm under all conditions
Percentage of time during the year (%)
Today’s capacity with static rating
Additionalcapacity with dynamic rating
Example of changing weather conditions' impacts on line capacity:• Ambient temperature +/- 1°C -/+ 1% capacity • Wind speed increase +1m/s [+35%,+45%] (depends on angle)• Solar radiation day/night variation up to 18% (night)
D CG T
COMMINFRSENSSYST
ENHANCE PHYSICAL
NETWORK

Smart Grids 81
• Technology: Physical infrastructure
• Grid integration:
– Deployed at electrical network substations
– Distributed (renewable) generation connections
– Micro-grid connections
• Potential benefits:
– Current stability improvements
– Protects installations
Demo
Maturity
FactCard: Fault Current Limiter (FCL)
Source: Neumann, “Application of fault current limiters”; U.S. Department of Energy, Office of Electricity Delivery and Energy Reliability (2009), “Fault Current Limiters Factsheet”; Zhang (2012), “State of the Art of Fault Current Limiters and Their Applications in Smart Grid”; Picture Credits: Cgsdigital.com
• A fault current occurs when the line intensity suddenly fluctuates, creating a short circuit that potentially overwhelms the electrical network components, causing failures, a tripped circuit or blown fuses. This fluctuation is generally due to lightning or a line outage
• The Fault Current Limiter (FCL) introduces a high impedance that actively absorbs the amplitude of the fluctuation
• “Development is driven by rising system fault current levels as energy demand increases and more distributed generation and clean energy sources, such as wind and solar” (DOE 2009)
• FCLs benefits:
– For utilities: great potential for cost savings (by maintaining a grid and protecting it from faults; and reducing damage to expensive T&D system components);
– For the consumer: higher power reliability and quality
time
Current
Current with FCLFault current
The FCL limits the first peak of the short circuit current (the first peak is responsible for mechanical damage coming from the fault current)
Fault
D CG T
COMMINFRSENSSYST
ENHANCE PHYSICAL
NETWORK

Smart Grids 82
WAN
• Technology: Power infrastructure
• Grid integration: Along transmission networks
• Maturity: Deployment
• Potential benefits:
– Provides dynamic voltage-control that enhances high voltage power quality, controllability and stability
– Increases utilization of transport infrastructure
– Defers installation of new or higher-voltage cables
Deployment
Maturity
FactCard: Flexible Alternating Current Transmission System (FACTS)
Source: EPRI (2011), “Estimating the costs and the benefits of Smart Grids”; University of New Brunswick (2004), “FACTS Technology”; ABB, “Overview about FACTS”;MIT (2011), “The Future of the Electric Grid”. Picture credits: ABB, SVC (FACTS) installation at the Parkdale substation.
• FACTS consists of very large capacitors and feedback-control mechanisms, which are installed on the AC transmission network to complement substations in order to enhance transmission network capacity
• FACTS comprises various power electronic devices (Static VarCompensator (SVC), thyristor, condensers, capacitors, and, potentially, phasor measurement units (PMU)), and costs up to $35-45 million per unit (compared with $15-35 million for a substation). Only one FACTS every 200 substations is needed to be installed on average, which statistically increases total substation capital expenditure by more than 10%
• FACTS “involves the injection of a variable-voltage source, which adjusts the power flow across a transmission line, resulting in variable voltage, impedance, and phase angle”. (EPRI 2011)
SubstationSubstation Substation
FACTS
Substation
FACTS
Substation
SCADA“smart” substation
“smart” substation
D CG T
COMMINFRSENSSYST
ENHANCE PHYSICAL
NETWORK

Smart Grids 83
-10
-5
0
5
10
-300
-200
-100
0
100
200
300
0 10 20 30 40 50 60
V…
FactCard: Volt/VAR Control (VVC), Static Var Compensators (SVC) and Capacitor Banks
1. Inductors possess long coiled wiring which “delays” the flow of electrons (i.e. the current signal) compared with the voltage signal delivered by the electricity provider. At the opposite, the voltage at the terminal of a capacitor only increases slowly as it charges, delaying voltage signal relative to the current, creating negative phase angle.Source: EPRI, Uluski B. (2011), “Volt/VAR Control and Optimization Concepts and Issues”; picture Credits: http://electric-motor-dealers.regionaldirectory.us/
100 W lightbulb 1000 W electric motor
-10
-5
0
5
10
-300
-200
-100
0
100
200
300
0 10 20 30 40 50 60
Voltage (V) Apparent power (VA)
Time (ms)
Voltage / current angle θ = 0°
Apparent (or total) power deliveredS = 1587 VA Reactive power
Q = S * sin (θ)= 587 VAR
Active (or real, or useful) power P = S * sin (θ) = 1000 W
θ = 36°
Apparent power = active power = 100 W
Voltage / current angle θ = 36°
Apparent power S (measured in Volt Ampere VA) can be split into active powerP (in Watt W) and reactive power Q (in Volt Ampere Reactive VAR), with S2 =P2 + Q2 and the ratio between Q and P is equal to tan(θ)
• Grid integration: T&D
• Potential benefits:
– Increase power quality
– Reduce undesired impacts on devices
– Save energy
Mature
Maturity
• Vol/VAR Control (VVC) is an essential feature of AC electricity networks, whose goal is to maintain acceptable voltages at all points of the grid under all loading conditions. While VVC principles are well known, advanced Vol/VAR optimization via algorithms and centralized control centers is in the demonstration phase in distribution grids (see CVR next slide), and in early deployment phase in transmission grid (though SVC built within FACTS)
• The working principle of VVC it to minimize the angle between voltage and current signal in the grid. Apparent (or total) electric power S delivered by the grid is the product of current (I) and voltage (V). Ideally, both sinusoids should peak and cancel as simultaneously as possible so as to maximize the product of both. Purely resistive loads like lightbulbs create no angle. However, inductive loads such as electric motors create a positive angle (θ) at the terminal, while capacitive loads such as capacitors create a negative one1. As a result, apparent power S changes sign at every AC cycle. The portion of apparent power that is positive when averaged over a complete AC cycle (i.e. that results in net transfer of energy in one direction) is called active (or real) power P, and is the only power utilized by the rotor to turn, and the only power billed to the consumer. The remaining portion, which oscillates symmetrically between positive and negative values, is called reactive power Q. It creates no useful work, but has to be transported back and forth by the grid, utilizing cable capacity and creating additional heat losses. Therefore, system operator interest is in minimizing reactive power, i.e. phase θ, which is VVC’s purpose
• Without VVC, because household demand is generally inductive (θ>0), any sudden increase in demand would create a large phase angle and an associated large reactive power flow into the grid, resulting in a drop of voltage
• VVC therefore requires capacitor banks (θ<0) at regular intervals in the grid to reduce phase angle, stabilize voltage, and allow appliances to work more efficiently near their optimal nominal voltage
D CG T
COMMINFRSENSSYST
ENHANCE PHYSICAL
NETWORK

Smart Grids 84
• Technology: Integrated system
• Grid integration: Buses along distribution feeder
• Maturity: Standalone CVR is mature butDMS-controlled CVR is in early deployment
• Potential benefits:
– Improved power quality (voltage quality)
– Customer energy saving (1-3% in pilot programs)
– Very useful for high DG penetration, or for customers demanding high quality-power (e.g. servers)
• Barriers: Disproportionately high costs for utilities when installing numerous devices along each feeder
Demo
Maturity
FactCard: Conservation Voltage Reduction (CVR)
Note: ANSI: American National Standards Institute; DMA: Distribution Management System.Source: Warner & Willoughby (2013), “Conservation Voltage Reduction: An Energy Efficiency Resource”, IEEE Smart Grid; EPRI, Uluski B. (2011), “Volt/VAR Control and Optimization Concepts and Issues”; BNEF (2013) “The convergence of AMI and distribution automation”; Picture Credits: (right) ABB DistribuSense current and voltage sensors; (left) http://wiki.powerdistributionresearch.com/index.php?title=File:Voltage_profile_distribution.jpg.
The prime purpose of CVR is to maintain a stable voltage along the distribution grid, using VVC techniques. It has two main benefits: improve power quality, and minimize energy losses from customer appliances.
Without CVR, voltage generally drops along the distribution-feeder cables (right-hand picture): houses closer to the substation will have to receive higher voltage than required to spare voltage for houses downstream. As appliances are optimized for a single nominal voltage, higher voltage results in energy waste.
With CVR added at various intervals along the feeder cables, voltage can be readjusted to maintain voltage delivered to the customer in the lower portion of the acceptable range, smoothing voltage drop and achieving energy savings. Voltage is readjusted automatically depending on the load: Standalone CVR operates on a predetermined set of rules, and is not considered “smart”. DMS-controlled CVR uses external grid data to exert a much smarter control over voltage (see graph below)
Traditional voltage profile
Voltage profile with CVR technology
CVR:
Electrical demand [-1.5%;-2.1%]
Power required [-1.3%;-2%]114
116
118
120
ANSI lower limit (114 Volts)
122
Voltage(V)
Distance
CVR
First customer
Last customer
Distribution transformer
Primary feeder
Secondary feeder
Distribution feeder line
Capacitor banks
Volt/VAR sensors
DMS
DMS-controlled CVR Rule-based standalone CVR
Distribution feeder line
Volt/VAR sensors
FAN
Standalone controller
Distribution pylon
Capacitor banks
D CG T
COMMINFRSENSSYST
ENHANCE PHYSICAL
NETWORK

Smart Grids 85
Optimize grid monitoring and control
Note: Numerous technologies have been voluntarily excluded from the scope of this report for reasons of simplification.Source: A.T. Kearney Energy Transition Institite analysis
Technology application
Micro-Grids and Smart Cities Micro-Grids and Smart Cities
Home Area Network (HAN)Field Area Network (FAN)Wide Area Network (WAN)
Building and Home Energy Management Systems (HEMS)
Supervisory Control and Acquisition Data (SCADA)
High Voltage/Direct Current (HV/DC), Superconductors
Smart Appliances,In-Home Display (IHD)
Smart Switches
Flexible AC Transmission Systems (FACTS)
Fault Current Limiters (FCL)
Vehicle-to-Grid (V2G)
ConsumptionDistributionTransmissionGeneration
Advanced Metering Infrastructure (AMI, Smart meters, MDMS…)
Phasor Measurement Unit (PMU)
Dynamic Line Rating (DLR)
Demand Response (DR)
Volt/VAR Control (VVC), Conservation Voltage Reduction (CVR) Net Metering
Capacitor Banks
Type of device
Electric powerinfrastructure
Electronic powerdevices and sensors
Systems and processes
Communication networks
Smart Inverters
Smart Protection: Predictive (Failure Prediction Algorithms) orReactive (Fault Detection, Isolation and Restoration, FDIR)
Virtual Power Plant (VPP)
Demand Forecasting
Distribution Management System (DMS),
Distribution Automation (DA)
Wide-Area Measurement System (WAMS)Wide-Area Monitoring & Control (WAMC)
Optimize grid monitoring and control Enable active customer contributionEnhance physical network capacity
(no transmission)
Smart-Grid technologies by application and device type
Click on each box to navigate to the associated FactCard
D CG T
COMMINFRSENSSYST

Smart Grids 86
WAN or FAN
• Technology: Software and hardware
• Grid integration: Utility control centers, generators or substations
• Maturity: Installed in every grid (non-smart technology)
• Potential benefits:
– Data acquisition for monitoring and grid control
– Active avoidance of cascading supply disruption
• Potential barriers:
– Low time resolution, over one second
Mature
Maturity
FactCard: Supervisory Control and Data Acquisition(SCADA)
Source: SCADA System, Moxa Inc.; MIT (2011), “The future of Electric Grid”; Motorola (2007), “SCADA Systems”; ABB (2009), “Network Manager SCADA/EMS and SCADA/GMS”
• Supervisory Control And Data Acquisition (SCADA) systems are a general set of computer technologies that monitor and control grid operations
• SCADA’s main function is to establish the link between:
– Grid sensors, to receive data from switches (open/closed), voltage, current, angle, active or reactive power;
– Energy Management Systems (EMS), for decision-making; and
– Remotely operated equipment, to send coded control signals to generators, substation power electronics, switches, voltage controllers, etc…
• SCADA is not a smart-grid technology in itself, having been part of the traditional grid-management system since computerized control was introduced in the 1960s. The purpose of Wide-Area Monitoring Systems (WAMS) is to enhance SCADA through installation of newer technologies (see next slide)
SCADARemotely operated
equipmentConventional EMS
sensors
D CG T
COMMINFRSENSSYST

Smart Grids 87
WAN
• Technology: Hardware and software
• Grid integration: Major Utility (TSO) controlcenters
• Communication protocol: Communicate through WAN
• Maturity: Early deployment
• Potential benefits:
– Real-time visualization and awareness for operators
– Efficiency and security of the transmission operations
– Optimal utilization of the transmission network
FactCard: Wide-Area Measurement System (WAMS) for Wide-Area Monitoring & Control (WAMC)
Source: Hauer and DeSteese (2007) “Descriptive Model of a Generic WAMS”, PNNL; MIT (2011), “The Future of the Electric Grid”; Shahraeini and Javidi(2012), "Wide Area Measurement Systems"; Picture Credits: Institute Mihailo Pupin “SCADA system at a control center”
• Wide-Area Measurement System (WAMS) refers to a combination of interconnected devices, which allows for a Wide-Area Monitoring & Control (WAMC) of the transmission grid. WAMS comprises of:– Advanced sensors: Phasor Management Unit (PMU), optionally
Dynamic Line Rating (DLR) or Fault Current Limiters (FCL);– Advanced software and algorithms, which process large amounts
of data in short timeframes to help decision-making; and– Advanced hardware, both centralized and distributed, with
improved memory storage, display, and communications systems.• Thanks especially to Phasor Measurement Unit (PMU), WAMC
operates on much greater portions of the grid and on much higher time resolutions than was possible with conventional SCADA systems
• Some new WAMC functionalities include Wide-Area Situational Awareness (WASA) and Wide-Area Adaptive Protection, Control And Automation (WAAPCA)
Remotely operated equipment
Advanced computer hardware and software
PMU
Controllable power plants
PDC
WAMS
FACTS
Other sensors
Deployment
Maturity
D CG T
COMMINFRSENSSYST

Smart Grids 88
WAN
• Technology: Electronic sensor
• Grid integration: Deployed at grid substations/nodes
• Maturity: Deployment stage in Transmission Grid, Demonstration stage in Distribution Grid
• Communication protocol: Send data to PDC then to WAMS by fiber or microwave
• Potential benefits (after software treatment):
– Enable real time and country scale system state vision
– Allow synchronous reconnection of a portion of the grid that has been islanded
– Improve power quality in distribution grids with a very high share of distributed generation
Deployment
Maturity
FactCard: Phasor Measurement Unit (PMU)
1. A.T. Kearney Energy Transition Institite estimates based on devices deployed; 2 A phasor is a measurement of the magnitude and angle of an electrical waveform, either current or voltage.Source: Sexauer et al. (2013), “Phasor Measurement Units for the Distribution Grid: Necessity and Benefits”; U.S. Department of Energy (2013), “Syncrophasor Technologies and Their Deployment”; IEEE (2011), “Standard for Synchrophasors for Power Systems”
• Phasor Measurement Units (PMU) are advanced sensors, which take synchronous measurements of the electrical signal dozens of times per AC cycle in order to digitalize the entire voltage and current waveform at specific locations of a grid, using a common time-source for synchronization – usually a GPS radio clock (see diagram)
• PMUs are crucial components of a smart grid, enabling a real-time understanding of the status of the grid. By contrast, conventional sensors only allow asynchronous signal measurement every few seconds or so
• PMUs are generally installed in transmission grids (ideally at each critical substation, every 10-100 kilometers1) for Wide-Area Measurement System (WAMS). Although capital intensive, PMU may also replace conventional sensors in a distribution grid to ensure power quality in case of high DG penetration
Visualization of:• Voltage change (e.g. losses)• Synchronization
Change in voltage
Frequency
Voltage
Change in phase
• Measure signal, transfer data• Compare output signal with
data from input signal
Transmission Line
Time synchronization in PMU
PMU PMUPMU
PDC
WAMS
10-100km
D CG T
COMMINFRSENSSYST

Smart Grids 89
FAN
• Technology: System and software
• Grid integration: Distribution system operatorcontrol centers
• Communication protocol: Communicate with transmission infrastructure to optimize load delivery
• Maturity: Deployment
• Potential benefits:– Real-time visualization and awareness for operators– Improved detection of losses, theft or faults– Reduces crew resources for monitoring– Enables advanced VVC and CVR, which facilitate integration
of distributed and variable electricity sources– Enables demand-side management and net metering
Deployment
Maturity
FactCard: Distribution Management System (DMS)for Distribution Automation (DA)
Source: Picture Credits: www.electricenergyonline.com: “How SMUD Deals with Big Data: Correlate, Analyze and Visualize It”
• Distribution Management System (DMS) refers to a combination of interconnected devices, which allow for an Distribution Automation (DA) of the distribution grid. DMS integrates:– Grid sensors: conventional volt/VAR sensors, and potentially
synchronous Phasor Measurement Units (PMU)– Edge-of-grid sensors: Advanced Metering Infrastructure (AMI);– IT systems: SCADA and software: Geographic Information
Systems (GIS), Workforce Management Systems (WMS), Outage Management Systems (OMS) for Fault Detection, Isolation and Restoration (FDIR)
• DMS adjusts system settings via remotely operated equipment to optimize load flows and operating conditions, given the constraints of the system
• DMS delivers real-time analysis and control of the distribution grid at the control centers, and is central to the integration of variable and distributed resources into the grid
Remotely operated equipment
SCADA
Sensors
AMI
Capacitor banks
Smart switches
DMS
OMS / FDIR
GIS
WMS
D CG T
COMMINFRSENSSYST

Smart Grids 90
FactCard: Smart protection: predictive1 or reactive2
1. failure-prediction algorithms 2. Fault Detection, Isolation and Restoration, FDIRSource: Smart Grid, Smart City (2012), "Smart Grid, Smart City Project"; Fang et al. (2012), “Smart Grid – The new and improved power grid: a survey”; Picture Credits: GE: https://www.gedigitalenergy.com/smartgrid_distribution.htm#DA; LLNL: https://casis.llnl.gov/technical_focus_area/machine_learning
Fault Detection, Isolation and Restoration (FDIR)• FDIR is a key component of an automated and self-healing distribution grid.
It integrates monitoring and reactive capabilities to reduce outage duration and area: It instantaneously detects both feeder and substation faults and takes immediate action, isolating faulty equipment and restoring unaffected network sections (picture below)
• FDIR requires field sensors to detect voltage/current faults at substations, along distribution feeders, or near-home AMI; algorithms, such as Outage Management System (OMS), combining fault location with feeder-network geographical maps and topology to determine the optimal isolation plan; and smart switches (reclosers) to isolate and re-route electricity flow without human intervention
Failure-prediction algorithms• Statistical approaches can predict weak points or failure
before they occur, and improve power reliability by taking preventing actions such as proactive maintenance
• Such machine-learning algorithms require vast amounts of historical and real-time data:
• Supply-related data such as wind or solar radiation;
• Grid data from PMU or DLR sensors; and
• Edge-of-grid data for demand prediction (see slide 93)
Machine learning and pattern analysis GE’s recloser control system
D CG T
COMMINFRSENSSYST
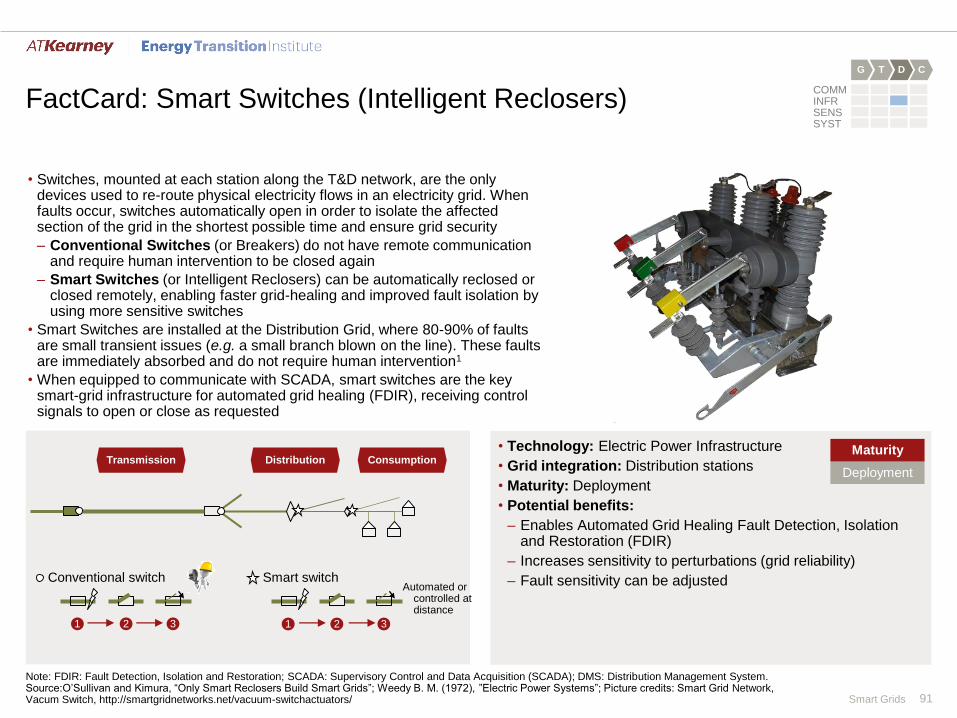
Smart Grids 91
• Technology: Electric Power Infrastructure
• Grid integration: Distribution stations
• Maturity: Deployment
• Potential benefits:
– Enables Automated Grid Healing Fault Detection, Isolation and Restoration (FDIR)
– Increases sensitivity to perturbations (grid reliability)
– Fault sensitivity can be adjusted
Deployment
Maturity
• Switches, mounted at each station along the T&D network, are the only devices used to re-route physical electricity flows in an electricity grid. When faults occur, switches automatically open in order to isolate the affected section of the grid in the shortest possible time and ensure grid security
– Conventional Switches (or Breakers) do not have remote communication and require human intervention to be closed again
– Smart Switches (or Intelligent Reclosers) can be automatically reclosed or closed remotely, enabling faster grid-healing and improved fault isolation by using more sensitive switches
• Smart Switches are installed at the Distribution Grid, where 80-90% of faults are small transient issues (e.g. a small branch blown on the line). These faults are immediately absorbed and do not require human intervention1
• When equipped to communicate with SCADA, smart switches are the key smart-grid infrastructure for automated grid healing (FDIR), receiving control signals to open or close as requested
FactCard: Smart Switches (Intelligent Reclosers)
Note: FDIR: Fault Detection, Isolation and Restoration; SCADA: Supervisory Control and Data Acquisition (SCADA); DMS: Distribution Management System.Source:O’Sullivan and Kimura, “Only Smart Reclosers Build Smart Grids”; Weedy B. M. (1972), ”Electric Power Systems”; Picture credits: Smart Grid Network, Vacum Switch, http://smartgridnetworks.net/vacuum-switchactuators/
Transmission Distribution Consumption
Conventional switch
1 2 3 1 2 3
Automated or controlled atdistance
Smart switch
D CG T
COMMINFRSENSSYST

Smart Grids 92
• Technology: Data analysis
• Grid integration: Consumer side
• Maturity: Demonstration
• Methods: Algorithm based on past data, behavioral analyses and demand anticipation
• Potential benefits:
– Minimize short-term balancing, which is often costly and carbon-intensive
– Optimize long-term plans aiming at ensuring adequacy between power plant capacity and future demand
Demonstration
Maturity
FactCard: Forecasting energy consumption
• Forecasting consumption has always been used by grid operators to maximize power reliability. However, better algorithms and sensors are making prediction with higher spatial and temporal granularity possible.
• Household demand varies according to season, weather, consumer behavior, time of day… Forecasting this is therefore crucial for power optimization, especially when variable and distributed energy sources within micro-grid systems are in use.
• To increase the accuracy and develop ever-more precise predictive methods, larger amounts of data need to be obtained and analyzed, in order to find recurrences in consumption patterns and correlations with external variables (see figure). Four main forecasting methods exist:
1. A learning period is very important for forecasting, as models are usually stochastic calculations based on historical data; 2 Unexpected/unplanned events are taken into account for the granularity and precision of algorithms (e.g. sporting events …).
Source: Campillo et al. (2012), “Energy demand model design for forecasting electricity consumption and simulating demand response scenarios in Sweden”; Arhgira et al. (2013), “Forecasting Energy Consumption in Dwellings”
Trend method: Projection based on historical data from the evolution of the consumption curve in a non-causal way. This method doesn’t explain, it projects.
Easy data availability and fast processing
Only suitable for short-term forecasting
Similar day method: Track several parameters (weather, time, day of week…) and refine projections, based on multiple correlations with records from previous days.
High short-term forecasting accuracy. Several computational tools can be used
Forecasting accuracy decreases with increased time-span
End-use method: Disaggregated approach to analyzing the individual usage patterns of appliances/systems, at all scales, predicting consumption based on the way each technology is deployed.
Suitable for long-term forecasting. Enable forecasts for energy-efficiency programs
Accuracy depends on the granularity of information. Limited samples prevent large-scale forecasts
Econometric method: Combine economic theory and statistical analysis such as similar-day method. Combined with end-use method for better accuracy.
Suitable for long-term forecasting and simulation of different demand scenarios
All variables (consumption history, economics, behavior…) for the same sample are required
Shortterm
(hour-week)
Longterm
(week-year)
Time t Time t+14
Algorithm
1
3
1 Compare current situation with past data
2 Find past consumption with similar criteria
2’ Take into account additional criteria
3 Predict future consumption based on computation
4 Compare real consumption with prediction1
5Other input criteriaDemand-response,distributed generation,time-of-use pricing …
2’
5 Adapt model and algorithm2 with retrofit
Predict future consumption
Compare real data with prevision
Pre-consumption period (forecast)
Post-consumption period (compare)
Available dataWeather, date, behavior,economic …
Forecasting step by step process description
2
D CG T
COMMINFRSENSSYSTOPTIMIZE GRID MONITORING
AND CONTROL

Smart Grids 93
Enable active customer contribution
Note: Numerous technologies have been voluntarily excluded from the scope of this report for reasons of simplification.Source: A.T. Kearney Energy Transition Institite analysis
Click on each box to navigate to the associated FactCard
Technology application
Micro-Grids and Smart Cities Micro-Grids and Smart Cities
Home Area Network (HAN)Field Area Network (FAN)Wide Area Network (WAN)
Building and Home Energy Management Systems (HEMS)
Supervisory Control and Acquisition Data (SCADA)
High Voltage/Direct Current (HV/DC), Superconductors
Smart Appliances,In-Home Display (IHD)
Smart Switches
Flexible AC Transmission Systems (FACTS)
Fault Current Limiters (FCL)
Vehicle-to-Grid (V2G)
ConsumptionDistributionTransmissionGeneration
Advanced Metering Infrastructure (AMI, Smart meters, MDMS…)
Phasor Measurement Unit (PMU)
Dynamic Line Rating (DLR)
Demand Response (DR)
Volt/VAR Control (VVC), Conservation Voltage Reduction (CVR) Net Metering
Capacitor Banks
Type of device
Electric powerinfrastructure
Electronic powerdevices and sensors
Systems and processes
Communication networks
Smart Inverters
Smart Protection: Predictive (Failure Prediction Algorithms) orReactive (Fault Detection, Isolation and Restoration, FDIR)
Virtual Power Plant (VPP)
Demand Forecasting
Distribution Management System (DMS),
Distribution Automation (DA)
Wide-Area Measurement System (WAMS)Wide-Area Monitoring & Control (WAMC)
Optimize grid monitoring and control Enable active customer contributionEnhance physical network capacity
(no transmission)
Smart-Grid technologies by application and device type
D CG T
COMMINFRSENSSYST
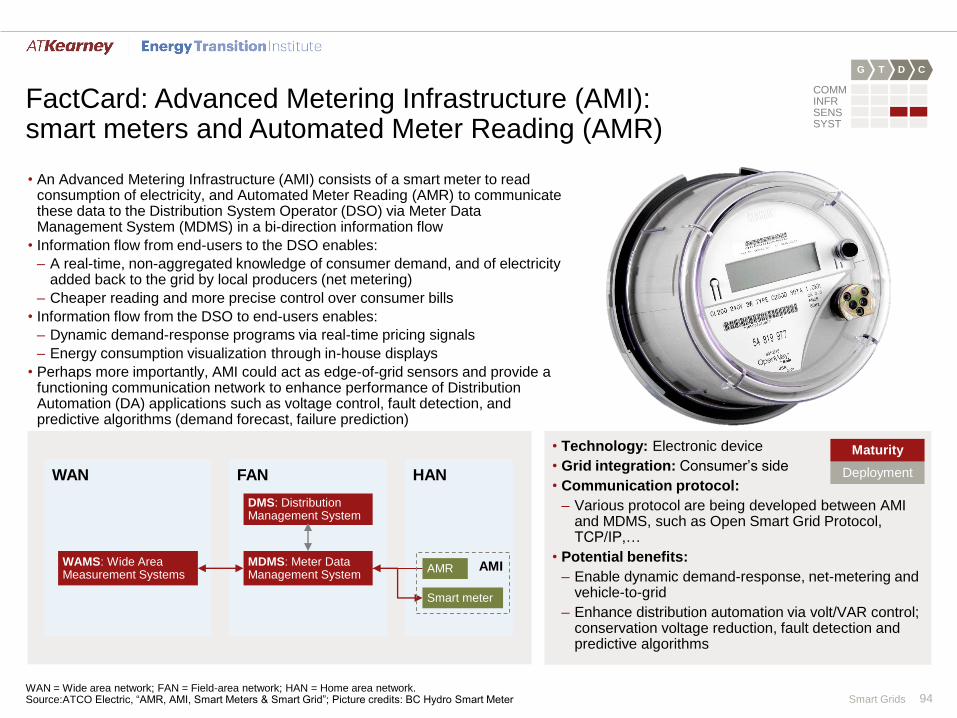
Smart Grids 94
• An Advanced Metering Infrastructure (AMI) consists of a smart meter to read consumption of electricity, and Automated Meter Reading (AMR) to communicate these data to the Distribution System Operator (DSO) via Meter Data Management System (MDMS) in a bi-direction information flow
• Information flow from end-users to the DSO enables:
– A real-time, non-aggregated knowledge of consumer demand, and of electricity added back to the grid by local producers (net metering)
– Cheaper reading and more precise control over consumer bills
• Information flow from the DSO to end-users enables:
– Dynamic demand-response programs via real-time pricing signals
– Energy consumption visualization through in-house displays
• Perhaps more importantly, AMI could act as edge-of-grid sensors and provide a functioning communication network to enhance performance of Distribution Automation (DA) applications such as voltage control, fault detection, and predictive algorithms (demand forecast, failure prediction)
FactCard: Advanced Metering Infrastructure (AMI): smart meters and Automated Meter Reading (AMR)
WAN = Wide area network; FAN = Field-area network; HAN = Home area network. Source:ATCO Electric, “AMR, AMI, Smart Meters & Smart Grid”; Picture credits: BC Hydro Smart Meter
WAN FAN HAN
MDMS: Meter Data Management System
AMR
Smart meter
WAMS: Wide Area Measurement Systems
AMI
DMS: Distribution Management System
• Technology: Electronic device
• Grid integration: Consumer’s side
• Communication protocol:
– Various protocol are being developed between AMI and MDMS, such as Open Smart Grid Protocol, TCP/IP,…
• Potential benefits:
– Enable dynamic demand-response, net-metering and vehicle-to-grid
– Enhance distribution automation via volt/VAR control; conservation voltage reduction, fault detection and predictive algorithms
Deployment
Maturity
D CG T
COMMINFRSENSSYST

Smart Grids 95
FactCard: Demand Response (DR)
DR programs enable Distribution System Operators (DSOs) to manage program participants’ consumption in response to grid imbalances, primarily during times of peak demand or unexpected drops in supply. End-user Energy Management Systems (EMS) are programmed to alter, at the reception of a trigger signal from the DSO, the demand of smart appliances at residential and commercial sites, or even the demand of electricity-intensive industrial plants that wish to cooperate. The trigger signal depends on the type of demand-response program implemented:
• Economic demand-response programs use price or time signals to allow consumers to optimize their electricity bills:
– Time-of-use signals define fixed prices for peak vs. off-peak periods pre-determined months in advance, without requiring any smart-grid infrastructure
– Dynamic signals improve DR effectiveness, but require smart meters to receive live control signals from Meter Data Management Systems (MDMS), such as real-time electricity spot-market prices, or the prices of various derivatives
• Emergency demand-response programs send signals calculated from both DMS and AMI data in order to force targeted load reductions in case of emergency imbalances. This avoids uncontrolled blackouts, in exchange for a pre-agreed fee (only applies to large load consumers)
AMI: Advanced Metering Infrastructure; IHD: In-Home Display.Source: Williamson (2012), "OG&E Smart Study Together Impact Result"; MIT (2011), “The Future of Electric Grid”
Benefits
• Reduce end-user electricity consumption and electricity bills.
• Provide large customers with remuneration in exchange for their “availability to shut-down”.
• Reduce the need for other flexibility sources (peaking power plants or storage capacity).
• Reduce grid instability in times of system distress.
• Time-of-use DR is already mature in countries, such as France, where peak-demand periods occur reasonably regularly, because of the high degree of penetration of electrical residential heating.
• Dynamic pricing is at the demonstration stage, with various regional pilot programs showing encouraging results in terms of load reductions. It seems particularly effective when used in conjunction with central air-conditioning and electrically heated water systems.
• Emergency DR is a more mature business model, as it primarily targets a reduced number of large industrial or commercial consumers. As of 2010, 11 GW of capacity had been installed in the U.S.
Effectiveness
FAN HAN
Smart appliances
Home EMS
IHD
MDMS
Grid status data
DR control signal
Consumption data
Controlled load
DMS AMI
Distribution grid
D CG T
COMMINFRSENSSYST
ENABLE ACTIVE CUSTOMER
CONTRIBUTION

Smart Grids 96
FactCard: Smart Appliances, In-Home Display (IHD)and Home Energy Management Systems (HEMS)
AMI: Advanced Metering Infrastructure; FAN: Field-Area Network; HAN: Home-Area Network; HVAC: Heating, ventilating, and air conditioning; MDMS: Meter data management system.Source: Picture credits: British Gas
• HEMS receive real-time custom messages from utility companies regarding billing and electricity prices, and are programmed to react to price spikes (or other signals) by ordering smart appliances to modify their electricity consumption, enabling demand-response programs. HEMS can also control residential distributed power generation, storage or electric vehicles, in the same way
• Smart appliances are appliances equipped with a load-control switch that are able to receive power commands from HEMS. The most common appliances are for heating, ventilating, and air-conditioning (HVAC), electrically heating water, and refrigeration
• An In-Home Display (IHD, see picture) communicates with utility smart meters (electric, gas, water) to display information such as electricity consumption and tariffs in real time, raising consumer awareness of electricity demand and control over it
FAN HAN
Smart appliances: Water heaters, HVAC,
refrigerators
HEMS
In Home Display
AMIMDMS
Electrical vehiclesStorageResidential distributed
generation
DMS
• Technology type: Various
• Grid integration: Consumer side
• Communication protocol:
– Wireless or Power Line Communication (PLC) within the Home Area Network (HAN)
• Potential benefits:
– Enable demand-response programs
– Enable integration of distributed generation and storage
– Raises consumer awareness of their electricity demand
– Contribute to reduce housing consumption
Deployment
Maturity
D CG T
COMMINFRSENSSYST
ENABLE ACTIVE CUSTOMER
CONTRIBUTION

Smart Grids 97
Smart home with dynamic price net metering and demand response
FactCard: Net metering and smart inverters
Net metering measures electricity generated locally and fed back into the grid, enabling end-users to contribute to total power supply.Smart inverters mounted at each local generator automatically reduce output in case of grid oversupply, enabling local producers to contribute more actively to grid management. There are various types of net-metering programs, but only those with dynamic and adaptive signals are considered “smart”: Conventional (energy-based) net metering gives kWh-credits to end-users when their production exceeds demand (i.e. their meters spin backwards). Such credits cannot exceed cumulated energy demand over the billing period. • Advanced (price-based) net metering gives financial credits to end-users when their production exceeds demand, allowing them to
receive financial revenues if cumulated supply exceeds demand over the billing period. This can enable a higher penetration of distributed generation and electric vehicles. Such configurations require bi-directional Smart Meters able to read electricity tariffs, calculate compensation credits, and be read remotely. Compensation rates generally depend on the electricity price prevailing at the time the surplus occurred: – Time-of-use net metering defines fixed rates for peak vs. off-peak periods pre-determined months in advance;– Dynamic pricing net metering offers variable rates calculated on the basis of real-time electricity prices.
• Feed-in-tariffs or purchasing agreements differ from net metering, since they do not subtract physical consumption from production prior to calculating financial compensation. They require two (unidirectional) meters: one records any electricity drawn from the grid and its associated cost, and the other records any electricity generated by the distributed plant and its associated revenues
Source: A.T. Kearney Energy Transition Institite analysis; NERA (2014) “Self-Consumption and Net Balancing: Issues and solutions”; Energy Tariff Expert (2014) “Net Metering in Massachusetts”
FAN
Distribution feeder
HAN
Solar PV
Wind turbine
Net consumption signal
Pricing signal
DR order
DR order
Electric vehicles
Smart inverter
(smart)appliances
Transformer
DMS
AMI & HEMS
• Technology: Electronic device
• Grid integration: Consumer side
• Maturity: Early deployment
• Communication protocol: Quantify production over consumption and communicate with Distribution System Operators (DSO) for credits calculation
• Potential benefits:
– Remote readings
– Compensation for over-production (feeding the network)
– Real time metering/monitoring for dynamic actions(e.g. pricing)
Deployment
Maturity
D CG T
COMMINFRSENSSYST
ENABLE ACTIVE CUSTOMER
CONTRIBUTION

Smart Grids 98
FactCard: Virtual Power Plants (VPP)
Source: National Energy Technology Laboratory, NTEL-DOE (2011), “Demand Dispatch –Intelligent Demand for a More Efficient Grid”; Zurboarg (2010), “Unlocking Customer Value: The Virtual Power Plant”; Picture credits: adapted from Zurboarg (2010)
• Virtual Power Plants (VPP) correspond to an aggregation of distributed generating end-users (residential, commercial, industrial) that could collectively generate power comparable to that of a centralized power plant. A central controller runs this cluster of dispatched generators, and manages and delivers electricity directly at the distribution level
• VPP clustering differs from individual energy programs (such as dynamic pricing, demand-response, distributed generation), by the depth of its granularity. VPP not only aggregates by type and location, but also by criteria such as topology, customer choices and resources
• With better clustering, utilities can better forecast, analyze and group customer consumption patterns and habits. VPPs are therefore able efficiently to combine physical models (DG, DR) with financial ones (dynamic pricing). The DMS would then execute the right program in order to optimize power flows across the distribution grid (better integration of variable renewables, reductions in peak demand…)
• The concept of VPP is linked to that of demand-dispatch, which – unlike demand-response – orders increases in supply as well as reductions in load
Distributed generation
Demand-response
Storage
Pricing program
• Technology: Energy managementsystem
• Grid integration: distribution andconsumption side
• Maturity: Research & Development
• Potential benefits:
– Pave the way for fully decentralized micro-grids and super-grids
R&D
Maturity
D CG T
COMMINFRSENSSYST
ENABLE ACTIVE CUSTOMER
CONTRIBUTION

Smart Grids 99
FactCard: Smart Electrical Vehicles (EVs) and Vehicle-to-Grid (V2G)
Source: IEA (2011), “Technology Roadmap, Smart Grids”; MIT (2011), “The Future of Electric Grid”; Morgan (2012), “Smart Grids and Electric Vehicles: Made for Each Other?”;
• The vehicle-to-grid technology concept is a version of battery-to-grid power, applied to vehicles. It enables users of electric, hybrid-electric and alternative-fuel vehicles to sell energy stored in vehicles back to the electricity utility
• With a smart grid, utilities can manage when and how EV charging occurs, while adhering to customer preferences. They can also collect EV-specific meter data, apply specific rates for EV charging, engage consumers with information on EV charging, and collect data for greenhouse-gas abatement credits
Petroleum
Fossil fuels, biomass, electrolysis, etc.
H2
Power grid
Transport
Gasoline
Transport
Transport
Battery electric vehicle
Hybrid vehicle
Fuel-cell vehicle
Cons Pros
• EV charging will have a direct impact on the distribution network, raising the power requirements of a single home with an EV from 30% to more than 200%
• It is likely that many EV owners would plug in their vehicles when they return home each day. In many instances, this would coincide with residential evening-load peak times. Unless consumers are offered opportunities to charge while at work, peak load would rise by 4% in a scenario where EVs represent ~1% of average electricity demand
• Vehicles are parked, on average, 95% of the time. Energy stored in vehicle batteries could provide operating reserves.
• EVs have a relatively large energy capacity (for instance, the “Tesla model S” has a capacity of 80 kWh, eight times more than the commercialized home energy storage solution “Tesla Powerwall”)
Different electric vehicles used as transportation and energy storage/source
D CG T
COMMINFRSENSSYST
ENABLE ACTIVE CUSTOMER
CONTRIBUTION

Smart Grids 100
Acronyms and bibliography

Smart Grids 101
Acronyms (1/2)
AC/DC Alternating/Direct Current
AMI Advanced Metering Infrastructure
AMR Automatic Meter Reading
ARRA American Recovery and Reinvestment Act
BRICS Brazil, Russia, India, China and South Africa
CAGR Compound Annual Growth Rate
CAPEX Capital Expenditure
CAIDI Customer Average Interruption Duration Index
CAIFI Customer Average Interruption Duration Index
CSP Concentrated Solar Power
CVR Conservation Voltage Reduction
DA Distribution Automation
D&D Demonstration & Deployment
DG Distributed Generation
DLR Dynamic Line Rating
DMS Distribution Management System
DR Demand Response
DSO Distribution System Operator
EMF Electro-magnetic Field
EMS Energy Management System
EPRI Electric Power Research Institute
ETP Energy Technology Perspective
EV Electric Vehicles
FACTS Flexible AC Transmission Systems
FAN Field Area Network
FCL Fault Current Limiter
FDIR Fault Detection, Isolation and Restoration
FERC Federal Energy Regulatory Commission
GCC Gulf Cooperation Council
GHG Greenhouse Gas
GIS Geographic Information System
HAN Home Area Network
HTSC High Transmission Superconducting Cables
HVAC Heating ventilation, and air conditioning
HVDC High Voltage Direct Current
ICT Information and Communication Technology
IEA International Energy Agency
IEEE Institute of Electrical and Electronics Engineers
IHD In-Home Displays
ISGAN International Smart Grid Action Network
ISO Independent System Operator
IT Information Technology
LAN Local-Area Network
MDMS Meter Data Management Systems
O&M Operation and Maintenance
OECD Organization for Economic Co-operation and Development
OFGEM Office of Gas and Electricity Markets
OMS Outage Management System
OPEX Operation Expenditure
PDC Phasor Data Concentrator

Smart Grids 102
Acronyms (2/2)
PE Private Equity
PMU Phasor Management Unit
PV Photovoltaic
R&D Research and Development
RDD&D Research, Development, Demonstration & Deployment
SAIDI System Average Interruption Duration Index
SCADA Supervisory Control & Acquisition Data
SVC Static VAR Compensator
T&D Transmission and Distribution
TSO Transmission System Operator
V2G Vehicle-to-grid
VC Venture Capital
VAR Volt-Ampere Reactive
VPP Virtual Power Plant
VRE Variable Renewable Energy
VVC Volt/VAR control
WAAPCA Wide-Area Adaptive Protection, Control and Automation
WACC Weighted Average Cost of Capital
WAMS Wide Area Monitoring System
WAMC Wide-Area Monitoring & Control
WAN Wide Area Network
WASA Wide-Area Situational Awareness
WMS Workforce Management System
Smart Grids 103
Bibliography (1/4)
ABB (2009). Network Manager SCADA/EMS and SCADA/GMS. Link
ABB. Overview about FACTS. Link
ABB. The Classic HVDC Transmission. Link
Adm21.fr. (2015). Moxa - Connecting to a SCADA System. Link
Aivaliotis, S.K. (2010). Dynamic Line Ratings for Optimal and Reliable Power Flow. The Valley Group. Link
Amin, M. (2011). Turning the Tide on Outages. University of Minnesota. Link
Arhgira, N., Ploix, S., Fagarasan, I., Iliescu, S. S. (2013), “Forecasting Energy Consumption in Dwellings”. Link
ATCO Electric. AMR, AMI, Smart Meters & Smart Grid.
Bloomberg New Energy Finance – BNEF database
Bloomberg New Energy Finance – BNEF (2013). The convergence of AMI and distribution automation
Bloomberg New Energy Finance – BNEF (2015). Q1 2015 Global Digital Energy Outlook;
Brown, M. H., Sedano, R. P. (2004). Electricity Transmission, A Primer. National Council on Electric Policy. Link
Campillo, J., Wallin, F., Torstensson, D., Vassileva, I. (2012), “Energy demand model design for forecasting electricity consumption and simulating demand response scenarios in Sweden”. Link
Clark, M. (2014). Aging US Power Grid Blacks Out More Than Any Other Developed Nation. International Business Times. Link
Collier, S. (2013). The Evolution of the Smart Grid. Institute of Electrical and Electronics Engineers – IEEE. Link
A.T. Kearney Energy Transition Institite (2013). Electricity Storage Factbook. Link
Dombek, C. (2015). Energy Storage, Dynamic Line Ratings Yield More Efficient Grid.Renewableenergyworld.com. Link
Edison Electric Institute (2010). RE: Addressing Policy and Logistical Challenges to Smart Grid Implementation. Link
Electric Power Research Institute - EPRI (2011). Estimating the Costs and Benefits of the Smart Grid. Link
ElMoursi, M. S., Sharaf, A. M. (2004). Flexible AC Transmission FACTS-Technology and Novel control Strategies for Power System Stability Enhancement. Electrical and Computer Engineering Department. University of New Brunswick. Link
Energy Tariff Expert (2014). Net Metering in Massachusetts Link
Eurelectric (2011). Regulation for Smart Grids. Link
European Commission (2013). Green Paper, A 2030 framework for climate and energy policies. Link
European Commission Joint Research Centre (2014). Smart Grid Projects Outlook 2014. Link

Smart Grids 104
Bibliography (2/4)
Fairley, P. (2015). Germany Takes the Lead in HVDC. Spectrum.ieee.org. Link
Fang, X., Misra, S., Xue, G., Yang, D. (2012), “Smart Grid – The new and improved power grid: a survey”. IEEE Communications surveys & tutorials, vol. 14, no. 4, fourth quarter 2012. Link
Fenrick, S., Macke, R., Getachew, L. Performance Based Regulation for Electric and Gas Distributors. Power System Engineering Inc's (PSE). Link Giordano, V., Onyeji, I., Fulli, G., Sánchez Jiménez, M. Filiou, C. (2015). Guidelines for conducting a cost-benefit analysis of Smart Grid projects. Ses.jrc.ec.europa.eu. JRC Smart Electricity Systems and Interoperability. Link
Federal Energy Regulatory Commission – FERC (2011). Assessment of Demand Response and Advanced Metering. Link
Hamerly, R. (2015). Direct Current Transmission Lines. Large.stanford.edu. Link
Hauer, J.F., DeSteese, J.G. (2007). Descriptive Model of a Generic WAMS. Pacific Northwest National Laboratory - PNNL. Prepared for U.S. Department of Energy Office of Electricity Delivery and Energy Reliability, under Contract DE-AC05-76RL01830. Link
Hidayatullah, N., Paracha, Z., & Kalam, A. (2011). Impact of Distributed Generation on Smart Grid Transient Stability. SGRE, 02(02). Link
Institute for energy research - IER. History of electricity. Link
Institute of Electrical and Electronics Engineers - IEEE (2011). Standard for Synchrophasors for Power Systems. Link
International Energy Agency - IEA (2011). Harnessing Variable Renewables. Link
International Energy Agency - IEA (2011). Technology Roadmap, Smart Grids. Link
International Energy Agency - IEA (2012). Energy Technology Perspectives 2012. Link
International Energy Agency - IEA (2013). Tracking Clean Energy Progress. Link
International Energy Agency - IEA (2014). World Energy Investment Outlook. Link
International Energy Agency - IEA (2014). World Energy Outlook 2014. Link
International Energy Agency - IEA (2015). Energy Technology Perspectives 2015. Link
International Smart Grid Action Network - ISGAN (2013). Smart Grid project catalogue: part 2, by contribution to policy goal. Link
Jamasb, T., Pollitt, M. (2000). Benchmarking and Regulation Of Electricity Transmission and Distribution Utilities Lessons from International Experience. University Of Cambridge. Link
Joskow, P.L., Wolfram, C.D. (2012). Dynamic Pricing of Electricity. Link
Kaminker, Ch., Stewart, F. (2012). The Role of Institutional Investors in Financing Clean Energy. OECD working papers on finance, insurance and private pensions. No. 23. Link
Larruskain, D. M., Zamora, I., Mazón, A. J., Abarrategui, O., Monasterio, J. Transmission and Distribution Networks: AC versus DC. Link

Smart Grids 105
Bibliography (3/4)
Laudani, G. A., Mitcheson, P.D. Comparison of cost and efficiency of DC versus AC in office buildings. Imperial College London.
Massachusetts Institute of Technology - MIT (2011). The Future of the Electric Grid. Link
Morgan, T. (2012). Smart Grids and Electric Vehicles: Made for Each Other?. International Transport Forum, Discussion Paper. Link
Motorola (2007). SCADA Systems. Link
National Grid. Annual Report and Accounts 2010/11. Link
National Energy Technology Laboratory - NTEL (2011), “Demand Dispatch –Intelligent Demand for a More Efficient Grid”. Link
National Institute of Standards and Technology - NIST (2012). Framework and Roadmap for Smart Grid Interoperability Standards. Release 2.0. Link
Navigant Research (2014). Executive Summary: Smart Grid Technologies.
Navigant Research (2013). Executive Summary: Smart Meters. Smart Electric Meters, Advanced Metering Infrastructure, and meter Communications: Global Market Analysis and Forecasts, United States.
Navigant Research (2014). Global Distributed Generation Deployment Forecast.
NERA (2014). Self-Consumption and Net Balancing: Issues and solutions; EPRG & CEEPR European Energy Policy Conference.
Neumann, A. (2007). Application of fault current limiters. [London]: BERR.
Northeast Group (2015). India Smart Grid: Market Forecast (2015-2025). Link
NRG Expert (2013). Electricity T&D white paper. Link
O’Sullivan, N., Kimura, B. Only Smart Reclosers Build Smart Grids. Link
Pratt, R. G. et al. (2010). The Smart Grid: An Estimation of the Energy and CO2 Benefits. Pacific Northwest National Laboratory (PNNL). Link
Purchala, K., Belmans, R., Exarchakos, L., Hawkes, A.D. Distributed generation and the grid integration issues. Imperial College London.
Relecura (2013). Smart Grid Patent Analysis. INDUS Technology. Link
Réseau de Transport d’Electricité, www.rte-france.com/fr/developpement-durable/eco2mix
Sexauer, J., Javanbakht, J., Mohagheghi, S. (2013). Phasor Measurement Units for the Distribution Grid: Necessity and Benefits. - IEEE.
Shahraeini, M., Javidi, M. H. (2012). Wide Area Measurement Systems. Intechopen.com. Link
Siemens (2011). Microgrid white paper. Link
Smart Grid, Smart City (2012). Smart Grid, Smart City Project. Monitoring and Measurement Report - report III. Grid Applications Streams: Fault Detection Isolation and Restoration. Link

Smart Grids 106
Bibliography (4/4)
Taylor, C. W. (2008). Voltage Stability for undergraduates. University of Minnesota Power Group. Link
The World Bank.
Ton, D. (2011). Smart Grid R&D at the U.S. Department of Energy. U.S. Department of Energy - Office of Electricity Delivery and Energy Reliability. Presented at the ONRL Sustainable Summit. Link
U.S. Department of Energy (2013). Syncrophasor Technologies and Their Deployment. American Recovery and Reinvestment Act of 2009. Link
U.S. Department of Energy (2013). Economic Impact of Recovery Act Investments in the Smart Grid. Electricity Delivery & Energy Reliability. Smart Grid Investments Grant Program. Link
U.S. Department of Energy (2013). Smart Grid Investment Grant Program. American Recovery and Reinvestment Act of 2009. Progress Report II. Link
U.S. Department of Energy, Office of Electricity Delivery and Energy Reliability. Link
U.S. Department of Energy (2009), Office of Electricity Delivery and Energy Reliability (2009). Fault Current Limiters Factsheet. Link
U.S. Department of Energy. The Smart Grid - An introduction. Link
Uluski, B. 2011. Volt/VAR Control and Optimization Concepts and Issues. Electric Power Research Institute – EPRI. Link
Vittal, V. (2003). Transient Stability and control of large scale power system. Power Systems Engineering Research Center. Iowa State University. Link
Warner, K., Willoughby, R. (2013). Conservation Voltage Reduction: An Energy Efficiency Resource. Institute of Electrical and Electronics Engineers -IEEE Smart Grid. Link
Weedy, B.M. (1972). Electric Power Systems.
Williamson, C. (2012), OG&E Smart Study Together Impact Result. Final Report - Summer 2011. 1299-02. Global Energy Partners. Link
World Energy Council (2012). Smart Grids best practices fundamentals for a modern energy system. Link
Wright, A. (2012). Ofgem’s response to DECC’s Consultation on the Draft DCC Licence and Licence Application Regulations. The Office of Gas and Electricity Markets – Ofgem. Link
Zhang, Y. (2012). State of the Art of Fault Current Limiters and Their Applications in Smart Grid. University of South Carolina. DOI: 10.1109/PESGM.2012.6344649 Conference: Power and Energy Society General Meeting, 2012 IEEE
Zurboarg, A. (2010). Unlocking Customer Value: The Virtual Power Plant. Word Power. Virtual Power plants. Link

Smart Grids 107
Picture Credits
Slide 5: (clockwise, from top left corner): 1st: General Electric (link); 6th ourpowercampaign.org (link); 7th BC Hydro Smart Meter; 8th British Gas; 10th
sustainablecitynetwork.com; 14th LNNL (link)
Slide 10: Foolcdn.com; National Geographic; H2heuro.org; Forbesimg.com
Slide 12: Bryan Christie Design
Slide 14: NASA
Slide 18: U.S. Department of Energy
Slide 33: ourpowercampaign.org (link)
Slide 34: cleanskies.org; prcee.org; sustainablecitynetwork.com
Slide 44: The Hindu (newspaper, online); Wikipedia (online)
Slide 78: ABB, HVDC light cable cross section; Siemens, HVDC power transformer on the Australia – Tasmania cable
Slide 79: ONRL (link)
Slide 80: PACWorld & Ceati
Slide 81: Cgsdigital.com
Slide 82: ABB, SVC (FACTS) installation at the Parkdale substation
Slide 83: Electric-motor-dealers (link)
Slide 84: wiki.powerdistributionresearch.com (link); ABB DistribuSense current and voltage sensors
Slide 87: Institute Mihailo Pupin “SCADA system at a control center”;
Slide 89: electricenergyonline.com: “How SMUD Deals with Big Data: Correlate, Analyze and Visualize It”
Slide 90: General Electric (link)
Slide 91: Smart Grid Network, Vacum Switch (link)
Slide 94: BC Hydro Smart Meter
Slide 96: British Gas
Slide 98: Zurboarg (2010), “Unlocking Customer Value: The Virtual Power Plant”

Smart Grids 108
The A.T. Kearney Energy Transition Institute is a nonprofit organization. It provides leading insights on global trends in energy
transition, technologies, and strategic implications for private sector businesses and public sector institutions. The Institute is
dedicated to combining objective technological insights with economical perspectives to define the consequences and
opportunities for decision makers in a rapidly changing energy landscape. The independence of the Institute fosters unbiased
primary insights and the ability to co-create new ideas with interested sponsors and relevant stakeholders.
For further information about the A.T. Kearney Energy Transition Institute and possible ways of collaboration, please visit
www.energy-transition-institute.com, or contact us at [email protected].
Permission is hereby granted to reproduce and distribute copies of this work for personal or nonprofit educational purposes. Any copy or extract
has to refer to the copyright of the A.T. Kearney Energy Transition Institute.