Embed Size (px)
Citation preview
E L S E V I E R Microporous Materials 3 (1995 ) 511 -530
MICROPOROUS MATERIALS
Zeolite synthesis from tetraalkylammonium silicate gels
C.S. Gittleman, S.S. Lee, A.T. Bell*, C.J. Radke Center Jbr Advanced Materials, Material Sciences Division, Lawrence Berkeley Laboratories and Department of
Chemical Engineering, University of CaliJbrnia, Berkeley. CA 94720, USA
Received 4 May 1994; accepted 15 July 1994
Abstract
Siliceous zeolite synthesis gels containing tetraalkylammonium (TAA +) and sodium cations were studied using X-ray diffraction, elemental analysis, ion exchange, 298i magic-angle spinning nuclear magnetic resonance spectroscopy, and scanning electron microscopy. The TAA + cations are encapsulated in silicate cages, and silicalite is formed via the rearrangement of these cages by the breaking and reformation of siloxane bonds. Tetrabutylammonium (TBA +) cations promote silicalite growth, but not as effectively as tetrapropylammonium (TPA +) because the larger TBA + cations do not conform as well to the silicalite lattice, thus forming an intergrowth of the silicalite-1 and silicalite-2 structures. The time to nucleate silicalite is not affected by the TBA + content of the gel, but the rate of silicalite crystal growth increases with increasing TBA + in the gel. The TBA + occupies all the channel intersections of the silicalite formed. Tetraethylammonium (TEA +) cations are encapsulated in silicate cages, but not to the same extent as TPA + and TBA +, because TEA + is not as hydrophobic. No silicalite forms in the TEA + silicate gel. The addition of tripropylamine (TriPA) to a TPA + silicate gel has no effect on the kinetics of silicalite formation. TriPA does not incorporate into the gel because it is neutral and, therefore, does not experience a coulombic attraction to the negatively charged surface of the gel.
Keywords: Zeolite synthesis; Tetraalkylammonium; Silicalite formation; Silicalite intergrowth; Hydrogel-solid transformation
1. Introduction
M a n y zeolites can be synthesized hydro- thermally f rom (alumino)si l icate gels containing alkali and t e t r a a l k y l a m m o n i u m ( T A A +) cations. Faujasite [1 ], zeolite A [1 ], sodalite [2], cancrinite [2], g ismondine [3], erionite [4], offretite [4], zeo- lite omega [5], EU-12 [6], EU-13 [7], and ZSM-4 [8] have been synthesized using t e t r ame thy l ammo- nium ( T M A + ) ; ZSM-20 [9], ZSM-25 [10], zeolite Beta [11], N U - 2 [12], ZSM-8 [13], ZSM-12 [14], and ZSM-5 [15] have been synthesized using tetra-
* Corresponding author.
0927-6513/95/$9.50 © 1995 Elsevier Science B.V. All rights reserved SSDI 0927-6513 (94)00062-X
e t h y l a m m o n i u m ( T E A +); ZSM-5 [ 16], silicalite- 1 [17], and ZK-4 [9] have been synthesized using t e t r a p r o p y l a m m o n i u m (TPA +); and ZSM- 11 [ 18 ] has been synthesized using t e t r abu ty la rnmonium (TBA+) .
There has been significant interest in the effects o f T A A + cat ions on the structure and distr ibution of silicate and aluminosil icate species in the gels used to synthesize zeolites. Trimethylsi lylat ion and nuclear magnet ic resonance ( N M R ) spect roscopy have been used to identify soluble (alumin0)si l icate species in silicate solutions containing TAA + cat- ions [19]. Doub le ring silicate anions ( D n R ) have been identified in these solutions by 29Si N M R [20,21], and these species have been proposed to
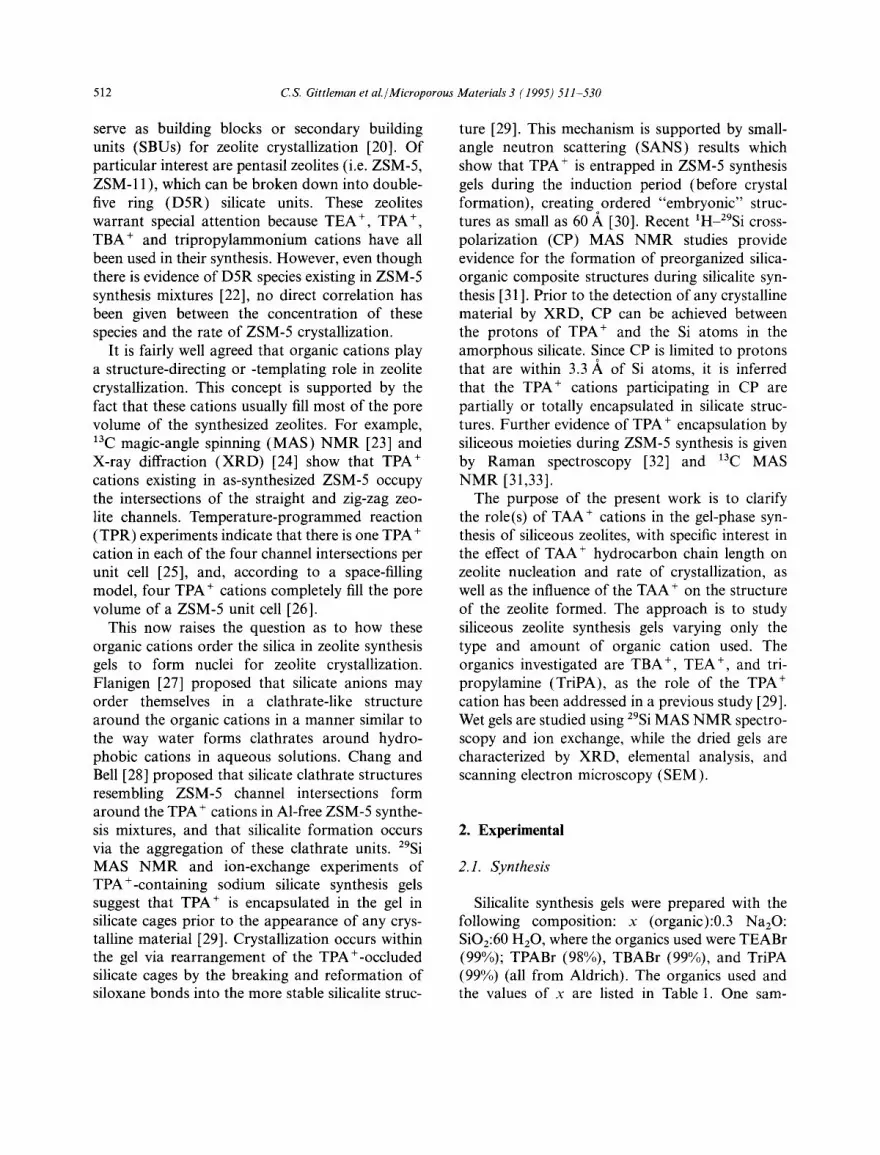
512 C.S. Gittleman et al./Microporous Materials 3 (1995) 511-530
serve as building blocks or secondary building units (SBUs) for zeolite crystallization [20]. Of particular interest are pentasil zeolites (i.e. ZSM-5, ZSM- 11 ), which can be broken down into double- five ring (D5R) silicate units. These zeolites warrant special attention because TEA +, TPA +, TBA + and tripropylammonium cations have all been used in their synthesis. However, even though there is evidence of D5R species existing in ZSM-5 synthesis mixtures [22], no direct correlation has been given between the concentration of these species and the rate of ZSM-5 crystallization.
It is fairly well agreed that organic cations play a structure-directing or -templating role in zeolite crystallization. This concept is supported by the fact that these cations usually fill most of the pore volume of the synthesized zeolites. For example, 13C magic-angle spinning (MAS) NMR [23] and X-ray diffraction (XRD) [24] show that TPA + cations existing in as-synthesized ZSM-5 occupy the intersections of the straight and zig-zag zeo- lite channels. Temperature-programmed reaction (TPR) experiments indicate that there is one TPA + cation in each of the four channel intersections per unit cell [25], and, according to a space-filling model, four TPA + cations completely fill the pore volume of a ZSM-5 unit cell [26].
This now raises the question as to how these organic cations order the silica in zeolite synthesis gels to form nuclei for zeolite crystallization. Flanigen [27] proposed that silicate anions may order themselves in a clathrate-like structure around the organic cations in a manner similar to the way water forms clathrates around hydro- phobic cations in aqueous solutions. Chang and Bell [28] proposed that silicate clathrate structures resembling ZSM-5 channel intersections form around the TPA + cations in Al-free ZSM-5 synthe- sis mixtures, and that silicalite formation occurs via the aggregation of these clathrate units. 298i MAS NMR and ion-exchange experiments of TPA+-containing sodium silicate synthesis gels suggest that TPA + is encapsulated in the gel in silicate cages prior to the appearance of any crys- talline material [29]. Crystallization occurs within the gel via rearrangement of the TPA +-occluded silicate cages by the breaking and reformation of siloxane bonds into the more stable silicalite struc-
ture [29]. This mechanism is supported by small- angle neutron scattering (SANS) results which show that TPA + is entrapped in ZSM-5 synthesis gels during the induction period (before crystal formation), creating ordered "embryonic" struc- tures as small as 60 A [30]. Recent 1H-Z9Si cross- polarization (CP) MAS NMR studies provide evidence for the formation of preorganized silica- organic composite structures during silicalite syn- thesis [31 ]. Prior to the detection of any crystalline material by XRD, CP can be achieved between the protons of TPA + and the Si atoms in the amorphous silicate. Since CP is limited to protons that are within 3.3 A of Si atoms, it is inferred that the TPA + cations participating in CP are partially or totally encapsulated in silicate struc- tures. Further evidence of TPA + encapsulation by siliceous moieties during ZSM-5 synthesis is given by Raman spectroscopy [32] and 13C MAS NMR [31,33].
The purpose of the present work is to clarify the role(s) of TAA + cations in the gel-phase syn- thesis of siliceous zeolites, with specific interest in the effect of TAA + hydrocarbon chain length on zeolite nucleation and rate of crystallization, as well as the influence of the TAA + on the structure of the zeolite formed. The approach is to study siliceous zeolite synthesis gels varying only the type and amount of organic cation used. The organics investigated are TBA +, TEA +, and tri- propylamine (TriPA), as the role of the TPA + cation has been addressed in a previous study [29]. Wet gels are studied using 29Si MAS NMR spectro- scopy and ion exchange, while the dried gels are characterized by XRD, elemental analysis, and scanning electron microscopy (SEM).
2. Experimental
2.1. Synthesis
Silicalite synthesis gels were prepared with the following composition: x (organic):0.3 Na20: 8iO2:60 H20, where the organics used were TEABr (99%); TPABr (98%), TBABr (99%), and TriPA (99%) (all from Aldrich). The organics used and the values of x are listed in Table 1. One sam-
C.S. Gittleman et al./Microporous Materials 3 (1995) 511-530 513
Table 1 Synthesis parameters and products formed
Sample Template x ¢ R d .~ Temperature Product Silicalite (°C) phase f crystallinity g (%)
1 TEA 1/10 10 10 150 a 0 2" TPA 1/10 10 l0 150 s 100 3" TPA 1/24 24 24 150 s 95 4 a TPA 1/48 48 48 150 s,m,a 50 5 a TPA 1/96 96 96 150 s,m,a 27 6 ~ TPA 1/10 10 10 180 s 100 7 TBA 1/10 10 10 150 i,a 7 8 TBA 1/10 10 10 180 i,k,q,a 50 9 TBA 1/'35 35 35 180 i,k,q,a 44
10 TBA 1/80 80 :30 180 i,k,q,a 22 11 TriPA l/10 3c, 10 150 a 0 12 b TPA 1/'24 24 10 150 s 1 (10
TriPA 7,/'120 13" None 0 oc ov 180 a 0
aSynthesis reported in Ref. [29], bBoth TPA and TriPA were used in sample 12. * x = T A A ~/Si molar ratio. d R = Si/TAA + molar ratio. eS= Si/(total organic) molar ratio. ra =amorphous ; s =silicalite-1; i=intergrowth; m=magad i i t e ; k=kenyai te ; q=qua r t z . gFinal percent crystallinity of silicalite-1 or intergrowth phases.
ple (sample 12) was prepared with both TPABr and TriPA. R is the Si/TAA + molar ratio and S is the Si/(total organic) molar ratio in the synthe- sis gels.
The synthesis gels were prepared by rapidly mixing a solution of the organic in deionized water (organic/HzO=x:30) with a solution of sodium silicate, N-Clear (PQ Corp., 28.8% SiO 2, 8.9°Z, NazO, 62.3% H20), in deionized water (SiO2/H20 = 1:30). The mixture of these two solu- tions produces a clear liquid with a pH of approxi- mately 11.3. Sulfuric acid (98%, Fisher) was titrated into the mixture until a gel precipitated at a pH of approximately 10.2. The gel was then mixed vigorously.
Immediately after mixing, the gel was placed into 23-cm 3 static, PTFE-lined, stainless-steel auto- claves, and then heated in an oven at 150 or 180"C. The autoclaves were removed from the oven at times ranging from 1 to 96 h and immediately placed in an ice-water bath to quench any reac- tions. The samples were then centrifuged (700 g) to separate the solid/gel phase from the mother
liquor. The solids were washed with deionized water and portions were dried at 95°C to be analyzed by XRD and SEM. Portions of the unheated initial gels were also centrifuged, washed, and dried for analysis. The mother liquors were analyzed for pH and elemental composition.
2.2. Analytical procedures
The solid and liquid phases of the synthesis gels were analyzed for chemical composition. C and N contents were determined by combustion analysis, and Si and Na contents were determined by induc- tively coupled plasma (ICP) emission spectros- copy. Samples were prepared for ICP analysis by dissolving the solids in an acid mixture with volu- metric composition 0.9 HF:2.1 HCI:HNO3:15 HaBO3 (5%):31 H20 [34].
X-Ray powder patterns were obtained on a Siemens Kristalloflex diffractometer with CuK~ radiation. Samples were step-scanned for 2(t values from 5 to 35 c and from 35 to 50 °, using 0.05 ° steps
514 C.S. Gittleman et al./Microporous Materials 3 (1995) 511-530
and 2-s counts. The amount of crystalline silicalite present was determined by comparing the peak height at 20=23.15 ° to that of a standard sample [35]. The standard, made as described above with Si/TPA= 10, was heated long enough (48 h at 180°C) so that there was no broad unresolved spectrum observed in the XRD pattern due to amorphous material, and until the silicalite peak heights did not increase upon further heating.
The size and morphology of the solids were characterized by SEM, using an ISI-DS130 electron microscope. Prior to examination, samples were mounted with carbon paste on aluminum pegs and coated with a film of evaporated gold.
To determine the accessibility of TAA- cations in the synthesis gel to ion exchange, the wet solid fraction was dispersed in an aqueous solution of 0.015 M Pt(NH3)4C12 (56-58% Pt, Strem) and stirred at room temperature for 24 h [28]. Ion- exchanged solids were washed with deionized water and dried at room temperature, and elemental compositions of the solids and exchange liquids were determined as described above. Pt composi- tions were analyzed by ICP.
298i MAS NMR spectroscopy was performed on a home-built, 180-MHz spectrometer equipped
with a Doty MAS probe operated at a resonant frequency of 35.77 kHz. Wet solids were spun at 2 kHz in sealed zirconia rotors, as described by Ginter et al. [36]. Room temperature spectra were obtained by signal averaging 1024 90 ° pulses with a 10-s recycle delay. Line broadening of 25 Hz was applied prior to Fourier transformation. 295i NMR spectra are referenced to tetramethylsilane (TMS) (0 ppm).
3. Results
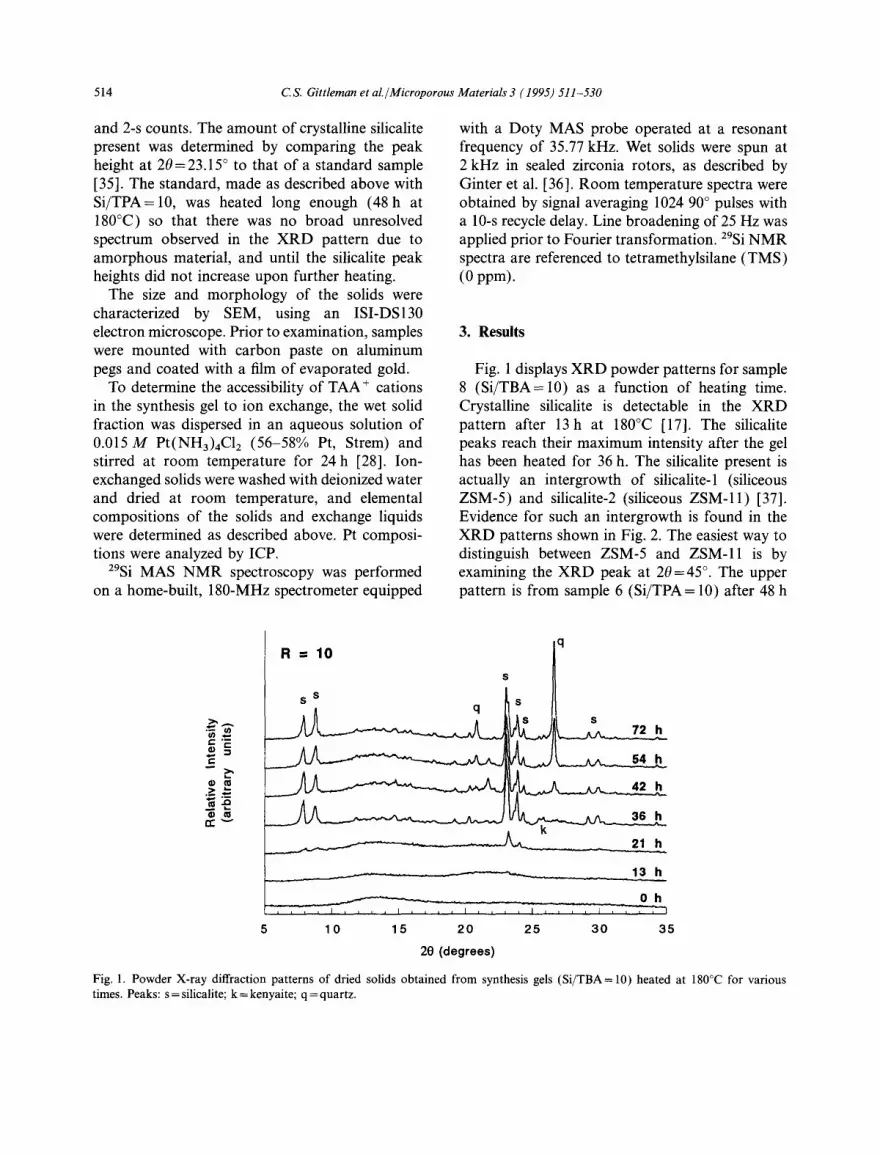
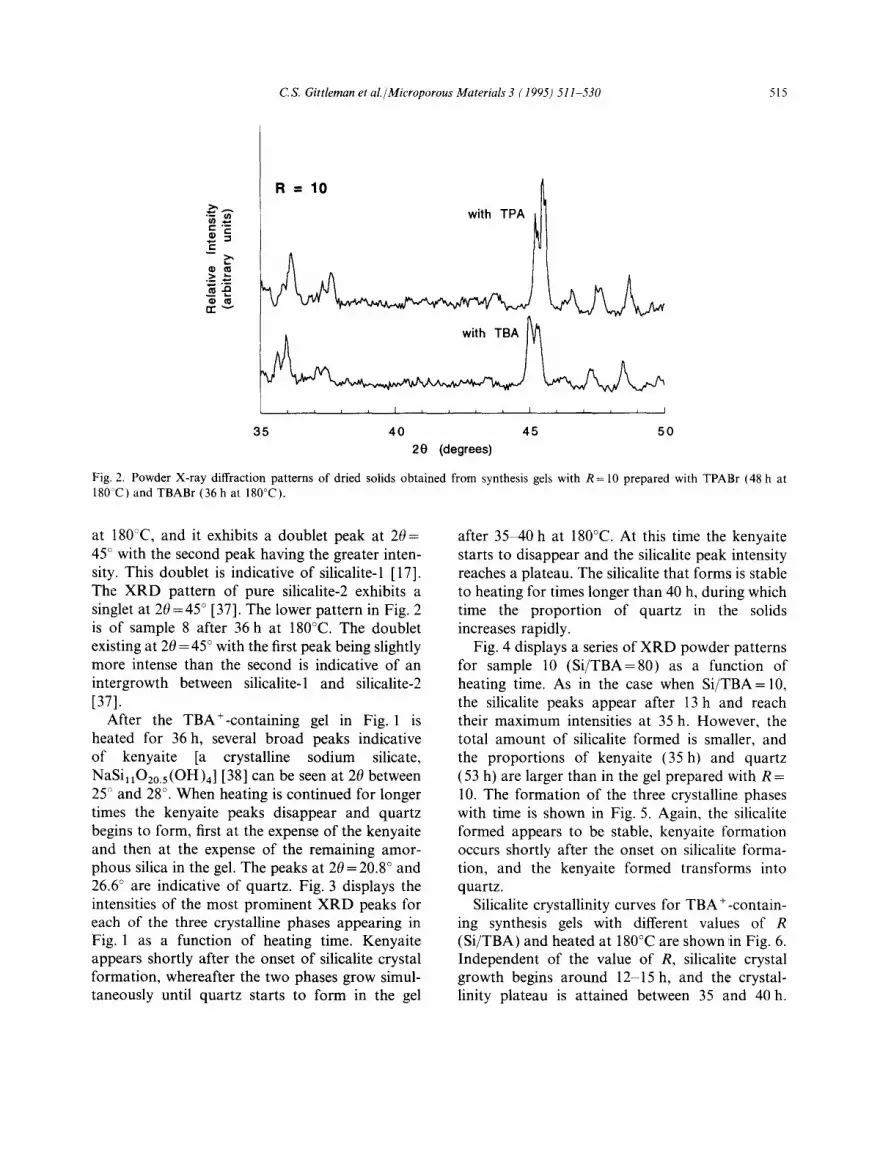
Fig. 1 displays XRD powder patterns for sample 8 (Si/TBA= 10) as a function of heating time. Crystalline silicalite is detectable in the XRD pattern after 13h at 180°C [17]. The silicalite peaks reach their maximum intensity after the gel has been heated for 36 h. The silicalite present is actually an intergrowth of silicalite-1 (siliceous ZSM-5) and silicalite-2 (siliceous ZSM-11) [37]. Evidence for such an intergrowth is found in the XRD patterns shown in Fig. 2. The easiest way to distinguish between ZSM-5 and ZSM-11 is by examining the XRD peak at 20 = 45 °. The upper pattern is from sample 6 (Si/TPA = 10) after 48 h
¢-
~ m
R = I O
S S S
S
54 h
10 15 20
20 (degrees)
21 h
13 h
Oh I , , , ~ J , , , , "1
25 30 35
Fig. 1. Powder X-ray diffraction patterns of dried solids obtained from synthesis gels (Si/TBA= 10) heated at 180°C for various times. Peaks: s=silicalite; k=kenyaite; q=quartz.
C.S. Gittleman et aL /Microporous Materials 3 (1995) 5 l 1-530 515
R = I O I
=
._> ~ ~ / ~
n - v
I L I ~ I I I I I J I I I L I
35 40 45 50
2e (degrees)
Fig. 2. Powder X-ray diffraction patterns of dried solids obtained from synthesis gels with R = 10 prepared with TPABr (48 h at 180:'C) and TBABr (36h at 180°C).
at 180°C, and it exhibits a doublet peak at 20= 45 ° with the second peak having the greater inten- sity. This doublet is indicative of silicalite-1 [17]. The XRD pattern of pure silicalite-2 exhibits a singlet at 20 =45 ° [37]. The lower pattern in Fig. 2 is of sample 8 after 36 h at 180°C. The doublet existing at 20 = 45 ° with the first peak being slightly more intense than the second is indicative of an intergrowth between silicalite-1 and silicalite-2 [371.
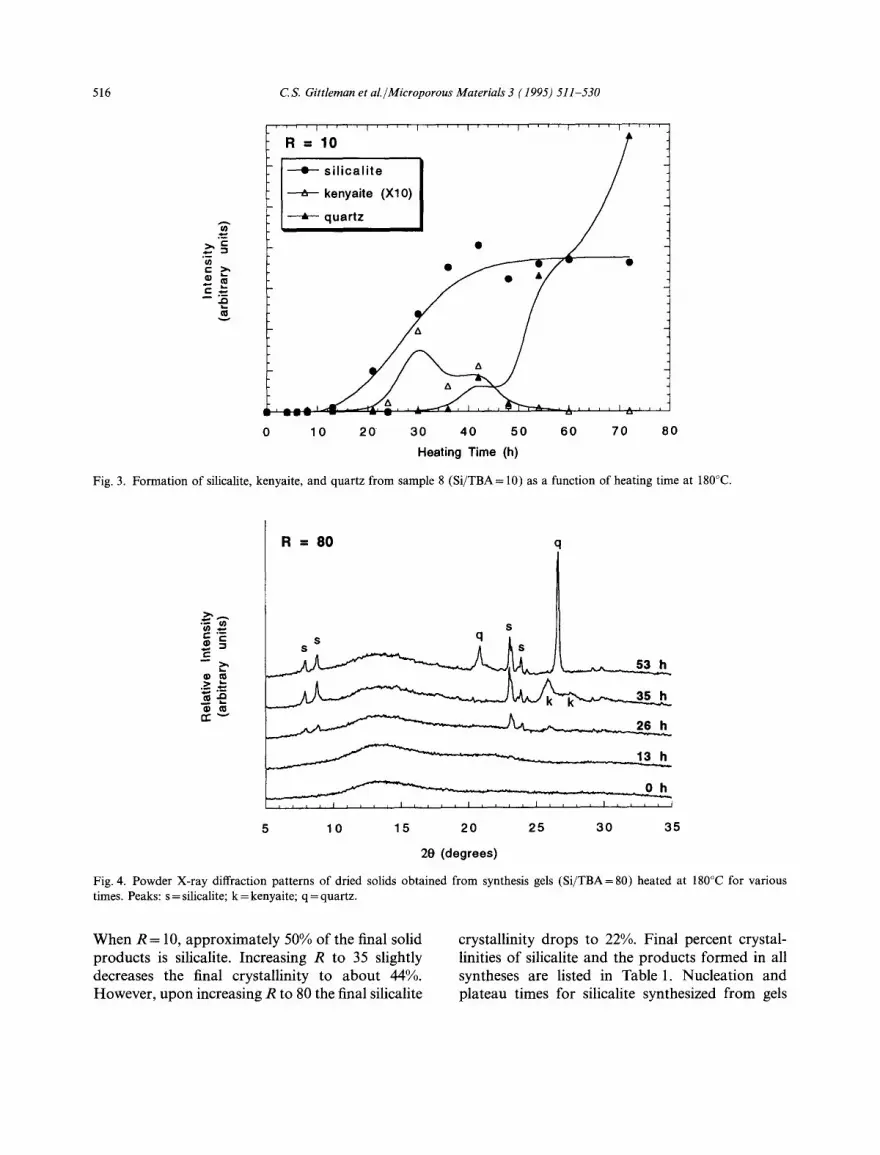
After the TBA+-containing gel in Fig. 1 is heated for 36 h, several broad peaks indicative of kenyaite [a crystalline sodium silicate, NaSi1102o.s(OH)4 ] [38] can be seen at 20 between 25" and 28 ° . When heating is continued for longer times the kenyaite peaks disappear and quartz begins to form, first at the expense of the kenyaite and then at the expense of the remaining amor- phous silica in the gel. The peaks at 20 = 20.8 ° and 26.6 ° are indicative of quartz. Fig. 3 displays the intensities of the most prominent XRD peaks for each of the three crystalline phases appearing in Fig. 1 as a function of heating time. Kenyaite appears shortly after the onset of silicalite crystal formation, whereafter the two phases grow simul- taneously until quartz starts to form in the gel
after 35 40 h at 180°C. At this time the kenyaite starts to disappear and the silicalite peak intensity reaches a plateau. The silicalite that forms is stable to heating for times longer than 40 h, during which time the proportion of quartz in the solids increases rapidly.
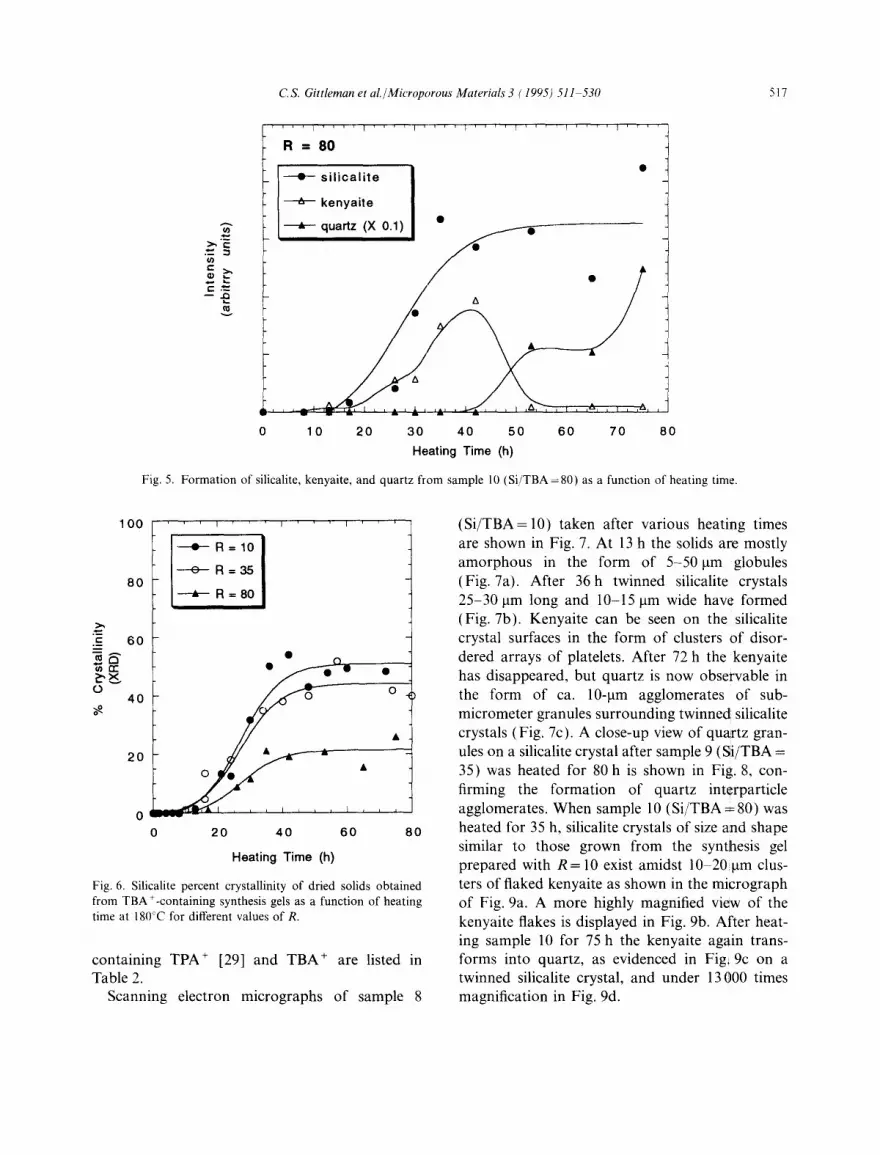
Fig. 4 displays a series of XRD powder patterns for sample 10 (Si/TBA=80) as a function of heating time. As in the case when Si/TBA= 10, the silicalite peaks appear after 13 h and reach their maximum intensities at 35 h. However, the total amount of silicalite formed is smaller, and the proportions of kenyaite (35 h) and quartz (53 h) are larger than in the gel prepared with R= 10. The formation of the three crystalline phases with time is shown in Fig. 5. Again, the silicalite formed appears to be stable, kenyaite formation occurs shortly after the onset on silicalite forma- tion, and the kenyaite formed transforms into quartz.
Silicalite crystallinity curves for TBA+-contain - ing synthesis gels with different values of R (Si/TBA) and heated at 180°C are shown in Fig. 6. Independent of the value of R, silicali~e crystal growth begins around 12-15 h, and the crystal- linity plateau is attained between 35 and 40 h.
516 C.S. Gittlernan et al./Microporous Materials 3 (1995) 511-530
i i , , I ' f ' ' I ' ' ' ' I ' ' ' ' I ' ' ' ' I ' ' ' F . . . . . , , ,
R = 1 0
] ~ s i l i c a l i t e
kenyaite (X10)
~" quartz
E - ra • - -
A
, _ - = ~ J - - . _ .~. . . . . I . . , , ,
0 10 20 30 40 50 60 70 80
Heating Time (h)
Fig. 3. Formation of silicalite, kenyaite, and quartz from sample 8 (Si/TBA = 10) as a function of heating time at 180°C.
=>, 0 3
r ' r ' ~
R = 8 0 q
S
35 h
26 h
~_ 13 h
0 h I i i I I i I i I I i i i i I i I I I ] I I i L I i L L i
5 10 15 20 25 30 35
20 (degrees)
Fig. 4. Powder X-ray diffraction patterns of dried solids obtained from synthesis gels (Si/TBA=80) heated at 180°C for various times. Peaks: s = silicalite; k = kenyaite; q = quartz.
When R = 10, approx imate ly 50% of the final solid products is silicalite. Increasing R to 35 slightly decreases the final crystallinity to abou t 44%. However , upon increasing R to 80 the final silicalite
crystallinity drops to 22%. Final percent crystal- linities o f silicalite and the products fo rmed in all syntheses are listed in Table 1. Nuclea t ion and p la teau times for silicalite synthesized f rom gels
C.S. Gittleman et al./Microporous Materials 3 (1995) 511 530 517
u )
v
R = 8 0
::'2'°;::2 • quartz (X 0.1) ~
0 10 20 30 40 50 60 70 80
Heating Time (h)
Fig. 5. Formation of silicalite, kenyaite, and quartz from sample 10 (Si /TBA=80) as a function of heating time.
100
8 0
.__>, = 6 0
O 4 0
= R = I O
o R = 3 5
• R = 80
I I
20 • • -- 0 • •
0 _ 2 - _ _ _ L r , ,
0 20 40 60 80
Heating Time (h)
Fig. 6. Silicalite percent crystallinity of dried solids obtained from TBA +-containing synthesis gels as a function of heating time at 180"C for different values of R.
containing TPA + [29] and TBA ÷ are listed in Table 2.
Scanning electron micrographs of sample 8
(Si/TBA=10) taken after various heating times are shown in Fig. 7. At 13 h the solids are mostly amorphous in the form of 5-50 ~tm globules (Fig. 7a). After 36 h twinned silicalite crystals 25-30 lam tong and 10-15 gm wide have formed (Fig. 7b). Kenyaite can be seen on the silicalite crystal surfaces in the form of clusters of disor- dered arrays of platelets. After 72 h the kenyaite has disappeared, but quartz is now observable in the form of ca. 10-1am agglomerates of sub- micrometer granules surrounding twinned silicalite crystals (Fig. 7c). A close-up view of quartz gran- ules on a silicalite crystal after sample 9 (Si/TBA = 35) was heated for 80 h is shown in Fig. 8, con- firming the formation of quartz interparticle agglomerates. When sample 10 (Si/TBA = 80) was heated for 35 h, silicalite crystals of size and shape similar to those grown from the synthesis gel prepared with R= 10 exist amidst 10 20gm clus- ters of flaked kenyaite as shown in the micrograph of Fig. 9a. A more highly magnified view of the kenyaite flakes is displayed in Fig. 9b. After heat- ing sample 10 for 75 h the kenyaite again trans- forms into quartz, as evidenced in Fig! 9c on a twinned silicalite crystal, and under 13 000 times magnification in Fig. 9d.

518 C.S. Git tleman et al. / Microporous Materials 3 (1995) 511 530
Table 2 Effects of synthesis conditions in gels prepared with TPA and TBA
Sample Template R b Temperature Nucleation Plateau Time of maximum (°C) time c (h) time d (h) Si/TAA (h)
2 a TPA 10 150 6 10 5 3 a TPA 24 150 8 24 8 4 a TPA 48 150 12 48 10 5 ~ TPA 96 150 18 48 18 6 a TPA I 0 180 3 6 3 7 TBA 10 150 35 32 8 TBA 10 180 13 36 13 9 TBA 35 180 12 34 12
10 TBA 80 180 13 35 13 12 TPA, TriPA 24 150 8 24 8
aSynthesis reported in Ref. [29]. bR=Si /TAA + molar ratio in the synthesis gel. CTime when first crystalline material is detected by XRD. dTime when silicalite percent crystallinity plateau begins.
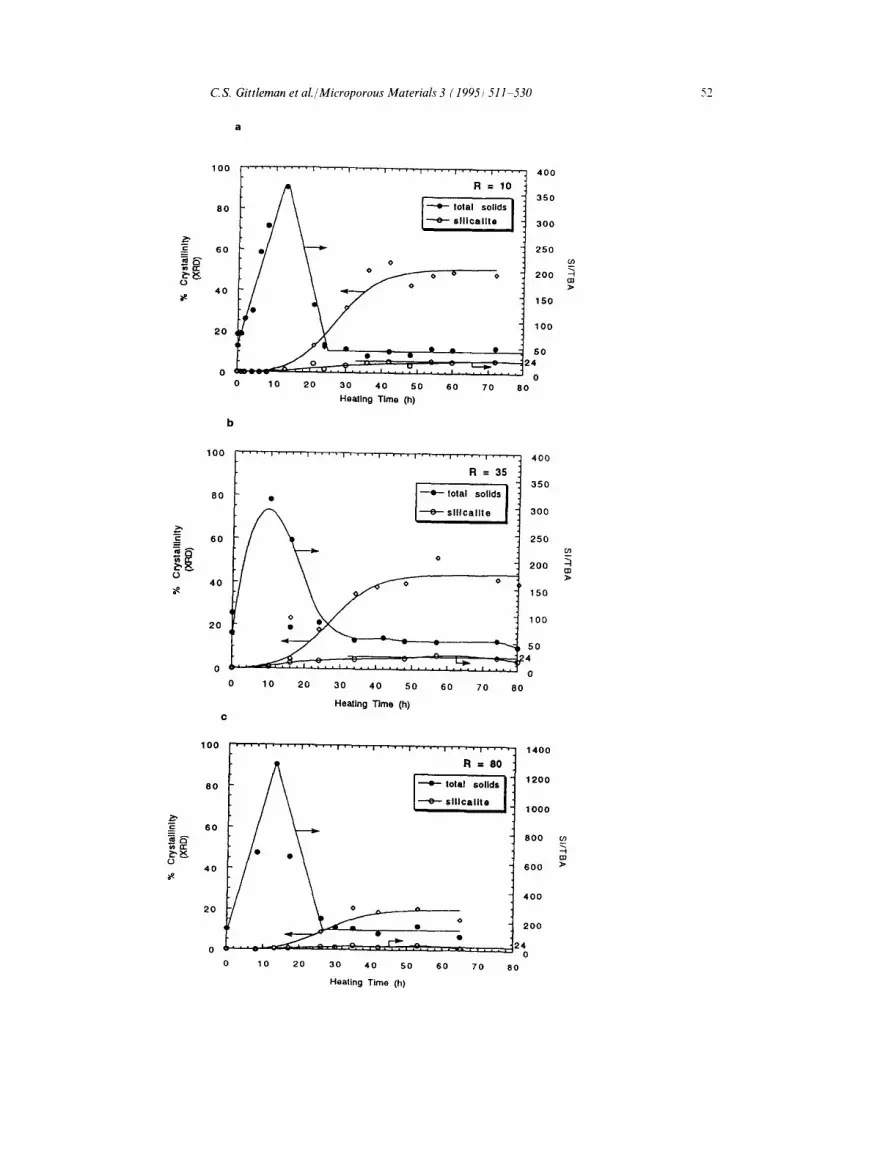
Elemental analysis of the dried solids indicates that TBA ÷ is present intact in all of the samples. The filled circles in Fig. 10 give the Si/TBA ratios in the total solid products of samples 8-10. All three plots display a rise in this ratio during the induction period, prior to the detection of crystal- line material in the solids. As the period of crystal growth begins, a decrease in the Si/TBA ratio is observed. The Si/TBA ratio in the solids then reaches its final value slightly before the silicalite crystallinity reaches its plateau. Similar behavior was observed in synthesis gels prepared with TPA + [29]. The maximum in the Si/TBA ratio for all three samples occurs between 12 and 13 h. The time to reach the maximum Si/TAA ratio in the solids obtained from synthesis gels prepared with TPA + [29] and TBA + are listed in Table 2.
By multiplying the curve for the total Si/TBA ratio in the solids by the silicalite crystallinity curve, a curve for the ratio of Si in crystalline silicalite to the total TBA + in the solids is obtained. In all samples, this curve (displayed as open circles in Fig. 10) rises monotonically from zero at the onset of crystallization and levels off at 24 once the percent crystallinity reaches its plateau. The value of 24 is significant because there are 24 Si atoms per silicalite channel intersection, suggesting that there is one TBA + cation per channel intersec- tion in the silicalite formed, assuming that all the
TBA + in the solids exist in the crystalline silicalite once the silicalite crystallinity reaches its plateau. This same result of one cation per silicalite channel intersection was observed in gels prepared with TPA + [29].
The wet solids were exchanged with a Pt(NH3)4CI 2 salt to determine the accessibility of the TBA + cations in the synthesis gels. In synthesis gels prepared with TPA +, the Pt(NH3)42 + cations exchanged for a significant amount of the TPA + in the gel during the induction period, yet there was no ion exchange during and after the period of crystal growth [29]. This was attributed to the entrapment of the TPA + by the amorphous silicate network in cages during the induction period, thus rendering the TPA ÷ inaccessible to ion exchange.
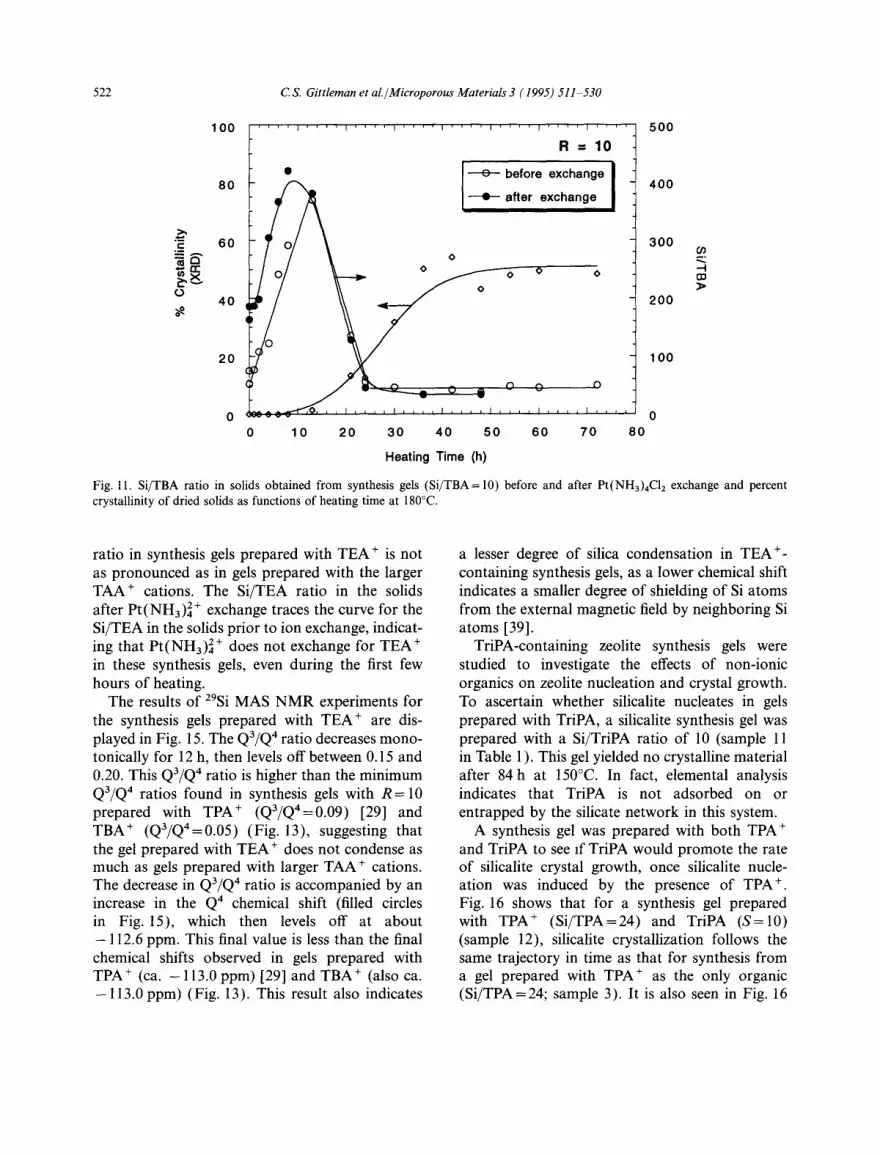
In synthesis gels prepared with TBA +, our ele- mental analysis results confirm that one Pt(NH3) 2+ cation is incorporated into the solids for each exchanged TBA +. The Si/TBA ratios in the solids of sample 8 (R= 10) before and after Pt(NH3)42+ exchange are plotted versus heating time in Fig. 11. As was observed in the TPA +- containing synthesis gels, a substantial amount of the TBA ÷ in the solids is exchangeable during the induction period. Also, once silicalite crystalliza- tion begins, the curves for the Si/TBA ratios in the solids before and after Pt(NH3)42+ exchange rapidly merge. Therefore, even before any crystal-

C.S. Gittleman et al./Microporous Materials 3 ( 1995! 5 l l 530 519
b
Fig. 7. Scanning electron micrographs of dried solids obtained from synthesis gels (Si/TBA = 10) heated for (a) 13 h, (b) 36 h, and (c) 72 h at 180°C. Horizontal white markers below each micrograph indicate the magnification.
f Fig. 8. Scanning electron micrograph of dried solids obtained from a synthesis gel (Si/TBA=35) heated for 80 h at 180'C. The horizontal white marker below the micrograph indicates the magnification.
line silicalite is observable by XRD, the TBA + in the solids is inaccessible to ion exchange. It is inferred from these results that TBA + cations are entrapped in the amorphous silicate network in cages during the induction period in a manner directly analogous to the entrapment of TPA + cations [29].
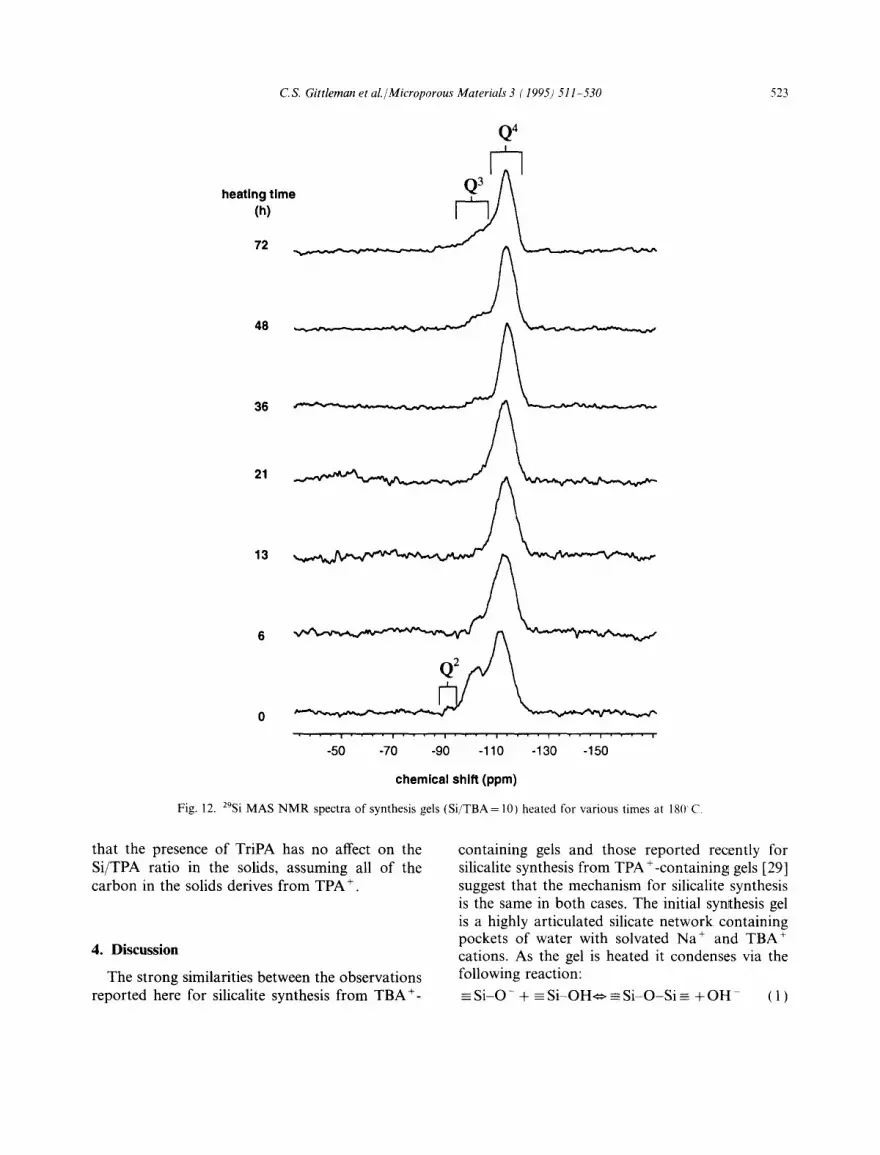
z9si MAS NMR spectroscopy was used to char- acterize the molecular structure of the Wet solids. A series of spectra for sample 8 (Si/TBA= 10) is displayed in Fig. 12. The Q3 peaks (between - 100 and - 105 ppm) and Q4 peaks (between - 110 and -115 ppm) are due to Si atoms conr~ected via siloxane bonds to three other Si atoms and to four other Si atoms, respectively. In the spectrum of the unheated gel (heating time = 0 h) a small peak indicative of Q2 Si connectivity is observed between -90 and -95 ppm. This peak is not observed in the other spectra.
Fig. 13 displays changes in the ratio of intensities of the Q3 to Q4 peaks and the chemical shift of the Q4 peak with heating time for sample 8 as determined from Fig. 12. The Q3/Q4 ratio (open circles) decreases during the induction period due to condensation of the amorphous gel, The Q3/Q4 ratio reaches a minimum at about 13 h, and then increases as first silicalite, then kenyaite, and finally quartz form in the solids. The Q4 chemical shift

520 C S. Gittleman et al./Microporous Mater&& 3 (1995) 511 530
a C
b d
Fig. 9. Scanning electron micrographs of dried solids obtained from synthesis gels (Si/TBA= 80) heated for (a, b) 35 h and (c, d) 75 h at 180°C. Horizontal white markers below each micrograph indicate the magnification.
(filled circles in Fig. 13) increases rapidly f rom - 1 1 0 to - 1 1 3 ppm during the induct ion period, after which it levels off at about - 113 ppm.
Silicalite synthesis gels prepared with T E A B r (sample 1 in Table 1 ) yielded no crystalline mate- rial after heating for 84 h at 150°C. It is possible that T E A + will p romote zeolite format ion upon further heating since it has been reported that
ZSM-8 crystallizes form T E A +-containing synthe- sis gels that have been heated at 120°C for 60 days [13].
The dependence o f heating time on the S i /TEA ratio in the solids o f sample 1 ( R = 10) is displayed in Fig. 14. This ratio rises to a max imum at 12 h, then decreases slightly and levels off at about 58 after 40 h. The max imum value o f the Si /TEA
Fig. 10. Si/TBA ratio in total dried solids and silicalite and percent crystallinity of dried solids obtained from TBA+-containing synthesis gels for (a) R = 10, (b) R = 35, (c) R = 80 as functions of heating time at 180°C.
C.S. Gittleman et al./Microporous MateriaLs" 3 ( 1995 ~ 511-530
a
52
_Z" c = e=
0
c~
1 0 0
8 0
6 0
4 0
2 0
0 ~ 0
1 0 0
8 0
6 0
4 0
2 0
0
0
1 0 0
8 0
6 0
4 0
2 0
. . . . i . . . . L . . . . i . . . . i . . . . i . . . . i . . . . i . . . .
e ~ ,,, R = I O
I " a t o t a l so l ids i
0 [ ' - - - e * - s l l l c a l l t e I
o o o ( > ...... o
i . i i •
o 1 0 2 0 3 0 4 0 5 0 6 0 7 0 8 0
Hea t i ng T ime (h)
, , , i . . . . f . . . . I . . . . i . . . . I . . . . i . . . . I . . . .
- - e - - t o t a l s o l i d s
0 s l l l c a l l t e • I
o
- = - :
• , i . . . . i i , , i ~ !
1 0 2 0 3 0 4 0 5 0
Hea t ing T ime (h)
4 0 0
3 5 0
3 0 0
2 5 0
2 0 0
1 5 0
1 0 0
5 0
. . . . i . . . . i . . . . i . . . . i . . . . i . . . .
. . _ ~ , ~ . . . . o . . . . . r ~ . : 1 0 2 0
4 0 0
R = 3 5
3 5 0
I 3 0 0
2 5 0
2 0 0
o
1 5 0
1 0 0
5O
. ) 4
0
6 0 7 0 8 0
= . . . . i • ' • 1 4 0 0
R = 8 0
t o ta l s o l i d s I 1 2 0 0
s l l l c a l l t e I 1 0 0 0
8 0 O
6OO
4OO
o 2OO
. . . . . . . . . ~,, . . . . . . ± 24 0
3 0 4 0 5 0 6 0 7 0 8 0
Hea t ing T ime (h)
522 C.S. Gittleman et al./Microporous Materials 3 (1995) 511 530
100 500
80 400
_~ 60 300 cn
e--- ~ 0 40 200
20 1 O0
0 0 0 10 20 30 40 50 60 70 80
Heating Time (h)
Fig. 11. Si/TBA ratio in solids obtained from synthesis gels (Si/TBA= 10) before and after Pt(NH3)4C12 exchange and percent crystallinity of dried solids as functions of heating time at 180°C.
ratio in synthesis gels prepared with TEA + is not as pronounced as in gels prepared with the larger TAA + cations. The Si/TEA ratio in the solids after Pt(NH3) 2+ exchange traces the curve for the Si/TEA in the solids prior to ion exchange, indicat- ing that Pt(NHa)] + does not exchange for TEA + in these synthesis gels, even during the first few hours of heating.
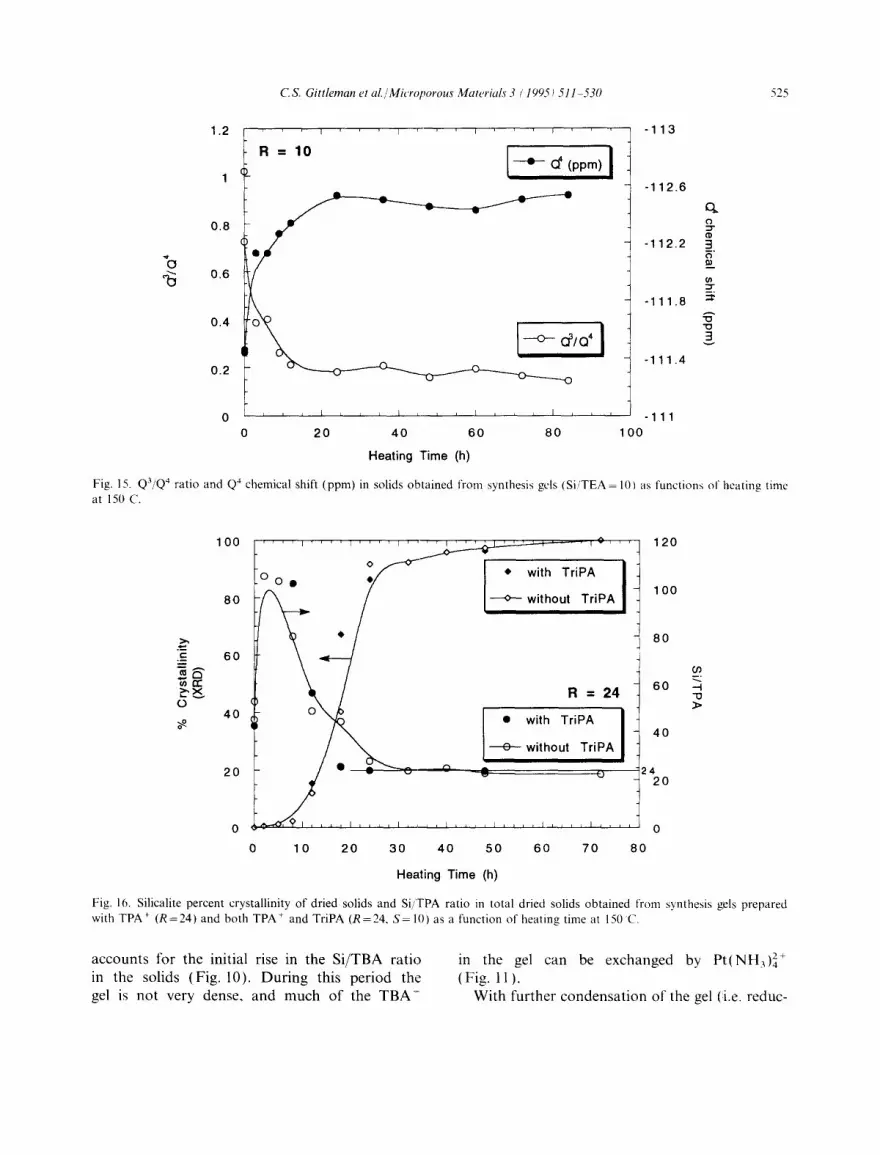
The results of z9si MAS NMR experiments for the synthesis gels prepared with TEA + are dis- played in Fig. 15. The Qa/Q4 ratio decreases mono- tonically for 12 h, then levels off between 0.15 and 0.20. This Q3/Q4 ratio is higher than the minimum Q3/Q4 ratios found in synthesis gels with R= 10 prepared with TPA + (Qa/Q4=0.09) [29] and TBA + (Q3/Q4=0.05) (Fig. 13), suggesting that the gel prepared with TEA + does not condense as much as gels prepared with larger TAA + cations. The decrease in Q3/Q4 ratio is accompanied by an increase in the Q4 chemical shift (filled circles in Fig. 15), which then levels off at about
- 112.6 ppm. This final value is less than the final chemical shifts observed in gels prepared with TPA + (ca. -113.0 ppm) [29] and TBA + (also ca. - l l 3 . 0 p p m ) (Fig. 13). This result also indicates
a lesser degree of silica condensation in TEA +- containing synthesis gels, as a lower chemical shift indicates a smaller degree of shielding of Si atoms from the external magnetic field by neighboring Si atoms [39].
TriPA-containing zeolite synthesis gels were studied to investigate the effects of non-ionic organics on zeolite nucleation and crystal growth. To ascertain whether silicalite nucleates in gels prepared with TriPA, a silicalite synthesis gel was prepared with a Si/TriPA ratio of 10 (sample 11 in Table 1 ). This gel yielded no crystalline material after 84h at 150°C. In fact, elemental analysis indicates that TriPA is not adsorbed on or entrapped by the silicate network in this system.
A synthesis gel was prepared with both TPA + and TriPA to see if TriPA would promote the rate of silicalite crystal growth, once silicalite nucle- ation was induced by the presence of TPA +. Fig. 16 shows that for a synthesis gel prepared with TPA + (Si/TPA=24) and TriPA (S=10) (sample 12), silicalite crystallization follows the same trajectory in time as that for synthesis from a gel prepared with TPA + as the only organic (Si/TPA=24; sample 3). It is also seen in Fig. 16
C.S. Gittleman et aL/Microporous Materials' 3 (1995) 511-530 523
Q4
"°"7.;''"
48
21
13
. . . . i . . . . i . . . . i . . . . i . . . . i . . . . i . . . . i
-50 -70 -90 -110 -130 -150
chemical shift (ppm)
Fig. 12. zgsi MAS NMR spectra of synthesis gels (Si/TBA = 10) heated for various times at 18(1 C
that the presence of Tr iPA has no affect on the Si /TPA rat io in the solids, assuming all o f the ca rbon in the solids derives f rom TPA +.
4. Discussion
The s trong similarities between the observat ions repor ted here for silicalite synthesis f rom T B A +-
containing gels and those repor ted recently for silicalite synthesis f rom TPA +-containing gels [29] suggest that the mechan ism for silicalite synthesis is the same in bo th cases. The initial synthesis gel is a highly art iculated silicate ne twork containing pockets o f water with solvated N a + and T B A + cations. As the gel is heated it condenses via the following reaction:
= S i - O - + = S i -OH<* _-- S i - O - S i -~ + O H ( 1 )

524 C.S. Gittleman et al./Microporous Materials 3 (1995) 511-530
"o
R = 1 0
0.8 " • •
0.6 P
0.4
0.2 0 0 0
0 0
0 i 0 10
I I
- Q • •
0
o
o
• (34 (ppm) J
O O
o o o o Q3/Q4 l
I I I I I I
20 30 40 50 60 70 80
-114
- 1 1 3
- 1 1 2
-111
-110
- 1 0 9
q.
t~ _3. o m_
=r" --°
A "10 "o
Heating Time (h)
Fig. 13. Q3/Q4 ratio and Q4 chemical shift (ppm) in solids obtained from synthesis gels (Si/TBA= 10) as functions of heating time at 180°C.
< LU 1--
03
8 0
7 0
6 0
5 0
4 0
3 0
2 0
10
0
r
R = I O
I I I
|
o before exchange [
I • after exchange
, , I ~ i i I i i I I i L i I L i i
0 20 40 60 80 100
Heating Time (h)
Fig. 14. Si/TEA ratio in solids obtained from synthesis gels (Si/TEA = 10) before and after Pt(NH3)4C1 z exchange as a function of heating time at 150°C.
This accounts for the decrease in the Q3/Q4 As the silicate gel condenses, it becomes more ratio (Fig. 13) and an increase in the p H o f hydrophobic and expels the water pockets the mother l iquor during the induct ion period, along with the dissolved cations. This process
C.S. Gittleman et al./Microporous Materials 3 ( 1995~ 511 530 525
1.2
0.8
0.6
I
R = I O
, f [ I I -113
-112.6 ck O
-112.2 3
-111.8 =
I I - - o - (f/Q, A ~ ~ "111.4
0 , , , L , , , I , , , 1 , , i , ' ' "111 0 20 40 60 80 100
Heating Time (h)
Fig. 15. Q3,Q4,, ratio and Q4 chemical shift (ppm) in solids obtained from synthesis gels (Si,'TEA = 10t as functions of heating time at 150 C.
100 f| . . . . I . . . . I , - ' , O I . . . . . . . . . . . . . I ' 120 * with TriPA
80 / ---o-- without TriPA 100
>, / 80 ._ 60
"~cc 60 =>,x R = 2 4 "o
,o I o~ ~ i with TriPA 40 without TriPA
20 c, ~ - - ~ O 2 4 20
0 10 20 30 40 50 60 70 80
Heating Time (h)
Fig. 10. Silicalite percent crystallinity of dried solids and Si/TPA ratio in total dried solids obtained from synthesis gels prepared with TPA ~ (R=24) and both TPA + and TriPA (R=24, S= 10) as a function of heating time at 150 C.
a c c o u n t s tb r the ini t ia l rise in the S i / T B A ra t io in the solids (F ig . 10). D u r i n g this pe r iod the gel is n o t very dense , a n d m u c h o f the T B A -
in the gel can be exchanged by P t ( N H 3 ) ] + (F ig . 11 ).
W i t h fu r the r c o n d e n s a t i o n o f the gel (i.e. reduc-
526 C.S. Gittleman et al./Microporous Materials 3 (1995) 511 530
tion in the ratio of Q3 to Q4 Si atoms), the synthesis mixture transforms from a single phase consisting of a polymeric silica network suspended in an aqueous solution into a colloidal two-phase system consisting of an aqueous solution called the mother liquor and a second phase made up of coagulated particles of gelatinous silica [40]. The surfaces of the silica gel particles are anionic in alkaline solutions and these surfaces become more hydrophobic as the gel condenses.
After heating the gel for 13 h most of the TBA + in the gel has been expelled into the mother liquor, as evidenced by the maximum in the Si/TBA ratio in the solids at this time (Fig. 10). This heating time also coincides with the attainment of the minimum value of the Q3/Q4 ratio (0.05) ( Fig. 13), which means that the gel is in its most hydrophobic state. The TBA ÷ cations in the mother liquor which have access to the surface of the silica gel particles are coulombically attracted to anionic =--Si-O- surface sites. Upon adsorption onto the surface of the silica particles, the alkyl groups of TBA ÷ cations are attracted via dispersive forces, or so-called "hydrophobic bonds" [41], to hydro- phobic = S ~ O - S i - linkages in the amorphous silica. The TBA + cations adsorbed on the surface of the silica particles are eventually encapsulated by silicate moieties as a consequence of the contin- ual dissolution and reformation of the amorphous silica. This process leads to the eventual occlusion of the TBA + cation in a completely siliceous, highly hydrophobic cage. In this configuration the TBA + cations can no longer be displaced by Pt(NH3) z+ cations. All the TBA + cations in the gel are inaccessible to exchange by Pt(NH3) z+ cations by the time of the earliest evidence of crystalline silicalite (Fig. 11), suggesting that all the TBA + in the gel has been encapsulated by silicate moieties prior to silicalite nucleation. It has been proposed that, for silicalite-1 synthesized from TPA+-containing gels, silicate-encapsulated TPA + structures serve as the nuclei for silicalite crystallization, and that these structures eventually become the channel intersections of the zeolite [29,31].
The silicalite formed contains 1 TBA + cation per 24 Si atoms (Fig. 10), assuming that all the TBA + cations in the solid products exist in the
silicalite phase, as TBA ÷ is not known to exist in either kenyaite or quartz. Since there are 24 Si atoms per silicalite channel intersection, each inter- section must contain 1 TBA + cation. Thus, we propose that crystalline silicalite is formed via rearrangement of the gel containing occluded TBA ÷ cations in such a way that the TBA ÷ cations end up in the channel intersections of the final zeolite.
Despite the similarities in the observables for silicalite synthesis from gels prepared with TPA ÷ and TBA ÷, there are also several significant differ- ences. The most obvious difference lies in the structure of the silicalite formed in the two systems: silicalite-1 forms from TPA+-containing gels whereas an intergrowth of silicalite-1 and silicalite-2 forms from gels prepared with TBA ÷. These structural differences are most likely due to the different sizes of the TAA ÷ cations. According to the templating theory for zeolite crystallization, silicalite-1 forms from TPA+-containing gels because TPA ÷ conforms better into the ZSM-5 channel intersections than into the ZSM-11 pore geometry. Conversely, TBA ÷ fits better in the ZSM-11 channel intersections, thus promoting ZSM- 11 formation from gels prepared with TBA ÷ [42]. We propose that TBA ÷ may have an even more favorable positioning in the channel intersec- tions of the silicalite intergrowth structure than in either the silicalite-1 or silicalite-2 lattices, and thus an intergrowth phase forms from TBA÷-contain - ing silicate gels. An intergrowth of silicalite-1 and silicalite-2 was also observed by Jablonski et al. [37] when using TBA ÷ as a template. The structure of such intergrowths is described in detail else- where [43,44].
Recent computer modelling supports the idea that the formation of a given zeolite structure is related to the structure of the organic cation in solution. Bell et al. [45] have used molecular dynamics, Monte Carlo simulations, and energy minimization techniques to probe the non-bonded interactions between TAA ÷ cations and pentasil zeolite frameworks, while ignoring any electro- static effects. When these simulations take into account the interactions between two template molecules in adjacent intersections, TPA ÷ is pre- dicted to be bound more favorably than TBA ÷ in
C.S. Gittleman et al./Microporous Materials' 3 (1995) 511-530 527
the silicalite-1 framework. Conversely, in silicalite-2 TBA + is more energetically favorable. These calculations are consistent with the observa- tion that ZSM-5 forms from TPA+-containing gels, whereas ZSM-11 forms from TBA+-contain - ing gels. In a related study, Harris and Zones [46] reported that the times necessary to achieve com- plete crystallization of nonasil and SSZ- 13 decrease linearly with increasing magnitude of the non- bonded interaction of the TAA + cation with the zeolite framework.
Another difference between the TPA +- and TBA+-containing synthesis gels is that silicalite crystallization occurs much more slowly from TBA +-containing synthesis gels than from synthe- sis gels containing TPA + (Table 2). For example, when R = 10, the nucleation time (the time at which crystalline silicalite is first observed by XRD) and the time to reach the plateau in silicalite percent crystallinity for TBA +-containing gels are 13 and 36 h, respectively, whereas for TPA+-con - taining gels the nucleation and plateau times are 3 and 6 h, respectively, for gels heated at 180~C [29]. Moreover, in TPA+-containing gels the nucleation and plateau times increase with decreas- ing TPA + gel content or increasing R [29], whereas the silicalite nucleation and plateau times in TBA +-containing gels are not affected by decreas- ing the TBA + gel content.
The lower rate of nucleation in synthesis gels prepared with TBA- as compared with those prepared with TPA + may be due to the greater hydrophobicity of the TBA + cation as a conse- quence of its longer alkyl chains, This greater hydrophobicity leads to a greater attraction to the amorphous silica, which is also hydrophobic, because hydrophobic species are attracted to each other in aqueous solutions [41]. Van der Donck et al. [47] have observed that the larger the TAA ÷ cation, the greater the adsorption onto silica in aqueous TAABr solutions. Consistent with this view, Table 2 shows that the time to reach the: maximum Si/TAA + ratio is greater for TBA + than for TPA +. Likewise, the rate at which the ratio of Q3/Q4 Si atoms decreases is lower for TBA + than for TPA +. Occlusion of TAA + into closely sur- rounding silicate cages occurs only after partial condensation of the silicate. Since such structures
are thought to initiate silicalite crystallization, any delay in the condensation of the amorphous silicate gel decreases the rate at which crystal growth is initiated.
The lower rate of silicalite crystal growth from synthesis gels prepared with TBA + than from gels prepared with TPA + is most likely due to the lattice strain present in the intergr0wth of silicalite-1 and -2. The presence of strain reduces the thermodynamic driving force for siliealite for- mation in the TBA + system relative to that found in the TPA + system. Another possible explanation for the lower rate of silicalite crystal growth from TBA +-containing synthesis gels than from TPA + containing gels is that the larger silicate cages which form around the TBA + cations may experi- ence a greater resistance to rearrangement into the silicalite structure.
However, even though the plateau Uimes for silicalite crystallization are similar for gels pre- pared with different Si/TBA ratios, the rate of silicalite crystal growth decreases with decreasing TBA + gel content or increasing R (cf. Fig. 6). The fact that the silicalite plateau times are independent of R can be explained by assuming that the nucle- ation time for quartz is constant (35-40 h) and that the rate of quartz crystallization is higher than the rate of silicalite crystallization (Figs. 3 and 5). Thus, silicalite no longer grows In the gel after quartz nucleation occurs, and the final silica- lite crystallinity is the percent crystallinity existing in the solids at the onset of quartz formation.
In the TPA+-containing silicalite synthesis system, magadiite (NaSiTO13(OH)3, a crystalline sodium polysilicate with a structure similar to that of kenyaite [38]) grows on the surface of silicalite crystals in gels with less than stoichiometric TPA + (Si/TPA>24) [29]. As silicalite crystal growth is rapid in these systems, magadiite formation does not occur until the completion of silicalite growth due to the exhaustion of TPA + in the gel, and 100% crystalline silicalite forms in gels prepared with excess TPA + (Si/TPA~<24) [29]. In the TBA+-containing silicalite synthesis system, how- ever, crystal growth of the silicalite intergrowth phase is slow compared with silicalite-I crystalliza- tion from TPA+-containing synthesis gels. This lower growth rate allows the formation of kenyaite

528 C S. Gittleman et al./Microporous Materials 3 (1995) 511 530
to compete with silicalite crystallization in these systems. Therefore, even when there is excess TBA + in the synthesis gel (R < 24), 100% crystal- line silicalite does not form (i.e. the final silicalite crystallinity for the gel prepared with R--10 is 50% (cf. Fig. 6)).
The formation of kenyaite begins shortly after the initial detection of crystalline silicalite in the solids (Figs. 3 and 5). Electron micrographs show- ing kenyaite residing on the surface of silicalite crystals (Fig. 7b) suggest that kenyaite nucleation occurs on the silicalite crystal surface in a manner similar to magadiite nucleation on silicalite-1 crys- tal surfaces in the TPA+-containing synthesis system [29]. The kenyaite is a metastable phase and is converted to quartz. Even though a trans- formation from kenyaite to quartz has been pre- viously observed [38], an explanation for this transformation has not been reported. Upon nucle- ation, the quartz crystallizes rapidly compared with the silicalite intergrowth, and thus suppresses further silicalite formation.
The formation of kenyaite and then quartz is responsible for the increase in the Q3/Q4 ratio in the solids after the onset of silicalite crystallization (Fig. 13). This is because the incorporation of more cations into the crystal lattice of kenyaite generates more Q3 Si atoms, thus increasing the total Q3/Q4 ratio in the solids. Kenyaite [NaSi1102o.5(OH)4] has 1 Na + and 4 H + cations per 11 Si atoms, leading to a Q3/Qa ratio of 0.833. Moreover, both the plate-like kenyaite (Fig. 9b) and the smaller quartz (Fig. 9d) crystals have a much greater external surface area per volume than the silicalite crystals, and the Si atoms on these surfaces possess Q3 connectivity. Therefore, the Q3/Qa ratio in the solids increases as these secondary phases form.
TEA + does not promote silicalite crystallization. This most likely arises because little, if any, TEA + is reincorporated into the silicate network via entrapment in silicate cages. Evidence for the lack of TEA + reincorporation is found in the shallow maximum in the Si/TEA curve (Fig. 14). The TEA + in the cages that do form is insufficient to promote rearrangement of the amorphous silica into crystalline zeolite during the time period inves- tigated. This finding is supported by calculations
which predict that the interaction of TEA + with the silicalite lattice is much less favorable energeti- cally than that of TPA + and TBA + [45].
There is insignificant cage formation in TEA +- containing synthesis gels because of the smaller hydrophobicity of the TEA + cations, which have shorter alkyl chains than both TPA ÷ and TBA +. Therefore there is less attraction to the silicate network by the TEA + cations. The silicate network in these systems does not condense as much as it does in systems prepared with TPA + or TBA + (i.e. the Q3/Q4 ratio is higher in TEA--containing gels). This again is because of the smaller hydro- phobicity of the TEA ÷, as the silica is drawn closer to the adsorbed cations via the so-called "hydrophobic bonding", thus forming a more condensed gel [41]. The observation that Pt(NH3) 2+ does not exchange for TEA + in these gels (Fig. 14) is harder to explain. It may be due to the inability of the larger Pt(NH3)~ + cations to get to the sites where the smaller TEA" cations reside.
TriPA does not promote silicalite growth because it is not incorporated into the silicate gel network. This is most likely due to the absence of coulombic attraction between the neutral TriPA and the anionic silica. Zhao et al. [15] were able to synthesize silicalite from a synthesis mixture containing TriPA and HF. They discovered that TriPA was incorporated into the zeolite in the form of tripropylammonium. The tripropylam- monium cation is attracted to the anionic silica, thus allowing the propyl chains to establish hydro- phobic bonds with the silicate gel and form the cages necessary for silicalite nucleation. Since the gels used in this study are highly alkaline, there is no possibility of forming tripropylammonium cat- ions. In systems prepared with both TPA + and TriPA, the TriPA has no effect whatsoever on silicalite crystallization, again because there is no coulombic attraction between the TriPA and the silica.
The finding that silicalite does not crystallize in synthesis gels prepared with TEA ÷ and TriPA illustrates the necessity of templates which are coulombically attracted to the silicate network as well as hydrophobic enough for the alkyl chains to be adsorbed by the silica in order to promote

C.S. Gittleman et al./Microporous Materials 3 (1995) 511 530 529
silicalite formation. The silicate cages necessary for silicalite growth will not form in gels containing templates that are only coulombic (i.e. TEA +) or only hydrophobic (i.e. TriPA) in nature.
5. Conclusions
not attracted to the anionic silica by coulombic forces, thus preventing the formation of silicate cages. Our findings illustrate the importance of using organic templates which are both cationic and hydrophobic in nature to promote silicalite crystallization.
Silicalite crystallization from TBA+-containing synthesis gels proceeds via a hydrogel-solid trans- formation mechanism similar to the mechanism proposed by Gittleman et al. [29] for silicalite-1 formation from TPA+-containing synthesis gels. In the TBA + synthesis system, an intergrowth of silicalite-1 and silicalite-2 forms as silicate cages containing encapsulated TBA + reconfigure in the gel. These cages form as the TBA + cations are attracted to the anionic surfaces of silicate gel particles, and the hydrophobic silica adsorbs the alkyl chains of the organic, thus engulfing the cation in a siliceous cage. The cages become the channel intersections of the zeolite formed, each containing one TBA + cation. The rate of crystalli- zation of the silicalite intergrowth structure is much lower than the rate of silicalite-1 crystalliza- tion from synthesis gels prepared with TPA +, most likely because the silicate cages which form around the larger TBA + cations experience a greater resis- tance to rearrangement into the silicalite structure.
The low rate of silicalite crystallization in the presence of TBA + allows kenyaite crystallization to compete for the silica in the gel, thus preventing the formation of 100% crystalline silicalite. The kenyaite nucleates on the silicalite crystal surface shortly after the onset of silicalite crystal growth, and then transforms into quartz. Quartz formation is rapid and suppresses any further silicalite crystal- lization, as the silicalite crystallinity levels at the value existing in the gel at the onset of quartz crystallization.
Synthesis gels prepared with TEA + and TriPA do not promote silicalite crystallization during the time frame studied. TEA + does not promote sili- calite growth because the smaller cation is not as hydrophobic as TPA ~ or TBA +, and thus is not encapsulated in cages by the silicate network to the same extent as the larger TAA + cations. TriPA does not promote silicalite growth because it is
Acknowledgement
This work was supported by the Director, Office of Energy Research, Office of Basic Energy Sciences, Material Science Division of the U.S. Department of Energy under Contract DE-AC03-76SF00098.
References
[1] R.M. Barrer. P.J. Denny and E.M. Flanigen, L[S. Pat., 3 306 922 ( 1967 ).
[2] R.M. Barrer and P.J. Denny, J. Chem. Soc., ( 1961 ) 971. [3] C. Baerlocher and W.M. Meier, Heir. Chim, Acta, 52
(1969) 1853. [4] R. Aiello and R.M. Barrer, J. Chem. Sot., (1970) 1470. [5] E.M. Flanigen and E.R. Kellberg, U.S. Pat., 4241 036
(1980). [6] A. Araya and B.M. Lowe, Eur. Pat., 105679 (1984). [7] A. Araya and B.M. Lowe, Eur. Pat., 108486 (1984). [8] T.V. Whittman, Eur. Pat., 55046 (1982). [9] J. Ciric, U.S. Pat., 3972983 (1976).
[10] H.G. Doherty, E.J. Rosinski and C.J. Plank, U.S. Pat., 4247416 (1981).
[11] R.L. Wadlinger, G.T. Kerr and E.J. Rosinski, hiS. Pat., 3 308 069 (1967).
[12] C.J. Plank, E.J. Rosinski and M.K. Rubin, Br. Pat., 1 334243 (1973).
[13] Z. Gabelica. M. Cavez, Bierman, P. Bodart, A. Gourgue and J.B. Nagy, in B. Drzaj, S. Hocevar and S. Pejovnik (Eds.), Zeolites, Synthesis, Structure. Technolog) and Application, Elsevier, Amsterdam, 1985, p. 55.
[14] E.J. Rosinski and M.K. Rubin, U.S. Pat., 3832449 (1974).
[15] D. Zhao, S. Qiu and W. Pang, Zeolites, 13 (1993) 478. [16] R.J. Argauer and G.R. Landolt, U.S. Pat., 3702886
(1972). [17] E.M. Flanigen, J.M. Bennett, R.W. Grose, LP. Cohen,
R.L. Patton. R.M. Kirchner and J.V. Smith, Nature, 271 (1978) 512.
[18] P. Chu, [[S Pat., 3709979 (1973). [19] A.V. McCormick, A.T. Bell and C.J. Radke, Zeolites, 7
(1987) 183.
530 C.S. Gittleman et al./Microporous Materials 3 (1995) 511-530
[20] E.J.J. Groenen, A.G.T.G. Kortbeek, M. Mackay and O. Sudmeijer, Zeolites, 6 (1986) 403.
[21] W.M. Hendricks, A.T. Bell and C.J. Radke, J. Phys. Chem., 95 (1991) 9513.
[22] G. Boxhoorn, O. Sudmeijer and P.H.T. van Kasteren, J. Chem. Soc., Chem. Commun., (1983) 1416.
[23] G. Boxhoorn, R.A. van Santen, W.A. van Erp, G.R. Hays, R. Huis and D. Clague, J. Chem. Soc., Chem Commun., (1982) 264.
[24] H. van Koningsveld, H. van Bekkum and J.C. Jansen, Acta Crystallogr., B43 (1987) 127.
[25] E.G. Derouane, S. Detremmerie, Z. Gabelica and N. Blom, Appl. Catal., 1 (1981) 201.
[26] J.B. Nagy, Z. Gabelica and E.G. Derouane, Zeolites, 3 (1983) 43.
[27] E.M. Flanigen, Pure Appl. Chem., 52 (1980) 2191. [28] C.D. Chang and A.T. Bell, Catal. Lett., 8 (1991) 305. [29] C.S. Gittleman, A.T. Bell and C.J. Radke, Microporous
Mater., 2 (1994) 145. [30] L.E. Iron, F. Trouw, T.O. Brun, LE. Epperson, J.W.
White and S.J. Henderson, Langmuir, 8 (1992) 1045. [31] S.L. Burkett and M.E. Davis, J. Phys. Chem., 98
(1994) 4647. [32] P.K. Dutta and M. Puri, J. Phys. Chem., 91 (1987) 4329. [33] K.F.M.G.J. Scholle, W.S. Veeman, P. Frenken and
G.P.M. van der Velden, Appl. Catal., 17 (1985) 233. [34] Leeman Applications, Analysis of Geological Samples,
Leeman Labs., Lowell, MA, 1984.
[35] K.R. Franklin and B.M. Lowe, ZeoBtes, 7 (1987) 135. [36] D.M. Ginter, A.T. Bell and C.J. Radke, J. Magn. Reson.,
81 (1989) 217. [37] G.A. Jablonski, L.B. Sand and J.A. Gard, Zeolites, 6
(1986) 396. [38] H.P. Eugster, Science, 157 (1967) 1177. [39] G. Engelhardt and D. Michel, High Resolution Solid-
State NMR of Silicates and Zeolites, Wiley, Chichester, 1987, p. 115.
[40] R.K. Iler, The Chemistry of Silica, Wiley, New York, NY, 1979, p. 365.
[41] R.K. Iler, The Chemistry of Silica, Wiley, New York, NY, 1979, p. 680.
[42] R. Szostak, Molecular Sieves: Principles of Synthesis and Identification, Van Nostrand Reinhold, New York, NY, 1989, p. 96.
[43] J.M. Thomas and G.R. MiUward, J. Chem. Soc., Chem. Commun., (1982) 1380.
[44] G.R. Millward, S. Ramdas, J.M. Thomas and M.T. Barlow, Z Chem. Soc., Faraday Trans. II, 79 (1982) 1075.
[45] R.G. Bell, D.W. Lewis, P. Voigt, C.M. Freeman, J.M. Thomas and C.R.A. Catlow, Stud. Surf Sci. Catal., 84 (1994) 2075.
[46] T.V. Harris and S.I. Zones, Stud. Surf Sci. Catal., 84 (1994) 29.
[47] J.C.J. van der Donck, G.E.J. Vaessen and H.N. Stein, Langmuir, 9 (1993) 3553.