Embed Size (px)
Citation preview
Italy
PHYSICAL REVIEW E, VOLUME 63, 031401
Growth kinetics and structure of fibrin gels
F. Ferri* and M. GrecoDipartimento di Scienze Chimiche, Fisiche e Matematiche, and INFM, Universita’ dell’Insubria at Como, via Valleggio 11,
22100 Como, Italy
G. Arcovito, F. Andreasi Bassi, and M. De SpiritoIstituto di Fisica, Facolta’ di Medicina e Chirurgia and INFM, Universita’ Cattolica del Sacro Cuore, L.go F.Vito 1, 00168 Roma,
E. PaganiniENEL-Ricerca, via Andrea Pisano, 120-56122 Pisa, Italy
M. RoccoUO Biologia Strutturale, Istituto Nazionale per la Ricerca sul Cancro (IST), c/o Centro Biotecnologie Avanzate (CBA),
Largo R. Benzi 10, 16132 Genova, Italy~Received 31 July 2000; published 14 February 2001!
The structure and kinetics of fibrin gels grown from fibrinogen solutions under quasiphysiological condi-tions, but in absence of Ca11, were investigated by means of elastic light scattering. By combining classicallight scattering and low-angle elastic light scattering, an overall wave-vector range of about three decades wasspanned, fromq;33102 to q;33105 cm21. The scattered intensity distribution of the gels was measured inabsolute units and fitted to a single function, which was able to reproduce accurately the data over the entirewave-vector range. From the fitting, it was possible to estimate the average diameterd of the fibrin fibers, theaverage crossover lengthj of the gel, and establish the fractal nature of the gel structure, with a measure of itsfractal dimensionDm . The measure of the intensity in absolute units also allowed the estimate of the densityr of the fibrin fibers and provided an independent measure of their size. The kinetics of formation of the gelwas described in terms of a simple growth model: the scaffold of the network is formed very early in the courseof the gelation process, at a ‘‘networking time,’’tn , which is much smaller than the time required to form thefinal gel. At timest.tn , the gel structure remains substantially unchanged and the successive growth consistsonly in a thickening of the gel fibers. Gels prepared under the same physical–chemical conditions, but atdifferent fibrinogen concentrations, exhibited rather similar structures and kinetics, showing that the modalitiesof the gelation process are mainly governed by the solution conditions, and only secondarily by the fibrinogenconcentration. For gels at fibrinogen concentration of;0.24 mg/ml, the gel parameters wered;130 nm, j;27mm, Dm;1.3, and r;0.4 g/cm3. Our d and r values are in very good agreement with electronmicroscopy- and turbidity-derived literature data, respectively, whilej seems to be related to the mesh size ofthe initial scaffold formed attn , rather than to the mesh size of the final aged gel.
DOI: 10.1103/PhysRevE.63.031401 PACS number~s!: 82.70.2y, 87.15.Nn, 82.35.2x
r-thlyhemasar,
t, a
-rss
atic
ac-tral
ith
ofeBs.
ingrils
riti-
I. INTRODUCTION
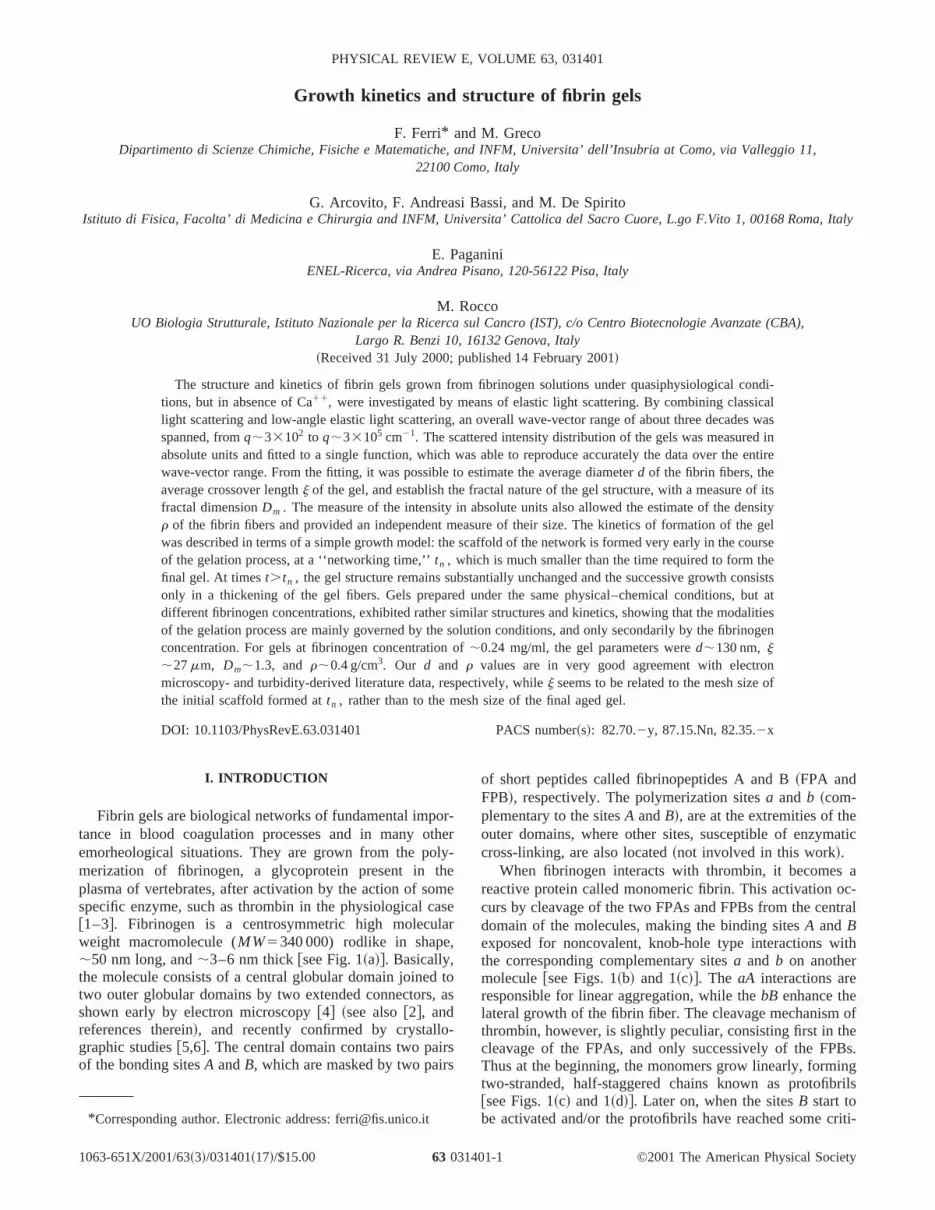
Fibrin gels are biological networks of fundamental impotance in blood coagulation processes and in many oemorheological situations. They are grown from the pomerization of fibrinogen, a glycoprotein present in tplasma of vertebrates, after activation by the action of sospecific enzyme, such as thrombin in the physiological c@1–3#. Fibrinogen is a centrosymmetric high moleculweight macromolecule (MW5340 000) rodlike in shape;50 nm long, and;3–6 nm thick@see Fig. 1~a!#. Basically,the molecule consists of a central globular domain joinedtwo outer globular domains by two extended connectorsshown early by electron microscopy@4# ~see also@2#, andreferences therein!, and recently confirmed by crystallographic studies@5,6#. The central domain contains two paiof the bonding sitesA andB, which are masked by two pair
*Corresponding author. Electronic address: [email protected]
1063-651X/2001/63~3!/031401~17!/$15.00 63 0314
er-
ee
os
of short peptides called fibrinopeptides A and B~FPA andFPB!, respectively. The polymerization sitesa and b ~com-plementary to the sitesA andB!, are at the extremities of theouter domains, where other sites, susceptible of enzymcross-linking, are also located~not involved in this work!.
When fibrinogen interacts with thrombin, it becomesreactive protein called monomeric fibrin. This activation ocurs by cleavage of the two FPAs and FPBs from the cendomain of the molecules, making the binding sitesA andBexposed for noncovalent, knob-hole type interactions wthe corresponding complementary sitesa and b on anothermolecule@see Figs. 1~b! and 1~c!#. The aA interactions areresponsible for linear aggregation, while thebB enhance thelateral growth of the fibrin fiber. The cleavage mechanismthrombin, however, is slightly peculiar, consisting first in thcleavage of the FPAs, and only successively of the FPThus at the beginning, the monomers grow linearly, formtwo-stranded, half-staggered chains known as protofib@see Figs. 1~c! and 1~d!#. Later on, when the sitesB start tobe activated and/or the protofibrils have reached some c
©2001 The American Physical Society01-1

neeoneroc
ur
onit
ol
ll ax
hieegin
on
iem
lsm
ndbe
dylsat--tic
gof
owof
hegle
es-
nits,
a-e
ersn ofut-n ons ofa-to
beheingps;gelsthecrib-tureSec.
m
f
erofy
al
F. FERRIet al. PHYSICAL REVIEW E 63 031401
cal length, they aggregate side-by-side and form fibersincreasing diameter@Fig. 1~e!#. Notice that the protofibrilsinside each fiber may not be densely packed, but intertwiwith solvent molecules, so that the fiber density may be ssibly smaller than the density of protofibrils. Dependingthe physical–chemical conditions of the solution, the fibgrow following different modalities, and eventually link teach other and form a three-dimensional gel. For referenand more detailed information on the fibrinogen structand its polymerization mechanisms, see Refs.@1–3#.
Fibrin gels have been the object of intense investigatisince the late 1940s, mainly using electron microscopy, wlight scattering techniques also playing an important r~see Refs.@2# and@3#, and references therein!. These studieshave shown that the physical properties of the gel as weits physiological functionality are determined, to a large etent, by the structure and morphology of the network. Tdepends on the size of the fibers, on the extent of thbranching, on their spatial distribution, and also on the avage distance between them, which corresponds to themesh size. The gel structure can be controlled by changthe physical–chemical parameters of the gelling solutisuch as salt concentration~e.g., ionic strength! and type,pH,kind of activating enzyme, and can be continuously varbetween two limiting classes in which fibrin gels are custoarily classified: ‘‘coarse’’ and ‘‘fine’’ gels. ‘‘Coarse’’ gelsare large-pore gels made of thick fibers, while ‘‘fine’’ geare narrow-pore gels made of thin fibers. An updated su
FIG. 1. Schematic models of fibrinogen and its basic polymization mechanism.~a! In the unactivated molecule, the two pairspolymerization sitesA andB in the central domain are masked bthe fibrinopeptides FPA and FPB.~b! Upon activation by the en-zyme thrombin, the two FPAs are removed.~c! Dimers are formedvia aA noncovalent interactions of sitesA with complementary sitesa, always available in the outer domains.~d! This polymerizationmechanism leads to the formation of double-stranded, hstaggered linear chains known as protofibrils.~e! Later on, when theFPBs are also removed, the protofibrils aggregate laterally viabBinteractions, giving rise to fibers of increasing size.
03140
of
dn-
s
ese
she
s-sirr-elg,
d-
-
mary of some of the different possible gel structures atheir dependence on the polymerization conditions canfound in Ref.@7#, and references therein.
The aim of this paper is to present a light scattering stuof the structure and growth kinetics of ‘‘coarse’’ fibrin gegrown under quasiphysiological conditions. The static sctered intensity distributionsR(q) of the aged gels were measured in absolute units by combining the low-angle elaslight scattering~LAELS! and the classical light scatterin~CLS! techniques, covering an overall wave-vector rangeabout three decades, fromq;33102 to q;33105 cm21.The main features of these distributions were the very lintensity scattered in the limit of zero angle, the presencea peak at lowq’s, and the presence of a sharp rolloff at higq’s, beyond whichR(q) decays very rapidly. The data werinterpreted in terms of a simple structural model and a sinfitting function, able to reproduce theR(q) behavior over thewhole wave-vector range, was devised. This allowed thetimate of the fiber diameterd, the gel crossover lengthj, themass fractal dimensionDm , and surface fractal dimensioDs of the fibers. By measuring the intensity in absolute unit was possible to recover also the densityr of the fibrinfibers and have an independent measure of their size.
The kinetics of formation of the gels was studied by mesuring the LAELS distributions at different times after thaddition of thrombin, and the behavior of the parametcharacterizing the gels structure was studied as a functiotime. A simple growth mechanism was devised as the ocome of this study. Several measurements were also takegels grown under the same physical–chemical conditionthe gelling solution, but at different fibrinogen concentrtions cF ; however, it is beyond the purpose of this workdescribe how the gel parameters depend oncF , and thereforethese results will be presented elsewhere~F. Ferri et al., inpreparation!.
This article is organized as follows: in Sec. II we descrithe procedure followed for preparing and handling tsample and give a brief description of the light scattertechniques together with their relative experimental setuthe experimental data taken on both aged and growingare presented in Sec. III; Sec. IV is devoted to illustratedata analysis and present a simple model capable of desing both the kinetics of the gelation process and the strucof the aged gel; the main results are then summarized inV.
II. MATERIALS AND METHODS
A. Materials
Human fibrinogen and thrombin were purchased froCalbiochem, San Diego, CA~Cat. No. 341576, lot B10707!and Sigma-Aldrich, Milano, Italy~Cat. No. T-6759, lot104H9314,;2000 NIH units/mg protein!, respectively. Tris-hydroxymethyl-aminomethane free base~Tris! and the hy-drochloride form~Tris-HCl! and all other chemicals were oreagent-grade from Merck~Bracco, Milano, Italia!. Double-distilled water was always used throughout this study.
-
f-
1-2
ng
es,,asre
ly
. Tp
ofor
ot
te
rodetne
ehtst
trie, ofluioits
uo
dis-rall
ticlechthis
s
n
eed
aled.edt
e
ep-led
inor 5tal
n-
The
GROWTH KINETICS AND STRUCTURE OF FIBRIN GELS PHYSICAL REVIEW E63 031401
B. Sample preparation and control
Solutions of human fibrinogen were purified by usisize-exclusion chromatography on a 10031.5 cm glass col-umn ~Pharmacia Biotech Italia, Milano, Italy! filled withSepharose CL-4B~Pharmacia Biotech Italia! eluted at 3 ml/hwith 0.1 M NaCl, 1 mM EDTA-Na2, 0.05 M Tris-HCl,pH7.4 buffer to remove large aggregates. The fibrinog‘‘monomer’’ peak fractions were pooled, divided in aliquotquick-frozen, and stored at220 °C. Just prior to analysisaliquot~s! were rapidly thawed at 37 °C. The solution wthen diluted in the appropriate buffer to reach the desifinal fibrinogen concentration and filtered through a 0.22mmpore low retention filter~Millex-GS, Millipore, Milano,Italy! directly into the scattering cell, which was previouscarefully washed with clean, 0.22-mm-filtered water tonearly dust-free conditions and then dried under vacuumstart the reaction, human thrombin was added under rastirring to the fibrinogen solution to a final molar ratio1:100. Fibrin cross-linking due to the enzyme ‘‘factXIIIa,’’ which may copurify with fibrinogen, was inhibitedby the addition of EDTA-Na2 to the buffer solutions.
Fibrinogen concentration was determined spectrophmetrically by measuring its absorbance at 280 nm (A280) andassuming an extinction coefficient«28051.51 ml mg21 cm21
@8#. Corrections for scattering contributions were accounfor by subtracting the solution absorbance at 320 nm.
The integrity of the sample was controlled via gel electphoresis as previously described@9#. The analyses showethat our ‘‘purified’’ samples were at the same level of herogeneity as the ‘‘physiological’’ fibrinogen, e.g., the ocirculating in blood vessels@10#.
C. Elastic light scattering techniques
Elastic light scattering techniques are based on the msure of the angular distribution of the intensity of the ligelastically scattered from a sample. In the theory of elalight scattering, the light scattered out of the incident beamdue to the presence of local fluctuations of the dielecconstant of the medium« over the entire scattering volumV. In many cases, such as for colloidal, macromoleculargel systems, these fluctuations are due to correspondingtuations of the sample density. Thus the intensity distributR(q) of the scattered light can be written, in absolute unas @11#
R~q!5p2
l04 S ]«
]f D 2EV^df~0!df~r !&eiq"rdr , ~1!
whereq is the scattering wave vector,l0 the vacuum wave-length of the light,f the sample volume fraction, and]«/]fcan be determined via the Lorentz-Lorenz relation@12#. Themagnitude ofq is related to the scattering angleu by therelationq54pn/l0 sin(u/2), wheren is the refraction indexof the medium.R(q) is customarily called Rayleigh-ratioand represents the power scattered by the sample persolid angle, per unit incident power, and per unit lengththe scattering volume and is expressed in cm21.
03140
n
d
oid
o-
d
-
-
a-
icisc
rc-
n,
nitf
When the sample can be assimilated to a solution orpersion of monodisperse interacting particles, the ovesample density–density correlation function^df(0)df(r )&can be expressed as the convolution of the single parcorrelation function and the pair correlation function whidescribes the spatial correlations among particles. Incase, Eq.~1! can be written as@12#
R~q!5KcM P~q!S~q!, ~2!
where K is the optical constant given byK5(4p2/NAl0
4)n2(]n/]c)2 with NA being the Avogadronumber,c the sample concentration~mg/ml!, ]n/]c the re-fractive index increment of the solute~ml/mg!, and M theparticle molecular weight~g/mole!. The form factorP(q)and the structure factorS(q) are dimensionless quantitiegiven by
P~q!5
Evh~r !eiq"rdr
Evh~r !dr
, ~3a!
S~q!511N
V EV@g~r !21#eiq"rdr , ~3b!
whereh(r ) is the single particle density–density correlatiofunction,h(r )5^r(0)r(r )&, with r andv being the particledensity and volume, respectively, whileg(r ) is the pair cor-relation function given by
g~r !5S V
ND 2 1
V (iÞ j
N
d~r 1r i2r j !, ~3c!
with r i being the particles coordinated andN/V the particlenumber density.g(r ) is such thatg(0)50 and g(`)51.When the particles are not correlated@g(r )51#, S(q)51for any q, and one finds the well-known result for dilutsolutions@12#. Conversely, when the particles are correlat@0,g(r ),1#, S(q50) is always,1, and tends to 1 onlyasymptotically forq values much larger than the reciprocof the length scales over which the particles are correlat
Equation~1! shows that density fluctuations characterizby a length scalez give contribution to the light scattered aq values given byq;2p/z. Therefore by measuring thintensity of the light scattered within a range@qmin ,qmax#, it ispossible to probe length scales in the range 2p/qmax,z,2p/qmin .
D. Experimental setup
In order to probe a range ofz as large as possible, wutilized two different elastic light scattering instruments oerating over differentq ranges. The first one is a low-angelastic light scattering~LAELS! instrument whose standarlayout is described in detail in Ref.@13#. The actual layoututilized in this work is slightly different and is sketchedFig. 2. The sample was contained in a square quartz 2mm thick cell placed inside a temperature controlled meblock kept at 2560.1 °C. The cell was placed along the coverging beam at a distancez from the detector, which islocated in correspondence to the focal plane of the lens.
1-3

de
th
wy
to
holy
ct-ovr t
fft
re
o
thit
inle
n,
ewfbein
ale
dd
ovulin
s
sityg.
gedlye
els
tturee
nder
M
ged,
w-
t
n
the
ing
-een
F. FERRIet al. PHYSICAL REVIEW E 63 031401
detector is made of an array of 31 annular photodiowhose thickness and distancesr from the optical axis arescaled logarithmically, so as to cover a large range ofscattering angleu5tg21(r /z). The cell holder is clampedonto a computer-controlled translation stage that allochanging the distancez in the range 150–50 mm. In this watheu range~in the medium! can be varied from;0.15°–15°to ;0.05°–5.0°, with a corresponding overall wave-vecrange from;1.23102 to ;3.33104 cm21. However, due tostray light problems, and to the fact that the innermost ptodiodes are very thin, the instrumental sensitivity is highdependent onq. Consequently, the actual minimum deteable angle is somewhat higher that the one reported aband depends on the particular sample being studied. Fogels studied in this work, the practicalq range was from;33102 to ;33104 cm21. A tiny hole in the center of thesensor ensures that the transmitted beam passes clear osensor plane and allows the measurement of the samplebidity. The instrument was calibrated by using latex sphe~from Duke Scientific Corporation., Palo Alto, Ca! of known~certified! diameters and concentrations. Since the electrics allows the sampling of the data at a rate~;0.1 s! which ismuch faster than the typical evolving times of the system,kinetics of the gelation process can be easily studied wthis instrument.
The second technique, called classical light scatter~CLS!, is much more common and operates at larger angtypically from ;15° to ;150°. In this work the CLS instru-ment was an ALV/SLS-5000 system from ALV, LangeGermany, equipped with a 4 Wargon laser~Innova 70, Co-herent, FRG! operating 488 nm and delivering onto thsample an average power of 100–200 mW. The beamfocused to a spot~at 1/e2! of ;50 mm and the detection othe scattered light was carried out with a monomode ficoupled to a photomultiplier, both mounted on a steppmotor-controlled rotating arm. The sample was containeda cylindrical cell ~8 mm inner diameter! immersed in atoluene-filled index-matching vat whose temperature wcontrolled to 2560.1 °C. In this instrument, the usabwave-vector range varies from;43104 to ;33105 cm21.Due to nonergodicity of the sample and to the monomofiber detection that selects a single coherence area, thewere accumulated by averaging the scattered intensitydifferent spatial configurations. This was realized by simtaneously rotating and vertically translating the scattercell during the measurements. Since the correlation timethe still sample~;10–100 ms! is much longer than the timerequired to change configuration, the latter one was e
FIG. 2. Schematic diagram of the optical layout for the loangle elastic light scattering~LAELS! instrument.
03140
s
e
s
r
-
e,he
theur-s
n-
eh
gs,
as
rgin
s
eataer-gof
ti-
mated by measuring the decay time of the intensity–intencorrelation function acquired while the sample was movinDepending on the detected wave vector, this value ranfrom ;0.2 to ;2 ms. Thus in order to have approximate105 independent measurements, the overall measuring timTwas varied from;20 to ;200 s. Previous utilization of thisinstrument for dynamic light scattering studies on fibrin gcan be found in Ref.@14#.
III. EXPERIMENTAL RESULTS
In this section we will illustrate the results of our lighscattering characterization of fibrin gels. The steady-strucof an aged gel will be described in Sec. III A, while thkinetics of the gelation process is reported in Sec. III B.
A. Structure of an aged gel
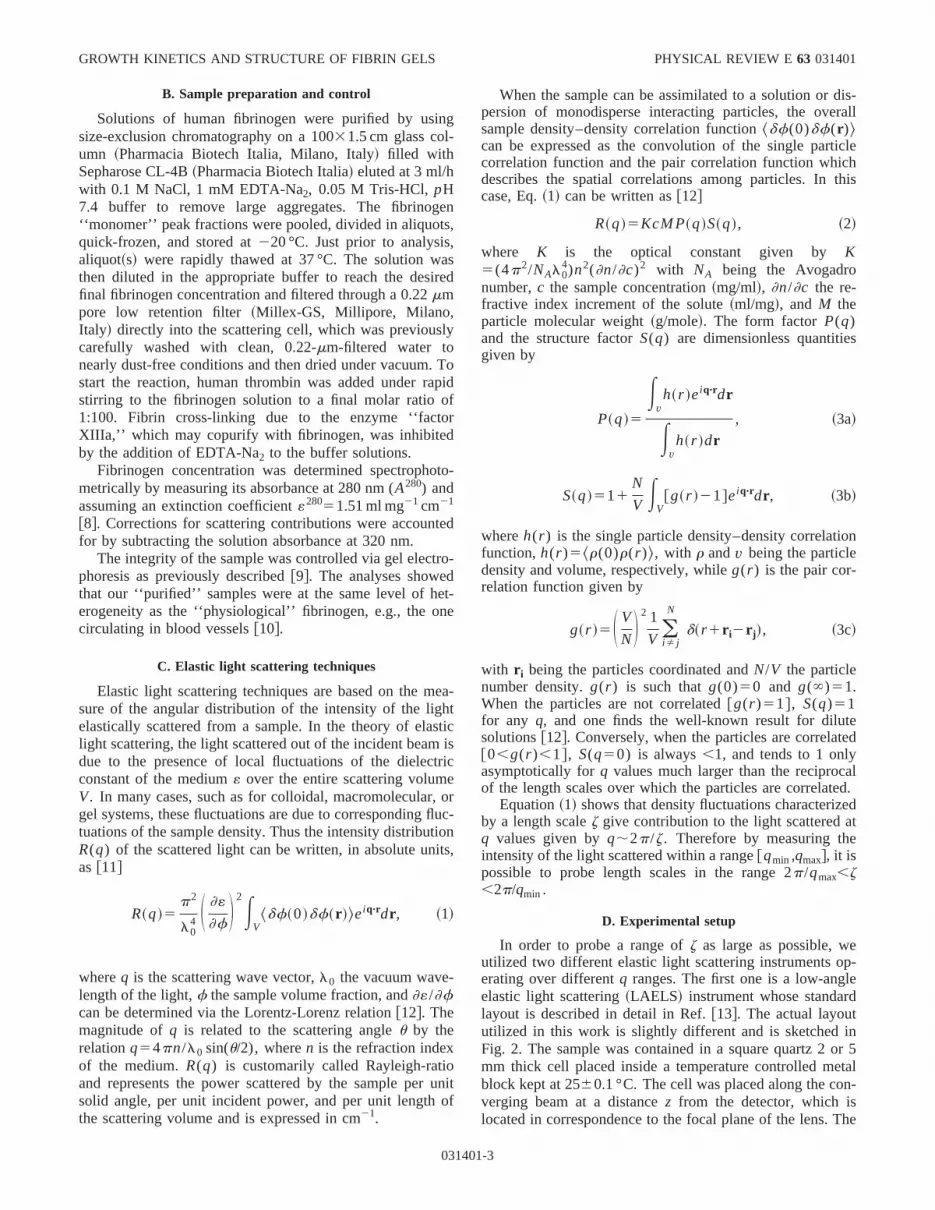
Figure 3 shows the intensity distributionR(q) scatteredfrom an aged fibrin gel as a function of the wave vectorq.The data were taken on two different samples prepared uthe same conditions by using the LAELS~circles! and CLS~squares! techniques. The samples were grown in a 0.1NaCl, 0.05 M Tris-HCl, 1 mM EDTA-Na2, pH 7.4 buffersolution at T52560.1 °C, with fibrinogen concentrationcF50.24 mg/ml and molar ratio thrombin/fibrinogen50.01.The data were collected when the gels were already a
FIG. 3. Log-log plot of the scattered intensity distributionR(q)as a function of the wave vectorq for an aged fibrin gel prepared athe fibrinogen concentrationcF50.24 mg/ml, in a 0.1 M NaCl, 0.05M TRIS, 1 mM EDTA, pH 7.4 buffer solution. The data have beetaken by using LAELS~circles! and CLS~squares! techniques. Thetwo dashed vertical lines and the arrows indicate theq values atwhich the crossovers between the three regimes described intext take place. The average gel crossover length isj;4.4/q1
;27mm, while the average fiber size isd;2.1/q2;132 nm ~seetext!. The solid curve passing through the data is the result of fittthe data with Eq.~4! ~see Sec. IV B!. The solid straight line showsthe power law decay ofR(q) characterized by the exponentam .The dotted line shows a slope of24 indicating the expected intensity decay for a system with sharp and smooth interfaces betwthe scattering and hosting media.
1-4
ata
t
w
-
hectaor,ar
arsb
gegs
agehic-e
an
iv
th
ela
f
ioele
io
ineehsw
s
le
lam-
yis
e
r
edhe
byla-
tyru-ti-akpo-ur
neng
theoarre-arsThe
fter
GROWTH KINETICS AND STRUCTURE OF FIBRIN GELS PHYSICAL REVIEW E63 031401
i.e., after a time long enough that their structures haveready attained a steady-state form, with a consequent sscattered intensity distribution. The data correspondingCLS were rescaled by a fixed factor so as to join smoothlythe LAELS data~see Ref.@9# for details!. The figure showsthat there are three different regimes, delimited by the twave vectorsq1 andq2 . For q1,q,q2 , R(q) decays as apower law function,R(q);q2am, characterized by the exponentam;1.20. Thus in thisq interval the gel exhibits aself-similar structure, and we will see in Sec. IV B that texponentam represents a good estimate of its mass fradimensionDm . For q.q2 there is a crossover to a behavitypical of surface fractals in whichR(q) decays much fasterconsistently with a power law behavior characterized byexponent ofas;4, or larger. The intercept of the two powelaw behaviors defines the crossover wave vectorq2 and al-lows estimating the weight average diameter^d&wt of the gelfibers. This is given byd&wt;2.1/q2 ~see Sec. IV C!, and inthe case of Fig. 2 isd&wt;130 nm. Finally, forq5q1 , R(q)exhibits a maximum beyond which it decreases towsmaller values. At these wave vectors, the scattered intenis only slightly larger than the blank signals, as evidencedthe increasingly larger error bars. The peak indicates@15# thepresence of a long-range order in the structure of thewhich can be characterized in terms of a characteristic lenscale, or crossover lengthj. This means that for length scalemuch smaller thanj ~but larger thand!, the gel behaves asfractal system. Conversely, for a length scale much larthan j, it can be considered a homogeneous system, wscatters only a little light. In Sec. IV A the gel will be modeled as a collection of fractal blobs closely packed togethandj will be interpreted as the average blob size. Its qutitative relation to the peak position isj;a/q1 , where a;4.4 is a dimensionless parameter whose value is derfrom the model. For the data of Fig. 2,j;27mm. The solidline reported in the figure is the best fit of the data tofunction ~4! which will be discussed in Sec. IV B.
B. Kinetics of growth
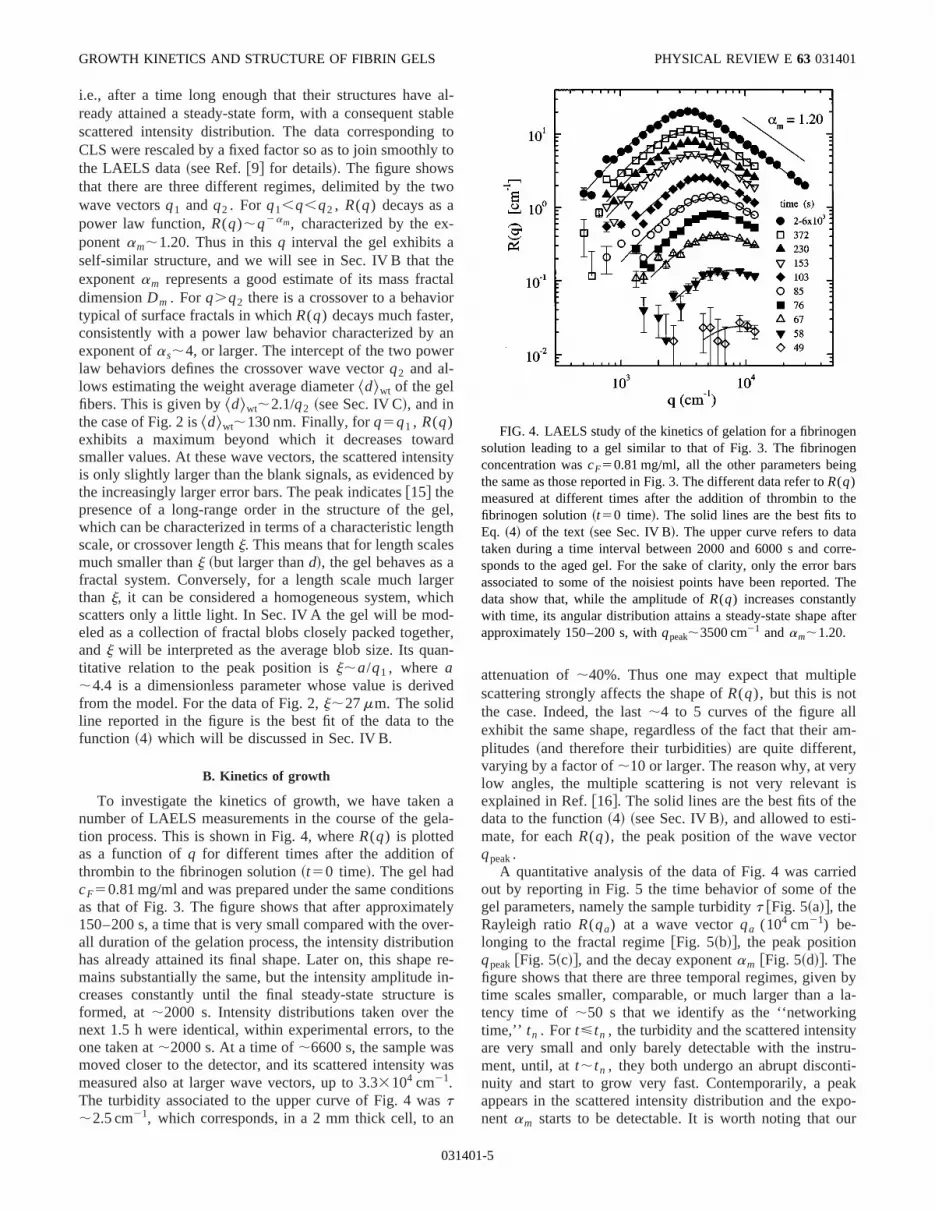
To investigate the kinetics of growth, we have takennumber of LAELS measurements in the course of the gtion process. This is shown in Fig. 4, whereR(q) is plottedas a function ofq for different times after the addition othrombin to the fibrinogen solution~t50 time!. The gel hadcF50.81 mg/ml and was prepared under the same conditas that of Fig. 3. The figure shows that after approximat150–200 s, a time that is very small compared with the ovall duration of the gelation process, the intensity distributhas already attained its final shape. Later on, this shapemains substantially the same, but the intensity amplitudecreases constantly until the final steady-state structurformed, at;2000 s. Intensity distributions taken over thnext 1.5 h were identical, within experimental errors, to tone taken at;2000 s. At a time of;6600 s, the sample wamoved closer to the detector, and its scattered intensitymeasured also at larger wave vectors, up to 3.33104 cm21.The turbidity associated to the upper curve of Fig. 4 wat;2.5 cm21, which corresponds, in a 2 mmthick cell, to an
03140
l-bletoo
o
l
n
dityy
l,th
rh
r,-
ed
e
a-
nsyr-nre--is
e
as
attenuation of;40%. Thus one may expect that multipscattering strongly affects the shape ofR(q), but this is notthe case. Indeed, the last;4 to 5 curves of the figure alexhibit the same shape, regardless of the fact that theirplitudes ~and therefore their turbidities! are quite different,varying by a factor of;10 or larger. The reason why, at verlow angles, the multiple scattering is not very relevantexplained in Ref.@16#. The solid lines are the best fits of thdata to the function~4! ~see Sec. IV B!, and allowed to esti-mate, for eachR(q), the peak position of the wave vectoqpeak.
A quantitative analysis of the data of Fig. 4 was carriout by reporting in Fig. 5 the time behavior of some of tgel parameters, namely the sample turbidityt @Fig. 5~a!#, theRayleigh ratioR(qa) at a wave vectorqa (104 cm21) be-longing to the fractal regime@Fig. 5~b!#, the peak positionqpeak@Fig. 5~c!#, and the decay exponentam @Fig. 5~d!#. Thefigure shows that there are three temporal regimes, giventime scales smaller, comparable, or much larger than atency time of;50 s that we identify as the ‘‘networkingtime,’’ tn . For t<tn , the turbidity and the scattered intensiare very small and only barely detectable with the instment, until, att;tn , they both undergo an abrupt disconnuity and start to grow very fast. Contemporarily, a peappears in the scattered intensity distribution and the exnent am starts to be detectable. It is worth noting that o
FIG. 4. LAELS study of the kinetics of gelation for a fibrinogesolution leading to a gel similar to that of Fig. 3. The fibrinogconcentration wascF50.81 mg/ml, all the other parameters beinthe same as those reported in Fig. 3. The different data refer toR(q)measured at different times after the addition of thrombin tofibrinogen solution~t50 time!. The solid lines are the best fits tEq. ~4! of the text~see Sec. IV B!. The upper curve refers to dattaken during a time interval between 2000 and 6000 s and cosponds to the aged gel. For the sake of clarity, only the error bassociated to some of the noisiest points have been reported.data show that, while the amplitude ofR(q) increases constantlywith time, its angular distribution attains a steady-state shape aapproximately 150–200 s, withqpeak;3500 cm21 andam;1.20.
1-5

’
g
oev
neo
hach
ithdeltate-the
ateorsingnts
y-
lexhun-ous:omer toareverytheeenite
oftheel
di-e
-at
hering
ter-
arethele,
cat-av-ncere
ne
he
F. FERRIet al. PHYSICAL REVIEW E 63 031401
definition of tn is almost equivalent to the ‘‘clotting time’defined in Ref.@17#. During the successive times (t>tn), tand R(qa) continue to grow fast,am changes from<1 to;1.2, andqpeak moves toward smallerq’s, reaching a stablevalue a factor of;2 smaller. This is the time period durinwhich the gel structure ripens untilR(q) attains its finalsteady-state shape~see Fig. 4! at a time of;200 s that thatwe have labeled as ‘‘ripening time,’’t r . Later on (t>t r),only an increase of the turbidity and of the amplitudeR(q) is observed, without any change of its shape, asdenced by the fact that bothqpeak and am remain constant.This increase stops at the ‘‘aging time,’’ta , when the gel hasattained its final steady-state structure. Thus during this fiphase (t r,t,ta), the gel structure remains fixed and the ggrowth consists only in a thickening of its fibers, with nchange in their relative positions. It is interesting to note tthe time required for forming the final aged gel is mulonger that the networking time (ta;40tn ,) and that theoverall increase ofR(qa) with respect to its value attn isfairly large, approximately by a factor of;300.
FIG. 5. Behavior of the sample turbidity~a!, Rayleigh ratio atqa5104 cm21 ~b!, peak position~c!, and exponentam ~d! as a func-tion of time for the same sample as that of Fig. 4. The vertical liat the ‘‘networking’’ time tn , the ‘‘ripening’’ time t r , and the‘‘aging’’ time ta delimit the three temporal regimes described in ttext.
03140
fi-
all
t
IV. DATA ANALYSIS AND DISCUSSION
In this section, we will address four issues associated wthe data analysis. First of all, we will propose a simple mocapable of describing the main features of the steady-sgel structure~IV A !. Then, based on this model, we will describe the function used for fitting the data and discussphysical meaning of its parameters~IV B !. Third, we willaddress the problem of how to obtain a quantitative estimof the fiber size from the data at very large wave vect~IV C!. Lastly, the kinetics data will be processed accordto a simple growth model, and self-consistency argumefor supporting such a model will be presented~IV D !.
A. Modeling of the steady-state gel structure
When a ‘‘coarse’’ fibrin gel has attained its final steadstate structure, it looks like~from electron microscopy~EM!pictures, see, for example, Ref.@18#! a random network ofmany thick fibers entangled together to form a very compstructure. The fibers, whose diameter can be as large asdreds of nanometers, appear to be very inhomogenesome of them are long and straight, some are bent, sbranch off, and their distribution in space does not appeabe uniform as well. The void spaces among the fibersalso very inhomogeneous, and in some cases, can belarge, up to several microns. Moreover, depending onphysical–chemical conditions under which the gel has bgrown, the EM pictures are very different and show qudifferent gel structures and morphologies~see, for example,Ref. @19#!. Nevertheless, in spite of this large varietycases, and on the basis of the nice features exhibited byscattered intensity distribution of Fig. 3, a very simple modcapable of describing the gel structure can be proposed.
Let us imagine the gel as a dense collection ofN blobspervading the entire scattering volumeV. Suppose that eachblob is made of an assembly ofn (n@1) segments whichcan be sketched as cylindrical segments with an averageameterd and an average lengthl. The segments represent thblobs ‘‘building blocks’’ ~not to be confused with the fibrinogen monomers!, are bonded together end-to-end, andeach bonding site they can either be linked to only anotsegment giving rise to linear chains, or branch off produca somewhat ramified structure.
In the first case the blobs are wormlike chains characized by a contour lengthL5nl, a persistence lengthl p , andan end-to-end distanceh which is function ofL andl p . As isknown @20#, depending on the chain flexibility,l p can varyfrom a minimum value ofl /2, which corresponds to randomcoils, to values much larger thanL for which the chain be-haves as a rigid cylinder. In the second case, the blobsbranched polymers with a morphology which depends onbranching mechanism. Both types of blobs are, in principconsistent with the observed power law decay of the stered intensity. If the blobs are wormlike chains, this behior may be due to a large polydispersity in the persistelength of the chains. The result is a self-similar structucharacterized by the Flory exponentn @20#, according towhich the end-to-end distance of the chainh scales ash; lnn and the scattered intensity decays asR(q);q21/n ~an
s
1-6

e
ly
-ag--
heh
ob
inerthd
thrdso
n,
e
heeh ofidnt
at-
r ofl
rallig.
GROWTH KINETICS AND STRUCTURE OF FIBRIN GELS PHYSICAL REVIEW E63 031401
example of a polydispersity inl p resulting in such a structuris reported and discussed in the Appendix!.
Alternatively, considering the blobs as branched pomers, they may be described in terms of fractal theory@21#,with the mass fractal dimensionDm depending on the physics of the polymerization process. In this case the aversize j of the blob scales asj; ln1/Dm and the scattered intensity decays asR(q);q2Dm. Therefore the two descriptions appear to be equivalent provided thatn51/Dm and thatthe end-to-end distanceh represents a good estimate of tblob size, i.e.,h;j. The range of length scales over whicthis is valid is set, at the upper limit, by the size of the bl~h or j! and, at the lower limit, by the segment lengthl.
Given this equivalence, we will adopt the descriptionterms of fractals. Thus, even without knowing the polymization mechanism and/or the microscopic details ofsegment–segment interactions, the gel can be assimilatea collection of fractal blobs of a given sizej and character-ized by a mass fractal dimensionDm . In order to account forthe observed peak in the scattered intensity distribution,blobs must be arranged in space with a long-range ospatial distribution. The simplest way to do this is to suppothat the blobs are closely packed, so that their overlap c
n
en
is
-
,ordith
ic
03140
-
e
-eto
eeren-
centration@20# is equal to the overall sample concentratioand their average distancej0;^N/V&2(1/3) is equal to theiraverage size, i.e.,j;j0 . This assumption is supported by thvery low intensity scattered in the limit of zero angle~see thediscussion in Sec. IV B!.
As a concluding remark, it may be worth noticing that tparameterl is somehow related to overall flexibility of thnetwork because it sets the minimum persistence lengtthe fibers. Thus we may expect that gels with more rigfibers would be modeled by blobs with longer segmelengths.
B. Fitting function
As described in Sec. II C, the intensity distribution sctered by a collection of interacting blobs~or particles! can bewritten as the product of a structure factorS(q), which de-scribes the spatial correlation between each blob’s centemass, and a form factorP(q), which describes the internastructure of the blobs@see Eq.~2!#. After several trials, wefound that a function which is able to reproduce the ovebehavior of the data over the entire wave-vector range of F3, is the following
~4!
ya-
ter
uldsity
bleetheut
where the productA(q)B(q) plays the role of the ‘‘particle’’form factor P(q). HereK is the optical constant defined iEq. ~2!, c is the blobs concentration, andM is the blob mo-lecular weight which is given by the product of the segmmassm5(rp/4)ld2 times the numbern;(j/ l )Dm of seg-ments per blob, i.e.,
M;NA
rp
4l 12DmjDmd2, ~5!
wherer is the segment density. One may notice that Eq.~5!provides the exact expression for the blob mass when theither a stiff cylinder~Dm51; j5L! or a random coil chain~Dm52; j5ALl !. Equation ~4! depends on many parameters, namely,r, b, g, j, Dm , d, l, andas . Of these, onlyr,j, Dm , andd were actually left to be floating in the fittingthe remaining ones being fixed to values determined accing to physical considerations. These are going to becussed below together with a thorough description ofthree factorsS(q), A(q), andB(q). Notice also that Eq.~4!describes a ‘‘monodisperse’’ system, i.e., a system in wh
t
is
d-s-e
h
all the blobs have the same sizej and are characterized bthe samed and l. The effects of polydispersity on these prameters will be considered in the next section.
Let us start by noticing that the recovery of the paramer is a direct consequence of measuringR(q) in absoluteunits and, of course, of knowing bothc and K ~K54.30 cm2/g2, employing a value of]n/]c50.192 cm3/g at633 nm, see Ref.@22#!. Indeed, the parameterr appears onlyin the prefactor of Eq.~4!, thus affecting only the amplitudeof the scattered intensity, not its shape. Incidentally, it shoalso be recalled that the densityr of the segment which addup to form a fiber, must not be confused with the densof the fibrinogen/fibrin monomer molecules (rF51.395 g/cm3). The latter value could also be a reasonaestimate for the two-stranded ‘‘protofibrils.’’ Instead, thsegment density may be sensibly smaller, meaning thatprotofibrils are not densely packed to form the fibers, bthey are intertwined with solvent molecules@23#.
As expected, the behavior ofR(q) at low q’s is deter-mined by the structure factorS(q). Indeed, forq!1/j, thefactorsA(q);B(q);1 andR(q);(12b)1bg2j2q2. The
1-7

s
d
ricfe
thh
re
co
na-
oui-e
cle
Ex
uc
enn.
eth
st
heo
e
to
he
de-is
, as
l
lsin
wthol-e
hom-atin-
tialtheof
l, it-theof
ctorc-ts
-
er–
oderatne
the
a
theeg-
s
ys
F. FERRIet al. PHYSICAL REVIEW E 63 031401
correlation amplitude is controlled by the parameterb thatcan vary between 0 and 1. Forb50, there is no correlationand S(q)51, independently ofq, while for b51, there isstrong correlation andS(0)50. Except for the early phaseof the gelation process~at timest;tn!, or for aged gels at thelowest concentrations, all our data are best fitted whenb51. This can be used for estimating the relative magnitubetween the blob sizej and their average distancej0 . In-deed, if we consider the blobs as monodisperse spheparticles with hard-sphere~HS! interactions, a value oSHS(0);0 would be attained only for a very high volumfraction f, namely whenf;0.52 @24#. This value corre-sponds to the condition of close packing, i.e., whensphere’s diameter is equal to its average distance. Tthough the blobs structure and interactions are very diffefrom the case of hard spheres, we think that whenS(0);0, the blobs are expected to be closely packed withj;j0 . It should be pointed out, however, that the HS struture factor appears to be highly inadequate to describeexperimental data. This is because, close to the conditioclose packing,SHS(q) exhibits several peaks and oscilltions, implying that the correlations extend over a rangeseveral interparticle distances. This is very different from omeasuredS(q) which, on the contrary, relaxes monotoncally to 1 asq→`. The reason for this behavior can battributed either to effects of a large polydispersity in partisizes@which smears out the oscillations present inSHS(q)#,or to the fact that the particles are clearly not spherical.amples for these two behaviors can be found in Ref.@25#.The actual expression ofS(q) used in Eq.~4! was foundheuristically, by using a simple function capable of reproding the data behavior at lowq’s.
The range over whichS(q) relaxes to its asymptotic valuis controlled by the parametergj appearing in the Gaussiaterm of S(q). The behavior of the pair correlation functiog(r ) associated toS(q) can be obtained by inverting Eq~3b!
g~r !512b
~2Ap!3
1
~N/V!g3j3e2~r /2gj!2
~6!
from which one sees thatg(r ) has a Gaussian shape with thparticles being spatially correlated over a length scale oforder of 2gj. In order to satisfy the constraint thatg(0)50~see Sec. II C!, the factor multiplying the Gaussian term mube 1, implying that
2gj5b1/3
Apj0 , ~7!
where we have usedj0;^N/V&2(1/3). Thus the correlationlength 2gj of the system scales asj0 and, since 0,b,1, itis upper limited to the value ofj0 /Ap;0.56j0 . Therefore ashape forS(q) as that reported in Eq.~4! implies that thecorrelation length of the system is of the order of half taverage distance between the blobs. If we recall that forgels b51 and j;j0 , it turns out from Eq.~7! that g
03140
e
al
eusnt
-urof
fr
-
-
e
ur
51/2Ap;0.28. This is the value to which we have fixed thparameterg in all our fittings.
As a comment, we would like to mention that we triedfit the data with other shapes ofS(q) as well. For example,we used the HS structure factor, but it did not work for treasons mentioned above. We also tried with theS(q) pro-posed by Dietleret al. @26#, where the correlationg(r ) wascharacterized by an exponential rather than a Gaussiancay. The results are similar, but the quality of the fittingsomewhat poorer at lowq’s. Lastly, we tried to interpret thedata in terms of a depletion zone surrounding each blobrecently suggested for the formation of colloidal@27# andemulsion@28# gels, or for the growth of semiconductor@29#and hard-sphere@30# crystallites. A phenomenological modebased on this effect was developed by Carpinetiet al. @31#and successfully applied to the formation of colloidal ge@27#. However, when we use the fitting function proposedRef. @31#, the data are very poorly fitted at the lowestq’s.This is comprehensible because our gels exhibit a grokinetics that is very different form that observed in the cloidal gels of Ref.@31#. In the latter ones, the size of thclusters vary very much in the course of gelation~roughly bya factor of ;10!, passing from values which are mucsmaller than the average clusters distance, up to values cparable with this distance, when the gel is formed. Thusthe beginning, the presence of the peak in the scatteredtensity is attributed to depletion effects and not to spacorrelations among clusters. Conversely, in our gelsblobs size varies very little because, from the appearingthe peak in the scattered intensity up to the final aged geincreases only by a factor of;2. Therefore spatial correlations appear to be responsible for this peak already frombeginning of the kinetics, and we believe that the analysisRef. @31# is not appropriate for our case.
We come now to discuss the form factorP(q). Sinceeach blob is an assembly of many segments, its form faP(q) can be written as the product of two terms: the struture factorA(q) describing the correlation among segmenand the form factorB(q) of the single segment. The lefthand side ofA(q) represents the ‘‘distinct’’ contribution tothis structure factor and was approximated to a FishBurford ~FB! function @32#. The factorp was introducedbecause it allows the recovery, forqj@p, of the exactasymptotic absolute scattering intensity for cylinders~seeSec. IV C!, and, at the same time, provides a quite goapproximation of the cylinders form factor at all the othvalues ofq ~maximum deviation being of the order of 10%qj;p!. It should also be pointed out that the FB functio~with the factorp! represents a good approximation of thform factor of random coils as well. For these systems,asymptotic decay isP(q);12/q2j2, while our model pre-dicts P(q);p2/q2j2 with an error of;220%. At all theotherq values, the approximation is also satisfactory withmaximum error of;22% at qj;p. In conclusion, theFisher–Burford function describes the fractal nature ofblobs which, from length scales comparable to the basic sment lengthl up to the blob sizej, behave as fractal objectcharacterized by a mass fractal dimensionDm . In this region(j21!q! l 21), the corresponding scattered intensity deca
1-8

cioa
th
nn
nd
i-o
r ftsth
lre
otns,
t-te
noo
hee
-
v
tcalo
p
r
alue
y-
rre-
n-
me
per-aw
li-ss-
e
tted-rted
data
GROWTH KINETICS AND STRUCTURE OF FIBRIN GELS PHYSICAL REVIEW E63 031401
asR(q);q2Dm. The right-hand side ofA(q) is the ‘‘self’’part of the blob structure factor and is equal to the reciproof the number of segments inside the blob. This contributrepresents the incoherent scattering from the segmentsbecomes comparable with the FB function whenql5p. Itshould be pointed out that this contribution may affectobserved power law decay ofR(q) when this is measuredover q values not!p/l. Thus the apparent decay exponeam , recovered by fitting the data to a power law, represean underestimate of the fractal dimension, i.e.,am,Dm . Anexample of this effect is going to be given later on ashown in Fig. 7.
In the region dominated by the segments (ql@p), thescattered intensity behaves asR(q);cM( l /j)DmB(q);Nnm2B(q), i.e., R(q) is given by the sum of the intensties scattered by all segments present in solutions, whtotal number isNn. The segment form factorB(q) was cho-sen heuristically, so as to recover the expected behaviothe scattered intensity distribution from cylindrical objecwith a sharp interface between them and the solvent. Incase,R(q) decays asymptotically for largeq’s as;q24 andits amplitude is a function only of the segment diameterd,with no dependence onDm , j, andl ~see Sec. IV C!. This issatisfied by Eq.~4! because, as soon asas54 andql, qd@1, we obtainR(q);cd21q24. In particular, the numericafactor 32 appearing inB(q) has been introduced to ensuthat also the absolute scale ofR(q) is correct~see Sec. IV C!.More generally, if the surface of the segments is not smoand/or the interface between them and the solvent issharp, the parameterasÞ4. In the case of sharp interfacethe surface fractal dimensionDs is related toas by Ds562as @33#. Thus for a smooth surface (Ds52) we haveas54, while for a totally rough surface (Ds53) it turns outthat as53. Alternatively, if the interface is not sharp buextends over a finite range,as.4 with the actual value depending on the interface profile. Our data seems to indicatendency to have values ofas.4, but this is only a vagueindication because the extension of theq range over whichthe surface fractal regime is observed is fairly narrow, andreliable estimate ofas can be given. Since we observed nsignificant dependence of the fitting results on the valueas , this value was set toas54 in all our fittings.
In order to gain further insights into the meaning of all tabove parameters and illustrate how these parameters dmine the behavior of the fitting function~4!, we report in thenext two figures a series ofR(q) curves obtained under different circumstances. Figure 6 reports the behavior ofR(q),together with the three factorsS(q), A(q), and B(q) ofwhich R(q) is the product, as a function of the reduced wavector qj. The plot was worked out by settingb51, g50.28, Dm51.30, as54, and l 5d51022j. Clearly, thethree factors determine the behavior ofR(q) at three differ-ent q regions. These three regimes are represented bythree asymptotes reported in the inset of Fig. 6. Onenotice that the two intercepts of the three asymptotes alan easy estimate of the parametersj and d. Namely, it isstraightforward to show that the two right-hand side asymtotes cross at a valueq2 given by q2
42Dm(d3/ l Dm21)
03140
alnnd
e
tts
se
or
is
h,ot
a
o
f
ter-
e
henw
-
532/pDm, in which the value ofas54 has been used. Fothe specific case of cylinders (Dm51) this reduces to theexpected value ofq2d5(32/p)1/3;2.2 ~see Sec. IV C!. Forthe more general case whenDmÞ1, we refer the reader toSec. IV C, but we can anticipate here that, because the vrecovered in our fitting is close to unity (Dm;1.3), the re-sult is almost independent onl and remains substantiallunchanged withq2d;2.1. The two left-hand side asymptotes cross at a valueqj5pDm/21Dmg22/(21Dm) ~supposingthat b51!. By using the values ofg50.28 andDm51.30,one finds thatqj;3.4. The actual peak positionqpeakfalls ata value that is somewhat shifted with respect to the cosponding asymptotes intercepts, e.g.,qpeakj;4.4.
Figure 7 reports a series ofR(q) functions obtained byvarying the diameterd of the fibers from 0.01 to 5mm andsupposing that the number concentrationN/V of the blobsremains fixed. All the other fitting parameters were kept costant and set to the valuesb51, g50.28, Dm51.30, as54, j530mm, andl 50.4mm. The figure shows that at lowq’s (q;1/j) all the curved are characterized by the sashape with their amplitude strongly dependent ond, namelyR(q);d4, as it can be easily seen by recalling thatcM;(N/V)M2 and by using Eq.~5!. Similarly, at high q’swhere the scattering is determined by the surface’s proties, all the curves exhibit the same asymptotic power ldecay and, as soon asq>1/d, the intensity decays asR(q);q24. The behavior ofR(q) is more subtle in the centraregion (1/j,q,1/d) where the scattering is either domnated by the fractal blobs or by the segments, with the croover between these two regimes occurring atql5p @see fac-tor A(q) in Eq. ~4!#. Thus depending on the ratiol /d
FIG. 6. Behavior of the scattered intensity distributionR ~solidline! predicted by Eq.~4! as a function of the dimensionless wavvectorqj. The three factorsS(q), A(q), andB(q), of which R(q)is the product, are also reported as dashed, dotted, and dodashed lines, respectively. In the inset, the same curve is repotogether with the three asymptotes described in the text. Thehave been generated withb51, g50.28,Dm51.30,as54, andl5d51022j.
1-9

ovha
th
acor
e
rlothve
irlyo
,te
-erth
re
th of
ure
ex-aluen-we
instns
e of
vede
es
f the
ation
ter-
re-
ter.,hea-
beof
d
onin-
ereral
eeth
F. FERRIet al. PHYSICAL REVIEW E 63 031401
between the segment length and its diameter, this crossmay interfere with the crossover associated to surface beior, andR(q) can exhibit very different profiles. Forl @d,the crossover from the fractal region to the region wherescattering is dominated by the segments (ql5p) occurs atqvalues smaller than the wave vector at which the surfregime starts (q.1/d). Consequently, there is a wave-vectrange (p/ l ,q,1/d) in which R(q) tends to level out andexhibits an upward curvature~see bottom curve in Fig. 7!.Conversely forl !d the two crossovers swap, and by thtime the segments start to dominate the scattering, theyready have entered the Porod regime. Therefore the ovebetween the fractal and the surface regimes leads to a brening of the transition, with a consequent narrowing ofwave-vector range over which the fractal regime is obserand withR(q) decaying faster than the expectedq24 behav-ior. The overall effect is a ‘‘rounding’’ of the curveR(q)with a downward curvature~see the upper curve in Fig. 7!.Lastly, whenl;d, the two effects~leveling and rounding!cancel out and a nice fractal power law decay with a fasharp transition to the surface regime is observed. Thiscurs over a quite wide range of the ratiol /d, as it can beobserved for the four central curves of Fig. 7 in whichl /dvaries between 0.4 and 4~top to bottom!. For these curvesthe power law decay exponentam represents a good estimaof the fractal dimensionDm with deviations smaller than210% for 1, l /d,4 and 110% for 0.4, l /d,1. At thesame time, the crossover wave vectorq2 can be easily determined from the intercept of the two straight lines charactizing the two regimes and provides a good estimate offiber size, i.e.,d;2.1/q2 ~see Sec. IV C!. Since our dataappear to be very similar to the central curves of the figu
FIG. 7. Behavior of the scattered intensity distributionR(q)predicted by Eq.~4! as a function of the wave vectorq for gelscharacterized by blobs having the same number densityN/V andthe same structure, but different fiber diameters varying betw0.01 and 5mm. The data have been generated by setting allother parameters to the valuesb51, g50.28, Dm51.30, as54,j530mm, andl 50.4mm.
03140
erv-
e
e
al-apad-ed
c-
-e
,
we expect that the segment diameter and segment lengour gel will exhibit similar magnitudes.
We conclude this section by summarizing the procedand the results of fitting the data of Fig. 3 to Eq.~4!. Thefitting was carried out with the floating parametersr, j, Dm ,and d, and by fixing the others to the valuesb51, g50.28, as54, and l 50.4mm. While the first three valueswere chosen according to physical considerations asplained above, the latter one was set to an average vfound by fitting the data relative to gels of different concetrations. This is probably not the best procedure becausenoticed a tendency of having higherl’s with highercF , but ithelped to make the fit much more stable and reliable agathe high number of floating parameters and correlatioamong them. On the other hand, even a marked changthe value assigned tol ~for example, a factor of 2!, neitherproduced substantial changes in the results, nor improsignificantly the quality of the fitting. The outputs of thfitting were r50.4260.2 g/cm3, j52762 mm, Dm51.3160.02, andd513265 nm. Finally, it is worth noticing thata density of;0.4 g/cm3 corresponds to fibers in which thprotofibrils are highly intertwined with solvent moleculeand occupies only about 1/3 of the cross sectional area ofibers ~fibrinogen density;1.395 g/cm3!. This result is con-sistent with that found by Carr and Hermans, who utilizeddifferent technique based on the measure of the extincspectrum of these gels@23#.
C. Polydispersity and fiber size determination
We discuss here the effect of polydispersity on the demination of the fiber diameterd used in Eq.~4!. This will bedone by analyzing the behavior ofR(q) around the crossoveregion atq;q2 and establishing a quantitative relation btween the value ofq2 and the fiber diameterd. As a result ofthe analysis reported below, we will shown that the diamed used in Eq.~4! is actually a weight average diameter, i.ed;^d&wt , and that it can also be estimated by using tLAELS data alone, but only if the scattered intensity is mesured in absolute units.
We start our analysis by supposing that the gel canassimilated to a solution of randomly oriented cylinderslength L and diameterd, polydisperse both in length andiameter. Since we are interested only in the largeq behaviorof R(q), which is independent on the long range interactibetween particles, we will consider the solution as beingfinitely dilute and, consequently, we will putS(q)51 in theexpression ofR(q) given by Eq.~2!. The presence of poly-dispersity transforms Eq.~3! into @12#
R~q!5Kc^M &wt^P~q!&z , ~8!
where^M &wt is the weight-averaged molecular weight of thparticles and P(q)&z is their z-averaged form factor. Focylinders,P(q) can be calculated numerically by using thRayleigh–Gans approximation; in particular, in the centregion L21,q,d21, P(q) can be worked out analytically(P(q)5p/qL, see Ref.@12#! and Eq.~8! becomes
ne
1-10

la
t
n
teisste
ar
ed
oqseren
s,
n
nce
-onbyar-
, if
t in
hate
q.he
e
m-
g
d
ateis
n
erto
al
red
ng
GROWTH KINETICS AND STRUCTURE OF FIBRIN GELS PHYSICAL REVIEW E63 031401
R~q!5pKc^M &wt^L21&zq
21 bL21,q,d21c ~9a!
5p2
4KcNAr^d2&wtq
21, ~9b!
wherer is the cylinders density, and we have used the retion ^M &wt^L
21&z5NA(p/4)r^d2&wt . Equation ~9b! showsthat R(q) decays asq21 ~which is consistent with the facthat the fractal dimension of a linear object is 1! and that itsamplitude does not depend on the cylinders length, but oon their squared weight-averaged diameter^d2&wt .
When we consider wave vectorsq.d21, the behavior ofR(q) changes drastically and starts to decay much fasasymptotically asq24. This is called the Porod regime anda direct consequence of the presence of sharp interfacetween the scattering and hosting media. For such a systhe asymptotic behavior ofR(q) is proportional to the over-all sample surface area per unit volume,S/V, and is given bythe expression@12#
R~q!52pKNAr2S S
VDq24. ~10!
If the sample is constituted by a solution of scattering pticles of known morphology, thenS/V5f^s&nb/^v&nb,where ^s&nb and ^v&nb, are the particles number-averagsurface and volume, andf is the sample volume fraction. Inparticular, for cylindersS/V54f^d21&wt , regardless oftheir length. Thus Eq.~10! becomes
R~q!58pKcNAr^d21&wt q24 @q@^d21&wt#. ~11!
It is worth noticing that also in this case, as for Eq.~9b!,R(q) does not depend on the cylinders length, but onlytheir weight-averaged diameter. Finally, by equating E~11! and~9b!, it is straightforward to show that the crossovwave vectorq2 at which the two asymptotes cross is givby
q2^d&wt;S 32
p D;2.2, ~12!
where the approximationd&wt3 ;^d2&wt /^d
21&wt has beenmade. Thus we see that the crossover wave vectorq2 isrelated to the weight average diameter of the cylinders.
Equation~12! was worked out for the case of cylinderi.e., particle with a fractal dimensionDm51. WhenDm.1,the analysis is very similar and is based on the expressiothe blob form factor@see Eq.~4!# which, in the fractal region(j21!q! l 21d21), is given byP(q)5(p/qj)Dm. Thus byrecalling that the blob molecular weight is given by Eq.~5!,and by using the relation ^M &wt^j
2Dm&z5NA(p/4)r^ l 12Dmd2&wt , it can be easily shown that Eq.~9b! istransformed into
R~q!5p11Dm
4KcNAr^ l 12Dmd2&wtq
2Dm
@j21!q! l 21,d21#. ~13!
03140
-
ly
r,
be-m,
-
n.
of
It is evident that now, differently from Eq.~11!, the ampli-tude of R(q) depends on the segment lengthl which ismodel dependent, and may be not known. However, sithe value ofDm is not very different from unity (Dm;1.3)and since we know that the range of variation ofl cannot bevery large~it is of the same magnitude ofd, see Sec. IV B!,the dependence of Eq.~13! on l is rather mild and leads tosomewhat limited errors. For example, if the value ofl iswrong by a factor of 2, the amplitude ofR(q) is affectedonly to ;620% (Dm51.3).
As far as concerns Eq.~11!, this remains unchanged because in this region the scattered intensity depends onlythe overall surface area of the sample. This is determinedthe surface area of the segments, not by their state ofrangement or aggregation inside the blobs. In particularthe segments are cylinders~as predicted by our model!, theirsurface area is a function of their inverse diameter^d21&wtonly and, therefore, Eq.~11! also depends only ond21&wt .Thus by equating Eqs.~13! and ~11!, one finds that
q2^d&wt5S 32
pDmD 1/~42Dm!S l
^d&wtD ~Dm21!/~42Dm!
;2.1,
~14!
where the value 2.1 was obtained by supposingl;^d&wt andDm;1.3, and the same approximation as that worked ouEq. ~12! was used. Equation~14! shows that, although inprinciple the value on the interceptq2 depends onDm , l, and^d&wt , only its dependence ond&wt is relevant. Indeed, thefirst factor of the right-hand side of Eq.~14! is always be-tween;2.0 and 2.2 for anyDm in the range 1–1.5, while thesecond factor is always;1620% even for variations of theratio l /^d&wt between 0.1 and 10. Thus we can conclude tEq. ~12! or ~14! provides a reliable method for estimating thsize of the gel fibers.
As a final comment, we would like to point out that E~14! allows the estimate of the fiber’s diameter without tnecessity of measuringR(q) in absolute units. However, wedo measureR(q) in absolute units. Thus in principle, wcould use either Eqs.~13! and/or~11! for recovering^d&wt .The use of Eq.~11! should be easier because the only paraeters required are the~known! optical constantK and thesegment densityr which can be either estimated by fittinthe overall LAELS1CLS data to the fitting function~4! ortaken from literature@23#. However, as already mentioneabove, the extension of theq range over which the Porodregime is observed is fairly narrow, and no reliable estimof ^d21&wt can be given. Conversely, the fractal regimefairly wide, but in order to use Eq.~13!, the knowledge of thesegment lengthl is also required. As for the density, this cabe estimated by fitting the LAELS1CLS data to Eq.~4! but,even when this value is not accurately known, Eq.~13! canstill be fruitfully employed. This was tested by computsimulations in which synthetic data, generated accordingEq. ~4!, were fitted in theq range corresponding to the fractregion by means of Eq.~13!. When a value ofl wrong by afactor of 2~or 0.5! was used, the average diameter recovewith Eq. ~13! was correct within an accuracy of;620%.When Eq.~13! is used for analyzing the data correspondi
1-11

eta
rA
r aine
unlo
n
s,
hiMreti
e
i-
fd
ilymenollf
inicall.
stinte.s,re
ru-inns,
theersen-
sts of
in-ers
estartion,ldethek inheto
fro-n isertoore
eo adis-red
ob-thetri-ingtherallctureuteaslso
ngth
-end
theent
tr-t a
e-
ged
F. FERRIet al. PHYSICAL REVIEW E 63 031401
to gels of Fig. 3 (cF50.24 mg/ml) and Fig. 4 (cF50.81 mg/ml), and the fit is carried out withr50.42 g/mland l 50.4mm, the average fiber diametersA^d2&wt were150 and 190 nm, respectively. The first value matches wthe 132 nm obtained by fitting the overall da(LAELS1CLS) of Fig. 3 to the function~4!. Thus we be-lieve that Eq.~13! is a reliable tool for estimating the fibediameters even when only LAELS data are available.example of this is given in Sec. IV D, where Eq.~13! will beused for recovering the time behavior of the fiber diametegelation proceeds, thus providing a useful tool for checkthe self-consistency of the kinetical and structural modproposed for the fibrin gels.
At this point, it may be worthwhile to compare the^d&wtvalues obtained for the gels of Figs. 3 and 4 with EMderived literature values. Although none were availableder the very same conditions employed by us, a quite csituation was found in Ref.@18#, where in one of theirsamples@gel of Fig. 2-A~a!#, the fibrinogen concentrationwas cF50.5 mg/ml, a value intermediate between the cocentrations of the two gels of Fig. 3~0.24 mg/ml! and Fig. 4~0.81 mg/ml!. All the other physical–chemical conditionwere almost the same~salt type, salt concentrationthrombin/fibrinogen molar ratio, no Ca11 ions!. From thenumber-average fiber diameter value reported in Table 2Ref. @18#, we have estimated the corresponding^d&wt , 85620 nm. However, two corrections must be applied to tnumber, the first one to account for the fact that in the Ethe fibers are dehydrated, the second to scale for the diffeconcentration of the gel reported in Fig. 3. Since the rabetween the density of anhydrous fibrinogen~1.395 mg/ml!and that of the hydrated fibers measured in this work~0.42mg/ml! is ;3.3, and since the density scales as the squarthe diameter, the equivalent hydrated diameter is^d&wt;155636 nm. Finally, taking into account that the fiber dameter scales as;cF
0.15 ~Ferri et al., in preparation!, onewould obtain, forcF50.24 and 0.81 mg/ml, the values o^d&wt;140633 and 167639 nm, respectively, in very gooagreement with our results.
D. Modeling of the growth kinetics
The data presented in Sec. III B, together with whatknown from literature on the early phases of the fibrin pomerization process, can be used for describing the gel fortion in terms of a very simple growth mechanism. Whfibrinogen is activated by thrombin, the fibrin monomer mecules start to polymerize and give rise to linear hastaggered semiflexible chains known as protofibrils@1–3#~see Sec. I!. As the polymerization proceeds, these chagrow in length and, depending on the physical–chemcondition of the gelling solution, may grow laterally as weHowever, under our working conditions in which no Ca11
ions are present, the protofibrils are expected to grow molinearly with a rather broad and skewed distribution,which long chains, intermediate oligomers, and nonactivamonomers are contemporarily present~see, for example, Ref@22#, and references therein!. Now, during these early phasethe intensity scattered by the sample is very low and ba
03140
ll
n
sgls
--
se
-
of
s
nto
of
s-a-
--
sl
ly
d
ly
detectable only at the largest angles of the LAELS instment. This is due to the fact that the protofibrils are very th~;5 nm! and, even when they are as long as several microthey simply do not scatter enough light. For example,zero angle intensity scattered by a sample of monodispprotofibrils 10mm long and 5 nm in diameter, at a concetration of 1 mg/ml~;our highest concentration!, is expectedto be of the order of 531022 cm21, a value which is wellbelow the LAELS instrumental sensitivity at the loweangles. However, the intensity scattered at wave vector;104 cm21 ~corresponding to the largest angles! is compa-rable with the instrumental sensitivity, and therefore thisformation can be used for estimating the size of the fibduring the early times of the gelation process~see below!.
When the longest chains become so long that their sizjbecomes comparable with their average distance, theyto interact and link to each other. This is the onset of gelatand occurs at a timetn that we labeled as networking timei.e., the time at which begins the building up of the scaffowhich will be used for the growing of the final gel. Thpresence of the network introduces a long-range order insystem, which is responsible for the appearance of a peathe scattered intensity distribution. Simultaneously with tnetwork formation, there is another effect which startstake place: while the longer chains become progressivelyzen by the network, the smaller ones, whose mass fractiostill very high, can diffuse freely and keep interacting eithto each other or with the frozen ones. Thus it is intuitiveunderstand that the fiber elongation becomes more and minhibited with time, while their lateral growth starts to bprominent. This is a cooperative effect which gives rise tfast increase of the scattering, as shown by the abruptcontinuity observed in the time behavior of both the scatteintensity and sample turbidity@see Figs. 4~a! and 4~b!#. Atthe same time this effect is probably responsible for theserved shift of the peak position and for the increase ofasymptotic power law decay of the scattered intensity disbution. A possible explanation can be found by considerthat, as the free fibers diffuse away from the pores ofnetwork and stick to the already frozen fibers, the oveaverage distance between fibers increases and their struchanges as well. A second mechanism, which may contribto the increase of the network mesh size, is the following:the frozen fibers become thicker and thicker, they are aexpected to become more rigid. Thus the persistence leof each blob~considered as a wormlike chain! should be-come larger, leading to an increase of the average end-todistance of the chain~see Fig. 10 in the Appendix!. Refor-mulated with the language of fractal blobs, an increase offiber’s rigidity should lead to an increase of the segmlength l and, therefore, to an increase of the sizej of a blobof a given mass@see Eq.~5!#. In both cases, the overall effecis a sort of restructuring or ripening of the gel/blobs mophology that tapers down with time, and eventually ends atime that we indicated in Fig. 4 as the ‘‘ripening time,’’t r .Later on, the successive growth betweent r and ta consistssimply of a thickening of the gel fibers, consistently with thfact that botham and qpeak do not change anymore. By referring to the structural model proposed above for the a
1-12

is
eanh
th
thsala
n-e
.
gh.e
e4
ath
riz
-timy-erdsinthtrathalesril1
tho
etoo
ththei
y to
-r
wnndi-
in
beed
or
notow,sitybut
etheve
soflds
der
theonethe
t tos at-
GROWTH KINETICS AND STRUCTURE OF FIBRIN GELS PHYSICAL REVIEW E63 031401
gel ~Sec. IV B!, this is equivalent to stating that during thphase all the parameters characterizing the gel structuremain fixed, with the exception of the fiber’s diameterd,whose value increases with time until the aged gel is form
According to the kinetical picture outlined above, we cdevelop a simple growth model, in which the behavior of tsize d(t) and the concentrationc(t) of the frozen fibersbonded to the network can be recovered as a functiontime. Let us suppose that, during the growth process,blobs become bigger increasing their sizej(t), but maintain-ing their structure substantially unchanged, i.e., withsame parametersDm , l, andr as those of the aged gel. Thuif the blobs are densely packed, their number density scas;j(t)23, and their concentration can be expressed, ming use of Eq.~5!, as
c~ t !
cF;S d~ t !
dFD 2S j~ t !
jFD Dm23
, ~15!
where the suffixF refers to the final aged gel, whose cocentration is supposed to be equal to the initial monomconcentrationcF . Let us apply this model to the gel of Fig4, for which cF50.81 mg/ml, dF;190 nm, andDm;1.20.The latter two values were estimated by fitting the straiportion of the data corresponding to the upper curve of Figby means of Eq.~13!, in which the other parameters were sto the valuesl 50.4mm and r50.42 g/cm3. Likewise, thefinal blob sizejF;13, together with the blob sizes at thearlier timesj(t), were recovered from the data of Fig.according to the relationqpeakj;4.4 ~see Sec. IV B!. Giventhe crudeness of this analysis, no effect of polydispersity wconsidered. Note that, at the beginning of gelation, whenblobs are probably not densely packed and are characteby values of valuesl, r, and Dm somewhat different fromthose of the aged gel, relation~15! may be grossly inaccurate. However, it becomes more and more reliable as theapproaches the ripening timet r and the gels attain a steadstate structure withj(t)5jF . Now, as soon as the diametd(t) of the frozen fibers becomes much bigger than theameter of the protofibrils~;5 nm!, the scattering becomedominated by the frozen fibers, and the contribution derivfrom the protofibrils can be neglected, even whenprotofibrils concentration is much higher than the concention of the frozen fibers. This is a direct consequence offact that, in the fractal regime, the scattered intensity scas R;cd2, see Eq.~13!. For example, if the frozen fiberhave a diameter 10 times the diameters of the protofibeven if their concentration is 10 times lower, they scattertimes stronger. Thus by neglecting the contribution ofprotofibrils, we can fit the straight portions of the curvesFig. 4 by using Eq.~13!, in which the expression forc(t)given by Eq.~15! is used. Consistently with the model, thfitting was carried out by fixing all the other parametersthe same values as those of the final aged gel reported abThe result, i.e., the temporal behavior ofd(t), is shown inthe main frame of Fig. 8, in which the arrows at;50,;200,and;1500 s indicate the networking, the ripening, andaging times, respectively. In the inset, the ratio betweenconcentration of the frozen fibers in the growing gel to th
03140
re-
d.
e
ofe
e
esk-
r
t4t
seed
e
i-
ge-es
s,0ef
ve.
eer
concentration in the final gel estimated via Eq.~15!, is re-ported. Rather surprisingly, the concentration necessarform the scaffold of the incipient gel attn is only a relativelysmall fraction~;10%–20%! of the overall monomers concentrationcF , the remaining;80%–90% being used fomaking the fibers thicker by a factor of;7. This is consis-tent with what was observed, a long time ago, on gels grofrom a purified fibrinogen/thrombin system by Hantgan aHermans@34#, and more recently, on gels formed in recalcfied plasma by Blomba¨ck et al. @35#. The interesting impli-cations of this behavior will be pointed out and discussedthe final section.
We end this section with a simple analysis that candone in order to corroborate the kinetic model proposabove. If we take the results of Figs. 5~a! and 5~b! and plottagainstR(qa) ~see Fig. 9!, we find out that the data~opensquares! are very well-described by a power law behavi~solid line! characterized by an exponentb50.7860.02.This means that the turbidity increases at a rate which isas fast as the growing rate of the scattered intensity. Nwhen during the course of a growing process the intendistribution remains fixed over all the scattering anglesonly an increase of its amplitude takes place,~as shown inFig. 4!, the turbidity is expected to scale linearly with thscattered intensity. This would be the case of our gels ifbehavior of Fig. 4 could also be extrapolated for high wavectors up tou5180°. However, when the gel fibers arethick that the crossover wave vectorq2 enters the range oq’s accessible to light scattering, this shape invariance hoonly over the fractal regime (q,q2), and the turbidity isexpected to grow slower than the scattered intensity. In orto find a relation betweent and R(qa), we can apply thedefinition of turbidity @12#
t5E4p
R~q!sin2~f!dV58pE0
1
R~x!x@122x212x4#dx,
~16!
FIG. 8. Increase of the diameter of the fibers bonded tonetwork during gelation. The data refer to the same gel as thedescribed in Fig. 4. In the inset, the increase of the ratio betweenconcentration of the frozen fibers in the growing gel with respectheir concentration in the final aged gel, is reported. The arrowtime tn;50, t r;200, andta;1500 s indicate the networking, ripening, and aging times, respectively.
1-13

n
th
e
ofc
atbyao
ntav
o
pa
lesex-ing
a-evi-
lsticpo-gi-ersu-nits
ny-
tedgtire
thectalirel.ance
forns., as.g.,eg-
fi-ar-
ium,e
ithees,o-
inmi-
thetoredy aini-
ork
in
a
ehetic
F. FERRIet al. PHYSICAL REVIEW E 63 031401
where sin2(f) is the dipole term~f being the angle betweethe laser polarization and the scattering wave vectork! andx5q/qmax, with qmax54p/l being the value ofq in corre-spondence ofu5180°. A rough estimate of Eq.~16! can becarried out by considering that the main contribution tointegral comes from the fractal region (x15q1 /qmax,x,x25q2 /qmax) in which R(x);d4x2Dm ~see Sec. IV C!. Indeed,for x.x2 , R(x) decays very fast as;x24, and forx,x1 thecontribution to the integral is quite negligible, the value ofx1being very small (x1;0.01). Thus by integrating Eq.~16!between 0 andx2 , dropping the terms inx2 and x4, andrecalling thatx2;1/d @see Eq.~14!# it can be easily workedout that t;d21Dm. The turbidity therefore scales with thscattering intensity as
t;R~qa!~21Dm!/4. ~17!
By using the valueDm51.2, the exponentb5(21Dm)/4becomesb50.80, which matches rather well the value0.78 found experimentally. It should be pointed out onagain that Eq.~17! has been obtained by grossly approximing the integral~16!. Nevertheless, the scaling predictedEq. ~17! appears to be consistent with the experimental dand provides a good physical insight into the mechanismthe growing process.
As a final consistency check between the experimedata and the model proposed for the gel formation, we hcalculated the expected behavior of the curvet versusR(qa)on the basis of Eqs.~4! and ~15!. This was done byfirst obtainingt @numerical integration of Eq.~4!# andR(qa)for the aged gel according to the parametersb51,g50.28, Dm51.20, as54, j512.7mm, l 50.4mm, andd5190 nm, which were obtained from the highest curveFig. 4 following the same procedure used in Eq.~15!. This isrepresented by the dotted circle shown in the upper right
FIG. 9. Behavior of the sample turbidityt as a function of theintensityR(qa) scattered atqa5104 cm21, describing the same datof panels~a! and~b! of Fig. 5. The scaling betweent andR(qa) ischaracterized by the exponentb whose value is consistent with thgrowth model proposed in the text. The circles joined by the dasline correspond to the expected behavior predicted by our kinemodel and calculated on the basis of Eq.~4!. The dotted circle at theend of the dashed line represents the aged gel, see the text.
03140
e
e-
taf
ale
f
rt
of Fig. 9. Then, by using the values ofd(t) andc(t) of Fig.8, one can generate the entire curvet versusR(qa) predictedby the model. The result, shown in Fig. 9 as open circjoined by a dashed line, agrees extremely well with theperimental data. It should be emphasized that this matchoccurs on an absolute scale for botht and R(qa), and thatthe simulation was carried out without any effective free prameter. Thus we believe that this provides rather strongdence for the goodness of our model.
V. SUMMARY AND CONCLUSIONS
In this work we have studied the structure of fibrin getogether with the kinetics of their formation by using elaslight scattering techniques. The gels were formed by thelymerization of fibrinogen monomers under quasiphysiolocal conditions, and the reaction was initiated by monomactivation via the enzyme thrombin. The intensity distribtions scattered from the gels were measured in absolute uover a very wide range of scattering wave vectors~up toabout three decades!, and were taken both while the solutiowas gelling and after the formation of a gel with a steadstate structure.
The data on the structure of the aged gel were interprein terms of a simple model, according to which a fittinfunction, able to reproduce accurately the data over the enwave-vector range, was devised. Following this model,fibrin gel can be represented as a dense collection of frablobs of sizej, closely packed together so as to fill the entsample volume. We calledj the crossover length of the geThe blobs are arranged in space so that their average distis of the same order of their sizej. This introduces a long-range order in the system, which is ultimately responsiblethe observed peak in the scattered intensity distributioEach blob is characterized by an almost linear structureevidenced by its fractal mass dimension close to unity, eDm;1.3. The blobs are made by the assembly of many sments ~or ‘‘building blocks’’! of length l and diameterd,which are bonded end-to-end and form semiflexible longbers with only a few branching points. The fibers are chacterized by a surface fractal dimensionDs;2, typical ofsharp interfaces between the fibers and the hosting medand appear to have a densityr smaller than the density of thfibrinogen monomers. This means that, in agreement wprevious reports@23#, inside each fiber the protofibrils arnot densely packed but intertwined with water moleculleading to a fiber density of about 1/3 of that of the monmers.
We have also shown that, alternative to the descriptionterms of fractal theory, the blobs can be seen as linear seflexible chains obtained by joining together end-to-endsegments with no branching points. However, in orderaccount for the observed power law decay of the scatteintensity distributions, the chains must be characterized blarge polydispersity in their persistence lengths, whose mmum value is given byl /2. Thus the microscopic parameterlof the model is expected to be related to the overall netwflexibility.
The kinetics of the gel formation was also modeled
dal
1-14

einctthheepist
l.
w
ait
is
dcan
eso
th
dca
hefi
then
a
dia
acin
theu
oblo
agtiohereertorapy
ofnddeimi-by
g-
n,r of
ss-e
foldheningm,ledeser toted
w-re
tedros-
ter,
blyelygel
scedom-ta.
cat-pro-
hat
gth.withthehow
yon
ed
d amec-
er-by
e to
GROWTH KINETICS AND STRUCTURE OF FIBRIN GELS PHYSICAL REVIEW E63 031401
terms of a very simple growth mechanism. The fibrinogmonomers polymerize into double-stranded linear cha~protofibrils! @1–3# until these are so long that they interaand link to each other. At this time, which we labeled asnetworking timetn , the onset of gelation takes place, and tscaffold for the building up of the final gel is outlined. Thformation of this network is accompanied by an abrupt, raincrease of the scattering due to the fact that the chainsto grow laterally and becomes thicker. The timetn is muchsmaller than the aging timeta required to form the aged geThe kinetics betweentn and ta is characterized by two dif-ferent phases, which occur before and after a time thatcalled the ripening timet r . For timestn,t,t r , there is a‘‘ripening phase,’’ in which the gel structure undergoessort of restructuring, which leads to a slight increase ofcrossover lengthj and of its fractal dimensionDm . Later on,for times t r,t,ta , a ‘‘thickening phase’’ takes over, inwhich the gel structure remains fixed and the growth consonly in a thickening of the gel fibers.
We tested the validity of the structural and kinetical moels reported above on gels grown under the same physichemical conditions, but at two different fibrinogen concetrations, namelycF50.24 mg/ml~Fig. 3! and cF50.81 mg/ml ~Fig. 4!. These gels exhibited quite similar structurcharacterized by a long-range order, with similar valuesDm , but somewhat differentd and a greater variation inj.Their kinetics were also very similar with the presence ofthree temporal regimes associated to the timestn , t r , andta .This similarity is surprising, but not completely unexpecteindeed, as we pointed out at the end of Sec. IV D, the sfold of the gel that is already present at the timetn is built byusing only a small fraction~;10%–20%! of the total initialfibrinogen mass available. The remaining;80%–90% isstill available in solution, and is mainly used for making tfibers thicker. Thus one is tempted to conclude that thebrinogen concentration plays a minor role in determiningmodalities of the gelation process, which, conversely, appto be mainly governed by the physical–chemical conditioof the gelling solution.
At this point, it is interesting to address the issue of whis the relation between the crossover length~or average blobsize! j and the effective gel mesh size, i.e., the averagetance between the fibers in the gel. Since the observed vof the gel fractal dimensionDm is close to unity (Dm;1.3), the blob structure is rather linear, meaning that eblob can be thought as assembly of a few semirigid cha~or fibers! grown by joining together many segments wionly a few branching points. As a consequence, we expthat the average distance between fibers is not very msmaller than the size of the blob itself. Thus since the blare in contact to each other, we can conclude that the bsizej provides at least an upper bound of the overall averdistance between the fibers in the gel. A quantitative relabetweenj and the effective gel mesh size would require tknowledge of microscopic details of the blob structuwhich are obviously not extractable from static light scatting data only. With respect to this point, it is helpfulanalyze some of the pictures of fibrin gels available in liteture. By looking at the high resolution electron microsco
03140
ns
e
dart
e
s
ts
-l–-
f
e
:f-
-ears
t
s-lue
hs
ctchsben
,-
-
~EM! images of dried gels, such as those reported in Fig. 2Ref. @18#, the gel fibers appear to be fairly entangled acurved, with a mesh size of about an order of magnitusmaller than the crossover length measured by us under slar conditions. Conversely, native fibrin gels observedconfocal laser three-dimensional~3D! microscopy@17# showa meshwork constituted by relatively straight rodlike sements which are linked mainly at denser nodes~the opticalsetup was able to visualize fibers as thin as;100 nm!. Forinstance, from the images in Fig. 3, panel D of Ref.@17#, inwhich a gel grown under conditions similar to ours is showone can see that the largest pores visible are of the orde10–20mm, e.g., of the same order of magnitude of the croover lengthj measured by us. It is therefore likely that thparameter represents the mesh size of the initial scafformed attn , composed by the longest fibers joined at tdenser nodes. The subsequent growth leads to a thickeof these fibers and a partial filling of the voids between thewith the creation of a somewhat finer and more entangmeshwork composed by thinner, more flexible fibers. Ththinner fibers appear not to have enough scattering poweaffect the peak position, which therefore seems to be relato the long-range order imposed by the initial scaffold. Hoever, the thinner fibers will contribute to the effective posize of the gel, which from the permeation data of Ref.@17#,lie somewhere in between the EM- and confocal-estimamesh sizes. It should also be pointed out that the 3D miccopy images are taken on native~hydrated! gels, while theEM pictures are taken on dried gels. The removal of wawhich occupies up to 99.9%~or even more! of the overallsample volume, requires handling procedures that inevitacompact and/or distort the gel structure. Therefore it is likthat largely spaced rodlike elements present in the nativestructure would become more bent, entangled, and coalefibers. Another point should also be emphasized when cparing visual images of fibrin gels with light scattering daThe first ones lead to an estimate of the gel parameters~suchasd or j! based on number-averages. Conversely, light stering is very sensitive to the mass of the scatterers andvides averages strongly biased by the heaviest~or largest!particles. Although we have not addressed the issue of wkind of average the estimate ofj refers to, this is expected tobe fairly larger than a number-averaged crossover lenThus a straight comparison between the results obtainedthe two techniques has to be taken with care. To verifycorrectness of these ideas, and determine quantitativelythe gel parameters depend oncF , more gels are currentlybeing studied in our laboratories.
Finally, it is worth mentioning that a growth kinetics versimilar to that reported for our gels was recently observedtwo other, different types of gels, namely highly cross-linkpoly~acrylamide! gels @36# and agarose-water gels@37#. Inboth cases, the scattered intensity distribution exhibitepeak at low angle and its amplitude increased with tiwithout changing its position. A fractal behavior with a fratal dimension close to our values was also observed@37#.The explanation for this behavior was, however, very diffent from ours. In both cases the data were interpretedsupposing that, at the beginning, the scattered light is du
1-15

tseao
el
uha-a
ofcreur
-
rsn
to
be
.
ner.o
a-
deth
s.qs.egike
n
F. FERRIet al. PHYSICAL REVIEW E 63 031401
thermodynamically driven density fluctuations associateda phase separation process. Successively, when the ongelation takes over, the coarsening of the fluctuations isrested, and only an increase in the scattered intensity isserved. Clearly, this explanation does not apply to our gin which no phase transition process is involved.
ACKNOWLEDGMENTS
We thank G. Dietler, M. Giglio, A. Pa´rola, and K. Kroyfor helpful discussions and suggestions. This work was sported by grants from Consiglio Nazionale delle Ricerc~CNR! to G.A. and F.F., Istituto Nazionale Fisica della Mteria ~INFM! to M.G., and by Agenzia Spaziale Italian~ASI! to M.R. and F.F.
APPENDIX
In this Appendix, we want to show how a collectionwormlike linear chains polydisperse in their persistenlength can give rise to a power law decay of their scatteintensity distribution. Effects of polydispersity in the contolength will be shown not to affect this feature.
Let us start by recalling how the form factorP(q) for amonodisperse wormlike chain of persistence lengthl p andcontour lengthLc looks like. The behavior ofP(q), whoseanalytical expression can be found in Ref.@38#, is reportedFig. 10 as a function ofq for three different chains characterized by the sameLc550mm and three differentl p , 500,5, and 0.5mm. Depending on the ratiob5 l p /Lc and on theq of observation, the curves exhibit quite different behavioFor b@1, the chain behaves as a rigid rod and, correspoingly, P(q) decays asymptotically asq21 as soon asqL@1 ~dotted curve!. Forb!1, the chain can be assimilateda random coil characterized by segments of lengthl k52l p
FIG. 10. Behavior of the form factorP(q) for wormlike chainscharacterized by the same contour lengthLc5100mm and threedifferent persistence lengthsl p , 500~dotted line!, 5 ~solid line!, and0.5 ~dashed line! mm. The two segments indicate the slopes of 1 a2, respectively, expected for rigid rods and random coils.
03140
ot ofr-b-s,
p-e
ed
.d-
( l k is traditionally called the Kuhn length!. In this case, theasymptotic behavior ofP(q) depends on the value ofl p
21
compared with the wave vector of observation. It caneasily shown that@38#
P~q!56
Lcl pq22, Rg
21<q< l p21 ~A1a!
P~q!5p
Lcq21, q< l p
21, ~A1b!
where Rg5ALcl p/3 is the radius of gyration of the chainEquations ~A1a! and ~A1b! predict that for intermediatewave vectors@case~A1a!# the scattered intensity distributiodecays asq22, as expected for random coils, while for largq’s @case~A1b!# it decays asq21, as expected for rigid rodsThe wave vectorq* at which the crossover between the twregimes takes place is obtained by equating Eqs.~A1a! and~A1b! and is given by
q* l p56
p;1.91. ~A2!
Thus if qmax denotes the maximum wave vector of the mesurement andq* .qmax, only the random coil behavior isobserved~dashed curve, Fig. 10, up toq;53104 cm21!,while when q* ,qmax, the two regions are both observe~solid curve, Fig. 10!. It should be noticed that, in spite of thfact thatP(q) is inversely proportional to the contour lengLc , the actual scattered intensityR(q)5KcM P(q) is Lcindependent becauseM;Lc . Therefore effects of polydis-persity onLc do not change the behavior predicted by Eq~A1!, consistent with the results obtained in Sec. IV C, E~9! and ~13!. Different is the case of polydispersity on thpersistence lengthl p which, obviously, leads to a broadeninof the transition between the random coil and the rodl
d
FIG. 11. Behavior of the form factorP(q) for wormlike chainshaving the same contour lengthLc5100mm, but polydisperse inl p
according to Eq.~A3!. The polydispersity exponentd is related tothe apparent decay exponentam as shown in the figure.
1-16
thnge
on
GROWTH KINETICS AND STRUCTURE OF FIBRIN GELS PHYSICAL REVIEW E63 031401
behaviors. In particular, if the distribution of thel p’s ishighly polydisperse as, for example, that described bypower law decay
n~ l p!; l p2d , l p1
< l p< l p2~A3!
n
F.
ra
.
gr
tic
rri
,
g
,
k,
d,
-
03140
ethe broadening region extends over a wave-vector ra2/l p2
<q<1/l p1. Within this range or part of this range,R(q)
behaves closely to a power law decayR(q);q2am with theexponentam comprising between 1 and 2 and dependingd as shown in Fig. 11.
.
ys-
s.
ev.
l.
k,
-
anE
@1# R. F. Doolittle, Annu. Rev. Biochem.53, 195 ~1984!.@2# Ann. N.Y. Acad. Sci.406 ~1983!.@3# B. Blomback, Thromb. Res.83, 1 ~1996!.@4# C. E. Hall and H. S. Slayter, J. Biophys. Biochem. Cytol.5, 11
~1959!.@5# J. H. Brown, N. Volkmann, G. Jun, A. H. Henshen-Edma
and C. Cohen, Proc. Natl. Acad. Sci. U.S.A.97, 85 ~2000!.@6# Z. Yang, I. Mochalkin, L. Veerapandian, M. Riley, and R.
Doolittle, Proc. Natl. Acad. Sci. U.S.A.97, 3907~2000!.@7# E. Di Stasio, C. Nagaswami, J. W. Weisel, and E. Di Ce
Biophys. J.75, 1973~1998!.@8# E. Mihaly, Biochemistry7, 208 ~1968!.@9# M. De Spirito, G. Arcovito, F. Andreasi-Bassi, M. Rocco, E
Paganini, M. Greco, and F. Ferri, Nuovo Cimento20D, 2409~1998!.
@10# Y. S. Liu, D. J. Anderson, and J. R. Shainoff, J. Chromato753, 63 ~1996!.
@11# B. J. Berne and R. Pecora,Dynamic Light Scattering~Wiley,New York, 1976!.
@12# M. Kerker,The Scattering of Light and Other ElectromagneRadiation~Academic, New York, 1969!.
@13# A. Bassini, S. Musazzi, E. Paganini, U. Perini, and F. FeRev. Sci. Instrum.69, 2484~1998!.
@14# G. Arcovito, F. Andreasi-Bassi, M. De Spirito, E. Di Stasioand M. Sabetta, Biophys. Chem.67, 287 ~1997!.
@15# See, for example, A. E. Gonzalez and G. Ramirez-SantiaPhys. Rev. Lett.74, 1238~1995!.
@16# L. Cipelletti, Ph.D. thesis, University of Milan, Milan, Italy1997.
@17# B. Blomback, K. Carlsson, B. Hessel, A. Liljeborg, R. Procyand N. Aslund, Biochim. Biophys. Acta997, 96 ~1989!.
@18# E. A. Ryan, L. F. Mockros, J. W. Weisel, and L. LoranBiophys. J.77, 2813~1999!.
@19# J. W. Weisel and C. Nagaswami, Biophys. J.63, 111 ~1992!.@20# See, for example, P. G. De Gennes,Scaling Concepts in Poly
mer Science~Cornell University Press, London, 1979!; M.Doi, Introduction to Polymer Physics~Clarendon, Oxford,1996!.
,
,
.
,
o,
@21# See, for example, J. Teixeira, inOn Growth and Form: Fractaland Non Fractal Patterns in Physics, edited by H. E. Stanleyand N. Ostrowsky~Nijhoff, Boston, 1986!.
@22# S. Bernocco, F. Ferri, A. Profumo, C. Cuniberti, and MRocco, Biophys. J.79, 561 ~2000!.
@23# M. E. Carr, Jr. and J. Hermans, Macromolecules11, 46 ~1978!.@24# See, for example, J. P. Hansen and I. R. McDonald,Theory of
Simple Fluids~Academic, London, 1986!.@25# B. Weyerich, J. Brunner-Popela, and O. Glatter, J. Appl. Cr
tallogr. 32, 197 ~1999!.@26# G. Dietler, C. Aubert, D. S. Cannell, and P. Wiltzius, Phy
Rev. Lett.57, 3117~1986!; 59, 246 ~1987!.@27# M. Carpineti and M. Giglio, Phys. Rev. Lett.68, 3327~1992!.@28# J. Bibette, T. G. Mason, Hu Gang, and D. A. Weitz, Phys. R
Lett. 69, 981 ~1992!.@29# V. Degiorgio, G. B. Banfi, G. Righini, and A. R. Rennie, App
Phys. Lett.57, 2879~1990!; G. B. Banfi, V. Degiorgio, A. R.Rennie, and J. G. Barker, Phys. Rev. Lett.69, 3401~1992!.
@30# K. Schatzel and B. J. Ackerson, Phys. Rev. Lett.68, 337~1992!.
@31# M. Carpineti, M. Giglio, and V. Degiorgio, Phys. Rev. E51,590 ~1995!.
@32# M. E. Fisher and R. J. Burford, Phys. Rev.156, 583 ~1967!.@33# H. D. Bale and P. W. Schmidt, Phys. Rev. Lett.53, 596
~1984!.@34# R. R. Hantgan and J. Hermans, J. Biol. Chem.254, 11 272
~1979!.@35# B. Blomback, K. Carlsson, K. Fatah, B. Hessel, and R. Procy
Thromb. Res.75, 521 ~1994!.@36# D. Asnaghi, M. Giglio, A. Bossi, and P. G. Righetti, Macro
molecules30, 6194~1997!; D. Asnaghi and M. Giglio, NuovoCimento20D, 2175~1998!.
@37# M. Manno and M. U. Palma, Phys. Rev. Lett.79, 4286~1997!;M. Manno, A. Emanuele, V. Martorana, D. Bulone, P. L. SBiagio, M. B. Palma-Vittorelli, and M. U. Palma, Phys. Rev.59, 2222~1999!.
@38# R. Koyama, J. Phys. Soc. Jpn.34, 1029~1973!.
1-17


