Embed Size (px)
Citation preview

] a m ~ d l~-l~wtmi~
~ d m k s E L S E V I E R J. Non-Newtonian Fluid Mech., 67 (1996) 311-323
Slow dynamics in gels 1
Hery R a n d r i a n a n t o a n d r o , T a c o Nicolai*, D o m i n i q u e D u r a n d , Freder ic P r o c h a z k a
Chirnie et Pysique des Materiaux Polyin&es, UMR CNRS, Universitk du Maine, 72017 Le Mans Ckdex, France
Received 1 February 1996; in revised form 29 April 1996
Abstract
Shear modulus data are presented for a polyurethane system at different stages of the gelation process. Data were collected over a wide frequency domain covering both the ct relaxation and the intemal mode relaxation. At the gel point, both the loss modulus G" and the storage modulus G' have a power law frequency dependence over four decades with an exponent 0.70 close to the value predicted by percolation theory assuming Rouse dynamics. After the gel point G' exhibits a gel modulus which increases with increasing reaction extent, while G" continues to have a power law behaviour at low frequencies with an exponent that decreases initially to 0.5 and then increases to 0.7 for the fully grown gels. The presence of slow dynamical processes in gels is visible in most reported dynamic mechanical measurements on different types of gels and is not expected by the standard model of polymeric gels. A number of possible explanations are mentioned, but we conclude that the slow dynamics in gels are at present an unexplained experimental observation.
Keywords: Dynamics; Gels; Polyurethane
1. Introduction
In this paper we draw attention to the existence of slow dynamical processes in gels which are not understood in terms of the prevalent model of a polymeric gel. Such slow dynamics are observed by dynamic light scattering [1-4] and dynamical mechanical measurements [5-13]. The standard model of a polymeric gel is a regular three-dimensional network of flexible cross-linked chains [14,15]. In this model any inelastic response to spontaneous thermal fluctuations or mechanical deformation is due to relaxations of parts of the chains between cross-links. Allowance can be made for movement of the cross-links around their average position. When the reaction extent p is reduced the elastic modulus decreases and becomes zero at a critical reaction extent Pc. At smaller reaction extents only branched particles are present.
* Corresponding author. 1 Presented at the workshop on 'Unresolved Experimental Dilemmas in the Dynamics of Complex Fluids' at the
Isaac Newton Institute, University of Cambridge, January 1996.
0377-0257/96/$15.00 Copyright © 1996 Elsevier Science B.V. All rights reserved 1'11 S0377-0257(96)01490-5
312 H. Randrianantoandro et al. / J. Non-Newtonian FluM Mech. 67 (1996) 311-323
The gelation occurs through growth of branched particles or aggregates starting form a more or less monodisperse distribution of polymers. As the reaction extent increases the viscosity q increases until at a critical reaction extent a macroscopic gel is formed with a finite elastic modulus and infinite viscosity. At the gel point aggregates of all sizes are present in the system which leads to relaxational processes over the whole frequency domain. After the gel point initially the largest aggregates attach to the macroscopic gel and with increasing reaction extent smaller and smaller aggregates connect to the macroscopic gel.
In the following section we will give a brief summary of the quantitative relations which describe the gelation process and apply them to model the frequency dependence of the shear modulus. We will then present experimental results on polyurethane (PU) systems. Before the gel point the shear modulus is very similar to the model calculations, but after the gel point there is a clear presence of slow dynamical processes which are currently not understood.
2. Model calculations
Two approaches for the description of the gelation process have been used in the literature: mean field theory [16] and percolation theory [17]. Both theories predict the formation of very polydisperse self-similar branched polymers. The molar mass M of the aggregates is related to the radius Rg of gyration by
mocRdg r M >> M0, (1)
where dr is the so-called fractal dimension and M0 is the molar mass of the initial polymers. The number distribution N(M) of particles with mass M is given by
N(M) w. M - ~f(M/Mz) M >> M0, (2)
where r is the polydispersity exponent,f (M/M=) is a cut-off function and M~ is the z-average molar mass. Mean field theory predicts dr= 4 and r = 2.5, while Monte Carlo simulations of site percolation give dr= 2.6 and r = 2.15 [18] (ref [17] gives 2.53 and 2.18 respectively).
Although mean field theory gives a good value for the critical reaction extent it cannot be used to describe large structural properties as it predicts dr> 3. Use of Eq. (1) with d r = 4 in three-dimensional space can only be justified if the density of individual polymers at the start of the reaction is very low in which case branched particles with increasing density can be formed. This argument has been used to justify the use of mean field theory to gelation via cross-linking of long flexible chains in the melt (vulcanization) [19]. In practice, however, only relatively small aggregates can be formed before the density of individual branched polymers becomes comparable with the overall segment density and loop formation becomes important. Therefore percolation seems more appropriate to describe the structural properties of the branched polymers close to the gel point. However, one could take Eqs. (1) and (2) as basic assumptions in which case dr and r are empirical parameters.
In order to model dynamical properties it is assumed that the self-diffusion coefficient Ds of the aggregates scales with the radius of gyration [20,21]:
6. (3)
If one assumes complete screening of hydrodynamic interactions, i.e. so-called Rouse dynamics, the friction coefficient is proportional to M and ~ = dr. If full hydrodynamic interactions are
H. Randrianantoandro et al. / J . Non-Newtonian Fluid Mech. 67 (1996) 311-323 313
assumed, i.e. so-called Zimm dynamics, than ~ = 1. Again one could also take ~ as an empirical parameter.
With the help of Eqs. (1)-(3) it is possible to model the shear modulus if we assume that the response to shear deformation is due to the relaxation of internal modes each with equal weight [20,21]. The relaxation time distribution of a single branched polymer is given by
A [In(r)] oc Mr - d f / (2 + ~) (4)
Here r is the relaxation time, not to be confused with the polydispersity exponent. It is generally assumed that the system does not contain entanglements, which is justified by the hierarchical size distribution, i.e. particles of similar size do not overlap. In this case, to calculate the relaxation distribution of the polydisperse system, one simply needs to integrate over all the particles large enough to contain the internal mode with relaxation time r:
A [In(r)] oc M ~ - ~r - dr/(2 + ~f(M/Mz) dM. (5) df/(2 + ~)
The loss (G") and storage (G') shear moduli can be calculated as
~0 °° o)2r 2 Gt(oJ) oc A(O 1 + (D2r 2 dr,
~0 °° (Dr G"(co) oc A(r) 1 + (o2r 2 dr, (6)
where oJ is the angular frequency. We have carried out model calculations of the shear modulus assuming local segmental
relaxation (so-called a-relaxation) at high frequencies and internal mode relaxation of percolat- ing clusters at lower frequencies. The shape and amplitude of the ~ relaxation are chosen as that of the PU system for which we will show experimental results in the next section. The internal mode relaxation is calculated using Eqs. (5) and (6) and taking Monte Carlo simulation results for dr, r andf(M/M~) [18]: d r= 2.6, r = 2 . 1 5 and
, exp{ '°45 053012 } L_ P < pc, (7)
{ ,°4'+1011 } f (M/M, ) = exp - [_ ~ P > Pc. (8)
We note that the cut-off function is not the same before and after the gel point (see also ref. [r7]). the prefactor in Eq. (6) is chosen to agree with the PU system. After the gel point one has to add the gel modulus Go to the storage modulus. The gel modulus is proportional to the number of effective elastic strands and in the case of an 'ideal' network to the number of polymer chains [14,15].
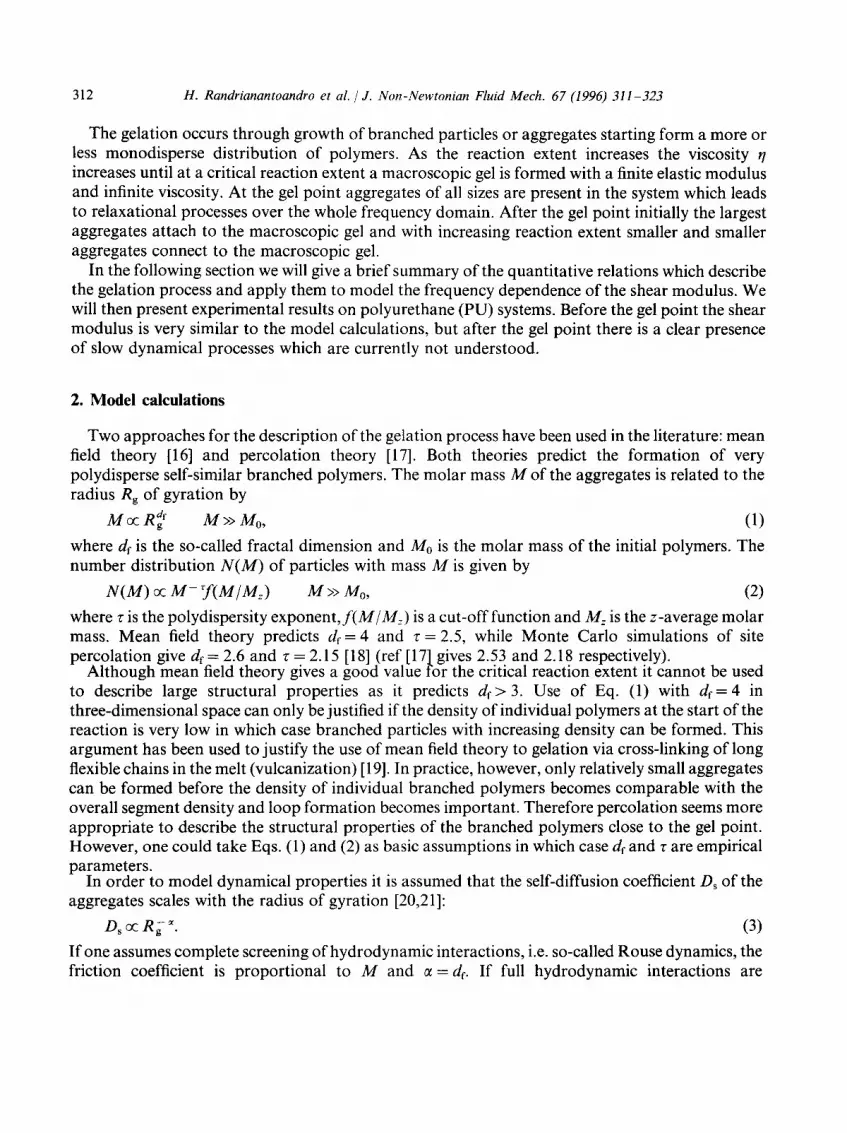
In Fig. 1 the frequency dependences of G' and G" are shown in a double-logarithmic representation at different values of • before the gel point where • = Lv-pcl/pc is a parameter which characterizes the approach to the gel point and scales with the z-average molar mass: e ocM~ -". Monte Carlo simulations [17,18] give t~--0.45 and prefactors which are different before and after the gel point owing to the different cut-off functions before and after the gel
314 H. Randrianantoandro et al. / J. Non-Newtonian Fluid Mech. 67 (1996) 311-323
=_o
9
8 -
7
6
5
4
3
2
1
0
-1
-2
-3
- 1 4 - 1 3 - 1 2 - 1 1 -10 -9
a
[ i I i i i [ i i i i i i i i
-8 -7 -6 -5 -4 -3 -2 -1 0 1 2
log(co) ( r ad / s )
EL v
v
o
9
8 -
7 -
6
5
4
3
2
1
0
-1
-2
-3
- 1 4 - 1 3 - 1 2 - 1 1 -10 -9 -8
b
- - - 1
. . . . 0.1
f ' _ _ / Z ' _ ~ _ _ _ 10 -3 / / , /
I I I I I I E I I 11 I I 1 I
-7 -6 -5 -4 -3 -2 -1 0 1 2
log(c0) ( rad / s )
Fig. 1. Model calculations of (a) the storage and (b) the loss modulus as a function of the radial frequency before the gel point for different values of E indicated in the figure.

H. Randrianantoandro et al. /J . Non-Newtonian Fluid Mech. 67 (1996) 311-323 315
point: 1.23 for p <Pc and 0.326 for p >Pc. At E = 1 only the ~ relaxation is observed as long as the initial polymer chains are small enough not to show themselves internal mode relaxation. As • decreases the branched polymers grow and the distribution of slow relaxation times broadens. Close to the gel point both G' and G" have a power law dependence on co for values of co much smaller than the relaxation rate of the ~ relaxation and much larger than the relaxation rate of the particles with M = M~: G'(co) oc G"(co) oc co~-l)df/(2 + ~). The frequency exponent is 0.65 in the case of Rouse dynamics and unity for Zimm dynamics. In the model calculations we have assumed Rouse dynamics. A very broad cross-over (4-5 decades) is visible between the slope of 0.65 and the limiting slope of 2 for G' and 1 for G".
In Fig. 2 the calculated results for G' and G" are shown at different values of • after the gel point. Again a very broad cross-over is visible between the slope of 0.65 and the gel modulus for G' or the limiting slope of unity for G". At complete reaction the gel modulus crosses over directly into ~ relaxation. The value of the gel modulus at complete reaction was chosen to be the same as that of the PU system. The gel modulus can be calculated if it is assumed that the gel at lower reaction extents is a regular network with mesh size Mz in which case Go scales with • as Go oc •(~- 1)/a OQ •2.56.
3. Experimental results
In this section we will show results of shear modulus measurements on PU systems obtained by polycondensation of polyoxypropylene (POP) triol with Mw = 720 g m o l - i and hexam- ethylene diisocyanate. A detailed description of these experiments will be published elsewhere [22]. PU systems at different reaction extents were obtained by varying the stoichiometric ratio of the isocyanate and alcohol groups: r = [NCO]/[OH]. The storage and loss moduli were measured on an Rheometrics RDA II rheometer with plate-plate geometry at different temperatures between - 6 5 and 85 °C. Deformation and geometry were chosen to obtain accurate torque response while remaining in the linear regime. Master curves were obtained by t ime-temperature superposition. For this system the ~ relaxation and the internal mode relaxation do not have the same t ime-temperature shifts [23]; at low temperatures the two relaxational processes approach each other. Therefore we have superimposed only the slower relaxational processes which means that at the highest frequencies the curves do not overlap. For clarity we show only the data at the reference temperature Tre f in this high frequency regime. As reference temperature we have chosen the temperature where the maximum loss shear modulus is situated at 1 rad s-1. This temperature is close to the glass transition temperature measured by dynamic scanning calorimetry and varies between - 5 5 ° C at r = 0 and - 13 °C at
Fig. 3 shows the results at different values of E before the gel point. One notices a good qualitative agreement with the model calculations shown in Fig. 1 both for the storage and the loss modulus. Very close to the gel point (re = 0.570) G' and G" exhibit a power law frequency dependence over 4 decades with exponent 0.702 _ 0.001 (Fig. 4). The value is the same as that observed during the cure at different stoichiometric ratios for r > rc [13] and is slightly, but significantly, above the value expected for Rouse dynamics. The main difference from the model calculation, however, is the presence of a cross-over regime between the limiting slope and the

3 1 6 H. Randrianantoandro et al./ J. Non-Newtonian Fluid Mech. 67 (1996) 311-323
t~ 13_ v
(.9 v
0
9
8 -
7 -
6
5 -
4 -
3 -
2 -
1 -
0 -
-1 - -
- 2 - -
-3
a
0.1
0.01
I I I I I I
- 1 4 - 1 3 - 1 2 - 1 1 - 1 0 - 9 -8
12.
(.9 o) 0
I I I I I I I I I
-7 -6 -5 -4 -3 -2 -1 0 1 2
log(o)) (rad/s)
3
2
1
0
-1
-2
-3
9
81 7
6
5
4
- 1 4 - 1 3 - 1 2 - 1 1 -10 -9
b
-1 --o.1
1o - 10-4
I I I I I I I I I I I I I I I
-8 -7 -6 -5 -4 -3 -2 -1 0 1 2
log(o)) (rad/s)
Fig. 2. Model calculations of (a) the storage and (b) the loss modulus as a function of the radial frequency after the gel point for different values of E indicated in the figure.

H. Randrianantoandro et al./ J. Non-Newtonian Fluid Mech. 67 (1996) 311-323 3 1 7
relaxation. This is due to internal mode relaxation of smaller aggregates which are not formed in the percolation regime. Size exclusion chromatography shows that the percolation regime is reached for particles which contain more than 8 POP triol molecules•
13-, V
v
~o o
9
8
7
6
5
4
3
2
I
0
-I
-2
i i i i I i i I i i i ]
a
/ o o
• 5 1.0
o o o
~ O. 1 2 • O 0 5 O " 0 .30
0 . 0 1 5 I I I I I I I I I I I I
0 - 9 - 8 - 7 - 6 - 5 -4- - 3 - 2 - 1 0 1 2
log( ) 3
13.,
r.3
o
9
8
7
6
5
4
3
2
1
0
- 1
I I I I i I I I I I I I
b
1.0
.,, .fjyf .......... 0 . 3 0
P . O 0 5 ...................... 0 . 1 2
0 . 0 1 5 I I I I I I I I I I I I
0 - 9 - 8 - 7 - 6 - 5 - 4 - 3 - 2 - 1 0 1 2
l o g ( o ~ ) ( r a d / s )
3
Fig. 3. Experimental results of (a) the storage and (b) the loss modulus as a function of the radial frequency before the gel point for different values of e indicated in the figure.

318 H. Randrianantoandro et al. / J. Non-Newtonian Fluid Mech. 67 (1996) 311-323
r.2
tzd) 0
9 r 8
7
6
5
4
3
2
1
0 - 1 0 - 9 - 8 - 7 - 6 - 5 - 4 - 3 - 2 - 1
log( ) (rad/s) 0 I 2 3
Fig. 4. Experimental results of the storage (©) and loss (D) moduli very close to the gel point (r = 0.570). - - of slope 0.70.
, lines
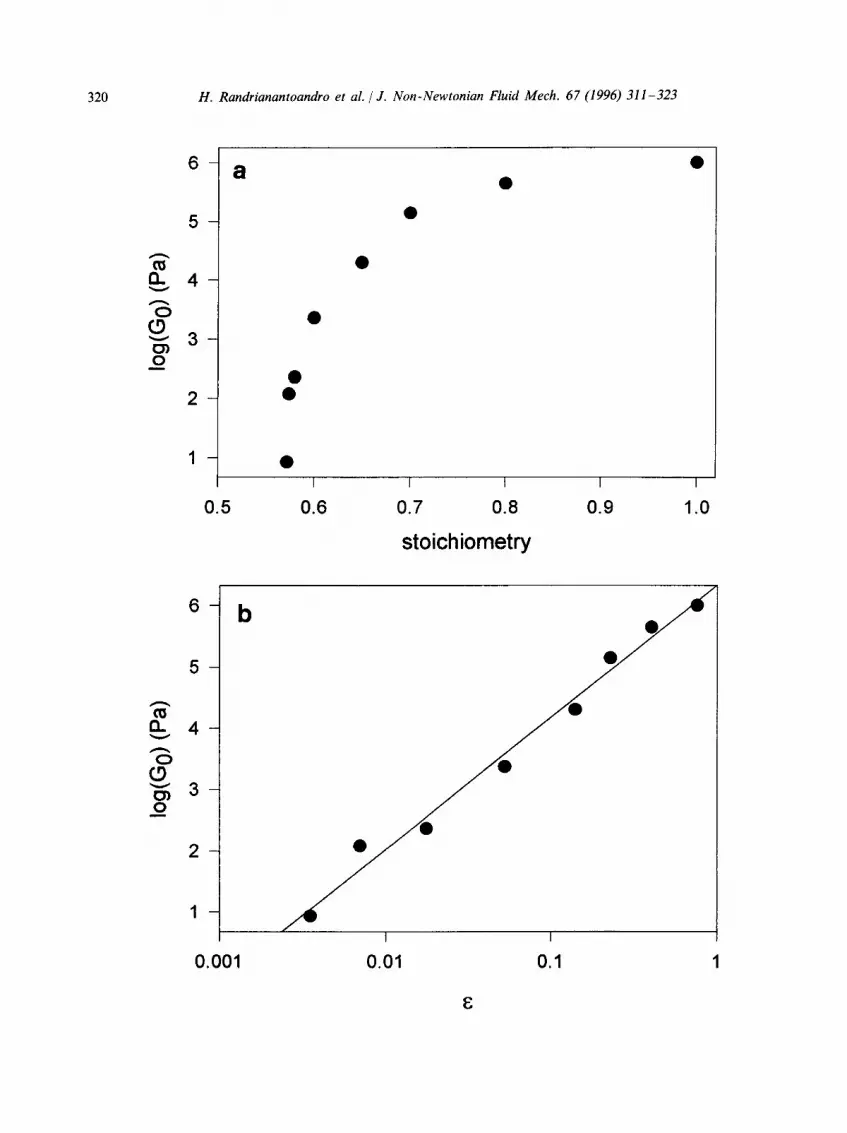
The frequency dependence of the storage modulus is shown in Fig. 5(a) for different values of e after the gel point. Again one can notice a qualitative agreement with the model calculations shown in Fig. 2(a). Apart from the presence of a cross-over regime between the limiting slope and the ~ relaxation, the main difference is that the plateau modulus approaches the limiting slope from above and not from below as in the model calculations. The plateau modulus increases with increasing reaction extent and reaches the value of 106 Pa at r = 1. This value lies between the calculated values for an affine and a phantom network in which each POP trial molecule forms elastically effective nodes. The dependence of Go on the stoichiometric ratio is plotted in Fig. 6(a). Using r = 0.570 for the critical stoichiometric ratio we can calculate E = (r - 0.570)/0.570 and plot the data as a function of E in a double-logarithmic representation; see Fig. 6(b). A linear least-squares fit through all the data gives a slope of 2.15 _ 0.05 which is somewhat smaller than the value predicted by percolation theory. The uncertainty is, however, larger than the standard error of the fit because E is not known with high precision and the data at the highest reaction extents are not expected to agree with the model owing to the presence of small non-percolating aggregates. In fact, the observed power law behaviour over the whole range of e is probably only approximate.
H. Randrianantoandro et al. / J. Non-Newtonian Fluid Mech. 67 (1996) 311-323 319
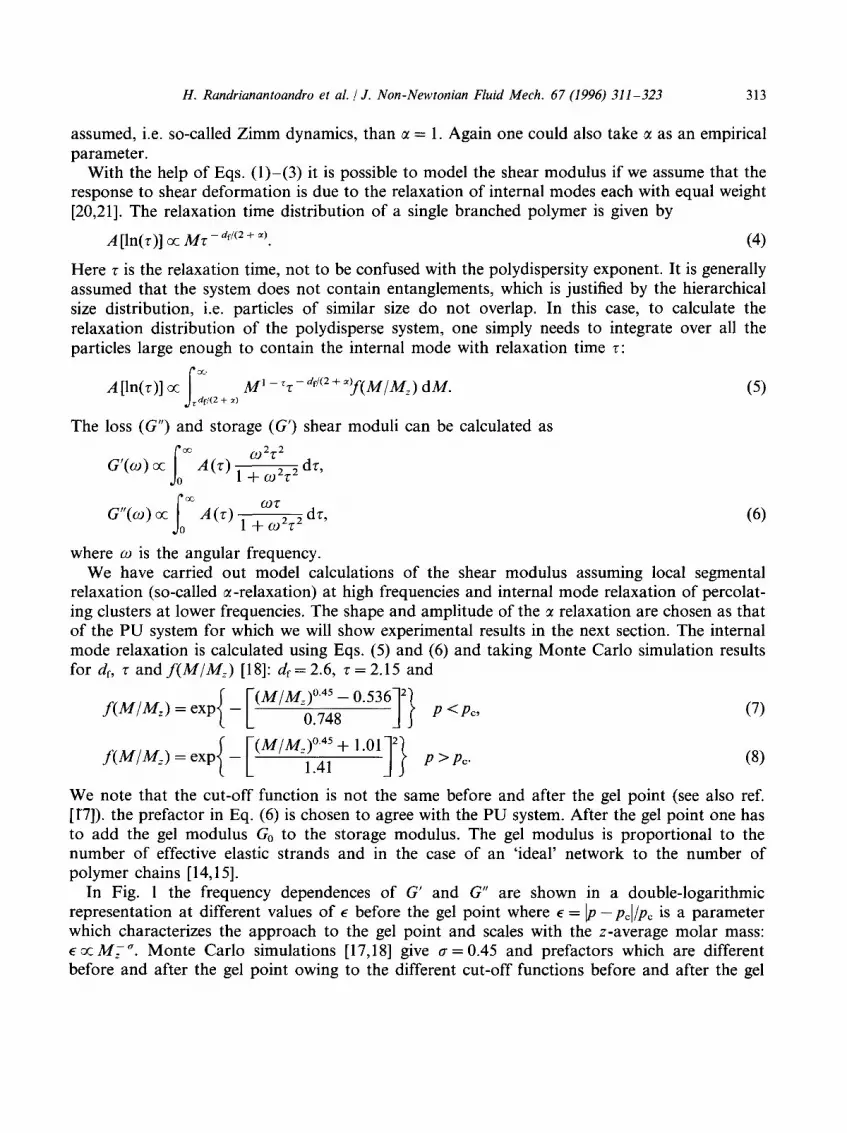
The frequency dependence of the loss modulus for a number of stoichiometries just after the gel point is shown in Fig. 5(b). These data show an important qualitative deviation form the model calculations shown in Fig. 2(b). Instead of decreasing, the loss modulus increases at low
9
8
7
6 c~ " - ' 5
4 b~ o 3
2
1
0
I i I f I I I i i I I I
.75 ........... b.40 . . . . . . . . . .
0.23 .........................
_~. 053 ~ ~
O.OiB ~=~-~.~" 0.007
~ I I I I I I I I I I I
0 - 9 - 8 - 7 - 6 - 5 - 4 - 3 - 2 - 1 0 1 2
] o g ( ~ ) ( t a d / s )
3
8
7
0
6
5
.--..4
3 b~ o 2
b l ) i I
3 .053 ...... ....... iiii
o.o07 / 0 . 0 J
I l I I I I I I I I I I
0 - 9 - 8 - 7 - 6 - 5 - 4 - 3 - 2 -1 0 1 2
log( )
3
Fig. 5. Experimental results of (a) the storage and (b) the loss modulus as a function of the radial frequency after the gel point for different values of E indicated in the figure.
320 H. Randrianantoandro et al. / J. Non-Newtonian Fluid Mech. 67 (1996) 311-323
v
O
v
0
_
_
_
_
_
_
I t
_
I I t I I
0 . 5 0 . 6 0 . 7 0 .8 0 . 9 1 .0
stoichiometry
b
_
I:1. 4 - v
O (.9 v 3 -
0
_
_
f 0
I I
0 . 0 0 1 0 .01 0.1 1

H. Randrianantoandro et aL / J . Non-Newtonian Fluid Mech. 67 (1996) 311-323 321
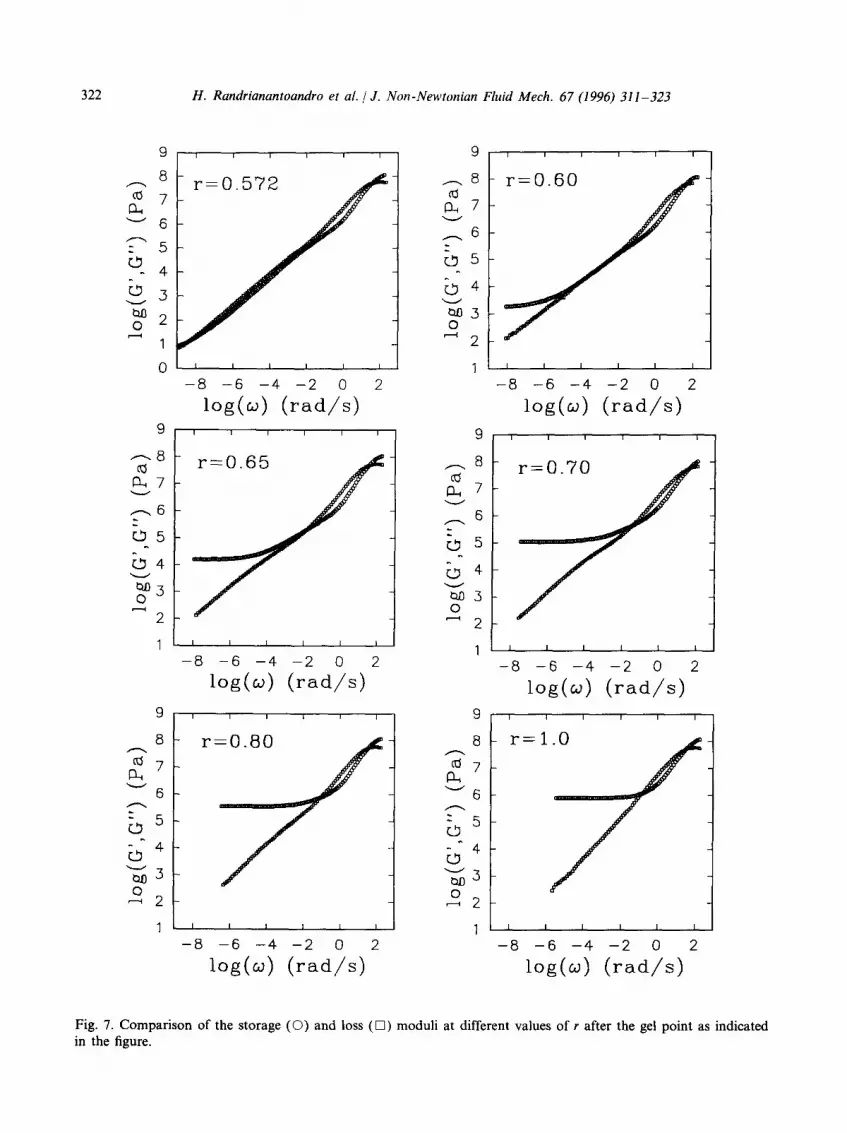
frequencies. The limiting slope in a double-logarithmic representation decreases in a very narrow stoichiometric range from 0.70 at the gel point (r = 0.570) to 0.5 at r = 0.6. At even higher stoichiometric ratios the loss modulus decreases with increasing r, but the limiting slopes remain significantly smaller than unity (close to 0.7) even for r = 1. In Fig. 7 we show the frequency dependence of the storage and loss moduli at different stoichiometries after the gel point. Close to the gel point one observes a power law behaviour for G' and G" with equal exponents as expected by the model. Above the gel point, however, the loss modulus continues to exhibit a power law dependence on 09 while the storage modulus has reached the plateau regime. This phenomenon is not in agreement with the standard model of gels. It clearly reveals the presence of slow relaxational processes of parts of the gel larger than Mz.
4. Discussion
The results presented above are as far as we are aware the only dynamical measurements of the gelation process over a frequency domain that covers both the 0t relaxation and the internal mode relaxation over up to 9 decades. However, the system studied is not unique in showing slow dynamics of the gel. Dynamic mechanical measurements of all gel-forming systems reported in the literature (e.g. Refs. [5-13]) reveal this feature which can be recognized by an increasing loss modulus through the gel point and a power law frequency dependence of G" after the gel point with an exponent smaller than unity. Generally, this feature is not discussed because attention is focused on the presence of the power law frequency dependence of G' and G" at the gel point with equal exponents. In many cases the value of the exponent is close to the value predicted by percolation theory assuming Rouse dynamics, but in a number of cases the value is very different and values between 0.1 and 1 have been reported. Only Adlof and Martin discussed the presence of slow dynamics in gels [8]. They observed that for three types of epoxy gels and two types of siloxane gels that the loss modulus exhibited the same power law frequency dependence for the fully grown gel and at the gel point. They explain these observations by proposing that the fully grown gel is not an ideal polymeric network, but a network of collapsed fractals. The slow relaxations are then due to internal mode relaxations of the fractals. However, this model predicts a gel modulus much smaller than that of a regular polymeric network which is not observed experimentally and does not explain the decrease in the power law exponent of G" just after the gel point which is often observed.
Other possible explanations for slow relaxations in gels are a non-homogeneous distribution of cross-links which is documented for PDMS gels [24] or dangling ends larger than the average mesh size of the gel. The latter option could possibly explain the slow dynamics for r > 0.65 with a suitable choice of the size distribution of the dangling ends [25], but one has to take into account their branched structure. It is not clear, however, how one could explain the observa- tions close to the gel point by relaxation of dangling ends.
Fig. 6. (a) Semilogarithmic representation of the gel modulus vs. the stoichiometric ratio. (b) Double-logarithmic representation of the gel modulus vs. E. - - , result of a linear least-squares fit through the data with a slope of 2.15 _+ 0.05.
322 H. Randrianantoandro et al. / J. Non-Newtonian Fluid Mech. 67 (1996) 311-323
8
6
- 4
1
9
~ ' . 8
~ 7
O 5
b 4 ~ 3 0
2
8
7
6
: 5 0 - 4 0 1:~)5 o
2
1 i i i i i
I I I I I I
- 8 - 6 - 4 - 2 0 2
log(w) (tad/s) i i i i i i
r = O .65 .~
I I I t I I
- 8 - 6 - 4 - 2 0 2
log(w) ( r a d / s )
i i i i i i
r ~ .
9
. . - . .8
I:~ 7
6
5
b 4 ~ 3 0
~ 2
9
. . _ . . 8
~ 7 v
6
r~ 5
b 4 v
t : ~ 3 0
~ 2
9
8
7
" - " 6
= 5
b 4 ~ 3 o
~ 2
i i i
r = 0 . 6 0
1 I I I I
- 8 - 6 -4 - 2 0
log( ) i i i t i
r=0.70
I
2
l l I I I I
- 8 - 6 - 4 - 2 0 2
log( ) I I I i i I
r = l . O
] I I I 1 I I 1 I I I I I I
- 8 - 6 - 4 - 2 0 2 - 8 - 6 -4 - - 2 0 2
log(~) (rad/s) log(~) (rad/s)
Fig. 7. Comparison of the storage (O) and loss (D) moduli at different values of r after the gel point as indicated in the figure.
H. Randrianantoandro et al. / J. Non-Newtonian Fluid Mech. 67 (1996) 311-323 323
References
[1] J.E. Martin, J. Wilcoxon and J. Odinek, Phys. Rev. A, 43 (1991) 858. [2] J. Bauer and W. Burchard, J. Phys. III, 2 (1992) 1053. [3] P. Lang and W. Burchard, Macormolecules, 24 (1992) 814. [4] V. Lesturgeon, T. Nicolai and D. Durand, unpublished results. [5] H.H. Winter and F. Chambon, J. Rheol., 30 (1986) 367. [6] F. Chambon, X.S. Petrovic, W.J. MacKnight and H.H. Winter, Macromolecules, 19 (1986) 2146. [7] M.A.V. Axelos and M. Kolb, Phys. Rev. Lett., 64 (1990) 1457. [8] D. Adolf and J.E. Martin, Macromolecules, 24 (1991) 6721. [9] C. Michon, G. Cuvelier and B. Launay, Rheol. Acta, 32 (1993) 94.
[10] D.F. Hodgson and E.J. Amis, Macromolecules, 23 (1990) 2512. [11] L. Matejka, Polym. Bull., 26 (1991) 109. [12] T. Matsumoto, M. Masahiro and T. Masuda, Macromolecules, 25 (1992) 5430. [13] F. Prochazka, T. Nicolai and D. Durand, Macromolecules, 29 (1996) 2260. [14] J. Mark and B. Erman, Rubberlike Elasticity, Wiley, New York, 1988. [15] J.D. Ferry, Viscoelastic Properties of Polymers, Wiley, New York, 2nd edn., 1970. [16] P.J. Flory, Principles of Polymer Chemistry, Cornell University Press, Ithaca, NY, 1953. [17] D. Stauffer and A. Aharony, Percolation Theory, Taylor & Francis, London, 2nd edn., 1992. [18] J.C. Gimel, D. Durand and T. Nicolai, unpublished results. [19] P.G. deGennes, Scaling Concepts in Polymer Physics, Cornell University Press, Ithaca, NY, 1979. [20] J.E. Martin and D. Adolf, Annu. Rev. Phys. Chem., 42 (1991) 311. [21] M. Rubinstein, R.H. Colby and J.R. Gillmor, in Space-Time Organization in Macromolecular Fluids, F.
Tanaka, M. Doi and T. Ohta (eds.), Springer, Berlin, 1989. [22] H. Randrianantoandro, T. Nicolai, D. Durand and F. Prochazka, in preparation. [23] A. Sch6nhals and E. Schlosser, Phys. Scr., T49 (1993) 233. [24] J. Bastide, F. Bou6 and M. Buzier, in Molecular Basis of Polymer Networks, A. Baumg/irtner and C.E. Picot
(eds.), Springer, Berlin, 1988. [25] J.G. Curro, D.S. Pearson and E. Helfmand, Macromolecules, 18 (1985) 1157.


