Embed Size (px)
Citation preview
1
1
2
3
4
Drug release from magnesium aluminium silicate-polyethylene oxide 5
(PEO) nanocomposite matrices: An investigation using the USP III 6
apparatus 7
Kofi Asare-Addoa*, Ana-Maria Toteaa, Ali Nokhodchib* 8
aUniversity of Huddersfield, Department of Pharmacy, Queensgate, Huddersfield, HD1 3DH 9
bPharmaceutics Research Laboratory, School of Life Sciences, University of Sussex, 10
Brighton, BN1 9QJ, UK 11
12
13
*Corresponding author: Dr Kofi Asare-Addo 14
Email: [email protected] 15
Tel: 01484472360 16
Corresponding author: Professor Ali Nokhodchi 17
Email: [email protected] 18
19
Submission: EJPS 20
21
2
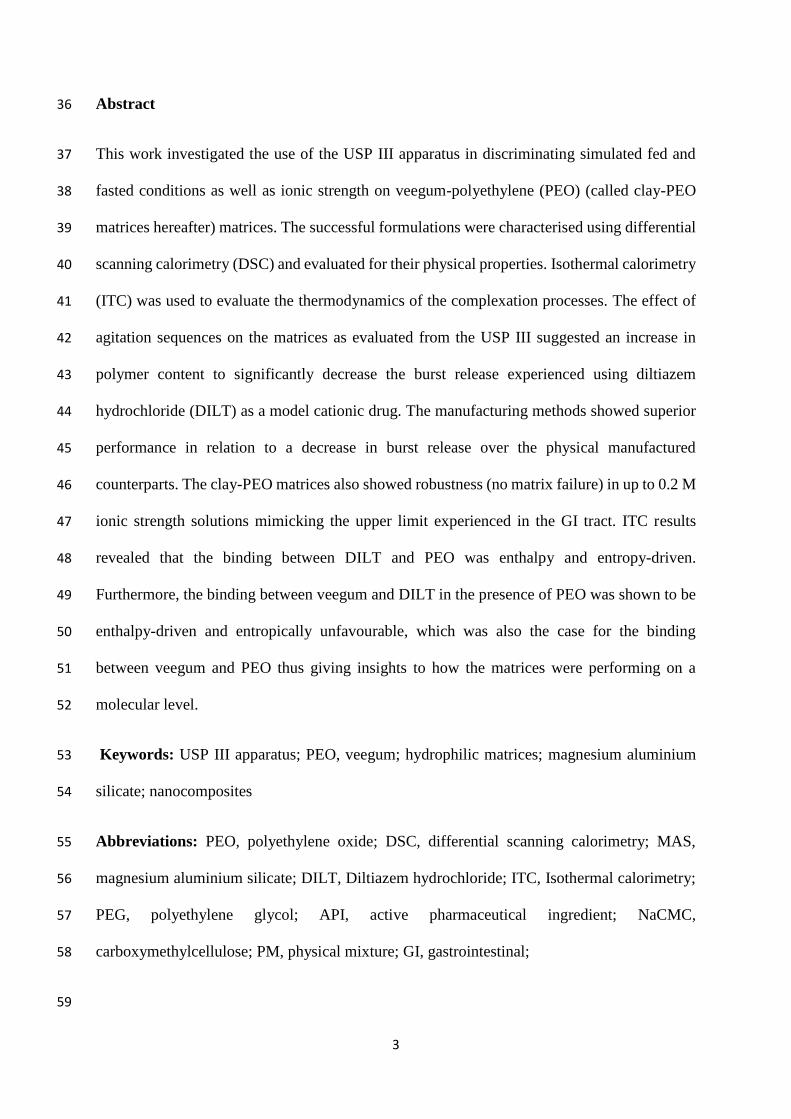
Highlights 22
ITC results show binding between DILT and PEO was enthalpy and entropy driven 23
Binding between veegum and DILT in the presence of PEO shown to be enthalpy driven and 24
entropically unfavourable 25
ITC results successfully explain drug release from veegum-PEO matrices 26
USP III used to successfully simulate fed and fasted states with matrices robust in up to 0.2 M 27
ionic strength 28
29
30
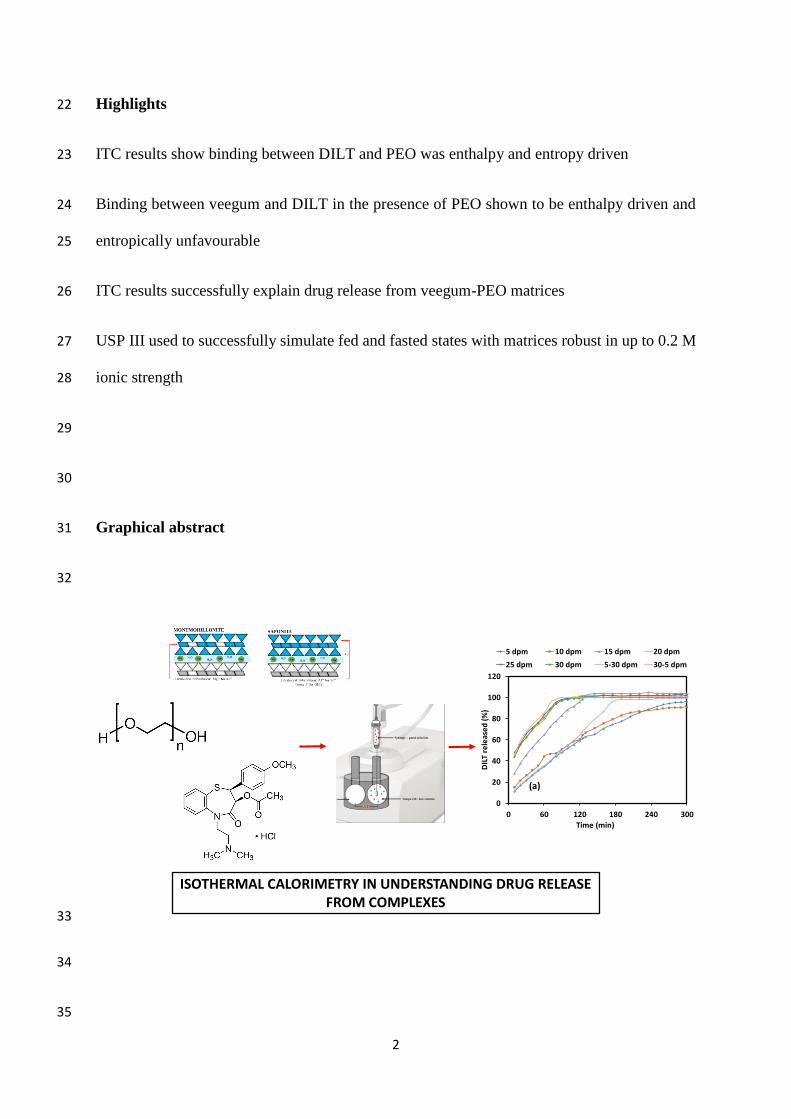
Graphical abstract 31
32
33
34
35
(A) (B)(c)(b)
(c)
0
20
40
60
80
100
120
0 60 120 180 240 300
DIL
T re
leas
ed
(%
)
Time (min)
(a)
5 dpm 10 dpm 15 dpm 20 dpm
25 dpm 30 dpm 5-30 dpm 30-5 dpm
ISOTHERMAL CALORIMETRY IN UNDERSTANDING DRUG RELEASE FROM COMPLEXES
3
Abstract 36
This work investigated the use of the USP III apparatus in discriminating simulated fed and 37
fasted conditions as well as ionic strength on veegum-polyethylene (PEO) (called clay-PEO 38
matrices hereafter) matrices. The successful formulations were characterised using differential 39
scanning calorimetry (DSC) and evaluated for their physical properties. Isothermal calorimetry 40
(ITC) was used to evaluate the thermodynamics of the complexation processes. The effect of 41
agitation sequences on the matrices as evaluated from the USP III suggested an increase in 42
polymer content to significantly decrease the burst release experienced using diltiazem 43
hydrochloride (DILT) as a model cationic drug. The manufacturing methods showed superior 44
performance in relation to a decrease in burst release over the physical manufactured 45
counterparts. The clay-PEO matrices also showed robustness (no matrix failure) in up to 0.2 M 46
ionic strength solutions mimicking the upper limit experienced in the GI tract. ITC results 47
revealed that the binding between DILT and PEO was enthalpy and entropy-driven. 48
Furthermore, the binding between veegum and DILT in the presence of PEO was shown to be 49
enthalpy-driven and entropically unfavourable, which was also the case for the binding 50
between veegum and PEO thus giving insights to how the matrices were performing on a 51
molecular level. 52
Keywords: USP III apparatus; PEO, veegum; hydrophilic matrices; magnesium aluminium 53
silicate; nanocomposites 54
Abbreviations: PEO, polyethylene oxide; DSC, differential scanning calorimetry; MAS, 55
magnesium aluminium silicate; DILT, Diltiazem hydrochloride; ITC, Isothermal calorimetry; 56
PEG, polyethylene glycol; API, active pharmaceutical ingredient; NaCMC, 57
carboxymethylcellulose; PM, physical mixture; GI, gastrointestinal; 58
59
4
1. Introduction 60
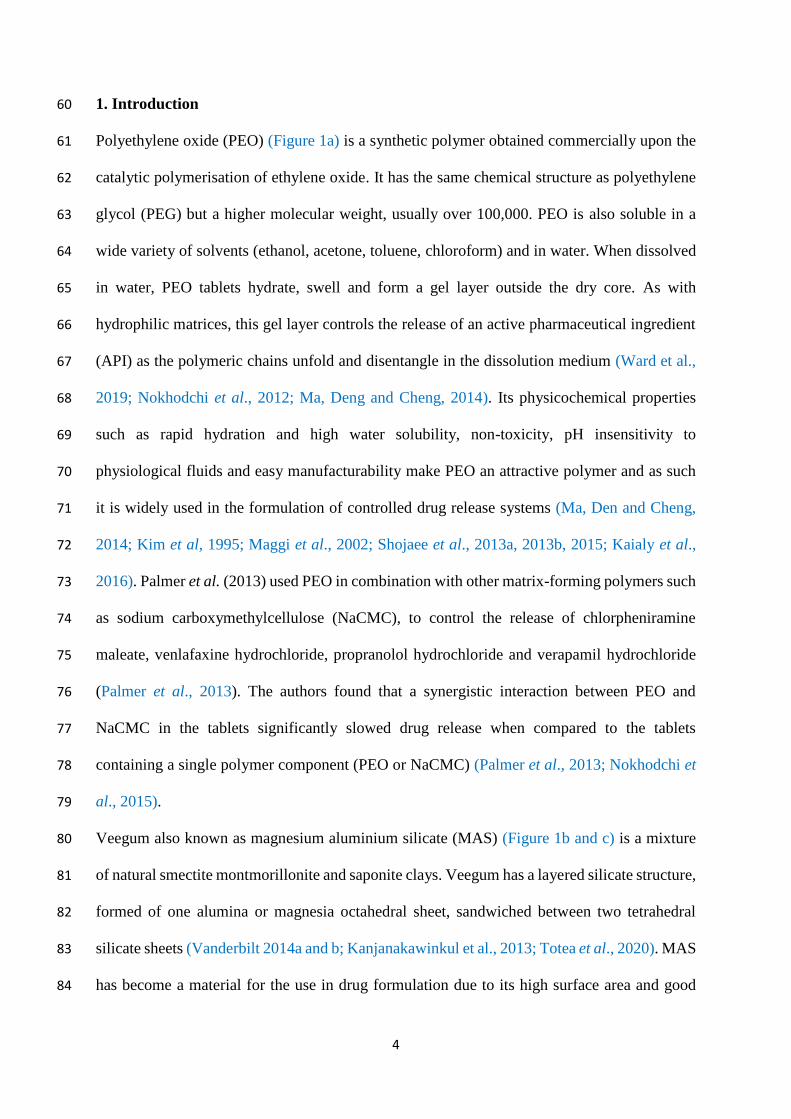
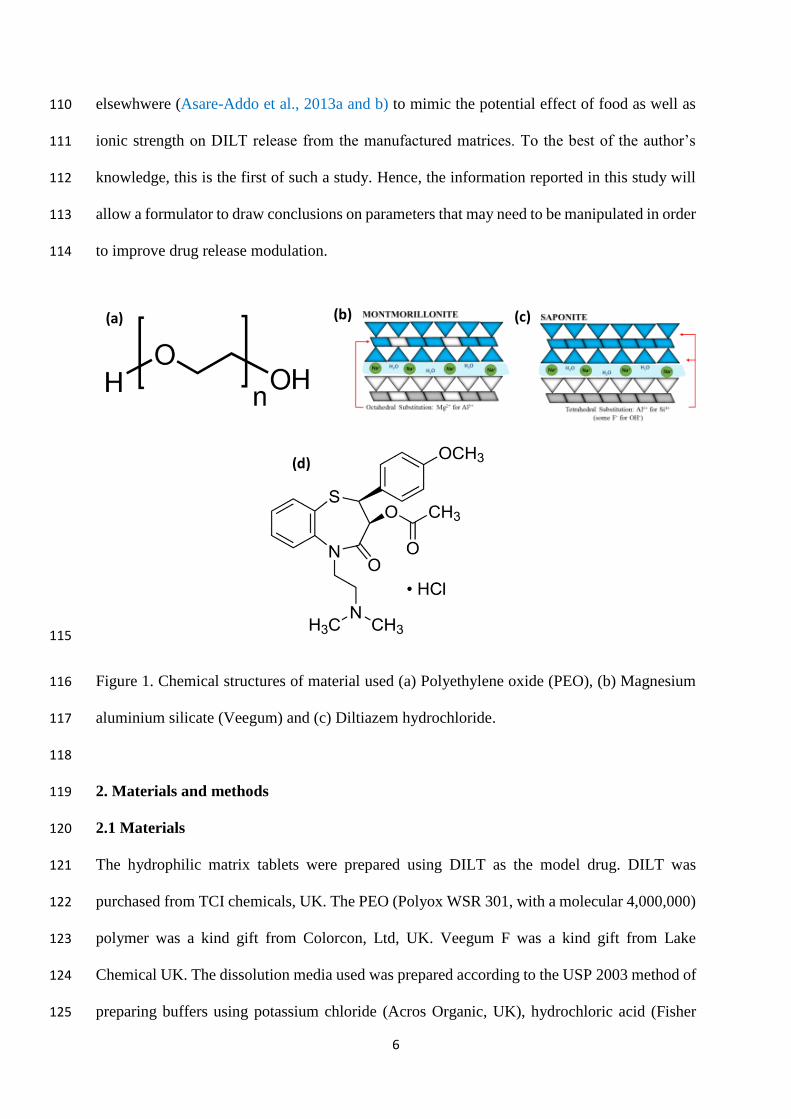
Polyethylene oxide (PEO) (Figure 1a) is a synthetic polymer obtained commercially upon the 61
catalytic polymerisation of ethylene oxide. It has the same chemical structure as polyethylene 62
glycol (PEG) but a higher molecular weight, usually over 100,000. PEO is also soluble in a 63
wide variety of solvents (ethanol, acetone, toluene, chloroform) and in water. When dissolved 64
in water, PEO tablets hydrate, swell and form a gel layer outside the dry core. As with 65
hydrophilic matrices, this gel layer controls the release of an active pharmaceutical ingredient 66
(API) as the polymeric chains unfold and disentangle in the dissolution medium (Ward et al., 67
2019; Nokhodchi et al., 2012; Ma, Deng and Cheng, 2014). Its physicochemical properties 68
such as rapid hydration and high water solubility, non-toxicity, pH insensitivity to 69
physiological fluids and easy manufacturability make PEO an attractive polymer and as such 70
it is widely used in the formulation of controlled drug release systems (Ma, Den and Cheng, 71
2014; Kim et al, 1995; Maggi et al., 2002; Shojaee et al., 2013a, 2013b, 2015; Kaialy et al., 72
2016). Palmer et al. (2013) used PEO in combination with other matrix-forming polymers such 73
as sodium carboxymethylcellulose (NaCMC), to control the release of chlorpheniramine 74
maleate, venlafaxine hydrochloride, propranolol hydrochloride and verapamil hydrochloride 75
(Palmer et al., 2013). The authors found that a synergistic interaction between PEO and 76
NaCMC in the tablets significantly slowed drug release when compared to the tablets 77
containing a single polymer component (PEO or NaCMC) (Palmer et al., 2013; Nokhodchi et 78
al., 2015). 79
Veegum also known as magnesium aluminium silicate (MAS) (Figure 1b and c) is a mixture 80
of natural smectite montmorillonite and saponite clays. Veegum has a layered silicate structure, 81
formed of one alumina or magnesia octahedral sheet, sandwiched between two tetrahedral 82
silicate sheets (Vanderbilt 2014a and b; Kanjanakawinkul et al., 2013; Totea et al., 2020). MAS 83
has become a material for the use in drug formulation due to its high surface area and good 84
5
affinity with cationic drugs which has been well documented and exploited (Rojtanatanya and 85
Pogjanyakul., 2010; Adebisi et al., 2015; Okeke and Boateng, 2016, 2017; Totea et al., 2019). 86
Several polymers including quaternary polymethacrylates, chitosan and alginate have also been 87
successfully crosslinked with veegum to produce coatings, films or matrices for the successful 88
delivery of drugs (Rongthong et al., 2013, 2020; Khuathan and Ponjanyakul, 2014; Khlibsuwan 89
et al., 2017; Khlibsuwan et al., 2016). Pappa et al. reported the intercalation of PEO between 90
nanolayers of sodium montmorillonite to formulate nanostructured composites, intended for 91
the dissolution modulation of aprepitant. The authors found the PEO and clay nanocomposites 92
were highly effective as drug carriers for sustained release (Pappa et al., 2018). 93
Diltiazem hydrochloride (DILT) (Figure 1d) is a non-dihydropyridine calcium channel blocker 94
with molecular weight and pKa of 450.98 g/mol and 7.8 respectively. DILT inhibits the calcium 95
channels in the blood vessels which leads to vasodilatation and, hence lower blood pressure 96
(Padial et al., 2016). DILT has an elimination half-life of 3.2 ± 1.3 h following oral 97
administration with a bioavailability of 42 ± 18 % following first-pass metabolism (Herman et 98
al., 1983) therefore making it an ideal candidate for extended release (Qazi et al., 2013; Li et 99
al., 2016) hence its use as the model cationic drug. 100
Although multiple studies have reported the efficient use of PEO as an excipient in the 101
formulation of controlled release systems on its own or in combination with other polymers or 102
materials such as clay, the effect of the polymer on the clay adsorption capacity has not been 103
previously explored at a molecular level. This experiment therefore aims to understand the 104
interactions between the model drug DILT, PEO and veegum at the molecular level and how 105
the interaction can potentially impact on the drug release from the clay-PEO matrices. This is 106
primarily investigated using isothermal calorimetry (ITC). Secondly, a more biorelevant 107
dissolution methodology (USP III) is utilised in conducting the dissolution studies using a 108
range of dip per minute (dpm) as well as dpm in ascending and descending order as reported 109
6
elsewhwere (Asare-Addo et al., 2013a and b) to mimic the potential effect of food as well as 110
ionic strength on DILT release from the manufactured matrices. To the best of the author’s 111
knowledge, this is the first of such a study. Hence, the information reported in this study will 112
allow a formulator to draw conclusions on parameters that may need to be manipulated in order 113
to improve drug release modulation. 114
115
Figure 1. Chemical structures of material used (a) Polyethylene oxide (PEO), (b) Magnesium 116
aluminium silicate (Veegum) and (c) Diltiazem hydrochloride. 117
118
2. Materials and methods 119
2.1 Materials 120
The hydrophilic matrix tablets were prepared using DILT as the model drug. DILT was 121
purchased from TCI chemicals, UK. The PEO (Polyox WSR 301, with a molecular 4,000,000) 122
polymer was a kind gift from Colorcon, Ltd, UK. Veegum F was a kind gift from Lake 123
Chemical UK. The dissolution media used was prepared according to the USP 2003 method of 124
preparing buffers using potassium chloride (Acros Organic, UK), hydrochloric acid (Fisher 125
(A) (B)(a) (c)
(d)
(b)
7
Scientific, UK) for pH 1.2 and 2.2, and potassium phosphate monobasic-white crystals (Fisher 126
BioReagents, UK) and sodium hydroxide (Fisher Scientific, UK) for pH 5.8, 6.8, 7.2 and 7.5 127
media. 128
When investigating the effect of ionic strength on the drug release, sodium chloride (Fisher 129
Scientific, UK) was used to adjust the ionic strength of each pH buffer. 130
131
2.2 Tablet preparation and mechanical strength test 132
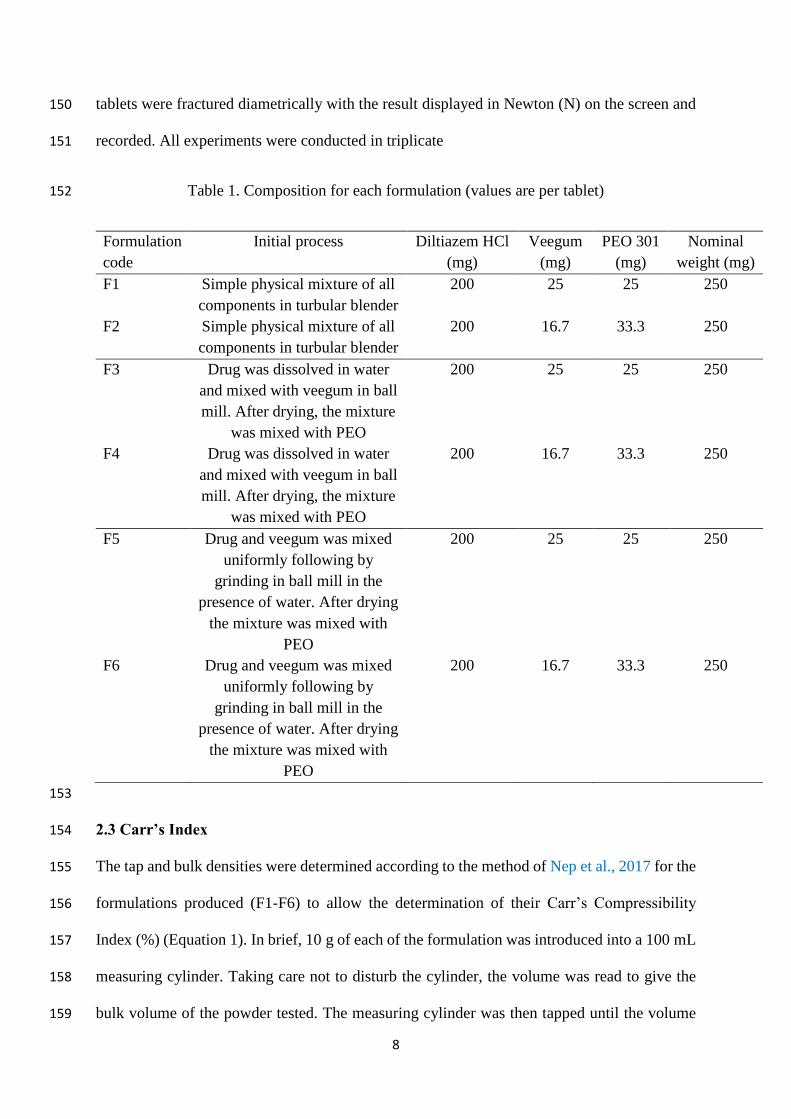
Six formulations in total were prepared in three distinct ways to aid comparisons. The first two 133
formulations (F1 and F2) were prepared by measuring out the components as in Table 1 and 134
mixed in the Turbula blender (Type T2C, Switzerland) for 10 min (these two formulations are 135
classified as the physical mixtures (PM)). For formulations F3 and F4, the drug (DILT) was 136
firstly dissolved in deionised water (5 mL) after which it was added to the veegum in a ball 137
mill (10 min at 400 rpm). After this was air-dried, it was mixed with the appropriate amount of 138
PEO in the turbula mix for 10 min. Formulation F5 and F6 were prepared by physically mixing 139
the veegum and DILT in the turbula mix for 10 min, introducing the clay-drug mix into the ball 140
mill (10 min at 400 rpm) then adding deionised water (5 mL) to the milling process. After the 141
drying process, the appropriate amount of PEO was again added and mixed on the turbula mix 142
for 10 min (Table 1). Round cylindrical tablets with a diameter of 9.6 mm (obtained using an 143
electronic digital calliper) with a target weight of 250 mg were then prepared (Table 1) using 144
a single punch tableting machine at 1500 psi (5.5 kN) (Model MTCM-1, Globe Pharma, US). 145
The die wall was lubricated each time before tablet compression using a 2 % suspension of 146
magnesium stearate in acetone to enable the easy removal of the tablets from the die. 147
As an additional investigation, the hardness of the compressed tablets was explored to aid 148
comparisons between the various formulations. Using a tablet hardness tester (Model 8M), 149
8
tablets were fractured diametrically with the result displayed in Newton (N) on the screen and 150
recorded. All experiments were conducted in triplicate 151
Table 1. Composition for each formulation (values are per tablet) 152
Formulation
code
Initial process Diltiazem HCl
(mg)
Veegum
(mg)
PEO 301
(mg)
Nominal
weight (mg)
F1 Simple physical mixture of all
components in turbular blender
200 25 25 250
F2 Simple physical mixture of all
components in turbular blender
200 16.7 33.3 250
F3 Drug was dissolved in water
and mixed with veegum in ball
mill. After drying, the mixture
was mixed with PEO
200 25 25 250
F4 Drug was dissolved in water
and mixed with veegum in ball
mill. After drying, the mixture
was mixed with PEO
200 16.7 33.3 250
F5 Drug and veegum was mixed
uniformly following by
grinding in ball mill in the
presence of water. After drying
the mixture was mixed with
PEO
200 25 25 250
F6 Drug and veegum was mixed
uniformly following by
grinding in ball mill in the
presence of water. After drying
the mixture was mixed with
PEO
200 16.7 33.3 250
153
2.3 Carr’s Index 154
The tap and bulk densities were determined according to the method of Nep et al., 2017 for the 155
formulations produced (F1-F6) to allow the determination of their Carr’s Compressibility 156
Index (%) (Equation 1). In brief, 10 g of each of the formulation was introduced into a 100 mL 157
measuring cylinder. Taking care not to disturb the cylinder, the volume was read to give the 158
bulk volume of the powder tested. The measuring cylinder was then tapped until the volume 159
9
of powder was constant representing the tapped volume. The bulk or tapped density was then 160
calculated. experiments were conducted in triplicates. 161
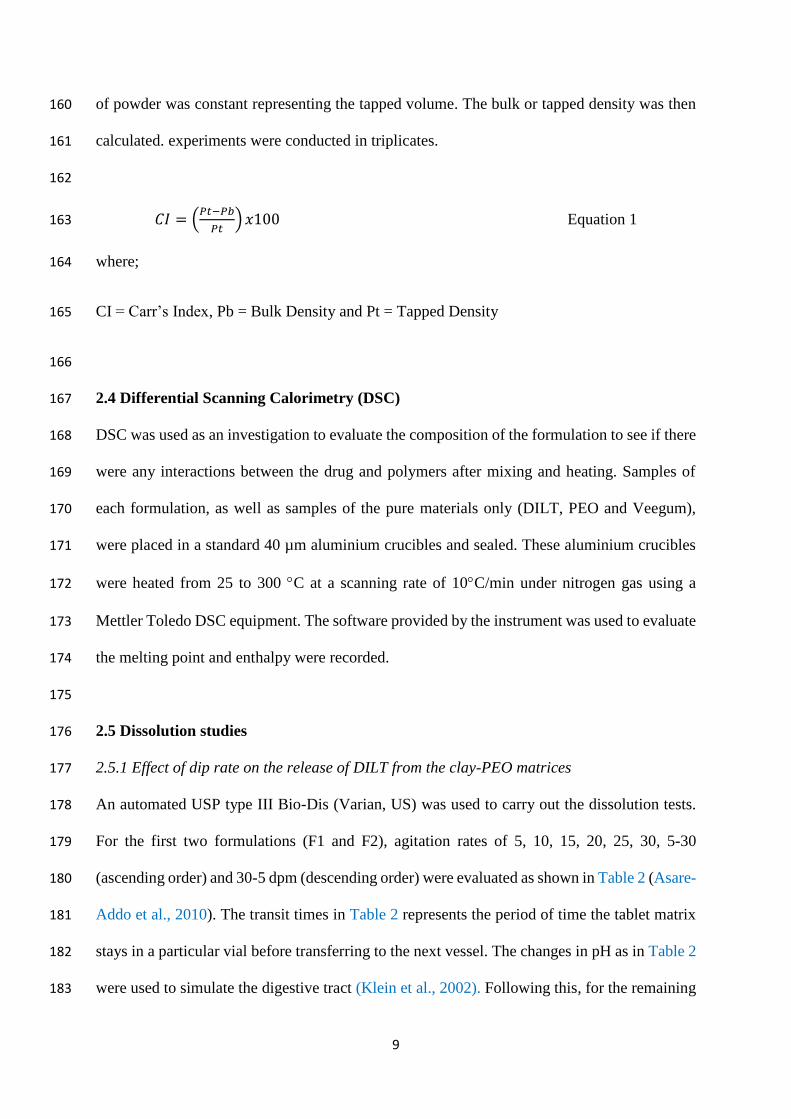
162
𝐶𝐼 = (𝑃𝑡−𝑃𝑏
𝑃𝑡)𝑥100 Equation 1 163
where; 164
CI = Carr’s Index, Pb = Bulk Density and Pt = Tapped Density 165
166
2.4 Differential Scanning Calorimetry (DSC) 167
DSC was used as an investigation to evaluate the composition of the formulation to see if there 168
were any interactions between the drug and polymers after mixing and heating. Samples of 169
each formulation, as well as samples of the pure materials only (DILT, PEO and Veegum), 170
were placed in a standard 40 µm aluminium crucibles and sealed. These aluminium crucibles 171
were heated from 25 to 300 C at a scanning rate of 10C/min under nitrogen gas using a 172
Mettler Toledo DSC equipment. The software provided by the instrument was used to evaluate 173
the melting point and enthalpy were recorded. 174
175
2.5 Dissolution studies 176
2.5.1 Effect of dip rate on the release of DILT from the clay-PEO matrices 177
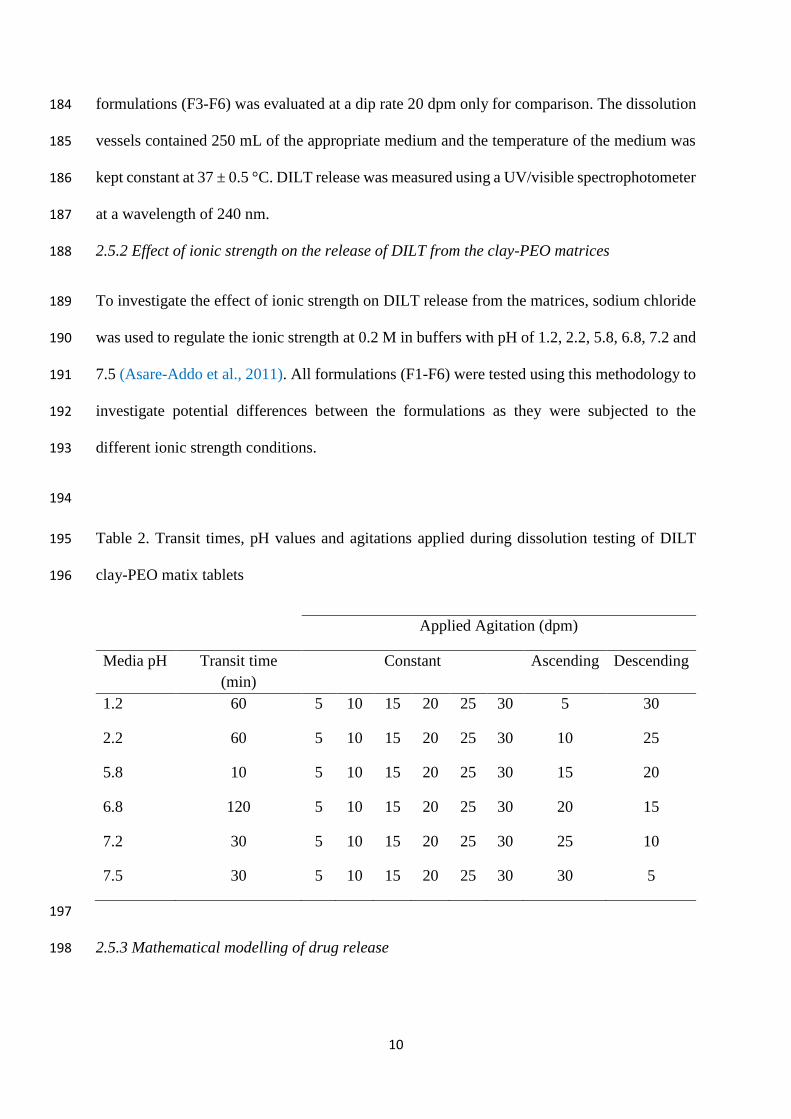
An automated USP type III Bio-Dis (Varian, US) was used to carry out the dissolution tests. 178
For the first two formulations (F1 and F2), agitation rates of 5, 10, 15, 20, 25, 30, 5-30 179
(ascending order) and 30-5 dpm (descending order) were evaluated as shown in Table 2 (Asare-180
Addo et al., 2010). The transit times in Table 2 represents the period of time the tablet matrix 181
stays in a particular vial before transferring to the next vessel. The changes in pH as in Table 2 182
were used to simulate the digestive tract (Klein et al., 2002). Following this, for the remaining 183
10
formulations (F3-F6) was evaluated at a dip rate 20 dpm only for comparison. The dissolution 184
vessels contained 250 mL of the appropriate medium and the temperature of the medium was 185
kept constant at 37 ± 0.5 °C. DILT release was measured using a UV/visible spectrophotometer 186
at a wavelength of 240 nm. 187
2.5.2 Effect of ionic strength on the release of DILT from the clay-PEO matrices 188
To investigate the effect of ionic strength on DILT release from the matrices, sodium chloride 189
was used to regulate the ionic strength at 0.2 M in buffers with pH of 1.2, 2.2, 5.8, 6.8, 7.2 and 190
7.5 (Asare-Addo et al., 2011). All formulations (F1-F6) were tested using this methodology to 191
investigate potential differences between the formulations as they were subjected to the 192
different ionic strength conditions. 193
194
Table 2. Transit times, pH values and agitations applied during dissolution testing of DILT 195
clay-PEO matix tablets 196
Applied Agitation (dpm)
Media pH Transit time
(min)
Constant Ascending Descending
1.2 60 5 10 15 20 25 30 5 30
2.2 60 5 10 15 20 25 30 10 25
5.8 10 5 10 15 20 25 30 15 20
6.8 120 5 10 15 20 25 30 20 15
7.2 30 5 10 15 20 25 30 25 10
7.5 30 5 10 15 20 25 30 30 5
197
2.5.3 Mathematical modelling of drug release 198
11
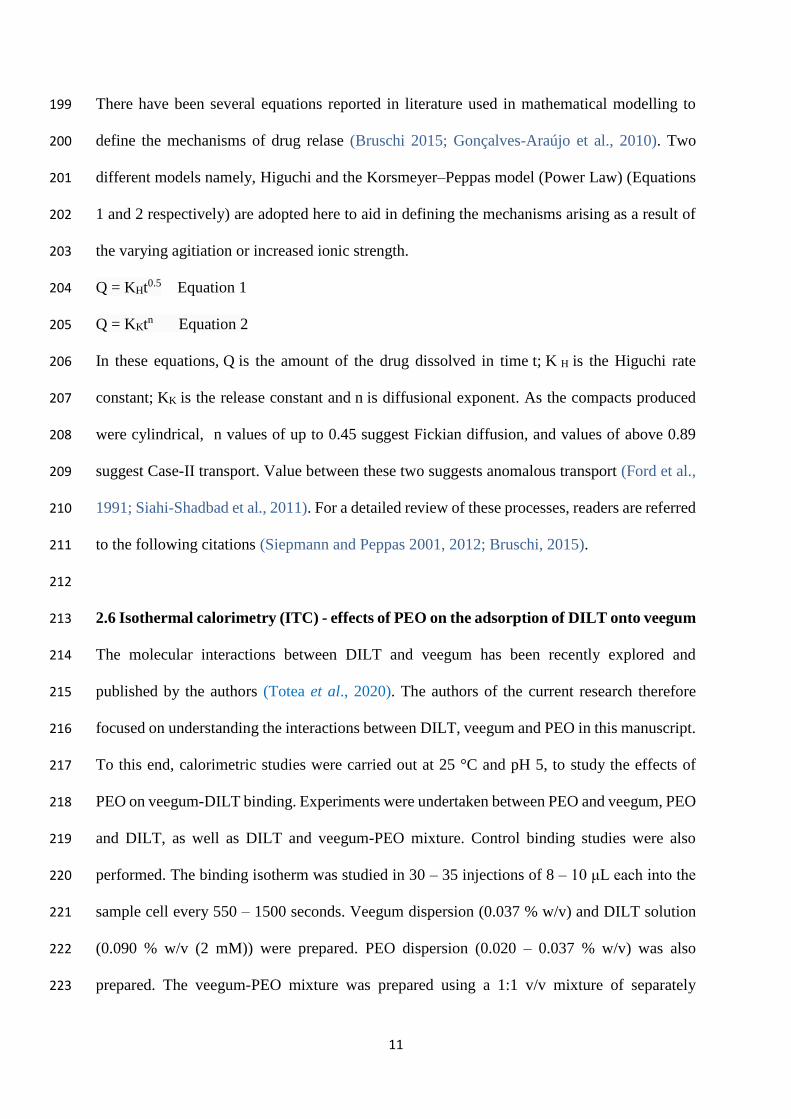
There have been several equations reported in literature used in mathematical modelling to 199
define the mechanisms of drug relase (Bruschi 2015; Gonçalves-Araújo et al., 2010). Two 200
different models namely, Higuchi and the Korsmeyer–Peppas model (Power Law) (Equations 201
1 and 2 respectively) are adopted here to aid in defining the mechanisms arising as a result of 202
the varying agitiation or increased ionic strength. 203
Q = KHt0.5 Equation 1 204
Q = KKtn Equation 2 205
In these equations, Q is the amount of the drug dissolved in time t; K H is the Higuchi rate 206
constant; KK is the release constant and n is diffusional exponent. As the compacts produced 207
were cylindrical, n values of up to 0.45 suggest Fickian diffusion, and values of above 0.89 208
suggest Case-II transport. Value between these two suggests anomalous transport (Ford et al., 209
1991; Siahi-Shadbad et al., 2011). For a detailed review of these processes, readers are referred 210
to the following citations (Siepmann and Peppas 2001, 2012; Bruschi, 2015). 211
212
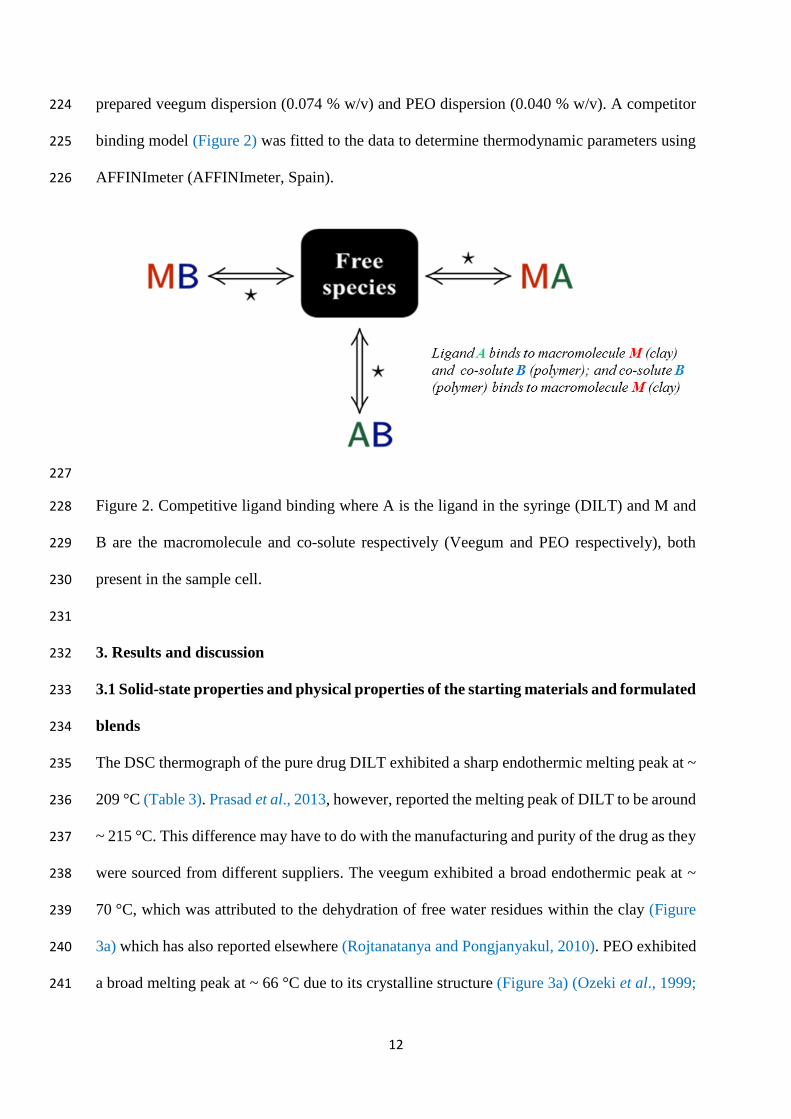
2.6 Isothermal calorimetry (ITC) - effects of PEO on the adsorption of DILT onto veegum 213
The molecular interactions between DILT and veegum has been recently explored and 214
published by the authors (Totea et al., 2020). The authors of the current research therefore 215
focused on understanding the interactions between DILT, veegum and PEO in this manuscript. 216
To this end, calorimetric studies were carried out at 25 °C and pH 5, to study the effects of 217
PEO on veegum-DILT binding. Experiments were undertaken between PEO and veegum, PEO 218
and DILT, as well as DILT and veegum-PEO mixture. Control binding studies were also 219
performed. The binding isotherm was studied in 30 – 35 injections of 8 – 10 μL each into the 220
sample cell every 550 – 1500 seconds. Veegum dispersion (0.037 % w/v) and DILT solution 221
(0.090 % w/v (2 mM)) were prepared. PEO dispersion (0.020 – 0.037 % w/v) was also 222
prepared. The veegum-PEO mixture was prepared using a 1:1 v/v mixture of separately 223
12
prepared veegum dispersion (0.074 % w/v) and PEO dispersion (0.040 % w/v). A competitor 224
binding model (Figure 2) was fitted to the data to determine thermodynamic parameters using 225
AFFINImeter (AFFINImeter, Spain). 226
227
Figure 2. Competitive ligand binding where A is the ligand in the syringe (DILT) and M and 228
B are the macromolecule and co-solute respectively (Veegum and PEO respectively), both 229
present in the sample cell. 230
231
3. Results and discussion 232
3.1 Solid-state properties and physical properties of the starting materials and formulated 233
blends 234
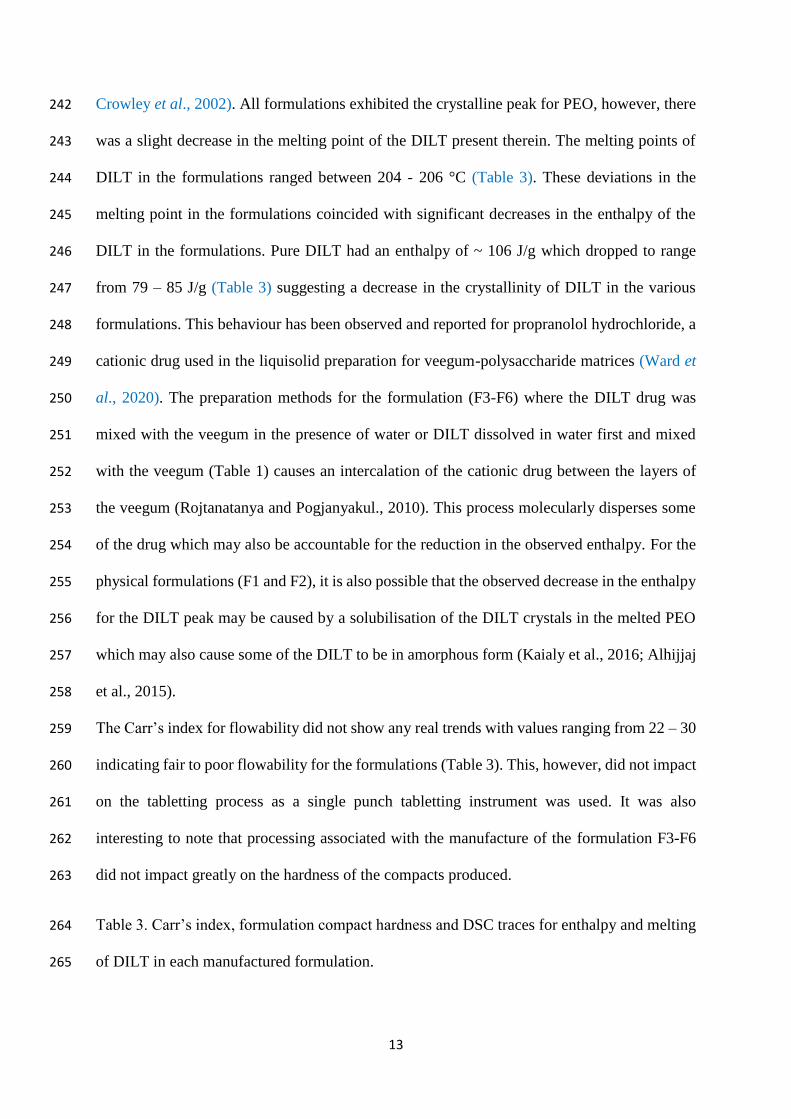
The DSC thermograph of the pure drug DILT exhibited a sharp endothermic melting peak at ~ 235
209 °C (Table 3). Prasad et al., 2013, however, reported the melting peak of DILT to be around 236
~ 215 °C. This difference may have to do with the manufacturing and purity of the drug as they 237
were sourced from different suppliers. The veegum exhibited a broad endothermic peak at ~ 238
70 °C, which was attributed to the dehydration of free water residues within the clay (Figure 239
3a) which has also reported elsewhere (Rojtanatanya and Pongjanyakul, 2010). PEO exhibited 240
a broad melting peak at ~ 66 °C due to its crystalline structure (Figure 3a) (Ozeki et al., 1999; 241
13
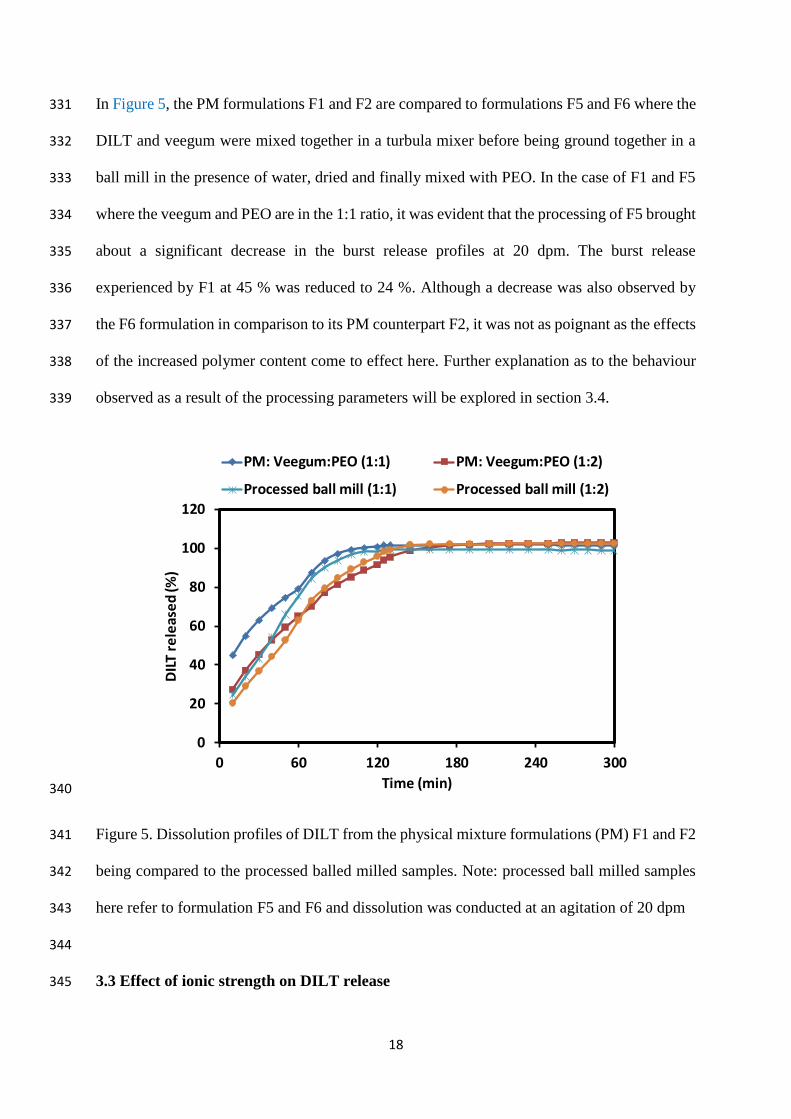
Crowley et al., 2002). All formulations exhibited the crystalline peak for PEO, however, there 242
was a slight decrease in the melting point of the DILT present therein. The melting points of 243
DILT in the formulations ranged between 204 - 206 °C (Table 3). These deviations in the 244
melting point in the formulations coincided with significant decreases in the enthalpy of the 245
DILT in the formulations. Pure DILT had an enthalpy of ~ 106 J/g which dropped to range 246
from 79 – 85 J/g (Table 3) suggesting a decrease in the crystallinity of DILT in the various 247
formulations. This behaviour has been observed and reported for propranolol hydrochloride, a 248
cationic drug used in the liquisolid preparation for veegum-polysaccharide matrices (Ward et 249
al., 2020). The preparation methods for the formulation (F3-F6) where the DILT drug was 250
mixed with the veegum in the presence of water or DILT dissolved in water first and mixed 251
with the veegum (Table 1) causes an intercalation of the cationic drug between the layers of 252
the veegum (Rojtanatanya and Pogjanyakul., 2010). This process molecularly disperses some 253
of the drug which may also be accountable for the reduction in the observed enthalpy. For the 254
physical formulations (F1 and F2), it is also possible that the observed decrease in the enthalpy 255
for the DILT peak may be caused by a solubilisation of the DILT crystals in the melted PEO 256
which may also cause some of the DILT to be in amorphous form (Kaialy et al., 2016; Alhijjaj 257
et al., 2015). 258
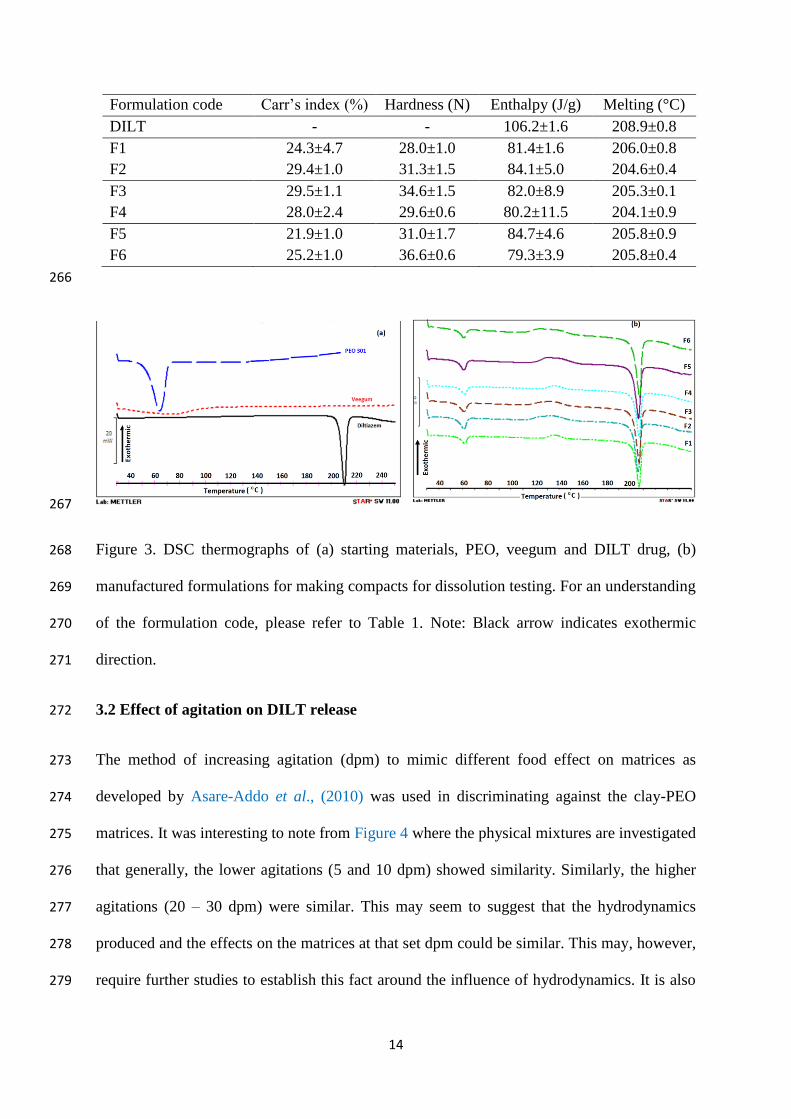
The Carr’s index for flowability did not show any real trends with values ranging from 22 – 30 259
indicating fair to poor flowability for the formulations (Table 3). This, however, did not impact 260
on the tabletting process as a single punch tabletting instrument was used. It was also 261
interesting to note that processing associated with the manufacture of the formulation F3-F6 262
did not impact greatly on the hardness of the compacts produced. 263
Table 3. Carr’s index, formulation compact hardness and DSC traces for enthalpy and melting 264
of DILT in each manufactured formulation. 265
14
Formulation code Carr’s index (%) Hardness (N) Enthalpy (J/g) Melting (°C)
DILT - - 106.2±1.6 208.9±0.8
F1 24.3±4.7 28.0±1.0 81.4±1.6 206.0±0.8
F2 29.4±1.0 31.3±1.5 84.1±5.0 204.6±0.4
F3 29.5±1.1 34.6±1.5 82.0±8.9 205.3±0.1
F4 28.0±2.4 29.6±0.6 80.2±11.5 204.1±0.9
F5 21.9±1.0 31.0±1.7 84.7±4.6 205.8±0.9
F6 25.2±1.0 36.6±0.6 79.3±3.9 205.8±0.4
266
267
Figure 3. DSC thermographs of (a) starting materials, PEO, veegum and DILT drug, (b) 268
manufactured formulations for making compacts for dissolution testing. For an understanding 269
of the formulation code, please refer to Table 1. Note: Black arrow indicates exothermic 270
direction. 271
3.2 Effect of agitation on DILT release 272
The method of increasing agitation (dpm) to mimic different food effect on matrices as 273
developed by Asare-Addo et al., (2010) was used in discriminating against the clay-PEO 274
matrices. It was interesting to note from Figure 4 where the physical mixtures are investigated 275
that generally, the lower agitations (5 and 10 dpm) showed similarity. Similarly, the higher 276
agitations (20 – 30 dpm) were similar. This may seem to suggest that the hydrodynamics 277
produced and the effects on the matrices at that set dpm could be similar. This may, however, 278
require further studies to establish this fact around the influence of hydrodynamics. It is also 279
15
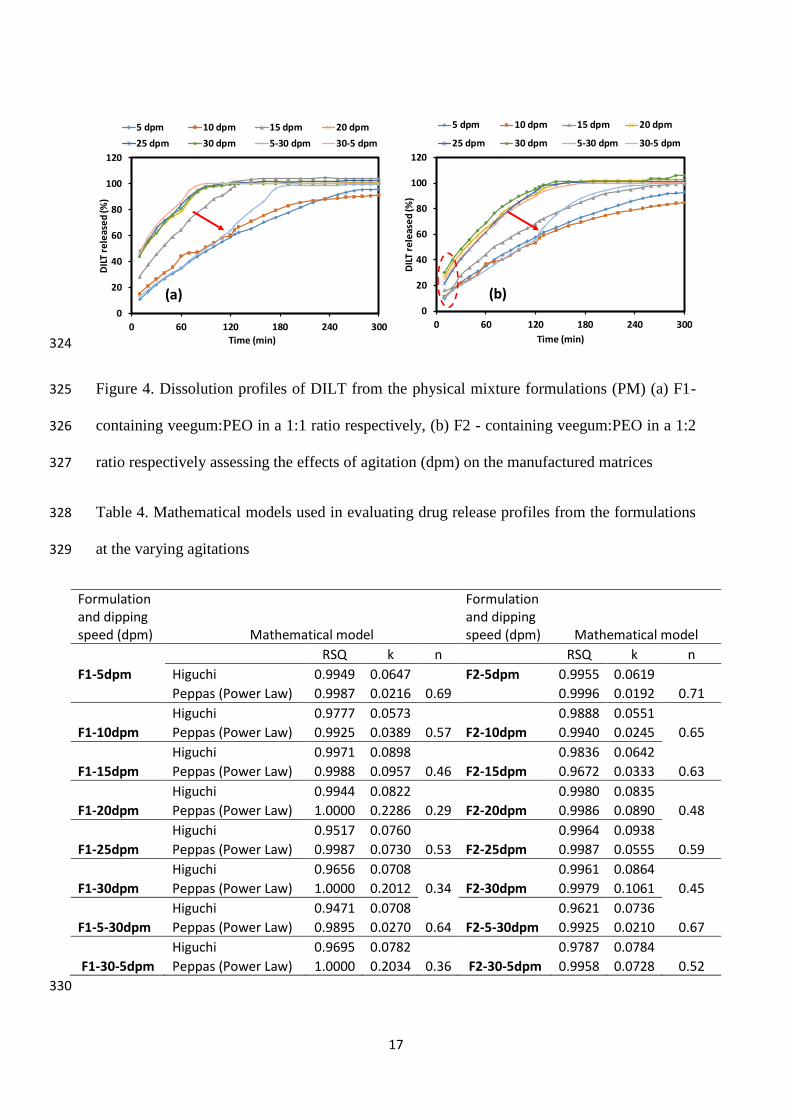
important to note that this behaviour may be polymer dependent (Asare-Addo et al., 2013). Of 280
interest also is the profiles of the ascending order (where agitation is increased by 5 dpm every 281
time the cylinder containing the formulation is moved from one vial to the other. This means 282
in pH 1.2, the agitation is 5 dpm, 10 dpm in pH 2.2, 15 dpm in pH 5.8, 20 dpm in pH 6.8, 25 283
dpm in pH 7.2 and finally 30 dpm in pH 7.5) and descending order (where the reverse 284
experimentation was conducted i.e. agitation was decreased by 5 dpm every time the cylinder 285
containing the formulation moved from one vial to the other meaning in pH 1.2, agitation was 286
kept at 30 dpm, in pH 2.2, agitation was kept at 25 dpm and so forth) of agitations. Here it was 287
observed that at the descending order of agitation, the drug release profile was similar to that 288
of the higher agitation (20-30 dpm) profiles with the drug all going into solution around 90-289
100 min (Figure 4a) or around 130-145 min (Figure 4b). Where the ascending order of agitation 290
is concerned, the lower agitation profiles of 5 and 10 dpm is followed closely till around the 291
120 min mark where agitation is set to now move to 15 dpm (indicated by the red arrow in 292
Figure 4). Here, it is possible that the gel layer formed is decreasing as a greater level of 293
agitation is applied and therefore erosion increased hence the sudden increase in drug release. 294
The different profiles obtained can, therefore, give an indication as to how different food effects 295
can influence drug release without the laboursome and often expensive methods of using actual 296
food in the dissolution testing method. In Table 4, the Higuchi and the Peppas (Power Law) 297
are applied to the release profiles. With the exceptions of drug release profiles from F2 at 10 298
and 15 dpm where the mathematical models suggested first order and the Higuchi as the 299
kinetics of release, all the dpms explored for both formulations (F1 and F2) had the Peppas 300
(Power Law) as the dominant kinetics of drug release. For the F1 matrices, the n values, where 301
the lowest agitation of 5 dpm was applied, anomalous transport was suggested to be occurring 302
with a value of 0.69. An increase in agitation or the dpm displayed a decrease in the value of n 303
up to the 20 dpm mark. This also suggested an increase in the contribution of Fickian diffusion 304
16
to accompany the increased agitation (Table 4). The ascending and descending order of 305
agitiation had a significant impact on the n values (0.64 and 0.36 respectively). These values 306
suggested that when agitation is started of slowly (5 dpm), anomalous transport dominated 307
whereas when agitation is faster initially (30 dpm), Fickian diffusion dominates (Table 4). 308
Figure 4 also signifies the phenomena where an increase in polymer content (PEO in this case) 309
significantly reduces the burst release. This observation has been recorded by several authors 310
for hydrophilic polymers (Ebube et al., 1997; Velasco et al., 1999; Mason et al., 2015). 311
Doubling the polymer content reduces the burst release experienced by the higher dpm profiles 312
(20-30 dpm), where over 40 % of the drug is released immediately (Figure 4a) to less than 30 313
% for these same dpm experiments (Figure 4b). This is indicated by dashed red lines in Figure 314
4b. This observed decrease is also explained further with the ITC data in section 3.4 where the 315
interactions between PEO, DILT and veegum is thought to have a contributory factor. Here 316
also (F2), there was a decrease in the n value that accompanied an increase in the level of 317
agitation from 5 dpm – 20 dpm (Table 4). In this case however, the increase in the polymer 318
content meant there was more of a contribution of swelling as indicated by their increased n 319
values (Table 4). The ascending and descending order of agitiation both displayed anomalous 320
transport with n values of 0.67 and 0.52 respectively suggesting that when agitation is started 321
of slowly, swelling tends to contribute a lot more than when agitation is faster initially (Table 322
4). 323
17
324
Figure 4. Dissolution profiles of DILT from the physical mixture formulations (PM) (a) F1-325
containing veegum:PEO in a 1:1 ratio respectively, (b) F2 - containing veegum:PEO in a 1:2 326
ratio respectively assessing the effects of agitation (dpm) on the manufactured matrices 327
Table 4. Mathematical models used in evaluating drug release profiles from the formulations 328
at the varying agitations 329
Formulation and dipping speed (dpm) Mathematical model
Formulation and dipping speed (dpm) Mathematical model
RSQ k n RSQ k n
F1-5dpm Higuchi 0.9949 0.0647 F2-5dpm 0.9955 0.0619
Peppas (Power Law) 0.9987 0.0216 0.69 0.9996 0.0192 0.71
Higuchi 0.9777 0.0573 0.9888 0.0551 F1-10dpm Peppas (Power Law) 0.9925 0.0389 0.57 F2-10dpm 0.9940 0.0245 0.65
Higuchi 0.9971 0.0898 0.9836 0.0642 F1-15dpm Peppas (Power Law) 0.9988 0.0957 0.46 F2-15dpm 0.9672 0.0333 0.63
Higuchi 0.9944 0.0822 0.9980 0.0835 F1-20dpm Peppas (Power Law) 1.0000 0.2286 0.29 F2-20dpm 0.9986 0.0890 0.48
Higuchi 0.9517 0.0760 0.9964 0.0938 F1-25dpm Peppas (Power Law) 0.9987 0.0730 0.53 F2-25dpm 0.9987 0.0555 0.59
Higuchi 0.9656 0.0708 0.9961 0.0864 F1-30dpm Peppas (Power Law) 1.0000 0.2012 0.34 F2-30dpm 0.9979 0.1061 0.45
Higuchi 0.9471 0.0708 0.9621 0.0736 F1-5-30dpm Peppas (Power Law) 0.9895 0.0270 0.64 F2-5-30dpm 0.9925 0.0210 0.67
Higuchi 0.9695 0.0782 0.9787 0.0784 F1-30-5dpm Peppas (Power Law) 1.0000 0.2034 0.36 F2-30-5dpm 0.9958 0.0728 0.52
330
0
20
40
60
80
100
120
0 60 120 180 240 300
DIL
T re
leas
ed
(%)
Time (min)
(a)
5 dpm 10 dpm 15 dpm 20 dpm
25 dpm 30 dpm 5-30 dpm 30-5 dpm
0
20
40
60
80
100
120
0 60 120 180 240 300
DIL
T re
leas
ed
(%)
Time (min)
(b)
5 dpm 10 dpm 15 dpm 20 dpm
25 dpm 30 dpm 5-30 dpm 30-5 dpm
18
In Figure 5, the PM formulations F1 and F2 are compared to formulations F5 and F6 where the 331
DILT and veegum were mixed together in a turbula mixer before being ground together in a 332
ball mill in the presence of water, dried and finally mixed with PEO. In the case of F1 and F5 333
where the veegum and PEO are in the 1:1 ratio, it was evident that the processing of F5 brought 334
about a significant decrease in the burst release profiles at 20 dpm. The burst release 335
experienced by F1 at 45 % was reduced to 24 %. Although a decrease was also observed by 336
the F6 formulation in comparison to its PM counterpart F2, it was not as poignant as the effects 337
of the increased polymer content come to effect here. Further explanation as to the behaviour 338
observed as a result of the processing parameters will be explored in section 3.4. 339
340
Figure 5. Dissolution profiles of DILT from the physical mixture formulations (PM) F1 and F2 341
being compared to the processed balled milled samples. Note: processed ball milled samples 342
here refer to formulation F5 and F6 and dissolution was conducted at an agitation of 20 dpm 343
344
3.3 Effect of ionic strength on DILT release 345
0
20
40
60
80
100
120
0 60 120 180 240 300
DIL
T re
leas
ed
(%)
Time (min)
PM: Veegum:PEO (1:1) PM: Veegum:PEO (1:2)
Processed ball mill (1:1) Processed ball mill (1:2)
19
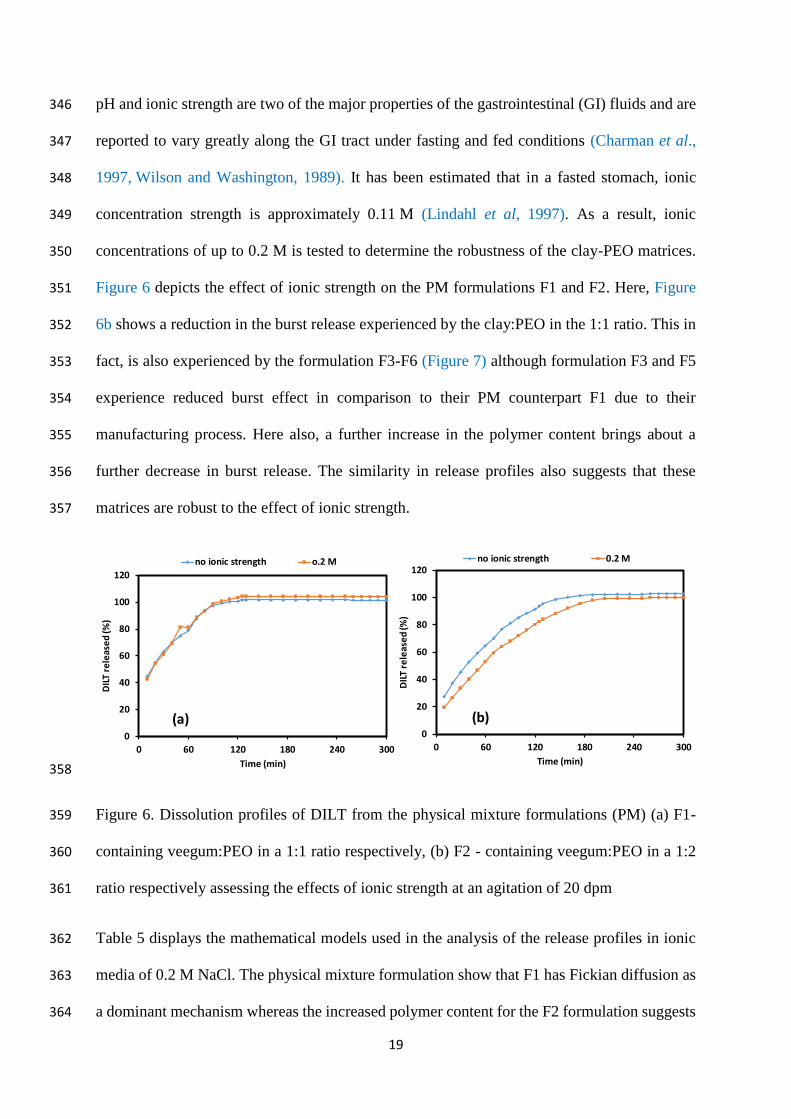
pH and ionic strength are two of the major properties of the gastrointestinal (GI) fluids and are 346
reported to vary greatly along the GI tract under fasting and fed conditions (Charman et al., 347
1997, Wilson and Washington, 1989). It has been estimated that in a fasted stomach, ionic 348
concentration strength is approximately 0.11 M (Lindahl et al, 1997). As a result, ionic 349
concentrations of up to 0.2 M is tested to determine the robustness of the clay-PEO matrices. 350
Figure 6 depicts the effect of ionic strength on the PM formulations F1 and F2. Here, Figure 351
6b shows a reduction in the burst release experienced by the clay:PEO in the 1:1 ratio. This in 352
fact, is also experienced by the formulation F3-F6 (Figure 7) although formulation F3 and F5 353
experience reduced burst effect in comparison to their PM counterpart F1 due to their 354
manufacturing process. Here also, a further increase in the polymer content brings about a 355
further decrease in burst release. The similarity in release profiles also suggests that these 356
matrices are robust to the effect of ionic strength. 357
358
Figure 6. Dissolution profiles of DILT from the physical mixture formulations (PM) (a) F1-359
containing veegum:PEO in a 1:1 ratio respectively, (b) F2 - containing veegum:PEO in a 1:2 360
ratio respectively assessing the effects of ionic strength at an agitation of 20 dpm 361
Table 5 displays the mathematical models used in the analysis of the release profiles in ionic 362
media of 0.2 M NaCl. The physical mixture formulation show that F1 has Fickian diffusion as 363
a dominant mechanism whereas the increased polymer content for the F2 formulation suggests 364
0
20
40
60
80
100
120
0 60 120 180 240 300
DIL
T re
leas
ed
(%)
Time (min)
no ionic strength o.2 M
0
20
40
60
80
100
120
0 60 120 180 240 300
DIL
T re
leas
ed
(%)
Time (min)
no ionic strength 0.2 M
(b)(a)
20
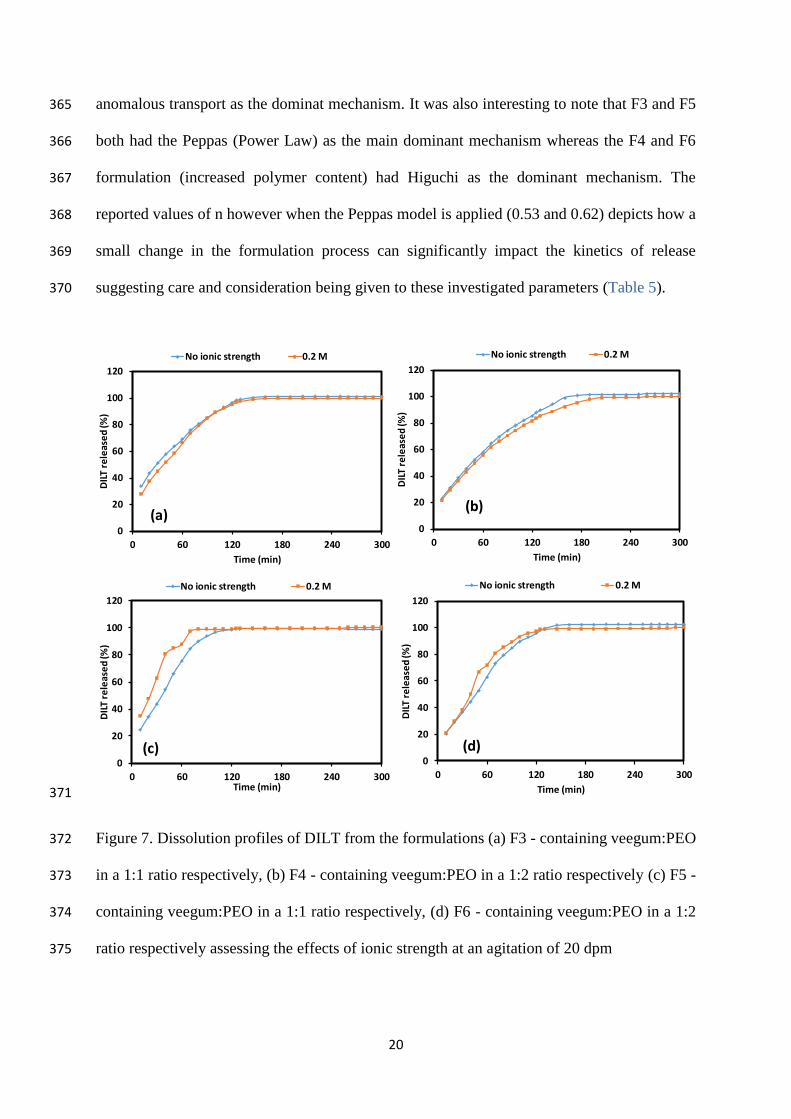
anomalous transport as the dominat mechanism. It was also interesting to note that F3 and F5 365
both had the Peppas (Power Law) as the main dominant mechanism whereas the F4 and F6 366
formulation (increased polymer content) had Higuchi as the dominant mechanism. The 367
reported values of n however when the Peppas model is applied (0.53 and 0.62) depicts how a 368
small change in the formulation process can significantly impact the kinetics of release 369
suggesting care and consideration being given to these investigated parameters (Table 5). 370
371
Figure 7. Dissolution profiles of DILT from the formulations (a) F3 - containing veegum:PEO 372
in a 1:1 ratio respectively, (b) F4 - containing veegum:PEO in a 1:2 ratio respectively (c) F5 - 373
containing veegum:PEO in a 1:1 ratio respectively, (d) F6 - containing veegum:PEO in a 1:2 374
ratio respectively assessing the effects of ionic strength at an agitation of 20 dpm 375
0
20
40
60
80
100
120
0 60 120 180 240 300
DIL
T re
leas
ed
(%)
Time (min)
(a)
No ionic strength 0.2 M
0
20
40
60
80
100
120
0 60 120 180 240 300
DIL
T re
leas
ed
(%)
Time (min)
(b)
No ionic strength 0.2 M
0
20
40
60
80
100
120
0 60 120 180 240 300
DIL
T re
leas
ed
(%)
Time (min)
(c)
No ionic strength 0.2 M
0
20
40
60
80
100
120
0 60 120 180 240 300
DIL
T re
leas
ed
(%)
Time (min)
(d)
No ionic strength 0.2 M
21
Table 5. Mathematical models used in evaluating drug release profiles from the formulations 376
in the ionic strength media (0.2 M) at 20 dpm only. 377
Formulation Mathematical model Formulation Mathematical model
RSQ k n RSQ k n
F1 Higuchi 0.9911 0.0892 F2 0.9969 0.0822
Peppas (Power Law) 1.0000 0.1900 0.35 0.9912 0.0524 0.56
Higuchi 0.9929 0.1005 0.9963 0.0809 F3 Peppas (Power Law) 0.9990 0.1068 0.45 F4 0.9958 0.0635 0.53
Higuchi 0.5452 0.0224 0.9814 0.1299 F5 Peppas (Power Law) 0.9867 0.0921 0.52 F6 0.9859 0.0534 0.62
378
3.4 ITC in understanding the effects of PEO on the adsorption of DILT onto MAS 379
It has been reported that cationic drugs intercalate between the layers of veegum or MAS 380
(Rojtanatanya and Pongjayakul 2010). This property has been exploited in the modulation of 381
drug release as well as in the preparation of nanocomposites for film coatings (Rongthong et 382
al., 2020; Pongjanyakul et al., 2013). Totea et al., 2019 and 2020 recently detailed the 383
thermodynamics of two cationic drugs binding to veegum. The authors found using propranolol 384
hydrochloride as a model drug that the overall change in enthalpy was exothermic with a 385
comparatively small entropic contribution to the total change in Gibbs free energy (Totea et 386
al., 2019). This suggested that the binding process was enthalpically driven and entropically 387
unfavourable meaning hydrogen bonding and electrostatic interactions dominating the 388
interaction. For DILT, the same authors found that a competitor binding model was needed and 389
therefore proposed one which suggested from the thermodynamics that DILT binding to 390
veegum was thought to enthalpy driven and entropically unfavourable (Totea et al., 2020). 391
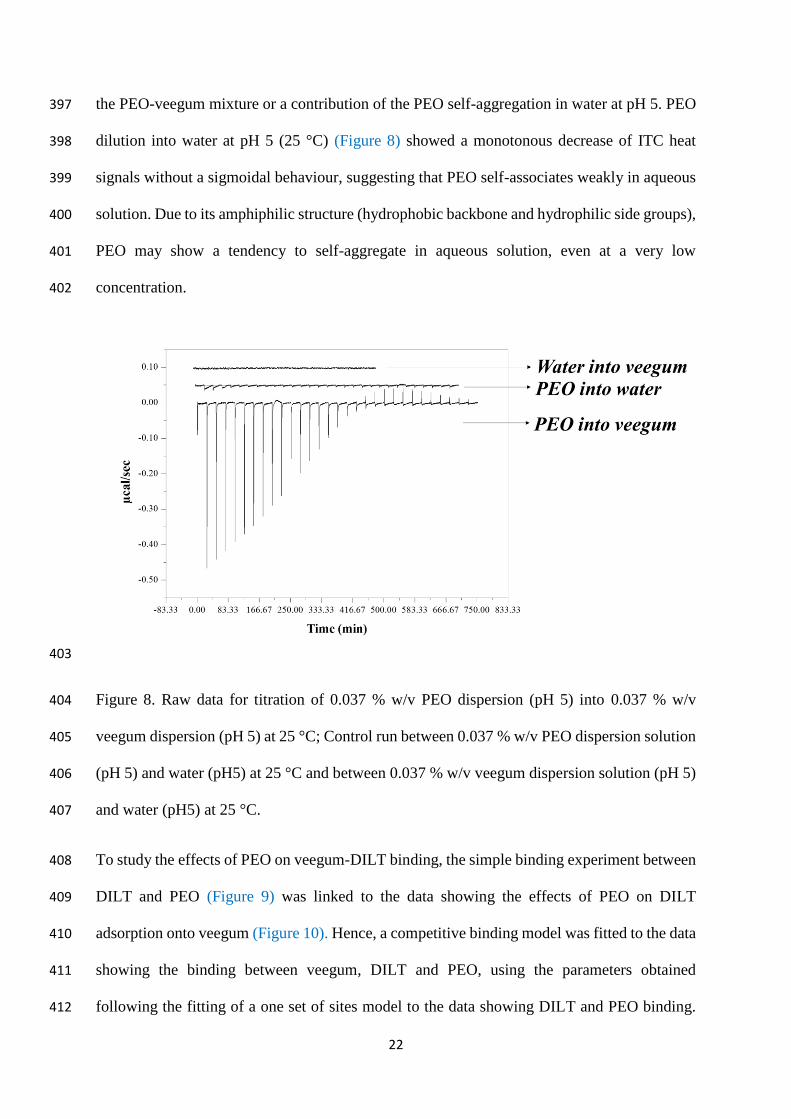
From the ITC studies conducted, the interaction between veegum and PEO at 25 ºC was shown 392
to be exothermic in nature. The non-constant heats and non-sigmoidal curve suggested that 393
PEO can weakly bind to veegum and form a complex by intercalation of PEO particles between 394
the veegum platelets (Figure 8) (Gao, 2004). The binding isotherm showed non-constant heats 395
at the end of titration in the presence of excess PEO. This could be due to the aggregation of 396
22
the PEO-veegum mixture or a contribution of the PEO self-aggregation in water at pH 5. PEO 397
dilution into water at pH 5 (25 °C) (Figure 8) showed a monotonous decrease of ITC heat 398
signals without a sigmoidal behaviour, suggesting that PEO self-associates weakly in aqueous 399
solution. Due to its amphiphilic structure (hydrophobic backbone and hydrophilic side groups), 400
PEO may show a tendency to self-aggregate in aqueous solution, even at a very low 401
concentration. 402
403
Figure 8. Raw data for titration of 0.037 % w/v PEO dispersion (pH 5) into 0.037 % w/v 404
veegum dispersion (pH 5) at 25 °C; Control run between 0.037 % w/v PEO dispersion solution 405
(pH 5) and water (pH5) at 25 °C and between 0.037 % w/v veegum dispersion solution (pH 5) 406
and water (pH5) at 25 °C. 407
To study the effects of PEO on veegum-DILT binding, the simple binding experiment between 408
DILT and PEO (Figure 9) was linked to the data showing the effects of PEO on DILT 409
adsorption onto veegum (Figure 10). Hence, a competitive binding model was fitted to the data 410
showing the binding between veegum, DILT and PEO, using the parameters obtained 411
following the fitting of a one set of sites model to the data showing DILT and PEO binding. 412
23
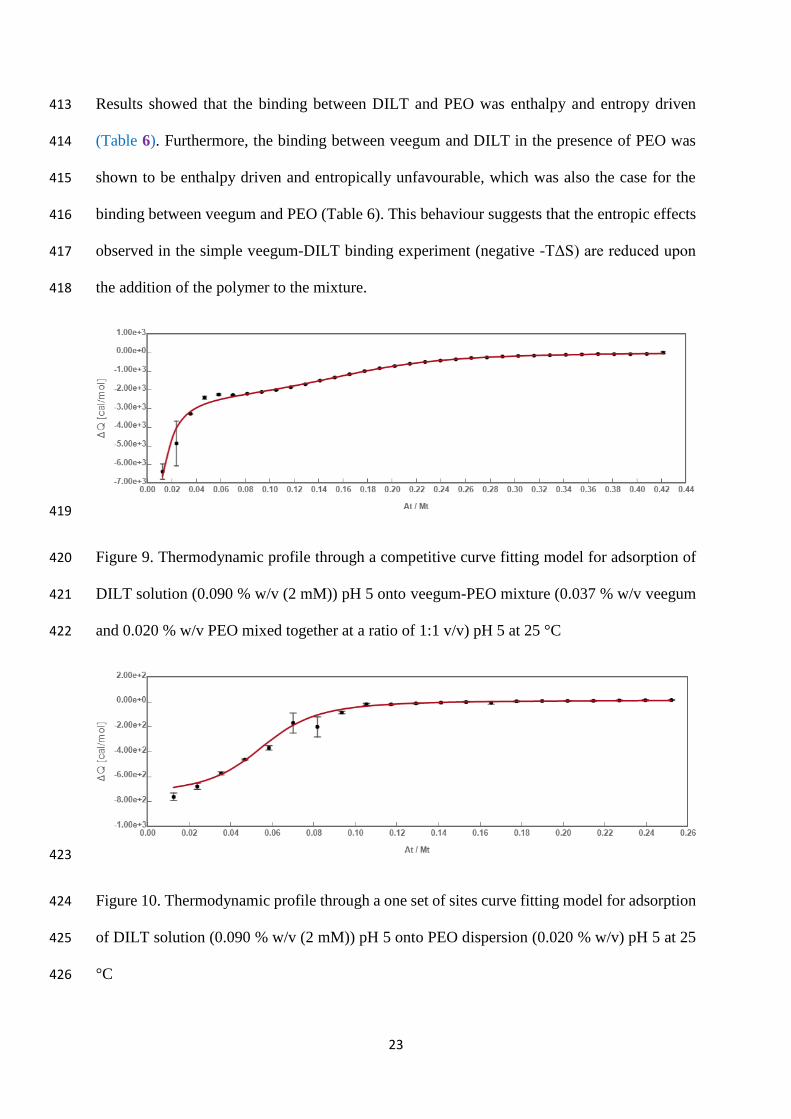
Results showed that the binding between DILT and PEO was enthalpy and entropy driven 413
(Table 6). Furthermore, the binding between veegum and DILT in the presence of PEO was 414
shown to be enthalpy driven and entropically unfavourable, which was also the case for the 415
binding between veegum and PEO (Table 6). This behaviour suggests that the entropic effects 416
observed in the simple veegum-DILT binding experiment (negative -TΔS) are reduced upon 417
the addition of the polymer to the mixture. 418
419
Figure 9. Thermodynamic profile through a competitive curve fitting model for adsorption of 420
DILT solution (0.090 % w/v (2 mM)) pH 5 onto veegum-PEO mixture (0.037 % w/v veegum 421
and 0.020 % w/v PEO mixed together at a ratio of 1:1 v/v) pH 5 at 25 °C 422
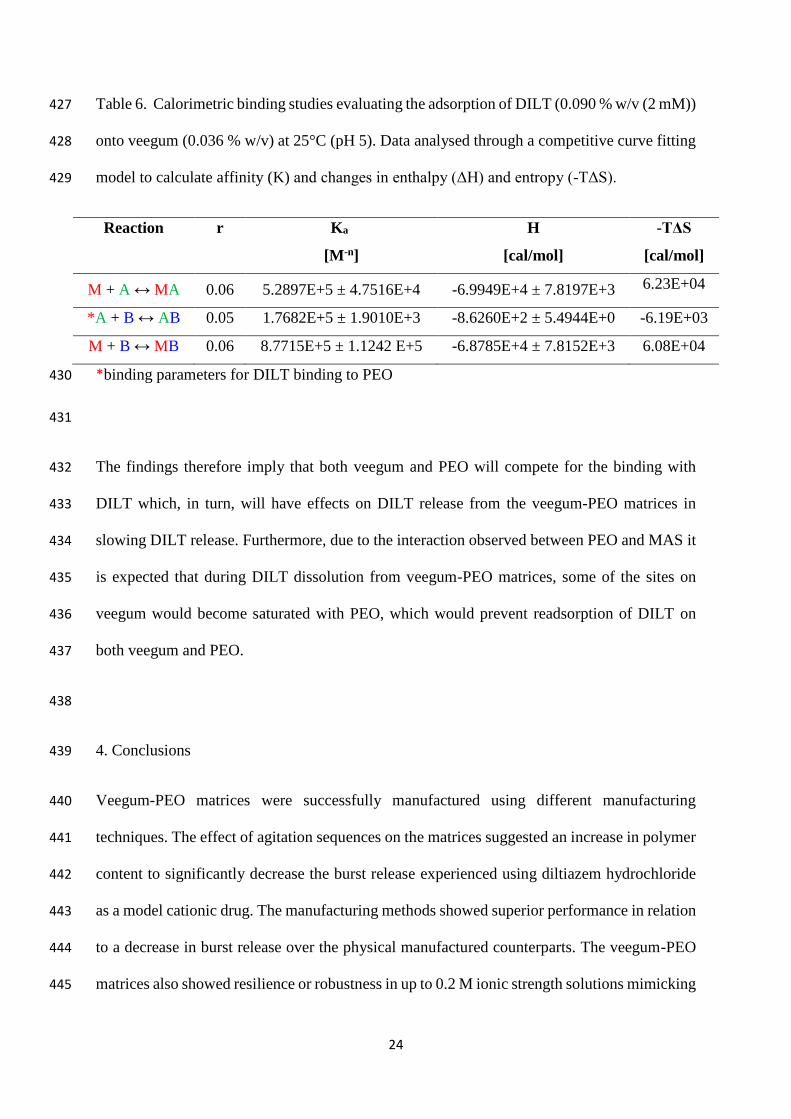
423
Figure 10. Thermodynamic profile through a one set of sites curve fitting model for adsorption 424
of DILT solution (0.090 % w/v (2 mM)) pH 5 onto PEO dispersion (0.020 % w/v) pH 5 at 25 425
°C 426
24
Table 6. Calorimetric binding studies evaluating the adsorption of DILT (0.090 % w/v (2 mM)) 427
onto veegum (0.036 % w/v) at 25°C (pH 5). Data analysed through a competitive curve fitting 428
model to calculate affinity (K) and changes in enthalpy (ΔH) and entropy (-TΔS). 429
Reaction r Ka
[M-n]
H
[cal/mol]
-TΔS
[cal/mol]
M + A ↔ MA 0.06 5.2897E+5 ± 4.7516E+4 -6.9949E+4 ± 7.8197E+3 6.23E+04
*A + B ↔ AB 0.05 1.7682E+5 ± 1.9010E+3 -8.6260E+2 ± 5.4944E+0 -6.19E+03
M + B ↔ MB 0.06 8.7715E+5 ± 1.1242 E+5 -6.8785E+4 ± 7.8152E+3 6.08E+04
*binding parameters for DILT binding to PEO 430
431
The findings therefore imply that both veegum and PEO will compete for the binding with 432
DILT which, in turn, will have effects on DILT release from the veegum-PEO matrices in 433
slowing DILT release. Furthermore, due to the interaction observed between PEO and MAS it 434
is expected that during DILT dissolution from veegum-PEO matrices, some of the sites on 435
veegum would become saturated with PEO, which would prevent readsorption of DILT on 436
both veegum and PEO. 437
438
4. Conclusions 439
Veegum-PEO matrices were successfully manufactured using different manufacturing 440
techniques. The effect of agitation sequences on the matrices suggested an increase in polymer 441
content to significantly decrease the burst release experienced using diltiazem hydrochloride 442
as a model cationic drug. The manufacturing methods showed superior performance in relation 443
to a decrease in burst release over the physical manufactured counterparts. The veegum-PEO 444
matrices also showed resilience or robustness in up to 0.2 M ionic strength solutions mimicking 445
25
the upper limit experienced in the GI tract. ITC results revealed that the binding between DILT 446
and PEO was enthalpy and entropy-driven. Furthermore, the binding between veegum and 447
DILT in the presence of PEO was shown to be enthalpy-driven and entropically unfavourable, 448
which was also the case for the binding between veegum and PEO thus giving insights to how 449
the matrices were performing on a molecular level. 450
451
Acknowledgements 452
The authors are grateful to the Universities of Huddersfield and Sussex for funding. The authors 453
also thank Laura Waters of the University of Huddersfield, Irina Dorin formerly of Malvern 454
Panalytical, UK and Juan Sabin of AFFINImeter, Spain for useful discussions and help with 455
the ITC experiments. 456
457
Author Contributions 458
Kofi Asare-Addo: Conceptualisation; Writing—Original Draft; Writing—Review & Editing; 459
Data curation 460
Ana-Maria Totea: Data curation; Formal analysis; Methodology; Investigation 461
Ali Nokhodchi: Conceptualisation; Data curation; Methodology; Investigation; Writing—462
Review & Editing 463
464
Conflicts of Interest 465
The authors declare no conflict of interest. 466
467
468
469
26
References 470
Adebisi, A. O., Conway, B. R., & Asare-Addo, K. (2015). The influence of fillers on 471
theophylline release from clay matrices. American Journal of Pharmacological Sciences, 3(5), 472
120-125. 473
Alhijjaj, M., Bouman, J., Wellner, N., Belton, P., & Qi, S. (2015). Creating drug solubilization 474
compartments via phase separation in multicomponent buccal patches prepared by direct hot 475
melt extrusion–injection molding. Molecular pharmaceutics, 12(12), 4349-4362. 476
Asare-Addo, K., Levina, M., Rajabi-Siahboomi, A. R., & Nokhodchi, A. (2010). Study of 477
dissolution hydrodynamic conditions versus drug release from hypromellose matrices: the 478
influence of agitation sequence. Colloids and Surfaces B: Biointerfaces, 81(2), 452-460. 479
Asare-Addo, K., Levina, M., Rajabi-Siahboomi, A. R., & Nokhodchi, A. (2011). Effect of ionic 480
strength and pH of dissolution media on theophylline release from hypromellose matrix 481
tablets—Apparatus USP III, simulated fasted and fed conditions. Carbohydrate 482
polymers, 86(1), 85-93. 483
Asare-Addo, K., Kaialy, W., Levina, M., Rajabi-Siahboomi, A., Ghori, M. U., Supuk, E., ... & 484
Nokhodchi, A. (2013b). The influence of agitation sequence and ionic strength on in vitro drug 485
release from hypromellose (E4M and K4M) ER matrices—The use of the USP III 486
apparatus. Colloids and Surfaces B: Biointerfaces, 104, 54-60. 487
Asare-Addo, K., Conway, B. R., Larhrib, H., Levina, M., Rajabi-Siahboomi, A. R., Tetteh, J., 488
... & Nokhodchi, A. (2013a). The effect of pH and ionic strength of dissolution media on in-489
vitro release of two model drugs of different solubilities from HPMC matrices. Colloids and 490
Surfaces B: Biointerfaces, 111, 384-391. 491
Bruschi, M. L. (2015). Strategies to modify the drug release from pharmaceutical systems. 492
Woodhead Publishing. 493
Charman, W. N., Porter, C. J., Mithani, S., & Dressman, J. B. (1997). Physicochemical and 494
physiological mechanisms for the effects of food on drug absorption: the role of lipids and 495
pH. Journal of pharmaceutical sciences, 86(3), 269-282. 496
Crowley, M. M., Zhang, F., Koleng, J. J., & McGinity, J. W. (2002). Stability of polyethylene 497
oxide in matrix tablets prepared by hot-melt extrusion. Biomaterials, 23(21), 4241-4248. 498
27
Ebube, N. K., Hikal, A. H., Wyandt, C. M., Beer, D. C., Miller, L. G., & Jones, A. B. (1997). 499
Sustained release of acetaminophen from heterogeneous matrix tablets: influence of polymer 500
ratio, polymer loading, and co-active on drug release. Pharmaceutical development and 501
technology, 2(2), 161-170. 502
Ford, J. L., Mitchell, K., Rowe, P., Armstrong, D. J., Elliott, P. N., Rostron, C., & Hogan, J. E. 503
(1991). Mathematical modelling of drug release from hydroxypropylmethylcellulose matrices: 504
effect of temperature. International journal of pharmaceutics, 71(1-2), 95-104. 505
Gao, F. (2004). Clay/polymer composites: the story. Materials today, 7(11), 50-55. 506
Gonçalves-Araújo, T., Rajabi-Siahboomi, A. R., & Caraballo, I. (2010). Polymer percolation 507
threshold in HPMC extended release formulation of carbamazepine and verapamil HCl. Aaps 508
Pharmscitech, 11(2), 558-562. 509
Kaialy, W., Bello, H., Asare‐Addo, K., & Nokhodchi, A. (2016). Effect of solvent on retarding 510
the release of diltiazem HC l from Polyox‐based liquisolid tablets. Journal of Pharmacy and 511
Pharmacology, 68(11), 1396-1402. 512
Hermann, P. H., Rodger, S. D., Remones, G., Thenot, J. P., London, D. R., & Morselli, P. L. 513
(1983). Pharmacokinetics of diltiazem after intravenous and oral administration. European 514
journal of clinical pharmacology, 24(3), 349-352. 515
Kanjanakawinkul, W., Rades, T., Puttipipatkhachorn, S., & Pongjanyakul, T. (2013). Nicotine–516
magnesium aluminum silicate microparticle surface modified with chitosan for mucosal 517
delivery. Materials Science and Engineering: C, 33(3), 1727-1736. 518
Khlibsuwan, R., & Pongjanyakul, T. (2016). Chitosan-clay matrix tablets for sustained-release 519
drug delivery: Effect of chitosan molecular weight and lubricant. Journal of Drug Delivery 520
Science and Technology, 35, 303-313. 521
Khlibsuwan, R., Siepmann, F., Siepmann, J., & Pongjanyakul, T. (2017). Chitosan-clay 522
nanocomposite microparticles for controlled drug delivery: Effects of the MAS content and 523
TPP crosslinking. Journal of Drug Delivery Science and Technology, 40, 1-10. 524
Khuathan, N., & Pongjanyakul, T. (2014). Modification of quaternary polymethacrylate films 525
using sodium alginate: film characterization and drug permeability. International journal of 526
pharmaceutics, 460(1-2), 63-72. 527
28
Kim, C. J. (1995). Drug release from compressed hydrophilic POLYOX‐WSR tablets. Journal 528
of Pharmaceutical Sciences, 84(3), 303-306. 529
Klein S., Rudolph M.W., Dressman J.B. Dissolution Technologies (2002) (Article 1) 530
Li, J., Luo, C., Zhang, D., Li, M., Fu, Q., & He, Z. (2016). Formulation and development of 531
ternary hybrid matrix tablets of diltiazem hydrochloride. Powder Technology, 294, 66-70. 532
Lindahl, A., Ungell, A. L., Knutson, L., & Lennernäs, H. (1997). Characterization of fluids 533
from the stomach and proximal jejunum in men and women. Pharmaceutical research, 14(4), 534
497-502. 535
Ma, L., Deng, L., & Chen, J. (2014). Applications of poly (ethylene oxide) in controlled release 536
tablet systems: a review. Drug development and industrial pharmacy, 40(7), 845-851. 537
Maggi, L., Segale, L., Torre, M. L., Machiste, E. O., & Conte, U. (2002). Dissolution behaviour 538
of hydrophilic matrix tablets containing two different polyethylene oxides (PEOs) for the 539
controlled release of a water-soluble drug. Dimensionality study. Biomaterials, 23(4), 1113-540
1119. 541
Mason, L. M., Campiñez, M. D., Pygall, S. R., Burley, J. C., Gupta, P., Storey, D. E., ... & 542
Melia, C. D. (2015). The influence of polymer content on early gel-layer formation in HPMC 543
matrices: the use of CLSM visualisation to identify the percolation threshold. European 544
Journal of Pharmaceutics and Biopharmaceutics, 94, 485-492. 545
Nep, E. I., Mahdi, M. H., Adebisi, A. O., Dawson, C., Walton, K., Bills, P. J., ... & Asare-546
Addo, K. (2017). The influence of hydroalcoholic media on the performance of Grewia 547
polysaccharide in sustained release tablets. International journal of pharmaceutics, 532(1), 548
352-364. 549
Nokhodchi, A., Palmer, D., Asare-Addo, K., Levina, M., & Rajabi-Siahboomi, A. (2015). 550
Application of polymer combinations in extended release hydrophilic matrices. Handbook of 551
Polymers for Pharmaceutical Technologies, 1, 23-49. 552
Nokhodchi, A., Raja, S., Patel, P., & Asare-Addo, K. (2012). The role of oral controlled release 553
matrix tablets in drug delivery systems. BioImpacts: BI, 2(4), 175. 554
Okeke, O. C., & Boateng, J. S. (2017). Nicotine stabilization in composite sodium alginate 555
based wafers and films for nicotine replacement therapy. Carbohydrate polymers, 155, 78-88. 556
29
Okeke, O. C., & Boateng, J. S. (2016). Composite HPMC and sodium alginate based buccal 557
formulations for nicotine replacement therapy. International journal of biological 558
macromolecules, 91, 31-44. 559
Ozeki, T., Yuasa, H., & Kanaya, Y. (1999). Control of medicine release from solid dispersion 560
composed of the poly (ethylene oxide)-carboxyvinylpolymer interpolymer complex by varying 561
molecular weight of poly (ethylene oxide). Journal of controlled release, 58(1), 87-95. 562
Padial, L. R., Baron-Esquivias, G., Madrid, A. H., Martín, D. M., Pallares-Carratala, V., & de 563
la Sierra, A. (2016). Clinical experience with diltiazem in the treatment of cardiovascular 564
diseases. Cardiology and therapy, 5(1), 75-82. 565
Palmer, D., Levina, M., Douroumis, D., Maniruzzaman, M., Morgan, D. J., Farrell, T. P., ... & 566
Nokhodchi, A. (2013). Mechanism of synergistic interactions and its influence on drug release 567
from extended release matrices manufactured using binary mixtures of polyethylene oxide and 568
sodium carboxymethylcellulose. Colloids and Surfaces B: Biointerfaces, 104, 174-180. 569
Pappa, C., Nanaki, S., Giliopoulos, D., Triantafyllidis, K., Kostoglou, M., Avgeropoulos, A., 570
& Bikiaris, D. (2018). Nanostructured Composites of Sodium Montmorillonite Clay and PEO 571
Used in Dissolution Improvement of Aprepitant Drug by Melt Mixing. Applied Sciences, 8(5), 572
786. 573
Pongjanyakul, T., & Rojtanatanya, S. (2012). Use of propranolol-magnesium aluminium 574
silicate intercalated complexes as drug reservoirs in polymeric matrix tablets. Indian journal 575
of pharmaceutical sciences, 74(4), 292. 576
Pongjanyakul, T., Khunawattanakul, W., Strachan, C. J., Gordon, K. C., Puttipipatkhachorn, 577
S., & Rades, T. (2013). Characterization of chitosan–magnesium aluminum silicate 578
nanocomposite films for buccal delivery of nicotine. International journal of biological 579
macromolecules, 55, 24-31. 580
Prasad, M. B., Vidyadhara, S., Sasidhar, R. L. C., Balakrishna, T., & Trilochani, P. (2013). 581
Development and evaluation of diltiazem hydrochloride controlled-release pellets by fluid bed 582
coating process. Journal of advanced pharmaceutical technology & research, 4(2), 101. 583
Qazi, F., Shoaib, M. H., Yousuf, R. I., Qazi, T. M., Mehmood, Z. A., & Hasan, S. M. F. (2013). 584
Formulation development and evaluation of Diltiazem HCl sustained release matrix tablets 585
using HPMC K4M and K100M. Pak J Pharm Sci, 26(4), 653-663. 586
30
Rongthong, T., Sungthongjeen, S., Siepmann, J., & Pongjanyakul, T. (2013). Quaternary 587
polymethacrylate–magnesium aluminum silicate films: molecular interactions, mechanical 588
properties and tackiness. International journal of pharmaceutics, 458(1), 57-64. 589
Rongthong, T., Sungthongjeen, S., Siepmann, F., Siepmann, J., & Pongjanyakul, T. (2020). 590
Eudragit RL-based film coatings: How to minimize sticking and adjust drug release using 591
MAS. European Journal of Pharmaceutics and Biopharmaceutics, 148, 126-133. 592
Rojtanatanya, S., & Pongjanyakul, T. (2010). Propranolol–magnesium aluminum silicate 593
complex dispersions and particles: Characterization and factors influencing drug 594
release. International journal of pharmaceutics, 383(1-2), 106-115. 595
Shojaee, S., Cumming, I., Kaialy, W., & Nokhodchi, A. (2013a). The influence of vitamin E 596
succinate on the stability of polyethylene oxide PEO controlled release matrix tablets. Colloids 597
and Surfaces B: Biointerfaces, 111, 486-492. 598
Shojaee, S., Asare-Addo, K., Kaialy, W., Nokhodchi, A., & Cumming, I. (2013b). An 599
investigation into the stabilization of diltiazem HCl release from matrices made from aged 600
polyox powders. AAPS PharmSciTech, 14(3), 1190-1198. 601
Shojaee, S., Nokhodchi, A., Cumming, I., Alhalaweh, A., & Kaialy, W. (2015). Investigation 602
of drug release from PEO tablet matrices in the presence of vitamin E as antioxidant. Current 603
drug delivery, 12(5), 591-599. 604
Siahi-Shadbad, M. R., Asare-Addo, K., Azizian, K., Hassanzadeh, D., & Nokhodchi, A. 605
(2011). Release behaviour of propranolol HCl from hydrophilic matrix tablets containing 606
psyllium powder in combination with hydrophilic polymers. Aaps Pharmscitech, 12(4), 1176-607
1182. 608
Siepmann, J., & Peppas, N. A. (2001). Mathematical modeling of controlled drug 609
delivery. Advanced drug delivery reviews, 48(2-3). 610
Siepmann, J., & Peppas, N. A. A. (2012). Modeling of drug release from delivery systems 611
based on hydroxypropyl methylcellulose (HPMC). Advanced drug delivery reviews, 64, 163-612
174. 613
31
Totea, A. M., Dorin, I., Gavrilov, G., Laity, P. R., Conway, B. R., Waters, L., & Asare-Addo, 614
K. (2019). Real time calorimetric characterisation of clay–drug complex dispersions and 615
particles. International journal of pharmaceutics: X, 1, 100003. 616
Totea, A. M., Sabin, J., Dorin, I., Hemming, K., Laity, P. R., Conway, B. R., ... & Asare-Addo, 617
K. (2020). Thermodynamics of clay–drug complex dispersions: Isothermal titration 618
calorimetry and high-performance liquid chromatography. Journal of Pharmaceutical 619
Analysis, 10(1), 78-85. 620
Ward, A., Walton, K., Mawla, N., Kaialy, W., Liu, L., Timmins, P., ... & Asare-Addo, K. 621
(2019). Development of a novel method utilising dissolution imaging for the measurement of 622
swelling behaviour in hydrophilic matrices. International journal of pharmaceutics: X, 1, 623
100013. 624
Ward, A., Walton, K., Stoycheva, S., Wallis, M., Adebisi, A., Nep, E., ... & Asare-Addo, K. 625
(2020). The use of visible and UV dissolution imaging for the assessment of propranolol 626
hydrochloride in liquisolid compacts of Sesamum radiatum gum. Journal of Drug Delivery 627
Science and Technology, 101511. 628
Washington, N., Washington, C., & Wilson, C. (2000). Physiological pharmaceutics: barriers 629
to drug absorption. CRC Press. 630
Vanderbilt Minerals (2014a) VEEGUM / VAN GEL Magnesium Aluminum Silicate Magnesium 631
Aluminum Silicate ® The Story. Norwalk. 632
Vanderbilt Minerals (2014b) ‘VEEGUM ® Magnesium Aluminum Silicate VANATURAL ® 633
Bentonite Clay For Personal Care and Pharmaceuticals What They Are’, pp. 1–27. 634
Velasco, M. V., Ford, J. L., Rowe, P., & Rajabi-Siahboomi, A. R. (1999). Influence of drug: 635
hydroxypropylmethylcellulose ratio, drug and polymer particle size and compression force on 636
the release of diclofenac sodium from HPMC tablets. Journal of Controlled Release, 57(1), 75-637
85. 638
639
640