Embed Size (px)
Citation preview
University of Calgary
PRISM: University of Calgary's Digital Repository
Graduate Studies The Vault: Electronic Theses and Dissertations
2020-11-16
Naturally Derived Silicate-based Nanoparticles for
Enhanced Oil Recovery in Sandstone Reservoirs
Sagala, Farad
Sagala, F. (2020). Naturally Derived Silicate-based Nanoparticles for Enhanced Oil Recovery in
Sandstone Reservoirs (Unpublished doctoral thesis). University of Calgary, Calgary, AB.
http://hdl.handle.net/1880/112759
doctoral thesis
University of Calgary graduate students retain copyright ownership and moral rights for their
thesis. You may use this material in any way that is permitted by the Copyright Act or through
licensing that has been assigned to the document. For uses that are not allowable under
copyright legislation or licensing, you are required to seek permission.
Downloaded from PRISM: https://prism.ucalgary.ca
UNIVERSITY OF CALGARY
Naturally Derived Silicate-based Nanoparticles for Enhanced Oil Recovery in Sandstone
Reservoirs
by
Farad Sagala
A THESIS
SUBMITTED TO THE FACULTY OF GRADUATE STUDIES
IN PARTIAL FULFILMENT OF THE REQUIREMENTS FOR THE
DEGREE OF DOCTOR OF PHILOSOPHY
GRADUATE PROGRAM IN CHEMICAL AND PETROLEUM ENGINEERING
CALGARY, ALBERTA
NOVEMBER, 2020
© Farad Sagala 2020
ii
Abstract
Chemical enhanced oil recovery (C-EOR) is a commonplace method used extensively to extract
trapped oil with reasonable recovery percentages during the tertiary stage of oil production.
Besides, new technologies have emerged and have been tested for their efficiency to increase oil
recovery after the conventional primary and secondary recovery techniques. Nanoparticles as a
branch of nanotechnology are emerging as a new alternative technology for C-EOR and recovery
processes of trapped oil. Tunable silicate-based nanoparticles as nanofluids can be injected into
the reservoir at the secondary/tertiary stage as a standalone or when coupled with some other
existing conventional techniques to enhance the recovery of the remaining trapped oil. Nanofluids
can be introduced into the reservoir at a typical chemical flood configuration to produce more oil
by changing the geochemical properties of the reservoir such as wettability, disjoining
pressure,IFT etc. In the first phase of this study, silicate-based nanoparticles were synthesized,
then partially altered their functionality by anchoring various agents such as silanes and polymers,
generating various forms of functionalized silicate based nanoparticles. Characterization
techniques, such as scanning electron microscope (SEM), transmission electron microscopy
(TEM), energy-dispersive X-ray spectroscopy (EDX), Fourier-transform infrared spectroscopy
(FTIR), X-ray diffraction (XRD), thermogravimetric analysis (TGA), Brunauer–Emmett–Teller
(BET), dynamic light scattering (DLS), and zeta potential were conducted for the produced
nanoparticles to confirm their surface identity, functionality, stability, and morphology. The EOR
performance was investigated by mainly interfacial tension (IFT), contact angle, spontaneous
imbibition, relative permeability measurements, conducting aggregation experiments and
displacement tests using Berea sandstone cores at reservoir conditions. Results showed that the
synthesized nanoparticles either alone or when integrated with existing conventional techniques
can recover substantial trapped oil at the tertiary stage. Furthermore, a considerable improvement
of oil recovery was achieved by combining silicate-based nanoparticles with low salinity water
flooding. Subsequently, using silicate-based nanoparticles as EOR agents provides a prospect of
being applied in EOR.
Keywords: Enhanced oil recovery, silicate, nanopyroxene, nanofluids, wettability, imbibition
iii
Acknowledgements
First and foremost, all praises are to Allah (God) for the blessings and providing me with the
strength, knowledge, ability, and wisdom to accomplish this research Journey and also to endure
and complete it adequately. Without his blessings, this achievement would not have been possible.
This thesis also would not have been attainable in its current form without supports and
encouragements from numerous individuals.
Throughout the completion of this study, many people have helped and support me. I would like
to take this opportunity to thank them all. I would like to express my sincere gratitude to my
supervisor professor Nashaat Nassar for allowing me to be a member of his great team. My special
thanks and appreciation is expressed to Dr Nassar for his endless support during hard times and
his beneficial advice to continue the research work. I have not only benefited from his incredible
talent and outstanding knowledge but also have learned numerous moral lessons from him. He also
gave the whole research steering wheel to me that boosted my confidence and independence.
I wish to thank the members of my advisory committee, Dr Hassan Hassanzadeh Dr Brij Maini as
well as my examining committee, Dr Mingzhe Dong, Dr Benjamin Tutolo, and Dr Martin Poitzsch
for their insightful comments and feedback.
Special thanks go to my good friends and teammates whom I have co-authored several scientific
papers together Afifi Hethanawi, Leidy Tatiana, Abdallah Manasrah, you guys are amazing. Also,
to the analytical team especially Dr Gerardo Vital, Dr Azfar Hassan, Mr Lante Carbognani and Dr
Monica Benatoli, Dr Ismail Badran, (now associate professor Qatar University) for their help in
the sample analysis, motivation, and collaboration. I would also like to thank all other members of
Dr Nassar Group for Nanotechnology Research at the University of Calgary, Yazan Mheibesh,
Mousa Taleb, Redhwan Al-Akbari, Arash Ostovar, and Sebastian Sessarego for providing a
iv
delightful and engaging environment through my years of study at the University of Calgary. We
have accomplished some incredible jobs collaboratively on the topic of nanomaterial synthesis,
characterization and application which always reminds me of those sweet days of working with
those amazing guys.
I would also like to thank all my friends and fellow graduate students(office mates), in particular:
Dr Laura Corredor, Mohamad Khalifa, Rita Fazila, for their continued friendship and support
during my PhD studies. The friendships with them are one of the most important treasures of my
life. I gratefully acknowledge the University of Calgary especially the Schulich School of
Engineering, and Islamic Development Bank (IsDB) for its financial support.
Finally, and the most importantly, I would like to express gratitude to my parent (Muhamad
Kaluuma and the Late Tijala Najjemba, My wife Aishah Namutebi and my son Hafiz Sagala
Fahad, my sisters (Janet and Namuyiga), and my brothers (Dr Hussein Kisiki Nsamba, Faizo,
Accram, Najib, Nassar for the love, support, and encouragement they have given me throughout
my PhD study, without which this work would not have been accomplished.

v
Dedication
To my lovely wife Aisha and little son Hafiz Sagala and also my family back home in Uganda who supported me from
day one.
vi
Table of Contents
Abstract ............................................................................................................................... ii
Acknowledgements ............................................................................................................ iii Dedication ............................................................................................................................v Table of Contents ............................................................................................................... vi List of Tables .......................................................................................................................x List of Figures and Illustrations ......................................................................................... xi
List of Symbols, Abbreviations and Nomenclature ......................................................... xvi Epigraph ......................................................................................................................... xviii
CHAPTER ONE: INTRODUCTION ..................................................................................1 1.1 Background ................................................................................................................1 1.2 Motivation ..................................................................................................................6
1.3 Objectives ..................................................................................................................7 1.4 Organization of the thesis ..........................................................................................8
1.5 References ................................................................................................................12
CHAPTER TWO: AN OVERVIEW ON ENHANCED OIL RECOVERY ....................16
2.1 Introduction ..............................................................................................................16 2.2 Background ..............................................................................................................16 2.3 Fundamentals of fluid flow in the porous medium ..................................................18
2.4 Fundamentals of Enhanced Oil Recovery (EOR) ....................................................24 2.5 Idealized characteristics of an EOR process ............................................................26
2.5.1 Efficient Microscopic and Macroscopic Displacement ...................................26 2.6 General description and classification of EOR processes .......................................29
2.6.1 Chemical EOR Techniques (CEOR) ...............................................................32 2.7 Wettability Fundamentals ........................................................................................33
2.7.1 Youngs equation ..............................................................................................34 2.7.2 Wenzel’s model ...............................................................................................36 2.7.3 Cassie-Baxter model ........................................................................................36
2.8 Determination of Wettability ...................................................................................37 2.8.1 Contact Angle Measurements ..........................................................................37 2.8.2 Amott wettability Measurements ....................................................................38
2.8.3 USBM (U.S. Bureau of Mines) method ..........................................................40 2.8.4 Imbibition method ...........................................................................................42 2.8.5 Relative permeability method ..........................................................................43
2.9 Laboratory determination of Relative permeability .................................................45 2.9.1 Johnson Bossler and Naumann (JBN) method ................................................46
2.10 Capillary Number and its Effect on Relative permeability ....................................47 2.11 Effect of Temperature on Relative Permeability ...................................................48
2.12 Conclusion .............................................................................................................49 2.13 References ..............................................................................................................49
CHAPTER THREE: NANOPARTICLES AS POTENTIAL AGENTS FOR ENHANCING
OIL RECOVERY .....................................................................................................52 3.1 Abstract ....................................................................................................................52
vii
3.2. Introduction .............................................................................................................53
3.3. Types of nanoparticles commonly used in enhancing oil recovery ........................58
3.4. Nanoparticle stabilization for EOR application ......................................................70 3.4.1. Commonly used stabilization techniques for EOR application ...........................72 3.5. Mechanisms of enhancing oil recovery using nanoparticles ..................................80
3.5.1. Wettability alterations and contact angle modifications ................................80 3.5.2. Viscosity reduction .........................................................................................84
3.5.3. Nanoparticles combined with polymer for enhanced oil recovery .................88 3.5.4. Nano-based surfactant for enhanced oil recovery ..........................................89 3.5.5. Application of nano stabilized foams for enhancing oil recovery ..................90 3.5.6. Enhancing oil recovery with stabilized Pickering emulsions .........................94 3.5.7. Nanoparticles for inhibition asphaltene and wax deposition ..........................96
3.5.8. Enhanced oil recovery due to structural disjoining pressure caused by
nanoparticles ..................................................................................................103 3.6. Effect of various factors on nanoparticle performance .........................................106
3.7. Economic analysis of using nanoparticles ............................................................113
3.8. Concerns and uncertainties of using nanotechnology in oil and gas applications 114 3.9. Conclusions and future outlook ............................................................................115 3.1 References ..............................................................................................................116
CHAPTER FOUR: NANOPYROXENE-BASED NANOFLUIDS FOR ENHANCED OIL
RECOVERY IN SANDSTONE CORES AT RESERVOIR TEMPERATURE ...130
4.1 Abstract ..................................................................................................................130 4.2 Introduction ............................................................................................................131 4.3. Materials and Methods ..........................................................................................134
4.3.1 Materials ........................................................................................................134
4.3.2. Brine Synthesis .............................................................................................135 4.3.3 Methods .........................................................................................................135 4.3.4. Synthesis of Nanoparticles and Nanofluids Preparation ..............................135
4.3.5. Nanoparticle and Nanofluid Characterization ..............................................138 4.3.6 Interfacial Tension (IFT) Measurements .......................................................139
4.3.7 Oil-Wet Core Plugs Preparation and Oil Pre-saturation ................................139
4.3.8. Contact Angle Measurements and Spontaneous Imbibition Tests ...............140 4.3.9 Displacement Tests. .......................................................................................141
4.4. Results and Discussion .........................................................................................143 4.4.1. Characterization Studies ...............................................................................143 4.4.2 Functionalization of nanoparticles ................................................................143
4.4.3 Nanofluid Stability (DLS and Zeta Potential Measurements) .......................147
4.4.4. Interfacial Tension Measurements ...............................................................149
4.4.5 Contact Angle and Spontaneous Imbibition Tests ........................................151 4.4.6 Mechanism of EOR Using Pyroxene-based Nanofluids ...............................157 4.4.7 Generalized Scaling Equation Based on Pyroxene-based Nanofluids ..........159 4.4.8 Displacement Tests. .......................................................................................162
4.5 Conclusion .............................................................................................................164
4.6 References ..............................................................................................................166
viii
CHAPTER FIVE: HYDROXYL-FUNCTIONALIZED SILICATE-BASED NANOFLUIDS
FOR ENHANCED OIL RECOVERY....................................................................172
5.1 Abstract ..................................................................................................................172 5.2. Introduction ...........................................................................................................173 5.3. Materials and Methods ..........................................................................................177
5.3.1 Materials ........................................................................................................177 5.3.2 Nanoparticle and Nanofluid Synthesis and Characterization .......................178
5.3.3. n-C7 Asphaltenes Extraction and Effect of Nanopyroxene Concentration on the
Asphaltene Aggregate Size ............................................................................179 5.3.4. Interfacial Tension (IFT) Measurements ......................................................180 5.3.5 Preparation of the Oil-Wet Cores Plugs, Substrates and Pre-Saturation .......181 5.3.6. Contact Angle and Spontaneous Imbibition of Oil Wet Sandstone Rocks ..182
5.3.7. Effect of Nanopyroxene Concentration on Wettability Index ......................183
5.3.8. Effect of Initial Water Saturation and pH on Wettability Alteration ...........184 5.3.9. Core Flooding Experiments ..........................................................................185
5.4. Results and Discussion .........................................................................................187
5.4.1. Core Plugs, Nanoparticle, and Nanofluid Characterizations ........................187 5.4.2. Characterization of the Crude Oil Sample and Sandstone Rock and the
Implication to the Rock Wettability ...............................................................190
5.4.3. Effect of Nanoparticle Concentration on Asphaltene Disaggregation .........194 5.4.4. Effect of Nanoparticle Concentration on Interfacial Tension ......................196
5.4.5. Quantification of Rock Wettability Before and After Treatment with and Without
Water Films ....................................................................................................197 5.4.6. Effect of Nanoparticle Concentration on Contact Angle, Wettability Index, and
Imbibition Rate ..............................................................................................199 5.4.7. Effect of Nanoparticle Concentration on Wettability Index .........................200
5.4.8. Effect of Zero Water Saturation on the Core Wettability .............................203 5.4.9. Effect of Irreducible Water Saturation on Wettability Alteration and Imbibition
........................................................................................................................204 5.4.10. Underlying Mechanism(s) of Interaction of Oil and the Rock with and Without
Initial Water Saturation and Implications to Wettability ...............................207 5.4.11. Effect of Solution pH During Wettability Alteration .................................208 5.4.12. Core flooding Experiments .........................................................................210
5.5. Conclusion ............................................................................................................213 5.6 References ............................................................................................................214
CHAPTER SIX: INTEGRATING SILICATE-BASED NANOPARTICLES WITH LOW
SALINITY WATER FLOODING FOR ENHANCED OIL RECOVERY IN
SANDSTONE RESERVOIRS ...............................................................................219
6.1. Abstract .................................................................................................................219 6.2. Introduction ...........................................................................................................220 6.3. Materials and Methods ..........................................................................................225
6.3.1. Fluid formulations. .......................................................................................226 6.3.2 Zeta potential measurements and LSW preparation: .....................................226
6.3.3. Preparation of Nanoparticles and Nanofluids ...............................................227 6.3.4. Nanoparticles and Nanofluid Characterization ............................................228 6.3.5. Core preparation and Wettability Index Measurements ...............................229
ix
6.3.6. Contact Angle Tests: ....................................................................................230
6.3.7.Spontaneous Imbibition Tests: ......................................................................231
6.3.8. Core Flooding Experiments .........................................................................231 6.3.9. Estimation of the Relative Permeability Curve ............................................233
6.4 Results and Discussion ..........................................................................................233 6.4.1 Characterization Studies ................................................................................233 6.4.2. Functionalization of Nanoparticles ...............................................................233
6.4.3. Zeta Potential Measurements and Nanofluid Stability .................................235 6.4.4. Impact of Brine Composition on Initial Wetting Conditions .......................238 6.4.5. Contact Angle and Spontaneous Imbibition Tests .......................................240 6.4.6. Displacement Tests .......................................................................................244 6.4.7: Effects of Brine Salinity in Irreducible Water Saturation During LSW Flooding
........................................................................................................................245
6.4.8. Presence of Monovalent Ions in Initial Brine ...............................................245 6.4.9. Presence of Divalent Ions (Mg2+ and Ca2+) in the Irreducible Water ..........246
6.4.10. Presence of Twice the Concentration of Divalent Ions in Irreducible Water248
6.4.11. Effect of Oil Composition ..........................................................................250 6.4.12. LSW Coupled with Nanofluids ..................................................................252 6.4.13. The pH of water produced ..........................................................................254
6.4.14. Residual Oil Saturation After Tertiary Stage .............................................256 6.5. Conclusion ............................................................................................................258
6.7 References ..............................................................................................................259
CHAPTER SEVEN: CONCLUSIONS AND RECOMMENDATIONS ........................264 7.1. Conclusions ...........................................................................................................264
7.2. Recommendations for Future Work. ....................................................................265
Appendix A. Supporting Information for Chapter Four .............................................267 Appendix B: Supporting Information for Chapter Five ...............................................273 Appendix C: Supporting Information for Chapter Six ................................................278
Appendix D: Copy right clearence ..............................................................................286
x
List of Tables
Table 2. 1: Wettability index approximations for different systems as suggested by cuiec
(Cuiec et al., 1978). ............................................................................................................... 40
Table 2.2: Craig's rule of thumb. .................................................................................................. 43
Table 4.1: Properties of the synthetic brine and brine containing different types of NPS at 25oC.
............................................................................................................................................. 135
Table 4.2: Estimated parameters obtained from fitting the obtained imbibition data. ............... 162
Table 4.3: Characteristics of the core sample used for the flooding test .................................... 163
Table 4.4: Recovered Oil during the Displacement Tests before and after Nanofluids Injection
............................................................................................................................................. 163
Table 5.1: Physical properties of the brine and prepared nanofluids at 25oC. ............................ 178
Table 5.2: Asphaltene elemental analysis ................................................................................... 179
Table 5.3: SARA Analysis of the Crude Oil Sample.................................................................. 191
Table 5.4: EOR Scenarios and Experimental Conditions ........................................................... 211
Table 6.1. Properties of selected oil samples. ............................................................................. 226
Table 6.2. Properties of Synthetic Formation Brine ................................................................... 226
Table 6.3. Physical properties of the brine and prepared nanofluids at 25oC. ............................ 227
Table 6.4. Experimental details for cores used in wettability quantification .............................. 230
Table 6.5. petrophysical properties and fluids saturation for various cores ............................... 232
Table 6.6. Relative permeability measurements ......................................................................... 242
Table 6.7 Summary of the results of the core flooding experiments .......................................... 244
xi
List of Figures and Illustrations
Figure 1.1: Literature references focused on nanotechnology applications for 2014
(SciFinder®, copyright© 2014 American Chemical Society). ............................................... 3
Figure 2.1: Global oil production forecast (OPEC’s 2015 World Oil Outlook). ......................... 17
Figure 2.2: Capillary pressure hysteresis curve (Green and Willhite 1998). ............................... 23
Figure 2.3: Classification of EOR Methods. ................................................................................. 26
Figure 2.4: Schematic of macroscopic displacement efficiency improvement with polymer
augmented waterflooding(Green & Willhite, 1998). ............................................................ 29
Figure 2.5: Incremental oil recovery from an EOR process(Sheng, 2010). ................................ 32
Figure 2.6: Oil/ water/ solid wetting angle. .................................................................................. 35
Figure 2.7: USBM wettability measurement: (I-brine drive. 11-oil drive) (a) water wet core,
(b) oil-wet core, (c) neutral wet core. (Anderson, 1986b). ................................................... 41
Figure 2.8: Relative permeability curves in water-wet and oil wet reservoirs (Crain’s
petrophysical Handbook). ..................................................................................................... 44
Figure 2.9: Schematic of capillary desaturation curves. (Lake, 1989). ....................................... 47
Figure 3.1: Various features contributing to the diversity of engineered nanoparticles. ............. 58
Figure 3.2: Schematic representation of electrostatic and steric stabilization. ............................ 76
Figure 3.3: Schematic representation of electrostatic and steric stabilization. ............................ 77
Figure 3.4: (a) Representation of a 2 nm nanoparticle of pyroxene showing the hydroxylated
surface. (b) Representation of half of the pyroxene nanoparticle reacted with the
triethoxy(octyl)silane (ball and stick) anchored by the hydroxyls present on the surface.
(c) Representation of the total pyroxene nanoparticle reacted with the
triethoxy(octyl)silane (ball and stick) anchored by the hydroxyls present on the surface. ... 79
Figure 3.5: Nanofluids of nanopyroxene functionalized with (a) triethoxy octyl silane pH 6.5
and (b) same solution pH adjusted to 9 (Sagala et al., 2019). ............................................... 79
Figure 3.6: A representation of how nanoparticle concentration affects the oil viscosity (a),
and (b) effect of shear rate on viscosity for different volumes of nanoparticle (Duan,
Kwek, & Crivoi, 2011; Shokrlu & Babadagli, 2014), respectively. ..................................... 87
Figure 3.7: Schematic representation of the morphological modulation modified from
reference (F. Yang, Paso, et al., 2015) after permission. .................................................... 103
xii
Figure 3.8: Illustration of how nanoparticles detach oil from the surface due to the structural
disjoining force (Sagala et al., 2019). ................................................................................. 103
Figure 3.9: Nanoparticle structuring in the wedge-film resulting in structural disjoining
pressure gradient at the wedge vertex (D. Wasan et al., 2011). .......................................... 105
Figure 3.10: Effect of nanoparticle concentration on oil recovery enhancement. Obtained
from reference (Lu, Li, & Zhou, 2017) with permission. ................................................... 107
Figure 3.11: SEM images of the core at different nanoparticle concentrations showing
permeability impairment (red circles) caused by the injection of nanofluids. Obtained
from reference (Lu, Li, Zhou, et al., 2017) with permission. ............................................ 108
Figure 3.12: Effects of different nanoparticle types on oil recovery enhancement. Obtained
from reference (M. Manan et al., 2015) after permission. .................................................. 109
Figure 3.13: Effect of nanoparticle size on oil recovery enhancement. Obtained from
reference (Jain et al., 2009) after permission. ..................................................................... 110
Figure 3.14: On the left (a) is the schematic diagram of different tested injection schemes
and on the right (b) is tertiary oil recovery rates for the selected runs. Modified from
reference (Lu, Li, Zhou, et al., 2017) after permission. ..................................................... 111
Figure 3.15: Oil recovery via Al2O3, TiO2, and SiO2 nanofluids at different temperatures
after brine flooding Obtained from reference (Esfandyari Bayat et al., 2014) after
permission. .......................................................................................................................... 112
Figure 3.16: Effect of temperature on IFT (a) and contact angle (b). Obtained and modified
from reference (Esfandyari Bayat et al., 2014) after permission. ...................................... 113
Figure 4.1: (a) Representation of Triethoxy(octyl)silane, (b) Corey Pauling Koltun (CPK)
representation of nanoparticle of nanopyroxene showing the hydroxylated surface, (c)
Representation of half of the nanopyroxene nanoparticle reacted with the
Triethoxy(octyl)silane (ball and stick) anchored by the hydroxyls present on the surface.
(d) Representation of the total nanopyroxene nanoparticle reacted with the
Triethoxy(octyl)silane (ball and stick) anchored by the hydroxyls present on the surface.
Red spheres represent oxygen atoms; grey spheres represent carbon atoms; white
spheres represent hydrogen atoms; yellow spheres represent silicon atom; green spheres
represent sodium atoms and purple spheres represent iron atoms. The visualizer module
of BIOVIA Materials Studio 2018 was used to draw the nanopyroxene nanoparticles
and their reaction with Triethoxy(octyl)silane. ................................................................... 137
Figure 4.3: Optical images of (a) NPNP and (b) wax balls stabilized with pyroxene and (c)
Janus SEM mapping to confirm the presence of NPNP on wax balls. ............................... 144
Figure 4.4: XRD pattern for the Virgin and functionalized nanopyroxene. .............................. 145
xiii
Figure 4.5: FTIR of pyroxene nanoparticles before and after surface modification with TOS
at framework regions of (a) 4000-2400 cm-1and (b) 1800-400 cm-1. ................................. 146
Figure 4.6: TGA thermograms of pyroxene nanoparticles before and after functionalization
with TOS. ............................................................................................................................ 147
Figure 4.7: Zeta potential of pyroxene nanofluids with different surface functionalities. ....... 148
Figure 4.8: DLS particle size distribution (a) before at the original pH of 6.5 and (b) after
adjusting the pH to 9. .......................................................................................................... 149
Figure 4.9: IFT of oil/fluid phases at different temperatures and atmospheric pressure. .......... 150
Figure 4.10: Contact angle measurements before and after treatment with nanofluids: (1) oil
drop/brine/substrate, (2) oil drop/NPNP fluid/substrate, (3) oil drop/HPNP
fluid/substrate and (4) oil drop/JPNP fluid/substrate. ......................................................... 153
Figure 4.11: Imbibition of pyroxene-based nanofluids and brine in Berea sandstone at 60 oC. 155
Figure 4.12: Underlying EOR mechanism of the pyroxene-based nanofluids for (a) without
nanoparticles, (b) in presence of nanoparticles, and (c) wedge film of nanoparticles leads
to a disjoining pressure gradient. ........................................................................................ 159
Figure 4.13: Normalized oil recovery against dimensionless imbibition time for NPNP,
JPNP and HPNP fitted by single parameter model. Points are experimental data, dashed-
lines are model fitting (Equation 4). ................................................................................... 161
Figure 4.14: Oil recovery and differential pressure (DP) profiles vs injected PV. .................... 164
Figure 5.1: Step-by-step schematic illustration of nanoparticle synthesis and its application
for oil recovery. ................................................................................................................... 177
Figure 5.2: Displacement test diagram: (1) carbon dioxide cylinder, (2), manometer gauge,
(3), (4), and (5) transfer cells for oil, brine, and nanofluids respectively, (6) valves, (7)
pressure transducer, (8) core holder, (9) data acquisition computer, (10) back pressure
regulator, (11) collector, (12) ISCO pump, (13) overburden pressure gauge. .................... 186
Figure 5.4: Scanning electron microscope (SEM) of hydroxylated-nanopyroxene and (b)
particle size distribution based on the DLS experiment (before and after pH adjustment)
blue and red respectively). .................................................................................................. 189
Figure 5.5: FTIR spectra of sand (green), oil sample(red) and sand after ageing with
oil(blue) at the framework of 400-4000 cm-1. ..................................................................... 193
Figure 5.6: Kinetics of n-C7 asphaltene aggregation in Heptol 50,60, and 70 solutions (a) and
(b) kinetics of n-C7 asphaltene aggregation in Heptol 60 in the presence of 0, 25,50 and
100 ppm. ............................................................................................................................. 196
xiv
Figure 5.7: IFT of oil-fluid phases at different temperatures and atmospheric pressure. .......... 197
Figure 5.8: Contact angle measurements before and after treatment with nanofluids: (a) oil
drop/brine/substrate (0 ppm), (b) brine with pH 10, (c) oil drop/25 ppm
nanofluid/substrate, (d) oil drop/50 ppm fluid/substrate, (e) oil drop/100 ppm
fluid/substrate. ..................................................................................................................... 200
Figure 5.9: Wettability index for different measured fluids. ..................................................... 202
Figure 5.10: Spontaneous imbibition of various fluids without initial water saturation (a) and
in the presence of initial water saturation (b) at 60 oC. ....................................................... 204
Figure 5.11: Mechanism of interactions between crude oil components and solid surface, (a)
typical crude oil components with polar functionality, (b) surface precipitation, (c) acid-
base interaction, (d) ion binding. ........................................................................................ 208
Figure 5.12: Zeta potential for the Berea sandstone in brine at various pH. ............................. 210
Figure 5.13: Oil recovery (a) and additional tertiary recovery (b) against injected PV for the
considered fluids. ................................................................................................................ 211
Figure 6.1: Selected TEM images for of a,b (N-PNP), c,d (N-PEI),e,f (N-PEO) and g,h (N-
TOS). ................................................................................................................................... 235
Figure 6.2: FTIR (a) and TGA thermograms (b) of pyroxene nanoparticles before and after
functionalization with TOS, PEI and PEO.......................................................................... 235
Figure 6.3: (a) Zeta potential measurements of sand particles in the presence of different
brine solutions and (b) effect of nanoparticles on Zeta potential measurements of
LSW(1000ppm) combined with 50ppm for each nanoparticle type in comparison to
FB(B). ................................................................................................................................. 237
Figure 6.4: (a) Zeta potential measurements using LSW (1000ppm) combined with 50ppm
for each nanoparticle and DLS measurements (b) for the nanofluids................................. 238
Figure 6.5: (a) Contact angle measured in presence of Na+ alone in brine, (b) the presence of
divalent ions (Mg2+ and Ca2+ in brine) (C) twice the concentration of Ca2+and Mg2+ in
the divalent ions in brine. .................................................................................................... 240
Figure 6.6: Contact angle measurements for (a) LSW alone, (b) LSW with nano-pyroxene
modified with N-PEI, (c) modified with N-PEO, (d) modified with N-TOS measured at
60 oC for 24h. ...................................................................................................................... 241
Figure 6.7: Spontaneous imbibition experiments for the nanofluids at 60 oC ........................... 242
Figure 6.8: Relative permeability curves for the (a) base case (FW) followed by LSW
injection and (b) FW followed by LSW + N-TOS. ............................................................ 244
xv
Figure 6.9: Oil recovery profile (primary vertical axis) and pressure drop (secondary vertical
axis) between injection and production end (DP) for the core plug C1 test. ...................... 246
Figure 6.10: Oil recovery factor and pressure drop between injection and production end
(DP) for the core plug C2 test. ............................................................................................ 248
Figure 6.11: Oil recovery factor and pressure drop between injection and production end
(DP) for the core plug C3 test. ............................................................................................ 250
Figure 6.12: Oil recovery profiles for the oil samples A, B and C Using FB-B and LSW
alone Using cores C2, C4 and C5. ...................................................................................... 252
Figure 6.13: Comparison of oil recovery profiles for the two oil samples A and B in the
presence of LSW coupled with N-TOS using cores plugs C6 and C7. .............................. 253
Figure 6.14: Effluent pH for different tests. .............................................................................. 254
Figure 6.15: Schematic representation describing the mechanism(s) involving organic
compound desorption from the clay surface at high pH. Colored spheres: red represents
oxygen atoms; white represents hydrogen atoms; dark green represents aluminium
atoms; orange represents silicon atoms; grey represents carbon atoms; dark green
represents nitrogen atoms. .................................................................................................. 256
Figure 6.16: Residual oil saturation and tertiary recovery obtained at different injection
scenarios. ............................................................................................................................. 258
xvi
List of Symbols, Abbreviations and Nomenclature
Abbreviations
AN = Acid number
BN = Base number
DLS = Dynamic light scattering
EOR = Enhanced oil recovery
ED = Displacment efficency
EDX = Energy disspersive x-ray
FB = Formation brine
FID = Flame ionization detector
FTIR = Fourier-transform infrared spectroscopy
HPNP = Hydroxyl-functionalized nano-pyroxene
IFT = Interfacial tension(mN/m)
JPNP = Janus pyroxene nanoparticles
LSWF = Low salinity water flooding
NPNP = Nanopyroxene nanoparticle
OOIP = Original oil in place (%)
PVI = Pore volume injected (cc)
PEI = Polyethylene amine
PEO = Polyethylene oxide
RF = Recovery factor (%)
RRF = Residual resisistance factor
SEM = Scanning electron microscope
TOS = Tri ethoxy oct silane
TEM = Transsimssion electron microscope
TGA = Thermo gravmetric analysis
VB = Bulk volume
XRD = X-ray diffraction
xvii
Symbols
L = Core length(cm)
D = Core diameter (cm)
𝐼 = Amott-Harvey relative displacement
Kabs = Absolute permeability, Darcy
Ko = Effective Permeability to oil(mD)
Kr = Relative permeability to oil
Kro = Oil relative permeability to oil
Krw = Oil relative permeability to water
∆p = differential pressure
𝑁𝐵 = Bond number
Pc = Capillary pressure
Soi = Initial oil saturation(%)
Sor = Residual oil saturation(%)
T = Time (s)
𝑡𝐷 = Dimmesionless time
Swi = Initial water saturation(%)
𝑟 = Pore radius (cm)
𝑁𝑐𝑎 = capillary number
Q = Volumetric flow rate cm3/s
WI = Wetterbilty index
Greek symbols
𝜌 = Density kg/m3
∆𝛾 = Structural disjoining force gradient or film tension gradient
𝜎 = Interfacial tension,Mn/m
𝜃 = Contact angle
𝜇 = viscosity
ξ = Zeta potential
∈ = dielectric constant

xviii
Epigraph
“Creativity is seeing what others see and thinking what no one else has ever thought”.
Einstein
1
Chapter One: Introduction
1.1 Background
Conventional world oil recovery methods (i.e., primary and secondary) typically extract
approximately one-third of the original oil-in-place in the reservoir (Lake & Venuto, 1990).
Estimated reserves worldwide range up to 1.5 trillion barrels and it is estimated that substatial oil
remains trapped as residual oil saturation (ROS) after conventional recovery (Council, 1976).
Several enhanced oil recovery (EOR) techniques, generally grouped as tertiary production
schemes such as thermal recovery, chemical flooding, i.e, alkaline flooding (A), polymer flooding
(P), surfactant flooding (S), or a combination of either technique, alkaline-polymer (AP), alkaline-
surfactant (AS), surfactant-polymer (SP), alkaline-surfactant-polymer (ASP) or gas flooding, have
targeted these huge unexploited reserves (Alvarado & Manrique, 2010; Bilak, 2006; Siddiqui,
2010; Thomas, 2008; Yousef, Al-Saleh, & Al-Jawfi, 2012). However, finding an economical and
efficient method to extract this remaining residual oil after primary and secondary recovery
remains a challenge, besides that, current tertiary practices depend on crude prices (Kong & Ohadi,
2010; Maggio & Cacciola, 2009). Hence, further studies are needed to introduce sustainable, cost-
effective, efficient, and environmentally friendly techniques.
Generally, any EOR technique aims to reduce residual oil saturation (ROS) that remains after
implementation of the primary and secondary recovery methods which have reached their
maximum production limit. There are reported mechanisms for reducing ROS (Lake, Johns,
Rossen, & Pope, 2014), among them include, the reduction of oil-water interfacial forces (Shah,
2012) which are directly proportional to capillary forces that are responsible for oil trapping (Green
& Willhite, 1998). Increasing the mobility ratio between oil and water has been suggested as
2
another possible way of reducing ROS (Abe, 2005). Using high viscosity agents for mobility
control (Sorbie, 2013), or applying thermal methods that always reduce the oil viscosity and
improve its mobility as well as altering the reservoir rock wettability are among other mechanisms
used in reducing the ROS (Shu & Hartman, 1986). Therefore, during the development of an EOR
technique, the aim is to achieve any of the above mechanisms. It is also important to consider that
the design must be economic, efficient, and reliable. Yet, many of these techniques are technically
successful but economically failures, creating a gap for venturing into more alternative means to
recover the residual oil (Olajire, 2014).
In recent years, nanotechnology as an alternative in form of nanoparticles alone or integrated with
the aforementioned conventional enhanced recovery processes has shown promising performance
in improving oil recovery (Giraldo, Benjumea, Lopera, Cortes, & Ruiz, 2013; Hendraningrat, Li,
& Torsæter, 2013; McElfresh, Holcomb, & Ector, 2012; Ogolo, Olafuyi, & Onyekonwu, 2012;
ShamsiJazeyi, Miller, Wong, Tour, & Verduzco, 2014; Torsater, Engeset, Hendraningrat, &
Suwarno, 2012). Nanotechnology is a branch of applied science and engineering focusing on the
design, synthesis, characterization, and application of materials on the nanoscale (1 to 100 nm), at
least in one dimension (Fiiipponi & Sutherland, 2012). These nanoparticles have greatly
revolutionized the perspective of researchers towards the use of smart materials. Advances in
nanotechnology have enabled scientists to design a collection of various unique nanomaterials,
nanodevices, and nanotools that can find tremendous uses in electronics, medicine, biomedicine,
drug delivery, photography, and energy (Chang & Wu, 2013; Cheng et al., 2007; Mout, Moyano,
Rana, & Rotello, 2012; Serrano, Rus, & Garcia-Martinez, 2009; Shen, Zhang, Huang, Xu, & Song,
2014; Subbiah, Veerapandian, & S Yun, 2010; K. Yang et al., 2012). Nanotechnology applications
have been addressed intensively throughout different fields of studies. For instance, to provide a
3
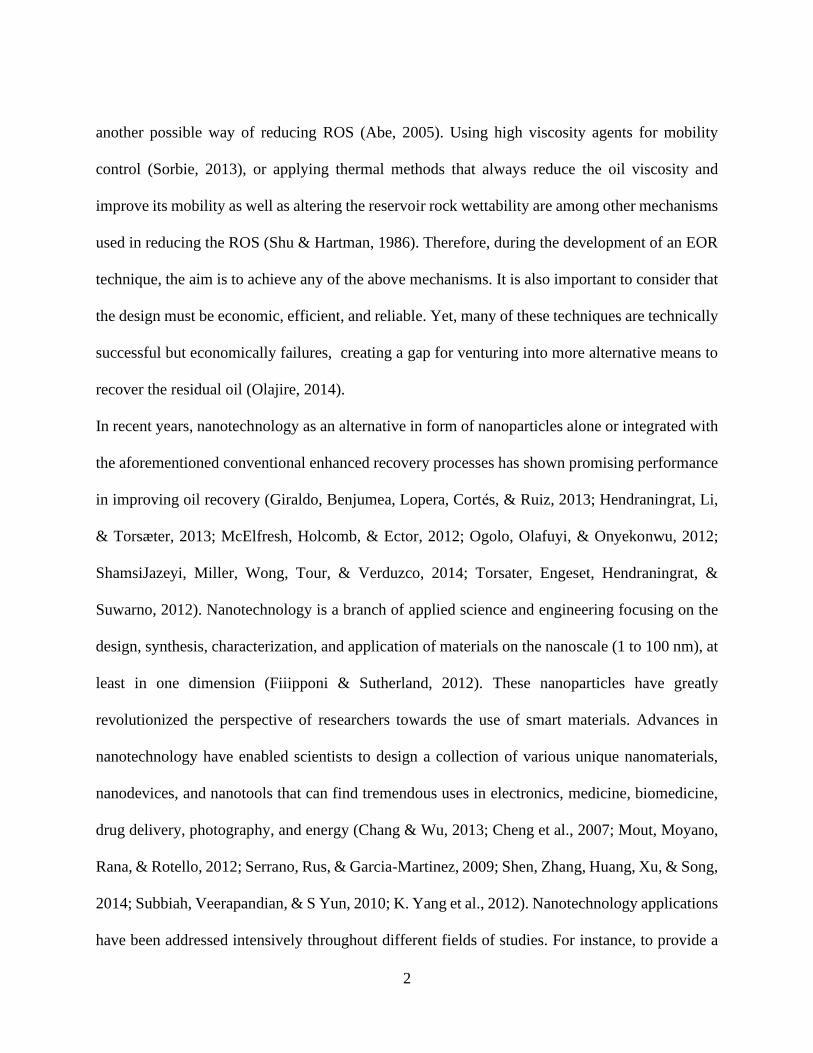
global overview of the state of art and science, a literature assessment published in the year (2014)
conducted by SciFinder® is illustrated in Figure 1.1 As seen, most of the literature deals with the
application of NP technology in the areas of medicine, energy, and environment.
Figure 1.1: Literature references focused on nanotechnology applications for 2014 (SciFinder®,
copyright© 2014 American Chemical Society).
Nanoparticles are defined as particles with a diameter between 1 and 100 nm, exhibiting novel
properties that are different from the same bulk-sized materials (Patil, 2008). This is due to their
smaller size that results in unique chemical and physical properties that are not often found in their
bulk counterparts (Kong & Ohadi, 2010). In bulk materials, the number of atoms at the surface is
significantly smaller than in the whole bulk material, which makes their chemical and physical
properties constant regardless of their size (Wong & De Leon, 2010). However, when the size is
reduced like in the case of nanoparticles, several properties such as quantum confinement i.e.,
optical and electronic properties, magnetism, thermal resistance, catalytic activities, internal
pressure, melting point, dispersion ability, and intrinsic reactivity are all altered (Perez, 2007).
This is due to the surface area to volume ratio that becomes larger, and the number of atoms at the
4
surface becomes significant, these atoms are exposed to the surface of the material with regards to
those in the bulk (Lei et al., 2010).
Nanoparticles not only offer environmental and cost-effective industrial processes but also offers
precise manipulation of their surfaces because of the existence of exceptionally high active sites
(Nafie, Vitale, Carbognani Ortega, & Nassar, 2017). This explains some of their special properties
such as high adsorption capability and catalytic activity (Serrano et al., 2009). In general,
nanoparticles are highly mobile in porous media given their smaller size compared to the pore
spaces and can be transported effectively while flowing into the reservoir formation (Jeong & Kim,
2009; Yu, An, Mo, Liu, & Lee, 2012). This rapid advancement in nanotechnology in the past few
decades has led to the application of various nanosized materials in oil and gas-related activities
ranging from exploration, drilling to production (Khalil, Jan, Tong, & Berawi, 2017; Matteo,
Candido, Vera, & Francesca, 2012). Nevertheless, the increasing global demand for energy and
the existing challenges in the application of the current conventional EOR methods has forced
researchers to embark on the search for the use of these nanomaterials in form of smart fluids to
extract more hydrocarbons (Khalil et al., 2017).
The use of nanoparticles in enhancing oil recovery (EOR) has attracted the attention of researchers
in recent years (Ogolo et al., 2012; Suleimanov, Ismailov, & Veliyev, 2011; T. Zhang, Davidson,
Bryant, & Huh, 2010). Nanoparticles can drastically improve oil recovery by changing the
geomechanics of the reservoir and modifying the reservoir properties, like altering the reservoir
wettability and reducing the interfacial tension between oil and water (Hendraningrat, Li, &
Torsater, 2013; H. Zhang, Nikolov, & Wasan, 2014). Based on their adsorption capability, they
can be used in overcoming production problems such as inhibiting asphaltene and wax deposition
(Negin, Ali, & Xie, 2016; Norrman, Solberg, Sjoblom, & Paso, 2016; F. Yang et al., 2015). Several
5
studies on the application of nanoparticles in EOR have concluded that nanoparticles, due to their
microstructures, access the pore spaces which are not accessible for conventional recovery
techniques ultimately improving oil recovery (Hashemi, Nassar, & Almao, 2014; Negin et al.,
2016; Ogolo et al., 2012). This can change both the reservoir and fluid properties and improve oil
recovery (Negin et al., 2016). Several applications of nanoparticles in EOR have been conducted
in laboratories to understand the phenomenology under which nanoparticles improve oil recovery
(Giraldo et al., 2013; Hendraningrat, Li, & Torsater, 2013; Hendraningrat & Torsaeter, 2014; Lu,
Li, Zhou, & Zhang, 2017). The proposed nano-EOR mechanism include interfacial tension
reduction (Li & Torsæter, 2014; Torsater et al., 2012), wettability alteration (Giraldo et al., 2013;
Hendraningrat, Li, & Torsater, 2013), oil viscosity reduction (Esfandyari Bayat, Junin, Samsuri,
Piroozian, & Hokmabadi, 2014; Hashemi et al., 2014), enhancing thermal recovery (Choi &
Eastman, 1995), improving the fluid rheology (Genc & Phulé, 2002) and structural disjoining
pressure gradient (SDP). This last mechanism is particularly interesting because it is unique to
nanoparticle solutions and it actively advances the three-phase oil-water-solid contact line while
sweeping oil from the rock. Also, several factors affecting nanoparticle-EOR have been
investigated including nanoparticle types, size, concentration, injection rate, etc. (Lu et al., 2017).
However, most of these studies have been conducted under ambient conditions. Moreover, the
recovery mechanism using nanoparticles still requires further investigation especially by using
environmentally friendly and cost-effective nanoparticles at reservoir conditions. Herein, we aim
at designing, characterizing, and producing naturally-derived silicate-based nanoparticles, then
evaluate their potential as nanofluids for EOR. Nanopyroxene is proposed for this study based on
the literature trend, that has screened and recommended the use of mainly silicate-based
nanoparticles especially in sandstone reservoirs (Hendraningrat, Li, & Torsæter, 2013;
6
Hendraningrat & Torsæter, 2014) because of the compatibility of silicate-based nanoparticles in
such formations. In this study, in-house synthesised nanoparticles are proposed, that offers options
for scalability with no environmental footprints. Besides, this study (use of nanopyroxene) for
EOR is conducted for the first time at reservoir conditions through core flooding experiments to
investigate the potential of these novel nanomaterials in EOR.
1.2 Motivation
Oil is predominately anticipated to be the most used source of energy in the coming decades (Asif
& Muneer, 2007). The projected global energy demand by 2030 is expected to be higher than
nowadays, yet the supply trends are predicted to decline due to the depletion of conventional oil
reservoirs. As such, efforts are put on enhanced oil recovery (EOR) techniques (Al Adasani & Bai,
2011; Cashin, Mohaddes, Raissi, & Raissi, 2014). Research in nanotechnology is trending in
various areas of study such as medicine (Douglas, Davis, & Illum, 1987), energy (You, Yang,
Ding, & Yang, 2013), wastewater treatment (Tiwari, Behari, & Sen, 2008) and oil and gas
(Hashemi et al., 2014). Oil and gas industries have gained attention in applying nanoparticles in
various stages of oil recovery ranging from exploration to production. The possibility of applying
engineered nanoparticles in EOR has been extensively investigated and the literature shows that
the unique characteristics of these nanoparticles make them interesting in terms of altering
reservoir properties such as wettability and improving current EOR methods (Hendraningrat, Li,
& Torsater, 2013; Torsater et al., 2012; H. Zhang et al., 2014). However, most of the current studies
(Al-Anssari, Barifcani, Wang, Maxim, & Iglauer, 2016; Esfandyari Bayat et al., 2014;
Hendraningrat, Li, & Torsæter, 2013) are focusing on using commercial nanoparticles which
makes the scalability and optimization of the process for pilot and field applications challenging
and expensive.
7
Herein, a new approach is proposed for synthesizing, characterizing, and applying naturally-
derived silicate-based nanoparticles as nanofluids for EOR in sandstone reservoirs. Iron silicate
nanoparticles (nanopyroxene) are chosen for this study because they are innocuous naturally-
derived materials (Vitale, 2013) and widely spread in nature making them environmentally
friendly. These nanomaterials are synthesized under mild hydrothermal conditions that allow their
preparation at very low temperatures and pressure (Vitale, 2013). Hence these synthesis pathways
provide scalability options (Vitale, 2013). These materials also have superficial cation exchange
capabilities that offer possibilities of anchoring various silanol/polymer or surfactant groups that
can improve their surface activity and stability. Anchoring or surface modification of these
materials can be accomplished directly and at room temperatures without using any bridge, unlike
the existing commercial nanoparticles. Moreover, their stability at high temperature and pressure
makes them suitable for harsh reservoir applications (Vitale, 2013). Besides, silicate-based
nanoparticles are preferred as EOR agents in sandstone since 99.8% of silicate-based nanoparticles
is silicon dioxide (SiO2) which is the main component of sandstones reservoirs (Miranda, Lara, &
Tonetto, 2012). This study aims to evaluate the performance of silicate-based nanoparticles when
used as nanofluids at optimized concentrations for EOR purposes in sandstone reservoir cores as
a standalone or when integrated with existing inexpensive conventional techniques.
1.3 Objectives
The main objective of this study is to synthesis and evaluate the performance of silicate-based
nanofluids for enhanced oil recovery in sandstone reservoirs. The specific objectives are:
1. Carry out an extensive review of the available literature and patent data on the application
of nanomaterials as chemical agents for EOR focusing on the recent progress and current
8
challenges. This review included identifying and gathering high-quality data based on the
nanoparticle types, recovery processes and mechanisms.
2. Prepare and characterize naturally derived silicate-based nanoparticles and functionalize
it with different polymers and/or silane.
3. Prepare different families of silicate-based nanofluids and characterize them with
advanced tools such as dynamic light scattering (DLS), zeta potential measurements.
4. Investigate the role of the formulated nanofluids on selected EOR parameters such as
interfacial tension, wettability, asphaltene aggregation, contact angle and conducting batch
recovery studies through imbibition and displacement experiments under different
reservoir conditions.
5. Apply silicate-based nanoparticles coated with polymers and/or silane in EOR by
integrating them with low salinity water flooding (LSWF) for EOR applications in
sandstone reservoirs.
1.4 Organization of the thesis
This thesis consists of seven chapters and three appendices. The thesis is a collection of three
articles all already published, and one book chapter submitted. In Chapter one, background,
motivation, objectives, and organization of the thesis are presented. A brief introduction has been
included in this chapter since each chapter has a detailed introduction related to the subject of the
paper.
Chapter Two gives a general literature overview and a background of some relevant concepts and
fundamentals of EOR and fluid flow in a porous media.
Chapter Three was considered to address the recent progress of nanoparticle application in
enhanced oil recovery. The output from this research phase has been submitted as a book chapter
9
to springer nature publisher with a tittle “Nanoparticles as Potential Agents for Enhancing Oil
Recovery” and it is a subchapter of the book titled: Nanotechnology for Enhancing In-Situ
Recovery and Upgrading of Oil and Gas Processing” published by Springer Nature. In this
chapter, a complete literature survey aiming at reviewing the recent works on the use of
nanoparticles as nanofluids for EOR is reported herein. Techniques for the design,
characterization, stabilization, and application of nanoparticles in EOR were explored. Moreover,
in this chapter, we investigated the applicable mechanisms of nanoparticles in EOR and compared
literature trends that are currently reported by several researchers. Besides, the effects of different
parameters such as nanoparticle types, size, concentration, temperature, salinity, and injection
sequence/cycle were also explored. We also highlighted the major types of nanoparticles that are
recommended for EOR in either sandstone or carbonate reservoirs and their limitations and/or
challenges. Building on the aforementioned factors, this chapter is expected to pave a way towards
the use of silicate-based nanoparticles phenomenally as nanofluids for EOR.
Chapter Four describes the synthesis of silicate-based nanoparticles and/or nanofluids for EOR
application in sandstone at reservoir conditions. This chapter was included in a paper entitled
“Nanopyroxene-Based Nanofluids for Enhanced Oil Recovery in Sandstone Cores at
Reservoir Temperature.” by Farad Sagala, Tatiana Montoya, Afif Hethnawi, Gerardo Vitale, and
Nashaat N. Nassar, and Published in Energy and Fuel, 2019, vol 33, P. 877-890. In this study,
we partially altered the functionality of the nanopyroxene by anchoring a hydrophobic
functionalizing agent of triethoxy (octyl) silane (TOS) to the hydroxylated binding sites,
generating half and fully hydroxyl-functionalized nano-pyroxene, namely: HPNPs and JPNPs,
respectively. Characterization techniques, such as SEM, FTIR, XRD, TGA, DLS, and Z-potential
were conducted for the produced NPs to confirm their surface identity, functionality, stability, and
10
morphology. After that, in comparison with brine, three different nanofluids were generated from
the synthesized NPs to test their performance toward EOR in sandstone cores.
Chapter Five describes the controlling parameters of HPNP from Chapter four towards oil
recovery. This chapter is part of an article entitled “Hydroxyl-Functionalized Silicate-Based
Nanofluids for Enhanced Oil Recovery” by Farad Sagala, Afif Hethnawi, and Nashaat N.
Nassar, published in Fuel 269, (2020), 117462.
Chapter Six focuses on integrating the optimized concentration of nanoparticles from chapter Five
with low salinity water flooding to understand the underlying mechanisms. This chapter is part of
an article entitled “Integrating Silicate-based Nanoparticles with Low Salinity Water
Flooding for Enhanced Oil Recovery in Sandstone Reservoirs” by Farad Sagala, Afif
Hethnawi, and Nashaat N. Nassar, and published in Industrial & Engineering Chemistry
Research, Ind. Eng. Chem. Res. 2020, 59, 16225−16239. The main objective of this study was
to understand, the fluid/rock interaction at different salinities in the presence of various surface
modified nanopyroxene nanoparticles. In this part of the study, nanopyroxene was surface
modified using polyethene amine (PEI), polyethene oxide (PEO) and Triethoxy octyl silane (TOS).
Surface charge, wettability measurements in the presence of various ions in the irreducible water
and core flooding experiments have been conducted to understand the underlying mechanism(s).
Surface charge was evaluated by zeta potential measurements and wettability was determined by
the contact angle, imbibition, and relative permeability measurements. Sandstone outcrops and
three oil samples with different composition were used in this study. The results showed that initial
rock wettability depends on the initial brine salinity and oil composition. Using brine with low
ionic strength (1000 ppm) combined with 0.005 wt% nanoparticles improved the nanofluid
stability. Additionally, in the presence of LSWF combined with nanoparticles, the thickness of the
11
double-layer on the rock surface greatly expands, thus increasing the magnitude of zeta potential
compared to LSWF alone. This creates a greater repulsive force that alters the rock wettability
from oil/neutral wet to stronger water-wet, with a high shift in the relative permeability curve to
the right. Consequently, this results in improved oil recovery by about 15% of the oil originally in
place. Based on the obtained finding from this study, LSWF coupled with nanoparticles provides
a prospect of being applied in EOR. Based on the obtained results, in the current study.
Finally, Chapter 7 concludes the important aspects of this research and provides recommendations
for future studies. It should be noted that the present thesis is based on refereed papers that have
already been published.
Unavoidably, there will be some repetitions between the chapters particularly in the introduction
part or in the sections dealing with the experimental set-up and analytical analysis.
Appendix A provides the Supporting Information for the first published paper with some details
from Chapter Four.
Appendix B provides the Supporting Information for the second published paper with some details
from Chapter Five.
Appendix C provides Supporting Information for the third published paper with some details from
Chapter Six.
12
1.5 References
Abe, A. A. (2005). Relative permeability and wettability implications of dilute surfactants at
reservoir conditions.
Al-Anssari, S., Barifcani, A., Wang, S., Maxim, L., & Iglauer, S. (2016). Wettability alteration of
oil-wet carbonate by silica nanofluid. Journal of colloid and interface science, 461, 435-
442.
Al Adasani, A., & Bai, B. (2011). Analysis of EOR projects and updated screening criteria. Journal
of Petroleum Science and Engineering, 79(1), 10-24.
Alvarado, V., & Manrique, E. (2010). Enhanced oil recovery: an updated review. Energies, 3(9),
1529-1575.
Asif, M., & Muneer, T. (2007). Energy supply, its demand and security issues for developed and
emerging economies. Renewable and Sustainable Energy Reviews, 11(7), 1388-1413.
Bilak, R. (2006). Enhanced oil recovery methods: Google Patents.
Cashin, P., Mohaddes, K., Raissi, M., & Raissi, M. (2014). The differential effects of oil demand
and supply shocks on the global economy. Energy Economics, 44, 113-134.
Chang, H., & Wu, H. (2013). Graphene-based nanocomposites: preparation, functionalization, and
energy and environmental applications. Energy & Environmental Science, 6(12), 3483-
3507.
Cheng, J., Teply, B. A., Sherifi, I., Sung, J., Luther, G., Gu, F. X., . . . Farokhzad, O. C. (2007).
Formulation of functionalized PLGA–PEG nanoparticles for in vivo targeted drug
delivery. Biomaterials, 28(5), 869-876.
Choi, S. U., & Eastman, J. A. (1995). Enhancing thermal conductivity of fluids with nanoparticles:
Argonne National Lab., IL (United States).
Council, N. (1976). Enhanced oil recovery–an analysis of the potential for enhanced oil recovery
from known fields in the United States–1976–2000. Washington, DC.
Douglas, S., Davis, S., & Illum, L. (1987). Nanoparticles in drug delivery. Critical reviews in
therapeutic drug carrier systems, 3(3), 233-261.
Esfandyari Bayat, A., Junin, R., Samsuri, A., Piroozian, A., & Hokmabadi, M. (2014). Impact of
metal oxide nanoparticles on enhanced oil recovery from limestone media at several
temperatures. Energy & Fuels, 28(10), 6255-6266.
Fiiipponi, L., & Sutherland, D. (2012). Nanotechnologies: principles, applications, implications
and hands-on activities: A compendium for educators: European Union, Directorate
General for Research and Innovation.
Genc, S., & Phulé, P. P. (2002). Rheological properties of magnetorheological fluids. Smart
Materials and Structures, 11(1), 140.
Giraldo, J., Benjumea, P., Lopera, S., Cortes, F. B., & Ruiz, M. A. (2013). Wettability alteration
of sandstone cores by alumina-based nanofluids. Energy & fuels, 27(7), 3659-3665.
Green, D. W., & Willhite, G. P. (1998). Enhanced oil recovery (Vol. 6): Henry L. Doherty
Memorial Fund of AIME, Society of Petroleum Engineers Richardson, TX.
Hashemi, R., Nassar, N. N., & Almao, P. P. (2014). Nanoparticle technology for heavy oil in-situ
upgrading and recovery enhancement: Opportunities and challenges. Applied Energy, 133,
374-387.
Hendraningrat, L., Li, S., & Torsæter, O. (2013). A coreflood investigation of nanofluid enhanced
oil recovery. Journal of Petroleum Science and Engineering, 111, 128-138.
13
Hendraningrat, L., Li, S., & Torsater, O. (2013). A coreflood investigation of nanofluid enhanced
oil recovery in low-medium permeability Berea sandstone. Paper presented at the SPE
International Symposium on Oilfield Chemistry.
Hendraningrat, L., & Torsæter, O. (2014). Effects of the initial rock wettability on silica-based
nanofluid-enhanced oil recovery processes at reservoir temperatures. Energy & Fuels,
28(10), 6228-6241.
Hendraningrat, L., & Torsaeter, O. (2014). Unlocking the potential of metal oxides nanoparticles
to enhance the oil recovery. Paper presented at the Offshore Technology Conference-Asia.
Jeong, S.-W., & Kim, S.-D. (2009). Aggregation and transport of copper oxide nanoparticles in
porous media. Journal of Environmental Monitoring, 11(9), 1595-1600.
Khalil, M., Jan, B. M., Tong, C. W., & Berawi, M. A. (2017). Advanced nanomaterials in oil and
gas industry: design, application and challenges. Applied energy, 191, 287-310.
Kong, X., & Ohadi, M. (2010). Applications of micro and nanotechnologies in the oil and gas
industry-overview of the recent progress. Paper presented at the Abu Dhabi international
petroleum exhibition and conference.
Lake, L. W., Johns, R. T., Rossen, W. R., & Pope, G. A. (2014). Fundamentals of enhanced oil
recovery.
Lake, L. W., & Venuto, P. B. (1990). A niche for enhanced oil recovery in the 1990s. Oil & Gas
Journal, 88(17), 62-67.
Lei, Y., Mehmood, F., Lee, S., Greeley, J., Lee, B., Seifert, S., . . . Redfern, P. C. (2010). Increased
silver activity for direct propylene epoxidation via subnanometer size effects. Science,
328(5975), 224-228.
Li, S., & Torsæter, O. (2014). An experimental investigation of EOR mechanisms for nanoparticles
fluid in glass micromodel. Paper presented at the Paper SCA2014-022 was prepared for
presentation at the International Symposium of the Society of Core Analysts held in
Avignon, France.
Lu, T., Li, Z., Zhou, Y., & Zhang, C. (2017). Enhanced oil recovery of low-permeability cores by
SiO2 nanofluid. Energy & fuels, 31(5), 5612-5621.
Maggio, G., & Cacciola, G. (2009). A variant of the Hubbert curve for world oil production
forecasts. Energy Policy, 37(11), 4761-4770.
Matteo, C., Candido, P., Vera, R., & Francesca, V. (2012). Current and future nanotech
applications in the oil industry. American Journal of Applied Sciences, 9(6), 784.
McElfresh, P. M., Holcomb, D. L., & Ector, D. (2012). Application of nanofluid technology to
improve recovery in oil and gas wells. Paper presented at the SPE International Oilfield
Nanotechnology Conference and Exhibition.
Miranda, C. R., Lara, L. S. d., & Tonetto, B. C. (2012). Stability and mobility of functionalized
silica nanoparticles for enhanced oil recovery applications. Paper presented at the SPE
International Oilfield Nanotechnology Conference and Exhibition.
Mout, R., Moyano, D. F., Rana, S., & Rotello, V. M. (2012). Surface functionalization of
nanoparticles for nanomedicine. Chemical Society Reviews, 41(7), 2539-2544.
Nafie, G., Vitale, G., Carbognani Ortega, L., & Nassar, N. N. (2017). Nanopyroxene grafting with
β-Cyclodextrin monomer for wastewater applications. ACS applied materials & interfaces,
9(48), 42393-42407.
Negin, C., Ali, S., & Xie, Q. (2016). Application of nanotechnology for enhancing oil recovery–
A review. Petroleum, 2(4), 324-333.
14
Norrman, J., Solberg, A., Sjoblom, J., & Paso, K. (2016). Nanoparticles for waxy crudes: effect of
polymer coverage and the effect on wax crystallization. Energy & fuels, 30(6), 5108-5114.
Ogolo, N., Olafuyi, O., & Onyekonwu, M. (2012). Enhanced oil recovery using nanoparticles.
Paper presented at the SPE Saudi Arabia section technical symposium and exhibition.
Olajire, A. A. (2014). Review of ASP EOR (alkaline surfactant polymer enhanced oil recovery)
technology in the petroleum industry: Prospects and challenges. Energy, 77, 963-982.
Patil, K. (2008). Chemistry of nanocrystalline oxide materials: combustion synthesis, properties
and applications: World Scientific.
Perez, J. M. (2007). Iron oxide nanoparticles: Hidden talent. Nature Nanotechnology, 2(9), 535-
536.
Serrano, E., Rus, G., & Garcia-Martinez, J. (2009). Nanotechnology for sustainable energy.
Renewable and Sustainable Energy Reviews, 13(9), 2373-2384.
Shah, D. O. (2012). Improved oil recovery by surfactant and polymer flooding: Elsevier.
ShamsiJazeyi, H., Miller, C. A., Wong, M. S., Tour, J. M., & Verduzco, R. (2014). Polymer‐coated
nanoparticles for enhanced oil recovery. Journal of applied polymer science, 131(15).
Shen, W., Zhang, X., Huang, Q., Xu, Q., & Song, W. (2014). Preparation of solid silver
nanoparticles for inkjet-printed flexible electronics with high conductivity. Nanoscale,
6(3), 1622-1628.
Shu, W. R., & Hartman, K. J. (1986). Thermal recovery method for viscous oil: Google Patents.
Siddiqui, S. A. (2010). Enhanced oil recovery methods. Paper presented at the Masters Abstracts
International.
Sorbie, K. S. (2013). Polymer-improved oil recovery: Springer Science & Business Media.
Subbiah, R., Veerapandian, M., & S Yun, K. (2010). Nanoparticles: functionalization and
multifunctional applications in biomedical sciences. Current medicinal chemistry, 17(36),
4559-4577.
Suleimanov, B., Ismailov, F., & Veliyev, E. (2011). Nanofluid for enhanced oil recovery. Journal
of Petroleum Science and Engineering, 78(2), 431-437.
Thomas, S. (2008). Enhanced oil recovery-an overview. Oil & Gas Science and Technology-Revue
de l'IFP, 63(1), 9-19.
Tiwari, D. K., Behari, J., & Sen, P. (2008). Application of nanoparticles in wastewater treatment
1.
Torsater, O., Engeset, B., Hendraningrat, L., & Suwarno, S. (2012). Improved oil recovery by
nanofluids flooding: an experimental study. Paper presented at the SPE Kuwait
international petroleum conference and exhibition.
Vitale, G. (2013). Iron Silicate Nano-Crystals as Potential Catalysts or Adsorbents for Heavy
Hydrocarbons Upgrading. The University of Calgary.
Wong, K. V., & De Leon, O. (2010). Applications of nanofluids: current and future. Advances in
Mechanical Engineering, 2, 519659.
Yang, F., Paso, K., Norrman, J., Li, C., Oschmann, H., & Sjoblom, J. (2015). Hydrophilic
nanoparticles facilitate wax inhibition. Energy & Fuels, 29(3), 1368-1374.
Yang, K., Hu, L., Ma, X., Ye, S., Cheng, L., Shi, X., . . . Liu, Z. (2012). Multimodal imaging-
guided photothermal therapy using functionalized graphene nanosheets anchored with
magnetic nanoparticles. Advanced materials, 24(14), 1868-1872.
15
You, H., Yang, S., Ding, B., & Yang, H. (2013). Synthesis of colloidal metal and metal alloy
nanoparticles for electrochemical energy applications. Chemical Society Reviews, 42(7),
2880-2904.
Yousef, A. A., Al-Saleh, S., & Al-Jawfi, M. S. (2012). Improved/enhanced oil recovery from
carbonate reservoirs by tuning injection water salinity and ionic content. Paper presented
at the SPE Improved Oil Recovery Symposium.
Yu, J., An, C., Mo, D., Liu, N., & Lee, R. L. (2012). Study of adsorption and transportation
behavior of nanoparticles in three different porous media. Paper presented at the SPE
improved oil recovery symposium.
Zhang, H., Nikolov, A., & Wasan, D. (2014). Enhanced oil recovery (EOR) using nanoparticle
dispersions: underlying mechanism and imbibition experiments. Energy & fuels, 28(5),
3002-3009.
Zhang, T., Davidson, D., Bryant, S. L., & Huh, C. (2010). Nanoparticle-stabilized emulsions for
applications in enhanced oil recovery. Paper presented at the SPE improved oil recovery
symposium.
16
Chapter Two: An Overview on Enhanced Oil Recovery
2.1 Introduction
Enhanced oil recovery (EOR) methods are well known for increasing oil recovery, however, the
selection of the most suitable method to adopt for specific field application is challenging. While
it is important to conduct experimental investigations, it is also important to establish a qualitative
knowledge of the underlying mechanisms that influence recovery potentials. An understanding of
the relationship between EOR/IOR, wettability and nanoparticles, a novel tool for addressing
reservoir challenges, is vital for process optimization. This chapter highlights the fundmentals and
the main concepts of of fluid flow in the porous media and their association to hydrocarbon
production from underground formations.
2.2 Background
The continuous growth in energy demand globally appears to be predominant amidst feasible
renewable energy alternatives. Unarguably, this newer energy sources, such as wind, geothermal
and solar are effective measures that are also currently addressing energy shortage (Guha, 1991).
However, they are yet to be sufficient alternatives for replacing the role of oil in meeting the ever-
rising energy demand. To date, these demands are currently being substantiated via hydrocarbon
sources especially petroleum, as oil is still the most valuable product with great global economic
impact. Some projections indicate global oil demand could peak soon after 2025, others expect
demand to continue to grow out after 2040 and beyond as shown in Figure 2.1.
17
Figure 2.1: Global oil production forecast for different regions (OPEC’s 2020 World Oil
Outlook).
Currently, there has been a continuous decline in conventional oil resources. In 2014, an increase
in oil consumption by 1.2 million barrels per day (b/d) globally was reported by the OPEC. Energy
Information Administration, which averaged about 92.4 million b/d (U.S. EIA, 2015). At the end
of the year 2015, the oil production rate was approximately 74 million b/d (OPEC’s 2015), an
increase equivalent to oil consumption rate increase of 1.4 million b/d (U.S. EIA, 2015).
Expectations were that the oil consumption rate globally would grow by 1.4 million b/d in 2016
and 1.5 million b/d by 2018. It is also imperative to mention that since 2014 to present, there is
more oil supply than demand, which is reflected by the drop in crude oil price. However, the
current excess in the oil supply is as a result of the exploitation of the unconventional oil resources
(i.e. tight reservoirs and shale reservoirs) (Fantazzini, Höök, & Angelantoni, 2011). The dramatic
growth in oil demand therefore over time has continuously driven the quest for novel approaches
to enhance oil production. Nanotechnology has recently proved to offer better application
18
alternatives for EOR in the oil and gas industry. However, this technology is still in its infancy
stages mainly at lab scale, mostly in oil production and upstream exploration. The oil industry
wants to improve oil recovery and utilize unconventional resources using these novel materials.
However, due to the research costs and enormous pressure arising from unstable oil prices, it is
becoming challenging to justify such investments. It is believed that nanoparticles may be
manipulated to develop novel nanomaterials with improved performance to overcome these
existing technical barriers. For example, nanosensors can allow precise measurements of reservoir
conditions. Also, nanofluids prepared using modified nanomaterials may show better performance
in numerous oil production processes. In this chapter we first address the fundamentals of fluid
flow in the porous medium, then we summarize the research progress and prospective applications
of nanotechnology and nanoparticle in the oil and gas industry separately as chapter three.
2.3 Fundamentals of fluid flow in the porous medium
Understanding the reservoir and fluid properties is imperative to understand how petroleum fluid
recovery works. When analyzing these properties at the evaluation stage of field development,
even small errors can misslead later, during the production. Hydrocarbon reservoirs are vastly
complex systems with large heterogeneities and varying situations. The parameters which control
fluid flow and determine the possible recovery of petroleum are found at the microscopic scale. A
great understanding of microstructures and their physical properties are required to accurately
determine the macroscopic properties of the reservoir media and are explained below.
2.3.1 Porosity
Porosity or void fraction(Ø) refers to the measure of the void "empty" spaces in a material. It is a
fraction of the volume of voids over the total volume, and it ranges between 0-100%. Pores are
free spaces or channels in the solid material and mathematically, porosity denotes the ratio of
19
interconnected pore volume, Vp, over the total bulk volume, Vb. Pore volume can be expressed
by subtracting grain volume, Vg, from the bulk volume. Porosity can be determined during good
logging or by core analysis. Mathematically, it is expressed as,
∅ =Vp
Vb=
Vb−Vg
Vb (2.1)
where,
∅ = porosity (%)
Vp = pore volume, m3
Vp = bulk volume, m3
Vp = grain volume, m3
Porosity can be divided as primary porosity and secondary porosity. Primary porosity forms during
deposition of sediments, while secondary porosity forms due to geological activities like
underground stresses, water movement or geological activities that take place after the formation
of the sediment. From an engineering point of view, the porosity can be classified as effective and
total porosity. Total porosity considers connected and isolated pore spaces and is therefore not
relevant to fluid flow. On the contrary, effective porosity corresponds to interconnected pores that
permit fluid flow through the formation and is of relevance that determines the measure of the
producible fluids in the porous medium. However, the term total porosity is often used to signify
the inclusion of both interconnected and isolated pores.
2.3.2 Permeability
Permeability(K) describes the ease with which a fluid can be conducted or transmitted in a porous
medium under an applied pressure gradient. Permeability depends on factors such as saturation,
density, and viscosity of the fluids in the medium. It is normally defined by Darcy’s law which
20
states that the apparent velocity of a fluid flowing through a porous medium is directly proportional
to the pressure gradient, dP/dx, and inversely proportional to fluid viscosity, as illustrated in the
equation 2.2. Where the constant of proportionality, k, is called the permeability of the porous
medium. The assumptions of Darcy’s law in determining K include, the flow being linear, lamina,
steady and the porous medium being homogenous.
𝑣 =𝑞
𝐴= −
𝑘
𝜇
𝑑𝑝
𝑑𝑥 (2.2)
where,
v = apparent flow velocity, cm/s
q = volumetric flow rate, cm3/s
A = cross sectional area, cm2
μ = fluid viscosity, cp
dP
dx= pressure gradient, atm/cm
k = permeability, Darcy
The rock permeability K can be determined in the laboratory by measuring the pressure drop across
the sample for different flow rates. The measured permeability is the absolute permeability which
refers to 100 % saturation of a one-phase fluid. Which is not the case in reservoir formations, and
it is, therefore, necessary to generalize Darcy’s law to describe the simultaneous flow of more than
one fluid in the porous medium.
Effective permeability, k phase, is the transmission of one phase that inhabits less than 100%
saturation of the pore space. It denotes the permeability to a given fluid when another fluid
occupies a part of the pore space. Since some of the pores are blocked by the presence of the second
fluid, effective permeability is generally lower than the absolute permeability. Relative
21
permeability, krphase, is the ratio of effective permeability of a phase, in the presence of other
phases, to the absolute permeability.
kr,phase =kphase
k (2.3)
where,
kr,phase = relative permeability of oil, water, or gas
kphase = effective permeability of the phase
Relative permeability makes it possible to extend Darcy’s law to immiscible three-phase, water
oil-gas systems. For a system were water is linearly displacing oil in a thin tube of porous media,
where ρ is the phase density, g is the gravitational constant and α the inclination angle, Darcy’s
law can be expressed by the volumetric flux, q, for each phase.
qo = −A.kkro
μo(
∂Po
∂x± ρogsinα) (2.4)
qw = −A.kkrw
μw(
∂Pw
∂x±ρwgsinα) (2.5)
qg = −A.kkrg
μg(
∂Po
∂x±ρogsinα) (2.6)
Where,
qo , qw and qg = flow rates for oil, water, and gas, cm3/s
ρo, ρw, and ρg = density for oil water and gas g/cm3
2.3.3 Capillary pressure
Capillary pressure, Pc, is defined as the pressure difference existing between two immiscible fluids
phases. Fluid -fluid interface in the porous medium occurs in small diameter pores and as a result,
they are highly curved. Because of the interfacial tension, the fluid pressure is not the same on
22
both sides of the curved interface. At the equilibrium, the difference in pressure across the interface
between two phases is the capillary pressure. The capillary pressure is proportional to the IFT and
the wetting angle, and inversely proportional to the effective radius, r, of the interface.
Mathematically, capillary pressure is expressed by the equation 2.7.
Pc = Pnw − Pw= 2 ∂cosθ
r (2.7)
where,
Pc = capillary pressure, psi
Pnw = non-wetting phase pressure, psi
Pw = wetting phase pressure, psi
r = pore radius
∂ = interfacial tension
θ = wetting angle
Capillary pressure, in porous rock, is a function of saturation. Using equation 2.7 above, the
capillary pressure is always positive assuming a water-wet system because the pressure would be
higher in the nonwetting phase than in the wetting phase. Only at higher saturation of the wetting
phase, where the non-wetting phase becomes discontinuous and the capillary pressure approaches
zero. The oil-water capillary pressure is usually expressed as the difference between oil pressure
and water pressure irrespective of which fluid is the wetting phase. This implies that capillary
pressure is always negative when oil is the wetting phase. Typical capillary pressure is shown in
Figure 2.2.
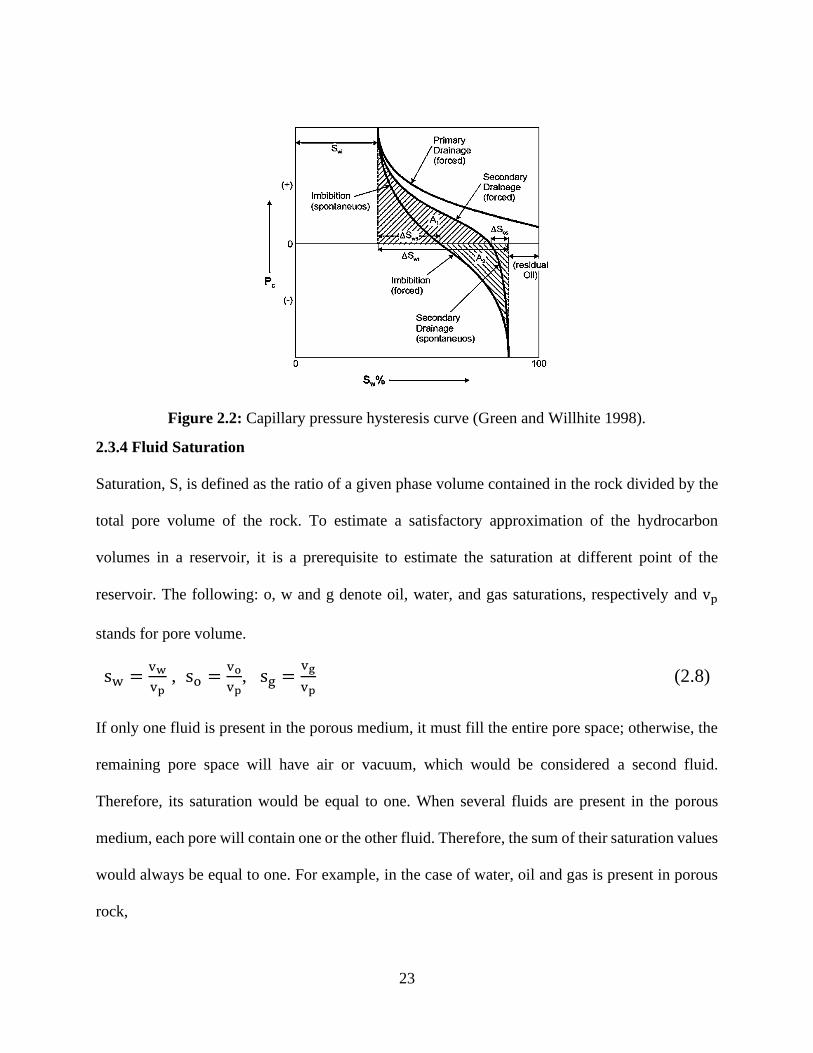
23
Figure 2.2: Capillary pressure hysteresis curve (Green and Willhite 1998).
2.3.4 Fluid Saturation
Saturation, S, is defined as the ratio of a given phase volume contained in the rock divided by the
total pore volume of the rock. To estimate a satisfactory approximation of the hydrocarbon
volumes in a reservoir, it is a prerequisite to estimate the saturation at different point of the
reservoir. The following: o, w and g denote oil, water, and gas saturations, respectively and vp
stands for pore volume.
sw =vw
vp , so =
vo
vp, sg =
vg
vp (2.8)
If only one fluid is present in the porous medium, it must fill the entire pore space; otherwise, the
remaining pore space will have air or vacuum, which would be considered a second fluid.
Therefore, its saturation would be equal to one. When several fluids are present in the porous
medium, each pore will contain one or the other fluid. Therefore, the sum of their saturation values
would always be equal to one. For example, in the case of water, oil and gas is present in porous
rock,
24
sw + so+sg = 1 (2.9)
2.4 Fundamentals of Enhanced Oil Recovery (EOR)
Hydrocarbon recovery is traditionally subdivided into three major stages: the primary, secondary,
and tertiary recoveries. These stages describe chronological oil production from the reservoir
historically(Green & Willhite, 1998). Primary production, the initial primary stage, refers to oil
displacement using the naturally existing energy in the reservoir. Secondary recovery, the second
stage is initiated after the decline of the primary production. Traditional secondary recovery
techniques include pressure maintenance, gas injection and water flooding. Tertiary recovery, the
third oil production stage refers to the production of oil after the secondary recovery processes
have become uneconomical(Thomas, 2008). These include miscible gas injection, chemicals,
and/or thermal energy, microbes (microbial EOR) etc. However, the drawback to consideration of
the three stages as the chronological sequence is that many reservoirs production operations are
not conducted in the specific order. A well-known example is the production of heavy oil. If the
crude oil is sufficiently viscous, it may not flow under economic rates under the natural energy
drives, so primary production would be negligible. For such reservoirs, water or gas flooding
would not be feasible. Therefore, the use of thermal energy may be the only way of recovering oil.
In such a way, a method considered to be a tertiary process in a normal chronological depletion
sequence would be used as the first, and perhaps the final, method of oil recovery. In other
situations, the tertiary recovery processes may be applied as secondary operation instead of water
flooding. This action might be dictated with various factors such as the availability of injections,
nature of the tertiary recovery process and the economics(Donaldson, Chilingarian, & Yen, 1989;
Green & Willhite, 1998). Foresentence if waterflood before application of the tertiary process
would diminish the overall effectiveness, then the water flooding stage might reasonably be
25
bypassed. Therefore, in petroleum engineering literature because of such situation, the term
“tertiary recovery” fell into disfavour and the designation of “enhanced oil recovery” (EOR)
become more accepted. Improved oil recovery (IOR) is another descriptive designation commonly
used, which includes EOR but also encompasses a broad range of activities such as, infill drilling,
reservoir characterization, and improved reservoir management(Alvarado & Manrique, 2010).
EOR is an effective approach for recovery of unreachable hydrocarbons as its practices
demonstrate great potentials of recovering trapped oil at the pore scale after the primary natural
drive and secondary mechanisms have reached the production and economic limit. EOR has been
referred to as all the artificial methods that are used to produce the trapped oil (Romero-Zerón,
2012). The significant drive for EOR is based on its ability to recover additional oil economically
with its recovery techniques and also the ability to turn residual cumulative oil into reserves(Owen,
Inderwildi, & King, 2010). Several processes and technologies are used in this regard to upsurge
or maintain recovery from existing fields. These processes include the injection of chemical-based
fluids (chemical EOR), gas injection (gas EOR), thermal energy, and lately microbes (microbial
EOR) are also been deployed in oil fields. Carbon dioxide, nitrogen, hydrocarbon gases and flue
gases are among the gases commonly used in EOR process(Green & Willhite, 1998). These
processes facilitate effective displacement of oil towards the producing well, thus, production from
matured fields is enhanced as the injected fluids (liquid or gas) interact with the formation rock
and oil systems, thereby creating a favourable condition for better oil mobility. Many liquid
chemicals commonly used in EOR include polymers, surfactants, and hydrocarbon solvents.
Thermal methods typically consist of the use of hot water or steam, or in-situ generation of thermal
energy through oil combustion in the reservoir rock(Banks, 1962). Also, the injected fluids interact
with the reservoir/oil system to create conditions that favour oil recovery. These interactions, for
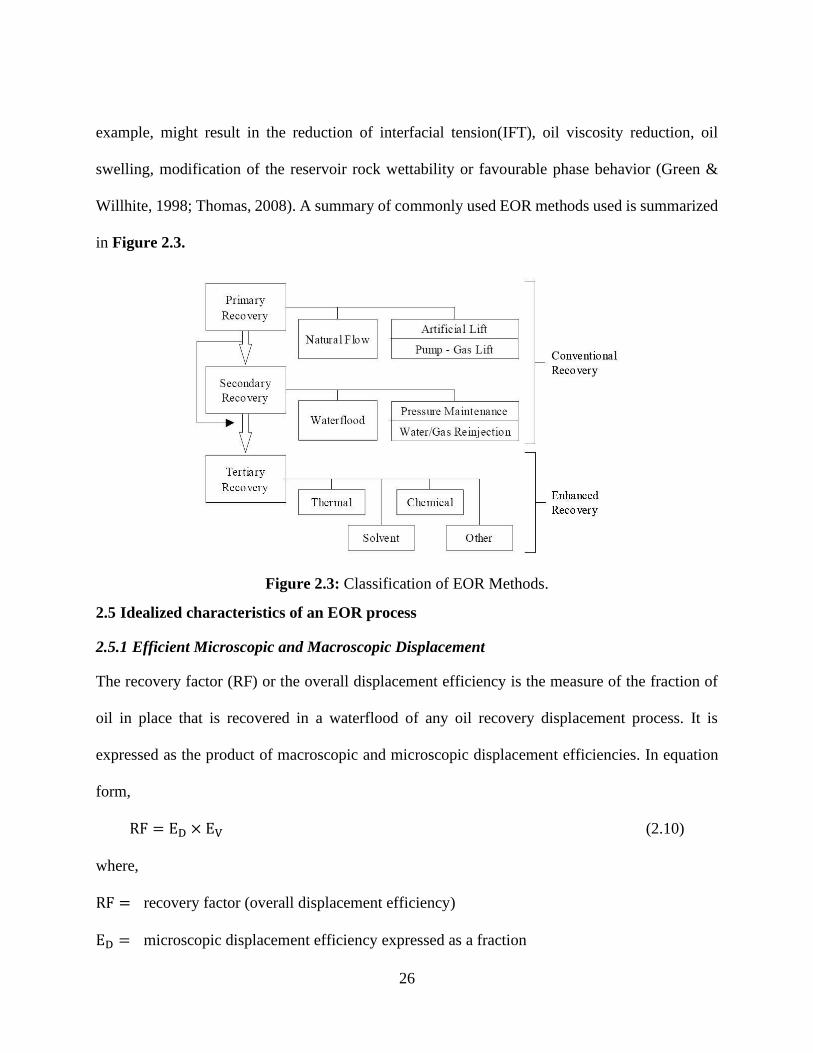
26
example, might result in the reduction of interfacial tension(IFT), oil viscosity reduction, oil
swelling, modification of the reservoir rock wettability or favourable phase behavior (Green &
Willhite, 1998; Thomas, 2008). A summary of commonly used EOR methods used is summarized
in Figure 2.3.
Figure 2.3: Classification of EOR Methods.
2.5 Idealized characteristics of an EOR process
2.5.1 Efficient Microscopic and Macroscopic Displacement
The recovery factor (RF) or the overall displacement efficiency is the measure of the fraction of
oil in place that is recovered in a waterflood of any oil recovery displacement process. It is
expressed as the product of macroscopic and microscopic displacement efficiencies. In equation
form,
RF = ED × EV (2.10)
where,
RF = recovery factor (overall displacement efficiency)
ED = microscopic displacement efficiency expressed as a fraction
27
EV = macroscopic(volumetric) displacement efficiency expressed as a fraction
Microscopic displacement efficiency relates to the displacement or mobilization of oil at the pore
scale. ED measures the effectiveness of the displacing fluid in mobilizing oil in those places were
the injected displacing fluid contacts the oil. ED is reflected in the magnitude of the residual oil
saturation, Sor in the region contacted by the displacing fluid. In contrast, macroscopic
displacement efficiency relates to the effectiveness of the displacing fluid(s) in contacting the
reservoir in a volumetric sense. EV measures how effectively the displacing fluid sweeps out the
volume of a reservoir both vertically and areally as well as how effectively the displacing fluid
moves the displaced oil towards the production well. EV is reflected in the magnitude of average
or overall residual oil saturation(Green & Willhite, 1998). In the EOR process, it is desirable that
the values of ED and EV consequently, approach 1.0. An idealized EOR process would be one in
which the primary slug removed all the oil from the pores contacted by the injected fluid (Sor→ 0)
and in which the displacing fluid contacted the total reservoir volume and displaced oil to the
production well.
Several chemical or physical interactions occur between the displacing fluid and oil that result in
efficient microscopic displacement and hence low Sor. These include IFT reduction, miscibility
between the fluids, oil viscosity reduction, and oil volume expansion. The maintenance of a
favourable mobility ratio between the displacing and displaced fluid also contributes to better
microscopic displacement efficiency. Therefore, EOR processes are developed targeting these
factors and the goal of any acceptable EOR fluid is to maintain the favourable interaction(s) if
possible, during the flooding processes.
Macroscopic displacement efficiency is improved by maintaining a favourable mobility ratio
between the displacing and displaced fluid throughout the process. Mobility ratio is defined as the
28
mobility of displacing fluid to the mobility of displaced fluid. Favourable ratios contribute to the
improvement of both areal and vertical sweep efficiencies. An ideal EOR fluid then is one that
maintains a favourable mobility ratio with the fluid being displaced. Density difference is another
parameter for good macroscopic displacement efficiency between the displaced and displacing
fluids. Larger density difference can result in gravity segregation i.e. the overriding and under
ridding of the fluid being displaced. Also, reservoir geological heterogeneity is another important
factor in the consideration of macroscopic displacement efficiency. The effects of mobility and
density difference can be amplified or diminished by the nature of the geology. An ideal EOR fluid
is the one that has a favourable mobility ratio with the fluid(s) being displaced and maintains this
favourable condition throughout the process.
M = λw
λo =
Kwμw
⁄
Koμo
⁄ (2.11)
where,
λw = mobility of displacing fluid
λO = mobility of the displaced fluid
μO = viscosity of oil
μw = viscosity of water
Kw = permeability of water
Ko = permeability of oil
For any ideal EOR process, favourable mobility ratio should be less than 1 (M≤ 1) for effective
displacement. If the displacing fluid is less viscous than the displaced fluid, the problem of viscous
fingering results due to the “adverse mobility ratio” the displaced fluid will be bypassed resulting
in lower EV and lower overall displacement efficiency. Mobility ratio is controlled by using
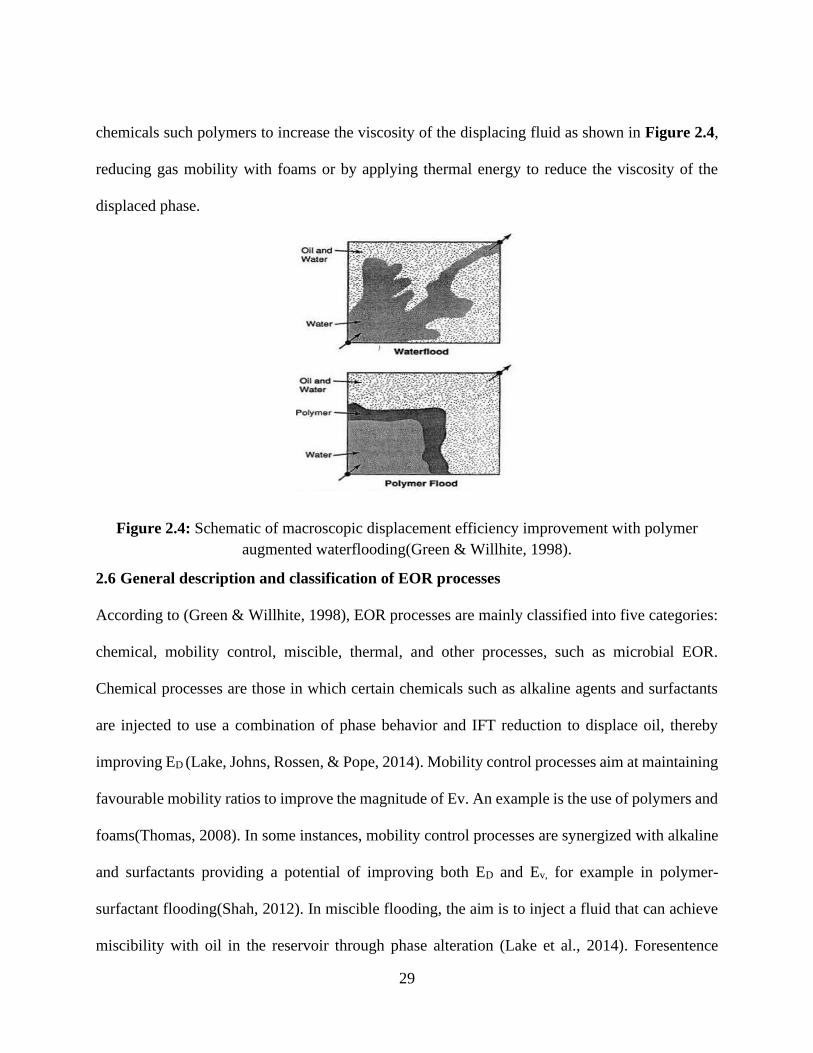
29
chemicals such polymers to increase the viscosity of the displacing fluid as shown in Figure 2.4,
reducing gas mobility with foams or by applying thermal energy to reduce the viscosity of the
displaced phase.
Figure 2.4: Schematic of macroscopic displacement efficiency improvement with polymer
augmented waterflooding(Green & Willhite, 1998).
2.6 General description and classification of EOR processes
According to (Green & Willhite, 1998), EOR processes are mainly classified into five categories:
chemical, mobility control, miscible, thermal, and other processes, such as microbial EOR.
Chemical processes are those in which certain chemicals such as alkaline agents and surfactants
are injected to use a combination of phase behavior and IFT reduction to displace oil, thereby
improving ED (Lake, Johns, Rossen, & Pope, 2014). Mobility control processes aim at maintaining
favourable mobility ratios to improve the magnitude of Ev. An example is the use of polymers and
foams(Thomas, 2008). In some instances, mobility control processes are synergized with alkaline
and surfactants providing a potential of improving both ED and Ev, for example in polymer-
surfactant flooding(Shah, 2012). In miscible flooding, the aim is to inject a fluid that can achieve
miscibility with oil in the reservoir through phase alteration (Lake et al., 2014). Foresentence
30
during the injection of CO2, hydrocarbon solvents, nitrogen and in such processes, phase behaviour
is the major factor in play. Thermal processes involve the injection of thermal energy or in-situ
generation of heat to improve oil recovery. Examples include steam injection, in-situ combustion
from oxygen or air. In all these processes, chemical reactions, oil viscosity alteration and
favourable phase behavior are the primary mechanisms leading to improved oil recovery (Green
& Willhite, 1998). Other EOR methods include microbial EOR, low salinity water flooding, smart
water injection and nanoparticle flooding.
Application of EOR methods for extracting residual oil is limited by mainly the economics and
the insufficient knowledge gaps in most of these techniques. In reservoirs with light oil, thermal
processes are typically not suitable. If a large amount of gas is not easily available, solvent methods
are also not feasible in such instances. For chemical flooding methods especially on offshore
platforms, transporting and storing a large volume of chemicals makes the process less feasible
given that higher chemical concentrations may be required to achieve higher recovery which may
not be economical. Besides, many of the chemical flooding mechanisms are not well understood.
Although chemical flooding is the least applied among the EOR process mentioned before, the
majority of research activities are taking place in this field(Alvarado & Manrique, 2010). This is
because of the ability to apply chemical flooding in different reservoir conditions. For any given
EOR method to be implemented, the following questions were proposed by (Taber, Martin, &
Seright, 1997) and should be considered when selecting an appropriate EOR method: 1) What
method is most appropriate depending on the reservoir characteristics and oil properties? 2) How
does the intended method compare with water flooding? and 3) is the proposed method
economical?
31
A comprehensive review of the literature was provided by (Taber et al., 1997) and later updated
by (Al-Adasani & Bai, 2010) relating to some of the questions above. The authors provided a good
framework for screening criteria that included investigation of oil properties such as viscosity,
density, composition, API, and reservoir characteristics such as porosity, permeability, oil
saturation, type of formation, and temperature. With these parameters, appropriate EOR methods
can be identified.
To assess the appropriate point to implement any EOR method, normally traditional water flooding
may be used as a determining point. However, some EOR techniques, such as polymer and thermal
flooding, produce the highest ultimate recovery rates when injected at the beginning of field
production (Taber et al., 1997). Otherwise, most EOR techniques are applied in mature, water
flooded fields. A comparison of most common EOR techniques to water flooding at the
microscopic and macroscopic scale and the limitations of these methods was presented by
(Muggeridge et al., 2014). The findings of the author can be used during design selection and
implementation of EOR methods.
Lastly, an economic evaluation is required, to compare the costs of implementing any EOR method
depending on the crude oil prices to estimate the profitability of the intended processes
(Muggeridge et al., 2014; Taber et al., 1997). Field investigations are typically not conducted until
positive results have been obtained and replicated since the volumes and amount of money
required is always large. A common estimate of the success of an EOR process is the incremental
oil recovery factor(Sheng, 2010) as shown in Figure 2.5.
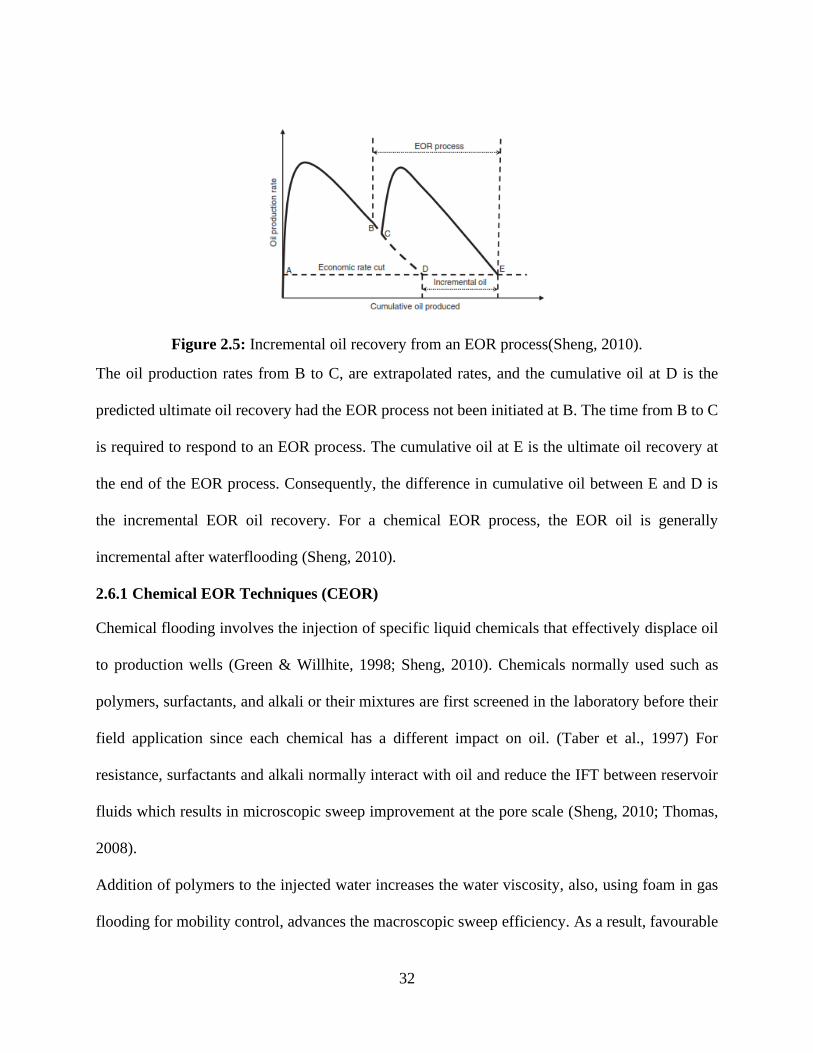
32
Figure 2.5: Incremental oil recovery from an EOR process(Sheng, 2010).
The oil production rates from B to C, are extrapolated rates, and the cumulative oil at D is the
predicted ultimate oil recovery had the EOR process not been initiated at B. The time from B to C
is required to respond to an EOR process. The cumulative oil at E is the ultimate oil recovery at
the end of the EOR process. Consequently, the difference in cumulative oil between E and D is
the incremental EOR oil recovery. For a chemical EOR process, the EOR oil is generally
incremental after waterflooding (Sheng, 2010).
2.6.1 Chemical EOR Techniques (CEOR)
Chemical flooding involves the injection of specific liquid chemicals that effectively displace oil
to production wells (Green & Willhite, 1998; Sheng, 2010). Chemicals normally used such as
polymers, surfactants, and alkali or their mixtures are first screened in the laboratory before their
field application since each chemical has a different impact on oil. (Taber et al., 1997) For
resistance, surfactants and alkali normally interact with oil and reduce the IFT between reservoir
fluids which results in microscopic sweep improvement at the pore scale (Sheng, 2010; Thomas,
2008).
Addition of polymers to the injected water increases the water viscosity, also, using foam in gas
flooding for mobility control, advances the macroscopic sweep efficiency. As a result, favourable
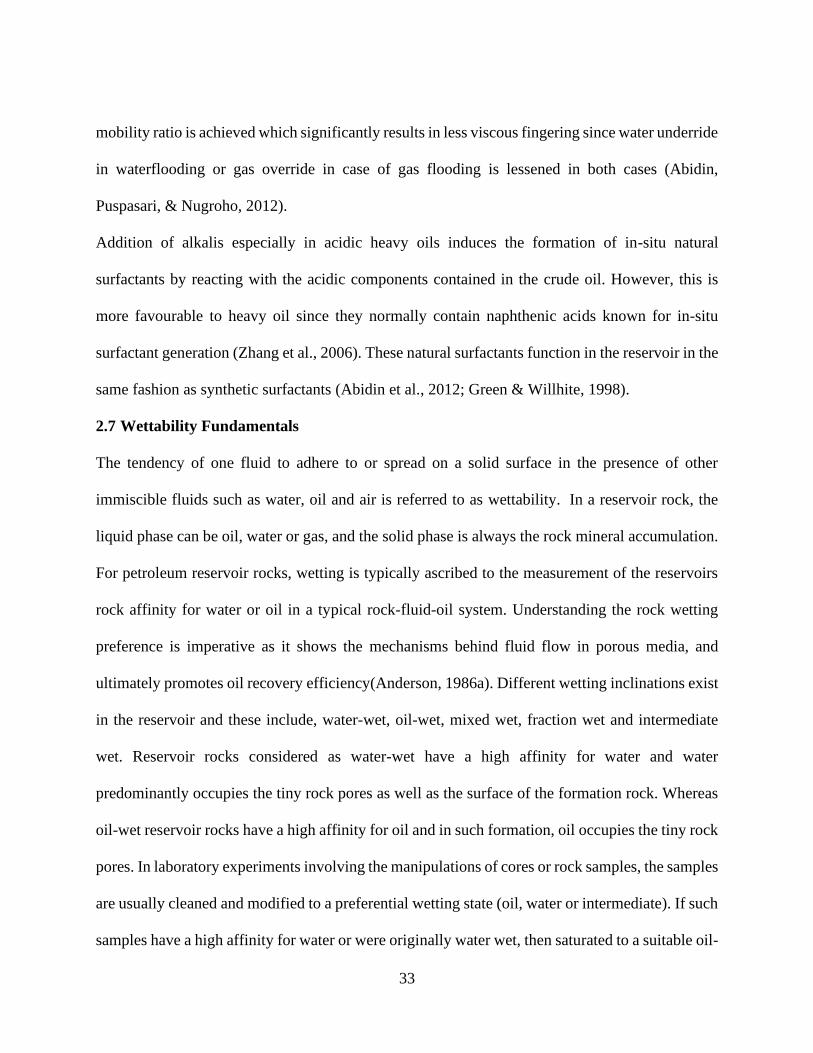
33
mobility ratio is achieved which significantly results in less viscous fingering since water underride
in waterflooding or gas override in case of gas flooding is lessened in both cases (Abidin,
Puspasari, & Nugroho, 2012).
Addition of alkalis especially in acidic heavy oils induces the formation of in-situ natural
surfactants by reacting with the acidic components contained in the crude oil. However, this is
more favourable to heavy oil since they normally contain naphthenic acids known for in-situ
surfactant generation (Zhang et al., 2006). These natural surfactants function in the reservoir in the
same fashion as synthetic surfactants (Abidin et al., 2012; Green & Willhite, 1998).
2.7 Wettability Fundamentals
The tendency of one fluid to adhere to or spread on a solid surface in the presence of other
immiscible fluids such as water, oil and air is referred to as wettability. In a reservoir rock, the
liquid phase can be oil, water or gas, and the solid phase is always the rock mineral accumulation.
For petroleum reservoir rocks, wetting is typically ascribed to the measurement of the reservoirs
rock affinity for water or oil in a typical rock-fluid-oil system. Understanding the rock wetting
preference is imperative as it shows the mechanisms behind fluid flow in porous media, and
ultimately promotes oil recovery efficiency(Anderson, 1986a). Different wetting inclinations exist
in the reservoir and these include, water-wet, oil-wet, mixed wet, fraction wet and intermediate
wet. Reservoir rocks considered as water-wet have a high affinity for water and water
predominantly occupies the tiny rock pores as well as the surface of the formation rock. Whereas
oil-wet reservoir rocks have a high affinity for oil and in such formation, oil occupies the tiny rock
pores. In laboratory experiments involving the manipulations of cores or rock samples, the samples
are usually cleaned and modified to a preferential wetting state (oil, water or intermediate). If such
samples have a high affinity for water or were originally water wet, then saturated to a suitable oil-
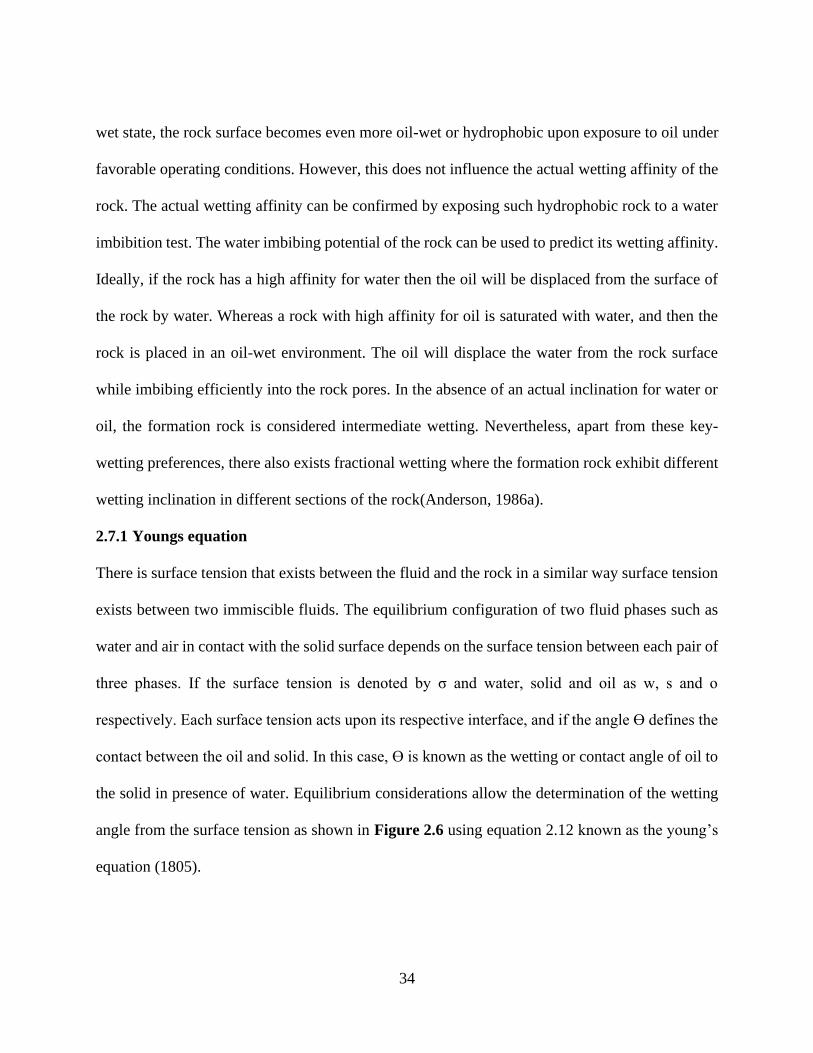
34
wet state, the rock surface becomes even more oil-wet or hydrophobic upon exposure to oil under
favorable operating conditions. However, this does not influence the actual wetting affinity of the
rock. The actual wetting affinity can be confirmed by exposing such hydrophobic rock to a water
imbibition test. The water imbibing potential of the rock can be used to predict its wetting affinity.
Ideally, if the rock has a high affinity for water then the oil will be displaced from the surface of
the rock by water. Whereas a rock with high affinity for oil is saturated with water, and then the
rock is placed in an oil-wet environment. The oil will displace the water from the rock surface
while imbibing efficiently into the rock pores. In the absence of an actual inclination for water or
oil, the formation rock is considered intermediate wetting. Nevertheless, apart from these key-
wetting preferences, there also exists fractional wetting where the formation rock exhibit different
wetting inclination in different sections of the rock(Anderson, 1986a).
2.7.1 Youngs equation
There is surface tension that exists between the fluid and the rock in a similar way surface tension
exists between two immiscible fluids. The equilibrium configuration of two fluid phases such as
water and air in contact with the solid surface depends on the surface tension between each pair of
three phases. If the surface tension is denoted by σ and water, solid and oil as w, s and o
respectively. Each surface tension acts upon its respective interface, and if the angle Ɵ defines the
contact between the oil and solid. In this case, Ɵ is known as the wetting or contact angle of oil to
the solid in presence of water. Equilibrium considerations allow the determination of the wetting
angle from the surface tension as shown in Figure 2.6 using equation 2.12 known as the young’s
equation (1805).
35
Figure 2.6: Oil/ water/ solid wetting angle.
𝜎ow cosθ = 𝜎ws − 𝜎os (2.12)
If 𝜎sw > 𝜎so , then cosθ > 0 and θ < 900, also if 𝜎sw < 𝜎so , then cosθ < 0 and θ > 900. For
a stable contact, the magnitude of cosθ ≤ 1, or equivalently the magnitude of 𝜎sw − 𝜎so ≤
𝜎wo .In other words this inequality is not satisfied when 𝜎ow + 𝜎so < 𝜎ws , when the liquid covers
the whole solid surface. When 𝜎ow + 𝜎sw < 𝜎so , then water displaces oil completely away from
the surface.
Young’s equation has been a commonplace model for several decades, however, the circumstances
under which it is practical is rather impractical for real surfaces especially in complex systems of
fluid/rock/oil interactions. Moreover, Chau et al(Chau, Bruckard, Koh, & Nguyen, 2009) noted
that this equation is primarily appropriate for implementation on an ideal surface that is non-
reactive, homogenous, typically flat, insoluble, without considering the possibility of contact angle
hysteresis that normally exists in real reservoir situations. Young’s equations were fundamentally
proposed for ideal surfaces; but, real surfaces are usually not ideal since they exhibit chemical
heterogeneity, rigidity and roughness. The deviation of real surfaces from the ideal surface resulted
in contact angle hysteresis a term that correlates the shift of a contact line due to the liquid droplet
36
enlargement or retraction. The hysteresis phenomenon can be further quantified via estimation of
the variations between the receding and advancing contact angle. Given the fact that a liquid
droplet in contact with a rough or porous substrate exhibits different wetting states, models such
as Wenzel model, where the liquid wets the rock pores that is directly under the droplet, and the
Cassie-Baxter model, where the liquid droplet is partly buoyed by the solid and air without the
liquid penetrating the rock pores have been established over time for better contact angle
description on such surfaces with several variables (Gambaryan-Roisman, 2014). Such surfaces
have diverse effects on the contact angles of wetting fluids. Wenzel and Cassie–Baxter models are
the two main models that attempt to describe the wetting of such textured surfaces.
2.7.2 Wenzel’s model
This model is defined by the equation below for the contact angle on a rough surface
cos(θ∗) = rcos(θ) (2.13)
where, θ∗ is the apparent contact angle corresponding to the stable equilibrium state. Roughness
ratio r measures how the surface roughness affects a homogenous surface. The roughness ratio r
is defined as the ratio of the true area of the solid surface to the apparent area. θ corresponds to
young contact angle as defined for an ideal or homogenous surface. However, the limitation of this
model is that it does not account for the contact angle hysteresis. Therefore, when dealing with
heterogeneous surfaces, the Wenzel model is not satisfactory.
2.7.3 Cassie-Baxter model
This is the most appropriate complex model that can be used to measure how the apparent contact
angle changes when different materials are involved. This model has defined the equation below.
cos(θ∗) = rffcos(θY) + f − 1 (2.14)
37
where rf is the roughness ratio of the wet surface area, f is the fraction of solid surface area wet by
the liquid. It should be noted that when f = 1 and rf = r, the Cassie–Baxter equations becomes
the Wenzel equation. The Cassie-Baxter model puts more emphasis on the area fractions under the
drops, it is alleged that a higher contact angle can be achieved if the area fraction of air is large(Seo
& Kim, 2015). Nevertheless, both models have been considered valid when the liquid droplet is
large enough compared to the roughness scale.
2.8 Determination of Wettability
There are various methods used in determining wettability of rock on various fluids. These can be
divided into two parts; qualitative and quantitative(Anderson, 1986b). The quantitative methods
include microscopic observation such as contact angle, Amott wettability measurements, USBM
(US bureau of mines) method, and the qualitative include, Imbibition Method, Relative
Permeability methods, flotation methods, glass Slide method, capillary pressure curves, Nuclear
magnetic resonance (NMR) longitudinal relaxation, dye desorption etc. In this thesis, the
commonly used methods will be discussed.
2.8.1 Contact Angle Measurements
This involves the direct observation and measurement of wetting angles on small rock samples or
substrate. This method is one of the best wettability measurement techniques that can be used when
artificial cores and pure fluids are applied since there is no possibility of wettability alteration due
to surfactants or any other compounds. Contact angle method can be used to determine whether a
crude oil can alter wettability and to examine the effects of parameters such as temperature,
pressure, and brine chemistry on the wettability of the rock surface. However, some difficulties
are involved in applying contact-angle measurements to reservoir cores. Many methods of contact-
angle measurement have been used. These include the tilting plate method, sessile drops or
38
bubbles, vertical rod method, tensiometry method, cylinder method, and capillary rise
method(Anderson, 1986b). However, the sessile drops method is the commonly used technique in
petroleum applications. This method uses a single or two flat, polished mineral crystal or substrate
mounted parallel to each other. In the case of measuring the contact angle with a single substrate,
the angle is measured between the solid surface and the tangent to the drop profile at the drop edge.
Normally because sandstone rock is made of quartz and limestone is made of calcite, quartz or
calcite crystals artificially made may be used to simulate the pore surface during contact angle
measurements. Several issues that affect contact angles measurements are, Rock-fluid interaction
such as solubility, pH, ions in the aqueous phase, polar groups in crude oil, the polished solids
(quartz, calcite) may not be representative of solid surfaces in porous media. Also, time to reach
equilibrium (when the contact angle is independent of time) may vary from seconds to days or
years. Consequently, the contact angle obtained in the laboratory may not represent the actual
wettability of the system under examination. In conclusion, contact angle measurements are
extremely difficult, and good data relies more on luck other than judgement.
2.8.2 Amott wettability Measurements
This method gives the macroscopic average wettability of rock to given fluids. It combines the
measurement of the number of fluids that spontaneously and forcibly imbibed by a rock sample.
With this method, both reservoir cores and fluids can be used in the test. This method is based on
the fact that the wetting phase imbibes spontaneously into the core, displacing the nonwetting
phase. The ratio of spontaneous imbibition to forced imbibition is used to reduce the effect of other
factors, such as relative permeability, viscosity, and the initial saturation of the rock. This method
has no validity as an absolute measurement, but it is an industry-standard for comparing the
wettability of various core plugs. The core plugs are normally prepared by centrifuging under brine
39
until the residual oil saturation (ROS) is reached. The Amott wettability measurement generally
consists of the following four steps: (1) immersing the core in oil, and measure the volume of water
displaced by the spontaneous (free) imbibition of oil; (2) centrifuge the core in oil until the
irreducible water saturation (IWS) is reached, and measure the total amount of water displaced,
including the volume displaced by spontaneous imbibition; (3) immerse the core in brine, and
measure the volume of oil spontaneously displaced by imbibition of water for a given time.; and
(4) centrifuge the core in oil until ROS is reached, and measure the total amount of oil displaced.
Alternatively, the core may be driven to IWS and ROS by core displacement rather than with a
centrifuge especially for unconsolidated material that cannot be centrifuged. Cuiec et al. (Cuiec,
Longeron, & Pacsirszky, 1978) proposed a modification of the Amott wettability test by
introducing the Amott-Harvey relative displacement index. However, with this procedure, the core
is centrifuged first under the brine and then under oil to reduce the plug to IWS. The displacement
by water and displacement by oil ratios are then calculated by the Amott method. The Amott-
Harvey relative displacement index is the displacement by water ratio minus the displacement by
oil ratio as shown in equation 2.15 below.
WI =VO1
VO1+VO2−
VW1
VW1+VW2 (2.15)
where,
VO1=volume of oil produced by spontaneous imbibition of brine or nanofluids,
VO2= volume of oil produced by forced imbibition of brine or nanofluids,
VW1= volume of water produced by spontaneous imbibition of oil,
VW2= volume of water produced by forced imbibition of oil.
40
This combines the two ratios into a single wettability index that varies from +1 for complete water
wetness to -1 for complete oil wet system as summarized in Table 2.1.
Table 2. 1: Wettability index approximations for different systems as suggested by cuiec (Cuiec
et al., 1978).
Methods Oil-Wet Neutral Wet Water Wet
WI −1 ≤ I ≤ −0.3 −0.3 ≤ I ≤ 0.3 0.3 ≤ I ≤ 1
A more accurate approach for measuring imbibition rates during the spontaneous imbibition
measurements was proposed by Morrow et al. (Morrow, Lim, & Ward, 1986). The author
suggested that in such measurements, the core is suspended in oil or water from an electronic
balance by a small line or string. Then, weight changes are monitored as a function of time as the
spontaneous imbibition occurs. The wettability of the core is then determined from both the Amott
wettability index and the spontaneous imbibition rates. This test may offer some advantages over
the standard Amott test because it is based on additional data. However, these two methods, the
Amott wettability test and its modifications are insensitive near-neutral wettability (Anderson,
1986b).
2.8.3 USBM (U.S. Bureau of Mines) method
This method also measures the macroscopic mean wettability of rock to given fluids. It is similar
to the Amott method but considers the work required to do a forced fluid displacement. As with
the Amott method, it has no validity as an absolute measurement but is the industry standard for
comparing the wettability of various core plugs. Unlike the Amott wettability test, the major
advantage of the USBM is, that it is more sensitive near-neutral wettability. Its minor disadvantage
is that the USBM wettability index can only be measured on plug-size samples because the samples
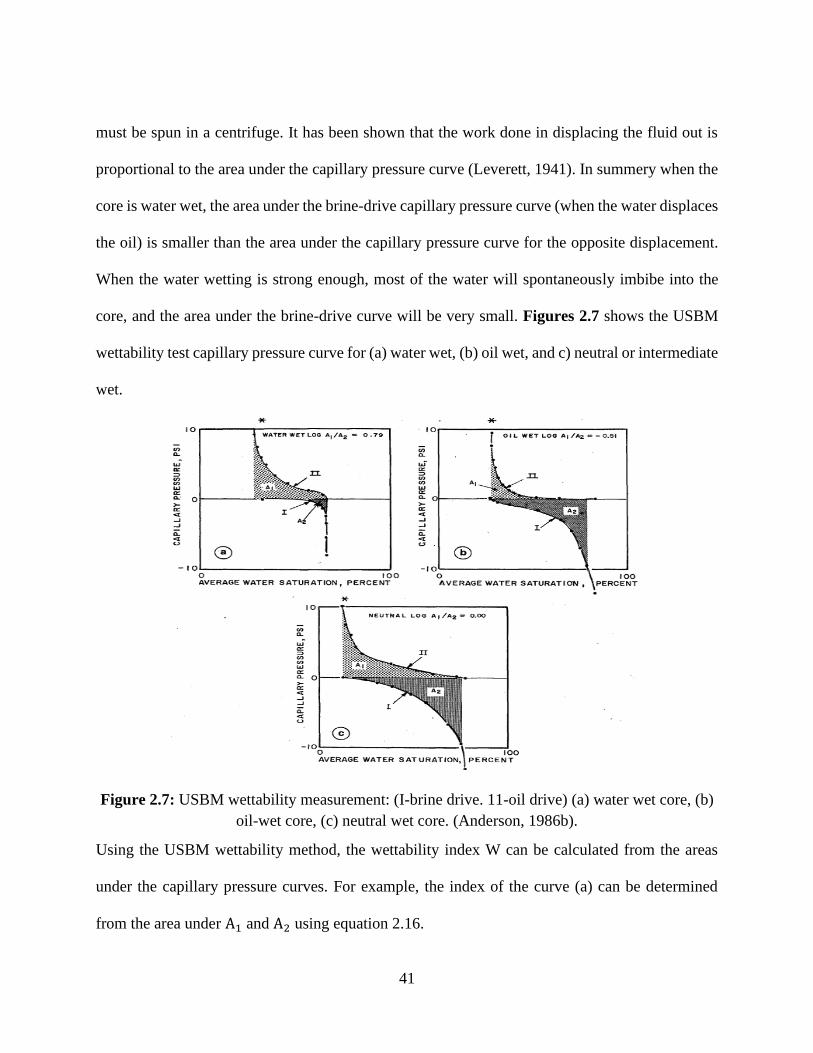
41
must be spun in a centrifuge. It has been shown that the work done in displacing the fluid out is
proportional to the area under the capillary pressure curve (Leverett, 1941). In summery when the
core is water wet, the area under the brine-drive capillary pressure curve (when the water displaces
the oil) is smaller than the area under the capillary pressure curve for the opposite displacement.
When the water wetting is strong enough, most of the water will spontaneously imbibe into the
core, and the area under the brine-drive curve will be very small. Figures 2.7 shows the USBM
wettability test capillary pressure curve for (a) water wet, (b) oil wet, and c) neutral or intermediate
wet.
Figure 2.7: USBM wettability measurement: (I-brine drive. 11-oil drive) (a) water wet core, (b)
oil-wet core, (c) neutral wet core. (Anderson, 1986b).
Using the USBM wettability method, the wettability index W can be calculated from the areas
under the capillary pressure curves. For example, the index of the curve (a) can be determined
from the area under A1 and A2 using equation 2.16.
42
w = log (A1
A2) (2.16)
Where A1 and A2 are the areas under the oil and brine drive curves, respectively. The same index
range shown in table 2.1 is used for the w wettability index using the USBM. When W >0, the
core is water-wet, and when W <0, the core is oil-wet. The wettability index near zero means that
the core is neutrally or intermediate wet. The larger the absolute value of W, the greater the wetting
preference.
2.8.4 Imbibition method
Imbibition method is the most commonly used qualitative wettability measurement. This is
because it gives a quick but rough idea of the wettability without requiring any complicated
equipment. The commonly used imbibition apparatus can be used to test the wettability at room
temperature and pressure. However, Kyte et al(Kyte, Naumann, & Mattax, 1961) described a
modification of the apparatus that allows wettability to be measured at reservoir conditions. In an
imbibition test, a core at IWS is first submerged in brine underneath a graduated cylinder, and the
rate and amount of oil displaced by brine imbibition are measured. The core is strongly water-wet
if large volumes of brine are rapidly imbibed, while lower rates and smaller volumes imply a weak
water wet core. If no water is imbibed, the core is either oil wet or neutrally wet. Non-water-wet
cores are then driven to ROS and submerged in oil. The imbibition apparatus is inverted, with the
graduated cylinder below the core to measure the rate and volume of water displaced by oil
imbibition. If the core imbibes oil, it is oil-wet. The strength of oil-wetness is indicated by the rate
and volume of oil imbibition. If neither oil nor water is imbibed, the core is neutrally wet. Finally,
some cores will imbibe both water and oil (Burkhardt, Ward, & McLean, 1958). These cores have
either fractional or mixed wettability. The problem of this method is that, in addition to wettability,
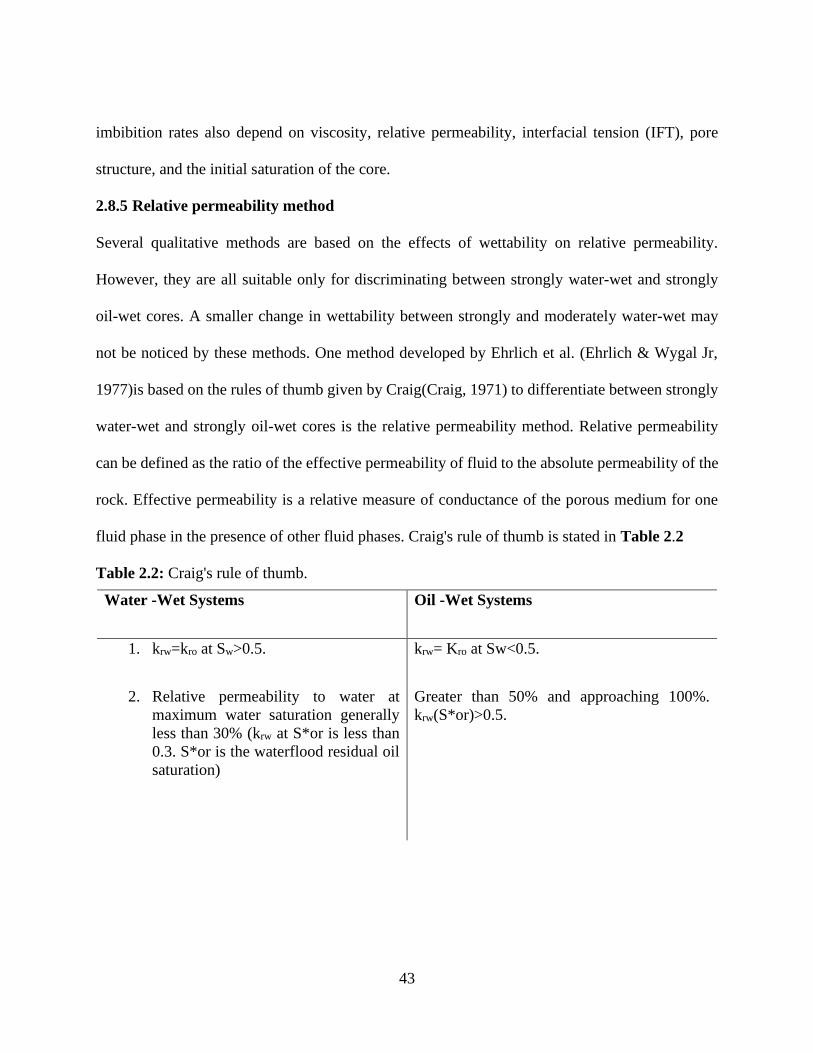
43
imbibition rates also depend on viscosity, relative permeability, interfacial tension (IFT), pore
structure, and the initial saturation of the core.
2.8.5 Relative permeability method
Several qualitative methods are based on the effects of wettability on relative permeability.
However, they are all suitable only for discriminating between strongly water-wet and strongly
oil-wet cores. A smaller change in wettability between strongly and moderately water-wet may
not be noticed by these methods. One method developed by Ehrlich et al. (Ehrlich & Wygal Jr,
1977)is based on the rules of thumb given by Craig(Craig, 1971) to differentiate between strongly
water-wet and strongly oil-wet cores is the relative permeability method. Relative permeability
can be defined as the ratio of the effective permeability of fluid to the absolute permeability of the
rock. Effective permeability is a relative measure of conductance of the porous medium for one
fluid phase in the presence of other fluid phases. Craig's rule of thumb is stated in Table 2.2
Table 2.2: Craig's rule of thumb.
Water -Wet Systems Oil -Wet Systems
1. krw=kro at Sw>0.5. krw= Kro at Sw<0.5.
2. Relative permeability to water at
maximum water saturation generally
less than 30% (krw at S*or is less than
0.3. S*or is the waterflood residual oil
saturation)
Greater than 50% and approaching 100%.
krw(S*or)>0.5.
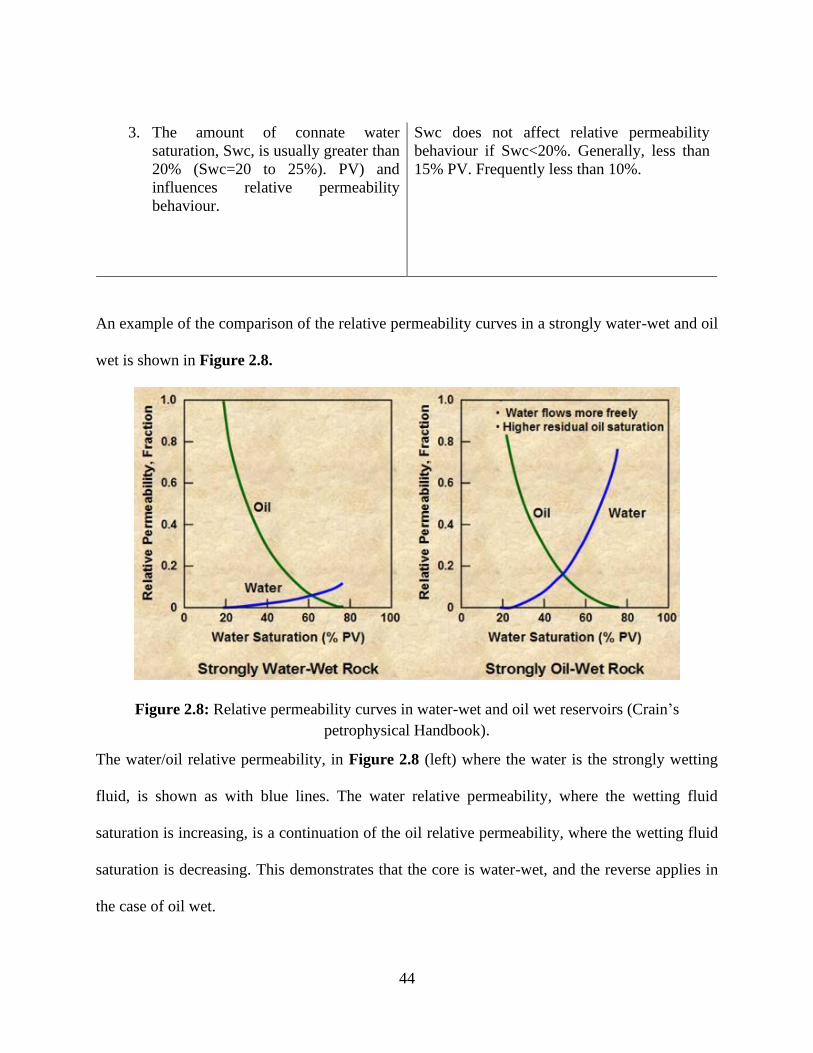
44
3. The amount of connate water
saturation, Swc, is usually greater than
20% (Swc=20 to 25%). PV) and
influences relative permeability
behaviour.
Swc does not affect relative permeability
behaviour if Swc<20%. Generally, less than
15% PV. Frequently less than 10%.
An example of the comparison of the relative permeability curves in a strongly water-wet and oil
wet is shown in Figure 2.8.
Figure 2.8: Relative permeability curves in water-wet and oil wet reservoirs (Crain’s
petrophysical Handbook).
The water/oil relative permeability, in Figure 2.8 (left) where the water is the strongly wetting
fluid, is shown as with blue lines. The water relative permeability, where the wetting fluid
saturation is increasing, is a continuation of the oil relative permeability, where the wetting fluid
saturation is decreasing. This demonstrates that the core is water-wet, and the reverse applies in
the case of oil wet.
45
2.9 Laboratory determination of Relative permeability
There are five means by which relative permeability data can be obtained these include; direct
measurement in the laboratory by a steady-state flow process, direct measurement in the laboratory
by an unsteady-state flow process, calculation of relative permeability data from capillary pressure
data, calculation from field performance data and theoretical or empirical correlations. Normally,
values obtained through laboratory measurements are usually preferred for engineering
calculations, since they are directly measured rather than estimated. Steady-state implies that
values are not measured until the tested sample has reached an agreed-upon level of steady-state
behaviour. Steady-state techniques of estimating relative permeability are often considered the
most reliable sources of relative permeability data. This is because a steady state is attained in
these tests. Moreover, it is possible to use Darcy’s law to determine the effective permeability for
each phase at a given saturation. In such tests, two phases are injected into the core plugs
simultaneously at constant rates and pressure. Once the measured pressure drop across the core
remains relatively constant, the system is assumed to be at steady state. At such points, the outlet
flow rate of each phase and the pressure drop is measured, and the subsequent values are used in
Darcy’s law to calculate the effective permeability of the fluid at that given saturation. The inlet
flow rate ratio is then changed, and the processes are repeated. In such procedures, relative
permeability curves for each phase can be obtained. The number of data points can be controlled
through the number of steady-state levels reached and the direction of the saturation changes
should be in one direction to avoid hysteresis.
On the contrary, the unsteady state technique experimentally and computationally is far more
complicated. Here, only one phase is injected into the core, equilibrium is not achieved during the
test and fluids are not injected simultaneously into the core as the case for steady-state. The test
46
involves displacing in-situ fluids with a constant rate and pressure driving fluid. The outlet fluid
composition and flow rate are measured and used for relative permeability calculations. The main
advantage of using unsteady state techniques is that they are faster and cheaper to run. However,
if time and budget constraints are not a deciding factor in the experiments, it is recommended that
the steady-state technique be performed to obtain the most reliable relative data.
2.9.1 Johnson Bossler and Naumann (JBN) method
A theoretically sound method was developed for calculating water-oil relative permeability from
waterflood data. This method has been found to yield reliable results which agree with direct
measurements of relative permeabilities obtained in steady-state flow test. Moreover, this method
is far less time consuming, faster, cheaper than other methods. Furthermore, relative permeability
values can be calculated from displacement data obtained from short cores. (Johnson, Bossler, &
Bossler, 1959) This method involves numerical differentiation, and it is important to have good
quality data that are relatively free from random noise. This method relies on data collected in
post-breakthrough part of the flood and the lowest water saturation at which relative permeability
can be inferred in the saturation at the flood front. The assumption for this method is that the effect
of capillary pressure and gravity is neglected. However, with this method, the relative permeability
points calculated by JBN method are typically scattered, and it is desirable to fit a smooth curve
through these points using proposed fitting analytical relationships in the least square sense. Some
parameters affect the relative permeability and or effective permeability characteristics and these
include capillary number, Pore geometry, heterogeneity of the system, the anisotropy of the
system, fluid viscosity, interfacial tension (IFT), flow rate, and wettability, some will be discussed
below.
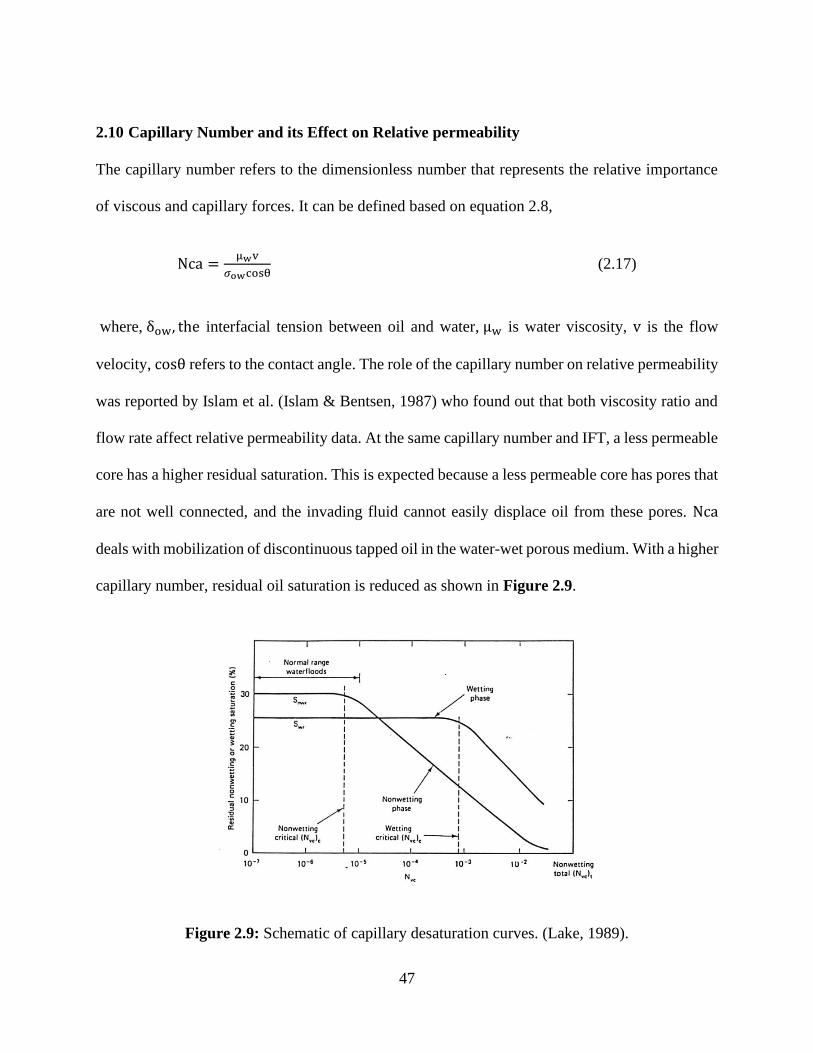
47
2.10 Capillary Number and its Effect on Relative permeability
The capillary number refers to the dimensionless number that represents the relative importance
of viscous and capillary forces. It can be defined based on equation 2.8,
Nca =μwv
𝜎owcosθ (2.17)
where, δow, the interfacial tension between oil and water, μw is water viscosity, v is the flow
velocity, cosθ refers to the contact angle. The role of the capillary number on relative permeability
was reported by Islam et al. (Islam & Bentsen, 1987) who found out that both viscosity ratio and
flow rate affect relative permeability data. At the same capillary number and IFT, a less permeable
core has a higher residual saturation. This is expected because a less permeable core has pores that
are not well connected, and the invading fluid cannot easily displace oil from these pores. Nca
deals with mobilization of discontinuous tapped oil in the water-wet porous medium. With a higher
capillary number, residual oil saturation is reduced as shown in Figure 2.9.
Figure 2.9: Schematic of capillary desaturation curves. (Lake, 1989).
48
The figure above shows the correlation of residual oil with the capillary number. It can be observed
from the graph that there is a range of capillary number over which the residual oil saturation
changes significantly, this also results in changes in the relative permeabilities. In the case of water
flooding alone, due to higher IFT, the capillary number is low and is within the range over which
the residual oil saturation does not change with the capillary number. Tertiary methods are applied
to increase the capillary number in ranges that will result in oil mobilization.
2.11 Effect of Temperature on Relative Permeability
Even though there are contradictory reports about the effects of temperature on relative
permeability, many researchers agreed that relative permeability changes as temperature changes.
Handy et al. (Hamouda & Karoussi, 2008) performed a two-phase flow in Berea sandstone and
indicated that at low IFT, relative permeability curves are affected by temperature. The author
noted that as temperature increases, relative permeability to oil increases and relative permeability
to water decreases at a given saturation while residual oil saturation decreases, and irreducible
water saturation increases. The oil-water relative permeability curves shift towards higher water
saturations. In general, as temperature increases, oil can flow much easier than water. The author's
results suggest that the sandstone becomes more water-wet, implying that the contact angle
decreases as temperature increases. Sufi et al. (Sufi, Ramey Jr, & Brigham, 1982) also found that
in the temperature range of 20 to 85 oC, the relative permeability of oil and water obtained from
unconsolidated clean Ottawa sands does not change. In a separate experiment, they saw that as
temperature increases, sor decreases. This observation is consistent with what was reported by
Handy et al. Sufi et al. also noted that as temperature increases, the viscosity ratio of the oil-water
49
system decreases. This reduction in the viscosity is responsible for the change of the fraction flow
curves thus, the change in sor is not necessarily due to a change in wettability.
2.12 Conclusion
Practically, EOR studies require a comprehensive understanding of fluid flow characteristics such
as petrophysical rock properties, reservoir pressure, fluid flow rate, etc and the volume of each
fluid phases may be affected by fluid flow behaviour in porous media. Depending on the needs of
the study, fluid flow can be visualized in 1D, 2D, 3D, or even radial geometry. Moreover, fluid
flow can be steady-state, unsteady state, or pseudo steady state. This chapter focused on the major
concepts and fundamentals of fluid flow in the porous medium. It also provided a strong basis and
a foundation for other chapters in this thesis.
2.13 References
Abidin, A., Puspasari, T., & Nugroho, W. (2012). Polymers for enhanced oil recovery technology.
Procedia Chemistry, 4, 11-16.
Al-Adasani, A., & Bai, B. (2010). Recent developments and updated screening criteria for
enhanced oil recovery techniques. Paper presented at the International Oil and Gas
Conference and Exhibition in China.
Alvarado, V., & Manrique, E. (2010). Enhanced oil recovery: an updated review. Energies, 3(9),
1529-1575.
Anderson, W. (1986a). 1987, Wettability literature survey–part 1 to part 6. J. Pet. Technol, 1125-
1144.
Anderson, W. (1986b). Literature survey. Part 2: wettability measurement. J. Pet. Technol, 38,
1246-1262.
Banks, W. P. (1962). Recovery of petroleum crude oil, by in situ combustions and situ
hydrogenation: Google Patents.
Burkhardt, J., Ward, M., & McLean, R. (1958). Effect of core surfacing and mud filtrate flushing
on the reliability of core analysis conducted on fresh cores. Paper presented at the Fall
Meeting of the Society of Petroleum Engineers of AIME.
Chau, T., Bruckard, W., Koh, P., & Nguyen, A. (2009). A review of factors that affect contact
angle and implications for flotation practice. Advances in colloid and interface science,
150(2), 106-115.
Craig, F. F. (1971). The reservoir engineering aspects of waterflooding (Vol. 3): HL Doherty
Memorial Fund of AIME New York, NY.
50
Cuiec, L., Longeron, D., & Pacsirszky, J. (1978). Recommendations for the determination of the
wettability of a specimen of the reservoir rock. Rev. Inst. Franc. Du Petrole, 33(6), 907-
914.
Donaldson, E. C., Chilingarian, G. V., & Yen, T. F. (1989). Enhanced oil recovery, II: Processes
and operations: Elsevier.
Ehrlich, R., & Wygal Jr, R. J. (1977). The interrelation of crude oil and rock properties with the
recovery of oil by caustic waterflooding. Society of Petroleum Engineers Journal, 17(04),
263-270.
Fantazzini, D., Höök, M., & Angelantoni, A. (2011). Global oil risks in the early 21st century.
Energy Policy, 39(12), 7865-7873.
Gambaryan-Roisman, T. (2014). Liquids on porous layers: wetting, imbibition and transport
processes. Current Opinion in Colloid & Interface Science, 19(4), 320-335.
Green, D. W., & Willhite, G. P. (1998). Enhanced oil recovery (Vol. 6): Henry L. Doherty
Memorial Fund of AIME, Society of Petroleum Engineers Richardson, TX.
Guha, A. (1991). Energy alternatives for the future. International Journal of Global Energy Issues,
2(4), 241-249.
Hamouda, A. A., & Karoussi, O. (2008). Effect of temperature, wettability and relative
permeability on oil recovery from oil-wet chalk. Energies, 1(1), 19-34.
Islam, M., & Bentsen, R. (1987). Effect of different parameters on two-phase relative permeability.
AOSTRA Journal of Research, 3, 69-90.
Johnson, E., Bossler, D., & Bossler, V. (1959). Calculation of relative permeability from
displacement experiments.
Kyte, J., Naumann, V., & Mattax, C. (1961). Effect of reservoir environment on water-oil
displacements. Journal of petroleum technology, 13(06), 579-582.
Lake, L. W. (1989). Enhanced oil recovery.
Lake, L. W., Johns, R. T., Rossen, W. R., & Pope, G. A. (2014). Fundamentals of enhanced oil
recovery.
Leverett, M. (1941). Capillary behaviour in porous solids. Transactions of the AIME, 142(01),
152-169.
Morrow, N. R., Lim, H. T., & Ward, J. S. (1986). Effect of crude-oil-induced wettability changes
on oil recovery. SPE Formation Evaluation, 1(01), 89-103.
Muggeridge, A., Cockin, A., Webb, K., Frampton, H., Collins, I., Moulds, T., & Salino, P. (2014).
Recovery rates, enhanced oil recovery and technological limits. Phil. Trans. R. Soc. A,
372(2006), 20120320.
Owen, N. A., Inderwildi, O. R., & King, D. A. (2010). The status of conventional world oil
reserves—Hype or cause for concern? Energy Policy, 38(8), 4743-4749.
Romero-Zerón, L. (2012). Advances in enhanced oil recovery processes Introduction to Enhanced
Oil Recovery (EOR) Processes and Bioremediation of Oil-Contaminated Sites: InTech.
Seo, K., & Kim, M. (2015). Re-derivation of Young’s Equation, Wenzel Equation, and Cassie-
Baxter Equation Based on Energy Minimization Surface Energy: InTech.
Shah, D. O. (2012). Improved oil recovery by surfactant and polymer flooding: Elsevier.
Sheng, J. (2010). Modern chemical enhanced oil recovery: theory and practice: Gulf Professional
Publishing.
51
Sufi, A. H., Ramey Jr, H. J., & Brigham, W. E. (1982). Temperature effects on relative
permeabilities of oil-water systems. Paper presented at the SPE Annual Technical
Conference and Exhibition.
Taber, J. J., Martin, F., & Seright, R. (1997). EOR screening criteria revisited-Part 1: Introduction
to screening criteria and enhanced recovery field projects. SPE Reservoir Engineering,
12(03), 189-198.
Thomas, S. (2008). Enhanced oil recovery-an overview. Oil & Gas Science and Technology-Revue
de l'IFP, 63(1), 9-19.
Zhang, A., Ma, Q., Wang, K., Liu, X., Shuler, P., & Tang, Y. (2006). Naphthenic acid removal
from crude oil through catalytic decarboxylation on magnesium oxide. Applied Catalysis
A: General, 303(1), 103-109.
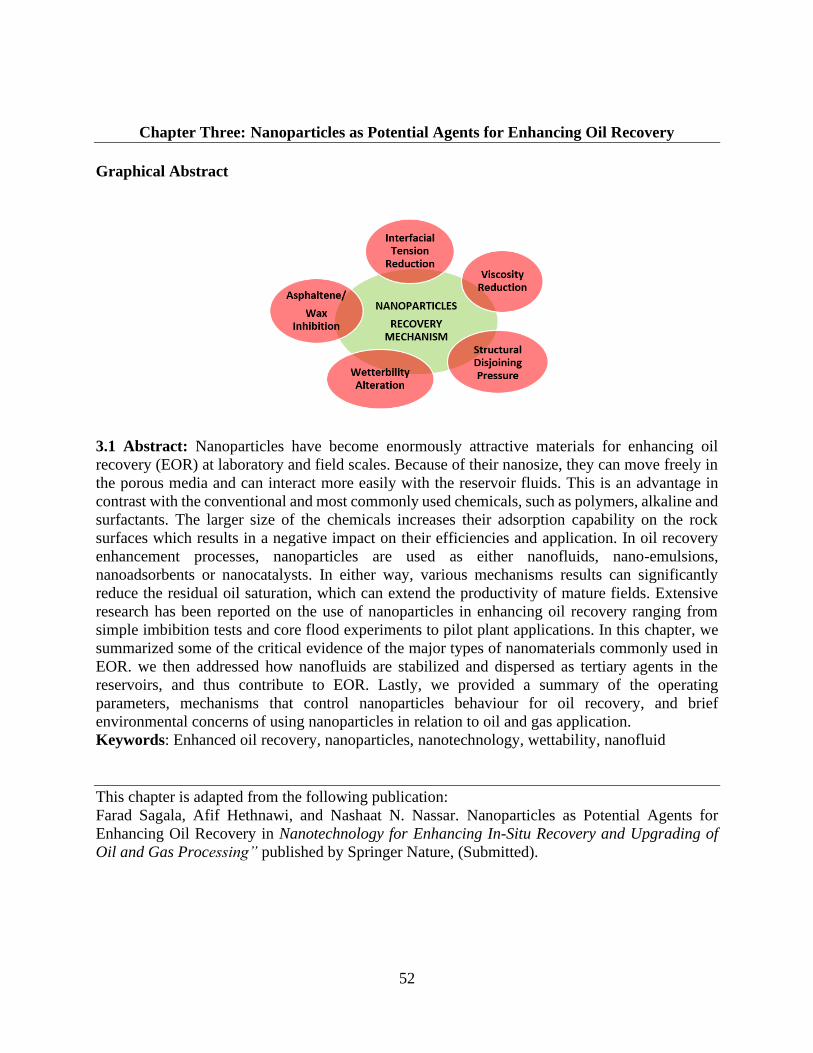
52
Chapter Three: Nanoparticles as Potential Agents for Enhancing Oil Recovery
Graphical Abstract
3.1 Abstract: Nanoparticles have become enormously attractive materials for enhancing oil
recovery (EOR) at laboratory and field scales. Because of their nanosize, they can move freely in
the porous media and can interact more easily with the reservoir fluids. This is an advantage in
contrast with the conventional and most commonly used chemicals, such as polymers, alkaline and
surfactants. The larger size of the chemicals increases their adsorption capability on the rock
surfaces which results in a negative impact on their efficiencies and application. In oil recovery
enhancement processes, nanoparticles are used as either nanofluids, nano-emulsions,
nanoadsorbents or nanocatalysts. In either way, various mechanisms results can significantly
reduce the residual oil saturation, which can extend the productivity of mature fields. Extensive
research has been reported on the use of nanoparticles in enhancing oil recovery ranging from
simple imbibition tests and core flood experiments to pilot plant applications. In this chapter, we
summarized some of the critical evidence of the major types of nanomaterials commonly used in
EOR. we then addressed how nanofluids are stabilized and dispersed as tertiary agents in the
reservoirs, and thus contribute to EOR. Lastly, we provided a summary of the operating
parameters, mechanisms that control nanoparticles behaviour for oil recovery, and brief
environmental concerns of using nanoparticles in relation to oil and gas application.
Keywords: Enhanced oil recovery, nanoparticles, nanotechnology, wettability, nanofluid
This chapter is adapted from the following publication:
Farad Sagala, Afif Hethnawi, and Nashaat N. Nassar. Nanoparticles as Potential Agents for
Enhancing Oil Recovery in Nanotechnology for Enhancing In-Situ Recovery and Upgrading of
Oil and Gas Processing” published by Springer Nature, (Submitted).
53
3.2. Introduction
World conventional oil recovery methods, best known as primary and secondary methods,
typically extract approximately one-third of the original oil-in-place in the reservoir (Lake, Johns,
Rossen, & Pope, 2014; Sen, 2008). Estimated reserves worldwide range up to 1.5 trillion barrels
(Abas, Kalair, & Khan, 2015). Thus, it is estimated that the remaining oil as a residual oil after
conventional recovery methods would be approximately 1.0 trillion barrels (Council, 1976).
Several enhanced oil recovery (EOR) techniques generally grouped as tertiary production schemes
have targeted these huge unexploited reserves (Alvarado & Manrique, 2010; Bilak, 2006; Siddiqui,
2010; Thomas, 2008; Yousef, Al-Saleh, & Al-Jawfi, 2012). However, finding a low cost and
effective method to extract this remaining residual oil after primary and secondary recovery
remains a challenge, given that the current tertiary practices depend on crude prices (Kong &
Ohadi, 2010; Maggio & Cacciola, 2009). Hence, a search is needed for sustainable, cost-effective,
efficient, and environmentally friendly techniques.
Generally, EOR techniques are aimed at increasing the overall recovery factor (RF), which is the
product of sweep (Ev) and displacement (ED) efficiencies. To increase the RF, mechanisms such
as oil-water interfacial tension reduction (Shah, 2012), wettability alteration (Abe, 2005), and fluid
viscosity enhancement (Shu & Hartman, 1986) are performed. These mechanisms are achieved
using the common EOR techniques such as chemicals, miscible and immiscible gas or liquid
flooding, and thermal methods. To design an EOR technique, the aim is to achieve any of the
aforementioned mechanisms. A successful design must also be cost-effective, efficient, and
reliable. However, most of the current methods are technically successful but highly expensive
hence creating a gap for venturing into more alternative techniques to recover the residual oil cost-
effectively and efficiently.
54
Alternatively, efficient and effective techniques using nanoparticle technology are emerging as an
alternative agent for enhancing the performance of EOR and have greatly changed the perspective
of researchers towards the use of smart materials (J. Giraldo, Benjumea, Lopera, Cortes, & Ruiz,
2013; Hendraningrat, Li, & Torsæter, 2013; McElfresh, Holcomb, & Ector, 2012; Ogolo, Olafuyi,
& Onyekonwu, 2012; Torsater, Engeset, Hendraningrat, & Suwarno, 2012). Nanotechnology is
the design, characterization, production and application of devices, materials and systems by
controlling their size and shape at the nanoscale, all in the range from 1 to100 nm at least in one
dimension (Khalil, Jan, Tong, & Berawi, 2017). Advances in nanotechnology have enabled
scientists to develop a collection of various unique nanomaterials, nanodevices, and nanotools with
many possible uses in electronics, medicine, biomedicine, drug delivery, photography, wastewater
treatment, and energy (Chang & Wu, 2013; Cheng et al., 2007; Mout, Moyano, Rana, & Rotello,
2012; Serrano, Rus, & Garcia-Martinez, 2009; Shen, Zhang, Huang, Xu, & Song, 2014; Subbiah,
Veerapandian, & S Yun, 2010; K. Yang et al., 2012). The diversification in their uses is due to
their unique size and shape that alters their chemical and physical properties in comparison to their
bulk counterparts (Kong & Ohadi, 2010). In bulk materials, the number of atoms at the surface is
significantly smaller than in the whole bulk material, which makes their chemical and physical
properties constant regardless of their size (Kong & Ohadi, 2010). However, when the size is
reduced, several properties such as quantum confinement, i.e., optical and electronic properties,
magnetism, thermal resistance, catalytic activities, internal pressure, melting point, dispersion
ability and intrinsic reactivity are all altered (Perez, 2007). This is due to the surface area to volume
ratio that becomes larger, and hence the number of atoms at the surface becomes significant, more
atoms are exposed to the surface of the material compared to the atoms in the bulk material thus
increasing the surface energy (Lei et al., 2010). Therefore, nanoparticles present favourable
55
characteristics, their active surface sites can be utilized in various ways and for this reason, doors
for research have been opened utilising these properties for oil and gas-related applications (Ogolo
et al., 2012).
Besides, nanotechnology not only offers environmental and cost-effective industrial processes but
also offers precise manipulation of atoms and molecules allowing the control of their properties
(Serrano et al., 2009). Therefore, the rapid advancement in nanotechnology in the past few decades
has led to the application of various nano-sized materials in the oil and gas industry, in the fields
of exploration, drilling, production and post-production activities (Khalil et al., 2017; Matteo,
Candido, Vera, & Francesca, 2012). This is because of the global demand for energy caused by
the population growth, and the challenges with the currently used conventional methods, hence
forcing the researchers to explore the mechanisms and applicability of nanomaterials in extracting
more hydrocarbons (Khalil et al., 2017), even from non-conventional resources (Ogolo et al.,
2012).
In the recent years, the use of nanoparticles in enhancing oil recovery (EOR) has attracted
the attention of many researchers (Ogolo et al., 2012; Suleimanov, Ismailov, & Veliyev,
2011; T. Zhang, Davidson, Bryant, & Huh, 2010). Nanoparticles can drastically improve oil
recovery by improving several fluid properties such as viscosity enhancement, thermal
conductivity, reducing the interfacial tension, improving the heat transfer coefficient of the
injected or produced fluids, and altering the rock wettability through the fluid-rock
interaction (Golas, Louie, Lowry, Matyjaszewski, & Tilton, 2010; Mittal, Chisti, &
Banerjee, 2013; Saravanan, Gopalan, & Chandrasekaran, 2008). Based on their adsorption
capability, nanoparticles can also extensively be used in overcoming production problems
56
such as inhibiting asphaltene deposition and the subsequent formation damage (Negin, Ali,
& Xie, 2016). Some studies on the application of nanoparticles in EOR have concluded that
nanoparticles, in terms of their size, can penetrate the pore space where the conventional
recovery techniques cannot reach, representing an advantage as they can change both the
reservoir fluid properties and improve oil recovery (Negin et al., 2016). Several applications
of nanoparticles in EOR have been extensively conducted mostly in laboratories to
understand the phenomena under which nanoparticles enhance oil recovery. The focus has
been on mechanisms such as interfacial tension reduction (Hendraningrat, Li, & Torsater,
2013), wettability alteration (J. Giraldo et al., 2013), oil viscosity reduction (Ehtesabi,
Ahadian, Taghikhani, & Ghazanfari, 2013), structural disjoining pressure (D. Wasan,
Nikolov, & Kondiparty, 2011), and how these mechanisms vary with different types,
morphologies and concentration of nanoparticles. Luky et al. (Hendraningrat & Shidong,
2012), conducted a study to investigate the impact of nanofluids injection on interfacial
tension reduction, permeability impairment, nanoparticle retention and how these
parameters contribute to oil recovery. They carried out their study in a glass micromodel and
the microscopic visualization showed that nanoparticles were adsorbed at the glass surface
due to the pressure log jamming that was observed during fluid injection. Subsequently,
nanoparticle entrapment resulted in wettability alteration and at same time permeability
impairment was noticed. The authors reported that nanoparticle morphology, type, and
concentration are among the key parameters that affect nano-enhanced oil recovery (nano-
EOR). They concluded that increasing nanoparticle concentration can drastically reduce the
IFT but also may result in a reduction of absolute permeability. Ali et al. (Esfandyari Bayat,
Junin, Samsuri, Piroozian, & Hokmabadi, 2014), investigated the impact of aluminium oxide
57
(Al2O3), titanium dioxide (TiO2) and silica dioxide (SiO2) nanoparticles on enhanced oil
recovery for a limestone media at several temperatures. At first, they carried out a transport
study and found out that Al2O3 nanoparticles had the lowest adsorption rate of 8.2%,
followed by TiO2 with 27.8% and finally the SiO2 with the highest adsorption rate of 43.4%.
They also noticed that all these three nanoparticles could potentially change the wettability
of the core from intermediate to strong water wet and reduce the capillary forces. Moreover,
a considerable viscosity reduction in the presence of Al2O3 and TiO2 nanoparticles at 50 oC
and 60 oC was noticed. Different researchers (R. Hashemi, Nassar, & Almao, 2014; Ogolo
et al., 2012) have used different nanomaterials for enhanced oil recovery featuring different
mechanisms. The massive multiplicity of the nanomaterials Figure 3.1 arising from their
wide biochemical nature, sizes, morphologies and shapes, the dispersant in which the
particles are present, the state of the medium of the particles and most significantly, the
numerous probable surface adjustments the nanoparticles can be exposed to make this an
imperative active field of science. However, there are not so many available studies
addressing the combination of the commonly used nanoparticles and the optimization of the
oil recovery parameters. Therefore, this chapter presents the opportunities and major critique
of the recently tested nanoparticles in EOR. It focuses on the underlying mechanisms of
nanoparticles in EOR, recovery parameters involved during the oil recovery enhancement
processes, nanofluid stabilization techniques applicable to EOR have also been reviewed.
Lastly, concerns and uncertainties raised due to nanomaterials exposure in oil and gas
applications have been reviewed. This review is helpful for readers, gaining insight into the
enhancement of oil recovery using state-of-art concepts and fundamentals for nanofluids.
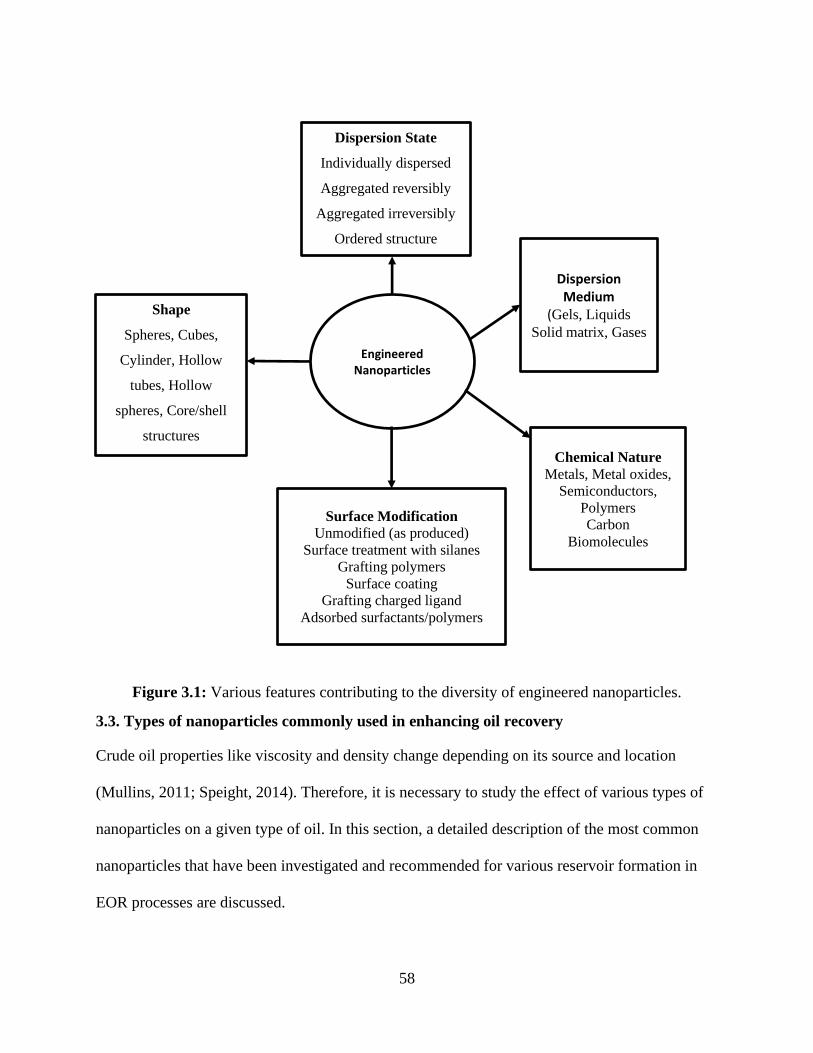
58
Figure 3.1: Various features contributing to the diversity of engineered nanoparticles.
3.3. Types of nanoparticles commonly used in enhancing oil recovery
Crude oil properties like viscosity and density change depending on its source and location
(Mullins, 2011; Speight, 2014). Therefore, it is necessary to study the effect of various types of
nanoparticles on a given type of oil. In this section, a detailed description of the most common
nanoparticles that have been investigated and recommended for various reservoir formation in
EOR processes are discussed.
Engineered Nanoparticles
Shape
Spheres, Cubes,
Cylinder, Hollow
tubes, Hollow
spheres, Core/shell
structures
Dispersion State
Individually dispersed
Aggregated reversibly
Aggregated irreversibly
Ordered structure
Dispersion Medium
(Gels, Liquids
Solid matrix, Gases
Surface Modification
Unmodified (as produced)
Surface treatment with silanes
Grafting polymers
Surface coating
Grafting charged ligand
Adsorbed surfactants/polymers
Chemical Nature
Metals, Metal oxides,
Semiconductors,
Polymers
Carbon
Biomolecules
59
3.3.1. Silica (SiO2) nanoparticles
In different parts of the world, silica or silicon dioxide is the major constituent of sand
(Pettijohn, Potter, & Siever, 2012). It is an oxide of silicon with the chemical formula SiO2,
most commonly found in nature as quartz and various living organisms. These nanomaterials
are environmentally friendly due to their vast existence in nature (Darling, 2011). Besides, the
surface area of SiO2 barely changes even when heated at elevated temperatures (650 oC). This
makes them thermally stable (L. Wang, Wang, Yang, & Yang, 1999a), and appropriate for
EOR applications especially in harsh reservoir conditions (L. Wang, Wang, Yang, & Yang,
1999b). Current studies have embarked on the application of these types of nanoparticles for
oil enhancement either alone or synergized with various conventional EOR methods
(Miranda, Lara, & Tonetto, 2012; Tushar Sharma, Iglauer, & Sangwai, 2016; Torsater et al.,
2012; H. Zhang, Nikolov, & Wasan, 2014). For instance, Zargartalebi et al. (Zargartalebi,
Kharrat, & Barati, 2015) improved surfactant oil enhancement by using modified silica,
hydrophilic and hydrophobic type, together with an anionic surfactant. They performed an
extensive series of measurements for interfacial tension and adsorption and observed a
reduction in surfactant adsorption and interfacial tension in the presence of these
nanoparticles. They concluded that the performance of surfactant flooding can be significantly
improved by the addition of an optimized concentration of SiO2 nanoparticles. (Jain, Wang,
Jones, Hawkett, & Warr, 2009) conducted a conclusive study, on the effect of particle size,
permeability, initial rock wettability, injection rate, and temperature using silica nanoparticles.
The author concluded that small particle size increases oil recovery and displacement
efficiency due to the reduction of the contact angle as the size decreases. The author also
reported that the highest recoveries were obtained from the intermediate wet system.
60
Increasing the injection rate reduced the oil recovery while increasing the temperature resulted
in incremental oil recovery. The main recovery mechanism of SiO2 has been reported to be
mainly wettability alteration due to adsorption on the rock surface. Generally, it is the most
widely and recommended EOR nano-type agent for all wettability conditions but performs
best in mainly sandstone reservoirs. Moreover, compared to other nanoparticle types with the
same concentration, the adsorption behavior of silica nanoparticles has been reported not to
result in significant porosity and permeability impairment especially in sandstone formations
(Yu, An, Mo, Liu, & Lee, 2012b). Notwithstanding their great recovery potential and ability
to enhance oil recovery, silica nanoparticles still suffer difficulty of reducing the interfacial
tension to very ultra-low values compared to conventional surfactants. Although Roustaei et
al. (Roustaei, Moghadasi, Bagherzadeh, & Shahrabadi, 2012) reported a drastic decrease in
oil-water IFT, from 26.3mN/m to 1.75 mN/m using lipophilic polysilicon. This is considered
premature since a different trend was reported by Onyekonwu et al. (Onyekonwu & Ogolo,
2010) for the same polysilicon nanoparticles. Moreover, in both studies ethanol was used as a
dispersing phase for the polysilicon nanoparticles and IFT reduction might have been caused
by the presence of ethanol but not the polysilicon nanoparticles alone. Hence, more research
and investigation are still desirable on how to obtain ultra-low IFT using nanofluids. Also,
most studies are focusing on using commercial silica which has limited its applicability at the
pilot and industrial levels. Therefore, synthesis pathways that are not only environmentally
friendly but also cost-effective are still needed that can offer options for scalability for pilot
and field-testing applications. However, from the aforementioned analysis, it is obvious to
anticipate that the use of silica nanoparticles in EOR offers many advantages compared to
other nanoparticles especially in sandstone reservoirs, owing to their physical structure and
61
affinity. Although, most of the reported works on this matter are still experimental studies
conducted on a bench-scale level and no real process or field application has been reported.
Hence, to have a clear understanding on the role of silica nanoparticles in EOR, more
laboratory investigations at reservoir conditions and pilot-scale testing are needed and are of
paramount importance to have a clear understanding of their ability to be accepted in the oil
and gas industry.
3.3.2. Aluminium oxide (Al2O3) nanoparticles
Al2O3 nanoparticles exist in white powder form and are mainly composed of alpha-phase
aluminium oxide, which exists naturally as aluminium oxide. Because of its wide availability,
several researchers have used it for EOR applications (Esfandyari Bayat et al., 2014; Nazari
Moghaddam, Bahramian, Fakhroueian, Karimi, & Arya, 2015; Ogolo et al., 2012). The main
mechanism deduced for improving oil recovery using this type of nanomaterial has been
mainly viscosity reduction by disaggregation and modulation of the asphaltene morphology
insitu (Esfandyari Bayat et al., 2014; Zaid, Latiff, Rasyada, & Yahya, 2014). Studies have
been conducted either using it alone or synergizing it with other EOR conventional methods.
Zaid et al. (Zaid et al., 2014) compared the effectiveness of Al2O3 and zinc oxide (ZnO) on
EOR. In their study, they measured interfacial tension in the presence of nanofluids and the
change in oil viscosity for various nanofluids concentrations. Core flooding experiments were
conducted and the oil recovery efficiency when nanofluids were injected was compared to
that of the commercial surfactant, 0.3 wt% sodium dodecyl sulfate (SDS) alone. 11.7%
increase in the oil recovery was obtained after injection of Al2O3 nanofluids, compared to 0.3
wt% SDS. Based on the nano-type, 5.12% additional oil was recovered by Al2O3 compared to
ZnO-based nanofluids. The performance of anionic surfactant as wettability modifiers in
62
sandstone cores was also improved by dispersing 100 ppm of alumina nanoparticles in the
surfactant (J. Giraldo et al., 2013). The authors concluded that alumina-based nanofluids can
improve the water flooding oil recovery efficiency in sandstone cores by altering the
wettability of the cores from strongly oil wet to strongly water wet. Notwithstanding their
potential to improve oil recovery, in comparison to SiO2 and TiO2, Al2O3 nanoparticles have
been reported to be unstable especially in a brine of higher ionic strength (Hendraningrat &
Torsæter, 2015). They tend to aggregate and form clusters that may impair the permeability
during the flooding process especially in sandstone formations (Bayat & Junin, 2015). Similar
to SiO2, Al2O3 also do not reduce the interfacial tension to very low ultra-values. Also,
economical synthesis pathways that are not only environmentally friendly but also cost-
effective are still needed that can offer options for scalability for pilot and field-testing
applications. From the aforementioned analysis, it is clear that the application of alumina-
based nanoparticles in EOR offers many merits, due to their physical structure and surface
morphologies. However, still, most of the reported work on their application in EOR is at
laboratory scale and ambient conditions. Although alumina nanoparticles were successfully
tested for field applications and gave promising results (Zabala et al., 2014), more laboratory
investigations, pilot-scale and field testing are still required to have a clear understanding of
their ability to be adopted in the oil and gas industry.
3.3.3. Nickel oxide (NiO) nanoparticles
Nickel (II) oxide (NiO) is notably a well-characterized oxide of nickel. It is classified as a basic
metal oxide. NiO is an important transition metal oxide with a cubic lattice structure and has
attracted increasing attention owing to its potential use in various applications. It is widely used as
a catalyst during aquathermolysis processes for heavy oil upgrading (Meyers, Mishra, & Benson,
63
2006; Mukherjee et al., 2001), and as an adsorbent for asphaltene removal and disaggregation from
oil matrix (Franco, Montoya, Nassar, Pereira-Almao, & Cortes, 2013; Nashaat N Nassar, Azfar
Hassan, & Pedro Pereira-Almao, 2011a; Nashaat N. Nassar, Azfar Hassan, & Pedro Pereira-
Almao, 2011). Sayed et al. (S. I. Hashemi et al., 2016) explored the effect of NiO nanoparticles
for asphaltene disaggregation in porous media. In the presence of carbon dioxide, the NiO
nanoparticles were injected in the porous medium via gas steam injection, in which they were
uniformly dispersed using polydimethylsiloxane (PDMS). The results showed that under
miscible CO2 state, there was a considerable improvement in permeability and porosity reduction
of the core, as well as less asphaltene deposition in porous media, which increased the oil
recovery factor after NiO nanoparticles had been applied. The dominant mechanism for NiO
types of nanomaterials has been reported to be mainly viscosity reduction due to asphaltene
disaggregation especially in heavy oil and acting as a catalyst during aquathermolysis process
that result in oil upgarding (Negin et al., 2016). (Ogolo et al., 2012) conducted a study on
different types of nanoparticles which included NiO, the results indicated that NiO nanoparticles
are good EOR agents. However, the authors found that more recovery can be obtained by using
ethanol as the dispersing agent other than brine. Reduction of oil viscosity still was reported as the
main dominant mechanism for oil recovery increment. Sandeep et al. (Rellegadla et al., 2018)
recently reported that the performance of polymer flooding can be improved by adding nickel
nanoparticles. In their study, the authors used a blend of xanthan gum and nickel nanoparticles to
evaluate the changes in the diluted solution viscosity of xanthan when dispersed with nickel
nanoparticles. They found out that a mixture of xanthan gum and nickel nanoparticles has a higher
intrinsic viscosity of 55.25 dL/g compared to 49.13 dL/g for the xanthan gum solution alone. They
further conducted a displacement test in a sand pack to evaluate the efficiency of nanoparticle
64
assisted polymer flooding by injecting approximately 0.6 PV of the solution. Flooding results
showed that additional 5.98% of oil initially in place could be recovered with xanthan-nickel
nanoparticle mixture in comparison to 4.48 and 4.58% for xanthan and nanoparticles alone,
respectively. They concluded that a synergy of nickel nanoparticles with xanthan polymer can
increase oil recovery compared to xanthan polymer or nickel nanoparticles alone. Nevertheless,
from the above-mentioned analysis, it is apparent to anticipate that the use of NiO nanoparticles
in EOR offers many benefits both in sandstone and carbonate reservoirs, due to their physical
assembly and structures. Like the previously mentioned nanoparticle types, also the application of
NiO is still at the bench scale with no real process or field application reported. Hence, more
laboratory, pilot and field-scale testing investigations are still desirable to have a clear
understanding of their capability in EOR enhancement to be adapted in the oil and gas industry.
3.3.4. Zinc oxide (ZnO) nanoparticles
Using ZnO in enhancing oil recovery is still limited as several researchers reported its negative
impact on the reservoir permeability (Ogolo et al., 2012). These nanoparticles exhibit antibacterial,
anti-corrosive, antifungal and UV filtering properties. Because of its higher density (5600 kg/m3),
ZnO has found many applications in rubber making (Gardiner, 1970; Lin et al., 2015), ceramic
industry (Sousa, Segadaes, Morelli, & Kiminami, 1999), and as additives in cement and various
paints as a coating agent (Moezzi, McDonagh, & Cortie, 2012; Oprea et al., 2014). Hassan et al.
(Soleimani et al., 2018) reported some promising findings of ZnO nanoparticles in EOR
applications by recovering an additional 11.8% of oil initially in place. Their findings are
questioned because the 0.05-0.5 wt% concentration of ZnO used in their study just resulted in only
2% IFT reduction. Although they concluded that this was the major mechanism for oil increment,
this reduction is very insignificant to remobilize any trapped oil due to capillary forces. Moreover,
65
the authors did not report any wettability measurements before and after adsorption of the
nanoparticles on the rock surface. Also, the concentration of ZnO used by the authors was so high
and no experimental evidence was reported for the effect of this concentration on the rock
properties since previous studies such as Ogolo et al. (Ogolo et al., 2012) had earlier reported the
effect of such nanomaterials on the rock properties.
3.3.5. Iron oxide nanoparticles
These types of nanomaterials mainly exist in two forms, magnetite (Fe3O4) and its oxidized
form maghemite (γ-Fe2O3). These nanoparticles are known for their superparamagnetic properties
that lead to their potential applications in many electrical and magnetic fields, where they may be
used as sensors and data storage (Negin et al., 2016). In oil enhancement, however, they are used
as catalysts and adsorbents, especially for heavy oil upgrading (Nassar, Hassan, Carbognani,
Lopez-Linares, & Pereira-Almao, 2012; Nashaat N. Nassar et al., 2011). Several studies have also
reported promising results with the use of iron oxide in in-situ upgrading processes (R. Hashemi,
Nassar, & Pereira Almao, 2013; Nassar & Husein, 2010). Nassar et al. (Nashaat N Nassar et al.,
2011a) investigated the role of Fe2O3 nanoparticles in asphaltene adsorption and catalytic steam
gasification/cracking. The authors found out that Fe2O3 was very efficient in adsorbing asphaltene
and could also act as a catalyst for steam gasification/cracking. These findings agree with what
was reported by Xingxun who found out that Fe2O3 nanoparticles significantly inhibited the
aggregation of asphaltene particles in a micro-sized pore by adsorbing asphaltene particles onto
their surface. Moreover, the authors noted that the asphaltene precipitation and aggregation could
be effectively prevented by increasing the Fe2O3 concentration (X. Li, Guo, Sun, Lan, & Guo,
2018). To the best of our findings, this nanoparticle type has been applied mainly in heavy oil
upgrading and mainly used as a catalyst or adsorbent. Viscosity reduction due to asphaltene
66
inhibition has been reported as the major underlying mechanism for oil recovery (Kazemzadeh et
al., 2015; Taborda, Franco, Ruiz, Alvarado, & Cortés, 2017). Some nanoparticles with active
charged sites and with higher affinty for asphaltenes can provide real inhibition/aspahltene
disaggregation since they prevent the flucculation of asphaltene molecules and also shift the
asphaltene onset pressure which can reduce the oil viscosity.
3.3.6. Zirconium oxide (ZrO2) nanoparticles
This nanomaterial is in the form of a white powder composed of particles of zirconium oxide, also
known as zirconia. It is used across a variety of fields for applications ranging from polishing
semiconductors, ceramics, to producing artificial jewellery (Nassar, 2012). Zirconium is produced
when ions in zirconia are replaced with yttrium, stabilizing the cubic phase of the material. This,
in turn, makes it possible to produce sintered zirconium oxide products and allows the material to
conduct certain ions. The use of these types of nanomaterials in the oil and gas industry is still in
its infancy stage, and few findings have been reported. ZrO2 nanoparticle efficiency at different
nanoparticle concentrations (0-0.05 wt%) was assessed through contact angle measurements. The
results from the experimental findings showed that ZrO2 nanofluids have great potential in
changing oil-wet limestone to the strongly water-wet state. However, the best performance was
observed at 0.05 wt% ZrO2 nanoparticle concentration which changed an originally strongly oil-
wet (152°) calcite substrate towards a strongly water-wet (44°) state. The authors concluded that
ZrO2 is a good agent for enhanced oil recovery (Nwidee, Al-Anssari, Barifcani, Sarmadivaleh, &
Iglauer, 2016). Similar studies were conducted by Karim et al. (Karimi et al., 2012) who used
ZrO2 for wettability alteration together with a non-ionic surfactant for a carbonate rock. The
authors reported that the nanomaterials used successfully altered the rock wettability from strongly
oil-wet to strongly water-wet and that more oil could be recovered by spontaneous imbibition.
67
However, the adsorption and growth of ZrO2 nanoparticles on the rock surface was a slow process
that required at least two days. In recent studies, ZrO2 has been reported to displays superior
thermal and chemical stability compared to alumina and silica nanoparticles (Petit & Monot,
2015). Moreover, silica and γ-alumina nanoparticles were reported to exhibit limited chemical and
physical stability compared with ZrO2 nanoparticles (Gopalan, Chang, & Lin, 1995). ZrO2 has a
high catalytic effect and is reported to be the only metal oxide with four chemical properties on
the surface: acidic/basic and reducing/oxidizing properties (Tanabe, 1985). From the
aforementioned studies, it is clear that the application of ZrO2 nanoparticles in EOR is mostly in
carbonates formation and at laboratory scale. Therefore, to have a clear understanding of their
performance especially in sandstone and at reservoir conditions, more investigations are still
needed to have a clear understanding of their underlying mechanism so that they can be adopted
in the oil and gas industry.
3.3.7. Graphene oxide (GOs)
Graphene oxide is a compound of graphene, oxygen, and hydrogen. It has many applications in
various fields, especially in modern technology. Graphene oxide can be used in light-emitting
diodes (LEDs) and solar cell devices in electronics (Jo et al., 2012; Xuan Wang, Zhi, & Müllen,
2008). Scientists are always looking for ways to increase the capacity and efficiency of energy
storage, and advances in the processes to make graphene oxide have aided in this search. It is used
as a material for energy storage in supercapacitors (Pumera, 2011; Stoller, Park, Zhu, An, & Ruoff,
2008; L. L. Zhang, Zhou, & Zhao, 2010). Its application in enhancing oil recovery has been
recently reported. GOs was applied to improve the viscosity stability of diluted polymer/seawater
solutions aged at reservoir conditions. In the presence of 300 ppm of GOs, the viscosity stability
of 1700 ppm acrylamide-based polymer in a sea-water solution increased from 92 °C to 135 °C
68
(Nguyen et al., 2014). This showed that GOs is a potential agent for enhancing oil recovery.
Nanofluids of graphene-based amphiphilic Janus nanosheets were also used at low concentration,
additional oil recovery was recovered due to interfacial tension reduction (Luo et al., 2016).
Graphene oxide (GO), nanographene oxide (nGO) and partially reduced graphene oxide (rGO)
were also studied as possible foam stabilizing agents for CO2 based enhanced oil recovery
(Barrabino, Holt, & Lindeberg, 2018). Notwithstanding their recent reported potential and ability
to enhance oil recovery, however, most studies have been performed at ambient conditions and
fewer studies have been performed with graphene in both sandstone and carbonates. Therefore,
further surveys are still required to understand a clear mechanism under which graphene may
enhance oil recovery, especially at reservoir conditions.
3.3.8. Carbon nanotubes (CNT)
Carbon nanotubes are tube-shaped material, made of carbon, having a diameter measuring on the
nanometer scale. CNT is unique because the bonding between the atoms is very strong and the
tubes can have extreme aspect ratios. These types of nanomaterials are light, strong, resistant to
corrosion, good conductors of heat, and have a very large surface area (D. T. Wasan & Nikolov,
2003). Nanotubes can be single, double, or multi-walled and each wall is made of graphene. CNT
exhibit astonishing properties due to the formation of the three sp2 hybridized bond and presence
of extra electron from each carbon atom, making these nanomaterials potential materials for
electrical, thermal and mechanical applications. The use of carbon nanotubes for enhancing oil
recovery has been recently reported. Mohamed et al. (Alnarabiji et al., 2016) examined the impact
of multi-wall carbon nanotubes (MWCNTs) concentration on oil recovery efficiency and fluid
mobility. The authors used nanofluids of three different concentrations: 0.01, 0.05 and 0.10 wt%.
A water flooding experiment was then carried out to assess the impact of these nanofluids. Results
69
showed that the MWCNTs fluid was a good EOR agent. The highest recovery efficiency of 31.8%
of residual oil in place (ROIP) was achieved with the 0.05 wt % MWCNTs concentration.
However, by observing the values of the mobility reduction factor (MRF) used to investigate the
fluid behaviour, the researchers concluded that the behaviour of hydrophobic MWCNTs in water
fluid was unpredictable. To the best of our findings, however, there has been little research about
the use of these types of nanoparticles for improving or enhancing oil recovery. Further
investigations are still required in both carbonate and sandstone reservoirs especially at reservoir
conditions to understand the mechanisms and phenomena involved when CNTs are used as EOR
agents.
3.3.9 Cellulose nanoparticles
Cellulose is considered the most abundant, renewable, and sustainable biopolymer on earth. It is
found in plants, tunicates, and some bacteria. Many distinctive chemical and physical properties
such as strength, the large surface area can be enhanced when cellulose is used at the nanoscale.
Its application in enhancing oil recovery has been reported. Bing et al. (Wei, Li, Jin, Li, & Wang,
2016) injected nanocellulose fluid of different particle charge densities and mass fraction in a
micro-glass model. They found out that oil recovery was a function of both the particle charge
density and concentration. Two nanocellulose NC-1 and NC-2, with charge density 0.72 and 1.51
meq/q, respectively were used. The authors realized that NC-2 with higher particle charge was
forming a homogenous nanofluid than NC-1. In terms of IFT reduction, NC-2 performed better
than NC-1 due to particle charge difference, and the viscosity loss of the nanocellulose was
noticeably lower than that of the commonly used hydrolyzed polyacrylamide (HPAM) normally
used in polymer flooding. They recommended nanocellulose as a potential candidate that can be
used as polymer-surfactant materials to improve the macro and micro-displacement efficiency at
70
low cost. However, this study was conducted under ambient conditions, the rheological properties
of nanocellulose nanofluids at various temperature is another study that requires further
investigation. Reidun et al. (Aadland et al., 2018) recently investigated the performance of two
types of nanocellulose, CNC (USDA) and CNC AIFT 0.1 wt% nanofluids as a good alternative
for current EOR technologies. In their study, the authors first investigated the retention and
transport behaviour of the two types in a sand pack as the porous media. From the static adsorption
experiments conducted, the authors found that neither of the two nanocellulose types seemed to
adsorb significantly on the sand grains. However, they noted that the retention of cellulose
nanoparticles on the rock surface depends on the salinity, size of the grains, type of nanocellulose
used, and flow rate. Adsorption of the nanocellulose on the rock surface and log-jamming was
reported as the major mechanism that caused the retention, especially at elevated salinity
concentrations and injection rate, respectively. They noted that as the size of nanocellulose
decreased, permeability reduction and nanoparticle retention increased, which was due to
aggregation of the nanocellulose. Moreover, each nanocellulose type was found to have
significantly different transport and retention properties. Nevertheless, the study was still
conducted under ambient conditions. Hence, the use of cellulose nanoparticles in EOR is still in
its infancy stage and more findings both in sandstones and carbonates at reservoir conditions are
still required to enhance their adaptability in oil and gas application.
3.4. Nanoparticle stabilization for EOR application
Nanoparticles are categorized as particles with various shape, sizes, particle crystallinity, surface
area, and chemical composition (Donaldson, Stone, Clouter, Renwick, & MacNee, 2001). As the
particle dimension decreases, the number of surface molecules exponentially increases resulting
in a higher surface area of nanoparticles compared to the bulk material. Nanomaterial can show
71
hydrophilic, hydrophobic or double-faced (Janus) characteristics depending on their application,
surface ligands, stabilizers and polymer/surfactants used (Singh, 2015). Nanoparticles for EOR
applications in most cases are dispersed in fluids such as oil, deionized water, brine, or gas to
formulate nanofluids. However, in most cases because of their sizes, they are not stable and tend
to aggregate and form sediments that minimize their dispersity (Saidur, Leong, & Mohammad,
2011). Due to this aggregation and precipitation, large particles with non-uniform size distribution
tend to form clusters, creating practical challenges and limitations for oil field applications (R.
Hashemi et al., 2014; Hendraningrat & Torsæter, 2015). Accordingly, particle morphology,
topology and size distribution need to be closely monitored to avoid aggregation that may limit
the application of the nanofluids. Increase of agglomerated particle size results in continuous
destabilization of nanoparticle and several mechanisms can be involved. These mechanisms can
quantitatively explain the stability of the colloids in terms of the energy barrier. This energy barrier
represents the difference between the repulsion and the attraction energy as presented in figure 2b.
Significantly, overcoming this energy barrier would result in the particles approaching each other
and hence come into contact. If the difference between the interaction and repulsion energy is
higher than the energy barrier, then the energy barrier is exceeded and the colloidal particles tend
to agglomerate, figure 2b (a). Otherwise, the colloidal particles remain stable in the aqueous
solution, figure 2b (b). Thus, depending on their activities in the stabilization of the colloidal
particles, various methods can be used to keep the particle stable in the nanofluids. These agents
can be considered as the driving force for using the nanoparticles in EOR. Therefore, the use of
vast categories of additives have been repeatedly reported, which fall into either hydrolyzing
agents, polymeric or surfactant functionalization (Radhakrishnan, Ranjan, & Brittain, 2006;
Studart, Amstad, & Gauckler, 2007; Zhao, Milanova, Warmoeskerken, & Dutschk, 2012).
72
Changing the ionic strength around the colloidal particles has a significant effect on the
stabilization mechanism. For instance, the stability of the nanoparticles can be reduced by double-
layer compression, which causes a change on the ionic strength induced from the addition of
different electrolytes, resulting in destabilizing of the colloids under unstable conditions(Thio,
Zhou, & Keller, 2011). Consequently, colloids get close to each other with the presence of thin
electric double layers that contribute to overcoming the energy barrier and subsequent aggregation
of the colloid’s particles. More reduction of the double layer can be achieved if salts of counter-
ion are added, exceeding double-layer repulsion that leads to coagulation of particles. Charge
neutralization is one more mechanism that can cause a lack of stability for the nanoparticles.
Charge neutralization is often carried out by absorption of metal hydrolysis species on the particle
surface, such that a negative surface charge can be neutralized by using a positively charged
ligands. To avoid exceeding the energy barrier through charge neutralization or double-layer
reduction, determination of Zeta-potential of the colloidal particles has to be an important concept
(Sennett & Olivier, 1965). It is essential to estimate the optimal dosage needed for a near-point of
zero charges of the particles. Via effective control of the Zeta-potential, the stability of the particles
can be enhanced or by coating the particle surface with organic material/surfactants that provide a
steric repulsion between the particles by involving elastic and osmotic effect.
3.4.1. Commonly used stabilization techniques for EOR application
Nanoparticle stabilization involves numerous procedures that have been proposed before their
application in EOR. These include ultrasonication, steric, and electrostatic stabilization (Jiang,
Oberdörster, & Biswas, 2009). In the ultrasonic method, nano-size particles are dispersed in
liquids, such as solvents, water, oil, or resins using an ultrasonic sonicator. The use of the ultrasonic
method to stabilize nanomaterials has manifold benefits, the most obvious is the homogenous
73
dispersion of nanoparticles in the liquid phase preventing them from agglomerating (Ghadimi,
Saidur, & Metselaar, 2011).
Electrostatic stabilization of nanoparticles in a suspension as shown in Figure 3.2a is designated
by the DLVO theory (Derjaguin, Landau, Verwey, and Overbeek) (L. Wu, Zhang, & Watanabe,
2011). The interaction between two particles in a suspension is related to the combination of van
der Waals attraction potential and the electric repulsion potential. However, electrostatic
stabilization is limited by the fact that it is applicable to only dilute systems, it is a kinetic
stabilization method, it does not apply to electrolyte sensitive systems, it is almost not possible to
disperse again the agglomerated particles, and since in a given condition, different solids develop
different surface charge and electric potential, it is difficult to apply it in multiple phase systems.
Steric stabilization also referred to as polymeric stabilization, involves the addition of inhibitors
such as surfactants with water-loving chains, water-loving polymers or other modifiers that prevent
aggregation of nanoparticles in suspensions by creating an effective repulsive force between the
nanoparticles (Iijima & Kamiya, 2009; Lourenco, Teixeira, Simões, & Gaspar, 1996). As shown
in Figure 3.2(b) the addition of polymers or surfactants helps to cover the system in such a way
that long tails extend out into the solution(ShamsiJazeyi, Miller, Wong, Tour, & Verduzco, 2014).
Colloidal particle stabilization via polymer encapsulation has been reported by researchers to
greatly improve nanoparticle stability. This is because the nanoparticles stabilized by specific types
of polymers such as polyampholyte and polyelectrolyte can remain stable even in harsh reservoir
conditions (Ranka, Brown, & Hatton, 2015). Mikhil et al. (Ranka et al., 2015) reported that
nanoparticles stabilized with polyampholyte polymers can be applied to reservoirs with extreme
salinity up to 120,000 mg/dm3 and up to 90 oC with long-term colloidal stability. Also,
polyelectrolyte polymers such as poly(acrylic acid), poly(vinyl pyrrolidone) or poly(styrene
74
sulfonate) can be applied to provide electrostatic repulsion between nanoparticles and stabilize
them in high salinity conditions (Ersenkal et al., 2011). Nanoparticle encapsulation using polymers
can be achieved in two ways, i.e, “grafting from” and “grafting to” methods. With grafting from,
the coating is achieved by first immobilising an initiator on the nanoparticle surface and then
polymerization of the corresponding monomer follows. For grafting to, the encapsulation is
achieved by grafting the polymer on the surface of the nanoparticle via electrostatic interaction
which is the easier approach in most cases. For oil and gas application, polymers are coated on
nanoparticles surfaces using the grafting to technique (ShamsiJazeyi et al., 2014). In this method,
polymers with functional groups that are reactive with groups on surfaces of nanoparticles are used
to achieve the modification. These groups can include, alcohols, carboxylic acid, silane, amine,
phosphoric acid etc, (Neoh & Kang, 2011). Various types of polymers have been used by different
researchers for nanoparticle stabilization. For instance, Barrera et al. (Barrera et al., 2012).
investigated the effect of poly (ethylene oxide)-silane graft molecular weight on the colloidal
properties of iron oxide nanoparticles. The authors used an X-ray photoelectron spectroscopy
initially to obtain information on the chemical nature of the nanoparticle surface before grafting,
the surface consisted of a mixture of amine groups and grafted polymer. They found out that the
exposure of the amine groups on the surface of the nanoparticle decreased as the polymer
molecular weight increased. This indicated that the particles obtained consisted of single iron oxide
cores coated with a polymer brush. The DLVO theory was used to analyze the particle stability
considering electrostatic, magnetic, steric, and van der Waals interactions. Experimental results
and colloidal stability theory indicated that stability was achieved after the grafting process
(Barrera et al., 2012).
75
Nirmesh Jain et al. (Jain et al., 2009). stabilized aqueous ferrofluids and magnetic nanoparticles of
6-8 nm diameter by grafting polyacrylamide copolymer (PAM) to form a thinnest steric stabilized
layer attached on the iron oxide surface. The thermogravimetric analysis (TGA) showed an
increase in weight of the dried particles with a consistent polymer coating of a 1nm thickness
which confirmed the existence of the polymer on the surface of the particles. The mass
spectrometry and the dynamic light scattering were consistent with 4-5 nm increase in the
hydrodynamic radius of the grafted nanoparticles and the magnetisation experiments indicated
nonmagnetic surface layers which resulted from attachment of poly (acrylic acid) block to the
nanoparticle surface (Jain et al., 2009). A similar study, conducted by Patricia et al, stabilized
magnetite nanoparticles using polyelectrolytes polymer types the colloidal stability of the particles
was assessed by measuring the turbidity of the sediments after a given time of increasing the ionic
strength. The sedimentation results were supported by conducting the dynamic light scattering
measurement of the particle hydrodynamic diameter that remained suspended. At high PH, the
polymers used because of their coordinative interaction with iron oxide surface improved the
particle stability. The author's investigation provided a guideline for the design of polymeric
stabilizers for magnetite nanoparticles according to the PH and ionic strength of the intended
applications (Golas et al., 2010).
Sterically stabilized systems tend to remain well dispersed even at high salt concentrations or under
circumstances where the zeta potential of the system is close to zero (Tiraferri, Chen, Sethi, &
Elimelech, 2008). Steric stabilization effectiveness is ascribed to the thermodynamic consequence
when one tries to curb polymeric chains to lesser volumes (Napper, 1977). Steric stabilization
offers advantages over the electrostatic stabilization method, where particles are always re-
dispersible since it is a thermodynamic method. Moreover, with this method, a very high
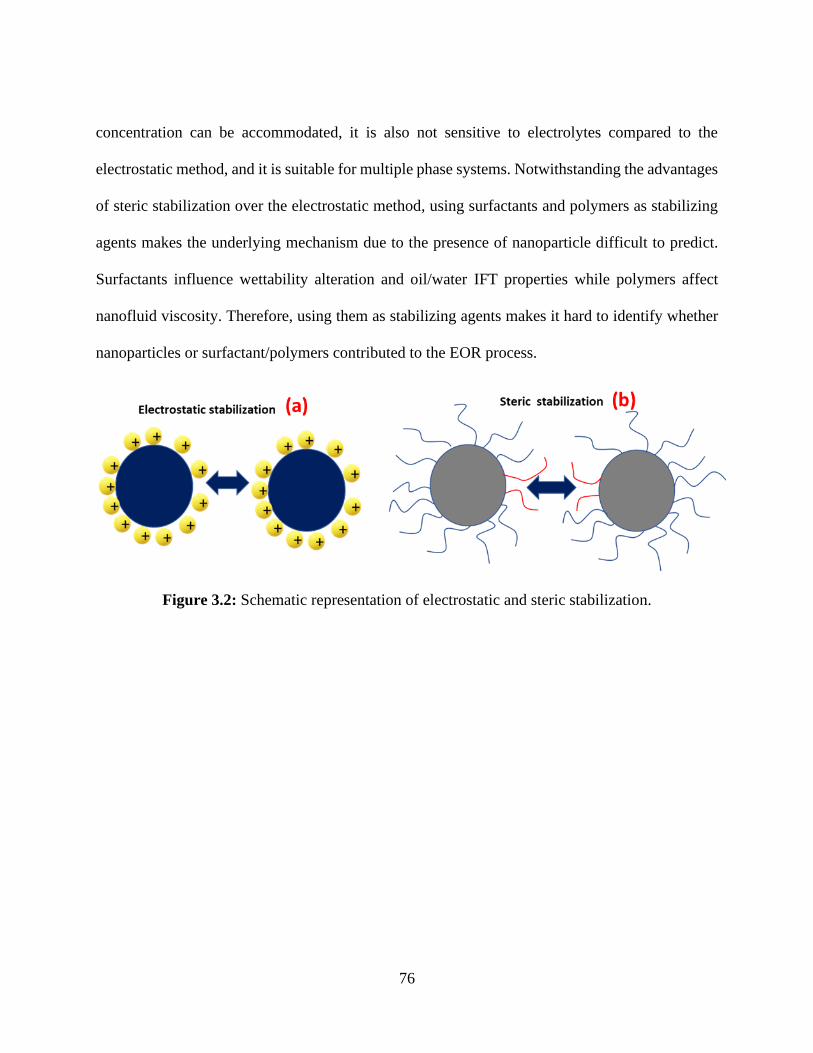
76
concentration can be accommodated, it is also not sensitive to electrolytes compared to the
electrostatic method, and it is suitable for multiple phase systems. Notwithstanding the advantages
of steric stabilization over the electrostatic method, using surfactants and polymers as stabilizing
agents makes the underlying mechanism due to the presence of nanoparticle difficult to predict.
Surfactants influence wettability alteration and oil/water IFT properties while polymers affect
nanofluid viscosity. Therefore, using them as stabilizing agents makes it hard to identify whether
nanoparticles or surfactant/polymers contributed to the EOR process.
Figure 3.2: Schematic representation of electrostatic and steric stabilization.
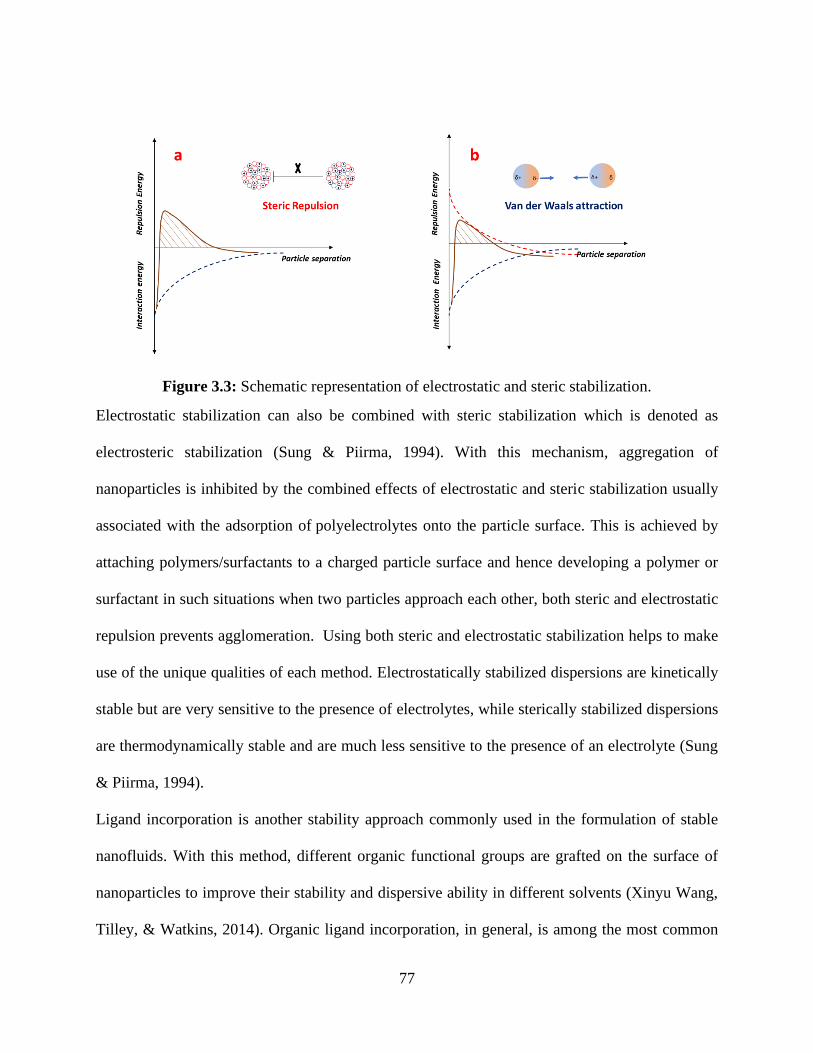
77
Figure 3.3: Schematic representation of electrostatic and steric stabilization.
Electrostatic stabilization can also be combined with steric stabilization which is denoted as
electrosteric stabilization (Sung & Piirma, 1994). With this mechanism, aggregation of
nanoparticles is inhibited by the combined effects of electrostatic and steric stabilization usually
associated with the adsorption of polyelectrolytes onto the particle surface. This is achieved by
attaching polymers/surfactants to a charged particle surface and hence developing a polymer or
surfactant in such situations when two particles approach each other, both steric and electrostatic
repulsion prevents agglomeration. Using both steric and electrostatic stabilization helps to make
use of the unique qualities of each method. Electrostatically stabilized dispersions are kinetically
stable but are very sensitive to the presence of electrolytes, while sterically stabilized dispersions
are thermodynamically stable and are much less sensitive to the presence of an electrolyte (Sung
& Piirma, 1994).
Ligand incorporation is another stability approach commonly used in the formulation of stable
nanofluids. With this method, different organic functional groups are grafted on the surface of
nanoparticles to improve their stability and dispersive ability in different solvents (Xinyu Wang,
Tilley, & Watkins, 2014). Organic ligand incorporation, in general, is among the most common
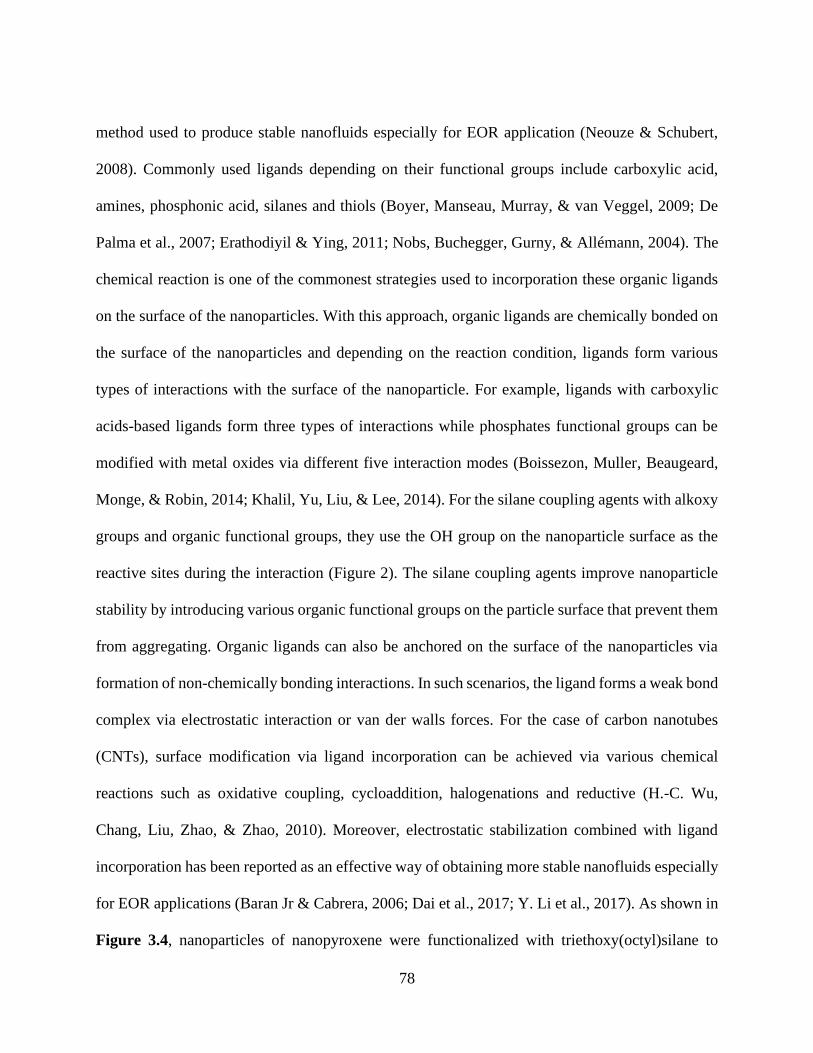
78
method used to produce stable nanofluids especially for EOR application (Neouze & Schubert,
2008). Commonly used ligands depending on their functional groups include carboxylic acid,
amines, phosphonic acid, silanes and thiols (Boyer, Manseau, Murray, & van Veggel, 2009; De
Palma et al., 2007; Erathodiyil & Ying, 2011; Nobs, Buchegger, Gurny, & Allémann, 2004). The
chemical reaction is one of the commonest strategies used to incorporation these organic ligands
on the surface of the nanoparticles. With this approach, organic ligands are chemically bonded on
the surface of the nanoparticles and depending on the reaction condition, ligands form various
types of interactions with the surface of the nanoparticle. For example, ligands with carboxylic
acids-based ligands form three types of interactions while phosphates functional groups can be
modified with metal oxides via different five interaction modes (Boissezon, Muller, Beaugeard,
Monge, & Robin, 2014; Khalil, Yu, Liu, & Lee, 2014). For the silane coupling agents with alkoxy
groups and organic functional groups, they use the OH group on the nanoparticle surface as the
reactive sites during the interaction (Figure 2). The silane coupling agents improve nanoparticle
stability by introducing various organic functional groups on the particle surface that prevent them
from aggregating. Organic ligands can also be anchored on the surface of the nanoparticles via
formation of non-chemically bonding interactions. In such scenarios, the ligand forms a weak bond
complex via electrostatic interaction or van der walls forces. For the case of carbon nanotubes
(CNTs), surface modification via ligand incorporation can be achieved via various chemical
reactions such as oxidative coupling, cycloaddition, halogenations and reductive (H.-C. Wu,
Chang, Liu, Zhao, & Zhao, 2010). Moreover, electrostatic stabilization combined with ligand
incorporation has been reported as an effective way of obtaining more stable nanofluids especially
for EOR applications (Baran Jr & Cabrera, 2006; Dai et al., 2017; Y. Li et al., 2017). As shown in
Figure 3.4, nanoparticles of nanopyroxene were functionalized with triethoxy(octyl)silane to
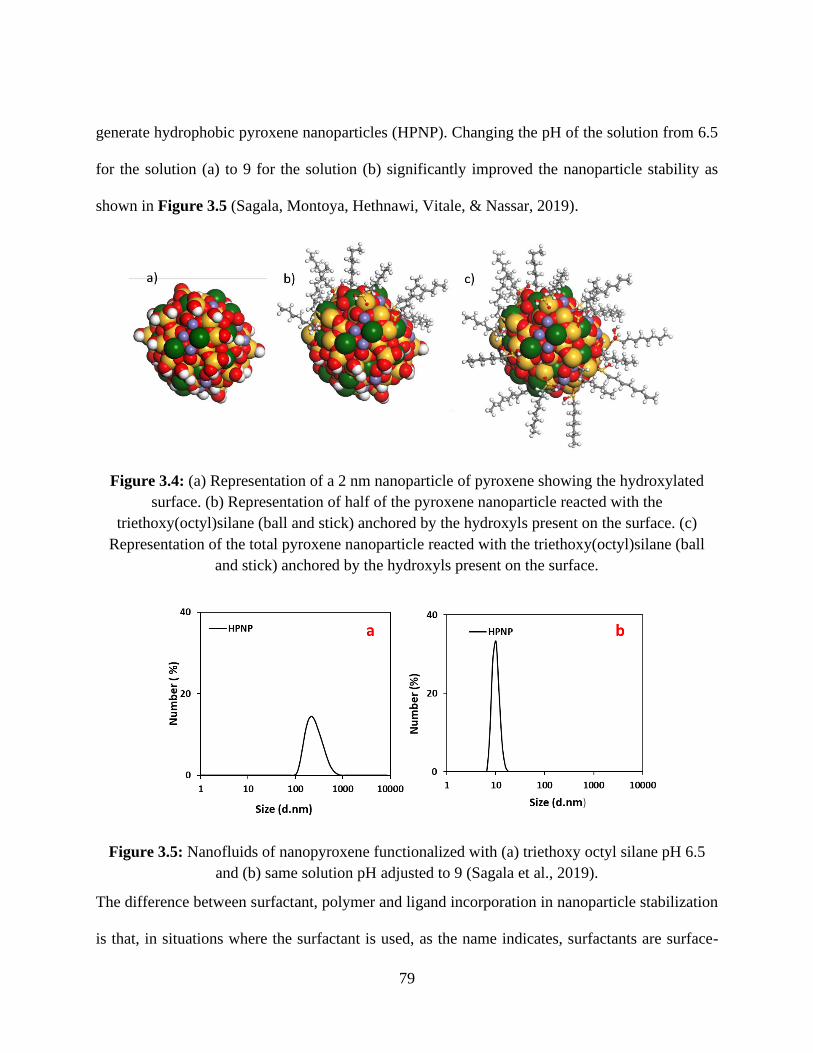
79
generate hydrophobic pyroxene nanoparticles (HPNP). Changing the pH of the solution from 6.5
for the solution (a) to 9 for the solution (b) significantly improved the nanoparticle stability as
shown in Figure 3.5 (Sagala, Montoya, Hethnawi, Vitale, & Nassar, 2019).
Figure 3.4: (a) Representation of a 2 nm nanoparticle of pyroxene showing the hydroxylated
surface. (b) Representation of half of the pyroxene nanoparticle reacted with the
triethoxy(octyl)silane (ball and stick) anchored by the hydroxyls present on the surface. (c)
Representation of the total pyroxene nanoparticle reacted with the triethoxy(octyl)silane (ball
and stick) anchored by the hydroxyls present on the surface.
Figure 3.5: Nanofluids of nanopyroxene functionalized with (a) triethoxy octyl silane pH 6.5
and (b) same solution pH adjusted to 9 (Sagala et al., 2019).
The difference between surfactant, polymer and ligand incorporation in nanoparticle stabilization
is that, in situations where the surfactant is used, as the name indicates, surfactants are surface-
80
active materials. They chemically react with the surface of nanoparticles thus the nanoparticle size
does not increase since surfactants have shorter chain molecule with a polar head and hydrocarbon
or non-polar chains. Surfactant heads attach to the surface of the nanoparticle while the chain
remains free to move in the surrounding medium. Polymers have large chains which entangle the
particle and thus increase the size that results in modifications of nanoparticle properties. In
situations where a capping agent or ligand is used, it mealy enclose the particle and does not react
with surface therefore, no effect on the nanoparticle morphology. However, for application
purposes, selection of either polymer, surfactant or ligand depends on various factors such as
nanotype and intended application. For example, if nanoparticles are to be used for applications
where we do not want much rise in viscosity, a surfactant is preferable. While for several promising
biomedical applications capping by biomolecules is preferable. For oil recovery applications other
factors such as compatibility with reservoir conditions may come into play.
3.5. Mechanisms of enhancing oil recovery using nanoparticles
Different mechanisms of nano-EOR have been reported recently by different researchers using
nanoparticles as nanofluids, nano-emulsions or nanocatalysts. The most commonly reported and
proposed mechanisms are detailed below.
3.5.1. Wettability alterations and contact angle modifications
Wettability plays an important role in the oil recovery process and reservoir productivity (Farad et
al., 2016; J. Giraldo et al., 2013). It is one of the fundamental factors that affect the waterflooding
process, oil-water relative permeability, capillary pressure, residual oil saturation, tertiary oil
recovery, and controlling the spatial fluid flow and distribution in porous media (Anderson, 1986).
Regardless of the mineral composition of the reservoir rocks, most reservoirs are considered to
have intermediate wettability; that is, they are neither completely wetted by oil or water (J. Giraldo
81
et al., 2013). During oil recovery, altering the reservoir to water-wet is preferred because it
accelerates the spontaneous imbibition of water into the rock matrix blocks, which results in
improved oil recovery especially during waterflooding (Salehi, Johnson, & Liang, 2008). Due to
rock and fluid interaction, however, there always exists a change from water-wet to oil-wet at
different stages of the producing life of a reservoir. Wettability alteration to oil-wet can be caused
by activities such as drilling, the drilling fluids especially the oil-based drilling fluids can alter the
wettability of the system to oil-wet or mixed-wet (Yan, Monezes, & Sharma, 1993). This occurs
because the ionic interactions and surface precipitation of these drilling fluids may precipitate at
the surface in the presence of water and result in new wetting preference (Al-Maamari & Buckley,
2003). Contact angle measurement is the common technique used to determine the wettability of
the rock. This is defined as the angle, conventionally measured through the liquid, where a liquid
or a vapour interface meets a solid surface. A surface is said to be water-wet if the contact angle is
< 900, or oil-wet if the contact angle is > 900 (ShamsiJazeyi et al., 2014). The spreading coefficient
(S) of water on a solid in contact with both oil and water can be defined in terms of the interfacial
tension between each phase by Equation 1.
S = 𝜎O
S
− 𝜎W
S
− 𝜎 O
W
(3.1)
where ∂O/S, ∂W/S and ∂O/W are the interfacial energies between oil/solid, water/solid and oil/water,
respectively. The contact angle formed largely depends on the force balance at the interface,
reducing the interfacial tension at the water-oil interface, results in increased S which reduces the
contact angle and hence results in a water-wet system (ShamsiJazeyi et al., 2014). Also, the effect
of wettability alteration can be explained using the adhesion work equation given by (Eq 2),
W = 𝜎(1 + cosθ) (3.2)
82
where W is the adhesive force retaining oil on the rock surface (mJ/m2), ∂ is the interfacial tension
between crude oil and nanofluids (mN/m), θ is the contact angle of oil/rock
surface/nanofluids(deg) measured in the denser phase. From equation 2 above, the adhesive force
responsible for holding oil on the rock surface W decreases as the wettability is altered towards
water wet, which implies that crude oil can be more easily detached from the rock surface and
higher oil recovery can be obtained. Recently, evidence has shown that nanoparticles dispersed in
various liquid agents can strongly alter the wettability of reservoir rocks from oil-wet to water-wet
by changing the contact angle between the fluid and the rock. (Munshi, Singh, Kumar, & Singh,
2008) investigated the variations in the macroscopic contact angle with various nanoparticles.
They used indium oxide (IO) nanoparticle coated Si substrates on two different fluids like
deionized water and diethylene glycol (DEG) with different nanoparticle sizes. These
IO nanoparticles had well-defined shapes and sizes. The authors concluded that the contact angle
depends strongly on the nanoparticle size.
For the nanoparticle sizes varying from 14 to 620 nm, the contact angle was found to vary from 24°
to 67° for the deionized water droplet and from 15° to 60° for DEG droplet. They concluded that
the contact angle decreased with particle size for any given fluid. Moreover, adsorption of the
nanoparticle on the rock surface may have an impact on the permeability impairment which can
result in absolute permeability reduction and an increase in the relative permeability of the oil.
Wettability alteration and contact angle are mainly affected by the size, type, concentration, and
morphologies of the nanoparticles used. However, nanoparticle size can affect the transportation
and adsorption capability of the nanoparticles in the porous medium. In a study conducted by
Jianjia et al. (Yu et al., 2012b), the transport, retention and adsorption behaviour of nanoparticles
in three different porous media: sandstone, limestone and dolomite. The results showed
83
equilibrium adsorption of 1.272 mg/g, 5.501 mg/g and 0 mg/respectively, obtained in less than 12
h for the three-porous media when 5000 ppm silica dispersion was used. The authors observed that
silica nanoparticles could easily flow in the sandstone rock without changing the core permeability.
However, adsorption was noticed during silica flooding in the limestone core, although no change
in the permeability was observed. They attributed this to the electrostatic attractive forces between
silica nanoparticles and limestone at the surface. High particle recovery was obtained using
dolomite core, indicating less adsorption of the nanoparticles on the dolomite surface, however,
they observed a pressure drop across the core which indicated nanoparticle plugging that might
have resulted in permeability alteration.
Surfactants have always been used as wettability modifiers; however, studies of nanoparticles
combined with surfactants have reported better wettability alterations than using either
nanoparticles or surfactant alone. Studies have been conducted to determine the synergistic effect
of surfactant and nanoparticles for various nanoparticle types and nanoparticle sizes. Karim et al.
(Karimi et al., 2012) investigated the effect of using zirconium oxide (ZrO2) nanofluids in a
carbonate reservoir to alter the wettability of carbonate rock. Several nanofluids were made
containing ZrO2 nanoparticles and a mixture of a non-ionic surfactant. Two nanoparticle
concentrations (50000 ppm and 100000 ppm) were used for the test. The effect of wettability
alteration of the injected nanofluids was determined by measuring the contact angle before and
after treatment with the nanofluids. They found out that the designed nanofluids could significantly
alter the wettability of the rock from a strongly oil-wet to a strongly water-wet, resulting in
additional oil recovery. Juliana et al. (J. Giraldo et al., 2013) conducted a similar study but
dispersed alumina-based nanofluids with different concentrations ranging from 100 ppm to 10000
ppm into an anionic commercial surfactant (PRNS). They also analyzed the effect of their resultant
84
nanofluids on wettability alteration by measuring the contact angle and carrying out imbibition
tests. They found out that designed nanofluids containing anionic surfactants could significantly
change the wettability of the sandstone cores from a strongly induced oil-wet to a strongly water-
wet condition. It was concluded that the effectiveness of the anionic surfactant as wettability
modifier could be improved when combined with nanoparticles in concentrations lower or equal
to 500 ppm because their best performance was achieved at a concentration of 100 ppm.
Rasoul et al. (Nazari Moghaddam et al., 2015) compared the effect of different nanoparticles on
altering the wettability of carbonate rocks. They compared zirconium dioxide (ZrO2), calcium
carbonate (CaCO3), titanium dioxide (TiO2), silicon dioxide (SiO2), magnesium oxide (MgO),
aluminium oxide (Al2O3), cerium oxide (CeO2), and carbon nanotubes (CNT) on their ability to
alter the wettability of carbonate rocks. The authors did a primary screening for the nanoparticles
by contact angle measurements. The selected nanoparticles were subjected to core flooding and
spontaneous imbibition experiments. The results from the core flooding and spontaneous
imbibition experiments confirmed the active role of CaCO3 and SiO2 nanoparticles for enhancing
oil recovery. The authors also examined the effects of the injected nanofluids on surface wettability
by drainage capillary pressure measurements and it showed an increase in irreducible water
saturation and entry capillary pressure after treatment with CaCO3 nanofluids. However, the core
flooding study was conducted at ambient conditions, reliable results may be obtainable when
similar studies are performed at reservoir conditions.
3.5.2. Viscosity reduction
Oil viscosity reduction is essential during production processes. Generally, crude oil with a
viscosity of less than 400 mPa.s at room temperature is the classical maximum desired pipeline
viscosity (Hasan, Ghannam, & Esmail, 2010; Núñez, Briceño, Mata, Rivas, & Joseph, 1996;
85
Schumacher, 1980). However, in many situations, this is not the case, and methods are being
devised on how viscosity reduction can be achieved. Thermal recovery methods are commonly
used for oil viscosity reduction (Shu & Hartman, 1986). Because of their heat transfer abilities,
these methods have been improved by applying nanoparticles. In these processes, nanoparticles
can act as catalysts for cracking heavy hydrocarbon and/or as an adsorbent for disaggregating
asphaltene flocs (R. Hashemi et al., 2014). Researchers have investigated the use of nanoparticles
in viscosity reduction and promising findings have been reported. Wei et al. (W. Li, Zhu, & Qi,
2007) used a nano-nickel catalyst that was prepared in methylcyclohexane-water-n-octanol-AEO9
micro-emulsion system, for the viscosity reduction process of Liaohe extra-heavy oil by
aquathermolysis. It was observed that nano-nickel can catalyze the aquathermolysis reaction of
extra-heavy oil at 280 °C. The experimental results demonstrated that compared with the original
crude oil sample, the mean molecular weight of the upgraded sample decreased. Also, the content
of sulfur changed from 0.45% to 0.23%, and the content of resin and asphaltenes was reduced to
15.83% and 15.33%, respectively. During the cooling process after the upgrading reaction, the w/o
emulsion was formed in the presence of the surfactant AEO9, changing the viscosity of the original
crude from 139800 mPa·s to 2400 mPa·s at 50 °C. This is approximately a 98.90% reduction by
the synergetic effects of upgrading, emulsification, and diluting, demonstrating the ability of the
nickel catalyst to greatly lower the viscosity of the heavy crude oil and improve the oil recovery.
Esteban et al. (Taborda, Franco, Lopera, Alvarado, & Cortés, 2016) reported promising results
using alumina, silica and acidic silica nanoparticles to reduce the viscosity of heavy crude oil (HO).
The effect was evaluated through n-C7 asphaltene adsorption and aggregation tests using UV–vis
spectrophotometry and dynamic light scattering. The authors selected the acidic silica
nanoparticles to prepare a water-based nanofluid at different concentrations in distilled water
86
because it exhibited the highest asphaltene adsorption capability during the batch adsorption test.
They added 2.0 wt% of non-ionic surfactant to determine the effect of the surfactants in the
presence of the silica nanoparticles to reduce the oil viscosity. The shear rheological response was
obtained as a function of nanoparticle concentration, temperature, and shear rate ranging from 0
to 100s-1. Experimental results indicated that increasing the concentration of nanoparticles in the
mixture up to 10,000 ppm, leads to a viscosity reduction of approximately 90% in comparison with
the nano particle-free crude oil. The main mechanism of viscosity reduction in the presence of
nanoparticles is mainly attributed to disaggrgation and modulation of asphaltene mophology that
results less viscous oil. The authors found that at higher concentration of nanoparticles, the
effectiveness of heavy oil viscosity reduction diminishes as noted in an earlier study by the same
authors (Taborda et al., 2017). The core flooding tests conducted under typical reservoir conditions
of pore and overburden pressures of 2600 and 3600 psi, respectively, and at 360 K resulted in an
additional 16% oil recovery after water flooding. They concluded that the reduction of viscosity is
achieved by adsorption of the asphaltenes on the surfaces of the dispersed nanoparticles. This study
demonstrated that because of a synergistic effect; nanoparticles dispersed in a carrier fluid
containing a surfactant were more effective than those that used surfactants alone.
Recently, the same authors Esteban et al. (Taborda et al., 2017) reported unexpected results while
investigating the effect of viscosity reduction of heavy and extra-heavy crude oils. Using
nanoparticles of different chemical nature, which consisted of SiO2, Fe3O4, and Al2O3, they
observed a viscosity reduction in all cases evaluated. However, the maximum viscosity reduction
of roughly 52% was obtained at a concentration of 1000 mg/L with 8 nm SiO2 nanoparticles and
shear rates below 10 s. The authors noted that particle size, concentration, and shear rate influenced
viscosity reduction. Increasing the particle size had less effect on viscosity reduction, due to the
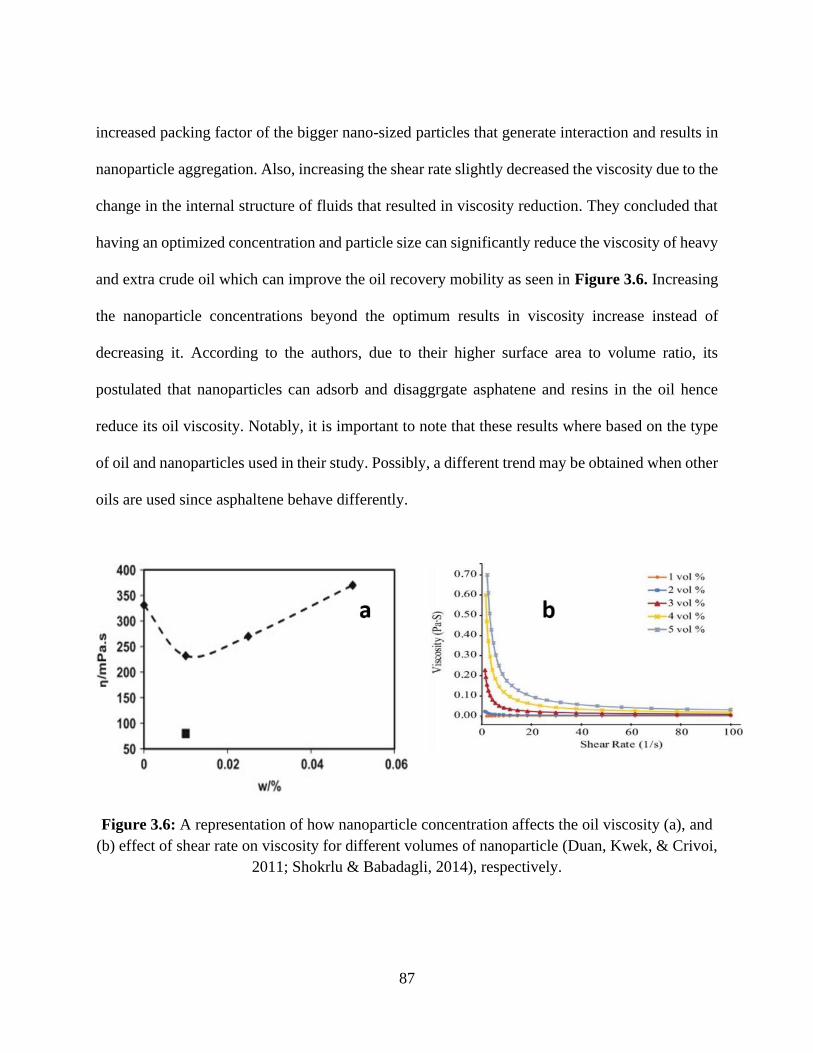
87
increased packing factor of the bigger nano-sized particles that generate interaction and results in
nanoparticle aggregation. Also, increasing the shear rate slightly decreased the viscosity due to the
change in the internal structure of fluids that resulted in viscosity reduction. They concluded that
having an optimized concentration and particle size can significantly reduce the viscosity of heavy
and extra crude oil which can improve the oil recovery mobility as seen in Figure 3.6. Increasing
the nanoparticle concentrations beyond the optimum results in viscosity increase instead of
decreasing it. According to the authors, due to their higher surface area to volume ratio, its
postulated that nanoparticles can adsorb and disaggrgate asphatene and resins in the oil hence
reduce its oil viscosity. Notably, it is important to note that these results where based on the type
of oil and nanoparticles used in their study. Possibly, a different trend may be obtained when other
oils are used since asphaltene behave differently.
Figure 3.6: A representation of how nanoparticle concentration affects the oil viscosity (a), and
(b) effect of shear rate on viscosity for different volumes of nanoparticle (Duan, Kwek, & Crivoi,
2011; Shokrlu & Babadagli, 2014), respectively.
88
3.5.3. Nanoparticles combined with polymer for enhanced oil recovery
Polymers are common chemical additives used in the recovery of heavy oil recovery. Scientists
have studied the macroscopic sweep mechanism of polymer flooding in enhancing oil recovery
(Wever, Picchioni, & Broekhuis, 2011). They have concluded that polymer increases the sweep
efficiency mainly by decreasing water permeability and increasing the injected fluid viscosity.
They are suitable for viscous oils because waterflood sweep efficiency is always low due to viscous
fingering and permeability orientation due to heterogeneity (Wassmuth, Green, Arnold, &
Cameron, 2009).
Synergistic studies of nanoparticles with polymers are emerging. Studies have been performed
either by grafting polymer chains on nanoparticles surfaces or using optimized concentrations of
nanoparticles to improve the rheology of the polymer-based fluids. Grafting polymers on the
surface of the nanoparticle can drastically improve solubility and stability. The resulting particles
after polymer grafting also have higher ability to stabilize foams and emulsions (ShamsiJazeyi et
al., 2014). Using nanoparticles together with polymers in EOR can improve oil recovery compared
to the conventional polymers without nanoparticles. Synergizing polymers with nanoparticles help
to (1) improve the rheological behaviour of polymers by increasing the intrinsic viscosity and
elasticity of the system which is mainly attributed to cross-linking properties of the nanoparticles
(Elias, Fenouillot, Majesté, & Cassagnau, 2007; Maghzi, Mohebbi, Kharrat, & Ghazanfari, 2013),
(2) inhibition of polymer degradation by lowering the degree of degradation in the presence of
nanoparticles (L. J. Giraldo et al., 2017), improving the thermal stability of polymers in presence
of high temperature and salinity (L. J. Giraldo et al., 2017),(3) reduction of IFT and wettability
alteration from oil wet to water wet has also been reported by adding silica nanoparticles to
polymer (Tushar Sharma et al., 2016). Nanofluids containing polyacrylamide clay were
89
investigated in a polymer flooding study for enhancing heavy oil recovery. Cheraghian &
Khalilinezhad focused on the roles of clay nanoparticles on polymer viscosity and their effect on
improving oil recovery for a heavy oil of about 200 cp. Results from the core floods showed that
nanoparticle-polymer fluids could increase the oil recovery in comparison to a baseline polymer
flood without nanoparticles. After one pore volume fluid injection, the flooding test showed a 5%
increment of oil with the nanoclay polymer solution compared to a polymer solution without the
nanoparticles (Cheraghian & Khalilinezhad, 2015).
Although studies have been performed to improve the application of polymer-nanoparticles in
enhanced oil recoveries, more research on this application is still required. Nanoparticles are
economical and hold potential promises in enhancing oil recovery. Nonetheless, for proper usage,
they need to remain stable in harsh reservoir conditions and at high salinities. Therefore studies
about the maximum duration of chemical stability and minimum adsorption on the reservoir rock
still need to be conducted (ShamsiJazeyi et al., 2014).
3.5.4. Nano-based surfactant for enhanced oil recovery
These are closely related to nanoparticle-polymer, as they are also created by either grafting the
surfactants together with a nanoparticle through electrostatic interactions or by synergising
optimized concentrations of nanoparticles with surfactants. When nanoparticles are coated by
surfactants, the surfactants form a monolayer on the surface of the nanoparticle, and hence the
nanoparticles become more hydrophobic and can be used to form stable foam and emulsions
compared to using a surfactant or nanoparticles alone. This process depends on the concentration,
sizes of the nanoparticles, and the surfactant type and concentrations used in the formulation (Sun
et al., 2014). Studies of nanoparticle-based surfactants in enhancing oil recovery have been applied
90
extensively in foam and emulsion stabilization (Friberg, Jansson, & Cederberg, 1976; Liu, Yang,
Huang, & Liu, 1996; Shupe & Maddox Jr, 1978). Researchers have recommended different
surfactants types for various applications, mainly based on the rock mineralogy composition and
the properties of a given reservoir. Poor selection of a surfactant can result in undesirable
wettability alterations that can affect the overall oil recovery. An extensive review of EOR suggests
that anionic surfactants are preferred for sandstone reservoirs, though in specific situations,
cationic, non-ionic or mixtures of both have occasionally been used. For carbonate reservoirs,
cationic surfactants or mixtures of them with non-ionic surfactants are preferred (Negin, Ali, &
Xie, 2017). A synergy of nanoparticles with biosurfactants has also been recently reported. Wang
et al. (D. Wang et al., 2018) dispersed SiO2 nanoparticles in bio nanofluids. According to the
analyses via visual observation, optical absorbance measurement, zeta potential determination, and
particle size measurements demonstrated that the bio nanofluids with 25 ppm of the biosurfactant
achieved the optimal stability. From contact angle measurement and imbibition test, results
showed that bio nanofluids could alter the wettability of oil-wet sandstone to strongly water-wet.
However, the best performance was achieved with a nanoparticle concentration of 1000 ppm.
Additionally, a micromodel test using bio nanofluid was carried out to evaluate the synergistic
effects of SiO2 nanoparticles and the biosurfactant on displacing oil. Nanofluid injection following
biosurfactant flooding improved oil recovery, yielding an additional 5% production. These results
reveal that the bio nanofluid prepared with SiO2 with the biosurfactant not only remained stable
but also provided a potential way for enhanced oil recovery.
3.5.5. Application of nano stabilized foams for enhancing oil recovery
Foams in the oil and gas industry have been extensively used for mobility control during gas
flooding to attenuate the fluid channelling in high permeability zones. Normally, surfactants of
91
varying concentrations and types are typically used to generate foams (Heller, 1994). However,
foams generated by surfactants alone are thermodynamically unstable especially at high reservoir
temperature (ShamsiJazeyi et al., 2014). The role of nanoparticles in foam stabilization has
attracted attention from various researchers (Chengara, Nikolov, Wasan, Trokhymchuk, &
Henderson, 2004; Kondiparty, Nikolov, Wu, & Wasan, 2011; D. Wasan et al., 2011; Yu, An, Mo,
Liu, & Lee, 2012a). Adoption of nanoparticles at the interface of water and gas requires more
energy which makes the resulting foams very stable even at high temperatures for longer periods
(Espinoza, Caldelas, Johnston, Bryant, & Huh, 2010). Stable supercritical carbon dioxide (CO2)
in water foams using 5 nm silica nanoparticles was generated using nanoparticles. The surface of
the nanoparticles was functionalized with short-chain polyethene glycol to form non-ionic
surfactants that were used to improve the water-CO2 interaction and enhance the foam stability.
The authors noticed that at low concentration of 0.05 wt% of nanoparticles, stabilized foams could
still be formed even at slightly higher temperatures of 95 oC. However, they concluded that larger
particle sizes are required for enhanced foam stability at higher salinities (Espinoza et al., 2010).
It should be noted that this study focused on the application of silica nanoparticle only, other
researchers have further investigated the effect of nanoparticle types and size on foam stability.
Manan et al, examined the performance of silicon dioxide (SiO2), aluminium oxide (Al2O3), copper
oxide (CuO), and titanium dioxide (TiO2) of different sizes in the presence of a fixed concentration
of anionic surfactant (AOS) on foam stability. Nanoparticle concentrations of 0.1 wt%, 0.3 wt%,
0.5 wt%, and 1 wt% were used to investigate the foam stability. Displacement tests were performed
to determine the oil recovery at the optimum concentrations for each nanoparticle at room
temperature and pressure. Results revealed that all different nanoparticles used could improve the
stability of CO2 foam at certain concentrations. Aluminium oxide nanoparticles, however, offered
92
better foam stability compared to other types (M. A. Manan, S. Farad, A. Piroozian, & M. J. A.
Esmail, 2015). This contrasts with what has been reported by David et al. (D. Wasan et al., 2011)
who confirmed that silica nanoparticles were more effective in stabilizing foams. Recently,
Songyan et al. (S. Li, Qiao, Li, & Wanambwa, 2017) investigated the synergistic effect of using
hydrophilic SiO2 nanoparticles and hexadecyltrimethylammonium bromide (CTAB) on CO2 foam
stability to improve oil recovery during CO2 flooding. CTAB/SiO2 was used in a concentration
ratio of 0.02-0.07, with 0.033 representing the best concentration ratio. The authors found out that
with the increase in the concentration ratio, the synergistic stabilization effect of CTAB/SiO2
dispersion first increased and then decreased. In the monolayer adsorption stage (concentration
ratio from 0.02 to 0.033), when the hydrophobicity of SiO2 nanoparticles increased with the
concentration ratio. The nanoparticles were adsorbed on the gas-liquid interface and the stability
of CO2 foam increased. However, for the double-layer adsorption stage (concentration from 0.033
to 0.07), the nanoparticles existed in the bulk phase and the stability of CO2 nanoparticles
decreased. They concluded that CTAB/SiO2 dispersion stabilized CO2 foam via three mechanisms:
decreasing the coarsening of CO2 bubbles, improving interfacial properties, and reducing liquid
discharge. The authors recommended that CTAB/SiO2 foam can greatly improve oil recovery
efficiency compared to water flooding. Weipeng et al. (W. Yang et al., 2017) studied the effect of
positively charged AlOOH nanoparticles via the adsorption of the anionic surfactant sodium
dodecyl sulphate (SDS) by in-situ modification on foam stability under different conditions.
Changes in the zeta potential and adsorption isotherm of the AlOOH nanoparticles confirmed the
effectiveness of this modification. The authors noted that the most stable foam was obtained with
an SDS/AlOOH concentration ratio of 5:1, while a further increase in the SDS concentration led
to a decrease and subsequent increase in foam stability. They concluded that nanoparticles with
93
partial hydrophobicity, positive or slightly negative charge and small aggregate size can be
adsorbed tightly to foam surfaces and form compact networks in the foam’s film, resulting in a
stable foam. The SDS/AlOOH-stabilized foam also showed good stability under high temperatures
and in the presence of oil. They also noticed that SDS/AlOOH-stabilized foams strongly enhanced
oil recovery due to their ability to remain stable even in harsh conditions. Qian Sun et al. (Sun et
al., 2014) conducted a similar study but they used partially hydrophobic modified SiO2
nanoparticles with the same anionic surfactant, sodium dodecyl sulphate (SDS), to increase foam
stability. The authors used a micro model and a sand pack to assess the stability of the SiO2
stabilized foam (SiO2/SDS foam) on enhancing oil recovery. The experimental data showed that
the foam stability decreased with an increase in temperature. SiO2/SDS foam showed better
temperature tolerance than the SDS foam (foam stabilized by SDS) due to the adsorption of
nanoparticles on the surface of the bubble. Almost all the bubbles maintained spherical or
ellipsoidal shape over prolonged periods due to the enhanced surface dilutional viscoelasticity,
which was different from that of SDS foam. The micro model flooding results demonstrated that
SiO2/SDS foam displaced more oil than brine flooding, SDS solution flooding, or SDS foam
flooding alone. As the foam stability was enhanced, gas mobility and channelling were controlled
effectively. Moreover, sand pack flooding results showed that the increase of differential pressure
and profile control effect was a proportional function of the SiO2 concentration in SiO2/SDS foam.
They concluded that higher oil recoveries were obtained when the SiO2 concentration was less
than 1.5 wt% and recommended this synergy for oil recovery applications. Yira et al. (Hurtado et
al., 2018) investigated the effect of surface acidity and Polarity of SiO2 nanoparticle on foam
stability when applied to natural gas flooding in a tight gas condensate reservoir. In their study,
they stabilized foams by adding modified silica nanoparticles, of varying surface acidity and
94
polarity. Four types of modified silica-based nanoparticles with varying surface acidity and
polarity (coated with vacuum residue) were synthesized and evaluated using surfactant adsorption
technique. The basic nanoparticles exhibited a greater adsorption capacity of the surfactant,
reaching an adsorbed amount of approximately 200 mg of surfactant per gram of nanoparticles,
and Type I adsorption behavior. The generated foams were evaluated based on their stability using
mechanical agitation and methane flooding, to determine the optimal concentration of
nanoparticles to be used. The nanofluid prepared using a surfactant solution and 500 mg/L of basic
nanoparticles reached a half-life 41% greater than that of the fluid without nanoparticles. This was
attributed to the formation of a steric layer due to nanoparticles adsorption on the surface of the
bubble, which hindered its contraction or expansion, thus allowing the nanostablized foam to have
more durability than the foam without nanoparticles. Furthermore, the authors conducted a
displacement test to evaluate the perdurability and generation of the foam (with and without
nanoparticles) by methane flooding and the mobility reduction at reservoir temperature of 100 °C.
10% of the original oil in place was recovered after foam flooding alone and an additional 18%
was also obtained when the foam was synergized with nanoparticles due to the stable foam that
increased sweep efficiency. From the aforementioned reported results by different researchers, it
is clear to anticipate that nanoparticles tremendously offer many advantages during foam EOR,
due to their physical structure and morphologies. However, more studies using other types on
nanoparticles may be required to enable their adoption for further pilot and filed applications.
3.5.6. Enhancing oil recovery with stabilized Pickering emulsions
Emulsion stabilized by solid particles that adsorb at the interface between two phases is referred
to as Pickering emulsion (J.pickering, 2001). A mixture of oil and water forms small oil droplets
which are dispersed throughout the water, eventually, these droplets will coalesce to decrease the
95
amount of energy in the system. However, if solid particles are added to the mixture, they will
bind to the surface of the interface and prevent the droplets from coalescing thus, forming a more
stable emulsion. The stability of these emulsions, however, depends on the properties of the
particles, including its hydrophobicity, shape, and size. The particle’s contact angle to the surface
of the droplet is a characteristic of the hydrophobicity. If the contact angle of the particle to the
interface is low, the particle will be mostly wetted by the droplet and therefore will not likely
prevent coalescence of the droplets.
Currently, surfactants and colloidal solids are used to stabilize emulsions. However, surfactants
are expensive and at high reservoir temperatures and in high saline conditions they are unstable
which limits their application as emulsion stabilizers. Temperature, composition, and droplet size
are among the major properties of an emulsion, that determine their stability and rheological
behaviours (Hasan et al., 2010). In recent years, nanoparticle-stabilized emulsions have been
shown to offer better emulsion stability. This is because of their specific characteristics and
advantages over conventional emulsions stabilized by surfactants or by colloidal particles. The
solid nanoparticles can be irreversibly attached to the oil-water interface and form a rigid
nanoparticle monolayer on the droplet surfaces, which results in highly stable emulsions that can
withstand harsh conditions. Besides, in comparison to colloidal particles, nanoparticles are one
hundred times smaller, and emulsions stabilized by them can travel a long distance in reservoirs
without much retention (Kong & Ohadi, 2010; T. Zhang et al., 2010). These characteristics
contribute to the applicability of these micro-sized particles for EOR applications.
Several studies have been reported on how nanoparticle-stabilized emulsion improved oil
recovery (Tushar Sharma, Kumar, & Sangwai, 2015). Sharma et al(T Sharma, Velmurugan, Patel,
96
Chon, & Sangwai, 2015) noticed that a combination of 0.5 PV polymer flood and 0.5 PV Pickering
emulsion in a Berea sandstone core sample was efficient to give an additional 1-6% oil recovery
after brine injection compared to the Pickering emulsion or polymer alone. Yoon et al. (Yoon et
al., 2016) carried out a core flooding test on a Berea sandstone by flooding a complex silica
colloidal dispersion of oil in water, forming a stabilized Pickering emulsion which produced a 4%
incremental oil recovery after water flooding. Their colloidal layer consisted of nanoparticles,
surfactant, and a polymer, they used silica nanoparticles, dodecyltimethylammonium bromide
(DTAB) as the cationic surfactant, and poly (4-styrenesulfonic acid-co-maleic acid) sodium salt
(PSS-co-MA) as the anionic polymer. The colloidal layer was generated by adsorption of PSS-co-
MA on the silica nanoparticle by the effect of van der waals forces of attraction and then adsorbed
the DTAB onto the PSS-co-MA layer by electrostatic attraction, which provided a mechanically
stable interface. They concluded that emulsions produced in the core could flow readily in the rock
pores due to the oil-water interface that made a complex attachment with a colloidal phase and
improved the structural stability of the emulsion droplets resulting in incremental oil recovery
(Yoon et al., 2016).
3.5.7. Nanoparticles for inhibition asphaltene and wax deposition
During oil production processes, it is well known that the reservoir conditions such as fluid
composition, pressure and temperature keep on changing. These changes may result in
precipitation of heavy organic solids such as asphaltenes (Montoya, Coral, Franco, Nassar, &
Cortes, 2014). Asphaltene is one of the most polarizable components with the highest molecular
weight and complex structure. Investigations have shown that asphaltenes are dispersed in crude
oil by resins as peptizing agents (Adebiyi & Thoss, 2015; Pereira et al., 2007; Rogel, Ovalles, &
Moir, 2010). Asphaltenes consist of aromatic rings attached to hydrocarbon chains and
97
heteroatoms such as oxygen, sulphur, and nitrogen as well as traces of heavy metals like nickel,
vanadium and iron, and its complex characterization differs from one crude to another (Doryani,
Malayeri, & Riazi, 2016).
Adsorption of the precipitated asphaltenes onto the mineral surface affects the entire production
chain beginning at the well where they plug the pores, damage the formation, and reduce the oil
effective permeability, and altering rock wettability towards more oil wet. Destabilized asphaltene
causes clogging in pipelines and wellbores, adsorption on the refining equipment, corrosion and
fouling of production equipment and coke formation (Adams, 2014; Dubey & Waxman, 1991;
Kim, Boudh-Hir, & Mansoori, 1990). Furthermore, due to their amphiphilic behaviour, asphaltene
acts as a surface-active agent and creates oil-water separation difficulties by creating water in oil
emulsions. As a result, asphaltenes is undesirable for all crude oil processes because it makes
upgrading challenging, costly and environmentally unfriendly (X. Yang, Verruto, & Kilpatrick,
2007).
Presently, the common prevention measures typically used in removing the deposited asphaltenes
and wax in the oil and gas industry include solvent injection, the addition of surfactants, wireline
cuttings and many other mechanical treatments (Junior, Ferreira, & da Silva Ramos, 2006;
Leontaritis & Mansoori, 1988; Yin & Yen, 2000). However, these methods are not only costly but
also temporary, since asphaltenes can easily redeposit again. Besides, these applied methods used
to inhibit asphaltenes at the reservoir level appear to be ineffective; because the asphaltene
inhibitors and the dispersants used almost have a similar chemical composition, making it hard to
prevent the formation of the residual (Zabala et al., 2014). As a result, scientists are motivated to
search for smart materials and techniques that are more sustainable, efficient, and cost-effective.
Research on nanomaterial application in asphaltene deposition prevention in oil and gas industry
98
has emerged (Betancur, Carmona, Nassar, Franco, & Cortes, 2016; Franco, Nassar, Ruiz, Pereira-
Almao, & Cortes, 2013; Kazemzadeh et al., 2015; Mohammadi et al., 2011a). Researchers have
gained interest in using nanoparticles to inhibit asphaltene deposition because of their unique
properties, such as their exponentially high surface area to volume ratio which is crucial for
adsorption capability and changing asphaltene aggregation mechanism (Franco, Nassar, et al.,
2013).
Application of nanotechnology in asphaltene deposition inhibition has been reported in several
studies that have been conducted at the laboratory, pilot, and field scale. Recently, Nasser et al.
(Nashaat N. Nassar et al., 2011) conducted a batch study to investigate the potential adsorption
effect of asphaltenes using different metal oxides nanoparticles; including FeO4, Co3O4, TiO2,
MgO, CaO, and NiO. The asphaltene adsorption capabilities followed the order CaO > Co3O4 >
FeO4 > MgO, NiO> TiO2, the authors concluded that adsorption mainly depends on the metal oxide
type (Nashaat N. Nassar et al., 2011). A similar study by Mohammad et al. (Mohammadi et al.,
2011a) investigated how TiO2, ZrO2 and, SiO2 nanoparticles can improve the stability of
asphaltene. They concluded that because of the formation of hydrogen bonds in acidic conditions,
TiO2 nanofluids can enhance the asphaltene stability. The reverse was true for the basic conditions
because of the absence of hydrogen bonds. The authors suggested that the surface acidity of the
adsorbent can enhance asphaltene stability (Mohammadi et al., 2011b). These findings are in
agreement with that of Nassar et al. (Nashaat N Nassar, Azfar Hassan, & Pedro Pereira-Almao,
2011b) who studied the effect of surface acidity and basicity of the alumina nanoparticles on
asphaltene adsorption. The authors concluded that the adsorption capability of asphaltenes onto
the alumina nanoparticles followed the order, acidic > basic > neutral. This signifies that using
specific acids as functionalizing agents can significantly improve adsorbent-adsorbate interactions.
99
Yousef et al. (Kazemzadeh et al., 2015) also investigated the behaviour of asphaltene adsorption
on other metal oxide types. SiO2, NiO and Fe3O4 nanoparticles were tested in a micro-glass module
to determine how they absorb asphaltene and prevent its precipitation. The authors concluded that
increasing n-heptane in the presence of the adsorbent resulted in more adsorption regardless of the
type of nanomaterial used. This enhanced the perdurability of asphaltene precipitation, however
for selection purposes, they noted that the adsorption of asphaltenes followed the order SiO2 > NiO
> Fe3O4 which implies that silicate nanoparticles have more affinity to asphaltene than NiO or
Fe3O4.
Camilo et al. (Franco, Nassar, et al., 2013) have investigated the effect of the chemical nature of
12 types of nanoparticles on asphaltene adsorption on a porous medium under flow conditions at
reservoir temperature and pressure. They reported fast adsorption of asphaltenes on the
nanoparticle surface, indicating the promising nature of adsorbents for delaying the agglomeration
and inhibiting the precipitation and deposition of asphaltenes. The authors concluded that due to
the ability of the adsorbents to adsorb and stabilize the asphaltenes, the nanoparticles were able to
restore production which led to the improvement in oil recovery (Franco, Nassar, et al., 2013). The
role of nanoparticle size and surface acidity in inhibiting formation damage was also investigated
by Stefanía et al. (Betancur et al., 2016). In their study, they synthesized silica nanoparticles in a
range of 11 to 240 nm and investigated their ability to adsorb asphaltenes and reduce asphaltene
self-association using batch-mode experiments. They also determined the kinetics of asphaltene
aggregate growth in the presence and absence of nanoparticles using DLS measurements with
different Heptol solutions. The authors found out that the smallest nanoparticle (11nm) exhibited
the highest adsorptive capacity for n-C7 asphaltenes among the nanoparticles studied. These same
nanoparticles were modified using acid, base, and neutral treatments, as S11A, S11B, S11N,
100
respectively. It was noticed that the asphaltene adsorption followed the trend S11A ≫ S11B ≃
S11N ≃ S11. Additionally, in their study, the authors performed a displacement test using the best
performance in batch-mode experiments to treat the asphaltene damaged core under flow
conditions in porous media under typical reservoir conditions using the nanoparticles. Nanofluid
treatment with silica nanoparticles increased the effective permeability to oil and enhanced the oil
recovery with an increase in the recovery factor of 11% under the reported conditions.
A successful field test was conducted by Zabala and coworkers (Zabala et al., 2014) who applied
commercial aluminium-based nanofluids to prevent formation damage that was caused by
asphaltenes. They first conducted a core flood test and later performed a field test by injecting
aluminium based nanofluids for asphaltene deposition inhibition in the Cupiagua sur oil field in
Colombia. They reported cumulative oil production of 150,000 barrels of oil after 271 days with
the use of alumina nanoparticle injection. The authors concluded that well-stabilized alumina-
based nanofluids have good retention in the formation for longer than 8 months. They suggested
that these nanoparticles may apply to the reservoir with very low permeability conditions (Zabala
et al., 2014).
Therefore, from the aforementioned investigations, it is noticeable that the use of nanoparticles for
asphaltene inhibition offers many benefits compared to the conventional chemical and mechanical
methods commonly used, owing to their chemical, structures, and surface functionality.
Nevertheless, most of the reported studies on this matter are tentatively conducted at lab scale with
few field applications reported. Since, nanoparticles are a promising technique for asphaltene
deposition control during oil recovery, to have a vibrant understanding on their role in asphaltene
deposition inhibition, more pilot and field test investigations are needed so that the technique can
be fully adopted in the oil and gas industry.
101
It should also be noted that some crude oil may contain considerable amounts of paraffin wax, that
constitutes the saturated fractions of the aliphatic compounds (Roenningsen, Bjoerndal, Baltzer
Hansen, & Batsberg Pedersen, 1991). When the temperature of the crude oil falls below the wax
appearance temperature (WAT), precipitation of wax occurs in an orthorhombic unit cell as a
needle- or plate-like crystals (Edwards, 1957). Because of large aspect ratios, precipitated wax
crystals often form a “house of cards” network structure at very low precipitated amounts (∼1 wt
%) (F. Yang, Li, Li, & Wang, 2013), thus increasing the pour point, viscosity, yield stress, and
non-Newtonian flow behaviour to waxy crude oils. Furthermore, pipeline transportation of waxy
crude oil and precipitation of paraffin wax from the continuous oil phase results in viscosity
increase and pressure losses that affect the fluid flow (Wardhaugh & Boger, 1991). Efficient
management of paraffin wax precipitation and deposition remains a challenge for flow assurance.
Current industrial practices for improving the flowability of waxy crude oil involves the addition
of oil-soluble pour point depressant (PPD) such as, poly (ethylene−vinyl acetate) (EVA), and comb
polymers, such as polyacrylate that help to change the morphology of the crystals by crystal
alteration and entropic repulsion (F. Yang, Zhao, Sjöblom, Li, & Paso, 2015). Recently,
nanoparticle application for wax inhibition has also become an attractive study among different
researchers, especially when hybridized with the conventional polymers normally used. Wang et
al. (F. Wang et al., 2011) compared the performance of nanohybrid PPDs with conventional poly
(ethylene−vinyl acetate) (EVA). According to the authors, the microscopic images of precipitated
wax crystals in the presence of nanohybrid PPDs showed that nanohybrid PPDs exhibit superior
pour point depression than EVAs alone. Norrman et al. (Norrman, Solberg, Sjoblom, & Paso,
2016) investigated the effects of the amount of coating materials by functionalizing the
nanoparticles with poly(octadecyl acrylate) (POA) on pour-point depressants and compared them
102
with bare nanoparticles. They used a waxy model oil system to demonstrate the pour-point
depressing performance. Their study focused on how the amount of coverage of the nanoparticles
could affect their performance. The adsorption of the POA on silica was determined using a quartz
crystal microbalance with dissipation monitoring (QCM-D). The nanoparticle performance was
estimated with rheology tests to determine the differences in the strength of the wax gel formed,
with differential scanning calorimetry (DSC) to assess the wax appearance temperature and any
differences in crystallization, and visual observation of the formed wax with polarized microscopy.
Rheological measurements showed that nanoparticles with low POA coverage had almost no effect
on the strength of the formed wax gel, while nanoparticles with full coverage of POA significantly
lowered the wax gel strength. Results from the DSC also showed that the wax appearance
temperature is lowered by the nanoparticles and that there is little or no effect when using
nanoparticles with more POA than 100% coverage. DSC confirmed that the presence of
nanoparticles changes the nature of the wax crystallization, most likely by introducing multiple
nucleation centres, causing a sharp peak in crystallization. Polarized microscopy showed that, in
the presence of the nanoparticles, large particles were formed, compared to those with the added
silica. Research conducted showed that it is possible to optimize the effect of coated nanoparticles
on wax gels, so that already low dosages provided by such particles may be further reduced,
improving economic and environmental viability (Norrman et al., 2016). The Proposed possible
mechanism of nanohybrid in wax inhibition includes modulation of the crystal morphology,
reduction of gelation point and rheological yield stress. Nanoparticles also act as additional
dispersed nucleation sites, resulting in the formation of a larger number of smaller crystals and co-
crystallization incorporating into the forming wax crystals, thereby hindering, or changing the
crystal growth as shown in Figure 3.7. Because of various nucleation sites in the presence of
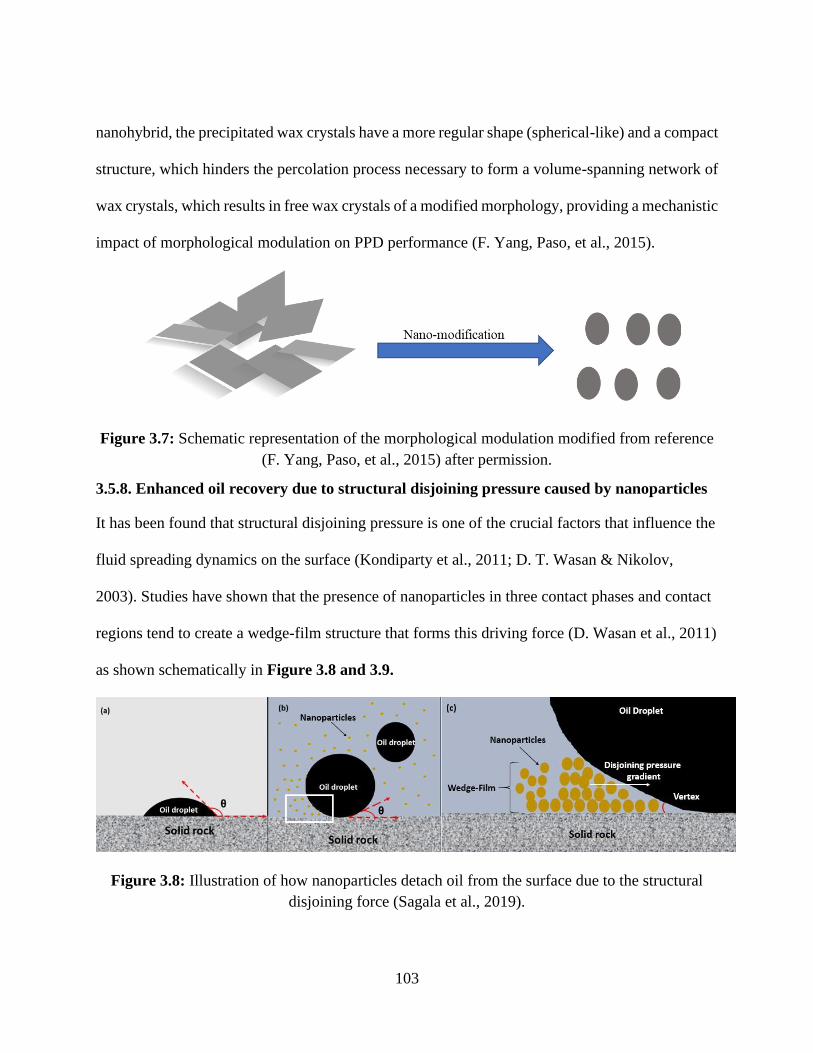
103
nanohybrid, the precipitated wax crystals have a more regular shape (spherical-like) and a compact
structure, which hinders the percolation process necessary to form a volume-spanning network of
wax crystals, which results in free wax crystals of a modified morphology, providing a mechanistic
impact of morphological modulation on PPD performance (F. Yang, Paso, et al., 2015).
Figure 3.7: Schematic representation of the morphological modulation modified from reference
(F. Yang, Paso, et al., 2015) after permission.
3.5.8. Enhanced oil recovery due to structural disjoining pressure caused by nanoparticles
It has been found that structural disjoining pressure is one of the crucial factors that influence the
fluid spreading dynamics on the surface (Kondiparty et al., 2011; D. T. Wasan & Nikolov,
2003). Studies have shown that the presence of nanoparticles in three contact phases and contact
regions tend to create a wedge-film structure that forms this driving force (D. Wasan et al., 2011)
as shown schematically in Figure 3.8 and 3.9.
Figure 3.8: Illustration of how nanoparticles detach oil from the surface due to the structural
disjoining force (Sagala et al., 2019).
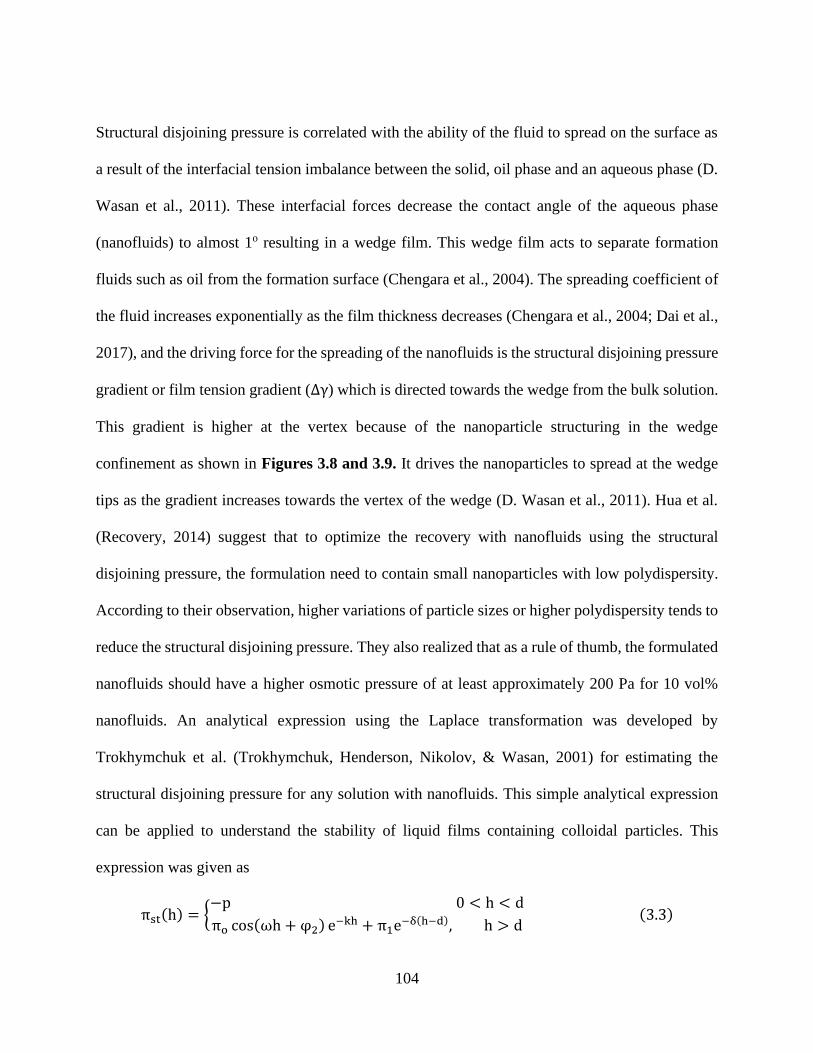
104
Structural disjoining pressure is correlated with the ability of the fluid to spread on the surface as
a result of the interfacial tension imbalance between the solid, oil phase and an aqueous phase (D.
Wasan et al., 2011). These interfacial forces decrease the contact angle of the aqueous phase
(nanofluids) to almost 1o resulting in a wedge film. This wedge film acts to separate formation
fluids such as oil from the formation surface (Chengara et al., 2004). The spreading coefficient of
the fluid increases exponentially as the film thickness decreases (Chengara et al., 2004; Dai et al.,
2017), and the driving force for the spreading of the nanofluids is the structural disjoining pressure
gradient or film tension gradient (∆γ) which is directed towards the wedge from the bulk solution.
This gradient is higher at the vertex because of the nanoparticle structuring in the wedge
confinement as shown in Figures 3.8 and 3.9. It drives the nanoparticles to spread at the wedge
tips as the gradient increases towards the vertex of the wedge (D. Wasan et al., 2011). Hua et al.
(Recovery, 2014) suggest that to optimize the recovery with nanofluids using the structural
disjoining pressure, the formulation need to contain small nanoparticles with low polydispersity.
According to their observation, higher variations of particle sizes or higher polydispersity tends to
reduce the structural disjoining pressure. They also realized that as a rule of thumb, the formulated
nanofluids should have a higher osmotic pressure of at least approximately 200 Pa for 10 vol%
nanofluids. An analytical expression using the Laplace transformation was developed by
Trokhymchuk et al. (Trokhymchuk, Henderson, Nikolov, & Wasan, 2001) for estimating the
structural disjoining pressure for any solution with nanofluids. This simple analytical expression
can be applied to understand the stability of liquid films containing colloidal particles. This
expression was given as
πst(h) = {−p 0 < h < d
πo cos(ωh + φ2) e−kh + π1e−δ(h−d), h > d (3.3)
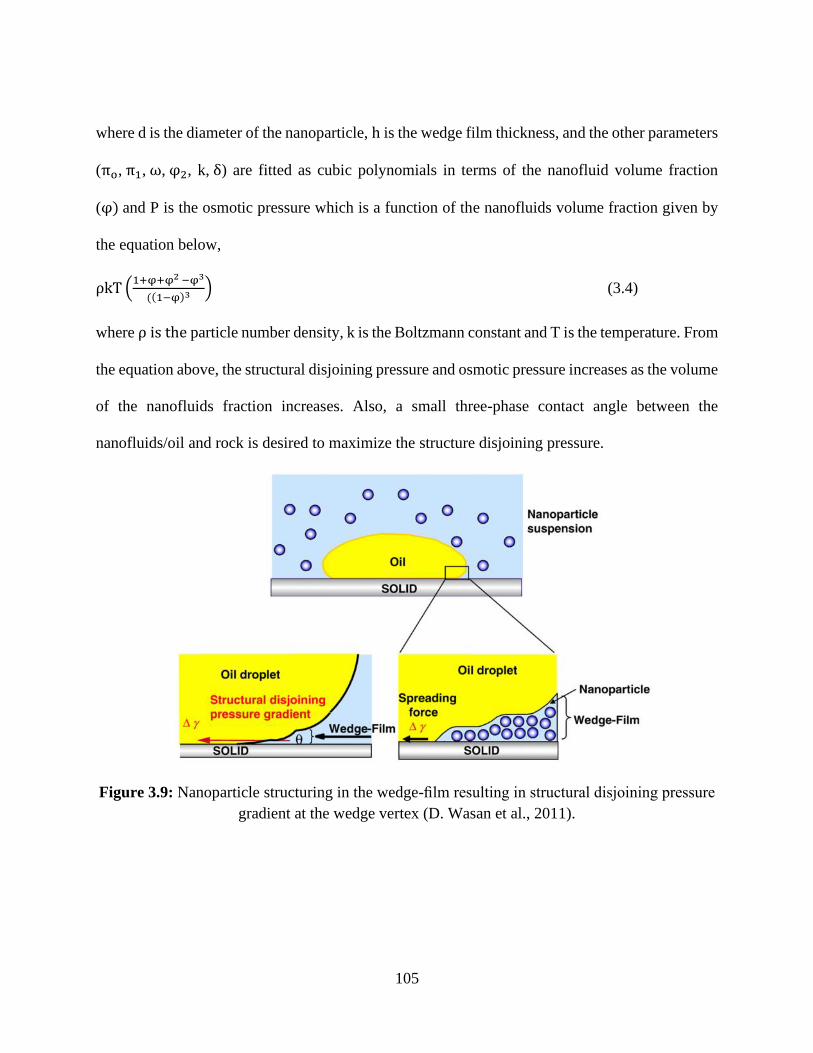
105
where d is the diameter of the nanoparticle, h is the wedge film thickness, and the other parameters
(πo, π1, ω, φ2, k, δ) are fitted as cubic polynomials in terms of the nanofluid volume fraction
(φ) and P is the osmotic pressure which is a function of the nanofluids volume fraction given by
the equation below,
ρkT (1+φ+φ2 −φ3
((1−φ)3 ) (3.4)
where ρ is the particle number density, k is the Boltzmann constant and T is the temperature. From
the equation above, the structural disjoining pressure and osmotic pressure increases as the volume
of the nanofluids fraction increases. Also, a small three-phase contact angle between the
nanofluids/oil and rock is desired to maximize the structure disjoining pressure.
Figure 3.9: Nanoparticle structuring in the wedge-film resulting in structural disjoining pressure
gradient at the wedge vertex (D. Wasan et al., 2011).
106
3.6. Effect of various factors on nanoparticle performance
Many different studies have tested the effects of various parameters on oil recovery during
nanofluids flooding. A summary of most of these factors that influence nanoparticle enhanced oil
recovery is disussed in the following sections.
3.6.1. Salinity
The stability of nanofluids in different saline environmentnts is one of the critical issues that must
be considered during flooding, especially for the subsurface applications. Nanofluids are greatly
affected and almost fail in the presence of oppositely charged ions due to excessive charge
screening (Ranka et al., 2015). The retention of nanoparticles in brine solution may be due to the
electrostatic attraction between the negatively charged particle cluster and parts of the formation
surface with a positive zeta potential (Nazari Moghaddam et al., 2015). Several researchers have
concluded that most non-interacting nanoparticles can be small particles with zero charge (Y. V.
Li, Cathles, & Archer, 2014; Nazari Moghaddam et al., 2015). Polyelectrolytes can be
encapsulated on the surfaces of nanoparticles but fail in high salinity conditions. However, special
polymers have been proposed to work in high saline conditions. Mikhil et al. (Ranka et al., 2015)
recently reported that nanoparticles stabilized with polyampholyte polymers can be applied to
reservoirs with extreme salinity up to 120,000 mg/dm3 and long-term colloidal stability can be
achieved.
3.6.2. Nanoparticle concentration
Nanoparticle concentration is an important factor that affects nanoparticle enhanced oil recovery.
However, it is not guaranteed that a high particle concentration yields higher oil recovery, and
there is always an optimum concentration that should be injected to maximize the oil recovery. In
a study carried out by Teng et al. (Lu, Li, & Zhou, 2017) to investigate the effects of the
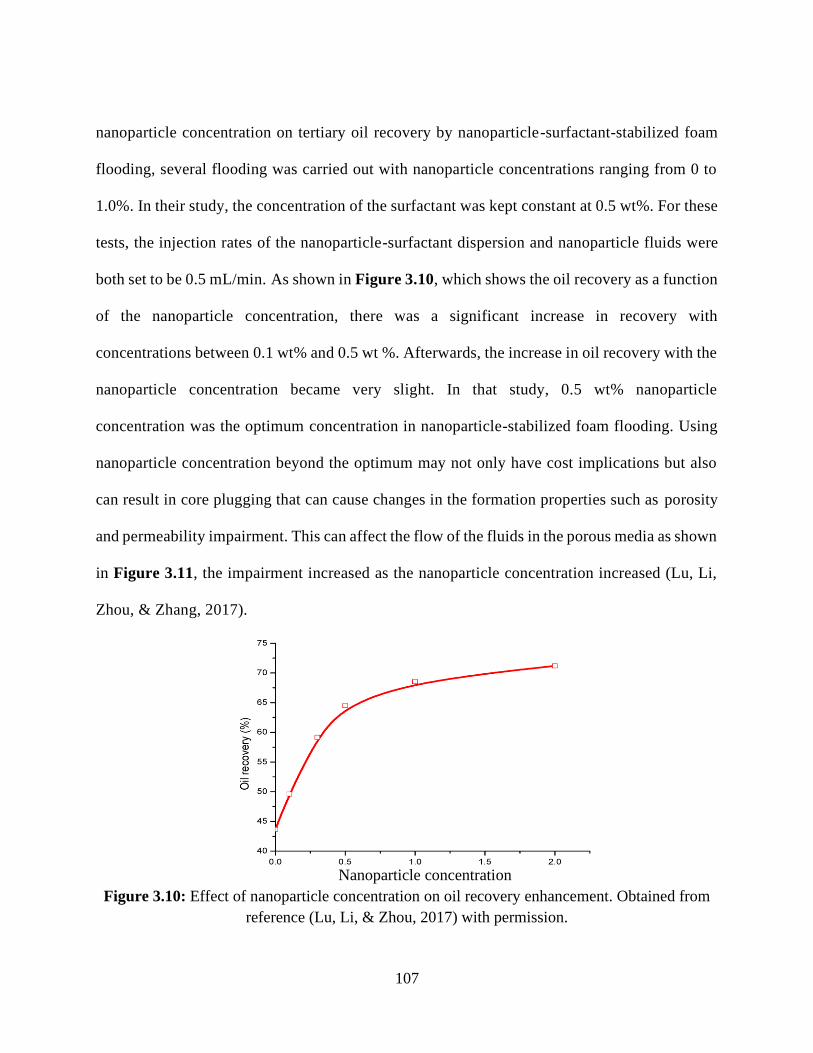
107
nanoparticle concentration on tertiary oil recovery by nanoparticle-surfactant-stabilized foam
flooding, several flooding was carried out with nanoparticle concentrations ranging from 0 to
1.0%. In their study, the concentration of the surfactant was kept constant at 0.5 wt%. For these
tests, the injection rates of the nanoparticle-surfactant dispersion and nanoparticle fluids were
both set to be 0.5 mL/min. As shown in Figure 3.10, which shows the oil recovery as a function
of the nanoparticle concentration, there was a significant increase in recovery with
concentrations between 0.1 wt% and 0.5 wt %. Afterwards, the increase in oil recovery with the
nanoparticle concentration became very slight. In that study, 0.5 wt% nanoparticle
concentration was the optimum concentration in nanoparticle-stabilized foam flooding. Using
nanoparticle concentration beyond the optimum may not only have cost implications but also
can result in core plugging that can cause changes in the formation properties such as porosity
and permeability impairment. This can affect the flow of the fluids in the porous media as shown
in Figure 3.11, the impairment increased as the nanoparticle concentration increased (Lu, Li,
Zhou, & Zhang, 2017).
Figure 3.10: Effect of nanoparticle concentration on oil recovery enhancement. Obtained from
reference (Lu, Li, & Zhou, 2017) with permission.
Nanoparticle concentration
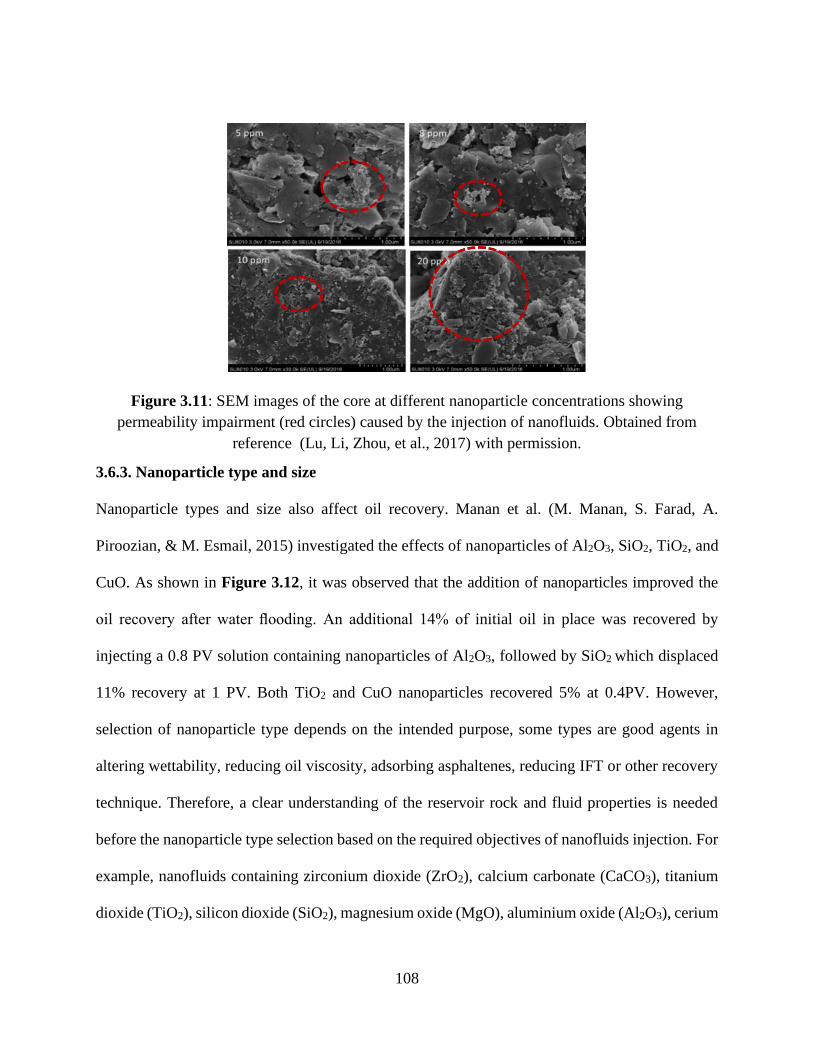
108
Figure 3.11: SEM images of the core at different nanoparticle concentrations showing
permeability impairment (red circles) caused by the injection of nanofluids. Obtained from
reference (Lu, Li, Zhou, et al., 2017) with permission.
3.6.3. Nanoparticle type and size
Nanoparticle types and size also affect oil recovery. Manan et al. (M. Manan, S. Farad, A.
Piroozian, & M. Esmail, 2015) investigated the effects of nanoparticles of Al2O3, SiO2, TiO2, and
CuO. As shown in Figure 3.12, it was observed that the addition of nanoparticles improved the
oil recovery after water flooding. An additional 14% of initial oil in place was recovered by
injecting a 0.8 PV solution containing nanoparticles of Al2O3, followed by SiO2 which displaced
11% recovery at 1 PV. Both TiO2 and CuO nanoparticles recovered 5% at 0.4PV. However,
selection of nanoparticle type depends on the intended purpose, some types are good agents in
altering wettability, reducing oil viscosity, adsorbing asphaltenes, reducing IFT or other recovery
technique. Therefore, a clear understanding of the reservoir rock and fluid properties is needed
before the nanoparticle type selection based on the required objectives of nanofluids injection. For
example, nanofluids containing zirconium dioxide (ZrO2), calcium carbonate (CaCO3), titanium
dioxide (TiO2), silicon dioxide (SiO2), magnesium oxide (MgO), aluminium oxide (Al2O3), cerium
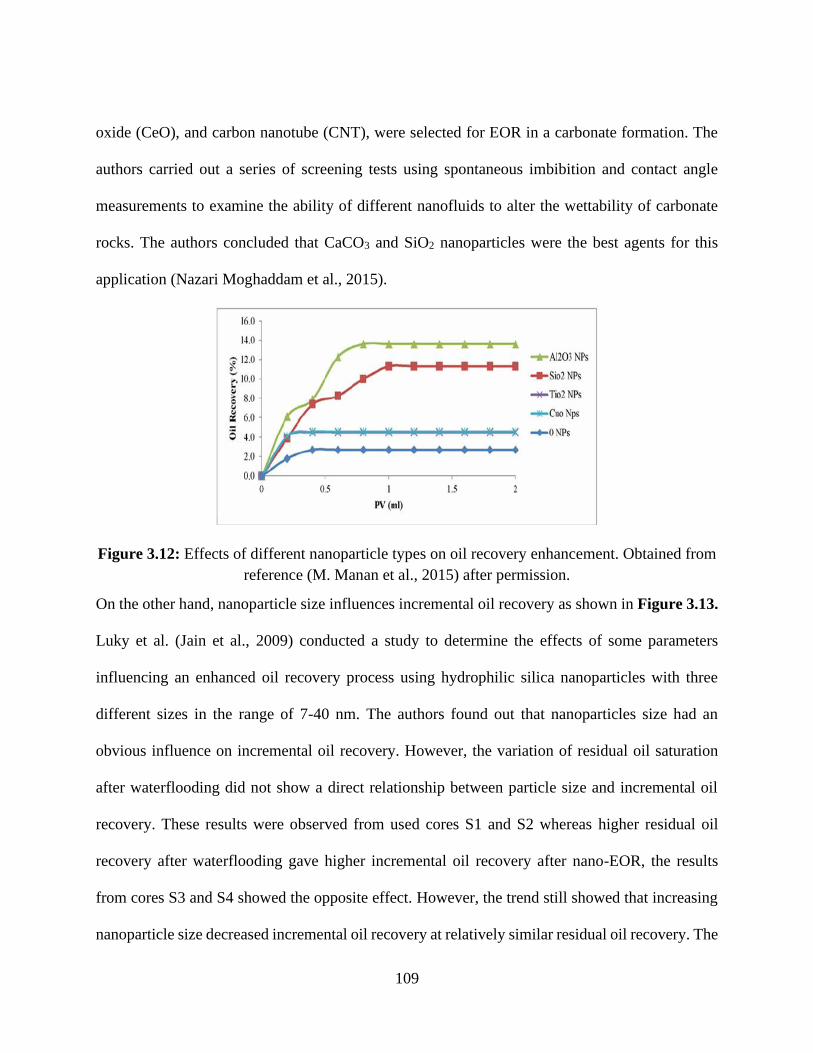
109
oxide (CeO), and carbon nanotube (CNT), were selected for EOR in a carbonate formation. The
authors carried out a series of screening tests using spontaneous imbibition and contact angle
measurements to examine the ability of different nanofluids to alter the wettability of carbonate
rocks. The authors concluded that CaCO3 and SiO2 nanoparticles were the best agents for this
application (Nazari Moghaddam et al., 2015).
Figure 3.12: Effects of different nanoparticle types on oil recovery enhancement. Obtained from
reference (M. Manan et al., 2015) after permission.
On the other hand, nanoparticle size influences incremental oil recovery as shown in Figure 3.13.
Luky et al. (Jain et al., 2009) conducted a study to determine the effects of some parameters
influencing an enhanced oil recovery process using hydrophilic silica nanoparticles with three
different sizes in the range of 7-40 nm. The authors found out that nanoparticles size had an
obvious influence on incremental oil recovery. However, the variation of residual oil saturation
after waterflooding did not show a direct relationship between particle size and incremental oil
recovery. These results were observed from used cores S1 and S2 whereas higher residual oil
recovery after waterflooding gave higher incremental oil recovery after nano-EOR, the results
from cores S3 and S4 showed the opposite effect. However, the trend still showed that increasing
nanoparticle size decreased incremental oil recovery at relatively similar residual oil recovery. The
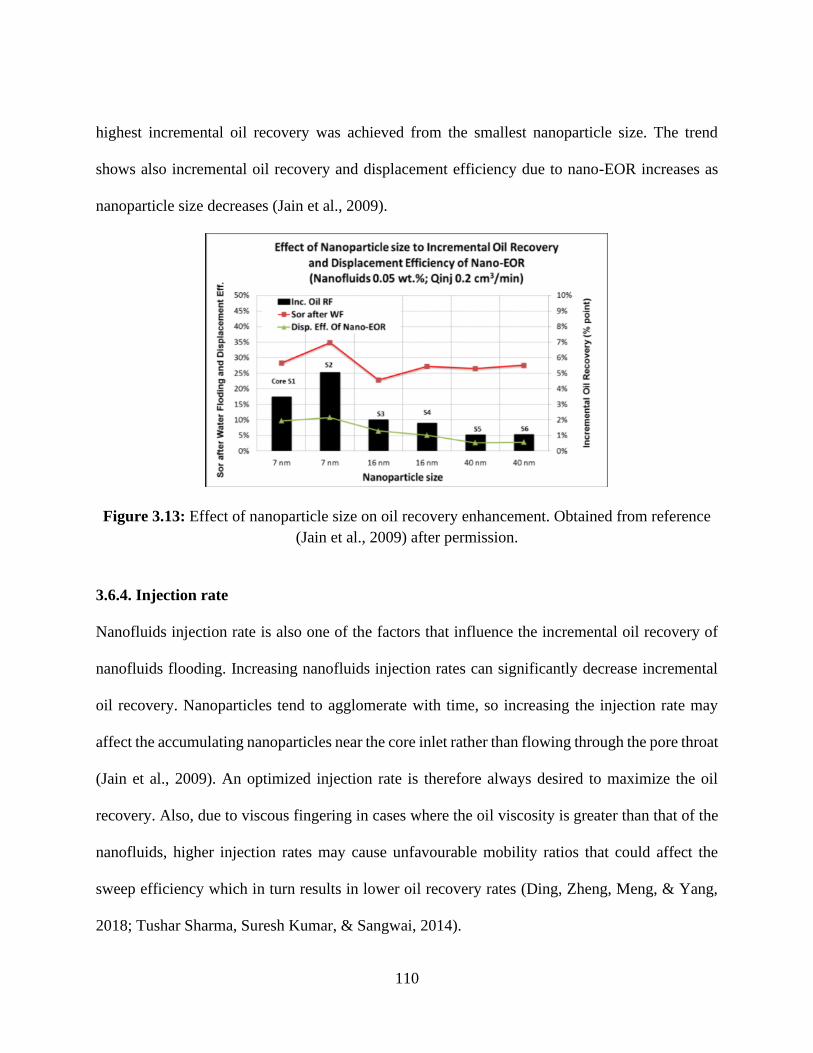
110
highest incremental oil recovery was achieved from the smallest nanoparticle size. The trend
shows also incremental oil recovery and displacement efficiency due to nano-EOR increases as
nanoparticle size decreases (Jain et al., 2009).
Figure 3.13: Effect of nanoparticle size on oil recovery enhancement. Obtained from reference
(Jain et al., 2009) after permission.
3.6.4. Injection rate
Nanofluids injection rate is also one of the factors that influence the incremental oil recovery of
nanofluids flooding. Increasing nanofluids injection rates can significantly decrease incremental
oil recovery. Nanoparticles tend to agglomerate with time, so increasing the injection rate may
affect the accumulating nanoparticles near the core inlet rather than flowing through the pore throat
(Jain et al., 2009). An optimized injection rate is therefore always desired to maximize the oil
recovery. Also, due to viscous fingering in cases where the oil viscosity is greater than that of the
nanofluids, higher injection rates may cause unfavourable mobility ratios that could affect the
sweep efficiency which in turn results in lower oil recovery rates (Ding, Zheng, Meng, & Yang,
2018; Tushar Sharma, Suresh Kumar, & Sangwai, 2014).
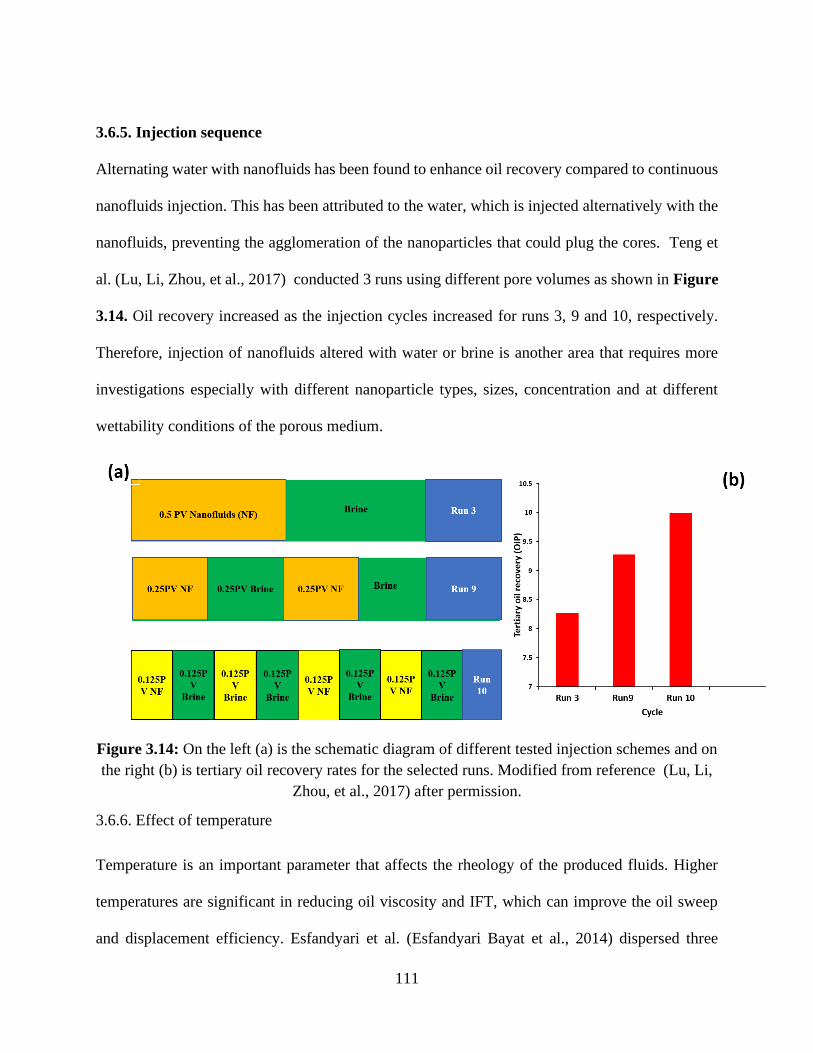
111
3.6.5. Injection sequence
Alternating water with nanofluids has been found to enhance oil recovery compared to continuous
nanofluids injection. This has been attributed to the water, which is injected alternatively with the
nanofluids, preventing the agglomeration of the nanoparticles that could plug the cores. Teng et
al. (Lu, Li, Zhou, et al., 2017) conducted 3 runs using different pore volumes as shown in Figure
3.14. Oil recovery increased as the injection cycles increased for runs 3, 9 and 10, respectively.
Therefore, injection of nanofluids altered with water or brine is another area that requires more
investigations especially with different nanoparticle types, sizes, concentration and at different
wettability conditions of the porous medium.
Figure 3.14: On the left (a) is the schematic diagram of different tested injection schemes and on
the right (b) is tertiary oil recovery rates for the selected runs. Modified from reference (Lu, Li,
Zhou, et al., 2017) after permission.
3.6.6. Effect of temperature
Temperature is an important parameter that affects the rheology of the produced fluids. Higher
temperatures are significant in reducing oil viscosity and IFT, which can improve the oil sweep
and displacement efficiency. Esfandyari et al. (Esfandyari Bayat et al., 2014) dispersed three
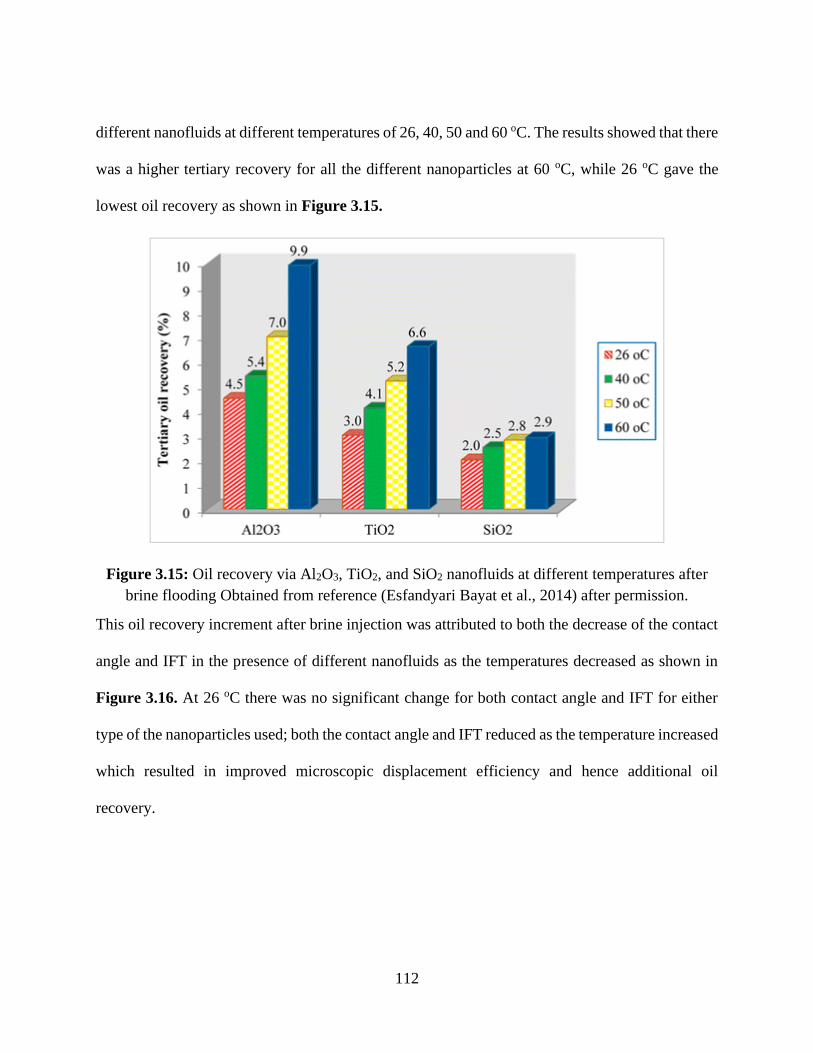
112
different nanofluids at different temperatures of 26, 40, 50 and 60 oC. The results showed that there
was a higher tertiary recovery for all the different nanoparticles at 60 oC, while 26 oC gave the
lowest oil recovery as shown in Figure 3.15.
Figure 3.15: Oil recovery via Al2O3, TiO2, and SiO2 nanofluids at different temperatures after
brine flooding Obtained from reference (Esfandyari Bayat et al., 2014) after permission.
This oil recovery increment after brine injection was attributed to both the decrease of the contact
angle and IFT in the presence of different nanofluids as the temperatures decreased as shown in
Figure 3.16. At 26 oC there was no significant change for both contact angle and IFT for either
type of the nanoparticles used; both the contact angle and IFT reduced as the temperature increased
which resulted in improved microscopic displacement efficiency and hence additional oil
recovery.
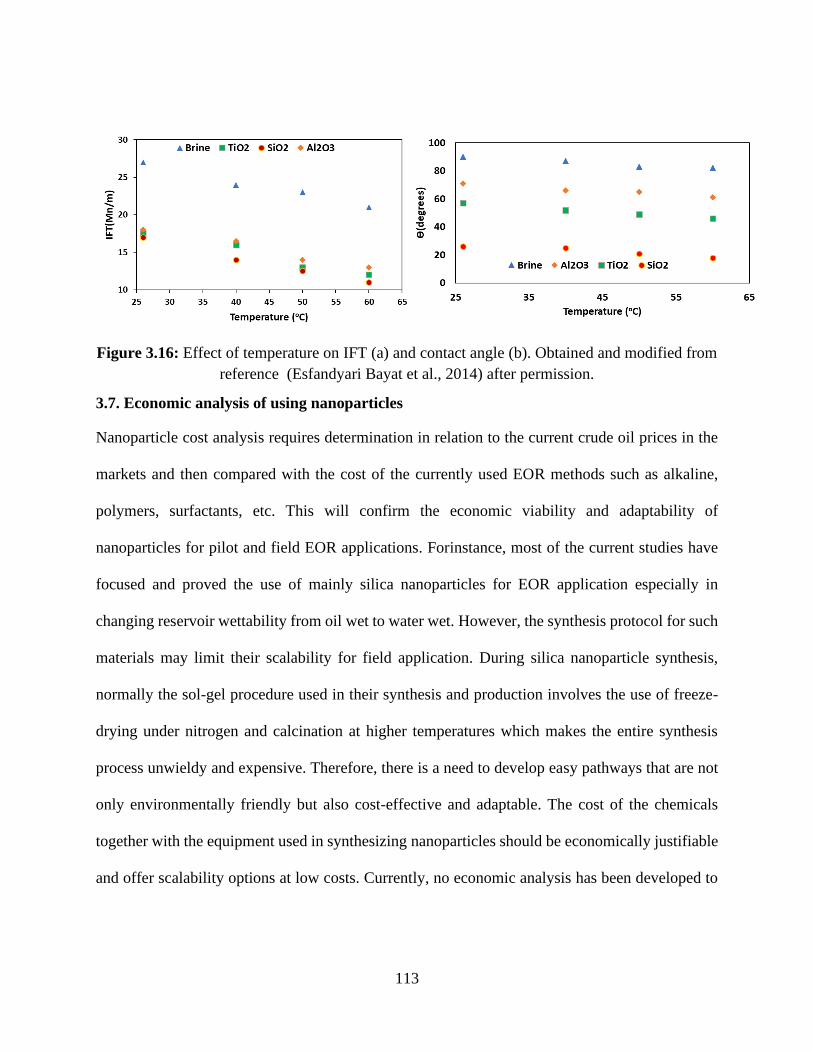
113
Figure 3.16: Effect of temperature on IFT (a) and contact angle (b). Obtained and modified from
reference (Esfandyari Bayat et al., 2014) after permission.
3.7. Economic analysis of using nanoparticles
Nanoparticle cost analysis requires determination in relation to the current crude oil prices in the
markets and then compared with the cost of the currently used EOR methods such as alkaline,
polymers, surfactants, etc. This will confirm the economic viability and adaptability of
nanoparticles for pilot and field EOR applications. Forinstance, most of the current studies have
focused and proved the use of mainly silica nanoparticles for EOR application especially in
changing reservoir wettability from oil wet to water wet. However, the synthesis protocol for such
materials may limit their scalability for field application. During silica nanoparticle synthesis,
normally the sol-gel procedure used in their synthesis and production involves the use of freeze-
drying under nitrogen and calcination at higher temperatures which makes the entire synthesis
process unwieldy and expensive. Therefore, there is a need to develop easy pathways that are not
only environmentally friendly but also cost-effective and adaptable. The cost of the chemicals
together with the equipment used in synthesizing nanoparticles should be economically justifiable
and offer scalability options at low costs. Currently, no economic analysis has been developed to
114
compare the oil prices with nanoparticle cost. This is a big hindrance for adoption of nanoparticles
in real field application of oil and gas application.
3.8. Concerns and uncertainties of using nanotechnology in oil and gas applications
Although nanotechnology contributes tremendously to technological advancement in many
applications and is attracting attention for possible applications in medicine, health, agriculture,
and energy industries, there are still some unresolved critical uncertainties (Kahan & Rejeski,
2009). It has been conceptualized as an environmentally friendly technique over the last decade
and many indirect and direct applications of nanomaterials are being used in the marketplace.
However, there is minimal data on the nanometric effect of nanoparticles on human health and the
environment due to limited filed applications (Kahan & Rejeski, 2009). Some primary findings
reported no health-related issues and concerns of nanomaterials (Nel, Xia, Mädler, & Li, 2006).
Forexample, UK Royal Society (London, UK) and the Royal Academy of Engineering (London,
UK) released a report which concluded that nanomaterials in several applications pose no new
health risks (Society, 2004). However, the associated benefits of nanoparticles from the
environmental perspective are combined with challenges that may be difficult to predict. Besides,
there is little information about the disposal, manufacturing, reactivation usage, regeneration,
disposal and any associated risk in the exposure to nanomaterials (Powers et al., 2006). Karin et
al. (Mattsson et al., 2017) demonstrated that plastic nanoparticles have an effect on the survival
of aquatic zooplankton and can penetrate the blood-to-brain barrier in fish and cause
behavioural disorders, however, more finding while using other nanoparticles requires
investigations. Nanomaterials based on their dimensions, shapes, and surface energy, may match
with some of the biological body molecules such as proteins or nucleic acids. Hence, when they
come in contact with the fluids of the body, they can be absorbed easily. These adsorbed materials
115
may spread to the target sites such as the heart, liver or blood cells and cause damage (Purohit et
al., 2017). However, studies have shown that remediation management and control of
nanomaterials can reduce their environmental and health hazards (Purohit et al., 2017). Less
exposure to nanomaterials and using respirators has been suggested as a possible measure of
preventing nanoparticles inhalation that may result in respiratory irritation and damage to body
organs (Nel et al., 2006). For example, Titanium, nickel, and CNTs, cobalt, and polystyrene have
been postulated as examples of nanoparticles responsible for respiratory toxicity compared to
quartz nanomaterials (Purohit et al., 2017). There is a need to create ethical related issues, test
protocols and procedures that will guarantee safe handling of nanomaterials for EOR laboratory,
pilot and field applications. Currently, several agencies have started health access and
environmental safety inspection of nanoparticles and have developed precautions. For example, in
the United States, agencies such as National Toxicology Program (NTP), National Center for
Environmental Research of the Environmental Protection Agency (EPA), National Institute of
Occupational Safety and Health (NIOSH), National Institute of Environmental Health have all
been commissioned for application and risk assessment of nanomaterials (Nel et al., 2006; Yekeen
et al., 2018).
In summary, as a recommendation to nanoparticle users, less exposure to nanomaterials and using
respirators has been suggested as a way of diminishing nanoparticles inhalation that may result in
respiratory irritation and damage to other body organs (Nel et al., 2006).
3.9. Conclusions and future outlook
Nanoparticles have a great potential of changing the perspective of the oil and gas industry in many
aspects. Presently, researchers have evidence that nanoparticles can be used in various sectors of
oil and gas ranging from exploration, production to refinery. In this review, we have explored some
116
of the common types of nanoparticles used in EOR. The underlying mechanisms and operating
parameters that control oil recovery with nano-EOR in both sandstone and carbonate reservoirs
have also been explored. Also, for the applicability of nanofluids in oil recovery, stabilization
techniques recommended for nano-EOR have been reviewed. Notwithstanding the recovery
potential of nanofluids, there is a need to develop synthesis pathways that are more cost-effective,
efficient and offer options for scalability to allow nanoparticles to be integrated into oil recovery
systems. Such nanoparticles should be easily adaptable and sustainable both to the users and the
environment. Most of the previous studies have focused on using isotropic (homogenous)
nanoparticles and fewer studies have been done with anisotropic types of nanomaterials in oil
recovery enhancement. Hence, more investigations using amphiphilic nanomaterials are still
needed. These materials have asymmetrical or double face properties that mimic the commonly
used surfactants in recovering residual oil. Because of the synergistic abilities for both the
surfactant and the nanoparticles, we expect that proposed anisotropic nanomaterials may perform
better compared to the existing commonly used isotropic nanoparticles. Also, many studies
regarding nano-EOR have reported promising results but under ambient conditions. Therefore,
similar studies of nano-EOR are still needed to enhance their adaptability for pilot and field
applications.
3.1 References
Aadland, R. C., Dziuba, C. J., Heggset, E. B., Syverud, K., Torsæter, O., Holt, T., . . . Bryant, S.
L. (2018). Identification of Nanocellulose Retention Characteristics in Porous Media.
Abas, N., Kalair, A., & Khan, N. (2015). Review of fossil fuels and future energy technologies.
Futures, 69, 31-49.
Abe, A. A. (2005). Relative permeability and wettability implications of dilute surfactants at
reservoir conditions.
Adams, J. J. (2014). Asphaltene Adsorption, a Literature Review. Energy & Fuels, 28(5), 2831-
2856. doi: 10.1021/ef500282p
117
Adebiyi, F., & Thoss, V. (2015). Spectroscopic characterization of asphaltene fraction of Nigerian
Bitumen. Petroleum Science and Technology, 33(2), 245-255.
Al-Maamari, R. S., & Buckley, J. S. (2003). Asphaltene precipitation and alteration of wetting: the
potential for wettability changes during oil production. SPE Reservoir Evaluation &
Engineering, 6(04), 210-214.
Alnarabiji, M. S., Yahya, N., Shafie, A., Solemani, H., Chandran, K., Hamid, S. B. A., & Azizi,
K. (2016). The influence of hydrophobic multiwall carbon nanotubes concentration on
enhanced oil recovery. Procedia Engineering, 148, 1137-1140.
Alvarado, V., & Manrique, E. (2010). Enhanced oil recovery: an updated review. Energies, 3(9),
1529-1575.
Anderson, W. (1986). 1987, Wettability literature survey–part 1 to part 6. J. Pet. Technol, 1125-
1144.
Baran Jr, J. R., & Cabrera, O. J. (2006). Use of surface-modified nanoparticles for oil recovery:
Google Patents.
Barrabino, A., Holt, T., & Lindeberg, E. (2018). Graphene Oxide as Foam Stabilizing Agent for
CO2 EOR.
Barrera, C., Herrera, A. P., Bezares, N., Fachini, E., Olayo-Valles, R., Hinestroza, J. P., & Rinaldi,
C. (2012). Effect of poly (ethylene oxide)-silane graft molecular weight on the colloidal
properties of iron oxide nanoparticles for biomedical applications. Journal of Colloid and
Interface Science, 377(1), 40-50.
Bayat, A. E., & Junin, R. (2015). Transportation of metal oxide nanoparticles through various
porous media for enhanced oil recovery. Paper presented at the SPE/IATMI Asia Pacific
Oil & Gas Conference and Exhibition.
Betancur, S., Carmona, J. C., Nassar, N. N., Franco, C. A., & Cortes, F. B. (2016). Role of particle
size and surface acidity of silica gel nanoparticles in inhibition of formation damage by
asphaltene in oil reservoirs. Industrial & Engineering Chemistry Research, 55(21), 6122-
6132.
Bilak, R. (2006). Enhanced oil recovery methods: Google Patents.
Boissezon, R., Muller, J., Beaugeard, V., Monge, S., & Robin, J.-J. (2014). Organophosphonates
as anchoring agents onto metal oxide-based materials: synthesis and applications. RSC
Advances, 4(67), 35690-35707.
Boyer, J.-C., Manseau, M.-P., Murray, J. I., & van Veggel, F. C. (2009). Surface modification of
upconverting NaYF4 nanoparticles with PEG− phosphate ligands for NIR (800 nm)
biolabeling within the biological window. Langmuir, 26(2), 1157-1164.
Chang, H., & Wu, H. (2013). Graphene-based nanocomposites: preparation, functionalization, and
energy and environmental applications. Energy & Environmental Science, 6(12), 3483-
3507.
Cheng, J., Teply, B. A., Sherifi, I., Sung, J., Luther, G., Gu, F. X., . . . Farokhzad, O. C. (2007).
Formulation of functionalized PLGA–PEG nanoparticles for in vivo targeted drug
delivery. Biomaterials, 28(5), 869-876.
Chengara, A., Nikolov, A. D., Wasan, D. T., Trokhymchuk, A., & Henderson, D. (2004).
Spreading of nanofluids driven by the structural disjoining pressure gradient. Journal of
colloid and interface science, 280(1), 192-201.
118
Cheraghian, G., & Khalilinezhad, S. S. (2015). Effect of Nanoclay on Heavy Oil Recovery During
Polymer Flooding. Petroleum Science and Technology, 33(9), 999-1007. doi:
10.1080/10916466.2015.1014962
Council, N. (1976). Enhanced oil recovery–an analysis of the potential for enhanced oil recovery
from known fields in the United States–1976–2000. Washington, DC.
Dai, C., Wang, X., Li, Y., Lv, W., Zou, C., Gao, M., & Zhao, M. (2017). Spontaneous imbibition
investigation of self-dispersing silica nanofluids for enhanced oil recovery in low-
permeability cores. Energy & Fuels, 31(3), 2663-2668.
Darling, P. (2011). SME mining engineering handbook (Vol. 1): SME.
De Palma, R., Peeters, S., Van Bael, M. J., Van den Rul, H., Bonroy, K., Laureyn, W., . . . Maes,
G. (2007). Silane ligand exchange to make hydrophobic superparamagnetic nanoparticles
water-dispersible. Chemistry of Materials, 19(7), 1821-1831.
Ding, Y., Zheng, S., Meng, X., & Yang, D. (2018). Low Salinity Hot Water Injection with Addition
of Nanoparticles for Enhancing Heavy Oil Recovery under Reservoir Conditions. Paper
presented at the SPE Western Regional Meeting.
Donaldson, K., Stone, V., Clouter, A., Renwick, L., & MacNee, W. (2001). Ultrafine particles.
Occupational and environmental medicine, 58(3), 211-216.
Doryani, H., Malayeri, M. R., & Riazi, M. (2016). Visualization of asphaltene precipitation and
deposition in a uniformly patterned glass micromodel. Fuel, 182, 613-622. doi:
10.1016/j.fuel.2016.06.004
Duan, F., Kwek, D., & Crivoi, A. (2011). Viscosity affected by nanoparticle aggregation in Al 2
O 3-water nanofluids. Nanoscale research letters, 6(1), 248.
Dubey, S., & Waxman, M. (1991). Asphaltene adsorption and desorption from mineral surfaces.
SPE Reservoir Engineering, 6(03), 389-395.
Edwards, R. (1957). Crystal habit of paraffin wax. Industrial & Engineering Chemistry, 49(4),
750-757.
Ehtesabi, H., Ahadian, M. M., Taghikhani, V., & Ghazanfari, M. H. (2013). Enhanced heavy oil
recovery in sandstone cores using TiO2 nanofluids. Energy & Fuels, 28(1), 423-430.
Elias, L., Fenouillot, F., Majesté, J.-C., & Cassagnau, P. (2007). Morphology and rheology of
immiscible polymer blends filled with silica nanoparticles. Polymer, 48(20), 6029-6040.
Erathodiyil, N., & Ying, J. Y. (2011). Functionalization of inorganic nanoparticles for bioimaging
applications. Accounts of chemical research, 44(10), 925-935.
Ersenkal, D. A., Ziylan, A., Ince, N. H., Acar, H. Y., Demirer, M., & Copty, N. K. (2011). Impact
of dilution on the transport of poly (acrylic acid) supported magnetite nanoparticles in
porous media. Journal of contaminant hydrology, 126(3), 248-257.
Esfandyari Bayat, A., Junin, R., Samsuri, A., Piroozian, A., & Hokmabadi, M. (2014). Impact of
metal oxide nanoparticles on enhanced oil recovery from limestone media at several
temperatures. Energy & fuels, 28(10), 6255-6266.
Espinoza, D. A., Caldelas, F. M., Johnston, K. P., Bryant, S. L., & Huh, C. (2010). Nanoparticle-
stabilized supercritical CO2 foams for potential mobility control applications. Paper
presented at the SPE Improved Oil Recovery Symposium.
Farad, S., Mugisa, J., Alahdal, H. A., Idris, A. K., Kisiki, N. H., & Kabenge, I. (2016). Effect of
wettability on oil recovery and breakthrough time for immiscible gas flooding. Petroleum
Science and Technology, 34(20), 1705-1711.
119
Franco, C. A., Montoya, T., Nassar, N. N., Pereira-Almao, P., & Cortes, F. B. (2013). Adsorption
and subsequent oxidation of Colombian asphaltenes onto nickel and/or palladium oxide
supported on fumed silica nanoparticles. Energy & fuels, 27(12), 7336-7347.
Franco, C. A., Nassar, N. N., Ruiz, M. A., Pereira-Almao, P., & Cortes, F. B. (2013). Nanoparticles
for inhibition of asphaltenes damage: adsorption study and displacement test on porous
media. Energy & Fuels, 27(6), 2899-2907.
Friberg, S., Jansson, P. O., & Cederberg, E. (1976). Surfactant association structure and emulsion
stability. Journal of colloid and interface science, 55(3), 614-623.
Gardiner, J. B. (1970). Studies in the Morphology and vulcanization of gum rubber blends. Rubber
Chemistry and Technology, 43(2), 370-399.
Ghadimi, A., Saidur, R., & Metselaar, H. (2011). A review of nanofluid stability properties and
characterization in stationary conditions. International Journal of Heat and Mass Transfer,
54(17-18), 4051-4068.
Giraldo, J., Benjumea, P., Lopera, S., Cortes, F. B., & Ruiz, M. A. (2013). Wettability alteration
of sandstone cores by alumina-based nanofluids. Energy & fuels, 27(7), 3659-3665.
Giraldo, L. J., Giraldo, M. A., Llanos, S., Maya, G., Zabala, R. D., Nassar, N. N., . . . Cortés, F. B.
(2017). The effects of SiO2 nanoparticles on the thermal stability and rheological
behaviour of hydrolyzed polyacrylamide based polymeric solutions. Journal of Petroleum
Science and Engineering, 159, 841-852.
Golas, P. L., Louie, S., Lowry, G. V., Matyjaszewski, K., & Tilton, R. D. (2010). Comparative
study of polymeric stabilizers for magnetite nanoparticles using ATRP. Langmuir, 26(22),
16890-16900.
Gopalan, R., Chang, C.-H., & Lin, Y. (1995). Thermal stability improvement on pore and phase
structure of sol-gel derived zirconia. Journal of materials science, 30(12), 3075-3081.
Hasan, S. W., Ghannam, M. T., & Esmail, N. (2010). Heavy crude oil viscosity reduction and
rheology for pipeline transportation. Fuel, 89(5), 1095-1100.
Hashemi, R., Nassar, N. N., & Almao, P. P. (2014). Nanoparticle technology for heavy oil in-situ
upgrading and recovery enhancement: Opportunities and challenges. Applied energy, 133,
374-387.
Hashemi, R., Nassar, N. N., & Pereira Almao, P. (2013). Enhanced heavy oil recovery by in situ
prepared ultradispersed multimetallic nanoparticles: A study of hot fluid flooding for
Athabasca bitumen recovery. Energy & fuels, 27(4), 2194-2201.
Hashemi, S. I., Fazelabdolabadi, B., Moradi, S., Rashidi, A. M., Shahrabadi, A., & Bagherzadeh,
H. (2016). On the application of NiO nanoparticles to mitigate in situ asphaltene deposition
in carbonate porous matrix. Applied Nanoscience, 6(1), 71-81.
Heller, J. P. (1994). CO2 foams in enhanced oil recovery: ACS Publications.
Hendraningrat, L., Li, S., & Torsæter, O. (2013). A coreflood investigation of nanofluid enhanced
oil recovery. Journal of Petroleum Science and Engineering, 111, 128-138.
Hendraningrat, L., Li, S., & Torsater, O. (2013). Effect of some parameters influencing enhanced
oil recovery process using silica nanoparticles: An experimental investigation. Paper
presented at the SPE Reservoir Characterization and Simulation Conference and
Exhibition.
Hendraningrat, L., & Shidong, L. (2012). A glass micromodel experimental study of hydrophilic
nanoparticles retention for EOR project. Paper presented at the SPE Russian Oil and Gas
Exploration and Production Technical Conference and Exhibition.
120
Hendraningrat, L., & Torsæter, O. (2015). Metal oxide-based nanoparticles: revealing their
potential to enhance oil recovery in different wettability systems. Applied Nanoscience,
5(2), 181-199.
Hurtado, Y., Beltran, C., Zabala, R. D., Lopera, S. H., Franco, C. A., Nassar, N. N., & Cortes, F.
B. (2018). Effects of Surface Acidity and Polarity of SiO2 Nanoparticles on the Foam
Stabilization Applied to Natural Gas Flooding in Tight Gas-Condensate Reservoirs.
Energy & fuels, 32(5), 5824-5833.
Iijima, M., & Kamiya, H. (2009). Surface modification for improving the stability of nanoparticles
in liquid media. KONA Powder and Particle Journal, 27, 119-129.
J.pickering. (2001). Pickering emulsions. Journal of chemical society.
Jain, N., Wang, Y., Jones, S. K., Hawkett, B. S., & Warr, G. G. (2009). Optimized steric
stabilization of aqueous ferrofluids and magnetic nanoparticles. Langmuir, 26(6), 4465-
4472.
Jiang, J., Oberdörster, G., & Biswas, P. (2009). Characterization of size, surface charge, and
agglomeration state of nanoparticle dispersions for toxicological studies. Journal of
Nanoparticle Research, 11(1), 77-89.
Jo, G., Choe, M., Lee, S., Park, W., Kahng, Y. H., & Lee, T. (2012). The application of graphene
as electrodes in electrical and optical devices. Nanotechnology, 23(11), 112001.
Junior, L. C. R., Ferreira, M. S., & da Silva Ramos, A. C. (2006). Inhibition of asphaltene
precipitation in Brazilian crude oils using new oil-soluble amphiphiles. Journal of
Petroleum Science and Engineering, 51(1-2), 26-36.
Kahan, D. M., & Rejeski, D. (2009). Project on emerging nanotechnologies.
Karimi, A., Fakhroueian, Z., Bahramian, A., Pour Khiabani, N., Darabad, J. B., Azin, R., & Arya,
S. (2012). Wettability alteration in carbonates using zirconium oxide nanofluids: EOR
implications. Energy & fuels, 26(2), 1028-1036.
Kazemzadeh, Y., Eshraghi, S. E., Kazemi, K., Sourani, S., Mehrabi, M., & Ahmadi, Y. (2015).
The behavior of asphaltene adsorption onto the metal oxide nanoparticle surface and its
effect on heavy oil recovery. Industrial & Engineering Chemistry Research, 54(1), 233-
239.
Khalil, M., Jan, B. M., Tong, C. W., & Berawi, M. A. (2017). Advanced nanomaterials in oil and
gas industry: design, application and challenges. Applied energy, 191, 287-310.
Khalil, M., Yu, J., Liu, N., & Lee, R. L. (2014). Non-aqueous modification of synthesized hematite
nanoparticles with oleic acid. Colloids and Surfaces A: Physicochemical and Engineering
Aspects, 453, 7-12.
Kim, S., Boudh-Hir, M., & Mansoori, G. (1990). The Role of Asphaltene in Wettability Reversal.
Paper presented at the SPE Annual Technical Conference and Exhibition.
Kondiparty, K., Nikolov, A., Wu, S., & Wasan, D. (2011). Wetting and spreading of nanofluids
on solid surfaces driven by the structural disjoining pressure: statics analysis and
experiments. Langmuir, 27(7), 3324-3335.
Kong, X., & Ohadi, M. (2010). Applications of micro and nanotechnologies in the oil and gas
industry-overview of the recent progress. Paper presented at the Abu Dhabi international
petroleum exhibition and conference.
Lake, L. W., Johns, R. T., Rossen, W. R., & Pope, G. A. (2014). Fundamentals of enhanced oil
recovery.
121
Lei, Y., Mehmood, F., Lee, S., Greeley, J., Lee, B., Seifert, S., . . . Redfern, P. C. (2010). Increased
silver activity for direct propylene epoxidation via subnanometer size effects. Science,
328(5975), 224-228.
Leontaritis, K. J., & Mansoori, G. A. (1988). Asphaltene deposition: a survey of field experiences
and research approaches. Journal of Petroleum Science and Engineering, 1(3), 229-239.
Li, S., Qiao, C., Li, Z., & Wanambwa, S. (2017). Properties of Carbon Dioxide Foam Stabilized
by Hydrophilic Nanoparticles and Hexadecyltrimethylammonium Bromide. Energy &
Fuels, 31(2), 1478-1488.
Li, W., Zhu, J.-h., & Qi, J.-h. (2007). Application of nano-nickel catalyst in the viscosity reduction
of Liaohe extra-heavy oil by aqua-thermolysis. Journal of Fuel Chemistry and Technology,
35(2), 176-180. doi: 10.1016/s1872-5813(07)60016-4
Li, X., Guo, Y., Sun, Q., Lan, W., & Guo, X. (2018). Effect of Nanoparticles on Asphaltene
Aggregation in a Micro-sized pore. Industrial & Engineering Chemistry Research.
Li, Y., Dai, C., Zhou, H., Wang, X., Lv, W., & Zhao, M. (2017). Investigation of spontaneous
imbibition by using a surfactant-free active silica water-based nanofluid for enhanced oil
recovery. Energy & Fuels, 32(1), 287-293.
Li, Y. V., Cathles, L. M., & Archer, L. A. (2014). Nanoparticle tracers in calcium carbonate porous
media. Journal of Nanoparticle Research, 16(8), 2541.
Lin, Y., Zeng, Z., Zhu, J., Chen, S., Yuan, X., & Liu, L. (2015). Graphene nanosheets decorated
with ZnO nanoparticles: facile synthesis and promising application for enhancing the
mechanical and gas barrier properties of rubber nanocomposites. RSC Advances, 5(71),
57771-57780.
Liu, F., Yang, J., Huang, L., & Liu, D. (1996). Effect of non-ionic surfactants on the formation of
DNA/emulsion complexes and emulsion-mediated gene transfer. Pharmaceutical
Research, 13(11), 1642-1646.
Lourenco, C., Teixeira, M., Simões, S., & Gaspar, R. (1996). Steric stabilization of nanoparticles:
size and surface properties. International journal of pharmaceutics, 138(1), 1-12.
Lu, T., Li, Z., & Zhou, Y. (2017). Flow Behavior and Displacement Mechanisms of Nanoparticle
Stabilized Foam Flooding for Enhanced Heavy Oil Recovery. Energies, 10(4), 560.
Lu, T., Li, Z., Zhou, Y., & Zhang, C. (2017). Enhanced oil recovery of low-permeability cores by
SiO2 nanofluid. Energy & fuels, 31(5), 5612-5621.
Luo, D., Wang, F., Zhu, J., Cao, F., Liu, Y., Li, X., . . . Ren, Z. (2016). Nanofluid of graphene-
based amphiphilic Janus nanosheets for tertiary or enhanced oil recovery: High
performance at low concentration. Proceedings of the National Academy of Sciences,
201608135.
Maggio, G., & Cacciola, G. (2009). A variant of the Hubbert curve for world oil production
forecasts. Energy Policy, 37(11), 4761-4770.
Maghzi, A., Mohebbi, A., Kharrat, R., & Ghazanfari, M. (2013). An experimental investigation of
silica nanoparticles effect on the rheological behavior of polyacrylamide solution to
enhance heavy oil recovery. Petroleum Science and Technology, 31(5), 500-508.
Manan, M., Farad, S., Piroozian, A., & Esmail, M. (2015). Effects of nanoparticle types on carbon
dioxide foam flooding in enhanced oil recovery. Petroleum Science and Technology,
33(12), 1286-1294.
122
Manan, M. A., Farad, S., Piroozian, A., & Esmail, M. J. A. (2015). Effects of Nanoparticle Types
on Carbon Dioxide Foam Flooding in Enhanced Oil Recovery. Petroleum Science and
Technology, 33(12), 1286-1294. doi: 10.1080/10916466.2015.1057593
Matteo, C., Candido, P., Vera, R., & Francesca, V. (2012). Current and future nanotech
applications in the oil industry. American Journal of Applied Sciences, 9(6), 784.
Mattsson, K., Johnson, E. V., Malmendal, A., Linse, S., Hansson, L.-A., & Cedervall, T. (2017).
Brain damage and behavioural disorders in fish induced by plastic nanoparticles delivered
through the food chain. Scientific Reports, 7(1), 11452.
McElfresh, P. M., Holcomb, D. L., & Ector, D. (2012). Application of nanofluid technology to
improve recovery in oil and gas wells. Paper presented at the SPE International Oilfield
Nanotechnology Conference and Exhibition.
Meyers, M. A., Mishra, A., & Benson, D. J. (2006). Mechanical properties of nanocrystalline
materials. Progress in materials science, 51(4), 427-556.
Miranda, C. R., Lara, L. S. d., & Tonetto, B. C. (2012). Stability and mobility of functionalized
silica nanoparticles for enhanced oil recovery applications. Paper presented at the SPE
International Oilfield Nanotechnology Conference and Exhibition.
Mittal, A. K., Chisti, Y., & Banerjee, U. C. (2013). Synthesis of metallic nanoparticles using plant
extracts. Biotechnology advances, 31(2), 346-356.
Moezzi, A., McDonagh, A. M., & Cortie, M. B. (2012). Zinc oxide particles: Synthesis, properties
and applications. Chemical Engineering Journal, 185, 1-22.
Mohammadi, M., Akbari, M., Fakhroueian, Z., Bahramian, A., Azin, R., & Arya, S. (2011a).
Inhibition of asphaltene precipitation by TiO2, SiO2, and ZrO2 nanofluids. Energy &
Fuels, 25(7), 3150-3156.
Mohammadi, M., Akbari, M., Fakhroueian, Z., Bahramian, A., Azin, R., & Arya, S. (2011b).
Inhibition of Asphaltene Precipitation by TiO2, SiO2, and ZrO2Nanofluids. Energy &
Fuels, 25(7), 3150-3156. doi: 10.1021/ef2001635
Montoya, T., Coral, D., Franco, C. A., Nassar, N. N., & Cortes, F. B. (2014). A novel solid-liquid
equilibrium model for describing the adsorption of associating asphaltene molecules onto
solid surfaces based on the “Chemical Theory”. Energy & Fuels, 28(8), 4963-4975.
Mout, R., Moyano, D. F., Rana, S., & Rotello, V. M. (2012). Surface functionalization of
nanoparticles for nanomedicine. Chemical Society Reviews, 41(7), 2539-2544.
Mukherjee, P., Ahmad, A., Mandal, D., Senapati, S., Sainkar, S. R., Khan, M. I., . . . Kumar, R.
(2001). Fungus-mediated synthesis of silver nanoparticles and their immobilization in the
mycelial matrix: a novel biological approach to nanoparticle synthesis. Nano Letters, 1(10),
515-519.
Mullins, O. C. (2011). The asphaltenes. Annual Review of Analytical Chemistry, 4, 393-418.
Munshi, A., Singh, V., Kumar, M., & Singh, J. (2008). Effect of nanoparticle size on sessile droplet
contact angle. Journal of Applied Physics, 103(8), 084315.
Napper, D. H. (1977). Steric stabilization. Journal of colloid and interface science, 58(2), 390-
407.
Nassar, N. N. (2012). Iron oxide nanoadsorbents for removal of various pollutants from
wastewater: an overview. Application of Adsorbents for Water Pollution Control, 81-118.
Nassar, N. N., Hassan, A., Carbognani, L., Lopez-Linares, F., & Pereira-Almao, P. (2012). Iron
oxide nanoparticles for rapid adsorption and enhanced catalytic oxidation of thermally
cracked asphaltenes. Fuel, 95, 257-262.
123
Nassar, N. N., Hassan, A., & Pereira-Almao, P. (2011a). Application of nanotechnology for heavy
oil upgrading: Catalytic steam gasification/cracking of asphaltenes. Energy & fuels, 25(4),
1566-1570.
Nassar, N. N., Hassan, A., & Pereira-Almao, P. (2011b). Effect of surface acidity and basicity of
aluminas on asphaltene adsorption and oxidation. Journal of colloid and interface science,
360(1), 233-238.
Nassar, N. N., Hassan, A., & Pereira-Almao, P. (2011). Metal Oxide Nanoparticles for Asphaltene
Adsorption and Oxidation. Energy & Fuels, 25(3), 1017-1023. doi: 10.1021/ef101230g
Nassar, N. N., & Husein, M. M. (2010). Ultradispersed particles in heavy oil: Part I, preparation
and stabilization of iron oxide/hydroxide. Fuel Processing Technology, 91(2), 164-168.
Nazari Moghaddam, R., Bahramian, A., Fakhroueian, Z., Karimi, A., & Arya, S. (2015).
Comparative Study of Using Nanoparticles for Enhanced Oil Recovery: Wettability
Alteration of Carbonate Rocks. Energy & Fuels, 29(4), 2111-2119. doi:
10.1021/ef5024719
Negin, C., Ali, S., & Xie, Q. (2016). Application of nanotechnology for enhancing oil recovery–
A review. Petroleum, 2(4), 324-333.
Negin, C., Ali, S., & Xie, Q. (2017). Most common surfactants employed in chemical enhanced
oil recovery. Petroleum, 3(2), 197-211.
Nel, A., Xia, T., Mädler, L., & Li, N. (2006). Toxic potential of materials at the nanolevel. science,
311(5761), 622-627.
Neoh, K. G., & Kang, E. T. (2011). Functionalization of inorganic nanoparticles with polymers
for stealth biomedical applications. Polymer Chemistry, 2(4), 747-759.
Neouze, M.-A., & Schubert, U. (2008). Surface modification and functionalization of metal and
metal oxide nanoparticles by organic ligands. Monatshefte für Chemie/Chemical Monthly,
139(3), 183-195.
Nguyen, B. D., Ngo, T. K., Bui, T. H., Pham, D. K., Dinh, X. L., & Nguyen, P. T. (2014). The
impact of graphene oxide particles on viscosity stabilization for diluted polymer solutions
using enhanced oil recovery at HTHP offshore reservoirs. Advances in Natural Sciences:
Nanoscience and Nanotechnology, 6(1), 015012.
Nobs, L., Buchegger, F., Gurny, R., & Allémann, E. (2004). Current methods for attaching
targeting ligands to liposomes and nanoparticles. Journal of pharmaceutical sciences,
93(8), 1980-1992.
Norrman, J., Solberg, A., Sjoblom, J., & Paso, K. (2016). Nanoparticles for waxy crudes: effect of
polymer coverage and the effect on wax crystallization. Energy & fuels, 30(6), 5108-5114.
Núñez, G. A., Briceño, M., Mata, C., Rivas, H., & Joseph, D. D. (1996). Flow characteristics of
concentrated emulsions of very viscous oil in water. Journal of Rheology, 40(3), 405-423.
Nwidee, L., Al-Anssari, S., Barifcani, A., Sarmadivaleh, M., & Iglauer, S. (2016). Nanofluids for
enhanced oil recovery processes: wettability alteration using zirconium oxide. Paper
presented at the Offshore Technology Conference Asia.
Ogolo, N., Olafuyi, O., & Onyekonwu, M. (2012). Enhanced oil recovery using nanoparticles.
Paper presented at the SPE Saudi Arabia section technical symposium and exhibition.
Onyekonwu, M. O., & Ogolo, N. A. (2010). Investigating the use of nanoparticles in enhancing
oil recovery. Paper presented at the Nigeria Annual international conference and
exhibition.
124
Oprea, O., Andronescu, E., Ficai, D., Ficai, A., N Oktar, F., & Yetmez, M. (2014). ZnO
applications and challenges. Current Organic Chemistry, 18(2), 192-203.
Pereira, J. C., López, I., Salas, R., Silva, F., Fernández, C., Urbina, C., & López, J. C. (2007).
Resins: the molecules responsible for the stability/instability phenomena of asphaltenes.
Energy & Fuels, 21(3), 1317-1321.
Perez, J. M. (2007). Iron oxide nanoparticles: Hidden talent. Nature Nanotechnology, 2(9), 535-
536.
Petit, M., & Monot, J. (2015). Functionalization of Zirconium Oxide Surfaces. Chemistry of
Organo-Hybrids: Synthesis and Characterization of Functional Nano-Objects, 168-199.
Pettijohn, F. J., Potter, P. E., & Silver, R. (2012). Sand and sandstone: Springer Science &
Business Media.
Powers, K. W., Brown, S. C., Krishna, V. B., Wasdo, S. C., Moudgil, B. M., & Roberts, S. M.
(2006). Research strategies for safety evaluation of nanomaterials. Part VI.
Characterization of nanoscale particles for toxicological evaluation. Toxicological
Sciences, 90(2), 296-303.
Pumera, M. (2011). Graphene-based nanomaterials for energy storage. Energy & Environmental
Science, 4(3), 668-674.
Purohit, R., Mittal, A., Dalela, S., Warudkar, V., Purohit, K., & Purohit, S. (2017). Social,
Environmental and Ethical Impacts of Nanotechnology. Materials Today: Proceedings,
4(4), 5461-5467.
Radhakrishnan, B., Ranjan, R., & Brittain, W. J. (2006). Surface initiated polymerizations from
silica nanoparticles. Soft Matter, 2(5), 386-396.
Ranka, M., Brown, P., & Hatton, T. A. (2015). Responsive stabilization of nanoparticles for
extreme salinity and high-temperature reservoir applications. ACS applied materials &
interfaces, 7(35), 19651-19658.
Recovery, E. O. (2014). Using Nanoparticle Dispersions: Underlying Mechanism and Imbibition
Experiments Zhang, Hua; Nikolov, Alex; Wasan, Darsh. Energy & Fuels, 28(5), 3002-
3009.
Rellegadla, S., Bairwa, H. K., Kumari, M. R., Prajapat, G., Nimesh, S., Pareek, N., . . . Agrawal,
A. (2018). An Effective Approach for Enhanced Oil Recovery Using Nickel Nanoparticles
Assisted Polymer Flooding. Energy & fuels, 32(11), 11212-11221.
Roenningsen, H. P., Bjoerndal, B., Baltzer Hansen, A., & Batsberg Pedersen, W. (1991). Wax
precipitation from North Sea crude oils: 1. Crystallization and dissolution temperatures,
and Newtonian and non-Newtonian flow properties. Energy & fuels, 5(6), 895-908.
Rogel, E., Ovalles, C., & Moir, M. (2010). Asphaltene stability in crude oils and petroleum
materials by solubility profile analysis. Energy & Fuels, 24(8), 4369-4374.
Roustaei, A., Moghadasi, J., Bagherzadeh, H., & Shahrabadi, A. (2012). An experimental
investigation of polysilicon nanoparticles' recovery efficiencies through changes in
interfacial tension and wettability alteration. Paper presented at the SPE international
oilfield nanotechnology conference and exhibition.
Sagala, F., Montoya, T., Hethnawi, A., Vitale, G., & Nassar, N. N. (2019). Nanopyroxene-based
Nanofluids for Enhanced Oil Recovery in Sandstone Cores. Energy & fuels.
Saidur, R., Leong, K., & Mohammad, H. (2011). A review on applications and challenges of
nanofluids. Renewable and Sustainable Energy Reviews, 15(3), 1646-1668.
125
Salehi, M., Johnson, S. J., & Liang, J.-T. (2008). Mechanistic study of wettability alteration using
surfactants with applications in naturally fractured reservoirs. Langmuir, 24(24), 14099-
14107.
Saravanan, P., Gopalan, R., & Chandrasekaran, V. (2008). Synthesis and characterisation of
nanomaterials. Defence Science Journal, 58(4), 504.
Schumacher, M. (1980). Enhanced recovery of residual and heavy oils: Noyes Publications.
Sen, R. (2008). Biotechnology in petroleum recovery: the microbial EOR. Progress in energy and
combustion Science, 34(6), 714-724.
Sennett, P., & Olivier, J. (1965). Colloidal dispersions, electrokinetic effects, and the concept of
zeta potential. Industrial & Engineering Chemistry, 57(8), 32-50.
Serrano, E., Rus, G., & Garcia-Martinez, J. (2009). Nanotechnology for sustainable energy.
Renewable and Sustainable Energy Reviews, 13(9), 2373-2384.
Shah, D. O. (2012). Improved oil recovery by surfactant and polymer flooding: Elsevier.
ShamsiJazeyi, H., Miller, C. A., Wong, M. S., Tour, J. M., & Verduzco, R. (2014). Polymer‐coated
nanoparticles for enhanced oil recovery. Journal of Applied Polymer Science, 131(15).
Sharma, T., Iglauer, S., & Sangwai, J. S. (2016). Silica nanofluids in an oilfield polymer
polyacrylamide: interfacial properties, wettability alteration, and applications for chemical
enhanced oil recovery. Industrial & Engineering Chemistry Research, 55(48), 12387-
12397.
Sharma, T., Kumar, G. S., & Sangwai, J. S. (2015). Comparative effectiveness of production
performance of Pickering emulsion stabilized by nanoparticle–surfactant–polymer over
surfactant–polymer (SP) flooding for enhanced oil recovery Brownfield reservoir. Journal
of Petroleum Science and Engineering, 129, 221-232.
Sharma, T., Suresh Kumar, G., & Sangwai, J. S. (2014). Enhanced oil recovery using oil-in-water
(o/w) emulsion stabilized by nanoparticle, surfactant and polymer in the presence of NaCl.
Geosystem Engineering, 17(3), 195-205.
Sharma, T., Velmurugan, N., Patel, P., Chon, B., & Sangwai, J. (2015). Use of oil-in-water
Pickering emulsion stabilized by nanoparticles in combination with polymer flood for
enhanced oil recovery. Petroleum Science and Technology, 33(17-18), 1595-1604.
Shen, W., Zhang, X., Huang, Q., Xu, Q., & Song, W. (2014). Preparation of solid silver
nanoparticles for inkjet-printed flexible electronics with high conductivity. Nanoscale,
6(3), 1622-1628.
Shokrlu, Y. H., & Babadagli, T. (2014). Viscosity reduction of heavy oil/bitumen using micro-and
nano-metal particles during aqueous and non-aqueous thermal applications. Journal of
Petroleum Science and Engineering, 119, 210-220.
Shu, W. R., & Hartman, K. J. (1986). Thermal recovery method for viscous oil: Google Patents.
Shupe, R. D., & Maddox Jr, J. (1978). Surfactant oil recovery process usable in high temperature,
high salinity formations: Google Patents.
Siddiqui, S. A. (2010). Enhanced oil recovery methods. Paper presented at the Masters Abstracts
International.
Singh, A. K. (2015). Engineered nanoparticles: structure, properties and mechanisms of toxicity:
Academic Press.
Society, R. (2004). Nanoscience and nanotechnologies: opportunities and uncertainties: Royal
Society.
126
Soleimani, H., Baig, M. K., Yahya, N., Khodapanah, L., Sabet, M., Demiral, B. M., & Burda, M.
(2018). Synthesis of ZnO nanoparticles for oil-water interfacial tension reduction in
enhanced oil recovery. Applied Physics A, 124(2), 128.
Sousa, V., Segadaes, A., Morelli, M., & Kiminami, R. (1999). Combustion synthesized ZnO
powders for varistor ceramics. International Journal of Inorganic Materials, 1(3-4), 235-
241.
Speight, J. G. (2014). The chemistry and technology of petroleum: CRC press.
Stoller, M. D., Park, S., Zhu, Y., An, J., & Ruoff, R. S. (2008). Graphene-based ultracapacitors.
Nano Letters, 8(10), 3498-3502.
Studart, A. R., Amstad, E., & Gauckler, L. J. (2007). Colloidal stabilization of nanoparticles in
concentrated suspensions. Langmuir, 23(3), 1081-1090.
Subbiah, R., Veerapandian, M., & S Yun, K. (2010). Nanoparticles: functionalization and
multifunctional applications in biomedical sciences. Current medicinal chemistry, 17(36),
4559-4577.
Suleimanov, B., Ismailov, F., & Veliyev, E. (2011). Nanofluid for enhanced oil recovery. Journal
of Petroleum Science and Engineering, 78(2), 431-437.
Sun, Q., Li, Z., Li, S., Jiang, L., Wang, J., & Wang, P. (2014). Utilization of Surfactant-Stabilized
Foam for Enhanced Oil Recovery by Adding Nanoparticles. Energy & Fuels, 28(4), 2384-
2394. doi: 10.1021/ef402453b
Sung, A.-M., & Piirma, I. (1994). Electrosteric stabilization of polymer colloids. Langmuir, 10(5),
1393-1398.
Taborda, E. A., Franco, C. A., Lopera, S. H., Alvarado, V., & Cortés, F. B. (2016). Effect of
nanoparticles/nanofluids on the rheology of heavy crude oil and its mobility on porous
media at reservoir conditions. Fuel, 184, 222-232. doi: 10.1016/j.fuel.2016.07.013
Taborda, E. A., Franco, C. A., Ruiz, M. A., Alvarado, V., & Cortés, F. B. (2017). Experimental
and Theoretical Study of Viscosity Reduction in Heavy Crude Oils by Addition of
Nanoparticles. Energy & Fuels, 31(2), 1329-1338. doi: 10.1021/acs.energyfuels.6b02686
Tanabe, K. (1985). Surface and catalytic properties of ZrO2. Materials chemistry and physics,
13(3-4), 347-364.
Thio, B. J. R., Zhou, D., & Keller, A. A. (2011). Influence of natural organic matter on the
aggregation and deposition of titanium dioxide nanoparticles. Journal of hazardous
materials, 189(1-2), 556-563.
Thomas, S. (2008). Enhanced oil recovery-an overview. Oil & Gas Science and Technology-Revue
de l'IFP, 63(1), 9-19.
Tiraferri, A., Chen, K. L., Sethi, R., & Elimelech, M. (2008). Reduced aggregation and
sedimentation of zero-valent iron nanoparticles in the presence of guar gum. Journal of
colloid and interface science, 324(1-2), 71-79.
Torsater, O., Engeset, B., Hendraningrat, L., & Suwarno, S. (2012). Improved oil recovery by
nanofluids flooding: an experimental study. Paper presented at the SPE Kuwait
international petroleum conference and exhibition.
Trokhymchuk, A., Henderson, D., Nikolov, A., & Wasan, D. T. (2001). A simple calculation of
structural and depletion forces for fluids/suspensions confined in a film. Langmuir, 17(16),
4940-4947.
127
Wang, D., Sun, S., Sha, T., Liu, T., Dong, H., Cui, K., . . . Zhang, Z. (2018). Synergistic Effect of
Silica Nanoparticles and Rhamnolipid on Wettability Alteration of Low Permeability
Sandstone Rocks. Energy & Fuels.
Wang, F., Zhang, D., Ding, Y., Zhang, L., Yang, M., Jiang, B., . . . Zhi, S. (2011). The effect of
nanohybrid materials on the pour-point and viscosity depressing of waxy crude oil. Chinese
science bulletin, 56(1), 14-17.
Wang, L., Wang, Z., Yang, H., & Yang, G. (1999a). The study of thermal stability of the SiO2
powders with a high specific surface area. Materials chemistry and physics, 57(3), 260-
263.
Wang, L., Wang, Z., Yang, H., & Yang, G. (1999b). The study of thermal stability of the SiO 2
powders with a high specific surface area. Materials chemistry and physics, 57(3), 260-
263.
Wang, X., Tilley, R. D., & Watkins, J. J. (2014). Simple ligand exchange reactions enabling
excellent dispersibility and stability of magnetic nanoparticles in polar organic, aromatic,
and protic solvents. Langmuir, 30(6), 1514-1521.
Wang, X., Zhi, L., & Müllen, K. (2008). Transparent, conductive graphene electrodes for dye-
sensitized solar cells. Nano Letters, 8(1), 323-327.
Wardhaugh, L., & Boger, D. (1991). Flow characteristics of waxy crude oils: application to
pipeline design. AIChE Journal, 37(6), 871-885.
Wasan, D., Nikolov, A., & Kondiparty, K. (2011). The wetting and spreading of nanofluids on
solids: Role of the structural disjoining pressure. Current Opinion in Colloid & Interface
Science, 16(4), 344-349.
Wasan, D. T., & Nikolov, A. D. (2003). Spreading of nanofluids on solids. Nature, 423(6936),
156.
Wassmuth, F., Green, K., Arnold, W., & Cameron, N. (2009). Polymer flood application to
improve heavy oil recovery at East Bodo. Journal of Canadian Petroleum Technology,
48(02), 55-61.
Wei, B., Li, Q., Jin, F., Li, H., & Wang, C. (2016). The potential of a novel nanofluid in enhancing
oil recovery. Energy & Fuels, 30(4), 2882-2891.
Wever, D., Picchioni, F., & Broekhuis, A. (2011). Polymers for enhanced oil recovery: a paradigm
for the structure-property relationship in aqueous solution. Progress in Polymer Science,
36(11), 1558-1628.
Wu, H.-C., Chang, X., Liu, L., Zhao, F., & Zhao, Y. (2010). Chemistry of carbon nanotubes in
biomedical applications. Journal of Materials Chemistry, 20(6), 1036-1052.
Wu, L., Zhang, J., & Watanabe, W. (2011). Physical and chemical stability of drug nanoparticles.
Advanced drug delivery reviews, 63(6), 456-469.
Yan, J., Monezes, J., & Sharma, M. M. (1993). Wettability alteration caused by oil-based muds
and mud components. SPE Drilling & completion, 8(01), 35-44.
Yang, F., Li, C., Li, C., & Wang, D. (2013). Scaling of structural characteristics of gelled model
waxy oils. Energy & fuels, 27(7), 3718-3724.
Yang, F., Paso, K., Norrman, J., Li, C., Oschmann, H., & Sjoblom, J. (2015). Hydrophilic
nanoparticles facilitate wax inhibition. Energy & fuels, 29(3), 1368-1374.
Yang, F., Zhao, Y., Sjöblom, J., Li, C., & Paso, K. G. (2015). Polymeric wax inhibitors and pour
point depressants for waxy crude oils: a critical review. Journal of Dispersion Science and
Technology, 36(2), 213-225.
128
Yang, K., Hu, L., Ma, X., Ye, S., Cheng, L., Shi, X., . . . Liu, Z. (2012). Multimodal imaging-
guided photothermal therapy using functionalized graphene nanosheets anchored with
magnetic nanoparticles. Advanced materials, 24(14), 1868-1872.
Yang, W., Wang, T., Fan, Z., Miao, Q., Deng, Z., & Zhu, Y. (2017). Foams Stabilized by In Situ-
Modified Nanoparticles and Anionic Surfactants for Enhanced Oil Recovery. Energy &
Fuels, 31(5), 4721-4730. doi: 10.1021/acs.energyfuels.6b03217
Yang, X., Verruto, V. J., & Kilpatrick, P. K. (2007). Dynamic asphaltene− resin exchange at the
oil/water interface: Time-dependent W/O emulsion stability for asphaltene/resin model
oils. Energy & Fuels, 21(3), 1343-1349.
Yekeen, N., Manan, M. A., Idris, A. K., Padmanabhan, E., Junin, R., Samin, A. M., . . . Oguamah,
I. (2018). A comprehensive review of experimental studies of nanoparticles-stabilized
foam for enhanced oil recovery. Journal of Petroleum Science and Engineering, 164, 43-
74.
Yin, Y., & Yen, A. (2000). Asphaltene deposition and chemical control in CO2 floods. Paper
presented at the SPE/DOE Improved Oil Recovery Symposium.
Yoon, K. Y., Son, H. A., Choi, S. K., Kim, J. W., Sung, W. M., & Kim, H. T. (2016). Core flooding
of complex nanoscale colloidal dispersions for enhanced oil recovery by in situ formations
of stable oil-in-water Pickering emulsions. Energy & Fuels, 30(4), 2628-2635.
Yousef, A. A., Al-Saleh, S., & Al-Jawfi, M. S. (2012). Improved/enhanced oil recovery from
carbonate reservoirs by tuning injection water salinity and ionic content. Paper presented
at the SPE Improved Oil Recovery Symposium.
Yu, J., An, C., Mo, D., Liu, N., & Lee, R. L. (2012a). Foam mobility control for nanoparticle-
stabilized supercritical CO2 foam. Paper presented at the SPE improved oil recovery
symposium.
Yu, J., An, C., Mo, D., Liu, N., & Lee, R. L. (2012b). Study of adsorption and transportation
behavior of nanoparticles in three different porous media. Paper presented at the SPE
Improved Oil Recovery Symposium.
Zabala, R., Mora, E., Botero, O., Cespedes, C., Guarin, L., Franco, C., . . . Ospina, N. (2014).
Nano-technology for asphaltenes inhibition in Cupiagua South Wells. Paper presented at
the IPTC 2014: International Petroleum Technology Conference.
Zaid, H. M., Latiff, A., Rasyada, N., & Yahya, N. (2014). The Effect of Zinc Oxide and Aluminum
Oxide Nanoparticles on Interfacial Tension and Viscosity of Nanofluids for Enhanced Oil
Recovery. Paper presented at the Advanced Materials Research.
Zargartalebi, M., Kharrat, R., & Barati, N. (2015). Enhancement of surfactant flooding
performance by the use of silica nanoparticles. Fuel, 143, 21-27.
Zhang, H., Nikolov, A., & Wasan, D. (2014). Enhanced oil recovery (EOR) using nanoparticle
dispersions: underlying mechanism and imbibition experiments. Energy & fuels, 28(5),
3002-3009.
Zhang, L. L., Zhou, R., & Zhao, X. (2010). Graphene-based materials as supercapacitor electrodes.
Journal of Materials Chemistry, 20(29), 5983-5992.
Zhang, T., Davidson, D., Bryant, S. L., & Huh, C. (2010). Nanoparticle-stabilized emulsions for
applications in enhanced oil recovery. Paper presented at the SPE improved oil recovery
symposium.
129
Zhao, J., Milanova, M., Warmoeskerken, M. M., & Dutschk, V. (2012). Surface modification of
TiO2 nanoparticles with silane coupling agents. Colloids and Surfaces A: Physicochemical
and Engineering Aspects, 413, 273-279.
130
Chapter Four: Nanopyroxene-based Nanofluids for Enhanced Oil Recovery in Sandstone
Cores at Reservoir Temperature
4.1 Abstract
Nanoparticles (NPs) have recently gained great attention as effective agents for enhanced oil
recovery (EOR) applications, especially at ambient temperatures. Nevertheless, harsh conditions
are needed to synthesize them, and many tend to lack stability, exhibiting strong limitations in
EOR application. As a solution, many researchers have used silica nanomaterials and grafted them
with various agents to enhance their stability and alter their functionality. However, altering their
overall functionality via coating could limit their stability in an aqueous media. Thus, partially
coated nanoparticles should be used, such that the functionalizing agent is bonded to certain active
groups on the nanoparticle surface. Herein, environmentally-safe and tunable silicate-based
nanoparticles, nano-pyroxene, were synthesized at mild conditions. Nanopyroxene consists of two
forms of binding sites on the surface made from the structural framework iron imparting a negative
charge on the surface which is compensated by sodium ions and the hydroxyl groups present on
the surface of the silicate framework, that is responsible for its hydrophilicity. In this study, we
partially altered the functionality of the nanopyroxene by anchoring a hydrophobic functionalizing
agent of triethoxy (octyl) silane (TOS) to the hydroxylated binding sites, generating half and fully
hydroxyl-functionalized nano-pyroxene, namely: HPNPs and JPNPs, respectively.
Characterization techniques, such as SEM, FTIR, XRD, TGA, DLS, and Z-potential were
conducted for the produced NPs to confirm their surface identity, functionality, stability, and
morphology. After that, in comparison with brine, three different nanofluids were generated from
the synthesized NPs to test their performance toward EOR in sandstone cores. The EOR
performance was investigated by interfacial tension (IFT), contact angle, spontaneous imbibition,
and displacement tests. The results showed that the HPNPs have the best stability and functionality
compared with the other nanoparticle types. Contact angle in the presence of NPNP, JPNP and
HPNP nanofluids were measured as 44˚ ± 2˚, 50˚ ± 2˚ and 55˚ ± 2˚, respectively, confirming
wettability alteration from oil-wet to water-wet. Interfacial tension was also noticeably reduced
with the produced nanofluids at all temperatures, showing their great potential of oil displacement
and to prove that a core flooding test was performed, confirming the capability of the stable
nanoparticles as effective EOR agents in hydrocarbon reservoirs by recovering an additional
10.57% after brine flooding.
KEYWORDS: Pyroxene, hydrophobic nanopyroxene, nanofluids, imbibition, enhanced oil
recovery
This chapter is adapted from the following publication:
Farad Sagala, Tatiana Montoya, Afif Hethnawi, Gerardo Vitale, and Nashaat N. Nassar
Nanopyroxene-based Nanofluids for Enhanced Oil Recovery in Sandstones Cores–, Published in
the Energy & Fuels Journal, 2019: https://pubs.acs.org/doi/abs/10.1021/acs.energyfuels.8b03749
131
4.2 Introduction
Oil, even with the presence of renewable sources of energy, is remaining and expected to be the most
important source of energy (Asif & Muneer, 2007). Accordingly, global oil demand is expected to
increase to keep up with global energy needs by 2040 (Office, 2016). However, conventional oil
reservoirs are depleting and based on that, the trends of supplying oil are declining. As such, efforts on
enhanced oil recovery (EOR) techniques are required(Alvarado & Manrique, 2010). Oil and gas
industries are currently focusing on maximizing the recovery from mature oilfields, avoiding the
difficulty of discovering new oilfields(Al Adasani & Bai, 2011; Cashin, Mohaddes, Raissi, & Raissi,
2014). The conventional EOR methods involve implementing processes that require the use of
chemicals and materials that do not exist in the reservoir, to alter the physical interaction of the reservoir
rock and injected fluids. This leads to prolonging of oil production especially in mature fields(Al
Adasani & Bai, 2011; Manrique et al., 2010; Thomas, 2008). For instance, water flooding is one of the
most common and oldest methods normally used after depletion of the natural reservoir driving forces.
However, this method suffers from poor sweep efficiency due to adverse mobility ratios between the
displacing fluid (water) and the displaced fluid (oil), resulting in more oil being trapped in spherical
globules (Alvarado & Manrique, 2010; Rose & Witherspoon, 1957). Additionally, higher capillary
forces due to high interfacial tension (IFT) between oil and water during water flooding results in small
capillary number (NC) that decreases the overall microscopic displacement efficiency (de Haan, 1959;
Terry, 2001; Thomas, 2008).
Chemicals such as surfactants, polymers and alkaline salts, as EOR agents, are added to water to
improve NC and viscosity (µ), and ultimately reduce the residual oil saturation (Pope & Baviere, 1991;
Sheng, 2015). However, these EOR agents also exhibit some limitations in harsh reservoir conditions
such as temperature, salinity, and chemical degradation by microbes (Ali & Thomas, 1996; Donaldson,
132
Chilingarian, & Yen, 1989; Olajire, 2014; Terry, 2001). Furthermore, adsorption of these chemicals on
the rock surface increases their consumption during the flooding process and has been postulated as
another problem during chemical EOR(Sheng, 2015). Recently, nanoparticles (NPs) in the form of
nanofluids or nanocatalysts have gained great attention as effective agents for enhanced oil recovery
(EOR) applications(Hashemi, Nassar, & Almao, 2014; Ju, Fan, & Ma, 2006a; Manan, Farad, Piroozian,
& Esmail, 2015; Onyekonwu & Ogolo, 2010; Suleimanov, Ismailov, & Veliyev, 2011; H. Zhang,
Nikolov, & Wasan, 2014). These types of fluids are obtained by mixing nanoparticles with different
base fluids (liquid or gas) for intensification of the dispersing media at various volume concentrations
(McElfresh, Holcomb, & Ector, 2012; Suleimanov et al., 2011). Because of their small particle size,
high surface area, and dispersibility NPs can improve the rock-fluid interaction that leads to wettability
alteration and enhancement in heat transfer coefficient(Esfandyari Bayat, Junin, Samsuri, Piroozian, &
Hokmabadi, 2014; Ju, Fan, & Ma, 2006b; Kakaç & Pramuanjaroenkij, 2009). Moreover, NPs have
been proposed to be more stable agents than the conventional chemicals used for EOR(Cheraghian &
Hendraningrat, 2016). Also, the surfaces of NPs can be modified or manipulated to form more complex
stable materials which can withstand harsh reservoir conditions(Ranka, Brown, & Hatton, 2015).
Several researchers have confirmed that using isotropic or homogenous nanoparticles at optimized
concentration, types, and sizes have a practical impact on tertiary oil recovery(Hendraningrat, Li, &
Torsater, 2013b; Ivanova, Cheremisin, & Spasennykh, 2017; D. T. Wasan & Nikolov, 2003; Yang, Ji,
Li, Qin, & Lu, 2015).
Several types of nanoparticles like CaCO3(Nazari Moghaddam, Bahramian, Fakhroueian, Karimi, &
Arya, 2015), SiO2(Hendraningrat, Li, et al., 2013b; S. Li, Hendraningrat, & Torsaeter, 2013),
TiO2(Ehtesabi, Ahadian, Taghikhani, & Ghazanfari, 2013; Hendraningrat & Torsaeter, 2014),
Al2O3(Giraldo, Benjumea, Lopera, Cortes, & Ruiz, 2013; Hendraningrat & Torsæter, 2014), carbon
133
nanotubes(CNT)(Nazari Moghaddam et al., 2015) and graphene oxide(GO)(Luo et al., 2016; Luo et
al., 2017) have been proven to enhance oil recovery. The reported mechanisms through which these
nanoparticles-based fluid solutions enhance oil recovery include oil-water interfacial tension
modification, rock hydrophobicity mitigation, and the structural disjoining pressure gradient (SDP).
This last mechanism is particularly interesting because it is unique to nanoparticle solutions and it
actively advances the three-phase oil-water-solid contact line while sweeping oil from the rock.
Comparing to polymeric or surfactant solutions, relatively little is known on the behaviour of these
types of fluids under reservoir flow conditions. Furthermore, despite all mentioned advantages of using
silica-based NPs in EOR especially in sandstone reservoirs, the effectiveness of these NPs can be
questioned based on the fact that it is difficult to achieve good performance compared with the
conventional methods. NPs tend to aggregate due to lack of stability, which limits their application in
enhancing oil recovery. To improve their stability, NPs are normally surface modified by anchoring
various materials that can improve the electrostatic repulsive charges on their surfaces. This results in
either hydrophilic or hydrophobic stable NPs that may have a positive impact on NP stability and
surface activity, that may improve oil recovery.
Herein, we synthesized pyroxene-based nanoparticles and tested them for EOR application for the first
time. Pyroxenes are synthetic and naturally occurring crystalline materials in the earth’s crust and have
been recently synthesized using a hydrothermal method that requires low temperature and pressure,
forming pure nano-pyroxene or aegirine of sodium iron-silicate(NaFeSi2O6) (Vitale, 2013).
Nanopyroxene consists of two forms of binding sites on the surface made from the structural
framework iron imparting a negative charge on the surface which is compensated by sodium ions and
the hydroxyl groups present on the surface of the silicate framework, which is responsible for its
original hydrophilicity. Thus, nanopyroxene are environmentally friendly and also have superficial
134
capabilities for functionalization (Hethnawi, Nassar, & Vitale, 2017). Their surfaces can be precisely
manipulated by anchoring different silane groups to improve their surface activity, such that the
functionalizing agent is bonded to certain active groups on the nanoparticle surface, which partially
alters their functionality. This study aims to synthesize and evaluate the performance of different forms
of nano-pyroxenes as unfunctionalized or neutral pyroxene (NPNP), half hydroxyl-functionalized or
Janus pyroxene (JPNP) and fully hydroxyl-functionalized hydrophobic pyroxene (HPNP) when each
is used as a nanofluid with a fixed concentration of 0.005 wt %. The performance of the formulated
nanofluids has been examined through contact angle, IFT measurements at various temperatures,
spontaneous imbibition, and core flooding tests to quantify the oil recovery using different pyroxene
based nanofluids.
4.3. Materials and Methods
4.3.1 Materials
A crude oil sample was provided by a local oil company in Calgary, Canada, and used as a source of
oil in this study. The crude oil has a viscosity of 31.30 ± 0.02 cP at 25 °C, density 0.87 g/cm3 at 25 °C,
an approximate content of 5.09 wt % of asphaltenes, and an acid number < 0.1. Its dynamic viscosity
as a function of temperature is provided in Appendix A Figure A1. Sodium silicate (27 wt% SiO2,10.85
wt% Na2O), hexahydrate iron (III) chloride (FeCl3.6H2O, 99%), sulfuric acid (H2SO4 97-98%), NaOH
(99 %), n-heptane (99%), methanol (99%), wax with a melting point of 57 oC, triethoxy (octyl) silane
(99%), cyclohexane (99 % purity), dichloromethane (99% purity), potassium bromide (KBr, 99%),
sodium chloride (NaCl 99%) and toluene (99%) were purchased from Sigma Aldrich and used as
received. For testing the oil recovery, sandstone cores, with 19-22% porosity and permeability of 63-
100 mD, were prepared at Kocurek Industries Inc., Caldwell, TX. The core characterization was
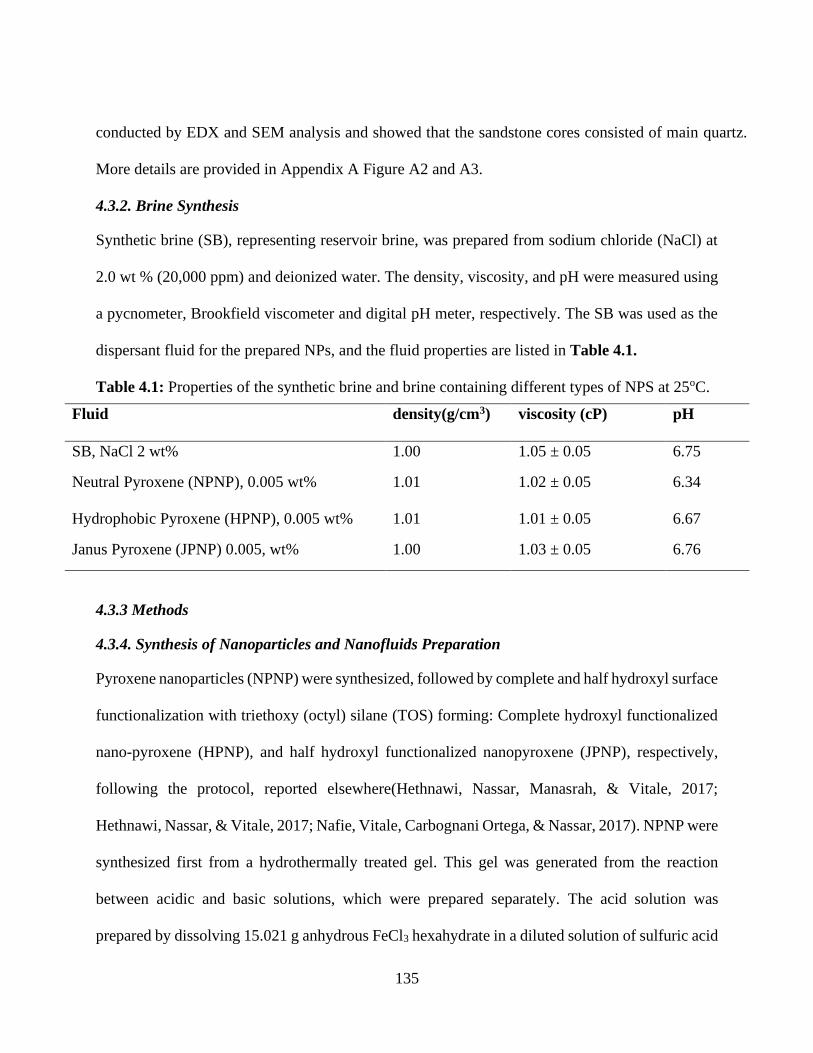
135
conducted by EDX and SEM analysis and showed that the sandstone cores consisted of main quartz.
More details are provided in Appendix A Figure A2 and A3.
4.3.2. Brine Synthesis
Synthetic brine (SB), representing reservoir brine, was prepared from sodium chloride (NaCl) at
2.0 wt % (20,000 ppm) and deionized water. The density, viscosity, and pH were measured using
a pycnometer, Brookfield viscometer and digital pH meter, respectively. The SB was used as the
dispersant fluid for the prepared NPs, and the fluid properties are listed in Table 4.1.
Table 4.1: Properties of the synthetic brine and brine containing different types of NPS at 25oC.
Fluid density(g/cm3) viscosity (cP) pH
SB, NaCl 2 wt% 1.00 1.05 ± 0.05 6.75
Neutral Pyroxene (NPNP), 0.005 wt% 1.01 1.02 ± 0.05 6.34
Hydrophobic Pyroxene (HPNP), 0.005 wt% 1.01 1.01 ± 0.05 6.67
Janus Pyroxene (JPNP) 0.005, wt% 1.00 1.03 ± 0.05 6.76
4.3.3 Methods
4.3.4. Synthesis of Nanoparticles and Nanofluids Preparation
Pyroxene nanoparticles (NPNP) were synthesized, followed by complete and half hydroxyl surface
functionalization with triethoxy (octyl) silane (TOS) forming: Complete hydroxyl functionalized
nano-pyroxene (HPNP), and half hydroxyl functionalized nanopyroxene (JPNP), respectively,
following the protocol, reported elsewhere(Hethnawi, Nassar, Manasrah, & Vitale, 2017;
Hethnawi, Nassar, & Vitale, 2017; Nafie, Vitale, Carbognani Ortega, & Nassar, 2017). NPNP were
synthesized first from a hydrothermally treated gel. This gel was generated from the reaction
between acidic and basic solutions, which were prepared separately. The acid solution was
prepared by dissolving 15.021 g anhydrous FeCl3 hexahydrate in a diluted solution of sulfuric acid
136
(18.067 g of concentrated H2SO4 diluted with 90 g of deionized water) under magnetic stirring at
300 rpm. The basic solution was then prepared by adding 60.129 g of sodium silicate to a diluted
solution of NaOH (22.495 g of NaOH dissolved in 60 g of deionized water). Both solutions were
slowly mixed for 10 min, resulting in a yellow gel. The gel was transferred into a 300-ml PARR
reactor for hydrothermal crystallization at 160 oC for 72 h under 300 rpm agitation. After treatment,
the crystallized nanoparticles were filtered off and washed with deionized water to achieve pH
close enough to 7. Then, the obtained solid was dried overnight at 25 oC and was recovered to
form the NPNP.
Second, the HPNP were synthesized from NPNP by completely anchoring the agent of triethoxy
(octyl) silane (TOS) on NPNP surface. This was accomplished by dispersing and sonicating 500
mg of NPNP in 80 mL of cyclohexane for 1 h. Then, 2.5 g of TOS was added dropwise to the
dispersed solution under agitation at 300 rpm. After that, the obtained solution was centrifuged at
5000 rpm for 10 min. Then, the supernatant was decanted and the solid was recovered, washed
with methanol, and dried at 60o C for 2 h, producing HPNP.
Third, amphiphilic JPNPs were synthesized similar to the procedure reported by Hong et al. (Hong,
Jiang, & Granick, 2006). In brief, 200 mg of NPNPs were dispersed in a 40 mL deionized water
inside the ultrasonic bath for 30 min. Then, the sonicated suspended solution of JPNP was heated
up to 65 oC. This was followed by adding 100 mg of paraffin wax under vigorous mixing with the
use of a bench stirrer at 1950 rpm for 1 h, forming a stabilized emulsion of nanoparticles. The
stabilized emulsion was then allowed to cool down. Cooling down the mixture led to the formation
of wax balls due to immobilization of the NPNPs on the wax surface. The wax balls were filtered
repeatedly with deionized water to wash off the NPNPs that were weakly attached and then air-
dried overnight. The wax balls were then placed in 80 mL of 2.5 mM TOS in methanol solution
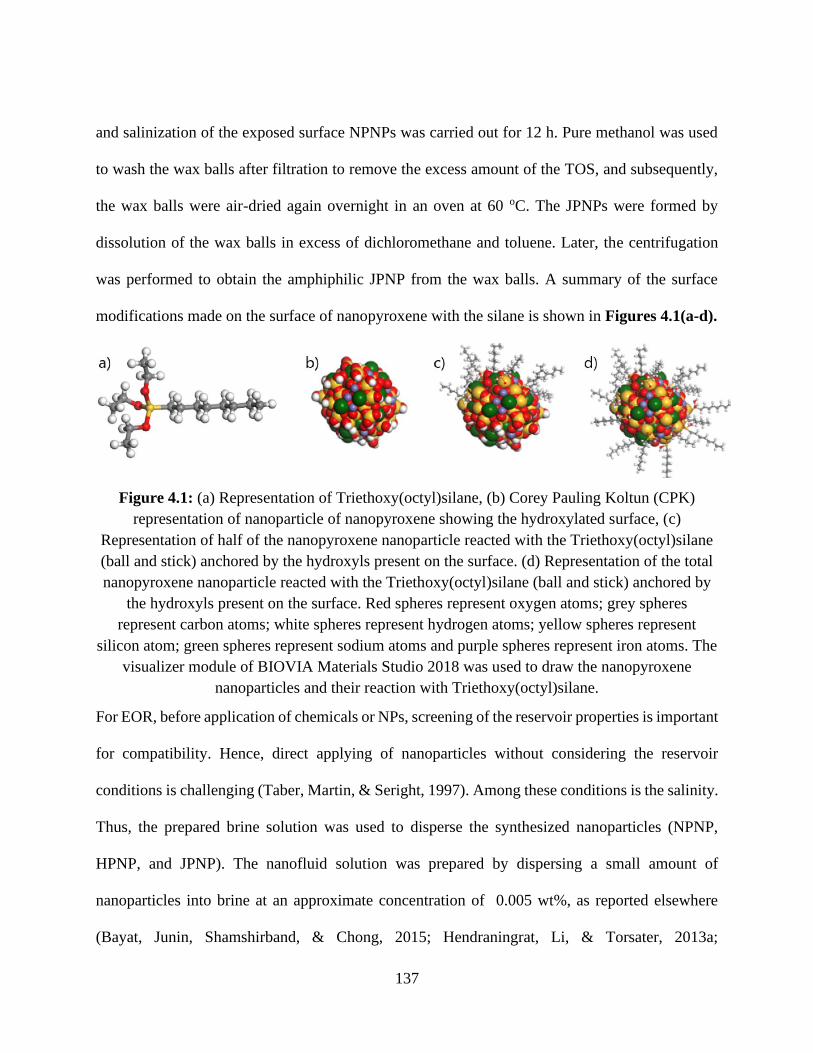
137
and salinization of the exposed surface NPNPs was carried out for 12 h. Pure methanol was used
to wash the wax balls after filtration to remove the excess amount of the TOS, and subsequently,
the wax balls were air-dried again overnight in an oven at 60 oC. The JPNPs were formed by
dissolution of the wax balls in excess of dichloromethane and toluene. Later, the centrifugation
was performed to obtain the amphiphilic JPNP from the wax balls. A summary of the surface
modifications made on the surface of nanopyroxene with the silane is shown in Figures 4.1(a-d).
Figure 4.1: (a) Representation of Triethoxy(octyl)silane, (b) Corey Pauling Koltun (CPK)
representation of nanoparticle of nanopyroxene showing the hydroxylated surface, (c)
Representation of half of the nanopyroxene nanoparticle reacted with the Triethoxy(octyl)silane
(ball and stick) anchored by the hydroxyls present on the surface. (d) Representation of the total
nanopyroxene nanoparticle reacted with the Triethoxy(octyl)silane (ball and stick) anchored by
the hydroxyls present on the surface. Red spheres represent oxygen atoms; grey spheres
represent carbon atoms; white spheres represent hydrogen atoms; yellow spheres represent
silicon atom; green spheres represent sodium atoms and purple spheres represent iron atoms. The
visualizer module of BIOVIA Materials Studio 2018 was used to draw the nanopyroxene
nanoparticles and their reaction with Triethoxy(octyl)silane.
For EOR, before application of chemicals or NPs, screening of the reservoir properties is important
for compatibility. Hence, direct applying of nanoparticles without considering the reservoir
conditions is challenging (Taber, Martin, & Seright, 1997). Among these conditions is the salinity.
Thus, the prepared brine solution was used to disperse the synthesized nanoparticles (NPNP,
HPNP, and JPNP). The nanofluid solution was prepared by dispersing a small amount of
nanoparticles into brine at an approximate concentration of 0.005 wt%, as reported elsewhere
(Bayat, Junin, Shamshirband, & Chong, 2015; Hendraningrat, Li, & Torsater, 2013a;
138
Hendraningrat, Li, et al., 2013b; S. Li et al., 2013). For better dispersion of nanoparticles, the
nanofluid suspension was agitated in an orbital shaker at 250 rpm. Then, it was ultra-sonicated by
the ultrasonic bath for 1 h, and the prepared nanofluids were ready for further usage. The properties
of the differently prepared nanofluids are also presented in Table 4.1.
4.3.5. Nanoparticle and Nanofluid Characterization
Morphology, crystalline size, surface area, and functionality of the synthesized nanoparticles were
all determined using a set of analytical techniques for the characterization. As for the morphology
and surface topology, it was performed by a JEM-2100 scanning electron microscopy (SEM) of
JEOL, Ltd. For XRD, the X-ray analysis was performed using a Rigaku ULTIMA III X-ray
diffractometer with Cu K-alpha radiation as the X-ray source. The scan was performed in the range
of 3 to 90 degrees of 2- using a 0.05-degree step and a counting time of 1.0 degree per minute,
operating at 40 kV and 44 mA to obtain the full diffractogram for the analyzed material. The
processing of the data was carried out with the Software PDXL from Rigaku and the crystalline
domain sizes were calculated using the Scherrer equation as implemented in the PDXL software.
The Crystallographic Open Database (COD) was used to identify the crystalline phases present in
the samples. The functional groups of the functionalized nanoparticles before and after surface
modification with TOS were identified by Fourier transform infrared spectroscopy (FTIR) (Nicolet
6700 FTIR of American Thermos Nicolet Company). Confirming the functionality of the
synthesized nanoparticles with TOS was also confirmed by a thermal gravimetric analysis (TGA)
analyzer (SDTQ600, TA instrument Inc., new castle, DE). TGA analysis was performed at an
airflow rate of 100 cm3/min and a heating rate of 20 oK/min.
For nanofluid samples, a dynamic light scattering (DLS) and Z-potential analyses were performed
to determine the average hydrodynamic size distribution and stability of the particles in the brine
139
solution as a function of pH, respectively. Pre-adjustment for the pH was achieved by a standard
solution of 0.1M NaOH. Images of the prepared nanofluids are provided in Appendix A Figure
A4.
4.3.6 Interfacial Tension (IFT) Measurements
Interfacial tension measurements (IFT) were performed for the prepared nanofluid to evaluate their
role in reducing the IFT between oil and brine at ambient pressure and temperatures at 25,30,40,50
and 60 oC. The measurements were carried out by a system inside the high-pressure chamber that
is manufactured by Biolin Scientific, Finland. The system consists of stainless steel (EN 1.4401)
chamber that enables surface and interfacial tension measurements at high pressure and various
temperatures, using the pendant drop technique. For sealing, an O-ring is equipped with the
standard system according to the used fluids. At the top of the chamber, there are three connection
ports for a temperature probe, sampling, and bulk fluid introduction. For each IFT measurement,
brine or one nanofluid was introduced inside the chamber. Then, an oil droplet was created through
a needle at the interface between the needle and the liquid phase using the pendent technique, IFT
was then determined for a given time interval. All measurements were repeated in triplicates, and
the mean ± standard error of the mean was reported.
4.3.7 Oil-Wet Core Plugs Preparation and Oil Pre-saturation
Generally, Berea sandstone grains develop greater molecular forces between themselves and water
than between themselves and oil. Therefore, they are commonly considered initially water wet.
They have a wettability index (Iw) around +0.7 to +0.9, which is considered strongly water wet
(Torsater, Li, & Hendraningrat, 2013). Thus, before each test, the oil-wet state in the core plugs
was established as follows: Cores were cut into uniform cylindrical columns with length and
diameter of 3 and 2.54 cm, respectively. Then, each core was cleaned using a Soxhlet apparatus
140
following the API standard to remove any hydrocarbon and salt from the core samples (Rabiei,
Sharifinik, Niazi, Hashemi, & Ayatollahi, 2013). The cleaned cores later were dried in an oven at
70 oC for 24 h. Next, the weights of the dried core were measured. Cores with (no initial water
saturation) were completely submerged in 10 V/V% solution of n-heptane and crude oil. The cores
were left to age at 70 oC for 30 days. Then, each core was removed and washed in n-heptane. After
that, the cores were dried at 60 oC for 5 h, generating oil wet core plugs (Karimi et al., 2012; H.
Zhang et al., 2014). These core plugs were then saturated with oil using a vacuum pump for 3 h.
The oil-saturated cores were taken out and kept in a glass jar for another 7 days to drain oil from
the core surface. After the ageing period, oil-saturated cores were weighed again, and the weight
difference was used to determine the volume of oil initially in each core (OIIP) and the cores were
ready for imbibition tests.
4.3.8. Contact Angle Measurements and Spontaneous Imbibition Tests
A quantitative assessment of wettability of the core plugs before and after the treatment with
nanofluids was first achieved by contact angle measurements. Polished sandstone substrates were
cut and aged in oil for about 1 week to alter their initial wettability at 70 oC and atmospheric
pressure and later dried in an oven for 6 h at 60 o C. Then, the wettability of the sandstone substrate
was first measured using a water drop before and after ageing in oil. Oil aged substrates were then
submerged into the prepared nanofluids for 48 h at 60 oC. After that, each substrate was dried in
an oven at 55 oC for 2 h. Contact angle measurements between sandstone substrate and brine or
nanofluid and oil drop system of the substrates treated with either brine or different nanofluids
were performed with an accuracy of ±2o. The angles were then analyzed to quantify the effect of
the nanofluid on wettability alteration.
141
The second technique to evaluate the wettability alteration was the spontaneous imbibition tests.
All imbibition tests were performed using Amott cells to evaluate the performance of variously
prepared nanofluids in altering the wettability of the oil wet saturated core plugs in comparison to
brine. The cores were immersed in imbibition cells, which were filled with either brine or 0.005
wt % of each nanofluid under the same conditions. The discharged oil volume from the cores as
the nanofluids imbibe in the cores was expressed as a percentage of original oil in place (% of
OOIP) and was plotted versus time. It is worth mentioning that all spontaneous imbibition tests in
this study were performed with no initial water saturation based on the assumption of using the
generalized scaling equation (Shouxiang, Morrow, & Zhang, 1997).
4.3.9 Displacement Tests.
Figure 4.2 shows a schematic representation of the core flooding experimental setup. The core
flooding tests aimed to reveal the capability of nanopyroxene nanofluids to recover residual oil in
sandstone reservoir rocks after water flooding. Based on the stability and imbibition tests, HPNP
nanofluids were selected for the core flooding study. HPNP nanofluids were injected as tertiary
fluids. At the beginning of the test, the core was inserted in the sleeve and then mounted in the
core-holder. Low pressure (~250 psi) CO2 gas was passed through the sample for 1 h. Because of
its high diffusivity, CO2 can displace and replace any air trapped in the pores. The remaining
CO2 after evacuation would readily be dissolved in the saturating dead brine and evacuated from
the core sample during the later in-situ saturation process. After flushing the sample by CO2, all
the flow-lines and the sample inside the core-holder were evacuated using a vacuum pump for 6
h. The temperature was set to the reservoir temperature using heating tapes. Then, the core sample
was saturated using brine, confining pressure was maintained at 400 psi and the injection rate was
set to 0.1cc/min. The injection rate was selected to approximate typical reservoir velocities
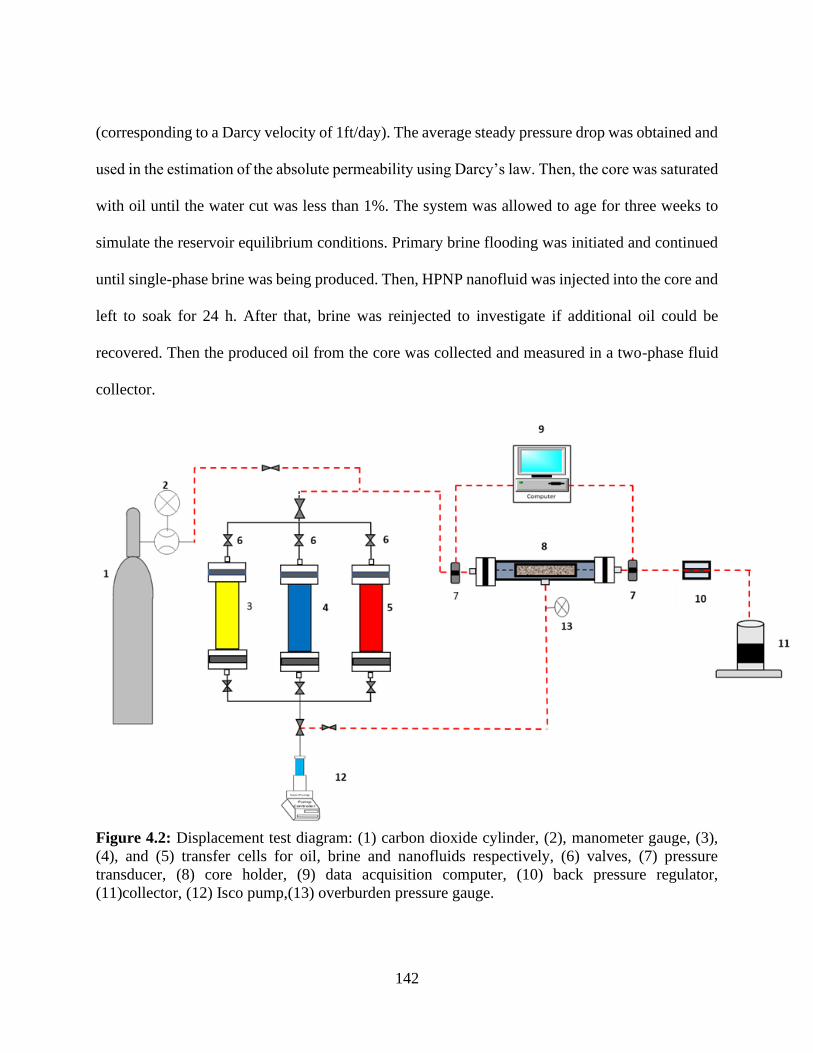
142
(corresponding to a Darcy velocity of 1ft/day). The average steady pressure drop was obtained and
used in the estimation of the absolute permeability using Darcy’s law. Then, the core was saturated
with oil until the water cut was less than 1%. The system was allowed to age for three weeks to
simulate the reservoir equilibrium conditions. Primary brine flooding was initiated and continued
until single-phase brine was being produced. Then, HPNP nanofluid was injected into the core and
left to soak for 24 h. After that, brine was reinjected to investigate if additional oil could be
recovered. Then the produced oil from the core was collected and measured in a two-phase fluid
collector.
Figure 4.2: Displacement test diagram: (1) carbon dioxide cylinder, (2), manometer gauge, (3),
(4), and (5) transfer cells for oil, brine and nanofluids respectively, (6) valves, (7) pressure
transducer, (8) core holder, (9) data acquisition computer, (10) back pressure regulator,
(11)collector, (12) Isco pump,(13) overburden pressure gauge.
143
4.4. Results and Discussion
Pyroxene nanoparticles (NPNP) were successfully synthesized by the hydrothermal method as
reported in our previous study (Nafie et al., 2017). Prepared NPNP were characterized using XRD
and Bruneur-Emmett-Teller (BET) (Brunauer, Emmett, & Teller, 1938). The estimated crystalline
size and surface areas were 10 nm and 178.0 m2/g, respectively. NPNP nanoparticles were
complete and half hydroxyl functionalized with triethoxy (octyl) silane (TOS), producing HPNP
and JPNP nanoparticles, respectively. TOS, as a common functionalizing agent used in numerous
industries,(Chu, Kirby, & Murphy, 1993; Mittal, 2004; Papirer & Balard, 1990; Salon, Bayle,
Abdelmouleh, Boufi, & Belgacem, 2008; Weaver, Stoffer, & Day, 1995) is a coupling agent that
has reactive moieties on the structure under aqueous conditions. Presence of alkoxy groups, OR,
allows anchoring to the surfaces bearing hydroxyl groups. The alkoxy groups OR in TOS are
composed of three functional groups of ethyl (-CH2CH3) bonded to three oxygen atoms, forming
tri-ethoxy groups (CH3CH2O-).
Thus, TOS was anchored on the surface of NPNP that is composed of sodium, iron, silicon, and
oxygen. Anchoring of OR groups was carried out on the hydroxyl groups, which are bonded to the
silicon on the nanoparticle surface. The resulting functionalized HPNP and JNPN nanoparticles
with TOS could increase the hydrophobicity of the nano-pyroxene since TOS has a chain of the
hydrophobic alkyl group. Therefore, functionalizing NPNP with TOS leads to the formation of
completely hydroxylated nanopyroxene (HNPN) or half hydroxylated nanopyroxene (JNPN).
4.4.1. Characterization Studies
4.4.2 Functionalization of nanoparticles
Figure 4.3 (a, b, & c) shows the SEM images of virgin or neutral pyroxene and pyroxene
immobilized on the wax surface after functionalization with TOS, respectively. EDX mapping was
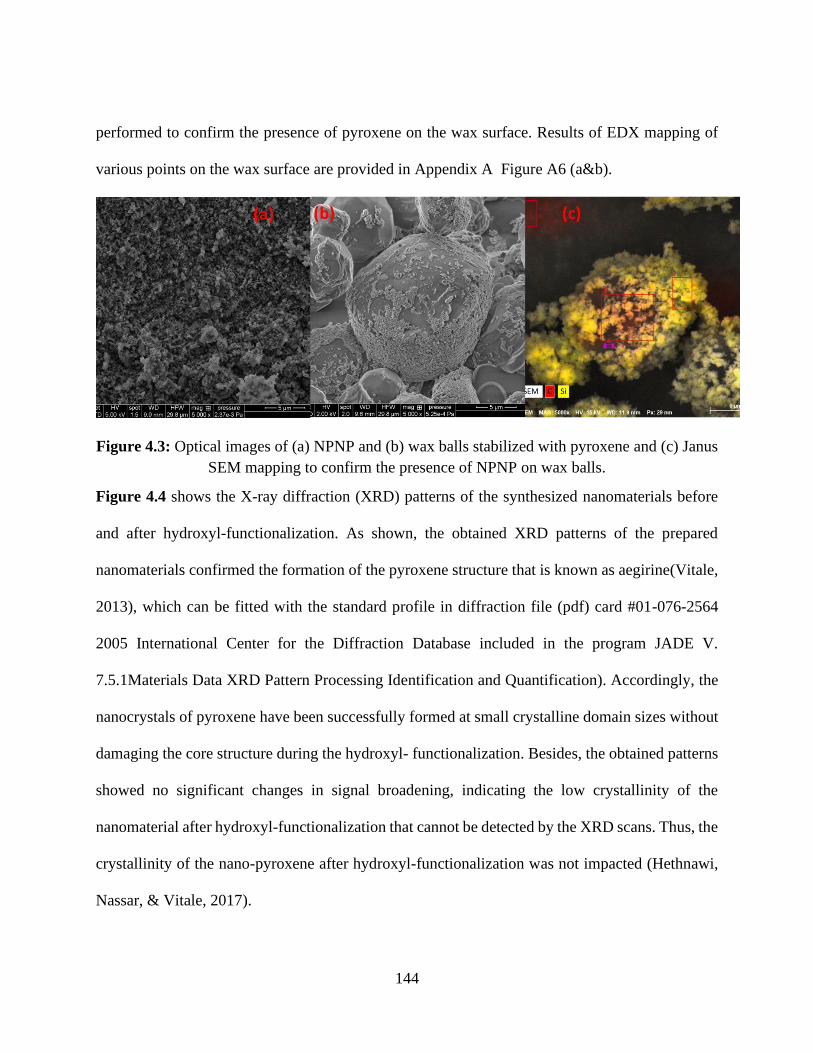
144
performed to confirm the presence of pyroxene on the wax surface. Results of EDX mapping of
various points on the wax surface are provided in Appendix A Figure A6 (a&b).
Figure 4.3: Optical images of (a) NPNP and (b) wax balls stabilized with pyroxene and (c) Janus
SEM mapping to confirm the presence of NPNP on wax balls.
Figure 4.4 shows the X-ray diffraction (XRD) patterns of the synthesized nanomaterials before
and after hydroxyl-functionalization. As shown, the obtained XRD patterns of the prepared
nanomaterials confirmed the formation of the pyroxene structure that is known as aegirine(Vitale,
2013), which can be fitted with the standard profile in diffraction file (pdf) card #01-076-2564
2005 International Center for the Diffraction Database included in the program JADE V.
7.5.1Materials Data XRD Pattern Processing Identification and Quantification). Accordingly, the
nanocrystals of pyroxene have been successfully formed at small crystalline domain sizes without
damaging the core structure during the hydroxyl- functionalization. Besides, the obtained patterns
showed no significant changes in signal broadening, indicating the low crystallinity of the
nanomaterial after hydroxyl-functionalization that cannot be detected by the XRD scans. Thus, the
crystallinity of the nano-pyroxene after hydroxyl-functionalization was not impacted (Hethnawi,
Nassar, & Vitale, 2017).
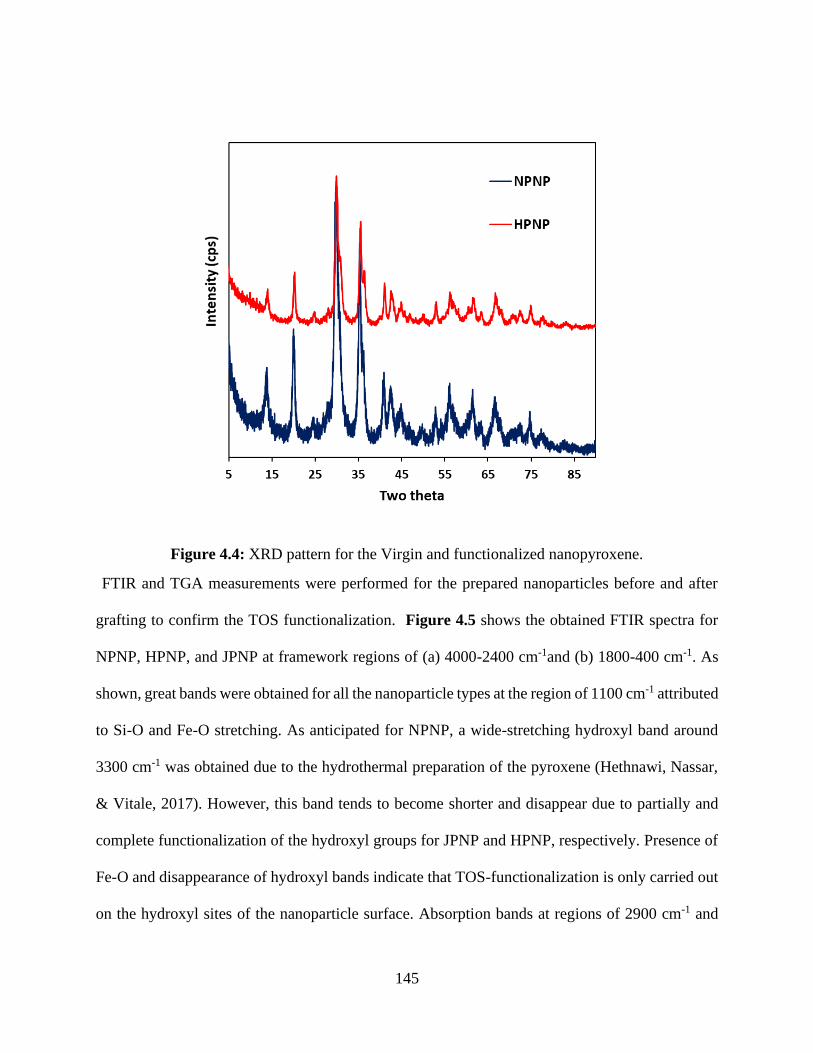
145
Figure 4.4: XRD pattern for the Virgin and functionalized nanopyroxene.
FTIR and TGA measurements were performed for the prepared nanoparticles before and after
grafting to confirm the TOS functionalization. Figure 4.5 shows the obtained FTIR spectra for
NPNP, HPNP, and JPNP at framework regions of (a) 4000-2400 cm-1and (b) 1800-400 cm-1. As
shown, great bands were obtained for all the nanoparticle types at the region of 1100 cm-1 attributed
to Si-O and Fe-O stretching. As anticipated for NPNP, a wide-stretching hydroxyl band around
3300 cm-1 was obtained due to the hydrothermal preparation of the pyroxene (Hethnawi, Nassar,
& Vitale, 2017). However, this band tends to become shorter and disappear due to partially and
complete functionalization of the hydroxyl groups for JPNP and HPNP, respectively. Presence of
Fe-O and disappearance of hydroxyl bands indicate that TOS-functionalization is only carried out
on the hydroxyl sites of the nanoparticle surface. Absorption bands at regions of 2900 cm-1 and
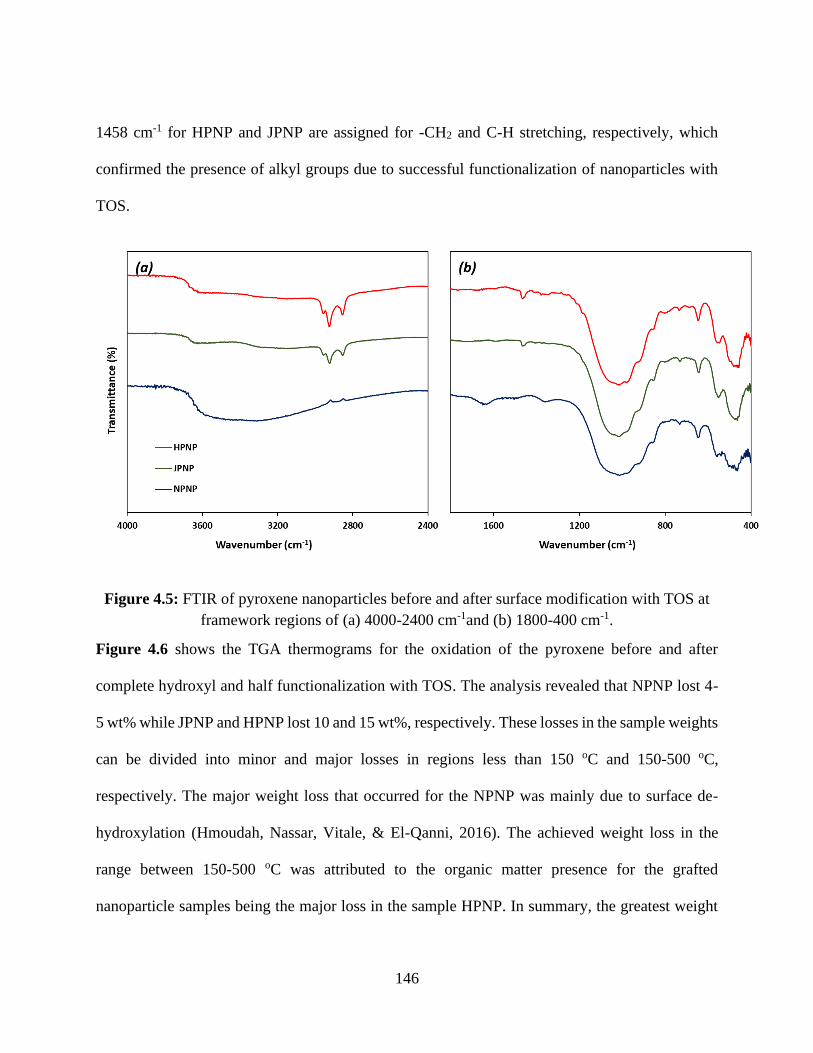
146
1458 cm-1 for HPNP and JPNP are assigned for -CH2 and C-H stretching, respectively, which
confirmed the presence of alkyl groups due to successful functionalization of nanoparticles with
TOS.
Figure 4.5: FTIR of pyroxene nanoparticles before and after surface modification with TOS at
framework regions of (a) 4000-2400 cm-1and (b) 1800-400 cm-1.
Figure 4.6 shows the TGA thermograms for the oxidation of the pyroxene before and after
complete hydroxyl and half functionalization with TOS. The analysis revealed that NPNP lost 4-
5 wt% while JPNP and HPNP lost 10 and 15 wt%, respectively. These losses in the sample weights
can be divided into minor and major losses in regions less than 150 oC and 150-500 oC,
respectively. The major weight loss that occurred for the NPNP was mainly due to surface de-
hydroxylation (Hmoudah, Nassar, Vitale, & El-Qanni, 2016). The achieved weight loss in the
range between 150-500 oC was attributed to the organic matter presence for the grafted
nanoparticle samples being the major loss in the sample HPNP. In summary, the greatest weight
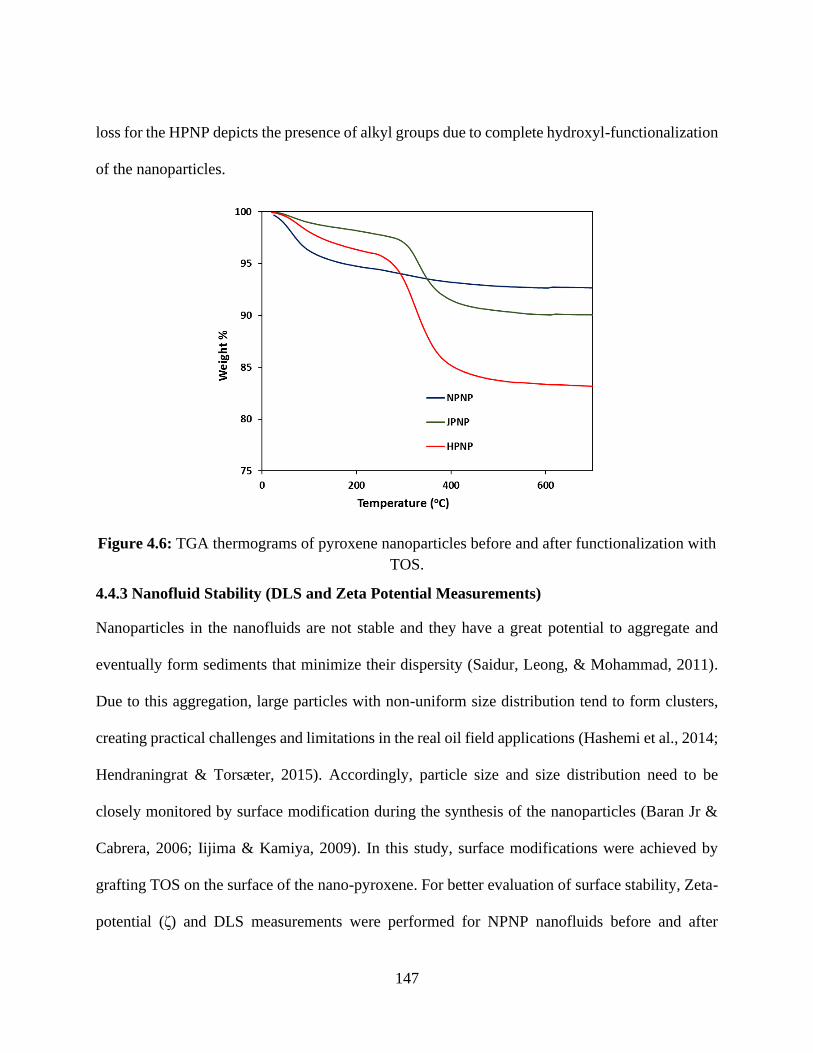
147
loss for the HPNP depicts the presence of alkyl groups due to complete hydroxyl-functionalization
of the nanoparticles.
Figure 4.6: TGA thermograms of pyroxene nanoparticles before and after functionalization with
TOS.
4.4.3 Nanofluid Stability (DLS and Zeta Potential Measurements)
Nanoparticles in the nanofluids are not stable and they have a great potential to aggregate and
eventually form sediments that minimize their dispersity (Saidur, Leong, & Mohammad, 2011).
Due to this aggregation, large particles with non-uniform size distribution tend to form clusters,
creating practical challenges and limitations in the real oil field applications (Hashemi et al., 2014;
Hendraningrat & Torsæter, 2015). Accordingly, particle size and size distribution need to be
closely monitored by surface modification during the synthesis of the nanoparticles (Baran Jr &
Cabrera, 2006; Iijima & Kamiya, 2009). In this study, surface modifications were achieved by
grafting TOS on the surface of the nano-pyroxene. For better evaluation of surface stability, Zeta-
potential (ζ) and DLS measurements were performed for NPNP nanofluids before and after
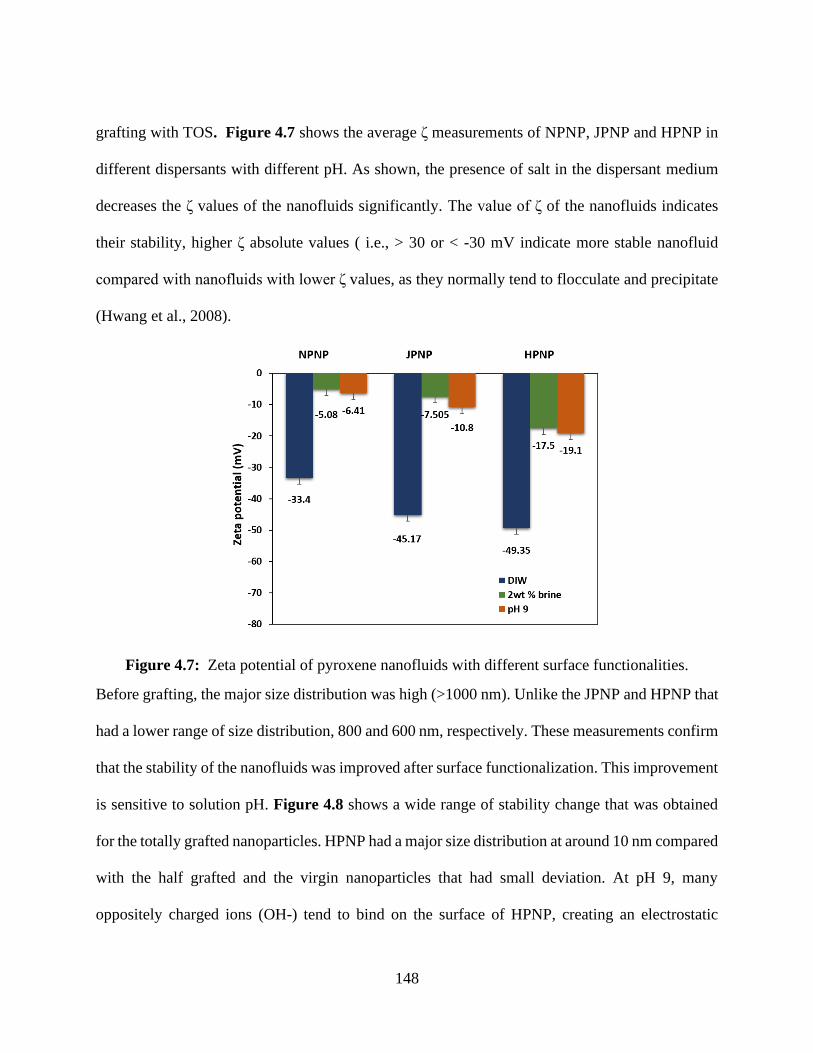
148
grafting with TOS. Figure 4.7 shows the average ζ measurements of NPNP, JPNP and HPNP in
different dispersants with different pH. As shown, the presence of salt in the dispersant medium
decreases the ζ values of the nanofluids significantly. The value of ζ of the nanofluids indicates
their stability, higher ζ absolute values ( i.e., > 30 or < -30 mV indicate more stable nanofluid
compared with nanofluids with lower ζ values, as they normally tend to flocculate and precipitate
(Hwang et al., 2008).
Figure 4.7: Zeta potential of pyroxene nanofluids with different surface functionalities.
Before grafting, the major size distribution was high (>1000 nm). Unlike the JPNP and HPNP that
had a lower range of size distribution, 800 and 600 nm, respectively. These measurements confirm
that the stability of the nanofluids was improved after surface functionalization. This improvement
is sensitive to solution pH. Figure 4.8 shows a wide range of stability change that was obtained
for the totally grafted nanoparticles. HPNP had a major size distribution at around 10 nm compared
with the half grafted and the virgin nanoparticles that had small deviation. At pH 9, many
oppositely charged ions (OH-) tend to bind on the surface of HPNP, creating an electrostatic
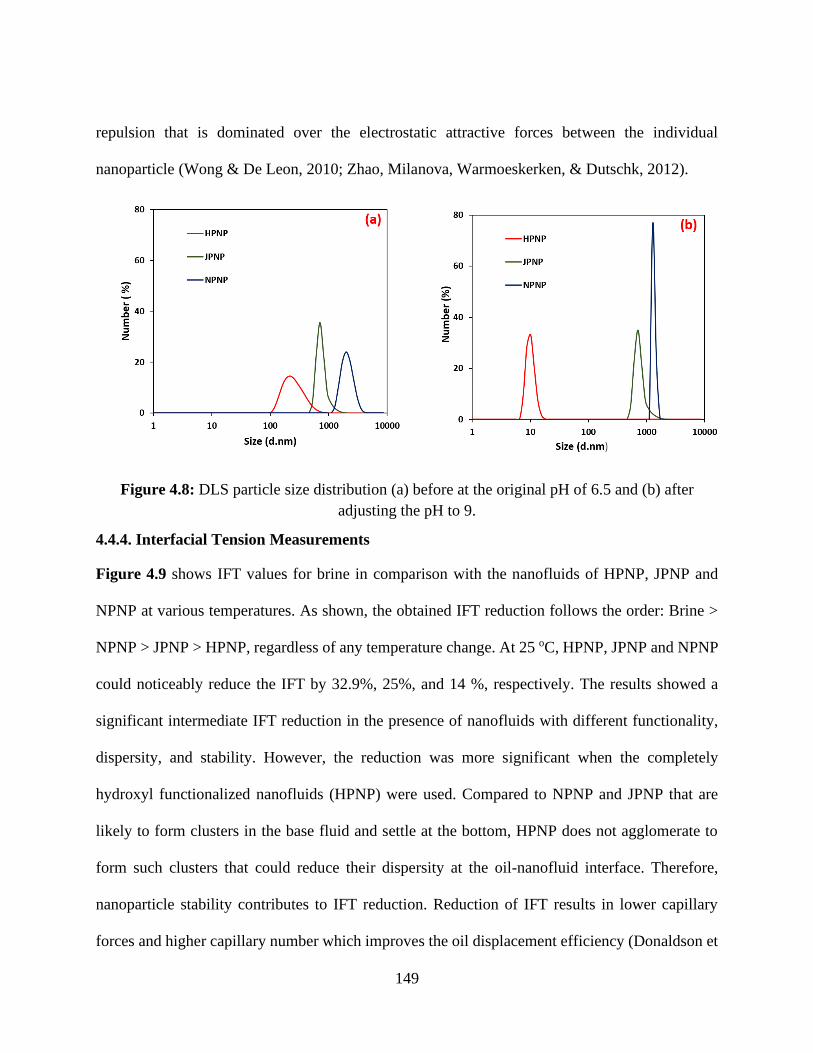
149
repulsion that is dominated over the electrostatic attractive forces between the individual
nanoparticle (Wong & De Leon, 2010; Zhao, Milanova, Warmoeskerken, & Dutschk, 2012).
Figure 4.8: DLS particle size distribution (a) before at the original pH of 6.5 and (b) after
adjusting the pH to 9.
4.4.4. Interfacial Tension Measurements
Figure 4.9 shows IFT values for brine in comparison with the nanofluids of HPNP, JPNP and
NPNP at various temperatures. As shown, the obtained IFT reduction follows the order: Brine >
NPNP > JPNP > HPNP, regardless of any temperature change. At 25 oC, HPNP, JPNP and NPNP
could noticeably reduce the IFT by 32.9%, 25%, and 14 %, respectively. The results showed a
significant intermediate IFT reduction in the presence of nanofluids with different functionality,
dispersity, and stability. However, the reduction was more significant when the completely
hydroxyl functionalized nanofluids (HPNP) were used. Compared to NPNP and JPNP that are
likely to form clusters in the base fluid and settle at the bottom, HPNP does not agglomerate to
form such clusters that could reduce their dispersity at the oil-nanofluid interface. Therefore,
nanoparticle stability contributes to IFT reduction. Reduction of IFT results in lower capillary
forces and higher capillary number which improves the oil displacement efficiency (Donaldson et
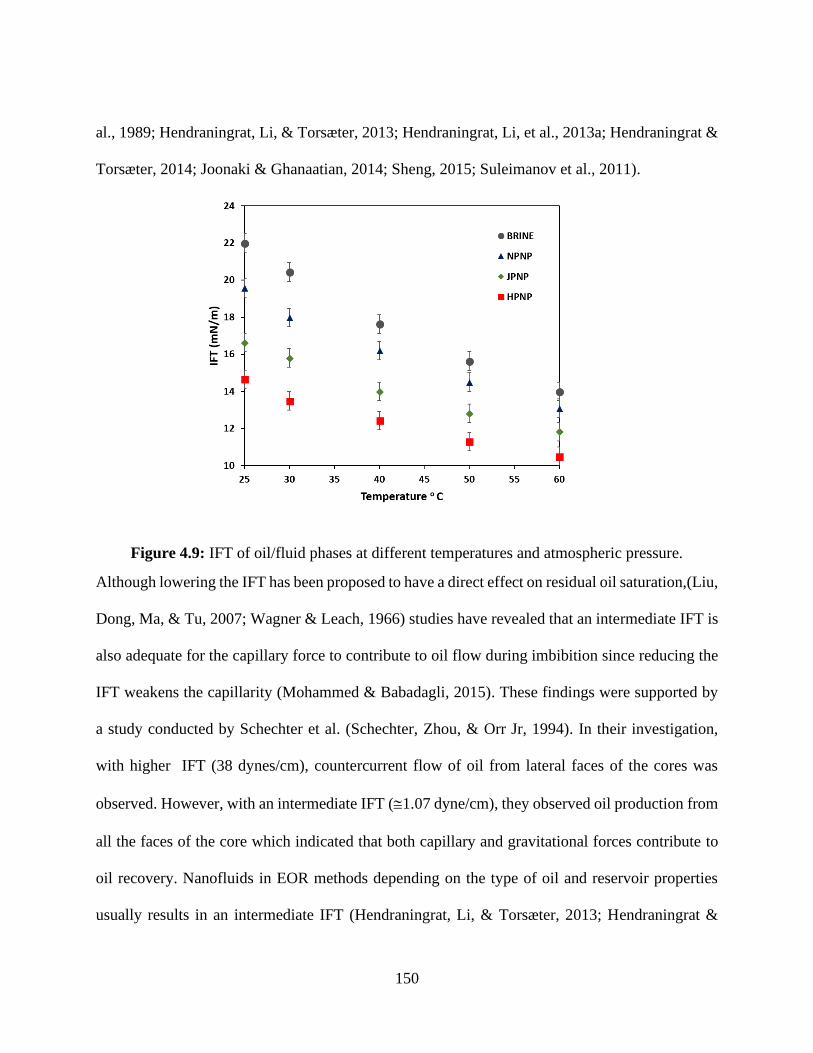
150
al., 1989; Hendraningrat, Li, & Torsæter, 2013; Hendraningrat, Li, et al., 2013a; Hendraningrat &
Torsæter, 2014; Joonaki & Ghanaatian, 2014; Sheng, 2015; Suleimanov et al., 2011).
Figure 4.9: IFT of oil/fluid phases at different temperatures and atmospheric pressure.
Although lowering the IFT has been proposed to have a direct effect on residual oil saturation,(Liu,
Dong, Ma, & Tu, 2007; Wagner & Leach, 1966) studies have revealed that an intermediate IFT is
also adequate for the capillary force to contribute to oil flow during imbibition since reducing the
IFT weakens the capillarity (Mohammed & Babadagli, 2015). These findings were supported by
a study conducted by Schechter et al. (Schechter, Zhou, & Orr Jr, 1994). In their investigation,
with higher IFT (38 dynes/cm), countercurrent flow of oil from lateral faces of the cores was
observed. However, with an intermediate IFT (1.07 dyne/cm), they observed oil production from
all the faces of the core which indicated that both capillary and gravitational forces contribute to
oil recovery. Nanofluids in EOR methods depending on the type of oil and reservoir properties
usually results in an intermediate IFT (Hendraningrat, Li, & Torsæter, 2013; Hendraningrat &
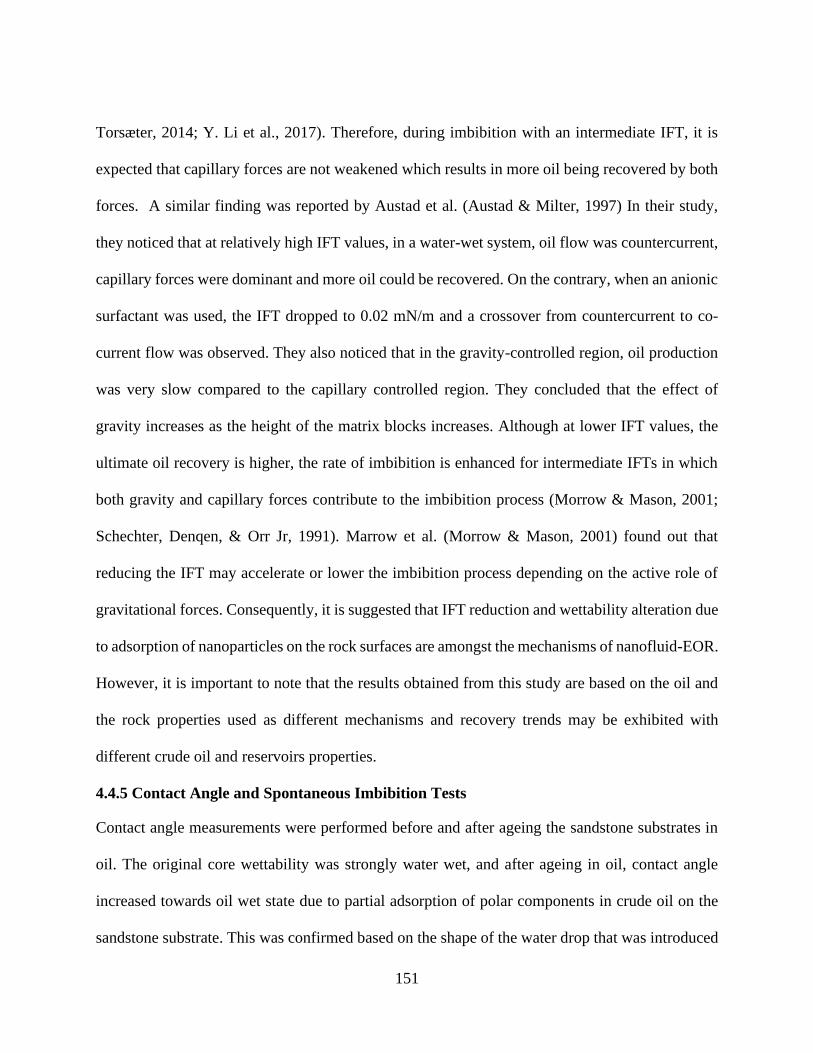
151
Torsæter, 2014; Y. Li et al., 2017). Therefore, during imbibition with an intermediate IFT, it is
expected that capillary forces are not weakened which results in more oil being recovered by both
forces. A similar finding was reported by Austad et al. (Austad & Milter, 1997) In their study,
they noticed that at relatively high IFT values, in a water-wet system, oil flow was countercurrent,
capillary forces were dominant and more oil could be recovered. On the contrary, when an anionic
surfactant was used, the IFT dropped to 0.02 mN/m and a crossover from countercurrent to co-
current flow was observed. They also noticed that in the gravity-controlled region, oil production
was very slow compared to the capillary controlled region. They concluded that the effect of
gravity increases as the height of the matrix blocks increases. Although at lower IFT values, the
ultimate oil recovery is higher, the rate of imbibition is enhanced for intermediate IFTs in which
both gravity and capillary forces contribute to the imbibition process (Morrow & Mason, 2001;
Schechter, Denqen, & Orr Jr, 1991). Marrow et al. (Morrow & Mason, 2001) found out that
reducing the IFT may accelerate or lower the imbibition process depending on the active role of
gravitational forces. Consequently, it is suggested that IFT reduction and wettability alteration due
to adsorption of nanoparticles on the rock surfaces are amongst the mechanisms of nanofluid-EOR.
However, it is important to note that the results obtained from this study are based on the oil and
the rock properties used as different mechanisms and recovery trends may be exhibited with
different crude oil and reservoirs properties.
4.4.5 Contact Angle and Spontaneous Imbibition Tests
Contact angle measurements were performed before and after ageing the sandstone substrates in
oil. The original core wettability was strongly water wet, and after ageing in oil, contact angle
increased towards oil wet state due to partial adsorption of polar components in crude oil on the
sandstone substrate. This was confirmed based on the shape of the water drop that was introduced
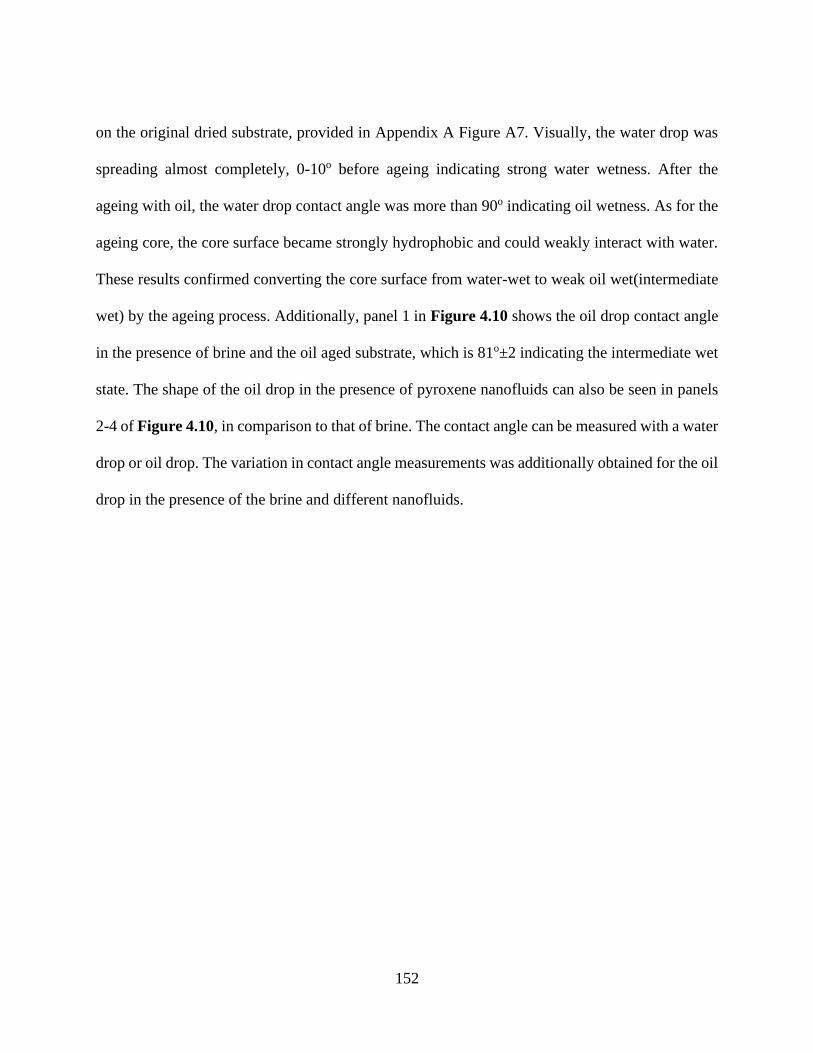
152
on the original dried substrate, provided in Appendix A Figure A7. Visually, the water drop was
spreading almost completely, 0-10o before ageing indicating strong water wetness. After the
ageing with oil, the water drop contact angle was more than 90o indicating oil wetness. As for the
ageing core, the core surface became strongly hydrophobic and could weakly interact with water.
These results confirmed converting the core surface from water-wet to weak oil wet(intermediate
wet) by the ageing process. Additionally, panel 1 in Figure 4.10 shows the oil drop contact angle
in the presence of brine and the oil aged substrate, which is 81o±2 indicating the intermediate wet
state. The shape of the oil drop in the presence of pyroxene nanofluids can also be seen in panels
2-4 of Figure 4.10, in comparison to that of brine. The contact angle can be measured with a water
drop or oil drop. The variation in contact angle measurements was additionally obtained for the oil
drop in the presence of the brine and different nanofluids.
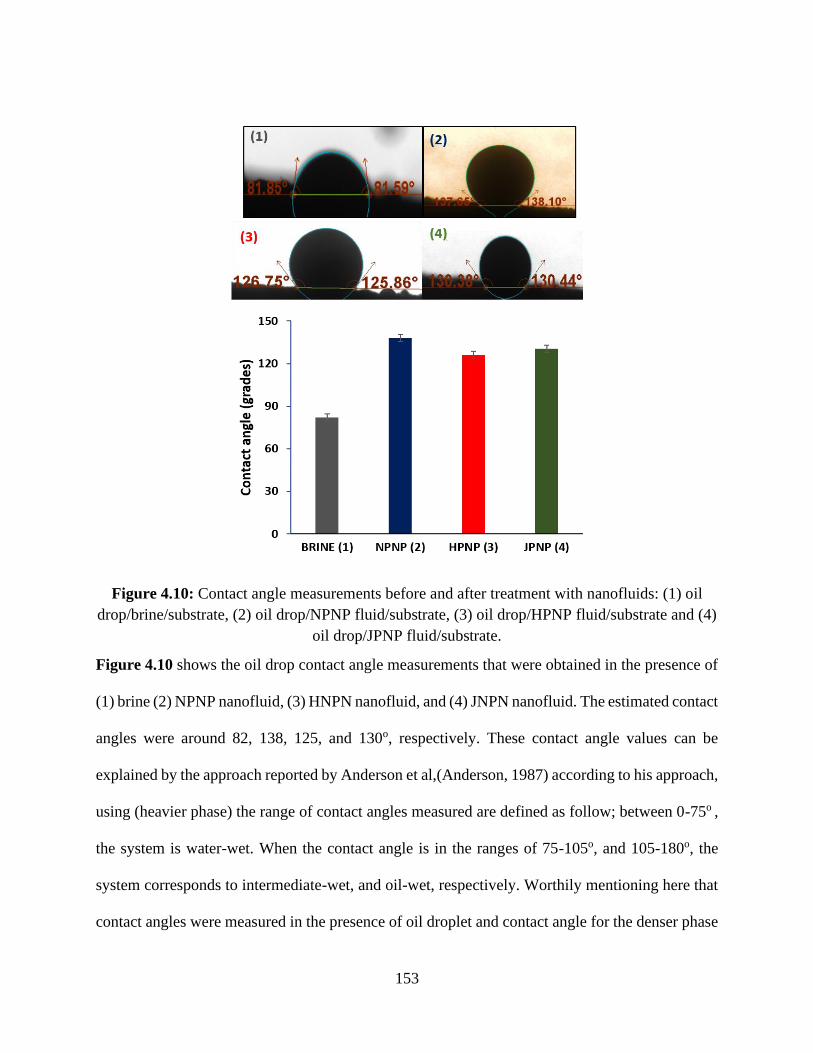
153
Figure 4.10: Contact angle measurements before and after treatment with nanofluids: (1) oil
drop/brine/substrate, (2) oil drop/NPNP fluid/substrate, (3) oil drop/HPNP fluid/substrate and (4)
oil drop/JPNP fluid/substrate.
Figure 4.10 shows the oil drop contact angle measurements that were obtained in the presence of
(1) brine (2) NPNP nanofluid, (3) HNPN nanofluid, and (4) JNPN nanofluid. The estimated contact
angles were around 82, 138, 125, and 130o, respectively. These contact angle values can be
explained by the approach reported by Anderson et al,(Anderson, 1987) according to his approach,
using (heavier phase) the range of contact angles measured are defined as follow; between 0-75o ,
the system is water-wet. When the contact angle is in the ranges of 75-105o, and 105-180o, the
system corresponds to intermediate-wet, and oil-wet, respectively. Worthily mentioning here that
contact angles were measured in the presence of oil droplet and contact angle for the denser phase
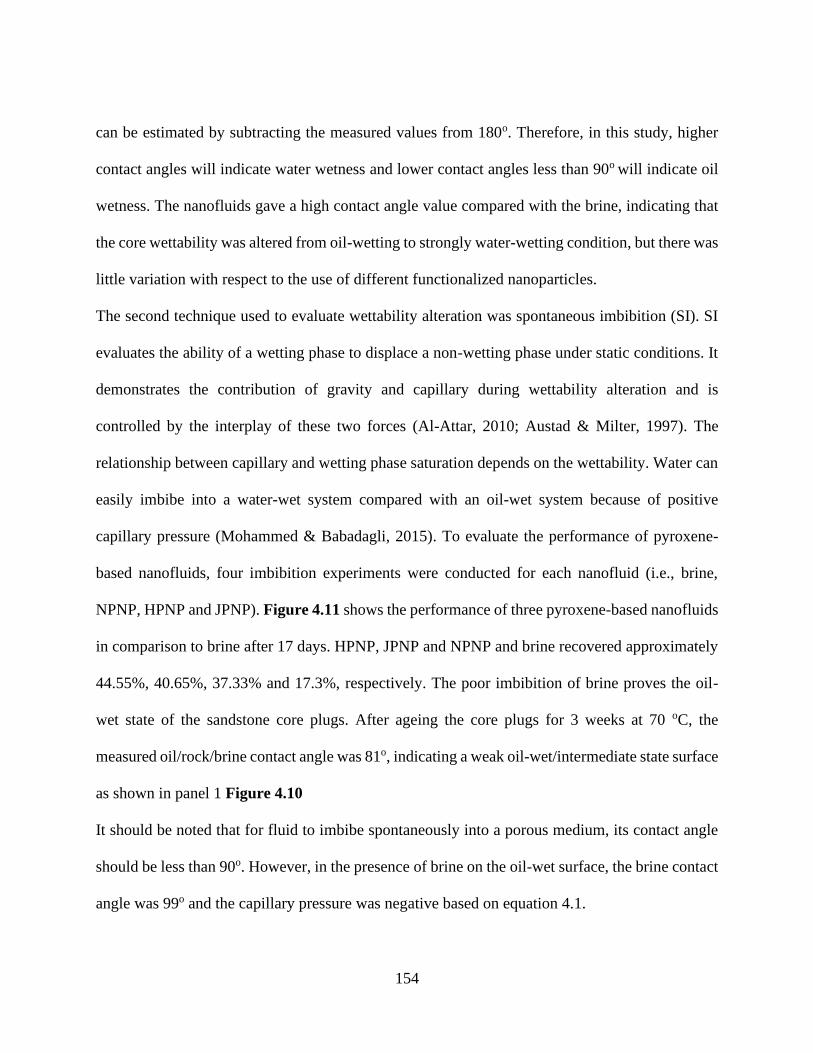
154
can be estimated by subtracting the measured values from 180o. Therefore, in this study, higher
contact angles will indicate water wetness and lower contact angles less than 90o will indicate oil
wetness. The nanofluids gave a high contact angle value compared with the brine, indicating that
the core wettability was altered from oil-wetting to strongly water-wetting condition, but there was
little variation with respect to the use of different functionalized nanoparticles.
The second technique used to evaluate wettability alteration was spontaneous imbibition (SI). SI
evaluates the ability of a wetting phase to displace a non-wetting phase under static conditions. It
demonstrates the contribution of gravity and capillary during wettability alteration and is
controlled by the interplay of these two forces (Al-Attar, 2010; Austad & Milter, 1997). The
relationship between capillary and wetting phase saturation depends on the wettability. Water can
easily imbibe into a water-wet system compared with an oil-wet system because of positive
capillary pressure (Mohammed & Babadagli, 2015). To evaluate the performance of pyroxene-
based nanofluids, four imbibition experiments were conducted for each nanofluid (i.e., brine,
NPNP, HPNP and JPNP). Figure 4.11 shows the performance of three pyroxene-based nanofluids
in comparison to brine after 17 days. HPNP, JPNP and NPNP and brine recovered approximately
44.55%, 40.65%, 37.33% and 17.3%, respectively. The poor imbibition of brine proves the oil-
wet state of the sandstone core plugs. After ageing the core plugs for 3 weeks at 70 oC, the
measured oil/rock/brine contact angle was 81o, indicating a weak oil-wet/intermediate state surface
as shown in panel 1 Figure 4.10
It should be noted that for fluid to imbibe spontaneously into a porous medium, its contact angle
should be less than 90o. However, in the presence of brine on the oil-wet surface, the brine contact
angle was 99o and the capillary pressure was negative based on equation 4.1.
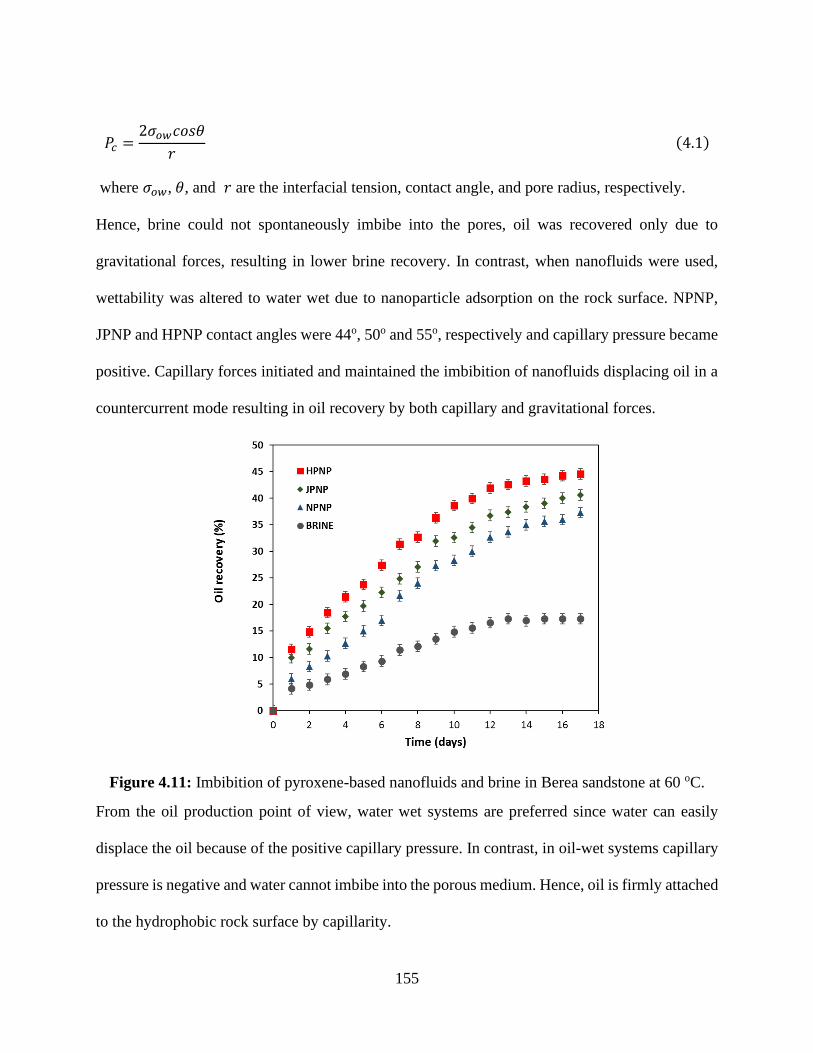
155
𝑃𝑐 =2𝜎𝑜𝑤𝑐𝑜𝑠𝜃
𝑟 (4.1)
where 𝜎𝑜𝑤, 𝜃, and 𝑟 are the interfacial tension, contact angle, and pore radius, respectively.
Hence, brine could not spontaneously imbibe into the pores, oil was recovered only due to
gravitational forces, resulting in lower brine recovery. In contrast, when nanofluids were used,
wettability was altered to water wet due to nanoparticle adsorption on the rock surface. NPNP,
JPNP and HPNP contact angles were 44o, 50o and 55o, respectively and capillary pressure became
positive. Capillary forces initiated and maintained the imbibition of nanofluids displacing oil in a
countercurrent mode resulting in oil recovery by both capillary and gravitational forces.
Figure 4.11: Imbibition of pyroxene-based nanofluids and brine in Berea sandstone at 60 oC.
From the oil production point of view, water wet systems are preferred since water can easily
displace the oil because of the positive capillary pressure. In contrast, in oil-wet systems capillary
pressure is negative and water cannot imbibe into the porous medium. Hence, oil is firmly attached
to the hydrophobic rock surface by capillarity.
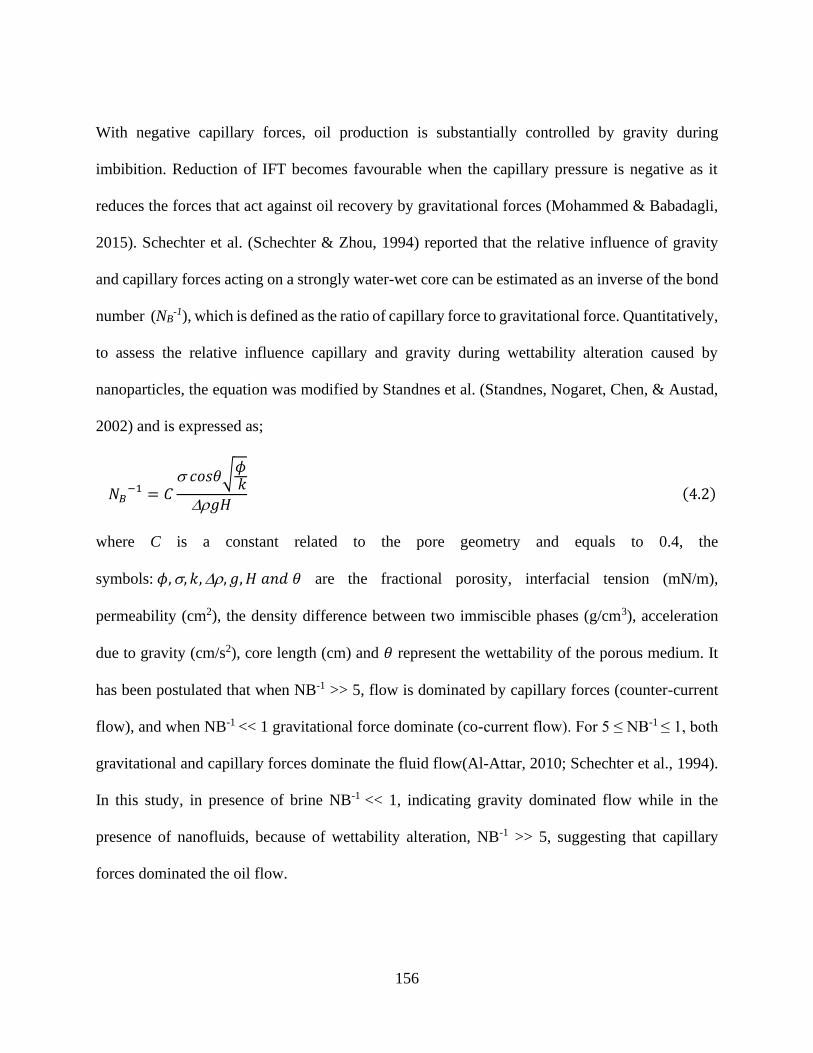
156
With negative capillary forces, oil production is substantially controlled by gravity during
imbibition. Reduction of IFT becomes favourable when the capillary pressure is negative as it
reduces the forces that act against oil recovery by gravitational forces (Mohammed & Babadagli,
2015). Schechter et al. (Schechter & Zhou, 1994) reported that the relative influence of gravity
and capillary forces acting on a strongly water-wet core can be estimated as an inverse of the bond
number (NB-1), which is defined as the ratio of capillary force to gravitational force. Quantitatively,
to assess the relative influence capillary and gravity during wettability alteration caused by
nanoparticles, the equation was modified by Standnes et al. (Standnes, Nogaret, Chen, & Austad,
2002) and is expressed as;
𝑁𝐵−1 = 𝐶
𝑐𝑜𝑠𝜃√𝜙 𝑘
𝑔𝐻 (4.2)
where C is a constant related to the pore geometry and equals to 0.4, the
symbols: 𝜙,, 𝑘,, 𝑔, 𝐻 𝑎𝑛𝑑 𝜃 are the fractional porosity, interfacial tension (mN/m),
permeability (cm2), the density difference between two immiscible phases (g/cm3), acceleration
due to gravity (cm/s2), core length (cm) and 𝜃 represent the wettability of the porous medium. It
has been postulated that when NB-1 >> 5, flow is dominated by capillary forces (counter-current
flow), and when NB-1 << 1 gravitational force dominate (co-current flow). For 5 ≤ NB-1 ≤ 1, both
gravitational and capillary forces dominate the fluid flow(Al-Attar, 2010; Schechter et al., 1994).
In this study, in presence of brine NB-1 << 1, indicating gravity dominated flow while in the
presence of nanofluids, because of wettability alteration, NB-1 >> 5, suggesting that capillary
forces dominated the oil flow.
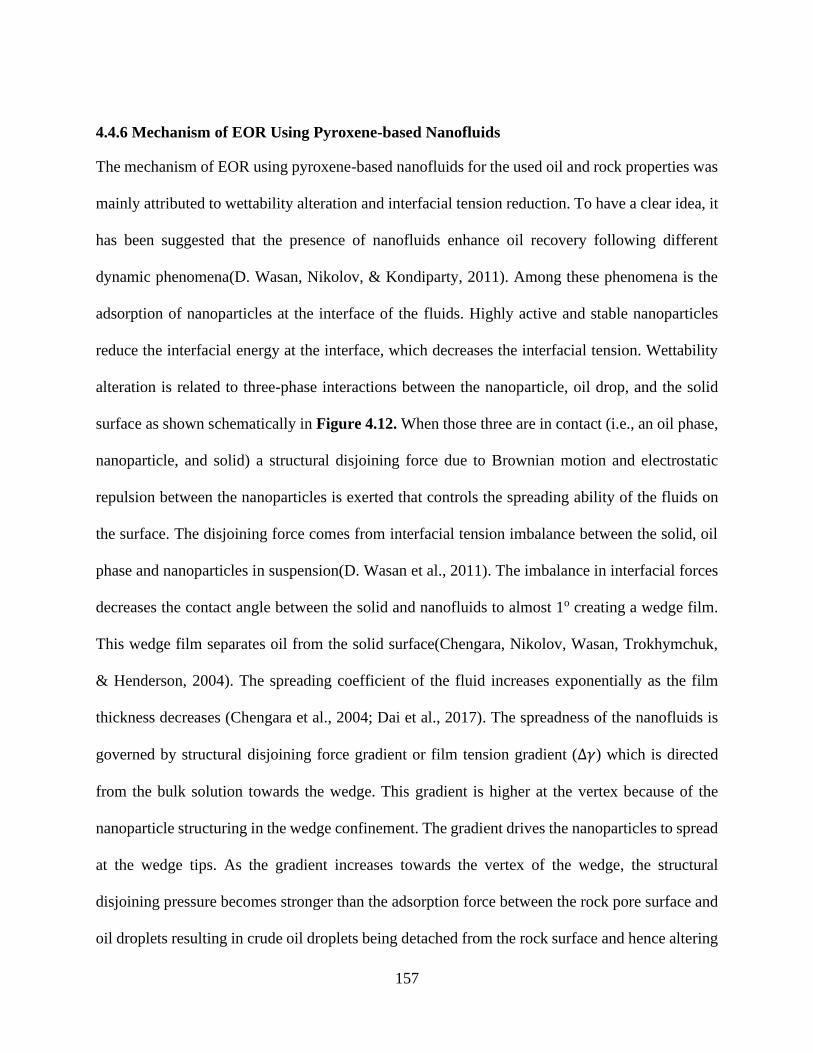
157
4.4.6 Mechanism of EOR Using Pyroxene-based Nanofluids
The mechanism of EOR using pyroxene-based nanofluids for the used oil and rock properties was
mainly attributed to wettability alteration and interfacial tension reduction. To have a clear idea, it
has been suggested that the presence of nanofluids enhance oil recovery following different
dynamic phenomena(D. Wasan, Nikolov, & Kondiparty, 2011). Among these phenomena is the
adsorption of nanoparticles at the interface of the fluids. Highly active and stable nanoparticles
reduce the interfacial energy at the interface, which decreases the interfacial tension. Wettability
alteration is related to three-phase interactions between the nanoparticle, oil drop, and the solid
surface as shown schematically in Figure 4.12. When those three are in contact (i.e., an oil phase,
nanoparticle, and solid) a structural disjoining force due to Brownian motion and electrostatic
repulsion between the nanoparticles is exerted that controls the spreading ability of the fluids on
the surface. The disjoining force comes from interfacial tension imbalance between the solid, oil
phase and nanoparticles in suspension(D. Wasan et al., 2011). The imbalance in interfacial forces
decreases the contact angle between the solid and nanofluids to almost 1o creating a wedge film.
This wedge film separates oil from the solid surface(Chengara, Nikolov, Wasan, Trokhymchuk,
& Henderson, 2004). The spreading coefficient of the fluid increases exponentially as the film
thickness decreases (Chengara et al., 2004; Dai et al., 2017). The spreadness of the nanofluids is
governed by structural disjoining force gradient or film tension gradient (∆𝛾) which is directed
from the bulk solution towards the wedge. This gradient is higher at the vertex because of the
nanoparticle structuring in the wedge confinement. The gradient drives the nanoparticles to spread
at the wedge tips. As the gradient increases towards the vertex of the wedge, the structural
disjoining pressure becomes stronger than the adsorption force between the rock pore surface and
oil droplets resulting in crude oil droplets being detached from the rock surface and hence altering
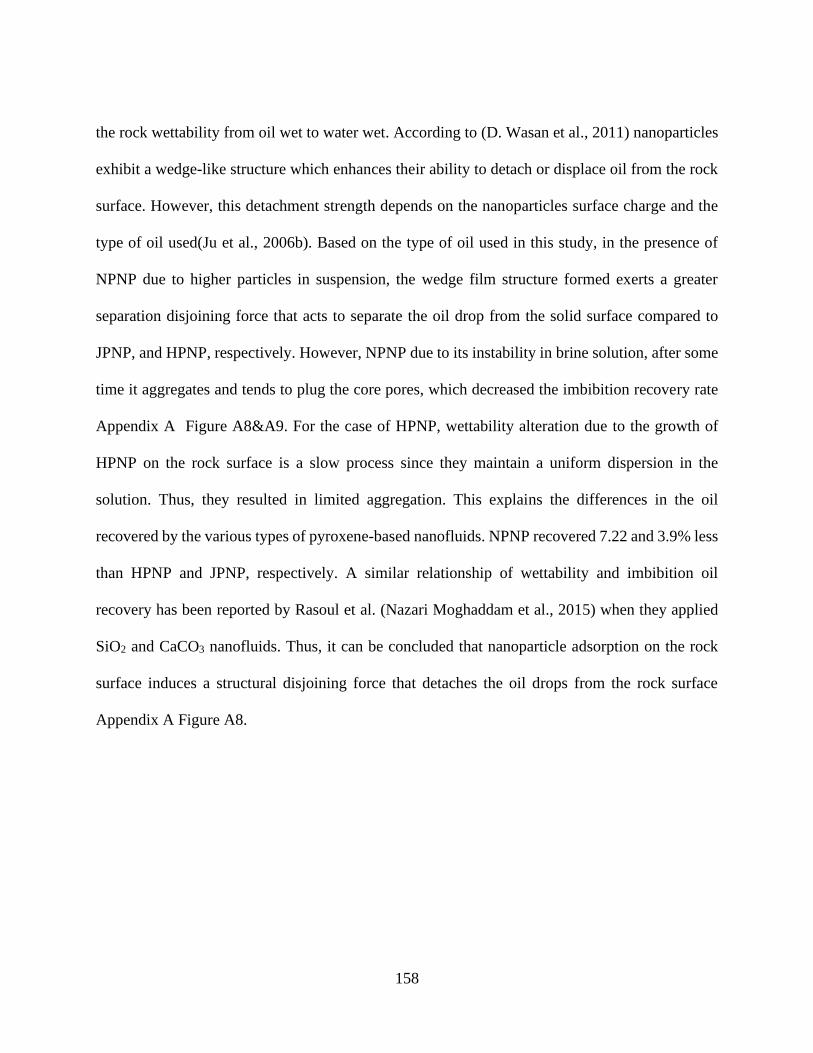
158
the rock wettability from oil wet to water wet. According to (D. Wasan et al., 2011) nanoparticles
exhibit a wedge-like structure which enhances their ability to detach or displace oil from the rock
surface. However, this detachment strength depends on the nanoparticles surface charge and the
type of oil used(Ju et al., 2006b). Based on the type of oil used in this study, in the presence of
NPNP due to higher particles in suspension, the wedge film structure formed exerts a greater
separation disjoining force that acts to separate the oil drop from the solid surface compared to
JPNP, and HPNP, respectively. However, NPNP due to its instability in brine solution, after some
time it aggregates and tends to plug the core pores, which decreased the imbibition recovery rate
Appendix A Figure A8&A9. For the case of HPNP, wettability alteration due to the growth of
HPNP on the rock surface is a slow process since they maintain a uniform dispersion in the
solution. Thus, they resulted in limited aggregation. This explains the differences in the oil
recovered by the various types of pyroxene-based nanofluids. NPNP recovered 7.22 and 3.9% less
than HPNP and JPNP, respectively. A similar relationship of wettability and imbibition oil
recovery has been reported by Rasoul et al. (Nazari Moghaddam et al., 2015) when they applied
SiO2 and CaCO3 nanofluids. Thus, it can be concluded that nanoparticle adsorption on the rock
surface induces a structural disjoining force that detaches the oil drops from the rock surface
Appendix A Figure A8.
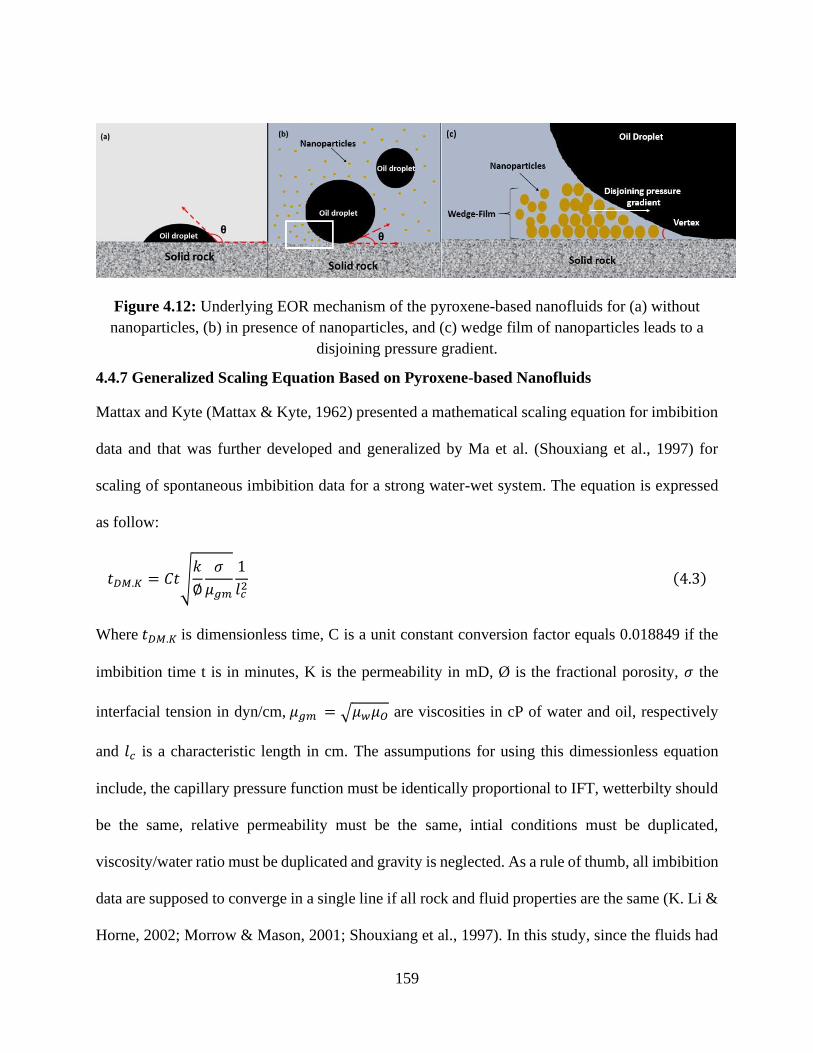
159
Figure 4.12: Underlying EOR mechanism of the pyroxene-based nanofluids for (a) without
nanoparticles, (b) in presence of nanoparticles, and (c) wedge film of nanoparticles leads to a
disjoining pressure gradient.
4.4.7 Generalized Scaling Equation Based on Pyroxene-based Nanofluids
Mattax and Kyte (Mattax & Kyte, 1962) presented a mathematical scaling equation for imbibition
data and that was further developed and generalized by Ma et al. (Shouxiang et al., 1997) for
scaling of spontaneous imbibition data for a strong water-wet system. The equation is expressed
as follow:
𝑡𝐷𝑀.𝐾 = 𝐶𝑡√𝑘
∅
𝜎
𝜇𝑔𝑚
1
𝑙𝑐2
(4.3)
Where 𝑡𝐷𝑀.𝐾 is dimensionless time, C is a unit constant conversion factor equals 0.018849 if the
imbibition time t is in minutes, K is the permeability in mD, Ø is the fractional porosity, 𝜎 the
interfacial tension in dyn/cm, 𝜇𝑔𝑚 = √𝜇𝑤𝜇𝑂 are viscosities in cP of water and oil, respectively
and 𝑙𝑐 is a characteristic length in cm. The assumputions for using this dimessionless equation
include, the capillary pressure function must be identically proportional to IFT, wetterbilty should
be the same, relative permeability must be the same, intial conditions must be duplicated,
viscosity/water ratio must be duplicated and gravity is neglected. As a rule of thumb, all imbibition
data are supposed to converge in a single line if all rock and fluid properties are the same (K. Li &
Horne, 2002; Morrow & Mason, 2001; Shouxiang et al., 1997). In this study, since the fluids had
160
different properties (IFT), the imbibition scaled data could not converge in a single line.
Furthermore, if some of core data do not fall on the same normalized/scaled curve, they probably
must be part of different hydraulic flow units "HFU". When dealing with a substantial volume of
core data, a plot of reservoir quality index (RQI) vs. porosity (Phiz) can help on deciding the
appropriate number of HFU for a given system. It should be noted that imbibition tests on a small
reservoir sample can scale imbibition behaviour for all reservoir matrix blocks of the same rock
type, shape and geometry (Mattax & Kyte, 1962). A single model was proposed by Aronofsky et
al. (Aronofsky, Masse, & Natanson, 1958) and further modified by Ma et al. (Shouxiang et al.,
1997) to fit the literature imbibition data of a strong water-wet system based on the following
equation.
𝑅
𝑅𝑚𝑎𝑥= 1 − 𝑒−𝛼𝑡𝐷 (4.4)
where R is the oil recovery by imbibition, 𝑅𝑚𝑎𝑥 is the ultimate oil recovery and 𝛼 is the oil
production decline constant. Figure 4.13 shows the data obtained from plotting the normalized
percentage of recovery (R/Rmax) of crude oil against dimensionless time (tD) by using the prepared
nanofluids. Figure 4.13 also includes the fitting of the obtained experimental data with equation
4.4, such that the obtained data are identified by points having different colours and the lines
represent their fitting with equation 4.4 A non-linear curve fitting between the experimental data
and the equation was performed using Origin Pro 8 SR4 software version 8.095. This fitting
allowed us statistically to estimate the oil production decline constant (𝛼) by minimizing the sum
squares of the difference between the experimental data and the predicted ones by the same
equation. As a result, the value of Chi-square (X2) for each curve was obtained, which was low in
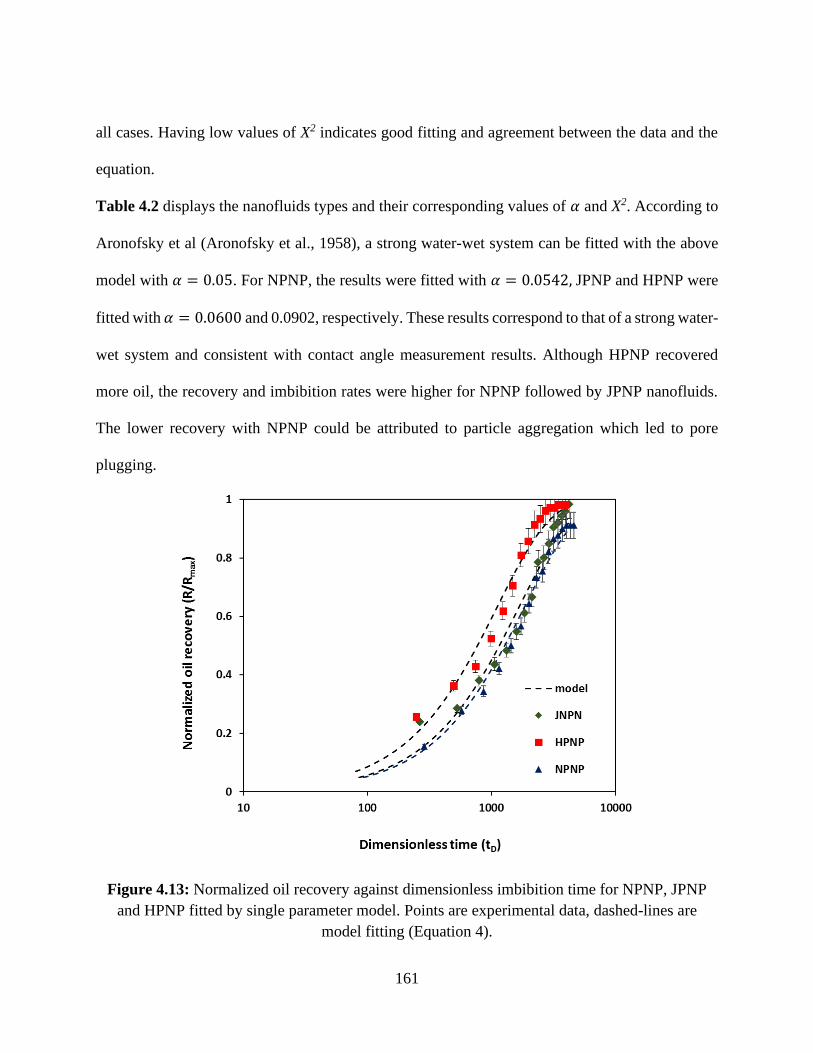
161
all cases. Having low values of X2 indicates good fitting and agreement between the data and the
equation.
Table 4.2 displays the nanofluids types and their corresponding values of 𝛼 and X2. According to
Aronofsky et al (Aronofsky et al., 1958), a strong water-wet system can be fitted with the above
model with 𝛼 = 0.05. For NPNP, the results were fitted with 𝛼 = 0.0542, JPNP and HPNP were
fitted with 𝛼 = 0.0600 and 0.0902, respectively. These results correspond to that of a strong water-
wet system and consistent with contact angle measurement results. Although HPNP recovered
more oil, the recovery and imbibition rates were higher for NPNP followed by JPNP nanofluids.
The lower recovery with NPNP could be attributed to particle aggregation which led to pore
plugging.
Figure 4.13: Normalized oil recovery against dimensionless imbibition time for NPNP, JPNP
and HPNP fitted by single parameter model. Points are experimental data, dashed-lines are
model fitting (Equation 4).
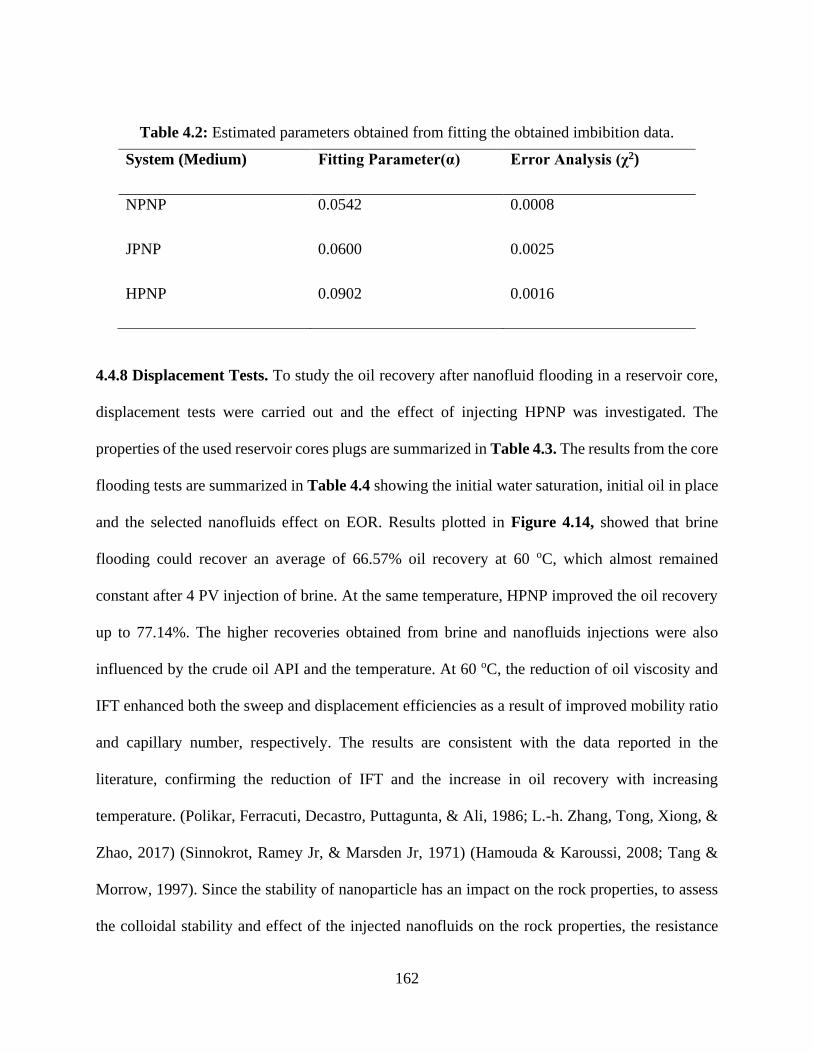
162
Table 4.2: Estimated parameters obtained from fitting the obtained imbibition data.
System (Medium) Fitting Parameter(α) Error Analysis (χ2)
NPNP 0.0542 0.0008
JPNP 0.0600 0.0025
HPNP 0.0902 0.0016
4.4.8 Displacement Tests. To study the oil recovery after nanofluid flooding in a reservoir core,
displacement tests were carried out and the effect of injecting HPNP was investigated. The
properties of the used reservoir cores plugs are summarized in Table 4.3. The results from the core
flooding tests are summarized in Table 4.4 showing the initial water saturation, initial oil in place
and the selected nanofluids effect on EOR. Results plotted in Figure 4.14, showed that brine
flooding could recover an average of 66.57% oil recovery at 60 oC, which almost remained
constant after 4 PV injection of brine. At the same temperature, HPNP improved the oil recovery
up to 77.14%. The higher recoveries obtained from brine and nanofluids injections were also
influenced by the crude oil API and the temperature. At 60 oC, the reduction of oil viscosity and
IFT enhanced both the sweep and displacement efficiencies as a result of improved mobility ratio
and capillary number, respectively. The results are consistent with the data reported in the
literature, confirming the reduction of IFT and the increase in oil recovery with increasing
temperature. (Polikar, Ferracuti, Decastro, Puttagunta, & Ali, 1986; L.-h. Zhang, Tong, Xiong, &
Zhao, 2017) (Sinnokrot, Ramey Jr, & Marsden Jr, 1971) (Hamouda & Karoussi, 2008; Tang &
Morrow, 1997). Since the stability of nanoparticle has an impact on the rock properties, to assess
the colloidal stability and effect of the injected nanofluids on the rock properties, the resistance
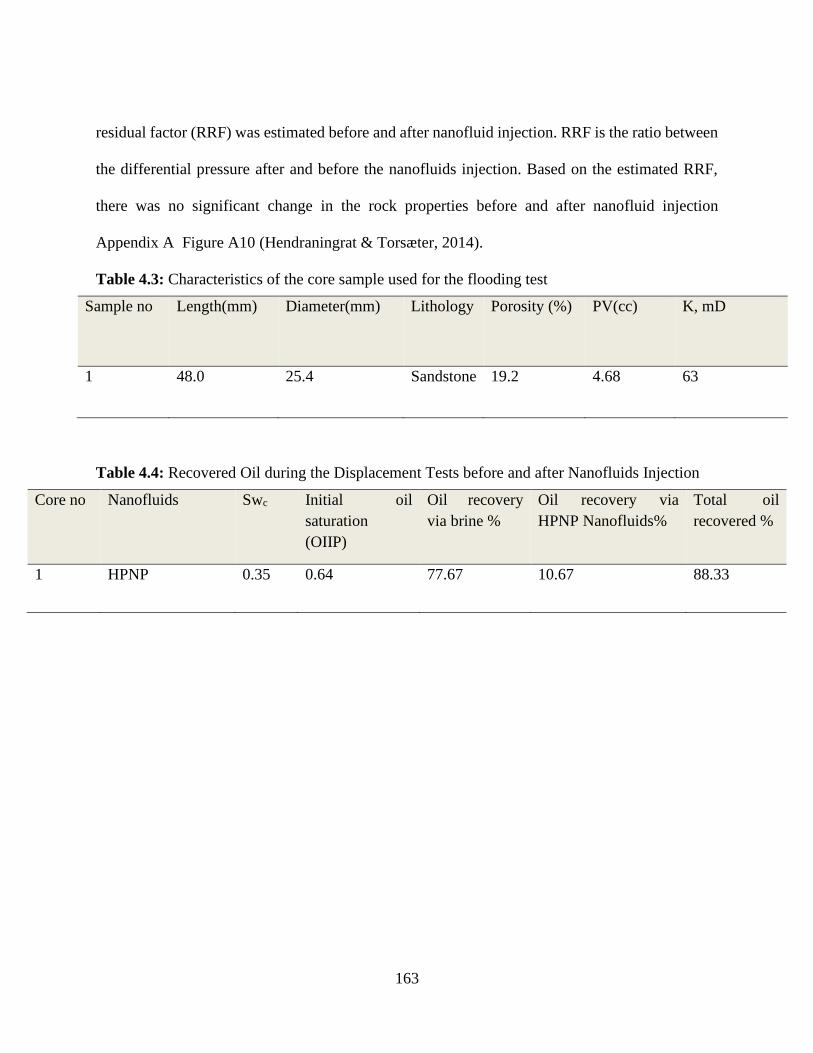
163
residual factor (RRF) was estimated before and after nanofluid injection. RRF is the ratio between
the differential pressure after and before the nanofluids injection. Based on the estimated RRF,
there was no significant change in the rock properties before and after nanofluid injection
Appendix A Figure A10 (Hendraningrat & Torsæter, 2014).
Table 4.3: Characteristics of the core sample used for the flooding test
Sample no Length(mm) Diameter(mm) Lithology Porosity (%) PV(cc) K, mD
1 48.0 25.4 Sandstone 19.2 4.68 63
Table 4.4: Recovered Oil during the Displacement Tests before and after Nanofluids Injection
Core no Nanofluids Swc Initial oil
saturation
(OIIP)
Oil recovery
via brine %
Oil recovery via
HPNP Nanofluids%
Total oil
recovered %
1 HPNP 0.35 0.64 77.67 10.67 88.33
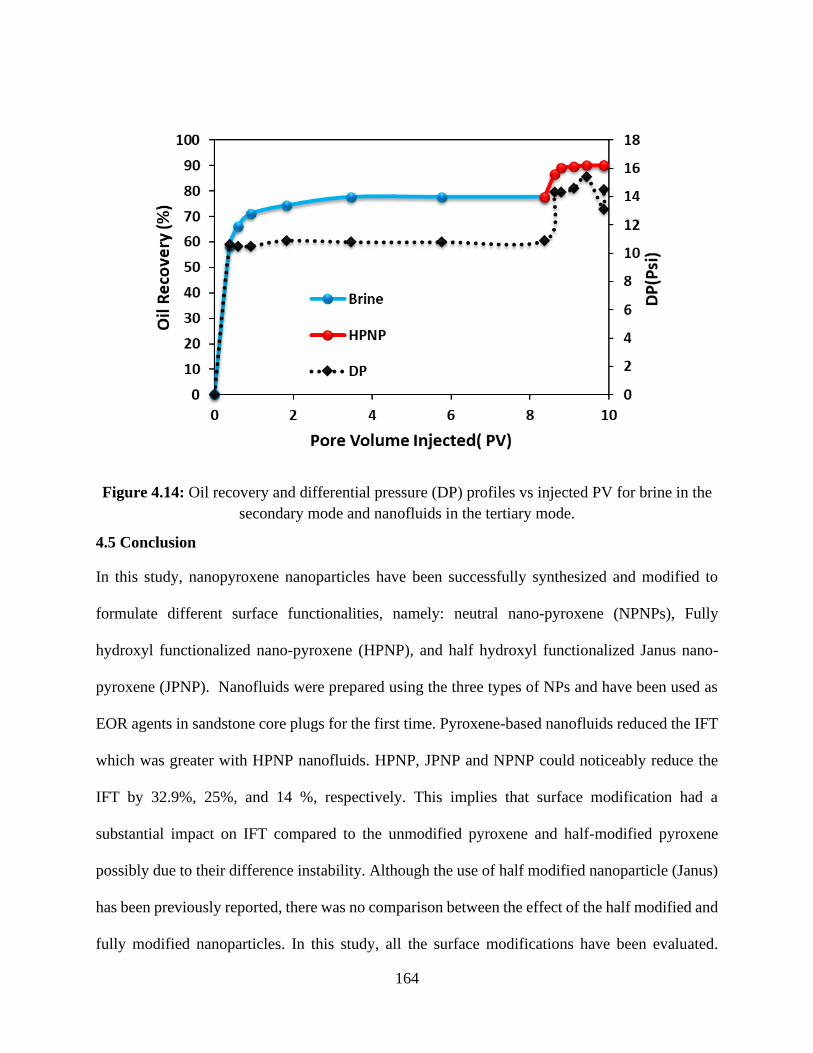
164
Figure 4.14: Oil recovery and differential pressure (DP) profiles vs injected PV for brine in the
secondary mode and nanofluids in the tertiary mode.
4.5 Conclusion
In this study, nanopyroxene nanoparticles have been successfully synthesized and modified to
formulate different surface functionalities, namely: neutral nano-pyroxene (NPNPs), Fully
hydroxyl functionalized nano-pyroxene (HPNP), and half hydroxyl functionalized Janus nano-
pyroxene (JPNP). Nanofluids were prepared using the three types of NPs and have been used as
EOR agents in sandstone core plugs for the first time. Pyroxene-based nanofluids reduced the IFT
which was greater with HPNP nanofluids. HPNP, JPNP and NPNP could noticeably reduce the
IFT by 32.9%, 25%, and 14 %, respectively. This implies that surface modification had a
substantial impact on IFT compared to the unmodified pyroxene and half-modified pyroxene
possibly due to their difference instability. Although the use of half modified nanoparticle (Janus)
has been previously reported, there was no comparison between the effect of the half modified and
fully modified nanoparticles. In this study, all the surface modifications have been evaluated.
165
Contact angle measurements in the presence of NPNP, JPNP and HPNP nanofluids was measured
as 44˚ ± 2˚, 50˚ ± 2˚ and 55˚ ± 2˚ respectively confirming wettability alteration from oil wet to
strongly water wet, which is in line with the structural disjoining force mechanism reported in the
literature. The unmodified nano-pyroxene (NPNP) form a thicker wedge film near the contact
point in comparison to JPNP and HPNP. Consequently, wettability is altered towards strong water
-wet. However, NPNPs due to their instability at higher temperatures formed agglomerates, and
their adsorption on the rock surface resulted in pore blockage, that later slowed down the oil
recovery process as finally obtained in the imbibition results. A scaled decline constant of greater
than 0.05 for all nanofluids showed that the data proved a strong water-wet system (consistent with
contact angle measurements). Core flooding tests confirmed the capability of pyroxene-based
nanofluids as effective EOR agents in hydrocarbon reservoirs by recovering an additional 10.57%
after water flooding.
166
4.6 References
Al-Attar, H. H. (2010). Experimental study of spontaneous capillary imbibition in selected
carbonate core samples. Journal of Petroleum Science and Engineering, 70(3-4), 320-326.
Al Adasani, A., & Bai, B. (2011). Analysis of EOR projects and updated screening criteria. Journal
of Petroleum Science and Engineering, 79(1), 10-24.
Ali, S., & Thomas, S. (1996). The promise and problems of enhanced oil recovery methods.
Journal of Canadian Petroleum Technology, 35(07).
Alvarado, V., & Manrique, E. (2010). Enhanced oil recovery: an updated review. Energies, 3(9),
1529-1575.
Anderson, W. G. (1987). Wettability literature survey-part 6: the effects of wettability on
waterflooding. Journal of petroleum technology, 39(12), 1,605-601,622.
Aronofsky, J., Masse, L., & Natanson, S. G. (1958). A model for the mechanism of oil recovery
from the porous matrix due to water invasion in fractured reservoirs.
Asif, M., & Muneer, T. (2007). Energy supply, its demand and security issues for developed and
emerging economies. Renewable and Sustainable Energy Reviews, 11(7), 1388-1413.
Austad, T., & Milter, J. (1997). Spontaneous imbibition of water into low permeable chalk at
different wettabilities using surfactants. Paper presented at the International Symposium
on Oilfield Chemistry.
Baran Jr, J. R., & Cabrera, O. J. (2006). Use of surface-modified nanoparticles for oil recovery:
Google Patents.
Bayat, A. E., Junin, R., Shamshirband, S., & Chong, W. T. (2015). Transport and retention of
engineered Al 2 O 3, TiO 2, and SiO 2 nanoparticles through various sedimentary rocks.
Scientific reports, 5, 14264.
Brunauer, S., Emmett, P. H., & Teller, E. (1938). Adsorption of gases in multimolecular layers.
Journal of the American chemical society, 60(2), 309-319.
Cashin, P., Mohaddes, K., Raissi, M., & Raissi, M. (2014). The differential effects of oil demand
and supply shocks on the global economy. Energy Economics, 44, 113-134.
Chengara, A., Nikolov, A. D., Wasan, D. T., Trokhymchuk, A., & Henderson, D. (2004).
Spreading of nanofluids driven by the structural disjoining pressure gradient. Journal of
colloid and interface science, 280(1), 192-201.
Cheraghian, G., & Hendraningrat, L. (2016). A review on applications of nanotechnology in the
enhanced oil recovery part B: effects of nanoparticles on flooding. International Nano
Letters, 6(1), 1-10.
Chu, C., Kirby, D., & Murphy, P. (1993). Interactions of amino silane with alumina and silica
substrates deposited from nonaqueous and aqueous media. Journal of Adhesion Science
and Technology, 7(5), 417-433.
Dai, C., Wang, X., Li, Y., Lv, W., Zou, C., Gao, M., & Zhao, M. (2017). Spontaneous imbibition
investigation of self-dispersing silica nanofluids for enhanced oil recovery in low-
permeability cores. Energy & Fuels, 31(3), 2663-2668.
de Haan, J. (1959). 25. Effect of Capillary Forces in the Water-Drive Process. Paper presented at
the 5th World Petroleum Congress.
Donaldson, E. C., Chilingarian, G. V., & Yen, T. F. (1989). Enhanced oil recovery, II: Processes
and operations: Elsevier.
167
Ehtesabi, H., Ahadian, M. M., Taghikhani, V., & Ghazanfari, M. H. (2013). Enhanced heavy oil
recovery in sandstone cores using TiO2 nanofluids. Energy & Fuels, 28(1), 423-430.
Esfandyari Bayat, A., Junin, R., Samsuri, A., Piroozian, A., & Hokmabadi, M. (2014). Impact of
metal oxide nanoparticles on enhanced oil recovery from limestone media at several
temperatures. Energy & Fuels, 28(10), 6255-6266.
Giraldo, J., Benjumea, P., Lopera, S., Cortes, F. B., & Ruiz, M. A. (2013). Wettability alteration
of sandstone cores by alumina-based nanofluids. Energy & fuels, 27(7), 3659-3665.
Hamouda, A. A., & Karoussi, O. (2008). Effect of temperature, wettability and relative
permeability on oil recovery from oil-wet chalk. Energies, 1(1), 19-34.
Hashemi, R., Nassar, N. N., & Almao, P. P. (2014). Nanoparticle technology for heavy oil in-situ
upgrading and recovery enhancement: Opportunities and challenges. Applied Energy, 133,
374-387.
Hendraningrat, L., Li, S., & Torsæter, O. (2013). A coreflood investigation of nanofluid enhanced
oil recovery. Journal of Petroleum Science and Engineering, 111, 128-138.
Hendraningrat, L., Li, S., & Torsater, O. (2013a). A coreflood investigation of nanofluid enhanced
oil recovery in low-medium permeability Berea sandstone. Paper presented at the SPE
International Symposium on Oilfield Chemistry.
Hendraningrat, L., Li, S., & Torsater, O. (2013b). Effect of some parameters influencing enhanced
oil recovery process using silica nanoparticles: An experimental investigation. Paper
presented at the SPE Reservoir Characterization and Simulation Conference and
Exhibition.
Hendraningrat, L., & Torsæter, O. (2014). Effects of the initial rock wettability on silica-based
nanofluid-enhanced oil recovery processes at reservoir temperatures. Energy & fuels,
28(10), 6228-6241.
Hendraningrat, L., & Torsæter, O. (2015). Metal oxide-based nanoparticles: revealing their
potential to enhance oil recovery in different wettability systems. Applied Nanoscience,
5(2), 181-199.
Hendraningrat, L., & Torsaeter, O. (2014). Unlocking the potential of metal oxides nanoparticles
to enhance the oil recovery. Paper presented at the Offshore Technology Conference-Asia.
Hethnawi, A., Nassar, N. N., Manasrah, A. D., & Vitale, G. (2017). Polyethylenimine-
functionalized pyroxene nanoparticles embedded on Diatomite for adsorptive removal of
dye from textile wastewater in a fixed-bed column. Chemical Engineering Journal, 320,
389-404.
Hethnawi, A., Nassar, N. N., & Vitale, G. (2017). Preparation and characterization of
polyethylenimine-functionalized pyroxene nanoparticles and its application in wastewater
treatment. Colloids and Surfaces A: Physicochemical and Engineering Aspects, 525, 20-
30.
Hmoudah, M., Nassar, N. N., Vitale, G., & El-Qanni, A. (2016). Effect of nanosized and surface-
structural-modified nano-pyroxene on adsorption of violanthrone-79. RSC Advances,
6(69), 64482-64493.
Hong, L., Jiang, S., & Granick, S. (2006). The simple method to produce Janus colloidal particles
in large quantity. Langmuir, 22(23), 9495-9499.
Hwang, Y., Lee, J.-K., Lee, J.-K., Jeong, Y.-M., Cheong, S.-i., Ahn, Y.-C., & Kim, S. H. (2008).
Production and dispersion stability of nanoparticles in nanofluids. Powder Technology,
186(2), 145-153.
168
Iijima, M., & Kamiya, H. (2009). Surface modification for improving the stability of nanoparticles
in liquid media. KONA Powder and Particle Journal, 27, 119-129.
Ivanova, A., Cheremisin, A., & Spasennykh, M. (2017). Application of Nanoparticles in Chemical
EOR. Paper presented at the IOR 2017-19th European Symposium on Improved Oil
Recovery.
Joonaki, E., & Ghanaatian, S. (2014). The application of nanofluids for enhanced oil recovery:
effects on interfacial tension and coreflooding process. Petroleum science and technology,
32(21), 2599-2607.
Ju, B., Fan, T., & Ma, M. (2006a). Enhanced oil recovery by flooding with hydrophilic
nanoparticles. China Particuology, 4(1), 41-46.
Ju, B., Fan, T., & Ma, M. (2006b). Enhanced oil recovery by flooding with hydrophilic
nanoparticles. China Particuology, 4(01), 41-46.
Kakaç, S., & Pramuanjaroenkij, A. (2009). Review of convective heat transfer enhancement with
nanofluids. International Journal of Heat and Mass Transfer, 52(13-14), 3187-3196.
Karimi, A., Fakhroueian, Z., Bahramian, A., Pour Khiabani, N., Darabad, J. B., Azin, R., & Arya,
S. (2012). Wettability alteration in carbonates using zirconium oxide nanofluids: EOR
implications. Energy & fuels, 26(2), 1028-1036.
Li, K., & Horne, R. N. (2002). A Scaling Method of Spontaneous Imbibition in Systems with
Different Wettability. Paper presented at the International Symposium of the Society of
Core Analysts, California, USA.
Li, S., Hendraningrat, L., & Torsaeter, O. (2013). Improved oil recovery by hydrophilic silica
nanoparticles suspension: 2 phase flow experimental studies. Paper presented at the IPTC
2013: International Petroleum Technology Conference.
Li, Y., Dai, C., Zhou, H., Wang, X., Lv, W., & Zhao, M. (2017). Investigation of spontaneous
imbibition by using a surfactant-free active silica water-based nanofluid for enhanced oil
recovery. Energy & Fuels, 32(1), 287-293.
Liu, Q., Dong, M., Ma, S., & Tu, Y. (2007). Surfactant enhanced alkaline flooding for Western
Canadian heavy oil recovery. Colloids and Surfaces A: Physicochemical and Engineering
Aspects, 293(1-3), 63-71.
Luo, D., Wang, F., Zhu, J., Cao, F., Liu, Y., Li, X., . . . Ren, Z. (2016). Nanofluid of graphene-
based amphiphilic Janus nanosheets for tertiary or enhanced oil recovery: High
performance at low concentration. Proceedings of the National Academy of Sciences,
113(28), 7711-7716.
Luo, D., Wang, F., Zhu, J., Tang, L., Zhu, Z., Bao, J., . . . Ren, Z. (2017). Secondary oil recovery
using graphene-based amphiphilic Janus nanosheet fluid at an ultralow concentration.
Industrial & Engineering Chemistry Research, 56(39), 11125-11132.
Manan, M., Farad, S., Piroozian, A., & Esmail, M. (2015). Effects of nanoparticle types on carbon
dioxide foam flooding in enhanced oil recovery. Petroleum Science and Technology,
33(12), 1286-1294.
Manrique, E. J., Thomas, C. P., Ravikiran, R., Izadi Kamouei, M., Lantz, M., Romero, J. L., &
Alvarado, V. (2010). EOR: current status and opportunities. Paper presented at the SPE
improved oil recovery symposium.
Mattax, C. C., & Kyte, J. (1962). Imbibition oil recovery from the fractured, water-driven
reservoir. Society of Petroleum Engineers Journal, 2(02), 177-184.
169
McElfresh, P. M., Holcomb, D. L., & Ector, D. (2012). Application of nanofluid technology to
improve recovery in oil and gas wells. Paper presented at the SPE International Oilfield
Nanotechnology Conference and Exhibition.
Mittal, K. L. (2004). Silanes and Other Coupling Agents, Volume 3: CRC Press.
Mohammed, M., & Babadagli, T. (2015). Wettability alteration: A comprehensive review of
materials/methods and testing the selected ones on heavy-oil containing oil-wet systems.
Advances in colloid and interface science, 220, 54-77.
Morrow, N. R., & Mason, G. (2001). Recovery of oil by spontaneous imbibition. Current Opinion
in Colloid & Interface Science, 6(4), 321-337.
Nafie, G., Vitale, G., Carbognani Ortega, L., & Nassar, N. N. (2017). Nanopyroxene grafting with
β-Cyclodextrin monomer for wastewater applications. ACS applied materials & interfaces,
9(48), 42393-42407.
Nazari Moghaddam, R., Bahramian, A., Fakhroueian, Z., Karimi, A., & Arya, S. (2015).
Comparative study of using nanoparticles for enhanced oil recovery: wettability alteration
of carbonate rocks. Energy & Fuels, 29(4), 2111-2119.
Office, G. P. (2016). International Energy Outlook 2016: With Projections to 2040: Government
Printing Office.
Olajire, A. A. (2014). Review of ASP EOR (alkaline surfactant polymer enhanced oil recovery)
technology in the petroleum industry: Prospects and challenges. Energy, 77, 963-982.
Onyekonwu, M. O., & Ogolo, N. A. (2010). Investigating the use of nanoparticles in enhancing
oil recovery. Paper presented at the Nigeria Annual international conference and
exhibition.
Papirer, E., & Balard, H. (1990). Influence of surface chemistry and surface morphology on the
acid-base interaction capacities of glass fibres and silica. Journal of Adhesion Science and
Technology, 4(1), 1-371.
Polikar, M., Ferracuti, F., Decastro, V., Puttagunta, R., & Ali, S. (1986). Effect of temperature on
bitumen-water endpoint relative permeabilities and saturations. Journal of Canadian
Petroleum Technology, 25(05).
Pope, G. A., & Baviere, M. (1991). Reduction of capillary forces by surfactants (Vol. 33): Elsevier
Applied Science.
Rabiei, A., Sharifinik, M., Niazi, A., Hashemi, A., & Ayatollahi, S. (2013). Core flooding tests to
investigate the effects of IFT reduction and wettability alteration on oil recovery during
MEOR process in an Iranian oil reservoir. Applied microbiology and biotechnology,
97(13), 5979-5991.
Ranka, M., Brown, P., & Hatton, T. A. (2015). Responsive stabilization of nanoparticles for
extreme salinity and high-temperature reservoir applications. ACS applied materials &
interfaces, 7(35), 19651-19658.
Rose, W., & Witherspoon, P. A. (1957). Studies of waterflood performance: Department of
Registration and Education of the State of Illinois.
Saidur, R., Leong, K., & Mohammad, H. (2011). A review on applications and challenges of
nanofluids. Renewable and Sustainable Energy Reviews, 15(3), 1646-1668.
Salon, M.-C. B., Bayle, P.-A., Abdelmouleh, M., Boufi, S., & Belgacem, M. N. (2008). Kinetics
of hydrolysis and self-condensation reactions of silanes by NMR spectroscopy. Colloids
and Surfaces A: Physicochemical and Engineering Aspects, 312(2-3), 83-91.
170
Schechter, D., Denqen, Z., & Orr Jr, F. (1991). Capillary imbibition and gravity segregation in
low IFT systems. Paper presented at the SPE Annual Technical Conference and Exhibition.
Schechter, D., & Zhou, D. (1994). Orr Jr FM. J. Pet. Sci. Eng., 1994, 11.
Schechter, D., Zhou, D., & Orr Jr, F. (1994). Low IFT drainage and imbibition. Journal of
Petroleum Science and Engineering, 11(4), 283-300.
Sheng, J. J. (2015). Status of surfactant EOR technology. Petroleum, 1(2), 97-105.
Shouxiang, M., Morrow, N. R., & Zhang, X. (1997). Generalized scaling of spontaneous
imbibition data for strongly water-wet systems. Journal of Petroleum Science and
Engineering, 18(3-4), 165-178.
Sinnokrot, A. A., Ramey Jr, H. J., & Marsden Jr, S. (1971). Effect of temperature level upon
capillary pressure curves. Society of Petroleum Engineers Journal, 11(01), 13-22.
Standnes, D. C., Nogaret, L. A., Chen, H.-L., & Austad, T. (2002). An evaluation of spontaneous
imbibition of water into oil-wet carbonate reservoir cores using a nonionic and a cationic
surfactant. Energy & Fuels, 16(6), 1557-1564.
Suleimanov, B., Ismailov, F., & Veliyev, E. (2011). Nanofluid for enhanced oil recovery. Journal
of Petroleum Science and Engineering, 78(2), 431-437.
Taber, J., Martin, F., & Seright, R. (1997). EOR screening criteria revisited—part 2: applications
and impact of oil prices. SPE Reservoir Engineering, 12(03), 199-206.
Tang, G., & Morrow, N. R. (1997). Salinity, temperature, oil composition, and oil recovery by
waterflooding. SPE Reservoir Engineering, 12(04), 269-276.
Terry, R. E. (2001). Enhanced oil recovery. Encyclopedia of physical science and technology, 18,
503-518.
Thomas, S. (2008). Enhanced oil recovery-an overview. Oil & Gas Science and Technology-Revue
de l'IFP, 63(1), 9-19.
Torsater, O., Li, S., & Hendraningrat, L. (2013). Effect of Some Parameters Influencing Enhanced
Oil Recovery Process using Silica Nanoparticles, SPE Reservoir Characterization and
Simulation Conference and Exhibition. Abu Dhabi, UAE, 16-18.
Vitale, G. (2013). Iron Silicate Nano-Crystals as Potential Catalysts or Adsorbents for Heavy
Hydrocarbons Upgrading. University of Calgary.
Wagner, O., & Leach, R. O. (1966). Effect of interfacial tension on displacement efficiency.
Society of Petroleum Engineers Journal, 6(04), 335-344.
Wasan, D., Nikolov, A., & Kondiparty, K. (2011). The wetting and spreading of nanofluids on
solids: Role of the structural disjoining pressure. Current Opinion in Colloid & Interface
Science, 16(4), 344-349.
Wasan, D. T., & Nikolov, A. D. (2003). Spreading of nanofluids on solids. Nature, 423(6936),
156.
Weaver, K. D., Stoffer, J. O., & Day, D. E. (1995). Interfacial bonding and optical transmission
for transparent fibreglass/poly (methyl methacrylate) composites. Polymer composites,
16(2), 161-169.
Wong, K. V., & De Leon, O. (2010). Applications of nanofluids: current and future. Advances in
Mechanical Engineering, 2, 519659.
Yang, J., Ji, S., Li, R., Qin, W., & Lu, Y. (2015). Advances of nanotechnologies in the oil and gas
industries. Energy Exploration & Exploitation, 33(5), 639-657.
171
Zhang, H., Nikolov, A., & Wasan, D. (2014). Enhanced oil recovery (EOR) using nanoparticle
dispersions: underlying mechanism and imbibition experiments. Energy & fuels, 28(5),
3002-3009.
Zhang, L.-h., Tong, J., Xiong, Y., & Zhao, Y.-l. (2017). Effect of temperature on the oil-water
relative permeability for sandstone reservoirs. International Journal of Heat and Mass
Transfer, 105, 535-548.
Zhao, J., Milanova, M., Warmoeskerken, M. M., & Dutschk, V. (2012). Surface modification of
TiO2 nanoparticles with silane coupling agents. Colloids and Surfaces A: Physicochemical
and Engineering Aspects, 413, 273-279.
172
Chapter Five: Hydroxyl-Functionalized Silicate-Based Nanofluids for Enhanced Oil
Recovery
5.1 Abstract
During the production life of a reservoir, wettability alteration from an oil-wet to a strongly water-
wet condition and/or lowering the interfacial tension (IFT) between the water and oil phases is
required at various stages to enhance oil recovery (EOR). Several chemical agents as potential
wettability modifiers (e.g., surfactants and polymers) have been regarded and widely used in oil-
wet systems. Recently, various nano-fluids, prepared by dispersing nanoparticles in brine solutions
or solvents, have attracted attention as injecting fluid due to their unique properties. A large
number of nanoparticles are being investigated for EOR applications either as stand-alone or in
combination with surfactants and/or polymers. Because of its stability in brine even at low
concentrations, totally or partially hydroxyl-functionalized nano-pyroxenes are capable of
recovering additional oil after water flooding. However, the influence of their concentration on
various parameters has not been previously investigated. Thus, in this study, we investigated the
influence of nano-pyroxene on wettability, IFT and asphaltene aggregation. Wettability
measurements were performed by contact angle measurements, imbibition experiments and
wettability index to understand the underlying mechanisms. The interaction between
nanopyroxene and asphaltene size distribution was investigated as a function of nanopyroxene
concentration by dynamic light scattering (DLS) measurements. Results from the IFT
measurements, contact angle, imbibition experiments and core flooding tests confirm that
nanopyroxene affects oil recovery. Contact angle and wettability index measurements confirmed
that adsorption of the nanoparticles on the rock surfaces alters the wettability from intermediate
wet to stronger water-wet in the absence and presence of initial water films. In the presence of
irreducible water saturation during wettability index measurements, depending on the brine
composition and pH, initial alteration with ageing resulted in a mixed or intermediate wet that
changed to stronger water-wet as the nanopyroxene concentration increased. Moreover, increasing
the concentration of nanopyroxene resulted in a noticeable IFT reduction but not an ultra-low range
that can remobilize trapped oil due to higher capillary forces. Core flooding tests indicated that
nanopyroxene-based nanofluid injection offers ∼ 12-14.5 % additional oil in addition to
waterflooding.
KEYWORDS: Silicate, nanopyroxene, nanofluids, imbibition, enhanced oil recovery
This chapter was adapted from the following publication:
Farad Sagala, Afif Hethnawi, Nashaat N. Nassar. Hydroxyl silicate-based nanofluids for Enhanced
oil recovery, Published in Fuel, 2020. https://doi.org/10.1016/j.fuel.2020.117462
173
5.2. Introduction
The demand for oil as an energy source has been raising over the last few decades(Melichar &
Atems, 2019). Even though the oil and gas industry faced some challenges in the last five years
arising from unstable oil prices, it continues to play an important role in terms of energy supply.
However, the unpredictable oil price translates itself into the need for more efficient, cost-effective
and environmentally harmless ways of producing hydrocarbons (Thorbecke, 2019). Conventional
oil production is declining, and exploration of new oil fields is also plummeting; thus, EOR
techniques are required to extend the production of mature and already producing
reservoirs(Babadagli, 2007; Miller & Sorrell, 2014; Muggeridge et al., 2014). Chemical flooding
is a commonplace technology that has been extensively used for the past years in EOR(Shutang &
Qiang, 2010). Through injecting certain chemicals (e.g., alkaline, surfactants, and polymers),
better recovery is achieved due to the improvement of the mobility ratio, reduction of the IFT, and
the wettability alteration of the rock (Sheng, 2014). For instance, the employment of water-soluble
polymers to recover the tapped oil results in a mobility ratio of less than one. However, most of
the oil is still trapped or adsorbed into the rock surface, because of the high capillary forces that
arise due to oil-wet rock and high oil/water IFT(Green & Willhite, 1998). Moreover, conventional
EOR techniques such as alkaline flooding, surfactant flooding, polymer flooding, or a combination
of one or more of these methods have other challenges (Katende & Sagala, 2019; Zhu, 2015). High
chemical consumption is among the commonly reported problems of chemical EOR. This is
attributed to the reservoir heterogeneities, dilution with resident water, adsorption of chemicals on
rock surfaces, chromatographic separation of the mixture, imbalanced salinity in the reservoir and
breakdown of the chemicals by bacteria and its adsorption on the rock surface (Green & Willhite,
1998). Applying the conventional EOR flooding fluids individually or together not only has
174
limited success in increasing the sweep and displacement efficiency but also adds extra operational
and capital costs to the EOR process. Furthermore, crude oils compounds such as asphaltenes and
resins, due to change in reservoir properties such as pressure and temperature, tend to interact with
rock surface resulting in wettability alteration from initial water-wet to oil-wet which lowers the
microscopic displacement efficiency (J. Buckley, Liu, & Monsterleet, 1998; Collins & Melrose,
1983). In oil-wet reservoirs, spontaneous imbibition of water is not possible due to negative or
smaller capillary forces (Standnes & Austad, 2000b). In such situations, even during water
injection, water bypasses the oil without displacing any significant amount of oil, resulting in poor
sweep efficiency and early water breakthrough (W. Anderson, 1986). As such, efficient EOR
techniques are required to mitigate these problems. Nanoparticles, in the form of nanofluids, are
proposed as an alternative flooding fluid for EOR because of their potential ability to exhibit
exceptional properties, owing to their small size and large surface area as well as dispersion ability
(Kong & Ohadi, 2010). The high dispersion of stable nanoparticles depends on its functionality
and interparticle interactions (Sagala, Montoya, Hethnawi, Vitale, & Nassar, 2019). Nanofluids
have been evidenced in the past decade, to offer tremendous advantages; they are thermally stable,
highly reactive and offer favourable catalytic properties compared to the existing chemicals used
in EOR (Hashemi, Nassar, & Almao, 2014; Nassar, Hassan, & Pereira-Almao, 2011). Moreover,
depending on the nanomaterial type, nanoparticles possess superficial ionic exchange properties
that permit surface modification by grafting different organic groups on their surface which can
improve their performance, especially in harsh reservoir conditions (Ranka, Brown, & Hatton,
2015; Sagala et al., 2019). EOR mechanism(s) for nanofluids have been reported in the literature
(Karimi et al., 2012). Underlying mechanisms include viscosity reduction,(Ehtesabi, Ahadian,
Taghikhani, & Ghazanfari, 2013) wettability alteration,(Karimi et al., 2012; Sagala et al., 2019)
175
IFT reduction,(Joonaki & Ghanaatian, 2014) structural disjoining pressure,(Wasan, Nikolov, &
Kondiparty, 2011) asphaltene inhibition formation damage,(Mohammadi et al., 2011) etc, Giraldo
et al. (Giraldo, Benjumea, Lopera, Cortes, & Ruiz, 2013) postulated that alumina-based nanofluids
can significantly alter an induced strong oil-wet wettability in sandstone cores to a water-wet state.
The authors also found that the effectiveness of anionic surfactants as wettability modifiers can be
improved by adding a relatively low concentration of alumina nanoparticles. Teng et al. (Lu, Li,
Zhou, & Zhang, 2017) studied the performance of silicon dioxide (SiO2) nanofluids in low
permeability sandstone cores. The authors found that cyclic nanofluid injection can provide higher
tertiary oil recovery than continuous nanofluid injection. Approximately 4.48-10.33% of
additional oil could be recovered during the nanofluid injection. However, many nanomaterials
are produced with rare metals and/or expensive ones that are not suitable for large scale
implementation for the oil and gas industry applications. Therefore, more environmental-friendly,
and inexpensive practical materials must be produced. Tailor-made mineral-like nanomaterials,
compatible with the environment with an economical-feasible synthesis method, should be
considered as well.
In this study, iron-silicate pyroxene materials, known as aegirine (NaFeSi2O6), comply with the
aforementioned requirements and offer cheap options for large scale commercialization are
considered (Vitale, 2013). In comparison to silica nanoparticles, that are commonly used for EOR
applications(Cheraghian, Kiani, Nassar, Alexander, & Barron, 2017), pyroxene nanoparticles do
not require well-monitored synthesis conditions (e.g., calcination at higher temperatures and
freeze-drying like in the case of silica)(Rahman & Padavettan, 2012). Silica nanoparticles, without
surface coating or functionalization, are characterized by having a high tendency to agglomerate
due to lack of stability, especially in high salinity and at high-temperature conditions(Miranda,
176
Lara, & Tonetto, 2012). In term of synthesis, nanopyroxene materials can be prepared at mild
hydrothermal conditions and require no calcination which offers options for scalability for pilot
and field applications(Vitale, 2013). As characterized previously, nanopyroxene surface has a
superficial ion exchange capabilities, permitting its surface modification (Vitale, 2013). Thus,
nanopyroxene can be considered as a better alternative for silica nanoparticles for EOR
applications. In our previous study, totally hydroxyl tri-ethoxy- octyl-silane functionalized-
nanopyroxene, compared with partially and non-functionalized nano-pyroxene, has proven to
enhance the recovery of additional oil from a sandstone core by spontaneous imbibition and core
flooding tests (Sagala et al., 2019). It has been reported that adding the functionalized
nanopyroxene to brine was capable of reducing the IFT and alter the oil-wet induced wettability
to water-wet (Sagala et al., 2019). The results obtained from the core flood revealed that, in the
presence of brine, nanoparticle type as well as their functionality, played an important role in the
oil recovery. Similar to our previous study, core flooding experiments have been reported to
describe the influence of different parameters of nanoparticle injection on oil recovery
(Hendraningrat, Li, & Torsæter, 2013; Hendraningrat, Li, & Torsater, 2013). However, these
studies lack the understanding of how oil recovery is affected by nanoparticles at different initial
wetting conditions using both static and dynamic experiments, especially in sandstone reservoirs.
Moreover, the effect of initial brine composition and pH on the initial rock wettability and how
the rock wettability may alter when contacted with oil containing polar components in the presence
and absence of nanoparticles is not clearly understood. Herein, in continuation of our previous
work, the role of pyroxene-based nanofluid for EOR applications in Berea sandstone cores under
the influence of various hydrodynamic and wetting conditions is being investigated. Thus, the
effects of different initial wetting conditions using various concentrations of fully
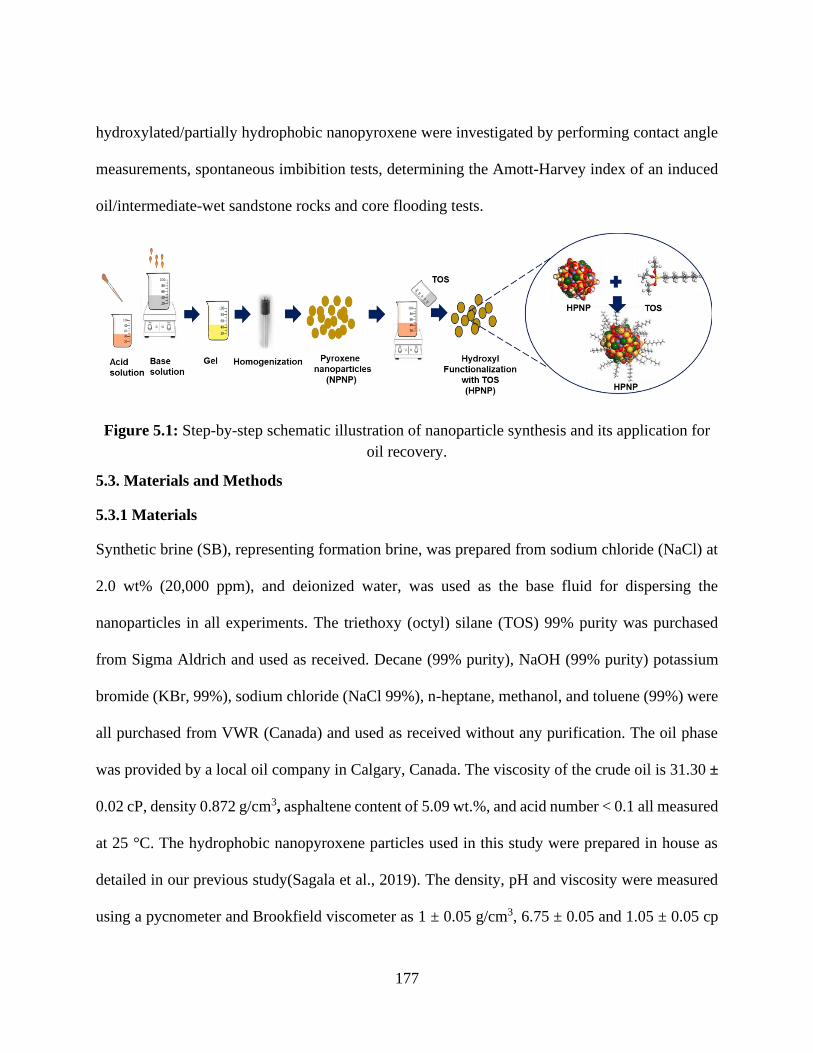
177
hydroxylated/partially hydrophobic nanopyroxene were investigated by performing contact angle
measurements, spontaneous imbibition tests, determining the Amott-Harvey index of an induced
oil/intermediate-wet sandstone rocks and core flooding tests.
Figure 5.1: Step-by-step schematic illustration of nanoparticle synthesis and its application for
oil recovery.
5.3. Materials and Methods
5.3.1 Materials
Synthetic brine (SB), representing formation brine, was prepared from sodium chloride (NaCl) at
2.0 wt% (20,000 ppm), and deionized water, was used as the base fluid for dispersing the
nanoparticles in all experiments. The triethoxy (octyl) silane (TOS) 99% purity was purchased
from Sigma Aldrich and used as received. Decane (99% purity), NaOH (99% purity) potassium
bromide (KBr, 99%), sodium chloride (NaCl 99%), n-heptane, methanol, and toluene (99%) were
all purchased from VWR (Canada) and used as received without any purification. The oil phase
was provided by a local oil company in Calgary, Canada. The viscosity of the crude oil is 31.30 ±
0.02 cP, density 0.872 g/cm3, asphaltene content of 5.09 wt.%, and acid number < 0.1 all measured
at 25 °C. The hydrophobic nanopyroxene particles used in this study were prepared in house as
detailed in our previous study(Sagala et al., 2019). The density, pH and viscosity were measured
using a pycnometer and Brookfield viscometer as 1 ± 0.05 g/cm3, 6.75 ± 0.05 and 1.05 ± 0.05 cp
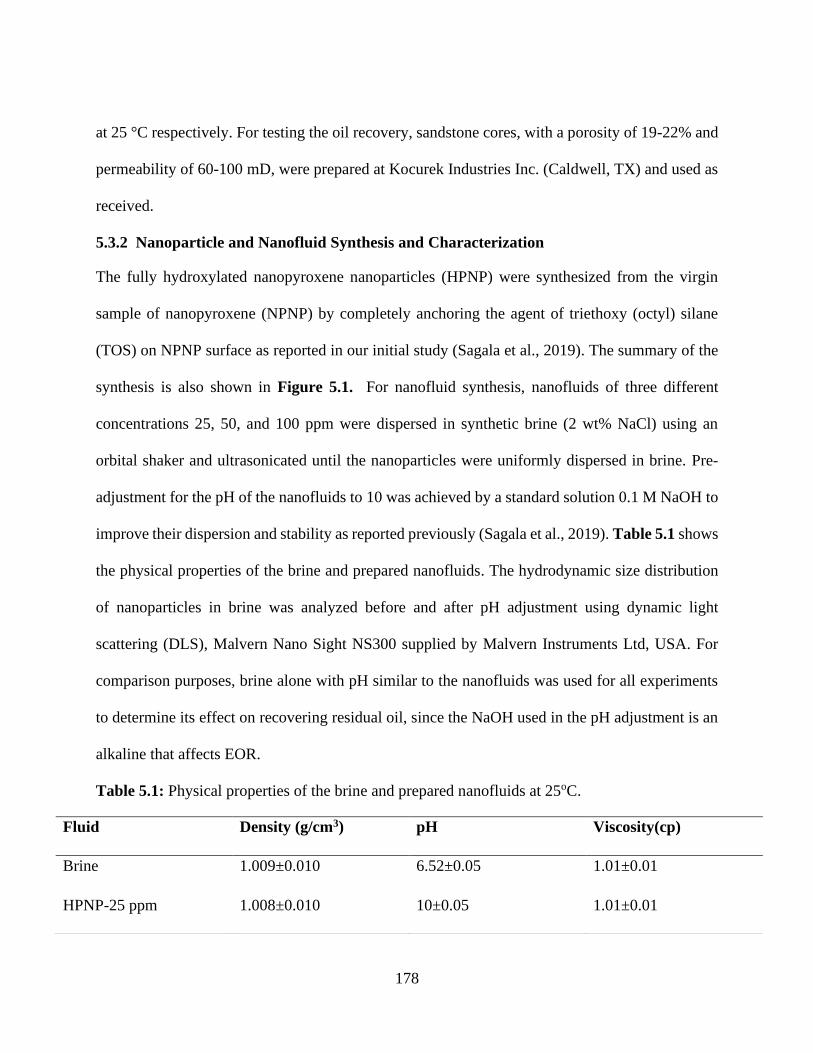
178
at 25 °C respectively. For testing the oil recovery, sandstone cores, with a porosity of 19-22% and
permeability of 60-100 mD, were prepared at Kocurek Industries Inc. (Caldwell, TX) and used as
received.
5.3.2 Nanoparticle and Nanofluid Synthesis and Characterization
The fully hydroxylated nanopyroxene nanoparticles (HPNP) were synthesized from the virgin
sample of nanopyroxene (NPNP) by completely anchoring the agent of triethoxy (octyl) silane
(TOS) on NPNP surface as reported in our initial study (Sagala et al., 2019). The summary of the
synthesis is also shown in Figure 5.1. For nanofluid synthesis, nanofluids of three different
concentrations 25, 50, and 100 ppm were dispersed in synthetic brine (2 wt% NaCl) using an
orbital shaker and ultrasonicated until the nanoparticles were uniformly dispersed in brine. Pre-
adjustment for the pH of the nanofluids to 10 was achieved by a standard solution 0.1 M NaOH to
improve their dispersion and stability as reported previously (Sagala et al., 2019). Table 5.1 shows
the physical properties of the brine and prepared nanofluids. The hydrodynamic size distribution
of nanoparticles in brine was analyzed before and after pH adjustment using dynamic light
scattering (DLS), Malvern Nano Sight NS300 supplied by Malvern Instruments Ltd, USA. For
comparison purposes, brine alone with pH similar to the nanofluids was used for all experiments
to determine its effect on recovering residual oil, since the NaOH used in the pH adjustment is an
alkaline that affects EOR.
Table 5.1: Physical properties of the brine and prepared nanofluids at 25oC.
Fluid Density (g/cm3) pH Viscosity(cp)
Brine 1.009±0.010 6.52±0.05 1.01±0.01
HPNP-25 ppm 1.008±0.010 10±0.05 1.01±0.01
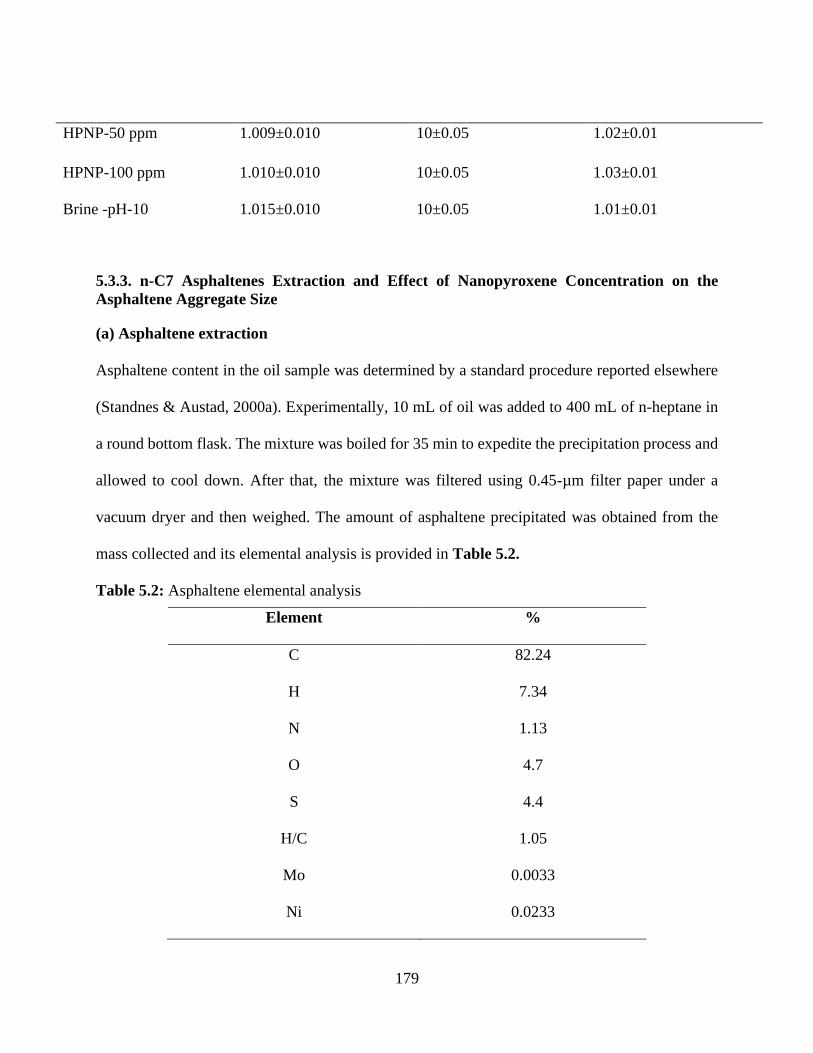
179
5.3.3. n-C7 Asphaltenes Extraction and Effect of Nanopyroxene Concentration on the
Asphaltene Aggregate Size
(a) Asphaltene extraction
Asphaltene content in the oil sample was determined by a standard procedure reported elsewhere
(Standnes & Austad, 2000a). Experimentally, 10 mL of oil was added to 400 mL of n-heptane in
a round bottom flask. The mixture was boiled for 35 min to expedite the precipitation process and
allowed to cool down. After that, the mixture was filtered using 0.45-µm filter paper under a
vacuum dryer and then weighed. The amount of asphaltene precipitated was obtained from the
mass collected and its elemental analysis is provided in Table 5.2.
Table 5.2: Asphaltene elemental analysis
Element %
C 82.24
H 7.34
N 1.13
O 4.7
S 4.4
H/C 1.05
Mo 0.0033
Ni 0.0233
HPNP-50 ppm 1.009±0.010 10±0.05 1.02±0.01
HPNP-100 ppm
Brine -pH-10
1.010±0.010
1.015±0.010
10±0.05
10±0.05
1.03±0.01
1.01±0.01
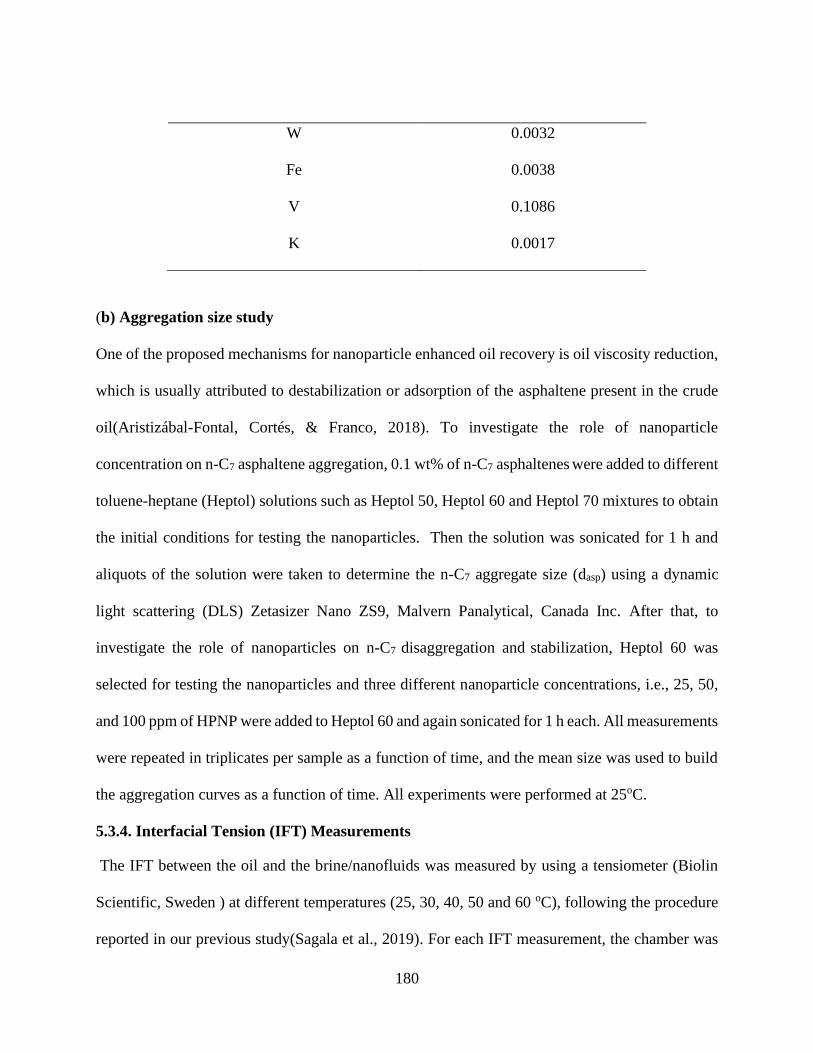
180
W 0.0032
Fe 0.0038
V 0.1086
K 0.0017
(b) Aggregation size study
One of the proposed mechanisms for nanoparticle enhanced oil recovery is oil viscosity reduction,
which is usually attributed to destabilization or adsorption of the asphaltene present in the crude
oil(Aristizábal-Fontal, Cortés, & Franco, 2018). To investigate the role of nanoparticle
concentration on n-C7 asphaltene aggregation, 0.1 wt% of n-C7 asphaltenes were added to different
toluene-heptane (Heptol) solutions such as Heptol 50, Heptol 60 and Heptol 70 mixtures to obtain
the initial conditions for testing the nanoparticles. Then the solution was sonicated for 1 h and
aliquots of the solution were taken to determine the n-C7 aggregate size (dasp) using a dynamic
light scattering (DLS) Zetasizer Nano ZS9, Malvern Panalytical, Canada Inc. After that, to
investigate the role of nanoparticles on n-C7 disaggregation and stabilization, Heptol 60 was
selected for testing the nanoparticles and three different nanoparticle concentrations, i.e., 25, 50,
and 100 ppm of HPNP were added to Heptol 60 and again sonicated for 1 h each. All measurements
were repeated in triplicates per sample as a function of time, and the mean size was used to build
the aggregation curves as a function of time. All experiments were performed at 25oC.
5.3.4. Interfacial Tension (IFT) Measurements
The IFT between the oil and the brine/nanofluids was measured by using a tensiometer (Biolin
Scientific, Sweden ) at different temperatures (25, 30, 40, 50 and 60 oC), following the procedure
reported in our previous study(Sagala et al., 2019). For each IFT measurement, the chamber was
181
filled with the aqueous phase. Then, an oil droplet was created through a needle and the IFT
measured by using the pendant drop technique. IFT was determined for a given time interval. All
measurements were repeated in triplicates, and the mean ± standard error (5%) of the mean was
reported.
5.3.5 Preparation of the Oil-Wet Cores Plugs, Substrates and Pre-Saturation
Berea sandstone core plugs with 2.54 cm diameter and an average length of 4.0 cm were used to
perform imbibition experiments. Before imbibition experiments, all cores were first dried up to 90
oC to obtain a constant weight. The initial weights of the dried cores were measured. Two
saturation procedures were followed before imbibition experiments: (1) cores with 100% initial
oil saturation and (2) cores with irreducible water saturation. For 100% saturated cores, oil
saturation using a vacuum pump for 24 h was used and full core oil saturation was obtained. The
porosity of the fully oil-saturated cores was recalculated with respect to oil to confirm full core
saturation using the weight difference between the dry and fully saturated cores, bulk volume, and
oil density. For cores with initial water saturation or at irreducible water saturation (Swi), dry
cylindrical cores were saturated with brine under vacuum for 24 h. After that, pore volume (PV)
and porosity were determined from the weight difference, which was obtained from brine density
and bulk volume. To establish ionic equilibrium between brine and the rock constituents, brine
saturated cores were left soaked in the same brine solution for about 5 days. After that, cores were
mounted in the Hasler core holder and flooded with oil in all directions to alleviate end effects. To
drive the core plugs to irreducible brine saturation, oil flooding at lower injection rates of 0.05
cm3/min and, confining pressure, not more than 500 psi was used. Using this method, cores could
remain consistently saturated with initial water close to 25-30%. The oil injection pressure was in
the range of 50 to 66 psi. This last procedure was also used in measuring the wettability index as
182
proposed by Anderson et al (W. Anderson, 1986). After establishing initial oil saturations with the
designated crude oil, the cores were completely submerged in a solution of oil and n-heptane to
cause surface precipitation of asphaltene on the mineral surface to alter the initial wettability. The
fully saturated cores (100% oil saturation) were aged at 80°C for 20 days in a closed container.
Using initial core weights before oil saturation, the oil initially in place (OIIP) was obtained after
the ageing period. To avoid the escape of light ends during the ageing process, the ageing container
was covered with aluminium foil and sealed with high-temperature glue. Table B1 of Appendix B
shows the summary of the cores used in the imbibition experiments.
5.3.6. Contact Angle and Spontaneous Imbibition of Oil Wet Sandstone Rocks
To assess the effect of nanoparticle concentration on the contact angle, the wettability of the core
plugs before and after the treatment with different concentrations of nanofluids was evaluated by
contact angle measurements. Sandstone substrates were cut, then aged in a mixture of 1:40 solution
of crude oil/n-heptane at 80 oC and atmospheric pressure for 24 h. Later, the substrates were dried
in an oven for 6 h at 60 oC. Oil aged substrates were then submerged into the prepared brine, brine
at pH 10 or nanofluids of different concentrations (25, 50 and 100 ppm) for 48 h at 60 oC. Each
substrate was dried in an oven at 60 oC for 24 h. Contact angle measurements between sandstone
substrate and brine or nanofluids of different concentrations and oil drop system of the substrates
treated with either brine or different nanofluids were performed with an accuracy of ±3o. The
angles were then analyzed to quantify the effect of the nanofluid concentration on contact angle
and wettability alteration.
Wettability alteration was also quantified using spontaneous imbibition tests to support the contact
angle measurement results with cores 100% saturated with oil. Imbibition experiments were
performed using Amott cell to assess the performance of variously prepared nanofluids in altering
183
the wettability of the oil-wet core plugs in comparison to brine or brine at pH 10. The cores were
immersed in imbibition cells, which were filled with either brine or various concentrations of
nanofluids. The imbibition experiments were conducted at 60oC. The produced oil volume from
the cores as the fluids spontaneously imbibe in the cores was expressed as a percentage of original
oil in place (% of OOIP) and was plotted against time.
5.3.7. Effect of Nanopyroxene Concentration on Wettability Index
To evaluate the effect of nanopyroxene concentration on the wettability index, the Amott-Harvey
relative displacement index method was used (W. Anderson, 1986). Cores were first driven with
oil to irreducible water saturations close to 25% by core flooding as discussed in Section 2.5. To
investigate the role of nanoparticle concentration on the wettability index, brine was injected into
the core and later displaced with oil to reduce the core plugs to irreducible water saturation (IWS).
Then, the oil-saturated cores were immersed in standard Amott cells containing either brine, brine
at pH 10 or nanofluids of different concentrations. The volume of oil displaced by spontaneous
imbibition of the imbibing fluids was measured as the volume of produced oil reached a constant
value (𝑣𝑜𝑠𝑝). Then, the core was mounted in a hassler core holder and brine or nanofluid was
injected to forcefully displace any remaining oil. The volume of oil displaced by brine or
nanofluids was recorded as 𝑣𝑜𝑓. After that, the same brine saturated core plug from the previous
test was immersed in oil. The volume of brine produced by spontaneous imbibition of oil was
measured as the volume of produced brine reached a constant value 𝑣𝑤𝑠𝑝. Finally, the core was
again oil-flooded forcefully to displace any movable brine/nanofluids and the amount of brine
displaced by forced imbibition of oil was measured 𝑣𝑤𝑓. The difference between displacement by
water ratio 𝐼𝑤 and displacement by oil ratio 𝐼𝑜 gives the Amott-Harvey relative displacement index
184
𝑊𝐼 (Equation 5.1). Properties of the used core plugs for the imbibition test are listed in Table B2
of Appendix B. The produced oil was measured with an accuracy of ± 0.05 mL due to errors that
may have occurred during core saturation and when reading the volumes of the produced oil during
spontaneous and forced imbibition. The Amott-Harvey relative displacement index 𝑊𝐼 was then
used to quantify the wettability of the rock with and without nanoparticles.
𝑊𝐼 = 𝐼𝑤 − 𝐼𝑜 =𝑣𝑜𝑠𝑝
𝑣𝑜𝑇−
𝑣𝑤𝑠𝑝
𝑣𝑤𝑇 (5.1)
5.3.8. Effect of Initial Water Saturation and pH on Wettability Alteration
To determine the wettability index, cores were first driven to irreducible water saturation as
proposed by Anderson (W. Anderson, 1986). However, the presence of initial water saturation,
composition and pH affects wettability during the ageing process. Therefore, we investigated their
effects before imbibition with various fluids; even though many researchers(Nazari Moghaddam,
Bahramian, Fakhroueian, Karimi, & Arya, 2015; Zhang, Nikolov, & Wasan, 2014) conducted
imbibition studies and created initial oil-wet conditions in the laboratory using 100% fully
saturated oil core plugs. In reality, reservoirs contain initial water saturation with various ions.
Therefore, it is important to investigate the effect of this initial water saturation, composition and
pH on wettability alteration and later determine the role of nanopyroxene-based nanofluids on
wettability reversal.
To investigate the effect of pH on wettability alteration in the presence of monovalent ions, a test
known as the bottle test was used as reported elsewhere (Dubey & Doe, 1993). Crushed sandstone
rock was used as a sample. Pre-treatment procedure was followed to prevent leaching of ions from
the glass to the actual test solution. Eight glass vials (one for each pH to be tested) were
equilibrated with 4 cc of the test brine and left for 48 h. The brine was then discarded. After that,
185
4 g of sand were added to each empty vial and equilibrated for 48 h with a new brine of appropriate
pH. Brine was then withdrawn and saved in the second series of vials. Then, oil was added in each
vial containing the sand and vigorously shaken to mix oil with the wet sand. Shaking was
performed twice a day and then brine was added back to the vials. With this technique, a water-
wet system could be identified when oil floats on top and sand is left at the bottom. For a non-
water wet case, oil sticks on the sand and sand appear to be discolored or saturated with oil as
shown in Figure B1 in Appendix B. The experiment was performed at 25oC.
5.3.9. Core Flooding Experiments
Figure. 5.2 shows a schematic representation of the core flooding experimental setup. The core
flooding tests aimed to evaluate the capability of nanopyroxene-based nanofluids as potential
agents of enhancing oil recovery in sandstone reservoir rocks after water flooding with various
concentrations. At the beginning of each test, a core was inserted in the sleeve and then mounted
in the core-holder. Low pressure (~250 psi) CO2 gas was passed through the sample for 1 h.
Because of its high diffusivity, CO2 can displace and replace any air trapped in the pores. The
remaining CO2 after evacuation would readily be dissolved in the saturating dead brine and
evacuated from the core sample during the later in-situ saturation process. After flushing the
sample with CO2, all the flowlines and the sample inside the core-holder were evacuated using a
vacuum pump for 6 h. Then, the core sample was saturated using brine, confining pressure was
kept at 600 psi and the injection rate was set to 0.2 cm3/min. The injection rate approximates typical
reservoir velocities (corresponding to a Darcy velocity of 1ft/day). (Ahmed, 2018) The average
steady pressure drop was obtained and used in the estimation of the absolute permeability using
Darcy’s law. Then, the core was saturated with oil (drainage process) until there was no more brine
being produced to establish the initial core saturations. Primary brine flooding (imbibition process)
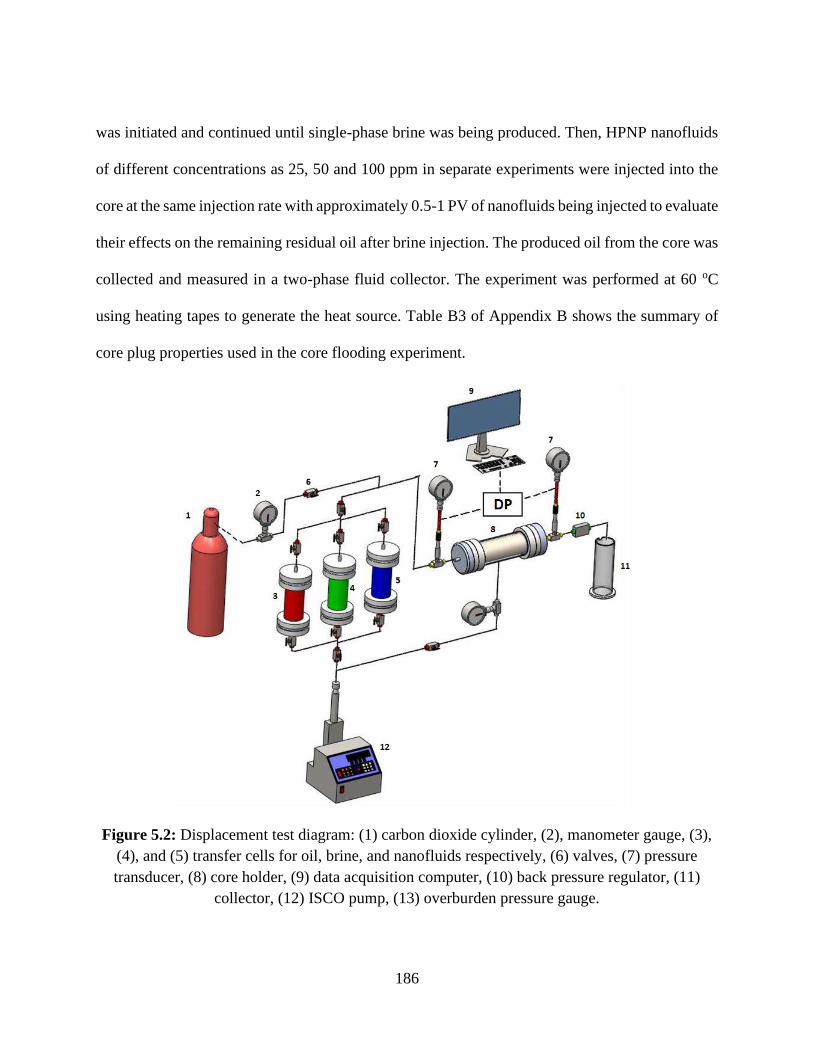
186
was initiated and continued until single-phase brine was being produced. Then, HPNP nanofluids
of different concentrations as 25, 50 and 100 ppm in separate experiments were injected into the
core at the same injection rate with approximately 0.5-1 PV of nanofluids being injected to evaluate
their effects on the remaining residual oil after brine injection. The produced oil from the core was
collected and measured in a two-phase fluid collector. The experiment was performed at 60 oC
using heating tapes to generate the heat source. Table B3 of Appendix B shows the summary of
core plug properties used in the core flooding experiment.
Figure 5.2: Displacement test diagram: (1) carbon dioxide cylinder, (2), manometer gauge, (3),
(4), and (5) transfer cells for oil, brine, and nanofluids respectively, (6) valves, (7) pressure
transducer, (8) core holder, (9) data acquisition computer, (10) back pressure regulator, (11)
collector, (12) ISCO pump, (13) overburden pressure gauge.
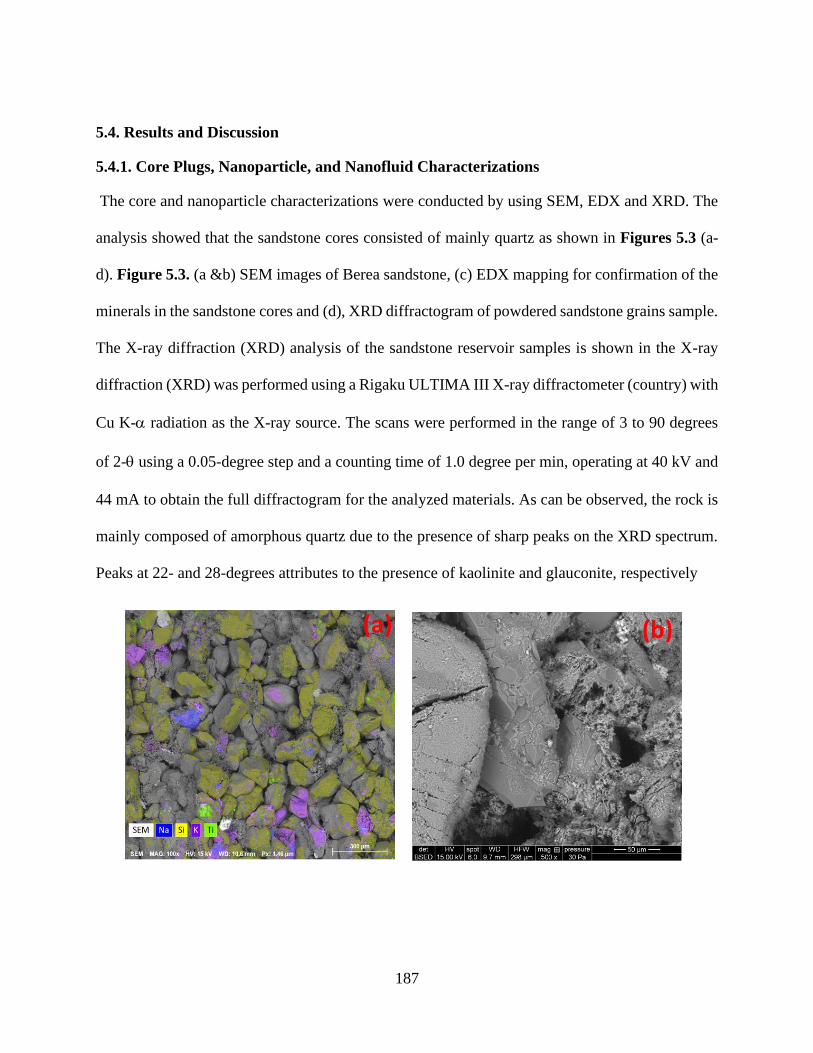
187
5.4. Results and Discussion
5.4.1. Core Plugs, Nanoparticle, and Nanofluid Characterizations
The core and nanoparticle characterizations were conducted by using SEM, EDX and XRD. The
analysis showed that the sandstone cores consisted of mainly quartz as shown in Figures 5.3 (a-
d). Figure 5.3. (a &b) SEM images of Berea sandstone, (c) EDX mapping for confirmation of the
minerals in the sandstone cores and (d), XRD diffractogram of powdered sandstone grains sample.
The X-ray diffraction (XRD) analysis of the sandstone reservoir samples is shown in the X-ray
diffraction (XRD) was performed using a Rigaku ULTIMA III X-ray diffractometer (country) with
Cu K- radiation as the X-ray source. The scans were performed in the range of 3 to 90 degrees
of 2- using a 0.05-degree step and a counting time of 1.0 degree per min, operating at 40 kV and
44 mA to obtain the full diffractogram for the analyzed materials. As can be observed, the rock is
mainly composed of amorphous quartz due to the presence of sharp peaks on the XRD spectrum.
Peaks at 22- and 28-degrees attributes to the presence of kaolinite and glauconite, respectively
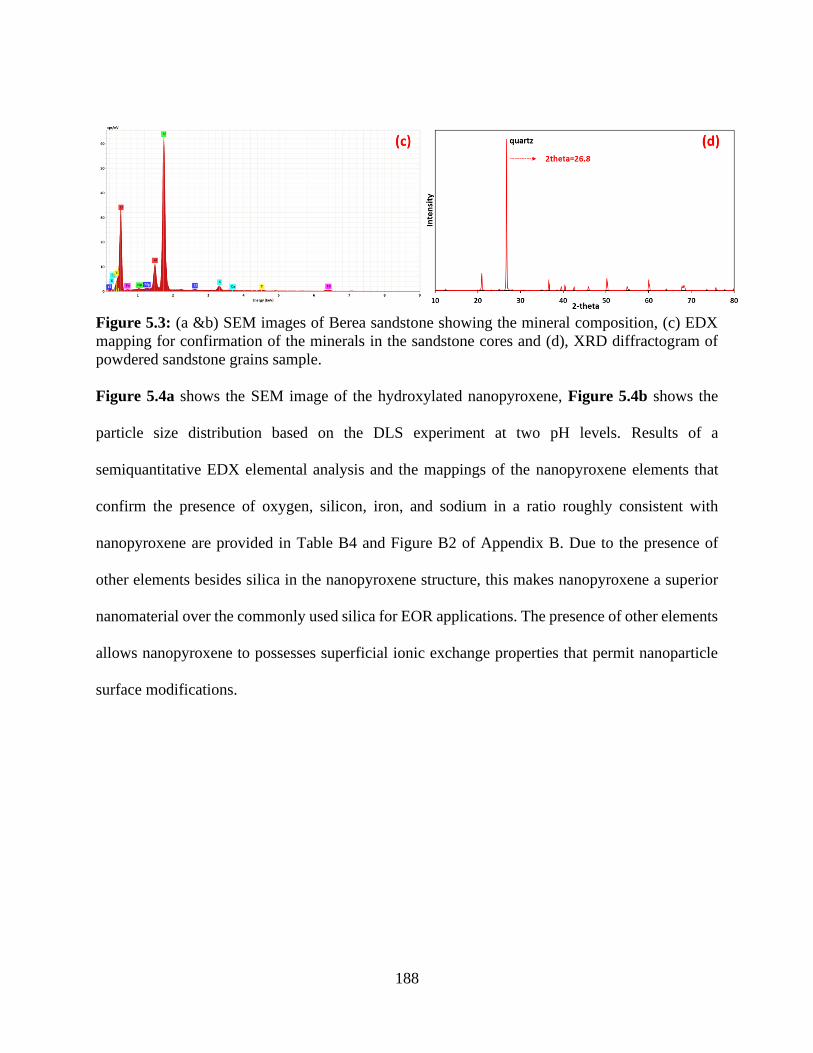
188
Figure 5.3: (a &b) SEM images of Berea sandstone showing the mineral composition, (c) EDX
mapping for confirmation of the minerals in the sandstone cores and (d), XRD diffractogram of
powdered sandstone grains sample.
Figure 5.4a shows the SEM image of the hydroxylated nanopyroxene, Figure 5.4b shows the
particle size distribution based on the DLS experiment at two pH levels. Results of a
semiquantitative EDX elemental analysis and the mappings of the nanopyroxene elements that
confirm the presence of oxygen, silicon, iron, and sodium in a ratio roughly consistent with
nanopyroxene are provided in Table B4 and Figure B2 of Appendix B. Due to the presence of
other elements besides silica in the nanopyroxene structure, this makes nanopyroxene a superior
nanomaterial over the commonly used silica for EOR applications. The presence of other elements
allows nanopyroxene to possesses superficial ionic exchange properties that permit nanoparticle
surface modifications.
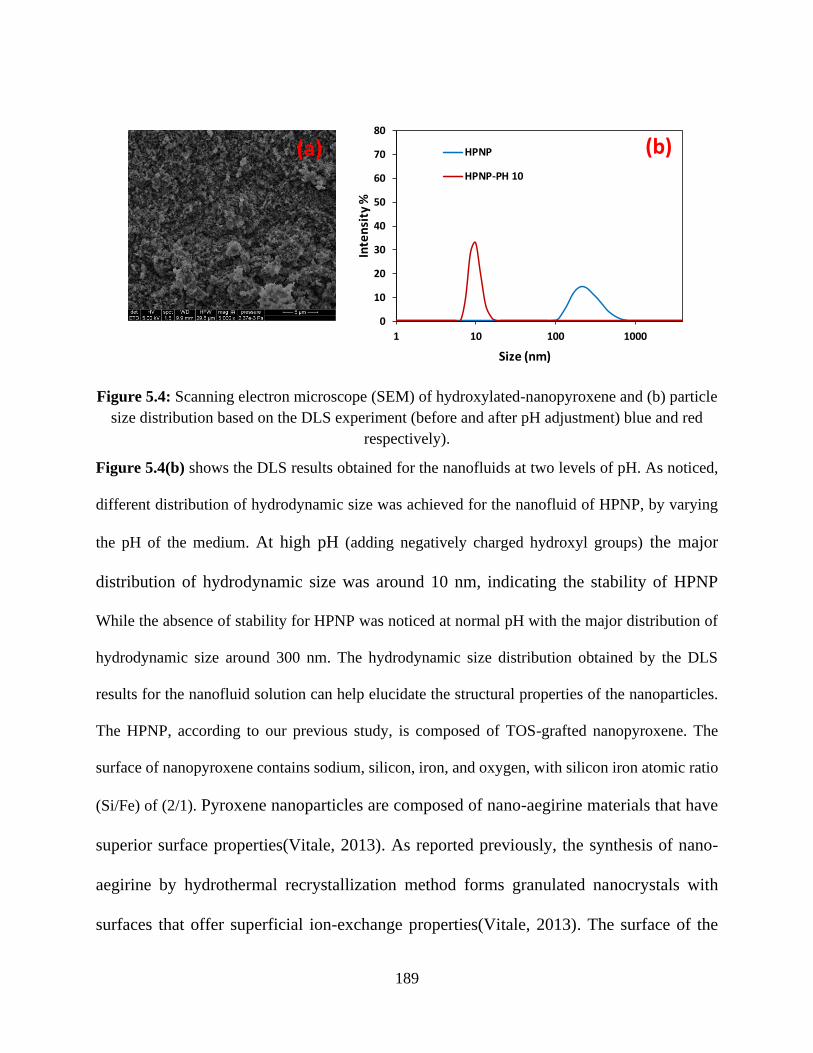
189
Figure 5.4: Scanning electron microscope (SEM) of hydroxylated-nanopyroxene and (b) particle
size distribution based on the DLS experiment (before and after pH adjustment) blue and red
respectively).
Figure 5.4(b) shows the DLS results obtained for the nanofluids at two levels of pH. As noticed,
different distribution of hydrodynamic size was achieved for the nanofluid of HPNP, by varying
the pH of the medium. At high pH (adding negatively charged hydroxyl groups) the major
distribution of hydrodynamic size was around 10 nm, indicating the stability of HPNP
While the absence of stability for HPNP was noticed at normal pH with the major distribution of
hydrodynamic size around 300 nm. The hydrodynamic size distribution obtained by the DLS
results for the nanofluid solution can help elucidate the structural properties of the nanoparticles.
The HPNP, according to our previous study, is composed of TOS-grafted nanopyroxene. The
surface of nanopyroxene contains sodium, silicon, iron, and oxygen, with silicon iron atomic ratio
(Si/Fe) of (2/1). Pyroxene nanoparticles are composed of nano-aegirine materials that have
superior surface properties(Vitale, 2013). As reported previously, the synthesis of nano-
aegirine by hydrothermal recrystallization method forms granulated nanocrystals with
surfaces that offer superficial ion-exchange properties(Vitale, 2013). The surface of the
(a)
0
10
20
30
40
50
60
70
80
1 10 100 1000
Inte
nsi
ty %
Size (nm)
HPNP
HPNP-PH 10
(b)
190
nano-pyroxene has a Si-O-Fe bond type that resembles that of zeolites, where a proton can
be anchored (ion exchange of the sodium that is compensating the negative charge on the
iron). The Si-O-Fe bond, under aqueous medium, can form hydroxylated silicon as well as
negatively charged iron ions. Thus, the surface offers great tendency for anchoring various
polymers and legends reducing the pH (adding protons) causes electrostatic charge neutralization,
which subsequently lowers its steric stabilization. However, at higher pH, on the other hand, the
nanoparticles tend to remain more stable without neutralizing the surface, resulting in the
formation of more stable nanofluids. For this purpose, at low pH, there is more tendency for surface
neutralization (close to the point of zero charge), which results in nanoparticle agglomeration due
to lower nanofluid stability.
5.4.2. Characterization of the Crude Oil Sample and Sandstone Rock and the Implication to
the Rock Wettability
The type of reservoir rock formation and mineralogical composition, sandstone or carbonates
influences the interaction between the polar components in crude oil and the rock (J. Buckley et
al., 1998; Pillai & Mandal, 2019a). For the oil sample used in this study, the method proposed by
Lante et al. (Carbognani et al., 2010) was used to determine the oil components; saturates,
aromatics, resin, and asphaltene (SARA). The quantification of SARA (maltenes) was performed
assuming a response factor for flame ionization detector (FID) of resins as 0.73, as shown in Table
5.3.
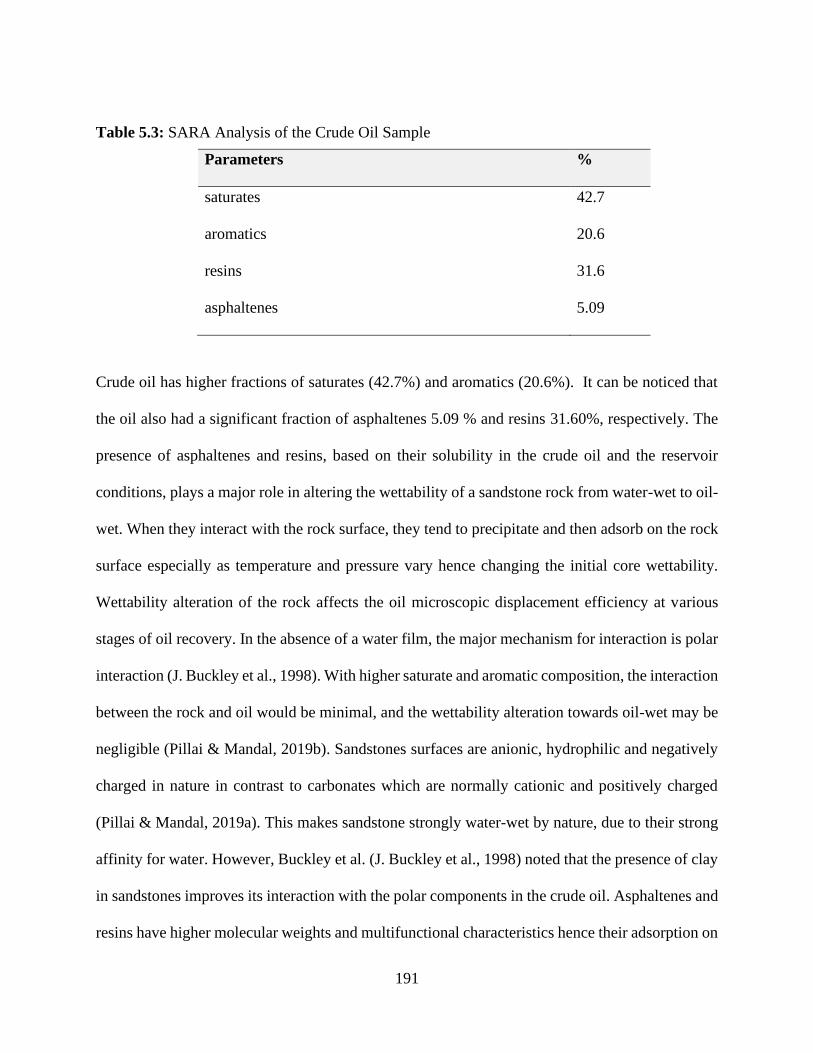
191
Table 5.3: SARA Analysis of the Crude Oil Sample
Parameters %
saturates 42.7
aromatics 20.6
resins 31.6
asphaltenes 5.09
Crude oil has higher fractions of saturates (42.7%) and aromatics (20.6%). It can be noticed that
the oil also had a significant fraction of asphaltenes 5.09 % and resins 31.60%, respectively. The
presence of asphaltenes and resins, based on their solubility in the crude oil and the reservoir
conditions, plays a major role in altering the wettability of a sandstone rock from water-wet to oil-
wet. When they interact with the rock surface, they tend to precipitate and then adsorb on the rock
surface especially as temperature and pressure vary hence changing the initial core wettability.
Wettability alteration of the rock affects the oil microscopic displacement efficiency at various
stages of oil recovery. In the absence of a water film, the major mechanism for interaction is polar
interaction (J. Buckley et al., 1998). With higher saturate and aromatic composition, the interaction
between the rock and oil would be minimal, and the wettability alteration towards oil-wet may be
negligible (Pillai & Mandal, 2019b). Sandstones surfaces are anionic, hydrophilic and negatively
charged in nature in contrast to carbonates which are normally cationic and positively charged
(Pillai & Mandal, 2019a). This makes sandstone strongly water-wet by nature, due to their strong
affinity for water. However, Buckley et al. (J. Buckley et al., 1998) noted that the presence of clay
in sandstones improves its interaction with the polar components in the crude oil. Asphaltenes and
resins have higher molecular weights and multifunctional characteristics hence their adsorption on
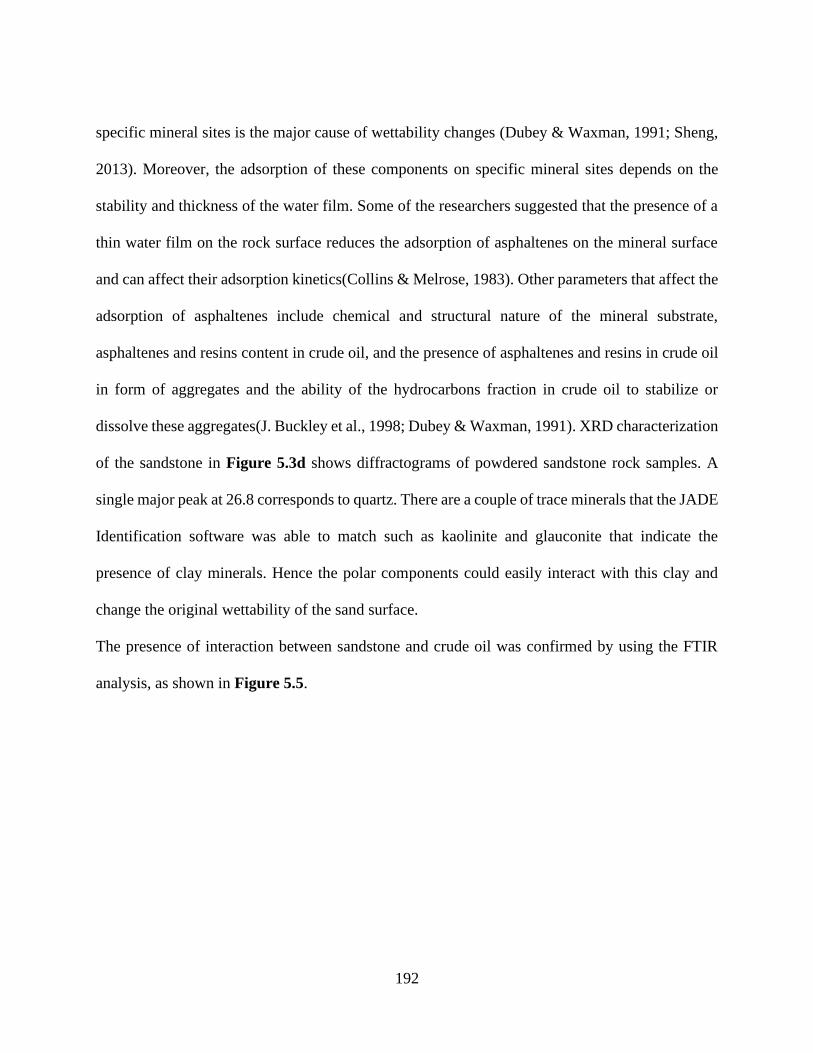
192
specific mineral sites is the major cause of wettability changes (Dubey & Waxman, 1991; Sheng,
2013). Moreover, the adsorption of these components on specific mineral sites depends on the
stability and thickness of the water film. Some of the researchers suggested that the presence of a
thin water film on the rock surface reduces the adsorption of asphaltenes on the mineral surface
and can affect their adsorption kinetics(Collins & Melrose, 1983). Other parameters that affect the
adsorption of asphaltenes include chemical and structural nature of the mineral substrate,
asphaltenes and resins content in crude oil, and the presence of asphaltenes and resins in crude oil
in form of aggregates and the ability of the hydrocarbons fraction in crude oil to stabilize or
dissolve these aggregates(J. Buckley et al., 1998; Dubey & Waxman, 1991). XRD characterization
of the sandstone in Figure 5.3d shows diffractograms of powdered sandstone rock samples. A
single major peak at 26.8 corresponds to quartz. There are a couple of trace minerals that the JADE
Identification software was able to match such as kaolinite and glauconite that indicate the
presence of clay minerals. Hence the polar components could easily interact with this clay and
change the original wettability of the sand surface.
The presence of interaction between sandstone and crude oil was confirmed by using the FTIR
analysis, as shown in Figure 5.5.
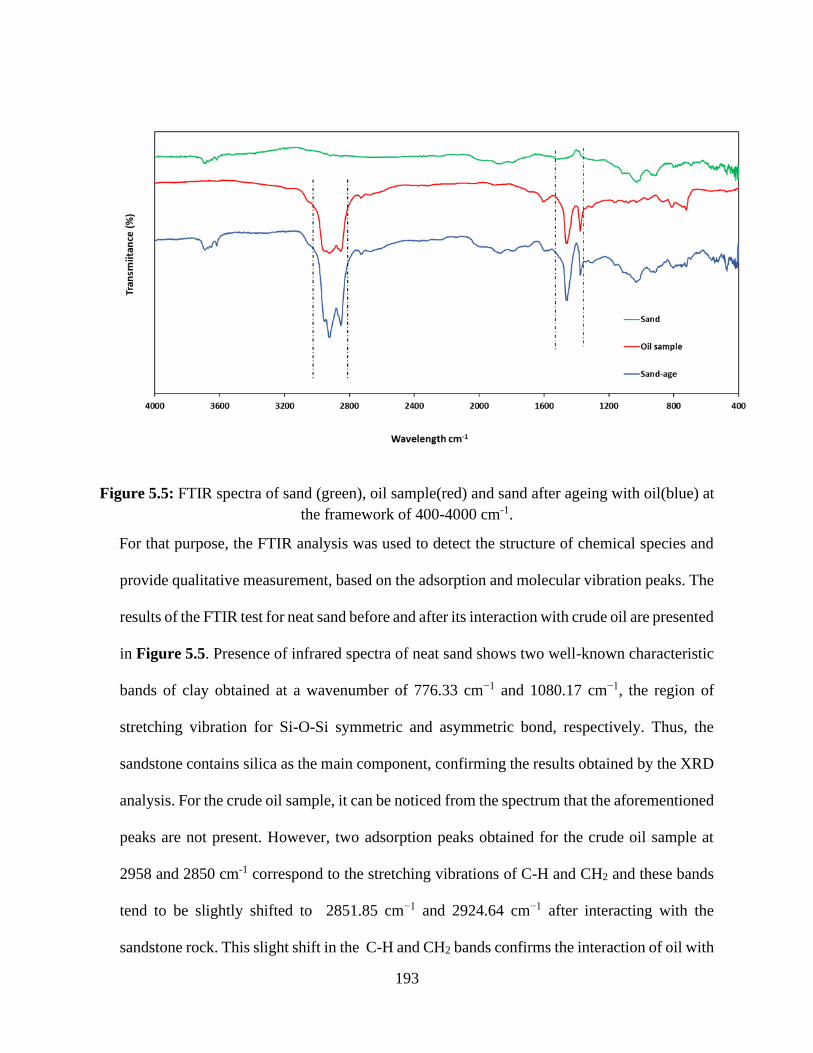
193
Figure 5.5: FTIR spectra of sand (green), oil sample(red) and sand after ageing with oil(blue) at
the framework of 400-4000 cm-1.
For that purpose, the FTIR analysis was used to detect the structure of chemical species and
provide qualitative measurement, based on the adsorption and molecular vibration peaks. The
results of the FTIR test for neat sand before and after its interaction with crude oil are presented
in Figure 5.5. Presence of infrared spectra of neat sand shows two well-known characteristic
bands of clay obtained at a wavenumber of 776.33 cm−1 and 1080.17 cm−1, the region of
stretching vibration for Si-O-Si symmetric and asymmetric bond, respectively. Thus, the
sandstone contains silica as the main component, confirming the results obtained by the XRD
analysis. For the crude oil sample, it can be noticed from the spectrum that the aforementioned
peaks are not present. However, two adsorption peaks obtained for the crude oil sample at
2958 and 2850 cm-1 correspond to the stretching vibrations of C-H and CH2 and these bands
tend to be slightly shifted to 2851.85 cm−1 and 2924.64 cm−1 after interacting with the
sandstone rock. This slight shift in the C-H and CH2 bands confirms the interaction of oil with
194
sandstone making it more oil wet. The Si-O-Si bands that are obtained around 1000 cm-1 for
oil wet sandstone appeared to be wider than that for the raw sandstone sample, which can also
be attributed to the oil-sandstone interaction.
5.4.3. Effect of Nanoparticle Concentration on Asphaltene Disaggregation
To evaluate the interaction between nanopyroxene and the n-C7 asphaltene aggregates,
kinetic tests were performed at ambient conditions and the effect of nanopyroxene
concentration on n-C7 asphaltene disaggregation was investigated. Asphaltenes, as a
complex fraction of crude oil, is highly soluble in toluene and insoluble in n-
heptane(Betancur, Carmona, Nassar, Franco, & Cortes, 2016). The complexity refers to
the presence of large percentages of complex organic materials (aliphatic or aromatic).
The elemental analysis presented in Table 5.2 showed that 90 wt% of the asphaltene
composed of organic compounds (large hydrocarbons contains various functional groups
derived from N, O, and S) and very low mass fractions of heavy metals (<0.5wt%). For
that purpose, asphaltene’s adsorption behaviour, depending on the precipitation method,
has limitations and cannot be easily observed. The investigation is not possible without
obtaining the optimal solubilizing conditions for the asphaltenes. Since asphaltenes are
insoluble in n-heptane increasing the heptane in the solution increases the rate at which n-
C7 asphaltene self-associate to form larger agglomerates(Nassar, Betancur, Acevedo,
Franco, & Cortes, 2015; Rahmani, Masliyah, & Dabros, 2003). Without complete
solubilization, precipitation of asphaltenes will interfere with the determination of its
interaction on the rock surface. Thus, solvent mixture at various volume ratio should be
used to achieve the best test conditions. Figure. 5.6(a) shows the kinetics behaviour of the
n-C7 with Heptol ratios 50, 60 and 70 V/V. The aggregated size was increasing as the
195
amount of n-heptane in Heptol solutions increased Heptol 60 was selected to test the
aggregation kinetics of n-C7 asphaltenes with and without nanoparticle dispersion. As
shown in Figure.5.6(b), it can be observed that the presence of nanoparticles reduced the
aggregate size of the n-C7 asphaltenes. It is worth mentioning that nanoparticle
concentration affected the aggregation size. There is a reduction trend of n-C7 asphaltenes
as the concentration of the nanopyroxene increased from 25 to 50 ppm. When the
concertation increased to 100 ppm the size increased again probably due to the formation
of big flocs of n-C7 asphaltenes and nanoparticles in the solution. This implies that there
is an optimum concentration required to reduce the self-association of n-C7. Increasing the
concentration beyond an optimum value may not reduce the size of n-C7 asphaltenes
aggregates. Nassar et al. (Nassar et al., 2015) found that the ability of the nanoparticles to
reduce the aggregate size of n-C7 asphaltenes depends on their ability to diffuse into the
solution. The presence of nanoparticles changes the nature of the asphaltene aggregation,
most likely by introducing multiple nucleation centres. The proposed possible mechanism
of asphaltene inhibition includes modulation of the aggregate morphology, reduction of
gelation point and rheological yield stress. However, as the nanoparticle concentration
increases, the aggregation phenomena dominate the growth, and the aggregate size
increases rapidly. When the aggregates grow lager enough, the hydrodynamic pressure
prevails so that disintegration becomes significant until equilibrium is reached(Betancur
et al., 2016; Nassar et al., 2015). In simple terms, increasing the nanoparticle concentration
beyond the optimum, due to nanoparticle aggregation/flocculation, the rate of nanoparticle
diffusion in the solution decreases as a result the aggregation phenomena dominates, and
the flock size of the asphaltene increases rapidly.
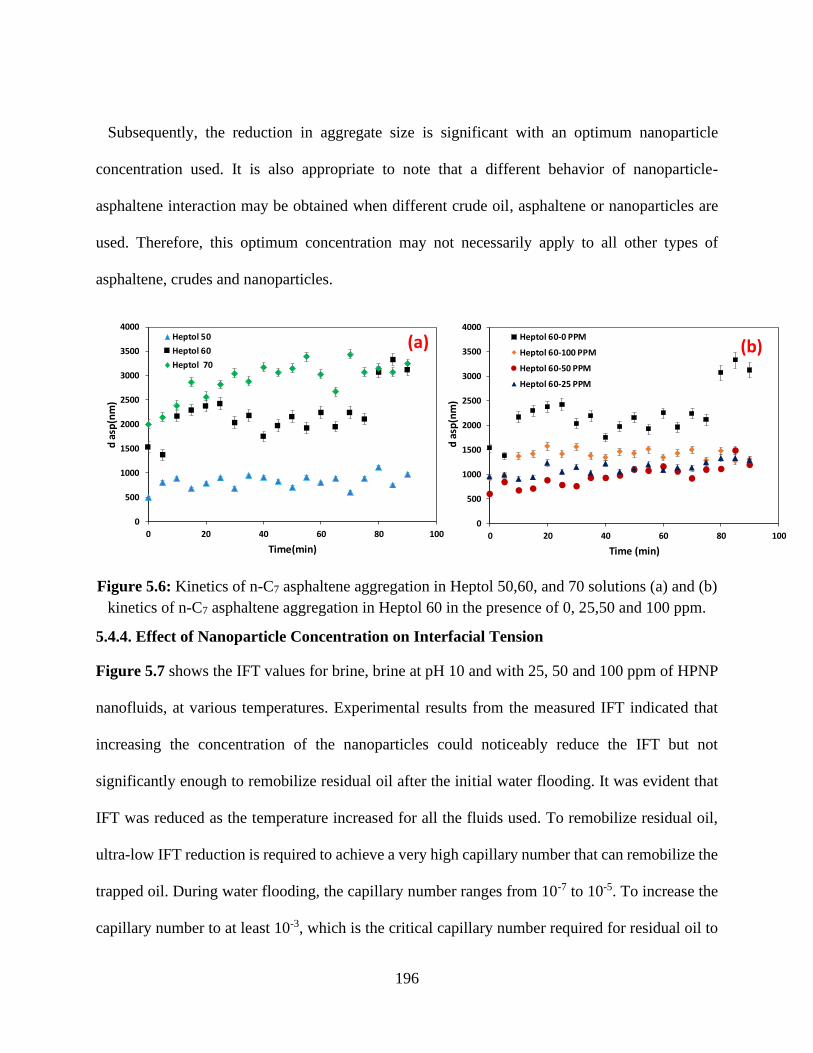
196
Subsequently, the reduction in aggregate size is significant with an optimum nanoparticle
concentration used. It is also appropriate to note that a different behavior of nanoparticle-
asphaltene interaction may be obtained when different crude oil, asphaltene or nanoparticles are
used. Therefore, this optimum concentration may not necessarily apply to all other types of
asphaltene, crudes and nanoparticles.
Figure 5.6: Kinetics of n-C7 asphaltene aggregation in Heptol 50,60, and 70 solutions (a) and (b)
kinetics of n-C7 asphaltene aggregation in Heptol 60 in the presence of 0, 25,50 and 100 ppm.
5.4.4. Effect of Nanoparticle Concentration on Interfacial Tension
Figure 5.7 shows the IFT values for brine, brine at pH 10 and with 25, 50 and 100 ppm of HPNP
nanofluids, at various temperatures. Experimental results from the measured IFT indicated that
increasing the concentration of the nanoparticles could noticeably reduce the IFT but not
significantly enough to remobilize residual oil after the initial water flooding. It was evident that
IFT was reduced as the temperature increased for all the fluids used. To remobilize residual oil,
ultra-low IFT reduction is required to achieve a very high capillary number that can remobilize the
trapped oil. During water flooding, the capillary number ranges from 10-7 to 10-5. To increase the
capillary number to at least 10-3, which is the critical capillary number required for residual oil to
0
500
1000
1500
2000
2500
3000
3500
4000
0 20 40 60 80 100
d a
sp(n
m)
Time (min)
Heptol 60-0 PPM
Heptol 60-100 PPM
Heptol 60-50 PPM
Heptol 60-25 PPM
(b)
0
500
1000
1500
2000
2500
3000
3500
4000
0 20 40 60 80 100
d a
sp(n
m)
Time(min)
Heptol 50
Heptol 60
Heptol 70
(a)
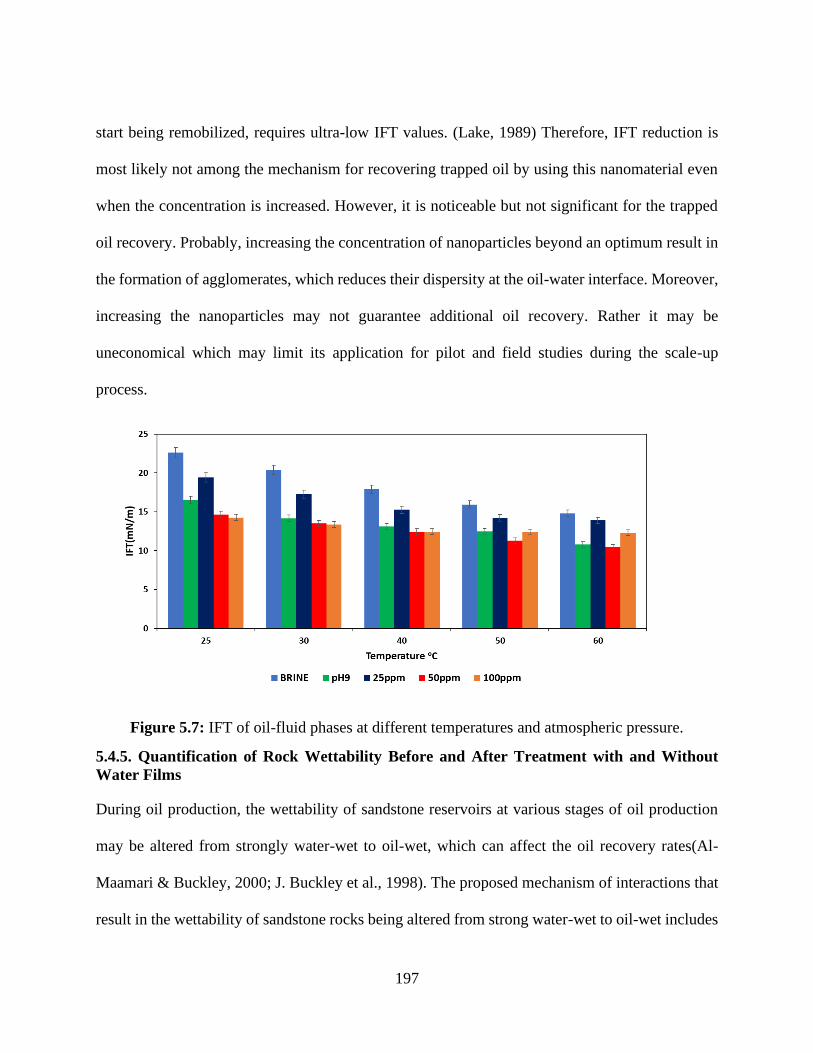
197
start being remobilized, requires ultra-low IFT values. (Lake, 1989) Therefore, IFT reduction is
most likely not among the mechanism for recovering trapped oil by using this nanomaterial even
when the concentration is increased. However, it is noticeable but not significant for the trapped
oil recovery. Probably, increasing the concentration of nanoparticles beyond an optimum result in
the formation of agglomerates, which reduces their dispersity at the oil-water interface. Moreover,
increasing the nanoparticles may not guarantee additional oil recovery. Rather it may be
uneconomical which may limit its application for pilot and field studies during the scale-up
process.
Figure 5.7: IFT of oil-fluid phases at different temperatures and atmospheric pressure.
5.4.5. Quantification of Rock Wettability Before and After Treatment with and Without
Water Films
During oil production, the wettability of sandstone reservoirs at various stages of oil production
may be altered from strongly water-wet to oil-wet, which can affect the oil recovery rates(Al-
Maamari & Buckley, 2000; J. Buckley et al., 1998). The proposed mechanism of interactions that
result in the wettability of sandstone rocks being altered from strong water-wet to oil-wet includes
198
the following: Polar interaction that predominates normally in the absence of water films between
the solid and oil and acid-base interaction that controls the surface charges at the solid-water and
oil-water interface. Other mechanisms include surface precipitation which depends mainly on
crude oil solvent properties with respect to asphaltenes and resins and finally ion binding or
specific interaction between charged sites and higher valency ions (J. Buckley et al., 1998;
Mohammed & Babadagli, 2015). In this study, wettability alteration with and without the presence
of initial water films was considered. In the absence of initial water films i.e. 100% cores saturated
with oil, the cores were treated with a mixture of crude oil and n-heptane using a solution of 1:40
causing surface precipitation of asphaltenes on the surface of sandstone rock. The rocks were again
aged for 20 days at 80 oC and the wettability of the rock before and after alteration was determined
by contact angle measurements, spontaneous imbibition and relative index method or the Amott-
Harvey wettability index (IW). As shown in Figure 5.8 (a) the substrate after ageing was close to
oil-wet/intermediate which confirms the procedure used in changing the initial water-wet state of
the core, Therefore, the predominate mechanism(s) that caused the wettability of the surface to
change in the absence of water film was precipitation onto the surface and polar interaction. For
the imbibition test, the treated core (oil-wet) expelled no oil for the first 5 days, and maximum oil
recovery of approximately 5% was reached after 20 days. On the other hand, the water-wet
sandstone recovered oil immediately after the first day, as seen in Figure 5.10a confirming the
initial wettability of the core and the treatment which is consistent with the contact angle
measurements. Moreover, for the oil wet rock sample under brine alone, oil was produced only
from two sides of the core rather than all sides of the core indicating a co-current flow controlled
by mainly gravity. This explains the lower recoveries during brine imbibition. For the water-wet
core, oil was produced from all faces indicating counter-current flow governed by mainly capillary
199
forces. In the presence of irreducible water saturation, before and after ageing the cores, the
measured index IW was +0.87 before treatment, which indicated that the cores were initially
strongly water wet. After treatment, IW of core samples changed to -0.31, which is considered
intermediate wet (W. Anderson, 1986).
5.4.6. Effect of Nanoparticle Concentration on Contact Angle, Wettability Index, and
Imbibition Rate
The contact angle is a quantitative technique of measuring the wetting preference of a surface in
the presence of more than one phase. According to Anderson et al,(W. G. Anderson, 1987) a
surface is either water wet, intermediate wet or oil-wet if the contact angle is between 0-75˚,75-
105˚ and 105-180˚, respectively when the contact angle is measured through the denser phase.
Figure 5.8 shows the oil drop contact angle measurements that were obtained in the presence of
(a) brine-0 ppm nanofluids (b) brine at pH 10, (c) 25 ppm nanofluid, (d) 50 ppm nanofluid, and (e)
100 ppm nanofluid. The estimated contact angles were around 76,103, 106, 132, and 139o,
respectively measured through a less dense phase. As we increase the nanofluids concentration the
contact angle increases, indicating that the core wettability is altered from intermediate wetting to
strongly water-wetting condition. Worth mentioning that although the highest concentration (100
ppm) resulted in a more water-wet state, oil recovery of using higher concentrations beyond the
optimum may not necessarily result in higher oil recovery. At higher concentrations, nanoparticles
tend to form clusters or aggregates and if injected in the porous medium, they can block the
reservoir pores and reduce the fluid mobility. Therefore, an optimum concentration is always
desirable for appropriate EOR applications (Hu, Azmi, Raza, Glover, & Wen, 2016; Lu et al.,
2017). The increase of contact angle as the concentration increases is related to the disjoining
mechanism that causes the structural disjoining force to increase towards the vertex and detach
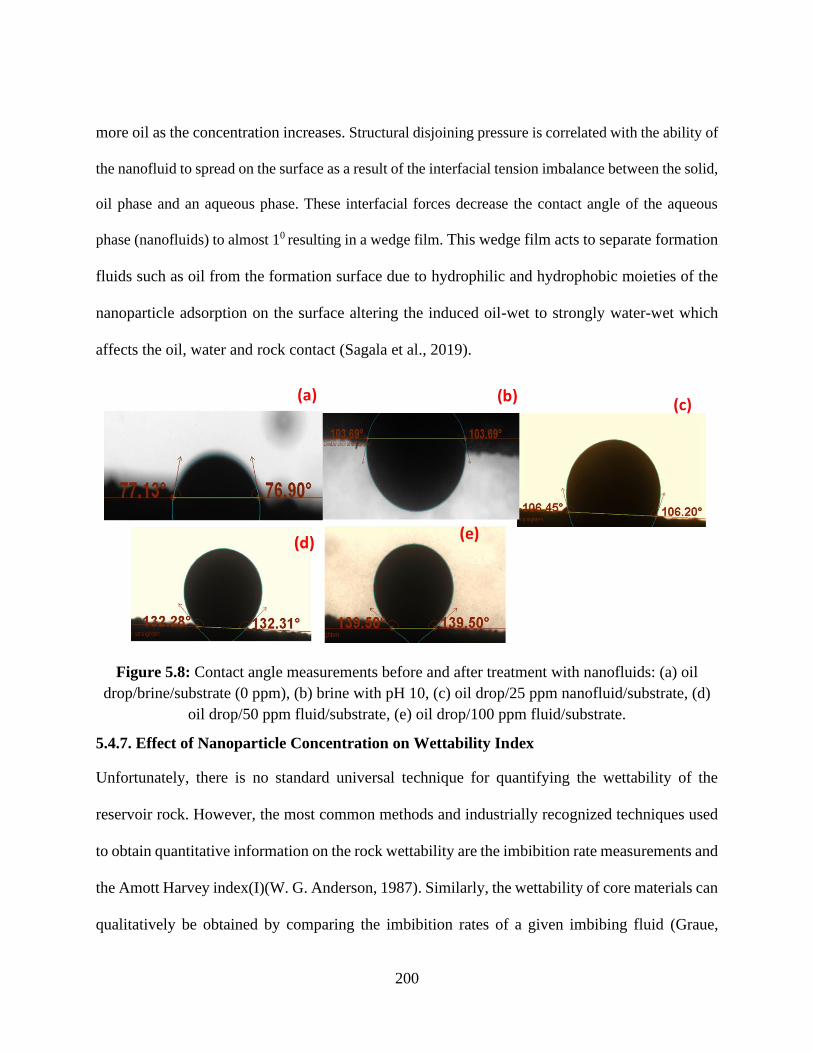
200
more oil as the concentration increases. Structural disjoining pressure is correlated with the ability of
the nanofluid to spread on the surface as a result of the interfacial tension imbalance between the solid,
oil phase and an aqueous phase. These interfacial forces decrease the contact angle of the aqueous
phase (nanofluids) to almost 10 resulting in a wedge film. This wedge film acts to separate formation
fluids such as oil from the formation surface due to hydrophilic and hydrophobic moieties of the
nanoparticle adsorption on the surface altering the induced oil-wet to strongly water-wet which
affects the oil, water and rock contact (Sagala et al., 2019).
Figure 5.8: Contact angle measurements before and after treatment with nanofluids: (a) oil
drop/brine/substrate (0 ppm), (b) brine with pH 10, (c) oil drop/25 ppm nanofluid/substrate, (d)
oil drop/50 ppm fluid/substrate, (e) oil drop/100 ppm fluid/substrate.
5.4.7. Effect of Nanoparticle Concentration on Wettability Index
Unfortunately, there is no standard universal technique for quantifying the wettability of the
reservoir rock. However, the most common methods and industrially recognized techniques used
to obtain quantitative information on the rock wettability are the imbibition rate measurements and
the Amott Harvey index(I)(W. G. Anderson, 1987). Similarly, the wettability of core materials can
qualitatively be obtained by comparing the imbibition rates of a given imbibing fluid (Graue,
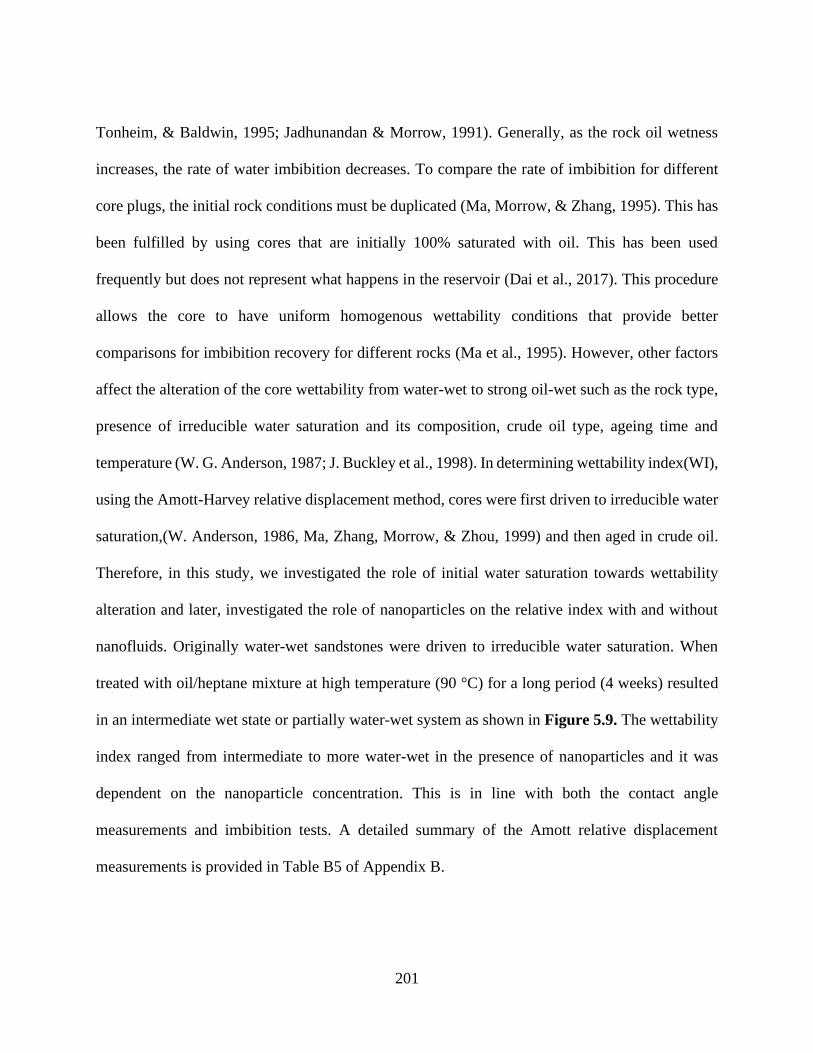
201
Tonheim, & Baldwin, 1995; Jadhunandan & Morrow, 1991). Generally, as the rock oil wetness
increases, the rate of water imbibition decreases. To compare the rate of imbibition for different
core plugs, the initial rock conditions must be duplicated (Ma, Morrow, & Zhang, 1995). This has
been fulfilled by using cores that are initially 100% saturated with oil. This has been used
frequently but does not represent what happens in the reservoir (Dai et al., 2017). This procedure
allows the core to have uniform homogenous wettability conditions that provide better
comparisons for imbibition recovery for different rocks (Ma et al., 1995). However, other factors
affect the alteration of the core wettability from water-wet to strong oil-wet such as the rock type,
presence of irreducible water saturation and its composition, crude oil type, ageing time and
temperature (W. G. Anderson, 1987; J. Buckley et al., 1998). In determining wettability index(WI),
using the Amott-Harvey relative displacement method, cores were first driven to irreducible water
saturation,(W. Anderson, 1986, Ma, Zhang, Morrow, & Zhou, 1999) and then aged in crude oil.
Therefore, in this study, we investigated the role of initial water saturation towards wettability
alteration and later, investigated the role of nanoparticles on the relative index with and without
nanofluids. Originally water-wet sandstones were driven to irreducible water saturation. When
treated with oil/heptane mixture at high temperature (90 °C) for a long period (4 weeks) resulted
in an intermediate wet state or partially water-wet system as shown in Figure 5.9. The wettability
index ranged from intermediate to more water-wet in the presence of nanoparticles and it was
dependent on the nanoparticle concentration. This is in line with both the contact angle
measurements and imbibition tests. A detailed summary of the Amott relative displacement
measurements is provided in Table B5 of Appendix B.
202
Figure 5.9: Wettability index for different measured fluids.
The effect of nanoparticle concentration on the imbibition rate was also studied using fully
hydroxylated nanoparticles (HPNP). The imbibition experiments were conducted at 60oC with
cores 100% saturated with oil and others at irreducible water saturation, using brine, brine at pH
10 or nanofluids of different concentrations in the range of 25 to 100 ppm. The results are
summarized below. As seen in Figures 5.10a and 5.10b, the imbibition rate increases as the
concentration increases. For the cores without initial water saturation, there was a delay in the
spontaneous imbibition of all the fluids due to the strong interaction of the asphaltenes and the
rock at the surface which made the outer surface of the core strongly oil-wet. The induction time
decreased following the order HPNP 100 ppm < 50 ppm < 25 < pH 10 < brine. This indicates that
as the concentration increased, more nanoparticles could diffuse to the rock detaching more oil
from the surface and changing the surface towards more water-wet, and more oil could start to be
mobilized due to the shift from negative to positive capillary force. This indicates a significant
impact of nanoparticle concentration on wettability alteration.
(a) (b)
203
5.4.8. Effect of Zero Water Saturation on the Core Wettability
In several studies, researchers have conducted imbibition studies without irreducible water
saturations(Nazari Moghaddam et al., 2015; Sagala et al., 2019; Zhang et al., 2014) and have
created initial oil-wet conditions using silica surfaces in the laboratory by saturating cores with
100% oil and then aged them in oil. Under these conditions, wettability alteration occurs when
polar functional groups present in the oil and polar sites of the mineral surface interact(J. Buckley
et al., 1998). This results in non-uniform distribution of surface-active components around the
core, phenomena known as chromatographic separation that causes non-homogeneous wetting
conditions (Austad & Standnes, 2003). Normally, the measured contact angles are intermediate or
weak water-wet and the interaction between the rock and oil is minor even after ageing under
temperature or with time(J. Buckley et al., 1998). This was also evident based on the obtained
contact angle measurements in Figure 5.7a, with brine alone after ageing, wettability of the rock
was still weakly oil-wet. However, it is important to note that these interactions are based on the
used crude oil/asphaltene properties in the current study, as different asphaltene in other crude oils
may show different behaviour depending on their composition/behaviour of the polar groups
present. From the imbibition experiment in Figure 5.10a, after 5 days, no oil was recovered from
the cores under the brine. The induction time for the fluid to start spontaneously imbibing increased
in the order brine > pH10 > 25 ppm > 50 ppm > 100 ppm. Austad et al. (Austad & Standnes, 2003)
reported that very little or no imbibition may be observed in the induction time, especially for
strongly oil-wet cores. However, the induction time according to Marrow and Mason(Morrow &
Mason, 2001) is not clearly understood but the authors related it to the time required for water
pathways to be established. Standnes and Austad(Standnes & Austad, 2000a) observed that during
the ageing period, an organic layer or a stronger coating is deposited at the rock surface which
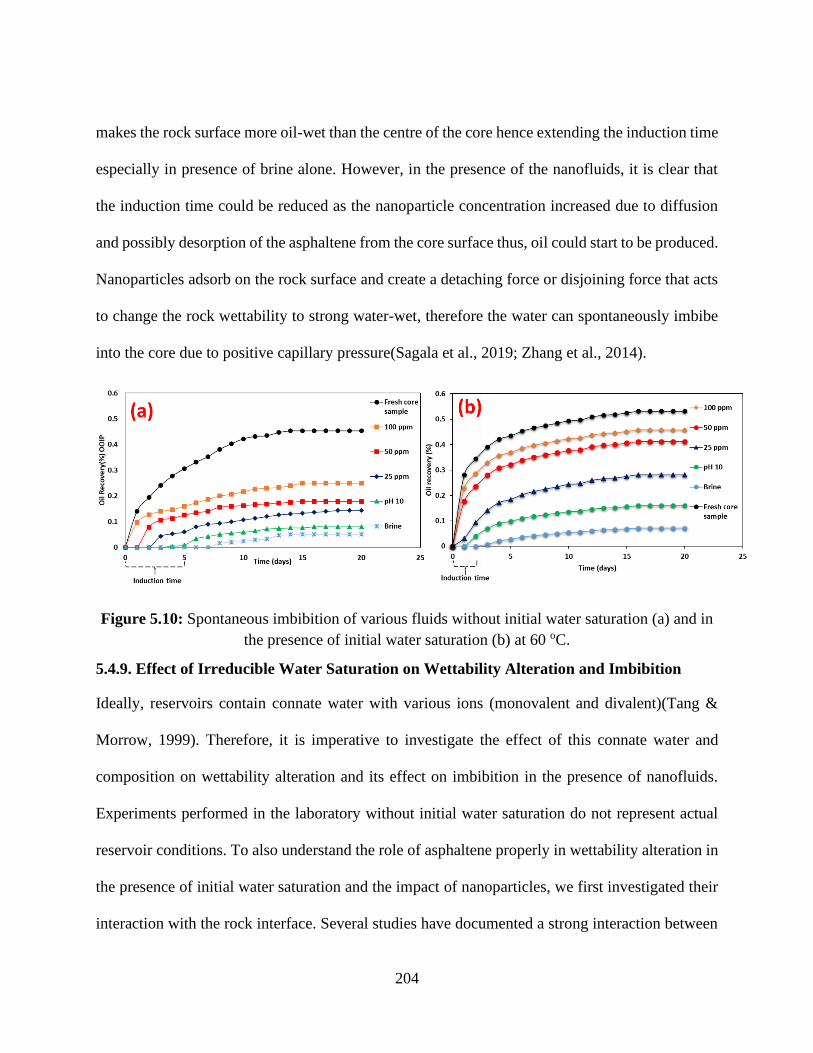
204
makes the rock surface more oil-wet than the centre of the core hence extending the induction time
especially in presence of brine alone. However, in the presence of the nanofluids, it is clear that
the induction time could be reduced as the nanoparticle concentration increased due to diffusion
and possibly desorption of the asphaltene from the core surface thus, oil could start to be produced.
Nanoparticles adsorb on the rock surface and create a detaching force or disjoining force that acts
to change the rock wettability to strong water-wet, therefore the water can spontaneously imbibe
into the core due to positive capillary pressure(Sagala et al., 2019; Zhang et al., 2014).
Figure 5.10: Spontaneous imbibition of various fluids without initial water saturation (a) and in
the presence of initial water saturation (b) at 60 oC.
5.4.9. Effect of Irreducible Water Saturation on Wettability Alteration and Imbibition
Ideally, reservoirs contain connate water with various ions (monovalent and divalent)(Tang &
Morrow, 1999). Therefore, it is imperative to investigate the effect of this connate water and
composition on wettability alteration and its effect on imbibition in the presence of nanofluids.
Experiments performed in the laboratory without initial water saturation do not represent actual
reservoir conditions. To also understand the role of asphaltene properly in wettability alteration in
the presence of initial water saturation and the impact of nanoparticles, we first investigated their
interaction with the rock interface. Several studies have documented a strong interaction between
205
asphaltenes and solids, especially clays(Clementz, 1982; Czarnecka & Gillott, 1980). Moreover,
the presence of water due to its higher dielectric constant (∈=78.5) has been postulated to
contribute to greater ionic interaction strength between the solid and fluid(J. Buckley, 1995). To
establish the irreducible water saturation, the cores were flooded with oil in each direction and the
volume of produced water from the core after oil saturation was used to estimate the oil in place.
After that, the cores were aged for 4 weeks at 90 oC with a similar oil heptane mixture used
previously. In the presence of initial water saturation, a longer period of ageing and the higher
temperature was desirable. For cores without initial water saturation, adsorption of polar
components on the rock surface is faster because there is no barrier (water film) for the interaction
to take place. However, in the presence of initial water saturation, the polar ends must pass the
water barrier and adsorb at the sandstone surface then reorganize in the pore structure. As such, to
get closer to the required thermodynamic state, and speed up the process, the ageing time and
temperature were increased higher than the previous temperature (without initial water) for
laboratory applications even though this does not guarantee a thermodynamically stable system.
Asphaltenes are not soluble in water, however, brine with a significant concentration was found to
dissolve in crude oil and the presence of initial water saturation increased the intermolecular
interactions between crude oil and the solid surface(J. Buckley, 1995). Other authors, on the
contrary, have reported that the presence of initial water saturation reduced the asphaltene
adsorption (Clementz, 1982; Collins & Melrose, 1983). In their study, they concluded however
that asphaltene adsorption also depends on the initial water saturation ratio. As the initial water
saturation increases, it can act as a shield and prevent the direct interaction of the surface with
asphaltenes. Also, depending on the DLVO forces that affect film stability, water in thin films may
prevent or promote the interaction of the asphaltene and the rock surface. From this current study,
206
based on the brine concentration used, the obtained wettability index (I) for the core plug under
brine alone after ageing was -0.31. This indicates that in the presence of only monovalent ions in
the initial water saturation, core plug did not result in a strongly oil-wet state due to week
interaction between the rock and asphaltene in the presence of water film. Cuiec.(Cuiec, 1984)
postulated that a system is intermediate-wet when -0.3≤I≤0.3. Therefore, the results of brine/oil-
rock interaction from this study were found to result in an intermediate of either patchy sort,
dalmatian, or of interconnected water-wet and non-water wet pathways. This is consistent with
what was reported by Salathiel. (Salathiel, 1973). The effect of initial water saturation on
wettability alteration might be negative or positive depending on its ratio. In fact, in the presence
of initial water saturation, only areas that are contacted with a crude oil change the wetting that is
significant to the displacement process. This was reflected in the recovered oil during the
spontaneous imbibition of brine alone (Figure 5.10b). A very slow spontaneous imbibition was
observed even after 20 days resulting in 7.14% of oil recovered, while during forced imbibition
still with brine almost 40% of OIIP was recovered. The slow recovery during spontaneous
imbibition may be attributed to the strong interaction of the asphaltene and the rock surface that
resulted in strong oil wetness at the surface hence water could not easily create pathways to access
the pores. Also, possibly because of the saturation end effects during the establishment of the
irreducible water saturation. However, when nanofluids were applied with increasing
concentrations, oil could be easily recovered due to nanoparticle diffusion that could result in the
preferentially strong water-wet surface.
207
5.4.10. Underlying Mechanism(s) of Interaction of Oil and the Rock with and Without Initial
Water Saturation and Implications to Wettability
In the absence of initial water saturation, the mechanism of interaction that causes wettability
alteration may be polar interaction and surface precipitation between mineral sites and polar oil
components. Figure 5.11 panel (a) and (b) respectively. In the presence of initial water saturation,
polar interactions between oil and wet mineral surfaces are less significant since water is always
the first fluid occupying the pores(J. Buckley & Liu, 1998). Therefore, another mechanism such
as surface precipitation as a result of a change in reservoir properties mainly pressure and
temperature reduction that causes asphaltene precipitation out of crude oil, acid-base interaction
or ion binding may be the source for wettability alteration as shown in Figure 5.11(b-d). In the
presence of initial water saturation with mostly monovalent ions, the interaction between the
rock/oil and brine depends on the composition and pH(Dubey & Doe, 1993). The mechanism that
controls the interaction between the rock/oil/brine is shown in panels (c) and (d) of Figure 5.11 in
the presence of initial water saturation. However, without divalent ions, the mechanism in Figure
5.11(d) becomes less significant. Comparing the two cases were the first scenario, 100% oil-
saturated core plugs were used in the imbibition test using various concentrations, the oil recovery
as a function of time shown in Figure 5.10, and the second scenario of the test that was done in
the presence of initial water saturation shown in Figure 5.10. In the former case wettability
alteration is mainly due to polar interaction and surface precipitation while in the later, wettability
alteration may be due to the acid-base interaction panel (c) in Figure 5.11 or ion binding (J.
Buckley & Liu, 1998; J. Buckley et al., 1998) panel (d) in Figure 5.11. In the presence of initial
water saturation, both the solid and oil interface become electrically charged depending on the
available components in the oil and composition of brine (J. S. Buckley, 1994). The polar
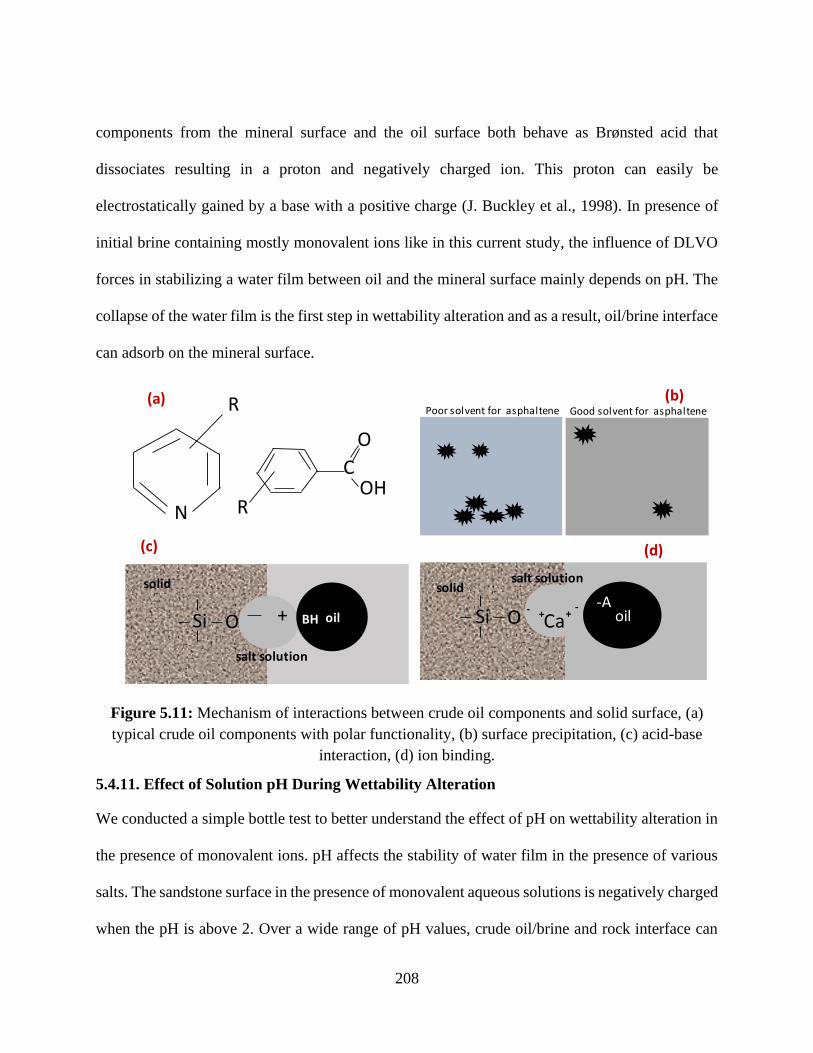
208
components from the mineral surface and the oil surface both behave as Brønsted acid that
dissociates resulting in a proton and negatively charged ion. This proton can easily be
electrostatically gained by a base with a positive charge (J. Buckley et al., 1998). In presence of
initial brine containing mostly monovalent ions like in this current study, the influence of DLVO
forces in stabilizing a water film between oil and the mineral surface mainly depends on pH. The
collapse of the water film is the first step in wettability alteration and as a result, oil/brine interface
can adsorb on the mineral surface.
Figure 5.11: Mechanism of interactions between crude oil components and solid surface, (a)
typical crude oil components with polar functionality, (b) surface precipitation, (c) acid-base
interaction, (d) ion binding.
5.4.11. Effect of Solution pH During Wettability Alteration
We conducted a simple bottle test to better understand the effect of pH on wettability alteration in
the presence of monovalent ions. pH affects the stability of water film in the presence of various
salts. The sandstone surface in the presence of monovalent aqueous solutions is negatively charged
when the pH is above 2. Over a wide range of pH values, crude oil/brine and rock interface can
(a)
salt solution
solid
Si O + oilBH Si O oilCa
salt solutionsolid
-A+
-- +
N
R
R
C
O
OH
(b)
(d)(c)
Good solvent for asphaltenePoor solvent for asphaltene
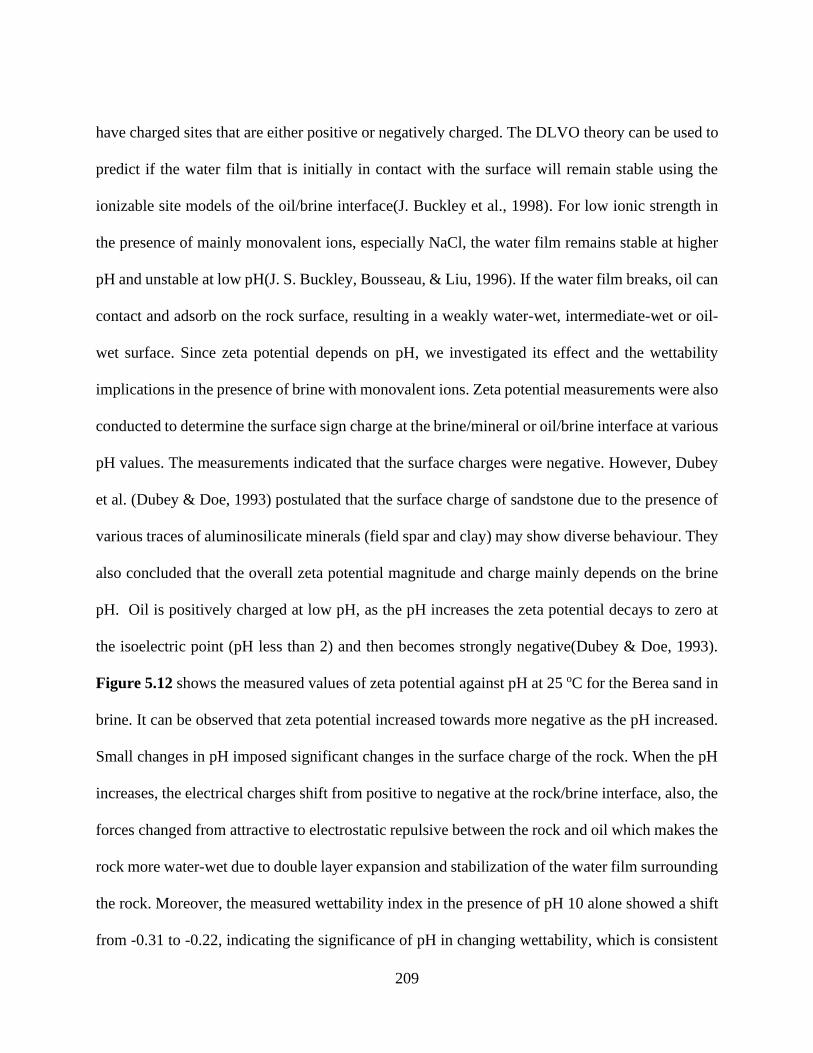
209
have charged sites that are either positive or negatively charged. The DLVO theory can be used to
predict if the water film that is initially in contact with the surface will remain stable using the
ionizable site models of the oil/brine interface(J. Buckley et al., 1998). For low ionic strength in
the presence of mainly monovalent ions, especially NaCl, the water film remains stable at higher
pH and unstable at low pH(J. S. Buckley, Bousseau, & Liu, 1996). If the water film breaks, oil can
contact and adsorb on the rock surface, resulting in a weakly water-wet, intermediate-wet or oil-
wet surface. Since zeta potential depends on pH, we investigated its effect and the wettability
implications in the presence of brine with monovalent ions. Zeta potential measurements were also
conducted to determine the surface sign charge at the brine/mineral or oil/brine interface at various
pH values. The measurements indicated that the surface charges were negative. However, Dubey
et al. (Dubey & Doe, 1993) postulated that the surface charge of sandstone due to the presence of
various traces of aluminosilicate minerals (field spar and clay) may show diverse behaviour. They
also concluded that the overall zeta potential magnitude and charge mainly depends on the brine
pH. Oil is positively charged at low pH, as the pH increases the zeta potential decays to zero at
the isoelectric point (pH less than 2) and then becomes strongly negative(Dubey & Doe, 1993).
Figure 5.12 shows the measured values of zeta potential against pH at 25 oC for the Berea sand in
brine. It can be observed that zeta potential increased towards more negative as the pH increased.
Small changes in pH imposed significant changes in the surface charge of the rock. When the pH
increases, the electrical charges shift from positive to negative at the rock/brine interface, also, the
forces changed from attractive to electrostatic repulsive between the rock and oil which makes the
rock more water-wet due to double layer expansion and stabilization of the water film surrounding
the rock. Moreover, the measured wettability index in the presence of pH 10 alone showed a shift
from -0.31 to -0.22, indicating the significance of pH in changing wettability, which is consistent
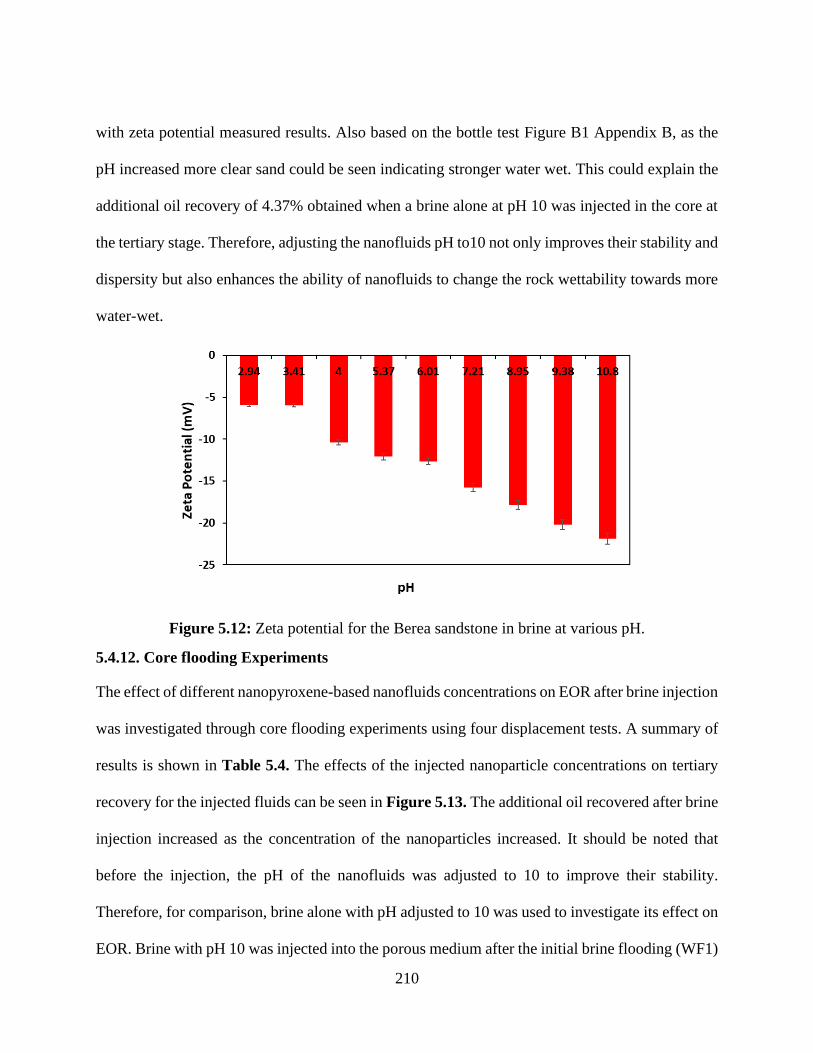
210
with zeta potential measured results. Also based on the bottle test Figure B1 Appendix B, as the
pH increased more clear sand could be seen indicating stronger water wet. This could explain the
additional oil recovery of 4.37% obtained when a brine alone at pH 10 was injected in the core at
the tertiary stage. Therefore, adjusting the nanofluids pH to10 not only improves their stability and
dispersity but also enhances the ability of nanofluids to change the rock wettability towards more
water-wet.
Figure 5.12: Zeta potential for the Berea sandstone in brine at various pH.
5.4.12. Core flooding Experiments
The effect of different nanopyroxene-based nanofluids concentrations on EOR after brine injection
was investigated through core flooding experiments using four displacement tests. A summary of
results is shown in Table 5.4. The effects of the injected nanoparticle concentrations on tertiary
recovery for the injected fluids can be seen in Figure 5.13. The additional oil recovered after brine
injection increased as the concentration of the nanoparticles increased. It should be noted that
before the injection, the pH of the nanofluids was adjusted to 10 to improve their stability.
Therefore, for comparison, brine alone with pH adjusted to 10 was used to investigate its effect on
EOR. Brine with pH 10 was injected into the porous medium after the initial brine flooding (WF1)
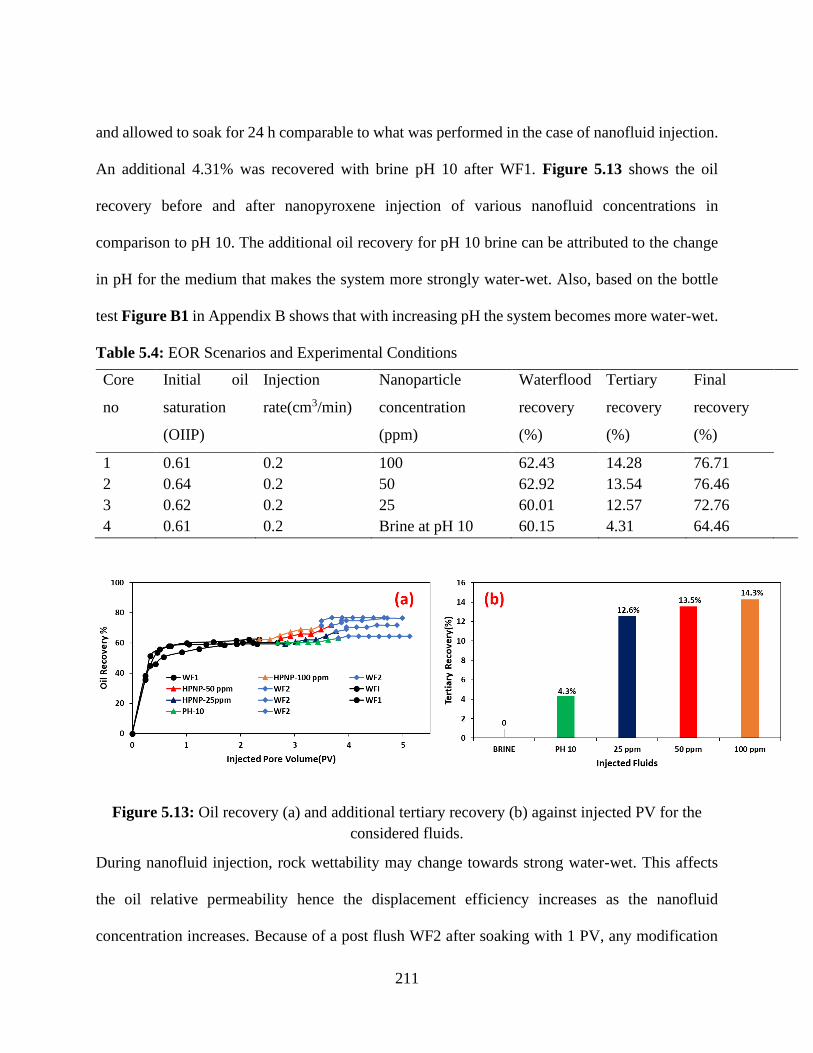
211
and allowed to soak for 24 h comparable to what was performed in the case of nanofluid injection.
An additional 4.31% was recovered with brine pH 10 after WF1. Figure 5.13 shows the oil
recovery before and after nanopyroxene injection of various nanofluid concentrations in
comparison to pH 10. The additional oil recovery for pH 10 brine can be attributed to the change
in pH for the medium that makes the system more strongly water-wet. Also, based on the bottle
test Figure B1 in Appendix B shows that with increasing pH the system becomes more water-wet.
Table 5.4: EOR Scenarios and Experimental Conditions
Core
no
Initial oil
saturation
(OIIP)
Injection
rate(cm3/min)
Nanoparticle
concentration
(ppm)
Waterflood
recovery
(%)
Tertiary
recovery
(%)
Final
recovery
(%)
1 0.61 0.2 100 62.43 14.28 76.71
2 0.64 0.2 50 62.92 13.54 76.46
3
4
0.62
0.61
0.2
0.2
25
Brine at pH 10
60.01
60.15
12.57
4.31
72.76
64.46
Figure 5.13: Oil recovery (a) and additional tertiary recovery (b) against injected PV for the
considered fluids.
During nanofluid injection, rock wettability may change towards strong water-wet. This affects
the oil relative permeability hence the displacement efficiency increases as the nanofluid
concentration increases. Because of a post flush WF2 after soaking with 1 PV, any modification
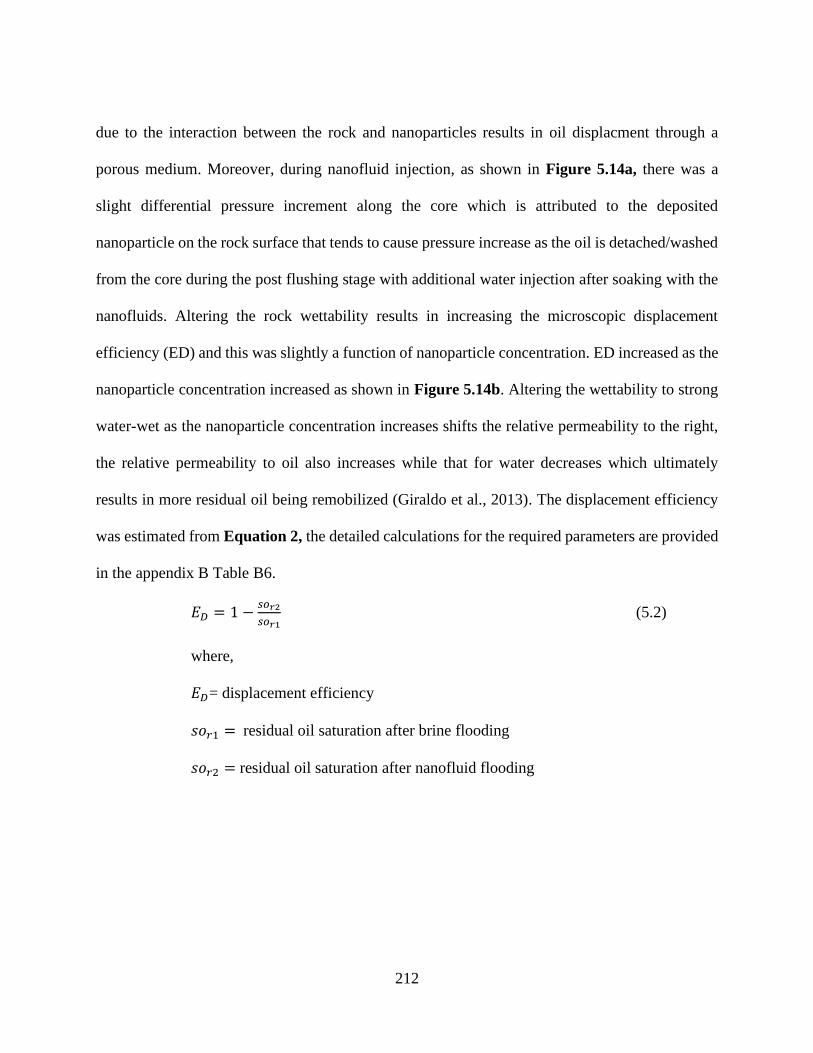
212
due to the interaction between the rock and nanoparticles results in oil displacment through a
porous medium. Moreover, during nanofluid injection, as shown in Figure 5.14a, there was a
slight differential pressure increment along the core which is attributed to the deposited
nanoparticle on the rock surface that tends to cause pressure increase as the oil is detached/washed
from the core during the post flushing stage with additional water injection after soaking with the
nanofluids. Altering the rock wettability results in increasing the microscopic displacement
efficiency (ED) and this was slightly a function of nanoparticle concentration. ED increased as the
nanoparticle concentration increased as shown in Figure 5.14b. Altering the wettability to strong
water-wet as the nanoparticle concentration increases shifts the relative permeability to the right,
the relative permeability to oil also increases while that for water decreases which ultimately
results in more residual oil being remobilized (Giraldo et al., 2013). The displacement efficiency
was estimated from Equation 2, the detailed calculations for the required parameters are provided
in the appendix B Table B6.
𝐸𝐷 = 1 −𝑠𝑜𝑟2
𝑠𝑜𝑟1 (5.2)
where,
𝐸𝐷= displacement efficiency
𝑠𝑜𝑟1 = residual oil saturation after brine flooding
𝑠𝑜𝑟2 = residual oil saturation after nanofluid flooding
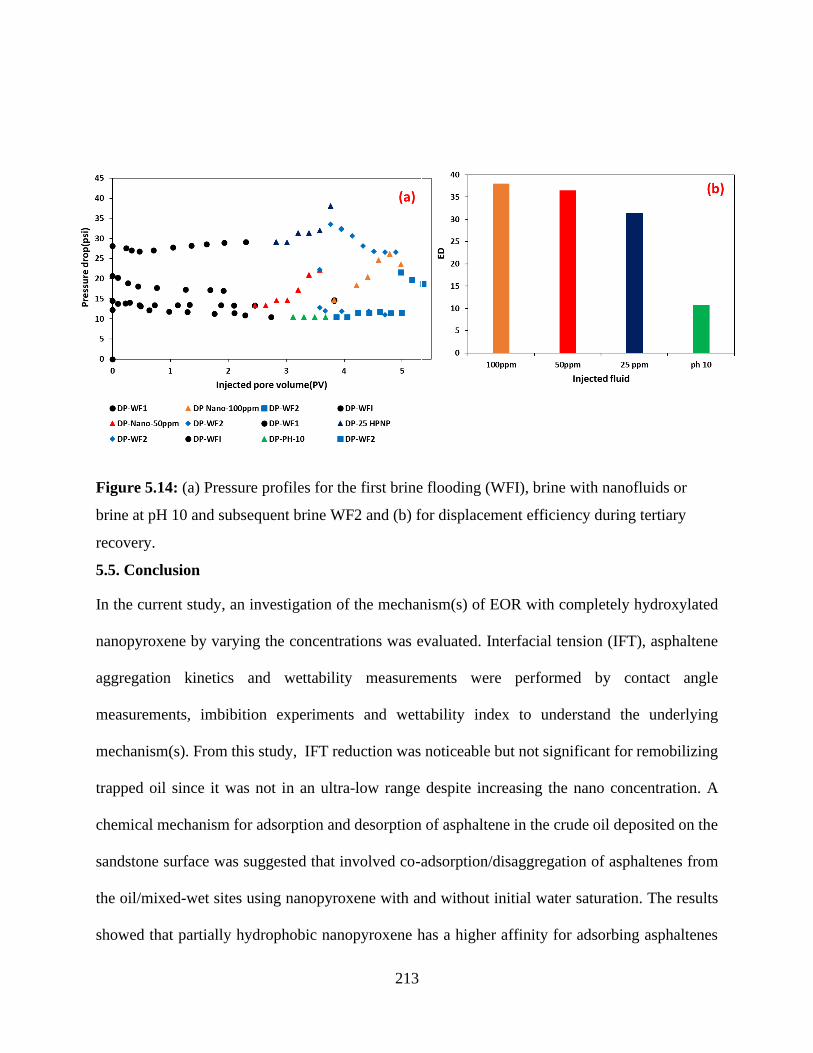
213
Figure 5.14: (a) Pressure profiles for the first brine flooding (WFI), brine with nanofluids or
brine at pH 10 and subsequent brine WF2 and (b) for displacement efficiency during tertiary
recovery.
5.5. Conclusion
In the current study, an investigation of the mechanism(s) of EOR with completely hydroxylated
nanopyroxene by varying the concentrations was evaluated. Interfacial tension (IFT), asphaltene
aggregation kinetics and wettability measurements were performed by contact angle
measurements, imbibition experiments and wettability index to understand the underlying
mechanism(s). From this study, IFT reduction was noticeable but not significant for remobilizing
trapped oil since it was not in an ultra-low range despite increasing the nano concentration. A
chemical mechanism for adsorption and desorption of asphaltene in the crude oil deposited on the
sandstone surface was suggested that involved co-adsorption/disaggregation of asphaltenes from
the oil/mixed-wet sites using nanopyroxene with and without initial water saturation. The results
showed that partially hydrophobic nanopyroxene has a higher affinity for adsorbing asphaltenes
214
in oil and reduce their aggregate size, however, there is an optimum concentration beyond which
the asphaltenes size reduction may be negligible and insignificant to EOR. Treatment of sandstone
cores that are initially strongly water wet with heptane/oil mixtures resulted in a mixed wet of
either patchy sort, dalmatian, or of interconnected water-wet and non-water wet pathways or
intermediate-wet as shown by the relative index measurements. Moreover, nanopyroxene
nanoparticles significantly affect the contact angle, imbibition, and wettability index, as they
increase as the nanoparticle concentration increases. In the presence of only monovalent ions,
wettability alteration depends on the brine/oil composition and pH of brine in the initial irreducible
water saturation. Furthermore, adjusting the nanofluid pH to 10 not only improved the nanofluid
stability and dispersibility but also had a substantial impact on EOR, almost 4.03% of the residual
oil could be recovered possibly due to the shift in the zeta potential that makes the rock surface
more water-wet. Core flooding experiments showed that nanopyroxene-based nanofluid injection
can recover an addition of∼12-14.5 % after waterflooding.
5.6 References
Ahmed, T. (2018). Reservoir engineering handbook: Gulf Professional Publishing.
Al-Maamari, R. S., & Buckley, J. S. (2000). Asphaltene precipitation and alteration of wetting:
can wettability change during oil production? Paper presented at the SPE/DOE Improved
Oil Recovery Symposium.
Anderson, W. (1986). Wettability literature survey-part 2: Wettability measurement. Journal of
Petroleum Technology, 38(11), 1,246-241,262.
Anderson, W. G. (1987). Wettability literature survey-part 6: the effects of wettability on
waterflooding. Journal of Petroleum Technology, 39(12), 1,605-601,622.
Aristizábal-Fontal, J. E., Cortés, F. B., & Franco, C. A. (2018). Viscosity reduction of extra-heavy
crude oil by magnetite nanoparticle-based ferrofluids. Adsorption Science & Technology,
36(1-2), 23-45.
Austad, T., & Standnes, D. C. (2003). Spontaneous imbibition of water into oil-wet carbonates.
Journal of Petroleum Science and Engineering, 39(3-4), 363-376.
Babadagli, T. (2007). Development of mature oil fields—A review. Journal of Petroleum Science
and Engineering, 57(3-4), 221-246.
Betancur, S., Carmona, J. C., Nassar, N. N., Franco, C. A., & Cortes, F. B. (2016). Role of particle
size and surface acidity of silica gel nanoparticles in inhibition of formation damage by
215
asphaltene in oil reservoirs. Industrial & Engineering Chemistry Research, 55(21), 6122-
6132.
Buckley, J. (1995). Asphaltene precipitation and crude oil wetting. SPE Advanced Technology
Series, 3(01), 53-59.
Buckley, J., & Liu, Y. (1998). Some mechanisms of crude oil/brine/solid interactions. Journal of
Petroleum Science and Engineering, 20(3-4), 155-160.
Buckley, J., Liu, Y., & Monsterleet, S. (1998). Mechanisms of wetting alteration by crude oils.
SPE Journal, 3(01), 54-61.
Buckley, J. S. (1994). Chemistry of the crude oil/brine interface. Paper presented at the Proc. 3 rd
International Symposium on Evaluation of Reservoir Wettability and Its Effect on Oil
Recovery.
Buckley, J. S., Bousseau, C., & Liu, Y. (1996). Wetting alteration by brine and crude oil: from
contact angles to cores. SPE Journal, 1(03), 341-350.
Carbognani, L., Roa-Fuentes, L., Diaz, L., Lopez-Linares, F., Vasquez, A., Pereira-Almao, P., . .
. Spencer, R. (2010). Monitoring bitumen upgrading, bitumen recovery, and
characterization of core extracts by hydrocarbon group-type SARA analysis. Petroleum
Science and Technology, 28(6), 632-645.
Cheraghian, G., Kiani, S., Nassar, N. N., Alexander, S., & Barron, A. R. (2017). Silica nanoparticle
enhancement in the efficiency of surfactant flooding of heavy oil in a glass micromodel.
Industrial & Engineering Chemistry Research, 56(30), 8528-8534.
Clementz, D. M. (1982). Alteration of rock properties by adsorption of petroleum heavy ends
implications for enhanced oil recovery. Paper presented at the SPE Enhanced Oil Recovery
Symposium.
Collins, S., & Melrose, J. (1983). Adsorption of asphaltenes and water on reservoir rock minerals.
Paper presented at the SPE Oilfield and Geothermal Chemistry Symposium.
Cuiec, L. (1984). Rock/crude-oil interactions and wettability: An attempt to understand their
interrelation. Paper presented at the SPE Annual Technical Conference and Exhibition.
Czarnecka, E., & Gillott, J. (1980). Formation and characterization of clay complexes with
bitumen from Athabasca oil sand. Clays and Clay Minerals, 28(3), 197-203.
Dai, C., Wang, X., Li, Y., Lv, W., Zou, C., Gao, M., & Zhao, M. (2017). Spontaneous imbibition
investigation of self-dispersing silica nanofluids for enhanced oil recovery in low-
permeability cores. Energy & fuels, 31(3), 2663-2668.
Dubey, S., & Doe, P. (1993). The base number and wetting properties of crude oils. SPE Reservoir
Engineering, 8(03), 195-200.
Dubey, S., & Waxman, M. (1991). Asphaltene adsorption and desorption from mineral surfaces.
SPE Reservoir Engineering, 6(03), 389-395.
Ehtesabi, H., Ahadian, M. M., Taghikhani, V., & Ghazanfari, M. H. (2013). Enhanced heavy oil
recovery in sandstone cores using TiO2 nanofluids. Energy & Fuels, 28(1), 423-430.
Giraldo, J., Benjumea, P., Lopera, S., Cortes, F. B., & Ruiz, M. A. (2013). Wettability alteration
of sandstone cores by alumina-based nanofluids. Energy & fuels, 27(7), 3659-3665.
Graue, A., Tonheim, E., & Baldwin, B. (1995). Control and alteration of wettability in low-
permeability chalk. Paper presented at the Proc.: 3rd International Symposium on
Evaluation of Reservoir Wettability and Its Effect on Oil Recovery, Laramie, Wy., USA.
Green, D. W., & Willhite, G. P. (1998). Enhanced oil recovery (Vol. 6): Henry L. Doherty
Memorial Fund of AIME, Society of Petroleum Engineers ….
216
Hashemi, R., Nassar, N. N., & Almao, P. P. (2014). Nanoparticle technology for heavy oil in-situ
upgrading and recovery enhancement: Opportunities and challenges. Applied Energy, 133,
374-387.
Hendraningrat, L., Li, S., & Torsæter, O. (2013). A coreflood investigation of nanofluid enhanced
oil recovery. Journal of Petroleum Science and Engineering, 111, 128-138.
Hendraningrat, L., Li, S., & Torsater, O. (2013). Effect of some parameters influencing enhanced
oil recovery process using silica nanoparticles: an experimental investigation. Paper
presented at the SPE Reservoir Characterization and Simulation Conference and
Exhibition.
Hu, Z., Azmi, S. M., Raza, G., Glover, P. W., & Wen, D. (2016). Nanoparticle-assisted water-
flooding in Berea sandstones. Energy & Fuels, 30(4), 2791-2804.
Jadhunandan, P., & Morrow, N. (1991). Spontaneous imbibition of water by crude oil/brine/rock
systems. In Situ;(United States), 15(4).
Joonaki, E., & Ghanaatian, S. (2014). The application of nanofluids for enhanced oil recovery:
effects on interfacial tension and coreflooding process. Petroleum Science and Technology,
32(21), 2599-2607.
Karimi, A., Fakhroueian, Z., Bahramian, A., Pour Khiabani, N., Darabad, J. B., Azin, R., & Arya,
S. (2012). Wettability alteration in carbonates using zirconium oxide nanofluids: EOR
implications. Energy & fuels, 26(2), 1028-1036.
Katende, A., & Sagala, F. (2019). A critical review of low salinity water flooding: mechanism,
laboratory and field application. Journal of Molecular Liquids.
Kong, X., & Ohadi, M. (2010). Applications of micro and nanotechnologies in the oil and gas
industry-overview of the recent progress. Paper presented at the Abu Dhabi international
petroleum exhibition and conference.
Lake, L. W. (1989). Enhanced oil recovery.
Lu, T., Li, Z., Zhou, Y., & Zhang, C. (2017). Enhanced oil recovery of low-permeability cores by
SiO2 nanofluid. Energy & fuels, 31(5), 5612-5621.
Ma, S., Morrow, N., & Zhang, X. (1995). Generalized scaling of spontaneous imbibition data for
strongly water-wet systems. Paper presented at the Technical Meeting/Petroleum
Conference of The South Saskatchewan Section.
Ma, S., Zhang, X., Morrow, N., & Zhou, X. (1999). Characterization of wettability from
spontaneous imbibition measurements. Journal of Canadian Petroleum Technology,
38(13).
Melichar, M., & Atems, B. (2019). Global crude oil market shocks and global commodity prices.
OPEC Energy Review, 43(1), 92-105.
Miller, R. G., & Sorrell, S. R. (2014). The future of oil supply: The Royal Society Publishing.
Miranda, C. R., Lara, L. S. d., & Tonetto, B. C. (2012). Stability and mobility of functionalized
silica nanoparticles for enhanced oil recovery applications. Paper presented at the SPE
International Oilfield Nanotechnology Conference and Exhibition.
Mohammadi, M., Akbari, M., Fakhroueian, Z., Bahramian, A., Azin, R., & Arya, S. (2011).
Inhibition of asphaltene precipitation by TiO2, SiO2, and ZrO2 nanofluids. Energy &
Fuels, 25(7), 3150-3156.
Mohammed, M., & Babadagli, T. (2015). Wettability alteration: A comprehensive review of
materials/methods and testing the selected ones on heavy-oil containing oil-wet systems.
Advances in colloid and interface science, 220, 54-77.
217
Morrow, N. R., & Mason, G. (2001). Recovery of oil by spontaneous imbibition. Current Opinion
in Colloid & Interface Science, 6(4), 321-337.
Muggeridge, A., Cockin, A., Webb, K., Frampton, H., Collins, I., Moulds, T., & Salino, P. (2014).
Recovery rates, enhanced oil recovery and technological limits. Philosophical
Transactions of the Royal Society A: Mathematical, Physical and Engineering Sciences,
372(2006), 20120320.
Nassar, N. N., Betancur, S., Acevedo, S. c., Franco, C. A., & Cortes, F. B. (2015). Development
of a population balance model to describe the influence of shear and nanoparticles on the
aggregation and fragmentation of asphaltene aggregates. Industrial & Engineering
Chemistry Research, 54(33), 8201-8211.
Nassar, N. N., Hassan, A., & Pereira-Almao, P. (2011). Application of nanotechnology for heavy
oil upgrading: Catalytic steam gasification/cracking of asphaltenes. Energy & Fuels, 25(4),
1566-1570.
Nazari Moghaddam, R., Bahramian, A., Fakhroueian, Z., Karimi, A., & Arya, S. (2015).
Comparative study of using nanoparticles for enhanced oil recovery: wettability alteration
of carbonate rocks. Energy & fuels, 29(4), 2111-2119.
Pillai, P., & Mandal, A. (2019a). Wettability modification and adsorption characteristics of
imidazole-based ionic liquid on carbonate rock: Implications for enhanced oil recovery.
Energy & fuels, 33(2), 727-738.
Pillai, P., & Mandal, A. (2019b). Wettability modification and adsorption characteristics of
imidazole-based ionic liquid on carbonate rock: Implications for enhanced oil recovery.
Energy & fuels.
Rahman, I. A., & Padavettan, V. (2012). Synthesis of silica nanoparticles by sol-gel: size-
dependent properties, surface modification, and applications in silica-polymer
nanocomposites—a review. Journal of Nanomaterials, 2012, 8.
Rahmani, N. H., Masliyah, J. H., & Dabros, T. (2003). Characterization of asphaltenes aggregation
and fragmentation in a shear field. AIChE Journal, 49(7), 1645-1655.
Ranka, M., Brown, P., & Hatton, T. A. (2015). Responsive stabilization of nanoparticles for
extreme salinity and high-temperature reservoir applications. ACS applied materials &
interfaces, 7(35), 19651-19658.
Sagala, F., Montoya, T., Hethnawi, A., Vitale, G., & Nassar, N. N. (2019). Nanopyroxene-based
Nanofluids for Enhanced Oil Recovery in Sandstone Cores. Energy & fuels.
Salathiel, R. (1973). Oil recovery by surface film drainage in mixed-wettability rocks. Journal of
Petroleum Technology, 25(10), 1,216-211,224.
Sheng, J. J. (2013). Review of surfactant enhanced oil recovery in carbonate reservoirs. Advances
in Petroleum Exploration and Development, 6(1), 1-10.
Sheng, J. J. (2014). A comprehensive review of alkaline–surfactant–polymer (ASP) flooding.
Asia‐Pacific Journal of Chemical Engineering, 9(4), 471-489.
Shutang, G., & Qiang, G. (2010). Recent progress and evaluation of ASP flooding for EOR in the
Daqing oil field. Paper presented at the SPE EOR Conference at Oil & Gas West Asia.
Standnes, D. C., & Austad, T. (2000a). Wettability alteration in chalk: 1. Preparation of core
material and oil properties. Journal of Petroleum Science and Engineering, 28(3), 111-121.
Standnes, D. C., & Austad, T. (2000b). Wettability alteration in chalk: 2. A mechanism for
wettability alteration from oil-wet to water-wet using surfactants. Journal of Petroleum
Science and Engineering, 28(3), 123-143.
218
Tang, G.-Q., & Morrow, N. R. (1999). Influence of brine composition and fines migration on crude
oil/brine/rock interactions and oil recovery. Journal of Petroleum Science and
Engineering, 24(2-4), 99-111.
Thorbecke, W. (2019). Oil Prices and the US Economy: Evidence from the stock market.
Vitale, G. (2013). Iron Silicate Nano-Crystals as Potential Catalysts or Adsorbents for Heavy
Hydrocarbons Upgrading. University of Calgary.
Wasan, D., Nikolov, A., & Kondiparty, K. (2011). The wetting and spreading of nanofluids on
solids: Role of the structural disjoining pressure. Current Opinion in Colloid & Interface
Science, 16(4), 344-349.
Zhang, H., Nikolov, A., & Wasan, D. (2014). Enhanced oil recovery (EOR) using nanoparticle
dispersions: underlying mechanism and imbibition experiments. Energy & fuels, 28(5),
3002-3009.
Zhu, Y. (2015). Current developments and remaining challenges of chemical flooding EOR
techniques in China. Paper presented at the SPE Asia Pacific enhanced oil recovery
conference.
219
Chapter Six: Integrating Silicate-based Nanoparticles with Low Salinity Water Flooding
for Enhanced Oil Recovery in Sandstone Reservoirs
Graphical Abstract
6.1. Abstract
A large number of researchers have endeavored to delineate the effects of injecting brine with a
low ionic strength in oil reservoirs in the last decade. However, we still cannot conclude the
overriding mechanism(s) of recovering oil from this technique. Even with a detailed review of
literature, the effect of low salinity water flooding (LSWF) shows that a bewildering array of
conflicting results have been reported. From the physicochemical point of view, understanding
how brine and oil chemistry affects oil recovery helps to optimize recovery from such processes.
Furthermore, the use of brine with low ionic strength coupled with nanoparticles during enhanced
oil recovery (EOR) especially in the presence of monovalent ions and/or divalent cations presents
a new field of study that requires further investigations. Herein, the main objective of this study
was to investigate the fluid/rock interactions at different salinities in the presence of various surface
modified pyroxene nanoparticles. Pyroxene was surface modified using polyethylene amine (PEI),
polyethylene oxide (PEO) and triethoxyoctylsilane (TOS). Surface charge, wettability
measurements in the presence of various ions in the irreducible water and core flooding
experiments have been conducted to understand the underlying mechanism(s). Surface charge was
evaluated by zeta potential measurements and wettability was determined by the contact angle,
imbibition, and relative permeability measurements. Sandstone outcrops and three oil samples with
different composition were used. The results show that adding 0.005 wt% nanoparticles to brine
with low ionic strength (1000 ppm) can improve the nanofluid stability and EOR. Additionally, in
220
the presence of LSWF combined with nanoparticles, the thickness of the double-layer on the rock
surface greatly expands, thus increasing the magnitude of zeta potential compared to LSWF alone.
Contact angle in the presence of LSW alone, N-PEO, N-PEI, and N-TOS nanofluids was measured
as 94±3˚, 118±3˚, 112±3˚, 130˚±3˚, respectively, conforming wettability alteration from oil/neutral
wet to stronger water-wet. Moreover, the greater repulsive force due to double layer expansion
creates a significant shift in the relative permeability curve to the right. Consequently, this results
in improved oil recovery by about 15% of the oil originally in place. Based on the obtained
findings, LSWF coupled with nanoparticles provides a prospect of being applied in EOR.
This chapter is adapted from the following publication:
Farad Sagala, Afif Hethnawi, and Nashaat N. Nassar*Integrating Silicate-based Nanoparticles with
Low Salinity Water Flooding for Enhanced Oil Recovery in Sandstone Reservoirs. (Published in
Industrial and Chemistry Research): https://doi.org/10.1021/acs.iecr.0c02326
6.2. Introduction
The oil industry has relentlessly endeavored to develop new feasible and economical techniques
of producing oil from mature and already producing fields due to the growing energy demand
globally (Chu & Majumdar, 2012; Miller & Sorrell, 2014). Moreover, oil companies are
persistently under pressure, continuously looking for novel techniques to recover the trapped oil,
which has taken up a huge portion of the total cost during oil recovery. With the emergence of
nanotechnology, researchers have explored the usage of nanomaterials in the oil recovery
especially in EOR applications (Nassar, Hassan, & Pereira-Almao, 2011a; Saha, Uppaluri, &
Tiwari, 2018). Currently, various types of nanoparticles such as metals and metal oxides have been
proven to recover additional oil after water flooding. The main fundamental mechanisms of EOR
by injecting nanoparticles include; disjoining pressure that aids detachment of oil drops from the
pore surface,(Wasan, Nikolov, & Kondiparty, 2011) rock wettability alteration towards water-wet
conditions,(Hou et al., 2019; Lu, Li, Zhou, & Zhang, 2017) reduction of interfacial tension (IFT)
between oil and brine,(Esfandyari Bayat, Junin, Samsuri, Piroozian, & Hokmabadi, 2014)
asphaltene and wax precipitation inhibition(Nassar, Hassan, Carbognani, Lopez-Linares, &
Pereira-Almao, 2012; Nassar, Hassan, & Pereira-Almao, 2011b; Yang et al., 2015) and pore
221
channels plugging (Sun, Zhang, Chen, & Gai, 2017). Besides, nanoparticles can be synergized
with other conventional techniques such as alkaline, surfactants or polymers to recover trapped oil
from the reservoir (ShamsiJazeyi, Miller, Wong, Tour, & Verduzco, 2014; Zargartalebi, Kharrat,
& Barati, 2015). Notwithstanding the substantially increasing interests of nanoparticle applications
in EOR, there still exists some challenges that limit their full adoption to field-scale such as
nanoparticle aggregation. Normally, due to harsh reservoir conditions such as salinity and
temperature, nanoparticles tend to aggregate and form clusters due to the force imbalance between
the attractive and repulsive forces (Bagwe, Hilliard, & Tan, 2006; Min, Akbulut, Kristiansen,
Golan, & Israelachvili, 2010). Agglomeration of nanoparticles results in a reduction of the
effective surface area to volume ratio, which impacts the overall performance of the nanofluids,
especially in these harsh environments (Timofeeva et al., 2007). Nevertheless, dispersing
nanoparticles in brine with a low salinity can help to improve their stability in solution and enhance
their performance. Over the past decade, Low salinity water flooding (LSWF) is one of the least
expensive new techniques that have been recognized as an alternative for EOR applications.
Moreover, laboratory experiments and field trials have shown that LSWF can recover additional
oil in sandstone reservoirs (Katende & Sagala, 2019; Nasralla, Alotaibi, & Nasr-El-Din, 2011).
The EOR prospect of LSWF was not considered until Morrow and his coworkers investigated the
effects of brine composition and/or chemistry on oil recovery; they evidenced that oil recovery
could be improved by injecting brine with a lower ionic composition(Jadhunandan & Morrow,
1995; Yildiz & Morrow, 1996). Since then, Tang and Morrow(Tang & Morrow, 1999) advanced
the exploration of the effect of brine composition on EOR, followed by active investigations by
the British Petroleum oil company, or BP (Lager, Webb, Black, Singleton, & Sorbie, 2008; Lager,
Webb, Collins, & Richmond, 2008). With this technique, the injected brine composition is the
222
driving force that determines the additional oil recovery. Presently, researchers have consistently
regarded several mechanisms of LSWF in EOR which include wettability alteration, cation
exchange, IFT reduction due to ion-exchange reactions and mineral dissolution that result in pH
increase due to the formation of excess hydroxyl ions, OH¯, and/or saponification that results in
the formation of natural surfactants (Bartels, Mahani, Berg, & Hassanizadeh, 2019; Katende &
Sagala, 2019; McGuire, Chatham, Paskvan, Sommer, & Carini, 2005; Rivet, Lake, & Pope, 2010;
Sheng, 2014). However, there is no unanimity about the controlling or leading mechanism(s). The
complex behavior of LSWF remains a new field of study by various researchers despite the
extensive laboratory and field tests. Nevertheless, wettability alteration from oil-wet or
intermediate wet to water-wet has been postulated as the main mechanism for the additional oil
recovery during LSWF, especially due to double-layer expansion in sandstone reservoirs (Nasralla
& Nasr-El-Din, 2014a). Wettability plays a key role in the process of oil recovery and reservoir
productivity as it controls the spatial fluid distribution, location, and flow in the porous medium
(W. Anderson, 1986; Farad et al., 2016). Because wettability controls the fluid distribution in the
porous medium, any changes in the reservoir rock wettability affect capillary pressure, water
flooding behavior and relative permeability (W. G. Anderson, 1987). Parameters such as oil
composition, rock surface chemistry, irreducible water saturation and its composition and pH are
cited as the major factors that control the wettability of the rock (Alotaibi, Nasralla, & Nasr-El-
Din, 2011; J. Buckley, Liu, & Monsterleet, 1998). Water flooding in a strongly water-wet system
results in higher oil recoveries at breakthrough, with little additional oil recovery after
breakthrough (W. G. Anderson, 1987). Contrary to water flooding in water-wet reservoirs, water
breakthrough in oil wet-reservoirs occurs much earlier and most of the oil is recovered after a long
simultaneous production of water and oil(W. G. Anderson, 1987). As thus, water floods are less
223
efficient in oil-wet systems compared to water-wet systems. Nevertheless, the injection of water
with low ionic strength as a secondary or tertiary technique has proven to significantly increase oil
recovery in sandstone formations(Alotaibi et al., 2011; Nasralla et al., 2011). Morrow et al.
(Morrow, Tang, Valat, & Xie, 1998) reported that 9% additional of the initial oil in place (OIIP)
could be obtained by reducing the ionic strength of their formation water by at least 10%. Zhang
et al(Zhang, Xie, & Morrow, 2007) recovered almost 16 % additional of the initial oil in place
(OIIP) by injecting less than 1,500 ppm NaCl as a tertiary mode. Additionally, successful field
application has been recently reported with the use of LSWF as a tertiary technique for EOR
applications (Katende & Sagala, 2019). Even though wettability alternation has been postulated as
the major mechanism behind this technique, understanding the factors that control wettability
variation are not clearly understood due to the occurring complex interactions in the oil/brine/rock
system and requires further investigation. The ability of the rock surface to retain its initial
wettability depends on the thickness and stability of the water film between the rock surface and
crude oil (Cuiec, 1984). Furthermore, water film stability depends on the repulsion of the electrical
double-layer between the rock/brine and oil/brine as a function of the surface charge. Despite
extensive studies of LSWF, the role of nanoparticles when dispersed in water with low ionic
strength for EOR application is a new field of study that requires further investigation. With its
higher efficiency and widely anticipated potentials, LSWF combined with nanoparticles presents
a promising future to tackle operational challenges, reduce environmental footprints, and allow
more feasible recoveries at low production costs hence increasing the ultimate oil recovery.
Reduction of fine migration in presence of nanoparticles has been reported as one of the possible
mechanisms during LSWF coupled with nanoparticles (Ogolo, 2013). Nonetheless, there several
other challenges that arise such as the selection of appropriate nanoparticles that can be integrated
224
with LSWF for EOR application. Numerous nanomaterials are manufactured with unusual metals
that are not suitable for large scale application for the oil industry. Therefore, more environmental-
friendly, and inexpensive practical materials must be used. Tailor-made mineral-like
nanomaterials, compatible with the environment with an economical-feasible synthesis method,
should be considered as well. As thus, iron-silicate pyroxene materials, known as aegirine
(NaFeSi2O6), comply with the aforementioned criteria and offer cheap options for large scale
commercialization. Herein, we synergized our previously prepared pyroxene nanomaterials with
LSWF by functionalizing its surface with various agents. Pyroxene is naturally-derived iron-
silicate nanomaterials that have specific ionic exchange properties that can allow surface alteration
to introduce various agents. This makes their surface attractive for heavy metals, polymers, and
capping agents, without primary surface treatment or modifications (Hmoudah, Nassar, Vitale, &
El-Qanni, 2016; Vitale, 2013). Hence, in this study, we are separately anchoring the surface of
pyroxene nanomaterials with triethoxyoctsilane (TOS), polyethylene amine (PEI) and
polyethylene oxide( PEO), and then tested for their effectiveness as EOR agents when dispersed
in brine with low ionic strength. The impact of injecting an optimized brine with a low ionic
composition in the presence of various modified pyroxene nanomaterials was investigated by
conducting surface charge or zeta potential measurements, contact angle measurements, imbibition
experiments, relative permeability measurements and core flooding experiments. This study
provides an insight to the oil industry who propose to improve the performance of conventional
water flooding by injecting nanoparticles dispersed in LSW, as one of the appropriate techniques
of recovering residual oil. The study also provides insights on the underlying chemistry of LSWF
when combined with nanoparticles for EOR applications in sandstone reservoirs at different
salinities.
225
6.3. Materials and Methods
Materials n-decane (99% purity), magnesium chloride (MgCl2 99%), calcium chloride (CaCl2
99%), sodium chloride (NaCl 99%), potassium bromide (KBr, 99%), n-heptane and toluene (99%)
were obtained from VWR (Canada) and used without treatment. Branched polyethyleneimine
(PEI) (99%) and polyethylene oxide (PEO) (99%) were purchased from VWR International,
Edmonton, Canada. Triethoxyoctylsilane (TOS) and cyclohexane both with 99% purity were
provided by Sigma Aldrich, Ontario, Canada. Deionized water (0 ppm NaCl) was used as the base
fluid in all preparations. The fluid properties such as pH, density, and viscosity were determined
using a pH meter, pycnometer(VWR, Canada) and Brookfield viscometer, Middleboro (USA)
respectively. Pyroxene nanomaterials used in this study were prepared as detailed in our previous
study(Sagala, Hethnawi, & Nassar, 2020; Sagala, Montoya, Hethnawi, Vitale, & Nassar, 2019).
Sandstone core plugs, with a permeability of 60-100 mD and porosity of 19-22% were supplied
by Kocurek Industries Inc., Caldwell, TX, USA. For zeta potential measurements, sandstone
outcrop rock containing mainly quartz crystal was crushed to powder to meet the particle size
requirement and used in the zeta potential measurements using the Malvern Nano Sight NS300
supplied by Malvern Instruments Ltd, Westborough, USA. Sandstone powder samples were
analyzed by Rigaku ULTIMA III X-ray (XRD) diffractometer with Cu Kα radiation as the X-ray
source to assess the mineralogy of the samples. The analysis indicated that the sandstone rocks
mainly contain quartz and clay (kaolinite and illite) as described in Figure C1 in Appendix C.
Oil samples. Three oil samples designated as A, B and C were used in this study. Sample A has
been used in our previous experiments(Sagala et al., 2019), while oil sample B was obtained by
diluting a heavy tank oil with toluene at a volume ratio of 80:20. The acid number (AN) of crude
oil B before dilution was 2.46 mg KOH/g oil and reduced to 0.71 after dilution. Oil sample C was
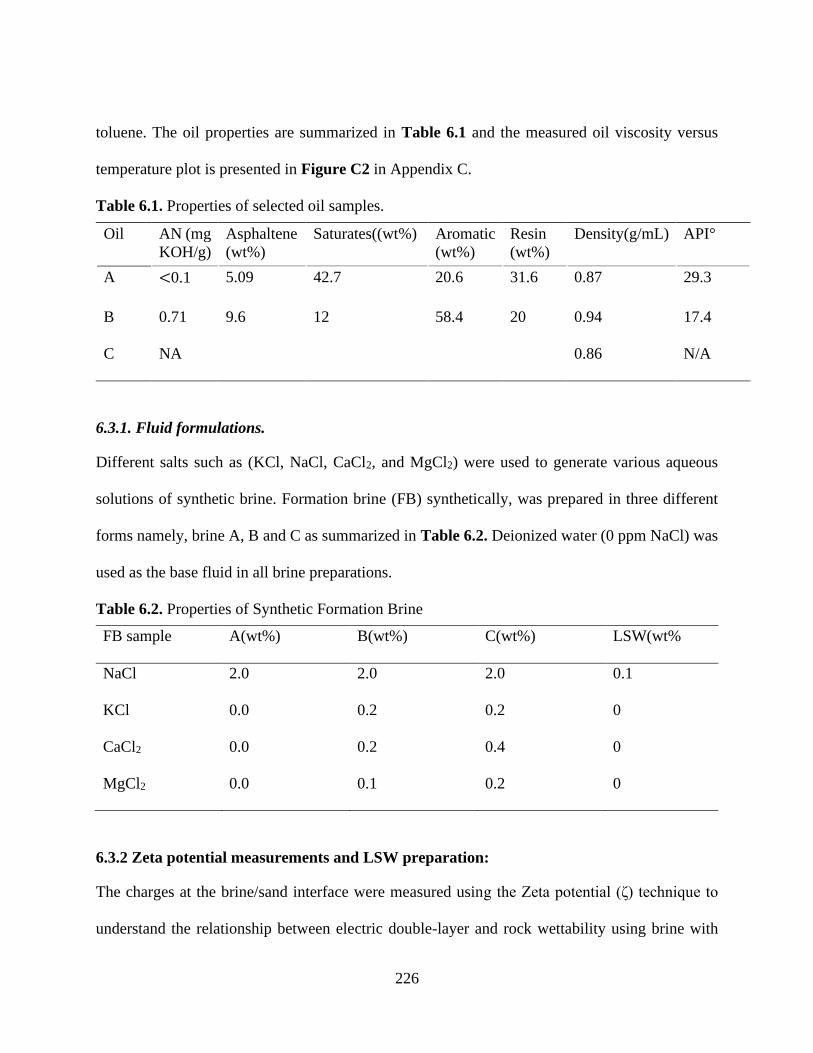
226
toluene. The oil properties are summarized in Table 6.1 and the measured oil viscosity versus
temperature plot is presented in Figure C2 in Appendix C.
Table 6.1. Properties of selected oil samples.
Oil AN (mg
KOH/g)
Asphaltene
(wt%)
Saturates((wt%) Aromatic
(wt%)
Resin
(wt%)
Density(g/mL) API°
A <0.1 5.09 42.7 20.6 31.6 0.87 29.3
B
C
0.71
NA
9.6
12 58.4 20 0.94
0.86
17.4
N/A
6.3.1. Fluid formulations.
Different salts such as (KCl, NaCl, CaCl2, and MgCl2) were used to generate various aqueous
solutions of synthetic brine. Formation brine (FB) synthetically, was prepared in three different
forms namely, brine A, B and C as summarized in Table 6.2. Deionized water (0 ppm NaCl) was
used as the base fluid in all brine preparations.
Table 6.2. Properties of Synthetic Formation Brine
FB sample A(wt%) B(wt%) C(wt%) LSW(wt%
NaCl 2.0 2.0 2.0 0.1
KCl 0.0 0.2 0.2 0
CaCl2 0.0 0.2 0.4 0
MgCl2 0.0 0.1 0.2 0
6.3.2 Zeta potential measurements and LSW preparation:
The charges at the brine/sand interface were measured using the Zeta potential (ζ) technique to
understand the relationship between electric double-layer and rock wettability using brine with
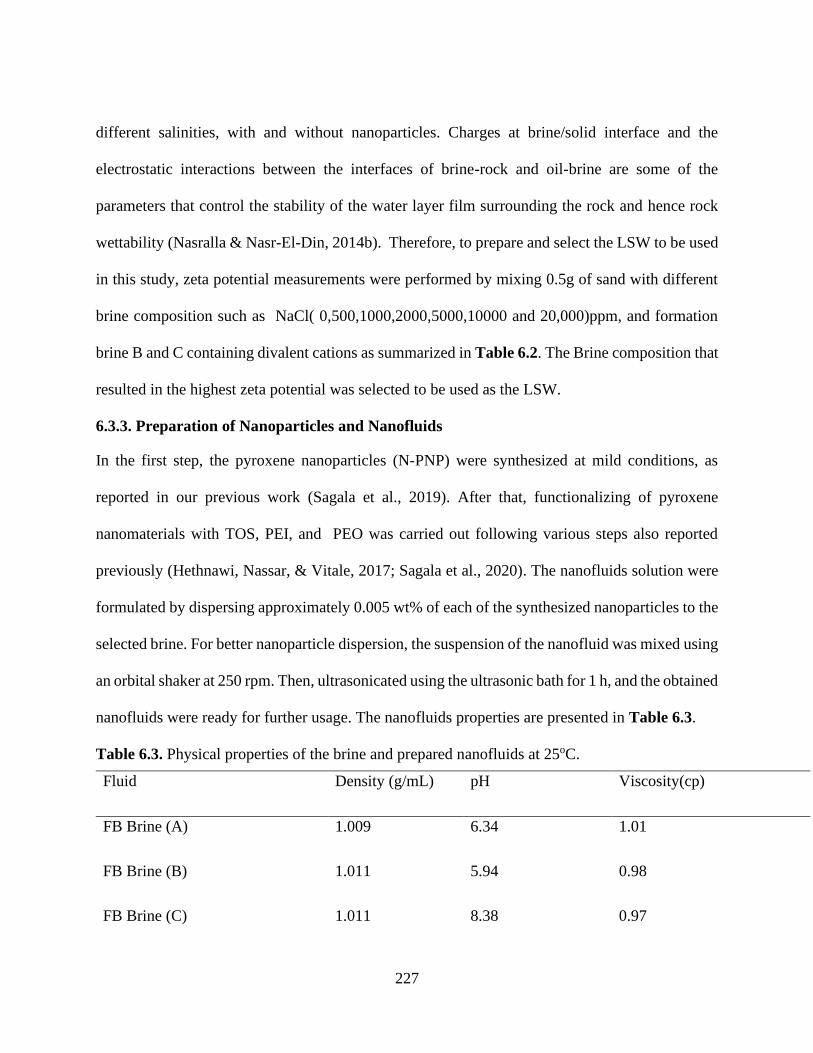
227
different salinities, with and without nanoparticles. Charges at brine/solid interface and the
electrostatic interactions between the interfaces of brine-rock and oil-brine are some of the
parameters that control the stability of the water layer film surrounding the rock and hence rock
wettability (Nasralla & Nasr-El-Din, 2014b). Therefore, to prepare and select the LSW to be used
in this study, zeta potential measurements were performed by mixing 0.5g of sand with different
brine composition such as NaCl( 0,500,1000,2000,5000,10000 and 20,000)ppm, and formation
brine B and C containing divalent cations as summarized in Table 6.2. The Brine composition that
resulted in the highest zeta potential was selected to be used as the LSW.
6.3.3. Preparation of Nanoparticles and Nanofluids
In the first step, the pyroxene nanoparticles (N-PNP) were synthesized at mild conditions, as
reported in our previous work (Sagala et al., 2019). After that, functionalizing of pyroxene
nanomaterials with TOS, PEI, and PEO was carried out following various steps also reported
previously (Hethnawi, Nassar, & Vitale, 2017; Sagala et al., 2020). The nanofluids solution were
formulated by dispersing approximately 0.005 wt% of each of the synthesized nanoparticles to the
selected brine. For better nanoparticle dispersion, the suspension of the nanofluid was mixed using
an orbital shaker at 250 rpm. Then, ultrasonicated using the ultrasonic bath for 1 h, and the obtained
nanofluids were ready for further usage. The nanofluids properties are presented in Table 6.3.
Table 6.3. Physical properties of the brine and prepared nanofluids at 25oC.
Fluid Density (g/mL) pH Viscosity(cp)
FB Brine (A) 1.009 6.34 1.01
FB Brine (B) 1.011 5.94 0.98
FB Brine (C) 1.011 8.38 0.97
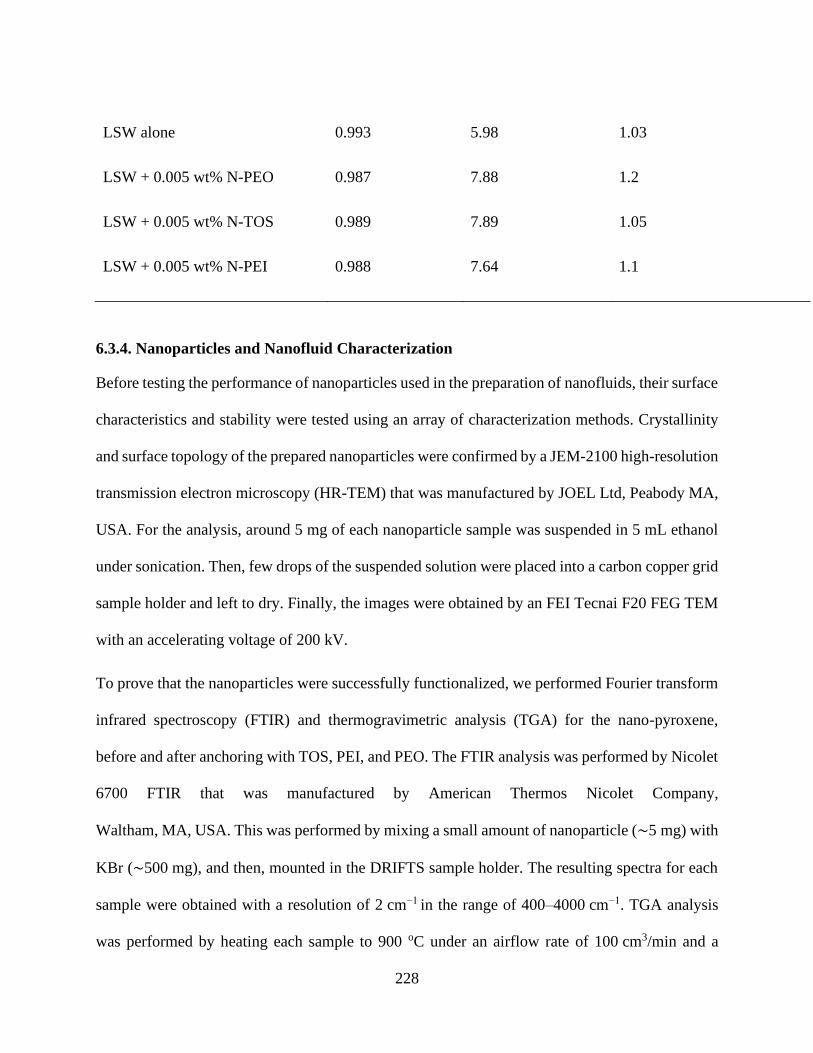
228
LSW alone 0.993 5.98 1.03
LSW + 0.005 wt% N-PEO 0.987 7.88 1.2
LSW + 0.005 wt% N-TOS 0.989 7.89 1.05
LSW + 0.005 wt% N-PEI 0.988 7.64 1.1
6.3.4. Nanoparticles and Nanofluid Characterization
Before testing the performance of nanoparticles used in the preparation of nanofluids, their surface
characteristics and stability were tested using an array of characterization methods. Crystallinity
and surface topology of the prepared nanoparticles were confirmed by a JEM-2100 high-resolution
transmission electron microscopy (HR-TEM) that was manufactured by JOEL Ltd, Peabody MA,
USA. For the analysis, around 5 mg of each nanoparticle sample was suspended in 5 mL ethanol
under sonication. Then, few drops of the suspended solution were placed into a carbon copper grid
sample holder and left to dry. Finally, the images were obtained by an FEI Tecnai F20 FEG TEM
with an accelerating voltage of 200 kV.
To prove that the nanoparticles were successfully functionalized, we performed Fourier transform
infrared spectroscopy (FTIR) and thermogravimetric analysis (TGA) for the nano-pyroxene,
before and after anchoring with TOS, PEI, and PEO. The FTIR analysis was performed by Nicolet
6700 FTIR that was manufactured by American Thermos Nicolet Company,
Waltham, MA, USA. This was performed by mixing a small amount of nanoparticle (∼5 mg) with
KBr (∼500 mg), and then, mounted in the DRIFTS sample holder. The resulting spectra for each
sample were obtained with a resolution of 2 cm−1 in the range of 400–4000 cm−1. TGA analysis
was performed by heating each sample to 900 oC under an airflow rate of 100 cm3/min and a
229
heating rate of 20 K/min using a simultaneous thermogravimetric differential scanning calorimetry
(TGA/DSC) analyzer (SDT Q600, TA Instruments, Inc., New Castle, DE). The instrument was
calibrated for mass and heat changes by using sapphire and zinc as references, respectively. To
test the stability of the nanofluid and zeta potential measurements for the nanofluids and the
sand/brine interface, dynamic light scattering (DLS) and zeta potential analyses were performed
using a Zetasizer instrument by Malvern Panalytical, Westborough, USA. For solid/brine zeta
potential measurements, a milled sand powder approximately 0.5 wt% was mixed with a fluid
under investigation. Then, the solutions were agitated at 100 rpm for 48 h at 25 oC. After that
aliquots were added to the cell for zeta potential measurement at 25 °C. Three measurements were
performed for each sample and the average value was reported.
6.3.5. Core preparation and Wettability Index Measurements
To perform wettability index and spontaneous imbibition experiments, Berea sandstone core plugs
with an average length of 4.0 cm and 2.54 cm diameter were used. Cores were dried first up to 90
oC to obtain a constant weight. The weights of the dried cores initially were recorded. Cores were
then saturated with brine of different salinities using a vacuum pump for 24 h. After that, pore
volume (PV) and porosity could be determined. To estimate the effect of wettability index using
different oil composition, the brine saturated cores were first driven to irreducible water Swi, by
injecting oil A or B using a Hasler core holder. The cores after saturation were aged in the two oil
samples A and B for at least 1 month and then used in wettability index measurements to determine
the effects of oil composition and brine salinity on the initial core wettability. A similar procedure
was reported by Anderson et al. (W. Anderson, 1986, Ma, Zhang, Morrow, & Zhou, 1999) for the
wettability index measurements. The properties of the cores used in wettability index
measurements are summarized in Table 6.4.
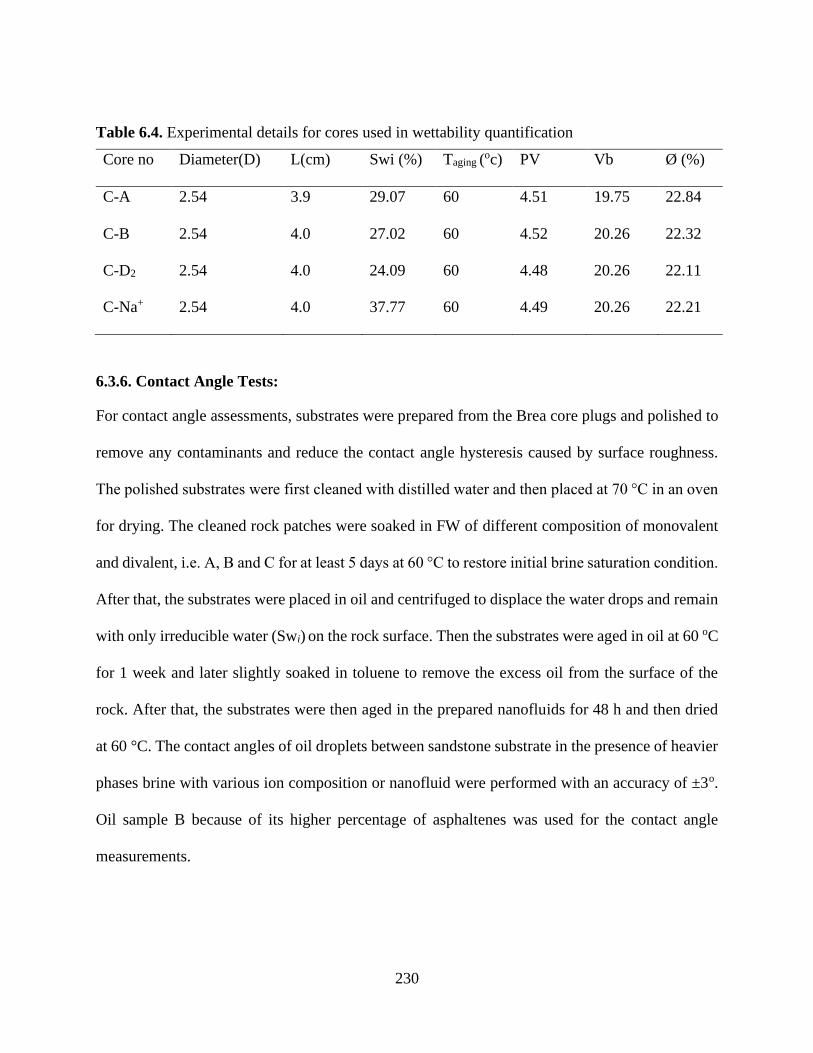
230
Table 6.4. Experimental details for cores used in wettability quantification
Core no Diameter(D) L(cm) Swi (%) Taging (oc) PV Vb Ø (%)
C-A 2.54 3.9 29.07 60 4.51 19.75 22.84
C-B
C-D2
2.54
2.54
4.0
4.0
27.02
24.09
60
60
4.52
4.48
20.26
20.26
22.32
22.11
C-Na+ 2.54 4.0 37.77 60 4.49 20.26 22.21
6.3.6. Contact Angle Tests:
For contact angle assessments, substrates were prepared from the Brea core plugs and polished to
remove any contaminants and reduce the contact angle hysteresis caused by surface roughness.
The polished substrates were first cleaned with distilled water and then placed at 70 °C in an oven
for drying. The cleaned rock patches were soaked in FW of different composition of monovalent
and divalent, i.e. A, B and C for at least 5 days at 60 °C to restore initial brine saturation condition.
After that, the substrates were placed in oil and centrifuged to displace the water drops and remain
with only irreducible water (Swi) on the rock surface. Then the substrates were aged in oil at 60 oC
for 1 week and later slightly soaked in toluene to remove the excess oil from the surface of the
rock. After that, the substrates were then aged in the prepared nanofluids for 48 h and then dried
at 60 °C. The contact angles of oil droplets between sandstone substrate in the presence of heavier
phases brine with various ion composition or nanofluid were performed with an accuracy of ±3o.
Oil sample B because of its higher percentage of asphaltenes was used for the contact angle
measurements.
231
6.3.7.Spontaneous Imbibition Tests:
The effect of LSW coupled with nanofluids was also investigated by spontaneous imbibition
experiments with cores having no initial water saturation using Amott cells. Oil sample B was used
in the imbibition experiments. After saturating and ageing the cores for 1 month, they were all
immersed in imbibition cells, containing formation water and the produced oil was recorded as a
function of time. After no more oil was being produced with formation water, either LSW or
nanofluid were added to the cells to replace the formation water and the additional produced oil
from the cores was also recorded and the total oil produced at the two stages was expressed as a
fraction of the original oil in place (% of OOIP). One test was performed for each imbibition
experiment. The petrophysical properties of the cores used in the imbibition experiment are shown
in Appendix C Table C1.
6.3.8. Core Flooding Experiments
A schematic representation of the core flooding experimental setup is shown in Figure C3 in
Appendix C. The core holder was surrounded by heating tapes to provide the required reservoir
temperature. The fluids used in this experiment were stored in the transfer cylinders. Each test
measurement started with, inserting the core in the sleeve, and then mounting the sleeve in the core
holder. By injecting lower pressure approximately 250 psi CO2 gas through the core sample for 1h
allowed opening the pores and remove any trapped air. CO2 has a high diffusivity, therefore; it can
replace any air trapped in the pores. After that, all the pipes, fittings and the sample inside the core-
holder were evacuated using a vacuum pump for 6 h. Then, the core sample was saturated using
brine at an injection rate of 0.2 mL/min. The injection rate approximates typical reservoir velocities
corresponding to a Darcy velocity of 1ft/day(Ahmed, 2018). The pressure drop between the inlet
and outlet of the core was measured by the pressure transducers. The absolute permeability was
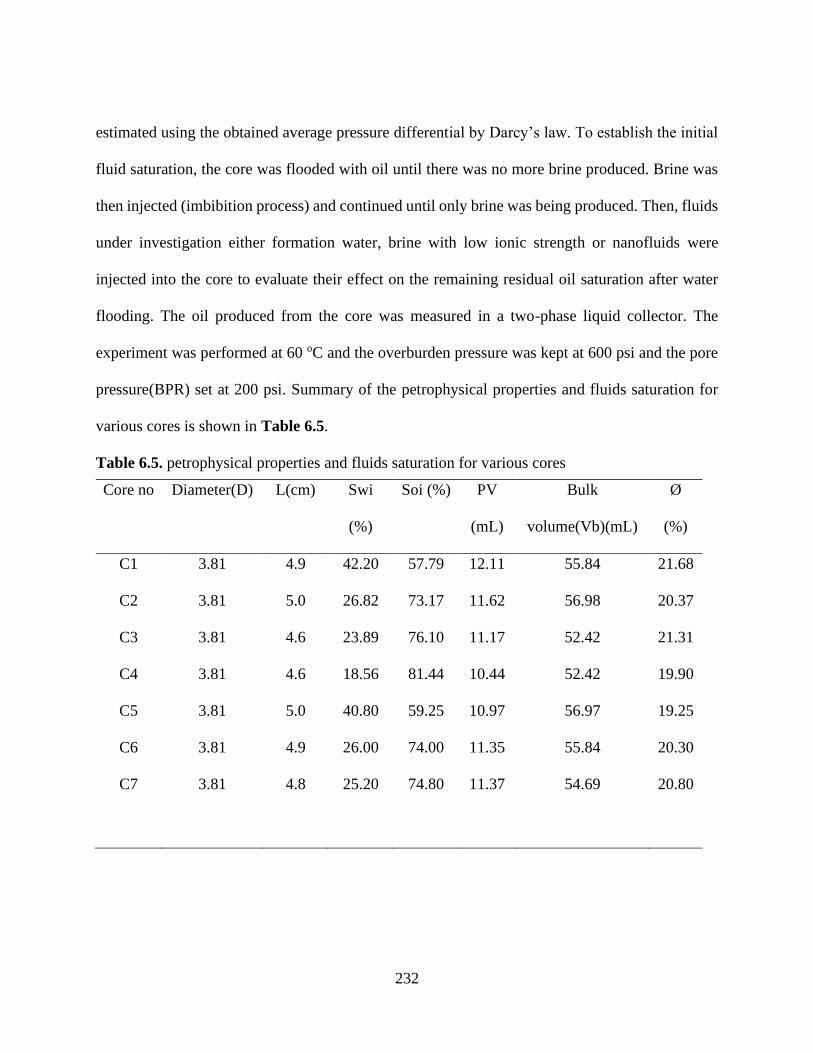
232
estimated using the obtained average pressure differential by Darcy’s law. To establish the initial
fluid saturation, the core was flooded with oil until there was no more brine produced. Brine was
then injected (imbibition process) and continued until only brine was being produced. Then, fluids
under investigation either formation water, brine with low ionic strength or nanofluids were
injected into the core to evaluate their effect on the remaining residual oil saturation after water
flooding. The oil produced from the core was measured in a two-phase liquid collector. The
experiment was performed at 60 oC and the overburden pressure was kept at 600 psi and the pore
pressure(BPR) set at 200 psi. Summary of the petrophysical properties and fluids saturation for
various cores is shown in Table 6.5.
Table 6.5. petrophysical properties and fluids saturation for various cores
Core no Diameter(D) L(cm) Swi
(%)
Soi (%) PV
(mL)
Bulk
volume(Vb)(mL)
Ø
(%)
C1 3.81 4.9 42.20 57.79 12.11 55.84 21.68
C2
C3
3.81
3.81
5.0
4.6
26.82
23.89
73.17
76.10
11.62
11.17
56.98
52.42
20.37
21.31
C4
C5
C6
C7
3.81
3.81
3.81
3.81
4.6
5.0
4.9
4.8
18.56
40.80
26.00
25.20
81.44
59.25
74.00
74.80
10.44
10.97
11.35
11.37
52.42
56.97
55.84
54.69
19.90
19.25
20.30
20.80
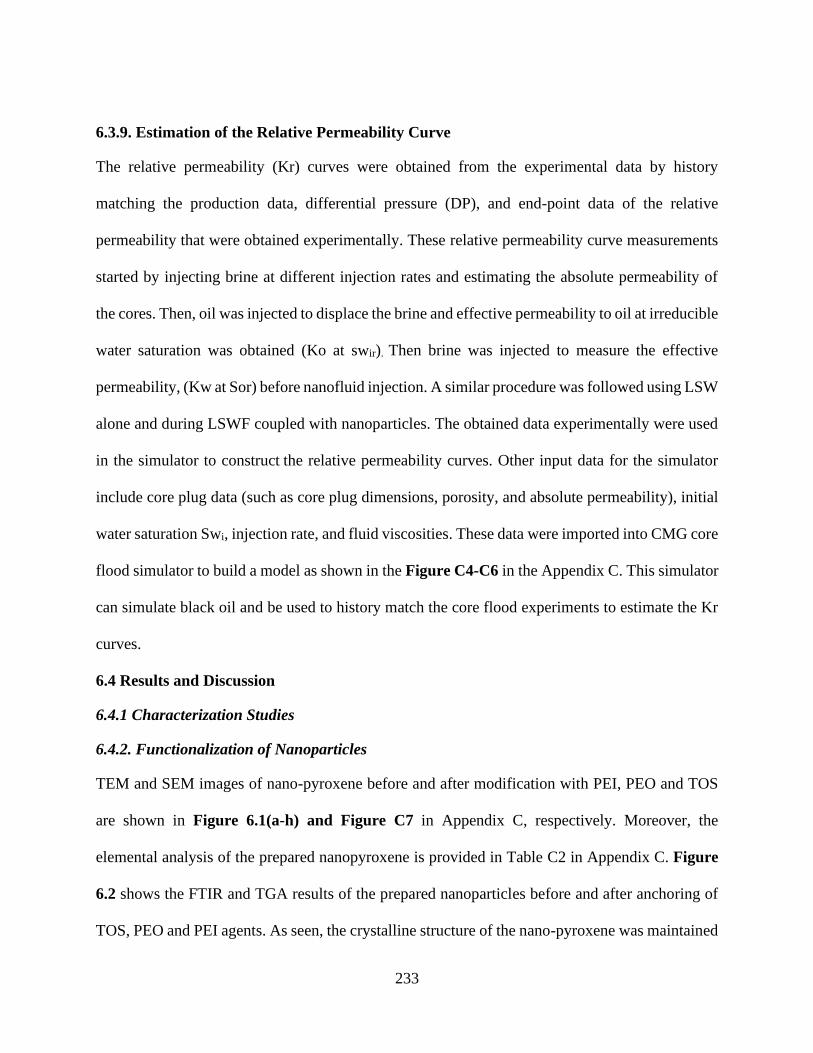
233
6.3.9. Estimation of the Relative Permeability Curve
The relative permeability (Kr) curves were obtained from the experimental data by history
matching the production data, differential pressure (DP), and end-point data of the relative
permeability that were obtained experimentally. These relative permeability curve measurements
started by injecting brine at different injection rates and estimating the absolute permeability of
the cores. Then, oil was injected to displace the brine and effective permeability to oil at irreducible
water saturation was obtained (Ko at swir). Then brine was injected to measure the effective
permeability, (Kw at Sor) before nanofluid injection. A similar procedure was followed using LSW
alone and during LSWF coupled with nanoparticles. The obtained data experimentally were used
in the simulator to construct the relative permeability curves. Other input data for the simulator
include core plug data (such as core plug dimensions, porosity, and absolute permeability), initial
water saturation Swi, injection rate, and fluid viscosities. These data were imported into CMG core
flood simulator to build a model as shown in the Figure C4-C6 in the Appendix C. This simulator
can simulate black oil and be used to history match the core flood experiments to estimate the Kr
curves.
6.4 Results and Discussion
6.4.1 Characterization Studies
6.4.2. Functionalization of Nanoparticles
TEM and SEM images of nano-pyroxene before and after modification with PEI, PEO and TOS
are shown in Figure 6.1(a-h) and Figure C7 in Appendix C, respectively. Moreover, the
elemental analysis of the prepared nanopyroxene is provided in Table C2 in Appendix C. Figure
6.2 shows the FTIR and TGA results of the prepared nanoparticles before and after anchoring of
TOS, PEO and PEI agents. As seen, the crystalline structure of the nano-pyroxene was maintained
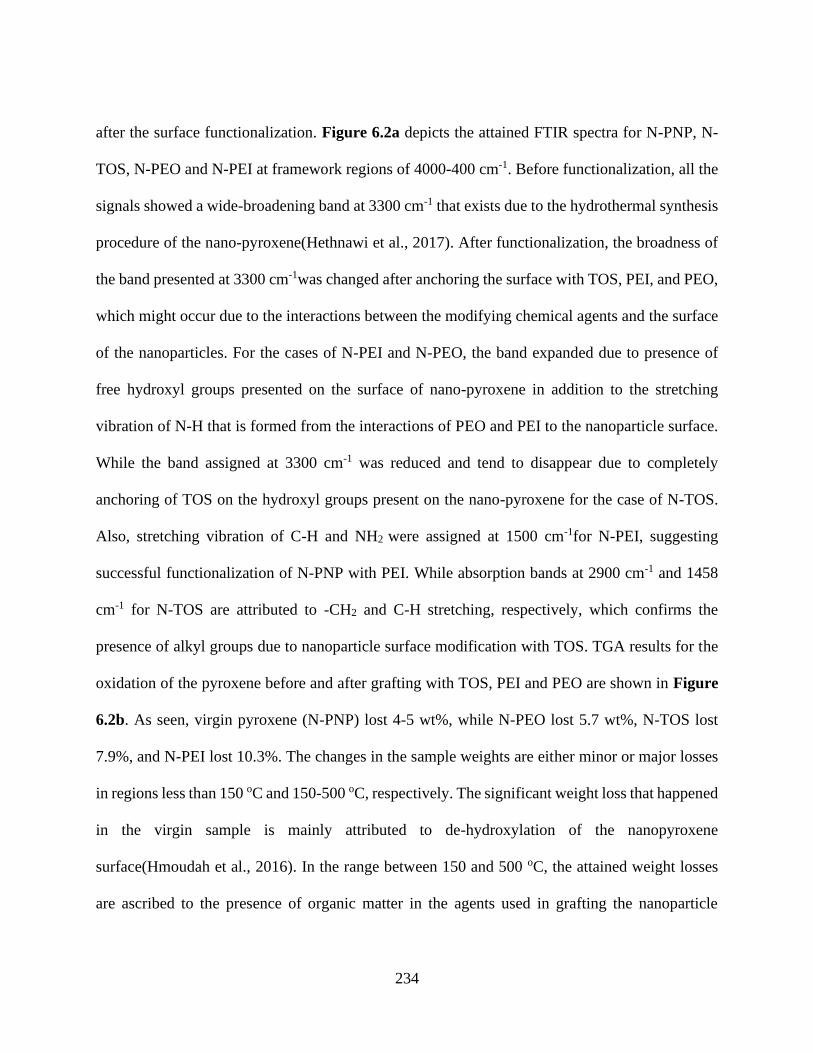
234
after the surface functionalization. Figure 6.2a depicts the attained FTIR spectra for N-PNP, N-
TOS, N-PEO and N-PEI at framework regions of 4000-400 cm-1. Before functionalization, all the
signals showed a wide-broadening band at 3300 cm-1 that exists due to the hydrothermal synthesis
procedure of the nano-pyroxene(Hethnawi et al., 2017). After functionalization, the broadness of
the band presented at 3300 cm-1was changed after anchoring the surface with TOS, PEI, and PEO,
which might occur due to the interactions between the modifying chemical agents and the surface
of the nanoparticles. For the cases of N-PEI and N-PEO, the band expanded due to presence of
free hydroxyl groups presented on the surface of nano-pyroxene in addition to the stretching
vibration of N-H that is formed from the interactions of PEO and PEI to the nanoparticle surface.
While the band assigned at 3300 cm-1 was reduced and tend to disappear due to completely
anchoring of TOS on the hydroxyl groups present on the nano-pyroxene for the case of N-TOS.
Also, stretching vibration of C-H and NH2 were assigned at 1500 cm-1for N-PEI, suggesting
successful functionalization of N-PNP with PEI. While absorption bands at 2900 cm-1 and 1458
cm-1 for N-TOS are attributed to -CH2 and C-H stretching, respectively, which confirms the
presence of alkyl groups due to nanoparticle surface modification with TOS. TGA results for the
oxidation of the pyroxene before and after grafting with TOS, PEI and PEO are shown in Figure
6.2b. As seen, virgin pyroxene (N-PNP) lost 4-5 wt%, while N-PEO lost 5.7 wt%, N-TOS lost
7.9%, and N-PEI lost 10.3%. The changes in the sample weights are either minor or major losses
in regions less than 150 oC and 150-500 oC, respectively. The significant weight loss that happened
in the virgin sample is mainly attributed to de-hydroxylation of the nanopyroxene
surface(Hmoudah et al., 2016). In the range between 150 and 500 oC, the attained weight losses
are ascribed to the presence of organic matter in the agents used in grafting the nanoparticle
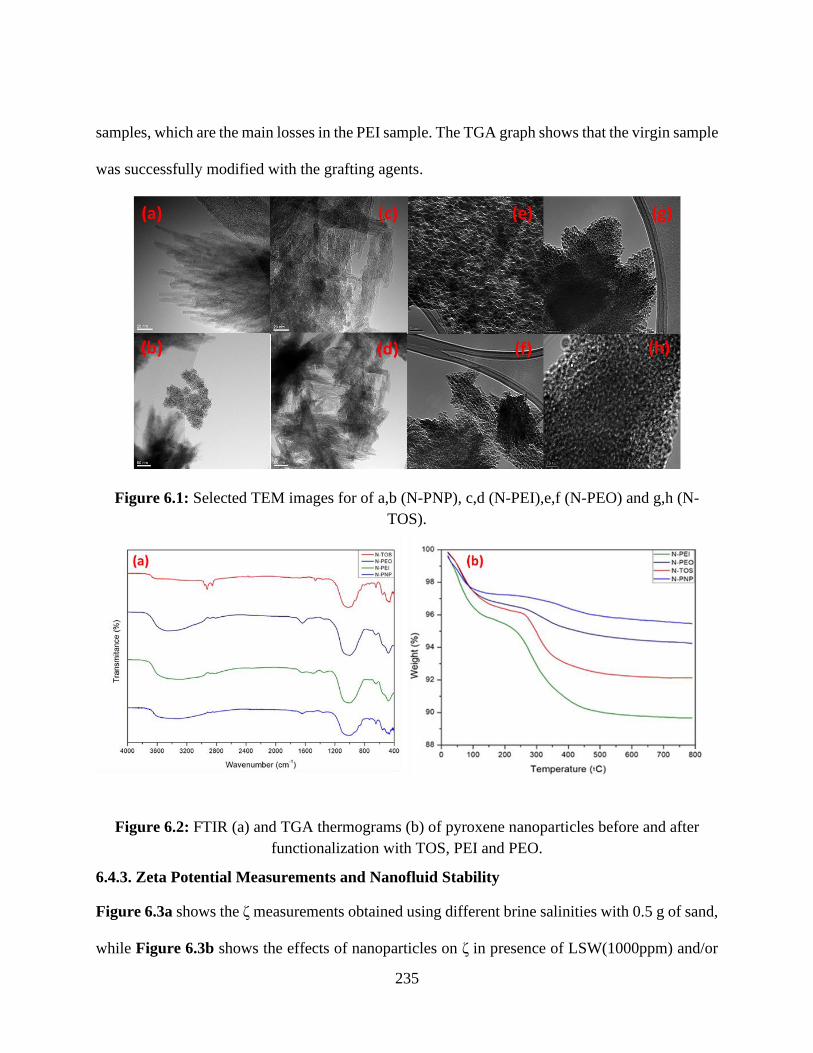
235
samples, which are the main losses in the PEI sample. The TGA graph shows that the virgin sample
was successfully modified with the grafting agents.
Figure 6.1: Selected TEM images for of a,b (N-PNP), c,d (N-PEI),e,f (N-PEO) and g,h (N-
TOS).
Figure 6.2: FTIR (a) and TGA thermograms (b) of pyroxene nanoparticles before and after
functionalization with TOS, PEI and PEO.
6.4.3. Zeta Potential Measurements and Nanofluid Stability
Figure 6.3a shows the ζ measurements obtained using different brine salinities with 0.5 g of sand,
while Figure 6.3b shows the effects of nanoparticles on ζ in presence of LSW(1000ppm) and/or
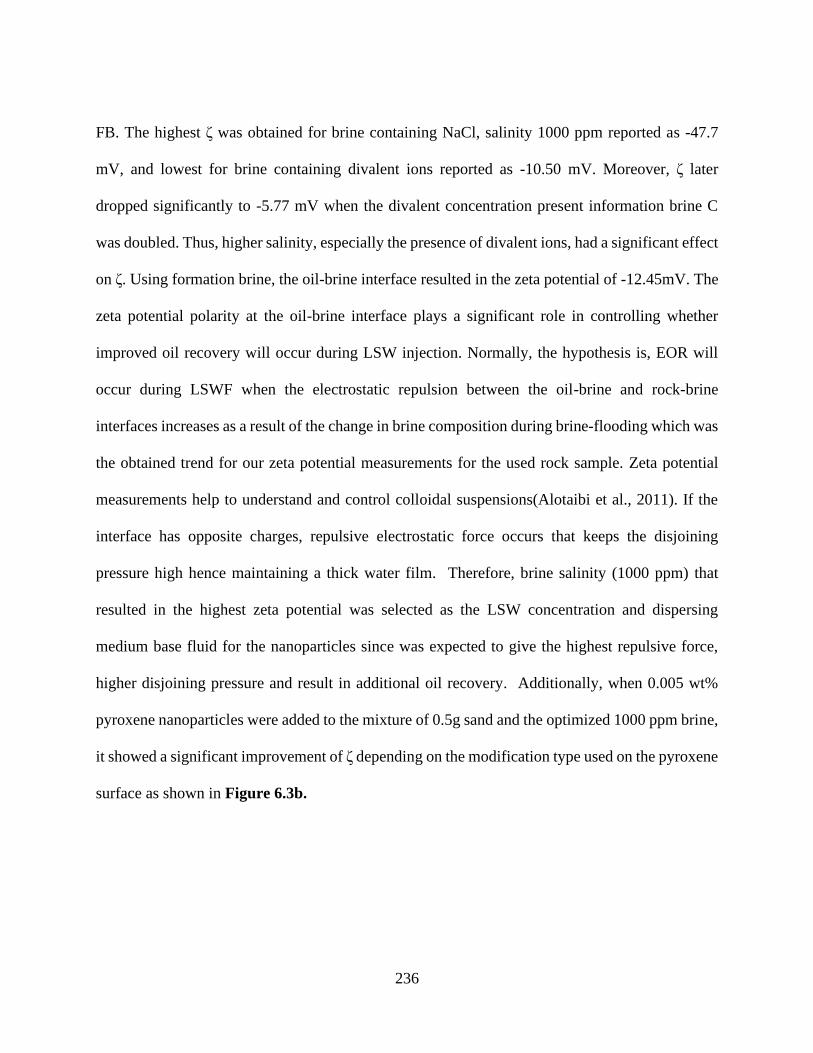
236
FB. The highest ζ was obtained for brine containing NaCl, salinity 1000 ppm reported as -47.7
mV, and lowest for brine containing divalent ions reported as -10.50 mV. Moreover, ζ later
dropped significantly to -5.77 mV when the divalent concentration present information brine C
was doubled. Thus, higher salinity, especially the presence of divalent ions, had a significant effect
on ζ. Using formation brine, the oil-brine interface resulted in the zeta potential of -12.45mV. The
zeta potential polarity at the oil-brine interface plays a significant role in controlling whether
improved oil recovery will occur during LSW injection. Normally, the hypothesis is, EOR will
occur during LSWF when the electrostatic repulsion between the oil-brine and rock-brine
interfaces increases as a result of the change in brine composition during brine-flooding which was
the obtained trend for our zeta potential measurements for the used rock sample. Zeta potential
measurements help to understand and control colloidal suspensions(Alotaibi et al., 2011). If the
interface has opposite charges, repulsive electrostatic force occurs that keeps the disjoining
pressure high hence maintaining a thick water film. Therefore, brine salinity (1000 ppm) that
resulted in the highest zeta potential was selected as the LSW concentration and dispersing
medium base fluid for the nanoparticles since was expected to give the highest repulsive force,
higher disjoining pressure and result in additional oil recovery. Additionally, when 0.005 wt%
pyroxene nanoparticles were added to the mixture of 0.5g sand and the optimized 1000 ppm brine,
it showed a significant improvement of ζ depending on the modification type used on the pyroxene
surface as shown in Figure 6.3b.
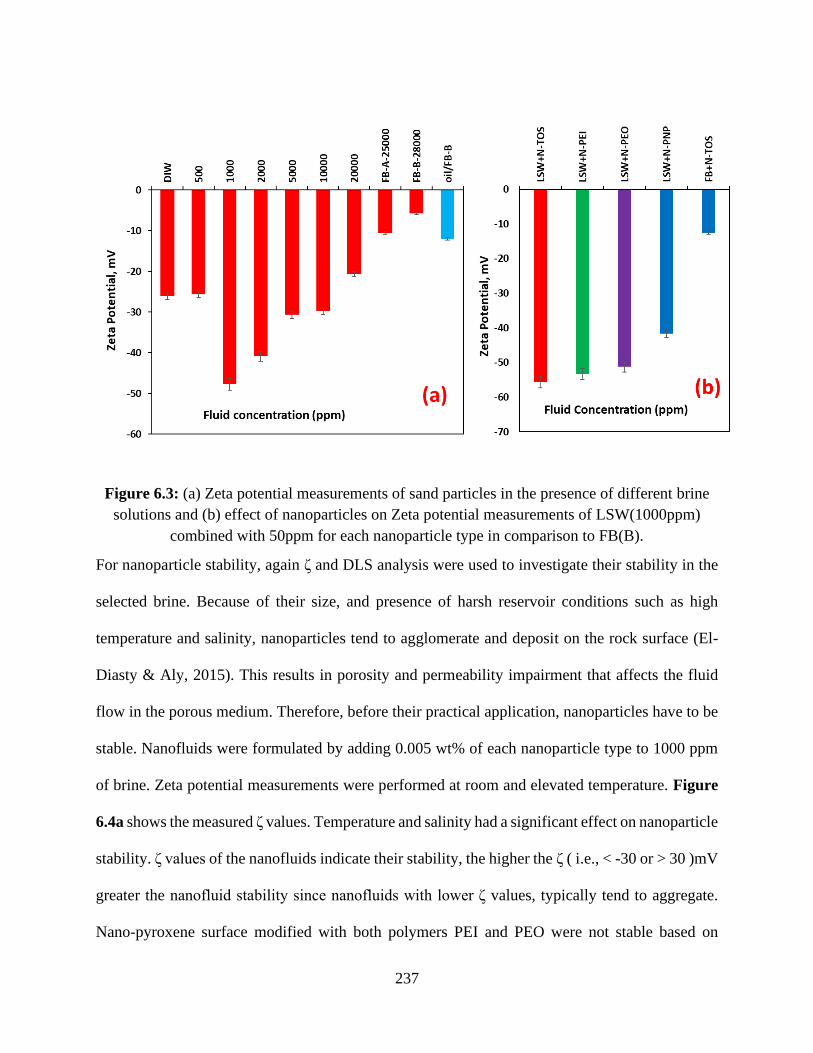
237
Figure 6.3: (a) Zeta potential measurements of sand particles in the presence of different brine
solutions and (b) effect of nanoparticles on Zeta potential measurements of LSW(1000ppm)
combined with 50ppm for each nanoparticle type in comparison to FB(B).
For nanoparticle stability, again ζ and DLS analysis were used to investigate their stability in the
selected brine. Because of their size, and presence of harsh reservoir conditions such as high
temperature and salinity, nanoparticles tend to agglomerate and deposit on the rock surface (El-
Diasty & Aly, 2015). This results in porosity and permeability impairment that affects the fluid
flow in the porous medium. Therefore, before their practical application, nanoparticles have to be
stable. Nanofluids were formulated by adding 0.005 wt% of each nanoparticle type to 1000 ppm
of brine. Zeta potential measurements were performed at room and elevated temperature. Figure
6.4a shows the measured ζ values. Temperature and salinity had a significant effect on nanoparticle
stability. ζ values of the nanofluids indicate their stability, the higher the ζ ( i.e., < -30 or > 30 )mV
greater the nanofluid stability since nanofluids with lower ζ values, typically tend to aggregate.
Nano-pyroxene surface modified with both polymers PEI and PEO were not stable based on
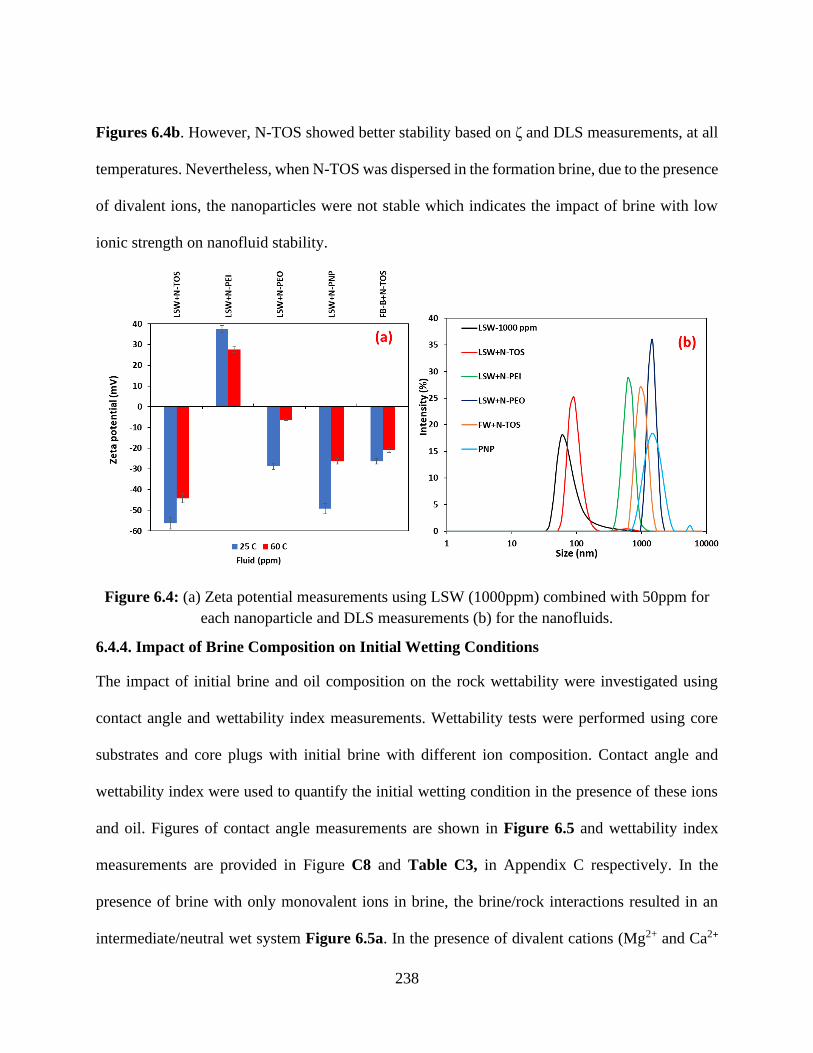
238
Figures 6.4b. However, N-TOS showed better stability based on ζ and DLS measurements, at all
temperatures. Nevertheless, when N-TOS was dispersed in the formation brine, due to the presence
of divalent ions, the nanoparticles were not stable which indicates the impact of brine with low
ionic strength on nanofluid stability.
Figure 6.4: (a) Zeta potential measurements using LSW (1000ppm) combined with 50ppm for
each nanoparticle and DLS measurements (b) for the nanofluids.
6.4.4. Impact of Brine Composition on Initial Wetting Conditions
The impact of initial brine and oil composition on the rock wettability were investigated using
contact angle and wettability index measurements. Wettability tests were performed using core
substrates and core plugs with initial brine with different ion composition. Contact angle and
wettability index were used to quantify the initial wetting condition in the presence of these ions
and oil. Figures of contact angle measurements are shown in Figure 6.5 and wettability index
measurements are provided in Figure C8 and Table C3, in Appendix C respectively. In the
presence of brine with only monovalent ions in brine, the brine/rock interactions resulted in an
intermediate/neutral wet system Figure 6.5a. In the presence of divalent cations (Mg2+ and Ca2+
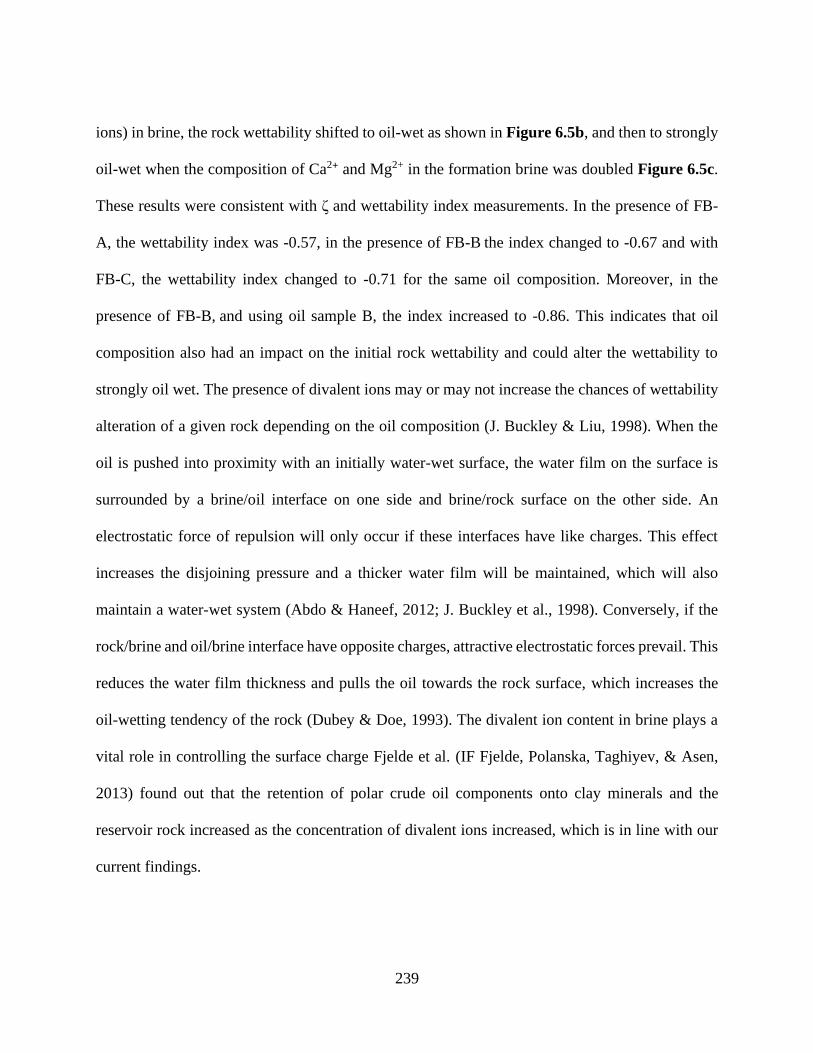
239
ions) in brine, the rock wettability shifted to oil-wet as shown in Figure 6.5b, and then to strongly
oil-wet when the composition of Ca2+ and Mg2+ in the formation brine was doubled Figure 6.5c.
These results were consistent with ζ and wettability index measurements. In the presence of FB-
A, the wettability index was -0.57, in the presence of FB-B the index changed to -0.67 and with
FB-C, the wettability index changed to -0.71 for the same oil composition. Moreover, in the
presence of FB-B, and using oil sample B, the index increased to -0.86. This indicates that oil
composition also had an impact on the initial rock wettability and could alter the wettability to
strongly oil wet. The presence of divalent ions may or may not increase the chances of wettability
alteration of a given rock depending on the oil composition (J. Buckley & Liu, 1998). When the
oil is pushed into proximity with an initially water-wet surface, the water film on the surface is
surrounded by a brine/oil interface on one side and brine/rock surface on the other side. An
electrostatic force of repulsion will only occur if these interfaces have like charges. This effect
increases the disjoining pressure and a thicker water film will be maintained, which will also
maintain a water-wet system (Abdo & Haneef, 2012; J. Buckley et al., 1998). Conversely, if the
rock/brine and oil/brine interface have opposite charges, attractive electrostatic forces prevail. This
reduces the water film thickness and pulls the oil towards the rock surface, which increases the
oil-wetting tendency of the rock (Dubey & Doe, 1993). The divalent ion content in brine plays a
vital role in controlling the surface charge Fjelde et al. (IF Fjelde, Polanska, Taghiyev, & Asen,
2013) found out that the retention of polar crude oil components onto clay minerals and the
reservoir rock increased as the concentration of divalent ions increased, which is in line with our
current findings.
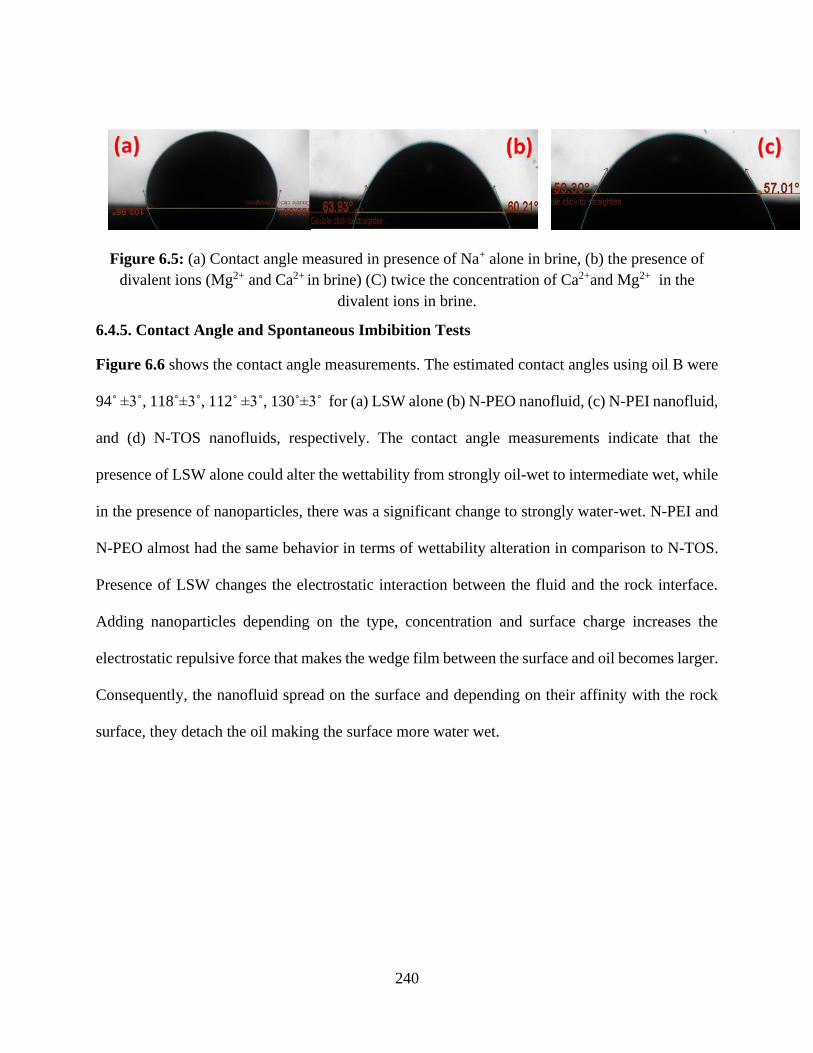
240
Figure 6.5: (a) Contact angle measured in presence of Na+ alone in brine, (b) the presence of
divalent ions (Mg2+ and Ca2+ in brine) (C) twice the concentration of Ca2+and Mg2+ in the
divalent ions in brine.
6.4.5. Contact Angle and Spontaneous Imbibition Tests
Figure 6.6 shows the contact angle measurements. The estimated contact angles using oil B were
94˚ ±3˚, 118˚±3˚, 112˚ ±3˚, 130˚±3˚ for (a) LSW alone (b) N-PEO nanofluid, (c) N-PEI nanofluid,
and (d) N-TOS nanofluids, respectively. The contact angle measurements indicate that the
presence of LSW alone could alter the wettability from strongly oil-wet to intermediate wet, while
in the presence of nanoparticles, there was a significant change to strongly water-wet. N-PEI and
N-PEO almost had the same behavior in terms of wettability alteration in comparison to N-TOS.
Presence of LSW changes the electrostatic interaction between the fluid and the rock interface.
Adding nanoparticles depending on the type, concentration and surface charge increases the
electrostatic repulsive force that makes the wedge film between the surface and oil becomes larger.
Consequently, the nanofluid spread on the surface and depending on their affinity with the rock
surface, they detach the oil making the surface more water wet.
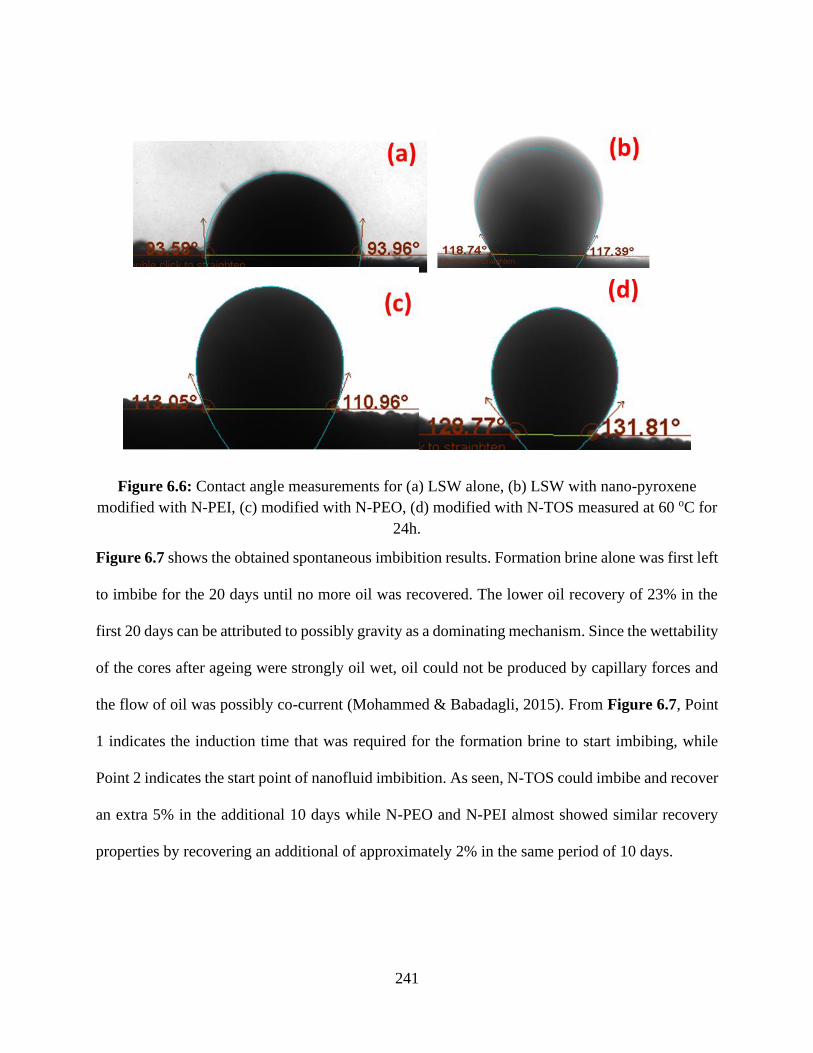
241
Figure 6.6: Contact angle measurements for (a) LSW alone, (b) LSW with nano-pyroxene
modified with N-PEI, (c) modified with N-PEO, (d) modified with N-TOS measured at 60 oC for
24h.
Figure 6.7 shows the obtained spontaneous imbibition results. Formation brine alone was first left
to imbibe for the 20 days until no more oil was recovered. The lower oil recovery of 23% in the
first 20 days can be attributed to possibly gravity as a dominating mechanism. Since the wettability
of the cores after ageing were strongly oil wet, oil could not be produced by capillary forces and
the flow of oil was possibly co-current (Mohammed & Babadagli, 2015). From Figure 6.7, Point
1 indicates the induction time that was required for the formation brine to start imbibing, while
Point 2 indicates the start point of nanofluid imbibition. As seen, N-TOS could imbibe and recover
an extra 5% in the additional 10 days while N-PEO and N-PEI almost showed similar recovery
properties by recovering an additional of approximately 2% in the same period of 10 days.
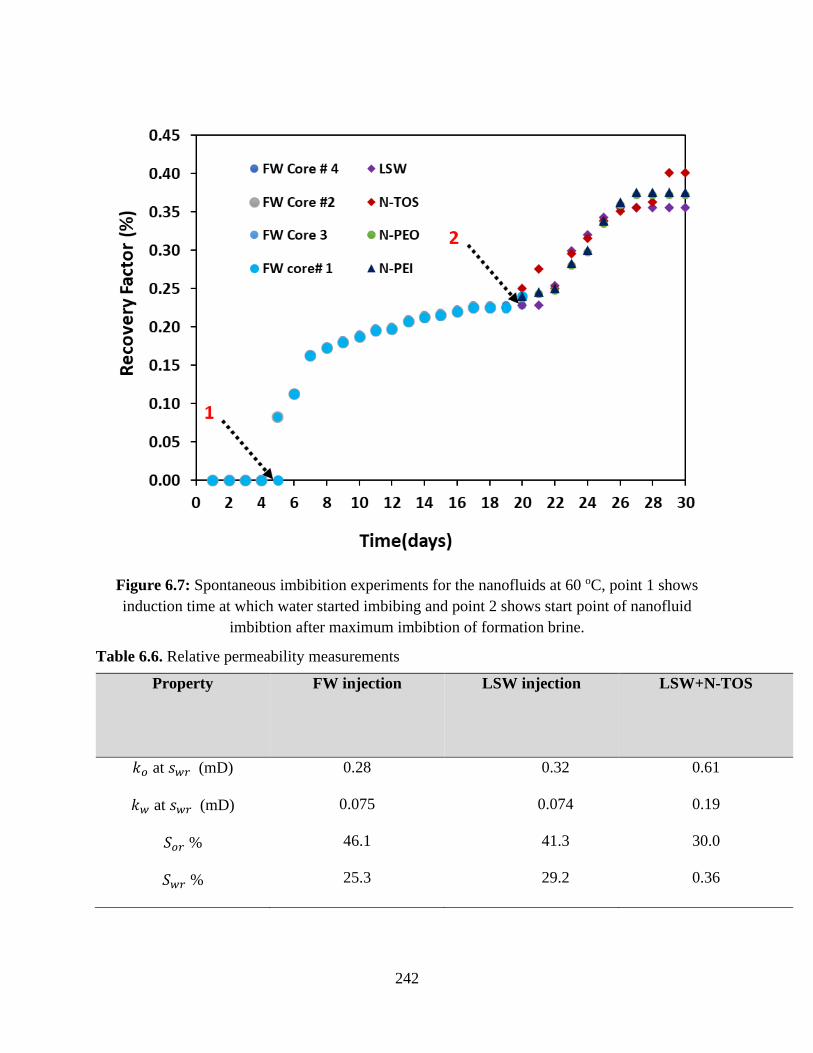
242
Figure 6.7: Spontaneous imbibition experiments for the nanofluids at 60 oC, point 1 shows
induction time at which water started imbibing and point 2 shows start point of nanofluid
imbibtion after maximum imbibtion of formation brine.
Table 6.6. Relative permeability measurements
Property FW injection LSW injection LSW+N-TOS
𝑘𝑜 at 𝑠𝑤𝑟 (mD)
𝑘𝑤 at 𝑠𝑤𝑟 (mD)
𝑆𝑜𝑟 %
𝑆𝑤𝑟 %
0.28
0.075
46.1
25.3
0.32
0.074
41.3
29.2
0.61
0.19
30.0
0.36
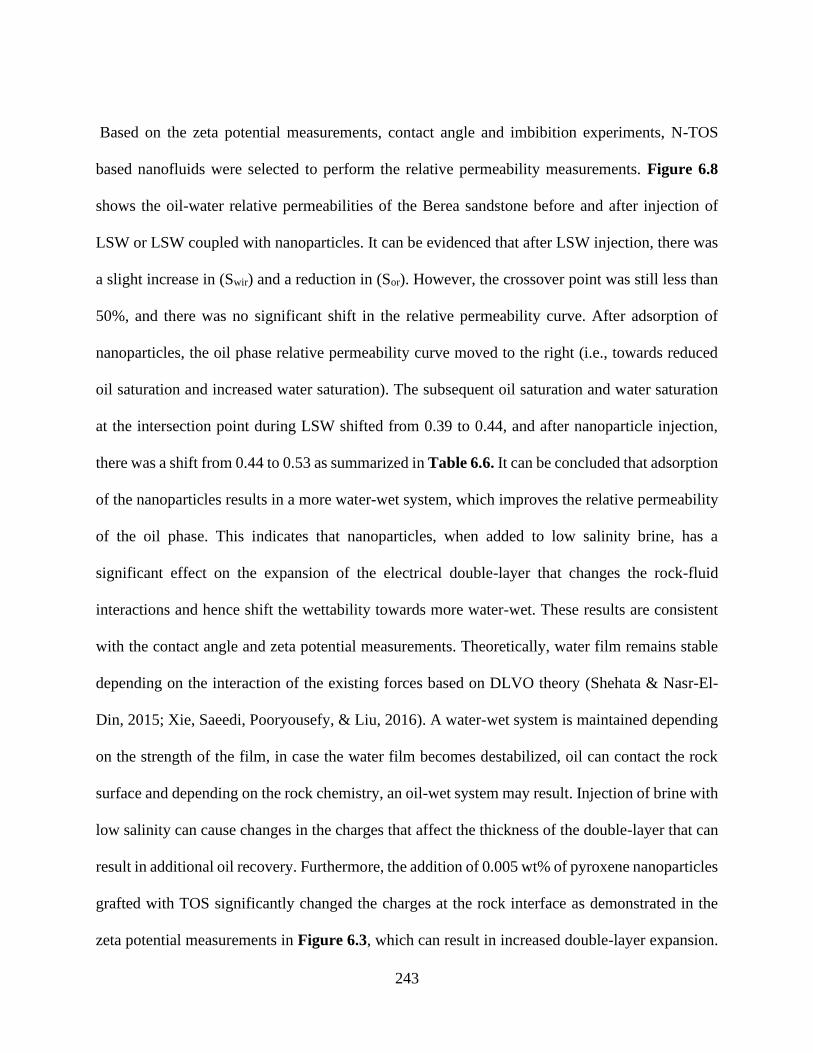
243
Based on the zeta potential measurements, contact angle and imbibition experiments, N-TOS
based nanofluids were selected to perform the relative permeability measurements. Figure 6.8
shows the oil-water relative permeabilities of the Berea sandstone before and after injection of
LSW or LSW coupled with nanoparticles. It can be evidenced that after LSW injection, there was
a slight increase in (Swir) and a reduction in (Sor). However, the crossover point was still less than
50%, and there was no significant shift in the relative permeability curve. After adsorption of
nanoparticles, the oil phase relative permeability curve moved to the right (i.e., towards reduced
oil saturation and increased water saturation). The subsequent oil saturation and water saturation
at the intersection point during LSW shifted from 0.39 to 0.44, and after nanoparticle injection,
there was a shift from 0.44 to 0.53 as summarized in Table 6.6. It can be concluded that adsorption
of the nanoparticles results in a more water-wet system, which improves the relative permeability
of the oil phase. This indicates that nanoparticles, when added to low salinity brine, has a
significant effect on the expansion of the electrical double-layer that changes the rock-fluid
interactions and hence shift the wettability towards more water-wet. These results are consistent
with the contact angle and zeta potential measurements. Theoretically, water film remains stable
depending on the interaction of the existing forces based on DLVO theory (Shehata & Nasr-El-
Din, 2015; Xie, Saeedi, Pooryousefy, & Liu, 2016). A water-wet system is maintained depending
on the strength of the film, in case the water film becomes destabilized, oil can contact the rock
surface and depending on the rock chemistry, an oil-wet system may result. Injection of brine with
low salinity can cause changes in the charges that affect the thickness of the double-layer that can
result in additional oil recovery. Furthermore, the addition of 0.005 wt% of pyroxene nanoparticles
grafted with TOS significantly changed the charges at the rock interface as demonstrated in the
zeta potential measurements in Figure 6.3, which can result in increased double-layer expansion.
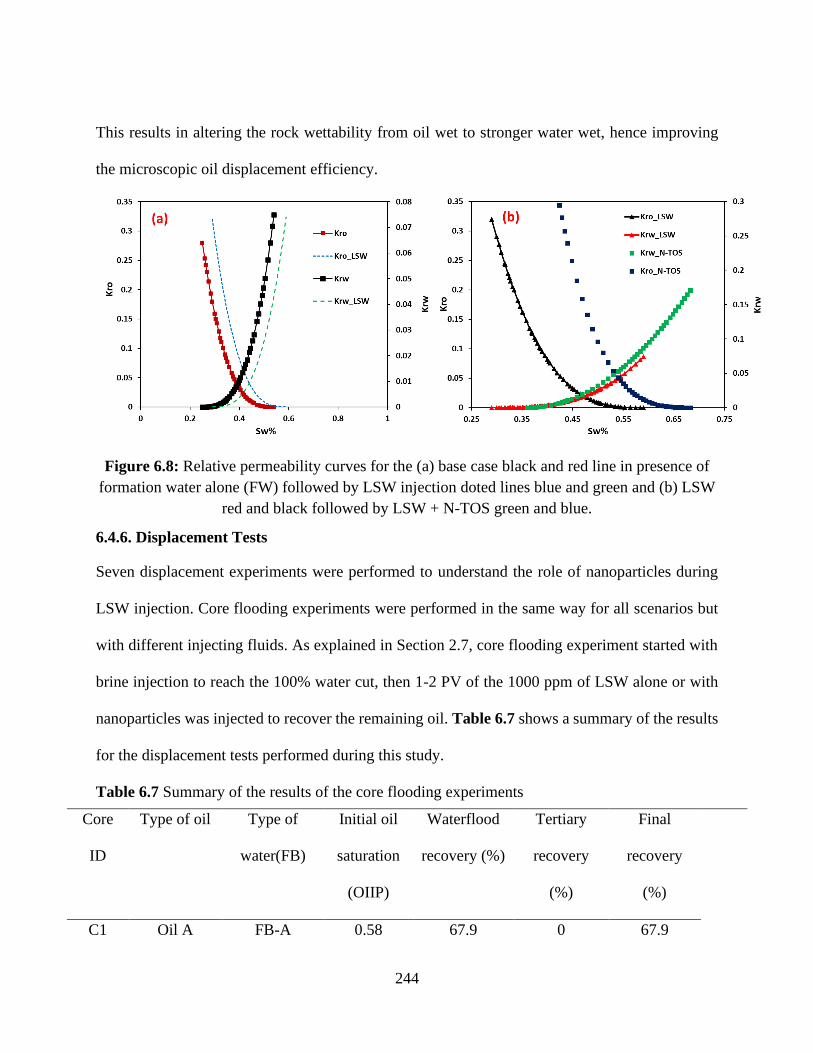
244
This results in altering the rock wettability from oil wet to stronger water wet, hence improving
the microscopic oil displacement efficiency.
Figure 6.8: Relative permeability curves for the (a) base case black and red line in presence of
formation water alone (FW) followed by LSW injection doted lines blue and green and (b) LSW
red and black followed by LSW + N-TOS green and blue.
6.4.6. Displacement Tests
Seven displacement experiments were performed to understand the role of nanoparticles during
LSW injection. Core flooding experiments were performed in the same way for all scenarios but
with different injecting fluids. As explained in Section 2.7, core flooding experiment started with
brine injection to reach the 100% water cut, then 1-2 PV of the 1000 ppm of LSW alone or with
nanoparticles was injected to recover the remaining oil. Table 6.7 shows a summary of the results
for the displacement tests performed during this study.
Table 6.7 Summary of the results of the core flooding experiments
Core
ID
Type of oil Type of
water(FB)
Initial oil
saturation
(OIIP)
Waterflood
recovery (%)
Tertiary
recovery
(%)
Final
recovery
(%)
C1 Oil A FB-A 0.58 67.9 0 67.9
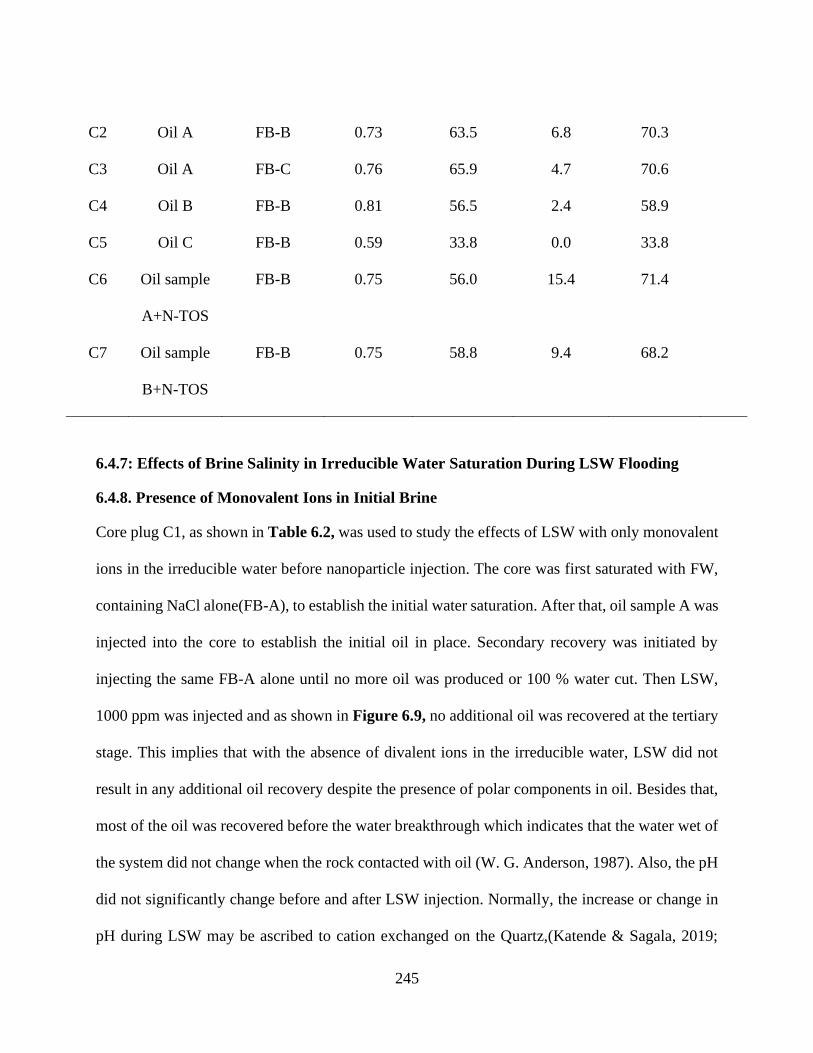
245
C2
C3
C4
C5
C6
Oil A
Oil A
Oil B
Oil C
Oil sample
A+N-TOS
FB-B
FB-C
FB-B
FB-B
FB-B
0.73
0.76
0.81
0.59
0.75
63.5
65.9
56.5
33.8
56.0
6.8
4.7
2.4
0.0
15.4
70.3
70.6
58.9
33.8
71.4
C7
Oil sample
B+N-TOS
FB-B 0.75 58.8 9.4 68.2
6.4.7: Effects of Brine Salinity in Irreducible Water Saturation During LSW Flooding
6.4.8. Presence of Monovalent Ions in Initial Brine
Core plug C1, as shown in Table 6.2, was used to study the effects of LSW with only monovalent
ions in the irreducible water before nanoparticle injection. The core was first saturated with FW,
containing NaCl alone(FB-A), to establish the initial water saturation. After that, oil sample A was
injected into the core to establish the initial oil in place. Secondary recovery was initiated by
injecting the same FB-A alone until no more oil was produced or 100 % water cut. Then LSW,
1000 ppm was injected and as shown in Figure 6.9, no additional oil was recovered at the tertiary
stage. This implies that with the absence of divalent ions in the irreducible water, LSW did not
result in any additional oil recovery despite the presence of polar components in oil. Besides that,
most of the oil was recovered before the water breakthrough which indicates that the water wet of
the system did not change when the rock contacted with oil (W. G. Anderson, 1987). Also, the pH
did not significantly change before and after LSW injection. Normally, the increase or change in
pH during LSW may be ascribed to cation exchanged on the Quartz,(Katende & Sagala, 2019;
246
McMillan, Rahnema, Romiluy, & Kitty, 2016) which possibly did not occur here. Therefore, in
the absence of divalent ions in FW, no cation exchange occurred and hence no additional oil
recovery was obtained. This indicates the significance of divalent ions during LSW flooding.
Similar findings have been reported by Behruz et al. (Shaker Shiran & Skauge, 2013) This
indicates that the composition of irreducible water affect LSW enhanced oil recovery.
Figure 6.9: Oil recovery profile (primary vertical axis) and pressure drop (secondary vertical
axis) between injection and production end (DP) for the core plug C1 test.
6.4.9. Presence of Divalent Ions (Mg2+ and Ca2+) in the Irreducible Water
A different run using core plug C2 was conducted by injecting 1000 ppm of LSW again in the
presence of formation brine (FB)-B containing divalent ions (Mg2+ and Ca2+) in the irreducible
water and after injecting (FB)-B in the secondary mode. An additional oil recovery of 6.8% of the
oil originally in place (OOIP) was recovered during the tertiary mode, as shown in Figure 6.10,
247
which shows the significance of divalent ions in formation water during LSW injection. Nasrallah
et al. (Nasralla & Nasr-El-Din, 2014b) investigated the role of LSW in recovering residual oil and
confirmed that the presence of divalent ions in the connate water results in cation exchange
between the surface of the rock, connate water and LSW which results in a change of the surface
charges of the rock. On the other hand, Skrettingland et al. (Skrettingland, Holt, Tweheyo, &
Skjevrak, 2011) suggested that the initial wetting condition affects LSW injection performance.
Divalent cations stabilize the clay and lower the ζ resulting in lowering of the repulsive forces
between the rock and brine. The polar oil components (like resins and asphaltenes) get attached to
clay surface due to the presence of these divalent cations making the surface more oil wet. When
brine with a lower salinity is injected in presence of these divalent cations, double-layer expansion
occurs due to cation exchange, ζ increases again and the polar components get detached from the
rock making the surface more water-wet, and thus more oil is recovered (Al-Saedi, Flori, & Brady,
2019; Austad, RezaeiDoust, & Puntervold, 2010). Moreover, reducing the water salinity results in
a thicker and stable water film compared to higher salinity injection due to electrical double-layer
expansion which increases the oil displacement efficiency.
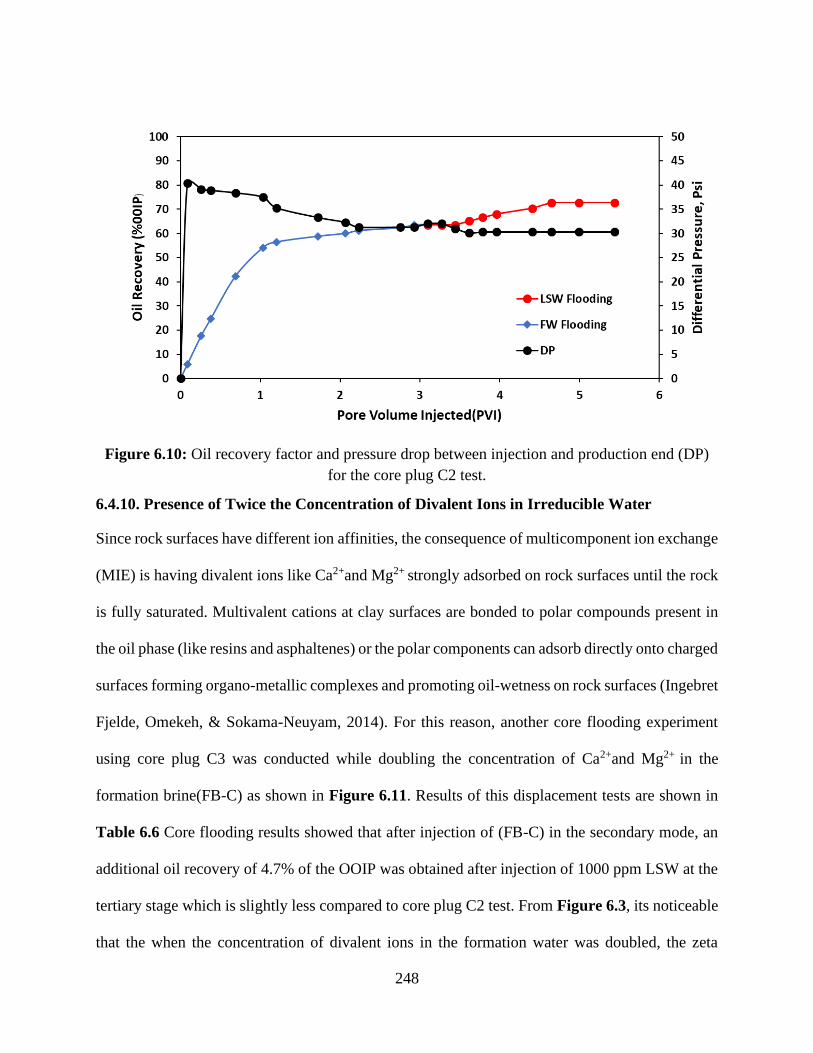
248
Figure 6.10: Oil recovery factor and pressure drop between injection and production end (DP)
for the core plug C2 test.
6.4.10. Presence of Twice the Concentration of Divalent Ions in Irreducible Water
Since rock surfaces have different ion affinities, the consequence of multicomponent ion exchange
(MIE) is having divalent ions like Ca2+and Mg2+ strongly adsorbed on rock surfaces until the rock
is fully saturated. Multivalent cations at clay surfaces are bonded to polar compounds present in
the oil phase (like resins and asphaltenes) or the polar components can adsorb directly onto charged
surfaces forming organo-metallic complexes and promoting oil-wetness on rock surfaces (Ingebret
Fjelde, Omekeh, & Sokama-Neuyam, 2014). For this reason, another core flooding experiment
using core plug C3 was conducted while doubling the concentration of Ca2+and Mg2+ in the
formation brine(FB-C) as shown in Figure 6.11. Results of this displacement tests are shown in
Table 6.6 Core flooding results showed that after injection of (FB-C) in the secondary mode, an
additional oil recovery of 4.7% of the OOIP was obtained after injection of 1000 ppm LSW at the
tertiary stage which is slightly less compared to core plug C2 test. From Figure 6.3, its noticeable
that the when the concentration of divalent ions in the formation water was doubled, the zeta
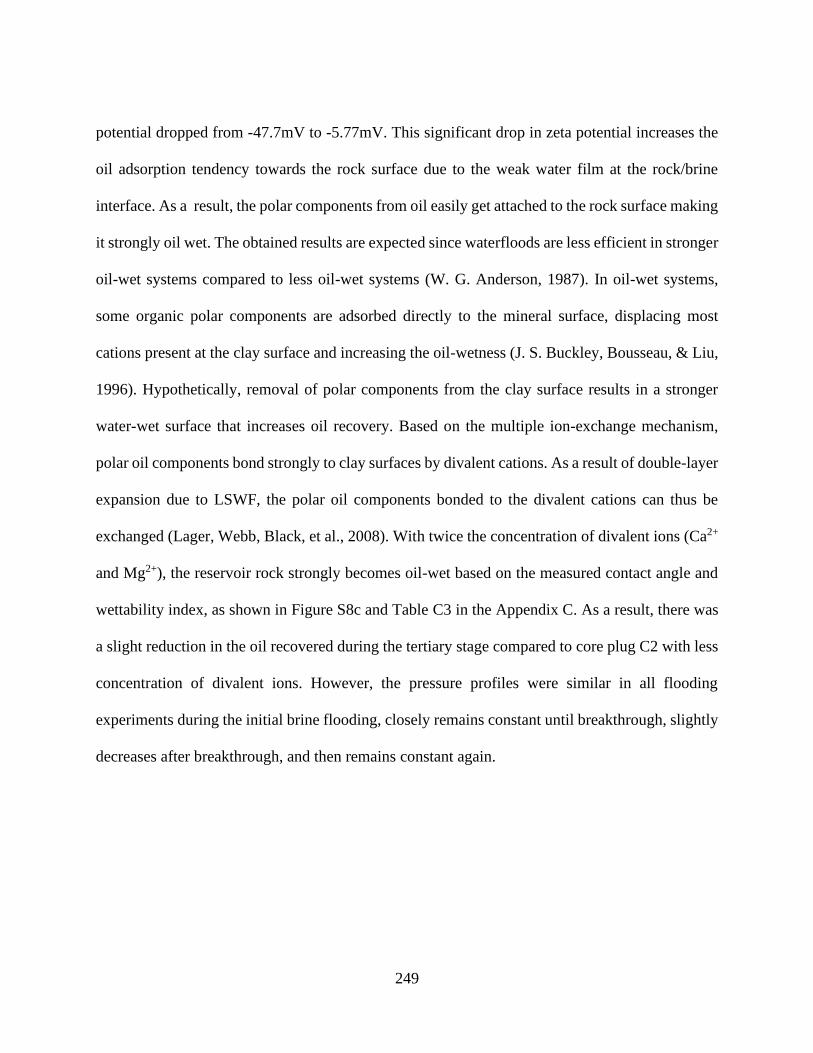
249
potential dropped from -47.7mV to -5.77mV. This significant drop in zeta potential increases the
oil adsorption tendency towards the rock surface due to the weak water film at the rock/brine
interface. As a result, the polar components from oil easily get attached to the rock surface making
it strongly oil wet. The obtained results are expected since waterfloods are less efficient in stronger
oil-wet systems compared to less oil-wet systems (W. G. Anderson, 1987). In oil-wet systems,
some organic polar components are adsorbed directly to the mineral surface, displacing most
cations present at the clay surface and increasing the oil-wetness (J. S. Buckley, Bousseau, & Liu,
1996). Hypothetically, removal of polar components from the clay surface results in a stronger
water-wet surface that increases oil recovery. Based on the multiple ion-exchange mechanism,
polar oil components bond strongly to clay surfaces by divalent cations. As a result of double-layer
expansion due to LSWF, the polar oil components bonded to the divalent cations can thus be
exchanged (Lager, Webb, Black, et al., 2008). With twice the concentration of divalent ions (Ca2+
and Mg2+), the reservoir rock strongly becomes oil-wet based on the measured contact angle and
wettability index, as shown in Figure S8c and Table C3 in the Appendix C. As a result, there was
a slight reduction in the oil recovered during the tertiary stage compared to core plug C2 with less
concentration of divalent ions. However, the pressure profiles were similar in all flooding
experiments during the initial brine flooding, closely remains constant until breakthrough, slightly
decreases after breakthrough, and then remains constant again.
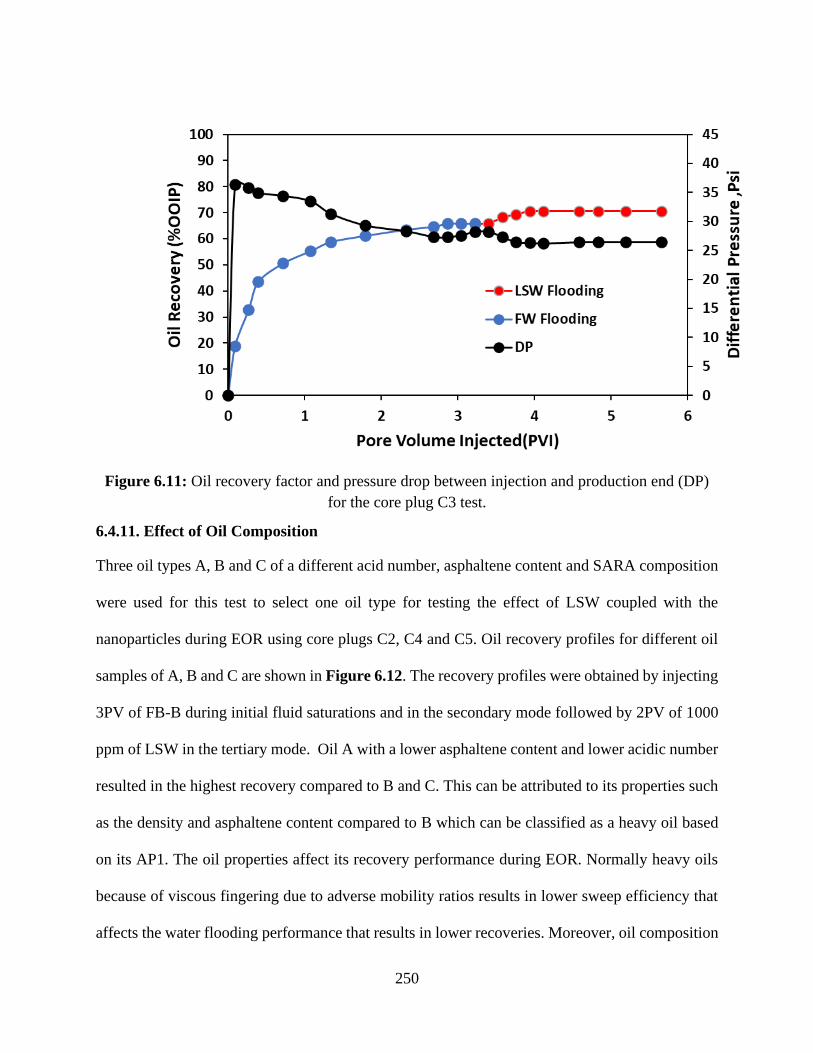
250
Figure 6.11: Oil recovery factor and pressure drop between injection and production end (DP)
for the core plug C3 test.
6.4.11. Effect of Oil Composition
Three oil types A, B and C of a different acid number, asphaltene content and SARA composition
were used for this test to select one oil type for testing the effect of LSW coupled with the
nanoparticles during EOR using core plugs C2, C4 and C5. Oil recovery profiles for different oil
samples of A, B and C are shown in Figure 6.12. The recovery profiles were obtained by injecting
3PV of FB-B during initial fluid saturations and in the secondary mode followed by 2PV of 1000
ppm of LSW in the tertiary mode. Oil A with a lower asphaltene content and lower acidic number
resulted in the highest recovery compared to B and C. This can be attributed to its properties such
as the density and asphaltene content compared to B which can be classified as a heavy oil based
on its AP1. The oil properties affect its recovery performance during EOR. Normally heavy oils
because of viscous fingering due to adverse mobility ratios results in lower sweep efficiency that
affects the water flooding performance that results in lower recoveries. Moreover, oil composition
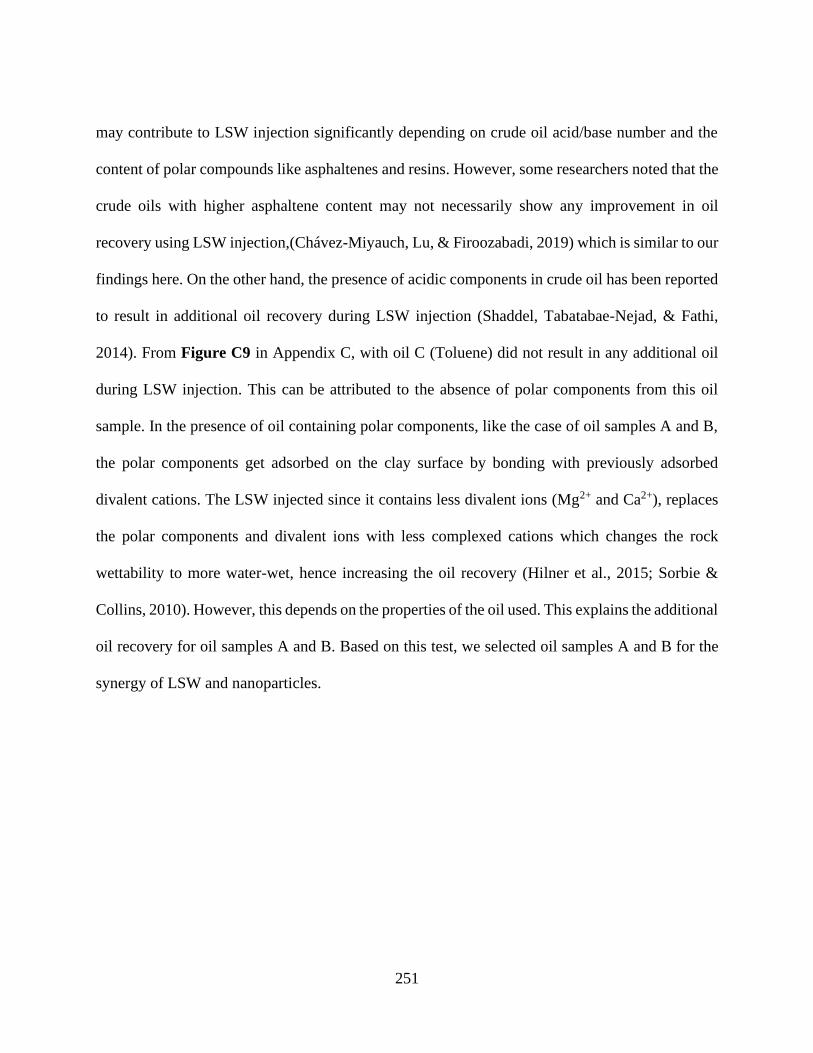
251
may contribute to LSW injection significantly depending on crude oil acid/base number and the
content of polar compounds like asphaltenes and resins. However, some researchers noted that the
crude oils with higher asphaltene content may not necessarily show any improvement in oil
recovery using LSW injection,(Chávez-Miyauch, Lu, & Firoozabadi, 2019) which is similar to our
findings here. On the other hand, the presence of acidic components in crude oil has been reported
to result in additional oil recovery during LSW injection (Shaddel, Tabatabae-Nejad, & Fathi,
2014). From Figure C9 in Appendix C, with oil C (Toluene) did not result in any additional oil
during LSW injection. This can be attributed to the absence of polar components from this oil
sample. In the presence of oil containing polar components, like the case of oil samples A and B,
the polar components get adsorbed on the clay surface by bonding with previously adsorbed
divalent cations. The LSW injected since it contains less divalent ions (Mg2+ and Ca2+), replaces
the polar components and divalent ions with less complexed cations which changes the rock
wettability to more water-wet, hence increasing the oil recovery (Hilner et al., 2015; Sorbie &
Collins, 2010). However, this depends on the properties of the oil used. This explains the additional
oil recovery for oil samples A and B. Based on this test, we selected oil samples A and B for the
synergy of LSW and nanoparticles.
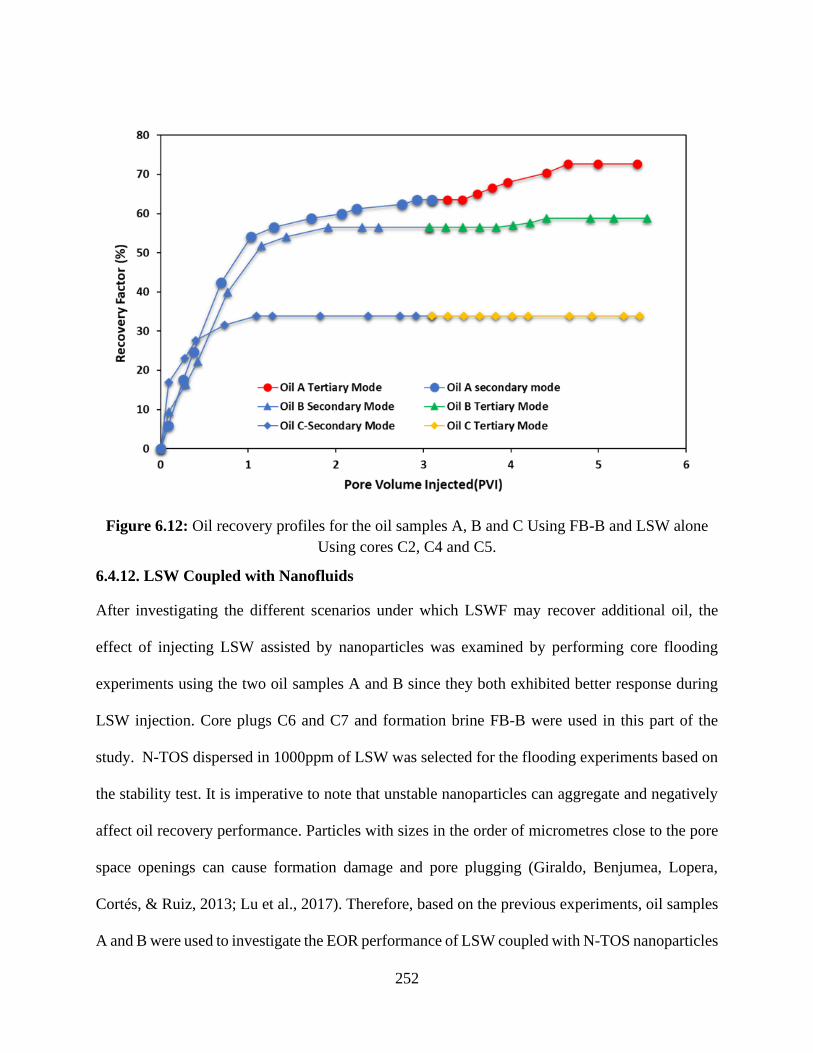
252
Figure 6.12: Oil recovery profiles for the oil samples A, B and C Using FB-B and LSW alone
Using cores C2, C4 and C5.
6.4.12. LSW Coupled with Nanofluids
After investigating the different scenarios under which LSWF may recover additional oil, the
effect of injecting LSW assisted by nanoparticles was examined by performing core flooding
experiments using the two oil samples A and B since they both exhibited better response during
LSW injection. Core plugs C6 and C7 and formation brine FB-B were used in this part of the
study. N-TOS dispersed in 1000ppm of LSW was selected for the flooding experiments based on
the stability test. It is imperative to note that unstable nanoparticles can aggregate and negatively
affect oil recovery performance. Particles with sizes in the order of micrometres close to the pore
space openings can cause formation damage and pore plugging (Giraldo, Benjumea, Lopera,
Cortes, & Ruiz, 2013; Lu et al., 2017). Therefore, based on the previous experiments, oil samples
A and B were used to investigate the EOR performance of LSW coupled with N-TOS nanoparticles
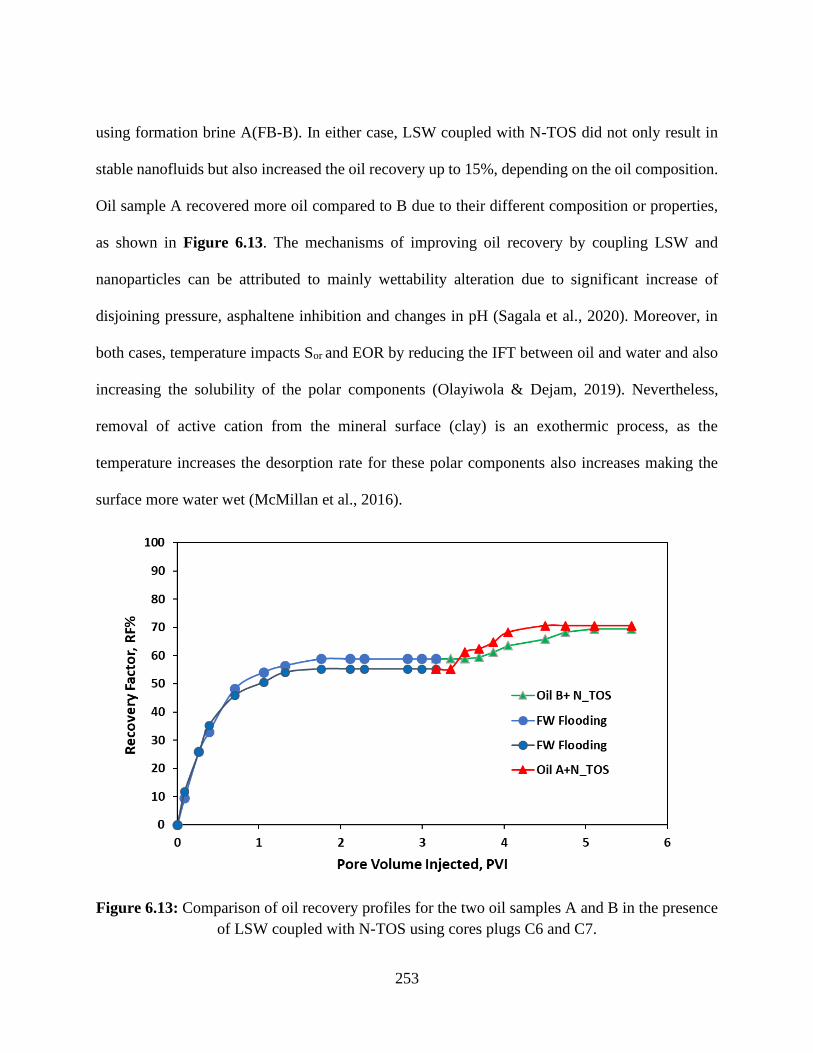
253
using formation brine A(FB-B). In either case, LSW coupled with N-TOS did not only result in
stable nanofluids but also increased the oil recovery up to 15%, depending on the oil composition.
Oil sample A recovered more oil compared to B due to their different composition or properties,
as shown in Figure 6.13. The mechanisms of improving oil recovery by coupling LSW and
nanoparticles can be attributed to mainly wettability alteration due to significant increase of
disjoining pressure, asphaltene inhibition and changes in pH (Sagala et al., 2020). Moreover, in
both cases, temperature impacts Sor and EOR by reducing the IFT between oil and water and also
increasing the solubility of the polar components (Olayiwola & Dejam, 2019). Nevertheless,
removal of active cation from the mineral surface (clay) is an exothermic process, as the
temperature increases the desorption rate for these polar components also increases making the
surface more water wet (McMillan et al., 2016).
Figure 6.13: Comparison of oil recovery profiles for the two oil samples A and B in the presence
of LSW coupled with N-TOS using cores plugs C6 and C7.
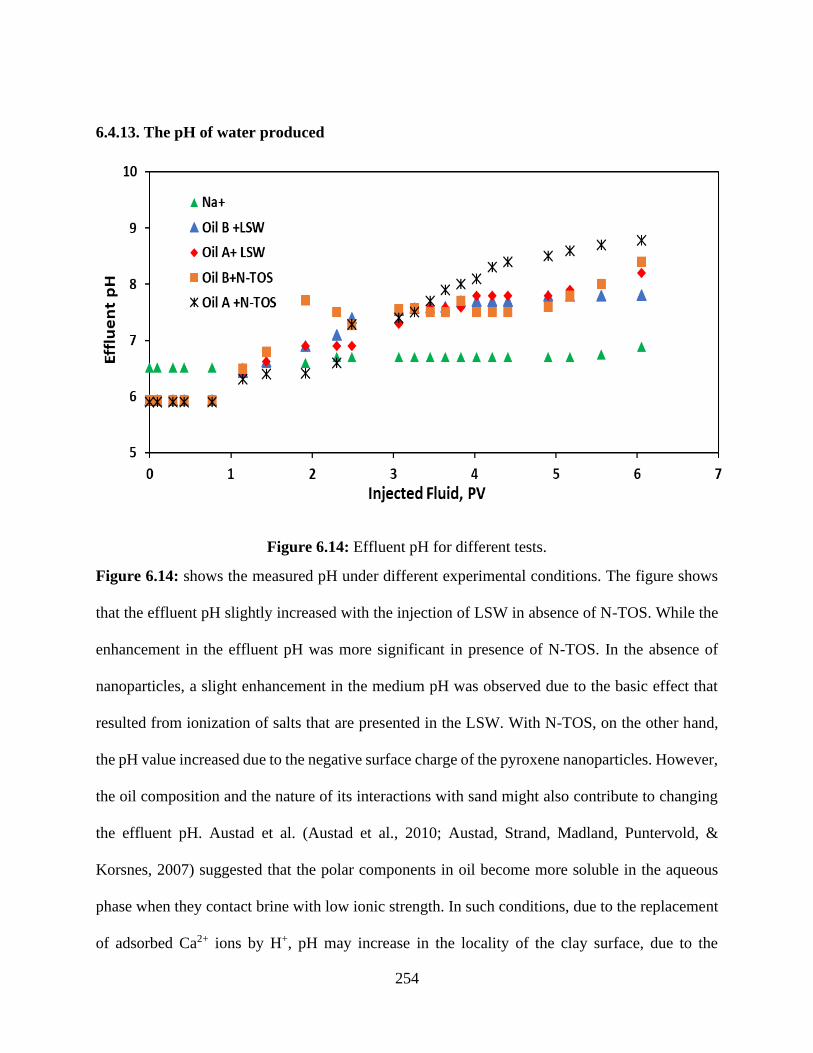
254
6.4.13. The pH of water produced
Figure 6.14: Effluent pH for different tests.
Figure 6.14: shows the measured pH under different experimental conditions. The figure shows
that the effluent pH slightly increased with the injection of LSW in absence of N-TOS. While the
enhancement in the effluent pH was more significant in presence of N-TOS. In the absence of
nanoparticles, a slight enhancement in the medium pH was observed due to the basic effect that
resulted from ionization of salts that are presented in the LSW. With N-TOS, on the other hand,
the pH value increased due to the negative surface charge of the pyroxene nanoparticles. However,
the oil composition and the nature of its interactions with sand might also contribute to changing
the effluent pH. Austad et al. (Austad et al., 2010; Austad, Strand, Madland, Puntervold, &
Korsnes, 2007) suggested that the polar components in oil become more soluble in the aqueous
phase when they contact brine with low ionic strength. In such conditions, due to the replacement
of adsorbed Ca2+ ions by H+, pH may increase in the locality of the clay surface, due to the
255
interactions between the negatively charged clay (Clay-) and the positively charged ion (e.g; Ca+2)
as shown in equation 6.1.
𝐶𝑙𝑎𝑦 − 𝐶𝑎2+ + 𝐻2𝑂 ↔ 𝐶𝑙𝑎𝑦 − 𝐻+ + 𝐶𝑎2+ + 𝑂𝐻− (6.1)
Several researchers(Aksulu, Hamsø, Strand, Puntervold, & Austad, 2012; RezaeiDoust,
Puntervold, & Austad, 2011) have proposed interaction equations between the sand, oil
components and saline water. They suggested that oil is composed of polar and nonpolar parts.
The polar part is composed of complex hydrocarbon chains (R), while the nonpolar part mainly
contains carboxylic acid (-COOH) and amine (NH+) functional groups. Therefore, oil can be
presented in forms like 𝑅 − 𝐶𝑂𝑂𝐻 and 𝑅3𝑁𝐻+. When both organic compounds are adsorbed on
the rock surface, they can be presented in forms of, 𝐶𝑙𝑎𝑦 − 𝑅𝐶𝑂𝑂𝐻 and 𝐶𝑙𝑎𝑦 − 𝑅3𝑁𝐻+. With
the local increment in pH (addition of OH-), reactions between adsorbed basic and acidic materials
are carried out, similar to those that take place in ordinary acid-base proton transfer reaction.
Accordingly, both acidic and basic organic compounds are desorbed from the clay surface as
shown in equations 6.2 and 6.3.
𝐶𝑙𝑎𝑦 − 𝑅𝐶𝑂𝑂𝐻 + 𝑂𝐻− ↔ 𝐶𝑙𝑎𝑦 + 𝑅𝐶𝑂𝑂− + 𝐻2𝑂 (6.2)
𝐶𝑙𝑎𝑦 − 𝑅3𝑁𝐻+ + 𝑂𝐻− ↔ Clay +𝑅3𝑁 + 𝐻2𝑂 (6.3)
For better understanding, Figure 6.15 describes the mechanisms of organic compound
desorption from the clay surface (e.g., Kaolinite) at high pH. As shown, the adsorbed organic
compounds of C𝑙𝑎𝑦 − 𝑅𝐶𝑂𝑂𝐻 𝑎𝑛𝑑 𝐶𝑙𝑎𝑦 − 𝑅3𝑁𝐻+ tend to become proton donors (Bronsted
acid), such that adsorbed organic compounds react with the free hydroxyl groups (𝑂𝐻−),
generating liberated conjugate bases of 𝑅𝐶𝑂𝑂− and 𝑅3𝑁. This weakens the coulombic force
between the organic bases and rock surface and hence increases the rock surface hydrophilicity
(Austad et al., 2010). Subsequently, the increase in pH values causes the organic material to detach
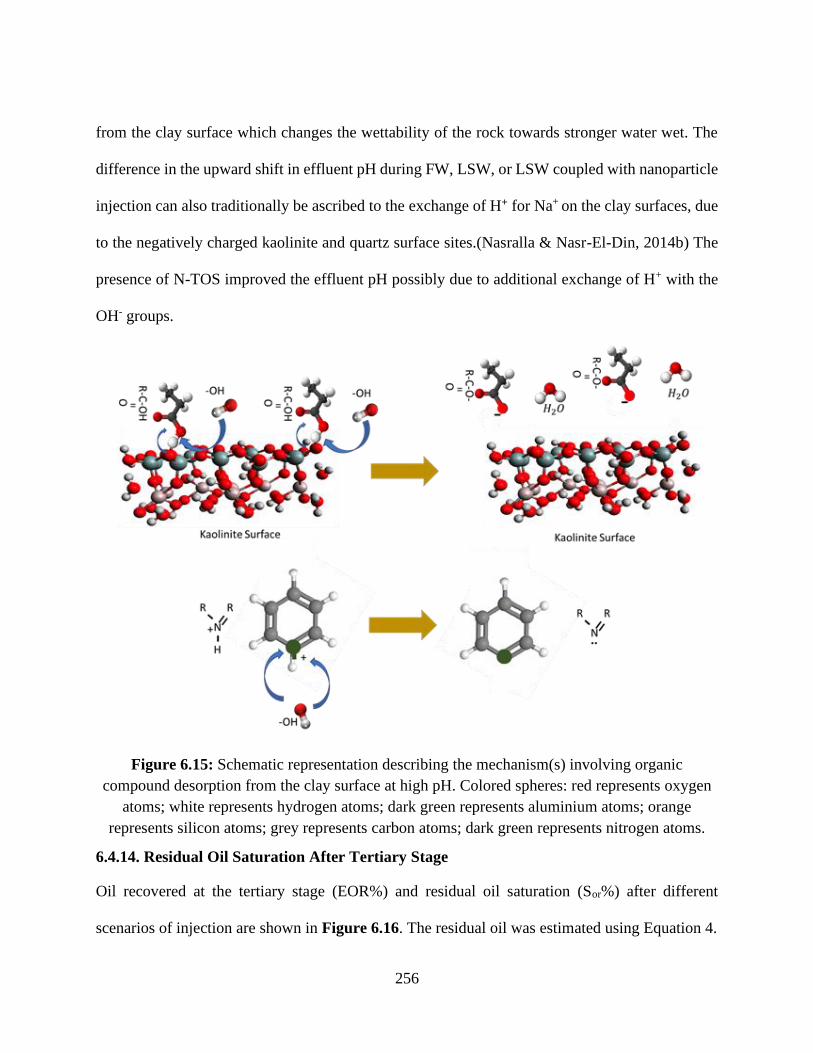
256
from the clay surface which changes the wettability of the rock towards stronger water wet. The
difference in the upward shift in effluent pH during FW, LSW, or LSW coupled with nanoparticle
injection can also traditionally be ascribed to the exchange of H+ for Na+ on the clay surfaces, due
to the negatively charged kaolinite and quartz surface sites.(Nasralla & Nasr-El-Din, 2014b) The
presence of N-TOS improved the effluent pH possibly due to additional exchange of H+ with the
OH- groups.
Figure 6.15: Schematic representation describing the mechanism(s) involving organic
compound desorption from the clay surface at high pH. Colored spheres: red represents oxygen
atoms; white represents hydrogen atoms; dark green represents aluminium atoms; orange
represents silicon atoms; grey represents carbon atoms; dark green represents nitrogen atoms.
6.4.14. Residual Oil Saturation After Tertiary Stage
Oil recovered at the tertiary stage (EOR%) and residual oil saturation (Sor%) after different
scenarios of injection are shown in Figure 6.16. The residual oil was estimated using Equation 4.
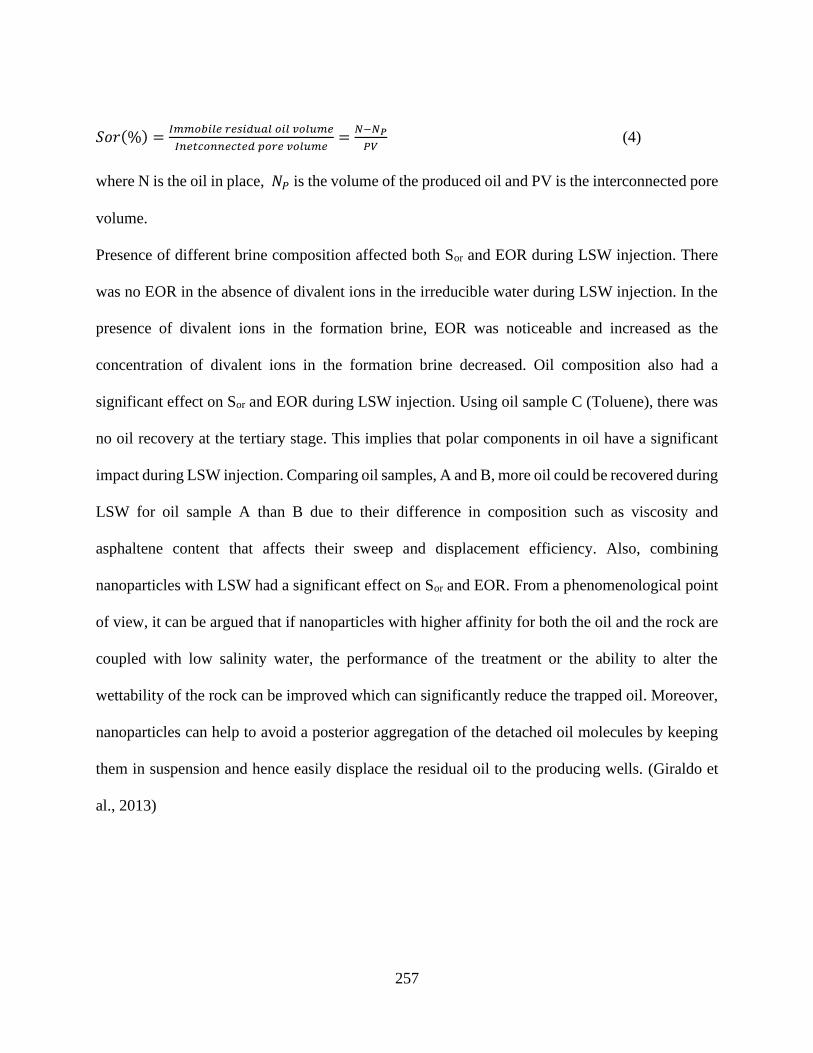
257
𝑆𝑜𝑟(%) =𝐼𝑚𝑚𝑜𝑏𝑖𝑙𝑒 𝑟𝑒𝑠𝑖𝑑𝑢𝑎𝑙 𝑜𝑖𝑙 𝑣𝑜𝑙𝑢𝑚𝑒
𝐼𝑛𝑒𝑡𝑐𝑜𝑛𝑛𝑒𝑐𝑡𝑒𝑑 𝑝𝑜𝑟𝑒 𝑣𝑜𝑙𝑢𝑚𝑒=
𝑁−𝑁𝑃
𝑃𝑉 (4)
where N is the oil in place, 𝑁𝑃 is the volume of the produced oil and PV is the interconnected pore
volume.
Presence of different brine composition affected both Sor and EOR during LSW injection. There
was no EOR in the absence of divalent ions in the irreducible water during LSW injection. In the
presence of divalent ions in the formation brine, EOR was noticeable and increased as the
concentration of divalent ions in the formation brine decreased. Oil composition also had a
significant effect on Sor and EOR during LSW injection. Using oil sample C (Toluene), there was
no oil recovery at the tertiary stage. This implies that polar components in oil have a significant
impact during LSW injection. Comparing oil samples, A and B, more oil could be recovered during
LSW for oil sample A than B due to their difference in composition such as viscosity and
asphaltene content that affects their sweep and displacement efficiency. Also, combining
nanoparticles with LSW had a significant effect on Sor and EOR. From a phenomenological point
of view, it can be argued that if nanoparticles with higher affinity for both the oil and the rock are
coupled with low salinity water, the performance of the treatment or the ability to alter the
wettability of the rock can be improved which can significantly reduce the trapped oil. Moreover,
nanoparticles can help to avoid a posterior aggregation of the detached oil molecules by keeping
them in suspension and hence easily displace the residual oil to the producing wells. (Giraldo et
al., 2013)
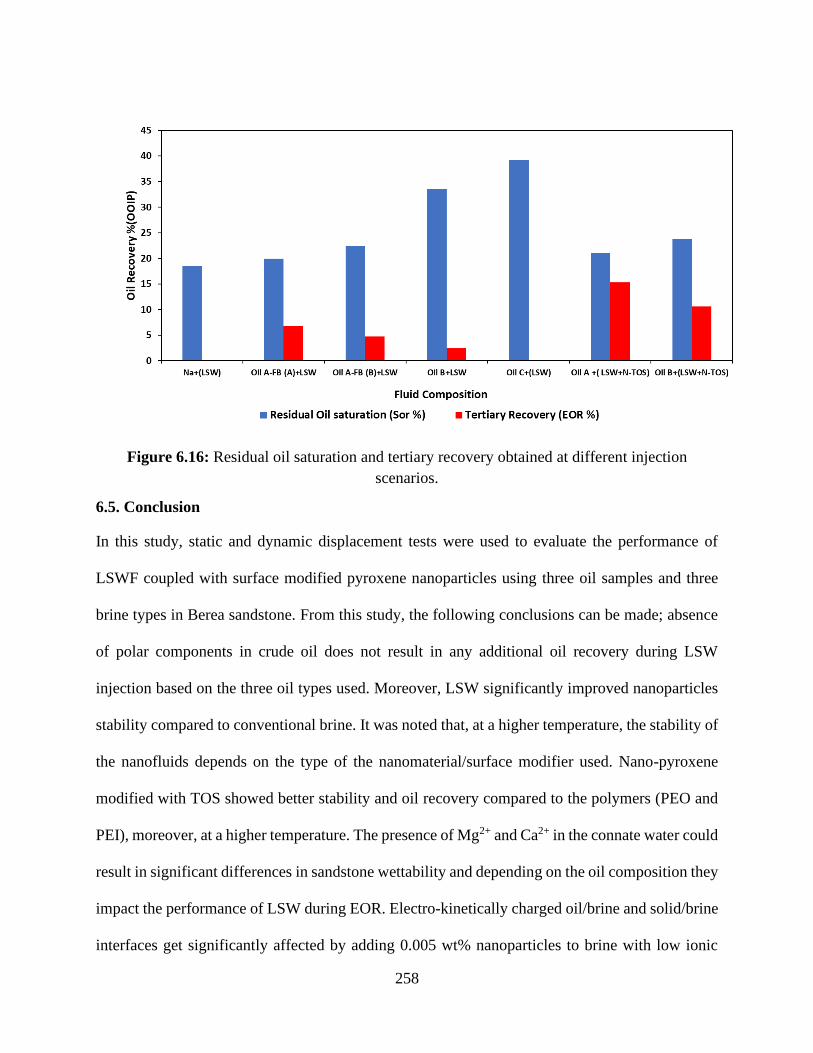
258
Figure 6.16: Residual oil saturation and tertiary recovery obtained at different injection
scenarios.
6.5. Conclusion
In this study, static and dynamic displacement tests were used to evaluate the performance of
LSWF coupled with surface modified pyroxene nanoparticles using three oil samples and three
brine types in Berea sandstone. From this study, the following conclusions can be made; absence
of polar components in crude oil does not result in any additional oil recovery during LSW
injection based on the three oil types used. Moreover, LSW significantly improved nanoparticles
stability compared to conventional brine. It was noted that, at a higher temperature, the stability of
the nanofluids depends on the type of the nanomaterial/surface modifier used. Nano-pyroxene
modified with TOS showed better stability and oil recovery compared to the polymers (PEO and
PEI), moreover, at a higher temperature. The presence of Mg2+ and Ca2+ in the connate water could
result in significant differences in sandstone wettability and depending on the oil composition they
impact the performance of LSW during EOR. Electro-kinetically charged oil/brine and solid/brine
interfaces get significantly affected by adding 0.005 wt% nanoparticles to brine with low ionic
259
strength based on the zeta potential measurements. Contact angle in the presence of LSW alone,
N-PEO, N-PEI, and N-TOS nanofluids was measured as 94±3˚, 118±3˚, 112±3˚, 130˚±3˚,
respectively, conforming wettability alteration from oil/neutral wet to stronger water-wet.
Furthermore, the greater repulsive force due to double layer expansion creates a significant shift
in the relative permeability curve to the right, hence improving the microscopic oil sweep
efficiency. During the displacement tests, the effluent pH increased during LSW coupled with
nanoparticles possibly due to dissolution/ion exchange of clay and formation of excess hydroxyl
ions, OH¯. Injection of LSW alone resulted in 6% additional recovery during the tertiary stage,
however, after incorporating the N-TOS an increment of up to 12-15% could be obtained
depending on the oil composition.
6.7 References
Abdo, J., & Haneef, M. (2012). Nano-enhanced drilling fluids: a pioneering approach to overcome
uncompromising drilling problems. Journal of Energy Resources Technology, 134(1).
Ahmed, T. (2018). Reservoir engineering handbook: Gulf Professional Publishing.
Aksulu, H., Hamsø, D., Strand, S., Puntervold, T., & Austad, T. (2012). Evaluation of low-salinity
enhanced oil recovery effects in sandstone: Effects of the temperature and pH gradient.
Energy & fuels, 26(6), 3497-3503.
Al-Saedi, H. N., Flori, R. E., & Brady, P. V. (2019). Effect of divalent cations in formation water
on wettability alteration during low salinity water flooding in sandstone reservoirs: Oil
recovery analyses, surface reactivity tests, contact angle, and spontaneous imbibition
experiments. Journal of Molecular Liquids, 275, 163-172.
Alotaibi, M. B., Nasralla, R. A., & Nasr-El-Din, H. A. (2011). Wettability studies using low-
salinity water in sandstone reservoirs. SPE Reservoir Evaluation & Engineering, 14(06),
713-725.
Anderson, W. (1986). Wettability literature survey-part 2: Wettability measurement. Journal of
petroleum technology, 38(11), 1,246-241,262.
Anderson, W. G. (1987). Wettability literature survey-part 6: the effects of wettability on
waterflooding. Journal of Petroleum Technology, 39(12), 1,605-601,622.
Austad, T., RezaeiDoust, A., & Puntervold, T. (2010). Chemical mechanism of low salinity water
flooding in sandstone reservoirs. Paper presented at the SPE improved oil recovery
symposium.
Austad, T., Strand, S., Madland, M. V., Puntervold, T., & Korsnes, R. I. (2007). Seawater in chalk:
an EOR and compaction fluid. Paper presented at the International petroleum technology
conference.
260
Bagwe, R. P., Hilliard, L. R., & Tan, W. (2006). Surface modification of silica nanoparticles to
reduce aggregation and nonspecific binding. Langmuir, 22(9), 4357-4362.
Bartels, W.-B., Mahani, H., Berg, S., & Hassanizadeh, S. (2019). Literature review of low salinity
water flooding from a length and time scale perspective. Fuel, 236, 338-353.
Buckley, J., & Liu, Y. (1998). Some mechanisms of crude oil/brine/solid interactions. Journal of
Petroleum Science and Engineering, 20(3-4), 155-160.
Buckley, J., Liu, Y., & Monsterleet, S. (1998). Mechanisms of wetting alteration by crude oils.
SPE Journal, 3(01), 54-61.
Buckley, J. S., Bousseau, C., & Liu, Y. (1996). Wetting alteration by brine and crude oil: from
contact angles to cores. SPE Journal, 1(03), 341-350.
Chávez-Miyauch, T. E., Lu, Y., & Firoozabadi, A. (2019). Low salinity water injection in Berea
sandstone: Effect of wettability, interface elasticity, and acid and base functionalities. Fuel,
116572.
Chu, S., & Majumdar, A. (2012). Opportunities and challenges for a sustainable energy future.
nature, 488(7411), 294.
Cuiec, L. (1984). Rock/crude-oil interactions and wettability: An attempt to understand their
interrelation. Paper presented at the SPE Annual Technical Conference and Exhibition.
Dubey, S., & Doe, P. (1993). The base number and wetting properties of crude oils. SPE Reservoir
Engineering, 8(03), 195-200.
El-Diasty, A. I., & Aly, A. M. (2015). Understanding the mechanism of nanoparticles applications
in enhanced oil recovery. Paper presented at the SPE North Africa technical conference
and exhibition.
Esfandyari Bayat, A., Junin, R., Samsuri, A., Piroozian, A., & Hokmabadi, M. (2014). Impact of
metal oxide nanoparticles on enhanced oil recovery from limestone media at several
temperatures. Energy & fuels, 28(10), 6255-6266.
Farad, S., Mugisa, J., Alahdal, H. A., Idris, A. K., Kisiki, N. H., & Kabenge, I. (2016). Effect of
wettability on oil recovery and breakthrough time for immiscible gas flooding. Petroleum
Science and Technology, 34(20), 1705-1711.
Fjelde, I., Omekeh, A. V., & Sokama-Neuyam, Y. A. (2014). Low salinity water flooding: Effect
of crude oil composition. Paper presented at the SPE Improved Oil Recovery Symposium.
Fjelde, I., Polanska, A., Taghiyev, F., & Asen, S. (2013). Low salinity water flooding: retention of
polar oil components in sandstone reservoirs. Paper presented at the IOR 2013-17th
European Symposium on Improved Oil Recovery.
Giraldo, J., Benjumea, P., Lopera, S., Cortes, F. B., & Ruiz, M. A. (2013). Wettability alteration
of sandstone cores by alumina-based nanofluids. Energy & fuels, 27(7), 3659-3665.
Hethnawi, A., Nassar, N. N., & Vitale, G. (2017). Preparation and characterization of
polyethylenimine-functionalized pyroxene nanoparticles and its application in wastewater
treatment. Colloids and Surfaces A: Physicochemical and Engineering Aspects, 525, 20-
30.
Hilner, E., Andersson, M. P., Hassenkam, T., Matthiesen, J., Salino, P., & Stipp, S. L. S. (2015).
The effect of ionic strength on oil adhesion in sandstone–the search for the low salinity
mechanism. Scientific Reports, 5, 9933.
Hmoudah, M., Nassar, N. N., Vitale, G., & El-Qanni, A. (2016). Effect of nanosized and surface-
structural-modified nano-pyroxene on adsorption of violanthrone-79. RSC advances,
6(69), 64482-64493.
261
Hou, B., Jia, R., Fu, M., Wang, Y., Jiang, C., Yang, B., & Huang, Y. (2019). Wettability alteration
of oil-wet carbonate surface induced by self-dispersing silica nanoparticles: Mechanism
and monovalent metal ion's effect. Journal of Molecular Liquids, 294, 111601.
Jadhunandan, P., & Morrow, N. R. (1995). Effect of wettability on waterflood recovery for crude-
oil/brine/rock systems. SPE Reservoir Engineering, 10(01), 40-46.
Katende, A., & Sagala, F. (2019). A critical review of low salinity water flooding: mechanism,
laboratory and field application. Journal of Molecular Liquids.
Lager, A., Webb, K. J., Black, C., Singleton, M., & Sorbie, K. S. (2008). Low salinity oil recovery-
an experimental investigation1. Petrophysics, 49(01).
Lager, A., Webb, K. J., Collins, I. R., & Richmond, D. M. (2008). LoSal enhanced oil recovery:
Evidence of enhanced oil recovery at the reservoir scale. Paper presented at the SPE
Symposium on improved oil recovery.
Lu, T., Li, Z., Zhou, Y., & Zhang, C. (2017). Enhanced oil recovery of low-permeability cores by
SiO2 nanofluid. Energy & fuels, 31(5), 5612-5621.
Ma, S., Zhang, X., Morrow, N., & Zhou, X. (1999). Characterization of wettability from
spontaneous imbibition measurements. Journal of Canadian Petroleum Technology,
38(13).
McGuire, P., Chatham, J., Paskvan, F., Sommer, D., & Carini, F. (2005). Low salinity oil recovery:
An exciting new EOR opportunity for Alaska's North Slope. Paper presented at the SPE
western regional meeting.
McMillan, M. D., Rahnema, H., Romiluy, J., & Kitty, F. J. (2016). Effect of exposure time and
crude oil composition on low-salinity water flooding. Fuel, 185, 263-272.
Miller, R. G., & Sorrell, S. R. (2014). The future of oil supply: The Royal Society Publishing.
Min, Y., Akbulut, M., Kristiansen, K., Golan, Y., & Israelachvili, J. (2010). The role of
interparticle and external forces in nanoparticle assembly Nanoscience And Technology: A
Collection of Reviews from Nature Journals (pp. 38-49): World Scientific.
Mohammed, M., & Babadagli, T. (2015). Wettability alteration: A comprehensive review of
materials/methods and testing the selected ones on heavy-oil containing oil-wet systems.
Advances in colloid and interface science, 220, 54-77.
Morrow, N. R., Tang, G.-q., Valat, M., & Xie, X. (1998). Prospects of improved oil recovery
related to wettability and brine composition. Journal of Petroleum Science and
Engineering, 20(3-4), 267-276.
Nasralla, R. A., Alotaibi, M. B., & Nasr-El-Din, H. A. (2011). The efficiency of oil recovery by
low salinity water flooding in sandstone reservoirs. Paper presented at the SPE Western
North American Region Meeting.
Nasralla, R. A., & Nasr-El-Din, H. A. (2014a). Double-layer expansion: is it a primary mechanism
of improved oil recovery by low-salinity waterflooding? SPE Reservoir Evaluation &
Engineering, 17(01), 49-59.
Nasralla, R. A., & Nasr-El-Din, H. A. (2014b). Impact of cation type and concentration in injected
brine on oil recovery in sandstone reservoirs. Journal of Petroleum Science and
Engineering, 122, 384-395.
Nassar, N. N., Hassan, A., Carbognani, L., Lopez-Linares, F., & Pereira-Almao, P. (2012). Iron
oxide nanoparticles for rapid adsorption and enhanced catalytic oxidation of thermally
cracked asphaltenes. Fuel, 95, 257-262.
262
Nassar, N. N., Hassan, A., & Pereira-Almao, P. (2011a). Application of nanotechnology for heavy
oil upgrading: Catalytic steam gasification/cracking of asphaltenes. Energy & Fuels, 25(4),
1566-1570.
Nassar, N. N., Hassan, A., & Pereira-Almao, P. (2011b). Effect of the particle size on asphaltene
adsorption and catalytic oxidation onto alumina particles. Energy & fuels, 25(9), 3961-
3965.
Ogolo, N. A. (2013). The trapping capacity of nanofluids on migrating fines in the sand. Paper
presented at the SPE Annual Technical Conference and Exhibition.
Olayiwola, S. O., & Dejam, M. (2019). A comprehensive review of the interaction of nanoparticles
with low salinity water and surfactant for enhanced oil recovery in sandstone and carbonate
reservoirs. Fuel, 241, 1045-1057.
RezaeiDoust, A., Puntervold, T., & Austad, T. (2011). Chemical verification of the EOR
mechanism by using low saline/smart water in sandstone. Energy & fuels, 25(5), 2151-
2162.
Rivet, S., Lake, L. W., & Pope, G. A. (2010). A coreflood investigation of low-salinity enhanced
oil recovery. Paper presented at the SPE annual technical conference and exhibition.
Sagala, F., Hethnawi, A., & Nassar, N. N. (2020). Hydroxyl-functionalized silicate-based
nanofluids for enhanced oil recovery. Fuel, 269, 117462.
Sagala, F., Montoya, T., Hethnawi, A., Vitale, G., & Nassar, N. N. (2019). Nanopyroxene-Based
Nanofluids for Enhanced Oil Recovery in Sandstone Cores at Reservoir Temperature.
Energy & fuels, 33(2), 877-890.
Saha, R., Uppaluri, R. V., & Tiwari, P. (2018). Silica nanoparticle assisted polymer flooding of
heavy crude oil: emulsification, rheology, and wettability alteration characteristics.
Industrial & Engineering Chemistry Research, 57(18), 6364-6376.
Shaddel, S., Tabatabae-Nejad, S. A., & Fathi, S. J. (2014). Low-salinity water flooding: Evaluating
the effect of salinity on oil and water relative permeability, Wettability, and oil recovery.
Special Topics & Reviews in Porous Media: An International Journal, 5(2).
Shaker Shiran, B., & Skauge, A. (2013). Enhanced oil recovery (EOR) by combined low salinity
water/polymer flooding. Energy & fuels, 27(3), 1223-1235.
ShamsiJazeyi, H., Miller, C. A., Wong, M. S., Tour, J. M., & Verduzco, R. (2014). Polymer‐coated
nanoparticles for enhanced oil recovery. Journal of Applied Polymer Science, 131(15).
Shehata, A. M., & Nasr-El-Din, H. A. (2015). Zeta potential measurements: Impact of salinity on
sandstone minerals. Paper presented at the SPE International Symposium on Oilfield
Chemistry.
Sheng, J. (2014). A critical review of low-salinity waterflooding. Journal of Petroleum Science
and Engineering, 120, 216-224.
Skrettingland, K., Holt, T., Tweheyo, M. T., & Skjevrak, I. (2011). Snorre Low-Salinity-Water
Injection--Coreflooding Experiments and Single-Well Field Pilot. SPE Reservoir
Evaluation & Engineering, 14(02), 182-192.
Sorbie, K. S., & Collins, I. (2010). A proposed pore-scale mechanism for how low salinity
waterflooding works. Paper presented at the SPE improved oil recovery symposium.
Sun, X., Zhang, Y., Chen, G., & Gai, Z. (2017). Application of nanoparticles in enhanced oil
recovery: a critical review of recent progress. Energies, 10(3), 345.
263
Tang, G.-Q., & Morrow, N. R. (1999). Influence of brine composition and fines migration on crude
oil/brine/rock interactions and oil recovery. Journal of Petroleum Science and
Engineering, 24(2-4), 99-111.
Timofeeva, E. V., Gavrilov, A. N., McCloskey, J. M., Tolmachev, Y. V., Sprunt, S., Lopatina, L.
M., & Selinger, J. V. (2007). Thermal conductivity and particle agglomeration in alumina
nanofluids: experiment and theory. Physical Review E, 76(6), 061203.
Vitale, G. (2013). Iron Silicate Nano-Crystals as Potential Catalysts or Adsorbents for Heavy
Hydrocarbons Upgrading.
Wasan, D., Nikolov, A., & Kondiparty, K. (2011). The wetting and spreading of nanofluids on
solids: Role of the structural disjoining pressure. Current Opinion in Colloid & Interface
Science, 16(4), 344-349.
Xie, Q., Saeedi, A., Pooryousefy, E., & Liu, Y. (2016). Extended DLVO-based estimates of
surface force in low salinity water flooding. Journal of Molecular Liquids, 221, 658-665.
Yang, F., Paso, K., Norrman, J., Li, C., Oschmann, H., & Sjoblom, J. (2015). Hydrophilic
nanoparticles facilitate wax inhibition. Energy & fuels, 29(3), 1368-1374.
Yildiz, H. O., & Morrow, N. R. (1996). Effect of brine composition on the recovery of Moutray
crude oil by waterflooding. Journal of Petroleum Science and Engineering, 14(3-4), 159-
168.
Zargartalebi, M., Kharrat, R., & Barati, N. (2015). Enhancement of surfactant flooding
performance by the use of silica nanoparticles. Fuel, 143, 21-27.
Zhang, Y., Xie, X., & Morrow, N. R. (2007). Waterflood performance by injection of brine with
different salinity for reservoir cores. Paper presented at the SPE annual technical
conference and exhibition.
264
Chapter Seven: Conclusions and Recommendations
Since a separate detailed conclusion is listed in each chapter, just essential conclusions and major
contributions of this thesis are shown here followed by recommendations for future studies.
7.1. Conclusions
• The synthesized pyroxene nanoparticles used in these study showed the great prospective
as EOR agents since they resulted in higher oil recovery during imbibition and
displacement experiments. This could be due to their ability to alter the induced oil wet
state to more water-wet.
• The synthesized nanoparticles can greatly improve the recovery performance either as a
standalone or when synergized with some conventional techniques such as low salinity
water flooding by mostly wettability alteration.
• The synthesized nanofluids showed a noticeable IFT reduction but not significant to
recover trapped oil due to higher capillary number. Therefore, alteration in wettability had
a greater effect on recovering trapped oil than lowering the IFT in this study.
• Using these synthesized nanofluids in EOR application offers future prospects, the major
mechanism of oil recovery can be deducted as disjoining pressure, enhancement of zeta
potential mechanism that results in wettability alteration that improved the displacement
efficiency.
• Increasing the nanoparticle concentration does not guarantee an improvement of oil
recovery. An optimum concentration is always desirable for EOR-NANO application;
however, this may depend on a variety of factors such as nanoparticle type, size dispersing
medium slug size, injection time etc.
265
7.2. Recommendations for Future Work.
Based on this research, the following recommendations can be made for future studies on the use
of nanopyroxene in oil recovery.
Even though the proposed synthesized nanoparticles showed improvement towards oil recovery
by mostly wettability alteration, it imperative to try synergizing these nanoparticles with different
types of surfactants to reduce the interfacial tension to ultra-low IFT values. This will help to
enhance the microscopic displacement efficiency and hence improve the recovery factor.
• The mechanism of nanoparticle transport in the porous medium and relevant governing
models require further investigation to understand the nano distribution in the porous
medium. Therefore, extensive experimental work should be performed to understand the
relevant mechanisms of the migration and transport behavior of nanoparticles in the
porous medium.
• Extensive laboratory studies are still required to formulate more effective nano solutions
to provide a comprehensive understanding of more underlying mechanisms for improved
oil recovery using nanoparticles.
• Application of these nanoparticles in form of nanofluids (pyroxene nanofluids) in
carbonate reservoirs requires further investigation to understand the underlying
mechanisms in comparison to sandstone reservoirs.
• Better performance and new application may be revealed if two or more different
nanoparticles, and at different concentrations, are investigated for the possibility of
synergism in their hybrid substances. Besides, the creation of new nano-fluids may be
possible if nanoparticles are dispersed in a mixture of different fluid types. Consequently,
266
studies on synergistic effects/hybrids are suggested for investigation in future
nanotechnology research.
• Majority of the oil and gas industry nanotechnology research is reported at laboratory scale;
therefore, field trials are appropriate to further understand their applicability of the
synthesized nanoparticles in the oil industry. Nanoparticles are expensive; so, it will be
cost beneficial to use the lowest nanoparticles concentration possible while still achieving
an acceptable level of the desired performance. Hence, optimization studies are also
recommended for examination in future nanotechnology research.
• Moreover, these synthesized nanoparticles may be potential components for enhancing the
performance of drilling fluids, enhancing the cement rheology and hydraulic fracturing.
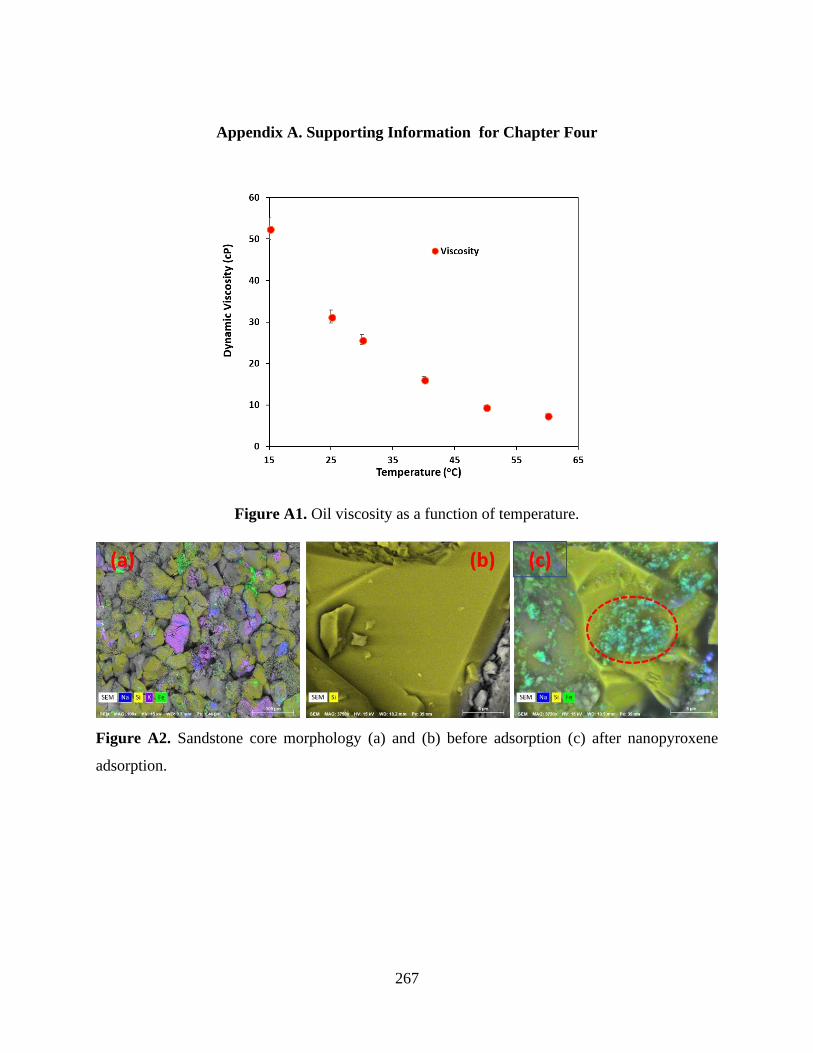
267
Appendix A. Supporting Information for Chapter Four
Figure A1. Oil viscosity as a function of temperature.
Figure A2. Sandstone core morphology (a) and (b) before adsorption (c) after nanopyroxene
adsorption.
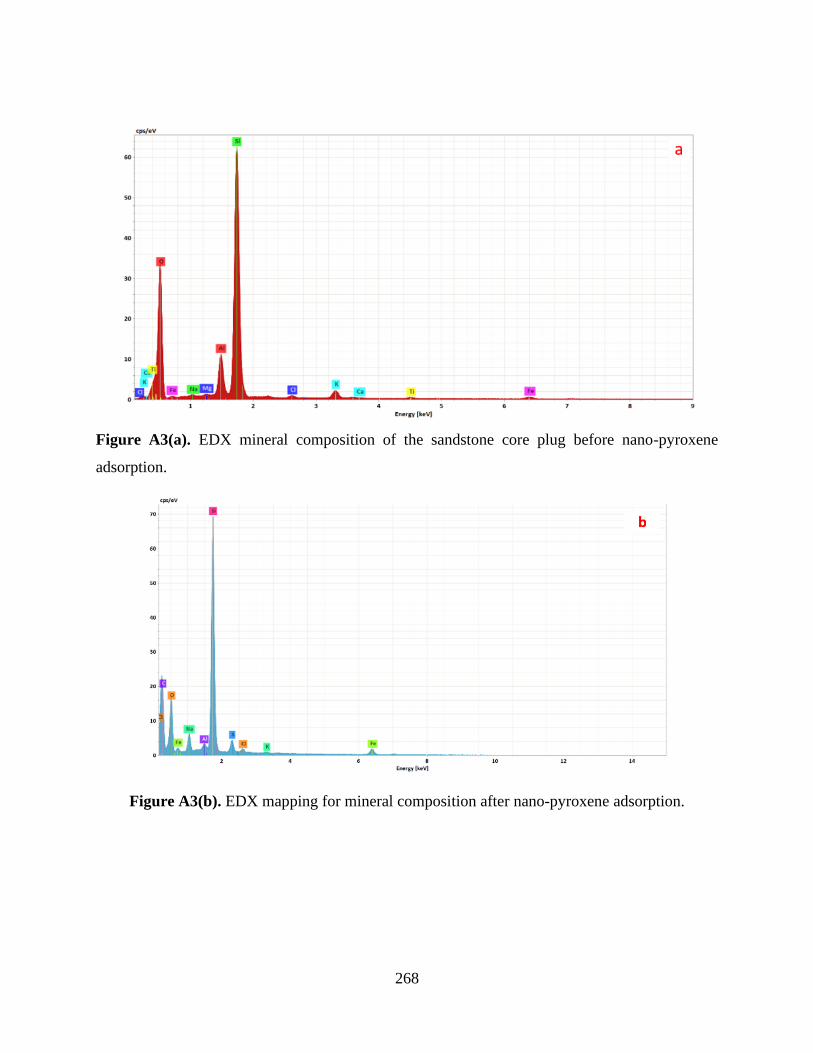
268
Figure A3(a). EDX mineral composition of the sandstone core plug before nano-pyroxene
adsorption.
Figure A3(b). EDX mapping for mineral composition after nano-pyroxene adsorption.
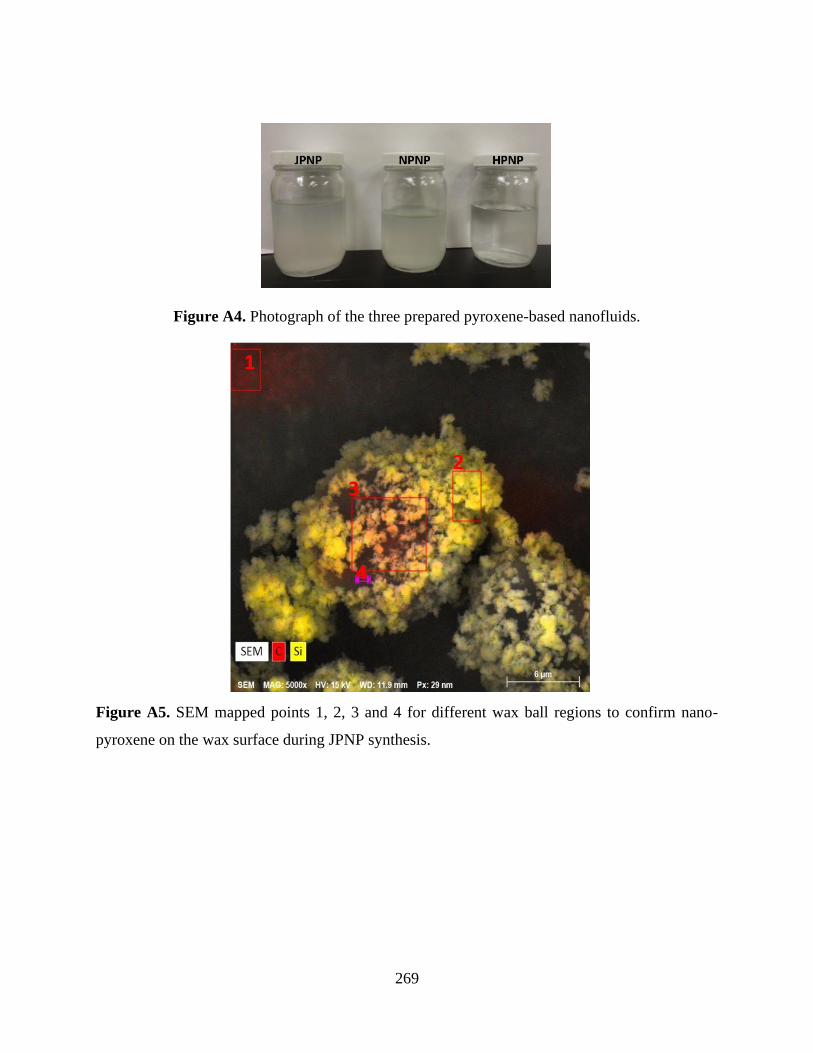
269
Figure A4. Photograph of the three prepared pyroxene-based nanofluids.
Figure A5. SEM mapped points 1, 2, 3 and 4 for different wax ball regions to confirm nano-
pyroxene on the wax surface during JPNP synthesis.
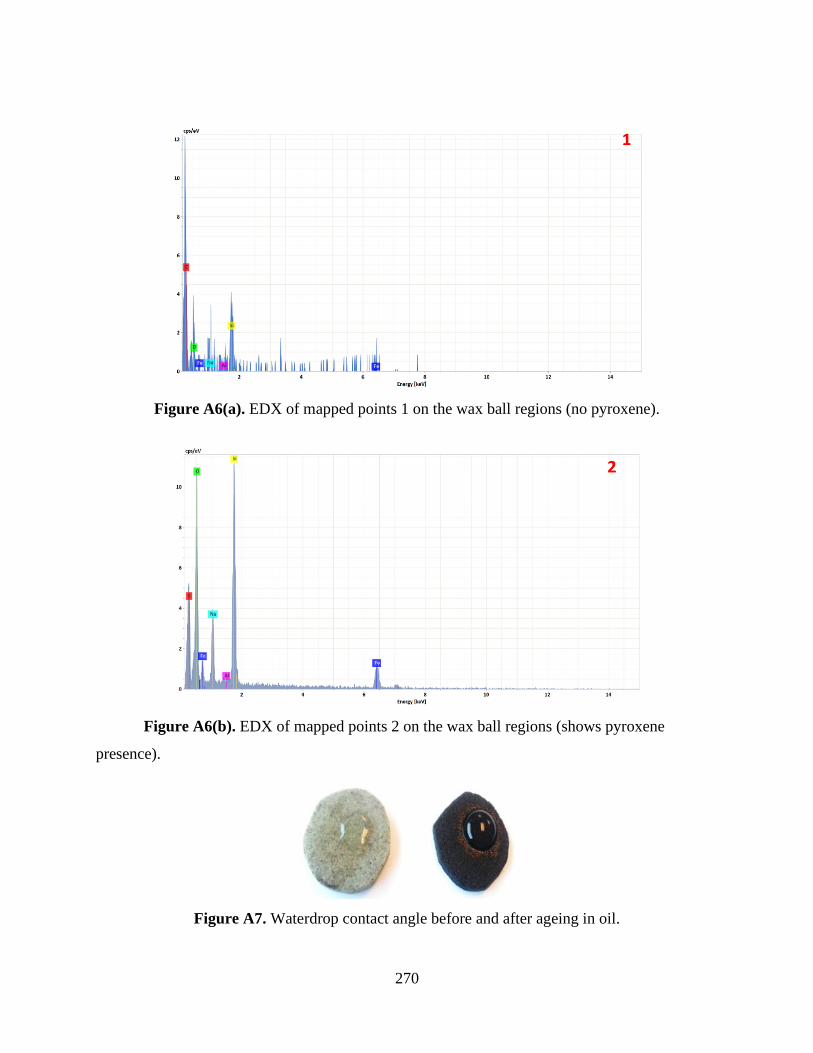
270
Figure A6(a). EDX of mapped points 1 on the wax ball regions (no pyroxene).
Figure A6(b). EDX of mapped points 2 on the wax ball regions (shows pyroxene
presence).
Figure A7. Waterdrop contact angle before and after ageing in oil.
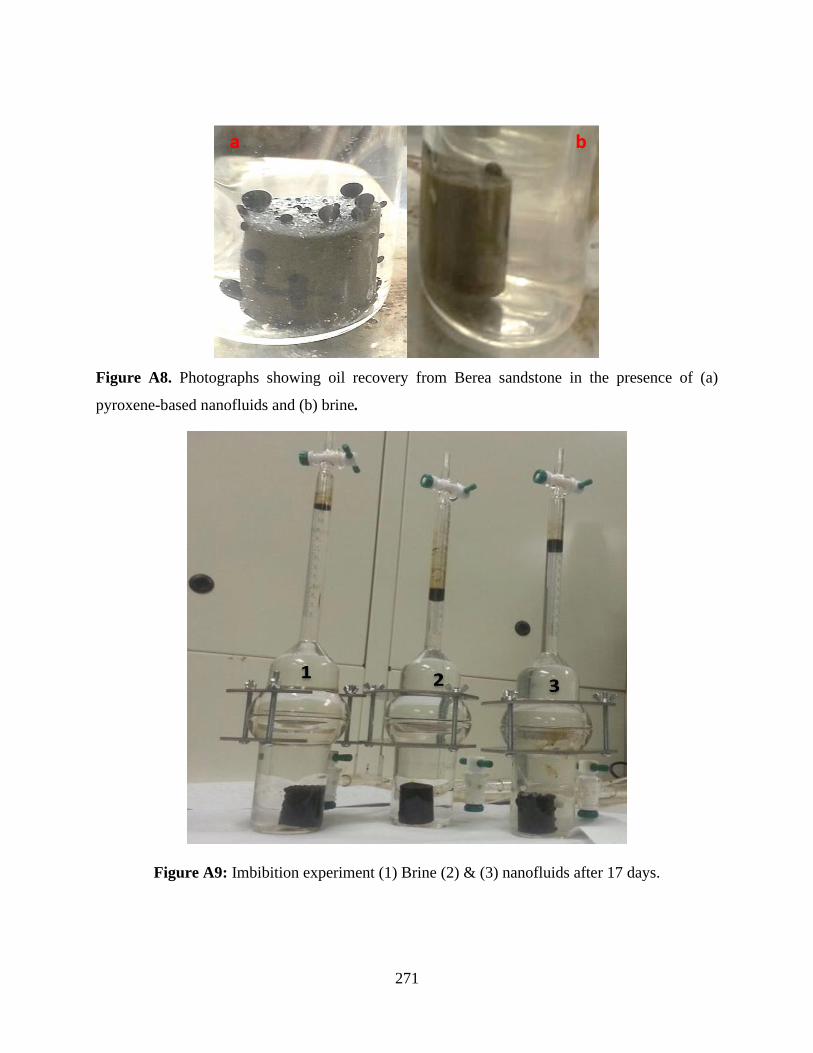
271
Figure A8. Photographs showing oil recovery from Berea sandstone in the presence of (a)
pyroxene-based nanofluids and (b) brine.
Figure A9: Imbibition experiment (1) Brine (2) & (3) nanofluids after 17 days.
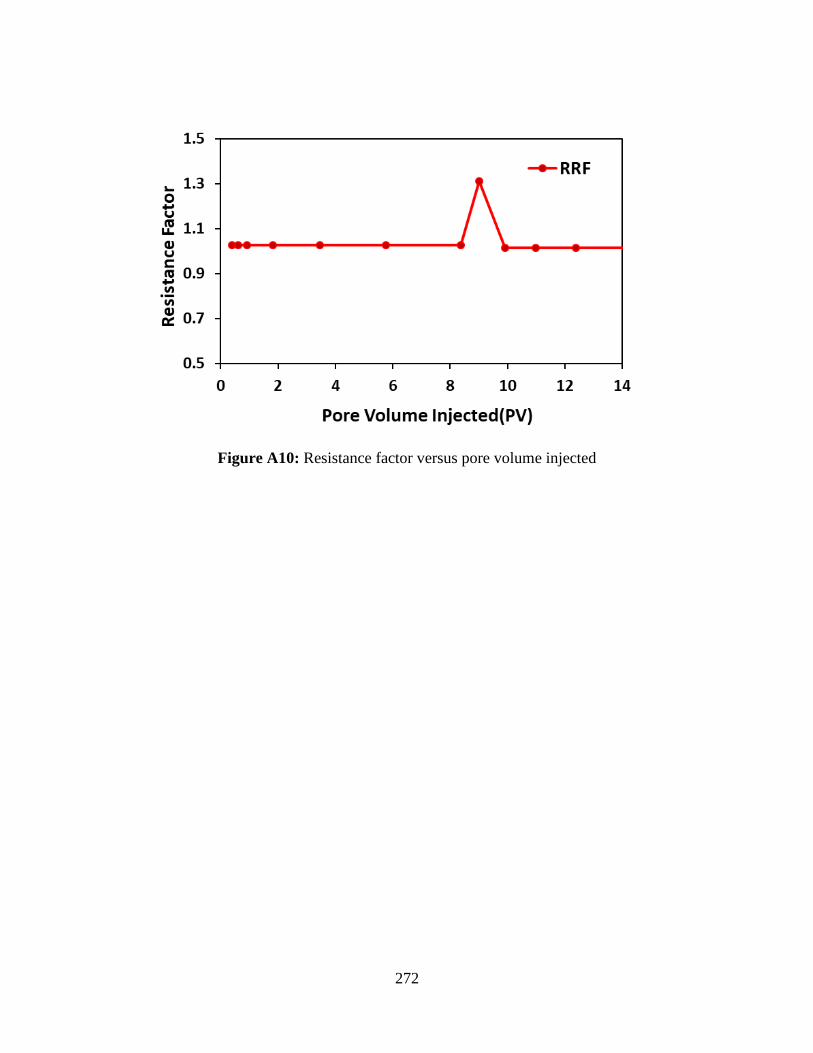
272
Figure A10: Resistance factor versus pore volume injected
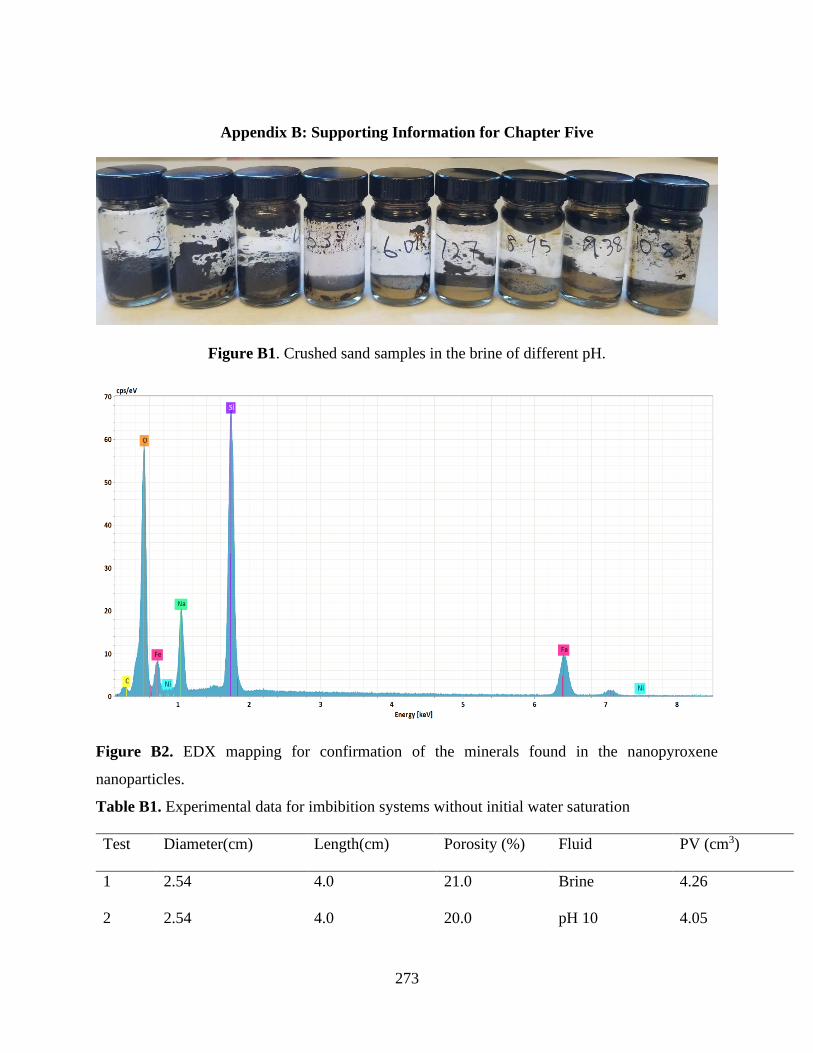
273
Appendix B: Supporting Information for Chapter Five
Figure B1. Crushed sand samples in the brine of different pH.
Figure B2. EDX mapping for confirmation of the minerals found in the nanopyroxene
nanoparticles.
Table B1. Experimental data for imbibition systems without initial water saturation
Test Diameter(cm) Length(cm) Porosity (%) Fluid PV (cm3)
1 2.54 4.0 21.0 Brine 4.26
2 2.54 4.0 20.0 pH 10 4.05
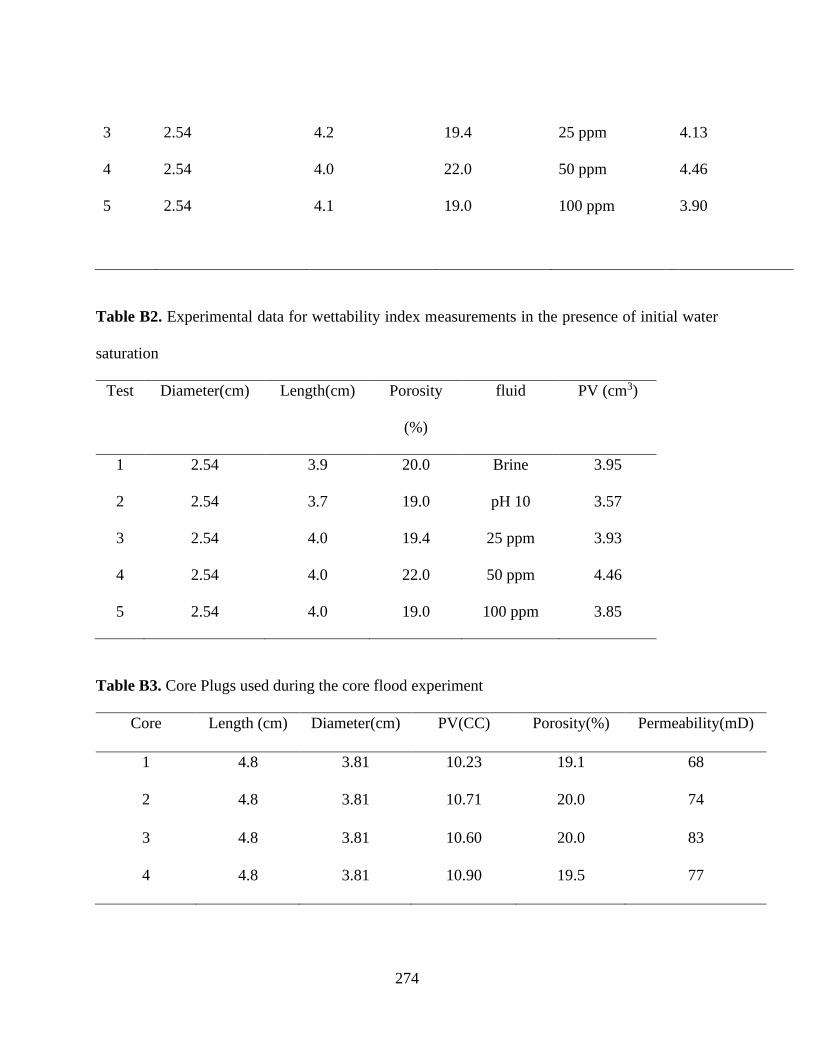
274
3 2.54 4.2 19.4 25 ppm 4.13
4 2.54 4.0 22.0 50 ppm 4.46
5 2.54 4.1 19.0 100 ppm 3.90
Table B2. Experimental data for wettability index measurements in the presence of initial water
saturation
Test Diameter(cm) Length(cm) Porosity
(%)
fluid PV (cm3)
1 2.54 3.9 20.0 Brine 3.95
2 2.54 3.7 19.0 pH 10 3.57
3 2.54 4.0 19.4 25 ppm 3.93
4 2.54 4.0 22.0 50 ppm 4.46
5 2.54 4.0 19.0 100 ppm 3.85
Table B3. Core Plugs used during the core flood experiment
Core Length (cm) Diameter(cm) PV(CC) Porosity(%) Permeability(mD)
1 4.8 3.81 10.23 19.1 68
2 4.8 3.81 10.71 20.0 74
3 4.8 3.81 10.60 20.0 83
4 4.8 3.81 10.90 19.5 77
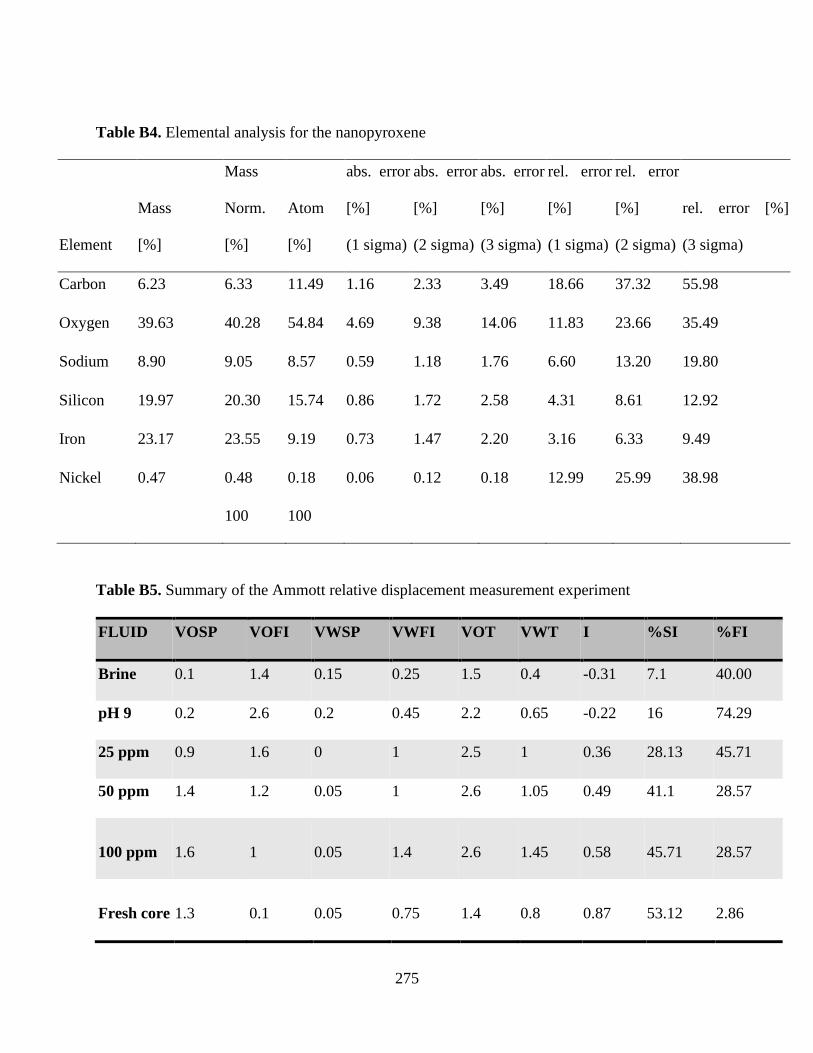
275
Table B4. Elemental analysis for the nanopyroxene
Element
Mass
[%]
Mass
Norm.
[%]
Atom
[%]
abs. error
[%]
(1 sigma)
abs. error
[%]
(2 sigma)
abs. error
[%]
(3 sigma)
rel. error
[%]
(1 sigma)
rel. error
[%]
(2 sigma)
rel. error [%]
(3 sigma)
Carbon 6.23 6.33 11.49 1.16 2.33 3.49 18.66 37.32 55.98
Oxygen 39.63 40.28 54.84 4.69 9.38 14.06 11.83 23.66 35.49
Sodium 8.90 9.05 8.57 0.59 1.18 1.76 6.60 13.20 19.80
Silicon 19.97 20.30 15.74 0.86 1.72 2.58 4.31 8.61 12.92
Iron 23.17 23.55 9.19 0.73 1.47 2.20 3.16 6.33 9.49
Nickel 0.47 0.48 0.18 0.06 0.12 0.18 12.99 25.99 38.98
100 100
Table B5. Summary of the Ammott relative displacement measurement experiment
FLUID VOSP VOFI VWSP VWFI VOT VWT I %SI %FI
Brine 0.1 1.4 0.15 0.25 1.5 0.4 -0.31 7.1 40.00
pH 9 0.2 2.6 0.2 0.45 2.2 0.65 -0.22 16 74.29
25 ppm 0.9 1.6 0 1 2.5 1 0.36 28.13 45.71
50 ppm 1.4 1.2 0.05 1 2.6 1.05 0.49 41.1 28.57
100 ppm 1.6 1 0.05 1.4 2.6 1.45 0.58 45.71 28.57
Fresh core 1.3 0.1 0.05 0.75 1.4 0.8 0.87 53.12 2.86
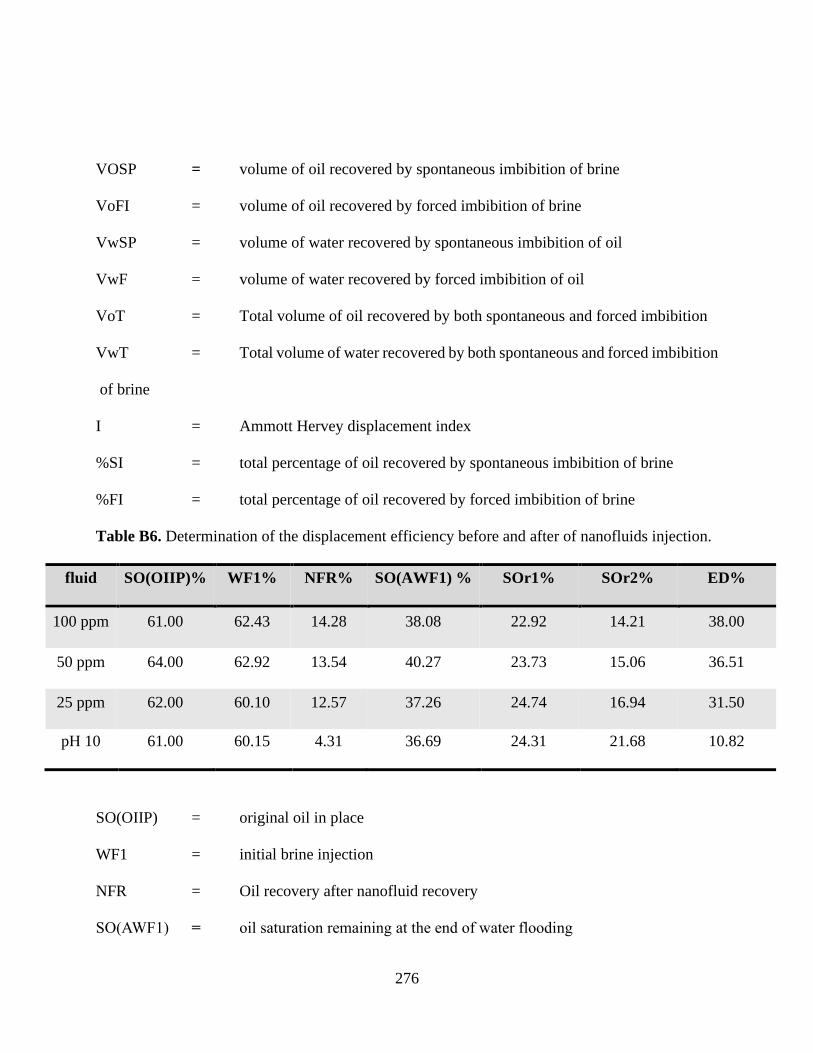
276
VOSP = volume of oil recovered by spontaneous imbibition of brine
VoFI = volume of oil recovered by forced imbibition of brine
VwSP = volume of water recovered by spontaneous imbibition of oil
VwF = volume of water recovered by forced imbibition of oil
VoT = Total volume of oil recovered by both spontaneous and forced imbibition
VwT = Total volume of water recovered by both spontaneous and forced imbibition
of brine
I = Ammott Hervey displacement index
%SI = total percentage of oil recovered by spontaneous imbibition of brine
%FI = total percentage of oil recovered by forced imbibition of brine
Table B6. Determination of the displacement efficiency before and after of nanofluids injection.
fluid SO(OIIP)% WF1% NFR% SO(AWF1) % SOr1% SOr2% ED%
100 ppm 61.00 62.43 14.28 38.08 22.92 14.21 38.00
50 ppm 64.00 62.92 13.54 40.27 23.73 15.06 36.51
25 ppm 62.00 60.10 12.57 37.26 24.74 16.94 31.50
pH 10 61.00 60.15 4.31 36.69 24.31 21.68 10.82
SO(OIIP) = original oil in place
WF1 = initial brine injection
NFR = Oil recovery after nanofluid recovery
SO(AWF1) = oil saturation remaining at the end of water flooding

277
SOr1% = residual oil saturation after initial brine injection
SOr2% = residual oil saturation after nanofluid injection
ED = displacement Efficiency
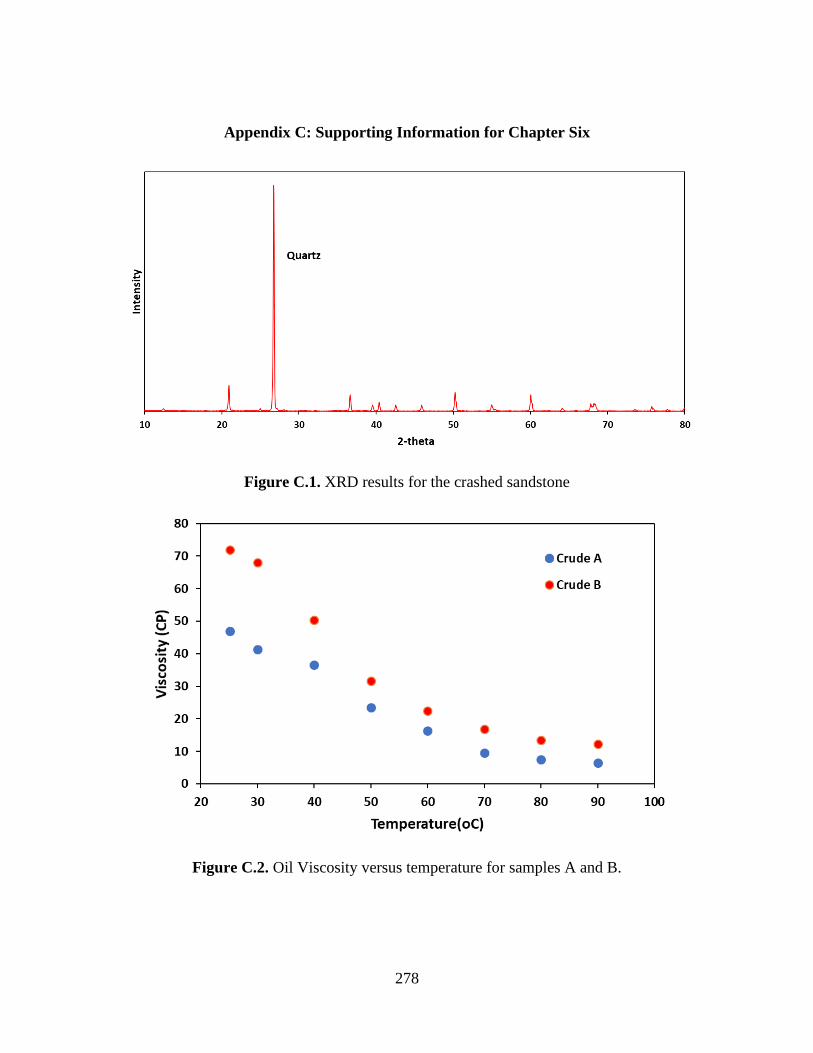
278
Appendix C: Supporting Information for Chapter Six
Figure C.1. XRD results for the crashed sandstone
Figure C.2. Oil Viscosity versus temperature for samples A and B.
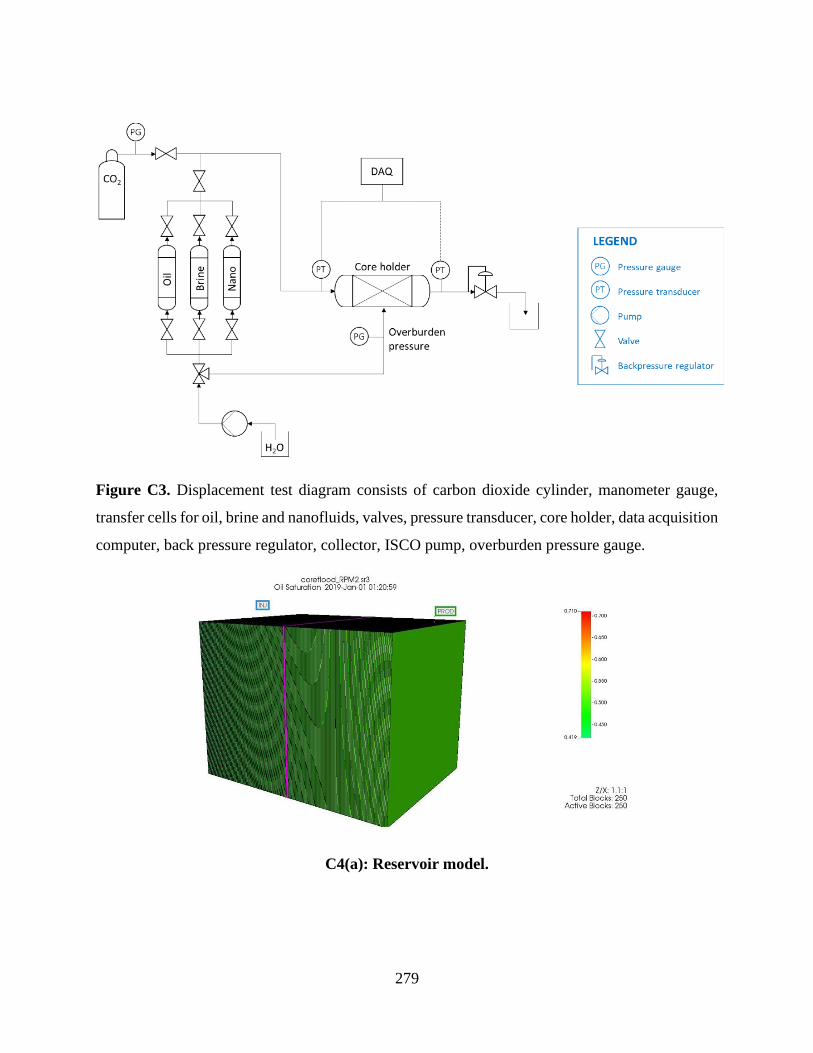
279
Figure C3. Displacement test diagram consists of carbon dioxide cylinder, manometer gauge,
transfer cells for oil, brine and nanofluids, valves, pressure transducer, core holder, data acquisition
computer, back pressure regulator, collector, ISCO pump, overburden pressure gauge.
C4(a): Reservoir model.
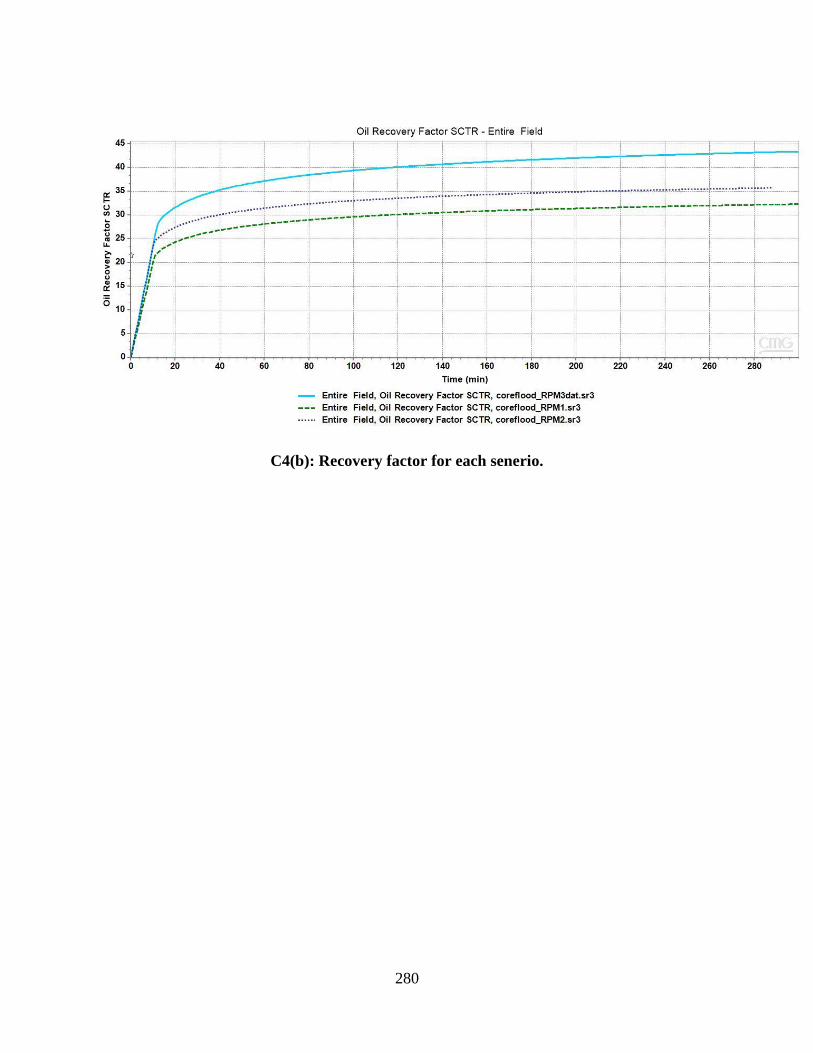
280
C4(b): Recovery factor for each senerio.
281
C5: Simulation input data.
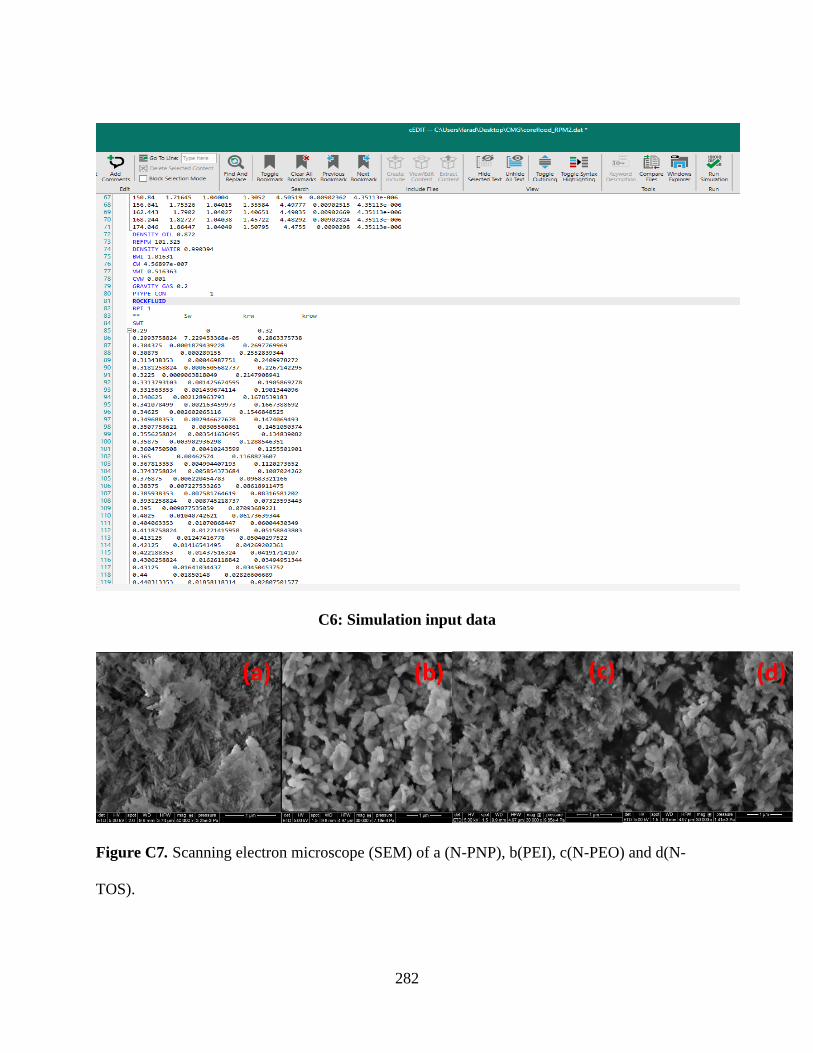
282
C6: Simulation input data
Figure C7. Scanning electron microscope (SEM) of a (N-PNP), b(PEI), c(N-PEO) and d(N-
TOS).
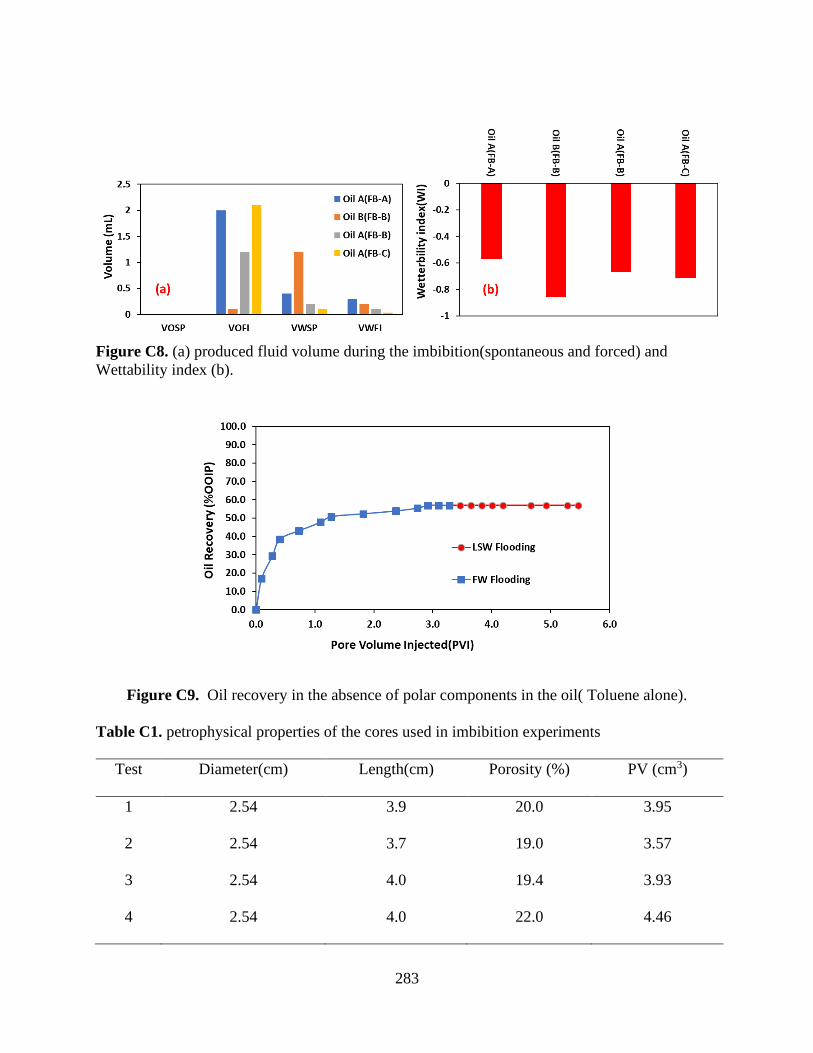
283
Figure C8. (a) produced fluid volume during the imbibition(spontaneous and forced) and
Wettability index (b).
Figure C9. Oil recovery in the absence of polar components in the oil( Toluene alone).
Table C1. petrophysical properties of the cores used in imbibition experiments
Test Diameter(cm) Length(cm) Porosity (%) PV (cm3)
1 2.54 3.9 20.0 3.95
2 2.54 3.7 19.0 3.57
3 2.54 4.0 19.4 3.93
4 2.54 4.0 22.0 4.46
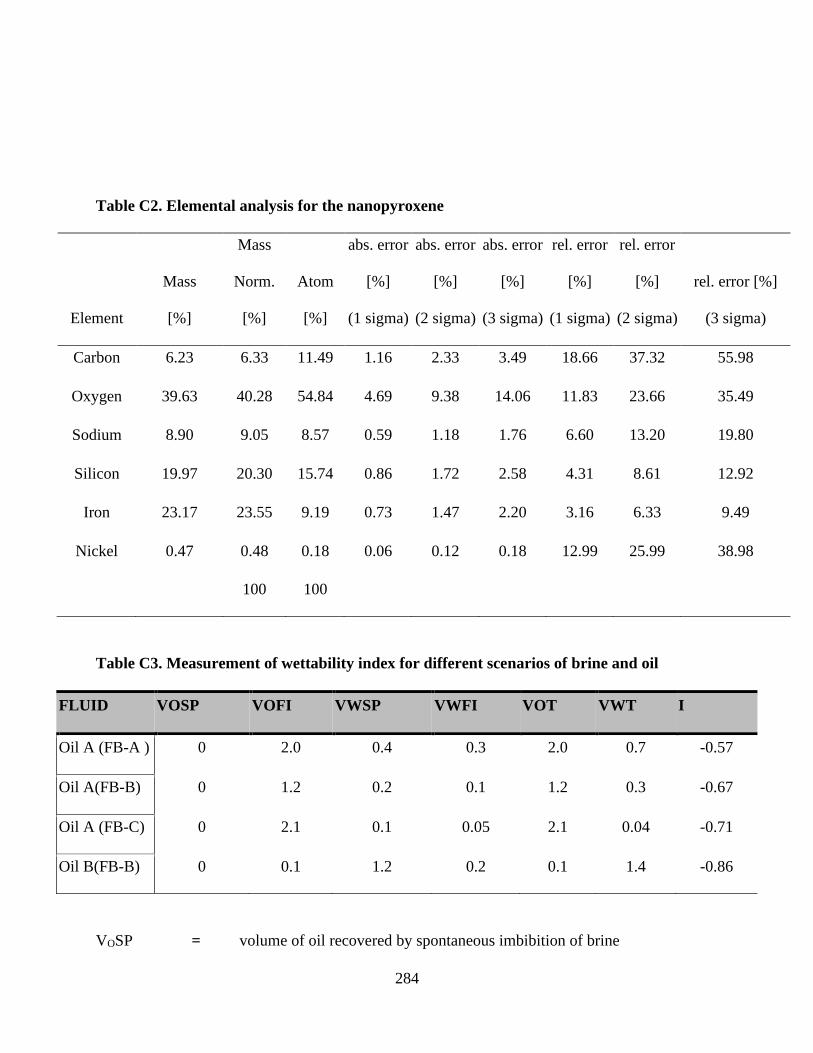
284
Table C2. Elemental analysis for the nanopyroxene
Element
Mass
[%]
Mass
Norm.
[%]
Atom
[%]
abs. error
[%]
(1 sigma)
abs. error
[%]
(2 sigma)
abs. error
[%]
(3 sigma)
rel. error
[%]
(1 sigma)
rel. error
[%]
(2 sigma)
rel. error [%]
(3 sigma)
Carbon 6.23 6.33 11.49 1.16 2.33 3.49 18.66 37.32 55.98
Oxygen 39.63 40.28 54.84 4.69 9.38 14.06 11.83 23.66 35.49
Sodium 8.90 9.05 8.57 0.59 1.18 1.76 6.60 13.20 19.80
Silicon 19.97 20.30 15.74 0.86 1.72 2.58 4.31 8.61 12.92
Iron 23.17 23.55 9.19 0.73 1.47 2.20 3.16 6.33 9.49
Nickel 0.47 0.48 0.18 0.06 0.12 0.18 12.99 25.99 38.98
100 100
Table C3. Measurement of wettability index for different scenarios of brine and oil
FLUID VOSP VOFI VWSP VWFI VOT VWT I
Oil A (FB-A ) 0 2.0 0.4 0.3 2.0 0.7 -0.57
Oil A(FB-B) 0 1.2 0.2 0.1 1.2 0.3 -0.67
Oil A (FB-C) 0 2.1 0.1 0.05 2.1 0.04 -0.71
Oil B(FB-B) 0 0.1 1.2 0.2 0.1 1.4 -0.86
VOSP = volume of oil recovered by spontaneous imbibition of brine
285
VoFI = volume of oil recovered by forced imbibition of brine
VwSP = volume of water recovered by spontaneous imbibition of oil
VwFI = volume of water recovered by forced imbibition of oil
VoT = Total volume of oil recovered by both spontaneous and forced imbibition
VwT = Total volume of water recovered by both spontaneous and forced
imbibition
of brine
I = Amott Harvey displacement index
Oil A (FB-A) = Brine with only monovalent ions using oil sample A
Oil A(FB-B) = Oil sample A and formation brine B
Oil A (FB-C) = Oil sample A with formation brine C
Oil B(FB-A) = Oil sample B with formation brine A

286
Appendix D: Copy right clearence
287