Embed Size (px)
Citation preview
What must be the Relation between Liquidity Ratios and
Profitability of the Banks in a Transition Economy?
The Case of Kyrgyzstan
Gulnaz Atabaeva1 , Farida Tashbaeva2, Nurlan Atabaev2 , Ibrahim Keles3
1Alatoo International University, Kyrgyzstan
2American University of Central Asia, Kyrgyzstan
3International Black Sea University, Georgia
Abstract
Liquidity and profitability are two main concerns of banks.
Stakeholders have different priorities for those aspects:
shareholders demand profit maximization, and the depositors
expect liquidity maximization, that is to be able to withdraw their
deposits whenever they need. Thus, banks are often challenged
with the need to satisfy these two stakeholder groups. This article
aims to determine the trade-off among liquidity and profitability in
Kyrgyzstan's banking sector for 2001-2019.
This article investigates the trade-off between liquidity and
profitability in the Kyrgyz banking system by focusing on ratios
such as liquidity, return on assets, return on equity, loan volume,
net interest margin, deposit volume, and exchange rate using the
Vector Auto Regression approach and Augmented Dickey-Fuller
test methods. Data were obtained from the National Bank of the
Kyrgyz Republic's publications.
The findings of this work showed a negative correlation between
liquidity and the economic development of Kyrgyzstan. The high
rate of the Kyrgyz banking system's liquidity ratio does not
positively impact economic growth. Besides this, no significant
relation among liquidity ratio and deposit volume was observed
for Kyrgyzstan.
Keywords: Credit Volume, Deposit Volume, Liquidity Ratio,
Profitability, Return on Assets, Return on Equity, Vector Auto
Regression.
JEL Classification Codes: E51, E52, E58.
Received 03 January 2022
Revised 25 February 2022
Accepted 04 March 2022
Citation: Atabaeva, G., Tashbaeva, F., Atabaev, N., & Keles, I. (2022). What must be the relation between liquidity ratios and profitability of the banks in a transition economy? The case of Kyrgyzstan. Journal of Sustainable Business, Economics and Finance, 1(1), 1-22. http://doi.org/10.31039/josbef.2022.1.1.2
Copyright: © 2022 by the authors. This article is an Open Access article distributed under the terms and conditions of the Creative Commons Attribution (CC BY) license (https://creativecommons.org/licenses/by/4.0/).
corresponding authors:

Atabaeva, G., Tashbaeva, F., Atabaev, N., & Keles, I. (2022). What must be the relation between liquidity ratios and profitability of the banks in a transition economy? The case of Kyrgyzstan. Journal of Sustainable Business, Economics and Finance, 1(1), 1-22. http://doi.org/10.31039/josbef.2022.1.1.2
2
1. Introduction
Banks are powerful actors in the finance sector and contributes to a big share of the
economy (Met et al., 2008). Amongs the various functions of banks, their primary role is to collect
funds from the public and distribute those funds as credits to businesses. In addition, banks provide
services such as collection and payment of credit instruments, discounting bills of exchange,
foreign currency exchange, check/cheque payment, remittance of funds, etc. To provide these
services, banks perform several activities on both asset and liability sides of the balance sheet. For
example, on the assets side of the balance sheet, loans receivables occur as a result of loaning
money. The responsibilities of the bank appear on the liability side of the balance sheet as deposits.
To increase profitability, bank managers will try to convert deposits into loans as much as possible.
But at the same time, to maintain liquidity, they will try to keep those deposits on hand. So there
is an inherent tradeoff and persistent decision dilemma between profitability and liquidity ratio
(Malik et al. 2016).
The banking sector helps develop and expand new businesses to drive economic
development and employment, and banks are required to balance the demand and supply of
liquidity appropriately. Concerns about liquidity issue arise because of potential failures in
resource management and unfavorable economic conditions may lead to excessive cash drawings
by the banks' depositors (Waleed et al. 2016).
The banking sector's liquidity ratio is one of the economic standards and requirements
tracked by the commercial banks of the Kyrgyz Republic (NBKR, 2017). During the last 19 years,
the Kyrgyz Republic's banking sector is maintain a high liquidity ratio. A high liquidity ratio is an
indicator of stability in the banking sector and provides a high degree of safety for depositors
(Westerfield, 1921). Nevertheless, there are opposing sides to the high liquidity ratio. As stated by
Brealey et al. (2011) and Westerfield (1921), a high liquidity ratio is not favorable for a bank's
profitability. By holding on to a high amount of liquid assets, banks do not invest these assets into
their loan portfolio; hence, interest revenue falls, and profitability falls. Consequently, lesser
investments and loan can be obtained by small and medium businesses, and these businesses fail
to grow prosper, leading to further GDP decreases. In other words, the banking sector's high
liquidity ratio likely affects the economy of the Kyrgyz Republic.
Atabaeva, G., Tashbaeva, F., Atabaev, N., & Keles, I. (2022). What must be the relation between liquidity ratios and profitability of the banks in a transition economy? The case of Kyrgyzstan. Journal of Sustainable Business, Economics and Finance, 1(1), 1-22. http://doi.org/10.31039/josbef.2022.1.1.2
3
A considerable relationship among bank profitability and bank liquidity was suggested by
many researchers (Tran et al. 2016). Several theories have been introduced to explain the
relationship between liquidity and profitability of banks. These include liquidity management
theories such as The Real Bills Doctrine (Humphrey, 1982), The Shift-Ability Theory (Mitchell,
1923), The Anticipated Income Theory (Prochnow, 1949). More recently, Osborne et al. (2012)
judged that greater liquidity results in higher cost and lower profitability for banks, and is not
entirely a bad outcome since, the trade-off theory proposes that higher liquidity rates decrease the
bank's risks for the coming periods and effectively compensate investors for the possibility of
bankruptcy risk (Osborne et al. (2012).
The aim of this study to analyse the association concerning a bank's liquidity and
profitability and show results for the Kyrgyz banks. The findings of the study suggested a
significant relationship net interest margin, Return on Equity, and Return on Assets which are the
main parameters of the liquidity and profitability of the Kyrgyz banks.
2. Literature Review
Banks are the leading, complex, and difficult to govern institutions, having an implicit 'too
big to fail' guarantee in most countries (Becht et al. 2011). Like other businesses, banks are profit-
oriented, and they have investors expecting dividends. To survive and develop, they must have
profitable operations. On top of that, they must also provide and ensure sufficient liquidity. They
must satisfy the withdrawal needs of their clients (Tursoy, 2018). As a result of these, bank actively
manages their liquidity, that is balancing the cost of attaining higher liquidity and the cost of
inefficient allocation of such liquidity (Jahan et al. 2014).
Djalilov & Piesse (2016) analyzed profitability factors in Central and Eastern Europe and
former USSR countries' banking systems for the 2000–2013 period using the
Generalized Method of Moments (GMM). Their findings showed that profitability endures, and
there are different factors affecting bank profitability of their banking system. Their results showed
that Central and Eastern Europe banking systems are more competitive, and credit risk and
profitability are positively correlated. On the former USSR countries' banking systems side, credit
risk and profitability are negatively correlated. Additionally, government spending and monetary
freedom negatively influence bank profitability, as well.
Atabaeva, G., Tashbaeva, F., Atabaev, N., & Keles, I. (2022). What must be the relation between liquidity ratios and profitability of the banks in a transition economy? The case of Kyrgyzstan. Journal of Sustainable Business, Economics and Finance, 1(1), 1-22. http://doi.org/10.31039/josbef.2022.1.1.2
4
Faizulayev & Wada (2019) studied the Eurasian Economic Union banks' financial
performance by using Generalized Least Square (GLS) approach for 2011–2017. Liquidity and
credit risk are the leading indicators of the profitability of the banks. In another transition country's
banking system, the Albanian banking system, was analyzed by Shijaku (2017) for 2008–2015
with 16 banks. His findings showed that greater concentration hurt bank stability and indicated
that bank stability is associated with macroeconomic circumstances and capital ratio and opposite
with operational efficiency. In the same line of investigation, Haji-Zada (2017) proposed that real
GDP growth rate, exchange rate, corruption, and the political risk are the parameters affecting
credit risk in Kyrgyzstan. The higher credit risk hurts liquidity and profitability. Thus, the real
GDP growth rate positively impacts liquidity and profitability, and the exchange rate, corruption,
and political risk hurt liquidity and profitability.
The impact of state ownership and business models on bank stability at the Eurasian
Economic Union (EAEU) 's three founding states (Russia, Kazakhstan, and Belarus) were
examined by Pak (2019) for 2008–2016 period and found that state ownership and the probability
of survival have positive relation but have a negative association with the Basel III Net Stable
Funding Ratio (NSFR). The diversification in funding structures develops their financial stability.
Generally, improved capitalization and less dependence on short-term borrowing enhance the
weak structural liquidity. Moreover, the same author (Pak, 2020) examined the bank profitability
for the same group of countries. She found a substantial degree of stability in net interest margin
(NIM) and a lack of persistence in return on assets (ROA).
Erdogan & Aksoy (2016) investigated the determining factors of banks' profits and the
regulations' outcomes by using the Prais-Winsten regression method. Their results showed a
positive correlation between capital, size, off-balance-sheet transactions, liquidity and loans and
performance, and a negative correlation among quality of loans, concentration, and performance.
The Ukrainian banking system was analyzed according to deposit activity (Kichurchak,
2019) and devaluation of the national currency (Sobolieva-Tereshchenko, O., & Zhukova, 2020).
The importance of two parameters on banks' stability in transition economies was analyzed, and it
was thought that a similar importance level is valid for Kyrgyzstan.
Morris & Shin (2016) determine the liquidity ratio as the possible amount of cash on the
asset side to short term liability amounts. So, possible money is defined as liquid assets (such as
Atabaeva, G., Tashbaeva, F., Atabaev, N., & Keles, I. (2022). What must be the relation between liquidity ratios and profitability of the banks in a transition economy? The case of Kyrgyzstan. Journal of Sustainable Business, Economics and Finance, 1(1), 1-22. http://doi.org/10.31039/josbef.2022.1.1.2
5
marketable securities and account receivable) plus other assets (such as advances paid to
employees or suppliers). Ratio analysis is one of the most popular tools that use financial
statements to estimate the company performance and compare the company with other companies
in the same industry by manipulating financial information such as balance sheets and income
statements. A sudden stop in an organization is usually defined as a sudden slowdown in
investments or positive cash flows, with an associated shift from sizeable current account deficits
into smaller deficits or small surpluses (Morris & Shin, 2016).
Tovar-García & Ruslana Kozubekova (2016) found that Kyrgyz banks with higher capital
ratios and liquidity charge higher interest rates on loans. But charging higher interest rates does
not give a guaranty for higher profitability.
3. Data and Methodology
The data on banking activities was collected from the website of NBKR, specifically from
the Bulletin of the National Bank of the Kyrgyz Republic, from the statistics on Deposits in
commercial banks by the end of the period, and from the statistics on Issued Credits of commercial
banks by the end of the period. The timeframe of all variables is from January 2007 to December
2019 monthly. The dataset included the following variables:
LC- Liquidity Ratio
ROA-Return on Assets
ROE-Return on Equity
DNIM- Net Interest Margin
DEPD/DEPS-Deposit Volume
VAR - Vector Autoregression model
ADF- Augmented Dickey-Fuller test
LOD/LOS-Issued Loans
DER-Exchange rate
TRAS/TRADES- Issued loans for trade
INDD-Issued loans for industry
Atabaeva, G., Tashbaeva, F., Atabaev, N., & Keles, I. (2022). What must be the relation between liquidity ratios and profitability of the banks in a transition economy? The case of Kyrgyzstan. Journal of Sustainable Business, Economics and Finance, 1(1), 1-22. http://doi.org/10.31039/josbef.2022.1.1.2
6
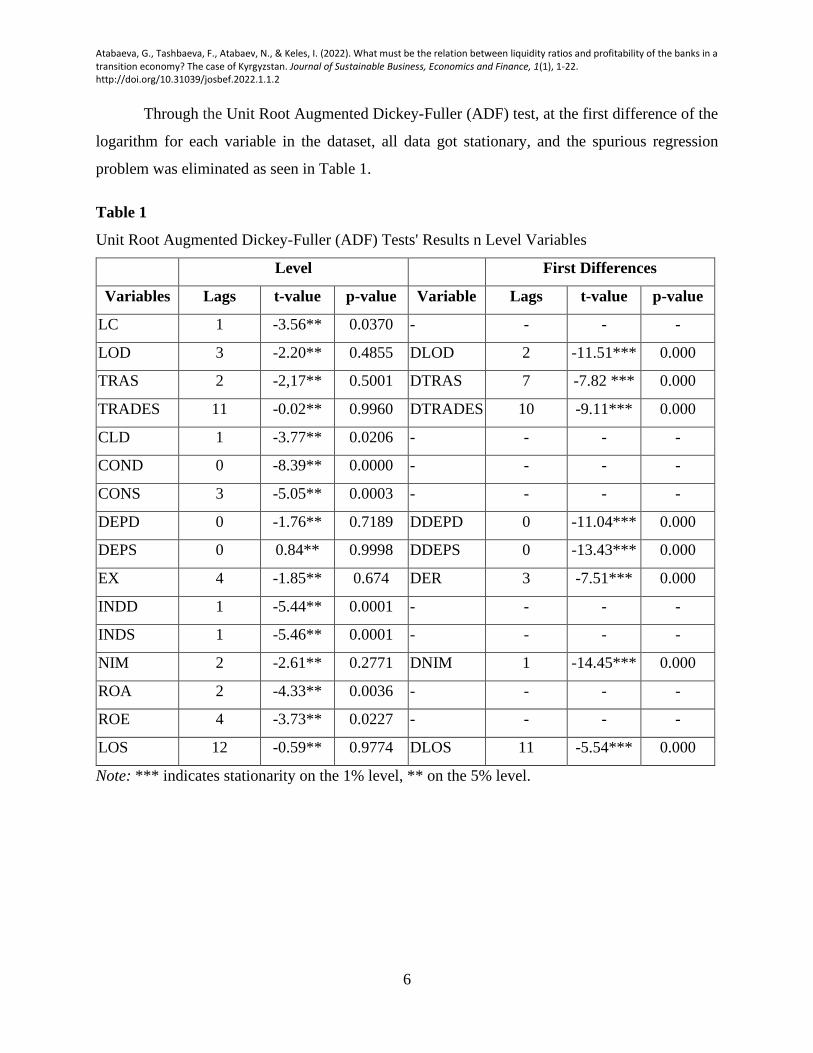
Through the Unit Root Augmented Dickey-Fuller (ADF) test, at the first difference of the
logarithm for each variable in the dataset, all data got stationary, and the spurious regression
problem was eliminated as seen in Table 1.
Table 1
Unit Root Augmented Dickey-Fuller (ADF) Tests' Results n Level Variables
Level First Differences
Variables Lags t-value p-value Variable Lags t-value p-value
LC 1 -3.56** 0.0370 - - - -
LOD 3 -2.20** 0.4855 DLOD 2 -11.51*** 0.000
TRAS 2 -2,17** 0.5001 DTRAS 7 -7.82 *** 0.000
TRADES 11 -0.02** 0.9960 DTRADES 10 -9.11*** 0.000
CLD 1 -3.77** 0.0206 - - - -
COND 0 -8.39** 0.0000 - - - -
CONS 3 -5.05** 0.0003 - - - -
DEPD 0 -1.76** 0.7189 DDEPD 0 -11.04*** 0.000
DEPS 0 0.84** 0.9998 DDEPS 0 -13.43*** 0.000
EX 4 -1.85** 0.674 DER 3 -7.51*** 0.000
INDD 1 -5.44** 0.0001 - - - -
INDS 1 -5.46** 0.0001 - - - -
NIM 2 -2.61** 0.2771 DNIM 1 -14.45*** 0.000
ROA 2 -4.33** 0.0036 - - - -
ROE 4 -3.73** 0.0227 - - - -
LOS 12 -0.59** 0.9774 DLOS 11 -5.54*** 0.000
Note: *** indicates stationarity on the 1% level, ** on the 5% level.
Atabaeva, G., Tashbaeva, F., Atabaev, N., & Keles, I. (2022). What must be the relation between liquidity ratios and profitability of the banks in a transition economy? The case of Kyrgyzstan. Journal of Sustainable Business, Economics and Finance, 1(1), 1-22. http://doi.org/10.31039/josbef.2022.1.1.2
7
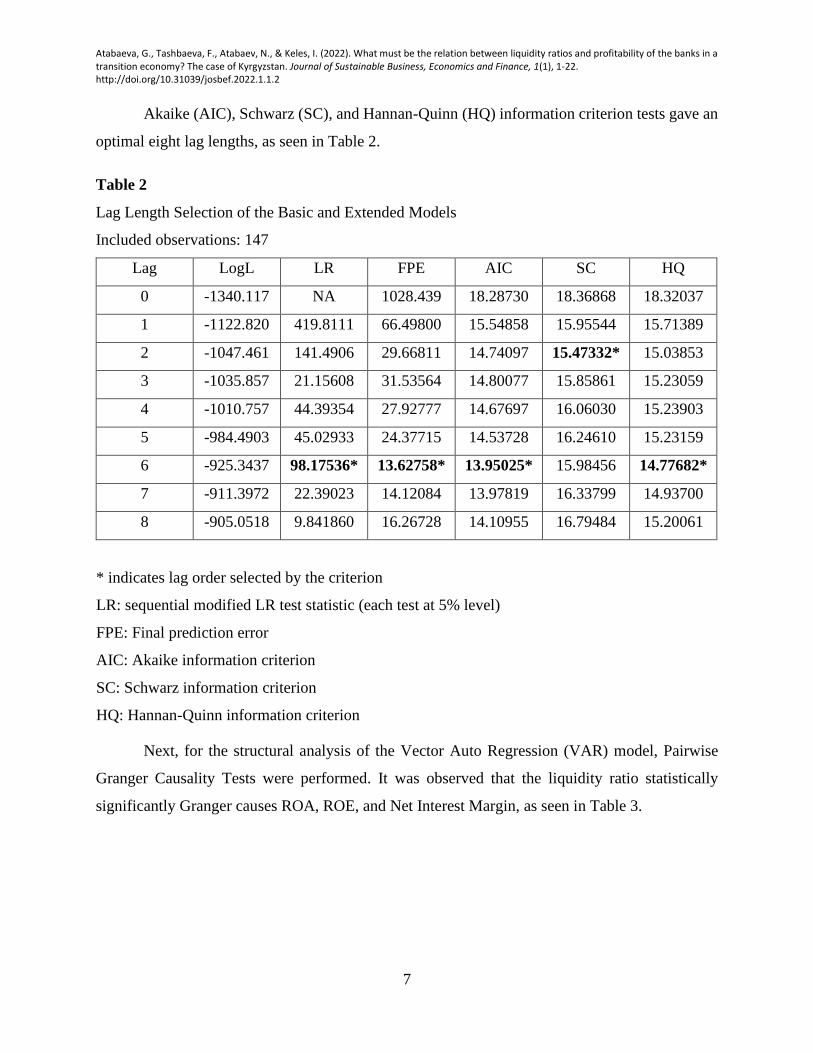
Akaike (AIC), Schwarz (SC), and Hannan-Quinn (HQ) information criterion tests gave an
optimal eight lag lengths, as seen in Table 2.
Table 2
Lag Length Selection of the Basic and Extended Models
Included observations: 147
Lag LogL LR FPE AIC SC HQ
0 -1340.117 NA 1028.439 18.28730 18.36868 18.32037
1 -1122.820 419.8111 66.49800 15.54858 15.95544 15.71389
2 -1047.461 141.4906 29.66811 14.74097 15.47332* 15.03853
3 -1035.857 21.15608 31.53564 14.80077 15.85861 15.23059
4 -1010.757 44.39354 27.92777 14.67697 16.06030 15.23903
5 -984.4903 45.02933 24.37715 14.53728 16.24610 15.23159
6 -925.3437 98.17536* 13.62758* 13.95025* 15.98456 14.77682*
7 -911.3972 22.39023 14.12084 13.97819 16.33799 14.93700
8 -905.0518 9.841860 16.26728 14.10955 16.79484 15.20061
* indicates lag order selected by the criterion
LR: sequential modified LR test statistic (each test at 5% level)
FPE: Final prediction error
AIC: Akaike information criterion
SC: Schwarz information criterion
HQ: Hannan-Quinn information criterion
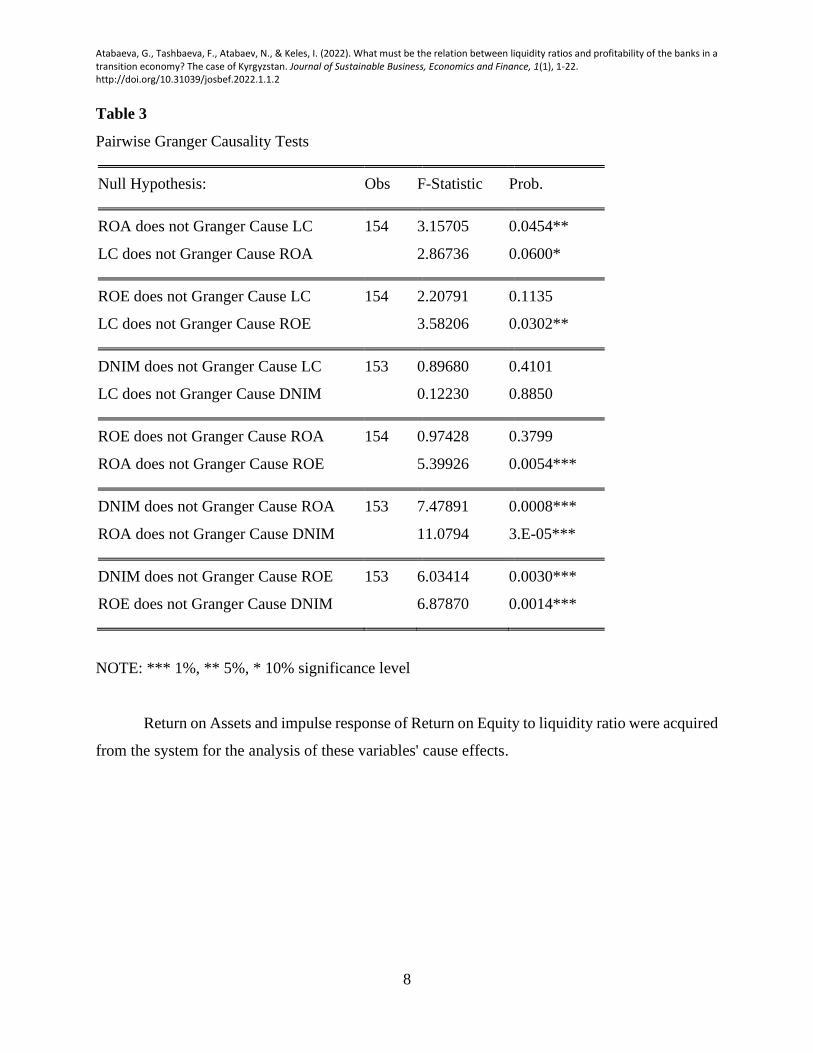
Next, for the structural analysis of the Vector Auto Regression (VAR) model, Pairwise
Granger Causality Tests were performed. It was observed that the liquidity ratio statistically
significantly Granger causes ROA, ROE, and Net Interest Margin, as seen in Table 3.
Atabaeva, G., Tashbaeva, F., Atabaev, N., & Keles, I. (2022). What must be the relation between liquidity ratios and profitability of the banks in a transition economy? The case of Kyrgyzstan. Journal of Sustainable Business, Economics and Finance, 1(1), 1-22. http://doi.org/10.31039/josbef.2022.1.1.2
8
Table 3
Pairwise Granger Causality Tests
Null Hypothesis: Obs F-Statistic Prob.
ROA does not Granger Cause LC 154 3.15705 0.0454**
LC does not Granger Cause ROA 2.86736 0.0600*
ROE does not Granger Cause LC 154 2.20791 0.1135
LC does not Granger Cause ROE 3.58206 0.0302**
DNIM does not Granger Cause LC 153 0.89680 0.4101
LC does not Granger Cause DNIM 0.12230 0.8850
ROE does not Granger Cause ROA 154 0.97428 0.3799
ROA does not Granger Cause ROE 5.39926 0.0054***
DNIM does not Granger Cause ROA 153 7.47891 0.0008***
ROA does not Granger Cause DNIM 11.0794 3.E-05***
DNIM does not Granger Cause ROE 153 6.03414 0.0030***
ROE does not Granger Cause DNIM 6.87870 0.0014***
NOTE: *** 1%, ** 5%, * 10% significance level
Return on Assets and impulse response of Return on Equity to liquidity ratio were acquired
from the system for the analysis of these variables' cause effects.
Atabaeva, G., Tashbaeva, F., Atabaev, N., & Keles, I. (2022). What must be the relation between liquidity ratios and profitability of the banks in a transition economy? The case of Kyrgyzstan. Journal of Sustainable Business, Economics and Finance, 1(1), 1-22. http://doi.org/10.31039/josbef.2022.1.1.2
9
3.1. Profitability
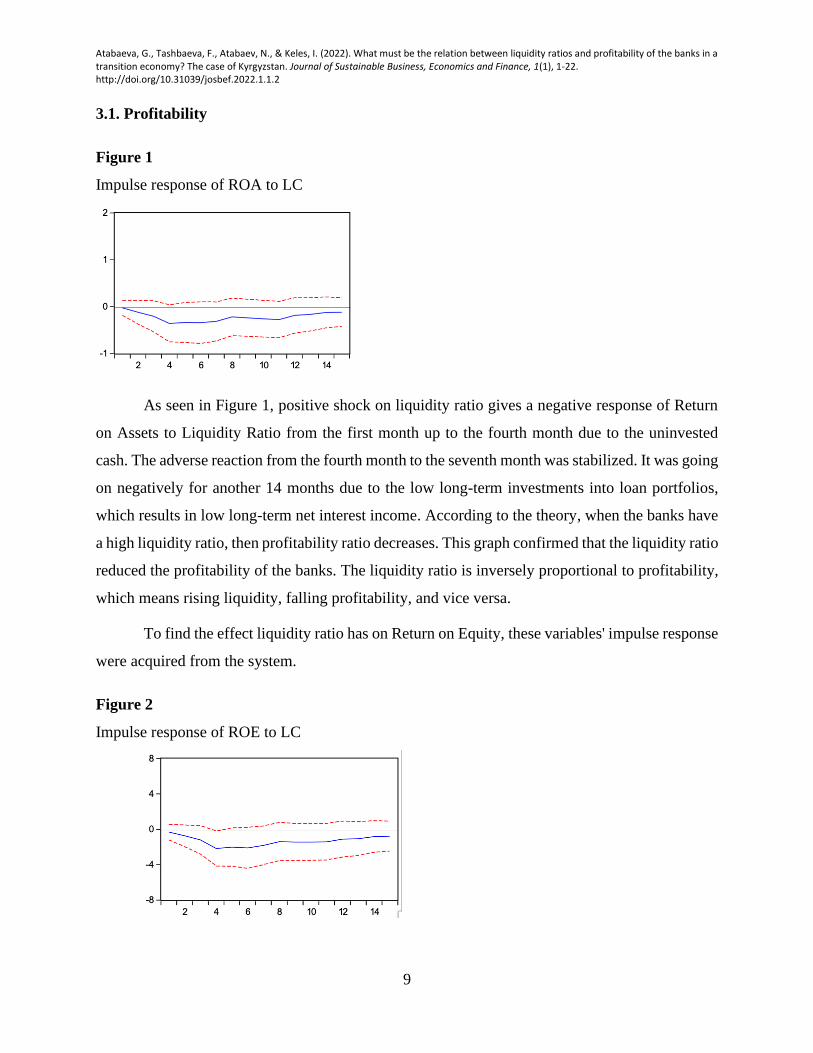
Figure 1
Impulse response of ROA to LC
As seen in Figure 1, positive shock on liquidity ratio gives a negative response of Return
on Assets to Liquidity Ratio from the first month up to the fourth month due to the uninvested
cash. The adverse reaction from the fourth month to the seventh month was stabilized. It was going
on negatively for another 14 months due to the low long-term investments into loan portfolios,
which results in low long-term net interest income. According to the theory, when the banks have
a high liquidity ratio, then profitability ratio decreases. This graph confirmed that the liquidity ratio
reduced the profitability of the banks. The liquidity ratio is inversely proportional to profitability,
which means rising liquidity, falling profitability, and vice versa.
To find the effect liquidity ratio has on Return on Equity, these variables' impulse response
were acquired from the system.
Figure 2
Impulse response of ROE to LC

Atabaeva, G., Tashbaeva, F., Atabaev, N., & Keles, I. (2022). What must be the relation between liquidity ratios and profitability of the banks in a transition economy? The case of Kyrgyzstan. Journal of Sustainable Business, Economics and Finance, 1(1), 1-22. http://doi.org/10.31039/josbef.2022.1.1.2
10
An impulse response of return on equity (ROE) to liquidity ratio is seen in Figure 2. There,
the positive shock in liquidity ratio gives an adverse reaction from ROE and short-term and long-
term. If a liquidity ratio increases, then return on equity decreases and vice versa. As Figure 2
shows, starting from the first month to the fourth month, return on equity decreased, it was
stabilized from the fourth month up to the seventh month, and it was going on correlate negatively
for another 14 months. This illustrates that a liquidity ratio negatively impacts profitability and on
the return mentioned above on assets when the banks increase the liquidity ratio, which means that
profitability decreases.
To find the effect liquidity ratio has on Net Interest Margin, these variables' impulse
response was also acquired from the system.
Figure 3
Impulse response of DNIM to LC
Figure 3 shows the impulse response of Net Interest Margin to liquidity ratio. A negative
shock in liquidity ratio gives a positive reaction of Net Interest Margin and short-term and long-
term due to the investments into government securities, which offers a high-interest revenue. So,
the fact that liquidity ratio increases when Net Interest Margin increases because the government
securities in a mostly short-term circulation, with high-interest rates, gives a high-interest revenue
and adds more profitability into the banking sector. This illustrates that banks invest in government
securities. As a result, liquidity ratio and profitability increases. The investment into a short -term
securities during the one-year liquidity ratio has a positive impact on profitability.
Atabaeva, G., Tashbaeva, F., Atabaev, N., & Keles, I. (2022). What must be the relation between liquidity ratios and profitability of the banks in a transition economy? The case of Kyrgyzstan. Journal of Sustainable Business, Economics and Finance, 1(1), 1-22. http://doi.org/10.31039/josbef.2022.1.1.2
11
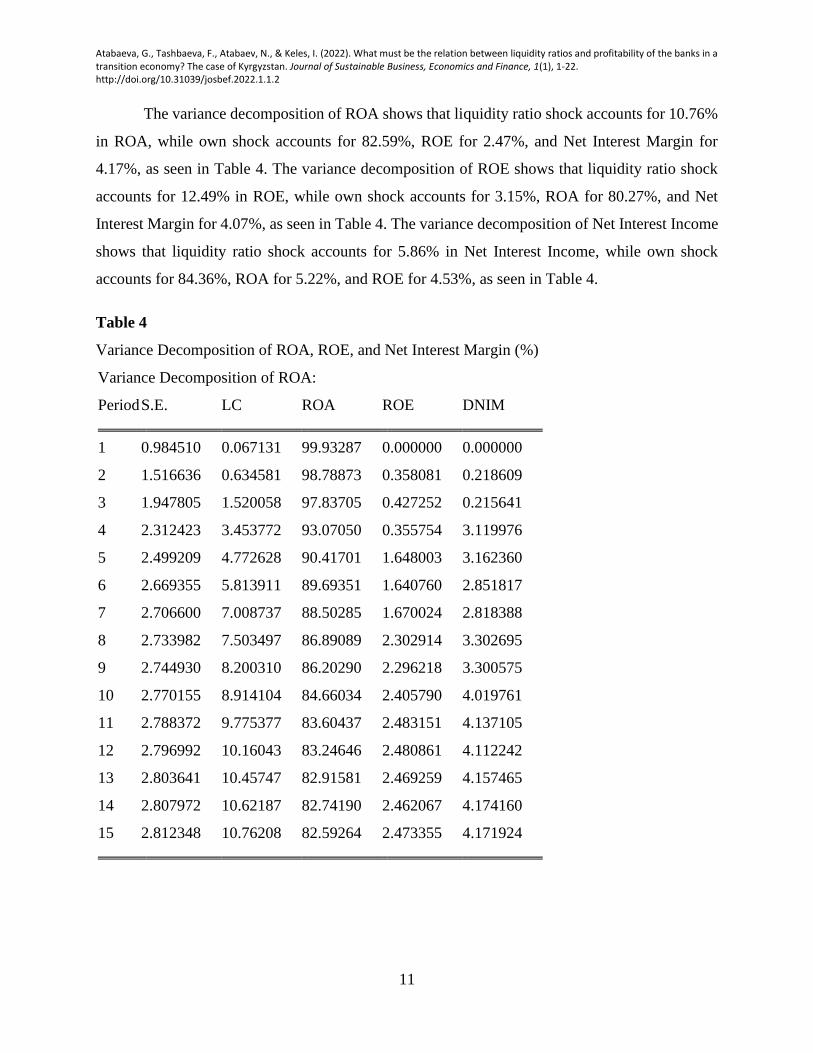
The variance decomposition of ROA shows that liquidity ratio shock accounts for 10.76%
in ROA, while own shock accounts for 82.59%, ROE for 2.47%, and Net Interest Margin for
4.17%, as seen in Table 4. The variance decomposition of ROE shows that liquidity ratio shock
accounts for 12.49% in ROE, while own shock accounts for 3.15%, ROA for 80.27%, and Net
Interest Margin for 4.07%, as seen in Table 4. The variance decomposition of Net Interest Income
shows that liquidity ratio shock accounts for 5.86% in Net Interest Income, while own shock
accounts for 84.36%, ROA for 5.22%, and ROE for 4.53%, as seen in Table 4.
Table 4
Variance Decomposition of ROA, ROE, and Net Interest Margin (%)
Variance Decomposition of ROA:
Period S.E. LC ROA ROE DNIM
1 0.984510 0.067131 99.93287 0.000000 0.000000
2 1.516636 0.634581 98.78873 0.358081 0.218609
3 1.947805 1.520058 97.83705 0.427252 0.215641
4 2.312423 3.453772 93.07050 0.355754 3.119976
5 2.499209 4.772628 90.41701 1.648003 3.162360
6 2.669355 5.813911 89.69351 1.640760 2.851817
7 2.706600 7.008737 88.50285 1.670024 2.818388
8 2.733982 7.503497 86.89089 2.302914 3.302695
9 2.744930 8.200310 86.20290 2.296218 3.300575
10 2.770155 8.914104 84.66034 2.405790 4.019761
11 2.788372 9.775377 83.60437 2.483151 4.137105
12 2.796992 10.16043 83.24646 2.480861 4.112242
13 2.803641 10.45747 82.91581 2.469259 4.157465
14 2.807972 10.62187 82.74190 2.462067 4.174160
15 2.812348 10.76208 82.59264 2.473355 4.171924

Atabaeva, G., Tashbaeva, F., Atabaev, N., & Keles, I. (2022). What must be the relation between liquidity ratios and profitability of the banks in a transition economy? The case of Kyrgyzstan. Journal of Sustainable Business, Economics and Finance, 1(1), 1-22. http://doi.org/10.31039/josbef.2022.1.1.2
12
Variance Decomposition of ROE:
Period S.E. LC ROA ROE DNIM
1 5.328915 0.369208 94.22092 5.409867 0.000000
2 7.156804 1.285809 95.60918 3.042462 0.062544
3 9.461017 2.354330 95.31680 1.757557 0.571311
4 11.64761 5.055575 90.23009 1.210260 3.504078
5 12.75013 6.732489 88.39101 1.951935 2.924562
6 13.87186 7.983150 87.58220 1.963790 2.470863
7 14.10312 9.385589 86.21066 1.980005 2.423747
8 14.28283 10.09933 84.24931 2.750917 2.900446
9 14.35931 10.99959 83.35673 2.758045 2.885634
10 14.53330 11.71787 81.38986 3.030788 3.861492
11 14.63679 12.49131 80.27598 3.152785 4.079921
12 14.68806 12.97274 79.79534 3.173532 4.058389
13 14.73583 13.40563 79.31299 3.165886 4.115500
14 14.76714 13.66503 79.06387 3.154682 4.116412
15 14.79728 13.88775 78.82807 3.170565 4.113620
Variance Decomposition of DNIM:
Period S.E. LC ROA ROE DNIM
1 0.443915 6.159289 8.376131 6.583373 78.88121
2 0.577457 5.867585 5.228730 4.535277 84.36841
3 0.592086 6.178213 5.138722 4.658427 84.02464
4 0.594358 6.248373 5.139947 4.628454 83.98323
5 0.601030 6.110714 5.027138 4.680915 84.18123
6 0.602224 6.092092 5.087788 4.891720 83.92840
7 0.614536 6.679141 4.886429 7.719392 80.71504
8 0.624793 6.701384 6.403982 8.740043 78.15459
9 0.628899 6.750838 7.012473 8.848175 77.38851
10 0.631541 6.763020 6.998260 8.829071 77.40965
11 0.638480 6.640623 6.998935 8.950969 77.40947
12 0.644384 6.524919 6.871367 8.951108 77.65261
13 0.644702 6.590419 6.873077 8.942887 77.59362
14 0.645868 6.600795 6.853201 8.967308 77.57870
15 0.646201 6.614120 6.847271 8.969683 77.56893
Cholesky Ordering: LC ROA ROE DNIM
Atabaeva, G., Tashbaeva, F., Atabaev, N., & Keles, I. (2022). What must be the relation between liquidity ratios and profitability of the banks in a transition economy? The case of Kyrgyzstan. Journal of Sustainable Business, Economics and Finance, 1(1), 1-22. http://doi.org/10.31039/josbef.2022.1.1.2
13
3.2. Deposit Volume
For the analysis of the relationship between liquidity ratio and deposit volume, and their
impact on the economy, the first parameter of VAR models was conducted. Through VAR
Residual Serial Correlation LM Test, it was proved that all three variables as deposit volume,
liquidity ratio, and exchange rate are not correlated to each other, the estimated VAR model is
stationary, and data is stable, as seen in Figure 4.
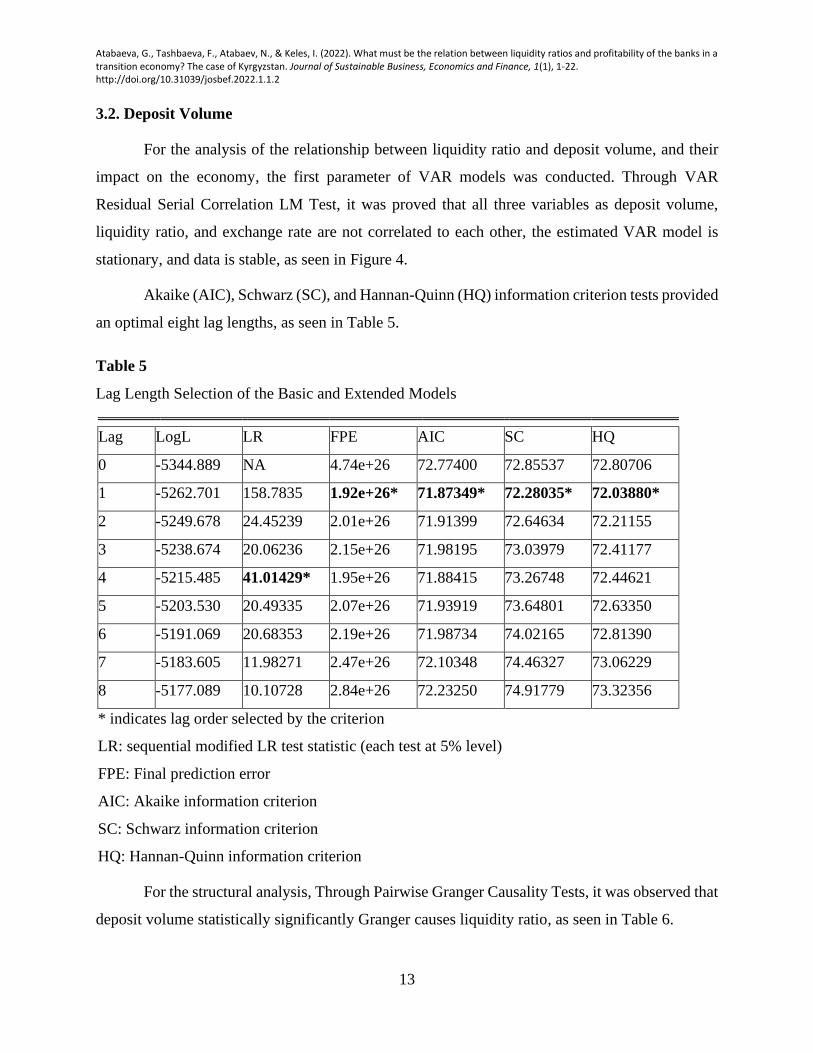
Akaike (AIC), Schwarz (SC), and Hannan-Quinn (HQ) information criterion tests provided
an optimal eight lag lengths, as seen in Table 5.
Table 5
Lag Length Selection of the Basic and Extended Models
Lag LogL LR FPE AIC SC HQ
0 -5344.889 NA 4.74e+26 72.77400 72.85537 72.80706
1 -5262.701 158.7835 1.92e+26* 71.87349* 72.28035* 72.03880*
2 -5249.678 24.45239 2.01e+26 71.91399 72.64634 72.21155
3 -5238.674 20.06236 2.15e+26 71.98195 73.03979 72.41177
4 -5215.485 41.01429* 1.95e+26 71.88415 73.26748 72.44621
5 -5203.530 20.49335 2.07e+26 71.93919 73.64801 72.63350
6 -5191.069 20.68353 2.19e+26 71.98734 74.02165 72.81390
7 -5183.605 11.98271 2.47e+26 72.10348 74.46327 73.06229
8 -5177.089 10.10728 2.84e+26 72.23250 74.91779 73.32356
* indicates lag order selected by the criterion
LR: sequential modified LR test statistic (each test at 5% level)
FPE: Final prediction error
AIC: Akaike information criterion
SC: Schwarz information criterion
HQ: Hannan-Quinn information criterion
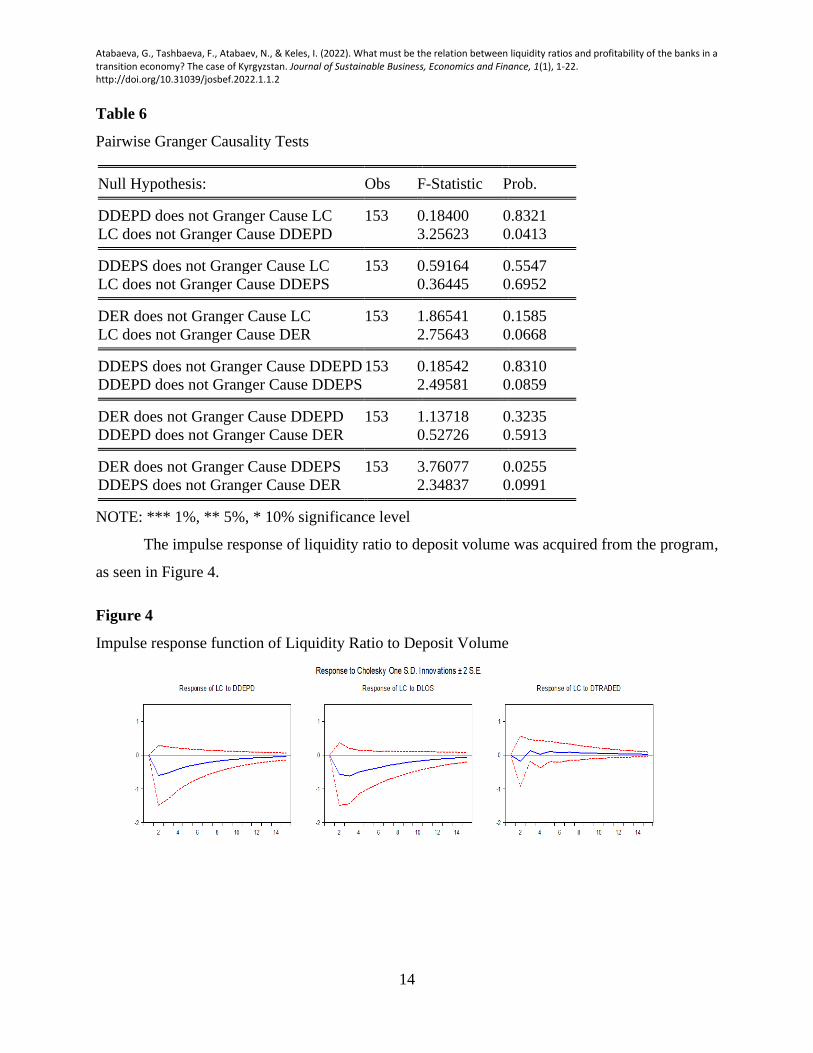
For the structural analysis, Through Pairwise Granger Causality Tests, it was observed that
deposit volume statistically significantly Granger causes liquidity ratio, as seen in Table 6.
Atabaeva, G., Tashbaeva, F., Atabaev, N., & Keles, I. (2022). What must be the relation between liquidity ratios and profitability of the banks in a transition economy? The case of Kyrgyzstan. Journal of Sustainable Business, Economics and Finance, 1(1), 1-22. http://doi.org/10.31039/josbef.2022.1.1.2
14
Table 6
Pairwise Granger Causality Tests
Null Hypothesis: Obs F-Statistic Prob.
DDEPD does not Granger Cause LC 153 0.18400 0.8321
LC does not Granger Cause DDEPD 3.25623 0.0413
DDEPS does not Granger Cause LC 153 0.59164 0.5547
LC does not Granger Cause DDEPS 0.36445 0.6952
DER does not Granger Cause LC 153 1.86541 0.1585
LC does not Granger Cause DER 2.75643 0.0668
DDEPS does not Granger Cause DDEPD 153 0.18542 0.8310
DDEPD does not Granger Cause DDEPS 2.49581 0.0859
DER does not Granger Cause DDEPD 153 1.13718 0.3235
DDEPD does not Granger Cause DER 0.52726 0.5913
DER does not Granger Cause DDEPS 153 3.76077 0.0255
DDEPS does not Granger Cause DER 2.34837 0.0991
NOTE: *** 1%, ** 5%, * 10% significance level
The impulse response of liquidity ratio to deposit volume was acquired from the program,
as seen in Figure 4.
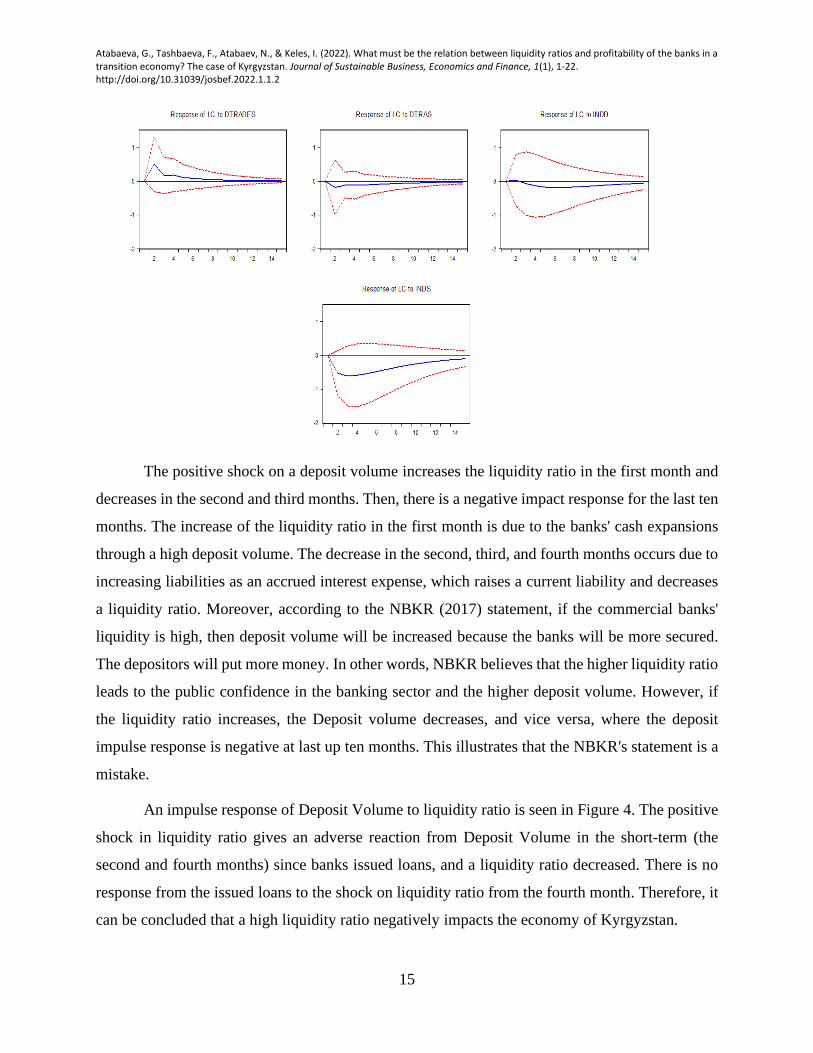
Figure 4
Impulse response function of Liquidity Ratio to Deposit Volume
Atabaeva, G., Tashbaeva, F., Atabaev, N., & Keles, I. (2022). What must be the relation between liquidity ratios and profitability of the banks in a transition economy? The case of Kyrgyzstan. Journal of Sustainable Business, Economics and Finance, 1(1), 1-22. http://doi.org/10.31039/josbef.2022.1.1.2
15
The positive shock on a deposit volume increases the liquidity ratio in the first month and
decreases in the second and third months. Then, there is a negative impact response for the last ten
months. The increase of the liquidity ratio in the first month is due to the banks' cash expansions
through a high deposit volume. The decrease in the second, third, and fourth months occurs due to
increasing liabilities as an accrued interest expense, which raises a current liability and decreases
a liquidity ratio. Moreover, according to the NBKR (2017) statement, if the commercial banks'
liquidity is high, then deposit volume will be increased because the banks will be more secured.
The depositors will put more money. In other words, NBKR believes that the higher liquidity ratio
leads to the public confidence in the banking sector and the higher deposit volume. However, if
the liquidity ratio increases, the Deposit volume decreases, and vice versa, where the deposit
impulse response is negative at last up ten months. This illustrates that the NBKR's statement is a
mistake.
An impulse response of Deposit Volume to liquidity ratio is seen in Figure 4. The positive
shock in liquidity ratio gives an adverse reaction from Deposit Volume in the short-term (the
second and fourth months) since banks issued loans, and a liquidity ratio decreased. There is no
response from the issued loans to the shock on liquidity ratio from the fourth month. Therefore, it
can be concluded that a high liquidity ratio negatively impacts the economy of Kyrgyzstan.
Atabaeva, G., Tashbaeva, F., Atabaev, N., & Keles, I. (2022). What must be the relation between liquidity ratios and profitability of the banks in a transition economy? The case of Kyrgyzstan. Journal of Sustainable Business, Economics and Finance, 1(1), 1-22. http://doi.org/10.31039/josbef.2022.1.1.2
16
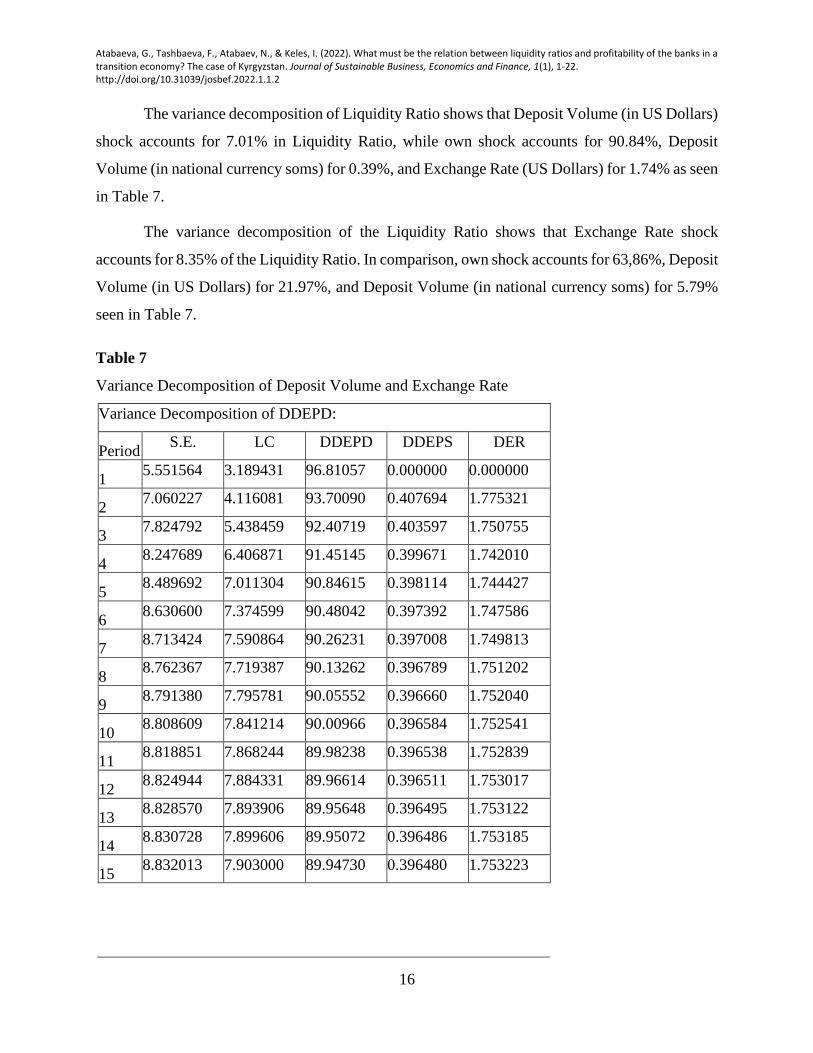
The variance decomposition of Liquidity Ratio shows that Deposit Volume (in US Dollars)
shock accounts for 7.01% in Liquidity Ratio, while own shock accounts for 90.84%, Deposit
Volume (in national currency soms) for 0.39%, and Exchange Rate (US Dollars) for 1.74% as seen
in Table 7.
The variance decomposition of the Liquidity Ratio shows that Exchange Rate shock
accounts for 8.35% of the Liquidity Ratio. In comparison, own shock accounts for 63,86%, Deposit
Volume (in US Dollars) for 21.97%, and Deposit Volume (in national currency soms) for 5.79%
seen in Table 7.
Table 7
Variance Decomposition of Deposit Volume and Exchange Rate
Variance Decomposition of DDEPD:
Period S.E. LC DDEPD DDEPS DER
1 5.551564 3.189431 96.81057 0.000000 0.000000
2 7.060227 4.116081 93.70090 0.407694 1.775321
3 7.824792 5.438459 92.40719 0.403597 1.750755
4 8.247689 6.406871 91.45145 0.399671 1.742010
5 8.489692 7.011304 90.84615 0.398114 1.744427
6 8.630600 7.374599 90.48042 0.397392 1.747586
7 8.713424 7.590864 90.26231 0.397008 1.749813
8 8.762367 7.719387 90.13262 0.396789 1.751202
9 8.791380 7.795781 90.05552 0.396660 1.752040
10 8.808609 7.841214 90.00966 0.396584 1.752541
11 8.818851 7.868244 89.98238 0.396538 1.752839
12 8.824944 7.884331 89.96614 0.396511 1.753017
13 8.828570 7.893906 89.95648 0.396495 1.753122
14 8.830728 7.899606 89.95072 0.396486 1.753185
15 8.832013 7.903000 89.94730 0.396480 1.753223

Atabaeva, G., Tashbaeva, F., Atabaev, N., & Keles, I. (2022). What must be the relation between liquidity ratios and profitability of the banks in a transition economy? The case of Kyrgyzstan. Journal of Sustainable Business, Economics and Finance, 1(1), 1-22. http://doi.org/10.31039/josbef.2022.1.1.2
17
Variance Decomposition of DDEPS:
Period S.E. LC DDEPD DDEPS DER
1 1855087. 2.494009 2.115653 95.39034 0.000000
2 1891920. 2.486760 4.305637 93.02784 0.179759
3 1907048. 2.515571 4.303149 92.94729 0.233990
4 1917348. 2.551359 4.307849 92.90690 0.233890
5 1923865. 2.578479 4.307427 92.88002 0.234075
6 1927819. 2.595616 4.306998 92.86296 0.234426
7 1930186. 2.606025 4.306695 92.85260 0.234681
8 1931598. 2.612259 4.306508 92.84639 0.234844
9 1932438. 2.615978 4.306394 92.84269 0.234942
10 1932938. 2.618194 4.306327 92.84048 0.235001
11 1933236. 2.619513 4.306286 92.83916 0.235037
12 1933414. 2.620299 4.306262 92.83838 0.235058
13 1933519. 2.620767 4.306248 92.83792 0.235070
14 1933582. 2.621045 4.306240 92.83764 0.235078
15 1933620. 2.621211 4.306234 92.83747 0.235082
Variance Decomposition of DER:
Period S.E. LC DDEPD DDEPS DER
1 1337949. 5.828269 21.42390 5.695186 67.05265
2 1358648. 5.761054 22.41264 5.971513 65.85480
3 1359517. 6.560612 22.37390 5.914776 65.15071
4 1359812. 7.244109 22.23635 5.869115 64.65043
5 1360009. 7.688999 22.13597 5.840302 64.33473
6 1360134. 7.960081 22.07299 5.822953 64.14398
7 1360210. 8.122263 22.03498 5.812616 64.03014
8 1360256. 8.218840 22.01229 5.806468 63.96241
9 1360283. 8.276298 21.99877 5.802812 63.92212
10 1360299. 8.310484 21.99073 5.800637 63.89815
11 1360309. 8.330828 21.98594 5.799343 63.88388
12 1360315. 8.342937 21.98310 5.798572 63.87539
13 1360318. 8.350145 21.98140 5.798114 63.87034
14 1360320. 8.354437 21.98039 5.797841 63.86733
15 1360321. 8.356992 21.97979 5.797678 63.86554
Cholesky Ordering: LC DDEPD DDEPS DER
Atabaeva, G., Tashbaeva, F., Atabaev, N., & Keles, I. (2022). What must be the relation between liquidity ratios and profitability of the banks in a transition economy? The case of Kyrgyzstan. Journal of Sustainable Business, Economics and Finance, 1(1), 1-22. http://doi.org/10.31039/josbef.2022.1.1.2
18
4. Discussion
According to the result, the banking sector's high liquidity ratio hurts the banking sector's
profitability in the long run. Firstly, by analyzing the cause-effect of return on assets, return on
equity, and net interest margin, it was found that these variables have a positive impact on the
negative shock on liquidity ratio in the short-term. This happens since banks hold profitable
government securities that increase their revenue and profitability in the short-term. In the long-
term, the positive shock on the liquidity ratio negatively impacts the net interest margin. Due to
the low investment from banks into the loan portfolio, the net interest margin of the banking sector
decreases in the long-run that reaffirms Brealey et al.'s (2011) and Westerfield's (1921) claims that
high liquidity shortens loan investments opportunities for the banks and decreases the banks'
profitability.
Second, the VAR model showed no evidence that a high liquidity ratio in the banking
sector leads to the increased deposit volume, as stated by NBKR (2017). Even more, the liquidity
ratio has a negative effect in the short run. Therefore, it can be implied that the judgment of NBKR
that the high liquidity ratio leads to the people's confidence and higher deposit volume is not a
reasonable policy for the Kyrgyz Republic's banking sector.
Thirdly, it was found that the liquidity ratio has a positive effect on the treasury bills
volume. This means that banks buy a high amount of government securities, and as a result, it
increases their liquidity ratio. Additionally, VAR model analysis found that there is no evidence
that a high liquidity ratio leads to the people's confidence in the banking sector, and as a result, to
the increased deposit volume as NBKR stated it.
Finally, regarding the impact of liquidity ratio on the Kyrgyz Republic economy, we found
that commercial banks hold a lot of liquidity because they receive income from interest on these
securities by purchasing short-term government securities during the year.
Overall, it can be inferred from the results that a high liquidity ratio hurts the banking
sector's profitability.
Atabaeva, G., Tashbaeva, F., Atabaev, N., & Keles, I. (2022). What must be the relation between liquidity ratios and profitability of the banks in a transition economy? The case of Kyrgyzstan. Journal of Sustainable Business, Economics and Finance, 1(1), 1-22. http://doi.org/10.31039/josbef.2022.1.1.2
19
5. Conclusion
Analyzing the relationship between bank profitability and liquidity of Kyrgyz Republic
banks for 2001-2019 with the ADF test and VAR model analyses was the main objective of this
research. Specifically, the impact of high liquidity ratio on the banks' revenue, profitability, deposit
volume, credit volume, and exchange rate. The findings of the study proved that liquidity
management has an important impact on the banks profits. The future and health of the banks
associated with liquidity and profitability. The above findings of the study showed that there is a
relationship between Liquidity ratio and net interest margin, return on equity, and return on assets.
The Vector Auto Regression model assessments the independent variable coefficient is valid for
the net interest margin and liquidity, but the coefficient is not valid in other cases.
The Vector Auto Regression model analysis found that the liquidity ratio in the Kyrgyz
Republic's banking sector hurts the net interest margin, return on assets, and return on equity that
measures the banking sector's profitability. Accordingly, bank can face unexpected market
conditions and need to decrease liabilities or increase assets in its balance sheet. Hence, when the
bank's liquid (current) assets are high, the bank's profitability decreases.
Liquidity and profitability are two essential aspects of banking operations and are
monitored by all banking system stakeholders. This study's primary concern was to figure out if
the banks' liquidity affects their profitability as these two issues are much important to the banks'
main stakeholders.
Finally, this study contributes to banking literature by analyzing the profitability and
liquidity aspects of a developing country, on one side, profit maximization expectations (return on
investment) of shareholders and, on the other side, risk awareness of depositors.
Atabaeva, G., Tashbaeva, F., Atabaev, N., & Keles, I. (2022). What must be the relation between liquidity ratios and profitability of the banks in a transition economy? The case of Kyrgyzstan. Journal of Sustainable Business, Economics and Finance, 1(1), 1-22. http://doi.org/10.31039/josbef.2022.1.1.2
20
References
Abdullah, M. N., & Jahan, N. (2014). The impact of liquidity on profitability in banking sector
of Bangladesh: a case of Chittagong stock exchange. EPRA International Journal of
Economic and Business Review, 2(10), 17-22.
Banks, E. (2004). Alternative risk transfer: Integrated risk management through insurance,
reinsurance, and the capital markets. John Wiley & Sons.
Becht, M., Bolton, P., & Röell, A. (2011). Why bank governance is different. Oxford Review of
Economic Policy, 27(3), 437-463. https://doi.org/10.1093/oxrep/grr024
Brunnermeier, M. K., & Pedersen, L. H. (2009). Market liquidity and funding liquidity. The
Review of Ffinancial Studies, 22(6), 2201-2238. https://doi.org/10.1093/rfs/hhn098
Djalilov, K., & Piesse, J. (2016). Determinants of bank profitability in transition countries: What
matters most?. Research in International Business and Finance, 38, 69-82.
https://doi.org/10.1016/j.ribaf.2016.03.015
Eichengreen, B., & Gibson, H. D. (2001). Greek banking at the dawn of the new
millennium. Available at SSRN 269391. https://ssrn.com/abstract=269391
Erdogan, M., & Aksoy, E. E. (2016). Banking regulation and determinants of banks profits:
Empirical evidence from Turkey. Eurasian Journal of Business and economics, 9(17),
109-124. https://doi.org/10.17015/ejbe.2016.017.07
Faizulayev, A., & Wada, I. (2019). What drives the banking performance? Case of Eurasian
economic union countries. In N. Ozatac, & K. Gokmenoglu (Eds.), Global issues in
banking and finance (pp. 27-33). Springer, Cham. https://doi.org/10.1007/978-3-030-
30387-7_3
Shijaku, G. (2017). Bank stability and competition: Evidence from Albanian banking market.
Eurasian Journal of Business and Economics, 10(19), 127-154.
https://doi.org/10.17015/ejbe.2017.019.07
Haji-Zada, E. (2017). The macroeconomic determinants of credit risk in the banking sector of
Kyrgyzstan [Unpublished master thesis]. Eastern Mediterranean University, Institute of
Graduate Studies and Research, Deptartment of Banking and Finance, North Cyprus.
http://irep.emu.edu.tr:8080/xmlui/bitstream/hand-
le/11129/3871/hajizadaevelina.pdf?sequence=1
Humphrey, T. M. (1982). The real bills doctrine. Federal Reserve Bank of Richmond Economic
Review, 68(5), 3-13. https://ssrn.com/abstract=2120000
International Monetary Fund. (2003). Kyrgyz Republic: Financial system stability assessment
including reports on the observance of standards and codes on the following topics:
Monetary and financial policy transparency, banking supervision, and payment systems.
IMF Staff Country Reports 2003/052. https://doi.org/10.5089/9781451821390.002
International Monetary Fund. (2016). Kyrgyz Repiblic: Second review under the three-year
arrangement under the extended credit facility, and request for modification of
performance criteria-press release; staff report; and statement by the executive director

Atabaeva, G., Tashbaeva, F., Atabaev, N., & Keles, I. (2022). What must be the relation between liquidity ratios and profitability of the banks in a transition economy? The case of Kyrgyzstan. Journal of Sustainable Business, Economics and Finance, 1(1), 1-22. http://doi.org/10.31039/josbef.2022.1.1.2
21
for the Kyrgyz Republic. IMF Staff Country Reports 2016/186.
https://doi.org/10.5089/9781475519198.002
Kichurchak, M. (2019). Bank deposit activity in Ukraine: Directions and factors of development
activation. Journal of Eastern European and Central Asian Research, 6(1), 145-160.
https://doi.org/10.15549/jeecar.v6i1.275
Malik, M. S., Awais, M., & Khursheed, A. (2016). Impact of liquidity on profitability: A
comprehensive case of Pakistan’s private banking sector. International Journal of
Economics and Finance, 8(3), 69-74. http://dx.doi.org/10.5539/ijef.v8n3p69
Met, O., Torobekova, V. & Keles, I. (2008). Financial system developments in transition
economies: The case of Kyrgyz financial system. Manas Üniversitesi Sosyal Bilimler
Dergisi, 10(19), 1-11. https://dergipark.org.tr/en/pub/manassosyal/issue/49945/640034
Mitchell, W. F. (1923). The institutional basis for the shiftability theory of bank
liquidity. University Journal of Business, 1(3), 334-356.
https://www.jstor.org/stable/2354871
Morris, S., & Shin, H. S. (2016). Illiquidity component of credit risk–the 2015 Lawrence R.
Klein lecture. International Economic Review, 57(4), 1135-1148.
https://doi.org/10.1111/iere.12192
National Bank of the Kyrgyz Republic. (2017). Regulation on economic ratios and requirements
binding to be fulfilled by the commercial banks of the Kyrgyz Republic. National Bank of
the Kyrgyz Republic.
https://www.nbkr.kg/contout.jsp?item=103&lang=ENG&material=86830
National Bank of the Kyrgyz Republic. (2020). The financial sector stability report of the Kyrgyz
Republic. National Bank of the Kyrgyz Republic.
https://www.nbkr.kg/DOC/21082020/000000000055183.pdf
Osborne, M., Fuertes, A., & Milne, A. (2012). Capital and profitability in banking: Evidence
from US banks. In 3rd Emerging Scholars in Banking and Finance Conference, Cass
Business School (pp. 1-54).
Pak, O. (2019). The impact of state ownership and business models on bank stability: Empirical
evidence from the Eurasian Economic Union. The Quarterly Review of Economics and
Finance, 71, 161-175. https://doi.org/10.1016/j.qref.2018.07.008
Pak, O. (2020). Bank profitability in the Eurasian Economic Union: Do funding liquidity and
systemic importance matter?. The North American Journal of Economics and
Finance, 54, Article: 101265. https://doi.org/10.1016/j.najef.2020.101265
Prochnow, H. V. (1949). Bank liquidity and the new doctrine of anticipated income. The Journal
of Finance, 4(4), 298-314. https://doi.org/2975424
Brealey, R. A., Myers, S. C. & Allen, F. (2011). Principles of corporate finance. The McGraw-
Hill/Irwin.
Sobolieva-Tereshchenko, O., & Zhukova, Y. (2020). Stress testing the banking systems:
Approach of Ukraine. Journal of Eastern European and Central Asian Research, 7(2),
205-218. https://doi.org/10.15549/jeecar.v7i2.358
Atabaeva, G., Tashbaeva, F., Atabaev, N., & Keles, I. (2022). What must be the relation between liquidity ratios and profitability of the banks in a transition economy? The case of Kyrgyzstan. Journal of Sustainable Business, Economics and Finance, 1(1), 1-22. http://doi.org/10.31039/josbef.2022.1.1.2
22
Tovar-García, E. D., & Kozubekova, R. (2016). The Third Pillar of the Basel Accord: Evidence
of borrower discipline in the Kyrgyz banking system. Journal of Eurasian Studies, 7(2),
195-204. https://doi.org/10.1016/j.euras.2016.02.002
Tran, V. T., Lin, C. T., & Nguyen, H. (2016). Liquidity creation, regulatory capital, and bank
profitability. International Review of Financial Analysis, 48, 98-109.
https://doi.org/10.1016/j.irfa.2016.09.010
Tursoy, T. (2018). Risk management process in the banking industry. MPRA Paper No. 86427.
https://mpra.ub.uni-muenchen.de/86427/ MPRA Paper No. 86427
Waleed, A., Pasha, A. & Akhtar, A. (2016). Exploring the Impact of Liquidity on Profitability:
Evidence from Banking Sector of Pakistan. Journal of Internet Banking and Commerce,
Vol. 21, No. 3, Dec. 2016,
Waleed, A., Pasha, A., & Akhtar, A. (2016). Exploring the impact of liquidity on profitability:
Evidence from banking sector of Pakistan. Journal of Internet Banking and
Commerce, 21(3). http://dx.doi.org/10.2139/ssrn.2899817
Westerfield, R. B. (1921). Banking principles and practice. Vol. 1 & II, The Roland Press
Company.


