Embed Size (px)
Citation preview
EUROPEAN ORGANIZATION FOR NUCLEAR RESEARCH
CERN-PPE/95-127
22 August 1995
Tau leptonic branching ratios
The ALEPH Collaboration�
Abstract
A sample of 62249 � -pair events is selected from data taken with the ALEPH detector
in 1991, 1992 and 1993. The measurement of the branching fractions for � decays
into electrons and muons is presented with emphasis on the study of systematic e�ects
from selection, particle identi�cation and decay classi�cation. The results obtained
are: Be = 17:79�0:12(stat)�0:06(syst)(%) and B� = 17:31�0:11(stat)�0:05(syst)(%).
Combined with the most recent ALEPH determination of the � lifetime, these results
provide a relative measurement of the leptonic couplings in the weak charged current
for transverse W bosons: g�=ge = 1:0002�0:0051 and g�=g� = 0:9943�0:0065.
(Submitted to Zeitschrift f�ur Physik C)
||||||||||||||{�) See next pages for the list of authors

The ALEPH Collaboration
D. Buskulic, D. Casper, I. De Bonis, D. Decamp, P. Ghez, C. Goy, J.-P. Lees, A. Lucotte, M.-N. Minard,
P. Odier, B. Pietrzyk
Laboratoire de Physique des Particules (LAPP), IN2P3-CNRS, 74019 Annecy-le-Vieux Cedex, France
F. Ariztizabal, M. Chmeissani, J.M. Crespo, I. Efthymiopoulos, E. Fernandez, M. Fernandez-Bosman,
V. Gaitan, Ll. Garrido,15 M. Martinez, S. Orteu, A. Pacheco, C. Padilla, F. Palla, A. Pascual, J.A. Perlas,
F. Sanchez, F. Teubert
Institut de Fisica d'Altes Energies, Universitat Autonoma de Barcelona, 08193 Bellaterra (Barcelona),Spain7
A. Colaleo, D. Creanza, M. de Palma, A. Farilla, G. Gelao, M. Girone, G. Iaselli, G. Maggi,3 M. Maggi,
N. Marinelli, S. Natali, S. Nuzzo, A. Ranieri, G. Raso, F. Romano, F. Ruggieri, G. Selvaggi, L. Silvestris,
P. Tempesta, G. Zito
Dipartimento di Fisica, INFN Sezione di Bari, 70126 Bari, Italy
X. Huang, J. Lin, Q. Ouyang, T. Wang, Y. Xie, R. Xu, S. Xue, J. Zhang, L. Zhang, W. Zhao
Institute of High-Energy Physics, Academia Sinica, Beijing, The People's Republic of China8
G. Bonvicini, M. Cattaneo, P. Comas, P. Coyle, H. Drevermann, A. Engelhardt, R.W. Forty, M. Frank,
R. Hagelberg, J. Harvey, R. Jacobsen,24 P. Janot, B. Jost, E. Kneringer, J. Knobloch, I. Lehraus, C. Markou,23
E.B. Martin, P. Mato, A. Minten, R. Miquel, T. Oest, P. Palazzi, J.R. Pater,27 J.-F. Pusztaszeri, F. Ranjard,
P. Rensing, L. Rolandi, D. Schlatter, M. Schmelling, O. Schneider, W. Tejessy, I.R. Tomalin, A. Venturi,
H. Wachsmuth, W. Wiedenmann, T. Wildish, W. Witzeling, J. Wotschack
European Laboratory for Particle Physics (CERN), 1211 Geneva 23, Switzerland
Z. Ajaltouni, M. Bardadin-Otwinowska,2 A. Barres, C. Boyer, A. Falvard, P. Gay, C. Guicheney, P. Henrard,
J. Jousset, B. Michel, S. Monteil, J-C. Montret, D. Pallin, P. Perret, F. Podlyski, J. Proriol, J.-M. Rossignol,
F. Saadi
Laboratoire de Physique Corpusculaire, Universit�e Blaise Pascal, IN2P3-CNRS, Clermont-Ferrand,63177 Aubi�ere, France
T. Fearnley, J.B. Hansen, J.D. Hansen, J.R. Hansen, P.H. Hansen, B.S. Nilsson
Niels Bohr Institute, 2100 Copenhagen, Denmark9
A. Kyriakis, E. Simopoulou, I. Siotis, A. Vayaki, K. Zachariadou
Nuclear Research Center Demokritos (NRCD), Athens, Greece
A. Blondel,21 G. Bonneaud, J.C. Brient, P. Bourdon, L. Passalacqua, A. Roug�e, M. Rumpf, R. Tanaka,
A. Valassi,6 M. Verderi, H. Videau
Laboratoire de Physique Nucl�eaire et des Hautes Energies, Ecole Polytechnique, IN2P3-CNRS, 91128
Palaiseau Cedex, France
D.J. Candlin, M.I. Parsons
Department of Physics, University of Edinburgh, Edinburgh EH9 3JZ, United Kingdom10
E. Focardi, G. Parrini
Dipartimento di Fisica, Universit�a di Firenze, INFN Sezione di Firenze, 50125 Firenze, Italy
M. Corden, M. Del�no,12 C. Georgiopoulos, D.E. Ja�e
Supercomputer Computations Research Institute, Florida State University, Tallahassee, FL 32306-4052, USA 13;14
A. Antonelli, G. Bencivenni, G. Bologna,4 F. Bossi, P. Campana, G. Capon, V. Chiarella, G. Felici, P. Laurelli,
G. Mannocchi,5 F. Murtas, G.P. Murtas, M. Pepe-Altarelli
Laboratori Nazionali dell'INFN (LNF-INFN), 00044 Frascati, Italy
S.J. Dorris, A.W. Halley, I. ten Have,6 I.G. Knowles, J.G. Lynch, W.T. Morton, V. O'Shea, C. Raine,
P. Reeves, J.M. Scarr, K. Smith, M.G. Smith, A.S. Thompson, F. Thomson, S. Thorn, R.M. Turnbull
Department of Physics and Astronomy, University of Glasgow, Glasgow G12 8QQ,United Kingdom10
U. Becker, O. Braun, C. Geweniger, G. Graefe, P. Hanke, V. Hepp, E.E. Kluge, A. Putzer, B. Rensch,
M. Schmidt, J. Sommer, H. Stenzel, K. Tittel, S. Werner, M. Wunsch
Institut f�ur Hochenergiephysik, Universit�at Heidelberg, 69120 Heidelberg, Fed. Rep. of Germany16
R. Beuselinck, D.M. Binnie, W. Cameron, D.J. Colling, P.J. Dornan, N. Konstantinidis, L. Moneta,
A. Moutoussi, J. Nash, G. San Martin, J.K. Sedgbeer, A.M. Stacey
Department of Physics, Imperial College, London SW7 2BZ, United Kingdom10
G. Dissertori, P. Girtler, D. Kuhn, G. Rudolph
Institut f�ur Experimentalphysik, Universit�at Innsbruck, 6020 Innsbruck, Austria18
C.K. Bowdery, T.J. Brodbeck, P. Colrain, G. Crawford, A.J. Finch, F. Foster, G. Hughes, T. Sloan,
E.P. Whelan, M.I. Williams
Department of Physics, University of Lancaster, Lancaster LA1 4YB, United Kingdom10
A. Galla, A.M. Greene, K. Kleinknecht, G. Quast, J. Raab, B. Renk, H.-G. Sander, R. Wanke,
P. van Gemmeren C. Zeitnitz
Institut f�ur Physik, Universit�at Mainz, 55099 Mainz, Fed. Rep. of Germany16
J.J. Aubert, A.M. Bencheikh, C. Benchouk, A. Bonissent,21 G. Bujosa, D. Calvet, J. Carr, C. Diaconu,
F. Etienne, M. Thulasidas, D. Nicod, P. Payre, D. Rousseau, M. Talby
Centre de Physique des Particules, Facult�e des Sciences de Luminy, IN2P3-CNRS, 13288 Marseille,France
I. Abt, R. Assmann, C. Bauer, W. Blum, D. Brown,24 H. Dietl, F. Dydak,21 G. Ganis, C. Gotzhein, K. Jakobs,
H. Kroha, G. L�utjens, G. Lutz, W. M�anner, H.-G. Moser, R. Richter, A. Rosado-Schlosser, S. Schael,
R. Settles, H. Seywerd, R. St. Denis, G. Wolf
Max-Planck-Institut f�ur Physik, Werner-Heisenberg-Institut, 80805 M�unchen, Fed. Rep. of Germany16
R. Alemany, J. Boucrot, O. Callot, A. Cordier, F. Courault, M. Davier, L. Du ot, J.-F. Grivaz, Ph. Heusse,
M. Jacquet, D.W. Kim,19 F. Le Diberder, J. Lefran�cois, A.-M. Lutz, G. Musolino, I. Nikolic, H.J. Park,
I.C. Park, M.-H. Schune, S. Simion, J.-J. Veillet, I. Videau
Laboratoire de l'Acc�el�erateur Lin�eaire, Universit�e de Paris-Sud, IN2P3-CNRS, 91405 Orsay Cedex,France
D. Abbaneo, P. Azzurri, G. Bagliesi, G. Batignani, S. Bettarini, C. Bozzi, G. Calderini, M. Carpinelli,
M.A. Ciocci, V. Ciulli, R. Dell'Orso, R. Fantechi, I. Ferrante, L. Fo�a,1 F. Forti, A. Giassi, M.A. Giorgi,
A. Gregorio, F. Ligabue, A. Lusiani, P.S. Marrocchesi, A. Messineo, G. Rizzo, G. Sanguinetti, A. Sciab�a,
P. Spagnolo, J. Steinberger, R. Tenchini, G. Tonelli,26 G. Triggiani, C. Vannini, P.G. Verdini, J. Walsh
Dipartimento di Fisica dell'Universit�a, INFN Sezione di Pisa, e Scuola Normale Superiore, 56010 Pisa,Italy
A.P. Betteridge, G.A. Blair, L.M. Bryant, F. Cerutti, Y. Gao, M.G. Green, D.L. Johnson, T. Medcalf,
Ll.M. Mir, P. Perrodo, J.A. Strong
Department of Physics, Royal Holloway & Bedford New College, University of London, Surrey TW20OEX, United Kingdom10
V. Bertin, D.R. Botterill, R.W. Cli�t, T.R. Edgecock, S. Haywood, M. Edwards, P. Maley, P.R. Norton,
J.C. Thompson
Particle Physics Dept., Rutherford Appleton Laboratory, Chilton, Didcot, Oxon OX11 OQX, UnitedKingdom10

B. Bloch-Devaux, P. Colas, S. Emery, W. Kozanecki, E. Lan�con, M.C. Lemaire, E. Locci, B. Marx, P. Perez,
J. Rander, J.-F. Renardy, A. Roussarie, J.-P. Schuller, J. Schwindling, A. Trabelsi, B. Vallage
CEA, DAPNIA/Service de Physique des Particules, CE-Saclay, 91191 Gif-sur-Yvette Cedex, France17
R.P. Johnson, H.Y. Kim, A.M. Litke, M.A. McNeil, G. Taylor
Institute for Particle Physics, University of California at Santa Cruz, Santa Cruz, CA 95064, USA22
A. Beddall, C.N. Booth, R. Boswell, S. Cartwright, F. Combley, I. Dawson, A. Koksal, M. Letho,
W.M. Newton, C. Rankin, L.F. Thompson
Department of Physics, University of She�eld, She�eld S3 7RH, United Kingdom10
A. B�ohrer, S. Brandt, G. Cowan, E. Feigl, C. Grupen, G. Lutters, J. Minguet-Rodriguez, F. Rivera,25
P. Saraiva, L. Smolik, F. Stephan,
Fachbereich Physik, Universit�at Siegen, 57068 Siegen, Fed. Rep. of Germany16
M. Apollonio, L. Bosisio, R. Della Marina, G. Giannini, B. Gobbo, F. Ragusa20
Dipartimento di Fisica, Universit�a di Trieste e INFN Sezione di Trieste, 34127 Trieste, Italy
J. Rothberg, S. Wasserbaech
Experimental Elementary Particle Physics, University of Washington, WA 98195 Seattle, U.S.A.
S.R. Armstrong, L. Bellantoni,30 P. Elmer, Z. Feng, D.P.S. Ferguson, Y.S. Gao, S. Gonz�alez, J. Grahl,
J.L. Harton,28 O.J. Hayes, H. Hu, P.A. McNamara III, J.M. Nachtman, W. Orejudos, Y.B. Pan, Y. Saadi,
M. Schmitt, I.J. Scott, V. Sharma,29 J.D. Turk, A.M. Walsh, Sau Lan Wu, X. Wu, J.M. Yamartino, M. Zheng,
G. Zobernig
Department of Physics, University of Wisconsin, Madison, WI 53706, USA11
1Now at CERN, 1211 Geneva 23, Switzerland.2Deceased.3Now at Dipartimento di Fisica, Universit�a di Lecce, 73100 Lecce, Italy.4Also Istituto di Fisica Generale, Universit�a di Torino, Torino, Italy.5Also Istituto di Cosmo-Geo�sica del C.N.R., Torino, Italy.6Supported by the Commission of the European Communities, contract ERBCHBICT941234.7Supported by CICYT, Spain.8Supported by the National Science Foundation of China.9Supported by the Danish Natural Science Research Council.10Supported by the UK Particle Physics and Astronomy Research Council.11Supported by the US Department of Energy, grant DE-FG0295-ER40896.12On leave from Universitat Autonoma de Barcelona, Barcelona, Spain.13Supported by the US Department of Energy, contract DE-FG05-92ER40742.14Supported by the US Department of Energy, contract DE-FC05-85ER250000.15Permanent address: Universitat de Barcelona, 08208 Barcelona, Spain.16Supported by the Bundesministerium f�ur Forschung und Technologie, Fed. Rep. of Germany.17Supported by the Direction des Sciences de la Mati�ere, C.E.A.18Supported by Fonds zur F�orderung der wissenschaftlichen Forschung, Austria.19Permanent address: Kangnung National University, Kangnung, Korea.20Now at Dipartimento di Fisica, Universit�a di Milano, Milano, Italy.21Also at CERN, 1211 Geneva 23, Switzerland.22Supported by the US Department of Energy, grant DE-FG03-92ER40689.23Now at University of Athens, 157-71 Athens, Greece.24Now at Lawrence Berkeley Laboratory, Berkeley, CA 94720, USA.25Partially supported by Colciencias, Colombia.26Also at Istituto di Matematica e Fisica, Universit�a di Sassari, Sassari, Italy.27Now at Schuster Laboratory, University of Manchester, Manchester M13 9PL, UK.28Now at Colorado State University, Fort Collins, CO 80523, USA.29Now at University of California at San Diego, La Jolla, CA 92093, USA.30Now at Fermi National Accelerator Laboratory, Batavia, IL 60510, USA.

Contents
1 Introduction 1
2 The ALEPH detector 2
3 Particle identi�cation 3
3.1 Likelihood identi�cation method : : : : : : : : : : : : : : : : : : : : : : : : : : 3
3.2 Selection of tracks and discriminating variables : : : : : : : : : : : : : : : : : : 4
3.3 Procedure and results : : : : : : : : : : : : : : : : : : : : : : : : : : : : : : : : 5
3.4 Measurement of identi�cation e�ciencies : : : : : : : : : : : : : : : : : : : : : 5
4 The selection of �� events 10
4.1 Preselection procedure : : : : : : : : : : : : : : : : : : : : : : : : : : : : : : : 10
4.2 Further selection using the likelihood particle identi�cation : : : : : : : : : : : 114.3 Estimate of remaining backgrounds : : : : : : : : : : : : : : : : : : : : : : : : 144.4 Measurement of selection e�ciencies : : : : : : : : : : : : : : : : : : : : : : : 18
5 Final de�nition of the leptonic decays 21
5.1 Requirement of a single track : : : : : : : : : : : : : : : : : : : : : : : : : : : 215.2 Hadronic veto : : : : : : : : : : : : : : : : : : : : : : : : : : : : : : : : : : : : 22
6 Additional systematic studies 22
6.1 Energy calibration and resolution : : : : : : : : : : : : : : : : : : : : : : : : : 266.2 Other uncertainties : : : : : : : : : : : : : : : : : : : : : : : : : : : : : : : : : 26
7 Results 27
8 Tests of lepton universality in W couplings 32
8.1 Test of �-e universality : : : : : : : : : : : : : : : : : : : : : : : : : : : : : : : 328.2 Tests of � -� and � -e universality : : : : : : : : : : : : : : : : : : : : : : : : : : 34
9 Conclusions 37

;
1 Introduction
Universality of couplings between di�erent quark-lepton families is a basic assumption of
the Standard Model. In the lepton sector, this hypothesis can be investigated in both the
neutral and charged weak currents. Whereas universality is observed to hold within 0.003
for the neutral couplings [1], the situation is less advanced for the charged couplings because
W decays so far have not been studied at the same level of precision already achieved in
Z decays. A more practical way to explore the charged couplings is the comparison of lepton
decay rates, i.e., the measurement of the purely leptonic decays ��!��e���e, �
�!��e���e and
��!���
����.
The leptonic widths can be computed in the Standard Model including radiative
corrections with essentially no uncertainties [2]. On the experimental side, the determination
of the � leptonic widths involves the measurements of the � lifetime and of the electron (Be)and muon (B�) branching fractions. The universality test also requires the knowledge ofthe � mass and the mass and lifetime of the muon which are known with high precision [3].The experimental situation in this �eld has been somewhat unclear in the past with some
discrepancy observed with respect to universality [4].
Further motivation to measure Be and B� with high precision is provided by the fact thatthe hadronic branching fraction, i.e., (1 � Be � B�), is sensitive to QCD corrections, hence
allowing a precise measurement of the strong coupling constant at the � mass scale [5, 6, 7].
In this paper, new precise results on Be and B� are reported from samples of 20571electronic and 20745 muonic � decays obtained in � pairs produced in e
+e� collisions at
LEP near the Z peak energy in 1991, 1992 and 1993. The fraction of the data taken at thepeak energy is 84.5%. Particular care is given to the study and the reduction of systematice�ects which could a�ect the processes of selection, particle identi�cation and decay channelclassi�cation.
The analysis starts with a selection of �� events (N��� 62000) with a large overall
e�ciency ("sel��� 78%) and a small contamination from background processes (fnon-��� � 0:9%).The �� selection has a large e�ciency for the leptonic decays ("sell � 77% for electrons, � 79%for muons) and results in a small non-� background contamination in the lepton samples
(fnon-�l � 1:2% for electrons, � 0:9% for muons). Most of the ine�ciency in the selection
comes from the geometical acceptance of � 85%. Leptons are identi�ed e�ciently (Nl decayswith an identi�cation e�ciency "
IDl � 93% for electrons, � 94% for muons) with a small
contamination from � hadronic decays (f �h!l� 1:3% for electrons, � 1:1% for muons). Thebranching ratios are obtained through the expression
Bl =Nl(1 � f
non-�l � f
�h!l)
2N�� (1� fnon-��� )
�"sel��
"sell
�1
"IDl
; (1)
where l stands for either electron or muon.
1

In order to achieve a systematic uncertainty of 10�3, the preevaluations for backgrounds
and e�ciencies from the simulation are corrected systematically with detailed comparisons to
the data. Throughout the analysis the standard V�Amatrix element is assumed as supported
by Ref. [8].
2 The ALEPH detector
A detailed description of the ALEPH detector is given elsewhere [9]. Charged particles are
detected successively by a silicon-strip vertex detector (VDET), a drift-cell inner tracking
chamber (ITC) and a large-volume time projection chamber (TPC). Beyond the TPC, the
electromagnetic calorimeter (ECAL) identi�es photons and electrons while the hadronic
calorimeter (HCAL) detects the showers produced by hadrons and separates out the muonswhich are further measured by two layers of streamer-tube chambers placed around HCAL.The inner volume including ECAL is immersed in a 1.5-T axial magnetic �eld produced bya superconducting solenoidal coil. The return yoke of the magnet provides the samplingabsorber material for HCAL.
The ITC cells have a maximum drift time of 130 ns, and its precise timing helps to reducethe cosmic background. The TPC is optimized to accurately measure the particle three-momenta through a maximum of 21 space points with r� (transverse to the beams) and z
(along the beams) precisions of 170 �m and 740 �m, respectively. The transverse momentumresolution using VDET, ITC and TPC is
�(pT )
pT= 6 � 10�4pT (GeV/c)� 0:005:
In addition to its principal role as a tracking device, the TPC also measures the ionizationloss (dE=dx) providing an independent identi�cation tool. For one-prong � decays a veryprecise dE=dx calibration can be performed [10] since the charged particle is isolated. The
separation between electrons and pions is larger than 4� up to 8 GeV/c.
Since the photon multiplicity is relatively large in � decays it is important to understand
their conversion in the detector. The amount of material expressed in radiation lengthsseen by a particle emerging perpendicularly to the beams is 0.3% for the beam pipe, 4.1% for
VDET, 0.3% (1.0%) for the ITC inner (outer) wall and 2.3% for the TPC inner wall. Detailed
checks of the Monte Carlo simulation of conversions are made with the data and show goodagreement for the description of the detector material.
The �ne granularity of ECAL is a key feature of the ALEPH detector for � physics. The
barrel and end cap parts of ECAL are divided into 12 modules, each covering 30� azimuthally.
The modules are built with 45 layers of lead and proportional wire chambers, and the cathode
2

pads are read out along projective towers. Fine granularity is achieved transversally and
longitudinally: each tower covers a solid angle of 0.9� � 0.9� and the 45 layers are regrouped
into three stacks of 4, 9, and 9 radiation lengths, respectively. The energy of photons and
electrons is measured with a resolution of
�(E)
E=
0:18qE(GeV)
+ 0:009:
Like ECAL the hadron calorimeter is composed of a barrel closed by two end caps. Its
depth of 7.2 interaction lengths is adequate for absorbing hadrons. The digital pattern
provided by the read out of the 23 planes of streamer tubes gives a two-dimensional picture
of hadronic showers and allows an easy separation of charged hadrons from penetrating
minimum-ionizing muons. Cathode pads are organized with a structure analogous to that
of ECAL, however with a larger tower size of 3.7�� 3.7�. The muon chambers provide three-dimensional hits which can be associated to penetrating tracks.
Finally the three-level trigger system is based on redundant requirements derived from
ITC charged-track elements and energy deposits in ECAL and HCAL, used individually orcorrelated in space. The trigger e�ciency within the detector acceptance and the selectioncuts is better than 99.99% for �� events.
3 Particle identi�cation
Charged particle identi�cation plays a role in the measurement of leptonic branching ratios.In this analysis, a likelihood method is used to incorporate the information from the relevantdetectors. In this way, each charged particle is assigned a set of probabilities with which aparticle type is chosen.
3.1 Likelihood identi�cation method
A set of discriminating variables xi is selected and the corresponding probability densitiesfji (xi) for given particle types j are set up using the ALEPH Monte Carlo simulation. Each
charged particle is assigned to the type with the largest global estimator Pj de�ned as
Pj =
Qi f
ji (xi)P
j
Qi f
ji (xi)
;
where j = e; �; h. No attempt is made at this point to separate pions from kaons in the
hadron sample.
3
A �rst version of this likelihood method was used in a previous analysis [11]. In the
present work the following improvements are made: (i) cracks between ECAL modules are
de�ned geometrically on the basis of the track extrapolation, (ii) muon chamber information
is now used, (iii) an additional variable from HCAL is introduced for � � � separation,
(iv) reference distributions for each variable are set up separately in several angular regions
of the detector both in polar angle (end caps, transition region, barrel) and in azimuthal
angle (to take into account non-instrumented zones in HCAL cracks), and (v) the very small
number of dead ECAL channels (registered on-line) are taken into account and a correction is
derived. Finally, complete systematic checks are made using low-energy lepton samples from
processes in addition to Bhabha and dimuon events. The misidenti�cation of hadrons as
leptons is investigated using pions tagged in �!��� decays by a reconstructed �0. In the
special case of hadrons misidenti�ed as electrons, a new method using dE=dx tagging is used
to check the calorimeter-dependent part of the identi�cation procedure.
3.2 Selection of tracks and discriminating variables
Some minimal cuts are necessary before a given particle track can be identi�ed. Because of
their range in HCAL, isolated muons can only be identi�ed reliably above 1.8 GeV/c. Hencea minimum momentum value of 2 GeV/c is required for muon and hadron candidates. Thecorresponding ine�ciency is 5.0% for muons and 5.7% for hadrons. Since electrons can bewell separated from heavier particles below 2 GeV/c by dE=dx, no minimum momentumis imposed on them beyond the requirement of track reconstruction in the TPC (pT >
150 MeV/c). Finally a cut is applied around ECAL cracks for electrons and hadrons leadingto an ine�ciency of 4.7%. These ine�ciencies are known very precisely as they rely either ongeometry or momentum calibration. The uncertainty from the momentum scale is estimatedto be 10�4. The uncertainty in the muon momentum distribution due to � polarisation isdiscussed in Section 6.2.
Eight variables are used in the identi�cation procedure: dE=dx in the TPC, two estimatorsof the shower pro�le in ECAL [12] (RT for transverse shape and energy deposition, RL for
longitudinal shape), the average shower width W measured with the HCAL tubes in the �red
planes, the number of �red planes among the last ten (N10), the energy EH measured with
HCAL pads, the number of hits (N�) in the muon chambers (within a road � 4�-wide aroundthe track extrapolation, where � is the standard deviation expected from multiple scattering)
and �nally, the average distance D� (in units of the multiple-scattering standard deviation)
of the hits from their expected position in the muon chambers.
The correlation between discriminating variables is small except between EH and W . Infact, EH was introduced to slightly improve �-h separation when a penetrating particle in
a hadron shower causes an abnormally small width W and contributes signi�cantly to the
N10 distribution. The EH variable is mainly used as a correction for this e�ect. No crack
cuts are imposed for HCAL as the iron absorber con�guration is azimuthally continuous.
4

However special probability densities are used for tracks which extrapolate to the small non-
instrumented areas between modules.
3.3 Procedure and results
The global e/�/h separation is applied to one-prong � hemispheres and uses all the available
variables. The reference distributions are checked against data using samples of known
particles. Small discrepancies are observed in some distributions, in particular RT and RL for
electrons. In the latter cases the distributions obtained from the electron data (see Section
3.4) are used when the identi�cation is performed on � data.
The identi�cation e�ciency matrix is �rst derived with the Monte Carlo simulation
based on the KORALZ generator [13] for � -pair production. A signi�cant improvement inperformance is obtained compared to the earlier version used for the analysis of 1989-90 data[11]: the hadron misidenti�cation to electron or muon is reduced by 40%.
The momentumdependence of the electron and muon e�ciencies is very weak. The hadrone�ciency increases by 1% over the full momentum range due to the combined increase ofhadron-to-electron and decrease of hadron-to-muon misidenti�cations.
A strong test of the validity of the method is obtained by looking at the distributions of thePj estimators for samples of identi�ed particles in data and Monte Carlo. By constructionone has
PPj = 1 and in practice, due to e-� \orthogonality" in the detector, one of the
following relations holds: Pe + Ph = 1 or P� + Ph = 1. Therefore the chosen particle has
always Pj larger than 0.5. The agreement is good (Fig. 1) over three orders of magnitude forall particle types. Indications of a slight overestimate of Monte Carlo e�ciency are observedfor muons and hadrons at the 10�3 level. Therefore the identi�cation e�ciencies are measuredwith data.
3.4 Measurement of identi�cation e�ciencies
The performance of the particle identi�cation method is measured using samples of taggedparticle types over the full momentum and angular ranges [14]. Bhabha events provide a
high-energy electron sample (> 8 GeV/c) and the ! e+e� process completes the range
in the lower energy part. Similarly, a broad-band muon sample is obtained from Z! �+��
and ! �+�� processes. In practice, lepton samples are obtained by tagging the opposite
particle in each event with strict identi�cation and momentum cuts. In all cases a small
contribution from �� events is subtracted in order to obtain the correct misidenti�cation rates
of leptons into hadrons. There are no suitable independent samples for hadrons, however �decays into ��� where the �
0 from � decay is reconstructed in ECAL, provide a sample of
charged pions over the relevant kinematical range.
5

1
10
10 210 310 4
Par
ticle
s/0.
02
1
10
10 210 310 4
1
1010 210 310 4
0.5 0.6 0.7 0.8 0.9 1Global Estimator for Identified Particles
ALEPH
Figure 1: The distributions of the global estimators (Pe, P�, and Ph) for
identi�ed particles from � decays. The plots show the data (triangles), the
Monte Carlo (shaded histogram), and � backgrounds (hatched histogram).
The latter correspond to misidenti�ed hadrons in the �rst two plots and
misidenti�ed leptons for the last plot. The hadronic veto de�ned in Section
5.2 is applied for electrons and muons in addition to the particle identi�cation.
6

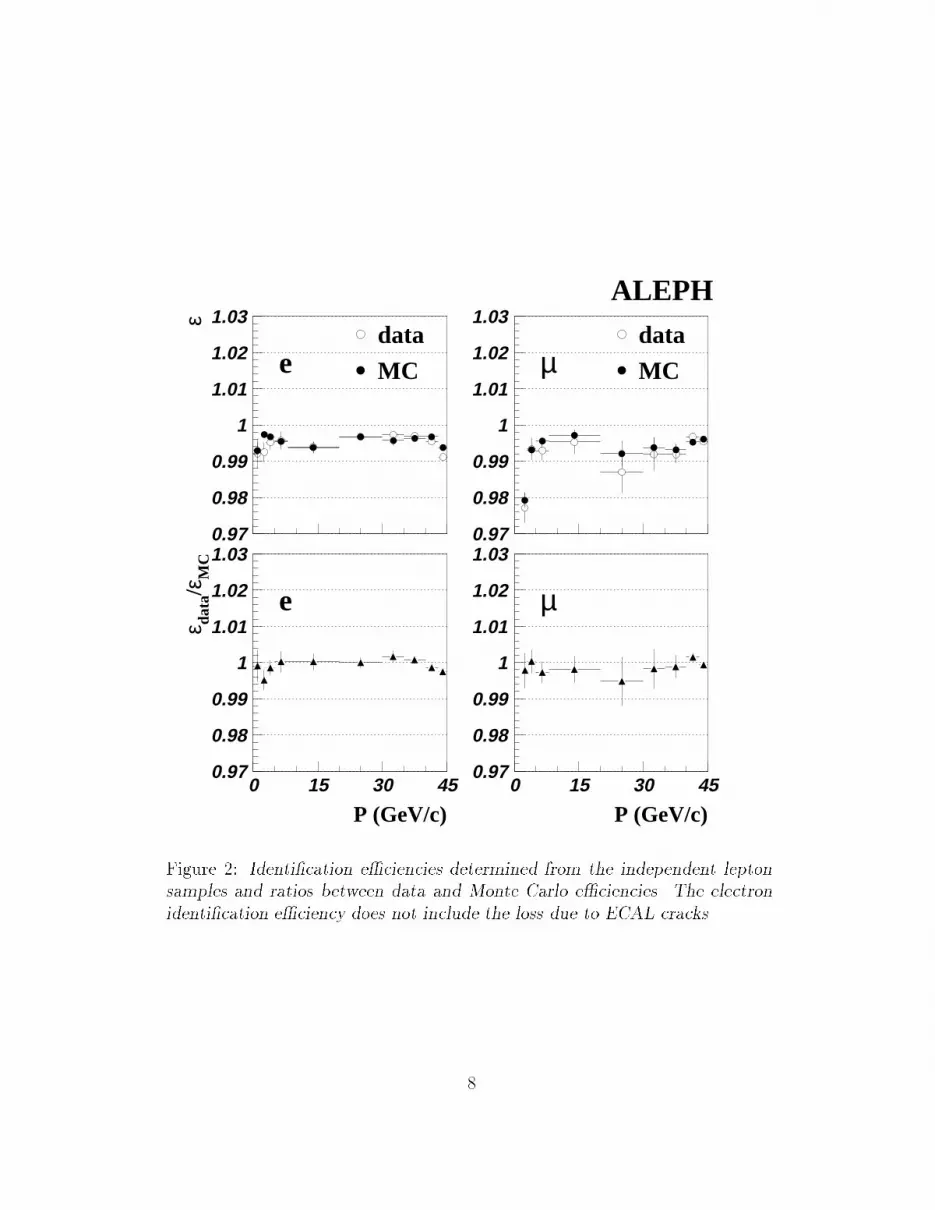
The results of the comparison between data and Monte Carlo e�ciencies is quite
satisfactory for electrons and muons as shown in Fig. 2 as a function of momentum. The
indication of a slightly smaller muon e�ciency in data compared to Monte Carlo is con�rmed
here at the level anticipated from Fig. 1. The ratio of identi�cation e�ciencies in the
independent lepton samples between data and Monte Carlo (Fig. 2) is used to renormalize
the e�ciency from the �� Monte Carlo. In this procedure, the values for the ratio in
the case of electrons are taken in each momentum bin, whereas for muons a linear �t is
performed. This linear �t, in agreement with the measurements, is justi�ed by the fact that
the muons from �� events are identi�ed mostly in HCAL and the muon chambers, and do
not interfere with the photon shower in ECAL. Furthermore, no fast variation of e�ciency
is expected for muons above 5 GeV/c. The situation is quite di�erent for electrons in ee
events, because of the interplay between dE=dx and ECAL estimators, and the presence of
additional electromagnetic activity in ECAL. The experimental and Monte Carlo errors are
then propagated and used as systematic uncertainties for the �nal identi�cation e�ciencies.
Angular dependence of the e�ciencies is checked in a similar way. A small e�ciencyloss is observed in the barrel-end cap transition region for electrons (about 1%) and is wellreproduced by the simulation. A similar e�ect is seen in the azimuthal distribution of muonscorresponding to the HCAL cracks, again well described by the Monte Carlo.
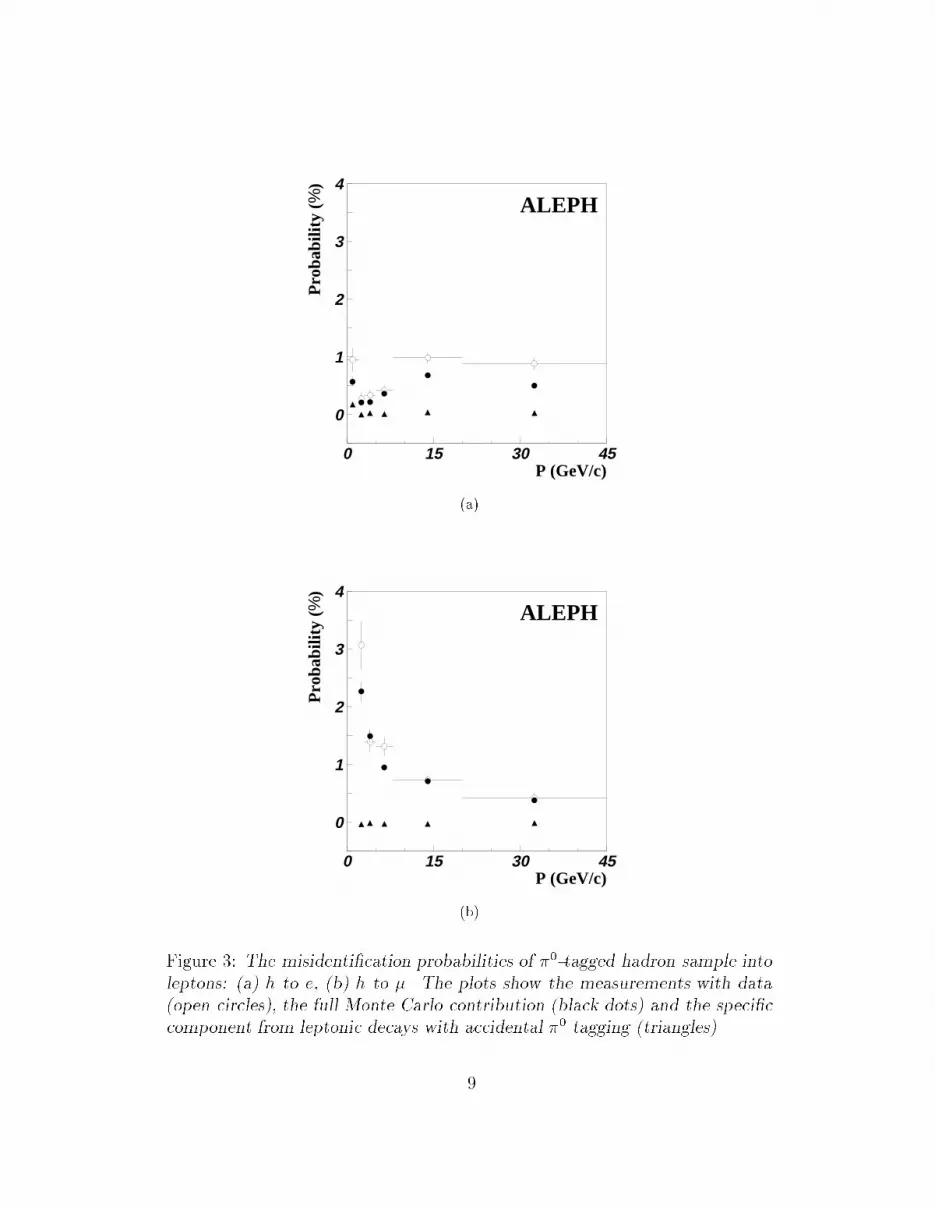
Hadron misidenti�cation requires special attention because there are more hadrons thanleptons and the simulation of their interactions in the calorimeters could be imperfect. The �0
tagging method allows a detailed comparison of data and Monte Carlo for these speci�c �nalstates, which are dominated by �!��
0 and a1!��0�0, but also include a small contribution
from K�!K�0. The hadron sample selected in this way is therefore representative of thehadron contribution from � decays. Fig. 3 shows good agreement for hadrons selected asmuons or electrons, at least in the lower momentum range for the latter. Above 10 GeV/c theMonte Carlo does not properly simulate hadron interactions in ECAL, particularly thoseinteractions producing a large �
0 multiplicity inducing an electron-like shower. In order tocheck the interpretation of the e�ect, a complementary investigation is carried out using an
independent hadron tagging using a tight dE=dx cut in the TPC. This procedure allows a �nal-state-independent study of the misidenti�cation, regardless of the number of �0's produced.
The results obtained with this method are in excellent agreement with the previous ones:
the excess of misidenti�cation probability in data over Monte Carlo is (1.8�0.5)�=�� with�0-tagging and (2.3�0.6)�=�� with the dE=dx method. This con�rms the discrepancy and
supports its interpretation in terms of hadron interactions. The measured identi�catione�ciency matrix is given in Table 1.
In summary, an accurate picture of particle identi�cation is achieved in one-prong � decays
with data. Lepton e�ciencies are measured with a systematic uncertainty of 1:0 � 10�3 andhadron contamination is obtained with an uncertainty of 1:7 � 10�3. It is however possibleto further reduce the contaminations (2.5% in each lepton sample) using the information on
additional photons in the lepton hemisphere as described in Section 5.2. Hence the respective
7
0.97
0.98
0.99
1
1.01
1.02
1.03data
MC
ε
e
0.97
0.98
0.99
1
1.01
1.02
1.03data
MCµ
ALEPH
0.97
0.98
0.99
1
1.01
1.02
1.03
0 15 30 45
e
P (GeV/c)
ε data/ε
MC
0.97
0.98
0.99
1
1.01
1.02
1.03
0 15 30 45
µ
P (GeV/c)
Figure 2: Identi�cation e�ciencies determined from the independent lepton
samples and ratios between data and Monte Carlo e�ciencies. The electron
identi�cation e�ciency does not include the loss due to ECAL cracks.
8
0
1
2
3
4
0 15 30 45P (GeV/c)
Pro
babi
lity
(%)
ALEPH
(a)
0
1
2
3
4
0 15 30 45P (GeV/c)
Pro
babi
lity
(%)
ALEPH
(b)
Figure 3: The misidenti�cation probabilities of �0-tagged hadron sample into
leptons: (a) h to e, (b) h to �. The plots show the measurements with data
(open circles), the full Monte Carlo contribution (black dots) and the speci�c
component from leptonic decays with accidental �0 tagging (triangles).
9
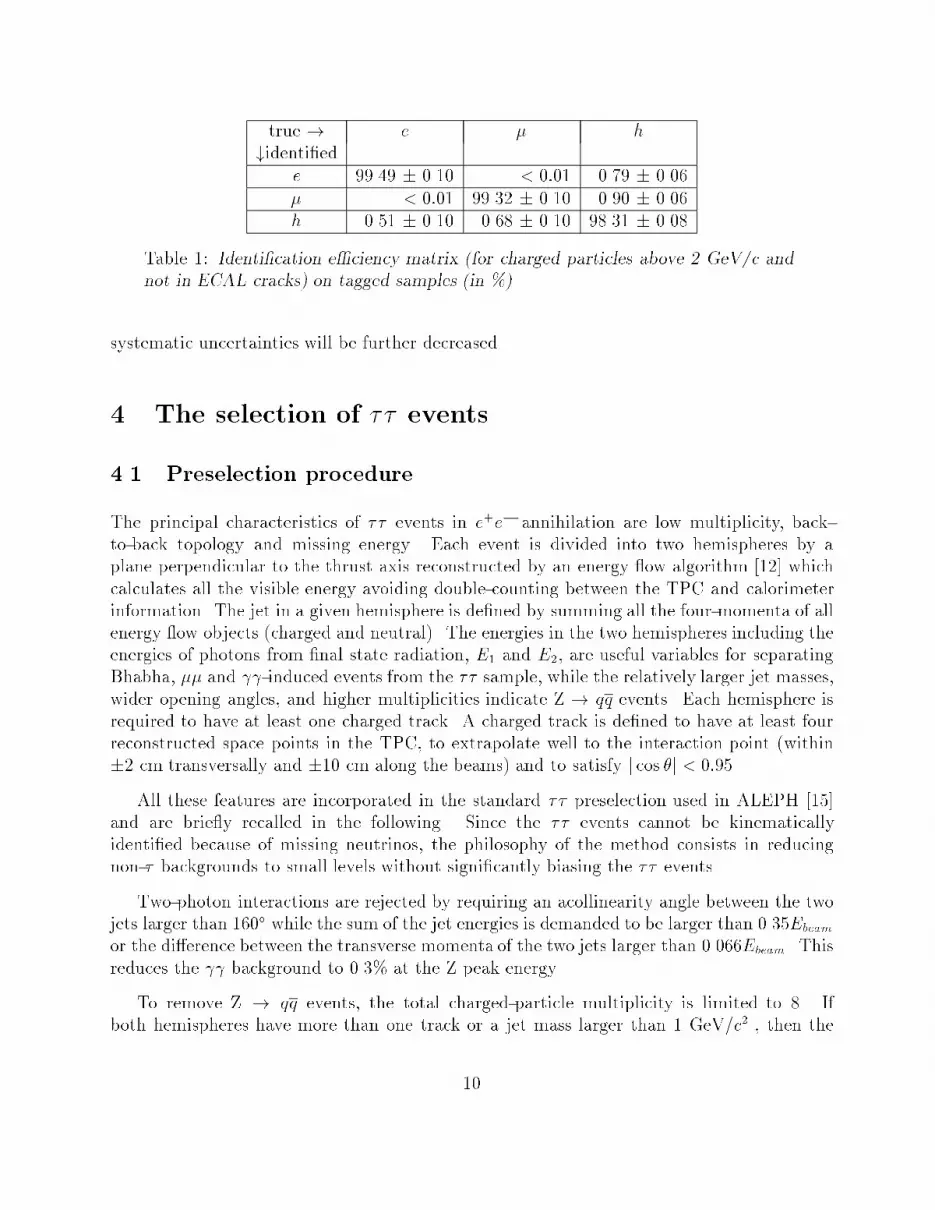
true ! e � h
#identi�ede 99.49 � 0.10 < 0:01 0.79 � 0.06
� < 0:01 99.32 � 0.10 0.90 � 0.06
h 0.51 � 0.10 0.68 � 0.10 98.31 � 0.08
Table 1: Identi�cation e�ciency matrix (for charged particles above 2 GeV/c and
not in ECAL cracks) on tagged samples (in %).
systematic uncertainties will be further decreased.
4 The selection of �� events
4.1 Preselection procedure
The principal characteristics of �� events in e+e� annihilation are low multiplicity, back-
to-back topology and missing energy. Each event is divided into two hemispheres by aplane perpendicular to the thrust axis reconstructed by an energy ow algorithm [12] which
calculates all the visible energy avoiding double-counting between the TPC and calorimeterinformation. The jet in a given hemisphere is de�ned by summing all the four-momenta of allenergy ow objects (charged and neutral). The energies in the two hemispheres including theenergies of photons from �nal state radiation, E1 and E2, are useful variables for separatingBhabha, �� and -induced events from the �� sample, while the relatively larger jet masses,
wider opening angles, and higher multiplicities indicate Z ! qq events. Each hemisphere isrequired to have at least one charged track. A charged track is de�ned to have at least fourreconstructed space points in the TPC, to extrapolate well to the interaction point (within�2 cm transversally and �10 cm along the beams) and to satisfy j cos �j < 0:95.
All these features are incorporated in the standard �� preselection used in ALEPH [15]and are brie y recalled in the following. Since the �� events cannot be kinematically
identi�ed because of missing neutrinos, the philosophy of the method consists in reducing
non-� backgrounds to small levels without signi�cantly biasing the �� events.
Two-photon interactions are rejected by requiring an acollinearity angle between the twojets larger than 160� while the sum of the jet energies is demanded to be larger than 0.35Ebeam
or the di�erence between the transverse momenta of the two jets larger than 0.066Ebeam. This
reduces the background to 0.3% at the Z peak energy.
To remove Z ! qq events, the total charged-particle multiplicity is limited to 8. If
both hemispheres have more than one track or a jet mass larger than 1 GeV/c2 , then the
10

following conditions are imposed: (i) the product of the number of energy- ow objects in each
hemisphere must be smaller than 75 and (ii) the sum of the maximum opening angles between
two tracks in each hemisphere is smaller than 0.25 rad. The background from hadronic
Z decays is thus reduced to 0.26%, as calculated by the JETSET Monte Carlo [16]. As
the remaining event con�gurations are quite atypical, checks are made comparing data and
Monte Carlo distributions for enlarged cut values. Good agreement is found and a systematic
uncertainty of 30% is estimated for this background.
Bhabha events must be treated with care because of their steep angular distribution and
large cross section. The scattering angle �� in the �� rest frame is calculated using the
measured polar angle �+ (��) of the positively (negatively) charged jet through the relation
cos �� =sin( �+���
2)
sin( �++��2
):
A cut j cos ��j < 0:90 de�nes the angular acceptance for the �� sample while rejecting small-angle Bhabha events. For Bhabha-like events (where all charged particles are identi�ed aselectrons with loose criteria) the normalized total energy, xtot = Etot=Ebeam, is required to be
smaller than 1.6 (or 1.4 if the tangent to the leading electron points to within �6 cm of anECAL crack). Here Etot includes the energy carried away by a radiative photon assumed tobe emitted along the beam line; its energy is calculated using three-body kinematics. All thisreduces the Bhabha contamination to 0.66% at peak energy, by far the largest background.
Finally, Z ! �� events are rejected by the requirement that the sum of the momenta ofthe two leading tracks is less than 1.6Ebeam. Also, for loosely de�ned dimuon events, xtot mustbe smaller than 1.8. The resulting �� background is 0.25%.
4.2 Further selection using the likelihood particle identi�cation
The total contamination after preselection is 1.78% at peak energy, including 0.14% from
four-fermion processes1 and 0.17% from cosmics (reduced in the preselection by tightening
the pointing cuts to the interaction region for at least one track). These results are improved[14] using the particle identi�cation described in Section 3.
Particular attention is paid to the complete event topology to reduce the Bhabha
background. For example, the track opposite to an identi�ed electron could go throughan ECAL crack and hence would not be identi�able as an electron. Also e-h topologies are
1The -processes mentioned above also involve four fermions, but are dominated by con�gurations with
two leptons in the detectors while electrons and positrons stay in the beam pipe. The four-fermion processes
refer here to high q2 events enhanced by the Z pole giving �nal states with three of four leptons at large angle
to the beams. The overlap between the two samples is negligible [17].
11

considered taking into account e ! h misidenti�cation. Additional cuts are applied in the
E1,E2 plane depending on the event topology and according to the cos �� range. In particular,
events where both sides are identi�ed as electrons are rejected for cos �� > 0.7 if E1 > 40 GeV
and E2 > 10 GeV or vice versa (Fig. 4). Other topologies (e-e with cos �� < 0.7, e-crack, e-h)
are treated in a similar way.
0
10
20
30
40
50
Ee(
GeV
)
0
10
20
30
40
50
0
10
20
30
40
50
0 10 20 30 40 50Ee(GeV)
Ee(
GeV
)
0
10
20
30
40
50
0 10 20 30 40 50Ee(GeV)
Figure 4: The energy distributions for e-e events with cos �� > 0:7 after
preselection. The plots correspond to samples of Bhabha Monte Carlo
(BABAMC [18] (a) and UNIBAB [19] (b)), �� Monte Carlo (c) and data
(d). The samples are not normalized to the same luminosity.
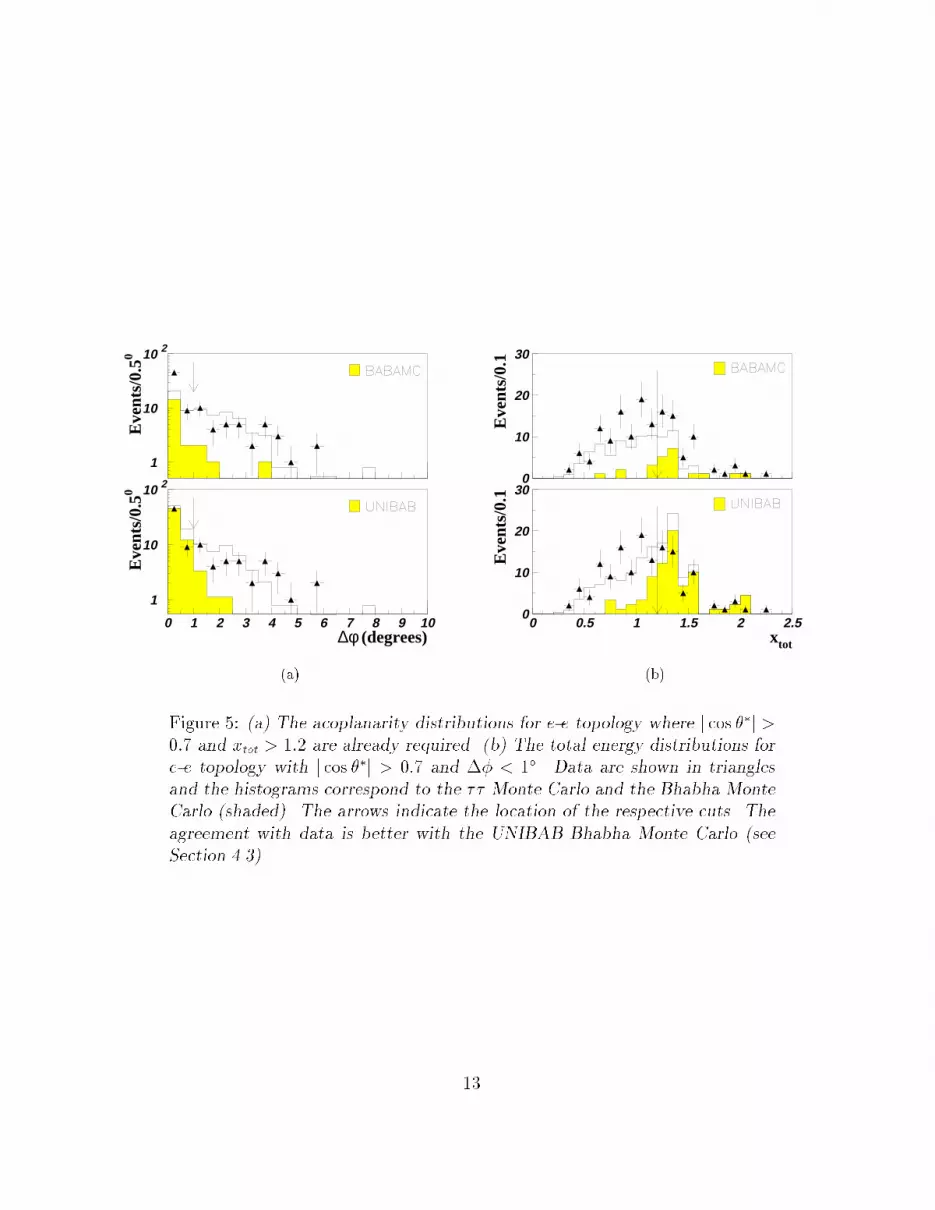
Finally a last cut is applied on xtot and the acoplanarity �� between the two jets: events
are rejected if �� < 1� and xtot > 1.2 for j cos ��j > 0:7 (Fig. 5), and, �� < 0:4� and xtot > 1.5for j cos ��j < 0:7.
These additional cuts decrease the �� e�ciency by only 0.13% while reducing the Bhabha
contamination by a factor of 5. The estimate of the �nal contamination is given below.
12
1
10
10 2
Eve
nts/
0.50
1
10
10 2
0 1 2 3 4 5 6 7 8 9 10 ∆φ (degrees)
Eve
nts/
0.50
(a)
0
10
20
30
Eve
nts/
0.1
0
10
20
30
0 0.5 1 1.5 2 2.5xtot
Eve
nts/
0.1
(b)
Figure 5: (a) The acoplanarity distributions for e-e topology where j cos ��j >0:7 and xtot > 1:2 are already required. (b) The total energy distributions for
e-e topology with j cos ��j > 0:7 and �� < 1�. Data are shown in triangles
and the histograms correspond to the �� Monte Carlo and the Bhabha Monte
Carlo (shaded). The arrows indicate the location of the respective cuts. The
agreement with data is better with the UNIBAB Bhabha Monte Carlo (see
Section 4.3).
13
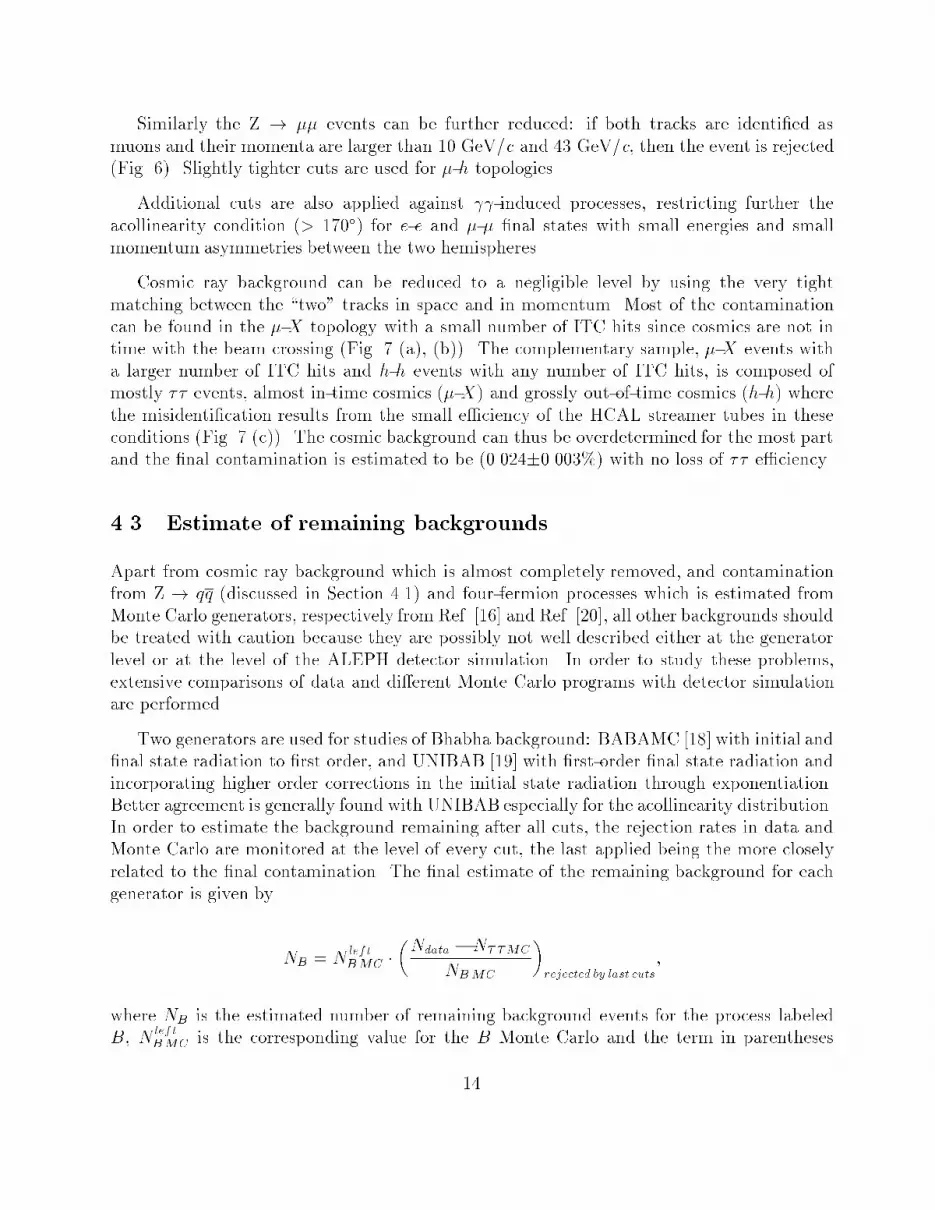
Similarly the Z ! �� events can be further reduced: if both tracks are identi�ed as
muons and their momenta are larger than 10 GeV/c and 43 GeV/c, then the event is rejected
(Fig. 6). Slightly tighter cuts are used for �-h topologies.
Additional cuts are also applied against -induced processes, restricting further the
acollinearity condition (> 170�) for e-e and �-� �nal states with small energies and small
momentum asymmetries between the two hemispheres.
Cosmic ray background can be reduced to a negligible level by using the very tight
matching between the \two" tracks in space and in momentum. Most of the contamination
can be found in the �-X topology with a small number of ITC hits since cosmics are not in
time with the beam crossing (Fig. 7 (a), (b)). The complementary sample, �-X events with
a larger number of ITC hits and h-h events with any number of ITC hits, is composed of
mostly �� events, almost in-time cosmics (�-X) and grossly out-of-time cosmics (h-h) where
the misidenti�cation results from the small e�ciency of the HCAL streamer tubes in theseconditions (Fig. 7 (c)). The cosmic background can thus be overdetermined for the most partand the �nal contamination is estimated to be (0.024�0.003%) with no loss of �� e�ciency.
4.3 Estimate of remaining backgrounds
Apart from cosmic ray background which is almost completely removed, and contaminationfrom Z ! qq (discussed in Section 4.1) and four-fermion processes which is estimated fromMonte Carlo generators, respectively from Ref. [16] and Ref. [20], all other backgrounds shouldbe treated with caution because they are possibly not well described either at the generator
level or at the level of the ALEPH detector simulation. In order to study these problems,extensive comparisons of data and di�erent Monte Carlo programs with detector simulationare performed.
Two generators are used for studies of Bhabha background: BABAMC [18] with initial and�nal state radiation to �rst order, and UNIBAB [19] with �rst-order �nal state radiation andincorporating higher order corrections in the initial state radiation through exponentiation.
Better agreement is generally found with UNIBAB especially for the acollinearity distribution.
In order to estimate the background remaining after all cuts, the rejection rates in data andMonte Carlo are monitored at the level of every cut, the last applied being the more closely
related to the �nal contamination. The �nal estimate of the remaining background for eachgenerator is given by
NB = NleftBMC �
�Ndata �N��MC
NBMC
�rejected by last cuts
;
where NB is the estimated number of remaining background events for the process labeledB, N left
BMC is the corresponding value for the B Monte Carlo and the term in parentheses
14

0
10
20
30
40
50
0 10 20 30 40 50Pµ(GeV/c)
Pµ(
GeV
/c)
(a)
0
10
20
30
40
50
0 10 20 30 40 50Pµ(GeV/c)
Pµ(
GeV
/c)
(b)
0
10
20
30
40
50
0 10 20 30 40 50Pµ(GeV/c)
Pµ(
GeV
/c)
(c)
Figure 6: The momentum distributions for �-� events after preselection. The
plots correspond to samples of (a) ee!�� Monte Carlo, (b) �� Monte Carlo
and (c) data. The samples are not normalized to the same luminosity.
15

0
10
20
30
40
50
0 10 20 30 40 50P (GeV/c)
P (
GeV
/c)
(a)
-2
-1
0
1
2
-2 -1 0 1 2d0 (cm)
d 0 (c
m)
(b)
-2
-1
0
1
2
-2 -1 0 1 2d0 (cm)
d 0 (c
m)
(c)
Figure 7: The cosmic ray rejection after preselection for �-X events with fewer than �ve
ITC hits for one track and fewer than six for the other, out of a maximum of eight hits
per track. The plots show the correlations between the two tracks for (a) momentum and
(b) transverse distance of approach to the interaction point. The transverse distance d� is
given a sign depending on the track angular momentum. The few events which do not show
momentum balance are kept as �� candidates (triangles) while the others are cosmic rays
(open circles). The last plot (c) corresponds to the complementary sample dominated by ��
events clustered at small d� values with tails due to bremsstrahlung and interactions in the
detector. The cosmic contamination in this sample is evident.
16

refers to the number of events rejected by the cuts applied after the preselection in the data,
the �� Monte Carlo and the B background Monte Carlo. In other words, the �nal estimate
relies on the shape of the Monte Carlo distributions of the variables used in the last cuts
while the absolute rate is normalized by the actual rejection rate of these cuts. The shapes
of the E1;2, ��, and Etot distributions are in good agreement between the two generators,
leading to consistent estimates for the remaining background. The consistency between the
two estimates is a test of the robustness of the method for estimating the background. This
comparison provides an estimate of the systematic e�ects related to the Bhabha Monte Carlo
generators, included in the �nal uncertainty on the non-� backgrounds.
A similar approach is taken for the other sources of background. In all cases the procedure
leads to an estimate of the background which does not depend on the absolute Monte Carlo
prediction. For Bhabha and Z! �� events, the estimates are signi�cantly di�erent from the
Monte Carlo predictions, a fact which is not surprizing considering the large rejection rateachieved and the di�culty to properly simulate the detector performance at this level. For
-induced processes however, the agreement between the estimate from data and the MonteCarlo prediction is good (data/Monte Carlo =1.03�0.26 for ee and 0.86�0.20 for ��)which is expected since the rejection is achieved essentially through kinematics and does notdepend crucially on detector resolution. The systematic uncertainties introduced by the cutswhich depend on energy calibration and resolution are discussed in Section 6.
The �nal contaminations with their systematic uncertainties are given in Table 2 for theselected �� events and for the identi�ed lepton samples de�ned more precisely in Section 5.The contamination in the �� sample is (0.88�0.09)% for the full data set. The background
is reduced by a factor of 2.2 compared to the preselection step at the expense of a total lossof 0.19% in �� e�ciency.
�� e �
Bhabha 0.15�0.03 0.49�0.08 0
cosmic rays 0.02 0 0.01
Z!�� 0.07�0.02 0 0.35�0.09 processes 0.23�0.03 0.46�0.10 0.47�0.10Z!q�q 0.26�0.08 0 0four-fermion 0.14�0.02 0.22�0.02 0.07�0.02sum 0.88�0.09 1.18�0.14 0.90�0.14
Table 2: Summary of non-� backgrounds in the �nal samples (in %).
17

4.4 Measurement of selection e�ciencies
Apart from simple cuts de�ning the geometrical acceptance which are not a�ected by
signi�cant systematics, the selection depends on energy cuts which are sensitive to the
simulation of the detector and must therefore be carefully evaluated. Ine�ciencies induced
by the major cuts are given in Table 3 for the di�erent �� topologies.
cause for ine�ciency �� e-X �-X h-h
geometrical acceptance and multiplicity
Number of good tracks < 2 or > 8
j cos ��j > 0:9
)16.51 17.14 16.04 16.36
preselection
Acollinearity< 160� 1.07 1.70 1.54 0.41
E1 + E2 <0.35�Ebeam when �PT < 0:066Ebeam 1.10 2.17 2.19 0.15Nobj 1 �Nobj 2 > 75 0.16 0 0 0.38Maximum opening angle sum> 0:25 rad 1.61 0.39 0.30 3.30
Leading energy sum > 1.6Ebeam 0.55 0.28 0.39 0.87xtot cut 1.23 1.40 0.85 1.22
additional cuts
Bhabha rejection 0.13 0.34 0 0.05
rejection 0.03 0.06 0.04 0Z!�� rejection 0.03 0 0.08 0
total ine�ciency 21.32 22.26 20.47 21.58
Table 3: Monte Carlo values for the ine�ciencies at peak energy (in %). h-h
is the event topology with both non-leptonic hemispheres. X corresponds to
any � decay �nal state.
Every cut has been examined in turn. The corresponding distributions from data and
Monte Carlo are compared before the cut is applied and the amount of data rejected by thecut is �tted, using the simulated distribution for the backgrounds. The latter is normalized at
an appropriate place in order to minimize the dependence on the simulation of the resolution.As an example, Fig. 8 illustrates this procedure for the xtot cut used to reject Bhabha events.
The e�ciency of the cut on data is determined with a statistical error from the data and
Monte Carlo samples, and a systematic error re ecting the uncertainty on the background
subtraction, obtained by changing the normalization point. This procedure applied to the
xtot cut (Fig. 8) yields a ratio of data to Monte Carlo e�ciencies di�ering from unity by(0:80�0:55(stat)�0:33(syst)) �10�3 . In all cases, corrections are applied to the Monte Carlo
e�ciencies and the errors are added in quadrature to obtain the systematic uncertainty.
18

xtot
1
10
10 2
10 3
0 0.5 1 1.5 2 2.5
Eve
nts/
0.05
Figure 8: xtot distributions for lepton events where the events are agged
as Bhabha-like. The shaded histogram corresponds to the �� Monte Carlo,
whereas the hatched histogram represents the simulated contribution of
Bhabha events generated with UNIBAB normalized in the three marked bins.
The vertical arrow corresponds to the location of the applied cut.
19

Taking into account all cuts applied to remove leptonic backgrounds, the measured
corrections to the Monte Carlo e�ciencies are found to be
�"e-X
"e-X= (�0:7�0:9) � 10�3
�"�-X"�-X
= (�0:1�0:7) � 10�3
for the leptonic samples e-X and �-X where X is any � �nal state.
Although the leptonic cuts are well reproduced by simulation, the situation is less
satisfactory concerning the hadronic cuts. Low energy calorimeter clusters are not simulated
accurately, leading to discrepancies in energy- ow variables, particularly the jet mass and thenumber of calorimeter objects. Assuming only that the two hemispheres are not correlated
for these two variables, it is possible to determine the e�ciency of the corresponding cutsby constructing unbiased jet samples both in data and Monte Carlo. The Monte Carlosample is used to evaluate the small correlations and to correct the result. The e�ect of allcuts a�ecting hadronic �nal states (both leptonic and hadronic cuts as shown in Table 3) isevaluated, revealing a small but signi�cant discrepancy between data and Monte Carlo:
�"h-h
"h-h= (�12:1�2:0) � 10�3:
The correction for hemisphere correlations mentioned above is (�2:0 � 1:0) � 10�3, and isincluded in the �nal value.
Taking all �nal states into consideration, the �� selection e�ciency at the Z peak is found
to be "�� = (78.27�0.12)%, where the uncertainty is dominated by the statistical error of thedata-Monte Carlo comparison. Other uncertainties can also a�ect "�� : in particular, triggeringand tracking could produce systematic e�ects not well simulated by Monte Carlo. Studieshave shown that the corresponding uncertainty is 0.12%. However it does not contribute
appreciably to this analysis as l-X and all �� �nal states are a�ected in a similar way because
of the dominance of one-prong decays.
It should be emphasized that although the �� Monte Carlo has been used as a referencein this determination, the e�ciency values are corrected with measurements from the data,
including detector e�ects not necessarily included in the simulation and possible de�ciencies
at the generator level such as radiative e�ects, for example. The \geometrical" part of theacceptance is calculated with the Monte Carlo which incorporates initial and �nal state
radiation; the corresponding statistical error (0.092%) is included in the �nal uncertaintyon "�� .
The statistics for the selected �� sample is summarized in Table 4.
20
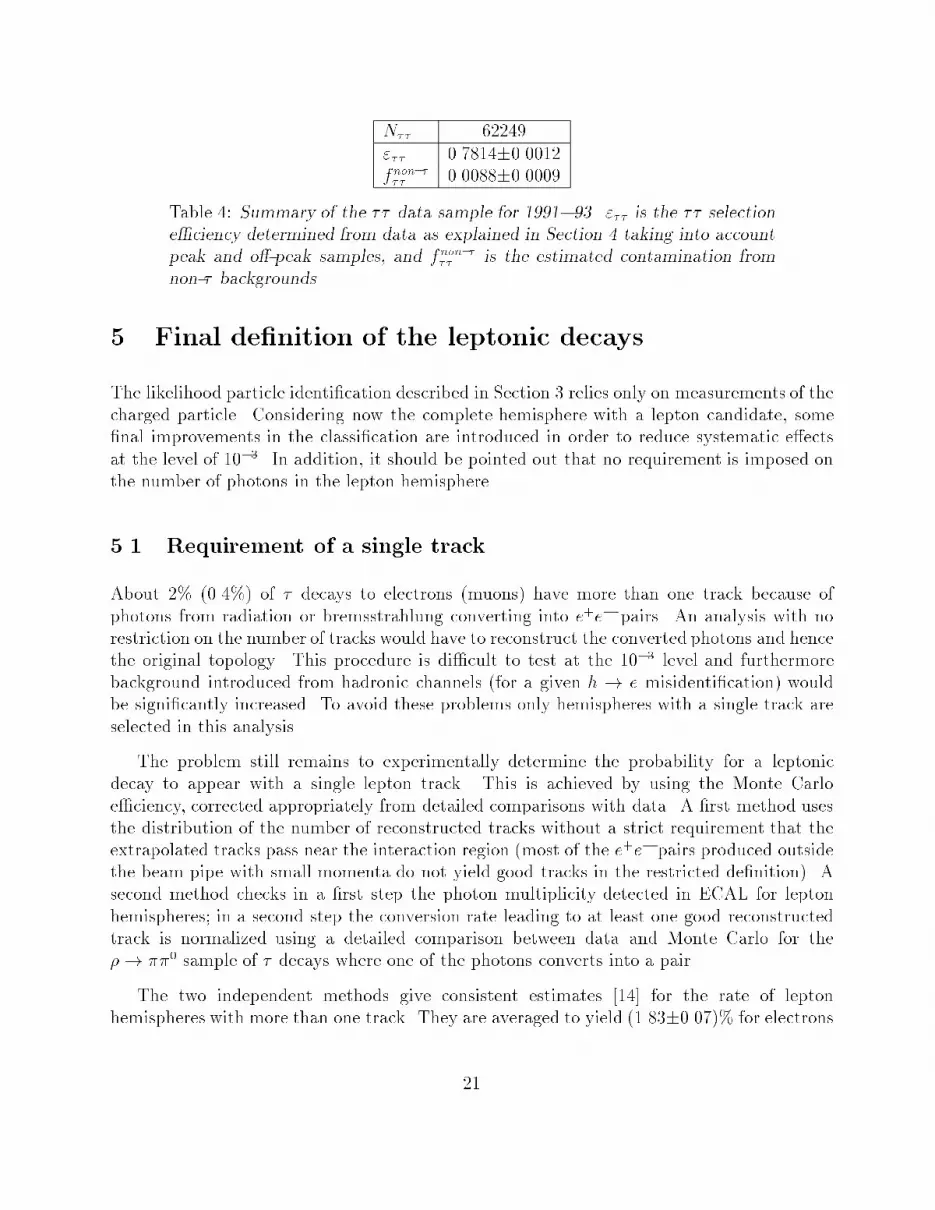
N�� 62249
"�� 0.7814�0.0012fnon-��� 0.0088�0.0009
Table 4: Summary of the �� data sample for 1991�93. "�� is the �� selection
e�ciency determined from data as explained in Section 4 taking into account
peak and o�-peak samples, and fnon-��� is the estimated contamination from
non-� backgrounds.
5 Final de�nition of the leptonic decays
The likelihood particle identi�cation described in Section 3 relies only on measurements of the
charged particle. Considering now the complete hemisphere with a lepton candidate, some�nal improvements in the classi�cation are introduced in order to reduce systematic e�ects
at the level of 10�3. In addition, it should be pointed out that no requirement is imposed onthe number of photons in the lepton hemisphere.
5.1 Requirement of a single track
About 2% (0.4%) of � decays to electrons (muons) have more than one track because of
photons from radiation or bremsstrahlung converting into e+e� pairs. An analysis with no
restriction on the number of tracks would have to reconstruct the converted photons and hencethe original topology. This procedure is di�cult to test at the 10�3 level and furthermorebackground introduced from hadronic channels (for a given h ! e misidenti�cation) wouldbe signi�cantly increased. To avoid these problems only hemispheres with a single track are
selected in this analysis.
The problem still remains to experimentally determine the probability for a leptonicdecay to appear with a single lepton track. This is achieved by using the Monte Carlo
e�ciency, corrected appropriately from detailed comparisons with data. A �rst method uses
the distribution of the number of reconstructed tracks without a strict requirement that theextrapolated tracks pass near the interaction region (most of the e+e� pairs produced outsidethe beam pipe with small momenta do not yield good tracks in the restricted de�nition). A
second method checks in a �rst step the photon multiplicity detected in ECAL for lepton
hemispheres; in a second step the conversion rate leading to at least one good reconstructedtrack is normalized using a detailed comparison between data and Monte Carlo for the
�! ��0 sample of � decays where one of the photons converts into a pair.
The two independent methods give consistent estimates [14] for the rate of lepton
hemispheres with more than one track. They are averaged to yield (1.83�0.07)% for electrons
21
and (0.35�0.03)% for muons whilst the simulation predicts (1.69�0.05)% and (0.36�0.02)%,respectively.
5.2 Hadronic veto
So far particle identi�cation only uses information related to the candidate particle, leading
to hadronic contamination of about 2.5%, which is known with an uncertainty of 0.17%.
Fortunately at least 75% of one-prong hadronic � decays are expected to include �0's which
can be detected in ECAL. More precisely, cuts can be applied on the hadronic invariant mass
(assigning the pion mass to the lepton candidate, M� :: ) and the \photonic" mass (M :: )
using all photon candidates in the lepton hemisphere. These cuts de�ne a hadronic veto which
overrides the lepton identi�cation from the likelihood method.
For muons, the hadronic veto is straightforward as photons are clearly detected withoutinterference from the minimum-ionizing particle: hemispheres with M :: > 0:1GeV/c2 and0:5 < M� :: < 1:4GeV/c2 are rejected. This cut removes a clear hadron signal, dominated
by the �!��0 and a1!��
0�0 channels which is well reproduced by the Monte Carlo (Fig. 9).
A similar procedure is applied to electrons. However the presence of photons in a hadronicdecay interferes with the charged track identi�cation and the values for the cuts are adjusted
depending on the likelihood probability of the lepton candidate. Fig. 10 shows the hadronicmass distribution with a clear hadronic contamination. Here the simulation underestimatesthe overall misidenti�cation as already discussed in Section 3. In most cases of hadronsmisidenti�ed as electrons, one energetic photon from a �
0 is merged into the ECAL showerassociated to the pion and the shower appears more \electromagnetic". For this reason the
M :: mass distribution is less useful than for muons and it is simpler to rely on M� :: alone(M� :: > 0:5GeV/c2).
After these cuts, the hadron contamination is reduced by a factor of 1.9 for electrons and
2.4 for muons with corresponding e�ciency losses of 0.07% and 0.04%, respectively. Thesystematic uncertainty on the lepton e�ciency is smaller than 10�3, including an estimate for
the e�ect of neglected QED higher orders in the radiative corrections for the �� �nal states
and � decays. The momentum dependence of the �nal contaminations is given in Fig. 11.Averaging over the hadron spectrum, this gives (1.26�0.07)% for electrons and (1.11�0.08)%for muons.
6 Additional systematic studies
The most important sources of systematics��� selection, lepton identi�cation, and hadron
contamination�have been discussed in the preceding sections. In this section, additional
22

M γ..γ
1
10
10 2
0 0.1 0.2 0.3 0.4 0.5(GeV/c2)
Hem
isph
eres
/0.0
25 G
eV/c2
(a)
Mπγ..γ
1
10
0 0.5 1 1.5 2(GeV/c2)
Hem
isph
eres
/0.0
5 G
eV/c2
(b)
Figure 9: M �� and M� �� distributions to veto hadronic �nal states in which
the particle is identi�ed as a muon. (a) M �� after M� �� cut, (b) M� �� after
M �� cut. The arrows show the cuts to further purify the muon sample. Data
are shown as triangles. The shaded histogram corresponds to Monte Carlo �
decays where the charged hadron is misidenti�ed as a muon, while the hatched
histogram represents the contribution from muonic � decays with at least one
photon.
23

Mπγ..γ
1
10
10 2
0 0.5 1 1.5 2(GeV/c2)
Hem
isph
eres
/0.0
5 G
eV/c2
Figure 10: M� �� distribution to veto hadronic �nal states in which the particle
is identi�ed as an electron. Data are shown as triangles and the shaded
histogram corresponds to Monte Carlo � decays where the charged hadron
is misidenti�ed as an electron. The hatched histogram shows the Monte
Carlo contribution from electronic � decays with at least one photon. The
arrow shows the cut on this mass to further purify the electron sample. The
discrepancy between data and Monte Carlo for the rate of hadron-to-electron
misidenti�cation is discussed in Section 3.
24

1
2
3
4
0 15 30 45
h to eALEPH
P (GeV/c)
fτ h →
e (
%)
1
2
3
4
0 15 30 45
h to µALEPH
P (GeV/c)
fτ h →
µ (
%)
Figure 11: The measured hadron contamination in the �nal lepton samples for
1991�93 data as a function of momentum.
25

estimates are given for less crucial, however important e�ects.
6.1 Energy calibration and resolution
Bhabha and �� backgrounds are evaluated with the help of simulation for the shape of
the distributions, but they are normalized using data through the procedure discussed in
Section 4. The energy distributions are sensitive to the detector resolution which could a�ect
the background calculation if improperly understood. These e�ects are studied on samples of
Bhabha and �� events and compared to the respective Monte Carlo samples.
In the Monte Carlo Bhabha samples, the distribution of the jet energies is shifted by 1
GeV as compared to the data with some di�erences in the radiative tail. A detailed study of
ECAL energy calibration and resolution performed for the di�erent detector elements (end-caps and barrel) shows a consistent e�ect. Finally, a conservative range of �2 GeV in theenergy cut value yields a systematic uncertainty of �13% for the Bhabha contamination inthe �� sample and �7% in the electron sample.
A similar study is carried out for muons. Momentum calibration is quite good here asit is based only on tracking, but the resolution is underestimated in the simulation by 10%.Changing the cut accordingly gives a systematic uncertainty of �14% and �16% for the ��
contamination in the �� and muon samples, respectively.
The e�ect of calibration and resolution on �� e�ciency is quite small: 0.2�=�� for �� and0.3�=�� for the leptonic samples. In any case, it is already taken into account with the procedure
described in Section 4.4.
6.2 Other uncertainties
Hadron contamination in the lepton sample is proportional to the one-prong hadronicbranching ratio (�50%) which is known to �1% absolute [21]. The e�ect on the leptonic
branching ratios is limited to �0.4�=��.
The e�ciency of the energy cuts depends on the � polarisation: leptons from left-handed
��'s are a�ected more by the Bhabha and �� cuts than right-handed �
�'s, while the oppositeis true for the cuts and the P >2 GeV/c condition for � identi�cation. The relative
e�ciency di�erence between the two helicities is estimated by Monte Carlo to be 2.4% for
electrons and 5.8% for muons, because of the 2 GeV/c cut applied to muons. An uncertaintyof 0.02 on the � polarisation [22] translates into a 0.2�=�� (0.4
�
=��) uncertainty on the electron(muon) e�ciency.
Finally, Table 5 summarizes the main uncertainties for the leptonic branching ratios.
26

e �
statistics (data) 6.5 6.4
statistics (Monte Carlo) 1.3 1.3
�� selection 1.5 1.5
non-� background 1.6 1.6
l selection 1.0 0.7single track 0.7 0.4
identi�cation e�ciency 1.0 1.0
hadron contamination 0.7 0.8hadronic branching ratios 0.4 0.4
� polarisation 0.2 0.4
total systematics 3.1 3.0
Table 5: Summary of relative uncertainties for leptonic branching ratios
(in �
=��).
7 Results
The statistics of the lepton samples is given in Table 6 with a summary of the relevante�ciencies, background fractions and their respective systematic uncertainties. The branchingratios are derived by means of Eq. 1 and the results for the di�erent periods of data-taking
are compared in Fig. 12.
e �
Nl 20571 20745
"sell 0.7689�0.0013 0.7923�0.0011"IDl 0.9292�0.0013 0.9386�0.0012fnon-�l 0.0118�0.0014 0.0090�0.0014f�h!l 0.0126�0.0007 0.0110�0.0008
Table 6: Summary of the lepton samples.
The results for the di�erent years are in fair agreement: the probabilities for all the
measurements to have uctuated around the central values more than expected from thequoted uncertainties is 10% for electrons and 25% for muons. Since both Be and B� show
some similar behaviour between the most precise data sets of 1992 and 1993, much e�ortwas devoted to �nd a possible common systematic e�ect. All the components entering in
Eq. 1 were carefully and systematically examined. No signi�cant di�erence is observed for
"sel�� (< 1:2�=
��), "sell (< 1:8�=
��), fnon-�l (< 1:7�=
��), f �h!l (< 1:2�=
��), and "
IDl (< 1:0�=
��). More
global checks were performed on the lepton momentum spectrum showing that the 1993/1992
\excess" is independent of momentum. Also the identi�cation of the � decay opposite to the
27

15 15.5 16 16.5 17 17.5 18 18.5 19
18.09±0.61 (89-90)
17.59±0.28 (91)
17.53±0.19 (92)
18.15±0.19 (93)
17.79±0.13 (91-93)
Be (%)
ALEPH
15 15.5 16 16.5 17 17.5 18 18.5 19
17.35±0.53 (89-90)
17.20±0.27 (91)
17.08±0.18 (92)
17.59±0.18 (93)
17.31±0.12 (91-93) ALEPH
Bµ (%)
Figure 12: Measurements of the � leptonic branching ratios for the di�erent
data sets. Results from 1989-90 data are already published [11].
28

lepton hemisphere revealed no signi�cant correlation for purely leptonic �nal states. Finally,
it was checked that o�-peak data (taken in the 1993 energy scan where non-� backgrounds
are higher) were not responsible for larger branching ratios. In summary, no systematic e�ect
is found beyond the quoted systematic uncertainties and the only remaining explanation is
a statistical uctuation in the number of electrons (mostly) and muons. This conclusion is
strengthened by the results of the global analysis [21] where it is observed that the \excess" of
leptons in the 1993 data compared to 1991-92 is not correlated to the drop of a speci�c hadron
channel (say �!��� or �!���) as could be expected from a misidenti�cation problem, but
is rather uniformly balanced by all hadronic modes.
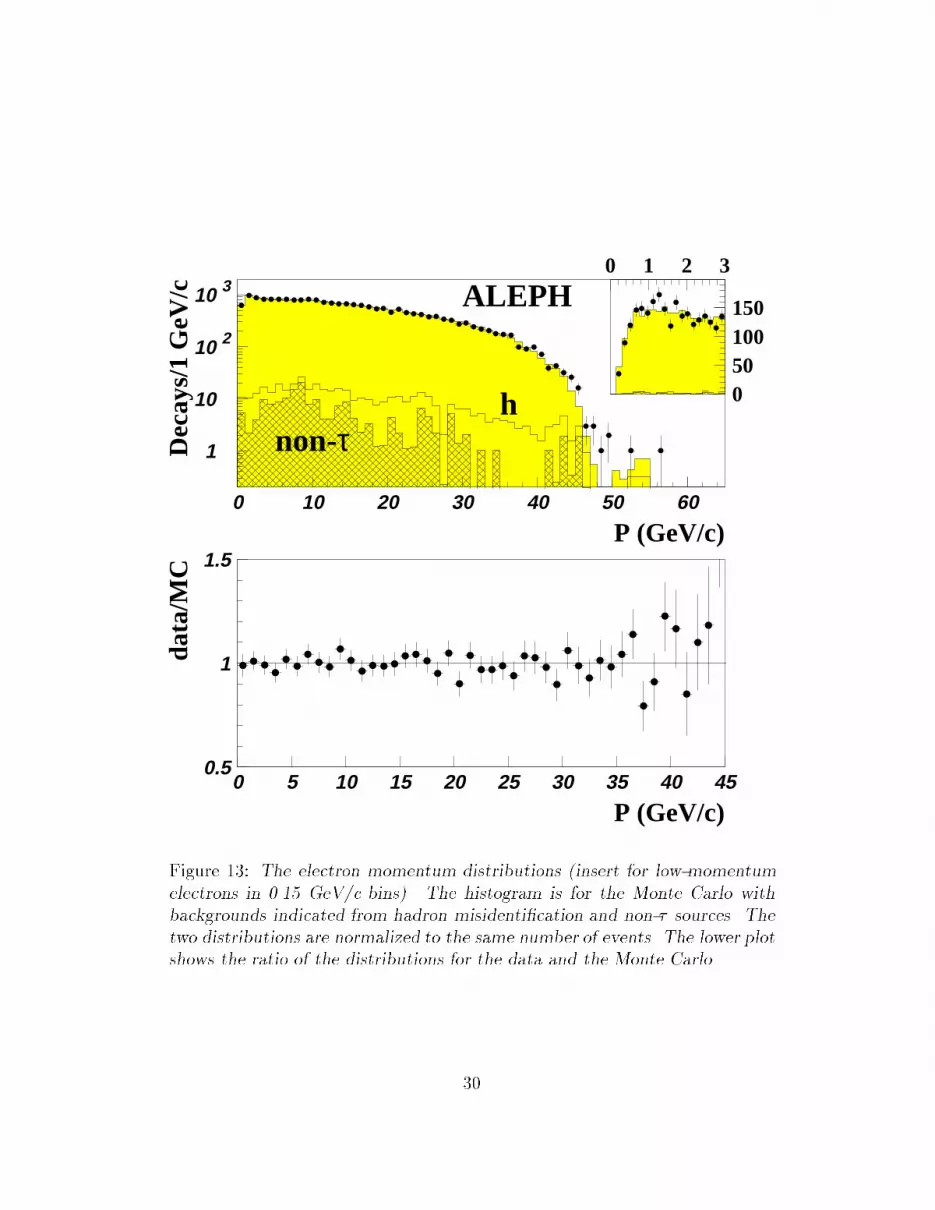
The only relevant observable in the leptonic channels is the lepton momentum. Fig. 13 and
Fig. 14 show the respective track momentum distributions for electrons and muons. They
are in good agreement with the simulation including backgrounds and with the Standard
Model spectrum. The electron data distribution shows some excess near the end point of thespectrum above the Monte Carlo prediction. This cannot be explained by an underestimate
of the Bhabha background since the calorimetric energy distributions for data and MonteCarlo are in excellent agreement in this region. Also, the particle content of the oppositehemispheres is completely consistent with the expectation from �� events. Finally a visualscanning of the events revealed no unforeseen contamination. The e�ect is probably related toa tail in the momentum resolution function for electrons, as the muons do not show an excess
at the same level. Since all checks performed provide no evidence for extra background, it isfair to assume that the apparent excess above 43 GeV/c (1.9�=�� of the electrons) should nota�ect the measurement of Be.
The �nal results of this analysis are obtained by averaging over 1991�93 data:
Be = 17:79�0:12(stat)� 0:06(syst) (%) (2)
B� = 17:31�0:11(stat)� 0:05(syst) (%) (3)
with a correlation coe�cient of �0.11 for the total errors.
The overall precision achieved is 7�=�� for both Be and B�. These new measurements agree
well with the published ALEPH values from 1989-90 data [11], but they are more precise by afactor of 4.3. Consequently, no signi�cant improvement in the errors and no practical change
in the �nal values are obtained if the published values are added to the new results. Theabove results are consistent within the uncertainties with those obtained in a global analysis
of all � branching fractions [21].
In Fig. 15, the ALEPH results are compared with those from other experiments. Theyagree well with the average values of other results, but they are signi�cantly more precise: the
29
1
10
10 2
10 3
0 10 20 30 40 50 60
hnon-τ
ALEPH
P (GeV/c)
Dec
ays/
1 G
eV/c 0 1 2 3
050100150
0.5
1
1.5
0 5 10 15 20 25 30 35 40 45
P (GeV/c)
data
/MC
Figure 13: The electron momentum distributions (insert for low-momentum
electrons in 0.15 GeV/c bins). The histogram is for the Monte Carlo with
backgrounds indicated from hadron misidenti�cation and non-� sources. The
two distributions are normalized to the same number of events. The lower plot
shows the ratio of the distributions for the data and the Monte Carlo.
30

1
10
10 2
10 3
0 10 20 30 40 50 60
h
non-τ
P (GeV/c)
Dec
ays/
1 G
eV/c
ALEPH
0.5
1
1.5
0 5 10 15 20 25 30 35 40 45
P (GeV/c)
data
/MC
Figure 14: The muon momentum distributions. The histogram is for the
Monte Carlo with backgrounds indicated from hadron misidenti�cation and
non-� sources. The two distributions are normalized to the same number of
events. The lower plot shows the ratio of the distributions for the data and
the Monte Carlo.
31
previous world averages [3] are2 Be =(17.90�0.17)% and B� =(17.44�0.23)%, and the recent
measurements of Be =(18.04�0.33)% and B� =(17.36�0.27)%, and Be =(17.51�0.39)% and
B� =(17.02�0.31)% are obtained by OPAL [24] and DELPHI [25], respectively.
8 Tests of lepton universality in W couplings
In the standard V�A theory with leptonic coupling gl at the Wl��l vertex, the � leptonic
partial width can be computed, including radiative corrections [2] and neglecting neutrino
masses3:
�(�!�� l��l( )) =G�Glm
5
�
192�3f
m
2
l
m2�
!��W �
� ; (4)
where
Gl =g2
l
4p2M2
W
(5)
��W = 1 +
3
5
m2
�
M2
W
(6)
�� = 1 +
�(m� )
2�
�25
4� �
2
�(7)
f(x) = 1� 8x+ 8x3 � x4 � 12x2 lnx: (8)
Numerically, the W propagator correction and the radiative corrections are small:
��W = 1 + 2:9 � 10�4 �
� = 1� 43:2 � 10�4:
8.1 Test of �-e universality
Taking the ratio of the two leptonic branching fractions, a direct test of �-e universality isobtained
B�
Be
=f(
m2�
m2�
)
f(m2e
m2�
)
�g�
ge
�2
; (9)
where f(m2e
m2�
) is equal to one for all practical purposes. The results presented here yield
2The \average" values are quoted here rather than the \�t" values which are a�ected by all the hadronic
modes. Problems are known to exist in the latter [23] introducing an undesirable bias in the leptonic modes.3A �� mass of 24 MeV/c2, the present limit from ALEPH [36], would change the � leptonic width by
1:5 � 10�3, well below the experimental accuracy of the measurements discussed in this paper.
32

15 16 17 18 19 20Be
ALEPH91-93
(%)
15 16 17 18 19 20Bµ
ALEPH91-93
(%)
Figure 15: Comparison of the present results with published experiments with
a total uncertainty less than 1% absolute. PDG94 includes the results of
experiments displayed below.
33
B�
Be
= 0:9732 � 0:0095(stat) � 0:0033(syst); (10)
where correlations in the statistical and systematical uncertainties have been taken into
account. Since f(m2
�
m2�
) is computed to be 0.9726, the above result is in excellent agreement
with �-e universality. Quantitatively, the result
g�
ge
= 1:0002 � 0:0051 (11)
is in agreement with the less precise values of 1.0009�0.0081 obtained from the world-average
leptonic branching ratios [3], and 0.994�0.012 and 1.000�0.013 from the recent OPAL [24]
and DELPHI [25] analyses, respectively.
The result (11) is in agreement with the best test of �-e universality of the W couplingsachieved in the comparison of the rates for �!���� and �!e��e where the two most preciseexperiments [37] [38] can be combined [39] to yield g�=ge = 1:0012�0:0016. Although theresult from � decay is less precise, it is nevertheless interesting as it checks the coupling to
a transverse W (helicity=�1) while the � decays measure the coupling to a longitudinal W(helicity=0). It is conceivable that either approach could be sensitive to di�erent non-standardcorrections to universality and the two tests are therefore complementary.
Since Be and B� are consistent with �-e universality their values can be combined, takingcommon errors into account, into a consistent leptonic branching ratio for a massless lepton
B(ml=0)
l = 17:793 � 0:071(stat)� 0:043(syst) (%): (12)
8.2 Tests of � -� and � -e universality
Comparing the rates for �!��e��e( ), �!�����e( ) and �!��e��e( ) provides direct checks of
the universality of � -�-e couplings. Taking the relevant ratios, one obtains
�g�
g�
�2
=��
��
�m�
m�
�5
Be
f(m2e
m2�
)
f(m2e
m2�
)�W� (13)
�g�
ge
�2=
��
��
�m�
m�
�5B�
f(m2e
m2�
)
f(m2
�
m2�
)�W� ; (14)
where f(m2e
m2�
) = 0:9998 and
�W =��W
��W
= 1� 2:9 � 10�4
34
� =��
��
= 1 + 8:5 � 10�5:
Usingm� = (1776:96�0:26) MeV/c2 measured by BES [40], the most recent determination
by ALEPH of the � lifetime [41]
�� = 293:7 � 2:7(stat)� 1:6(syst) (fs); (15)
the branching ratios measured in this analysis, and values for the other quantities from the
Particle Data Group [3], universality can be tested:
g�
g�
= 0:9943 � 0:0037(Be)� 0:0053(�� )� 0:0004(m� ) (16)
g�
ge= 0:9946 � 0:0035(B�)� 0:0053(�� )� 0:0004(m� ): (17)
Thus universality for � -� and � -e is veri�ed with an accuracy of 6.5�=��.
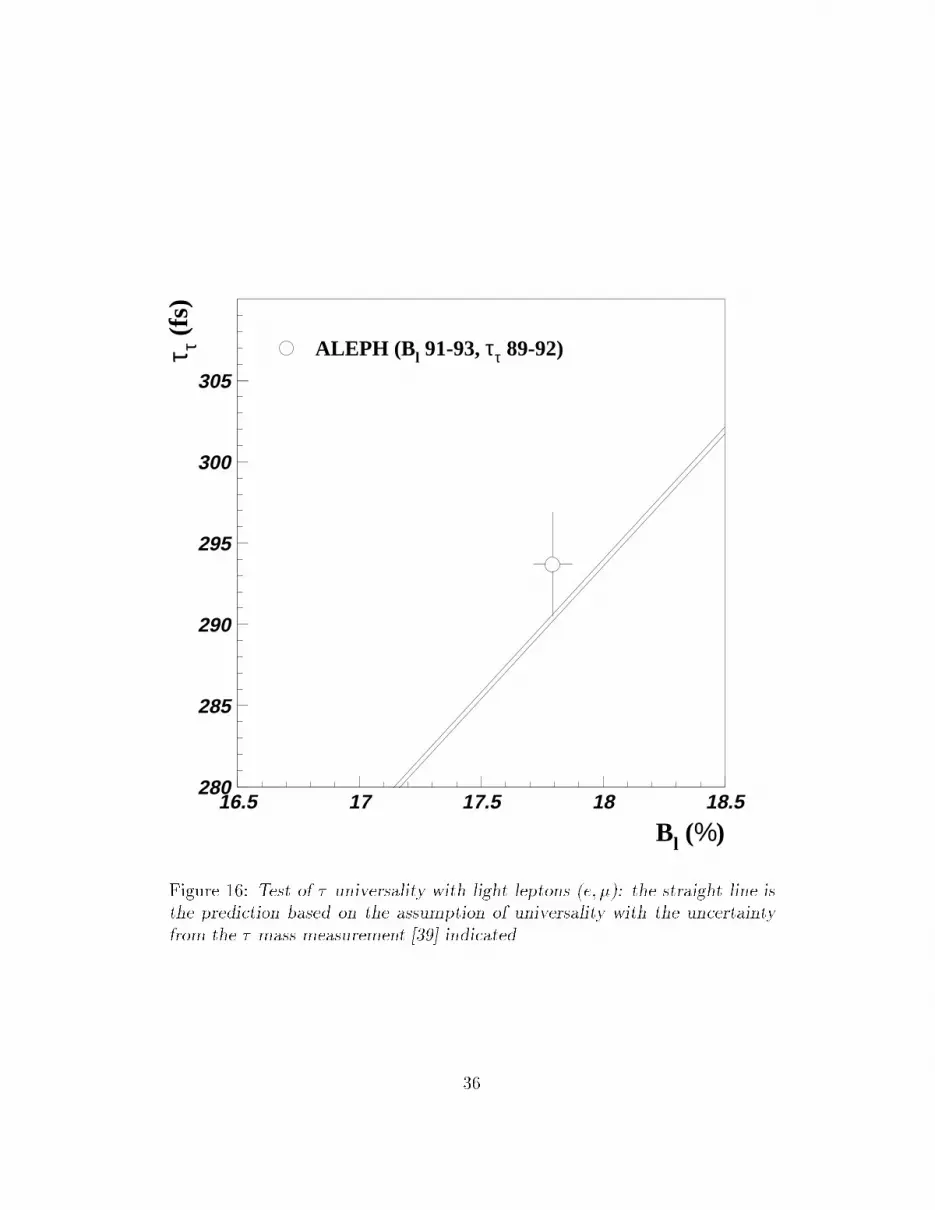
Alternatively, if universality is assumed for the light leptons (e; �), it is possible toinvestigate the behaviour of the heavy � lepton with a more stringent test using the combinedleptonic branching ratio (12):
g�
ge;�= 0:9945 � 0:0023(Bl)� 0:0053(�� )� 0:0004(m� ); (18)
as shown in Fig. 16. The result (18) is consistent with universality and agrees with the
value obtained from the world average [3, 4] (0.9928�0.0065) and the recent determinationby OPAL [24] (1.007�0.007).
35
280
285
290
295
300
305
16.5 17 17.5 18 18.5
ALEPH (B l 91-93, ττ 89-92)
Bl (%)
τ τ (f
s)
Figure 16: Test of � universality with light leptons (e; �): the straight line is
the prediction based on the assumption of universality with the uncertainty
from the � mass measurement [39] indicated.
36
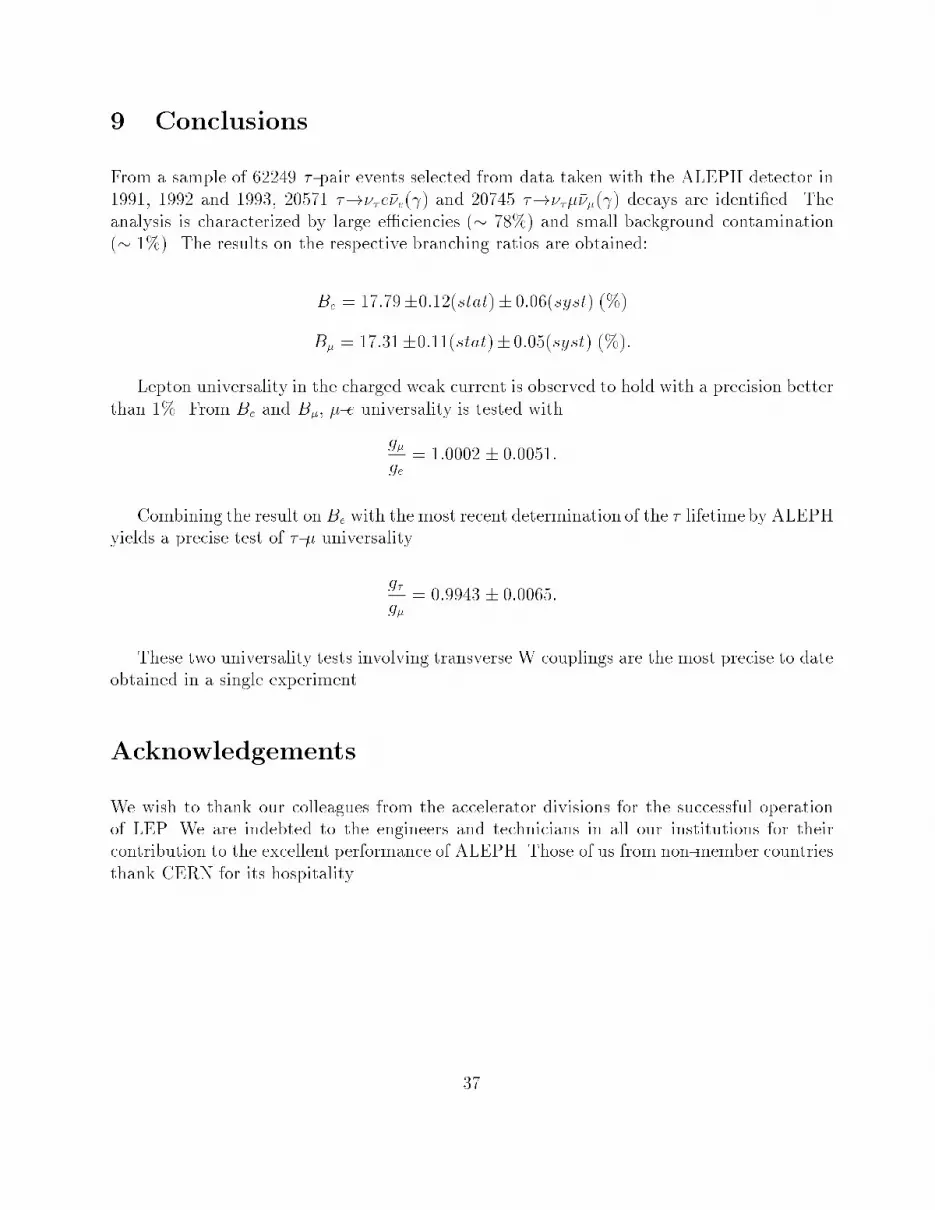
9 Conclusions
From a sample of 62249 � -pair events selected from data taken with the ALEPH detector in
1991, 1992 and 1993, 20571 �!��e��e( ) and 20745 �!������( ) decays are identi�ed. The
analysis is characterized by large e�ciencies (� 78%) and small background contamination
(� 1%). The results on the respective branching ratios are obtained:
Be = 17:79�0:12(stat)� 0:06(syst) (%)
B� = 17:31�0:11(stat)�0:05(syst) (%):
Lepton universality in the charged weak current is observed to hold with a precision better
than 1%. From Be and B�, �-e universality is tested with
g�
ge= 1:0002 � 0:0051:
Combining the result onBe with the most recent determination of the � lifetime by ALEPHyields a precise test of � -� universality
g�
g�= 0:9943 � 0:0065:
These two universality tests involving transverse W couplings are the most precise to dateobtained in a single experiment.
Acknowledgements
We wish to thank our colleagues from the accelerator divisions for the successful operationof LEP. We are indebted to the engineers and technicians in all our institutions for theircontribution to the excellent performance of ALEPH. Those of us from non-member countries
thank CERN for its hospitality.
37

References
[1] D. Schaile, Proceedings of the XXVII International Conference on High Energy Physics
(Glasgow, July 1994), to be published.
[2] W. Marciano and A. Sirlin, Phys. Rev. Lett. 61, (1988) 1815.
[3] Particle Data Group, L. Montanet et al., Phys. Rev. D50 (1994) 1173.
[4] M. Davier, Proceedings of the 3rd Workshop on Tau Lepton Physics, Montreux 1994,
L. Rolandi ed., Nucl. Phys. (Proc. Suppl.) (1995).
[5] E. Braaten, S. Narison and A. Pich, Nucl. Phys. B373 (1992) 581.
[6] ALEPH Collaboration, D. Buskulic et al., Phys. Lett. B307 (1993) 209.
[7] L. Du ot (ALEPH Coll.), Proceedings of the 3rd Workshop on Tau Lepton Physics,
Montreux 1994, L. Rolandi ed., Nucl. Phys. (Proc. Suppl.) (1995).
[8] ALEPH Collaboration, D. Buskulic et al., Phys. Lett. B346 (1995) 379.
[9] ALEPH Collaboration, D. Decamp et al., Nucl. Inst. and Meth. A294 (1990) 121.
[10] ALEPH Collaboration, D. Buskulic et al., Phys. Lett. B332 (1994) 209.
[11] ALEPH Collaboration, D. Decamp et al., Z. Phys. C54 (1992) 211.
[12] ALEPH Collaboration, D. Buskulic et al., Nucl. Inst. and Meth. A360 (1995) 481.
[13] S. Jadach, B.F.L. Ward, and Z. W�as, Comp. Phys. Comm. 79 (1994) 503; S. Jadach et
al., Comp. Phys. Comm. 76 (1993) 361.
[14] For details see H.J. Park, Ph.D thesis, Universit�e de Paris-Sud, LAL 95-08, 1995.
[15] ALEPH Collaboration, D. Decamp et al., Z. Phys. C62 (1994) 539.
[16] T. Sj�ostrand, Comp. Phys. Comm. 39 (1986) 347.
[17] ALEPH Collaboration, D. Buskulic et al., Z. Phys. C66 (1995) 3.
[18] M. B�ohm, A. Denner and W. Hollik, Nucl. Phys. B304 (1988) 687; F.A. Berends,
R. Kleiss and W. Hollik, Nucl. Phys. B304 (1988) 712.
[19] H. Anlauf et al., Comp. Phys. Comm. 79 (1994) 466.
[20] J.M. Hilgart, R. Kleiss and F. LeDiberder, Comp. Phys. Comm. 75 (1993) 191.
[21] ALEPH Collaboration, D. Buskulic et al., to be published.
38
[22] ALEPH Collaboration, D. Buskulic et al., CERN-PPE/95-023, 1995. Submitted to
Z. Phys..
[23] M. Davier, Proceedings of the 2nd Workshop on Tau Lepton Physics, Columbus 1992,
K.K. Gan ed., World Scienti�c (1993).
[24] OPAL Collaboration, R. Akers et al., Z. Phys. C66 (1995) 543.
[25] DELPHI Collaboration, P. Abreu et al., CERN-PPE/95-114, 1995.
[26] L3 Collaboration, O. Adriani et al., Phys. Rep., 236 (1993) 1.
[27] DELPHI Collaboration, P. Abreu et al., Z. Phys., C55 (1992) 555.
[28] CLEO Collaboration, D.S. Akerib et al., Phys. Rev. Lett. 69 (1992) 3610; (erratum) 71
(1993) 3395.
[29] ARGUS Collaboration, H. Albrecht et al., Z. Phys., C53 (1992) 367.
[30] CLEO Collaboration, R. Ammar et al., Phys. Rev. D45 (1992) 3976.
[31] OPAL Collaboration, G. Alexander et al., Phys. Lett. B266 (1991) 201.
[32] HRS Collaboration, S. Abachi et al., Phys. Rev. D41 (1990) 1414.
[33] CELLO Collaboration, H.J. Behrend et al., Z. Phys., C46 (1990) 537.
[34] Mark III Collaboration, R.M. Baltrusaitis et al., Phys. Rev. Lett. 55 (1985) 1842.
[35] Mark J Collaboration, B. Adeva et al., Phys. Rev. D38 (1988) 2665.
[36] ALEPH Collaboration, D. Buskulic et al., Phys. Lett. B349 (1995) 585.
[37] D.I. Britton et al., Phys. Rev. Lett. 68 (1992) 3000.
[38] C. Czapek et al., Phys. Rev. Lett. 70 (1993) 17.
[39] W. Marciano, Proceedings of the 3rd Workshop on Tau Lepton Physics, Montreux 1994,L. Rolandi ed., Nucl. Phys. (Proc. Suppl.) (1995).
[40] Qi Nading (BES Coll.), Proceedings of the 3rd Workshop on Tau Lepton Physics,Montreux 1994, L. Rolandi ed., Nucl. Phys. (Proc. Suppl.) (1995).
[41] ALEPH Collaboration, D. Buskulic et al., CERN-PPE/95-128, 1995.
39


![Theory of (quasi-) two-body non-leptonic B decays [-0.1cm]](https://img.dokumen.tips/doc/110x75/63253ced5c2c3bbfa803185f/theory-of-quasi-two-body-non-leptonic-b-decays-01cm.jpg)


![[ebook] Marketing pe intelesul tau - [].pdf](https://img.dokumen.tips/doc/110x75/636103754b9aa63a9e008ed1/ebook-marketing-pe-intelesul-tau-pdf.jpg)


