Embed Size (px)
Citation preview
International Journal of Economics, Commerce and Management United Kingdom Vol. VI, Issue 5, May 2018
Licensed under Creative Common Page 556
http://ijecm.co.uk/ ISSN 2348 0386
LIQUIDITY MANAGEMENT IN NIGERIAN DEPOSIT MONEY
BANKS: ISSUES, CHALLENGES AND PROGNOSIS
Godwin E. Bassey
Department of Economics, Faculty of Social Sciences
University of Uyo, Uyo, Akwa Ibom State, Nigeria
Udo N. Ekpo
Department of Economics, Faculty of Social and Management Sciences
Akwa Ibom State University, Ikot Akpaden, Akwa Ibom State, Nigeria
Abstract
The major focus of this paper was to identify the key issues, challenges and the way forward for
effective liquidity management by the Central Bank and Deposit Money Banks (DMBs) in
Nigeria. The paper adopted a descriptive approach using published data from the balance
sheets of DMBs. It examined the critical role played by the CBN and DMBs in fashioning out
appropriate framework for liquidity management and identified the challenges inhibiting effective
performance of these roles. In particular, the study revealed that deposit liabilities constituted a
major source of funding liquidity by DMBs while loans and advances constituted the bulk of the
illiquid assets. It was further found that DMBs in Nigeria operated above solvency level, having
current ratio greater than unity. Also, DMBs in Nigeria are over cautious, investing more in
short-term securities to protect their liquidity positions. But money market instruments played a
diminishing role as a source of liquidity funding by DMBs. Among the major liquidity
management challenges identified in the study was the inability of the monetary authorities to
determine appropriate mix of policy instruments that would exert minimum costs while achieving
monetary policy targets. As a way forward the paper recommended the adoption of price level
as nominal anchor of monetary policy and the alignment of movements in systemic liquidity with
the announced target of monetary policy stance of the CBN. Furthermore, banks should
strengthen their credit risk assessment mechanism so as to increase their credit exposure to the
International Journal of Economics, Commerce and Management, United Kingdom
Licensed under Creative Common Page 557
private sector. Finally the paper concluded that DMBs should establish a robust liquidity risk
management framework that is well integrated into the bank-wide risk management process and
ensure that competitive pressures do not compromise the integrity of their liquidity risk
management framework, control functions, limit systems and liquidity cushion.
Keywords: Liquidity Management, DMB’s Balance Sheets, Money Market Instruments, Nigeria
INTRODUCTION
A major challenge which financial managers the world over, face is how to maintain sufficient
funds to meet their obligations as they mature while at the same time ensuring adequate returns
on their investment. This rises from the apparent conflict that exists between the management
objective of simultaneously maintaining a high level of liquidity and profitability. As explained in
Olagunju, Adenauju and Olabode (2011), both goals run in opposite direction in the sense that
an attempt by a bank to achieve higher profitability will certainly take a toll on the liquidity level
and solvency position and vice versa.
Elaborating on this point, Bassey and Moses (2015) argued that the contradictory nature
of liquidity and profitability objectives can be explained by the intuitive reasoning that a bank
operating with high liquidity level (and in the process tying down investible funds) may have low
insolvency risk, but with a trade-off of low profitability. It behoves on a financial institution
seeking to thrive under the existing competitive environment to ensure astute management of its
profitability and liquidity levels as both variables can make or mar its future.
At the macroeconomic level, liquidity is critical for the conduct of monetary policy,
financial sector soundness and economic growth. Consequently, efficient and effective
management of liquidity is at the heart of the conduct of monetary policy (CBN, 2011). From the
monetary authorities’ point of view, liquidity management is critical in delivering on the mandate
of monetary and price stability. Adequate liquidity promotes a sound banking and financial
system which provides a virile platform for sustainable economic growth and development.
The financial meltdown which engulfed the world economy between 2007 and 2009
clearly demonstrated the dire adverse consequences of liquidity mismanagement. The Zenith
Economic Quarterly (2008) reported that the global equity market lost about $30 trillion to the
crises while stock market prices fell by 35 percent in the UK, 31 percent in the US and 73.6
percent in Russia. In the process, financial giants in the USA like Fannie Mac, Freddie Mac,
Merrill Lynch, Lehman Brothers and American International Group (AIG) became major victims.
© Bassey & Ekpo
Licensed under Creative Common Page 558
In Nigeria, the Central Bank of Nigeria (CBN) injected over N620 billion into the banking system
to improve the banks' liquidity and keep them from failing as a result of the financial melt-down
between 2008 and 2009 (CBN, 2013). Nigerian banks wrote off loans equivalent to 66% of their
total capital during the crises. Furthermore, the dire consequences of inefficient liquidity
management in banks were brought to the fore in Nigeria during the liquidation and distress era
of the late 1980s and early 1990s. Pat and James (2011) as cited in Bassey (2012) reported
that there were eight (8) distressed banks in 1991, sixteen (16) in 1992, thirty eight (38) in 1993,
fifty five (55) in 1994 and sixty (60) in 1996. As a result of the liquidity crises during that period,
the number of commercial and merchant banks in the country fell from about 120 in 1991 to 89
in 2004. Bassey (2012) reported that out of the 89 banks that survived in 2004, 69 of them were
declared marginal or fringe players while eleven (11) were in distress conditions. The CBN in
the exercise of its mandate to ensure a sound financial structure for Nigeria, implemented a
number of financial sector reforms which culminated in the recapitalization and consolidation
exercise that raised the equity base of banks from N2 billion in 2004 to N25 billion in 2005,
resulting in further reduction in the number of banks from 89 to 25 at the end of the exercise.
Against the backdrop of the above analysis, this study seeks to examine the concept
and major issues of liquidity management, challenges and way the forward for sound liquidity
management in Nigeria.
THE CONCEPT OF LIQUIDITY
Liquidity is defined in different ways by different people and for different reasons. The CBN
Monetary Policy Series No. 4 (2011) viewed liquidity as a macroeconomic concept which refers
to the overall monetary conditions, indicating the extent of mismatch between demand and
supply of monetary resources. It also considered liquidity in the context of the financial markets,
as the ease of undertaking transactions in financial assets at narrow bid-ask spreads. Still from
the financial market perspective, Allen and Carletti (2013) defined liquidity as the ease to raise
funds by selling asset instead of borrowing against it. From corporate finance point of view,
Olagunju, Adeyanju and Olabode (2011) defined liquidity as the ability of a company to meet its
short term obligations or the ability of a company to convert its assets into cash. Thus, an asset
is liquid if it can be turned into cash quickly without loss (Kohn, 1994). Bank liquidity therefore,
means the ability of a bank to maintain sufficient funds to meet financial commitments or pay for
its maturing obligations at a reasonable price. In a rather technical sense,
PricewaterhouseCoopers (PwC) (2015) in a global Study of Financial Market Liquidity, defined
liquidity as a multi-dimensional concept, generally referring to the ability to execute large
International Journal of Economics, Commerce and Management, United Kingdom
Licensed under Creative Common Page 559
transactions with limited price impact, and tends to be associated with low transaction cost and
immediacy in execution. The study identified the different dimensions of liquidity as follows:
i) Immediacy: This refers to the time it takes to complete a transaction under an agency
trading system.
ii) Depth and resilience: A market is deep when there is a large inflow of trading orders on
both the buy and sell side. There should be a sustained interest and willingness to trade with
large orders with minimum price impact,
iii) Breadth: This refers to the consistency with which liquidity is distributed within asset
classes and the differences in liquidity characteristics across markets.
iv) Tightness: This refers to the financial cost of completing the transaction, it is measured
by the bid-ask spread.
v) Stability: The price of the asset should remain stable regardless of the level of
transaction. There should be no price loss at the time of resale.
From the foregoing, liquidity can be seen as the ability to ensure the availability of funds to meet
financial commitments or maturing obligations at a reasonable price at all times. It measures the
extent to which financial assets can be sold at, or close to, full market value at short notice. It
could also be defined as the availability of funds, or assurance that funds would be available, to
honour all cash outflow commitments (both on-and-off balance sheet) as they fall due. To this
end, the most liquid financial assets are currency and transferable deposits as they are
exchangeable immediately at their full nominal value. Money in its basic form of bank notes and
coins is the most liquid asset and is held as a medium of exchange and store of value. On the
contrary, some assets are described as illiquid because they may not be easily traded or their
full market value realized at short notice. Such assets include unsecured loans to bank
customers, shares of moribund companies or real estate (CBN, 2011).
Types of Liquidity
From a liquidity management perspective, there are three broad types of liquidity. These are
central bank liquidity, market liquidity and funding liquidity (CBN, 2011; CBN, 2013; Buschmann
and Heidorn, 2014).
Central bank liquidity: This refers to deposits of financial institutions at the central bank, often
known as reserves or settlement balances. These reserves are held by financial institutions to
meet statutory prudential requirements, if any, and to achieve final settlement of all transactions
in the payments system. Such reserves are traded in the interbank money market.
© Bassey & Ekpo
Licensed under Creative Common Page 560
Market liquidity: This relates to the ability to buy and sell assets in reasonably large quantities
without significantly affecting the asset price.
Funding liquidity: This describes the ability of an individual or corporation to raise cash or its
equivalent in reasonably large quantities either through asset sales or by borrowing.
According to Buschmann and Heidorn (2014), while funding liquidity and market liquidity
are crucial elements of a bank’s liquidity management which heavily rely on the bank’s business
model, and therefore are intrinsically linked to both sides of bank’s balance sheet, central bank
liquidity is measured by money supply and is influenced by a country’s economic growth and
stability, monetary circulation and monetary policy.
Sources of Liquidity
In respect of central bank liquidity, five primary sources of liquidity in the financial system have
been identified. These are monetary financing by the central bank, net foreign assets, monetary
operations, bank rescue and fiscal operations of the government (CBN, 2011).
Monetary Financing
This involves central bank’s accommodating monetary policy of lending to the government in the
form of Ways and Means Advances (WMA) as in the case of Nigeria or outright deficit financing
in other jurisdictions. Any time the central bank lends to the government to finance its deficits, it
is injecting liquidity into the system.
Net Foreign Assets/External Reserves Build up
The level of net foreign assets of the Central Bank and Deposit Money Banks (DMBs) could
lead to an increase in the net domestic assets of the economy. This can occur in two ways,
either by government monetizing its foreign assets, and hence increasing domestic liquidity or
through the monetization of private flows by individuals and corporate organizations. Through
this process, liquidity is injected into the financial system.
Monetary Operations
Central banks intervene in the domestic money market from time to time to alter the liquidity
conditions through open market operations (OMO). This is achieved through treasury bills and
foreign exchange transactions, which are complemented by REPO, Reverse REPO, standing
deposit and lending facilities as well as special instruments.
International Journal of Economics, Commerce and Management, United Kingdom
Licensed under Creative Common Page 561
Bank Rescue
This is another source through which liquidity is injected into the financial system. As the central
bank or government injects funds into a bank to shore-up its capital base/liquidity, liquidity is
injected into the banking system.
Fiscal Operations
The sales proceeds from NNPC are deposited in the domestic banks, which after a few days,
are transferred to the statutory account in the CBN. The distributed oil and tax revenues are
subsequently credited to the accounts of various tiers of the government. Moreover, oil
revenues are used for (extra-budgetary) payments for fuel subsidy and other discretionary
spending programs. Thus, spending oil revenue beyond the levels dictated by the budget oil
price rule and the current practice of once-a-month distribution of oil and tax revenues generate
large movements in the available liquidity (IMF, 2013).
THE CONCEPT AND THEORIES OF LIQUIDITY MANAGEMENT
Meaning of Liquidity Management.
From the stand point of Monetary Authorities, liquidity management involves the control of the
level of liquidity in the economy in order to maintain monetary and financial stability (CBN,
2011). Adequate control of liquidity is essential to achieve price stability as too much or too little
liquidity affects the behaviour of banks, and indirectly the economy. Still from the point of view of
the monetary authorities, Ibe (2013) defined liquidity management as the strategic supply or
withdrawal from the market or circulation the amount of liquidity consistent with a desired level
of short term reserve money without distorting the profit making ability and operations of the
banks. Looking at the concept from the view point of corporate organisation generally, Olagunju
et al. (2011) defined liquidity management as the planning and control necessary to ensure that
the organisation maintains enough liquid assets either as an obligation to customers of the
organisation so as to meet some obligations incidental to survival of the business or as a
measure to adhere to the monetary policies of the Central Bank.
Theories of Liquidity Management
The Real Bills Doctrine
The real bill doctrine states that a commercial bank should advance only short-term self
liquidating loans to business firms. Self liquidating loans are those which are meant to finance
the production and movement of goods through the successive stage of production, storage,
transportation and distribution. When such goods are ultimately sold, the loans are considered
© Bassey & Ekpo
Licensed under Creative Common Page 562
to liquidate themselves automatically. The advantages of such loans are that (1) being self
liquidating loans, they do not run the risk of turning into bad debts. (2) They ensure adequate
return to the bank on the loans.
According to this doctrine, the central bank would supply liquid reserves to commercial
banks whenever they need funds to make loans for productive investment. Such loans were
discount loans in which the collateral was various forms of short term high-quality commercial
papers. The central bank would buy the commercial papers at a discount while the commercial
bank would buy back the papers at face value. When business activity increased and there was
greater demand for liquidity as evidenced by increase in commercial papers, the central bank
would supply the liquidity, lending notes and reserves to commercial banks that presented these
real bills as collateral. (Baye and Jansen, 2006)
However, the success of the scheme depended on the continuation of the lending by
the banks. If the banks withhold lending, the supply will fall and the economy will be depressed
thus making it impossible for the existing debtors to repay the loans. Moreover, the doctrine is
rooted in Say’s law which assets that supply create its own demand. If there is depression, the
economy’s aggregate demand will be deficient and sales would fall, thus creating repayment
difficulties for the banks.
Anticipated Income Theory
This theory holds that a bank’s liquidity can be managed through the proper phasing and
structuring of the loan commitments made by a bank to the customers. Here the liquidity can be
planned if the scheduled loan payments by a customer are based on the future income of the
borrower. According to Nzotta (1997) the theory emphasizes that the earning potential and the
credit worthiness of a borrower are the ultimate guarantees for ensuring adequate liquidity.
Nwankwo (1991) posited that the theory pointed to the movement towards self-liquidating
commitments by banks.
Shiftability Theory
This theory posited that a bank’s liquidity is maintained if it holds assets that can be shifted or
sold to other lenders or investors for cash. This point of view contended that a bank’s liquidity
could be enhanced if it always has assets to sell and provided the Central Bank and the
discount Market stands ready to purchase the asset offered for discount. Thus this theory
recognized and contended that shiftability, marketability or transferability of a bank's assets is a
basis for ensuring liquidity (Ibe, 2013).
International Journal of Economics, Commerce and Management, United Kingdom
Licensed under Creative Common Page 563
LIQUIDITY MANAGEMENT IN NIGERIA- THE ROLE OF CBN
In Nigeria, the Central Bank has over the years controlled the volume of liquidity in the banking
system through the Deposit Money banks (DMBs) by employing various techniques and
instruments. In order to achieve the objective of optimum liquidity, some processes and
institutional arrangements are put in place by the CBN.
The Process of Liquidity Management
The process of liquidity management by the CBN is part of the larger risk management
framework of the financial services industry against the background of the need to deliver on the
mandate of monetary and price stability. The processes involved are the setting of objectives,
formulation of policy targets, implementation through the use of direct and indirect instruments
and monitoring of policy implementation (CBN, 2011).
Objectives of Liquidity Management
While the overall objective of monetary policy is the maintenance of monetary and price stability,
the specific objectives of liquidity management according to the CBN are to:
- honour all cash outflow commitments (both on- and off-balance sheet) on an ongoing,
daily basis;
- avoid raising funds at market premiums or through the forced sale of assets; and
- to satisfy statutory reserve requirements (liquidity ratio and cash reserve requirement).
Formulation of Liquidity Management Policies
The formulation of liquidity management policies involves the setting of monetary and liquidity
targets. Target setting is such a difficult but important activity in the liquidity management
process. The targets are designed to generate an assessment of achieved performance. Setting
appropriate and realistic targets is vital in the liquidity management process. Policy targets are
grouped into three categories:
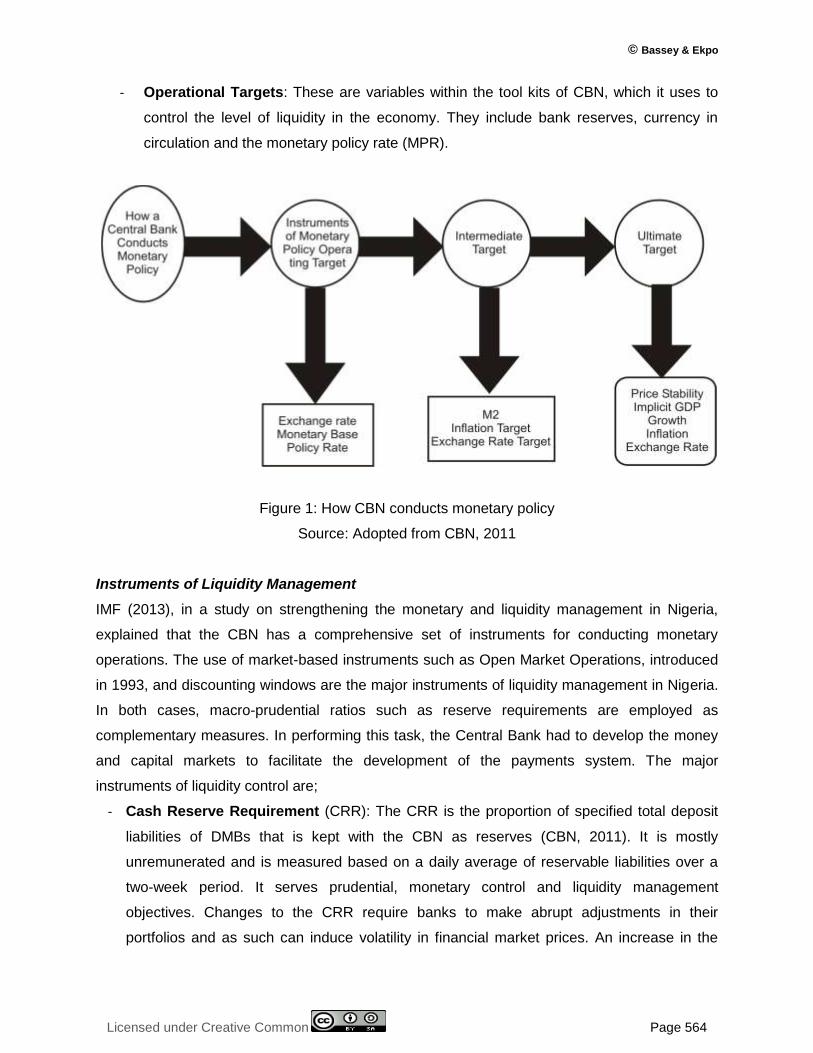
- The Ultimate Targets: These are macroeconomic variables that represent the ultimate
objectives of economic policy. They include the price level, the level of output,
employment and balance of payments.
- The Intermediate Targets: These are macroeconomic variables that have strong
relationship with the ultimate targets, which the CBN wish to influence indirectly through
the operational targets. They include money supply, interest rate, exchange rates and
credit to the private sector.
© Bassey & Ekpo
Licensed under Creative Common Page 564
- Operational Targets: These are variables within the tool kits of CBN, which it uses to
control the level of liquidity in the economy. They include bank reserves, currency in
circulation and the monetary policy rate (MPR).
Figure 1: How CBN conducts monetary policy
Source: Adopted from CBN, 2011
Instruments of Liquidity Management
IMF (2013), in a study on strengthening the monetary and liquidity management in Nigeria,
explained that the CBN has a comprehensive set of instruments for conducting monetary
operations. The use of market-based instruments such as Open Market Operations, introduced
in 1993, and discounting windows are the major instruments of liquidity management in Nigeria.
In both cases, macro-prudential ratios such as reserve requirements are employed as
complementary measures. In performing this task, the Central Bank had to develop the money
and capital markets to facilitate the development of the payments system. The major
instruments of liquidity control are;
- Cash Reserve Requirement (CRR): The CRR is the proportion of specified total deposit
liabilities of DMBs that is kept with the CBN as reserves (CBN, 2011). It is mostly
unremunerated and is measured based on a daily average of reservable liabilities over a
two-week period. It serves prudential, monetary control and liquidity management
objectives. Changes to the CRR require banks to make abrupt adjustments in their
portfolios and as such can induce volatility in financial market prices. An increase in the
International Journal of Economics, Commerce and Management, United Kingdom
Licensed under Creative Common Page 565
CRR, particularly when it is unremunerated, imposes additional costs on banks, which then
get passed on to the economy in the form of wider interest rate spreads. In a study, IMF
(2013) estimated that where banks have constant costs per unit of deposit, a 2 percent
increase in the level of the CRR adds approximately 0.5 percent to the spread between
deposit and lending rates. The study recommended that changes in the ratio should be
infrequent and made only when there is a strong reason not to use market-based
instruments.
- The Monetary Policy Rate (MPR): The MPR is the interest rate set by the CBN to serve
as indicative rate for transactions in the interbank market. It was introduced in December
2006 and is used as the operating target for monetary policy. It also serves as a signaling
device for the monetary policy stance. The Monetary Policy Committee (MPC) sets an
interest rate corridor of MPR ± 2-5 percentage points as the tolerable margin for the Open
Buy Back (OBB) rate. At times, the CBN used asymmetric corridor around the MPR,
particularly in the aftermath of the 2009 banking crisis.
- Government Securities (FGN T-bills and bonds) Auctions: The Debt Management
Office and the CBN are committed to scheduled auctions for FGN bonds and Nigerian
Treasury Bills (NTBs) respectively, based on the Federal Government’s funding
requirements. The NTBs auctions are held every other week and the tenors range between
91 to 364-days. The 3-month rate is the second most important reference rate used by
market participants after the Central Bank rate (MPR). The FGN-bond auctions held once
every four weeks has tenors ranging from 2, 3, 5, 10, and 20 years (IMF, 2013)
- CBN Bills: These are interest bearing instruments issued by the CBN for liquidity
management purposes. They are sold when additional sterilization is required. While these
are sold as CBN securities however, once issued, the market does not differentiate
between CBN Bills and NTBs. Given this absence of segmentation between the two types
of bills, there is no loss of trading liquidity for CBN bills.
- Sale (and purchase) of foreign exchange: This is another instrument that helps the CBN
to influence liquidity. However, the main objective of the foreign exchange operations is to
ensure stability of the Naira. The CBN acts as the net supplier of foreign exchange in the
market given that the government surrenders almost all of its foreign exchange earnings
from oil sales to it. The CBN also supplies about 40 percent of foreign exchange to the
market. Because the CBN is able to choose the volumes it sells at the bi-weekly auctions
window, this instrument could be used to manage liquidity. The study by IMF (2013)
confirmed that CBN typically sells $2.5 billion a month of foreign exchange as part of its
role as structural supplier. In the process, supplying the foreign exchange market with
© Bassey & Ekpo
Licensed under Creative Common Page 566
dollars also mops up part of domestic liquidity injection arising from government spending
of oil receipts.
- The Standing Deposit Facility (SDF): This provides a floor on rates, with the CBN
accepting an unlimited amount of deposits from banks on an overnight basis. The SDF rate
serves as the lower bound of the MPR corridor. While banks’ excess reserves do not earn
interest, a bank or discount house wanting to earn interest using the SDF must apply to the
CBN Liquidity Management Office for transfer of funds from their Current Account to the
SDF. The principal amount, plus interest, is repaid to the bank automatically on the
following business day (IMF, 2013).
- The standing lending facility (SLF): This serves as the upper bound of the MPR corridor.
It is available to all banks and discount houses upon application, like the SDF. The eligible
securities are; NTBs, FGN Bonds, and CBN Bills. The amount of collateral required is set at
110 percent of the amount borrowed, based on nominal and not market values of the
securities. The title to the securities is transferred to the CBN. The advantages of the
standing facilities are to encourage interbank trading, thereby deepening the money
market, smoothening or eliminating volatility of short-term overnight interest rates, providing
liquidity in the money market, reducing or eliminating excess bank reserves and influencing
other rates in the economy (IMF, 2013).
- Repos/reverse repos are used for short term liquidity management by banks. Repos are
used to inject liquidity and reverse repos to mop up liquidity on a temporary basis. Under
repo agreement, the trading desk of CBN buys securities from dealers who agree to
purchase them back at specified price and specified date (Akhtar, 1997). The repo facility is
available up to 90 days, with a rate set at an increasing margin to the MPR for longer-term
repos. Under the reverse repo contract, the trading desk undertakes to sell securities to a
dealer with a simultaneous undertaking to buy them back at a specified price and date. The
reverse repos are available only up to 28 days, with decreasing margin to the MPR relative
to the length of the reverse repo. The eligible securities are; NTBs, FGN Bonds, and CBN
Bills. For repos, the CBN holds a portfolio of government securities.
- Outright Transactions: These adopt a two way quote and are used often by the CBN to
influence liquidity levels. One obligation of being a Money Market Dealer is to provide two-
way quotes in NTBs to other dealers in amounts of ₦250 million and to the CBN in ₦1
billion. When the CBN is buying and a dealer may not have the NTBs in their portfolio, the
dealer will have to ask at least three other dealers for prices to cover the position because
the CBN transaction is four times the size of a standard market transaction. In addition to
International Journal of Economics, Commerce and Management, United Kingdom
Licensed under Creative Common Page 567
management of liquidity, another rationale for using this instrument is to provide the CBN
information about the market prices of NTBs (IMF, 2013)
- Deposit auctions, where banks can bid for deposits at the central bank, have recently
been added to the toolkit, but have not yet been used. (IMF, 2013)
LIQUIDITY MANAGEMENT IN NIGERIA- THE ROLE OF BANKS
The ability of banks to meet their financial obligations is usually measured by examining their
balance sheet and relating their current assets to current liabilities. A close look at the balance
sheet of Deposit Money Banks (DMBs) reveals the liquidity management strategy adopted by
the banks.
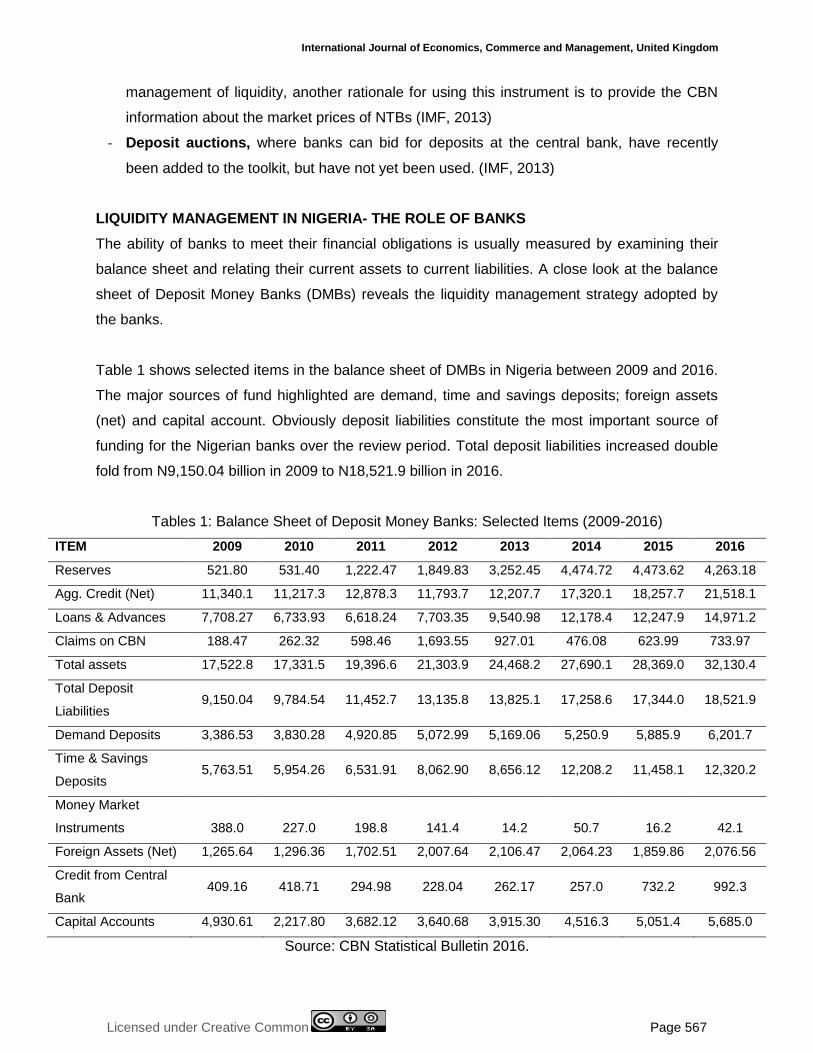
Table 1 shows selected items in the balance sheet of DMBs in Nigeria between 2009 and 2016.
The major sources of fund highlighted are demand, time and savings deposits; foreign assets
(net) and capital account. Obviously deposit liabilities constitute the most important source of
funding for the Nigerian banks over the review period. Total deposit liabilities increased double
fold from N9,150.04 billion in 2009 to N18,521.9 billion in 2016.
Tables 1: Balance Sheet of Deposit Money Banks: Selected Items (2009-2016)
ITEM 2009 2010 2011 2012 2013 2014 2015 2016
Reserves 521.80 531.40 1,222.47 1,849.83 3,252.45 4,474.72 4,473.62 4,263.18
Agg. Credit (Net) 11,340.1 11,217.3 12,878.3 11,793.7 12,207.7 17,320.1 18,257.7 21,518.1
Loans & Advances 7,708.27 6,733.93 6,618.24 7,703.35 9,540.98 12,178.4 12,247.9 14,971.2
Claims on CBN 188.47 262.32 598.46 1,693.55 927.01 476.08 623.99 733.97
Total assets 17,522.8 17,331.5 19,396.6 21,303.9 24,468.2 27,690.1 28,369.0 32,130.4
Total Deposit
Liabilities 9,150.04 9,784.54 11,452.7 13,135.8 13,825.1 17,258.6 17,344.0 18,521.9
Demand Deposits 3,386.53 3,830.28 4,920.85 5,072.99 5,169.06 5,250.9 5,885.9 6,201.7
Time & Savings
Deposits 5,763.51 5,954.26 6,531.91 8,062.90 8,656.12 12,208.2 11,458.1 12,320.2
Money Market
Instruments 388.0 227.0 198.8 141.4 14.2 50.7
16.2
42.1
Foreign Assets (Net) 1,265.64 1,296.36 1,702.51 2,007.64 2,106.47 2,064.23 1,859.86 2,076.56
Credit from Central
Bank 409.16 418.71 294.98 228.04 262.17 257.0 732.2 992.3
Capital Accounts 4,930.61 2,217.80 3,682.12 3,640.68 3,915.30 4,516.3 5,051.4 5,685.0
Source: CBN Statistical Bulletin 2016.
© Bassey & Ekpo
Licensed under Creative Common Page 568
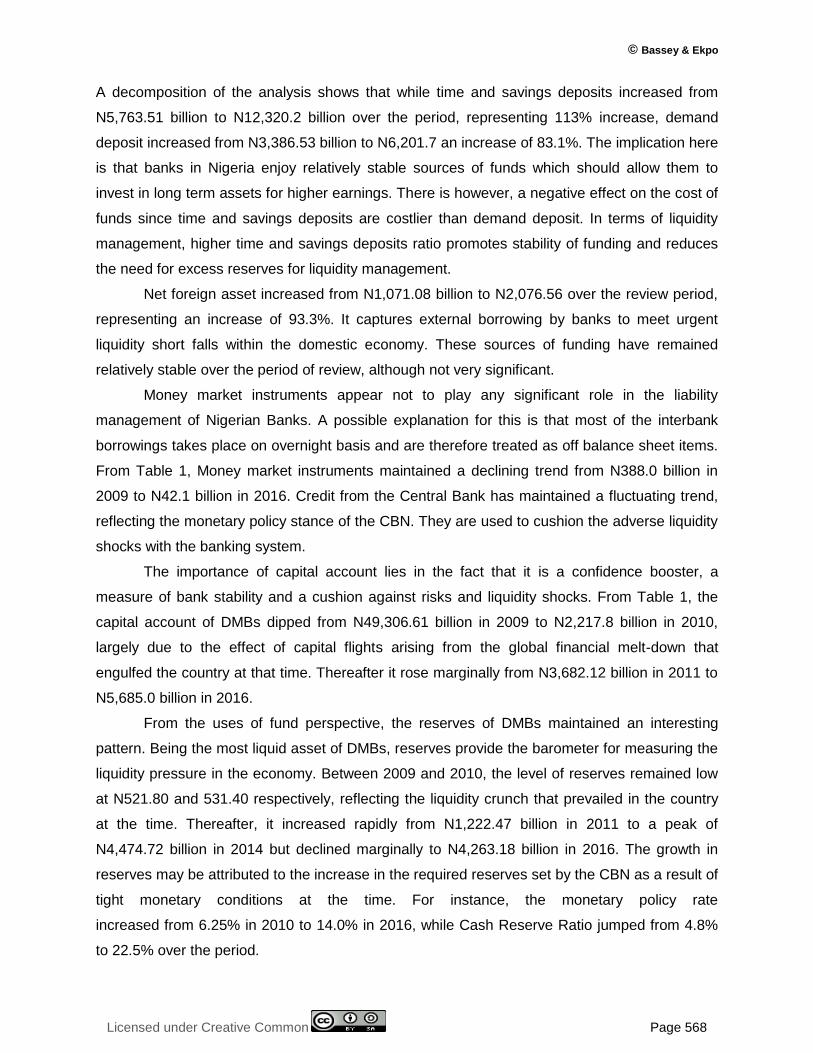
A decomposition of the analysis shows that while time and savings deposits increased from
N5,763.51 billion to N12,320.2 billion over the period, representing 113% increase, demand
deposit increased from N3,386.53 billion to N6,201.7 an increase of 83.1%. The implication here
is that banks in Nigeria enjoy relatively stable sources of funds which should allow them to
invest in long term assets for higher earnings. There is however, a negative effect on the cost of
funds since time and savings deposits are costlier than demand deposit. In terms of liquidity
management, higher time and savings deposits ratio promotes stability of funding and reduces
the need for excess reserves for liquidity management.
Net foreign asset increased from N1,071.08 billion to N2,076.56 over the review period,
representing an increase of 93.3%. It captures external borrowing by banks to meet urgent
liquidity short falls within the domestic economy. These sources of funding have remained
relatively stable over the period of review, although not very significant.
Money market instruments appear not to play any significant role in the liability
management of Nigerian Banks. A possible explanation for this is that most of the interbank
borrowings takes place on overnight basis and are therefore treated as off balance sheet items.
From Table 1, Money market instruments maintained a declining trend from N388.0 billion in
2009 to N42.1 billion in 2016. Credit from the Central Bank has maintained a fluctuating trend,
reflecting the monetary policy stance of the CBN. They are used to cushion the adverse liquidity
shocks with the banking system.
The importance of capital account lies in the fact that it is a confidence booster, a
measure of bank stability and a cushion against risks and liquidity shocks. From Table 1, the
capital account of DMBs dipped from N49,306.61 billion in 2009 to N2,217.8 billion in 2010,
largely due to the effect of capital flights arising from the global financial melt-down that
engulfed the country at that time. Thereafter it rose marginally from N3,682.12 billion in 2011 to
N5,685.0 billion in 2016.
From the uses of fund perspective, the reserves of DMBs maintained an interesting
pattern. Being the most liquid asset of DMBs, reserves provide the barometer for measuring the
liquidity pressure in the economy. Between 2009 and 2010, the level of reserves remained low
at N521.80 and 531.40 respectively, reflecting the liquidity crunch that prevailed in the country
at the time. Thereafter, it increased rapidly from N1,222.47 billion in 2011 to a peak of
N4,474.72 billion in 2014 but declined marginally to N4,263.18 billion in 2016. The growth in
reserves may be attributed to the increase in the required reserves set by the CBN as a result of
tight monetary conditions at the time. For instance, the monetary policy rate
increased from 6.25% in 2010 to 14.0% in 2016, while Cash Reserve Ratio jumped from 4.8%
to 22.5% over the period.
International Journal of Economics, Commerce and Management, United Kingdom
Licensed under Creative Common Page 569
Aggregate Credit (Net) from the DMBs, which captures financial leverage within the system,
maintained an upward trend, rising from N11,340.1 billion in 2009 to N21,518.1 billion in 2016.
Similarly, loans and advances rose from N7,708.27 billion in 2009 to N14,971.2 billion in 2016,
an increase of 94.2%. Being a less liquid asset, increase in credit and loan portfolio means
more earnings and less liquidity for the banks. The Claims on CBN, which consist mostly of
overnight calls, maintained a fluctuating trend reflecting changes in the monetary policy stance
of the CBN.
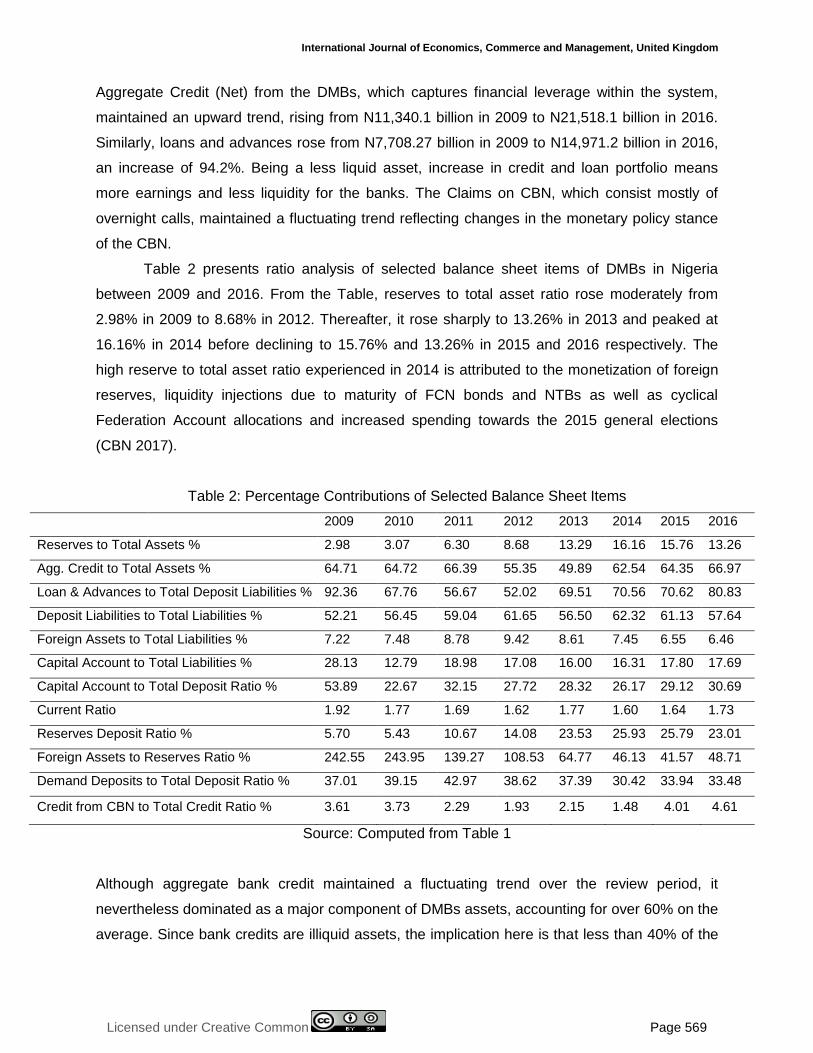
Table 2 presents ratio analysis of selected balance sheet items of DMBs in Nigeria
between 2009 and 2016. From the Table, reserves to total asset ratio rose moderately from
2.98% in 2009 to 8.68% in 2012. Thereafter, it rose sharply to 13.26% in 2013 and peaked at
16.16% in 2014 before declining to 15.76% and 13.26% in 2015 and 2016 respectively. The
high reserve to total asset ratio experienced in 2014 is attributed to the monetization of foreign
reserves, liquidity injections due to maturity of FCN bonds and NTBs as well as cyclical
Federation Account allocations and increased spending towards the 2015 general elections
(CBN 2017).
Table 2: Percentage Contributions of Selected Balance Sheet Items
2009 2010 2011 2012 2013 2014 2015 2016
Reserves to Total Assets % 2.98 3.07 6.30 8.68 13.29 16.16 15.76 13.26
Agg. Credit to Total Assets % 64.71 64.72 66.39 55.35 49.89 62.54 64.35 66.97
Loan & Advances to Total Deposit Liabilities % 92.36 67.76 56.67 52.02 69.51 70.56 70.62 80.83
Deposit Liabilities to Total Liabilities % 52.21 56.45 59.04 61.65 56.50 62.32 61.13 57.64
Foreign Assets to Total Liabilities % 7.22 7.48 8.78 9.42 8.61 7.45 6.55 6.46
Capital Account to Total Liabilities % 28.13 12.79 18.98 17.08 16.00 16.31 17.80 17.69
Capital Account to Total Deposit Ratio % 53.89 22.67 32.15 27.72 28.32 26.17 29.12 30.69
Current Ratio 1.92 1.77 1.69 1.62 1.77 1.60 1.64 1.73
Reserves Deposit Ratio % 5.70 5.43 10.67 14.08 23.53 25.93 25.79 23.01
Foreign Assets to Reserves Ratio % 242.55 243.95 139.27 108.53 64.77 46.13 41.57 48.71
Demand Deposits to Total Deposit Ratio % 37.01 39.15 42.97 38.62 37.39 30.42 33.94 33.48
Credit from CBN to Total Credit Ratio % 3.61 3.73 2.29 1.93 2.15 1.48 4.01 4.61
Source: Computed from Table 1
Although aggregate bank credit maintained a fluctuating trend over the review period, it
nevertheless dominated as a major component of DMBs assets, accounting for over 60% on the
average. Since bank credits are illiquid assets, the implication here is that less than 40% of the
© Bassey & Ekpo
Licensed under Creative Common Page 570
total bank asset was available for effective liquidity management during the review period. The
use of this ratio as a measure of illiquidity has been criticized on the ground that it measures
only the asset illiquidity and excludes the possibility of raising funds other than through the sale
of assets (Ibe, 2013).
Loan and advances to total deposit liabilities ratio is another important measure of the
liquidity conditions of DMBs. It represents the portion of the bank deposit that is given out as
loans vis a vis what is left in liquid form. Between 2009 and 2012, the loan to deposit ratio
declined progressively from 92.36% to 52.02%. Thereafter, it increased gradually from 69.51%
in 2013 to 80.3% in 2016. The observed trend can be explained in terms the fall outs of the
global financial crises that crippled bank lending and the subsequent recovery due to
expansionary fiscal operations of the government. The implication of this ratio is that banks use
it as a guide in lending and investment and to evaluate their credit expansion programs. But the
ratio fails to indicate the maturity or quality of the assets and does not give accurate indication of
liquidity needs (Olagunju, et al, 2011; Ibe, 2013).
Taking a look at the sources side of the DMBs balance sheet, it is obvious that deposit
liabilities remained a stable source of funding for the DMBs in Nigeria. They accounted for more
than 50% on the average. Also the ratio of demand deposit to total deposit liabilities fluctuated
between 30% and 40% over the period, indicating a low level of banking habits. The implication
for liquidity management is that DMBs in Nigeria enjoy a stable source of funding and may not
need to maintain large excess reserves for liquidity management. But the costs of funds are
higher which have negative implications for bank efficiency and profitability.
Foreign assets to total deposit liability ratio has been suggested as a possible indicator
of liquidity conditions within the banking system. It indicates what percentage of total funding is
accounted for by foreign asset. Apart from the fact that foreign assets account for less than
10% of the total funding over the period, its contribution as a percentage of total reserves has
shown a dramatic decline. This demonstrates the diminishing importance of net foreign assets
as a tool for liquidity management in Nigeria, probably due to the limited global impact of
Nigerian banks.
Credit from CBN played a minimal role as a source of funding for the DMBs. According
to IMF (2013) it is mainly used as a sterilization device. The funds are borrowed mostly on
overnight basis and accessed by banks that need to meet daily statutory liquidity ratio. Over the
review period CBN credit accounted for less than 5% of the total funding to the DMBs.
Capital accounts accounted for less than 20% of the total funding of DMBs over the
review period on the average. This betrays the fragile nature of Nigerian banks despite the
recapitalization and consolidation efforts of 2005. Similarly the capital adequacy ratio
International Journal of Economics, Commerce and Management, United Kingdom
Licensed under Creative Common Page 571
maintained a declining trend dropping from 53.89% in 2009 to 30.69% in 2016. This has
adverse implications for liquidity management since bank capital has a cushioning effect during
liquidity crises. The thin equity base of DMBs in Nigeria should be a source of concern since it
can ignite another spate of bank liquidity crises in the nearest future, unless remedial actions
are taken.
The current ratio is calculated as current assets divided by current liabilities and is a
measure of a DMB short term solvency. The current assets are composed of cash and those
assets which can be converted into cash in a short period which include marketable securities,
receivables, inventories, and prepaid expenses. Current liabilities consist of all obligations
maturing within a year. They include accounts payable, bills payable, note payable, accrued
expenses and tax liability. A current ratio that is greater than one is adjudged satisfactory for
most business firms even though it is difficult to authoritatively set one standard for all firms
(Olagunju, et al., 2011). Going by this explanation, one can safely say that DMBs in Nigeria
operated above solvency level, having ratio greater than unity. The ratio fluctuates from 1.92%
in 2009 to 1.60% in 2014 and settled at 1.73% in 2016.
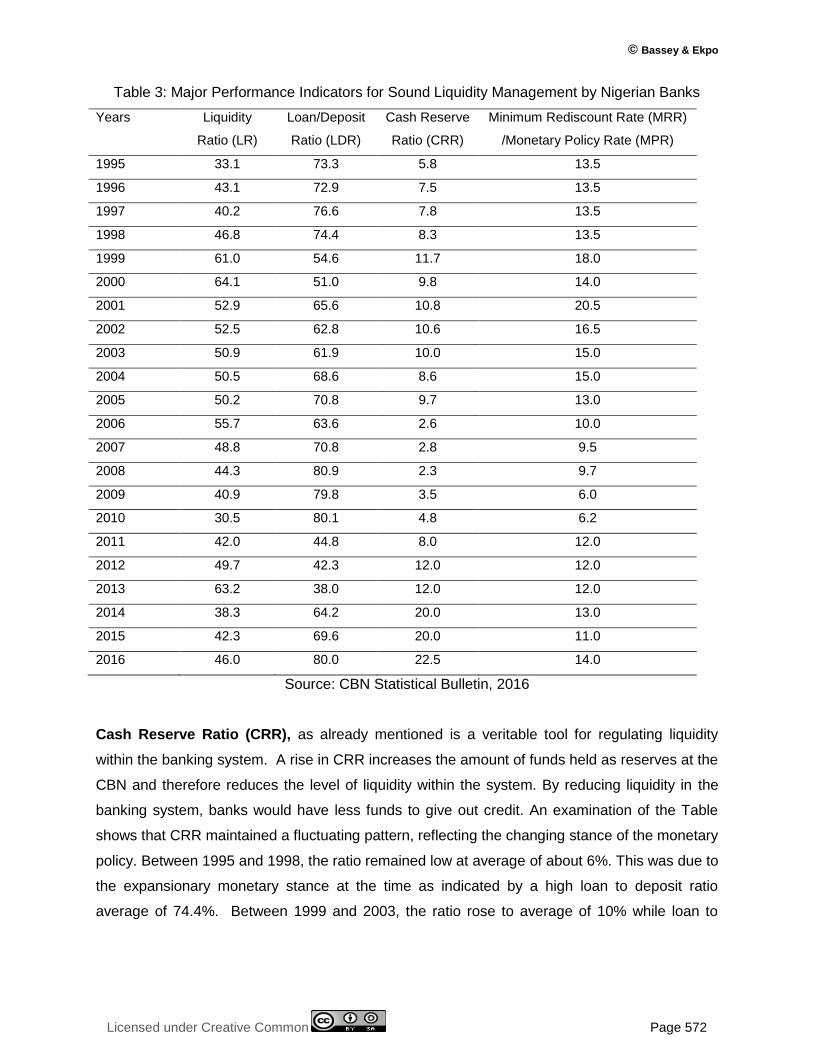
Table 3 gives the trend in major performance indicators of sound liquidity management
in Nigeria over the period 1995-2016. The major performance indicators used are Liquidity Ratio
(LR), Loan/Deposit Ratio (LDR), Cash Reserve Ratio (CRR) and Monetary Policy Rate (MPR).
A cursory examination of the Table reveals that DMBs in Nigeria generally maintain liquidity
ratios that are above the required minimum. Therefore, the policy of minimum liquidity is not
binding on them. What this suggests is that DMBs in Nigeria are over cautious investing more in
short-term securities to protect their liquidity positions. While this approach may ensure bank
safety, it has a negative implication for bank’s profitability. Since DMBs enjoy stable funding
through time and savings deposits, keeping a large chunk of bank resources in liquid form
deprives the system of funds that should be deployed to finance real investment and economic
growth.
A trend analysis shows that liquidity ratio, which mirrors the liquidity conditions in the
system, increased steadily from 33.1% in1995 to a peak of 64.1% in the year 2000. Between
2001 and 2005 the ratio stabilized at about 50% but fluctuated widely thereafter to terminate at
46% in 2016. The use of liquidity ratio as index of liquidity management has been criticized on
the ground that it measures only asset liquidity while ignoring liquidity available through the
bank’s ability to borrow (Ibe, 2013).
© Bassey & Ekpo
Licensed under Creative Common Page 572
Table 3: Major Performance Indicators for Sound Liquidity Management by Nigerian Banks
Years Liquidity
Ratio (LR)
Loan/Deposit
Ratio (LDR)
Cash Reserve
Ratio (CRR)
Minimum Rediscount Rate (MRR)
/Monetary Policy Rate (MPR)
1995 33.1 73.3 5.8 13.5
1996 43.1 72.9 7.5 13.5
1997 40.2 76.6 7.8 13.5
1998 46.8 74.4 8.3 13.5
1999 61.0 54.6 11.7 18.0
2000 64.1 51.0 9.8 14.0
2001 52.9 65.6 10.8 20.5
2002 52.5 62.8 10.6 16.5
2003 50.9 61.9 10.0 15.0
2004 50.5 68.6 8.6 15.0
2005 50.2 70.8 9.7 13.0
2006 55.7 63.6 2.6 10.0
2007 48.8 70.8 2.8 9.5
2008 44.3 80.9 2.3 9.7
2009 40.9 79.8 3.5 6.0
2010 30.5 80.1 4.8 6.2
2011 42.0 44.8 8.0 12.0
2012 49.7 42.3 12.0 12.0
2013 63.2 38.0 12.0 12.0
2014 38.3 64.2 20.0 13.0
2015 42.3 69.6 20.0 11.0
2016 46.0 80.0 22.5 14.0
Source: CBN Statistical Bulletin, 2016
Cash Reserve Ratio (CRR), as already mentioned is a veritable tool for regulating liquidity
within the banking system. A rise in CRR increases the amount of funds held as reserves at the
CBN and therefore reduces the level of liquidity within the system. By reducing liquidity in the
banking system, banks would have less funds to give out credit. An examination of the Table
shows that CRR maintained a fluctuating pattern, reflecting the changing stance of the monetary
policy. Between 1995 and 1998, the ratio remained low at average of about 6%. This was due to
the expansionary monetary stance at the time as indicated by a high loan to deposit ratio
average of 74.4%. Between 1999 and 2003, the ratio rose to average of 10% while loan to
International Journal of Economics, Commerce and Management, United Kingdom
Licensed under Creative Common Page 573
deposit ratio fell to 63% over the period, indicating a tight monetary posture. As a result, liquidity
ratio fell to average of 51% in sympathy.
Between 2004 and 2010, the CRR dropped to average of 2.9% while loan to deposit
ratio increased to 73.5% on the average over the period, reflecting an era of monetary ease.
Between 2011 and 2016, CRR rose sharply to average of 15.8% while loan deposit fell to 56.4%
on the average to capture the tight monetary stance of CBN over the period.
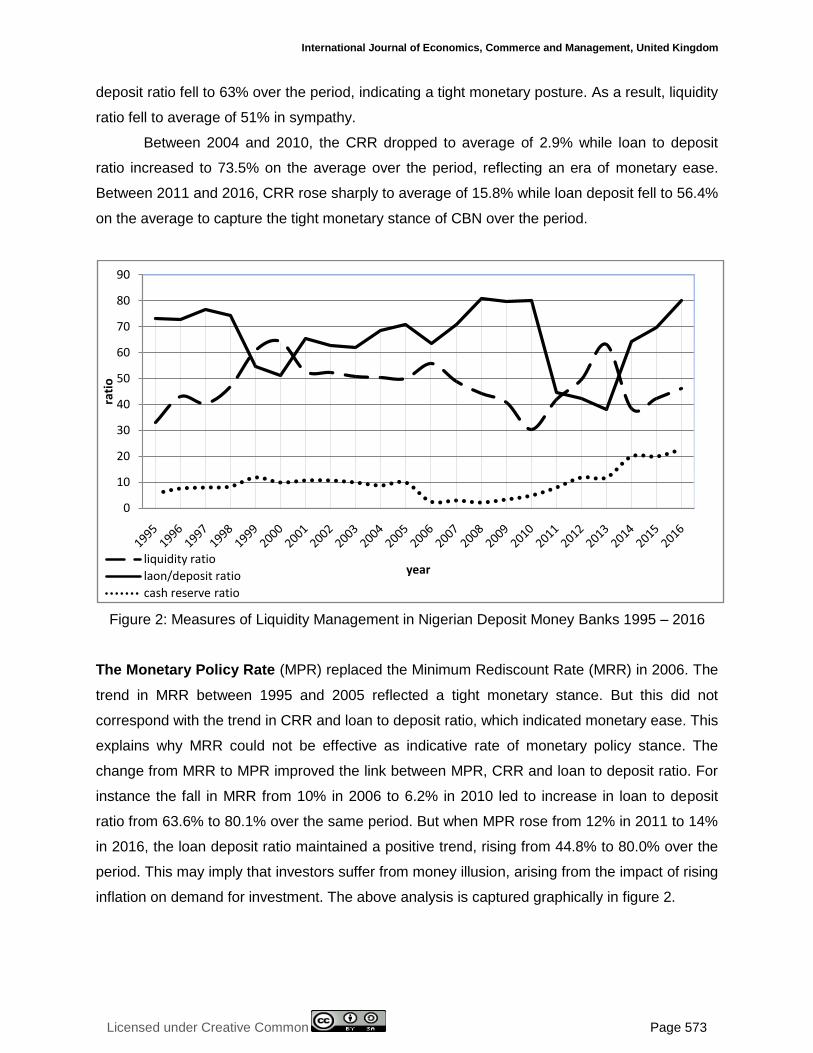
Figure 2: Measures of Liquidity Management in Nigerian Deposit Money Banks 1995 – 2016
The Monetary Policy Rate (MPR) replaced the Minimum Rediscount Rate (MRR) in 2006. The
trend in MRR between 1995 and 2005 reflected a tight monetary stance. But this did not
correspond with the trend in CRR and loan to deposit ratio, which indicated monetary ease. This
explains why MRR could not be effective as indicative rate of monetary policy stance. The
change from MRR to MPR improved the link between MPR, CRR and loan to deposit ratio. For
instance the fall in MRR from 10% in 2006 to 6.2% in 2010 led to increase in loan to deposit
ratio from 63.6% to 80.1% over the same period. But when MPR rose from 12% in 2011 to 14%
in 2016, the loan deposit ratio maintained a positive trend, rising from 44.8% to 80.0% over the
period. This may imply that investors suffer from money illusion, arising from the impact of rising
inflation on demand for investment. The above analysis is captured graphically in figure 2.
0
10
20
30
40
50
60
70
80
90
ratio
yearliquidity ratio
laon/deposit ratio
cash reserve ratio
© Bassey & Ekpo
Licensed under Creative Common Page 574
THE CHALLENGES OF LIQUIDITY MANAGEMENT
The pursuit of multiple objectives by CBN
The Banking Act of 2007assigned to the CBN multiplicity of objectives which tended to be at
conflict with one another, leading to policy inconsistencies. For instance, after the 2009 financial
crisis, the CBN decided not to raise interest rate in view of poor liquidity and solvency position of
banks. This was in conflict with the significant pressure on the currency and prices due to
expansionary fiscal policy of the government. The use of excessive foreign exchange sales to
arrest the Naira depreciation led not only to the depletion in international reserves but also to a
double digit inflation.
Market Segmentation
Market segmentation in the money market on the basis of perceived credit risk has remained a
daunting challenge despite efforts by the CBN to redress the situation. As rates for standing
facilities increased, banks with excess liquidity appear to prefer deploying their funds to the CBN
Standing Deposit Facility (SDF) instead of supplying them into the interbank market. Thus some
banks considered as high credit risk have little or no access to credit from banks with excess
liquidity. This created a situation whereby some banks have liquidity shortages while others are
awash with excess liquidity. This has compounded the problem of determining the optimal
liquidity needs for the system.
Persistent Excess Liquidity
One common feature of the Nigerian money market is the prevalence of excess liquidity. This is
caused largely by lodgment of large funds by bankers bidding for foreign exchange during the
weekly or daily auctions. Furthermore, admitting AMCON bonds for discount window operations
was another factor contributing to excess liquidity (IMF, 2013). Besides, banks are said to be
reluctant in giving credit to private sector operators due to their poor credit ratings.
Fiscal Operations of the Government
One major source of liquidity in the financial system is the monetization of oil receipts and other
oil related inflows from the government. The spending of this oil revenue beyond the levels
dictated by the budget oil price rule and the current practice of once a month distribution of oil
and tax revenues makes forecasting and managing liquidity in the banking system difficult.
Moreover, fiscal operations of states and local governments, which account for about half of
public spending, are not fully reflected in the liquidity projection plans. Therefore, effort to
International Journal of Economics, Commerce and Management, United Kingdom
Licensed under Creative Common Page 575
improve liquidity forecasting must focus on better coverage of fiscal operations of government at
all levels (IMF, 2013).
Money Market Volatility
Money market volatility is largely caused by sporadic injection of liquidity through monetization
of oil receipts and related foreign exchange inflows. Other sources of instability include lumpy
disbursement from the federation account and the maturity of government bonds and securities.
Often, the CBN responds to these shocks through foreign exchange sales and issuance of
government securities to sterilize the excess liquidity. These policy responses by CBN are not
without trade-offs in terms of rising interest rates in the case of open market sales or an
appreciated exchange rate in case of foreign exchange sales. The goal of liquidity management
should be to seek the “least cost” mix of sterilization.
Frequent Changes in CRR
These have been identified as major challenge to liquidity management. When CRR is changed,
banks are required to make necessary adjustment in their portfolio which may alter finance
market prices. According to IMF (2013), CRR is best used to create stable demand for reserves
consistent with the level of systematic liquidity. An increase in the CRR, particularly when it is
unremunerated imposes additional cost on banks, which can be passed on to the economy in
the form of wider interest spreads. Therefore, changes in the CRR should be infrequent and
made only when there is a strong reason not to use market bond instruments.
Volatility in Short term Money Market Rates
Despite efforts by the CBN to establish interest rate corridor around the MPR to keep short term
interbank rates within limits, excessive gyration in short term still persist in the market.
According to IMF (2013) this volatility ranges between 3% and 30%. This is attributed to the
volatility in the underlying liquidity base as well as the high risk premium charged, depending on
the credit worthiness of the borrowing bank and the quality of bank asset pledged as collateral.
The introduction of CBN guarantees and the purchase of nonperforming assets by AMCON
have mitigated the problem.
The Contagion Effect
Banks in Nigeria trade in the same market and in similar products and are subject to the same
market vagaries and uncertainties. There is little or no diversification in the products and
services provided. It is therefore possible that liquidity crisis in one bank can easily spread like
© Bassey & Ekpo
Licensed under Creative Common Page 576
wild fire across the entire system. This is made even worse by the fact that banks in Nigeria
adopt branch banking instead of unit banking in which case the failure of one bank has a far
reaching impact on other banks and the entire economy.
Low level of Trading in the Interbank Market
Money market activities remain relatively low despite attempts by CBN to promote the market.
As mentioned earlier, money market instruments maintained a declining trend from N388.0
billion in 2009 to N42.1 billion in 2016. This may be due to high risk premium on marketable
securities, asymmetric information problem, leading to credit rationing and the availability of
cheaper source of funding through CBN’s Standing Facilities.
Fragile Equity Base
As noted earlier, despite the bank recapitalization and consolidation exercise of 2005, the equity
base of banks remain weak and fragile. For instance, the capital adequacy ratio of Nigerian
DMBs fell from 53.89% in 2009 to 30.69% in 2016. This has adverse implications for liquidity
management since bank capital has a cushioning effect during liquidity crises.
THE PROGNOSIS
Based on the foregoing analysis and findings, the following recommendations are made as the
way forward for the effective management of liquidity by the CBN and Nigerian banks.
Reduce Multiple Objectives of Liquidity Management
As a positive step towards addressing this problem, the CBN should set monetary and price
stability as its overriding objective for liquidity management. Other objectives of monetary policy
such as maintenance of external reserves, promotion of sound financial system and balance of
payments viability should be secondary and subsumed in the price stability. This is based on the
logical reasoning that the Central Bank should do what it knows best to do- maintaining price
stability. To achieve this objective the CBN should work towards adoption of price level as the
nominal anchor for monetary policy through a policy of inflation targeting.
Reduce Money Market Segmentation
To reduce segmentation in the money market, the CBN needs to address the gaps in bank
supervision framework and take measures to enhance credibility of its assessment of banks
health. Insistence on disclosure by banks of their true net worth and asset qualities through
adherence to prudential guidelines will help to ward off possible threats of liquidity crises.
International Journal of Economics, Commerce and Management, United Kingdom
Licensed under Creative Common Page 577
Address the Problem of Excess Liquidity
The use of large foreign exchange sales to mop up excess liquidity even though it has a
salutary effect of strengthening the Naira, may fail to deal with problem of excess liquidity. This
is because while the announced policy measures of the government have maintenance period
of two weeks, major sources of systemic liquidity shocks such as oil receipts and disbursement
come on monthly basis. There is therefore the need to align systemic liquidity with the
announced policy stance through the adoption of medium term forecast of banking system
liquidity. Also banks should strengthen their credit risk assessment mechanism so as to
increase their credit exposure to the private sector.
Reduce Monetization of Crude Oil Receipts
The current practice whereby oil receipts from excess crude oil account of the federation are
monetized should be discontinued. Instead such funds should be invested in medium to long
term securities to deepen the money and capital markets and promote investment and growth of
the economy. Besides, strict adherence to budget oil price rule and avoidance of extra
budgetary spending from excess crude account will help to mitigate the problem.
Reduce Volatility in the Money Market
Despite the concerted effort of the CBN, volatility in the quantity and prices of assets remains a
regular feature of the Nigerian money market. To address this problem, the major source of this
instability should be identified and controlled. The major sources of this instability include
monetization of crude oil receipts, CBN large sales of foreign exchange, and frequent changes
in CRR as well as high risk premium on interbank rates and conflict in the monetary policy
stance of Government. To redress these problems, the CBN should use its full array of
instruments to ensure adequate supply of liquidity to meet banks demand for reserves. There
should be clearly articulated monetary framework so that market participants can understand
applicable operating target of monetary policy.
Reduce Frequent Changes in CRR
Since changes in CRR entails some costs on the part of the banks, using it as instrument of
monetary policy should be infrequent and only used when there is a strong reason for not using
market based instruments. Study by IMF (2013) has also confirmed that changes in CRR widen
the spread between lending and deposit rates.
© Bassey & Ekpo
Licensed under Creative Common Page 578
Adopt of Sound Principles of Liquidity Risk Management by Banks
The following selected principles for sound liquidity risk management by banks, enunciated by
Basel Committee on Bank Supervision (2008) are quite instructive and are adopted in this
study.
i. DMBs should establish a robust liquidity risk management framework that ensures they
maintain sufficient liquidity, including a cushion of unencumbered, high quality liquid
assets, to withstand a range of stress event, including those involving the loss or
impairment of both secured and unsecured funding sources.
ii. DMBs should clearly articulate a liquidity risk tolerance that is appropriate for their
businesses and role in the financial system.
iii. DMBs should have sound processes for identifying, measuring, monitoring and
controlling liquidity risk. These processes should include a robust framework for
comprehensively projecting cash flows arising from assets, liabilities and off-balance
sheet items over appropriate set of time horizons.
iv. DMBs should actively monitor and control liquidity risk exposures and funding needs
within and across legal entities, business lines and currencies, taking into consideration
legal, regulatory and operational limitations to the transferability of liquidity.
v. DMBs should establish a funding strategy that provides effective diversification in the
sources and tenor of funding. They should maintain an ongoing presence in their chosen
funding markets and strong relationships with fund providers.
vi. DMBs should actively manage their collateral positions, differentiating between
encumbered and unencumbered assets. They should monitor the legal entity and
physical location where collaterals are held and how it will be mobilized in a timely
manner.
vii. DMBs should publicly disclose information on a regular basis that enables market
participants to make an informed judgment about the soundness of their liquidity risk
management framework and liquidity position.
CONCLUSION
The major focus of this paper was to identify key issues, challenges and the way forward for
effective liquidity management by DMBs in Nigeria. The paper adopted a descriptive approach
using published data from the balance sheets of DMBs. It examined the critical role played by
the CBN and DMBs in fashioning out appropriate framework for liquidity management and
identified the challenges inhibiting effective performance of these roles. In particular, study
revealed that deposit liabilities constituted a major source of funding liquidity by DMBs while
International Journal of Economics, Commerce and Management, United Kingdom
Licensed under Creative Common Page 579
loans and advances constituted the bulk of the illiquid assets. It was further found that DMBs in
Nigeria operated above solvency level, having current ratio greater than unity. Also, DMBs in
Nigeria are over cautious investing more in short-term securities to protect their liquidity
positions. The money market instruments however, play a diminishing role as a source of
liquidity funding by DMBs. Among the major liquidity management challenges identified in the
study are the inability of the monetary authorities to determine appropriate mix of policy
instruments that would exert minimum costs while achieving monetary policy targets and the
problem of market segmentation which create a situation whereby some banks have liquidity
shortages while others are a washed with excess liquidity.
In conclusion, DMBs should establish a robust liquidity risk management framework that
is well integrated into the bank-wide risk management process. A primary objective of the
liquidity risk management framework should be to ensure with a high degree of confidence that
DMBs are in a position to both address their daily liquidity obligations and withstand periods of
liquidity stress affecting both secured and unsecured funding, the source of which could be
bank-specific or market-wide. In addition to maintaining sound liquidity risk governance and
management practices, DMBs should hold adequate liquidity cushion comprising readily
marketable assets to be in a position to survive such periods of liquidity stress. They should
demonstrate that their liquidity cushion is commensurate with the complexity of their on- and off-
balance sheet activities, the liquidity of their assets and liabilities, the extent of their funding
mismatches and the diversity of their business mix and funding strategies. Furthermore, DMBs
should not allow competitive pressures to compromise the integrity of their liquidity risk
management, control functions, limit systems and liquidity cushion. Rather, they should
strengthen their credit risk assessment mechanism so as to increase their credit exposure to the
private sector.
SCOPE FOR FURTHER STUDIES
This work undertook a descriptive analysis of the liquidity management issues and challenges in
Nigeria, using the CBN’s liquidity management instruments and the DMBs balance sheet
performance as reference points. Further empirical studies are required to establish the link
between the CBN instruments and the liquidity management performance of the DMBs. Apart
from allowing for strong policy inferences to be drawn; such studies would give room for
effective evaluation of the relative importance of the monetary policy variables within the tool
kits of the CBN.
© Bassey & Ekpo
Licensed under Creative Common Page 580
REFERENCES
Adebayo, O. Adeyani O. and Olabode, O. (2011): Liquidity Management and Commercial Banks Profitability in Nigeria. Research Journal of Finance and Accounting 2(7/8): pp. 24.
Allen, F. and Carletti, E. (2013), Financial Markets Institution and Liquidity. Reserve Bank of Australia (Conference Volume): 77-106.
Bassey G. (2012), The Impact of Recapitalization and Consolidation on Bank Performance in Nigeria. International Journal of Africa Culture Politics and Development, 7(2): 1-16.
Bassey, G. and Moses, C. (2015). Bank Profitability and Liquidity Management: A Case Study of Selected Nigeria Deposit Money Banks. International Journal of Economics, Commerce and Management.111 (4) pp. 1
Baye, M. R. and Jansen, D. W. (2006), Money, Banking and Financial Market: An Economics Approach. India: A. I. T. B. S.
Buschman, C. And Hedorn, T. (2014), The Liquidity Reserve Funding and Management Strategies, Frankfort School Working Paper Series. No. 210: 1-45.
CBN (2011). Liquidity Management in Nigeria. Understanding Monetary Policy Series No. 4 pp. 1.
CBN (2013) Banking System Liquidity. Understanding Monetary Policy Series, No. 34
CBN (2017), The conduct of Monetary Policy. http://www.cbn.gov.ng.
Ibe, S. O. (2013), The Impact of Liquidity Management on the Profitability of Banks in Nigeria. Journal of Finance and Bank Management 1(1): 37-48.
IMF (2013). Strengthening Monetary and Liquidity Management: Technical Note. Public Sector Assessment Programme Update, July
Kohn, M. (2006). Financial Institution and Market, New Delhi: Tata Mc Graw-Hue Publishing Co Ltd.
Nwankwo, U. (1991), Economic Agenda for Nigeria. Lagos: Centralist Production Ltd.
Nzotta, S. M. (1997). Theory of Money and Finance. Owerri,: Intercontinental Educational Books and Publishers.
Pat, D. and James, O. (2011). Effects of the Consolidation of the Banking Industry on the Nigerian Capital Market, Journal of Economics, 2(1): 57-65
Pwe (2015), Global Financial Market Liquidity Study. www.pwe.com: 1-152.
Zenith Bank Plc (2008). Global Financial Crisis: Recession, Depression and Other Threats. Zenith Economic Quarterly. 3(4)