Embed Size (px)
Citation preview

100 Production Ratios
www.cometis-publishing.de

Preface
Dear Readers,
Production plays an important role in the quest for a company’s competitiveness and profitability. Substantial capital needs, complex production structures, neces-sity of securing know-how, vast technological progress, integration in corporate process chains and the demands of rapidly changing markets pose enormous challenges to production management and controlling. In this environment indi-cators become indispensable orientation parameters and - in the form of process benchmarks - serve as the basis for analyses of variance and as planning specifi-cations for future development. The long-standing practice in production manage-ment to focus on productivity and cost reduction (process centricity) is no longer sufficient to meet these demands.
Instead, production management and production controlling need indicators which represent the financial aspect of production-related activities as well as the considerable effect they have on customers and suppliers. Innovative contribu-tions to company development, driven by production staff, and the contribution of a high-performance IT structure to the reengineering of business processes must not be neglected either.
An integrative approach of this kind is the overall concept of the performance in-dicator guide at hand. Therefore we revert to the proven method of the balanced scorecard (BSC) as the structural scheme, thus the indicators are arranged in the four perspectives of the BSC.
Workable indicators need a hierarchy in order to avoid data graveyards. This guide therefore distinguishes between key performance indicators (KPI) and less impor-tant performance indicators (PI) over which the KPIs take priority. They are marked in the footer as KPI and PI.
The distinction may give reason to debate, but it is largely oriented on current controlling practice.
Strategic and operational measures are deduced from indicator values. As a lead for readers, frequently practiced activities are added to the indicators in form of catchwords. They are certainly not complete; the reader will find action alternatives from his own experience.
Production indicators for cost-effectiveness and profitability (e.g. result, cash flow, profit contribution) can only be applied within limits in production because sales-
www.cometis-publishing.de
specific services are rarely generated there. Nevertheless, it is attempted these days to evaluate such performance with the profit centre approach, by transfer pricing or maybe by target price. This is also done in the performance indicator guide at hand. This way important financial effects of production-oriented steps become quantifiable, the mere centricity on cost is prised open. Then, however, practicability of financial indicators in production needs to be adjusted: indicators for results and cash flow have to be deduced with indirect methods mainly from cost and performance accounting.
Indicators contained in this guide are backed with examples. At the start of the book the data of a model company (gearbox assembly) are given, on which these examples are based. The tables in that chapter are intended to help the reader with the calculation of performance indicators, but they also represent an expandable data framework for his own company. The framework cannot be presented exhau-stively. Assumptions and questions which remain open cannot be precluded, but they should not be a problem for the production controller.
Indicators can be configured in different ways: as single, group or average values. The user can easily change the characteristics of their breakdown. The basis of some indicators may also be changed: whether costs are based on manufacturing time, quantity unit, or proportionally on primary costs, depends on what the reader requires for his particular case. Modern controlling uses high-performance IT systems for calculating performance indicators and for analysis. ERP systems and data warehouses provide interesting possibilities for evaluating process data; this guide briefly refers to the application of these systems for generating indicators.
Indicators in production management intersect with those of other areas. This is the reason why this guide is not limited to production. We would also like to sug-gest the proven cometis reference books in the related fields of logistics, personnel and finance.
Prof. Jürgen Bauer Prof. Dr. Egbert Hayessen
Preface
www.cometis-publishing.de
contents
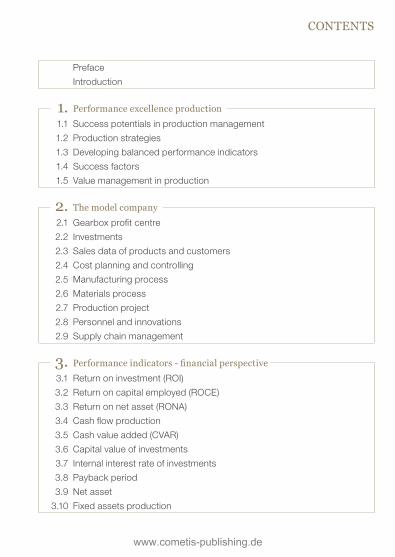
Preface
Introduction
1. Performance excellence production
1.1 Success potentials in production management
1.2 Production strategies
1.3 Developing balanced performance indicators
1.4 Success factors
1.5 Value management in production
2. the model company
2.1 Gearbox profit centre
2.2 Investments
2.3 Sales data of products and customers
2.4 Cost planning and controlling
2.5 Manufacturing process
2.6 Materials process
2.7 Production project
2.8 Personnel and innovations
2.9 Supply chain management
3. Performance indicators - financial perspective
3.1 Return on investment (ROI)
3.2 Return on capital employed (ROCE)
3.3 Return on net asset (RONA)
3.4 Cash flow production
3.5 Cash value added (CVAR)
3.6 Capital value of investments
3.7 Internal interest rate of investments
3.8 Payback period
3.9 Net asset
3.10 Fixed assets production
www.cometis-publishing.de

contents
3.11 Equity-to-fixed-assets ratio production
3.12 Working capital production
4. Performance indicators - customer perspective
4.1 Relative market share
4.2 Profit contribution per customer
4.3 Share of sales revenue product portfolio
4.4 Successive profit contributions
4.5 Production-related complaints
4.6 Production-related loss of customers
4.7 Production-related new customers
4.8 Cycle time customer order
4.9 Order-to-cash time
4.10 Deviation from deadline customer order
4.11 Scope of customer orders
5. Performance indicators - process perspective
5.1 Cycle time production order
5.2 Order’s deviation from schedule
5.3 Holding time order
5.4 Cycle time factor
5.5 Performance efficiency
5.6 Range of orders production
5.7 Backlog of orders
5.8 Average order lot size
5.9 Plant’s degree of activity
5.10 Idle costs of a plant
5.11 Flexibility of plants
5.12 Average age of machines
5.13 Profit contribution per manufacturing hour
5.14 Manufacturing costs per manufacturing hour
5.15 Cost variance cost centre
www.cometis-publishing.de
contents
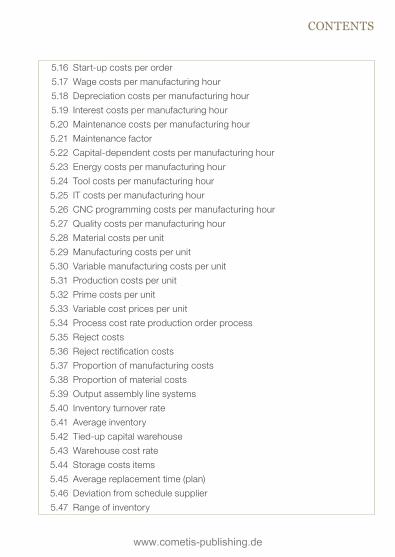
5.16 Start-up costs per order
5.17 Wage costs per manufacturing hour
5.18 Depreciation costs per manufacturing hour
5.19 Interest costs per manufacturing hour
5.20 Maintenance costs per manufacturing hour
5.21 Maintenance factor
5.22 Capital-dependent costs per manufacturing hour
5.23 Energy costs per manufacturing hour
5.24 Tool costs per manufacturing hour
5.25 IT costs per manufacturing hour
5.26 CNC programming costs per manufacturing hour
5.27 Quality costs per manufacturing hour
5.28 Material costs per unit
5.29 Manufacturing costs per unit
5.30 Variable manufacturing costs per unit
5.31 Production costs per unit
5.32 Prime costs per unit
5.33 Variable cost prices per unit
5.34 Process cost rate production order process
5.35 Reject costs
5.36 Reject rectification costs
5.37 Proportion of manufacturing costs
5.38 Proportion of material costs
5.39 Output assembly line systems
5.40 Inventory turnover rate
5.41 Average inventory
5.42 Tied-up capital warehouse
5.43 Warehouse cost rate
5.44 Storage costs items
5.45 Average replacement time (plan)
5.46 Deviation from schedule supplier
5.47 Range of inventory
www.cometis-publishing.de
contents
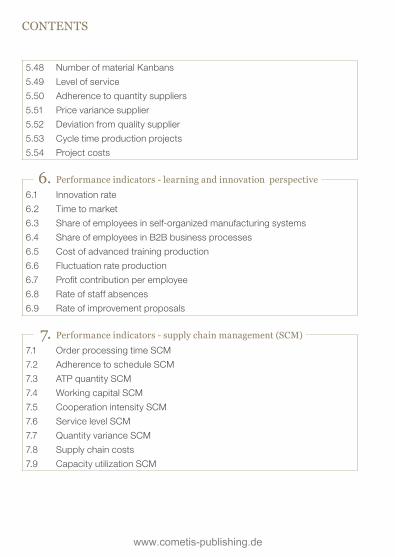
5.48 Number of material Kanbans
5.49 Level of service
5.50 Adherence to quantity suppliers
5.51 Price variance supplier
5.52 Deviation from quality supplier
5.53 Cycle time production projects
5.54 Project costs
6. Performance indicators - learning and innovation perspective
6.1 Innovation rate
6.2 Time to market
6.3 Share of employees in self-organized manufacturing systems
6.4 Share of employees in B2B business processes
6.5 Cost of advanced training production
6.6 Fluctuation rate production
6.7 Profit contribution per employee
6.8 Rate of staff absences
6.9 Rate of improvement proposals
7. Performance indicators - supply chain management (scM)
7.1 Order processing time SCM
7.2 Adherence to schedule SCM
7.3 ATP quantity SCM
7.4 Working capital SCM
7.5 Cooperation intensity SCM
7.6 Service level SCM
7.7 Quantity variance SCM
7.8 Supply chain costs
7.9 Capacity utilization SCM
www.cometis-publishing.de
contents
8. How to determine performance indicators
8.1 Determining performance indicators in the ERP system
8.2 Determining performance indicators in the data warehouse
appendix
Glossary
Literature index
www.cometis-publishing.de
.................................................................................................................................................. 47
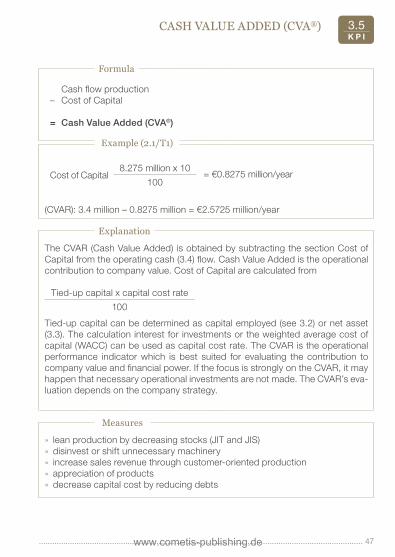
casH value added (cva®) 3.5K P I
formula
Cash flow production– Cost of Capital
= Cash Value Added (CVA®)
example (2.1/t1)
Cost of Capital8.275 million x 10
= €0.8275 million/year100
(CVAR): 3.4 million – 0.8275 million = €2.5725 million/year
explanation
The CVAR (Cash Value Added) is obtained by subtracting the section Cost of Capital from the operating cash (3.4) flow. Cash Value Added is the operational contribution to company value. Cost of Capital are calculated from
Tied-up capital x capital cost rate
100
Tied-up capital can be determined as capital employed (see 3.2) or net asset (3.3). The calculation interest for investments or the weighted average cost of capital (WACC) can be used as capital cost rate. The CVAR is the operational performance indicator which is best suited for evaluating the contribution to company value and financial power. If the focus is strongly on the CVAR, it may happen that necessary operational investments are not made. The CVAR’s eva-luation depends on the company strategy.
Measures
» lean production by decreasing stocks (JIT and JIS)» disinvest or shift unnecessary machinery» increase sales revenue through customer-oriented production» appreciation of products» decrease capital cost by reducing debts
www.cometis-publishing.de

50 ..................................................................................................................................................
Payback Period3.8P I
formula
Investment amount
Reflux per year
example (2.2/t6)
Reflux:360,000 – 40,000 – 160,000 – 10,000 – 20,000 – 26,000 – 20,000 – 4,000 –5,000 + 40,000 = €115,000/year
TA:200,000
= 1.74 years profitable115,000
explanation
The payback period TA is the time span in which the investment amount is paid off by reflux. Reflux is calculated from savings without depreciation plus a possible sales revenue increase caused by the investment object. Reflux R from year 1 to year n (n = economic life of the investment object) is seen as a fixed figure. If reflux is not fixed, the payback period has to be determined by simula-tion (dynamic payback period). TA should be smaller than about three years for production machinery with a lifespan of five to six years; in case of increased risk or high yield expectations TA should be smaller than two years. Aside from that, the payback period should generally be smaller than the economic lifespan.
A low TA is an indicator for a profitable investment. This performance indicator is only suitable for a rough assessment of investments, however, because the effect of interest is not taken into consideration. Larger investments have to be assessed on the basis of capital and internal interest.
Measures
» optimize underlying production processes» schematize application procedures
www.cometis-publishing.de


![Transcript [00:00] My name is Tamseel Hussain, and I'm 30](https://img.dokumen.tips/doc/110x75/631977680255356abc0846cb/transcript-0000-my-name-is-tamseel-hussain-and-im-30-.jpg)


