Embed Size (px)
Citation preview
Available online at www.sciencedirect.com
2008) 675–696www.elsevier.com/locate/geomorph
Geomorphology 97 (
Weathering, mineralogical evolution and soil organic matter along aHolocene soil toposequence developed on carbonate-rich materials
Markus Egli a,⁎, Christian Merkli a, Giacomo Sartori b, Aldo Mirabella c, Michael Plötze d
a Department of Geography, University of Zurich, Winterthurerstrasse 190, 8057 Zurich, Switzerlandb Museo Tridentino di Scienze Naturali, Via Calepino 14, 38050 Trento, Italy
c Istituto Sperimentale per lo Studio e la Difesa del Suolo, Piazza D'Azeglio 30, 50121 Firenze, Italyd ETH Zurich, Institute for Geotechnical Engineering, 8093 Zurich, Switzerland
Received 29 May 2007; received in revised form 24 September 2007; accepted 25 September 2007Available online 29 September 2007
Abstract
A toposequence of Holocene soils located between 1100–2400 m asl in the Italian Alps served as the basis for the followinganalyses: the weathering of limestone and dolomite, the calculation of mass balances, understanding the formation of pedogenic Feand Al, the determination of soil mineral and clay mineral reactions and transformation and the measurement of accumulation andstabilisation mechanisms of soil organic matter. Leaching of carbonates is most intense at the lower elevations, although calcite anddolomite have a higher solubility at low temperatures. The pCO2 in the soil is higher at lower elevations and weathering is drivenmainly by carbonic acids. At higher elevations, organic acids appear to determine the mineral transformations and weatheringreactions to a greater extent. This suggests that two very different weathering regimes (carbonic and organic acid weathering) existalong the toposequence. The transformation of mica into vermiculite is the main process in both the clay and fine-earth fraction.Weathering of silicate minerals started even before the carbonates had been completely removed from the soils. The transformationmechanisms of silicate minerals in the A and O horizon at higher elevations was at least as intensive as that at the climaticallywarmer sites. The neoformation of pedogenetic clays at climatically cooler sites was slightly greater than that at the warmer sites.However, the formation rate of secondary Fe and Al phases was more pronounced at lower elevation, which means that this processseemed to be driven dominantly by carbonic acid (weathering of primary minerals). Soil organic matter (SOM) abundance in themineral soil is nearly 15 kg/m2 at all sites and, surprisingly, no climate-driven effect could be detected. In general, the preservationand stabilisation of SOM was due to poorly crystalline Al and Fe phases and vermiculite, regardless of some variations in thecomposition of the parent material (varying calcite/dolomite ratio).© 2007 Elsevier B.V. All rights reserved.
Keywords: Element losses; Weathering; Alpine soils; Clay mineralogy; Holocene; Soil organic matter
⁎ Corresponding author. Tel.: +41 44 635 51 14; fax: +41 44 635 6841.
E-mail address: [email protected] (M. Egli).
0169-555X/$ - see front matter © 2007 Elsevier B.V. All rights reserved.doi:10.1016/j.geomorph.2007.09.011
1. Introduction
Soil sequences can give an insight into the influenceof factors that determine weathering rates. The currentlyoccurring worldwide climate changes are fuelling agrowing interest in the effects of climate and time on thelandscape and consequently soil evolution. Soils play a

Fig. 1. Location of the Brenta region and of the investigation sites. Trentino is shown as opaque area in the small map of Italy.
676 M. Egli et al. / Geomorphology 97 (2008) 675–696
major role in the biogeochemical cycle, includingweathering and the storage of nutrients and carbon(Bain et al., 1994; Richter et al., 2007). Carbon dioxideis converted to bicarbonate and nutrients are releasedduring carbonic acid weathering, thus contributing toboth carbon and nutrient cycling.
The interpretation of the effects that the climate factorhas on weathering rates and on mineral formation andtransformation is still being intensely debated. Studieshave either failed to show any trends or have givencontradictory results. According to von Blanckenburg(2005) neither precipitation nor temperature appears toexert any influence on silicate weathering. However, in
previous studies the effect of climate on weathering andsoil development could be clearly documented. Commontrends reported in these studies included changes in SOM(soil organic matter), clay content, acidity, and exchange-able ions (e.g. Laffan et al., 1989; Bockheim et al., 2000).Higher temperatures should theoretically increase rates ofchemical weathering (Muhs et al., 2001); however, thiswas not fully supported by other findings (Hall et al.,2002; Egli et al., 2003; Rasmussen et al., 2007).West et al.(2005) proposed that warmer environments generallyshould mean higher chemical weathering rates, but somevery warm environments paradoxically had extremelylow cation weathering rates.

677M. Egli et al. / Geomorphology 97 (2008) 675–696
Calcareous minerals are very soluble and dissolverapidly, and generally congruently (i.e., yielding upondissolution the same stoichiometric proportions in thesolution as the proportions in the dissolving mineral andwithout forming new solid phases (Stumm and Morgan,1996)). In calcareous soils H2O and H2CO3 are the mainreactants at the initial stage of soil formation. The netresult of the reaction is the release of cations (Ca2+, Mg2+,K+, Na+) from the soil and the production of alkalini-ty via HCO3
−. The atmosphere provides a reservoir forCO2 and for oxidants required in the weathering pro-cess. The soil biota assists the weathering processes byproviding organic ligands and acids and by supplyingincreased CO2 concentrations in the soil. Calcite anddolomite show a relatively strong temperature depen-dent solubility. In contrast to many silicates, lower tem-peratures lead to an increased solubility (Stumm andMorgan, 1996) and consequently enhanced leaching ofbase cations.
Mass-balance calculations in Alpine areas with asilicatic parent material indicated that mineral weather-ing and element denudation was greatest in subalpineforests near the timberline (Mirabella and Sartori, 1998;Mirabella and Egli, 2003; Egli et al., 2003; Egli et al.,2006). Weathering rates decreased with elevation bothhigher and lower than the timberline. This indicated thatthey were not only driven by climate but also by thevegetation. The clay mineral assemblage showed asimilar pattern. Highest smectite contents with up to30% of the soil clay fraction were found at sites insubalpine forest near the timberline. Higher precipita-
Table 1Characteristics of the sites along the topographic sequence
Profile Site Elevationm asl
Exposure°N
Slope%
Parent material Vege
A1 Val diTovel
1120 100 65 Limestonedebris
Decidinters
A2 Val di Ceda 1200 100 65 Limestonedebris
Decidinters
B3 Val Brenta 1450 200 40 Dolomitedebris
MixeAbies
B4 Vald'Ambiez
1470 100 50 Limestone/Dolomite debris
Mixe
C5 Val diTovel
1730 145 60 Limestonedebris
Conif
C6 Vallesinella 1740 200 70 Limestone/Dolomite debris
ConifLarix
D7 Le Crosette 2240 60 35 Dolomite debris Alpin
D8 Grosté 2340 215 30 Dolomite debris Alpin
tion rates and the production of chelating compounds inthe soil are believed to promote the transformation ofclay minerals and, thus, the appearance of smectites.
Consequently, our main hypothesis was that weath-ering reactions are most intensive close to the timberlinealso in soils developing from calcareous parentmaterials. This should be detectable in leaching ratesof elements and in clay mineral formation andtransformation. Climate (temperature and precipitation)together with the state factor vegetation (which is in factnot fully independent) should determine the weatheringregime.
2. Investigation sites and geological setting
A soil profile sequence along an elevation gradientranging from 1100 up to 2400 m asl in the BrentaNatural Park (Fig. 1) was investigated (Table 1). Thesequence is located in the southern Alpine belt innorthern Italy. The lithology consists of Mesozoicsedimentary rocks. The southern part of the Brentaregion has thick middle Triassic dolomite sheets and thenorthern Brenta region has predominantly Jurassic andCretaceous limestone and dolomite. The soils developedfrom limestone and/or dolomite debris. The parentmaterial had thus a varying calcite/dolomite ratio. Thepresent-day climate ranges from temperate below thetimberline to alpine above timberline. The climate ishumid. Mean annual temperature and precipitationcorrelate with elevation: mean annual temperature andprecipitation in nearby Pinzolo (776 m asl) is 8.8 °C and
tation Soil type (WRB; FAO, 1998;Soil Taxonomy; Soil SurveyStaff, 2006)
uous forest (Fagus silvaticapersed with Abies alba)
Calcari-Mollic Cambisol(Inceptic Haprendoll)
uous forest (Fagus silvaticapersed with Picea abies, Abies alba)
Haplic Luvisol(Haplic Hapludalf)
d forest (Fagus silvatica, Picea abies,alba)
Calcari-Mollic Cambisol(Rendollic Eutrudept)
d forest (Fagus silvatica, Picea abies) Calcari-Mollic Cambisol(Rendollic Eutrudept)
erous forest (Picea abies) Calcari-Mollic Cambisol(Inceptic Haprendoll)
erous forest (Picea abies,decidua)
Calcari-Mollic Cambisol(Inceptic Haprendoll)
e meadow Hyperhumi-Rendzic Leptosol(Typic Cryrendoll)
e meadow Hyperhumi-Rendzic Leptosol(Typic Cryrendoll)
678 M. Egli et al. / Geomorphology 97 (2008) 675–696
1097 mm/y respectively (Sartori et al., 2005) and meanannual temperature at Grosté (2505 m asl) is −0.4 °Cand around 1200 mm/y. In the eastern part of the Brentaregion, however, annual precipitation is slightly lower(Sboarina and Cescatti, 2004).
According to Sartori et al. (2005) the followingvegetation zones can be found in the Brenta region:
i. Lower montane zone (up to 800–900 m asl) withthermophilic deciduous trees such as Fraxinusornus, Ostyria carpinifolia, Quercus pubescensand mesophilic species such as Carpinus betulus.
ii. Upper montane zone (up to 1600m asl) withFagussylvatica, Abies alba and Pinus sylvestris in thelower part and in the upper part with Picea abies.
iii. Subalpine zone with Larix decidua and, locally,Pinus cembra up to approximately 2200 m aslShrubs become more important in the upper part(e.g. Alnus viridis).
iv. Alpine zone with shrubs and meadows. Seslerio-Caricetum sempervirentis and Caricetum firmaeare typical for carbonate-rich parent materials.
The Brenta region was covered with glaciers duringthe last ice-age. The onset of deglaciation of Alpineglaciers was around 20000 years BP (Ivy-Ochs et al.,2004). The investigated sites were in the inner part of theBrenta region on valley slopes. The highest sites wereclose to the Egesen stadial and having thus a minimumage of around 12000 years (cf. Baroni and Carton, 1990;Kerschner, 2000). The valleys remained glaciated untilthe oldest Dryas (about 16000 yBP; cf. Filippi et al.,2007; Oetheimer, 1990). The investigated landscape hastherefore been ice-free for about 12000–16000 years.
3. Materials and methods
3.1. Sampling
During an inventory (soil mapping) the soil profileswere selected which gave an overview of the differentsoil types, their characteristics and variability. A total ofeight sites was investigated and the chosen soils areassumed to be representative of the elevation zones. Soilprofile pits were dug down to the C horizon. Takingadvantage of the profile pits, undisturbed soil sampleswere taken down to the C horizon. Special attention wasgiven to insure that the soils showed an undisturbedevolution (according to their macromorphology) withalmost no signs of erosion or burial. From 2 to 3 kg ofsoil material was collected per soil horizon. Soil bulkdensity was determined with a soil core sampler.
3.2. Soil chemistry
Element pools in the soil (Ca, Mg, K, Na, Fe, Al, Mn,Si, and Ti) were determined by a total dissolution method.Oven-dried samples were dissolved using a mixture ofHF, HCl, HNO3, and H3BO3 (Hossner, 1996) in a closedsystem (microwave oven and under high pressure,25 bar). Concentrations of Ca, Mg, K, Na, Fe, Mn, Al,Si and Ti were determined by atomic absorptionspectroscopy. Additionally, the dithionite- and oxalate-extractable fractions were measured for the elements Fe,Al and Si (McKeague et al., 1971). Total organic C and Ncontents were determined by the Walkley–Black (Walk-ley and Black, 1934) and the Kjeldahl methods (Bremner,1996), respectively. Soil pH (in 0.01 M CaCl2) wasdetermined on fine earth using a soil solution ratio of1:2.5. CaCO3 and CaMg(CO3)2 contents were obtainedby using the total elemental contents (Ca, Mg) and XRDdata (Autoquan; see below). This procedure enabled thedistinction between CaCO3, MgCO3 phase, on the onehand and CaO and MgO (silicatic) phases on the other.
3.3. Soil mineralogy and grain sizes
The clay fraction (b2 μm) was obtained from the soilafter destruction of organic matter with dilute and Na-acetate buffered H2O2 (pH 5) by dispersion with Calgonand sedimentation in water. Oriented specimens on glassslides were analysed by X-ray diffraction using Cu–Kαradiation from 2 to 15°2θwith steps of 0.02°2θ at 2 s perstep. The following treatments were performed: Mgsaturation, ethylene glycol solvation (EG) and Ksaturation, followed by heating for 2 h at 335° and at550 °C. Digitised X-ray data were smoothed andcorrected for Lorentz and polarisation factors (Mooreand Reynolds, 1997). The d(060) region was studied onrandom mounts prepared by backfilling Al holders andgently pressing over filter paper and then step-scannedfrom 58 to 64°2θ with steps of 0.02°2θ at 10 s intervals.Peak separation and profile analysis were carried out bythe Origin PFM™ using the Pearson VII algorithm aftersmoothing the diffraction patterns by a Fourier trans-form function. Background values were calculated bymeans of a nonlinear function (polynomial, second-order function; Lanson, 1997). The presence of kaoliniteand imogolite was checked with infrared (IR) (BrukerOptics GmbH, Tensor 27). The quantitative mineralog-ical composition of the inorganic fine-earth component(b2 mm) was characterised using Rietveld analysis(program AutoQuan, GE SEIFERT) of XRD patterns ofrandomly oriented specimens (PHILIPS PW1820; Cu–Kα, 40 kV, 30 mA 4–70° 2θ, 0.02°2θ steps, 3 s/step,

679M. Egli et al. / Geomorphology 97 (2008) 675–696
automatic slits) (Bergmann and Kleeberg, 1998).DRIFT (Diffuse Reflectance Infrared Fourier Transfor-mation; Bruker Optics GmbH, Tensor 27) spectra wererecorded over the range of 4000 to 250 cm− 1 frompowder mounts made with 6 mg of sample and 300 mgof KBr.
After pretreating the samples with H2O2 (3%),particle-size distribution of the coarse fraction of thefine earth (b2 mm) was measured by wetsieving (2000–32 μm). The fine fraction was determined by the pipettemethod after dispersion and sedimentation in deionizedwater (Gee and Bauder, 1986).
3.4. Calculation of weathering rates
Long-term weathering rates of soils were derivedfrom the calculations of enrichment/depletion factorsdetermined relative to immobile element contents.Investigations in the surrounding areas have shownthat weathering rates can be well expressed by the use ofthe immobile element Ti (Egli et al., 2003). Loss of
Table 2Physical properties of the investigated soils
Profile Horizon Depth (cm) Munsell color Skeleton a weig
A1 O 5–10 7.5YR 2.5/1 75.7Bw 10–45 7.5YR 3/3 73.5BC 45–75 7.5YR 4/3 60.0C 75–100+ 7.5YR 5/3 69.1
A2 A 6–12 10YR 3/1 56.6AB 12–40 7.5YR 3/2 59.2Bt 40–80/85 10YR 5/4 43.5CR 80/85–110+ 7.5YR 5/4 nd b
B3 A 4–11/18 7.5YR 3/1 39.3Bw 11/18–35/50 7.5YR 3/3 72.2C 35/50–80+ 7.5YR 3/4 77.8
B4 A 0–12/17 7.5YR 3/1 58.1Bw 12/17–33 7.5YR 3/3 66.8BC 33–55 7.5YR 4/4 83.0C 55–80+ 7.5YR 5/3 83.8
C5 A 1–9 7.5YR 3/2 46.8AB 9–25 7.5YR 3/3 73.4Bw 25–50 7.5YR 3/4 73.3BC 50–65 7.5YR 5/4 57.4C 65–80+ 7.5YR 5/3 58.5
C6 A 7–33 7.5YR 2.5/1 61.9Bw 33–55 10YR 4/3 62.6C 55–80+ 10YR 5/4 81.9
D7 O 0.5–15 10YR 3/2 14.3AC 15–24 10YR 5/4 61.3C 24–40+ 10YR 8/3 82.0
D8 O 0–18 10YR 2/1 37.7AC 18–25/40 10YR 4/3 79.8C 25/40+ 10YR 5/3 80.1
a material with a diameter of N2 mm.b nd = no data.
carbonates is calculated by the comparison of soilcharacteristics, such as carbonate concentration and soilbulk density, with the parent material. In contrast tomethods using immobile elements such as Zr or Ti, thenoncarbonate fraction of the soil can also be consideredas an immobile phase (Egli and Fitze, 2001). Thederivation of mass-balance equations and their applica-tions to pedologic processes are discussed in detail byBrimhall and Dietrich (1987) and Chadwick et al.(1990) and revised by Egli and Fitze (2000).
Volumetric changes that occur during pedogenesiswere determined by adopting the classical definition ofstrain, εi,w (Brimhall and Dietrich, 1987):
ei;w ¼ DzwDz
� 1 ð1Þ
with Δz as the columnar height (m) of a representativeelementary volume of protore p (or unweathered parentmaterial) and Δzw is the weathered equivalent height(m) w. Where possible, the standardised strain coeffi-cient obtained by the carbonate weathering calculation
ht (%) Density (g/cm3) Sand (%) Silt (%) Clay (%)
1.00 5 78 171.64 30 62 81.90 76 16 81.96 69 24 71.08 8 90 21.40 15 77 81.24 9 86 51.64 nd nd nd0.51 12 72 171.68 50 37 131.85 68 25 71.33 8 68 241.52 25 64 111.61 46 38 161.89 50 28 220.55 12 50 381.09 10 60 301.37 24 62 14nd 57 32 111.96 60 29 111.29 9 81 101.48 36 56 91.53 72 24 40.56 4 70 271.55 53 45 21.78 68 31 20.51 nd nd nd1.43 52 37 111.94 60 35 5

Fig. 2. Development of particle-size distribution within the soilprofiles (from the C up to the A or O horizon). The B horizons alsoinclude the AC horizon where no B horizon is present in the soilprofile.
680 M. Egli et al. / Geomorphology 97 (2008) 675–696
procedure was compared to the strain using the contentof the immobile element Ti.
The calculation of the open-system mass transportfunction τj,w was defined by (Chadwick et al., 1990)
sj;w ¼ qwCj;w
qpCj;pei;w þ 1� � !
� 1 ð2Þ
with Cj,p (kg/t) as the concentration of element j inprotolith (e.g. unweathered parent material, bedrock),Cj,w as the concentration of element j in the weatheredproduct (kg/t) and with ρp and ρw being the bulk density(t/m3) of the protolith and the weathered soil, respec-tively. With n soil layers the calculation of changes inthe mass of element j was given by (Egli and Fitze,2000)
mP j;flux zwð Þ ¼Xna¼1
Cj;pqp1
ei;w þ 1
� �sj;wDzw ð3Þ
where τj,w corresponds to the mass transport function,εi,w to the strain, Cj,p (kg/t) to the concentration ofelement j in the protolith (e.g., unweathered parentmaterial, bedrock), ρp being the bulk density (t/m3) ofthe protolith and Δz the weathered equivalent of thecolumnar height (m) of a representative elementaryvolume.
The amounts of oxyhydroxides (Fed, Ald, Feo, Alo),formed from weathering in the fine-earth fraction, wereestimated by comparing the content in the soil with thatof the parent material according to
Wj ¼Xna¼1
zwqw Cj;wfw � Cj;p fp� � ð4Þ
where Wj corresponds to the mass of the weatheringproduct j, zw to the thickness of the corresponding soilhorizon, ρw being the bulk density (t/m3) of the soilhorizon, Cj,w and Cj,p (kg/t) to the concentration (fineearth) of compound j in the corresponding soil horizonand parent material, respectively and fw and fp to therelative fraction of fine earth in the soil horizon andparent material, respectively.
3.5. Statistics
Because of the partially normal and nonnormaldistribution pattern of the data, correlation coefficientswere calculated with a nonparametric procedure (theSpearman rank correlation coefficient RSpearman; Bahren-berg andGiese, 1975). This procedure was checkedwith atwo-sided test for significance (error probability p).
4. Results
4.1. Soil characteristics
At lower elevation, the soil types could be classifiedas Calcari-Mollic Cambisol (Inceptic Haprendoll) andHaplic Luvisol (Haplic Hapludalf). At the transitionfrom the upper montane zone to the subalpine zone, theCalcari-Mollic Cambisols (Rendollic Eutrudept) disap-pear in favour of Hyperhumi-Rendzic Leptosols (TypicCryrendoll) (Table 1). The profiles at the higher siteswere generally thinner compared to those at lowerelevation. All soils had a considerable skeleton (materialN2 mm in diameter) content. Grain sizes usuallydecrease from the parent material to the surface soilhorizons where the highest clay and silt contents arefound (Table 2). A low percentage of sand (≤12%) wasdetected within the surface (A or O) horizons. Thesurface horizons are silt loam or loam. The decrease ofthe grain size (see Fig. 2) is a concomitant effect ofweathering due to physical breakdown and chemicaldissolution of carbonate particles or possibly due toeolian silt contribution (see e.g. Ollier, 1969; Brongerand Heinkele, 1989; and also below in Section 4.2.).
Most soils are either neutral or slightly alkaline. Thecarbonate content in the surface horizons was low in mostsoils. The C/N ratio typically varies between about 13 and23 in the mineral topsoil (Table 3). The Corg content inmost soil surface horizons is high with values exceeding10%. The oxalate- and dithionite-extractable Fe and Al

Table 3Chemical characteristics of the investigated sites
Profile Horizon pH (CaCl2) CaCO3 (g/kg) Corg (g/kg) N (g/kg) C/N aFeo (g/kg)aAlo (g/kg)
aFed (g/kg)aAld (g/kg)
A1 O 6.2 20 165.0 9.1 18 2.3 2.5 18.3 4.3Bw 7.1 184 66.0 4.3 15 3.0 3.1 18.9 4.5BC 7.3 801 28.9 1.7 17 0.9 1.2 3.7 1.0C 7.5 929 10.5 1.2 19 0.5 0.8 2.3 0.6
A2 A 6.9 41 64.5 4.0 16 1.9 3.0 17.2 3.7AB 7.1 91 41.5 2.6 16 1.8 3.0 15.6 3.6Bt 7.3 28 11.2 0.9 12 1.2 2.3 14.1 2.7
B3 A 7.3 189 90.1 4.9 18 4.0 3.5 18.7 3.6Bw 7.4 820 13.0 1.1 12 1.5 1.4 6.5 1.2C 7.7 974 1.9 0.2 11 0.5 0.4 2.9 0.4
B4 A 6.5 16 137.0 9.9 14 6.8 5.6 22.5 4.0Bw 7.1 248 50.2 4.5 11 4.9 4.5 17.7 3.0BC 7.5 719 6.8 0.8 9 1.4 1.3 7.0 1.2C 7.6 799 9.4 0.7 14 1.2 1.3 6.4 1.1
C5 A 5.8 0 140.0 6.1 23 3.2 3.2 20.0 4.5AB 6.8 8 62.8 3.3 19 3.2 3.4 24.2 4.9Bw 7.2 346 30.0 2.1 14 2.5 3.1 19.7 3.9BC 7.4 703 14.9 1.3 11 1.3 1.9 7.9 1.7C 7.5 871 7.3 0.8 10 0.7 1.0 3.7 0.7
C6 A 7.0 200 143.0 7.6 19 4.8 5.0 16.9 4.4Bw 7.3 670 25.6 2.0 13 1.9 2.3 7.7 1.7C 7.6 900 4.5 0.4 13 0.6 0.6 3.6 0.5
D7 O 6.3 12 238.0 17.0 14 3.9 4.4 12.8 3.2AC 7.6 834 6.0 0.7 9 0.4 0.4 0.7 0.3C 7.6 941 nd b nd nd 0.1 0.2 0.3 0.1
D8 O 6.8 130 197.1 15.5 13 3.6 4.9 13.8 3.4AC 7.2 620 36.0 3.3 11 1.5 2.4 12.0 3.6C 7.3 940 10.6 1.1 10 0.5 0.9 3.1 1.1
a o = oxalate-extractable content and d = dithionite-extractable content.b nd = no data.
681M. Egli et al. / Geomorphology 97 (2008) 675–696
decreased with depth from the surface. In the surface soilhorizons, oxyhydroxides enriched either passively due tothe leaching of carbonates or were partially newly formedby weathering of silicatic minerals present in thecarbonate.
4.2. Total elemental contents and mineralogy
As a consequence of the carbonate dissolution, thetotal content of Fe, Al, Si, etc. within the fine-earthfraction strongly increased with decreasing soil depth(Table 4). Carbonate dissolution led to a correspondingrelative enrichment of these elements in the fine earth.Calcareous skeleton material was, however, found up tothe soil surface. Due to the geology, the trend of totalelement content within the soil profile (Table 4) showsdifferences between the sites, especially for Mg and Ca.
To evaluate the type and intensity of weathering,determining the mineralogical composition prior toweathering and in the soil profile is necessary. To a largeextent, the soil material in the study area is dominated by
calcite and dolomite (Table 5). The percentage of otherminerals is b8% in the C horizon. Limestone consists ofquite pure calcite (98.4% CaCO3 as mean value of thefraction N2 mm; data not shown). The same is true fordolomite with 51.9% CaCO3 and 48.1% MgCO3. Theconcentration of quartz and mica was in most cases b5%in the parent material. The presence of noncarbonateminerals could be inferred with DRIFT measurementsof the skeleton material of the C horizon (Fig. 3). Quartzwas recognised by the typical peak doublet at 780 and800 cm−1. Also, kaolinite could be partially measured inthe parent material (peak at 3692 and 3622 cm−1). Thepeaks at 3022, 2898, 2527, 1821, 822, 853 and729 cm−1 could be attributed to dolomite and those at2893, 2875, 2513, 1796, 877, 848 and 713 cm−1 tocalcite. Within the A (or O) and, partially, within theB horizon, a large part of the carbonates were dis-solved and consequently more noncarbonate mineralswere detectable. The B horizon contained quartzand mica with a concentration around 20%. Plagioclase,K-feldspar, vermiculite or chlorite reached values of

Table 4Total element contents in the soils
Profile Horizon Al (g/kg) Si (g/kg) Ca (g/kg) Mg (g/kg) K (g/kg) Na (g/kg) Fe (g/kg) Mn (g/kg) Ti (g/kg)
a) Fine earth (b2 mm)A1 O 61.0 142.2 17.7 6.7 8.78 3.80 33.6 1.01 5.71
Bw 71.9 167.0 56.9 7.9 10.04 4.43 40.9 1.01 6.77BC 13.0 33.5 330.1 3.8 2.71 0.85 7.7 0.22 1.12C 9.1 39.2 347.3 3.8 3.86 0.65 5.4 0.13 0.80
A2 A 79.3 195.3 20.3 12.0 15.02 5.97 44.4 0.78 8.10AB 83.0 205.7 29.4 12.6 15.46 6.32 46.5 0.81 8.34Bt 95.0 251.1 9.6 13.5 20.24 8.81 51.2 0.77 9.03
B3 A 54.1 115.0 44.9 36.8 10.05 1.71 31.9 0.76 5.24Bw 18.9 50.1 184.4 106.8 4.85 0.56 10.8 0.26 1.36C 8.1 25.8 213.9 116.9 3.29 0.39 6.4 0.11 0.62
B4 A 70.9 174.8 12.9 14.4 14.53 2.86 41.4 1.41 7.12Bw 66.5 155.4 46.6 37.7 15.10 3.22 37.5 1.10 6.72BC 25.8 64.8 252.5 36.1 7.07 1.23 15.7 0.30 2.57C 22.9 54.5 232.6 52.0 6.37 0.92 15.0 0.26 2.17
C5 A 68.6 180.3 12.1 7.5 10.39 4.24 36.9 0.68 6.59AB 81.8 217.3 13.7 8.5 11.83 5.15 46.4 0.61 8.26Bw 57.7 147.3 159.9 7.3 8.68 3.17 33.4 0.50 5.29BC 21.7 62.2 299.4 5.1 4.48 1.03 15.1 0.30 2.10C 12.4 43.3 343.1 5.9 3.32 0.59 8.0 0.20 1.29
C6 A 56.6 122.6 39.5 32.3 9.26 2.57 31.9 0.81 5.69Bw 29.0 67.9 156.2 92.2 6.34 1.51 15.9 0.33 2.75C 14.0 42.2 248.1 80.0 4.83 0.79 8.2 0.14 1.22
D7 O 54.0 116.1 12.4 13.6 11.08 2.17 27.8 0.61 5.80CA 4.3 9.8 217.4 123.8 0.99 0.25 10.7 0.06 0.54C 2.4 4.5 218.2 124.5 0.58 0.22 1.4 0.04 0.33
D8 O 51.5 108.2 24.7 19.9 9.64 2.42 27.4 0.67 5.47AC 27.6 58.0 154.6 93.8 4.65 1.45 16.6 0.21 3.56C 8.2 15.1 205.3 120.3 1.22 0.42 5.3 0.09 1.11
b) Soil skeleton (material N2 mm up to 200 mm)A1 AO 1.26 5.1 397.5 4.1 0.34 0.14 0.80 0.03 0.07
Bw 3.02 5.5 392.1 3.7 0.73 0.21 1.86 0.07 0.03BC 1.30 9.4 399.7 4.2 0.74 0.14 0.89 0.04 0.03C 1.64 5.6 396.3 4.1 0.62 0.11 1.08 0.05 0.05
A2 A 2.22 7.3 384.8 6.1 0.74 0.21 1.28 0.05 0.38AB 2.05 6.6 383.2 5.2 0.50 0.17 1.25 0.05 0.33Bt 2.97 9.5 389.7 3.9 1.32 0.30 1.73 0.06 0.52
B3 A 0.80 3.1 223.2 127.5 0.34 0.19 0.50 0.01 0.17Bw 0.92 3.9 223.9 129.2 0.37 0.20 0.61 0.03 0.27C 0.77 13.5 227.8 129.3 0.90 0.23 0.42 0.03 0.15
B4 A 2.01 9.5 344.2 37.7 0.65 0.17 1.63 0.06 0.05Bw 2.16 16.3 334.2 48.9 0.62 0.21 1.37 0.05 0.04BC 1.88 8.3 341.6 34.2 0.65 0.17 1.22 0.04 0.03C 1.93 21.1 298.2 64.6 0.73 0.20 1.35 0.06 0.02
C5 OA 1.29 6.1 377.5 11.2 0.47 0.13 0.79 0.04 0.24AB 1.46 20.2 378.9 6.4 0.53 0.13 0.92 0.05 0.20Bw 1.30 4.5 386.3 4.1 0.52 0.11 0.89 0.06 0.10BC 1.04 5.0 392.7 3.6 0.46 0.10 0.82 0.04 0.06C 1.02 8.4 389.3 3.7 0.37 0.10 2.34 0.04 0.10
C6 AO 1.50 4.9 229.4 120.7 0.40 0.19 0.96 0.05 0.16Bw 2.20 5.0 225.8 123.2 0.46 0.27 1.31 0.05 0.11C 2.30 6.2 299.6 64.1 0.69 0.17 1.95 0.06 0.22
D7 A 1.35 3.7 231.8 119.5 0.42 0.18 0.84 0.06 0.18CA 0.79 2.7 228.1 128.8 0.29 0.23 0.41 0.02 0.02C 0.89 2.3 226.9 129.6 0.25 0.23 0.40 0.02 0.03
682 M. Egli et al. / Geomorphology 97 (2008) 675–696

Table 4 (continued)
Profile Horizon Al (g/kg) Si (g/kg) Ca (g/kg) Mg (g/kg) K (g/kg) Na (g/kg) Fe (g/kg) Mn (g/kg) Ti (g/kg)
b) Soil skeleton (material N2 mm up to 200 mm)D8 AO 1.39 4.4 230.0 126.0 0.50 0.13 1.71 0.04 0.23
AC 1.70 4.6 231.1 123.8 0.85 0.20 0.88 0.04 0.14C 1.45 3.3 231.2 126.4 0.54 0.14 0.74 0.04 0.03
Profile Horizon Org.matter(%)
Al2O3
(%)SiO2
(%)TiO2
(%)CaCO3
(%)CaO(%)
MgCO3
(%)MgO(%)
K2O(%)
Na2O(%)
Fe2O3
(%)MnO2
(%)∑(%)
c) Normative compounds (whole material: soil skeleton+fine-earthA1 AO 8.51 2.98 8.2 0.12 75.9 0.33 1.6 0.27 0.29 0.14 1.25 0.03 99.7
Bw 3.41 4.02 10.3 0.15 75.7 0.00 1.7 0.31 0.39 0.18 1.75 0.04 98.0BC 0.99 1.13 4.1 0.04 92.0 0.83 1.4 0.00 0.18 0.06 0.52 0.01 101.3C 0.27 0.75 3.4 0.03 95.2 0.00 1.4 0.00 0.20 0.04 0.35 0.01 101.6
A2 A 6.10 6.74 19.0 0.33 56.3 0.25 3.0 0.85 0.84 0.37 2.86 0.05 96.7AB 3.21 6.63 18.8 0.32 59.7 0.00 2.8 0.82 0.80 0.36 2.82 0.05 96.3Bt 1.16 10.40 31.3 0.46 43.7 0.00 3.2 1.26 1.45 0.69 4.24 0.06 97.9Cr 0.00 0.56 2.0 0.09 97.3 0.00 1.3 0.00 0.16 0.04 0.25 0.01 101.8
B3 A 12.40 6.26 15.2 0.28 28.2 0.50 25.1 1.06 0.75 0.15 2.80 0.06 92.8Bw 0.67 1.12 3.6 0.06 52.6 0.58 42.7 0.00 0.19 0.04 0.49 0.01 102.0C 0.05 0.45 3.5 0.03 55.7 0.39 43.9 0.00 0.17 0.04 0.25 0.01 104.5
B4 A 18.85 5.84 16.9 0.25 50.7 0.56 9.7 0.85 0.78 0.17 2.62 0.08 107.3Bw 3.45 4.44 13.4 0.19 59.5 0.16 15.7 0.36 0.65 0.16 1.91 0.05 99.9BC 0.35 1.12 3.8 0.04 80.9 0.63 12.0 0.04 0.21 0.05 0.53 0.01 99.7C 0.32 1.01 5.7 0.03 71.4 0.40 21.7 0.00 0.20 0.04 0.51 0.01 101.3
C5 OA 21.67 7.01 21.1 0.31 44.8 0.90 3.2 0.66 0.69 0.31 2.86 0.05 103.6AB 8.64 4.31 15.5 0.21 70.0 0.39 2.4 0.37 0.43 0.20 1.86 0.03 104.4Bw 3.10 3.09 9.1 0.13 80.5 0.88 1.7 0.25 0.33 0.13 1.37 0.02 100.6BC 0.64 1.86 6.3 0.08 86.8 1.32 1.5 0.14 0.26 0.07 0.98 0.02 100.0C 0.31 1.08 4.9 0.05 92.4 0.00 1.6 0.15 0.19 0.04 0.67 0.01 101.4
C6 AO 11.07 4.25 10.6 0.20 39.2 0.00 30.2 0.35 0.45 0.15 1.82 0.04 98.4Bw 1.76 2.31 6.1 0.10 47.2 2.74 38.7 0.00 0.32 0.10 0.97 0.02 100.3C 0.12 0.83 2.7 0.05 71.4 1.11 23.2 0.00 0.17 0.04 0.44 0.01 100.1
D7 A 38.89 8.79 21.4 0.42 9.7 1.19 8.3 1.69 1.15 0.25 3.42 0.07 95.3CA 0.41 0.41 1.2 0.02 53.5 2.46 43.5 0.46 0.07 0.03 0.63 0.00 102.7C 0.00 0.22 0.6 0.01 55.7 0.61 44.7 0.00 0.04 0.03 0.08 0.00 101.9
D8 AO 28.82 6.16 14.8 0.30 25.5 0.00 20.6 0.22 0.75 0.21 2.53 0.06 99.9AC 1.86 1.31 3.3 0.08 53.2 0.68 40.5 0.30 0.19 0.06 0.58 0.01 102.1C 0.27 0.53 1.2 0.02 56.2 0.20 43.4 0.00 0.08 0.03 0.24 0.01 102.3
683M. Egli et al. / Geomorphology 97 (2008) 675–696
around 6–12% only in the A (or O) horizon (Table 5). Ingeneral, the ratio of weathering products to quartzdecreased with increasing soil depth indicating activemineral weathering (or mineral transformations).
The influence of loess deposits can be inferred by thequantity of silt in the soil and its mineralogicalcomposition. The dominant mineral of loess is usuallyquartz (Ollier, 1969; Bronger and Heinkele, 1989), micaand kaolinite. Although there was a strong decrease ofthese minerals with increasing soil depth, eoliandeposits could not directly be inferred from thesefindings as a relative enrichment of these minerals alsooccurs with the dissolution of calcite and dolomite. Thetotal elements content (Table 4) does not suggest that thesoils have received major relevant additions of eolianorigin. The ratio of (CaO+MgO+K2O+Na2O)/TiO2
steadily increased with depth, except for the soil A2,which indicates a typical increase in weathering in-tensity (rather than eolian contribution).
4.3. Carbonate leaching
The open-system mass transport function, τ, gavestrongly negative values for the whole soil profile(Table 6) and correspondingly high Ca and Mg losses(Fig. 4). This means that a large part of the carbonateswere dissolved and leached during pedogenesis. No cleartrendwith elevation could be observed for the topsoil (i.e.,0–25 cm; Fig. 4). If the whole soil is taken into con-sideration, then a certain trend of higher carbonateleaching at the climatically warmer sites can be seen.Well-expressed trends of carbonate leaching along the
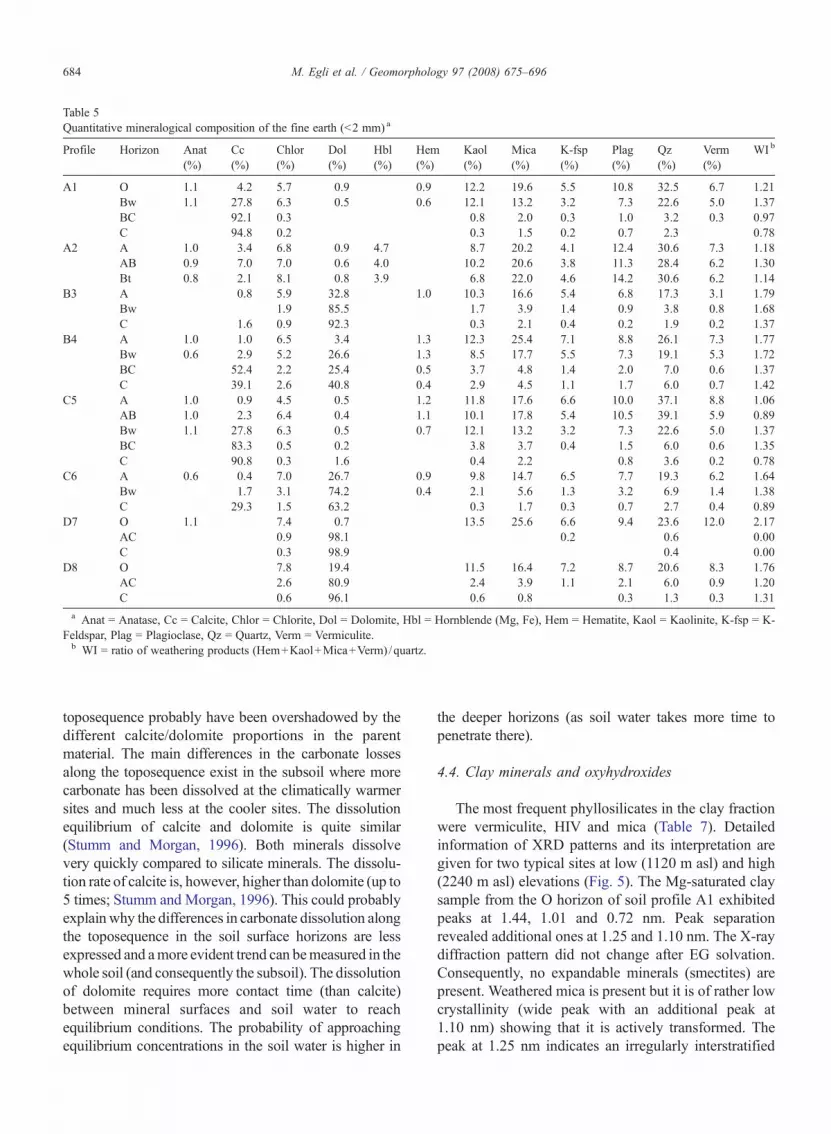
Table 5Quantitative mineralogical composition of the fine earth (b2 mm) a
Profile Horizon Anat(%)
Cc(%)
Chlor(%)
Dol(%)
Hbl(%)
Hem(%)
Kaol(%)
Mica(%)
K-fsp(%)
Plag(%)
Qz(%)
Verm(%)
WI b
A1 O 1.1 4.2 5.7 0.9 0.9 12.2 19.6 5.5 10.8 32.5 6.7 1.21Bw 1.1 27.8 6.3 0.5 0.6 12.1 13.2 3.2 7.3 22.6 5.0 1.37BC 92.1 0.3 0.8 2.0 0.3 1.0 3.2 0.3 0.97C 94.8 0.2 0.3 1.5 0.2 0.7 2.3 0.78
A2 A 1.0 3.4 6.8 0.9 4.7 8.7 20.2 4.1 12.4 30.6 7.3 1.18AB 0.9 7.0 7.0 0.6 4.0 10.2 20.6 3.8 11.3 28.4 6.2 1.30Bt 0.8 2.1 8.1 0.8 3.9 6.8 22.0 4.6 14.2 30.6 6.2 1.14
B3 A 0.8 5.9 32.8 1.0 10.3 16.6 5.4 6.8 17.3 3.1 1.79Bw 1.9 85.5 1.7 3.9 1.4 0.9 3.8 0.8 1.68C 1.6 0.9 92.3 0.3 2.1 0.4 0.2 1.9 0.2 1.37
B4 A 1.0 1.0 6.5 3.4 1.3 12.3 25.4 7.1 8.8 26.1 7.3 1.77Bw 0.6 2.9 5.2 26.6 1.3 8.5 17.7 5.5 7.3 19.1 5.3 1.72BC 52.4 2.2 25.4 0.5 3.7 4.8 1.4 2.0 7.0 0.6 1.37C 39.1 2.6 40.8 0.4 2.9 4.5 1.1 1.7 6.0 0.7 1.42
C5 A 1.0 0.9 4.5 0.5 1.2 11.8 17.6 6.6 10.0 37.1 8.8 1.06AB 1.0 2.3 6.4 0.4 1.1 10.1 17.8 5.4 10.5 39.1 5.9 0.89Bw 1.1 27.8 6.3 0.5 0.7 12.1 13.2 3.2 7.3 22.6 5.0 1.37BC 83.3 0.5 0.2 3.8 3.7 0.4 1.5 6.0 0.6 1.35C 90.8 0.3 1.6 0.4 2.2 0.8 3.6 0.2 0.78
C6 A 0.6 0.4 7.0 26.7 0.9 9.8 14.7 6.5 7.7 19.3 6.2 1.64Bw 1.7 3.1 74.2 0.4 2.1 5.6 1.3 3.2 6.9 1.4 1.38C 29.3 1.5 63.2 0.3 1.7 0.3 0.7 2.7 0.4 0.89
D7 O 1.1 7.4 0.7 13.5 25.6 6.6 9.4 23.6 12.0 2.17AC 0.9 98.1 0.2 0.6 0.00C 0.3 98.9 0.4 0.00
D8 O 7.8 19.4 11.5 16.4 7.2 8.7 20.6 8.3 1.76AC 2.6 80.9 2.4 3.9 1.1 2.1 6.0 0.9 1.20C 0.6 96.1 0.6 0.8 0.3 1.3 0.3 1.31
a Anat = Anatase, Cc = Calcite, Chlor = Chlorite, Dol = Dolomite, Hbl = Hornblende (Mg, Fe), Hem = Hematite, Kaol = Kaolinite, K-fsp = K-Feldspar, Plag = Plagioclase, Qz = Quartz, Verm = Vermiculite.b WI = ratio of weathering products (Hem+Kaol+Mica+Verm) /quartz.
684 M. Egli et al. / Geomorphology 97 (2008) 675–696
toposequence probably have been overshadowed by thedifferent calcite/dolomite proportions in the parentmaterial. The main differences in the carbonate lossesalong the toposequence exist in the subsoil where morecarbonate has been dissolved at the climatically warmersites and much less at the cooler sites. The dissolutionequilibrium of calcite and dolomite is quite similar(Stumm and Morgan, 1996). Both minerals dissolvevery quickly compared to silicate minerals. The dissolu-tion rate of calcite is, however, higher than dolomite (up to5 times; Stumm and Morgan, 1996). This could probablyexplainwhy the differences in carbonate dissolution alongthe toposequence in the soil surface horizons are lessexpressed and amore evident trend can bemeasured in thewhole soil (and consequently the subsoil). The dissolutionof dolomite requires more contact time (than calcite)between mineral surfaces and soil water to reachequilibrium conditions. The probability of approachingequilibrium concentrations in the soil water is higher in
the deeper horizons (as soil water takes more time topenetrate there).
4.4. Clay minerals and oxyhydroxides
The most frequent phyllosilicates in the clay fractionwere vermiculite, HIV and mica (Table 7). Detailedinformation of XRD patterns and its interpretation aregiven for two typical sites at low (1120 m asl) and high(2240 m asl) elevations (Fig. 5). The Mg-saturated claysample from the O horizon of soil profile A1 exhibitedpeaks at 1.44, 1.01 and 0.72 nm. Peak separationrevealed additional ones at 1.25 and 1.10 nm. The X-raydiffraction pattern did not change after EG solvation.Consequently, no expandable minerals (smectites) arepresent. Weathered mica is present but it is of rather lowcrystallinity (wide peak with an additional peak at1.10 nm) showing that it is actively transformed. Thepeak at 1.25 nm indicates an irregularly interstratified

Fig. 3. DRIFT measurements of the coarse material (diameter N2 mm) from the C horizon (dolomitic and calcitic parent material) with indication ofpeak positions of the minerals calcite and dolomite (cm−1). The y-axis shows a relative intensity enabling a direct comparison between calcitic anddolomitic material.
685M. Egli et al. / Geomorphology 97 (2008) 675–696
mineral with mica as one component and vermiculite (orHIV) as the other (see below). K saturation caused arelative increase of the 1.01 nm peak and a corre-sponding collapse of the peak at 1.44 nm, which isindicative of vermiculite. Heating at 335 °C caused afurther shift of the 1.44 nm peak toward 1.01 nm. Thisallowed the determination of HIV. A part of HIV seemedto be either strongly Al-hydroxy-interlayered or had aninterstratification with chlorite. At 550 °C the chloritepeak near 1.4 nm and a broader peak around 1.2 nmwerevisible. The peak at 0.72 nm can be attributed to chlorite(d002) and kaolinite. DRIFT measurements showed thatkaolinite is present in this sample. The B horizon hadsimilar XRD patterns, but peaks showed slightlydifferent intensities, which indicated the presence ofmica, vermiculite, HIV, chlorite and kaolinite. In general,an increasing proportion of mica in the interstratifiedmica–vermiculite (or HIV) was discernible with in-creasing soil depth due to shift of the peak from 1.25 nmin the O horizon to 1.22 nm in the Bw horizon and1.17 nm in the BC horizon (data not shown; cf. Mooreand Reynolds, 1997). Besides mica, HIV, vermiculite,chlorite and kaolinite are present in the C horizon. Somemica is regularly interstratified with vermiculite (or HIV,due to a weak peak at 2.39 nm). The analysis of the d060region (Fig. 6, profile A1) revealed in all horizons apeak between 0.1502–0.1507 nm that can be attributed
to dioctahedral structures (muscovite, dioctahedralvermiculite) and another near 0.1490 nm indicating thepresence of kaolinite. The peaks at 0.1528, 0.1555 and0.1560 nm can be usually assigned to trioctahedralminerals. As calcite also has a peak at 0.1528 nm, thed060 analysis does not clearly evidence a transformationof trioctahedral minerals (Mg2+ or Fe2+ in the octahedralsheet) into dioctahedral species (having Fe3+ or Al3+ inthe octahedral sheet). The increase of this peak withincreasing soil depth can primarily be attributed tochanges in the calcite content.
The peak positions of the diffractograms of profileD7 were similar for all horizons. The mica peak at1.00 nm was recognisable in all XRD patterns andshowed an increase with soil depth. To a lesser extent,an increase in chlorite (peak at 1.43 nm after heating at550 °C) with soil depth could be measured. Somevermiculite could be inferred for the O and AC horizonsfrom a relative increase of the peak at 1.00 nm after Ksaturation. Almost no vermiculite is present in the parentmaterial. Some irregularly interstratified mica–vermic-ulite (or HIV) is detectable in all horizons. Kaolinite wasidentified with FT-IR. Dolomite could be recognised inthe d060 region at 0.1469 and 0.1570 nm. The peak at0.1545 nm can be assigned to either quartz or dolomite.X-ray profile fitting of the samples enabled the separa-tion of a kaolinite peak at 0.1490 nm and of trioctahedral
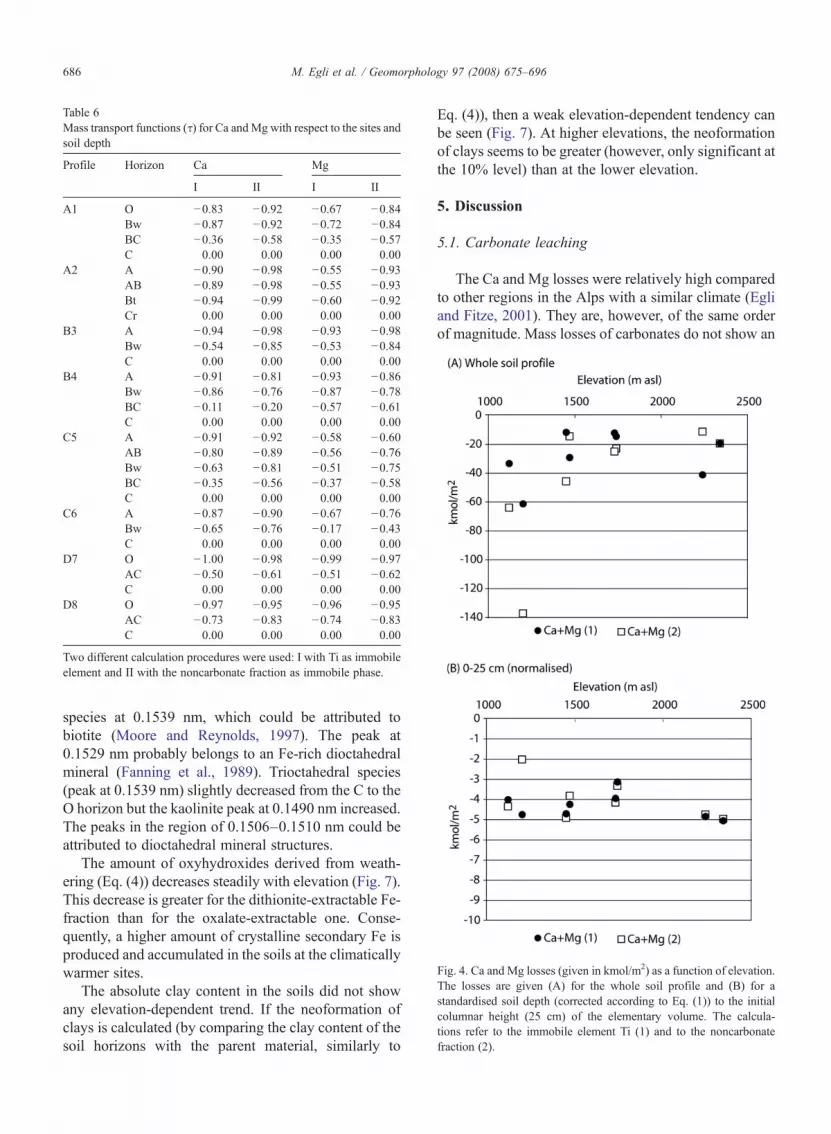
Table 6Mass transport functions (τ) for Ca andMg with respect to the sites andsoil depth
Profile Horizon Ca Mg
I II I II
A1 O −0.83 −0.92 −0.67 −0.84Bw −0.87 −0.92 −0.72 −0.84BC −0.36 −0.58 −0.35 −0.57C 0.00 0.00 0.00 0.00
A2 A −0.90 −0.98 −0.55 −0.93AB −0.89 −0.98 −0.55 −0.93Bt −0.94 −0.99 −0.60 −0.92Cr 0.00 0.00 0.00 0.00
B3 A −0.94 −0.98 −0.93 −0.98Bw −0.54 −0.85 −0.53 −0.84C 0.00 0.00 0.00 0.00
B4 A −0.91 −0.81 −0.93 −0.86Bw −0.86 −0.76 −0.87 −0.78BC −0.11 −0.20 −0.57 −0.61C 0.00 0.00 0.00 0.00
C5 A −0.91 −0.92 −0.58 −0.60AB −0.80 −0.89 −0.56 −0.76Bw −0.63 −0.81 −0.51 −0.75BC −0.35 −0.56 −0.37 −0.58C 0.00 0.00 0.00 0.00
C6 A −0.87 −0.90 −0.67 −0.76Bw −0.65 −0.76 −0.17 −0.43C 0.00 0.00 0.00 0.00
D7 O −1.00 −0.98 −0.99 −0.97AC −0.50 −0.61 −0.51 −0.62C 0.00 0.00 0.00 0.00
D8 O −0.97 −0.95 −0.96 −0.95AC −0.73 −0.83 −0.74 −0.83C 0.00 0.00 0.00 0.00
Two different calculation procedures were used: I with Ti as immobileelement and II with the noncarbonate fraction as immobile phase.
Fig. 4. Ca and Mg losses (given in kmol/m2) as a function of elevation.The losses are given (A) for the whole soil profile and (B) for astandardised soil depth (corrected according to Eq. (1)) to the initialcolumnar height (25 cm) of the elementary volume. The calcula-tions refer to the immobile element Ti (1) and to the noncarbonatefraction (2).
686 M. Egli et al. / Geomorphology 97 (2008) 675–696
species at 0.1539 nm, which could be attributed tobiotite (Moore and Reynolds, 1997). The peak at0.1529 nm probably belongs to an Fe-rich dioctahedralmineral (Fanning et al., 1989). Trioctahedral species(peak at 0.1539 nm) slightly decreased from the C to theO horizon but the kaolinite peak at 0.1490 nm increased.The peaks in the region of 0.1506–0.1510 nm could beattributed to dioctahedral mineral structures.
The amount of oxyhydroxides derived from weath-ering (Eq. (4)) decreases steadily with elevation (Fig. 7).This decrease is greater for the dithionite-extractable Fe-fraction than for the oxalate-extractable one. Conse-quently, a higher amount of crystalline secondary Fe isproduced and accumulated in the soils at the climaticallywarmer sites.
The absolute clay content in the soils did not showany elevation-dependent trend. If the neoformation ofclays is calculated (by comparing the clay content of thesoil horizons with the parent material, similarly to
Eq. (4)), then a weak elevation-dependent tendency canbe seen (Fig. 7). At higher elevations, the neoformationof clays seems to be greater (however, only significant atthe 10% level) than at the lower elevation.
5. Discussion
5.1. Carbonate leaching
The Ca and Mg losses were relatively high comparedto other regions in the Alps with a similar climate (Egliand Fitze, 2001). They are, however, of the same orderof magnitude. Mass losses of carbonates do not show an

Table 7Estimated clay mineral assemblages (relative proportions)
Profile Horizon Chlorite (%) Mica (%) Mixed-layered minerals a (%) HIVb (%) Vermiculite (%) Kaolinite (%) Smectite (%)
A1 O 6 20 11 27 25 12 0Bw 4 10 6 33 31 15 0BC 6 45 6 19 16 8 0C 6 53 21 9 5 5 0
A2 A 8 10 12 14 33 12 10AB 3 18 9 32 16 13 9Bt 3 23 20 10 19 16 8
B3 A 10 17 6 7 37 4 18Bw 11 28 10 12 22 3 15C 5 52 15 5 1 3 19
B4 A 2 17 14 18 18 7 23Bw 2 18 11 7 24 8 30BC 4 27 16 10 15 6 20C 2 44 4 11 11 5 22
C5 A 6 9 22 24 31 9 0AB 10 9 5 32 31 12 0Bw 7 15 9 28 25 15 0BC 4 31 10 18 27 10 0C 2 51 7 17 15 8 0
C6 A 5 16 5 35 16 10 13Bw 5 17 9 17 26 8 17C 3 43 10 11 9 6 17
D7 O 11 21 5 17 24 22 0CA 9 25 13 15 26 12 0C 13 46 3 9 13 16 0
D8 O 16 17 4 21 25 9 8AC 13 13 11 29 23 11 0C 18 20 4 35 14 9 0
a Mica/HIV or mica/vermiculite.b HIV = hydroxy-interlayered vermiculite.
687M. Egli et al. / Geomorphology 97 (2008) 675–696
obvious elevation-dependent trend regarding the stan-dardised soil depth 0–25 cm. However, over the wholesoil profile, a trend of lower carbonate losses withincreasing elevation is observed. Carbonate leaching isviewed as primarily being a function of a combination ofthe influences of water supply and its consequentpercolation within the soil, CO2 production, temperatureand surface properties of the carbonates (Stumm andMorgan, 1996). With increasing elevation, temperaturedecreases and percolation in the soil increases due tomore precipitation and less evapotranspiration. Onewould expect that carbonate leaching increases withincreasing elevation. The contrary was, however, thecase. Microbial activity must therefore be the drivingforce for carbonate leaching because higher tempera-tures generally lead to an increased activity and,consequently, to increased CO2 production. Leachingrates obtained from the soil profile were calculatedaccording to Eq. (3) and divided by soil age (assuming amean age of 15,000 years) and net hydrologic output(precipitation minus evapotranspiration). Approximate
soil water fluxes were derived from Sboarina andCescatti (2004) and were estimated to be 400 mm for thesites at the lowest and 600 mm for the sites at the highestelevation. In the carbonate system, the main geochem-ical processes are governed by the production of CO2 inthe soil by microbially mediated reactions (decomposi-tion of organic matter), root respiration and thedissolution of carbonates (Table 8). For interactionsbetween calcite, dolomite and the soil solution, thesaturation state of the solution can be determined usingthe following equation for calculating the degree ofsaturation (logSIcalcite, dolomite):
log SIcalcite;dolomite ¼ logQp
KTcalcite;dolomite
ð5Þ
where Qp is the ion-activity product of the solution and Kis the thermodynamic solubility-product constant of themineral phase of interest at the temperature T. A logSIvalue N0 suggests oversaturation and logSIb0 under-saturation. The equilibrium constants were corrected for
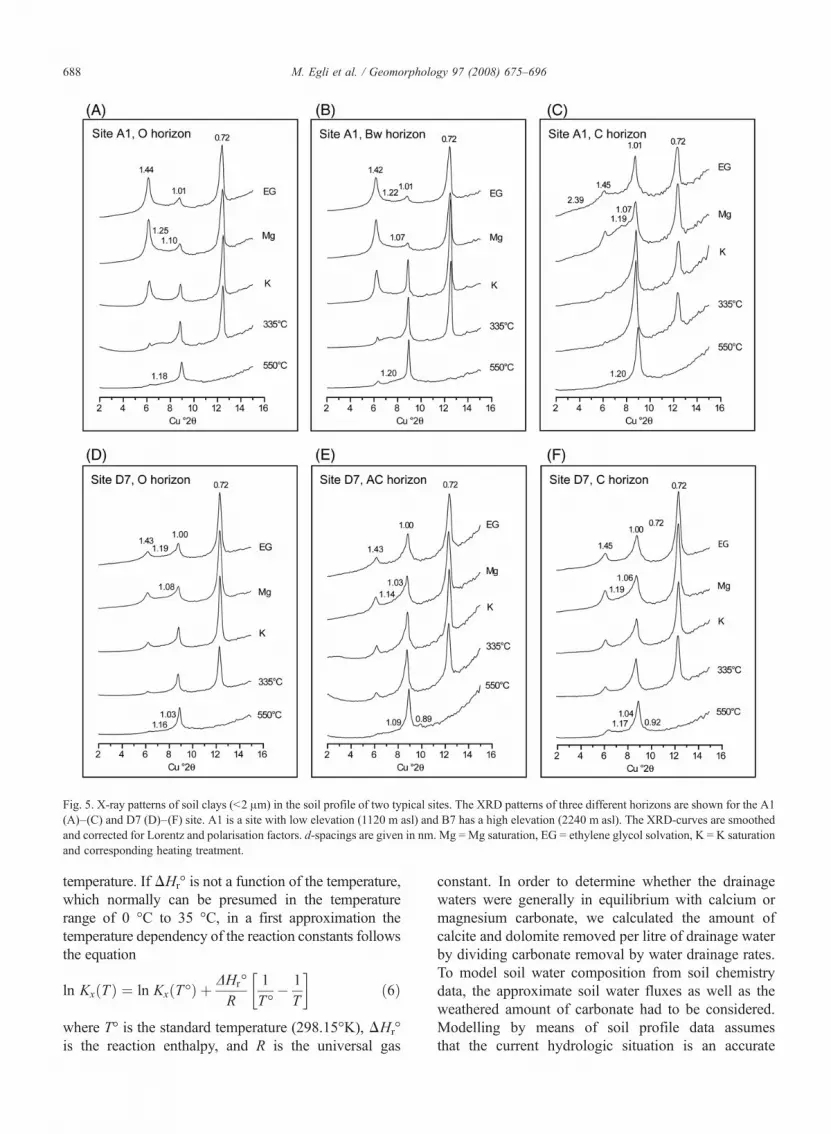
Fig. 5. X-ray patterns of soil clays (b2 μm) in the soil profile of two typical sites. The XRD patterns of three different horizons are shown for the A1(A)–(C) and D7 (D)–(F) site. A1 is a site with low elevation (1120 m asl) and B7 has a high elevation (2240 m asl). The XRD-curves are smoothedand corrected for Lorentz and polarisation factors. d-spacings are given in nm. Mg = Mg saturation, EG = ethylene glycol solvation, K = K saturationand corresponding heating treatment.
688 M. Egli et al. / Geomorphology 97 (2008) 675–696
temperature. If ΔHr° is not a function of the temperature,which normally can be presumed in the temperaturerange of 0 °C to 35 °C, in a first approximation thetemperature dependency of the reaction constants followsthe equation
ln Kx Tð Þ ¼ ln Kx T-ð Þ þ DHr-
R1T-
� 1T
� �ð6Þ
where T° is the standard temperature (298.15°K), ΔHr°is the reaction enthalpy, and R is the universal gas
constant. In order to determine whether the drainagewaters were generally in equilibrium with calcium ormagnesium carbonate, we calculated the amount ofcalcite and dolomite removed per litre of drainage waterby dividing carbonate removal by water drainage rates.To model soil water composition from soil chemistrydata, the approximate soil water fluxes as well as theweathered amount of carbonate had to be considered.Modelling by means of soil profile data assumesthat the current hydrologic situation is an accurate

Fig. 6. XRD patterns in the d060 region of the soil clays from the C and A horizons of two typical soils (A1 and D7 sites). The XRD patterns of themost contrasting horizons are shown (A) and (B) for a site at low elevation (A1 with 1120 m asl) and (C) and (D) for a site at high elevation (D7 with2240 m asl); d-spacings are given in nm.
689M. Egli et al. / Geomorphology 97 (2008) 675–696
description of conditions prevailing since the beginningof the soil formation. This assumption agrees, at least,with the fact that the extent of the alpine glaciers hasvaried during the last 12,000 years within the borders ofthe moraines of the year 1850. It indicates more or lessstable climatic conditions, whereby we can concludethat the mean characteristics of the hydrologic situationhave not drastically changed (cf. Burga and Perret,1997).
The modelling of soil water composition by means ofsoil profile data gives reasonable results, although themodel is only a rough approximation. Percolating wateris in equilibrium or slightly oversaturated with respect tocalcite and dolomite (Table 8, Fig. 8), although thedissolution rate of dolomite is lower (up to 5 times) thanthat of calcite (Stumm and Morgan, 1996). Thus, thebehaviour of Ca2+ and Mg2+ can be explained by thesetwo mineral phases. The pCO2 seems to vary greatly in
the soils. Nonetheless, a relationship between pCO2 andelevation can be seen with a generally higher pCO2
pressure in the soils at lower elevation (Fig. 8). Ourresults are in full agreement with recent findings ofBorsato et al. (2007). These authors measured thehydrochemistry of hypogean waters (235 cave watersamples) in Trentino. The solubility of the mostcommon karstic lithotypes, i.e., dolomite and calcite,displayed the same behaviour. The concentrations ofHCO3
−, Ca2+ and Mg2+ gave negative correlations withelevation and thus showed a climate dependency.Additionally, the pCO2 was higher at lower elevations,which was explained by the higher biological activity atthese sites (soils). Our calculated pCO2 (on the basis ofsoil mass balances) corresponds, furthermore, reason-ably well with the measured values of Borsato et al.(2007). In general, most of the log (pCO2) values werebetween −3 and −2.
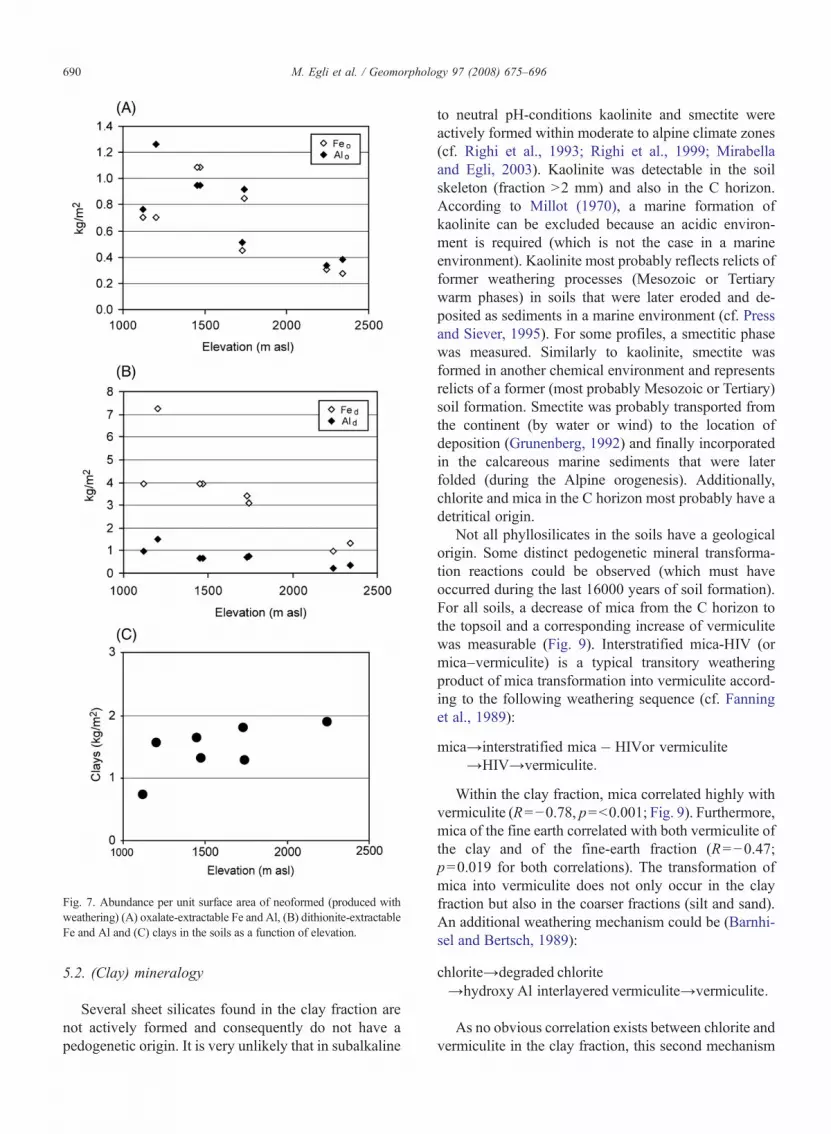
Fig. 7. Abundance per unit surface area of neoformed (produced withweathering) (A) oxalate-extractable Fe and Al, (B) dithionite-extractableFe and Al and (C) clays in the soils as a function of elevation.
690 M. Egli et al. / Geomorphology 97 (2008) 675–696
5.2. (Clay) mineralogy
Several sheet silicates found in the clay fraction arenot actively formed and consequently do not have apedogenetic origin. It is very unlikely that in subalkaline
to neutral pH-conditions kaolinite and smectite wereactively formed within moderate to alpine climate zones(cf. Righi et al., 1993; Righi et al., 1999; Mirabellaand Egli, 2003). Kaolinite was detectable in the soilskeleton (fraction N2 mm) and also in the C horizon.According to Millot (1970), a marine formation ofkaolinite can be excluded because an acidic environ-ment is required (which is not the case in a marineenvironment). Kaolinite most probably reflects relicts offormer weathering processes (Mesozoic or Tertiarywarm phases) in soils that were later eroded and de-posited as sediments in a marine environment (cf. Pressand Siever, 1995). For some profiles, a smectitic phasewas measured. Similarly to kaolinite, smectite wasformed in another chemical environment and representsrelicts of a former (most probably Mesozoic or Tertiary)soil formation. Smectite was probably transported fromthe continent (by water or wind) to the location ofdeposition (Grunenberg, 1992) and finally incorporatedin the calcareous marine sediments that were laterfolded (during the Alpine orogenesis). Additionally,chlorite and mica in the C horizon most probably have adetritical origin.
Not all phyllosilicates in the soils have a geologicalorigin. Some distinct pedogenetic mineral transforma-tion reactions could be observed (which must haveoccurred during the last 16000 years of soil formation).For all soils, a decrease of mica from the C horizon tothe topsoil and a corresponding increase of vermiculitewas measurable (Fig. 9). Interstratified mica-HIV (ormica–vermiculite) is a typical transitory weatheringproduct of mica transformation into vermiculite accord-ing to the following weathering sequence (cf. Fanninget al., 1989):
mica→interstratified mica� HIVor vermiculite→HIV→vermiculite:
Within the clay fraction, mica correlated highly withvermiculite (R=−0.78, p=b0.001; Fig. 9). Furthermore,mica of the fine earth correlated with both vermiculite ofthe clay and of the fine-earth fraction (R=−0.47;p=0.019 for both correlations). The transformation ofmica into vermiculite does not only occur in the clayfraction but also in the coarser fractions (silt and sand).An additional weathering mechanism could be (Barnhi-sel and Bertsch, 1989):
chlorite→degraded chlorite→hydroxy Al interlayered vermiculite→vermiculite:
As no obvious correlation exists between chlorite andvermiculite in the clay fraction, this second mechanism

Table 8Characteristic reactions with respect to the carbonate system
Reaction log K a (25 °C) ΔHr° (kJ mol−1)
CaCO3+2H+=CO2(g)+H2O+Ca2+ 9.80 −14.76
0.5CaMg(CO3)2+2H+=0.5Ca2++0.5 Mg2++H2O+CO2(g) 9.62 −21.90
CO2(g)+H2O=H2CO3 −1.47 −20.77H2CO3=H
++HCO3 −6.35 7.6a Stumm and Morgan, 1996.
691M. Egli et al. / Geomorphology 97 (2008) 675–696
is of minor importance. A weak, negative correlationwas found (R=−0.36; p=0.06) in the XRD analyses ofthe fine earth, however, which points to a certaintransformation of chlorite (fine earth) into vermiculite(clay fraction). Consequently, HIV and vermiculiteprimarily originate from mica weathering (and to alesser extent from chlorite transformation). In agreementwith Wilke et al. (1984), clay mineral weathering startedeven before carbonates had been dissolved andcompletely removed from the soils.
Quartz is a frequent component of the acid-resistantfraction of carbonates and was detectable in the fineearth with XRD within all soil horizons and partiallyalso in the soil skeleton (DRIFT). Quartz most probablywas deposited as detritus during the formation ofcarbonates. Its content generally increased from the Chorizon to the topsoil. This can be attributed to a pas-sive enrichment (because of carbonate losses). Therelative proportion of quartz in the carbonate-free frac-tion did not vary greatly in the soil profile and con-sequently it was not more abundant in surface horizons.This means that loess attributions were of minorimportance.
The relative concentration of vermiculite in the clayfraction did not show any trend with elevation. Asignificant tendency of higher vermiculite contents inthe A (or O) horizons with increasing elevation could,however, be measured in the fine earth (R2 =0.63;pb0.01). Transformation mechanisms of silicate miner-als in the A (or O) horizon at climatically cooler sitesseem to be at least equally intensive as those atclimatically warmer sites. This agrees well with theobservation that the neoformation of clays (pedogeneti-cally formed) at high elevation is similar or even slightlymore intense than at lower sites. As the biologicalactivity is reduced at climatically cooler sites, less CO2
and probably more organic acids are produced duringorganic matter decomposition. This means that mineraltransformations and weathering reactions at highelevation are consequently more intensely driven byorganic acids as the major proton donors (cf. Ugoliniet al., 1991) than by carbonic acids.
5.3. Organic matter
Organic C abundance in the mineral soil does notvary with elevation. The thickness of the organic layer(organic litter), however, usually increased with in-creasing elevation. This layer was not sampled. Theabundance of SOM in the mineral soil was approxi-mately 15 kg C/m2 at all sites. At higher elevation sites,the soil volume is smaller. Consequently, the concen-tration of organic C in the soil is higher and a trend withelevation was observed (R=0.74; p=0.035). Themeasured SOM abundances were similar to those on asilicate parent material at elevations around 1200 m asl(Egli et al., 2006). In the high-alpine region, the SOMstocks on silicate parent material, however, distinctlyexceeded those on carbonates. In such environments,the acid and nutrient-poor conditions lead to anaccumulation of organic matter in the mineral soilwhich is generally not the case with calcareous parentmaterial.
Regression analysis suggests that organic matter isstabilised in the investigated soils by noncrystallineoxyhydroxides, as a close correlation between theoxalate-extractable fraction of Fe (or Al) and organic Cexists, regardless of the calcite/dolomite ratio in the parentmaterial (Fig. 10). The formation of organo-metalliccomplexes is known to strengthen SOM resistance tobiodegradation (Brunner and Blaser, 1989). Metal oxideshave been demonstrated to be particularly effective inadsorbing and stabilising organic matter in soils (Kaiserand Zech, 1999; Kleber et al., 2005). Clay minerals orphyllosilicates can also help to preserve SOM (Schimelet al., 1985; Wiseman and Püttmann, 2006). Interactionoccurs with polar organic functional groups of amphi-philes via ligand exchange with singly-coordinatedmineral hydroxyls forming stable inner-sphere com-plexes, proteinaceous materials adsorbed on chargedsurfaces (“contact” zone; Kleber et al., 2007) andassociation of hydrophobic substances with nonchargedmineral surfaces. Vermiculite in the clay as well as in thefine-earth fraction displayed a significant and positivecorrelation with SOM (Fig. 10) and was not influenced by

Fig. 8. Comparison of modelled concentrations of Ca, Mg and pCO2,obtained from soil profile calculations, to equilibrium concentrationsof (A) calcite and (B) dolomite for a logK at 0 °C and 8 °C. Thecalculated pCO2 in the soils (C) was derived from mass-balancecalculations with the immobile element and the noncarbonate fractionand is given as a function of elevation.
692 M. Egli et al. / Geomorphology 97 (2008) 675–696
the calcite/dolomite ratio of the parent material. The clayfraction as a total, however, did not correlate with SOM.The results of Percival et al. (2000) suggested thatchemical stabilisation of organic matter is the key processcontrolling C accumulation rather than the clay content,which correlated poorly to soil C in their investigation. Asshown by Denef and Six (2004), the type of clay mineralscan affect the macroaggregate formation and stabilisation(and consequently organic C). Illite led to stronger organicbonds when compared to kaolinite clay (Denef and Six,2004). In the studied soils, we must assume that 2:1 clayminerals such as vermiculite contribute to establishingstrong clay-organic matter bonds. Additionally, carbonatemay contribute to structural stabilisation (Le Bissonnais,1996). Statistical analyses gave, however, a negativecorrelation. A possible SOM stabilisation effect ofcarbonates was overshadowed by the leaching ofcarbonates that was most intense in the topsoils (wherealso the highest amount of SOM was found).
6. Conclusion
The hypothesis that weathering reactions should bemost intensive close to the timberline could not beverified. Weathering is overwhelmingly dominated bycarbonate dissolution and thus leaching of Ca and Mg.Although the solubility of carbonates is higher at lowertemperatures, the biologically-driven production of CO2
at lower elevation overcompensated for this temperatureeffect. The pCO2 in soils at climatically warmer siteswas up to an order of magnitude higher. The weatheringat these sites is mainly driven by carbonic acids. At theclimatically cooler sites mineral transformations andweathering reactions are to a greater extent determinedby organic acids. This suggests that, most probably, twodifferent weathering regimes (carbonic and organic acidweathering) exist along the toposequence.
From X-ray data, we infer that the transformation ofmica into vermiculite is the main mineralogical processin the clay as well as in the fine-earth fraction. Trans-formation of biotite (mica) to vermiculite is, therefore,an early weathering reaction of silicic minerals althoughthe soil still contains carbonates. Weathering of chloriteinto vermiculite is of minor importance. Kaolinite andsmectite are relicts of a former soil formation (Mesozoicto Tertiary?). The neoformation of clays showed only aweak elevation-dependent tendency and the vermiculiteconcentration did not show any. Weathering mechan-isms regarding sheet silicates (clay fraction and fineearth) were at high-alpine sites at least equally intensiveas those at climatically warmer sites. With respect toclay mineralogy, alpine tundra soils can be as well
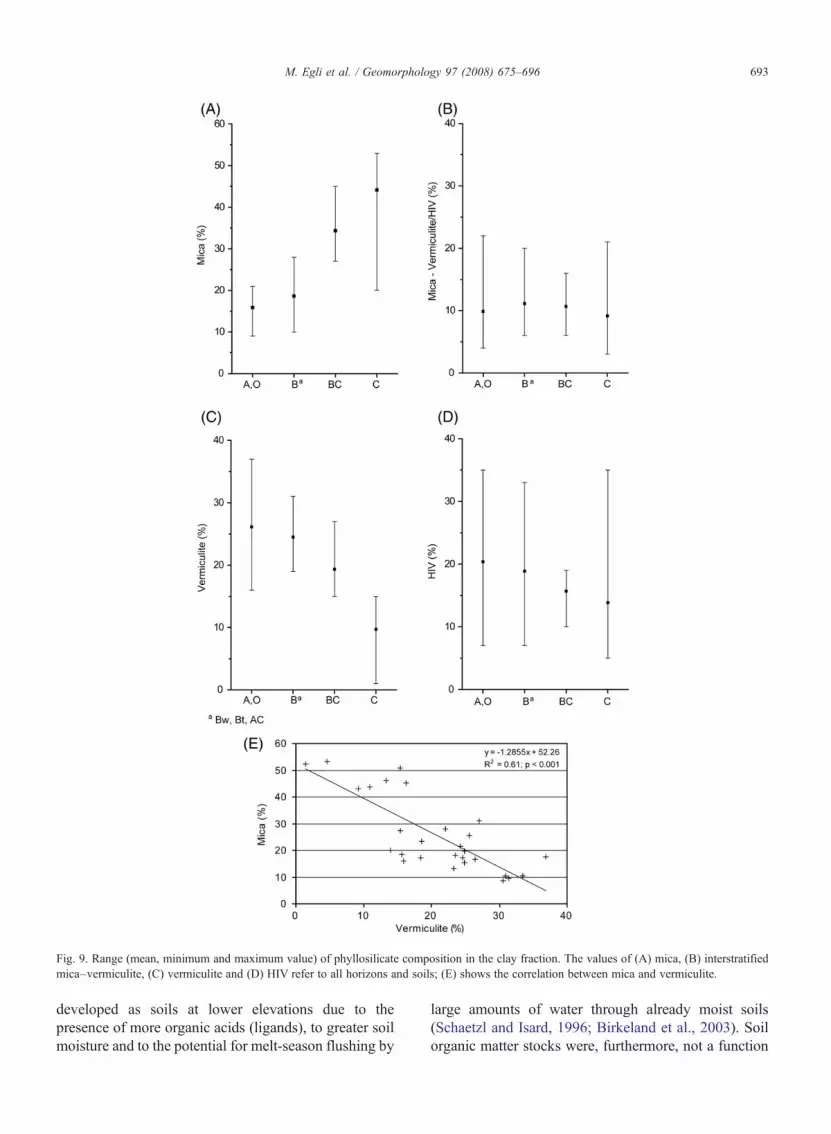
Fig. 9. Range (mean, minimum and maximum value) of phyllosilicate composition in the clay fraction. The values of (A) mica, (B) interstratifiedmica–vermiculite, (C) vermiculite and (D) HIV refer to all horizons and soils; (E) shows the correlation between mica and vermiculite.
693M. Egli et al. / Geomorphology 97 (2008) 675–696
developed as soils at lower elevations due to thepresence of more organic acids (ligands), to greater soilmoisture and to the potential for melt-season flushing by
large amounts of water through already moist soils(Schaetzl and Isard, 1996; Birkeland et al., 2003). Soilorganic matter stocks were, furthermore, not a function

Fig. 10. Correlation of soil organic matter with (A) poorly crystallineoxyhydroxides (Fe and Al), (B) vermiculite in the clay fraction and(C) vermiculite in the fine-earth fraction.
694 M. Egli et al. / Geomorphology 97 (2008) 675–696
of elevation. Approximately 15 kg C/m2 of SOM wasmeasured in the mineral soil at all sites. The organiclitter layer (not measured) was, however, thicker athigher elevation. The main factors in determining theSOM preservation are Fe-oxyhydroxides and vermicu-lite, which contribute to strong clay-organic matterbonds and are not influence by the variability of theparent material.
Several scenarios of global warming propose as-cending vegetation zones, with the subalpine coniferousforest and Ericaceous shrubs becoming able to colonisemeadows at higher elevations (Ozenda and Borel,1991). Within the time span of decades to centuries,
vegetation communities can change (Zanelli et al.,2006). Especially at climatically cooler sites, a warmerclimate could give rise to a changed microbiology withthe consequence that the weathering regime and SOMstorage mechanisms change. An organic-acid-dominat-ed weathering regime might change into a carbonic aciddominated weathering regime. This could have distinctconsequences for the weathering mechanisms and forthe storage of soil organic matter. We hypothesise thatmore favourable conditions in the soils at highelevations could lead to an intensified biological activityin the short- to mid-term and, consequently, to an in-creased SOM decomposition (cf. Egli et al., 2004; thesoil could become a C source and not a sink in thistransient period).
Acknowledgements
We would like to express our appreciation to B. Kägiand D. Giaccai for their assistance in the laboratory. Weare, furthermore, indebted to Margaret J. Guccione andto two unknown reviewers for their helpful commentson an earlier version of the manuscript.
References
Bahrenberg, G., Giese, E., 1975. Statistische Methoden und ihreAnwendung in der Geographie. Teubner Studienbücher, Stuttgart,Germany.
Bain, D.C., Mellor, A., Wilson, M.J., Duthie, D.M.L., 1994. Chemicaland mineralogical weathering rates and processes in an uplandgranitic till catchment in Scotland. Water, Air, and Soil Pollution73, 11–27.
Barnhisel, R.I., Bertsch, P.M., 1989. Chlorites and hydroxy-interlayeredvermiculite and smectite, In: Dixon, J.B.,Weed, S.B. (Eds.),Mineralsin Soil Environments, 2nd ed. SSSABook Series, vol. 1. Soil ScienceSociety of America, Madison, WI, USA, pp. 729–788.
Baroni, C., Carton, A., 1990. Variazioni oloceniche della Vedretta dellaLobbia (gruppo dell'Adamello, Alpi Centrali). Geografia FisicaDinamica Quaternaria 13, 105–119.
Bergmann, J., Kleeberg, R., 1998. Rietveld analysis of disorderedlayer silicates. Materials Science Forum 278–281, 300–305.
Birkeland, P.W., Shroba, R.R., Burns, S.F., Price, A.B., Tonkin, P.J.,2003. Integrating soils and geomorphology in mountains — anexample from the Front Range of Colorado. Geomorphology 55,329–344.
Bockheim, J.G., Munroe, J.S., Douglass, D., Koerner, D., 2000. Soildevelopment along an elevational gradient in the southeasternUinta Mountains, Utah, USA. Catena 39, 169–185.
Borsato, A., Miorandi, R., Corradini, F., Frisia, S., 2007. Idrochimicadelle acque ipogee in Trentino: specie, variabilità stagionale,gradiente altitudinale e implicazioni per gli studi climatico-ambientale da speleotemi. Acta Geologica 82, 77–104.
Bremner, J.M., 1996. Nitrogen - Total. In: Sparks, D.L. (Ed.), Methodsof Soil Analysis, Part 3 Chemical Methods. Soil Science Society ofAmerica Inc. and American Society of Agronomy Inc., Madison,Wisconsin, pp. 1085–1102.
695M. Egli et al. / Geomorphology 97 (2008) 675–696
Brimhall, G.H., Dietrich, W.E., 1987. Constitutive mass balancerelations between chemical composition, volume, density, poros-ity, and strain in metasomatic hydrochemical systems: Results onweathering and pedogenesis. Geochimica et Cosmochimica Acta51, 567–587.
Bronger, A., Heinkele, T., 1989. Paleosol sequences as witnesses ofPleistocene climatic history. In: Bronger, A., Catt, J.A. (Eds.),Paleopedology — Nature and Applications of Paleosols. CatenaSupplement, vol. 16, pp. 163–186.
Brunner, W., Blaser, P., 1989. Mineralization of soil organic matter andadded carbon substrates in two acidic soils with high non-exchangeable aluminium. Zeitschrift für Pflanzenernährung undBodenkunde 152, 367–372.
Burga, C., Perret, R., 1997. Vegetation und Klima der Schweiz seitdem jüngeren Eiszeitalter. Ott Verlag, Thun, Switzerland.
Chadwick, O.A., Brimhall, G.H., Hendricks, D.M., 1990. From ablack to a gray box — a mass balance interpretation ofpedogenesis. Geomorphology 3, 369–390.
Denef, K., Six, J., 2004. Clay mineralogy determines the importanceof biological versus abiotic processes for macroaggregateformation and stabilization. European Journal of Soil Science56, 469–479.
Egli, M., Fitze, P., 2000. Formulation of pedologic mass balance basedon immobile elements: a revision. Soil Science 165, 437–443.
Egli, M., Fitze, P., 2001. Quantitative aspects of carbonate leaching ofsoils with differing ages and climates. Catena 46, 35–62.
Egli, M., Mirabella, A., Sartori, G., Fitze, P., 2003. Weathering rates asa function of climate: results from a climosequence of the ValGenova (Trentino, Italian Alps). Geoderma 111, 99–121.
Egli, M., Hitz, C., Fitze, P., Mirabella, A., 2004. Experimentaldetermination of climate change effects on above-ground andbelow-ground organic matter in alpine grasslands by translocationof soil cores. Journal of Plant Nutrition and Soil Science 167,457–470.
Egli, M., Mirabella, A., Bischof, S., Zanelli, R., Mancabelli, A.,Sartori, G., 2006. Effect of north and south exposition onweathering and clay mineral formation in Alpine soils. Catena67, 155–174.
Fanning, D.S., Keramidas, V.Z., El-Desoky,M.A., 1989.Micas, In: Dixon,J.B., Weed, S.B. (Eds.), Minerals in Soil Environment, 2nd ed. SoilScience Society of America, Madison, WI, USA, pp. 551–634.
FAO, 1998. World Reference Base for Soil Resources. World SoilResources Reports, vol. 84. FAO, Rome, Italy.
Filippi, M.L., Arpenti, E., Heiri, O., Frisia, S., Angeli, N., van derBorg, K., Blockley, S., 2007. Lake Lavarone Late-glacial topresent palaeoenvironmental changes: a unique multi–proxyrecord from Trentino, NE Italy. Geophysical Research Abstracts9, 06639.
Gee, G.W., Bauder, J.W., 1986. Particle size analysis. In: Klute, E.(Ed.), Methods of Soil Analysis. Part 1. Physical and Mineralog-ical Methods. 2nd ed. Soil Science Society of America Inc. andAmerican Society of Agronomy Inc., Madison, WI, pp. 383–411.
Grunenberg, T., 1992. Ursachen von Farben und Verfärbungen inNatursteinplatten aus Treuchtlinger Marmor. Ph.D. Thesis, Uni-versity Erlangen-Nürnberg, Germany.
Hall, K., Thorn, C.E., Matsuoka, N., Prick, A., 2002. Weathering incold regions: some thoughts and perspectives. Progress in PhysicalGeography 26, 557–603.
Hossner, C.R., 1996. Dissolution for total elemental analysis. In:Sparks, D.L. (Ed.), Methods of Soil Analysis, Part 3, ChemicalMethods. Soil Science Society of America Inc. and AmericanSociety of Agronomy Inc., Madison, WI, pp. 49–64.
Ivy-Ochs, S.D., Schäfer, J., Kubik, P.W., Synal, H.-A., Schlüchter, C.,2004. Timing of deglaciation on the northern Alpine foreland(Switzerland). Eclogae Geoligicae Helveticae 97, 47–55.
Kaiser, K., Zech, W., 1999. Release of natural organic matter sorbed tooxides and a subsoil. Soil Science Society of America Journal 63,1157–1166.
Kerschner, H., 2000. Alpine Younger Dryas glaciers as paleo-precipitation gauges. Annals of Glaciaology, 31, 80–84.
Kleber, M., Mikutta, R., Torn, M.S., Jahn, R., 2005. Poorly crystallinemineral phases protect organic matter in acid subsoil horizons.European Journal of Soil Science 56, 717–725.
Kleber, M., Sollins, P., Sutton, R., 2007. A conceptual model oforgano-mineral interactions in soils: self-assembly of organicmolecular fragments into zonal structures on mineral surfaces.Biogeochemistry 85, 9–24.
Laffan, M.D., Daly, J.S., Whitton, T., 1989. Soil patterns inweathering, clay translocation and podzolisation on hilly andsteep land at Port Underwood, Marlborough Sounds, NewZealand: classification and relation to landform and altitude.Catena 16, 251–268.
Lanson, B., 1997. Decomposition of experimental X-ray diffractionpatterns (profile fitting): a convenient way to study clay minerals.Clays and Clay Minerals 45, 132–146.
Le Bissonnais, Y., 1996. Aggregate stability and assessment of soilcrustability and erodibility: I. Theory and methodology. EuropeanJournal of Soil Science 47, 425–437.
McKeague, J.A., Brydon, J.E., Miles, N.M., 1971. Differentiation offorms of extractable iron and aluminium in soils. Soil ScienceSociety of America Proceedings 35, 33–38.
Millot, G., 1970. Geology of clays: Weathering–Sedimentology–Geochemistry. Springer Verlag, New York, NY.
Mirabella, A., Sartori, G., 1998. The effect of climate on themineralogical properties of soils from the Val Genova Valley(Trentino, Italy). Fresenius Environmental Bulletin 7, 478–483.
Mirabella, A., Egli, M., 2003. Structural transformations of clayminerals in soils of a climosequence in an Italian alpineenvironment. Clays and Clay Minerals 51, 264–278.
Moore, D.M., Reynolds, R.C., 1997. X-ray diffraction and theidentification and analysis of clay minerals, 2nd ed. OxfordUniversity Press, New York, NY.
Muhs, D.R., Bettis, E.A., Been, J., McGeehin, J.P., 2001. Impact ofclimate and parent material on chemical weathering in loess-derived soils of the Mississippi River valley. Soil Science Societyof America Journal 65, 1761–1777.
Oetheimer, C., 1990. La foresta sommersa del Lago di Tovel(Trentino): reinterpretazione e datazione dendrocronologica.Studi trentini di scienze naturali. Acta geologica 67, 3–23.
Ollier, C.D., 1969. Weathering. Oliver & Boyd, Edingburgh, Scotland.Ozenda, P., Borel, J.L., 1991. Les conséquences écologiques possibles
des changements climatiques dans l'Arc alpin. Rapport Futuralp,vol. 1. ICALPE, Le Bourget-du-Lac, France.
Percival, H.J., Parfitt, R.L., Scott, N.A., 2000. Factors controlling soilcarbon levels in NewZealand grasslands: is clay content important?Soil Science Society of America Journal 64, 1623–1630.
Press, F., Siever, R., 1995. Allgemeine Geologie. Spektrum Akade-mischer Verlag, Heidelberg, Germany.
Rasmussen, C., Matsuyama, N., Dahlgren, R.A., Southard, R.J.,Brauer, N., 2007. Soil genesis and mineral transformation acrossan environmental gradient on andesitic lahar. Soil Science Societyof America Journal 71, 225–237.
Richter, D.D., Hofmockel, M., Callaham, M.A., Powlson, D.S., Smith,P., 2007. Long-term soil experiments: keys to managing Earth's

696 M. Egli et al. / Geomorphology 97 (2008) 675–696
rapidly changing ecosystem. Soil Science Society of AmericaJournal 71, 266–279.
Righi, D., Petit, S., Bouchet, A., 1993. Characterization of hydroxy-interlayered vermiculite and illite/smectite interstratified mineralsfrom the weathering of chlorite in a Cryorthod. Clays and ClayMinerals 41, 484–495.
Righi, D., Huber, K., Keller, C., 1999. Clay formation and podzoldevelopment from postglacial moraines in Switzerland. ClayMinerals 34, 319–332.
Sartori, G., Mancabelli, A., Wolf, U., Corradini, F., 2005. Atlante deisuoli del Parco Naturale Adamello-Brenta. Suoli e paesaggi.Museo Tridentino di Scienze Naturali, Trento, Italy.
Sboarina, C., Cescatti, A., 2004. Il clima del Trentino—Distribuzionespaziale delle principali variabili climatiche. Centro di EcologiaAlpina, Trento, Italy.
Schaetzl, R.J., Isard, S.A., 1996. Regional-scale relationships betweenclimate and strength of podzolization in the Great Lakes Region,North America. Catena 28, 47–69.
Schimel, D.S., Coleman, D.C., Horton, K.A., 1985. Soil organicmatter dynamics in paired rangeland and cropland toposequencesin North Dakota. Geoderma 36, 201–214.
Soil Survey Staff, 2006. Keys to Soil Taxonomy, 10th ed. USDA-Natural Resources Conservation Service, Washington, DC.
Stumm, W., Morgan, J.J., 1996. Aquatic chemistry. Third ed. JohnWiley and Sons, Inc., New York.
Ugolini, F.C., Dahlgren, R., Lamanna, J., Nuhn, W., Zachara, J., 1991.Mineralogy and weathering processes in recent and Holocene tephradeposits of the Pacific Northwest, USA. Geoderma 51, 277–299.
von Blanckenburg, F., 2005. The control mechanisms of erosion andweathering at basin scale from cosmogenic nuclides in riversediments. Earth and Planetary Science Letters 237, 462–479.
Walkley, A., Black, I.A., 1934. An examination of the Degtjareff methodfor determing soil organic matter and a proposed modification of thechromic acid titration method. Journal of Soil Science 37, 29–38.
West, A.J., Galy, A., Bickle, M., 2005. Tectonic and climatic controls onsilicateweathering. Earth andPlanetary ScienceLetters 235, 211–228.
Wilke, B.-M., Mishra, V.-K., Rehfuess, K.E., 1984. Clay mineralogyof a soil sequence in slope deposits derived from Hauptdolomit(dolomite) in the Bavarian Alps. Geoderma 32, 103–116.
Wiseman, C.L.S., Püttmann, W., 2006. Interactions between mineralphases in the preservation of soil organic matter. Geoderma 134,109–118.
Zanelli, R., Egli, M., Fitze, P., Giaccai, D., Mirabella, A., 2006.Influence of laurophyllous species, chestnut and native vegetationon organic matter in soils in Southern Switzerland and NorthernItaly. Geoderma 136, 723–737.