Embed Size (px)
Citation preview
SCALING AND MAPPING REGIONAL CALCULATIONS OF SOILCHEMICAL WEATHERING RATES IN SWEDEN
CECILIA AKSELSSON1, JOHAN HOLMQVIST2, MATTIAS ALVETEG1,DANIEL KURZ3 and HARALD SVERDRUP1
1 Department of Chemical Engineering II, Lund Institute of Technology, P.O. Box 124, SE-221 00Lund, Sweden; 2 SWECO International AB, Geijersgatan 8, SE-216 18 Malmö, Sweden;
3 EKG Geo-Science, Ralligweg 10, CH-3012 Bern, Switzerland(∗ author for correspondence, e-mail: [email protected];
phone: +46 46-222 48 66; fax: +46 46-14 91 56)
(Received 20 August 2002; accepted 1 April 2003)
Abstract. Weathering rates of base cations are crucial in critical load calculations and assessmentsof sustainable forestry. The weathering rate on a single site with detailed geological data can be mod-elled using the PROFILE model. For environmental assessments on a regional scale, the weatheringrates for sites are scaled into regional maps. The step from sites to regional level requires focus onthe spatial variation of weathering rates. In this paper, a method is presented by which weatheringrates are calculated for 25589 Swedish sites with total elemental analysis for the soil. Based on a partof the results, a methodology for creating area covering maps by geostatistical analysis and krigingis described. A normative reconstruction model was used to transform total elemental analysis tomineralogy. Information from the Swedish Forest Inventory database and other databases were usedto derive texture and other important information for the sites, e.g. climate, deposition and vegetationdata. The calculated weathering rates show a regional pattern that indicates possibilities for interpol-ation of data in large parts of Sweden. Geostatistical analysis of an area in southern Sweden showsdifferent properties for different base cations. Kriging was performed for potassium to demonstratethe method. It was concluded that different base cations and different regions have to be analysedseparately, in order to optimise the kriging method.
Keywords: base cations, geostatistics, kriging, mineralogy, PROFILE, Sweden, weathering
1. Introduction
Estimations of weathering rates are needed in the nutrient budget calculations incalculations of critical loads of acidity (Posch et al., 2001), as well as for assessingsustainable harvesting in forest ecosystems (Holmqvist, 2001). There are a fewmethods to estimate weathering rates. The historic weathering rate can be estim-ated by comparing the mineralogy at soil depths affected by weathering with notweathered layers (Olsson et al., 1993). Current weathering rates can be estimatedon a catchment scale through mass balance studies in catchments (Paces, 1986).For sites with detailed information on mineralogy, soil texture, and land use, thecurrent weathering rate also can be estimated using the PROFILE model (Sverdrupand Warfvinge, 1993, 1995; Warfvinge and Sverdrup, 1995; Sverdrup et al., 1996).
Water, Air, and Soil Pollution: Focus 4: 671–681, 2004.© 2004 Kluwer Academic Publishers. Printed in the Netherlands.
672 C. AKSELSSON ET AL.
The PROFILE model has been used earlier to calculate weathering rates andcritical loads for 1883 Swedish forest soils (Warfvinge and Sverdrup, 1995; Ber-tills and Lövblad, 2002) within the Convention on Long-range TransboundaryAir Pollution (CLRTAP). As such calculations were part of the scientific basis inthe emission reduction negotiations within the Convention, results typically wereaggregated to either the 50 km by 50 km or the 150 km by 150 km resolutionused by the European Monitoring and Evaluation Programme (EMEP). While suchresolutions may be useful when sharing the burden of reducing emissions betweencountries, a much higher resolution, and consequently many more sites, is neededto estimate the sustainable harvesting of sawlogs, pulpwood and biofuels. It hasbeen shown that at the EMEP50 and EMEP150 resolutions, a high proportion ofthe uncertainty in the aggregated results is due to the limited number of sites used(Barkman and Alveteg, 2001). Recently, total elemental analyses for soil from26754 Swedish sites were made available to us, and because a plausible miner-alogy can be calculated from a total elemental analysis, this drastically improvesthe estimation of weathering rates in Sweden.
The aim of this paper is to describe a method by which weathering rates canbe calculated for these 26754 sites and to show how geostatistical analysis can beused to create kriged maps of weathering rates in Sweden.
2. Methods
2.1. THE PROFILE MODEL
PROFILE is a steady-state soil chemistry model, originally developed to calculatethe effect of acid rain on soil chemistry (Sverdrup and Warfvinge, 1993, 1995;Warfvinge and Sverdrup, 1995; Sverdrup et al., 1996). PROFILE includes process-oriented descriptions of chemical weathering of minerals, leaching and accumula-tion of dissolved chemical components and solution equilibrium reactions. In PRO-FILE, the soil is divided into soil layers with different properties, preferably basedon the naturally occurring soil stratification. Weathering is calculated using trans-ition state theory and the geochemical properties of the soil system, such as soilwetness, mineral surface area, hydrogen, cation and organic acid concentrations,temperature and mineral composition.
2.2. REQUIRED INPUT
The basis for this study is 22940 till sites with total elemental analyses of soil ata depth of 1 metre, supplied by the Swedish Geological Survey (SGU), togetherwith total elemental analyses of soil from 1897 sites from the National ForestInventory coordinated by the Swedish University of Agricultural Sciences (SLU)and 1917 sites from Terra Mining (total of 26754 sites). Total elemental analyseswere transformed to mineralogy using a normalisation model (Section 2.2.1).
REGIONAL MAPPING OF WEATHERING RATES IN SWEDEN 673
TABLE I
Input data parameters to PROFILE
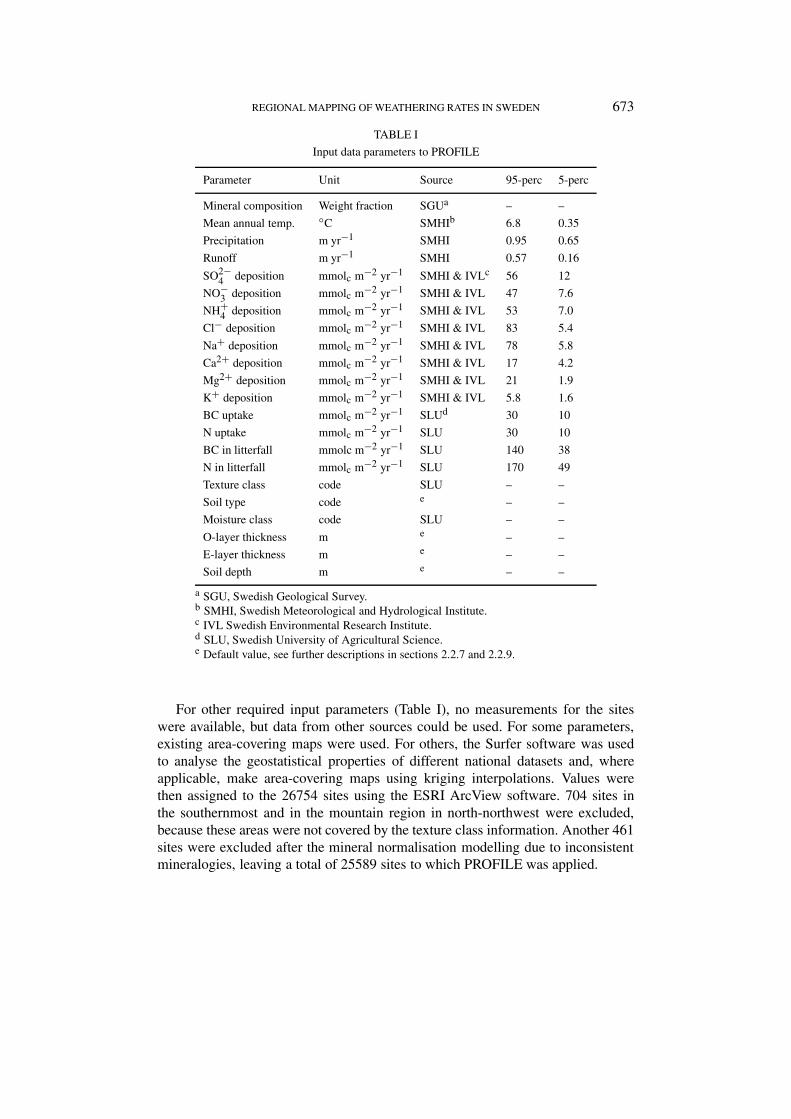
Parameter Unit Source 95-perc 5-perc
Mineral composition Weight fraction SGUa – –
Mean annual temp. ◦C SMHIb 6.8 0.35
Precipitation m yr−1 SMHI 0.95 0.65
Runoff m yr−1 SMHI 0.57 0.16
SO2−4 deposition mmolc m−2 yr−1 SMHI & IVLc 56 12
NO−3 deposition mmolc m−2 yr−1 SMHI & IVL 47 7.6
NH+4 deposition mmolc m−2 yr−1 SMHI & IVL 53 7.0
Cl− deposition mmolc m−2 yr−1 SMHI & IVL 83 5.4
Na+ deposition mmolc m−2 yr−1 SMHI & IVL 78 5.8
Ca2+ deposition mmolc m−2 yr−1 SMHI & IVL 17 4.2
Mg2+ deposition mmolc m−2 yr−1 SMHI & IVL 21 1.9
K+ deposition mmolc m−2 yr−1 SMHI & IVL 5.8 1.6
BC uptake mmolc m−2 yr−1 SLUd 30 10
N uptake mmolc m−2 yr−1 SLU 30 10
BC in litterfall mmolc m−2 yr−1 SLU 140 38
N in litterfall mmolc m−2 yr−1 SLU 170 49
Texture class code SLU – –
Soil type code e – –
Moisture class code SLU – –
O-layer thickness m e – –
E-layer thickness m e – –
Soil depth m e – –
a SGU, Swedish Geological Survey.b SMHI, Swedish Meteorological and Hydrological Institute.c IVL Swedish Environmental Research Institute.d SLU, Swedish University of Agricultural Science.e Default value, see further descriptions in sections 2.2.7 and 2.2.9.
For other required input parameters (Table I), no measurements for the siteswere available, but data from other sources could be used. For some parameters,existing area-covering maps were used. For others, the Surfer software was usedto analyse the geostatistical properties of different national datasets and, whereapplicable, make area-covering maps using kriging interpolations. Values werethen assigned to the 26754 sites using the ESRI ArcView software. 704 sites inthe southernmost and in the mountain region in north-northwest were excluded,because these areas were not covered by the texture class information. Another 461sites were excluded after the mineral normalisation modelling due to inconsistentmineralogies, leaving a total of 25589 sites to which PROFILE was applied.
674 C. AKSELSSON ET AL.
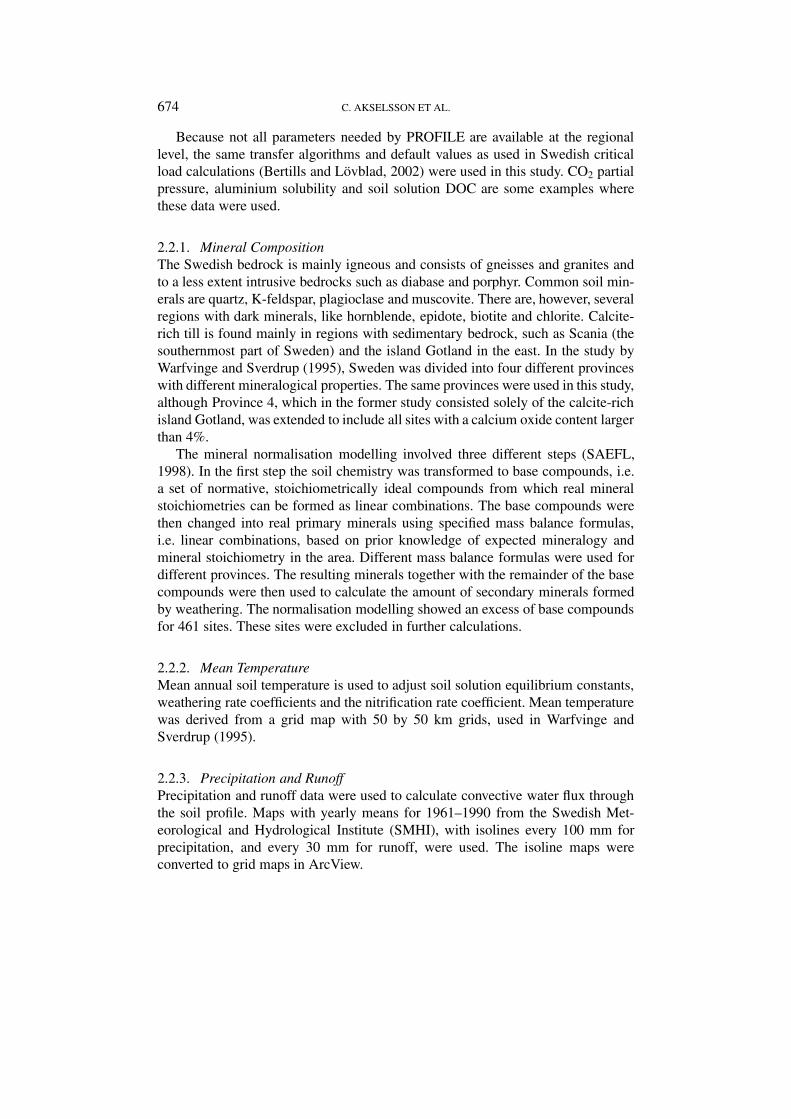
Because not all parameters needed by PROFILE are available at the regionallevel, the same transfer algorithms and default values as used in Swedish criticalload calculations (Bertills and Lövblad, 2002) were used in this study. CO2 partialpressure, aluminium solubility and soil solution DOC are some examples wherethese data were used.
2.2.1. Mineral CompositionThe Swedish bedrock is mainly igneous and consists of gneisses and granites andto a less extent intrusive bedrocks such as diabase and porphyr. Common soil min-erals are quartz, K-feldspar, plagioclase and muscovite. There are, however, severalregions with dark minerals, like hornblende, epidote, biotite and chlorite. Calcite-rich till is found mainly in regions with sedimentary bedrock, such as Scania (thesouthernmost part of Sweden) and the island Gotland in the east. In the study byWarfvinge and Sverdrup (1995), Sweden was divided into four different provinceswith different mineralogical properties. The same provinces were used in this study,although Province 4, which in the former study consisted solely of the calcite-richisland Gotland, was extended to include all sites with a calcium oxide content largerthan 4%.
The mineral normalisation modelling involved three different steps (SAEFL,1998). In the first step the soil chemistry was transformed to base compounds, i.e.a set of normative, stoichiometrically ideal compounds from which real mineralstoichiometries can be formed as linear combinations. The base compounds werethen changed into real primary minerals using specified mass balance formulas,i.e. linear combinations, based on prior knowledge of expected mineralogy andmineral stoichiometry in the area. Different mass balance formulas were used fordifferent provinces. The resulting minerals together with the remainder of the basecompounds were then used to calculate the amount of secondary minerals formedby weathering. The normalisation modelling showed an excess of base compoundsfor 461 sites. These sites were excluded in further calculations.
2.2.2. Mean TemperatureMean annual soil temperature is used to adjust soil solution equilibrium constants,weathering rate coefficients and the nitrification rate coefficient. Mean temperaturewas derived from a grid map with 50 by 50 km grids, used in Warfvinge andSverdrup (1995).
2.2.3. Precipitation and RunoffPrecipitation and runoff data were used to calculate convective water flux throughthe soil profile. Maps with yearly means for 1961–1990 from the Swedish Met-eorological and Hydrological Institute (SMHI), with isolines every 100 mm forprecipitation, and every 30 mm for runoff, were used. The isoline maps wereconverted to grid maps in ArcView.
REGIONAL MAPPING OF WEATHERING RATES IN SWEDEN 675
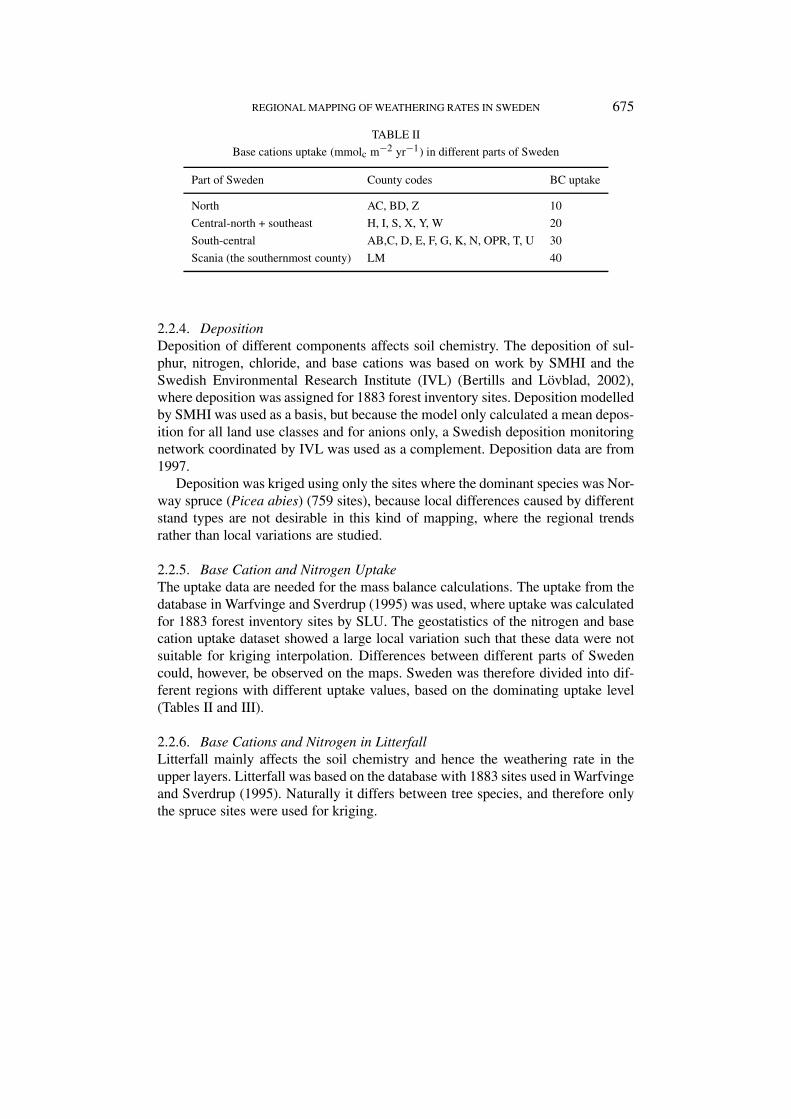
TABLE II
Base cations uptake (mmolc m−2 yr−1) in different parts of Sweden
Part of Sweden County codes BC uptake
North AC, BD, Z 10
Central-north + southeast H, I, S, X, Y, W 20
South-central AB,C, D, E, F, G, K, N, OPR, T, U 30
Scania (the southernmost county) LM 40
2.2.4. DepositionDeposition of different components affects soil chemistry. The deposition of sul-phur, nitrogen, chloride, and base cations was based on work by SMHI and theSwedish Environmental Research Institute (IVL) (Bertills and Lövblad, 2002),where deposition was assigned for 1883 forest inventory sites. Deposition modelledby SMHI was used as a basis, but because the model only calculated a mean depos-ition for all land use classes and for anions only, a Swedish deposition monitoringnetwork coordinated by IVL was used as a complement. Deposition data are from1997.
Deposition was kriged using only the sites where the dominant species was Nor-way spruce (Picea abies) (759 sites), because local differences caused by differentstand types are not desirable in this kind of mapping, where the regional trendsrather than local variations are studied.
2.2.5. Base Cation and Nitrogen UptakeThe uptake data are needed for the mass balance calculations. The uptake from thedatabase in Warfvinge and Sverdrup (1995) was used, where uptake was calculatedfor 1883 forest inventory sites by SLU. The geostatistics of the nitrogen and basecation uptake dataset showed a large local variation such that these data were notsuitable for kriging interpolation. Differences between different parts of Swedencould, however, be observed on the maps. Sweden was therefore divided into dif-ferent regions with different uptake values, based on the dominating uptake level(Tables II and III).
2.2.6. Base Cations and Nitrogen in LitterfallLitterfall mainly affects the soil chemistry and hence the weathering rate in theupper layers. Litterfall was based on the database with 1883 sites used in Warfvingeand Sverdrup (1995). Naturally it differs between tree species, and therefore onlythe spruce sites were used for kriging.
676 C. AKSELSSON ET AL.
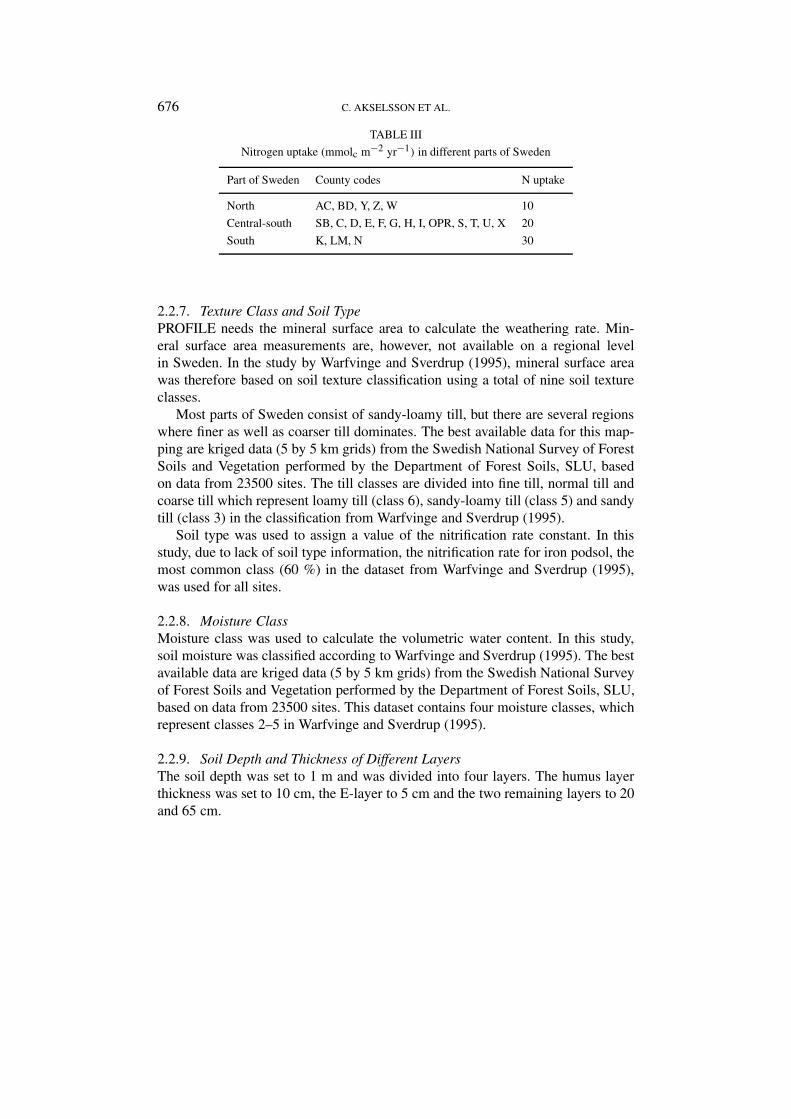
TABLE III
Nitrogen uptake (mmolc m−2 yr−1) in different parts of Sweden
Part of Sweden County codes N uptake
North AC, BD, Y, Z, W 10
Central-south SB, C, D, E, F, G, H, I, OPR, S, T, U, X 20
South K, LM, N 30
2.2.7. Texture Class and Soil TypePROFILE needs the mineral surface area to calculate the weathering rate. Min-eral surface area measurements are, however, not available on a regional levelin Sweden. In the study by Warfvinge and Sverdrup (1995), mineral surface areawas therefore based on soil texture classification using a total of nine soil textureclasses.
Most parts of Sweden consist of sandy-loamy till, but there are several regionswhere finer as well as coarser till dominates. The best available data for this map-ping are kriged data (5 by 5 km grids) from the Swedish National Survey of ForestSoils and Vegetation performed by the Department of Forest Soils, SLU, basedon data from 23500 sites. The till classes are divided into fine till, normal till andcoarse till which represent loamy till (class 6), sandy-loamy till (class 5) and sandytill (class 3) in the classification from Warfvinge and Sverdrup (1995).
Soil type was used to assign a value of the nitrification rate constant. In thisstudy, due to lack of soil type information, the nitrification rate for iron podsol, themost common class (60 %) in the dataset from Warfvinge and Sverdrup (1995),was used for all sites.
2.2.8. Moisture ClassMoisture class was used to calculate the volumetric water content. In this study,soil moisture was classified according to Warfvinge and Sverdrup (1995). The bestavailable data are kriged data (5 by 5 km grids) from the Swedish National Surveyof Forest Soils and Vegetation performed by the Department of Forest Soils, SLU,based on data from 23500 sites. This dataset contains four moisture classes, whichrepresent classes 2–5 in Warfvinge and Sverdrup (1995).
2.2.9. Soil Depth and Thickness of Different LayersThe soil depth was set to 1 m and was divided into four layers. The humus layerthickness was set to 10 cm, the E-layer to 5 cm and the two remaining layers to 20and 65 cm.
REGIONAL MAPPING OF WEATHERING RATES IN SWEDEN 677
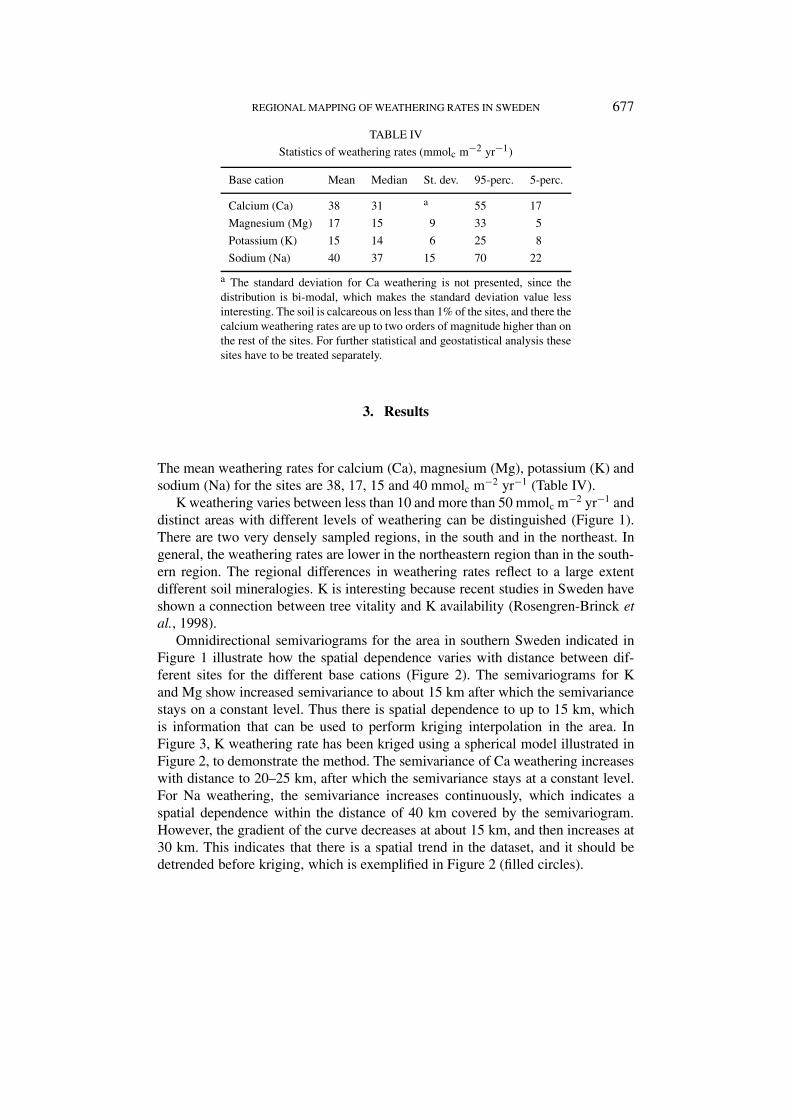
TABLE IV
Statistics of weathering rates (mmolc m−2 yr−1)
Base cation Mean Median St. dev. 95-perc. 5-perc.
Calcium (Ca) 38 31 a 55 17
Magnesium (Mg) 17 15 9 33 5
Potassium (K) 15 14 6 25 8
Sodium (Na) 40 37 15 70 22
a The standard deviation for Ca weathering is not presented, since thedistribution is bi-modal, which makes the standard deviation value lessinteresting. The soil is calcareous on less than 1% of the sites, and there thecalcium weathering rates are up to two orders of magnitude higher than onthe rest of the sites. For further statistical and geostatistical analysis thesesites have to be treated separately.
3. Results
The mean weathering rates for calcium (Ca), magnesium (Mg), potassium (K) andsodium (Na) for the sites are 38, 17, 15 and 40 mmolc m−2 yr−1 (Table IV).
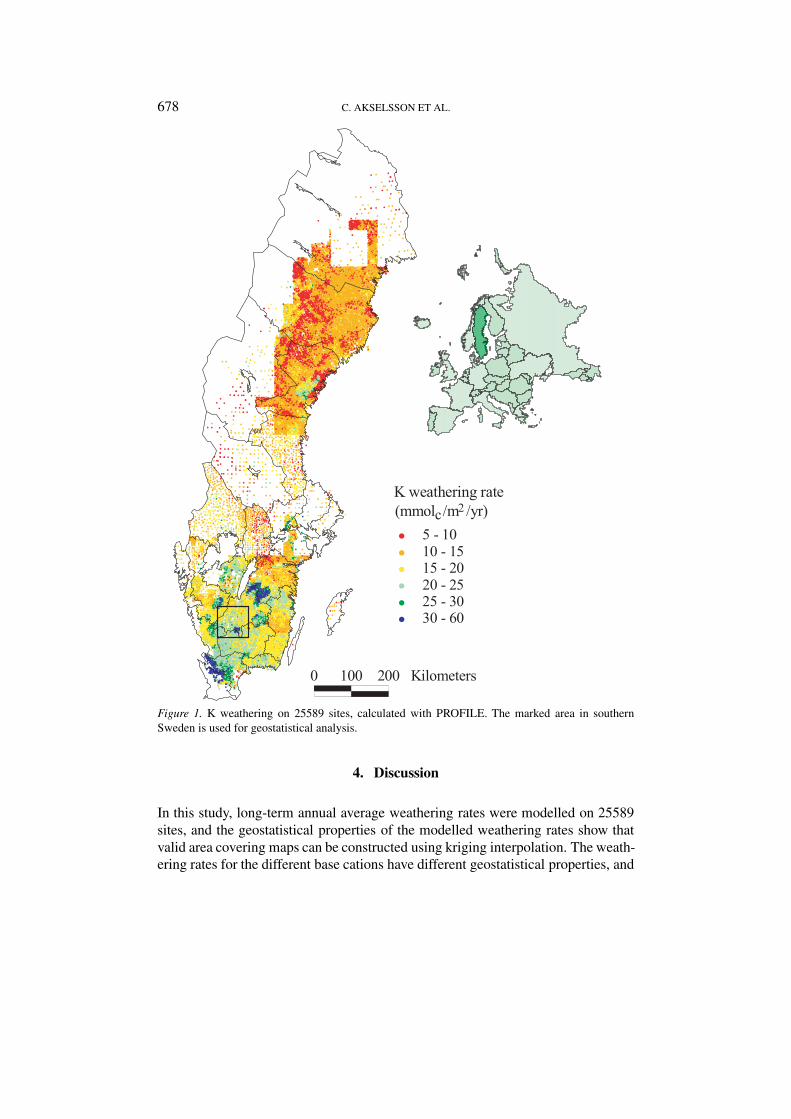
K weathering varies between less than 10 and more than 50 mmolc m−2 yr−1 anddistinct areas with different levels of weathering can be distinguished (Figure 1).There are two very densely sampled regions, in the south and in the northeast. Ingeneral, the weathering rates are lower in the northeastern region than in the south-ern region. The regional differences in weathering rates reflect to a large extentdifferent soil mineralogies. K is interesting because recent studies in Sweden haveshown a connection between tree vitality and K availability (Rosengren-Brinck etal., 1998).
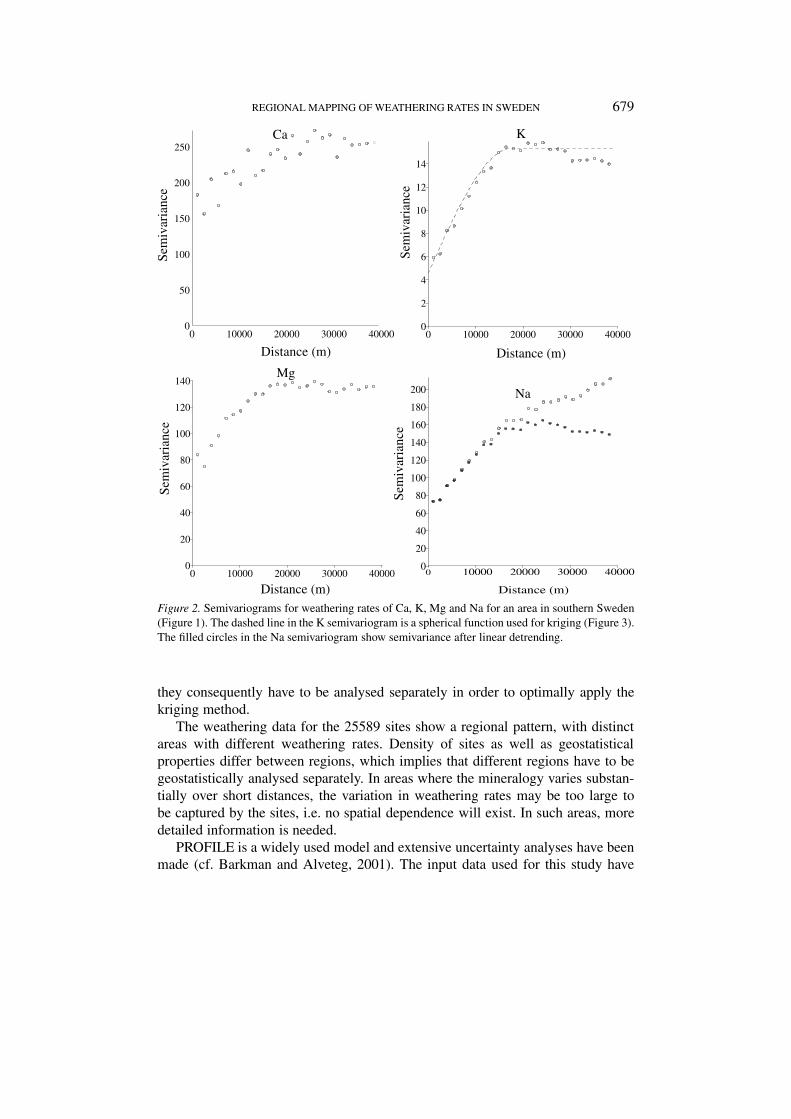
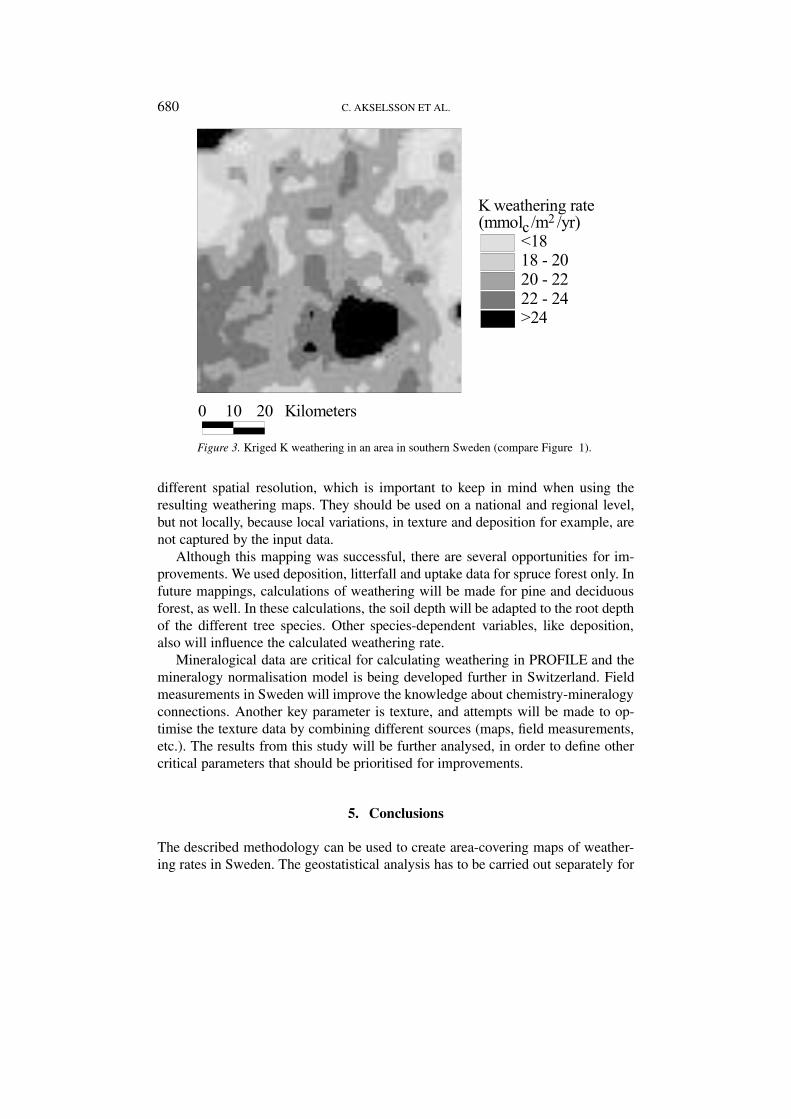
Omnidirectional semivariograms for the area in southern Sweden indicated inFigure 1 illustrate how the spatial dependence varies with distance between dif-ferent sites for the different base cations (Figure 2). The semivariograms for Kand Mg show increased semivariance to about 15 km after which the semivariancestays on a constant level. Thus there is spatial dependence to up to 15 km, whichis information that can be used to perform kriging interpolation in the area. InFigure 3, K weathering rate has been kriged using a spherical model illustrated inFigure 2, to demonstrate the method. The semivariance of Ca weathering increaseswith distance to 20–25 km, after which the semivariance stays at a constant level.For Na weathering, the semivariance increases continuously, which indicates aspatial dependence within the distance of 40 km covered by the semivariogram.However, the gradient of the curve decreases at about 15 km, and then increases at30 km. This indicates that there is a spatial trend in the dataset, and it should bedetrended before kriging, which is exemplified in Figure 2 (filled circles).
678 C. AKSELSSON ET AL.
Figure 1. K weathering on 25589 sites, calculated with PROFILE. The marked area in southernSweden is used for geostatistical analysis.
4. Discussion
In this study, long-term annual average weathering rates were modelled on 25589sites, and the geostatistical properties of the modelled weathering rates show thatvalid area covering maps can be constructed using kriging interpolation. The weath-ering rates for the different base cations have different geostatistical properties, and
REGIONAL MAPPING OF WEATHERING RATES IN SWEDEN 679
Figure 2. Semivariograms for weathering rates of Ca, K, Mg and Na for an area in southern Sweden(Figure 1). The dashed line in the K semivariogram is a spherical function used for kriging (Figure 3).The filled circles in the Na semivariogram show semivariance after linear detrending.
they consequently have to be analysed separately in order to optimally apply thekriging method.
The weathering data for the 25589 sites show a regional pattern, with distinctareas with different weathering rates. Density of sites as well as geostatisticalproperties differ between regions, which implies that different regions have to begeostatistically analysed separately. In areas where the mineralogy varies substan-tially over short distances, the variation in weathering rates may be too large tobe captured by the sites, i.e. no spatial dependence will exist. In such areas, moredetailed information is needed.
PROFILE is a widely used model and extensive uncertainty analyses have beenmade (cf. Barkman and Alveteg, 2001). The input data used for this study have
680 C. AKSELSSON ET AL.
Figure 3. Kriged K weathering in an area in southern Sweden (compare Figure 1).
different spatial resolution, which is important to keep in mind when using theresulting weathering maps. They should be used on a national and regional level,but not locally, because local variations, in texture and deposition for example, arenot captured by the input data.
Although this mapping was successful, there are several opportunities for im-provements. We used deposition, litterfall and uptake data for spruce forest only. Infuture mappings, calculations of weathering will be made for pine and deciduousforest, as well. In these calculations, the soil depth will be adapted to the root depthof the different tree species. Other species-dependent variables, like deposition,also will influence the calculated weathering rate.
Mineralogical data are critical for calculating weathering in PROFILE and themineralogy normalisation model is being developed further in Switzerland. Fieldmeasurements in Sweden will improve the knowledge about chemistry-mineralogyconnections. Another key parameter is texture, and attempts will be made to op-timise the texture data by combining different sources (maps, field measurements,etc.). The results from this study will be further analysed, in order to define othercritical parameters that should be prioritised for improvements.
5. Conclusions
The described methodology can be used to create area-covering maps of weather-ing rates in Sweden. The geostatistical analysis has to be carried out separately for
REGIONAL MAPPING OF WEATHERING RATES IN SWEDEN 681
different areas and different base cations in order to optimise the kriging method.In some areas, where the local variation is too large to be captured by the currentlyavailable sites, more information will be needed to create area-covering maps.
Acknowledgements
This study was financed by ASTA (International and National Abatement Strategiesfor Transboundary Air Pollution) and SUFOR (Sustainable Forestry in SouthernSweden), two research programs in Sweden. Part of the dataset used in this pub-lication is based on the Swedish National Survey of Forest Soils and Vegetation,performed by the Department of Forest Soils, SLU. Other data sources were SGU(Swedish Geological Survey), IVL Swedish Environmental Research Institute,SMHI (Swedish Meteorological and Hydrological Institute) and Terra Mining. Theauthors are solely responsible for the interpretation of these data.
References
Barkman, A. and Alveteg, M.: 2001, ‘Identifying potentials for reducing uncertainty in critical loadcalculation using the PROFILE model’, Water, Air, Soil Pollut. 125, 35–54.
Bertills, U. and Lövblad, G.: 2002, ‘Kritisk belastning för svavel och kväve’, Technical Report,Rapport 5174, Naturvårdsverket, Stockholm (in Swedish).
Holmqvist, J.: 2001, ‘Modelling chemical weathering in different scales’, Ph.D. Thesis, Departmentof Chemical Engineering II, Lund University.
Olsson, M., Rosén, K. and Melkerud, P-A.: 1993, ‘Regional modelling of base cation losses fromSwedish forest soils due to whole-tree harvesting’, Appl. Geochem. Suppl. Issue 2, 189–194.
Paces, T.: 1986, ‘Weathering rates of gneiss and depletion of exchangeable cations in soils underenvironmental acidification’, J. Geol. Soc. 143, 673–677.
Posch, M., de Smet, P. A. M., Hettelingh, J-P. and Downing, R. (eds): 2001, ‘Modelling and Map-ping of Critical Thresholds in Europe. Status Report 2001’, Technical Report, RIVM Report No.259101010, Coordination Center for Effects, Bilthoven, The Netherlands.
Rosengren-Brinck, U., Nihlgård, B., Bengtsson, M. and Thelin, G.: 1998, ‘Samband mellan bar-rförlust, barrkemi och markkemi i Skåne’, Technical Report, Barrförlust och luftföroreningar,Rapport 4890, Naturvårdsverket, Stockholm.
SAEFL: 1998, ‘Critical loads of acidity for forest soils’, Technical Report, Environmental Document-ation No. 88, Air/Forest, Swiss Agency for the Environment, Forest and Landscape (SAEFL),Bern, Switzerland.
Sverdrup, H. and Warfvinge, P.: 1993, ‘Calculating field weathering rates using a mechanisticgeochemical model (PROFILE)’, J. Appl. Geochem. 8, 273–283.
Sverdrup, H. and Warfvinge, P.: 1995, ‘Estimating field weathering rates using laboratory kinetics’,in A. F. White and S. L. Brantly (eds), Chemical Weathering of Silicate Minerals, MineralogicalSociety of America, Washington DC, Reviews in Mineralogy, Vol. 31, pp. 485–541.
Sverdrup, H., Warfvinge, P. and Rosén, K.: 1996, ‘Critical loads of acidity and nitrogen, based onmultiple criteria for different Swedish ecosystems’, Water, Air, Soil Pollut. 85, 2375–2380.
Warfvinge, P. and Sverdrup, H.: 1995, ‘Critical Loads of Acidity to Swedish Forest Soils’, TechnicalReport, Department of Chemical Engineering II, Lund University, Lund.