Embed Size (px)
Citation preview

Court of Appeal File No. C65807
COURT OF APPEAL FOR ONTARIO
IN THE MATTER OF A REFERENCE to the Court of Appeal pursuant to section 8 of the Courts of Justice Act, RSO 1990, c. C. 34, by Order-in-Council 1014/2018 respecting the
constitutionality of the Greenhouse Gas Pollution Pricing Act, Part 5 of the Budget Implementation Act, No. 1, SC 2018, c. 12
RECORD OF THE INTERVENOR, INTERGENERATIONAL CLIMATE COALITION
(GENERATION SQUEEZE ET AL)
(Reference returnable April 15-18, 2019)
RATCLIFF & COMPANY LLP 500-221 West Esplanade North Vancouver, BC V7M 3J3
Nathan Hume / Emma K. Hume Tel.: (604) 988-5201 Fax: (604) 988-1352 Email: [email protected] [email protected]
Counsel for the International Climate Coalition (Generation Squeeze, et al.)
TO:
PARTIES:
THE ATTORNEY GENERAL OF ONTARIO Constitutional Law Branch 720 Bay Street, 4th Floor Toronto, ON M7A 2S9
Josh Hunter/ Padraic Ryan/ Thomas Lipton LSO Nos.: 49037M / 61687J / 60776V Tel.: (416) 326-3840 / (416) 326-0131 / (416) 326-0296Fax: (416) 326-4015E-mail: [email protected] /[email protected] /[email protected] for the Attorney General of Ontario
DEPARTMENT OF JUSTICE CANADA Prairie Regional Office (Winnipeg) 301-310 BroadwayWinnipeg, MB R3C 0S6
Sharlene Telles-Langdon Tel.: (204) 983-0862 Fax: (204) 984-8495 E-mail: [email protected]
Additional e-mails for service: [email protected]; [email protected]; [email protected]; [email protected]; [email protected]; [email protected]
Counsel for the Attorney General of Canada
ATTORNEY GENERAL OF BRITISH COLUMBIA 1001 Douglas Street Victoria, BC V8W 9J7
Gareth Morley [email protected] Senior Counsel for the Attorney General of British Columbia
GODDARD NASSERI LLP 55 University Avenue, Suite 1100 Toronto, ON M5J 2H7
Justin H. Nasseri, LSO: 64173W Tel: 647.351.7944 Fax: 647.846.7733 Email: [email protected]
Toronto agent for the Attorney General of British Columbia
AND TO:
INTERVENORS:
SASKATCHEWAN MINISTRY OF JUSTICE Constitutional Law Branch 820-1874 Scarth StreetRegina, SK S4P 4B3
P. Mitch McAdam, Q.C. / Alan JacobsenTel.: (306) 787-7846Fax: (306) 787-9111Email: [email protected] /[email protected] for the Attorney General ofSaskatchewan
ATTORNEY GENERAL OF NEW BRUNSWICK Chancery Place 675 King Street, Room 2078, Floor 2 P.O. Box 6000 Fredericton, NB E3B 5H1
William E. Gould Tel.: (506) 453-2222 Fax: (506) 453-3275 Email: [email protected] Counsel for the Attorney General of New Brunswick
ASSEMBLY OF FIRST NATIONS 55 Metcalfe Street, Suite 1600 Ottawa, ON K1P 6L5
Stuart Wuttke / Jeremy Kolodziej Tel.: (613) 241-6789 Fax: (613) 241-5808 Email: [email protected] / [email protected]
Additional email : [email protected]
Counsel for the Assembly of First Nations
ECOJUSTICE ENVIRONMENTAL LAW CLINIC University of Ottawa 261-1 Stewart StreetOttawa, ON K1N 6N5
Amir Attaran Tel.: (613) 562-5800 x 3382 Fax: (613) 562-5319 Email: [email protected]
WOODWARD & COMPANY LAWYERS LLP 1022 Government Street, Suite 200 Victoria, BC V8W 1X7
Matt Hulse Tel.: (250) 383-2356 Fax: (250) 380-6560 Email: [email protected]
Additional emails: [email protected]
Counsel for the Athabasca Chipewyan First Nation

UNIVERSITY OF OTTAWA, FACULTY OF LAW 57 Louis Pasteur Street Ottawa, ON K1N 6N5
Stewart Elgie Tel.: (613) 562-5800 x 1270 Fax: (613) 564-5124 Email: [email protected]
Additional email : Nathalie Chalifour ([email protected])
Counsel for Canada’s Ecofiscal Commission
CANADIAN ENVIROMENTAL LAW ASSOCIATION 1500 – 55 University Avenue Toronto, ON M5J 2H7
Joseph F. Castrilli / Richard D. Lindgren Tel.: (416) 960-2284 x 7218 / 7214 Fax: (416) 960-9392 Email: [email protected] / [email protected] Counsel for the Canadian Environmental Law Association, Environmental Defence, and the Sisters of Providence of St. Vincent de Paul
GOWLING WLG (CANADA) LLP 1 First Canadian Place 100 King Street West, Suite 1600 Toronto, ON M5X 1G5
Jennifer L. King / Michael Finley / Liane Langstaff Tel.: (416) 862-5778 / (416) 369-6990 / (416) 814-5637 Fax: (416) 862-7661 Email: [email protected] / [email protected] / [email protected]
Additional email: [email protected]
Counsel for the Canadian Public Health Association
CREASE HARMAN LLP 800-1070 Douglas Street Victoria, BC V8W 2C4
R. Bruce E. Hallsor, QC Tel.: (250) 388-5421 Fax: (250) 388-4294 Email: [email protected] Counsel for the Canadian Taxpayers Federation
MICHEL BÉLANGER AVOCATS INC. 454, avenue Laurier Est Montréal, QC H2J 1E7
Marc Bishai/David Robitaille Tel: 514-991-9005 Fax: 514-844-7009 Email: [email protected] / [email protected]
Counsel for the Centre québécois du droit de l’environnement (CQDE) and Équiterre
ECOJUSTICE ENVIRONMENTAL LAW CLINIC University of Ottawa 216-1 Stewart Street Ottawa, ON K1N 6N5
Joshua Ginsberg / Randy Christensen/Emily Billard Tel.: (613) 562-5800 x 3399 / (604) 685-5618 x 234 Fax: (613) 562-5319 Email: [email protected] / [email protected]/ [email protected]
Counsel for the David Suzuki Foundation
DEMARCO ALLAN LLP 333 Bay Street, Suite 625 Toronto, ON M5H 2R2
Lisa DeMarco / Jonathan McGillivray Tel.: (647) 991-1190 / (647) 208-2677 Fax: (888) 734-9459 Email: [email protected] / [email protected]
Counsel for the International Emissions Trading Association
WESTAWAY LAW GROUP 55 Murray Street, Suite 230 Ottawa, ON K1N 5M3 Cynthia Westaway/Dawn Misner Tel.: (613) 722-9091 Fax: (613) 722-9097 Email: [email protected] / [email protected]
FACULTY OF LAW, UNIVERSITY OF OTTAWA 57 Louis Pasteur Street Ottawa, ON K1N 6N5
Nathalie Chalifour Tel.: (613) 562-5800 x 3331 Fax: (613) 564-5124 Email: [email protected] Counsel for the United Chiefs and Councils of Mnidoo Mnising
McLENNAN ROSS LLP 600 McLennan Ross Building 12220 Stony Plain Road Edmonton, AB T5N 3Y4
Ryan Martin / Steven Dollansky / Justine Bell Tel.: (780) 482-9200 Fax: (780) 482-9100 Email:[email protected]/ [email protected]
Counsel for the United Conservative Association
Court of Appeal File No. C65807
INDEX
TAB DOCUMENT PAGE
1. Affidavit of Paul Kershaw, affirmed December 18, 2018 1 - 15
A. Written Submission for the Pre-Budget Consultations in Advance of the 2019 Federal Budget, By: Dr. Paul Kershaw of the University of British Columbia on behalf of Generation Squeeze.
Published by Intergenerational Justice Review - 2018
16- 25
B. Curriculum Vitae of Dr. Paul Kershaw 26 - 30
C. Intergenerational Justice in public Finance: A Canadian Case Study , By: Paul Kershaw
Published by Intergenerational Justice Review - 2018
31 - 44
D. Health and Climate Change: Policy Responses to Protect Public Health
Published by The Lancet – 2015 45 - 98
E. Excerpt from IPCC Report “Global Warming of 1.5°C – Summary for Policy Makers”
Entire report can be accessed at: https://www.ipcc.ch/site/assets/uploads/sites/2/2018/07/SR15_SPM_High_Res.pdf
99 - 111
F. Trajectories of the Earth System in the Anthropocene, By: Steffen et. Al
Published by Proceedings of the National Academy of Sciences of the United States of America – July 2018
112 - 120
G. Excerpt from the paper “Acting on Climate Change: Solutions from Canadian Scholars.” The entire paper can be accessed at: https://www.crcresearch.org/sites/default/files/u443/en_15mars_17h_lowres.pdf
121 - 147
H. Acting on Climate Change: Extending the Dialogue Among Canadians 148 - 156
I. Excerpt from paper “Climate Clubs: Overcoming Free-riding in International Climate Policy” By, William Nordhaus 157 - 169

TAB DOCUMENT PAGE
The entire paper can be accessed at: https://pubs.aeaweb.org/doi/pdf/10.1257/aer.15000001.
J. Excerpt from the United Nations Environment Programme Emissions Gap Report 2018.
The entire report can be accessed at: http://wedocs.unep.org/bitstream/handle/20.500.11822/26895/EGR2018_FullReport_EN.pdf?isAllowed=y&sequence=1.
170 - 184
K. Letter of support from the Saskatchewan Public Health Association, dated December 17, 2018
185
L. Letter of support from Public Health Association of British Columbia, dated December 14, 2018
186 - 187
M. Letter of support from Youth Climate Lab, dated December 16, 2018 188 - 189
N. Letter of support from United Nations’ Convention on the Rights of the Child, dated December 17, 2018
190 - 194
O. Excerpt from General Comment No. 15 (2013) on the right of the child to enjoyment of the highest attainable standard of health (art.24)
The entire General Comment No. 15 can be accessed at: https://www2.ohchr.org/english/bodies/crc/docs/GC/CRC-C-GC-15_en.doc.
195 - 203
P. Excerpt from Analytical Study on the relationship between climate change and the full effective enjoyment of the rights of the child” May 2017 analytical study by Office of the United Nations High Commissioner for Human Rights
The entire study can be accessed at: https://undocs.org/en/a/hrc/35/13.
204 - 215
Q. Excerpt from Report of the Special Rapporteur on the issue of human rights obligations relating to the enjoyment of a safe, clean, healthy and sustainable environment
The entire Special Rapporteur report can be accessed at: http://undocs.org/A/HRC/37/58.
216 - 230
R. Letter of support from CAPE dated December 14, 2018 231 - 236
S. Excerpt from the 2017 Lancet Countdown Report, “Tracking Progress on Health and Climate Change”. The full 2017 Lancet Countdown Report can be accessed at: https://www.thelancet.com/action/showPdf?pii=S0140-6736%2817%2932464-9.
237 - 257

TAB DOCUMENT PAGE
T. Excerpt from Lancet Countdown Policy Brief: Canada in 2018.
The full 2018 Lancet Canada Policy Brief can be accessed at https://cape.ca/wp-content/uploads/2018/11/2018-Lancet-Countdown-Policy-Brief-Canada.pdf
258 - 272


Court of Appeal File No.: C65807
COURT OF APPEAL FOR ONTARIO
IN THE MATTER OF A REFERENCE to the Court of Appeal pursuant to section 8 of the Courts of Justice Act, RSO 1990, c. C.34, by Order-in-Council 1014/2018 respecting the constitutionality of the Greenhouse Gas Pollution Pricing Act, Part 5 of the Budget Implementation Act, 2018, No. 1, SC 2018, c. 12
AFFIDAVIT OF PAUL KERSHAW AFFIRMED ON DECEMBER 18, 2018
FILED ON BEHALF OF THE INTERVENOR, INTERGENERATIONAL CLIMATE CO
RATCLIFF & COMPANY LLP 500-221 West EsplanadeNorth Vancouver, BC V7M 3J3
Nathan Hume / Emma K. Hume
Tel.: (604) 988-5201 Fax: (604) 988-1352 Email: [email protected] [email protected]
Counsel for the International Climate Coalition (Generation Squeeze, et al.)
1
2

3
4

5

6

7

8

9
10

11

12

13

14

15

GENERATION I squeeze
Written Submission for the Pre-Budget Consultations in Advance of the 2019 Federal Budget.
By: Dr. Paul Kershaw of the University ofB.C. on behalf of Generation Squeeze.
Generation Squeeze is a voice for younger Canadians in politics and the market, supported by cutting-edge research
www.gensqueeze.ca
August 1, 2018
1
This is Exhibit "A" referred to in the
Affidavit of Paul Kershaw, sworn
before me at North Vancouver this 18th day of December, 2018.
A om.missioner for taking
Affidavits within British Columbia
16
Recommendations for Economic Growth: Ensuring Canada’s Competitiveness
Since the growing ratio of elderly citizens relative to those in the paid workforce dampens
economic growth, and enhancing productivity from younger Canadians is necessary to maintain
national competitiveness as the population ages, Generation Squeeze recommends:
1. That the government report age patterns in its spending and revenue collection since
1976, when today’s aging population started out as young adults.
2. That the government report changes in the ability to pay of younger and older
Canadians today by comparison with the same age groups four decades earlier to
support MPs to evaluate the age trends in government spending and revenue collection.
3. That the government devote time of one staff person in the Ministry of Finance to
perform this reporting using existing budget information, and historical data from
Statistics Canada. A peer-reviewed, academic methodology to perform this reporting is
included as a link to support Finance staff to conduct this work.
4. That the government grow annual combined spending on child care and parental leave
as of 2022 by at least one-third of the amount it grows annual spending on Old Age
Security over the same period.
5. That the government use the Department of Finance’s review of federal tax expenditures
as an opportunity to review the Age and Pension Income credits to confirm they remain
the most target-efficient uses of public spending as the budget for old age security grows,
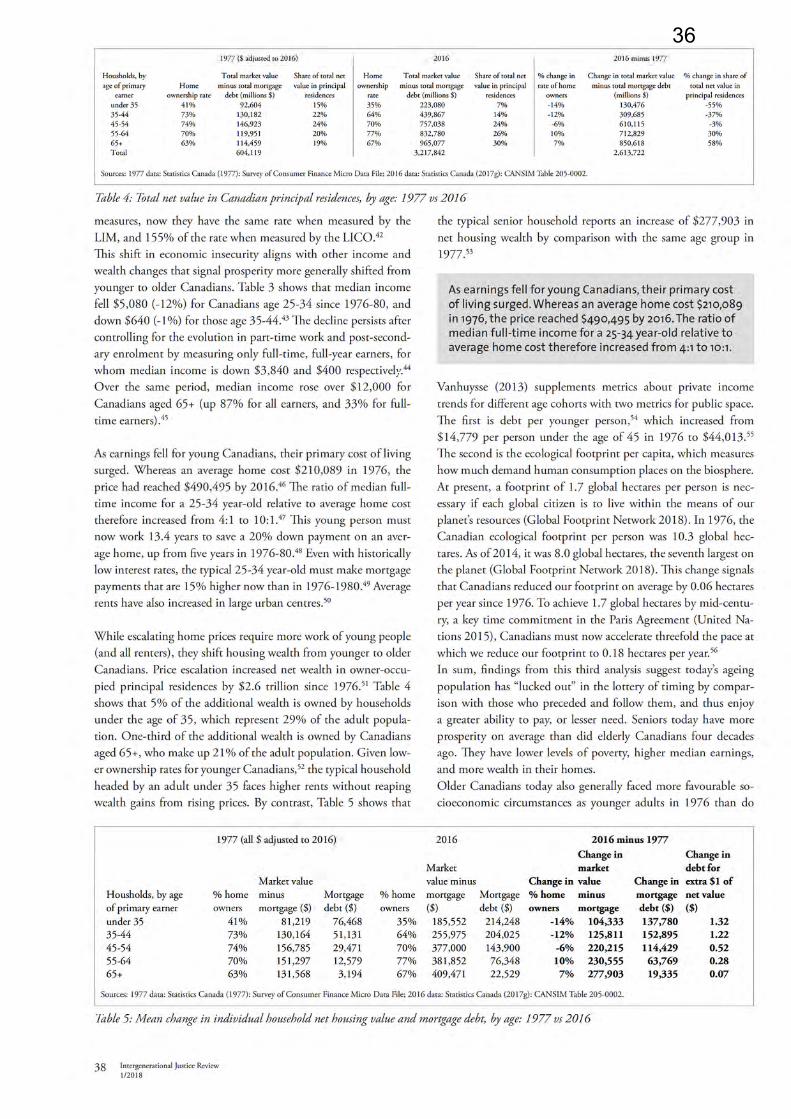
as well as the tax treatment of housing wealth. The latter is a growing source of
inequality between younger and older Canadians. Revisions to the tax treatment of
housing wealth could pay for cuts to income taxes to improve Canadian competitiveness,
while narrowing the gap between earnings and housing costs.
17

Background
Canada is adapting to an aging population. Whereas there were nearly seven workers for every
senior in 1976 when today’s aging population started as young adults, there are now four
workers and soon there will be fewer than three (Statistics Canada 2014). Population aging
slows economic growth, and recent research finds that a 10% increase in the population over age
60 decreases GDP growth per person by 5.5% (Maestas, Mullen & Powell 2016). Such evidence
underscores the need for public policy makers to anticipate the health and financial needs of a
growing group of retirees while also adapting to new challenges facing younger generations and
investing in their productivity to maintain national competitiveness.
Canadians are hindered in planning optimally for these demographic and economic
changes because government budget documents do not report spending and revenue trends by
age. Whereas the European Union now provides member countries with analyses of
intergenerational trends in public finance every three years, currently no senior level of
government in Canada provides public finance data broken down by age. Generation Squeeze
recommends that the Canadian government begin reporting age trends in public finance
starting in 2019. Reporting should compare today to 1976 (when today’s aging population
started out as young adults), and account for inflation and economic growth in line with the four
themes identified below. By doing so, age analyses would be integrated as part of the “+” in the
government’s recent commitment to GBA+ (Gender-Based Analyses+) to inform budget
decisions. (For more information on why Generation Squeeze recommends age comparisons in
public finance, see: https://www.gensqueeze.ca/why_we_make_generational_comparisons)
18

A Peer-Reviewed Methodology to Follow
The Generation Squeeze Lab, led by Dr. Paul Kershaw at the University of BC, has
prepared a peer-reviewed methodology for the Government of Canada to adapt (see
“Intergenerational Justice in Public Finance: A Canadian Case Study” at
https://www.gensqueeze.ca/intergenerational_injustice_in_canadian_public_finance). The study
examines public finance data in 2016 compared to 1976 in light of four themes:
a) Change in the ratio of social spending for those age 65+ relative to those under age 45
b) Change in taxes paid for OAS and Medical Care for those age 65+
c) Ability to pay of different age groups, now and in the past
d) Sustainability measured as government debt per person under age 45 and the ecological
footprint measured per capita
It is possible to update these analyses for the 2019 budget with time from one Finance staff
person. The most recent data show:
Spending: 1976-2016
• Spending has grown faster for those age 65+. Governments increased annual per capita
spending for seniors 4.2 times faster since 1976 than for those under the age of 45.
• Governments responded to demographic changes for older Canadians more generously
than for younger Canadians. The 4 million increase in seniors today compared to 1976
coincided with a $92 billion increase in annual spending on medical care and retirement
security for those over 65. By contrast, the 4.6 million increase in Canadians under age
45 who have postsecondary credentials coincided with little change to postsecondary
spending – up $2.7 billion. Similarly, there are 2.3 million more women age 25-44 in the
19

labour force. Despite the resulting increase in demand for child care, annual spending on
this budget line grew approximately $3.6 billion.
• Social spending on younger Canadians hasn’t kept pace with economic growth. Since
1976, spending per person age 65+ grew 6% faster than economic growth. By contrast,
spending per person under age 45 grew 29% slower than economic growth, or $1,052 less
per person under age 45. This equals $21.3 billion less in annual spending when
multiplied by all the people under age 45 – a sum that represents enough to fund, for
example, a high-quality, universal childcare programme twice over, or nearly a 50%
increase to the post-secondary budget.
• Governments allowed health care spending to leave other social spending behind.
Governments have disproportionately used economic growth over the past four decades
to invest in medical care. However, new research affirms that health does not start with
health care. Health starts with the conditions into which Canadians are born, grow, live,
work and age – conditions that are shaped by social spending on income security or
major costs like child care, housing, time at home with newborns, education, etc. New
research affirms that Canadian governments are more likely to improve life expectancy,
and reduce preventable mortality, by ensuring that social spending keeps pace with
medical spending (Dutton et al. 2018).
20

Revenue: 1976-2016
• Canadian governments have prioritized cuts to income tax rates. In addition to
prioritizing investments in medical care and retirement income, Canadian governments
used economic growth since 1976 to reduce income tax rates, particularly for middle and
higher earners.
• Younger Canadians today pay more in income taxes toward the elderly. Despite the shift
to lower income tax rates, the dramatic growth in spending on medical care and old age
security means that public finance requires younger Canadians to contribute 22%-62%
more in income taxes for the elderly now by comparison with 1976. Not only do these
revenue trends leave less fiscal room to adapt to new challenges facing younger residents
(like the much larger gap between home prices and median earnings, or climate change),
21

they require younger citizens to pay thousands of dollars more over their working lives
toward benefits for the aging population than the latter paid on behalf of their elders.
Ability to Pay: 1976-2016
Prioritizing larger spending increases for retirees and asking more in taxes for such programs
from today’s younger Canadians may be appropriate if the latter have a greater ability to pay
compared to when today’s aging population started out as young adults. However, data
reveal that the contemporary aging population has a greater ability to pay than cohorts
immediately before and after them.
• Seniors today have more prosperity on average than did elderly Canadians four decades
ago. They have lower levels of poverty, higher median earnings, and more wealth in their
homes.
• Older Canadians today also generally encountered more favourable socioeconomic
circumstances as younger adults in 1976 than do younger Canadians now. Older
Canadians started with higher median earnings, which could stretch further when paying
for rent, saving for a down payment, and paying a mortgage.
22
Sustainability: 1976-2016
• Young people inherit larger debts today than four decades earlier. Government debt has
grown from $15,000 per person under 45 in 1976 to over $44,000 today.
• Today’s seniors reduced their ecological footprint at one-third of the rate that young
adults must now do given the risks of climate change.
Age Trends in the 2018 Federal Budget
The 2018 federal budget projects a $16.1 billion annual increase in spending on old age security
(OAS) as of 2022 (Government of Canada 2018a, p. 324). By contrast, annual spending on child
care is projected to increase $540 million, while spending on parental leave will increase by $330
million (Government of Canada 2018a, pp. 332-335 and 351). Since supporting parental
attachment to the labour market and work-life balance are important for enhancing the
productivity of today’s younger Canadians, Generation Squeeze recommends that the federal
government grow annual combined spending on child care and parental leave as of 2022 by at
least one-third of the amount it grows annual spending on Old Age Security over the same
period.
As the Finance department continues to review federal tax expenditures, attention should
be given to the Age credit, Pension Income credit, and Pension Income Splitting credit. These
expenditures are projected to cost the federal government, respectively, $3.83 billion, $1.31
billion and $1.415 billion in 2019 (Government of Canada 2018b). Generation Squeeze
recommends that the government review these expenditures to confirm they remain the most
target-efficient uses of public spending as the budget for OAS grows faster than any line item
in the federal budget.
23

When evidence emerges of intergenerational imbalance in public finance, the search for
policy responses should target cleavages between age groups. A current cleavage is the gap
between home prices and earnings, which reduces the ability to pay among young adults, while
driving wealth accumulation for many seniors. An extensive international literature observes that
residential property often enjoys favourable tax treatment, including in Canada. For example,
capital gains from the sale of principal residences are not counted as income for tax purposes,
representing a federal tax expenditure of $6 billion in 2019 (Government of Canada 2018b), and
corresponding reductions for provincial coffers. Simultaneously, annual revenue from municipal
property taxation is down $4.4 billion as a share of GDP compared to 1976 (Kershaw 2018).
Generation Squeeze encourages the federal government to review the tax treatment of high
value homes as an opportunity to pay for cuts to income taxes, narrow the gap between earnings
and housing costs, grow revenue for old age security, and pay for policy investments in younger
generations as part of a national growth and competitiveness strategy.
References
Dutton, Daniel J, Pierre-Gerlier Forest, Ronald D Kneebone, and Jennifer D Zwicker. 2018. "Effect of provincial spending on social services and health care on health outcomes in Canada: an observational longitudinal study." Canadian Medical Association Journal 190 (3):E66-71.
Government of Canada. 2018a. “Budget 2018: Equality & Growth.” Department of Finance,
https://www.budget.gc.ca/2018/home-accueil-en.html Government of Canada. 2018b. "Report on Federal Tax Expenditures: Concepts, Estimates and
Evaluations." Department of Finance, https://www.fin.gc.ca/taxexp-depfisc/2018/taxexp-depfisc18-eng.pdf.
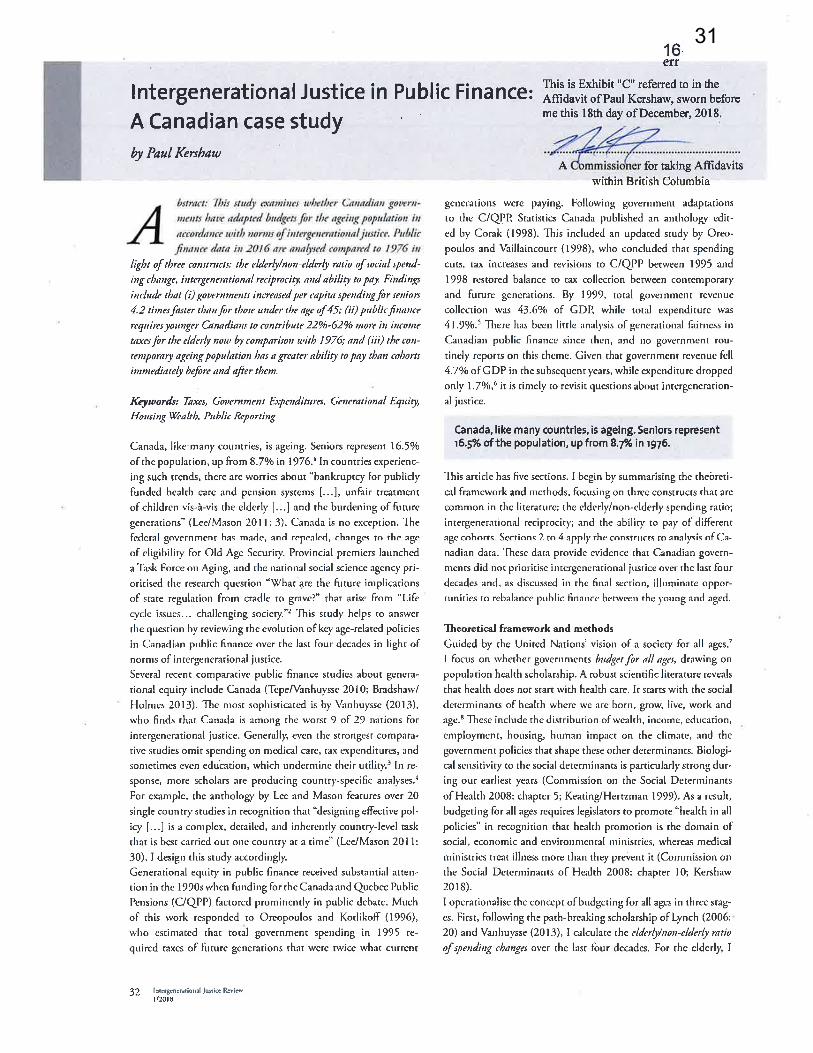
Kershaw, Paul. 2018. “Intergenerational Justice in Public Finance: A Canadian case study.”
Intergenerational Justice Review 12(1):32-46.
24

Maestas, Nicole, Kathleen J. Mullen, and David Powell. 2016. "The effect of population aging
on economic growth, the labor force and productivity." NBER Working Paper Series (Working Paper 22452), http://www.nber.org/papers/w22452
Statistics Canada. 2014. "Population projections: Canada, the provinces and territories, 2013 to
2063." Industry Canada, http://www.statcan.gc.ca/daily-quotidien/140917/dq140917a-eng.htm.
25
26
prices. Against this socioeconomic backdrop, the article finds that Canadian governments have increased social investment for Canadians age 65+ faster than for Canadians under age 45, and provides a framework for assessing the intergenerational fairness of public finance decisions.
Kershaw, Paul. 2018. “The need for health in all policies in Canada.” Canadian Medical Association Journal 190 (64):E64-65. Health doesn’t start with health care. It starts with the conditions into which people are born, grow, live, work and age. Since the growing gap between earnings and home prices is eroding these conditions for younger Canadians, the article recommends linking the intergovernmental Health Accord to the new National Housing Strategy.
Kershaw, Paul, Eric Swanson and Andrea Stucchi. 2017. "A surgical intervention for the body politic: Generation Squeeze applies the Advocacy Coalition Framework to social determinants of health knowledge translation." Canadian Journal of Public Health. 108(2): e199-e204. This article describes the “knowledge to action” strategy that Dr. Kershaw designed when founding Generation Squeeze.
Kershaw, Paul, and Lynell Anderson. 2016. Measuring the Age Distribution in Canadian Social Spending. Canadian Public Administration, 59(4), 556-579. This article provides a comprehensive analysis of Canadian government social spending, including on housing, and examines the distribution of that spending by age.
Sample Publications for the Community
Kershaw, Paul. 2017. “Code Red: B.C. is the worst performing economy in Canada for younger generations.” Report published by Generation Squeeze: Vancouver, BC. 45 pages. Available at: http://bit.ly/GS_BCworsteconomy Downloaded 971 times. While BC has reported some of strongest economic growth in recent years, this article observes that this GDP growth reflects faster expansion of the real estate, rental and leasing sector. These now represent 18% of provincial GDP, but less than 3% of provincial employment. This paper documents the growing gap between young people’s earnings and home prices according to 3 Housing Squeeze indicators: years to save for a down payment; months to pay for annual mortgage; months to pay for annual rent. These indicators are calculated for every province, revealing that BC is now the province where hard work pays off the least in Canada when it comes to young people paying for their major cost of living – housing. The Housing Squeeze indicators are also calculated for Metro Vancouver, Victoria, Kelowna, Kamploops and Prince George.
Kershaw, Paul. 2017. “Code Red: Ontario is the second worst economy in Canada for younger generations.” Report published by Generation Squeeze: Vancouver, BC. 45 pages. Available at: http://bit.ly/GS_ON2ndworstecon Downloaded 324 times. While Ontario has reported some of the fastest rates of economic growth in recent years, this article observes that this GDP growth reflects faster expansion of the real estate, rental and leasing sector. These now represent 14% of provincial GDP, but less than 3% of provincial employment. This paper documents the growing gap between young people’s earnings and home prices according to 3 Housing Squeeze indicators: years to save for a down payment; months to pay for annual mortgage; months to pay for annual rent. These indicators are calculated for every province, revealing that Ontario is the second worst performing economy in Canada when measured in terms of young people paying for their major cost of living. The Housing Squeeze indicators are also calculated for the Greater Toronto Area, Ottawa, Hamilton, Kitchener, London and Windsor.
Kershaw, Paul. 2017. “Swamplight: Making sense of the BC 2017 election platforms for voters under age 45.” Report published by Generation Squeeze: Vancouver, BC. 14 pages. Available at: http://bit.ly/GS_SwamplightBC2017 Downloaded 424 times. This study provided an evidence-based, non-partisan analysis of the housing promises included in the BC political party platforms in the 2017 provincial election.
27

Kershaw, Paul and Eric Swanson. 2016. “Building Housing Common Ground.” Report published by Generation Squeeze: Vancouver, BC. 15 pages. https://www.gensqueeze.ca/building_housing_common_ground_report Downloaded 791 times. This study is the proceedings from a day-long event that gathered a diverse group of housing leaders from Vancouver and Toronto to search for common ground to the challenges posed by home prices leaving behind local earnings. Participants included developers, home builders, realtors, financial institutions, non-profit housing providers, landlords & property managers, renters groups, people living the squeeze, academics, think tank researchers, mayors, councilors and senior municipal planners. Together, we identified 10 common ground principles to guide policy adaptations. These principles subsequently guided Generation Squeeze policy advocacy.
Kershaw, Paul and Anita Minh. 2016. “Code Red: Rethinking Canadian Housing Policy.” Report published by Generation Squeeze: Vancouver BC. 28 pages. Available at: http://bit.ly.GSCodeRed Downloaded 2,041 times. This study examined BC Assessment data to find that just 15% of Metro Vancouver’s housing supply in 2013 cost less than half a million dollars while providing access to more than two bedrooms. By contrast, half a million dollars bought two entire average priced homes in 1976 (after adjusting for inflation). In response, the authors propose 10 principles for housing policy reform, including a surge in supply, a reduction in harmful demand, and rebalancing the tax treatment of earnings and housing wealth. Note: when the data were updated for 2017, we found that just 2% of homes in Metro Vancouver cost less than half a million dollars and provided access to more than two bedrooms. The same is now true in Victoria, and only 14% of homes in Kelowna meet these criteria.
Knowledge to Action Experience See Kershaw et al. (2017) for the Knowledge to Action framework that guides my activities, including: Make meaning of socioeconomic changes and shape public opinion:
• Publish studies: see examples above • Media: I have written or been cited in over 1,200+ print articles between 2015 and 2017, as tracked
by Troy Media Monitoring, and delivered an additional 300+ TV and Radio interviews. • Invited presentations to community stakeholders: 112 presentations between 2015 and 2017. • Briefings to Decision makers: 97 briefings in 2016 & 2017.
Frame policy beliefs, set an agenda, build a coalition, and mobilize person power: Generation Squeeze: I founded Generation Squeeze to become a voice for Canadians in their 20s, 30s and 40s in the world of politics and the market so that younger voices could be a conduit for academic research to shape decision making. The organization has attracted 32,666 supporters (over 24,000 are part of our email list serve). Many participate by lending their voice in support of housing issues, including:
• Homes First Petition: https://www.gensqueeze.ca/code_red Currently, there are 4,251 signatures. • Toronto Vacant Homes Tax Petition: https://www.gensqueeze.ca/vht_gta 3,247 signatures
submitted to Toronto in 2017 by City Councilor Ana Bailao. • Toronto Close the Rental Loophole Petition:
https://www.gensqueeze.ca/1991_rent_loophole_success 3,233 signatures submitted to Government of Ontario in 2017 by the Minister of Housing.
• YIMBY Voices. Volunteers resists NIMBY’ism by speaking in favour of projects that add supply suitable for younger generations in cities throughout Metro Vancouver. Over 20 projects supported in the last 18 months. See https://www.gensqueeze.ca/housing_supply_summary
• Support a BC #TaxShift: https://www.gensqueeze.ca/support_the_taxshift 501 letters sent in June 2018 to BC Premier, Finance Minister and local MLAs in support of lower taxes on local earnings, higher taxes on unhealthy home values, and better investment in young and old alike.
28
*Knowledge to Action Housing Policy Victory Featured for CMHC Gold Roof Award
Adding Young Adults to the “Most In Need” Group in the National Housing Strategy (NHS). Promoted via: • March 11 & March 23, 2016: Brief Hilary Leftick, policy staff re Youth Portfolio in Prime Minister’s Office • June 17, 2016: Invited to advise at Prime Minister’s Vancouver Expert Roundtable on the Housing Crisis • June 27, 2016: Invited to advise Minister Duclos and CMHC President Evan Siddall re National Housing Strategy. • September 6, 2016: Brief MP Murray Rankin about Gen Squeeze housing recommendations • September 14, 2016: Brief Colleen Lamothe, policy staff for Minister Duclos • September 20, 2016: Brief Mathieu Laberge, policy staff for Minister Duclos • September 30, 2016: Brief MP Dan Ruimy re Gen Squeeze re housing policy recommendations • October 4, 2016: Brief Federal Standing Committee on Finance re Generation Squeeze recommendations • October 6, 2016: Briefing Note submitted to CHMC Let’s Talk Housing Consultation for NHS • November 2, 2016: Brief Tim Krupa, policy staff in Prime Minister’s Office re Gen Squeeze recommendations • November 27, 2016: Op Ed for Post Media chain following the release of the CMHC “What We Heard Report.”
Article suggests that the National Housing Strategy risks being outdated before it is even launched if it does not identify “young adults” among the “most in need” group. https://theprovince.com/opinion/paul-kershaw-is-the-national-housing-strategy-outdated-before-it-begins
• December 22, 2016: Brief Colleen Lamothe, policy staff for Minister Duclos, re Gen Squeeze’s concern that young adults are omitted from “most in need” group in CMHC “What We Heard” Report
• March 22, 2017: Federal budget continues to omit “young adults” from NHS’ “most in need” group • March 23, 2017: Brief Tim Krupa, policy staff in Prime Minister’s Office, re Gen Squeeze concern that young adults are
omitted from “most in need” group in the 2017 federal budget discussion of the NHS • March 23, 2017: Analysis of 2017 federal budget shared with Gen Squeeze list serve of over 24,000. It highlights that
young adults are omitted from “most in need” group in the budget’s discussion of funds for the National Housing Strategy. • March 27, 2017: Briefing with Dylan Marando, policy staff to Minister Duclos, re Gen Squeeze’s concern that young adults
are omitted from “most in need” group • April 3, 2017: Briefing with Elliot Hughes, Department of Finance, re the age implications of the current tax treatment of
housing wealth. • April 18, 2017: Briefing with Debbie Stewart, Director of Housing Needs, Policy and Research, and Michel Tremblay, Senior
VP at CMHC re Gen Squeeze housing policy recommendations • May 26, 2017: Briefing with MP Erskine-Smith re Gen Squeeze housing recommendations and concern that young adults
are omitted from “most in need” group • October 25, 2017: Briefing with MP Wilkonson re Gen Squeeze housing recommendations and concern that young adults
are omitted from “most in need” group • October 25, 2017: Briefing with MP Erskine-Smith re Gen Squeeze recommendations and concern that young adults are
omitted from “most in need” group • October 25, 2017: Briefing with Peter Schiefke re Gen Squeeze recommendations and concern that young adults are
omitted from “most in need” group • October 26, 2017: Briefing with MP Lametti re Gen Squeeze recommendations and concern that young adults are omitted
from “most in need” group • October 26, 2017: Briefing with Joyce Murray re Gen Squeeze recommendations and concern that young adults are omitted
from “most in need” group • November 1, 2017: Briefing with Bob Dugan, Chief Economist, and Vinay Bhardwaj, Director Market Analysis, CMHC re
Gen Squeeze housing research, recommendations and concern that young adults are omitted from “most in need” group • November 2, 2017: Briefing with Dylan Marando and Colleen Lamothe, policy staff to Minister Duclos, re Gen Squeeze
housing recommendations and concern that young adults are omitted from “most in need” group November 22, 2017: National Housing Strategy included “young adults” among the “most in need” group.
Vancouver Quadra MP Joyce Murray, Parliamentary Secretary to Treasury, writes: “Dr. Kershaw has contributed to the direction of the National Housing Strategy, engaged young people in the national discussion on housing, and provided invaluable research on the evolution of the housing market in Canada. My staff and I have attended a number of his presentations in Ottawa where Dr. Kershaw shared his research with policy makers. He also enthusiastically participated in a discussion I hosted on the current financial situation faced by millennials, for which housing affordability is a key factor.”
29
Other Knowledge to Action Housing Victories include:
1. City of Vancouver Empty Homes Tax, the first of its kind in North America2. Housing Vancouver Strategy, including revisions to zoning that previously privileged single-
detached homesI was invited by the City of Vancouver to brief decision makers 17 times in 2016 and 2017, deliver three presentations at its international conference that invited experts to advise on its plans, review a draft of the city’s new Housing Strategy, and participate in media activities with the Mayor to support new policy trajectories, including at the media scrum for the announcement of the Empty Homes Tax, and in the media release for the Housing Vancouver Strategy. The latter strategy specifically cites Generation Squeeze research.
Vancouver Mayor, Gregor Robertson, writes: “The spike in Vancouver’s housing prices and low rental vacancy rates are hitting our younger residents particularly hard, and Generation Squeeze has played an important role in advocating for them in the housing conversation. Generation Squeeze brings a fresh and collaborative approach to the policy process, and as a result the organization has been an integral part of Vancouver’s work to develop responsive housing policy that meets the needs of our city’s residents.”
3. Elimination of Ontario policy that allowed limitless rent increases for units built after 1991I was invited by the Government of Ontario to provide 9 briefings in 2017 about housing policy, and was the onlymember of its Fair Housing Plan Advisory that was appointed from outside of the province. The governmentarranged for Generation Squeeze to participate in media events with the Ministers of Finance and Housing to explainthe changes to rent control on the day following the Fair Housing Plan announcement. The Housing Minister invitedme specifically to the legislature on April 27, 2017 to thank Generation Squeeze for our work, refer to the over 3,000signatures we collected in support of policy change, and identify our activities as a key motivation for policy reform.
James Janeiro, Senior Policy Advisor in the Office of the Ontario Premier, writes: "I have been consistently impressed with the quality of research Generation Squeeze produces and the accessible, people-friendly way in which they present their findings. Their work on housing issues in particular was of great use to the government. I look forward to working with them in future."
4. Development Approvals for Housing Projects facing NIMBY resistanceSee summary of 20+ projects supported at https://www.gensqueeze.ca/housing_supply_summary
Virginia Bird, of Pottinger Bird Community Relations, writes: “We recently engaged the team at Gen Squeeze on a rental housing proposal in the City of North Vancouver. We were impressed by their ability to mobilize a group of diverse, passionate volunteers in support of rental housing. We look forward to continuing our relationship with Gen Squeeze and supporting their mission to ease the squeeze for all Canadians.”
North Vancouver Mayor, Darrel Mussatto, writes: “Gen Squeeze is an essential voice for housing affordability in Vancouver and across Canada. I have had several opportunities to speak with Dr. Kershaw about Gen Squeeze and its successes and goals in rethinking housing policy in Canada, and am both impressed and appreciative of his leadership in this regard. His recent presentation to North Shore elected officials stimulated important discussions about what each level of government can do to support housing affordability for younger Canadians, and gave us the building blocks to move forward in collaborating for greater affordability on the North Shore.”
Mayor of Victoria, Lisa Helps, writes: “Generation Squeeze is emerging as a clear thought leader on affordability and liveability, critical issues facing their generation, and affecting us all. And they are turning their thinking into action, most importantly by informing decision makers and shaping public policy. They work across sectors and draw people together into meaningful and collaborative dialogue. Their inclusive and diverse approach means that the solutions they propose get support and buy in from a wide cross section of the community. Generation Squeeze is already having a positive and lasting impact on our community.”
30

31

32

33

34

35
36

37

38

39

40
41
42

43

44

45

The Lancet Commissions
1862 www.thelancet.com Vol 386 November 7, 2015
Prof P Gong PhD, X Jiang PhD, M Li PhD, L Liang PhD,
Prof Y Luo PhD, S Venevsky PhD, Prof B Xu PhD, J Yang PhD,
Y Yin PhD, C Yu PhD, Prof Q Zhang PhD); Department
of Politics and International Studies, University of
Cambridge, Cambridge, UK (J Depledge PhD); Stockholm Resilience Centre, Stockholm
University, Stockholm, Sweden (V Galaz PhD,
M Svensdotter MSc); International Livestock
Research Institute, Nairobi, Kenya (D Grace PhD);
Department of Health Sciences, University of York, York, UK
(Prof H Graham PhD); London School of Hygiene and Tropical
Medicine, London, UK (Prof A Haines FMedSci); and UN
University Institute for Environment and Human Security, Bonn, Germany
(K Warner PhD)
Correspondence to:Mr Nick Watts, Institute for
Global Health, University College London WC1E 6BT, London
increased access to green spaces. Such measures improve adaptive capacity, whilst also reducing urban pollution, greenhouse gas emissions, and rates of cardiovascular disease, cancer, obesity, diabetes, mental illness, and respiratory disease.
Achieving a decarbonised global economy and securing the public health benefi ts it off ers is no longer primarily a technical or economic question—it is now a political oneMajor technical advances have made buildings and vehicles more effi cient and renewable energy sources far more cost eff ective. Globally, there is plentiful fi nancial resource available, however much of it is still being directed towards the fossil-fuel industry. Bold political commitment can ensure that the technical expertise, technology, and fi nance to prevent further signifi cant climate change is readily available, and is not a barrier to action.
The Commission recommends that over the next 5 years, governments:5 Establish the framework for a strong, predictable, and
international carbon pricing mechanism.6 Rapidly expand access to renewable energy in low-
income and middle-income countries, thus providing reliable electricity for communities and health facilities; unlocking substantial economic gains; and promoting health equity. Indeed, a global development pathway that fails to achieve this expansion will come at a detriment to public health, and will not achieve long-term economic growth.
7 Support accurate quantifi cation of the avoided burden of disease, reduced health-care costs, and enhanced economic productivity associated with climate change mitigation. These will be most eff ective when combined with adequate local capacity and political support to develop low-carbon healthy energy choices.
The health community has a vital part to play in accelerating progress to tackle climate changeHealth professionals have worked to protect against health threats, such as tobacco, HIV/AIDS, and polio, and have often confronted powerful entrenched interests in doing so. Likewise, they must be leaders in responding to the health threat of climate change. A public health perspective has the potential to unite all actors behind a common cause—the health and wellbeing of our families, communities, and countries. These concepts are far more tangible and visceral than tonnes of atmospheric CO2, and are understood and prioritised across all populations irrespective of culture or development status.
Reducing inequities within and between countries is crucial to promoting climate change resilience and improving global health. Neither can be delivered without accompanying sustainable development that addresses
key health determinants: access to safe water and clean air, food security, strong and accessible health systems, and reductions in social and economic inequity. Any prioritisation in global health must therefore place sustainable development and climate change front and centre.
The Commission recommends that over the next 5 years, governments:8 Adopt mechanisms to facilitate collaboration
between Ministries of Health and other government departments, empowering health professionals and ensuring that health and climate considerations are thoroughly integrated in government-wide strategies. A siloed approach to protecting human health from climate change will not work. This must acknowledge and seek to address the extent to which additional global environmental changes, such as deforestation, biodiversity loss, and ocean acidifi cation, will impact on human health and decrease resilience to climate change.
9 Agree and implement an international agreement that supports countries in transitioning to a low-carbon economy. Whilst the negotiations are very complex, their goals are very simple: agree on ambitious and enforceable global mitigation targets, on adaptation of fi nance to protect countries’ rights to sustainable development, and on the policies and mechanisms that enable these measures. To this end, international responsibility for reducing greenhouse gas emissions is shared: interventions that reduce emissions and promote global public health must be prioritised irrespective of national boundaries.
Responding to climate change could be the greatest global health opportunity of the 21st century.
To help drive this transition, the 2015 Lancet Commission on Health and Climate Change will:10 Develop a new, independent Countdown to 2030:
Global Health and Climate Action, to provide expertise in implementing policies that mitigate climate change and promote public health, and to monitor progress over the next 15 years. The Collaboration will be led by this Commission, reporting in The Lancet every 2 years, tracking, supporting, and communicating progress and success along a range of indicators in global health and climate change
IntroductionIn 2009, the UCL–Lancet Commission on Managing the Health Eff ects of Climate Change called climate change “the biggest global health threat of the 21st century”.1 6 years on, a new multidisciplinary, international Commission reaches the same conclusion, whilst adding that tackling climate change could be the greatest global opportunity of the 21st century.
46
The Lancet Commissions
www.thelancet.com Vol 386 November 7, 2015 1863
The Commission represents a collaboration between European and Chinese climate scientists and geographers, social and environmental scientists, biodiversity experts, engineers and energy policy experts, economists, political scientists and public policy experts, and health professionals—all seeking a response to climate change that is designed to protect and promote human health.
The physical basisThe Intergovernmental Panel on Climate Change (IPCC) has described the physical basis for, the impacts of, and the response options to climate change.2 In brief, short-wave solar radiation passes through the Earth’s atmosphere to warm its surface, which emits longer wavelength (infrared) radiation. Greenhouse gases (GHGs) in the atmosphere absorb this radiation and re-emit it, sharing it with other atmospheric elements, and with the Earth below. Without this eff ect, surface temperatures would be more than 30°C lower than they are today.3 One such GHG is carbon dioxide (CO2), primarily released when fossil fuels (ie, oil, coal, and natural gas) are burned. Others, such as methane (CH4) and nitrous oxide (N2O), are generated through fossil-fuel
use and human agricultural practice. GHG emissions have steadily climbed since the industrial revolution.4 CO2 remains in the atmosphere for a long time, with a part remaining for thousands of years or longer.5 As a result, atmospheric GHG concentrations have risen steeply in the industrial age, those of CO2 reaching more than 400 parts per million (ppm) in 2014, for the fi rst time since humans walked the planet. Every additional ppm is equivalent to about 7·5 billion tonnes of atmospheric CO2.6,7
In view of their proven physical properties, such rising concentrations must drive a net positive energy balance, the additional heat distributing between gaseous atmosphere, land surface, and ocean. The IPCC’s 2014 report confi rms that such global warming, and the role of human activity in driving it, are unequivocal. The oceans have absorbed the bulk (90% or more) of this energy in recent years and ocean surface temperatures have risen.8 However, temperatures at the Earth’s surface have also risen, with each of the last three decades being successively warmer than any preceding decade since 1850. Indeed, 2014 was the hottest year on record. Overall, the Earth (global average land and ocean temperature) has warmed
Reduced agriculturalproductivity
Bacterialdiarrhoea
Undernutrition Impact onmental health
Cardiovasculardisease
Respiratorydisease
Harmfulalgal blooms
Vector-bornedisease
Greenhousegas emissions
Climate change
Ocean acidification Other air pollutants(eg, particulates)
Raised average, and extreme temperaturesAltered rainfall patterns Sea-level rise
Ozone increase
Particulatepollution
Pollenallergenicityburden
Extreme weather
Flood Heatwaves Drought Fire
Reduced fisheryand aquacultureproductivity
Reduced physical workcapacity
Biodiversity loss, ecosystemcollapse, pests
Social mediatingfactors
Loss of habitation
Poverty
Mass migration
Violent conflict
Other socialdeterminants ofhealth
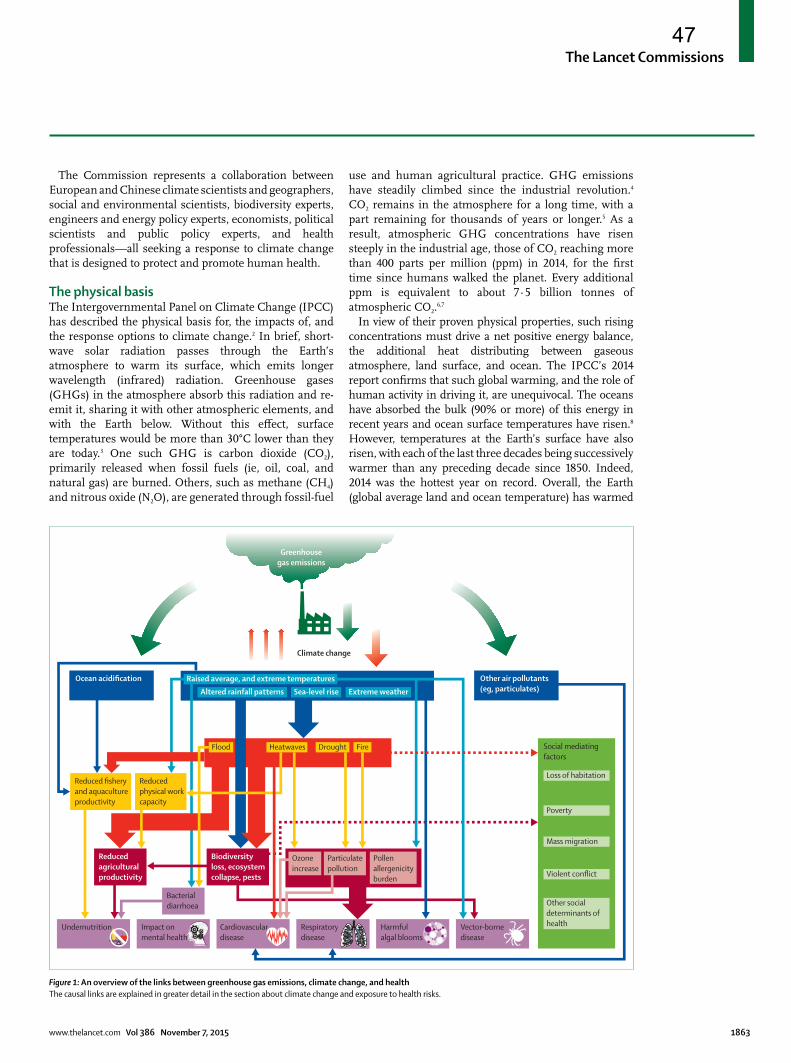
Figure 1: An overview of the links between greenhouse gas emissions, climate change, and healthThe causal links are explained in greater detail in the section about climate change and exposure to health risks.
47

The Lancet Commissions
1864 www.thelancet.com Vol 386 November 7, 2015
by some 0·85°C between 1880 and 2012.8 Arctic sea ice is disappearing at a rate of up to 50 000 km² per year, the Antarctic ice sheet is now losing 159 billion tonnes of ice each year, and sea levels are rising inexorably.9
Much of past emissions remain in the atmosphere and will drive continued warming in the future. GHG concentrations in the atmosphere are continuing to rise at a rate that is incompatible with limiting warming to 2°C in the coming 35 years (by 2050), and which exceeds the IPCC’s “worst case scenario”.10 We are on track for a global average temperature rise of more than 4°C above pre-industrial temperatures in the next 85 years, at which point global temperature will still be increasing by roughly 0·7°C per decade (due to the lag in reaching equilibrium). This distribution will not be even: the so-called polar amplifi cation phenomena might cause temperatures in parts of the Arctic to increase by 11°C in this timeframe.8
The health impacts of climate changeThe resultant climate change poses a range of threats to human health and survival in multiple, interacting ways (fi gure 1). Impacts can be direct (eg, heatwaves and extreme weather events such as a storm, forest fi re, fl ood, or drought) or indirectly mediated through the eff ects of climate change on ecosystems (eg, agricultural losses and changing patterns of disease), economies, and social structure (eg, migration and confl ict). After only 0·85°C warming, many anticipated threats have already become real-world impacts. Table 1 summarises the evidence attributing climate change to specifi c extreme weather events, outlining the role that climate change is playing in the present day (2013). It demonstrates increasing certainty that climate change signifi cantly alters the probability of extreme weather, most often in directions that have dangerous health consequences.
Summary statement Anthropogenic infl uence increased event likelihood or strength
Anthropogenic infl uence decreased event likelihood or strength
Anthropogenic infl uence not found or uncertain
Number of papers
Heat Long-duration heatwaves during the summer and prevailing warmth for annual conditions are becoming increasingly likely because of a warming planet
Europe heat, 2003 (Stott et al, 200411); Russia heat, 2010 (Rahmstorf and Couman, 2011;12 Otto et al, 201213); USA heat, 2012 (Diff enbaugh and Scherer, 2013;14 Knutson et al, 2013);14 Australia heat, 2013 (Arblaster et al, 2014; King et al, 2014; Knutson et al, 2014; Lewis et al, 2014; Perkins et al, 2014);15 Europe heat, 2013 (Dong et al, 2014);15 China heat, 2013 (Zhou et al, 2014);15 Japan heat, 2013 (Imada et al, 2014);15 Korea heat, 2013 (Min et al, 2014)15
·· ·· 14
Cold Prolonged cold waves have become much less likely than they were previously, such that the probability of reoccurrence of the 2013 severely cold winter in the UK might have fallen by 30 times because of global warming
·· UK cold spring, 2013 (Christidis et al, 2014)15
UK extreme cold, 2010–11 (Christidis and Stott, 2012)16
2
Heavy precipitation and fl ood
Extreme precipitation events were found to have been much less influenced by human-induced climate change than extreme temperature events
UK fl oods, 2011 (Pall et al, 2011);17 USA seasonal precipitation, 2013 (Knutson et al, 2014);15 India precipitation, 2013 (Singh et al, 2014)15
USA Great Plains drought, 2013 (Hoerling et al, 2014)15
Thailand fl oods, 2011 (Van Oldenborgh et al, 2012);16 UK summer fl oods, 2012 (Sparrow et al, 2013);14 north China fl oods, 2012 (Tett et al, 2013);14 southwest Japan fl oods, 2012 (Imada et al, 2013);14 southeast Australia fl oods (2012); (King et al, 2013,14 Christidis et al, 2013);14 southern Europe Precipitation, 2013 (Yiou and Cattiaux, 2014);15 central Europe precipitation, 2013 (Schaller et al, 2014)15
14
Drought Droughts are highly complex meteorological events and research groups have analysed diff erent factors that aff ect droughts, such as sea surface temperature, heat, or precipitation
East African drought, 2011 (Funk et al, 2012);16 Texas drought, 2011 (Rupp et al, 2012);16 Iberian Peninsula drought, 2011 (Trigo et al, 2012);16 east African drought 2012, (Funk et al, 2012);16 New Zealand drought, 2013 (Harrington et al, 2014);15
USA California drought, 2013 (Swain et al, 2014)15
·· Central USA drought, 2012 (Rupp et al, 2013);14 USA California drought, 2013 (Funk et al, 2014);16 (Wang and Schubert, 2014)15
9
Storms No clear evidence of human influence was shown for any of the four very intense storms examined
·· ·· USA hurricane Sandy, 2012 (Sweet et al, 2013);14 cyclone Christian, 2013 (von Storch et al, 2014);15 Pyrenees snow, 2013 (Anel et al, 2014);15 USA south Dakota blizzard, 2013 (Edwards et al, 2014)15
4
Number of papers
·· 23 2 18 43
References are in Peterson et al, 2012;16 Peterson et al, 2013;14 Herring et al, 2014;15 or listed separately. Adapted from the Bulletin of the American Meteorological Society.
Table 1: Detection and attribution studies linking recent extreme weather events to climate change
48

The Lancet Commissions
www.thelancet.com Vol 386 November 7, 2015 1865
Some population groups are particularly vulnerable to the health eff ects of climate change, whether because of existing socioeconomic inequalities, cultural norms, or intrinsic physiological factors. These groups include women, young children and older people, people with existing health problems or disabilities, and poor and marginalised communities. Such inequalities are often also present in relation to the causes of climate change: women and children both suff er the majority of the health impacts of indoor air pollution from ineffi cient cookstoves and kerosene lighting, and so mitigation measures can help to reduce existing health inequities such as these.
Non-linearities, interactions, and unknown unknownsThe magnitude and nature of health impacts are hard to predict with precision; however, it is clear that they are pervasive and refl ect eff ects on key determinants of health, including food availability. There are real risks that the eff ects will become non-linear as emissions and global temperatures increase. First, large-scale disruptions to the climate system are not included in climate modelling and impact assessments.18 As we proceed rapidly towards 4°C warming by the end of the century, the likelihood of crossing thresholds and tipping points rises, threatening further warming and accelerated sea-level rise. Second, small risks can interact to produce larger-than-expected chances of catastrophic outcomes, especially if they are correlated (panel 1).22,23
Such impacts (and their interactions) are unlikely to be trivial and could be suffi cient to trigger a discontinuity in the long-term progression of humanity.24 Whilst the poorest and most vulnerable communities might suff er fi rst, the interconnected nature of climate systems, ecosystems, and global society means that none will be immune. Indeed, on the basis of current emission trajectories, temperature rises in the next 85 years may be incompatible with an organised global community.25
The health co-benefi ts of emissions reductionActing to reduce GHG emissions evidently protects human health from the direct and indirect impacts of climate change. However, it also benefi ts human health through mechanisms quite independent of those relating to modifying climate risk: so-called health co-benefi ts of mitigation.26
Reductions in emissions (eg, from burning fossil fuels) reduce air pollution and respiratory disease, whilst safer active transport cuts road traffi c accidents and reduces rates of obesity, diabetes, coronary heart disease, and stroke. These are just some of the many health co-benefi ts of mitigation, which often work through several causal pathways via the social and environmental determinants of health. Protecting our ecosystems will create the wellbeing we gain from nature and its diversity.27
Aff ordable renewable energy will also have huge benefi ts for the poorest. WHO found that in 11 sub-Saharan African
countries, 26% of health facilities had no energy at all and only 33% of hospitals had what could be called “reliable electricity provision”, defi ned as no outages of more than 2 h in the past week.28 Solar power is proposed as an ideal alternative energy solution, providing reliable energy that does not harm cardiovascular or respiratory health in the same way that diesel generators do. Clean cookstoves and fuels will not only protect the climate from black carbon (a very short-lived climate pollutant), but also cut deaths from household air pollution—a major killer in low-income countries. Buildings and houses designed to provide better insulation, heating effi ciency, and protection from extreme weather events will reduce heat and cold exposure, disease risks from mould and allergy, and from infectious and vector-borne diseases.29
Many other co-benefi ts exist across diff erent sectors, from agriculture to the formal health system. The cost savings of the health co-benefi ts achieved by policies to cut GHG emissions are potentially large. This is particularly important in a context where health-care expenditure is growing relative to total government expenditure globally. The health dividend on savings must be factored into any economic assessment of the costs of mitigation and adaptation. The poorest people are also most vulnerable to climate change, meaning that the costs of global development will rise if we do nothing, and poverty alleviation and sustainable development goals will not be achieved.
Panel 1: Teeth in the tails
Tail risks are those whose probability of occurring is low (ie, >2 or 3 SDs from the mean). The size of the tail and the combination of tails will decide the chance of extreme or catastrophic outcomes. Interactions between tail risks greatly aff ect the risk of several happening at once—eg, interactions between crop decline and population migration, or between heatwaves, water insecurity and crop yields. The 2008 global fi nancial crisis is an example. Here, rating agencies catastrophically mispriced the risks of pooled mortgage-related securities. For example, Nate Silver showed that if fi ve mortgages, each with a 5% risk of defaulting, are pooled, the risks of a default of all fi ve is 0·00003% as long as the default is perfectly uncorrelated.19 If they are perfectly correlated (as almost happened with the housing crash) the risk is 5%. In other words, if rating agencies assumed no interaction, their risk would be miscalculated by a factor of 160 000.19
We must not assume that individual climate tail risks will be uncorrelated. In complex systems, individual events might become more highly correlated when events place the whole system under stress. For example, in the UK in 2007, fl ooding threatened electricity substations in Gloucestershire. The authorities requested the delivery of pumps and other equipment to keep one of these substations, Walham, from fl ooding. Loss of the substation would have left the whole county, and part of Wales and Herefordshire without power, and many people without drinking water. Equipment had to be delivered by road. Parts of the road system in the region of the substation fl ooded, which almost prevented the delivery of equipment. Under normal conditions, disturbances to the three subsystems—roads, electricity, and the public water supply—are uncorrelated and simultaneous failure of all three very unlikely. With extreme fl ooding they became correlated under the infl uence of a fourth variable, resulting in a higher than expected probability of all three failing together.20,21 Indeed, these extremes of weather, which will occur more frequently with unmitigated climate change, are the ones that are often most important for human health.
49
The Lancet Commissions
1866 www.thelancet.com Vol 386 November 7, 2015
This Commission6 years ago, the fi rst Lancet Commission called climate change “the biggest global health threat of the 21st century”.1 Since then, climate threats continue to become a reality, GHG emissions have risen beyond worst-case projections, and no international agreement on eff ective action has been reached. The uncertainty around thresholds, interactions and tipping points in climate change and its health impacts are serious enough to mandate an immediate, sustained, and globally meaningful response.
This report further examines the evidence of threat, before tabling a prescription for both prevention and symptom management. We begin in section 1 by re-examining the causal pathways between climate change and human health, before off ering new estimates of exposure to climate health risks in the coming decades. The changes in the spatial distribution of populations, and their demographic structure over the coming century, will put more people in harm’s way.
Given that the world is already locked in to a signifi cant rise in global temperatures (even with meaningful action to reduce GHG emissions), section 2 considers measures that must be put in place to help lessen their unavoidable health impacts. Adaptation strategies are those that reduce vulnerability and enhance resilience—ie, the capacity of a system to absorb disturbance and re-organise—so as to retain function, structure, identity, and feedbacks.30 We identify institutional and decision-making challenges related to uncertainty, multicausal pathways, and complex interactions between social, ecological, and economic factors. We also show tangible ways ahead with adaptations that provide clear no-regret options and co-benefi ts for food security, human migration and displacement, and dynamic infectious disease risks.
Symptomatic intervention and palliation must, however, be accompanied by immediate action to address the cause of those symptoms: the epidemiology and options for scaling up low-carbon technologies and technical responses are discussed in section 3, in addition to the necessary measures required to facilitate their deployment. This section also explores the health implications of various mitigation options, with particular attention to those which both promote public health and mitigate climate change.
Transformation to a global low-carbon economy requires political will, a feasible plan, and the requisite fi nance. Section 4 examines the fi nancial, economic, and policy options for decarbonisation. The goal of mitigation policy should be to reduce cumulative and annual GHG emissions. Early emissions reduction will delay climate disruption and reduce the overall cost of abatement by avoiding drastic and expensive last-minute action. Immediate action off ers a wider range of technological options, allows economies of scale and prospects for learning, and will reduce costs over time. The window of
opportunity for evolutionary and revolutionary new technologies to develop, commercialise, and deploy is also held open for longer.
In section 5, we examine the political processes and mechanisms that might play a part in delivering a low-carbon economy. Multiple levels are considered, including the global response (the UN Framework Convention on Climate Change), national and subnational (cities, states, and provinces) policy, and the role of individuals. The interaction between these diff erent levels, and the lessons learnt from public health are given particular attention.
Finally, in section 6 we propose the formation of an international Countdown to 2030: Global Health and Climate Action. We outline how an international, multidisciplinary coalition of experts should monitor and report on: the health impacts of climate change; progress in policy to reduce GHG emissions, and synergies used to promote and protect health; and progress in health adaptation action to reduce population vulnerability to build climate resilience and to implement climate-ready low-carbon health systems. A Countdown process would complement rather than replace existing IPCC reports, and would bring the full weight and voice of the health and scientifi c communities to this critical population health challenge.
Section 1: climate change and exposure to health risksNo region is immune from the negative impacts of climate change, which will aff ect the natural world, economic activities, and human health and wellbeing in every part of the world.31 There are already observed impacts of climate change on health, directly through extreme weather and hazards and indirectly through changes in land use and nutrition. Lags in the response of the climate system to historical emissions means the world is committed to signifi cant warming over coming decades.
All plausible futures resulting from realistic anticipated emissions trajectories expose the global population to worsening health consequences. In 2014, WHO estimated an additional 250 000 potential deaths annually between 2030 and 2050 for well understood impacts of climate change. WHO suggest their estimates represent lower bound fi gures because they omit important causal pathways. The eff ects of economic damage, major heatwave events, river fl ooding, water scarcity, or the impacts of climate change on human security and confl ict, for example, are not accounted for in their global burden estimates.32 Without action to address continued and rising emissions, the risks, and the number of people exposed to those risks, will likely increase signifi cantly. WHO emphasises that the importance of the interactions between climate change and many other trends aff ecting public health, stressing the need for interventions designed to address climate change and poverty—two key drivers of ill health.32 Similarly, the authors of the IPCC
50

The Lancet Commissions
www.thelancet.com Vol 386 November 7, 2015 1867
assessment of climate change on health emphasise that the health impacts become amplifi ed over time.21
This report provides new insights into the potential exposure of populations, showing that when demographic trends are accounted for, such as ageing, migration, and aggregate population growth, the populations exposed to climate change that negatively aff ect health risk are more seriously aff ected than suggested in many global assessments. It involves new analysis on specifi c and direct climate risks of heat, drought and heavy precipitation that directly link climate change and wellbeing. The number of people exposed to such risk is amplifi ed by social factors: the distribution of population density resulting from urbanisation, and changes in population demographics relating to ageing.
Thus, human populations are likely to be growing, ageing, and migrating towards greater vulnerability to climate risks. Such data emphasise the need for action to avoid scenarios where thresholds in climate greatly increase exposure, as well as adaptation to protect populations from consequent impacts.
How climate aff ects human healthMechanisms linking climate and healthThe principal pathways linking climate change with health outcomes are shown in fi gure 2, categorised as direct and indirect mechanisms that interact with social
dynamics to produce health outcomes. All these risks have social and geographical dimensions, are unevenly distributed across the world, and are infl uenced by social and economic development, technology, and health service provision. The IPCC report documents in expansive detail the scientifi c knowledge on many individual risks.31 Here, we discuss how these risks could change globally as a result of a changing climate and of evolving societal and demographic factors.
Changes in extreme weather and resultant storm, fl ood, drought, or heatwave are direct risks. Indirect risks are mediated through changes in the biosphere (eg, in the burden of disease and distribution of disease vectors, or food availability), and others through social processes (leading, for instance, to migration and confl ict). These three pillars, shown in fi gure 2, interact with one another, and with changes in land use, crop yield, and ecosystems that are being driven by global development and demographic processes. Climate change will limit development aspirations, including the provision of health and other services through impacts on national economies and infrastructure. It will aff ect wellbeing in material and other ways. Climate change will, for example, exacerbate perceptions of insecurity and infl uence aspects of cultural identity in places directly aff ected.33
Thus, in fi gure 2, climate risks might be both amplifi ed and modifi ed by social factors. The links between food
Storms
Drought
Flood
Heatwave
Water qualityAge and gender
Socioeconomicstatus
Health status
Social capital
Public healthinfrastructure
Mobility andconflict status
Air pollution
Land use change
Ecological change
Health impactDirect effects Indirect effects Social dynamics
Clim
ate
chan
ge
Mental illness
Cardiovascular diseases
Undernutrition Allergies
Injuries Respiratory diseases Poisoning
Infectious diseases
Figure 2: The direct and indirect eff ects of climate change on health and wellbeingThere are complex interactions between both causes and eff ects. Ecological processes, such as impacts on biodiversity and changes in disease vectors, and social dynamics, can amplify these risks. Social responses also ameliorate some risks through adaptive actions.
51

The Lancet Commissions
1868 www.thelancet.com Vol 386 November 7, 2015
production and food security in any country, for instance, are strongly determined by policies, regulations and subsidies to ensure adequate food availability and aff ordable prices.34 Vulnerabilities thus arise from the interaction of climatic and social processes. The underpinning science shows that impacts are unevenly distributed, with greater risks in less developed countries, and with specifi c subpopulations such as poor and marginalised groups, people with disabilities, the elderly, women, and young children bearing the greatest burden of risk in all regions.31
In many regions, the consequences of lower socio-economic status and cultural gender roles combine to increase the health risks that women and girls face as a result of climate change relative to men and boys in the same places, although the converse might apply in some instances. Whilst in developed countries, males comprise approximately 70% of fl ood disaster fatalities (across studies in which sex was reported), the converse is generally true for disaster-related health risks in developing country settings, in which the overall impacts are much greater.35,36 For example, in some cultures women may be forbidden from leaving home unaccompanied, are less likely to have learnt how to swim, and may have less political representation and access to public services. Additionally, women’s and girls’ nutrition tends to suff er more during periods of climate-related food scarcity than that of their male counterparts, as well as starting from a lower baseline, because they are often last in household food hierarchies.37
Direct mechanisms and risks: exposure to warming and heatwavesWhile societies are adapted to local climates across the world, heatwaves represent a real risk to vulnerable populations and signifi cant increases in the risks of
extreme heat are projected under all scenarios of climate change.38 On an individual basis, tolerance to any change is diminished in those whose capacity for temperature homoeostasis is limited by, for example, extremes of age or dehydration. There is a well-established relationship between extreme high temperatures and human morbidity and mortality.39 There is also now strong evidence that such heat-related mortality is rising as a result of climate change impacts across a range of localities.31
Evidence from previous heatwave events suggests that the key parameters of mortality risk include the magnitude and duration of the temperature anomaly and the speed of temperature rise. The risks are culturally defi ned, even temperate cities experience such mortality as it is deviation from expectations that drives weather-related risks. This is especially true when hot periods occur at the beginning of summer, before people have acclimatised to hotter weather.38 The incidence of heatwaves has increased in the past few decades, as has the area aff ected by them.40,41
The most severe heatwave, measured with the Heat Wave Magnitude Index, was the summer 2010 heatwave in Russia.40 More than 25 000 fi res over an area of 1·1 million hectares42 raised concentrations of carbon monoxide, nitrogen oxides, aerosols, and particulates (PM10) in European Russia. The concentration of particulate matter doubled from its normal level in the Moscow region in August, 2010, when a large smoke plume covered the entire capital.43 In combination with the heat wave, the air pollution increased mortality between July and August, 2010, in Moscow, resulting in more than 11 000 additional deaths compared with July to August, 2009.44 Projections under climate scenarios show that events with the magnitude of the Russian heatwave of 2010 could have become much more common and
Figure 3: Exposure to warming resulting from projections of 21st century climate and population changeChanges in summertime temperatures (June–July–August for the northern hemisphere, and December–January–February for the southern hemisphere) between 1995 and 2090, for the RCP8.5 scenario, using the mean of the projections produced by the CMIP5 climate models (A). Change in the mean warming experienced by a person under RCP8.5 (red lines) and RCP2.6 (blue lines), calculated using the 2010 population (dashed lines), and time-varying future population scenarios (continuous lines; B). To encompass the range of possible exposures, we have paired the high-growth SSP3 population scenario with RCP8.5 and the low-growth SSP1 population scenario with RCP2.6. RCP=Representative Concentration Pathway.
A
−150 −100 −50 0 –5 100 150
–50
0
50
2020 2040 2060 2080 21000
1
2
3
4
6
5
Mea
n w
arm
ing
expe
rienc
ed (K
)
Year
BSSP3 plus RCP8·52010 population plus RCP8·5SSP1 plus RCP2·62010 population plus RCP2·6
1 2 3 4 5 6 7
K
52

The Lancet Commissions
www.thelancet.com Vol 386 November 7, 2015 1869
with high-end climate scenarios could become almost the summer norm for many regions.40,45
Rising mean temperatures mean that the incidence of cold events is likely to diminish. The analysis here focuses on the heat-related element because the health benefi ts of reductions in cold are not established. Whilst there is an increase in deaths during winter periods in many climates, the mechanisms responsible for this increase are not easily delineated. Most winter-related deaths are cardiovascular, yet the link between temperature and cardiovascular mortality rates is weak. There is a stronger link between respiratory deaths and colder temperatures but these account for a smaller percentage of winter deaths.46
The impact of cold temperatures can be measured considering seasonal means, extreme cold spells, and relative temperature changes. Seasonal means and extreme cold spells (or absolute temperature) have relatively small or ambiguous relationships with numbers of winter deaths, however temperature cooling
relative to an area’s average temperature does more clearly correlate with mortality rates.46,47 There may be modest reductions in cold-related deaths; however, these reductions will be largely outweighed at the global scale by heat-related mortality.46 Whilst climate change will have an impact on cold-related deaths, particularly in some countries with milder climates, the overall impact is uncertain.48,49
Population growth, urbanisation trends, and migration patterns mean that the numbers exposed to hot temperature extremes, in particular, will increase, with major implications for public health planning. Urban areas will expand: urban land cover is projected to triple by 2030 from year 2000 levels.50 Many assessments of climate risks, including those for heat, do not consider the detail of demographic shifts, in eff ect, overlooking the location of vulnerable populations as a part of the calculus. We have produced models that consider both climate and population projections. We use Shared Socioeconomic Pathway (SSP) population projections to
Figure 4: Changing exposure to heatwave resulting from projections of 21st century climate and population and demographic changeChange in heatwave frequency between 1995 and 2090 for the RCP8.5 scenario, in which a heatwave is defi ned as more than 5 consecutive days for which the daily minimum temperature exceeds the summer mean daily minimum temperature in the historical period (1986–2005) by more than 5°C (A). Change in the mean number of heatwave exposure events annually per km2 for people older than 65 years as a result of the climate change in panel A and assuming the 2010 population and demography (B). The same scenario as for panel B, but for the 2090 population and demography under the SSP2 population scenario (C). Time series of the change in the number of annual heatwave exposure events for people older than 65 years with (red line) and without (blue line) population and demographic change (D).
A
−150 −100 −50 0 50 100 150
–50
0
50
−150 −100 −50 0 50 100 150
–50
0
50
C
−150
25 50 75 100 150 200 500275
Exposure events per km2 per year−100 −50 0 50 100 150
–50
0
50
25 50 75 100 150 200 500275
Exposure events per km2 per year
B
2020 205020402030 2060 20902070 20800
1
2
3
Chan
ge in
exp
osur
e ev
ents
(bill
ions
per
year
)
Year
DChange with population and demographic changeChange without population and demographic change
Ratio
0·1 0·5 0·9 1·3 1·7 2·1 2·5 2·9
53

The Lancet Commissions
1870 www.thelancet.com Vol 386 November 7, 2015
calculate future demographic trends alongside Coupled Model Intercomparison Project Phase 5 (CMIP5) climate models (as used in the IPCC 5th Assessment report) and projected emission pathways (so-called Representative Concentration Pathways [RCPs]).51–54 Appendix 1 outlines assumptions, together with the data and the climate and population scenarios used to estimate the scale of various health risks for the 21st century, shown in fi gures 3–7.
The projected global distribution of changes in heat in the coming decades is shown in fi gure 3A using the high-emission projections of RCP8.5, as explained in appendix 1. This focuses on summer temperatures, hence the graph represents the summer months for both the northern (June to August) and southern (December to February) hemispheres. Climatic impact will not be experienced uniformly across the globe. At such levels of warming, the return period of extreme heat events, such as those experienced in 2003 in western Europe, is signifi cantly shortened. Figure 3B makes clear that future health risks arising from exposure to warming (measured as the mean temperature increase experienced by a
person) might also be extensively driven by demographics, shown as the divergence between red and blue lines driven by diff erent warming and population scenarios across the incoming decades. In other words, population change in areas of the world where population growth is signifi cant, fundamentally aff ects the increase in numbers of people exposed to the impacts of climate change.
Whilst hotter summers increase vulnerability to heat-related morbidity, heatwaves in particular have a negative impact on health. Figure 4 re-analyses projections from the latest climate models (the CMIP5 models as used in the IPCC 5th Assessment report) in terms of the number of exposure events per year for heatwaves. Heatwaves here are defi ned as 5 consecutive days of daily minimum night-time temperatures more than 5°C greater than the presently observed patterns of daily minimums. Although heatwaves have diff erent characteristics, this defi nition focuses on health impacts based on deviation from normal temperature, duration, and extent.
Elderly populations are especially vulnerable to heatwaves, and demographic and climatic changes will
A
−150
1 2 3 4 5 6 7
−100 −50 0 50 100 150
–50
0
50
−150 −100 −50 0 50 100 150
–50
0
50
C
−150Person-years per km2 per year
−100 −50 0 50 100 150
–50
0
50
K
Person-years per km2 per year
1 2·5 5 10 25 50
1 2·5 5 10 25 50
B
206020402020 2080 2100
50
150
250La
bour
lost
(mill
ion
pers
on-y
ears
)
Year
DSSP22010
Figure 5: Change in outdoor labour productivity resulting from projections of 21st century climate and rural population changeChange in summer mean (June–July–August for the northern hemisphere, and December–January–February for the southern hemisphere) wet-bulb globe temperature65 for the RCP8.5 scenario (A). Annual loss of outdoor labour productivity due to the climate change in panel A and assuming the 2010 rural population (B). The same scenario as for panel B, but for the 2090 rural population under the SSP2 population scenario (C). Time series of the annual loss of outdoor labour with (red line) and without (blue line) rural population change (D).
See Online for appendix 1
54

The Lancet Commissions
www.thelancet.com Vol 386 November 7, 2015 1871
combine to shape population heatwave vulnerability in coming decades (fi gure 4).55 We use populations projected over 65 years of age rather than a frailty index, recognising the underlying health of elderly populations and the cultural context of ageing are both likely to change over time.56 Educational levels and other demographic factors are also important in the ability of societies to cope with extreme events.57 Allowing for these caveats, fi gure 4D shows growing exposure in global projections of the number of people older than 65 years exposed to heatwave risks. The numbers of events of elderly people experiencing high temperatures reaches more than 3 billion towards the end of the century. A key message is that demographic change added to climate changes will expose increasing numbers of elderly people to increasing numbers of heat waves, especially in the developed and transition economies.
Heat also poses signifi cant risks to occupational health and labour productivity in areas where people work outdoors for long hours in hot regions.58 Heavy labour in
hot humid environments is a particular health and economic risk to millions of working people and their families in hot tropical and sub-tropical parts of the world.59 These have been documented in young and middle-aged men in France 2003,60 agricultural workers in the USA,61 and sugar-cane harvesters in Central America.62 The Climate Vulnerability Monitor 2012 estimated the annual costs in China and India at US$450 billion in 2030.63 The percentage of GDP losses due to increasing workplace heat is greater than the current spending on health systems in many low-income and middle-income countries.64
Impacts of heat on labour productivity will be compounded in cities by increased urbanisation and the corresponding heat island eff ect, but will also be off set by reductions in populations working outdoors in sectors (eg, construction and agriculture).38 Tolerance to any given temperature will be infl uenced by humidity, which alters the capacity for thermoregulation through the evaporation of sweat. These measures are combined in an index known as wet-bulb globe temperature (WBGT),
A
−150 −100 −50 0 50 100 150
–50
0
50
−150 −100 −50 0 50 100 150
–50
0
50
C
−150Exposure events per km2 per year
−100 −50 0 50 100 150
–50
0
50
0·3 0·7 0·9 1·1 1·3 1·5 2
Ratio
B
2020 205020402030 2060 20902070 20800·2
0·6
1·0
1·4
Chan
ge in
exp
osur
e ev
ents
(bill
ions
per
year
)
Year
DSSP22010
Exposure events per km2 per year
25 50 75 100 150 200
25 50 75 100 150 200
Figure 6: Changing exposure to drought resulting from projections of 21st century climate and population changeChange in drought intensity between 1995 and 2090 for the RCP8.5 scenario, defi ned as the ratio of the mean annual maximum number of consecutive dry days (2080–99, 1986–2005), in which a dry day is any day with less than 1 cm of precipitation (A). Change in the mean number of drought exposure events annually per km² as a result of the climate change in panel A and assuming the 2010 population (B). The same scenario as for panel B, but for the 2090 population under the SSP2 population scenario (C). Time series of the change in the number of annual drought exposure events with (red line) and without (blue line) population change (D).
55

The Lancet Commissions
1872 www.thelancet.com Vol 386 November 7, 2015
used to determine how long an individual can work before a break, with work capacity falling substantially after WBGT 26–30°C.58
Using projections from RCP8.5 and SSP2, fi gure 5 estimates the extent of lost labour productivity (on the basis of the response function between temperature and productivity used by Dunne et al, 201265) across the coming decades, focusing on proportion of the labour force in rural and urban areas. Again the impact of climate change is greater in regions such as sub-Saharan Africa and India. But some trends off set the potential impact, including the trend towards employment in service and other sectors where exposure is reduced (assumed in the SSP2 used here; fi gure 5C, D). As demographic trends towards urban settlement and secondary and tertiary sector employment progress, increasing urbanisation may reduce the negative impacts of warming on total outdoor labour productivity, depending on the population scenario (SSP2 in fi gure 5D).
Loss of agricultural productivity through impaired labour will be amplifi ed by direct climate change impacts on crop and livestock production.66 The impact of increasing temperatures on labour productivity can be mitigated—eg, by use of air conditioning or by altering working hours. However, these actions are predicated on aff ordability, infrastructure, the suitability of a job to night labour, and energy availability.67
Indirect and complex mechanisms linking climate change and healthMost climate-related health impacts are mediated through complex ecological and social processes. For risks associated with transmission vectors and water, for example, rising temperatures and changes in precipitation pattern alter the viable distribution of disease vectors such as mosquitoes carrying dengue or malaria. Climate conditions aff ect the range and reproductive rates of malarial mosquitoes and also aff ect the lifecycle of the parasitic protozoa responsible for malaria. The links between climate change, vector populations and hence malarial range and incidence may become signifi cant in areas where the temperature is currently the limiting factor, possibly increasing the incidence of a disease that causes 660 000 deaths per year.68 In some highland regions, malaria incidence has already been linked to warmer air temperatures although successful control measures in Africa have cut the incidence of malaria in recent decades, and there are long established successes of managing malaria risk in temperate countries including in southern USA and in Europe.69,70 There are equally complex relationships and important climate-related risks associated with dengue fever, cholera and food safety.54,71,72 Dengue fever for example has 390 million recorded infections each year, and the number is rising.54,73
Changing weather patterns are also likely to aff ect the incidence of diseases transmitted through infected water sources, either through contamination of drinking water or by providing the conditions needed for bacterial
growth.74 Cholera is transmitted through infected water sources and often occurs in association with seasonal algal blooms with outbreaks sometimes experienced following extreme weather events such as hurricanes that result in the mixing of wastewater and drinking water, and in association with El Niño events.72 Such extreme weather events are likely to increase in frequency in the coming decades and waterborne epidemics need to be planned for and monitored carefully.
In eff ect, all health outcomes linked to climate variables are shaped by economic, technological, demographic, and governance structures. Institutions and social norms of behaviour and expectation will play a signifi cant part in how new weather patterns impact health.38,71 Changes in temperature, precipitation frequency, and air stagnation also aff ect air pollution levels with signifi cant risks to health. Climate aff ects pollution levels through pollutant formation, transport, dispersion, and deposition. In total, fi ne particulate air pollution is estimated to be responsible for 7 million additional deaths globally in 2012, mainly due to respiratory and cardiovascular disease.75 Its eff ect is amplifi ed by changes in ambient temperature, precipitation frequency, and air stagnation—all crucial for air pollutant formation, transport, dispersion and deposition.
Ground-level ozone (GLO) and particulate air pollutants are elements that will be most aff ected by climate change. Whilst the net global eff ect is unclear, regional variation will see signifi cant diff erences in local exposure.31,76 GLO is more readily created and sustained in an environment with reduced cloudiness and decreased precipitation frequency, but especially by rising temperatures.77 Thus, ozone levels were substantially elevated during the European heatwave of summer 2003.76,78 Climate change is predicted to elevate GLO levels over large areas in the USA and Europe, especially in the summer, although the background of GLO in the remote areas shows a decreased trend.77,79–82 In the USA, the main impact of future climate change on GLO is centred over the northeast and mid-west where the future GLO are expected to increase by 2–5 ppbv (about 3–7%) in the next 50–90 years under the IPCC A1 scenario.79,81 Knowlton and colleagues estimated that ozone-related acute mortality in the USA would rise by 4·5% from 1990 to 2050, through climate change alone.83 Likewise, climate change is predicted to increase concentrations of fi ne particulate matter (2·5 micron particles [PM2.5]) in some areas.80,84
The interactions between air pollution and climate are highly diff erentiated by region. In China, for example, the interactions between climate and a range of pollutants is especially acute. While action on carbon emissions dominate energy policy in China, climatic changes will have a signifi cant impact on air pollutants in all regions of the country.84,85 Chinese ozone concentrations in 2050 have been projected to likely increase beyond present levels under many climate scenarios through the combined eff ects of emissions and climate change. The greatest rises will be in eastern and northern China.85
56

The Lancet Commissions
www.thelancet.com Vol 386 November 7, 2015 1873
Compared with ozone, PM2.5 levels rely more on changes in emissions than temperature. The concentrations of SO4²−, black carbon and organic carbon are projected to fall, but those of NO3
− to rise, across China under many possible climate futures.84 Levels of aerosols (especially NO3
−) in the eastern Chinese spring will be especially aff ected by 2030. Falling emissions would reduce overall PM2.5 concentrations by 1–8 μg/m³ in 2050 compared with those in 2000 despite a small increase (10–20%) driven by climate change alone.84 Although emission changes play a key part in projections, climate-driven change should not be ignored if warming exceeds 2°C. PM2.5 is sensitive to precipitation and monsoon changes and global warming will alter Chinese precipitation seasonally and regionally, thereby changing the regional concentration of PM2.5.76,86 Independent of climate change, China’s air pollution has already come at great cost, with an annual pollution-related mortality of 1·21 million in 2010.87
Climate change has important implications for livelihoods, food security, and poverty levels, and on the capacity of governments and health systems to manage emerging health risks. Crops and livestock have physiological limits to their health, productivity, and survival, which include those related to temperature. For every degree greater than 30°C, the productivity of maize production in Africa might be reduced by 1% in optimum conditions and 1·7% in drought, with a 95% chance of climate change-related harm to the production of South African maize and wheat in the absence of adaptation.88,89
Sensitivity of crops and livestock to weather variation has a substantial impact on food security in regions that are already food insecure, pushing up food prices and ultimately aff ecting food availability and aff ordability to poor populations and contributing to malnutrition.90 This eff ect is amplifi ed by polices on food stocks, reactions to food prices by producer countries, and by the global demand for land to hedge against climate shifts. The increased volatility of the global food system under climate change has impacts on labour, on farmer livelihoods and on consumers of food, with attendant health outcomes for all these groups.66
Within this complex relationship between climate and food security, the availability of water for agricultural production is a key parameter. Figure 6 shows very signifi cant changes in exposure to drought-like meteorological conditions over the coming decades. The analysis shows that the population changes (from SSP2) alongside climate change could lead to 1·4 billion additional person drought exposure events per year by the end of the century. Importantly, the geographical distribution of this exposure is highly localised and variable (eg, across Asia and Europe), acutely degrading water supply and potentially quality. But all such estimates focus on availability of surface water, whereby both long-term water availability and supply for specifi c regions are also aff ected by groundwater resources, which have been shown to be in a critical state in many regions.91,92
Increased frequency of fl oods, storm surges, and hurricanes will have a substantial eff ect on health. Extreme events have immediate risks, exemplifi ed by more than 6000 fatalities as a result of typhoon Haiyan in the Philippines in late 2013. Floods also have long-term and short-term eff ects on wellbeing through disease outbreaks, mental health burdens, and dislocation.93
Risks related to water shortages, fl ood, and other mechanisms involve large populations. Projections suggest, for example, that an additional 50 million people and 30 000 km² of land could be aff ected by coastal storm surges in 2100, with attendant risks of direct deaths and of infectious diseases.94,95 Involuntary displacement of populations as a result of extreme events has major public health and policy consequences. In the longer term, fl ooding aff ects perceptions of security and safety, and can cause depression, anxiety, and post-traumatic stress disorder.93,96
Figure 7 shows estimates of extreme precipitation events (events exceeding 10 year return period) under the RCP8.5 (high-emission) scenario. We estimate that there would be around 2 billion additional extreme rainfall exposure events annually (individuals exposed once or multiple times during any year), partly due to population growth in exposed areas and partly due to the changing incidence of extreme events associated with climate change. Whilst not all extreme rainfall events translate into fl oods, such extreme precipitation will inevitably increase fl ood risk. Regions of large population growth dominate changes in the number exposed to fl ood risk (especially in sub-Saharan Africa and South Asia).97
All these climate-related impacts are detrimental to the security and wellbeing of populations around the world. Whilst there is, as yet, no defi nitive evidence that climate change has increased the risk of violent civil confl ict or war between states, there are reasons for concern. The IPCC concludes that climate change will directly aff ect poverty, resource uncertainty and volatility, and the ability of governments to fulfi l their obligations to protect settlements and people from weather extremes.33,98 These factors are important correlates of violent confl ict within states, suggesting that climate change is detrimental to peaceful and secure development, even if they do not directly enhance confl ict risks.99 Similarly, migration has signifi cant complex consequences for human security. The continued movement of migrant populations into cities, the potential for climate hazards in high-density coastal mega-cities, and impaired air quality create signifi cant public health challenges, not least for migrants themselves.100,101
The direct and indirect eff ects of climate change outlined here represent signifi cant risks for human health. The precautionary case for action is amplifi ed with three additional dimensions: (1) interventions to adapt to evolving climate risks as discussed in section 2 might not be as eff ective as required; (2) unforeseen
57

The Lancet Commissions
1874 www.thelancet.com Vol 386 November 7, 2015
interactions and amplifi cations of climate risks are possible (eg, emerging zoonotic and other diseases being aff ected through complex ecological changes, covered in more detail in the Lancet Commission on Planetary Health); (3) the risk that tipping elements in the climate system could rapidly accelerate climate change at regional or global scale. Lags in warming and climate impacts mean that irrespective of the mitigation pathway taken, many impacts and risks will increase in the coming decades.
Section 2: action for resilience and adaptationAdaptation measures are already required to adapt to the eff ects of climate change being experienced today. As shown in section 1, these risks will increase as worsening climate change aff ects more people, especially in highly exposed geographical regions and for the most vulnerable members of society.
This section outlines possible and necessary actions to limit the negative impacts and burden on human health, including direct and indirect impacts within and beyond
the formal health system. Responses aim to reduce the underlying vulnerability of populations; empower actors to cope or adapt to the impacts; and whenever possible support longer-term development. The health sector has a central part to play in leading climate change adaptation and resilience eff orts.102,103 However, eff ective adaptation measures must cross multiple societal sectors, identify ways to overcome barriers to achieve co-benefi ts, and target vulnerable groups and regions.
Early action to address vulnerability allows for more options and fl exibility before we face indispensable and involuntary adaptation.104,105 Panel 2 provides defi nitions of vulnerability, adaptation, and resilience.
Adaptation to the direct health impacts of climate changeThe direct health impacts result from extreme weather events such as storms, fl oods, droughts, and heatwaves. Many responses centre on the importance of health system strengthening; however, actions in other sectors are also needed.
Figure 7: Changing exposure to fl ood resulting from projections of 21st century climate and population changeChange in fl ood frequency between 1995 and 2090 for the Representative Concentration Pathway (RCP) 8.5 scenario, in which a fl ood event is defi ned as a 5 day precipitation total exceeding the 10 year return level in the historical period (1986–2005; A). Change in the mean number of fl ood exposure events annually per km² due to the climate change in panel A and assuming the 2010 population (B). The same scenario as for panel B, but for the 2090 population under the SSP2 population scenario (C). Time series of the change in the number of fl ood exposure events with (red line) and without (blue line) population change (D).
A
−150 −100 −50 0 50 100 150
–50
0
50
−150 −100 −50 0 50 100 150
–50
0
50
C
−150Exposure events per km2 per year
−100 −50 0 50 100 150
–50
0
50
Exposure events per km2 per year
B
2020 205020402030 2060 20902070 2080
0·5
1·0
2·0
1·5
Chan
ge in
exp
osur
e ev
ents
(bill
ions
per
year
)
Year
DSSP22010
0·3 0·7 0·9 1·1 1·3 1·5 2
Ratio
25 50 75 100 150 200 275
25 50 75 100 150 200 275
58

The Lancet Commissions
www.thelancet.com Vol 386 November 7, 2015 1875
Early warning systems for extreme eventsApproaches to the health management of extreme weather events involve improved early warning systems (EWS), eff ective contingency planning, and identifi cation of the most vulnerable and exposed communities.111 They include forecasting, predicting possible health outcomes, triggering eff ective and timely response plans, targeting vulnerable populations, and communicating prevention responses. Public health authorities need to upgrade existing emergency programmes and conduct exercises to enhance preparedness for anticipated health risks due to new extreme events such as sea level rise, saline water intrusion into drinking water courses, and severe fl ooding from storm surges. These eff orts to improve disaster preparedness must also run in parallel with eff orts to strengthen local community resilience.
Actions to reduce burdens of heatwavesThe frequency, intensity, and duration of extreme heat days and heatwaves will increase with climate change, leading to heat stress and increased death rates (see section 1). The eff ects are worsened by the so-called urban heat island eff ect, which results from greater heat retention of buildings and paved surfaces, compared with refl ective, transpiring, shading, and air-fl ow-promoting vegetation-covered surfaces. Evidence suggests that eff ective adaptation measures would reduce the death rates associated with these heat waves. The 2003 European heatwave, which killed up to 70 000 people led France to introduce a heatwave warning system and a national action plan.111 Health worker training was modifi ed, urban planning altered, and new public health infrastructure developed. The 2006 heatwave suggested that these measures had been eff ective, with 4400 fewer anticipated deaths.112
Adaptation options within health care include training of health-care workers and integrated heatwave early warning systems (HEWS), especially for the most vulnerable populations.111,113 Adaptation measures also include increasing green infrastructures and urban green spaces, improving the design of social care facilities, schools, other public spaces, and public transport to be more climate-responsive.113,114 This also entails mitigating eff ort to reduce air pollutants, which in turn reduces air quality related morbidity and mortality.115
Floods and stormsIn general, adaptive measures to fl oods can be classifi ed as structural or non-structural. Infrastructure such as reservoirs, dams, dykes, and fl oodways can be used to keep fl ooding away from people and property. In some areas there is also the possibility to incorporate fl oodable low-lying areas into the urban design that can be temporarily under water during an extreme event. Structural programmes are considered by many fl ood managers as a priority and are also the principal source
of funds for eff orts to control fl oods. However, the construction of fl ood control works may have a maladaptive eff ect, encouraging more rapid economic development of the fl ood plains, and hence ultimately increasing fl ood losses.116
Adaptation to fl ood risk requires comprehensive approaches (panel 3). Non-structural measures include fl ood insurance, development policies, zoning laws, fl ood-plain regulations, building codes, fl ood proofi ng, tax incentives, emergency preparedness, fl ood fore-casting, and post-fl ood recovery.116,121 Non-structural fl ood
Panel 2: Vulnerability, adaptation, and resilience
Vulnerability is here defi ned as the degree to which a system is susceptible to, or unable to cope with, the adverse eff ects of climate change.106 This defi nition considers demographics, geographical circumstances, eff ectiveness, and coverage of the health-care system, pre-existing conditions, and socioeconomic factors such as inequity.107
Adaptation to climate change is here defi ned as “the process of adjustment to actual or expected climate and its eff ects, in human systems in order to moderate harm or exploit benefi cial opportunities, and in natural systems human intervention may facilitate adjustment to expected climate”.108
Resilience is here defi ned as the capacity of a system to absorb disturbance and reorganise while undergoing change, so as to still retain essentially the same function, structure, identity and feedbacks.30 Resilience has also been referred to the ability of human communities to withstand external shocks to their social infrastructure.109 Resilience includes the capacity of a system to not only absorb a disturbance, but to innovate and transform.110
Panel 3: Adaptation to fl oods and storms in Bangladesh
In a mid-range climate-sensitivity projection, the number of people fl ooded per year globally is expected to increase by 10–25 million per year by 2050.117 Bangladesh is one of the most vulnerable countries to climate change in south Asia, regularly suff ering from events such as fl ooding, cyclones, or coastal erosion, which cause inundation of farmlands, aff ect migration, and lead to displacement.118 More than 5 million Bangladeshis live in areas highly vulnerable to cyclones and storm surges, and more than half the population lives within 100 km of the coast.119 In 2007, cyclone Sidr killed roughly 4000 people in Bangladesh. By comparison, an equivalent storm in 1970 killed 300 000 people.120 Bangladesh achieved this reduction in mortality via collaborations between governmental and non-governmental organisations and local communities. Together, these groups improved general disaster reduction, deployed early warning systems, and built a network of cyclone shelters.31
59

The Lancet Commissions
1876 www.thelancet.com Vol 386 November 7, 2015
adaptation options aim to reduce fl ood damages and enhance the ecological functions of fl ood plains. Many opportunities to increase resilience to extreme weather events are found in improved planning, zoning, and the management of land use. These have the additional advantage of providing multiple co-benefi ts (see ecosystem-based adaptation below).
Action for resilience to indirect impactsAdaptation to indirect eff ects poses diffi cult challenges to policy making due to complex causal chains and limited predictibility.122 These complex interactions can result in “surprises”—situations in which the behaviour in a system, or across systems, diff ers qualitatively from expectations or previous experiences. These indirect impacts pose serious obstacles for climate adaptation, especially where health responses require integrated and cross-sectoral interventions.123
Food insecurityFood insecurity and its health impacts play out at the local level, but have clear links to drivers and changes at the national and international level. The compounded impacts of climate change and ocean acidifi cation will aff ect both agricultural production and fi sheries, including food availability and prices.124 –126 Adaptation policies should consider agro-food systems and fi sheries and aquaculture alike.
Resilience to increased food insecurity and price volatility is of great importance to human health. Food security could be enhanced while simultaneously ensuring the long-term ability of ecosystems to produce multiple benefi ts for human wellbeing (panel 4). Issues such as improved local ecosystem stewardship (see section on ecosystem-based adaptation), good governance, and international mechanisms to enhance food security in vulnerable regions are of essence.130,131 Even though the drivers of increased food prices and price volatilities are contested, investment in improved food security could provide multiple co-benefi ts and no-regret options.132,133
Important adaptation options for food security action include:• Enhancement of food security through improved
ecosystem based management and ecosystem restoration. Case studies show the benefi ts of implementing strategies to improve ecosystem management as a means to increase not only food security, but also to achieve other social goals. Examples include collaborative management of mangrove forests to promote conservation, mitigation of climate change and alleviation of poverty among people dependent on the mangroves and adjacent marine ecosystems.125 Such strategies require supportive institutions, partnerships, collaboration with farmers’ innovation networks, and connections from sustainable farms to markets.129,131 Similar strategies have recently been explored for fi sheries and aquaculture.134
• Increased investments in agricultural research and human capital are often raised as an important strategy to improve yields and long-term food security.131 Agricultural research and development (R&D) has proven to have high economic rates of return.135 Innovative crop insurance mechanisms, new uses of information technology, and improved weather data also hold promise for increased agricultural production.136 Education in agricultural areas is critical to enhance the diff usion of technologies and crop management, and as a means to increase household incomes and promote gender equality.131,137
• Increased investments in rural and water infrastructure. Investment is essential for situations in which underdeveloped infrastructure results in poor supply chains and large food losses. Investments could boost agricultural production, reduce price volatilities, and enhance food security in the long term. The investments required in developing countries to support this expansion in agricultural output have been estimated to be an average annual net investment of US$83 billion (not including public goods such as roads, large scale irrigation projects, and electrifi cation).131
• Enhanced international collaboration. International collaboration is critical for food security in food insecure regions. Early warning systems, fi nancial support, emergency food and grain reserves, the ability to scale up safety nets such as child nutrition schemes, and capacity building play a key part in emergency responses to food crises, and can be supported by international organisations.131,138
Environmental migrationChanges in human mobility patterns have multiple drivers,139 and range from large-scale displacement (often in emergency situations), to slow-onset migration (in which people seek new homes and livelihoods over a lengthy period of time as conditions in their home communities worsen).140 The effi cacy of national and international policies, institutions, and humanitarian
Panel 4: Food security, climate change, and human health
Today, agriculture uses 38% of all ice-free land areas and accounts for 70% of freshwater withdrawals and roughly a third of global greenhouse gas emissions.127 The provision for global food demand by 2050 cannot assume improved crop yields through sustainable agricultural intensifi cation because of the negative eff ects on crop growth from an increased frequency of weather extremes. Multifunctional food production systems will prove important in a warmer world. These systems are managed for benefi ts beyond yield, and provide multiple ecosystem services, support biodiversity, improve nutrition, and can enhance resilience to shocks such as crop failure or pest outbreaks. 128,129
60

The Lancet Commissions
www.thelancet.com Vol 386 November 7, 2015 1877
responses also infl uence whether people are able to cope with the after-eff ects of natural hazard in a manner that allows them to recover their homes and livelihoods.141
Displacement occurs when choices are limited and movement is more or less forced by land loss, for example due to extreme events.142 Population displacement can further aff ect health through increased spread of communicable diseases and malnutrition, resulting from overcrowding and lack of safe water, food, and shelter.143 Additional impacts on economic development and political instability could develop, generating poverty and civil unrest that will exacerbate the population burden of disease.1,143
Existing vulnerabilities will determine the degree to which people are forced to migrate.144 The availability of alternative livelihoods or other coping capacities in the aff ected area generally determines the scale and form of migration that may take place. Confl ict undermines the capacity of populations to cope with climate change, leading to greater displacement than might have been the case in a more stable environment. Confl icts have also been shown to reduce mobility and trap populations in vulnerable areas, exposing politically marginalised populations to greater environmental risks.145
Migration from both slow and rapid-onset crises is likely to be immediately across borders from one poor country into another. Receiving countries could have few resources and poor legal structures or institutional capacity to respond to the needs of the migrants. Destination areas may face similar environmental challenges (eg, drought or desertifi cation) and may off er little respite. In rural areas, drought particularly aff ects rural to urban migration.143 Urbanisation can be benefi cial for health and livelihood, but also entails many risks.121,142 The social disruption provoked by migration can lead to a breakdown in traditional institutions and associated coping mechanisms.146 Furthermore, the lack of mobility and risks entailed by those migrating into areas of direct climate-related risk, such as low-lying coastal deltas, presents a further hazard.121 The mental health implications of involuntary migration are often down-stream eff ects, seen as a result of multiple interacting social factors (panel 5).
No or low-regret policies to reduce environmental migrationEff ective public health and adaptation strategies to reduce environmental migration or reduce the negative impact of environmental migration should entail the coordinated eff orts of local institutions, national and international governments and agencies.100 There are several no or low-regret practices that generate both short-term and long-term benefi ts if integrated with existing national development, public health and poverty reduction strategies.1 Slowing down the rate of environmental change,
including mitigation policies and reducing land degradation.121,154
2 Reducing the impact of environmental change through early warning systems, integrated water management, rehabilitation of degraded coastal and terrestrial ecosystems, and robust building standards.154,155
3 Promoting long-term resilience through enhanced livelihoods, increased social protection, and provision of services. These include ecosystem-based invest-ments, and processes that decrease marginalisation of vulnerable groups—eg, by increased access to health services.
Limitations of migration as a means of adaptationMigration has been proposed as a transformational adaptive strategy or response to climate change. The policy response is often referred to as “managed retreat”.121,156 With changes in climate, resource productivity, population growth, and risks various governments have now, as part of their adaptation strategies, engaged in planning to move settlement.33 As an example, fi ve indigenous communities in Alaska have planned for relocation with government funding support. Research on experience of migration policy concludes that a greater emphasis on mobility within adaptation policies could be eff ective.100,156
Using migration as a strategy to cope with environmental stress might however create conditions of increased (rather than reduced) vulnerability.100,144,156 Even though migration is used as a strategy to deal with imminent risks to livelihoods and food security, many vulnerable low-income groups do
Panel 5: Mental health impacts and interventions
Climate change aff ects mental health through various pathways by infl icting natural disasters on human settlements and by causing anxiety-related responses, and later chronic and severe mental health disorders, and implications for mental health systems.147,148 These eff ects will fall disproportionately on individuals who are already vulnerable, especially for indigenous people and those living in low-resource settings.147 Additionally, individuals might feel a distressing sense of loss, known as solastalgia, that people experience when their land is damaged and they lose amenity and opportunity.149
Elevated levels of anxiety, depression, and post-traumatic stress disorders have been reported in populations who have experienced fl ooding and during slow-developing events such as prolonged droughts;93,96 impacts include chronic distress and increased incidence of suicide.150,151 Even in high-income regions where the humanitarian crisis might be less, the impact on the local economy, damaged homes, and economic losses can persist for years after natural disasters.152 Government and agencies now emphasise psychological and psychosocial interventions within disaster response and emergency management. Social adaptation processes can mediate public risk perceptions and understanding, psychological and social impacts, coping responses, and behavioural adaptation.153
61
The Lancet Commissions
1878 www.thelancet.com Vol 386 November 7, 2015
not have the resources to migrate in order to avoid fl oods, storms, and droughts.157 In addition, studies of resettlement programmes demonstrate negative social outcomes, often analysed as breaches in individual human rights.154 There are signifi cant perceptions of cultural loss and the legitimacy, and success depends on incorporating cultural and psychological factors in the planning processes.158
Dynamic infectious disease risksInteractions and changes in demographics, human connectivity, climate, land use, and biodiversity will substantially alter disease risks at local, national and international scales.159 For example, vector-borne infectious disease risks are aff ected by not only changing temperatures, but also sea level rise.160 The geographical distribution of African trypanosomiasis is predicted to shift due to temperature changes induced by climate change.161 Biodiversity loss may to lead to an increase in the transmission of infectious diseases such as Lyme disease, schistosomiasis, Hantavirus and West Nile virus.162 Infectious disease risks are dynamic and subject to multiple and complex drivers. Adaptation responses therefore must consider multiple uncertainties associated with dynamic disease risks, which include a focus on co-benefi ts, no regrets and resilience.113,163–165
Adaptation policy options for infectious disease risks1 Investing in public healthDeterminants of health, such as education, health care, public health prevention eff orts, and infrastructure play a major part in vulnerability and resilience.166 Adapting to climate change will not only be benefi cial in reducing climate change impacts, but also have positive eff ects on public health capacity.163 Furthermore, health improvements account for 11% of economic growth in low-income and middle-income countries.167 The UN Framework Convention on Climate Change (UNFCCC) estimates the costs of health-sector adaptation in developing countries to be US$4–12 billion in 2030. However, the health consequences of not investing would be more expensive, and it is clear that there are several health impacts that we will not be able to adapt to.168
2 One-health approachesThese approaches involve collaboration across multiple disciplines and geographical territories to protect the health for people, animals and the environment. 70% of emerging infectious diseases are zoonotic169 and have multiple well-established links to poverty.170 They also pose considerable global risks (eg, avian infl uenza, Ebola). Eff ective responses to emerging infectious diseases require well-functioning national animal and public health systems, reliable diagnostic capacities, and robust long-term funding. Critical gaps are present in existing health systems, including poor reporting, severe institutional fragmentation, and defi cient early response capacities.171,172
Zoonosis outbreaks are costly: the economic losses from six major outbreaks of highly fatal zoonoses between 1997 and 2009 cost at least US$80 billion.173 Implementing a one-health approach is, by contrast, economically sensible: the World Bank values its global benefi ts at $6·7 billion per year.173 It provides no-regret options because investments will contribute to reduced vulnerability applicable across climate futures, and it enhances resilience by linking government and civil society partners, facilitating early warning and building capacities to respond to multiple disease risks.
3 Surveillance and monitoringStrengthening the capacity of countries to monitor and respond to disease outbreaks is vital, as shown by the ongoing Ebola epidemic in West Africa. Climate-change adaptation for human health requires a range of data, including on health climate risks or vulnerabilities, and specifi c diseases related to climate change impacts. Information and data collected from public health surveillance or monitoring systems can be used to determine disease burdens and trends, identify vulnerable people and communities, understand disease patterns, and prepare response plans and public health interventions.174,175
Health co-benefi ts from climate adaptationEven though many climate-related health eff ects are beset by uncertainties, policy makers and communities can prepare if they focus on measures that: 1) create multiple societal and environmental benefi ts; 2) are robust to multiple alternative developments, and 3) enable social actors to respond, adapt and innovate as a response to change. 164,165
Ecosystem-based adaptation (EbA)–co-benefi ts for indirect eff ectsEcosystem services contribute to human health in multiple ways and can act as buff ers, increasing the resilience of natural and human systems to climate change impacts and disasters.155
Ecosystem-based Adaptation (EbA) utilises ecosystem services, biodiversity, and sustainable resource management as an adaptation strategy to enhance natural resilience and reduce vulnerability (covered in more detail in a forthcoming Lancet Commission on Planetary Health).176,177 Natural barriers can act as a defence against climatic and non-climatic events—eg, restoration of mangroves for protecting coastal settlements and conservation of forests to regulate water fl ow for vulnerable communities.178,179 EbA is considered to be more cost eff ective than many hard-engineered solutions, and thought to minimise the scope for maladaptation.155,180 It can be combined with engineered infrastructure or other technological approaches. EbA interventions can be eff ective in reducing certain climate change vulnerability as it provides both disaster risk reduction functions, and enables improvements in livelihoods and food security, especially in poor and vulnerable settings.181 However, the
62
The Lancet Commissions
www.thelancet.com Vol 386 November 7, 2015 1879
scientifi c evidence about their role in reducing vulnerabilities to disasters is developing, and the limits and timescales of EbA interventions need further evaluation. Drawbacks can include the amount of land they require, uncertainty regarding costs, the long time needed before they become eff ective, and the cooperation required across institutions and sectors.180
Ecosystem-based adaptation in urban areasEbA also has the potential to yield benefi ts for highly urban areas, through the development of green infrastructure.180 The evidence comes mainly from the northern hemisphere, in high-income settings with a dense city core. In many cases enhancement of urban ecosystems provides multiple co-benefi ts for health such as clean air and temperature regulation.182 EbA can further create synergies between adaptation and climate-change mitigating measures by assisting in carbon sequestration and storage, and enhancing various ecosystem services considered benefi cial for human health.176,183 Trees are particularly considered to be effi cient in reducing concentrations of pollutants, although the capacity can vary by up to 15 times between species.184
Green urban design can reduce obesity and improve mental health through increased physical activity and social connectivity.164 Increased neighbourhood green spaces reduces both morbidity and mortality from many cardiovascular and respiratory diseases and stress-related illnesses.31 Tree canopies have a higher albedo eff ect than other hard surfaces and can work to reduce the urban heat island eff ect, lowering heat mortality by 40–99%.185 Whilst resulting in improved public health and community resilience, many of these measures will also act to mitigate climate change.
Overcoming adaptation barriersGlobally, relatively few national strategies bring climate change into public health decision-making processes. The health impacts of climate change are often poorly communicated and poorly understood by the public and policy makers. Barriers to health climate adaptation include competing spending priorities, widespread poverty, lack of data to inform adaptation policies, weak institutions, a lack of capital, distorted economic incentives, and poor governance. Here, we elaborate these barriers and discuss some ways to overcome them.
Institutional collaborationHealth-adaptation policies and programmes require engagement of numerous agencies and organisations, including government agencies, non-governmental organisations (NGOs), informal associations, kinship networks, and traditional institutions.186 At the same time, institutional fragmentation, lack of coordination and communication across levels of government, and confl icts of interest between ministries are overly common.186,187 Strengthening institutions at multiple levels is vital, and
institutional capacity needs-assessment and collaboration are critical for health adaptation to climate change.188 The support of bridging organisations, as well as partnerships through networks, are critical as a means to overcome fragmentation and improve collaboration, information fl ows, and learning.189
FinanceLack of fi nance is commonly cited as a major obstacle to adaptation, especially in the poorest regions and communities. This might result in economic incentives for investment in adaptation appearing small, individuals or fi rms lowering initial costs by avoiding expensive adaptation technologies or options, and the fact that the long-term benefi ts of health risk reduction, health improvements, and other societal benefi ts (reduced public health care costs) are heavily discounted.
Community and informal networks may provide fi nancial support, but regional, national, and international funds as well as private sector funding will be required for adaptation responses at a larger scale.190 To date, adaptation funding is inadequate compared to the risks and hazards faced. This is covered in more detail, in section 4 of the Commission.
CommunicationPublic awareness of the health risks of climate change, even from heatwaves and other extreme weather events, is currently low.191 Innovative media strategies are needed to enhance awareness of such risks and improve public adaptive skills and eff ectiveness.192 health professionals, being knowledgeable and trusted, are in a strong position to communicate the risks posed by climate change and the benefi ts of adaptation.102
Monitoring indicators for adaptation to indirect impactsSeveral indicators can serve as proxies for investments in adaptation and resilience to the indirect health eff ects of climate change.
National adaptation programmes of actionNational adaptation programmes of action (NAPAs) are designed for low-resource countries to communicate their most urgent adaptation needs to the UNFCCC for funding.193 Health projects are more often included in the NAPAs and they typically address current disease (eg, malaria) control issues.168 To this end, there is a need to provide ongoing assessment of the number of countries that integrate health aspects in their NAPA, as well as the extent to which health is integrated. This indicator should assess adaptation for both direct and indirect health impacts.
Early warning systemsThis indicator should include the number of countries that have upgraded early warning systems for extreme weather events, climate-change-sensitive diseases, food
63

The Lancet Commissions
1880 www.thelancet.com Vol 386 November 7, 2015
security, and migration movements. Early warning systems have proved to be a critical and co-benefi cial investment and, if matched with response capacities, could help societies adapt more promptly to changing circumstances that aff ect human health.
Ecosystem-based adaptationInvestments in ecosystem based adaptation for both direct (eg, fl ood risk) and indirect (eg, food security, disease mitigation) health impacts could create multiple co-benefi ts and provide no-regret options for several of the indirect eff ects discussed above.
ConclusionThis section has outlined interventions available to enhance community resilience and adapt to the health eff ects of climate change. Many of these are no-regret options that could provide co-benefi ts across several dimensions including food security, disease prevention, and sustainability in general. Adaptation will provide both short-term and long-term benefi ts beyond human health. Eff ective adaptation requires institutional collaboration across levels, integrated approaches, appropriate long term funding, and institutions fl exible enough to cope with changing circumstances and
surprise. Urgent mitigation eff orts must accompany the recommendations provided in section 2, a subject covered in section 3 of this Commission.
Section 3: transition to a low-carbon energy infrastructureIt is technically feasible to transition to a low-carbon infrastructure with new technologies, the use of alternate materials, changing patterns of demand, and by creating additional sinks for GHGs. This requires challenging the deeply entrenched use of fossil fuels. Any signifi cant deployment to meet demanding CO2 targets will require the reduction of costs of mitigation options, carbon pricing, improvement in the research and development process and the implementation of policies and regulations to act as enabling mechanisms, as well as recognition of the strong near-term and long-term co-benefi ts to health.
The technologies for reducing GHG emissions related to energy and many energy-related end-uses have been in existence for at least 40 years (table 2), and several key technologies have their roots deep in the 19th century. The technologies are available now. We have a reasonable grasp of their performance, economics and side-eff ects (unintended impacts). They treat the causes of the problem (fossil fuel GHG emissions) rather than the symptoms (climate change). Other technologies, such as those described under geo-engineering have a high degree of uncertainty as to their eff ectiveness and also their side eff ects. We view these technologies as being highly risky but also (at this time) unnecessary, as we have the tools needed to achieve emission targets to avoid catastrophic climate change. Geo-engineering is analogous to using unlicensed drugs to treat Ebola when public health and hygiene could have prevented the problem in the fi rst place. It is also important to recognise that for an energy source to be renewable, it must satisfy a low-carbon requirement, and consider the use of scarce resources such as copper, silicon, and rare earth metals.
Public health has much to gain from the mitigation of short lived climate pollutants (SLCPs) such as methane, black carbon, hydrofl uorocarbons, and tropospheric ozone. The benefi ts for health, climate change, and crop yields are covered in great detail in a report by WHO and the Climate and Clean Air Coalition.200
Main sources of GHG emissionsIn 2010, annual global GHG emissions were estimated at 49 GtCO2e.201 The majority (about 70%) of all GHG emissions can be linked back to the burning of fossil fuel for the production of energy services, goods or energy extraction (fi gure 8).202 Global emissions from heat and electricity production and transport have tripled and doubled respectively since 1970, whereas the contribution from agriculture and land-use change has slightly reduced from 1990 levels.203
When upstream and electricity sector emissions are allocated on an end-use basis, most emissions (about 61%)
Potential mitigation eff ects
Energy effi ciency
Supply-side effi ciency Save 14% of primary energy supply (121 EJ by 2050)194
End-user effi ciency 1·5 Gt of CO2-equivalent in 2020195
Carbon sequestration
Land carbon sequestration
Aff orestation and reforestation 183 Gt of carbon by 2060196
Biochar 0·55 Gt of carbon per year196
Upstream oil and gas industry methane recovery 570 Mt of CO2-equivalent in 2020195
Ocean carbon-sink enhancement
Increase ocean alkalinity 0·27 Gt of carbon per year after 100 years196
Iron fertilisation 3·5 Gt of carbon per year for fi rst 100 years196
Carbon capture and storage
Carbon capture during energy generation Can reduce lifecycle CO2 emission from fossil-fuel combustion at stationary sources by 65–85%195
Direct air capture 3·6 Gt CO2 per year with 10 million units197
Carbon intensity reduction
Renewable energy*
Geothermal 0·2–5·6 Gt of CO2 per year by 2050198
Bioenergy 2·0–5·3 Gt of CO2 per year by 2050198
Ocean energy (thermal, wave, tidal) 0·0–1·4 Gt of CO2 per year by 2050198
Solar energy 0·4–15·0 Gt of CO2 per year by 2050198
Hydropower 0·6–4·5 Gt of CO2 per year by 2050198
Wind energy 1·2–9·8 Gt of CO2 per year by 2050198
Nuclear energy 1·5–3·0 Gt of CO2 per year with current capacity199
*We obtained the values of CO2 emission mitigation for renewable energy from fi gure 10. 20 of the Intergovernmental Panel on Climate Change (IPCC) special report on renewable sources and climate change mitigation.198 The ranges represented the minimum and maximum values from four future energy scenarios.
Table 2: List of high-impact technologies for climate mitigation
64
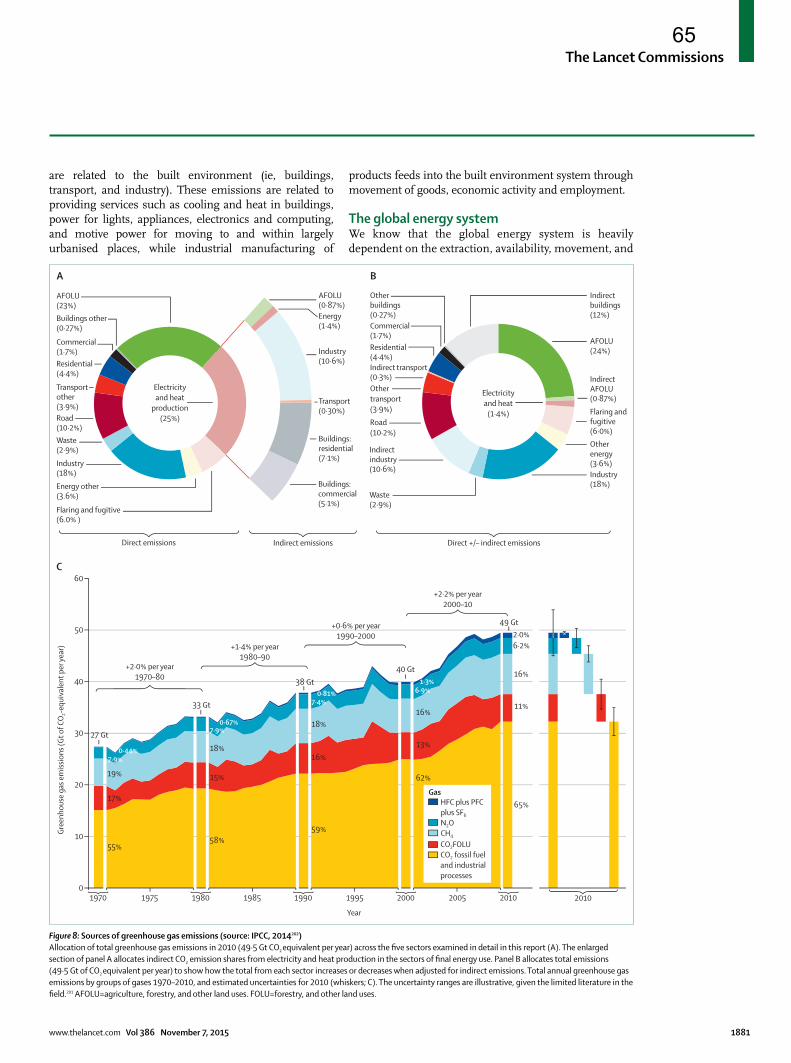
The Lancet Commissions
www.thelancet.com Vol 386 November 7, 2015 1881
are related to the built environment (ie, buildings, transport, and industry). These emissions are related to providing services such as cooling and heat in buildings, power for lights, appliances, electronics and computing, and motive power for moving to and within largely urbanised places, while industrial manufacturing of
products feeds into the built environment system through movement of goods, economic activity and employment.
The global energy systemWe know that the global energy system is heavily dependent on the extraction, availability, movement, and
Indirectbuildings(12%)
Otherbuildings(0·27%)Commercial(1·7%)Residential(4·4%)Indirect transport(0·3%)Othertransport(3·9%)Road(10·2%)
Indirectindustry(10·6%)
Waste(2·9%)
Industry(18%)
Otherenergy(3·6%)
Flaring andfugitive(6·0%)
IndirectAFOLU(0·87%)
AFOLU(24%)
Direct +/– indirect emissions
27 Gt
33 Gt
55%
17%
19%
7·9%0·44%
58%
15%
18%
7·9%0·67%
62%
13%
16%
6·9%1·3%38 Gt
40 Gt
59%
16%
18%
7·4%0·81%
49 Gt
65%
11%
16%
6·2%2·0%
Indirect emissionsDirect emissions
Buildings other(0·27%)
Commercial(1·7%)Residential(4·4%)
Transportother(3·9%)Road(10·2%)Waste(2·9%)
Industry(18%)Energy other(3.6%)
Flaring and fugitive(6.0% )
Electricityand heat
production(25%)
Electricityand heat
(1·4%)
AFOLU(23%)
Buildings:commercial(5·1%)
Buildings:residential(7·1%)
Transport(0·30%)
Industry(10·6%)
Energy(1·4%)
AFOLU(0·87%)
A
C
B
0
10Gree
nhou
se g
as e
miss
ions
(Gt o
f CO
2-eq
uiva
lent
per
year
)
20
30
40
+2·0% per year1970–80
+1·4% per year1980–90
+0·6% per year1990–2000
+2·2% per year2000–10
50
60
1970 1975 1980 1985 1990 1995 2000 2005 2010 2010
Gas
CO2FOLUCO2 fossil fueland industrial processes
HFC plus PFC plus SF6
N2OCH4
Year
Figure 8: Sources of greenhouse gas emissions (source: IPCC, 2014202)Allocation of total greenhouse gas emissions in 2010 (49·5 Gt CO2 equivalent per year) across the fi ve sectors examined in detail in this report (A). The enlarged section of panel A allocates indirect CO2 emission shares from electricity and heat production in the sectors of fi nal energy use. Panel B allocates total emissions (49·5 Gt of CO2 equivalent per year) to show how the total from each sector increases or decreases when adjusted for indirect emissions. Total annual greenhouse gas emissions by groups of gases 1970–2010, and estimated uncertainties for 2010 (whiskers; C). The uncertainty ranges are illustrative, given the limited literature in the fi eld.201 AFOLU=agriculture, forestry, and other land uses. FOLU=forestry, and other land uses.
65

The Lancet Commissions
1882 www.thelancet.com Vol 386 November 7, 2015
consumption of fossil fuels, and this system shows vulnerabilities when stressed. For example, the 1972 Organization of the Petroleum Exporting Countries (OPEC) oil embargo (which resulted in a cut of global production by 6·5% over 2 months) or the fi rst Persian Gulf War (which caused a doubling of global oil prices over 3–4 months) each caused major pressure on the access and security of global energy supplies.204 Furthermore, many of the world’s largest actual and potential conventional oil reserves are in areas of historic volatility and civil unrest.205
Climate change poses a risk to the existing energy system. Under a changing climate, these vulnerabilities could result in disruption in both supply and production of power under extreme weather events, operations (eg, water availability for cooling towers), viability of infrastructure (eg, location of power lines or hydroelectric systems), impact on transmission (eg, high temperatures or wind damage), and higher demand for cooling and building system performance.206,207
The usefulness of fossil fuels relates to their power and energy density, portability, and relative cost compared with other forms of energy. These attributes have acted as challenges to the transition to low-carbon energy sources and vectors, such as renewable and nuclear electricity and hydrogen. Maintaining power supply based on intermittent electricity sources such as wind power is a complex system integration problem.208 Practical solutions will involve combinations of energy stores (hydroelectric, thermochemical), demand-side management, and the harnessing of geographical diversity with respect to demand and supply. Cross-continental power grids can play a signifi cant part in reducing low-carbon systems costs because greater diversity of demand and supply reduces the need for expensive energy storage.
The growth in energy demandGlobal energy demand has grown by 27% from 2001–10, largely concentrated in Asia (79%), the Middle East and Africa (32%), and Latin America (32%), but with near stable but high demand (on a territorial accounting basis) in the 1990 Organisation for Economic cooperation and Development (OECD) group of countries.203 China doubled its energy demand during this period and represented the single largest proportion of the global increase (44%).209 Most global growth in energy was in coal (44%) for use in electricity production, a dangerous reality for human health.210
Economic productivity has risen alongside global energy demand. Whilst fossil fuel-based energy demand has grown slowly in OECD countries since 1970, gains were made in GDP terms that were largely a result of de-industrialisation of the economy (largely exported to Asia). As a result, Asia has made a signifi cant leap in energy consumption, emissions and GDP. The energy intensity of large global economies (ie, the USA, China, EU, India) have fallen progressively over the period of industrialisation.211 Figure 9 shows that economic gains need not be strongly coupled to CO2 emissions, though the association is partly obscured by the export of CO2 emissions. Moving energy-intensive industries off shore (most of which remain fossil-fuel powered) allows for territorial emissions to fall, but at the cost of increased emissions elsewhere.
Growth in demand for energy will probably continue over the coming 25 years, particularly in lower-middle and low-income economic regions, where most citizens lack access to safe and aff ordable energy. The growth in global per capita energy demand is linked to improvements in the standard of living in developing regions and directly supports development goals. Expected energy demand in non-OECD countries may double by 2035 (107%) from 2010, while OECD countries may increase by 14% over the same period.209 However, this growth in demand will continue to directly benefi t high-income regions through exported production of goods.
Meeting our future energy needsAccess to energy is a key enabler of economic development and social wellbeing. In recognition of energy being a key determinant of economic and social development, and of health and wellbeing, the UN has declared that 2014–24 is the UN Decade of Sustainable Energy for All. The world’s population must be able to access clean forms of energy that can provide these basic needs, which can minimise the health burden from both direct exposure and indirect from future climate change risks. The Sustainable Development Goals (SDGs) have emphasised the role that energy plays in securing a sustainable future for a global 9 billion population by 2050, and has outlined four targets to support, which could act as progress metrics. The indicators measuring
Figure 9: Per head CO2 emission trends in relation to income for a selection of countries (1990–2008)212,213
*Based on purchasing power parity.
0 5000 10 000 15 000 20 000 25 000 30 000 35 000 40 000 45 000 50 0000
5
10
15
20
25
CO2 e
miss
ions
(ton
nes p
er h
ead)
GDP per head (US$ billion, 2005)
USA
Australia
Canada
Germany
UK
France
Japan
South Korea
Poland
Brazil
China
India
66
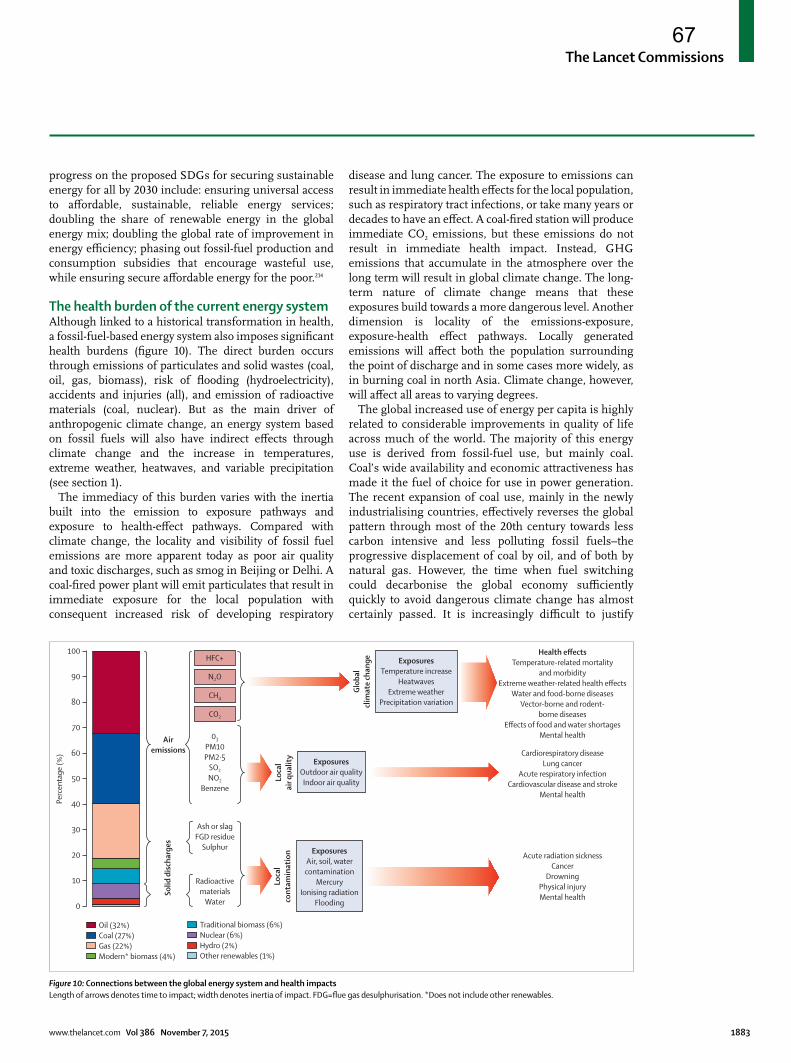
The Lancet Commissions
www.thelancet.com Vol 386 November 7, 2015 1883
progress on the proposed SDGs for securing sustainable energy for all by 2030 include: ensuring universal access to aff ordable, sustainable, reliable energy services; doubling the share of renewable energy in the global energy mix; doubling the global rate of improvement in energy effi ciency; phasing out fossil-fuel production and consumption subsidies that encourage wasteful use, while ensuring secure aff ordable energy for the poor.214
The health burden of the current energy systemAlthough linked to a historical transformation in health, a fossil-fuel-based energy system also imposes signifi cant health burdens (fi gure 10). The direct burden occurs through emissions of particulates and solid wastes (coal, oil, gas, biomass), risk of fl ooding (hydroelectricity), accidents and injuries (all), and emission of radioactive materials (coal, nuclear). But as the main driver of anthropogenic climate change, an energy system based on fossil fuels will also have indirect eff ects through climate change and the increase in temperatures, extreme weather, heatwaves, and variable precipitation (see section 1).
The immediacy of this burden varies with the inertia built into the emission to exposure pathways and exposure to health-eff ect pathways. Compared with climate change, the locality and visibility of fossil fuel emissions are more apparent today as poor air quality and toxic discharges, such as smog in Beijing or Delhi. A coal-fi red power plant will emit particulates that result in immediate exposure for the local population with consequent increased risk of developing respiratory
disease and lung cancer. The exposure to emissions can result in immediate health eff ects for the local population, such as respiratory tract infections, or take many years or decades to have an eff ect. A coal-fi red station will produce immediate CO2 emissions, but these emissions do not result in immediate health impact. Instead, GHG emissions that accumulate in the atmosphere over the long term will result in global climate change. The long-term nature of climate change means that these exposures build towards a more dangerous level. Another dimension is locality of the emissions-exposure, exposure-health eff ect pathways. Locally generated emissions will aff ect both the population surrounding the point of discharge and in some cases more widely, as in burning coal in north Asia. Climate change, however, will aff ect all areas to varying degrees.
The global increased use of energy per capita is highly related to considerable improvements in quality of life across much of the world. The majority of this energy use is derived from fossil-fuel use, but mainly coal. Coal’s wide availability and economic attractiveness has made it the fuel of choice for use in power generation. The recent expansion of coal use, mainly in the newly industrialising countries, eff ectively reverses the global pattern through most of the 20th century towards less carbon intensive and less polluting fossil fuels–the progressive displacement of coal by oil, and of both by natural gas. However, the time when fuel switching could decarbonise the global economy suffi ciently quickly to avoid dangerous climate change has almost certainly passed. It is increasingly diffi cult to justify
Traditional biomass (6%)Nuclear (6%)Hydro (2%)Other renewables (1%)
Oil (32%)Coal (27%)Gas (22%)Modern* biomass (4%)
0
10
20
30
40
Solid
dis
char
ges
Airemissions
Loca
lai
r qua
lity
Ash or slagFGD residue
Sulphur
Radioactivematerials
Water
50
60
70
80
90
100
Perc
enta
ge (%
)
HFC+
N2O
CH4
CO2
03
PM10PM2·5
SO2
NO2
Benzene
ExposuresOutdoor air qualityIndoor air quality
ExposuresTemperature increase
HeatwavesExtreme weather
Precipitation variation
Health effectsTemperature-related mortality
and morbidityExtreme weather-related health effects
Water and food-borne diseasesVector-borne and rodent-
borne diseasesEffects of food and water shortages
Mental health
Cardiorespiratory diseaseLung cancer
Acute respiratory infectionCardiovascular disease and stroke
Mental health
Acute radiation sicknessCancer
DrowningPhysical injuryMental health
Loca
lco
ntam
inat
ion
Glob
alcl
imat
e ch
ange
ExposuresAir, soil, watercontamination
MercuryIonising radiation
Flooding
Figure 10: Connections between the global energy system and health impactsLength of arrows denotes time to impact; width denotes inertia of impact. FDG=fl ue gas desulphurisation. *Does not include other renewables.
67

The Lancet Commissions
1884 www.thelancet.com Vol 386 November 7, 2015
large-scale investment in unabated gas-fi red infrastructure. The dangerous impacts of coal on health from exposure to air pollution in the form of noxious particulates and heavy metals, the environmental degradation (eg, contaminating water courses and habitat loss) from the extraction and processing of coal, and the major contribution that burning coal and the release of GHGs has in changing the long-term climate almost certainly undermines the use of coal as a long-term fuel. Although the use of coal as a fuel source for power generation will be linked to economic growth and (sometimes precarious) improvements in quality of life, the risk that coal has on our global health through climate change and habitat loss means that moving to low-emission fuels in areas of high coal demand is a major part of the global low-carbon energy transition. Whilst the use of technologies such as carbon capture and storage (CCS) are consistently cited in reducing the impact of coal-based power generation, at present, these technologies have many major unknowns and are without substantial government investment or the use of carbon pricing.
One important strategy to protect against the health burdens of local and national energy choices, is to ensure that health impact assessments are built in to the planning, costing, and approval phases of a new project. By developing the tools and capacity to enforce this, policy makers can better understand the broader consequences of their decisions.
Actions, technologies, and health outcomesActions that seek to mitigate climate change have the potential to be benefi cial to health, both directly and indirectly.1,29 Across a number of sectors, the potential health benefi ts of switching to low-carbon technologies include a reduction in carbon emissions from power generation,215,216 improved indoor air quality through clean household cooking technologies in low-income settings and housing thermal effi ciency in high-income settings, and lowered particulate-matter exposure from low-emission transport.217,218
Decarbonising the power supply sector holds both risks and benefi ts for health. The direct benefi ts centre on reducing exposure to air pollutants from fossil-fuel burning.216 In the UK, the associated burden of air pollution from the power sector is estimated to account for 3800 respiratory related deaths per year.216 In China, air pollution is thought to result in 7·4 times more premature deaths from PM2.5 than in the EU.215 It has been estimated that current ambient concentrations of particulate matter led to the loss of about 40 months from the average life expectancy in China, but that this loss could be cut by half by 2050 if climate mitigation strategies were implemented. The risks to health from decarbonisation are more likely to be indirect; if the deployment and adoption of technologies that aim to reduce carbon emissions, reduce energy demand, or
switch fuels are not undertaken with care, there are risks of unintended consequences through, for example, poor housing ventilation.219 Besides air quality, several links between climate mitigation practices and technologies and potential health benefi ts have been established (fi gure 11).220,221 Using active transport as an example, the shift from car driving to walking and cycling not only reduces the air pollutant emissions, but also increases levels of exercise, which in turn can lead to reduced risks of several health outcomes, including cardiovascular diseases, diabetes, and some cancers.218
The formal health sector itself also has a role to play in reducing its emissions. Hospitals and health systems, particularly in more industrialised settings, account for around 10% of GDP and have a signifi cant carbon footprint. While the full extent of health care’s climate impacts is not known, emerging data confi rms its signifi cance and the need for mitigation strategies. For instance, the NHS in England calculated its carbon footprint at more than 18 million tonnes of CO2 each year—25% of total public sector emissions.222 72% of the NHS’s carbon footprint is related to procurement and the remaining split between travel and energy use in buildings.223 In the USA, the health-care sector is responsible for 8% of the country’s total GHG emissions.224 With among the largest sectoral purchasing power globally, the health sector could reduce its impact through the products it purchases and through investment in its infrastructure (ie, hospitals, ambulatory services, and clinics).
By moving toward low-carbon health systems, health care can mitigate its own climate impact, become more resilient to the impacts of climate change, save money, and lead by example. For instance, in South Korea, Yonsei University Health System is targeting reducing GHG emissions by 30% by 2020. Energy effi ciency measures saved the system $1·7 million and reduced GHG emissions by 5316 tonnes of CO2 in 2011 alone.225 In the USA, Gunderson Health has increased effi ciency by 40%, saving $2 million annually, while deploying solar, wind, geothermal, and biomass to signifi cantly reduce its carbon footprint and end its dependence on fossil fuels.226 In England, the NHS Public Health and Social Care System has similarly committed to reducing their carbon footprint by at least 34% by 2020.227
Conversely, accounting for the health co-benefi ts of climate change mitigation, can help to bring down the overall cost of greenhouse gas mitigation. Jensen and colleagues have shown that the incorporation of health co-benefi ts of cleaner vehicles and active travel can make those mitigation practices cost eff ective.228 The health benefi ts of reducing methane emission in industrialised nations could exceed costs even under the least aggressive mitigation scenario between 2005 and 2030.229 For example, in the UK, retrofi ts aimed at improving energy performance of English dwellings have the potential to
68

The Lancet Commissions
www.thelancet.com Vol 386 November 7, 2015 1885
off er substantial health benefi t over the long-term, providing ventilation to control indoor pollutants is installed (see appendix 2).
Pathways to (GHG emissions reduction) pathwaysOver the last two centuries, the prevailing pattern of national development has involved dramatic increases in productive capacity, supporting transformations in nutrition and housing, underpinned by development of fossil-fi red energy supply, conversion, and distribution systems. Three overlapping stages of development can be identifi ed:
• Stage 1: typically low technology, relatively ineffi cient and with little regard for damage due to pollution and other externalities.
• Stage 2: locally clean. As countries become wealthier, they can aff ord to invest in the longer term and deal with the local health problems associated with burning fossil fuels.
• Stage 3: regionally and globally clean. This involves the development of energy systems that address transboundary pollution problems including that of anthropogenic climate change. Stage 3 is generally associated with high GDP and indices of public health.
Figure 11: Frequently cited co-benefi ts of major mitigation techniquesRed arrows between a mitigation technology and an eff ect indicate that the technology will increase the eff ect; green arrows indicate an opposite trend.
See Online for appendix 2
69

The Lancet Commissions
1886 www.thelancet.com Vol 386 November 7, 2015
Importantly, improvements in technology and effi ciency have historically accompanied and assisted, but have not been primarily driven by the goal of pollution control. The patterns of development associated with stages 1 and 2 are complex and multi-dimensional, and stage 3 is unlikely to be diff erent. Stages 1 and 2 have historically been associated with increasing income and health.
This pattern of development has resulted in emission of about 1600 GtCO2 since 1870, with a consequent rise in global mean temperature anomaly of +0·85°C (1870–2010). To have a better than 66% probability of keeping the rise in global temperatures to below 2°C, cumulative greenhouse gas emissions from 2011 on would need to be limited to around 630–1180 GtCO2,eq.201,230,231 At the current global emission rate, this budget would be used up in between 13 and 24 years.
The last 30 years of OECD data have shown that signifi cant changes to global energy systems are possible. Indeed, the whole of the 20th century has been characterised by a succession of transitions in energy technologies. However, this process has not been inevitable and decisions on energy systems have been aligned with other national objectives—eg, enhanced
security of supply or reduced air pollution. This suggests that the transition to low-carbon energy will need to be predicated on achieving multiple objectives, including climate change, health, equity, and economic prosperity.
Many trajectories that are consistent with such a budget (panel 6 shows those of the UK and China) are in principle possible. Such trajectories necessarily involve emissions in the second half of the century in the region of 90% lower than emissions between 2011–50.232 All would require an unprecedented global commitment to change, and none appears easy. To stabilise CO2
−
equivalent concentrations in the range 450–650 ppm (consistent with 2–4°C of warming) will require the global emission rate to fall by between 3–6% per year, a rate that so far has only been associated with major social upheaval and economic crisis.25 Postponing deep cuts in emissions may allow for new policies and technologies, but at the cost of signifi cant impacts (eg, for land use and food production) in the second half of the century.
Achieving a 2°C warming targetMany technologies exist or have been proposed to mitigate climate change. But they vary in their potential
Panel 6: Decarbonisation pathways for the UK and China230
The Deep Decarbonisation Pathways Project (DDPP) aims to understand and show how major emitting countries can transition to low-carbon economies and, in doing so, move towards the internationally agreed 2°C target by 2050. The project comprises representatives of 15 countries contributing to more than 70% of current global greenhouse gas emissions, and is led by the UN Sustainable Development Solutions Network (SDSN), and the Institute for Sustainable Development and International Relations (IDDRI), Paris.227
The project’s interim report describes pathways that achieve a 45% decrease of total CO2-energy emissions over the period (falling to 12·3 Gt by 2050, from 22·3 Gt in 2010). Although the interim pathways do not reach a 50% probability of restricting climate change to 2°C, they provide important insights. Three key pillars of decarbonisation are crucial in all the countries studied: energy effi ciency and conservation, a shift to low-carbon electricity, and a switch to lower carbon fuels. However, the balance between these pillars depends on national circumstances.
The UK pathway is characterised by early decarbonisation of the power generation sector, and increased electrifi cation of end-use sectors from 2030, leading to an 83% reduction in CO2-energy emissions by 2050 (see fi gures 12A and B). The cumulative investment requirements for such a large-scale decarbonisation are in the region of £200–300 billion, and require a strong policy framework, including electricity market reform. After 2030, radical changes in energy vectors are necessary, with heating switching from gas to heat pumps and district heating, and transport increasingly electrifi ed. Greater-than-marginal reductions in emissions (eg, associated with heating) require
sustained strategic vision and interdecadal coordination between energy supply and demand sectors of the economy. Challenges to delivery will probably include the scale of infrastructure investment, and public acceptability across end-use sectors.
The challenge in China is to achieve decarbonisation alongside continued rapid economic growth. The pathway shows GDP per head increasing by six times from 2010 to 2050; this increase is off set by a 72% reduction in energy intensity of GDP—a substantial decoupling. Emissions peak by 2030, and fall by 34% by 2050, driven by falling energy intensity and almost complete decarbonisation of power generation. Despite electricity generation more than doubling by 2050, unabated coal is replaced by renewables, nuclear, and carbon capture and storage (fi gures 13A and B). In industry, carbon capture and storage and higher effi ciency could reduce emissions by 57% by 2050. But growth will continue in the transport sector due to an increase of ten times in mobility, only partly off set by higher effi ciency and little penetration of low-carbon vehicles.
Key to the transition of the Chinese energy system is rapid development and deployment of low-carbon technologies, and a shift away from unabated coal use, facilitated by energy market reform and carbon pricing.
The project shows the crucial need for large-scale global technology research, development, demonstration, and deployment, and transfer eff orts. A common feature of most pathways is the need to decarbonise freight transport and industry. The fi nal DDPP report will review investment levels and policy frameworks to enable the transition.
70

The Lancet Commissions
www.thelancet.com Vol 386 November 7, 2015 1887
mitigation impacts, stages of development, costs, and potential risks. Table 2 summarises mitigation technologies. Among them are climate engineering approaches such as land and sea sequestration. Although these have signifi cant potential, they carry signifi cant risks, including the possibility of damage to ecosystems. It is currently uncertain that the necessary international consensus to allow the deployment of such technologies could be achieved. Energy effi ciency improvement is considered as the least risky of the options, although on its own it is insuffi cient to achieve the necessary decarbonisation.233
Individual behaviour is an important factor that aff ects the end-user energy effi ciency—eg, using high-effi ciency heating and cooling systems, adopting more effi cient driving practices, routine maintenance of vehicles and building systems, managing temperatures for heating, and hot water for washing.234,235 But behavioural changes are not so easily achieved and pose considerable risk as a mitigation strategy. The medical professions have decades of experience with attempts to induce mass changes of behaviour through health promotion. The most prominent campaigns have been targeted at alcohol consumption, smoking, diabetes, and obesity. The overarching lesson is that even when behaviour change yields direct personal benefi ts, amounting in some cases to a decade or more of life expectancy, it is extraordinarily
diffi cult to achieve through persuasion. In practice, diff erent societies favour divergent approaches to infl uencing behaviour, ranging from the economic, through the physical to the psychological.236
Technologies that have the greatest decarbonisation potential include nuclear power, off shore wind, concentrated solar power (CSP), and CCS.237,238 Solar photovoltaic (PV) and wind systems have been growing exponentially for decades (wind about 12% per year, PV about 35%), with consequent reductions in costs due to learning and increasing scale of production and deployment, while both CSP and CCS have not yet been deployed at any signifi cant scale and so cannot capture signifi cant learning eff ects. CCS suff ers from similar problems to nuclear—ie, large unit sizes, potential regulatory concerns, and long lead times, which means weak and delayed learning once deployment has begun. But CCS’s additional disadvantage compared with nuclear and renewables is that while the latter decouple economies from the threat of future rising and volatile fossil fuel costs, CCS magnifi es these threats. Even in the absence of carbon pricing, renewables and nuclear can be justifi ed as a hedge against future increases in fossil fuel prices, whereas CCS cannot.
Attempts to understand the adaptation of the whole energy system in the context of rapid transitions to low- carbon emissions have been predominantly from the
2010 20500
50
100
150
200
250
300
224524–6
350
400
450
500 489
–83%28
105
128
70
15885
CO2 e
miss
ions
(MT)
Year
2010 2020 2030 2040 20500
100
200
300
400
600
500
Elec
trici
ty g
erer
atio
n (T
Wh)
Year
OtherBuildingsTransportationIndustryElectricity generation
A B
Other renewablesBiomass with CCSSolarWindHydroNuclear
Natural gas with CCSNatural gasCoal
0
200
300
500503
–10
Carbon intensity(g of CO
2 per kWh)
Figure 12: Energy-related CO2 emissions pathway for the UK in 2010 and 2050 (A), and energy supply pathway for electricity generation for the UK, 2010–50 (B)230
CCS=carbon capture and storage.
71

The Lancet Commissions
1888 www.thelancet.com Vol 386 November 7, 2015
discipline of economics. Among these is the Deep Decarbonization Pathways Project (DDPP), which has developed pathways for 15 countries.230 Panel 6 provides an example of these technology pathways for the UK and China. Transforming the global economy in anything like the timescale implied by the above discussion requires unprecedented action in both industrialised and developing countries. The former will need to embark more-or-less immediately on CO2 reduction programmes with a high level of ambition. Developing countries will need to move directly from stage 1 to stage 3 (signifi cantly reduced emissions with associated high GDP and indices of public health) probably with both capital and technical support from developed countries. Delayed emission reduction would lower the possibility to control climate change, raise costs and force the uptake of riskier and unproven mitigation technologies with increased risk of unintended consequences for human wellbeing and ecosystems.239
The range of unintended consequences when the technologies are administered to diff erent systems is large, complicated, and in some areas poorly understood. Ultimately, rapid mass deployment of low-carbon technologies requires a better understanding of the drivers and barriers to delivery within diff erent economic sectors, the scale and opportunity of deployment, and the setting and its context including
the actors and decision makers involved. The application of low-carbon technologies, their impact, deployment, and co-benefi ts must be maximised by understanding what works, where it works, and why it works. This understanding is particularly important to support emerging technologies that are yet to reach market-scale deployment. Three key drivers are required to support pathways to a low-carbon future: maximising the effi cacy of low and zero carbon technologies, maximising the deployment of these technologies, and maximising and internalising the potential health co-benefi ts of decarbonisation.
Maximising effi cacyAlthough signifi cant progress has been made in adopting clean technologies, the resulting impact on energy intensities and carbon emissions has been lower than expected. Barriers to adoption and deployment of mitigation technology include a lack of awareness and access to technical knowledge, segmentation and fragmentation within and amongst sectors, and fi nancial disincentives. These barriers will be particularly acute in developing countries where the benefi ts of energy effi ciency are not necessarily recognised and may be a lower priority compared to many other urgent issues, such as poverty eradication, public health improvement, and crime reduction; this may be further aff ected by a lack of means of
Figure 13: Energy-related CO2 emissions pathway for China in 2010 and 2050 (A), and energy supply pathway for electricity generation for China, 2010–50 (B)230 CCS=carbon capture and storage.
2010 20500
1000
2000
3000
4000
5000
6000
66752
1601
2018
329
7000
80007247
–34%
54633634
2999
2927
4766
CO2 e
miss
ions
(MT)
Year
2010 2020 2030 2040 20500
5000
2500
7500
12 500
10 000
Elec
trici
ty g
ener
atio
n (T
Wh)
Year
OtherBuildingsTransportationIndustryElectricity generation
A B
Other renewablesBiomass with CCSSolarWindHydroNuclear
Natural gas with CCSNatural gasCoal with CCSCoal
0
200
400
600
800743
32
Carbon intensity(g of CO
2 per kWh)
72

The Lancet Commissions
www.thelancet.com Vol 386 November 7, 2015 1889
communication. Furthermore, due to a lack of quantitative and reliable measurements of energy performance, many stakeholders are not aware of energy savings potential. We propose three actions to improve effi cacy:1 Understanding the direct and indirect impacts of
technologies from an integrated technical, economic, social, health and cultural, and political perspective;
2 Gathering, evaluating, and reporting real-world evidence to support and guide development and implementation of mitigation strategy;
3 Put in place policies and regulations (such as reporting schemes, inspections, and benchmarks) to make performance visible within the market.
Maximising uptakeMinimum deployment of low-carbon technologies poses a signifi cant risk to the transition to a low-carbon future. The International Energy Agency (IEA) has stated that nine out of ten low-carbon technologies that are essential for energy effi ciency and decarbonisation are failing to meet their deployment objectives. Limited deployment, particularly early in the process, limits learning and constrains subsequent progress.
Inertia in the technology diff usion process within many sectors means that many off -the-shelf technologies today could take 20 years to achieve signifi cant market penetration without incentives to support their uptake. Overcoming such inertia requires clear guidance on technology potential; robust data on technology performance, impact, and costs; detailed information on existing sectors and historic structures; removal of disincentives and perverse incentives; and strong regulations. For certain technologies, regulation can play a major part in accelerating deployment. Criteria for regulations to be eff ective in this role may be summarised as follows: that the goal of regulation should be unambiguous; that the technical nature of measures which will achieve the goal should be clear, and they should be easy to apply; that the technical nature of these measures should make it easy for the regulator to confi rm that they have been implemented; that the total benefi ts should outweigh costs; and that both benefi ts and costs should be a small part of some larger economic transaction.240 Cities off er opportunities and challenges for technology deployment. For appropriate technologies, economies of scale are quickly achieved with population and economic densities supported by larger tax bases, deployment through existing services and a history of operating large scale infrastructure. Density intensifi es local environmental problems (particulates, noise, etc), which can in turn make it politically possible to introduce local regulation favouring low-carbon technologies. Resulting niches and learning can then accelerate the development and wider deployment of key mitigation technologies.241
Development status is another important driver of deployment. The bulk of technology transfer occurs
between developed countries who dominate the invention of technologies for climate mitigation.242 This does nothing to overcome the low availability of mitigation technologies in developing countries. Major barriers to technology transfer from developed to developing countries include insuffi cient local human capital and technology support capabilities, lack of capital, trade and policy barriers, lax intellectual property regimes in developing countries, and the potential lack of commercial viability of the technology itself.243 These barriers need to be overcome to enable countries seeking to achieve a high quality of life to tunnel from stage 1 to stage 3.
Mechanisms to support low-carbon technology uptake should include:• Enacting policy regulations to improve deployment of
technologies (such as incremental minimum performance standards or delivery obligations)
• Developing strong national-level commitments and sources of funds for investment in low-carbon infrastructure that is accessible to local delivery agents.
• Targeting decision makers who can achieve maximum on-the-ground change and uptake of technologies and changes in practices (ie, sector heads, mayors, and councils).
Maximising co-benefi ts and avoiding unintended consequencesMany low-carbon technologies provide benefi ts other than reducing greenhouse gas emissions—eg, increased energy security, improved asset values, improved air quality, greater disposable income, and improved health and comfort. Some low-carbon technologies are primarily deployed because of their co-benefi ts.
Low-carbon technologies inappropriately deployed can hurt the economic and social development of developing countries. The increased use of expensive low-carbon energy sources could delay essential structural changes and slow down the construction of much needed infrastructure. Higher energy prices can aff ect economic growth and exacerbate poverty and inequality. However, abstaining from mitigation technologies in developing countries carries the risk of lock-in into a high-carbon-intensity economy.244 In order to avoid such unintended consequences, a balanced strategy focusing on both human development and climate mitigation in developing countries is needed.
Mechanisms to maximise co-benefi ts should include:• Developing compelling arguments for action that
emphasise co-benefi ts (ie, health, quality of life, air quality, a creative and resilient economy).
• Putting in place national and international level mechanisms to support and encourage technology adoption (ie, carbon pricing).
• Putting in place policies and economic tools that can facilitate the technology transfer from developed countries to developing countries (ie, the importance of the Green Climate Fund).
73

The Lancet Commissions
1890 www.thelancet.com Vol 386 November 7, 2015
ConclusionsEnergy systems comprise some of the largest, most complex and enduring capital structures in modern economies. Decarbonisation and reducing energy demand is not a simple challenge of cleaning up pollutants or installing new equipment, it requires systemic transformations of energy infrastructures and associated systems. We need to put in place mechanisms that support the uptake of technologies in an eff ective manner (ie, support pathways to impact pathways or pathways to pathways). Finally, it should be noted that the full potential of mitigation technologies will only be achieved if the social and political systems around these technologies co-evolve to deliver carbon targets.
There is a clear and compelling need for the industrialised world to achieve faster and much deeper emission reductions than anything delivered to date. At the same time, industrialisation historically has been accompanied by rising greenhouse gas emissions (particularly CO2) up to income levels of $10–15 000 per capita. Some of the major emerging economies are
already reaching such levels, with concomitant emissions; helping others to avoid doing so, or helping those (like India) still with huge challenges to lift hundreds of millions of people out of extreme poverty, will require international assistance.
Through a multipronged approach that advocates co-benefi ts, targets decision makers and puts in eff ective measures that are understood, it might be possible to make real progress towards meeting our emission reduction goals. These mechanisms represent a public health-style approach to developing and implementing mitigation strategies, with the end goal of many co-benefi ts.
Section 4: fi nancial and economic actionThe total economic cost of fossil-fuel usePast failures to reduce GHG emissions mean that remaining within the required carbon budget is becoming progressively challenging. We are increasingly committed to a certain level of climate disruption, requiring adaptation measures to reduce the impact this is likely to have. Given that the world is already committed to some degree of climate change, and given too that the combustion of fossil fuels also emits a variety of other pollutants, the total external costs of burning fossil fuels (ie, those costs that are not included in the price of fossil fuels) may be expressed as shown in panel 7.
The optimum outcome of this formula is that which minimises TECff , computed over the time horizon of interest. Unfortunately, the state of knowledge now, or at any likely point in time in the future, does not permit such a dynamic optimum to be computed. The purpose of this section is to explore the estimates of these diff erent cost categories that appear in the literature to draw conclusions regarding the extent of climate change adaptation and mitigation that should be attempted, and the policies that might be able to deliver it.
The question of what is optimum in economic terms (GDP or welfare per head) for a given level of carbon emissions and discount rate requires the computation of an optimal time path. What is optimum today (without regard for the future) will not be optimal if the future is to be taken into account. And of course the relation between low prevention costs now means very high treatment costs later, compared with high prevention costs now means lower treatment costs later will be subject to very great uncertainty. Higher uncertainty may mean that high prevention costs would be wasted. On the other hand, with higher uncertainty comes the increased probability that high prevention costs are not high enough. However, whatever the answers to these questions, models reviewed in the IPCC’s Working Group III Fifth Assessment Report (AR5) indicate with suffi cient certainty that more needs to be spent earlier rather than later if even a moderate value is given to the intermediate and long term future.201
Panel 7: Total external costs of burning fossil fuels
The prices of fossil fuels routinely do not account for their global impacts related to climate change, or their local impacts on human health and ecosystems. These external costs of fossil fuels can be expressed by the following formula:
Where TECff are the total external economic costs of burning fossil fuels; Ccc are the costs related to climate change, which can in turn be regarded as the sum of Ccd (the damage costs of unmitigated climate change), Cad (the costs of adapting to climate change, either present or anticipated), and Cmg (the costs of mitigating climate change); and Ctap—the costs of local air pollution—which can be regarded as the sum of Cpd (the pollution damages to buildings, crops and health of such pollution), Che (the health and other expenditures to remedy this pollution damage) and Cpc (the costs of controlling this pollution). There is symmetry in these cost terms relating to climate change and local air pollution, between Ccd and Cpd (the estimated damage costs), Cad and Che (the actual expenditures in response to the pollution), Cmg and Cpc and (the costs of reducing the extent of the pollution). The components of this formula are also dependent on each other, in conceptually simple if often practically complex ways, as follows:
• Ccd is a function of Cmg, such that increased mitigation will reduce the costs of climate damage, with a similar relationship between Cpd and Cpc for local air pollution.
• Cad is also a function of Cmg, such that increased mitigation will reduce the costs of adaptation, with a similar relationship between Che and Cpc for local air pollution.
• Clap is also a function of Cmg, such that increased mitigation will reduce the costs of air pollution.
• Ccd is a function of Cad, such that increased adaptation will reduce the costs of climate damage, with a similar association between Che and Cpd for local air pollution.
Notably, in each case, the eff ects of the diff erent variables on each other might act over widely diff ering timescales. Furthermore, whereas the above equation has been discussed in terms of the combustion of fossil fuels, which make the major contribution to anthropogenic greenhouse gas emissions, for full cost-eff ectiveness of climate mitigation the equation should be computed over the full range of greenhouse gas emissions to ensure that relatively cheap abatement measures are not overlooked.
TECff = Ccc + Clap = (Ccd + Cad + Cmg) + (Cpd + Che + Cpc)
74

The Lancet Commissions
www.thelancet.com Vol 386 November 7, 2015 1891
The health and related economic benefi ts of adaptationThere are signifi cant research gaps regarding the scientifi c evaluation of the health benefi ts of climate-change adaptation due to its highly diff use and context-specifi c nature, with only scattered quantitative or semi-quantitative studies on the health costs and benefi ts of adaptation options.245 Monetising these costs and benefi ts is an even more diffi cult task. However, the studies that do exist present a strong message. Seven of the eight studies on the eff ectiveness of heatwave early warning systems reported fewer deaths after the systems were implemented. For example, in the summer of 2006, a heatwave in France produced around 2000 excess deaths—4000 less than anticipated based on previous events.31 A national assessment attributed this to greater public awareness of the health risks of heat, improved health-care facilities, and the introduction of a heatwave early warning system in 2004.112 A Climate Forecast Applications Network developed in the USA had successfully forecast three major fl oods in 2007 and 2008 in Bangladesh 10 days in advance, allowing farmers to harvest crops, shelter animals, store clean water, and secure food before the event.246 Webster also strongly advocates the establishment of a network between weather and climate forecasters in the developed world, and research and governmental and non-governmental organisations in the less-developed world.246 According to his estimation, such a network could produce 10–15 day forecasts for south and east Asia for a wide range of hydrometeorological hazards (including slow-rise monsoon fl oods, droughts, and tropical cyclones) at an annual cost of around $1 million, but with prevention of “billions of dollars of damage and protecting thousands of lives”. To support assessments such as these, WHO Europe have prepared an economic analysis tool to enable health systems to calculate the health and adaptation costs of climate change, which was in turn tested in their study of seven European countries.247,248
The health and related economic benefi ts of mitigationUnmitigated climate change presents serious health risks that could reach potentially catastrophic proportions. Mitigating climate change not only signifi cantly reduces this risk, but can also yield substantial health co-benefi ts against contemporary circumstances.
Panel 8 illustrates the proportion of national GDP directed to health care increasing with wealth, along with the proportion accounted for by government expenditures. This suggests that governments of high and increasing income countries should give signifi cant priority to mitigating climate change to prevent detrimental health impacts, which could result in the need for signifi cant extra health expenditures, from both governmental and personal fi nances. Indeed, the direct and indirect cost of existing pollution-induced illnesses alone is signifi cant. The OECD estimates the cost of
ambient air pollution in terms of the value of lives lost and ill health in OECD countries, plus India and China, to be more than $3·5 trillion annually (about 5% gross world product [GWP]), with India and China combined accounting for 54% of this total.251 Globally, and with the addition of indoor air pollution, this value is likely to be substantially higher (appendix 3)
The European Commission has estimated that in the EU alone, reduced air pollution from policies to mitigate climate change could deliver benefi ts valued at €38 billion a year by 2050 through reduced mortality. From a broader perspective, the European Commission estimates that moving to a low-carbon economy could reduce the control costs of non-CO2 air pollutants by €50 billion by 2050.252 With an increase to 36% renewables in global fi nal energy consumption by 2030 (from 18% in 2010), IRENA calculates up to $230 billion of avoided external health costs annually by 2030.253 In addition, West and colleagues note that if RCP4.5 is achieved, annual global premature deaths avoided reach 500 000 by 2030, 1·3 million by 2050, and 2·2 million by 2100. Global average marginal benefi ts of avoided mortality are $50–380 per tCO2, exceeding marginal abatement costs in 2030 and 2050. The greatest benefi t is projected for east Asia, with
Panel 8: Global expenditure on health care
Figure 14 shows the global range of total expenditure on health care as a proportion of GDP in 2011. Total expenditure is 9·1% gross world product (GWP)—about US$6·8 trillion—with geographical variation ranging from 1·65% GDP in South Sudan, to 17·7% in the USA. At a global level, 59% of expenditure is sourced from government budgets (of which 60% is via social security mechanisms), accounting for more than 15% of total expenditure by governments worldwide. The remaining 41% is sourced from the private sector (of which 38% is in the form of health insurance, with 50% out-of-pocket expense). Total average global health expenditure per capita was $1053, in purchasing power parity (PPP) terms.247
Figure 15 shows the variation between the economies of diff erent average income levels against these global totals. Total expenditure per head varies between an average of $64 in low-income countries and $4319 in high-income countries in PPP terms. This increase in expenditure proportional to income is accompanied by the increasing use of insurance mechanisms (either private or social security), and decreased reliance on external (international) resources (principally development assistance and funding from non-governmental-organisations), and private expenditure and out-of-pocket expenses (in proportional terms). Whereas private expenditure and out-of-pocket expenses remain a signifi cant component in all groups, external resources decrease rapidly, from 29% in low-income countries to 2·3% in lower middle-income countries, 0·4% in upper middle-income countries, and 0% in high-income countries.
See Online for appendix 3
75

The Lancet Commissions
1892 www.thelancet.com Vol 386 November 7, 2015
220 000–470 000 premature deaths avoided per annum by 2030, with marginal benefi ts of $70–840/tCO2—a range 10–70 times that of the projected marginal cost254 (see appendix 3 for more about the cost of ambient air pollution in China). In the USA, Thompson and colleagues estimate that human health benefi ts associated with air quality improvements driven by CO2 mitigation policies can off set the cost of the policies by up to ten times.255
Mitigation actions have other health-related benefi ts. Policies in the transport sector that encourage active travel (eg, walking and cycling) produce signifi cant reductions in cardiovascular disease, dementia, diabetes, and several cancers, in addition to reduced
duration and severity of depressive episodes—all of which are linked to obesity and are costly to treat.218 For example, increased levels of active travel coupled with increased fuel effi ciency in the UK’s urban areas could lead to a net saving to public funds cumulatively exceeding £15 billion by 2030, whilst achieving GHG reductions of over 15% in the private transport sector by 2030.228 Patz and colleagues have comprehensively reviewed the health, environ mental, and economic benefi ts of active travel.256
In many countries, climate-change mitigation through increased energy effi ciency will have the benefi t of reducing fuel poverty (a condition in which low-income households have to spend a high proportion of their income to keep warm or cool), and associated impacts on excess winter mortality, respiratory health of children and infants, and the mental health of adults.257 Nicol and colleagues estimated that improved housing in England alone could save the UK NHS more than €700 million per year in treatment no longer required.258 In addition, Copenhagen Economics estimates that improvements in housing energy effi ciency in Europe would, alongside the production of direct energy and health-care savings, reduce public subsidies for energy consumption by €9–12 billion per year.259 Various other health and ancillary benefi ts exist. Appendix 4 provides information about a recently developed framework to quantity key co-benefi ts.
It is apparent both that societies spend very large sums on health care and that measures to mitigate climate change would directly reduce existing and projected damages to health from the combustion of fossil fuels, and associated costs. In fact, Markandya and colleagues estimated that in India, if the health benefi ts of reduced PM2.5 emissions alone, resulting
Figure 14: Total expenditure on health as proportion of GDP (2011)249
Not applicable1·3–4·7% GDP4·8–6·5% GDP6·6–8·7% GDP8·8–19·7% GDPData not available
Figure 15: Global health-care expenditure profi le (2011)250
PPP=purchasing power parity.
Low income Lower middleincome
Upper middleincome
High income Global0
10
20
30
40
50
60
70
80
90
100
Prop
ortio
n of
tota
l hea
lth-c
are
expe
nditu
re (%
)
0
500
1000
1500
2000
2500
3000
3500
4500
4000 Total health-care expenditure per head(PPP international $)
Out-of-pocket expensesExternal resourcesOther private expenditure
Private health insuranceOther government expenditureSocial security
Total health-careexpenditure
See Online for appendix 4
76

The Lancet Commissions
www.thelancet.com Vol 386 November 7, 2015 1893
from a 50% reduction in CO2 emissions by 2050 (from 1990 levels) from electricity generation, were valued similarly to the approach used in the EU for air pollution, then they off set the cost of GHG emissions reductions in full.215 As such, a signifi cant proportion of expenditures for climate-change mitigation (and adaptation) may legitimately be seen as off setting health expenditures, existing or anticipated, or even put forward itself as expenditure on the treatment and prevention of ill health. If a large part of the costs of climate-change mitigation and adaptation is off set by improved health of the existing population, and if unabated climate change is itself a major health risk, investment in such actions is clearly an attractive and sensible proposition.
Investment required for mitigation and adaptationIn industrialised countries, large-scale investment in energy systems is required simply to maintain existing services as infrastructures age and need to be replaced. Emerging and developing economies will require very large energy system investments to meet growing demand as they develop and to provide increasing proportions of their populations with access to modern energy services. It is estimated that such business-as-usual investments will total around $105 trillion between 2010 and 2050, with average annual investment requirements rising rapidly over time.260 However, this value excludes the costs of climate damage to the energy system or resilience measures to reduce it. Such costs could be signifi cant.
The IEA estimates that to achieve a trajectory that produces an 80% chance of remaining on a 2°C stabilisation pathway, additional cumulative investment of $36 trillion in the energy system is required by 2050—roughly $1 trillion per year (in the order of 1% GWP under moderate growth assumptions or about 10% of existing expenditure on health care), although recent estimates from the New Climate Economy report suggest that this value may be a much reduced $270 billion per year.260,261 The insurance premium represented by this additional investment is very modest in relation to the potential costs that are being avoided, even without the off setting health and other co-benefi ts such as those described above. To achieve both the requisite level of decarbonisation whilst meeting increasing global demand for energy, the IEA estimates that investments in low-carbon technologies and energy effi ciency must account for around 90% of energy system investment by 2035.262 Currently, this value is around 23%.262
Estimates for the investment required for adaptation measures to protect against climate impacts to which the world is already committed are limited. The most comprehensive global estimate thus far was produced by the World Bank (2010), which estimates the annual global cost of adaptation even on a 2°C trajectory to be $70–100 billion by 2050.171
Estimating existing expenditure on adaptation actions is not much easier than estimating the possible future costs of adaptation. Buchner and colleagues263 estimate that in 2012, about $22 billion was invested in activities with an explicit adaptation objective. However, the lack of common agreement on what constitutes an adaptation measure over other investment classifi cations and objectives mean understanding of existing fi nancial fl ows to adaptation measures is poor. Even so, whilst the magnitude is diffi cult to determine, it is reasonable to conclude that existing fi nancial fl ows for climate change adaptation are not suffi cient to match long-term requirements, even for impacts resulting from current and past emissions.
Macroeconomic implications of mitigation and adaptationThe macroeconomic impacts of climate changeAttempts to estimate the marginal social cost of CO2 emissions in the absence of mitigation or adaptation measures have produced an extremely wide range of results, spanning at least three orders of magnitude.264 Table 3 illustrates the multifaceted, diverse, and potentially extreme nature of the impacts involved.
The IPCC’s AR5 chapter on impacts, adaptation and vulnerability estimates an aggregate loss of up to 2% GDP if global mean temperatures reach 2·5°C above pre-industrial levels.266 A world of unabated GHG emissions, what might be called a business-as-usual pathway (in which a global mean temperature increase is likely to far exceed 2·5°C, and in which many of the kinds of impacts in the last row and column of table 3 are likely to be experienced) could produce costs equivalent to reducing annual GDP by 5–20% now, and forever, compared with a world with no climate change, according to the Stern Review on the Economics of Climate Change.267
It may be noted that these costs are the result of a low discount rate, the validity of which has been questioned.268 However, the relevant point here is that the physical impacts underlying the upper range of these costs represent a substantial risk to human
Market Non-market Multiple stresses and socially contingent
Projection (trend) Coastal protection, dry-land loss, energy (heating and cooling)
Heat stress, wet-land loss, ocean acidifi cation, ecosystem, migration and termination
Displacement from coastal zones, regional systemic impacts
Climate variability and (bounded) extremes
Agriculture, water, storms Loss of life, biodiversity, environmental services
Cascading social eff ects, environmental migration
System changes and surprises
So-called tipping-point eff ects on land and resources
High-order social eff ects, irreversible losses
Regional collapse, famine, war
Adapted from Grubb et al, 2014.265
Table 3: Social cost of CO2 emissions—assessment framework
77
The Lancet Commissions
1894 www.thelancet.com Vol 386 November 7, 2015
societies—what Weitzmann269 has called the “fat tails” of climate-risk distributions. The costs of mitigation may be seen to represent a premium paid to reduce these risks and, hopefully, avoid the worst climate outcomes entirely. In any case, even these large costs derive from economic models built upon climate science and impact models, which themselves necessarily cannot fully characterise all processes and interactions known to be of importance.270
The macroeconomic impacts of responding to climate changeThe theoretical microeconomics position on the balance to be struck between mitigation and adaptation is clear—there should be investment in mitigation up to the point where the marginal cost of further investment is higher than the marginal cost of adaptation plus that of remaining climate damages. In practice, the robust identifi cation of this point is impossible, because of the uncertainty of the costs concerned and how they will develop over time, the diffi culties of valuing non-market costs, and the lack of consensus over the appropriate discount rate for such costs, when they are incurred over long and varied time periods.271 Given that some climate impacts (such as the phenomena in the bottom-right corner of table 3) cannot be adapted to at any computable cost, mitigation-focused investment would seem to be the prudent priority at a global level. In a globally interdependent world, even regions that might be less negatively aff ected by climate change itself, could expect considerable economic and social disruption from those regions that were thus aff ected.
The macroeconomic impacts of reducing CO2 emissions derive from several sources, all of which need to be taken into account if the overall impact is to be properly evaluated. First, there are the impacts of the various kinds of investments discussed above. Investments in energy effi ciency measures and technologies are often cost eff ective at prevailing energy prices, and there is substantial evidence that opportunities for such investments are considerable.272 Such investments will themselves tend to increase GDP. Investments in low-carbon energy that are redirected from fossil fuel investments will, where the low-carbon energy is more expensive than fossil fuels and leaving out considerations of avoided climate change and co-benefi ts, tend to reduce GDP. However, if fossil fuel prices increase from their currently relatively low levels and remain volatile, and the capital costs of renewables (especially solar and wind) continue to fall, then at some point renewable electricity may become economically preferable to fossil-fuel derived power, irrespective of other factors.
Investments in low-carbon energy that are additional —such as the extra $1 trillion required annually as identifi ed above—may increase or reduce GDP depending on whether they employ unutilised
resources or, in a situation of full employment, crowd out more productive investment, and whether they can build domestic supply chains and new competitive industries that can substitute for imports. Whilst employment in fossil fuel-related and emission-intensive industries would decline over time, low-carbon technology industries would expand and increase employment. IRENA estimate a net global increase of 900 000 jobs in core activities alone (i.e. not including supply chain activities), if the level of renewable energy in global fi nal energy consumption doubles from 18% in 2010 to 36% of by 2030.253 Advantages may accrue to those countries or industries that begin investment in decarbonisation quickly, by gaining technological leadership through experience and innovation, aff ording the fi rst mover a competitive edge in a growing market.
For fossil-fuel importing countries, investment in indigenous low-carbon energy sources will reduce the need to import fossil fuels. In the EU, the trade defi cit in energy products in 2012 was €421 billion (3·3% EU GDP),273 and is projected to rise to €600 billion (in 2010 euros) by 2050, as the EU’s dependence on foreign fossil fuels increases.274 Low-carbon investments that reduce the need to import fossil fuels are macroeconomically benefi cial, with the value of these trade eff ects in the future being uncertain and dependent on the price of oil and other fossil fuels. Such uncertainty is itself a cost, which is amplifi ed when allied with price volatility—a common characteristic of fossil-fuel markets.
Possible sources of fi nanceIn the public sector (aside from the extensive resources to be found in local, regional, national, and supranational government budgets), sovereign wealth funds, as of August 2014, held over $6·7 trillion in assets.275 However, in the private sector, institutional investors held a global total of $75·9 trillion in assets under management in 2013 (this includes $22·8 trillion with pension funds, $24·6 trillion with insurance companies, and $1·5 trillion in foundations and endowments).276
Institutional investors are likely to be critical sources of fi nance for mitigation and adaptation due to the scale of resources available and the presence of long-term investment obligations. However, only 0·1% of institutional investor assets (excluding sovereign wealth funds) are currently invested in low-carbon energy infrastructure projects ($75 billion).277 Commercial banks are also a key source of fi nance and are one of the main existing sources of renewable investment capital. The resources held by non-fi nancial companies are also extensive, with the largest 1000 such companies estimated to hold $23 trillion in cash reserves.278
International fi nancial institutions (IFIs) such as the Bretton Woods institutions and other multilateral development banks (MDBs), multilateral fi nance
78

The Lancet Commissions
www.thelancet.com Vol 386 November 7, 2015 1895
institutions (MFIs), and regional investment banks (RIBs), whilst not holding collective assets to match those above, are also leaders in existing mitigation and adaptation fi nance, and are likely to be key in building a low-carbon economy in developing countries; their mandates are explicitly focused on development and poverty reduction promoted through low-interest, long-term loans—suitable for large infrastructure projects. Existing dedicated funds for climate-change mitigation and adaptation under the UNFCCC, such as the Green Climate Fund (GCF), are also important resources. The GCF, established by the UNFCCC in 2010 and launched in 2013, aims to raise $100 billion of new and additional funding per annum from industrialised nations, by 2020 (from both public and private fi nance), to support mitigation and adaptation pathways in developing countries. In 2012, $125·9 billion of offi cial development assistance (ODA) was delivered by donor countries, equivalent to 0·29% of their combined gross national income (GNI). Were states to meet their ODA commitments of 0·7% of GNI, another $174·7 billion would be mobilised.279
Enabling architecture and policy instrumentsThe mobilisation of such fi nancial resources requires robust policy-generated incentive frameworks, under-pinned by credible political commitments. By the end of 2013, 66 countries had enacted 487 climate mitigation and adaptation-related laws (or policies of equivalent status), with a rich diversity of approaches.280 The Stern Review considered that a policy framework for CO2 abatement should have three elements: carbon pricing, technology policy, and the removal of barriers to behaviour change.267 This three-part classifi cation maps closely to three policy pillars, which in turn correspond to three diff erent domains of change.265 Figure 16 illustrates this framework, which can be applied to develop both mitigation and adaptation policy.
Each of the three domains refl ects three distinct spheres of economic decision making and development. The fi rst, satisfi cing, describes the tendency of individuals and organisations to base decisions on habit, assumptions, and rules of thumb, and, to some extent, the presence of psychological distancing (discussed in section 5). Such occurrences are the subject matter of behavioural and organisational economics, which can explain the signifi cant presence of unutilised opportunities for already cost-eff ective energy effi ciency measures. The fi rst pillar of policy, standards and engagement, seeks to address these issues, resulting in fi rms and individuals making smarter choices. The second domain, optimising, describes the rational approach that refl ects traditional assumptions around market behaviour and corresponding theories of neoclassical and welfare economics. The second pillar of policy, markets and pricing, seeks to harness markets, mainly acting through producers rather than consumers,
to deliver cleaner products and processes. The fi nal domain, transformation, uses insights from evolutionary and institutional economics to describe the ways in which complex systems develop over time under the infl uence of strategic choices made by large entities, particularly governments, multinational corporations and institutional investors. The third pillar of policy arising from such analysis seeks to deliver strategic investment in low-carbon innovation and infrastructure.265
Each of the three domains and policy pillars, whilst presented as conceptually distinct, interact through numerous channels. For example, as fi gure 16 illustrates, whilst the impact of each policy pillar is strongest in one domain, each of the pillars of policy have at least some infl uence on all three domains. All three pillars of policy have an important role in producing a low-carbon global energy system.265
Standards and engagementEnergy effi ciency standards may take many forms. However, all act to push a market, product or process to higher levels of effi ciency (or lower levels of emission intensity), through regulation. Such regulations help to overcome market failures such as split incentives, a prominent example of which is the landlord–tenant problem, when the interests of the landlord and tenants are misaligned. The problem arises because, whilst the installation of energy effi ciency measures would benefi t the energy bill-paying tenant, savings do not accrue to the landlord who therefore has no incentive to bear the cost of installing such measures. Instead, standards can require their installation, or other measures to induce the same eff ect.
The main typologies of standards relating to mitigation are CO2 intensity standards, energy intensity standards and technology standards. The fi rst two specify a target limit for specifi c CO2 emissions or energy consumption. Examples are a cap on CO2
Figure 16: Three pillars of policy Adapted from Grubb et al, 2014.265
H
H
H
L/M
M
L/M
M
L
L
Policy pillars1
Standards andengagementDomain To deliver
2Markets
and prices
3Strategic
investment
Satisfice
Optimise
Transform
Smarterchoices
Cleanerproducts and
processes
Innovation andinfrastructure
Highest relevanceMedium relevanceLowest relevance
79

The Lancet Commissions
1896 www.thelancet.com Vol 386 November 7, 2015
emissions from passenger cars per kilometre driven (based on the average rating for all cars sold per manufacturer), or on the annual energy consumption of a new building per unit of fl oor area. Both such policies (and variants) have been successfully implemented in the EU and around the world, and have proven eff ective. Technology standards may act in a similar manner to CO2 or energy intensity standards, but may also proscribe the use of certain components in products, or prevent the sale of the least effi cient models of a product type. Such standards may be applied with a legal basis, or through the use of voluntary agreements. Standards may also be applied to produce adaptation actions, for example by amending building codes to obligate developers to incorporate resilience measures in new construction.
Processes and mechanisms for targeted communication and engagement between governments, businesses, other organisations, communities and individuals help to overcome issues of psychological distancing, motivational issues, split incentives and information asymmetry, and act to pull the market towards higher effi ciency, lower emissions and greater resilience. Such mechanisms can take many forms and include training and education campaigns, but also labelling and certifi cation, public reporting and other information disclosure and transparency measures. All these approaches act to provide consumers and investors with information surrounding environmental performance of a product, service, process or organisation at the point of use, or across the product lifecycle or organisational operations and supply chain, in order to help them to make informed decisions regarding investments and purchases. This encourages organisations to mitigate risks by reducing organisational (and possibly supply chain) emissions and to invest in adaptation measures to improve resilience, ensuring they retain a strong customer base and remain a safe investment. The introduction of these instruments may also reveal opportunities for effi ciency measures that have an economic rationale independent of environmental considerations.
Markets and pricesThe Stern Review called the market externality of GHG emissions in the global economy “the greatest and widest-ranging market failure ever seen”.267 Carbon pricing is the economist’s preferred means to address this externality. Such pricing may be achieved through national or regional explicit carbon taxes or cap-and-trade emissions trading systems (ETS), which are increasingly present around the world. A carbon tax sets the carbon price directly, but not the level of abatement, whilst an ETS sets the level of abatement, but the price derives from the carbon market. Regardless of the pricing mechanism, market actors may be expected to factor the
existing and expected carbon price into short-term operational and long-term investment decisions. Figure 17 summarises the state of pricing mechanisms around the world. As of June 2014, around 40 national and over 20 subnational jurisdictions were engaged in carbon pricing of varied scope and instrument design, covering about 12% of annual global GHG emissions (the Australian ETS was discontinued in July 2014).281 The largest ETS is the European ETS, established in 2005, and capping more than 40% of annual GHG emissions from power generation and energy-intensive and emission-intensive heavy industry across the EU-28 (plus Norway, Iceland, and Lichtenstein). This is followed in scale by the aggregate of the seven ETS pilot schemes in China, described in appendix 5. As of 2014, the total value of all explicit pricing mechanisms was around $30 billion.281
For sectors of the economy for which explicit carbon pricing is infeasible or administratively burdensome, taxes on energy products (such as transport fuels) could be realigned to refl ect their carbon content (producing an implicit carbon price) By implementing Environmental Tax Reform (ETR) principles, in which the burden of taxation increases on environmentally damaging activities and is reduced on desired inputs, such as labour, the increase in energy prices can be neutralised from a macroeconomic perspective. Parry and colleagues estimate that corrective taxation that internalises CO2 emissions, local air pollution, and additional transport-related externalities (such as congestion and accidental injury) arising from coal, natural gas, gasoline, and diesel, could raise additional revenues of 2·6% GDP globally, whilst simultaneously reducing CO2 emissions by 23% and pollution-related mortality by 63%.282 If this revenue was used to off set labour taxation (eg, by a reduction in payroll or other corporate taxation), revenue neutrality is achieved whilst producing a double dividend eff ect of employment, as well as environmental improvement.283 Alternatively, carbon pricing mechanisms can be used to fi nance, subsidise, or otherwise incentivise investments into other mitigation and adaptation measures, as discussed below.
In addition to pricing pollution, distorting subsidies for the extraction and consumption of fossil fuels should be removed. For consumers, such subsidies (aimed at providing energy at below market price, and principally applied in developing countries) total around $400 billion annually,284 whilst producer subsidies (aimed at sustaining otherwise uncompetitive production, principally applied in industrialised countries), are around $100 billion annually.285
Both fossil-fuel subsidies and the presence of externalities tend disproportionately to benefi t the wealthiest in society (in both national and international contexts), as energy consumption (and associated emissions) increases with prosperity, both directly (eg,
See Online for appendix 5
80

The Lancet Commissions
www.thelancet.com Vol 386 November 7, 2015 1897
via additional travel demand, domestic heating and cooling requirements) and indirectly through additional consumption of energy embodied in products and services. Globally, an estimated 80% of such subsidies actually benefi t the wealthiest 40% of the population.286 However, the introduction of carbon pricing and the removal of fossil fuel subsidies may be regressive, as the poorest in society spend a greater proportion of their disposable income on energy. Reduced taxation of the low paid may partly off set this in industrialised economies, although further targeted support, such as the provision of energy effi ciency measures for low-income or vulnerable households (funded by carbon price revenues and foregone subsidy), or the introduction of electricity tariff s diff erentiated by consumption level, is also likely to be required. In developing countries where most consumer fossil-fuel subsidies are provided, and where a greater proportion of the population is not employed in the formal economy or have no access to electricity, more targeted interventions to remove disproportionate eff ects on low-income households, such as the expansion of social security, health care, and education provision, will be required.
Strategic investmentWhilst a price on carbon is a key component for mitigation, it is technologically agnostic and mainly encourages the adoption of mature low-carbon
technologies. To encourage deployment, improvement and cost-reduction of less mature technologies, direct investment is also required. Although various options exist, Feed-in tariff s (FiTs), used in the electricity sector to provide a guaranteed rate of return to low-carbon generators, have been the most eff ective policy instrument used for this purpose, and have been responsible for a signifi cant majority of installed global renewable power capacity (appendix 6). A FiT-style instrument may also be used to encourage the deployment of non-electric renewable technologies, including heating and cooling options.
However, FiTs and comparable instruments only encourage diff usion and incremental improvements for technologies around the end of the innovation chain (market accumulation and diff usion). For technologies in the earlier stages (applied research to demonstration and commercialisation), concerted R&D eff orts are required, comparable to public and private pharma-ceutical research that has been shown to produce innovative new drugs.287 Such eff orts may be analogous to the Manhattan Project for nuclear technology, or the Apollo Program for space fl ight, but focused perhaps on energy storage technologies, which are often seen as crucial for the eff ective decarbonisation of the global energy system.
Public-led strategic investment is also required in urban low-carbon travel infrastructure (eg, segregated cycle lanes), along with investment in electric-car
ETS implemented or scheduled for implementationCarbon tax implemented or scheduled for implementationETS or carbon tax under considerationCarbon tax implemented or scheduled, ETS under considerationETS and carbon tax implemented or scheduled
Alberta Manitoba
QuebecIceland
France
NorwayDenmark
Switzerland
EU
Sweden South KoreaFinland
Ukraine Kazakhstan
China
Thailand
Japan
TurkeyUK andIreland
RGGI*
Ontario
Brazil
South Africa
Australia
New Zealand
Rio de Janeiro
TokyoShanghai
ShenzhenGuangdong
KyotoSaitama
São Paulo
BritishColumbia
WashingtonOregon
California
Mexico
Chile
Beijing
Tianjin
HubeiChong-qing
Figure 17: Existing, emerging, and potential regional, national, and subnational carbon pricing instruments (ETS and tax)281
*The RGGI (Regional Greenhouse Gas Initiative) is a coordinated cap and trade programme, operating between nine Northeastern and Mid-Atlantic States in the USA and Canada. ETS=emissions trading scheme.
See Online for appendix 6
81

The Lancet Commissions
1898 www.thelancet.com Vol 386 November 7, 2015
charging points. This also applies to the electricity transmission network, which is under state ownership in most countries. Such investments may be fi nanced in a number of ways, including directly by governments, multilateral organisations, or other public bodies, through the use of carbon pricing revenues or by the issuance of specialised climate bonds (appendix 7).
Institutional reform and supportBeyond the appropriate selection of policy instruments and timeframes for implementation, investments in decarbonisation and adaptation measures will depend on the existence of eff ective and supportive governance and well-functioning markets. Good governance requires the well-defi ned division of responsibilities between govern ment departments, agencies and hierarchies, enforcement of standards and regulations, transparency at key stages of the regulatory process and subsequent monitoring and reporting, and eff ective communication and stakeholder engagement. Additionally, governments are often the largest consumer in the market, with public spending accounting for 15–30% of GDP in any given country.288 Sustainable public procurement (SPP) policies act to provide a market for effi cient, low-carbon goods and services.
Governments may promote well-functioning markets through the kinds of policies described above, and by reducing institutional barriers to low-carbon investment and innovation. For example, many pension funds across the world are barred from investing in infrastructure, including all in China (except the National Social Security Fund) and many in the EU. Whilst these regulations aim to alleviate legitimate concerns (such as preventing pension funds from becoming an extension of government budgets), they are often excessive and increasingly irrelevant as funds gradually become independent of political interference.276 Reform of such rules is essential in mobilising capital from institutional investors, irrespective of the policy and incentive mechanisms in place to encourage investment in developing the low-carbon economy.
Section 5: delivering a healthy low-carbon futureCentral to this Commission’s work is the question of whether human societies can deliver a healthy, low-carbon future. Sections 1 and 2 have explained the scientifi c basis for concern, the potential health dimensions of impacts, and the adaptation responses required. Sections 3 and 4 have demonstrated the technological and economic feasibility of tackling the problem. Yet over the past decade, global emissions have still risen sharply. The evidence to date of humanity’s ability to respond eff ectively is not encouraging. The diffi culty, essentially, is ourselves: the tendency of
humans to ignore or discount unpleasant facts or diffi cult choices (something familiar to doctors); the nature of companies and countries to defend their own rather than collective interests (something familiar to those working in global health); and the narrow, short-term horizons of most human institutions, which feed into the diffi culties of global negotiations.
Over the past century, the world has made enormous strides in overcoming similar obstacles in the fi eld of health, with international cooperation on health challenges as a shining example. The problem of anthropogenic climate change is more recent, arguably more complex, and the eff orts to tackle it more nascent. But there are some promising developments, and a great deal can be learned by examining the history of eff orts to date.
One conclusion evident throughout our report is that much of the technical expertise, technology, and fi nance required to turn climate change from a public health threat into an opportunity is readily available, but politically restricted. In essence, whether we respond to “the biggest global health threat of the 21st century” is no longer a technical or economic question—it is political. This section analyses the politics of climate change and provides suggestions for action. We examine the international regime (under the UN Framework Convention on Climate Change and its Kyoto Protocol); national policy responses; the role of sub-national governance processes, particularly in major cities; and the importance of individuals and public opinion. Importantly, we stress the need for better synergy between top-down and bottom-up approaches. We seek to draw lessons from global health governance mechanisms, and make suggestions for how health-related issues can inform the climate change negotiation process.
Three phases of response—the international regimeIt is almost 30 years since climate change emerged onto political agendas, with three phases of response since then, of roughly a decade each.
First phase: understanding the evidence and establishing institutions and broad goalsThe fi rst phase established the institutional basis for responding to climate change, including for scientifi c input into policy processes. Building on long-held concerns of the scientifi c community, a series of international workshops in the mid-1980s, hosted by the World Meteorological Organisation and the UN Environment Programme, led governments to establish the IPCC in 1988, as the offi cial channel of scientifi c advice to the international community. In 1990, the IPCC’s fi rst report expressed enough concern for governments to formally launch international negotiations aimed at tackling the problem, and 2 years later to agree on the UNFCCC. The UNFCCC now enjoys almost universal membership.
See Online for appendix 7
82

The Lancet Commissions
www.thelancet.com Vol 386 November 7, 2015 1899
The UNFCCC established the “ultimate objective” of stabilising GHG concentrations at a level that would prevent dangerous human interference in the climate system (UNFCCC, article 2). This objective has been recently interpreted as implying that global temperatures should not rise more than 2°C above pre-industrial levels, an aim reiterated in frequent statements under the UNFCCC and other international fora, such as the G8. The 2°C goal implies a need to roughly halve global emissions by 2050; stabilising the atmosphere at any level ultimately means bringing net emissions (emissions minus removals from forests, oceans, and other carbon sinks) to zero.
The UNFCCC established that industrialised countries would take the lead in curbing GHG emissions, setting them a non-binding goal of returning their emissions to 1990 levels by 2000. All parties, including developing countries, were given general commitments to address climate change, as well as reporting obligations. The UNFCCC also set up a raft of institutions to monitor implementation and pursue ongoing negotiations, under the auspices of the main decision-making body, the Conference of the Parties (COP).
Health concerns feature, albeit in general terms, in the UNFCCC, which lists impacts on human health and wellbeing as part of the adverse eff ects of climate change (defi nitions, article 1). The only other reference requires parties to consider the broader implications of their mitigation and adaptation actions on human health.289
Second phase: leading through top-down international commitmentsIn 1995, governments accepted the fi ndings of the IPCC’s second report and launched negotiations to strengthen the UNFCCC’s commitments. The working assumption was that the international response would be led by specifi c, binding emission targets for industrialised countries, which would then be implemented at a national level. This was the approach adopted in the Kyoto Protocol of 1997, which built mainly on designs proposed by the USA under President Clinton.
However, the fact that developing countries were not subject to any such specifi c commitments weakened the Protocol’s short-term impact and undermined its political viability, particularly in the USA, where strong political forces were opposed to any robust action on climate change. The subsequent US repudiation of the Kyoto Protocol made it clear that the Kyoto-type top-down model was unworkable in these circumstances as the principal way forward.
Third phase: bottom-up initiativesGlobal negotiations continued, but with widely varying objectives and perceptions. Whilst the EU and developing countries continued to support a Kyoto-style approach with specifi c targets, few others believed that to be
feasible, or even appropriate. Academics and commentators increasingly argued that action happens from the bottom up, not in response to binding top-down commitments, and pointed to a wide range of initiatives, including at state level in the USA, to argue that a fundamentally diff erent approach was needed.
These divergent views came to a head at a summit in Copenhagen in 2009, which collapsed in acrimony save for two pages of unoffi cial outline text hammered out as a fallback compromise, initially between the USA and major emerging economies. The so-called Copenhagen Accord did register some landmark achievements, notably confi rming the 2°C goal, and a promise to raise $100 billion per year of international fi nance by 2020 to help developing countries deal with climate change. In terms of emission commitments, however, there were no binding targets; instead, the Copenhagen Accord called on countries to declare domestically-generated voluntary pledges of what they might deliver. Since then, almost all major emitters have registered pledges, although based on varying indicators and with very diff erent levels of precision and ambition.
Negotiations in Durban in 2011 saw the launch of a new round of talks aimed at agreeing a universal framework to deal with climate change from 2020. According to the so-called Durban Platform, this new agreement should be applicable to all parties, and “raise the ambition” of the international community.
Patchy progress in the negotiationsIf global emission trends are the only indicator of progress, the results of the negotiations to date have been dismal. The 2014 IPCC report warned that global emissions since 2000 have been rising ever faster at around 2% every year, powered largely by spectacular growth in China, and other emerging economies.201 Viewed more closely, the picture is more nuanced. Taken together, the industrialised countries did meet the UNFCCC’s goal of returning their emissions to 1990 levels by 2000 (helped by massive declines in the former Soviet Union and Eastern Bloc). The industrialised countries that accepted targets under the Kyoto Protocol and remained parties to that agreement also all achieved their offi cial goals. There is no question that in the EU, the Protocol provided the legal framework and impetus for strengthening mitigation policies.
The international process has also had successes in other areas. Through the Kyoto Protocol’s Clean Development Mechanism (CDM), many developing countries came forward with new projects that generated cheap emission reductions (that could then be sold on to industrialised countries), and by most accounts contributed to the establishment of renewable energy industries and other low-carbon technologies. Through a levy on CDM transactions, the Kyoto Protocol also established a fund to help fi nance adaptation measures in developing countries.
83

The Lancet Commissions
1900 www.thelancet.com Vol 386 November 7, 2015
The UNFCCC also provides a crucial ingredient of transparency. A major achievement has been in establishing a robust system of reporting and review, for both national emissions data and broader policy actions. In 1992, when the UNFCCC was adopted, many countries had very little knowledge of their emissions profi le—ie, what GHGs they were emitting and from what sources. The UNFCCC’s provisions, building on the IPCC’s methodological work, have been crucial in fi lling that knowledge gap, which lays the foundation for an eff ective response to climate change.
Despite patchy progress, the global negotiations continue, and indeed are regaining momentum. It is likely that the hybrid course set out in the Copenhagen Accord, and ratifi ed in 2010 by the Cancun Agreements, of domestic aspirations, policies, and objectives will defi ne the primary ingredients of a future global agreement. Perhaps most importantly, it is also now clear that international agreements must run concurrent with (rather than precede) implementation eff orts. The future of the international negotiations will inevitably have to combine elements of top-down and bottom-up policies within the global framework.
One indication of both the opportunities and challenges is found in a joint US–China agreement of 2014, in which the US Administration pledged to reduce its emissions by 26–28% below 2005 levels by 2025, and China off ered to cap its emissions growth by 2030, or sooner if possible. On the positive side, this is the fi rst time that any major emerging economy has stated it is willing to cap its emission growth in absolute terms, and interactions between the USA and China helped each to a new level of commitment.
On the negative side, it illustrates the scale of the gap between science and action: if viewed in terms of per-capita emissions, it means that the USA is planning to come down somewhat below 15 tCO2 per capita, whilst China wants headroom to reach potentially 10 tCO2 per capita by 2030, before declining. This is a far cry from the scientifi c goals—a 2°C limit implies the need for a global average close to 2 tCO2 per capita by mid-century. It emphasises that in isolation, such decentralised policy action also seems unlikely in the aggregate to deliver the necessary global mitigation eff ort eff ectively, equitably, and effi ciently, and points to the risks of abandoning any collective, science-led direction to the global eff ort.
There are indeed reasons for concern regarding the international regime’s ability to deliver on its promise.290 The international relations literature has tended to assume that regimes start off weak, but as scientifi c evidence hardens and political will increases, parties agree to ratchet up their commitments and the regime strengthens; this was clearly the assumption of the early climate change negotiators.291,292 It is diffi cult to say, however, whether the climate change regime is now getting stronger or weaker. On the one hand, the
regime’s coverage is expanding and deepening among the developing countries parties. The voluntary approach of the Copenhagen Accord and Cancun Agreements has engaged a much wider group of countries, including all major emitters, into national target-setting. At the same time, the Durban Platform mandate implies that all countries, not just the industrialised ones, are expected to raise their ambition in the new post-2020 regime. On the other hand, the engagement of industrialised countries is weakening compared with in the 1990s and early 2000s, with major emitters, such as Canada, Japan, Russia and, of course, the USA, now operating only under the Copenhagen Accord and Cancun Agreements, whose targets are voluntary and not subject to common metrics.
The outlook for future international negotiations is therefore challenging, to say the least. The rest of this section turns to consider reasons why progress on this issue is so diffi cult (from both a top-down, and bottom-up perspective), and what can be done to change this.
The generic barriersThe technological, investment, and behavioural changes needed to meet ambitious long-term goals, as illustrated in sections 3 and 4, are, in principle, entirely feasible. But they need to be accomplished in the face of highly diverse social, cultural, economic, and political contexts. Opposing national (and vested) interests, clashing views of what constitutes fair distribution of eff ort, and a model of economic growth that is currently tied to fossil fuel use, can make progress fraught. There are several key issues, as outlined by Hulme, 2009:293
• Uncertainty and complexity. The climate is naturally variable and the science that has identifi ed dangerous, anthropogenic climate change to a very high level of probability is complex. This leaves considerable room for public ignorance or misunderstanding of the nature and severity of the issue. Moreover, climate scientists can be ineff ective at communicating the issue to the public.294
• Climate change is psychologically distant along four dimensions—temporal, social, geographical, and degree of uncertainty—whereas people tend to connect more easily with issues that are close in time, space and social group, and about which there is little uncertainty. These dimensions interact with each other, all tending to dampen concern and willingness to act.295
• There is enormous lock-in to current economic patterns.296 Fossil-fuel use is at the heart of the industrial economy, often operating through long-lived infrastructure (eg, roads, buildings, and power plants) and enabling valued dimensions of modern lifestyles (eg, travel and temperature control in buildings). It is no exaggeration to say that human societies are addicted to fossil fuels, or at least the services they provide. Providing these valued services
84

The Lancet Commissions
www.thelancet.com Vol 386 November 7, 2015 1901
through alternative, lower-carbon means requires systemic change over a long period.
• These three factors can all come together in a fourth: the active promotion of misinformation, motivated by either ideology or vested economic interests. Here, parallels can be drawn between public health eff orts to reduce tobacco consumption (appendix 8). It is estimated that US industry spent close to $500 million in its successful campaign against the 2010 House of Representatives proposal to cap US emissions. A major study of the Climate Change Counter Movement in the USA identifi es funding of around $900 million annually.297
These obstacles are further compounded by the economic characteristics of responses. Low-carbon technologies are generally more capital-intensive than their fossil-fuel alternatives, albeit with much lower running costs. Their implementation therefore requires more upfront investment and a longer time horizon, resulting initially either in higher energy prices or higher taxes, or some combination of the two. The same is true of most adaptation measures; fl ood protection defences, for example, are capital-intensive investments with uncertain returns.
A large-scale shift to such technologies will require very large investments over a prolonged period of time. This shift in fi nancial fl ows will need to be incentivised, in the early periods at least, by strong, consistent, and credible public policies, and a change in fi nancial structures. Such policies are far from easy to introduce and sustain, given other political priorities that may be perceived as more pressing, and the political complexities indicated above.
Cities, states, and provinces: progress at the subnational levelDespite all these obstacles, action does continue in varied ways, at many levels. Local issues have long been part of the broader agenda of international environmental politics, and local governments have an increasingly well-documented track record in climate action.
In the past two decades, cities have been pivotal in producing multiple policy-making frameworks and advocacy coalitions. This has fostered a thick texture of para-diplomatic links and policy action around climate change and environmental health.298,299 The rise and cross-cutting international spread of cities as actors in climate action also evidences a more refi ned pattern of transnational connections that are not solely bottom up, but rather off er a level of governance from the middle that cuts horizontally across international and national frameworks, involving an expanding variety of public-private structures and off ering a distinct variation on civil society models of climate action.300,301
The leaders of cities around the world, from major metropolitan hubs like New York and São Paulo, to smaller centres like Rabat or Medellin, are increasingly
using the networked reach of their municipal governments to address climate change in ways that are often more fl exible and more directly applied than those of the national or international levels. Evermore city leaders have been leveraging their network power through international networks such as the United Cities and Local Governments (UCLG), ICLEI Local Governments for Sustainability, the World Mayors Council on Climate Change and the Climate Leadership Group (or C40).299
These groups are now a well-established presence in the international climate change arena,302 pointing to the emerging imprint on global environmental governance by city leaders.303 Their most crucial contribution to climate action is that of leveraging city diplomacy to implement specifi c actions on the ground via municipal management and multi-city initiatives. In practice, this governance from the middle is about taking advantage of the pooled networked connections of cities to implement a plethora of initiatives aimed at direct and quick implementation, which then injects urban elements in wider international processes.
Among the networks of larger cities, there is an emerging pattern of their local policy priorities becoming aggregated under a single strategic issue, as seen in integrated planning, climate, and sustainability plans such as Sustainable Sydney 2030. Concurrently, climate action has taken place on municipal purview areas such as energy regulation, transport and mobility, building retrofi t, or waste management. Major centres like New York or Tokyo, for instance, have implemented building energy retrofi t schemes across their city infrastructures.
Taken together, such a two-headed agency can enable cities to collectively attract and therefore release investment capital to execute wide-ranging policy programmes (such as C40’s Energy Effi ciency Building Retrofi t programme). This ability to leverage global capital by eff ectively generating a large single market can be highly infl uential insofar as the cities are able to act quickly, often within the space of a year, and increasingly represent a signifi cant proportion of the world’s population and energy generation. This stands by contrast with national governments, where climate policy is often subsumed within other priorities rather than as an organising aim across government.
City-level governance may also provide the fl exibility and scope to include health in actions on climate change, with city leaders becoming key actors in recognising and responding to the health co-benefi ts of doing so. It is important that the UN-led international negotiations process takes account of this dimension of multi-level governance, which operates in both formal and informal ways.
Public opinion and behaviourUltimately, eff ective actions by local and national governments, and by businesses, are unsustainable without supportive public opinion. Public support for
See Online for appendix 8
85

The Lancet Commissions
1902 www.thelancet.com Vol 386 November 7, 2015
stronger action on climate change is a necessary, albeit far from suffi cient, factor, and is essential if behavioural change is to contribute to solving the problem. In this respect, the evidence is somewhat mixed. Cross-national studies, such as the 2013 survey presented in fi gure 18, suggest that most people view climate change as a threat, although with some signifi cant variation within regions.304
Public understandings of climate change are shaped by broader knowledge and belief systems, including religious convictions and political beliefs.294 There is evidence that the public recognises that climate change is complex, and interconnected with other environmental and social challenges.305 Eff ective communication about climate change requires trust.306 The most trusted sources vary across time and place,
Figure 18: Perceptions of the threat of climate change, 2013304
0 10 20 30 40 50Percentage (%)
Afr
ica
Med
iter
rane
an to
sout
heas
t Asi
aEu
rope
Sout
h A
mer
ica
Asi
a Pa
cific
Nor
thA
mer
ica
60 70 80 90 100
Nigeria
South Africa
Senegal
Ghana
Uganda
Kenya
Egypt
Palestine
Turkey
Tunisia
Jordan
Israel
Lebanon
Russia
Poland
Czech Republic
UK
France
Spain
Italy
Germany
Greece
Pakistan
China
Malaysia
Indonesia
Australia
Philippines
Japan
South Korea
Venezuela
Mexico
Bolivia
El Salvador
Argentina
Chile
Brazil
USA
Canada
Major threat Minor threat Not a threat Not known or refused
86

The Lancet Commissions
www.thelancet.com Vol 386 November 7, 2015 1903
and can include family and friends, environmental groups, scientists, and the media; local and city-level authorities may provide an important conduit for communicating information from trusted sources. For scientists to engage eff ectively with the public, however, they need to seek a greater understanding of prior knowledge and belief systems, and com munication skills radically diff erent from those of academia. They must move beyond traditional scientifi c discourse to convey a big picture of climate change with which members of the public can engage; this can then provide a context and framing for the discussion of new scientifi c results and their consequences.294
Public responses to climate changeThe causes of climate change lie ultimately in human behaviour, in particular in the economies and lifestyles of rich societies.307 However, it has been science, rather than social science, that has underpinned climate change communication and policy development.308 There is as yet little evidence on how to change behaviours that contribute to climate change,309 but taking broader evidence on the determinants of behaviour and behavioural change, four themes stand out.
First, knowledge defi cits are not the primary barrier to action; knowing about the causes and consequences of climate change does not, on its own, motivate people to change their lifestyles.310 Instead, it is emotions—the feelings that accompany thinking—that are central.311 Negative emotions, including fear, pessimism, and guilt, can produce passive and defensive responses, and do little to encourage individuals to change their behaviour and to press for wider social action. So-called fear appeals only work if accompanied by equally strong messages about how to address the problem.312 Representations of climate change as inexorably heading for catastrophe close off the possibility that individual and collective action can make a diff erence.294
Second, climate change is best represented in ways that anchor it in positive emotions,313 by framing action in ways that connect with people’s core values and identities. Examples include framing climate change as: an ethical and intergenerational issue; about safeguarding ancestral lands and the sanctity of the natural world; or an appreciation of the global injustice of anthropogenic climate change driven by rich countries but paid for by poorer ones.107,314 Aligning climate change to a range of ethical positions and a core set of identities can off er a way of appealing to diverse social groups, and thus securing a broad and inclusive platform of public support for action. This could be facilitated by avoiding the rhetoric of climate catastrophe, and emphasising, instead, human capacity to steer a way to a sustainable future, including lifting the burdens that unmitigated climate change would otherwise impose on future generations.313,315
Third, integral to such an ethical framing of climate change is the implied duty on national and international
organisations to take action. A recurrent fi nding is that the public sees the main responsibility for action lying with governments and other powerful institutions, not least because the options open to individuals to take radical action to cut their own GHG emissions are often sorely limited by cost or availability (eg, poor public transport provision). Public willingness to take action is also contingent on those considered responsible for climate change taking action themselves.316 The majority of the public in cross-national surveys believe that their country has a responsibility to take action on climate change, and that their government is not doing enough.317
Fourth, many climate-aff ecting behaviours are habitual and resistant to change. Everyday domestic energy use (eg, cooking, heating the home), travel behaviour, and eating patterns are undertaken as part of a daily routine and without conscious thought. Such behaviours are resistant to change, even if alternative options are available, and interventions relying on increasing knowledge have limited eff ect.318
ConclusionsIt is clear that in isolation, a top-down approach (international agreement followed by national legislation with which individuals and business must comply) to managing climate change is no longer a suffi cient response. Other actors are already taking steps independent of any agreement to reduce their emissions, and a voluntary transformation to a low-carbon economy may already be underway. At the same time, as indicated throughout this report, these bottom-up initiatives have hardly, as yet, taken us any closer to the scale of global action required to protect human health against the risks of climate change, than has the decade of targets under the Kyoto Protocol.
Section 1 has underlined the way in which the continued acceleration of GHG emissions and atmospheric concentrations, mapped on to changing global demographics, is making climate change an increasingly severe risk to global health. Despite the threat that climate change poses to human development, it remains but one of many factors infl uencing decision makers, and rarely the most important one. Precautionary adaptation is clearly inadequate and prevailing patterns of energy production and consumption are still driving the world towards a dangerous climatic future. Current economic drivers of growth lock communities into patterns of energy use which no amount of reframing can change unless coordinated realignment of these drivers takes place. And the argument that others should be doing more to tackle climate change, because they are more to blame, remains one of the most politically potent excuses for inadequate action.
Thus the challenge, and the crucial test of the international process, will be fi nding a synthesis of
87

The Lancet Commissions
1904 www.thelancet.com Vol 386 November 7, 2015
top-down and bottom-up forces. An eff ective international agreement will be one that supports stronger eff orts everywhere and at every level. The diverse worlds of bottom-up initiatives in cities, companies and many others should in turn help overcome the obstacles that impede the ability or willingness of national governments to commit to stronger national actions. To be truly eff ective, any future agreement will thus need not only to agree goals and aspirations, but also identify what is necessary at the international and national levels to achieve them. This may also require a mechanism, such as a feedback loop, that will motivate increased national ambitions over time. A system of review will be a crucial component, with regular assessments of the eff ectiveness of national policies, actions, and targets.
Section 6: bringing the health voice to climate changeOur studies point to multiple ways in which the health agenda may help accelerate the response to climate change. First are the positive lessons for international cooperation. No-one would suggest that national action to protect health should depend on a global, all-encompassing treaty. Yet few would deny that WHO and numerous other fora of international cooperation are important in accelerating, coordinating, and deepening responses to health challenges—particularly, but not exclusively, those with transboundary dimensions. The health experience neatly illustrates the falsity of the dichotomy between top-down and bottom-up: one measure of success is how each can reinforce the other. Learning from the health experience may illuminate the most eff ective actions at a particular level or levels of governance, and how the multi-level governance framework and international negotiation process can mutually reinforce actions at diff erent levels.
Second, political lessons from health have particular, and largely encouraging, resonance for a climate dialogue increasingly characterised by pessimism about the ability to control the problem. The denialism of HIV, responsible for perhaps a million deaths, did eventually give way to global acceptance of the science. 50 years of tobacco industry resistance and obfuscation of the science on lung cancer has to a large extent been overcome, including with recognition embodied in WHO’s Framework Convention on Tobacco Control, that governments have a duty to resist such lobbying forces.
Third, the health implications could and should be more eff ectively harnessed in eff orts to build support for a stronger response to climate change. The health impacts of climate change discussed in this Commission are not well represented in global negotiations, but they are a critical factor to be considered in mitigation and adaptation actions. A better understanding of the health impacts of climate change can help to drive top-down negotiations and
bottom-up action in many realms. A sophisticated approach is needed, which draws on the universal desire to tackle threats to health and wellbeing (without any particular philosophical slant), in order to motivate rapid action, and a policy framing that is more human than purely environment, technology, or economy focused. This requires making the impact of climate change on people explicit, rather than implicit. By considering directly how climate change will impact on human health, we are naturally drawn to the human component of climate impacts, rather than the environmental (fl ooding, forest fi res) or more abstract eff ects (the economy, the climate). This supports a human framing of climate change, putting it in terms that may be more readily understood by the public. Fostering such public resonance can act as a powerful policy driver: public pressure is, of course, a crucial factor motivating both national governments and their negotiators in the international arena.
Fourth, local health benefi ts could in themselves help to drive key adaptation and mitigation actions. The numerous health co-benefi ts of many adaptation measures were emphasised in section 2, whilst section 3 noted substantial health co-benefi ts of many mitigation measures. Examples of the latter include the reduced health risks and costs when populations live in well-insulated buildings, and the reduction in air pollution (and other health) damages associated with fossil fuel use, which, as noted, even in strictly economic terms typically amount to several percent of GDP, as well as adding directly to the strain on limited health-care resources. With the direct costs of deep cuts in emissions estimated at around 10% of global expenditure on health, both the direct and indirect health dimensions should be a major driver for mitigation eff orts. It is also commonly seen that responding to climate change from a public health perspective brings together both mitigation and adaptation interventions, yielding powerful synergies.
Fifth, analogies in health responses can also help to underline that there is rarely a single solution to complex problems: diff erent and complementary measures are required to tackle diff erent dimensions, and pursuing both prevention (mitigation) and treatment (adaptation) is crucial:
With severely ill or vulnerable patients, the fi rst step is to stabilise the patient and tackle the immediate symptoms. Helping poor countries particularly to adapt to the impacts of climate change is similarly a priority. But as noted in section 2, adaptation cannot indefi nitely protect human health in the face of continuing and accumulating degrees of climate change, any more than tackling the symptoms will cure a serious underlying disease.• For infectious diseases, antimicrobials and a
functioning health system to produce, distribute, and administer drugs eff ectively are essential components. The obvious analogy here is with specifi c greenhouse
88

The Lancet Commissions
www.thelancet.com Vol 386 November 7, 2015 1905
gas mitigation policies, such as energy effi ciency programmes and technology programmes that span the full spectrum from R&D through to policies to support industrial scale deployment and related infrastructure.
• Deeply-ingrained patterns of behaviour are best addressed by comprehensive approaches and the use of multiple policy levers. Evidence from studies of health behaviour change suggests that, to be sustained, changes in the individual’s everyday environments are required. Structural levers are also important for addressing social inequalities in harmful behaviours. Such evidence could be harnessed to inform policies to address climate change—eg, the behaviour change checklists developed to guide policy to reduce tobacco use and tackle harmful alcohol consumption may be particularly useful. Applying lessons from health behaviour change may help to accelerate policy development, building an evidence platform for interventions to promote mitigative and adaptive behaviours.
• As with the evolution of drug-resistant bacteria, the challenges of drug addiction, or the rising health problems of obesity, medical fi xes cannot solve all health problems. Similarly, in our energy systems, specifi c mitigation policies and projects are constantly faced with the ingenuity of the fossil fuel industry in fi nding and driving down the costs of extracting new fossil fuel resources and marketing them. The long-term antidote is more analogous to programmes of sustained immunisation, education, incentives, and enforcement, all oriented towards supporting healthier lives.
The single most powerful strategic instrument to inoculate human health against the risks of climate change would be for governments to introduce strong and sustained carbon pricing, in ways pledged to strengthen over time until the problem is brought under control. Like tobacco taxation, it would send powerful signals throughout the system, to producers and users, that the time has come to wean our economies off fossil fuels, starting with the most carbon intensive and damaging like coal. In addition to the direct incentives, the revenues could be directed to measures across the spectrum of adaptation, low-carbon innovation, and the global diff usion of better technologies and practices. As outlined in section 4, carbon pricing thus has immense potential, particularly when embedded in comprehensive policy packages. This most powerful antidote, however, still faces many political obstacles.
The crux of the matter is that stabilising the atmosphere at any level ultimately requires reducing net emissions to zero. A healthy patient cannot continue with indefi nitely rising levels of a toxin in the blood; even nutrients essential to a healthy body (like salt) can become damaging if not stabilised. The climate-change analogy
is obvious and focuses global attention on the need to stabilise atmospheric concentrations, which in climate terms, means getting net emissions (that is, emissions minus removals by forests, oceans, and other sinks) to zero. On most scientifi c indicators, it means getting to zero during the second half of this century. A unifying goal, therefore may be a commitment to achieve zero emissions based on multiple partnerships involving diff erent actors. If any region can achieve net zero, there is no fundamental reason why that should not become global. Getting to net zero also focuses us on a common task: how to get there, which is potentially harder for the societies that have become more dependent on fossil fuels, whilst in developing countries, it sends a clear signal that the sooner their emissions can peak, the better for their own path towards that common goal. If the goal is net zero, all actors in all societies have a sense of the direction of the international framework for action in order to protect everyone’s health against the risks posed by continual increases in the global concentration of heat-trapping gases.
A Countdown to 2030: global health and climate actionIf we are to minimise the health impacts of climate change, we must monitor and hold governments accountable for progress and action on emissions reduction and adaptation. One might argue that action on climate change is already eff ectively addressed by the IPCC, World Bank, UNFCCC, WHO, and the G20. We believe, however, that the health dimension of the climate change crisis has been neglected. There are four reasons why an independent accountability and review process is warranted:1 The size of the health threat from climate change is
on a scale quite diff erent from localised epidemics or specifi c diseases. On current emissions trajectories there could be serious population health impacts in every region of the world within the next 50 years.
2 There is a widespread lack of awareness of climate change as a health issue.191
3 Several independent accountability groups have brought energy, new ideas and advocacy to other global health issues. For example, the Institute of Health Metrics and Evaluation in Seattle have led analyses of the Global Burden of Disease, the Countdown to 2015 child survival group has monitored global progress since 2003, and the Global Health 2035 group have stimulated new ideas about global health fi nancing.
4 Perhaps the paramount reason for an independent review is the authority of health professional voices with policy makers and communities. Doctors and nurses may be trusted more than environmentalists. They also bring experience of collating evidence and conducting advocacy to cut deaths as a result of tobacco, road traffi c accidents, infectious disease, and lifestyle-related non-communicable diseases.
89

The Lancet Commissions
1906 www.thelancet.com Vol 386 November 7, 2015
We propose the formation of an independent international Countdown to 2030: global health and climate action coalition, along the same lines as other successful global health monitoring groups. We recommend that a broad international coalition of experts across disciplines from health to the environment, energy, economics, and policy, together with lay observers, drawn from every region of the world, should monitor and report every 2 years. The report would provide a summary of evidence on the health impacts of climate change; progress in mitigation policies and the extent to which they consider and take advantage of the health co-benefi ts; and progress with broader adaptation action to reduce population vulnerability and to build climate resilience
and to implement low-carbon, sustainable health systems.
A Countdown process would complement rather than replace existing IPCC and other UN reports. UN reports understandably seek cautious consensus. An in dependent review of progress would add the full weight and voice of the health community and valuable metrics to this critical population health challenge. A Countdown to 2030: global health and climate action coalition would independently decide the structure of their reports and the sentinel indicators they would choose to monitor progress towards key outcomes, policies and practice. Panel 9 outlines one possible framework for monitoring progress in three critical areas: health impacts; progress with action to reduce GHG emissions; and progress with actions to support adaptation, and the resilience of both populations and health systems, to climate change.
OptimismWe should draw considerable strength in the face of the challenges of climate change from the way in which the global community has addressed numerous other threats to health in the recent past. Although the threats are great and time is short, we have an opportunity for social transformation that will link solutions to climate change with a progressive green global economy, reductions in social inequalities, the end of poverty, and a reversal of the pandemic of non-communicable disease.
There are huge opportunities for social and technological innovation. We have modern com-munications to share successful local learning. At the highest levels of state, there are opportunities for political leaders to grasp the global challenge with transformative climate initiatives of a scale and ambition to match the Marshall plan, the Apollo and Soyuz space programmes, and the commercial success of mobile telephony. Scalable, low-carbon, and renewable energy technologies require billions of dollars of new investment and ideas. In cities, municipal governments are already bringing energy and innovation to create connected, compact urban communities, better buildings, managed growth, and more effi cient transport systems. In local communities transformative action creates greater environmental awareness and facilitates low-carbon transition. And within local government, civil society, and business, many people aim to bring about social and economic transformation. All of us can help cut GHG emissions and reduce the threat of climate change to our environment and health. At every level, health must fi nd its voice. In health systems we can set an example with scale up of renewables, combined heat and power generation in health facilities, decentralisation of care and promotion of active transport, and low-carbon healthy lifestyles. But time is limited. Immediate action is needed. The Countdown to 2030 coalition must begin its work immediately.
Panel 9: Framework of indicators for monitoring progress in three critical areas
Health impactsAn updated review of evidence on the health impacts of climate change:• Heat stress and heatwaves• Climate-sensitive dynamic infectious diseases• Air pollution and allergy• Climate-related migration• Food insecurity and crop yields• Extreme weather events• Ecosystem service damage
Actions to reduce greenhouse gas emissions that improve public healthInternational progress and compliance with:• A strong and equitable international agreement• Low-carbon and climate-resilient technology innovation
and investment• Climate governance (fi nance, decision making,
coordination, legislation)
Regional and national progress and successes with:• Phasing out of coal-fi red power generation and removal
of fossil-fuel subsidies• Urban planning, spatial infrastructure, and liveable cities• Government incentives capital for low-carbon, resilient
buildings and infrastructure
Adaptation, resilience, and climate-smart health systemsProgress and successes with:• Poverty reduction and reductions in inequities• Vulnerability and exposure reduction in high-risk
populations• Food security in poor countries• Communication of climate risks and community
engagement for local solutions• Development of climate resilient, low-carbon health
systems; scale up of renewables and combined heat and power generation in health facilities; use of climate fi nance for health infrastructure; decentralisation of care
90

The Lancet Commissions
www.thelancet.com Vol 386 November 7, 2015 1907
ContributorsThe 2015 Lancet Commission on Health and Climate Change is an international collaboration led by University College London, Tsinghua University, the University of Exeter, the Stockholm Resilience Centre, and Umeå University. The Commission undertook its work within fi ve central working groups, which were responsible for the design, drafting, and review of their individual sections. All commissioners contributed to the overall report structure and concepts, and provided input and expertise in facilitating integration between the fi ve core sections.Members of Working Group 1 (climate change and exposure to health risks): W Neil Adger, Mat Collins, Peter M Cox, Andy Haines, Alasdair Hunter, Xujia Jiang, Mark Maslin, Tara Quinn, Sergey Venevsky, Qiang Zhang. Members of Working Group 2 (action for resilience and adaptation): Victor Galaz, Delia Grace, Moxuan Li, Georgina Mace, My Svensdotter, Koko Warner, Yongyuan Yin, Chaoqing Yu, Bing Xu. Members of Working Group 3 (transition to a low-carbon energy infrastructure): Ian Hamilton, Lu Liang, Robert Lowe, Tadj Oreszczyn, Steve Pye, Jun Yang.Members of Working Group 4 (fi nancial and economic action): Wenjia Cai, Paul Drummond, Paul Ekins, Paolo Agnolucci, Melissa Lott. Members of Working Group 5 (delivering a healthy low-carbon future): Jason Blackstock, Sarah Chaytor, Adam Cooper, Joanna Depledge, Hilary Graham, Michael Grubb, Yong Luo.Michael Grubb acted as the integrating editor for mitigation (working across Working Groups 3, 4, and 5), and Maria Nilsson acted as the integrating editor for health (working across all working groups). Peter Byass, Ilan Kelman, and Tim Colbourn provided global health expertise for a number of working groups, and contributed to the Commission’s overall direction. Nick Watts, Anthony Costello, Hugh Montgomery, and Peng Gong were responsible for the strategic direction, integration, and editing of the Commission.
Declaration of interestsFive commissioners (PD, MG, MLo, MS, and NW) were compensated for their time whilst working on the Commission’s drafting and development. The Commission also covered meeting and travel costs for each author, helping to facilitate improved integration between working groups. NA has received grants from the Natural Environment Research Council UK during the conduct of the study. HG has received an ESRC grant ES/L003015/1 Health of Populations and Ecosystems (HOPE), outside the submitted work. MM is Executive Director and co-founding shareholder of Rezatec. This company uses remote sensing and ground data to provide companies with data on the state of the environment. It does not engage with global health or health related work. HM is a member of the Executive Committee of the UK Climate and Health Council. NW works as a consultant for WHO’s Department of Public Health, Environmental, and Social Determinants of Health, and is the Director of the Global Climate and Health Alliance. The UCL Institute for Sustainable Resources receives funding from BHP Billiton, outside of the Commission’s work.
AcknowledgmentsCentral funding for the Commission was provided by ClimateWorks Foundation, the European Climate Foundation, Microsoft Research Asia, the Norwegian Agency for Development Cooperation (NORAD), the National Environment Research Council through an Impact Acceleration award to the University of Exeter (NE/L012782/1), Martin Rushton-Turner, the Stordalen Foundation, and University College London’s Grand Challenge for Global Health. In-kind support was also provided from Tsinghua University, University College London (UCL), and the Stockholm Resilience Centre through the Dynamic Drivers of Disease in Africa Consortium (DDDAC). The contributions of WNA and PMC were supported by the National Institute for Health Research Health Protection Research Unit (NIHR HPRU) in Environmental Change and Health at the London School of Hygiene and Tropical Medicine in partnership with Public Health England (PHE), and in collaboration with the University of Exeter, University College London, and the Met Offi ce. Whilst carrying out its work, the Commission received invaluable technical advice and input from a number of individuals including Michele Acuto (UCL), John Ashton (E3G), Sukaina Bharwani (Stockholm Environment Institute-Oxford), Isobel Braithwaite (Global Climate and Health Alliance), Michael Depledge (University of Exeter), Helen Fry (University College London), Josh Karliner (Health Care Without
Harm), and Duan Maosheng (Tsinsghua University). Olivia Stevenson (University College London) provided ongoing guidance and policy expertise to the Commission. Neil Morisetti (University College London) provided ongoing guidance and strategic input throughout the Commission’s process. Elaine Fletcher and Marina Maiero from WHO’s Department of Public Health, Environmental and Social Determinants of Health, and Bettina Menne from WHO’s Regional Offi ce for Europe provided both formal and informal advice and assistance to the Commission. The Commission also worked with various practitioner commissioners who reviewed its progress independently, and provided policy insight and guidance on how the fi nal report could be most useful to decision makers. The practitioner commissioners included Diarmid Campbell-Lendrum (WHO), Matthew Pencharz (Greater London Authority), Virginia Murray (PHE), and Martin Frick (German Federal Foreign Offi ce). In particular, the Commission would like to thank Diarmid Campbell-Lendrum, who leads WHO’s eff orts on health and climate change, for his advice and ongoing work in understanding the health impacts and adaptation responses to climate change, which provided a foundation for much of our report. Various experts in the fi elds of fi nance and economics provided invaluable guidance during the initial preparation stages for section 4, for which the authors are most grateful. These include Bernie Bulkin (Ludgate Investment), Mark Campanale (Carbon Tracker Initiative), Martin Rushton-Turner (Swiss Re), Michael Mainelli (Z/Yen), Andrew Scott (Overseas Development Institute), Adrian Gault (Committee on Climate Change), Paul Dickinson (CDP, formerly Carbon Disclosure Project), Jim Watson (UK Energy Research Centre), and Simon Buckle (Organization for Economic Cooperation and Development). Administrative, communications, and design support was provided by Ron Finaly, and by Ayesha Ally, Anila Babla, Faye Basset, Rosie Bartlett, Helen Hopkins, Kate Hoyland, and Maxine Lenza at UCL.
References1 Costello A, Abbas M, Allen A, et al. Managing the health eff ects of
climate change: Lancet and University College London Institute for Global Health Commission. Lancet 2009; 373: 1693–733.
2 IPCC. Summary for policymakers. In: Field CB, Barros VR, Dokken DJ, et al, eds. Climate change 2014: impacts, adaptation, and vulnerability. Part A: global and sectoral aspects. Cambridge, UK, and New York, NY, USA: Cambridge University Press, 2014: 1–32.
3 Cubasch U, Wuebbles D, Chen D, et al. Introduction. In: Stocker TF, Qin D, Plattner G-K, et al, eds. Climate change 2013: the physical science basis contribution of Working Group I to the Fifth Assessment Report of the Intergovernmental Panel on Climate Change. Cambridge, UK and New York, NY, USA: Cambridge University Press, 2013: 119–58.
4 British Petroleum. BP statistical review of world energy June 2014. London: BP, 2014.
5 Ciais P, Sabine C, Bala G, et al. Carbon and Other Biogeochemical Cycles. In: Stocker TF, Qin D, Plattner G-K, et al, eds. Climate change 2013: the physical science basis contribution of Working Group I to the Fifth Assessment Report of the Intergovernmental Panel on Climate Change. Cambridge, UK and New York, NY, USA: Cambridge University Press, 2013: 465–570.
6 National Oceanic and Atmospheric Administration. Trends in atmospheric carbon dioxide. 2014. http://www.esrl.noaa.gov/gmd/ccgg/trends/weekly.html (accessed Dec 22, 2014).
7 Balla G. Digesting 400 ppm for global mean CO2 concentration. Curr Sci 2013; 104: 1471–72.
8 IPCC. Summary for Policymakers. In: Stocker TF, Qin D, Plattner G-K, et al, eds. Climate change 2013: the physical science basis contribution of Working Group I to the Fifth Assessment Report of the Intergovernmental Panel on Climate Change. Cambridge, UK and New York, NY, USA: Cambridge University Press, 2013: 1–30.
9 McMillan M, Shepherd A, Sundal A, et al. Increased ice losses from Antarctica detected by CryoSat-2. Geophys Res Lett 2014; 41: 3899–905.
10 Riahi K, Rao S, Krey V, et al. RCP 8.5—A scenario of comparatively high greenhouse gas emissions. Clim Change 2011; 109: 33–57.
11 Stott PA, Stone DA, Allen MR. Human contribution to the European heatwave of 2003. Nature 2004; 432: 610–14.
12 Rahmstorf S, Coumou D. Increase of extreme events in a warming world. Proc Natl Acad Sci USA 2011; 108: 17905–09.
91

The Lancet Commissions
1908 www.thelancet.com Vol 386 November 7, 2015
13 Otto F, Massey N. Oldenborgh Gv, Jones R, Allen M. Reconciling two approaches to attribution of the 2010 Russian heat wave. Geophys Res Lett 2012; 39: L04702.
14 Peterson T, Hoerling M, Stott P, Herring S. Explaining extreme events of 2012 from a climate perspective. Bull Am Meteor Soc 2013; 94: S1–106.
15 Herring S, Hoerling M, Peterson T, Stott P. Explaining extreme events of 2013 from a climate perspective. Bull Am Meteor Soc 2014; 95: S1–96.
16 Peterson T, Stott P, Herring S. Explaining extreme events of 2011 from a climate perspective. Bull Am Meteor Soc 2012; 93: 1041–67.
17 Pall P, Aina T, Stone DA, et al. Anthropogenic greenhouse gas contribution to fl ood risk in England and Wales in autumn 2000. Nature 2011; 470: 382–85.
18 World Bank. Turn down the heat: why a 4°C warmer world must be avoided. 2012. https://openknowledge.worldbank.org/handle/10986/11860 (accessed May 10, 2015).
19 Silver N. The signal and the noise: the art and science of prediction. London: Penguin UK, 2012.
20 McMaster R, Baber C. Multi-agency operations: cooperation during fl ooding. Appl Ergon 2012; 43: 38–47.
21 Overview and Scrutiny Management Committee. Scrutiny inquiry into the summery emergency 2007. Gloucestershire: Gloucestershire County Council, 2007.
22 Rockström J, Steff en W, Noone K, et al. Planetary boundaries: exploring the safe operating space for humanity. Ecol Soc 2009; 14: 32.
23 Lenton TM, Held H, Kriegler E, et al. Tipping elements in the Earth’s climate system. Proc Natl Acad Sci USA 2008; 105: 1786–93.
24 Haines A, Ebi KL, Smith KR, Woodward A. Health risks of climate change: act now or pay later. Lancet 2014; 384: 1073–75.
25 Anderson K, Bows A. Beyond ‘dangerous’ climate change: emission scenarios for a new world. Philos Trans A Math Phys. Eng Sci 1934; 2011: 20–44.
26 WHO. Health in the Green Economy. Geneva: World Health Organisation, 2011.
27 Watts G. The health benefi ts of tackling climate change: an Executive Summary for the Lancet Series. Nov 25, 2009. http://www.thelancet.com/pb/assets/raw/Lancet/stories/series/health-and-climate-change.pdf (accessed May 10, 2015).
28 WHO, World Bank. Access to modern energy services for health facilities in resource-constrained settings. Geneva: World Health Organization, 2015.
29 Haines A, McMichael AJ, Smith KR, et al. Public health benefi ts of strategies to reduce greenhouse-gas emissions: overview and implications for policy makers. Lancet 2009; 374: 2104–14.
30 Walker BH, Gunderson LH, Kinzig AP, Folke C, Carpenter SR, Schultz L. A handful of heuristics and some propositions for understanding resilience in social-ecological systems. Ecol Soc 2006; 11: 13.
31 Smith KR, Woodward A, Campell-Lendrum D, et al. Human health—impacts adaptation and co-benefi ts. Climate change 2014: impacts, adaptation, and vulnerability Working Group II contribution to the IPCC 5th Assessment Report. Cambridge, UK and New York, NY, USA: Cambridge University Press, 2014.
32 Hales S, Kovats S, Lloyd S, Campbell-Lendrum D. Quantitative risk assessment of the eff ects of climate change on selected causes of death, 2030s and 2050s. Geneva: World Health Organization, 2014.
33 Adger WN, Pulhin JM, Barnett J, et al. Human security. In: Field CB, Barros VR, Dokken DJ, et al, eds. Climate change 2014: impacts, adaptation, and vulnerability. Part A: global and sectoral aspects contribution of Working Group II to the Fifth Assessment Report of the Intergovernmental Panel of Climate Change. Cambridge, UK and New York, NY, USA: Cambridge University Press; 2014: 755–91.
34 Barrett CB. Food security and sociopolitical stability. Oxford: Oxford University Press, 2013.
35 Bradshaw S, Fordham M. Women, girls and disasters: a review for DFID. London: Department for International Development (DFID), 2013.
36 Jonkman SN, Kelman I. An analysis of the causes and circumstances of fl ood disaster deaths. Disasters 2005; 29: 75–97.
37 WHO. Gender, climate change and health. Geneva: World Health Organization, 2014.
38 Patz JA, Campbell-Lendrum D, Holloway T, Foley JA. Impact of regional climate change on human health. Nature 2005; 438: 310–17.
39 Aström C, Orru H, Rocklöv J, Strandberg G, Ebi KL, Forsberg B. Heat-related respiratory hospital admissions in Europe in a changing climate: a health impact assessment. BMJ Open 2013; 3: e001842.
40 Russo S, Dosio A, Graversen RG, et al. Magnitude of extreme heat waves in present climate and their projection in a warming world. J Geophys Res D Atmospheres 2014; 199: 12 500–512.
41 Coumou D, Robinson A. Historic and future increase in the global land area aff ected by monthly heat extremes. Environ Res Lett 2013; 8: 034018.
42 Ryazantzev S. Demographic and socio-economic consequences of heat wave and forest fi res of 2010 in European Russia. Ecol Life 2011; 5: 80–85.
43 van Donkelaar A, Martin RV, Levy RC, et al. Satellite-based estimates of ground-level fi ne particulate matter during extreme events: a case study of the Moscow fi res in 2010. Atmos Environ 2011; 45: 6225–32.
44 Revitch B, Shaposhnikov D. Climate change, heat and cold waves as risk factors of increased mortality in Russia. Ecoforum 2012; 2: 122–38.
45 Barriopedro D, Fischer EM, Luterbacher J, Trigo RM, García-Herrera R. The hot summer of 2010: redrawing the temperature record map of Europe. Science 2011; 332: 220–24.
46 Ebi K, Mills D. Winter mortality in a warming climate: a reassessment. Wiley Interdiscip Rev Clim Change 2013; 4: 203–12.
47 Healy JD. Excess winter mortality in Europe: a cross country analysis identifying key risk factors. J Epidemiol Community Health 2003; 57: 784–89.
48 Woodward A. Heat, cold and climate change. J Epidemiol Community Health 2014; 68: 595–96.
49 Staddon P, Montgomery H, Depledge M. Climate warming will not decrease winter mortality. Nature Clim Change 2014; 4: 190–94.
50 Seto KC, Güneralp B, Hutyra LR. Global forecasts of urban expansion to 2030 and direct impacts on biodiversity and carbon pools. Proc Natl Acad Sci USA 2012; 109: 16083–88.
51 O’Neill B, Kriegler E, Ebi K, et al. The roads ahead: narratives for shared socioeconomic pathways describing world futures in the 21st century. Glob Environ Change 2015; published online Feb 12. DOI:10.1016/j.gloenvcha.2015.01.004.
52 Samir K, Lutz W. The human core of the shared socioeconomic pathways: population scenarios by age, sex and level of education for all countries to 2100. Glob Environ Change 2014; published online July 4. DOI:10.1016/j.gloenvcha.2014.06.004.
53 Kriegler E, O’Neill BC, Hallegatte S, et al. The need for and use of socio-economic scenarios for climate change analysis: a new approach based on shared socio-economic pathways. Glob Environ Change 2012; 22: 807–22.
54 Bhatt S, Gething PW, Brady OJ, et al. The global distribution and burden of dengue. Nature 2013; 496: 504–07.
55 Kovats RS, Hajat S. Heat stress and public health: a critical review. Annu Rev Public Health 2008; 29: 41–55.
56 Quinn T, Adger N. Climate change when you are getting on in life. Environ Plann A 2011; 43: 2257–60.
57 Lutz W, Muttarak R, Striessnig E. Environment and development. Universal education is key to enhanced climate adaptation. Science 2014; 346: 1061–62.
58 Kjellstrom T, Holmer I, Lemke B. Workplace heat stress, health and productivity—an increasing challenge for low and middle-income countries during climate change. Global Health Action 2009; 2: 10.3402/gha.v2i0.2047.
59 Parsons K. Human thermal environment: the eff ects of hot, moderate and cold temperatures on human health, comfort and performance, 3rd edn. New York: CRC Press, 2014.
60 Hémon D, Jougla E. Surmortalité liée à la Canicule d’Août 2003: Rapport d’Étape. Estimation de la Surmortalite et Principales Caracteristiques Epidemiologiques. Rapport remis au Ministre de la Santé, de la Famille et des Personnes Handicapées. Paris: Institut National de la Santé et de la Recherche Médicale (INSERM), 2003.
61 Centers for Disease Control and Prevention (CDC). Heat-related deaths among crop workers—United States, 1992–2006. MMWR Morb Mortal Wkly Rep 2008; 57: 649–53.
92

The Lancet Commissions
www.thelancet.com Vol 386 November 7, 2015 1909
62 Wesseling C, Crowe J, Hogstedt C, Jakobsson K, Lucas R, Wegman DH, and the First International Research Workshop on the Mesoamerican Nephropathy. Resolving the enigma of the mesoamerican nephropathy: a research workshop summary. Am J Kidney Dis 2014; 63: 396–404.
63 DARA and the Climate Vulnerability Forum. Climate vulnerability monitor 2012: a guide to the cold calculus of a hot planets. Barcelona: Fundacion DARA Internacional, 2012.
64 United Nations Development Programme (UNDP). Human development report 2011. Sustainability and equity: a better future for all. London: UNDP, 2011.
65 Dunne JP, Stouff er RJ, John JG. Reductions in labour capacity from heat stress under climate warming. Nature Clim Change 2013; 3: 563–66.
66 Porter JR, Xie L, Challinor AJ, et al. Food security and food production systems. In: Field CB, Barros VR, Dokken DJ, et al. Climate change 2014: impacts, adaptation, and vulnerability. Part A: global and sectoral aspects contribution of Working Group II to the Fifth Assessment Report of the Intergovernmental Panel on Climate Change. Cambridge, UK and New York, NY, USA: Cambridge University Press, 2014: 485–533.
67 Sherwood SC, Huber M. An adaptability limit to climate change due to heat stress. Proc Natl Acad Sci USA 2010; 107: 9552–55.
68 WHO. World malaria report. Geneva: World Health Organization, 2012.
69 Ndyomugyenyi R, Magnussen P. Trends in malaria-attributable morbidity and mortality among young children admitted to Ugandan hospitals, for the period 1990–2001. Ann Trop Med Parasitol 2004; 98: 315–27.
70 Siraj AS, Santos-Vega M, Bouma MJ, Yadeta D, Ruiz Carrascal D, Pascual M. Altitudinal changes in malaria incidence in highlands of Ethiopia and Colombia. Science 2014; 343: 1154–58.
71 Sutherst RW. Global change and human vulnerability to vector-borne diseases. Clin Microbiol Rev 2004; 17: 136–73.
72 WHO, World Meteorological Organisation. Atlas of health and climate. Geneva: World Health Organization, 2012.
73 Hopp J, Foley J. Worldwide fl uctuations in dengue fever case related to climate variability. Clim Res 2003; 25: 85–94.
74 Lipp EK, Huq A, Colwell RR. Eff ects of global climate on infectious disease: the cholera model. Clin Microbiol Rev 2002; 15: 757–70.
75 WHO. Burden on disease from air pollution in 2012. 2014. http://www.who.int/phe/health_topics/outdoorair/databases/FINAL_HAP_AAP_BoD_24March2014.pdf (accessed Oct 7, 2014).
76 Jacob DJ, Winner DA. Eff ect of climate change on air quality. Atmos Environ 2009; 43: 51–63.
77 Giorgi F, Meleux F. Modelling the regional eff ects of climate change on air quality. C R Geosci 2007; 339: 721–33.
78 Schär C, Vidale PL, Lüthi D, et al. The role of increasing temperature variability in European summer heatwaves. Nature 2004; 427: 332–36.
79 Wu S, Mickley LJ, Leibensperger EM, Jacob DJ, Rind D, Streets DG. Eff ects of 2000–2050 global change on ozone air quality in the United States. J Geophys Res, D, Atmospheres 2008; 113: D06302.
80 Tagaris E, Manomaiphiboon K, Liao K-J, et al. Impacts of global climate change and emissions on regional ozone and fi ne particulate matter concentrations over the United States. J Geophys Res, D, Atmospheres 2007; 112: D14312.
81 Murazaki K, Hess P. How does climate change contribute to surface ozone change over the United States? J Geophys Res, D, Atmospheres 2006; 111: D05301.
82 Mickley LJ, Jacob DJ, Field BD, Rind D. Eff ects of future climate change on regional air pollution episodes in the United States. Geophys Res Lett 2004; 31: L24103.
83 Knowlton K, Rosenthal JE, Hogrefe C, et al. Assessing ozone-related health impacts under a changing climate. Environ Health Perspect 2004; 112: 1557–63.
84 Jiang H, Liao H, Pye HOT, et al. Projected eff ect of 2000–2050 changes in climate and emissions on aerosol levels in China and associated transboundary transport. Atmos Chem Phys 2013; 13: 7937–60.
85 Wang Y, Shen L, Wu S, Mickley L, He J, Hao J. Sensitivity of surface ozone over China to 2000–2050 global changes of climate and emissions. Atmos Environ 2013; 75: 374–82.
86 Jiang Z, Zhang X, Wang J. Projection of climate change in China in the 21st century by IPCC-AR4 models. Geograph Res 2008; 27: 787–99.
87 Lim SS, Vos T, Flaxman AD, et al. A comparative risk assessment of burden of disease and injury attributable to 67 risk factors and risk factor clusters in 21 regions, 1990–2010: a systematic analysis for the Global Burden of Disease Study 2010. Lancet 2012; 380: 2224–60.
88 Lobell DB, Banziger M, Magorokosho C, Vivek B. Nonlinear heat eff ects on African maize as evidenced by historical yield trials. Nature Clim Change 2011; 1: 42–45.
89 Lobell DB, Schlenker W, Costa-Roberts J. Climate trends and global crop production since 1980. Science 2011; 333: 616–20.
90 Grace K, Davenport F, Funk C, Lerner AM. Child malnutrition and climate in Sub-Saharan Africa: An analysis of recent trends in Kenya. Appl Geogr 2012; 35: 405–13.
91 Taylor RG, Scanlon B, Doll P, et al. Ground water and climate change. Nature Clim Change 2013; 3: 322–29.
92 Schewe J, Heinke J, Gerten D, et al. Multimodel assessment of water scarcity under climate change. Proc Natl Acad Sci USA 2014; 111: 3245–50.
93 Ahern M, Kovats RS, Wilkinson P, Few R, Matthies F. Global health impacts of fl oods: epidemiologic evidence. Epidemiol Rev 2005; 27: 36–46.
94 Dasgupta S, Laplante B, Meisner C, Wheeler D, Yan J. The impact of sea level rise on developing countries: a comparative analysis. Clim Change 2009; 93: 379–88.
95 Nicholls R, Marinova N, Lowe J, et al. Sea-level rise and its possible impacts given a ‘beyond 4°C world’ in the twenty-fi rst century. Philos Trans R Soc A 1934; 2011: 161–81.
96 Paranjothy S, Gallacher J, Amlôt R, et al. Psychosocial impact of the summer 2007 fl oods in England. BMC Public Health 2011; 11: 145.
97 Jongman B, Ward PJ, Aerts JCJH. Global exposure to river and coastal fl ooding: Long term trends and changes. Glob Environ Change 2012; 22: 823–35.
98 Olsson L, Opondo M, Tschakert P, et al. Livelihoods and poverty. In: Field CB, Barros VR, Dokken DR, et al, eds. Climate change 2014: impacts, adaptation, and vulnerability. Part A: global and sectoral aspects contribution of Working Group II to the Fifth Assessment Report of the Intergovernmental Panel on Climate Change. Cambridge, UK and New York, NY: Cambridge University Press, 2014: 793–832.
99 Gleditsch NP. Whither the weather? Climate change and confl ict. J Peace Res 2012; 49: 3–9.
100 McMichael C, Barnett J, McMichael AJ. An ill wind? Climate change, migration, and health. Environ Health Perspect 2012; 120: 646–54.
101 Black R, Arnell NW, Adger WN, Thomas D, Geddes A. Migration, immobility and displacement outcomes following extreme events. Environ Sci Pol 2013; 27 (suppl 1): S32–43.
102 Frumkin H, McMichael AJ. Climate change and public health: thinking, communicating, acting. Am J Prev Med 2008; 35: 403–10.
103 Frumkin H, Hess J, Luber G, Malilay J, McGeehin M. Climate change: the public health response. Am J Public Health 2008; 98: 435–45.
104 O’Brien K. Global environmental change II: From adaptation to deliberate transformation. Prog Hum Geogr 2012; 36: 667–76.
105 Pelling M. Adaptation to climate change: from resilience to transformation. London: Routledge, 2011.
106 Adger WN. Vulnerability. Glob Environ Change 2006; 16: 268–81.107 Patz J, Gibbs H, Foley J, Rogers J, Smith K. Climate change and
global health: quantifying a growing ethical crisis. EcoHealth 2007; 4: 397–405.
108 IPCC. Glossary of terms. In: Field CB, Stocker TF, Qin D, eds. Managing the risks of extreme events and disasters to advance climate change adaptation. A special report of Working Groups I and II of the Intergovernmental Panel on Climate Change. London, UK and New York, NY: Cambridge University Press, 2012: 555–64.
109 Adger WN. Social and ecological resilience: are they related? Prog Hum Geogr 2000; 24: 347–64.
110 Hackmann H, St Clair AL. Transformative cornerstones of social science research for global change. Paris: International Social Science Council, 2012.
111 Pascal M, Laaidi K, Ledrans M, et al. France’s heat health watch warning system. Int J Biometeorol 2006; 50: 144–53.
93
The Lancet Commissions
1910 www.thelancet.com Vol 386 November 7, 2015
112 Fouillet A, Rey G, Wagner V, et al. Has the impact of heat waves on mortality changed in France since the European heat wave of summer 2003? A study of the 2006 heat wave. Int J Epidemiol 2008; 37: 309–17.
113 Ebi KL, Burton I. Identifying practical adaptation options: an approach to address climate change-related health risks. Environ Sci Policy 2008; 11: 359–69.
114 Matthies F, Bickler G, Marin NC, Hales S. Heat-health action plans: guidance. Copenhagen: World Health Organization Regional Offi ce for Europe, 2008.
115 Pugh TAM, Mackenzie AR, Whyatt JD, Hewitt CN. Eff ectiveness of green infrastructure for improvement of air quality in urban street canyons. Environ Sci Technol 2012; 46: 7692–99.
116 UN Economic and Social Commission for Asia and the Pacifi c, UN Offi ce for Disaster Risk Reduction. Reducing vulnerability and exposure to disasters. The Asia-Pacifi c disaster report 2012. Bangkok: ESCAP and UNISDR, 2012.
117 Nicholls RJ, Lowe JA. Benefi ts of mitigation of climate change for coastal areas. Glob Environ Change 2004; 14: 229–44.
118 Etzold B, Ahmed AU, Hassan SR, Neelormi S. Clouds gather in the sky, but no rain falls. Vulnerability to rainfall variability and food insecurity in Northern Bangladesh and its eff ects on migration. Clim Dev 2013; 6: 18–27.
119 McGranahan G, Balk D, Anderson B. The rising tide: assessing the risks of climate change and human settlements in low elevation coastal zones. Environ Urban 2007; 19: 17–37.
120 Foresight. Migration and global environmental change: future challenges and opportunities. London: UK Government Offi ce for Science, 2011.
121 Michel-Kerjan E. Catastrophe economics: the national fl ood insurance program. J Econ Perspect 2010; 24: 165–86.
122 Laff erty KD. Calling for an ecological approach to studying climate change and infectious diseases. Ecology 2009; 90: 932–33.
123 Zinsstag J, Schelling E, Wyss K, Mahamat MB. Potential of cooperation between human and animal health to strengthen health systems. Lancet 2005; 366: 2142–45.
124 Allison EH, Perry AL, Badjeck M-C, et al. Vulnerability of national economies to the impacts of climate change on fi sheries. Fish Fish 2009; 10: 173–96.
125 Dulvy N, Allison E. A place at the table? Nature Rep Clim Change 2009; 3: 68–70.
126 Gephart J, Pace M, D’Odorico P. Freshwater savings from marine protein consumption. Environ Res Lett 2014; 9: 014005.
127 Foley JA, Ramankutty N, Brauman KA, et al. Solutions for a cultivated planet. Nature 2011; 478: 337–42.
128 Bajželj B, Richards K, Allwood J, et al. Importance of food-demand management for climate mitigation. Nature Clim Change 2014; 4: 924–29.
129 UN Environment Programme (UNEP). Avoiding future famines: strengthening the ecological foundation of food security through sustainable food systems. Nairobi: UNEP, 2012.
130 Food and Agricultural Organization (FAO), International Fund for Agricultural Development, World Food Programme. The state of food insecurity in the world: how does international price volatility aff ect domestic economies and food security? Rome: FAO, 2011.
131 Food and Agricultural Organization (FAO), Organization for Economic Cooperation and Development. Price volatility in food and agricultural markets: policy responses. Rome: FAO, 2011.
132 Gilbert CL, Morgan CW. Food price volatility. Phil Trans R Soc B 2010; 365: 3023–34.
133 UN Conference on Trade and Development (UNCTAD). Promoting low-carbon investment. New York and Geneva: UNCTAD, 2013.
134 Cochrane K, Young C, De Soto D, Bahri T. Climate change implications for fi sheries and aquaculture - overview of current scientifi c knowledge. Rome: Food and Agricultural Organization, 2009.
135 Alston J, Marra M, Pardey P, Wyatt T. Research returns redux: a meta-analysis of the returns to agricultural R&D. Aust J Agric Resour Econ 2000; 44: 185–215.
136 von Braun J, Ahmed A, Asenso-Okyere K, et al. High food prices: the what, who, and how of proposed policy actions. Washington DC: International Food Policy Research Institute, 2008.
137 Rosegrant MW, Cline SA. Global food security: challenges and policies. Science 2003; 302: 1917–19.
138 UN High Level Task Force on the Global Food Security Crisis. Scaling up nutrition: a framework for action. 2010. http://siteresources.worldbank.org/NUTRITION/Resources/281846-1131636806329/PolicyBriefNutrition.pdf (accessed May 10, 2015).
139 Hugo G. Future demographic change and its interactions with migration and climate change. Glob Environ Change 2011; 21: S21–33.
140 Martin SF, Warner K. Climate change, migration, and development. In: Omelaniuk I, ed. Global perspectives on migration and development. New York: Springer Books, 2012: 153–72.
141 Collinson S. Developing adequate humanitarian responses. Background papers of the study team on climate change and migration. Washington DC: The German Marshall Fund of the United States, 2010.
142 Oppenheimer M, Campos M, Warren R, et al. Emergent risks and key vulnerabilities. Climate change 2014: impacts, adaptation, and vulnerability Working Group II Contribution to the IPCC 5th Assessment Report. Cambridge, UK and New York, NY: Cambridge University Press; 2014. 1039–99.
143 Confalonieri U, Menne B, Akhtar R, et al. Human health. In: Parry MC, Palutikof OF, van der Linden JP, et al, eds. Climate change 2007: impacts, adaptation and vulnerability contribution of Working Group II to the Fourth Assessment Report of the Intergovernmental Panel on Climate Change. Cambridge: Cambridge University Press; 2007: 391–431.
144 Warner K, Afi fi T, Kälin W, et al. Changing climate, moving people: framing migration, displacement and planned relocation. Policy brief no 8. Bonn: UN University Institute for Environment and Human Security, 2013.
145 Raleigh C. The search for safety: The eff ects of confl ict, poverty and ecological infl uences on migration in the developing world. Glob Environ Change 2011; 21 (suppl 1): S82–93.
146 O’Brien K, Pelling M, Patwardhan A, et al. Toward a sustainable and resilient future. In: Field CB, Stocker TF, Qin D, et al, eds. Managing the risks of extreme events and disasters to advance climate change adaptation. A special report of Working Groups I and II of the Intergovernmental Panel on Climate Change. Cambridge, UK and New York, NY: Cambridge University Press, 2012: 437–86.
147 Berry HL, Bowen K, Kjellstrom T. Climate change and mental health: a causal pathways framework. Int J Public Health 2010; 55: 123–32.
148 Fritze JG, Blashki GA, Burke S, Wiseman J. Hope, despair and transformation: climate change and the promotion of mental health and wellbeing. Int J Ment Health Syst 2008; 2: 13.
149 Albrecht G, Sartore GM, Connor L, et al. Solastalgia: the distress caused by environmental change. Australas Psychiatry 2007; 15 (suppl 1): S95–98.
150 Hanigan IC, Butler CD, Kokic PN, Hutchinson MF. Suicide and drought in New South Wales, Australia, 1970-2007. Proc Natl Acad Sci USA 2012; 109: 13950–55.
151 Keshavarz M, Karami E, Vanclay F. The social experience of drought in rural Iran. Land Use Policy 2013; 30: 120–29.
152 Kessler RC, Galea S, Gruber MJ, Sampson NA, Ursano RJ, Wessely S. Trends in mental illness and suicidality after Hurricane Katrina. Mol Psychiatry 2008; 13: 374–84.
153 Reser JP, Swim JK. Adapting to and coping with the threat and impacts of climate change. Am Psychol 2011; 66: 277–89.
154 Johnson CA. Governing climate displacement: the ethics and politics of human resettlement. Env Polit 2012; 21: 308–28.
155 Lal PN, Mitchell T, Aldunce P, et al. National systems for managing the risks from climate extremes and disasters. In: Field CB, Stocker TF, Qin D, et al, eds. Managing the risks of extreme events and disasters to advance climate change adaptation. A special report of Working Groups I and II of the Intergovernmental Panel on Climate Change. Cambridge, UK and New York, NY: Cambridge University Press; 2012: 339–92.
156 Barnett J, Webber M. Migration as adaptation: opportunities and limits. In: McAdam J, ed. Climate change and displacement: multidisciplinary perspectives. Oxford: Hart Publishing, 2010: 55.
157 Warner K, Afi fi T. Where the rain falls: evidence from 8 countries on how vulnerable households use migration to manage the risk of rainfall variability and food insecurity. Clim Devel 2014; 6: 1–17.
158 Bronen R, Chapin FS 3rd. Adaptive governance and institutional strategies for climate-induced community relocations in Alaska. Proc Natl Acad Sci USA 2013; 110: 9320–25.
94
The Lancet Commissions
www.thelancet.com Vol 386 November 7, 2015 1911
159 Shuman EK. Global climate change and infectious diseases. N Engl J Med 2010; 362: 1061–63.
160 Ramasamy R, Surendran SN. Possible impact of rising sea levels on vector-borne infectious diseases. BMC Infect Dis 2011; 11: 18.
161 Moore S, Shrestha S, Tomlinson KW, Vuong H. Predicting the eff ect of climate change on African trypanosomiasis: integrating epidemiology with parasite and vector biology. J R Soc Interface 2012; 9: 817–30.
162 Keesing F, Belden LK, Daszak P, et al. Impacts of biodiversity on the emergence and transmission of infectious diseases. Nature 2010; 468: 647–52.
163 Ebi K, Berry P, Campbell-Lendrum D, et al. Protecting health from climate change: vulnerability and adaptation assessment. Geneva: World Health Organization and Pan American Health Organization, 2012.
164 Cheng JJ, Berry P. Health co-benefi ts and risks of public health adaptation strategies to climate change: a review of current literature. Int J Public Health 2013; 58: 305–11.
165 Heltberg R, Siegel PB, Jorgensen SL. Addressing human vulnerability to climate change: toward a ‘no-regrets’ approach. Glob Environ Change 2009; 19: 89–99.
166 Keim ME. Building human resilience: the role of public health preparedness and response as an adaptation to climate change. Am J Prev Med 2008; 35: 508–16.
167 Jamison DT, Summers LH, Alleyne G, et al. Global health 2035: a world converging within a generation. Lancet 2013; 382: 1898–955.
168 Parry M, Arnell N, Berry P, et al. Assessing the costs of adaptation to climate change: a review of the UNFCCC and other recent estimates. London: Imperial College London and International Institute for Environment and Development, 2009.
169 Jones KE, Patel NG, Levy MA, et al. Global trends in emerging infectious diseases. Nature 2008; 451: 990–93.
170 Grace D, Mutua F, Ochungo P, Kruska R. Mapping of poverty and likely zoonoses hotspots. London: International Livestock Research Institute, 2012.
171 World Bank. The costs to developing countries of adapting to climate change: new methods and estimates. Washington DC: World Bank, 2010.
172 Dye C. After 2015: infectious diseases in a new era of health and development. Philos Trans R Soc Lond B Biol Sci 2014; 369: 20130426.
173 World Bank. People, pathogens and our planet: the economics of one health. Washington DC: World Bank, 2012.
174 Semenza JC, Suk JE, Estevez V, Ebi KL, Lindgren E. Mapping climate change vulnerabilities to infectious diseases in Europe. Environ Health Perspect 2012; 120: 385–92.
175 Teutsch SM, Churchill RE. Principles and practice of public health surveillance, 2nd edn. New York, NY: Oxford University Press, 2000.
176 Colls A, Ash N, Ikkala N. Ecosystem-based adaptation: a natural response to climate change. Switzerland: International Union for Conservation of Nature, 2009.
177 Pramova E, Locatelli B, Brockhaus M, Fohlmeister S. Ecosystem services in the national adaptation programmes of action. Clim Pol 2012; 12: 393–409.
178 Pramova E, Locatelli B, Djoudi H, Somorin OA. Forests and trees for social adaptation to climate variability and change. Wiley Interdiscip Rev Clim Chang 2012; 3: 581–96.
179 Spalding MD, Ruff o S, Lacambra C, et al. The role of ecosystems in coastal protection: adapting to climate change and coastal hazards. Ocean Coast Manage 2014; 90: 50–57.
180 Mimura N, Pulwarty R, Duc D, et al. Adaptation planning and implementation. Climate change 2014: impacts, adaptation, and vulnerability Working Group II Contribution to the IPCC 5th Assessment Report. Cambridge, UK and New York, NY: Cambridge University Press, 2014.
181 The Royal Society. Resilience to extreme weather. London: The Royal Society Science Policy Centre, 2014.
182 Gill SE, Handley JF, Ennos AR, Pauleit S. Adapting cities for climate change: the role of the green infrastructure. Built Environ 2007; 33: 115–33.
183 Munang R, Thiaw I, Alverson K, Mumba M, Liu J, Rivington M. Climate change and Ecosystem-based Adaptation: a new pragmatic approach to buff ering climate change impacts. Curr Opin Environ Sustain 2013; 5: 67–71.
184 Drewniak B, Snyder P, Steiner A, Twine T, Wuebbles D. Simulated changes in biogenic VOC emissions and ozone formation from habitat expansion of Acer Rubrum (red maple). Environ Res 2014; 9: 014006.
185 Stone B Jr, Vargo J, Liu P, et al. Avoided heat-related mortality through climate adaptation strategies in three US cities. PLoS One 2014; 9: e100852.
186 Huang C, Vaneckova P, Wang X, Fitzgerald G, Guo Y, Tong S. Constraints and barriers to public health adaptation to climate change: a review of the literature. Am J Prev Med 2011; 40: 183–90.
187 Wilbanks T, Leiby P, Perlack R, Ensminger JT, Wright S. Toward an integrated analysis of mitigation and adaptation: some preliminary fi ndings. Mitig Adapt Strategies Glob Change 2007; 12: 713–25.
188 California Natural Resources Agency. 2009 California climate adaptation strategy: a report to the Governor of the state of California in response to Executive Order S-13-2008. Sacramento: California Natural Resources Agency, 2009.
189 Feiock RC. Metropolitan Governance and Institutional Collective Action. Urban Aff Rev 2008; 44: 356–77.
190 UNFCCC. Third synthesis report on technology needs identifi ed by Parties not included in Annex I to the Convention. Document FCCC/SBSTA/2013/Inf7 Subsidiary Body for Scientifi c and Technological Advice, thirty-ninth session. Warsaw: UNFCCC, 2013.
191 Leiserowitz A, Maibach E, Roser-Renouf C, Feinberg G, Rosenthal S, Marlon J. Public perceptions of the health consequences of global warming. New Haven: Yale University and George Mason University, 2014.
192 Moser SC, Dilling L. Creating a climate for change: communicating climate change and facilitating social change. Cambridge: Cambridge University Press, 2007.
193 Noble I, Huq S, Ayers J, et al. Adaptation needs and options. Climate change 2014: impacts, adaptation, and vulnerability Working Group II Contribution to the IPCC 5th Assessment Report. Cambridge, UK and New York, NY: Cambridge University Press, 2014.
194 Graus W, Blomen E, Worrell E. Global energy effi ciency improvement in the long term: a demand-and supply-side perspective. Energy Effi ciency 2011; 4: 435–63.
195 International Energy Agency (IEA). Redrawing the energy-climate map. World energy outlook special report. Paris: IEA, 2013.
196 Vaughan N, Lenton T. A review of climate geoengineering proposals. Clim Change 2011; 109: 745–90.
197 Lackner KS, Brennan S, Matter JM, Park AH, Wright A, van der Zwaan B. The urgency of the development of CO2 capture from ambient air. Proc Natl Acad Sci USA 2012; 109: 13156–62.
198 Fischedick M, Schaeff er R, Adedoyin A, et al. Mitigation potential and costs. In: Edenhofer O, Pichs-Madruga R, Sokona Y, et al, eds. IPCC special report on renewable energy sources and climate change mitigation. Cambridge, UK and New York, NY: Cambridge University Press, 2011.
199 Bvd Z. The role of nuclear power in mitigating emissions from electricity generation. Energy Strat Rev 2013; 1: 296–301.
200 Scovronick N, Adair-Rohani H, Borgford-Parnell N, et al. Reducing global health risks through mitigation of short-lived climate pollutants: scoping report for policymakers. Geneva: World Health Organization and Climate and Clean Air Coalition, 2015.
201 Summary for policymakers. In: Edenhofer O, Pichs-Madruga R, Sokona Y, et al, eds. Climate change 2014: mitigation of climate change contribution of Working Group III to the Fifth Assessment Report of the Intergovernmental Panel on Climate Change. Cambridge, UK and New York, NY: Cambridge University Press, 2014.
202 Victor D, Zhou D, Ahmed E, et al. Introductory Chapter. In: Edenhofer O, Pichs-Madruga R, Sokona Y, et al, eds. Climate change 2014: mitigation of climate change contribution of Working Group III to the Fifth Assessment Report of the Intergovernmental Panel on Climate Change. Cambridge, UK and New York, NY: Cambridge University Press, 2014.
203 Bruckner T, Bashmakov I, Mulugetta Y, et al. Energy Systems. In: Edenhofer O, Pichs-Madruga R, Sokona Y, et al, eds. Climate change 2014: mitigation of climate change contribution of Working Group III to the Fifth Assessment Report of the Intergovernmental Panel on Climate Change. Cambridge, UK and New York, NY: Cambridge University Press, 2014.
95

The Lancet Commissions
1912 www.thelancet.com Vol 386 November 7, 2015
204 Staff ord Smith M, Horrocks L, Harvey A, Hamilton C. Rethinking adaptation for a 4°C world. Philos Trans A Math Phys Eng Sci 2011; 369: 196–216.
205 Basedau M, Lay J. Resource curse or rentier peace? The ambiguous eff ects of oil wealth and oil dependence on violent confl ict. J Peace Res 2009; 46: 757–76.
206 Schaeff er R, Szkloa A, Pereira-de-Lucena A, et al. Energy sector vulnerability to climate change: a review. Energy 2012; 38: 1–12.
207 Schaeff er M, Hare W, Rahmstorf S, Vermeer M. Long-term sea-level rise implied by 1·5°C and 2°C warming levels. Nature Clim Change 2012; 2: 867–70.
208 Czisch G. Scenarios for a future electricity supply: cost-optimised variations on supplying Europe and its neighbours with electricity from renewable energies. Stevenage: Institution of Engineering and Technology, 2011.
209 International Energy Agency (IEA). World energy outlook 2013. Paris: IEA, 2013.
210 Barrett J, Le Quéré, Lenzen M, Peters G, Roelich K, Wiedmann T. Consumption-based emissions reporting. Memorandum submitted by UKERC (CON 19). 2011. http://www.publications.parliament.uk/pa/cm201012/cmselect/cmenergy/writev/consumpt/con20.htm (accessed May 10, 2015).
211 Blanco G, Gerlagh R, Suh S, et al. Drivers, trends and mitigation. In: Edenhofer O, Pichs-Madruga R, Sokona Y, et al, eds. Climate change 2014: mitigation of climate change contribution of Working Group III to the Fifth Assessment Report of the Intergovernmental Panel on Climate Change. Cambridge, UK and New York, NY: Cambridge University Press, 2014.
212 World Bank. World development indicators—GDP per capita (constant 2005 US$). Washington, DC: World Bank, 2015.
213 World Bank. World development indicators—CO2 emissions (metric tons per capita). Tennessee: World Bank, 2015.
214 Open Working Group proposal for Sustainable Development Goals. New York: UN Department of Economic and Social Aff airs, Division for Sustainable Development, 2014.
215 Markandya A, Armstrong BG, Hales S, et al. Public health benefi ts of strategies to reduce greenhouse-gas emissions: low-carbon electricity generation. Lancet 2009; 374: 2006–15.
216 Markandya A, Wilkinson P. Electricity generation and health. Lancet 2007; 370: 979–90.
217 Wilkinson P, Smith KR, Davies M, et al. Public health benefi ts of strategies to reduce greenhouse-gas emissions: household energy. Lancet 2009; 374: 1917–29.
218 Woodcock J, Edwards P, Tonne C, et al. Public health benefi ts of strategies to reduce greenhouse-gas emissions: urban land transport. Lancet 2009; 374: 1930–43.
219 Davies M, Oreszczyn T. The unintended consequences of decarbonising the built environment: a UK case study. Energy Build 2012; 46: 80–85.
220 Proust K, Newell B, Brown H, et al. Human health and climate change: leverage points for adaptation in urban environments. Int J Environ Res Public Health 2012; 9: 2134–58.
221 Shaw MR, Overpeck JT, Midgley GF. Cross-chapter box on ecosystem based approaches to adaptation—emerging opportunities. In: Field CB, Barros VR, Dokken DJ, et al, eds. Climate change 2014: impacts, adaptation, and vulnerability. Part A: global and sectoral aspects contribution of Working Group II to the Fifth Assessment Report of the Intergovernmental Panel of Climate Change. Cambridge, UK and New York, NY, USA: Cambridge University Press, 2014: 101–03.
222 NHS Sustainable Development Unit. Saving carbon, improving health: NHS carbon reduction strategy. Cambridge: Sustainable Development Unit, 2009.
223 Public Health England and NHS England. Module: carbon hotspots. Sustainable development strategy for the health and care system 2014–2020. London: Sustainable Development Unit, 2014.
224 US Environmental Protection Agency (EPA). Inventory of US greenhouse gas emissions and sinks: 1990–2009. Washington, DC: EPA, 2011.
225 Global Green and Healthy Hospitals Network. Greenhouse Gas Emissions Reduction and Availability of Energy-Saving Practices in the Special Context of a Hospital Environment: Yonsei University Health System. 2014. http://greenhospitals.net/en/case-studies/ (accessed Dec 7, 2014).
226 Health G. Gundersen reaches fi rst days of energy independence: fi rst health system in nation to achieve this distinction. 2014. http://www.gundersenenvision.org/gundersen-reaches-fi rst-days-of-energy-independence (accessed Dec 7, 2014).
227 Sustainable Development Unit. NHS, Public Health and Social Care. A cross England health system statement for the UN Climate Summit. Cambridge: Sustainable Development Unit, 2014.
228 Jensen HT, Keogh-Brown MR, Smith RD, et al. The importance of health co-benefi ts in macroeconomic assessments of UK greenhouse gas emission reduction strategies. Clim Change 2013; 121: 223–37.
229 West J, Fiore A, Horowitz L. Scenarios of methane emission reductions to 2030: abatement costs and co-benefi ts to ozone air quality and human mortality. Clim Change 2012; 114: 441–61.
230 Institute for Sustainable Development and International Relations, Sustainable Development Solutions Network. Pathways to deep decarbonization: interim 2014 report. Washington, DC: SDSN and IDDRI, 2014.
231 Clarke L, Jiang K, Akimoto K, et al. Assessing transformation pathways. In: Edenhofer O, Pichs-Madruga R, Sokona Y, et al, eds. Climate change 2014: mitigation of climate change contribution of Working Group III to the Fifth Assessment Report of the Intergovernmental Panel on Climate Change. Cambridge, UK and New York, NY, USA: Cambridge University Press, 2014.
232 Krey V, Masera G, Blanford T, et al. Annex II: metrics & methodology. In: Edenhofer O, Pichs-Madruga R, Sokona Y, et al, eds. Climate change 2014: mitigation of climate change contribution of Working Group III to the Fifth Assessment Report of the Intergovernmental Panel on Climate Change. Cambridge, UK and New York, NY, USA: Cambridge University Press, 2014.
233 Mills B, Schleich J. Residential energy-effi cient technology adoption, energy conservation, knowledge, and attitudes: an analysis of European countries. Energy Pol 2012; 49: 616–28.
234 Gilligan J, Dietz T, Gardner G, Stern P, Vandenbergh M. The behavioural wedge. Signifi cance 2010; 7: 17–20.
235 Mohareb E, Kennedy C. Scenarios of technology adoption towards low-carbon cities. Energy Pol 2014; 66: 685–93.
236 Verbeek P. Ethiek en technologie: moreel actorschap en subjectiviteit in een technologische cultuur. Ethische Perspectiven 2006; 16: 267–89.
237 International Energy Agency. Energy technology perspectives 2012. Paris: IEA, 2012.
238 International Energy Agency. Coal medium-term market report 2012. Paris: IEA, 2012.
239 Mills E. Weighing the risks of climate change mitigation strategies. Bull At Sci 2012; 68: 67–78.
240 Lowe R. Defi ning and meeting the carbon constraints of the 21st Century. Build Res Inform 2000; 28: 159–75.
241 Geels F. Technological transitions and system innovations: a co-evolutionary and socio-technical analysis. Cheltenham: Edward Elgar, 2005.
242 Dechezlepretre A, Glachant M, Hascic I, Johnstone N, Meniere Y. Invention and transfer of climate change-mitigation technologies: a global analysis. Rev Environ Econ Pol 2011; 5: 109–30.
243 Karakosta C, Doukas H, Psarras J. Technology transfer through climate change: setting a sustainable energy pattern. Renew Sustain Energy Rev 2010; 14: 1546–57.
244 Jakob M, Steckel J. How climate change mitigation could harm development in poor countries. Wiley Interdiscip Rev Clim Change 2014; 5: 161–68.
245 Chambwera M, Heal G, Dubeux C, et al. Economics of adaptation. In: Field CB, Barros VR, Dokken DJ, et al, eds. Climate change 2014: impacts, adaptation, and vulnerability. Part A: global and sectoral aspects contribution of Working Group II to the Fifth Assessment Report of the Intergovernmental Panel of Climate Change. Cambridge, UK and New York, NY, USA: Cambridge University Press, 2014: 945–77.
246 Webster PJ. Meteorology: improve weather forecasts for the developing world. Nature 2013; 493: 17–19.
247 WHO Regional Offi ce for Europe. Climate change and health: a tool to estimate health and adaptation costs. Copenhagen: World Health Organization, 2013.
248 WHO Regional Offi ce for Europe. Climate, environment and health action plan and information system: policy monitoring and assessment. Copenhagen: World Health Organzation, 2011.
96

The Lancet Commissions
www.thelancet.com Vol 386 November 7, 2015 1913
249 WHO. Global health expenditure database. 2014. http://apps.who.int/nha/database/World_Map/Index/en?id=REPORT_4_WORLD_MAPS&mapType=3&ws=0 (accessed Dec 22, 2014).
250 WHO. World health statistics 2014. http://www.who.int/mediacentre/news/releases/2014/world-health-statistics-2014/en/ (accessed Sept 7, 2014).
251 Organisation of Economic Co-operation and Development. The cost of air pollution: health impacts of road transport. Paris: OECD, 2014.
252 European Commission. Communication from the Commission to the European Parliament, the Council, the European Economic and Social Committee and the Committee of the Regions: a roadmap for moving to a competitive low carbon economy in 2050. Brussels: European Commission, 2011.
253 International Renewable Energy Agency. REmap 2030: a renewable energy roadmap. Abu Dhabi: IRENA, 2014.
254 West JJ, Smith SJ, Silva RA, et al. Co-benefi ts of global greenhouse gas mitigation for future air quality and human health. Nature Clim Chang 2013; 3: 885–89.
255 Thompson T, Rausch S, Saari R, Selin N. A systems approach to evaluating the air quality co-benefi ts of US carbon policies. Nature Clim Change 2014; 4: 917–23.
256 Patz JA, Frumkin H, Holloway T, Vimont DJ, Haines A. Climate change: challenges and opportunities for global health. JAMA 2014; 312: 1565–80.
257 Liddell C, Morris C. Fuel poverty and human health: A review of recent evidence. Energy Pol 2010; 38: 2987–97.
258 Nicol S, Roys M, Davidson M, Ormandy D, Ambrose P. Quantifying the economic cost of unhealthy housing—a case study from England. In: Braubach M, Jacobs DE, Ormandy D, eds. Environmental burden of disease associated with inadequate housing: a method guide to the quantifi cation of health eff ects of selected housing risks in the WHO European Region. Copenhagen: World Health Organization Regional Offi ce for Europe, 2011: 197–208.
259 Copenhagen Economics. Multiple benefi ts of investing in energy effi cient renovation of buildings: impact on public fi nances. Copenhagen: Renovate Europe, 2012.
260 International Energy Agency. World energy outlook. Paris: IEA, 2012.261 The New Climate Economy. Better growth, better climate. New
York: The Global Commission on the Economy and Climate, 2014.262 International Energy Agency. World energy investment outlook.
Paris: IEA, 2014.263 Buchner B, Herve-Mignucci M, Trabacchi C, et al. The global
landscape of climate fi nance. San Francisco: Climate Policy Initiative, 2013.
264 Watkiss P, Downing T. The social cost of carbon: valuation estimates and their use in UK policy. Integr Assess J 2008; 8: 85–105.
265 Grubb M. Planetary economics: energy, climate change and the three domains of sustainable development. London: Routledge, 2014.
266 Arent DJ, Tol RSJ, Faust E, et al. Key economic sectors and services. In: Field CB, Barros VR, Dokken DJ, et al, eds. Climate change 2014: impacts, adaptation, and vulnerability. Part A: global and sectoral aspects contribution of Working Group II to the Fifth Assessment Report of the Intergovernmental Panel of Climate Change. Cambridge, UK and New York, NY, USA: Cambridge University Press, 2014: 659–708.
267 Stern N. Stern Review on the economics of climate change. London: HM Treasury, 2006.
268 Nordhaus W. A review of the Stern Review on the economics of climate change. J Econ Lit 2007; XLV: 703–724.
269 Weitzmann M. Fat-tailed uncertainty in the economics of catastrophic climate change. Rev Environ Econ Policy 2011; 5: 275–92.
270 Stern N. The structure of economic modeling of the potential impacts of climate change: grafting gross underestimation of risk onto already narrow science models. J Econ Lit 2013; 51: 838–59.
271 Goulder L, Williams R. The choice of discount rate for climate change policy evaluation. Clim Change Econ 2012; 3: 18.
272 International Energy Agency. Mind the gap: quantifying principal-agent problems in energy effi ciency. Paris: IEA, 2007.
273 European Commission. Energy economic developments in Europe: European economy. Brussels: European Commission, 2014.
274 Capros P, De Vita A, Tasios D, et al. EU Energy, transport and GHG emissions: trends to 2050–reference scenario. Luxembourg: European Commission, 2013.
275 Sovereign Wealth Funds Institute. Fund rankings 2013. http://www.swfi nstitute.org/fund-rankings/ (accessed Aug 25, 2014).
276 Fulton M, Capalino R. Investing in the clean trillion: closing the clean energy investment gap. Boston: Ceres, 2014.
277 Kaminker C, Kawanishi O, Stewart F, Caldecott B, Howarth N. Institutional investors and green infrastructure investments: selected case studies. Paris: Organization for Economic Co-operation and Development, 2013.
278 Macmillan I, Prakash I, Shoult R. The cash paradox: how record cash reserves are infl uencing corporate behaviour. July, 2014. http://dupress.com/articles/excess-cash-growth-strategies/ (accessed Dec 20, 2014).
279 UN. Millennium Development Goal 8, the challenge we face: MDG Gap Task Force Report 2013. New York: United Nations, 2013.
280 Nachmany M, Fankhauser S, Townshend T, et al. The GLOBE climate legislation study: a review of climate legislation study: a review of climate change legislation in 66 countries. London: GLOBE International and the Grantham Research Institute, London School of Economics, 2014.
281 World Bank Group. State and trends of carbon pricing. Washington, DC: World Bank, 2014.
282 Parry IWH, Heine D, Lis E. Getting the prices right: from principle to practice. Washington, DC: International Monetary Fund, 2014.
283 Schöb R. The Double Dividend Hypothesis of Environmental Taxes. Working Paper no.946. Munich: Centre for Economic Studies & the ifo Group, 2003.
284 International Energy Agency. World Energy Outlook. Paris; 2010.285 Victor D. The politics of fossil-fuel subsidies: global subsidies
initiative & the international institute for sustainable development. Geneva: Global Subsidies Initiative, International Institute for Sustainable Development, 2009.
286 International Monetary Fund. World economic outlook. Washington, DC: IMF, 2010.
287 Mazzucato M. The entrepreneurial state: debunking public vs private sector myths. London: Anthem Press, 2013.
288 Ravenel P, Brites J, Dichamp G, Monteillet C, Yaker MF, Enmanuel CA. The impacts of sustainable public procurement: eight illustrative case studies. Paris: UNEP Sustainable Consumption and Production Branch, 2012.
289 UN Framework Convention on Climate Change (UNFCCC). United Nations Framework Convention on Climate Change. Geneva: IUCC, 1992.
290 Depledge J. The global climate change regime. In: Ekins P, Bradshaw M, Watson J, eds. Global energy: issues, potentials and policy implications. Oxford: Oxford University Press, 2015.
291 Bodansky D. The United Nations Framework Convention on Climate Change: a commentary. Yale J Int Law 1993; 18: 451–558.
292 Susskind L. Environmental diplomacy, negotiating more eff ective global agreements. New York: Oxford University Press, 1994.
293 Hulme M. Why we disagree about climate change: understanding controversy, inaction and opportunity. Cambridge: Cambridge University Press, 2009.
294 Rapley CG, de Meyer K, Carney J, et al. Time for change? climate science reconsidered. Report of the UCL Policy Commission on Communicating Climate Science. London: UCL, 2014.
295 Spence A, Poortinga W, Pidgeon N. The psychological distance of climate change. Risk Anal 2012; 32: 957–72.
296 Unruh GC. Understanding carbon lock-in. Energy Pol 2000; 28: 817–30.
297 Brulle R. Institutionalizing delay: foundation funding and the creation of US climate change counter-movement organizations. Clim Change 2014; 122: 681–94.
298 Bulkeley H. Betsill. M. Cities and climate change: urban sustainability and global environmental governance. New York: Routledge, 2003.
299 Boutiligier S. Cities, networks, and global environmental governance. London: Routledge, 2013.
300 Roman M. Governing from the middle: the C40 Cities Leadership Group. Corp Gov 2010; 10: 73–84.
301 Curtis S. Global Cities and the Transformation of the International System. Rev Int Stud 2011; 37: 1923–47.
97

The Lancet Commissions
1914 www.thelancet.com Vol 386 November 7, 2015
302 Gordon DJ. Between local innovation and global impact: cities, networks, and the governance of climate change. Can Foreign Pol J 2013; 19: 288–307.
303 Rvd P Melissen J. City diplomacy: the expanding role of cities in international politics. The Hague: Netherlands Institute of International Relations, 2007.
304 Center PR. Climate change and fi nancial instability seen as top global threats. Washington, DC: Pew Research Center, 2013.
305 Darier É, Schüle R. ‘Think globally, act locally’? Climate change and public participation in Manchester and Frankfurt. Local Environ 1999; 4: 317–29.
306 Poortinga W, Pidgeon NF. Exploring the dimensionality of trust in risk regulation. Risk Anal 2003; 23: 961–72.
307 Pretty J. The consumption of a fi nite planet: well-being, convergence, divergence and the nascent green economy. Environ Resour Econ 2013; 55: 475–99.
308 Hulme M. Reducing the future to climate: a story of climate determinism and reductionism. Osiris 2011a; 26: 245–66.
309 Webb J. Climate change and society: the chimera of behaviour change technologies. Sociology 2012; 46: 109–25.
310 Wolf J, Moser SC. Individual understandings, perceptions, and engagement with climate change: insights from in–depth studies across the world. Wiley Interdiscip Rev Clim Chang 2011; 2: 547–69.
311 Höijer B. Emotional anchoring and objectifi cation in the media reporting on climate change. Public Underst Sci 2010; 19: 717–31.
312 Witte K, Allen M. A meta-analysis of fear appeals: implications for eff ective public health campaigns. Health Educ Behav 2000; 27: 591–615.
313 Markowitz EM, Shariff AF. Climate change and moral judgement. Nature Climate Change 2012; 2: 243–47.
314 Green D, Billy J, Tapim A. Indigenous Australians’ knowledge of weather and climate. Clim Change 2010; 100: 337–54.
315 Giddens A. The politics of climate change. Cambridge: John Wiley and Sons, 2009.
316 Vignola R, Klinsky S, Tam J, McDaniels T. Public perception, knowledge and policy support for mitigation and adaption to climate change in Costa Rica: comparisons with North American and European studies. Mitig Adapt Strategies Glob Change 2013; 18: 303–23.
317 World Bank Group. Public attitudes toward climate change: fi ndings from a multi-country poll. Background note to the world development report 2010. Washington, DC: World Bank, 2009.
318 Marteau TM, Hollands GJ, Fletcher PC. Changing human behavior to prevent disease: the importance of targeting automatic processes. Science 2012; 337: 1492–95.
98
99

100

Global warming of 1.5°CAn IPCC Special Report on the impacts of global warming of 1.5°C
above pre-industrial levels and related global greenhouse gas emission pathways, in the context of strengthening the global response to the threat of climate change,
sustainable development, and efforts to eradicate poverty
Summary for Policymakers
Edited by
Valérie Masson-Delmotte Panmao ZhaiCo-Chair Working Group I Co-Chair Working Group I
Hans-Otto Pörtner Debra Roberts Co-Chair Working Group II Co-Chair Working Group II
Jim Skea Priyadarshi R. ShuklaCo-Chair Working Group III Co-Chair Working Group III
Anna Pirani Wilfran Moufouma-Okia Clotilde Péan Head of WGI TSU Head of Science Head of Operations
Roz Pidcock Sarah Connors J. B. Robin MatthewsHead of Communication Science Officer Science Officer
Yang Chen Xiao Zhou Melissa I. GomisScience Officer Science Assistant Graphics Officer
Elisabeth Lonnoy Tom Maycock Melinda Tignor Tim Waterfield Project Assistant Science Editor Head of WGII TSU IT Officer
Working Group I Technical Support Unit
101

Front cover layout: Nigel HawtinFront cover artwork: Time to Choose by Alisa Singer - www.environmentalgraphiti.org - © Intergovernmental Panel on Climate Change. The artwork was inspired by a graphic from the SPM (Figure SPM.1).
© 2018 Intergovernmental Panel on Climate Change. Printed October 2018 by the IPCC, Switzerland. Electronic copies of this Summary for Policymakers are available from the IPCC website www.ipcc.ch
ISBN 978-92-9169-151-7
102
6
Introduction Chapter 2
Chapter 1Summary for Policymakers
103

SPMSPM
Summary for PolicymakersSummary for Policymakers
3
Drafting Authors:Myles Allen (UK), Mustafa Babiker (Sudan), Yang Chen (China), Heleen de Coninck (Netherlands/EU), Sarah Connors (UK), Renée van Diemen (Netherlands), Opha Pauline Dube (Botswana), Kristie L. Ebi (USA), Francois Engelbrecht (South Africa), Marion Ferrat (UK/France), James Ford (UK/Canada), Piers Forster (UK), Sabine Fuss (Germany), Tania Guillén Bolaños (Germany/Nicaragua), Jordan Harold (UK), Ove Hoegh-Guldberg (Australia), Jean-Charles Hourcade (France), Daniel Huppmann (Austria), Daniela Jacob (Germany), Kejun Jiang (China), Tom Gabriel Johansen (Norway), Mikiko Kainuma (Japan), Kiane de Kleijne (Netherlands/EU), Elmar Kriegler (Germany), Debora Ley (Guatemala/Mexico), Diana Liverman (USA), Natalie Mahowald (USA), Valérie Masson-Delmotte (France), J. B. Robin Matthews (UK), Richard Millar (UK), Katja Mintenbeck (Germany), Angela Morelli (Norway/Italy), Wilfran Moufouma-Okia (France/Congo), Luis Mundaca (Sweden/Chile), Maike Nicolai (Germany), Chukwumerije Okereke (UK/Nigeria), Minal Pathak (India), Antony Payne (UK), Roz Pidcock (UK), Anna Pirani (Italy), Elvira Poloczanska (UK/Australia), Hans-Otto Pörtner (Germany), Aromar Revi (India), Keywan Riahi (Austria), Debra C. Roberts (South Africa), Joeri Rogelj (Austria/Belgium), Joyashree Roy (India), Sonia I. Seneviratne (Switzerland), Priyadarshi R. Shukla (India), James Skea (UK), Raphael Slade (UK), Drew Shindell (USA), Chandni Singh (India), William Solecki (USA), Linda Steg (Netherlands), Michael Taylor (Jamaica), Petra Tschakert (Australia/Austria), Henri Waisman (France), Rachel Warren (UK), Panmao Zhai (China), Kirsten Zickfeld (Canada).
This Summary for Policymakers should be cited as:IPCC, 2018: Summary for Policymakers. In: Global warming of 1.5°C. An IPCC Special Report on the impacts of global warming of 1.5°C above pre-industrial levels and related global greenhouse gas emission pathways, in the context of strengthening the global response to the threat of climate change, sustainable development, and efforts to eradicate poverty [V. Masson-Delmotte, P. Zhai, H. O. Pörtner, D. Roberts, J. Skea, P. R. Shukla, A. Pirani, W. Moufouma-Okia, C. Péan, R. Pidcock, S. Connors, J. B. R. Matthews, Y. Chen, X. Zhou, M. I. Gomis, E. Lonnoy, T. Maycock, M. Tignor, T. Waterfield (eds.)]. World Meteorological Organization, Geneva, Switzerland, 32 pp.
Summary for PolicymakersSPM
104

SPM
Summary for Policymakers
4
Acknowledgements
We are very grateful for the expertise, rigour and dedication shown throughout by
the volunteer Coordinating Lead Authors and Lead Authors, working across scientific
disciplines in each chapter of the report, with essential help by the many Contributing
Authors. The Review Editors have played a critical role in assisting the author teams and
ensuring the integrity of the review process. We express our sincere appreciation to all the
expert and government reviewers. A special thanks goes to the Chapter Scientists of this
report who went above and beyond what was expected of them: Neville Ellis, Tania Guillén
Bolaños, Daniel Huppmann, Kiane de Kleijne, Richard Millar and Chandni Singh.
We would also like to thank the three Intergovernmental Panel on Climate Change (IPCC)
Vice-Chairs Ko Barrett, Thelma Krug, and Youba Sokona as well as the members of the
WGI, WGII and WGIII Bureaux for their assistance, guidance, and wisdom throughout the
preparation of the Report: Amjad Abdulla, Edvin Aldrian, Carlo Carraro, Diriba Korecha
Dadi, Fatima Driouech, Andreas Fischlin, Gregory Flato, Jan Fuglestvedt, Mark Howden,
Nagmeldin G. E. Mahmoud, Carlos Mendez, Joy Jacqueline Pereira, Ramón Pichs-Madruga,
Andy Reisinger, Roberto Sánchez Rodríguez, Sergey Semenov, Muhammad I. Tariq, Diana
Ürge-Vorsatz, Carolina Vera, Pius Yanda, Noureddine Yassaa, and Taha Zatari.
Our heartfelt thanks go to the hosts and organizers of the scoping meeting and the
four Special Report on 1.5°C Lead Author Meetings. We gratefully acknowledge the
support from the host countries and institutions: World Meteorological Organization,
Switzerland; Ministry of Foreign Affairs, and the National Institute for Space Research
(INPE), Brazil; Met Office and the University of Exeter, the United Kingdom; Swedish
Meteorological and Hydrological Institute (SMHI), Sweden; the Ministry of Environment
Natural Resources Conservation and Tourism, the National Climate Change Committee
in the Department of Meteorological Services and the Botswana Global Environmental
Change Committee at the University of Botswana, Botswana; and Korea Meteorological
Administration (KMA) and Incheon Metropolitan City, the Republic of Korea. The support
provided by governments and institutions, as well as through contributions to the IPCC
Trust Fund, is thankfully acknowledged as it enabled the participation of the author
teams in the preparation of the Report. The efficient operation of the Working Group I
Technical Support Unit was made possible by the generous financial support provided by
the government of France and administrative and information technology support from the
Université Paris Saclay (France), Institut Pierre Simon Laplace (IPSL) and the Laboratoire des
Sciences du Climat et de l’Environnement (LSCE). We thank the Norwegian Environment
Agency for supporting the preparation of the graphics for the Summary for Policymakers.
We thank the UNEP Library, who supported authors throughout the drafting process by
providing literature for the assessment.
105

SPM
Summary for Policymakers
5
We would also like to thank Abdalah Mokssit, Secretary of the IPCC, and the staff of the
IPCC Secretariat: Kerstin Stendahl, Jonathan Lynn, Sophie Schlingemann, Judith Ewa, Mxolisi
Shongwe, Jesbin Baidya, Werani Zabula, Nina Peeva, Joelle Fernandez, Annie Courtin, Laura
Biagioni and Oksana Ekzarkho. Thanks are due to Elhousseine Gouaini who served as the
conference officer for the 48th Session of the IPCC.
Finally, our particular appreciation goes to the Working Group Technical Support Units
whose tireless dedication, professionalism and enthusiasm led the production of this
Special Report. This report could not have been prepared without the commitment of
members of the Working Group I Technical Support Unit, all new to the IPCC, who rose
to the unprecedented Sixth Assessment Report challenge and were pivotal in all aspects
of the preparation of the Report: Yang Chen, Sarah Connors, Melissa Gomis, Elisabeth
Lonnoy, Robin Matthews, Wilfran Moufouma-Okia, Clotilde Péan, Roz Pidcock, Anna Pirani,
Nicholas Reay, Tim Waterfield, and Xiao Zhou. Our warmest thanks go to the collegial and
collaborative support provided by Marlies Craig, Andrew Okem, Jan Petzold, Melinda Tignor
and Nora Weyer from the WGII Technical Support Unit and Bhushan Kankal, Suvadip Neogi
and Joana Portugal Pereira from the WGIII Technical Support Unit. A special thanks goes
to Kenny Coventry, Harmen Gudde, Irene Lorenzoni, and Stuart Jenkins for their support
with the figures in the Summary for Policymakers, as well as Nigel Hawtin for graphical
support of the Report. In addition, the following contributions are gratefully acknowledged:
Jatinder Padda (copy edit), Melissa Dawes (copy edit), Marilyn Anderson (index), Vincent
Grégoire (layout) and Sarah le Rouzic (intern).
The Special Report website has been developed by Habitat 7, led by Jamie Herring, and
the report content has been prepared and managed for the website by Nicholas Reay and
Tim Waterfield. We gratefully acknowledge the UN Foundation for supporting the website
development.
106
Summary for Policymakers
6
Introduction
This Report responds to the invitation for IPCC ‘... to provide a Special Report in 2018 on the impacts of global warming of 1.5°C above pre-industrial levels and related global greenhouse gas emission pathways’ contained in the Decision of the 21st Conference of Parties of the United Nations Framework Convention on Climate Change to adopt the Paris Agreement.1
The IPCC accepted the invitation in April 2016, deciding to prepare this Special Report on the impacts of global warming of 1.5°C above pre-industrial levels and related global greenhouse gas emission pathways, in the context of strengthening the global response to the threat of climate change, sustainable development, and efforts to eradicate poverty.
This Summary for Policymakers (SPM) presents the key findings of the Special Report, based on the assessment of the available scientific, technical and socio-economic literature2 relevant to global warming of 1.5°C and for the comparison between global warming of 1.5°C and 2°C above pre-industrial levels. The level of confidence associated with each key finding is reported using the IPCC calibrated language.3 The underlying scientific basis of each key finding is indicated by references provided to chapter elements. In the SPM, knowledge gaps are identified associated with the underlying chapters of the Report.
A. Understanding Global Warming of 1.5°C4
A.1 Human activities are estimated to have caused approximately 1.0°C of global warming5 above pre-industrial levels, with a likely range of 0.8°C to 1.2°C. Global warming is likely to reach 1.5°C between 2030 and 2052 if it continues to increase at the current rate. (high confidence) (Figure SPM.1) {1.2}
A.1.1 Reflecting the long-term warming trend since pre-industrial times, observed global mean surface temperature (GMST) for the decade 2006–2015 was 0.87°C (likely between 0.75°C and 0.99°C)6 higher than the average over the 1850–1900 period (very high confidence). Estimated anthropogenic global warming matches the level of observed warming to within ±20% (likely range). Estimated anthropogenic global warming is currently increasing at 0.2°C (likely between 0.1°C and 0.3°C) per decade due to past and ongoing emissions (high confidence). {1.2.1, Table 1.1, 1.2.4}
A.1.2 Warming greater than the global annual average is being experienced in many land regions and seasons, including two to three times higher in the Arctic. Warming is generally higher over land than over the ocean. (high confidence) {1.2.1, 1.2.2, Figure 1.1, Figure 1.3, 3.3.1, 3.3.2}
A.1.3 Trends in intensity and frequency of some climate and weather extremes have been detected over time spans during which about 0.5°C of global warming occurred (medium confidence). This assessment is based on several lines of evidence, including attribution studies for changes in extremes since 1950. {3.3.1, 3.3.2, 3.3.3}
SPM
1 Decision 1/CP.21, paragraph 21.
2 The assessment covers literature accepted for publication by 15 May 2018.
3 Each finding is grounded in an evaluation of underlying evidence and agreement. A level of confidence is expressed using five qualifiers: very low, low, medium, high and very high, and typeset in italics, for example, medium confidence. The following terms have been used to indicate the assessed likelihood of an outcome or a result: virtually certain 99–100% probability, very likely 90–100%, likely 66–100%, about as likely as not 33–66%, unlikely 0–33%, very unlikely 0–10%, exceptionally unlikely 0–1%. Additional terms (extremely likely 95–100%, more likely than not >50–100%, more unlikely than likely 0–<50%, extremely unlikely 0–5%) may also be used when appropriate. Assessed likelihood is typeset in italics, for example, very likely. This is consistent with AR5.
4 See also Box SPM.1: Core Concepts Central to this Special Report.
5 Present level of global warming is defined as the average of a 30-year period centred on 2017 assuming the recent rate of warming continues.
6 This range spans the four available peer-reviewed estimates of the observed GMST change and also accounts for additional uncertainty due to possible short-term natural variability. {1.2.1, Table 1.1}
107
Summary for Policymakers
7
A.2 Warming from anthropogenic emissions from the pre-industrial period to the present will persist for centuries to millennia and will continue to cause further long-term changes in the climate system, such as sea level rise, with associated impacts (high confidence), but these emissions alone are unlikely to cause global warming of 1.5°C (medium confidence). (Figure SPM.1) {1.2, 3.3, Figure 1.5}
A.2.1 Anthropogenic emissions (including greenhouse gases, aerosols and their precursors) up to the present are unlikely to cause further warming of more than 0.5°C over the next two to three decades (high confidence) or on a century time scale (medium confidence). {1.2.4, Figure 1.5}
A.2.2 Reaching and sustaining net zero global anthropogenic CO2 emissions and declining net non-CO2 radiative forcing would halt anthropogenic global warming on multi-decadal time scales (high confidence). The maximum temperature reached is then determined by cumulative net global anthropogenic CO2 emissions up to the time of net zero CO2 emissions (high confidence) and the level of non-CO2 radiative forcing in the decades prior to the time that maximum temperatures are reached (medium confidence). On longer time scales, sustained net negative global anthropogenic CO2 emissions and/or further reductions in non-CO2 radiative forcing may still be required to prevent further warming due to Earth system feedbacks and to reverse ocean acidification (medium confidence) and will be required to minimize sea level rise (high confidence). {Cross-Chapter Box 2 in Chapter 1, 1.2.3, 1.2.4, Figure 1.4, 2.2.1, 2.2.2, 3.4.4.8, 3.4.5.1, 3.6.3.2}
A.3 Climate-related risks for natural and human systems are higher for global warming of 1.5°C than at present, but lower than at 2°C (high confidence). These risks depend on the magnitude and rate of warming, geographic location, levels of development and vulnerability, and on the choices and implementation of adaptation and mitigation options (high confidence). (Figure SPM.2) {1.3, 3.3, 3.4, 5.6}
A.3.1 Impacts on natural and human systems from global warming have already been observed (high confidence). Many land and ocean ecosystems and some of the services they provide have already changed due to global warming (high confidence). (Figure SPM.2) {1.4, 3.4, 3.5}
A.3.2 Future climate-related risks depend on the rate, peak and duration of warming. In the aggregate, they are larger if global warming exceeds 1.5°C before returning to that level by 2100 than if global warming gradually stabilizes at 1.5°C, especially if the peak temperature is high (e.g., about 2°C) (high confidence). Some impacts may be long-lasting or irreversible, such as the loss of some ecosystems (high confidence). {3.2, 3.4.4, 3.6.3, Cross-Chapter Box 8 in Chapter 3}
A.3.3 Adaptation and mitigation are already occurring (high confidence). Future climate-related risks would be reduced by the upscaling and acceleration of far-reaching, multilevel and cross-sectoral climate mitigation and by both incremental and transformational adaptation (high confidence). {1.2, 1.3, Table 3.5, 4.2.2, Cross-Chapter Box 9 in Chapter 4, Box 4.2, Box 4.3, Box 4.6, 4.3.1, 4.3.2, 4.3.3, 4.3.4, 4.3.5, 4.4.1, 4.4.4, 4.4.5, 4.5.3}
SPM
108

60
50 3 000
2 000
1 000
40
30
20
10
0 0
3
2
1
0
Cumulative emissions of CO2 and future non-CO2 radiative forcing determine the probability of limiting warming to 1.5°C
Billion tonnes CO2 per year (GtCO2/yr) Billion tonnes CO2 (GtCO2) Watts per square metre (W/m2)
b) Stylized net global CO2 emission pathways d) Non-CO2 radiative forcing pathwaysc) Cumulative net CO2 emissions
a) Observed global temperature change and modeled responses to stylized anthropogenic emission and forcing pathways
Observed monthly global mean surface temperature
Estimated anthropogenic warming to date and likely range
Faster immediate CO2 emission reductions limit cumulative CO2 emissions shown in panel (c).
Maximum temperature rise is determined by cumulative net CO2 emissions and net non-CO2 radiative forcing due to methane, nitrous oxide, aerosols and other anthropogenic forcing agents.
Global warming relative to 1850-1900 (°C)
CO2 emissions decline from 2020 to reach net zero in 2055 or 2040
Cumulative CO2 emissions in pathways reaching net zero in 2055 and 2040
Non-CO2 radiative forcing reduced a�er 2030 or not reduced a�er 2030
1960
1980 2020 2060 2100 1980 2020 2060 2100 1980 2020 2060 2100
1980 2000 2020
2017
2040 2060 2080 2100
2.0
1.5
1.0
0.5
0
Likely range of modeled responses to stylized pathways
Faster CO2 reductions (blue in b & c) result in a higher probability of limiting warming to 1.5°C
No reduction of net non-CO2 radiative forcing (purple in d) results in a lower probability of limiting warming to 1.5°C
Global CO2 emissions reach net zero in 2055 while net non-CO2 radiative forcing is reduced a�er 2030 (grey in b, c & d)
SPM
Summary for Policymakers
8
Figure SPM.1 | Panel a: Observed monthly global mean surface temperature (GMST, grey line up to 2017, from the HadCRUT4, GISTEMP, Cowtan–Way, and NOAA datasets) change and estimated anthropogenic global warming (solid orange line up to 2017, with orange shading indicating assessed likely range). Orange dashed arrow and horizontal orange error bar show respectively the central estimate and likely range of the time at which 1.5°C is reached if the current rate of warming continues. The grey plume on the right of panel a shows the likely range of warming responses, computed with a simple climate model, to a stylized pathway (hypothetical future) in which net CO2 emissions (grey line in panels b and c) decline in a straight line from 2020 to reach net zero in 2055 and net non-CO2 radiative forcing (grey line in panel d) increases to 2030 and then declines. The blue plume in panel a) shows the response to faster CO2 emissions reductions (blue line in panel b), reaching net zero in 2040, reducing cumulative CO2 emissions (panel c). The purple plume shows the response to net CO2 emissions declining to zero in 2055, with net non-CO2 forcing remaining constant after 2030. The vertical error bars on right of panel a) show the likely ranges (thin lines) and central terciles (33rd – 66th percentiles, thick lines) of the estimated distribution of warming in 2100 under these three stylized pathways. Vertical dotted error bars in panels b, c and d show the likely range of historical annual and cumulative global net CO2 emissions in 2017 (data from the Global Carbon Project) and of net non-CO2 radiative forcing in 2011 from AR5, respectively. Vertical axes in panels c and d are scaled to represent approximately equal effects on GMST. {1.2.1, 1.2.3, 1.2.4, 2.3, Figure 1.2 and Chapter 1 Supplementary Material, Cross-Chapter Box 2 in Chapter 1}
109

SPM
Summary for Policymakers
9
B. Projected Climate Change, Potential Impacts and Associated Risks
B.1 Climate models project robust7 differences in regional climate characteristics between present-day and global warming of 1.5°C,8 and between 1.5°C and 2°C.8 These differences include increases in: mean temperature in most land and ocean regions (high confidence), hot extremes in most inhabited regions (high confidence), heavy precipitation in several regions (medium confidence), and the probability of drought and precipitation deficits in some regions (medium confidence). {3.3}
B.1.1 Evidence from attributed changes in some climate and weather extremes for a global warming of about 0.5°C supports the assessment that an additional 0.5°C of warming compared to present is associated with further detectable changes in these extremes (medium confidence). Several regional changes in climate are assessed to occur with global warming up to 1.5°C compared to pre-industrial levels, including warming of extreme temperatures in many regions (high confidence), increases in frequency, intensity, and/or amount of heavy precipitation in several regions (high confidence), and an increase in intensity or frequency of droughts in some regions (medium confidence). {3.2, 3.3.1, 3.3.2, 3.3.3, 3.3.4, Table 3.2}
B.1.2 Temperature extremes on land are projected to warm more than GMST (high confidence): extreme hot days in mid-latitudes warm by up to about 3°C at global warming of 1.5°C and about 4°C at 2°C, and extreme cold nights in high latitudes warm by up to about 4.5°C at 1.5°C and about 6°C at 2°C (high confidence). The number of hot days is projected to increase in most land regions, with highest increases in the tropics (high confidence). {3.3.1, 3.3.2, Cross-Chapter Box 8 in Chapter 3}
B.1.3 Risks from droughts and precipitation deficits are projected to be higher at 2°C compared to 1.5°C of global warming in some regions (medium confidence). Risks from heavy precipitation events are projected to be higher at 2°C compared to 1.5°C of global warming in several northern hemisphere high-latitude and/or high-elevation regions, eastern Asia and eastern North America (medium confidence). Heavy precipitation associated with tropical cyclones is projected to be higher at 2°C compared to 1.5°C global warming (medium confidence). There is generally low confidence in projected changes in heavy precipitation at 2°C compared to 1.5°C in other regions. Heavy precipitation when aggregated at global scale is projected to be higher at 2°C than at 1.5°C of global warming (medium confidence). As a consequence of heavy precipitation, the fraction of the global land area affected by flood hazards is projected to be larger at 2°C compared to 1.5°C of global warming (medium confidence). {3.3.1, 3.3.3, 3.3.4, 3.3.5, 3.3.6}
B.2 By 2100, global mean sea level rise is projected to be around 0.1 metre lower with global warming of 1.5°C compared to 2°C (medium confidence). Sea level will continue to rise well beyond 2100 (high confidence), and the magnitude and rate of this rise depend on future emission pathways. A slower rate of sea level rise enables greater opportunities for adaptation in the human and ecological systems of small islands, low-lying coastal areas and deltas (medium confidence). {3.3, 3.4, 3.6}
B.2.1 Model-based projections of global mean sea level rise (relative to 1986–2005) suggest an indicative range of 0.26 to 0.77 m by 2100 for 1.5°C of global warming, 0.1 m (0.04–0.16 m) less than for a global warming of 2°C (medium confidence). A reduction of 0.1 m in global sea level rise implies that up to 10 million fewer people would be exposed to related risks, based on population in the year 2010 and assuming no adaptation (medium confidence). {3.4.4, 3.4.5, 4.3.2}
B.2.2 Sea level rise will continue beyond 2100 even if global warming is limited to 1.5°C in the 21st century (high confidence). Marine ice sheet instability in Antarctica and/or irreversible loss of the Greenland ice sheet could result in multi-metre rise in sea level over hundreds to thousands of years. These instabilities could be triggered at around 1.5°C to 2°C of global warming (medium confidence). (Figure SPM.2) {3.3.9, 3.4.5, 3.5.2, 3.6.3, Box 3.3}
7 Robust is here used to mean that at least two thirds of climate models show the same sign of changes at the grid point scale, and that differences in large regions are statistically significant.
8 Projected changes in impacts between different levels of global warming are determined with respect to changes in global mean surface air temperature.
110

Summary for Policymakers
10
SPM
B.2.3 Increasing warming amplifies the exposure of small islands, low-lying coastal areas and deltas to the risks associated withsea level rise for many human and ecological systems, including increased saltwater intrusion, flooding and damage to infrastructure (high confidence). Risks associated with sea level rise are higher at 2°C compared to 1.5°C. The slower rate of sea level rise at global warming of 1.5°C reduces these risks, enabling greater opportunities for adaptation including managing and restoring natural coastal ecosystems and infrastructure reinforcement (medium confidence). (Figure SPM.2) {3.4.5, Box 3.5}
B.3 On land, impacts on biodiversity and ecosystems, including species loss and extinction, are projected to be lower at 1.5°C of global warming compared to 2°C. Limiting global warming to 1.5°C compared to 2°C is projected to lower the impacts on terrestrial, freshwater and coastal ecosystems and to retain more of their services to humans (high confidence). (Figure SPM.2) {3.4, 3.5, Box 3.4, Box 4.2, Cross-Chapter Box 8 in Chapter 3}
B.3.1 Of 105,000 species studied,9 6% of insects, 8% of plants and 4% of vertebrates are projected to lose over half of theirclimatically determined geographic range for global warming of 1.5°C, compared with 18% of insects, 16% of plants and 8% of vertebrates for global warming of 2°C (medium confidence). Impacts associated with other biodiversity-related risks such as forest fires and the spread of invasive species are lower at 1.5°C compared to 2°C of global warming (high confidence). {3.4.3, 3.5.2}
B.3.2 Approximately 4% (interquartile range 2–7%) of the global terrestrial land area is projected to undergo a transformationof ecosystems from one type to another at 1ºC of global warming, compared with 13% (interquartile range 8–20%) at 2°C (medium confidence). This indicates that the area at risk is projected to be approximately 50% lower at 1.5°C compared to 2°C (medium confidence). {3.4.3.1, 3.4.3.5}
B.3.3 High-latitude tundra and boreal forests are particularly at risk of climate change-induced degradation and loss, with woodyshrubs already encroaching into the tundra (high confidence) and this will proceed with further warming. Limiting global warming to 1.5°C rather than 2°C is projected to prevent the thawing over centuries of a permafrost area in the range of 1.5 to 2.5 million km2 (medium confidence). {3.3.2, 3.4.3, 3.5.5}
B.4 Limiting global warming to 1.5°C compared to 2ºC is projected to reduce increases in ocean temperature as well as associated increases in ocean acidity and decreases in ocean oxygen levels (high confidence). Consequently, limiting global warming to 1.5°C is projected to reduce risks to marine biodiversity, fisheries, and ecosystems, and their functions and services to humans, as illustrated by recent changes to Arctic sea ice and warm-water coral reef ecosystems (high confidence). {3.3, 3.4, 3.5, Box 3.4, Box 3.5}
B.4.1 There is high confidence that the probability of a sea ice-free Arctic Ocean during summer is substantially lower at globalwarming of 1.5°C when compared to 2°C. With 1.5°C of global warming, one sea ice-free Arctic summer is projected per century. This likelihood is increased to at least one per decade with 2°C global warming. Effects of a temperature overshoot are reversible for Arctic sea ice cover on decadal time scales (high confidence). {3.3.8, 3.4.4.7}
B.4.2 Global warming of 1.5°C is projected to shift the ranges of many marine species to higher latitudes as well as increase theamount of damage to many ecosystems. It is also expected to drive the loss of coastal resources and reduce the productivity of fisheries and aquaculture (especially at low latitudes). The risks of climate-induced impacts are projected to be higher at 2°C than those at global warming of 1.5°C (high confidence). Coral reefs, for example, are projected to decline by a further 70–90% at 1.5°C (high confidence) with larger losses (>99%) at 2ºC (very high confidence). The risk of irreversible loss of many marine and coastal ecosystems increases with global warming, especially at 2°C or more (high confidence). {3.4.4, Box 3.4}
9 Consistent with earlier studies, illustrative numbers were adopted from one recent meta-study.
111


112

PERSPECTIVE
Trajectories of the Earth System inthe AnthropoceneWill Steffena,b,1, Johan Rockströma, Katherine Richardsonc, Timothy M. Lentond, Carl Folkea,e, Diana Livermanf,Colin P. Summerhayesg, Anthony D. Barnoskyh, Sarah E. Cornella, Michel Crucifixi,j, Jonathan F. Dongesa,k,Ingo Fetzera, Steven J. Ladea,b, Marten Schefferl, Ricarda Winkelmannk,m, and Hans Joachim Schellnhubera,k,m,1
Edited by William C. Clark, Harvard University, Cambridge, MA, and approved July 6, 2018 (received for review June 19, 2018)
We explore the risk that self-reinforcing feedbacks could push the Earth System toward a planetarythreshold that, if crossed, could prevent stabilization of the climate at intermediate temperature rises andcause continued warming on a “Hothouse Earth” pathway even as human emissions are reduced. Crossingthe threshold would lead to a much higher global average temperature than any interglacial in the past1.2 million years and to sea levels significantly higher than at any time in the Holocene. We examinethe evidence that such a threshold might exist and where it might be. If the threshold is crossed, theresulting trajectory would likely cause serious disruptions to ecosystems, society, and economies. Col-lective human action is required to steer the Earth System away from a potential threshold and stabilize it in ahabitable interglacial-like state. Such action entails stewardship of the entire Earth System—biosphere,climate, and societies—and could include decarbonization of the global economy, enhancement of biospherecarbon sinks, behavioral changes, technological innovations, new governance arrangements, and trans-formed social values.
Earth System trajectories | climate change | Anthropocene | biosphere feedbacks | tipping elements
The Anthropocene is a proposed new geological ep-och (1) based on the observation that human impactson essential planetary processes have become so pro-found (2) that they have driven the Earth out of theHolocene epoch in which agriculture, sedentary com-munities, and eventually, socially and technologicallycomplex human societies developed. The formaliza-tion of the Anthropocene as a new geological epoch isbeing considered by the stratigraphic community (3),but regardless of the outcome of that process, it isbecoming apparent that Anthropocene conditionstransgress Holocene conditions in several respects(2). The knowledge that human activity now rivals geo-logical forces in influencing the trajectory of the EarthSystem has important implications for both Earth Sys-tem science and societal decision making. While
recognizing that different societies around the worldhave contributed differently and unequally to pres-sures on the Earth System and will have varied capa-bilities to alter future trajectories (4), the sum total ofhuman impacts on the system needs to be taken intoaccount for analyzing future trajectories of theEarth System.
Here, we explore potential future trajectories of theEarth System by addressing the following questions.
Is there a planetary threshold in the trajectory of theEarth System that, if crossed, could prevent stabili-zation in a range of intermediate temperature rises?
Given our understanding of geophysical and bio-sphere feedbacks intrinsic to the Earth System,where might such a threshold be?
aStockholm Resilience Centre, Stockholm University, 10691 Stockholm, Sweden; bFenner School of Environment and Society, The AustralianNational University, Canberra, ACT 2601, Australia; cCenter for Macroecology, Evolution, and Climate, University of Copenhagen, Natural HistoryMuseum of Denmark, 2100 Copenhagen, Denmark; dEarth System Science Group, College of Life and Environmental Sciences, University of Exeter,EX4 4QE Exeter, United Kingdom; eThe Beijer Institute of Ecological Economics, The Royal Swedish Academy of Science, SE-10405 Stockholm, Sweden;fSchool of Geography and Development, The University of Arizona, Tucson, AZ 85721; gScott Polar Research Institute, Cambridge University, CB2 1ERCambridge, United Kingdom; hJasper Ridge Biological Preserve, Stanford University, Stanford, CA 94305; iEarth and Life Institute, Universite catholique deLouvain, 1348 Louvain-la-Neuve, Belgium; jBelgian National Fund of Scientific Research, 1000 Brussels, Belgium; kResearch Domain Earth System Analysis,Potsdam Institute for Climate Impact Research, 14473 Potsdam, Germany; lDepartment of Environmental Sciences, Wageningen University & Research,6700AA Wageningen, The Netherlands; and mDepartment of Physics and Astronomy, University of Potsdam, 14469 Potsdam, GermanyAuthor contributions: W.S., J.R., K.R., T.M.L., C.F., D.L., C.P.S., A.D.B., S.E.C., M.C., J.F.D., I.F., S.J.L., M.S., R.W., and H.J.S. wrote the paper.The authors declare no conflict of interest.This article is a PNAS Direct Submission.This open access article is distributed under Creative Commons Attribution-NonCommercial-NoDerivatives License 4.0 (CC BY-NC-ND).1To whom correspondence may be addressed. Email: [email protected] or [email protected] article contains supporting information online at www.pnas.org/lookup/suppl/doi:10.1073/pnas.1810141115/-/DCSupplemental.Published online August 6, 2018.
8252–8259 | PNAS | August 14, 2018 | vol. 115 | no. 33 www.pnas.org/cgi/doi/10.1073/pnas.1810141115
PERSPECTIV
E
113

If a threshold is crossed, what are the implications, especially forthe wellbeing of human societies?
What human actions could create a pathway that would steerthe Earth System away from the potential threshold and towardthe maintenance of interglacial-like conditions?
Addressing these questions requires a deep integration ofknowledge from biogeophysical Earth System science with thatfrom the social sciences and humanities on the development andfunctioning of human societies (5). Integrating the requisite knowl-edge can be difficult, especially in light of the formidable range oftimescales involved. Increasingly, concepts from complex systemsanalysis provide a framework that unites the diverse fields of in-quiry relevant to the Anthropocene (6). Earth System dynamicscan be described, studied, and understood in terms of trajectoriesbetween alternate states separated by thresholds that are con-trolled by nonlinear processes, interactions, and feedbacks. Basedon this framework, we argue that social and technological trendsand decisions occurring over the next decade or two could sig-nificantly influence the trajectory of the Earth System for tens tohundreds of thousands of years and potentially lead to conditionsthat resemble planetary states that were last seen several millionsof years ago, conditions that would be inhospitable to currenthuman societies and to many other contemporary species.
Risk of a Hothouse Earth PathwayLimit Cycles and Planetary Thresholds. The trajectory of theEarth System through the Late Quaternary, particularly the Holo-cene, provides the context for exploring the human-drivenchanges of the Anthropocene and the future trajectories of thesystem (SI Appendix has more detail). Fig. 1 shows a simplifiedrepresentation of complex Earth System dynamics, where thephysical climate system is subjected to the effects of slow changesin Earth’s orbit and inclination. Over the Late Quaternary (past1.2 million years), the system has remained bounded betweenglacial and interglacial extremes. Not every glacial–interglacialcycle of the past million years follows precisely the same trajectory(7), but the cycles follow the same overall pathway (a term that weuse to refer to a family of broadly similar trajectories). The full glacialand interglacial states and the ca. 100,000-years oscillations be-tween them in the Late Quaternary loosely constitute limit cycles(technically, the asymptotic dynamics of ice ages are best modeledas pullback attractors in a nonautonomous dynamical system). Thislimit cycle is shown in a schematic fashion in blue in Fig. 1, LowerLeft using temperature and sea level as the axes. The Holocene isrepresented by the top of the limit cycle loop near the label A.
The current position of the Earth System in the Anthropoceneis shown in Fig. 1, Upper Right by the small ball on the pathwaythat leads away from the glacial–interglacial limit cycle. In Fig. 2, astability landscape, the current position of the Earth System isrepresented by the globe at the end of the solid arrow in thedeepening Anthropocene basin of attraction.
The Anthropocene represents the beginning of a very rapidhuman-driven trajectory of the Earth System away from the gla-cial–interglacial limit cycle toward new, hotter climatic conditionsand a profoundly different biosphere (2, 8, 9) (SI Appendix). Thecurrent position, at over 1 °C above a preindustrial baseline (10), isnearing the upper envelope of interglacial conditions over thepast 1.2 million years (SI Appendix, Table S1). More importantly,the rapid trajectory of the climate system over the past half-century along with technological lock in and socioeconomic
inertia in human systems commit the climate system to conditionsbeyond the envelope of past interglacial conditions. We, there-fore, suggest that the Earth System may already have passed one“fork in the road” of potential pathways, a bifurcation (near A inFig. 1) taking the Earth System out of the next glaciation cycle (11).
In the future, the Earth System could potentially follow manytrajectories (12, 13), often represented by the large range ofglobal temperature rises simulated by climate models (14). Inmost analyses, these trajectories are largely driven by the amountof greenhouse gases that human activities have already emittedand will continue to emit into the atmosphere over the rest of thiscentury and beyond—with a presumed quasilinear relationshipbetween cumulative carbon dioxide emissions and global tem-perature rise (14). However, here we suggest that biogeophysicalfeedback processes within the Earth System coupled with directhuman degradation of the biosphere may play a more importantrole than normally assumed, limiting the range of potential futuretrajectories and potentially eliminating the possibility of the in-termediate trajectories. We argue that there is a significant riskthat these internal dynamics, especially strong nonlinearities infeedback processes, could become an important or perhaps,even dominant factor in steering the trajectory that the EarthSystem actually follows over coming centuries.
Fig. 1. A schematic illustration of possible future pathways of theclimate against the background of the typical glacial–interglacialcycles (Lower Left). The interglacial state of the Earth System is at thetop of the glacial–interglacial cycle, while the glacial state is at thebottom. Sea level follows temperature change relatively slowlythrough thermal expansion and the melting of glaciers and ice caps.The horizontal line in the middle of the figure represents thepreindustrial temperature level, and the current position of the EarthSystem is shown by the small sphere on the red line close to thedivergence between the Stabilized Earth and Hothouse Earthpathways. The proposed planetary threshold at ∼2 °C above thepreindustrial level is also shown. The letters along the Stabilized Earth/Hothouse Earth pathways represent four time periods in Earth’s recentpast that may give insights into positions along these pathways (SIAppendix): A, Mid-Holocene; B, Eemian; C, Mid-Pliocene; and D,Mid-Miocene. Their positions on the pathway are approximate only.Their temperature ranges relative to preindustrial are given in SIAppendix, Table S1.
Steffen et al. PNAS | August 14, 2018 | vol. 115 | no. 33 | 8253
114

This risk is represented in Figs. 1 and 2 by a planetary threshold(horizontal broken line in Fig. 1 on the Hothouse Earth pathwayaround 2 °C above preindustrial temperature). Beyond thisthreshold, intrinsic biogeophysical feedbacks in the Earth System(Biogeophysical Feedbacks) could become the dominant pro-cesses controlling the system’s trajectory. Precisely where a po-tential planetary threshold might be is uncertain (15, 16). Wesuggest 2 °C because of the risk that a 2 °C warming could acti-vate important tipping elements (12, 17), raising the temperaturefurther to activate other tipping elements in a domino-like cas-cade that could take the Earth System to even higher tempera-tures (Tipping Cascades). Such cascades comprise, in essence, thedynamical process that leads to thresholds in complex systems(section 4.2 in ref. 18).
This analysis implies that, even if the Paris Accord target of a1.5 °C to 2.0 °C rise in temperature is met, we cannot exclude therisk that a cascade of feedbacks could push the Earth System
irreversibly onto a “Hothouse Earth” pathway. The challenge thathumanity faces is to create a “Stabilized Earth” pathway that steersthe Earth System away from its current trajectory toward thethreshold beyond which is Hothouse Earth (Fig. 2). The human-created Stabilized Earth pathway leads to a basin of attractionthat is not likely to exist in the Earth System’s stability landscapewithout human stewardship to create andmaintain it. Creating sucha pathway and basin of attraction requires a fundamental change inthe role of humans on the planet. This stewardship role requiresdeliberate and sustained action to become an integral, adaptivepart of Earth System dynamics, creating feedbacks that keep thesystem on a Stabilized Earth pathway (Alternative StabilizedEarth Pathway).
We now explore this critical question in more detail by con-sidering the relevant biogeophysical feedbacks (BiogeophysicalFeedbacks) and the risk of tipping cascades (Tipping Cascades).
Biogeophysical Feedbacks. The trajectory of the Earth System isinfluenced by biogeophysical feedbacks within the system thatcan maintain it in a given state (negative feedbacks) and those thatcan amplify a perturbation and drive a transition to a differentstate (positive feedbacks). Some of the key negative feedbacks thatcould maintain the Earth System in Holocene-like conditions—notably, carbon uptake by land and ocean systems—are weakeningrelative to human forcing (19), increasing the risk that positivefeedbacks could play an important role in determining the EarthSystem’s trajectory. Table 1 summarizes carbon cycle feedbacksthat could accelerate warming, while SI Appendix, Table S2 de-scribes in detail a more complete set of biogeophysical feedbacksthat can be triggered by forcing levels likely to be reached withinthe rest of the century.
Most of the feedbacks can show both continuous responsesand tipping point behavior in which the feedback processbecomes self-perpetuating after a critical threshold is crossed;subsystems exhibiting this behavior are often called “tipping el-ements” (17). The type of behavior—continuous response ortipping point/abrupt change—can depend on the magnitude orthe rate of forcing, or both. Many feedbacks will show somegradual change before the tipping point is reached.
A few of the changes associated with the feedbacks are re-versible on short timeframes of 50–100 years (e.g., change inArctic sea ice extent with a warming or cooling of the climate;Antarctic sea ice may be less reversible because of heat accu-mulation in the Southern Ocean), but most changes are largelyirreversible on timeframes that matter to contemporary societies(e.g., loss of permafrost carbon). A few of the feedbacks do nothave apparent thresholds (e.g., change in the land and oceanphysiological carbon sinks, such as increasing carbon uptake due
Table 1. Carbon cycle feedbacks in the Earth System that could accelerate global warming
FeedbackStrength of feedback
by 2100,* °CRefs. (SI Appendix, Table
S2 has more details)
Permafrost thawing 0.09 (0.04–0.16) 20–23Relative weakening of land and ocean physiological C sinks 0.25 (0.13–0.37) 24Increased bacterial respiration in the ocean 0.02 25, 26Amazon forest dieback 0.05 (0.03–0.11) 27Boreal forest dieback 0.06 (0.02–0.10) 28
Total 0.47 (0.24–0.66)
The strength of the feedback is estimated at 2100 for an ∼2 °C warming.*The additional temperature rise (degrees Celsius) by 2100 arising from the feedback.
Fig. 2. Stability landscape showing the pathway of the Earth Systemout of the Holocene and thus, out of the glacial–interglacial limit cycleto its present position in the hotter Anthropocene. The fork in theroad in Fig. 1 is shown here as the two divergent pathways of theEarth System in the future (broken arrows). Currently, the EarthSystem is on a Hothouse Earth pathway driven by human emissions ofgreenhouse gases and biosphere degradation toward a planetarythreshold at∼2 °C (horizontal broken line at 2 °C in Fig. 1), beyondwhichthe system follows an essentially irreversible pathway driven by intrinsicbiogeophysical feedbacks. The other pathway leads to Stabilized Earth, apathway of Earth System stewardship guided by human-createdfeedbacks to a quasistable, human-maintained basin of attraction.“Stability” (vertical axis) is defined here as the inverse of the potentialenergy of the system. Systems in a highly stable state (deep valley) havelow potential energy, and considerable energy is required to move themout of this stable state. Systems in an unstable state (top of a hill) havehigh potential energy, and they require only a little additional energy topush themoff the hill anddown toward a valley of lower potential energy.
8254 | www.pnas.org/cgi/doi/10.1073/pnas.1810141115 Steffen et al.
115
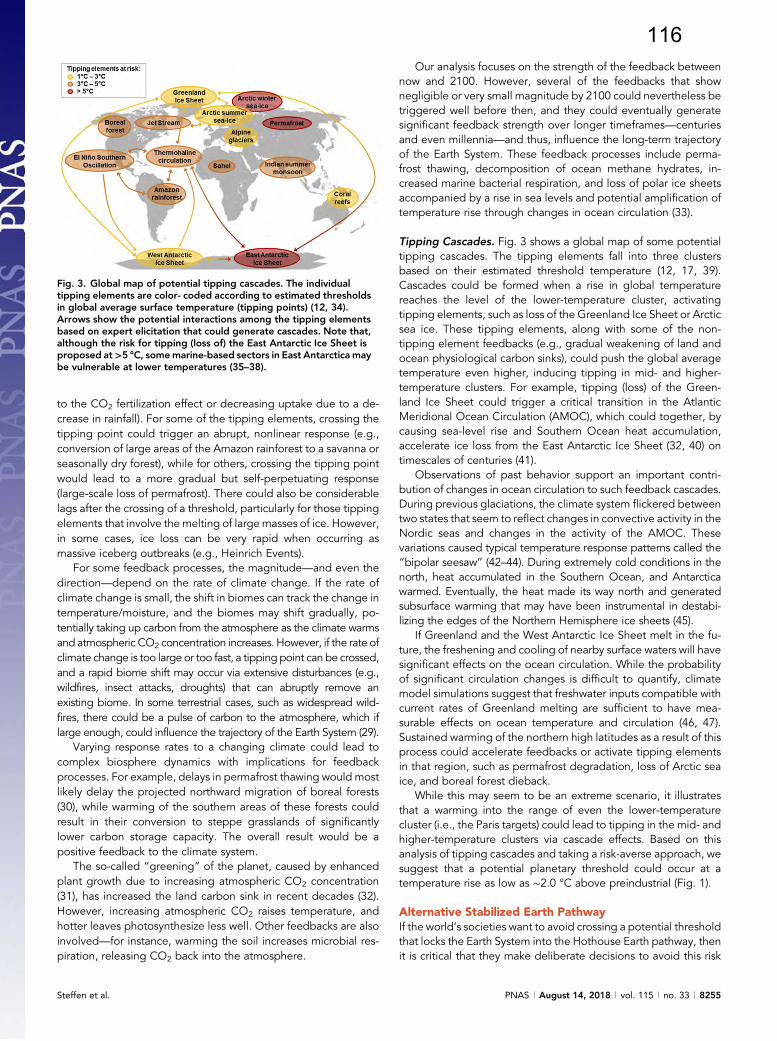
to the CO2 fertilization effect or decreasing uptake due to a de-crease in rainfall). For some of the tipping elements, crossing thetipping point could trigger an abrupt, nonlinear response (e.g.,conversion of large areas of the Amazon rainforest to a savanna orseasonally dry forest), while for others, crossing the tipping pointwould lead to a more gradual but self-perpetuating response(large-scale loss of permafrost). There could also be considerablelags after the crossing of a threshold, particularly for those tippingelements that involve the melting of large masses of ice. However,in some cases, ice loss can be very rapid when occurring asmassive iceberg outbreaks (e.g., Heinrich Events).
For some feedback processes, the magnitude—and even thedirection—depend on the rate of climate change. If the rate ofclimate change is small, the shift in biomes can track the change intemperature/moisture, and the biomes may shift gradually, po-tentially taking up carbon from the atmosphere as the climate warmsand atmospheric CO2 concentration increases. However, if the rate ofclimate change is too large or too fast, a tipping point can be crossed,and a rapid biome shift may occur via extensive disturbances (e.g.,wildfires, insect attacks, droughts) that can abruptly remove anexisting biome. In some terrestrial cases, such as widespread wild-fires, there could be a pulse of carbon to the atmosphere, which iflarge enough, could influence the trajectory of the Earth System (29).
Varying response rates to a changing climate could lead tocomplex biosphere dynamics with implications for feedbackprocesses. For example, delays in permafrost thawing would mostlikely delay the projected northward migration of boreal forests(30), while warming of the southern areas of these forests couldresult in their conversion to steppe grasslands of significantlylower carbon storage capacity. The overall result would be apositive feedback to the climate system.
The so-called “greening” of the planet, caused by enhancedplant growth due to increasing atmospheric CO2 concentration(31), has increased the land carbon sink in recent decades (32).However, increasing atmospheric CO2 raises temperature, andhotter leaves photosynthesize less well. Other feedbacks are alsoinvolved—for instance, warming the soil increases microbial res-piration, releasing CO2 back into the atmosphere.
Our analysis focuses on the strength of the feedback betweennow and 2100. However, several of the feedbacks that shownegligible or very small magnitude by 2100 could nevertheless betriggered well before then, and they could eventually generatesignificant feedback strength over longer timeframes—centuriesand even millennia—and thus, influence the long-term trajectoryof the Earth System. These feedback processes include perma-frost thawing, decomposition of ocean methane hydrates, in-creased marine bacterial respiration, and loss of polar ice sheetsaccompanied by a rise in sea levels and potential amplification oftemperature rise through changes in ocean circulation (33).
Tipping Cascades. Fig. 3 shows a global map of some potentialtipping cascades. The tipping elements fall into three clustersbased on their estimated threshold temperature (12, 17, 39).Cascades could be formed when a rise in global temperaturereaches the level of the lower-temperature cluster, activatingtipping elements, such as loss of the Greenland Ice Sheet or Arcticsea ice. These tipping elements, along with some of the non-tipping element feedbacks (e.g., gradual weakening of land andocean physiological carbon sinks), could push the global averagetemperature even higher, inducing tipping in mid- and higher-temperature clusters. For example, tipping (loss) of the Green-land Ice Sheet could trigger a critical transition in the AtlanticMeridional Ocean Circulation (AMOC), which could together, bycausing sea-level rise and Southern Ocean heat accumulation,accelerate ice loss from the East Antarctic Ice Sheet (32, 40) ontimescales of centuries (41).
Observations of past behavior support an important contri-bution of changes in ocean circulation to such feedback cascades.During previous glaciations, the climate system flickered betweentwo states that seem to reflect changes in convective activity in theNordic seas and changes in the activity of the AMOC. Thesevariations caused typical temperature response patterns called the“bipolar seesaw” (42–44). During extremely cold conditions in thenorth, heat accumulated in the Southern Ocean, and Antarcticawarmed. Eventually, the heat made its way north and generatedsubsurface warming that may have been instrumental in destabi-lizing the edges of the Northern Hemisphere ice sheets (45).
If Greenland and the West Antarctic Ice Sheet melt in the fu-ture, the freshening and cooling of nearby surface waters will havesignificant effects on the ocean circulation. While the probabilityof significant circulation changes is difficult to quantify, climatemodel simulations suggest that freshwater inputs compatible withcurrent rates of Greenland melting are sufficient to have mea-surable effects on ocean temperature and circulation (46, 47).Sustained warming of the northern high latitudes as a result of thisprocess could accelerate feedbacks or activate tipping elementsin that region, such as permafrost degradation, loss of Arctic seaice, and boreal forest dieback.
While this may seem to be an extreme scenario, it illustratesthat a warming into the range of even the lower-temperaturecluster (i.e., the Paris targets) could lead to tipping in the mid- andhigher-temperature clusters via cascade effects. Based on thisanalysis of tipping cascades and taking a risk-averse approach, wesuggest that a potential planetary threshold could occur at atemperature rise as low as ∼2.0 °C above preindustrial (Fig. 1).
Alternative Stabilized Earth PathwayIf the world’s societies want to avoid crossing a potential thresholdthat locks the Earth System into the Hothouse Earth pathway, thenit is critical that they make deliberate decisions to avoid this risk
Fig. 3. Global map of potential tipping cascades. The individualtipping elements are color- coded according to estimated thresholdsin global average surface temperature (tipping points) (12, 34).Arrows show the potential interactions among the tipping elementsbased on expert elicitation that could generate cascades. Note that,although the risk for tipping (loss of) the East Antarctic Ice Sheet isproposed at>5 °C, somemarine-based sectors in East Antarctica maybe vulnerable at lower temperatures (35–38).
Steffen et al. PNAS | August 14, 2018 | vol. 115 | no. 33 | 8255
116
and maintain the Earth System in Holocene-like conditions. Thishuman-created pathway is represented in Figs. 1 and 2 by whatwe call Stabilized Earth (small loop at the bottom of Fig. 1, UpperRight), in which the Earth System is maintained in a state with atemperature rise no greater than 2 °C above preindustrial (a“super-Holocene” state) (11). Stabilized Earth would require deepcuts in greenhouse gas emissions, protection and enhancement ofbiosphere carbon sinks, efforts to remove CO2 from the atmosphere,possibly solar radiationmanagement, and adaptation to unavoidableimpacts of the warming already occurring (48). The short broken redline beyond Stabilized Earth in Fig. 1, Upper Right represents a po-tential return to interglacial-like conditions in the longer term.
In essence, the Stabilized Earth pathway could be conceptu-alized as a regime of the Earth System in which humanity plays anactive planetary stewardship role in maintaining a state in-termediate between the glacial–interglacial limit cycle of the LateQuaternary and a Hothouse Earth (Fig. 2). We emphasize thatStabilized Earth is not an intrinsic state of the Earth System butrather, one in which humanity commits to a pathway of ongoingmanagement of its relationship with the rest of the Earth System.
A critical issue is that, if a planetary threshold is crossed towardthe Hothouse Earth pathway, accessing the Stabilized Earthpathway would become very difficult no matter what actions hu-man societies might take. Beyond the threshold, positive (reinforcing)feedbacks within the Earth System—outside of human influence orcontrol—could become the dominant driver of the system’s pathway,as individual tipping elements create linked cascades through timeand with rising temperature (Fig. 3). In other words, after the EarthSystem is committed to the Hothouse Earth pathway, the alternativeStabilized Earth pathway would very likely become inaccessible asillustrated in Fig. 2.
What Is at Stake? Hothouse Earth is likely to be uncontrollableand dangerous to many, particularly if we transition into it in only acentury or two, and it poses severe risks for health, economies, po-litical stability (12, 39, 49, 50) (especially for the most climate vul-nerable), and ultimately, the habitability of the planet for humans.
Insights into the risks posed by the rapid climatic changesemerging in the Anthropocene can be obtained not only fromcontemporary observations (51–55) but also, from interactions inthe past between human societies and regional and seasonalhydroclimate variability. This variability was often much morepronounced than global, longer-term Holocene variability (SIAppendix). Agricultural production and water supplies are espe-cially vulnerable to changes in the hydroclimate, leading to hot/dry or cool/wet extremes. Societal declines, collapses, migrations/resettlements, reorganizations, and cultural changes were oftenassociated with severe regional droughts and with the globalmegadrought at 4.2–3.9 thousand years before present, all oc-curring within the relative stability of the narrow global Holocenetemperature range of approximately ±1 °C (56).
SI Appendix, Table S4 summarizes biomes and regional bio-sphere–physical climate subsystems critical for human wellbeingand the resultant risks if the Earth System follows a Hothouse Earthpathway. While most of these biomes or regional systems may beretained in a Stabilized Earth pathway, most or all of them wouldlikely be substantially changed or degraded in a Hothouse Earthpathway, with serious challenges for the viability of human societies.
For example, agricultural systems are particularly vulnerable,because they are spatially organized around the relatively stableHolocene patterns of terrestrial primary productivity, which de-pend on a well-established and predictable spatial distribution of
temperature and precipitation in relation to the location of fertilesoils as well as on a particular atmospheric CO2 concentration.Current understanding suggests that, while a Stabilized Earthpathway could result in an approximate balance between in-creases and decreases in regional production as human systemsadapt, a Hothouse Earth trajectory will likely exceed the limits ofadaptation and result in a substantial overall decrease in agricul-tural production, increased prices, and even more disparity be-tween wealthy and poor countries (57).
The world’s coastal zones, especially low-lying deltas and theadjacent coastal seas and ecosystems, are particularly importantfor human wellbeing. These areas are home to much of the world’spopulation, most of the emerging megacities, and a significantamount of infrastructure vital for both national economies and in-ternational trade. A Hothouse Earth trajectory would almost cer-tainly flood deltaic environments, increase the risk of damage fromcoastal storms, and eliminate coral reefs (and all of the benefits thatthey provide for societies) by the end of this century or earlier (58).
Human Feedbacks in the Earth System. In the dominant climatechange narrative, humans are an external force driving change to theEarth System in a largely linear, deterministic way; the higher theforcing in terms of anthropogenic greenhouse gas emissions,the higher the global average temperature. However, our anal-ysis argues that human societies and our activities need to berecast as an integral, interacting component of a complex, adaptiveEarth System. This framing puts the focus not only on human systemdynamics that reduce greenhouse gas emissions but also, on thosethat create or enhance negative feedbacks that reduce the risk thatthe Earth System will cross a planetary threshold and lock into aHothouse Earth pathway.
Humanity’s challenge then is to influence the dynamicalproperties of the Earth System in such a way that the emergingunstable conditions in the zone between the Holocene and a veryhot state become a de facto stable intermediate state (StabilizedEarth) (Fig. 2). This requires that humans take deliberate, integral,and adaptive steps to reduce dangerous impacts on the EarthSystem, effectively monitoring and changing behavior to formfeedback loops that stabilize this intermediate state.
There is much uncertainty and debate about how this can bedone—technically, ethically, equitably, and economically—andthere is no doubt that the normative, policy, and institutional as-pects are highly challenging. However, societies could take a widerange of actions that constitute negative feedbacks, summarizedin SI Appendix, Table S5, to steer the Earth System toward Sta-bilized Earth. Some of these actions are already altering emissiontrajectories. The negative feedback actions fall into three broadcategories: (i) reducing greenhouse gas emissions, (ii) enhancingor creating carbon sinks (e.g., protecting and enhancing bio-sphere carbon sinks and creating new types of sinks) (59), and (iii)modifying Earth’s energy balance (for example, via solar radiationmanagement, although that particular feedback entails very large risksof destabilization or degradation of several key processes in the EarthSystem) (60, 61). While reducing emissions is a priority, much morecould be done to reduce direct human pressures on critical biomesthat contribute to the regulation of the state of the Earth Systemthrough carbon sinks and moisture feedbacks, such as the Amazonand boreal forests (Table 1), and to build much more effective stew-ardship of the marine and terrestrial biospheres in general.
The present dominant socioeconomic system, however, isbased on high-carbon economic growth and exploitative resourceuse (9). Attempts to modify this system have met with some
8256 | www.pnas.org/cgi/doi/10.1073/pnas.1810141115 Steffen et al.
117
success locally but little success globally in reducing greenhousegas emissions or building more effective stewardship of the bio-sphere. Incremental linear changes to the present socioeconomicsystem are not enough to stabilize the Earth System. Widespread,rapid, and fundamental transformations will likely be required toreduce the risk of crossing the threshold and locking in the Hot-house Earth pathway; these include changes in behavior, tech-nology and innovation, governance, and values (48, 62, 63).
International efforts to reduce human impacts on the EarthSystem while improving wellbeing include the United NationsSustainable Development Goals and the commitment in the Parisagreement to keep warming below 2 °C. These internationalgovernance initiatives are matched by carbon reduction com-mitments by countries, cities, businesses, and individuals (64–66) ,but as yet, these are not enough to meet the Paris target. En-hanced ambition will need new collectively shared values, prin-ciples, and frameworks as well as education to support suchchanges (67, 68). In essence, effective Earth System stewardship isan essential precondition for the prosperous development ofhuman societies in a Stabilized Earth pathway (69, 70).
In addition to institutional and social innovation at the globalgovernance level, changes in demographics, consumption, be-havior, attitudes, education, institutions, and socially embeddedtechnologies are all important to maximize the chances ofachieving a Stabilized Earth pathway (71). Many of the neededshifts may take decades to have a globally aggregated impact (SIAppendix, Table S5), but there are indications that society may bereaching some important societal tipping points. For example,there has been relatively rapid progress toward slowing or re-versing population growth through declining fertility resultingfrom the empowerment of women, access to birth control tech-nologies, expansion of educational opportunities, and rising in-come levels (72, 73). These demographic changes must becomplemented by sustainable per capita consumption patterns,especially among the higher per capita consumers. Some changesin consumer behavior have been observed (74, 75), and oppor-tunities for consequent major transitions in social norms overbroad scales may arise (76). Technological innovation is contrib-uting to more rapid decarbonization and the possibility for re-moving CO2 from the atmosphere (48).
Ultimately, the transformations necessary to achieve the Sta-bilized Earth pathway require a fundamental reorientation andrestructuring of national and international institutions towardmore effective governance at the Earth System level (77), with amuch stronger emphasis on planetary concerns in economicgovernance, global trade, investments and finance, and techno-logical development (78).
Building Resilience in a Rapidly Changing Earth System. Even ifa Stabilized Earth pathway is achieved, humanity will face a tur-bulent road of rapid and profound changes and uncertainties onroute to it—politically, socially, and environmentally—that chal-lenge the resilience of human societies (79–82). Stabilized Earthwill likely be warmer than any other time over the last 800,000 yearsat least (83) (that is, warmer than at any other time in which fullymodern humans have existed).
In addition, the Stabilized Earth trajectory will almost surely becharacterized by the activation of some tipping elements (TippingCascades and Fig. 3) and by nonlinear dynamics and abruptshifts at the level of critical biomes that support humanity (SIAppendix, Table S4). Current rates of change of important fea-tures of the Earth System already match or exceed those of abrupt
geophysical events in the past (SI Appendix). With these trendslikely to continue for the next several decades at least, the con-temporary way of guiding development founded on theories,tools, and beliefs of gradual or incremental change, with a focuson economy efficiency, will likely not be adequate to cope withthis trajectory. Thus, in addition to adaptation, increasing resil-ience will become a key strategy for navigating the future.
Generic resilience-building strategies include developing in-surance, buffers, redundancy, diversity, and other features ofresilience that are critical for transforming human systems in theface of warming and possible surprise associated with tippingpoints (84). Features of such a strategy include (i) maintenance ofdiversity, modularity, and redundancy; (ii) management of con-nectivity, openness, slow variables, and feedbacks; (iii) un-derstanding social–ecological systems as complex adaptivesystems, especially at the level of the Earth System as a whole (85);(iv) encouraging learning and experimentation; and (v) broaden-ing of participation and building of trust to promote polycentricgovernance systems (86, 87).
ConclusionsOur systems approach, focusing on feedbacks, tipping points,and nonlinear dynamics, has addressed the four questions posedin the Introduction.
Our analysis suggests that the Earth System may be approachinga planetary threshold that could lock in a continuing rapid pathwaytoward much hotter conditions—Hothouse Earth. This pathwaywould be propelled by strong, intrinsic, biogeophysical feedbacksdifficult to influence by human actions, a pathway that could not bereversed, steered, or substantially slowed.
Where such a threshold might be is uncertain, but it could beonly decades ahead at a temperature rise of ∼2.0 °C above pre-industrial, and thus, it could be within the range of the Paris Ac-cord temperature targets.
The impacts of aHothouseEarth pathwayonhuman societieswouldlikely be massive, sometimes abrupt, and undoubtedly disruptive.
Avoiding this threshold by creating a Stabilized Earth pathwaycan only be achieved and maintained by a coordinated, de-liberate effort by human societies to manage our relationship withthe rest of the Earth System, recognizing that humanity is an in-tegral, interacting component of the system. Humanity is nowfacing the need for critical decisions and actions that could in-fluence our future for centuries, if not millennia (88).
How credible is this analysis? There is significant evidence froma number of sources that the risk of a planetary threshold and thus,the need to create a divergent pathway should be taken seriously:
First, the complex system behavior of the Earth System in theLate Quaternary is well-documented and understood. The twobounding states of the system—glacial and interglacial—arereasonably well-defined, the ca. 100,000-years periodicity of thelimit cycle is established, and internal (carbon cycle and ice albedofeedbacks) and external (changes in insolation caused by changesin Earth’s orbital parameters) driving processes are generally well-known. Furthermore, we know with high confidence that theprogressive disintegration of ice sheets and the transgression ofother tipping elements are difficult to reverse after critical levels ofwarming are reached.
Second, insights from Earth’s recent geological past (SI Ap-pendix) suggest that conditions consistent with the HothouseEarth pathway are accessible with levels of atmospheric CO2
concentration and temperature rise either already realized orprojected for this century (SI Appendix, Table S1).
Steffen et al. PNAS | August 14, 2018 | vol. 115 | no. 33 | 8257
118

Third, the tipping elements and feedback processes thatoperated over Quaternary glacial– interglacial cycles arethe same as several of those proposed as critical for the fu-ture trajectory of the Earth System (Biogeophysical Feed-backs, Tipping Cascades, Fig. 3, Table 1, and SI Appendix,Table S2).
Fourth, contemporary observations (29, 38) (SI Appendix) oftipping element behavior at an observed temperature anomaly ofabout 1 °C above preindustrial suggest that some of these ele-ments are vulnerable to tipping within just a 1 °C to 3 °C increasein global temperature, with many more of them vulnerable athigher temperatures (Biogeophysical Feedbacks and TippingCascades) (12, 17, 39). This suggests that the risk of tipping cas-cades could be significant at a 2 °C temperature rise and couldincrease sharply beyond that point. We argue that a planetarythreshold in the Earth System could exist at a temperature rise aslow as 2 °C above preindustrial.
The Stabilized Earth trajectory requires deliberate manage-ment of humanity’s relationship with the rest of the Earth System ifthe world is to avoid crossing a planetary threshold. We suggestthat a deep transformation based on a fundamental reorientationof human values, equity, behavior, institutions, economies, andtechnologies is required. Even so, the pathway toward StabilizedEarth will involve considerable changes to the structure and func-tioning of the Earth System, suggesting that resilience-buildingstrategies be given much higher priority than at present in decisionmaking. Some signs are emerging that societies are initiating someofthe necessary transformations. However, these transformations arestill in initial stages, and the social/political tipping points that
definitively move the current trajectory away from Hothouse Earthhave not yet been crossed, while the door to the Stabilized Earthpathway may be rapidly closing.
Our initial analysis here needs to be underpinned by more in-depth, quantitative Earth System analysis and modeling studies toaddress three critical questions. (i) Is humanity at risk for pushingthe system across a planetary threshold and irreversibly down aHothouse Earth pathway? (ii) What other pathways might be pos-sible in the complex stability landscape of the Earth System, andwhat risks might they entail? (iii) What planetary stewardship strat-egies are required to maintain the Earth System in a manageableStabilized Earth state?
AcknowledgmentsWe thank the three reviewers for their comments on the first version of themanuscript and two of the reviewers for further comments on a revised versionof the manuscript. These comments were very helpful in the revisions. We thanka member of the PNAS editorial board for a comprehensive and very helpfulreview. W.S. and C.P.S. are members of the Anthropocene Working Group.W.S., J.R., K.R., S.E.C., J.F.D., I.F., S.J.L., R.W. and H.J.S. are members of thePlanetary Boundaries Research Network PB.net and the Earth League’s EarthDocProgramme supported by the Stordalen Foundation. T.M.L. was supported bya Royal Society Wolfson Research Merit Award and the European UnionFramework Programme 7 Project HELIX. C.F. was supported by the Erling–Persson Family Foundation. The participation of D.L. was supported by theHaury Program in Environment and Social Justice and National ScienceFoundation (USA) Decadal and Regional Climate Prediction using EarthSystem Models Grant 1243125. S.E.C. was supported in part by Swedish Re-search Council Formas Grant 2012-742. J.F.D. and R.W. were supported byLeibniz Association Project DOMINOES. S.J.L. receives funding from FormasGrant 2014-589. This paper is a contribution to European Research CouncilAdvanced Grant 2016, Earth Resilience in the Anthropocene Project 743080.
1 Crutzen PJ (2002) Geology of mankind. Nature 415:23.2 Steffen W, Broadgate W, Deutsch L, Gaffney O, Ludwig C (2015) The trajectory of the Anthropocene: The great acceleration. Anthropocene Rev 2:81–98.3 Waters CN, et al. (2016) The Anthropocene is functionally and stratigraphically distinct from the Holocene. Science 351:aad2622.4 Malm A, Hornborg A (2014) The geology of mankind? A critique of the Anthropocene narrative. Anthropocene Rev 1:62–69.5 Donges JF, et al. (2017) Closing the loop: Reconnecting human dynamics to Earth System science. Anthropocene Rev 4:151–157.6 Levin SA (2003) Complex adaptive systems: Exploring the known, the unknown and the unknowable. Bull Am Math Soc 40:3–20.7 Past Interglacial Working Group of PAGES (2016) Interglacials of the last 800,000 years. Rev Geophys 54:162–219.8 Williams M, et al. (2015) The Anthropocene biosphere. Anthropocene Rev 2:196–219.9 McNeill JR, Engelke P (2016) The Great Acceleration (Harvard Univ Press, Cambridge, MA).
10 Hawkins E, et al. (2017) Estimating changes in global temperature since the pre-industrial period. Bull Am Meteorol Soc 98:1841–1856.11 Ganopolski A, Winkelmann R, Schellnhuber HJ (2016) Critical insolation-CO2 relation for diagnosing past and future glacial inception. Nature 529:200–203.12 Schellnhuber HJ, Rahmstorf S, Winkelmann R (2016) Why the right climate target was agreed in Paris. Nat Clim Change 6:649–653.13 Schellnhuber HJ (1999) ‘Earth system’ analysis and the second Copernican revolution. Nature 402(Suppl):C19–C23.14 IPCC (2013) Summary for policymakers. Climate Change 2013: The Physical Science Basis, Contribution of Working Group I to the Fifth Assessment Report of the
Intergovernmental Panel on Climate Change, eds Stocker TF, et al. (Cambridge Univ Press, Cambridge, UK), pp 3–29.15 Drijfhout S, et al. (2015) Catalogue of abrupt shifts in Intergovernmental Panel on Climate Change climate models. Proc Natl Acad Sci USA 112:E5777–E5786.16 Stocker TF, et al. (2013) Technical summary. Climate Change 2013: The Physical Science Basis. Contribution of Working Group I to the Fifth Assessment Report of
the Intergovernmental Panel on Climate Change, eds Stocker TF, et al. (Cambridge Univ Press, Cambridge, UK).17 Lenton TM, et al. (2008) Tipping elements in the Earth’s climate system. Proc Natl Acad Sci USA 105:1786–1793.18 Scheffer M (2009) Critical Transitions in Nature and Society (Princeton Univ Press, Princeton).19 Raupach MR, et al. (2014) The declining uptake rate of atmospheric CO2 by land and ocean sinks. Biogeosciences 11:3453–3475.20 Schaefer K, Lantuit H, Romanovsky VE, Schuur EAG, Witt R (2014) The impact of the permafrost carbon feedback on global climate. Environ Res Lett 9:085003.21 Schneider von Deimling T, et al. (2015) Observation-based modelling of permafrost carbon fluxes with accounting for deep carbon deposits and thermokarst
activity. Biogeosciences 12:3469–3488.22 Koven CD, et al. (2015) A simplified, data-constrained approach to estimate the permafrost carbon-climate feedback. Philos Trans A Math Phys Eng Sci
373:20140423.23 Chadburn SE, et al. (2017) An observation-based constraint on permafrost loss as a function of global warming. Nat Clim Change 7:340–344.24 Ciais P, et al. (2013) Carbon and other biogeochemical cycles. Climate Change 2013: The Physical Science Basis, Contribution of Working Group I to the Fifth
Assessment Report of the Intergovernmental Panel on Climate Change, eds Stocker TF, et al. (Cambridge Univ Press, Cambridge, UK), pp 465–570.25 Segschneider J, Bendtsen J (2013) Temperature-dependent remineralization in a warming ocean increases surface pCO2 through changes in marine ecosystem
composition. Global Biogeochem Cycles 27:1214–1225.26 Bendtsen J, Hilligsøe KM, Hansen J, Richardson K (2015) Analysis of remineralisation, lability, temperature sensitivity and structural composition of organic matter
from the upper ocean. Prog Oceanogr 130:125–145.27 Jones C, Lowe J, Liddicoat S, Betts R (2009) Committed terrestrial ecosystem changes due to climate change. Nat Geosci 2:484–487.28 Kurz WA, Apps MJ (1999) A 70-year retrospective analysis of carbon fluxes in the Canadian forest sector. Ecol Appl 9:526–547.29 Lewis SL, Brando PM, Phillips OL, van der Heijden GMF, Nepstad D (2011) The 2010 Amazon drought. Science 331:554.30 Herzschuh U, et al. (2016) Glacial legacies on interglacial vegetation at the Pliocene-Pleistocene transition in NE Asia. Nature Commun 7:11967.
8258 | www.pnas.org/cgi/doi/10.1073/pnas.1810141115 Steffen et al.
119

31 Mao J, et al. (2016) Human-induced greening of the northern extratropical land surface. Nat Clim Change 6:959–963.32 Keenan TF, et al. (2016) Recent pause in the growth rate of atmospheric CO2 due to enhanced terrestrial carbon uptake. Nature Commun 7:13428, and erratum
(2017) 8:16137.33 Hansen J, et al. (2016) Ice melt, sea level rise and superstorms: Evidence from paleoclimatedata, climate modeling, and modern observations that 2 °C global
warming could be dangerous. Atmos Chem Phys 16:3761–3812.34 Kriegler E, Hall JW, Held H, Dawson R, Schellnhuber HJ (2009) Imprecise probability assessment of tipping points in the climate system. Proc Natl Acad Sci USA
106:5041–5046.35 Pollard D, DeConto RM (2009) Modelling West Antarctic ice sheet growth and collapse through the past five million years. Nature 458:329–332.36 Pollard D, DeConto RM, Alley RB (2015) Potential Antarctic Ice Sheet retreat driven by hydrofracturing and ice cliff failure. Earth Planet Sci Lett 412:112–121.37 DeConto RM, Pollard D (2016) Contribution of Antarctica to past and future sea-level rise. Nature 531:591–597.38 Rintoul SR, et al. (2016) Ocean heat drives rapid basal melt of the Totten Ice Shelf. Sci Adv 2:e1601610.39 US Department of Defense (2015) National security implications of climate-related risks and a changing climate. Available at archive.defense.gov/pubs/150724-
congressional-report-on-national-implications-of-climate-change.pdf?source=govdelivery. Accessed February 7, 2018.40 Mengel M, Levermann A (2014) Ice plug prevents irreversible discharge from East Antarctica. Nat Clim Change 4:451–455.41 Armour KC, et al. (2016) Southern Ocean warming delayed by circumpolar upwelling and equatorward transport. Nat Geosci 9:549–554.42 Stocker TF, Johnsen SJ (2003) A minimum thermodynamic model for the bipolar seesaw. Paleoceanography 18:1087.43 Rahmstorf S (2002) Ocean circulation and climate during the past 120,000 years. Nature 419:207–214.44 Hemming SR (2004) Heinrich events: Massive late Pleistocene detritus layers of the North Atlantic and their global climate imprint. Rev Geophys 42:1–43.45 Alvarez-Solas J, et al. (2010) Link between ocean temperature and iceberg discharge during Heinrich events. Nat Geosci 3:122–126.46 Stouffer RJ, et al. (2006) Investigating the causes of the response of the thermohaline circulation to past and future climate changes. J Clim 19:1365–1387.47 Swingedow D, et al. (2013) Decadal fingerprints of freshwater discharge around Greenland in a multi-model ensemble. Clim Dyn 41:695–720.48 Rockström J, et al. (2017) A roadmap for rapid decarbonization. Science 355:1269–1271.49 Schleussner C-F, Donges JF, Donner RV, Schellnhuber HJ (2016) Armed-conflict risks enhanced by climate-related disasters in ethnically fractionalized countries.
Proc Natl Acad Sci USA 113:9216–9221.50 McMichael AJ, et al., eds (2003) Climate Change and Human Health: Risks and Responses (WHO, Geneva).51 Udmale PD, et al. (2015) How did the 2012 drought affect rural livelihoods in vulnerable areas? Empirical evidence from India. Int J Disaster Risk Reduct
13:454–469.52 Maldonado JK, Shearer C, Bronen R, Peterson K, Lazrus H (2013) The impact of climate change on tribal communities in the US: Displacement, relocation, and
human rights. Clim Change 120:601–614.53 Warner K, Afifi T (2014) Where the rain falls: Evidence from 8 countries on how vulnerable households use migration to manage the risk of rainfall variability and
food insecurity. Clim Dev 6:1–17.54 Cheung WW, Watson R, Pauly D (2013) Signature of ocean warming in global fisheries catch. Nature 497:365–368.55 Nakano K (2017) Screening of climatic impacts on a country’s international supply chains: Japan as a case study.Mitig Adapt Strategies Glob Change 22:651–667.56 Latorre C, Wilmshurst J, von Gunten L, eds (2016) Climate change and cultural evolution. PAGES (Past Global Changes) Magazine 24:1–32.57 IPCC (2014) Summary for policymakers. Climate Change 2014: Impacts, Adaptation, and Vulnerability. Part A: Global and Sectoral Aspects. Contribution of
Working Group II to the Fifth Assessment Report of the Intergovernmental Panel on Climate Change, eds Field CB, et al. (Cambridge Univ Press, Cambridge, UK),pp 1–32.
58 Schleussner C-F, et al. (2016) Science and policy characteristics of the Paris Agreement temperature goal. Nat Clim Change 6:827–835.59 Griscom BW, et al. (2017) Natural climate solutions. Proc Natl Acad Sci USA 114:11645–11650.60 Barrett S, et al. (2014) Climate engineering reconsidered. Nat Clim Change 4:527–529.61 Mathesius S, Hofmann M, Calderia K, Schellnhuber HJ (2015) Long-term response of oceans to CO2 removal from the atmosphere. Nat Clim Change
5:1107–1113.62 Geels FW, Sovacool BK, Schwanen T, Sorrell S (2017) Sociotechnical transitions for deep decarbonization. Science 357:1242–1244.63 O’Brien K (2018) Is the 1.5 °C target possible? Exploring the three spheres of transformation. Curr Opin Environ Sustain 31:153–160.64 Young OR, et al. (2006) The globalization of socioecological systems: An agenda for scientific research. Glob Environ Change 16:304–316.65 Adger NW, Eakin H, Winkels A (2009) Nested and teleconnected vulnerabilities to environmental change. Front Ecol Environ 7:150–157.66 UN General Assembly (2015) Transforming Our World: The 2030 Agenda for Sustainable Development, A/RES/70/1. Available at https://
sustainabledevelopment.un.org/content/documents/21252030%20Agenda%20for%20Sustainable%20Development%20web.pdf. Accessed July 18, 2018.67 Wals AE, Brody M, Dillon J, Stevenson RB (2014) Science education. Convergence between science and environmental education. Science 344:583–584.68 O’Brien K, et al. (2013) You say you want a revolution? Transforming education and capacity building in response to global change. Environ Sci Policy 28:48–59.69 Chapin FS, III, et al. (2011) Earth stewardship: A strategy for social–ecological transformation to reverse planetary degradation. J Environ Stud Sci 1:44–53.70 Folke C, Biggs R, Norström AV, Reyers B, Rockström J (2016) Social-ecological resilience and biosphere-based sustainability science. Ecol Soc 21:41.71 Westley F, et al. (2011) Tipping toward sustainability: Emerging pathways of transformation. Ambio 40:762–780.72 Lutz W, Muttarak R, Striessnig E (2014) Environment and development. Universal education is key to enhanced climate adaptation. Science 346:1061–1062.73 Bongaarts J (2016) Development: Slow down population growth. Nature 530:409–412.74 Defila R, Di Giulio A, Kaufmann-Hayoz R, eds (2012) The Nature of Sustainable Consumption and How to Achieve It: Results from the Focal Topic “From
Knowledge to Action–New Paths Towards Sustainable Consumption” (Oakum, Munich).75 Cohen MJ, Szejnwald Brown H, Vergragt P, eds (2013) Innovations in Sustainable Consumption: New Economics, Socio-Technical Transitions and Social Practices
(Edward Elgar, Cheltenham, UK).76 Nyborg K, et al. (2016) Social norms as solutions. Science 354:42–43.77 Biermann F, et al. (2012) Science and government. Navigating the anthropocene: Improving Earth system governance. Science 335:1306–1307.78 Galaz V (2014) Global Environmental Governance, Technology and Politics: The Anthropocene Gap (Edward Elgar, Cheltenham, UK).79 Peters DPC, et al. (2004) Cross-scale interactions, nonlinearities, and forecasting catastrophic events. Proc Natl Acad Sci USA 101:15130–15135.80 Walker B, et al. (2009) Environment. Looming global-scale failures and missing institutions. Science 325:1345–1346.81 Hansen J, Sato M, Ruedy R (2012) Perception of climate change. Proc Natl Acad Sci USA 109:E2415–E2423.82 Galaz V, et al. (2017) Global governance dimensions of globally networked risks: The state of the art in social science research. Risks Hazards Crisis Public Policy
8:4–27.83 Augustin L, et al.; EPICA community members (2004) Eight glacial cycles from an Antarctic ice core. Nature 429:623–628.84 Polasky S, Carpenter SR, Folke C, Keeler B (2011) Decision-making under great uncertainty: Environmental management in an era of global change. Trends Ecol
Evol 26:398–404.85 Capra F, Luisi PL (2014) The Systems View of Life; A Unifying Vision (Cambridge Univ Press, Cambridge, UK).86 Carpenter SR, et al. (2012) General resilience to cope with extreme events. Sustainability 4:3248–3259.87 Biggs R, et al. (2012) Toward principles for enhancing the resilience of ecosystem services. Annu Rev Environ Resour 37:421–448.88 Figueres C, et al. (2017) Three years to safeguard our climate. Nature 546:593–595.
Steffen et al. PNAS | August 14, 2018 | vol. 115 | no. 33 | 8259
120


121

UNESCO Chair for Dialogueson Sustainability
United NationsEducational, Scientific and
Cultural Organization
122

123
UNESCO Chair for Dialogueson Sustainability
United NationsEducational, Scientific and
Cultural Organization
124

4
125
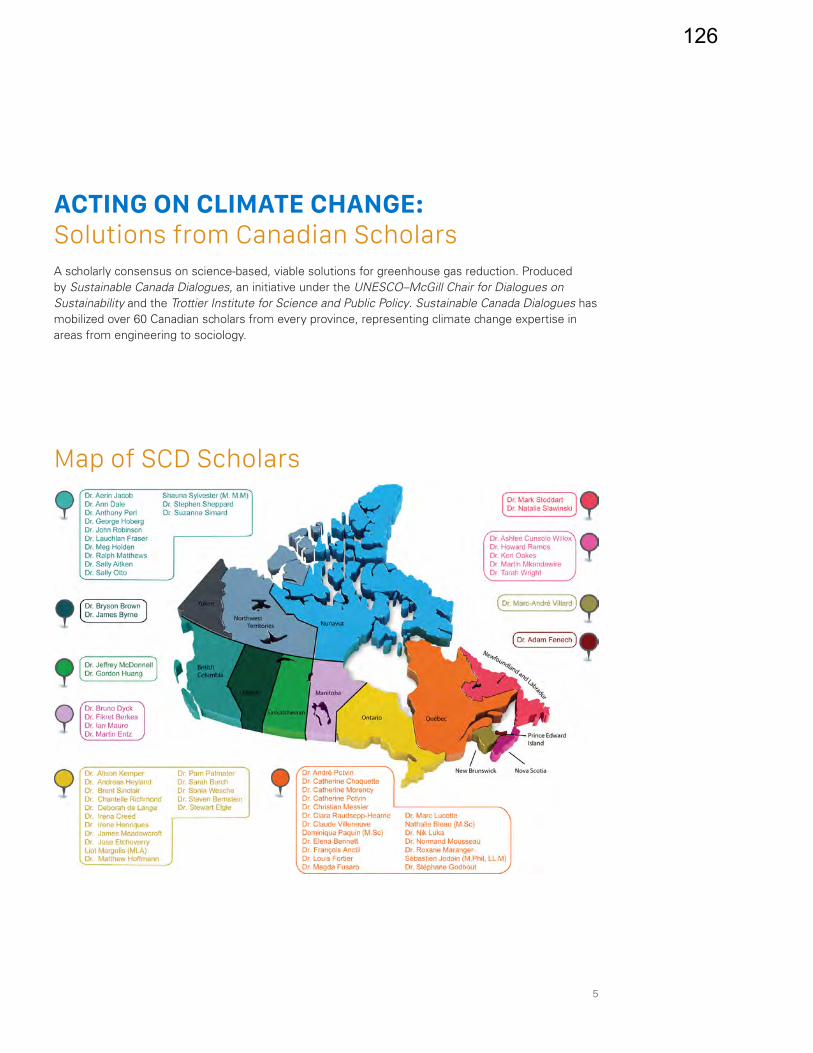
5
ACTING ON CLIMATE CHANGE:
Solutions from Canadian ScholarsA scholarly consensus on science-based, viable solutions for greenhouse gas reduction. Produced by Sustainable Canada Dialogues, an initiative under the UNESCO–McGill Chair for Dialogues on Sustainability and the Trottier Institute for Science and Public Policy. Sustainable Canada Dialogues has mobilized over 60 Canadian scholars from every province, representing climate change expertise in areas from engineering to sociology.
Map of SCD Scholars
126

6
127

7
EXECUTIVE SUMMARY
In fall 2014, United Nations Secretary Ban Ki-moon exhorted all countries in the world to raise the am-bitions of their climate change policies to avoid a global temperature increase of more than 2°C during this century. Answering this call, the scholars of Sustainable Canada Dialogues1 (SCD), an initiative that mobilizes over 60 researchers from every province, worked collectively to identify a possible pathway to a low carbon economy in Canada. Our network of scholars represents disciplines across engineering, sciences and social sciences, with sustainability at the heart of our research programs.
Acting on Climate Change: Solutions from Canadian Scholars identifies ten policy orientations illustrated by actions that could be immediately adopted to kick-start Canada’s necessary transition toward a low carbon economy and sustainable society. We unanimously recommend putting a price on carbon.
The Sustainable Canada Dialogues benefited from collaboration with the Consortium OURANOS2 that carried out climate simulations for the position paper. The simulations, based on the greenhouse gas mitigation scenarios of the Intergovernmental Panel on Climate Change (IPCC)3, show that immediate global actions to reduce greenhouse gas emissions would successfully limit temperature increases in Canada. We must act today to ensure tomorrow.
Besides putting a price on carbon Acting on Climate Change: Solutions from Canadian Scholars exa-mines how Canada can reduce its greenhouse gas emissions (GHG) by: 1) producing electricity with low carbon emissions sources; 2) modifying energy consumption through evolving urban design and a transportation revolution; and 3) linking transition to a low-carbon economy with a broader sustainability agenda, through creation of participatory and open governance institutions that engage the Canadian public. Our proposals take into account Canada’s assets and are based on the well-accepted “polluter pays” principle. They are presented in details in the core document that can be downloaded from the SCD website.
In the short term, policy orientations that could trigger climate action include:
• Implementing either a national carbon tax or a national economy-wide cap and trade program;
• Eliminating subsidies to the fossil fuel industry and fully integrating the oil and gas productionsector in climate policies;
• Integrating sustainability and climate change into landscape planning at the regional and city le-vels to ensure that, amongst other goals, new and maintenance infrastructure investments areconsistent with the long-term goal of decarbonizing.
1 http://www.sustainablecanadadialogues.ca/en/scd
2 http://www.ouranos.ca/
3 http://ipcc.ch/home_languages_main_french.shtml
128

8
In the short- to middle-terms, the transition could be facilitated by:
• East-West intelligent grid connections that allow provinces producing hydroelectricity to sell elec-tricity to their neighbors while taking full advantage of Canada’s low carbon energy potential;
• Well-managed energy efficiency programs that produce significant positive economic returnsacross the board, through cost savings as well as job creation. Energy efficiency programs couldtarget the building sector as well as businesses and industries.
In the short- to long-terms, the transition could support a transportation “revolution”:
• Transportation strategies that move the sector away from its dependence on fossil fuel could reston the implementation of a basket of options, ranging from electrification of transport to collectiveand active transportation.
Because renewable energy resources are plentiful, we believe that Canada could reach 100% reliance on low carbon electricity by 2035. This makes it possible, in turn, to adopt a long-term target of at least 80% reduction in emissions by the middle of the century, consistent with Canada’s international cli-mate mitigation responsibility. In the short-term, we think Canada, in keeping with its historical position of aligning with United States’ targets, could adopt a 2025 target of 26-28% GES reductions relative to our 2005 levels.
We envision climate policy as the ongoing, long-term project of making the transition to a low-carbon society and economy. This notion of transition has many advantages: the 80% target establishes the direction of change, allowing Canada to plan for the future while recognizing that goals will take time to accomplish. It permits governments, businesses and citizens to situate their activities within a dynamic context. As with other past and future major transitions, e.g. industrialization or electrification, there will be controversies and setbacks. Some economic sectors will contract as others expand. The most impor-tant aspect of Canadian climate policies is to build a sustainable future starting today.
Recognition that certain forms of economic development were causing environmental damage led to the notion of sustainable development as ‘‘development that meets the needs of the present without compromising the ability of future generations to meet their own needs.’’ We have adopted a more re-cent definition of sustainability that emphasizes the importance of desired futures. We propose that the specific transition pathways to a low carbon economy in Canada could rest on the hopes of Canadians for social and environmental well-being and help articulate a vision for the country.
The transition to a low carbon sustainable society will usher in great opportunities for innovation by developing new technologies, businesses and employment. The international landscape has changed substantively since Canada withdrew from the Kyoto Protocol in December 2011. Canada’s major trade partner, the USA, doubled their GHG emissions reduction target in 2014. In 2011, the International En-ergy Agency (IEA) estimated that investments for energy efficiency were worth USD 310-360 billion4. A clear climate policy framework would reduce uncertainty in the business environment, encouraging companies to invest in low-carbon technologies.
We have identified policy orientations designed to deliver viable, large impacts based on our expertise and on dialogue among our members. We do not claim to offer all possible policies or incentives to achieve sustainability, and we understand that further analyses, debate and refinement will be required. However, in virtually all cases, our proposals are in line with a number of international and national ana-lyses of viable policy options to decarbonize.
We believe that putting options on the table is long overdue in Canada and hope that our input will help governments at all levels to make ambitious and thoughtful commitments to emission reductions be-fore December 2015 and the 2015 Paris-Climate Conference. We wish for an intense period of consulta-tion and policy development to identify the policy instruments, regulations and incentives best suited to Canada. We offer our full cooperation to all levels of government in this challenging, but exciting, period. The time is now ripe to initiate ambitious climate change mitigation efforts.
4 http://www.iea.org/bookshop/463-Energy_Efficiency_Market_Report_2014
129

9
CORE WRITING TEAM
Potvin, C., Department of Biology, McGill University ; Aitken, S., Faculty of Forestry, University of British Columbia ; Anc-
til, F., Inst. Environnement, Développement et Société, Université Laval ; Bennett, E., Department of Natural Resource
Sciences, McGill University ; Berkes, F., Natural Resource Institute, University of Manitoba ; Byrne, J., Department of Geo-
graphy, University of Lethbridge ; Creed, I., Department of Biology, Western University ; Cunsolo Willox, A., Department of
Nursing and Indigenous Studies, Cape Breton University ; Dale, A., School of Environment and Sustainability, Royal Roads
University ; de Lange, D., Ted Rogers School of Management, Ryerson University ; Entz, M., Department of Plant Science,
University of Manitoba ; Fraser, L., Faculty of Science, Thompson Rivers University ; Hoberg, G., Faculty of Forestry, Univer-
sity of British Columbia ; Holden, M., Department of Urban Studies and Department of Geography, Simon Fraser University ;
Jacob, A., Department of Geography, University of Victoria ; Jodoin, S., Faculty of Law, McGill University ; Margolis, L.,
John H. Daniels Faculty of Architecture, Landscape and Design, University of Toronto ; Meadowcroft, J., School of Public
Policy and Administration, Carleton University ; Morency, C., Department of Civil, Geological and Mining Engineering, Poly-
technique Montréal ; Mousseau, N., Départment de Physique, Université de Montréal ; Oakes, K., Department of Biology,
Cape Breton University ; Otto, S., Department of Zoology, University of British Columbia ; Palmer, T.S., Knowledge Transfer
Consultant; Paquin, D., Climate Simulation and Analysis, Ouranos Consortium on Regional Climatology and Adaptation to Cli-
mate Change, Montreal ; Perl, A., Department of Political Science, Simon Fraser University ; Potvin, A., École d’architecture,
Université Laval ; Raudsepp-Hearne, C., Consultant ; Sinclair, B., Department of Biology, Western University ; Slawinski,
N., Faculty of Business Administration, Memorial University ; Stoddart, M., Department of Sociology, Memorial University ;
Wright, T., Faculty of Science, Dalhousie University.
OTHER CONTRIBUTING RESEARCHERS
Bourque, A., Impacts and Adaptation Program, Ouranos ; Dyck, B., Asper School of Business, University of Manitoba ;
Godbout, S., Biological Sciences, Université Laval ; Heyland, A., Department of Integrative Biology, Guelph University ;
Huang, G., Institute for Energy, Environment and Sustainable Communities, University of Regina ; Kemper, A., Faculty of
Entrepreneurship, Ryerson University ; Lucotte, M., Department of Earth and Atmospheric Sciences, Université du Québec
à Montréal ; Maranger, R., Department of Biological Sciences, Université de Montréal ; Matthews, R., Department of Socio-
logy, University of British Columbia ; Mauro, I., Department of Geography, University of Winnipeg ; McDonnell, J., School of
Environment and Sustainability, U. Saskatchewan ; Mkandawire, M., Verschuren Centre for Sustainabilty in Energy and the
Environment, Cape Breton University ; Messier, C., Department of Biological Sciences, Université de Québec en Outaouais ;
Palmater, P., Departments of Politics and Public Administration, Ryerson University ; Simard, S., Faculty of Forestry, Univer-
sity of British Columbia ; Slawinski, N., Faculty of Business Administration, Memorial University ; Villard, M-A., Department
of Biology, University of Moncton ; Villeneuve, C., Department of Fundamental Sciences, Université du Québec à Chicouti-
mi ; Wesche, S., Department of Geography, University of Ottawa.
SCD REVIEW TEAM
Bernstein, S., Department of Political Science, University of Toronto ; Bleau, N., Built Environment Program, Ouranos
Consortium on Regional Climatology and Adaptation to Climate Change, Montreal ; Brown, B., Department of Philosophy,
University of Lethbridge ; Burch, S., Department of Geography and Environmental Management, University of Waterloo ;
Etcheverry, J., Faculty of Environmental Studies, York University ; Fenech, A., Climate Laboratory, University of Prince Ed-
ward Island ; Henriques, I., Schulich School of Business, York University ; Hoffmann, M., Department of Political Science,
University of Toronto ; Ramos, H., Department of Sociology and Social Anthropology, Dalhousie University ; Robinson, J.,
Institute for Resources, Environment and Sustainability, University of British Columbia ; Simard, S., Faculty of Forestry,
University of British Columbia.
EXTERNAL REVIEW TEAM
Reviewers who read and commented on earlier versions :
Anjos, M.F., Trottier Institute for Energy, Polytechnique Montréal ; Bécaert, V., Department of Chemical Engineering, Polytechnique Montréal ; Harvey, L.D.D., Department of Geography, University of Toronto ; Jaccard, M., School of Resource and Environmental Management, Simon Frazer University ; Layzell, D., Department of Biological Sciences, University of Calgary ; Miller, E. J., Department of Civil Engineering, University of Toronto ; Pedersen, T., Pacific Ins-titute for Climate Solutions, University of Victoria ; Pineau, P.-O., Hautes Études Commerciales Montréal ; Ragan, C., Department of Economy, McGill University ; Whitmore, J., Hautes Études Commerciales Montréal.
130

Intentionally Left Blank
131
To Adèle ( 2 months ), Alice ( 4 years ), Arthur ( 17 months ), Avery ( 2 years ), Brookelyn ( 7 years ), Camille ( 3 years ), Elias ( 5 years ), Emma ( 1 week ),
Evan ( 8 years, ), Gabriel ( 2 days ), Hanah ( 9 years ), Isis ( 3 years ), Jai ( 10 years ), Josh ( 10 years ), Jules ( 2 weeks ), Keestin ( 5 years ),
Louve ( 11 years ), Maggie ( 13 years ), Megan ( 13 years ), Manami ( 2 years ), Matthew ( 6 years ), Mireille ( 13 years ),
Naomi ( 13 years ), Penelope ( 7 years ), Samantha ( 18 months ), Tal ( 16 months ), Wilson ( 12 years ), Wusko ( 9 years ),
and all other children.
Your future is our inspiration.
132

ACKNOWLEDGEMENTS
This project was developed by the UNESCO-McGill Chair Dialogues on Sustainability and made possible thanks to the support of the Trottier Institute for Science and Public Policy of McGill University to Catherine Potvin.
Many dedicated people supported this initiative, our deepest acknowledgements. We are grateful to Rosine Faucher, who ensured implementation of the Delphi survey. Taysha Palmer did a great job as copy editor. Thanks also to Martine Larouche and Suzanne Simard for proofreading the document. We are most grateful to David Aldred who provided the information necessary to produce the map of sustainable energies in Canada. The magical touch of Globaïa and Felix Pharand-Deschênes gave another life to our position paper. Monica Granados helped us with the PowerPoint presentations. Jocelyne Néron came to help when tiredness was starting. Last but not least, Natalie Richards helped keep the ship afloat over an intense 18 months of work.
Thanks to M. Anjos, F. Bouffard, C. A. Cañizares, E. Feurtey, J. Gibbons, L. D. D. Harvey, R. Lanoue, W. Locke, G. Marleau, J. Meadowcroft, N. Mousseau, P.-O. Pineau, I. H. Rowlands, H. Tremblay, L. Trottier, M. S. Winfield, J. Whitmore and E. Yiridoe for contributions and stimulating discussions during a workshop on Eastern Canada Energy5.
5 http://normandmousseau.com/-A-common-energy-policy-for-Eastern-.html?lang=en
133

Intentionally Left Blank
134

2727
Chapter 2CANADA’S TRANSITION TO A LOW-CARBON SOCIETY
Canada needs an integrated climate action plan. The most important aspect of the plan is to get going today.
This Chapter identifies policy orientations ( in blue ), illustrated by a number of actions ( in green ) that could allow Canada to adopt new emissions reduction targets before the 2015 Paris-Climate Confe-rence. Transitioning to a low-carbon society could be facilitated by climate policies designed with the following characteristics :
Environmentally effective Policies meeting GHG reduction targets without causing other excessive environmental impacts ;
Cost-effective Policies achieving the necessary GHG reductions at the least possible cost ;
Administratively feasible Complexity of policies being within the governance capacity of the implementing jurisdictions ;
Equitable Policies that are not placing unjustified burdens on any region, sector, or income group ;
Politically feasible Policies acceptable to Canadian publics and their elected representatives46.
Climate policies could rest on the “polluter pays” principle. Canadians are accustomed to this notion : for instance, taxes on cigarettes are justified in part by generating the income necessary to cover the health-related costs of smoking.
In addition, meaningful climate policies require three elements :
1. An objective ( clear target and timeline ) ;
2. A choice of policy instruments ( subsidies or tax incentives, regulation, carbon tax or cap and trade, research and development ) ; and
3. The design of policy instruments to achieve the stated objective.
46 Adapted from Jaccard, M., and Rivers, N. ( 2008 ). Canadian Policies for Deep Greenhouse Reduction. A Canadian Priorities Agenda : Policy Choices to Improve Economic and Social Well-Being. Jeremy Leonard, Christopher Ragan and France St-Hilaire, eds. Ottawa : IRPP. http://irpp.org/research-studies/jaccard-rivers-2007-10-29/
135

28
Because energy, transport, and building infrastructure last several decades, and they lock in develop-ment along specific pathways47, we believe that a long-term target of 80 % emissions reduction, aligned with IPCC’s recommendation for developed countries48, should be adopted immediately to in-form current decision making. Failure to do so would imprison Canada in a high-carbon development pathway.
A medium-term target is needed for 2025 that will raise the ambition of Canada’s emissions reduction effort beginning now. To maintain past consistency with US objectives, Canada could adopt the recently announced US target of 26-28 % below 2005 levels by 2025.
2.1 KEY ENABLING POLICY
KEY POLICY ORIENTATION # 1 : Put a price on carbon
Challenging trade-offs among different policy options means there is no mechanism for reducing GHG emissions that fully meets all desired characteristics of climate policies. For example, a basket of regu-lations can be effective, and more politically palatable to some, but could be less cost-effective than a carbon tax or cap and trade49. It could however be a tremendous administrative challenge to regulate non-industrial sources of GHG emissions that collectively account for a significant share of Canada’s emissions.
Widespread agreement nevertheless exists among climate policy analysts that carbon pricing should be a key component of any comprehensive climate change policy. There is less agreement on which carbon pricing mechanism ( a carbon tax, or cap and trade ) provides the best balance.
2.1.1 Carbon Tax or Cap and trade ?
Carbon taxes have been the preferred instrument of economists for decades because of their cost-ef-fectiveness and administrative simplicity. British Columbia implemented an effective model of a reve-nue-neutral carbon tax in 2008 that is receiving increasing recognition around the world50. In the contem-porary political climate, however, carbon taxes come with special political baggage.
Cap and trade, when designed effectively, can be virtually as cost-effective as a carbon tax, although its administrative complexity likely makes it more costly than a tax. The basic feature of a cap and trade system is that the government establishes an absolute cap on emissions designed to decline over time, allowing it to meet a GHG reduction target. The government issues allowances or permits to emitters, and emitters can trade their allowances in a regulated market. This approach has the advantage of direc-tly controlling the quantity of emissions, as well as providing greater certainty and accountability that targets will be met. However, cap and trade poses special administrative challenges because the market in permits must be regulated to avoid manipulation. A cap and trade system has been in place in the European Union for eight years, and is also operating in California and Québec51. However, overall, we find more advantages to a national approach.
The choice between carbon tax or cap and trade depends on the weight placed upon different criteria and consequences. If price certainty and administrative simplicity are valued most, then carbon tax is the better instrument. If avoiding new types of taxes and greater certainty over emission control are most important, then cap and trade is the better instrument. Either a carbon tax or a cap and trade sys-tem could work effectively, efficiently, and fairly to enable Canada to meet a ambitious GHG reduction targets.
47 Lecocq, F. and Shalizi, Z. ( 2014 ). The economics of targeted mitigation in infrastructure. Climate Policy, 14( 2 ), 187-208.
48 http://www.ipcc.ch/pdf/assessment-report/ar5/syr/SYR_AR5_SPMcorr1.pdf
49 Nordhaus, W. ( 2013 ). The Climate Casino : Risk, Uncertainty, and Economics for a Warming World. New Haven : Yale University Press. Part IV.
50 Harrison, K. ( 2013 ). The Political Economy of British Columbia’s Carbon Tax. OECD Environmental Working Paper 63. http://www.oecd-ilibrary.org/docserver/download/5k3z04gkkhkg.pdf ?expires=1394731610&id=id&accname=guest&checksum=D7C2C9BF73AFC-88901C793F4A343698D
51 Newell, R., et al. ( 2013 ). Carbon markets 15 years after Kyoto : Lessons learned, new challenges. The Journal of Economic Perspectives, 123-146.
136

29
2.1.2 National or Provincial ?
Persistent concerns about regional equity suggest that to be politically feasible, climate policies should not result in significant regional redistribution. The relatively decentralized nature of Canada’s federation raises questions about which is more desirable : a national plan or a differentiated province-led approach like the one Canada has today.
From a cost-effectiveness standpoint, a national GHG reduction plan has advantages. There would be concerns about fairness and competitiveness if emitters in one province paid a significantly different carbon price than emitters elsewhere in Canada. A cap and trade system would realize economic bene-fits from being applied to a larger and more diverse area. Moreover, a national approach would avoid the challenging question about how to allocate emission reduction targets to provinces, because in either the carbon tax approach or a cap and trade system, provincial emission levels would be responses to market signals, not established in advance. But a national approach would be politically challenging, es-pecially given the diverse policy instruments currently in use by different provinces and various political sensitivities within the country.
In the short term, adopt either a national carbon tax or a national cap and trade program.
National Carbon Tax A national revenue-neutral carbon tax could be built on the British Columbia model and apply to all fuel use. The tax would need to increase over time for Canada to meets its emission reduction targets.
National Cap and Trade A national cap and trade could be modeled on the basic design of the Québec system. Since it is linked to the much larger California system, some of the risks of administrative complexity are reduced.
2.1.3 National Carbon Tax
With a national carbon tax, one approach to adjusting the price over time would be to link the tax to the social cost of carbon ( currently $40/tonne CO2 or higher52 and estimated to increase annually by $1/tonne CO2 ). To improve equity, carbon tax revenues could be distributed back to the provinces of origin. Adjustments to the tax system could be made ( as is the case in British Columbia ) to ensure the carbon tax does not disadvantage low-income groups. Any national system would require provinces with diffe-rent policy instruments already in place to adapt. If Québec wanted to keep its cap and trade system, for example, it could either negotiate an equivalency agreement that ensures its carbon price levels are similar to the rest of the country, or comply with a province-specific emission cap.
2.1.4 National Cap and Trade
A national cap and trade program would benefit from building on an existing system. Careful design, guided by the following questions, could help smooth the transition :
• What sources are covered ? Our proposal would cover industrial and utility emissions and fuel distributors.
• Are allowances auctioned or issued for free ( “ grandparenting ” ) ? Québec-California’s Cap and Trade system provides free allowances to certain industries. Our proposal would begin by provi-ding free allowances but then increase the fraction of allowances auctioned over time. While this approach would slow the flow of new revenues to governments, it would ease the transition to the new climate policy and allow emitters time to adjust.
• Are prices regulated with price floors, caps, or both ? Our proposal would establish a price floor that would increase over time, and a mechanism to minimize permit price volatility.
52 Hope C, Hope M. ( 2013 ) The social cost of CO2 in a low-growth world. Nature Climate Change 3, 722-724. and Howarth RB, Gerst MD, Borsuk ME. ( 2013 ) Risk mitigation and the social cost of carbon. Global Environmental Change 24,123-131.
137
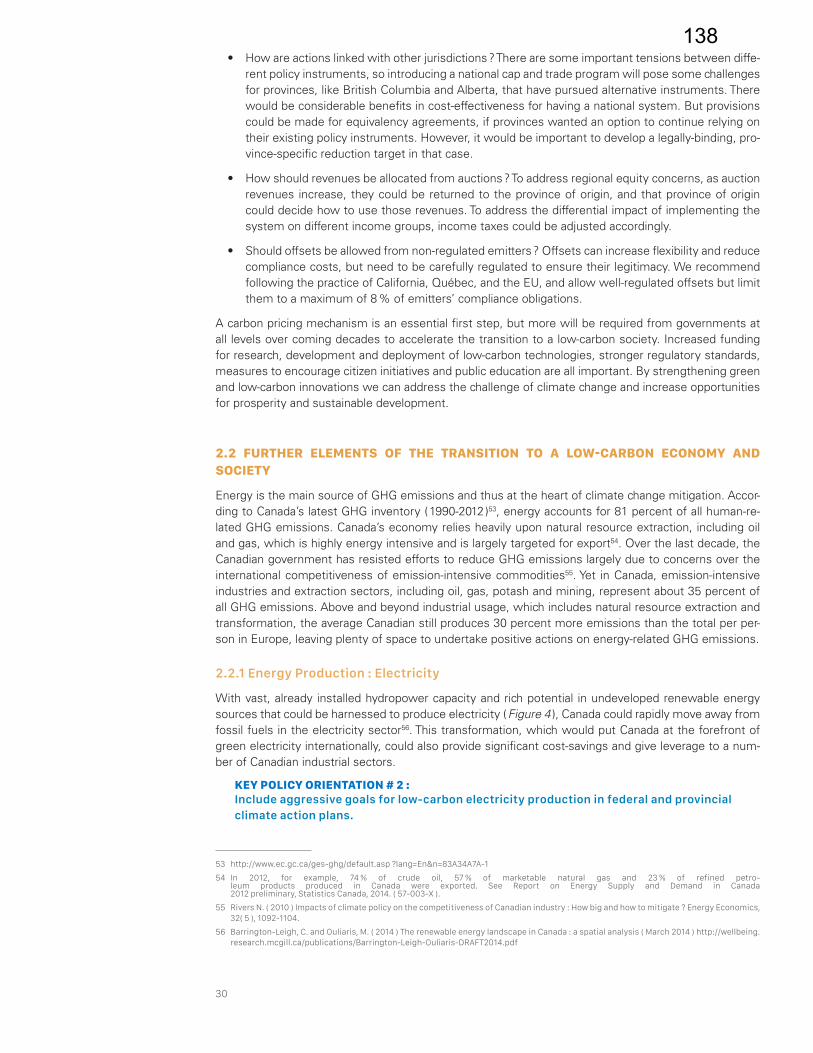
30
• How are actions linked with other jurisdictions ? There are some important tensions between diffe-rent policy instruments, so introducing a national cap and trade program will pose some challenges for provinces, like British Columbia and Alberta, that have pursued alternative instruments. There would be considerable benefits in cost-effectiveness for having a national system. But provisions could be made for equivalency agreements, if provinces wanted an option to continue relying on their existing policy instruments. However, it would be important to develop a legally-binding, pro-vince-specific reduction target in that case.
• How should revenues be allocated from auctions ? To address regional equity concerns, as auction revenues increase, they could be returned to the province of origin, and that province of origin could decide how to use those revenues. To address the differential impact of implementing the system on different income groups, income taxes could be adjusted accordingly.
• Should offsets be allowed from non-regulated emitters ? Offsets can increase flexibility and reduce compliance costs, but need to be carefully regulated to ensure their legitimacy. We recommend following the practice of California, Québec, and the EU, and allow well-regulated offsets but limit them to a maximum of 8 % of emitters’ compliance obligations.
A carbon pricing mechanism is an essential first step, but more will be required from governments at all levels over coming decades to accelerate the transition to a low-carbon society. Increased funding for research, development and deployment of low-carbon technologies, stronger regulatory standards, measures to encourage citizen initiatives and public education are all important. By strengthening green and low-carbon innovations we can address the challenge of climate change and increase opportunities for prosperity and sustainable development.
2.2 FURTHER ELEMENTS OF THE TRANSITION TO A LOW-CARBON ECONOMY AND SOCIETY
Energy is the main source of GHG emissions and thus at the heart of climate change mitigation. Accor-ding to Canada’s latest GHG inventory ( 1990-2012 )53, energy accounts for 81 percent of all human-re-lated GHG emissions. Canada’s economy relies heavily upon natural resource extraction, including oil and gas, which is highly energy intensive and is largely targeted for export54. Over the last decade, the Canadian government has resisted efforts to reduce GHG emissions largely due to concerns over the international competitiveness of emission-intensive commodities55. Yet in Canada, emission-intensive industries and extraction sectors, including oil, gas, potash and mining, represent about 35 percent of all GHG emissions. Above and beyond industrial usage, which includes natural resource extraction and transformation, the average Canadian still produces 30 percent more emissions than the total per per-son in Europe, leaving plenty of space to undertake positive actions on energy-related GHG emissions.
2.2.1 Energy Production : Electricity
With vast, already installed hydropower capacity and rich potential in undeveloped renewable energy sources that could be harnessed to produce electricity ( Figure 4 ), Canada could rapidly move away from fossil fuels in the electricity sector56. This transformation, which would put Canada at the forefront of green electricity internationally, could also provide significant cost-savings and give leverage to a num-ber of Canadian industrial sectors.
KEY POLICY ORIENTATION # 2 : Include aggressive goals for low-carbon electricity production in federal and provincial climate action plans.
53 http://www.ec.gc.ca/ges-ghg/default.asp ?lang=En&n=83A34A7A-1
54 In 2012, for example, 74 % of crude oil, 57 % of marketable natural gas and 23 % of refined petro-leum products produced in Canada were exported. See Report on Energy Supply and Demand in Canada 2012 preliminary, Statistics Canada, 2014. ( 57-003-X ).
55 Rivers N. ( 2010 ) Impacts of climate policy on the competitiveness of Canadian industry : How big and how to mitigate ? Energy Economics, 32( 5 ), 1092-1104.
56 Barrington-Leigh, C. and Ouliaris, M. ( 2014 ) The renewable energy landscape in Canada : a spatial analysis ( March 2014 ) http://wellbeing.research.mcgill.ca/publications/Barrington-Leigh-Ouliaris-DRAFT2014.pdf
138
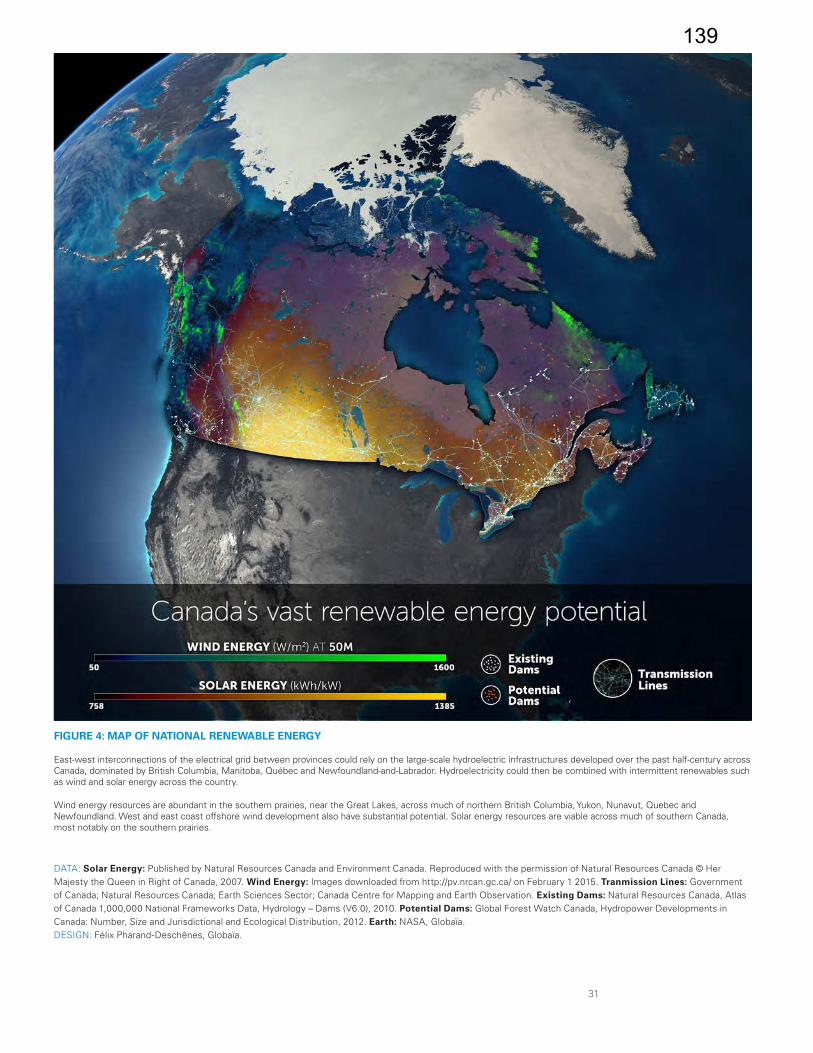
31
FIGURE 4: MAP OF NATIONAL RENEWABLE ENERGY
East-west interconnections of the electrical grid between provinces could rely on the large-scale hydroelectric infrastructures developed over the past half-century across Canada, dominated by British Columbia, Manitoba, Québec and Newfoundland-and-Labrador. Hydroelectricity could then be combined with intermittent renewables such as wind and solar energy across the country.
Wind energy resources are abundant in the southern prairies, near the Great Lakes, across much of northern British Columbia, Yukon, Nunavut, Quebec and Newfoundland. West and east coast offshore wind development also have substantial potential. Solar energy resources are viable across much of southern Canada, most notably on the southern prairies.
DATA: Solar Energy: Published by Natural Resources Canada and Environment Canada. Reproduced with the permission of Natural Resources Canada © Her Majesty the Queen in Right of Canada, 2007. Wind Energy: Images downloaded from http://pv.nrcan.gc.ca/ on February 1 2015. Tranmission Lines: Government of Canada; Natural Resources Canada; Earth Sciences Sector; Canada Centre for Mapping and Earth Observation. Existing Dams: Natural Resources Canada, Atlas of Canada 1,000,000 National Frameworks Data, Hydrology – Dams (V6.0), 2010. Potential Dams: Global Forest Watch Canada, Hydropower Developments in Canada: Number, Size and Jurisdictional and Ecological Distribution, 2012. Earth: NASA, Globaïa.DESIGN: Félix Pharand-Deschênes, Globaïa.
139

32
Among the number of possible actions to support this first step toward a low-carbon Canada, two appear especially promising :
In the short-term, adopt ambitious sectorial targets for low-carbon electricity production.
Seventy-seven percent of Canada’s electricity is already produced from low-carbon emission sources. Combining current hydroelectric production capacity with plentiful untapped renewable energy re-sources and east-west intelligent grid connections57 between provinces ( see next action bullet ), could allow Canada to adopt a target of 100 percent low-carbon electricity production by 2035. While this mi-ght seem very ambitious, it is in fact coherent with lowering prices for renewable technologies58 and the current international context. Norway, for example, already generates 100 percent of its electricity using renewable energy while a number of European countries and regions59 60 61 62 have adopted, above and beyond low-carbon electricity, a 100 percent renewable energy target. A number of studies and reports63 propose pathways to achieve such ambitious targets.
Fully developing Canada’s low-carbon energy potential however would have to be done taking into ac-count broader sustainability issues, since energy infrastructure can have important environmental and social costs64. In addition, the potential of new technologies ( such as carbon capture and storage ) for reaching 100 percent low-carbon electricity needs to be evaluated65. Finally there are technical, political, social and economic barriers to adoption of low-carbon energy solutions that need to be identified and eliminated in a systematic manner to reach the 100 percent low-carbon energy target and meet the mul-tiple needs of local communities while protecting ecosystems. Many of the technical barriers appear in fact to be barriers of information66 and seem easier to surpass at the municipal level than at higher level of governments67.
In the short to mid-term, support interprovincial electricity transportation infrastructure.
High-voltage east-west electricity transportation infrastructure between adjacent provinces would al-low provinces that produce hydroelectricity ( British Columbia, Manitoba, Newfoundland-Labrador and Québec ) to sell it to their neighbors. This infrastructure development could be in part supported by the Federal government. Simulations by CESAR., at University of Calgary, show that importing hydro power from BC could lower Alberta’s electricity emissions ( although this would require development of untapped hydro reserve and a framework for interprovincial cooperation68 ). Similarly, modelling69 70, done at the University of Regina indicates that importing hydroelectricity from Manitoba would allow Saskatchewan to lower emissions from electricity production, pointing out that once hydro and wind ca-pacities have reached maximum available levels, the least-cost option would then be electricity import. It is noteworthy that Québec and Ontario have recently signed an agreement to expand electricity trading
57 The Deep Decarbonization Canada chapter emphasizes the importance of an “enhanced transmission grid flexibility and energy storage technologies to allow more electricity generation from intermittent renewables” ( p. 14 ).
58 Prices for wind energy, for example, are quickly falling. On December 16, 2014, Hydro-Québec announced that it has accepted three sub-missions for 450 MW at an average price of 7.6 ¢/kWh including 1.3 ¢/kWh for transport. http://nouvelles.hydroquebec.com/fr/commu-niques-de-presse/697/appel-doffres-visant-lachat-de-450-mw-denergie-eolienne-hydro-quebec-distribution-retient-3-soumissions-totalisant-4464-mw/
59 http://www.umweltbundesamt.de/en/publikationen/germany-2050-a-greenhouse-gas-neutral-country
60 http://www.nytimes.com/2014/11/11/science/earth/denmark-aims-for-100-percent-renewable-energy.html ?_r=0
61 http://www.scotland.gov.uk/Topics/archive/National-Planning-Policy/themes/renewables
62 http://www.esv.or.at/english/energy-in-upper-austria/
63 http://go100re.net/e-library/studies-and-reports/ and The New Climate Economy Report to “raise ambition for zero-carbon electricity ( NCE -Energy, p 27-28 )”. and https ://web.stanford.edu/group/efmh/jacobson/Articles/I/susenergy2030.html
64 Shaw, K. ( 2011 ). Climate deadlocks : the environmental politics of energy systems. Environmental Politics, 20( 5 ), 743-763.
65 Van Alphen, K., et al. ( 2010 ). Accelerating the deployment of carbon capture and storage technologies by strengthening the innovation system. International Journal of Greenhouse Gas Control, 4( 2 ), 396-409.
66 Richards, G., et al. ( 2012 ). Barriers to renewable energy development : A case study of large-scale wind energy in Saskatchewan, Canada. Energy Policy, 42, 691-698.
67 St-Denis, G. and Parker, P. ( 2009 ). Community energy planning in Canada : The role of renewable energy. Renewable and Sustainable Energy Reviews, 13( 8 ), 2088-2095.
68 Transforming Alberta’s power sector to address barriers to oil sands production and export, David B. Layzell, CESAR Initiative, University of Alberta, Presentation at the Conoco Phillips IRIS Seminar Series ( June 4th, 2014 ). http://www.cesarnet.ca/research/exploring-strate-gies-transforming-alberta-s-electrical-systems
69 Lin, Q. G., et al. ( 2005 ). An energy systems modelling approach for the planning of power generation : a North American case study. Inter-national journal of computer applications in technology ( International Network of Centres for Computer Applications ), 22( 2 ), 151-159.
70 Lin, Q. G., et al. ( 2010 ) The Optimization of Energy Systems under Changing Policies of Greenhouse-gas Emission Control—A Study for the Province of Saskatchewan, Canada. Energy Sources, Part A : Recovery, Utilization, and Environmental Effects, 32( 17 ), 1587-1602.
140

33
and cooperate on climate change71.
2.2.2 Energy Production : Oil and Gas
In 2012, according to Environment Canada72, oil and gas production was responsible for about 160 Mt CO2 eq. ; more than three times the GHG emissions associated with energy consumed by the rest of Canada’s industry ( Figure 3 ). As such, the oil and gas extraction and transformation sector comes just after transportation for national GHG emissions and could surpass it, if growth continues.
KEY POLICY ORIENTATION # 3 : Integrate the oil and gas production sector in climate policies
In a continental energy market, Canadian energy producers and exporters in energy intensive industries will face pressure to harmonize with the US. A strong regulatory framework incorporating carbon pricing could favor the development and deployment of innovations73.
In the short-term, eliminate all direct and indirect subsidies to the fossil fuel industry74.
In addition, federal and provincial governments could orient the industry.
In the short- to mid- terms, develop a clear regulatory framework coherent with the transi-tion to a low-carbon society and economy.
2.3 ENERGY CONSUMPTION
It is important to understand that reducing GHG emissions demands limiting negative environmental impacts of energy use through energy switching, energy efficiency and some form of energy conserva-tion75. Energy efficiency, in particular, is crucial to avoiding unnecessary expansion of energy infrastruc-ture76, and serves as a focus for innovation and increased competitiveness. It was shown almost twenty years ago that the earlier energy efficiency measures would be adopted in Canada, the lower the cost of GHG emission reduction77.
KEY POLICY ORIENTATION # 4 : Adopt a multi-level energy policy with energy efficiency and cooperation in electrification at its core.
Following the lead of the USA, Canada has positioned itself as a leader in efficiency standards in a few sectors, such as industrial electric motors. However, Canada’s Energy Efficiency Act78 lags behind current best practices. The following considerations could be addressed by a national energy efficiency policy elaborated jointly by the federal and provincial governments.
In the short-term, develop a national energy policy with long-term plans for transitioning to low-carbon energy.
Currently decision-making is made in a fragmented way disconnecting energy production, transport and consumption, as well as jurisdiction. A multi-level energy policy could incorporate the following elements :
1. Update norms and standards of energy efficiency across the economic sectors to the highest possible levels, with automatic increments planned ahead ;
71 http://www.cbc.ca/news/business/ontario-quebec-sign-deals-on-electricity-climate-change-1.2844837
72 http://www.ec.gc.ca/ges-ghg/default.asp ?lang=En&n=83A34A7A-1
73 Van Alphen, K., et al. ( 2010 ). Accelerating the deployment of carbon capture and storage technologies by strengthening the innovation system. International Journal of Greenhouse Gas Control, 4( 2 ), 396-409.
74 According to the New Climate Economy Report : “With oil-producing country governments facing the greatest asset stranding risk, there will be a need to address and manage the budgetary consequences of reduced demand and the falling oil prices that would result. This should include more rapid phasing out of current fossil fuel subsidies” ( NCE - Finance Chapter p. 35-37 http://newclimateeconomy.re-port/ ).
75 See for recent overview : Richards, G., et al. ( 2012 ). Barriers to renewable energy development : A case study of large-scale wind energy in Saskatchewan, Canada. Energy Policy, 42, 691-698.
76 Shaw, K. ( 2011 ). Climate deadlocks : the environmental politics of energy systems. Environmental Politics, 20( 5 ), 743-763.
77 Harvey, L.D.D., et al. ( 1997 ). Achieving ecologically-motivated reductions of Canadian CO2 emissions. Energy, 22( 7 ), 705-724.
78 http://www.nrcan.gc.ca/energy/regulations-codes-standards/6861
141

34
2. Favour low- or zero-carbon energy sources whenever possible ;
3. Adopt a lifecycle integrated approach to energy projects ;
4. Limit energy losses by favouring energy reuse.
In the short-term, ensure government efficiency standards and procurement.
Government leadership for climate action could be shown by ensuring that government purchases at fe-deral, provincial and municipal levels should be “smart” ( i.e. secure, sustainable ). Governments are big purchasers, and their practices can influence private industry to follow, especially since private industry supplies government entities79.
In the mid- to long-term, implement efficiency targets for energy use in the extractive in-dustry.
An energy framework could be designed to improve energy efficiency in all natural resource extraction. Extractive industries, which are generally energy intensive, are often located far away from connected electricity grids. It is important to encourage these industries toward maximizing low-carbon energy and moving to low-carbon electricity production, even for the most remote sites. The mining industry is directly affected by climate change and already identifying mitigation options80 81.
2.4 ENERGY CONSUMPTION : TRANSPORTATION
Canada’s transportation system will need to undergo a major revision in the context of the transforma-tion of the energy sector proposed above. Realistic visions for a sustainable Canada mean advancing sustainable ways to transport people and goods over long and short distances82. Given the long turn-around time associated with transportation because of vehicle and infrastructure lifespans, it is essen-tial that industry, public sector and consumer investments start to be guided by the need to achieve a reduction of 80 percent in emissions within 35 years.
Governments’ investment orientations need to consider that infrastructures built today must foster and sustain a transition to a low-carbon society83. This is essential to ensure Canadians have the most cost-effective transportation alternatives in the future. Federal money could support the transformation of transport through development of necessary infrastructure.
KEY POLICY ORIENTATION # 5 : Throughout Canada, rapidly adopt low-carbon transportation strategies.
Given the complexity of the transportation sector84, a range of actions might be needed and remain to be fully evaluated in terms of cost/benefit returns :
In the short term, update emissions standards for vehicles and support fuel diversification.
National emission standards could match regions with “best practices” ( European or Californian stan-dards within North America ), not only for cars, but also for sport utility vehicles and trucks. In addition, the use of natural gas hybrids, biodiesel and the development of electric alternatives for the cars and the heavy trucking industry can contribute to the transition. The production of biodiesel fuel should be strictly controlled to avoid creating adverse effects on biodiversity or water quality.
In the mid- to long-terms, electrify road transport.
79 Brammer, S. and Walker, H. ( 2011 ). Sustainable procurement in the public sector : an international comparative study. International Journal of Operations & Production Management, 31( 4 ), 452-476.
80 Ford, J. D., et al. ( 2010 ). Perceptions of climate change risks in primary resource use industries : a survey of the Canadian mining sector. Regional Environmental Change, 10( 1 ), 65-81.
81 Ford, J. D., et al. ( 2011 ). Canary in a coal mine : perceptions of climate change risks and response options among Canadian mine opera-tions. Climatic change, 109( 3-4 ), 399-415.
82 Richard, G. and Perl, A. ( 2010 ). Transport Revolutions : Moving People and Freight Without Oil. Gabriola Island, BC : New Society Publishers, 433 pp.
83 Lecocq, F. and Shalizi, Z. ( 2014 ). The economics of targeted mitigation in infrastructure. Climate Policy, 14( 2 ), 187-208. and Nilsson, M. and Eckerberg, K. ( 2007 ). Environmental Policy Integration in Practice : Shaping Institutions for Learning, London : Earthscan.
84 Kennedy, C., et al. ( 2005 ). The four pillars of sustainable urban transportation. Transport Reviews, 25( 4 ), 393-414.
142
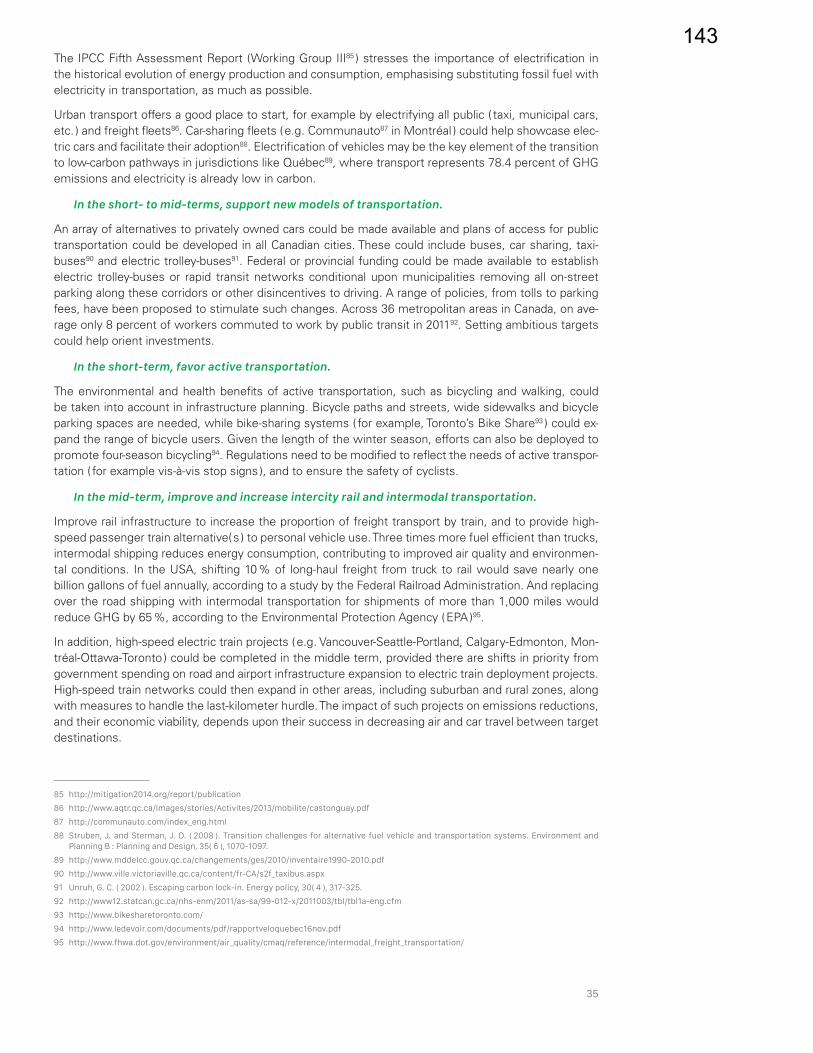
35
The IPCC Fifth Assessment Report ( Working Group III85 ) stresses the importance of electrification in the historical evolution of energy production and consumption, emphasising substituting fossil fuel with electricity in transportation, as much as possible.
Urban transport offers a good place to start, for example by electrifying all public ( taxi, municipal cars, etc. ) and freight fleets86. Car-sharing fleets ( e.g. Communauto87 in Montréal ) could help showcase elec-tric cars and facilitate their adoption88. Electrification of vehicles may be the key element of the transition to low-carbon pathways in jurisdictions like Québec89, where transport represents 78.4 percent of GHG emissions and electricity is already low in carbon.
In the short- to mid-terms, support new models of transportation.
An array of alternatives to privately owned cars could be made available and plans of access for public transportation could be developed in all Canadian cities. These could include buses, car sharing, taxi-buses90 and electric trolley-buses91. Federal or provincial funding could be made available to establish electric trolley-buses or rapid transit networks conditional upon municipalities removing all on-street parking along these corridors or other disincentives to driving. A range of policies, from tolls to parking fees, have been proposed to stimulate such changes. Across 36 metropolitan areas in Canada, on ave-rage only 8 percent of workers commuted to work by public transit in 201192. Setting ambitious targets could help orient investments.
In the short-term, favor active transportation.
The environmental and health benefits of active transportation, such as bicycling and walking, could be taken into account in infrastructure planning. Bicycle paths and streets, wide sidewalks and bicycle parking spaces are needed, while bike-sharing systems ( for example, Toronto’s Bike Share93 ) could ex-pand the range of bicycle users. Given the length of the winter season, efforts can also be deployed to promote four-season bicycling94. Regulations need to be modified to reflect the needs of active transpor-tation ( for example vis-à-vis stop signs ), and to ensure the safety of cyclists.
In the mid-term, improve and increase intercity rail and intermodal transportation.
Improve rail infrastructure to increase the proportion of freight transport by train, and to provide high-speed passenger train alternative( s ) to personal vehicle use. Three times more fuel efficient than trucks, intermodal shipping reduces energy consumption, contributing to improved air quality and environmen-tal conditions. In the USA, shifting 10 % of long-haul freight from truck to rail would save nearly one billion gallons of fuel annually, according to a study by the Federal Railroad Administration. And replacing over the road shipping with intermodal transportation for shipments of more than 1,000 miles would reduce GHG by 65 %, according to the Environmental Protection Agency ( EPA )95.
In addition, high-speed electric train projects ( e.g. Vancouver-Seattle-Portland, Calgary-Edmonton, Mon-tréal-Ottawa-Toronto ) could be completed in the middle term, provided there are shifts in priority from government spending on road and airport infrastructure expansion to electric train deployment projects. High-speed train networks could then expand in other areas, including suburban and rural zones, along with measures to handle the last-kilometer hurdle. The impact of such projects on emissions reductions, and their economic viability, depends upon their success in decreasing air and car travel between target destinations.
85 http://mitigation2014.org/report/publication
86 http://www.aqtr.qc.ca/images/stories/Activites/2013/mobilite/castonguay.pdf
87 http://communauto.com/index_eng.html
88 Struben, J. and Sterman, J. D. ( 2008 ). Transition challenges for alternative fuel vehicle and transportation systems. Environment and Planning B : Planning and Design, 35( 6 ), 1070-1097.
89 http://www.mddelcc.gouv.qc.ca/changements/ges/2010/inventaire1990-2010.pdf
90 http://www.ville.victoriaville.qc.ca/content/fr-CA/s2f_taxibus.aspx
91 Unruh, G. C. ( 2002 ). Escaping carbon lock-in. Energy policy, 30( 4 ), 317-325.
92 http://www12.statcan.gc.ca/nhs-enm/2011/as-sa/99-012-x/2011003/tbl/tbl1a-eng.cfm
93 http://www.bikesharetoronto.com/
94 http://www.ledevoir.com/documents/pdf/rapportveloquebec16nov.pdf
95 http://www.fhwa.dot.gov/environment/air_quality/cmaq/reference/intermodal_freight_transportation/
143

36
2.5 ENERGY CONSUMPTION : CITIES AND BUILDINGS
Cities are home to 81 percent of Canadians96. They concentrate wealth, innovation, education, consump-tion, and GHG emissions, as well as poverty and vulnerability. SCD’s vision of cities is articulated at three interconnected levels : landscape, city and building.
KEY POLICY ORIENTATION # 6 : Integrate landscape, land use, transportation and energy infrastructure planning policies at multiple scales to ensure climate change mitigation.
In 2011, 52 percent of Canada’s metropolitan population lived in medium- and high-density neighbourhoods, and 48 percent lived within 9 km of a city centre97. However, throughout Canada, cities are increasing urban density, mixed land uses and non-automobile transportation options, while encouraging climate-friendly buildings and reduction of energy consumption. Strategic landscape planning can provide environmental, economic and social benefits to both rural and urban areas, including resilience to the effects of climate extremes and protection of agriculture, as well as improving cultural, recreational, public health, social equity and education benefits.
In the short-term, integrate climate change into the heart of territorial and urban planning and identify new avenues for financing.
New “smart” urban development projects such as providing incentives to build-in ecological resilience and reduce reliance on cars will require considerable investment. Land value tax financing is probably neither sufficient nor adequate since it incentivizes developer-led. New financing approaches, such as divesting from currently planned road and highway expenses, could be considered. Valuation of natural and constructed landscapes for their ecosystem functioning and environmental management benefits, for example climate change mitigation via thermal cooling98, represents a critical paradigm shift in mu-nicipal and provincial planning.
In the short-term, acknowledge the importance of, and support, green infrastructure and “ smart growth99” city planning.
Landscape and open-space planning is tied to mobility because “smart” city planning reduces the need to travel and creates space for active mobility, such as walking and bicycling. “ Smart growth100 ” cities are designed for high amenity, mixed land use and medium to high dwelling density, with all systems ( water, waste, energy, transportation, buildings, etc. ) made sustainable, clean, accessible, integrated and connected using advanced technologies. In this context, the “ green infrastructure ” of urban regions becomes an important component of public infrastructure irrespective of the size of the urban area101.
Canada has a harsh climate and heating is a considerable energy expense. In total, building heating is responsible for about 80 Mt CO2 eq102. Heating across the country is mostly done by natural gas and oil, except in Québec and Manitoba where renewable electricity provides a considerable proportion of heat for residential, commercial and institutional buildings. Urban densities and designs that allow access to sunshine are critical for implementation of passive and active solar heating strategies. The building sector should be a leader in reducing energy use and GHG emissions.
96 Statistics Canada, 2011. “Population, urban and rural, by province and territory.” http://www.statcan.gc.ca/tables-tableaux/sum-som/l01/cst01/demo62a-eng.htm
97 Statistics Canada, 2011. “Population, urban and rural, by province and territory.” http://www.statcan.gc.ca/tables-tableaux/sum-som/l01/cst01/demo62a-eng.htm
98 Hough, M. ( 2004 ). Cities and natural process : a basis for sustainability. Routledge.
99 “Smart growth” cities are designed for high amenity, mixed land use and medium to high dwelling density, with all systems ( water, waste, energy, transportation, buildings, etc. ) made sustainable, clean, accessible, integrated, and connected using advanced technologies.
100 http://www.epa.gov/smartgrowth/tisg.htm
101 Green infrastructure is defined as spatially and functionally integrated networks of natural and constructed vegetative systems and green technologies that leverage the functions of natural ecosystems to provide environmental, social and economic benefits http://www.asla.org/greeninfrastructure.aspx
102 http://www.ec.gc.ca/ges-ghg/default.asp ?lang=En&n=83A34A7A-1
144

37
KEY POLICY ORIENTATION # 7 : Support evolution of the building sector toward a carbon neutral or carbon-positive sector103.
While energy efficiency in the residential sector improved 29 percent from 1990-2007, overall energy use in this sector increased 7 percent104. Between 1990 and 2007, the number of households increased 31 percent while the average Canadian home became 10 percent larger leading to an increase in the number of dwellings and more energy consumed.
In the short-term, adopt ambitious targets for energy demand and efficiency of buildings and include climate change mitigation in national building codes.
By 2035, nearly three- quarters of Canada’s buildings will be new or renovated. A new building code, improving energy efficiency of the housing sector to support Architecture 2030105 targets, could be developed. Such a code could incorporate stringent performance standards such as PassivHaus106 and consider post-occupancy evaluation in green building projects107.
A range of actions could help the building sector become carbon neutral or net-positive108 : energy de-mand could be cut significantly through proper siting, building and urban density, and by incorporating daylighting, solar heating and natural ventilation. The energy efficiency of environmental control systems could increase and the remaining energy demand could be met by active low-carbon energy.
However tighter building regulations represent additional costs to the developers, and extra labor and work hours for the workers. Changing industry practices could be supported through improved training in the workforce, financing by governments, financial incentives to build better, more sustainable and efficient buildings and disincentives to developers that don’t follow best practice guidelines.
In the short- to mid-term, invest in renewable and ambient energy for new and existing buildings.
Design and technology are available to create more climate-friendly buildings at little or no additional cost through cutting demand, increasing efficiency, and shifting to low-carbon energy sources109. Op-tions for 100 percent heating transfer to renewable energy include hydroelectricity, solar, biomass and geothermal heat. As with the transportation sector, evolution of the building sector is slow and requires considerable investments. Including requirements for natural lighting, passive heating and cooling and use of active renewable energy in new urban developments is one of the possible ways forward.
Existing buildings could be renovated to the highest possible technical standards for energy efficiency110. This could be facilitated by funding from the federal and/or provincial governments. The “ pay as you save ” policy developed in the UK for building energy efficiency111 is an interesting model that could be considered for buildings already in place. Electric heat pumps and new insulation can reduce the GHG emissions of old buildings.
2.6 TRANSITIONING TO A LOW-CARBON SOCIETY
Understanding GHG reduction as part of a medium- to long-term transition to a low-carbon society has many advantages.
103 Kolokotsa, D., et al. ( 2011 ). A roadmap towards intelligent net zero-and positive-energy buildings. Solar Energy, 85( 12 ), 3067-3084. and Reed, W. ( 2007 ). Shifting from ‘sustainability’to regeneration. Building Research & Information, 35( 6 ), 674-680.
104 http://oee.nrcan.gc.ca/publications/statistics/trends09/chapter3.cfm ?attr=0
105 http://architecture2030.org/
106 http://www.passivhaus.org.uk/
107 e.g. UK’s CarbonBuzz initiative http://www.carbonbuzz.org/
108 See section 3.5 for definition and example.
109 Cole, R. ( 2013 ). Shifting Performance Expectations : Net Positive Buildings. Retrieved from http://www.cesb.cz/cesb13/proceedings/0_keynote/CESB13-Key_Cole.pdf ; Building Performance Institute Europe : http://bpie.eu/eusew_2014.html#.VMpn1ryON8U ; Dekay, M. and Brown, G. Z. ( 2014 ). Sun, wind, and light : Architectural design strategies. John Wiley & Sons. : New-York, 413 p.
110 Harvey LDD. ( 2014 ) Global climate-oriented building energy use scenarios, Energy Policy, 67, 473-487
111 http://www.ukgbc.org/content/pay-you-save-task-group
145

38
• It establishes the direction of change, allowing Canada to plan for the future while recognizing goals take time to accomplish ( Figure 5 ) ;
• It permits governments, businesses and citizens to situate their activities within the context of expected changes ;
• It provides historical references allowing Canadians to understand the transition to a low-carbon economy and society in the light of past social and technical changes, such as industrialization, electrification, the rise of information and communications technologies or democratization.
As with other past and future major transitions, there will be controversies and setbacks. Some eco-nomic sectors will contract as others expand and adjustment policies may be required. But it will also usher in great opportunities for developing new technologies, businesses and employment.
There are many different routes and pathways consistent with a low-carbon future in Canada. Carbon emissions from transport can be cut by encouraging people to walk, ride a bike, take public transit or drive a low-emission vehicle. Probably we will do more of all of these—but how they will be combined into the future we choose to build remains to be seen. Similarly, we can generate low-carbon electricity with hydro, wind, solar and other renewable energies, but also with nuclear power or fossil sources equipped with carbon capture and storage.
Different regions will opt for different combinations of these and other technologies depending on their vision, energy mixes112 and emissions sectors113. Decarbonisation priorities in Québec, with its hy-dro-based electricity system, will look different from those in Alberta, which relies substantially on coal and has a developed a hydrocarbon extraction sector. Different realities exist in the other provinces as well. Determining decarbonisation pathways necessarily involves choices about what is acceptable and desirable in the low-carbon world we want to build.
Viewed from the standpoint of the country as a whole, this diversity is complicated. However, it can also be seen as an advantage because different regions can explore different routes, drawing on different technologies, industries and practices. There is room for creativity and cooperation as different provincial and city governments develop transition pathways suitable to their particular circumstances, mobilizing local resources, business interests, technological prowess and cultural norms to encourage movement toward low-carbon emission solutions.
112 http://www.cesarnet.ca/background-energy-systems
113 http://www.cesarnet.ca/blog/dividing-big-picture-visualizing-provincial-diversity
20100
100
200
300
400
500
600
700
800
2015 2020 2025 2030 2035 2040 2045 2050 2055
Years
Tota
l em
issi
ons
(Mt C
O2 e
q.)
KNOWLEDGEBUILD UP
POLICYORIENTATIONSADOPTION
IMPLEMENTATIONOF CLIMATE POLICY
AND ACTIONS
RESULTEVALUATION
-26% of 2005
100% low carbonelectricity
-80% in 2050
FIGURE 5: TRANSITION TOWARDS A LOW CARBON ECONOMY Emissions reduction targets as well as target for the production of electricity from renewable sources will flag the road for the transition to a low carbon economy. Progress should be monitored periodically and, at each time, the most appropriate policies and actions, according to the current state of knowledge, should be implemented.
146

39
Above all, it should be recognized that no one knows in advance which technologies or institutional solu-tions will ultimately prove most effective, cost-efficient and socially acceptable. We do not know exactly what the world will look like in thirty or fifty years’ time. However, Canada will not be travelling solo on this road to transformation. Nations around the globe engage with the challenge of defining low-carbon development trajectories. Indeed, almost every carbon reduction method advanced in this position pa-per has already been taken up by decision-makers in one or another developed States. And many coun-tries—including Germany, Sweden, Denmark and the United Kingdom—have already begun to set their policies within the framework of a deliberate transition to a low-carbon emission society. Advancing this transition means getting going now, applying policies that are most appropriate according to the current state of knowledge, then systematically monitoring progress and adjusting our efforts over time on the basis of lessons learned ( Figure 6 ).
147


148

A collection of texts in response to
Acting on Climate Change:Solutions from Canadian Scholars,
a consensus document released in March 2015
Acting on Climate Change: Extending the Dialogue
Among Canadians
© STÉPHAN DAIGLE
UNESCO Chair for Dialogueson Sustainability
United NationsEducational, Scientific and
Cultural OrganizationUNESCO Chair for Dialogueson Sustainability
United NationsEducational, Scientific and
Cultural Organization
UNESCO Chair for Dialogueson Sustainability
United NationsEducational, Scientific and
Cultural Organization
149

170
Generation Squeeze is a uniquely positioned, national, non-partisan organization that speaks up for Canadians in their 20s, 30s, 40s and younger who are squeezed by lower incomes, higher costs, less time, and a deteriorating environment. Because governments are less willing to adapt for younger Canadians than others, we’re squeezing back so Canada works for all generations.
A CARP for Younger Canada: our enterprise takes inspiration from the model of generational organizing implemented by the Canadian Association of Retired Persons (CARP), which lobbies on behalf of Canadians age 50+.
Our theory of change is simple: if younger Canadians had an organization with political and market clout that matched that of CARP, governments would be more likely to adapt policies to address the squeeze on their generation with the same conviction they do for the aging population. Presently, Canadian governments combine to spend $33 000 to $40 000 annually per person age 65 and older, compared to less than $12 000 per person under age 45; and governments leave younger generations larger fiscal and environmental debts than were inherited by today’s aging population when they were young adults.
FOR MORE INFORMATION, PLEASE CONTACT [email protected]
OFFICIAL WEBSITE gensqueeze.ca
ABOUT THE ORGANIZATION
GENERATION SQUEEZEPAUL KERSHAW
150

RESEARCH SHOWS THAT CANADIANS IN THEIR 20S, 30S, 40S AND THE CHILDREN
THEY RAISE ARE SQUEEZED BY LOWER INCOMES, HIGHER COSTS, LESS TIME
AND A DETERIORATING ENVIRONMENT COMPARED TO A GENERATION AGO.
© GENERATION SQUEEZE
151

172
Contributed by
GENERATION SQUEEZE
Building Political Willfor a Low-carbon, High Prosperity Canada
Endorsing the Report. Adopting its Recommendations.
Generation Squeeze1 applauds the time, expertise and process used to produce the Sustainable Canada Dialogues 2015 report Acting on Climate Change: Solutions from Canadian Scholars. We are inspired by the vision for Canada presented in the report, and enthusiastically embrace its recommenda-tions to move toward a sustainable, low-car-bon, high prosperity Canada that works for all generations. The recommendations are powerful in part because they reflect a consensus among more than 60 scholars representing every region in the country, and also because they articulate science-based, viable solutions for greenhouse gas (GHG) reductions that will ensure Canadians successfully meet our international obliga-tions, along with our domestic commitments to intergenerational fairness.
Generation Squeeze has integrated the Acting on Climate Change: Solutions from Canadian Scholars recommendations to inform our vision for a Better Generational
1 http://www.gensqueeze.ca
Deal 2: one that gives all Canadians a chance to live up to our potential, enough time and money to enjoy life, and the opportunity to work together to leave our country and planet better off than we found them. To this end, we pursue policy adaptations that enhance the ability of younger Canadians to:
• Pay off student debt
• Find a good job
• Reduce the time it takes to save and pay for a home
• Afford a family
• Save for retirement
• All while leaving at least as much as we inherited
• Using and collecting tax dollars better
In pursuit of the final two components of a Better Generational Deal, we formally endorse recommendations from Acting on Climate Change: Solutions from Canadian Scholars.
2 http://www.gensqueeze.ca/policies
152
173
Acting on Climate Change: Extending the Dialogue Among Canadians - 2015
Specifically, in order to leave at least as much as we inherit, Generation Squeeze endorses the recommendations to:
• Build East-West intelligent grid connec-tions that allow provinces producing hydroelectricity to sell electricity to their neighbours while taking full advantage of Canada’s low-carbon energy potential. Hydroelectricity could then be combined with intermittent renewables such as wind and solar energy across the country so Canada relies 100% on low-carbon electri-city production by 2035.
• Well-managed energy efficiency programs that produce significant positive economic returns across the board, through cost savings as well as job creation. Energy efficiency programs could target the building sector, businesses and industries, and especially transportation.
• Support evolution of the building sector toward a carbon neutral or carbon-positive sector, including investment in renewable and ambient energy for new and existing buildings. Integrate sustainability and climate change into landscape planning at the regional and city levels to ensure that, amongst other goals, new and maintenance infrastructure investments are consistent with the long-term goal of decarbonizing.
• Support sustainable fisheries, forestry and agriculture practices, offering opportu-nities not only to limit GHG emissions but also, where possible, to enhance carbon sequestration, protect biological diversity and water quality.
To ensure we collect and use tax dollars better, Generation Squeeze recommends that Canada:
• Eliminate subsidies for fossil fuel indus-tries, and fully integrate the oil and gas production sector in climate policies.
• Price pollution. This requires the intro-duction of either a national carbon tax or a national economy-wide cap-and-trade program. Revenue from pricing pollution can be used to reduce other taxes and/or invest in other components of a Better Generational Deal.
Building Political Will for a Low-carbon, High Prosperity Canada
While numerous research networks across the country deliver scientific expertise on climate change and sustainability, the Acting on Climate Change: Solutions from Canadian Scholars report acknowledges that “informa-tion alone is not enough to trigger leadership on climate change and more effective climate change governance. It is clear that decisions are made more on the basis of intuition and values than on rational, careful consideration of costs and benefits of action” (p. 47).
As experts about the large gap between scien-tific evidence and public policy decisions, Generation Squeeze affirms this conclusion. We believe that this component of the report could be strengthened by adding that government decisions respond to those who organize and show up.
Although all Canadians over age 18 have political entitlements, generational cohorts vary significantly in the way they exercise these liberties. Data show that citizens over the age of 45 are much more likely to cast a
153

174
Acting on Climate Change: Extending the Dialogue Among Canadians - 2015
ballot than are citizens under age 453; and the latter group consists frequently of parents of minors who have no voting rights. Similarly, with over 300 000 members, the Canadian Association of Retired Persons (CARP) has built political clout for its constituency that is age 50+. By contrast, until Generation Squeeze began first as an awareness-rai-sing campaign in 2011, and developed into a campaign to build political power for Canadians in their 20s, 30s, 40s and their children, there had been no pan-Canadian, big-tent generational organization to speak up for younger Canada. We still have conside-rable distance to travel to catch up to CARP’s membership and associated political clout.
This age pattern in voting and political organizing poses a major barrier to the trans-lation of research about climate change into government budgets and policy adaptations, because the risks of inaction to reduce GHGs are borne primarily by younger stakeholders, and the families they will be raising in the middle of this century. So long as Canadians under 45 are less likely to vote and organize in between elections, all political parties are less likely to design platforms that adapt for younger generations. This pattern is evident not only in regards to Canada’s tepid commitment to climate change policy in comparison to international leaders, but also in regards to other policy areas related to population health. For instance, groups like Global AgeWatch4 rank Canada among the top countries worldwide for aging because of spending on medical care, Old Age Security and the Canada Public Pension Plan. By contrast, groups like UNICEF5 rank Canada
3 Uppal, S. and LaRochelle-Côté, S. (2012). Factors asso-ciated with voting. Perspectives on Labour and Income, 1-15.
4 Global AgeWatch (2013). Global AgeWatch Index 2013, http://www.helpage.org/global-agewatch/, accessed on March 25th, 2014.
5 UNICEF (2008). The child care transition: A league table of early childhood education and care in economically ad-vanced countries. In Innocenti Report Card 8, UNICEF Inno-
among the least generous Organisation for Economic Co-operation and Development (OECD) countries for investments in the generation raising young children, judging that our parental leave and childcare services fall below international standards.
In order for Canada to implement Acting on Climate Change: Solutions from Canadian Scholars’ recommendations, Generation Squeeze recommends that the authors urge greater attention be paid to the imple-mentation of interventions designed to increase the power of younger generations in the world of politics. Certainly, they have the most to lose.
Our organization is at the forefront of one such intervention, and is enthusiastic about the opportunities to partner with authors from Sustainable Canada Dialogues to scale it up.
Consistent with the report’s emphasis on the “need to establish organizations focused on the transition to low-carbon pathways” (p. 47), we are building a non-profit lobby designed to grow one million Generation Squeeze supporters by the medium-term. As our network grows, we will bring to the world of politics the one commodity that can out-compete money in a democracy – genuine person power.
To do this, we are organizing allies in part according to their residence in electoral districts. Once our membership is sufficiently large, we intend to approach all candidates running for office, particularly in districts that historically have close election results. In a strictly non-partisan way, we will share with all parties that: 1) the last election was won or lost by less than, for example, 1500 votes;
centi Research Centre, Florence, http://www.unicef-irc.org/publications/pdf/rc8_eng.pdf, accessed on July 31st, 2009.
154

175
Acting on Climate Change: Extending the Dialogue Among Canadians - 2015
that 2) Generation Squeeze has thousands of allies in their district; and that 3) we only need to move a fraction of those allies to make the difference between winning and losing their local election. As we operatio-nalize this strategy in upwards of 20 ridings, we will build an organization that can make the difference between winning and losing a majority government provincially and/or federally. We will use the resulting influence to transform existing priorities articulated by political parties across the political spectrum in ways that ensure their platforms embrace components of a Better Generational Deal so that Canada works for all generations.
By adopting the recommendations from Acting on Climate Change: Solutions from Canadian Scholars as part of our vision for a Better Generational Deal, Generation Squeeze is an intervention designed to grow political will in support of the scholarly consensus articulated in that report. This is a variation on the report’s emphasis regarding “social mobilisation” (p. 48) – one that not only focuses on behaviour change to promote sustainability at the individual level, but also to increase our collective capacity to promote sustainability at the population level.
In keeping with the authors’ focus on “the importance of triggering a values shift in response to climate change” (p. 47), Genera-tion Squeeze recommends that Sustainable Canada Dialogues contribute to telling a broader narrative about generational prosperity and intergenerational fairness.
Generation Squeeze organizes its political mobilization activity around a communica-tions narrative that has been expertly shaped in the light of Canadian values about interge-
nerational fairness, and emerging concerns that younger Canadians are inheriting a socioeconomic and environmental standard of living that is deteriorating compared to the one their parents inherited a generation ago in Canada. Accordingly, we purposefully link interests and values related to sustainability with concerns that people feel immediately in their wallets as a result of stagnant wages, high housing costs, less time and larger government debts. This innovative commu-nication frame marries the environmental and economic, often in deeply personal ways for people, and can complement existing communication strategies within green environmental movements. Specifically, our plan to build political will in support of a low-carbon, high prosperity Canada makes available a unique opportunity to attract the interest, time, and eventually clout, of a broader constituency of Canadians who have not yet connected the dots between the risks of climate change with other components of the time, money and service squeeze they are feeling more immediately in their lives.
In sum, Sustainable Canada Dialogues has identified the policy adaptations that will put Canada on a secure path to a low-carbon, high prosperity future. It is time to embed these recommendations in interventions designed to grow the political will required to achieve their implementation. Building a national lobby for those in their 20s, 30s and 40s, along with the children they parent – one that is organized around a broad narrative of generational prosperity and fairness – can be a major contributor to building this political will. Generation Squeeze therefore welcomes the opportunity to work in collaboration with Sustainable Canada Dialogues partners in support of their inspiring vision for Canada.
155

192
This contribution is part of a collection of texts, Acting on Climate Change: Extending the Dialogue Among Canadians, stemming from interactions between Sustainable Canada Dialogues, an initiative of the UNESCO-McGill Chair for Dialogues on Sustainability, and business associations, First Nations, non-governmental organizations, labour groups, institutions, organizations and private citizens.
Sustainable Canada Dialogues is a voluntary initiative that mobilizes over 60 researchers from every province in Canada, representing disciplines across engineering, sciences and social sciences. We are motivated by a shared view that putting options on the table will stimulate action and is long overdue in Canada.
Together, the contributions enrich the scope of possible solutions and show that Canada is brimming with ideas, possibilities and the will to act. The views expressed in Acting on Climate Change: Extending the Dialogue Among Canadians are those of the contributors, and are not necessarily endorsed by Sustainable Canada Dialogues.
We thank all contributors for engaging in this dialogue with us to help reach a collective vision of desired pathways to our futures.
FOR MORE INFORMATION, VISIT OUR WEBSITE
sustainablecanadadialogues.ca/en/scd/acting-on-climate-change
SUSTAINABLE CANADA DIALOGUES
ABOUT THE INITIATIVE
156


157

1340 THE AMERICAN ECONOMIC REVIEW ApRIl 2015
of free-riding is the failure of the only significant international climate treaty, the Kyoto Protocol, and the difficulties of forging effective follow-up regimes.
While free-riding is pervasive, it is particularly difficult to overcome for global pub-lic goods. Global public goods differ from national market failures because no mecha-nisms—either market or governmental—can deal with them effectively. Arrangements to secure an international climate treaty are hampered by the Westphalian dilemma. The 1648 Treaty of Westphalia established the central principles of modern interna-tional law. First, nations are sovereign and have the fundamental right of political self-determination; second, states are legally equal; and third, states are free to manage their internal affairs without the intervention of other states. The current Westphalian system requires that countries consent to joining international agreements, and all agreements are therefore essentially voluntary (Treaty of Vienna 1969, article 34).
B. Clubs as a Mechanism to Overcome Free-riding
Notwithstanding the Westphalian dilemma, nations have overcome many trans-national conflicts and spillovers through international agreements. There are over 200,000 UN-registered treaties and actions, which are presumptive attempts to improve the participants’ welfare. Countries enter into agreements because joint action can take into account the spillover effects among the participants.
How have countries overcome the tendency toward free-riding associated with the Westphalian system? Consider the many important international agreements in international trade and finance as well as alliances that have reduced the lethality of interstate military conflicts. These have often been accomplished through the mech-anism of “clubs.” A club is a voluntary group deriving mutual benefits from sharing the costs of producing an activity that has public-good characteristics. The gains from a successful club are sufficiently large that members will pay dues and adhere to club rules in order to gain the benefits of membership.
The theory of clubs is a little-known but important corner of the social sciences. (For an early analysis, see Buchanan 1965, while for a fine survey, see Sandler and Tschirhart 1980.) The major conditions for a successful club include the following: (i) that there is a public-good-type resource that can be shared (whether the benefits from a military alliance or the enjoyment of a golf course); (ii) that the cooperative arrangement, including the dues, is beneficial for each of the members; (iii) that non-members can be excluded or penalized at relatively low cost to members; and (iv) that the membership is stable in the sense that no one wants to leave. For the current inter-national-trade system, the advantages are the access to other countries’ markets with low trade barriers. For military alliances, the benefits are peace and survival. In all cases, countries must contribute dues—these being low trade barriers for trade or bur-den sharing in defense treaties. If we look at successful international clubs, we might see the seeds of an effective international system to deal with climate change.
The organization of this paper is as follows. After a sketch of the proposal, I begin with a discussion of the issues of free-riding and previous analyses of potential solu-tions. I examine potential approaches to internalizing the transnational spillovers and conclude that a Climate Club with penalties for nonmembers is the most fruitful mechanism. The following sections develop a model of coalition formation with climate economics (the Coalition-DICE or C-DICE model) and show the results of
158

1341Nordhaus: Climate Clubs: overComiNg free-ridiNgvol. 105 No. 4
illustrative calculations. The bottom line—that clubs with penalties or sanctions on nonparticipants can support a strong international climate agreement—is summa-rized at the end of the paper.
C. A Sketch of the Climate Club
The idea of a Climate Club should be viewed as an idealized solution of the free-riding problem that prevents the efficient provision of global public goods. Like free trade or physics in a vacuum, it will never exist in its pure form. Rather, it is a blueprint that can be used to understand the basic forces at work and sketch a system that can overcome free-riding.
Here is a brief description of the proposed Climate Club: the club is an agreement by participating countries to undertake harmonized emissions reductions. The agreement envisioned here centers on an “international target carbon price” that is the focal provi-sion of an international agreement. For example, countries might agree that each coun-try will implement policies that produce a minimum domestic carbon price of $25 per ton of carbon dioxide (CO2). Countries could meet the international target price require-ment using whatever mechanism they choose—carbon tax, cap-and-trade, or a hybrid.
A key part of the club mechanism (and the major difference from all current pro-posals) is that nonparticipants are penalized. The penalty analyzed here is uniform percentage tariffs on the imports of nonparticipants into the club region. Calculations suggest that a relatively low tariff rate will induce high participation as long as the international target carbon price is up to $50 per ton.
An important aspect of the club is that it creates a strategic situation in which countries acting in their self-interest will choose to enter the club and undertake high levels of emissions reductions because of the structure of the incentives. The balance of this study examines the club structure more carefully and provides an empirical model to calculate its effectiveness.
II. Background on International Agreements on Climate Change
A. Basic Free-riding Equilibrium
There is a large literature on the strategic aspects of international environmental agreements, including those focused on climate change. One important strand is the analytical work on global public goods. The clear message is that without special features the outcome will be a prisoners’ dilemma or tragedy of the commons in which there is too little abatement. This point is illustrated with a simple model that will form the backbone of the empirical model below.
I begin by analyzing the costs and benefits of national climate policies in a noncooperative (NC) framework (Nash 1950). In the NC framework, countries act individually and are neither rewarded nor penalized by other countries for their pol-icies. The analysis assumes that countries maximize their national economic wel-fare and ignores partisan, ideological, myopic, and other nonoptimizing behaviors. While history is full of wooden-headed actions of countries and their leaders, as well as policies that are farsighted and attend to global welfare, attempting to incor-porate these features is beyond the scope of this study of climate regimes.
159
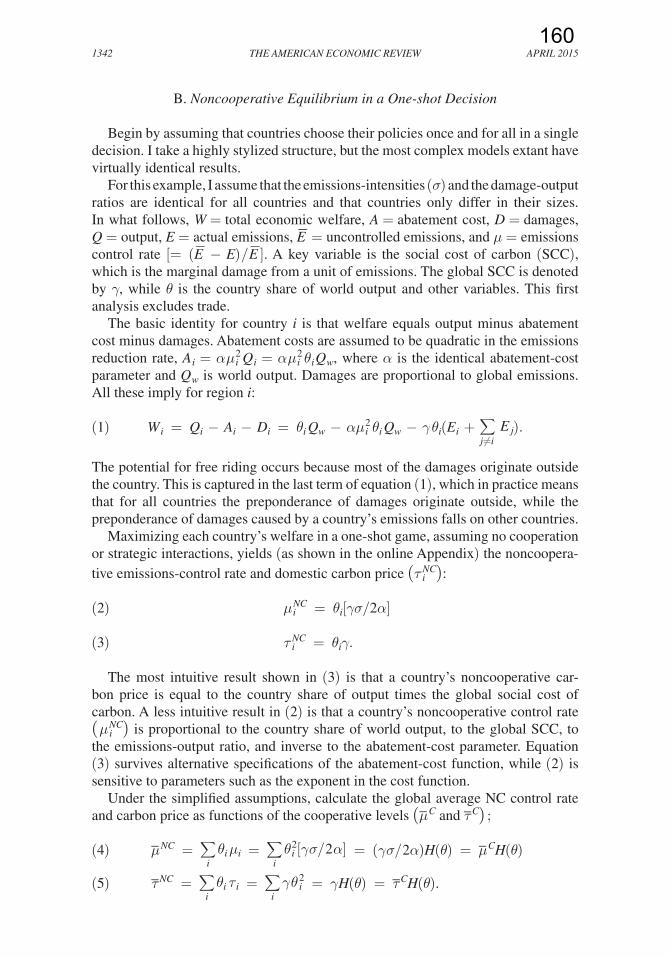
1342 THE AMERICAN ECONOMIC REVIEW ApRIl 2015
B. Noncooperative Equilibrium in a One-shot Decision
Begin by assuming that countries choose their policies once and for all in a single decision. I take a highly stylized structure, but the most complex models extant have virtually identical results.
For this example, I assume that the emissions-intensities (σ) and the damage-output ratios are identical for all countries and that countries only differ in their sizes. In what follows, W = total economic welfare, A = abatement cost, D = damages, Q = output, E = actual emissions,
_ E = uncontrolled emissions, and μ = emissions
control rate [ = ( _
E − E) / _ E ]. A key variable is the social cost of carbon (SCC),
which is the marginal damage from a unit of emissions. The global SCC is denoted by γ, while θ is the country share of world output and other variables. This first analysis excludes trade.
The basic identity for country i is that welfare equals output minus abatement cost minus damages. Abatement costs are assumed to be quadratic in the emissions reduction rate, A i = α μ i 2 Q i = α μ i 2 θ i Q w , where α is the identical abatement-cost parameter and Q w is world output. Damages are proportional to global emissions. All these imply for region i:
(1) W i = Q i − A i − D i = θ i Q w − α μ i 2 θ i Q w − γ θ i ( E i + ∑ j≠i
E j ).
The potential for free riding occurs because most of the damages originate outside the country. This is captured in the last term of equation (1), which in practice means that for all countries the preponderance of damages originate outside, while the preponderance of damages caused by a country’s emissions falls on other countries.
Maximizing each country’s welfare in a one-shot game, assuming no cooperation or strategic interactions, yields (as shown in the online Appendix) the noncoopera-tive emissions-control rate and domestic carbon price ( τ i NC ):
(2) μ i NC = θ i [γσ/2α]
(3) τ i NC = θ i γ .
The most intuitive result shown in (3) is that a country’s noncooperative car-bon price is equal to the country share of output times the global social cost of carbon. A less intuitive result in (2) is that a country’s noncooperative control rate ( μ i NC ) is proportional to the country share of world output, to the global SCC, to the emissions-output ratio, and inverse to the abatement-cost parameter. Equation (3) survives alternative specifications of the abatement-cost function, while (2) is sensitive to parameters such as the exponent in the cost function.
Under the simplified assumptions, calculate the global average NC control rate and carbon price as functions of the cooperative levels ( μ C and τ C ) ;
(4) μ NC = ∑ i θ i μ i = ∑
i θ i 2 [γ σ/ 2 α] = (γ σ/ 2α)H(θ) = μ C H(θ)
(5) τ NC = ∑ i θ i τ i = ∑
i γ θ i 2 = γ H(θ) = τ C H(θ) .
160

1343Nordhaus: Climate Clubs: overComiNg free-ridiNgvol. 105 No. 4
In these equations, H(θ)= ∑ i θ i 2 is the Herfindahl index of country size.
Equations (4) and (5) show the basic free-riding equilibrium for a global public good with the simplified structure. The globally averaged noncooperative carbon price and control rate are equal to the Herfindahl index times the cooperative values. For example, if there are ten equally sized countries, the Herfindahl index is 10 percent, and the global carbon tax and emissions-control rates are 10 percent of the efficient levels.
The Herfindahl index for country gross domestic products (GDPs) is about 12 per-cent, indicating that (when emissions-intensities and damage ratios are equal for each country) the noncooperative control rate and carbon price are about 12 percent of the cooperative values. This figure is close to calculations that have been made in more complete models (see Nordhaus and Yang 1996; Nordhaus 2010; Bosetti et al. 2012). For example in the multiperiod RICE-2010 model with 12 regions, the noncooperative price is estimated to be is 11 percent of the efficient price (Nordhaus 2010, supplemental materials).
C. Outcomes with Repeated Decisions
A more complete treatment of country interactions in climate-change policy views interactions in a dynamic framework with decisions over time. The standard analysis uses the framework of a repeated prisoners’ dilemma (RPD) game. For simplicity, assume that the structure above is repeated every few years with identical parameters. One equilibrium of a RPD is just the iterated inefficient one-shot equi-librium with minimal abatement as described above. However, because players can reward and punish other players for good and bad behavior, RPD games generally have multiple equilibria; these might include more efficient outcomes if country discount rates are low (these being the generalized results of various folk theorems). The efficient RPD equilibrium with large numbers of countries will be hampered by free-riding and inability to construct renegotiation-proof strategies in situations with large number of agents.
The strategic significance of the analysis of NC behavior is threefold. First, the overall level of abatement in the noncooperative equilibrium will be much lower than in the efficient (cooperative) strategy. A second and less evident point is that countries will have strong incentives to free-ride by not participating in strong climate-change agreements. Finally, the difficulty of escaping from a low-level, noncooperative equilibrium is amplified by the intertemporal trade-off because the current generation pays for the abatement while future generations are the beneficiaries of lower damages. But to a first approximation, the noncooperative analysis in this section describes international climate policy as of 2015.
III. Climate Coalitions and International Environmental Treaties
A. Key Definitions on Sanctions and Coalitions
Might coalitions of countries form cooperative arrangements or treaties that improve on noncooperative arrangements? Questions involving the formation, value, and stability of coalitions have a long history in game theory, oligopoly theory, as well as in environmental economics. In this section, I analyze coalitions
161
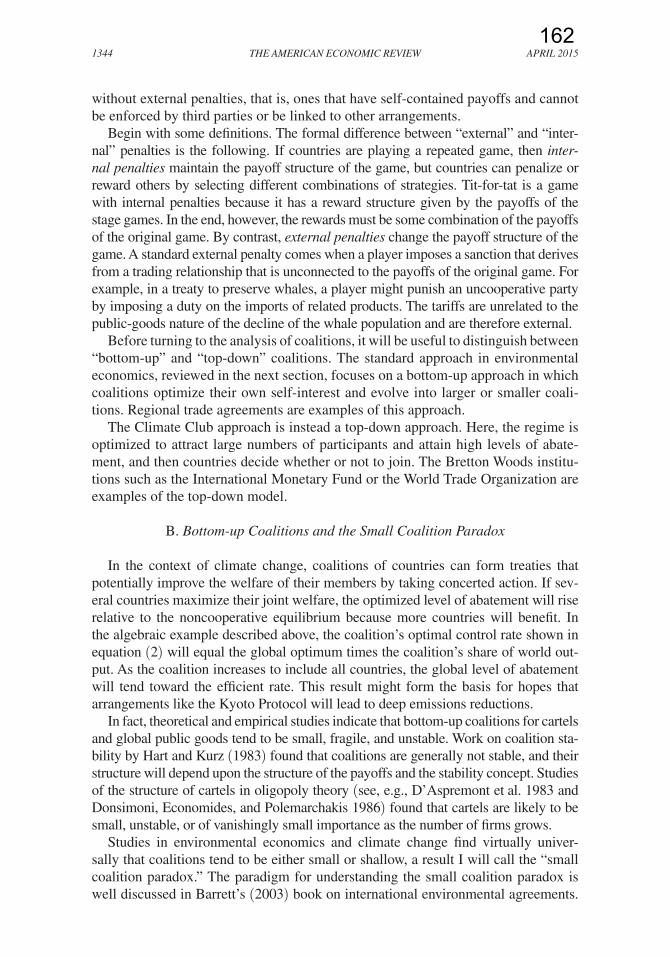
1344 THE AMERICAN ECONOMIC REVIEW ApRIl 2015
without external penalties, that is, ones that have self-contained payoffs and cannot be enforced by third parties or be linked to other arrangements.
Begin with some definitions. The formal difference between “external” and “inter-nal” penalties is the following. If countries are playing a repeated game, then inter-nal penalties maintain the payoff structure of the game, but countries can penalize or reward others by selecting different combinations of strategies. Tit-for-tat is a game with internal penalties because it has a reward structure given by the payoffs of the stage games. In the end, however, the rewards must be some combination of the payoffs of the original game. By contrast, external penalties change the payoff structure of the game. A standard external penalty comes when a player imposes a sanction that derives from a trading relationship that is unconnected to the payoffs of the original game. For example, in a treaty to preserve whales, a player might punish an uncooperative party by imposing a duty on the imports of related products. The tariffs are unrelated to the public-goods nature of the decline of the whale population and are therefore external.
Before turning to the analysis of coalitions, it will be useful to distinguish between “bottom-up” and “top-down” coalitions. The standard approach in environmental economics, reviewed in the next section, focuses on a bottom-up approach in which coalitions optimize their own self-interest and evolve into larger or smaller coali-tions. Regional trade agreements are examples of this approach.
The Climate Club approach is instead a top-down approach. Here, the regime is optimized to attract large numbers of participants and attain high levels of abate-ment, and then countries decide whether or not to join. The Bretton Woods institu-tions such as the International Monetary Fund or the World Trade Organization are examples of the top-down model.
B. Bottom-up Coalitions and the Small Coalition Paradox
In the context of climate change, coalitions of countries can form treaties that potentially improve the welfare of their members by taking concerted action. If sev-eral countries maximize their joint welfare, the optimized level of abatement will rise relative to the noncooperative equilibrium because more countries will benefit. In the algebraic example described above, the coalition’s optimal control rate shown in equation (2) will equal the global optimum times the coalition’s share of world out-put. As the coalition increases to include all countries, the global level of abatement will tend toward the efficient rate. This result might form the basis for hopes that arrangements like the Kyoto Protocol will lead to deep emissions reductions.
In fact, theoretical and empirical studies indicate that bottom-up coalitions for cartels and global public goods tend to be small, fragile, and unstable. Work on coalition sta-bility by Hart and Kurz (1983) found that coalitions are generally not stable, and their structure will depend upon the structure of the payoffs and the stability concept. Studies of the structure of cartels in oligopoly theory (see, e.g., D’Aspremont et al. 1983 and Donsimoni, Economides, and Polemarchakis 1986) found that cartels are likely to be small, unstable, or of vanishingly small importance as the number of firms grows.
Studies in environmental economics and climate change find virtually univer-sally that coalitions tend to be either small or shallow, a result I will call the “small coalition paradox.” The paradigm for understanding the small coalition paradox is well discussed in Barrett’s (2003) book on international environmental agreements.
162

1345Nordhaus: Climate Clubs: overComiNg free-ridiNgvol. 105 No. 4
His analysis emphasizes credible or “self-enforcing” treaties (Barrett 1994). These are ones that combine individual rationality (for each player individually) and col-lective rationality (for all players together). This concept is weaker than the concept of coalition stability discussed later, which adds rationality for each subset of the players. Barrett emphasizes the difficulties of reaching agreements on global public goods with large numbers of participants because of free-riding. Similar to the results for cartels, Barrett and others find that stable climate coalitions tend to have few members; therefore, as the number of countries rises, the fraction of global emissions covered by the agreement declines. He further argues, based on a comprehensive review of existing treaties, that there are very few treaties for global public goods that succeed in inducing countries to increase their investments significantly above the noncooperative levels. Moreover, the ones that do succeed include external penalties.
How can we understand the small coalition paradox? Here is the intuition for climate change: clearly, two countries can improve their welfare by combining and raising their carbon price to the level that equals the sum of their SCCs. Either coun-try is worse off by dropping out. The 2014 agreement between China and the United States to join forces in climate policy might be interpreted as an example of a small bottom-up coalition.
Does it follow that, by increasing the number of countries in the treaty, this process would accumulate into a grand coalition of all countries with efficient abatement? That conclusion is generally wrong. The problem arises because, as more countries join, the cooperative carbon price becomes ever higher, and ever further from the NC price. The discrepancy gives incentives for individual countries to defect. When a country defects from an agreement with m countries, the remainder coalition (of m − 1 countries) would reoptimize its levels of abatement. The revised levels of abatement would still be well above the NC levels for the remainder coalition, while the defector free-rides on the abatement of the remainder coalition. The exact size of the coalitions would depend upon the cost and damage structure as well as the number of countries.
The online Appendix provides a simple analysis of the bottom-up coalition equi-librium for identical countries with the cost and damage structure shown in equations (1)–(5). The only stable coalitions have two or three countries. (For simplicity, assume the lower number holds in the case of ties.) The size of the stable coalition is independent of the number of countries, the social cost of carbon, output, emissions, and the emissions intensity. If there are ten identical countries, there will be five coalitions of two countries each. The global average carbon price is twice that of the NC equilibrium. This result is clear because each country-pair has a joint SCC that is the sum of the two countries’ SCCs. The globally averaged carbon price will be one-fifth of the efficient level. With countries of different sizes but equal intensities, countries will group together in stable coalitions of size two, with the countries of similar sizes grouped together in pairs (i.e., largest with second-largest, and so on).
The key result is that bottom-up coalitions perform only slightly better than the noncooperative equilibrium.
C. Modeling Results for Bottom-up Coalitions
The coalition theories described above generally use highly stylized structures and assumptions, so it is useful to examine empirical models of climate-policy
163
1346 THE AMERICAN ECONOMIC REVIEW ApRIl 2015
coalitions with more realistic assumptions. Several empirical studies have examined the structure of coalitions or international agreements using a variety of alternative cooperative structures and coalition assumptions. A brief description of key studies is contained in the online Appendix.
The central results of existing studies reproduce the finding of the small coalition paradox. Without penalties on nonparticipants, stable coalitions tend to be small and have emissions reductions that are close to the noncooperative level. In addition, many studies find that coalitions tend to be unstable, particularly if transfers among regions are included.
IV. Sanctions on Nonparticipants to Promote an Effective Climate Club
As noted above, the syndrome of free-riding along with the international norm of voluntary participation appears to doom international climate agreements like the Kyoto Protocol. The suggestion in this paper is that a club structure—where external sanctions are imposed on nonmembers—will be necessary to induce effective agree-ments. I analyze in depth a specific model of sanctions (tariffs on nonparticipants), but the model illustrates the more general point that external sanctions are necessary to promote participation in effective agreements to provide global public goods.
A. Stable Coalitions
While it is easy to design potential international climate agreements, the reality is that it is difficult to construct ones that are effective and stable. Effective means abatement approaching the global optimum. The concept of stability used here is denoted as a coalition Nash equilibrium. Under this definition, a coalition is stable if no group (sub-coalition) among the countries can improve its welfare by changing its status. That is, it combines individual rationality (for each player individually), collective rationality (for all players together), and coalition rationality (for each subset of the players). This is a natural extension of a Nash equilibrium, which applies to single countries. The concept is widely used in different fields and was originally called strong equilibrium in Aumann (1959); also see Bernheim, Peleg, and Whinston (1987). The term coalition Nash is more intuitive and is used here.
The small coalition paradox motivates the current approach. The goal here is to find a structure that is stable and effective for a wide variety of country prefer-ences, technologies, and strategies. The most appealing structure is one that does not depend on sophisticated and fragile repeated-game strategies and instead has an efficient equilibrium for every period (in the stage games) in a repeated game. I therefore focus on one-shot games that have efficient and unique equilibria. If these are then turned into a repeated game, each of the one-shot games will be a sub-game-perfect coalition Nash equilibrium, and the repeated game will have an efficient coalition-Nash equilibrium.
B. Transfers Undermine Coalition Stability
The present study assumes that there is no sharing of the gains from cooperation among members of the coalition. In some cases, particularly those with asymmetric
164

Intentionally Left Blank
165

1365Nordhaus: Climate Clubs: overComiNg free-ridiNgvol. 105 No. 4
damages. There will be second-order effects through cost-of-capital factors, GDP, and other economic variables. But a changed discount rate will affect the outcome primarily through changes in the SCC.
VIII. Conclusion
The present study analyzes the syndrome of free-riding in climate agreements such as the Kyoto Protocol and considers potential structures for overcoming free-riding. This concluding section summarizes the basic approach and conclusions.
A. The Climate Club
The structure of climate change as a global public good makes it particularly susceptible to free-riding. The costs of abatement are national, while the benefits are
Table 3—Country Preferred International Target Carbon Prices (For global SCC of $25)
Region
Global target carbon price that maximizes domestic welfare for SCC
$25/t CO2 and penalty tariff of 5 percent
South Africa 9China 14Eurasia 14
Southeast Asia 17Russia 19ROW 24
United States 28Brazil 29Latin America 31
India* 31Canada* 34Japan 38
European Union* 38Sub-Saharan Africa 39Mideast 40
Memorandum items ($ per ton CO2)Global SCC 25
Average preferred price GDP weights 28 Population weights 27
Median preferred price GDP weights 28 Population weights 29
Notes: What international target carbon price would regions prefer when the global SCC is $25 per ton? For example, the US national welfare is highest when the target price is $28 per ton. Countries with high damages and low abatement costs such as the EU prefer high target prices. The table shows the optima without trade effects. The optima with trade effects have higher country-preferred target carbon prices.
* Countries with multiple local optima.
166

1366 THE AMERICAN ECONOMIC REVIEW ApRIl 2015
global and independent of where emissions take place. An additional complication is that the abatement costs are paid today while most of the benefits of abatement come in the distant future. The present study shows, in a stylized model of costs and damages, that the global noncooperative carbon price and abatement rate are pro-portional to the Herfindahl index of country size. This implies, given realistic data, that the global noncooperative carbon price and control rate will be in the order of one-tenth of the efficient cooperative levels.
Next consider possible mechanisms to combat free-riding and focus on a Climate Club. It is generally assumed that the most effective approach will be to impose trade sanctions on nonparticipants, and this is the route followed here. Most trade sanctions rely on duties on carbon-intensive goods. For strategic, economic, and technical rea-sons, this paper instead considers penalties that take the form of uniform ad valorem tariffs levied by club participants on nonparticipants. In the analysis, the tariff rates vary from 0 percent to 10 percent. It is further assumed that a climate treaty will amend trade rules so that a penalty tariff conforms with international trade law and retaliation by nonparticipants is prohibited.
This study assumes that countries adopt an international carbon-price target rather than a quantity target as the policy instrument. The assumed target price ranges from $12.5–$100 per ton CO2. In the experiments, the international target carbon price is always set equal to the global social cost of carbon.
Individual countries are assumed to adopt climate policies that maximize their national economic welfare. Welfare equals standard income less damages less abatement costs less the costs of trade sanctions. I assume a one-shot static game, but this can be interpreted as the stage game of a repeated game. The equilibrium, described as a coalition Nash equilibrium, is a coalition of countries that is stable against any combination of joiners and defectors. The equilibrium is calculated by an evolutionary algorithm that tests each coalition against a random collection of countries that can defect and join.
The study introduces a new approach called the C-DICE model (Coalition DICE, or Coalition Dynamic Integrated Model of Climate and the Economy). It is a 15-region model with abatement, damages, international trade, and the economic impacts of tariffs. Using an evolutionary algorithm, the model can be used to find stable coalition Nash equilibria.
B. Qualifications
I begin with qualifications on the results that relate to the data and structural parameters. The data on output, CO2 emissions, and trade are relatively well mea-sured. The global SCC is uncertain but can be varied as shown in the different experiments. The national SCCs are also uncertain, but since they are all small relative to the global SCC, their exact magnitudes are not critical for the findings. Other structural uncertainties relate to the abatement cost function and the optimal tariff rate.
A related question is whether a trade-penalty-plus-carbon-price regime can oper-ate in the future with the rising carbon prices that are generally associated with an efficient climate-change program. Answering this question requires a multiperiod coalition model and is on the agenda for future research.
167

1367Nordhaus: Climate Clubs: overComiNg free-ridiNgvol. 105 No. 4
These results are presented in the spirit of an extended example used to clarify the free-riding in international agreements rather than as a specific proposal for a cli-mate treaty. A Climate Club of the kind analyzed here raises central issues about the purpose of the global trading system, about the goals for slowing climate change, about the justice of a system that puts all countries on the same footing, and about how countries would actually negotiate such a regime. The dangers to the world trading system of such a proposal are so important that they must be reiterated. Today’s open trading system is the result of decades of negotiations to combat pro-tectionism. It has undoubtedly produced large gains to living standards around the world. A regime that ties a climate-change agreement to the trading system should be embraced only if the benefits to slowing climate change are clear and the dangers to the trading system are worth the benefits.
C. Results
One major result is to confirm that a regime without trade sanctions will dissipate to the low-abatement, noncooperative (NC) equilibrium. This is true starting from a random selection of participating countries. More interestingly, starting from the Kyoto coalition (Annex I countries as defined by the Kyoto treaty) with no sanc-tions, the coalition always degenerates to the NC structure with minimal abatement.
A surprising result is that the Climate Club structure generates stable coalitions for virtually all sets of parameters. A few regimes produce quasi-stable coalitions with similar numbers of participants.
A next set of results concerns the impact of different Climate Club parameters on the participation structure. The participation rate and the average global carbon price rise with the tariff rate. For the lowest target carbon prices ($12.5 and $25 per ton), full participation and efficiency are achieved with relatively low tariffs (2 per-cent or more). However, as the target carbon price rises, it becomes increasingly difficult to attain the cooperative equilibrium. For a $50 per ton target carbon price, the Club can attain 90+ percent efficiency with a tariff rate of 5 percent or more. However, for a target carbon price of $100 per ton, it is difficult to induce more than the noncooperative level of abatement.
Why is it so difficult to attain efficient abatement with high social costs of carbon even with high penalty tariffs? The reason is that the gap between the cooperative and the noncooperative equilibrium rises sharply as the global SCC increases. Take the case of a large country like China or the United States. For these countries the national SCC might be 10 percent of the global SCC. For a global SCC and target price of $25 per ton, participation would require increas-ing the domestic carbon price from $2.5 to $25, while a global SCC of $100 would require increasing from $10 to $100. Because abatement costs are sharply increasing in the target carbon price, this implies that the costs of cooperation become much larger as the target carbon price rises. On the other hand, the costs of trade penalties associated with nonparticipation are independent of the global SCC. So the national cost-benefit trade-off tilts toward nonparticipation as the international target carbon price rises.
Next examine the patterns of gains and losses. Here, measure the impact rela-tive to the noncooperative equilibrium. Note as well that these results assume no
168

1368 THE AMERICAN ECONOMIC REVIEW ApRIl 2015
transfers among countries. The benefits are widely distributed among countries. The only regions showing losses across several regimes are Eurasia and South Africa; however, the losses are small relative to gains for other regions. There are no regimes with aggregate losses.
Look at the distribution of gains and losses to determine whether a Climate Club would be attractive to most countries relative to existing arrangements. All regions would prefer a regime with penalties and modest carbon prices to a regime with no penalties. Paradoxically, this is the case even for countries that do not partici-pate. The reason is that the gains from strong mitigation measures of participants outweigh the losses from the tariffs for nonparticipants as long as the tariff rate is not too high. This powerful result indicates that a regime with sanctions should be attractive to most regions.
D. Bottom Line
Here is the bottom line: the present study finds that without sanctions there is no stable climate coalition other than the noncooperative, low-abatement coalition. This conclusion is soundly based on public-goods theory, on C-DICE model sim-ulations, on the history of international agreements, and on the experience of the Kyoto Protocol.
The analysis shows how an international climate treaty that combines target car-bon pricing and trade sanctions can induce substantial abatement. The modeling results indicate that modest trade penalties on nonparticipants can induce a coalition that approaches the optimal level of abatement as long as the target carbon price is up to $50 per ton at current income and emission levels. The attractiveness of a Climate Club must be judged relative to the current approaches, where international climate treaties are essentially voluntary and have little prospect of slowing climate change.
REFERENCES
Aumann, R. J. 1959. “Acceptable Points in General Cooperative N-Person Games.” Contributions to the Theory of Games IV, edited by A. W. Tucker and R. D. Luce, 287–324. Princeton, NJ: Princ-eton University Press.
Barrett, Scott. 1994. “Self-Enforcing International Environmental Agreements.” Oxford Economic Papers 46 (0): 878–94.
Barrett, Scott. 2003. Environment and Statecraft: The Strategy of Environmental Treaty-Making. Oxford and New York: Oxford University Press.
Bernheim, B. Douglas, Bezalel Peleg, and Michael D. Whinston. 1987. “Coalition-Proof Nash Equi-libria: Concepts.” Journal of Economic Theory 42 (1): 1–12.
Bordoff, Jason E. 2009. “International Trade Law and the Economics of Climate Policy: Evaluating the Legality and Effectiveness of Proposals to Address Competitiveness and Leakage Concerns.” In Climate Change, Trade, and Competitiveness: Is a Collision Inevitable? edited by Lael Brain-ard and Isaac Sorkin, 35–68. Washington, DC: Brookings Institution.
Bosetti, Valentina, Carlo Carraro, Enrica DeCian, Emanuele Massetti, and Massimo Tavoni. 2012. “Incentives and Stability of International Climate Coalitions: An Integrated Assessment.” Energy Policy 55: 44–56.
Brainard, Lael, and Isaac Sorkin (eds.). 2009. Climate Change, Trade, and Competitiveness: Is aCollision Inevitable? Washington, DC: Brookings Institution Press.
Buchanan, J. M. 1965. “An Economic Theory of Clubs.” Economica NS 32 (0): 1–14.Carraro, Carlo, and Domenico Siniscalco. 1993. “Strategies for the International Protection of the
Environment.” Journal of Public Economics 52 (3): 309–28.CDIAC. 2014. Carbon Dioxide Infromation Analysis Center. http://cdiac.ornl.gov/.
169


170
171

172
173

174
175

176

177

178

179

180
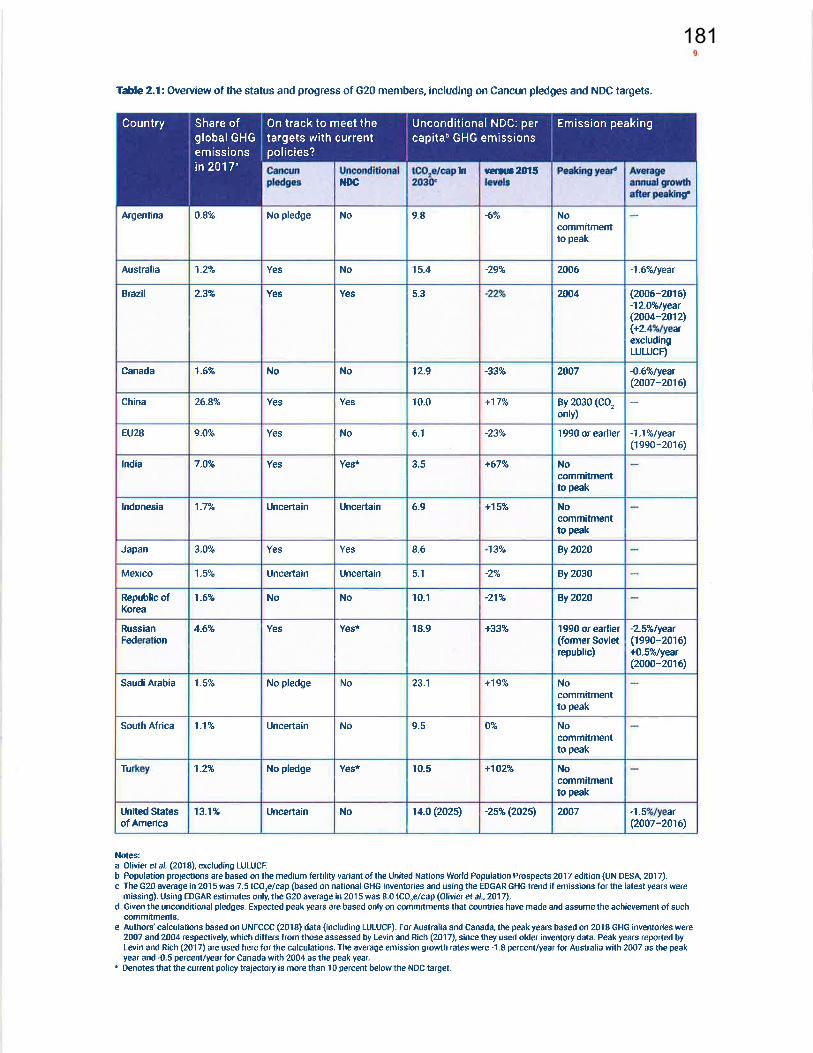
181
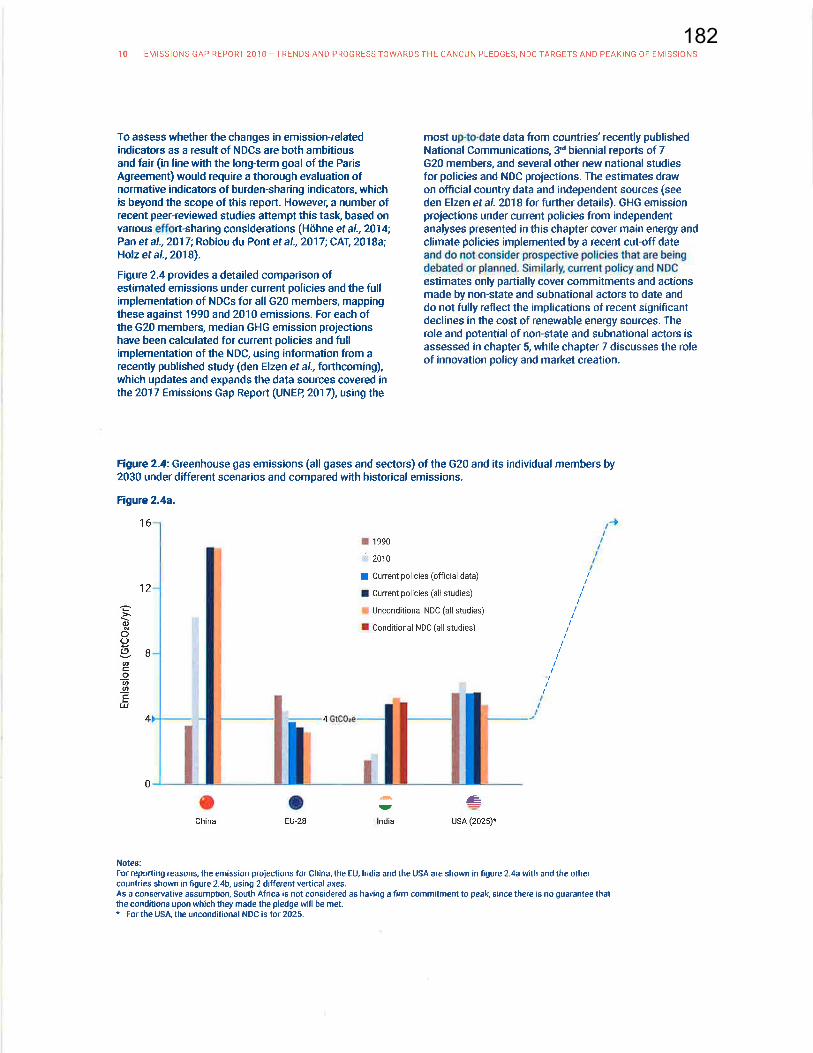
182

183
184


185


186

Climate change is an urgent problem that demands attention to targets and timelines. As the second Lancet Commission on Climate Change pointed out, “The effects of climate change are being felt today, and future projections represent an unacceptably high and potentially catastrophic risk to human health.”1 We know the impacts from greenhouse gas emissions and climate change will fall most heavily on today’s children and future generations. We recognize that a national price on GHG emissions is an essential part of an effective climate change plan.
Again, PHABC is proud to be a member of the intergenerational climate coalition applying for leave to intervene in the Reference Case.
Sincerely,
Shannon Turner Executive Director
1 The Lancet, Health and climate change: policy responses to protect public health,” Vol. 386, No. 10006, p. 1861.
187
188
2
received over 350 applications and supported 10 teams of young entrepreneurs from four continents. This project is in partnership with Green Growth Global Institute (GGGI) and Student Energy.
• Delegation Support Teams, in which youth from small island developing states andclimate-vulnerable Commonwealth countries work with youth from other countries tosupport national negotiating teams at international climate negotiations. I have enclosed acopy of the report from our Seychelles Support Team at COP23 for your information.1
Again, Youth Climate Lab is proud to be a member of the intergenerational climate coalition applying for leave to intervene in the Reference Case.
Sincerely,
Larissa Parker Director of Programs (Canada)
encl.
1 https://static1.squarespace.com/static/59ec036ef9a61ebf918040ac/t/5ae9cc688a922d1389c65ac5/1525271657272/ Seychelles+Support+Team_+Report+from+COP23.pdf
189
190

December 15, 2018 Via Email Generation Squeeze Attn: Dr. Paul Kershaw 17280 Ford Road Pitt Meadows, BC Dear Dr. Kershaw:
Re: Court of Appeal for Ontario, File No. C65807, respecting the constitutionality of the Greenhouse Gas Pollution Pricing Act, Part 5 of the Budget Implementation Act, 2018, No. 1, SC 2018, c. 12 (the “Reference Case”)
I write on behalf of the Canadian Coalition for the Rights of Children (“CCRC”) to confirm our support for and membership in the coalition of organizations joining Generation Squeeze in applying for leave to intervene in the Reference Case. We share your commitment to intergenerational justice in climate policy and we believe this application is an important opportunity to protect the rights of young Canadians and future generations to a healthy and sustainable climate. The Canadian Coalition for the Rights of Children The CCRC is a network of organizations and individuals who promote respect for the rights of children. It was formed in 1989, following Canada’s adoption of the United Nations Convention on the Rights of the Child (the “Convention”), to inform the Canadian public about the Convention and provide a forum for civil society to participate in its implementation. The CCRC has status as a UN-recognized NGO independent of the government. Ontario joined Canada and other provinces in ratification of the Convention in 1991. The CCRC is composed of national organizations that work with children, local children’s charities, and individuals with expertise and interest in implementation of the Convention in Canada, including UNICEF Canada, the Justice for Children and Youth Foundation, the Child Welfare League of Canada, and Plan International – Canada. The CCRC board, elected at each Annual General Meeting, is composed of staff persons from children’s rights organizations and professionals with experience and expertise in children’s rights. The CCRC has engaged and continues to engage in a wide range of activities to increase awareness and involvement in the implementation of the Convention, including:
• organizing national, multi-disciplinary conferences, such as The Best Interests of the Child: Its Meaning and Application in Canada (2009), Children’s Rights Impact
191

Assessments: Making Children Visible in Public Policy (2013) and Raising the Bar for Children’s Rights in Canada (2018);
• providing policy advice at the national level for specific legislation that affects children, for Canada’s Action Plan entitled “A Canada Fit for Children,” and for parliamentary committees studying issues related to children’s rights; and
• providing an avenue for Canadian civil society organizations to participate in the regular five-year reviews of Canada’s implementation of the Convention before the UN Committee on the Rights of the Child and other international children’s rights events, such as the UN Special Session for Children.
Board members and other members of the CCRC have participated in the development of international guidelines for implementation of the Convention, including:
• the General Comment on the Rights of Indigenous Children, which addresses the relationship between collective rights, rights to cultural identity, and the individual rights of a child, within the framework of the Convention; and
• “General comment No. 15 (2013) on the right of the child to the enjoyment of the highest attainable standard of health (art. 24),” which concerns children’s right to health under Article 24 of the Convention (“General Comment No. 15”).
The CCRC also has intervened and otherwise participated in prominent reference cases concerning the rights of children, including:
• Canada (Prime Minister) v. Khadr, 2010 SCC 3, regarding the duty of a state to protect the rights and best interests of a Canadian child being exploited through use as a child soldier; and
• Reference re: Section 293 of the Criminal Code of Canada, 2011 BCSC 1588, regarding the state’s obligation to protect Canadian persons under the age of 18 in relation to the practice of polygamy.
Children’s Rights, the Environment, and Climate Change The CCRC recognizes the connection between children’s rights and the environment and has worked to increase awareness and engagement on this issue. In particular, climate change is a fundamental threat to children’s health and development, and therefore is a serious threat to the rights protected by the Convention. Many of the rights protected by the Convention depend on a healthy environment, including the rights:
• to life, survival and maximum development (Article 6); • to the enjoyment of the highest attainable standard of health (Article 24); • to a standard of living adequate for the child's physical, mental, spiritual, moral and social
development (Article 27); and • to rest and leisure, to engage in play and recreational activities appropriate to the age of
the child and to participate freely in cultural life and the arts (Article 31).
192

In January 2018, the Special Rapporteur on human rights and the environment to the United Nations General Assembly Human Rights Council (the “Special Rapporteur”) released the “Report of the Special Rapporteur on the issue of human rights obligations relating to the enjoyment of a safe, clean, healthy and sustainable environment.”1 That report focuses on the way that environmental harm prevents children from enjoying their human rights and the obligations of states to protect children from such harm. Among other things, the Special Rapporteur observed that:
• no group is more vulnerable to environmental harm than children, and environmental harm has especially severe effects on children under the age of five (para. 15);
• a healthy environment is necessary for children’s enjoyment of the rights to life, development and health (para. 33); and
• the cumulative effects of long-term environmental harm, such as climate change and the loss of biodiversity, increase over time, so that decisions taken today will affect children much more than adults (para. 57).
The UN Committee on the Rights of the Child (the “Committee”) was established under the Convention to examine the progress made by states in realizing the obligations set out in the Convention and to provide guidance to states through, among other things, General Comments and General Days of Discussion. In December 2012, the Committee issued its “Concluding observations on the combined third and fourth periodic report of Canada,” which included a recommendation that “the views of the child be a requirement for all official decision-making processes that relate to children, including custody cases, child welfare decisions, criminal justice, immigration, and the environment” (para. 37).2 Since receiving the Concluding Observations in 2012, the CCRC has consistently advocated for an action plan to respond to its recommendations. Among other things, the CCRC participated in the public review process on Bill C-69 (An Act to enact the Impact Assessment Act and the Canadian Energy Regulator Act, to amend the Navigation Protection Act and to make consequential amendments to other Acts) and made a submission on Bill C-69 regarding youth voice in the environmental assessment process.3 In 2013, the Committee issued General Comment No. 15, which elaborates the right to the enjoyment of the highest attainable standard of health and provides guidance to states on how to implement it.4 Among other things, the Committee:
1 http://undocs.org/A/HRC/37/58 2 https://tbinternet.ohchr.org/_layouts/treatybodyexternal/Download.aspx?symbolno=CRC/C/CAN/CO/3-4&Lang=En 3 http://rightsofchildren.ca/wp-content/uploads/2018/04/Rights-of-Children-to-a-Healthy-Environment-and-Bill-C-69.pdf 4 https://www2.ohchr.org/english/bodies/crc/docs/GC/CRC-C-GC-15_en.doc
193
• acknowledges “There is also a growing understanding of the impact of climate changeand rapid urbanization on children’s health” (para. 5); and
• “draws attention to the relevance of the environment, beyond environmental pollution, tochildren’s health. Environmental interventions should, inter alia, address climate change,as this is one of the biggest threats to children’s health and exacerbates health disparities.States should, therefore, put children’s health concerns at the centre of their climatechange adaptation and mitigation strategies” (para. 50).
In May 2017, the Office of the United Nations High Commissioner for Human Rights released an “Analytical study on the relationship between climate change and the full and effective enjoyment of the rights of the child.”5 That study found, among other things:
• all children are exceptionally vulnerable to the negative impacts of climate change,including the increasing frequency and intensity of natural disasters, changingprecipitation patterns, food and water shortages, and the increased transmission ofcommunicable diseases (para. 50);
• a child rights-based approach to climate change requires that children should not betreated as passive victims of events beyond their influence, but rather as agents of changewhose preferences and choices are fairly reflected in policy design and implementation(para. 40); and
• the principle of intergenerational equity underlying international frameworks, such as theParis Agreement, places a duty on current generations to act as responsible stewards ofthe planet and ensure the rights of future generations to meet their developmental andenvironmental needs (para. 35).
In Canada, federal, provincial, and territorial governments share the duties of states to implement the Convention because the responsibility for public policies that affect children’s rights crosses jurisdictional divisions of power. The CCRC has presented to Ministers and Senate Committees evidence that implementation of the Convention by all levels of government advances fulfillment of shared obligations to protect the rights and well-being of children. For this reason, the CCRC believes the international legal obligations of Canada under the Convention should also be considered when interpreting the jurisdictional provisions of the Constitution.
Conclusion
Again, the CCRC is proud to be a member of the intergenerational climate coalition applying for leave to intervene in the Reference Case.
Sincerely,
Katherine Vandergrift Chair, CCRC
5 https://undocs.org/en/a/hrc/35/13
194


195
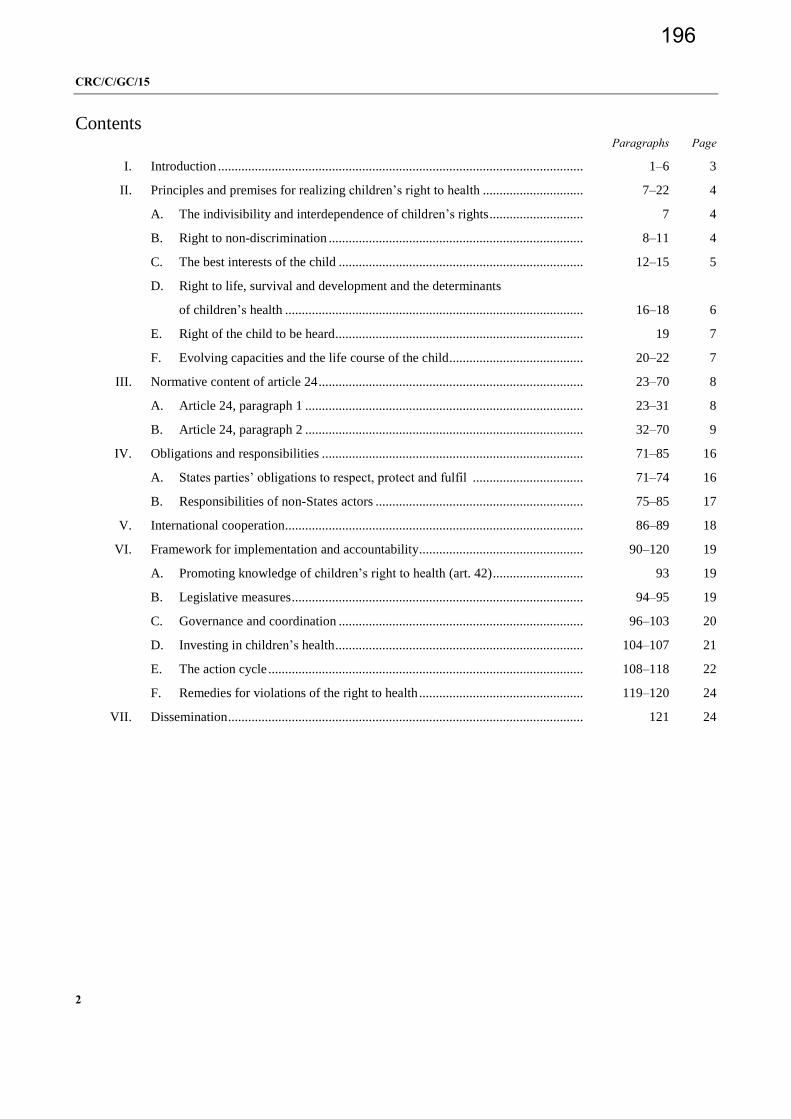
CRC/C/GC/15
2
Contents Paragraphs Page
I. Introduction ............................................................................................................. 1–6 3
II. Principles and premises for realizing children’s right to health .............................. 7–22 4
A. The indivisibility and interdependence of children’s rights ............................ 7 4
B. Right to non-discrimination ............................................................................ 8–11 4
C. The best interests of the child ......................................................................... 12–15 5
D. Right to life, survival and development and the determinants
of children’s health ......................................................................................... 16–18 6
E. Right of the child to be heard .......................................................................... 19 7
F. Evolving capacities and the life course of the child ........................................ 20–22 7
III. Normative content of article 24 ............................................................................... 23–70 8
A. Article 24, paragraph 1 ................................................................................... 23–31 8
B. Article 24, paragraph 2 ................................................................................... 32–70 9
IV. Obligations and responsibilities .............................................................................. 71–85 16
A. States parties’ obligations to respect, protect and fulfil ................................. 71–74 16
B. Responsibilities of non-States actors .............................................................. 75–85 17
V. International cooperation ......................................................................................... 86–89 18
VI. Framework for implementation and accountability ................................................. 90–120 19
A. Promoting knowledge of children’s right to health (art. 42) ........................... 93 19
B. Legislative measures ....................................................................................... 94–95 19
C. Governance and coordination ......................................................................... 96–103 20
D. Investing in children’s health .......................................................................... 104–107 21
E. The action cycle .............................................................................................. 108–118 22
F. Remedies for violations of the right to health ................................................. 119–120 24
VII. Dissemination .......................................................................................................... 121 24
196

CRC/C/GC/15
3
I. Introduction
1. The present general comment is based on the importance of approaching children’s health from a child-rights perspective that all children have the right to opportunities to survive, grow and develop, within the context of physical, emotional and social well-being, to each child’s full potential. Throughout this general comment, “child” refers to an individual below the age of 18 years, in accordance with article 1 of the Convention on the Rights of the Child (hereinafter “the Convention’’). Despite the remarkable achievements in fulfilling children’s rights to health in recent years since the adoption of the Convention, significant challenges remain. The Committee on the Rights of the Child (hereinafter “the Committee”) recognizes that most mortality, morbidity and disabilities among children could be prevented if there were political commitment and sufficient allocation of resources directed towards the application of available knowledge and technologies for prevention, treatment and care. The present general comment was prepared with the aim of providing guidance and support to States parties and other duty bearers to support them in respecting, protecting and fulfilling children’s right to the enjoyment of the highest attainable standard of health (hereinafter “children’s right to health”).
2. The Committee interprets children’s right to health as defined in article 24 as an inclusive right, extending not only to timely and appropriate prevention, health promotion, curative, rehabilitative and palliative services, but also to a right to grow and develop to their full potential and live in conditions that enable them to attain the highest standard of health through the implementation of programmes that address the underlying determinants of health. A holistic approach to health places the realization of children’s right to health within the broader framework of international human rights obligations.
3. The Committee addresses this general comment to a range of stakeholders working in the fields of children’s rights and public health, including policymakers, programme implementers and activists, as well as parents and children themselves. It is explicitly generic in order to ensure its relevance to a wide range of children’s health problems, health systems and the varied contexts that exist in different countries and regions. It focuses primarily on article 24, paragraphs 1 and 2, and also addresses article 24, paragraph 4.1 Implementation of article 24 must take into account all human rights principles, especially the guiding principles of the Convention, and must be shaped by evidence-based public health standards and best practices.
4. In the Constitution of the World Health Organization, States have agreed to regard health as a state of complete physical, mental and social well-being and not merely the absence of disease or infirmity.2 This positive understanding of health provides the public health foundation for the present general comment. Article 24 explicitly mentions primary health care, an approach to which was defined in the Declaration of Alma-Ata 3 and reinforced by the World Health Assembly.4 This approach emphasizes the need to eliminate exclusion and reduce social disparities in health; organize health services around people’s needs and expectations; integrate health into related sectors; pursue collaborative models of
1 Article 24, paragraph 3, is not covered because a general comment on harmful practices is currently
being developed. 2 Preamble to the Constitution of the World Health Organization (WHO) as adopted by the
International Health Conference, New York, 22 July 1946. 3 Declaration of Alma-Ata, International Conference on Primary Health Care, Alma-Ata, 6–12
September 1978. 4 World Health Assembly, Primary health care including health systems strengthening, document
A62/8.
197

CRC/C/GC/15
4
policy dialogue; and increase stakeholder participation, including the demand for and appropriate use of services.
5. Children’s health is affected by a variety of factors, many of which have changed during the past 20 years and are likely to continue to evolve in the future. This includes the attention given to new health problems and changing health priorities, such as: HIV/AIDS, pandemic influenza, non-communicable diseases, importance of mental health care, care of the new born, and neonatal and adolescent mortality; increased understanding of the factors that contribute to death, disease and disability in children, including structural determinants, such as the global economic and financial situation, poverty, unemployment, migration and population displacements, war and civil unrest, discrimination and marginalization. There is also a growing understanding of the impact of climate change and rapid urbanization on children’s health; the development of new technologies, such as vaccines and pharmaceuticals; a stronger evidence base for effective biomedical, behavioural and structural interventions, as well as some cultural practices that relate to child-rearing and have proved to have a positive impact on children.
6. Advances in information and communication technologies have created new opportunities and challenges to achieve children’s right to health. Despite the additional resources and technologies that have now become available to the health sector, many countries still fail to provide universal access to basic children’s health promotion, prevention and treatment services. A wide range of different duty bearers need to be involved if children’s right to health is to be fully realized and the central role played by parents and other caregivers needs to be better recognized. Relevant stakeholders will need to be engaged, working at national, regional, district and community levels, including governmental and non-governmental partners, private sector and funding organizations. States have an obligation to ensure that all duty bearers have sufficient awareness, knowledge and capacity to fulfil their obligations and responsibilities, and that children’s capacity is sufficiently developed to enable them to claim their right to health.
II. Principles and premises for realizing children’s right to health
A. The indivisibility and interdependence of children’s rights
7. The Convention recognizes the interdependence and equal importance of all rights (civil, political, economic, social and cultural) that enable all children to develop their mental and physical abilities, personalities and talents to the fullest extent possible. Not only is children’s right to health important in and of itself, but also the realization of the right to health is indispensable for the enjoyment of all the other rights in the Convention. Moreover, achieving children’s right to health is dependent on the realization of many other rights outlined in the Convention.
B. Right to non-discrimination
8. In order to fully realize the right to health for all children, States parties have an obligation to ensure that children’s health is not undermined as a result of discrimination, which is a significant factor contributing to vulnerability. A number of grounds on which discrimination is proscribed are outlined in article 2 of the Convention, including the child’s, parent’s or legal guardian’s race, colour, sex, language, religion, political or other opinion, national, ethnic or social origin, property, disability, birth or other status. These also include sexual orientation, gender identity and health status, for example HIV status
198
CRC/C/GC/15
5
and mental health.5 Attention should also be given to any other forms of discrimination that might undermine children’s health, and the implications of multiple forms of discrimination should also be addressed.
9. Gender-based discrimination is particularly pervasive, affecting a wide range of outcomes, from female infanticide/foeticide to discriminatory infant and young child feeding practices, gender stereotyping and access to services. Attention should be given to the differing needs of girls and boys, and the impact of gender-related social norms and values on the health and development of boys and girls. Attention also needs to be given to harmful gender-based practices and norms of behaviour that are ingrained in traditions and customs and undermine the right to health of girls and boys.
10. All policies and programmes affecting children’s health should be grounded in a broad approach to gender equality that ensures young women’s full political participation; social and economic empowerment; recognition of equal rights related to sexual and reproductive health; and equal access to information, education, justice and security, including the elimination of all forms of sexual and gender-based violence.
11. Children in disadvantaged situations and under-served areas should be a focus of efforts to fulfil children’s right to health. States should identify factors at national and subnational levels that create vulnerabilities for children or that disadvantage certain groups of children. These factors should be addressed when developing laws, regulations, policies, programmes and services for children’s health, and work towards ensuring equity.
C. The best interests of the child
12. Article 3, paragraph 1, of the Convention places an obligation on public and private social welfare institutions, courts of law, administrative authorities and legislative bodies to ensure that the best interests of the child are assessed and taken as a primary consideration in all actions affecting children. This principle must be observed in all health-related decisions concerning individual children or children as a group. Individual children’s best interests should be based on their physical, emotional, social and educational needs, age, sex, relationship with parents and caregivers, and their family and social background, and after having heard their views according to article 12 of the Convention.
13. The Committee urges States to place children’s best interests at the centre of all decisions affecting their health and development, including the allocation of resources, and the development and implementation of policies and interventions that affect the underlying determinants of their health. For example, the best interests of the child should:
(a) Guide treatment options, superseding economic considerations where feasible;
(b) Aid the resolution of conflict of interest between parents and health workers; and
(c) Influence the development of policies to regulate actions that impede the physical and social environments in which children live, grow and develop.
14. The Committee underscores the importance of the best interests of the child as a basis for all decision-making with regard to providing, withholding or terminating
5 General comment No. 4 (2003) on adolescent health and development in the context of the
Convention on the Rights of the Child, Official Records of the General Assembly, Fifty-ninth Session, Supplement No. 41 (A/59/41), annex X, para. 6.
199

CRC/C/GC/15
6
treatment for all children. States should develop procedures and criteria to provide guidance to health workers for assessing the best interests of the child in the area of health, in addition to other formal, binding processes that are in place for determining the child’s best interests. The Committee in its general comment No. 3 6 has underlined that adequate measures to address HIV/AIDS can be undertaken only if the rights of children and adolescents are fully respected. The child’s best interests should therefore guide the consideration of HIV/AIDS at all levels of prevention, treatment, care and support.
15. In its general comment No. 4, the Committee underlined the best interests of the child to have access to appropriate information on health issues.7 Special attention must be given to certain categories of children, including children and adolescents with psychosocial disabilities. Where hospitalization or placement in an institution is being considered, this decision should be made in accordance with the principle of the best interests of the child, with the primary understanding that it is in the best interests of all children with disabilities to be cared for, as far as possible, in the community in a family setting and preferably within their own family with the necessary supports made available to the family and the child.
D. Right to life, survival and development and the determinants of children’s health
16. Article 6 highlights the States parties’ obligation to ensure the survival, growth and development of the child, including the physical, mental, moral, spiritual and social dimensions of their development. The many risks and protective factors that underlie the life, survival, growth and development of the child need to be systematically identified in order to design and implement evidence-informed interventions that address a wide range of determinants during the life course.
17. The Committee recognizes that a number of determinants need to be considered for the realization of children’s right to health, including individual factors such as age, sex, educational attainment, socioeconomic status and domicile; determinants at work in the immediate environment of families, peers, teachers and service providers, notably the violence that threatens the life and survival of children as part of their immediate environment; and structural determinants, including policies, administrative structures and systems, social and cultural values and norms.8
18. Among the key determinants of children’s health, nutrition and development are the realization of the mother’s right to health9 and the role of parents and other caregivers. A significant number of infant deaths occur during the neonatal period, related to the poor health of the mother prior to, and during, the pregnancy and the immediate post-partum
6 General comment No. 3 (2003) on HIV/AIDS and the rights of the child, Official Records of the
General Assembly, Fifty-ninth Session, Supplement No. 41 (A/59/41), annex IX. 7 General comment No. 4 (2003) on adolescent health and development in the context of the
Convention, Official Records of the General Assembly, Fifty-ninth Session, Supplement No. 41 (A/59/41), annex X, para. 10.
8 See general comment No. 13 (2011) on the right of the child to be free from all forms of violence, Official Records of the General Assembly, Sixty-seventh Session, Supplement No. 41 (A/67/41), annex V.
9 See Committee on the Elimination of Discrimination against Women, general recommendation No. 24 (1999) on women and health, Official Records of the General Assembly, Fifty-fourth Session, Supplement No. 38 (A/54/38/Rev.1), chap. I, sect. A.
200

CRC/C/GC/15
7
period, and to suboptimal breastfeeding practices. The health and health-related behaviours of parents and other significant adults have a major impact on children’s health.
E. Right of the child to be heard
19. Article 12 highlights the importance of children’s participation, providing for children to express their views and to have such views seriously taken into account, according to age and maturity. 10 This includes their views on all aspects of health provisions, including, for example, what services are needed, how and where they are best provided, barriers to accessing or using services, the quality of the services and the attitudes of health professionals, how to strengthen children’s capacities to take increasing levels of responsibility for their own health and development, and how to involve them more effectively in the provision of services, as peer educators. States are encouraged to conduct regular participatory consultations, which are adapted to the age and maturity of the child, and research with children, and to do this separately with their parents, in order to learn about their health challenges, developmental needs and expectations as a contribution to the design of effective interventions and health programmes.
F. Evolving capacities and the life course of the child
20. Childhood is a period of continuous growth from birth to infancy, through the preschool age to adolescence. Each phase is significant as important developmental changes occur in terms of physical, psychological, emotional and social development, expectations and norms. The stages of the child’s development are cumulative and each stage has an impact on subsequent phases, influencing the children’s health, potential, risks and opportunities. Understanding the life course is essential in order to appreciate how health problems in childhood affect public health in general.
21. The Committee recognizes that children’s evolving capacities have a bearing on their independent decision-making on their health issues. It also notes that there are often serious discrepancies regarding such autonomous decision-making, with children who are particularly vulnerable to discrimination often less able to exercise this autonomy. It is therefore essential that supportive policies are in place and that children, parents and health workers have adequate rights-based guidance on consent, assent and confidentiality.
22. To respond and understand children’s evolving capacities and the different health priorities along the life cycle, data and information that are collected and analysed should be disaggregated by age, sex, disability, socioeconomic status and sociocultural aspects and geographic location, in accordance with international standards. This makes it possible to plan, develop, implement and monitor appropriate policies and interventions that take into consideration the changing capacities and needs of children over time, and that help to provide relevant health services for all children.
10 See general comment No. 12 (2009) on the right of the child to be heard, Official Records of the
General Assembly, Sixty-fifth Session, Supplement No. 41 (A/65/41), annex IV.
201

Intentionally Left Blank
202

CRC/C/GC/15
12
Convention on Tobacco Control. Special measures should be taken to promote community and workplace support for mothers in relation to pregnancy and breastfeeding and feasible and affordable childcare services; and compliance with the International Labour Organization Convention No. 183 (2000) concerning the revision of the Maternity Protection Convention (Revised), 1952.
45. Adequate nutrition and growth monitoring in early childhood are particularlyimportant. Where necessary, integrated management of severe acute malnutrition should beexpanded through facility and community-based interventions, as well as treatment ofmoderate acute malnutrition, including therapeutic feeding interventions.
46. School feeding is desirable to ensure all pupils have access to a full meal every day,which can also enhance children’s attention for learning and increase school enrolment. TheCommittee recommends that this be combined with nutrition and health education,including setting up school gardens and training teachers to improve children’s nutritionand healthy eating habits.
47. States should also address obesity in children, as it is associated with hypertension,early markers of cardiovascular disease, insulin resistance, psychological effects, a higherlikelihood of adult obesity, and premature death. Children’s exposure to “fast foods” thatare high in fat, sugar or salt, energy-dense and micronutrient-poor, and drinks containinghigh levels of caffeine or other potentially harmful substances should be limited. Themarketing of these substances – especially when such marketing is focused on children –should be regulated and their availability in schools and other places controlled.
(c) The provision of clean drinking water
48. Safe and clean drinking water and sanitation are essential for the full enjoyment oflife and all other human rights.15 Government departments and local authorities responsiblefor water and sanitation should recognize their obligation to help realize children’s right tohealth, and actively consider child indicators on malnutrition, diarrhoea and other water-related diseases and household size when planning and carrying out infrastructureexpansion and the maintenance of water services, and when making decisions on amountsfor free minimum allocation and service disconnections. States are not exempted from theirobligations, even when they have privatized water and sanitation.
(d) Environmental pollution
49. States should take measures to address the dangers and risks that localenvironmental pollution poses to children’s health in all settings. Adequate housing thatincludes non-dangerous cooking facilities, a smoke-free environment, appropriateventilation, effective management of waste and the disposal of litter from living quartersand the immediate surroundings, the absence of mould and other toxic substances, andfamily hygiene are core requirements to a healthy upbringing and development. Statesshould regulate and monitor the environmental impact of business activities that maycompromise children’s right to health, food security and access to safe drinking water andto sanitation.
50. The Committee draws attention to the relevance of the environment, beyondenvironmental pollution, to children’s health. Environmental interventions should, inter alia,address climate change, as this is one of the biggest threats to children’s health andexacerbates health disparities. States should, therefore, put children’s health concerns at thecentre of their climate change adaptation and mitigation strategies.
15 General Assembly resolution 64/292 on the human right to water and sanitation.
203

204
A/HRC/35/13
2
Contents Page
I. Introduction ................................................................................................................................... 3
II. Key impacts of climate change on children .................................................................................. 3
A. Extreme weather and natural disasters .................................................................................. 4
B. Water scarcity and food insecurity ....................................................................................... 4
C. Air pollution ......................................................................................................................... 5
D. Vector-borne and infectious diseases .................................................................................... 5
E. Impacts on mental health ...................................................................................................... 6
F. Disproportionate impacts on children in vulnerable situations ............................................. 6
III. Human rights obligations and responsibilities of States and other actors ..................................... 8
IV. Good practices in promoting children’s rights in climate action ................................................... 12
A. Educational policies .............................................................................................................. 12
B. Disaster risk reduction .......................................................................................................... 12
C. Litigation .............................................................................................................................. 13
D. Engagement by human rights mechanisms ........................................................................... 13
V. Conclusions and recommendations ............................................................................................... 14
A. Conclusions .......................................................................................................................... 14
B. Recommendations ................................................................................................................. 15
205

A/HRC/35/13
3
I. Introduction
1. The present study is submitted pursuant to Human Rights Council resolution 32/33, in which the Council requested the Office of the United Nations High Commissioner for Human Rights (OHCHR) to conduct a detailed analytical study, in consultation with relevant stakeholders, on the relationship between climate change and the full and effective enjoyment of the rights of the child.
2. On 9 September 2016, OHCHR circulated a note verbale and questionnaire to Member States requesting inputs for the study. Communications were also sent to other stakeholders, including international organizations, national human rights institutions and civil society. Their inputs were summarized in a conference room paper prepared by OHCHR in advance of the panel discussion on the adverse impact of climate change on States’ efforts to realize the rights of the child and related policies, lessons learned and good practices, held on 2 March 2017.1 The panel discussion, written inputs, consultations and independent research have informed the present study.
3. In the study, OHCHR examines the impacts of climate change on children and the related human rights obligations and responsibilities of States and other actors, including the elements of a child rights-based approach to climate change policies. It provides examples of good practices and concludes with concrete recommendations for fulfilling human rights obligations, particularly those related to children’s rights, in the context of climate change.
II. Key impacts of climate change on children
4. Children are disproportionately affected by changes in their environment, due to their unique metabolism, physiology and developmental needs.2 Changes in temperature, air and water quality and nutrition are likely to have more severe and long-term impacts on children’s health, development and well-being. Young children, because of their less developed physiology and immune systems, will experience most intensely the effects of climate change-related stresses.3 During childhood, alterations to the social and physical environment can have far-reaching implications for children’s long-term physical and mental health and overall quality of life.
5. According to United Nations Children’s Fund (UNICEF), there may be no greater threat facing the world’s children, and future generations, than climate change.4 In 2014, there were 2.2 billion children in the world, with approximately 30 per cent of the world’s population being under 18 years old.5 Existing and future demographic trends reveal that many of the countries that have been identified as highly vulnerable to climate change also have higher proportions of children in their overall population. These include parts of South Asia, the Pacific islands and other small island developing States, equatorial Africa and the Pacific coast of South America.
6. As discussed below, some of the most substantial impacts of climate change on children are caused by extreme weather and natural disasters, water scarcity and food insecurity, air pollution and vector-borne diseases and resulting psychological trauma. Children in vulnerable situations are disproportionately affected by climate change.
1 For the summary of the panel discussion, see A/HRC/35/14. The original inputs received and the
informal summary of those inputs are available at www.ohchr.org/EN/Issues/HRAndClimateChange/Pages/RightsChild.aspx.
2 See generally World Health Organization (WHO), Inheriting a Sustainable World? Atlas on Children’s Health and the Environment (2017), available at www.who.int/ceh/publications/inheriting-a-sustainable-world/en/.
3 P.J. Landrigan and A. Garg, “Children are not little adults”, in Children’s Health and the Environment: A Global Perspective, J. Pronczuk-Garbino, ed. (Geneva, WHO, 2005).
4 UNICEF, Unless We Act Now: The Impact of Climate Change on Children (New York, 2015), p. 6. 5 UNICEF, The State of the World’s Children 2014: Every Child Counts (New York, 2014).
206

A/HRC/35/13
4
A. Extreme weather and natural disasters
7. Climate change contributes to the increasing frequency and intensity of extreme weather events. Globally, nearly 160 million children have been identified as living in areas of high or extremely high drought severity.6 More than half a billion children live in zones of extremely high flood occurrence, and approximately 115 million children live in zones of high or extremely high tropical cyclone risk. 7 Even under a medium-low emission scenario, the Intergovernmental Panel on Climate Change predicts a global sea-level rise of 0.53 metres by 2100, with coastal and low-lying areas at risk of submergence, flood damage, erosion and impeded drainage. 8 Floods and other natural disasters caused by extreme weather are likely to elevate mortality and morbidity among children.
8. Young children are more susceptible to injury and death during natural disasters. In the aftermath of the 2010 floods in Pakistan, rates of under-5 mortality in flood-affected areas were notably higher than the national average.9 Natural disasters can also result in the separation of children from their family unit, increasing their vulnerability to subsequent harm.
9. Climate change is also expected to increase the duration and intensity of heat waves. This will affect children disproportionately, as their bodies adapt at a slower rate to changes in heat and they may suffer from heat rash, heat-related cramps, exhaustion, renal disease, respiratory illness, stroke and death.10
10. Extreme weather events can disrupt access to essential educational, health and housing services. For example, children’s access to education can be interrupted by damage to educational facilities and critical infrastructure and by the use of schools as emergency shelters.11 Similarly, damage to health infrastructure and essential drug supplies can make post-emergency interventions less effective. Floods and landslides, sea-level rise and powerful storms can degrade and destroy housing units and water and sanitation infrastructure, worsening living conditions, particularly for children, in unplanned and underserviced settlements.12
11. Climate change-related disasters can also disrupt child protection systems and exacerbate pre-existing tensions and conflicts, leaving children susceptible to abuse, child labour, trafficking and other forms of exploitation.13
B. Water scarcity and food insecurity
12. Climate change is already affecting water and food supplies, with severe consequences for children in poor communities. Changing patterns of precipitation, sea-level rise and increased evaporation as a result of climate change will reduce surface and
6 UNICEF, Unless We Act Now. 7 Ibid. 8 Christopher B. Field and others, eds., Climate Change 2014: Impacts, Adaptation and Vulnerability,
Working Group II contribution to the Fifth Assessment Report of the Intergovernmental Panel on Climate Change (New York, Cambridge University Press, 2014), pp. 368-369.
9 UNICEF, Unless We Act Now, p. 30; see also WHO, “Pakistan floods 2010: early recovery plan for the health sector” (2011), p. 52.
10 See, for example, Johns Hopkins Medicine, “Heat-related illnesses (heat cramps, heat exhaustion, heat stroke)”, available from www.hopkinsmedicine.org/healthlibrary/conditions/pediatrics/heat-related_illnesses_heat_cramps_heat_exhaustion_heat_stroke_90,P01611/.
11 Katie Harris and Kelly Hawrylyshyn, “Climate extremes and child rights in South Asia: a neglected priority” (Overseas Development Institute, 2012).
12 See generally A/64/255 on climate change and the right to adequate housing, para. 21 on the disproportionate impacts on children.
13 Sheridan Bartlett, “Climate change and urban children: impacts and implications for adaptation in low- and middle-income countries”, Environment and Urbanization, vol. 20, No. 2 (October 2008), pp. 509-510; Global Protection Cluster, “Strengthening protection in natural disaster response: children”, available at www.globalprotectioncluster.org/en/tools-and-guidance/essential-protection-guidance-and-tools/protection-in-natural-disasters-essential-guidance-and-tools.html.
207

A/HRC/35/13
5
groundwater resources in most dry subtropical regions. 14 Droughts are expected to intensify, reducing access to water for personal consumption, agriculture and economic activities. Acidification and increasing water temperatures further threaten the fisheries upon which many coastal communities rely for subsistence.
13. Shortages of safe drinking water and food staples will have disproportionate impacts on children, particularly the poor. Children’s consumption needs per body weight are higher than those of adults and food and water scarcity undermines their physical and cognitive growth.15 Globally, undernutrition is responsible for nearly half of all under-5 deaths and is a major factor exacerbating the frequency and severity of other diseases and infections.16 Inadequate responses to malnourishment during the first two years of life result in irreversible stunting with lifelong consequences for children’s cognitive capacity, school performance and economic productivity.17 It is estimated that, by 2030, climate change will result in an additional 7.5 million children under the age of 5 who are moderately or severely stunted.18
14. Food and water crises pose additional risks, such as increased incidences of school dropout, child labour and domestic violence. Crop and income loss has been linked to significant increases in the level of child labour used for household chores such as fetching water and searching for firewood. 19 When extreme weather affects the security of household incomes and families increase their reliance on child labour, children have less time and energy to dedicate to school activities.
C. Air pollution
15. In 2012, indoor and outdoor air pollution combined were linked to approximately 700,000 deaths among children under 5 years of age.20 Although air pollution is not caused by climate change, some forms of air pollution cause climate change. Further, climate change can exacerbate some forms of air pollution, for example, by intensifying the toxicity of pollutants, such as ozone, a trigger of childhood asthma. 21 The heightened risk of wildfires associated with heat waves and drought affects air quality and children’s respiratory systems, and warmer temperatures are also linked with the release of airborne allergens that can exacerbate asthma and allergic respiratory diseases.22 Thus, air pollution and climate change contribute to a vicious cycle that disproportionately affects children, who, due to their higher breathing rate, are more susceptible to respiratory problems and infections related to air pollution.23
D. Vector-borne and infectious diseases
16. Children are more susceptible than adults to many vector-borne and infectious diseases. Waterborne diseases typically spread in the aftermath of climate change-related floods and storms, especially when water and sanitation infrastructure is damaged. Poor hygiene and consumption of contaminated water can contribute to increased incidence of diarrhoea and cholera, among other illnesses. Diarrhoea is the second leading cause of
14 Field and others, Climate Change 2014, p. 232. 15 Landrigan and Garg, “Children”, pp. 3-4. 16 UNICEF, “Undernutrition contributes to nearly half of all deaths in children under 5 and is
widespread in Asia and Africa”, available at https://data.unicef.org/topic/nutrition/malnutrition/. 17 Cesar G. Victora, and others, “Maternal and child undernutrition: consequences for adult health and
human capital”, Lancet, vol. 371, No. 9609 (2008). 18 WHO, Quantitative Risk Assessment of the Effects of Climate Change on Selected Causes of Death,
2030s and 2050s (Geneva, 2014), p. 80. 19 Kathleen Beegle, Rajeev H. Dehejia and Roberta Gatti, “Child labor and agricultural shocks”, Journal
of Development Economics, vol. 81, No. 1 (October 2006). 20 WHO, Inheriting a Sustainable World?, p. 16. 21 UNICEF, Unless We Act Now, p. 44. 22 Field and others, Climate Change 2014, p. 729. 23 Landrigan and Garg, “Children”.
208
A/HRC/35/13
6
mortality in children under 5.24 By 2030, it is projected that climate change impacts will result in 48,000 additional deaths from diarrhoeal disease in children under 15.25
17. Climate change is also likely to expand the seasonal and geographic range of vector-borne diseases, including insect-borne diseases with hosts sensitive to variations in temperature, humidity and precipitation. Malaria is expected to expand into tropical highland regions where the medical and immunological responses of populations may be ill-equipped to cope.26 Infants and young and poor children living in areas with substandard health facilities are at particular risk. In 2015, roughly 300,000 children under the age of 5 died from malaria; 27 the majority lived on the African continent. Outbreaks of other diseases that affect children, such as dengue, Zika, leptospirosis, viral infections, meningitis, varicella, viral hepatitis, leishmaniasis and pertussis, have been linked to climate change.28
E. Impacts on mental health
18. Climate change and the impacts of traumatic stress connected to climate change, such as war/insecurity, sexual and physical violence and witnessing deaths and injury related to extreme weather disasters, negatively affect children’s mental health. Children who lose a family member or experience life-threatening situations as a result of the impacts of climate change have a higher chance of experiencing post-traumatic stress, anxiety disorders, suicidal ideation and depression. Disasters can also affect children’s cognitive capacity with corresponding impacts on their emotional well-being. For example, children affected by El Niño during early childhood posted lower scores in language development, memory and spatial reasoning than other children of a similar age.29 Lower cognitive functioning in early life has been shown to increase the risk of future mental health problems.30
19. Children may also experience anxiety related to fear of separation from their families and heightened household tensions resulting from the loss of family livelihoods.31 Children whose families are affected by climate change may be exposed to higher risks of violence, physical abuse, child labour, trafficking and exploitation. Their needs for rest and play may be subordinated to basic survival interests. In cases of displacement, separation from traditional lands and territories, from communities and from family members can have impacts on children’s education, cultural identity and access to social support systems. All of these climate impacts have potentially severe mental health repercussions.
F. Disproportionate impacts on children in vulnerable situations
20. According to the Intergovernmental Panel on Climate Change, “people who are socially, economically, culturally, politically, institutionally or otherwise marginalized are especially vulnerable to climate change and also to some adaptation and mitigation responses”.32 The negative impacts of climate change will disproportionately affect poor children, indigenous children, minorities, migrants and other children on the move, children
24 WHO, “Diarrhoeal disease”, Fact sheet No. 330 (2013), available from
www.who.int/mediacentre/factsheets/fs330/en/. 25 WHO, Quantitative Risk, p. 44. 26 UNICEF, Unless We Act Now, p. 48. 27 WHO, “Malaria in children under 5” (2016), available at
www.who.int/malaria/areas/high_risk_groups/children/en/. 28 A/HRC/32/23. 29 Arturo Aguilar and Marta Vicarelli, “El Niño and Mexican children: medium-term effects of early-
life weather shocks on cognitive and health outcomes” (2011). 30 Chuan Yu Chen and others, “Mild cognitive impairment in early life and mental health problems in
adulthood”, American Journal of Public Health, vol. 96, No. 10 (October 2006). 31 Agnes A. Babugara, “Vulnerability of children and youth in drought disasters: a case study of
Botswana”, Children, Youth and Environments, vol. 18, No. 1 (2008). 32 Field and others, Climate Change 2014, p. 50.
209

Intentionally Left Blank
210
A/HRC/35/13
14
recommendation on gender-related dimensions of disaster risk reduction in a changing climate,75 while the Committee on the Rights of the Child has issued, on several occasions, concluding observations including observations and recommendations on climate change.76 In 2015, the Commonwealth Forum of National Human Rights Institutions issued the St. Julian’s Declaration on Climate Justice, in which the institutions committed to, inter alia, “promote the principle of equality and non-discrimination in climate action, including the rights of children”. The Special Rapporteur on the issue of human rights obligations relating to the enjoyment of a safe, clean, healthy and sustainable environment, whose forthcoming report will focus on children, and other special procedure mandate holders have focused on the impacts of climate change on human rights in their reporting.77 Finally, specific recommendations related to climate change and its impacts on the rights of the child have been issued on several occasions in the context of the universal periodic review of the Human Rights Council.78
V. Conclusions and recommendations
49. The conclusions and recommendations below are derived from the various elements that have informed the present study.
A. Conclusions
50. The negative impacts of climate change, including the increasing frequency and intensity of natural disasters, changing precipitation patterns, food and water shortages, and the increased transmission of communicable diseases, threaten the enjoyment by children of their rights to health, life, food, water and sanitation, education, housing, culture and development, among others. Climate change heightens existing social and economic inequalities, intensifies poverty and reverses progress towards improvement in children’s well-being. All children are exceptionally vulnerable to the negative impacts of climate change, with the youngest children being most at risk.
51. Climate change has a disproportionate impact on some children, including children with disabilities, children on the move, poor children, children separated from their families and indigenous children. Girls also face heightened risks due to climate change. In climate-vulnerable States and climate-sensitive areas, climate change poses a contemporaneous threat to inhabitants’ rights to life, survival and development, among others. The rights and opportunities of children living in such areas can be severely affected. Beyond threatening children’s physical well-being, climate change poses a threat to their cultural identity, to their connections with the natural environment and to their education.
52. The human rights obligations and responsibilities contained in the Convention on the Rights of the Child, the Paris Agreement and other international human rights instruments require States and other duty bearers, including businesses, to take action to protect the rights and best interests of children from the adverse effects of climate change. Many States already have in place laws, policies and commitments related to the protection of children’s rights, the preservation of a healthy environment and climate change mitigation and adaptation. However, further action is needed to promote accountability for all actors, ensure children’s access to justice and protect children from the negative impacts of climate change. Children have a right to meaningful participation in climate policymaking aimed at accomplishing these
75 See www.ohchr.org/EN/HRBodies/CEDAW/Pages/DraftGRDisasterRisk.aspx. 76 See, for example, CRC/C/GBR/CO/5. 77 See, for example, A/HRC/31/52 and www.thecvf.org/wp-
content/uploads/2015/05/humanrightsSRHRE.pdf. 78 See, for example, A/HRC/33/6 (Samoa, 2016), A/HRC/30/13 and Corr.1 (Marshall Islands, 2015),
A/HRC/26/9 (Vanuatu, 2014), A/HRC/24/8 (Tuvalu, 2013) and A/HRC/16/7 (Maldives, 2011).
211

A/HRC/35/13
15
objectives and should play an active role in inspiring and shaping more effective climate policies.
53. Human rights, climate change, development and disaster risk reduction, including relevant international instruments and processes, are inextricably linked. A child rights-based approach to climate change mitigation and adaptation is called for by the intersections of these various frameworks with human rights obligations. It requires States to take affirmative measures to respect, protect, promote and fulfil the human rights of all children and to integrate their rights in all climate mitigation and adaptation policies and actions.
54. Fundamentally, a child rights-based approach requires:
(a) Ambitious mitigation measures to minimize the future negative impacts of climate change on children to the greatest extent possible by limiting warming to no more than 1.5°C above pre-industrial levels, as called for in the Paris Agreement;
(b) Adaptation measures that focus on protecting those children most vulnerable to the impacts of climate change;
(c) Mitigation and adaptation actions that are the product of participatory, evidence-based decision-making processes that take into account the ideas and best interests of children as expressed by children themselves.
55. Within these efforts, particular attention should be paid to girls, children with disabilities, indigenous children and other children who may be disproportionately affected by climate change. All children should be treated as active participants in climate action.
56. Truly sustainable, rights-based development requires climate actions that are informed by and take into consideration children’s rights, intergenerational equity and the needs of future generations. These actions should be evidence based and supported by a free, transparent exchange of good practices, resources and technical assistance adequate to address the threat of climate change in line with international human rights laws, norms and standards.
B. Recommendations
57. A child-rights based approach to climate change requires all relevant actors to take steps to ensure children’s rights policy coherence, empower children to participate in climate policymaking, guarantee children access to remedies for climate harm, better understand the impacts of climate change on children and mobilize adequate resources for child rights-based climate action. When pursuing these objectives, the particular needs of those children most vulnerable to climate change and its impacts must be taken into account.
1. Ensure children’s rights policy coherence
58. States should ensure that children’s rights considerations are integrated in their climate, disaster risk reduction and development activities. Efforts should be taken to link actions, positions and processes related to the United Nations Framework Convention on Climate Change, the Human Rights Council, the 2030 Agenda for Sustainable Development and the Sendai Framework for Disaster Risk Reduction 2015-2030 in order to establish a coherent approach to sustainable development that benefits all persons, particularly children. This should include:
(a) Implementing the Sustainable Development Goals relating to child poverty and malnutrition, access to education, child mortality and health, and water and sanitation, among others, in such a way as to enhance children’s resilience to climate change and reduce inequalities;
(b) Integrating children’s rights considerations in the implementation of the United Nations Framework Convention on Climate Change, including in the
212
A/HRC/35/13
16
transparency framework, in intended nationally determined contributions and other communications and in the work of the Warsaw International Mechanism for Loss and Damage associated with Climate Change Impacts and its taskforce on displacement, in order to promote accountability and more effective climate policies;
(c) Ensuring that climate adaptation policies improve disaster risk preparedness and enhance the adaptation capacities of all children, taking into account the needs and vulnerabilities of those most at risk. Gender considerations, for example, should be accounted for in climate change and disaster risk management policies, projects and planning processes.
59. Human rights mechanisms, including the Committee on the Rights of the Child, should consider ways to hold States accountable for their climate commitments, to better document the impacts of climate change and to promote rights-based climate action. As recommended during the day of general discussion on children’s rights and the environment held by the Committee on the Rights of the Child, the issue of the environment could be routinely integrated in concluding observations. Civil society inputs to the Committee review process should address climate change and its impacts on children’s rights and draw attention to the adequacy of States’ individual contributions to efforts to limit climate change to 1.5°C above pre-industrial levels, as well as the impacts of climate actions. Similarly, States should use the universal periodic review mechanism of the Human Rights Council to promote accountability for climate and human rights commitments.
2. Empower children to participate in climate policymaking
60. All children, without discrimination, should be prepared for and included in climate decision-making in order to ensure that their best interests are protected. Children’s involvement in the design and implementation of climate policies and climate vulnerability assessments should be facilitated according to their age and maturity. 79 Consultative mechanisms, improved dissemination of information and other strategies to engage children are needed for their meaningful participation. States should facilitate the participation of children in ongoing processes related to the United Nations Framework Convention on Climate Change that are likely to affect their development and survival.
61. Climate change education can empower educators, parents and children as agents of change. Educational curricula should transfer knowledge and develop skills that will equip children to confront climate-related challenges taking into account each child’s particular local context and, as appropriate, traditional knowledge. Climate education should, inter alia:
(a) Raise awareness about appropriate lifestyle choices for sustainable development, such as low-carbon transportation, energy and consumption behaviours;80
(b) Emphasize solidarity, promote cooperation with children from other countries and create opportunities for children’s participation in environmental decision-making;81
(c) Include access to up-to-date, meaningful and age-appropriate information about the causes of climate change, its impacts and adaptive responses, including disaster risk reduction and emergency preparedness.
79 For example, the inclusion of girls as participants in the design, planning and implementation of
climate strategies will lead to more effective policy formation. See, for example, United Nations Entity for Gender Equality and the Empowerment of Women (UN-Women) and Mary Robinson Foundation — Climate Justice, The Full View: Ensuring a Comprehensive Approach to Achieve the Goal of Gender Balance in the UNFCCC Process, 2nd ed. (2016), available at www.mrfcj.org/wp-content/uploads/2016/11/MRFCJ-Full-View-Second-Edition.pdf.
80 See, for example, target 4.7 of the Sustainable Development Goals. 81 See, for example, Committee on the Rights of the Child, general comment No. 1, paras. 9 and 13.
213

A/HRC/35/13
17
3. Guarantee children access to remedies
62. States and other responsible actors should take measures to ensure that children have access to effective remedies when they suffer harm from climate action and inaction. Such measures could include:
(a) Integrating the right to a healthy environment and the rights of future generations in national constitutions and legislation in order to promote the justiciability of those rights and strengthen accountability systems;
(b) Ratifying the Optional Protocol to the Convention on the Rights of the Child on a communications procedure, which established a complaints procedure for violations of children’s rights;
(c) Employing extraterritorial jurisdiction and taking other measures, as appropriate, to ensure responsible conduct by businesses not only in emissions reductions but also in remedying past harm;
(d) Developing a loss and damage system that ensures effective remedies for climate-related human rights harm, particularly that experienced by children;
(e) Ensuring that climate mitigation and adaptation projects provide access to effective redress mechanisms for human rights harm.
4. Better understand the impacts of climate change on children
63. In order to better protect children from the impacts of climate change, all actors should support improved understanding of the relationship between climate change and children’s rights. This could be promoted through measures such as:
(a) Disaggregated data collection;
(b) Impact assessments with respect to children’s rights and future generations;
(c) Enhanced intersectoral cooperation, as called for in the Geneva Pledge for Human Rights in Climate Action;
(d) Establishment of standing consultative committees that include children’s perspectives;
(e) Improved reporting on children’s rights and climate change to relevant United Nations Framework Convention on Climate Change and human rights mechanisms.
64. In this regard, civil society actors and participants at the 2010 Social Forum have called for the appointment of a United Nations special rapporteur on human rights and climate change.82
5. Mobilize adequate resources for child rights-based climate action
65. States, keeping in mind their human rights obligations and their common but differentiated responsibilities and respective capabilities, should take measures to mobilize adequate resources for effective climate action that does not harm but rather benefits children. States should ensure transparent, participatory and informed decision-making in the allocation of resources, including by conducting impact assessments with respect to children’s rights and future generations. Further, measures should be taken to improve international cooperation and build capacity for climate action in developing countries through the transfer of technology and the sharing of technical expertise. Mitigation must be a top priority, as it is the key to minimizing the negative impacts of climate change. In these efforts, businesses also have human rights responsibilities, which must not be neglected.
66. With regard to climate adaptation, resources should be directed towards efforts to promote non-discriminatory access to basic necessities and services for children in
82 A/HRC/16/62.
214

A/HRC/35/13
18
the light of the adverse effects of climate change. Investments in education and related infrastructure are a rights-based, cost-effective and sustainable method of empowering children. Health, water and sanitation, housing infrastructure and related services are also critical to children’s adaptation and resilience. Disaster risk reduction, including training for teachers, parents and children, and climate-resilient schools and infrastructure, is another key area for investment. In the aftermath of climate-related disasters, resources should be devoted to ensure children’s access to health services, to reunite children with their families and to not only protect them with physical support, such as food and clean water, but also to provide psychosocial care to prevent or address fear and traumas. 83 Support should take into account children’s distinct needs for play and safety.
83 See Committee on the Rights of the Child, general comment No. 15, para. 40.
215

216
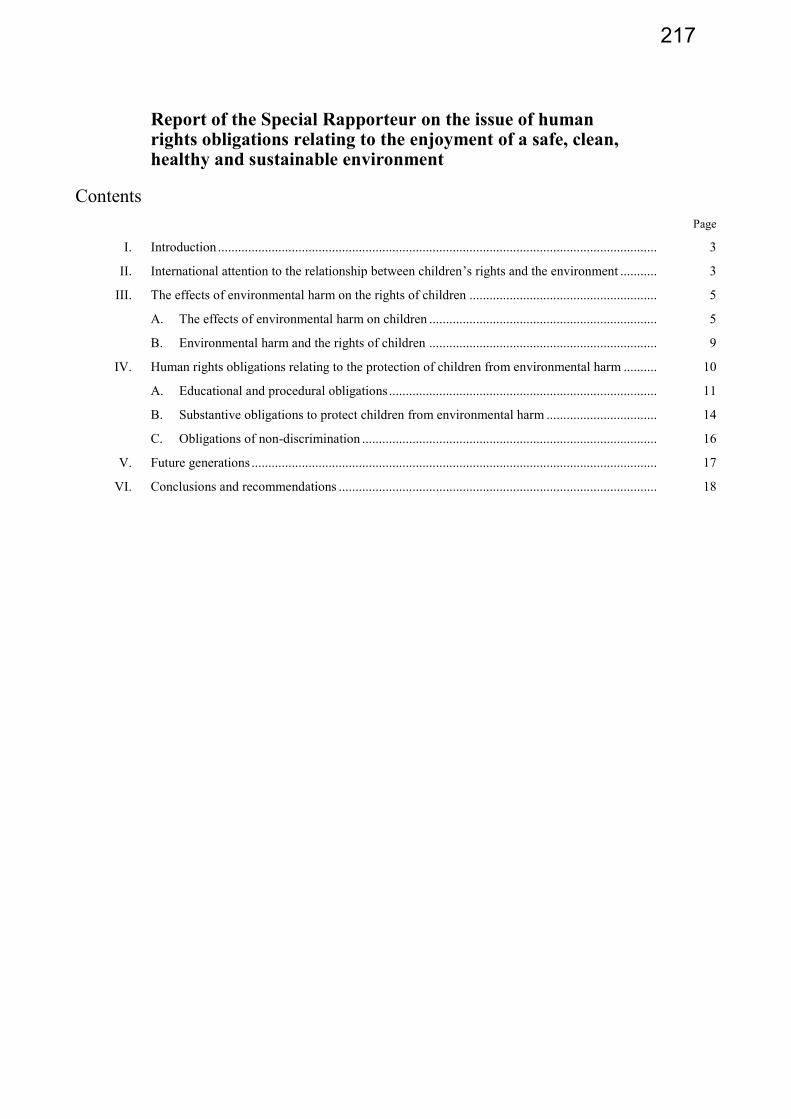
Report of the Special Rapporteur on the issue of human rights obligations relating to the enjoyment of a safe, clean, healthy and sustainable environment
Contents Page
I. Introduction ................................................................................................................................... 3
II. International attention to the relationship between children’s rights and the environment ........... 3
III. The effects of environmental harm on the rights of children ........................................................ 5
A. The effects of environmental harm on children .................................................................... 5
B. Environmental harm and the rights of children .................................................................... 9
IV. Human rights obligations relating to the protection of children from environmental harm .......... 10
A. Educational and procedural obligations ................................................................................ 11
B. Substantive obligations to protect children from environmental harm ................................. 14
C. Obligations of non-discrimination ........................................................................................ 16
V. Future generations ......................................................................................................................... 17
VI. Conclusions and recommendations ............................................................................................... 18
217

I. Introduction
1. After reviewing the activities of the Special Rapporteur in 2017, the present report focuses on the rights of children in relation to the environment, addressing the ways that environmental harm prevents children from enjoying their human rights and the obligations that States have to protect children from such harm.
2. The Special Rapporteur held an expert meeting and a public consultation on 17–18 October on “framework principles” on human rights and the environment, which are the subject of a separate report to the thirty-seventh session of the Council (A/HRC/37/59). He carried out two country visits, to Uruguay in April and to Mongolia in September, which are also the subject of separate reports (A/HRC/37/58/Add.1 and Add.2). He sent or joined in 27 communications to States regarding alleged violations of human rights obligations relating to the environment. He worked with the United Nations Environment Programme and other partners, including the Global Judicial Institute for the Environment, to conduct a regional workshop for judges on rights-based approaches to environmental issues, which was held in Brasília on 22–23 May. A regional workshop for Asian judges is expected to take place in Pakistan in February 2018.
3. In accordance with the encouragement of the Council in its resolution 28/11 to continue to contribute to and participate in, where appropriate, intergovernmental conferences and meetings relevant to the mandate, the Special Rapporteur spoke on 31 July to the negotiators of a regional agreement on implementation of principle 10 of the Rio Declaration on Environment and Development, on rights of information, participation and remedy. He presented a statement to the sixth meeting of the parties to the Convention on Access to Information, Public Participation in Decision-Making and Access to Justice in Environmental Matters (the Aarhus Convention) on 14 September, and on 4–5 December, he participated in the third session of the United Nations Environment Assembly, in Nairobi. He also spoke at the World Bank on 4 May, and at the Swedish International Development Cooperation Agency on 19 October.
4. The Special Rapporteur continues to draw attention to threats facing environmental defenders around the world. He participated in conferences on environmental defenders at the University of Oxford, in the United Kingdom of Great Britain and Northern Ireland, on 20–21 June and in Mexico City on 6 November. Together with the Universal Rights Group, he organized a meeting of environmental defenders in Bogotá on 8–9 November, at which the Spanish-language version of a web portal for environmental defenders, environment-rights.org, was launched. He also supported a new environmental rights initiative at the United Nations Environment Programme, which will, among other things, try to address threats facing individuals and groups working to protect the environment.
5. In preparation for the present report, the Special Rapporteur participated in the day of general discussion of the Committee on the Rights of the Child on children’s rights and the environment, on 23 September 2016. He held an expert meeting and a public consultation on 22–23 June 2017, and sent a questionnaire to States and other interested stakeholders, which elicited over 40 responses. He also examined statements and reports of human rights mechanisms and international organizations, as well as other sources.
6. Section II of the present report reviews the increasing attention being paid to the relationship of the rights of children to environmental harm. Section III describes the severe effects of environmental harm on the rights of children. Section IV outlines the human rights obligations relating to children’s rights in the environmental context. Section V addresses the relationship of future generations and children’s rights. Section VI concludes with recommendations aimed at protecting the rights of children from environmental harm.
II. International attention to the relationship between children’s rights and the environment
7. The international community has long recognized that environmental harm interferes with the full enjoyment of the rights of children. The Convention on the Rights of the Child, adopted in 1989, requires its parties to pursue full implementation of children’s right to
218

health by taking measures, among others, to combat disease and malnutrition through “the provision of adequate nutritious foods and clean drinking-water, taking into consideration the dangers and risks of environmental pollution” (art. 24 (2) (c)).
8. In the World Declaration on the Survival, Protection and Development of Children, adopted at the World Summit for Children in 1990, States recognized that millions of children suffer from environmental degradation, and committed to work for common measures for the protection of the environment, at all levels, so that all children can enjoy a safer and healthier future (see A/45/625, annex, paras. 5 and 20 (9)). The World Programme of Action for Youth to the Year 2000 and Beyond, adopted in 1995, includes specific environmental initiatives and states that implementation of the Programme of Action requires the full enjoyment by young people of all human rights and fundamental freedoms (see General Assembly resolution 50/81, annex, para. 20). States reiterated the importance of environmental protection in the document entitled “A world fit for children”, adopted in 2002, one of whose ten principles and objectives is to “protect the Earth for children” (see General Assembly resolution S-27/2, annex, para. 7).
9. At the national level, many States reported to the Special Rapporteur that they have taken innovative steps to recognize and protect children’s rights to live in a healthy environment. For example, the Plurinational State of Bolivia, El Salvador, Mexico and Paraguay have introduced national legislation that recognizes the right of children to a healthy, ecological and sustainable environment. Denmark, Saudi Arabia and Slovenia have adopted measures to protect children’s health from environmental degradation and chemicals. Serbia is using the media to raise children’s awareness about environmental issues, and Germany is promoting their participation in environmental initiatives. Many States, including Australia, Azerbaijan, El Salvador, France, Georgia, the State of Palestine, the Philippines and Switzerland, report that they have introduced measures to improve children’s environmental education. Oman and Qatar have each designated a “national day of the environment” through which they raise awareness about the environment among children and promote children’s participation in environmental activities.1
10. The Human Rights Council has often drawn attention to the effects of climate change on the rights of children. In its resolution 32/33, it recognized that children are among the most vulnerable to climate change, which may have a serious impact on their enjoyment of the highest attainable standard of physical and mental health, access to education, adequate food, adequate housing, safe drinking water and sanitation. In its resolution 35/20, it emphasized that climate change affects some children more than others, including children with disabilities, children on the move, children living in poverty, children separated from their families and indigenous children. In resolution 32/33, the Council called on States to continue and enhance international cooperation and assistance for adaptation measures to help developing countries, especially those that are particularly vulnerable to the adverse effects of climate change and persons in vulnerable situations, including children most at risk.
11. In recent years, human rights experts have begun to examine more closely the effect of environmental harm on the enjoyment of children’s rights. In 2015, the United Nations Children’s Fund (UNICEF) published a report on the effects of climate change on children.2 In August 2016, the Special Rapporteur on the implications for human rights of the environmentally sound management and disposal of hazardous substances and wastes, Baskut Tuncak, issued a report describing the “silent pandemic” of disability and disease associated with childhood exposure to toxics and pollution, and explaining the obligations of States and the responsibilities of business enterprises to protect against such exposure (A/HRC/33/41). At the request of the Human Rights Council, the Office of the United Nations High Commissioner for Human Rights (OHCHR) issued a report in May 2017 on the relationship between climate change and the rights of the child (A/HRC/35/13).
1 All of the submissions are available at www.ohchr.org/EN/Issues/Environment/SREnvironment/Pages/RepliesEnvironmentAndRightsChild.aspx.
2 UNICEF, Unless we act now: The impact of climate change on children (November 2015).
219
12. The Committee on the Rights of the Child has also given increasing attention to the relationship of environmental protection and children’s rights. The Committee often addresses environmental concerns in its review of country reports under the Convention.3 At its day of general discussion on 23 September 2016, the Committee brought together over 250 participants, including children, representatives of Governments, civil society organizations, United Nations agencies and academics, to examine the effects of environmental harm on the rights of children, both directly and through aggravating underlying causes of serious violations through conflict over limited resources, increasing inequalities, forced migration and even early marriage.4
13. The Committee on the Rights of the Child, UNICEF, other special procedures, States and civil society organizations, among others, continue to study and clarify the relationship of children’s rights and the environment. The Special Rapporteur hopes that the present report will contribute to that ongoing discussion by providing an overview of the principal effects of environmental harm on the rights of children and outlining the corresponding obligations of States.
III. The effects of environmental harm on the rights of children
14. This section describes first the effects of environmental harm on children’s well-being, and then how those effects interfere with the enjoyment of their human rights, including their rights to life, health and development, to an adequate standard of living and to play and recreation.
A. The effects of environmental harm on children
15. Taken as a whole, no group is more vulnerable to environmental harm than children (persons under the age of 18), who make up 30 per cent of the world’s population. Environmental harm has especially severe effects on children under the age of 5. Of the 5.9 million deaths of children under the age of 5 in 2015, the World Health Organization (WHO) estimates that more than one quarter — more than 1.5 million deaths — could have been prevented through the reduction of environmental risks.5 In addition, one quarter of the total disease burden in children under the age of 5 is attributed to environmental exposures.6 Childhood exposure to pollutants and other toxic substances also contributes to disabilities, diseases and premature mortality in adulthood.
1. Air pollution
16. Air pollution causes approximately 600,000 deaths of children under the age of 5 every year. 7 Countless more children suffer disease and disability, often with lifelong effects. Children are more susceptible to air pollution than adults for many reasons, including that their smaller respiratory airways are more easily blocked by infections, and that they breathe more quickly and take in more air per unit of body weight.8 Because their
3 The Special Rapporteur compiled statements of the Committee on the Rights of the Child on environmental issues in “Mapping human rights obligations relating to the enjoyment of a safe, clean, healthy and sustainable environment: individual report on the United Nations Convention on the Rights of the Child” (December 2013). Available at http://srenvironment.org/mapping-report-2014-2/.
4 Committee on the Rights of the Child, “Report of the 2016 day of general discussion: children’s rights and the environment”, p. 5. Available from www.ohchr.org/EN/HRBodies/CRC/Pages/Discussion2016.aspx.
5 WHO, “Don’t pollute my future! The impact of the environment on children’s health” (Geneva, 2017), p. 1.
6 Ibid., p. 22. 7 Ibid., p. 3. Roughly 500,000 of these deaths are attributed to household air pollution and 100,000 to
ambient air pollution. See UNICEF, Clear the air for children: The impact of air pollution on children (2016), p. 24.
8 UNICEF, Clear the air for children, pp. 8 and 40.
220

immune systems are still developing, they are at higher risk of respiratory infections and have less ability to combat them.9
17. Ambient air pollution mainly results from factories and vehicles, and household air pollution comes primarily from the use of wood, coal and other solid fuels for cooking and heating. The vast majority of children — about 2 billion — live in areas that exceed the WHO ambient standard for particulate matter, and 300 million children live in areas whose ambient air pollution exceeds international standards by six times or more.10 Over 1 billion children around the world live in homes that use solid fuels for cooking and heating.11 WHO has estimated that together, ambient and household air pollution cause more than one half of all lower respiratory infections, such as pneumonia and bronchitis, in children under 5 in low- and middle-income countries, and that lower respiratory infections accounted for 15.5 per cent of deaths of all children under the age of 5 in 2015.12
18. Children who survive early exposure to air pollution can still suffer from it throughout their lives: it can disrupt their physical and cognitive development and make them more prone to lung cancer, asthma, other respiratory diseases and cardiovascular diseases.13 The harm from air pollution begins before birth. As the Special Rapporteur on hazardous substances and wastes has said, children are often born “pre-polluted” because of their mothers’ exposure to pollutants during pregnancy, which is associated with preterm delivery, lower birthweight and early fetal loss (see A/HRC/33/41, paras. 5 and 16).14
2. Water pollution
19. Water pollution resulting primarily from unsafe sanitation practices contributes to diarrhoeal diseases that cause more than 350,000 deaths a year of children under 5 years old, and another 80,000 deaths of children aged 5 to 14.15 Water pollution also contributes to intestinal and parasitic infections such as schistosomiasis, which gravely affect the physical and cognitive development of children.16 These infections, as well as diarrhoea, impair the proper functioning of the digestive system and prevent the absorption of nutrients essential for growth and development.17 Lack of access to safe water also increases the incidence of other diseases, including trachoma, the main preventable cause of blindness. 18 More generally, unsafe water contributes to food insecurity, malnutrition and stunting of children.19 UNICEF stated in 2013 that approximately 165 million children under 5 suffer from stunting as a result of inadequate nutrition and unhealthy water and sanitation. 20 Stunted children are not only shorter than they should be for their age; they suffer harm throughout their lives, including weaker immune systems and reduced brain development.
20. Children are particularly at risk from water pollution, like air pollution, because their bodies are still developing. In addition, they drink more water than adults in relation to their body weight, and they absorb a greater proportion of some waterborne chemicals. 21
9 Ibid., pp. 9 and 40. 10 Ibid., pp. 8 and 60. 11 Ibid., p. 9. 12 WHO, “Don’t pollute my future!”, pp. 2–3. 13 UNICEF, Clear the air for children, pp. 29–32; WHO, “Don’t pollute my future!”, p. 8. 14 See also UNICEF, Clear the air for children, pp. 8 and 43–44; WHO, Inheriting a sustainable world?
Atlas on children’s health and the environment (Geneva, 2017), p. 49. 15 WHO, “Don’t pollute my future!”, pp. 3 and 13. 16 Ibid., p. 5. 17 WHO, Inheriting a sustainable world?, p. 25. 18 WHO, Preventing disease through healthy environments: A global assessment of the burden of
disease from environmental risks (Geneva, 2016), p. 22; WHO, Inheriting a sustainable world?, p. 26.
19 WHO, “Don’t pollute my future!”, p. 6; WHO, Inheriting a sustainable world?, pp. 10–11. 20 UNICEF, “Sustainable development starts and ends with safe, healthy and well-educated children”
(May 2013), p. 8. 21 WHO, Inheriting a sustainable world?, p. 25.
221

Children spend more time than adults playing in water bodies that are unclean, and they may be less able than adults to recognize or act upon environmental risks.22
21. Between 1990 and 2015, as the number of people without access to an improved source of water fell from over 2 billion to approximately 660 million, the number of diarrhoeal deaths of children under 5 years more than halved.23 Some waterborne diseases, such as guinea worm, have been nearly eradicated. But much more remains to be done. At least one in every four people around the world still drinks water that is faecally contaminated.24 Proper management of water sources is also critical to reducing vector-borne diseases such as malaria. Although the number of malarial deaths of children under 5 decreased by more than one half between 2000 and 2015, malaria still caused approximately 300,000 deaths in 2015, accounting for one in every ten child deaths in sub-Saharan Africa.25
3. Climate change
22. The Executive Director of UNICEF has stated that “there may be no greater, growing threat facing the world’s children — and their children — than climate change”.26 As explained in the 2017 OHCHR report (A/HRC/35/13), climate change contributes to extreme weather events, water scarcity and food insecurity, air pollution and vector-borne and infectious diseases, all of which already have severe effects on children.
23. For example, climate change increases the frequency and severity of droughts, and approximately 160 million children already live in areas of high or extremely high drought severity.27 Because children need to consume more food and water per unit of body weight than adults, they are more vulnerable to the deprivation of food and water, which can lead to irreversible stunting.28 Water scarcity leads to the use of unsafe water, which in turn contributes to communicable diseases.29
24. Climate change also contributes to severe storms and flooding. More than 500 million children live in areas, mostly in Asia, that have extremely high likelihoods of flooding, and approximately 115 million live in zones of high or extremely high risk of tropical cyclones.30 Beyond the immediate dangers of death and injury, severe storms and floods cause a cascade of additional harms, including compromising safe water supplies, damaging sanitation facilities and destroying housing. Like droughts, floods can cause massive displacement. Children are particularly vulnerable during displacements, when the loss of connections to families, communities and protective services can increase their vulnerability to abuses including child labour and trafficking.31
25. Climate change has many other harmful effects on human health, including increasing the frequency and severity of heatwaves, compounding the toxicity of fossil-fuel pollutants such as ozone and contributing to wildfires. 32 Children are, again, more vulnerable to all of these effects. For example, UNICEF has indicated that “infants and small children are more likely to die or suffer from heatstroke because they are unable or lack agency to regulate their body temperature and control their surrounding environment”.33 Over the longer term, rising temperatures and changing rainfall patterns are likely to exacerbate the spread of vector-borne diseases such as malaria, dengue and cholera,34 and contribute to food scarcity and undernutrition. WHO estimates that by 2030,
22 Ibid., pp. 25–26. 23 Ibid., p. 24. 24 Ibid. 25 Ibid., p. 38. 26 UNICEF, Unless we act now, p. 6. 27 Ibid., p. 22 28 Ibid. 29 Ibid. 30 Ibid., pp. 30 and 34. 31 Ibid. 32 Ibid., pp. 40 and 44 33 Ibid., p. 40. 34 Ibid., pp. 48–52.
222

the effects of climate change on nutrition will result in an additional 7.5 million children who are moderately or severely stunted, and approximately 100,000 additional deaths.35
26. The ramifications of climate change for children go far beyond its effects on theirhealth, as disastrous as those may be. As OHCHR has stated, “climate change heightensexisting social and economic inequalities, intensifies poverty and reverses progress towardsimprovement in children’s well-being” (see A/HRC/35/13, para. 50). To give just oneexample, climate change-induced food insecurity is already increasing the number ofmarriages of girl children, who are pressured to marry to reduce burdens on their familiesof origin.36
4. Chemicals, toxic substances and waste
27. The 2016 report of the Special Rapporteur on hazardous substances and wastesdescribes the harms to children from exposure to chemicals, toxic substances and waste. Hestates that the number of deaths from air and water pollution is only one part of a silentpandemic of disability and disease, much of which may not manifest for years or decades(see A/HRC/33/41, para. 4). The rapid growth of hazardous chemicals in the environmenthas occurred together with increasing incidence of cancer, diabetes and asthma, amongother diseases. More than 800 chemicals have been identified as known or suspecteddisruptors of the normal functioning of human and/or animal endocrine systems, andhumans are most sensitive to endocrine disruption during periods of development,including early childhood and puberty.37 Children begin their exposure to toxic substancesbefore birth; hundreds of hazardous chemicals have been found in children as a result oftheir mother’s exposure, resulting in the children being born “pre-polluted” (seeA/HRC/33/41, para. 5). He emphasizes that children in low-income, minority, indigenousand marginalized communities are at more risk, as exposure levels in such communities areoften higher and are exacerbated by malnutrition, with the adverse effects inadequatelymonitored (ibid., para. 6).
28. Although the connection between exposure to a particular toxic substance and theharm to an individual is not always traceable, in large part because information aboutexposure to and effects of these substances is typically not required or provided, someeffects are clear. For example, lead poisoning causes irreversible intellectual disabilities in600,000 children annually (ibid., para. 9). Artisanal and small-scale mining, in whichapproximately 1 million children participate, commonly employs mercury, which causeslifelong harm to the developing nervous systems of children, as well as contributing tocardiovascular and other diseases. 38 Discarded mobile telephones and other electronicproducts are often shipped from high-income to lower-income countries. Children are oftenemployed to extract valuable elements from these products, without protective equipment,exposing themselves to toxic substances such as lead, mercury, cadmium, chromium andarsenic.39
29. Another increasing source of harm is the use of pesticides, the subject of a recentjoint report by the Special Rapporteur on hazardous substances and wastes and the SpecialRapporteur on the right to food. They state that exposure to even low levels of pesticides,for example through wind drift or residues on food, may be very damaging to children’shealth, disrupting their mental and physiological growth and possibly leading to a lifetimeof diseases and disorders (see A/HRC/34/48, para. 24). The effects of pesticides and ofchemicals ingested other ways, including through food, may include asthma, cancer andneurological damage.40
35 WHO, Quantitative risk assessment of the effects of climate change on selected causes of death, 2030s and 2050s (Geneva, 2014), pp. 80 and 89.
36 Gethin Chamberlain, “Why climate change is creating a new generation of child brides”, Guardian, 26 November 2017; Human Rights Watch, “Marry before your house is swept away: child marriage in Bangladesh”, 9 June 2015.
37 WHO, “Don’t pollute my future!”, p. 6. 38 WHO, Inheriting a sustainable world?, pp. 81–82. 39 Ibid., p. 88. 40 Ibid., pp. 67 and 72.
223

Intentionally Left Blank224
Child does not have an explicit provision on remedies, the requirement of effective remedies to redress violations is implicit in the Convention. To provide for effective remedies, States should ensure that individuals have access to judicial and administrative procedures that meet basic requirements, including that the procedures are impartial, independent, affordable, transparent and fair (see A/HRC/37/59, annex, framework principle 10). Decisions should be made public and promptly and effectively enforced. States should provide guidance about how to seek access to justice, and should help to overcome obstacles to access such as language, illiteracy, expense and distance.
52. Because children’s dependent status creates obstacles to their pursuit of remedies, the Committee on the Rights of the Child has made clear that States need to give particular attention to ensuring that there are effective, child-sensitive procedures available to children and their representatives. These should include the provision of child-friendly information, advice, advocacy, including support for self-advocacy, and access to independent complaints procedures and to the courts with necessary legal and other assistance. Where rights are found to have been breached, there should be appropriate reparation, including compensation, and, where needed, measures to promote physical and psychological recovery, rehabilitation and reintegration, as required by article 39.69
53. In the context of environmental harm, children may face additional barriers to access to justice. For example, they and their representatives may lack information about the effects of particular harms or the harms may manifest only years after exposure, which may make it difficult or impossible for those affected to have standing to bring a case, meet applicable limitations periods or carry their burdens of proof and persuasion.70 States should take steps to overcome these obstacles, including by allowing collective suits (or “class actions”) on behalf of children. Moreover, when determining the level or form of reparation, mechanisms should take into account that children can be more vulnerable to the effects of abuse of their rights than adults and that the effects can be irreversible and result in lifelong damage. They should also take into account the evolving nature of children’s development and capacities and reparation should be timely to limit ongoing and future damage to the child or children affected; for example, if children are identified as victims of environmental pollution, immediate steps should be taken by all relevant parties to prevent further damage to the health and development of children and repair any damage done.71
54. Because environmental harm can cause irreversible effects, such as early mortality or lifelong disability, for which no remedies are truly adequate, States must do what they can to prevent the harm from occurring in the first place. In some cases, that may be possible through injunctive relief ordered by judicial tribunals or administrative bodies. In addition, States must adopt and enforce effective regulatory measures, as described in the following section.
B. Substantive obligations to protect children from environmental harm
55. Ideally, States would set substantive environmental standards at levels that would prevent all harmful environmental interference with the full enjoyment of human rights. While States have obligations to take deliberate, concrete and targeted measures towards that goal, they have some discretion in deciding which means are appropriate in light of available resources. 72 However, this discretion is not unlimited. For example, environmental standards must comply with obligations of non-discrimination, and they should take into account relevant international health and safety standards (see A/HRC/37/59, annex, framework principle 11). Once States have adopted substantive environmental standards, they should ensure their effective implementation by private as well as public actors (ibid., framework principle 12).
69 See Committee on the Rights of the Child, general comment No. 5, para. 24. 70 Committee on the Rights of the Child, “Report of the 2016 day of general discussion”, pp. 21–22. 71 See Committee on the Rights of the Child, general comment No. 16, para. 31. 72 See, for example, Committee on the Rights of the Child, general comment No. 15, para. 72.
225

56. The discretion of States with respect to the protection of children’s rights is further restricted by their obligations under the Convention on the Rights of the Child and other agreements to adopt and implement special measures of protection, assistance and care for children, and to ensure that the best interests of children are a primary consideration in all actions concerning children.73 These obligations require States not just to protect children from harm, but also to ensure their well-being and development, including by taking into account the possibility of future risk and harm.74
57. The discretion accorded States in deciding appropriate levels of environmental protection rests on the assumption that societies will make informed decisions as to how to balance the costs of environmental harm against the benefits of spending resources for other goals, such as faster short-term economic growth. But the cost-benefit calculus is very different for children, especially younger children. The consequences of environmental harm are usually far more severe, and may include death or irreversible, lifelong effects. The cumulative effects of long-term environmental harm, such as climate change and the loss of biodiversity, increase over time, so that decisions taken today will affect children much more than adults. The lack of full information about many types of environmental harm means that their long-term effects are often poorly understood and underestimated. And, finally, the voices of children are only rarely heard in environmental decision-making.
58. Therefore, to satisfy their obligations of special protection and care, and to ensure that the best interests of the child are taken into account, States have heightened obligations to take effective measures to protect children from environmental harm. They should make certain that they are protecting children’s rights before they make decisions that may cause environmental harm, including by: collecting and disseminating disaggregated information on the effects of pollution, chemicals and other potentially toxic substances on the health and well-being of children; ensuring that the views of children are taken into account in environmental decision-making; and carrying out children’s rights impact assessments. States should adopt and implement environmental standards that are consistent with the best available science and relevant international health and safety standards, and they should never take retrogressive measures.75 The lack of full scientific certainty should never be used to justify postponing effective and proportionate measures to prevent environmental harm to children, especially when there are threats of serious or irreversible damage. On the contrary, States should take precautionary measures to protect against such harm.76 Once standards protective of children’s rights are adopted, States must ensure that they are effectively implemented and enforced. To that end, they must provide regulatory agencies with sufficient resources to monitor and enforce compliance with domestic laws, including by investigating complaints and bringing appropriate remedial actions.77
59. As part of their obligations to protect children from environmental harm, States must adequately regulate private actors, including business enterprises. Businesses can cause environmental harm to children’s rights in many ways, including by producing hazardous products, polluting the air and water, creating hazardous waste, contributing to climate change and destroying forests and other natural ecosystems.78 They can also commit human rights abuses such as violating child labour protections or colluding with governmental or private security forces to use violence against peaceful protestors.
60. As the Committee on the Rights of the Child has stated, States must take all necessary, appropriate and reasonable measures to prevent business enterprises from causing or contributing to abuses of children’s rights. 79 This includes ensuring that businesses comply with all applicable environmental standards. States should require businesses, including State-owned businesses, to carry out “child-rights due diligence” to
73 See Convention on the Rights of the Child, art. 3; International Covenant on Economic, Social and Cultural Rights, art. 10 (3).
74 See Committee on the Rights of the Child, general comment No. 14, paras. 24 and 71. 75 See Committee on the Rights of the Child, general comment No. 15, para. 72. 76 See Rio Declaration on Environment and Development, principle 15. 77 See Committee on the Rights of the Child, general comment No. 16, para. 61. 78 Ibid., para. 19. 79 Ibid., para. 28.
226

ensure that they identify, prevent and mitigate their impact on children’s rights.80 This due diligence should include careful consideration of the effects of their actual and proposed actions on the rights of children through environmental harm. States must also ensure that information held by businesses relevant to the health and well-being of children is made publicly available.
61. States should cooperate with one another to address the effects of global and transboundary harm on the rights of children. 81 For example, in the negotiation and implementation of multilateral environmental agreements, they should address children’s rights, for example by providing that national action plans should include strategies to protect children as well as other vulnerable segments of the population.82 States should work together to ensure that businesses operating in more than one country comply with their obligations under all applicable domestic laws. The Committee on the Rights of the Child has set out a framework for such cooperation: host States have the primary responsibility to regulate business enterprises operating within their territory, but home States can also have regulatory obligations when there is a reasonable link between the State and the conduct in question. For example, home States in such situations should assist host States with investigation and enforcement; enable access to effective remedies for children and their families who have suffered human rights abuses; and provide that their international assistance agencies identify and protect against harmful effects of any projects that they support.83
62. Businesses have direct responsibilities to respect children’s rights. To meet these responsibilities, it is necessary, but not sufficient, that businesses comply with domestic laws. Certainly businesses should never seek to evade applicable laws through corruption or other practices, or abuse those laws by, for example, bringing criminal defamation suits against those who oppose their activities. But that is a low bar. To respect the rights of children to be free from environmental harm, businesses should comply with the Guiding Principles on Business and Human Rights; the Children’s Rights and Business Principles;84 and the recommendations of the Committee on the Rights of the Child in its general comment No. 16 (2013) on State obligations regarding the impact of the business sector on children’s rights. Among other things, they should undertake environmental and human rights impact assessments that examine the effects of proposed actions on children; develop and make public information about the effects of their actions and products on the health and well-being of children; facilitate children’s participation, as appropriate, in consultations; seek to strengthen environmental, health and safety standards, rather than lobby against them; and, in general, avoid causing or contributing to environmental harm to children and remediate any such harm when it does occur.
C. Obligations of non-discrimination
63. The Convention on the Rights of the Child requires its States parties to respect and ensure the rights in the Convention to each child within their jurisdiction without discrimination of any kind, irrespective of the child’s or his or her parent’s or legal guardian’s race, colour, sex, language, religion, political or other opinion, national, ethnic or social origin, property, disability, birth or other status (art. 2). Children are also encompassed by the non-discrimination obligations of States under many other human rights agreements, including the International Covenant on Civil and Political Rights (arts. 2 (1) and 26)) and the International Covenant on Economic, Social and Cultural Rights (art. 2 (2)).
64. The obligations of States to prohibit discrimination and to ensure equal and effective protection against discrimination undoubtedly apply to the equal enjoyment of human rights relating to a safe, clean, healthy and sustainable environment (see A/HRC/37/59, annex, framework principle 3). These obligations apply not only to direct discrimination, but also
80 Ibid., para. 62. 81 Ibid., para. 41. 82 See, for example, Minamata Convention on Mercury, annex C, art. 1 (i). 83 See Committee on the Rights of the Child, general comment No. 16, paras. 42–45. 84 The Children’s Rights and Business Principles were developed by UNICEF, the United Nations
Global Compact and Save the Children, and released in 2012.
227
to indirect discrimination, when facially neutral laws, policies or practices have a disproportionate impact on the exercise of human rights as distinguished by prohibited grounds of discrimination.85 The Committee on the Rights of the Child has emphasized that the right to non-discrimination does not just prohibit all forms of discrimination in the enjoyment of rights under the Convention, but also requires appropriate proactive measures taken by the State to ensure effective equal opportunities for all children to enjoy the rights under the Convention. This may require positive measures aimed at redressing a situation of real inequality.86
65. While all children are vulnerable to environmental harm, some are particularly at risk. To highlight just a few examples: girl children are more likely to suffer from the lack of clean and safe sources of water; indigenous children from the destruction of natural ecosystems on which they rely for food, water, housing and culture; children with disabilities from the failure to anticipate and respond safely and effectively to natural disasters; and children from low-income families from a vast range of environmental problems, including household air pollution, lack of clean water, exposure to toxic substances and a lack of access to safe and clean opportunities for play and recreation.
66. States should take effective measures to ensure that children in these and other particularly vulnerable situations are able to exercise their human rights on an equal basis, and that environmental harm does not affect them disproportionately. For example, States and business enterprises should require that their children’s rights impact assessment procedures take fully into account the impacts of proposed policies, programmes and projects on the most vulnerable. Environmental educational programmes should reflect the cultural and environmental situation of the children involved. States should collect disaggregated data to identify disparate impacts of environmental harm on different groups of children.87 Environmental information should be made available to children and their parents or other caretakers in their own language. States should ensure that girls, children with disabilities and children from marginalized communities are able to voice their views and that their views are given due weight.88 States should take steps to enable children with disabilities, as well as others, to play and engage in recreational activities in safe and healthy environments.89 Children at particular risk and their caretakers should be provided with assistance in accessing effective remedies.
V. Future generations
67. International environmental agreements and declarations on sustainable development often express concerns about the effects of environmental harm on future generations.90 Indeed, the definition of sustainable development is “development that meets the needs of the present without compromising the ability of future generations to meet their own needs”.91 However, human rights law does not attempt to define the rights of future generations or of obligations of States to them. It is understandable that international environmental and development policy and human rights law take different approaches to
85 See Committee on Economic, Social and Cultural Rights, general comment No. 20 (2009) on non-discrimination in economic, social and cultural rights, para. 7.
86 See Committee on the Rights of the Child, general comment No. 14, para. 41. 87 See, for example, Committee on the Rights of the Child, general comment No. 5, para. 12; general
comment No. 9 (2006) on the rights of children with disabilities, para. 19; general comment No. 11 (2009) on indigenous children and their rights under the Convention, para. 26.
88 See, for example, Committee on the Rights of the Child, general comment No. 12, paras. 77–78; general comment No. 9, para. 32; general comment No. 11, para. 39.
89 See Convention on the Rights of Persons with Disabilities, art. 30; Committee on the Rights of the Child, general comment No. 17, para. 50.
90 The many examples include the Rio Declaration on Environment and Development, principle 3; the United Nations Framework Convention on Climate Change, art. 3 (1); the Convention on Biological Diversity, preamble; Transforming our world: the 2030 Agenda for Sustainable Development.
91 See the report of the World Commission on Environment and Development entitled “Our Common Future” (A/42/427, annex), ch. 2, para. 1 (p. 54). See also the report of the Secretary-General on intergenerational solidarity and the needs of future generations (A/68/322).
228
issues concerning future generations. While the former is concerned with the long-term as well as short-term consequences of present decisions, the latter is based primarily on the rights of individual human beings. It is difficult, if not impossible, to define the rights of individuals who are not yet alive.
68. Nevertheless, the division between present and future generations is less sharp than it sometimes appears to be. Concerns about future generations and sustainable development often focus on the state of the environment in particular years in the future, such as the year 2030 or 2100. Many people that will be living in 2100 are not yet born, and in that sense truly belong to future generations. But many people who will be living then are already alive today. To take a personal example, the Special Rapporteur has twin nieces who were born in 2016. The next century will begin before they celebrate their eighty-fourth birthday. Moreover, the line between future generations and today’s children shifts every time another baby arrives and inherits their full entitlement of human rights. It is critical, therefore, that discussions of future generations take into account the rights of the children who are constantly arriving, or have already arrived, on this planet. We do not need to look far to see the people whose future lives will be affected by our actions today. They are already here.
VI. Conclusions and recommendations
69. No group is more vulnerable to environmental harm than children. Air pollution, water pollution and exposure to toxic substances, together with other types of environmental harm, cause 1.5 million deaths of children under the age of 5 every year, and contribute to disease, disability and early mortality throughout their life. In addition, climate change and the loss of biodiversity threaten to cause long-term effects that will blight children’s lives for years to come. Making matters worse, children are often not able to exercise their rights, including their rights to information, participation and access to effective remedies.
70. States must do more to respect, protect and fulfil the rights of children in relation to environmental harm. To that end, the present report includes a number of specific recommendations, which build on the work of other special rapporteurs, the Committee on the Rights of the Child, OHCHR, UNICEF, WHO and the many others who submitted oral and written communications during the preparation of the report.
71. With respect to children’s educational and procedural rights, States should, among other things:
(a) Ensure that educational programmes increase children’s understanding of environmental issues and strengthen their capacity to respond to environmental challenges;
(b) Ensure that the effects of proposed measures on children’s rights are assessed before the measures are taken or approved;
(c) Collect information about sources of environmental harm to children and make the information publicly available and accessible;
(d) Facilitate the participation of children in environmental decision-making processes, and protect them from reprisals for their participation or otherwise expressing their views on environmental matters;
(e) Remove barriers that children face to access to justice for environmental harm to the full enjoyment of their human rights.
72. States also have heightened obligations to take effective substantive measures to protect children from environmental harm, including by ensuring that their best interests are a primary consideration with respect to all decision-making that may cause them environmental harm. In particular, States should adopt and implement environmental standards that are consistent with the best available science and relevant international health and safety standards, never take retrogressive measures,
229
and pursue precautionary measures to protect against environmental harm, especially when there are threats of serious or irreversible damage.
73. In this light, States should consider and, wherever possible, implementrecommendations from expert agencies on specific measures to protect children’shealth and well-being from environmental harm.92 WHO and UNICEF, in particular,have published detailed recommendations, including many examples of goodpractices.93 Some simple changes could have enormous effects. For example, WHOstates that widespread handwashing with soap after defecation and before preparingfood would greatly reduce the incidence of diarrhoea, trachoma and respiratoryinfections that kill or harm so many children under the age of 5.94
74. States should cooperate to address the effects of environmental harm on therights of children, including by sharing information on the toxicity and othercharacteristics of chemicals and other products and ensuring that international tradein chemicals and waste is in full compliance with the relevant environmental treaties.
75. With respect to the activities of business enterprises operating in more than oneState, the States concerned should cooperate to ensure that the businesses comply withall applicable environmental laws, including by providing that victims ofenvironmental harm allegedly caused by businesses have access to effective remediesin the courts of the States where the businesses are based as well as the States wherethe victims experienced the harm.
76. States should ensure that children in particularly vulnerable situations are ableto exercise their human rights on an equal basis and that environmental harm doesnot affect them disproportionately, including by ensuring that impact assessmentprocedures take fully into account the effects of proposed policies, programmes andprojects on the children most at risk.
77. States that have not yet done so should become parties to the Optional Protocolto the Convention on the Rights of the Child, and the State that has not yet ratified theConvention on the Rights of the Child should do so without further delay.
78. International financial mechanisms should ensure that the projects that theysupport do not cause environmental harm that adversely affects the rights of children,by including appropriate protections in their social and environmental safeguards.
79. Business enterprises should protect children’s rights from environmental harmfrom their activities, including by carrying out environmental and human rightsimpact assessments that examine the effects of proposed actions on children, and byfully complying with the Guiding Principles on Business and Human Rights, theChildren’s Rights and Business Principles, and the recommendations of theCommittee on the Rights of the Child in its general comment No. 16.
80. The Committee on the Rights of the Child should consider adopting a newgeneral comment on children’s rights and the environment.
92 States should also implement the recommendations of the Special Rapporteur on hazardous substances and wastes with respect to the threats to children from toxic chemicals (see A/HRC/33/41, paras. 110–114), and those of OHCHR contained in its report on climate change and human rights (see A/HRC/35/13, paras. 57–66).
93 See, for example, WHO, Inheriting a sustainable world?; WHO, “Don’t pollute my future!”, UNICEF, Clear the air for children; UNICEF, Unless we act now.
94 WHO, Inheriting a sustainable world?, p. 32, indicates that it is estimated that handwashing with soap could reduce diarrhoeal disease by 23 per cent and prevent 297,000 deaths per year from diarrhoea alone.
230


231

December 14, 2018 Via Email Generation Squeeze Attn: Dr. Paul Kershaw 17280 Ford Road Pitt Meadows, BC Dear Dr. Kershaw: Re: Court of Appeal for Ontario, File No. C65807, a reference respecting the
constitutionality of the Greenhouse Gas Pollution Pricing Act, Part 5 of the Budget Implementation Act, 2018, No. 1, SC 2018, c. 12 (the “Reference Case”)
I write on behalf of the Canadian Association of Physicians for the Environment (“CAPE”) to confirm our support for and membership in the coalition of organizations joining Generation Squeeze in applying for leave to intervene in the Reference Case. We share your commitment to intergenerational justice in climate policy and we believe this application is an important opportunity to protect the interests of young Canadians and future generations in a healthy and sustainable climate. The Canadian Association of Physicians for the Environment CAPE is a volunteer, non-profit organization founded by three doctors in 1993 with the mission to improve human health by protecting the planet. The majority of our board members are physicians, with spots held for medical learners, an Indigenous physician, and several available for members from other disciplines. CAPE acts as a resource to physicians, other healthcare workers, public health professionals, the public and policy makers to better understand how environmental issues can impact public health and how policies and programs can protect the public and improve public health. Among other things, CAPE produces informational material for public health professionals and doctors regarding the relationship between environmental factors and public health. CAPE also conducts and publishes research and publicly advocates for meaningful, evidence-based policies that reflect the important interaction between public health and the environment. Our areas of focus include the relationship between climate health and policy, the development of healthy and sustainable energy, and the development of healthy and sustainable communities.
232
Climate-Related Impacts to Public Health are Serious and Increasing In 2015, the Lancet Commission on Health and Climate Change concluded that changes to the climate from human activity threatened to undermine the gains made in public health worldwide over the last 50 years. The Commission also concluded that a comprehensive response to climate change could be the greatest global health opportunity of the 21st century. Following the 2015 Commission report, a multi-disciplinary collaboration between 24 academic institutions and intergovernmental organizations was organized to track progress on health and climate change and publish its findings annually in the Lancet, the world’s leading medical journal, until 2030. This annual report, the Lancet Countdown: Tracking Progress on Health and Climate Change, provides an independent assessment of the health effects of climate change. The Lancet Countdown will track a number of indicators of progress and report annually on the state of the climate, the implementation of the Paris Agreement, and efforts to mitigate and adapt to climate change. The Lancet Countdown’s 2017 report1 set out a number of key messages based on the analysis of 40 indicators including:
• The human symptoms of climate change are unequivocal and potentially irreversible – affecting the health of populations around the world today;
• Global wheat production has been demonstrated to be reduced by 6% for every 1 degree Celsius increase in temperature;
• To meet the mitigation levels set out in the Paris Agreement, energy systems will need to largely complete the transition to near zero-carbon emissions by around 2050 and emissions will then need to be negative in the second half of the century;
• The delayed response to climate change over the past 25 years has jeopardised human life and livelihoods; and
• Although progress has been historically slow, the past five years have seen an accelerated response, and in 2017, momentum is building across a number of sectors; the direction of travel is set, with clear and unprecedented opportunities for public health.
As part of the Lancet Countdown process, briefing reports were written for a number of individual countries that provide information on indicators contextualized to that country. I was the lead author of both the Lancet Countdown 2017 Report: Briefing for Canadian
1 https://www.thelancet.com/journals/lancet/article/PIIS0140-6736(17)32464-9/fulltext
233

Policymakers2 and the Lancet Countdown 2018 Report: Briefing for Canadian Policymakers 3. The 2017 Lancet Canada Brief builds on the central conclusion of the Lancet Countdown, stating that “[t]he human symptoms of climate change are unequivocal and potentially irreversible – affecting the health of populations around the world, today. Whilst these effects will disproportionately impact the most vulnerable in society, every community will be affected.” Global inaction to prevent or mitigate climate change to date has created a high-end emissions trajectory with between 2.6 degrees Celsius and 4.8 degrees Celsius of global surface temperature warming by the end of the century. This level could be disastrous to health even if we maximize our efforts to adapt. A wide range of adverse health effects from climate change are, and will be, experienced by Canadians across all regions, including:
• Increased heat-related illness, such as heat stroke and death;
• Higher pollen levels (with the potential to trigger more severe asthma);
• Increased air pollution from wildfire smoke;
• Increased ground-level ozone resulting in increased heart and respiratory disease;
• Increased food insecurity in the Canadian Artic from reduced access to traditional foods;
• Region-specific impacts on agriculture that range from potentially helpful milder winters to crop-damaging severe weather and drought;
• Increased stress and displacement for individual Canadians from disasters like wildfires and floods;
• An increase in the range of vector-borne diseases, such as Lyme Disease;
• Increased risk of water-borne diseases from changed precipitation patterns; and
• Greater exposure to higher levels of ultraviolet radiation. The 2017 Lancet Canada Brief also noted the impact of recent weather-related disasters on public health in Canada, including the following wildfire activity:
2 https://www.cpha.ca/sites/default/files/uploads/advocacy/2017_lancet_canada_brief.pdf 3 https://cape.ca/wp-content/uploads/2018/11/2018-Lancet-Countdown-Policy-Brief-Canada.pdf
234
• The evacuation of 13,000 people from La Ronge, Saskatchewan in 2015, the largest evacuation in Saskatchewan history;
• 2014 wildfires in Northwest Territories that left Yellowknife covered in smoke for much of the summer;
• Fires in and around Fort McMurray, Alberta that resulted in a mandatory evacuation order, the loss of approximately 2400 buildings, and impacts felt by approximately 88,000 people; and
• 2017 wildfires in and around Williams Lake, British Columbia forcing the evacuation of 24,000 people.
From a public health perspective these wildfire events cause, in addition to the local damage and evacuation orders, massive smoke plumes that can travel large distances and can increase exposure to air pollution for populations located far from the originating fire. Wildfire smoke is linked to a number of adverse health consequences, including increased asthma exacerbations; pneumonia; conjunctivitis; headache; feelings of sadness, isolation, and worry about climate change; and possible reduced birth weight in infants exposed in utero. The 2018 Lancet Canada Brief, which was released on November 29, 2018, made a number of statements regarding the health impacts in Canada from climate change and Canada’s role in causing climate change, including:
• “Present day changes in labour capacity, vector-borne disease, and food security provide early warning of compounded and overwhelming impacts expected if temperature continues to rise. Trends in climate change impacts, exposures, and vulnerabilities demonstrate an unacceptably high level of risk for the current and future health of populations across the world.”
• Especially vulnerable populations include children and pregnant women; and
• Canada is not doing its fair share to reduce greenhouse gas emissions, as Canadian emissions increased more than 100 megatonnes between 1990 and 2016.
235

Conclusion
Again, CAPE is proud to be a member of the intergenerational climate coalition applying for leave to intervene in the Reference Case.
Sincerely,
Dr. Courtney Howard President, CAPE
236

237

Review
www.thelancet.com Vol 391 February 10, 2018 581
The Lancet Countdown on health and climate change: from 25 years of inaction to a global transformation for public healthNick Watts, Markus Amann, Sonja Ayeb-Karlsson, Kristine Belesova, Timothy Bouley, Maxwell Boykoff, Peter Byass, Wenjia Cai, Diarmid Campbell-Lendrum, Jonathan Chambers, Peter M Cox, Meaghan Daly, Niheer Dasandi, Michael Davies, Michael Depledge, Anneliese Depoux, Paula Dominguez-Salas, Paul Drummond, Paul Ekins, Antoine Flahault, Howard Frumkin, Lucien Georgeson, Mostafa Ghanei, Delia Grace, Hilary Graham, Rébecca Grojsman, Andy Haines, Ian Hamilton, Stella Hartinger, Anne Johnson, Ilan Kelman, Gregor Kiesewetter, Dominic Kniveton, Lu Liang, Melissa Lott, Robert Lowe, Georgina Mace, Maquins Odhiambo Sewe, Mark Maslin, Slava Mikhaylov, James Milner, Ali Mohammad Latifi, Maziar Moradi-Lakeh, Karyn Morrissey, Kris Murray, Tara Neville, Maria Nilsson, Tadj Oreszczyn, Fereidoon Owfi, David Pencheon, Steve Pye, Mahnaz Rabbaniha, Elizabeth Robinson, Joacim Rocklöv, Stefanie Schütte, Joy Shumake-Guillemot, Rebecca Steinbach, Meisam Tabatabaei, Nicola Wheeler, Paul Wilkinson, Peng Gong*, Hugh Montgomery*, Anthony Costello*
Executive summaryThe Lancet Countdown tracks progress on health and climate change and provides an independent assess-ment of the health effects of climate change, the implementation of the Paris Agreement,1 and the health implications of these actions. It follows on from the work of the 2015 Lancet Commission on Health and Climate Change,2 which concluded that anthropogenic climate change threatens to undermine the past 50 years of gains in public health, and conversely, that a comprehensive response to climate change could be “the greatest global health opportunity of the 21st century”.
The Lancet Countdown is a collaboration between 24 academic institutions and intergovernmental organ isations based in every continent and with representation from a wide range of disciplines. The collaboration includes climate scientists, ecologists, economists, engineers, experts in energy, food, and transport systems, geographers, mathematicians, social and political scientists, public health professionals, and doctors. It reports annual indicators across five sections: climate change impacts, exposures, and vulnerability; adaptation planning and resilience for health; mitigation actions and health co-benefits; economics and finance; and public and political engagement.
The key messages from the 40 indicators in the Lancet Countdown’s 2017 report are summarised below.
The human symptoms of climate change are unequivocal and potentially irreversible—affecting the health of populations around the world todayThe impacts of climate change are disproportionately affecting the health of vulnerable populations and people in low-income and middle-income countries (LMICs). By undermining the social and environmental determinants that underpin good health, climate change exacerbates social, economic, and demographic inequalities, with the impacts eventually felt by all populations.
The evidence is clear that exposure to more frequent and intense heatwaves is increasing, with an estimated 125 million additional vulnerable adults exposed to heatwaves between 2000 and 2016 (Indicator 1.2).
During this time, increasing ambient temperatures have resulted in an estimated reduction of 5·3% in outdoor manual labour productivity worldwide (Indicator 1.3). As a whole, the frequency of weather-related disasters has increased by 46% since 2000, with no clear upward or downward trend in the lethality of these extreme events (Indicator 1.4), potentially suggesting the beginning of an adaptive response to climate change. Yet the impacts of climate change are projected to worsen with time, and current levels of adaptation will become insufficient in the future. The total value of economic losses resulting from climate-related events has been increasing since 1990, totalling US$129 billion in 2016. 99% of these economic losses in low-income countries were uninsured (Indicator 4.4). Additionally, in the longer term, altered climatic conditions are contributing to growing vectorial capacity for the transmission of dengue fever by Aedes aegypti, reflecting an estimated 9·4% increase since 1950 (Indicator 1.6).
If governments and the global health community do not learn from the past experiences of HIV/AIDS and the recent outbreaks of Ebola and Zika viruses, another slow response will result in an irreversible and unacceptable cost to human health.
The delayed response to climate change over the past 25 years has jeopardised human life and livelihoodsSince the UN Framework Convention on Climate Change (UNFCCC) commenced global efforts to tackle climate change in 1992, most of the indicators tracked by the Lancet Countdown have either shown limited progress, particularly with regards to adaptation, or moved in the wrong direction, particularly in relation to mitigation. Most fundamentally, carbon emissions and global temperatures have continued to increase.
An increasing number of countries are assessing their vulnerabilities to climate change, developing adaptation and emergency preparedness plans, and providing climate information to health services (Indicators 2.1, 2.3–2.6). The same is seen at the city level, with more than 449 cities around the world
Lancet 2018; 391: 581–630
Published Online October 30, 2017 http://dx.doi.org/10.1016/S0140-6736(17)32464-9
See Online for infographic
This online publication has been corrected. The corrected version first appeared at thelancet.com on November 23, 2017
*Co-chairs
Institute of Global Health (N Watts MBBS, N Wheeler MSc), UCL Energy Institute (J Chambers PhD, I Hamilton PhD, Prof R Lowe PhD, S Pye MSc), UCL Institute for Environmental Design and Engineering (Prof M Davies PhD), UCL Institute of Sustainable Resources (P Drummond MSc, M Lott MSEng, Prof P Ekins PhD), Bartlett School of Environment, Energy and Resources, Bartlett Faculty of the Built Environment (Prof T Oreszczyn PhD), Department of Geography (L Georgeson MSc, Prof M Maslin PhD), UCL Institute of Epidemiology and Health Care (Prof A Johnson MD), UCL Institute for Risk and Disaster Reduction (I Kelman PhD), Department of Genetics, Evolution and Environment (Prof G Mace DPhil), Centre for Human Health and Performance, Division of Medicine (Prof H Montgomery MD), University College London, London, UK; Air Quality and Greenhouse Gases Program and Greenhouse Gas Initiative, International Institute for Applied Systems Analysis, Vienna, Austria (M Amann PhD,
238

Review
582 www.thelancet.com Vol 391 February 10, 2018
G Kiesewetter PhD); Environmental Migration,
Social Vulnerability and daptation section (EMSVA),
Institute for Environment and Security, United Nations
University, Bonn, Germany (S Ayeb-Karlsson MA);
Department of Geography, University of Sussex, Brighton,
UK (Prof D Kniveton PhD); Department of Social and
Environmental Health Research, London School of
Hygiene & Tropical Medicine, London, UK (K Belesova MA,
Prof A Haines FMedSci, J Milner PhD, R Steinbach PhD,
Prof P Wilkinson FRCP); Climate Change Department, World Bank, Washington, DC, USA
(T Bouley MD); Center for Science and Technology Policy,
University of Colorado-Boulder, Boulder, CO, USA
(M Boykoff PhD, M Daly MA); Epidemiology & Global Health,
Department of Public Health and Clinical Medicine, Umeå
University, Umeå, Sweden (Prof P Byass PhD,
M Odhiambo Sewe PhD, M Nilsson PhD, J Rocklöv PhD);
School of Environment, Tsinghua University, Beijing,
China (W Cai PhD); Department of Public Health,
Environmental and Social Determinants of Health
(D Campbell-Lendreum DPhil, T Neville MSc), Department of
Maternal, Newborn, Child and Adolescent Health
(Prof A Costello FMedSci), World Health Organization, Geneva,
Switzerland; College of Engineering, Mathematics, and
Physical Sciences (Prof P M Cox PhD), Medical
School (Prof M Depledge PhD), European Centre for
Environment & Human Health (K Morrissey PhD), University of
Exeter, Exeter, UK; International Development
Department, University of Birmingham, Birmingham, UK
(N Dasandi PhD); Centre Virchow-Villermé for Public
Health Paris-Berlin, Paris, France (A Depoux PhD,
Prof A Flahault PhD, R Grojsman MSc, S Schütte PhD); Department of Production and
Population Health, Royal Veterinary College, London, UK (P Dominguez-Salas PhD); Food Safety and Zoonoses Program,
International Livestock Research Institute, Nairobi,
Kenya (D Grace PhD);
reporting having undertaken a climate change risk assessment (Indicator 2.2). However, the coverage and adequacy of such measures in protecting against the growing risks of climate change to health remain uncertain. Indeed, health and health-related adaptation funding accounts for only 4·6% and 13·3% of total global adaptation spending, respectively (Indicator 4.9).
Although there has been some recent progress in strengthening health resilience to climate impacts, it is clear that adaptation to new climatic conditions can only protect up to a point; an analogy to human physiology is useful here. The human body can adapt to insults caused by a self-limiting minor illness with relative ease. However, when disease steadily worsens, positive feedback cycles and limits to adaptation are quickly reached. This is particularly true when many systems are affected and when the failure of one system affects the function of another, as is the case for multiorgan system failure or when the body has already been weakened through repeated diseases or exposures. The same is true for the health consequences of climate change. It acts as a threat multiplier, compounding many of the issues communities already face and strengthening the correlation between multiple health risks, making them more likely to occur simultaneously. Indeed, climate change is not a single-system disease but instead often compounds existing pressures on housing, food and water security, poverty, and many determinants of good health. Adaptation has limits, and prevention is better than cure to avert potentially irreversible effects of climate change.
Progress in mitigating climate change since the signing of the UNFCCC has been limited across all sectors, with only modest improvements in carbon emission reduction from electricity generation. Although sustainable travel has increased in Europe and some evidence suggests a decrease in dependence on private motor vehicles in cities in the USA and Australia, the situation is generally less favourable in cities within emerging economies (Indicator 3.7). In addition to a slow transition away from highly polluting forms of electricity generation, this change has yielded a modest improvement in air pollution in some urban centres. However, global population-weighted fine particular matter (PM2·5) exposure has increased by 11·2% since 1990, and about 71% of the 2971 cities in the WHO air pollution database exceed guideline annual PM2·5 exposure (Indicator 3.5). The strength and coverage of carbon pricing covers only 13·1% of global anthropogenic carbon dioxide (CO2) emissions, with the weighted average carbon price of these instruments at $8·81 per tonne of emitted CO2 in 2017 (Indicator 4.7). Furthermore, responses to climate change have yet to fully take advantage of the health co-benefits of mitigation and adaptation interventions, with action taken to date only yielding modest improvements in human wellbeing. In part, this reflects a need for further evidence and research on these ancillary effects and the available cost savings.
However, it also reflects a need for more joined-up policy making by health and non-health ministries of national governments.
This delayed mitigation response puts the world on a high-end emissions trajectory that will result in global warming of 2·6–4·8°C by the end of the century.
The voice of the health profession is essential in driving forward progress on climate change and realising the health benefits of this responseFollowing in the footsteps of previous Lancet Commissions, we argue that the health profession not only has the ability but the responsibility to act as public health advocates by communicating the threats and opportunities to the public and policy makers and ensuring climate change is understood as being central to human wellbeing.
Attention to health and climate change is growing in the media and in academic reports, with global newspaper coverage of the issue increasing 78% and the number of scientific reports more than tripling since 2007 (Indicator 5.1.1 and 5.2). However, despite these positive examples, the 2017 indicators make it clear that further progress is urgently needed.
Although progress has been historically slow, the past 5 years have seen an accelerated response, and in 2017, momentum is building across a number of sectors; the direction of travel is set, with clear and unprecedented opportunities for public healthIn 2015, the Lancet Commission2 made ten recom-mendations to governments to accelerate action in the following 5 years. The Lancet Countdown’s 2017 indicators track against these 2015 recommendations, with results suggesting that discernible progress has been made in many of these areas (panel 1), breathing life into previously stagnant mitigation and adaptation efforts. Indeed, the transition to low-carbon electricity generation now appears inevitable. Alongside the Paris Agreement, this progress provides reason to believe that a broader transformation is underway.
Following the US Goverment’s announced intention to withdraw from the Paris Agreement, the global community has demonstrated overwhelming support for enhanced action on climate change, affirming clear political will and ambition to reach the treaty’s targets. The mitigation and adaptation interventions committed to under the Paris Agreement have very positive short-term and long-term health benefits, but greater ambition is now essential. Although progress has been historically slow, there is evidence of a recent turning point, with transitions in sectors that are crucial to public health reorienting towards a low-carbon world. These efforts must be greatly accelerated and sustained in the coming decades to meet the commitments, but recent policy changes and the indicators presented here suggest that the direction of travel is set.
239

Review
www.thelancet.com Vol 391 February 10, 2018 583
Department of Environmental and Occupational Health Sciences, University of Washington, Seattle, WA, USA (Prof H Frumkin MD); Chemical Injuries Research Center, University of Medical Sciences, Tehran, Iran (M Ghanei MD); Department of Health Sciences, University of York, York, UK (Prof H Graham PhD); Centre for Earth System Science, Tsinghua University, Beijing, China (Prof P Gong PhD); Unidad de Desarrollo Integral, Ambiente y Salud, Universidad Peruana Cayetano Heredia, Lima, Peru (S Hartinger PhD); School of Forestry and Natural Resources, University of Arkansas at Monticello, Monticello, AR, USA (L Liang PhD); Institute for Analytics and Data Science, University of Essex, Colchester, UK (Prof S Mikhaylov PhD); Applied Biotechnology Research Center, Baqiyatallah University of Medical Sciences, Tehran, Iran (A M Latifi PhD); Iran University of Medical Sciences, Tehran, Iran (M Moradi-Lakeh MPH); Grantham Institute—Climate Change and the Environment, Imperial College London, London, UK (K Murray PhD); Iranian Fisheries Science Research Institute, AREEO, Tehran, Iran (F Owfi PhD, M Rabbaniha PhD); Sustainable Development Unit, Cambridge, UK (D Pencheon MA); School of Agriculture, Policy and Development, University of Reading, Reading, UK (Prof E Robinson PhD); WHO/WMO Joint Climate and Health Office, World Meteorological Organization, Geneva, Switzerland (J Shumake-Guillemot DrPH); and Biofuel Research Team, Agricultural Biotechnology Research Institute of Iran, AREEO, Karaj, Iran (M Tabatabaei PhD)
Correspondence to: Dr Nick Watts, Institute for Global Health, University College London, WC1E 6BT, UK [email protected]
Between 2017 and 2030, the Lancet Countdown will continue to report annually on progress in implementing the commitments of the Paris Agreement, future commitments that build on them, and the health benefits that result.
IntroductionClimate change has serious implications for our health, wellbeing, livelihoods, and the structure of organised society. Its direct effects result from rising temperatures and changes in the frequency and strength of storms, floods, droughts, and heatwaves—with physical and mental health consequences. The impacts of climate change will also be mediated through less direct pathways, including changes in crop yields, the burden and
distribution of infectious disease, and in climate-induced population displacement and violent conflict.3–5 Although many of these effects are already seen, their progression in the absence of climate change mitigation will greatly amplify existing global health challenges and inequalities.2 The effects also threaten to undermine many of the social, economic, and environmental drivers of health that have contributed greatly to human progress.
Urgent and substantial climate change mitigation will help protect human health from the worst of these effects, and a comprehensive and ambitious response to climate change could transform the health of the world’s populations.2 The potential benefits and opportunities are enormous, including cleaning the air of polluted cities, delivering more nutritious diets, ensuring energy, food,
Panel 1: Progress towards the recommendations of the 2015 Lancet Commission on Health and Climate Change2
In 2015, we made ten policy recommendations. Of these, good progress has been made against the following recommendations.
Recommendation 1: invest in climate change and public health researchSince 2007, the number of scientific papers on health and climate change has more than tripled (Indicator 5.2).
Recommendation 2: scale-up financing for climate-resilient health systemsSpending on health adaptation is 4·63% of global adaptation spend (US$16·46 billion); in 2017, health adaptation from global development and climate financing mechanisms is at an all-time high although absolute spending remains low (Indicators 4.9 and 4.10).
Recommendation 3: phase-out coal-fired powerIn 2015, more renewable energy capacity (150 gigawatts) than fossil fuel capacity was added to the global energy mix. Overall, annual installed renewable generation capacity (almost 2000 gigawatt) exceeds that for coal, with about 80% of this recently added renewable capacity located in China (Indicator 3.2). Although investment in coal capacity has increased since 2006, this investment turned and decreased substantially in 2016, and several countries have now committed to phasing out coal (Indicator 4.1).
Recommendation 4: encourage a city-level low-carbon transition to reduce urban pollutionDespite historically modest progress in the past two decades, the transport sector is approaching a new threshold, with electric vehicles expected to reach cost parity with their non-electric counterparts by 2018—a phenomenon that was not expected to occur until 2030 (Indicator 3.6).
Recommendation 6: rapidly expand access to renewable energy, unlocking the substantial economic gains available from this transitionEvery year since 2015, more renewable energy has been added to the global energy mix than all other sources, and in 2016,
global employment in the renewable energy sector reached 9·8 million people, more than 1 million more people than are employed in fossil fuel extraction sector. The transition has become inevitable. However, in the same year, 1·2 billion people still did not have access to electricity, and 2·7 billion people were relying on the burning of unsafe and unsustainable solid fuels (Indicators 3.3, 4.6, and 3.4).
Recommendation 9: agree and implement an international treaty that facilitates the transition to a low-carbon economyIn December, 2015, 195 countries signed the Paris Agreement, which provides a framework for enhanced mitigation and adaptation and pledges to keep the global mean temperature rise to well below 2°C. Going forward, an enhanced programme of work dedicated to health within the UN Framework Convention on Climate Change would provide a clear and essential entry point for health professionals at the national level, ensuring that the implementation of the Paris Agreement maximises the health opportunities for populations around the world.
Recommendation 10: Develop a new, independent collaboration to provide expertise in implementing policies that mitigate climate change and promote public health, and to monitor progress over the next 15 yearsThe Lancet Countdown is a collaboration between 24 academic institutions and intergovernmental organisations based in every continent and with representation from a wide range of disciplines. It monitors and reports on indicators across five sections and will continue to do so up to 2030.
240

Review
584 www.thelancet.com Vol 391 February 10, 2018
and water security, and alleviating poverty and social and economic inequalities.
Monitoring this transition, from threat to opportunity, is the central role of the Lancet Countdown: Tracking Progress on Health and Climate Change.6 The collaboration is a partnership of 24 academic institutions from every continent and brings together individuals with a broad range of expertise across disciplines (including climate scientists, ecologists, mathematicians, geographers, engineers, energy, food, and transport experts, economists, social and political scientists, public health professionals, and doctors). Until 2030, the Lancet Countdown will track a series of indicators of progress and to report annually on the state of the climate, the implementation of the Paris Agreement, and efforts to mitigate and adapt to climate change (panel 2). The initiative was formed after the 2015 Lancet Commission on Health and Climate Change,2 which concluded that “tackling climate change could be the greatest global health opportunity of the 21st century”.It builds on and reinforces the work of the expanding group of researchers, health practitioners, national governments, and WHO, who are working to ensure that this opportunity becomes a reality.
Indicators of progress on health and climate changeIn 2016, the Lancet Countdown proposed a set of potential indicators to be monitored and launched a global consultation to define a conclusive set of indicators for 2017.6 A number of factors determined the selection of indicators, including: (1) their relevance to public health, both in terms of the impacts of climate change on health and the health effects of the response to climate change; (2) their relevance to the main anthropogenic drivers of climate change; (3) their geographical coverage and relevance to a broad range of countries and income groups; (4) data availability; and (5) resource and timing constraints. These indicators are divided into five broad sections: climate change impacts, exposures, and vulnerabilities; adaptation planning and resilience for health; mitigation actions and health co-benefits; economics and finance; and public and political engagement (panel 3). These sections are aligned with the global action agenda on climate change and health that was agreed to at the Second WHO Global Conference on Health and Climate in July, 2016.
The results and analysis of each indicator are presented alongside a brief description of the data sources and methods. A more complete account of each indicator can be found in the appendix. For a number of areas, such as the impacts of climate change on mental health or hydrological mapping of flood exposure, a robust methodology for an annual indicator has not been reported, reflecting the complexity of the topic and the paucity of data rather than its lack of importance. The thematic groups and indicator titles provide an overview of the domain being tracked, allowing for the growth and development of these metrics (eg, to more directly capture health outcomes) in subsequent years.
Delivering the Paris Agreement for better healthThe Paris Agreement1 has been ratified at the national level by 153 of 197 parties to the UNFCCC, and covers 84·7% of greenhouse gas emissions at present. The agreement set out an ambitious commitment to reduce greenhouse gas emissions and to limit climate change to well below a global average temperature rise of 2°C above pre-industrial levels, with an aim to limit temperature increases to 1·5 °C.
187 countries have committed to near-term (up to 2030) actions to reduce greenhouse gas emission through their nationally determined contributions. Article 4 paragraph 2 of the Paris Agreement1 states that each signatory “shall prepare, communicate and maintain successive nationally determined contributions that it intends to achieve”. However, the nationally determined contributions of the 153 parties that have ratified the agreement now fall short of the necessary reductions by 2030 to meet the 2°C pathway.11
Panel 2: Developing Lancet Countdown’s indicators: an iterative and open process
In developing the Lancet Countdown’s indicators, we took a pragmatic approach, taking into account the considerable limitations in data availability, resources, and time. Consequently, the indicators presented here represent what is feasible for 2017 and will evolve over time in response to feedback and data improvements.
The purpose of this collaboration is to track progress on the links between public health and climate change, and yet much of the data analysed here were originally collected for purposes not directly relevant to health. Initial analysis therefore principally captures changes in exposure, states, or processes as proxies for health outcomes—the ultimate goal. Employing new methodologies to improve attribution to climate change is a particular priority. Subsequent reports will see the Lancet Countdown set 2030 targets for its indicators that align more directly with the Paris Agreement, allowing an assessment of its implementation during the next 13 years.
The indicators presented thus far are the beginning of an ongoing, iterative, and open process, which will work to continuously improve as capacity, data quality, and methods evolve. The objectives of the Lancet Countdown are both ambitious and essential, relying on support from a broad range of actors. To this end, the collaboration welcomes support from academic institutions and technical experts that are able to provide new analytical methods and novel datasets with appropriate geographical coverage. A short overview of several parallel and complementary processes currently underway is provided in the appendix (pp 1–10).
For the registry of nationally determined contributions see
http://unfccc.int/focus/ndc_registry/items/9433.php
See Online for appendix
241
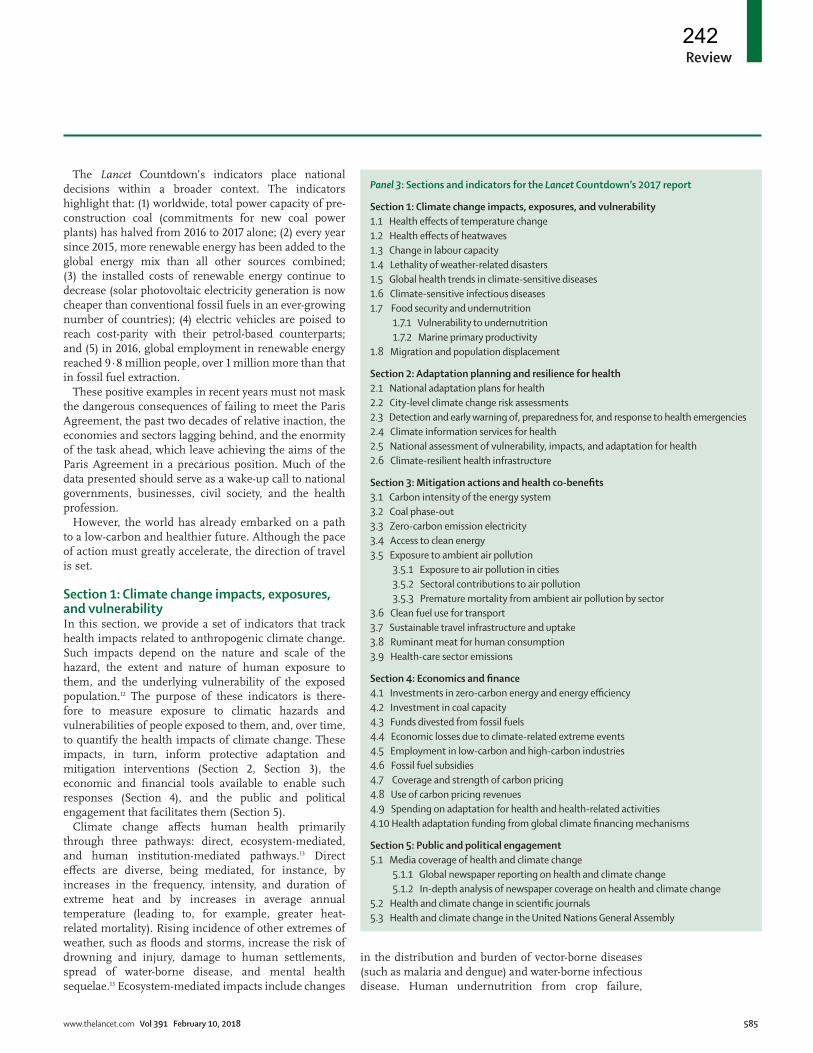
Review
www.thelancet.com Vol 391 February 10, 2018 585
The Lancet Countdown’s indicators place national decisions within a broader context. The indicators highlight that: (1) worldwide, total power capacity of pre-construction coal (commitments for new coal power plants) has halved from 2016 to 2017 alone; (2) every year since 2015, more renewable energy has been added to the global energy mix than all other sources combined; (3) the installed costs of renewable energy continue to decrease (solar photovoltaic electricity generation is now cheaper than conventional fossil fuels in an ever-growing number of countries); (4) electric vehicles are poised to reach cost-parity with their petrol-based counterparts; and (5) in 2016, global employment in renewable energy reached 9·8 million people, over 1 million more than that in fossil fuel extraction.
These positive examples in recent years must not mask the dangerous consequences of failing to meet the Paris Agreement, the past two decades of relative inaction, the economies and sectors lagging behind, and the enormity of the task ahead, which leave achieving the aims of the Paris Agreement in a precarious position. Much of the data presented should serve as a wake-up call to national governments, businesses, civil society, and the health profession.
However, the world has already embarked on a path to a low-carbon and healthier future. Although the pace of action must greatly accelerate, the direction of travel is set.
Section 1: Climate change impacts, exposures, and vulnerabilityIn this section, we provide a set of indicators that track health impacts related to anthropogenic climate change. Such impacts depend on the nature and scale of the hazard, the extent and nature of human exposure to them, and the underlying vulnerability of the exposed population.12 The purpose of these indicators is there-fore to measure exposure to climatic hazards and vulnerabilities of people exposed to them, and, over time, to quantify the health impacts of climate change. These impacts, in turn, inform protective adaptation and mitigation interventions (Section 2, Section 3), the economic and financial tools available to enable such responses (Section 4), and the public and political engagement that facilitates them (Section 5).
Climate change affects human health primarily through three pathways: direct, ecosystem-mediated, and human institution-mediated pathways.13 Direct effects are diverse, being mediated, for instance, by increases in the frequency, intensity, and duration of extreme heat and by increases in average annual temperature (leading to, for example, greater heat-related mortality). Rising incidence of other extremes of weather, such as floods and storms, increase the risk of drowning and injury, damage to human settlements, spread of water-borne disease, and mental health sequelae.13 Ecosystem-mediated impacts include changes
in the distribution and burden of vector-borne diseases (such as malaria and dengue) and water-borne infectious disease. Human undernutrition from crop failure,
Panel 3: Sections and indicators for the Lancet Countdown’s 2017 report
Section 1: Climate change impacts, exposures, and vulnerability1.1 Health effects of temperature change1.2 Health effects of heatwaves1.3 Change in labour capacity1.4 Lethality of weather-related disasters1.5 Global health trends in climate-sensitive diseases1.6 Climate-sensitive infectious diseases1.7 Food security and undernutrition
1.7.1 Vulnerability to undernutrition 1.7.2 Marine primary productivity
1.8 Migration and population displacement
Section 2: Adaptation planning and resilience for health2.1 National adaptation plans for health2.2 City-level climate change risk assessments2.3 Detection and early warning of, preparedness for, and response to health emergencies2.4 Climate information services for health2.5 National assessment of vulnerability, impacts, and adaptation for health2.6 Climate-resilient health infrastructure
Section 3: Mitigation actions and health co-benefits3.1 Carbon intensity of the energy system3.2 Coal phase-out3.3 Zero-carbon emission electricity3.4 Access to clean energy3.5 Exposure to ambient air pollution
3.5.1 Exposure to air pollution in cities 3.5.2 Sectoral contributions to air pollution 3.5.3 Premature mortality from ambient air pollution by sector
3.6 Clean fuel use for transport3.7 Sustainable travel infrastructure and uptake3.8 Ruminant meat for human consumption3.9 Health-care sector emissions
Section 4: Economics and finance4.1 Investments in zero-carbon energy and energy efficiency4.2 Investment in coal capacity4.3 Funds divested from fossil fuels4.4 Economic losses due to climate-related extreme events4.5 Employment in low-carbon and high-carbon industries4.6 Fossil fuel subsidies4.7 Coverage and strength of carbon pricing4.8 Use of carbon pricing revenues4.9 Spending on adaptation for health and health-related activities4.10 Health adaptation funding from global climate financing mechanisms
Section 5: Public and political engagement5.1 Media coverage of health and climate change
5.1.1 Global newspaper reporting on health and climate change 5.1.2 In-depth analysis of newspaper coverage on health and climate change
5.2 Health and climate change in scientific journals5.3 Health and climate change in the United Nations General Assembly
242

Review
586 www.thelancet.com Vol 391 February 10, 2018
population displacement from sea-level rise, and occupational health risks are examples of human institution-mediated impacts.
Although reported data, and indeed some of the data presented here, have traditionally focused on impacts such as the spread of infectious diseases and mortality from extreme weather, the health effects from non-communicable diseases are just as important. Mediated through a variety of pathways, they take the form of cardiovascular disease, acute and chronic respiratory disease from worsening air pollution and aero-allergens, or the often-unseen mental health effects of extreme weather events or of population displacement.14,15 Indeed, emerging evidence is suggesting links between a rising incidence of chronic kidney disease, dehydration, and climate change.16,17
Eight indicators were selected and developed for this section. Headline findings for all indicators are provided at the beginning of each indicator; additional detailed disussion on the data and methods used (as well as the
limitations and challenges encountered in the selection of each indicator) are provided in the appendix (p 16). The indirect indicators (Indicators 1.5–1.8) each provide a proof of concept rather than being fully comprehensive, focusing variably on a specific diseases, populations, or locations. Additionally, in future reports by the Lancet Countdown, we will seek to capture indicators of the links between climate change and air pollution, and with mental illness.
Indicator 1.1: Health effects of temperature changeThis indicator reports that people experience far more than the global mean temperature rise. This indicator reports that between 2000 and 2016, human exposure to warming was about 0·9oC, more than double the global area average temperature rise during the same period.
Increasing temperatures can exacerbate existing health problems in populations and introduce new health threats (including cardiovascular disease and chronic kidney disease). The extent to which human populations are exposed to this temperature change, and thus the health implications of temperature change, depends on the detailed spatiotemporal trends of population and temperature over time.
Temperature anomalies were calculated relative to 1986–2008 from the European Research Area, produced by the European Centre for Medium-Range Weather Forecasts (ECMWF). This dataset uses ECMWF climate reanalysis to give a description of recent climate, produced by combining models with observations.
Changes in each country population were obtained from NASA’s Socioeconomic Data and Applications Center and the data were projected onto the gridded population. Exposure-weighted warming from 2000 to 2016 (0·9°C) is much higher than the area-weighted warming (0·4°C) during the same period (figure 1). Hence, mean exposure to warming is more than double the global warming since 2000.
The increase in exposure relative to the global average is driven partly by growing population densities in India, parts of China, and sub-Saharan Africa. Accounting for population when assessing temperature change provides a vital insight into how human wellbeing is likely to be affected by temperature change, with the analysis here showing that temperature change where people are living is much higher than average global warming. Details of the global distribution of this warming can be found in the appendix (p 16).
Indicator 1.2: Health effects of heatwavesThis indicator reports that between 2000 and 2016, the number of vulnerable people exposed to heatwave events increased by about 125 million, with a record 175 million more people exposed to heatwaves in 2015.
The health impacts of extreme heat range from direct heat stress and heat stroke, to exacerbations of pre-existing heart failure, and even an increased incidence of
Figure 2: The change in heatwave exposure (in people older than 65 years), relative to the 1986–2008 average
2000 2002 2004 2006 2008 2010 2012 2014 2016–25
Chan
ge in
exp
osur
e of p
eopl
e to
heat
wav
es(m
illio
ns p
er ye
ar)
Year
0
50
100
150
25
75
125
175
For European Centre for Medium-Range Weather
Forecasts see https://www.ecmwf.int/
For the European Centre for Medium-Range Weather
Forecasts’ climate reanalysis see https://www.ecmwf.int/en/
research/climate-reanalysis
For Socioeconomic Data and Applications Center’s Gridded
Population of the World v4 see http://sedac.ciesin.columbia.edu/data/collection/gpw-v4
Figure 1: Mean summer warming relative to the 1986–2008 averageThe time series are global mean temperatures calculated from the gridded data, weighted by area (to avoid bias from measurements near the poles) and by exposure (to show the number of people exposed).
2000 2002 2004 2006 2008 2010 2012 2014 20160
Mea
n w
arm
ing
(ºC)
Year
0·2
0·4
0·6
0·8
Exposure weightedArea weightedExposure trendGlobal trend
243

Review
www.thelancet.com Vol 391 February 10, 2018 587
acute kidney injury from dehydration in vulnerable populations. Elderly people, children younger than 12 months, and people with chronic cardiovascular and renal disease are particularly sensitive to these changes.13
Our definition of a heatwave is a period of more than 3 days during which the minimum temperature is greater than the 99th percentile of the historical minima (1986–2008 average).18 This metric therefore focuses on periods of high night-time temperatures, which are crucial in denying vulnerable people vital recuperation between hot days. Heatwave data were calculated against the historical period 1986–2008. The population for the exposure calculations was limited to people older than 65 years (as this age group is most vulnerable to the health impacts of heatwaves), and data were obtained on a per-country basis from the UN World Population Prospects archives for each year considered.
The highest number of exposure events was recorded in 2015, with about 175 million additional people exposed to heatwaves (figure 2). Over time, the mean number of heatwave days experienced by people during any one heatwave (exposure-weighted) increases at a much faster rate than the global mean (area-weighted) number of heatwave days per heatwave (figure 3) because of high population densities in areas where heatwaves have occurred.
Indicator 1.3: Change in labour capacityThis indicator reports that global labour capacity in rural populations exposed to temperature change is estimated to have decreased by 5·3% from 2000 to 2016.
Higher temperatures pose profound threats to occupational health and labour productivity, particularly for people undertaking manual, outdoor labour in hot areas. This indicator shows the change in labour capacity (and thus productivity) worldwide and for rural regions specifically, weighted by population (appendix p 18). Loss of labour capacity has important implications for the livelihoods of individuals, families, and communities, especially those relying on subsistence farming.
Estimation of labour capacity is based on wet bulb globe temperatures, as described by Watts and colleagues.2 We estimated change in outdoor labour productivity as a percentage relative to the reference period (1986–2008) (figure 4). Labour capacity is estimated to have decreased by 5·3% between 2000 and 2016, with a dramatic decrease of more than 2% between 2015 and 2016. Although there are some peaks of increased labour capacity (notably in 2000, 2004, and 2008), the overwhelming trend is one of reduced capacity. These effects are most notable in some of the most vulnerable countries in the world (figure 5).
This indicator only captures the effects of heat on rural labour capacity. The Lancet Countdown will work to expand this metric to capture impacts on labour capacity in other sectors, including manufacturing,
construction, transportation, tourism, and agriculture. Through collaboration with HEAT-SHIELD,19 the Lancet Countdown will work to develop this process, providing more detailed analysis of labour capacity loss and the health implications of heat and heatwaves worldwide.20
Indicator 1.4: Lethality of weather-related disastersThis indicator reports that the frequency of weather-related disasters has increased by 46% from 2007 to 2016 (compared with the 1990–99 average), with no clear upward or downward trend in the lethality of these extreme events.
Weather-related events have been associated with more than 90% of all disasters worldwide in the past 20 years. As expected, considering its population and area, Asia is the continent most affected by weather-related disasters. 2843 events were recorded between 1990 and 2016, affecting 4·8 billion people and killing 505 013 people. Deaths from natural hazard-related disasters are largely concentrated in poor countries.21 Crucially, this must be understood in the context of potentially overwhelming
Figure 3: Change in mean heatwave lengths worldwide, relative to the 1986–2008 average
Figure 4: Labour capacity change worldwide, relative to the 1986–2008 average
2000 2002 2004 2006 2008 2010 2012 2014 2016–0·25
Chan
ge in
the
mea
n le
ngth
of h
eatw
aves
(day
s)Year
0
0·50
1·00
1·50
0·25
0·75
1·25
Exposure weightedArea weightedExposure trendGlobal trend
2000 2002 2004 2006 2008 2010 2012 2014 2016
–5
Labo
ur ca
pacit
y ch
ange
(%)
Year
–4
–3
–2
0
–1
1 Exposure weightedExposure trend
244

Review
588 www.thelancet.com Vol 391 February 10, 2018
health impacts of future climate change, worsening profoundly in the coming years. Indeed, the 2015 Lancet Commission estimated that an additional 1·4 billion drought exposure events and 2·3 billion flood exposure events will occur by the end of the century, showing clear public health limits to adaptation.2
Disaster impact is a function of hazard and vulnerability, with vulnerability from a climate change perspective sometimes defined as a function of exposure, sensitivity, and adaptive capacity.22 This indicator measures the ratio of the number of deaths to the number of people affected by weather-related disasters. Weather-related disasters include droughts, floods, extreme temperature events, storms, and wildfires. The health impacts of weather-related disasters expand beyond mortality alone, including injuries, mental health impacts, spread of disease, and food and water insecurity. Data for the calculations for this indicator come from the Emergency Events Database (EM-DAT). Here, in line with the EM-DAT data used for analysis, a disaster is defined as either: (1) ten or more people killed; (2) 100 or more peopleaffected; (3) a declaration of a state of emergency; or(4) a call for international assistance.
Between 1994 and 2013, the frequency of reportedweather-related events (mainly floods and storms) increased substantially. However, this trend might be partially accounted for by information systems having improved in the past 35 years, and statistical data are now more available because of increased sociocultural sensitivity to disaster consequences and occurrence.23 From 2007 to 2016, EM-DAT recorded an average of 306 weather-related disasters per year, an increase of
46% from the 1990–99 average.24 However, owing to impressive poverty reduction and health adaptation efforts, this increase in weather-related disasters has not yet been accompanied by any discernible trend in number of deaths or in number of people affected by disasters (or in the ratio of these two; figure 6). Indeed, separating out the disasters by the type of climate and weather hazard associated with the disaster, we found a significant decrease in the number of people affected by floods worldwide, equating to a decrease of 3 million people annually. Importantly, best available estimates and projections expect a sharp reversal in these trends in the coming decades, and it is notable that mortality associated with weather-related disasters has increased in many countries, many of which are high-income countries, illustrating that no country is immune to the impacts of climate change (appendix p 19).
The relative stability of the number of deaths in a disaster as a proportion of those affected, despite an increase in the number of disasters, could be interpreted in a number of ways. One plausible conclusion is that this represents an increase in health service provision and risk reduction. However, although weather-related disasters have become more frequent in the past three to four decades, the data here do not capture the severity of such events—a factor directly relevant to a country’s vulnerability and ability to adapt.22 It is also important to note the difficulties in discerning overall trends, owing to the stochastic nature of the data and the relatively short time series. This poses limitations on the significance of findings that can be drawn from analysis to date. Improving the validity of this indicator will be a focus going forward.
Figure 5: Change in labour capacity loss, relative to the 1986–2008 average
For EM-DAT see http://www.emdat.be/
–30 –20 –10 0 10 20 30
Change in labour capacity (%)
245

Review
www.thelancet.com Vol 391 February 10, 2018 589
Indicator 1.5: Global health trends in climate-sensitive diseasesThis indicator reports that global health initiatives have improved the health profile of populations around the world—a trend that unmitigated climate change is expected to undermine.
Disease occurrence is determined by a complex composite of social and environmental conditions and health service provision, all of which vary geographically. Nonetheless, some diseases are particularly sensitive to variations in climate and weather and might therefore be expected to vary with both longer-term climate change and shorter-term extreme weather events.13 This indicator draws from Global Burden of Disease (GBD) 2015 mortality estimates to show trends in deaths associated with seven climate-sensitive diseases since 1990 (figure 7).
These disease trends reveal worldwide increases in dengue mortality, particularly in the Asia-Pacific, Latin American, and Caribbean regions, with some peak years (including 1998) known to be associated with El Niño conditions.25 Beyond climate, likely drivers of dengue mortality include trade, urbanisation, global and local mobility, and climate variability. The association between increased dengue mortality and climate change is therefore complex.26 It naturally follows that an increased spread of the disease resulting from climate change will be an important contributing factor in the increased likelihood of an associated increase in mortality.
Malignant melanoma is a distinctive example of a non-communicable disease with a clear link to ultraviolet exposure. Mortality has been increasing steadily despite advances in surveillance and treatment, although increased exposures also occur as a result of changing lifestyles (eg, an increase in sun tanning). Heat and cold exposure is a potentially important aspect of climate-influenced mortality, although the underlying attribution of deaths to these causes in the estimates is uncertain.27–32 Deaths directly related to forces of nature have been adjusted for the effects of the most severe seismic events. Of the ten highest country-year mortality estimates due to forces of nature, seven were directly due to specific seismic activity, and these have been discounted by replacing with the same countries’ force of nature mortality for the following year. The remaining major peaks relate to three extreme weather events (Bangladesh cyclone of 1991, Venezuela floods and mudslides of 1999, and Myanmar cyclone of 2008), which accounted for more than 300 000 deaths.
Overall, the findings highlight the effectiveness and success of global health initiatives in largely reducing deaths associated with these diseases since 1990. Furthermore, these trends provide a proxy for the global health profile of climate-sensitive diseases and thus, to some degree, indication of existing vulnerabilities and exposures to them.
Indicator 1.6: Climate-sensitive infectious diseasesThis indicator reports that climate trends have led to a global increase in the vectorial capacity for the transmission of dengue from A aegypti and Aedes albopictus, of 3·0% and 5·9%, respectively, compared with 1990 levels, and of 9·4% and 11·1%, respectively, compared with 1950 levels.
Despite a decreasing overall trend, infectious diseases still account for about 20% of the global burden of disease and underpin more than 80% of international health hazards, as classified by WHO.33,34 Climatic factors are routinely implicated in the epidemiology of infectious diseases, and they often interact with other factors, including behavioural, demographic, socioeconomic, topographic, and other environmental factors, to influence infectious disease emergence, distribution, incidence, and burden.4,35 Understanding the contribution of climate change to infectious disease risk is thus complex but necessary for advancing climate change mitigation and
Figure 6: Number of deaths and people affected by weather-related disasters (A) Number of deaths, number of affected people, and the ratio of these (measured against the 1990–2009 average), worldwide. (B) Number of people affected by different weather-related disasters worldwide.
For Global Burden of Disease Study 2015 data resources see http://ghdx.healthdata.org/gbd-2015
–200
Chan
ge co
mpa
red
with
199
0–20
09
Change in occurrences compared w
ith 1990–2009
0
200
400
600
–100
–50
–40
–30
–20
–10
0
10
20
30
40
50
100
300
500
A
Y = 1·8902x –3783·4R2 = 0·42
Y = –3E+06x + 2E + 08R2 = 0·14
Deaths and affectedDeathsAffectedOccurrencesTrend (occurrences)
DroughtExtreme temperatureFloodStormWildfireTrend (flood)
1990 1992 1994 1996 1998 2000 2002 2004 2006 2008 2010 2012 2014 2016
1990 1992 1994 1996 1998 2000 2002 2004 2006 2008 2010 2012 2014 2016
0
Num
ber o
f peo
ple
affec
ted
(mill
ions
)
Year
150
250
350
450
100
50
200
300
400
B
246

Review
590 www.thelancet.com Vol 391 February 10, 2018
adaptation policies.17 This indicator is divided into two components: (1) a systematic literature review of the links between climate change and infectious diseases; and (2) a vectorial capacity model for the transmission of dengue virus by the climate-sensitive vectors.
For the first component, we systematically reviewed the scientific literature describing effects of climate change and infectious diseases (appendix p 23), in which evolutionary trends in knowledge and direction of the impact of climate change disease risk associations were measured (figure 8). The number of new reports fitting the search criteria in 2016 (n=89) was the highest yet reported, almost double the number of reports in 2015 (n=50) and more than triple the number of reports in 2014 (n=25). During this period, the complexity of interactions between climate change and infectious disease has been increasingly recognised and understood.
Trends in the global potential for dengue virus transmission (as represented by vectorial capacity in the mosquito vectors A aeqypti and A albopictus, the principal vectors of dengue) are presented in figure 9. WHO defines vectorial capacity as the rate (usually daily) at which a bloodsucking insect population generates new inoculations from a currently infectious case. We
conducted a global, mechanistic investigation of changes in annual transmission potential for dengue fever, a model, high-burden, climate-sensitive vector-borne disease. For both vectors, vectorial capacity in locations where these vectors exist reached its highest or equal highest average level in 2015 during the period considered (figure 9). This consolidates a clear and significant increase in vectorial capacity starting in the late 1970s (3·0% and 6·0% increases in vectorial capacity compared with 1990 levels for A aegypti and A albopictus, respectively). Nearly all Aedes-positive countries showed relative increases in vectorial capacity for both vectors during the period considered (figure 9). Annual numbers of cases of dengue fever have doubled every decade since 1990, with 58·4 million apparent cases (95% CI 23·6 million–121·9 million) in 2013, accounting for more than 10 000 deaths and 1·14 million disability-adjusted life-years (95% CI 0·73 million–1·98 million).36 Climate change has been suggested as one potential contributor to this increase in burden.37 A aegypti and A albopictus also carry other important emerging or re-emerging arboviruses, including Yellow Fever, Chikungunya, Mayaro, and Zika viruses, which are probably similarly responsive to climate change.
Deat
hs p
er 1
00 0
00 p
opul
atio
n
600
800
1000
1400
1200
All causes
0
0·2
0·4
0·8
0·6
Dengue
0
50
150
100
Diarrhoeal disease
0
5
10
Forces of natureDe
aths
per
100
000
pop
ulat
ion
1990 2015
0
Year
1
2
3
Heat and cold exposure
1990 2015
0
Year
50
150
100
Malaria
1990 2015
0
Year
1
2
3
Malignant melanoma
1990 2015
0
Year
20
60
40
Protein–energy malnutrition
AfricaEurope
AmericasSoutheast Asia
Eastern MediterraneanWestern Pacific
Figure 7: Trends in mortality from selected causes of death, as estimated by the Global Burden of Disease Study 2015, by WHO region
247
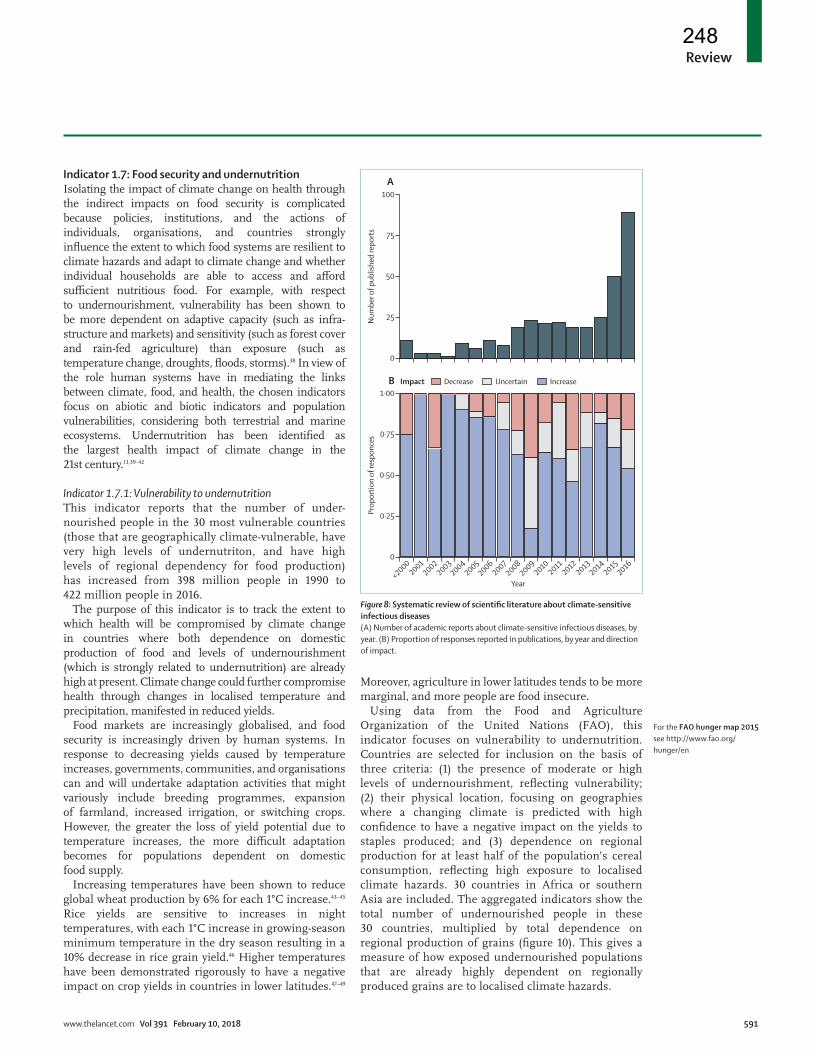
Review
www.thelancet.com Vol 391 February 10, 2018 591
Indicator 1.7: Food security and undernutritionIsolating the impact of climate change on health through the indirect impacts on food security is complicated because policies, institutions, and the actions of individuals, organisations, and countries strongly influence the extent to which food systems are resilient to climate hazards and adapt to climate change and whether individual households are able to access and afford sufficient nutritious food. For example, with respect to undernourishment, vulnerability has been shown to be more dependent on adaptive capacity (such as infra-structure and markets) and sensitivity (such as forest cover and rain-fed agriculture) than exposure (such as temperature change, droughts, floods, storms).38 In view of the role human systems have in mediating the links between climate, food, and health, the chosen indicators focus on abiotic and biotic indicators and population vulnerabilities, considering both terrestrial and marine ecosystems. Undernutrition has been identified as the largest health impact of climate change in the 21st century.13,39–42
Indicator 1.7.1: Vulnerability to undernutritionThis indicator reports that the number of under-nourished people in the 30 most vulnerable countries (those that are geographically climate-vulnerable, have very high levels of undernutriton, and have high levels of regional dependency for food production) has increased from 398 million people in 1990 to 422 million people in 2016.
The purpose of this indicator is to track the extent to which health will be compromised by climate change in countries where both dependence on domestic production of food and levels of undernourishment (which is strongly related to undernutrition) are already high at present. Climate change could further compromise health through changes in localised temperature and precipitation, manifested in reduced yields.
Food markets are increasingly globalised, and food security is increasingly driven by human systems. In response to decreasing yields caused by temperature increases, governments, communities, and organisations can and will undertake adaptation activities that might variously include breeding programmes, expansion of farmland, increased irrigation, or switching crops. However, the greater the loss of yield potential due to temperature increases, the more difficult adaptation becomes for populations dependent on domestic food supply.
Increasing temperatures have been shown to reduce global wheat production by 6% for each 1°C increase.43–45 Rice yields are sensitive to increases in night temperatures, with each 1°C increase in growing-season minimum temperature in the dry season resulting in a 10% decrease in rice grain yield.46 Higher temperatures have been demonstrated rigorously to have a negative impact on crop yields in countries in lower latitudes.47–49
Moreover, agriculture in lower latitudes tends to be more marginal, and more people are food insecure.
Using data from the Food and Agriculture Organization of the United Nations (FAO), this indicator focuses on vulnerability to undernutrition. Countries are selected for inclusion on the basis of three criteria: (1) the presence of moderate or high levels of undernourishment, reflecting vulnerability; (2) their physical location, focusing on geographieswhere a changing climate is predicted with highconfidence to have a negative impact on the yields tostaples produced; and (3) dependence on regionalproduction for at least half of the population’s cerealconsumption, reflecting high exposure to localisedclimate hazards. 30 countries in Africa or southernAsia are included. The aggregated indicators show thetotal number of undernourished people in these30 countries, multiplied by total dependence onregional production of grains (figure 10). This gives ameasure of how exposed undernourished populationsthat are already highly dependent on regionallyproduced grains are to localised climate hazards.
<20002002
20042006
20082010
20122014
20012003
20052007
20092011
20132015
2016
0N
umbe
r of p
ublis
hed
repo
rts
Year
25
50
75
100
0
Prop
ortio
n of
resp
once
s
0·25
0·50
0·75
1·00DecreaseImpact Uncertain Increase
A
B
Figure 8: Systematic review of scientific literature about climate-sensitive infectious diseases(A) Number of academic reports about climate-sensitive infectious diseases, by year. (B) Proportion of responses reported in publications, by year and direction of impact.
For the FAO hunger map 2015 see http://www.fao.org/hunger/en
248
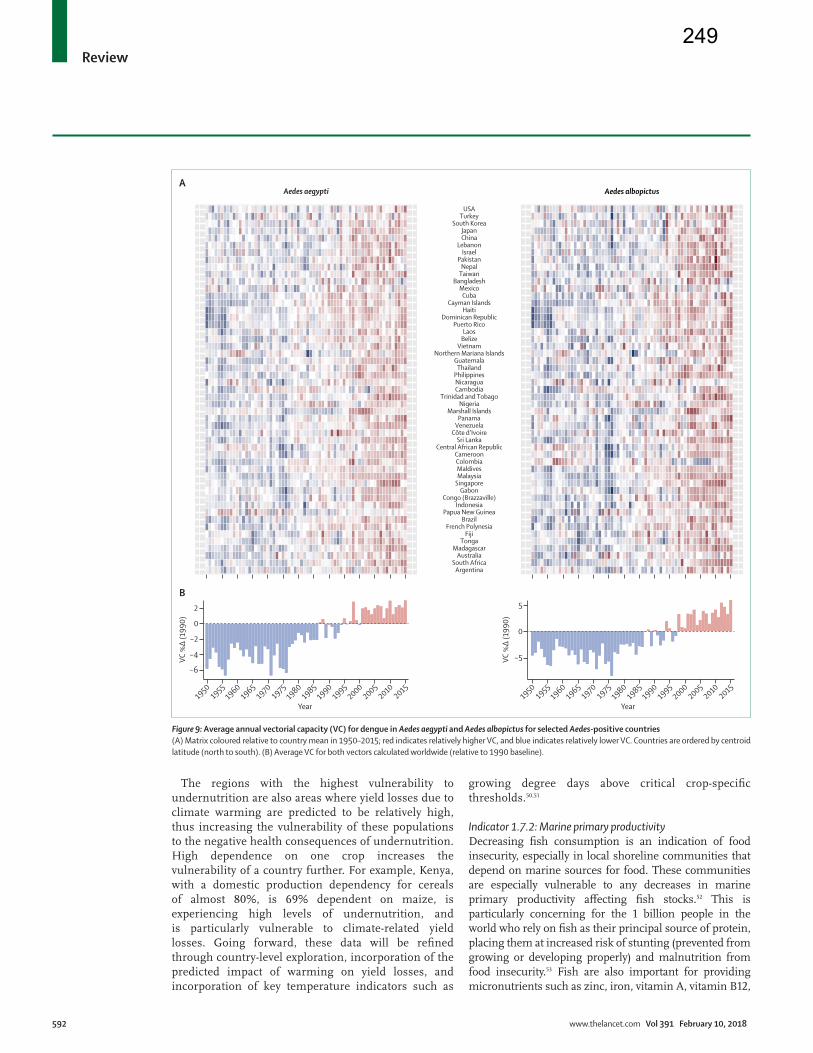
Review
592 www.thelancet.com Vol 391 February 10, 2018
The regions with the highest vulnerability to undernutrition are also areas where yield losses due to climate warming are predicted to be relatively high, thus increasing the vulnerability of these populations to the negative health consequences of undernutrition. High dependence on one crop increases the vulnerability of a country further. For example, Kenya, with a domestic pro duction dependency for cereals of almost 80%, is 69% dependent on maize, is experiencing high levels of under nutrition, and is particularly vulnerable to climate-related yield losses. Going forward, these data will be refined through country-level exploration, incorporation of the predicted impact of warming on yield losses, and incorporation of key temperature indicators such as
growing degree days above critical crop-specific thresholds.50,51
Indicator 1.7.2: Marine primary productivityDecreasing fish consumption is an indication of food insecurity, especially in local shoreline communities that depend on marine sources for food. These communities are especially vulnerable to any decreases in marine primary productivity affecting fish stocks.52 This is particularly concerning for the 1 billion people in the world who rely on fish as their principal source of protein, placing them at increased risk of stunting (prevented from growing or developing properly) and malnutrition from food insecurity.53 Fish are also important for providing micronutrients such as zinc, iron, vitamin A, vitamin B12,
19501955
19601965
19701975
19801985
19901995
20002005
20102015
19501955
19601965
19701975
19801985
19901995
20002005
20102015
Aedes aegypti
USATurkey
South KoreaJapanChina
LebanonIsrael
PakistanNepal
TaiwanBangladesh
MexicoCuba
Cayman IslandsHaiti
Dominican RepublicPuerto Rico
LaosBelize
VietnamNorthern Mariana Islands
GuatemalaThailand
PhilippinesNicaraguaCambodia
Trinidad and TobagoNigeria
Marshall IslandsPanama
VenezuelaCôte d’Ivoire
Sri LankaCentral African Republic
CameroonColombiaMaldivesMalaysia
SingaporeGabon
Congo (Brazzaville)Indonesia
Papua New GuineaBrazil
French PolynesiaFiji
TongaMadagascar
AustraliaSouth Africa
Argentina
Aedes albopictusA
B
VC %
Δ (1
990)
VC %
Δ (1
990)
Year Year
−6
−4
−2
0
2
−5
0
5
Figure 9: Average annual vectorial capacity (VC) for dengue in Aedes aegypti and Aedes albopictus for selected Aedes-positive countries(A) Matrix coloured relative to country mean in 1950–2015; red indicates relatively higher VC, and blue indicates relatively lower VC. Countries are ordered by centroid latitude (north to south). (B) Average VC for both vectors calculated worldwide (relative to 1990 baseline).
249
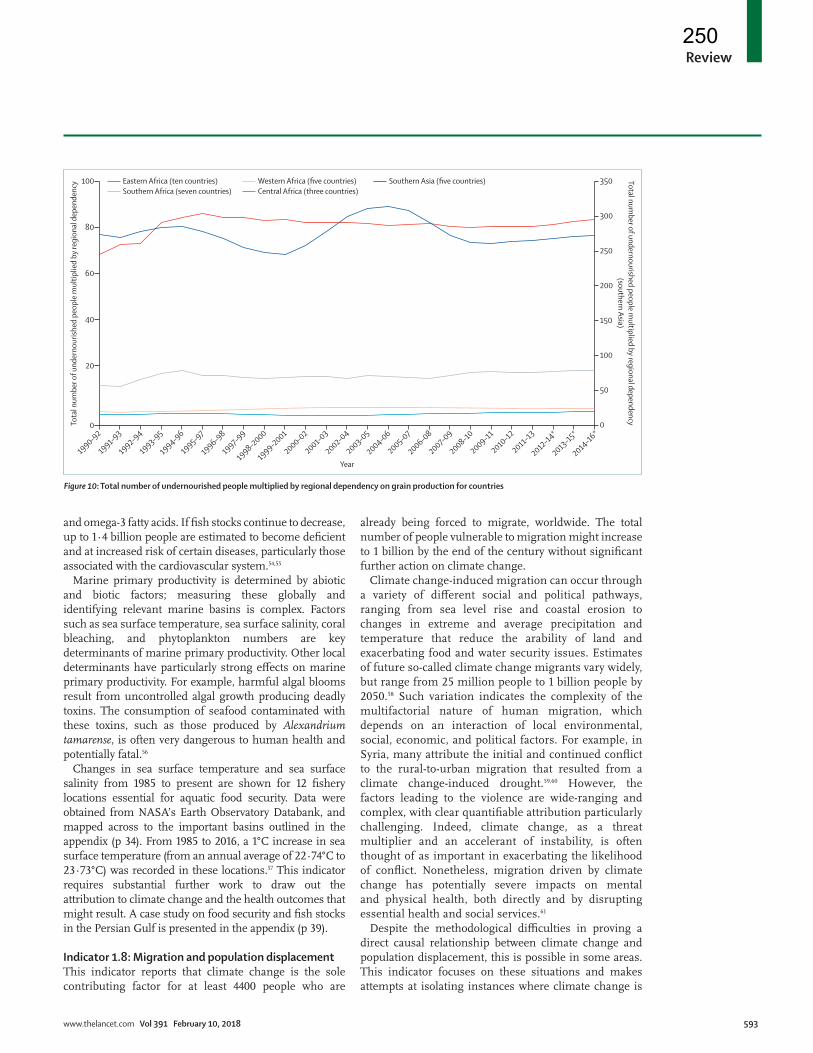
Review
www.thelancet.com Vol 391 February 10, 2018 593
and omega-3 fatty acids. If fish stocks continue to decrease, up to 1·4 billion people are estimated to become deficient and at increased risk of certain diseases, particularly those associated with the cardiovascular system.54,55
Marine primary productivity is determined by abiotic and biotic factors; measuring these globally and identifying relevant marine basins is complex. Factors such as sea surface temperature, sea surface salinity, coral bleaching, and phytoplankton numbers are key determinants of marine primary productivity. Other local determinants have particularly strong effects on marine primary productivity. For example, harmful algal blooms result from uncontrolled algal growth producing deadly toxins. The consumption of seafood contaminated with these toxins, such as those produced by Alexandrium tamarense, is often very dangerous to human health and potentially fatal.56
Changes in sea surface temperature and sea surface salinity from 1985 to present are shown for 12 fishery locations essential for aquatic food security. Data were obtained from NASA’s Earth Observatory Databank, and mapped across to the important basins outlined in the appendix (p 34). From 1985 to 2016, a 1°C increase in sea surface temperature (from an annual average of 22·74°C to 23·73°C) was recorded in these locations.57 This indicator requires substantial further work to draw out the attribution to climate change and the health outcomes that might result. A case study on food security and fish stocks in the Persian Gulf is presented in the appendix (p 39).
Indicator 1.8: Migration and population displacementThis indicator reports that climate change is the sole contributing factor for at least 4400 people who are
already being forced to migrate, worldwide. The total number of people vulnerable to migration might increase to 1 billion by the end of the century without significant further action on climate change.
Climate change-induced migration can occur through a variety of different social and political pathways, ranging from sea level rise and coastal erosion to changes in extreme and average precipitation and temperature that reduce the arability of land and exacerbating food and water security issues. Estimates of future so-called climate change migrants vary widely, but range from 25 million people to 1 billion people by 2050.58 Such variation indicates the complexity of the multifactorial nature of human migration, which depends on an interaction of local environmental, social, economic, and political factors. For example, in Syria, many attribute the initial and continued conflict to the rural-to-urban migration that resulted from a climate change-induced drought.59,60 However, the factors leading to the violence are wide-ranging and complex, with clear quantifiable attribution particularly challenging. Indeed, climate change, as a threat multiplier and an accelerant of instability, is often thought of as important in exacerbating the likelihood of conflict. Nonetheless, migration driven by climate change has potentially severe impacts on mental and physical health, both directly and by disrupting essential health and social services.61
Despite the methodological difficulties in proving a direct causal relationship between climate change and population displacement, this is possible in some areas. This indicator focuses on these situations and makes attempts at isolating instances where climate change is
1990–92
1991–93
1992–94
1993–95
1994–96
1995–97
1996–98
1997–99
1998–2000
1999–2001
2000–02
2001–03
2002–04
2003–05
2004–06
2005–07
2006–08
2007–09
2008–10
2009–11
2010–12
2011–13
2012–14*
2013–15*
2014–16*0To
tal n
umbe
r of u
nder
nour
ished
peo
ple
mul
tiplie
d by
regi
onal
dep
ende
ncy Total num
ber of undernourished people multiplied by regional dependency
(southern Asia)
Year
40
20
60
80
100
150
200
250
350
100
50
0
300
Eastern Africa (ten countries)Southern Africa (seven countries)
Western Africa (five countries)Central Africa (three countries)
Southern Asia (five countries)
Figure 10: Total number of undernourished people multiplied by regional dependency on grain production for countries
250
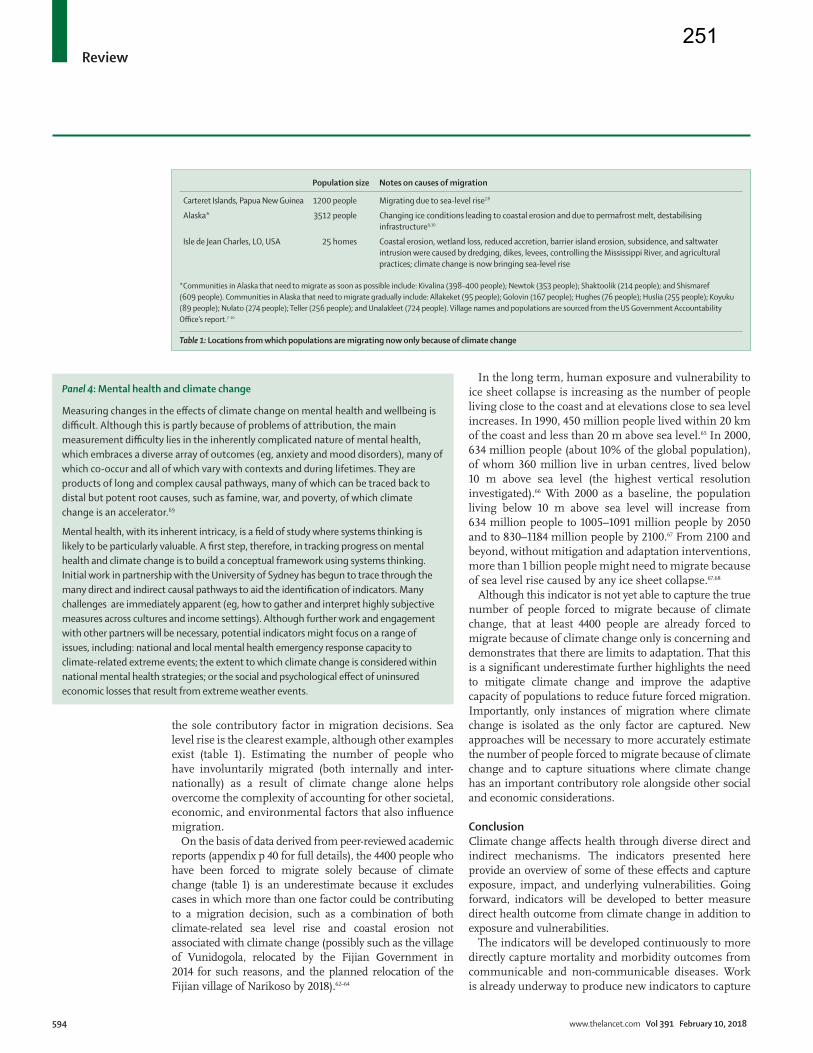
Review
594 www.thelancet.com Vol 391 February 10, 2018
the sole contributory factor in migration decisions. Sea level rise is the clearest example, although other examples exist (table 1). Estimating the number of people who have involuntarily migrated (both internally and inter-nationally) as a result of climate change alone helps overcome the complexity of accounting for other societal, economic, and environmental factors that also influence migration.
On the basis of data derived from peer-reviewed academic reports (appendix p 40 for full details), the 4400 people who have been forced to migrate solely because of climate change (table 1) is an underestimate because it excludes cases in which more than one factor could be contributing to a migration decision, such as a combination of both climate-related sea level rise and coastal erosion not associated with climate change (possibly such as the village of Vunidogola, relocated by the Fijian Government in 2014 for such reasons, and the planned relocation of the Fijian village of Narikoso by 2018).62–64
In the long term, human exposure and vulnerability to ice sheet collapse is increasing as the number of people living close to the coast and at elevations close to sea level increases. In 1990, 450 million people lived within 20 km of the coast and less than 20 m above sea level.65 In 2000, 634 million people (about 10% of the global population), of whom 360 million live in urban centres, lived below 10 m above sea level (the highest vertical resolution investigated).66 With 2000 as a baseline, the population living below 10 m above sea level will increase from 634 million people to 1005–1091 million people by 2050 and to 830–1184 million people by 2100.67 From 2100 and beyond, without mitigation and adaptation interventions, more than 1 billion people might need to migrate because of sea level rise caused by any ice sheet collapse.67,68
Although this indicator is not yet able to capture the true number of people forced to migrate because of climate change, that at least 4400 people are already forced to migrate because of climate change only is concerning and demonstrates that there are limits to adaptation. That this is a significant underestimate further highlights the need to mitigate climate change and improve the adaptive capacity of populations to reduce future forced migration. Importantly, only instances of migration where climate change is isolated as the only factor are captured. New approaches will be necessary to more accurately estimate the number of people forced to migrate because of climate change and to capture situations where climate change has an important contributory role alongside other social and economic considerations.
ConclusionClimate change affects health through diverse direct and indirect mechanisms. The indicators presented here provide an overview of some of these effects and capture exposure, impact, and underlying vulnerabilities. Going forward, indicators will be developed to better measure direct health outcome from climate change in addition to exposure and vulnerabilities.
The indicators will be developed continuously to more directly capture mortality and morbidity outcomes from communicable and non-communicable diseases. Work is already underway to produce new indicators to capture
Panel 4: Mental health and climate change
Measuring changes in the effects of climate change on mental health and wellbeing is difficult. Although this is partly because of problems of attribution, the main measurement difficulty lies in the inherently complicated nature of mental health, which embraces a diverse array of outcomes (eg, anxiety and mood disorders), many of which co-occur and all of which vary with contexts and during lifetimes. They are products of long and complex causal pathways, many of which can be traced back to distal but potent root causes, such as famine, war, and poverty, of which climate change is an accelerator.69
Mental health, with its inherent intricacy, is a field of study where systems thinking is likely to be particularly valuable. A first step, therefore, in tracking progress on mental health and climate change is to build a conceptual framework using systems thinking. Initial work in partnership with the University of Sydney has begun to trace through the many direct and indirect causal pathways to aid the identification of indicators. Many challenges are immediately apparent (eg, how to gather and interpret highly subjective measures across cultures and income settings). Although further work and engagement with other partners will be necessary, potential indicators might focus on a range of issues, including: national and local mental health emergency response capacity to climate-related extreme events; the extent to which climate change is considered within national mental health strategies; or the social and psychological effect of uninsured economic losses that result from extreme weather events.
Population size Notes on causes of migration
Carteret Islands, Papua New Guinea 1200 people Migrating due to sea-level rise7,8
Alaska* 3512 people Changing ice conditions leading to coastal erosion and due to permafrost melt, destabilising infrastructure9,10
Isle de Jean Charles, LO, USA 25 homes Coastal erosion, wetland loss, reduced accretion, barrier island erosion, subsidence, and saltwater intrusion were caused by dredging, dikes, levees, controlling the Mississippi River, and agricultural practices; climate change is now bringing sea-level rise
*Communities in Alaska that need to migrate as soon as possible include: Kivalina (398–400 people); Newtok (353 people); Shaktoolik (214 people); and Shismaref (609 people). Communities in Alaska that need to migrate gradually include: Allakeket (95 people); Golovin (167 people); Hughes (76 people); Huslia (255 people); Koyuku (89 people); Nulato (274 people); Teller (256 people); and Unalakleet (724 people). Village names and populations are sourced from the US Government Accountability Office’s report.7–10
Table 1: Locations from which populations are migrating now only because of climate change
251

Review
www.thelancet.com Vol 391 February 10, 2018 595
these concepts for future reports. One such ongoing process is focusing on mental health and climate change (panel 4).
Adaptation pathways can help to minimise some of the negative health impacts of global warming, especially for the lower range of projected average temperature rises. However, there are powerful limits to adaptation, and we have drawn attention to the non-linearity and the spatial distribution of the health impacts of climate change. The indicators demonstrate clearly that these impacts are experienced in all parts of the world today and provide a strong imperative for both adaptation and mitigation interventions to protect and promote public health.
Section 2: Adaptation, planning, and resilience for healthClimate change adaptation is defined by the Inter-governmental Panel on Climate Change as the “adjustment in natural or human systems in response to actual or expected climatic stimuli or their effects, which moderates harm or exploits beneficial opportunities”.70 With respect to health, adaptation consists of efforts to reduce injury, illness, disability, and suffering from climate-related causes. Resilience has been defined by the Rockefeller Foundation as “the capacity of individuals, communities, and systems to survive, adapt, and grow in the face of stress and shocks, and even transform when conditions require it”.71 In the context of climate change and health, resilience is an attribute of individuals, communities, and health-care systems; resilience at all levels can reduce adverse health outcomes of climate change and should be a goal of adaptation planning.
Identifying indicators of resilience and adaptation is challenging. Resilience is related to, but not synonymous with, preparedness, response, resource management, and coordination capacity. Understanding the resilience of a population’s health and health systems at present provides some indication of resilience to climate change, although direct indicators measuring this have not yet been developed by the Lancet Countdown. The indicators presented here are predominantly process-based, focusing on health adaptation planning, capacity, and response. Although the underlying resilience of communities is present to some extent in all indicators in this section, it is currently only captured directly for health systems. Most indicators that follow will therefore focus more specifically on health adaptation.
We have identified six indicators. Headline findings for all indicators are provided at the beginning of each indicator; detailed discussion of the data and methods used is available in the appendix (p 49).
Indicator 2.1: National adaptation plans for healthThis indicator reports that 30 out of 40 countries responding to the survey have a national health adaptation plan or strategy approved by the relevant national health authority.
Effective national responses to climate risks require that the health sector identify strategic goals in response to anticipated and unanticipated threats. A crucial step in achieving these strategic goals is developing national health adaptation plans and outlining priority actions, resource requirements, and a specific timeline and process for implementation. This indicator tracks the policy commitments of national governments for health and climate change adaptation, and data are drawn from the recent WHO Climate and Health Country Survey (panel 5).
Of the 40 countries responding to the survey, 30 reported having a national adaptation strategy for health approved by their Ministry of Health or relevant health authority (figure 11). Among these 30 countries are countries with a health component of their National Adaptation Plan, which was established by the UNFCCC to help nations identity medium-term and long-term adaptation needs and develop and implement programmes to address those needs.72 There is a need for caution in extrapolating the results to global level because many of the respondent countries have received support from WHO in developing and implementing their plans.73,74 Nonetheless, with 75% of respondents in the survey having an approved national health adaptation plan, there is evidence that the need to adapt to climate change is recognised. Countries with national health adaptation plans are found in all regions and, perhaps most importantly, include some of the most vulnerable countries in Africa, southeast Asia, and South America. In future iterations of the survey, data
Panel 5: WHO—United Nations Framework Convention on Climate Change (UNFCCC) Climate and Health Country Profile project
The WHO–UNFCCC Climate and Health Country Profile Project forms the foundation of WHO’s national level provision of information and monitoring of progress in this field. The profiles, developed in collaboration with ministries of health and other health determining sectors, support evidence-based decision making to strengthen the climate resilience of health systems and promote actions that improve health while reducing carbon emissions. In part, the data used in the development of the climate and health country profiles are collected through a biennial WHO Climate and Health Country Survey. Data from this survey are reported on for Indicators 2.1, 2.5, and 2.6.
The 2015 baseline survey findings for 40 responding nations are presented in this report (a complete list of country respondents is provided in the appendix, p 49). The findings include countries from all WHO regions (high-income, middle-income, and low-income groups) and with varying levels of risks and vulnerabilities to the health effects of climate change. The 2015 survey data were validated as part of the national consultation process seeking input on respective WHO–UNFCCC Climate and Health Country Profiles from key in-country stakeholders, including representatives of the ministry of health, ministry of environment, meteorological services, and WHO country and regional technical officers.
The validated data presented in this report tended to include many countries that are actively working on climate and health with WHO; as such, the results here are indicative and are not meant to be inferred as an exact indicator of global status. The number of country respondents is expected to double in subsequent iterations of the survey. As such, the results represent the beginning of the development of a more comprehensive survey and offer insights to findings at the start of this process.
For the UNFCCC’s National Adaptation Plans see http://unfccc.int/adaptation/workstreams/national_adaptation_plans/items/6057.php
252

Intentionally Left Blank
253

Review
www.thelancet.com Vol 391 February 10, 2018 613
self-reported estimates of emissions, but this reporting is rarely standardised across sites. We will continue our work on developing a standardised indicator on health-care sector emissions for future reports.
ConclusionThe indicators presented in this section have provided an overview of activities in energy, transport, food, and health-care sectors that are relevant to mitigating the effects of climate change on public health. They have been selected for their relevance to both climate change and human health and wellbeing.
A number of areas show remarkable promise, each of which should yield impressive benefits for human health. However, these positive examples must not distract from the enormity of the task at hand. The indicators presented in this section serve as a reminder of the scale and scope of increased ambition required to meet commitments under the Paris Agreement. They demonstrate a world that is only just beginning to respond to climate change and hence only just unlocking the opportunities available for better health.
Section 4: Finance and economicsInterventions to protect human health from climate change have been presented above. In this section, we focus on the economic and financial mechanisms necessary for these interventions to be implemented and their implications. Some of the indicators do not have an explicit link to human health, and yet increasing investment in renewable energy and decreasing investment in coal capacity, for instance, are essential in displacing fossil fuels and reducing their two principal externalities: the social cost of climate change and the health costs from air pollution. Other indicators, such as economic and social losses from extreme weather events, have more explicit links to human wellbeing.
In the 2006 Stern Review on the Economics of Climate Change,156 the impacts of climate change were estimated to cost the equivalent of reducing annual global gross world product (GWP; the sum of global economic output) by “5–20% now, and forever”, compared with a world without climate change. In their Fifth Assessment Report, the Intergovernmental Panel on Climate Change estimates an aggregate loss of up to 2% of GWP even if the rise in global mean temperatures is limited to 2·5°C above pre-industrial levels.22 However, such estimates depend on numerous assumptions such as the rate at which future costs and benefits are discounted. Furthermore, existing analytical approaches are poorly suited to producing estimates of the economic impact of climate change, and hence their magnitude is probably greatly underestimated.157,158 In view of such uncertainty, with potentially catastrophic outcomes, risk minimisation through stringent emission reduction seems the sensible course of action.
The ten indicators in this section seek to track flows of finance and impacts on the economy and social welfare resulting from action (and inaction) on climate change. These indicators fall into four broad themes: investing in a low-carbon economy; the economic benefits of tackling climate change; pricing greenhouse gas emissions from fossil fuels; and adaptation financing. Headline findings for all indicators are provided at the beginning of each indicator; additional detailed disussion of the data and methods used is available in the appendix (p 73).
Indicator 4.1: Investments in zero-carbon energy and energy efficiencyThis indicator reports that proportional investment in renewable energy and energy efficiency increased in 2016, whereas absolute and proportional investment in fossil fuels decreased and, crucially, ceased to account for most annual investments in the global energy system.
This indicator tracks the level of global investment in zero-carbon energy and energy efficiency in absolute terms and as a proportion of total energy-system investment. In 2015, total investment in the energy system was around $1·83 trillion (in US$2016), accounting for 2·4% of GWP (figure 31).159,160 19% of this investment went to renewables and nuclear energy, and 12% of this investment was for energy efficiency. Most investment (54%) was in fossil fuel infrastructure. Electricity networks accounted for the remaining 15%. In 2016, total investment in the energy system reduced to around $1·68 trillion, accounting for 2·2% of GWP. Although the absolute value of investment in renewables and nuclear energy reduced slightly in absolute (real) terms, its proportional contribution increased to 20% of total investment. Investment in energy efficiency
2015 2016
984
825
266 277
223 231
353 342
0
US$2
016
billi
on
Year
200
400
600
800
1000
1200
1400
1600
1800
2000Renewables and nuclear Energy efficiency
Electricity networksFossil fuels
Figure 31: Annual investment in the global energy system
254

Review
614 www.thelancet.com Vol 391 February 10, 2018
increased in both absolute and proportional terms to 14% of total investment. Fossil fuel infrastructure suffered a substantial reduction in investment, ceasing to account for the majority of investment (at 49%). Such trends broadly represent a continuation of the trends seen between 2014 and 2015.161
Investment in renewables and nuclear energy is driven by renewable electricity capacity (with more than 87% of investment by value in this category in 2016). This, in turn, is largely driven by investments in solar photovoltaic power and onshore wind. Solar photovoltaic capacity additions in 2016 were 50% higher than in 2015 (reaching a record high of 73 gigawatts). This development was driven by new capacity in China, the USA, and India, but it was coupled with just a 20% increase in investment that resulted from a 20% reduction in the cost of solar photovoltaic units. By contrast, investments in onshore wind decreased by around 20% between 2015 and 2016, largely because of changes to incentive schemes and increased wind power curtailment rates in China. The increase in energy efficiency investment was driven by policies that shifted markets towards more energy-efficient goods (eg, appliances and lighting) and buildings (along with the expansion of the construction industry) and an increase in the sales of energy-efficient (and low-carbon) vehicles. Europe accounted for the largest proportion of spending on energy efficiency (30%), followed by China (27%). This change in spending was driven by efficiency investments in the buildings and transport sectors.160
The substantially reduced investment in fossil fuel infrastructure, both upstream (eg, mining, drilling, and pipelines, which dominate fossil fuel investment) and downstream (eg, fossil fuel power plants), is driven by a combination of low (and decreasing) fossil fuel prices and cost reductions (particularly upstream, which have on average decreased by 30% since 2014).160
To hold a 66% probability of remaining within 2°C of global warming, average annual investments in the energy system must reach $3·5 trillion between 2016 and 2050, with renewable energy investments increasing by more than 150% and energy efficiency increasing by around a factor of ten.162
Indicator 4.2: Investment in coal capacityThis indicator reports that, although investment in coal capacity has increased since 2006, in 2016 this trend turned and investment has decreased substantially.
Coal combustion is the most CO2-intensive method of generating of electricity.163 This indicator tracks annual investment in coal-fired power capacity.
Global investment in coal-fired electricity capacity generally increased from 2006 to 2012, before returning to 2006 levels in 2013–14 and rebounding to more than 40% above this level in 2015 (figure 32). This rapid growth was driven principally by China, which increased investment in coal-fired power capacity by 60% from 2014, representing half of all new global coal capacity in 2015 (with investment in India and other Asian non-OECD countries also remaining high).161 The subsequent reduction in investment in 2016 was similarly driven by reduced investment in China because of overcapacity in generation, concerns about local air pollution, and new government measures to reduce new capacity additions and halt the construction of some plants already in progress.160
Indicator 4.3: Funds divested from fossil fuelsThis indicator reports that the Global Value of Funds Committing to Divestment in 2016 was $1·24 trillion, of which Health Institutions was $2·4 billion; this represents a cumulative sum of $5·45 trillion (with health accounting for $30·3 billion).
The fossil fuel divestment movement seeks to encourage institutions and investors to divest themselves of assets involved in the extraction of fossil fuels. Some organisations have made a binding commitment to divest from coal companies, whereas others have fully divested from any investments in fossil fuel companies and have committed to avoiding such investments in the future. Proponents cite divestment as embodying both a moral purpose (eg, reducing the fossil fuel industry’s so-called social licence to operate) and an economic risk-reduction strategy (eg, reducing the investor’s exposure to the risk of stranded assets). However, others believe active engagement between investors and fossil fuel businesses is a more appropriate course of action (eg, encouraging diversification into less carbon-intensive assets through stakeholder resolutions).164
This indicator tracks the global total value of funds committing to divestment in 2016 ($1·24 trillion) and the value of funds committed to divestment by health institutions in 2016 ($2·4 billion). The values presented above are calculated from data collected and provided
2006 2007 2008 2009 2010 2011 2012 2013 2014 2015 201660
Inde
x of g
loba
l inv
estm
ent i
n co
al-fi
red
pow
er ca
pacit
y
Year
70
80
90
100
110
120
130
140
150
Figure 32: Annual investment in coal-fired power capacity from 2006 to 2016An index score of 100 corresponds to 2006 levels. Source: International Energy Agency.
255

Review
www.thelancet.com Vol 391 February 10, 2018 615
by 350.org. They represent the total assets (or assets under management) for institutions that have committed to divest in 2016 and thus do not directly represent the sums divested from fossil fuel companies. They also only include those institutions for which such information is publicly available (or provided by the institution itself ), with non-US$ values converted using the market exchange rate when the commitment was made.
By the end of 2016, 694 organisations with cumulative assets worth at least $5·45 trillion, including 13 health organisations with assets of at least $30·3 billion, had committed to divestment. From the start of January, 2017, to the end of March, 2017, a further 12 organisations with assets worth $46·87 billion joined this total (including Australia’s Hospitals Contribution Fund, with assets of $1·45 billion).
Indicator 4.4: Economic losses due to extreme climate-related eventsThis indicator reportst that in 2016, a total of 797 events resulted in $129 billion in overall economic losses, with 99% of losses in low-income countries uninsured.
Climate change will continue to increase the frequency and severity of meteorological (tropical storms), climatological (droughts), and hydrological (flooding) phenomena across the world. As demonstrated by indicator 1·4, the number of weather-related disasters has increased in recent years. The number of people affected and the economic costs
associated with this increase are expected to have risen. This indicator tracks the number of events and the total economic losses (insured and uninsured) resulting from such events. In addition to the health impacts of these events, economic losses (particularly uninsured losses) have potentially devastating impacts on wellbeing and mental health.165
The data upon which this indicator is based were sourced from Munich Re’s NatCatSERVICE. Economic losses (insured and uninsured) refer to the value of physical assets and do not include the economic value of loss of life or ill health, or of health and casualty insurance. Values are first denominated in local currency, converted to US$ using the market exchange rate in the month the event occurred, and inflated to US$2016 using country-specific Consumer Price Indices. This indicator and underlying data do not seek to attribute events and economic losses to climate change per se but might plausibly be interpreted as showing how climate change is changing the frequency and severity of these events.
An annual average of 700 events resulted in an annual average of $127 billion in overall economic losses per year between 2010 and 2016 (figure 33). Around two-thirds of the recorded events and around 90% of economic losses were in upper-middle and high-income countries, with less than 1% attributable to low-income countries. The same ratios for the number of events and economic losses between income groups are present in the data for 1990–2016, despite an increasing trend in the
Low
inco
me
Low
er-m
iddl
e
Uppe
r-mid
dle
Hig
h in
com
e
Low
inco
me
Low
er-m
iddl
e
Uppe
r-mid
dle
Hig
h in
com
e
Low
inco
me
Low
er-m
iddl
e
Uppe
r-mid
dle
Hig
h in
com
e
Low
inco
me
Low
er-m
iddl
e
Uppe
r-mid
dle
Hig
h in
com
e
Low
inco
me
Low
er-m
iddl
e
Uppe
r-mid
dle
Hig
h in
com
e
Low
inco
me
Low
er-m
iddl
e
Uppe
r-mid
dle
Hig
h in
com
e
Low
inco
me
Low
er-m
iddl
e
Uppe
r-mid
dle
Hig
h in
com
e0
Econ
omic
loss
es (U
S$/$
1000
GDP
, US$
2016
)
2010 2011 2012 2013 2014 2015 2016
20
40
60
80
100
120
140 Insured lossesUninsured losses
Figure 33: Economic losses from climate-related events—absoluteInsured and uninsured economic losses resulting from all large meteorological, climatological, and hydrological events across the world, by country income group. GDP=gross domestic product.
For 350.org see https://350.org/
For the NatCatSERVICE see https://www.munichre.com/en/reinsurance/business/non-life/natcatservice/index.html
256

Review
616 www.thelancet.com Vol 391 February 10, 2018
total global number of events and associated total value of economic losses during this period.
However, the data do not indicate the relative scale of impacts across different income groups. For example, although most economic losses have occurred in upper-middle and high-income countries, these countries are among the most populous, with more economically valuable property and infrastructure (in absolute terms). A rather different picture emerges when data are analysed in terms of intensity (insured and uninsured economic losses per $1000 gross domestic product [GDP]; figure 34).
Between 2010 and 2016, high-income and upper-middle-income countries had the lowest average annual economic loss as a proportion of GDP ($1·45/$1000 GDP and $1·95/$1000 GDP, respectively), with low-income and lower-middle-income countries subject to somewhat higher values ($2·65/$1000 GDP and $2·3/$1000 GDP, respectively). Economic losses in low-income countries were more than three times higher in 2016 than in 2010. However, for the period 1990–2016, average annual values vary substantially (full dataset included in the appendix p 77). Although high-income and upper-middle income countries maintain relatively similar values ($1·60/$1000 GDP and $2·9/$1000 GDP, respectively), average annual economic losses in low-income and lower-middle income countries increase substantially (to $10·95/$1000 GDP and $4·22/$1000 GDP, respectively).
On average, economic loss as a proportion of GDP is greater in low-income countries than in high-income countries. However, a more striking result is the
difference in the proportion of economic losses that are uninsured. In high-income countries, on average around half of economic losses experienced are insured. This share drops rapidly to less than 10% in upper-middle income countries, and to much less than 1% in low-income countries. From 1990 to 2016, uninsured losses in low-income countries were on average equivalent to more than 1·5% of their GDP. By contrast, according to Global Health Observatory data, expenditure on health care in low-income countries on average for the period 1995–2015 was equivalent to 5·3% of GDP.
Indicator 4.5: Employment in low-carbon and high-carbon industriesThis indicator reports that in 2016, global employment in renewable energy reached 9·8 million people, with employment in fossil fuel extraction trending downwards to 8·6 million people.
The generation and presence of employment oppor-tunities in low-carbon and high-carbon industries have important health implications, both in terms of the safety of the work environment itself and financial security for individuals and communities. As the low-carbon transition gathers pace, high-carbon industries and jobs will decline. A clear example is seen in fossil fuel extraction. Some fossil fuel extraction activities, such as coal mining, have substantial impacts on human health. In 2008, coal mining accidents led to more than 1000 deaths in China alone (a rapid decrease from nearly 5000 deaths in 2003), with exposure to particulate matter and harmful pollutants responsible for elevated incidence
Low
inco
me
Low
er-m
iddl
e
Uppe
r-mid
dle
Hig
h in
com
e
Low
inco
me
Low
er-m
iddl
e
Uppe
r-mid
dle
Hig
h in
com
e
Low
inco
me
Low
er-m
iddl
e
Uppe
r-mid
dle
Hig
h in
com
e
Low
inco
me
Low
er-m
iddl
e
Uppe
r-mid
dle
Hig
h in
com
e
Low
inco
me
Low
er-m
iddl
e
Uppe
r-mid
dle
Hig
h in
com
e
Low
inco
me
Low
er-m
iddl
e
Uppe
r-mid
dle
Hig
h in
com
e
Low
inco
me
Low
er-m
iddl
e
Uppe
r-mid
dle
Hig
h in
com
e0
Econ
omic
loss
es (U
S$/$
1000
GDP
, US$
2016
)
2010 2011 2012 2013 2014 2015 2016
1
2
3
4
5
6 Insured lossesUninsured losses
Figure 34: Economic losses from climate-related events—intensityGDP=gross domestic product.
257


258
Introduction
Climate change is the biggest global health threat of the 21st century,1 and tackling it could be our greatest health opportunity.2 In this era of strained ecological systems, is clear that our ability to optimize Planetary Health, defined as “the health of human civilization and the natural systems upon which it depends,”3 will define wellness globally for generations to come.
This briefing, launched in parallel with the 2018 International Lancet Countdown on Health and Climate Change, focuses on the links between climate change and health, and their implications for Canadian policymakers. It has been developed in conjunction with the Canadian Medical Association and the Canadian Public Health Association, and draws on data provided by the Lancet Countdown to make evidence-informed recommendations.
Acknowledgements
The concept of this brief was developed by the Lancet Countdown on Health and Climate Change. This brief was written by Courtney Howard, MD; Caren Rose, PhD; and Nicholas Rivers, PhD. Scientific review was provided by Peter Berry, PhD and colleagues from Health Canada. Edits and review were provided by (alphabetical): Owen Adams, PhD; Sandra Allison, MD, MPH; Michael Brauer, ScD; Ian Culbert, Ashlee Cunsolo, PhD; Ian Hamilton, PhD; Trevor Hancock MB, BS, MHSc, HonFFPH; Katie Hayes, MA; Margot Parkes, MD, MBChB, MAS, PhD; Kim Perrotta, MSc; Andre Picard; Bora Plumptre, MSc; Robert Rattle, BSc; and Joe Vipond, MD. Contributions and review on behalf of the Lancet Countdown were provided by Dr Nick Watts.
Strategic Partners
259

About the Lancet CountdownThe “Lancet Countdown: Tracking Progress on Health and Climate Change” is a global, interdisciplinary research collaboration between 27 academic institutions and inter-governmental organizations. It monitors progress on the relationships between health and climate, and their implications for national governments, reporting annually. The 2018 report presents data on 41 indicators selected following a consultation process in 2017. These span 5 domains, from health impacts and adaptation, to mitigation and the economic and political drivers of response.2
About the Canadian Medical AssociationThe Canadian Medical Association (CMA) unites physicians on national health and medical matters. Formed in Quebec City in 1867, the CMA’s rich history of advocacy led to some of Canada’s most important health policy changes. As we look to the future, the CMA will focus on advocating for a healthy population and a vibrant profession.
About the Canadian Public Health Association The Canadian Public Health Association (CPHA) is a national, independent, non-governmental organization that advances public health education, research, policy and practice in Canada and around the world through the Canadian Journal of Public Health, position statements, discussion documents and other resources.
260

Recommendations for 2018
Recommendation 1Coordinate federal governmental departments, local governments and national institutions to standardize surveillance and reporting of heat-related illness and deaths; develop knowledge translation strategies to inform the public about the threat of heatwaves to health; and generate a clinical and public health response plan that minimizes the health impacts of heat now, and anticipates worsening impacts to come as climate change progresses.
Recommendation 2Rapidly integrate climate change and health into the curriculum of all medical and health sciences faculties.
Recommendation 3Increase ambition in reducing greenhouse gas emissions and air pollution in Canada and twin this with an emphasis on Just Transition Policies to support an equitable transition for people who work in the fossil fuel industry as the energy economy transforms.
Recommendation 4Phase out coal-powered electricity in Canada by 2030 or sooner, with a minimum of two thirds of the power replaced by non-emitting sources, and any gap made up by lowest-emitting natural gas technology in a system designed to minimize fugitive methane emissions.
Recommendation 5 Apply carbon pricing instruments as soon and as broadly as possible, enhancing ambition gradually in a predictable manner, and integrate study of resulting air pollution-related health and healthcare impacts into ongoing policy decisions.
261

Recommendation 6Ensure consistent, pro-active external communications by health-related organizations pointing out the links between climate change and health impacts in real time as events that have been shown to be increasing due to climate change (e.g. heat waves, spread of tick-borne disease, wildfires, extreme weather) occur.
Recommendation 7Fund increased study into the mental health impacts of climate change and psychosocial adaptation opportunities.
262

Key Messages from the 2018 International Lancet Countdown Report• Present day changes in labour capacity, vector-borne disease, and food security provide early
warning of compounded and overwhelming impacts expected if temperature continues to rise. Trends in climate change impacts, exposures, and vulnerabilities demonstrate an unacceptably high level of risk for the current and future health of populations across the world.
• A lack of progress in reducing emissions and building adaptive capacity threatens both human lives and the viability of the national health systems they depend on, with the potential to disrupt core public health infrastructure and overwhelm health services.
• Despite these delays, trends in a number of sectors are breathing life in to the beginning of a low-carbon transition, and it is clear that the nature and scale of the response to climate change will be the determining factor in shaping the health of nations for centuries to come.
• Ensuring a widespread understanding of climate change as a central public health issue will be vital in delivering an accelerated response, with the health profession beginning to rise to this challenge.2
Figure 1: Health Impacts of Climate Change. Credit: M.Lee for the US Lancet Countdown Brief
263
Overview of the Health Impacts of Climate Change in Canada
Though Canada’s well-developed healthcare and public health system provides advantages in terms of initial adaptation to climate change, as a circumpolar country it contains some of the most rapidly-warming areas in the world: observed temperatures in Inuvik, Northwest Territories have increased by 3°C in the past 50 years.4
Rapid change in the Arctic is already increasing health risks from food insecurity due to decreased access to traditional foods,5, 6 decreased safety of ice-based travel, and mental health impacts from changed landscapes.7,8
Health concerns in the rest of Canada vary by region, but include increased heat stroke and death;6,9 more intense and prolonged pollen seasons with the potential to cause additional hay fever and asthma exacerbations;6 trauma, post-traumatic stress disorder and displacement from wildfire and floods;10-12 spread of Lyme disease;13,14 cardiorespiratory impacts from worsening air pollution due to wildfires,15 and increased ground-level ozone.6
Milder winters and increased precipitation in parts of the country could potentially improve agricultural yields, and thus reduce food insecurity, but this is balanced by the possibility of crop-damaging severe weather and drought in other areas.16 There is an increased risk of water-borne disease following changed precipitation patterns, and of greater exposure to higher levels of ultraviolet radiation.6 The potential for ‘tipping cascades’ makes the risk of rapid and dramatic climate change impacts more difficult to predict and more likely.17
264
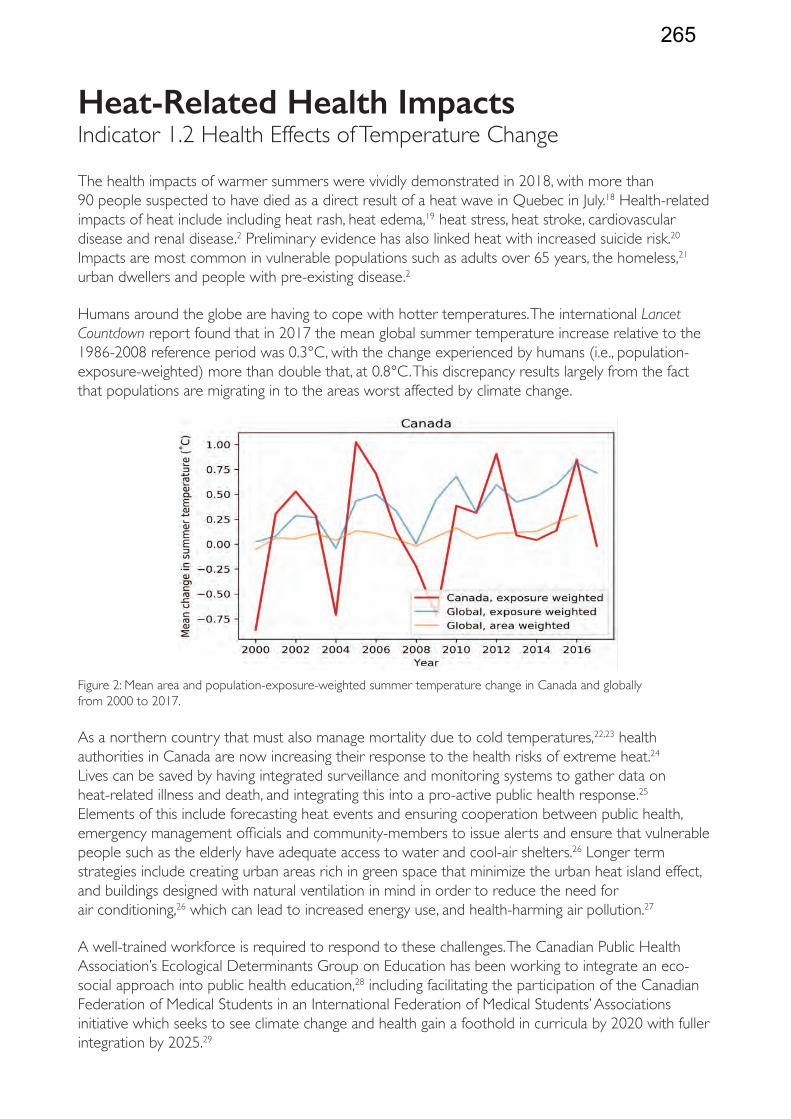
The health impacts of warmer summers were vividly demonstrated in 2018, with more than 90 people suspected to have died as a direct result of a heat wave in Quebec in July.18 Health-related impacts of heat include including heat rash, heat edema,19 heat stress, heat stroke, cardiovascular disease and renal disease.2 Preliminary evidence has also linked heat with increased suicide risk.20 Impacts are most common in vulnerable populations such as adults over 65 years, the homeless,21 urban dwellers and people with pre-existing disease.2
Humans around the globe are having to cope with hotter temperatures. The international Lancet Countdown report found that in 2017 the mean global summer temperature increase relative to the 1986-2008 reference period was 0.3°C, with the change experienced by humans (i.e., population-exposure-weighted) more than double that, at 0.8°C. This discrepancy results largely from the fact that populations are migrating in to the areas worst affected by climate change.
Figure 2: Mean area and population-exposure-weighted summer temperature change in Canada and globally from 2000 to 2017.
As a northern country that must also manage mortality due to cold temperatures,22,23 health authorities in Canada are now increasing their response to the health risks of extreme heat.24 Lives can be saved by having integrated surveillance and monitoring systems to gather data on heat-related illness and death, and integrating this into a pro-active public health response.25 Elements of this include forecasting heat events and ensuring cooperation between public health, emergency management officials and community-members to issue alerts and ensure that vulnerable people such as the elderly have adequate access to water and cool-air shelters.26 Longer term strategies include creating urban areas rich in green space that minimize the urban heat island effect, and buildings designed with natural ventilation in mind in order to reduce the need for air conditioning,26 which can lead to increased energy use, and health-harming air pollution.27
A well-trained workforce is required to respond to these challenges. The Canadian Public Health Association’s Ecological Determinants Group on Education has been working to integrate an eco-social approach into public health education,28 including facilitating the participation of the Canadian Federation of Medical Students in an International Federation of Medical Students’ Associations initiative which seeks to see climate change and health gain a foothold in curricula by 2020 with fuller integration by 2025.29
Heat-Related Health Impacts Indicator 1.2 Health Effects of Temperature Change
265

Recommendation 1Coordinate federal governmental departments, local governments and national institutions to standardize surveillance and reporting of heat-related illness and deaths; develop knowledge translation strategies to inform the public about the threats of heatwaves to health; and generate a clinical and public health response plan that minimizes the health impacts of heat now and anticipates worsening impacts to come as climate change progresses.
Recommendation 2Rapidly integrate climate change and health into the curriculum of all medical and health sciences faculties.
266

Health Costs of Energy and Air PollutionTowards a healthier, low-carbon world.
Canada is not doing its fair share to reduce greenhouse gas (GHG) emissions. In 2016, Canadian emissions were 704 MT CO2eq, an actual increase of over one hundred megatonnes since 1990.30 In contrast, the United Kingdom reduced its greenhouse gas emissions 41% between 1990 and 2016,31 and China is hitting its greenhouse gas targets ahead of schedule.32 The 2017 Canadian Federal Auditor General’s report estimated that emissions in 2020 are projected to be 111 MT CO2eq above Canada’s 2020 target of 620 MT CO2eq.33 In 2016, the Canadian transportation sector accounted for 25% of total national emissions, while the oil and gas sector accounted for 26% of total national emissions, having gone up 70% from 107 Mt CO2eq in 1990 to 183 Mt CO2eq in 2016, an increase that is mostly attributable to higher levels of production of crude oil and the expansion of the oil sands industry.30
Business-as-usual emissions trajectories currently have the world on course to 2.6-4.8°C of warming by 2100.34 As the 2018 Lancet Countdown states, “present day changes in labour capacity, vector-borne disease, and food security provide early warning of compounded and overwhelming impacts expected if temperature continues to rise. Trends in climate change impacts, exposures, and vulnerabilities demonstrate an unacceptably high level of risk for the current and future health of populations across the world.”2
In an effort to alter course, in December 2015, 195 countries, including Canada, signed the Paris Agreement, which pledges to keep the global mean temperature rise to well below 2°C. A recent report by the Intergovernmental Panel on Climate Change underlines the health benefits of keeping warming to 1.5°C,13 but makes clear the magnitude of that challenge, stating, “global warming is likely to reach 1.5°C between 2030 and 2052 if it continues to increase at the current rate.”35 It finds that in order to stay below 1.5°C, “global net human-caused emissions of carbon dioxide (CO2) would need to fall by about 45 percent from 2010 levels by 2030, reaching ‘net zero’ around 2050.”35
There are signs of progress: the 2018 Lancet Countdown reports that in 2017 there were 157 Gigawatts (GW) of new installed renewable energy, as compared to 70 GW of fossil fuel capacity; a 50% increase in the uptake of electric vehicles across the global rolling stock; and a cumulative total of $33.6 billion USD now divested of fossil fuels by health institutions.2
Many policies that reduce greenhouse gas emissions also decrease air pollution, resulting in immediate benefits to health and healthcare cost savings, as described in the next section.
267

Indicator 3.5.2 Premature Mortality from Air Pollution by Sector
Headline Finding: Data for Canada provided by the Lancet Countdown shows a total of 7142 deaths from chronic exposure to anthropogenic PM2.5 air pollution in 2015, (Figure 3) resulting in a loss in economic welfare for Canadians valued at approximately $53.5 billion.36
Figure 3: Annual Premature Deaths from Ambient PM2.5 in Canada
The 2018 International Lancet Countdown report found that fine particulate ambient air pollution (PM2.5) resulted in more than 2.9 million deaths globally in 2015, with coal responsible for about 16% of this.2 These numbers are based on chronic exposure and include deaths from ischemic heart disease, stroke, lung cancer, acute lower respiratory infections and COPD.
Health Canada estimated in 2017 that 9,500 deaths per year in Canada are attributable to above-background concentrations of PM2.5.37 A 2016 report by the World Bank showed 9,466 deaths in Canada in 2013 due to PM2.5 with direct welfare costs of US$40.4 billion (2011 prices).38 This analysis by the Lancet Countdown showed 7142 deaths including 345 deaths from coal-fired power plants; another 105 from coal-related industries; 2,762 deaths from non-coal industry; 1063 from Land-based Transport; and 1282 from Agriculture.2 Using official Health Canada methodologies, this translates into a loss in economic welfare for Canadians valued at approximately $53.5 billion.36
In addition to its air-pollution-mediated mortality impacts, in 2016 the Canadian transportation sector accounted for 25% of national GHG emissions.30 The 2017 Lancet Countdown Briefing for Canadian Policymakers showed that Canada has quite a low proportion of trips taken via means of sustainable transport including by transit, bike or on foot,39 and recommended the development of a National Active Transport Strategy.39 Multiple health benefits would stem from this: exercise reduces anxiety40 and depression;41 commuting on foot or by bike has been shown to decrease cardiovascular mortality, and cycling decreases all-cause mortality and mortality from cancer. 42
To reduce coal-related morbidity, mortality, and greenhouse gas emissions, the Government of Canada has committed to an accelerated phase out of unabated coal-fired power by 2030.43 As per the Regulatory Impact Analysis Statement of the proposed amendment to existing legislation on GHGs from coal-fired generation, the expected resulting reduction in cumulative GHG emissions is approximately 100Mt,44 with $3.6 billion in avoided climate change damage benefits, and $1.3 billion in health and environmental benefits from air quality improvement.44 The Pembina Institute previously
0 1000 2000 3000 4000 5000 6000 7000
Non-Coal
Coal 1_Power plants
2_Industry
3_Land-based Transport
4_Households
5_Waste
6_Ships
7_Agriculture
8_Other
268

estimated health benefits of $5 billion in a scenario where coal-fired plants are shut down after 40 years of operation or by 2030, and which assumes the replacement of coal power by two thirds renewables and one third best-in-class gas-power.45
A transition which proceeds as much as possible directly from coal-fired to renewably-generated electricity is required. Methane, the primary component of natural gas, has 84 times the GHG potential of CO2 over a twenty year period,46 and the upstream extraction and transport system is leaky,47-49 leading to near-term warming risks. Additionally, an increasing proportion of natural gas in Canada is being produced via hydraulic fracturing,50 for which evidence is accumulating of negative impacts: a quantitative assessment of the peer-reviewed scientific evidence from 2009-2015 indicated that 84% of studies on public health, 69% of studies on water and 87% of studies on air quality showed concerning findings.51
Encouragingly, Canada’s coal phase-out commitments enabled the Canadian Government to join forces with the United Kingdom at COP23 to launch the Powering Past Coal Alliance, which now has at least 60 national, provincial, state, city, business and organizational members.52 In Canada, a Just Transition Task Force has been created to support coal workers as they move towards new employment.53 This important initiative would do well to expand to support the social determinants of health of fossil-fuel-industry workers across Canada as the nation transforms its energy economy.
Recommendation 3 Increase ambition in reducing greenhouse gas emissions and air pollution in Canada and twin this with an emphasis on Just Transition Policies to support an equitable transition for people who work in the fossil fuel industry as the energy economy transforms.
Recommendation 4Phase out coal-powered electricity in Canada by 2030 or sooner, with a minimum of two thirds of the power replaced by non-emitting sources, and any gap made up by lowest-emitting natural gas technology in a system designed to minimize fugitive methane emissions.
269
Headline Finding: When the Chinese National Emissions Trading Scheme comes online this year, approximately 20% of global anthropogenic GHG emissions will be subject to a carbon price.2
The 2015 Lancet Commission on Climate Change and Health stated, “The single most powerful strategic instrument to inoculate human health against the risks of climate change would be for governments to introduce strong and sustained carbon pricing, in ways pledged to strengthen over time until the problem is brought under control. Like tobacco taxation, it would send powerful signals throughout the system, to producers and users, that the time has come to wean our economies off fossil fuels, starting with the most carbon intensive and damaging like coal.”54 On the basis of this argument, the Canadian Medical Association passed a motion at its General Council in 2015 to “promote the health benefits of a strong, predictable price on carbon emissions.”55
News of increasing carbon pricing coverage internationally comes at a critical juncture for Canada. Carbon prices currently apply to 75% of greenhouse gas emissions in British Columbia, 72% in Alberta, 84% in Ontario, and 81% in Quebec, such that in total 61% of emissions in Canada are subject to a carbon price (42% after Ontario’s proposed cap-and-trade elimination).56
The federal carbon pricing backstop is due to come into effect in 2019. It will start at a minimum of $10 per tonne in 2018, and rise by $10 per year to $50 per tonne in 2022.57 Successful application of the federal carbon pricing backstop in 2019 will result in coverage of 79% of total Canadian emissions by a carbon price.56 The current plan will be revenue-neutral at the federal level, with all proceeds staying in the province in which they were collected.58 About 70% of Canadians will receive as much or more back in rebates as what they paid.58
A review of studies of BC’s carbon tax showed that it has reduced emissions in the province by 5-15% compared to what they would have been without the tax, and that the tax has had negligibleeffects on aggregate economic performance.59 Similar reductions in emissions in response to carbonprices have been found in other jurisdictions.60,61
A neglected part of the public conversation is the impact carbon pricing could have on human health, via decreases in the air-pollution-related deaths detailed in section 3.5.2. A study in the US found that “monetized human health benefits associated with air quality improvements can offset 26-1050% of the cost of US carbon policies.”62 Similarly, a recent study from China which simulated the impact of a price on CO2 emissions consistent with China’s pledge to reach a peak in CO2 emissions by 2030, found that “national health co-benefits from improved air quality would partially or fully offset policy costs depending on chosen health valuation.”63 There is a critical need to carry out similar studies in the Canadian context.
Recommendation 5Apply carbon pricing instruments as soon and as broadly as possible, enhancing ambition gradually in a predictable manner, and integrate study of resulting air pollution-related health and healthcare impacts into ongoing policy decisions.
Financial and Economic Drivers of a Low-Carbon Transition Indicator 4.7 Coverage and Strength of Carbon Pricing This section co-authored by Nicholas Rivers, Canada Research Chair in Climate and Energy Policy.
270

Indicator 5.1 Media Coverage of Health and Climate Change Headline Finding: Against a backdrop of a 42% global increase in media coverage between 2007 and 2017, the average aggregate number of articles per year referencing both climate change and health in 3 Canadian Newspapers (The Globe and Mail, The Toronto Star, and The National Post) dropped 24% from 98 in 2009 to 75 in 2017. (Data courtesy of the Lancet Countdown)
Media coverage is critical for helping populations become aware of the risks of climate change, and in influencing public support for national policy change.64 Research shows that presenting climate change in a health frame, as opposed to as an environmental or security issue, is the best way to elicit emotional reactions consistent with support for climate change mitigation and adaptation,65 and that more strongly positive reactions are associated with information about the health benefits of mitigation policy (e.g. the number of asthma exacerbations that will be saved as a result of the phase-out of a coal-fired power plant) than with information about health risks.66
A 2017 poll commissioned by Health Canada demonstrates quite a high level of public concern related to climate change: 79% of Canadians are convinced that climate change is happening, and of these, 53% accept that it is a current health risk, and 40% believe it will be a health risk in the future.67
Figure 4: Number of articles in specific newspapers covering Climate Change and Health. Data provided by the Lancet Countdown.2
The three Canadian newspapers in the dataset, The Globe and Mail, The Toronto Star, and The NationalPost, each saw a drop in climate change and health coverage, with the average number of articles per year in Canada decreasing 24% from 98 in 2009 to 75 in 2017. In contrast, over the same period, the New York Times saw an increase of 86%. (Figure 4)
Recommendation 6Ensure consistent, pro-active external communications by health-related organizations pointing out the links between climate change and health impacts in real time as events which have been shown to be increasing due to climate change (e.g. heat waves, spread of tick-borne disease, wildfires, extreme weather) occur.
0
20
40
60
80
100
120
140
160
180
2007 2008 2009 2010 2011 2012 2013 2014 2015 2016 2017
Globe & Mail (Canada) Toronto Star (Canada) National Post (Canada)
New York Times (US) Times (UK)
271
Case Study: Canadian Contributions to Understanding of Climate Change, Mental Health and Ecological GriefClimate-related weather events and environmental change have been linked to elevated rates of depression, anxiety, and pre-and-post-traumatic stress; increased drug and alcohol usage; and increased suicidal ideation, suicide attempts and death by suicide.68 As a result, mental health considerations are likely to be increasingly included in climate vulnerability and impact assessments.69 Research in Canada has particularly contributed to the evolution of concepts such as “solastalgia,” explained as ‘feeling homesick when you’re still at home,’ ecological grief and eco-anxiety.68
Canada’s Arctic is one of the most rapidly-warming areas on earth, and has been inhabited for millennia by Indigenous communities whose close connection to and knowledge of the land make them sensitive observers of ecological change. A multi-year, community-driven enquiry into the mental health impacts of environmental change in the community of Rigolet, Nunatsiavut, demonstrated that climate change is “negatively affecting feelings of place attachment by disrupting hunting, fishing, foraging, trapping, and traveling, and changing local landscapes--changes which subsequently impact physical, mental, and emotional health and well-being.” These results called for an understanding of place-based attachment as a vital indicator of health and well-being.7
Southwest of Rigolet, in the high subarctic area surrounding the Northwest Territories’ capital of Yellowknife, the “SOS-Summer of Smoke” project investigated the health and wellness impacts of a prolonged smoke and fire exposure in 2014.11 It found double the normal rates of emergency department visits for asthma, and interview analysis revealed strong themes of isolation, fear, loss of connection to the land and to traditional summertime activities; lack of physical activity; and a feeling of ecological grief or eco-anxiety, as participants placed the summer in the overall context of the changing climate and wondered if such summers would become the “new normal.”11
A recent paper in Nature Climate Change defined ecological grief as, “the grief felt in relation to experienced or anticipated ecological losses.68 It points out that, “grief is a natural and legitimate response to ecological loss, and one that may become more common as climate impacts worsen.”68
Both the SOS study and the paper on ecological grief were published in spring 2018, just prior to one of western Canada’s most severe wildfire seasons on record. As millions of Canadians sat blanketed in smoke, media interest in the concepts of solastalgia and ecological grief was unprecedented,12,70
opening up new discussions that, at the very least, decrease people’s feelings of loneliness in their grief. Grief and mourning has “we-creating” capacities, allowing for opportunities to reach across differences to connect with others.68 Though difficult, these conversations may well create new possibilities in the pursuit of a healthy approach to climate change.
Recommendation 7 Fund increased study into the mental health impacts of climate change and psychosocial adaptation opportunities.
272
IN THE MATTER OF A REFERENCE to the Court of Appeal pursuant to section 8 of the Courts of Court of Appeal File No.: C65807 Justice Act, RSO 1990, c. C.34, by Order-in-Council 1014/2018 respecting the constitutionality of the Greenhouse Gas Pollution Pricing Act, Part 5 of the Budget Implementation Act, 2018, No. 1, SC 2018, c. 12
COURT OF APPEAL FOR ONTARIO Proceedings commenced at Toronto
RECORD OF THE INTERVENOR, INTERGENERATIONAL CLIMATE
COALITION (GENERATION SQUEEZE ET AL)
RATCLIFF & COMPANY LLP 500-221 West Esplanade North Vancouver, BC V7M 3J3
Nathan Hume / Emma K. Hume
Tel.: (604) 988-5201 Fax: (604) 988-1352 Email: [email protected] [email protected]
Counsel for the International Climate Coalition (Generation Squeeze, et al.)
Email to: [email protected] [email protected] [email protected] [email protected]