Embed Size (px)
Citation preview

Seediscussions,stats,andauthorprofilesforthispublicationat:https://www.researchgate.net/publication/238746015
OntarioTobaccoSurvey
ARTICLE
CITATION
1
READS
17
4AUTHORS:
LoriMDiemert
UniversityofToronto
15PUBLICATIONS86CITATIONS
SEEPROFILE
J.CharlesVictor
InstituteforClinicalEvaluativeSciences
120PUBLICATIONS1,002CITATIONS
SEEPROFILE
MichaelChaiton
UniversityofToronto
55PUBLICATIONS411CITATIONS
SEEPROFILE
SusanJBondy
UniversityofToronto
126PUBLICATIONS2,543CITATIONS
SEEPROFILE
Availablefrom:LoriMDiemert
Retrievedon:05February2016
Ontario Tobacco Survey
Technical Report 1: Baseline Data
Lori Diemert J. Charles Victor Michael Chaiton Susan J. Bondy
Updated April 2010

Diemert, L., Victor, J.C., Chaiton, M., Bondy, S.J. Ontario Tobacco Survey Technical Report 1: Baseline Data. Toronto, ON: Ontario Tobacco Research Unit, April 2010.
Ontario Tobacco Research Unit iii
Study Team for the Ontario Tobacco Survey
The Ontario Tobacco Survey (OTS) was developed by the Ontario Tobacco Research Unit which receives funding from the Ontario Ministry of Health Promotion. The OTRU Principal Investigators are responsible for the development and implementation of the OTS. This includes: Principal Investigators Susan J. Bondy, Ph.D., University of Toronto K. Stephen Brown, Ph.D., University of Waterloo Joanna E. Cohen, Ph.D., University of Toronto Roberta Ferrence, Ph.D., Centre for Addiction and Mental Health John Garcia, Ph.D., Cancer Care Ontario Paul W. McDonald, Ph.D., University of Waterloo Robert Schwartz, Ph.D., University of Toronto Peter Selby, M.D., Centre for Addiction and Mental Health Thomas Stephens, Ph.D., Thomas Stephens & Associates Project Management Lori Diemert Data Management Charles Victor and Michael Chaiton Survey Fieldwork Mary Thompson, Director, Fiona Health, Manager, and staff at the Survey Research Centre, University of Waterloo For more information on the OTS, please visit our website at http://www.otru.org/tobacco_survey.html or contact us at: OTRU 33 Russell St. Toronto, ON M5S 2S1 Tel: 416-595-6888 Fax: 416-595-6068 Email: [email protected]

iv Ontario Tobacco Research Unit
Acknowledgements
We would like to thank the management, staff and interviewers at the Survey Research Centre for their assistance with study design, fieldwork management and data collection. We would also like to thank Emily Adlparvar and Michelle Costa for their assistance with OTS technical documentation, Sonja Johnston for her technical assistance, and all reviewers of this report.
Ontario Tobacco Research Unit v
Table of Contents
Study Team for the Ontario Tobacco Survey .............................................................................................. iii Acknowledgements ......................................................................................................................................... iv Table of Contents ............................................................................................................................................. v Appendices ....................................................................................................................................................... vi List of Tables ................................................................................................................................................... vii List of Figures .................................................................................................................................................. vii Executive Summary .......................................................................................................................................... 1 Overview ............................................................................................................................................................ 2 Methodology ..................................................................................................................................................... 2
Study Design ................................................................................................................................................. 2 Survey Recruitment and Baseline Protocols ................................................................................................. 5
Study Instruments ........................................................................................................................................ 7 The Role of Skip Logic in the OTS ........................................................................................................ 8
Pilot Testing and Quality Control ............................................................................................................. 9 Ethical Approvals ......................................................................................................................................... 9
Data Weighting ............................................................................................................................................... 10 Algorithm .................................................................................................................................................... 10 Calculations ................................................................................................................................................ 11
Baseline Study Data ........................................................................................................................................ 12 Recruitment Statistics ................................................................................................................................ 12 Baseline Study Participants ....................................................................................................................... 14 Evaluation of the OTS Baseline Sample .................................................................................................. 16
Data Analysis and Requirements for Data Use .......................................................................................... 17 Data Suppression and Protection of Privacy .......................................................................................... 18 Analytic Techniques Appropriate to Complex Survey Design ............................................................ 18
Special Note on Sub-population Analysis .......................................................................................... 19 Acknowledgement of Estimate Precision in Reports Released ........................................................ 20 Accounting for Skip Logic .................................................................................................................... 20
Data Limitations ......................................................................................................................................... 21 Accessing OTS Data ....................................................................................................................................... 21 Citing Technical Reports and OTS Data ..................................................................................................... 21
Acknowledgements .................................................................................................................................... 22 References ........................................................................................................................................................ 23

vi Ontario Tobacco Research Unit
Appendices
Appendix A – OTS Baseline Surveys, Waves 1 – 6 A1 – OTS Baseline Cohort 1 Survey (July-December 2005) A2 – OTS Baseline Cohort 2 Survey (January-June 2006) A3 – OTS Baseline Cohort 3 Survey (July-December 2006) A4 – OTS Baseline Cohort 4 Survey (January-June 2007) A5 – OTS Baseline Cohort 5 Survey (July-December 2007) A6 – OTS Baseline Cohort 6 Survey (January-June 2008) Appendix B – OTS Baseline Question Database Appendix C – OTS Derived Variables Appendix D – OTS Baseline Data Dictionary OTS Baseline Question Edits (.xls)

Ontario Tobacco Research Unit vii
List of Tables
Table 1: Study Design and Data Collection Schedule for the Ontario Tobacco Survey (OTS) ............ 4 Table 2: OTS Recruitment of Recent Smokers ............................................................................................ 6 Table 3: Major Content Areas for the OTS, by Recruitment Status (Recent Smokers vs.
Non-smokers) ................................................................................................................................... 8 Table 4: Number of Non-smokers and Recent Smokers in the OTS by Sampling Stratum ................ 10 Table 5: Estimated Number of Ontario Telephones by Sampling Stratum ........................................... 11 Table 6: Census Data for the 2006 Ontario Population by Age and Sex, 18 Years of Age
and Older ........................................................................................................................................ 12 Table 7: Baseline Recruitment Statistics of Recent Smokers and Non-smokers in the OTS,
by Cohort and Overall ................................................................................................................... 13 Table 8: Demographic Characteristics of the Complete OTS Baseline Sample (Includes
Smokers and Non-smokers) ......................................................................................................... 15 Table 9: Key Smoking Indicators Among Baseline Current Smokers ................................................... 15 Table 10:Weighted OTS Baseline Sample versus 2006 Census Data, Ontarians 20 Years of
Age and Older ................................................................................................................................. 17 Table 11:Weights for the OTS Baseline Data (July 2005 – June 2008) .................................................... 17 Table 12:OTS Baseline Data Sampling Design Elements and Corresponding Variables in
Data Files ......................................................................................................................................... 18 Table 13:Sample Code for SAS and STATA Analyses to Demonstrate OTS Design Variables
and Sub-population Analyses ....................................................................................................... 19 Table 14:Coefficient of Variation (CV) Data Suppression Guidelines .................................................... 20 List of Figures
Figure 1: OTS Recruitment into the Recent Smoker and Non-smoker Sample ...................................... 6


OTS Technical Report 1: Baseline Data
Ontario Tobacco Research Unit 1
Executive Summary
The Ontario Tobacco Survey (OTS) is a provincial longitudinal survey of adult smokers and cross-sectional survey of non-smokers on smoking attitudes and behaviours. It was undertaken to evaluate and inform the Smoke-Free Ontario Strategy and to gain a better understanding of the processes of, and influences on, smoking cessation and relapse. The OTS is a unique study as smokers are re-interviewed every six months for a minimum of three years. Baseline data collection for the OTS began in July 2005 and concluded in June 2008. This report outlines the study design for the OTS and further focuses on specific details regarding the baseline data for all six waves of study recruitment. Smokers (any smoking in the past six months) completed interviews that averaged 23 minutes, while non-smokers completed interviews approximately 13 minutes in length. Overall, the OTS has an adjusted response rate of 57% (ineligible and estimated ineligible respondents were removed from the denominator); the smoker and non-smoker response rates were 61% and 51%, respectively. The cooperation rate was 85% for smokers and 89% for non-smokers. This report discusses data weighting for the OTS and describes the baseline sample and representativeness to the Ontario adult population. Details for data analysis and requirements for data use are also discussed. This report is the first of three technical guides for the OTS. The technical reports to follow include:
OTS Technical Report II: Six and Twelve Month Follow-up OTS Technical Report III: Complete data

OTS Technical Report 1: Baseline Data
2 Ontario Tobacco Research Unit
Overview
The Ontario Tobacco Survey (OTS), conducted by the Ontario Tobacco Research Unit (OTRU), is a population-based provincial study monitoring tobacco use and opinions about tobacco control to inform the progress of the Smoke-Free Ontario (SFO) Strategy. The OTS combines six semi-annual cross-sectional surveys of smokers, and of non-smokers, with a major longitudinal study of adult smokers. The study focuses on attitudes, behaviours, and beliefs about tobacco, the factors that influence smoking cessation, and exposure to smoking-related government policies and programs. The main objectives of the study are:
To evaluate existing SFO projects or policies; To serve as a baseline for evaluating new or likely projects or policies; and To serve as a basis for planning projects rated as likely or high priority.
This report describes the overall OTS study design, sampling strategy, and content areas of the overall OTS initiative. Also presented in this first technical report are: response rates and sample description; description of study data for all baseline interviews in both the smokers and non-smoker samples; and the specific questionnaires for each cohort. Future Technical Reports will address the longitudinal components and samples for the OTS. Methodology
Study Design
The cross-sectional survey component of the OTS consists of a set of six population- representative telephone surveys of Ontario adults (18 years of age and over), stratified by region (Eastern, Greater Toronto Area, South Western, and Northern based on telephone area code) and smoking status (any smoking in the past six months, see below).1 Data collection for the first baseline survey (Cohort 1 of the OTS) began in July 2005; collection of the final baseline study (Cohort 6) was completed in June 2008. These six cross-sectional surveys samples were paired with a longitudinal component that allowed for repeated follow-up interviews of the recent smokers (had smoked within the past six months at recruitment). Follow-up interviews took place at approximately six-month intervals, for a minimum of three years. This cross-sectional / longitudinal hybrid design provides descriptive snapshots of the Ontario population and allows for the examination of changes over time in behaviours, exposures and attitudes. Survey data for the OTS are collected by the Survey Research Centre (SRC) at the University of Waterloo using computer-assisted telephone interview (CATI) technology. The sample is stratified

OTS Technical Report 1: Baseline Data
Ontario Tobacco Research Unit 3
into four regional strata defined by telephone area code (see Survey Recruitment and Baseline Protocols below). Oversampling of recent smokers was used in order to accommodate attrition in the longitudinal design. During each month of recruitment, quota sampling of recent smokers and non-smokers was maintained. For each of six waves of the survey, 1250 new study participants were recruited, comprising:
750 recent smokers who are invited to participate one baseline (cross-sectional interview) and a minimum of three follow-up surveys occurring in 6-month intervals; and
500 non-smokers who are invited to participate in a single baseline (cross-sectional only) survey.2
Table 1 provides an illustration of the overall study design and data collection schedule for the OTS. Specific details regarding the longitudinal design and protocols will be detailed in the next Technical Report for the OTS.

OTS Technical Report 1: Baseline Data
4 Ontario Tobacco Research Unit
Table 1: Study Design and Data Collection Schedule for the Ontario Tobacco Survey (OTS)
Wave Date Cross-Section Non Smokers
Longitudinal Smokers – Baseline
Longitudinal Smokers – Follow-Up 1
Follow-Up 2 Follow-Up 3 Follow-up 4 Follow-up 5 Follow-up 6
1 July - December, 2005 500 750
BLC1
2 January - June, 2006 500 750 F1C1
BLC2
3 July - December, 2006 500 750 F1C2 F2C1
BLC3
4 January - June, 2007 500 750 F1C3 F2C2 F3C1
BLC4
5 July - December, 2007 500 750 F1C4 F2C3 F3C2
BLC5
6 January - June, 2008 500 750 F1C5 F2C4 F3C3 F4C2
BLC6
7 July - December, 2008 F1C6 F2C5 F3C4 F4C3 F5C2
8 January - June, 2009 F2C6 F3C5 F4C4 F5C3 F6C2
9 July - December 2009 F3C6 F4C5 F5C4 F6C3
10 January - June 2010 F4C6 F5C5 F6C4
11 July - December 2010 F5C6 F6C5
12 January - June 2011 F6C6
Notes: BLCx represents the baseline survey for cohort x (e.g. BLC1 = baseline survey for Cohort 1); FyCx represents the interview follow-up survey y in cohort x (e.g. F2C3 =
Follow-up 2 for Cohort 3). Cohort 1 has only three follow-up interviews as per the original study design which was extended to six follow-up interviews for Cohorts 2 to 6.
Each colour represents one of the six cohorts in the OTS. The darker colours represent the cross-sectional non-smokers; the lighter colours represent the cohorts of recent smokers that are followed over time.
OTS Technical Report 1: Baseline Data
Ontario Tobacco Research Unit 5
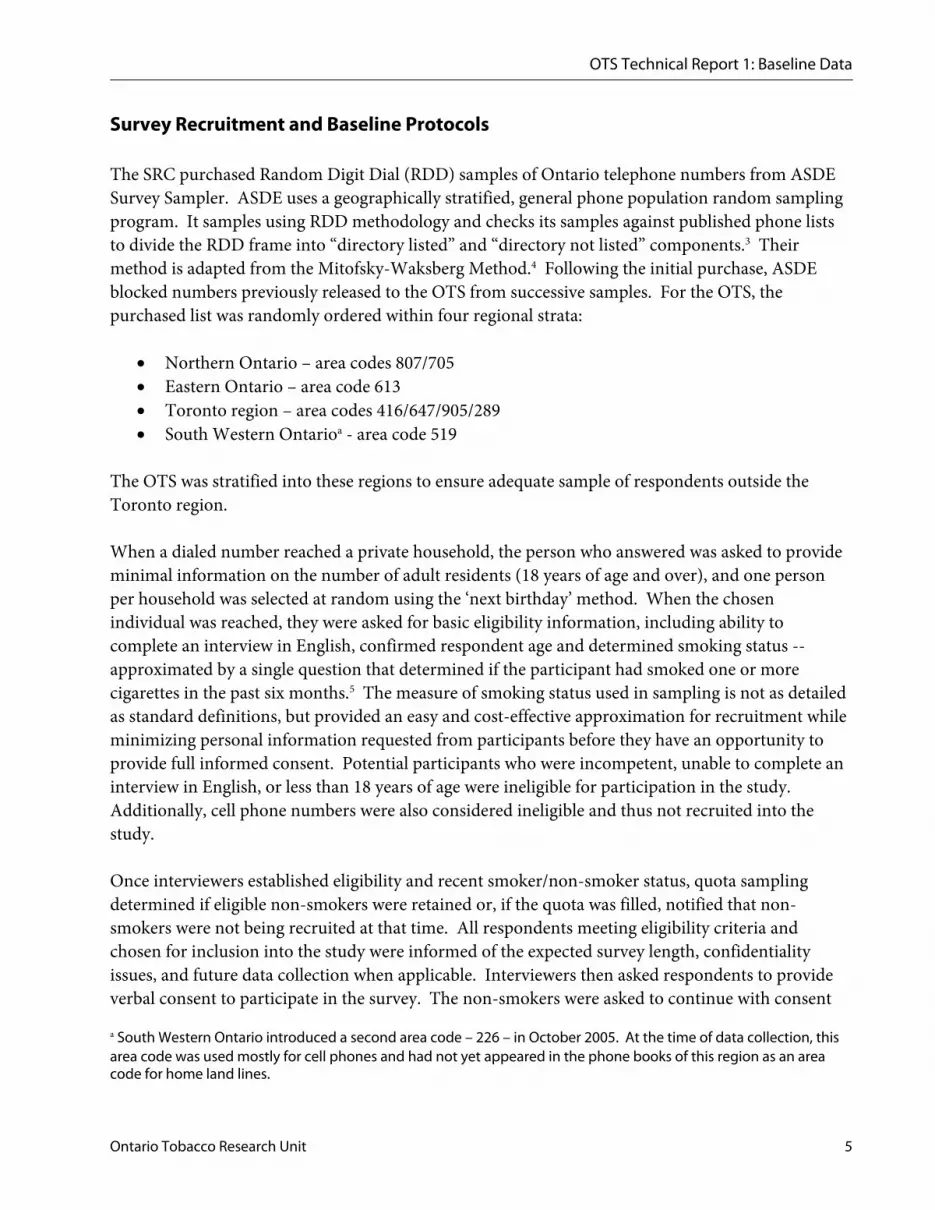
Survey Recruitment and Baseline Protocols
The SRC purchased Random Digit Dial (RDD) samples of Ontario telephone numbers from ASDE Survey Sampler. ASDE uses a geographically stratified, general phone population random sampling program. It samples using RDD methodology and checks its samples against published phone lists to divide the RDD frame into “directory listed” and “directory not listed” components.3 Their method is adapted from the Mitofsky-Waksberg Method.4 Following the initial purchase, ASDE blocked numbers previously released to the OTS from successive samples. For the OTS, the purchased list was randomly ordered within four regional strata:
Northern Ontario – area codes 807/705 Eastern Ontario – area code 613 Toronto region – area codes 416/647/905/289 South Western Ontarioa - area code 519
The OTS was stratified into these regions to ensure adequate sample of respondents outside the Toronto region. When a dialed number reached a private household, the person who answered was asked to provide minimal information on the number of adult residents (18 years of age and over), and one person per household was selected at random using the ‘next birthday’ method. When the chosen individual was reached, they were asked for basic eligibility information, including ability to complete an interview in English, confirmed respondent age and determined smoking status -- approximated by a single question that determined if the participant had smoked one or more cigarettes in the past six months.5 The measure of smoking status used in sampling is not as detailed as standard definitions, but provided an easy and cost-effective approximation for recruitment while minimizing personal information requested from participants before they have an opportunity to provide full informed consent. Potential participants who were incompetent, unable to complete an interview in English, or less than 18 years of age were ineligible for participation in the study. Additionally, cell phone numbers were also considered ineligible and thus not recruited into the study. Once interviewers established eligibility and recent smoker/non-smoker status, quota sampling determined if eligible non-smokers were retained or, if the quota was filled, notified that non-smokers were not being recruited at that time. All respondents meeting eligibility criteria and chosen for inclusion into the study were informed of the expected survey length, confidentiality issues, and future data collection when applicable. Interviewers then asked respondents to provide verbal consent to participate in the survey. The non-smokers were asked to continue with consent a South Western Ontario introduced a second area code – 226 – in October 2005. At the time of data collection, this area code was used mostly for cell phones and had not yet appeared in the phone books of this region as an area code for home land lines.

OTS Technical Report 1: Baseline Data
6 Ontario Tobacco Research Unit
and complete an interview of approximately 12 minutes. Figure 1 illustrates OTS recruitment into the recent smoker (longitudinal panel) or the non-smoker (cross-sectional) survey. Respondents identified as recent smokers were asked to consent to the longitudinal component of the OTS and complete an interview of a maximum length of 25 minutes. Figure 1: OTS Recruitment into the Recent Smoker and Non-smoker Sample
The OTS was originally designed to interview recent smokers at baseline and three follow-up interviews. In January 2008, the longitudinal study design was enhanced by doubling the number of follow-up interviews for consenting participants. At recruitment (i.e., baseline), cohorts in the OTS consented to follow-up participation as detailed in Table 2. Table 2: OTS Recruitment of Recent Smokers
OTS Cohort Number (Data Collection Date)
Number of Follow-up Interviews Follow-up Recruitment Script at Time of Consent
COHORT 1 (July – December 2005)
Eligible for 3 follow-up interviews
At recruitment:“There will be 3 additional follow-up surveys that take place every six months.”
COHORTS 2 – 4 (January 2006 – June 2007)
Eligible for 6 follow-up interviews
At recruitment: “There will be 3 additional follow-up surveys that take place every six months.” At the end of follow-up three: These cohorts were invited to continue their participation in the survey for up to three additional follow-up interviews.
COHORTS 5 & 6 (July 2007 – June 2008)
Eligible for 6 follow-up interviews
At recruitment:“There will be up to six additional follow-up surveys ranging from 10-20 minutes in length that take place every six months.”
Have you smoked one or more
cigarettes in the past 6 months?
RECENT SMOKER PANEL 1 x 25 minute baseline survey on attitudes, exposures
and detailed smoking history with a focus on lifetime behaviours;
3 x 20 minute follow-up surveys on attitudes, exposures and smoking behaviours in the past 6 months (Follow-up 1, 2, and 3 for all cohorts)
3 X 10 minute follow-up surveys on smoking behaviours (Follow-up 4, 5, and 6 for cohorts 2 to 6)
NON-SMOKER SURVEY 1 x 12 minute baseline survey on attitudes, exposures
and abbreviated smoking history
YES
NO

OTS Technical Report 1: Baseline Data
Ontario Tobacco Research Unit 7
When consenting participants were unable to complete the interview at the time of recruitment, the telephone interview was scheduled for a mutually convenient time over the next 14 days. For household numbers where there was no contact, a minimum of 14 call attempts were made. In order to increase representativeness, calls were made at various times of the day (e.g. morning, afternoon, and evenings) as well as different days of the week, including Sundays. There were no calls made on Saturdays or during any holiday weekend. The OTS included protocols for refusal conversions on numbers with an initial ‘soft’ refusal (those stating that they are too busy or not interested). These numbers were placed in a callback list that was first called no sooner than 14 days after the first refusal (in Waves 1 and 2, these callbacks were made anywhere from 3 to 14 days). If a second refusal for participation was received during the second call, the number was given a final refusal disposition and retired from the queue. At the time of recruitment, participants were informed that they will be compensated for their participation. After being recruited to the survey, each participant was mailed a thank-you letter along with a $15 honourarium. Every six months, longitudinal participants are mailed a reminder letter regarding their participation in the upcoming phase of the study, along with a $15 honourarium, two weeks prior to re-contact. At follow-up 1, recent smokers with complete baseline data were eligible for recontact. Specific details regarding longitudinal protocols will be outlined in the next Technical Report for the OTS.
Study Instruments
The OTS questionnaires focused on smoking behaviours, cessation and protection of Ontario adults from second-hand smoke (SHS). Baseline (cross-sectional) telephone interview scripts were programmed to include significantly more information from smokers than non-smokers. Both recent smokers and non-smokers were asked questions about their attitudes and beliefs regarding smoking, environmental tobacco smoke, exposure to tobacco industry marketing, mass media tobacco control campaigns aired in Ontario, and demographic information. For smokers (longitudinal participants), the baseline script also included detailed questions about their personal smoking behaviour and experience, including past quit attempts and quit intentions, as well as their lifetime exposure to smoking cessation aids and resources. Table 3 outlines the major content areas of the OTS instruments for recent smokers and non-smokers. In general, the baseline instrument and data presented in this technical report focuses on EVER or LIFETIME behaviour and experiences of smokers. Follow-up instruments focus on smoking behaviours in the six-months (since their last interview) and provide more detailed information on the factors that may have initiated these changes.

OTS Technical Report 1: Baseline Data
8 Ontario Tobacco Research Unit
Table 3: Major Content Areas for the OTS, by Recruitment Status (Recent Smokers vs. Non-smokers) Content Area Recent Smokers Non-Smokers
General Smoking Behaviour Current / past tobacco use ● ●
Detailed Smoking Behaviour Frequency / Quantity ● ●
Addiction Perceived addiction / Fagerstrom ●
Quitting Behaviour Previous attempts and motivation Intentions / Stages of Change Perceived ability to quit
●
Quit Aids Usage / Opinions of quit aids ●
Health Professionals Previous advice Likelihood of seeking advice
●
Purchasing Profile Specific brand / Discount purchasing ●
Point of Sale Awareness of signage ● ●
Second-Hand Smoke Exposure at home, work, public places Workplace and household policies
● ●
Typology6 Attitudes and behaviours regarding smoking
● ●
Tobacco Industry Exposure to tobacco sponsored events ● ●
Mass Media Aided recall of mass media campaigns ● ●
Demographics ● ●
Throughout data collection, the OTS instruments were modified in order to rectify errors or problems identified. Over time, a modest number of new questions were incorporated into baseline questionnaires. These new questions reflected changes in the tobacco control policy environment, as identified by the Principal Investigators. The OTS Question Database (Appendix B) details the data collection period for each survey question (by cohort) while the survey questionnaires (Appendix A) detail for each question any edits or notes from the previous waves. (Note: an electronic supporting document can be accessed on our website; the OTS Baseline Question Edits file details edits or revisions made for each question over the baseline collection period.). The study questionnaires also note any changes made throughout the data collection (Appendices A1 to A6). The Role of Skip Logic in the OTS
The OTS study instruments employ a significant amount of skip logic in order to minimize respondent burden while obtaining detailed information from respondents where appropriate. In the baseline instruments, the most significant logical branching is the distinction made between

OTS Technical Report 1: Baseline Data
Ontario Tobacco Research Unit 9
recent smokers (any smoking in the past six months) and non-smokers. There are also numerous questions that will skip out respondents for whom the questions are less relevant. As an example, many questions are relevant for current smokers only (respondents smoking in the past month), such as detailed smoking behaviours in the past 30 days. As a second example, detailed information about plans to quit smoking or recent quit attempts are limited to those who have smoked at least 100 cigarettes in their lifetime as these questions are less relevant to those who are beginning or experimenting with cigarettes. Respondents that are skipped out of a question will be given a ‘Not Applicable’ code of 7, 77, or 777 depending on the type of question (See Appendix D – OTS Baseline Data Dictionary). The data analyst should pay particular attention to the respondent eligibility for each question. This is the question coverage provided in the questionnaires (Appendix A) under each interview question. Please refer to the table at the beginning of the questionnaires for common coverage definitions (e.g., current smoker versus self-report smoker). The skip patterns in the OTS must be assessed for each question and fully understood by the data analyst. This issue is discussed in more detail in the Data Analysis section below.
Pilot Testing and Quality Control
Baseline recruitment protocols and the baseline study instrument were pilot tested in April 2005 on more than 150 recent smokers and non-smokers. Questionnaire and technical issues were identified and adjusted prior to the beginning of study data collection which commenced in July 2005. The SRC trained interviewers participated in OTS interviewer training prior to the pilot study and prior to the beginning of each new wave of the study. Additionally, the SRC held mid-wave training, allowing for a discussion of specific item issues and participant responses. Training sessions also allowed for SRC managers to inform interviewers about monthly quotas, review progress, and outline targets for the coming months. The SRC provides manager supervision of interviewers at all times. Managers also monitored interviewers’ performance by patching into a terminal to listen in on the execution of an interview as well as assess the interviewer’s coding of responses. Managers provided regular feedback to interviewers to help enhance their interview skills, ensure study protocols were followed, and participant responses were entered accurately.
Ethical Approvals
Ethical approval for the OTS initiative was received from the appropriate Human Subjects Research Ethics Committees of the Universities of Waterloo and Toronto. A priori explicit ethical approval was obtained for the OTS initial protocol design and pilot studies, as well as all changes to the protocol, questionnaires, recruitment and remuneration scripts and procedures over time.

OTS Technical Report 1: Baseline Data
10 Ontario Tobacco Research Unit
Data Weighting
Expansion weights (xwt2006 ) were produced for baseline respondents. Weights were calculated for each wave of data collection and according to the sample characteristics and completion rates for each wave respectively. For the purposes of the combined baseline dataset, all weights were recalibrated to sum to the 2006 census population.
Algorithm
The numbers of OTS baseline survey respondents are as follows: Table 4: Number of Non-smokers and Recent Smokers in the OTS by Sampling Stratum
Region Non-smokers Recent Smokers
416; 647; 905; 289 706 868
519 808 1296
613 767 1094
807; 705 720 1246
Total 3001 4504
For new respondents, the sampling design samples households randomly within each of the four area code regions. When a household is screened, the next birthday adult is interviewed if they are a smoker; if they are a non-smoker, the respondent is interviewed if the non-smoker quota is open. If the non-smoker quota is closed but the next birthday adult is a non-smoker, the household is ruled ineligible. The following computation of preliminary (inverse inclusion probability weights) is done within each region. The same method was used in all waves (Wave 1 through 6). Let N be the estimated number of households for the region, at the time of the Wave. Let n be the total number of non-refusal households screened in the region, where the next birthday person is determined, and approached if eligible. Let nopen be the total number of non-refusal households where the next birthday person is determined while the non-smoker quota is open. Now consider an individual j in the sample. Let a j be the number of adults in the household of that person. If j is a smoker, the inverse or reciprocal of the probability of inclusion may be approximated as

OTS Technical Report 1: Baseline Data
Ontario Tobacco Research Unit 11
(1) Nn a j
1csm
where csm is a “completion rate” for smokers. If j is a non-smoker, the inverse of the probability of inclusion may be approximated as
(2) Nn
nnopen
a j 1
cns
N
nopen
a j 1
cns
where cns is a “completion rate” for non-smokers.
Calculations
Weights were calculated for respondents with complete data on all variables required for weight calculation or calibration (including age and sex). Details of the actual calculation are as follows: Where a j was more than 4, its value was replaced by 4; where a j was missing, its value was set equal to 1. Region was defined through area codes, as indicated below. The values of N used were the estimated numbers of telephones provided by ASDE. These were as follows: Table 5: Estimated Number of Ontario Telephones by Sampling Stratum
Region ASDE Estimated No. of Ontario Telephones
Wave 1 Wave 2 Waves 3 – 6
519 916 000 899 287 899 995
613 629 825 623 777 633 207
705-807 633 438 641 432 640 709
416-905-647-289 2 295 688 2 121 388 2 095 077
Total 4 475 331 4 285 384 4 268 988Source: ASDE Survey Sampler3 This total seems reasonable, since the estimated number of occupied dwellings in Ontario from the 2006 census was 4,554,251.

OTS Technical Report 1: Baseline Data
12 Ontario Tobacco Research Unit
The reciprocals of the completion rates were taken to be 1.25 for smokers and 1.25 for non-smokers. The weights obtained from (1) and (2), summed over the entire sample, yielded about 9,380,000 as a raw estimate of the population size. For production of the final weights (xwt2006), the weights from (1) and (2) were then calibrated so that within age-sex groups the weights would sum to the corresponding population estimates for Ontario from the 2006 Census. The estimates, taken from the Statistics Canada website are as follows: Table 6: Census Data for the 2006 Ontario Population by Age and Sex, 18 Years of Age and Older
Age Group Male Female
18 – 24 years 565 955 554 910
25 – 44 years 1 679 910 1 772 145
45 – 64 years 1 571 805 1 646 080
65+ years 717 510 931 660
Total 4 535 180 4 904 795Source: Statistics Canada10 Note: The OTS weights are calibrated to reflect this sample of Ontario adults All respondents who provided a valid response to age were assigned a weight. In the OTS, there were 45 females and 56 males that did not give their age; of these, 92 were partial and 9 were complete interviews. These individuals could not be used in the calculation of weights, and therefore do not have any weights associated with their records. Baseline Study Data
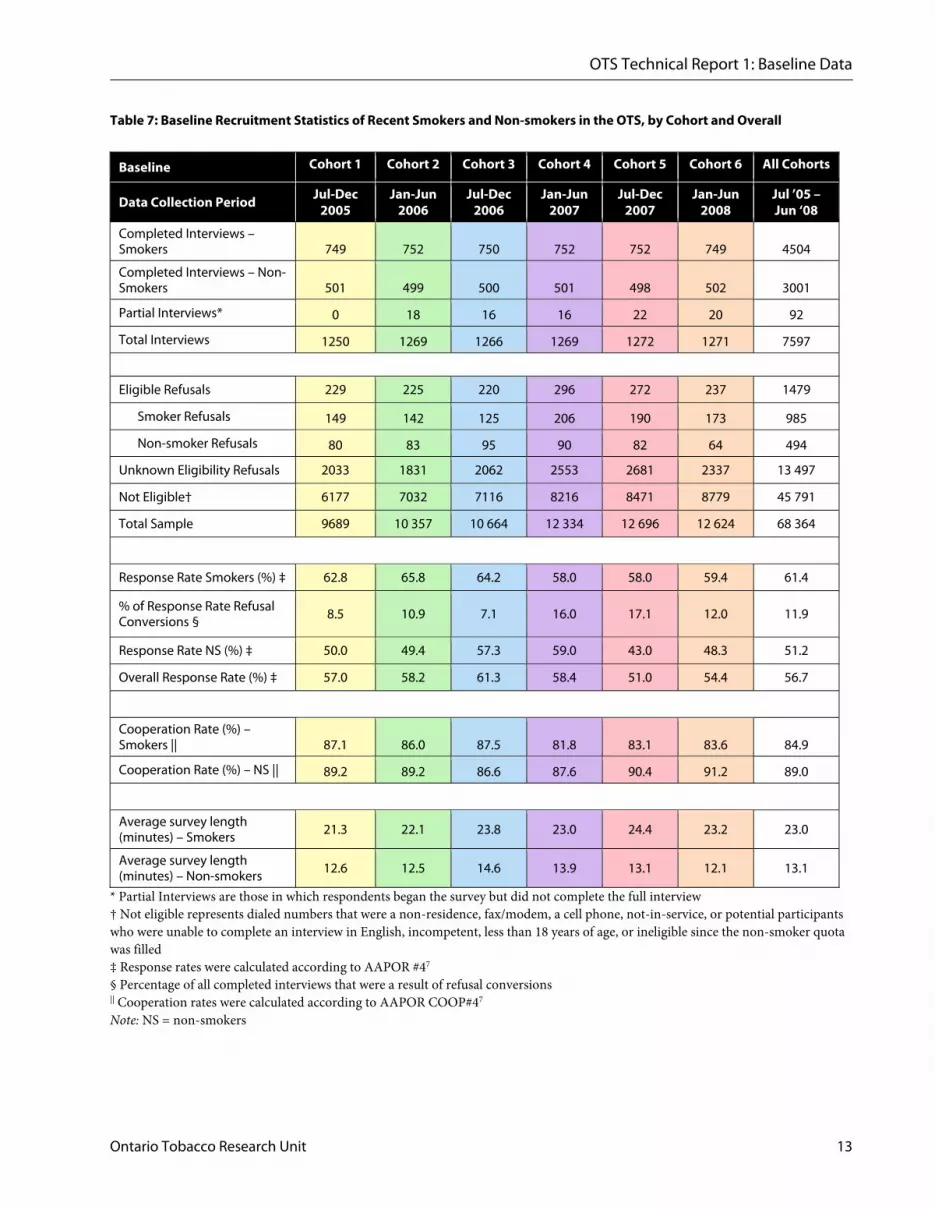
Recruitment Statistics
Table 7 details the recruitment statistics by cohort (or six-month waves), including the interviewed sample of smokers and non-smokers, a summary of the total sample, and smoker and non-smoker response and cooperation rates, as well as survey length. OTS response rates were calculated according to the American Association for Public Opinion Research Guidelines Response Rate #4, which removes from the denominator those who were ineligible (e.g. language problem) and those estimated to be ineligible among those with unknown eligibility.7 As seen in Table 7, the smoker response rate was generally higher than the non-smoker response rate. The combined baseline data for the OTS has a smoker response rate of 61% and a non-smoker response rate of 51% – the overall response rate for smokers and non-smokers is 57%. These rates are higher than recently reported response rates for other surveys in Ontario and Canada.8,9 In addition, the OTS had exceptional cooperation rates for both smokers and non-smokers: 85% and 89% respectively (Table 7).
OTS Technical Report 1: Baseline Data
Ontario Tobacco Research Unit 13
Table 7: Baseline Recruitment Statistics of Recent Smokers and Non-smokers in the OTS, by Cohort and Overall
Baseline Cohort 1 Cohort 2 Cohort 3 Cohort 4 Cohort 5 Cohort 6 All Cohorts
Data Collection Period Jul-Dec 2005
Jan-Jun 2006
Jul-Dec 2006
Jan-Jun 2007
Jul-Dec 2007
Jan-Jun 2008
Jul ’05 –Jun ‘08
Completed Interviews – Smokers 749 752 750 752 752 749 4504
Completed Interviews – Non-Smokers 501 499 500 501 498 502 3001
Partial Interviews* 0 18 16 16 22 20 92
Total Interviews 1250 1269 1266 1269 1272 1271 7597
Eligible Refusals 229 225 220 296 272 237 1479
Smoker Refusals 149 142 125 206 190 173 985
Non-smoker Refusals 80 83 95 90 82 64 494
Unknown Eligibility Refusals 2033 1831 2062 2553 2681 2337 13 497
Not Eligible† 6177 7032 7116 8216 8471 8779 45 791
Total Sample 9689 10 357 10 664 12 334 12 696 12 624 68 364
Response Rate Smokers (%) ‡ 62.8 65.8 64.2 58.0 58.0 59.4 61.4
% of Response Rate Refusal Conversions § 8.5 10.9 7.1 16.0 17.1 12.0 11.9
Response Rate NS (%) ‡ 50.0 49.4 57.3 59.0 43.0 48.3 51.2
Overall Response Rate (%) ‡ 57.0 58.2 61.3 58.4 51.0 54.4 56.7
Cooperation Rate (%) – Smokers || 87.1 86.0 87.5 81.8 83.1 83.6 84.9
Cooperation Rate (%) – NS || 89.2 89.2 86.6 87.6 90.4 91.2 89.0
Average survey length (minutes) – Smokers 21.3 22.1 23.8 23.0 24.4 23.2 23.0
Average survey length (minutes) – Non-smokers 12.6 12.5 14.6 13.9 13.1 12.1 13.1
* Partial Interviews are those in which respondents began the survey but did not complete the full interview † Not eligible represents dialed numbers that were a non-residence, fax/modem, a cell phone, not-in-service, or potential participants who were unable to complete an interview in English, incompetent, less than 18 years of age, or ineligible since the non-smoker quota was filled ‡ Response rates were calculated according to AAPOR #47 § Percentage of all completed interviews that were a result of refusal conversions || Cooperation rates were calculated according to AAPOR COOP#47 Note: NS = non-smokers

OTS Technical Report 1: Baseline Data
14 Ontario Tobacco Research Unit
Baseline Study Participants
In the public use data file, partial interviews without weight information are omitted. Partial interviews (N=92) represent those where the respondent started the interview, but terminated the interview prior to completion. In these cases, it is not possible to assign a final weight including post-stratification adjustments, because partial respondents’ ages are unknown. Therefore, respondents with partial data have been excluded from this public use data file, but may be made available upon request.b In addition, nine participants with complete survey data did not provide their age and therefore are given a final weight (xwt2006) of zero. These individuals are included in the baseline public use data file, however, will automatically be excluded by the software from any weighted analysis. Thus, the public use dataset has 7505 respondents, of which 7496 respondents have weight information. The actual unweighted numbers of total eligible participants described in reports and publications using OTS data may deviate from analysis to analysis depending on when the analysis was completed during the extended period of data collection for the OTS initiative. Reported totals may vary slightly across analyses for several reasons. First, the number of observations available for analyses using probability sampling weights may change as a small number of participants have provided information required to assign design weights only on follow-up interviews. Second, under Ontario privacy legislation, changes in described total numbers of eligible participants may reflect participants who withdrew their consent to participate, retrospectively, and requested their data be removed (this is a theoretically possible but rare occurrence). Either of these causes can be expected to explain differences of fewer than five unweighted observations and should have a negligible influence on any, otherwise reliable, statistical analysis. The third reason for deviation is that different analysts will apply different inclusion/exclusion criteria for the immediate uses (examples include restriction of the analysis to baseline smokers based on differing definitions). Deviations in explicit inclusion/exclusion criteria can have a larger effect on total Ns. Detailed inclusion criteria will appear in the method section of the report in question. Finally, the OTS baseline weights were adjusted in February 2010, thus prior analyses may result in slightly different estimates. Table 8 provides basic demographic information regarding the baseline study sample in the public use file which includes the sample of recent smokers and non-smokers with complete data. Table 9 outlines key smoking indicators among current smokers at baseline.
b Recent smokers with partial data at baseline are not recontacted for follow-up interviews.

OTS Technical Report 1: Baseline Data
Ontario Tobacco Research Unit 15
Table 8: Demographic Characteristics of the Complete OTS Baseline Sample (Includes Smokers and Non-smokers)
Demographic Number of Interviews
Weighted %
Total N 7505 7496
Age (years)
18-29 1361 18.5
30-44 2211 29.8
45-64 2910 34.2
65+ 949 17.5
Missing 74
Sex
Male 3257 48.0
Female 4248 52.0
Marital Status
Married / Partner 4390 67.9
Widowed 476 4.7
Divorced 635 4.9
Separated 400 2.6
Never married 1562 20.0
Missing 42
Regional Status (Area Code)
807 / 705 1966 13.9
613 1861 14.4
519 2104 19.8
416 / 647 / 905 / 289 1574 51.9
Highest Education
Less than high school 1006 9.0
Completed high school 2071 24.5
Some college or university 789 10.3
Graduated college or university 3489 53.8
Other 121 2.4
Missing 29
6-month Smoking (study selection variable)
Yes (recent smoker / longitudinal participant) 4504 22.6
No (non-smoker / cross-sectional participant) 3001 77.4
Smoking Status*
Current smoking 4064 19.9
Formerly smoker 1428 28.7
Never smoked 2006 51.4
Missing 7
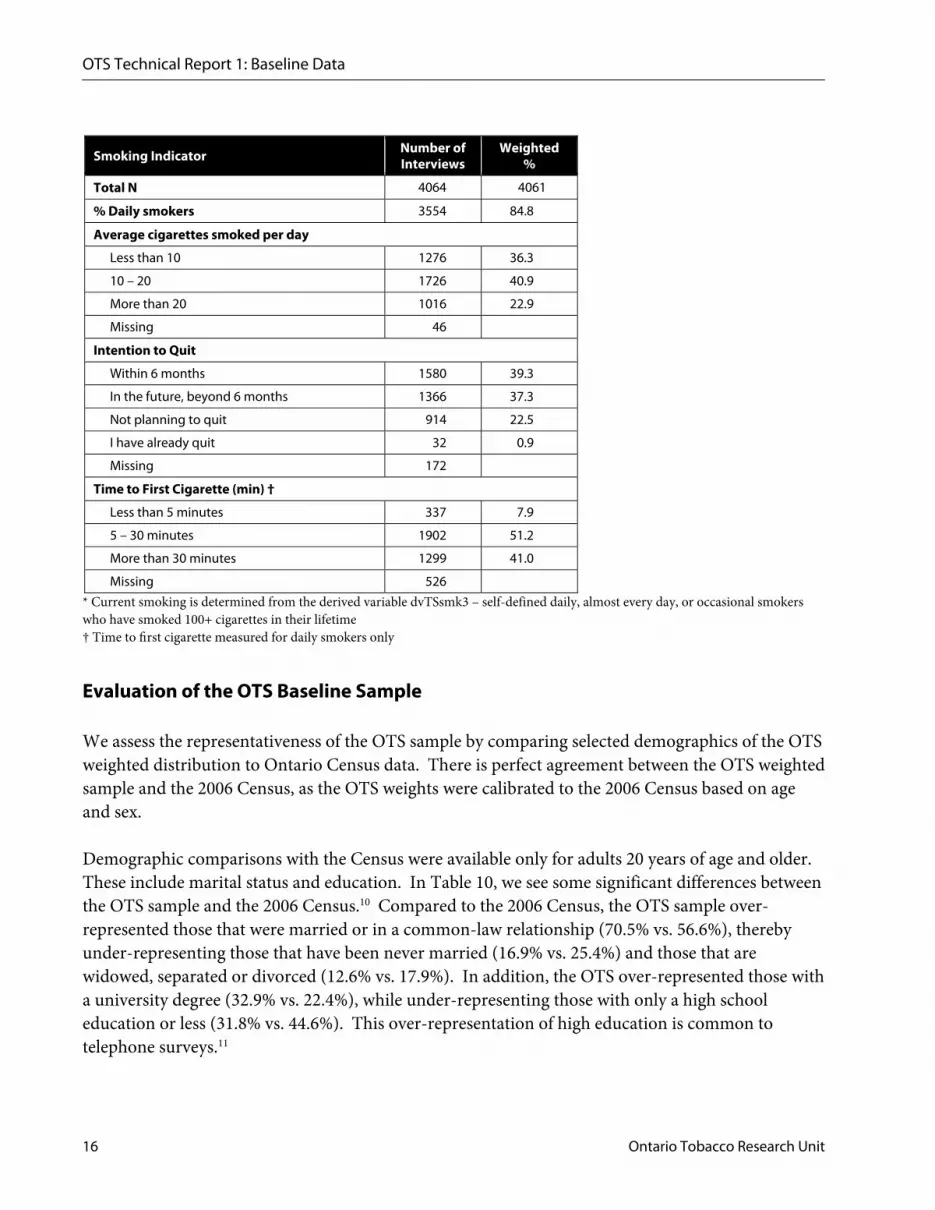
* Smoking status is based on the derived variable dvTSsmk3 as outlined in the OTS Derived Variables document in Appendix C Table 9: Key Smoking Indicators Among Baseline Current Smokers*
OTS Technical Report 1: Baseline Data
16 Ontario Tobacco Research Unit
Smoking Indicator Number of Interviews
Weighted%
Total N 4064 4061
% Daily smokers 3554 84.8
Average cigarettes smoked per day
Less than 10 1276 36.3
10 – 20 1726 40.9
More than 20 1016 22.9
Missing 46
Intention to Quit
Within 6 months 1580 39.3
In the future, beyond 6 months 1366 37.3
Not planning to quit 914 22.5
I have already quit 32 0.9
Missing 172
Time to First Cigarette (min) †
Less than 5 minutes 337 7.9
5 – 30 minutes 1902 51.2
More than 30 minutes 1299 41.0
Missing 526* Current smoking is determined from the derived variable dvTSsmk3 – self-defined daily, almost every day, or occasional smokers who have smoked 100+ cigarettes in their lifetime † Time to first cigarette measured for daily smokers only
Evaluation of the OTS Baseline Sample
We assess the representativeness of the OTS sample by comparing selected demographics of the OTS weighted distribution to Ontario Census data. There is perfect agreement between the OTS weighted sample and the 2006 Census, as the OTS weights were calibrated to the 2006 Census based on age and sex. Demographic comparisons with the Census were available only for adults 20 years of age and older. These include marital status and education. In Table 10, we see some significant differences between the OTS sample and the 2006 Census.10 Compared to the 2006 Census, the OTS sample over-represented those that were married or in a common-law relationship (70.5% vs. 56.6%), thereby under-representing those that have been never married (16.9% vs. 25.4%) and those that are widowed, separated or divorced (12.6% vs. 17.9%). In addition, the OTS over-represented those with a university degree (32.9% vs. 22.4%), while under-representing those with only a high school education or less (31.8% vs. 44.6%). This over-representation of high education is common to telephone surveys.11

OTS Technical Report 1: Baseline Data
Ontario Tobacco Research Unit 17
Table 10: Weighted OTS Baseline Sample versus 2006 Census Data, Ontarians 20 Years of Age and Older
OTS Baseline Sample*
(N=7154) Weighted % (95% CI)
2006 Ontario Census (N=9,116,375)
Marital Status
Married / Common Law 70.5 [68.7, 72.3] 56.6
Widowed / Separated / Divorced 12.6 [11.5, 13.8] 17.9
Never Married 16.9 [15.3, 18.4] 25.4
Education
High school or less 31.8 [30.1, 33.6] 44.6
Some post-secondary 35.4 [33.5, 37.3] 33.0
University degree 32.9 [30.8, 34.6] 22.4
* OTS data excludes missing items Source: Statistics Canada10 Data Analysis and Requirements for Data Use
The OTS employed complex sampling procedures in the recruitment of its sample. For each component of the OTS, and several combinations of OTS elements, probability sampling weights have been defined and are to be used with appropriate survey software (see following section) to provide survey estimates that can be generalized to the Ontario adult population for the study years. The standard population structure used to define probability sampling weights reflected the population of Ontario adults (aged 18 and older) residing in private dwellings during the respective year of baseline data collection (stratified by age group, sex and geographical stratum). Underlying population structure estimates were derived from 2006 Census estimates.10 Due to the complexity introduced by the stratified, quota-based sampling of recent smokers and non-smokers (described above), OTS survey data are not used to estimate the crude proportion of recent smokers and non-smokers in the population. A summary of weight variables and descriptions are in Table 11. Table 11: Weights for the OTS Baseline Data (July 2005 – June 2008)
Weight Purpose
Combined Data - All Waves
xwt2006 Population expansion weight for all respondents across all waves calibrated to the 2006 Census age and sex distribution
Individual Waves*
xwt_w1_0 Population expansion weight for Wave 1
xwt_w2_0 Population expansion weight for Wave 2
xwt_w3_0 Population expansion weight for Wave 3
xwt_w4_0 Population expansion weight for Wave 4
xwt_w5_0 Population expansion weight for Wave 5
xwt_w6_0 Population expansion weight for Wave 6 * All weights have been calibrated to the 2006 Census age and sex distribution
OTS Technical Report 1: Baseline Data
18 Ontario Tobacco Research Unit
Data Suppression and Protection of Privacy
To protect against identification of respondents, any analysis with OTS data that generates an unweighted cell size of less than five respondents is required to be suppressed. This would include tabular analyses which produce 100% and 0% cells. Further suppression guidelines based on precision are given below. For the purposes of the public use data file, all geographic personal identifiers have been omitted including postal code and telephone number. Only area code (regional stratification variable) is provided. For reasons of confidentiality, responses to open-ended questions are also not provided in the public use file; however, these may be released upon request pending approval.
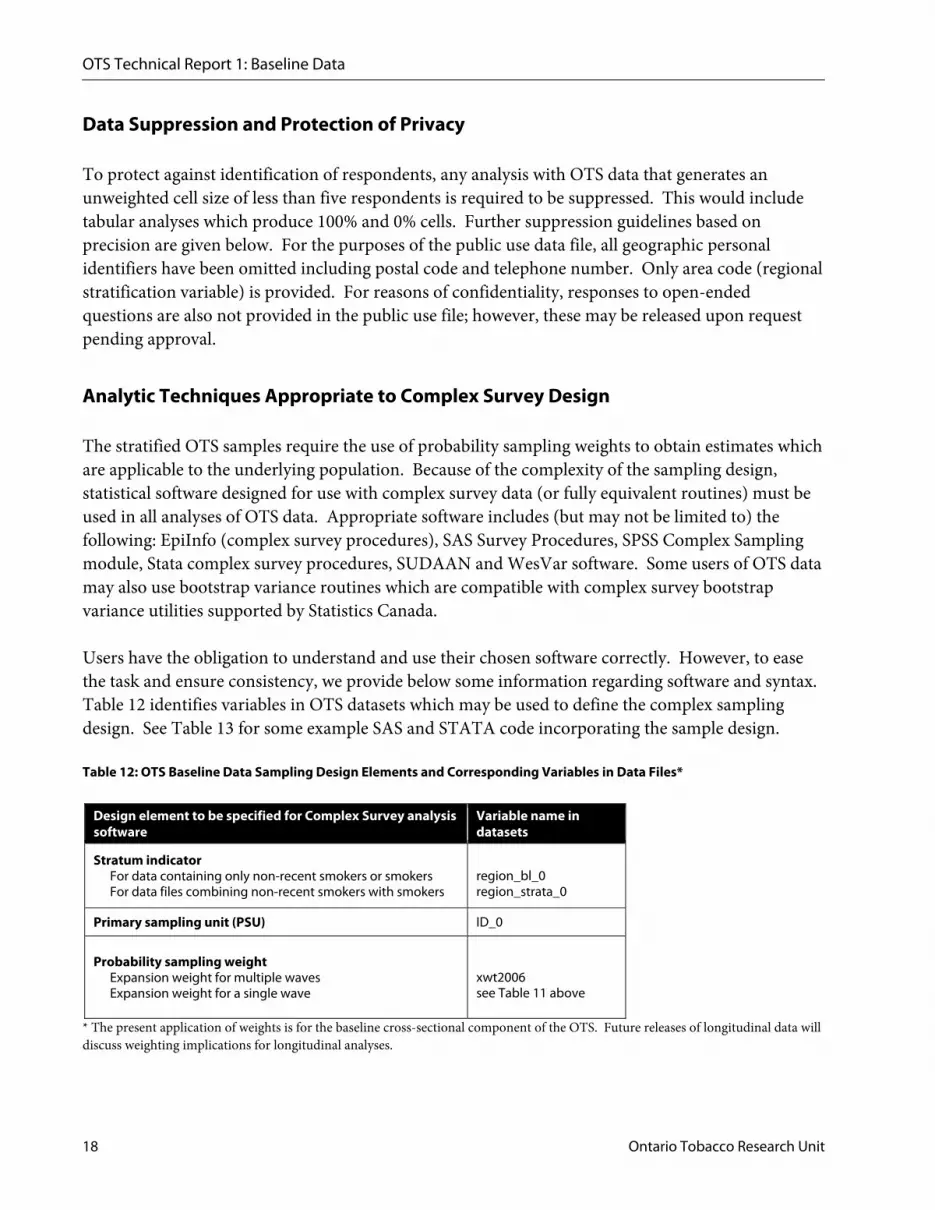
Analytic Techniques Appropriate to Complex Survey Design
The stratified OTS samples require the use of probability sampling weights to obtain estimates which are applicable to the underlying population. Because of the complexity of the sampling design, statistical software designed for use with complex survey data (or fully equivalent routines) must be used in all analyses of OTS data. Appropriate software includes (but may not be limited to) the following: EpiInfo (complex survey procedures), SAS Survey Procedures, SPSS Complex Sampling module, Stata complex survey procedures, SUDAAN and WesVar software. Some users of OTS data may also use bootstrap variance routines which are compatible with complex survey bootstrap variance utilities supported by Statistics Canada. Users have the obligation to understand and use their chosen software correctly. However, to ease the task and ensure consistency, we provide below some information regarding software and syntax. Table 12 identifies variables in OTS datasets which may be used to define the complex sampling design. See Table 13 for some example SAS and STATA code incorporating the sample design. Table 12: OTS Baseline Data Sampling Design Elements and Corresponding Variables in Data Files*
Design element to be specified for Complex Survey analysis software
Variable name in datasets
Stratum indicator For data containing only non-recent smokers or smokers For data files combining non-recent smokers with smokers
region_bl_0 region_strata_0
Primary sampling unit (PSU) ID_0
Probability sampling weight Expansion weight for multiple waves Expansion weight for a single wave
xwt2006 see Table 11 above
* The present application of weights is for the baseline cross-sectional component of the OTS. Future releases of longitudinal data will discuss weighting implications for longitudinal analyses.

OTS Technical Report 1: Baseline Data
Ontario Tobacco Research Unit 19
Special Note on Sub-population Analysis
In order to calculate appropriate variance estimates, confidence intervals, and p-values when analysing survey data using complex survey procedures, the entire sample must be used in the statistical procedure. When the user wants to create estimates or perform statistical tests on a sub-population (e.g. females, respondents with complete data on certain variables, respondents reporting a quit attempt), incorrect variances, confidence intervals and p-values will be produced if the user employs standard subsetting techniques (e.g. ‘by’ statement, ‘if’ statement, ‘where’ statement, or a minimised dataset). Instead, the user should employ domain analysis. For a further discussion of domain analysis see Lohr (1999).12 In brief, the user should create an indicator variable identifying whether each respondent on the dataset should be included in the analysis (1) or omitted (0). This indicator variable will then be used in the statistical procedure (see Table 13). However, domain analysis is NOT required when the sub-population examined represents one stratum on which the sample was chosen (e.g. recent smokers, non-smokers, geographic region). Table 13: Sample Code for SAS and STATA Analyses to Demonstrate OTS Design Variables and Sub-population Analyses
Analysis SAS v9.2 Code STATA v10.0 Code
Estimate of Mean of VARIABLE across all waves
proc surveymeans data=DATA; cluster id_0; strata region_strata_0; weight xwt2006; var VARIABLE; run;
svyset id_0 [pweight=xwt2006], strata(region_strata_0) svy: mean VARIABLE
Estimate of Mean of VARIABLE across all waves FOR ONLY FEMALES (Sub-population analysis – create FEMALE variable that is 1=F, 0=M)
proc surveymeans data=DATA; cluster id_0; strata region_strata_0; weight xwt2006; domain FEMALE; var VARIABLE; run;
svyset id_0 [pweight=xwt2006], strata(region_strata_0) svy, subpop(FEMALE): mean VARIABLE
Estimate a proportion or frequency of VARIABLE
Proc surveyfreq data=DATA; cluster id_0; strata region_strata_0; weight xwt2006; tables VARIABLE; Run;
svyset id_0 [pweight=xwt2006], strata(region_strata_0) svy: tabulate VARIABLE
Estimate of proportion of VARIABLE across all waves FOR ONLY FEMALES (Sub-population analysis – create FEMALE variable that is 1=F, 0=M)
proc surveyfreq data=DATA; cluster id_0; strata region_strata_0; weight xwt2006; tables FEMALE*VARIABLE; run;
svyset id_0 [pweight=xwt2006], strata(region_strata_0) svy, subpop(FEMALE): tabulate VARIABLE

OTS Technical Report 1: Baseline Data
20 Ontario Tobacco Research Unit
Acknowledgement of Estimate Precision in Reports Released
All users of OTS data producing survey estimates reflecting the population must use population-weighted data along with appropriate demonstration of estimate precision (e.g., 95% confidence intervals) calculated using appropriate techniques as listed above. Users of OTS data preparing population descriptive documents, especially those intended to a mixed or lay audience are strongly advised to apply data suppression criteria based on the coefficient of variation (CV = standard error of estimate/ estimate *100) and the guidelines for suppression of estimates based on CV used by Statistics Canada.13 Data suppression guidelines based on CV are detailed in Table 14. Table 14: Coefficient of Variation (CV) Data Suppression Guidelines
CV range Estimate Stability and Action
0 - 16.5 Estimate is stable and reportable
16.6 - 33.3 Estimate has moderate sampling variability and should be interpreted with caution
33.4 and above Estimate is unstable and should be suppressed
Users of OTS data writing for scientific and professional audiences are also encouraged to comply with data suppression criteria above, and, at a minimum, comply with best practice for presenting data including data precision. This includes reporting numbers of observations in each step of the analysis and the use of 95% confidence intervals and/or standard error estimates and p-values to an appropriate number of decimal places for all estimates.14 Also recall that for purposes of confidentiality, any analysis with OTS data that generates an unweighted cell size less than five respondents is required to be suppressed. Accounting for Skip Logic
As described above under Study Instruments, the OTS questionnaires incorporate significant skip logic in order to minimize respondent burden. The data analyst must evaluate the question coverages (or skip logic) for each question being analysed. This will require the analyst identify their study population to answer their research question(s). Subsequently, the analyst should assess the coverage for each survey item (or question) to be analysed and determine if the coverage for each question matches their study population. If so, no further action is required for the given question; if not, the analyst must assess the following:
Who is excluded from this question but included in your study population? Why are these individuals excluded? Are they skipped out because of their response(s) from
previous questions or is it a limitation to the study data? If it is the former, then the analyst must evaluate the questionnaire(s) and skip logic to determine if re-coding (or imputation)

OTS Technical Report 1: Baseline Data
Ontario Tobacco Research Unit 21
can be done to include these respondents. If it is the latter, the analyst may have to revise their study population to reflect the OTS data.
Data Limitations
Those using or interpreting OTS data should recognise (and acknowledge as appropriate) study limitations. These include:
Oversampling. Since the OTS oversamples smokers, there are different sampling schemes for smokers and non-smokers; therefore, this study data cannot be used to estimate smoking prevalence in the population.
Telephone-based sample. Since the OTS targets Ontario households with a telephone, homeless populations and individuals residing in institutions (prisons, hospitals, and military establishments) were not eligible for participation. Additionally, cell-phone-only individuals are not captured in this study.
Self-report. The OTS, as with all survey data, relies on self-reported behaviours which may underestimate the actual frequency of such behaviours.
Language. Individuals unable to adequately communicate in English were not eligible to participate in this study.
Accessing OTS Data
Research teams may apply for access to OTS data through one of the following university-based data libraries:
Propel Population Health Data Repository at the University of Waterloo (http://ice-rci.org/data_repository/index.cfm);
University of Toronto Data Library (http://www.chass.utoronto.ca/datalib/). Please refer to our website for release dates of OTS datasets: http://www.otru.org/tobacco_survey.html. Citing Technical Reports and OTS Data
The OTS Technical Reports should be cited as indicated on the second page of each report. This technical report should be cited as follows:
OTS Technical Report 1: Baseline Data
22 Ontario Tobacco Research Unit
Diemert, L., Victor, J.C., Chaiton, M., Bondy, S.J. Ontario Tobacco Survey Technical Report 1: Baseline Data. Toronto, ON: Ontario Tobacco Research Unit, April 2010.
Data files from the OTS must be cited and will vary depending on the distributor of the data. For example, baseline data accessed from the University of Waterloo Propel Population Health Repository should be cited as follows: Ontario Tobacco Research Unit. Ontario Tobacco Survey: Baseline Data [computer file]. Toronto,
ON: Ontario Tobacco Research Unit [producer], 2010. Propel Population Health Data Repository [distributor], 2010.
The bibliographic citation for datasets using baseline and six-month follow-up data accessed from
the University of Toronto Data Library Service would cite: Ontario Tobacco Research Unit. Ontario Tobacco Survey: Baseline and Six Month Follow-up Data
[computer file]. Toronto, ON: Ontario Tobacco Research Unit [producer], 2010. University of Toronto Data Library Service [distributor], 2010.
Acknowledgements
Users of this data must acknowledge the funding and developers of the OTS. The statement below should be used in all publications that result from secondary data analysis: The Ontario Tobacco Survey is a project of the Ontario Tobacco Research Unit which receives funding from the Ontario Ministry of Health Promotion.
OTS Technical Report 1: Baseline Data
Ontario Tobacco Research Unit 23
References
1 Bondy, S., Brown, K.S., Cohen, J., Ferrence, R., Garcia, J., McDonald, P., Selby, P., Stephens, T., Diemert, L.M., Victor, J.C. (2006). Development and design of the Ontario Tobacco Survey. Proceedings of Statistics Canada International Symposium 2006: Methodological Issues in Measuring Population Health. Gatineau, QC; 2006 November 1-3. Ottawa: Statistics Canada. 2 Victor, J.C., O’Connor, S., Diemert, L.M., Bondy, S., Brown, K.S., Cohen, J., Ferrence, R., Garcia, J., McDonald, P., Selby, P., Stephens, T. (2006). Estimating sample size for complex surveys: building consensus in an environment of multiple hypotheses, multiple stakeholders and limited budgets. Proceedings of Statistics Canada International Symposium 2006: Methodological Issues in Measuring Population Health. Gatineau, QC; 2006 November 1-3. Ottawa: Statistics Canada. 3 ASDE Survey Sampler. Random Digit Dial Samples (RDD). Available at: http://www.surveysampler.com/RDD-Samples.htm. Accessed on: February 4, 2009. 4 Waksberg, J. (1978). Sampling methods for random digit dialing. Journal of the American Statistical Association, 73:40-46. 5 Diemert, L.M., Bondy, S.J., Victor, J.C., Cohen, J.E., Brown, K.S., Ferrence, R., Garcia, J., McDonald, P., Selby, P. Stephens, T. (2008). Efficient screening of current smoking status in recruitment of smokers for population-based research. Nicotine & Tobacco Research, 10(11): 1663-7. 6 Poland, B.D., Cohen, J.E., Ashley, M.J., Adlaf, E., Ferrence, R., Pederson, L.L., Bull, S.B., Raphael, D. (2000). Heterogeneity among smokers and non-smokers in attitudes and behaviour regarding smoking and smoking restrictions. Tobacco Control, 9: 364–71. 7 American Association for Public Opinion Research. (2006). Standard definitions: Final dispositions of case codes and outcome rates for surveys. (4th ed.). Lenexa, Kansas: AAPOR. 8 Ialomiteanu, A., Adlaf, E.M. (2008). CAMH Monitor 2007: Technical Guide. Toronto, Centre for Addiction and Mental Health.
9 Thompson, M.E., Fong, G.T., Hammond, D., Boudreau, C., Driezen, P., Hyland, A., Borland, R., Cummings, K.M., Hastings, G.B., Siahpush, M. Mackintost, A.M., Laux, F.L. (2006). Methods of the International Tobacco Control (ITC) four country survey. Tobacco Control, 15(Suppl. 3), iii12–8.
10 Statistics Canada. 2006 Census data products. Catalogue Number 97-551-XCB2006009. Available at: http://www12.statcan.ca/english/census06/data/topics/Index.cfm. Accessed on: February 1, 2009. 11 Trewin, D., Lee, G. (1988). International comparisons of telephone coverage. In R.M. Groves, P.P. Biemer, L.E. Lyberg, J.T. Massy, W.I. Nicholls & J. Waksberg (Eds.). Telephone Survey Methodology. New York: John Wiley & Sons. pp.9-24. 12 Lohr, S.L. (1999). Sampling: Design and analysis. Pacific Grove: Duxbury Press. 13 Statistics Canada. Survey Methods and Practices. Ottawa, ON: National Library of Canada; 2003 October. Catalogue Number 12-587-XPE. 14 International Committee of Medical Journal Editors. Uniform requirements for manuscripts submitted to biomedical journals: writing and editing for biomedical publication. Available at: http://www.icmje.org/. Accessed on: February 5, 2009.