Embed Size (px)
Citation preview

General Interest
Microbiological Reduction Strategies of Irrigation Water forFresh Produce
J. L. BANACH* AND H. J. VAN DER FELS-KLERX
Wageningen Food Safety Research (WFSR), Wageningen University & Research, P.O. Box 230, 6700 AE Wageningen, The Netherlands (ORCID: https://orcid.org/0000-0003-3439-854X [J.L.B.]; https://orcid.org/0000-0002-7801-394X [H.J.F.K.])
MS 19-466: Received 27 September 2019/Accepted 24 January 2020/Published Online 22 May 2020
ABSTRACT
Irrigation water can be a source of pathogenic contamination of fresh produce. Controlling the quality of the water usedduring primary production is important to ensure food safety and protect human health. Several measures to control themicrobiological quality of irrigation water are available for growers, including preventative and mitigation strategies. However,clear guidance for growers on which strategies could be used to reduce microbiological contamination is needed. This studyevaluates pathogenic microorganisms of concern in fresh produce and water, the microbiological criteria of water intended foragricultural purposes, and the preventative and mitigative microbial reduction strategies. This article provides suggestions forcontrol measures that growers can take during primary production to reduce foodborne pathogenic contamination coming fromirrigation water. Results show that controlling the water source, regime, and timing of irrigation may help to reduce the potentialexposure of fresh produce to contamination. Moreover, mitigation strategies like electrolysis, ozone, UV, and photocatalystshold promise either as a single treatment, with pretreatments that remove suspended material, or as combined treatments withanother chemical or physical treatment(s). Based on the literature data, a decision tree was developed for growers, whichdescribes preventative and mitigation strategies for irrigation-water disinfection based on the fecal coliform load of the irrigationwater and the water turbidity. It helps guide growers when trying to evaluate possible control measures given the quality of theirrigation water available. Overall, the strategies available to control irrigation water used for fresh produce should be evaluatedon a case-by-case basis because one strategy or technology does not apply to all scenarios.
HIGHLIGHTS
� Guidelines and regulations on water quality for agriculture use vary by region.� Control of irrigation water source, regime, and timing are preventative strategies.� Electrolysis, ozone, UV, and photocatalysts are mitigative strategies.� A decision tree can help prioritize control measures for growers.
Key words: Decision tree; Food safety; Growers; Irrigation water criteria; Pathogenic microorganisms; Water disinfection
Several foodborne outbreaks associated with pathogensin fresh produce have been reported in the past years (38,138). Fresh produce can become contaminated withpathogens at any step in the supply chain and often becauseof environmental or human factors. To protect humanhealth, supply chain actors should prevent or mitigatefoodborne pathogens early in the fresh produce supply chainto avoid further growth or cross-contamination at subse-quent stages in the chain. Potential vectors and routes ofmicrobiological contamination during the primary produc-tion of fresh produce include animals or insects, soil,manure, organic fertilizers, equipment, workers, and water.In particular, irrigation water and harvest washing waterhave been identified as key sources of pathogeniccontamination for fresh produce (116, 119). Fresh produce
with the greatest vulnerability for contamination includelow foliar crops (e.g., lettuce, spinach, other leafy-greenvegetables), root crops (e.g., onions), off-ground crops (e.g.,tomatoes), and fruits because they are vulnerable to multiplesources of contamination, are grown in the open field, andcan be consumed raw (119).
Good agricultural practices aim to provide safe food foractors further along the supply chain, such as industry,retailers, and consumers. GLOBALG.A.P. is a worldwideprivate standard that provides guidelines for primaryproduction processes to ensure good agricultural practices.Among those guidelines are water management and controlmeasures, which, e.g., aim to prevent pathogenic contam-ination in water and focus on irrigation requirements,irrigation and fertigation management, water quality, thesupply of irrigation and fertigation, and water storagefacilities (47). In addition, water quality should comply withpublished guidelines of the World Health Organization
* Author for correspondence. Tel: þ31 614 323 125; E-mail:[email protected].
1072
Journal of Food Protection, Vol. 83, No. 6, 2020, Pages 1072–1087https://doi.org/10.4315/JFP-19-466This is an open access article under the CC BY-NC-ND license (https://creativecommons.org/licenses/by-nc-nd/4.0/)
Dow
nloaded from http://m
eridian.allenpress.com/jfp/article-pdf/83/6/1072/2495672/i0362-028x-83-6-1072.pdf by W
ageningen UR
user on 12 June 2020
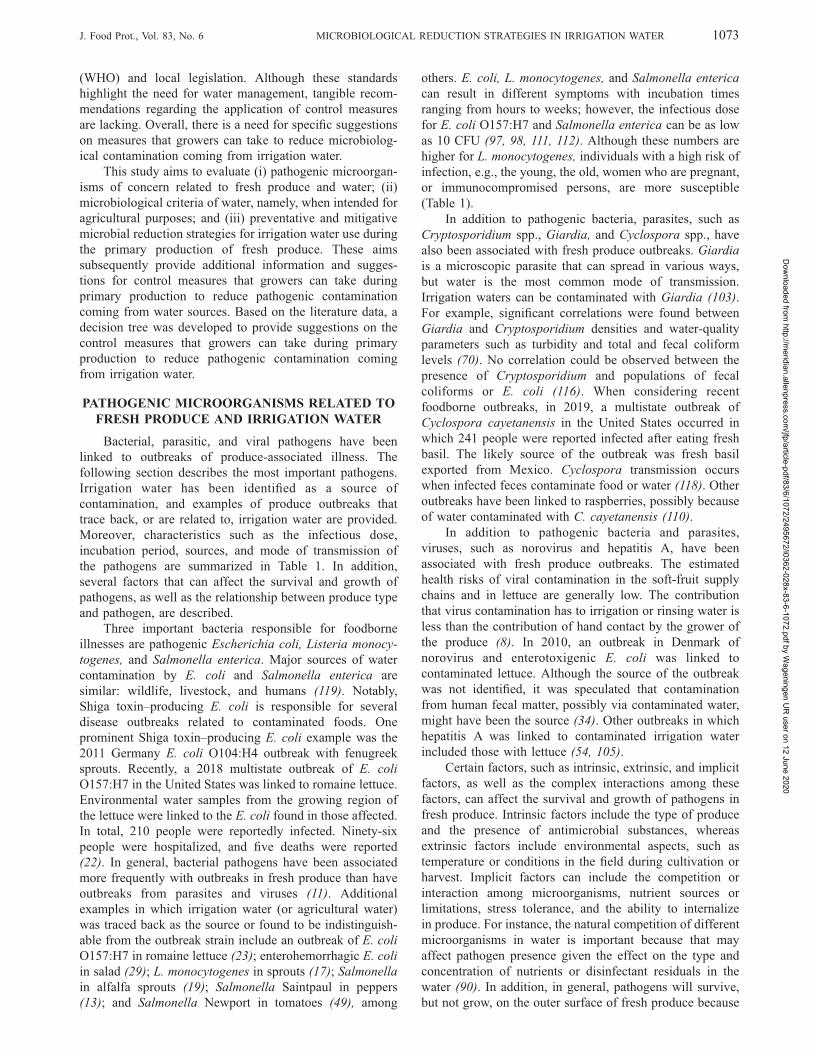
(WHO) and local legislation. Although these standardshighlight the need for water management, tangible recom-mendations regarding the application of control measuresare lacking. Overall, there is a need for specific suggestionson measures that growers can take to reduce microbiolog-ical contamination coming from irrigation water.
This study aims to evaluate (i) pathogenic microorgan-isms of concern related to fresh produce and water; (ii)microbiological criteria of water, namely, when intended foragricultural purposes; and (iii) preventative and mitigativemicrobial reduction strategies for irrigation water use duringthe primary production of fresh produce. These aimssubsequently provide additional information and sugges-tions for control measures that growers can take duringprimary production to reduce pathogenic contaminationcoming from water sources. Based on the literature data, adecision tree was developed to provide suggestions on thecontrol measures that growers can take during primaryproduction to reduce pathogenic contamination comingfrom irrigation water.
PATHOGENIC MICROORGANISMS RELATED TOFRESH PRODUCE AND IRRIGATION WATER
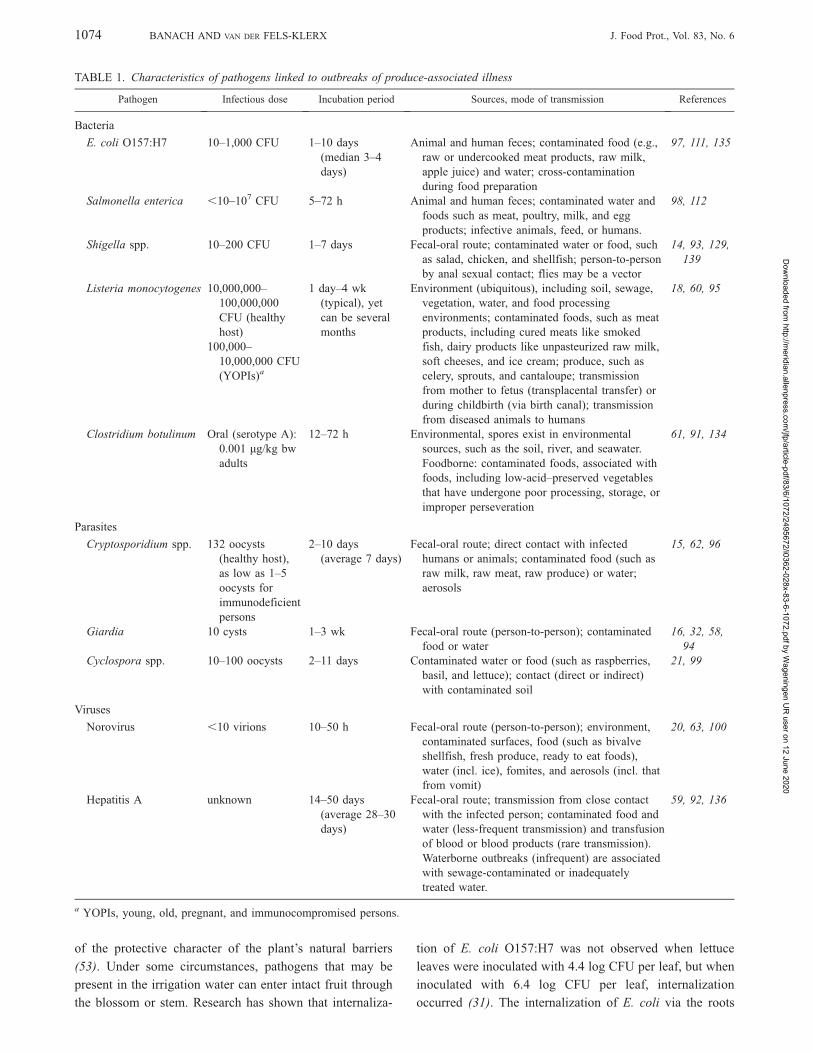
Bacterial, parasitic, and viral pathogens have beenlinked to outbreaks of produce-associated illness. Thefollowing section describes the most important pathogens.Irrigation water has been identified as a source ofcontamination, and examples of produce outbreaks thattrace back, or are related to, irrigation water are provided.Moreover, characteristics such as the infectious dose,incubation period, sources, and mode of transmission ofthe pathogens are summarized in Table 1. In addition,several factors that can affect the survival and growth ofpathogens, as well as the relationship between produce typeand pathogen, are described.
Three important bacteria responsible for foodborneillnesses are pathogenic Escherichia coli, Listeria monocy-togenes, and Salmonella enterica. Major sources of watercontamination by E. coli and Salmonella enterica aresimilar: wildlife, livestock, and humans (119). Notably,Shiga toxin–producing E. coli is responsible for severaldisease outbreaks related to contaminated foods. Oneprominent Shiga toxin–producing E. coli example was the2011 Germany E. coli O104:H4 outbreak with fenugreeksprouts. Recently, a 2018 multistate outbreak of E. coliO157:H7 in the United States was linked to romaine lettuce.Environmental water samples from the growing region ofthe lettuce were linked to the E. coli found in those affected.In total, 210 people were reportedly infected. Ninety-sixpeople were hospitalized, and five deaths were reported(22). In general, bacterial pathogens have been associatedmore frequently with outbreaks in fresh produce than haveoutbreaks from parasites and viruses (11). Additionalexamples in which irrigation water (or agricultural water)was traced back as the source or found to be indistinguish-able from the outbreak strain include an outbreak of E. coliO157:H7 in romaine lettuce (23); enterohemorrhagic E. coliin salad (29); L. monocytogenes in sprouts (17); Salmonellain alfalfa sprouts (19); Salmonella Saintpaul in peppers(13); and Salmonella Newport in tomatoes (49), among
others. E. coli, L. monocytogenes, and Salmonella entericacan result in different symptoms with incubation timesranging from hours to weeks; however, the infectious dosefor E. coli O157:H7 and Salmonella enterica can be as lowas 10 CFU (97, 98, 111, 112). Although these numbers arehigher for L. monocytogenes, individuals with a high risk ofinfection, e.g., the young, the old, women who are pregnant,or immunocompromised persons, are more susceptible(Table 1).
In addition to pathogenic bacteria, parasites, such asCryptosporidium spp., Giardia, and Cyclospora spp., havealso been associated with fresh produce outbreaks. Giardiais a microscopic parasite that can spread in various ways,but water is the most common mode of transmission.Irrigation waters can be contaminated with Giardia (103).For example, significant correlations were found betweenGiardia and Cryptosporidium densities and water-qualityparameters such as turbidity and total and fecal coliformlevels (70). No correlation could be observed between thepresence of Cryptosporidium and populations of fecalcoliforms or E. coli (116). When considering recentfoodborne outbreaks, in 2019, a multistate outbreak ofCyclospora cayetanensis in the United States occurred inwhich 241 people were reported infected after eating freshbasil. The likely source of the outbreak was fresh basilexported from Mexico. Cyclospora transmission occurswhen infected feces contaminate food or water (118). Otheroutbreaks have been linked to raspberries, possibly becauseof water contaminated with C. cayetanensis (110).
In addition to pathogenic bacteria and parasites,viruses, such as norovirus and hepatitis A, have beenassociated with fresh produce outbreaks. The estimatedhealth risks of viral contamination in the soft-fruit supplychains and in lettuce are generally low. The contributionthat virus contamination has to irrigation or rinsing water isless than the contribution of hand contact by the grower ofthe produce (8). In 2010, an outbreak in Denmark ofnorovirus and enterotoxigenic E. coli was linked tocontaminated lettuce. Although the source of the outbreakwas not identified, it was speculated that contaminationfrom human fecal matter, possibly via contaminated water,might have been the source (34). Other outbreaks in whichhepatitis A was linked to contaminated irrigation waterincluded those with lettuce (54, 105).
Certain factors, such as intrinsic, extrinsic, and implicitfactors, as well as the complex interactions among thesefactors, can affect the survival and growth of pathogens infresh produce. Intrinsic factors include the type of produceand the presence of antimicrobial substances, whereasextrinsic factors include environmental aspects, such astemperature or conditions in the field during cultivation orharvest. Implicit factors can include the competition orinteraction among microorganisms, nutrient sources orlimitations, stress tolerance, and the ability to internalizein produce. For instance, the natural competition of differentmicroorganisms in water is important because that mayaffect pathogen presence given the effect on the type andconcentration of nutrients or disinfectant residuals in thewater (90). In addition, in general, pathogens will survive,but not grow, on the outer surface of fresh produce because
J. Food Prot., Vol. 83, No. 6 MICROBIOLOGICAL REDUCTION STRATEGIES IN IRRIGATION WATER 1073D
ownloaded from
http://meridian.allenpress.com
/jfp/article-pdf/83/6/1072/2495672/i0362-028x-83-6-1072.pdf by Wageningen U
R user on 12 June 2020
of the protective character of the plant’s natural barriers
(53). Under some circumstances, pathogens that may be
present in the irrigation water can enter intact fruit through
the blossom or stem. Research has shown that internaliza-
tion of E. coli O157:H7 was not observed when lettuce
leaves were inoculated with 4.4 log CFU per leaf, but when
inoculated with 6.4 log CFU per leaf, internalization
occurred (31). The internalization of E. coli via the roots
TABLE 1. Characteristics of pathogens linked to outbreaks of produce-associated illness
Pathogen Infectious dose Incubation period Sources, mode of transmission References
Bacteria
E. coli O157:H7 10–1,000 CFU 1–10 days(median 3–4days)
Animal and human feces; contaminated food (e.g.,raw or undercooked meat products, raw milk,apple juice) and water; cross-contaminationduring food preparation
97, 111, 135
Salmonella enterica ,10–107 CFU 5–72 h Animal and human feces; contaminated water andfoods such as meat, poultry, milk, and eggproducts; infective animals, feed, or humans.
98, 112
Shigella spp. 10–200 CFU 1–7 days Fecal-oral route; contaminated water or food, suchas salad, chicken, and shellfish; person-to-personby anal sexual contact; flies may be a vector
14, 93, 129,139
Listeria monocytogenes 10,000,000–100,000,000CFU (healthyhost)
1 day–4 wk(typical), yetcan be severalmonths
Environment (ubiquitous), including soil, sewage,vegetation, water, and food processingenvironments; contaminated foods, such as meatproducts, including cured meats like smokedfish, dairy products like unpasteurized raw milk,soft cheeses, and ice cream; produce, such ascelery, sprouts, and cantaloupe; transmissionfrom mother to fetus (transplacental transfer) orduring childbirth (via birth canal); transmissionfrom diseased animals to humans
18, 60, 95
100,000–10,000,000 CFU(YOPIs)a
Clostridium botulinum Oral (serotype A):0.001 μg/kg bwadults
12–72 h Environmental, spores exist in environmentalsources, such as the soil, river, and seawater.Foodborne: contaminated foods, associated withfoods, including low-acid–preserved vegetablesthat have undergone poor processing, storage, orimproper perseveration
61, 91, 134
Parasites
Cryptosporidium spp. 132 oocysts(healthy host),as low as 1–5oocysts forimmunodeficientpersons
2–10 days(average 7 days)
Fecal-oral route; direct contact with infectedhumans or animals; contaminated food (such asraw milk, raw meat, raw produce) or water;aerosols
15, 62, 96
Giardia 10 cysts 1–3 wk Fecal-oral route (person-to-person); contaminatedfood or water
16, 32, 58,94
Cyclospora spp. 10–100 oocysts 2–11 days Contaminated water or food (such as raspberries,basil, and lettuce); contact (direct or indirect)with contaminated soil
21, 99
Viruses
Norovirus ,10 virions 10–50 h Fecal-oral route (person-to-person); environment,contaminated surfaces, food (such as bivalveshellfish, fresh produce, ready to eat foods),water (incl. ice), fomites, and aerosols (incl. thatfrom vomit)
20, 63, 100
Hepatitis A unknown 14–50 days(average 28–30days)
Fecal-oral route; transmission from close contactwith the infected person; contaminated food andwater (less-frequent transmission) and transfusionof blood or blood products (rare transmission).Waterborne outbreaks (infrequent) are associatedwith sewage-contaminated or inadequatelytreated water.
59, 92, 136
a YOPIs, young, old, pregnant, and immunocompromised persons.
1074 BANACH AND VAN DER FELS-KLERX J. Food Prot., Vol. 83, No. 6D
ownloaded from
http://meridian.allenpress.com
/jfp/article-pdf/83/6/1072/2495672/i0362-028x-83-6-1072.pdf by Wageningen U
R user on 12 June 2020

of a plant is rare, e.g., it has been shown that E. coli does notpersist longer than a week (31, 33). The internalization ofpathogenic bacteria in tomatoes was shown to occur whenimmersed in contaminated water, despite the similartemperatures of the product and the water (57). In brief,intrinsic, extrinsic, and implicit factors, as well as thecomplex interactions among those factors, can affect thesurvival and growth of pathogens in produce.
As far as a relationship between produce type and thepathogen of concern, several European Food SafetyAuthority (EFSA) reports regarding food of nonanimalorigin ranked fresh produce-pathogen combinations that areoften linked to foodborne disease have been published (38–40). This research demonstrated that norovirus is oftendetected in fruit; mostly berries were of concern. Sproutswere mostly contaminated with Salmonella, whereastomatoes were found to be susceptible to both Salmonellaand norovirus. Red peppers and tomatoes were moresusceptible to Salmonella contamination than were greencrops (77). Both tomatoes and leafy greens, such as parsleyand lettuce, were susceptible to Salmonella and E. coli.Notably, the presence of human pathogens can differdepending on the cultivar (77).
MICROBIOLOGICAL QUALITY CRITERIAOF WATER
Because water is an important contamination source,criteria on the microbiological quality of (treated) waste-water to be used for agriculture, recreational water,irrigation water, and drinking water have been describedin several guidelines and regulations worldwide (Table 2).When assessing water quality for agricultural practices, E.coli concentrations in water are used as a hygiene indicator.This organism was found to be a suitable index organism forSalmonella enterica and Shiga toxin–producing E. coli, butto a lesser extent for Campylobacter spp. (24). Values toassess the microbiological quality of water are commonlyexpressed in fecal coliforms rather than total coliforms. Theterm fecal coliforms concerns the coliforms that live in theintestinal tract of many animals and humans, whereas theterm total coliforms is used as a general indicator ofpotential contamination with pathogenic organisms.
GLOBALG.A.P. specifies that the water quality to treator wash produce before and after harvest stages should meetmicrobiological standards for drinking water as defined bythe WHO. Treated wastewater used at the preharvest stageshould meet the WHO microbiological guideline for thesafe use of treated wastewater in agriculture. WHOguidelines for the use of wastewater in agriculture haveindicated that, for the irrigation of crops that are likely to beeaten uncooked, a geometric mean of �1,000 CFU/100 mLhas been recommended (126). Since then, a more recentWHO guideline for unrestricted wastewater used inagriculture has recommended different criteria, based onthe type of crop and irrigation (Table 2) (130).
According to the European guidelines on recreationalwaters (e.g., of rivers, lakes, and coastal waters), differentcriteria for inland and coastal or transitional waters areprovided. For inland waters, including lakes and rivers,concentrations of E. coli are recommended to be ,900
CFU/100 mL, whereas, for coastal and transitional waters,concentrations ,500 CFU/100 mL of E. coli have beenproposed (36). Guidelines from the WHO and the UnitedStates are presented for comparison (Table 2).
The Council of the European Union lays down thequality of water intended for human consumption inDirective 98/83/EC, indicating microbiological parametersof 0 CFU of E. coli per 100 mL and 0 CFU of enterococciper 100 mL, with exceptions for water sold in bottles orcontainers (35). Guidelines from the WHO and the UnitedStates are presented for comparison (Table 2).
The European Commission has provided a notice onguidelines for addressing microbiological risks in fresh fruitand vegetables (FFVs) at primary production through goodhygiene, wherein a matrix on the microbiological riskassessment of agricultural water is provided (37). Duringpreharvest and harvest, for FFVs that are to be eatenuncooked and where the irrigation water comes into directcontact with the edible portion of the crop, there is anindicator fecal contamination target value of E. coli of 100CFU/100 mL. For FFVs that are to be eaten uncooked andwhere the irrigation water does not come into direct contactwith the edible portion of the crop, or for FFVs that are tobe eaten cooked and where the irrigation water comes intocontact with the edible portion of the crop, there is anindicator fecal contamination target value of E. coli of 1,000CFU/100 mL. Finally, for FFVs that are to be eaten cookedand where the irrigation water does not come into directcontact with the edible portion of the crop, there is anindicator fecal contamination target value of E. coli of10,000 CFU/100 mL (37). When required, e.g., if the resultsof the water source indicate a potential problem, growersshould take action to reduce the risk to consumers and carryout further testing to verify the effectiveness of thoseactions (37).
Regular water analysis is particularly important forproduce that is not cooked before consumption when theedible part of the crop is in contact with water, and when awater source vulnerable to contamination such as wastewa-ter, surface water, or reclaimed water is used. Testingfrequencies of a minimum of three samples during thegrowing season and a minimum of five samples per year arerecommended in guidance documents (47, 117). It remainsto be determined whether this is sufficient.
In the United States, under the Food Safety Modern-ization Act produce safety rule, definitions for agriculturalwater and its intended use have been described. Require-ments for water quality are established based on E. coli.For instance, “no detectable generic E. coli in 100 mL ofagricultural water” is a criterion that is described for someuses of agricultural water, whereas numerical criteria foragricultural water to be used directly on growing produce(except for sprouts) is based on a geometric mean of �126CFU of E. coli per 100 mL of water and a statisticalthreshold of �410 CFU of E. coli in 100 mL of water(117).
MICROBIOLOGICAL REDUCTION STRATEGIES
To reduce the probability of pathogenic contaminationassociated with fresh produce from contaminated irrigation
J. Food Prot., Vol. 83, No. 6 MICROBIOLOGICAL REDUCTION STRATEGIES IN IRRIGATION WATER 1075D
ownloaded from
http://meridian.allenpress.com
/jfp/article-pdf/83/6/1072/2495672/i0362-028x-83-6-1072.pdf by Wageningen U
R user on 12 June 2020

water, preventative and mitigation strategies can be applied.Preventative strategies aim to reduce or prevent theexposure of fresh produce to contaminated irrigation water.Mitigation strategies aim to reduce the pathogenic load ofthe irrigation water by pretreatment of irrigation water withchemical or physical methods before application.
Preventative strategies. With the aim to reduceexposure of fresh produce to contaminated irrigation water,it is vital that the irrigation water source, regime, and timeare well selected. These three preventative strategies arefurther elaborated in the following sections.
(i) Selection of irrigation water source. Selecting theappropriate irrigation source as a preventive measure has asubstantial effect on the microbial exposure of freshproduce. The probability of finding pathogenic microorgan-isms is shown to be greatest in untreated wastewater,whereas surface water and recycled or reclaimed water haveshown to have an intermediate probability (76, 85). Waterswith a low probability of contamination are tap water,groundwater, and rainwater (76, 86). Groundwater has astable composition over time and contains fewer impurities.Surface water originates from rivers, canals, lakes, ponds,reservoirs, or open wells. These sources are in direct contactwith the environment, and therefore, variable in composi-
TABLE 2. Guidelines and legislation for the microbiological quality of treated wastewater, recreational water, irrigation water, anddrinking water
Country/region Criteria (CFU/100 mL)a Document type Reference(s)
(Treated) wastewater
WHO (unrestricted)b Guideline 130Root cropsc �103 E. coli
�1 helminth eggs (no./L)Leaf cropsd �104 E. coliDrip irrigation, high-growing cropse �105 E. coliDrip irrigation, low-growing cropsf �103 E. coli
Italy ,10 E. coli and absence of Salmonella Regulation 25, 119Spain ,100 E. coli Regulation 2, 119
Recreational waters (coastal and fresh waters)
WHO ,500 enterococci Guideline 128EUg Inland waters: ,330 enterococci or ,900 E. coli Guideline 36
Coastal and transitional waters: ,185 enterococcior ,500 E. coli
United States ,35 enterococci or ,126 E. coli Guideline 114
Irrigation water (for all water types)
Canada ,100 fecal coliforms Guideline 109, 1191,000 total coliforms
Canada (British Columbia) 200 fecal coliforms Guideline 109, 11977 E. coli,20 fecal streptococci
EU Between 100 and 10,000 E. coli Guideline 37
Drinking water
WHO ,1 E. coli Guideline 132EU 0 E. coli Directive 35
0 enterococciFor water in bottles or containers:a
0 E. coli/250 mL0 enterococci/250 mL0 Pseudomonas aeruginosa/250 mLColony count 228C: 100 CFU/mLColony count 378C: 20 CFU/mL
The Netherlands 0 E. coli Decree 1080 enterococci
United States 0 for total coliforms, fecal coliforms, and E. coli Regulation 115
a Unless stated otherwise.b The use of treated wastewater to grow crops usually eaten raw.c That may be eaten uncooked.d Nonrooted salad crops, including vegetables eaten uncooked, e.g., lettuce, cabbage.e Crops that are grown aboveground that generally do not touch the soil, e.g., fruit trees, olives.f Nonrooted crops grown low or near the soil surface.g EU, European Union.
1076 BANACH AND VAN DER FELS-KLERX J. Food Prot., Vol. 83, No. 6D
ownloaded from
http://meridian.allenpress.com
/jfp/article-pdf/83/6/1072/2495672/i0362-028x-83-6-1072.pdf by Wageningen U
R user on 12 June 2020
tion in place and time; hence, care should be taken whenusing such sources. For example, water quality can worsenafter periods of heavy rainfall or flooding if water has beenin contact with other sources of contamination (e.g., animalfeces, sewage, and runoff water). Environmental conditionsare shown to influence the potential of bacterial pathogens;in water, pathogens have been reported to be influenced byenvironmental conditions, such as water temperature, pH,oxygen, and organic and inorganic nutrient types (90).These variables are important to consider when selecting theirrigation source.
When selecting an irrigation source, the turbidity of thewater should also be considered since it may be related topathogen prevalence. Turbid water often leads to sedimentdisturbance-generating particles and nutrients in the water.Particulates in water are a concern because microbes areparticulates, and nonmicrobe particulates may serve asindicators of pathogen presence or protect pathogens fromdisinfectants (27). Higher counts of fungus-like oomyceteswere found to be associated with higher turbidity levels increeks; for example, research demonstrated that an averageincrease in 2.4 nephelometric turbidity units (NTUs) led toan average increase of 29 CFU/L oomycetes for creek watersamples (66). Activities upstream of surface water,including rivers, streams, and creeks, can increase waterturbidity and can rapidly change the level of contaminants,thereby affecting overall water quality. The relationshipbetween pathogens like Salmonella and biological orphysicochemical indicators is complicated because clearcorrelations between these are not consistent. McEgan et al.(78) reported that E. coli was a reasonable predictor ofSalmonella levels in surface water in Florida, and at somestudied sites, physicochemical parameters, including tur-bidity, oxidation-reduction potential, and conductivity, werepredictors of Salmonella in surface water. However, whenphysicochemical parameters across studied sites wereaggregated, there was no clear correlation. In another study,Francy et al. (44) studied the presence and absence ofbacterial pathogen gene markers (for E. coli, eaeA; forShigella, ipaH; for Salmonella, spvC) at inland Ohio waters.Authors observed that when data for several parameterswere combined (rainfall, conductivity, turbidity, watertemperature, and model probability), there was a relation-ship with at least one of the genes mentioned above, but aninconsistent relationship with E. coli concentrations.Overall, water quality parameters, as well as other data,such as site properties and precipitation, may help predictthe pathogen prevalence of water for irrigation purposes.For growers, their activities, including the location thereof,which may negatively influence the water turbidity, can alsobe considered when selecting an irrigation water source.
The extent to which enteric pathogens survive inirrigation water varies substantially depending on thequality and origin of the water (120). Studies on theirrigation water quality of eight Belgian lettuce producersconfirm that surface water quality is unpredictable (119). E.coli values for surface water collected from rivers in thisstudy were within the range of 1.5 to 3.3 log CFU/mL.Another study concluded that irrigation waters of different
origins can transmit enteric pathogens differently and affectthe ability of the pathogens to survive and grow on thelettuce (120). Competition with resident aquatic microbiotainfluences pathogen behavior. In addition, persistence andsurvival on produce are variable, ranging from 1 day to 4weeks on leafy greens (119). Given these variations,strategies should focus on prevention to decrease theprobability of potential pathogenic contamination.
Apart from selecting the most appropriate irrigationsource, other strategies to control the microbiologicalirrigation water quality include decreasing pathogen inflowfrom reservoirs and input sources. Examples of pathogeninput sources are runoff, sewage discharge, direct deposi-tion, infiltration, and sideward flow in shallow soils (85). Inone study, storage of rainfall water in a raised pond withelevated edges reduced mean E. coli concentrations 1.7 logCFU/100 mL compared with a pond that is not protected toprevent runoff (26). In another study, analysis of New Yorksurface waters showed ponds to be positive for E. coli,Salmonella, and oomycetes. Creeks were most oftenpositive for oomycetes, whereas canals contained unambig-uously low amounts of microorganisms (66).
In brief, when selecting an irrigation water source,consider the possibility of pathogen inflow from reservoirsand input sources as well as the other variables mentionedabove, such as water origin and type, influencing environ-mental factors, and activities that may contribute toincreased water turbidity.
(ii) Irrigation regime. The irrigation regime, alongwith the amount of water used for irrigation, can influencethe availability of niches, where pathogens may persist and/or multiply under field and postharvest conditions (46).During preharvest irrigation, moisture on the plant fromirrigation may promote growth and survival of bacterialpopulations. When the plant is in direct contact with theirrigation water, the probability of contamination is greatest.Contact can be avoided through “indirect” irrigationpractices (furrow or drip, subsurface, etc.) because theseare a better choice compared with spray or surface irrigation(46). A study evaluated the survival of E. coli in lettucefields when bacteria were introduced, showing that drip andfurrow irrigation reduced survival on produce slightly afterinoculation as compared with spray irrigation. In trialsinvolving inoculation of E. coli in the field, a consistentobservation was that leaves of plants that were sprinklerirrigated were positive 1 to 3 days after the introduction ofthe bacteria, whereas furrow- and drip-irrigated plants werenegative for E. coli in most evaluations (43). With dripirrigation, compared with overhead spraying, pathogentransfer onto low-growing crops (e.g., root crops, lettuce)was reduced by up to 2 log. For higher-growing crops (e.g.,tomatoes), a 4-log reduction was observed (131). Hence, theirrigation method can influence the bacteria transfer rate.Nevertheless, even though another study did not show aclear link between the type of irrigation system andcontamination with bacterial pathogens (88), there may beother factors that influence the irrigation regime andpathogen contamination. For example, Marvasi et al. (77)
J. Food Prot., Vol. 83, No. 6 MICROBIOLOGICAL REDUCTION STRATEGIES IN IRRIGATION WATER 1077D
ownloaded from
http://meridian.allenpress.com
/jfp/article-pdf/83/6/1072/2495672/i0362-028x-83-6-1072.pdf by Wageningen U
R user on 12 June 2020
found that the irrigation regime–dependent differences weredependent upon the season and the weather.
Drip irrigation is a precise and controllable method thathas been shown to be a preferable method to that of spray orsurface irrigation. Nevertheless, the longevity of such asystem is affected by system management, maintenanceprotocols, and source water quality. These aspects shouldnot be ignored. For example, the use of reclaimed watercontains many nutrient salts, particles, organics, microor-ganisms, and other substances; thereby, increasing thelikelihood of emitter clogging (71). This effect would thenmake the method less effective and could consequentlyintroduce an opportunity for pathogenic contamination.Overall, when properly applied and managed, indirectirrigation methods may help to reduce the potentialexposure of fresh produce to contaminated irrigation water.
(iii) Timing of irrigation. In addition to irrigationwater source and regime, another important variable thatcan help to reduce the exposure of fresh produce tocontaminated irrigation water is the timing. The effects thatthe temperature and season or weather may have, as well asthe timing of the irrigation, are described.
During preharvest, when the temperature of theirrigated water or soil is increased, there was a reducedsurvival of E. coli. Field studies were performed in Arizona,where survival of E. coli was measured after its introductioninto lettuce fields by sprinkler or furrow irrigation. Thestudy showed that, in winter, the persistence of E. coli insoil was around 2.5 weeks, whereas, in summer, theestimated survival was around 5 days (43). Interestingly,lower chances for bacterial introduction in the field areexpected during times in which more prolonged survivaloccurred. A seasonal effect for the presence of pathogensand indicator bacteria has also been shown in watersamples. They tend to be more detectable during monthswith higher temperatures when the fresh produce ismaturing (55). This effect is most likely because ofenvironmental factors, such as wildlife intrusion, irrigationfrequency, and insect activity (72).
Another study reviewed the effects that weather has onthe concentration of indicator bacteria on fresh produce,which was determined by evaluating the mean andmaximum temperature as well as precipitation for 1 weekup to 1 month before harvest (87). Results substantiatedhow precipitation data could predict produce contamination,in this instance, for that of spinach contamination with E.coli at preharvest. In short, farm management, environment,and weather were found to be important to reduce producecontamination (87). Further research has been performed todefine the effect of weather dynamics in the period betweencontamination and sampling on the presence and concen-tration of bacteria on fresh produce. Precipitation (�0.64cm) that occurs 3 days before sampling correlated with boththe presence and the highest counts of Salmonella (175CFU/100 mL) according to a study on fruit and vegetablecrops in New York (66). After rainfall, microbial popula-tions increased by 1.5 to 3 log CFU/g on lettuce leaves (42).Overall, temperature and season, including weather condi-
tions, such as precipitation, have a role in the potentialcontamination of produce. Thus, strategies that aim toreduce the potential effect that these conditions may have onthe presence of pathogens should be considered.
One control measure that can be considered duringpreharvest is the timing of last water irrigation. It has beenobserved that the timing of last water irrigation from naturalsources, such as rainwater or surface water, was shown tocritically affect the postharvest microbial population offresh produce (42, 43). To be able to reduce the microbialload, the challenge is to increase the irrigation interval up tothe threshold at which quality and yield are not yetcompromised because of moisture stress. A recent studyreported that the timing of irrigation was a key risk factorfor the presence of L. monocytogenes, namely, that isolatedL. monocytogenes was significantly greater in fieldsirrigated 3 days versus that of at least 10 days beforesample collection (125). Authors suggested that refrainingfrom irrigation within 3 days of harvest may reduce theprobability of produce contamination.
Despite this advice, another study concluded thatcessation for 3 days before the harvest was inadequate toexclude the possibility of viable E. coli O157:H7 cells onspinach or rocket (3). The amount of time to apply betweenlast irrigation and harvest allows for pathogenic microor-ganisms to die off on the field. In another study, Kisluk andYaron (69) determined that the persistence of Salmonellaenterica serotype Typhimurium on parsley occurred for atleast 48 h after irrigation with water containing lowconcentrations (approximately 300 CFU/mL). Furthermore,irrigation with water containing Salmonella Typhimurium at8.5 log CFU/mL, representing heavily contaminated water,resulted in the persistence of bacteria for at least 4 weeks.The population steadily declined during the first 2 days witha Salmonella Typhimurium reduction of approximately 2log CFU/g (69). Overall, contamination was affected bypathogen quantity in the irrigation water and timingbetween irrigation and harvest (69). In terms of control,the U.S. Food and Drug Administration (FDA) (116)advises a preharvest interval of irrigation for a maximumof 4 days. Although the timing of irrigation is a relevantfactor that warrants further research, preventing irrigationwater contamination is nonetheless critical. Given asystematic literature review by Park et al. (88) on riskfactors for produce at preharvest, authors found thatrepeated irrigation, including spray irrigation, was associ-ated with an increased likelihood of produce contamination,and thus, reducing microbial contamination of irrigationwater was a notable preventative control strategy. Insummary, these findings show that the timing of irrigationis important to control during the preharvest period toreduce the exposure of fresh produce to contamination.
Mitigation strategies. Water treatment strategies at theprimary production stage can include sedimentation,coagulation, flocculation, filtration, and disinfection. Sev-eral mitigation strategies that may help to improve themicrobial quality of irrigation water include disinfection bychemical treatments, such as chlorine dioxide, electrolysis,
1078 BANACH AND VAN DER FELS-KLERX J. Food Prot., Vol. 83, No. 6D
ownloaded from
http://meridian.allenpress.com
/jfp/article-pdf/83/6/1072/2495672/i0362-028x-83-6-1072.pdf by Wageningen U
R user on 12 June 2020
and chemical oxidation. Physical disinfection treatmentsthat can be performed include the use of UV, ultrasound(US), or filtration (45). Most strategies are not effective inremoving all types of microbiological agents but lead to areduction in the overall level of pathogenic microorganisms.The appropriate water-treatment method for each situationcan depend on multiple factors, including technological,managerial, and sustainability criteria (121). The followingsections describe water disinfection technologies whoseefficacy on the reduction of fecal coliforms was seen aspossibly advantageous for use during primary production.
(i) Removal of suspended material. The turbidity ofthe surface water is caused by suspended particles andfloating debris, including organic matter, clay, sand, and silt.Microorganisms can colonize the surface of particles, suchas sediment, which can then provide a protective barrier forsurvival (124). Hence, it is important to remove suspendedmaterial from irrigation water before use. Groundwater anddrinking water have turbidity levels below 1 NTU.Turbidity values above 5 NTUs become perceptible to theeye (4). Water sources with moderate plant and animal lifecan have NTUs up to 10 (50). Floating debris can easily beremoved. The type of suspended residues in the water andthe required degree of purification will determine themethod of choice. Several methods may be implemented toremove suspended matter from runoff water, includingsedimentation, flocculation, and coagulation.
Sedimentation through gravity is a slow, but econom-ical, process. Most suspended material will settle out of thewater in a collection basin or sedimentation pond within afew hours up to several days. During flocculation, acombination of alum, ferric sulfate, or a polymer is addedto the water to flocculate the suspended particles resulting ina rapid (ca 5 min) sedimentation of clay (84). Coagulationoccurs when a chemical (such as alum or ferric) is added towater to destabilize colloidal suspensions. Decreasing pH(to levels as low as 4 or 5) increases the feed rate ofcoagulants (64).
Several treatment processes are often combined toremove suspended matter. These include, in general,coagulation and filtration and may require a flocculationtank or a pressure vessel after the coagulation addition.Filtration methods that require influent water should have aturbidity of ,5 to 10 NTUs and color of ,20 to 30 colorunits (82). For irrigation water with many suspendedparticles, removal of suspended material is recommendedas a pretreatment measure to ensure subsequent propermembrane or cartridge filtration. For Cryptosporidiumremoval, studies have shown that coagulation pretreatmentmost influenced the effectiveness of subsequent conven-tional treatment processes (7, 28).
(ii) Filtration. Filtration is mainly applied to removeparticulate matter and some dissolved material from thewater. Filtration systems effective in removing mostmicroorganisms have a small pore size and need a prefilterwith a larger pore size to reduce turbidity by filtering outparticles. Particulates that are smaller than the membrane
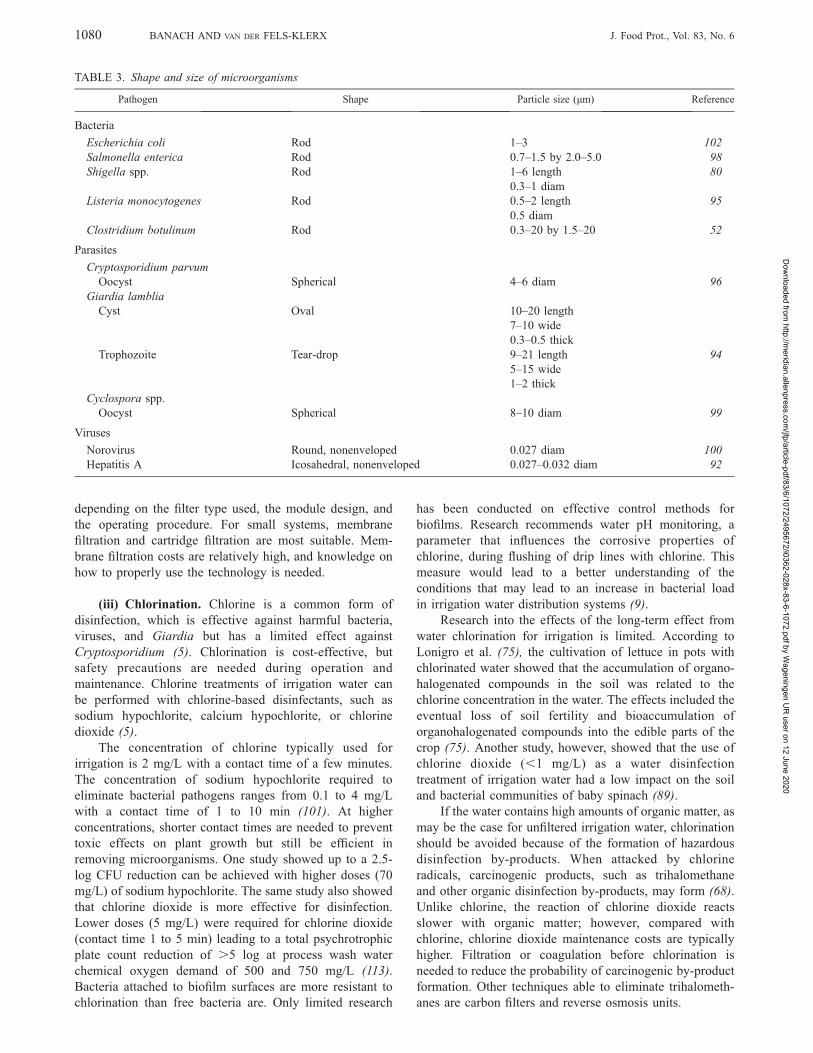
pore size can transfer through, meaning it is important torealize the size of the microorganism targeted for thefiltration strategy. Bacteria are about 1 μm in size, whereasviruses have a size of 0.02 to 0.4 μm and are much smaller(Table 3). Microfiltration and ultrafiltration membranes(approximately 0.1 μm) remove sediment and bacteria;ultrafiltration membrane filters (approximately 0.01 μm)may also remove viruses. Nanofiltration (approximately0.001 μm) or reverse osmosis (,0.0005 μm) is veryefficient in removing microorganisms. Microporous ceramicmembranes are used in developing countries for waterpurification with a filtration speed of 1 to 3 L/h and anefficiency of reducing E. coli concentrations 4 log or moredepending on coating thickness (73). Membranes, cartridg-es, or sand can be used as a filter.
Membrane filtration can be performed using twooperating procedures: either with a constant flux, or withpressure. Depending on the module design, the water passesin different ways through the membrane. In dead-endfiltration, the suspended solids remain on the feed side ofthe membrane. In a configuration with inside-out filtration,feed water enters the inside of the capillaries or tubularmembranes. With cross-flow filtration, often used for waterwith a high concentration of suspended solids, a small partof the water permeates through the membrane, and mostflows across the membrane. Membranes for liquid filtrationcan be made of different types of material. Ceramicmembranes can be made of aluminum, titanium, or siliconcarbide, whereas polymeric membranes can be composed ofcellulose acetate, nitrocellulose, or polyamide.
Cartridge filters are a simple and lightweight option forfiltration, especially for small systems. Cartridge filtration isa physical process in which the water flows from outside toinside (a vessel), whereby the water is strained throughporous media (82).
Slow sand filtration effectively removes turbidity andpathogenic organisms (10). If the turbidity is ,1 NTU, areduction of 2 to 4 log infectious units of enteric viruses and1 to 3 log units of coliforms (CFU) can be achieved (83). Adisadvantage is that an extensive land area is required forthis low-flow operation, meaning the technique may be lesspractical in areas in which space is an issue (e.g., in TheNetherlands). Sand filtration of irrigation water led to an E.coli reduction of about 0.7 log CFU in groundwater(pumped from boreholes) and about 0.3 log CFU inrainwater (collected from stored ponds) at fields in Belgiumduring the summer and fall. In comparison, sand-filtration–treated groundwater and rainwater had a lower estimatedprobability of E. coli in strawberries in the summer and fallperiods. Overall, the presence of E. coli in irrigation water isinfluenced by irrigation water type and lack of priortreatment (untreated versus sand filtration) (26). Rapid sandfiltration is effective in removing large suspended particlescausing turbidity (usually ,0.1 to 1 NTU) but is ineffectivein removing bacteria. The method is mostly used incombination with other pretreatment and posttreatments.
In general, all filtration methods are effective in theremoval of pathogenic microorganisms. However, theefficiency of particle and microorganism removal differs
J. Food Prot., Vol. 83, No. 6 MICROBIOLOGICAL REDUCTION STRATEGIES IN IRRIGATION WATER 1079D
ownloaded from
http://meridian.allenpress.com
/jfp/article-pdf/83/6/1072/2495672/i0362-028x-83-6-1072.pdf by Wageningen U
R user on 12 June 2020
depending on the filter type used, the module design, andthe operating procedure. For small systems, membranefiltration and cartridge filtration are most suitable. Mem-brane filtration costs are relatively high, and knowledge onhow to properly use the technology is needed.
(iii) Chlorination. Chlorine is a common form ofdisinfection, which is effective against harmful bacteria,viruses, and Giardia but has a limited effect againstCryptosporidium (5). Chlorination is cost-effective, butsafety precautions are needed during operation andmaintenance. Chlorine treatments of irrigation water canbe performed with chlorine-based disinfectants, such assodium hypochlorite, calcium hypochlorite, or chlorinedioxide (5).
The concentration of chlorine typically used forirrigation is 2 mg/L with a contact time of a few minutes.The concentration of sodium hypochlorite required toeliminate bacterial pathogens ranges from 0.1 to 4 mg/Lwith a contact time of 1 to 10 min (101). At higherconcentrations, shorter contact times are needed to preventtoxic effects on plant growth but still be efficient inremoving microorganisms. One study showed up to a 2.5-log CFU reduction can be achieved with higher doses (70mg/L) of sodium hypochlorite. The same study also showedthat chlorine dioxide is more effective for disinfection.Lower doses (5 mg/L) were required for chlorine dioxide(contact time 1 to 5 min) leading to a total psychrotrophicplate count reduction of .5 log at process wash waterchemical oxygen demand of 500 and 750 mg/L (113).Bacteria attached to biofilm surfaces are more resistant tochlorination than free bacteria are. Only limited research
has been conducted on effective control methods forbiofilms. Research recommends water pH monitoring, aparameter that influences the corrosive properties ofchlorine, during flushing of drip lines with chlorine. Thismeasure would lead to a better understanding of theconditions that may lead to an increase in bacterial loadin irrigation water distribution systems (9).
Research into the effects of the long-term effect fromwater chlorination for irrigation is limited. According toLonigro et al. (75), the cultivation of lettuce in pots withchlorinated water showed that the accumulation of organo-halogenated compounds in the soil was related to thechlorine concentration in the water. The effects included theeventual loss of soil fertility and bioaccumulation oforganohalogenated compounds into the edible parts of thecrop (75). Another study, however, showed that the use ofchlorine dioxide (,1 mg/L) as a water disinfectiontreatment of irrigation water had a low impact on the soiland bacterial communities of baby spinach (89).
If the water contains high amounts of organic matter, asmay be the case for unfiltered irrigation water, chlorinationshould be avoided because of the formation of hazardousdisinfection by-products. When attacked by chlorineradicals, carcinogenic products, such as trihalomethaneand other organic disinfection by-products, may form (68).Unlike chlorine, the reaction of chlorine dioxide reactsslower with organic matter; however, compared withchlorine, chlorine dioxide maintenance costs are typicallyhigher. Filtration or coagulation before chlorination isneeded to reduce the probability of carcinogenic by-productformation. Other techniques able to eliminate trihalometh-anes are carbon filters and reverse osmosis units.
TABLE 3. Shape and size of microorganisms
Pathogen Shape Particle size (μm) Reference
Bacteria
Escherichia coli Rod 1–3 102Salmonella enterica Rod 0.7–1.5 by 2.0–5.0 98Shigella spp. Rod 1–6 length 80
0.3–1 diamListeria monocytogenes Rod 0.5–2 length 95
0.5 diamClostridium botulinum Rod 0.3–20 by 1.5–20 52
Parasites
Cryptosporidium parvumOocyst Spherical 4–6 diam 96
Giardia lambliaCyst Oval 10–20 length
7–10 wide0.3–0.5 thick
Trophozoite Tear-drop 9–21 length 945–15 wide1–2 thick
Cyclospora spp.Oocyst Spherical 8–10 diam 99
Viruses
Norovirus Round, nonenveloped 0.027 diam 100Hepatitis A Icosahedral, nonenveloped 0.027–0.032 diam 92
1080 BANACH AND VAN DER FELS-KLERX J. Food Prot., Vol. 83, No. 6D
ownloaded from
http://meridian.allenpress.com
/jfp/article-pdf/83/6/1072/2495672/i0362-028x-83-6-1072.pdf by Wageningen U
R user on 12 June 2020

The Netherlands is one of the few European Unioncountries in which chlorine is not commonly used fordisinfection of drinking water; instead, physical processtreatments, such as sedimentation, filtration, and UVdisinfection are performed (106). Drinking water in TheNetherlands should contain a maximum value of 0.3 to 2mg/L free chlorine after chlorination (79). A WHOprovisional guideline value for chlorine in drinking waterof 0.7 mg/L has been proposed (127, 133).
(iv) Electrolysis. Electrolyzed water is another disin-fection water pretreatment method that can help to reducemicrobial contaminations. It is generated by applying anelectric current to a dilute saltwater solution. The electro-lytic process uses a membrane cell and produces very acidicelectrolyzed water. Alternatively, with a nonmembrane cell,diluted hydrochloric acid is used to produce slightly acidicelectrolyzed water containing chlorine (10 to 30 mg/L). Theacidity of the water, the oxidation potential, and concentra-tion of chlorine lead to reduced survival of bacteria such asE. coli, Listeria, and Salmonella. Electrolysis has beenreported to have strong activity against most pathogenicbacteria and is recognized as a safe and relatively quickmethod, given a water flow of around 3.6 L/h (48, 65).Moreover, combined strong acidic electrolyzed water andalkaline electrolyzed water have stronger sterilizationability than single acidic electrolyzed water or slightlyacidic electrolyzed water (51). A cooling system for theelectrolysis reactor and cooling and control of chlorinestorage are recommended to achieve production of minimalamounts of chlorine (104).
(v) Chemical oxidation. For inactivation of protozoanparasites in water systems, ozone is a more effectivechemical disinfectant than chlorine dioxide or chlorine (32).Capital and operational costs and the complexity of thetechnology and maintenance are relatively high comparedwith other treatments, such as chlorine usage (101).Scientific reports that document the feasibility and perfor-mance of on-farm water treatment with ozone are scarce.
Application of hydrogen peroxide (H2O2) may beanother pretreatment technique to consider because itquickly decomposes in fresh produce-processing water.Van Haute et al. (122) tested the disinfection efficacy ofH2O2 (500 mg/L) in combination with the stabilizingsubstance Bacsan (10 mg/L Cu). The authors observed thegreatest log reductions of aerobic psychrotrophic platecount and E. coli at that concentration. For example, duringtrials with that ratio in artificially made process wash water(chemical oxygen demand, 848 mg O2/L), after 30 min,there was a 4.5-log reduction in aerobic psychrotrophicplate count and .5-log reduction in E. coli (113, 122).
Furthermore, the application of ozone and H2O2 canalso be combined during water treatment. Sommer et al.(107) reported a 6-log reduction in E. coli and viralpathogens during water treatment pilots with 2.5 mg/Lozone and 1.5 mg/L H2O2. The ozone/hydrogen peroxideprocess showed good microbicidal efficacy (107).
(vi) UV treatment and solar-driven disinfection.Various methods exist for harnessing photonic energy todrive solar disinfection: UV, photocatalysis, photosensitiz-ers, and solar disinfection (SODIS) (74). Disinfection withshort-wavelength UV light irradiation (UV-C) is effectiveagainst bacteria, protozoa, and most viruses. UV applicationrequires energy and regular replacement of UV lamps. UVchambers for treating irrigation water are designed to doseUV light at a given flow rate. Because UV systems are mosteffective when the water is clear and free of suspendedparticles, surface water will often need to be filtered toensure efficacy. However, Jones et al. (67) described a99.9% inactivation (3 log) even at relatively high turbiditylevels (20 NTU) with a UV dose of 14.2 mJ/cm2. Generally,as the turbidity increased, the UV effectiveness decreased.Reported log reductions ranged from 10.0 to 6.1 forbacterial pathogens and from 5.0 to 4.2 for Phytophthoracapsici (67). Dissolved solids in the water, such as iron, canalso absorb UV light and decrease UV transmittance.
By performing filtration (60 μm filter) before UVradiation (dose 60 mW/s/cm2) for fresh produce processingwater (chemical oxygen demand 800 mg/l), a totalpsychrotrophic plate count log reduction of 4.5 CFU/mLcould be observed, while UV treatment on the same samplethat was not prefiltered showed a total psychrotrophic platecount log reduction of 3.5 CFU/mL. Performing filtration(with 10 and 60 μm) before UV treatment at lower doses,20 mW/s/cm2 reduced the bacterial load only slightly(,0.6 CFU/mL) (113).
Compared with bacterial pathogens, UV radiation isless efficient in inactivating protozoan parasites, such asGiardia and Cryptosporidium, that can be present in surfacewater (but are mostly absent from groundwater systems)(81). It has been shown that UV radiation at 10 mW/s/cm2
kills Giardia cysts effectively, whereas encysting parasitesand trophozoites can recover from UV treatment at 50 and100 mW/s/cm2, respectively (30).
Once water is disinfected with UV, it should be usedimmediately and not stored for later use in tanks becauserecontamination can occur, e.g., from backflow or biofilmsbecause there is no residual disinfectant in the water aftertreatment. UV treatment is not appropriate for irrigationsituations requiring very high volumes. The volume ofwater that can be treated at one time is limited because ofthe small path length through which UV can penetrate water(81).
Titanium dioxide (TiO2) is an effective materialshowing photocatalytic capability. When exposed to light(UV-light-emitting diode, solar irradiation, mercury medi-um pressure lamp), it functions as a catalyst, altering therate of a chemical reaction. Under ideal conditions,photocatalysts are predicted to be able to treat up to 30 L/m2/s water for E. coli for 2-log reduction and 10 L/m2/swater for a 2-log reduction of viral pathogens (MS2bacteriophage). For the more resistant Cryptosporidium,treatment up to 3 L/m2/s is possible. At the laboratory scale,around 2 L/m2/s can be treated. The performance of UV-Clight-emitting diodes is around 10 L/m2/s for a 2-logreduction of Cryptosporidium and E. coli. This treatment is
J. Food Prot., Vol. 83, No. 6 MICROBIOLOGICAL REDUCTION STRATEGIES IN IRRIGATION WATER 1081D
ownloaded from
http://meridian.allenpress.com
/jfp/article-pdf/83/6/1072/2495672/i0362-028x-83-6-1072.pdf by Wageningen U
R user on 12 June 2020

not effective for viruses. Photosensitizers show, in contrast,a very high treatment capacity (approximately 700 L/m2/s)for viruses compared with E. coli and Cryptosporidium. Theefficiency of viral reduction by photosensitizers was,however, not reported in that article (74, 137).
SODIS uses solar radiation (UV-A light and tempera-ture) to destroy pathogenic bacteria and viruses present inthe water. It is a simple water-treatment method that can beused to disinfect small quantities of water with lowturbidity. However, the technique is slow, with a waitingperiod between 6 and 12 h, is weather dependent, and isapplicable to only small volumes. The water-treatmentcapacity of SODIS is about 0.0005 L/m2/s (12). On theother hand, it does not require investments. It has beenshown that in ,30 min, about 1 L of water can bedisinfected by reducing the concentration of pathogenicmicroorganisms by 4 log units (12). Possibly, the addition ofspecific additives has the potential to decrease the relativelylong inactivation time (41, 74).
(vii) Ultrasound. US uses cyclic sound pressure witha frequency higher than the upper limit of human hearing.US treatment can reduce the presence of microbialpathogens on produce and in irrigation water. When appliedto irrigation water, microbial loads of E. coli can be reducedby about 0.5 log units compared with untreated water (123).
US can be combined with other techniques, such asheat, UV, and electrolysis. Continuous-flow US and UVtreatment of wastewater showed about a 4-log reduction offecal coliforms (140). For removal of pathogens on produce,continuous US combined with heat showed a 5-logreduction of inoculated Listeria (6). Electrolyzed watercombined with ultrasonication for 15 min at 210 W led to a4.4-log reduction of E. coli O157:H7 on lettuce, whereas 5min of US eliminated the pathogen on tomatoes (1).
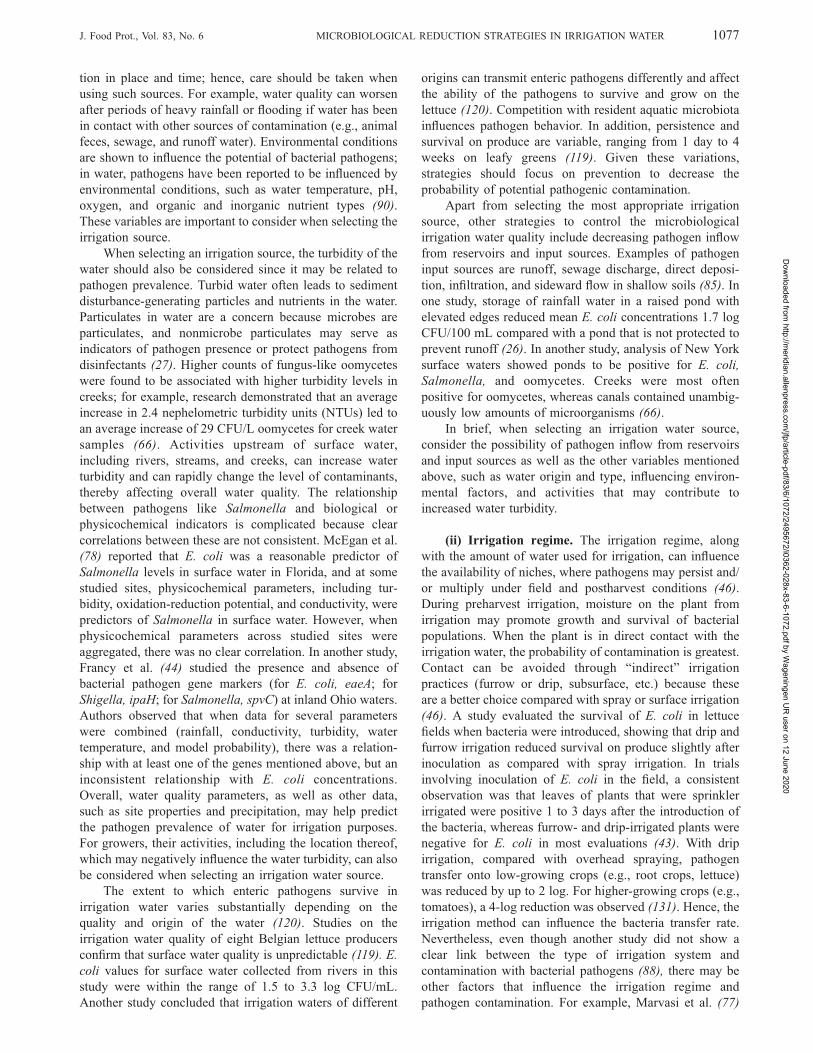
Overall control strategies. Based on the literaturestudied, a decision tree was drafted (Fig. 1), which describespotential control strategies that growers can take forirrigation water disinfection, based on the fecal coliformload of the irrigation water and water turbidity, to helpfarmers in choosing water-treatment technologies or waysto reduce exposure of produce to contaminated water.
Microbial reduction strategies should be applied whenthe water does not meet the requirements for fresh produce.When the microbial load is intermediate (defined as 100 to1,000 CFU/100 mL in Fig. 1), it is recommended to lowerthe levels. According to the literature, electrolysis, ozone,UV, and photocatalysts hold promise, either as singletreatments with pretreatments that remove suspendedmaterial, or as combined treatments, with another chemicalor physical treatment method(s) (Fig. 1). Additionalresearch is required to quantify the optimal dosage andprocedure or the field performance of the differenttechniques. The chance that produce becomes contaminatedby water with a high microbial load depends on variables,such as the type of irrigation strategy used and whether theproduce is grown in greenhouses or on the open field.Several risk-reduction strategies can be performed when
irrigation water is contaminated with pathogenic microor-ganisms, e.g., exposure of produce to contaminated watercan be reduced and/or the water can be pretreated (Fig. 1).Some measures can be applied more immediately thanothers, such as switching to tap water, SODIS, or, ifpossible, prolonging the preharvest interval. Others may beenvisaged in the longer term, such as changing irrigationsystems, using soil-less growing systems, or water pretreat-ment.
The inactivation effectiveness of several disinfectiontechniques has been evaluated; the range of microbialreduction was 1 to 5 log CFU for single treatments and 4 to9 log CFU for combined disinfection treatments. Theefficiency of microbial removal or inactivation dependsgreatly on the physicochemical parameters of the watersource, such as its turbidity, temperature, pH, and organicload. Most techniques reduce all types of microbial (target)organisms, but efficiency differs for pathogenic bacteria,protozoa, and viruses. Combining diverse methods allowsbroader antimicrobial action and increases the efficacy. Forwater pretreatment procedures to be effective in reducingpathogens, a low (,5 NTU) to middle (5 to 10 NTU)turbidity level is important. When the water has a middle orhigh (.10 NTU) turbidity level, the removal of suspendedsolids is recommended. Turbidity can, in situations in whichsuspended materials in the water are caused by runoff, beused as an indicator of microbial water quality (56).
According to current worldwide guidelines for micro-bial water quality of irrigation water, levels should be,1,000 CFU of fecal coliforms per 100 mL. Whencontamination levels are slightly higher than indicated bythe current guidelines, single treatments should be suffi-cient. When aiming for levels as indicated by drinking waterguidelines, double purification is needed.
CONCLUSIONS AND RECOMMENDATIONS
This study reviewed the knowledge on pathogenicmicroorganisms of concern related to fresh produce andwater, microbiological criteria of irrigation water, as well aspreventative and mitigative microbial reduction strategiesfor irrigation water use during the primary production offresh produce. The decision tree developed in this studyprovides suggestions to select control measures that growerscan take during primary production to reduce pathogeniccontamination coming from irrigation water.
Various water-disinfection technologies are currentlyavailable on the market. Electrolysis, ozone, UV, andphotocatalysts hold promise either as single treatments, withpretreatments that remove suspended material, or ascombined treatments with another chemical or physicaltreatment(s). Knowledge on the range of bacterial contam-ination during growing and harvest, as well as the range ofwater capacity used over time for irrigation, needs to becollected from producers to better estimate which controloptions to employ. Regular monitoring of water sourceswould, therefore, be useful. Such research on the waterquality and distribution system can be used not only todetermine optimal dosage and application of the disinfec-tion technique in field conditions but also to estimate its
1082 BANACH AND VAN DER FELS-KLERX J. Food Prot., Vol. 83, No. 6D
ownloaded from
http://meridian.allenpress.com
/jfp/article-pdf/83/6/1072/2495672/i0362-028x-83-6-1072.pdf by Wageningen U
R user on 12 June 2020

cost-effectiveness. Additional information on the watertreatment capacity needed could be obtained from producersbecause this can help better access the technology to thevarious production scales and farm sizes at which thetechnology can be applied. Overall, the most effectivepreventative and mitigation strategies depend on multiplefactors and should be assessed on a case-by-case basis.
Besides the microbial efficacy of a water disinfectiontechnique, other criteria related to the technological (e.g.,safety issues of the techniques and treatment capacity),managerial (e.g., costs and the complexity of the technol-ogy), and sustainability (e.g., the reusability of the water)can be considered. Future research can focus on evaluatingthe feasibility of several criteria of water-disinfectiontechnologies to better assess case-specific questions. Inaddition, further research focusing on promising water-disinfection methods, including, e.g., the combination ofmethods in preharvest practices that allow improvement andrefinement of water quality in agriculture are warranted.The effectiveness of the different prevention and mitigationstrategies, such as water-disinfection technologies orcombinations thereof, should be validated under laboratoryconditions and in field studies. Combined approaches tendto show increased effectiveness in reducing fecal coliforms.Combining techniques, however, creates an increasedcomplexity that may require skilled personnel and stan-dardized guidelines for proper operation. Consequently, byusing a combination of techniques, costs may increase. Dataon the capacity of water that can be treated in a specifiedtime window using combined methods are also needed tobetter decide among mitigation methods.
ACKNOWLEDGMENTS
This research has been financed by the Dutch Ministry of EconomicAffairs (EZ) under the project Microbiology in Horticulture (PPS 296, BO-33.05-001-001) from the TopSector Horticulture and Starting Materials.The authors acknowledge the contributions from the Dutch fruit and
vegetable industry. Suzanne van de Nobelen, Monique Nijkamp, andHermien van Bokhorst-van de Veen are acknowledged for theircontributions to this study. We thank Esther van Asselt for her suggestionsto an earlier version of the paper.
REFERENCES
1. Afari, G. K., Y. C. Hung, C. H. King, and A. Hu. 2016. Reductionof Escherichia coli O157:H7 and Salmonella Typhimurium DT 104on fresh produce using an automated washer with near neutralelectrolyzed (NEO) water and ultrasound. Food Control 63:246–254.
2. Agencia Estatal Boletín Oficial del Estado (BOE). 2007. Spanishroyal decision, 1620/2007: royal decree where is regulated the legalregime for reuse of purified waste waters, no. 294. Boletín oficialdel Estado. Ministerio de la Presidencia, Madrid, Spain. (InSpanish.)
3. Alam, M., C. Ahlström, S. Burleigh, C. Olsson, S. Ahrné, M. El-Mogy, G. Molin, P. Jensén, M. Hultberg, and B. W. Alsanius. 2014.Prevalence of Escherichia coli O157:H7 on spinach and rocket asaffected by inoculum and time to harvest. Sci. Hortic. 165:235–241.
4. Allen, M. J., R. W. Brecher, R. Copes, S. E. Hrudey, and P.Payment. 2008. Turbidity and microbial risk in drinking water.Prepared for the Minister of Health, Province of British Columbia,pursuant to Section 5 of the Drinking Water Protection Act (S.B.C.2001), vol. 5. Ministry of Health, Vancouver, British Columbia,Canada.
5. Allende, A., and J. Monaghan. 2015. Irrigation water quality forleafy crops: a perspective of risks and potential solutions. Int. J.Environ. Res. Public Health 12:7457–7477.
6. Anese, M., M. Maifreni, F. Bot, I. Bartolomeoli, and M. C. Nicoli.2015. Power ultrasound decontamination of wastewater from fresh-cut lettuce washing for potential water recycling. Innov. Food Sci.Emerg. Technol. 32:121–126.
7. Betancourt, W. Q., and J. B. Rose. 2004. Drinking water treatmentprocesses for removal of Cryptosporidium and Giardia. Vet.Parasitol. 126:219–234.
8. Bouwknegt, M., K. Verhaelen, A. Rzezutka, I. Kozyra, L. Maunula,C. H. von Bonsdorff, A. Vantarakis, P. Kokkinos, T. Petrovic, S.Lazic, I. Pavlik, P. Vasickova, K. A. Willems, A. H. Havelaar, S. A.Rutjes, and A. M. de Roda Husman. 2015. Quantitative farm-to-fork risk assessment model for Norovirus and Hepatitis A virus inEuropean leafy green vegetable and berry fruit supply chains. Int. J.Food Microbiol. 198:50–58.
FIGURE 1. Decision tree of preventionand mitigation strategies when the averageconcentration of fecal coliforms in theirrigation water samples is intermediate orhigh, as judged from regular inspections ofthe water source. Values selected to dividesamples into low, middle, or high catego-ries are dependent on the fecal coliformconcentration, which is based on guide-lines used by GLOBAL G.A.P. taken fromthe World Health Organization (WHO)standards on wastewater. Values for tur-bidity level are indicative.
J. Food Prot., Vol. 83, No. 6 MICROBIOLOGICAL REDUCTION STRATEGIES IN IRRIGATION WATER 1083D
ownloaded from
http://meridian.allenpress.com
/jfp/article-pdf/83/6/1072/2495672/i0362-028x-83-6-1072.pdf by Wageningen U
R user on 12 June 2020

9. Callahan, T., M. Marine, S. Everts, K. Micallef, and A. Shirley.2016. Drip line flushing with chlorine may not be effective inreducing bacterial loads in irrigation water distribution systems. J.Food Prot. 6:896–1055.
10. Calvo-Bado, L. A., T. R. Pettitt, N. Parsons, G. M. Petch, J. A. W.Morgan, and J. M. Whipps. 2003. Spatial and temporal analysis ofthe microbial community in slow sand filters used for treatinghorticultural irrigation water. Appl. Environ. Microbiol. 69:2116–2125.
11. Carstens, C. K., J. K. Salazar, and C. Darkoh. 2019. Multistateoutbreaks of foodborne illness in the United States associated withfresh produce from 2010 to 2017. Front. Microbiol. 10:2667.
12. Caslake, L. F., D. J. Connolly, V. Menon, C. M. Duncanson, R.Rojas, and J. Tavakoli. 2004. Disinfection of contaminated water byusing solar irradiation. Appl. Environ. Microbiol. 70:1145–1150.
13. Centers for Disease Control and Prevention (CDC). 2008.Multistate outbreak of Salmonella Saintpaul infections linked toraw produce (final update). Available at: https://www.cdc.gov/salmonella/2008/raw-produce-8-28-2008.html. Accessed 10 Janu-ary 2020.
14. Centers for Disease Control and Prevention (CDC). 2011. Questions& answers: Shigella—Shigellosis. Centers for Disease Control andPrevention (CDC), Atlanta, GA.
15. Centers for Disease Control and Prevention (CDC). 2015.Parasites—Cryptosporidium (also known as “Crypto”). Availableat: https://www.cdc.gov/parasites/crypto/index.html. Accessed 18May 2019.
16. Centers for Disease Control and Prevention (CDC). 2015.Parasites—Giardia. Available at: https://www.cdc.gov/parasites/giardia/index.html. Accessed 18 May 2019.
17. Centers for Disease Control and Prevention (CDC). 2015.Wholesome Soy Products, Inc. sprouts and investigation of humanlisteriosis cases (final update). Available at: https://www.cdc.gov/listeria/outbreaks/bean-sprouts-11-14/index.html. Accessed 10 Jan-uary 2020.
18. Centers for Disease Control and Prevention (CDC). 2016. Listeria(Listeriosis). Available at: https://www.cdc.gov/listeria/index.html.Accessed 18 May 2019.
19. Centers for Disease Control and Prevention (CDC). 2016.Multistate outbreak of Salmonella infections linked to alfalfasprouts from one contaminated seed lot (final update). Available at:https://www.cdc.gov/salmonella/muenchen-02-16/index.html. Ac-cessed 10 January 2020.
20. Centers for Disease Control and Prevention (CDC). 2016.Norovirus. Available at: https://www.cdc.gov/norovirus/index.html. Accessed 18 May 2019.
21. Centers for Disease Control and Prevention (CDC). 2016.Parasites—Cyclosporiasis (Cyclospora Infection). Available at:https://www.cdc.gov/parasites/cyclosporiasis/index.html. Accessed18 May 2019.
22. Centers for Disease Control and Prevention (CDC). 2018.Multistate outbreak of E. coli O157:H7 infections linked to romainelettuce (final update). Available at: https://www.cdc.gov/ecoli/2018/o157h7-04-18/index.html. Accessed 7 January 2020.
23. Centers for Disease Control and Prevention (CDC). 2019. Outbreakof E. coli infections linked to romaine lettuce—final update.Available at: https://www.cdc.gov/ecoli/2018/o157h7-11-18/index.html. Accessed 10 January 2020.
24. Ceuppens, S., G. S. Johannessen, A. Allende, E. C. Tondo, F. El-Tahan, I. Sampers, L. Jacxsens, and M. Uyttendaele. 2015. Riskfactors for Salmonella, Shiga toxin-producing Escherichia coli andCampylobacter occurrence in primary production of leafy greensand strawberries. Int. J. Environ. Res. Public Health 12:9809–9831.
25. Cirelli, G. L., S. Consoli, and V. Di Grande. 2008. Long-termstorage of reclaimed water: the case studies in Sicily (Italy).Desalination 218:62–73.
26. Delbeke, S., S. Ceuppens, C. T. Hessel, I. Castro, L. Jacxsens, L. DeZutter, and M. Uyttendaele. 2015. Microbial safety and sanitaryquality of strawberry primary production in Belgium: risk factors
for Salmonella and Shiga toxin-producing Escherichia colicontamination. Appl. Environ. Microbiol. 81:2562–2570.
27. De Roos, A. J., P. L. Gurian, L. F. Robinson, A. Rai, I. Zakeri, andM. C. Kondo. 2017. Review of epidemiological studies of drinking-water turbidity in relation to acute gastrointestinal illness. Environ.Health Perspect. 125:086003.
28. Dugan, N. R., K. R. Fox, J. H. Owens, and R. J. Miltner. 2001.Controlling Cryptosporidium oocysts using conventional filtration.J. Am. Water Works Assoc. 93:64–76.
29. Edelstein, M., C. Sundborger, M.-P. Hergens, S. Ivarsson, R.Dryselius, M. Insulander, C. Jernberg, Y. Hutin, and A. Wallensten.2014. Barriers to trace-back in a salad-associated EHEC outbreak,Sweden, June 2013. PLoS Curr. 6.
30. Einarsson, E., S. G. Svärd, and K. Troell. 2015. UV irradiationresponses in Giardia intestinalis. Exp. Parasitol. 154:25–32.
31. Erickson, M. C., J. Liao, A. S. Payton, D. G. Riley, C. C. Webb, L.E. Davey, S. Kimbrel, L. Ma, G. Zhang, I. Flitcroft, M. P. Doyle,and L. R. Beuchat. 2010. Preharvest internalization of Escherichiacoli O157:H7 into lettuce leaves, as affected by insect and physicaldamage. J. Food Prot. 73:1809–1816.
32. Erickson, M. C., and Y. R. Ortega. 2006. Inactivation of protozoanparasites in food, water, and environmental systems. J. Food Prot.69:2786–2808.
33. Erickson, M. C., C. C. Webb, J. C. Diaz-Perez, L. E. Davey, A. S.Payton, I. D. Flitcroft, S. C. Phatak, and M. P. Doyle. 2014.Absence of internalization of Escherichia coli O157:H7 intogerminating tissue of field-grown leafy greens. J. Food Prot.77:189–196.
34. Ethelberg, S., M. Lisby, B. Böttiger, A. C. Schultz, A. Villif, T.Jensen, K. E. Olsen, F. Scheutz, C. Kjelsø, and L. Muller. 2010.Outbreaks of gastroenteritis linked to lettuce, Denmark, January2010. Euro Surveill. 15:19484.
35. European Commission. 1998. Council directive 98/83/EC of 3November 1998 on the quality of water intended for humanconsumption. Off. J. Eur. Communities 41:32–54.
36. European Commission. 2006. Directive 2006/7/EC of the EuropeanParliament and of the Council concerning the management ofbathing water quality and repealing directive 76/160/EEC. Off. J.Eur. Union 49:37–51.
37. European Commission. 2017. Commission notice on guidancedocument on addressing microbiological risks in fresh fruits andvegetables at primary production through good hygiene. Off. J. Eur.Union 60:1–40.
38. European Food Safety Authority (EFSA). 2013. Scientific opinionon the risk posed by pathogens in food of non-animal origin, part 1:Outbreak data analysis and risk ranking of food/pathogencombinations. EFSA J. 11:3025.
39. European Food Safety Authority (EFSA). 2014. Scientific opinionon the risk posed by pathogens in food of non-animal origin, part 2:Salmonella and Norovirus in tomatoes. EFSA J. 12:3832.
40. European Food Safety Authority (EFSA). 2014. Scientific opinionon the risk posed by pathogens in food of non animal origin, part 2:Salmonella and Norovirus in leafy greens eaten raw as salads. EFSAJ. 12:3706.
41. Fisher, M. B., C. R. Keenan, K. L. Nelson, and B. M. Voelker. 2008.Speeding up solar disinfection (SODIS): Effects of hydrogenperoxide, temperature, pH, and copper plus ascorbate on thephotoinactivation of E. coli. J. Water Health 6:35–51.
42. Fonseca, J. M. 2006. Postharvest quality and microbial populationof head lettuce as affected by moisture at harvest. J. Food Sci.71:M45–M49.
43. Fonseca, J. M., S. D. Fallon, C. A. Sanchez, and K. D. Nolte. 2011.Escherichia coli survival in lettuce fields following its introductionthrough different irrigation systems. J. Appl. Microbiol. 110:893–902.
44. Francy, D. S., E. A. Stelzer, J. W. Duris, A. M. G. Brady, J. H.Harrison, H. E. Johnson, and M. W. Ware. 2013. Predictive modelsfor Escherichia coli concentrations at inland lake beaches andrelationship of model variables to pathogen detection. Appl.Environ. Microbiol. 79:1676–1688.
1084 BANACH AND VAN DER FELS-KLERX J. Food Prot., Vol. 83, No. 6D
ownloaded from
http://meridian.allenpress.com
/jfp/article-pdf/83/6/1072/2495672/i0362-028x-83-6-1072.pdf by Wageningen U
R user on 12 June 2020
45. Gil, M. I., M. V. Selma, T. Suslow, L. Jacxsens, M. Uyttendaele, andA. Allende. 2015. Pre- and postharvest preventive measures andintervention strategies to control microbial food safety hazards offresh leafy vegetables. Crit. Rev. Food Sci. Nutr. 55:453–468.
46. Gil, M. I., J. A. Tudela, M. C. Luna, and A. Allende. 2013. Watermanagement and its effect on the postharvest quality of fresh-cutvegetables. Stewart Postharvest Rev. 9.
47. GLOBALG.A.P. 2015. Integrated farm assurance: all farm base cropsbase fruit and vegetables V5.0. GLOBALG.A.P., Cologne, Germany.
48. Gómez-López, V. M., M. I. Gil, L. Pupunat, and A. Allende. 2015.Cross-contamination of Escherichia coli O157:H7 is inhibited byelectrolyzed water combined with salt under dynamic conditions ofincreasing organic matter. Food Microbiol. 46:471–478.
49. Greene, S. K., E. R. Daly, E. A. Talbot, L. J. Demma, S. Holzbauer,N. J. Patel, T. A. Hill, M. O. Walderhaug, R. M. Hoekstra, M. F.Lynch, and J. A. Painter. 2008. Recurrent multistate outbreak ofSalmonella Newport associated with tomatoes from contaminatedfields, 2005. Epidemiol. Infect. 136:157–165.
50. Gregorio, D. 2009. The clean water team guidance compendium forwatershed monitoring and assessment state water resources controlboard. Turbidity fact sheet, 3.1.5.0. In The clean water teamguidance compendium for watershed monitoring and assessmentstate water resources control board. California EnvironmentalProtection Agency, Sacramento.
51. Hao, J., H. Li, Y. Wan, and H. Liu. 2015. Combined effect of acidicelectrolyzed water (AcEW) and alkaline electrolyzed water (AlEW)on the microbial reduction of fresh-cut cilantro. Food Control50:699–704.
52. Hardy Diagnostics. 2016. Clostridium. Available at: https://catalog.hardydiagnostics.com/cp_prod/Content/hugo/Clostridium.htm. Ac-cessed 6 August 2017.
53. Harris, L., J. Farber, L. Beuchat, M. Parish, T. Suslow, E. Garrett,and F. Busta. 2003. Outbreaks associated with fresh produce:Incidence, growth, and survival of pathogens in fresh and fresh-cutproduce. Compr. Rev. Food Sci. Food Saf. 2:78–141.
54. Heaton, J. C., and K. Jones. 2008. Microbial contamination of fruitand vegetables and the behaviour of enteropathogens in thephyllosphere: a review. J. Appl. Microbiol. 104:613–626.
55. Holvoet, K., I. Sampers, M. Seynnaeve, and M. Uyttendaele. 2014.Relationships among hygiene indicators and enteric pathogens inirrigation water, soil and lettuce and the impact of climaticconditions on contamination in the lettuce primary production.Int. J. Food Microbiol. 171:21–31.
56. Huey, G. M., and M. L. Meyer. 2010. Turbidity as an indicator ofwater quality in diverse watersheds of the Upper Pecos River Basin.Water 2:273–284.
57. Ibarra-Sánchez, L. S., S. Alvarado-Casillas, M. O. Rodríguez-García, N. E. Martínez-Gonzáles, and A. Castillo. 2004. Internal-ization of bacterial pathogens in tomatoes and their control byselected chemicals. J. Food Prot. 67:1353–1358.
58. Institute of Environmental Science and Research Ltd. (ESR). 2001.Giardia intestinalis (parasite). New Zealand Ministry of Health,Wellington, New Zealand.
59. Institute of Environmental Science and Research Ltd. (ESR). 2001.Hepatitis A (virus). New Zealand Ministry of Health, Wellington,New Zealand.
60. Institute of Environmental Science and Research Ltd. (ESR). 2001.Listeria monocytogenes. New Zealand Ministry of Health, Wel-lington, New Zealand.
61. Institute of Environmental Science and Research Ltd. (ESR). 2010.Clostridium botulinum (bacteria). New Zealand Food SafetyAuthority, Wellington, New Zealand.
62. Institute of Environmental Science and Research Ltd. (ESR). 2010.Cryptosporidium parvum and Cryptosporidium hominis (parasites).New Zealand Food Safety Authority, Wellington, New Zealand.
63. Institute of Environmental Science and Research Ltd. (ESR). 2010.Human norovirus. New Zealand Food Safety Authority, Wellington,New Zealand.
64. IWA Publishing. 2017. Coagulation and flocculation in water andwastewater treatment. Available at: http://www.iwapublishing.com/
news/coagulation-and-flocculation-water-and-wastewater-treatment. Accessed 4 August 2017.
65. Jadeja, R., and Y.-C. Hung. 2014. Efficacy of near neutral andalkaline pH electrolyzed oxidizing waters to control Escherichiacoli O157:H7 and Salmonella Typhimurium DT 104 from beefhides. Food Control 41:17–20.
66. Jones, L. A., R. W. Worobo, and C. D. Smart. 2014. Plant-pathogenic oomycetes, Escherichia coli strains, and Salmonellaspp. frequently found in surface water used for irrigation of fruit andvegetable crops in New York State. Appl. Environ. Microbiol.80:4814–4820.
67. Jones, L. A., R. W. Worobo, and C. D. Smart. 2014. UV lightinactivation of human and plant pathogens in unfiltered surfaceirrigation water. Appl. Environ. Microbiol. 80:849–854.
68. Kim, J., Y. Chung, D. Shin, M. Kim, Y. Lee, Y. Lim, and D. Lee.2003. Chlorination by-products in surface water treatment process.Desalination 151:1–9.
69. Kisluk, G., and S. Yaron. 2012. Presence and persistence ofSalmonella enterica serotype Typhimurium in the phyllosphere andrhizosphere of spray-irrigated parsley. Appl. Environ. Microbiol.78:4030–4036.
70. LeChevallier, M. W., W. D. Norton, and R. G. Lee. 1991.Occurrence of Giardia and Cryptosporidium spp. in surface watersupplies. Appl. Environ. Microbiol. 57:2610–2616.
71. Li, Y., P. Song, and B. Zhou. 2013. Microbiology mechanism andcontrolling methods for emitter clogging in the reclaimed water dripirrigation system. Trans. Chin. Soc. Agric. Eng. 29:98–107.
72. Liu, C., N. Hofstra, and E. Franz. 2016. Impacts of climate andmanagement variables on the contamination of preharvest leafygreens with Escherichia coli. J. Food Prot. 79:17–29.
73. Liu, X., Q. Zhang, H. Zhang, Y. Jiang, and Y. He. 2016.Development and characterization of microporous Ti3SiC2 ceramicmembranes for filtration of microorganisms. J. Mater. Sci. 51:2594–2597.
74. Loeb, S., R. Hofmann, and J. H. Kim. 2016. Beyond the pipeline:assessing the efficiency limits of advanced technologies for solarwater disinfection. Environ. Sci. Technol. Lett. 3:73–80.
75. Lonigro, A., N. Montemurro, and G. Laera. 2017. Effects ofresidual disinfectant on soil and lettuce crop irrigated withchlorinated water. Sci. Total Environ. 584–585:595–602.
76. Lopez-Galvez, F., A. Allende, F. Pedrero-Salcedo, J. J. Alarcon, andM. I. Gil. 2014. Safety assessment of greenhouse hydroponictomatoes irrigated with reclaimed and surface water. Int. J. FoodMicrobiol. 191:97–102.
77. Marvasi, M., A. S. George, M. C. Giurcanu, G. J. Hochmuth, J. T.Noel, and M. Teplitski. 2015. Effect of the irrigation regime on thesusceptibility of pepper and tomato to post-harvest proliferation ofSalmonella enterica. Food Microbiol. 46:139–144.
78. McEgan, R., G. Mootian, L. D. Goodridge, D. W. Schaffner, and M.D. Danyluk. 2013. Predicting Salmonella populations frombiological, chemical, and physical indicators in Florida surfacewaters. Appl. Environ. Microbiol. 79:4094–4105.
79. Ministerie van Volkshuisvesting, Ruimtelijke Ordening en Milieu-beheer (VROM) for the Netherlands.. 2010. Decision drinkingwater quality decree [Besluit kwaliteit drinkwater BES]. Availableat: https://wetten.overheid.nl/BWBR0028642/2010-10-10. Ac-cessed 9 September 2019.
80. Moyer, N. P., and A. J. Degnan. 2006. Shigella, p. 145–148.Waterborne pathogens: AWWA Manual M48, 2nd ed., vol. 48.American Water Works Association, Denver, CO.
81. National Drinking Water Clearinghouse (NDWC). 1996. Disinfec-tion: order DWFSOM50. National Environmental Services Center,Morgantown, WV.
82. National Drinking Water Clearinghouse (NDWC). 1996. Filtration:order DWFSOM51. National Environmental Services Center,Morgantown, WV.
83. National Drinking Water Clearinghouse (NDWC). 2000. Slow sandfiltration: order DWFSOM40. National Environmental ServicesCenter, Morgantown, WV.
J. Food Prot., Vol. 83, No. 6 MICROBIOLOGICAL REDUCTION STRATEGIES IN IRRIGATION WATER 1085D
ownloaded from
http://meridian.allenpress.com
/jfp/article-pdf/83/6/1072/2495672/i0362-028x-83-6-1072.pdf by Wageningen U
R user on 12 June 2020
84. Newman, J. 2009. Greenhouse and nursery management practicesto protect water quality, publication 3508. University of CaliforniaAgriculture and Natural Resources, Davis.
85. Pachepsky, Y., D. R. Shelton, J. E. McLain, J. Patel, and R. E.Mandrell. 2011. Irrigation waters as a source of pathogenicmicroorganisms in produce: a review. Adv. Agron. 113:73–138.
86. Pagadala, S., S. C. Marine, S. A. Micallef, F. Wang, D. M. Pahl, M.V. Melendez, W. L. Kline, R. A. Oni, C. S. Walsh, K. L. Everts, andR. L. Buchanan. 2015. Assessment of region, farming system,irrigation source and sampling time as food safety risk factors fortomatoes. Int. J. Food Microbiol. 196:98–108.
87. Park, S., S. Navratil, A. Gregory, A. Bauer, I. Srinath, B. Szonyi, K.Nightingale, J. Anciso, M. Jun, D. Han, S. Lawhon, and R. Ivanek.2014. Farm management, environment, and weather factors jointlyaffect the probability of spinach contamination by genericEscherichia coli at the preharvest stage. Appl. Environ. Microbiol.80:2504–2515.
88. Park, S., B. Szonyi, R. Gautam, K. Nightingale, J. Anciso, and R.Ivanek. 2012. Risk factors for microbial contamination in fruits andvegetables at the preharvest level: a systematic review. J. FoodProt. 75:2055–2081.
89. Pilar, T., G. María Isabel, S. Trevor, and A. Ana. 2018. Impact ofchlorine dioxide disinfection of irrigation water on the epiphyticbacterial community of baby spinach and underlying soil. PLoS One13:e0199291.
90. Prest, E. I., F. Hammes, M. C. van Loosdrecht, and J. S.Vrouwenvelder. 2016. Biological stability of drinking water:controlling factors, methods, and challenges. Front. Microbiol. 7:45.
91. Public Health Agency of Canada. 2011. Clostridium botulinum.Health Canada, Ottawa, Ontario, Canada.
92. Public Health Agency of Canada. 2011. Hepatitis A virus. HealthCanada, Ottawa, Ontario, Canada.
93. Public Health Agency of Canada. 2011. Shigella spp. HealthCanada, Ottawa, Ontario, Canada.
94. Public Health Agency of Canada. 2012. Giardia lamblia. HealthCanada, Ottawa, Ontario, Canada.
95. Public Health Agency of Canada. 2012. Listeria monocytogenes.Health Canada, Ottawa, Ontario, Canada.
96. Public Health Agency of Canada. 2014. Cryptosporidium parvum.Health Canada, Ottawa, Ontario, Canada.
97. Public Health Agency of Canada. 2015. Escherichia coli, enter-ohemorrhagic. Health Canada, Ottawa, Ontario, Canada.
98. Public Health Agency of Canada. 2015. Salmonella enterica spp.Health Canada, Ottawa, Ontario, Canada.
99. Public Health Agency of Canada. 2016. Cyclospora spp. HealthCanada, Ottawa, Ontario, Canada.
100. Public Health Agency of Canada. 2017. Norovirus. Health Canada,Ottawa, Ontario, Canada.
101. Raudales, R. E., J. L. Parke, C. L. Guy, and P. R. Fisher. 2014.Control of waterborne microbes in irrigation: a review. Agric. WaterManag. 143:9–28.
102. Reshes, G., S. Vanounou, I. Fishov, and M. Feingold. 2008. Cellshape dynamics in Escherichia coli. Biophys. J. 94:251–264.
103. Robertson, L. J. 2013. Giardia as a foodborne pathogen. Springer,New York.
104. Schuch, I., D. Dannehl, M. Bandte, J. Suhl, Y. Gao, and U. Schmidt.2016. Minimising chlorate in the electrolytic disinfection ofirrigation water. Landtechnik 71:25–33.
105. Seymour, I. J., and H. Appleton. 2001. Foodborne viruses and freshproduce. J. Appl. Microbiol. 91:759–773.
106. Smeets, P. W. M. H., G. J. Medema, and J. C. Van Dijk. 2009. TheDutch secret: how to provide safe drinking water without chlorinein the Netherlands. Drink. Water Eng. Sci. 2:1–14.
107. Sommer, R., W. Pribil, S. Pfleger, T. Haider, M. Werderitsch, and P.Gehringer. 2004. Microbicidal efficacy of an advanced oxidationprocess using ozone/hydrogen peroxide in water treatment. WaterSci. Technol. 50:159–164.
108. Staatssecretaris van Infrastructuur en Milieu for the Netherlands.2018. Drinking water decree (Drinkwaterbesluit). Government ofThe Netherlands, The Hague.
109. Steele, M., and J. Odumeru. 2004. Irrigation water as source offoodborne pathogens on fruit and vegetables. J. Food Prot.67:2839–2849.
110. Strausbaugh, L. J., and B. L. Herwaldt. 2000. Cyclosporacayetanensis: a review, focusing on the outbreaks of cyclosporiasisin the 1990s. Clin. Infect. Dis. 31:1040–1057.
111. Teunis, P. F., I. D. Ogden, and N. J. Strachan. 2008. Hierarchicaldose response of E. coli O157:H7 from human outbreaksincorporating heterogeneity in exposure. Epidemiol. Infect.136:761–770.
112. Teunis, P. F. M., F. Kasuga, A. Fazil, L. D. Ogden, O. Rotariu, andN. J. C. Strachan. 2010. Dose-response modeling of Salmonellausing outbreak data. Int. J. Food Microbiol. 144:243–249.
113. Tryland, I. 2014. The potential of water treatment involving UV,chlorine dioxide and hydrogen peroxide. In J. van der Vorst (ed.),Veg-i-trade: impact of climate change and globalisation on safety offresh produce—governing a supply chain of uncompromised foodsovereignty. Seventh Framework Programme for Research of theEuropean Commission, Brussels.
114. U.S. Environmental Protection Agency (EPA). 2012. US Environ-mental Protection Agency: recreational water quality criteria. EPA,Washington, DC.
115. U.S. Environmental Protection Agency (EPA). 2017. Nationalprimary drinking water regulations. EPA, Washington, DC.
116. U.S. Food and Drug Administration (FDA). 2015. Analysis andevaluation of preventive control measures for the control andreduction/elimination of microbial hazards on fresh and fresh-cutproduce: chapter IV—Outbreaks associated with fresh and fresh-cutproduce; incidence, growth, and survival of pathogens in fresh andfresh-cut produce. Available at: http://www.fda.gov/Food/FoodScienceResearch/SafePracticesforFoodProcesses/ucm091265.htm. Accessed 18 April 2016.
117. U.S. Food and Drug Administration (FDA). 2019. Food SafetyModernization Act (FSMA) final rule on produce safety. Fed.Regist. 21:12490–12491.
118. U.S. Food and Drug Administration (FDA). 2019. Outbreakinvestigation of Cyclospora illnesses linked to imported fresh basil,July 2019. Available at: https://www.fda.gov/food/outbreaks-foodborne-illness/outbreak-investigation-cyclospora-illnesses-linked-imported-fresh-basil-july-2019. Accessed 1 July 2020.
119. Uyttendaele, M., L.-A. Jaykus, P. Amoah, A. Chiodini, D. Cunliffe,L. Jacxsens, K. Holvoet, L. Korsten, M. Lau, P. McClure, G.Medema, I. Sampers, and P. Rao Jasti. 2015. Microbial hazards inirrigation water: standards, norms, and testing to manage use ofwater in fresh produce primary production. Compr. Rev. Food Sci.Food Saf. 14:336–356.
120. Van der Linden, I., B. Cottyn, M. Uyttendaele, N. Berkvens, G.Vlaemynck, M. Heyndrickx, and M. Maes. 2014. Enteric pathogensurvival varies substantially in irrigation water from Belgian lettuceproducers. Int. J. Environ. Res. Public Health 11:10105–10124.
121. Van Haute, S., I. Sampers, L. Jacxsens, and M. Uyttendaele. 2015.Selection criteria for water disinfection techniques in agriculturalpractices. Crit. Rev. Food Sci. Nutr. 55:1529–1551.
122. Van Haute, S., I. Tryland, A. Veys, and I. Sampers. 2014. Washwater disinfection of a full-scale leafy vegetables washing processwith hydrogen peroxide and the use of a commercial metal ionmixture to improve disinfection efficiency. Food Control 50:173–183.
123. Villanueva, M. V., M. C. Luna, M. I. Gil, and A. Allende. 2015.Ultrasound treatments improve the microbiological quality of waterreservoirs used for the irrigation of fresh produce. Food Res. Int.75:140–147.
124. Wang, Y., P. Pandey, Y. Zheng, E. R. Atwill, and G. Pasternack.2018. Particle attached and free floating pathogens survival kineticsunder typical stream and thermal spring temperature conditions.AMB Express 8:100.
125. Weller, D., M. Wiedmann, and L. K. Strawn. 2015. Irrigation issignificantly associated with an increased prevalence of Listeriamonocytogenes in produce production environments in New YorkState. J. Food Prot. 78:1132–1141.
1086 BANACH AND VAN DER FELS-KLERX J. Food Prot., Vol. 83, No. 6D
ownloaded from
http://meridian.allenpress.com
/jfp/article-pdf/83/6/1072/2495672/i0362-028x-83-6-1072.pdf by Wageningen U
R user on 12 June 2020

126. World Health Organization (WHO). 1989. Health guidelines for theuse of wastewater in agriculture and aquaculture. WHO, Geneva.
127. World Health Organization (WHO). 2003. Chlorine in drinking-water background document for development of WHO Guidelinesfor drinking-water quality. WHO, Geneva.
128. World Health Organization (WHO). 2003. Guidelines for saferecreational water environments. volume 1: Coastal and freshwaters. WHO, Geneva.
129. World Health Organization (WHO). 2005. Guidelines for thecontrol of shigellosis, including epidemics due to Shigelladysenteriae type. WHO, Geneva.
130. World Health Organization (WHO). 2006. Guidelines for the safeuse of wastewater, excreta and greywater, vol. 1. WHO, Geneva.
131. World Health Organization (WHO). 2006. WHO and UnitedNations Environmental Programs. Guidelines for the safe use ofwastewater, excreta and greywater. WHO, Geneva.
132. World Health Organization (WHO). 2011. Guidelines for drinking-water quality. WHO, Geneva.
133. World Health Organization (WHO). 2015. Chlorine dioxide,chlorate and chlorite in drinking-water draft revised background
document for development of WHO Guidelines for drinking-waterquality. WHO, Geneva.
134. World Health Organization (WHO). 2016. Botulism. WHO,Geneva.
135. World Health Organization (WHO). 2016. E. coli. Fact sheet.WHO, Geneva.
136. World Health Organization (WHO). 2017. Hepatitis A. WHO,Geneva.
137. Yao, K. S., D. Y. Wang, W. Y. Ho, J. J. Yan, and K. C. Tzeng. 2007.Photocatalytic bactericidal effect of TiO2 thin film on plantpathogens. Surf. Coating Technol. 201:6886–6888.
138. Yeni, F., S. Yavaş, H. Alpas, and Y. Soyer. 2016. Most commonfoodborne pathogens and mycotoxins on fresh produce: a review ofrecent outbreaks. Crit. Rev. Food Sci. Nutr. 56:1532–1544.
139. Zhang, W., Y. Luo, J. Li, L. Lin, Y. Ma, C. Hu, S. Jin, L. Ran, and S.Cui. 2011. Wide dissemination of multidrug-resistant Shigellaisolates in China. J. Antimicrob. Chemother. 66:2527–2535.
140. Zhou, X., H. Guo, Z. Li, J. Zhao, and Y. Yun. 2015. Experimentalstudy on the disinfection efficiencies of a continuous-flowultrasound/ultraviolet baffled reactor. Ultrason. Sonochem. 27:81–86.
J. Food Prot., Vol. 83, No. 6 MICROBIOLOGICAL REDUCTION STRATEGIES IN IRRIGATION WATER 1087D
ownloaded from
http://meridian.allenpress.com
/jfp/article-pdf/83/6/1072/2495672/i0362-028x-83-6-1072.pdf by Wageningen U
R user on 12 June 2020