Embed Size (px)
Citation preview
Measuring and predicting thevapour pressure of organic
molecules to reduce uncertainties inair-quality and climate change
models
A thesis submitted to The University of Manchester for the degree of Doctor of Philosophy
in the Faculty of Science and Engineering.
2021
Petroc Shelley
Department of Earth and Environmental Sciences

BLANK PAGE
2
Contents
List of Figures 5
List of Listings 7
Abstract 9
Declaration 11
Copyright Statement 13
Acknowledgement 15
1 Introduction 17
1.1 Motivation . . . . . . . . . . . . . . . . . . . . . . . . . . . . . . . . . . . . . 17
1.2 Thesis Overview . . . . . . . . . . . . . . . . . . . . . . . . . . . . . . . . . . 18
1.3 Atmospheric Aerosols . . . . . . . . . . . . . . . . . . . . . . . . . . . . . . . 19
1.4 Vapour Pressure . . . . . . . . . . . . . . . . . . . . . . . . . . . . . . . . . . 22
1.5 Studied compounds and atmospheric importance . . . . . . . . . . . . . . . . 26
References . . . . . . . . . . . . . . . . . . . . . . . . . . . . . . . . . . . . . . . . . 28
2 Literature Review 33
2.1 Experimental vapour pressure methods . . . . . . . . . . . . . . . . . . . . . . 33
2.1.1 Knudsen cell based methods . . . . . . . . . . . . . . . . . . . . . . . . 34
2.1.2 Single particle methods . . . . . . . . . . . . . . . . . . . . . . . . . . 34
2.1.3 Particle size distribution methods . . . . . . . . . . . . . . . . . . . . . 35
2.1.4 Thermal desorption methods . . . . . . . . . . . . . . . . . . . . . . . 36
2.1.5 The Clausius-Clapeyron equation . . . . . . . . . . . . . . . . . . . . . 37
2.2 Group contribution vapour pressure prediction methods . . . . . . . . . . . . 38
References . . . . . . . . . . . . . . . . . . . . . . . . . . . . . . . . . . . . . . . . . 43
3 Instrumentation 47
3.1 The University of Manchester Knudsen effusion mass spectrometry system
(KEMS) . . . . . . . . . . . . . . . . . . . . . . . . . . . . . . . . . . . . . . . 47
3.1.1 Using the homologous PEG series as a reference data set . . . . . . . 50
3
3.2 Differential Scanning Calorimetry (DSC) . . . . . . . . . . . . . . . . . . . . . 51
3.3 The ETH Zurich electrodynamic balance (EDB) . . . . . . . . . . . . . . . . 52
References . . . . . . . . . . . . . . . . . . . . . . . . . . . . . . . . . . . . . . . . . 53
4 Code development 55
4.1 Changes to the UManSysProp suite . . . . . . . . . . . . . . . . . . . . . . . 55
4.1.1 Adding SIMPOL to UManSysProp . . . . . . . . . . . . . . . . . . . . 56
4.1.2 Bug fixing exitsting GCMs within UManSysProp . . . . . . . . . . . . 61
References . . . . . . . . . . . . . . . . . . . . . . . . . . . . . . . . . . . . . . . . . 63
5 Results 65
5.1 Paper 1: Measured solid state and sub-cooled liquid vapour pressures of
nitroaromatics using Knudsen effusion mass spectrometry . . . . . . . . . . . 66
5.2 Paper 2: Measured solid state and sub-cooled liquid vapour pressures of
benzaldehydes using Knudsen effusion mass spectrometry . . . . . . . . . . . 64
5.3 Paper 3: Exploring the importance of functionality in vapour pressure
estimation techniques using multivariate regression . . . . . . . . . . . . . . . 65
References . . . . . . . . . . . . . . . . . . . . . . . . . . . . . . . . . . . . . . . . . 66
6 Conclusion 67
6.1 Summary of key research findings . . . . . . . . . . . . . . . . . . . . . . . . . 67
6.2 Work for the future . . . . . . . . . . . . . . . . . . . . . . . . . . . . . . . . . 69
References . . . . . . . . . . . . . . . . . . . . . . . . . . . . . . . . . . . . . . . . . 69
A Appendices 71
A.1 Supplementary material for Paper 3 . . . . . . . . . . . . . . . . . . . . . . . 71
A.2 Publications and conference presentations . . . . . . . . . . . . . . . . . . . . 77
A.2.1 Contributions to scientific publications . . . . . . . . . . . . . . . . . . 77
A.2.2 Conference presentations . . . . . . . . . . . . . . . . . . . . . . . . . 77
A.3 DTP Training Plan . . . . . . . . . . . . . . . . . . . . . . . . . . . . . . . . . 77
Word Count: 42,062
4
List of Figures
1.1 Schematic multi-modal particle size distribution and the typical
transformations that occur within each mode . . . . . . . . . . . . . . . . . . 23
2.1 GCMs split a compound into its carbon backbone and its functional groups . 38
2.2 A hydroperoxide group will be split into an ether and an alcohol if the GCM
does not contain any parameters for hydroperoxide groups . . . . . . . . . . . 39
3.1 KEMS schematic reproduced from (Booth et al., 2009) . . . . . . . . . . . . . 48
4.1 Structure of alcohols and enols . . . . . . . . . . . . . . . . . . . . . . . . . . 61
4.2 SMILE strings and structures provided to illustrate disagreement . . . . . . . 62
5

BLANK PAGE
6
Listings
4.1 Format for SIMPOL.data . . . . . . . . . . . . . . . . . . . . . . . . . . . . . 56
4.2 SMARTS string to find the total number of carbons within a compound . . . 57
4.3 SMARTS for determine the presence of an aromatic ring . . . . . . . . . . . . 57
4.4 SMARTS describing a nitro group . . . . . . . . . . . . . . . . . . . . . . . . 58
4.5 code to call from SIMPOL.data . . . . . . . . . . . . . . . . . . . . . . . . . . 58
4.6 code to call from SIMPOL.smarts . . . . . . . . . . . . . . . . . . . . . . . . . 58
4.7 code to search compounds for functionality using the SIMPOL SMARTS . . . 58
4.8 result[’0’] and result[’1’] . . . . . . . . . . . . . . . . . . . . . . . . . . . . . . 59
4.9 result[’3’] and result[’4’] . . . . . . . . . . . . . . . . . . . . . . . . . . . . . . 59
4.10 result[’17’] . . . . . . . . . . . . . . . . . . . . . . . . . . . . . . . . . . . . . . 59
4.11 result[’30’] . . . . . . . . . . . . . . . . . . . . . . . . . . . . . . . . . . . . . . 60
4.12 estimating vapour pressure using SIMPOL . . . . . . . . . . . . . . . . . . . . 60
4.13 aggregate_matches function . . . . . . . . . . . . . . . . . . . . . . . . . . . . 60
7

BLANK PAGE
8
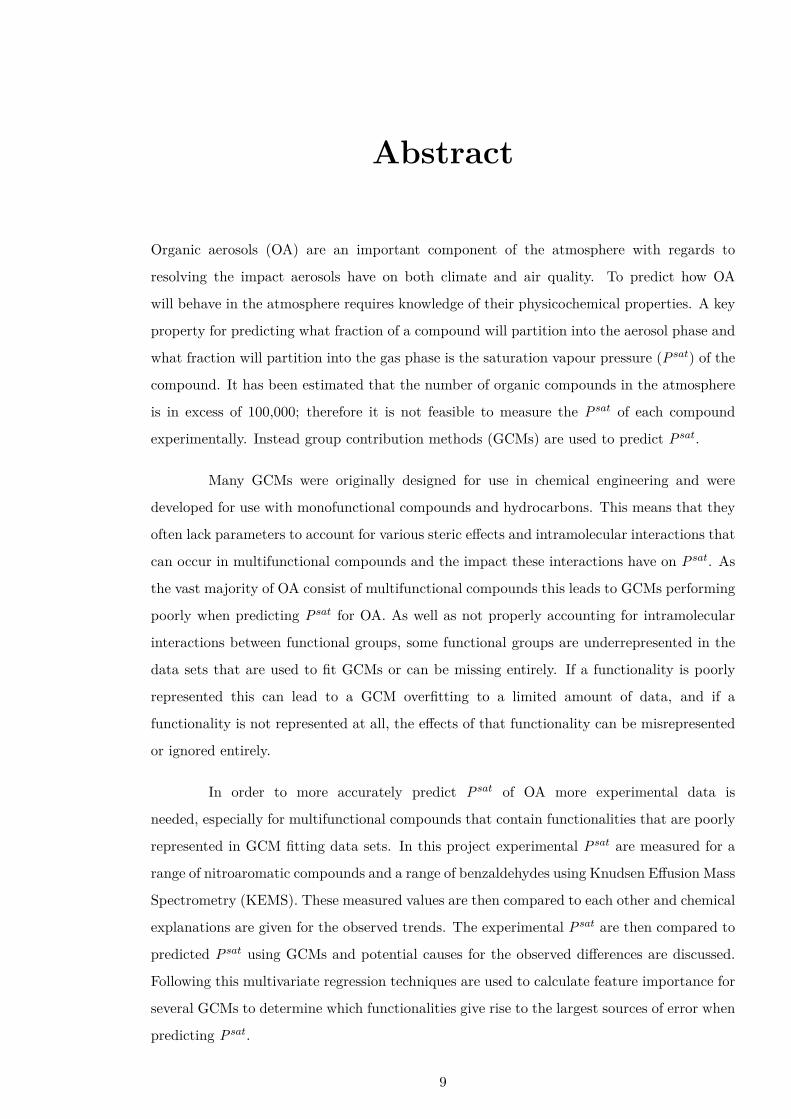
Abstract
Organic aerosols (OA) are an important component of the atmosphere with regards to
resolving the impact aerosols have on both climate and air quality. To predict how OA
will behave in the atmosphere requires knowledge of their physicochemical properties. A key
property for predicting what fraction of a compound will partition into the aerosol phase and
what fraction will partition into the gas phase is the saturation vapour pressure (Psat) of the
compound. It has been estimated that the number of organic compounds in the atmosphere
is in excess of 100,000; therefore it is not feasible to measure the Psat of each compound
experimentally. Instead group contribution methods (GCMs) are used to predict Psat.
Many GCMs were originally designed for use in chemical engineering and were
developed for use with monofunctional compounds and hydrocarbons. This means that they
often lack parameters to account for various steric effects and intramolecular interactions that
can occur in multifunctional compounds and the impact these interactions have on Psat. As
the vast majority of OA consist of multifunctional compounds this leads to GCMs performing
poorly when predicting Psat for OA. As well as not properly accounting for intramolecular
interactions between functional groups, some functional groups are underrepresented in the
data sets that are used to fit GCMs or can be missing entirely. If a functionality is poorly
represented this can lead to a GCM overfitting to a limited amount of data, and if a
functionality is not represented at all, the effects of that functionality can be misrepresented
or ignored entirely.
In order to more accurately predict Psat of OA more experimental data is
needed, especially for multifunctional compounds that contain functionalities that are poorly
represented in GCM fitting data sets. In this project experimental Psat are measured for a
range of nitroaromatic compounds and a range of benzaldehydes using Knudsen Effusion Mass
Spectrometry (KEMS). These measured values are then compared to each other and chemical
explanations are given for the observed trends. The experimental Psat are then compared to
predicted Psat using GCMs and potential causes for the observed differences are discussed.
Following this multivariate regression techniques are used to calculate feature importance for
several GCMs to determine which functionalities give rise to the largest sources of error when
predicting Psat.
9

BLANK PAGE
10

Declaration
No portion of the work referred to in the thesis has been submitted in support of an application
for another degree or qualification of this or any other university or other institute of learning.
11

BLANK PAGE
12
Copyright Statement
(i) The author of this thesis (including any appendices and/or schedules to this thesis)
owns certain copyright or related rights in it (the “Copyright”) and s/he has given
The University of Manchester certain rights to use such Copyright, including for
administrative purposes.
(ii) Copies of this thesis, either in full or in extracts and whether in hard or electronic copy,
may be made only in accordance with the Copyright, Designs and Patents Act 1988
(as amended) and regulations issued under it or, where appropriate, in accordance with
licensing agreements which the University has from time to time. This page must form
part of any such copies made.
(iii) The ownership of certain Copyright, patents, designs, trademarks and other intellectual
property (the “Intellectual Property”) and any reproductions of copyright works in the
thesis, for example graphs and tables (“Reproductions”), which may be described in
this thesis, may not be owned by the author and may be owned by third parties. Such
Intellectual Property and Reproductions cannot and must not be made available for
use without the prior written permission of the owner(s) of the relevant Intellectual
Property and/or Reproductions.
(iv) Further information on the conditions under which disclosure, publication and
commercialisation of this thesis, the Copyright and any Intellectual Property and/or
Reproductions described in it may take place is available in the University IP Policy
(see http://documents.manchester.ac.uk/DocuInfo.aspx?DocID=24420), in any relevant
Thesis restriction declarations deposited in the University Library, The University
Library’s regulations (see http://www.library.manchester.ac.uk/about/regulations/) and
in The University’s policy on Presentation of Theses.
13

BLANK PAGE
14
Acknowledgement
I would like to thank David Topping, Rami Alfarra and Tom Bannan for all of their help
over the course of my PhD. I would particularly like to thank Tom for putting up with me
repeatedly breaking the KEMS during the early stages of the PhD. I would also like to thank
Stephen Worrall for his help with the chemistry sections of my first and second publications.
His help made the process of making the collected data understandable and presentable was
essential. And a final thank you to lunch club with our tea and coffee breaks that occurred
daily like clockwork.
15

BLANK PAGE
16
1
Introduction
1.1 Motivation
Atmospheric aerosol particles are one of the most important factors in determining air
quality and are viewed as one of the most damaging of regional pollutants (Hallquist
et al., 2009). Atmospheric aerosol particles play a major role in atmospheric chemistry
(Chacon-Madrid and Donahue, 2011), and are known to have impacts on human health
(Mauderly et al., 2008). They also both directly and indirectly influence the Earth’s
climatic system on both a regional and global level (Masson-Delmotte et al., 2019). Aerosol
particles sit in a complex ’soup’ of gas phase products in the atmosphere. To predict the
impact of atmospheric aerosols in the complex and ever changing chemical composition
of the atmosphere numerical models are used to predict the partitioning of hundreds of
thousands of compounds between the gas phase and the condensed phase. Uncertainties in
the physicochemical properties of pure components and condensed phase mixtures greatly
impact our ability to accurately predict partitioning. One of the key properties to accurately
predict partitioning is pure component saturation vapour pressure (Psat). Surprisingly, given
its importance for accurately modelling partitioning, experimental Psat data is very sparse
for atmospherically relevant compounds. The vast majority of experimental Psat within the
literature is focused on long chain hydrocarbons, and monofunctional compounds, which are
of interest to chemical engineers and the oil industry. The predictive models that are tuned to
this data, unsurprisingly, perform poorly when applied to compounds of atmospheric interest
which are typically multifunctional compounds. Within the wider atmospheric community, a
variety of instruments have been constructed to specifically measure the Psat of atmospheric
aerosols, and expand the existing database of experimental Psat.
One of these instruments that was constructed is the University of Manchester
Knudsen effusion mass spectrometry (KEMS) system. Using the KEMS system, it is possible
to measure experimental Psat of compounds that are poorly represented in the literature,
17
and by extension predictive models. Additionally, using this new experimental data and
multivariate regression it is possible to investigate the impact these new measurements
have had on the predictive techniques and to highlight further areas of study that are
important in continuing to improve the accuracy of these predictive techniques when applied
to atmospheric aerosols.
1.2 Thesis Overview
In this thesis the experimental and predicted Psat for a chemically diverse range of
nitroaromatic and benzaldehyde compounds are given with the aim of identifying where
current models are lacking data to make accurate predictions and to help fill those gaps.
The experimental Psat were measured using a Knudsen effusion mass spectrometry (KEMS)
system and the predicted Psat were estimated using a selection of commonly used group
contribution methods (GCMs). Following on from this, using a combination of literature
sources and primary data collected using the KEMS, the estimated error in predicted Psat
was calculated using multivariate regression and plotted over the chemical space of the master
chemical mechanism (MCM) to identify the most important functionalities that impact the
predictive ability of the GCMs.
Chapter 1 gives an introduction to atmospheric organic aerosols, their basic roles
in climate and air quality, and an explanation of Psat and why it is essential to a better
understanding of the behaviours and impacts of organic aerosols (OAs). Chapter 2 consists of
a literature review which covers some of the common methods for experimentally determining
Psat, as well as detailed looks at many of the common GCMs that are used for predicting
Psat of OAs, as well as the general community consensus of their strengths and weaknesses.
Chapter 3 details the instruments used for the data collection for both the nitroaromatic
compounds and the benzladehyde compounds, including the KEMS, the electrodynamic
balance (EDB) from ETH Zurich, and a differential scanning calorimeter (DSC). Chapter
4 details the processes used to determine the estimated error and the importance of chemical
features on the estimated error. Addition of new vapour pressure GCMs to the UManSysProp
suite are also detailed in this chapter.
Chapter 5 contains the three major projects undertaken during the course of the
PhD. Paper 1 (Chapter 5.1) uses KEMS and DSC to predict the solid state (PsatS ) and
sub-cooled liquid vapour pressures (PsatL ) of a chemically diverse range of nitroaromatic
compounds. Comparisons are made between these experimental values and chemical and
structural explanations are given to explain the observed trends. Additional measurements
18
of a select few of these compounds were also measured using the EDB from ETH Zurich
to verify the accuracy of the KEMS measurements. Additionally the experimental Psat
were compared to predicted Psat using several different GCMS. The areas where each GCM
performed well and poorly were identified and explanations were given for why such errors
occured with recommendations given on what is the most suitable GCM to use to predict the
Psat of nitroaromatics. Paper 2 (Chapter 5.2) follows on from Paper 1 focusing on a selection
of benzaldehydes. PsatS and Psat
L were collected using a combination of KEMS and DSC.
Comparisons between the measured data was made to identify the chemical properties that
had the most significant impact on Psat. The Psat were then compared with predicted Psat
using GCMs to identify where the GCMs performed well and where they performed poorly.
Paper 3 (Chapter 5.3) uses gradient boosting regression with stratified k-fold cross validation
to determine the feature importance for the GCMs within UManSysProp to determine the
importance of different functionalities in determining the error associated with GCM. The
experimental Psat values from the KEMS were then included and the feature importance
recalculated to assess the impact that the KEMS data has on feature importance, and see
which functionalities currently have the largest predicted error within each GCM.
Chapter 6 provides an overview of the outcomes of this research and provides
recommendations for areas of future study.
1.3 Atmospheric Aerosols
Atmospheric aerosols consist of both organic and inorganic compounds. The conversion of
inorganic gases such as SO2, NO2 and NH3 into the particulate phase is now fairly well
understood. Comparatively for organic compounds these processes are considerably more
uncertain (Hallquist et al., 2009).
OAs consist of primary organic aerosols (POA), that are emitted directly into the
atmosphere as aerosols, and secondary organic aerosols (SOA), that form through various
processes in the atmosphere. POA enter the atmosphere through a mixture of anthropogenic
and biogenic sources. These include traffic emissions, residential heating (Crippa et al.,
2013), and biomass burning (Hallquist et al., 2009) for anthropogenic sources and emissions
from terrestrial and aquatic ecosystems (Crippa et al., 2013), sea spray and biological
mass (Hallquist et al., 2009) for biogenic sources. The processes that release OA into the
atmosphere also release other organic compounds in the form of gaseous volatile organic
compounds (VOC) (Crippa et al., 2013). The mixture of POA and VOC undergo constant
evolution once released into the atmosphere through processes such as reversible phase
19
partitioning, dry and wet deposition and chemical reactions with oxidant species. The latter
can lead to the formation of SOA when the oxidation products of these reactions reduce in
volatility sufficiently to partition into the aerosol phase. The processes from which inorganic
gases are converted into the condensed phase is fairly well understood. However there is
significant uncertainty over SOA formation when VOCs in the atmosphere undergo gas-phase
photochemical reactions followed by gas to particle partitioning. This is because an estimated
100 000 organic compounds have been measured in the atmosphere so far. To compound this
each VOC in the atmosphere has multiple different degradation pathways to form multiple
products that may or may not contribute to SOA formation (Hallquist et al., 2009). Even the
time of day can have a significant effect on SOA formation as oxidation via hydroxyl (OH)
is dominant in the daytime whereas nitrate (NO3) is dominant during the night (Crippa
et al., 2013). There are four major gas-phase degradation pathways for VOCs. These are
via photolysis or via reaction with OH·, O3 or NO3· (Atkinson and Arey, 2003). For some
aromatic hydrocarbons, such as benzene, reactions with OH· can be reversible, with OH-
aromatic adducts undergoing thermal desorption back to the reactants if further reactions do
not occur within a certain time frame (Atkinson and Arey, 2003). In certain circumstances
under marine conditions, Cl has been known to initiate the oxidation process. The oxidation
process typically leads to the generation of an organic product with a polar oxygenated
functional group. The addition of the polar oxygenated functional group tends to lead to a
decrease in volatility. Further oxidation steps lead to more polar oxygen containing functional
groups which in turn lead to a further decrease in volatility. If the volatility decrease is
significant enough it will lead to the oxidation product partitioning into the particulate state
and the formation of a SOA. To complicate matters, however, the oxidation process can also
lead to fragmentation of the parent molecule (Chacon-Madrid and Donahue, 2011). This leads
to the oxidation products having lower molecular weights and therefore higher volatilities.
As the oxidation process occurs there is competition between fragmentation and the addition
of polar oxygenated functional groups, which can result in either an increase or decrease in
volatility. The vast number of organic compounds in the atmosphere are due to the large
mixture of VOCs emitted and the complex degradation pathways of these VOCs (Hallquist
et al., 2009). Additionally some work by Robinson et al. (2007) suggests that the reactions
of some less volatile organic compounds may also lead to the formation of SOA. Prior to the
work by Robinson et al. (2007) it was assumed that POA dominated the urban OA budget.
However the results of Robinson et al. (2007) implied that the majority of the population was
exposed to mostly SOA with the health and climate impacts of SOA differing from those of
POA. The dominant OA sources and species are known to vary, not only by region, but also
by season, as discussed by Crippa et al (Crippa et al., 2013).
20
VOCs and OA are known to have negative environmental and health effects.
Burning of fossil fuel and biomass are two of the most significant anthropogenic sources
of OA and OA precursors, and these processes have increased massively since the industrial
revolution(Pöschl, 2005) but has tailed off in recent decades. In many cities the release of
VOCs and POA, and the subsequent formation of SOA, can result in a ’photochemical smog’
enveloping the area (Volkamer et al., 2006).
The effects of aerosols on climate are either considered direct or indirect with respect
to the radiative forcing of a climate system. Radiative forcings are changes in the energy
fluxes of solar radiation and terrestrial radiation in the atmosphere caused by changes in
atmospheric composition, Earth surface properties, or solar activity. A negative forcing tends
to cool the surface of the Earth, whereas a positive forcing leads to a warming of the surface
of the Earth. The greenhouse effect is an example of positive forcing. Direct effects involve
aerosol particles either scattering or absorbing radiation, whereas indirect effects result from
the influence of aerosol particles on clouds and precipitation (Pöschl, 2005).
OA are capable of both scattering and absorbing solar radiation (Kanakidou et al.,
2005). Not only can OA lead to global cooling as they can scatter visible radiation, they
may also contain a light-absorbing component known as brown carbon (BrC). BrC has been
widely observed during biomass burning, coal burning, and in SOA formation (Lin et al.,
2014). Finer OA particles are expected to have a greater climatic impact than larger OA
particles as they are closer in size to the wavelengths of visible light so more effectively scatter
or absorb the radiation. They are also more readily transferred by wind and so have far less
localised effects than their larger counterparts (Kanakidou et al., 2005). Recent work has
shown that the presence of isoprene, the dominant biogenic VOC globally, can supress SOA
generation and overall mass yields from monoterpenes in mixtures of atmospheric vapours
(McFiggans et al., 2019). In this work it is demonstrated that the simple linear addition of
SOA mass yields from individual SOA precursor VOCs will substantially overestimate SOA
production, and that to more accurately predict SOA mass this supression of SOA formation
must be accounted for.
Hydrophilic aerosols can indirectly effect radiative forcing by acting as cloud
condensation nuclei (CCN) and impact the atmosphere via cloud formation (Kanakidou
et al., 2005). The extent that OA effect radiative forcing is still largely unknown due to
the discrepancies in the worldwide OA mass budget, as well as the complex nature of SOA
formation, and the uncertainty of the SOA physical and chemical properties, and the ability
of some OA to act as CCN (Lin et al., 2014). Several climate and air quality models appear
to under predict the amount of particulate matter in the atmosphere (Mahmud et al., 2010)
21
and SOA concentrations at the boundary layer(Lin et al., 2012).
SOA make up a significant fraction of PM2.5 with a study of the Pittsburgh area
of USA stating total SOA contributions of between 10-35% depending on the season (Hodan
and Barnard, 2003) and a report from the Air Quality Expert Group on behalf of DEFRA
giving a mean annual contribution of SOA to PM2.5 of 8% for the UK in 2009. Later
in the report however it states that the models used typically under predict for SOA so
the actual contribution may be slightly higher (Air Quality Expert Group, 2012). Another
study focusing on the Pearl River Delta region in southern China also identified a 10%
contribution to PM2.5 from SOA (Zou et al., 2017). The health impact of fine particulate
matter such as PM2.5 has been made apparent with numerous epidemiological studies showing
strong correlation of higher concentrations with higher mortality and morbidity rates due to
cardiovascular and respiratory diseases (Pöschl, 2005). Silva et al. (2013) estimate that 1.3-
3.0 million premature deaths occur annually due to PM2.5 from anthropogenic sources. It
is also believed that long term exposure to PM2.5 can lead to certain forms of cancer, as
well as reproductive issues (Pui et al., 2014). Ultra fine particles with diameters of less than
100nm are considered especially dangerous as they are small enough to penetrate through
membranes and enter blood circulation or even be transferred to the brain (Pöschl, 2005).
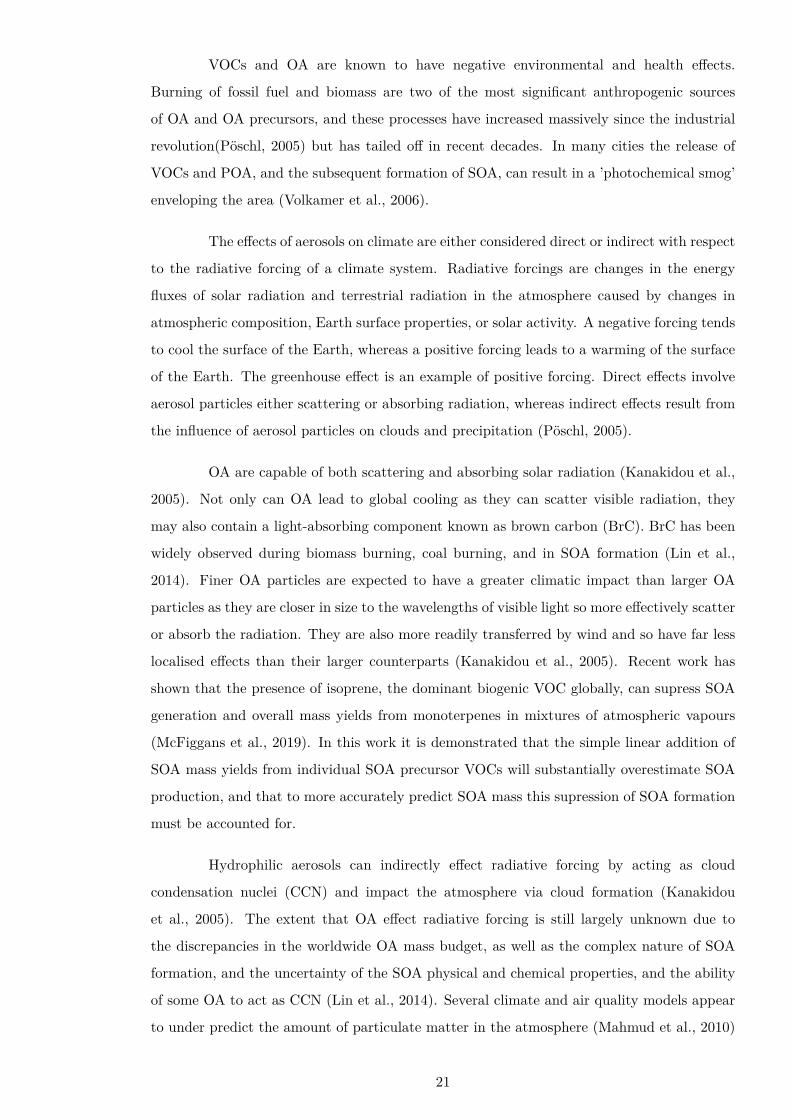
The size distribution of atmospheric aerosols consists of a number of different modes,
as shown in Figure 1.1. These modes overlap as particle sizes are continuously changing due
to a combination of processes that both grow and shrink particles. The smallest particles
form by gas-to-particle conversion in the nucleation mode. They continue to grow relatively
quickly through the Aitken mode via condensation of gases and water vapour. As particle
size increases through the accumulation mode the growth becomes slower growing through
coagulation and coalescence. Above particle sizes of 100 nm efficiency of deposition increases
significantly.(Seinfeld and Pandis, 2016)
1.4 Vapour Pressure
There are several different types of vapour pressure that will be mentioned in this thesis
all having slightly different definitions and meanings. These are the saturation vapour
pressure, equilibrium vapour pressure, solid state vapour pressure and sub-cooled liquid
vapour pressure.
The IUPAC definition for saturation vapour pressure (Psat) is “the pressure exerted
by a pure substance (at a given temperature) in a system containing only the vapour
22
Figure 1.1: Schematic multi-modal particle size distribution and the typical transformationsthat occur within each mode
and the condensed phase (liquid or solid) of the substance” (Calvert, 1990). Equilibrium
vapour pressure is similar to saturation vapour pressure except in a multicomponent
system. Equilibrium vapour pressure of an organic compound strongly depends on the pure-
component saturation vapour pressure of said compound, but is also related to the chemical
composition of the mixture that the organic compound is apart of (Bilde et al., 2015). The
equilibrium vapour pressure of a component i can be given by Equation 1.1.
Pi = xiP∗i (1.1)
where Pi is the equilibrium vapour pressure of component i, xi is the mole fraction
of component i and P∗i is the saturation vapour pressure of compound i.
Solid state vapour pressure (PsatS ) is the saturation vapour pressure of the solid
state and the sub-cooled liquid vapour pressure (PsatL ) is the saturation vapour pressure of
the sub-cooled liquid.
Vapour pressure is typically measured in Pascals (Pa) or atmospheres (atm).
The process of gas/particle partitioning of a compound depends on said compounds
PsatL . As Psat
L falls, the partitioning towards the particulate state increases. VOCs undergo
oxidation once released into the atmosphere and typically become less volatile. The degree of
volatility of a product can be defined by its PsatL and from this value it is possible to estimate
23
if the product will remain in the gaseous phase, partially partition to the particulate phase,
or partition fully into the particle phase becoming a SOA (Schroder et al., 2016).
When discussing organic compounds in the atmosphere, the volatility of a compound
is commonly used to broadly define groups of compounds. Organic compounds are classified
dependent on what fraction of the compound is in the vapour and condensed phases under
ambient conditions. The following terms have been defined dependent on their saturation
mass concentrations. These terms are volatile organic compounds (VOCs), intermediate-
volatile organic compounds (IVOCs), semivolatile organic compounds (SVOCs), low-volatility
organic compounds (LVOCs) and extremely-low-volatility compounds (ELVOCs). VOCs are
in the gas phase, IVOCs are generally gas phase, but can partially partition into the condensed
phase in extremely concentrated smoke plumes, SVOCs have a substantional fraction in both
the gas and condensed phases, LVOCs are primarily in the condensed phase, and ELVOCs
are almost entirely in the condensed phase (Bilde et al., 2015). Volatility itself does not have
a defined numerical value, but is instead commonly described using Psat. A substance with
a high Psat at ambient conditions would be referred to as volatile (Speight, 2017)
There are two pathways for condensation from the gaseous phase to the condensed
phase. These are absorption into a bulk and adsorption onto a surface. The absorption
process is dominant in SOA formation (Hallquist et al., 2009) and describes the process of
organic molecules condensing into an organic matrix. As it is the more dominant of the
two pathways for SOA formation, it is typically the method used in atmospheric models
(Bilde et al., 2015). It has also been shown that some SOA, formed from terpene oxidation
products, can form nanometer sized molecular cluster with some inorganic molecules such
as H2SO4 or ammonia that can act as cloud condensation nuclei (Shrivastava et al., 2017).
Phenolic compounds have been shown to undergo aqueous phase photochemical reactions in
the atmosphere leading to SOA formation (Shrivastava et al., 2017).
Condensational growth is driven by a difference in partial pressure above the surface
of a particle and that of the gas phase. As the concentrations in the gas phase change the
partitioning process redistributes species between the gaseous and particulate phase according
to a combination of pure component and mixture properties. For absorptive partitioning, the
dynamic process of mass and heat transfer can be described using a differential equation
known as the droplet growth equation. The droplet growth equation (Jacobson, 2005) when
applied to a condensing gas i is given by Equation 1.2:
dma,i
dt = 4πrDg,i(pg,i − pg,i,r)Dg,iLe,ipg,i,r
κi,airT ( Le,i
Rg,iT − 1) + Rg,iT(1.2)
24
where dma,i is the change in mass of compound i into the particulate phase, dt is
the change in time, r is the droplet radius (cm), Dg,i is the molecular diffusion coefficient
of compound i (cm2s−1), pg,i and pg,i,r are the partial pressure and equilibrium vapour
pressure of compound i away from and at the droplet surface(104hPa), κi,air is the thermal
conductivity of compound i in air (Jcm−1s−1K−1), T is the temperature (K), Le,i is the
latent heat of evaporation of compound i and Rg,i is the gas constant for compound i
obtained by dividing the ideal gas constant (Rgas) by the molecular weight of compound
i (Jg−1k−1). The equilibrium vapour pressure above the surface of the droplet (pg,i,r) can
be influenced by non-homogeneity in the droplet or any dissociation, reaction or non-ideality
effects (Jacobson, 2005). Whilst the latent heat is important when applying the droplet
growth equation to water vapour, it is often ignored for other gases as there is a negligible
impact on the denominator of Equation 1.2. Equation 1.2 then becomes:
dma,i
dt = 4πrDg,i(pg,i − pg,i,r)Rg,iT
(1.3)
The vapour pressure, pg,i is related to the density, ρg,i (gcm−3) through the ideal
gas equation, Equation 1.4 through Equation 1.7
pg,iVg,i = NiRgasT = mi
Mw,iRgasT (1.4)
where Vg,i is the volume of compound i, Ni is the number of moles of compound i,
mi is the mass of compound i and Mw,i is the molecular weight of compound i.
Equation 1.4 can be rewritten as Equation 1.5
pg,iMw,i
RgasT= mi
Vg,i= ρg,i (1.5)
Equation 1.5 can be rewritten as Equation 1.6
pg,i = ρg,iRgasTMw,i
(1.6)
As stated previously, Rg,i is the ideal gas constant Rgas divided by Mw,i. Therefore,
Equation 1.6 can be rewritten as Equation 1.7.
pg,i = ρg,iRg,iT (1.7)
25
By using Equation 1.7, Equation 1.3 can be rewritten as 1.8
dma,i
dt = 4πrDg,i(ρg,i − ρg,i,r) (1.8)
As can be seen from Equation 1.3 both the vapour pressure on the droplets surface,
and the vapour pressure in the gas phase of compound i are very important factors in the
condensational growth if SOA. Equation 1.8 demonstrates the importance of the density of
the compound i.
AdditionallyPsat can be used to predict the temporal and spatial distribution of
SOA, when other key properties such as the enthalpies of vapourisation and sublimation are
known (Bilde et al., 2015). There are several established databases, such as the Dortmund
Data Bank (DDB), which contain extensive Psat data sets. The vast majority of this data
however, is focused on hydrocarbons with simple structures with little to no functionality
for use in distillation and purification processes in the chemical industry. They typically
have Psat in the range of 103 − 105 Pa. SOA on the other hand tend to be multifunctional,
with relatively high molecular weights (150-300 amu), and Psat typically several orders of
magnitude less then 0.1 Pa at ambient conditions. There is very little data available in such
databases for compounds with Psat on these orders of magnitude (Barley and McFiggans,
2010).
1.5 Studied compounds and atmospheric importance
In this thesis there are two compound classes that were focused on. These were
nitroaromatics, discussed in detail in section 5.1, and benzaldehydes, discussed in detail
in section 5.2.
The nitroaromatics, consisting of a selection of substituted nitrophenols,
nitrobenzaldehydes, and substituted nitrobenzoic acids, where the first compounds
investigated and were selected for a variety of reasons. From the perspective of atmospheric
relevance nitroaromatics have been observed in field measurements (Chow et al., 2016;
Schummer et al., 2009; Kitanovski et al., 2012) and are useful tracers for anthropogenic
emissions (Grosjean, 1992). From the perspective of human health many nitroaromatics are
noted to be highly toxic (Kovacic and Somanathan, 2014). Nitroaromatics are also poorly
represented in atmospheric Psat literature, with many of the most commonly used GCMs
containing very few nitroaromatic compounds in the fitting data sets (Shelley et al., 2020).
26
The Nannoolal et al. method (Nannoolal et al., 2008) contains 13 aromatic nitro compounds,
the Myrdal and Yalkowsky method (Myrdal and Yalkowsky, 1997) contains only 3, and
SIMPOL (Pankow and Asher, 2008) contains 25, although this data potentially has other
problems (discussed in section 5.1). Bilde et al. made several recommendations for areas in
which GCMs would benefit from additional measurements in their review paper (Bilde et al.,
2015). Two of the areas highlighted were the lack of available data for nitro compounds in
the literature, as well a poor understanding of the impacts of intramolecular interactions,
such as hydrogen bonding, on Psat (Bilde et al., 2015). The nitroaromatics that were studied
in section 5.1 allowed for investigation of both of these areas. As each compound contained a
nitro group this study expanded the existing data available for nitro aromatics. The selected
nitroaromatics also allowed for investigation of the impacts of both inter and intramolecular
interactions on Psat. Both the nitrophenol and the nitrobenzoic acid sub groups are capable
of forming hydrogen bonds in the pure component, and through comparisons between
different isomers, the impacts of the relative positioning of these functional groups could
be investigated. One limitation on what compounds could be studied with the KEMS is the
requirement for all samples to have a purity of 99% or greater.
The benzaldehydes, containing a mixture of compounds that could and could not
hydrogen bond in the pure component, where selected for the follow up study. Whereas the
work on the nitroaromatic componds had a heavy focus on the impacts of hydrogen bonding
on Psat, the work on the benzaldehydes contained more compounds that could not hydrogen
bond in the pure component. In the work on the nitroaromatic compounds, it was found
that the relative positioning of the functional groups had a significant impact on the relative
strength of the hydrogen bonds, which by extension had a significant impact on Psat. In
the work on the benzaldehyde compounds, the greater amount of non hydrogen bonding
compounds allowed for investigation of the impact of the relative positioning of functional
groups on Psat for non hydrogen bonding compounds, with a greater focus on the impacts
of the compounds polarisability and steric effects caused by bulky functional groups. Like
nitroaromatic compounds, there is also very little literature data for experimental Psat of
benzaldehyde compounds. Benzaldhydes can be emitted directly into the atmosphere from
both anthropogenic (Caralp et al., 1999) and biogenic sources (Baghi et al., 2012), as well as
form in the atmosphere as secondary pollutants (Thiault et al., 2004). Vanillin, one of the
benzaldehydes that is investigated, can act as an atmospheric precursor for the formation of
nitroaromatic compounds (Pang et al., 2019).
27
References
Air Quality Expert Group: Fine Particulate Matter (PM2.5) in theUnited Kingdom Please check the image part, Tech. rep., DEFRA,London, URL http://uk-air.defra.gov.uk/assets/documents/reports/cat11/1212141150 AQEG Fine Particulate Matter in the UK.pdfhttps://uk-air.defra.gov.uk/assets/documents/reports/cat11/1212141150 AQEG Fine Particulate Matter in the UK.pdf, 2012.
Atkinson, R. and Arey, J.: Atmospheric Degradation of Volatile Organic Compounds, doi:10.1021/cr0206420, URL https://pubs.acs.org/sharingguidelines, 2003.
Baghi, R., Helmig, D., Guenther, A., Duhl, T., and Daly, R.: Contribution of flowering treesto urban atmospheric biogenic volatile organic compound emissions, Biogeosciences, 9,3777–3785, doi:10.5194/bg-9-3777-2012, URL www.biogeosciences.net/9/3777/2012/, 2012.
Barley, M. H. and McFiggans, G.: The critical assessment of vapour pressure estimationmethods for use in modelling the formation of atmospheric organic aerosol, Atmos. Chem.Phys, 10, 749–767, doi:10.5194/acp-10-749-2010, URL www.atmos-chem-phys.net/10/749/2010/http://www.atmos-chem-phys.net/10/749/2010/, 2010.
Bilde, M., Barsanti, K., Booth, M., Cappa, C. D., Donahue, N. M., Emanuelsson,E. U., McFiggans, G., Krieger, U. K., Marcolli, C., Topping, D., Ziemann, P., Barley,M., Clegg, S., Dennis-Smither, B., Hallquist, M., Hallquist, A. M., Khlystov, A.,Kulmala, M., Mogensen, D., Percival, C. J., Pope, F., Reid, J. P., V Ribeiro daSilva, M. A., Rosenoern, T., Salo, K., Pia Soonsin, V., Yli-Juuti, T., Prisle, N. L.,Pagels, J., Rarey, J., Zardini, A. A., and Riipinen, I.: Saturation Vapor Pressures andTransition Enthalpies of Low-Volatility Organic Molecules of Atmospheric Relevance:From Dicarboxylic Acids to Complex Mixtures, Chem. Rev, 115, 4115–4156, doi:10.1021/cr5005502, URL http://pubs.acs.org/doi/abs/10.1021/cr5005502http://pubs.acs.org/doi/pdfplus/10.1021/cr5005502, 2015.
Calvert, J. G.: Glossary of atmospheric chemistry terms (Recommendations 1990), Pureand Applied Chemistry, 62, 2167–2219, URL https://www.degruyter.com/downloadpdf/j/pac.1990.62.issue-11/pac199062112167/pac199062112167.pdf, 1990.
Caralp, F., Foucher, V., Lesclaux, R., Wallington, T. J., and Michael Hurley, B. D.:Atmospheric chemistry of benzaldehyde : UV absorption spectrum and reaction kineticsand mechanisms of the radical C6H5C(O)O2, Phys. Chem. Chem. Phys., 1, 3509–3517,URL https://pubs.rsc.org/en/content/articlepdf/1999/cp/a903088c, 1999.
Chacon-Madrid, H. J. and Donahue, N. M.: Atmospheric Chemistry and PhysicsFragmentation vs. functionalization: chemical aging and organic aerosol formation,Atmos. Chem. Phys, 11, 10 553–10 563, doi:10.5194/acp-11-10553-2011, URL www.atmos-chem-phys.net/11/10553/2011/, 2011.
Chow, K. S., Huang, X. H. H., and Yu, J. Z.: Quantification of nitroaromatic compoundsin atmospheric fine particulate matter in Hong Kong over 3 years: field measurementevidence for secondary formation derived from biomass burning emissions, EnvironmentalChemistry, 13, 665, doi:10.1071/EN15174, URL http://www.publish.csiro.au/?paper=EN15174, 2016.
Crippa, M., Canonaco, F., Slowik, J. G., Haddad, I. E., Decarlo, P. F., Mohr, C.,Heringa, M. F., Chirico, R., Marchand, N., Temime-Roussel, B., Abidi, E., Poulain, L.,Wiedensohler, A., Baltensperger, U., and Prévôt, A. S. H.: Geoscientific InstrumentationMethods and Data Systems Primary and secondary organic aerosol origin by combinedgas-particle phase source apportionment, Atmos. Chem. Phys, 13, 8411–8426, doi:10.5194/acp-13-8411-2013, URL www.atmos-chem-phys.net/13/8411/2013/, 2013.
28
Grosjean, D.: In situ organic aerosol formation during a smog episode: Estimated productionand chemical functionality, Atmospheric Environment. Part A. General Topics, 26,953–963, doi:10.1016/0960-1686(92)90027-I, URL https://www.sciencedirect.com/science/article/pii/096016869290027I, 1992.
Hallquist, M., Wenger, J. C., Baltensperger, U., Rudich, Y., Simpson, D., Claeys, M.,Dommen, J., Donahue, N. M., George, C., Goldstein, A. H., and Hamilton, J. F.: Theformation, properties and impact of secondary organic aerosol: current and emergingissues, Atmos. Chem. Phys. Atmospheric Chemistry and Physics, 9, 5155–5236, URLwww.atmos-chem-phys.net/9/5155/2009/, 2009.
Hodan, W. M. and Barnard, W. R.: Evaluating the Contribution of PM2.5 Precursor Gasesand Re-entrained Road Emissions to Mobile Source PM2.5 Particulate Matter Emissions,13th International Emission Inventory Conference "Working for Clean Air in Clearwater",p. 58, URL https://www3.epa.gov/ttnchie1/conference/ei13/mobile/hodan.pdfhttp://www.epa.gov/ttnchie1/conference/ei13/mobile/hodan.pdf, 2003.
Jacobson, M. Z.: Fundamentals of atmospheric modeling, Cambridge UniversityPress, Cambridge, 2nd edn., URL https://books.google.com/books/about/Fundamentals of Atmospheric Modeling.html?id=FrHcZmwj7JQC, 2005.
Kanakidou, M., Seinfeld, J. H., Pandis, S. N., Barnes, I., Dentener, F. J., Facchini, M. C.,Van Dingenen, R., Ervens, B., Nenes, A., Nielsen, C. J., Swietlicki, E., Putaud, J. P.,Balkanski, Y., Fuzzi, S., Horth, J., Moortgat, G. K., Winterhalter, R., Myhre, C.E. L., Tsigaridis, K., Vignati, E., Stephanou, E. G., and Wilson, J.: Organic aerosoland global climate modelling: a review, Atmospheric Chemistry and Physics, 5, 1053–1123, doi:10.5194/acp-5-1053-2005, URL www.atmos-chem-phys.org/acp/5/1053/http://www.atmos-chem-phys.net/5/1053/2005/, 2005.
Kitanovski, Z., Grgić, I., Vermeylen, R., Claeys, M., and Maenhaut, W.: Liquidchromatography tandem mass spectrometry method for characterization of monoaromaticnitro-compounds in atmospheric particulate matter, Journal of Chromatography A, 1268,35–43, doi:10.1016/J.CHROMA.2012.10.021, URL https://www.sciencedirect.com/science/article/pii/S0021967312015762?via%3Dihub, 2012.
Kovacic, P. and Somanathan, R.: Nitroaromatic compounds: Environmental toxicity,carcinogenicity, mutagenicity, therapy and mechanism, Journal of Applied Toxicology, 34,810–824, doi:10.1002/jat.2980, URL http://doi.wiley.com/10.1002/jat.2980, 2014.
Lin, G., Penner, J. E., Sillman, S., Taraborrelli, D., and Lelieveld, J.: Global modeling ofSOA formation from dicarbonyls, epoxides, organic nitrates and peroxides, AtmosphericChemistry and Physics, 12, 4743–4774, doi:10.5194/acp-12-4743-2012, URL http://www.atmos-chem-phys.net/12/4743/2012/, 2012.
Lin, G., Penner, J. E., Flanner, M. G., Sillman, S., Xu, L., and Zhou, C.: Radiative forcing oforganic aerosol in the atmosphere and on snow: Effects of SOA and brown carbon, Journalof Geophysical Research: Atmospheres, 119, 7453–7476, doi:10.1002/2013JD021186, URLhttp://doi.wiley.com/10.1002/2013JD021186, 2014.
Mahmud, A., Hixson, M., Hu, J., Zhao, Z., Chen, S.-H., and Kleeman, M. J.: Climateimpact on airborne particulate matter concentrations in California using seven year analysisperiods, Atmos. Chem. Phys. Atmospheric Chemistry and Physics, 10, 11 097–11 114, doi:10.5194/acp-10-11097-2010, URL www.atmos-chem-phys.net/10/11097/2010/, 2010.
Masson-Delmotte, V., Zhai, P., Pörtner, H.-O., Roberts, D., Skea, J., Calvo, E., Priyadarshi,B., Shukla, R., Ferrat, M., Haughey, E., Luz, S., Neogi, S., Pathak, M., Petzold, J., Pereira,J. P., Vyas, P., Huntley, E., Kissick, K., Belkacemi, M., and Malley, J.: Climate Changeand Land An IPCC Special Report on climate change, desertification, land degradation,sustainable land management, food security, and greenhouse gas fluxes in terrestrialecosystems, IPCC, URL www.ipcc.ch, 2019.
29
Mauderly, J. L., Chow, J. C., Cassee, F., Costa, D., Lewis, J., Li, N., Madden, M.,Mcdonald, J., Rohr, A., Schauer, J., Turpin, B., Watson, J., Wyzga, R., Zielinska, B.,and Respira, L.: Inhalation Toxicology International Forum for Respiratory ResearchHealth Effects of Organic Aerosols Health Effects of Organic Aerosols, vol. 20, doi:10.1080/08958370701866008, URL http://www.tandfonline.com/action/journalInformation?journalCode=iiht20http://dx.doi.org/10.1080/08958370701866008, 2008.
McFiggans, G., Mentel, T. F., Wildt, J., Pullinen, I., Kang, S., Kleist, E., Schmitt, S.,Springer, M., Tillmann, R., Wu, C., Zhao, D., Hallquist, M., Faxon, C., Le Breton,M., Hallquist, A. M., Simpson, D., Bergström, R., Jenkin, M. E., Ehn, M., Thornton,J. A., Alfarra, M. R., Bannan, T. J., Percival, C. J., Priestley, M., Topping, D.,and Kiendler-Scharr, A.: Secondary organic aerosol reduced by mixture of atmosphericvapours, Nature, 565, 587–593, doi:10.1038/s41586-018-0871-y, URL https://doi.org/10.1038/s41586-018-0871-y, 2019.
Myrdal, P. B. and Yalkowsky, S. H.: Estimating Pure Component Vapor Pressures of ComplexOrganic Molecules, Ind. Eng. Chem. Res., 36, 2494–2499, URL https://pubs-acs-org.manchester.idm.oclc.org/doi/pdf/10.1021/ie950242l, 1997.
Nannoolal, Y., Rarey, J., and Ramjugernath, D.: Fluid Phase EquilibriaEstimation of pure component properties Part 3. Estimation of the vaporpressure of non-electrolyte organic compounds via group contributions and groupinteractions, Fluid Phase Equilibria, 269, 117–133, doi:10.1016/j.fluid.2008.04.020,URL https://ac-els-cdn-com.manchester.idm.oclc.org/S0378381208001611/1-s2.0-S0378381208001611-main.pdf? tid=50024cd4-1148-4a88-b3e7-e14cb5022fe2&acdnat=1526383962 50cf9f9aa4a5a1fa154e3356d052da78https://ac.els-cdn.com/S0378381208001611/1-s2.0-S03783812080016, 2008.
Pang, H., Zhang, Q., Lu, X., Li, K., Chen, H., Chen, J., Yang, X., Ma, Y., Ma, J., and Huang,C.: Nitrite-Mediated Photooxidation of Vanillin in the Atmospheric Aqueous Phase,Environmental Science & Technology, 53, 14 253–14 263, doi:10.1021/acs.est.9b03649, URLhttps://pubs.acs.org/sharingguidelines, 2019.
Pankow, J. F. and Asher, W. E.: SIMPOL.1: A simple group contribution methodfor predicting vapor pressures and enthalpies of vaporization of multifunctionalorganic compounds, Atmospheric Chemistry and Physics, 8, 2773–2796, doi:10.5194/acp-8-2773-2008, URL www.atmos-chem-phys.net/8/2773/2008/, 2008.
Pöschl, U.: Atmospheric Aerosols: Composition, Transformation, Climate and Health Effects,Angewandte Chemie International Edition, 44, 7520–7540, doi:10.1002/anie.200501122,URL http://doi.wiley.com/10.1002/anie.200501122, 2005.
Pui, D. Y. H., Chen, S.-C., Zuo, Z., and Pui, D. Y. H.: PM 2.5 in China: Measurements,sources, visibility and health effects, and mitigation, Particuology, 13, 1–26, doi:10.1016/j.partic.2013.11.001, URL http://dx.doi.org/10.1016/j.partic.2013.11.001, 2014.
Robinson, A. L., Donahue, N. M., Shrivastava, M. K., Weitkamp, E. A., Sage, A. M.,Grieshop, A. P., Lane, T. E., Pierce, J. R., and Pandis, S. N.: Rethinking organicaerosols: semivolatile emissions and photochemical aging., Science, 315, 1259–62, doi:10.1126/science.1133061, URL http://www.ncbi.nlm.nih.gov/pubmed/17332409http://science.sciencemag.org/content/sci/315/5816/1259.full.pdf, 2007.
Schroder, B., Fulem, M., and Martins, M.: Vapor pressure predictions of multi-functionaloxygen-containing organic compounds with COSMO-RS, Atmospheric Environment,133, 135–144, doi:10.1016/j.atmosenv.2016.03.036, URL http://www.sciencedirect.com/science/article/pii/S1352231016302060https://ac.els-cdn.com/S1352231016302060/1-s2.0-S1352231016302060-main.pdf? tid=6cd95480-aa8d-11e7-b191-00000aacb362&acdnat=1507291192 7962777250b9529cd3de98545846e50e, 2016.
Schummer, C., Groff, C., Al Chami, J., Jaber, F., and Millet, M.: Analysis of phenols and
30
nitrophenols in rainwater collected simultaneously on an urban and rural site in east ofFrance, Science of The Total Environment, 407, 5637–5643, doi:10.1016/J.SCITOTENV.2009.06.051, URL https://www.sciencedirect.com/science/article/pii/S0048969709006317,2009.
Seinfeld, J. H. and Pandis, S. N.: Atmospheric Chemistry and Physics : From Air Pollutionto Climate Change, John Wiley & Sons, Incorporated, New York, 3 edn., 2016.
Shelley, P. D., Bannan, T. J., Worrall, S. D., Alfarra, M. R., Krieger, U. K., Percival,C. J., Garforth, A., and Topping, D.: Measured solid state and subcooled liquidvapour pressures of nitroaromatics using Knudsen effusion mass spectrometry, AtmosphericChemistry and Physics, 20, 8293–8314, doi:10.5194/acp-20-8293-2020, URL https://www.atmos-chem-phys.net/20/8293/2020/, 2020.
Shrivastava, M., Cappa, C. D., Fan, J., Goldstein, A. H., Guenther, A. B.,Jimenez, J. L., Kuang, C., Laskin, A., Martin, S. T., Ng, N. L., Petaja, T.,Pierce, J. R., Rasch, P. J., Roldin, P., Seinfeld, J. H., Shilling, J., Smith,J. N., Thornton, J. A., Volkamer, R., Wang, J., Worsnop, D. R., Zaveri, R. A.,Zelenyuk, A., and Zhang, Q.: Recent advances in understanding secondary organicaerosol: Implications for global climate forcing, Reviews of Geophysics, 55, 509–559, doi:10.1002/2016RG000540, URL https://agupubs.onlinelibrary.wiley.com/doi/full/10.1002/2016RG000540https://agupubs.onlinelibrary.wiley.com/doi/abs/10.1002/2016RG000540https://agupubs.onlinelibrary.wiley.com/doi/10.1002/2016RG000540, 2017.
Silva, R. A., West, J. J., Zhang, Y., Anenberg, S. C., Lamarque, J.-F., Shindell, D. T., Collins,W. J., Dalsoren, S., Faluvegi, G., Folberth, G., Horowitz, L. W., Nagashima, T., Naik, V.,Rumbold, S., Skeie, R., Sudo, K., Takemura, T., Bergmann, D., and Zeng, G.: Globalpremature mortality due to anthropogenic outdoor air pollution and the contribution ofpast climate change, Environ. Res. Lett, 8, 34 005–11, doi:10.1088/1748-9326/8/3/034005,URL http://iopscience.iop.org/article/10.1088/1748-9326/8/3/034005/pdf, 2013.
Speight, J. G.: Introduction Into the Environment, in: Environmental Organic Chemistryfor Engineers, pp. 263–303, Elsevier, doi:10.1016/b978-0-12-804492-6.00006-x, 2017.
Thiault, G., Mellouki, A., Le Bras, G., Chakir, A., Sokolowski-Gomez, N., andDaumont, D.: UV-absorption cross sections of benzaldehyde, ortho-, meta-, andpara-tolualdehyde, Journal of Photochemistry and Photobiology A: Chemistry, 162,273–281, doi:10.1016/J.NAINR.2003.08.012, URL https://www.sciencedirect.com/science/article/pii/S1010603003003691, 2004.
Volkamer, R., Jimenez, J. L., San Martini, F., Dzepina, K., Zhang, Q., Salcedo,D., Molina, L. T., Worsnop, D. R., and Molina, M. J.: Secondary organic aerosolformation from anthropogenic air pollution: Rapid and higher than expected, GeophysicalResearch Letters, 33, L17 811, doi:10.1029/2006GL026899, URL http://doi.wiley.com/10.1029/2006GL026899, 2006.
Zou, B. B., Huang, X. F., Zhang, B., Dai, J., Zeng, L. W., Feng, N., and He, L. Y.: Sourceapportionment of PM2.5 pollution in an industrial city in southern China, AtmosphericPollution Research, 8, 1193–1202, doi:10.1016/j.apr.2017.05.001, 2017.
31

BLANK PAGE
32
2
Literature Review
2.1 Experimental vapour pressure methods
Ideally, when measuring Psat or equilibrium vapour pressure of a specific compound, the
gas phase concentration of the compound in thermodynamic phase equilibrium over the
condensed (solid or liquid) phase is measured directly. This doesn’t work for the least
volatile atmospheric particles, however, as the corresponding gas-phase concentrations are
typically unreachable by current instrumentation, especially at ambient conditions where
there are orders of magnitude more air molecules relative to the investigated compound.
Several methods have been used to investigate the Psat and some methods have even
probed equilibrium vapour pressures of organic compounds over simple mixtures of water
and inorganic salts common in the atmosphere (Bilde et al., 2015).
In many studies size or mass changes due to evaporation or condensation of small
condensed-phase samples have been monitored instead of direct observation of gas-phase
equilibrium which is difficult for very low volatility compounds that have very low gas-
phase concentrations. Other methods use mass spectrometry techniques of the gas phase,
but at much lower pressures than atmospheric pressure. Some methods work at higher
temperatures relative to atmospheric temperatures and can overcome some of the problems
of investigating Psat of low volatility compounds as Psat has a strong increasing relationship
with temperature. Some methods try to operate as close to equilibrium conditions as
possible, whilst others infer equilibrium vapour pressure and Psat from observations of
dynamic evaporation or condensation. In the dynamic case, calculations on the dynamic
mass transport are needed to interpret the experimental observations of evaporation or
condensation rate.
The methods developed for investigating Psat of low volatility compounds differ
from each other in terms of sample generation method, size, phase (liquid or solid), time
33
scales, relative humidity, temperature, and Psat ranges probed. Additionally the primary
observable varies between techniques as well. This leads to the different methods having a
range of sensitivities to Psat, equilibrium vapour pressure, and the enthalpies of vapourisation
and sublimation. For an experimentally determined enthalpy the temperature dependence of
Psat has to be determined (Bilde et al., 2015).
There are four types of methods for determining Psat, with two or three methods
in each. The four types are the Knudsen cell methods, single particle methods, particle size
distribution methods, and thermal desorption methods (Bilde et al., 2015).
2.1.1 Knudsen cell based methods
Knudsen cell methods consist of Knudsen mass loss and Knudsen effusion mass spectrometry
(KEMS).
Knudsen mass loss methods require a few mg of bulk sample and operate in dry
conditions. It functions below atmospheric pressure at < 10−2 Pa and has a temperature
range of 253-543 K. Knudsen mass loss methods measure the change in mass over time as
the sample is heated. The limit of detection for Knudsen mass loss is limited by having to
effuse enough material for the balance to detect a change in mass. Some typical problems
of Knudsen mass loss spectrometry are the need to extrapolate down to 298 K from higher
temperatures for low volatility compounds and the risk of sample contamination from higher
volatility compounds (Bilde et al., 2015).
KEMS also requires a few mg of sample and typically operates under dry conditions,
but has been used for the liquid polyethylene glycols (PEGs) (Krieger et al., 2018). The
KEMS system operates at < 10−5 Pa and has a temperature range of 298-338 K. The KEMS
system measures a gas phase mass spectrum of both the sample compound and a reference
compound with a well defined Psat at various temperatures. The limit of detection for the
KEMS system is limited by the limit of detection of the mass spectrometer. KEMS is limited
by the need of a reference sample of well defined Psat, preferably confirmed by multiple other
techniques in good agreement, and knowledge of the ionisation cross sections at 70 eV. The
ionisation cross sections for most organic compounds are known so this isn’t a major draw
back (Bilde et al., 2015).
2.1.2 Single particle methods
The single particle methods consist of the electrodynamic balance (EDB) and optical tweezers.
34
The EDB can investigate particles with diameters of 5-20 µm and can be used
on both solid and liquid samples. The EDB operates at atmospheric pressure and between
248-315 K. The EDB measures the particle diameter over time and the particle morphology
to investigate the diffusion controlled evaporation rates of single, micrometer sized particles.
The experiments are repeated at various humidities to obtain a range of concentrations of the
sample in the gas phase. To calculate the equilibrium vapour pressure from these evaporation
rates, the composition of the particle, the density of the particle, the molar mass of the
organic compound, and the diffusivity in the buffer gas need to be known accurately. For
solid particles, if non-spherical, the shape of the particle needs to be accounted for.
Optical tweezers can be used to investigate particles with diameters of 4-16 µm.
Crystalline solids are unable to be investigated with this method due to their lack of
symmetry. Consequently, only liquid mixtures, aqueous solutions, or amorphous solids can
be investigated with this technique. Optical tweezers operate at atmospheric pressure and
a temperature range of 180-304 K. The optical tweezers investigate the refractive index of a
compound (Bilde et al., 2015).
2.1.3 Particle size distribution methods
Particle size distribution methods consist of the flow tube-tandem differential mobility
analyser (FT-TDMA), the volatility-TDMA (V-TDMA) and the integrated volume method
(IVM). By using multiple particles instead of a single particle, particles of smaller diameters
can be investigated relative to those that can be investigated with single particle methods.
FT-TDMA can investigate solids and liquids with particles sizes ranging from 10-
600 nm. The FT-TDMA operates at atmospheric pressure, between 288-333 K and under
non-equilibrium conditions. The FT-TDMA measures the diameter of the sample particles
over time and infers the equilibrium vapour pressure from the evaporation rates similar to
the single particle methods. This requires knowledge of the diffusivity, activity coefficient
(if an aqueous solution), accommodation coefficient of the evaporating compound, and the
surface tension or free energy and density of the mixed particles.
V-TDMA can investigate both solid and liquid samples. The samples are initially
atomised and then dried in silica diffusion dryers to reach a desired relative humidity of <5%.
The sample passes through an oven and is heated and compares the particle diameters before
and after heating. This is done at multiple temperatures ranging from 298-573 K. V-TDMA
uses a similar dynamic evaporation calculation to the FT-TDMA. The V-TDMA operates
under non-equilibrium conditions.
35
IVM can investigate solid particles and observes integrated volume changes of aerosol
particle size distribution as a function of temperature. IVM operates under quasi-equilibrium
conditions. The IVM consists of two chambers. One that measures particle diameter at room
298 K and one at, typically, 300-330 K. As these measurements are performed under quasi-
equilibrium conditions no assumptions are required for the activity coefficient. The only
direct assumption made is that the particles are spherical. IVM is limited to compounds
that are chemically inert with respect to the walls of the thermodenuder used. If the sample
reacts with the walls of the thermodenuder then equilibrium is impossible to achieve (Bilde
et al., 2015).
2.1.4 Thermal desorption methods
Thermal desorption methods consist of thermal desorption particle beam mass spectrometry
(TDPB-MS), temperature programmed desorption proton transfer chemical ionisation mass
spectrometry (TPD-PT-CIMS) and atmospheric solids analysis probe mass spectrometry
(ASAP-MS). Both TDPB-MS and TPD-PT-CIMS are used to determine Psat from the
measurement of temperature-dependent evaporation rates from compounds collected on a
temperature controlled surface.
TDPB-MS uses a µg amount of atomised and dried sample with particle diameter
between 100-300 nm. Particles are initially collected on a plate at temperature low enough
that evaporation is negligible (typically 223 K). The sample is then heated (up to a maximum
of 373 K) and the evaporating molecules are detected via electron impact mass spectrometry.
The results are plotted as a normalised mass thermogram. TDPB-MS typically operates at
6×10⁻⁶ Pa.
Similar to TDPB-MS, the particles used by TPD-PT-CIMS is generated by
atomising and drying a sample. These particles are then collected in a pile, with a diameter
of 1 mm, on a plate that can be cooled to 250 K. The plate is capable of being heated to
430 K, and the sample is heated at a constant rate (normally a few kelvin per minute), and
the evaporation rate is measured.
ASAP-MS is another thermal desorption technique where evaporation rate is
determined from samples that are deposited on a probe tip. There are two ways this is
done. For a pure compound, the analyte is dissolved in a solvent and a small volume is
placed on the tip. For SOA samples the sample is transferred directly by having the probe
tip dragged across a collected sample. ASAP-MS operates at atmospheric pressure. As
molecules evaporate they are ionised and detected by the mass spectrometer (Bilde et al.,
36
2015).
2.1.5 The Clausius-Clapeyron equation
Of the techniques mentioned previously KEMS, V-TDMA, IVM and TDPB-MS all require
the use of the Clausius-Clapeyron equation at one point or another when determining either
equilibrium or saturation vapour pressure. The vapour pressure of a compound varies
with temperature and the Clausius-Clapeyron equation gives the temperature dependence
of vapour pressure. The Clausius-Clapeyron equation is as follows:
dp0i
dT = ∆Htrs,i
T∆νm,i(2.1)
where T is temperature and ∆Htrs,i and ∆νm,i are the changes of molar enthalpy
and volume upon phase transition. At temperatures below the critical temperature, the
change in molar volume upon transition to the gas phase can normally be approximated by
the molar volume of the gas. Assuming that the gas behaves ideally Equation 2.1 can be
rewritten as Equation 2.2
dp0i (T )dT = ∆Htrs,i
RT 2 p0i (2.2)
where R is the molar gas constant. The Clausius-Clapeyron equation can be
integrated assuming that ∆Htrs,i is independent of temperature giving Equation 2.3
p0i (T ) = p0
i (T ref )exp[∆Htrs,i
R
( 1T ref
− 1T
)](2.3)
where T ref and p0i (T ref ) are the temperature and saturation vapour pressure at a
reference state (e.g. boiling point). The temperature dependence can then be expressed as
lnp0i (T ) = −∆Htrs,i
RT + C (2.4)
where C is a constant containing information about the reference state. For the
University of Manchester KEMS system which focuses primarily on measurements of the
37
solid state Equation 2.4 becomes Equation 2.5.
lnp0i,S(T ) = −∆Hsub
RT + ∆SsubR (2.5)
where p0i,S(T ) is the solid state saturation vapour pressure, ∆Hsub is the enthalpy of
sublimation, ∆Ssub is the entropy of sublimation (Booth et al., 2009). At a given temperature
T below the melting point, the saturation vapour pressure of the solid phase is lower than
that over the sub-cooled liquid.
p0i,S(T ) can be converted to the sub-cooled liquid saturation vapour pressure,p0
i,L
using the Prausnitz equation (Prausnitz et al., 1998), Equation 2.6
ln
(p0i,L
p0i,S
)= ∆Hfus
RTm
(Tm
T − 1)
− ∆cp,slR
(Tm
T − 1)
+ ∆cp,slR ln
(Tm
T
)(2.6)
where ∆Hfus is the enthalpy of fusion, ∆cp,sl is the change in heat capacity between
the solid and liquid states and Tm is the melting point.
2.2 Group contribution vapour pressure prediction methods
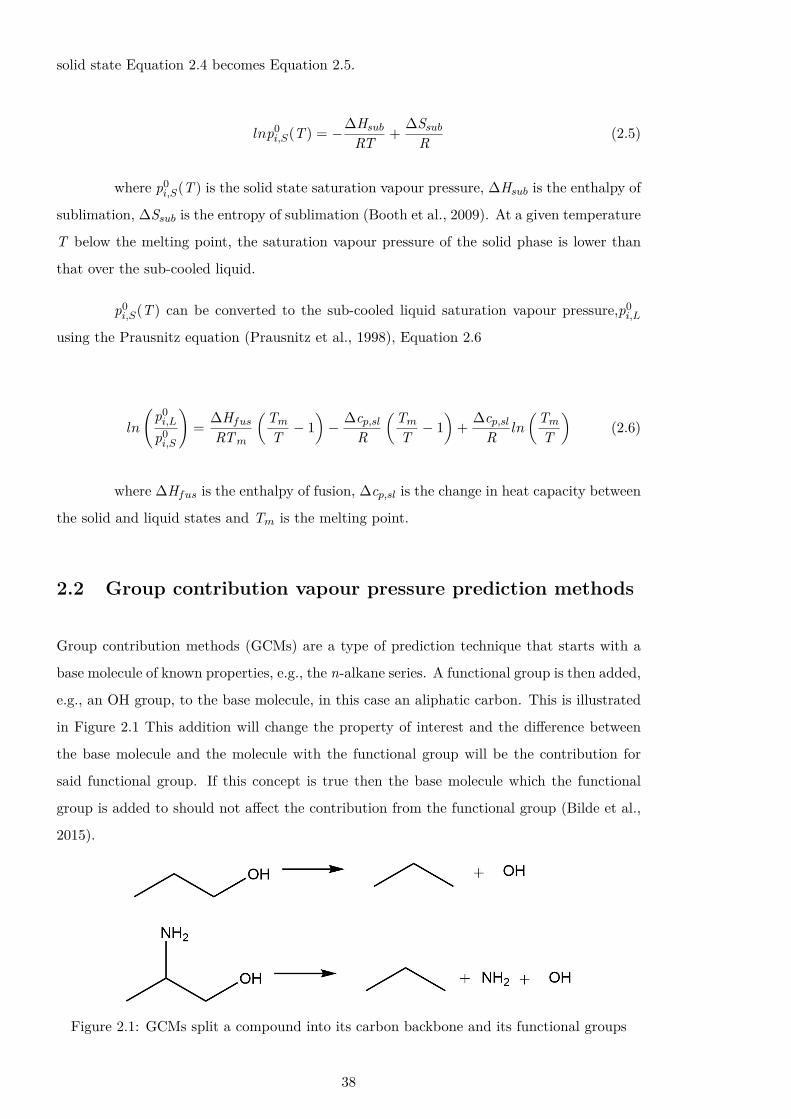
Group contribution methods (GCMs) are a type of prediction technique that starts with a
base molecule of known properties, e.g., the n-alkane series. A functional group is then added,
e.g., an OH group, to the base molecule, in this case an aliphatic carbon. This is illustrated
in Figure 2.1 This addition will change the property of interest and the difference between
the base molecule and the molecule with the functional group will be the contribution for
said functional group. If this concept is true then the base molecule which the functional
group is added to should not affect the contribution from the functional group (Bilde et al.,
2015).
Figure 2.1: GCMs split a compound into its carbon backbone and its functional groups
38
This does hold true in many cases, but there a numerous exceptions. These
exceptions should be able to be explained on a molecular basis, and described by a physically
realistic correction term. These corrections are typically required when so-called proximity
effects occur such as neighbouring groups interacting with each other or mesomeric effects on
a system. Once the form of the functional used in the the predictive equation is determined,
parameters are derived from experimental data. Due to the limited amount of data related
to atmospheric compounds available, care must be taken when weighting the influence of
different functional groups to avoid over or under fitting. GCMs work best when used
on compounds that are similar to compounds from the reference data set that the GCM
was based on. When a compound of interest has functional groups that weren’t present
in the original data set then the GCM may not have the appropriate tools to predict for
this specific group. Peroxide groups and their derivatives are an example which have very
limited experimental data due to their relatively high reactivity and low stability. When a
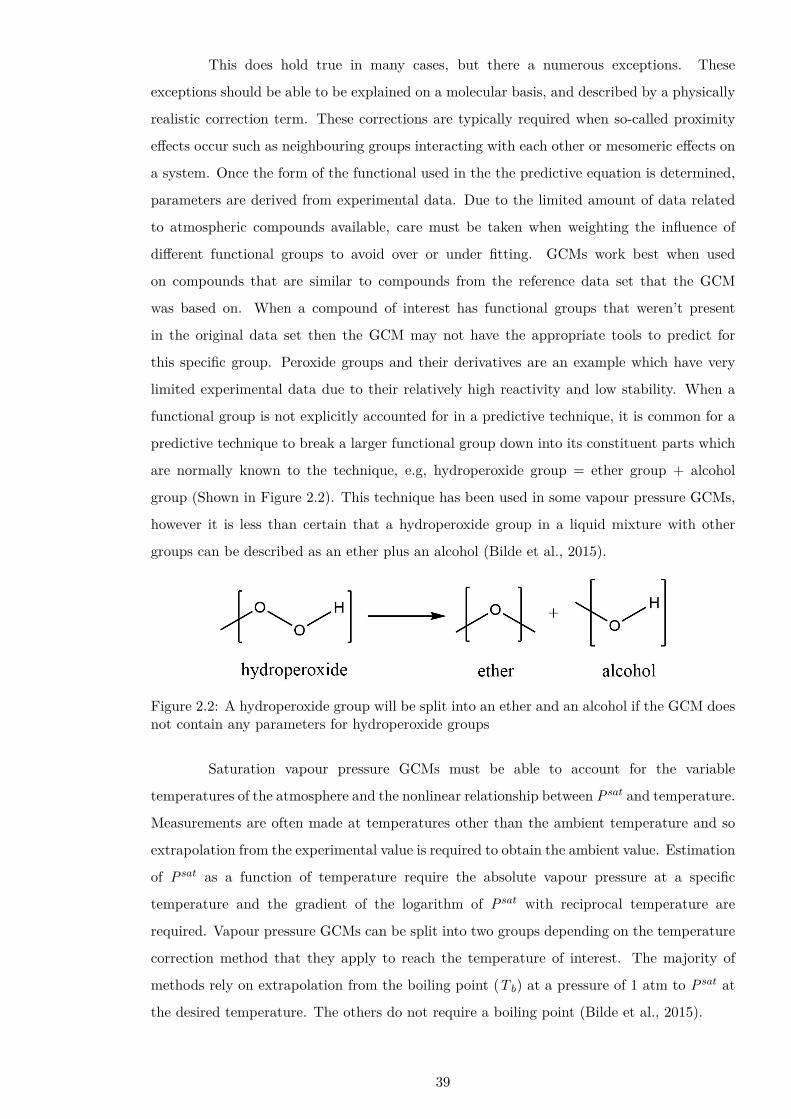
functional group is not explicitly accounted for in a predictive technique, it is common for a
predictive technique to break a larger functional group down into its constituent parts which
are normally known to the technique, e.g, hydroperoxide group = ether group + alcohol
group (Shown in Figure 2.2). This technique has been used in some vapour pressure GCMs,
however it is less than certain that a hydroperoxide group in a liquid mixture with other
groups can be described as an ether plus an alcohol (Bilde et al., 2015).
Figure 2.2: A hydroperoxide group will be split into an ether and an alcohol if the GCM doesnot contain any parameters for hydroperoxide groups
Saturation vapour pressure GCMs must be able to account for the variable
temperatures of the atmosphere and the nonlinear relationship between Psat and temperature.
Measurements are often made at temperatures other than the ambient temperature and so
extrapolation from the experimental value is required to obtain the ambient value. Estimation
of Psat as a function of temperature require the absolute vapour pressure at a specific
temperature and the gradient of the logarithm of Psat with reciprocal temperature are
required. Vapour pressure GCMs can be split into two groups depending on the temperature
correction method that they apply to reach the temperature of interest. The majority of
methods rely on extrapolation from the boiling point (T b) at a pressure of 1 atm to Psat at
the desired temperature. The others do not require a boiling point (Bilde et al., 2015).
39
The Myrdal and Yalkowsky (Myrdal and Yalkowsky, 1997) and Nannoolal et al.
(Nannoolal et al., 2008) methods both extrapolate from T b. Moller et al. (Moller et al., 2008)
refined the Nannoolal et al. (Nannoolal et al., 2008) method by adding an additional term to
improve prediction of aliphatic alcohols and carboxylic acids, additional hydrocarbon groups,
and new size dependent groups to improve the predictions for several functional groups. As
some of the compounds of atmospheric interest have a T b of over 700 K, when extrapolating
to ambient temperatures, often around 298 K, a small error in the gradient can lead to a
large difference in the predicted Psat. There is also the Lee-Kesler method (Lee and Kesler,
1975) which uses the critical temperature (T c) instead of T b.
Many atmospherically relevant compounds have unknown T bs and therefore they
must be estimated (Bilde et al., 2015). This is also commonly done with GCMs. For this
there is the Joback and Reid (Joback et al., 1987) method which contains a reference data
set of 41 compounds. It does, however, have a tendency for overestimating the T b. The Stein
and Brown (Stein and Brown, 1994) method is a modification of the Joback and Reid method
where an additional 44 groups were added, as was a correction for high T bs. Nannoolal et
al. (Nannoolal et al., 2004) also developed a GCM for estimating T b. The method includes
both primary and secondary groups, as well group interactions terms giving 207 terms in
total. The secondary group terms allow for some correction for proximity effects, although
still limited by the compounds and functional groups that make up the parent data set (Bilde
et al., 2015).
The SIMPOL (Pankow and Asher, 2008) method and the EVAPORATION
(Compernolle et al., 2011) method are two methods that do not require a boiling point
to estimate a compounds Psat.
The SIMPOL method considers 30 structural groups and uses an initial basis set of
272 compounds. The compounds that make up the basis set have experimental data available
with PsatL as a function of temperature. The range of Psat in the basis set span 14 orders of
magnitude. The initial test set was comprised of 184 compounds and had a T range as large
as 273.15 to 393.15 K for some compounds. All Psat predictions of the initial test set were
predicted within a factor of 2. In the conclusion of this study (Pankow and Asher, 2008) state
that there is an obvious increase in error for the predictions at low Psat and temperatures
due to the lack of available data and the difficulty in obtaining it (Pankow and Asher, 2008).
The EVAPORATION method is a vapour pressure GCM that only requires a
molecular structure input. The method predicts PsatL of zero-, mono-, and poly- functional
organic molecules. The method takes into account, temperature dependence, contributions
due to carbon skeleton, functional groups and intramolecular interactions between the
40
groups. The method also takes into account the non-additivity of certain functional groups.
Compernolle et al. state that the method is well suited to products resulting from the
oxidation of biogenic molecules and SOAs. The data set contained nonfunctionalised
hydrocarbons, monofunctional compounds, and multifunctional compounds. In general
monofunctional compounds have a wide range of data available, however, hydroperoxides,
peracids and peroxy acyl nitrates are lacking. The availability of multifunctional Psat data
varies largely depending on the functional group combination. Diols and diacids have data
for over 30 molecules with multiple data points available, whereas, for hydroxynitrate and
hydroxyacid containing compounds the data can be limited to a single molecule with a single
data point, or in the case of carbonyl nitrates have no data available at all. The fitting set
consists of 579 species. In the conclusion of this study Compernolle et al. state that the
EVAPORATION method performs reasonably well, and whilst it performs worse for more
highly functionalised compounds, it still performs the best of any GCM available at the time.
They argue that one of the reasons for the worse performance for more highly functionalised
compounds is the disagreement between experimentally derived values for these Psat and
that for this method to improve additional and more accurate data is required (Compernolle
et al., 2011).
When predicting the Psat of dicarboxylic acids most of the GCMs mentioned tend
to overestimate Psat relative to experimental data up to and including a C8 backbone. The
Moller et al. (Moller et al., 2008) method overestimates up until a backbone of C7. The
EVAPORATION method (Compernolle et al., 2011) and the Nannoolal et al. method
(Nannoolal et al., 2008) in conjunction with the Joback and Reid (Joback et al., 1987)
boiling point method did not overestimate Psat relative to the the experimental data. For
dicarboxylic acids with carbon backbone of C6 or greater, Psat is under predicted by the
Nannoolal et al. (Nannoolal et al., 2008) method and the Joback and Reid (Joback et al.,
1987) method. The EVAPORATION (Compernolle et al., 2011) method had the best
agreement, but this is expected as it uses the dicarboxylic acids in its original data set
from which the method is derived. The Moller et al. (Moller et al., 2008) method performs
better than the Nannoolal et al. (Nannoolal et al., 2008) vapour pressure method when using
the Stein and Brown (Stein and Brown, 1994) or Nannoolal et al. (Nannoolal et al., 2004)
boiling points method. This is also expected as the Moller at al. (Moller et al., 2008) method
was designed specifically to improve the Nannoolal et al. (Nannoolal et al., 2008) method
for compounds with this functionality, however, it doesn’t use the dicarboxylic acids in its
reference data set (Bilde et al., 2015).
Using a test set of 45 multifunctional compounds, Barley and McFiggans assessed
the predictive capabilities of various GCMs to test their applicability to multifunctional
41
compounds (Barley and McFiggans, 2010). They found that the Nannoolal et al. (Nannoolal
et al., 2004) boiling point estimation method gave the most accurate T b, with the Stein
and Brown method (Stein and Brown, 1994) being the second best. Of the vapour pressure
prediction techniques assessed it was found that the Nannoolal et al. (Nannoolal et al.,
2008) and the Moller et al. (Moller et al., 2008) methods performed best when used in
conjunction with Nannoolal et al. (Nannoolal et al., 2004) T b prediction method.(Barley and
McFiggans, 2010) Barley and McFiggans suggest that the Moller et al. (Moller et al., 2008)
may be the preferred method due to its additional term for alcohols and acids which can
potentially improve accuracy for atmospherically relevant compounds. It is also stated that
errors in the estimation of T b dominate the smaller differences between different techniques
and that to improve the accuracy of vapour pressure prediction methods that rely on a T b
then improvements to T b estimation is necessary.
The work by (O’Meara et al., 2014) builds on the work done by (Barley and
McFiggans, 2010) by expanding the data set from 45 to 90 compounds with a focus on
lower volatility compounds and assesses some additional methods such as the Lee-Kesler (Lee
and Kesler, 1975) method. (O’Meara et al., 2014) found that the EVAPORATION method
(Compernolle et al., 2011) gave the minimum mean average error (MAE) for a reduced
dataset. A reduced data set was required as the EVAPORATION method (Compernolle
et al., 2011) is not applicable to all functional groups. The Lee-Kesler method (Lee and
Kesler, 1975) gave the minimum MAE for the full data set. The Nannoolal et al. method
(Nannoolal et al., 2008) gave the minimum mean bias error (MBE), but performed relatively
poorly for compounds of low volatility. The Myrdal and Yalkowsky method (Myrdal and
Yalkowsky, 1997) also performed poorly for the lower volatility compounds with a tendency
to overestimate. The conclusion from O’Meara et al. is to use the EVAPORATION method
(Compernolle et al., 2011) when possible and the Lee-Kesler method (Lee and Kesler, 1975)
otherwise for Psat prediction (O’Meara et al., 2014).
When investigating a GCM it is important to be aware of the possibility of
overfitting. Overfitting can occur when an insufficient number of compounds or functionalities
are used to fit a large number of functional group parameters or develop a correction term.
There is a danger that this term may be just fitting the noise or fluctuations in the data
rather than the actual trend (Bilde et al., 2015).
In the review by (Bilde et al., 2015) the constituent parts of an ideal experimental
basis set is outlined. The following three criteria were given: (1) The basis set must include
atmospherically relevant molecules and functional groups, (2) it must include a wide range of
functional group combinations and structures, and (3) it must represent well defined phase
42
states.
Some of the types of under represented molecules, functional groups, molecular
bonds and other properties that should be investigated are also outlined. These include longer
chain hydrocarbons (C18-C28) and longer chain monofunctional alcohols (C18-C25). Data for
nitro and nitrate containing compounds are also somewhat limited especially for compounds
containing nitro/nitrate groups as well carboxylic acid or alcohol groups. Intramolecular
hydrogen bonds are very orientation and position dependent for the interacting groups and
have been shown to both increase and decrease Psat. Some polar functional groups (e.g.
ketones, aldehydes, ethers, and esters) have very little impact on volatility by themselves,
however, if they form a hydrogen bond with an alcohol or carboxylic acid they can greatly
modify the contribution of that group (Bilde et al., 2015).
For a lot of atmospherically relevant molecules it is almost impossible to obtain
an accurate T b, especially for compounds with lots of functional groups, as they tend to
decompose before they reach T b. This means that Psat data has to be extrapolated up to
T b, which will likely cause significant errors for experimentally derived T bs. An alternative
approach has been suggested where T b is measured at 1 Pa instead of the normal 1 atm.
This has the advantage of less extrapolation so experimentally derived T bs would be more
accurate, but lots of data for higher volatility compounds wouldn’t be able to be included
in the final model. A model using this method would have a relatively small data set which
would only be applicable to low volatility compounds, but may perform much better for highly
functionalised low volatility compounds compared to current GCMs (Bilde et al., 2015).
References
Barley, M. H. and McFiggans, G.: The critical assessment of vapour pressure estimationmethods for use in modelling the formation of atmospheric organic aerosol, Atmos. Chem.Phys, 10, 749–767, doi:10.5194/acp-10-749-2010, URL www.atmos-chem-phys.net/10/749/2010/http://www.atmos-chem-phys.net/10/749/2010/, 2010.
Bilde, M., Barsanti, K., Booth, M., Cappa, C. D., Donahue, N. M., Emanuelsson,E. U., McFiggans, G., Krieger, U. K., Marcolli, C., Topping, D., Ziemann, P., Barley,M., Clegg, S., Dennis-Smither, B., Hallquist, M., Hallquist, A. M., Khlystov, A.,Kulmala, M., Mogensen, D., Percival, C. J., Pope, F., Reid, J. P., V Ribeiro daSilva, M. A., Rosenoern, T., Salo, K., Pia Soonsin, V., Yli-Juuti, T., Prisle, N. L.,Pagels, J., Rarey, J., Zardini, A. A., and Riipinen, I.: Saturation Vapor Pressures andTransition Enthalpies of Low-Volatility Organic Molecules of Atmospheric Relevance:From Dicarboxylic Acids to Complex Mixtures, Chem. Rev, 115, 4115–4156, doi:10.1021/cr5005502, URL http://pubs.acs.org/doi/abs/10.1021/cr5005502http://pubs.acs.org/doi/pdfplus/10.1021/cr5005502, 2015.
Booth, A. M., Markus, T., Mcfiggans, G., Percival, C. J., Mcgillen, M. R., and Topping,D. O.: Design and construction of a simple Knudsen Effusion Mass Spectrometer (KEMS)
43
system for vapour pressure measurements of low volatility organics, Atmos. Meas. Tech, 2,355–361, doi:10.5194/amt-2-355-2009, URL www.atmos-meas-tech.net/2/355/2009/http://www.atmos-meas-tech.net/2/355/2009/, 2009.
Compernolle, S., Ceulemans, K., and Müller, J. F.: Evaporation: A new vapour pressureestimation methodfor organic molecules including non-additivity and intramolecularinteractions, Atmospheric Chemistry and Physics, 11, 9431–9450, doi:10.5194/acp-11-9431-2011, URL www.atmos-chem-phys.net/11/9431/2011/, 2011.
Joback, K. G., Reid, R. C., and Reid, C.: ESTIMATION OF PURE-COMPONENTPROPERTIES FROM GROUP-CONTRIBUTIONS, Chem. Eng. Commun., 157,233–243, doi:10.1080/00986448708960487, URL http://www.tandfonline.com/action/journalInformation?journalCode=gcec20https://doi.org/10.1080/00986448708960487,1987.
Krieger, U. K., Siegrist, F., Marcolli, C., Emanuelsson, E. U., Gøbel, F. M., Bilde,M., Marsh, A., Reid, J. P., Huisman, A. J., Riipinen, I., Hyttinen, N., Myllys,N., Kurtén, T., Bannan, T., Percival, C. J., and Topping, D.: A referencedata set for validating vapor pressure measurement techniques: homologous seriesof polyethylene glycols, Atmos. Meas. Tech, 11, 49–63, doi:10.5194/amt-11-49-2018,URL https://search.proquest.com/docview/1985551482?pq-origsite=gscholarhttps://www.atmos-meas-tech.net/11/49/2018/amt-11-49-2018.pdf, 2018.
Lee, B. I. and Kesler, M. G.: A generalized thermodynamic correlation based on three-parameter corresponding states, AIChE Journal, 21, 510–527, doi:10.1002/aic.690210313,URL http://doi.wiley.com/10.1002/aic.690210313, 1975.
Moller, B., Rarey, J., and Ramjugernath, D.: Estimation of the vapourpressure of non-electrolyte organic compounds via group contributions andgroup interactions, J. Mol. Liq., 143, 25–63, doi:10.1016/j.molliq.2008.04.020,URL https://ac-els-cdn-com.manchester.idm.oclc.org/S0167732208000858/1-s2.0-S0167732208000858-main.pdf? tid=d8fc0c57-f660-42bd-bcfc-0bae3060be66&acdnat=1526385659 9050b669c4d15bda248ef1b53479a70f, 2008.
Myrdal, P. B. and Yalkowsky, S. H.: Estimating Pure Component Vapor Pressures of ComplexOrganic Molecules, Ind. Eng. Chem. Res., 36, 2494–2499, URL https://pubs-acs-org.manchester.idm.oclc.org/doi/pdf/10.1021/ie950242l, 1997.
Nannoolal, Y., Rarey, J., Ramjugernath, D., and Cordes, W.: Estimation ofpure component properties Part 1. Estimation of the normal boiling pointof non-electrolyte organic compounds via group contributions and groupinteractions, Fluid Phase Equilibria, 226, 45–63, doi:10.1016/j.fluid.2004.09.001,URL https://ac-els-cdn-com.manchester.idm.oclc.org/S037838120400425X/1-s2.0-S037838120400425X-main.pdf? tid=1ca55a4d-da82-483c-a764-419204799420&acdnat=1526384121 4b28465609e2541ce31908e0dca0d66d, 2004.
Nannoolal, Y., Rarey, J., and Ramjugernath, D.: Fluid Phase EquilibriaEstimation of pure component properties Part 3. Estimation of the vaporpressure of non-electrolyte organic compounds via group contributions and groupinteractions, Fluid Phase Equilibria, 269, 117–133, doi:10.1016/j.fluid.2008.04.020,URL https://ac-els-cdn-com.manchester.idm.oclc.org/S0378381208001611/1-s2.0-S0378381208001611-main.pdf? tid=50024cd4-1148-4a88-b3e7-e14cb5022fe2&acdnat=1526383962 50cf9f9aa4a5a1fa154e3356d052da78https://ac.els-cdn.com/S0378381208001611/1-s2.0-S03783812080016, 2008.
O’Meara, S., Booth, A. M., Barley, M. H., Topping, D., and Mcfiggans, G.: An assessment ofvapour pressure estimation methods, Phys. Chem. Chem. Phys., 16, 19 453–19 469, doi:10.1039/c4cp00857j, URL http://pubs.rsc.org.manchester.idm.oclc.org/en/content/articlepdf/2014/cp/c4cp00857j, 2014.
44
Pankow, J. F. and Asher, W. E.: SIMPOL.1: A simple group contribution methodfor predicting vapor pressures and enthalpies of vaporization of multifunctionalorganic compounds, Atmospheric Chemistry and Physics, 8, 2773–2796, doi:10.5194/acp-8-2773-2008, URL www.atmos-chem-phys.net/8/2773/2008/, 2008.
Prausnitz, J., Lichtenthaler, R., and Azevedo, E. d.: Molecular thermodynamics of fluid-phase equilibria, Pearson Education, Upper Saddle River, 1998.
Stein, S. E. and Brown, R. L.: Estimation of Normal Boiling Points from GroupContributions, J. Chem. Inf. Comput. Sci, 34, 581–587, URL https://pubs-acs-org.manchester.idm.oclc.org/doi/pdf/10.1021/ci00019a016, 1994.
45

BLANK PAGE
46
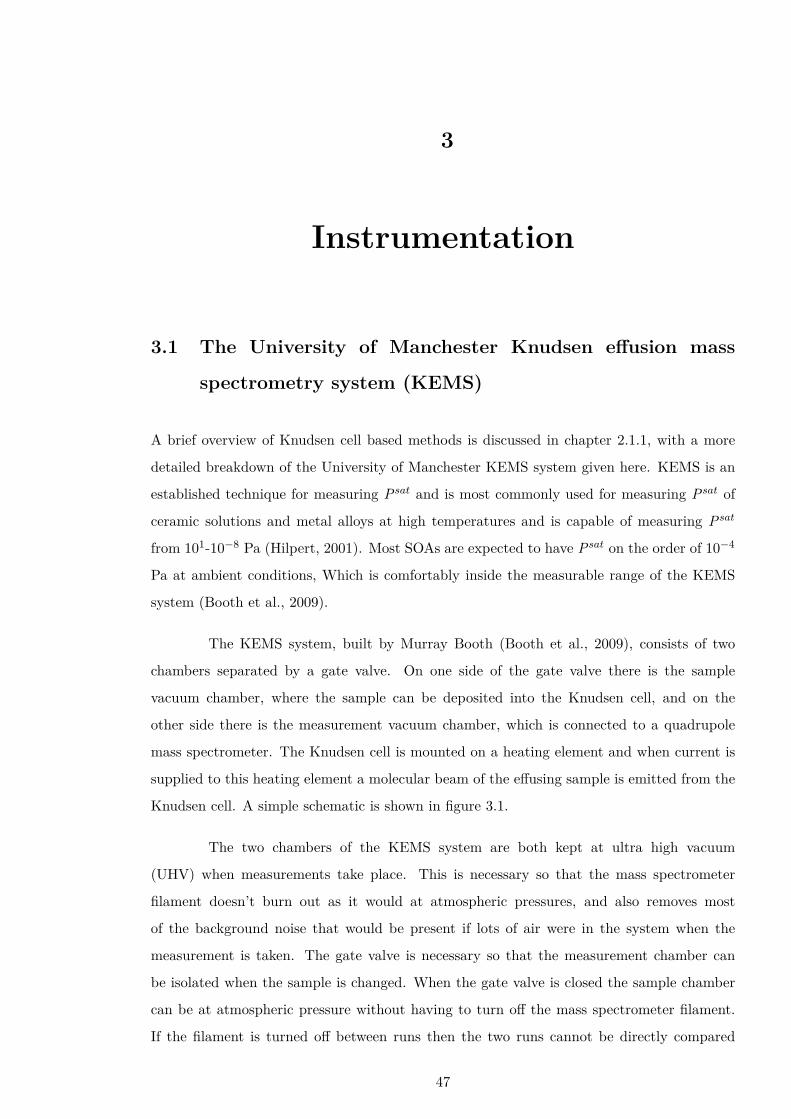
3
Instrumentation
3.1 The University of Manchester Knudsen effusion mass
spectrometry system (KEMS)
A brief overview of Knudsen cell based methods is discussed in chapter 2.1.1, with a more
detailed breakdown of the University of Manchester KEMS system given here. KEMS is an
established technique for measuring Psat and is most commonly used for measuring Psat of
ceramic solutions and metal alloys at high temperatures and is capable of measuring Psat
from 101-10−8 Pa (Hilpert, 2001). Most SOAs are expected to have Psat on the order of 10−4
Pa at ambient conditions, Which is comfortably inside the measurable range of the KEMS
system (Booth et al., 2009).
The KEMS system, built by Murray Booth (Booth et al., 2009), consists of two
chambers separated by a gate valve. On one side of the gate valve there is the sample
vacuum chamber, where the sample can be deposited into the Knudsen cell, and on the
other side there is the measurement vacuum chamber, which is connected to a quadrupole
mass spectrometer. The Knudsen cell is mounted on a heating element and when current is
supplied to this heating element a molecular beam of the effusing sample is emitted from the
Knudsen cell. A simple schematic is shown in figure 3.1.
The two chambers of the KEMS system are both kept at ultra high vacuum
(UHV) when measurements take place. This is necessary so that the mass spectrometer
filament doesn’t burn out as it would at atmospheric pressures, and also removes most
of the background noise that would be present if lots of air were in the system when the
measurement is taken. The gate valve is necessary so that the measurement chamber can
be isolated when the sample is changed. When the gate valve is closed the sample chamber
can be at atmospheric pressure without having to turn off the mass spectrometer filament.
If the filament is turned off between runs then the two runs cannot be directly compared
47
Figure 3.1: KEMS schematic reproduced from (Booth et al., 2009)
to each other. As previously stated the KEMS system calculates the Psat of a compound
by comparing the mass spectrum of the sample with that of a reference compound of well
defined Psat. If the filament is disabled between runs when the compounds of interest are
changed then the two mass spectra cannot be compared and no Psat can be calculated. After
the sample has been changed the sample chamber is returned to UHV before the gate valve
is opened. The two chambers use backing pumps to get the pressure down to the order of
10−1 mbar, and then Varian V81-T and V84-FS turbo pumps to achieve the desired pressure
of <10−5 mbar.
Although both chambers are at UHV when a measurement is taken, there are still
traces of contamination from the major components of air present in the spectra. These
contaminants are also present in background measurements which are taken so that a baseline
can be determined. The main contaminants are N2, O2, H2O, and small amounts of CO2
(Booth et al., 2009).
Because of this unavoidable contamination the mass spectra of sample compounds
and reference compounds are only compared for mass to charge ratios (m/z) of 41 and above.
The Knudsen cell consists of a removable cell, which is loaded with sample and a
lid that is fixed on top. The lid contains a small hole, known as the effusion orifice. Effusion
48
orifices have been made for this KEMS system with hole diameters of 200 µm, 1 mm, 2 mm,
and 3 mm. The size of the orifice selected needs to be 1/10 of the mean free path of the
compound so that effusion through the orifice doesn’t effect the thermodynamic equilibrium
of the lower cell (Hilpert, 2001). A smaller orifice size is typically used for higher, but still
relatively low, volatility compounds and the larger orifice sizes are used for lower volatility
compounds (Booth et al., 2009).
When the Knudsen cell is heated and a molecular beam is emitted, the beam
is ionised via electron impact at 70 eV. The intensity of the molecular beam emitted is
proportional to the Psat in the cell above the sample. Psat of the i-th component, Pi,
measured in the KEMS system can be calculated using the following equation:
Pi = kIiTσi
(3.1)
where I i is the sum of the ion intensity measured in the mass spectrum, T is the
temperature of the Knudsen cell in Kelvin, σi is the ionisation cross section, and k is the
machine constant that incorporates information on the geometry of the system, clausing factor
of the effusion orifice and any other correction factors. k is determined by using a reference
compound. σi is calculated by summing up the ionisation cross section of each atom in a
the molecule at the ionisation energy (70 eV). The size of the effusion orifice selected directly
effects k.
For a compound of well defined Psat, after obtaining a mass spectrum, Pi, I i, T,
and σi are all known. Therefore k can be calculated.
For a compound of unknown Psat everything is known with the exception of Pi and
k. Once a value of k has been calculated from a reference compound Pi of the sample of
unknown Psat can be calculated.
Spectra of both the reference compound and sample compound are taken at multiple
temperatures (usually starting at 293 or 298 K, dependent on the temperature of the room
containing the KEMS system, with temperature increments of 5 K until 323 or 328 K).
Once the Psat have been calculated at several temperatures it is possible to calculate both
the enthalpy and entropy of sublimation using equation 2.4. This is done by plotting the
natural log of the Psat (ln(P)) against one over the temperature (1/T) and calculating a
linear regression. The intercept of the linear regression will be equal to ∆Ssub/R and the
gradient will be equal to ∆H sub/R (Booth et al., 2012). Once both ∆H sub and ∆Ssub have
49
been calculated equation 2.4 can be used to calculate P298.
The compounds that are studied with the KEMS are typically solid meaning that
it is PsatS that is determined. However, in the atmosphere many of these compounds actually
exist as sub-cooled liquid aerosols. PsatL is also what is typically used by activity models
and gas/particle partitioning models. This means that PsatL is preferred as it allows easier
comparison. It is possible to correct a PsatS to Psat
L with thermochemical data obtained from
differential scanning calorimetry (DSC) by using the Prausnitz equation (Prausnitz et al.,
1998):
lnplps
= ∆Hfus
RTm(Tm
T − 1) − ∆cp,slR (Tm
T − 1) + ∆cp,slR ln
Tm
T (3.2)
where pl/ps is the ratio of the vapour pressures with s referring to the solid and l to
the sub-cooled liquid, ∆Hfus is the enthalpy of fusion (J mol−1), ∆cp,sl is the best estimate of
the change in heat capacity between the liquid and solid state at the melting point (J mol−1
K−1), T is the temperature (K) and Tm is the melting point (K).
3.1.1 Using the homologous PEG series as a reference data set
Historically, Psat measurements of semivolatile and low-volatility organic compounds at
atmospheric temperatures can differ by several orders of magnitude depending on the
measurement technique used. These discrepancies between techniques are normally well
outside the stated uncertainty of each given technique. Recently (Krieger et al., 2018) tried
to address this problem by investigating the potential of the homologous polyethylene glycol
(PEG) series as a standard reference set that could be used as for intercomparison between
techniques. The PEG series used consisted of (H-(O-CH2-CH2)n) for n = 3 to 8. Psat of
the PEG series was assessed using multiple different measurement techniques and quantum
chemistry calculations. The measurement techniques used were three different EBDs from
ETH Zurich, Union College Schenectady and the University of Bristol, the FT-TDMA from
the University of Aarhus, and the KEMS system from the University of Manchester. The
quantum chemistry calculations were performed primarily using COSMOtherm. Psat of the
PEG series ranged from 10−7 to 5 × 10⁻² Pa at 298 K. As this is a homologous series
that covers 5-6 orders of magnitude it can be used to assess the lower detection limits of
the different techniques as well as potentially identifying sources of systematic errors. In
fact most of the deviations between the different techniques used occurred around the lower
50
detection limits of each technique. (Krieger et al., 2018) found that extrapolation of Psat
from higher temperatures to ambient temperatures was permissible for about 100 K for the
PEG series, which suggests that for lower volatility compounds that have low Psat that are
difficult to measure experimentally at ambient temperatures could be investigated at higher
temperatures and extrapolated to ambient temperatures.
In Section 5.1 the measured Psat of three nitroaromatic compounds are compared,
with measurements from the KEMS using a PEG reference, the KEMS using a malonic acid
reference, and from the ETH Zurich EDB.The measurements obtained from the KEMS using
a PEG reference showed much better agreement with the measurements obtained from the
EDB compared to the agreement between the KEMS using a malonic acid reference and the
EDB. This is discussed more in depth in Section 5.1.
3.2 Differential Scanning Calorimetry (DSC)
DSC is a thermoanalytical technique that measures the difference in the amount of energy
required to raise the temperature of a sample compared to a reference compound. DSC is
performed over a temperature range, where the temperature of the sample and reference
are typically ramped at a constant temperature, with the temperatures of the sample and
reference kept as close as possible (Tomoda et al., 2020). The reference compound is selected
as a compound with a well defined heat capacity over the range of temperatures scanned.
In order to use Equation 3.2 to convert PsatS to Psat
L ∆Hfus, Tm and ∆cp,sl are
required. All three of these values can be obtained from DSC. In sections 5.1 and 5.2 a TA
Instruments DSC 2500 Differential Scanning Calorimeter was used to measure these values.
The process used is described here: heat flow and temperature were calibrated using
an indium reference, and heat capacity using a sapphire reference. A heating rate of 10 K
min−1 was used. 5 - 10 mg of sample was measured using a microbalance, then pressed into
a hermetically sealed aluminium DSC pan. A purge gas of N2 was used with a flow rate of
30 mL min−1. Data processing was performed using the ‘Trios’ software supplied with the
instrument. ∆cp,sl was estimated using ∆cp,sl = ∆Sfus (Mauger et al., 1972; Grant et al.,
1984).
51
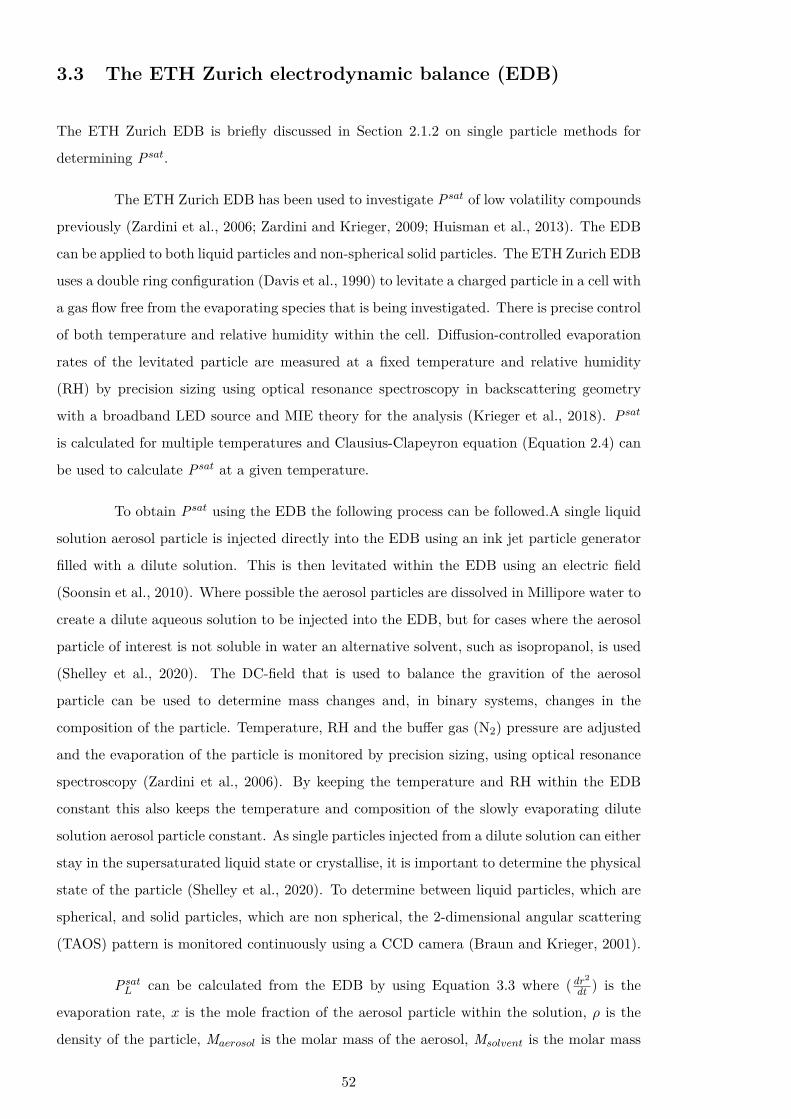
3.3 The ETH Zurich electrodynamic balance (EDB)
The ETH Zurich EDB is briefly discussed in Section 2.1.2 on single particle methods for
determining Psat.
The ETH Zurich EDB has been used to investigate Psat of low volatility compounds
previously (Zardini et al., 2006; Zardini and Krieger, 2009; Huisman et al., 2013). The EDB
can be applied to both liquid particles and non-spherical solid particles. The ETH Zurich EDB
uses a double ring configuration (Davis et al., 1990) to levitate a charged particle in a cell with
a gas flow free from the evaporating species that is being investigated. There is precise control
of both temperature and relative humidity within the cell. Diffusion-controlled evaporation
rates of the levitated particle are measured at a fixed temperature and relative humidity
(RH) by precision sizing using optical resonance spectroscopy in backscattering geometry
with a broadband LED source and MIE theory for the analysis (Krieger et al., 2018). Psat
is calculated for multiple temperatures and Clausius-Clapeyron equation (Equation 2.4) can
be used to calculate Psat at a given temperature.
To obtain Psat using the EDB the following process can be followed.A single liquid
solution aerosol particle is injected directly into the EDB using an ink jet particle generator
filled with a dilute solution. This is then levitated within the EDB using an electric field
(Soonsin et al., 2010). Where possible the aerosol particles are dissolved in Millipore water to
create a dilute aqueous solution to be injected into the EDB, but for cases where the aerosol
particle of interest is not soluble in water an alternative solvent, such as isopropanol, is used
(Shelley et al., 2020). The DC-field that is used to balance the gravition of the aerosol
particle can be used to determine mass changes and, in binary systems, changes in the
composition of the particle. Temperature, RH and the buffer gas (N2) pressure are adjusted
and the evaporation of the particle is monitored by precision sizing, using optical resonance
spectroscopy (Zardini et al., 2006). By keeping the temperature and RH within the EDB
constant this also keeps the temperature and composition of the slowly evaporating dilute
solution aerosol particle constant. As single particles injected from a dilute solution can either
stay in the supersaturated liquid state or crystallise, it is important to determine the physical
state of the particle (Shelley et al., 2020). To determine between liquid particles, which are
spherical, and solid particles, which are non spherical, the 2-dimensional angular scattering
(TAOS) pattern is monitored continuously using a CCD camera (Braun and Krieger, 2001).
PsatL can be calculated from the EDB by using Equation 3.3 where (dr2
dt ) is the
evaporation rate, x is the mole fraction of the aerosol particle within the solution, ρ is the
density of the particle, Maerosol is the molar mass of the aerosol, Msolvent is the molar mass
52
of the solvent and D is the diffusivity of the aerosol in the buffer atmosphere.
PsatL = −1
2dr2
dtxρRT
(xM aerosol + (1 − x)Msolvent)D(3.3)
For solid, non-spherical particles, the shape of the particle must be considered. The
TAOS pattern only allows for the determination of whether or not a particle is spherical or not,
without giving specific information on the actual shape of the non-spherical particle (Soonsin
et al., 2010). Equivalent sphere radius approximation can be used to allow for evaporation
rates to still be deduced. This is done by assigning a size parameter to a specific resonance
in the optical resonance spectra and monitoring its temporal evolution. The results can vary
slightly depending on if the minimum enclosing ball radius of the non-spherical sphere is used
or if its mean radius is used. The relative error in Psat using this approximation along with
uncertainties in the gas phase diffusivities is estimated to be 35%.
References
Booth, A. M., Markus, T., Mcfiggans, G., Percival, C. J., Mcgillen, M. R., and Topping,D. O.: Design and construction of a simple Knudsen Effusion Mass Spectrometer (KEMS)system for vapour pressure measurements of low volatility organics, Atmos. Meas. Tech, 2,355–361, doi:10.5194/amt-2-355-2009, URL www.atmos-meas-tech.net/2/355/2009/http://www.atmos-meas-tech.net/2/355/2009/, 2009.
Booth, A. M., Bannan, T., McGillen, M. R., Barley, M. H., Topping, D. O., McFiggans, G.,and Percival, C. J.: The role of ortho, meta, para isomerism in measured solid state andderived sub-cooled liquid vapour pressures of substituted benzoic acids, RSC Advances, 2,4430, doi:10.1039/c2ra01004f, URL http://pubs.rsc.org/en/Content/ArticlePDF/2012/RA/c2ra01004fhttp://xlink.rsc.org/?DOI=c2ra01004f, 2012.
Braun, C. and Krieger, U. K.: Two-dimensional angular light-scattering in aqueousNaCl single aerosol particles during deliquescence and efflorescence, Optics Express,8, 314, doi:10.1364/oe.8.000314, URL https://www.osapublishing.org/viewmedia.cfm?uri=oe-8-6-314&seq=0&html=truehttps://www.osapublishing.org/abstract.cfm?uri=oe-8-6-314https://www.osapublishing.org/oe/abstract.cfm?uri=oe-8-6-314, 2001.
Davis, E. J., Buehler, M. F., and Ward, T. L.: The double-ring electrodynamic balancefor microparticle characterization, Review of Scientific Instruments, 61, 1281, doi:10.1063/1.1141227, URL https://doi.org/10.1063/1.1141227, 1990.
Grant, D., Mehdizadeh, M., Chow, A.-L., and Fairbrother, J.: Non-linear van’t Hoffsolubility-temperature plots and their pharmaceutical interpretation, International Journalof Pharmaceutics, 18, 25–38, doi:10.1016/0378-5173(84)90104-2, URL https://www.sciencedirect.com/science/article/pii/0378517384901042, 1984.
Hilpert, K.: Potential of mass spectrometry for the analysis of inorganic high-temperaturevapors, in: Fresenius’ Journal of Analytical Chemistry, vol. 370, pp. 471–478, Springer, doi:10.1007/s002160100835, URL https://link-springer-com.manchester.idm.oclc.org/article/10.1007/s002160100835, 2001.
Huisman, A. J., Krieger, U. K., Zuend, A., Marcolli, C., and Peter, T.: Vapor pressures
53
of substituted polycarboxylic acids are much lower than previously reported, AtmosphericChemistry and Physics, 13, 6647–6662, doi:10.5194/acp-13-6647-2013, URL https://www.atmos-chem-phys.net/13/6647/2013/, 2013.
Krieger, U. K., Siegrist, F., Marcolli, C., Emanuelsson, E. U., Gøbel, F. M., Bilde,M., Marsh, A., Reid, J. P., Huisman, A. J., Riipinen, I., Hyttinen, N., Myllys,N., Kurtén, T., Bannan, T., Percival, C. J., and Topping, D.: A referencedata set for validating vapor pressure measurement techniques: homologous seriesof polyethylene glycols, Atmos. Meas. Tech, 11, 49–63, doi:10.5194/amt-11-49-2018,URL https://search.proquest.com/docview/1985551482?pq-origsite=gscholarhttps://www.atmos-meas-tech.net/11/49/2018/amt-11-49-2018.pdf, 2018.
Mauger, J. W., Paruta, A. N., and Gerraughty, R. J.: Solubilities of Sulfadiazine,Sulfisomidine, and Sulfadimethoxine in Several Normal Alcohols, Journal ofPharmaceutical Sciences, 61, 94–97, doi:10.1002/JPS.2600610117, URL https://www.sciencedirect.com/science/article/pii/S0022354915382769, 1972.
Prausnitz, J., Lichtenthaler, R., and Azevedo, E. d.: Molecular thermodynamics of fluid-phase equilibria, Pearson Education, Upper Saddle River, 1998.
Shelley, P. D., Bannan, T. J., Worrall, S. D., Alfarra, M. R., Krieger, U. K., Percival,C. J., Garforth, A., and Topping, D.: Measured solid state and subcooled liquidvapour pressures of nitroaromatics using Knudsen effusion mass spectrometry, AtmosphericChemistry and Physics, 20, 8293–8314, doi:10.5194/acp-20-8293-2020, URL https://www.atmos-chem-phys.net/20/8293/2020/, 2020.
Soonsin, V., Zardini, A. A., Marcolli, C., Zuend, A., and Krieger, U. K.: The vaporpressures and activities of dicarboxylic acids reconsidered: The impact of the physicalstate of the aerosol, Atmospheric Chemistry and Physics, 10, 11 753–11 767, doi:10.5194/acp-10-11753-2010, 2010.
Tomoda, B. T., Yassue-Cordeiro, P. H., Ernesto, J. V., Lopes, P. S., Péres, L. O.,da Silva, C. F., and de Moraes, M. A.: Characterization of biopolymer membranes andfilms: Physicochemical, mechanical, barrier, and biological properties, in: BiopolymerMembranes and Films, pp. 67–95, Elsevier, doi:10.1016/b978-0-12-818134-8.00003-1, 2020.
Zardini, A. A. and Krieger, U. K.: Evaporation kinetics of a non-spherical, levitated aerosolparticle using optical resonance spectroscopy for precision sizing, Optics Express, 17,4659, doi:10.1364/OE.17.004659, URL https://www.osapublishing.org/abstract.cfm?URI=oe-17-6-4659, 2009.
Zardini, A. A., Krieger, U. K., and Marcolli, C.: White light Mie resonance spectroscopy usedto measure very low vapor pressures of substances in aqueous solution aerosol particles,Optics Express, 14, 6951, doi:10.1364/OE.14.006951, URL https://www.osapublishing.org/oe/abstract.cfm?uri=oe-14-15-6951, 2006.
54
4
Code development
4.1 Changes to the UManSysProp suite
UManSysProp is an open source software suite for molecular property prediction and
atmospheric aerosol calculations (Topping et al., 2016). The range of predictions includes
cloud condensation nuclei (CCN) activation potential, equilibrium absorptive partitioning
calculations, activity coefficients in liquids, critical properties of organic compounds,
hygroscopic growth factors, sub-cooled density of organic compounds and Psat of organic
compounds.
UManSysProp uses a group contribution approach to extract relevant information
from a SMILES (Simplified Molecular Input Line Entry System) string input necessary for
the calculations required to predict a property. A SMILES string allows for the representation
of 2D chemical structure using a short ASCII string. SMILES notation is commonly used
in both commercial and open source software for predicting chemical properties and most
chemical editors allow for SMILES strings to converted into 2D or 3D structures.
To search a SMILES string and extract the relevant structural information required
for a GCM to predict a property SMARTS strings are used. SMARTS allow for specific
substructures within a SMILES string to be searched for.
When UManSysProp was first released it only contained the Nannoolal et al. vapour
pressure method (Nannoolal et al., 2008), the Myrdal and Yalkowsky vapour pressure method
(Myrdal and Yalkowsky, 1997), and the EVAPORATION method (Compernolle et al., 2011).
As the Nannoolal et al. vapour pressure method (Nannoolal et al., 2008) and the Myrdal and
Yalkowsky methods (Myrdal and Yalkowsky, 1997) are combined methods, discussed in detail
in Section 2.2, they require boiling point methods to be able to predict Psat. UManSysProp
contains three boiling point methods, the Nannoolal et al. boiling point method (Nannoolal
et al., 2004), the Joback and Reid method (Joback et al., 1987), and the Stein and Brown
55
method (Stein and Brown, 1994).
SIMPOL (Pankow and Asher, 2008) is GCM discussed in Section 2.2 which has since
been added to UManSysProp in release version 1.03 (Topping and Shelley, 2019) as well as
a correction for EVAPORATION in regards to how enols were treated. In UManSysProp
release version 1.04 (Topping and Shelley, 2020) a bug with how nitro groups where detected
for the Nannoolal et al. vapour pressure method (Nannoolal et al., 2008) and the Myrdal
and Yalkowsky method (Myrdal and Yalkowsky, 1997) and was corrected so that nitro groups
were correctly identified when represented in there charge balanced forms.
4.1.1 Adding SIMPOL to UManSysProp
The SIMPOL group contribution method can be used to predict the sub-cooled liquid vapour
pressure of a compound as a function of temperature (T) only requiring the structure of the
compound and a temperature as an input. For each compound, i, SIMPOL assumes the
following relationship between vapour pressure and temperature shown in equation 4.1,
log10PL,i(T ) = Σkνk,ibk(T ) (4.1)
where PL,i is the sub-cooled liquid vapour pressure, νk,i is the number of groups of
type k, and bK(T) is the contribution to log10 PL,i(T) by each group of type k.
The temperature dependence of bk(T ) is defined in equation 4.2,
bk(T ) = B1,kT
+B2,k +B3,kT +B4,kln(T ) (4.2)
where the values for B1,k to B4,k for each instance of k are available in (Pankow and
Asher, 2008).
Within SIMPOL, a total of 30 structural groups are considered, as well as a zeroth
group used in all calculations leading to 31 different k values ranging from k = 0 to k = 30.
To later be called by UManSysProp these values need to be stored in a text file. This file
contains 5 columns separated by white space with the columns titles being the k, B1,k, B2,k,
B3,k, and B4,k. This file is saved with the file extension ’.data’. This functions the same as a
.txt file and is just used as convention within UManSysProp to identify files that contain the
parameters used in calculation. The format for SIMPOL.data is shown in Listing 4.1.1 # group Bk1 Bk2 Bk3 Bk42 0 -4.26938E+02 2.89223E -01 4.42057E -03 2.92846E -013 1 -4.11248E+02 8.96919E -01 -2.48607E -03 1.40312E -01
56
4 2 -1.46442E+02 1.54528 E+00 1.71021E -03 -2.78291E -015 3 3.50262 E+01 -9.20839E -01 2.24399E -03 -9.36300E -02
Listing 4.1: Format for SIMPOL.data
To be able to call the required information from the .data file, it is necessary to
identify which groups/functionalities are present within a compound. The structural input for
use with UManSysProp are SMILES strings. SMILES strings can be searched for structural
features using SMARTS. The features that are important for SIMPOL can range from very
simple, such as the number of carbon atoms present within a compound to the more complex,
such as is C=C-C=O present in a NON-aromatic ring. The SMARTS that are used in
SIMPOL are stored in a ’.smarts’ file which, similar to the .data file behave the same as a .txt
file and is just used as convention within UManSysProp. The .smarts file contains columns
separated by white space with the first column corrosponding to k, and the second column
containing the SMARTS. In SIMPOL k = 1 corrosponds to the total number of carbons
within the compound of interest. The SMARTS for k = 1 within SIMPOL.smarts is shown
in Listing 4.21 1 [#6]
Listing 4.2: SMARTS string to find the total number of carbons within a compound
The SMART [#6] searches for all instances where the element with atomic number 6 occurs.
[#6] is used in this instance rather than C as in SMARTS C would only identify aliphatic
carbons, and would therefore miss any aromatic carbons.
k = 3 is used for whether or not an aromatic ring is present, and if an aromatic
ring is present, how many there are. This is more complex to search for than the number of
carbons and the example SMARTS are shown in Listing 4.3.1 301 [#6 ,#7 ,#8; r3;a]2 302 [#6 ,#7 ,#8; r4;a]3 303 [#6 ,#7 ,#8; r5;a]4 304 [#6 ,#7 ,#8; r6;a]5 305 [#6 ,#7 ,#8; r7;a]6 306 [#6 ,#7 ,#8; r8;a]
Listing 4.3: SMARTS for determine the presence of an aromatic ring
In this instance there are multiple SMARTS used to identify one feature. This is due to
aromatic rings not having a fixed size, and the need to not only identify whether an aromatic
ring is present, but also the number of rings. In 301 ’#6, #7, #8’ searches for either carbon,
nitrogen or oxygen atoms, ’r3’ searches for a ring of size 3 and ’a’ searches for aromaticity.
’,’ acts as on or oporator and ’;’ acts as an and operator. This means that 301 searches for
atoms in a ring of size 3, that is also aromatic, and can be either a carbon, nitrogen or oxygen.
’r4’ will search for a ring of size 4, ’r5’ will search for a ring of size 5 ect. If only whether an
aromatic ring was present was required this could be solved simply with the SMART [r;a],
57
with ’r’ being the SMARTS to search for an atom in a ring, ’a’ being the SMARTS for an
atom that is aromatic, and ’;’ requiring both ’r’ and ’a’ to be true. 301-306 don’t give the
total number of aromatic rings present, but instead the total number of atoms in aromatic
rings. Whilst this is not the desired information the information that is provided can be
carried forward to determine the number of rings which will be shown shortly.
k = 16 is used for the nitro functionality. Whilst the correct SMILES representation
of a nitro group is [N+](=O)[O−] it is not uncommon for the SMILES to be represented as
N(=O)=O . Listing 4.4 shows 1601 which searches for a nitro group where no charges are
included in the input, and 1602 which searches for nitro groups where charges are present.1 1601 [#6][$([ NX3 ](=O)=O)]2 1602 [#6][$([ NX3 +](=O)[O -])]
Listing 4.4: SMARTS describing a nitro group
Now that the .data file and .SMARTS file have been constructed an __init__.py
file should be created in the same directory. This allows for the information within each
column of these files to be easily accessed by other scripts. This is shown in Listing 4.51 SIMPOL_1 = _read_data (’SIMPOL .data ’, value_col
=1)2 SIMPOL_2 = _read_data (’SIMPOL .data ’, value_col
=2)3 SIMPOL_3 = _read_data (’SIMPOL .data ’, value_col
=3)4 SIMPOL_4 = _read_data (’SIMPOL .data ’, value_col
=4)
Listing 4.5: code to call from SIMPOL.data
When SIMPOL_1 is called by another function it will return column 1 from
SIMPOL.data which contains the data for Bk,1. The following line should also be included
in the __init__.py to call the SMARTS from SIMPOL.smarts shown in Listing 4.6.1 SIMPOL_SMARTS = _read_smarts (’SIMPOL . smarts ’)
Listing 4.6: code to call from SIMPOL.smarts
To use the SIMPOL SMARTS to search a compound for the functionality that it
contains the following code can be used shown in Listing 4.7.
Here a function is defined to search a compound for which groups it contains. In
line 1 a function is for ’simpol’ is defined only requiring the ’compound’ as an input. In this
case ’compound’ will be SMILES string. In line 2 the ’matches’ function is used to return a
mapping of group identifiers to the number of matches. ’matches’ is a user defined function
with the following format.1 def simpol ( compound ):2 m = matches (data. SIMPOL_SMARTS , compound )3 result = {}
Listing 4.7: code to search compounds for functionality using the SIMPOL SMARTS
58
An overview of several of the group identifiers within SIMPOL are given below.
result[’0’] (shown in Listing 4.8 is equal to 1 as this is the case for all SIMPOL calculations as
defined in (Pankow and Asher, 2008). result[’1’] searches the SMILES string for matches to
the feature described by m[’1’], as described in the SIMPOL.smarts file each carbon present
in the SMILES string will increase m[1] by 1. So ethane (SMILES string = CC) will have
result[’1’] = 2, and propane (SMILES string = CCC) will have result[’1’] = 3.1 # Zeroth group ( constant term used in all calculations )2 result [’0’] = 13 #total number of carbons present4 result [’1’] = m[1]
Listing 4.8: result[’0’] and result[’1’]
result[’3’] and result[’4’] (shown in Listing 4.9 are used to count the number of rings
(aromatic or aliphatic) within a molecule. The SMARTS that are used to search for the
number of rings actually count each atom within a ring. For this reason if all atoms in a 3
membered rings are counted then to get the number of rings it is necessary to divide by 3.1 result [’3’] = ceil(2 m[301] / 3 + m[302] / 4 + m[303] / 53 + m[304] / 6 + m[305] / 7 + m[306] / 84 )5 # Aliphatic ring present6 #same theory as result [’3’]7 result [’4’] = ceil(8 m[401] / 3 + m[402] / 4 + m[403] / 59 + m[404] / 6 + m[405] / 7 + m[406] / 8
10 )
Listing 4.9: result[’3’] and result[’4’]
This works when multiple rings within a molecule do not share the same atoms, however in
the case of fused rings this function would break down. Taking naphthalene as an example,
there are two 6 membered rings, but only 10 carbons making up these 2 rings. This would
cause result[’4’] to return a non integer answer for the number of rings. To account for this
the ’ceil’ function is used to round up to the next integer value.
In the case of result[’17’] (shown in Listing 4.10 the result is divided by 2 as the
SMARTS string searches both ways around the aromatic ring counting each hydroxyl group
twice.1 #total number of aromatic hydroxyl groups present unless there is a nitro
group bonded to the aromatic2 #ring3 # divided by 2 as each OH counted twice. Both ways around ring4 result [’17’] = m[17] / 2
Listing 4.10: result[’17’]
result[’30’] (shown in Listing 4.11) searches for the nitroester functionality. As a
nitroester contains an ester group it will return a positive match for the ester functionality,
and whilst it is true that the ester functionality is present, the proximity of the nitro group
59
changes its chemical behaviour significantly and for the purpose of property estimation a
nitro ester and an ester are distinctly different groups. So for the cases where result[’30’] is
true result[’11’] (result for an ester group) must be equal to zero. this can achieved using a
conditional ’if’ statement.1 #total number of nitroester groups present2 #group 3001 is for the nitro part represented as -N(=O)=O3 #group 3002 is for the nitro part represented as -[N+](=O)[O-]4 result [’30’] = m [3001] + m [3002]5 if result [’30’] > 0:6 result [’11’] = 0
Listing 4.11: result[’30’]
Once which functionalities within a compound are known an estimation of the Psat
can be made. This can be done using the following function shown in Listing 4.12.1 def simpol (compound , temperature ):2 m = groups . simpol ( compound )34 b1 = groups . aggregate_matches (m, data. SIMPOL_1 )5 b2 = groups . aggregate_matches (m, data. SIMPOL_2 )6 b3 = groups . aggregate_matches (m, data. SIMPOL_3 )7 b4 = groups . aggregate_matches (m, data. SIMPOL_4 )89 bkT = b1 / temperature + b2 + b3 * temperature + b4 * log( temperature )
10 return bkT
Listing 4.12: estimating vapour pressure using SIMPOL
Line 1 defines the vapour pressure estimation method as ’simpol’ requiring a
compound in the format of a SMILES sting and a temperature as an input. Line 2 calls the
’simpol’ function for searching for functionalities from the group file, using the the SMILES
string as an input.
Line 4 calls the aggregate_matches function on each for each instance of m and its
corrosponding contribution to the Psat stored in the SIMPOL.data file for B1,k. lines 5-7 do
the same for B2−4,k.
line 9 returns the log10 of the Psat in atm.
The aggregate_matches function (shown in Listing 4.13 sums the number of matches
for each group multiplied by the contribution for each group.1 def aggregate_matches (matches , coefficients , groups =None):2 """3 Calculates the biased sum of a set of matches .45 The * matches * parameter specifies a mapping of groups to values to be6 summed . The * coefficients * parameter specifies mapping of groups to7 coefficient values .89 The optional * groups * parameter specifies the subset of the keys of
10 * matches * which are to be summed . If this is not specified , it defaultsto
11 all keys of * matches *.1213 For each group in * groups *, the corresponding values from * matches * and14 * coefficients * will be multiplied . The result is the sum of all these15 multiplications .
60
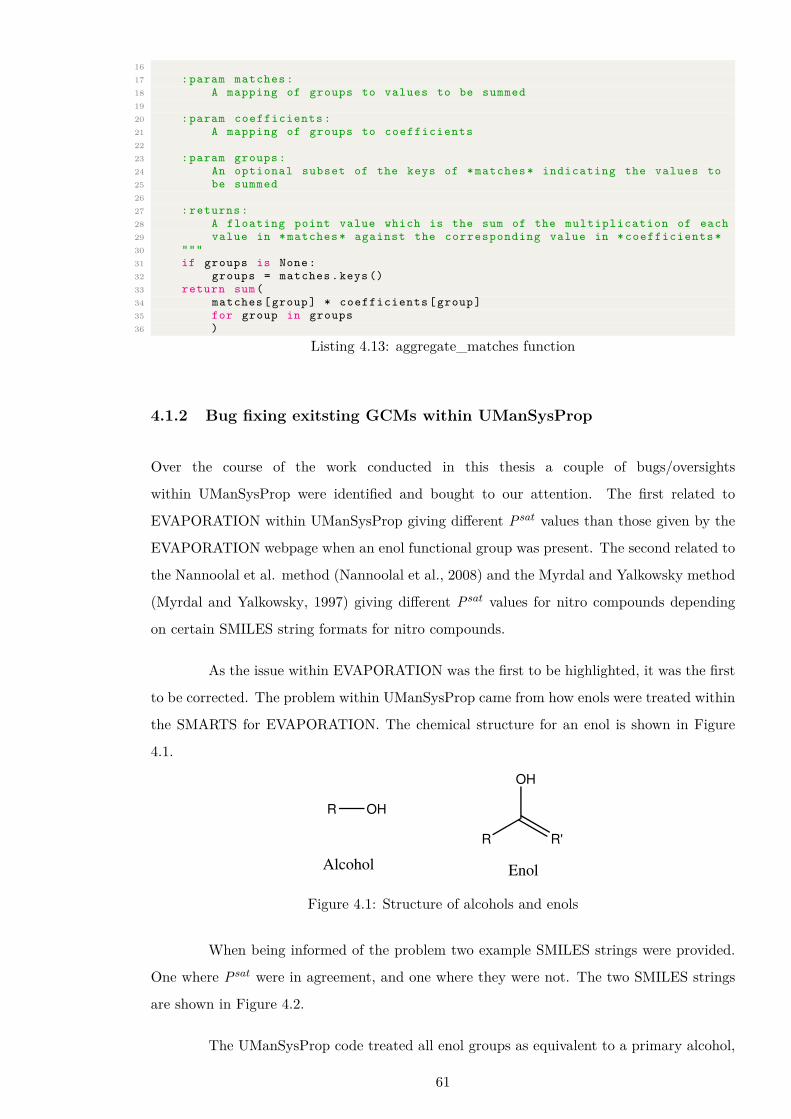
1617 :param matches :18 A mapping of groups to values to be summed1920 :param coefficients :21 A mapping of groups to coefficients2223 :param groups :24 An optional subset of the keys of * matches * indicating the values to25 be summed2627 : returns :28 A floating point value which is the sum of the multiplication of each29 value in * matches * against the corresponding value in * coefficients *30 """31 if groups is None:32 groups = matches .keys ()33 return sum(34 matches [group] * coefficients [group]35 for group in groups36 )
Listing 4.13: aggregate_matches function
4.1.2 Bug fixing exitsting GCMs within UManSysProp
Over the course of the work conducted in this thesis a couple of bugs/oversights
within UManSysProp were identified and bought to our attention. The first related to
EVAPORATION within UManSysProp giving different Psat values than those given by the
EVAPORATION webpage when an enol functional group was present. The second related to
the Nannoolal et al. method (Nannoolal et al., 2008) and the Myrdal and Yalkowsky method
(Myrdal and Yalkowsky, 1997) giving different Psat values for nitro compounds depending
on certain SMILES string formats for nitro compounds.
As the issue within EVAPORATION was the first to be highlighted, it was the first
to be corrected. The problem within UManSysProp came from how enols were treated within
the SMARTS for EVAPORATION. The chemical structure for an enol is shown in Figure
4.1.
R OH
R R'
OH
AlcoholEnol
Figure 4.1: Structure of alcohols and enols
When being informed of the problem two example SMILES strings were provided.
One where Psat were in agreement, and one where they were not. The two SMILES strings
are shown in Figure 4.2.
The UManSysProp code treated all enol groups as equivalent to a primary alcohol,
61
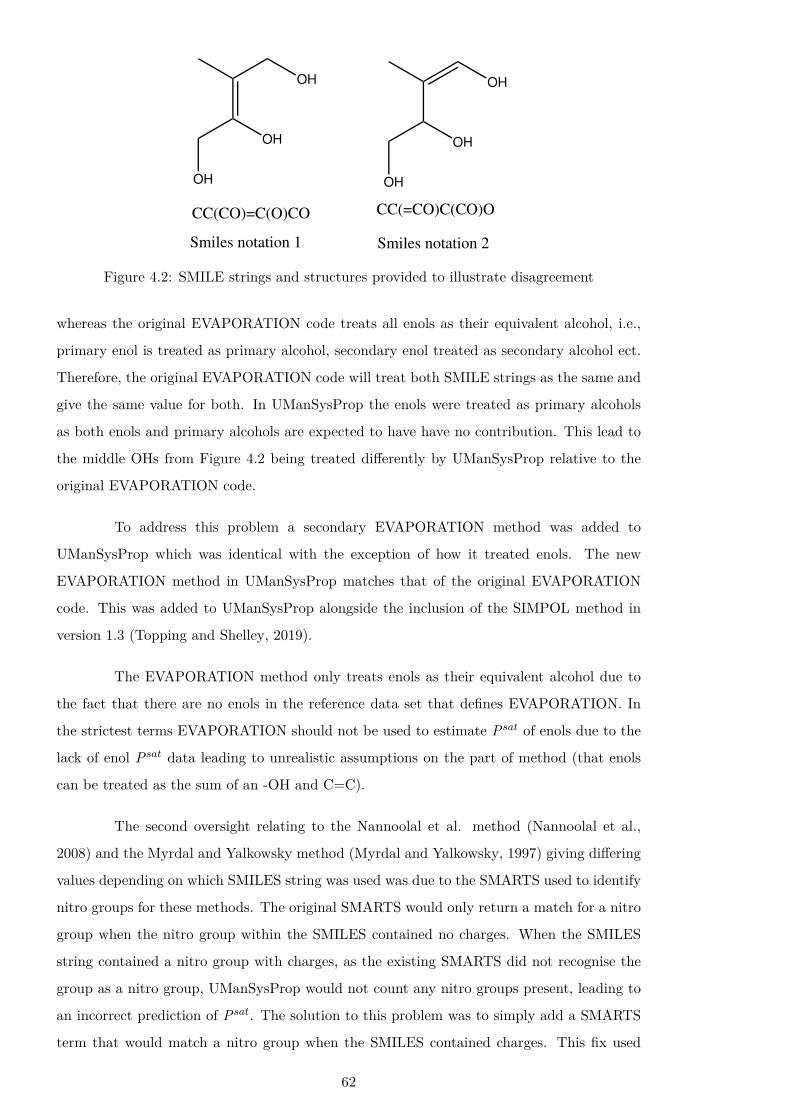
OH
OH
OH
OH
OH
OH
CC(CO)=C(O)CO CC(=CO)C(CO)O
Smiles notation 1 Smiles notation 2
Figure 4.2: SMILE strings and structures provided to illustrate disagreement
whereas the original EVAPORATION code treats all enols as their equivalent alcohol, i.e.,
primary enol is treated as primary alcohol, secondary enol treated as secondary alcohol ect.
Therefore, the original EVAPORATION code will treat both SMILE strings as the same and
give the same value for both. In UManSysProp the enols were treated as primary alcohols
as both enols and primary alcohols are expected to have have no contribution. This lead to
the middle OHs from Figure 4.2 being treated differently by UManSysProp relative to the
original EVAPORATION code.
To address this problem a secondary EVAPORATION method was added to
UManSysProp which was identical with the exception of how it treated enols. The new
EVAPORATION method in UManSysProp matches that of the original EVAPORATION
code. This was added to UManSysProp alongside the inclusion of the SIMPOL method in
version 1.3 (Topping and Shelley, 2019).
The EVAPORATION method only treats enols as their equivalent alcohol due to
the fact that there are no enols in the reference data set that defines EVAPORATION. In
the strictest terms EVAPORATION should not be used to estimate Psat of enols due to the
lack of enol Psat data leading to unrealistic assumptions on the part of method (that enols
can be treated as the sum of an -OH and C=C).
The second oversight relating to the Nannoolal et al. method (Nannoolal et al.,
2008) and the Myrdal and Yalkowsky method (Myrdal and Yalkowsky, 1997) giving differing
values depending on which SMILES string was used was due to the SMARTS used to identify
nitro groups for these methods. The original SMARTS would only return a match for a nitro
group when the nitro group within the SMILES contained no charges. When the SMILES
string contained a nitro group with charges, as the existing SMARTS did not recognise the
group as a nitro group, UManSysProp would not count any nitro groups present, leading to
an incorrect prediction of Psat. The solution to this problem was to simply add a SMARTS
term that would match a nitro group when the SMILES contained charges. This fix used
62
similar SMARTS to those shown in Section 4.1.1, Listing 4.4. This correction was included
in UManSysProp version 1.04 (Topping and Shelley, 2020).
References
Compernolle, S., Ceulemans, K., and Müller, J. F.: Evaporation: A new vapour pressureestimation methodfor organic molecules including non-additivity and intramolecularinteractions, Atmospheric Chemistry and Physics, 11, 9431–9450, doi:10.5194/acp-11-9431-2011, URL www.atmos-chem-phys.net/11/9431/2011/, 2011.
Joback, K. G., Reid, R. C., and Reid, C.: ESTIMATION OF PURE-COMPONENTPROPERTIES FROM GROUP-CONTRIBUTIONS, Chem. Eng. Commun., 157,233–243, doi:10.1080/00986448708960487, URL http://www.tandfonline.com/action/journalInformation?journalCode=gcec20https://doi.org/10.1080/00986448708960487,1987.
Myrdal, P. B. and Yalkowsky, S. H.: Estimating Pure Component Vapor Pressures of ComplexOrganic Molecules, Ind. Eng. Chem. Res., 36, 2494–2499, URL https://pubs-acs-org.manchester.idm.oclc.org/doi/pdf/10.1021/ie950242l, 1997.
Nannoolal, Y., Rarey, J., Ramjugernath, D., and Cordes, W.: Estimation ofpure component properties Part 1. Estimation of the normal boiling pointof non-electrolyte organic compounds via group contributions and groupinteractions, Fluid Phase Equilibria, 226, 45–63, doi:10.1016/j.fluid.2004.09.001,URL https://ac-els-cdn-com.manchester.idm.oclc.org/S037838120400425X/1-s2.0-S037838120400425X-main.pdf? tid=1ca55a4d-da82-483c-a764-419204799420&acdnat=1526384121 4b28465609e2541ce31908e0dca0d66d, 2004.
Nannoolal, Y., Rarey, J., and Ramjugernath, D.: Fluid Phase EquilibriaEstimation of pure component properties Part 3. Estimation of the vaporpressure of non-electrolyte organic compounds via group contributions and groupinteractions, Fluid Phase Equilibria, 269, 117–133, doi:10.1016/j.fluid.2008.04.020,URL https://ac-els-cdn-com.manchester.idm.oclc.org/S0378381208001611/1-s2.0-S0378381208001611-main.pdf? tid=50024cd4-1148-4a88-b3e7-e14cb5022fe2&acdnat=1526383962 50cf9f9aa4a5a1fa154e3356d052da78https://ac.els-cdn.com/S0378381208001611/1-s2.0-S03783812080016, 2008.
Pankow, J. F. and Asher, W. E.: SIMPOL.1: A simple group contribution methodfor predicting vapor pressures and enthalpies of vaporization of multifunctionalorganic compounds, Atmospheric Chemistry and Physics, 8, 2773–2796, doi:10.5194/acp-8-2773-2008, URL www.atmos-chem-phys.net/8/2773/2008/, 2008.
Stein, S. E. and Brown, R. L.: Estimation of Normal Boiling Points from GroupContributions, J. Chem. Inf. Comput. Sci, 34, 581–587, URL https://pubs-acs-org.manchester.idm.oclc.org/doi/pdf/10.1021/ci00019a016, 1994.
Topping, D. and Shelley, P.: UManSysProp_public: Base version V1.03, Zenodo, doi:10.5281/ZENODO.3369746, URL https://zenodo.org/record/3369746, 2019.
Topping, D. and Shelley, P.: UManSysProp_public: Base version V1.04, Zenodo, doi:10.5281/ZENODO.4110145, URL https://zenodo.org/record/4110145, 2020.
Topping, D., Barley, M., Bane, M. K., Higham, N., Aumont, B., Dingle, N., and Mcfiggans,G.: UManSysProp v1.0: an online and open-source facility for molecular propertyprediction and atmospheric aerosol calculations, Geosci. Model Dev, 9, 899–914, URLwww.geosci-model-dev.net/9/899/2016/, 2016.
63

BLANK PAGE
64

5
Results
65
5.1 Paper 1: Measured solid state and sub-cooled liquid
vapour pressures of nitroaromatics using Knudsen
effusion mass spectrometry
Authors: P. D. Shelley, T.J. Bannan, S.D. Worrall, M. R. Alfarra, U. K. Krieger, C. J.
Percival, A. Garforth, D. Topping
Journal: Atmospheric Chemistry and Physics, 20, 8293-8314, 2020.
https://doi.org/10.5194/acp-20-8293-2020.
Publication date: 17 July 2020.
Overview: This study used Knudsen effusion mass spectrometry (KEMS) and differential
scanning calorimetry (DSC) to determine PsatS and Psat
L of a range of atmospherically relevant
nitroaromatic compounds. Three subsets of nitroaromatic compounds were investigated:
nitrophenols, nitrobenzaldehydes and nitrobenzoic acids. The selected nitroaromatic
compounds contained a range of different functional groups and structural isomers allowing for
the impact of these factors on PsatS to be investigated. The ability of a compound to hydrogen
bond (H bond), and the strength of the H bond appeared to have most significant impact on
the measured Psat. Psat of a selection of the nitroaromatic compounds were also measured
using an electrodynamic balance (EDB). The KEMS and EDB showed good agreement for
the compounds that were investigated. The experimental PsatL were compared to predicted
PsatL predicted using a range of group contribution methods (GCMs). The differences between
measured and predicted PsatL were found to be up to 7 orders of magnitude. These significant
differences can be attributed to the GCMs not properly accounting for relative functional
group positioning around an aromatic ring, or the interactions between functional groups.
Author’s contribution: I was responsible for the KEMS and DSC operation during data
collection, data processing, data analysis, and the writing of the paper.
Contributions from co-authors: Thomas Bannan was responsible for the operation of the
KEMS, as well as training on the KEMS, and reviewed and edited of the initial manuscript
draft. Stephan Worrall performed some of the data analysis, contributed to the initial
draft, and reviewed and edited the manuscript. Rami Alfarra was responsible for project
supervision and review of the manuscript. Ulrich Krieger carried out experiments on the
EDB to corroborate the KEMS results, perfomed some of the data analysis, and reviewed
the manuscript. Carl Percival contributed to the initial manuscript. Arthur Garforth was
responsible for access to and training on the DSC. David Topping was responsible for project
66

supervision and reviewed the manuscript.
67
1
Measured solid state and sub-cooled liquid vapour pressures of nitroaromatics using Knudsen effusion mass spectrometry
Petroc D. Shelley1, Thomas J. Bannan1, Stephen D. Worrall2, M. Rami Alfarra1,3, Ulrich K. Krieger4, Carl J. Percival5, Arthur Garforth6, David Topping1 1Department of Earth and Environmental Sciences, University of Manchester, Manchester, UK 5 2Aston Institute of Materials Research, School of Engineering and Applied Science, Aston University, Birmingham, UK 3National Centre for Atmospheric Science (NCAS), University of Manchester, Manchester, UK 4Institute for Atmospheric and Climate Science, ETH Zurich, Switzerland 5NASA Jet Propulsion Laboratory, California Institute of Technology, 4800 Oak Grove Dr, Pasadena, CA 91109, USA 6Department of Chemical Engineering & Analytical Science, University of Manchester, Manchester, UK 10
Correspondence to: Petroc D. Shelley ([email protected]), Thomas J. Bannan ([email protected]), Stephen D. Worrall ([email protected]), M. Rami Alfarra ([email protected]), Ulrich K. Krieger ([email protected]), Carl J. Percival ([email protected]), Arthur Garforth ([email protected]), David Topping ([email protected]) 15
Abstract. Knudsen Effusion Mass Spectrometry (KEMS) was used to measure the solid state saturation vapour pressure (P )
of a range of atmospherically relevant nitroaromatic compounds over the temperature range from 298 to 328 K. The selection
of species analysed contained a range of geometric isomers and differing functionalities, allowing for the impacts of these
factors on saturation vapour pressure (P ) to be probed. Three subsets of nitroaromatics were investigated: nitrophenols,
nitrobenzaldehydes and nitrobenzoic acids. The P values were converted to subcooled liquid saturation vapour pressures 20
(P ) using experimental enthalpy of fusion and melting point values measured using differential scanning calorimetry (DSC).
The P values were compared to those estimated by predictive techniques and, with a few exceptions, were found to be up
to 7 orders of magnitude lower. The large differences between the estimated P and the experimental values can be attributed
to the predictive techniques not containing parameters to adequately account for functional group positioning around an
aromatic ring, or the interactions between said groups. When comparing the experimental P of the measured compounds 25
the ability to hydrogen bond (H Bond), and the strength of a H bond formed appear to have the strongest influence on the
magnitude of the P with steric effects and molecular weight also being major factors. Comparisons were made between the
KEMS system and data from diffusion-controlled evaporation rates of single particles in an electrodynamic balance (EDB).
The KEMS and the EDB showed good agreement with each other for the compounds investigated.
1 Introduction 30
Organic aerosols (OA) are an important component of the atmosphere with regards to resolving the impact aerosols have on
both climate and air quality (Kroll and Seinfeld, 2008). To predict how OA will behave requires knowledge of their
physiochemical properties. OA consist of primary organic aerosols (POA) and secondary organic aerosols (SOA). POA are
emitted directly into the atmosphere as solid or liquid particulates and make up about 20% of OA mass globally (Ervens et al.,
2011), but the exact percentage of POA varies by a significant amount from region to region. SOA are not emitted into the 35
atmosphere directly as aerosols, but instead form through atmospheric processes such as gas phase photochemical reactions
followed by gas-to-particle partitioning in the atmosphere (Pöschl, 2005). A key property for predicting the partitioning of
compounds between the gaseous and aerosol phase is the pure component equilibrium vapour pressure, also known as the
saturation vapour pressure (P ) (Bilde et al., 2015). It has been estimated that the number of organic compounds in
2
the atmosphere is in excess of 100,000 (Hallquist et al., 2009); therefore it is not feasible to measure the P of each 40
experimentally. Instead, P are often estimated using group contribution methods (GCMs) that are designed to capture the
functional dependencies on predicting absolute values. GCMs start with a base molecule with known properties, typically the
carbon skeleton. A functional group is then added to the base molecule. This addition will change the P and the difference
between the base molecule and the functionalised molecule is the contribution from that particular functional group. If this
concept is true then the contribution from the functional group should not be affected by the base molecule to which it is added 45
(Bilde et al., 2015). Whilst this is true in many cases, there are numerous exceptions. These exceptions normally occur when
proximity effects occur, such as neighbouring group interactions or other mesomeric effects. In this work there will be a focus
on the Nannoolal et al. method (Nannoolal et al., 2008), the Myrdal and Yalkowsky method (Myrdal and Yalkowsky, 1997)
and SIMPOL (Pankow and Asher, 2008). Detailed assessments of such methods have been made by Barley and McFiggans (
2010) and O’Meara et al. (2014) often showing predicted values differ significantly from experimental data. The limitations 50
and uncertainties of GCMs come from a range of factors including underrepresentation of long chain hydrocarbons (>C18),
underrepresentation of certain functional groups, such as nitro or nitrate groups, a lack of data for the impact of intramolecular
bonding, and the temperature dependence due to the need for extrapolation over large temperature ranges to reach ambient
conditions (Bilde et al., 2015). This has important implications for partitioning modelling, in a mechanistic sense, such as an
over or underestimation of the fraction partitioning to the particulate state. Different GCMs have different levels of reliability 55
for different classes of compound and perform much more reliably if the compound of interest resembles those used
in the parametrisation data set of the GCM (Kurtén et al., 2016). For example, in the assessment by O’Meara et al. (2014), for
the compounds to which it is applicable, EVAPORATION (Compernolle et al., 2011) was found to give the minimum mean
absolute error, the highest accuracy for SOA loading estimates and the highest accuracy for SOA composition. Despite this
EVAPORATION should not be used for aromatic compounds, as there are no aromatic compounds in the parametrisation 60
dataset (Compernolle et al., 2011). Methods developed with OA in mind, such as EVAPORATION (Estimation of VApour
Pressure of ORganics, Accounting for Temperature, Intramolecular, and Non-additivity effects, Compernolle et al., 2011), are
not without their limitations due to the lack of experimental data available for highly functionalised, low volatility organic
compounds (Bannan et al., 2017). As the degree of functionality increases so does the difficulty in predicting the P as more
intramolecular forces, steric effects, and shielding effects must be considered. The majority of GCMs designed for estimating 65
P of organic compounds were developed for the chemical industry with a focus on monofunctional compounds with P
on the order of 103 – 105 Pa (Bilde et al., 2015). SOA, in contrast, are typically multifunctional compounds with P often
many orders of magnitude below 10-1 Pa (Barley and McFiggans, 2010). GCM development, with a focus on the P of SOA
has to deal with a lack of robust experimental data and, historically, large differences in measurement data depending on the
technique and instrument used to acquire the data. To address this problem Krieger et al. (2018) identified a reference data set 70
for validating P measurements using the polyethylene glycol (PEG) series. To improve the performance of GCMs when
3
applied to highly functionalised compounds, more data is required that probes both the effect of relative functional group
positioning and the effects of interaction between functional groups on P , such as in the work by Booth et al. (2012) and
Dang et al. (2019). In this study the solid state saturation vapour pressure (P ) and sub-cooled liquid saturation vapour
pressures (P ) of three families of nitroaromatic compounds are determined using KEMS, building on the work done by 75
Dang et al. (2019) and Bannan et al. (2017). These include substituted nitrophenols, substituted nitrobenzoic acids and
nitrobenzaldehydes. Nitroaromatics are useful tracers for anthropogenic emissions (Grosjean, 1992), and many nitroaromatic
compounds are noted to be highly toxic (Kovacic and Somanathan, 2014). Studies quantifying the overall role of nitrogen
containing organics on aerosol formation would also benefit from more refined P (Duporté et al., 2016; Smith et al., 2008).
Even if mechanistic models perform poorly predicting aerosol mass due to missing process phenomena, resolving the 80
partitioning is still important. Several studies have reported the observation of methyl nitrophenols (Chow et al., 2016;
Kitanovski et al., 2012; Schummer et al., 2009) and nitrobenzoic acids (van Pinxteren and Herrmann, 2007).
Nitrobenzaldehydes can form from the photo-oxidation of toluene in a high NOx environment (Bouya et al., 2017). Both
nitrophenols and nitrobenzoic acids were identified in the review paper by Bilde et al. (2015) as compounds of interest and
recommendations for further study. Aldehyde groups tend to have little impact on P by themselves but the =O of the 85
aldehyde group can act as a hydrogen bond acceptor.
There is a general lack of literature vapour pressure data for nitroaromatic compounds, and despite recent work on
nitrophenols by Bannan et al. (2017), there is still a lack of data on such compounds in the literature. This is reflected, in part,
in the effectiveness of the GCMs to predict the P of such compounds.
Here we present P and P data for 20 nitroaromatic compounds. The P data was collected using Knudsen effusion mass 90
spectrometry (KEMS) with a sub-cooled correction performed with thermodynamic data from a differential scanning
calorimeter (DSC). The trends in the P data are considered and chemical explanations are given to explain the observed
differences.
As identified by Bilde et al. (2015), experimental P can differ by several orders of magnitude among techniques. One way
of mitigating this is to collect data for a compound using multiple techniques, whilst running reference compounds to assess 95
consistency among the employed methods. We therefore use supporting data from the electro dynamic balance (EDB) at ETH
Zurich for three of the nitroaromatic compounds.
The P data is then compared with the predicted P of the GCMs, highlighting where they perform well and where they
perform poorly. Finally, these measurements using the new PEG reference standards are compared to past KEMS
measurements using an old reference standard due to differences in experimental P between this work and previous KEMS 100
work.
4
2 Experimental
Compound Selection
A total of 10 nitrophenol compounds were selected for this study including 9 monosubstituted, 4 nitrobenzaldehydes including
1 monosubstituted, and 6 nitrobenzoic acids including 5 monosubstituted. The nitrophenols are shown in Table 1, the 105
nitrobenzaldehydes are shown in Table 2, and the nitrobenzoic acids are shown in Table 3. All compounds selected for this
study were purchased at a purity of 99% and were used without further preparation. All compounds are solid at room
temperature.
2.1 Knudsen effusion mass spectrometry system (KEMS)
The KEMS system is the same system that has been used in previous studies (Bannan et al., 2017; Booth et al., 2009, 110
2010) and a summary of the measurement procedure will be given here. For a more detailed overview see Booth et al. (2009).
To calibrate the KEMS, a reference compound of known P is used. In this study the polyethylene glycol series (PEG series),
PEG-3 (P298 = 6.68x10⁻² Pa) and PEG-4 (P298 = 1.69×10⁻² Pa) (Krieger et al., 2018), were used. The KEMS has been shown
to accurately measure the P of PEG-4 in the study by Krieger et al. (2018) but the KEMS did not measure the P of PEG-
3. In this study when using PEG-4 as a reference compound for PEG-3 the measured P of PEG-3 had an error of 30 % 115
compared to the experimental values from Krieger et al. ( 2018), well within the quoted 40 % error margin of the KEMS
(Booth et al., 2009). When using PEG-3 as the reference compound for PEG-4 the measured P of PEG-4 had an error of 20
%.
The reference compound is placed in a temperature controlled Knudsen cell. The cell has a chamfered orifice through which
the sample effuses creating a molecular beam. The size of the orifice is ≤1/10 the mean free path of the gas molecules in the 120
cell. This ensures that the particles effusing through the orifice do not disturb the thermodynamic equilibrium of the cell. The
molecular beam is then ionised using a standard 70 eV electron impact ionisation, and analysed using a quadrupole mass
spectrometer.
After correcting for the ionisation cross section (Booth et al., 2009) the signal generated is proportional to the P . Once the
calibration process is completed it is possible to measure a sample of unknown P . When the sample is changed it is 125
necessary to isolate the sample chamber from the measurement chamber using a gate valve so that the sample chamber can be
vented, whilst the ioniser filament and the secondary electron multiplier (SEM) detector can remain on and allow for direct
comparisons with the reference compound. The P of the sample can be determined from the intensity of the mass spectrum,
if the ionisation cross section at 70 eV, and the temperature at which the mass spectrum was taken are known. The samples
of unknown P are typically solid so it is the P that is determined. After the P (Pa), has been determined for multiple 130
temperatures, the Clausius-Clapeyron equation (Eq. 1) can be used to determine the enthalpy and entropy of sublimation as
shown in Booth et al. (2009).
ln(𝑃 ) =∆
+∆
(1)
5
where T is the temperature (K), R is the ideal gas constant (J mol−1 K−1), ∆Hsub is the enthalpy of sublimation (J mol−1) and
∆Ssub is the entropy of sublimation (J mol−1 K−1). P was obtained over a range of 30 K in this work starting at 298 K and 135
rising to 328 K. The reported solid state vapour pressures are calculated from a linear fit of ln (P ) vs 1/T using the Clausius-
Clapeyron equation.
2.2 Differential scanning calorimetry (DSC)
According to the reference state used in atmospheric models, and as predicted by GCMs, P is required. Therefore it is
necessary to convert the P determined by the KEMS system into a P . As with previous KEMS studies (Bannan et al., 140
2017; Booth et al., 2010, 2017) the melting point (Tm) and the enthalpy of fusion (∆Hfus) are required for the conversion. These
values were measured with a TA Instruments DSC 2500 Differential Scanning Calorimeter (DSC). Within the DSC, heat flow
and temperature were calibrated using an indium reference, and heat capacity using a sapphire reference. A heating rate of 10
K min−1 was used. 5-10 mg of sample was measured using a microbalance and then pressed into a hermetically sealed
aluminium DSC pan. A purge gas of N2 was used with a flow rate of 30 mL min−1. Data processing was performed using the 145
‘Trios’ software supplied with the instrument. ∆cp,sl was estimated using ∆cp,sl = ∆Sfus (Grant et al., 1984; Mauger et al., 1972).
2.3 Electrodynamic balance (EDB)
The recently published paper by Dang et al. (2019) measured the P of several of the same compounds that are studied
in this paper using the same KEMS system, however in this study the newly defined best practice reference sample was
used (Krieger et al., 2018), whereas Dang et al. (2019) used malonic acid. The difference in reference compound led to a 150
discrepancy in the experimental P . Supporting measurements for the compounds were performed using the EDB from ETH
Zurich in order to rule out instrumental problem with the KEMS. The EDB from ETH Zurich has been used to investigate
P of low volatility compounds in the past (Huisman et al., 2013; Zardini et al., 2006; Zardini and Krieger, 2009) and a brief
overview will be given here. For full details see Zardini et al. (2006) and Zardini and Krieger (2009). The EDB can be applied
to both liquid particles and non-spherical solid particles (Bilde et al., 2015). The EDB uses a double ring configuration (Davis 155
et al., 1990) to levitate a charged particle in a cell with a gas flow free from the evaporating species under investigation. There
is precise control of both temperature and relative humidity within the cell. Diffusion-controlled evaporation rates of the
levitated particle are measured at a fixed temperature and relative humidity by precision sizing using optical resonance
spectroscopy in backscattering geometry with a broadband LED source and Mie theory for the analysis (Krieger et al., 2018).
P is calculated at multiple temperatures and the Clausius-Clapeyron equation can be used to calculate P at a given 160
temperature (Eq. 1).
As single particles injected from a dilute solution may either stay in a supersaturated, liquid state or crystallize, it is important
to identify its physical state.
6
For 4-methyl-3-nitrophenol a 3 % solution dissolved in isopropanol was injected into the EDB. After the injection and fast
evaporation of the isopropanol, all particles were non-spherical, but with only small deviations from a sphere, meaning that it 165
was unclear whether the phase was amorphous or crystalline. To determine the phase of this first experiment, a second
experiment was performed, where a solid particle was injected directly into the EDB. Mass loss with time was measured by
following the DC voltage necessary to compensate the gravitational force acting on the particle to keep the particle levitating.
When comparing the P from both of these experiments it is clear that the initial measurement of 4-methyl-3-nitrophenol
was in the crystalline phase. 170
3-methyl-4-nitrophenol was only injected as a solution but the particle crystallized and was clearly in the solid state.
4-methyl-2-nitrophenol was injected as both a 3 % and 10 % solution. Despite being able to trap a particle, the particle would
completely evaporate within about 30 seconds. This evaporation time scale is too small to allow the EDB to collect any
quantitative data. Using the equation for large particles neglecting evaporative cooling (Hinds, 1999) (Eq. 2) it is possible to
estimate P 175
𝑡 =∙
(2)
where t is the time that the particle was trapped within the cell of the EDB, R is the ideal gas constant, ρ is the density of the
particle, dp is the diameter of the particle, D is the diffusion coefficient, M is the molecular mass, T is the temperature, and Psat
is the saturation vapour pressure. Eq. 2 gives approximately 4.3E-03 Pa for P at 290 K.
180
3 Theory
3.1 Sub-cooled correction
The conversion between P and P is done using the Prausnitz equation (Prausnitz et al., 1998) (Eq. 3)
ln =∆
− 1 −∆ ,
− 1 +∆ ,
𝑙𝑛 (3)
where P /P is the ratio between P and P , ∆Hfus is the enthalpy of fusion (J mol−1), ∆cp,sl is the change in heat capacity 185
between the solid and liquid states (J mol−1 K−1),T is the temperature (K) and Tm is the melting point (K).
3.2 Vapour pressure predictive techniques
The most common P prediction techniques are GCMs. Several different GCMs have been developed (Moller et al., 2008;
Myrdal and Yalkowsky, 1997; Nannoolal et al., 2008; Pankow and Asher, 2008) with some being more general and others,
such as the EVAPORATION method (Compernolle et al., 2011), having been developed with OA as the target compounds. 190
The Myrdal and Yalkowsky method (Myrdal and Yalkowsky, 1997), the Nannoolal et al. method (Nannoolal et al., 2008), and
the Moller et al. method (Moller et al., 2008) are combined methods requiring a boiling point, Tb, as an input. If the Tb of a
compound is known experimentally it is an advantage, but most atmospherically relevant compounds have an unknown Tb so
the Tb that is used as an input is calculated using a GCM. The combined methods use a Tb calculated using a GCM for many
7
of the same reasons that GCMs are used to calculate P , i.e. the difficulty in acquiring experimental data for highly reactive 195
compounds or compounds with short lifetimes. The Nannoolal et al. method (Nannoolal et al., 2004), Stein and Brown method
(Stein and Brown, 1994), and Joback and Reid method (Joback et al., 1987) are most commonly used. The Joback and Reid
method is not considered in this paper due to its known biases (Barley and McFiggans, 2010) and the Stein and Brown method
being an improved version of Joback and Reid. The Tb used in the combined methods is, however, another source of potential
error and for methods that extrapolate P from Tb, the size of this error increases with increasing difference between Tb and 200
the temperature to which it is being extrapolated (O’Meara et al., 2014). EVAPORATION (Compernolle et al., 2011) and
SIMPOL (Pankow and Asher, 2008) do not require a boiling point, only requiring a structure and a temperature of interest.
The main limitation for many GCMs, aside from the data required to create and refine them, is not accounting for
intramolecular interactions, such as hydrogen bonding, or steric effects. The Nannoolal et al. method (Nannoolal et al., 2008),
Moller et al. method (Moller et al., 2008), and EVAPORATION (Compernolle et al., 2011) attempt to address this by having 205
secondary interaction terms. In the Nannoolal et al. method (Nannoolal et al., 2008), there are terms to account for -ortho,
-meta, -para isomerism of aromatic compounds, however there are no terms for dealing with tri- or greater substituted
aromatics, and in these instances all isomers give the same prediction. A common misuse of GCMs occurs when a GCM is
applied to a compound containing functionality not included in the training set, e.g. using EVAPORATION (Compernolle et
al., 2011) with aromatic compounds or using SIMPOL (Pankow and Asher, 2008) with compounds containing halogens. As 210
the GCM does not have the tools to deal with this functionality it will either misattribute a contribution, in the EVAPORATION
(Compernolle et al., 2011) example the aromatic structure would be treated as a cyclical aliphatic structure, or simply ignore
the functionality, as is the case when SIMPOL (Pankow and Asher, 2008) is used for halogen containing compounds. When
selecting a GCM to model P it is essential to investigate whether the method is applicable to the compounds of interest. Of
the popular P GCMs, the Myrdal and Yalkowsky method (Myrdal and Yalkowsky, 1997) contains only three nitroaromatic 215
compounds, the Nannoolal et al. method (Nannoolal et al., 2008) contains thirteen, the Moller et al. (Moller et al., 2008)
contains no more than fourteen, SIMPOL (Pankow and Asher, 2008) contains twenty five, and EVAPORATION
(Compernolle et al., 2011) contains zero. The specific nitroaromatics used by the Nannoolal et al. method and the Moller et
al. method are not stated (to the author’s knowledge) as the data was taken directly from the Dortmund Data Bank. Despite
the SIMPOL (Pankow and Asher, 2008) method containing twenty five nitroaromatic compounds, eleven of these are taken 220
from a gas chromatography method using a single data point from a single data set (Schwarzenbach et al., 1988).
3.3 Inductive and resonance effects
All functional groups around an aromatic ring either withdraw or donate electron density. This is a result of two major effects,
the inductive effect and the resonance effect, or a combination of the two (Ouellette et al., 2015a). The inductive effect is the
unequal sharing of the bonding electron through a chain of atoms within a molecule. A methyl group donates electron density, 225
relative to a hydrogen atom, so is therefore considered an electron donating group, whereas a chloro group withdraws electron
8
density and is therefore considered an electron withdrawing group. The resonance effect occurs when a compound can have
multiple resonance forms. In a nitro group, as the oxygen atoms are more electronegative than the nitrogen atom, a pair of
electrons from the nitrogen-oxygen double bond can be moved onto the oxygen atom followed by a pair of electrons being
moved out of the ring to form a carbon-nitrogen double bond and leaving the ring with a positive charge. This leads to the 230
nitro group acting as an electron withdrawing group. In an amino group, on the other hand, the hydrogens are not more electro
negative than the nitrogen; instead the lone pair on the nitrogen can be donated into the ring, causing the ring to have a negative
charge, and the amino group to act as an electron donating group. Examples of the inductive effect and the resonance effect
are given in Fig. 1 (Ouellette et al., 2015a).
Some functional groups, such as an aromatic OH group, can both donate and withdraw electron density at the same time. In 235
phenol the OH group withdraws electron density via the inductive effect, but it also donates electron density via the resonance
effect. This is shown in Fig. 2. As the resonance effect is typically much stronger than the inductive effect, OH has a net
donation of electron density in phenol (see Fig.2).
The positioning of the functional groups around the aromatic ring determine to what extent the inductive and resonance effects
occur. The changes in electron density due to the inductive effect and the resonance effect also change the partial charges on 240
the atoms within the aromatic ring. These changes impact the strength of any potential H-bonds that may form.
4 Results and discussion
4.1 Solid state vapour pressure
P measured directly by the KEMS are given in Tables 4, 5 and 6 for the nitrophenols, nitrobenzaldehydes and nitrobenzoic
acids respectively. Measurements were made at increments of 5 K from 298 to 328 K with the exception of the following 245
compounds that melted during the temperature ramp. 2-nitrophenol was measured between 298 K and 318 K, 3-methyl-4-
nitrophenol was measured between 298 K and 313K, 4-methyl-2-nitrophenol was measured between 298 K and 303 K, 5-
fluoro-2-nitrophenol was measured between 298 K and 308 K, and 2-nitrobenzaldehyde was measured between 298 K and
313 K. The Clausius-Clapeyron equation (Eq. 1) was used to calculate the enthalpies and entropies of sublimation. The melting
points of compounds studied are given in Table 7. Generally speaking, considering the different groups of compounds as a 250
whole, the nitrobenzaldehydes studied exhibit higher P (order of magnitude) than the nitrophenols and nitrobenzoic acids
studied. This is most likely due to the fact that none of the nitrobenzaldehydes studied herein are capable of undergoing
hydrogen bonding (H-bonding) whilst all of the nitrophenols and nitrobenzoic acids, to varying extents, are capable of
hydrogen bonding. The nitrophenols and nitrobenzoic acids studied exhibit a range of overlapping P so nothing can be
inferred when considering these two types of compounds together as groups; therefore the differences within each of the groups 255
must be considered.
9
Considering first the nitrophenols, Table 4, the highest P compound is 2-fluoro-4-nitrophenol (2.75E-02 Pa). There are two
potential H-bonding explanations for why this compound has such a high P relative to the other nitrophenols and fluoro
nitrophenols. First, in this isomer the presence of the F atom on the C adjacent to the OH group gives rise to intramolecular H-
bonding (Fig. 3 left) which reduces the extent of intermolecular interaction possible and increases P . This effect can clearly 260
be seen from the fact that in 3-fluoro-4-nitrophenol, where the F atom is positioned further away from the OH group, the P
is significantly lower (4.55E-03) due to the fact that intermolecular H-bonding can occur (Fig. 3 right).However, in the work
by Shugrue et al. (2016) it is stated that neutral organic fluoro and nitro groups form very weak hydrogen bonds, which whilst
they do exist, can be difficult to even detect by many conventional methods.
The second explanation depends on the inductive effect mentioned previously. By using MOPAC2016 (Stewart, 2016), a semi 265
empirical quantum chemistry program based on the neglect of diatomic differential overlap (NDDO) approximation (Dewar
and Thiel, 1977), the partial charges of the phenolic carbon can be calculated. The partial charge of the phenolic carbon can
be dependent on the orientation of the OH if the molecule doesn’t have a plane of symmetry, so in this work the partial charge
used is an average of the two extreme orientations of the OH, as shown in Fig. 4. A plot of P vs the partial charge of the
phenolic carbon for the nitrophenols can be found in Fig. 5. 270
The partial charge of the phenolic carbon in 2-fluoro-4-nitrophenol is 0.275 with a P of 2.75E-02 Pa, whereas for 3-fluoro-
4-nitrophenol it is 0.379 with a P of 4.55E-03 Pa. The more positive the partial charge of the phenolic carbon the better it is
able to stabilise the increased negative charge which will develop on the O atom as a result of H-bond formation. As a result
stronger intermolecular H-bonds are formed, therefore giving rise to a lower P . Moving the nitro group from being para to
the OH in 3-fluoro-4-nitrophenol to meta to the OH in 5-fluoro-2-nitrophenol further reduces the P to 4.25E-03 Pa. This 275
reduction in P can also be explained via the combination of the inductive effect and the resonance effect as the partial charge
of the phenolic carbon rises from 0.379 to 0.396, again implying stronger intermolecular H-bonds and, therefore, a lower P .
For the fluoro nitrophenols, as shown in Fig. 5, as the partial charge of the phenolic carbon increases the PSsat increases.
A similar trend occurs in the methyl nitrophenols as in the fluoro nitrophenols with a larger partial charge of the phenolic
carbon corresponding to a lower P , as shown in Fig 5. 3-methyl-2-nitrophenol is an exception to this and is discussed shortly. 280
3-methyl-4-nitrophenol has the most positive partial charge with 0.362 and the lowest P of 1.78E-03 Pa, 4-methyl-2-
nitrophenol has the next most positive partial charge of 0.343 and the next lowest P of 3.11E-03, and 4-methyl-3-nitrophenol
has the least positive partial charge of 0.249 and the highest P of 1.08E-02. 3-methyl-2-nitrophenol does not follow this
trend, however, with it having a partial charge of 0.378 and a P of 9.90E-03. As shown in Fig. 5 3-methyl-2-nitrophenol
would be expected to have a much lower PSsat than is observed due to the high partial charge on the phenolic carbon. A possible 285
explanation as to why 3-methyl-2-nitrophenol does not follow this same trend is the positioning of its functional groups. As
shown in Fig. 6 (left), all of the functional groups are clustered together and the proximity of the functional groups sterically
10
hinders the formation of H-bonds, thus increasing the P . Conversely as shown in Fig. 6 (right) the fact that the methyl group
is further away in 4-methyl-2-nitrophenol leads to less steric hindrance of H-bond formation.
Whilst 3-methyl-2-nitrophenol has a higher P than is expected given the partial charge on the phenolic carbon, 4-amino-2-290
nitrophenol has a much lower P (Fig. 5). This is likely due to 4-amino-2-nitrophenol being capable of forming more than
one hydrogen bond, whereas all the other compounds investigated were only capable of forming one H-bond. However, despite
4-amino-2-nitrophenol being capable of forming more than 1 H-bond, replacing the methyl group on 4-methyl-2-nitrophenol
with an amino group to form 4-amino-2-nitrophenol surprisingly increases the P from 3.11E-03 Pa to 3.36E-03 Pa. The
higher P can be explained via the combination of the inductive effect and the resonance effect. Whilst the partial charge of 295
the phenolic carbon in 4-methyl-2-nitrophenol is 0.343, the partial charge of the phenolic carbon in 4-amino-2-nitrophenol is
only 0.264 and the partial charge of the carbon bonded to the amine group is only 0.211. So whilst 4-amino-2-nitrophenol is
capable of forming two intermolecular H-bonds compared to 4-methyl-2-nitrophenol’s one, they will be much weaker. 4-
amino-2-nitrophenol is a good example of a compound with multiple competing factors affecting P leading to higher P
than would be expected due to one factor and lower P than expected from another. 300
Similar to 4-amino-2-nitrophenol, 4-chloro-3-nitrophenol also has a lower P than expected according to the partial charge
of the phenolic carbon. This can be seen in Fig. 5. Unlike 4-amino-2-nitrophenol the explanation for 4-chloro-3-nitrophenol is
simpler. Replacing the methyl group on 4-methyl-3-nitrophenol with a chloro group to form 4-chloro-3-nitrophenol reduces
the P from 1.08E-02 Pa to 2.26E-03 Pa. This reduction in P can be explained by the increase in partial charge of the
phenolic carbon from 0.249 to 0.266, as well as a 13% increase in molecular weight. 305
Replacing the F atom in 3-fluoro-4-nitrophenol with a methyl group to form 3-methyl-4-nitrophenol further reduces the P
(1.78E-03) although exactly why is unclear. The methyl group cannot engage in intermolecular H-bonding, it will sterically
hinder any H-bonding that the NO2 group undergoes and it reduces the partial charge of the phenolic carbon of the molecule
(from 0.379 to 0.362) (Stewart, 2016) which would reduce the strength of H-bonding interactions between the molecules.. It
is possible that the crystallographic packing density of 3-methyl-4-nitrophenol is higher although no data is available to support 310
this, although when looking at P data (Section 4.2) 3-methyl-4-nitrophenol exhibits a higher P than 3-fluoro-4-
nitrophenol which is what would be expected given the respective partial charges of the phenolic carbons.
Removing the methyl group from 4-methyl-2-nitrophenol to give 2-nitrophenol causes the P to drop from 3.11E-03 Pa to
8.94E-04 Pa. This reduction in P matches an increase in the positive partial charge of the phenolic carbon, from 0.343 to
0.383, implying an increase in the strength of the intermolecular H-bonds and therefore a reduction in P . 315
Now considering the nitrobenzaldehydes (Table 5) the highest P compound is 2-nitrobenzaldehyde (3.32E-01). Comparing
this to 2-nitrophenol (8.94E-04) shows how significant the ability to form H-bonds is to the P of a compound, with replacing
a hydroxyl group (capable of H-bonding) with an aldehyde group (incapable of H-bonding) raising the P of the compound
by more than two orders of magnitude. The decrease in P observed by moving the nitro group from being ortho to the
11
aldehyde group in 2-nitrobenzaldehyde, to being meta in 3-nitrobenzaldehyde (1.21E-01) and para in 4-nitrobenzaldehyde 320
(3.40E-02) can be explained using the different crystallographic packing densities of the three isomers as shown in Fig. 7.
Crystallographic packing density is a measure of how densely packed the molecules of a given compound are when they
crystallise, the more closely packed molecules are the greater the overall extent of interaction between them and the lower the
P . The order of the P observed here for the three isomers of nitrobenzaldehyde matches that of their crystallographic
packing densities (Coppens and Schmidt, 1964; Engwerda et al., 2018; King Jnr and Bryant Jnr, 1996), with the lowest P 325
correlating with the highest packing density and vice versa.
The addition of a Cl atom to 3-nitrobenzaldehyde is also observed to decrease the compounds P . This can be simply
rationalised due to the greater than 25% increase this causes to the molecular weight. The higher a compounds molecular
weight the greater the overall extent of interaction between its molecules and the lower its P .
Finally considering the nitrobenzoic acids (Table 6), the highest P compound is 4-methyl-3-nitrobenzoic acid (4.67E-03). 330
Its isomer 3-methyl-4-nitrobenzoic acid possesses a slightly lower P (3.97E-03) as well as a slightly lower partial charge of
the carboxylic carbon (0.644 vs 0.628) although the difference in P is not significant.
Removing the methyl group from 4-methyl-3-nitrobenzoic acid to give 3-nitrobenzoic acid (1.10E-03) reduces the observed
P most likely due to the reduction in steric hindrance around the nitro group which would allow for more effective H-
bonding. In addition 3-nitrobenzoic acid possesses a lower P than the corresponding 3-nitrobenzaldehyde due to its ability 335
to form H-bonds. Adding a hydroxyl group or a Cl atom to 3-nitrobenzoic acid to give 2-hydroxy-5-nitrobenzoic acid (1.79E-
03) or 2-chloro-3-nitrobenzoic acid (1.97E-03) respectively increases the observed P as the addition of the extra functional
group leads to increased intramolecular H-bonding occurring. Additionally, comparing 2-hydroxy-5-nitrobenzoic acid with 2-
fluoro-4-nitrophenol demonstrates how the increased ability of carboxylic acid to partake in H-bonding compared to a F atom
leads to a suppression of P . 5-Chloro-2-nitrobenzoic acid has a higher P (2.98E-03 Pa) than 2-chloro-3-nitrobenzoic acid 340
(1.97E-03 Pa), its structural isomer. The increase in P can be attributed to the increase partial charge of the carbon within
the carboxylic acid group (0.627 increasing to 0.640).
When comparing nitrobenzoic acids as a whole with nitrophenols, nitrobenzoic acids have a much higher P than would be
expected based solely on the partial charges of the carboxylic carbon. As can be seen in Fig. 8, there is overlap in the range of
P for the nitrobenzoic acids and many of the nitrophenols, however there is no overlap in terms of partial charges of the 345
carboxylic and phenolic carbons, with all of the nitrobenzoic acids having partial charges of the carboxylic carbon greater than
0.6, whilst the nitrophenols had much lower partial charges of the phenolic carbon between 0.2 and 0.4. It is widely known
that the H-bonds of carboxylic acids are stronger than the H-bonds of alcohols (Ouellette et al., 2015b) so therefore it would
be expected that the carboxylic acids would have a lower P . A likely reason as to why the P of the nitrobenzoic acids is
higher than would be expected, compared to the nitrophenols, based only on the partial charge of the carboxylic carbon is the 350
propensity for carboxylic acids to dimerise (see Fig. 9). Nitrophenols are unable to dimerise, instead being able to form H-
12
bonds with up to 2 other molecules as shown in Fig. 9. By dimerising the nitrobenzoic acids, despite having much stronger H-
bonds than the nitrophenols, will not have a proportionally lower P .
In summary the ability to form H-bonds appears to be the most significant factor affecting the P of a compound, where
molecules that are able to form these strong intermolecular interactions generally always exhibit lower P than those that 355
cannot. Additionally different functional groups are able to form different numbers of H-bonds; with those that are able to
form more H-bonds generally supressing P to a greater extent than those that form less. The relative positioning of those
functional groups responsible for the H-bonding is also important as when positioned too close together intramolecular H-
bonding can occur, which competes with intermolecular H-bonding and generally raises P . The positioning of non H-
bonding functional groups within the molecule can also have an impact upon the extent of H-bonding, with bulky substituents 360
positioned close to H-bonding groups causing steric hindrance which reduces the extent of H-bonding and generally raises
P . The positioning of all the functional groups around the aromatic ring affect the partial charges of the atoms, via a
combination of the inductive effect and the resonance effect. The inductive effect and the partial charges appear to be most
important when comparing isomers, and less important when one functional group has been swapped for another. In addition
greater molecular weight, and increased crystallographic packing density also negatively correlate with P as they both lead 365
to increased overall intermolecular interactions. However in many cases these different factors compete with each other,
making it difficult to predict the expected P and currently it is not possible to determine which factor will dominate in any
given case. Dipole moments were also investigated but overall showed very little impact on P .
4.2 Sub-cooled liquid vapour pressure
The P were obtained from the P using thermochemical data obtained through use of a DSC and Eq. 3. The results are 370
detailed in Table 7.
Comparing the P of the nitrophenols with the solid state values there are a few changes in the overall ordering but they
mostly have little effect upon the preceding discussion. A few previously significant increases/decreases in P become
insignificant and a few that were insignificant are now significant. One point of note however, is that 3-methyl-4-nitrophenol
(5.86E-02) now exhibits a higher P than 3-fluoro-4-nitrophenol (3.32E-02). This trend is what would be expected based on 375
the reduction in steric hindrance, increased potential for H-bonding and increase in the partial charge of the phenolic carbon
that the F atom provides in comparison to the methyl group.
For the nitrobenzaldehydes one change in the overall ordering of the P s is observed after converting to P but this has no
effect on the preceding discussion.
Finally for the nitrobenzoic acids whilst some previously insignificant differences in P have now become significant, the 380
only change that impacts upon the discussion is that the P of 3-methyl-4-nitrobenzoic acid (3.04E-01) is now higher than
that of 4-methyl-3-nitrobenzoic acid (5.76E-02). This change could be explained as a result of the higher partial charge of the
13
carboxylic carbon of 4-methyl-3-nitrobenzoic acid (0.646 vs 0.628) (Stewart, 2016) playing a more important role in the
subcooled liquid state than in the solid state.
4.3 Comparison with estimations from GCMs 385
In Fig. 10 the experimentally determined P of the nitroaromatics are compared to the predicted values of several GCMs. All
predicted values can be found in Table S1 in the Supplement. The average difference between the experimental P and the
predicted P for each class of compound and overall is shown in Table 8.These GCMs are SIMPOL (Pankow and Asher,
2008), the Nannoolal et al. method (Nannoolal et al., 2008), and the Myrdal and Yalkowsky method (Myrdal and Yalkowsky,
1997). The Nannoolal et al. method (Nannoolal et al., 2008) and the Myrdal and Yalkowsky method (Myrdal and Yalkowsky, 390
1997) are both combined methods which require a boiling point to function. As for many compounds where the experimental
boiling point is unknown boiling point group contribution methods are required. The Nannoolal et al. method (Nannoolal et
al., 2004) and the Stein and Brown method (Stein and Brown, 1994) are used.
The Myrdal and Yalkowsky method (Myrdal and Yalkowsky, 1997) shows poor agreement with the experimental data for
almost all compounds, but is not particularly surprising given that it only contains 3 nitroaromatic compounds in this method’s 395
fitting data set, with none of these compounds containing both a nitro group and another oxygen containing group. The Myrdal
and Yalkowsky method (Myrdal and Yalkowsky, 1997) is the oldest method examined in this study, and much of the
atmospherically relevant P data has been collected after the end of the development of this model. The Myrdal and
Yalkowsky method’s (Myrdal and Yalkowsky, 1997) reliance on a predicted boiling point may also be a major source of error
in the P predictions of the nitroaromatics. 400
On average the SIMPOL method (Pankow and Asher, 2008) predicts values closest to the experimental data, on average
predicting PLsat 1.3 orders of magnitude higher than the experimental values, despite absolute differences of up to 4.4 orders of
magnitude.
The Nannoolal et al. method (Nannoolal et al., 2004) is persistently worse than the Stein and Brown method (Stein and Brown,
1994) for the nitroaromatic compounds involved in this study as shown in Table 8. When discussing the Nannoolal et al. 405
method (Nannoolal et al., 2008) and the Myrdal and Yalkowsky method (Myrdal and Yalkowsky, 1997) from this point
onwards it is used with the Stein and Brown method (Stein and Brown, 1994) unless stated otherwise.
The Nannoolal et al. method (Nannoolal et al., 2008) has slightly better agreement with the experimental data when compared
to the Myrdal and Yalkowsky method (Myrdal and Yalkowsky, 1997) on average predicting PLsat 2.52 orders of magnitude
higher than the experimental values, whereas the Myrdal and Yalkowsky method (Myrdal and Yalkowsky, 1997) on average 410
predicts PLsat 2.65 orders of magnitude higher than the experimental values. The Nannoolal et al. method (Nannoolal et al.,
2008), unlike the others, contains parameters for ortho, meta, para isomerism and even demonstrates the same trend as the
experimental data for 2-nitrobenzaldehyde, 3-nitrobenzaldehyde and 4-nitrobenzaldehyde, although 3 orders of magnitude
14
higher. Despite the ortho, meta, para parameters, as soon as a third functional group is present around the aromatic ring the
Nannoolal et al. method (Nannoolal et al., 2008) no longer accounts for relative positioning of the functional groups. 415
Figure 10a shows the comparison between the experimental and predicted 𝐏𝐋𝐬𝐚𝐭 for the nitrophenols. Both SIMPOL (Pankow
and Asher, 2008) and the Nannoolal et al. method (Nannoolal et al., 2008) contain nitrophenol data from Schwarzenbach et
al. (Schwarzenbach et al., 1988). This data of Schwarzenbach et al. (Schwarzenbach et al., 1988), however, is questionable in
reliability due to being taken from a single data point from a single data set. The values given are also 3-4 orders of magnitude
greater than those measured in this work as well as those measured by Bannan et al. (Bannan et al., 2017) and those measured 420
by Dang et al. (Dang et al., 2019). The use of the Schwarzenbach et al. (Schwarzenbach et al., 1988) nitrophenol 𝐏𝐬𝐚𝐭 data,
which makes up 11 of the 12 nitrophenol data points within the fitting data set of the SIMPOL method (Pankow and Asher,
2008), is a likely cause of the SIMPOL method (Pankow and Asher, 2008) overestimating the 𝐏𝐬𝐚𝐭 of nitrophenols by 3 to 4
orders of magnitude. The one nitrophenol used in the SIMPOL method(Pankow and Asher, 2008) not from Schwarzenbach et
al. (Schwarzenbach et al., 1988), 3-nitrophenol from Ribeiro da Silva et al. (Ribeiro da Silva et al., 1992), has a much lower 425
𝐏𝐬𝐚𝐭 than those of Schwarzenbach et al. and is only one order of magnitude higher than that from Bannan et al. (Bannan et al.,
2017). Additionally, Whilst the Nannoolal et al. (Nannoolal et al., 2008) method performs slightly better than the Myrdal and
Yalkowsky method (Myrdal and Yalkowsky, 1997) overall for this study, when taking the nitrophenol data in isolation this
performance is flipped with the Myrdal and Yalkowsky method (Myrdal and Yalkowsky, 1997) showing better performance
(overestimating on average by 3.4 to 3.5 orders of magnitude). 430
Figure 10b shows the comparison between the experimental and predicted P for the nitrobenzaldehydes. There are no
nitrobenzaldehydes present in any fitting data set of the GCMs considered in this study. Despite this, whilst not capturing the
effects of ortho, meta, para isomerism, SIMPOL (Pankow and Asher, 2008) predicts the P of the nitrobenzaldehydes to, on
average, 0.29 orders of magnitude. As polar groups such as aldehydes have been shown to have little impact on volatility in
the pure component, and by extension P (Bilde et al., 2015), this implies that SIMPOL (Pankow and Asher, 2008) captures 435
the contribution of the nitro group very well. Similar to the nitrophenols the performance of the Nannoolal et al. method
(Nannoolal et al., 2008) and the Myrdal and Yalkowsky method (Myrdal and Yalkowsky, 1997) has switched for the
nitrobenzaldehydes compared to the entire data set. The Myrdal and Yalkowsky method (Myrdal and Yalkowsky, 1997)
overestimates by 2.4 orders of magnitude compared to the Nannoolal et al. method (Nannoolal et al., 2008) which
overestimates by 2.5 orders of magnitude. 440
Figure 10c shows the comparison between the experimental and predicted P for the nitrobenzoic acids. SIMPOL (Pankow
and Asher, 2008) contains, though in limited amounts, nitrobenzoic acid data in its fitting parameters. Although there are no
lists of the data used to form the Nannoolal et al. method (Nannoolal et al., 2008) available (to the authors knowledge), it is
stated that the values come from the Dortmund Data Bank and from searches on this database there is nitrobenzoic acid P
data available. Having even this limited data available for the nitrobenzoic acids allows for SIMPOL (Pankow and Asher, 445
15
2008) to predict the P s of 5-chloro-2-nitrobenzoic acid, 3-nitrobenzoic acid, 2-chloro-3-nitrobenzoic acid and 2-hydroxy-5-
nitrobenzoic acid to within one order of magnitude of the experimental values. On average the SIMPOL (Pankow and Asher,
2008) method underestimates P by 0.8 orders of magnitude. The nitrobenzoic acids that had large discrepancies with
SIMPOL (Pankow and Asher, 2008), 4-methyl-3-nitrobenzoic acid and 3-methyl-4-nitrobenzoic acid, as well as 2-hydroxy-5-
nitrobenzoic acid agreed to within one order of magnitude of the Nannoolal et al. method (Nannoolal et al., 2008). On average 450
the Nannoolal et al. method (Nannoolal et al., 2008) overestimates P by 0.9 orders of magnitude.
Overall SIMPOL (Pankow and Asher, 2008) performs relatively well for the nitrobenzaldehydes and the nitrobenzoic acids,
and the Nannoolal et al. method (Nannoolal et al., 2008) performs moderately well for the nitrobenzoic acids when compared
to the experimental values found in this study. All of the methods perform poorly when compared to the experimental
nitrophenol values. These observations are not particularly surprising when taking into account how the methods were fitted 455
and what data is present in the fitting set.
One surprising observation comes when looking at the halogenated nitroaromatics. SIMPOL (Pankow and Asher, 2008) has
the smallest order of magnitude difference between experimental and predicted P for all of the halogenated nitroaromatics
in this study. This is particularly surprising as SIMPOL (Pankow and Asher, 2008) contains no halogenated compounds in its
fitting data set, whereas the other GCMs do. This implies that accurately predicting the impact on P of carbon skeleton and 460
other functional groups such as, nitro, hydroxy, aldehyde and carboxylic acid are more important than the impact of a chloro
or fluoro group.
When looking at nitroaromatics as a whole SIMPOL (Pankow and Asher, 2008) shows the smallest difference between
experimental and predicted P (as shown in Table 8) and would therefore be the most appropriate method to use when
predicting P for this group of compounds. In the case of nitrophenols, despite SIMPOL (Pankow and Asher, 2008) showing 465
the best performance the absolute differences are still close to 3 orders of magnitude, so any work using these predictions
should be aware of the very larger errors that these predictions could introduce. For nitrobenzaldehydes SIMPOL (Pankow
and Asher, 2008) shows very good agreement and is the clear choice to be used when predicting P . For nitrobenzoic acids
the preferred method for predicting P is not quite as clear. Both the Nannoolal et al. method (Nannoolal et al., 2008) and
SIMPOL (Pankow and Asher, 2008) predict P within an order of magnitude, with Nannoolal et al. (Nannoolal et al., 2008) 470
generally overestimating and SIMPOL (Pankow and Asher, 2008) underestimating.
4.4 Comparison with existing experimental data
For the compounds in this study that had previous literature data there are differences from the values determined
experimentally in this work. The differences between the values from this work and those of Dang et al. (2019) are discussed
in sect. 4.5 but can be attributed to the use of a different reference compound. 475
For the nitrophenols, shown in Fig. 10a, the differences between the experimental values and the literature values from
Schwarzenbach et al. (1988) range from 3 to 4 orders of magnitude. The relationship between the P and temperature from
16
Schwarzenbach et al. (1988) was derived from gas chromatographic (GC) retention data. This GC method requires a reference
compound of known P , and for the reference compound and the compound of interest to have very similar interactions with
the stationary phase of the GC. Schwarzenbach et al. (1988) used 2-nitrophenol as the reference compound for all of the other 480
nitrophenol data they collected. In this work the P at 298 K was 1.38E-03 Pa whereas Schwarzenbach et al. (1988) reported
it as 2.69E+01 Pa. As the difference between the P of 2-nitrophenol in this work and Schwarzenbach et al. (1988) differs
by approximately 4 orders of magnitude this could explain why the other nitrophenol measurements also differ by 3-4 orders
of magnitude.
For the nitrobenzaldehydes, shown in Fig. 10b, the literature data from Perry et al. (1984) and the experimental data from this 485
work agree within one order of magnitude with 2-nitrobenzaldehyde especially agreeing very closely (2.39E+00 Pa vs
2.15E+00 Pa).
The nitrobenzoic acids are shown in Fig. 10c. The value for 3-nitrobenzoic acid from this work is 1.90E-03 Pa compared to
5.05E-03 from Ribeiro da Silva et al. (1999) Whilst not matching perfectly, the P of 3-nitrobenzoic acid is on this order of
magnitude. The disagreements between the values of this work and the values from Monte et al. (2001) for 4-methyl-3-490
nitrobenzoic acid and 3-methyl-4-nitrobenzoic acid are quite large. 4-methyl-3-nitrobenzoic acid differs by over one order of
magnitude and 3-methyl-4-nitrobenzoic acid is closer to two orders of magnitude. The P values from Monte et al. (2001)
where collected using a Knudsen mass loss method. Knudsen mass loss is similar to KEMS in that it also utilises a Knudsen
cell which effuses the compound of interest. However for an amount of mass to be lost such that it can be detected the
experiments need to be performed at higher temperatures than the KEMS. This means that the data must be extrapolated further 495
to reach ambient temperatures. This is a potential source of error and could explain the difference. Measurement by a third or
even fourth technique would be required to confirm this.
4.5 Sensitivity of vapour pressure measurement techniques to reference standards
The recently published paper by Dang et al. (2019) measured the P of several of the same compounds that are studied
in this paper using the same KEMS system, however in this study the newly defined best practice reference sample was 500
used (Krieger et al., 2018), whereas Dang et al. (2019) used malonic acid. These compounds were 4-methyl-3-nitrophenol, 3-
methyl-4-nitrophenol and 4-methyl-2-nitrophenol. The difference in reference compound led to a discrepancy in the
experimental P (shown in Table 9). Due to these differences additional measurements were made using malonic acid as the
reference material. Additionally, supporting measurements for the compounds were performed using the EDB from ETH
Zurich in order to rule out instrumental problem with the KEMS. 505
Comparisons between P at 298 K from the KEMS using a PEG reference, the KEMS using a malonic acid reference, Dang
et al. (2019) and the EDB are shown in Table 9. Following this, P values , extrapolated down to 290 K, from KEMS using
a PEG reference and the KEMS using a malonic acid reference are compared to the estimated P based on the findings from
the EDB using Eq. (2).
17
Whilst the absolute values of the nitrophenols shown in Table 9 changed, the P trends did not. The values from Dang et al. 510
(2019) are between 4.39 and 7.81 times lower than those in this work using the PEGs as the reference compound, which is
now deemed as best practice in the community. To ensure that the difference in reference compound was the cause of the
difference in P 4-methyl-2-nitrophenol, 4-methyl-3-nitrophenol and 3-methyl-4-nitrophenol were also measured using
malonic acid as a reference again. The differences between the P determined by Dang et al. (2019) and those in this work
using malonic acid as a reference compound were between 2 % and 27 %, well within the quoted 40 % error margin of the 515
KEMS, (Booth et al., 2009) therefore showing that the instrument is behaving reproducibly but with now improved reference
standards being used, as is discussed below.
Starting with 4-methyl-3-nitrophenol the EDB has much better agreement with the KEMS when the PEGs are used as the
reference compound than when malonic acid is used as the reference compound. When the quoted errors of both the EDB
(shown in Table 9) and the KEMS (± 40% for P and ± 75% for P (Booth et al., 2009)) are taken into account the lower 520
limit of the EDB (1.57E-02 Pa) and the upper limit of the KEMS using the PEG references (1.51E-02 Pa) almost overlap
whereas the EDB data is almost 1 order of magnitude larger than the KEMS when the malonic acid reference is used (shown
in Fig. 11).
For 3-methyl-4-nitrophenol a comparison can be made for both P and P . Looking first at the P the EDB appears to be
somewhere in between the KEMS depending on what the KEMS is using as a reference, with its absolute value being closer 525
to that of the Malonic acid reference. However when the quoted errors are taken into account (shown in Table 9) the EDB
actually has better agreement with the KEMS when the PEG references are used. This can be seen more clearly in Fig. 11. For
P the EDB and the KEMS when using the PEG references appears to agree very well with a large overlap when the quoted
errors are taken into account. This can also be seen in Fig. 11.
The confidence with which the comparison between the EDB and the KEMS can be made for 4-methyl-2-nitrophenol is lower 530
than with the other compounds looked at due to how quickly 4-methyl-2-nitrophenol evaporated in the EDB. To make this
comparison the P from the KEMS measurements has been extrapolated down to 290 K to match that of the EDB estimation.
The predicted EDB value (shown in Fig. 11) is higher than the KEMS for both references but has a very large error margin
(approximately a factor of 5). When this error is considered the KEMS using the PEG reference is within this range, whereas
there is close to an order of magnitude difference between the lower limit of this estimate and the upper limit of the KEMS 535
when malonic acid is used as the reference.
In all cases the EDB showed better agreement with the KEMS using the PEGs as the reference material compared to when
malonic acid was used as the reference material. For 4-methyl-3-nitrophenol the agreement was very close between the EDB
and the KEMS using the PEGs as the reference compounds, and for 3-methyl-4-nitrophenol the measurements for the EDB
and the KEMS agreed with each other within the quoted errors. For 4-methyl-2-nitrophenol the KEMS with PEG as a reference 540
18
also showed the best agreement with the EDB, but as this was an estimate with a large error range this comparison is the least
certain.5 Conclusions
Experimental values for the P and P have been obtained using KEMS and DSC for nitrophenols, nitrobenzaldehydes, and
nitrobenzoic acids.
The predictive models have been shown to overestimate P in almost every instance by several orders of magnitude. As the 545
P from these predictive techniques are often used in mechanistic partitioning models (Lee-Taylor et al., 2011; Shiraiwa et
al., 2013), the overestimation of the P can lead to an overestimation of the fraction in gaseous state. The experimental values
from this study can be used in conjunction with other measurements to improve the accuracy of GCMs, and give an insight
into the impact of functional group positioning which is missing, or only available in a limited capacity, for the currently
available GCMs. 550
The differences in trends of the experimental P have been explained chemically, with the potential and strength of H-
bonding appearing to be the most significant factor, where present, in determining the P . With the stronger the hydrogen
bond and the increasing number of possible hydrogen bonds decreasing the P . Whilst H-bonding is typically the most
important factor, it isn’t the only factor. Steric effects by functional groups can also have significant effects on the P . In the
solid state crystallographic packing density can also be an important factor. To further investigate the impacts of H-bonding, 555
inductive and resonance effects, and steric effects on P more compounds need to be investigated, with select compounds
being chosen to probe these effects.
The predictive models consistently overestimate the P s by up to 6 orders of magnitude with the nitrophenols performing
especially poorly. This demonstrates a need for more experimental data to be used in the fitting data sets of the GCMs to
reduce the errors and give more accurate results for nitroaromatic compounds. 560
Deviations between the measurements in Dang et al. (2019) and this work can be explained by the difference of the reference
material used which demonstrates the necessity of a consistent, widely used reference compound. The PEG series, looked at
by Krieger et al. (, 2018), is currently the preferred reference/calibration series.
Comparisons between the KEMS and the EDB from ETH were made for several nitrophenols. The EDB showed close
agreement with the KEMS when the PEG series was used as the reference compounds. 565
Compounds such as the nitrobenzaldehydes, which are capable of being H-bond acceptors but not H-bond donors, are likely
to deviate negatively from Raoult’s law in mixtures with compounds that can act as H-bond donors, due to the adhesive forces
present. This could call into question the validity of pure component vapour pressure measurements for looking at atmospheric
systems due to the atmosphere not being made up of the pure component. This would be an interesting avenue of research and
the natural progression from pure component measurements to investigate their usefulness. 570
19
Data Availability
All data in this paper is available from http://doi.org/10.5281/zenodo.3613581 (Shelley et al., 2020b).
Supplementary Material
The supplementary material is available from https://doi.org/10.5281/zenodo.3625641 (Shelley et al., 2020a)
Author Contributions 575
Petroc D. Shelley carried out the experiments on the KEMS and DSC. Ulrich K. Krieger carried out the experiments on the
EDB. Formal analysis of the data was carried out by Petroc D. Shelley, Stephen D. Worrall and Ulrich K. Krieger. Project
supervision was undertaken by David Topping, M. Rami Alfarra and Thomas J. Bannan. KEMS training was performed by
Thomas J. Bannan. Access to and training on the DSC was undertaken by Arthur Garforth. Verification on the reliability of
the KEMS was carried out by Ulrich K. Krieger, with the EDB measurements being used to validate the KEMS measurements. 580
The original draft manuscript was written by Petroc D. Shelley, Stephen D. Worrall and Carl J. Percival. Internal review and
editing was performed by Thomas J. Bannan, David Topping, M. Rami Alfarra, Stephen D. Worrall and Ulrich K. Krieger.
Competing Interests
The Authors declare that they have no conflict of interest.
Acknowledgements 585
The work contained in this paper contains work conducted during a PhD study supported by the Natural Environment Research
Council (NERC) EAO Doctoral Training Partnership and is fully-funded by NERC whose support is gratefully acknowledged.
Grant ref no is NE/L002469/1
The work by Carl J. Percival was carried out at Jet Propulsion Laboratory, California Institute of Technology, under contract
with the National Aeronautics and Space Administration (NASA), and was supported by the Upper Atmosphere Research and 590
Tropospheric Chemistry Programs.
References
Bannan, T. J., Booth, A. M., Jones, B. T., O’meara, S., Barley, M. H., Riipinen, I., Percival, C. J. and Topping, D.: Measured
Saturation Vapor Pressures of Phenolic and Nitro-aromatic Compounds, Environ. Sci. Technol, 51(7), 3922–3928,
doi:10.1021/acs.est.6b06364, 2017. 595
Barley, M. H. and McFiggans, G.: The critical assessment of vapour pressure estimation methods for use in modelling the
formation of atmospheric organic aerosol, Atmos. Chem. Phys, 10(2), 749–767, doi:10.5194/acp-10-749-2010, 2010.
Bilde, M., Barsanti, K., Booth, M., Cappa, C. D., Donahue, N. M., Emanuelsson, E. U., McFiggans, G., Krieger, U. K.,
Marcolli, C., Topping, D., Ziemann, P., Barley, M., Clegg, S., Dennis-Smither, B., Hallquist, M., Hallquist, Å. M., Khlystov,
A., Kulmala, M., Mogensen, D., Percival, C. J., Pope, F., Reid, J. P., V Ribeiro da Silva, M. A., Rosenoern, T., Salo, K., Pia 600
Soonsin, V., Yli-Juuti, T., Prisle, N. L., Pagels, J., Rarey, J., Zardini, A. A. and Riipinen, I.: Saturation Vapor Pressures and
Transition Enthalpies of Low-Volatility Organic Molecules of Atmospheric Relevance: From Dicarboxylic Acids to Complex
Mixtures, Chem. Rev, 115(10), 4115–4156, doi:10.1021/cr5005502, 2015.
Booth, A. M., Markus, T., Mcfiggans, G., Percival, C. J., Mcgillen, M. R. and Topping, D. O.: Design and construction of a
20
simple Knudsen Effusion Mass Spectrometer (KEMS) system for vapour pressure measurements of low volatility organics, 605
Atmos. Meas. Tech, 2(2), 355–361, doi:10.5194/amt-2-355-2009, 2009.
Booth, A. M., Barley, M. H., Topping, D. O., Mcfiggans, G., Garforth, A. and Percival, C. J.: Solid state and sub-cooled liquid
vapour pressures of substituted dicarboxylic acids using Knudsen Effusion Mass Spectrometry (KEMS) and Differential
Scanning Calorimetry, Atmos. Chem. Phys, 10(10), 4879–4892, doi:10.5194/acp-10-4879-2010, 2010.
Booth, A. M., Bannan, T., McGillen, M. R., Barley, M. H., Topping, D. O., McFiggans, G. and Percival, C. J.: The role of 610
ortho, meta, para isomerism in measured solid state and derived sub-cooled liquid vapour pressures of substituted benzoic
acids, RSC Adv., 2(10), 4430, doi:10.1039/c2ra01004f, 2012.
Booth, A. M., Bannan, T. J., Benyezzar, M., Bacak, A., Alfarra, M. R., Topping, D. and Percival, C. J.: Development of lithium
attachment mass spectrometry – knudsen effusion and chemical ionisation mass spectrometry (KEMS, CIMS), Analyst,
142(19), 3666–3673, doi:10.1039/C7AN01161J, 2017. 615
Bouya, H., Al Rashidi, M., Roth, E., Salghi, R. and Chakir, A.: Atmospheric degradation of 2- nitrobenzaldehyde: Photolysis
and reaction with OH radicals, Atmos. Environ., 171, 221–228, doi:10.1016/J.ATMOSENV.2017.10.021, 2017.
Chow, K. S., Huang, X. H. H. and Yu, J. Z.: Quantification of nitroaromatic compounds in atmospheric fine particulate matter
in Hong Kong over 3 years: field measurement evidence for secondary formation derived from biomass burning emissions,
Environ. Chem., 13(4), 665–673, doi:10.1071/EN15174, 2016. 620
Compernolle, S., Ceulemans, K. and Müller, J. F.: Evaporation: A new vapour pressure estimation methodfor organic
molecules including non-additivity and intramolecular interactions, Atmos. Chem. Phys., 11(18), 9431–9450,
doi:10.5194/acp-11-9431-2011, 2011.
Coppens, P. and Schmidt, G. M. J.: X-ray diffraction analysis of o-nitrobenzaldehydes, Acta Crystallogr., 17(3), 222–228,
doi:10.1107/S0365110X64000585, 1964. 625
Dang, C., Bannan, T., Shelley, P., Priestley, M., Worrall, S. D., Waters, J., Coe, H., Percival, C. J. and Topping, D.: The effect
of structure and isomerism on the vapour pressures of organic molecules and its potential atmospheric relevance, Aerosol Sci.
Technol., 53, 1–32, doi:10.1080/02786826.2019.1628177, 2019.
Davis, E. J., Buehler, M. F. and Ward, T. L.: The double-ring electrodynamic balance for microparticle characterization, Rev.
Sci. Instrum., 61, 1281, doi:10.1063/1.1141227, 1990. 630
Dewar, M. J. S. and Thiel, W.: A semiempirical model for the two-center repulsion integrals in the NDDO approximation,
Theor. Chim. Acta, 46(2), 89–104, doi:10.1007/BF00548085, 1977.
Duporté, G., Parshintsev, J., Barreira, L. M. F., Hartonen, K., Kulmala, M. and Riekkola, M.-L.: Nitrogen-Containing Low
Volatile Compounds from Pinonaldehyde-Dimethylamine Reaction in the Atmosphere: A Laboratory and Field Study,
Environ. Sci. Technol., 50(9), 4693–4700, doi:10.1021/acs.est.6b00270, 2016. 635
Engwerda, A. H. J., Brugman, S. J. T., Tinnemans, P. and Vlieg, E.: 3-Nitrobenzaldehyde, IUCrData, 3(1), x180092,
doi:10.1107/S2414314618000925, 2018.
Ervens, B., Turpin, B. J. and Weber, R. J.: Secondary organic aerosol formation in cloud droplets and aqueous particles
(aqSOA): a review of laboratory, field and model studies, Atmos. Chem. Phys. Atmos. Chem. Phys., 11(21), 11069–11102,
doi:10.5194/acp-11-11069-2011, 2011. 640
Grant, D. J. W., Mehdizadeh, M., Chow, A. H.-L. and Fairbrother, J. E.: Non-linear van’t Hoff solubility-temperature plots
and their pharmaceutical interpretation, Int. J. Pharm., 18(1–2), 25–38, doi:10.1016/0378-5173(84)90104-2, 1984.
Grosjean, D.: In situ organic aerosol formation during a smog episode: Estimated production and chemical functionality,
Atmos. Environ. Part A. Gen. Top., 26(6), 953–963, doi:10.1016/0960-1686(92)90027-I, 1992.
Hallquist, M., Wenger, J. C., Baltensperger, U., Rudich, Y., Simpson, D., Claeys, M., Dommen, J., Donahue, N. M., George, 645
C., Goldstein, A. H. and Hamilton, J. F.: The formation, properties and impact of secondary organic aerosol: current and
emerging issues, Atmos. Chem. Phys. Atmos. Chem. Phys., 9, 5155–5236 [online] Available from: www.atmos-chem-
21
phys.net/9/5155/2009/ (Accessed 27 October 2017), 2009.
Hinds, W. C.: Aerosol Technology: Properties, Behavior, and Measurement of airborne Particles, in Aerosol Technology:
Properties, Behavior, and Measurement of airborne Particles, p. 504, John Wiley & Sons, New York., 1999. 650
Huisman, A. J., Krieger, U. K., Zuend, A., Marcolli, C. and Peter, T.: Vapor pressures of substituted polycarboxylic acids are
much lower than previously reported, Atmos. Chem. Phys., 13(13), 6647–6662, doi:10.5194/acp-13-6647-2013, 2013.
Joback, K. G., Reid, R. C. and Reid, C.: ESTIMATION OF PURE-COMPONENT PROPERTIES FROM GROUP-
CONTRIBUTIONS, Chem. Eng. Commun., 157, 233–243, doi:10.1080/00986448708960487, 1987.
King Jnr, J. A. and Bryant Jnr, G. L.: p-Nitrobenzaldehyde, Acta Crystallogr. Sect. C Cryst. Struct. Commun., 52(7), 1691–655
1693, doi:10.1107/S0108270196001254, 1996.
Kitanovski, Z., Grgić, I., Vermeylen, R., Claeys, M. and Maenhaut, W.: Liquid chromatography tandem mass spectrometry
method for characterization of monoaromatic nitro-compounds in atmospheric particulate matter, J. Chromatogr. A, 1268, 35–
43, doi:10.1016/J.CHROMA.2012.10.021, 2012.
Kovacic, P. and Somanathan, R.: Nitroaromatic compounds: Environmental toxicity, carcinogenicity, mutagenicity, therapy 660
and mechanism, J. Appl. Toxicol., 34(8), 810–824, doi:10.1002/jat.2980, 2014.
Krieger, U. K., Siegrist, F., Marcolli, C., Emanuelsson, E. U., Gøbel, F. M., Bilde, M., Marsh, A., Reid, J. P., Huisman, A. J.,
Riipinen, I., Hyttinen, N., Myllys, N., Kurtén, T., Bannan, T., Percival, C. J. and Topping, D.: A reference data set for validating
vapor pressure measurement techniques: homologous series of polyethylene glycols, Atmos. Meas. Tech, 11(1), 49–63,
doi:10.5194/amt-11-49-2018, 2018. 665
Kroll, J. H. and Seinfeld, J. H.: Chemistry of secondary organic aerosol: Formation and evolution of low-volatility organics in
the atmosphere, Atmos. Environ., 42, 3593–3624, doi:10.1016/j.atmosenv.2008.01.003, 2008.
Kurtén, T., Tiusanen, K., Roldin, P., Rissanen, M., Luy, J.-N., Boy, M., Ehn, M. and Donahue, N.: α-Pinene Autoxidation
Products May Not Have Extremely Low Saturation Vapor Pressures Despite High O:C Ratios, J. Phys. Chem. A, 120(16),
2569–2582, doi:10.1021/acs.jpca.6b02196, 2016. 670
Lee-Taylor, J., Madronich, S., Aumont, B., Baker, A., Camredon, M., Hodzic, A., Tyndall, G. S., Apel, E. and Zaveri, R. A.:
Explicit modeling of organic chemistry and secondary organic aerosol partitioning for Mexico City and its outflow plume,
Atmos. Chem. Phys., 11(24), 13219–13241, doi:10.5194/acp-11-13219-2011, 2011.
Mauger, J. W., Paruta, A. N. and Gerraughty, R. J.: Solubilities of Sulfadiazine, Sulfisomidine, and Sulfadimethoxine in
Several Normal Alcohols, J. Pharm. Sci., 61(1), 94–97, doi:10.1002/JPS.2600610117, 1972. 675
Moller, B., Rarey, J. and Ramjugernath, D.: Estimation of the vapour pressure of non-electrolyte organic compounds via group
contributions and group interactions, J. Mol. Liq., 143(1), 25–63, doi:10.1016/j.molliq.2008.04.020, 2008.
Monte, M. J. S., Hillesheim, D. M., Monte, M. J. S. and Hillesheim, D. M.: Thermodynamic study on the sublimation of six
methylnitrobenzoic acids, J. Chem. Thermodyn., 33, 103–112, doi:10.1006/jcht.2000.0729, 2001.
Myrdal, P. B. and Yalkowsky, S. H.: Estimating Pure Component Vapor Pressures of Complex Organic Molecules, Ind. Eng. 680
Chem. Res., 36(6), 2494–2499 [online] Available from: https://pubs-acs-
org.manchester.idm.oclc.org/doi/pdf/10.1021/ie950242l (Accessed 15 May 2018), 1997.
Nannoolal, Y., Rarey, J., Ramjugernath, D. and Cordes, W.: Estimation of pure component properties Part 1. Estimation of
the normal boiling point of non-electrolyte organic compounds via group contributions and group interactions, Fluid Phase
Equilib., 226, 45–63, doi:10.1016/j.fluid.2004.09.001, 2004. 685
Nannoolal, Y., Rarey, Ju. and Ramjugernath, D.: Fluid Phase Equilibria Estimation of pure component properties Part 3.
Estimation of the vapor pressure of non-electrolyte organic compounds via group contributions and group interactions, Fluid
Phase Equilib., 269, 117–133, doi:10.1016/j.fluid.2008.04.020, 2008.
O’Meara, S., Booth, A. M., Barley, M. H., Topping, D. and Mcfiggans, G.: An assessment of vapour pressure estimation
methods, Phys. Chem. Chem. Phys., 16(16), 19453–19469, doi:10.1039/c4cp00857j, 2014. 690
22
Ouellette, R. J., Rawn, J. D., Ouellette, R. J. and Rawn, J. D.: Aromatic Compounds, Princ. Org. Chem., 133–162,
doi:10.1016/B978-0-12-802444-7.00005-7, 2015a.
Ouellette, R. J., Rawn, J. D., Ouellette, R. J. and Rawn, J. D.: Carboxylic Acids and Esters, Princ. Org. Chem., 287–314,
doi:10.1016/B978-0-12-802444-7.00011-2, 2015b.
Pankow, J. F. and Asher, W. E.: SIMPOL.1: A simple group contribution method for predicting vapor pressures and enthalpies 695
of vaporization of multifunctional organic compounds, Atmos. Chem. Phys., 8(10), 2773–2796, doi:10.5194/acp-8-2773-2008,
2008.
Perry, R. H., Green, D. W. and Maloney, J. O.: Perry’s Chemical engineers’ handbook., 6th ed., McGraw-Hill., 1984.
van Pinxteren, D. and Herrmann, H.: Determination of functionalised carboxylic acids in atmospheric particles and cloud water
using capillary electrophoresis/mass spectrometry, J. Chromatogr. A, 1171(1–2), 112–123, 700
doi:10.1016/J.CHROMA.2007.09.021, 2007.
Pöschl, U.: Atmospheric Aerosols: Composition, Transformation, Climate and Health Effects, Angew. Chemie Int. Ed.,
44(46), 7520–7540, doi:10.1002/anie.200501122, 2005.
Prausnitz, J., Lichtenthaler, R. and Azevedo, E. de: Molecular thermodynamics of fluid-phase equilibria, Pearson Education,
Upper Saddle River., 1998. 705
Ribeiro da Silva, M. A. V., Reis, A. M. M. V., Monte, M. J. S., Bártolo, M. M. S. S. F. and Rodrigues, J. A. R. G. O.: Enthalpy
of combustion, vapour pressures, and enthalpy of sublimation of 3-nitrophenol, J. Chem. Thermodyn., 24(6), 653–659,
doi:10.1016/S0021-9614(05)80037-0, 1992.
Ribeiro Da Silva, M. A. V, Agostinha, M., Matos, R., Monte, M. J. S., Hillesheim, D. M., Marques, M. C. P. O. and Vieira,
N. F. T. G.: Enthalpies for combustion, vapour pressures, and enthalpies of sublimation of three methoxy-nitrobenzoic acids. 710
Vapour pressures and enthalpies of sublimation of the three nitrobenzoic acids, J. Chem. Thermodyn., 31, 1429–1441, 1999.
Schummer, C., Groff, C., Al Chami, J., Jaber, F. and Millet, M.: Analysis of phenols and nitrophenols in rainwater collected
simultaneously on an urban and rural site in east of France, Sci. Total Environ., 407(21), 5637–5643,
doi:10.1016/J.SCITOTENV.2009.06.051, 2009.
Schwarzenbach, R. P., Stierli, R., Folsom, B. R. and Zeyer, J.: Compound Properties Relevant for Assessing the Environmental 715
Partitioning of Nitrophenols, Environ. Sci. Technol, 22, 83–92 [online] Available from: https://pubs.acs.org/sharingguidelines
(Accessed 9 August 2018), 1988.
Shelley, P. D., Bannan, T. J., Worrall, S. D., Alfarra, M. R., Krieger, U. K., Percival, C. J., Garforth, A. and Topping, D.:
PetrocShelley/Measured-solid-state-and-sub-cooled-liquid-vapour-pressures-of-nitroaromatics-Supplementary-material,
Zenodo, doi:10.5281/ZENODO.3625641, 2020a. 720
Shelley, P. D., Bannan, T. J., Worrall, S. D., Alfarra, M. R., Krieger, U. K., Percival, C. J., Garforth, A. and Topping, D.:
PetrocShelley/Measured-solid-state-and-sub-cooled-liquid-vapour-pressures-of-nitroaromatics-using-KEMS-Data-Set,
Zenodo, doi:10.5281/ZENODO.3613581, 2020b.
Shiraiwa, M., Zuend, A., Bertram, A. K. and Seinfeld, J. H.: Gas–particle partitioning of atmospheric aerosols: interplay of
physical state, non-ideal mixing and morphology, Phys. Chem. Chem. Phys., 15(27), 11441, doi:10.1039/c3cp51595h, 2013. 725
Shugrue, C. R., Defrancisco, J. R., Metrano, A. J., Brink, B. D., Nomoto, R. S. and Linton, B. R.: Organic & Biomolecular
Chemistry Detection of weak hydrogen bonding to fluoro and nitro groups in solution using H/D exchange †, Org. Biomol.
Chem., 14, 2223, doi:10.1039/c5ob02360b, 2016.
Smith, J. N., Dunn, M. J., VanReken, T. M., Iida, K., Stolzenburg, M. R., McMurry, P. H. and Huey, L. G.: Chemical
composition of atmospheric nanoparticles formed from nucleation in Tecamac, Mexico: Evidence for an important role for 730
organic species in nanoparticle growth, Geophys. Res. Lett., 35(4), L04808, doi:10.1029/2007GL032523, 2008.
Stein, S. E. and Brown, R. L.: Estimation of Normal Boiling Points from Group Contributions, J. Chem. Inf. Comput. Sci, 34,
581–587 [online] Available from: https://pubs-acs-org.manchester.idm.oclc.org/doi/pdf/10.1021/ci00019a016 (Accessed 15
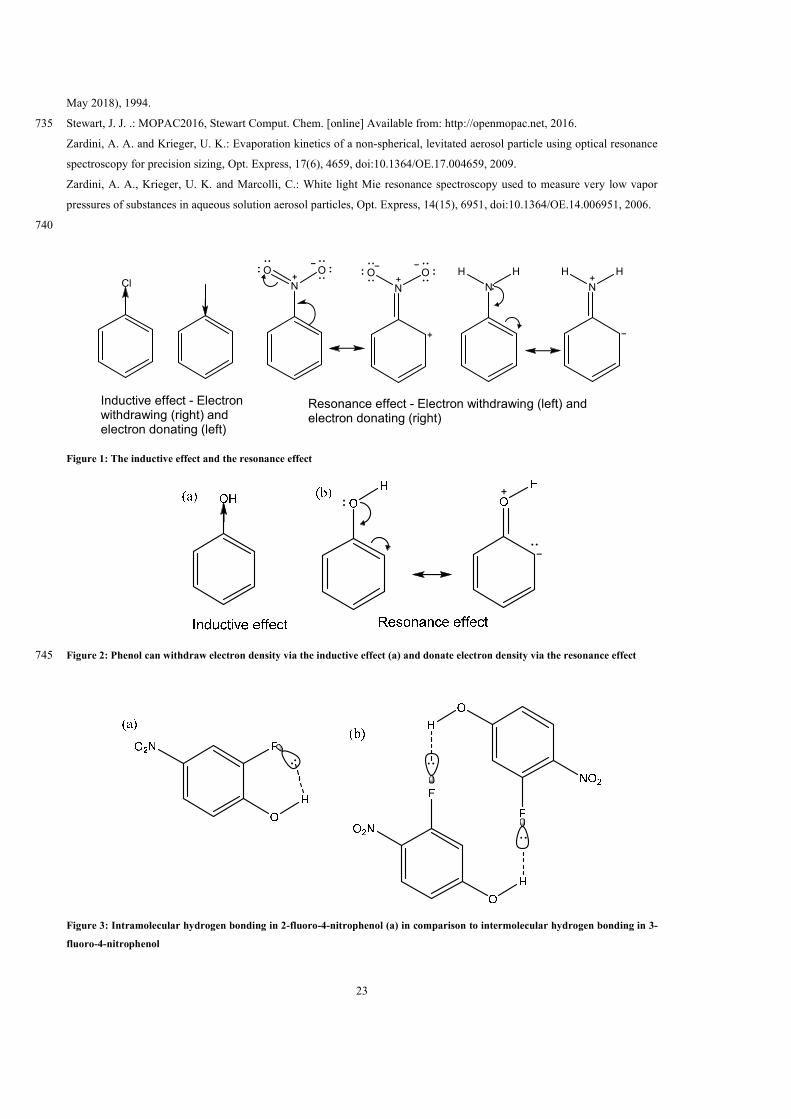
23
May 2018), 1994.
Stewart, J. J. .: MOPAC2016, Stewart Comput. Chem. [online] Available from: http://openmopac.net, 2016. 735
Zardini, A. A. and Krieger, U. K.: Evaporation kinetics of a non-spherical, levitated aerosol particle using optical resonance
spectroscopy for precision sizing, Opt. Express, 17(6), 4659, doi:10.1364/OE.17.004659, 2009.
Zardini, A. A., Krieger, U. K. and Marcolli, C.: White light Mie resonance spectroscopy used to measure very low vapor
pressures of substances in aqueous solution aerosol particles, Opt. Express, 14(15), 6951, doi:10.1364/OE.14.006951, 2006.
740
Cl N
O O
N
O ON
H H
N
H H
Inductive effect - Electronwithdrawing (right) andelectron donating (left)
Resonance effect - Electron withdrawing (left) andelectron donating (right)
Figure 1: The inductive effect and the resonance effect
Figure 2: Phenol can withdraw electron density via the inductive effect (a) and donate electron density via the resonance effect 745
Figure 3: Intramolecular hydrogen bonding in 2-fluoro-4-nitrophenol (a) in comparison to intermolecular hydrogen bonding in 3-
fluoro-4-nitrophenol
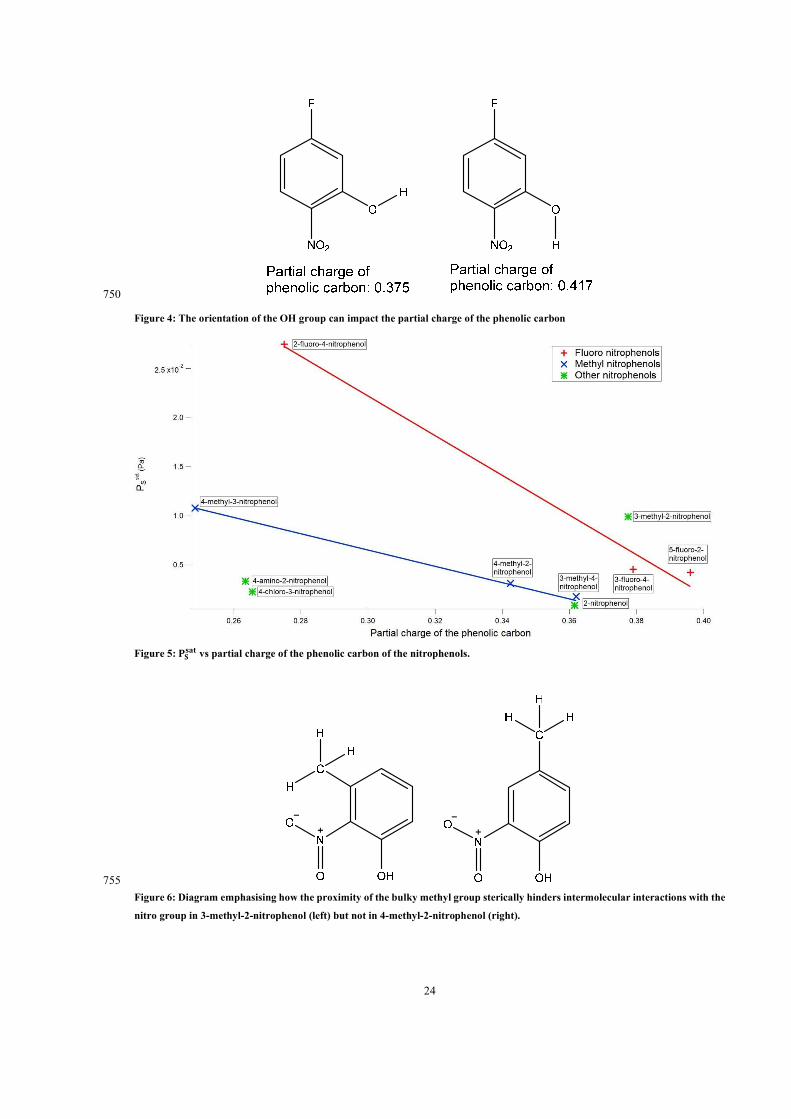
24
750
Figure 4: The orientation of the OH group can impact the partial charge of the phenolic carbon
Figure 5: 𝐏𝐒𝐬𝐚𝐭 vs partial charge of the phenolic carbon of the nitrophenols.
755
Figure 6: Diagram emphasising how the proximity of the bulky methyl group sterically hinders intermolecular interactions with the
nitro group in 3-methyl-2-nitrophenol (left) but not in 4-methyl-2-nitrophenol (right).
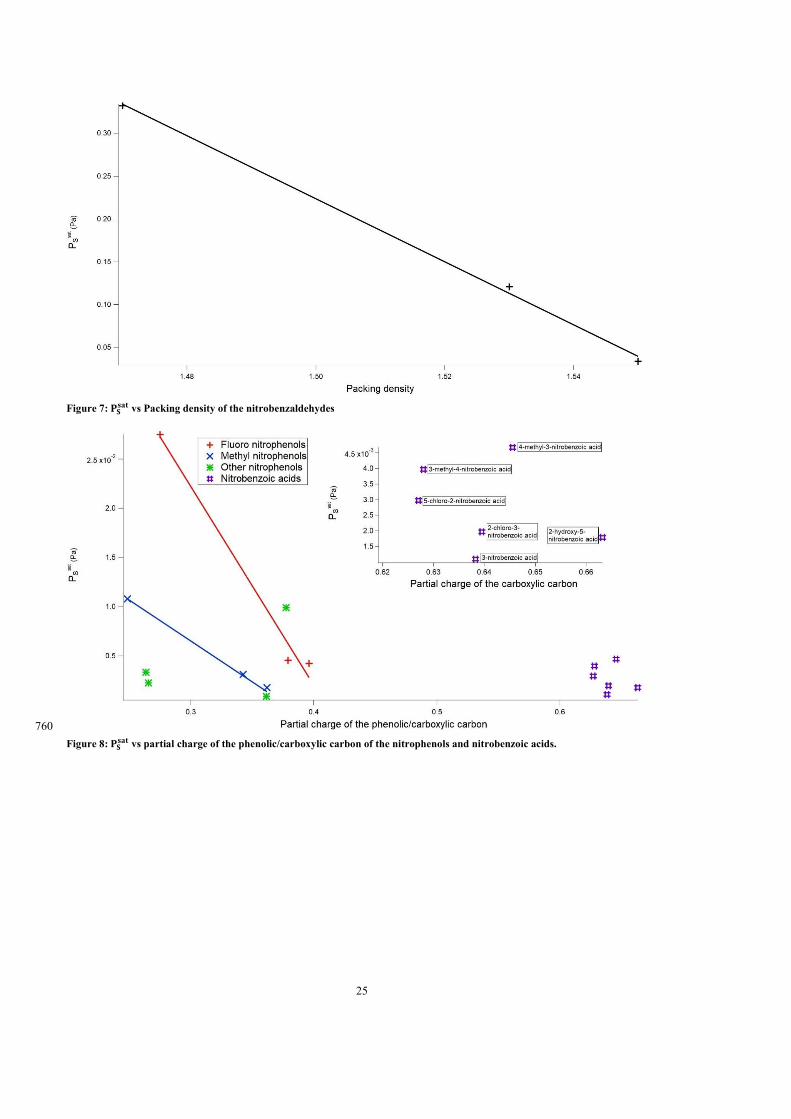
25
Figure 7: 𝐏𝐒𝐬𝐚𝐭 vs Packing density of the nitrobenzaldehydes
760
Figure 8: 𝐏𝐒𝐬𝐚𝐭 vs partial charge of the phenolic/carboxylic carbon of the nitrophenols and nitrobenzoic acids.
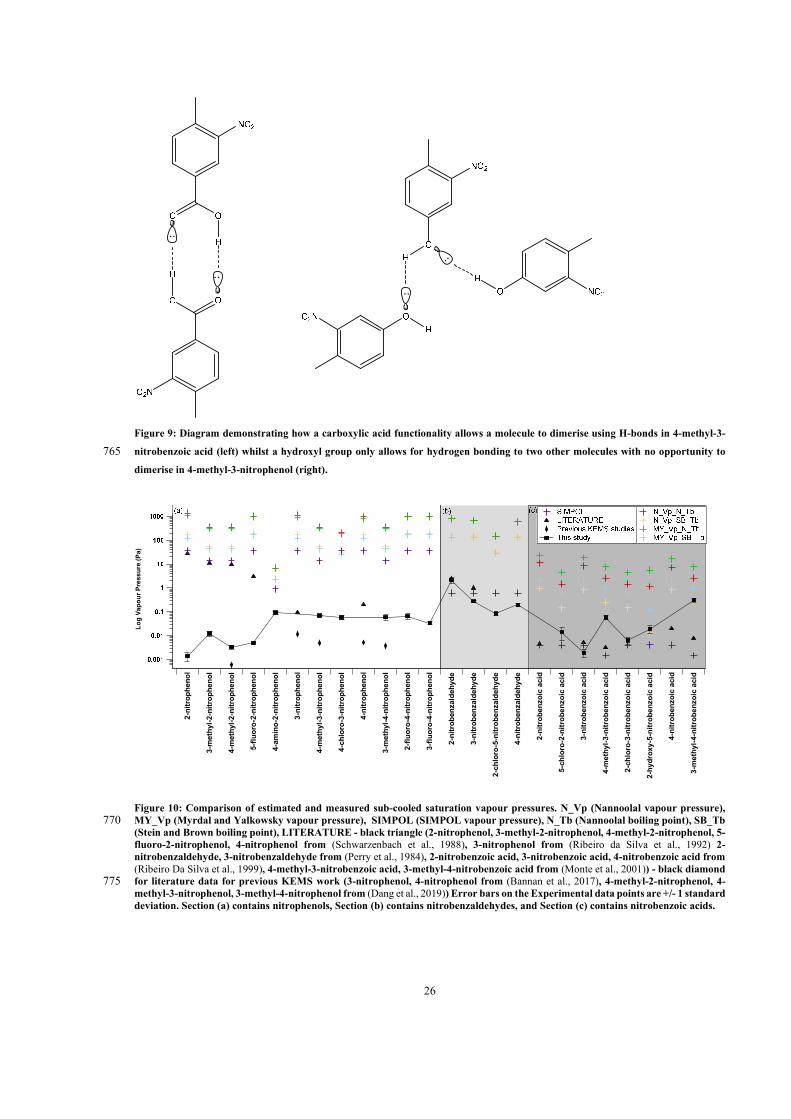
26
Figure 9: Diagram demonstrating how a carboxylic acid functionality allows a molecule to dimerise using H-bonds in 4-methyl-3-
nitrobenzoic acid (left) whilst a hydroxyl group only allows for hydrogen bonding to two other molecules with no opportunity to 765
dimerise in 4-methyl-3-nitrophenol (right).
Figure 10: Comparison of estimated and measured sub-cooled saturation vapour pressures. N_Vp (Nannoolal vapour pressure), MY_Vp (Myrdal and Yalkowsky vapour pressure), SIMPOL (SIMPOL vapour pressure), N_Tb (Nannoolal boiling point), SB_Tb 770 (Stein and Brown boiling point), LITERATURE - black triangle (2-nitrophenol, 3-methyl-2-nitrophenol, 4-methyl-2-nitrophenol, 5-fluoro-2-nitrophenol, 4-nitrophenol from (Schwarzenbach et al., 1988), 3-nitrophenol from (Ribeiro da Silva et al., 1992) 2-nitrobenzaldehyde, 3-nitrobenzaldehyde from (Perry et al., 1984), 2-nitrobenzoic acid, 3-nitrobenzoic acid, 4-nitrobenzoic acid from (Ribeiro Da Silva et al., 1999), 4-methyl-3-nitrobenzoic acid, 3-methyl-4-nitrobenzoic acid from (Monte et al., 2001)) - black diamond for literature data for previous KEMS work (3-nitrophenol, 4-nitrophenol from (Bannan et al., 2017), 4-methyl-2-nitrophenol, 4-775 methyl-3-nitrophenol, 3-methyl-4-nitrophenol from (Dang et al., 2019)) Error bars on the Experimental data points are +/- 1 standard deviation. Section (a) contains nitrophenols, Section (b) contains nitrobenzaldehydes, and Section (c) contains nitrobenzoic acids.
Lo
g V
apo
ur
Pre
ssu
re (
Pa)
2-n
itro
ph
eno
l
3-m
eth
yl-2
-nit
rop
hen
ol
4-m
eth
yl-2
-nit
rop
hen
ol
5-fl
uo
ro-2
-nit
rop
hen
ol
4-am
ino
-2-n
itro
ph
eno
l
3-n
itro
ph
eno
l
4-m
eth
yl-3
-nit
rop
hen
ol
4-ch
loro
-3-n
itro
ph
eno
l
4-n
itro
ph
eno
l
3-m
eth
yl-4
-nit
rop
hen
ol
2-fl
uo
ro-4
-nit
rop
hen
ol
3-fl
uo
ro-4
-nit
rop
hen
ol
2-n
itro
ben
zald
ehyd
e
3-n
itro
ben
zald
ehyd
e
2-ch
loro
-5-n
itro
ben
zald
ehyd
e
4-n
itro
ben
zald
ehyd
e
2-n
itro
ben
zoic
aci
d
5-ch
loro
-2-n
itro
ben
zoic
aci
d
3-n
itro
ben
zoic
aci
d
4-m
eth
yl-3
-nit
rob
enzo
ic a
cid
2-ch
loro
-3-n
itro
ben
zoic
aci
d
2-h
ydro
xy-5
-nit
rob
enzo
ic a
cid
4-n
itro
ben
zoic
aci
d
3-m
eth
yl-4
-nit
rob
enzo
ic a
cid
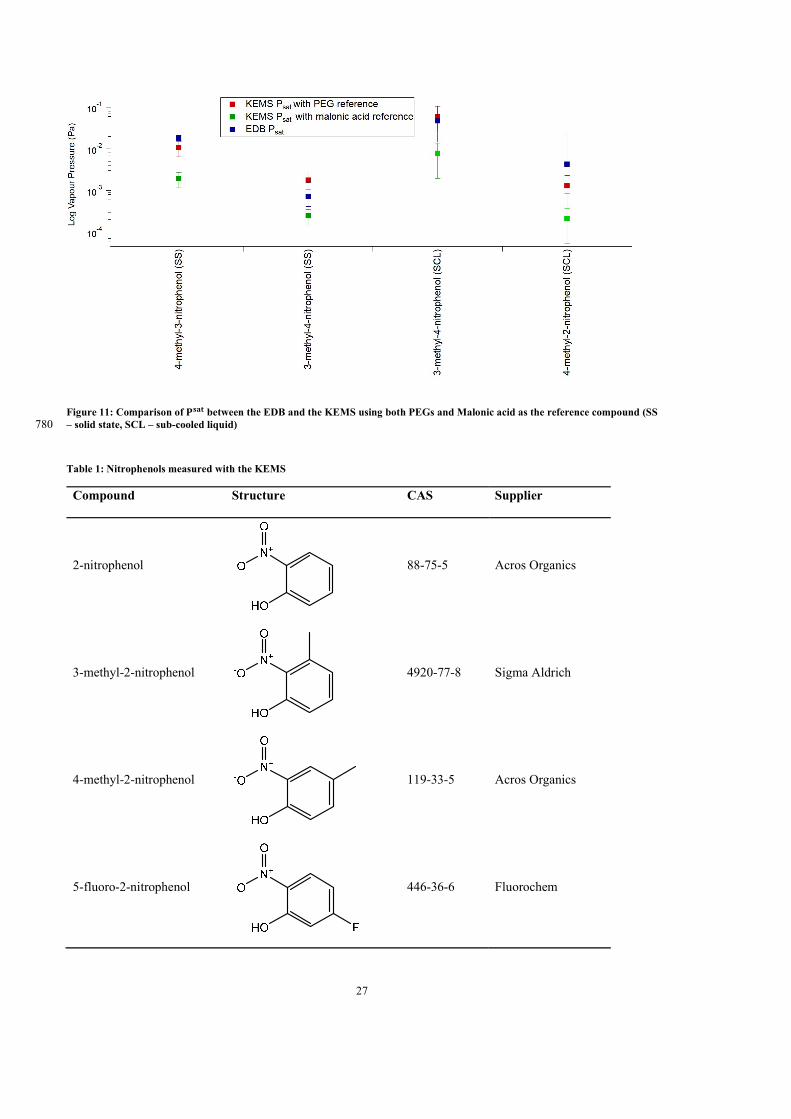
27
Figure 11: Comparison of 𝐏𝐬𝐚𝐭 between the EDB and the KEMS using both PEGs and Malonic acid as the reference compound (SS – solid state, SCL – sub-cooled liquid) 780
Table 1: Nitrophenols measured with the KEMS
Compound Structure CAS Supplier
2-nitrophenol
88-75-5 Acros Organics
3-methyl-2-nitrophenol
4920-77-8 Sigma Aldrich
4-methyl-2-nitrophenol
119-33-5 Acros Organics
5-fluoro-2-nitrophenol
446-36-6 Fluorochem
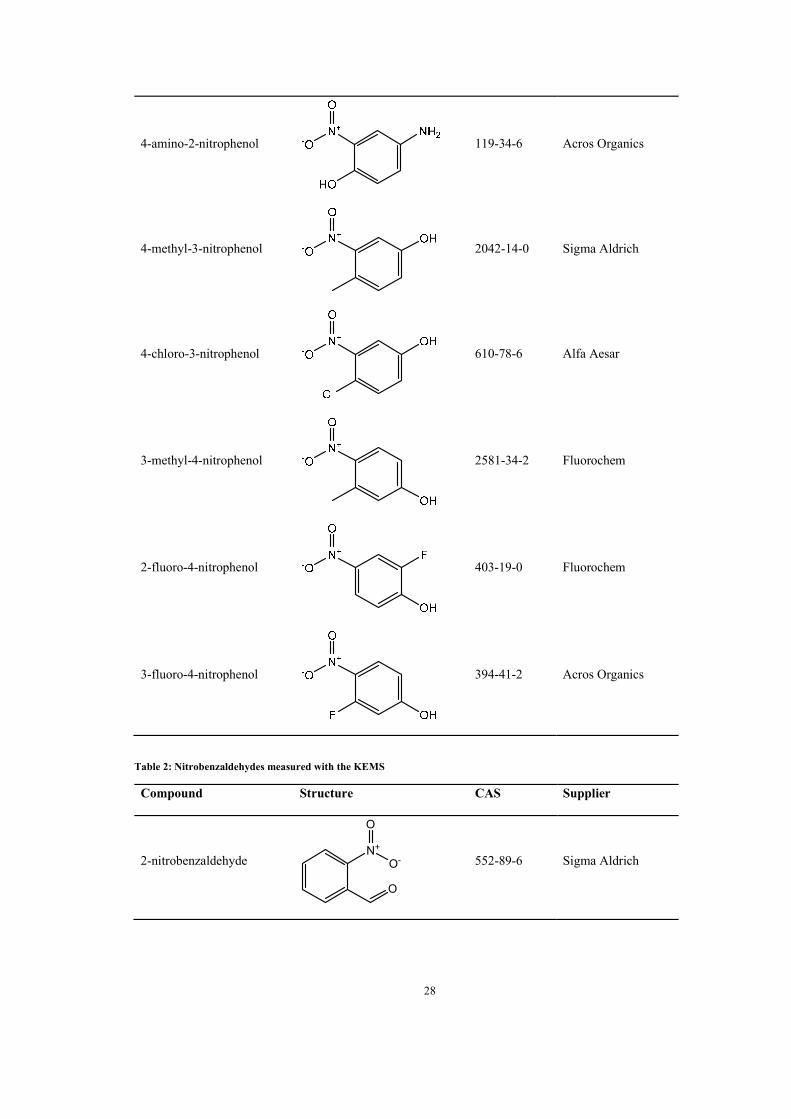
28
4-amino-2-nitrophenol
119-34-6 Acros Organics
4-methyl-3-nitrophenol
2042-14-0 Sigma Aldrich
4-chloro-3-nitrophenol
610-78-6 Alfa Aesar
3-methyl-4-nitrophenol
2581-34-2 Fluorochem
2-fluoro-4-nitrophenol
403-19-0 Fluorochem
3-fluoro-4-nitrophenol
394-41-2 Acros Organics
Table 2: Nitrobenzaldehydes measured with the KEMS
Compound Structure CAS Supplier
2-nitrobenzaldehyde
O
N+
O
O-
552-89-6 Sigma Aldrich
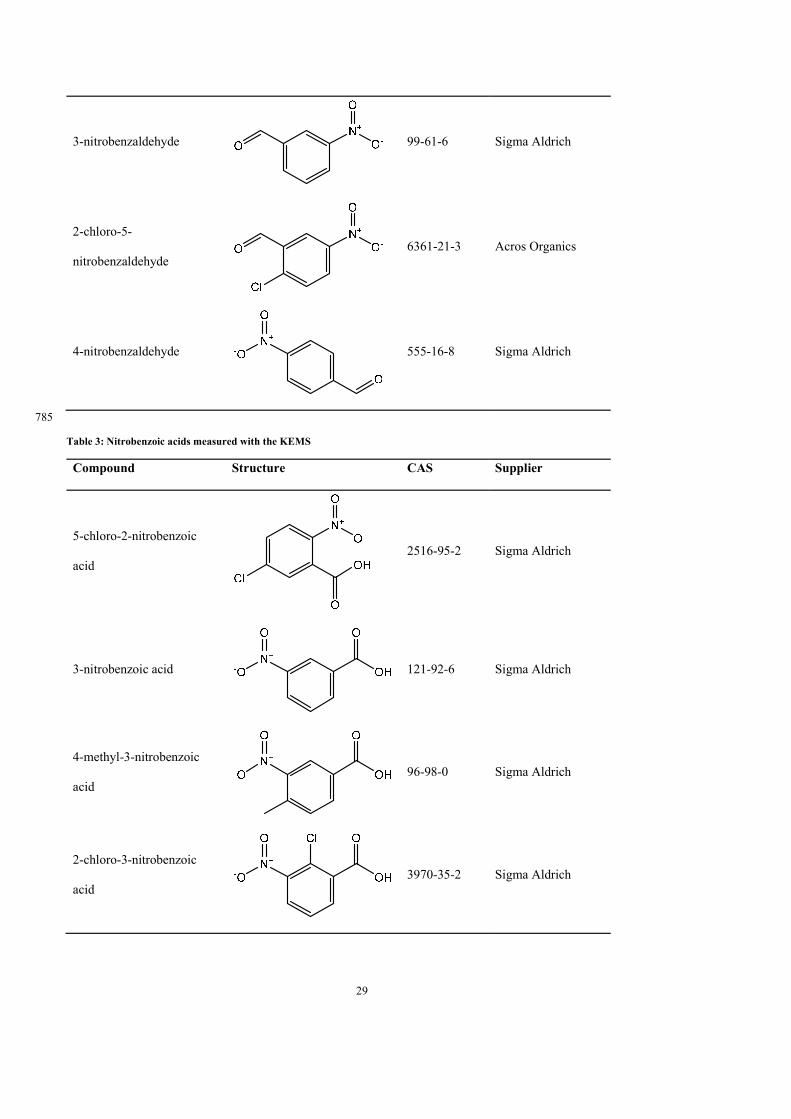
29
3-nitrobenzaldehyde
99-61-6 Sigma Aldrich
2-chloro-5-
nitrobenzaldehyde
6361-21-3 Acros Organics
4-nitrobenzaldehyde
555-16-8 Sigma Aldrich
785
Table 3: Nitrobenzoic acids measured with the KEMS
Compound Structure CAS Supplier
5-chloro-2-nitrobenzoic
acid
2516-95-2 Sigma Aldrich
3-nitrobenzoic acid
121-92-6 Sigma Aldrich
4-methyl-3-nitrobenzoic
acid
96-98-0 Sigma Aldrich
2-chloro-3-nitrobenzoic
acid
3970-35-2 Sigma Aldrich
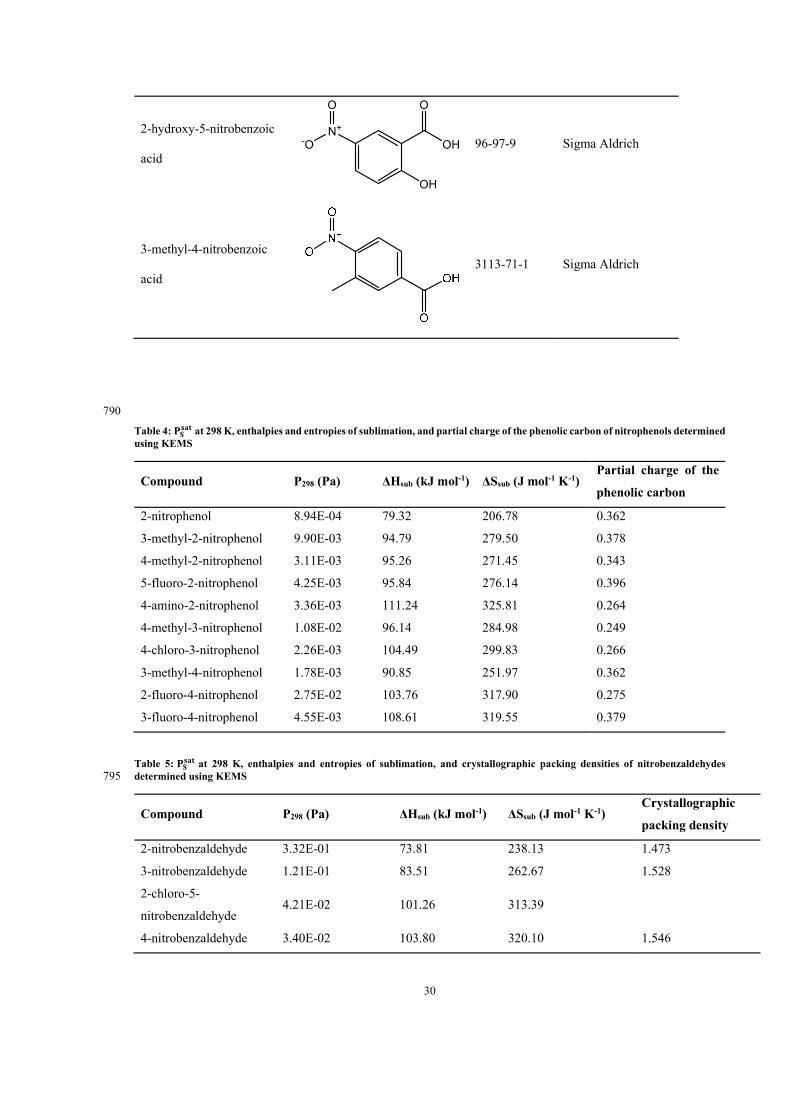
30
2-hydroxy-5-nitrobenzoic
acid
O
OHN+
O
-O
OH
96-97-9 Sigma Aldrich
3-methyl-4-nitrobenzoic
acid
3113-71-1 Sigma Aldrich
790
Table 4: 𝐏𝐒𝐬𝐚𝐭 at 298 K, enthalpies and entropies of sublimation, and partial charge of the phenolic carbon of nitrophenols determined
using KEMS
Compound P298 (Pa) ΔHsub (kJ mol-1) ΔSsub (J mol-1 K-1) Partial charge of the
phenolic carbon
2-nitrophenol 8.94E-04 79.32 206.78 0.362
3-methyl-2-nitrophenol 9.90E-03 94.79 279.50 0.378
4-methyl-2-nitrophenol 3.11E-03 95.26 271.45 0.343
5-fluoro-2-nitrophenol 4.25E-03 95.84 276.14 0.396
4-amino-2-nitrophenol 3.36E-03 111.24 325.81 0.264
4-methyl-3-nitrophenol 1.08E-02 96.14 284.98 0.249
4-chloro-3-nitrophenol 2.26E-03 104.49 299.83 0.266
3-methyl-4-nitrophenol 1.78E-03 90.85 251.97 0.362
2-fluoro-4-nitrophenol 2.75E-02 103.76 317.90 0.275
3-fluoro-4-nitrophenol 4.55E-03 108.61 319.55 0.379
Table 5: 𝐏𝐒𝐬𝐚𝐭 at 298 K, enthalpies and entropies of sublimation, and crystallographic packing densities of nitrobenzaldehydes
determined using KEMS 795
Compound P298 (Pa) ΔHsub (kJ mol-1) ΔSsub (J mol-1 K-1) Crystallographic
packing density
2-nitrobenzaldehyde 3.32E-01 73.81 238.13 1.473
3-nitrobenzaldehyde 1.21E-01 83.51 262.67 1.528
2-chloro-5-
nitrobenzaldehyde 4.21E-02 101.26 313.39
4-nitrobenzaldehyde 3.40E-02 103.80 320.10 1.546
31
Table 6: 𝐏𝐒𝐬𝐚𝐭 at 298 K, enthalpies and entropies of sublimation, and partial charge of the carboxylic carbon of nitrobenzoic acids
determined using KEMS
Compound P298 (Pa) ΔHsub (kJ mol-1) ΔSsub (J mol-1 K-1) Partial charge of the
carboxylic carbon
5-chloro-2-nitrobenzoic
acid 2.98E-03 80.66 221.09 0.627
3-nitrobenzoic acid 1.10E-03 87.82 237.49 0.638
4-methyl-3-nitrobenzoic
acid 4.67E-03 74.66 205.82 0.646
2-chloro-3-nitrobenzoic
acid 1.97E-03 73.54 194.48 0.640
2-hydroxy-5-
nitrobenzoic acid 1.79E-03 78.20 209.30 0.663
3-methyl-4-nitrobenzoic
acid 3.97E-03 65.95 175.21 0.628
Table 7: 𝐏𝐋𝐬𝐚𝐭, melting point, and the enthalpy and entropy of fusion of the nitrophenols. 800
Compound P298 (Pa) Tm (K) ΔHfus (kJ mol-1) ΔSfus (J mol-1 K-1)
2-nitrophenol 1.38E-03 319.77 18.55 58.02
3-methyl-2-nitrophenol 1.22E-02 313.47 10.73 34.23
4-methyl-2-nitrophenol 3.29E-03 306.67 2.43 7.92
5-fluoro-2-nitrophenol 5.01E-03 309.16 11.63 37.62
4-amino-2-nitrophenol 9.29E-03 401.89 37.15 92.44
4-methyl-3-nitrophenol 6.85E-02 351.59 32.74 93.13
4-chloro-3-nitrophenol 5.80E-02 400.32 36.15 90.31
3-methyl-4-nitrophenol 5.86E-02 401.27 38.87 96.86
2-fluoro-4-nitrophenol 6.42E-02 394.17 9.95 25.24
3-fluoro-4-nitrophenol 3.32E-02 366.46 29.36 80.12
2-nitrobenzaldehyde 2.15E+00 317.66 77.98 245.49
3-nitrobenzaldehyde 2.75E-01 332.71 20.66 62.09
2-chloro-5-
nitrobenzaldehyde 8.41E-02 353.38 12.30 34.82
4-nitrobenzaldehyde 1.93E-01 380.40 22.51 59.16
5-chloro-2-nitrobenzoic
acid 1.40E-02 458.17 13.75 30.00
3-nitrobenzoic acid 1.90E-03 418.03 5.57 13.33
4-methyl-3-nitrobenzoic
acid 5.76E-02 464.70 21.87 47.06
32
2-chloro-3-nitrobenzoic
acid 6.29E-03 458.17 10.28 22.43
2-hydroxy-5-nitrobenzoic
acid 1.87E-02 505.55 18.68 36.95
3-methyl-4-nitrobenzoic
acid 3.04E-01 492.43 35.39 71.86
Table 8: Average difference between the experimental 𝐏𝐋𝐬𝐚𝐭 and the predicted 𝐏𝐋
𝐬𝐚𝐭. N_Vp is the Nannoolal et al. vapour pressure method (Nannoolal et al., 2008), MY_Vp is the Myrdal and Yalkowsky vapour pressure method (Myrdal and Yalkowsky, 1997), N_Tb is the Nannoolal et al. boiling point method (Nannoolal et al., 2004), SB_Tb is the Stein and Brown boiling point method (Stein and Brown, 1994) 805
Average difference
(orders of magnitude)
N_VP_N_Tb N_VP_SB_Tb MY_VP_N_Tb MY_VP_SB_Tb SIMPOL
nitrophenols 4.24 3.49 4.21 3.40 2.92
nitrobenzaldehydes 3.18 2.50 3.17 2.46 0.29
nitrobenzoic acids 2.06 0.91 2.56 1.52 -0.83
all compounds 3.38 2.52 3.50 2.65 1.26
Table 9: Comparison between nitrophenols measured in this paper and by Dang et al. (2019)
Compound Solid State P298 (Pa) Sub-Cooled P298 (Pa)
4-methyl-3-nitrophenol
1.08 ± 0.43E-02 6.85 ± 5.14E-02 This work - PEG
reference
1.94 ± 0.78E-03 1.23 ± 0.92E-02 This work - malonic
acid reference
2.46 ± 0.98E-03 4.85 ± 3.64E-03 Dang et al. (Dang et al.,
2019)
1.84 .. E-02 EDB
3-methyl-4-nitrophenol
1.78 ± 0.71E-03 5.86 ± 4.40E-02 This work - PEG
reference
2.45 ± 0.98E-04 7.80 ± 5.85E-03 This work - malonic
acid reference
2.28 ± 0.91E-04 3.78 ± 2.84E-03 Dang et al. (Dang et al.,
2019)
7.20 .. E-04 4.70 .
. E-02 EDB
4-methyl-2-nitrophenol
3.11 ± 1.24E-03 3.29 ± 2.47E-03 This work - PEG
reference
5.61 ± 2.24E-04 5.76 ± 4.32E-04 This work - malonic
acid reference

33
5.72 ± 2.29E-04 5.97 ± 4.48E-04 Dang et al. (Dang et al.,
2019)
810
5.2 Paper 2: Measured solid state and sub-cooled liquid
vapour pressures of benzaldehydes using Knudsen effusion
mass spectrometry
Authors: P. D. Shelley, T.J. Bannan, S.D. Worrall, M. R. Alfarra,C. J. Percival, A. Garforth,
D. Topping
Journal: Atmosphere, 12, 2021 https://doi.org/10.3390/atmos12030397
Publication date: 19 March 2021
Overview: This study built on the previous publication and looked at PsatS and Psat
L of
benzaldehydes. In the previous paper focusing on nitroaromatics the presence and strength
of H bonds was identified as the most important factor impacting Psat. In this study the
range of benzaldehydes selected contained a mix of compounds that could and could not H
bond. As with the nitroaromatics the ability of a compound to H bond had the greatest
impact on Psat, but for those compounds that could not H bond the polarisability of the
compound had the greatest impact on Psat. The experimental Psat were also compared to
predicted Psat using GCMs to identify where the predictive techniques perform well and
where they perform poorly.
Author’s contribution: I was responsible for the KEMS and DSC operation during data
collection, data processing, data analysis, and the writing of the paper.
Contributions from co-authors: Thomas Bannan was responsible for the operation of the
KEMS, as well as training on the KEMS, and reviewed and edited of the initial manuscript
draft. Stephan Worrall performed some of the data analysis, contributed to the initial
draft, and reviewed and edited the manuscript. Rami Alfarra was responsible for project
supervision and review of the manuscript. Carl Percival contributed to the initial manuscript.
Arthur Garforth was responsible for access to and training on the DSC. David Topping was
responsible for project supervision and reviewed the manuscript.
64
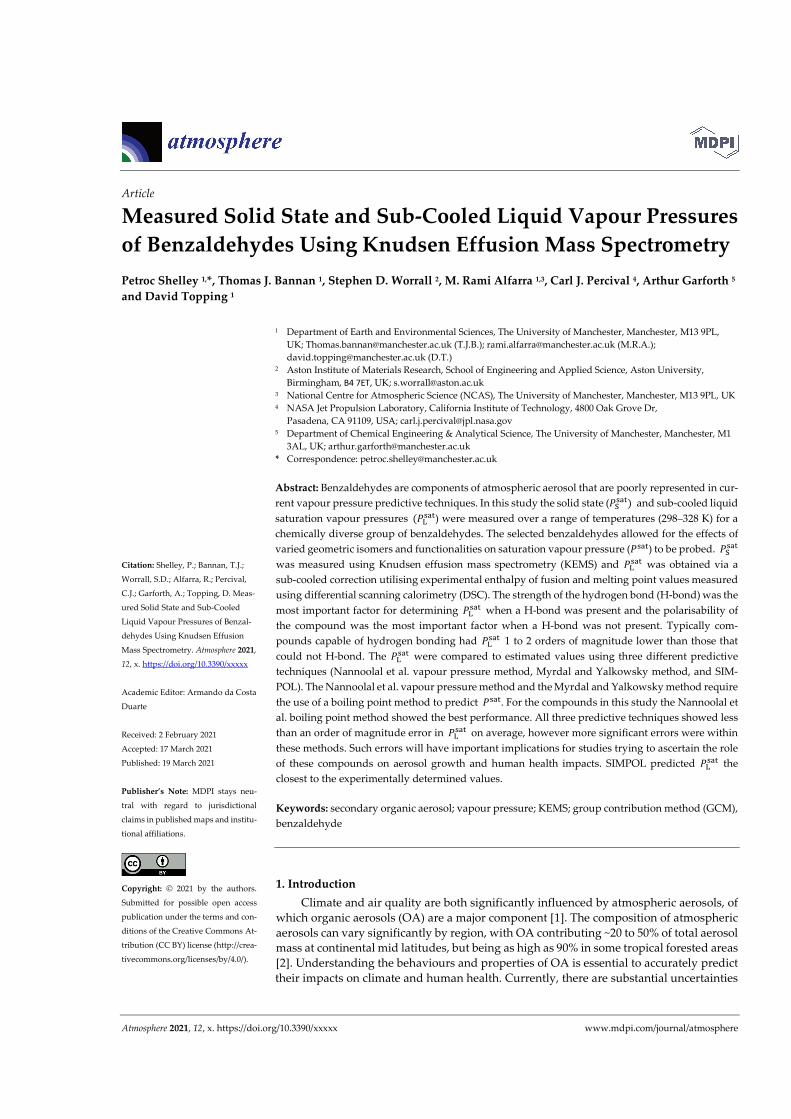
Atmosphere 2021, 12, x. https://doi.org/10.3390/xxxxx www.mdpi.com/journal/atmosphere
Article
Measured Solid State and Sub-Cooled Liquid Vapour Pressures of Benzaldehydes Using Knudsen Effusion Mass Spectrometry Petroc Shelley 1,*, Thomas J. Bannan 1, Stephen D. Worrall 2, M. Rami Alfarra 1,3, Carl J. Percival 4, Arthur Garforth 5 and David Topping 1
1 Department of Earth and Environmental Sciences, The University of Manchester, Manchester, M13 9PL, UK; [email protected] (T.J.B.); [email protected] (M.R.A.); [email protected] (D.T.)
2 Aston Institute of Materials Research, School of Engineering and Applied Science, Aston University, Birmingham, B4 7ET, UK; [email protected]
3 National Centre for Atmospheric Science (NCAS), The University of Manchester, Manchester, M13 9PL, UK 4 NASA Jet Propulsion Laboratory, California Institute of Technology, 4800 Oak Grove Dr,
Pasadena, CA 91109, USA; [email protected] 5 Department of Chemical Engineering & Analytical Science, The University of Manchester, Manchester, M1
3AL, UK; [email protected] * Correspondence: [email protected]
Abstract: Benzaldehydes are components of atmospheric aerosol that are poorly represented in cur-rent vapour pressure predictive techniques. In this study the solid state (𝑃 ) and sub-cooled liquid saturation vapour pressures (𝑃 ) were measured over a range of temperatures (298–328 K) for a chemically diverse group of benzaldehydes. The selected benzaldehydes allowed for the effects of varied geometric isomers and functionalities on saturation vapour pressure (𝑃 ) to be probed. 𝑃 was measured using Knudsen effusion mass spectrometry (KEMS) and 𝑃 was obtained via a sub-cooled correction utilising experimental enthalpy of fusion and melting point values measured using differential scanning calorimetry (DSC). The strength of the hydrogen bond (H-bond) was the most important factor for determining 𝑃 when a H-bond was present and the polarisability of the compound was the most important factor when a H-bond was not present. Typically com-pounds capable of hydrogen bonding had 𝑃 1 to 2 orders of magnitude lower than those that could not H-bond. The 𝑃 were compared to estimated values using three different predictive techniques (Nannoolal et al. vapour pressure method, Myrdal and Yalkowsky method, and SIM-POL). The Nannoolal et al. vapour pressure method and the Myrdal and Yalkowsky method require the use of a boiling point method to predict 𝑃 . For the compounds in this study the Nannoolal et al. boiling point method showed the best performance. All three predictive techniques showed less than an order of magnitude error in 𝑃 on average, however more significant errors were within these methods. Such errors will have important implications for studies trying to ascertain the role of these compounds on aerosol growth and human health impacts. SIMPOL predicted 𝑃 the closest to the experimentally determined values.
Keywords: secondary organic aerosol; vapour pressure; KEMS; group contribution method (GCM), benzaldehyde
1. Introduction Climate and air quality are both significantly influenced by atmospheric aerosols, of
which organic aerosols (OA) are a major component [1]. The composition of atmospheric aerosols can vary significantly by region, with OA contributing ~20 to 50% of total aerosol mass at continental mid latitudes, but being as high as 90% in some tropical forested areas [2]. Understanding the behaviours and properties of OA is essential to accurately predict their impacts on climate and human health. Currently, there are substantial uncertainties
Citation: Shelley, P.; Bannan, T.J.;
Worrall, S.D.; Alfarra, R.; Percival,
C.J.; Garforth, A.; Topping, D. Meas-
ured Solid State and Sub-Cooled
Liquid Vapour Pressures of Benzal-
dehydes Using Knudsen Effusion
Mass Spectrometry. Atmosphere 2021,
12, x. https://doi.org/10.3390/xxxxx
Academic Editor: Armando da Costa
Duarte
Received: 2 February 2021
Accepted: 17 March 2021
Published: 19 March 2021
Publisher’s Note: MDPI stays neu-
tral with regard to jurisdictional
claims in published maps and institu-
tional affiliations.
Copyright: © 2021 by the authors.
Submitted for possible open access
publication under the terms and con-
ditions of the Creative Commons At-
tribution (CC BY) license (http://crea-
tivecommons.org/licenses/by/4.0/).
Atmosphere 2021, 12, x FOR PEER REVIEW 2 of 18
surrounding many of the physicochemical properties of atmospheric aerosols [3]. OA con-sist of primary organic aerosols (POA), which are emitted directly into the atmosphere as particulates, and secondary organic aerosols (SOA), which typically form when gas phase organic compounds in the atmosphere undergo oxidation. The products of these oxida-tion reactions tend to have lower vapour pressures then the reactants and are more likely to partition to the aerosol phase [2]. To predict whether a compound will partition, knowledge of its pure component equilibrium vapour pressure, also known as saturation vapour pressure (𝑃 ), is required [4]. Due to the complexity of the organic fraction of atmospheric aerosols, estimated to contain over 100,000 distinct organic species [5], and a lack of experimental data, the 𝑃 of many compounds must be estimated.
The most common way of estimating 𝑃 is using group contribution methods (GCMs). GCMs are based on the principle that functional groups within a molecule con-tribute additively to the property of interest. However, as compounds become more func-tionalised, the interaction between functional groups within a compound means this is often not the case. The Nannoolal et al. method [6], the Myrdal and Yalkowsky method [7], SIMPOL [8] and EVAPORATION (Estimation of VApour Pressure of Organics, Ac-counting for Temperature, Intramolecular, and Non-additivity effects) [9] are among the most common GCMs that are used for predicting 𝑃 . Both Barley and McFiggans (2010) [10] and O’Meara et al. (2014) [11] performed detailed assessments for these techniques comparing predicted and experimental 𝑃 for a range of compounds selected for their particular relevance to the formation of atmospheric aerosols. In both studies there was significant disagreement between the experimental and predicted 𝑃 for many of the compounds involved. Several of the older GCMs were developed primarily for use with higher volatility hydrocarbons or monofunctional compounds, whereas SOA are lower volatility and often highly functionalised. EVAPORATION [9] was developed specifically for predicting the 𝑃 of OA and the assessment by O’Meara et al. (2014) [11] showed the best performance for the compounds to which it was applicable. This highlights two larger issues GCMs have when predicting the 𝑃 of SOA. The older and more widely applica-ble methods show larger errors as 𝑃 decreases, while the newer and more targeted methods are limited by the functionalities represented within the data set they are fit to. Further development of new GCMs to expand the range of compounds to which they are applicable is limited by a lack of experimental data for the 𝑃 of relatively low volatility multifunctional compounds. GCMs also struggle to account for the impacts the relative positions of the functional groups can have on the 𝑃 , as well as the effects of internal interactions between functional groups on a compound of interest.
This work builds on previous work by Booth et al. (2012) [12], Dang et al. (2019) [13] and Shelley et al. (2020) [14] investigating the impacts of functional group positioning and the interaction of functional groups within a molecule on 𝑃 . In previous work by Shel-ley at al. (2020) [14] large absolute differences between experimental and estimated 𝑃 were observed, especially for nitrophenol compounds. One of the major reasons for these differences was due to the lack of previous experimental 𝑃 data for compounds with similar functionalities. Similar to nitroaromatics, benzaldehydes also have a lack of experimental 𝑃 data available. In this study the solid state saturation vapour pressure (𝑃 ) of atmospherically relevant benzaldehydes and other benzaldehydes of similar functionalities are determined using Knudsen Effusion Mass Spectrometry (KEMS). A sub-cooled correction is then made using data obtained using differential scanning calo-rimetry (DSC) to calculate the sub-cooled liquid saturation vapour pressures (𝑃 ).
Benzaldehydes have both anthropogenic [15] and biogenic sources [16] and can be emitted directly into the atmosphere or formed as secondary pollutants [17]. The major primary source for benzaldehydes is the direct emission from vehicle exhausts and they are therefore ubiquitous in the polluted urban atmosphere, with undiluted emissions from engines containing up to several hundred ppb [18]. Engine emission studies have found benzaldehydes from both diesel and biodiesel powered engines [19], as well as from pet-rol and petrol/ethanol blended powered engines [20]. Benzaldehydes are also produced
Atmosphere 2021, 12, x FOR PEER REVIEW 3 of 18
in situ within the atmosphere and act as intermediates in the oxidation of aromatic com-pounds [15]. Benzaldehydes have also been observed in multiple atmospheric chamber experiments such as those by Hamilton et al. (2005) investigating the photo-oxidation of toluene in a large volume smog chamber [21] and those by Caralp et al. (1999) investigat-ing the reaction kinetics of benzoyl and peroxybenzoyl radicals in a smog chamber [15]. Benzaldehydes are present in the Master Chemical Mechanism (MCM v3.2) [22,23] as pre-cursors, reactants and products. Benzaldehydes are therefore an important class of com-pounds to have accurate measurements of 𝑃 , which are then compared to the predicted 𝑃 values of multiple GCMs to highlight areas of uncertainty. This will enable studies trying to ascertain the role of benzaldehydes on aerosol growth and human health impacts to be supported by accurate experimental data.
In this work 𝑃 and 𝑃 values are presented for 17 benzaldehydes. The 𝑃 val-ues are compared to each other and chemical and steric arguments are given to explain the observed trends and differences. Following on from this, the experimental 𝑃 values and predicted 𝑃 values from several GCMs are compared. In this comparison areas and functionalities that perform well, as well as those that perform poorly are highlighted and recommendations for the GCM most suited to predicting benzaldehydes are made.
2. Experimental A total of 17 benzaldehydes were selected for this study, shown in Table 1. All com-
pounds selected for this study were purchased at a purity of 99% and used without further preparation. All compounds are solid at room temperature. The compounds selected cover a range of functionalities in addition to benzaldehyde including phenol, amino, ether, ester, and carboxylic acid. Several compounds also contain more bulky ethyl groups that can disrupt intermolecular interactions. Of the 17 compounds selected 8 can form H-bonds.
Table 1. Benzaldehydes measured with the Knudsen effusion mass spectrometry (KEMS). Compounds above the dashed line are capable of H-Bonding in the pure component and those below cannot.
Compound Structure CAS Supplier
Vanillin (4-hydroxy-3-methoxybenzaldehyde)
121-33-5 Sigma Aldrich
Isovanillin (3-hydroxy-4-methoxybenzaldehyde)
621-59-0 Sigma Aldrich
o-vanillin (2-hydroxy-3-methoxybenzaldehyde)
148-53-8 Fisher Scientific
3-hydroxybenzaldehyde
100-83-4 Sigma Aldrich
Atmosphere 2021, 12, x FOR PEER REVIEW 4 of 18
4-hydroxybenzaldehyde
123-08-0 Fisher Scientific
2,5-dihydroxybenzaldehyde
1194-98-5 Fisher Scientific
3-ethoxy-4-hydroxybenzaldehyde
121-32-4 Sigma Aldrich
2-formylbenzoic acid
119-67-5 Fisher Scientific
4-dimethylaminobenzaldehyde
100-10-7 Fisher Scientific
4-diethylaminobenzaldehyde
120-21-8 Sigma Aldrich
methyl-4-formylbenzoate
O
O
O
1571-08-0 Sigma Aldrich
terephthalaldehyde
623-27-8 Sigma Aldrich
3,4-dimethoxybenzaldehyde
120-14-9 Sigma Aldrich
Atmosphere 2021, 12, x FOR PEER REVIEW 5 of 18
2,6-dimethoxybenzaldehyde
3392-97-0 Alfa Aesar
3-ethoxy-4-methoxybenzaldehyde
1131-52-8 Sigma Aldrich
2,4-dimethoxy-3-methylbenzaldehyde
7149-92-0 Sigma Aldrich
2,3,4-trimethoxybenzaldehyde
2103-57-3 Sigma Aldrich
2.1. The Knudsen Effusion Mass Spectrometry System (KEMS) KEMS is an established vapour pressure measurement technique capable of measur-
ing vapour pressures from 101 to 10−8 Pa. The KEMS system is the same instrument that has been used in previous studies [4,14,24,25] and a summary of the measurement proce-dure will be given here. For a more detailed overview see Booth et al. (2009) [25]. To cali-brate the KEMS, a reference compound of known 𝑃 is used. In this study the polyeth-ylene glycol series (PEG series), PEG-3 (P298 = 6.68 × 10⁻² Pa) and PEG-4 (P298 = 1.69 × 10⁻² Pa) [26] were used as was implemented in Booth et al. (2017) [27], Bannan et al. (2019) [28], and Shelley et al. (2020) [14].
The reference compound is placed in a temperature controlled stainless steel Knud-sen cell. The cell has an orifice through which the sample effuses creating a molecular beam. The size of the orifice is ≤1/10 the mean free path of the gas molecules in the cell. This ensures that the particles effusing through the orifice do not significantly disturb the thermodynamic equilibrium of the cell [25,29]. The molecular beam is then ionised using a standard 70 eV electron ionisation and analysed using a quadrupole mass spectrometer.
The ionisation cross sections for each compound were estimated by summing the ionisation cross section for each atom in the compound at the ionisation energy (70 eV) [29]. The ionisation cross sections for each atom where taken from the NIST: Electron-impact cross section database [30]. After correcting for the ionisation cross section, the mass spectral signal is proportional to the 𝑃 . Once the calibration process is completed it is possible to measure a sample of unknown 𝑃 . When the sample is changed it is necessary to isolate the sample chamber from the measurement chamber using a gate valve so that the sample chamber can be vented, whilst the ioniser filament and the sec-ondary electron multiplier (SEM) detector can remain on and allow for direct comparisons with the reference compound. The 𝑃 of the sample can be determined from the inten-sity of the mass spectrum, and the temperature at which the mass spectrum was taken are
Atmosphere 2021, 12, x FOR PEER REVIEW 6 of 18
known. The samples of unknown 𝑃 are typically solid so it is the 𝑃 that is deter-mined. After the 𝑃 (Pa), has been determined for multiple temperatures, the August equation (Equation (1)) can be used to determine the enthalpy and entropy of sublimation as shown in Booth et al. (2009) [25].
ln(𝑃 ) = −∆𝐻
𝑅𝑇+
∆𝑆
𝑅 (1)
where T is the temperature (K), R is the ideal gas constant (J mol−1 K−1), ∆Hsub is the en-thalpy of sublimation (J mol−1) and ∆Ssub is the entropy of sublimation (J mol−1 K−1). 𝑃 was obtained over a range of 30 K in this work starting at 298 K and rising to 328 K. The reported solid state vapour pressures are calculated from a linear fit of ln(𝑃 ) vs. 1/T using the August equation. ∆𝐻 can be extracted from the gradient of this linear fit and ∆𝑆 can be extracted from the intercept [4].
2.2. Differential Scanning Calorimetry (DSC) According to the reference state used in atmospheric models and as predicted by
GCMs, 𝑃 is required. Therefore, it is necessary to convert the 𝑃 determined by the KEMS system into a 𝑃 . As with previous KEMS studies [4,14,24] the melting point (Tm) and the enthalpy of fusion (∆Hfus) are required for the conversion. These values were measured with a TA Instruments DSC 2500 Differential Scanning Calorimeter (DSC) sourced from TA Instruments UK, Elstree, UK. Within the DSC, heat flow and tempera-ture were calibrated using an indium reference, and heat capacity using a sapphire refer-ence. A heating rate of 10 K min−1 was used, then, 5–10 mg of sample was measured using a microbalance and then pressed into a hermetically sealed aluminium DSC pan. A purge gas of N2 was used with a flow rate of 30 mL min−1. Data processing was performed using the "Trios" software supplied with the instrument. ∆cp,sl was estimated using ∆cp,sl = ∆Sfus [31,32].
2.3. MOPAC2016 MOPAC2016 [33] is a semi empirical quantum chemistry program based on the ne-
glect of diatomic differential overlap (NDDO) approximation [34]. This software was used to calculate the partial charges of the phenolic carbon and the molecular polarisibility (αm) of the compounds investigated.
3. Theory 3.1. Sub-Cooled Correction
The conversion between 𝑃 and 𝑃 is done using the Prausnitz equation [35] (Equation (2)).
ln𝑃
𝑃=
∆𝐻
𝑅𝑇
𝑇
𝑇− 1 −
∆𝑐 ,
𝑅
𝑇
𝑇− 1 +
∆𝑐 ,
𝑅𝑙𝑛
𝑇
𝑇 (2)
where ∆Hfus is the enthalpy of fusion (J mol−1), ∆cp,sl is the change in heat capacity between the solid and liquid states (J mol−1K−1),T is the temperature (K), and Tm is the melting point (K).
3.2. Vapour Pressure Predictive Techniques Due to a lack of experimental data for SOA GCMs are often used to predict 𝑃 val-
ues. GCMs operate under the principal that the contribution, from a functional group, to a property is constant and that the contribution is unaffected by the base molecule (e.g., the contribution from -OH to a property of interest in ethanol and propanol is the same) [3]. This concept is valid in many instances, however there are many where it is not. The most common of which is when multiple functional groups within a molecule interact with each other, changing each of their relative contributions.
Atmosphere 2021, 12, x FOR PEER REVIEW 7 of 18
GCMs such as EVAPORATION [9] and SIMPOL [8] predict 𝑃 requiring only chemical structure and target temperature, whereas other GCMs such as the Nannoolal et al. method [6] and the Myrdal and Yalkowsky method [7] also require boiling point (Tb), which are known as combined methods. For many of the same reasons as for 𝑃 , there is also a lack of experimental Tb data for SOA and Tb must also be predicted using GCMs. The Nannoolal et al. method [36], the Joback and Reid method [37], and the Stein and Brown method [38] are most commonly used. The Joback and Reid method [37] is not considered in this work because the Stein and Brown method [38] is an improved version and it is known to have many biases [10]. For the combined GCMs the need to also esti-mate Tb gives rise to another source of error. This size of the error introduced by estimating Tb increases the greater the difference between the estimated Tb and the temperature at which 𝑃 is calculated [11].
Due to many of the GCMs often used to predict 𝑃 of SOA having been originally developed for use with monofunctional compounds and hydrocarbons [25], they do not account for intramolecular interactions or steric effects, which are present in multifunc-tional compounds. There are also some functionalities that are either poorly represented within the fitting data set of a GCM or not represented at all. If the functionality is poorly represented within a GCM it can lead to overfitting. If the functionality is not represented at all, the effects of the functional group may be misrepresented or ignored entirely. For instance, many GCMs do not account for hydroperoxides (-O-O-H) but do account for both ethers (-O-) and hydroxy (-O-H). If the GCM does not contain a parameter for hy-droperoxides it would instead treat the group as a combination of an ether and a hydroxy which would lead to a large error, as chemically these groups are very different [3]. Alter-natively, if a GCM contained no parameters for halogens, it would simply ignore any hal-ogen atoms when predicting 𝑃 . GCMs also struggle with the proximity effects and iso-mers that can occur in multifunctional compounds. The Nannoolal et al. method [6] does contain parameters for -ortho, -meta, -para isomerism, but as soon as a third functional group is added to the aromatic ring it can no longer distinguish between the different isomers.
Despite the previous work to assess the performance of GCMs such as those by Bar-ley and McFiggans (2010) [10] and O’Meara et al. (2014) [11] these assessments were done generally for a wide range of SOA and contained few benzaldehydes in the test set. Barley and McFiggans (2010) [10] only contained 2 benzaldehydes in the test sets and O’Meara et al. (2014) [11] contained no more than 5.
4. Results and Discussion 4.1. Solid State Vapour Pressure
𝑃 measured directly by the KEMS is given in Table 2. Measurements were made at increments of 5 K from 298 K to 328 K for a total of seven measurements (with the exception of compounds that melted during the temperature ramp). A minimum of two KEMS measurements were made for each compound, with each individual measurement calculating 𝑃 using both PEG-3 and PEG-4 as reference compounds. 𝑃 was then taken as the mean of these four values. In the instances where there were large differences between the calculated 𝑃 additional measurements were made. The calculated 𝑃 of each KEMS measurement can be found in the accompanying dataset [39]. The August equation (Equation (1)) was used to calculate the enthalpies and entropies of sublimation over the studied temperature range. Overall, the compounds with the highest vapour pressure are incapable of forming hydrogen bonds (H-bonds) as they do not contain any H-bond donors. The compounds that cannot H-bond have on average 50% higher 𝑃 , with this discussed in detail in Section 4.2.
Atmosphere 2021, 12, x FOR PEER REVIEW 8 of 18
Table 2. 𝑃Ssat at 298 K, and enthalpies and entropies of sublimation of benzaldehydes determined using KEMS. The com-
pounds below the dashed line are capable of H-bonding in the pure component and those above the dashed line are not.
Compound P298 (Pa) ΔHsub (kJ mol−1) ΔSsub (J mol−1 K−1) Methyl 4-formylbenzoate 3.97 × 10⁻¹ 75.98 247.24
terephthalaldehyde 2.34 × 10⁻¹ 76.66 245.10 2,3,4-trimethoxybenzaldehyde 1.11 × 10⁻¹ 87.51 275.35
2,4-dimethoxy-3-methylbenzaldehyde 1.09 × 10⁻¹ 79.02 246.18 3,4-dimethoxybenzaldehyde 6.64 × 10⁻² 91.58 284.67
3-ethoxy-4-methoxybenzaldehyde 5.72 × 10⁻² 94.49 293.23 4-dimethylaminobenzaldehyde 5.19 × 10⁻² 95.42 295.11 4-diethylaminobenzaldehyde 4.44 × 10⁻² 92.28 283.70 2,6-dimethoxybenzaldehyde 7.29 × 10⁻³ 118.09 355.16
o-vanillin 3.88 × 10⁻¹ 67.75 219.30 3-ethoxy-4-hydroxybenzaldehyde 3.14 × 10⁻² 100.35 307.95
Vanillin 2.14 × 10⁻² 108.16 330.77 2,5-dihydroxybenzaldehyde 1.63 × 10⁻² 102.50 309.66
3-hydroxybenzaldehyde 1.58 × 10⁻² 109.90 334.17 4-hydroxybenzaldehyde 5.86 × 10⁻³ 107.76 318.80
Isovanillin 3.43 × 10⁻³ 119.00 352.12 2-formylbenzoic acid 1.11 × 10⁻³ 114.82 328.51
4.2. Sub-Cooled Liquid Vapour Pressure 𝑃 were obtained from the 𝑃 using thermochemical data obtained through use
of a DSC and Equation 2. The results are detailed in Table 3 for H-bonding compounds and Table 4 for non H-bonding compounds.
Table 3. 𝑃 at 298 K, melting point, enthalpy of fusion, entropy of fusion, and the partial charge of the phenolic carbon of the H-bonding benzaldehydes (carboxylic carbon in the case of 2-formyl-benzoic acid).
Compound P298 (Pa) Tm (K) ΔHfus (kJ mol−1) ΔSfus (J mol−1 K−1) Partial Charge of the Phe-nolic/Carboxylic Carbon
o-vanillin 6.44 × 10⁻¹ 320.09 19.06 59.55 0.311 3-ethoxy-4-hydroxybenzaldehyde 1.31 × 10⁻¹ 351.70 25.27 71.85 0.244
3-hydroxybenzaldehyde 9.21 × 10⁻² 378.98 23.19 61.20 0.272 2,5-dihydroxybenzaldehyde 7.02 × 10⁻² 373.15 20.16 54.02 0.329 (intra) 0.184 (inter)
Vanillin 6.73 × 10⁻² 356.82 18.88 52.90 0.245 4-hydroxybenzaldehyde 2.78 × 10⁻² 391.40 18.60 47.53 0.335
Isovanillin 2.36 × 10⁻² 390.34 23.20 59.44 0.167 2-formylbenzoic acid 4.96 × 10⁻³ 375.12 20.36 54.28 0.621
Table 4. 𝑃 at 298 K, melting point, enthalpy of fusion, entropy of fusion and polarisability of the non H-bonding ben-zaldehydes.
Compound P298 (Pa) Tm (K) ΔHfus (kJ mol−1) ΔSfus (J mol−1 K−1) αm (Å3) methyl 4-formylbenzoate 1.07 × 100 337.21 22.48 66.66 17.424
terephthalaldehyde 9.43 × 10⁻¹ 390.06 16.82 43.11 14.888 2,4-dimethoxy-3-methylbenzalde-
hyde 2.38 × 10⁻¹ 327.43 22.81 69.66 19.931
2,3,4-trimethoxybenzaldehyde 1.73 × 10⁻¹ 313.63 22.64 72.17 20.658 4-dimethylaminobenzaldehyde 1.57 × 10⁻¹ 349.37 20.24 57.93 18.488
3,4-dimethoxybenzaldehyde 1.38 × 10⁻¹ 321.53 20.77 64.61 18.206 3-ethoxy-4-methoxybenzaldehyde 1.14 × 10⁻¹ 324.96 21.67 66.67 20.071
Atmosphere 2021, 12, x FOR PEER REVIEW 9 of 18
4-diethylaminobenzaldehyde 6.49 × 10⁻² 314.53 18.59 59.11 22.224 2,6-dimethoxybenzaldehyde 4.50 × 10⁻² 373.19 25.16 67.43 17.944
When comparing the 𝑃 of two compounds direct comparisons were made when only one change occurs between the compounds. If more than one structural change oc-curs, it becomes difficult to determine the exact cause of the change in 𝑃 due to the many competing factors, such as steric effects, inter- and intra- molecular bonding, and interactions between neighbouring groups. In previous KEMS studies where direct com-parisons have been made between the 𝑃 of similar compounds this was done in the solid state [13,14]. In this work the comparisons will be done for 𝑃 rather than 𝑃 as 𝑃 is more often used in models and is what is predicted by GCMs allowing for easier comparisons to take place.
For the direct comparisons between compounds the key factors are, in order of ap-parent importance, if the compounds are capable of forming H-bonds, to what extent these H-bonds are intermolecular vs. intramolecular [14], and if no H-bonds are present, the αm of the compound. Previous studies have found a strong correlation between αm and 𝑃 for compounds whose primary interactions are dispersive in nature [40–42].
For compounds that are capable of forming H-bonds, the relative positioning of the functional groups is an important factor in determining the potential strength of these H-bonds, and by extension 𝑃 . Through the inductive and resonance effects the positioning of the functional groups can affect the partial charge on the phenolic carbon and the more positive this value the stronger the H-bonds formed, assuming no other effects such as steric hindrance occur. The phenolic carbon of an aromatic compound is shown in Figure 1. This is discussed in more detail in Shelley at el. (2020) [14].
Figure 1. The phenolic carbon on a compound is the carbon directly bonded to the oxygen of the phenol group.
For compounds that are not capable of forming H-bonds there appears to be a rela-tionship between 𝑃 and the polarisability of the compound. This relationship has been investigated in work done by Staikova et al. (2004, 2005) and Liang and Gallagher (1998). This relationship between 𝑃 and αm is strongest for non-polar compounds, gets weaker the more polar the compound of interest becomes, and is weakest for compounds capable of forming H-bonds. The strong correlation between αm and 𝑃 for nonpolar hydrocar-bons is consistent with the fact that αm is related to the dispersion forces, which are the main component of the intermolecular forces for nonpolar compounds [43]. The poorer performance for polar compounds such as ketones can be explained by the permanent dipoles of these compounds reducing the chance of instantaneous dipoles forming, which are the basis of dispersion interactions.
4.2.1. H-Bonding Compounds Looking first at the compounds capable of H-bonding Figure 2 shows a plot of 𝑃
vs. partial charge. In general, as the partial charge of the phenolic carbon increases 𝑃 decreases.
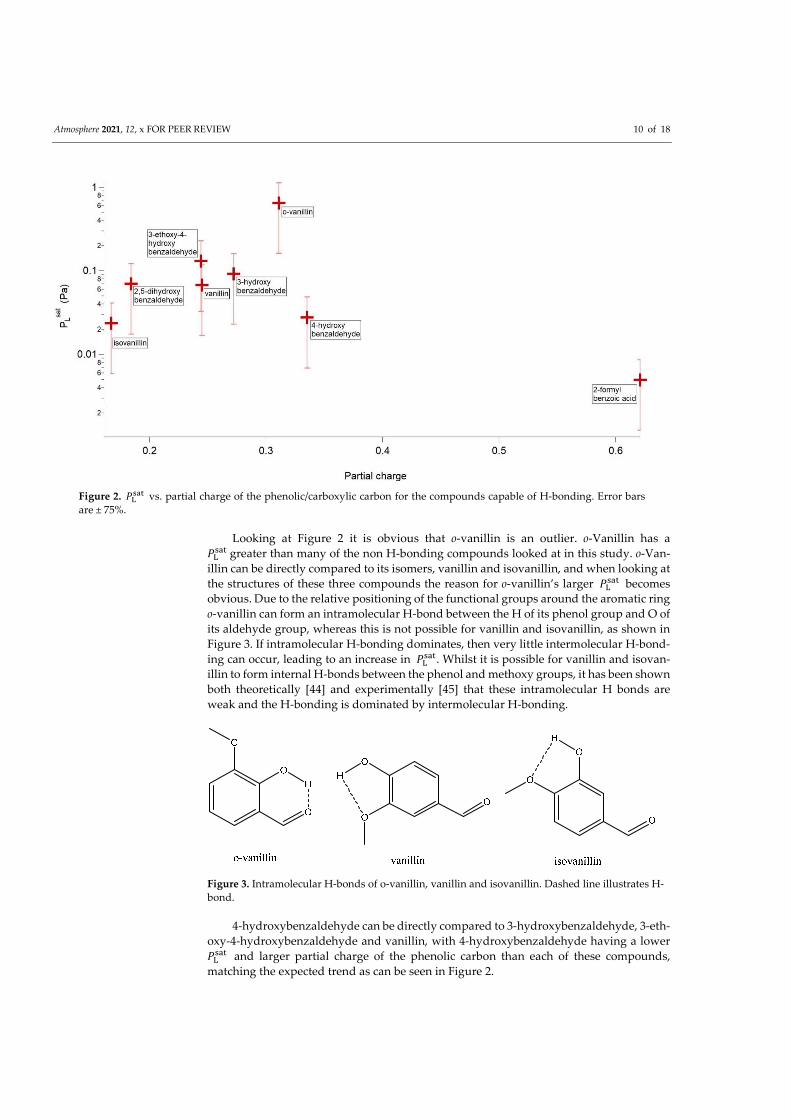
Atmosphere 2021, 12, x FOR PEER REVIEW 10 of 18
Figure 2. 𝑃 vs. partial charge of the phenolic/carboxylic carbon for the compounds capable of H-bonding. Error bars are ± 75%.
Looking at Figure 2 it is obvious that o-vanillin is an outlier. o-Vanillin has a 𝑃 greater than many of the non H-bonding compounds looked at in this study. o-Van-illin can be directly compared to its isomers, vanillin and isovanillin, and when looking at the structures of these three compounds the reason for o-vanillin’s larger 𝑃 becomes obvious. Due to the relative positioning of the functional groups around the aromatic ring o-vanillin can form an intramolecular H-bond between the H of its phenol group and O of its aldehyde group, whereas this is not possible for vanillin and isovanillin, as shown in Figure 3. If intramolecular H-bonding dominates, then very little intermolecular H-bond-ing can occur, leading to an increase in 𝑃 . Whilst it is possible for vanillin and isovan-illin to form internal H-bonds between the phenol and methoxy groups, it has been shown both theoretically [44] and experimentally [45] that these intramolecular H bonds are weak and the H-bonding is dominated by intermolecular H-bonding.
Figure 3. Intramolecular H-bonds of o-vanillin, vanillin and isovanillin. Dashed line illustrates H-bond.
4-hydroxybenzaldehyde can be directly compared to 3-hydroxybenzaldehyde, 3-eth-oxy-4-hydroxybenzaldehyde and vanillin, with 4-hydroxybenzaldehyde having a lower 𝑃 and larger partial charge of the phenolic carbon than each of these compounds, matching the expected trend as can be seen in Figure 2.
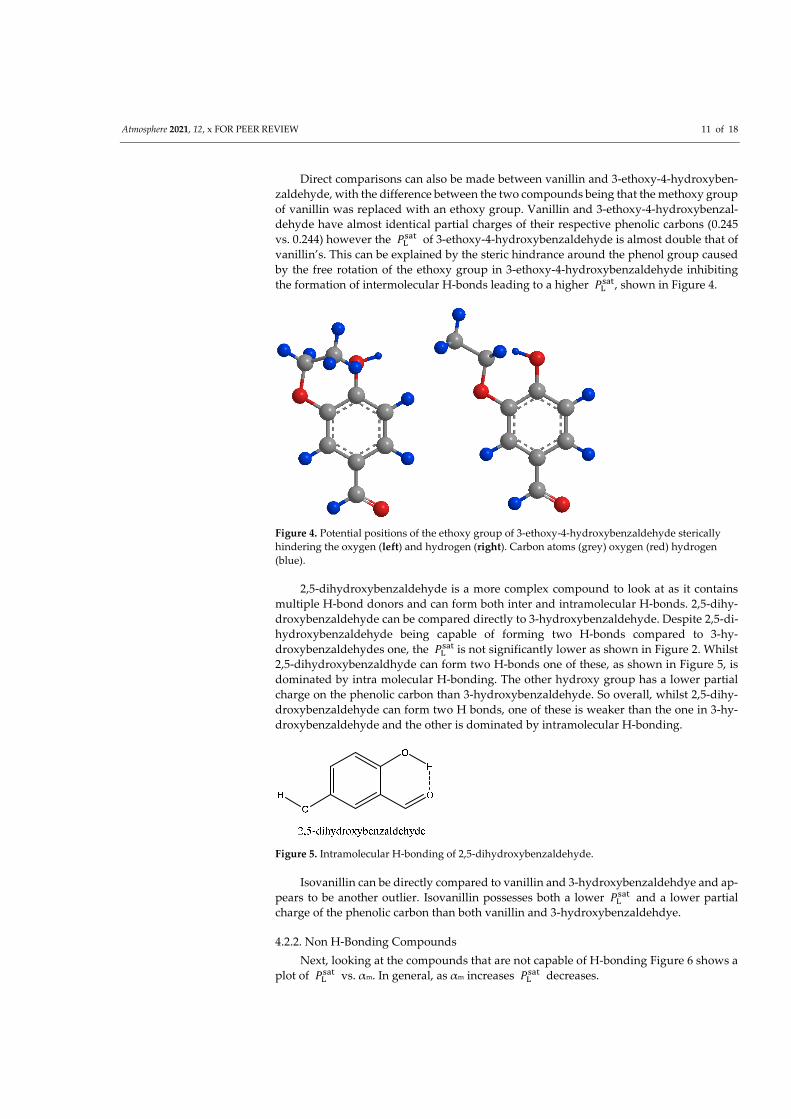
Atmosphere 2021, 12, x FOR PEER REVIEW 11 of 18
Direct comparisons can also be made between vanillin and 3-ethoxy-4-hydroxyben-zaldehyde, with the difference between the two compounds being that the methoxy group of vanillin was replaced with an ethoxy group. Vanillin and 3-ethoxy-4-hydroxybenzal-dehyde have almost identical partial charges of their respective phenolic carbons (0.245 vs. 0.244) however the 𝑃 of 3-ethoxy-4-hydroxybenzaldehyde is almost double that of vanillin’s. This can be explained by the steric hindrance around the phenol group caused by the free rotation of the ethoxy group in 3-ethoxy-4-hydroxybenzaldehyde inhibiting the formation of intermolecular H-bonds leading to a higher 𝑃 , shown in Figure 4.
Figure 4. Potential positions of the ethoxy group of 3-ethoxy-4-hydroxybenzaldehyde sterically hindering the oxygen (left) and hydrogen (right). Carbon atoms (grey) oxygen (red) hydrogen (blue).
2,5-dihydroxybenzaldehyde is a more complex compound to look at as it contains multiple H-bond donors and can form both inter and intramolecular H-bonds. 2,5-dihy-droxybenzaldehyde can be compared directly to 3-hydroxybenzaldehyde. Despite 2,5-di-hydroxybenzaldehyde being capable of forming two H-bonds compared to 3-hy-droxybenzaldehydes one, the 𝑃 is not significantly lower as shown in Figure 2. Whilst 2,5-dihydroxybenzaldhyde can form two H-bonds one of these, as shown in Figure 5, is dominated by intra molecular H-bonding. The other hydroxy group has a lower partial charge on the phenolic carbon than 3-hydroxybenzaldehyde. So overall, whilst 2,5-dihy-droxybenzaldehyde can form two H bonds, one of these is weaker than the one in 3-hy-droxybenzaldehyde and the other is dominated by intramolecular H-bonding.
Figure 5. Intramolecular H-bonding of 2,5-dihydroxybenzaldehyde.
Isovanillin can be directly compared to vanillin and 3-hydroxybenzaldehdye and ap-pears to be another outlier. Isovanillin possesses both a lower 𝑃 and a lower partial charge of the phenolic carbon than both vanillin and 3-hydroxybenzaldehdye.
4.2.2. Non H-Bonding Compounds Next, looking at the compounds that are not capable of H-bonding Figure 6 shows a
plot of 𝑃 vs. αm. In general, as αm increases 𝑃 decreases.
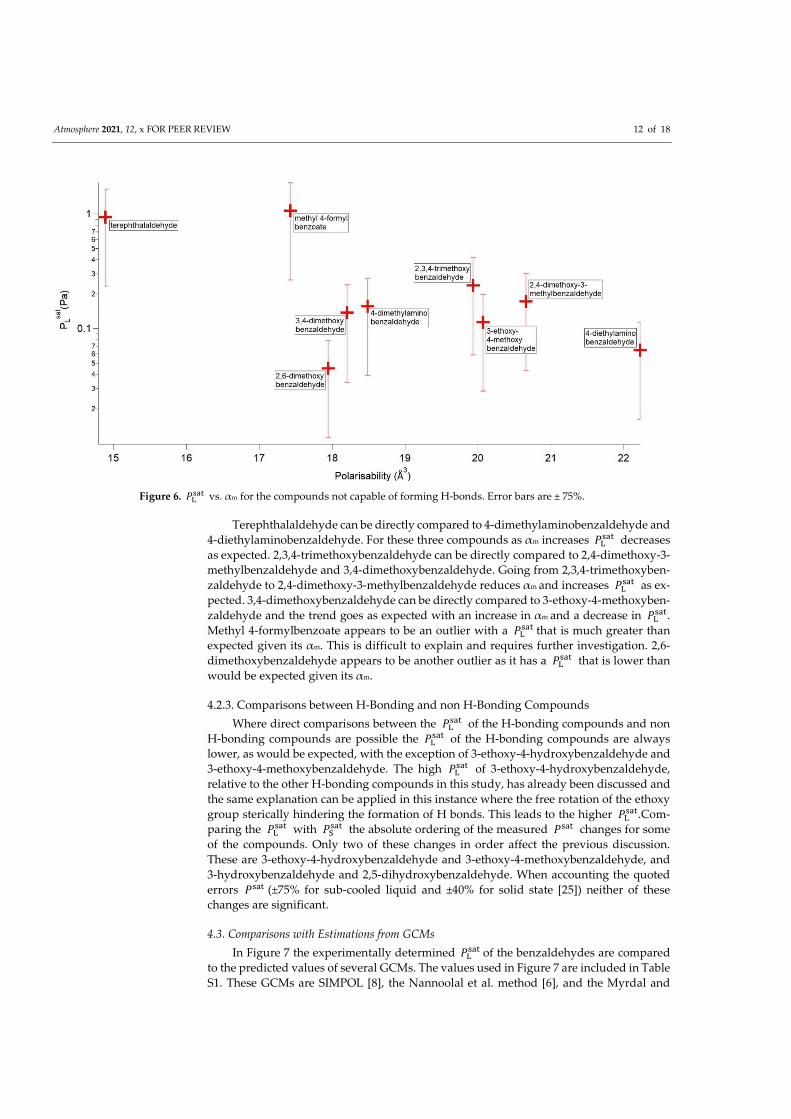
Atmosphere 2021, 12, x FOR PEER REVIEW 12 of 18
Figure 6. 𝑃 vs. αm for the compounds not capable of forming H-bonds. Error bars are ± 75%.
Terephthalaldehyde can be directly compared to 4-dimethylaminobenzaldehyde and 4-diethylaminobenzaldehyde. For these three compounds as αm increases 𝑃 decreases as expected. 2,3,4-trimethoxybenzaldehyde can be directly compared to 2,4-dimethoxy-3-methylbenzaldehyde and 3,4-dimethoxybenzaldehyde. Going from 2,3,4-trimethoxyben-zaldehyde to 2,4-dimethoxy-3-methylbenzaldehyde reduces αm and increases 𝑃 as ex-pected. 3,4-dimethoxybenzaldehyde can be directly compared to 3-ethoxy-4-methoxyben-zaldehyde and the trend goes as expected with an increase in αm and a decrease in 𝑃 . Methyl 4-formylbenzoate appears to be an outlier with a 𝑃 that is much greater than expected given its αm. This is difficult to explain and requires further investigation. 2,6-dimethoxybenzaldehyde appears to be another outlier as it has a 𝑃 that is lower than would be expected given its αm.
4.2.3. Comparisons between H-Bonding and non H-Bonding Compounds Where direct comparisons between the 𝑃 of the H-bonding compounds and non
H-bonding compounds are possible the 𝑃 of the H-bonding compounds are always lower, as would be expected, with the exception of 3-ethoxy-4-hydroxybenzaldehyde and 3-ethoxy-4-methoxybenzaldehyde. The high 𝑃 of 3-ethoxy-4-hydroxybenzaldehyde, relative to the other H-bonding compounds in this study, has already been discussed and the same explanation can be applied in this instance where the free rotation of the ethoxy group sterically hindering the formation of H bonds. This leads to the higher 𝑃 .Com-paring the 𝑃 with 𝑃 the absolute ordering of the measured 𝑃 changes for some of the compounds. Only two of these changes in order affect the previous discussion. These are 3-ethoxy-4-hydroxybenzaldehyde and 3-ethoxy-4-methoxybenzaldehyde, and 3-hydroxybenzaldehyde and 2,5-dihydroxybenzaldehyde. When accounting the quoted errors 𝑃 (±75% for sub-cooled liquid and ±40% for solid state [25]) neither of these changes are significant.
4.3. Comparisons with Estimations from GCMs In Figure 7 the experimentally determined 𝑃 of the benzaldehydes are compared
to the predicted values of several GCMs. The values used in Figure 7 are included in Table S1. These GCMs are SIMPOL [8], the Nannoolal et al. method [6], and the Myrdal and
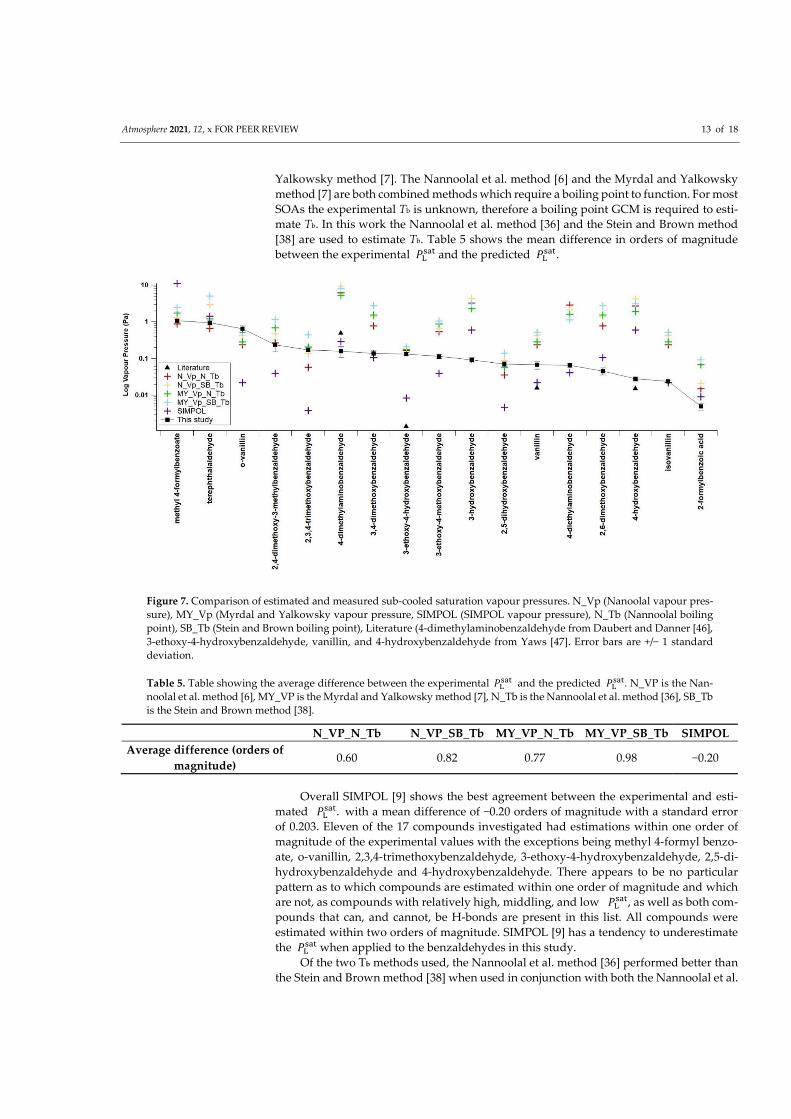
Atmosphere 2021, 12, x FOR PEER REVIEW 13 of 18
Yalkowsky method [7]. The Nannoolal et al. method [6] and the Myrdal and Yalkowsky method [7] are both combined methods which require a boiling point to function. For most SOAs the experimental Tb is unknown, therefore a boiling point GCM is required to esti-mate Tb. In this work the Nannoolal et al. method [36] and the Stein and Brown method [38] are used to estimate Tb. Table 5 shows the mean difference in orders of magnitude between the experimental 𝑃 and the predicted 𝑃 .
Figure 7. Comparison of estimated and measured sub-cooled saturation vapour pressures. N_Vp (Nanoolal vapour pres-sure), MY_Vp (Myrdal and Yalkowsky vapour pressure, SIMPOL (SIMPOL vapour pressure), N_Tb (Nannoolal boiling point), SB_Tb (Stein and Brown boiling point), Literature (4-dimethylaminobenzaldehyde from Daubert and Danner [46], 3-ethoxy-4-hydroxybenzaldehyde, vanillin, and 4-hydroxybenzaldehyde from Yaws [47]. Error bars are +/− 1 standard deviation.
Table 5. Table showing the average difference between the experimental 𝑃 and the predicted 𝑃 . N_VP is the Nan-noolal et al. method [6], MY_VP is the Myrdal and Yalkowsky method [7], N_Tb is the Nannoolal et al. method [36], SB_Tb is the Stein and Brown method [38].
N_VP_N_Tb N_VP_SB_Tb MY_VP_N_Tb MY_VP_SB_Tb SIMPOL Average difference (orders of
magnitude) 0.60 0.82 0.77 0.98 −0.20
Overall SIMPOL [9] shows the best agreement between the experimental and esti-mated 𝑃 . with a mean difference of −0.20 orders of magnitude with a standard error of 0.203. Eleven of the 17 compounds investigated had estimations within one order of magnitude of the experimental values with the exceptions being methyl 4-formyl benzo-ate, o-vanillin, 2,3,4-trimethoxybenzaldehyde, 3-ethoxy-4-hydroxybenzaldehyde, 2,5-di-hydroxybenzaldehyde and 4-hydroxybenzaldehyde. There appears to be no particular pattern as to which compounds are estimated within one order of magnitude and which are not, as compounds with relatively high, middling, and low 𝑃 , as well as both com-pounds that can, and cannot, be H-bonds are present in this list. All compounds were estimated within two orders of magnitude. SIMPOL [9] has a tendency to underestimate the 𝑃 when applied to the benzaldehydes in this study.
Of the two Tb methods used, the Nannoolal et al. method [36] performed better than the Stein and Brown method [38] when used in conjunction with both the Nannoolal et al.
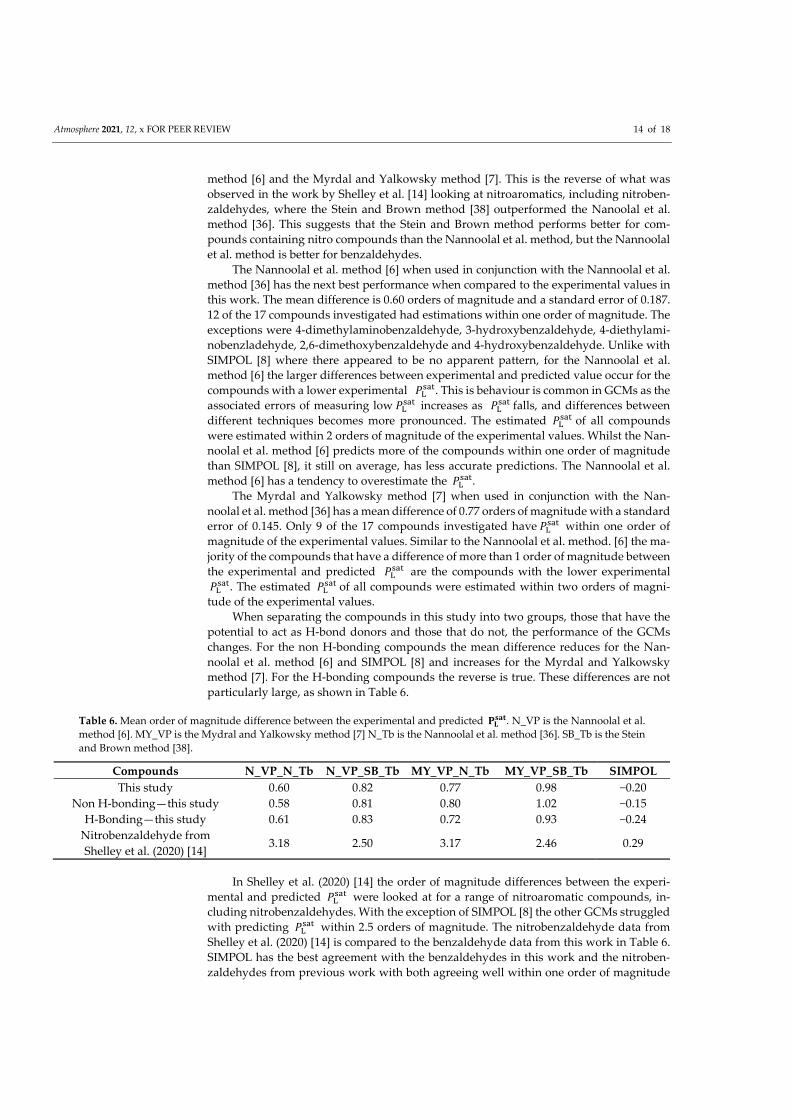
Atmosphere 2021, 12, x FOR PEER REVIEW 14 of 18
method [6] and the Myrdal and Yalkowsky method [7]. This is the reverse of what was observed in the work by Shelley et al. [14] looking at nitroaromatics, including nitroben-zaldehydes, where the Stein and Brown method [38] outperformed the Nanoolal et al. method [36]. This suggests that the Stein and Brown method performs better for com-pounds containing nitro compounds than the Nannoolal et al. method, but the Nannoolal et al. method is better for benzaldehydes.
The Nannoolal et al. method [6] when used in conjunction with the Nannoolal et al. method [36] has the next best performance when compared to the experimental values in this work. The mean difference is 0.60 orders of magnitude and a standard error of 0.187. 12 of the 17 compounds investigated had estimations within one order of magnitude. The exceptions were 4-dimethylaminobenzaldehyde, 3-hydroxybenzaldehyde, 4-diethylami-nobenzladehyde, 2,6-dimethoxybenzaldehyde and 4-hydroxybenzaldehyde. Unlike with SIMPOL [8] where there appeared to be no apparent pattern, for the Nannoolal et al. method [6] the larger differences between experimental and predicted value occur for the compounds with a lower experimental 𝑃 . This is behaviour is common in GCMs as the associated errors of measuring low 𝑃 increases as 𝑃 falls, and differences between different techniques becomes more pronounced. The estimated 𝑃 of all compounds were estimated within 2 orders of magnitude of the experimental values. Whilst the Nan-noolal et al. method [6] predicts more of the compounds within one order of magnitude than SIMPOL [8], it still on average, has less accurate predictions. The Nannoolal et al. method [6] has a tendency to overestimate the 𝑃 .
The Myrdal and Yalkowsky method [7] when used in conjunction with the Nan-noolal et al. method [36] has a mean difference of 0.77 orders of magnitude with a standard error of 0.145. Only 9 of the 17 compounds investigated have 𝑃 within one order of magnitude of the experimental values. Similar to the Nannoolal et al. method. [6] the ma-jority of the compounds that have a difference of more than 1 order of magnitude between the experimental and predicted 𝑃 are the compounds with the lower experimental 𝑃 . The estimated 𝑃 of all compounds were estimated within two orders of magni-tude of the experimental values.
When separating the compounds in this study into two groups, those that have the potential to act as H-bond donors and those that do not, the performance of the GCMs changes. For the non H-bonding compounds the mean difference reduces for the Nan-noolal et al. method [6] and SIMPOL [8] and increases for the Myrdal and Yalkowsky method [7]. For the H-bonding compounds the reverse is true. These differences are not particularly large, as shown in Table 6.
Table 6. Mean order of magnitude difference between the experimental and predicted 𝐏𝐋𝐬𝐚𝐭. N_VP is the Nannoolal et al.
method [6]. MY_VP is the Mydral and Yalkowsky method [7] N_Tb is the Nannoolal et al. method [36]. SB_Tb is the Stein and Brown method [38].
Compounds N_VP_N_Tb N_VP_SB_Tb MY_VP_N_Tb MY_VP_SB_Tb SIMPOL This study 0.60 0.82 0.77 0.98 −0.20
Non H-bonding—this study 0.58 0.81 0.80 1.02 −0.15 H-Bonding—this study 0.61 0.83 0.72 0.93 −0.24
Nitrobenzaldehyde from Shelley et al. (2020) [14]
3.18 2.50 3.17 2.46 0.29
In Shelley et al. (2020) [14] the order of magnitude differences between the experi-mental and predicted 𝑃 were looked at for a range of nitroaromatic compounds, in-cluding nitrobenzaldehydes. With the exception of SIMPOL [8] the other GCMs struggled with predicting 𝑃 within 2.5 orders of magnitude. The nitrobenzaldehyde data from Shelley et al. (2020) [14] is compared to the benzaldehyde data from this work in Table 6. SIMPOL has the best agreement with the benzaldehydes in this work and the nitroben-zaldehydes from previous work with both agreeing well within one order of magnitude
Atmosphere 2021, 12, x FOR PEER REVIEW 15 of 18
(-0.20 and 0.29 orders of magnitude respectively). For the Nannoolal et al. method [6] and the Myrdal and Yalkowsky method [7], the differences between the benzaldehydes and the nitrobenzaldehydes are much larger going from under 1 order of magnitude to 2.4 to 3.2 orders of magnitude, depending on the Tb estimation method used. This shows that the Nannoolal et al. method [6] and the Myrdal and Yalkowsky method [7] especially struggle with compounds containing nitro groups, compared to compounds that do not contain a nitro group.
Based on differences between the experimental and predicted 𝑃 from the study the authors recommend the use of SIMPOL [8] for benzaldehydes over the other methods investigated. However, users should still be aware that the errors for individual predic-tions can be much larger than the average and SIMPOL’s tendency to underpredict 𝑃 for benzaldehydes.
Other previous studies of the 𝑃 of multifunctional aromatic compounds such as those by Bannan et al. (2017) [24] and Dang et al. (2019) [13] also showed much larger differences between the experimental 𝑃 and the predicted 𝑃 . It is now important to understand the sensitivity of modelling studies to the type of uncertainty in 𝑃 that are reported in studies of this type.
5. Conclusions Experimental values for the 𝑃 and 𝑃 have been obtained using KEMS and DSC
for several atmospherically relevant benzaldehydes and other benzaldehydes of similar functionalities.
The differences in 𝑃 have been explained chemically, with the strength of H-bonding being the most important factor where present, and the molecular polarisability being the most important factor when H-bonding is not present. Whilst these are generally the most important factors, they are not the only factors in play. Steric effects caused by the presence of functional groups can also have a major impact as shown by 3-ethoxy-4-hydroxybenzaldehdye. To further investigate the impacts of H-bonding, inductive and resonance effects, and steric effects on 𝑃 more compounds need to be investigated, with select compounds being chosen to probe these effects.
The predictive models consistently predicted the 𝑃 to within two orders of mag-nitude of the experimental 𝑃 values. The predictive models predict the 𝑃 of benzal-dehydes much more accurately than those of other aromatic compounds such as, nitroar-omatic compounds [13,14,24] and dihydroxynaphthalenes [24]. The new data presented here should support studies trying to ascertain the role of benzaldehydes on aerosol growth and human health impacts.
Supplementary Materials: The following are available online at www.mdpi.com/xxx/s1, [48]. Table S1: Estimated sub-cooled liquid vapour pressures at 298 K.
Author Contributions: Conceptualization, P.S., T.J.B., M.R.A., and D.T.; methodology, C.J.P., T.J.B., and P.S.; software, P.S.; formal analysis, P.S. and S.D.W.; investigation, P.S.; resources, C.J.P. and A.G.; data curation, P.S.; writing—original draft preparation, P.S., S.D.W., and C.J.P.; writing—re-view and editing, P.S, T.J.B., S.D.W., M.R.A., and D.T.; visualization, P.S.; supervision, T.J.B., M.R.A., and D.T.; funding acquisition, D.T. and M.R.A. All authors have read and agreed to the published version of the manuscript.
Funding: The work contained in this paper contains work conducted during a Ph.D. study sup-ported by the Natural Environment Research Council (NERC) EAO Doctoral Training Partnership and is fully-funded by NERC whose support is gratefully acknowledged. Grant ref no is NE/L002469/1. The work by C.J.P. was carried out at the Jet Propulsion Laboratory, California Insti-tute of Technology, under contract with the National Aeronautics and Space Administration (NASA), and was supported by the Upper Atmosphere Research Program and Tropospheric Chem-istry Program.
Institutional Review Board Statement: Not applicable.
Informed Consent Statement: Not applicable.
Atmosphere 2021, 12, x FOR PEER REVIEW 16 of 18
Data Availability Statement: All data in this paper is available from https://doi.org/10.5281/ze-nodo.4117801 [39].
Conflicts of Interest: The authors declare no conflict of interest.
References 1. Seinfeld, J.H.; Pandis, S.N. Atmospheric Chemistry and Physics: From Air Pollution to Climate Change, 3rd ed.; John Wiley & Sons,
Incorporated: New York, NY, USA, 2016. 2. Kanakidou, M.; Seinfeld, J.H.; Pandis, S.N.; Barnes, I.; Dentener, F.J.; Facchini, M.C.; van Dingenen, R.; Ervens, B.; Nenes, A.;
Nielsen, C.J.; et al. Organic aerosol and global climate modelling: A review. Atmos. Chem. Phys. 2005, 5, 1053–1123, doi:10.5194/acp-5-1053-2005.
3. Bilde, M.; Barsanti, K.; Booth, M.; Cappa, C.D.; Donahue, N.M.; Emanuelsson, E.U.; McFiggans, G.; Krieger, U.K.; Marcolli, C.; Topping, D.; et al. Saturation Vapor Pressures and Transition Enthalpies of Low-Volatility Organic Molecules of Atmospheric Relevance: From Dicarboxylic Acids to Complex Mixtures. Chem. Rev. 2015, 115, 4115–4156, doi:10.1021/cr5005502.
4. Booth, A.M.; Barley, M.H.; Topping, D.O.; Mcfiggans, G.; Garforth, A.; Percival, C.J. Solid state and sub-cooled liquid vapour pressures of substituted dicarboxylic acids using Knudsen Effusion Mass Spectrometry (KEMS) and Differential Scanning Calorimetry. Atmos. Chem. Phys. 2010, 10, 4879–4892, doi:10.5194/acp-10-4879-2010.
5. Hallquist, M.; Wenger, J.C.; Baltensperger, U.; Rudich, Y.; Simpson, D.; Claeys, M.; Dommen, J.; Donahue, N.M.; George, C.; Goldstein, A.H.; et al. The formation, properties and impact of secondary organic aerosol: Current and emerging issues. Atmos. Chem. Phys. Atmos. Chem. Phys. 2009, 9, 5155–5236.
6. Nannoolal, Y.; Rarey, J.; Ramjugernath, D. Fluid Phase Equilibria Estimation of pure component properties Part 3. Estimation of the vapor pressure of non-electrolyte organic compounds via group contributions and group interactions. Fluid Phase Equilib. 2008, 269, 117–133, doi:10.1016/j.fluid.2008.04.020.
7. Myrdal, P.B.; Yalkowsky, S.H. Estimating Pure Component Vapor Pressures of Complex Organic Molecules. Ind. Eng. Chem. Res. 1997, 36, 2494–2499.
8. Pankow, J.F.; Asher, W.E. SIMPOL.1: A simple group contribution method for predicting vapor pressures and enthalpies of vaporization of multifunctional organic compounds. Atmos. Chem. Phys. 2008, 8, 2773–2796, doi:10.5194/acp-8-2773-2008.
9. Compernolle, S.; Ceulemans, K.; Müller, J.F. Evaporation: A new vapour pressure estimation methodfor organic molecules including non-additivity and intramolecular interactions. Atmos. Chem. Phys. 2011, 11, 9431–9450, doi:10.5194/acp-11-9431-2011.
10. Barley, M.H.; McFiggans, G. The critical assessment of vapour pressure estimation methods for use in modelling the formation of atmospheric organic aerosol. Atmos. Chem. Phys 2010, 10, 749–767, doi:10.5194/acp-10-749-2010.
11. O’Meara, S.; Booth, A.M.; Barley, M.H.; Topping, D.; Mcfiggans, G. An assessment of vapour pressure estimation methods. Phys. Chem. Chem. Phys. 2014, 16, 19453–19469, doi:10.1039/c4cp00857j.
12. Booth, A.M.; Bannan, T.; McGillen, M.R.; Barley, M.H.; Topping, D.O.; McFiggans, G.; Percival, C.J. The role of ortho, meta, para isomerism in measured solid state and derived sub-cooled liquid vapour pressures of substituted benzoic acids. RSC Adv. 2012, 2, 4430, doi:10.1039/c2ra01004f.
13. Dang, C.; Bannan, T.; Shelley, P.; Priestley, M.; Worrall, S.D.; Waters, J.; Coe, H.; Percival, C.J.; Topping, D. The effect of structure and isomerism on the vapour pressures of organic molecules and its potential atmospheric relevance. Aerosol. Sci. Technol. 2019, 53, 1–32, doi:10.1080/02786826.2019.1628177.
14. Shelley, P.D.; Bannan, T.J.; Worrall, S.D.; Alfarra, M.R.; Krieger, U.K.; Percival, C.J.; Garforth, A.; Topping, D. Measured solid state and subcooled liquid vapour pressures of nitroaromatics using Knudsen effusion mass spectrometry. Atmos. Chem. Phys. 2020, 20, 8293–8314, doi:10.5194/acp-20-8293-2020.
15. Caralp, F.; Foucher, V.; Lesclaux, R.; Wallington, T.J.; Michael Hurley, B.D. Atmospheric chemistry of benzaldehyde: UV absorption spectrum and reaction kinetics and mechanisms of the radical C6H5C(O)O2. Phys. Chem. Chem. Phys. 1999, 1, 3509–3517.
16. Baghi, R.; Helmig, D.; Guenther, A.; Duhl, T.; Daly, R. Contribution of flowering trees to urban atmospheric biogenic volatile organic compound emissions. Biogeosciences 2012, 9, 3777–3785, doi:10.5194/bg-9-3777-2012.
17. Thiault, G.; Mellouki, A.; Le Bras, G.; Chakir, A.; Sokolowski-Gomez, N.; Daumont, D. UV-absorption cross sections of benzaldehyde, ortho-, meta-, and para-tolualdehyde. J. Photochem. Photobiol. A Chem. 2004, 162, 273–281, doi:10.1016/J.NAINR.2003.08.012.
18. Dubtsov, S.N.; Dultseva, G.G.; Dultsev, E.N.; Skubnevskaya, G.I. Investigation of aerosol formation during benzaldehyde photolysis. J. Phys. Chem. B 2006, 110, 645–649, doi:10.1021/jp0555394.
19. Peng, C.-Y.; Yang, H.-H.; Lan, C.-H.; Chien, S.-M. Effects of the biodiesel blend fuel on aldehyde emissions from diesel engine exhaust. Atmos. Environ. 2008, 42, 906–915.
20. Magnusson, R.; Nilsson, C.; Andersson, B. Emissions of Aldehydes and Ketones from a Two-Stroke Engine Using Ethanol and Ethanol-Blended Gasoline as Fuel. Environ. Sci. Technol. 2002, 36, 1656–1664, doi:10.1021/ES010262G.
21. Hamilton, J.F.; Webb, P.J.; Lewis, A.C.; Reviejo, M.M. Quantifying small molecules in secondary organic aerosol formed during the photo-oxidation of toluene with hydroxyl radicals. Atmos. Environ. 2005, 39, 7263–7275, doi:10.1016/J.ATMOSENV.2005.09.006.
Atmosphere 2021, 12, x FOR PEER REVIEW 17 of 18
22. Jenkin, M.E.; Saunders, S.M.; Wagner, V.; Pilling, M.J. Protocol for the development of the Master Chemical Mechanism, MCM v3 (Part B): Tropospheric degradation of aromatic volatile organic compounds. Atmos. Chem. Phys. 2003, 3, 181–193, doi:10.5194/acp-3-181-2003.
23. Bloss, C.; Wagner, V.; Jenkin, M.E.; Volkamer, R.; Bloss, W.J.; Lee, J.D.; Heard, D.E.; Wirtz, K.; Martin-Reviejo, M.; Rea, G.; et al. Development of a Detailed Chemical Mechanism (MCMv3.1) for the Atmospheric Oxidation of Aromatic Hydrocarbons. Atmos. Chem. Phys. 2005, 5, 641–644.
24. Bannan, T.J.; Booth, A.M.; Jones, B.T.; O’meara, S.; Barley, M.H.; Riipinen, I.; Percival, C.J.; Topping, D. Measured Saturation Vapor Pressures of Phenolic and Nitro-aromatic Compounds. Environ. Sci. Technol. 2017, 51, 3922–3928, doi:10.1021/acs.est.6b06364.
25. Booth, A.M.; Markus, T.; Mcfiggans, G.; Percival, C.J.; Mcgillen, M.R.; Topping, D.O. Design and construction of a simple Knudsen Effusion Mass Spectrometer (KEMS) system for vapour pressure measurements of low volatility organics. Atmos. Meas. Tech. 2009, 2, 355–361, doi:10.5194/amt-2-355-2009.
26. Krieger, U.K.; Siegrist, F.; Marcolli, C.; Emanuelsson, E.U.; Gøbel, F.M.; Bilde, M.; Marsh, A.; Reid, J.P.; Huisman, A.J.; Riipinen, I.; et al. A reference data set for validating vapor pressure measurement techniques: Homologous series of polyethylene glycols. Atmos. Meas. Tech. 2018, 11, 49–63, doi:10.5194/amt-11-49-2018.
27. Booth, A.M.; Bannan, T.J.; Benyezzar, M.; Bacak, A.; Alfarra, M.R.; Topping, D.; Percival, C.J. Development of lithium attachment mass spectrometry—Knudsen effusion and chemical ionisation mass spectrometry (KEMS, CIMS). Analyst 2017, 142, 3666–3673, doi:10.1039/C7AN01161J.
28. Bannan, T.J.; Le Breton, M.; Priestley, M.; Worrall, S.D.; Bacak, A.; Marsden, N.A.; Mehra, A.; Hammes, J.; Hallquist, M.; Alfarra, M.R.; et al. A method for extracting calibrated volatility information from the FIGAERO-HR-ToF-CIMS and its experimental application. Atmos. Meas. Tech. 2019, 12, 1429–1439, doi:10.5194/amt-12-1429-2019.
29. Hilpert, K. Potential of mass spectrometry for the analysis of inorganic high-temperature vapors. In Proceedings of the Fresenius’ Journal of Analytical Chemistry; Springer: Berlin/Heidelberg, Germany, 2001; Volume 370, pp. 471–478.
30. Atomic Total Energies: Atomic Reference Data for Electronic Structure Calculations. Available online: https://physics.nist.gov/PhysRefData/Ionization/atom_index.html (accessed on 11 March 2021).
31. Mauger, J.W.; Paruta, A.N.; Gerraughty, R.J. Solubilities of Sulfadiazine, Sulfisomidine, and Sulfadimethoxine in Several Normal Alcohols. J. Pharm. Sci. 1972, 61, 94–97, doi:10.1002/JPS.2600610117.
32. Grant, D.J.W.; Mehdizadeh, M.; Chow, A.H.-L.; Fairbrother, J.E. Non-linear van’t Hoff solubility-temperature plots and their pharmaceutical interpretation. Int. J. Pharm. 1984, 18, 25–38, doi:10.1016/0378-5173(84)90104-2.
33. Stewart, J.J. MOPAC2016; Stewart Computational Chemistry: Colorado Springs, CO, USA, 2016. 34. Dewar, M.J.S.; Thiel, W. A semiempirical model for the two-center repulsion integrals in the NDDO approximation. Theor. Chim.
Acta 1977, 46, 89–104, doi:10.1007/BF00548085. 35. Prausnitz, J.; Lichtenthaler, R.; de Azevedo, E. Molecular Thermodynamics of Fluid-Phase Equilibria; Pearson Education: Upper
Saddle River, NJ, USA, 1998. 36. Nannoolal, Y.; Rarey, J.; Ramjugernath, D.; Cordes, W. Estimation of pure component properties Part 1. Estimation of the normal
boiling point of non-electrolyte organic compounds via group contributions and group interactions. Fluid Phase Equilib. 2004, 226, 45–63, doi:10.1016/j.fluid.2004.09.001.
37. Joback, K.G.; Reid, R.C.; Reid, C. Estimation of pure-component properties from group-contributions. Chem. Eng. Commun. 1987, 157, 233–243, doi:10.1080/00986448708960487.
38. Stein, S.E.; Brown, R.L. Estimation of Normal Boiling Points from Group Contributions. J. Chem. Inf. Comput. Sci. 1994, 34, 581–587.
39. Shelley, P.D.; Bannan, T.J.; Worrall, S.D.; Alfarra, M.R.; Percival, C.J.; Garforth, A.; Topping, D. PetrocShelley/Measured_Solid_State_and_Sub_Cooled_Liquid_Vapour_Pressures_of_Benzaldehydes_Using_KEMS_Data_Set: Pre Release; Zenodo: Genève, Switzerland, 2020; doi:10.5281/ZENODO.4117801.
40. Staikova, M.; Wania, F.; Donaldson, D.J. Molecular polarizability as a single-parameter predictor of vapour pressures and octanol–air partitioning coefficients of non-polar compounds: A priori approach and results. Atmos. Environ. 2004, 38, 213–225, doi:10.1016/J.ATMOSENV.2003.09.055.
41. Staikova, M.; Messih, P.; Lei, Y.D.; Wania, F.; Donaldson, J.D. Prediction of Subcooled Vapor Pressures of Nonpolar Organic Compounds Using a One-Parameter QSPR. J. Chem. Eng. Data 2005, 50, 438–443, doi:10.1021/JE049732N.
42. Liang, C.; Gallagher, D.A. QSPR Prediction of Vapor Pressure from Solely Theoretically-Derived Descriptors. J. Chem. Inf. Comput. Sci. 1998, 38, 321–324, doi:10.1021/CI970289C.
43. Schwarzenbach, R.P.; Gschwend, P.M.; Imboden, D.M. Environmental Organic Chemistry; John Wiley & Sons, Incorporated: Hoboken, NJ, USA, 2016; ISBN 9781118767238.
44. Remko, M.; Polcin, J. Theoretical study of the hydrogen bonding ability of phenol and its ortho, meta and para substituted derivatives. Adv. Mol. Relax. Interact. Process. 1977, 11, 249–254, doi:10.1016/0378-4487(77)80037-X.
45. Stymne, B.; Stymne, H.; Wettermark, G. Substituent Effects in the Thermodynamics of Hydrogen Bonding as Obtained by Infrared Spectrometry. J. Am. Chem. Soc. 1973, 95, 3490–3494, doi:10.1021/ja00792a600.
46. Daubert, T.E.; Danner, R.P. Physical and Thermodynamic Properties of Pure Chemicals: Data Compilation; Hemisphere Pub. Corp.: New York, NY, USA, 1989.
47. Yaws, C.L. Handbook of Vapor Pressure; Gulf Pub. Co.: Houston, TX, USA, 1994.

Atmosphere 2021, 12, x FOR PEER REVIEW 18 of 18
48. Shelley, P.D.; Bannan, T.J.; Worrall, S.D.; Alfarra, M.R.; Percival, C.J.; Garforth, A.; Topping, D. PetrocShelley/Measured-Solid-State-and-Sub-Cooled-Liquid-Vapour-Pressures-of-Benzaldehydes-Supplementary-Material 0.2; Zenodo: Genève, Switzerland, 2020; doi:10.5281/ZENODO.4117835.
5.3 Paper 3: Exploring the importance of functionality in
vapour pressure estimation techniques using multivariate
regression
Authors: P. D. Shelley, S. Compernolle, U. K. Krieger, D. Topping
Journal: to be submitted to Atmospheric Chemistry and Physics.
Supplementary material is reproduced in Chapter A.1.
Overview: In the two previous studies the differences between experimental and predicted
Psat for both nitroaromatic compounds and benzaldehydes were highlighted. One of the
most likely explanations for these differences is due to the lack of representation within
GCM fitting data sets of the functionalities contained within these compounds.In this study
multivariate regression was used to predict the expected error when using various different
GCMs (Nannoolal et al. method (Nannoolal et al., 2008), Myrdal and Yalkowsky method
(Myrdal and Yalkowsky, 1997), SIMPOL (Pankow and Asher, 2008) and EVAPORATION
(Compernolle et al., 2011)) to predict Psat of a broad range of compounds. This was done to
over 900 different compounds used in the fitting data sets of EVAPORATION and SIMPOL,
as well as any compound that had had it’s Psat experimentally determined by the University
of Manchester KEMS system, the majority of which are not contained within any GCM
fitting data set. Gradient boosting regression in combination with stratified K-fold cross
validation was then used to calculate the feature importance for each GCM, first using only
the data from EVAPORATION and SIMPOL, and then using all of the data. Calculating
the feature importance for each GCM shows which chemical functionalities have the greatest
impact on the predicted error. Calculating the feature importance both with and without
the KEMS data shows which chemical features become more ’important’ with the addition
of the KEMS data. A regressor was also used to predict expected error in using a GCM,
and applied to the compounds within the Master Chemical Mechanism (MCM), to explore
the range of uncertainties over the MCM chemical space. The error over the MCM chemical
space increased when the regressor used also contained the KEMS data.
Author’s contribution: I was responsible for the data processing, data analysis, and writing
the paper
Contributions from co-authors: Steven Compernolle and Ulrich Krieger were responsible
for data collection. David Topping was responsible for data processing, data analysis and
reviewed the manuscript.
65
1
Exploring the importance of functionality in vapour pressure
estimation techniques using multivariate regression
Petroc D. Shelley1, Steven Compernolle2, Ulrich K. Krieger3, David Topping1
1Department of Earth and Environmental Sciences, The University of Manchester, Manchester, UK
2Royal Belgian Institute for Space Aeronomie (BIRA-IASB), Ringlaan 3 Avenue Circulaire, 1180 Brussels, Belgium 5 3Institute for Atmospheric and Climate Science, ETH Zurich, Zurich, Switzerland
Correspondence to: Petroc D. Shelley ([email protected])
Abstract. Due to a lack of experimental data for the saturation vapour pressure (𝑃sat) of many of the compounds that make
up secondary organic aerosols (SOA), group contribution methods (GCM) are used to predict 𝑃sat. However, due to a lack of 10
experimental 𝑃sat data for some of the functionalities possessed by SOA, as well as problems predicting 𝑃sat of
multifunctional compounds in general, GCM can incorrectly predict 𝑃sat of SOA by several orders of magnitude. Whilst new
measurements on Psat have been made over the past decade, it is unlikely experimental work will be able to cover all of the
potential compounds used and predicted within atmospheric chemical mechanisms. With this in mind, in this work we combine
multivariate regression techniques with experimental data and predictions from GCMs to try and quantify what gaps exist and 15
what improvements have been made by collected new data using the University of Manchester Knudsen effusion mass
spectrometry (KEMS) system. Specifically, gradient boosting regression using stratified k-fold cross validation was used to
calculate the feature importance for several GCMs (the Nannoolal et al. method, the Myrdal and Yalkowsky method, SIMPOL,
and EVAPORATION). We focus on compounds in the SIMPOL and EVAPORATION fitting data sets, as well as
experimental 𝑃sat data from the (KEMS) system, noting that data availability remains an issue and should be improved. When 20
fitting to just the data from SIMPOL and EVAPORATION datasets, carboxylic acid and alcohol dominated the feature
importance. After the KEMS data was introduced carboxylic acid and alcohol both remained important, but aromatic
parameters began to dominate instead, along with an increase in nitro. Using a regressor to predict expected error in using a
GCM, we then explore the range of uncertainties over the master chemical mechanism (MCM) chemical space, with error
increasing when the KEMS data was introduced. This increase in error, as well as the changes in feature importance after the 25
introduction of the KEMS data show the impact of the KEMS data on predicting 𝑃sat, as well as the importance of this data
being used to improve GCMs. We finish by discussing a strategy for future measurements.
1. Introduction
Organic aerosols (OA) are a major component of atmospheric aerosols and are known to have a significant impact on both
climate and air quality [1]. OA contribution to the total atmospheric aerosol mass can vary significantly by region, with OA 30
contributing as much as 90% in some tropical forested areas, whereas in continental mid latitudes its contribution is ~20 –
50% [2]. OA can be further broken down into primary organic aerosols (POA), which are emitted directly into the atmosphere
as aerosols, and secondary organic aerosols (SOA), which are typically formed in the atmosphere when volatile organic
compounds (VOCs) undergo various oxidation processes [3]. Many of these oxidation products are less volatile than the
original VOCs and are much more likely to partition into the aerosol phase [2]. Understanding OA behaviour in the atmosphere, 35
as well as their properties, is essential to accurately predicting the environmental and human health impacts of OA.
To predict to what extent a compound will partition into the aerosol phase, knowledge of the compounds pure component
saturation vapour pressure (𝑃sat) is required [4]. Due to the extreme complexity of the OA fraction of atmospheric aerosol
(estimated to include more than 100,000 organic compounds [5]), and a lack of experimental data, 𝑃sat must be estimated for
many compounds. Currently there are substantial uncertainties surrounding many of the physiochemical properties of OA [6], 40
including with estimating 𝑃sat [7,8].
2
The most common way of estimating 𝑃sat is to use a group contribution method (GCM). In this work there is a focus on four
of the more commonly used GCMs. These are the Nannoolal et al. method [9], the Myrdal and Yalkowsky method [10],
SIMPOL [11], and EVAPORATION (Estimation of Vapour Pressure of Organics, Accounting for Temperature,
Intramolecular, and Non-additivity effects Compernolle et al., 2011). GCMs operate on the basis that functional groups within 45
a molecule contribute additively to a given property. This holds true for more chemically simple compounds such as straight
chain hydrocarbons and monofunctional compounds [6]. For multifunctional compounds, this assumption that each functional
group will contribute additively to a property stops being the case, due to interactions between different functionalities within
the compound.
The Nannoolal et al. method [9] and EVAPORATION [12] both contain terms to attempt to account for the impact on 𝑃sat 50
from secondary interactions within molecules. SIMPOL [11] contains conditional statements for additional contributions to be
used when certain functionalities are both present in the same compound for the same reason. Despite this there are still
significant differences between experimental and estimated 𝑃sat values especially for lower volatility multifunctional
compounds [13–15]
Atmospheric chemical mechanisms provide us with understanding on the range of compounds expected from single and mixed 55
VOCs. Used in box models and regional models alike, predicting the partitioning from a mechanistic perspective requires an
accurate prediction of each pure component vapour pressure value. However, as mechanisms and empirical evidence evolve,
it is unlikely that continued measurements will cover the entire space required. Whilst gaps in measurements have been
identified in tandem with compounds identified in ambient samples, it is also important to better understand the value of
previous and continued measurements where they can be made, beyond the routine comparison between measured and 60
predicted individual values.
With this in mind, in this study we propose a number of steps to provide an evidence base on which to form a discussion
around that moves towards answering this question. First we build a regressor of the expected error in values taken from
popular GCMs. Once built, we can interrogate this regressor to quantify the most important functionalities that dictate this
error. In multivariate regressor parlance, we refer to these as 'features'. These features are dictated by the GCMS. For example, 65
ortho, meta and para groups used in the Nannoolal et al. method [9] are features and we might observe that carboxyloic acid
groups dominate the predicted error. Of course, each regressor is built on data. Our focus in previous studies [13,14] has been
on using the University of Manchester Knudsen effusion mass spectrometry (KEMS) system. By including and then excluding
data from the KEMS, we evaluate the difference and thus discuss the impact from those measurements. Finally, we then discuss
the predicted error from our regressor over the space dictated by the Master Chemical Mechanism (MCM). This provides a 70
narrative on which we discuss future experimental needs.
When referring to ‘error’ going forwards in this work, it is defined as the percentage difference between the experimental 𝑃sat
and the predicted 𝑃sat using the following equation (Equation 1):
𝐸𝑟𝑟𝑜𝑟 = 𝑃𝑒𝑥𝑝
𝑠𝑎𝑡 − 𝑃𝑝𝑟𝑒𝑑𝑠𝑎𝑡
𝑃𝑒𝑥𝑝𝑠𝑎𝑡 × 100 (1) 75
where 𝑃𝑒𝑥𝑝𝑠𝑎𝑡 is the experimental saturation vapour pressure and 𝑃𝑝𝑟𝑒𝑑
𝑠𝑎𝑡 is the predicted saturation vapour pressure. The ‘absolute
error’ is defined as the absolute percentage difference between the experimental 𝑃sat and the predicted 𝑃sat using the following
equation (Equation 2):
𝐴𝑏𝑠𝑜𝑙𝑢𝑡𝑒 𝑒𝑟𝑟𝑜𝑟 = |𝑃𝑒𝑥𝑝
𝑠𝑎𝑡 − 𝑃𝑝𝑟𝑒𝑑𝑠𝑎𝑡
𝑃𝑒𝑥𝑝𝑠𝑎𝑡 | × 100 (2)
With regards to the predicted error from popular GCMs we focus on the Nannoolal et al. method [9], the Myrdal and 80
Yalkowsky method [10], SIMPOL [11] and EVAPORATION (Compernolle et al., 2011). With regards to the data used to fit
the error, and therefore quantify the feature importance, the data from 925 different compounds on which SIMPOL and
3
EVAPORATION were fit, as well as compounds that have had 𝑃sat experimentally determined using the University of
Manchester KEMS system were used. The feature importance for each GCM was calculated using gradient boosting regression
in combination with stratified k-fold cross validation, in order to identify the most important features of each GCM. 85
2.Theory
2.1 Vapour pressure predictive techniques
The most common way to predict 𝑃sat is to use GCMs. The vapour pressure GCMs investigated in this work are the ones
currently available within UManSysProp V1.04 [16]. GCMs operate under the principal that the contribution to a given
property from a given functional group is the same regardless of the base molecule to which the functional group is attached. 90
For example, the contribution of -OH to a given property is the same in both ethanol and propanol [6]. This concept is valid in
many instances, especially for straight chain hydrocarbons and monofunctional compounds, but issues begin to arise when this
simplistic model is applied to multifunctional compounds, where intramolecular interactions can occur between groups within
a compound changing the contribution to the given property. This means that for many multifunctional compounds GCMs can
predict 𝑃sat several orders of magnitude higher or lower than the experimentally determined value. Historically the data that 95
GCMs were based on came primarily come from high 𝑃sat compounds (often at temperatures well above ambient conditions),
with a small proportion of the experimental data being for low 𝑃sat compounds and many functionalities are either
underrepresented or not represented at all in GCMs. If a functionality is poorly represented in a GCM this can lead to
overfitting. If a functionality is not represented in a GCM this can lead to the contribution being ignored or misattributed as
being a different functionality. For instance, if hydroperoxide (-O-O-H) is not present in a GCM but hydroxy (-O-H) is the 100
hydroperoxide can be misinterpreted as a hydroxy group which would lead to a large error as chemically hydroperoxide and
hydroxy groups are very different. GCMs can also struggle with proximity effects structural isomers that can occur in
multifunctional compounds.
Of the vapour pressure GCMs within UManSysProp SIMPOL [11] and EVAPORATION [12] only require a chemical
structure (in the form of a SMILES string) and target temperature to predict 𝑃sat. Whereas, the Nannoolal et al. method [9] 105
and the Myrdal and Yalkowsky method [10] are combined methods. This means that in order to estimate 𝑃sat it is also
necessary to know the boiling point (Tb) of the compound. For similar reason as to why there is a lack of experimental 𝑃sat
data for SOA there is also a lack of experimental Tb data. Tb is a property that can also be estimated using GCMs and there are
three Tb GCMs included in UManSysprop. These are the Joback and Reid method [17], the Stein and Brown method [18], and
the Nannoolal et al. Tb method [19]. Of these three GCMs the Joback and Reid method [17] is known to have many biases and 110
the Stein and Brown method [18] is an improved version of Joback and Reid [7]. In the assessment done by O’Meara et al.
(2014) it was found that there was no significant difference in 𝑃sat estimation depending on if the Stein and Brown method
[18] or the Nannoolal et al. Tb method [19] was used. For this reason going forward when discussing the Nannoolal et al.
method [9] and the Myrdal and Yalkowsky method [10] they have been calculated using the Nanoolal et al. Tb method [19].
The Nannoolal et al. method [9] does contain parameters to attempt to account for the effects of -ortho, -meta, -para isomerism 115
on 𝑃sat, but as soon as a third functional group is introduced to the aromatic ring it can no longer distinguish between isomers.
EVAPORATION [12] also contains secondary interaction parameters, and was developed with a focus on SOAs, but is not
without its own limitations when it comes to atmospheric applications as it does not contain any parameters for aromatic
compounds, so it is must be used much more selectively.
2.2 SMILES and SMARTS 120
To estimate 𝑃sat for all compounds investigated in this work the UManSysProp suite [20] was used. UManSysProp is an open
source software suite for molecular property predictions and atmospheric aerosol calculations, which includes the functionality
4
for predicting 𝑃sat using GCMs. The GCMs for predicting 𝑃sat in UManSysProp are the Nannoolal et al. method [9], the
Myrdal and Yalkowsky method [10], SIMPOL [11] and EVAPORATION [12]. To calculate 𝑃sat UManSysProp requires a
SMILES (Simplified Molecular Input Line Entry System) string representation of the compounds of interest. A SMILES string 125
allows for the representation of a 2D chemical structure in an ASCII string format. The SMILES format is commonly used in
both commercial and open source software for predicting chemical properties [20] and most chemical editing software can
convert SMILES strings into 2D and 3D structures.
For each GCM within UManSysProp there is a SMARTS library that has been constructed containing a key for each chemical
group or feature described in the techniques. From this UManSysProp can parse the SMILES strings using the SMARTS 130
libraries to create a dictionary containing the number of occurrences of each key in each input structure. Figure 1 shows a
schematic of how UManSysProp generates a key dictionary.
3. Methodology
3.1 Obtaining SMILES, experimental 𝑷𝐬𝐚𝐭 and predicted 𝑷𝐬𝐚𝐭
The experimental 𝑃sat in this study comes from 3 sources. The first source comes from the data used in creation of 135
EVAPORATION [12], from which experimental 𝑃sat and SMILES strings of 648 compounds were extracted. These included
the 579 compounds described in the EVAPORATION paper [12], as well as 69 additional compounds consisting primarily of
nitrate and nitro compounds which were not included in the original EVAPORATION paper. The second source of data comes
from the supplementary material from the SIMPOL paper [11] which details compounds used in the development of SIMPOL
from which the data of 239 compounds was extracted. This can be found at http://www.atmos-chem-140
phys.net/8/2773/2008/acp-8-2773-2008-supplement.pdf (last accessed 15/04/2021). The final source data comes from the
collated data of all compounds that have had an experimental 𝑃sat determined using the University of Manchester Knudsen
effusion mass spectrometry (KEMS) system. This contained the data of 100 compounds. Much of this data has been published
previously in papers investigating the impacts of chemical structure and multifunctionality on 𝑃sat [4,13–15,21,22] but a full
list of compounds and their experimental 𝑃sat values are included in the supplementary material. The data from the KEMS 145
focuses on dicarboxylic acids, substituted dicarboxylic acids, substituted benzoic acids, phenolic compounds, nitroaromatic
compounds and benzaldehydes. From these 3 sources there is a slight overlap in the compounds included so overall there are
925 unique compounds. It is not uncommon for compounds which have had their experimental 𝑃sat determined by different
techniques to have different values. For this reason, compounds with multiple entries have not been removed.
UManSysProp was then passed all the collected SMILES strings so that estimated 𝑃sat could be calculated for all compounds 150
using the Nannoolal et al. method [9], the Myrdal and Yalkowsky method [10], SIMPOL [11], and EVAPORATION [12].
Using both UManSysProp and the Pybel package [23] H:C and O:C ratios were also calculated for all compounds.
After obtaining experimental 𝑃sat and predicted 𝑃sat for each GCM, the error and absolute error were calculated using the
experimental and predicted values for each GCM.
3.2 Feature importance 155
By utilising the dictionary of keys generated by UManSysProp, the absolute error and the gradient boosting regression
functionality of Scikit-learn [24] it is possible to rank the feature importance of each GCM for the compounds investigated.
The feature importance for each GCM was calculated using the following method.
Using a combination of Pybel [23] and UManSysProp to parse the SMILES strings of the studied compounds a key dictionary
was generated containing how many times each SMART from a given GCM was present. This key dictionary was converted 160
into a key matrix. The key matrix and the absolute error are treated as the x and y terms. The data within the x and y terms are
5
then split via a stratified k-fold method into equally weighted training and test sets. The weighting was based on the log10 𝑃sat.
This process was cycled through 4 times using a different subset of the data as the training set each time. For each cycle
gradient boosting regression was used to determine the feature importance of each feature within the GCM currently being
investigated. After all 4 cycles a mean average of each features importance was calculated, and the overall feature importance 165
were ranked. These feature importance for each GCM was calculated both with and without the KEMS data to investigate the
impact on feature importance of adding the KEMS data. A workflow diagram is shown in Fig. 2.
3.3 Calculating predicted error across the MCM chemical space
A key matrix of features was obtained for all the organic compounds within the MCM [25,26] using each set of GCM
SMARTS. Using pybel [23] the O:C and H:C ratios were calculated for each compound. Using the fold with the lowest mean 170
squared error (MSE) of the feature importance generated from the corresponding SMARTS, an estimated error is predicted for
each organic compound within the MCM. This was done for each set of GCM SMARTS both with and without the KEMS
data.
4. Results and discussion
4.1 Feature Importance 175
The features that are ranked for each GCM differ slightly, depending on how they were labelled in the original publications of
each GCM. For example, the Myrdal and Yalkosky method [10] uses SMARTS terms to search for ‘aromatic C-H’ and
‘aromatic C not bonded to H’, whereas SIMPOL[11] uses a SMART that searches specifically for an ‘aromatic ring’. Whilst
in absolute terms these SMARTS are looking for slightly different features, overall both are highlighting the aromaticity of
the compound. The general features that are considered the most important are consistent throughout. 180
When the KEMS data is not included in the feature importance calculations, three functionalities dominate the feature
importance for the Nannoolal et al. method [9], the Myrdal and Yalkowsky method [10] and SIMPOL [11]. These are
carboxylic acid, aliphatic alcohol and nitro. Aliphatic carbon is also important for all GCMs, but this is due to it describing the
carbon skeleton of each compound and is always present (with the exception of some aromatic compounds).
When the KEMS data is introduced and the feature importance of each GCM is recalculated any feature related to aromaticity 185
jumps in importance. With aromatic carbon and phenol especially ranking much higher. The increase in feature importance of
aromatic features when the KEMS data is introduced is likely due to a large portion of the KEMS measurements focusing on
various multifunctional aromatic [13–15,22]. However, an important point to note is the reliance of feature importance on data,
as well as SMARTS describing the feature. If there is a lack of data for a certain feature in the data set then there will be no
change in feature importance. Likewise if there is no SMART describing a feature, then that feature won’t appear in the feature 190
importance at all.
The changes in the feature importance for the Nannoolal et al. method [9] are shown in Figure 3.
When the KEMS data is introduced for the Nannoolal et al. method aromatic C-H increases from the 8th most important feature
to the most important. There are also significant increases in importance for phenol, and aromatic carbon bonded to an
electronegative atom. Before the KEMS data was introduced carboxylic acid and nitro were the most important features, aside 195
from features that describe the carbon skeleton. After the KEMS data is introduced their importance in terms of absolute rank
decreases, but both remain highly ranked in the feature importance. After the KEMS data is introduced the importance of long
chain alcohols are reduced.
Similar changes occur for the Myrdal and Yalkowsky method [10] as shown in Figure 4.
Both carboxylic acid and nitro are the most important features for the Myrdal and Yalkowsky method before the KEMS data 200
was introduced. In Myrdal and Yalkowsky secondary alcohols rank much higher in the feature importance than in the
6
Nannoolal et al. method, with ketones also ranking relatively highly. When the KEMS data is introduced, aromatic carbon
bonded to hydrogen becomes the most important feature, with aromatic carbon NOT bonded to hydrogen also ranking much
higher, suggesting that aromaticity is now considered much more important. The ranking of phenol also increases. Carboxylic
acid, secondary alcohol, nitro and ketone all remain highly ranked in the feature importance but have been displaced in the 205
rankings by the various aromatic features.
The feature importances for SIMPOL are shown in Figure 5.
Before the KEMS data is introduced to SIMPOL the feature importance is dominated, by carboxylic acid, ketone, non-aromatic
alcohol and nitro, with all the aromatic features not ranking very high. When the KEMS data is introduced, the aromatic
features increase in importance, but not to the same extent that they did for the Nannoolal et al. method or the Myrdal and 210
Yalkowsky method. Nitro also ranks higher in feature importance when the KEMS is introduced, whereas ketone becomes
less important.
The feature importance for EVAPORATION is shown in Figure 6.
Like the other GCMs, before the KEMS data is introduced, carboxylic acid and alcohol are the most important features, along
with the features describing the carbon skeleton. Unlike the other GCMs there is not an increase in importance for any aromatic 215
features. This is due to EVAPORATION not containing any aromatic terms, and therefore no aromatic features. After the
KEMS data is introduced, alcohol and carboxylic acid remain the most important features, with esters and aldehydes and
ketones increasing in importance. Nitrates and hydroperoxides became less important.
Overall after the KEMS data is introduced aromaticity is a very important feature when it comes to predicting 𝑃sat, as are
oxygen containing functionalities which are capable of hydrogen bonding such as carboxylic acids and alcohols. Nitro is 220
another important functionality. In order to improve GCM performance GCMs need to be refitted containing more of these
compounds within their training datasets.
4.2 Difference between experimental and predicted 𝑷𝐬𝐚𝐭
To get an overview of the difference between the experimental 𝑃sat and the estimated 𝑃sat values and how this varies across
the range of 𝑃sat of the compounds studied and their O:C ratios, log10𝑃sat was plotted against O:C ratio and log10(error). An 225
example is shown in Figure 7.
SOA often has 𝑃sat many orders of magnitude lower than 0.1 Pa and GCMs have historically struggled with accurately
predicting 𝑃sat of SOA due to a lack of robust historical data and differences in experimental values between techniques [7].
As can be seen in Figure 7 some of the largest differences between experimental and estimated 𝑃sat occur in the lower 𝑃sat
ranges that SOA typically occupy. The smaller differences are more concentrated in the higher 𝑃sat ranges. However, there 230
are still many higher 𝑃sat compounds that have large differences between experimental and estimated 𝑃sat. Figure 7 shows
that there are significant differences across the entire vapour pressure range, and whilst focusing new measurements on low
volatility compounds is not wrong, this should not mean that the predicted 𝑃sat of higher volatility compounds should be
automatically assumed to be correct. The majority of new 𝑃sat measurements for SOA are focussed on low volatility
compounds as this is where the data is most scarce, but improvements to 𝑃sat prediction is needed for compounds of all levels 235
of volatility. Figures S1 – S3 in the supplementary material, show that there is a similar distribution of error between
experimental and estimated 𝑃sat for all GCMs investigated in this work.
4.3 Predicted error over the MCM chemical space
The predicted error across the MCM chemical space was calculated for each GCM, both with and without the KEMS data. In
Figure 8 the H:C ratio is plotted against the O:C ratio with log10(MCM error) represented as a colour gradient for each organic 240
compound within the MCM.
7
Error appears to increase when KEMS data is added, but this is likely because the compounds measured with the KEMS are
typically low volatility, high functionality compounds that would be expected to have a larger error. The fact that when the
KEMS data is introduced the error of the predictive techniques gets worse suggests that the data for the compounds the KEMS
has studied needs to be added to the fitting data sets of the models. 245
5. Conclusion
Gradient boosting regression, in combination with stratified k fold cross validation, has been used to calculate feature
importance for multiple GCMs. This was performed using experimental vapour pressure data taken from the fitting data sets
of SIMPOL [11] and EVAPORATION [12], as well as experimental data collected using the University of Manchester KEMS
system. When the KEMS 𝑃sat data, containing targeted measurements of compounds and functionalities important to SOA, is 250
introduced there is a clear shift in feature importance. For the Nannoolal et al. method [9], the Myrdal and Yalkowsky method
[10] and SIMPOL [11] aromatic features become much more highly ranked in the feature importance. Aromatics did not
become more important for EVAPORATION, but this is because EVAPORATION contains no aromatic parameters, so
therefore has no aromatic features. This highlights the need for more measurements of highly functionalised, low volatility
compounds as their inclusion in error assessments have significant impacts on feature importance. 255
When fitting this predicted error to the MCM chemical space the introduction of the KEMS data shows an absolute increase
in error, but this is because the KEMS data contains primarily low volatility functionalised compounds, which would be
expected to have larger errors using current GCMs. Predicted error getting worse after the KEMS data is introduced only
further highlights the importance of these measurements being included in the fitting data set of a GCM.
Over the past decade the limitations of current GCMs have been broadly discussed [6,8] and specific areas of weakness have 260
been highlighted for various classes of compounds [13–15,21,22,27] on many occasions. However, despite the new
experimental data that has been collected, this new data has not been utilised to improve current GCMs so the previously
highlighted areas of weakness remain. With this in mind, the authors recommend that the next step should be to use the new
experimental data, alongside the old experimental data and either refit an existing GCM using the newer data or to create a
new GCM that incorporates all of the existing experimental data. 265
Acknowledgements
The work contained in this paper contains work conducted during a PhD study supported by the Natural Environment Research
Council (NERC) EAO Doctoral Training Partnership and is fully-funded by NERC whose support is gratefully acknowledged.
Grant ref no is NE/L002469/1
References 270
1. Seinfeld, J.H.; Pandis, S.N. Atmospheric Chemistry and Physics : From Air Pollution to Climate Change; 3rd ed.; John
Wiley & Sons, Incorporated: New York, 2016;
2. Kanakidou, M.; Seinfeld, J.H.; Pandis, S.N.; Barnes, I.; Dentener, F.J.; Facchini, M.C.; Van Dingenen, R.; Ervens, B.;
Nenes, A.; Nielsen, C.J.; et al. Organic aerosol and global climate modelling: a review. Atmos. Chem. Phys. 2005, 5,
1053–1123, doi:10.5194/acp-5-1053-2005. 275
3. Pöschl, U. Atmospheric Aerosols: Composition, Transformation, Climate and Health Effects. Angew. Chemie Int. Ed.
2005, 44, 7520–7540, doi:10.1002/anie.200501122.
4. Booth, A.M.; Barley, M.H.; Topping, D.O.; Mcfiggans, G.; Garforth, A.; Percival, C.J. Solid state and sub-cooled
liquid vapour pressures of substituted dicarboxylic acids using Knudsen Effusion Mass Spectrometry (KEMS) and
8
Differential Scanning Calorimetry. Atmos. Chem. Phys 2010, 10, 4879–4892, doi:10.5194/acp-10-4879-2010. 280
5. Hallquist, M.; Wenger, J.C.; Baltensperger, U.; Rudich, Y.; Simpson, D.; Claeys, M.; Dommen, J.; Donahue, N.M.;
George, C.; Goldstein, A.H.; et al. The formation, properties and impact of secondary organic aerosol: current and
emerging issues. Atmos. Chem. Phys. Atmos. Chem. Phys. 2009, 9, 5155–5236.
6. Bilde, M.; Barsanti, K.; Booth, M.; Cappa, C.D.; Donahue, N.M.; Emanuelsson, E.U.; McFiggans, G.; Krieger, U.K.;
Marcolli, C.; Topping, D.; et al. Saturation Vapor Pressures and Transition Enthalpies of Low-Volatility Organic 285
Molecules of Atmospheric Relevance: From Dicarboxylic Acids to Complex Mixtures. Chem. Rev 2015, 115, 4115–
4156, doi:10.1021/cr5005502.
7. Barley, M.H.; McFiggans, G. The critical assessment of vapour pressure estimation methods for use in modelling the
formation of atmospheric organic aerosol. Atmos. Chem. Phys 2010, 10, 749–767, doi:10.5194/acp-10-749-2010.
8. O’Meara, S.; Booth, A.M.; Barley, M.H.; Topping, D.; Mcfiggans, G. An assessment of vapour pressure estimation 290
methods. Phys. Chem. Chem. Phys. 2014, 16, 19453–19469, doi:10.1039/c4cp00857j.
9. Nannoolal, Y.; Rarey, Ju.; Ramjugernath, D. Fluid Phase Equilibria Estimation of pure component properties Part 3.
Estimation of the vapor pressure of non-electrolyte organic compounds via group contributions and group interactions.
Fluid Phase Equilib. 2008, 269, 117–133, doi:10.1016/j.fluid.2008.04.020.
10. Myrdal, P.B.; Yalkowsky, S.H. Estimating Pure Component Vapor Pressures of Complex Organic Molecules. Ind. 295
Eng. Chem. Res. 1997, 36, 2494–2499.
11. Pankow, J.F.; Asher, W.E. SIMPOL.1: A simple group contribution method for predicting vapor pressures and
enthalpies of vaporization of multifunctional organic compounds. Atmos. Chem. Phys. 2008, 8, 2773–2796,
doi:10.5194/acp-8-2773-2008.
12. Compernolle, S.; Ceulemans, K.; Müller, J.F. Evaporation: A new vapour pressure estimation methodfor organic 300
molecules including non-additivity and intramolecular interactions. Atmos. Chem. Phys. 2011, 11, 9431–9450,
doi:10.5194/acp-11-9431-2011.
13. Shelley, P.; Bannan, T.J.; Worrall, S.D.; Alfarra, M.R.; Percival, C.J.; Garforth, A.; Topping, D. Measured Solid State
and Sub-Cooled Liquid Vapour Pressures of Benzaldehydes Using Knudsen Effusion Mass Spectrometry. Atmosphere
(Basel). 2021, 12, 397, doi:10.3390/atmos12030397. 305
14. Shelley, P.D.; Bannan, T.J.; Worrall, S.D.; Alfarra, M.R.; Krieger, U.K.; Percival, C.J.; Garforth, A.; Topping, D.
Measured solid state and subcooled liquid vapour pressures of nitroaromatics using Knudsen effusion mass
spectrometry. Atmos. Chem. Phys. 2020, 20, 8293–8314, doi:10.5194/acp-20-8293-2020.
15. Bannan, T.J.; Booth, A.M.; Jones, B.T.; O’meara, S.; Barley, M.H.; Riipinen, I.; Percival, C.J.; Topping, D. Measured
Saturation Vapor Pressures of Phenolic and Nitro-aromatic Compounds. Environ. Sci. Technol 2017, 51, 3922–3928, 310
doi:10.1021/acs.est.6b06364.
16. Topping, D.; Shelley, P. UManSysProp_public: Base version V1.04. Zenodo 2020, doi:10.5281/ZENODO.4110145.
17. Joback, K.G.; Reid, R.C.; Reid, C. ESTIMATION OF PURE-COMPONENT PROPERTIES FROM GROUP-
CONTRIBUTIONS. Chem. Eng. Commun. 1987, 157, 233–243, doi:10.1080/00986448708960487.
18. Stein, S.E.; Brown, R.L. Estimation of Normal Boiling Points from Group Contributions. J. Chem. Inf. Comput. Sci 315
1994, 34, 581–587.
19. Nannoolal, Y.; Rarey, J.; Ramjugernath, D.; Cordes, W. Estimation of pure component properties Part 1. Estimation
of the normal boiling point of non-electrolyte organic compounds via group contributions and group interactions. Fluid
Phase Equilib. 2004, 226, 45–63, doi:10.1016/j.fluid.2004.09.001.
20. Topping, D.; Barley, M.; Bane, M.K.; Higham, N.; Aumont, B.; Dingle, N.; Mcfiggans, G. UManSysProp v1.0: an 320
online and open-source facility for molecular property prediction and atmospheric aerosol calculations. Geosci. Model
Dev 2016, 9, 899–914.
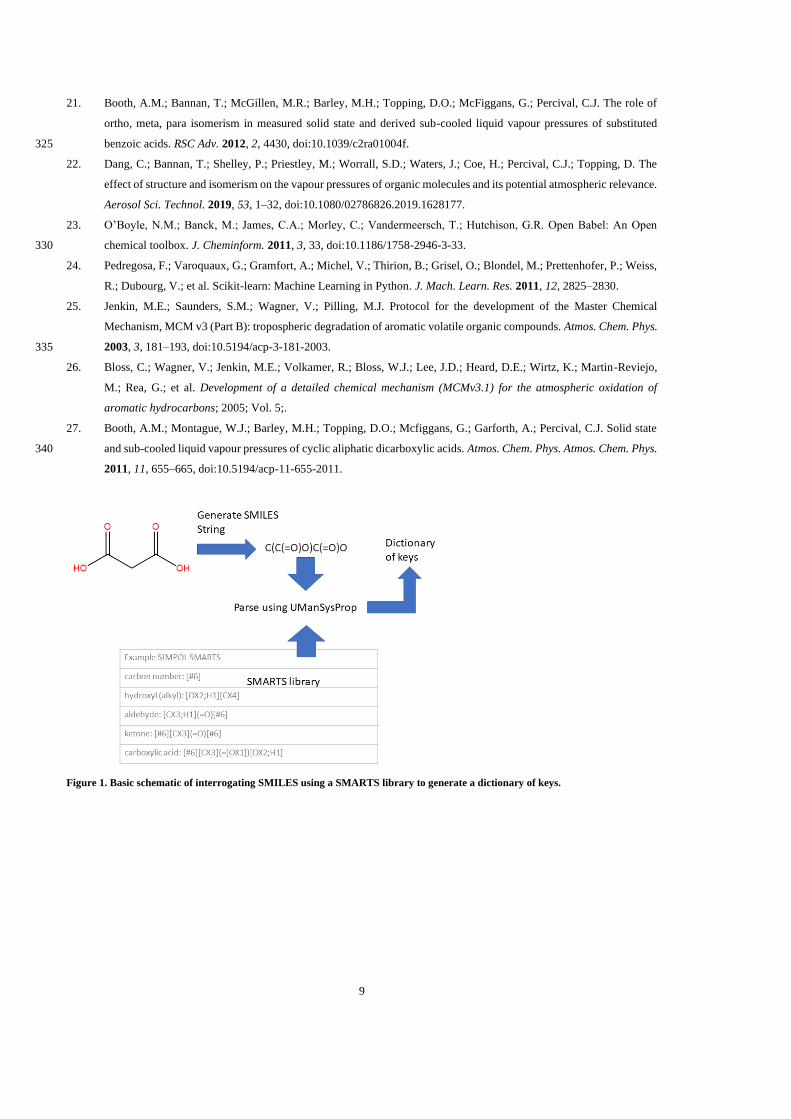
9
21. Booth, A.M.; Bannan, T.; McGillen, M.R.; Barley, M.H.; Topping, D.O.; McFiggans, G.; Percival, C.J. The role of
ortho, meta, para isomerism in measured solid state and derived sub-cooled liquid vapour pressures of substituted
benzoic acids. RSC Adv. 2012, 2, 4430, doi:10.1039/c2ra01004f. 325
22. Dang, C.; Bannan, T.; Shelley, P.; Priestley, M.; Worrall, S.D.; Waters, J.; Coe, H.; Percival, C.J.; Topping, D. The
effect of structure and isomerism on the vapour pressures of organic molecules and its potential atmospheric relevance.
Aerosol Sci. Technol. 2019, 53, 1–32, doi:10.1080/02786826.2019.1628177.
23. O’Boyle, N.M.; Banck, M.; James, C.A.; Morley, C.; Vandermeersch, T.; Hutchison, G.R. Open Babel: An Open
chemical toolbox. J. Cheminform. 2011, 3, 33, doi:10.1186/1758-2946-3-33. 330
24. Pedregosa, F.; Varoquaux, G.; Gramfort, A.; Michel, V.; Thirion, B.; Grisel, O.; Blondel, M.; Prettenhofer, P.; Weiss,
R.; Dubourg, V.; et al. Scikit-learn: Machine Learning in Python. J. Mach. Learn. Res. 2011, 12, 2825–2830.
25. Jenkin, M.E.; Saunders, S.M.; Wagner, V.; Pilling, M.J. Protocol for the development of the Master Chemical
Mechanism, MCM v3 (Part B): tropospheric degradation of aromatic volatile organic compounds. Atmos. Chem. Phys.
2003, 3, 181–193, doi:10.5194/acp-3-181-2003. 335
26. Bloss, C.; Wagner, V.; Jenkin, M.E.; Volkamer, R.; Bloss, W.J.; Lee, J.D.; Heard, D.E.; Wirtz, K.; Martin-Reviejo,
M.; Rea, G.; et al. Development of a detailed chemical mechanism (MCMv3.1) for the atmospheric oxidation of
aromatic hydrocarbons; 2005; Vol. 5;.
27. Booth, A.M.; Montague, W.J.; Barley, M.H.; Topping, D.O.; Mcfiggans, G.; Garforth, A.; Percival, C.J. Solid state
and sub-cooled liquid vapour pressures of cyclic aliphatic dicarboxylic acids. Atmos. Chem. Phys. Atmos. Chem. Phys. 340
2011, 11, 655–665, doi:10.5194/acp-11-655-2011.
Figure 1. Basic schematic of interrogating SMILES using a SMARTS library to generate a dictionary of keys.
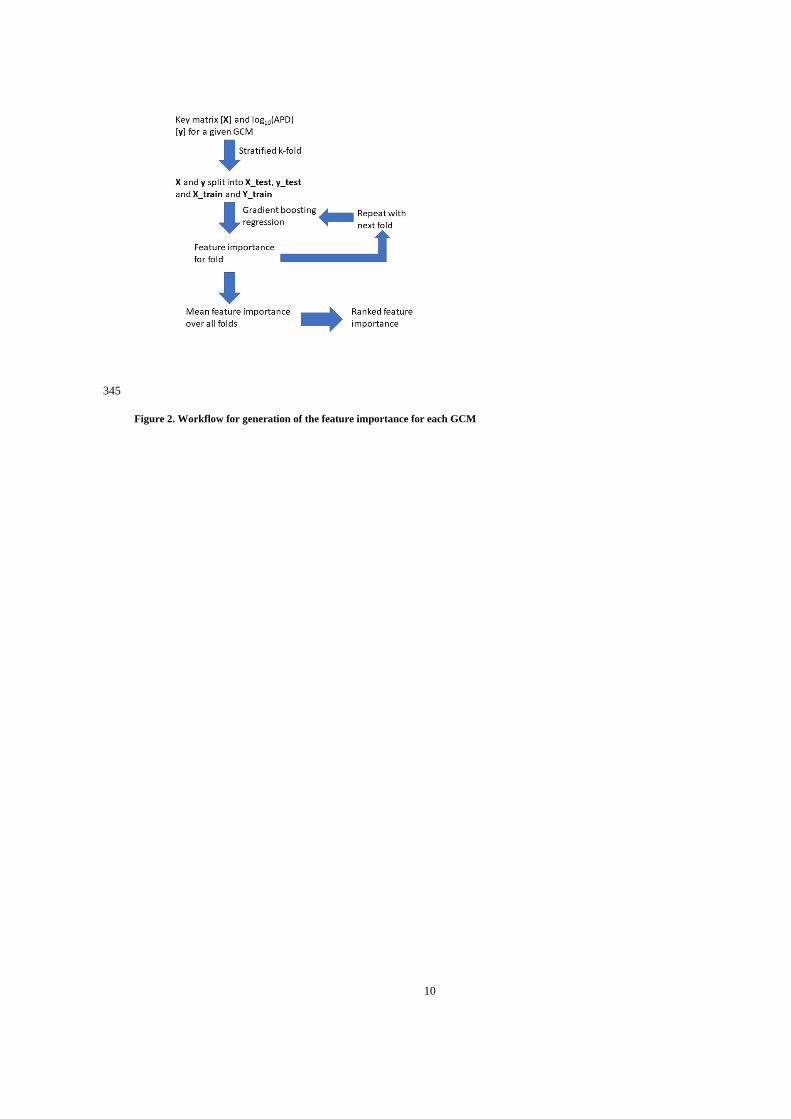
10
345
Figure 2. Workflow for generation of the feature importance for each GCM
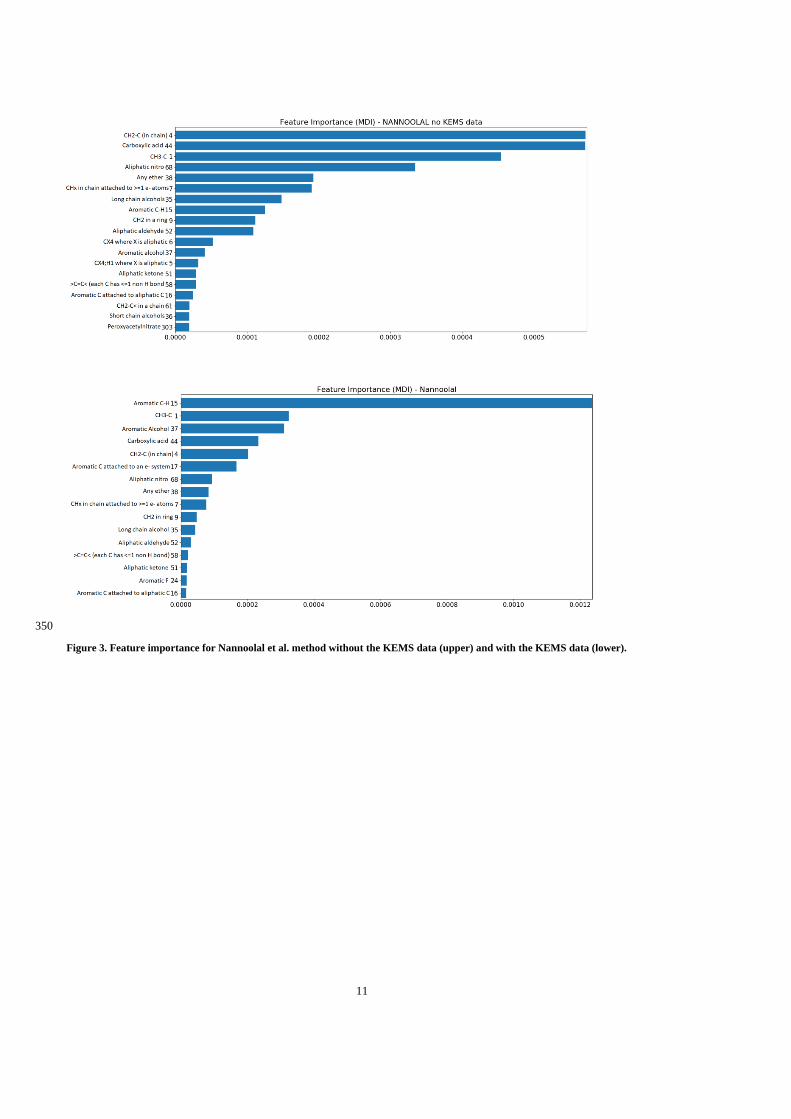
11
350
Figure 3. Feature importance for Nannoolal et al. method without the KEMS data (upper) and with the KEMS data (lower).
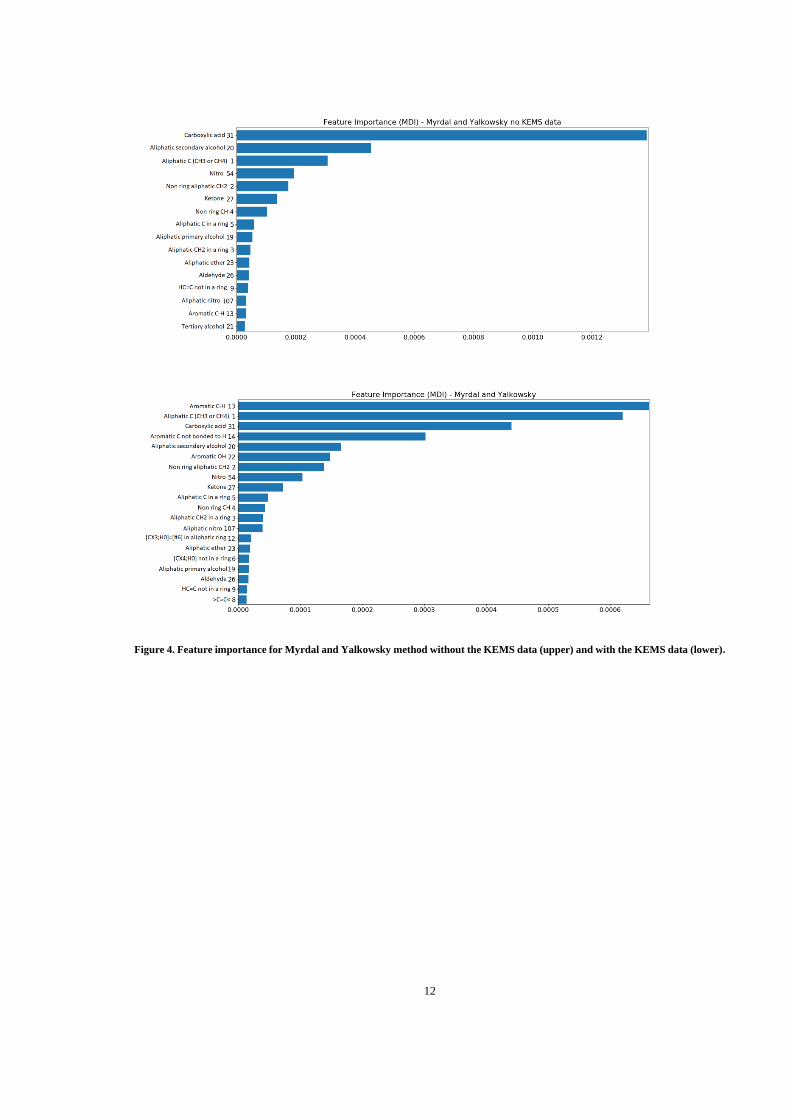
12
Figure 4. Feature importance for Myrdal and Yalkowsky method without the KEMS data (upper) and with the KEMS data (lower).
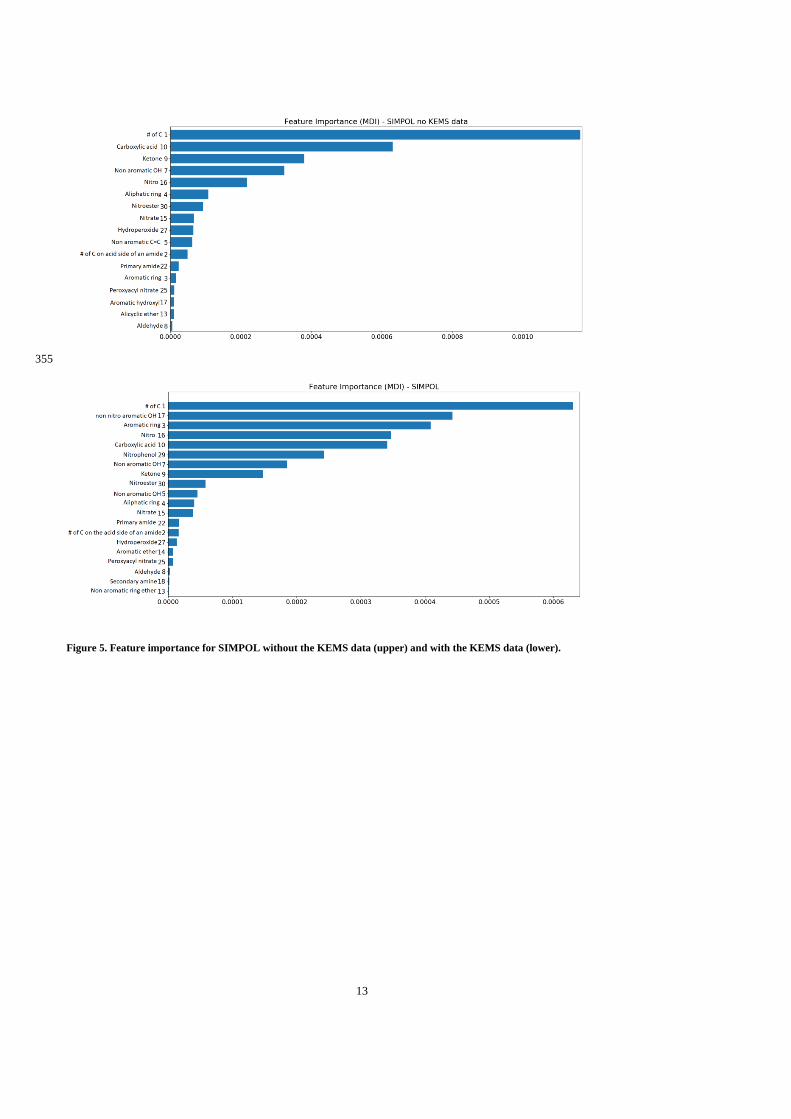
13
355
Figure 5. Feature importance for SIMPOL without the KEMS data (upper) and with the KEMS data (lower).
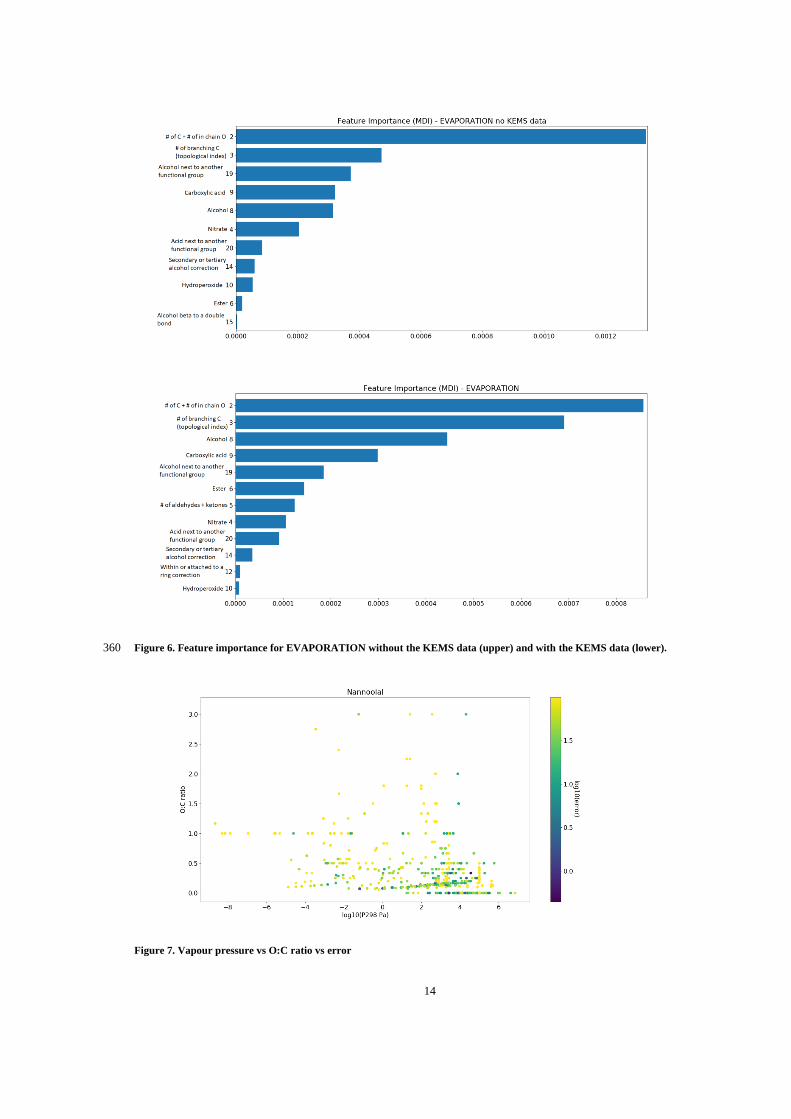
14
Figure 6. Feature importance for EVAPORATION without the KEMS data (upper) and with the KEMS data (lower). 360
Figure 7. Vapour pressure vs O:C ratio vs error
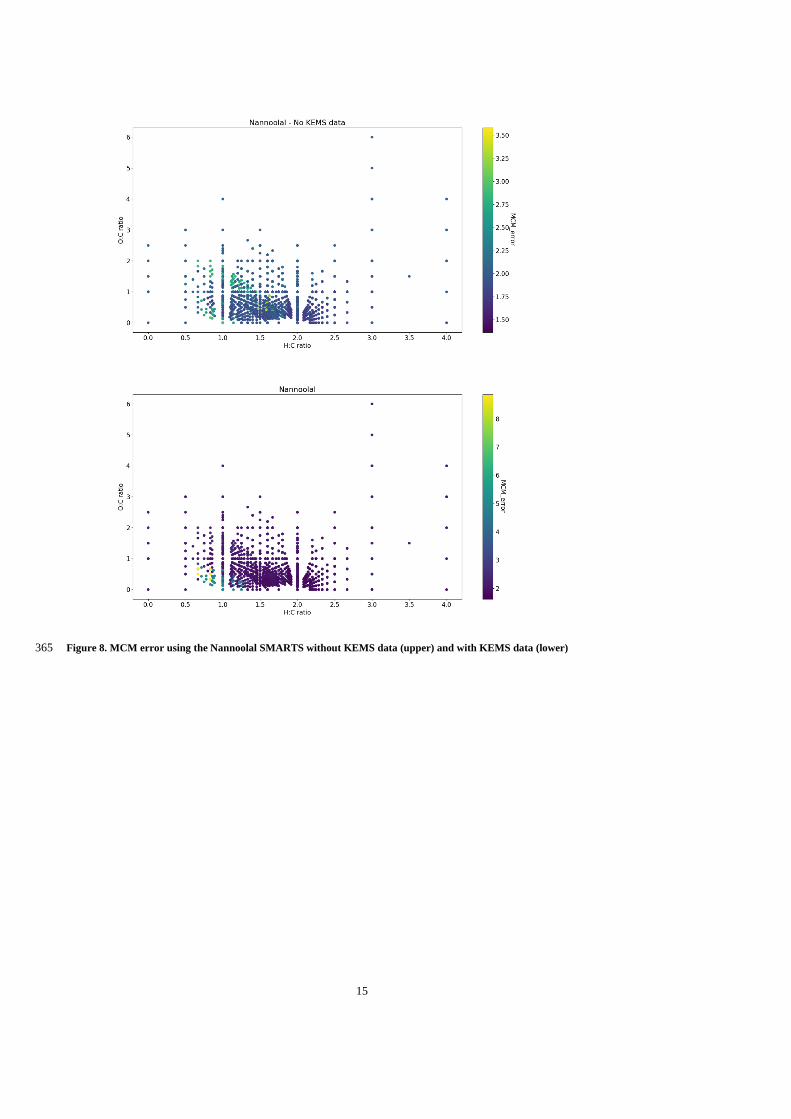
15
Figure 8. MCM error using the Nannoolal SMARTS without KEMS data (upper) and with KEMS data (lower) 365
References
Compernolle, S., Ceulemans, K., and Müller, J. F.: Evaporation: A new vapour pressureestimation methodfor organic molecules including non-additivity and intramolecularinteractions, Atmospheric Chemistry and Physics, 11, 9431–9450, doi:10.5194/acp-11-9431-2011, URL www.atmos-chem-phys.net/11/9431/2011/, 2011.
Myrdal, P. B. and Yalkowsky, S. H.: Estimating Pure Component Vapor Pressures of ComplexOrganic Molecules, Ind. Eng. Chem. Res., 36, 2494–2499, URL https://pubs-acs-org.manchester.idm.oclc.org/doi/pdf/10.1021/ie950242l, 1997.
Nannoolal, Y., Rarey, J., and Ramjugernath, D.: Fluid Phase EquilibriaEstimation of pure component properties Part 3. Estimation of the vaporpressure of non-electrolyte organic compounds via group contributions and groupinteractions, Fluid Phase Equilibria, 269, 117–133, doi:10.1016/j.fluid.2008.04.020,URL https://ac-els-cdn-com.manchester.idm.oclc.org/S0378381208001611/1-s2.0-S0378381208001611-main.pdf? tid=50024cd4-1148-4a88-b3e7-e14cb5022fe2&acdnat=1526383962 50cf9f9aa4a5a1fa154e3356d052da78https://ac.els-cdn.com/S0378381208001611/1-s2.0-S03783812080016, 2008.
Pankow, J. F. and Asher, W. E.: SIMPOL.1: A simple group contribution methodfor predicting vapor pressures and enthalpies of vaporization of multifunctionalorganic compounds, Atmospheric Chemistry and Physics, 8, 2773–2796, doi:10.5194/acp-8-2773-2008, URL www.atmos-chem-phys.net/8/2773/2008/, 2008.
66
6
Conclusion
6.1 Summary of key research findings
In Chapter 5.1 the PsatS and Psat
L of a range of nitroaromatic compounds, inlcuding multiple
sets of structural isomers, were measured using KEMS. The measured PsatS for each compound
were then compared to each other to determine possible chemical and structural explanations
for the observed trends. Of the 20 compounds selected only 4 were not capable of H-bonding
in the pure component. These 4 compounds had PsatS that were orders of magnitude higher
than those that could H-bond. This showed the major impact that H-bonds had on Psat and
that in general compounds that can not H-bond in the pure component have higher Psat.
When comparing the PsatS of compounds that were capable of H-bonding the importance of
the H bond itself became apparent. In general, the relative strength of the H-bond, estimated
using the partial charge on the adjacent carbon, matched the observed trends in PsatS with
the stronger H-bonds corresponding to the lower PsatS . Whilst the the presence and strength
of the H-bonds were the most important factors, steric effects, and which other functional
groups were present were also significant factors.
Chapter 5.2 follows on from the work done in Chapter 5.1. However this time there is a greater
mix of compounds that both can and can not H-bond in the pure component. Comparisons
were again made between the measured PsatL values. For the compounds capable of H-bonding
similar trends to those seen in Chapter 5.1 were seen, with H-bonding compounds again
having lower PsatL and the relative strength of the H-bond corresponding to Psat
L . However
there was one notable exception to this being o-vanillin, which despite being capable of H-
bonding in the pure component had PsatL an order of magnitude greater than its isomers.
This is because the the H-bond in o-vanillin was intramolecular, so it would therefore not be
used in intermolecular interactions leading to a higher PsatL . This demonstrates that simply
being capable of H-bonding does not necessarily lead to a lower PsatL and that it is important
to account for the positions of functional groups relative to each other.
67
As Chapter 5.2 also contains a greater number of non H-bonding compounds it was possible
to investigate some of the factors that affect PsatL for non h-bonding compounds. When
no H-bonds are present the polarisability of the compound has the largest impact on PsatL ,
however steric effects still remained significant.
In both Chapter 5.1 and Chapter 5.2 PsatL for all compounds was compared to predicted Psat
L
from several GCMs.These GCMs were the Nannoolal et al. method (Nannoolal et al., 2008),
the Myrdal and Yalkowsky method (Myrdal and Yalkowsky, 1997) and SIMPOL (Pankow
and Asher, 2008). For both the nitroaromatics and benzaldehydes SIMPOL predicted closest
to the experimentally determined values, although for nitroaromatics they were still absolute
differences between the experimental and predicted PsatL of over 4 orders of magnitude.
These large errors, especially for the nitroaromatics are due to a mixture of not only a
lack of experimental data, but also differences between different measurements of the same
compound. If a certain functionality is represented in a data set by very few compounds,
then the data set is much more susceptible to mispredict for said functionality if a compound
has an incorrect value in the data set. This is discussed more in Chapter 5.1.
In Chapter 5.1 and Chapter 5.2 the limitations of current GCMs were highlighted when
it comes to predicting Psat of certain classes of compound. Whilst the extent of these
limitations were not precisely known, the need for additional experimental measurements
and to improve GCMs for use with atmospherically relevant compounds has been apparent
for some time (Bilde et al., 2015; O’Meara et al., 2014). Whilst new measurements of Psat
have been made over the last decade, it is unlikely experimental work will be able to cover all
of the potential compounds used and predicted within atmospheric chemical mechanisms.
In Chapter 5.3 multivariate regression techniques are combined with experimental data
and predictions from GCMs to try and quantify what gaps exist and what improvements
have been made by new data collected using the University of Manchester KEMS system.
Specifically, gradient boosting regression using stratified k-fold cross validation was used to
calculate the feature importance for several GCMs (the Nannoolal et al. method (Nannoolal
et al., 2008), the Myrdal and Yalkowsky method (Myrdal and Yalkowsky, 1997), SIMPOL
(Pankow and Asher, 2008) and EVAPORATION (Compernolle et al., 2011). The feature
importance for each GCM was calculated using a combination of the fitting data set used for
SIMPOL and the fitting data set used for EVAPORATION, and was calulated a second time
using this data as well as the experimental data from the University of Manchester KEMS
system. This was done so that the impact of the KEMS data on feature importance could be
investigated. Before the KEMS data was introduced carboxylic acid and alcohol dominated
the feature importance. After the KEMS data is introduced carboxylic acid and alcohol both
remain important features but aromatic parameters become the most important. Following
68
this a regressor was used to predict the expected error in using a GCM over the Master
Chemical Mechanism (MCM) chemical space. Once without including the KEMS data and
once including the KEMS data. After the KEMS data is introduced the error over the MCM
chemical space increases. This increase in error, as well as the changes in feature importance,
demonstrates the impact that the KEMS data has predicting Psat.
6.2 Work for the future
To understand the role of OA in air quality and climate it is necessary to quantify the
partitioning of organic compounds between the gas and particulate phases. Uncertainties
in the vapour pressures of SOA impact the ability to accurately predict the partitioning
of such compounds in the atmosphere. This in turn can lead to inaccuracies of larger scale
atmospheric models that rely on accurate partitioning parameters. Whilst there has been new
experimental Psat data collected over the past decade, particularly for the lower volatility,
highly functionalised compounds that make up a significant part of SOA, this new data has
so far only shown the limitations of current GCMs and areas where they struggle. To improve
the ability to accurately predict Psat for SOA this new data must be used to either refit an
existing GCM, or be used alongside previously available literature data to construct a new
one. To enable the best GCM possible it is essential that all experimental measurement data
is open source and readily available.
References
Bilde, M., Barsanti, K., Booth, M., Cappa, C. D., Donahue, N. M., Emanuelsson,E. U., McFiggans, G., Krieger, U. K., Marcolli, C., Topping, D., Ziemann, P., Barley,M., Clegg, S., Dennis-Smither, B., Hallquist, M., Hallquist, A. M., Khlystov, A.,Kulmala, M., Mogensen, D., Percival, C. J., Pope, F., Reid, J. P., V Ribeiro daSilva, M. A., Rosenoern, T., Salo, K., Pia Soonsin, V., Yli-Juuti, T., Prisle, N. L.,Pagels, J., Rarey, J., Zardini, A. A., and Riipinen, I.: Saturation Vapor Pressures andTransition Enthalpies of Low-Volatility Organic Molecules of Atmospheric Relevance:From Dicarboxylic Acids to Complex Mixtures, Chem. Rev, 115, 4115–4156, doi:10.1021/cr5005502, URL http://pubs.acs.org/doi/abs/10.1021/cr5005502http://pubs.acs.org/doi/pdfplus/10.1021/cr5005502, 2015.
Compernolle, S., Ceulemans, K., and Müller, J. F.: Evaporation: A new vapour pressureestimation methodfor organic molecules including non-additivity and intramolecularinteractions, Atmospheric Chemistry and Physics, 11, 9431–9450, doi:10.5194/acp-11-9431-2011, URL www.atmos-chem-phys.net/11/9431/2011/, 2011.
Myrdal, P. B. and Yalkowsky, S. H.: Estimating Pure Component Vapor Pressures of ComplexOrganic Molecules, Ind. Eng. Chem. Res., 36, 2494–2499, URL https://pubs-acs-org.manchester.idm.oclc.org/doi/pdf/10.1021/ie950242l, 1997.
Nannoolal, Y., Rarey, J., and Ramjugernath, D.: Fluid Phase Equilibria
69
Estimation of pure component properties Part 3. Estimation of the vaporpressure of non-electrolyte organic compounds via group contributions and groupinteractions, Fluid Phase Equilibria, 269, 117–133, doi:10.1016/j.fluid.2008.04.020,URL https://ac-els-cdn-com.manchester.idm.oclc.org/S0378381208001611/1-s2.0-S0378381208001611-main.pdf? tid=50024cd4-1148-4a88-b3e7-e14cb5022fe2&acdnat=1526383962 50cf9f9aa4a5a1fa154e3356d052da78https://ac.els-cdn.com/S0378381208001611/1-s2.0-S03783812080016, 2008.
O’Meara, S., Booth, A. M., Barley, M. H., Topping, D., and Mcfiggans, G.: An assessment ofvapour pressure estimation methods, Phys. Chem. Chem. Phys., 16, 19 453–19 469, doi:10.1039/c4cp00857j, URL http://pubs.rsc.org.manchester.idm.oclc.org/en/content/articlepdf/2014/cp/c4cp00857j, 2014.
Pankow, J. F. and Asher, W. E.: SIMPOL.1: A simple group contribution methodfor predicting vapor pressures and enthalpies of vaporization of multifunctionalorganic compounds, Atmospheric Chemistry and Physics, 8, 2773–2796, doi:10.5194/acp-8-2773-2008, URL www.atmos-chem-phys.net/8/2773/2008/, 2008.
70
A
Appendices
A.1 Supplementary material for Paper 3
71
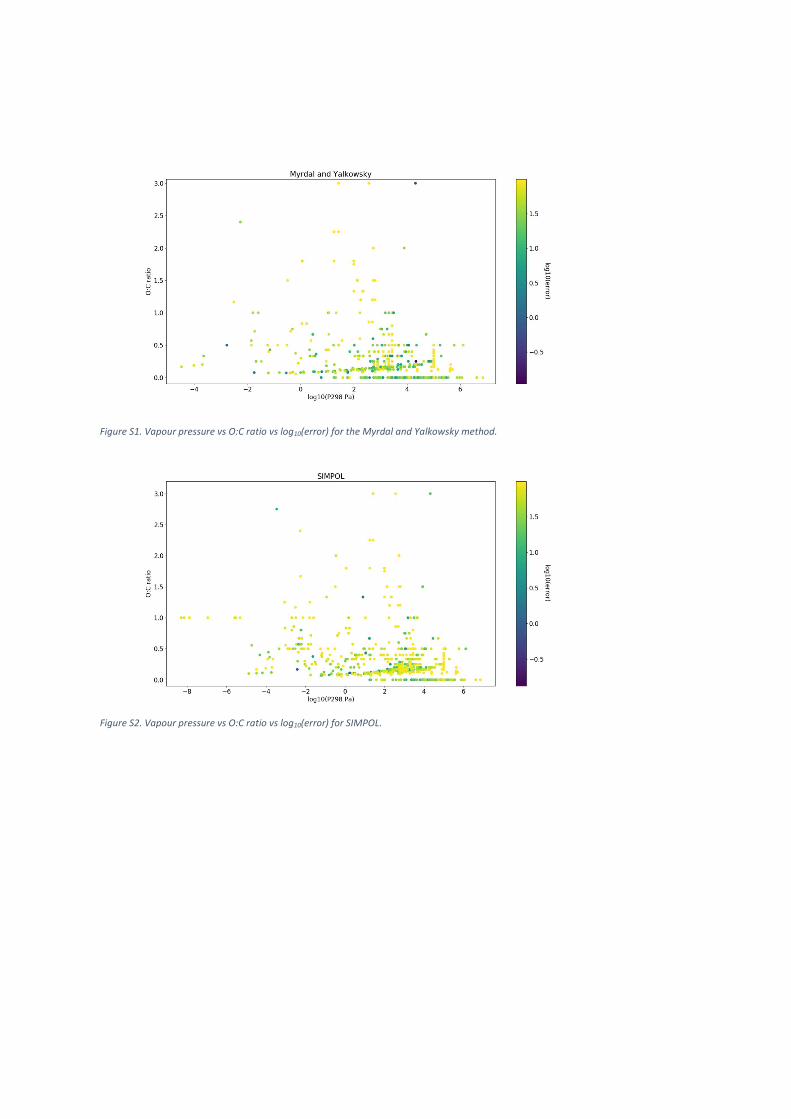
Figure S1. Vapour pressure vs O:C ratio vs log10(error) for the Myrdal and Yalkowsky method.
Figure S2. Vapour pressure vs O:C ratio vs log10(error) for SIMPOL.
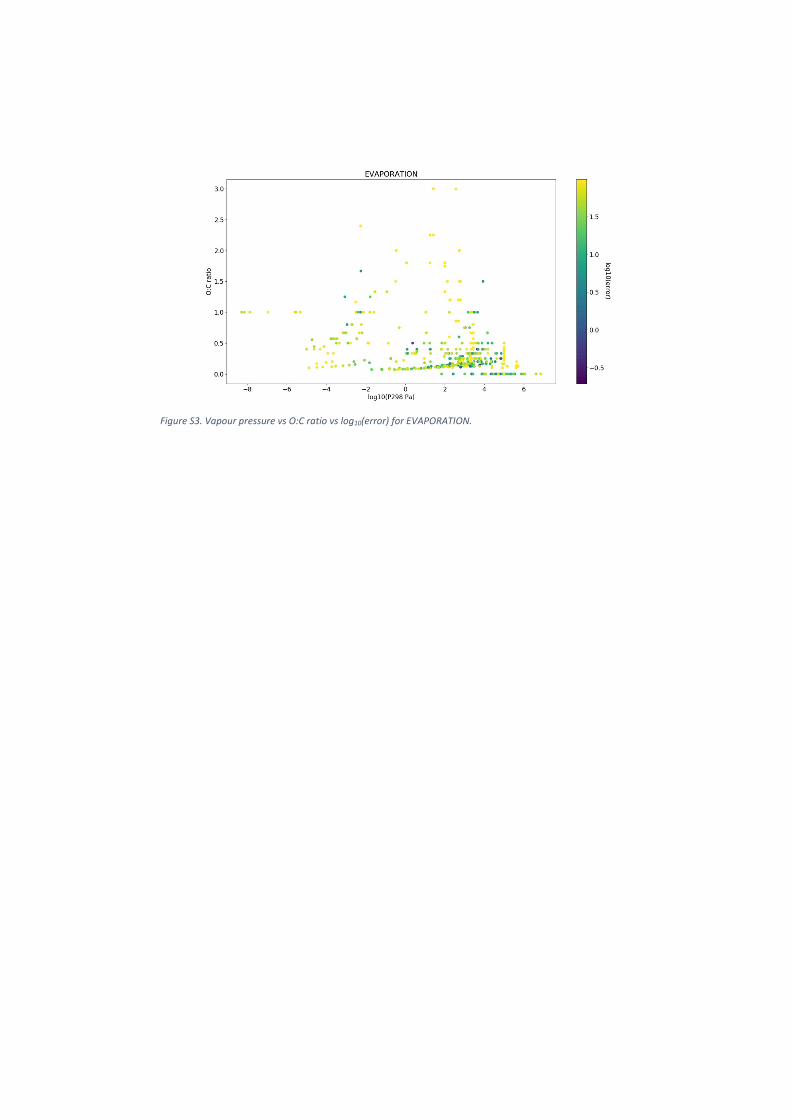
Figure S3. Vapour pressure vs O:C ratio vs log10(error) for EVAPORATION.
Figure S4. MCM error using the Myrdal and Yalkowsky SMARTS without KEMS data (upper) and with KEMS data (lower).
Figure S5. MCM error using the SIMPOL SMARTS without KEMS data (upper) and with KEMS data (lower).
Figure S6. MCM error using the EVAPORATION SMARTS without KEMS data (upper) and with KEMS data (lower).
A.2 Publications and conference presentations
A.2.1 Contributions to scientific publications
Caroline Dang, Thomas Bannan, Petroc Shelley, Michael Priestley, Stephen D. Worrall, John
Waters, Hugh Coe, Carl J. Percival & David Topping (2019) The effect of structure and
isomerism on the vapor pressures of organic molecules and its potential atmospheric relevance,
Aerosol Science and Technology, 53:9, 1040-1055,DOI: 10.1080/02786826.2019.1628177.
A.2.2 Conference presentations
European Geophysical Union Conference (EGU) 2019 in Vienna, Austria
• EGU2019-14767 Investigating the vapour pressures of nitroaromatic compounds using
Knudsen effusion mass spectrometry by Petroc Shelley, Thomas J. Bannan, M. Rami
Alfarra and David Topping (poster presentation)
A.3 DTP Training Plan
This project was funded by the Natural Environment Research Council (NERC) as part of
the Manchester Liverpool Doctoral Training Programme (DTP), Understanding the Earth,
Atmosphere and Ocean. The aim of this DTP was to support integration in the reaserch
community and to emphasise multidisciplinary training.
Funding covers a three and a half year period. Each student is required to complete a
personalised training plan, completing at least 8 units each in both subject specific training
and transferable skills. An outline of my completed training plan is included below.
77

Page 1 of 5
Manchester – Liverpool DTP
Skills audit and Training Plan
Name: Petroc Shelley NERC Ref: NE/L002469/1 Start date: 13/10/2017
Project: Measuring and predicting the vapour pressure of organic molecules to reduce uncertainties in air-quality and climate change models within an existing US-EU collaborative network
Supervisors and affiliations:
Supervisor: David Topping Co-supervisor: Rami Alfarra
Academic qualifications and other training1:
Masters of Chemistry (Hons) – Second Class, Division one (2.1) (Integrated Masters) Scientist, ZIPLOC research cruise JC150, (Pointe a Pitre, Guadeloupe – Santa Cruz, Tenerife) 48 days at sea
Student’s core knowledge and skills2:
Knowledge of Chemistry Basic MATLAB and UNIX
Research knowledge and skills required for PhD3:
Python knowledge Be able to use the KEMS Be able to run simulations to model vapour pressures of certain compounds on the CSF
Summary of subject-specific training required4:
Training on use of KEMS Training courses on introduction to atmospheric science and aerosols Training on COSMO-RS
Transferable skills training required5:
Unix training Python training Git training LaTeX training
Employability6:

Page 2 of 5
The training in use of programs such as Python, Git and LaTeX are not only very helpful and necessary for the completion of my PhD, but also highly transferable beyond scientific research. Being able to use git’s version control functionality and Github makes collaboration with other researchers easier. DTP conferences will give experience in public speaking and communication of science.
Training programme7
(8 units required, except where student has an MSc in a relevant subject, in which case 6 units required)
Please add more activities/courses to this list when necessary.
Activity/course Date8
☒
1
Name: DTP Induction 03/10/2017
04/10/2017
☒
Nature/Location: Introductory Talks / University of Liverpool Skills: Networking/ Awareness of current research in the field
2
Name: Introduction to Atmospheric Science
22/01/201826/01/2018
☒
Nature/Location: Training course/ University of Leeds Skills: Introduction to key aspects of atmospheric science such as weather, composition and climate science
3
Name: COSMO-RS symposium
06/03/201808/03/2018
☒
Nature/Location: Training course/ Cologne Skills: Training workshops on the COSMO-RS and Turbomole software packages which will form a significant section of my PhD
4 & 5
Name: 2nd HAAR summer school
07/06/201813/06/2018
☒
Nature/Location: Summer school/ Greece 2 Units Skills: Theory and practice of aerosol chemistry and engineering for climate, air quality, emissions and health effects
6
Name: BMSS Introduction to mass spectrometry course 10/09/201811/09/2018
☒
Nature/Location: Training course/ University of Cambridge Skills: Introduction to mass spectrometry
Name: NCAS Introduction to scientific computing
19/11/201823/11/2018

Page 3 of 5
7 Nature/Location: Training course/ LEEDS ☒
Skills: 5 days of UNIX/GIT/PYTHON training along with training on the numpy and matplotlib PYTHON modules
7 . 5
Name: Fundamentals of Aerosol Science 2017 (1 day ½ unit)
08/11/2017
☒ Nature/Location: Training course/ Birmingham Skills: Introduction to aerosol science ranging from drug delivery to atmospheric and environmental aspects.
8
Name: Short Courses from EGU 2019 (1 day ½ unit) 08/11/2017
☒ Nature/ Location: Short Course/ Vienna
Skills: Ideas and resources for teaching climate change Pitching your research to the press: The science of the press release Visualizing science
Transferable skills programme9
(8 units required of which 3 should be IT courses, ie programming)
Please add more activities/courses to this list when necessary.
Activity/course Date8
☒
1
Name: RLaTeX introduction to LaTeX
23/10/2017
☒
Nature/Location: Workshop/ University of Manchester Skills: Knowledge of LaTeX for typesetting thesis/ academic papers
2
Name: Software Carpentry workshop 06/11/2017
07/11/2017
☒
Nature/Location: Workshop/ University of Manchester Skills: Training in Unix, Python and Git
3
Name: DTP Autumn School
13/11/201717/11/2017
☒
Nature/Location: DTP cohort event/ University of Liverpool and University of Manchester Skills: Communication skills, careers skills and multidisciplinary awareness

Page 4 of 5
4
Name: RGIT Introduction to version control using Git
02/05/2018
☒
Nature/Location: Workshop/ University of Manchester
Skills: Training of using GIT for version control
5
Name: HTML & CSS training 17/04/2019
18/04/2019
☒
Nature/Location: Manchester
Skills: HTML and CSS training
6
Name: Introduction to Parallel programming
04/04/2019
☒
Nature/Location: Training course/workshop Skills: how to code when parallel programming
7
Name: DTP spring school 18/03/2019
22/03/2018
☒
Nature/Location: Knutsford Skills: Communication skills, careers skills and multidisciplinary awareness
8
Name: Introduction to GTA(FSE) (1/2 unit) FSE GTA Roles and Expectations(1/2) unit
22/02/201817/01/2018
☒ Nature/Location: Training/ University of Manchester
Skills: Demonstrator training to be a GTA
Notes:
1. List degrees, pathways, project work and other training. 2. The audit should define the skill strengths of candidate. 3. Outline the skills and knowledge required to prosecute the research. 4. A key component. This should cover the skills deficit or advanced skills needed to undertake
the research and this should be directly addressed in the training programme. 5. This should cover broader skills/knowledge training, including additional employability skills
and the student taking opportunity of the broad training available. 6. This should address the NERC/UK skills priorities. Employability of the individual and
addressing the UK’s skills gaps are important. If these aspects are addressed by the research or the skills support the student’s long-term career aspirations, they can be recorded here. (May be deferred on initial completion of the audit/training plan)
7. The training programme should be a full list of skills/knowledge training activities. The training course or activity should be named. The nature of the training – length, type (short
Page 5 of 5
course, degree course) and the ‘supplier’ should be identified. The skills focus should be recognized.
8. The date of the course listed. Add a X to show when completed. 9. The transferable skills should be listed separately. 10. NB for extra training boxes, copy and paste.
Key links: NERC Advanced Training Short Courses http://www.nerc.ac.uk/funding/available/postgrad/advanced/atsc/ NCAS Residential Schools: https://www.ncas.ac.uk/index.php/en/education-and-staff-development University of Manchester transferable skills provision http://www.researchsupport.eps.manchester.ac.uk/research_staff/programme/Workshop_calendar/ : IT skills courses are offered by the Research Applications group: http://wiki.rac.manchester.ac.uk/community/Courses University of Liverpool transferable skills Provision http://www.liv.ac.uk/pgr-development/programme/. http://www.liv.ac.uk/student-administration/research/pgr-handbook/