Embed Size (px)
Citation preview
ANTIMICROBIAL ACTIVITY OF ESSENTIAL OILS AS LIQUID AND VAPOUR
APPLICATIONS
ELLENA RAE ELCOCKS
A thesis submitted in partial fulfilment of the requirements of the University of
the West of England, Bristol for the degree of Doctor of Philosophy (PhD)
Faculty of Applied Sciences, University of the West of England, Bristol
December 2019
Word Count: 32,613
ii
ABSTRACT
Essential oils produced by plants have been used as antimicrobial agents
historically, however, many essential oils remain under-exploited as
alternatives to current antimicrobials. Therefore, the aim of this thesis was to
evaluate the antibacterial efficacy of selected essential oils against bacteria
which have the ability to form biofilms. The broad-spectrum activity of several
essential oils is demonstrated, with subsequent focus on the strong
antimicrobial activity of cinnamon essential oil extracted from Cinnamomum
zeylanicum bark. Cinnamon bark essential oil showed broad spectrum activity
against a range of bacteria, some of which are relevant clinically, including
Pseudomonas aeruginosa which is capable of forming biofilms and implicated
in many human diseases. Cinnamon bark essential oil killed planktonic P.
aeruginosa at concentrations as low as 0.125% (v/v), and within 2 min when
at concentrations of ≥1% (v/v). It also exhibited anti-biofilm activity, in both
liquid and vapour form, against P. aeruginosa biofilms grown using a Centre
for Disease Control biofilm reactor on polycarbonate and stainless steel
surfaces. Liquid application of 2% (v/v) resulted in biofilm eradication in as little
as 10 min. When assessed in a novel testing chamber, designed and built as
part of this project, cinnamon EO reduced biofilms at vapour concentrations
as low as 0.2 µL cm-3. These results provide clear evidence for the potential
of cinnamon bark essential to be considered as a novel antimicrobial, and to
contribute to the improvement of hygiene and sanitation. As well as addressing
the global issue of antibiotic resistance, data presented also provide evidence
for the ability of essential oils to inhibit and eradicate biofilms, which increases
tolerance of pathogenic bacteria to antimicrobials. Data presented here
provide the basis of additional work to investigate development of disinfectant
products, evaluate essential oil toxicity, and further study the role of essential
oils in combatting antimicrobial resistance.
iii
ACKNOWLEDGEMENTS
I would first like to thank my supervisors, Emmanuel Adukwu and Peter
Spencer-Phillips, for their roles in this project, their guidance, and for helping
me to become the researcher I am. I would also like to thank the co-funders of
this PhD, Medical Wire and Equipment, without whom this PhD would not have
been possible.
I’d like to thank all the staff at UWE. A special thanks to the micro technicians,
Lee, Gill and Barbara, for their constant support, admirable patience and
putting up with my singing through thin walls. A big thanks to Dave Patton for
his SEM skills, to Paul Bowdler for his help with GC-MS, to Dave Corry and
the rest of the technical team for facilitating such a great workspace to carry
out research, and to Paul from stores for always having what I need and being
my chief cardboard supplier.
A big thank you to all of my friends, colleagues, academics and PGRs in the
department. I thank them for the advice they’ve offered, drinks they’ve bought,
bake off sweepstakes, scavenger hunts, annual BBQs, Christmas quizzes,
and endless innuendoes.
Llama and Lizzy, you’ve been there in the good times and the bad, and for that
I am forever grateful. Thank you for letting TMI no longer be in our vocabulary,
for pyjamas and slippers being a given, and for always keeping me in check
with pragmatic perspectives. I don’t think I would have made it this far without
you. I love you guys, and I will cherish our friendship always.
Malwyn, you’ve been so supportive, thoughtful and just the best human being.
Thank you for keeping me sane and putting up with me during this emotional
rollercoaster. You’ve kept me happy and smiling, I love you.
To my family, thank you for your strength and encouragement. You constantly
remind me to stay true to myself and strive for the top. I wouldn’t be me without
you, and for that I am grateful.
And to Coco, my beautiful sister. Never a day goes by when you aren’t missed.
You’ll never know the impact you’ve made and how you’ve shaped me into the
person I am. You’ve taught me to be strong, to be brave in my beliefs, to love
fiercely, and live with no regrets.
I dedicate this work to you.
iv
TABLE OF CONTENTS
ABSTRACT ................................................................................................... ii
ACKNOWLEDGEMENTS ............................................................................ iii
TABLE OF CONTENTS ............................................................................... iv
LIST OF TABLES ......................................................................................... ix
LIST OF FIGURES ........................................................................................ x
LIST OF ABBREVIATIONS......................................................................... xii
1 INTRODUCTION .................................................................................... 3
1.1 Antimicrobial resistance (AMR) ....................................................... 3
1.1.1 Origin and impact ....................................................................... 3
1.1.2 Drivers of resistance ................................................................... 5
1.1.2.1 Inappropriate prescribing and misuse .................................. 6
1.1.2.2 Extensive agricultural use .................................................... 8
1.1.2.3 Availability of few new antimicrobials ................................... 8
1.1.3 Bacterial mechanisms of resistance ......................................... 11
1.1.4 Biofilms ..................................................................................... 12
1.1.5 Biofilm formation....................................................................... 12
1.1.5.1 Attachment......................................................................... 13
1.1.5.2 Growth and maturation ...................................................... 14
1.1.5.3 Detachment and dispersal ................................................. 16
1.1.6 Biofilm tolerance ....................................................................... 17
1.2 Combatting AMR & current status ................................................. 18
1.2.1 Essential oils ............................................................................ 20
1.2.1.1 Extraction and composition ................................................ 21
1.2.1.2 Known uses ....................................................................... 22
1.2.1.3 Essential oils as antimicrobials .......................................... 23
1.2.1.4 Modes of action of essential oil .......................................... 24
1.2.1.5 Safety ................................................................................ 26
1.3 Summary and aims ........................................................................ 27
v
2 MATERIALS AND METHODS ............................................................. 31
2.1 Chemicals and media .................................................................... 31
2.2 Maintenance and growth of bacteria .............................................. 31
2.3 Essential oils .................................................................................. 32
2.3.1 Oil analysis ............................................................................... 32
2.3.2 Preparation of essential oils (EOs) ........................................... 33
2.4 Biofilm growth in vitro ..................................................................... 34
2.4.1 Microtitre plate method (crystal violet biofilm assay) ................ 34
2.4.2 CDC biofilm reactor .................................................................. 35
2.5 Imaging .......................................................................................... 37
2.5.1 Scanning electron microscopy (SEM) ...................................... 37
2.6 Data analysis ................................................................................. 37
3 THE ANTIMICROBIAL ACTIVITY OF ESSENTIAL OILS ................... 41
3.1 Introduction .................................................................................... 41
3.1.1 Chapter progression ................................................................. 42
3.2 Methods ......................................................................................... 43
3.2.1 Test organisms and standardisation of overnight cultures ....... 43
3.2.2 Effect of dimethyl sulfoxide (DMSO) on bacterial growth ......... 44
3.2.3 Headspace analysis of E. coli in DMSO by selected-ion flow-tube mass spectrometer (SIFT-MS) .............................................................. 44
3.2.4 Quantification of metabolites produced by E. coli in presence of DMSO using SIFT-MS .......................................................................... 45
3.2.4.1 Influence of DMSO on antimicrobial testing ....................... 46
3.2.5 Essential oils ............................................................................ 47
3.2.6 Disc diffusion assay .................................................................. 47
3.2.7 Determination of minimum inhibitory concentration (MIC) and minimum bactericidal concentration (MBC) .......................................... 47
3.2.8 Gas chromatography mass spectrometry (GC-MS) analysis ... 48
3.2.9 Time-kill assay.......................................................................... 49
3.2.10 Metabolic activity assay ............................................................ 50
3.2.11 Scanning electron microscopy (SEM) ...................................... 51
3.2.12 Release of nucleic acids and proteins ...................................... 51
3.2.13 Data analysis ............................................................................ 52
3.3 Results ........................................................................................... 52
vi
3.3.1 Effect of dimethyl sulfoxide (DMSO) on bacterial growth ......... 52
3.3.2 Headspace analysis of E. coli in DMSO by selected-ion flow-tube mass spectrometry (SIFT-MS) .............................................................. 52
3.3.3 Quantification of metabolites produced by E. coli in presence of DMSO using SIFT-MS .......................................................................... 53
3.3.4 Influence of DMSO on antimicrobial testing ............................. 57
3.3.5 Disc diffusion assay .................................................................. 57
3.3.6 Determination of minimum inhibitory concentration (MIC) and minimum bactericidal concentration (MBC) .......................................... 58
3.3.7 Gas chromatography mass spectrometry (GC-MS) analysis ... 62
3.3.8 Time-kill assay.......................................................................... 62
3.3.9 Metabolic activity assay ............................................................ 65
3.3.10 Scanning electron microscopy (SEM) ...................................... 65
3.3.11 Release of nucleic acids and proteins ...................................... 71
3.4 Discussion ..................................................................................... 73
4 GROWTH OF BACTERIAL BIOFILMS AND TREATMENT OF
PSEUDOMONAS AERUGINOSA BIOFILMS WITH CINNAMON BARK EO
IN LIQUID PHASE ....................................................................................... 84
4.1 Introduction .................................................................................... 84
4.1.1 Chapter progression ................................................................. 85
4.2 Methods ......................................................................................... 86
4.2.1 Crystal violet (CV) biofilm assay ............................................... 86
4.2.2 Minimum biofilm inhibition concentration (MBIC) ..................... 86
4.2.3 Minimum biofilm eradication concentration (MBEC) ................. 87
4.2.4 Growth of P. aeruginosa biofilms in the Centre for Disease Control biofilm reactor (CBR) ............................................................................ 88
4.2.5 Essential oil .............................................................................. 88
4.2.6 Direct treatment of biofilms grown in CBR ................................ 88
4.2.7 Data analysis ............................................................................ 89
4.3 Results ........................................................................................... 91
4.3.1 CV biofilm assay....................................................................... 91
4.3.2 MBIC and MBEC ...................................................................... 92
4.3.3 Direct treatment of biofilms on polycarbonate (PC) .................. 94
4.3.4 Direct treatment of biofilms on stainless steel (SS) .................. 95
4.4 Discussion ................................................................................... 100
vii
5 VAPOUR CHAMBER DEVELOPMENT AND TREATMENT OF
PSEUDOMONAS AERUGINOSA BIOFILMS WITH CINNAMON BARK
ESSENTIAL OIL VAPOUR........................................................................ 111
5.1 Introduction .................................................................................. 111
5.1.1 Chapter progression ............................................................... 113
5.2 Methods ....................................................................................... 113
5.2.1 Growth of P. aeruginosa biofilms in the Centre for Disease Control biofilm reactor (CBR) .......................................................................... 113
5.2.2 Vapour chamber development and biofilm treatment ............. 114
5.2.3 Further vapour treatment ........................................................ 118
5.2.4 Assessment of tolerance ........................................................ 118
5.3 Results ......................................................................................... 119
5.3.1 Effect of coupon position in vapour chamber ......................... 119
5.3.2 Further vapour treatment of Pseudomonas biofilms ............... 121
5.3.3 Assessment of tolerance in Pseudomonas biofilms ............... 125
5.4 Discussion ................................................................................... 127
6 SELECTED ION FLOW TUBE MASS SPECTROMETRY (SIFT-MS)
ANALYSIS OF CINNAMON EO VAPOUR AND EFFECTS OF CINNAMON
EO COMPONENTS ALONE AND IN COMBINATION .............................. 137
6.1 Introduction .................................................................................. 137
6.1.1 Chapter progression ............................................................... 139
6.2 Methods ....................................................................................... 139
6.2.1 Vapour chamber headspace analysis .................................... 139
6.2.2 Minimum inhibitory concentration (MIC) and minimum bactericidal concentration (MBC) of cinnamon bark essential oil components ...... 140
6.2.3 Data analysis .......................................................................... 142
6.3 Results ......................................................................................... 142
6.3.1 SIFT-MS analysis of vapour chamber headspace .................. 142
6.3.2 MIC and MBC of liquid components ....................................... 149
6.4 Discussion ................................................................................... 151
7 DISINFECTANT POTENTIAL OF CINNAMON BARK ESSENTIAL OIL
............................................................................................................ 161
7.1 Introduction .................................................................................. 161
viii
7.1.1 Chapter progression ............................................................... 163
7.2 Methods ....................................................................................... 163
7.2.1 Media and reagents ................................................................ 163
7.2.1.1 Diluent ............................................................................. 163
7.2.1.2 Disinfectant product ......................................................... 164
7.2.1.3 Interfering substance ....................................................... 164
7.2.1.4 Neutraliser ....................................................................... 164
7.2.2 Test organisms and culture preparation ................................. 164
7.2.2.1 Preparation of working culture ......................................... 165
7.2.2.2 Test suspension ............................................................... 165
7.2.2.3 Validation suspension ...................................................... 165
7.2.3 Neutraliser validation .............................................................. 165
7.2.3.1 Neutraliser toxicity ........................................................... 166
7.2.3.2 Neutraliser quenching ...................................................... 166
7.2.4 Suspension testing ................................................................. 167
7.2.5 Extended contact suspension testing ..................................... 167
7.2.6 Data analysis .......................................................................... 168
7.3 Results ......................................................................................... 168
7.3.1 Neutraliser toxicity .................................................................. 168
7.3.2 Neutraliser quenching ............................................................ 168
7.3.3 Suspension testing ................................................................. 170
7.3.4 Extended contact suspension testing ..................................... 172
7.4 Discussion ................................................................................... 174
8 DISCUSSION AND FURTHER WORK .............................................. 181
REFERENCES .......................................................................................... 189
APPENDIX 1 – PUBLICATIONS ............................................................... 231
ix
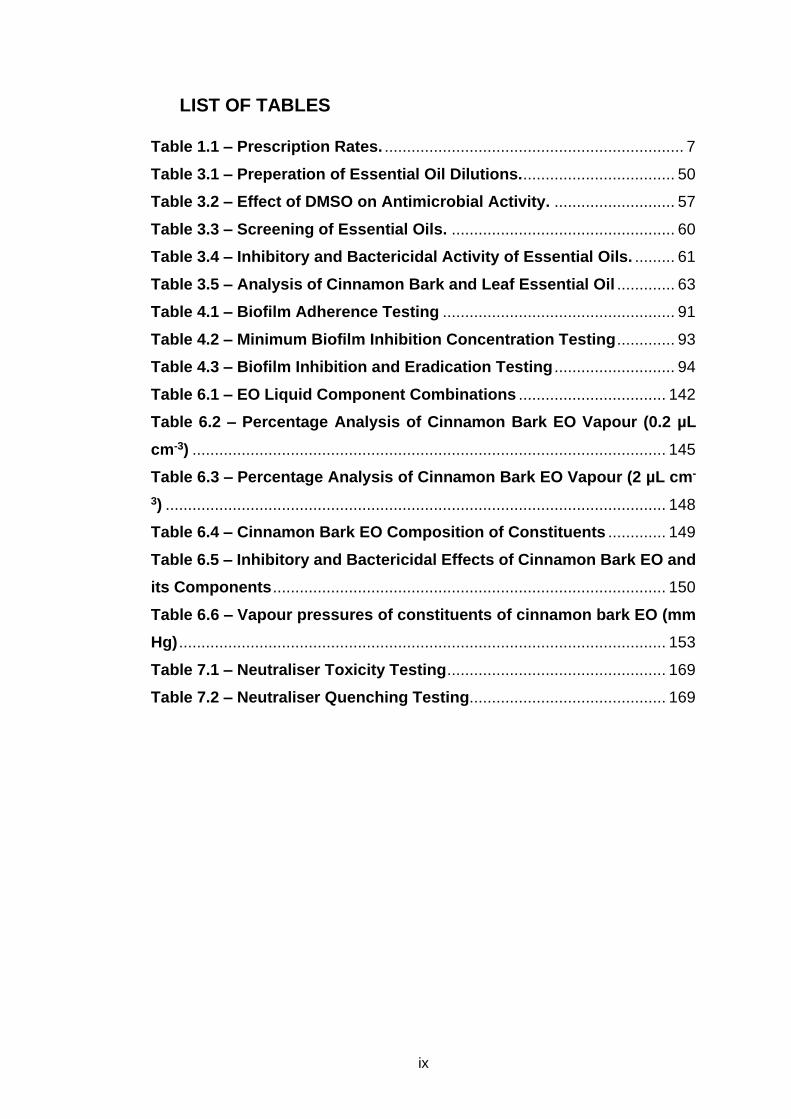
LIST OF TABLES
Table 1.1 – Prescription Rates. ................................................................... 7
Table 3.1 – Preperation of Essential Oil Dilutions. .................................. 50
Table 3.2 – Effect of DMSO on Antimicrobial Activity. ........................... 57
Table 3.3 – Screening of Essential Oils. .................................................. 60
Table 3.4 – Inhibitory and Bactericidal Activity of Essential Oils. ......... 61
Table 3.5 – Analysis of Cinnamon Bark and Leaf Essential Oil ............. 63
Table 4.1 – Biofilm Adherence Testing .................................................... 91
Table 4.2 – Minimum Biofilm Inhibition Concentration Testing ............. 93
Table 4.3 – Biofilm Inhibition and Eradication Testing ........................... 94
Table 6.1 – EO Liquid Component Combinations ................................. 142
Table 6.2 – Percentage Analysis of Cinnamon Bark EO Vapour (0.2 µL
cm-3) .......................................................................................................... 145
Table 6.3 – Percentage Analysis of Cinnamon Bark EO Vapour (2 µL cm-
3) ................................................................................................................ 148
Table 6.4 – Cinnamon Bark EO Composition of Constituents ............. 149
Table 6.5 – Inhibitory and Bactericidal Effects of Cinnamon Bark EO and
its Components ........................................................................................ 150
Table 6.6 – Vapour pressures of constituents of cinnamon bark EO (mm
Hg) ............................................................................................................. 153
Table 7.1 – Neutraliser Toxicity Testing ................................................. 169
Table 7.2 – Neutraliser Quenching Testing............................................ 169
x
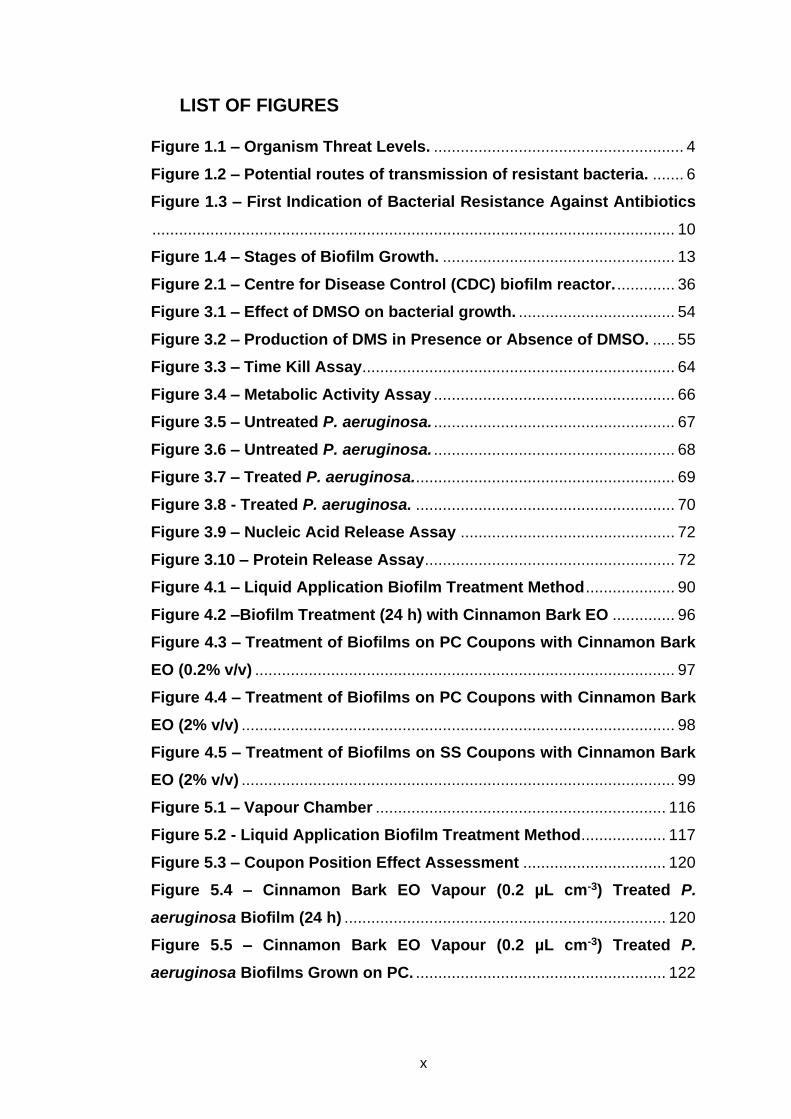
LIST OF FIGURES
Figure 1.1 – Organism Threat Levels. ........................................................ 4
Figure 1.2 – Potential routes of transmission of resistant bacteria. ....... 6
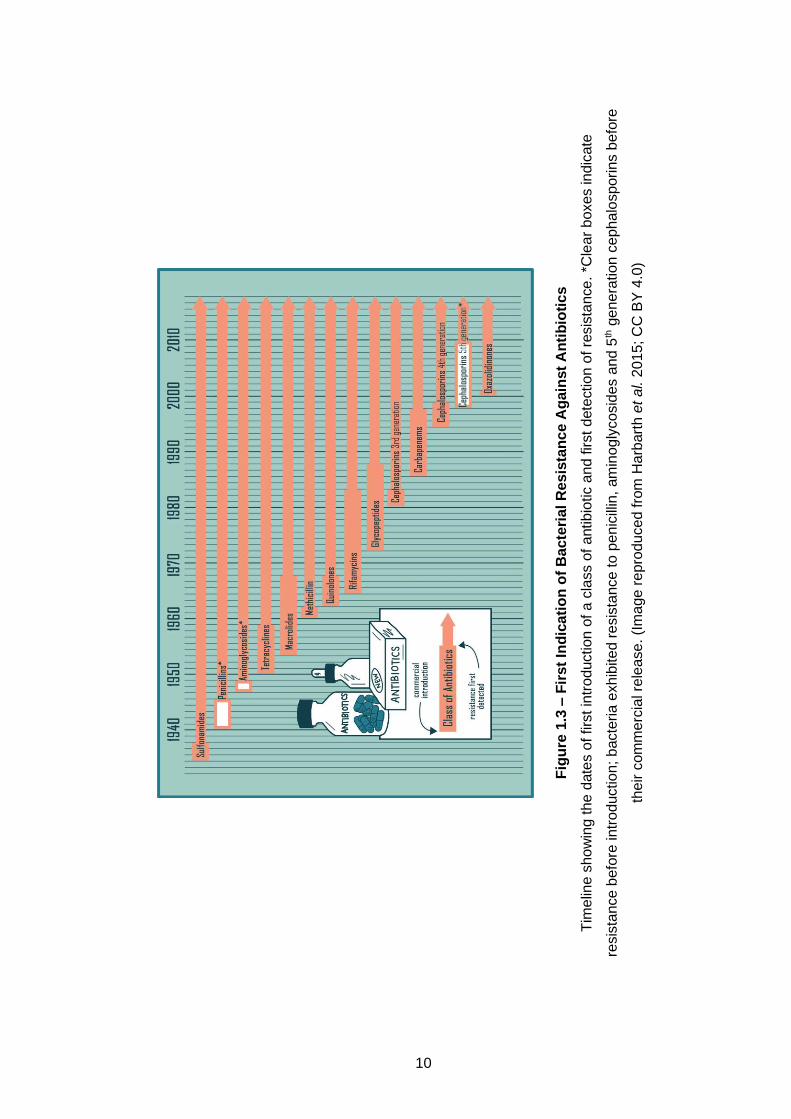
Figure 1.3 – First Indication of Bacterial Resistance Against Antibiotics
..................................................................................................................... 10
Figure 1.4 – Stages of Biofilm Growth. .................................................... 13
Figure 2.1 – Centre for Disease Control (CDC) biofilm reactor. ............. 36
Figure 3.1 – Effect of DMSO on bacterial growth. ................................... 54
Figure 3.2 – Production of DMS in Presence or Absence of DMSO. ..... 55
Figure 3.3 – Time Kill Assay ...................................................................... 64
Figure 3.4 – Metabolic Activity Assay ...................................................... 66
Figure 3.5 – Untreated P. aeruginosa. ...................................................... 67
Figure 3.6 – Untreated P. aeruginosa. ...................................................... 68
Figure 3.7 – Treated P. aeruginosa. .......................................................... 69
Figure 3.8 - Treated P. aeruginosa. .......................................................... 70
Figure 3.9 – Nucleic Acid Release Assay ................................................ 72
Figure 3.10 – Protein Release Assay ........................................................ 72
Figure 4.1 – Liquid Application Biofilm Treatment Method .................... 90
Figure 4.2 –Biofilm Treatment (24 h) with Cinnamon Bark EO .............. 96
Figure 4.3 – Treatment of Biofilms on PC Coupons with Cinnamon Bark
EO (0.2% v/v) .............................................................................................. 97
Figure 4.4 – Treatment of Biofilms on PC Coupons with Cinnamon Bark
EO (2% v/v) ................................................................................................. 98
Figure 4.5 – Treatment of Biofilms on SS Coupons with Cinnamon Bark
EO (2% v/v) ................................................................................................. 99
Figure 5.1 – Vapour Chamber ................................................................. 116
Figure 5.2 - Liquid Application Biofilm Treatment Method................... 117
Figure 5.3 – Coupon Position Effect Assessment ................................ 120
Figure 5.4 – Cinnamon Bark EO Vapour (0.2 µL cm-3) Treated P.
aeruginosa Biofilm (24 h) ........................................................................ 120
Figure 5.5 – Cinnamon Bark EO Vapour (0.2 µL cm-3) Treated P.
aeruginosa Biofilms Grown on PC. ........................................................ 122
xi
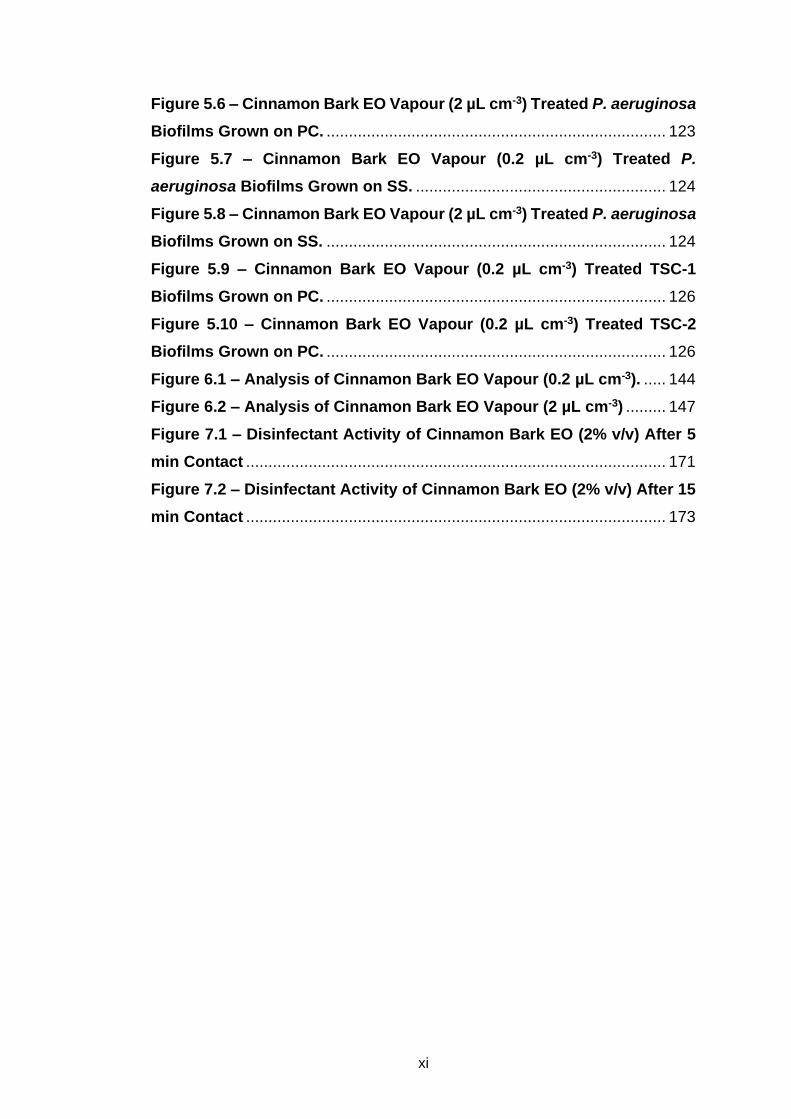
Figure 5.6 – Cinnamon Bark EO Vapour (2 µL cm-3) Treated P. aeruginosa
Biofilms Grown on PC. ............................................................................ 123
Figure 5.7 – Cinnamon Bark EO Vapour (0.2 µL cm-3) Treated P.
aeruginosa Biofilms Grown on SS. ........................................................ 124
Figure 5.8 – Cinnamon Bark EO Vapour (2 µL cm-3) Treated P. aeruginosa
Biofilms Grown on SS. ............................................................................ 124
Figure 5.9 – Cinnamon Bark EO Vapour (0.2 µL cm-3) Treated TSC-1
Biofilms Grown on PC. ............................................................................ 126
Figure 5.10 – Cinnamon Bark EO Vapour (0.2 µL cm-3) Treated TSC-2
Biofilms Grown on PC. ............................................................................ 126
Figure 6.1 – Analysis of Cinnamon Bark EO Vapour (0.2 µL cm-3). ..... 144
Figure 6.2 – Analysis of Cinnamon Bark EO Vapour (2 µL cm-3) ......... 147
Figure 7.1 – Disinfectant Activity of Cinnamon Bark EO (2% v/v) After 5
min Contact .............................................................................................. 171
Figure 7.2 – Disinfectant Activity of Cinnamon Bark EO (2% v/v) After 15
min Contact .............................................................................................. 173
xii
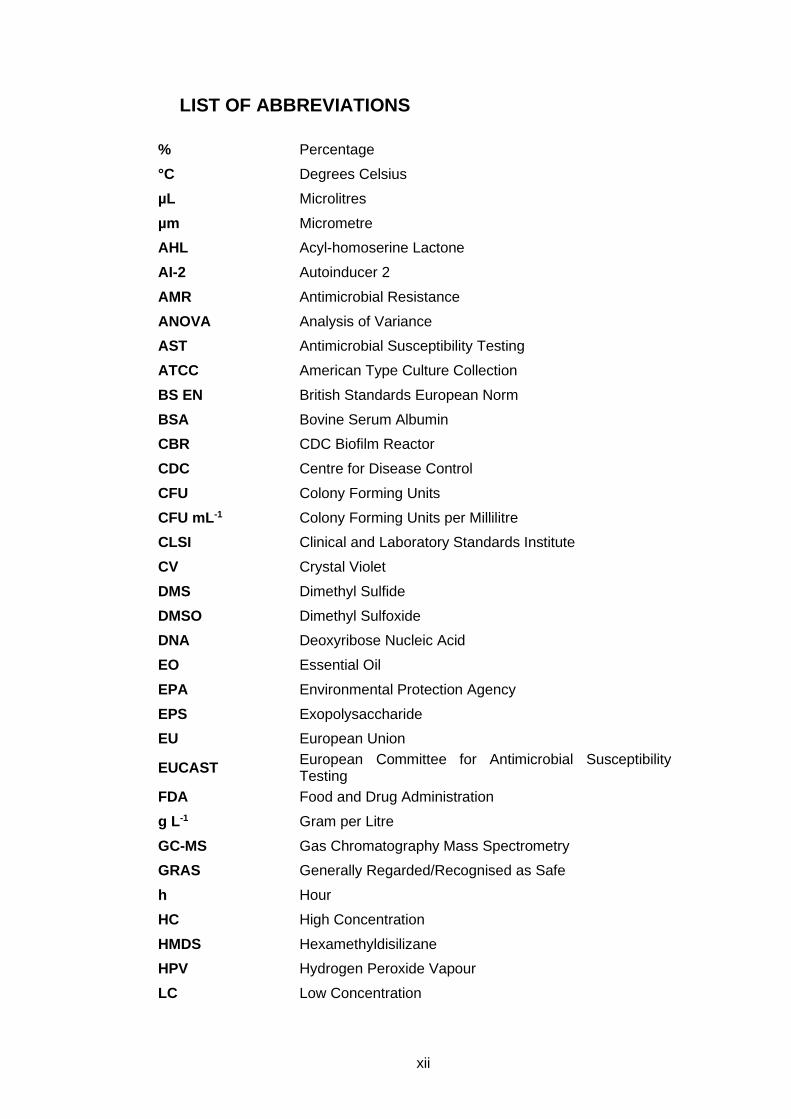
LIST OF ABBREVIATIONS
% Percentage
°C Degrees Celsius
µL Microlitres
µm Micrometre
AHL Acyl-homoserine Lactone
AI-2 Autoinducer 2
AMR Antimicrobial Resistance
ANOVA Analysis of Variance
AST Antimicrobial Susceptibility Testing
ATCC American Type Culture Collection
BS EN British Standards European Norm
BSA Bovine Serum Albumin
CBR CDC Biofilm Reactor
CDC Centre for Disease Control
CFU Colony Forming Units
CFU mL-1 Colony Forming Units per Millilitre
CLSI Clinical and Laboratory Standards Institute
CV Crystal Violet
DMS Dimethyl Sulfide
DMSO Dimethyl Sulfoxide
DNA Deoxyribose Nucleic Acid
EO Essential Oil
EPA Environmental Protection Agency
EPS Exopolysaccharide
EU European Union
EUCAST European Committee for Antimicrobial Susceptibility Testing
FDA Food and Drug Administration
g L-1 Gram per Litre
GC-MS Gas Chromatography Mass Spectrometry
GRAS Generally Regarded/Recognised as Safe
h Hour
HC High Concentration
HMDS Hexamethyldisilizane
HPV Hydrogen Peroxide Vapour
LC Low Concentration
xiii
log Logarithmic
m/z Mass to Charge Ratio
MBC Minimum Bactericidal Concentration
MBEC Minimum Biofilm Eradication Concentration
MBIC Minimum Biofilm Inhibition Concentration
MDR Multidrug Resistance
MHA Mueller Hinton Agar
MIC Minimum Inhibitory Concentration
min Minute
mL Millilitre
mmHg Millimetre of Mercury
MRSA Methicillin Resistant Staphylococcus aureus
MSSA Methicillin Susceptible Staphylococcus aureus
NA Nutrient Agar
NCTC National Collection of Type Cultures
nm Nanometre
OD Optical Density
P Probability
PBS Phosphate Buffered Saline
PC Polycarbonate
QS Quorum Sensing
SEM Scanning Electron Microscopy
SIFT-MS Select Ion Flow Tube Mass Spectrometry
SPME Solid Phase Microextraction
SS Stainless Steel
TSA Tryptone Soy Agar
TSB Tryptone Soy Broth
TSC-1 Tolerance Subculture 1
TSC-2 Tolerance Subculture 2
UHMW Ultra-High Molecular Weight
v/v Volume per Volume
VOC Volatile Organic Compounds
w:w Weight to Weight
WEDD Wet Effluent Diffusion Denuder

1
CHAPTER 1

3
1 INTRODUCTION
1.1 Antimicrobial resistance (AMR)
1.1.1 Origin and impact
In 1929, Sir Alexander Fleming demonstrated the potential antimicrobial use
of penicillin. In 1943, penicillin was introduced for therapeutic use (Ventola
2015) and by the late 1940s, many antibiotics became commercially available,
becoming crucial in combating previously untreatable infections and diseases
(Debabov 2013). However, Fleming proposed that inappropriate use of
penicillin might cause Staphylococcus aureus to mutate, leading to more
severe infections and the transmission of these resistant strains from host to
host, thus predicting AMR (Rosenblatt-Farrell 2009). Even before the
introduction of penicillin in 1943, in 1940, resistance to this drug was already
demonstrated (Ventola 2015). Thus, in agreement with the evidence, and true
to Fleming’s warnings, within one year of widespread use, substantial numbers
of staphylococcal strains were exhibiting resistance to penicillin (Lobanovska
and Pilla 2017). A few years later, over 50% of S. aureus species were no
longer susceptible (Alanis 2005).
Approximately 100,000 tons of antibiotics are produced globally per year
(Martens and Demain 2017), and for every 10 min passed, 2 tonnes of
antibiotics are used (Harbarth et al. 2015). Not only have bacteria developed
resistance but many strains have become resistant to multiple antibiotics and
chemotherapeutic agents, termed multi-drug resistance (MDR; Nikaido 2009).
MDR can be defined as non-susceptibility to at least one agent, in three or
more antimicrobial categories (Magiorakos et al. 2012). The Centre for
4
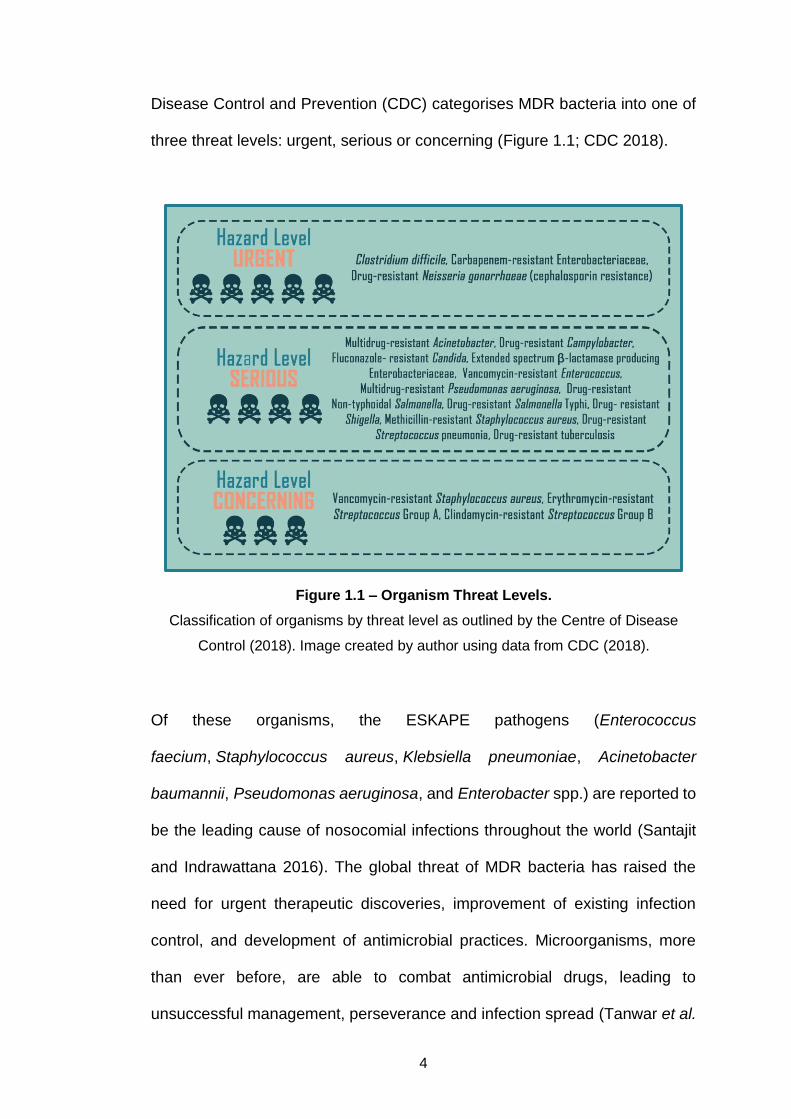
Disease Control and Prevention (CDC) categorises MDR bacteria into one of
three threat levels: urgent, serious or concerning (Figure 1.1; CDC 2018).
Of these organisms, the ESKAPE pathogens (Enterococcus
faecium, Staphylococcus aureus, Klebsiella pneumoniae, Acinetobacter
baumannii, Pseudomonas aeruginosa, and Enterobacter spp.) are reported to
be the leading cause of nosocomial infections throughout the world (Santajit
and Indrawattana 2016). The global threat of MDR bacteria has raised the
need for urgent therapeutic discoveries, improvement of existing infection
control, and development of antimicrobial practices. Microorganisms, more
than ever before, are able to combat antimicrobial drugs, leading to
unsuccessful management, perseverance and infection spread (Tanwar et al.
Figure 1.1 – Organism Threat Levels.
Classification of organisms by threat level as outlined by the Centre of Disease
Control (2018). Image created by author using data from CDC (2018).
5
2014). Within the EU, MDR infections are responsible for approximately
25,000 patient deaths per year, with over 63,000 patient deaths per year in the
United States caused by hospital-acquired bacterial infections (Aminov 2010).
MDR bacterial infections result in extra healthcare costs and productivity
losses costing the EU at least 1.5 billion euros each year (Department of
Health 2016). Deaths attributable to AMR are expected to reach 10 million per
year by 2050, which would overtake cancer as the leading cause of death
(O’Neill 2014).
1.1.2 Drivers of resistance
One of the biggest drivers of AMR is the overuse and abuse of antibiotics.
Their abundant consumption since introduction and inappropriate distribution
has played a massive role in AMR (Ventola 2015). The substantial use of
antibiotics in agriculture and aquaculture, for growth promotion and reduction
of disease, (Prestinaci et al. 2015), and the lack of funding and budgets within
healthcare for new effective antibiotics to be available commercially (Levy and
Bonnie 2004), also contribute to AMR. However, though antibiotic misuse is a
primary driver for AMR, it is not the only culprit. Biocides, metals and naturally
occurring resistance genetics all play a role in increased AMR (Singer et al.
2016). Biocides such as ethanol, formaldehyde, chlorhexidine,
triclosan, and quaternary ammonium compounds, and metals which originate
from drainage water, household effluent and traffic related emissions both
contribute to the co-selection of genes that promote resistance (Singer et al.
2016). Resistance transmission routes are distributed throughout our
6
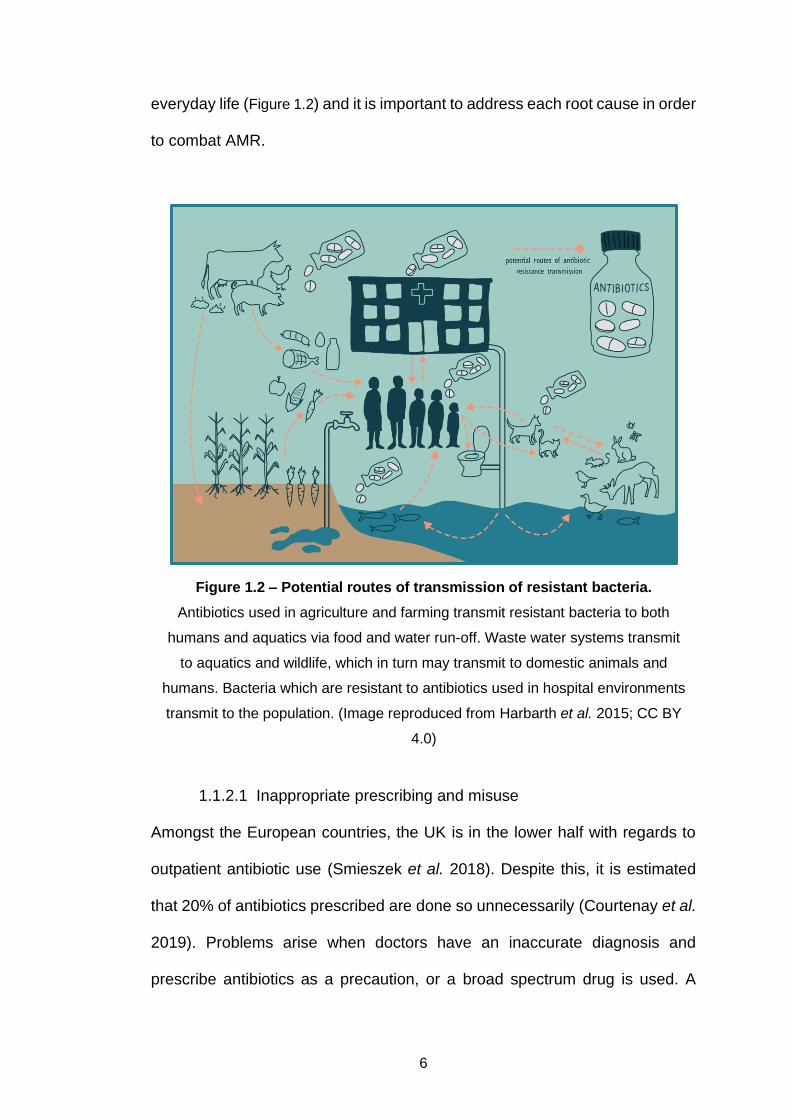
everyday life (Figure 1.2) and it is important to address each root cause in order
to combat AMR.
1.1.2.1 Inappropriate prescribing and misuse
Amongst the European countries, the UK is in the lower half with regards to
outpatient antibiotic use (Smieszek et al. 2018). Despite this, it is estimated
that 20% of antibiotics prescribed are done so unnecessarily (Courtenay et al.
2019). Problems arise when doctors have an inaccurate diagnosis and
prescribe antibiotics as a precaution, or a broad spectrum drug is used. A
Figure 1.2 – Potential routes of transmission of resistant bacteria.
Antibiotics used in agriculture and farming transmit resistant bacteria to both
humans and aquatics via food and water run-off. Waste water systems transmit
to aquatics and wildlife, which in turn may transmit to domestic animals and
humans. Bacteria which are resistant to antibiotics used in hospital environments
transmit to the population. (Image reproduced from Harbarth et al. 2015; CC BY
4.0)
7
recent report by Public Health England revealed that the majority of
prescriptions given for antibiotics were for respiratory or urinary tract
infections, although nearly a third of these gave no clinical reasoning (Public
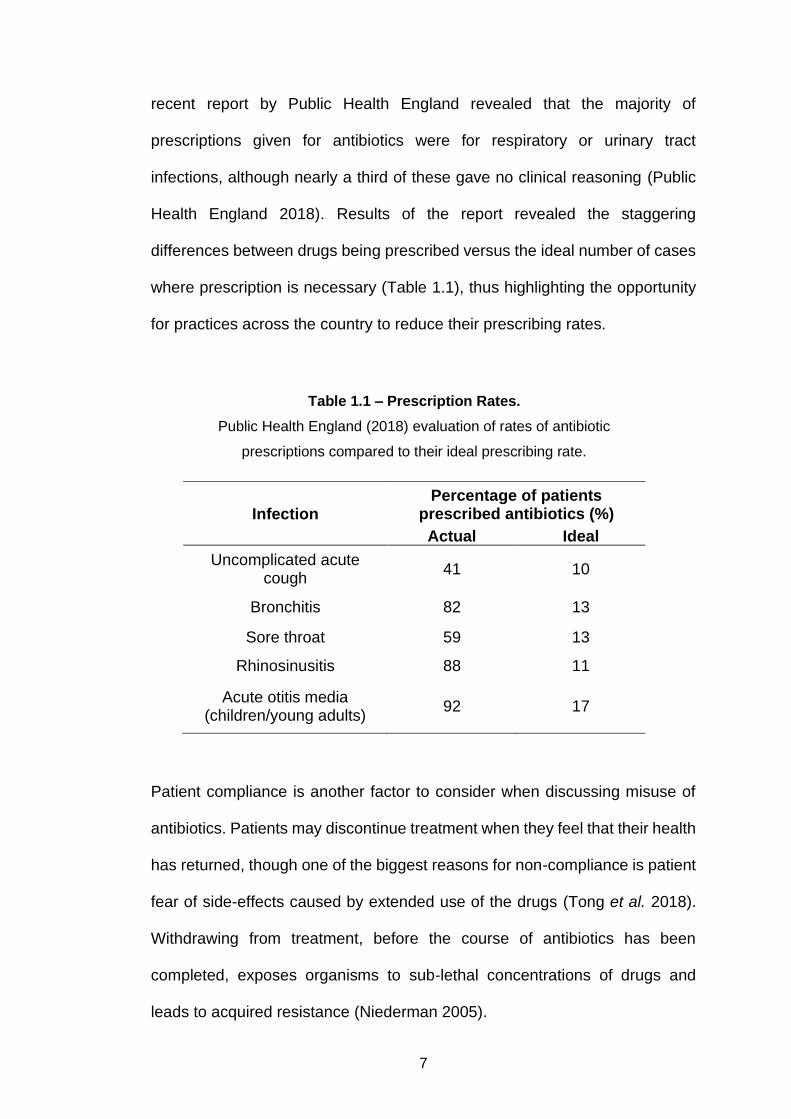
Health England 2018). Results of the report revealed the staggering
differences between drugs being prescribed versus the ideal number of cases
where prescription is necessary (Table 1.1), thus highlighting the opportunity
for practices across the country to reduce their prescribing rates.
Patient compliance is another factor to consider when discussing misuse of
antibiotics. Patients may discontinue treatment when they feel that their health
has returned, though one of the biggest reasons for non-compliance is patient
fear of side-effects caused by extended use of the drugs (Tong et al. 2018).
Withdrawing from treatment, before the course of antibiotics has been
completed, exposes organisms to sub-lethal concentrations of drugs and
leads to acquired resistance (Niederman 2005).
Table 1.1 – Prescription Rates.
Public Health England (2018) evaluation of rates of antibiotic
prescriptions compared to their ideal prescribing rate.
Infection Percentage of patients
prescribed antibiotics (%)
Actual Ideal
Uncomplicated acute cough
41 10
Bronchitis 82 13
Sore throat 59 13
Rhinosinusitis 88 11
Acute otitis media (children/young adults)
92 17
8
Another recognised factor to consider is the lack of regulatory and legislative
controls in many countries, which would normally govern the distribution of
antimicrobials (Michael et al. 2014). In developing countries, where healthcare
is not provided universally, antibiotics are often uncontrolled, with regulatory
guidelines varying from country to country (Zaman et al. 2017). Self-
medicating with antibiotics is a regular occurrence in developing countries
where prescriptions are not necessary and supply chains are not controlled
(Ayukekbong et al. 2017)
1.1.2.2 Extensive agricultural use
The majority of antimicrobials used in agriculture are similar, if not identical, to
those used clinically in the human population, and the food-chain is reported
to be the primary route of transmission of AMR organisms (Zaman et al. 2017).
Antibiotics used at sub-lethal doses are used in agriculture, farming, fisheries
and crops to treat infections, prevent disease and promote growth. In animals
this leads to gut microflora developing high resistance and becoming a
reservoir of AMR organisms (Gupta and Deka 2018). Although the use of
growth promoter antibiotics has been banned in Europe since 2006 (Prestinaci
et al. 2015), the US are only more recently following suit. In contrast to this,
places like China, India, Pakistan and Egypt, are showing an inflation in
antibiotic use in animals (Anomaly 2019).
1.1.2.3 Availability of few new antimicrobials
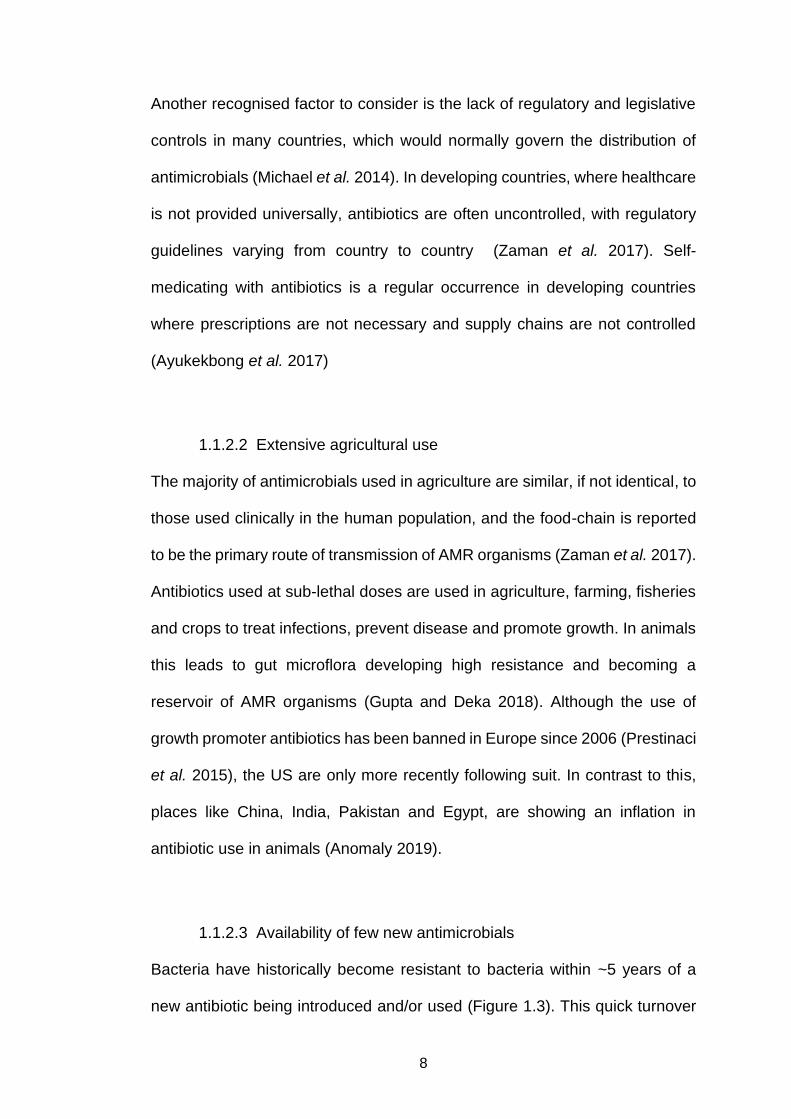
Bacteria have historically become resistant to bacteria within ~5 years of a
new antibiotic being introduced and/or used (Figure 1.3). This quick turnover
9
of new antibiotics has been detrimental to our repertoire of effective drugs.
This, in combination with the lack of novel antimicrobials reaching end stage,
often due to a lack of funding or incentive, is another driver of resistance. The
sheer nature of antibiotic consumption, which is usually a short-course
treatment, is not usually motivation for drug companies to develop these drugs
which will not bring them much revenue in the long term (Gould and Bal 2013).
Furthermore, many of the drugs used are mass produced at low prices,
therefore many drug companies are apprehensive to invest in new drugs as
they fear they will incur million dollar losses (Ventola 2015). The Food and
Drug Administration (FDA) have regulatory strategies in place, aimed at fast-
tracking the development of novel antimicrobials in their later stages of
research, though these often overlook the smaller companies who lack the
funds to reach the later stages of research required to benefit (Simpkin et al.
2017).
10
Fig
ure
1.3
– F
irs
t In
dic
ati
on
of
Ba
cte
ria
l R
esis
tan
ce A
gain
st
An
tib
ioti
cs
Tim
elin
e s
how
ing t
he d
ate
s o
f firs
t in
troduction o
f a c
lass o
f antibio
tic a
nd first
dete
ction o
f re
sis
tance.
*Cle
ar
boxes indic
ate
resis
tance b
efo
re intr
oductio
n;
bacte
ria
exh
ibite
d r
esis
tance
to
pe
nic
illin
, am
inog
lyco
sid
es a
nd
5th g
ene
ratio
n c
eph
alo
sporin
s b
efo
re
their c
om
me
rcia
l re
lease
. (I
ma
ge
re
pro
du
ced fro
m H
arb
art
h e
t a
l. 2
015; C
C B
Y 4
.0)
11
1.1.3 Bacterial mechanisms of resistance
Resistance relies on two factors: the antimicrobial which is effective against
susceptible organisms and selects resistant ones; and the resistance
mechanisms present in the organism selected by the drug (Levy and Bonnie
2004). Resistance emerges when these two factors come together. There are
many described mechanisms of resistance, and unfortunately no antibiotic has
avoided one (Bonomo and Rossolini 2008). The basis of AMR can be
simplified to fall into two categories: genetic or mechanistic (Munita and Arias
2016), but often these two categories overlap and/or influence each other.
Genetic resistance can be intrinsic or acquired. Intrinsic mechanisms are
already present in the genetic composition of bacteria, whereas acquired
resistance is usually obtained by horizontal gene transfer via plasmids,
bacteriophage, naked DNA, transposons or integrons (Levy and Bonnie 2004,
Peterson and Kaur 2018). Intrinsic mechanisms include generic efflux pumps
capable of pumping antimicrobials out of the cell, inactivation enzymes
capable of incapacitating the drug, and permeability barriers that will prevent
the penetration of drugs (Fajardo et al. 2008, Blair et al. 2015). Acquired
mechanisms include plasmid encoded efflux and enzymes for modification of
drugs (Peterson and Kaur 2018). Bacteria can also use alternative metabolic
pathways to those targeted by the drug (Tenover 2006), can prevent binding
of drugs via target modification (Miller 2016), or over-express the target
enzyme to negate the inhibitory effects of the antibiotic (Palmer and Kishony
2014). Another bacterial mechanism of resistance that should be considered
is the ability to form a biofilm, and its resistance can be attributed to physical,
physiological and genetic mechanisms (Ciofu and Tolker-Nielsen 2019).
12
1.1.4 Biofilms
It was once believed that bacteria only acted singularly in a planktonic state,
but it is now understood that this is not the case. Biofilms are dense
populations of bacteria, which are irreversibly attached to a surface, and
protected by a robust exopolymeric matrix. Biofilm formation is often thought
to be the primary underlying cause for the failure of an antimicrobial agent,
with 65-80% of all infections believed to be biofilm-related (Coenye and Nelis
2010). Cells existing as a biofilm often have an increased resistance to
microbial agents of up to 10–1000 times (Mah and O’Toole 2001).
Bacteria instigate biofilm formation and communicate via quorum sensing
(Gerdt and Blackwell 2014). It is described as an intercellular chemical
signalling mechanism that is used by bacteria to monitor cell population and
density. Biofilms are cell density dependent and require sufficient quantities to
induce QS signal accumulation and thus QS gene expression. Many of these
genes activated by QS are group beneficial and aid in the secretion of
proteases, siderophores and toxins (Gerdt and Blackwell 2014).
1.1.5 Biofilm formation
The formation and survival of biofilms can be broken down into several steps,
usually attachment, growth, maturation and detachment (Figure 1.4; O’Toole
2003). Initial attachment relies on many factors for success, growth and
maturation. Biofilms need a continued supply of nutrients, flow of waste and
efficient communication within the biofilm, and effective survival requires the
detachment of cells to begin the cycle again. Furthermore, naturally occurring
biofilms will often consist of a mixed-species arrangement (Kommerein et al.
13
2018). This interspecies arrangement involves communication (QS),
metabolic cooperation, and interactions can be competitive or synergistic
(Elias and Banin 2012).
1.1.5.1 Attachment
Initial attachment relies on a surface, which would ideally be hydrophobic with
nano or micro-scale roughness, and triggers physiochemical bacterial surface
detection factors which administrate adherence (Cortés et al. 2011). Almost
all natural surfaces have an overall negative charge, which primarily acts
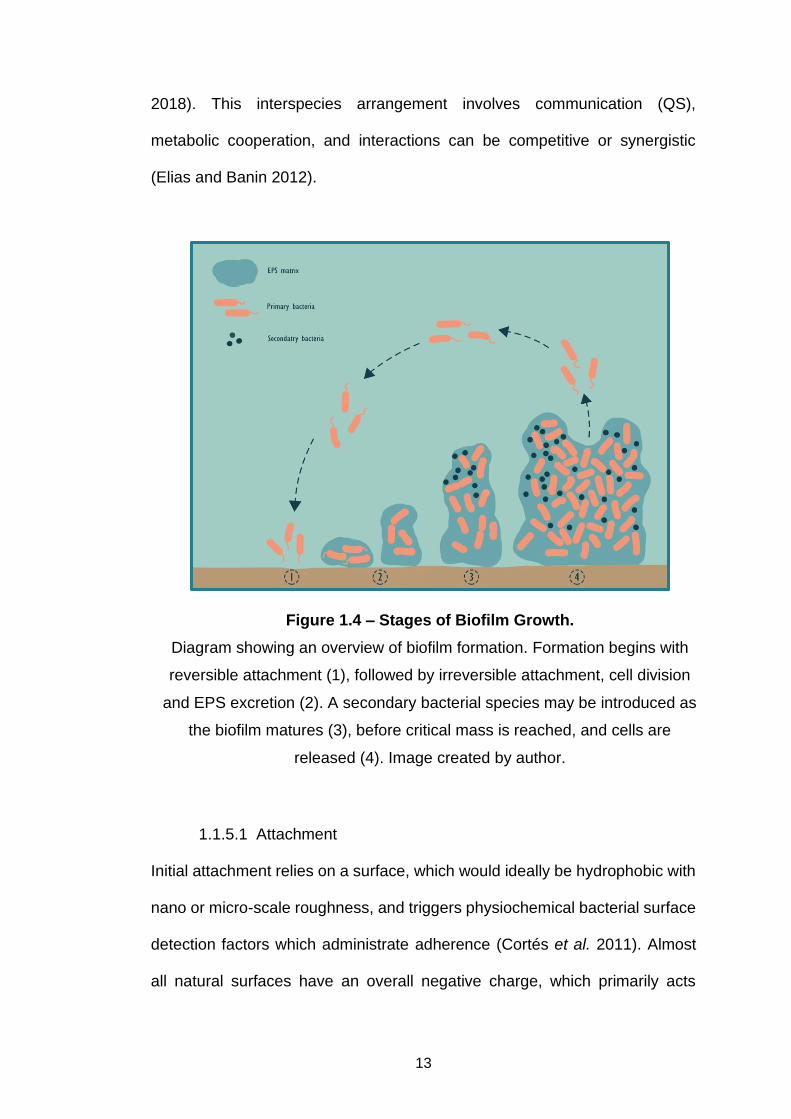
Figure 1.4 – Stages of Biofilm Growth.
Diagram showing an overview of biofilm formation. Formation begins with
reversible attachment (1), followed by irreversible attachment, cell division
and EPS excretion (2). A secondary bacterial species may be introduced as
the biofilm matures (3), before critical mass is reached, and cells are
released (4). Image created by author.
14
repulsively towards the electrostatic charges in bacterial adhesion, thus
adherence must overcome this using attractive Lifshitz-van der Waals, Lewis
acid-base, hydrophobic, and other specific interaction forces (Van Merode et
al. 2006). Bacteria can be transported to a surface via Brownian motion,
specific gravity sedimentation or convective transport in a bulk fluid (Palmer et
al. 2007). Initial formation begins with polar attachment of planktonic bacteria
which at this stage is reversible, followed by movement of cells to align
themselves flat to the surface and resist attempts of removal (Armbruster and
Parsek 2018). In cases where bacteria possess flagella for motility, repression
of the flagellum is often initiated after attachment, mediated by the cytoplasmic
signalling molecule cyclic diguanylate, and supporting the formation of a non-
motile aggregation of cells (Guttenplan and Kearns 2013). Irreversible cell
attachment involves robust cell to cell organisation with binding proteins,
hydrolysation of cell adhesion molecules by enzymes and protein adsorption
(Pavithra and Doble 2008). Furthermore, all of the above mentioned processes
are influenced by flow, carbon and oxygen levels, pH, nutrient availability and
temperature (O’Toole et al. 2000, Toyofuku et al. 2016). Once bacteria have
overcome this process of biofilm formation, growth and maturation can begin.
1.1.5.2 Growth and maturation
Increased quorum sensing, development of micro-colonies and the formation
of extracellular polymeric covering mark the beginnings of biofilm growth,
which eventually leads to a 3-dimensional structure of cell clusters (Toyofuku
et al. 2016, Arunasri and Mohan 2019). Cells in micro-colonies begin to
actively replicate by cell division (Toyofuku et al. 2016), generating
15
extracellular components which form a glycoprotein and glycolipid covering,
following interaction with organic and inorganic materials surrounding them
(Dunne 2002). The polymer matrix, or exopolysaccharide matrix (EPS), can
be described as a gel like substance with high water content, which protects
microbial cells from desiccation, among other purposes (Carpentier 1993).
EPS are biopolymers consisting of polysaccharides, proteins, glycoproteins,
glycolipids and extracellular DNA (Flemming et al. 2007); it has channels that
facilitate the transportation of water, nutrients and removal of waste (Arunasri
and Mohan 2019); and its quantity varies throughout maturation, often
doubling in mass when reaching maturation (Jiao et al. 2010), but is also
dependent on environmental factors and the strain of bacteria forming the
biofilm (Harmsen et al. 2010). The structure of a mature biofilm largely
depends on location, constituent organisms and nutrient concentration, and its
structure can represent a homogeneous layer, dispersed micro-colonies, or
protruding cell clusters (Reisner et al. 2003).
When a high density of cells is reached, chemical signals which are recognised
by receptors within the same cells, known as autoinducers, are released.
These chemical signals were originally thought to be released as
siderophores, antibiotics, or as waste products (Hense and Schuster 2015).
Acyl-homoserine lactones (AHLs), oligopeptide autoinducers, and autoinducer
2 (AI-2; furanosyl borate diester) are all recognised autoinducer molecules that
have been found in bacteria (Hense and Schuster 2015). When the level of
autoinducers reaches a critical level, bacteria respond with repression or
expression of target genes (Wolska et al. 2016). Gene expression can benefit
the biofilm by increasing virulence, promoting genetic transfer, upregulating
16
biofilm EPS production, upregulating efflux pumps, and contributing to
resistance to stressors (Cortés et al. 2011, Butt and Khan 2015, Subhadra et
al. 2016). Once maturation is reached, cells become inactive and die due to
lack of nutrients, pH fluctuations, oxygen deprivation or poisoning by toxic
accumulations of waste (Dunne 2002). At this point, biofilms will initiate a
detachment and dispersal process to support survival.
1.1.5.3 Detachment and dispersal
Dispersal of a biofilm can occur after a number of processes take place. Cells
could cease synthesis of biofilm matrix compounds, active degradation of the
matrix could occur, or disruption of covalent bonds between matrix
components could all accomplish detachment and dispersal (Solano et al.
2014). Bacteria may leave a biofilm by either desorption, detachment or
dispersion, which are all classified as methods of “escape” (Davies 2011).
These mechanisms can also be classified into active or passive, where active
escape is initiated by the bacteria and passive escape is determined by
external forces such as collision forces, predation, fluid shear, and human
intervention (Kaplan 2010), formally known as abrasion, grazing, erosion, and
sloughing, respectively (Petrova et al. 2016). Active escape mechanisms are
usually induced by the selection pressures experienced by bacteria and the
inane strategy for survival (Davies 2011). Once the biofilm has reached a
critical mass, the outermost layer experiences dynamic equilibrium and
planktonic cells are generated (Dunne 2002). The release of cells from the
margins and outermost layers of a biofilm is the more commonly observed
method of escape detachment, although cells may escape from the interior of
17
the biofilm which is known as dispersion (Davies 2011). The cells released can
move freely, colonise surfaces and begin the cycle over again (Dunne 2002).
1.1.6 Biofilm tolerance
Biofilm tolerance to antimicrobials can be explained primarily by the failure of
the antimicrobial agent to penetrate the biofilm, largely due to the presence of
an EPS layer that is secreted when the biofilm is maturing (Butt and Khan
2015). This EPS acts as a preliminary barrier that will delay or completely
prevent penetration by antimicrobial agents, although studies have indicated
that this feature is often not alone in preventing infiltration (Mah and O’Toole
2001). Another cause is the slow growth rate. When biofilms are forming there
is inevitably nutritional limitation and this stressor causes biofilms to exhibit a
slower growth rate, which has been connected to an increased resistance as
the bacteria approach stationary phase (Evans et al. 1991). Wentland et al.
(1996) implemented a staining technique that was used to visualise the
different growth rates within a bacterial biofilm and found that slow growth was
apparent within the denser sections of biofilm, and bacteria exposed to the
bulk medium showed faster growth rate. Williamson et al. (2012) concluded
that cells deepest within a thick biofilm were in a viable, but antibiotic-tolerant,
slow growing state. The general stress response can also be a significant
indicator of increased resistance when in a biofilm. Stressors induce many
physiological changes which act to protect the cell from starvation, osmolarity
changes, pH shifts, heat shock or DNA damage (Hengge 2014).
18
1.2 Combatting AMR & current status
Directly addressing the drivers of resistance, as mentioned before, are the
steps necessary to combatting AMR. Improving education and knowledge on
AMR, global interventions to reduce the overuse and misuse of the antibiotics
we have, and investments and support to boost the search for novel or
alternative antimicrobials are just a few ways we can combat the crisis. Some
countries sought to combat the threat of AMR as early as the 1990s (Harbarth
et al. 2015), but it is not until more recently that other countries have joined
suit. The UK has had anti-AMR strategies in place since 2000 (Mayor 2019).
In 2014, David Cameron, Prime Minister of the United Kingdom, enlisted the
help of economics expert Jim O’Neill to evaluate the AMR situation (O’Neill
2014). In 2016, Barack Obama, president of the United States, nearly doubled
the US funding for combatting and preventing AMR, pledging to invest $1.2
billion (Obama White House 2015). The report put forward by Jim O’Neill
indicates 10 interventions that need to be carried out without delay, in order to
combat AMR. These 10 steps include: increasing global awareness of AMR
using campaigns and programmes; improving hygiene and sanitation to
prevent infection spread; reduce the use of antimicrobials in agriculture;
improve surveillance of resistance and antimicrobial consumption; renew
efforts to search for rapid diagnostic technology; use vaccines and alternatives
to antibiotics; improve incentives for working in the field of infectious diseases;
increased funding for non-commercial research; promote investments into
new drugs and improve existing ones; and generate a global alliance in
combatting AMR. In 2019, the UK published its most recent 5 year strategy to
combat AMR (HM Government 2019). Data from the previous 5 year plan,
19
spanning 2013-2018, demonstrate a 7% decrease in human antibiotic
consumption and a 40% decrease in sales of antibiotics for agriculture.
Despite the reduction in antibiotic sales, blood stream infections caused by
resistant organisms increased 35% over the 2013-2018 time frame (Courtenay
et al. 2019). The work within this thesis will primarily focus on the search for
alternative antimicrobials, specifically in those that are effective against
biofilms. Potential options for novel antimicrobials include the use of natural
compounds such as those derived from plants (essential oils, phenolics,
lectins and polyacetylenes), animals (lactoferrin, chitosan and lysozymes),
bacteria (bacteriocin, reuterin), algae, and fungi (Cowan 1999, Gyawali and
Ibrahim 2014). Alternatives may also include prebiotics and probiotics, drugs
that target communication within bacterial communities, or antibody based
drugs (Harbarth et al. 2015). Recent approaches include exploring peptide
based antibiotics (Roshan et al. 2018), renewing phage-therapy based
techniques (Kortright et al. 2019), employing metal, polymeric and lipid based
nanoparticles as antimicrobials (Lakshminarayanan et al. 2018), developing
nanohybrid combinations of silica and antibiotics (Mosselhy et al. 2018), and
the sequencing of prokaryote genomes to discover novel antimicrobial
molecules (Tracanna et al. 2017). Bacterial biofilms can be combatted with
several different aims in mind: prevent initial contamination; minimise initial
attachment; or penetrate the preformed biofilms and eradicate the associated
cells (Donlan 2002).
The research put forward in this thesis will also contribute to several aspects
of the 10 interventions outlined by O’Neill (2016). It will address the need for
novel antimicrobials, contributing to the improvement of hygiene and

20
sanitation, and potentially improve existing antimicrobials. It will do this by
exploring essential oils as a novel antimicrobial that could contribute to
combatting AMR.
1.2.1 Essential oils
Essential oils (EOs) are naturally occurring products of plants, which can be
extracted from the leaves, petals, stems, seeds, or roots of plants (Butnariu
and Sarac 2018). The term “essential oil” is thought to have come from the
Swiss alchemist Paracelsus von Hohenheim in the 16th century (Nazzaro et al.
2017), who used the term “Qunita essentia” to describe plant products
produced via distillation (Guenther 2013). However, the use of oils extracted
from plants has been documented much earlier than this (Baser and
Buchbauer 2015). As early as 4500 B.C., ancient Egyptians recognised the
therapeutic potential of oils extracted from plants (Boire 2013), and regarded
them so highly that King Tutankhamen was buried with approximately 350
litres of aromatic oils (Narayanasamy et al. 2019). China’s use of herbal
medicine dates back to 3000 B.C., during the reign of Shen Nong Shi, whose
work with medicinal plants is thought to be one of the earliest medical
compendiums in China (Boire 2013). Commercial production and use of EOs
is widespread globally, with over 100 countries producing EOs for decades
(Govindasamy et al. 2013). However, of the ~3000 EOs known, only about
300 are commercially used (Ghabraie et al. 2016). The oils most popular in
the industrial sector include: orange, mint, eucalyptus, citronella, peppermint,
and lemon, whilst oils most commonly intended for domestic use include:
lavender, chamomile, peppermint, tea tree oil, eucalyptus, geranium, jasmine,
21
rose, lemon, orange, rosemary, frankincense, and sandalwood (Barbieri and
Borsotto 2018).
1.2.1.1 Extraction and composition
Three methods are known to be used to extract essential oils from plants
including expression, hydro-distillation and dry distillation (Baser and
Buchbauer 2015). The most common of these extraction methods, hydro-
distillation, or steam distillation as it is otherwise known, is used throughout
commercial production of EOs on industrial scales (Barreto and Coelho 2015).
Extraction is usually expensive because of the relatively minimal return of final
product from the raw material (Butnariu and Sarac 2018). For example,
Semeniuc et al. (2017) found that parsley, basil and thyme yielded 0.16%,
0.4% and 2.2% oil per gram of raw material, respectively. Soni et al. (2016)
found that nutmeg yielded an average of 5.93 mL per 100g dry weight, López
et al. (2018) obtained a 1.8% yield from lemongrass, and Zheljazkov et al.
(2013) extracted a maximum yield of 6.8% oil from lavender. Many factors
have an influence on yield of oil from plants including: the species of plant; the
part of the plant the oil is extracted from; the drying conditions; the location of
plant growth; the level of milling carried out on dry matter; and distillation times
(Wang et al. 2009, Zheljazkov et al. 2013, Asbahani et al. 2015, Baser and
Buchbauer 2015, Bowes and Zheljazkov 2019). Chemical composition of the
oil is also dependent on many of these same factors (Eslahi et al. 2017), as
well as seasonal variations (Zouari-Bouassida et al. 2018), maturity of the
plant, and genetics, although the factors effecting composition and yield are
often interconnected and influence each other (Dhifi et al. 2016). An essential
22
oil is a complex mixture of highly volatile substances (Butnariu and Sarac
2018). The complexity can often reach over 300 different compounds, which
belong to several different chemical classes including: alcohols, ethers,
aldehydes, ketones, esters, amines, amides, phenols, heterocycles, and
terpenes (Dhifi et al. 2016). Terpenes are the most represented family of
compound within EOs and can be divided into monoterpenes, sequiterpenes
and diterpenes, and also categorised as cyclic or acyclic (Buckle 2015).
Because of the highly complex composition of EOs it is very difficult to replicate
them synthetically in the lab (Butnariu and Sarac 2018).
1.2.1.2 Known uses
In nature, EOs have many roles in plant life. They are thought to protect the
plant from disease, deter insects which may act as carriers of infection, repel
predators or even entice pollinators (Nazzaro et al. 2017). Many people
associate essential oils with aromatherapy, an alternative or complementary
treatment that uses EOs (Lee et al. 2012). Populations from Egypt, China and
India have been using EOs in aromatherapy for over 6000 years (Ali et al.
2015) and it has been described in cancer care (Reis and Jones 2017),
reduction of anxiety (Muzzarelli et al. 2006) and sleep improvement (Lin et al.
2019). EOs, alone or in combination, have been used extensively for the
treatment of wounds, inflammation, cystitis, rheumatic joints, skin sores,
bleeding, fungal infections, burns, pharyngitis, syphilis, and leprosy
(Narayanasamy et al. 2019). Commercially, EOs are usually destined for food
and drink companies, perfume and fragrance companies, cosmetics, personal
23
care products and pharmaceuticals (Govindasamy et al. 2013). However, EOs
have recently gained a lot of attention due to their antimicrobial properties.
1.2.1.3 Essential oils as antimicrobials
EOs have been used medicinally for many years and are widely reported as
possessing antibacterial, antifungal and anti-plasmodial properties
(Utchariyakiat et al. 2016). EOs have been described as one of the most
promising natural products to combat fungal infections (Nazzaro et al. 2017).
Work by Zabka et al. (2014) found that the antifungal activity of some
essentials were similar to that of synthetic fungicides, and after an extensive
review of the antifungal properties of essential oils reported in the literature,
Whiley et al. (2018) found that clove oil was most researched and was a potent
antifungal agent, as well as thyme, tea tree, oregano and citrus oils.
The antiviral efficacy of EOs has also been evaluated. Brochot et al. (2017)
found that blends of EOs were active against influenza virus and herpes
simplex virus 1 (HSV-1), whilst Astani et al. (2011) revealed that EO from star
anise was highly effective against HSV-1.
EOs are extensively reported for their activity against both Gram-negative and
Gram-positive bacteria in both motile and sessile states (Millezi et al. 2016).
Janssen et al. (1986) screened 53 EOs for antibacterial activity against
pathogens such as E. coli, P. aeruginosa, C. albicans, B. subtilis and S.
aureus, and found that all of the oils showed activity against at least 1 of the
organisms tested. In other studies, thyme, oregano, tea tree, cinnamon, lemon
grass, bay laurel, lemon myrtle, clove, and rosewood EOs showed
antimicrobial effects against E. coli at concentrations of <1%, with some oils
24
effective at concentrations as low as 0.02% (Nazzaro et al. 2019). Fine et al.
(2007) found that in vivo tests evaluating the use of an EO-containing mouth
rinse revealed significant reduction of oral pathogenic bacteria such as
Porphyromonas gingivalis, Fusobacterium nucleatum and Veillonella sp., after
2 weeks of use. EOs have also been shown to have synergistic effects when
used in combination with antibiotics and even prevent transmission of
resistance (Mulani et al. 2019). EOs have also been well documented for their
antibiofilm activities (Budzyńska et al. 2011, Saviuc et al. 2015, Artini et al.
2018, Kuhn et al. 2019, Mittal et al. 2019).
EOs have even been studied in vitro for their potential use in treating cancer,
for example, Oliveira et al. (2015) found that marigold EO showed no
cytotoxicity in tumour cell lines. Because of the known volatility of EOs, their
vapour phase has also been investigated for antimicrobial properties. In 1960,
Maruzzella and Sicurella (1960) studied 133 EO vapours for antibacterial
activity and found that thyme, cassia, cinnamon, origanum, and cherry laurel
EO vapour inhibited a broad spectrum of bacteria. More recently, EO vapours
have been used to inhibit moulds in food products (Ji et al. 2019); eradicate
pneumonia causing bacteria (Houdkova et al. 2018); and combat biofilm
forming bacteria (Benzaid et al. 2019).
1.2.1.4 Modes of action of essential oil
The antimicrobial activity of EOs against organisms can be related directly, but
not exclusively, to their composition, configuration, volume and interactions
with the pathogen. EOs can affect one or multiple targets within
microorganisms (Dhifi et al. 2016) and their mode of action as whole oil is most
25
likely to be attributed to their composition. Essential oils are usually described
as having 2 or 3 major constituents, often representing up to 85% of the entire
composition, and usually responsible for the biological activity the oil exerts
(Chouhan et al. 2017). However, it has been shown that the minor components
often have a role to play as well (Feyaerts et al. 2018). The chemical class of
the antimicrobial constituent typically eludes to the mechanism of action of the
oil against bacteria (Swamy et al. 2016). Oils with a high proportion of
aldehydes and phenols usually have a strong antimicrobial activity, whilst
those with ketones, esters or terpene hydrocarbons have a weaker activity, or
lack any antimicrobial efficacy at all (Bassolé and Juliani 2012). One of the
most important characteristics of oil EOs is their hydrophobicity, which results
in increased cell permeability and leads to cell leakage (Dhifi et al. 2016). The
majority of EOs act on the cell wall or membrane of bacteria and can cause
the release of lipopolysaccharides from the membrane (Faleiro 2011).
Intracellular and external ATP balances are likely to be affected as well as
protein synthesis, pH fluctuation, intracytoplasmic changes such as
coagulation of cytoplasmic material, DNA disruption and inhibition of quorum
sensing (Faleiro 2011, Lopez-Romero et al. 2015). Processes influencing
energy conversion, nutritional balances, structural macromolecule synthesis
and growth regulation have all been reportedly effected by EOs (Swamy et al.
2016).
Phenolic compounds, for example carvacrol, eugenol and thymol, have
reportedly affected the cytoplasmic membrane, proton forces, electron flow,
active transportation and cell content coagulation (Dhifi et al. 2016). It is also
reported that components contributing to the composition of EOs may have a
26
synergistic, additive or antagonistic effect on one another (Pei et al. 2009),
therefore it is essential to have a clear understanding of the composition of
any particular EO, to have a clear understanding of mode of action.
1.2.1.5 Safety
The majority of EOs are classified by the Food and Drug Administration as
generally recognised as safe (GRAS), and several have been approved for
use in food applications and for consumption (Ali et al. 2015). The most
common adverse reaction encountered from EOs is typically a result of
individual hypersensitivity, and risks are usually controllable (Rather et al.
2016). Common complaints caused by EO interactions are related to eye,
mucous membrane and skin irritation or sensitization (Ali et al. 2015).
However, more serious cases of toxicity have been reported where vomiting,
epigastric pain, diarrhoea, convulsions, renal failure, and central nervous
system depression have been observed (Eisenhut 2007). The toxicity of an oil
can be increased by improper storage, which could lead to photoisomerisation,
photocyclisation, oxidation, peroxidation and decomposition of alcohols,
ketone hydrolysis, and overall degradation, potentially reducing the safety of
an EO (Sarkic and Stappen 2018). Whilst toxicity testing on EOs is often
limited to specific named EOs, several studies have investigated the toxicity
of oils in vivo in rodent and small mammal models. For example, Mekonnen et
al. (2019) found that lavender EO was not toxic when evaluated orally and
dermally in mice and rabbits. In vitro studies have also been used to access
toxicity of oils in human cell lines. Puškárová et al. (2017) looked at the toxicity
of several essential oils when introduced to human embryo lung cells and
27
found that none of the oils induced any genotoxic effects. There have been
reports of accidental or intentional ingestion of EOs in humans, although in
cases where citronella EO was ingested no toxicity was shown (Vigan 2010),
and where near fatal incidents have occurred, consumption was thought to be
at extremely high doses (Nath et al. 2012). With safety in mind, it is sensible
to suggest that toxicity of most oils can be circumvented by avoiding ingestion,
diluting oil for topical applications and ensuring proper storage (Hammer et al.
2006).
1.3 Summary and aims
The increasing development of resistant bacteria is putting an enormous strain
on the current repertoire of antimicrobials. This global crisis of AMR is the
result of years of antibiotic abuse and misuse, among other drivers of
resistance. AMR is a financial burden to the whole world and is already having
a catastrophic effect on the population. Concerted efforts must be made to
develop new policies of use, continue research efforts, and develop novel
interventions to mitigate this threat. Combatting those bacteria most highly
implicated in this crisis, and specifically focussing on the mechanisms of
resistance that they possess, is fundamental in the development of successful
antimicrobials. EOs are a naturally occurring product of plants and have
historically been used as antimicrobials, but many EOs remain neglected in
research.
The aims of this thesis are to explore EOs as alternative antimicrobials, to
investigate their anti-biofilm activity and to evaluate their potential to contribute
to the control of AMR. These aims hope to support or refute the hypotheses
28
that EOs will be effective antimicrobials with the ability to combat biofilms, EOs
could be successfully incorporated into future development of new
antimicrobials that can aid in the reduction of AMR, and that investigation into
EOs as novel antimicrobials is warranted.

29
CHAPTER 2

31
2 MATERIALS AND METHODS
2.1 Chemicals and media
All chemicals and media used in this study were purchased from Sigma Aldrich
(Dorset, UK), Oxoid (Hampshire, UK) or Fisher Scientific (Leicestershire, UK),
unless otherwise specified. All media were made using deionised water and
sterilised by autoclave, unless otherwise specified.
2.2 Maintenance and growth of bacteria
Bacteria tested throughout this study were obtained from the microbiology
culture collection at the University of the West of England, Bristol, UK. The
strains used were: Escherichia coli (Strain B; ATCC 23848), Escherichia coli
(NCTC 9001), Escherichia coli (ATCC 10536), Staphylococcus aureus (ATCC
6538), Staphylococcus aureus (NCTC 12981), Pseudomonas aeruginosa
(PAO1), Pseudomonas aeruginosa (NCTC 8505), Pseudomonas aeruginosa
(ATCC 15442), Hospital Acquired Methicillin-Resistant Staphylococcus
aureus (MRSA) isolate, Methicillin-Susceptible Staphylococcus aureus
(MSSA; NCTC 13297), Acinetobacter baumannii (NCTC 12156),
Acinetobacter baumannii (ATCC 17978) and Enterococcus hirae (ATCC
10541). All bacteria were stored on beads (Microbank, Pro Lab Diagnostics,
Canada) at -80°C and revived on nutrient agar (NA; Oxoid, Hampshire, UK)
slopes at 37°C for 24 h. These slopes were kept at 4°C as working cultures for
a maximum of 6 weeks. Overnight broth cultures were prepared using one to
three colonies of bacteria from these slopes, which were added to 10 mL of
tryptone soy broth (TSB; Oxoid, Hampshire, UK) and incubated at 37°C for 24
h. When required, cultures were standardised by diluting with TSB and
32
measuring optical density at 600 nm to obtain a reading of 0.08-0.1 (McFarland
0.5), giving a standardised inoculum of ~1-2 x 10⁸ CFU mL-1.
2.3 Essential oils
Fifteen essential oils were used, and included EOs from: bergamot (Citrus
bergamia; peel), cinnamon (Cinnamomum zeylanicum; bark and leaf), clove
(Eugenia caryophyllus; bud), grapefruit (Citrus paradise; peel), lavender
(Lavandula angustifolia; flower), lemon (Citrus limonum; peel), lemongrass
(Cymbopogon citratus, dried grass), lime (Citrus aurantifolia, fruit), manuka
(Leptospermum scoparium; leaves), sweet orange (Citrus sinensis; peel), rose
geranium (Pelargonium graveolens; whole plant), rosemary (Rosmarinus
officinalis; leaves), North Indian rosewood (Dalbergia sissoo; wood), tea tree
(Melaleuca alternifolia; leaves) and thyme (Thymus vulgaris; whole plant). All
of these oils were donated by Amphora Aromatics Ltd, Bristol, UK for research
purposes, with the exception of cinnamon leaf oil which was purchased
separately and manufactured by Natural by Nature Ltd, UK. Oils were
considered to be at 100% concentration in their neat form and subsequent
dilutions stated as a percentage (v/v) reflects this.
2.3.1 Oil analysis
Gas Chromatography Mass Spectrometry (GC-MS) analysis of cinnamon bark
EO was performed using methods adapted from Adukwu et al. (2012).
Cinnamon leaf EO was also analysed as a comparator to the bark EO to
identify the differences in the components as these EOs are obtained from
different parts of the same plant. GC-MS analysis used an Agilent 6890N
33
Network Gas Chromatograph system and 5973 Network Mass Selective
Detector (Agilent Technologies, USA). Samples were dissolved in acetone
with a 1 µL injection volume. Inlet temperature was 300°C with a split ratio of
10:1. Temperature of the transfer line was 300°C and solvent delay was 3 min.
The carrier gas was helium with a column flow rate of 1 mL min-1 and operating
at constant flow. The oven temperature started at 50°C and was held for 2
min, then increased until 280°C was reached at a rate of 10°C min-1, with a
total run time of 25 min. Compound separation was achieved with a HP-5MS
column (30 m × 0.25 mm × 0.25 µm). An electron impact ion source at 230°C,
and a quadrupole mass analyser at 150°C was used. Electron ionization mass
spectrometric data were collected between 30 to 550 m/z. Oil components
were identified by comparison of mass spectral patterns with those from the
spectra from the National Institute of Standards and Technology (NIST) library
(MS Search 2.0) provided by the software of the GC-MS system.
2.3.2 Preparation of essential oils (EOs)
Where EO was required at different concentrations, unless otherwise
indicated, a stock solution of EO was prepared in TSB containing dimethyl
sulfoxide (DMSO; Sigma Aldrich, Dorset, UK) which is a solvent used as a
dispersal agent (Kačániová et al. 2017). Further two-fold dilutions of this stock,
in TSB, produced a range of EO concentrations from 0.015% to 8% (v/v), with
DMSO concentrations of 0.0098% to 5% (v/v), respectively. This produced an
EO to DMSO ratio of 1:0.625, which was maintained throughout experiments
in this thesis.
34
2.4 Biofilm growth in vitro
2.4.1 Microtitre plate method (crystal violet biofilm assay)
Methods for assessing in vitro biofilm growth were adapted from Stepanović
et al. (2000). An overnight culture was standardised as described in section
2.2, with the exception of being diluted in TSB supplemented with 1% (v/v)
glucose. Two hundred microliters of this suspension were added to each well
of the microtitre plate. Three wells each were used per bacterial strain,
ensuring adequate spacing between each to avoid risk of contamination.
Negative control wells contained TSB with 1% glucose only. Plates were
incubated at 37°C for 24 hours. The wells were then carefully aspirated and
washed three times using 250µl of sterile PBS. Bacteria were fixed using 200µl
of methanol for 15 minutes, wells were emptied and then air dried. After air
drying, wells were stained with 250µl of 0.1% crystal violet for 5 minutes.
Excess stain was removed by rinsing gently with tap water. After leaving to air
dry, the bound stain was solubilised with 250µl of 33% (v/v) acetic acid. The
optical density (OD) of wells in the plate was then measured using a TECAN
Infinite® 200 PRO plate reader at OD595nm. Biofilm growth was categorised by
strength of adherence which was defined as: non-adherent, weak, moderate
and strong. This classification depended on the OD values of wells and its
comparison to the OD cut-off (ODc) value. ODc was defined as three standard
deviations above the mean OD of the negative control. Experiments were
carried out independently in triplicate and categorisation of biofilms was based
on the following formulae:
35
𝑂𝐷 ≤ 𝑂𝐷𝑐 = 𝑛𝑜𝑛-𝑎𝑑ℎ𝑒𝑟𝑒𝑛𝑡
𝑂𝐷𝑐 < 𝑂𝐷 ≤ 2 × 𝑂𝐷𝑐 = 𝑤𝑒𝑎𝑘𝑙𝑦 𝑎𝑑ℎ𝑒𝑟𝑒𝑛𝑡
2 × 𝑂𝐷𝑐 < 𝑂𝐷 ≤ 4 × 𝑂𝐷𝑐 = 𝑚𝑜𝑑𝑒𝑟𝑎𝑡𝑒𝑙𝑦 𝑎𝑑ℎ𝑒𝑟𝑒𝑛𝑡
𝑂𝐷 > 4 × 𝑂𝐷𝑐 = 𝑠𝑡𝑟𝑜𝑛𝑔𝑙𝑦 𝑎𝑑ℎ𝑒𝑟𝑒𝑛𝑡
2.4.2 CDC biofilm reactor
A Centre for Disease Control (CDC) Biofilm Reactor (CBR; model CBR 90-2;
BioSurface Technologies, USA) was used to produce biofilms under high
shear and continuous flow (Figure 2.1). Full specifications for this equipment
and its use can be found in the manufacturer’s manual. Briefly, it consists of a
1 L Pyrex beaker with an outlet port at 400 mL, resulting in an approximate
working volume of 350 mL. The ultra-high molecular weight (UHMW)
polyethylene ported lid holds 8 polypropylene rods, which each accommodate
3 coupons (1.27 cm width, 0.3 cm thickness). Medium is circulated through the
vessel and the shear is generated by a magnetic baffle and digital stir plate.
Coupons used were polycarbonate or stainless steel, and they were cleaned
by sonicating for 5 min in 1:1000 Decon90 (Fisher Scientific, Leicestershire,
UK), rinsing in deionised water, followed by a 5 min sonication in deionised
water. Polycarbonate coupons underwent a further 2 h soak in 2 M
hydrochloric acid. Coupons were left to air dry in Petri dishes lined with filter
paper. The assembled CBR, including cleaned coupons, was filled with 500
mL of 300 mg L-1 TSB and autoclaved at 121°C for 15 min. Once cooled, the
reactor was inoculated with 1 mL of standardised P. aeruginosa culture and
placed on a digital stir plate operating at 130 rpm at room temperature. The
CBR was operated in batch phase for 24 h, followed by continuous flow phase
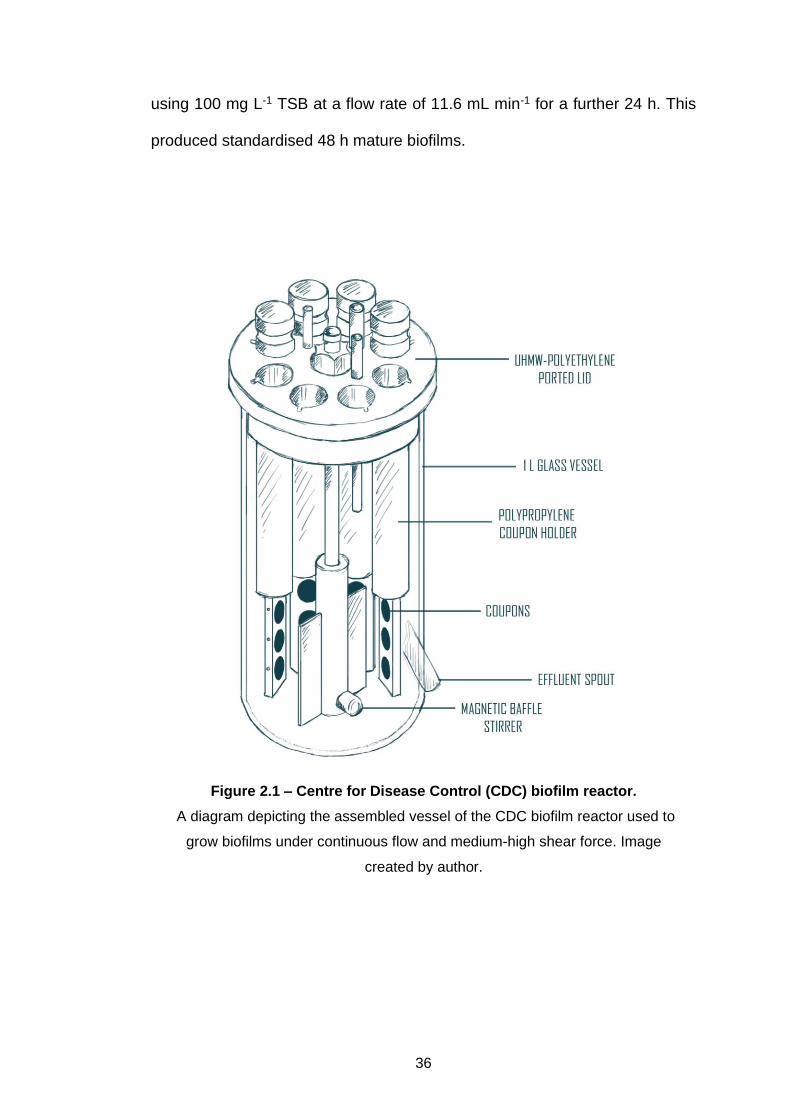
36
using 100 mg L-1 TSB at a flow rate of 11.6 mL min-1 for a further 24 h. This
produced standardised 48 h mature biofilms.
Figure 2.1 – Centre for Disease Control (CDC) biofilm reactor.
A diagram depicting the assembled vessel of the CDC biofilm reactor used to
grow biofilms under continuous flow and medium-high shear force. Image
created by author.
37
2.5 Imaging
2.5.1 Scanning electron microscopy (SEM)
Samples for SEM were prepared using the method reported by Murtey and
Ramasamy (2016) and adjusted as indicated below. Briefly, small squares of
poly-l-lysine coated microscope slides (Sigma Aldrich, Dorset, UK) were
placed in wells of a 12-well plate. Wells were inoculated with 1 mL of bacterial
samples in broth culture and left to adhere for 1 h. The squares of microscope
slide were removed and placed in a new 12-well plate. The attached cells were
then fixed by immersion in 4% (v/v) glutaraldehyde (Sigma Aldrich, Dorset,
UK) in 0.1 M phosphate buffer (10.22 g L-1 Na2HPO4, 3.36 g L-1 NaH2PO4) for
30 min, washed with the same buffer three times and then dehydrated through
a series of ethanol concentrations for 10 min each, followed by
hexamethyldisilizane (HMDS; Sigma Aldrich, Dorset, UK) for 10 min two times.
The squares were mounted on aluminium stubs (Agar Scientific Ltd, Essex,
UK) and coated with gold in a sputter coater and viewed using a scanning
electron microscope (FEI Quanta 650 FEG, Sigma Aldrich, UK).
2.6 Data analysis
The following data analysis was carried out, unless otherwise specified. Data
were analysed using Microsoft Excel 2016 (Microsoft Corporation, Redmond,
USA) and GraphPad Prism version 8.00 for Windows (GraphPad Software, La
Jolla California, USA). Minimum level of significance was set to P<0.05, and
where asterisks were used to indicate significance: * = P<0.05; ** = P<0.01;
*** = P<0.001; **** = P<0.0001.


39
CHAPTER 3

41
3 THE ANTIMICROBIAL ACTIVITY OF ESSENTIAL OILS
3.1 Introduction
Many essential oils (EOs) are well described to have antimicrobial activity
(Millezi et al. 2016). Despite the widespread use of EOs for multiple purposes,
only a small proportion of the known EOs are used commercially (Ghabraie et
al. 2016). Whilst it is thought that the majority of EOs act on the cell wall and
membrane of bacteria (Faleiro 2011), studies assessing mode of action of
individual oils are still required. Furthermore, very few studies exploring the
antimicrobial activities of EOs investigate their potential for rapid killing, i.e.
under 10 min contact time. Friedman et al. (2004) investigated the activities of
EOs and their components against E. coli O157:H7 with incubation times of
≥5 min, and Tangjitjaroenkun et al. (2012) studied the antimicrobial effects of
EO from Zanthoxylum limonella with incubation times of ≥3 min. Mayaud et al.
(2008) assessed the inhibitory action of various EOs against bacteria with
contact times of ≥5 min. However, to my knowledge, to date no study has
evaluated the antimicrobial efficacy of EOs against P. aeruginosa with less
than 5 min contact time. As part of the search for novel antimicrobials, efficacy
of new antimicrobial compounds must be quantitatively assessed using
antimicrobial screening assays. These often include broth dilution methods to
determine the minimum inhibitory concentration (MIC), a value representing
the lowest concentration of antimicrobial required to inhibit microorganism
growth. Dimethyl sulfoxide (DMSO) is a clear odourless liquid which acts as
an aprotic solvent (Brayton 1986). It has a strong affinity to and is soluble in
water, but can also solubilise in ethanol, acetone, diethyl ether, benzene and
42
chloroform (Pope and Oliver 1966). It is a useful solvent for compounds such
as therapeutic and toxic agents, which are not soluble in water, and is often
used in place of methanol or ethanol when these two solvents are incapable
of dissolving a compound of interest (Wadhwani et al. 2012). It is important to
consider any possible effects that these supplements have on the outcome of
such experiments, and whether they would interfere with the results.
Therefore, this chapter first aims to investigate the potential effects of DMSO
on the chosen panel of bacteria, whether it enhances or suppresses growth
and if it influences the outcome of antimicrobial testing. As previously
described, there is a large breadth of essential oils available to investigate,
therefore this chapter further aims to assess the effects of a selection of EOs
against a panel of bacteria, with the aim to streamline investigations to focus
on one selected EO, exhibiting the greatest antimicrobial effects, and
investigate its rapid bactericidal potential and mode of action.
3.1.1 Chapter progression
The following flow diagram depicts a summary of the progression of this
chapter.
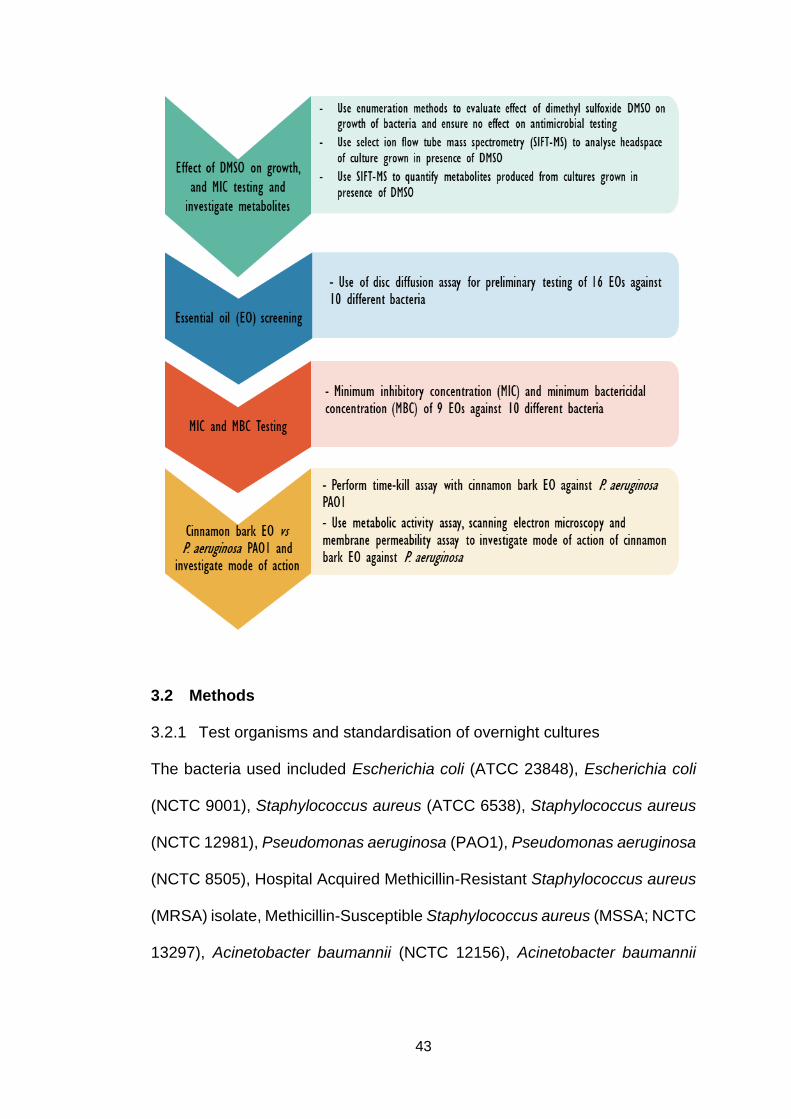
43
3.2 Methods
3.2.1 Test organisms and standardisation of overnight cultures
The bacteria used included Escherichia coli (ATCC 23848), Escherichia coli
(NCTC 9001), Staphylococcus aureus (ATCC 6538), Staphylococcus aureus
(NCTC 12981), Pseudomonas aeruginosa (PAO1), Pseudomonas aeruginosa
(NCTC 8505), Hospital Acquired Methicillin-Resistant Staphylococcus aureus
(MRSA) isolate, Methicillin-Susceptible Staphylococcus aureus (MSSA; NCTC
13297), Acinetobacter baumannii (NCTC 12156), Acinetobacter baumannii
44
(ATCC 17978). Their storage and standardisation were carried out as
described in section 2.2.
3.2.2 Effect of dimethyl sulfoxide (DMSO) on bacterial growth
Methods to assess the effect of DMSO on bacterial growth were adapted from
those previously described by Wadhwani et al. (2012). Standardised overnight
cultures were further diluted in TSB (1:150) and 100 µL of this (approximately
5x10⁵ CFU mL-1) was added to the wells of a 96-well microtitre plate.
Concentrations of 2.5% and 5% DMSO were prepared in TSB and 100 µL of
each concentration was added to the inoculated wells to give final
concentrations of 1.25% and 2.5%. Microtitre plates were incubated at 37°C
for 24 h. Contents of wells were diluted and 100 µL spread onto NA agar
plates, which were incubated for 24 h at 37°C and then enumerated. TSB and
bacterial culture in equal parts was used as a negative control. DMSO and
TSB alone were also included to ensure no contamination was present. Each
organism was grown in triplicate and three independent experiments were
carried out. Final values are expressed as mean CFU mL-1.
3.2.3 Headspace analysis of E. coli in DMSO by selected-ion flow-tube mass
spectrometer (SIFT-MS)
Methods to assess headspace of broth culture were adapted from methods
outlined by Slade et al. (2017). Briefly, 9 mL of 1.25% DMSO in TSB was
added to sterile 250 mL glass bottles with a screw cap containing a silicone
septum. A standardised overnight culture of E. coli (ATCC 23848) was diluted
1:150 and 1 mL of this suspension was used to inoculate the glass bottles. A
45
glass bottle containing only TSB with culture was used as a negative control.
Bottles were incubated for 4 h at 37°C. Headspace analysis of the culture was
analysed using a SIFT-MS (Instrument Science Limited, UK) in ‘Full Mass
Scan’ mode and an H3O+ precursor ion was used. A sterile needle attached
to the SIFT-MS direct sampling inlet was used to pierce the silicon septum of
the sample bottle and the sample was vented using another sterile needle
(Fisher Scientific, Leicestershire, UK) attached to a 0.2 µm syringe filter
(Sartorious Stedim Biotech, Germany) to allow for free-flowing headspace
gases. Three analyses were carried out using repeat scans of 60 s, over a
spectrum range of 10–200 m/z, and three independent experiments were
carried out.
3.2.4 Quantification of metabolites produced by E. coli in presence of DMSO
using SIFT-MS
Headspace analysis identified a dominant peak relating to the presence of
dimethyl sulfide (DMS); thus, the following method was used to quantify this
compound. Briefly, the headspace of the chamber was analysed using a SIFT-
MS in ‘Selected Ion’ mode to quantify headspace concentration of DMS. H3O+,
NO+ and O2+ were used as precursor ions. A sterile needle attached to the
SIFT-MS direct sampling inlet was used to pierce the silicon septum of the
vapour chamber and the sample was vented using another sterile needle
attached to a 0.2 µm syringe filter to allow for free-flowing headspace gases.
Three analyses were carried out using repeat scans of 90 s and three
independent experiments were carried out. Final values were calculated as
mean parts per billion (ppb).
46
3.2.4.1 Influence of DMSO on antimicrobial testing
The broth dilution method of antimicrobial testing was used in future chapters
of this thesis to determine minimum inhibitory concentration (MIC) and used
DMSO as a solvent. An alternative method was employed to evaluate whether
the presence of DMSO influenced the results. The agar dilution method, which
was not chosen for studies within this thesis, but widely used in other studies,
does not employ DMSO as a solvent. Thus, this method was used to
determine the MIC of cinnamon bark, clove and tea tree essential oil against
E. coli B (ATCC 23848) and the results compared to those from MIC testing
described in chapter 4. Methods used here were adapted from Clinical and
Laboratory Standard Institute (CLSI; 2012) and Griffin et al. (2000). Briefly,
MHA agar was prepared and supplemented with 0.5% Tween 20 (v/v).
Essential oil was added to 15 mL aliquots of this molten agar, to achieve
doubling concentrations ranging from 0.03% to 2% (v/v). Molten agar was
mixed thoroughly, whilst avoiding production of bubbles, and poured into petri
dishes and allowed to set at room temperature. A standardised overnight
culture of E. coli B (ATCC 23848) was prepared as described in section 2.2
and further diluted 1:150 in TSB. Once the prepared agar plates were dry,
plates were inoculated with 10 µL spots of diluted culture. One agar plate
inoculated with the test organism in the absence of essential oil was used as
a negative control with each experiment. Each plate was inoculated with three
spots and three independent replicates were carried out.
47
3.2.5 Essential oils
The EOs used in this chapter are described in section 2.3.
3.2.6 Disc diffusion assay
Screening of EOs for anti-bacterial activity was performed using a paper disc
diffusion approach adapted from the Clinical and Laboratory Standards
Institute (CLSI) Antimicrobial Susceptibility Testing (AST) Standards (Clinical
and Laboratory Standards Institute 2015). MHA plates were inoculated with
100 μL of standardised culture for each test bacterium, spread evenly over the
entire surface of the agar using a sterile cotton swab by swabbing in three
directions (Howe and Andrews 2012). The inoculum applied to each plate was
~1-2 x 10⁷ CFU mL-1. A volume of 10 μL of EO was used to saturate a set of
six mm diameter filter paper discs (Whatman, Sigma Aldrich, UK), one of which
was then placed onto the centre of each inoculated plate. Sterile discs (6mm)
without EO were used as a negative control and discs containing 30 μg
gentamicin (Oxoid, Hampshire, UK) were used as a positive reference. Plates
were incubated at 37°C for 24 h and antibacterial activity was assessed by
measuring the diameter of the zones of inhibition in mm using Vernier callipers.
Three independent experiments were performed in triplicate.
3.2.7 Determination of minimum inhibitory concentration (MIC) and minimum
bactericidal concentration (MBC)
The MIC of EOs was determined by the broth microdilution method as outlined
by the CLSI (2012) and adapted from previously described methods (Cao et
al. 2009). EO dilutions were prepared as described in section 2.3.2. One
48
hundred microliters of each EO concentration were added to wells of a 96-well
microtitre plate. A standardised overnight culture (as described in section 2.2)
was diluted 1:150 with TSB, and 100 µL of this was added to each well of the
microtitre plate. Final concentrations of EO ranged from 0.007% to 4% (v/v)
with DMSO concentrations of 0.0049% to 2.5% (v/v) respectively. Final cell
density of the inoculum was approximately 5 x 10⁵ CFU mL-1. Microplate wells
of EO dilutions without bacteria, and TSB and DMSO alone, were used as
negative controls, and plates were incubated at 37°C for 24 h. MIC values
were determined by the well with the lowest concentration of EO where no
visible microbial growth was observed. Each concentration of EO had three
replicates and experiments were independently repeated four times.
MBC was determined by spot inoculation similar to methods outlined by
Adukwu et al. (2012). Briefly, 10 µL was pipetted from the microtitre wells
showing no growth onto MHA, and incubated for 24 h at 37°C. Each
concentration of EO had three replicates and experiments were independently
repeated four times. MBC values were determined as the lowest concentration
of EO where no growth was observed.
3.2.8 Gas chromatography mass spectrometry (GC-MS) analysis
Following determination of MICs and MBCs, cinnamon bark EO demonstrated
broad-spectrum activity against all tested organisms, including P. aeruginosa
at <4% (v/v). Thus, this oil was selected for testing rapid bactericidal effects
against P. aeruginosa.
GC-MS analysis of cinnamon bark EO was performed as described in 2.3.1.
Cinnamon leaf EO was also analysed as a comparator to the bark EO, to
49
identify the differences in the components, as these EOs are obtained from
different parts of the same plant species.
3.2.9 Time-kill assay
Time kill kinetics were determined for cinnamon bark EO against P.
aeruginosa PAO1 using methods adapted from Carson et al. (2002). Six 50
mL conical flasks containing 15 mL of TSB were inoculated with 50 µL of
standardised P. aeruginosa PAO1 overnight culture to achieve approximately
5 x 10⁵ CFU mL-1. A 100 µL aliquot was removed from each flask and added
to 9.9 mL of TSB, diluted serially and plated onto MHA to confirm starting
inoculum density, representing the zero min time point (T0). Table 3.1 shows
the volumes of EO and DMSO added to the flasks to achieve a series of
concentrations for the time-kill assay. The concentration of cinnamon bark EO
ranged from 0.125% (v/v; 1 x MIC) to 2% (v/v; 16 x MIC), with a negative
control flask containing DMSO alone. After the addition of EO and DMSO, the
flasks were vortexed and incubated without shaking at room temperature. At
each time point the flasks were vortexed again and aliquots were removed at
2, 4, 6, 10 and 30 min and at 1, 2, 4, 6 and 24 h, diluted serially and plated
onto MHA. All plates were incubated at 37°C for 24 h before enumeration of
the colonies. The effect of an antimicrobial compound is considered
bactericidal if a ⩾99.9% decrease in the initial inoculum (i.e. a three-log
reduction) is observed, as described by the CLSI (1999).

50
3.2.10 Metabolic activity assay
A triphenyltetrazolium chloride (TTC) metabolic activity assay was performed
to investigate the effect of EO on metabolic activity during the time-kill assay,
as described by Ahmed (2013). One hundred microlitre aliquots of the treated
organisms from each time point were transferred to wells of a 96-well plate. A
5 µL volume of sterile 1% aqueous solution of TTC (Sigma Aldrich, Dorset,
UK) was added to each well and plates were wrapped in aluminium foil and
incubated at 37 °C with orbital shaking at 120 rpm for 24 h. TSB containing no
bacteria was used as a negative control. The presence of viable bacterial cells
was indicated by the reduction of the yellow TTC to a red colour. Optical
density of the wells was measured using a TECAN Infinite® 200 PRO plate
Table 3.1 – Preperation of Essential Oil Dilutions.
Volumes of EO and DMSO prepared before adding to flasks containing 15 mL
TSB inoculated with P. aeruginosa to achieve range of final cinnamon bark EO
concentrations
Concentration of EO required (v/v)
Volume of EO added (µL)
Volume of DMSO added (µL)
0% 0 187.5
0.125% 18.8 11.7
0.25% 37.5 23.4
0.5% 75 46.9
1% 150 93.8
2% 300 187.5
51
reader at 595 nm. Data were normalised to T0 and expressed as a percentage
relevant to this time point. All assays were performed in triplicate on three
separate occasions.
3.2.11 Scanning electron microscopy (SEM)
SEM was used to assess morphological effects on P. aeruginosa PAO1 after
treatment with cinnamon bark EO at 2% (v/v) for 10 min. Both untreated and
treated samples were prepared for SEM as described in section 2.5.1.
3.2.12 Release of nucleic acids and proteins
The release of 260 nm absorbing nucleic acids and 280nm absorbing proteins
from P. aeruginosa PAO1 after treatment with cinnamon bark EO was
measured according to methods described by Miksusanti et al. (2008), with
some adaptations. A 50 mL conical flask containing 15 mL of cinnamon bark
EO at either 2% (v/v) or 1.25% (v/v) in TSB with 1.25% (v/v) or 0.08% (v/v) of
DMSO, respectively, was inoculated with 50 µL of standardised overnight P.
aeruginosa PAO1 culture. The flask was vortexed, incubated at room
temperature for 2 h and then a 1 mL aliquot was removed and filtered with
0.45 µm filter (Sartorious Stedim Biotech, Germany). The absorbance of this
filtrate was measured at 260 nm and 280 nm. Negative controls were treated
with DMSO (1.25% v/v) alone. The absorbance of filtrate from controls without
culture added were deducted from the absorbance of the respective samples
with EO added. Experiments were performed in triplicate on three separate
occasions, and results are expressed as mean OD of nucleic acids (260 nm)
and protein (280 nm) released.
52
3.2.13 Data analysis
A one-way ANOVA with Tukey’s multiple comparisons test was used to
compare means of growth of bacteria in absence or presence of DMSO at
different concentrations. A two-tailed t-test was used to identify significant
differences in DMS production when in presence or absence of DMSO.
3.3 Results
3.3.1 Effect of dimethyl sulfoxide (DMSO) on bacterial growth
The effects of DMSO solvent on bacterial growth are presented in Figure 3.1.
DMSO at either 1.25% or 2.5% (v/v) had little to no effect on the growth of any
organism, with the exception of E. coli B (ATCC 23848). E. coli B (ATCC
23848) in the presence of either concentration of DMSO showed a promotion
of growth, double that of the control, and produced an unpleasant odour after
overnight incubation.
3.3.2 Headspace analysis of E. coli in DMSO by selected-ion flow-tube mass
spectrometry (SIFT-MS)
Due to the growth promotion and odour observed for E. coli B (ATCC 23848),
further investigations were made to analyse the headspace of the culture in
the presence of DMSO. A noticeable peak at 63 m/z, coupled with
identification using the built-in compound library, indicated a production of
DMS that was more than 100-fold greater in the culture with DMSO present.
53
3.3.3 Quantification of metabolites produced by E. coli in presence of DMSO
using SIFT-MS
Results from further quantification investigations are presented in Figure 3.2.
When E. coli is in the presence of 1.25% (v/v) DMSO, DMS production is
significantly greater than when E. coli is not exposed to DMSO (P<0.05). DMS
produced in the presence of DMSO was determined to be 10434.8 ppb whilst
DMS produced in the absence of DMSO was 2.3 ppb.
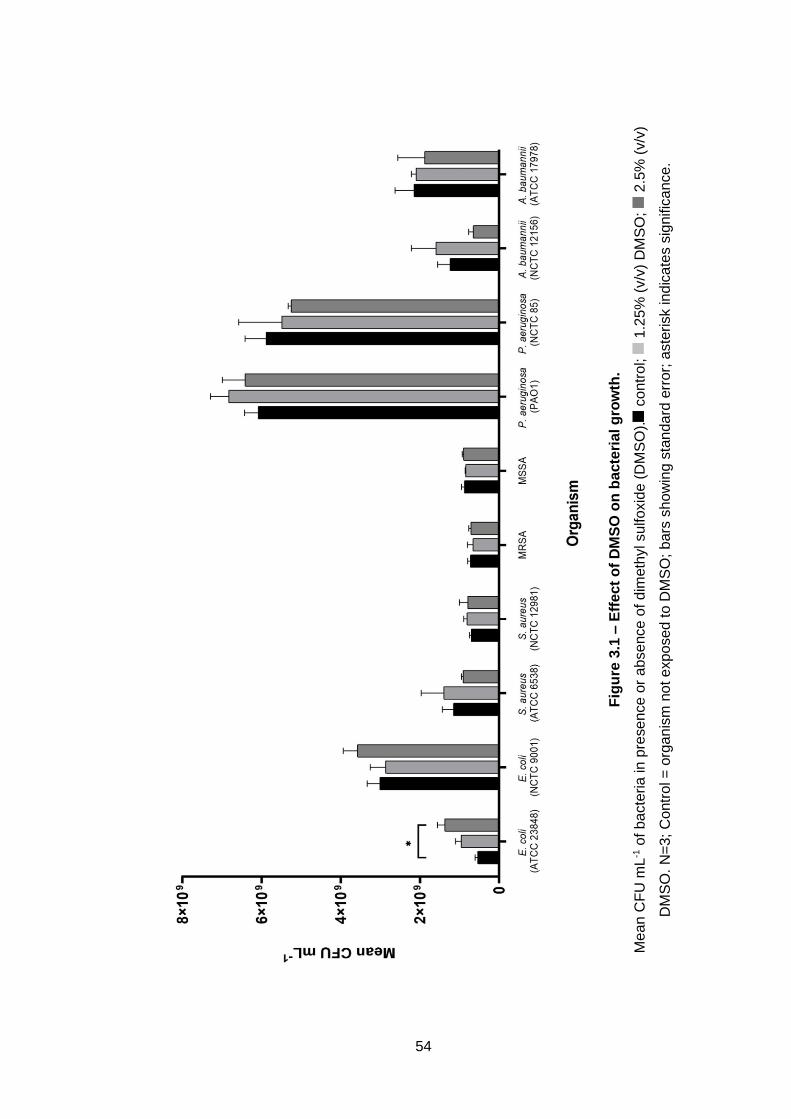
54
Fig
ure
3.1
– E
ffe
ct
of
DM
SO
on
bacte
ria
l g
row
th.
Me
an
CF
U m
L-1 o
f b
acte
ria
in
pre
se
nce
or
ab
se
nce
of d
imeth
yl su
lfo
xid
e (
DM
SO
). c
ontr
ol;
1.2
5%
(v/v
) D
MS
O;
2.5
% (
v/v
)
DM
SO
. N
=3;
Co
ntr
ol =
org
an
ism
no
t e
xpo
sed t
o D
MS
O;
bars
sh
ow
ing s
tan
da
rd e
rror;
aste
risk in
dic
ate
s s
ignific
ance
.
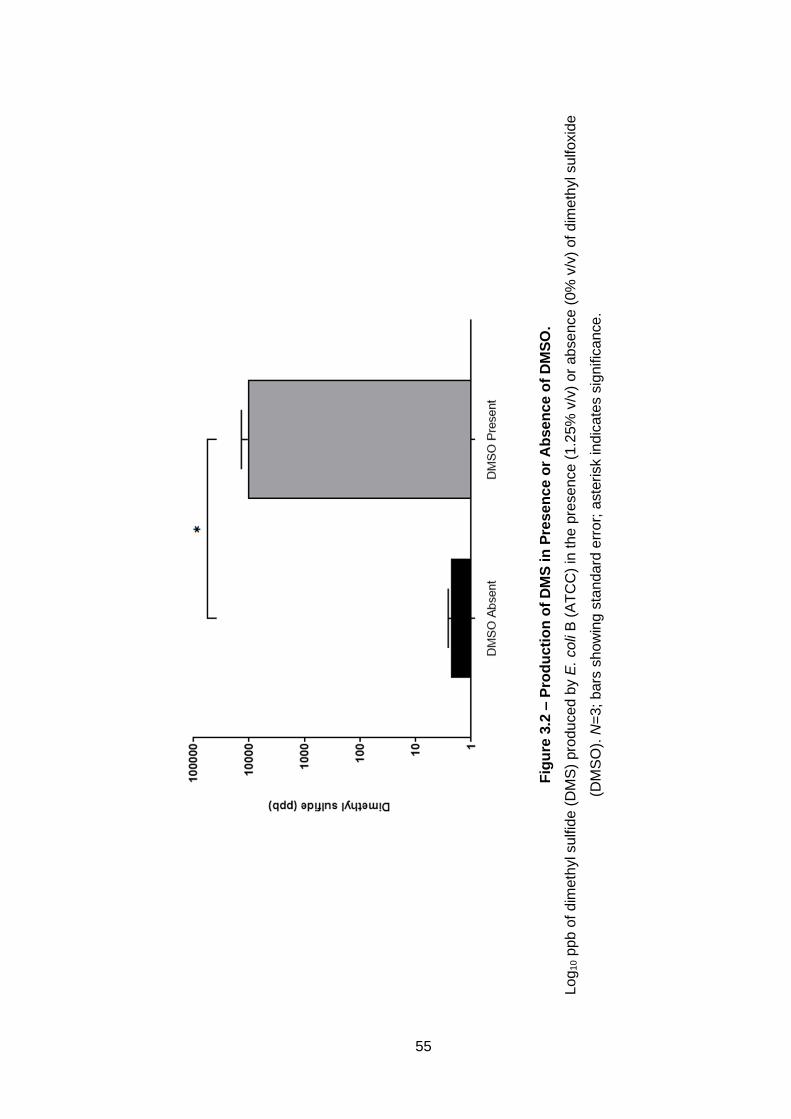
55
Fig
ure
3.2
– P
rod
ucti
on
of
DM
S in
Pre
se
nc
e o
r A
bse
nc
e o
f D
MS
O.
Log
10 p
pb o
f dim
eth
yl sulfid
e (
DM
S)
pro
duced b
y E
. coli
B (
AT
CC
) in
the p
resence (
1.2
5%
v/v
) or
absence (
0%
v/v
) of
dim
eth
yl sulfoxid
e
(DM
SO
). N
=3;
bars
sh
ow
ing s
tand
ard
err
or;
aste
risk in
dic
ate
s s
ignific
ance
.

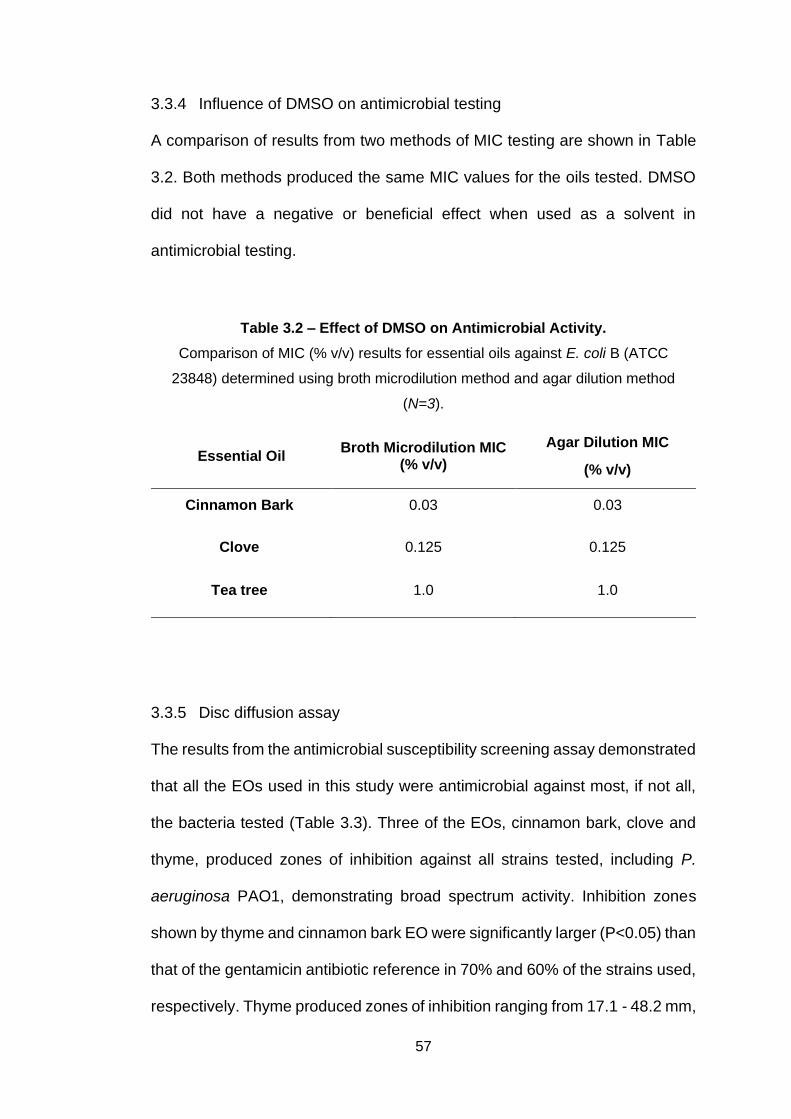
57
3.3.4 Influence of DMSO on antimicrobial testing
A comparison of results from two methods of MIC testing are shown in Table
3.2. Both methods produced the same MIC values for the oils tested. DMSO
did not have a negative or beneficial effect when used as a solvent in
antimicrobial testing.
3.3.5 Disc diffusion assay
The results from the antimicrobial susceptibility screening assay demonstrated
that all the EOs used in this study were antimicrobial against most, if not all,
the bacteria tested (Table 3.3). Three of the EOs, cinnamon bark, clove and
thyme, produced zones of inhibition against all strains tested, including P.
aeruginosa PAO1, demonstrating broad spectrum activity. Inhibition zones
shown by thyme and cinnamon bark EO were significantly larger (P<0.05) than
that of the gentamicin antibiotic reference in 70% and 60% of the strains used,
respectively. Thyme produced zones of inhibition ranging from 17.1 - 48.2 mm,
Table 3.2 – Effect of DMSO on Antimicrobial Activity.
Comparison of MIC (% v/v) results for essential oils against E. coli B (ATCC
23848) determined using broth microdilution method and agar dilution method
(N=3).
Essential Oil Broth Microdilution MIC
(% v/v)
Agar Dilution MIC
(% v/v)
Cinnamon Bark 0.03 0.03
Clove 0.125 0.125
Tea tree 1.0 1.0
58
whilst cinnamon bark produced zones ranging from 16.7 – 36.2 mm. Rose
geranium EO showed activity against all strains excluding P. aeruginosa
NCTC 8505, producing zones ranging from 5.3 – 18.3 mm. Cinnamon leaf EO
showed activity against all strains excluding P. aeruginosa PAO1, producing
zones ranging from 8.7 – 18.2 mm. Lavender, lemongrass, lime, rosemary,
rosewood and tea tree EOs showed effects against both Gram positive and
Gram negative bacteria, excluding the Pseudomonas species. Of these oils,
lemongrass produced the largest zones of inhibition, ranging from 10.1 - 36.9
mm. The smallest zones of inhibition were produced by bergamot, grapefruit,
lemon, manuka and sweet orange EOs. Blank disc negative controls did not
affect the growth of any of the strains. In accordance with the breakpoint tables
for inhibition zone interpretation published by the European Committee on
Antimicrobial Susceptibility Testing (EUCAST 2018), all bacteria in this study
were sensitive to gentamicin with the exception of MRSA and A. baumannii
NCTC 12156.
3.3.6 Determination of minimum inhibitory concentration (MIC) and minimum
bactericidal concentration (MBC)
Nine EOs were selected, based on their antimicrobial activity shown in the disc
diffusion assay, to determine their MIC and MBC (Table 3.4). The data shows
that rose geranium, rosewood and tea tree EOs produced MICs between 0.5
and 4% or greater (v/v) against most strains and that MBC values for these
are either equal or double the MIC value. Although Manuka EO demonstrated
a MIC as low as 0.06% (v/v), the inhibitory effects were only against Gram-
positive S. aureus strains. Manuka EO did not demonstrate any bactericidal
59
action at <4% (v/v). Thyme, lemongrass, cinnamon leaf and clove EOs
presented MICs and MBCs of ≤1.0% (v/v) for all strains of bacteria excluding
the P. aeruginosa strains. The only EO which demonstrated broad spectrum
antimicrobial activity was cinnamon bark EO. All the bacteria tested including
the Pseudomonas spp. were inhibited by cinnamon bark EO at ≤0.25% (v/v),
which also demonstrated bactericidal activity at the same concentration.
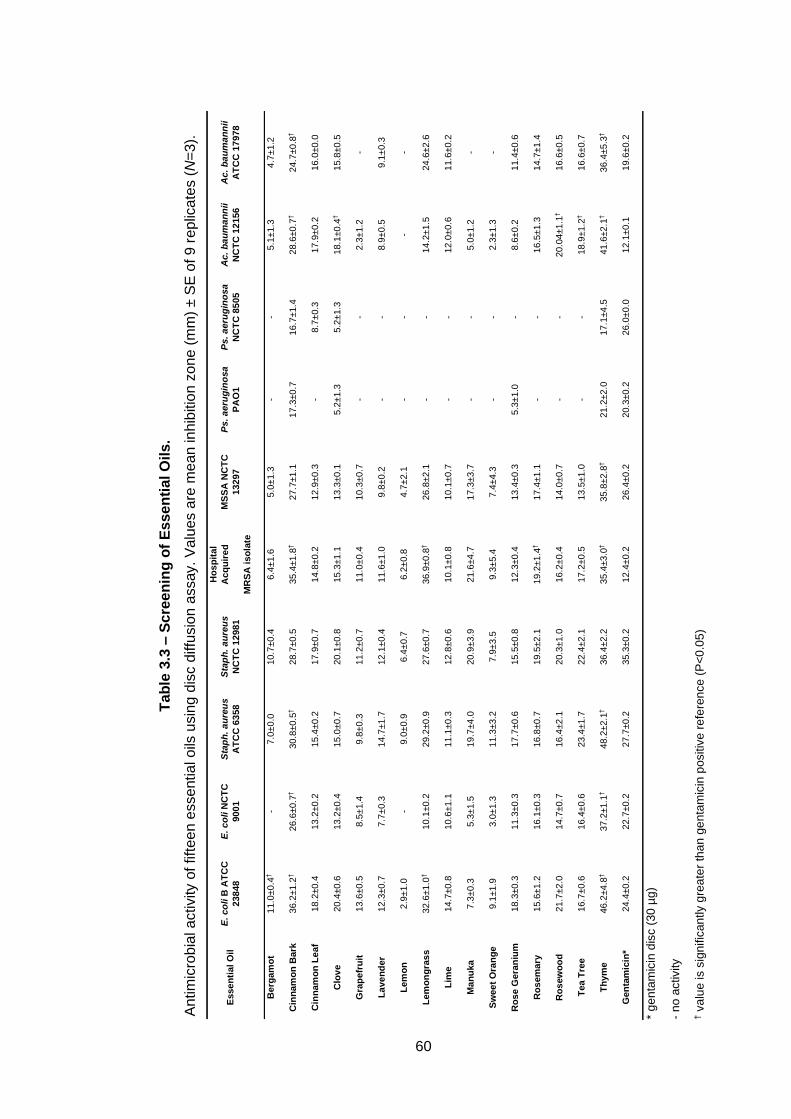
60
Ta
ble
3.3
– S
cre
en
ing
of
Es
se
nti
al O
ils
.
An
tim
icro
bia
l a
ctivity o
f fift
een e
ssentia
l o
ils u
sin
g d
isc d
iffu
sio
n a
ssay. V
alu
es a
re m
ean in
hib
itio
n z
one
(m
m)
± S
E o
f 9
re
plic
ate
s (
N=
3).
Esse
nti
al
Oil
E
. co
li B
AT
CC
238
48
E. co
li N
CT
C
900
1
Sta
ph
. a
ure
us
AT
CC
63
58
Sta
ph
. a
ure
us
NC
TC
12
981
Ho
sp
ital
Acq
uir
ed
MR
SA
iso
late
MS
SA
NC
TC
132
97
Ps. a
eru
gin
osa
PA
O1
Ps. a
eru
gin
osa
NC
TC
85
05
Ac.
ba
um
an
nii
NC
TC
12
156
Ac.
ba
um
an
nii
AT
CC
17
978
Berg
am
ot
11.0
±0.4
†
- 7.0
±0.0
10.7
±0.4
6.4
±1.6
5.0
±1.3
-
- 5.1
±1.3
4.7
±1.2
Cin
nam
on
Bark
36.2
±1.2
†
26.6
±0.7
†
30.8
±0.5
†
28.7
±0.5
35.4
±1.8
†
27.7
±1.1
17.3
±0.7
16.7
±1.4
28.6
±0.7
†
24.7
±0.8
†
Cin
nam
on
Le
af
18.2
±0.4
13.2
±0.2
15.4
±0.2
17.9
±0.7
14.8
±0.2
12.9
±0.3
-
8.7
±0.3
17.9
±0.2
16.0
±0.0
Clo
ve
20.4
±0.6
13.2
±0.4
15.0
±0.7
20.1
±0.8
15.3
±1.1
13.3
±0.1
5.2
±1.3
5.2
±1.3
18.1
±0.4
†
15.8
±0.5
Gra
pefr
uit
13.6
±0.5
8.5
±1.4
9.8
±0.3
11.2
±0.7
11.0
±0.4
10.3
±0.7
-
- 2.3
±1.2
-
La
ve
nd
er
12.3
±0.7
7.7
±0.3
14.7
±1.7
12.1
±0.4
11.6
±1.0
9.8
±0.2
-
- 8.9
±0.5
9.1
±0.3
Lem
on
2.9
±1.0
-
9.0
±0.9
6.4
±0.7
6.2
±0.8
4.7
±2.1
-
- -
-
Lem
on
gra
ss
32.6
±1.0
†
10.1
±0.2
29.2
±0.9
27.6
±0.7
36.9
±0.8
†
26.8
±2.1
-
- 14.2
±1.5
24.6
±2.6
Lim
e
14.7
±0.8
10.6
±1.1
11.1
±0.3
12.8
±0.6
10.1
±0.8
10.1
±0.7
-
- 12.0
±0.6
11.6
±0.2
Ma
nu
ka
7.3
±0.3
5.3
±1.5
19.7
±4.0
20.9
±3.9
21.6
±4.7
17.3
±3.7
-
- 5.0
±1.2
-
Sw
ee
t O
ran
ge
9.1
±1.9
3.0
±1.3
11.3
±3.2
7.9
±3.5
9.3
±5.4
7.4
±4.3
-
- 2.3
±1.3
-
Ro
se G
era
niu
m
18.3
±0.3
11.3
±0.3
17.7
±0.6
15.5
±0.8
12.3
±0.4
13.4
±0.3
5.3
±1.0
-
8.6
±0.2
11.4
±0.6
Ro
sem
ary
15.6
±1.2
16.1
±0.3
16.8
±0.7
19.5
±2.1
19.2
±1.4
†
17.4
±1.1
-
- 16.5
±1.3
14.7
±1.4
Ro
sew
oo
d
21.7
±2.0
14.7
±0.7
16.4
±2.1
20.3
±1.0
16.2
±0.4
14.0
±0.7
-
- 20.0
4±1
.1†
16.6
±0.5
Tea T
ree
16.7
±0.6
16.4
±0.6
23.4
±1.7
22.4
±2.1
17.2
±0.5
13.5
±1.0
-
- 18.9
±1.2
†
16.6
±0.7
Th
ym
e
46.2
±4.8
†
37.2
±1.1
†
48.2
±2.1
†
36.4
±2.2
35.4
±3.0
†
35.8
±2.8
†
21.2
±2.0
17.1
±4.5
41.6
±2.1
†
36.4
±5.3
†
Gen
tam
icin
* 24.4
±0.2
22.7
±0.2
27.7
±0.2
35.3
±0.2
12.4
±0.2
26.4
±0.2
20.3
±0.2
26.0
±0.0
12.1
±0.1
19.6
±0.2
* g
en
tam
icin
dis
c (
30
µg
)
- n
o a
ctivity
† v
alu
e is s
ign
ific
an
tly g
rea
ter
tha
n g
en
tam
icin
positiv
e r
efe
ren
ce
(P
<0
.05
)
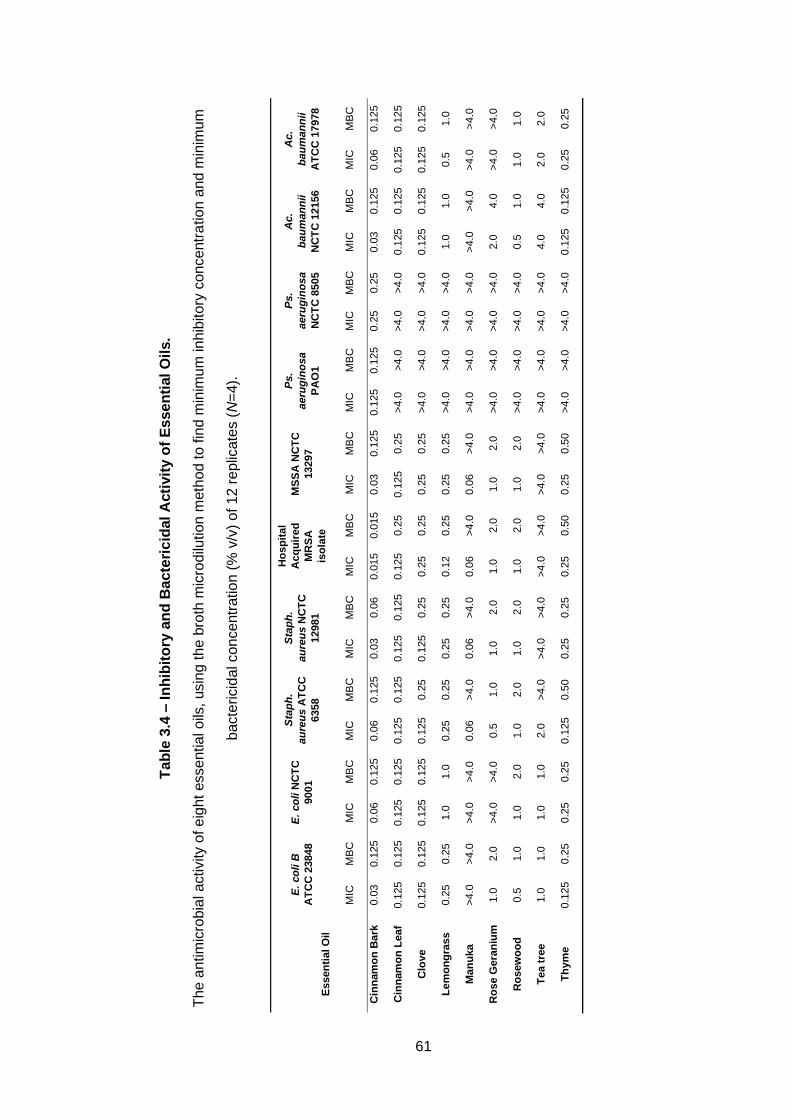
61
Ta
ble
3.4
– I
nh
ibit
ory
an
d B
acte
ric
idal A
cti
vit
y o
f E
sse
nti
al O
ils.
The
an
tim
icro
bia
l a
ctivity o
f e
ight
esse
ntia
l o
ils, usin
g t
he b
roth
mic
rodilu
tion
meth
od
to
fin
d m
inim
um
in
hib
ito
ry c
once
ntr
atio
n a
nd
min
imu
m
bacte
ricid
al concentr
ation (
% v
/v)
of 12 r
eplic
ate
s (
N=
4).
Essen
tial O
il
E.
co
li B
AT
CC
23848
E.
co
li N
CT
C
9001
Sta
ph
.
au
reu
s A
TC
C
6358
Sta
ph
.
au
reu
s N
CT
C
12981
Ho
sp
ital
Acq
uir
ed
MR
SA
iso
late
MS
SA
NC
TC
13297
Ps.
aeru
gin
os
a
PA
O1
Ps.
aeru
gin
os
a
NC
TC
8505
Ac.
ba
um
an
nii
NC
TC
12156
Ac.
ba
um
an
nii
AT
CC
17978
M
IC
MB
C
MIC
M
BC
M
IC
MB
C
MIC
M
BC
M
IC
MB
C
MIC
M
BC
M
IC
MB
C
MIC
M
BC
M
IC
MB
C
MIC
M
BC
Cin
nam
on
Bark
0.0
3
0.1
25
0.0
6
0.1
25
0.0
6
0.1
25
0.0
3
0.0
6
0.0
15
0.0
15
0.0
3
0.1
25
0.1
25
0.1
25
0.2
5
0.2
5
0.0
3
0.1
25
0.0
6
0.1
25
Cin
nam
on
Leaf
0.1
25
0.1
25
0.1
25
0.1
25
0.1
25
0.1
25
0.1
25
0.1
25
0.1
25
0.2
5
0.1
25
0.2
5
>4.0
>
4.0
>
4.0
>
4.0
0.1
25
0.1
25
0.1
25
0.1
25
Clo
ve
0.1
25
0.1
25
0.1
25
0.1
25
0.1
25
0.2
5
0.1
25
0.2
5
0.2
5
0.2
5
0.2
5
0.2
5
>4.0
>
4.0
>
4.0
>
4.0
0.1
25
0.1
25
0.1
25
0.1
25
Le
mo
ng
rass
0.2
5
0.2
5
1.0
1.0
0.2
5
0.2
5
0.2
5
0.2
5
0.1
2
0.2
5
0.2
5
0.2
5
>4.0
>
4.0
>
4.0
>
4.0
1.0
1.0
0.5
1.0
Ma
nu
ka
>4.0
>
4.0
>
4.0
>
4.0
0.0
6
>4.0
0.0
6
>4.0
0.0
6
>4.0
0.0
6
>4.0
>
4.0
>
4.0
>
4.0
>
4.0
>
4.0
>
4.0
>
4.0
>
4.0
Ro
se G
era
niu
m
1.0
2.0
>
4.0
>
4.0
0.5
1.0
1.0
2.0
1.0
2.0
1.0
2.0
>
4.0
>
4.0
>
4.0
>
4.0
2.0
4.0
>
4.0
>
4.0
Ro
sew
oo
d
0.5
1.0
1.0
2.0
1.0
2.0
1.0
2.0
1.0
2.0
1.0
2.0
>
4.0
>
4.0
>
4.0
>
4.0
0.5
1.0
1.0
1.0
Tea t
ree
1.0
1.0
1.0
1.0
2.0
>
4.0
>
4.0
>
4.0
>
4.0
>
4.0
>
4.0
>
4.0
>
4.0
>
4.0
>
4.0
>
4.0
4.0
4.0
2.0
2.0
Th
ym
e
0.1
25
0.2
5
0.2
5
0.2
5
0.1
25
0.5
0
0.2
5
0.2
5
0.2
5
0.5
0
0.2
5
0.5
0
>4.0
>
4.0
>
4.0
>
4.0
0.1
25
0.1
25
0.2
5
0.2
5
62
3.3.7 Gas chromatography mass spectrometry (GC-MS) analysis
Components of cinnamon bark and cinnamon leaf EO and their percentage
composition are reported in Table 3.5. Cinnamon bark EO is composed of
85.312% Σ-cinnamaldehyde, whereas cinnamon leaf EO is 84.481% eugenol.
3.3.8 Time-kill assay
A time-kill assay was performed to evaluate the bactericidal potential of
cinnamon bark EO against P. aeruginosa PAO1 (Figure 3.3). At the MIC,
0.125% (v/v), cinnamon bark EO was bactericidal (three-log reduction) against
P. aeruginosa PAO1 after 6 h. At concentrations two-fold and four-fold of the
MIC, 0.25% (v/v) and 0.5% (v/v), a 99.999% (five-log) kill, was achieved within
30 and 6 min respectively. At the higher EO concentrations of 1% and 2%
(v/v), 5-log reduction was achieved within 2 min.
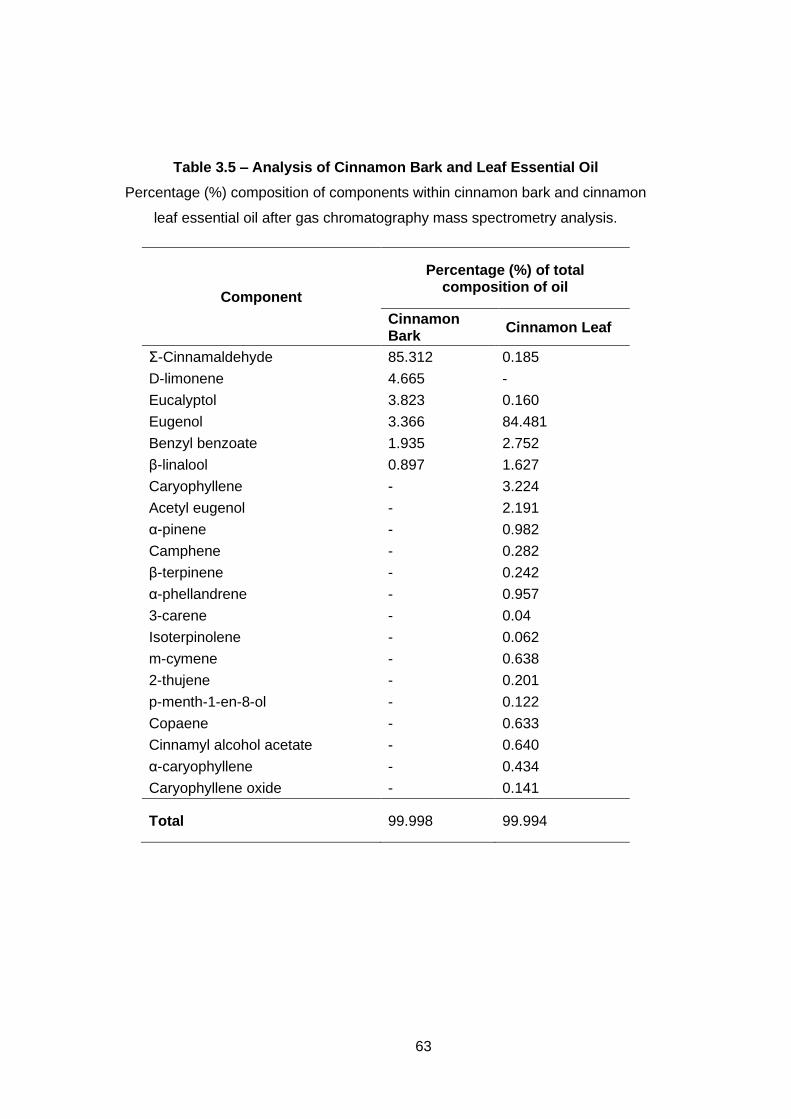
63
Table 3.5 – Analysis of Cinnamon Bark and Leaf Essential Oil
Percentage (%) composition of components within cinnamon bark and cinnamon
leaf essential oil after gas chromatography mass spectrometry analysis.
Component
Percentage (%) of total composition of oil
Cinnamon Bark
Cinnamon Leaf
Σ-Cinnamaldehyde 85.312 0.185
D-limonene 4.665 -
Eucalyptol 3.823 0.160
Eugenol 3.366 84.481
Benzyl benzoate 1.935 2.752
β-linalool 0.897 1.627
Caryophyllene - 3.224
Acetyl eugenol - 2.191
α-pinene - 0.982
Camphene - 0.282
β-terpinene - 0.242
α-phellandrene - 0.957
3-carene - 0.04
Isoterpinolene - 0.062
m-cymene - 0.638
2-thujene - 0.201
p-menth-1-en-8-ol - 0.122
Copaene - 0.633
Cinnamyl alcohol acetate - 0.640
α-caryophyllene - 0.434
Caryophyllene oxide - 0.141
Total 99.998 99.994
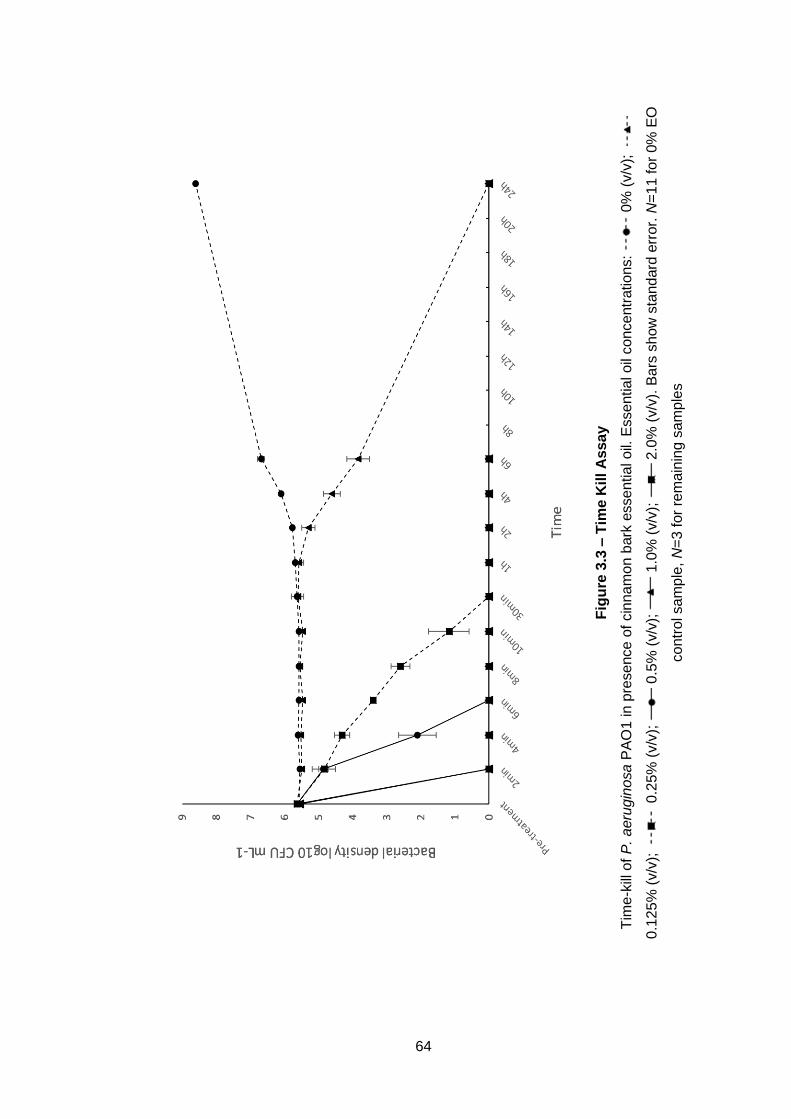
64
Fig
ure
3.3
– T
ime K
ill A
ssay
Tim
e-k
ill o
f P
. a
eru
gin
osa
PA
O1
in p
rese
nce
of
cin
na
mo
n b
ark
esse
ntia
l o
il. E
sse
ntia
l o
il co
nce
ntr
atio
ns:
0%
(v/v
);
0.1
25
% (
v/v
);
0.2
5%
(v/v
);
0.5
% (
v/v
);
1.0
% (
v/v
);
2.0
% (
v/v
). B
ars
sh
ow
sta
nd
ard
err
or.
N=
11
fo
r 0%
EO
co
ntr
ol sa
mp
le, N
=3 f
or
rem
ain
ing s
am
ple
s
65
3.3.9 Metabolic activity assay
Reduction of TTC from a yellow to red colour was observed in microtitre wells
containing viable P. aeruginosa, but no colour change was observed when
cells were non-viable (Figure 3.4). Negative control wells with TSB containing
no bacteria remained clear with no colour change. P. aeruginosa continued to
show metabolic activity after 10 min of contact time when cinnamon bark EO
was at 0%, 0.125% and 0.25% (v/v), with some activity after 4 min contact time
with EO at 0.5% (v/v), but no activity after 6 min. Metabolic activity had ceased
after 2 min of contact time at concentrations equal or greater to 1% (v/v).
3.3.10 Scanning electron microscopy (SEM)
Electron micrographs of both untreated and cinnamon bark EO treated P.
aeruginosa cells are presented in Figures 4.5-4.8. The untreated cells (
Figure 3.5 and Figure 3.6) show a turgid structure with a particulate surface
and are of expected lengths (1 to 5 µm). In contrast, cells treated with
cinnamon bark EO showed an altered morphology (Figure 3.7 and
Figure 3.8) with cells appearing collapsed with loss of turgidity and few surface
particles after 10 min contact time with 2% (v/v) cinnamon bark EO.
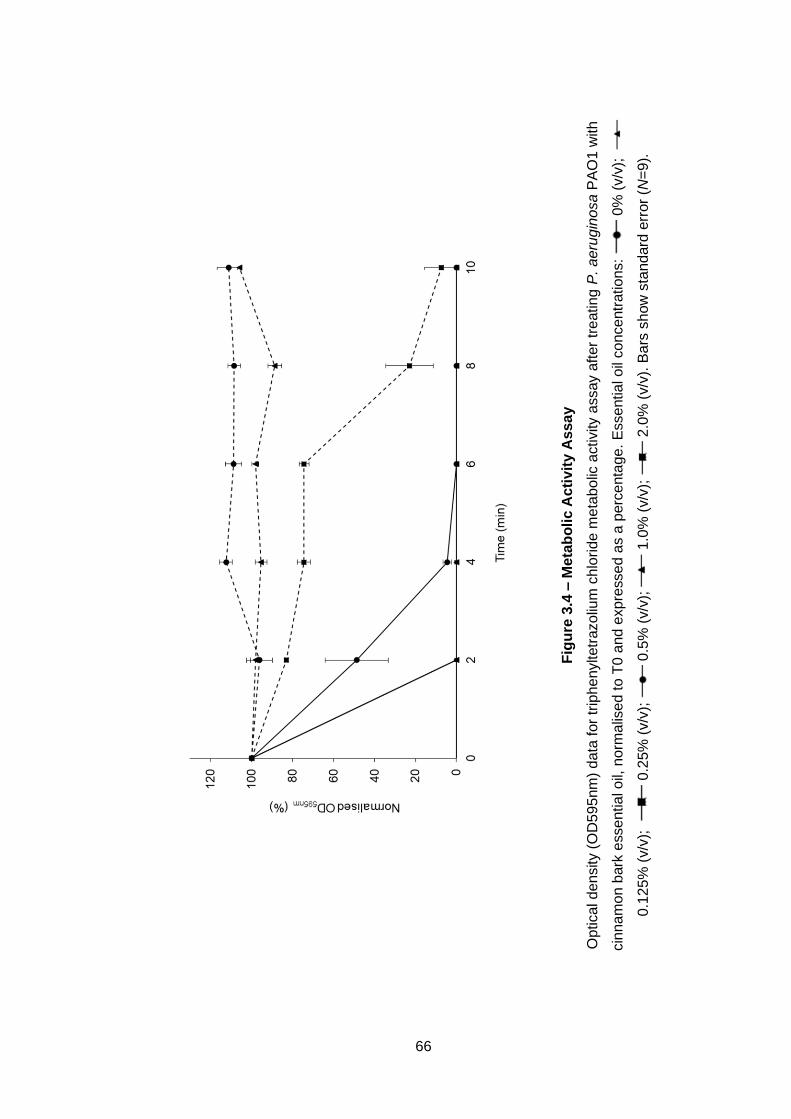
66
Fig
ure
3.4
– M
eta
bo
lic A
cti
vit
y A
ssa
y
Op
tical d
en
sity (
OD
595
nm
) d
ata
for
trip
he
nyltetr
azo
lium
ch
loride
me
tab
olic
activity a
ssay a
fter
tre
atin
g P
. a
eru
gin
osa P
AO
1 w
ith
cin
na
mo
n b
ark
esse
ntia
l o
il, n
orm
alis
ed to T
0 a
nd e
xpre
sse
d a
s a
perc
enta
ge
. E
sse
ntia
l o
il co
nce
ntr
atio
ns:
0%
(v/v
);
0.1
25
% (
v/v
);
0.2
5%
(v/v
);
0.5
% (
v/v
);
1.0
% (
v/v
);
2.0
% (
v/v
). B
ars
sh
ow
sta
nd
ard
err
or
(N=
9).
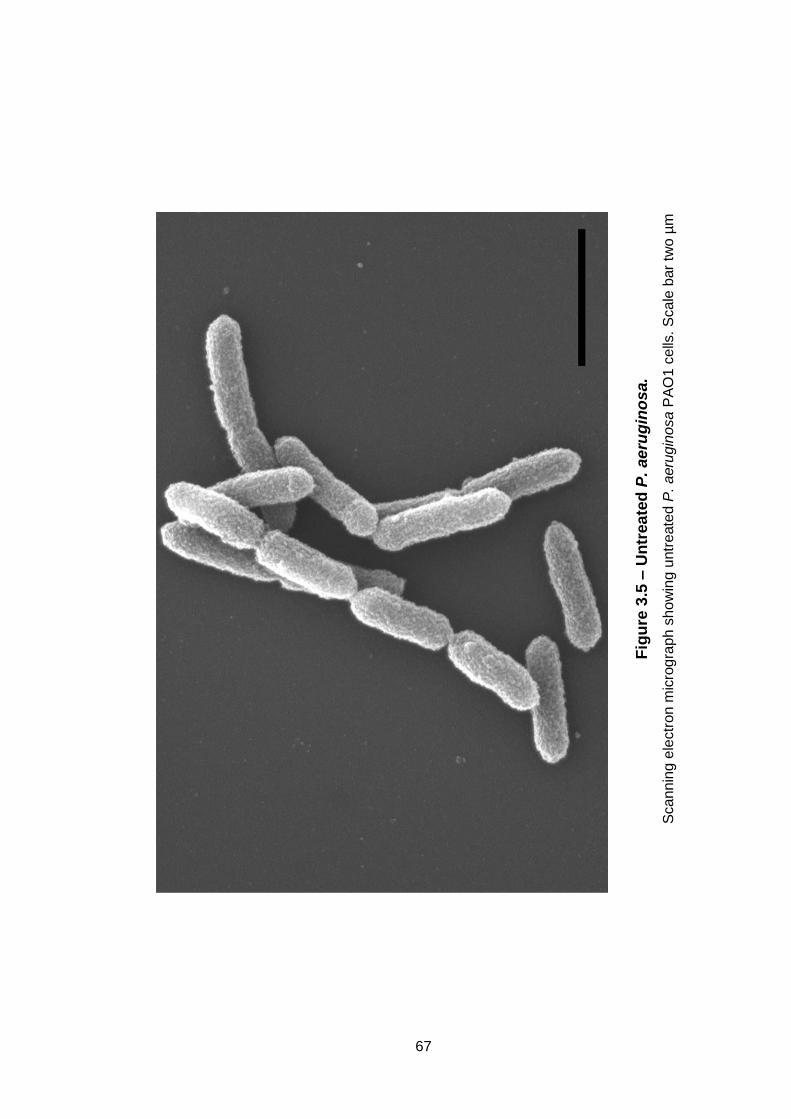
67
Fig
ure
3.5
– U
ntr
ea
ted
P.
ae
rug
ino
sa.
Sca
nn
ing e
lectr
on m
icro
gra
ph
sh
ow
ing u
ntr
eate
d P
. a
eru
gin
osa
PA
O1
ce
lls.
Sca
le b
ar
two
µm
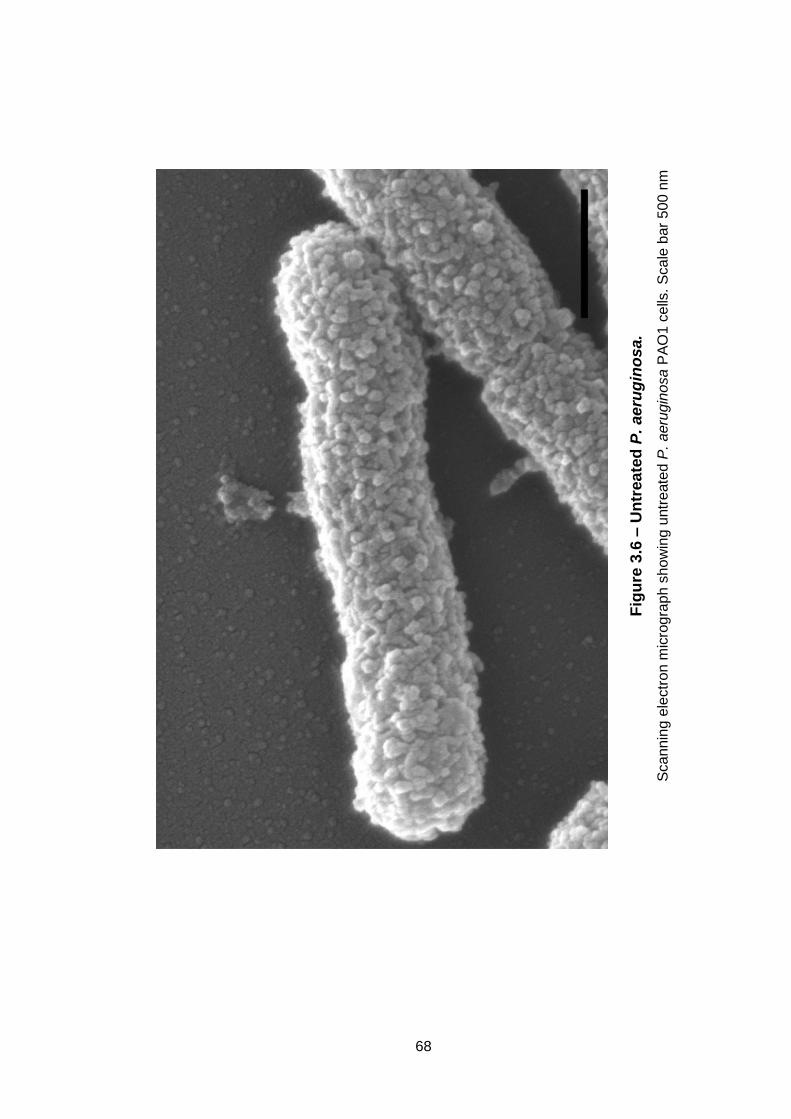
68
Fig
ure
3.6
– U
ntr
ea
ted
P.
ae
rug
ino
sa.
Sca
nn
ing e
lectr
on m
icro
gra
ph
sh
ow
ing u
ntr
eate
d P
. a
eru
gin
osa
PA
O1
ce
lls.
Sca
le b
ar
500 n
m
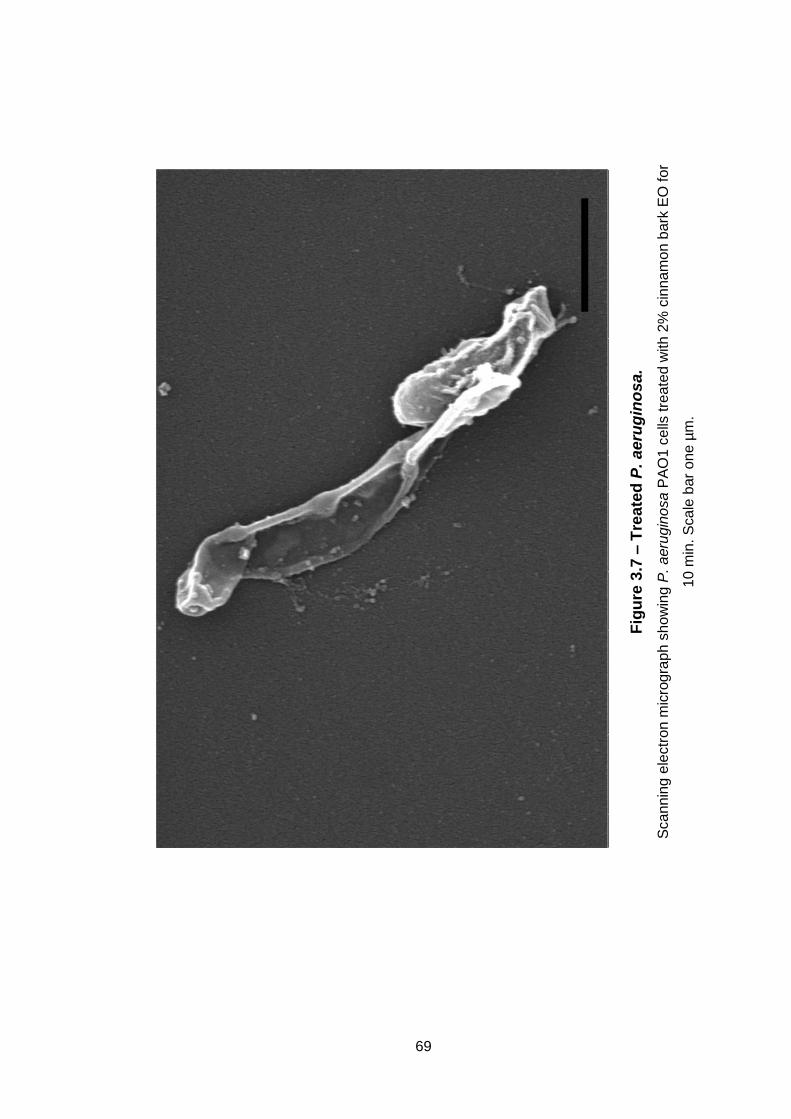
69
Fig
ure
3.7
– T
rea
ted
P.
aeru
gin
os
a.
Sca
nn
ing e
lectr
on m
icro
gra
ph
sh
ow
ing P
. a
eru
gin
osa
PA
O1 c
ells
tre
ate
d w
ith
2%
cin
na
mo
n b
ark
EO
fo
r
10 m
in. S
ca
le b
ar
one µ
m.
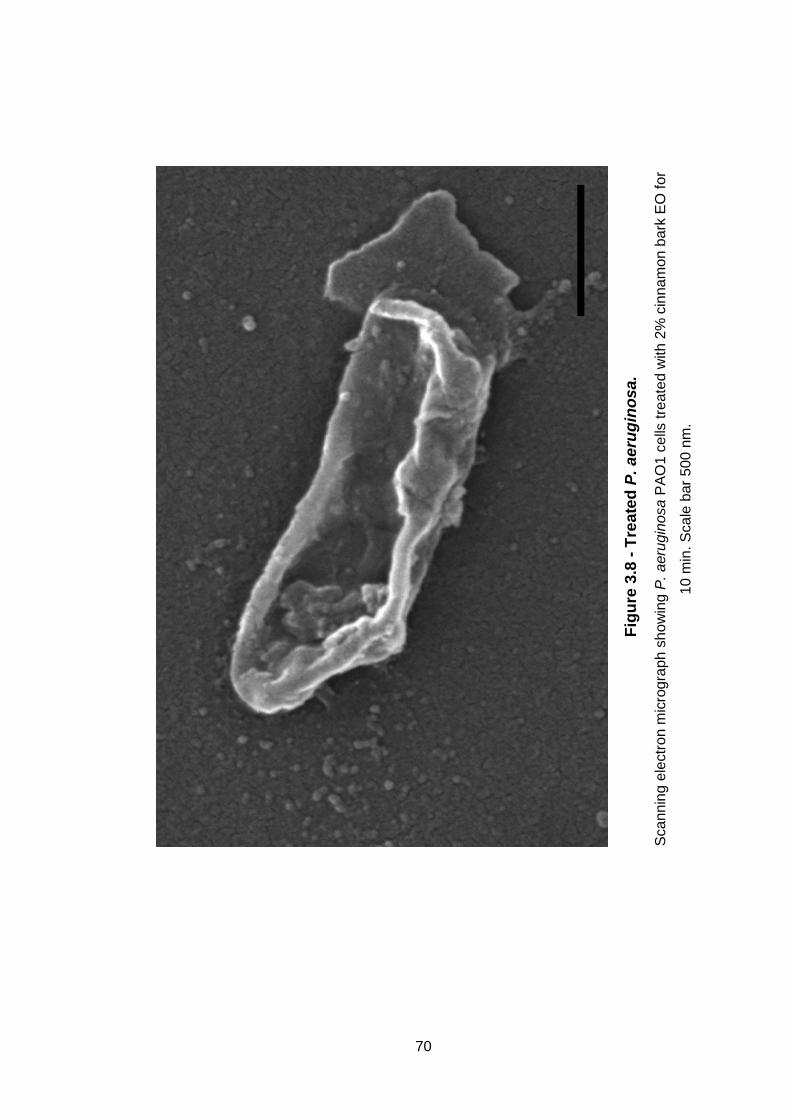
70
Fig
ure
3.8
- T
rea
ted
P.
ae
rug
ino
sa
.
Sca
nn
ing e
lectr
on m
icro
gra
ph
sh
ow
ing P
. a
eru
gin
osa
PA
O1 c
ells
tre
ate
d w
ith
2%
cin
na
mo
n b
ark
EO
fo
r
10 m
in. S
ca
le b
ar
500 n
m.
71
3.3.11 Release of nucleic acids and proteins
Relative optical densities of filtrate from P. aeruginosa untreated or treated
with cinnamon bark EO measured at 260 nm and 280 nm are displayed in
Figure 3.9 and Figure 3.10, respectively. Increased OD260 nm readings signifies
an increase in nucleic acids, whilst an increase in OD280 nm indicates an
increase in proteins (Miksusanti et al. 2008) released from bacterial cells. An
increase was seen in both OD260 nm and OD280 nm when bacteria were treated
with cinnamon bark EO at either 0.125% or 2% (v/v) when compared to the
untreated cultures. Release of nucleic acids was significantly different after
treatment with 0.125% (v/v) EO (P<0.05) and 2% (v/v) EO (P<0.01) when
compared to untreated bacteria.
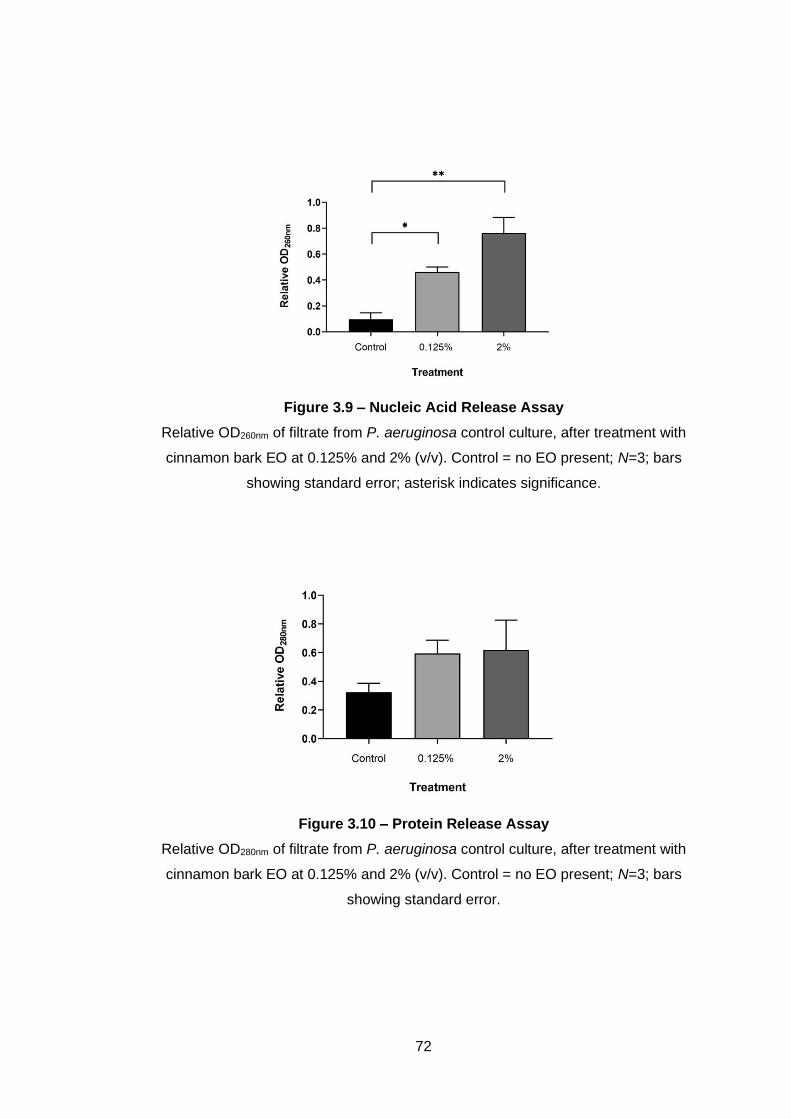
72
Figure 3.9 – Nucleic Acid Release Assay
Relative OD260nm of filtrate from P. aeruginosa control culture, after treatment with
cinnamon bark EO at 0.125% and 2% (v/v). Control = no EO present; N=3; bars
showing standard error; asterisk indicates significance.
Figure 3.10 – Protein Release Assay
Relative OD280nm of filtrate from P. aeruginosa control culture, after treatment with
cinnamon bark EO at 0.125% and 2% (v/v). Control = no EO present; N=3; bars
showing standard error.
73
3.4 Discussion
When searching for novel antimicrobials, several different methods can be
employed to establish the MIC value of an antimicrobial, with more common
techniques including broth microdilution. When using essential oils (EOs) as
an antimicrobial, their hydrophobicity often poses a problem when trying to
disperse them in solutions for dilution. A solvent is often used in antimicrobial
screening to assist with the dilution of insoluble compounds, and DMSO is a
frequently chosen solvent in broth dilution methods (Ugur et al. 2016, Oliveira
et al. 2017, Brahmbhatt et al. 2018, Romulo et al. 2018). The effects of
solvents on bacterial growth have been investigated in other studies
(Wadhwani et al. 2012), which found DMSO to be the best solvent when used
at concentrations of 3% or less compared to methanol or ethanol. The
suitability of DMSO amongst the Gram-negative and Gram-positive bacteria
used in this study was assessed. DMSO when used at concentrations <2.5%
(v/v) had little to no effect on the growth of any organism, with the exception
of E. coli B (ATCC 23848), which is similar to the findings previously seen in
the study by Wadhwani et al. (2012). However, in the present study, E. coli B
(ATCC 23848) in the presence of either concentration of DMSO showed a
promotion of growth, double that of the control, and produced an unpleasant
odour after overnight incubation. Similar results were reported by Markarian et
al. (2002) who found that the growth rate of E. coli in the presence of DMSO
(1-2% concentration) was almost 4-fold higher than the control. However,
there was no report of an emitted odour. Following headspace analysis using
SIFT-MS, it was shown that when E. coli was grown in the presence DMSO,
DMS was produced at levels 100-fold greater than if grown without. DMS is an
74
organosulphur compound that is ubiquitous in marine environments and
released by phytoplankton and algae (Todd et al. 2010). DMS is also known
to have an unpleasant odour (Siebert et al. 2010). DMS has been shown to be
a product of E. coli in studies looking at DMS production in co-cultured blood
samples (Umber et al. 2013), and in studies of volatile organic compounds
produced by inoculated urine samples (Storer et al. 2011). Umber et al. (2013)
speculate that this DMS production could be a stress related response of E.
coli in the presence of bactericidal components. However, data from Storer et
al. (2011), coupled with findings from the present study, suggest that DMS is
produced without the presence of an antimicrobial compound. Many
microorganisms use DMSO as a terminal electron acceptor, ultimately
reducing the compound to DMS through use of a DMSO reductase (De Bont
et al. 1981), and it has been reported that E. coli possesses several of these
DMSO reductase enzymes (Sambasivarao et al. 1991).
Due to the increased growth exhibited by E. coli in the presence of DMSO,
further investigations were carried out to assess whether DMSO affected EO
MIC values against this strain. This was determined by the use of an
alternative method of antimicrobial testing, the agar dilution method, that did
not use a solvent. It was established that the presence of DMSO did not have
an effect on results of antimicrobial testing, thus, DMSO was used throughout
this thesis as a solvent to aid in the homogeneity of essential oils in solutions.
This chapter continued to examine the effect of EOs against pathogenic
bacteria, some of which exhibit antimicrobial resistance. Disc diffusion assays
using EOs at 100% (v/v) concentration demonstrated antimicrobial activity
against a selected the panel of Gram-positive and Gram-negative bacteria and
75
proved to be a useful screening method to identify EOs that showed
antimicrobial activity against these organisms. The use of an established
antibiotic (gentamicin) provided a reference against which the sensitivity of the
bacteria was assessed, and EUCAST breakpoint tables were used to
determine expected zones of inhibition (EUCAST 2018). Gentamicin
sensitivity was observed in all tested bacteria with the exception of MRSA and
A. baumannii NCTC 12156. Zones of inhibition breakpoints conferring
resistance for MRSA and A. baumannii treated with gentamicin were >18 mm
and >17 mm, respectively.
Following the disc diffusion assay the greatest inhibitory activity was shown
following exposure to thyme, cinnamon bark and lemongrass. Of these, thyme
EO was most effective, an observation reported previously by Semeniuc et al.
(2017) where it was most effective when compared to three other oils.
Although the MRSA strain used was resistant to gentamicin in this study,
cinnamon bark, lemongrass, manuka, rosemary and thyme EOs all produced
zones greater than 18 mm, exceeding the resistance breakpoint of gentamicin
against this pathogen. A. baumannii NCTC 12156 also showed resistance
against gentamicin, although tea tree, thyme, rosewood, clove, cinnamon bark
and cinnamon leaf EOs all produced zones ≥ 17 mm, exceeding the resistance
breakpoint of gentamicin against this bacteria. These data are in line with
published reports (Doran et al. 2009, Adukwu et al. 2012, Priti and Shridhar
2012, Yap et al. 2014, Sakkas et al. 2016), which indicate that EOs are
capable of working effectively against bacteria resistant to commercial
antibiotics. However, as pointed out by Jorgensen and Ferraro (2009), whilst
the disc diffusion method has a place in routine or preliminary testing, the
76
results should be considered more qualitative than quantitative. Thus, further
testing was carried out to assess the minimum inhibitory (MIC) and minimum
bactericidal concentrations (MBC) of selected oils which produced the largest
zones of inhibition. MIC and MBC testing showed that lemon, lemongrass,
manuka, sweet orange and tea tree EO were more effective against the Gram-
positive bacteria in comparison to the Gram-negative bacteria. Lemongrass
and manuka in particular were shown to have lower MICs/MBCs for S. aureus
when compared to other bacteria tested. These findings are in agreement with
studies that found manuka EO to be more effective against S. aureus
compared to E. coli and P. aeruginosa (Porter and Wilkins 1998), and studies
where lemongrass EO also showed good effect against Gram-positive
bacteria (Hammer et al. 1999). In the present study, cinnamon bark at very
low concentrations (i.e. 0.015% v/v), was bactericidal against MRSA, which is
supported by Cui et al. (2016) where cinnamon oil was found to be bactericidal
against MRSA at 0.25 mg mL-1, approximately 0.025% (v/v).
Cinnamon leaf, clove, lemongrass, rosewood and thyme oils at <4% (v/v) were
bactericidal against all the bacteria, excluding Pseudomonas species. This is
in agreement with a study by Kavanaugh and Ribbeck (2012), who reported
that clove, thyme and tea tree EO were not bactericidal against Pseudomonas
spp. at concentrations less than or equal to 4% (v/v).
Other studies have shown that EOs are more effective against Gram-positive
bacteria (Lodhia et al. 2009), which is supported by some of the results
presented here. However, equal or greater efficacy was observed when the
Gram-negative bacteria were treated with some of the oils. Bergamot,
cinnamon bark, cinnamon leaf, clove, grapefruit, lime, rose geranium and
77
rosewood EOs all produced greater zones of inhibition in some Gram-negative
bacteria compared to zones produced for Gram-positive bacteria. Of the oils
tested for MIC, cinnamon leaf, clove, rosewood, tea tree and thyme had lower
or equal MIC for Gram-negative bacteria. Cinnamon bark EO demonstrated
bactericidal effects against all the strains used in this study at very low
concentrations (i.e. ≤ 0.25% v/v).
When comparing the oils to justify further testing, disc diffusion testing
indicated that cinnamon bark, lemongrass and thyme were most effective
overall, exhibiting the largest zones of inhibition on average. When looking at
MIC and MBC testing, again cinnamon bark and thyme were similar in their
efficacy. However, whilst both cinnamon bark and thyme exhibited broad
spectrum activity and efficacy at low concentrations, only cinnamon bark EO
was effective against Pseudomonas spp. at concentrations of <4% (v/v).
Therefore, cinnamon bark EO was selected for further investigations to identify
its capability of rapid bactericidal activity and its possible mode of action.
GC-MS analysis showed that the major component of cinnamon leaf oil used
in this study was eugenol, which was 84.5% of the total oil composition, a
similar finding to other published studies (Mallavarapu et al. 1995,
Paranagama et al. 2001, Raina et al. 2001, Jayawardena and Smith 2010). In
contrast, the major component of the cinnamon bark oil used in this study was
Σ-cinnamaldehyde at 85.3% of the total composition. The high levels of this
component in the bark EO has been demonstrated elsewhere in other studies
(Paranagama et al. 2001, Jayawardena and Smith 2010, Shahina et al. 2018).
This contrasting composition of the two oils provides an explanation of their
different effects as antimicrobials, as it has been shown that cinnamaldehyde
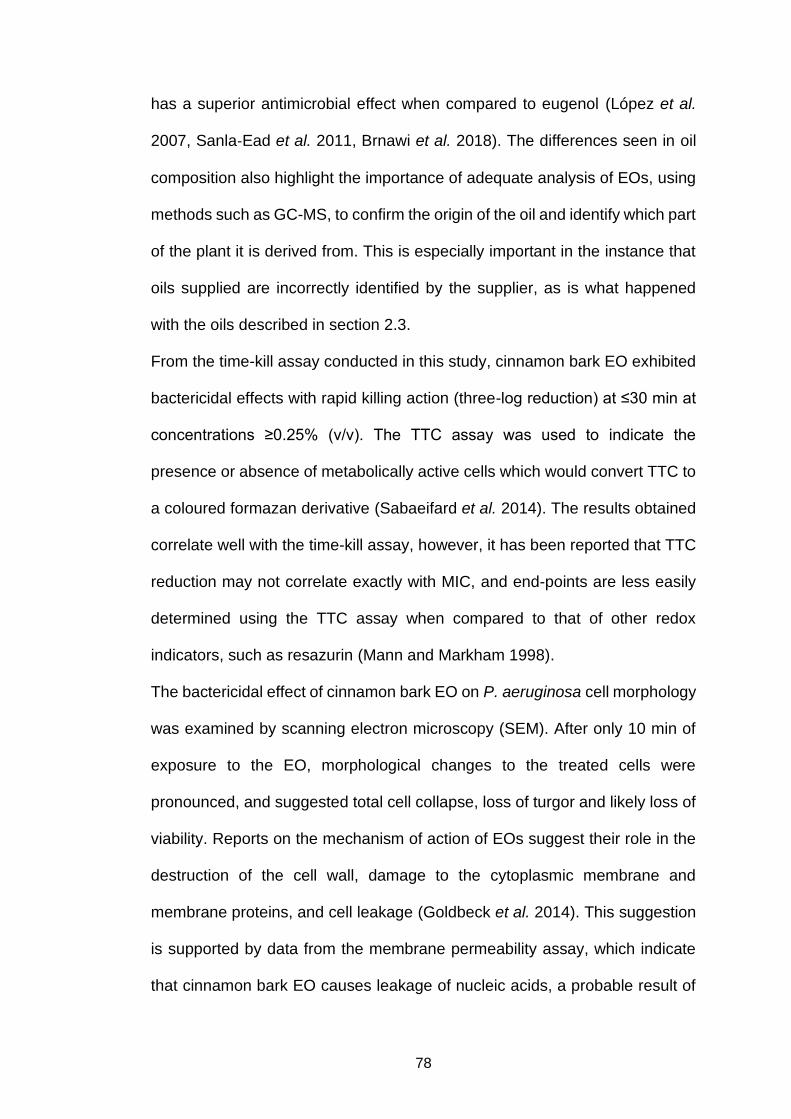
78
has a superior antimicrobial effect when compared to eugenol (López et al.
2007, Sanla-Ead et al. 2011, Brnawi et al. 2018). The differences seen in oil
composition also highlight the importance of adequate analysis of EOs, using
methods such as GC-MS, to confirm the origin of the oil and identify which part
of the plant it is derived from. This is especially important in the instance that
oils supplied are incorrectly identified by the supplier, as is what happened
with the oils described in section 2.3.
From the time-kill assay conducted in this study, cinnamon bark EO exhibited
bactericidal effects with rapid killing action (three-log reduction) at ≤30 min at
concentrations ≥0.25% (v/v). The TTC assay was used to indicate the
presence or absence of metabolically active cells which would convert TTC to
a coloured formazan derivative (Sabaeifard et al. 2014). The results obtained
correlate well with the time-kill assay, however, it has been reported that TTC
reduction may not correlate exactly with MIC, and end-points are less easily
determined using the TTC assay when compared to that of other redox
indicators, such as resazurin (Mann and Markham 1998).
The bactericidal effect of cinnamon bark EO on P. aeruginosa cell morphology
was examined by scanning electron microscopy (SEM). After only 10 min of
exposure to the EO, morphological changes to the treated cells were
pronounced, and suggested total cell collapse, loss of turgor and likely loss of
viability. Reports on the mechanism of action of EOs suggest their role in the
destruction of the cell wall, damage to the cytoplasmic membrane and
membrane proteins, and cell leakage (Goldbeck et al. 2014). This suggestion
is supported by data from the membrane permeability assay, which indicate
that cinnamon bark EO causes leakage of nucleic acids, a probable result of
79
a compromised cell membrane. This is in agreement with Bouhdid et al. (2010)
who found that cinnamon bark oil affected the membrane of P. aeruginosa
which ultimately led to cell death. This contrasts however, with the findings by
Cox and Markham (2007) and Helander et al. (2000) who showed that Σ-
cinnamaldehyde, a predominant component of the cinnamon bark EO used in
this study, did not have an effect on the membrane of P. aeruginosa and was
deemed to not be a pore forming compound. This highlights the importance of
using whole oils, and not their isolated compounds, as it may not reflect the
antimicrobial capability of an oil. It also further highlights the need for oil
analysis to identify the blend of different compounds present and the role they
play in the antimicrobial effects of an EO.
Cinnamon EO is sourced from either the bark or the leaf of the plants (Park et
al. 2018), with the EO extracted from bark most often investigated for its
antimicrobial activity (Nabavi et al. 2015). Cinnamon bark EO is already well
described for its antimicrobial activity (Manso et al. 2014, Wu et al. 2015, Wen
et al. 2016, Zhang et al. 2016, Chouhan et al. 2017), and shown to be highly
bactericidal against Pseudomonas spp. (Utchariyakiat et al. 2016). However,
to our knowledge, the present study is the first to demonstrate the rapid killing
effect of the oil against P. aeruginosa, with contact times of <30 min.
Although 4% (v/v) was the highest concentration tested, and the maximum
concentration recommended by the manufacturer for topical use, cinnamon oil
is widely reported to be “Generally Regarded/Recognised as Safe” (GRAS)
(Tzortzakis 2008, Xing et al. 2011, Ojagh et al. 2014, Cui et al. 2016, Bravo
Cadena et al. 2018). As of May 2019, the Food and Drug Administration (FDA)
consider cinnamon bark EO, from either C. zeylanicum, C. cassia or C. loureirii
80
to be GRAS (FDA 2019). A study by Adams et al. (2004) further supported the
GRAS status of cinnamon oil after investigating the toxicity of 55 cinnamyl
derivatives commonly found in cinnamon oil, used as flavouring agents, and
determining them to be GRAS. Whilst toxicity testing for cinnamon oil is limited,
Ranasinghe et al. (2012) report that preclinical in vivo studies are yet to show
significant toxic effects but acknowledge that more clinical trials are needed to
further understand the therapeutic safety of cinnamon in humans. Also, many
of the studies that investigate toxicity of “cinnamon” in mouse or rat models
are in fact testing the pure cinnamaldehyde component (Jenner et al. 1964,
Hébert et al. 1994, Adams et al. 2004). However, cinnamon oil is recognised
as a skin irritant (Veal 1996). Several case reports of contact dermatitis were
described by Connolly et al. (2017), although patients in this report were
subsequently patch tested for allergies and were all confirmed to be sensitive
to cinnamaldehyde or other related compounds. A study by Bickers et al.
(2005) reported that cinnamaldehyde below a concentration of 1.25% will not
cause primary irritation, though it will be an irritant at concentrations greater
than 3%. With these reports in mind, safety regarding the use of these natural
compounds is a potential issue and risks must be recognised when contact
with humans (and other animals) occurs. However, as previously described,
antimicrobial effects of cinnamon bark oil seen in this study have been evident
at concentrations as low as 0.015% (v/v) and effective concentrations
throughout MIC testing do not exceed 0.25% (v/v). Furthermore, the intended
use of the EO reported in this study is not directly associated with oral or
dermal contact in humans. Contact would be the same as with any other
antimicrobial disinfectant or sanitiser, and so toxicity of cinnamon EO does not
81
pose the same risks as those reported in case studies regarding adverse
reactions (Bickers et al. 2005).
EOs have thus far shown their potential as antimicrobials, though their real-
world application is not limited to this function. EOs have been used as
antimicrobials, flavourings and fragrances in aromatherapy, medicine,
industrial food and drink production and the cosmetic industry (Baser and
Buchbauer 2015).
In summary, the preliminary experiments investigating DMSO highlighted the
importance of investigating solvents that are used to disperse EOs, which may
have an effect on results during antimicrobial screening. Growth promotion in
antimicrobial testing may lead to inoculum effect, causing significant increases
in MIC (Brook 1989), which would be detrimental to novel antimicrobial
screening, however in this instance DMSO did not have an effect on MIC
values. This chapter has also investigated the possible volatile organic
compounds that microorganisms may produce in the presence of solvents.
Further investigation of these compounds in the headspace of cultures
supplemented with solvents, and additional work to fully refine the SIFT-MS
analysis, is required. However, despite these limitations, this study highlights
the potential of this technique for the rapid identification of volatile compounds
in microbial cultures.
This chapter has shown that EOs are effective antimicrobial agents and many
possess broad-spectrum activity. Cinnamon bark EO in particular has
demonstrated strong bacteriostatic and bactericidal action against P.
aeruginosa. This provides a sound basis for further work to explore the use of
82
cinnamon bark EO as an alternative to conventional antimicrobial products
owing to its fast-acting bactericidal properties at low concentrations.
The work presents in this chapter has confirmed that cinnamon bark is an
antimicrobial EO which provides broad spectrum, high bactericidal activity
when used at low concentrations and within a short contact time. These
qualities make it an ideal candidate as an alternative to current antimicrobials,
for example on surfaces in clinical and food preparation applications, in
disinfection and infection control. Many studies investigating time kill and
bactericidal activity of EOs expose bacteria to longer contact times, though it
is important that shorter contact times are investigated, and this study
highlights the importance of performing antimicrobial tests using contact times
<10 min. Findings from this study further support the reports that the mode of
action of cinnamon bark EO against P. aeruginosa is due to effects on the
membrane of the bacteria, leading to cell leakage and cell death, shown here
by of SEM and membrane permeability assays. Although EOs are generally
recognised as safe (GRAS) by the Food and Drugs Administration (FDA),
including that of cinnamon (Maisanaba et al. 2017), more investigation is
needed to assess cinnamon EO’s application to control bacterial pathogens
and subsequent interaction with humans. This study also highlights the
importance of analysing these natural products before use, in order to
determine their composition and to identify their key components. The
composition and antimicrobial diversity observed amongst oils originating from
different parts of the same species of plant emphasises the need for batch
control and consistency when developing these oils for antimicrobial purposes.

83
CHAPTER 4
84
4 GROWTH OF BACTERIAL BIOFILMS AND TREATMENT OF
PSEUDOMONAS AERUGINOSA BIOFILMS WITH
CINNAMON BARK EO IN LIQUID PHASE
4.1 Introduction
An important feature of Pseudomonas is its ability to form and exist as robust,
protective biofilms which aids in its survival and resistance to antimicrobials
(Sabaeifard et al. 2014). Biofilm formation is often thought to be the primary
underlying cause for the failure of an antimicrobial agent, with 65-80% of all
infections believed to be biofilm-related (Coenye and Nelis 2010). Cells
existing as a biofilm often have an increased resistance to antimicrobial agents
of up to 10–1000 times, with multiple mechanisms of resistance recognised
within a single community (Mah and O’Toole 2001). The resistance to
antimicrobials shown by bacteria in biofilms can be explained by the failure of
the antimicrobial agent to penetrate the biofilm, largely due to the presence of
an exopolysaccharide matrix (EPS) that is secreted when the biofilm is
maturing (Butt and Khan 2015). Difficulty to treat biofilms, their increased
resistance and their significance in current infections, indicates a necessity to
develop new ways to combat them. The antimicrobial activity of many EOs,
including that of cinnamon EO against Pseudomonas spp., has been
investigated previously and some studies, including this thesis, have shown
that cinnamon bark EO has good antibacterial activity (Bouhdid et al. 2010,
Utchariyakiat et al. 2016). However, these studies did not assess the effects
of cinnamon bark EO against Pseudomonas biofilms. Where the effect of EOs
on biofilms have been studied using alternative EOs and biofilm bacteria (Kalia
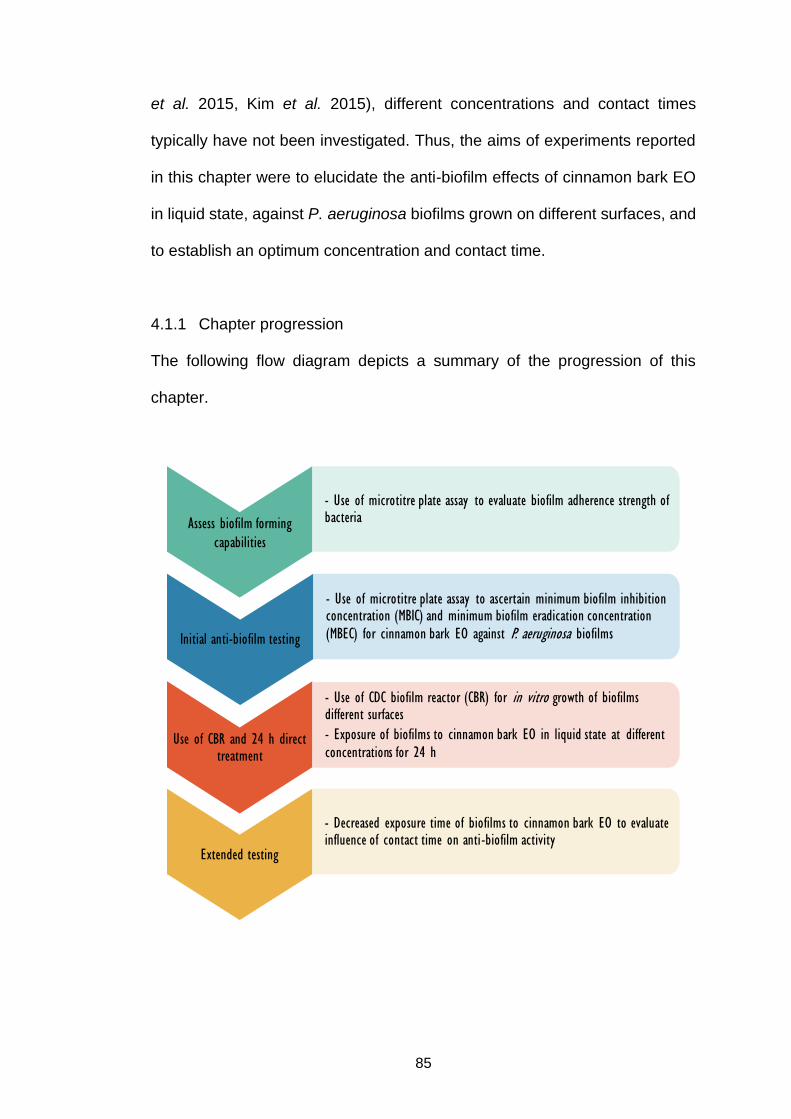
85
et al. 2015, Kim et al. 2015), different concentrations and contact times
typically have not been investigated. Thus, the aims of experiments reported
in this chapter were to elucidate the anti-biofilm effects of cinnamon bark EO
in liquid state, against P. aeruginosa biofilms grown on different surfaces, and
to establish an optimum concentration and contact time.
4.1.1 Chapter progression
The following flow diagram depicts a summary of the progression of this
chapter.
Assess biofilm forming
capabilities
- Use of microtitre plate assay to evaluate biofilm adherence strength of bacteria
Initial anti-biofilm testing
- Use of microtitre plate assay to ascertain minimum biofilm inhibition concentration (MBIC) and minimum biofilm eradication concentration (MBEC) for cinnamon bark EO against P. aeruginosa biofilms
Use of CBR and 24 h direct treatment
- Use of CDC biofilm reactor (CBR) for in vitro growth of biofilms different surfaces
- Exposure of biofilms to cinnamon bark EO in liquid state at different concentrations for 24 h
Extended testing
- Decreased exposure time of biofilms to cinnamon bark EO to evaluate influence of contact time on anti-biofilm activity
86
4.2 Methods
4.2.1 Crystal violet (CV) biofilm assay
CV biofilm assay was carried out as described in section 2.4.1.
4.2.2 Minimum biofilm inhibition concentration (MBIC)
Methods to assess MBIC concentration were adapted from Stepanović et al.
(2000) and Adukwu et al. (2012) and were similar to methods described in
section 2.4.1. An overnight culture of P. aeruginosa was standardised to ~1.5
x 108 CFU mL-1 as described in section 2.2, with the exception of being diluted
with TSB medium supplemented with 1% (v/v) glucose. One hundred
microliters of this suspension were added to each well of a 96-well microtitre
plate, in addition to 100 µL of TSB containing cinnamon bark EO
concentrations, ranging from 0.015% to 2% (v/v) (prepared as described in
section 2.3.2). Negative controls contained no EO. Plates were incubated at
37°C for 24 h. Then each well was carefully aspirated and washed three times
using 250 µl of sterile phosphate buffered saline (PBS). Bacteria were fixed
using 200 µL of methanol for 15 min, wells were emptied and then air dried.
After air drying, wells were stained with 250 µL of 0.1% crystal violet for 5 min.
Excess stain was removed by rinsing with tap water. After leaving to air dry,
the bound stain was solubilised with 250 µl of 33% (v/v) acetic acid. The optical
density (OD) of wells in the plate was then read using a TECAN Infinite® 200
PRO plate reader at 595 nm. Absorbance values of oil dilutions were
subtracted from OD values to correct for turbidity exhibited by oils. Inhibition
of biofilm growth was indicated if the OD was less than or equal to the OD cut-
off (ODc), defined as three standard deviations above the mean OD of the
87
negative control. Three wells were used per EO concentration and the
experiment was independently carried out in triplicate.
4.2.3 Minimum biofilm eradication concentration (MBEC)
Methods for assessing MBEC were adapted from Malic et al. (2013). Briefly,
wells of a 24-well microtitre plate were filled with 1 mL of overnight culture that
was standardised to ~1.5 x 10⁸ CFU mL-1, as described in section 2.2, with the
exception of being diluted with TSB medium supplemented with 1% (v/v)
glucose. Plates were incubated at 37°C for 24 h. Next, the medium was
removed gently using a pipette and wells were washed with 1 mL of PBS. EO
dilutions were prepared as described in section 2.3.2 and 1 mL of each EO
was added to separate biofilms wells. Plates were incubated for a further 24 h
at 37°C. The medium again was removed gently by aspiration and wells were
washed with PBS. One millilitre of TSB was added to each biofilm, followed by
disruption via repeated agitation with a pipette. Aliquots (100 µL) of each well
were plated onto MHA in triplicate and incubated at 37°C for 24 h and
observed for growth. The same 24 well plates were incubated for a further 6 h
under the same conditions as before and aliquots were removed and plated
after this time, to assess bacterial viability. MBEC was defined as the lowest
concentration of EO capable of preventing regrowth after subsequent 6 h
incubation step. Three independent experiments were carried out in triplicate.
88
4.2.4 Growth of P. aeruginosa biofilms in the Centre for Disease Control
biofilm reactor (CBR)
Standardised 48 h mature P. aeruginosa PAO1 biofilms were grown on
polycarbonate (PC) or stainless steel 316L (SS) coupons using the CBR as
described in section 2.4.2.
4.2.5 Essential oil
Cinnamon bark EO was used as described in section 2.3.
4.2.6 Direct treatment of biofilms grown in CBR
A schematic of this method is demonstrated in Figure 4.1. Dilutions of
cinnamon EO were made in 30 mL TSB to achieve concentrations of 2%, 0.2%
and 0.02% (v/v), with DMSO used as a solvent at concentrations of 1.25%,
0.125% and 0.0125% (v/v), respectively. A control was used for each
treatment with only TSB and DMSO at respective concentrations. Rods from
the CBR holding mature biofilms, on either PC or SS coupons were removed
from the reactor, rinsed with sterile phosphate buffered saline (PBS) and
placed into the TSB containing cinnamon bark EO, previously described. Rods
were removed from the treatment after 24 h of contact. In some cases, further
testing at 5, 10, 30, 60 min and 6 and 12 h was carried out. After removal from
treatment, rods were rinsed in sterile PBS and each coupon released into 10
mL of TSB, sonicated for 10 min and vortexed for 30 s. The disaggregated
biofilms were diluted serially and plated onto MHA and incubated at 37°C for
24 h. The CFU mL-1 from three coupons were enumerated for each condition
per experiment and the experiment was repeated in triplicate. Results were
89
expressed as mean log CFU mL-1. When 10-0 dilution was plated, limit of
detection was 10 CFU mL-1.
4.2.7 Data analysis
Two-Way ANOVA and comparison of column factors was used to assess
significant differences between treatments and controls following direct
treatment of biofilms.
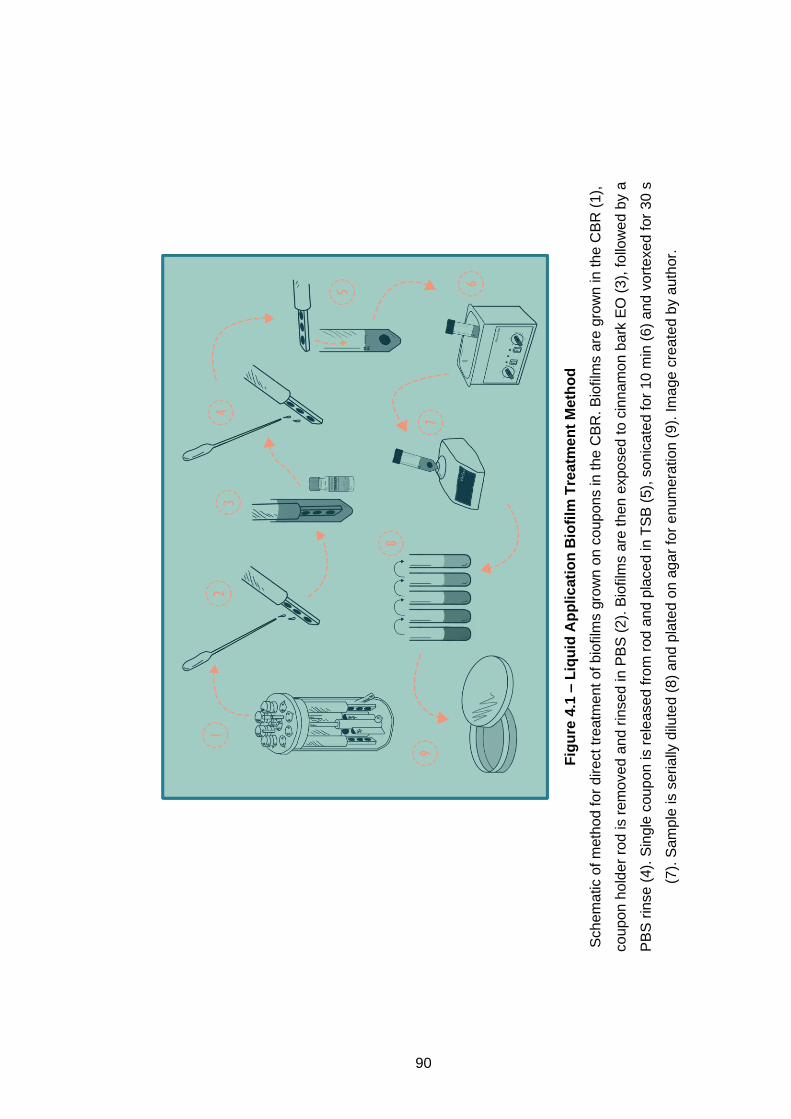
90
Fig
ure
4.1
– L
iqu
id A
pp
lic
ati
on
Bio
film
Tre
atm
en
t M
eth
od
Sch
em
atic o
f m
eth
od
fo
r d
ire
ct tr
eatm
ent o
f b
iofilm
s g
row
n o
n c
oup
on
s in
th
e C
BR
. B
iofilm
s a
re g
row
n in t
he C
BR
(1),
co
up
on
ho
lder
rod is r
em
oved
an
d r
insed
in P
BS
(2
). B
iofilm
s a
re th
en
expo
sed
to c
inna
mo
n b
ark
EO
(3
), fo
llow
ed b
y a
PB
S r
inse (
4).
Sin
gle
cou
po
n is r
ele
ase
d fro
m r
od
an
d p
laced in
TS
B (
5),
so
nic
ate
d fo
r 1
0 m
in (
6)
and
vo
rte
xed
for
30 s
(7).
Sam
ple
is s
eria
lly d
ilute
d (
8)
and
pla
ted o
n a
ga
r fo
r e
nu
mera
tion
(9
). Im
age
cre
ate
d b
y a
uth
or.
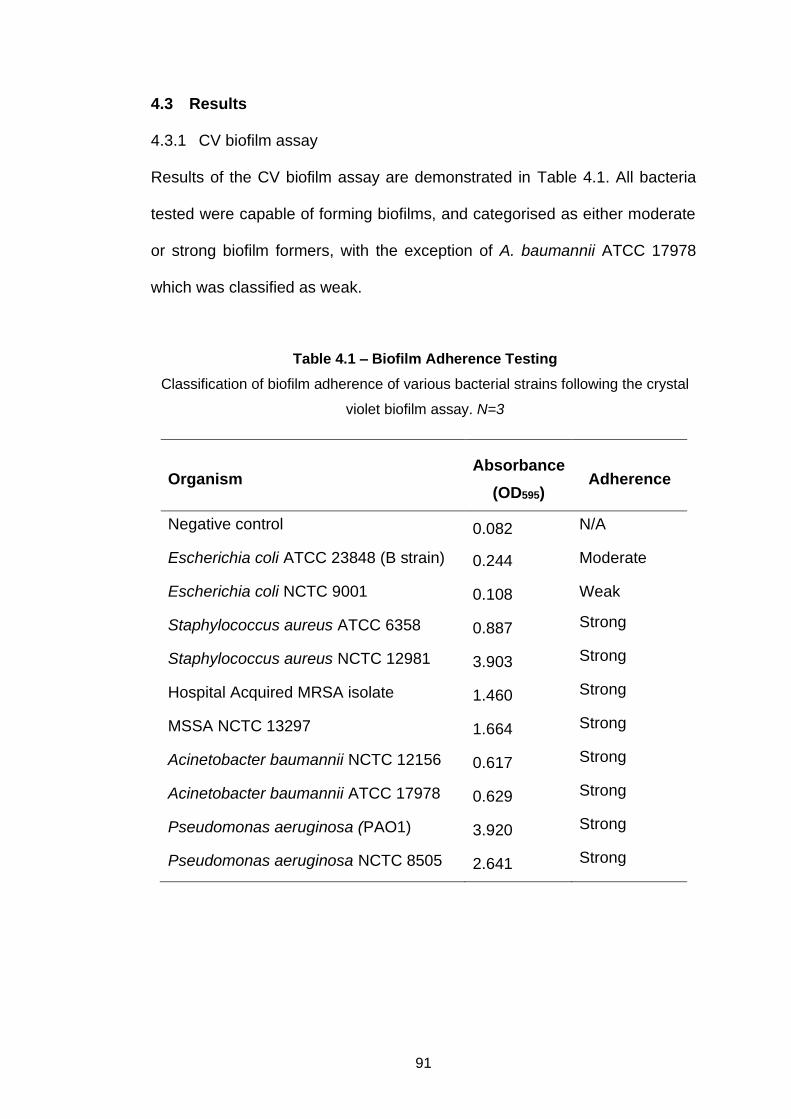
91
4.3 Results
4.3.1 CV biofilm assay
Results of the CV biofilm assay are demonstrated in Table 4.1. All bacteria
tested were capable of forming biofilms, and categorised as either moderate
or strong biofilm formers, with the exception of A. baumannii ATCC 17978
which was classified as weak.
Table 4.1 – Biofilm Adherence Testing
Classification of biofilm adherence of various bacterial strains following the crystal
violet biofilm assay. N=3
Organism Absorbance
(OD595) Adherence
Negative control 0.082 N/A
Escherichia coli ATCC 23848 (B strain) 0.244 Moderate
Escherichia coli NCTC 9001 0.108 Weak
Staphylococcus aureus ATCC 6358 0.887 Strong
Staphylococcus aureus NCTC 12981 3.903 Strong
Hospital Acquired MRSA isolate 1.460 Strong
MSSA NCTC 13297 1.664 Strong
Acinetobacter baumannii NCTC 12156 0.617 Strong
Acinetobacter baumannii ATCC 17978 0.629 Strong
Pseudomonas aeruginosa (PAO1) 3.920 Strong
Pseudomonas aeruginosa NCTC 8505 2.641 Strong
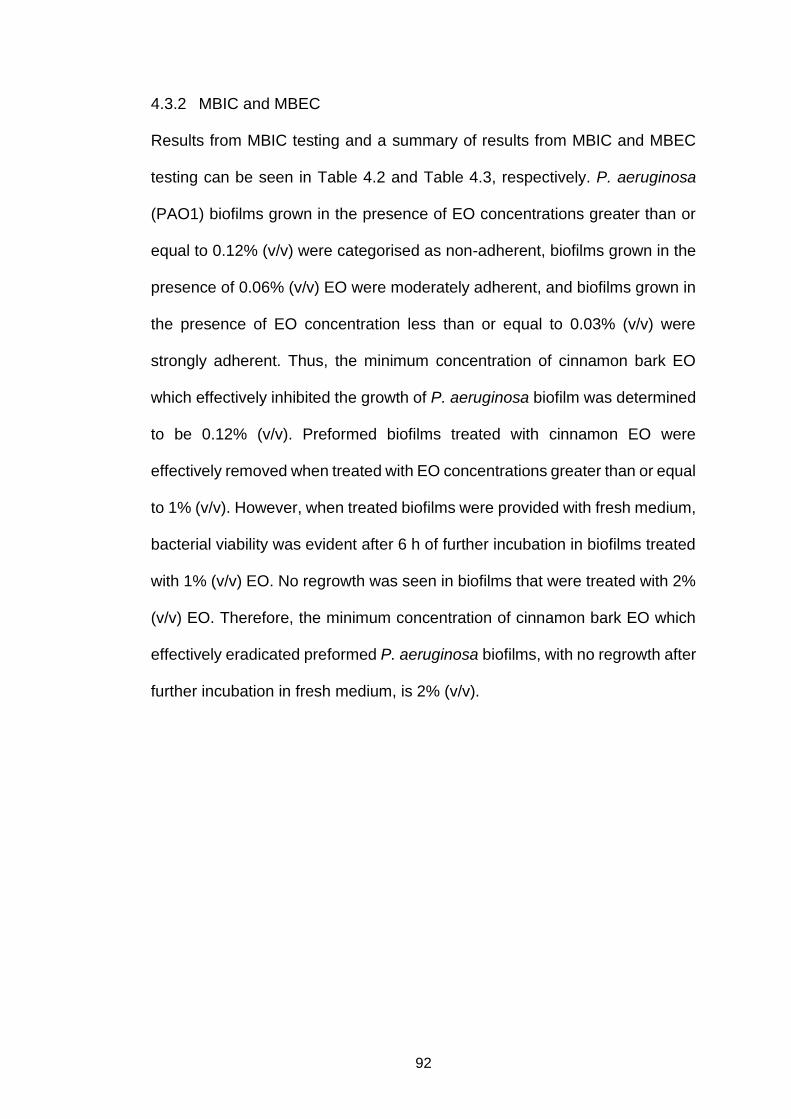
92
4.3.2 MBIC and MBEC
Results from MBIC testing and a summary of results from MBIC and MBEC
testing can be seen in Table 4.2 and Table 4.3, respectively. P. aeruginosa
(PAO1) biofilms grown in the presence of EO concentrations greater than or
equal to 0.12% (v/v) were categorised as non-adherent, biofilms grown in the
presence of 0.06% (v/v) EO were moderately adherent, and biofilms grown in
the presence of EO concentration less than or equal to 0.03% (v/v) were
strongly adherent. Thus, the minimum concentration of cinnamon bark EO
which effectively inhibited the growth of P. aeruginosa biofilm was determined
to be 0.12% (v/v). Preformed biofilms treated with cinnamon EO were
effectively removed when treated with EO concentrations greater than or equal
to 1% (v/v). However, when treated biofilms were provided with fresh medium,
bacterial viability was evident after 6 h of further incubation in biofilms treated
with 1% (v/v) EO. No regrowth was seen in biofilms that were treated with 2%
(v/v) EO. Therefore, the minimum concentration of cinnamon bark EO which
effectively eradicated preformed P. aeruginosa biofilms, with no regrowth after
further incubation in fresh medium, is 2% (v/v).
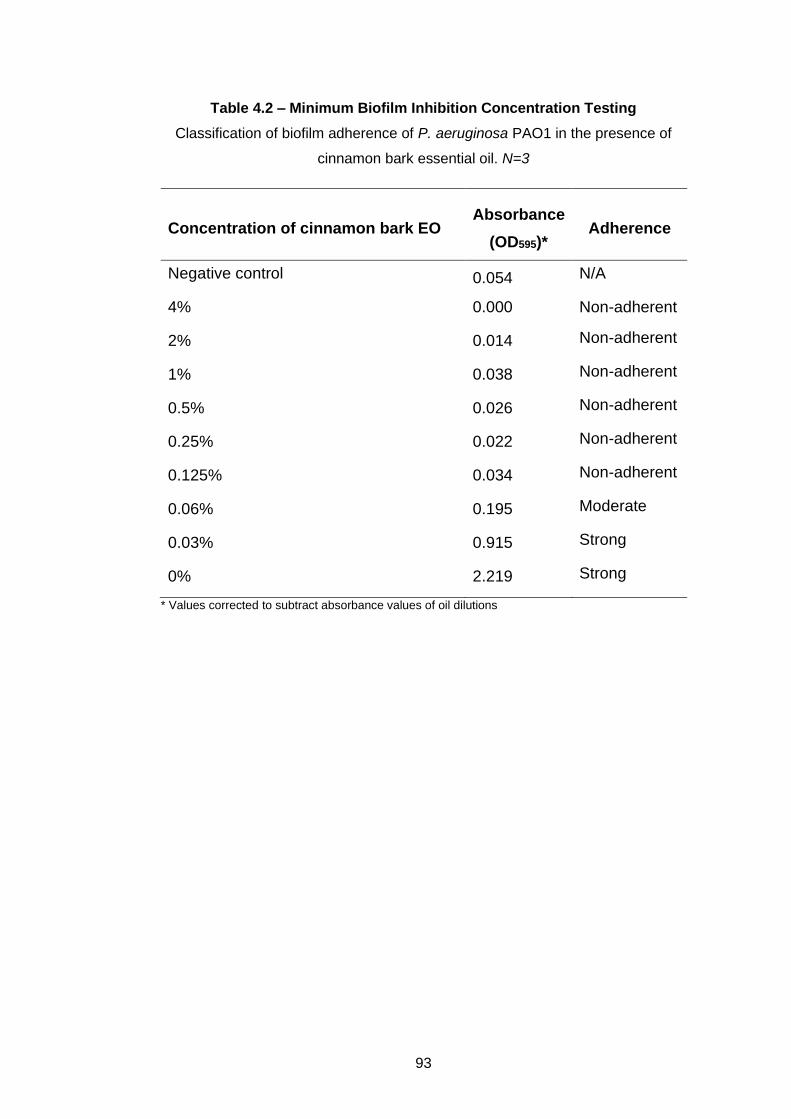
93
Table 4.2 – Minimum Biofilm Inhibition Concentration Testing
Classification of biofilm adherence of P. aeruginosa PAO1 in the presence of
cinnamon bark essential oil. N=3
Concentration of cinnamon bark EO Absorbance
(OD595)* Adherence
Negative control 0.054 N/A
4% 0.000 Non-adherent
2% 0.014 Non-adherent
1% 0.038 Non-adherent
0.5% 0.026 Non-adherent
0.25% 0.022 Non-adherent
0.125% 0.034 Non-adherent
0.06% 0.195 Moderate
0.03% 0.915 Strong
0% 2.219 Strong
* Values corrected to subtract absorbance values of oil dilutions
94
4.3.3 Direct treatment of biofilms on polycarbonate (PC)
Results of treating P. aeruginosa biofilms grown on PC coupons with
cinnamon bark EO in liquid state is shown in Figure 4.2, Figure 4.3 and Figure
4.4. After 24 h of contact time, treatment with 0.02% (v/v) had no significant
effect on biofilms (P>0.05), however, biofilms treated with either 0.2% (v/v) or
2% (v/v) were significantly reduced after 24 h of treatment (P<0.0001).
Treatment with 0.2% (v/v) resulted in a 5.22 log reduction of viable bacteria
whereas 2% (v/v) resulted in 8 log reduction and complete eradication of
biofilm (100% reduction). Further testing for 0.2% and 2% (v/v) treatment
included 10, 30 and 60 min, and 6 and 12 h contact times (Figure 4.3 and
Figure 4.4). After 10, 30 and 60 min exposure to 0.2% (v/v), less than 2 log
reduction in CFU mL-1 was observed in biofilms grown on PC coupons. After
6 h and 12 h, 3.39 and 3.84 log reductions were observed, respectively.
Exposure to 2% (v/v) again produced 100% reduction after only 10 min contact
time and this was maintained across all further contact times (Figure 4.4).
Table 4.3 – Biofilm Inhibition and Eradication Testing
Minimum biofilm inhibition concentration (MBIC) and minimum biofilm eradication
concentration (MBEC) values for cinnamon bark EO against P. aeruginosa PAO1
Cinnamon bark EO concentration (v/v)
MBIC 0.12%
MBEC 2%
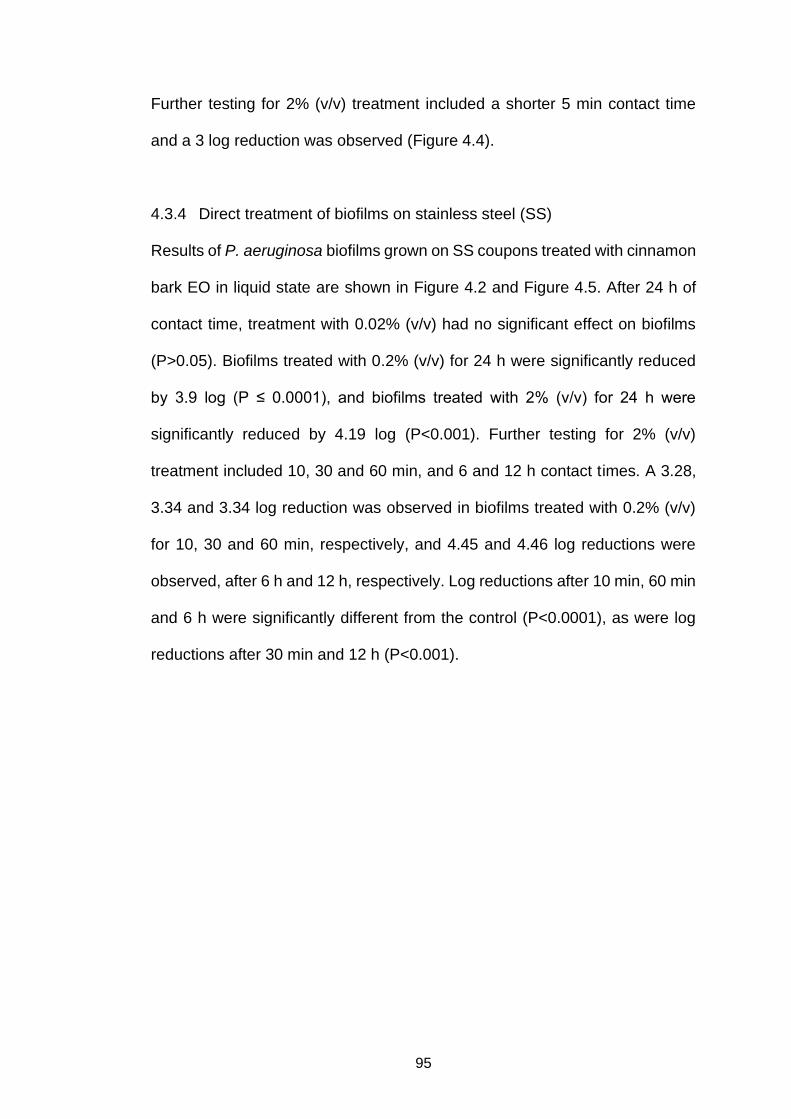
95
Further testing for 2% (v/v) treatment included a shorter 5 min contact time
and a 3 log reduction was observed (Figure 4.4).
4.3.4 Direct treatment of biofilms on stainless steel (SS)
Results of P. aeruginosa biofilms grown on SS coupons treated with cinnamon
bark EO in liquid state are shown in Figure 4.2 and Figure 4.5. After 24 h of
contact time, treatment with 0.02% (v/v) had no significant effect on biofilms
(P>0.05). Biofilms treated with 0.2% (v/v) for 24 h were significantly reduced
by 3.9 log (P ≤ 0.0001), and biofilms treated with 2% (v/v) for 24 h were
significantly reduced by 4.19 log (P<0.001). Further testing for 2% (v/v)
treatment included 10, 30 and 60 min, and 6 and 12 h contact times. A 3.28,
3.34 and 3.34 log reduction was observed in biofilms treated with 0.2% (v/v)
for 10, 30 and 60 min, respectively, and 4.45 and 4.46 log reductions were
observed, after 6 h and 12 h, respectively. Log reductions after 10 min, 60 min
and 6 h were significantly different from the control (P<0.0001), as were log
reductions after 30 min and 12 h (P<0.001).
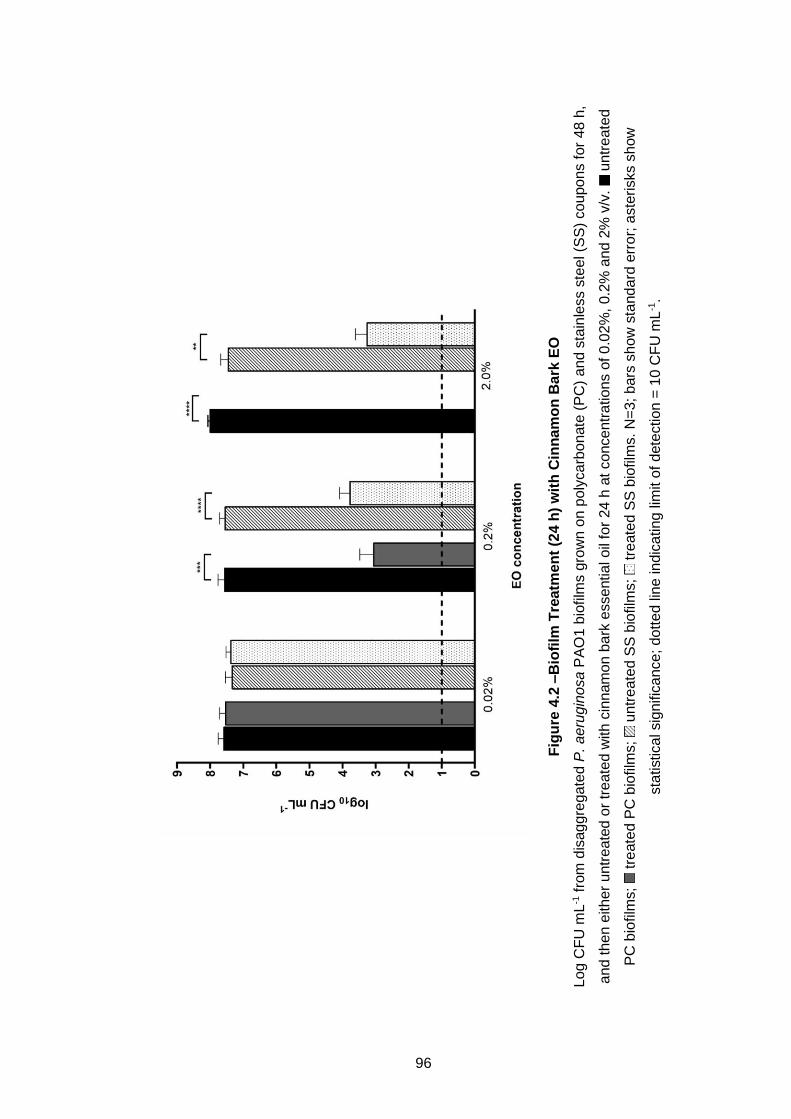
96
Fig
ure
4.2
–B
iofi
lm T
rea
tme
nt
(24 h
) w
ith
Cin
na
mo
n B
ark
EO
Log
CF
U m
L-1 fro
m d
isag
gre
ga
ted P
. a
eru
gin
osa P
AO
1 b
iofilm
s g
row
n o
n p
oly
ca
rbo
nate
(P
C)
and s
tain
less s
teel (S
S)
co
upo
ns f
or
48 h
,
and
th
en e
ith
er
untr
eate
d o
r tr
eate
d w
ith
cin
nam
on b
ark
essentia
l o
il fo
r 24
h a
t co
nce
ntr
ation
s o
f 0
.02
%,
0.2
% a
nd
2%
v/v
. u
ntr
ea
ted
PC
bio
film
s;
tre
ate
d P
C b
iofilm
s;
untr
eate
d S
S b
iofilm
s;
tre
ate
d S
S b
iofilm
s. N
=3;
bars
sh
ow
sta
nd
ard
err
or;
aste
risks s
how
sta
tistica
l sig
nific
ance
; do
tte
d lin
e in
dic
ating
lim
it o
f d
ete
ction =
10 C
FU
mL
-1.
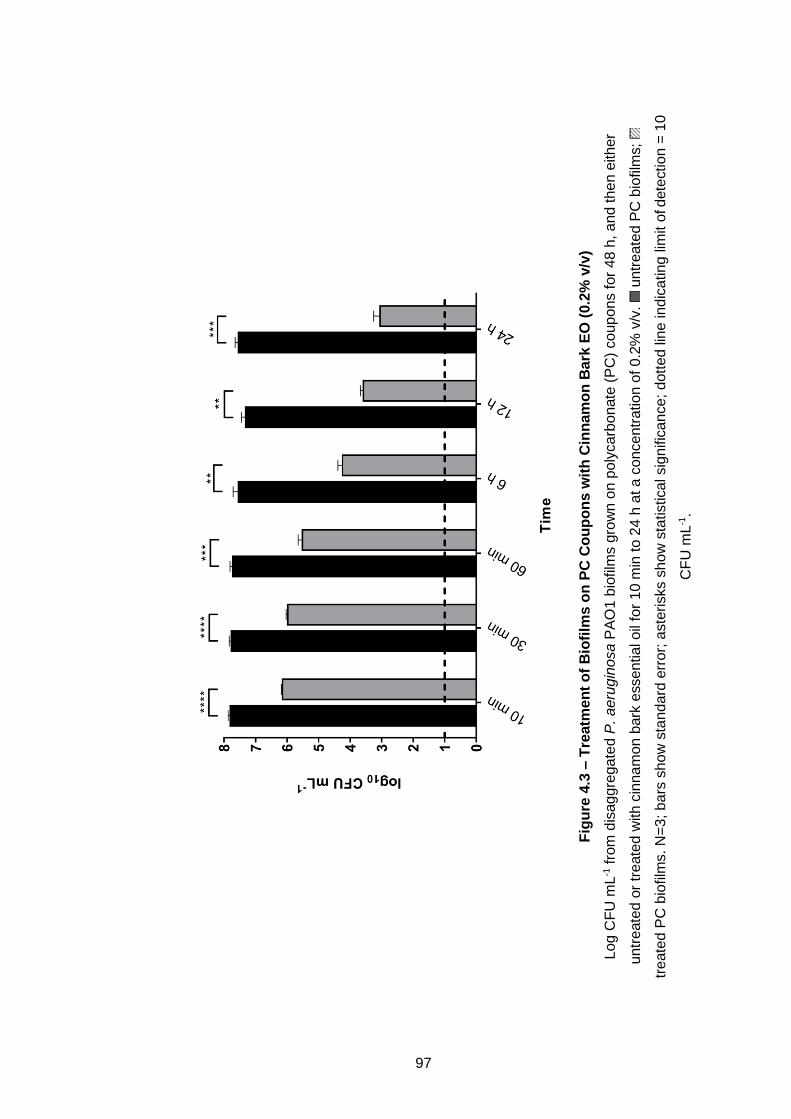
97
Fig
ure
4.3
– T
reatm
en
t o
f B
iofi
lms o
n P
C C
ou
po
ns w
ith
Cin
nam
on
Ba
rk E
O (
0.2
% v
/v)
Log
CF
U m
L-1 fro
m d
isag
gre
ga
ted P
. a
eru
gin
osa P
AO
1 b
iofilm
s g
row
n o
n p
oly
ca
rbo
nate
(P
C)
co
up
on
s f
or
48 h
, a
nd
th
en e
ith
er
untr
eate
d o
r tr
eate
d w
ith c
inna
mo
n b
ark
esse
ntia
l o
il fo
r 1
0 m
in t
o 2
4 h
at a c
once
ntr
ation o
f 0
.2%
v/v
. u
ntr
eate
d P
C b
iofilm
s;
tre
ate
d P
C b
iofilm
s.
N=
3; b
ars
sh
ow
sta
nd
ard
err
or;
aste
risks s
ho
w s
tatistica
l sig
nific
an
ce
; d
ott
ed lin
e in
dic
atin
g lim
it o
f d
ete
ctio
n =
10
CF
U m
L-1.
98
Fig
ure
4.4
– T
reatm
en
t o
f B
iofi
lms o
n P
C C
ou
po
ns w
ith
Cin
nam
on
Ba
rk E
O (
2%
v/v
)
Log
CF
U m
L-1 fro
m d
isag
gre
ga
ted P
. a
eru
gin
osa P
AO
1 b
iofilm
s g
row
n o
n p
oly
ca
rbo
nate
(P
C)
co
up
on
s f
or
48 h
, a
nd
th
en e
ith
er
untr
eate
d o
r tr
eate
d w
ith c
inna
mo
n b
ark
esse
ntia
l o
il fo
r 1
0 m
in t
o 2
4 h
at a c
once
ntr
ation o
f 2
% v
/v.
untr
eate
d P
C b
iofilm
s;
tre
ate
d
PC
bio
film
s.
N=
3; b
ars
sh
ow
sta
nd
ard
err
or;
aste
risks s
how
sta
tistica
l sig
nific
ance
; d
ott
ed lin
e in
dic
ating
lim
it o
f d
ete
ctio
n =
10 C
FU
mL
-1.
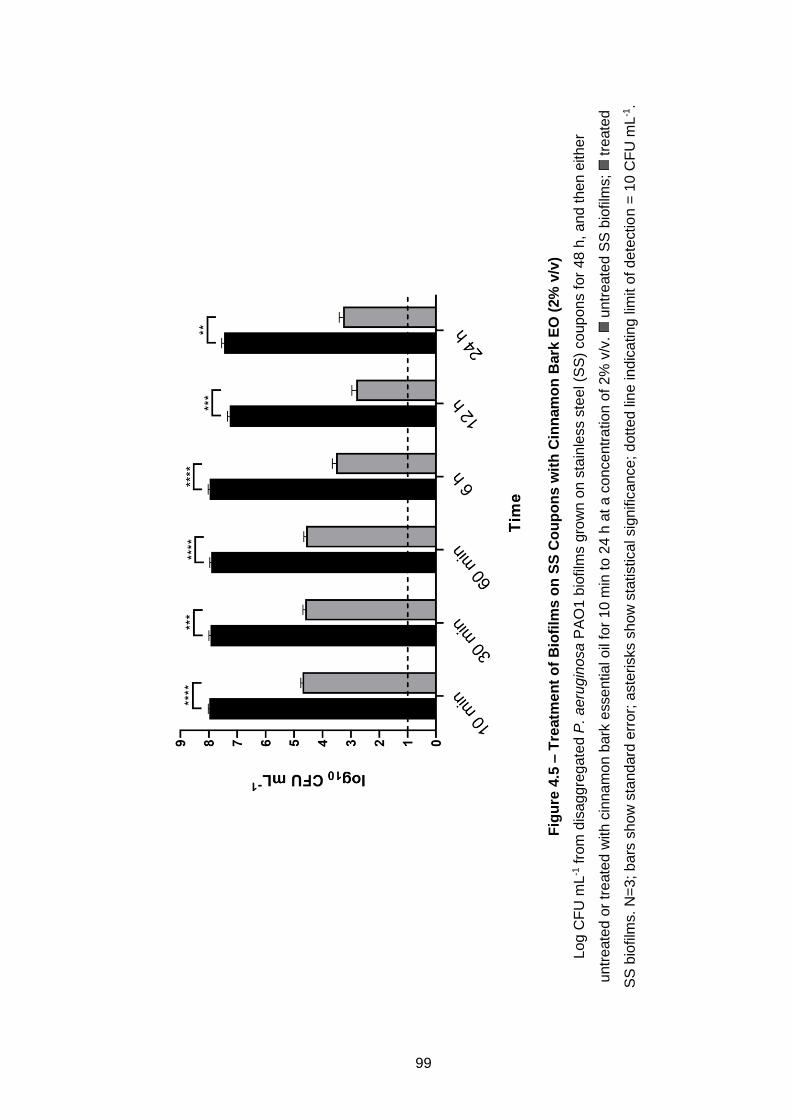
99
Fig
ure
4.5
– T
reatm
en
t o
f B
iofi
lms o
n S
S C
ou
po
ns w
ith
Cin
nam
on
Bark
EO
(2%
v/v
)
Log C
FU
mL
-1 fro
m d
isag
gre
ga
ted P
. a
eru
gin
osa P
AO
1 b
iofilm
s g
row
n o
n s
tain
less s
teel (S
S)
co
up
on
s f
or
48 h
, a
nd
th
en e
ith
er
untr
eate
d o
r tr
eate
d w
ith c
inna
mo
n b
ark
esse
ntia
l o
il fo
r 1
0 m
in t
o 2
4 h
at a c
once
ntr
ation o
f 2
% v
/v.
untr
eate
d S
S b
iofilm
s;
tre
ate
d
SS
bio
film
s. N
=3
; b
ars
sh
ow
sta
nd
ard
err
or;
aste
risks s
how
sta
tistica
l sig
nific
ance
; d
ott
ed lin
e in
dic
ating
lim
it o
f d
ete
ctio
n =
10 C
FU
mL
-1.
100
4.4 Discussion
Due to the importance of the role of biofilms in AMR, this chapter aimed to
investigate the biofilm forming capabilities of several species of bacteria and
assess the anti-biofilm activity of cinnamon bark EO. Investigations began with
an assessment of adherence using the crystal violet (CV) biofilm assay. The
CV biofilm assay can be considered to be a semi-quantitative method and
useful as a comparative tool to classify biofilm production (Di Domenico et al.
2016). Although the previous chapter focused on the effects of cinnamon bark
EO against P. aeruginosa PAO1, the other species and/or strains of bacteria
previously used were also included in the CV biofilm assay in this chapter. This
was because P. aeruginosa is a known biofilm former, therefore the CV biofilm
assay employed in this study not only confirmed this for the PAO1 strain, but
also compared it to the other strain of P. aeruginosa and other species of
bacteria used earlier in this study. Although all of the bacteria assessed in this
chapter were capable of forming biofilms of varying strength, the knowledge
that P. aeruginosa PAO1 formed strongly-adherent biofilms, coupled with
previous findings from chapter 4 and 5 showing Pseudomonas to be the least
tolerant to essential oils, justified the continued testing to assess anti-biofilm
properties of cinnamon EO against only Pseudomonas biofilms. Use of the CV
biofilm assay has its strengths and weaknesses for assessing biofilms and
their treatment. Some of the main strengths of the CV biofilm assay are its
simplicity, low cost, and ability to rapidly assess multiple samples at the same
time (Wilson et al. 2017). The main disadvantage is that CV is a positively
charged dye which will stain the surface of any negatively charged molecules,
including the polysaccharide extracellular matrix of bacteria (Petrachi et al.
101
2017). Thus the assay indicates the amount of biomass that is left behind
regardless of whether cells are living or dead (Pantanella et al. 2013).
Nevertheless, the initial use of multi-well plates for biofilm growth provided a
reliable high-throughput assay method for testing the biofilm forming
capabilities of the bacteria used in this study.
The microtitre plate method of biofilm growth is a frequently used closed
system model of growth (Macià et al. 2014), which can be easily adapted for
anti-biofilm testing. However, it also comes with advantages and
disadvantages similar to those of the CV biofilm assay. Using the microtitre
plate biofilms for antimicrobial testing gives the user the ability to test multiple
species, several treatments and/or growth conditions, changes in temperature
and humidity, or all of the above, at the same time (Coenye and Nelis 2010).
Unfortunately, its closed system with no inward or outward flow means that
uncontrolled changes will happen to the environment within the wells of the
plate, including nutrient depletion, oxygen limitation, accumulation of
metabolites or other molecules, and interference from planktonic cells (Merritt
et al. 2011, Lüdecke et al. 2014, Macià et al. 2014, Azeredo et al. 2017).
Despite these downfalls, this method was used first in this chapter to gain a
preliminary understanding of the concentrations that might be required for later
testing against biofilms.
The MBIC of cinnamon bark EO was determined as 0.12% (v/v), which is the
same as the minimum inhibitory concentration of this EO against planktonic
cells of this bacterium (chapter 3). This is similar to the data of Firmino et al.
(2018), who found that cinnamon oil as low as 0.12 mg mL-1, approximately
0.012% (v/v), reduced biofilm growth of P. aeruginosa after 24 h of culture
102
when assessing biomass, and 1.92 mg mL-1, approximately 0.192% (v/v),
prevented biofilm growth entirely.
With regards to MBEC methods in this study, the use of subculturing allowed
an estimation of the viability of the bacteria following exposure to the EO.
Methods used in this chapter employed a further 6 h incubation in fresh
medium, however the duration of re-incubation could have been improved to
better reflect real-time generation of Pseudomonas biofilms. Pericolini et al.
(2018) report that whilst the generation time for P. aeruginosa PAO1 is less
than 30 min, the maximum biofilm biomass is reached after 24 h incubation.
Therefore, to ensure that a biofilm has been truly eradicated and unable to re-
establish as a biofilm, a longer re-incubation time would be required following
treatment. However, further incubation for 6 h, as was used here, can be used
to comment on whether or not viable bacteria remain. These bacteria then
have the potential to re-establish a biofilm.
Results from this chapter revealed that whilst 1% (v/v) EO was able to remove
preformed P. aeruginosa biofilms, the remaining bacteria were viable and able
to recover after further incubation with fresh media. Thus, the MBIC of
cinnamon bark EO was determined as 2% (v/v) when used to treat P.
aeruginosa PAO1 biofilms.
CFU counts are a simple and effective indicator of viability, more robust and
thorough testing could be performed to give a definitive indication of viability.
It has been reported that methods for assessing viability should take into
consideration the method of antimicrobial testing, and ideally a combination of
these methods could be utilised (Cai et al. 2014). These include indirect
methods requiring further culturing or reactions, such as the CFU
103
determination or detection of metabolic activity using stains and indicators, or
direct methods which use molecular probes such as the BacLightTM Live/Dead
stain kit (Cai et al. 2014). Whilst using these methods might be preferable,
they were deemed unnecessary for the present study. This is because,
although valuable, the use of microtitre plates for biofilm growth is not relatable
to naturally occurring biofilms due to many of the disadvantages covered
earlier. To address this, the anti-biofilm activity of cinnamon EO was
investigated further using the CDC biofilm reactor (CBR).
The CBR was developed by Donlan et al. (2002) to provide a biofilm model
that operates as a continuous-flow stirred tank reactor. Holders within the
reactor are capable of accommodating 24 coupons, made of any chosen
material, on which bacteria will attach and form biofilms. The reactor sits upon
a stir plate, which can provide heat if required, and generates a shear force
across the surface of the coupons by way of a magnetic baffle. Rigorous
statistical assessments of the reactor ruggedness and repeatability have been
examined by Goeres et al. (Goeres et al. 2005) who found that the CBR is a
reliable model for biofilm growth and a useful tool in answering diverse
research questions regarding biofilms. In fact, the recently produced American
standards for biofilm disinfection uses the CBR as the primary growth model
(Environmental Protection Agency 2017). Buckingham-Meyer et al. (2007)
highlight the importance of choosing a biofilm model that will closely replicate
the natural environment that the test bacteria typically are associated with,
where several factors including shear force will create diverse and dynamic
growth conditions.
104
P. aeruginosa is ubiquitous in the environment and commonly found in water,
soil or associated with animals (Fazeli et al. 2012). This organism has been
synonymous with hospital acquired infections for over 50 years and evidence
has shown that hospital water plumbing networks are implicated in these
endemic outbreaks (Quick et al. 2014). P. aeruginosa are regularly found in
hospital water samples (Asghari et al. 2013) and generally harboured in and
on water-related sites such as taps, sinks, showers, ice makers, mop heads
and buckets, hydrotherapy pools and bath toys (Kerr and Snelling 2009,
Aspelund et al. 2016, Bédard et al. 2016, Lalancette et al. 2017). This is
evidence that Pseudomonas biofilms are likely to thrive in conditions where
they are subjected to shear forces and continuous flow, and thus the CBR is
ideal for use as a growth model to study this organism. It has been shown that
biofilms grown using the CBR are not as easily removed compared to other
models (Buckingham-Meyer et al. 2007) but that CBR biofilms are better
models for removal with good relevance to industrial or clinical settings
(Shelobolina et al. 2018).
Testing using the CBR provided evidence of the inefficiency of cinnamon bark
EO to reduce PAO1 biofilms at very low concentrations (i.e. 0.02% v/v), when
in liquid state, and showed cinnamon EO was unable to significantly reduce
biofilms grown on either PC or SS surfaces at this concentration. This is a
reasonable finding considering results from the MBEC testing performed
earlier. However, this study demonstrated that low concentrations of cinnamon
EO (i.e. 0.2% v/v) were capable of producing at least 3 log reduction in biofilms
grown on either PC or SS after 24 h of contact time.
105
This reduction in biofilms is not only significant statistically (P<0.001) but also
significant when considering cinnamon EO as a potential disinfectant in situ.
Disinfection protocols are deployed routinely in the prevention and reduction
of infection spread (Muniesa et al. 2019) and should conform to standards
such as the British Standards European Norm (BS EN). Currently, only the
United States Environmental Protection Agency (EPA) have published
standardized protocols for anti-biofilm efficacy testing, and there are no
European standards in this area (Ledwoch et al. 2019). Therefore, new
disinfectants developed within the UK rely on the BS EN standards 1276 and
13697 for suspension and surface disinfection, though these are relative to
planktonic state bacteria only. Consequently, if these standards are to be used
as a benchmark for anti-biofilm efficacy then contact time should be 5 min and
log reduction in CFU should exceed 5 (British Standards Institution 2009,
2015). In 2017 the EPA became the first agency to offer methods and
guidance in combatting biofilms growing on hard non-porous surfaces, and
recommended that a successful product should reduce biofilms by at least 6
log CFU, with a minimum starting bacterial load of 8 log CFU, and a contact
time not exceeding 10 min (Environmental Protection Agency 2017). Whilst
investigating the anti-biofilm effects of cinnamon bark EO within this chapter,
both of these standards were considered when evaluating successes and/or
failures of cinnamon bark EO.
Further testing to investigate 2% (v/v) EO proved the oil to be even more
effective and showed that cinnamon EO was able to cause significant
reduction of biofilms within 5 and 10 min when grown on PC and SS,
respectively. When grown on PC coupons, biofilms exposed to 2% (v/v) EO
106
were reduced by 3.02 log CFU mL-1 after 5 min of contact time (P<0.001).
Following exposure to the EO for 10 min or more, biofilms on PC coupons
were reduced completely and no viable bacteria were seen in further
cultivation steps (P<0.001). In contrast to this, biofilms grown on SS coupons
remained viable after all durations of exposure to 2% (v/v) EO. After 10 min
contact time, a 3.28 log reduction in CFU mL-1 (P<0.001) was observed.
Despite further reduction as duration of treatment increased, after 24 h of
contact time ~44% of bacteria remained viable on the coupon, compared to
that of 0% viable bacteria on PC coupon biofilms tested in comparable
conditions.
In the previous chapter it was noted that the toxicity of cinnamon bark oil would
need to be taken into consideration when evaluating its uses. In this chapter,
cinnamon oil at 2% was highly effective, which is lower than the described
concentration that could cause skin irritation (Bickers et al. 2005), thus
providing promise in its use which could potentially lead to contact with human
skin.
The present study grew biofilms on two different surfaces, polycarbonate
plastic (PC) and 316L stainless steel (SS). Both of these materials are
commonly used surface materials, especially in hospital environments
(Schmidt et al. 2012). Saka et al. (2017) report that microbial pathogens can
survive for extended periods of time on both SS and polymeric materials. The
present study has indicated that cinnamon EO appeared to be more effective
at reducing biofilms when they were grown on PC as opposed to SS coupons.
This may be explained by a difference in surface attachment between biofilms
on PC and SS. Results from the study by Abdallah et al. (2014), indicate that
107
when P. aeruginosa was grown on SS, the adhesion rate was double that of
biofilms grown on PC. This is possibly connected to surface smoothness, as
a rougher surface could play a role in adhesion by offering protection against
shear forces (Barnes et al. 1999). Baker (1984) also found that when
investigating bacterial attachment in rivers, roughened substrates were
colonised significantly faster than the smoother surfaces. Baker speculates if
this is due to rougher surfaces providing protection, but also suggests that
roughened surfaces would have an increased surface area, providing a larger
area for colonization. A study by Holah and Thorpe (1990) used scanning
electron microscopy to assess the surface roughness of both PC and SS
surfaces, and found untampered PC to be the smoothest. These reports
corroborate findings from this study and emphasize the importance of surface
of growth when testing antimicrobial efficacy against biofilms.
In conclusion, this study aimed to address the question of how effective
cinnamon bark EO is against P. aeruginosa biofilms. Preliminary biofilm
models utilised microtitre plates for high-throughput and multiple treatment
environments. This found the MBIC to be a low concentration of 0.125% (v/v)
and showed an MBEC of 2% (v/v). Continuing from these tests, the CBR was
employed to produce robust mature biofilms which more closely reflected
those that are naturally occurring. The anti-biofilm effects of cinnamon bark
EO were tested against biofilms grown on either PC plastic or SS surfaces,
mimicking surfaces commonly found in both industrial and healthcare settings.
Cinnamon bark EO at 2% (v/v) proved to be the most effective, especially
against biofilms grown on PC coupons, and successfully reduced these
biofilms by 100% after 10 min of contact time. A 5 min contact time of 2% (v/v)
108
EO against biofilms on PC also reduced biofilms by 3 log CFU mL-1. It was
shown that cinnamon bark EO was more effective against biofilms grown on
PC versus SS and this could be explained by the microscopic differences
between these two surfaces and how bacteria may interact with them. If US
standards for anti-biofilm activity are used to evaluate the findings from this
study, then cinnamon bark EO is an eligible product for biofilm disinfection,
producing a greater than 6 log reduction within 10 min of contact time.
Nonetheless, it is evident that European standards need to be reviewed and
updated to include the growth of bacteria as biofilms that are ubiquitous in the
environment.

109
CHAPTER 5

111
5 VAPOUR CHAMBER DEVELOPMENT AND TREATMENT
OF PSEUDOMONAS AERUGINOSA BIOFILMS WITH
CINNAMON BARK ESSENTIAL OIL VAPOUR.
5.1 Introduction
Essential oils (EOs) are well known for their volatility and have long been
utilised in their vapour state. The use of EO vapour as an antimicrobial has
been well documented in the literature (Doran et al. 2009, Fisher and Phillips
2009, Nedorostova et al. 2009, Nostro et al. 2009, Tyagi and Malik 2010a,
Velázquez-Nuñez et al. 2013) and several studies also include cinnamon EO
vapour (Inouye et al. 2001, López et al. 2007, Goñi et al. 2009, Seo et al. 2015,
Ghabraie et al. 2016, Feyaerts et al. 2018, Lee et al. 2018). Methods that are
usually employed in these studies include the use of the disc-volatilisation
method which often comes under many other pseudonyms. Regardless of the
name given, this method usually involves the use of a petri-dish containing
organisms growing on solid agar, which is then inverted and the EO is placed
in the lid to assess antimicrobial vapour effects (Doran et al. 2009), similar to
disc diffusion assays seen previously in this thesis (Chapter 2). The space
between the agar surface and the lid can then be calculated and thus vapour
can be expressed per litre of air, though this is not an accurate representation
of concentration (Kloucek et al. 2012). Others have gone further and created
environments for vapour testing using sealed boxes, usually plastic or glass,
and usually a much larger volume. For example, Fisher and Phillips (2009)
used a 600 L capacity sealed box to test a blend of citrus EOs against bacteria
growing in broth cultures. Inouye et al (2001) utilised 1.3 L capacity foil lined
112
plastic boxes to test bacteria growing on solid agar plates. Doran et al (2009)
studied the effects of a combination of lemongrass and geranium EO in a
similar manner using 64 L capacity boxes and, further to this, tested the effects
of this EO mix on airborne microbes in office spaces by utilising an ST ProTM
machine to disperse EO throughout a 25 m2 room. However, whilst all these
methods are well placed in testing the potential of EO vapours as
antimicrobials, all these studies fail to assess the EO vapour effect against
biofilms. Studies that look at the antibiofilm properties of EO vapour are
extremely limited.
Nostro et al (2009) exposed biofilms grown in 35mm polystyrene plates to
vapour of carvacrol, a common component of EOs. Laird et al. (2012) grew
biofilms on 2 cm stainless steel discs and placed them in a 600 L capacity
sealed box with a blend of orange and bergamot EO vapour. More recently,
Benzaid et al (2019) treated Candida albicans biofilms, growing on collagen
scaffolds, with peppermint (Mentha × piperita) vapour. These three studies are
the limit to EO vapour versus biofilm work published to date, and these studies
are limited by the use of static biofilm model systems. It is also noted that no
study to date has investigated the effect of EO vapours against P. aeruginosa
biofilms or of cinnamon bark EO vapour against biofilms. Therefore, the
current chapter aimed to address the gaps within the literature and set out to
develop a method of exposing P. aeruginosa biofilms, grown in a continuous
flow biofilm model system, to cinnamon bark EO vapour.
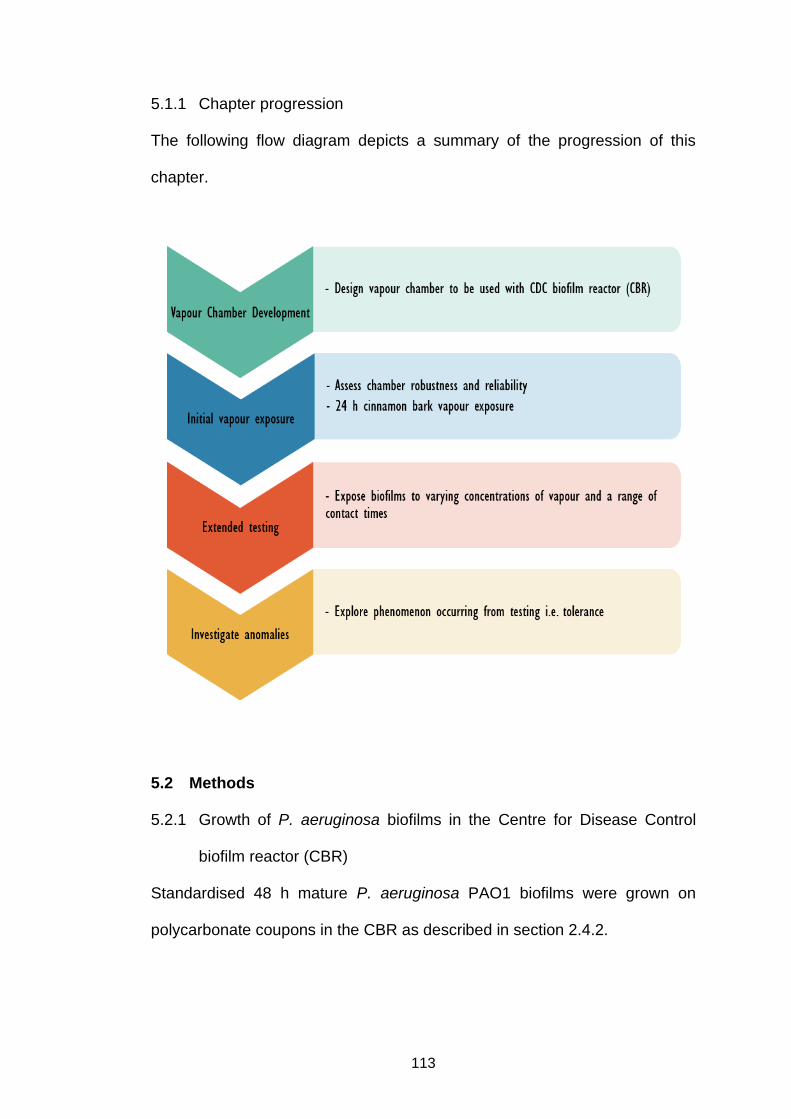
113
5.1.1 Chapter progression
The following flow diagram depicts a summary of the progression of this
chapter.
5.2 Methods
5.2.1 Growth of P. aeruginosa biofilms in the Centre for Disease Control
biofilm reactor (CBR)
Standardised 48 h mature P. aeruginosa PAO1 biofilms were grown on
polycarbonate coupons in the CBR as described in section 2.4.2.
114
5.2.2 Vapour chamber development and biofilm treatment
A novel custom-made vapour chamber (Figure 5.1) was developed for treating
biofilms and adapted for use with a CBR. Due to the configuration of the CBR,
it was necessary to design a chamber that would accommodate the coupons,
making it possible to treat them with vapour, but also minimising their
disruption. This would most likely be achieved by avoiding the removal of the
coupons from their rods. A feature of the CBR is easily removed rods for
sampling, thus an airtight plastic receptacle with a shape that replicated the
CBR could be used and adapted so as to accommodate the rods. This would
facilitate the easy removal of rods from the CBR and replacement in this
modified chamber, followed by subsequent treatment using vapours. It was
anticipated that further analysis may be needed on the vapours within the
chamber, thus a method of accessing the interior environment without
disturbing the vapour equilibrium or the biofilms was needed. The final
chamber design consisted of a 1.3 L volume (1300cm3) plastic container,
measuring 11 x 27 cm, and featured a removable airtight lid. The container
was orientated so that this lid subsequently became the base, and the top of
the container was adapted to include four ports in which rods from the reactor
fit snuggly, with a fifth smaller central hole in which a silicon septum was fitted.
Vapour chambers were wrapped in foil, sterilised by autoclaving and allowed
to dry before use. A schematic of the method for vapour treatment of mature
biofilms is demonstrated in Figure 5.2. Briefly, coupon holder rods were
removed from the reactor aseptically and rinsed with sterile PBS. After rinsing,
rods were carefully inserted into the upper ports of the sterile vapour chamber.
In circumstances where all four ports were not filled with rods containing
115
coupons, a sterile blank coupon holder was used to fill the space, to ensure a
closed unit for vapour treatment.
For treatment using cinnamon bark essential oil, a sterile 47 mm filter paper
disc (Whatman, UK) was placed in a sterile 50 mm glass petri dish and placed
in the bottom of the vapour chamber. The filter paper was then saturated with
260 µL of cinnamon EO, representing a concentration of 0.2 µL cm-3 and the
vapour chamber was immediately sealed. A separate negative control vapour
chamber had a petri dish with only filter paper present. The chambers were
incubated at 37°C for 24 hours, after which, rods were aseptically removed,
rinsed in sterile PBS, and each coupon released into a separate tube
containing 10 mL of TSB. Coupons were then sonicated for 10 min and
vortexed for 30 seconds. The disaggregated biofilms were then serially diluted
and plated onto MHA and incubated at 37°C for 24 h. During initial
development of the vapour chamber, the position of the coupon within the
chamber was assessed for influence on biofilm CFU. The position of coupon
was noted, i.e. top, middle or bottom, and three coupons were enumerated for
each position for test condition and control and the experiment was carried out
in triplicate. Initial testing to assess coupon placement was carried out on
biofilms grown on polycarbonate coupons and using EO concentration of 0.2
µL cm-3.

116
Figure 5.1 – Vapour Chamber
Diagram of 1.3 L capacity vapour chamber used for vapour treatment of biofilms
grown in the CDC biofilm reactor. Image created by author.
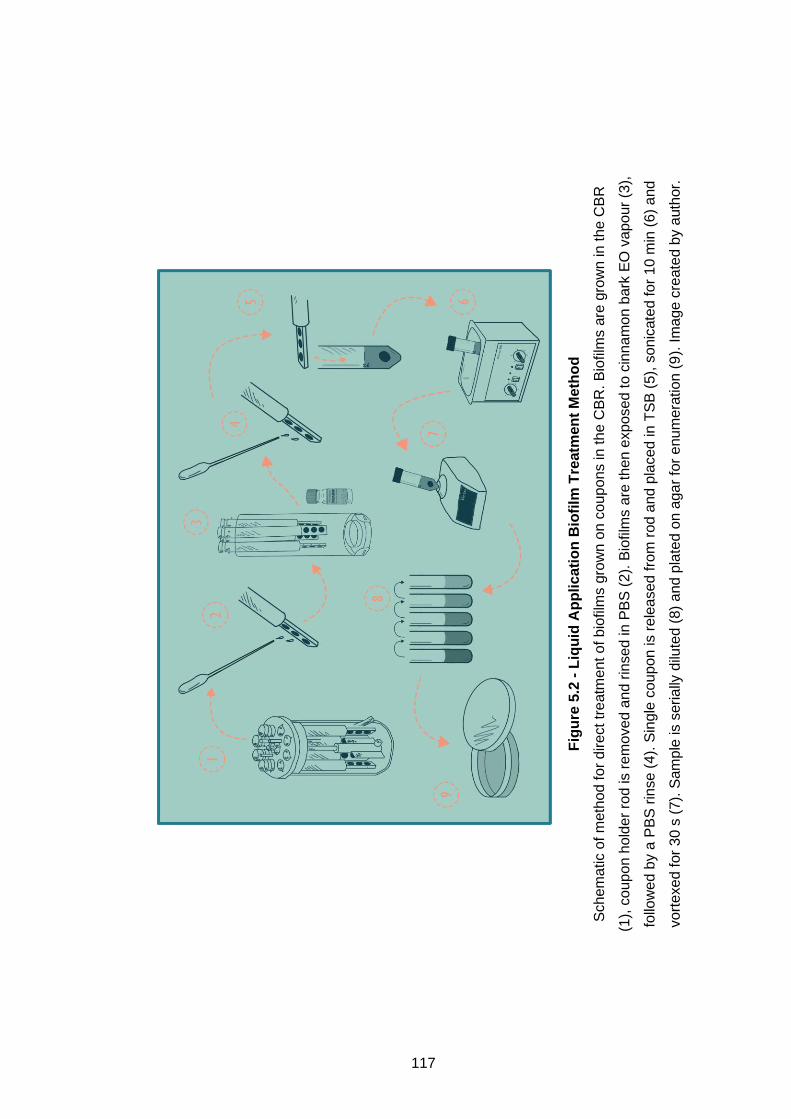
117
Fig
ure
5.2
- L
iqu
id A
pp
lic
ati
on
Bio
film
Tre
atm
en
t M
eth
od
Sch
em
atic o
f m
eth
od
fo
r d
ire
ct tr
eatm
ent o
f b
iofilm
s g
row
n o
n c
oup
on
s in
th
e C
BR
. B
iofilm
s a
re g
row
n in t
he C
BR
(1),
co
up
on h
old
er
rod is r
em
ove
d a
nd
rin
sed
in P
BS
(2
). B
iofilm
s a
re t
hen e
xpo
sed
to c
inna
mo
n b
ark
EO
va
po
ur
(3),
follo
we
d b
y a
PB
S r
inse (
4).
Sin
gle
co
up
on
is r
ele
ased
fro
m r
od a
nd p
laced
in T
SB
(5),
so
nic
ate
d fo
r 1
0 m
in (
6)
and
vort
exed f
or
30 s
(7).
Sam
ple
is s
erially
dilu
ted (
8)
and p
late
d o
n a
gar
for
enum
era
tion (
9).
Im
age c
reate
d b
y a
uth
or.
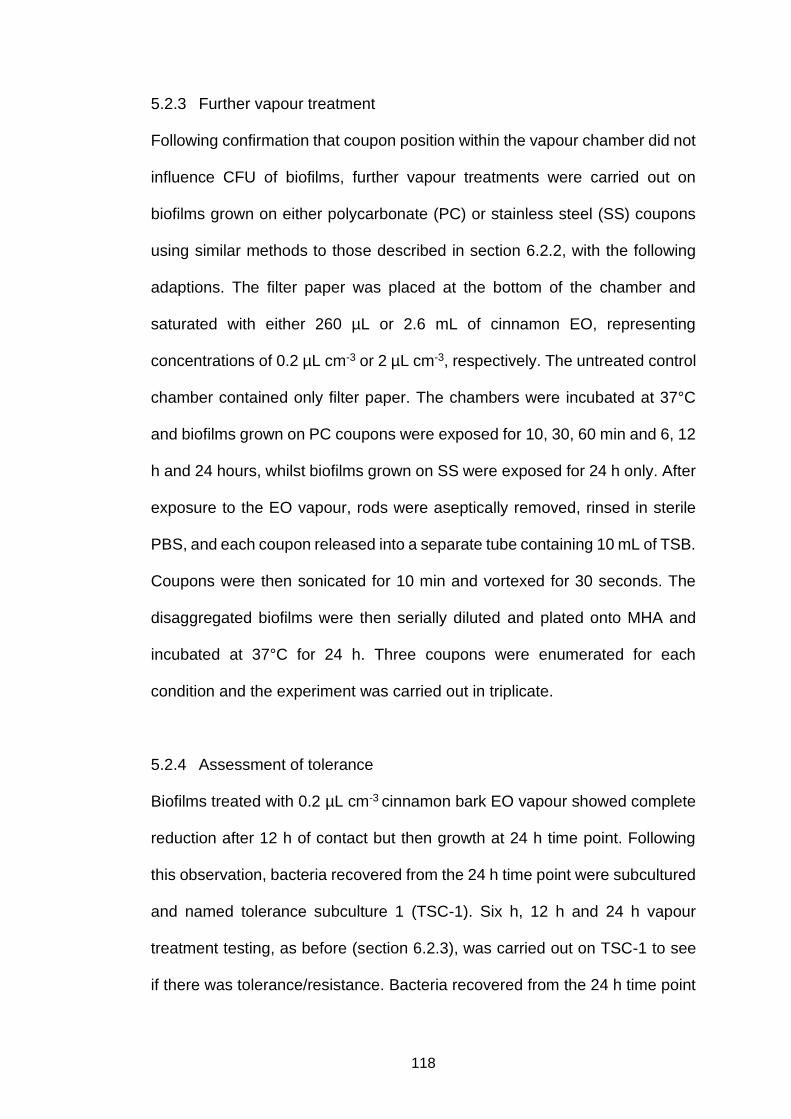
118
5.2.3 Further vapour treatment
Following confirmation that coupon position within the vapour chamber did not
influence CFU of biofilms, further vapour treatments were carried out on
biofilms grown on either polycarbonate (PC) or stainless steel (SS) coupons
using similar methods to those described in section 6.2.2, with the following
adaptions. The filter paper was placed at the bottom of the chamber and
saturated with either 260 µL or 2.6 mL of cinnamon EO, representing
concentrations of 0.2 µL cm-3 or 2 µL cm-3, respectively. The untreated control
chamber contained only filter paper. The chambers were incubated at 37°C
and biofilms grown on PC coupons were exposed for 10, 30, 60 min and 6, 12
h and 24 hours, whilst biofilms grown on SS were exposed for 24 h only. After
exposure to the EO vapour, rods were aseptically removed, rinsed in sterile
PBS, and each coupon released into a separate tube containing 10 mL of TSB.
Coupons were then sonicated for 10 min and vortexed for 30 seconds. The
disaggregated biofilms were then serially diluted and plated onto MHA and
incubated at 37°C for 24 h. Three coupons were enumerated for each
condition and the experiment was carried out in triplicate.
5.2.4 Assessment of tolerance
Biofilms treated with 0.2 µL cm-3 cinnamon bark EO vapour showed complete
reduction after 12 h of contact but then growth at 24 h time point. Following
this observation, bacteria recovered from the 24 h time point were subcultured
and named tolerance subculture 1 (TSC-1). Six h, 12 h and 24 h vapour
treatment testing, as before (section 6.2.3), was carried out on TSC-1 to see
if there was tolerance/resistance. Bacteria recovered from the 24 h time point
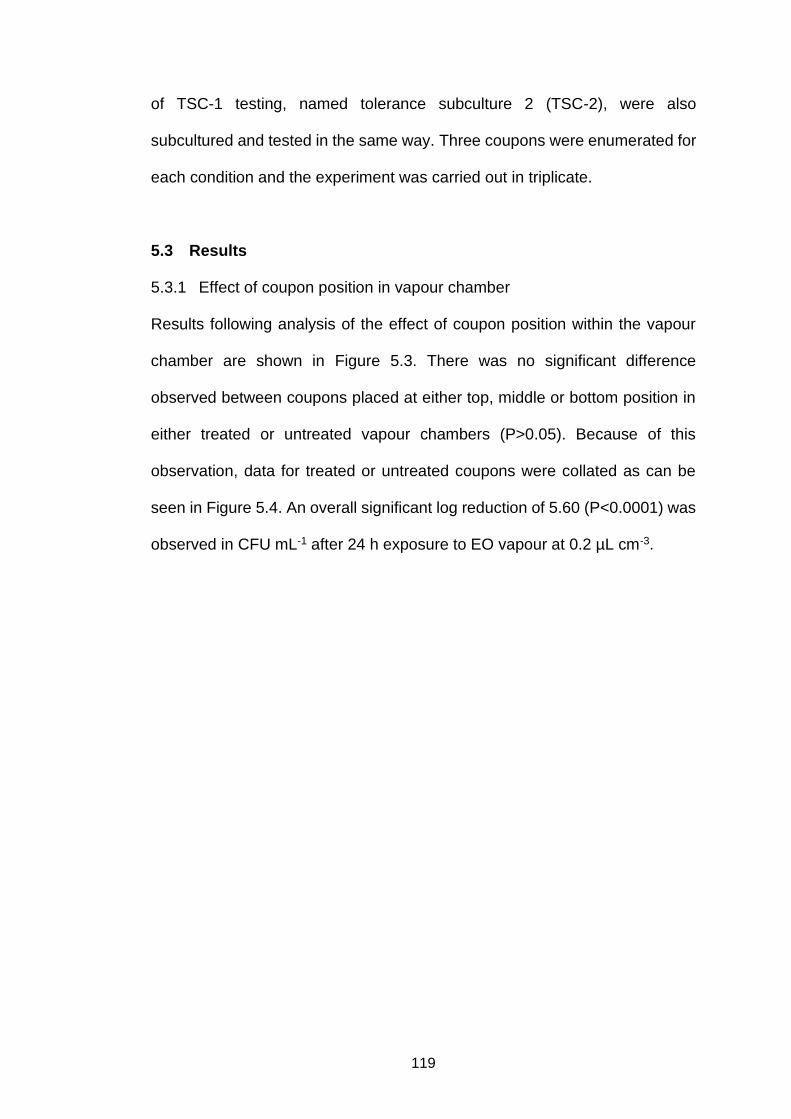
119
of TSC-1 testing, named tolerance subculture 2 (TSC-2), were also
subcultured and tested in the same way. Three coupons were enumerated for
each condition and the experiment was carried out in triplicate.
5.3 Results
5.3.1 Effect of coupon position in vapour chamber
Results following analysis of the effect of coupon position within the vapour
chamber are shown in Figure 5.3. There was no significant difference
observed between coupons placed at either top, middle or bottom position in
either treated or untreated vapour chambers (P>0.05). Because of this
observation, data for treated or untreated coupons were collated as can be
seen in Figure 5.4. An overall significant log reduction of 5.60 (P<0.0001) was
observed in CFU mL-1 after 24 h exposure to EO vapour at 0.2 µL cm-3.
120
Figure 5.3 – Coupon Position Effect Assessment
Assessment of coupon position (top, middle, or bottom) within vapour chamber
where P. aeruginosa PAO1 biofilms grown on polycarbonate coupons are
untreated or treated with 0.2 µL cm-3 cinnamon bark essential oil vapour for 24 h.
untreated biofilms; treated biofilms. Bars show standard error; N=3; ns = not
significant; dotted line indicating limit of detection = 10 CFU mL-1.
top
mid
dle
bottom to
p
mid
dle
bottom
0
1
2
3
4
5
6
7
8
9
Position
log
10 C
FU
mL
-1
ns
ns
Figure 5.4 – Cinnamon Bark EO Vapour (0.2 µL cm-3) Treated P. aeruginosa
Biofilm (24 h)
P. aeruginosa PAO1 biofilms, grown on polycarbonate coupons, untreated or
treated with 0.2 µL cm-3 cinnamon bark essential oil vapour for 24 h. untreated
biofilms; treated biofilms. Bars show standard error; N=9; asterisks indicate
significance; dotted line indicating limit of detection = 10 CFU mL-1.
untreated treated
0
1
2
3
4
5
6
7
8
log
10 C
FU
mL
-1
✱✱✱✱
121
5.3.2 Further vapour treatment of Pseudomonas biofilms
Log reduction of biofilms grown on PC coupons following cinnamon bark
vapour treatment at 0.2 µL cm-3 is shown in Figure 5.5. Log reduction after 10,
30 and 60 min of vapour treatment was minimal (<0.5 log). Overall log
reduction at 6 h and 12 h was 7.50 and 7.76, respectively. Following 24 h of
vapour exposure, log reduction was 5.60, suggesting lower reduction of biofilm
CFU mL-1 compared to that seen at 6 h and 12 h.
Log reductions of biofilms grown on polycarbonate coupons following
cinnamon bark vapour treatment at 2.0 µL cm-3 are shown in Figure 5.6. Log
reductions after 10, 30 and 60 min of vapour treatment were minimal (<0.5
log). Log reduction at 6 h, 12 h and 24 h was significantly reduced by 3.84,
4.05 and 3.90, respectively (P<0.0001).
Log reductions of biofilms grown on stainless steel coupons following
exposure to cinnamon bark EO vapour are shown in Figure 5.7 and Figure
5.8. Both concentrations produced a significant log reduction (P<0.001) in
CFU mL-1. For 0.2 and 2 µL cm-3, cinnamon vapour produced 3.96 and 4.39
log reductions were produced, respectively.
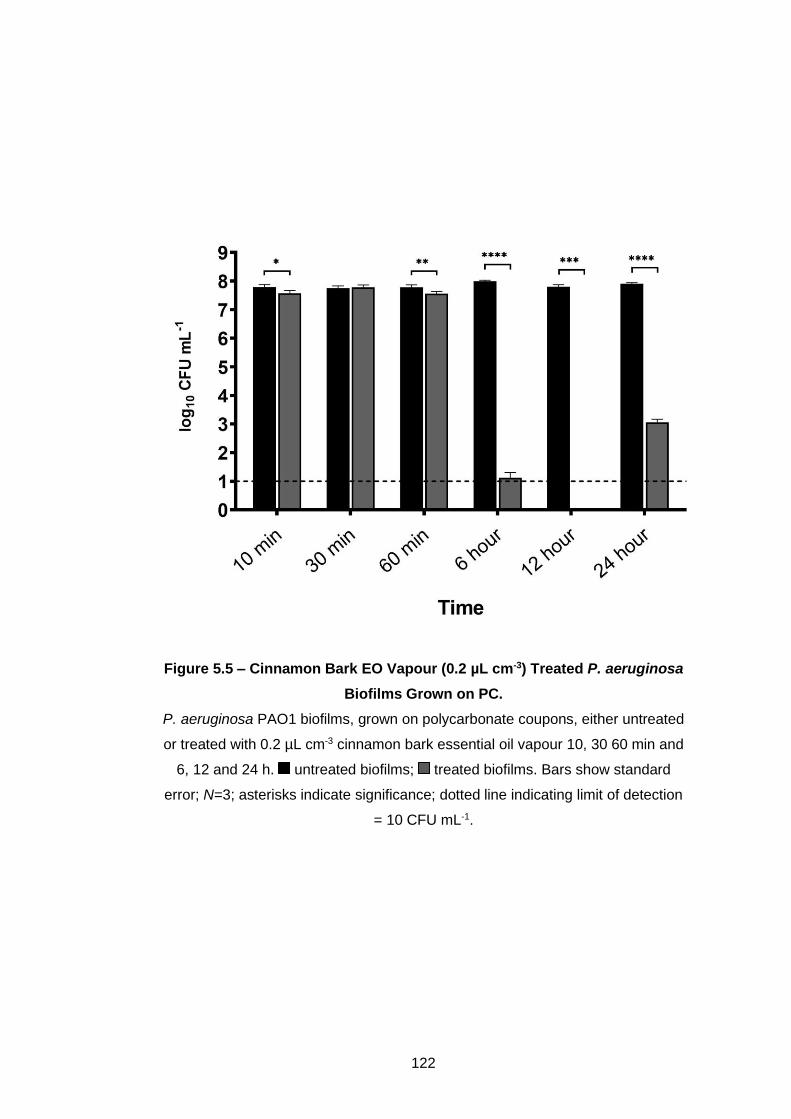
122
Figure 5.5 – Cinnamon Bark EO Vapour (0.2 µL cm-3) Treated P. aeruginosa
Biofilms Grown on PC.
P. aeruginosa PAO1 biofilms, grown on polycarbonate coupons, either untreated
or treated with 0.2 µL cm-3 cinnamon bark essential oil vapour 10, 30 60 min and
6, 12 and 24 h. untreated biofilms; treated biofilms. Bars show standard
error; N=3; asterisks indicate significance; dotted line indicating limit of detection
= 10 CFU mL-1.
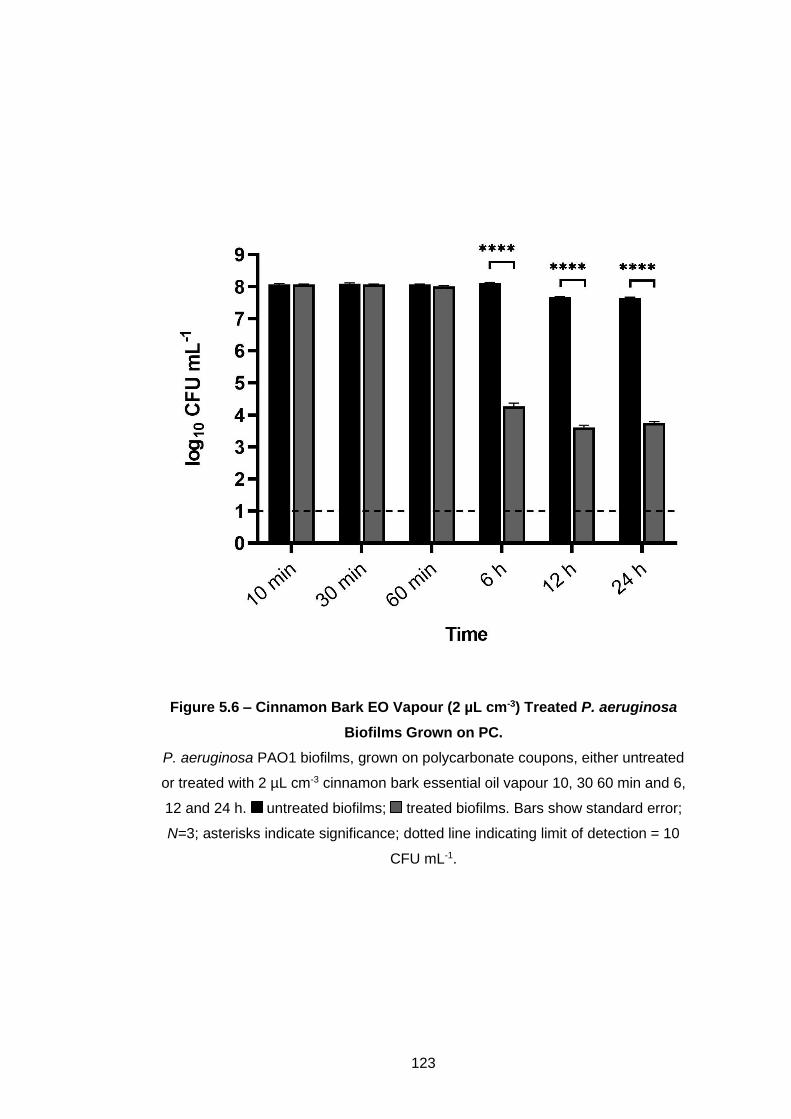
123
Figure 5.6 – Cinnamon Bark EO Vapour (2 µL cm-3) Treated P. aeruginosa
Biofilms Grown on PC.
P. aeruginosa PAO1 biofilms, grown on polycarbonate coupons, either untreated
or treated with 2 µL cm-3 cinnamon bark essential oil vapour 10, 30 60 min and 6,
12 and 24 h. untreated biofilms; treated biofilms. Bars show standard error;
N=3; asterisks indicate significance; dotted line indicating limit of detection = 10
CFU mL-1.
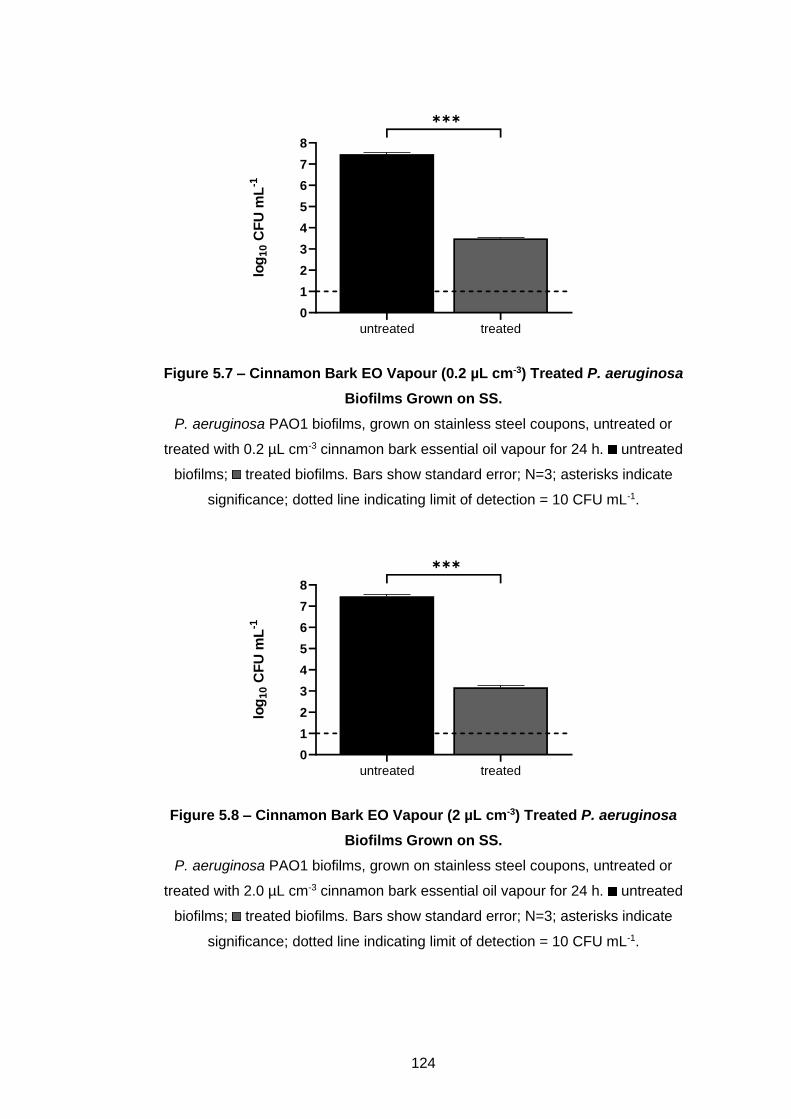
124
Figure 5.7 – Cinnamon Bark EO Vapour (0.2 µL cm-3) Treated P. aeruginosa
Biofilms Grown on SS.
P. aeruginosa PAO1 biofilms, grown on stainless steel coupons, untreated or
treated with 0.2 µL cm-3 cinnamon bark essential oil vapour for 24 h. untreated
biofilms; treated biofilms. Bars show standard error; N=3; asterisks indicate
significance; dotted line indicating limit of detection = 10 CFU mL-1.
untreated treated
0
1
2
3
4
5
6
7
8
log
10 C
FU
mL
-1
✱✱✱
Figure 5.8 – Cinnamon Bark EO Vapour (2 µL cm-3) Treated P. aeruginosa
Biofilms Grown on SS.
P. aeruginosa PAO1 biofilms, grown on stainless steel coupons, untreated or
treated with 2.0 µL cm-3 cinnamon bark essential oil vapour for 24 h. untreated
biofilms; treated biofilms. Bars show standard error; N=3; asterisks indicate
significance; dotted line indicating limit of detection = 10 CFU mL-1.
untreated treated
0
1
2
3
4
5
6
7
8
log
10 C
FU
mL
-1
✱✱✱
125
5.3.3 Assessment of tolerance in Pseudomonas biofilms
Following observation of regrowth at the 24 h contact point, the tolerance
subculture 1 (TSC-1) was subjected to further testing, with results of this
shown in Figure 5.9. Log reduction of TSC-1 biofilms after 6, 12 and 24 h of
exposure were 4.89, 5.55 and 5.17, respectively (P<0.0001). Tolerance
subculture 2 (TSC-2) was also subjected to further testing, with results of this
shown in Figure 5.10. Log reduction of TSC-2 biofilms after 6, 12 and 24 h of
exposure were 5.03, 5.82 and 5.94, respectively (P<0.0001).
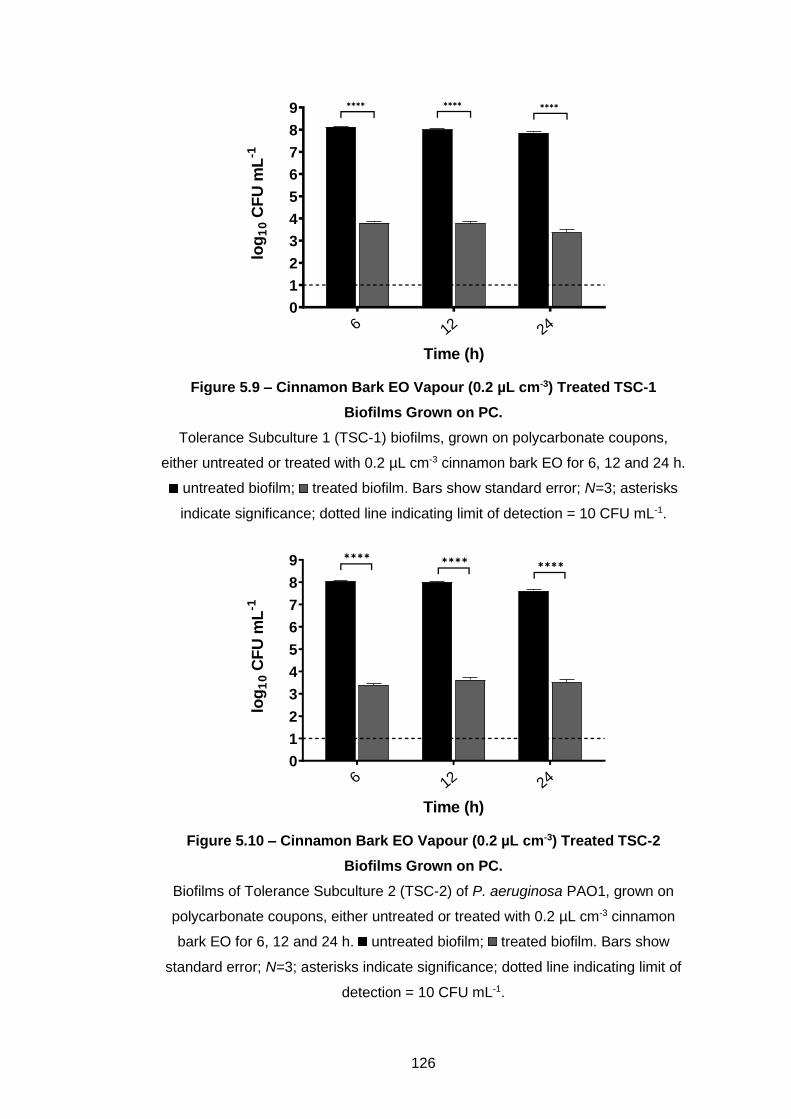
126
Figure 5.9 – Cinnamon Bark EO Vapour (0.2 µL cm-3) Treated TSC-1
Biofilms Grown on PC.
Tolerance Subculture 1 (TSC-1) biofilms, grown on polycarbonate coupons,
either untreated or treated with 0.2 µL cm-3 cinnamon bark EO for 6, 12 and 24 h.
untreated biofilm; treated biofilm. Bars show standard error; N=3; asterisks
indicate significance; dotted line indicating limit of detection = 10 CFU mL-1.
6 12 24
0
1
2
3
4
5
6
7
8
9
Time (h)
log
10 C
FU
mL
-1
✱✱✱✱ ✱✱✱✱ ✱✱✱✱
Figure 5.10 – Cinnamon Bark EO Vapour (0.2 µL cm-3) Treated TSC-2
Biofilms Grown on PC.
Biofilms of Tolerance Subculture 2 (TSC-2) of P. aeruginosa PAO1, grown on
polycarbonate coupons, either untreated or treated with 0.2 µL cm-3 cinnamon
bark EO for 6, 12 and 24 h. untreated biofilm; treated biofilm. Bars show
standard error; N=3; asterisks indicate significance; dotted line indicating limit of
detection = 10 CFU mL-1.
6 12 240
1
2
3
4
5
6
7
8
9
Time (h)
log
10 C
FU
mL
-1
✱✱✱✱✱✱✱✱
✱✱✱✱
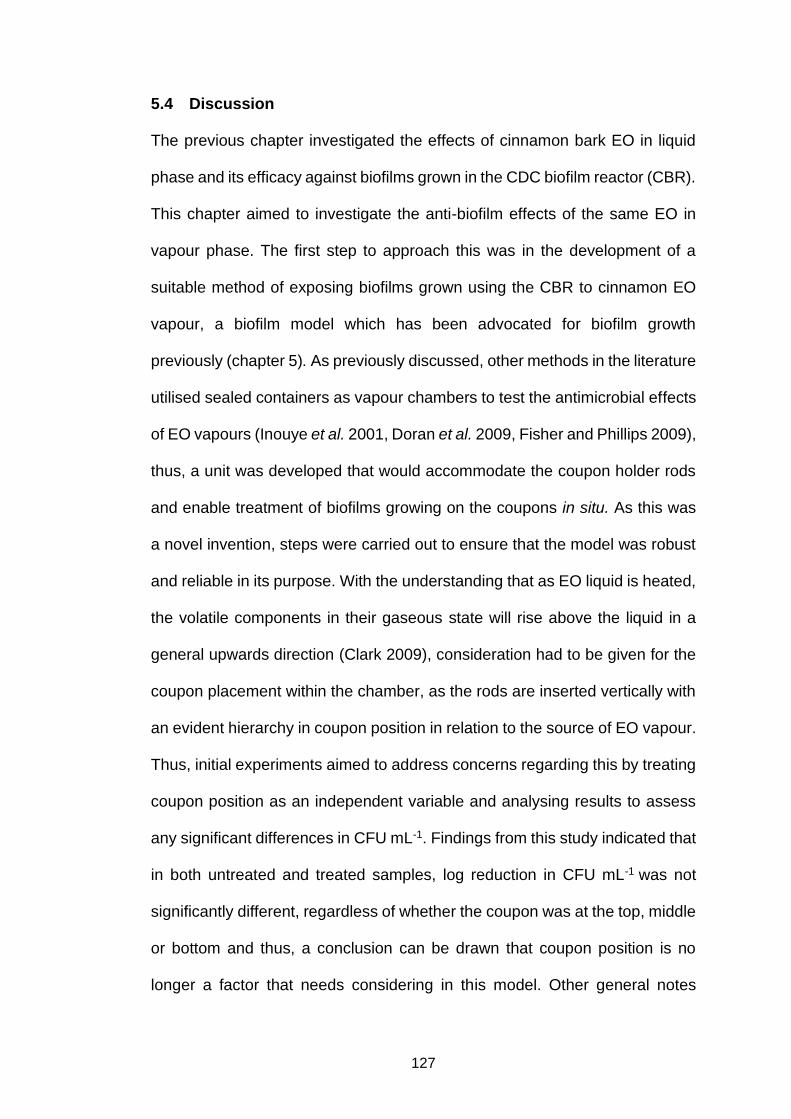
127
5.4 Discussion
The previous chapter investigated the effects of cinnamon bark EO in liquid
phase and its efficacy against biofilms grown in the CDC biofilm reactor (CBR).
This chapter aimed to investigate the anti-biofilm effects of the same EO in
vapour phase. The first step to approach this was in the development of a
suitable method of exposing biofilms grown using the CBR to cinnamon EO
vapour, a biofilm model which has been advocated for biofilm growth
previously (chapter 5). As previously discussed, other methods in the literature
utilised sealed containers as vapour chambers to test the antimicrobial effects
of EO vapours (Inouye et al. 2001, Doran et al. 2009, Fisher and Phillips 2009),
thus, a unit was developed that would accommodate the coupon holder rods
and enable treatment of biofilms growing on the coupons in situ. As this was
a novel invention, steps were carried out to ensure that the model was robust
and reliable in its purpose. With the understanding that as EO liquid is heated,
the volatile components in their gaseous state will rise above the liquid in a
general upwards direction (Clark 2009), consideration had to be given for the
coupon placement within the chamber, as the rods are inserted vertically with
an evident hierarchy in coupon position in relation to the source of EO vapour.
Thus, initial experiments aimed to address concerns regarding this by treating
coupon position as an independent variable and analysing results to assess
any significant differences in CFU mL-1. Findings from this study indicated that
in both untreated and treated samples, log reduction in CFU mL-1 was not
significantly different, regardless of whether the coupon was at the top, middle
or bottom and thus, a conclusion can be drawn that coupon position is no
longer a factor that needs considering in this model. Other general notes
128
regarding the design of the vapour chamber may consider the possibility for
“leaks”. Whilst a concerted effort was made to ensure the rods were fitted
snuggly, and the lid/base had intact seals, this was not an issue that was
focussed on. In fact, this research welcomed the occurrence of minor escaping
of vapour as this would represent that of real-life scenarios where this method
of application may be used.
In the previous chapter of this study, evidence showed that a concentration of
0.2% (v/v) cinnamon bark EO in broth dilution was capable of producing >3
log reductions in biofilms grown on polycarbonate coupons, after 24 h contact,
and at a concentration of 2% (v/v), greater than 8 log reductions within 10
minutes of contact time were observed. Whilst it is difficult to make a direct
comparison of broth dilution concentrations to cinnamon bark EO in vapour
form, volumes of EO used in the base of the vapour chamber were chosen to
represent practical volumes, which kept cost in mind, though also reflected
comparable concentrations.
Results from the coupon position experiment were collated to represent 24
hour testing of biofilms with 0.2 µL cm-3 EO vapour. This revealed a significant
5.60 log reduction of biofilms after this contact time (P<0.0001). Further testing
to include lower contact times led to findings showing minimal log reduction
after 10, 30 and 60 min, but a 7.50 and 7.76 log reduction after 6 h and 12 h,
respectively, the latter representing a 100% reduction in CFU mL-1. These
results, in combination with the results from 24 h, indicate an increase in
observed biofilm growth after 12 h exposure and the possibility that P.
aeruginosa showed tolerance to the EO vapour. To investigate this further,
colonies from the 24 h contact point of this experiment were subcultured, used
129
to inoculate the CBR and grow mature biofilms, and re-tested in the vapour
chamber for 6 to 24 h using the same concentration of EO vapour. This strain
was called tolerance subculture 1 (TSC-1) and results showed that TSC-1
were less susceptible to the vapour than their original counterpart. Whilst the
original biofilms were reduced to less than 1.5 log CFU mL-1 after 6 h, TSC-1
did not reduce to less than 3 log CFU mL-1 throughout the testing. This was
also mirrored in further testing carried out on a subculture of TSC-1 (i.e. TSC-
2). Thus, this indicates that reduction by the vapour was still moderately
successful, in that it achieved a >4 log reduction, the effect was markedly
different from the original testing and further supports the hypothesis that P.
aeruginosa biofilms exhibited tolerance to cinnamon bark EO. This is
supported by studies that have reported P. aeruginosa to show intrinsic
tolerance to both EOs as a whole and EO components. Cox and Markham
(2007) found that P. aeruginosa exhibited intrinsic tolerance to eugenol,
linalool, geraniol, a-terpineol and citral, and may have an energy dependent
multidrug resistance efflux pump system. MexAB-OprM is an efflux system
driven by ATP that is reported to be involved in P. aeruginosa tolerance to
hydrophobic solvents such as hexane and p-xylene (Li, Zhang, et al. 1998).
These reports could explain the tolerance that is being observed in results of
this study, though further research is required to corroborate this. In contrast,
Becerril et al (2012) found that cinnamon oil did not cause an increase in MIC
in any of the 48 isolates they studied, nor did it induce any tolerance in P.
aeruginosa following 50 passages of EO treatment. Despite these findings, it
is evident that cinnamon bark EO vapour is capable of reducing the viability of
preformed mature biofilms at low concentrations. Although current published
130
literature surrounding the effects of EO vapour on biofilms is limited, similar
findings have been seen for cinnamon EO direct contact treatment of biofilms
(chapter 5) and in work investigating cinnamon EO vapour against planktonic
bacteria. For example, Utchariyakiat et al. (2016) found cinnamon bark vapour
to be effective against P. aeruginosa at a 0.5mg/L of air concentration, which
is a very low concentration. Inouye et al (2001) found that cinnamon bark EO
vapour had a minimum inhibitory dose range of 1.56 – 12.5 mg/L air against a
range of Gram-negative and Gram-positive bacteria. Křůmal et al. (2015)
conducted a study investigating the antimicrobial activity of EOs placed inside
a desiccator with planktonic bacteria and found that 5 mL of cinnamon EO (leaf
and bark mix) reduced bacterial numbers by 5 log in 3 days. These findings,
and the findings presented in this chapter, are in contrast to research carried
out by Goñi et al (2009) and López et al (2007) who found that cinnamon EO
vapour was not effective against P. aeruginosa, however, neither of these
studies indicate if the EO was leaf or bark origin and discussions in chapter 4
have already outlined the importance of this detail, highlighting the inferior
antimicrobial activity of leaf oil compared to bark oil.
Interestingly, in the present study, when volume of oil used in the chamber
was increased, the treated biofilms were less susceptible to the vapour
compared to those treated with a lower concentration of EO vapour. The log
reductions seen for biofilms exposed to 0.2 µL cm-3 EO vapour was
significantly lower (P<0.01) than that of log reductions of biofilms exposed to
2 µL cm-3 vapour. This dose effect is especially obvious at 6 hour and 12 hour
time points where biofilms treated with 0.2 µL cm-3 were more reduced, if not
eradicated completely, compared to biofilms treated with 2 µL cm-3 vapour
131
which showed growth throughout testing. Without further investigations it is
difficult to speculate as to why this may be occurring, though comment can be
made on the volatility of components within the oil. Up to 300 volatile
compounds have been reported to be found in essential oil from the cinnamon
plant (Kazemi and Mokhtariniya 2016) and these components can be found in
trace amounts or comprise up to 90% amount of the EO (Senatore 2002,
Nabavi et al. 2015). In liquid phase, the proportions of these components are
found to be fairly stable (Reyes-Jurado et al. 2019). However, because each
compound has a different vapour pressure and thus a varying volatility, the
volatile compounds will disperse at different rates until an equilibrium is
reached in a closed environment (Kloucek et al. 2012). Cinnamaldehyde is
known to be the main constituent of cinnamon bark EO and is reported to be
responsible for the antimicrobial activity of this oil (Nabavi et al. 2015) and
within the oil presented in this study, represents 85% (chapter 4). More
investigations are required to assess the composition of the vapour chamber
headspace at these different vapour concentrations, which would potentially
shed light on the arrangement of volatile compounds in this space and give a
possible explanation for the differences seen in efficacy.
Concentrations of vapour used in this chapter were loosely based on the
concentrations of liquid cinnamon bark EO used to treat biofilms in the
previous chapter. In the previous chapter, concentrations 0.02, 0.2 and 2%
(v/v) were used and thus, by using a crude conversion of v/v to µL per L of air
to represent a vapour concentration in percentage, the same concentrations
were used here, with the exception of the higher concentration as this would
have been an inappropriate volume of oil at the bottom of the chamber.
132
However, to ensure accurate depiction of the concentration of oil in vapour
treatment, concentrations were reported as µL cm-3. The previous chapter
(Chapter 5) identified differences when treating biofilms grown on PC coupons
compared to those grown on SS coupons. Although the results of the 0.2 µL
cm-3 vapour treatment of biofilms agreed to the previous findings, as
reductions were greater for PC biofilms than SS biofilms, the same was not
observed in the 2 µL cm-3 vapour treated biofilms. This observation may also
be in connection with the possible differences in vapour phase antimicrobials
at the different concentrations.
Another notable outcome of this research is that, if a conversion of the vapour
concentration is carried out to translate 2 µL cm-3 to µL per L of air and thus
percentage EO vapour, 0.2 µL cm-3 would be expressed as 0.02% (v/v). This
concentration is up to 100-fold less than concentrations used in the direct
treatment experiments of chapter 5, though was capable of achieving
comparable log reductions in preformed biofilms compared to higher
concentrations used in liquid application. A similar phenomenon was seen in
work by Tyagi and Malik (2010b) who reported in their studies assessing
activity of lemongrass EO against Candida albicans that lemongrass EO was
much more potent in vapour form compared to lemongrass EO in broth
dilutions.
The US Environmental Protection Agency (EPA) defines a disinfectant as a
successful antibiofilm agent when it is capable of producing a 6 log reduction
of biofilm after no more than 10 min of exposure (Environmental Protection
Agency 2017). Whilst the findings presented in this chapter do not advocate
the replacement of current disinfection methods with cinnamon vapour, its use
133
may however provide additional steps in decontaminating areas prone to
biofilm formation and supporting existing protocols. Current vapour
decontamination protocols include hydrogen peroxide vapour/aerosolisation
systems and gaseous ozone treatments (Boyce 2016). Work investigating the
decontamination of various bacteria from surfaces using gaseous ozone
showed a maximum log reduction of 5.05, and this study does not imply that
bacteria were in biofilm state (Moat et al. 2009). Hems et al. (2005) found that
gaseous ozone had no significant effect on Enterococcus faecalis biofilms and
Marino (2018) advocates the use of gaseous ozone for longer periods of time,
i.e. overnight, to achieve adequate reduction of biofilms in small spaces.
Watson et al. (2018) found that hydrogen peroxide vapour (HPV) was able to
completely inactivate biofilms, including P. aeruginosa biofilms, after 100 min
of exposure, and Otter et al (2010) reported that no Gram-negative rod
bacteria were cultivated from 63 sites within an intensive care unit following
HPV decontamination, although this was following a 12 hour decontamination
process and an overnight aeration step. The results from this chapter suggest
that cinnamon bark EO vapour shows promise in the context of air and surface
decontamination, especially in healthcare settings where current protocols use
dangerous substances (Laird et al. 2012) and often require extensive
decontamination times.
In summary, this chapter aimed to address the gaps in literature which have
so far failed to investigate the effect of cinnamon bark EO vapour against P.
aeruginosa biofilms, grown in non-static biofilm growth models. This chapter
presents the development of a novel vapour chamber designed to assess the
vapour effects of EOs and similar compounds on biofilm viability. The CBR is
134
an established model for investigating biofilm growth in vitro, therefore this
chamber was adapted to be used in conjunction with the CBR to assess the
effects of vapour exposure to biofilms grown using it. Initial experiments using
this vapour chamber assessed the setup and whether its design affected the
application of EO vapour to the biofilms. It was found that the position of the
coupon did not influence the effect of the EO vapour and thus the vapour
chamber was suitable for further testing of vapour against biofilms. Cinnamon
vapour at 0.2 µL cm-3 produced a complete reduction of biofilm after 12 h of
contact, though 24 h contact was not as effective. This occurrence was further
investigated to explore the possibility for tolerance of P. aeruginosa to
cinnamon vapour. After passages of treatment, although the bacteria were not
as susceptible to the cinnamon vapour, they were still significantly reduced by
>4 log CFU mL-1. Interestingly, when the volume of oil in the vapour chamber
was increased, there was no improvement in antibiofilm effects and efficacy
was in fact reduced. Speculation may suggest that there may be differences
in the equilibrium of volatile components within the chamber, but further
investigations are required. Overall, cinnamon EO vapour shows promise in
contributing to current cleaning processes and may aid in decontamination
that utilises no touch protocols.

135
CHAPTER 6

137
6 SELECTED ION FLOW TUBE MASS SPECTROMETRY
(SIFT-MS) ANALYSIS OF CINNAMON EO VAPOUR AND
EFFECTS OF CINNAMON EO COMPONENTS ALONE AND
IN COMBINATION
6.1 Introduction
In the previous chapter (chapter 6), evaluation of the antimicrobial effects of
cinnamon bark EO in vapour phase revealed that biofilms were less
susceptible when EO vapour concentration was increased from 0.2 µL cm-3 to
2 µL cm-3. It was hypothesised that the proportion of volatile components within
the vapour chamber, at the different concentrations, were causing changes in
anti-biofilm efficacy. The complexity of EOs, and their volatility, has already
been discussed (chapter 3-6). Constituents of EOs can typically be classified
into one of many compound classifications; alcohols, ethers, aldehydes,
ketones, esters, amines, amides, phenols, heterocycles, and terpenes (Dhifi
et al. 2016). Each of these constituents have a different vapour pressure,
which can be used to indicate the rate of evaporation of a liquid, with
substances that have higher vapour pressures, vaporising more readily
(Speight 2019). The composition of a vapour mixture produced from an EO
will be dependent on the vapour pressure of each constituent in the liquid
phase (Guenther 1948).
The composition of cinnamon bark EO in liquid phase was analysed using gas
chromatography mass spectrometry (GC-MS) in chapter 3 which identified 6
main compounds including cinnamaldehyde, limonene, eucalyptol, eugenol,
benzyl benzoate and linalool. Analysis of the gaseous headspace that

138
cinnamon EO generates can be used to quantify these identified compounds.
Selected ion flow tube mass spectrometry (SIFT-MS) is an analysis technique
that has already been utilised in this thesis (chapter 3), and is a form of direct
mass spectrometry that utilises soft chemical ionization to produce real-time
quantitative analysis of volatile compounds (Smith and Španěl 2011). Other
methods that have been used to accomplish essential oil volatile analysis
include solid-phase microextraction (SPME) with follow up analysis using gas
chromatography mass spectrometry (GC-MS), gas chromatography with
flame ionisation detection (GC-FID) and wet effluent diffusion denuder
(WEDD) techniques with GC-MS analysis (Tyagi and Malik 2011, Křůmal et
al. 2015, Stojanović et al. 2019). However, all of these techniques necessitate
extraction of the volatiles from the methods in which they are generated, often
requiring pre-concentration of compounds before analysis and/or
consideration for the fibre or compound absorption material. To my knowledge,
there are no other studies that utilise SIFT-MS to investigate the vapour phase
of essential oils or investigate vapour composition to elucidate anti-biofilm
effects in situ. Therefore, this chapter aims to use SIFT-MS to analyse the
headspace of vapour chambers used to treat biofilms and to investigate the
composition of the volatile mixture produced from vaporisation of cinnamon
bark EO within these chambers. This will potentially explain the differences
seen in antimicrobial activity of cinnamon bark EO vapour at varying
concentrations.
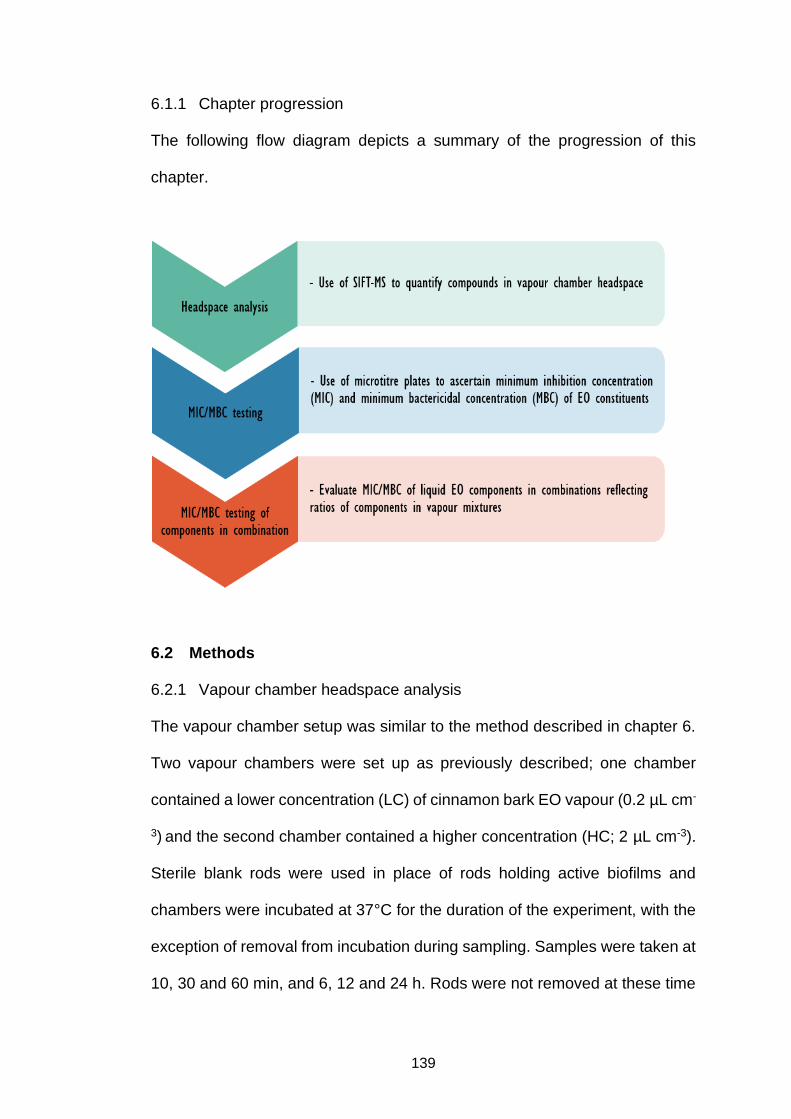
139
6.1.1 Chapter progression
The following flow diagram depicts a summary of the progression of this
chapter.
6.2 Methods
6.2.1 Vapour chamber headspace analysis
The vapour chamber setup was similar to the method described in chapter 6.
Two vapour chambers were set up as previously described; one chamber
contained a lower concentration (LC) of cinnamon bark EO vapour (0.2 µL cm-
3) and the second chamber contained a higher concentration (HC; 2 µL cm-3).
Sterile blank rods were used in place of rods holding active biofilms and
chambers were incubated at 37°C for the duration of the experiment, with the
exception of removal from incubation during sampling. Samples were taken at
10, 30 and 60 min, and 6, 12 and 24 h. Rods were not removed at these time
140
points as sampling using the SIFT-MS instrument mimicked the removal of
rods at these times. SIFT-MS was used to analyse the headspace of vapour
chambers using methods adapted from Slade et al. (2017). Briefly, chambers
were set up as previously described in chapter 6, and the headspace of the
chamber was analysed using SIFT-MS (Instrument Science Limited, UK) in
‘Selected Ion’ mode to quantify headspace concentration of cinnamaldehyde,
limonene, benzyl benzoate, eucalyptol, eugenol and linalool. Three precursor
ions of H3O+, NO+ and O2+ were used. The silicon septum of the vapour
chamber was wiped with 70% ethanol before being pierced with a sterile
needle attached to the SIFT-MS direct sampling inlet. The sample was vented
using another sterile needle attached to a 0.2 µm syringe filter (Sartorious
Stedim Biotech, Germany) which allowed headspace gases to flow freely. The
SIFT-MS instrument was run for 5 seconds to allow for settling of gases and
then an average part per billion (ppb) of analytes was calculated over 10
seconds of readings. The experiment was carried out independently in
triplicate and results are express as average ppb.
6.2.2 Minimum inhibitory concentration (MIC) and minimum bactericidal
concentration (MBC) of cinnamon bark essential oil components
Results from SIFT-MS analysis of the vapour chambers (section 7.2.1)
identified eucalyptol as a dominant compound present in the headspace of
both low concentration (LC) and high concentration (HC) chambers.
Therefore, eucalyptol was chosen, and its antimicrobial efficacy was
compared to that of cinnamaldehyde, the dominant constituent of the
condensate. The MIC and MBC was determined for eucalyptol and
141
cinnamaldehyde liquid components, alone and in combination, using methods
described in chapter 4. Combinations of eucalyptol and cinnamaldehyde were
mixed to reflect the ratios of the components at different time points within the
vapour chamber headspace, based on methods and results of section 7.2.1.
The ratios of cinnamaldehyde to eucalyptol used in combinations 1-6 are
shown in Table 6.1. These ratios were calculated by dividing the concentration
of eucalyptol present in the headspace by the concentration of
cinnamaldehyde present in the headspace. Pure chemical compounds of
eucalyptol (Sigma Aldrich, Dorset, UK) and cinnamaldehyde (Sigma Aldrich,
Dorset, UK) were mixed reflecting the ratios described and diluted serially. The
final concentration of cinnamaldehyde in combinations 1-3 ranged from
0.007% - 4% (v/v), with corresponding eucalyptol concentration ranging from
0.01% - 16.4% (v/v). Final tested concentrations of cinnamaldehyde in
combinations 4-6 ranged from 0.007% - 2% (v/v), with corresponding
eucalyptol concentration ranging from 0.07% - 28.75% (v/v).
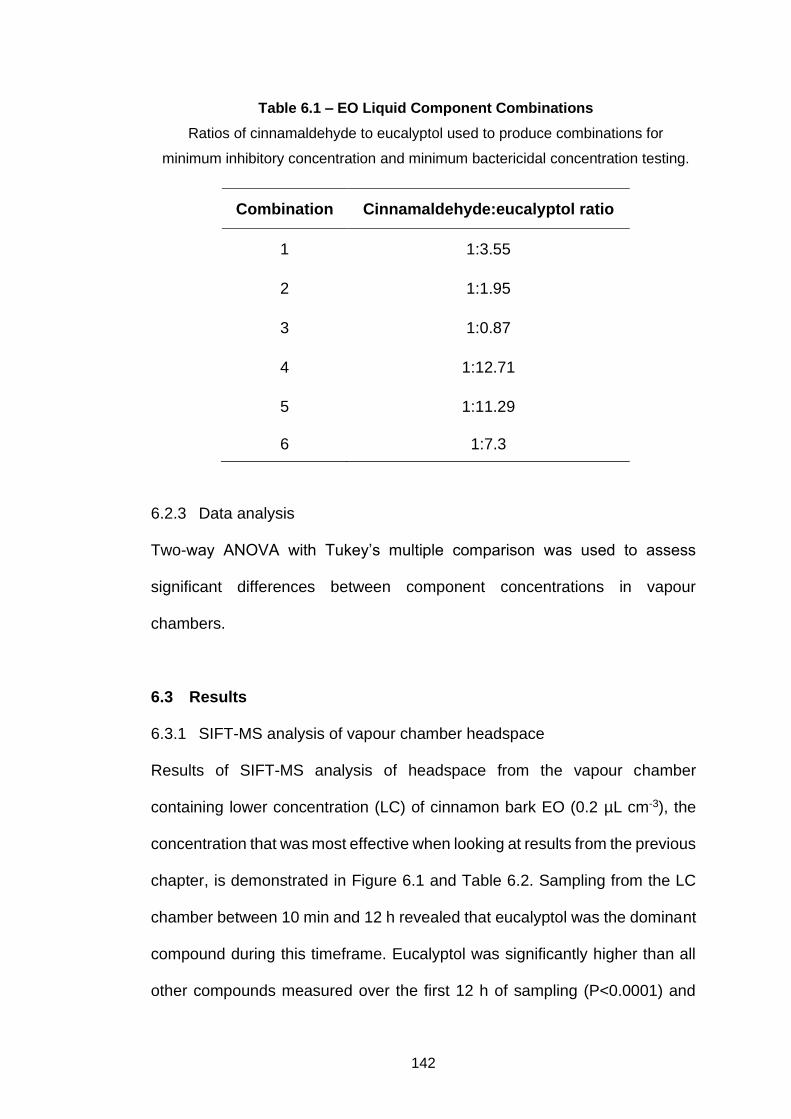
142
6.2.3 Data analysis
Two-way ANOVA with Tukey’s multiple comparison was used to assess
significant differences between component concentrations in vapour
chambers.
6.3 Results
6.3.1 SIFT-MS analysis of vapour chamber headspace
Results of SIFT-MS analysis of headspace from the vapour chamber
containing lower concentration (LC) of cinnamon bark EO (0.2 µL cm-3), the
concentration that was most effective when looking at results from the previous
chapter, is demonstrated in Figure 6.1 and Table 6.2. Sampling from the LC
chamber between 10 min and 12 h revealed that eucalyptol was the dominant
compound during this timeframe. Eucalyptol was significantly higher than all
other compounds measured over the first 12 h of sampling (P<0.0001) and
Table 6.1 – EO Liquid Component Combinations
Ratios of cinnamaldehyde to eucalyptol used to produce combinations for
minimum inhibitory concentration and minimum bactericidal concentration testing.
Combination Cinnamaldehyde:eucalyptol ratio
1 1:3.55
2 1:1.95
3 1:0.87
4 1:12.71
5 1:11.29
6 1:7.3
143
represented 67% of the total measured compounds after 10 min of incubation
in the LC chamber. However, after an initial significant increase in
concentration (P<0.0001), eucalyptol concentration significantly decreased
after 60 min (P<0.0001). In contrast to this, in the same LC chamber,
cinnamaldehyde concentration increases over time and its concentration after
24 h of incubation is significantly greater than its concentration at 10 min
(P<0.0001). At the 24 h sampling point, cinnamaldehyde is the dominant
compound. Eugenol, linalool and benzyl benzoate concentrations did not
significantly change over time (P>0.005) and limonene concentration
significantly decreased over time (P<0.0001) in the LC chamber.
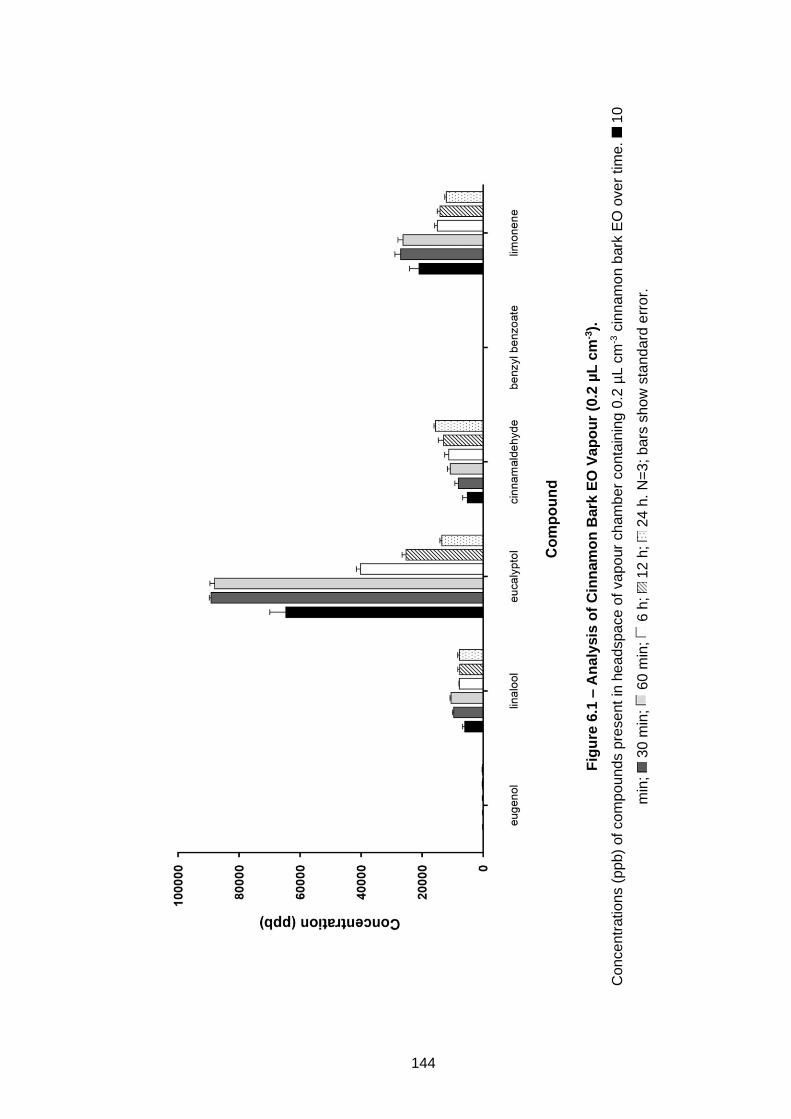
144
Fig
ure
6.1
– A
naly
sis
of
Cin
nam
on
Bark
EO
Va
po
ur
(0.2
µL
cm
-3).
Co
nce
ntr
atio
ns (
ppb)
of co
mp
ou
nd
s p
rese
nt
in h
ead
spa
ce o
f va
po
ur
ch
am
ber
co
nta
inin
g 0
.2 µ
L c
m-3 c
inna
mo
n b
ark
EO
ove
r tim
e.
10
min
; 3
0 m
in;
60 m
in;
6 h
; 1
2 h
; 2
4 h
. N
=3
; b
ars
sh
ow
sta
nd
ard
err
or.
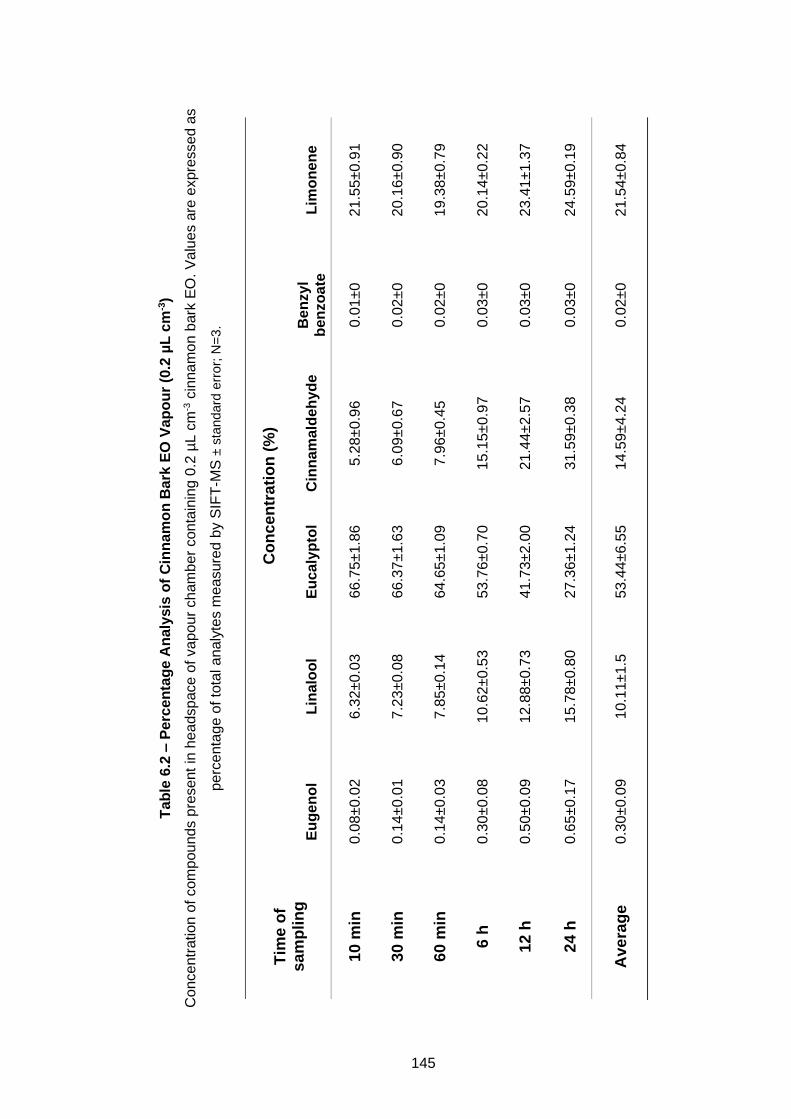
145
Ta
ble
6.2
– P
erc
en
tag
e A
naly
sis
of
Cin
na
mo
n B
ark
EO
Va
po
ur
(0.2
µL
cm
-3)
Co
nce
ntr
atio
n o
f com
pou
nd
s p
resent
in h
ea
dsp
ace
of va
po
ur
ch
am
ber
con
tain
ing 0
.2 µ
L c
m-3 c
inna
mo
n b
ark
EO
. V
alu
es a
re e
xpre
ssed a
s
perc
enta
ge o
f to
tal a
na
lyte
s m
easure
d b
y S
IFT
-MS
± s
tandard
err
or;
N=
3.
Tim
e o
f s
am
pli
ng
Co
nc
en
tra
tio
n (
%)
Eu
ge
no
l L
ina
loo
l E
uca
lyp
tol
Cin
na
ma
ldeh
yd
e
Be
nzy
l b
en
zo
ate
L
imo
ne
ne
10
min
0
.08
±0.0
2
6.3
2±0.0
3
66.7
5±1.8
6
5.2
8±
0.9
6
0.0
1±0
21.5
5±0.9
1
30
min
0
.14
±0.0
1
7.2
3±0.0
8
66.3
7±1.6
3
6.0
9±
0.6
7
0.0
2±0
20.1
6±0.9
0
60
min
0
.14
±0.0
3
7.8
5±0.1
4
64.6
5±1.0
9
7.9
6±
0.4
5
0.0
2±0
19.3
8±0.7
9
6 h
0
.30
±0.0
8
10.6
2±0.5
3
53.7
6±0.7
0
15.1
5±
0.9
7
0.0
3±0
20.1
4±0.2
2
12
h
0.5
0±0.0
9
12.8
8±0.7
3
41.7
3±2.0
0
21.4
4±
2.5
7
0.0
3±0
23.4
1±1.3
7
24
h
0.6
5±0.1
7
15.7
8±0.8
0
27.3
6±1.2
4
31.5
9±
0.3
8
0.0
3±0
24.5
9±0.1
9
Av
era
ge
0.3
0±0.0
9
10.1
1±1.5
5
3.4
4±6.5
5
14.5
9±
4.2
4
0.0
2±0
21.5
4±0.8
4
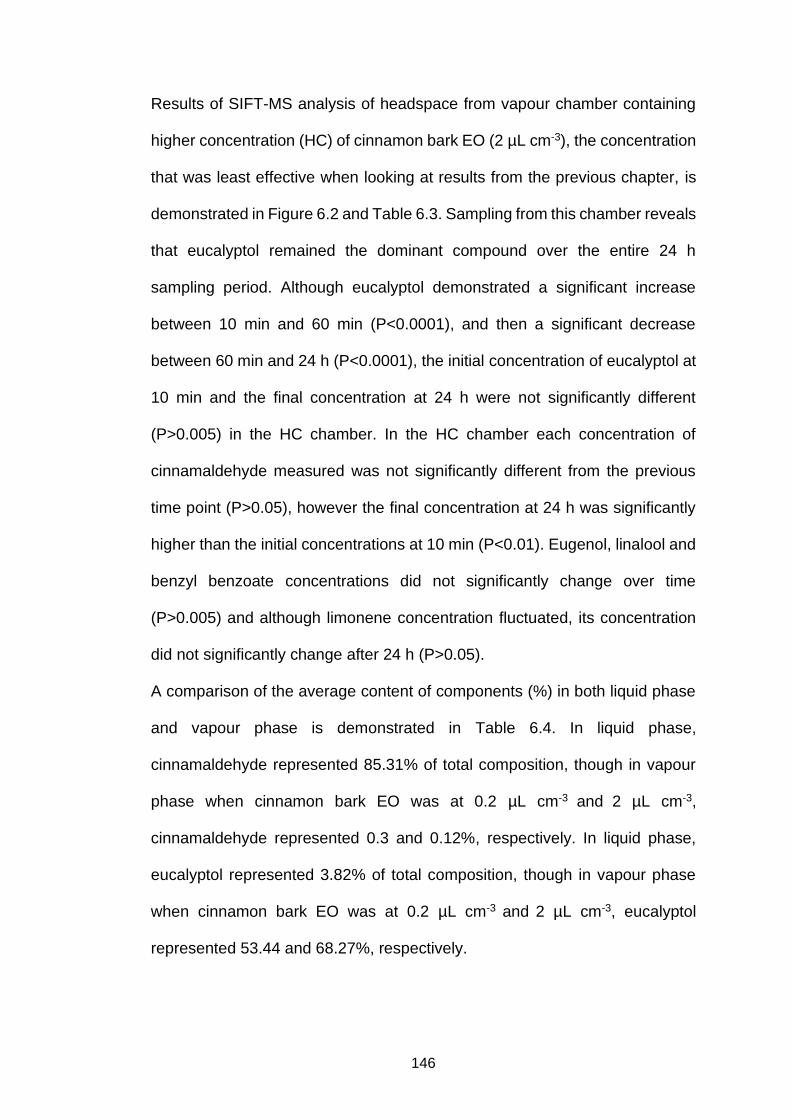
146
Results of SIFT-MS analysis of headspace from vapour chamber containing
higher concentration (HC) of cinnamon bark EO (2 µL cm-3), the concentration
that was least effective when looking at results from the previous chapter, is
demonstrated in Figure 6.2 and Table 6.3. Sampling from this chamber reveals
that eucalyptol remained the dominant compound over the entire 24 h
sampling period. Although eucalyptol demonstrated a significant increase
between 10 min and 60 min (P<0.0001), and then a significant decrease
between 60 min and 24 h (P<0.0001), the initial concentration of eucalyptol at
10 min and the final concentration at 24 h were not significantly different
(P>0.005) in the HC chamber. In the HC chamber each concentration of
cinnamaldehyde measured was not significantly different from the previous
time point (P>0.05), however the final concentration at 24 h was significantly
higher than the initial concentrations at 10 min (P<0.01). Eugenol, linalool and
benzyl benzoate concentrations did not significantly change over time
(P>0.005) and although limonene concentration fluctuated, its concentration
did not significantly change after 24 h (P>0.05).
A comparison of the average content of components (%) in both liquid phase
and vapour phase is demonstrated in Table 6.4. In liquid phase,
cinnamaldehyde represented 85.31% of total composition, though in vapour
phase when cinnamon bark EO was at 0.2 µL cm-3 and 2 µL cm-3,
cinnamaldehyde represented 0.3 and 0.12%, respectively. In liquid phase,
eucalyptol represented 3.82% of total composition, though in vapour phase
when cinnamon bark EO was at 0.2 µL cm-3 and 2 µL cm-3, eucalyptol
represented 53.44 and 68.27%, respectively.
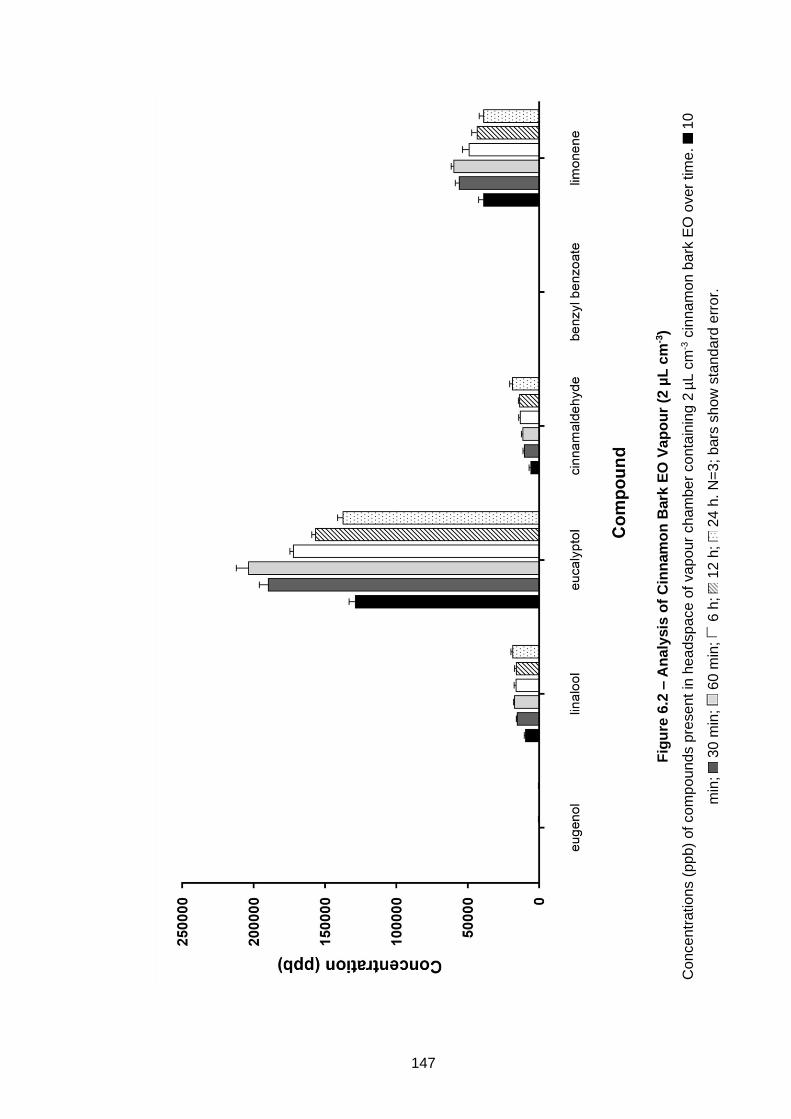
147
Fig
ure
6.2
– A
naly
sis
of
Cin
nam
on
Bark
EO
Va
po
ur
(2 µ
L c
m-3)
Co
nce
ntr
atio
ns (
pp
b)
of co
mp
ou
nd
s p
rese
nt
in h
ea
dsp
ace
of va
po
ur
ch
am
be
r co
nta
inin
g 2
µL c
m-3 c
inna
mo
n b
ark
EO
over
tim
e.
10
min
; 3
0 m
in;
60 m
in;
6 h
; 1
2 h
; 2
4 h
. N
=3
; b
ars
sh
ow
sta
nd
ard
err
or.
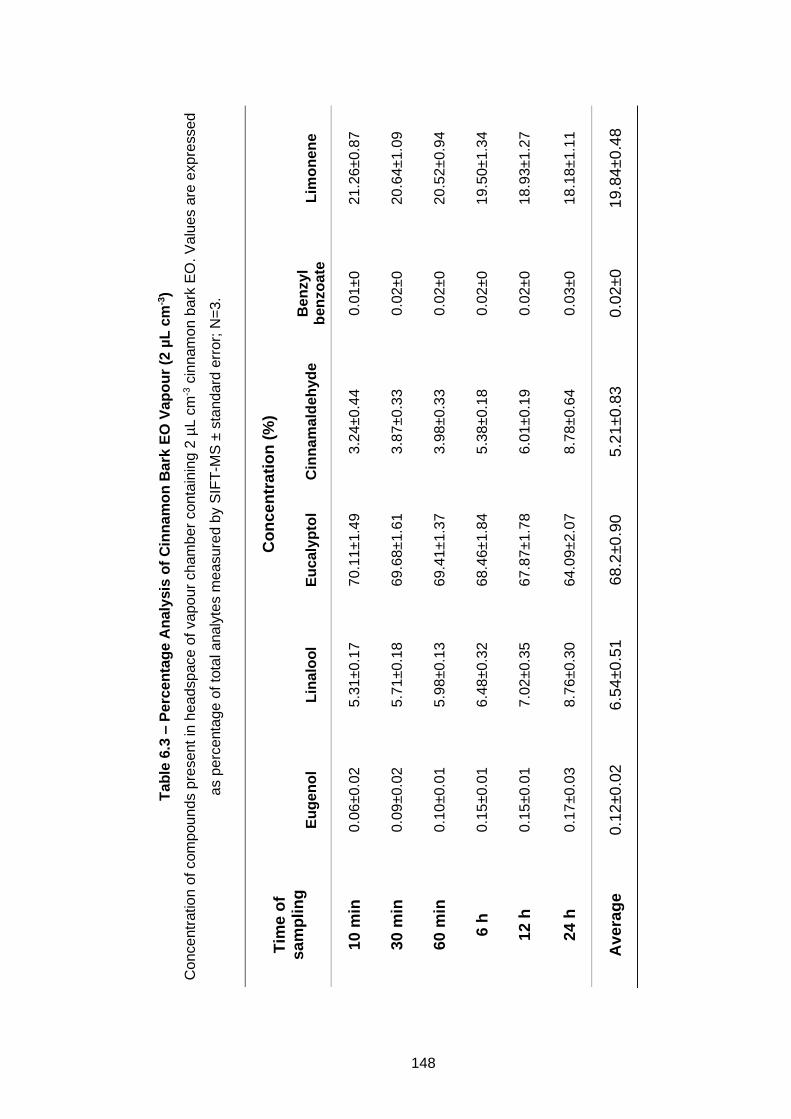
148
Ta
ble
6.3
– P
erc
en
tag
e A
naly
sis
of
Cin
na
mo
n B
ark
EO
Va
po
ur
(2 µ
L c
m-3)
Co
nce
ntr
atio
n o
f com
pou
nd
s p
resent
in h
ea
dsp
ace
of va
po
ur
ch
am
ber
con
tain
ing 2
µL c
m-3 c
innam
on b
ark
EO
. V
alu
es a
re e
xp
resse
d
as p
erc
enta
ge o
f to
tal a
na
lyte
s m
easu
red b
y S
IFT
-MS
± s
tand
ard
err
or;
N=
3.
Tim
e o
f s
am
pli
ng
Co
nc
en
tra
tio
n (
%)
Eu
ge
no
l L
ina
loo
l E
uca
lyp
tol
Cin
na
ma
ldeh
yd
e
Be
nzy
l b
en
zo
ate
L
imo
ne
ne
10
min
0
.06
±0.0
2
5.3
1±0.1
7
70.1
1±1.4
9
3.2
4±0.4
4
0.0
1±0
21
.26
±0.8
7
30
min
0
.09
±0.0
2
5.7
1±0.1
8
69.6
8±1.6
1
3.8
7±0.3
3
0.0
2±0
20
.64
±1.0
9
60
min
0
.10
±0.0
1
5.9
8±0.1
3
69.4
1±1.3
7
3.9
8±0.3
3
0.0
2±0
20
.52
±0.9
4
6 h
0
.15
±0.0
1
6.4
8±0.3
2
68.4
6±1.8
4
5.3
8±0.1
8
0.0
2±0
19
.50
±1.3
4
12
h
0.1
5±0.0
1
7.0
2±0.3
5
67.8
7±1.7
8
6.0
1±0.1
9
0.0
2±0
18
.93
±1.2
7
24
h
0.1
7±0.0
3
8.7
6±0.3
0
64.0
9±2.0
7
8.7
8±0.6
4
0.0
3±0
18
.18
±1.1
1
Ave
rag
e
0.1
2±0
.02
6.5
4±0
.51
68
.2±0
.90
5.2
1±0
.83
0
.02
±0
19
.84
±0
.48
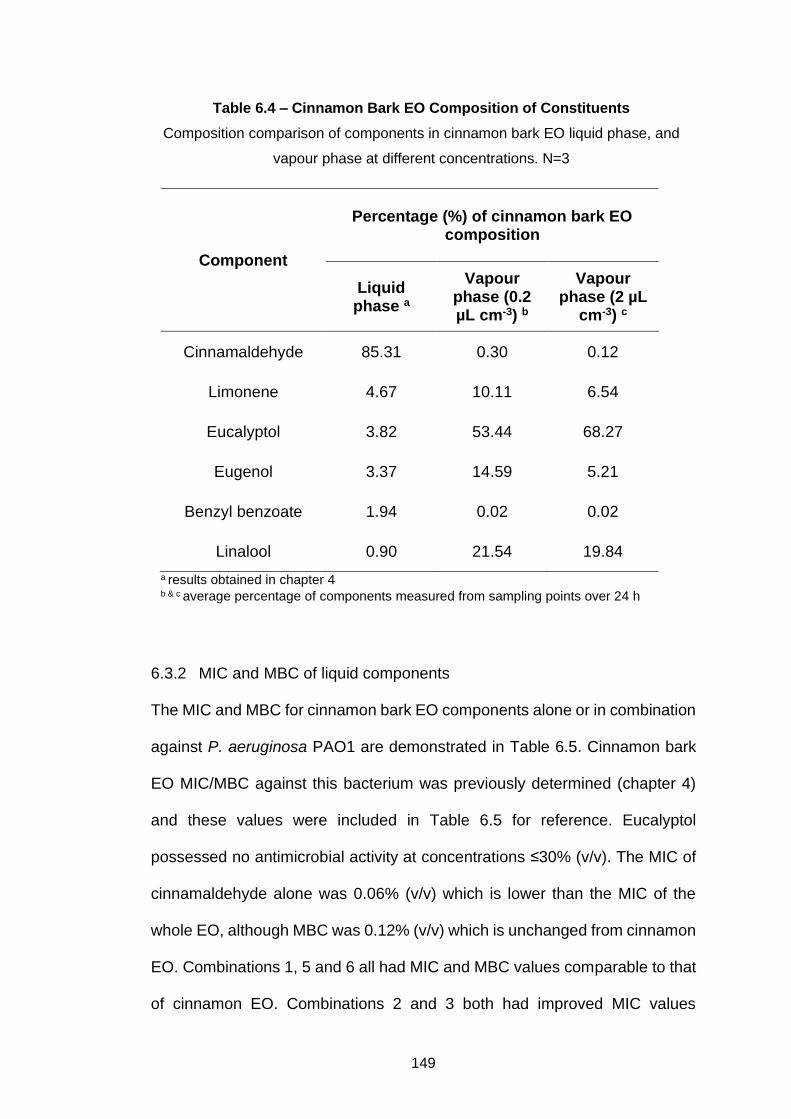
149
6.3.2 MIC and MBC of liquid components
The MIC and MBC for cinnamon bark EO components alone or in combination
against P. aeruginosa PAO1 are demonstrated in Table 6.5. Cinnamon bark
EO MIC/MBC against this bacterium was previously determined (chapter 4)
and these values were included in Table 6.5 for reference. Eucalyptol
possessed no antimicrobial activity at concentrations ≤30% (v/v). The MIC of
cinnamaldehyde alone was 0.06% (v/v) which is lower than the MIC of the
whole EO, although MBC was 0.12% (v/v) which is unchanged from cinnamon
EO. Combinations 1, 5 and 6 all had MIC and MBC values comparable to that
of cinnamon EO. Combinations 2 and 3 both had improved MIC values
Table 6.4 – Cinnamon Bark EO Composition of Constituents
Composition comparison of components in cinnamon bark EO liquid phase, and
vapour phase at different concentrations. N=3
Component
Percentage (%) of cinnamon bark EO composition
Liquid phase a
Vapour phase (0.2 µL cm-3) b
Vapour phase (2 µL
cm-3) c
Cinnamaldehyde 85.31 0.30 0.12
Limonene 4.67 10.11 6.54
Eucalyptol 3.82 53.44 68.27
Eugenol 3.37 14.59 5.21
Benzyl benzoate 1.94 0.02 0.02
Linalool 0.90 21.54 19.84
a results obtained in chapter 4 b & c average percentage of components measured from sampling points over 24 h
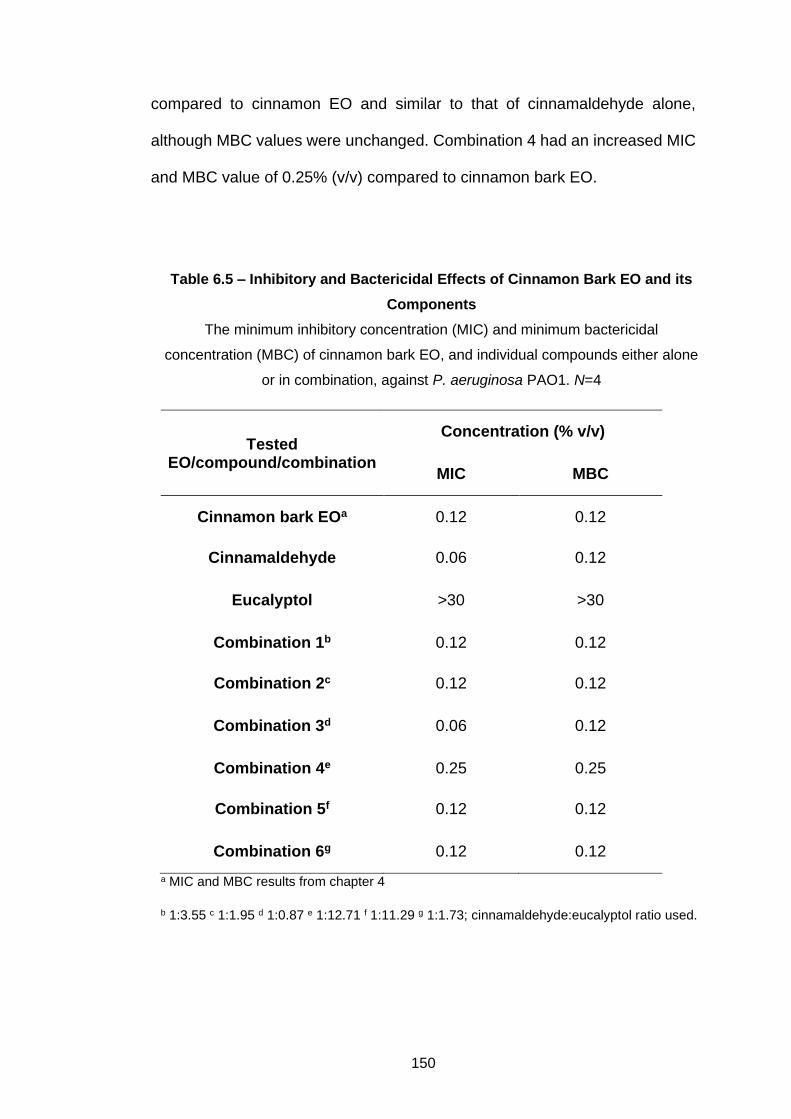
150
compared to cinnamon EO and similar to that of cinnamaldehyde alone,
although MBC values were unchanged. Combination 4 had an increased MIC
and MBC value of 0.25% (v/v) compared to cinnamon bark EO.
Table 6.5 – Inhibitory and Bactericidal Effects of Cinnamon Bark EO and its
Components
The minimum inhibitory concentration (MIC) and minimum bactericidal
concentration (MBC) of cinnamon bark EO, and individual compounds either alone
or in combination, against P. aeruginosa PAO1. N=4
Tested EO/compound/combination
Concentration (% v/v)
MIC MBC
Cinnamon bark EOa 0.12 0.12
Cinnamaldehyde 0.06 0.12
Eucalyptol >30 >30
Combination 1b 0.12 0.12
Combination 2c 0.12 0.12
Combination 3d 0.06 0.12
Combination 4e 0.25 0.25
Combination 5f 0.12 0.12
Combination 6g 0.12 0.12
a MIC and MBC results from chapter 4
b 1:3.55 c 1:1.95 d 1:0.87 e 1:12.71 f 1:11.29 g 1:1.73; cinnamaldehyde:eucalyptol ratio used.
151
6.4 Discussion
The previous chapter (chapter 6) investigated the anti-biofilm effects of
cinnamon bark EO vapour and results demonstrated decreased success when
concentration of EO was increased within the chamber. This chapter continued
to investigate these findings and did so by focusing on analysing the
headspace of vapour chambers containing cinnamon bark EO at different
concentrations, with the aim to elucidate why this outcome occurred. The
vapour chambers were designed with a silicon port to facilitate in situ sampling
of the headspace. Analysis was carried out using SIFT-MS, an instrument
capable of identifying and quantifying volatile organic compounds (VOCs) and
a method that has been described extensively elsewhere (Wang et al. 2002,
Španěl et al. 2006, Smith and Španěl 2011, Lacko et al. 2019). Other methods
such as SPME, GC-FIDD and WEDD can be time-consuming and cannot be
used to easily measure constant chemical evolution of a headspace (Lacko et
al. 2019). The advantage of using SIFT-MS is that this method does not suffer
from these drawbacks, there is no need for pre-concentration or extraction of
volatiles and thus, real-time in situ sampling is carried out without disruption of
the vapour environment and experiment. After literature survey, it is to the best
of my knowledge that this study is the first to use SIFT-MS to analyse EO
headspace and quantify the composition of the vapour mixture produced.
Whilst studies have been carried out to evaluate the vapour composition of
EOs (Tyagi and Malik 2011, Křůmal et al. 2015, Stojanović et al. 2019), these
studies use the methods described above, they do not assess alternative
concentrations of EOs and sampling is not in the circumstance of anti-biofilm
testing. Analysis of cinnamon bark EO using GC-MS in chapter 4 identified the
152
main components in liquid phase. These components were used in the
experimental setup of SIFT-MS to identify their composition in the vapour
headspace. In the lower concentration (LC) vapour chamber, containing 260
µL of cinnamon EO, SIFT-MS analysis revealed that after 10 minutes of
incubation, eucalyptol was the dominant constituent. This is in contrast to the
liquid phase composition of cinnamon EO which identified cinnamaldehyde as
the dominant constituent. This observation was mirrored in the higher
concentration (HC) vapour chamber containing 2.6 mL of EO, where
eucalyptol was also dominant in the headspace. An EO vapour mixture is the
result of volatile components of the EO going into gaseous state. Its
composition relies on the partial vapour pressures of the EO constituents. In
circumstances where a liquid is comprised of constituents possessing varying
vapour pressures, components with the higher vapour pressure, and thus
greater volatility, will be found in higher concentrations within the headspace
(Guenther 1948). The vapour pressure of the constituents of cinnamon bark
EO are demonstrated in Table 6.6. This data shows that of the 6 compounds
present in cinnamon EO, eucalyptol has the highest vapour pressure which
explains the dominance of eucalyptol in the vapour phase of cinnamon EO.
This is comparable to results demonstrated by Křůmal et al. (2015) who also
compared the composition of cinnamon oil (bark/leaf mix) in both liquid and
gaseous states using WEDD, and found that although cinnamaldehyde was
the major constituent of the liquid phase, it was no longer the main compound
in vapour state. Stojanović et al (2019) found that in several species of Thymus
(thyme) essential oils, the main constituent in liquid phase was not the main
constituent in gaseous state and Tyagi and Malik (2011) also observed
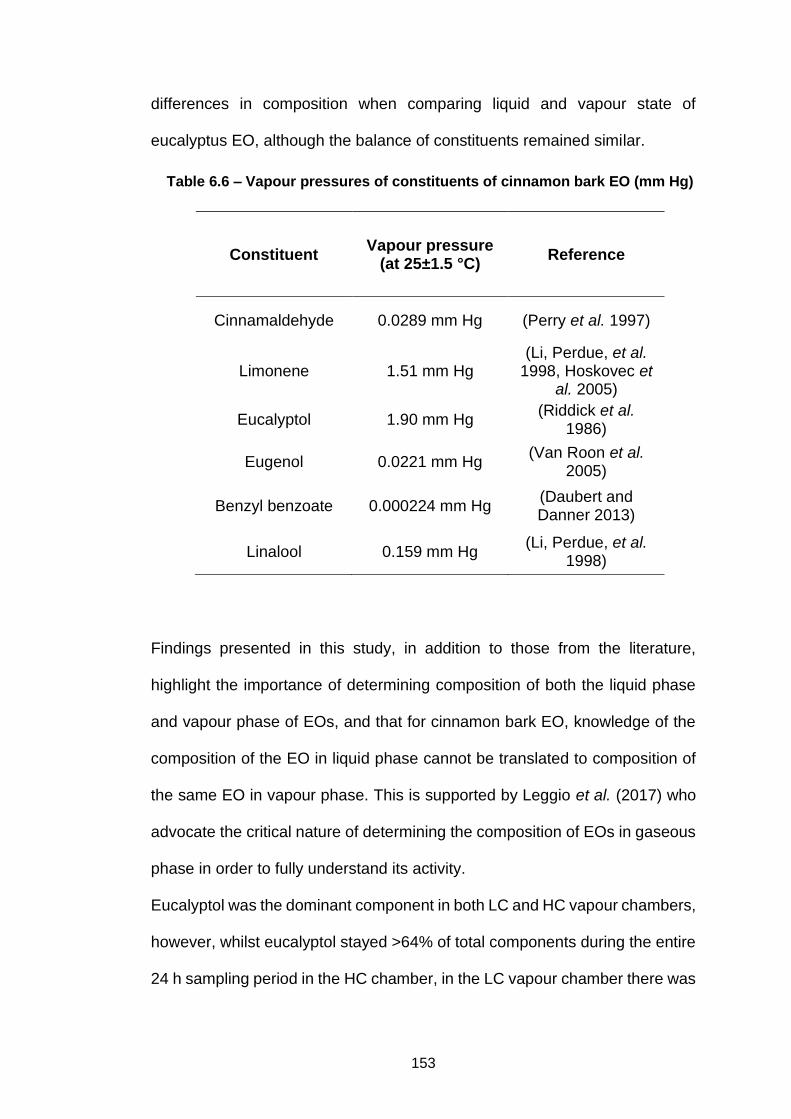
153
differences in composition when comparing liquid and vapour state of
eucalyptus EO, although the balance of constituents remained similar.
Findings presented in this study, in addition to those from the literature,
highlight the importance of determining composition of both the liquid phase
and vapour phase of EOs, and that for cinnamon bark EO, knowledge of the
composition of the EO in liquid phase cannot be translated to composition of
the same EO in vapour phase. This is supported by Leggio et al. (2017) who
advocate the critical nature of determining the composition of EOs in gaseous
phase in order to fully understand its activity.
Eucalyptol was the dominant component in both LC and HC vapour chambers,
however, whilst eucalyptol stayed >64% of total components during the entire
24 h sampling period in the HC chamber, in the LC vapour chamber there was
Table 6.6 – Vapour pressures of constituents of cinnamon bark EO (mm Hg)
Constituent Vapour pressure
(at 25±1.5 °C) Reference
Cinnamaldehyde 0.0289 mm Hg (Perry et al. 1997)
Limonene 1.51 mm Hg (Li, Perdue, et al.
1998, Hoskovec et al. 2005)
Eucalyptol 1.90 mm Hg (Riddick et al.
1986)
Eugenol 0.0221 mm Hg (Van Roon et al.
2005)
Benzyl benzoate 0.000224 mm Hg (Daubert and Danner 2013)
Linalool 0.159 mm Hg (Li, Perdue, et al.
1998)
154
reduction in eucalyptol and this component was no longer dominant after 24
h. The main constituent after 24 h in the LC chamber was cinnamaldehyde.
This is a possible explanation for the greater antimicrobial efficacy of the LC
chamber against biofilms described in chapter 6 as cinnamaldehyde is
suggested to be the main antimicrobial constituent. In the HC chamber,
cinnamaldehyde did not exceed 8.78% of the total composition which could
also explain the inferior anti-biofilm effects of the HC chamber. Studies have
reported that minor components of oil composition are often critical in the
antimicrobial effects of the whole oil (Burt 2004), and although the effects of
the minor components are often reported as synergistic (Goñi et al. 2009),
there have been reports of antagonism (Gill et al. 2002, Mourey and Canillac
2002, Bassolé and Juliani 2012). Synergism is when combinations of
antimicrobials result in an increase in antimicrobial activity that is greater than
the sum of individual components, whereas antagonism is a decrease in
antimicrobial activity when in combination (Chouhan et al. 2017). Thus, this
chapter continued investigations to evaluate the antimicrobial properties of
eucalyptol and cinnamaldehyde, alone and in combination, to look for
synergistic or antagonistic behaviour in liquid phase when used to treat P.
aeruginosa. Cinnamaldehyde alone had an MIC lower than that of the whole
oil (Table 6.5), whereas eucalyptol possessed no antimicrobial activity at
tested concentrations. Combinations of these two constituents revealed that
when eucalyptol was less than cinnamaldehyde in the final mixture (i.e.
combination 3), the MIC and MBC reflected the MIC and MBC values of
cinnamaldehyde alone. This finding is supported by Tak and Isman (2017)
who found that when eucalyptol was added to cinnamaldehyde at a ratio of
155
1:0.8 (cinnamaldehyde:eucalyptol), synergistic effects were observed and
insecticidal activity was increased. In the present study, when the combination
resulted in eucalyptol being no more than 12 times greater than
cinnamaldehyde (i.e. combinations 1, 2, 5 and 6), the MIC and MBC values
were comparable to the MIC/MBC value for the whole EO, and when
eucalyptol was more than 12 times that of cinnamaldehyde in the mixture (i.e.
combination 4), the MIC and MBC value was increased. This not only supports
the literature which suggests that cinnamaldehyde exerts the majority of
cinnamon bark EOs’ antimicrobial effects, but these findings also indicate that
eucalyptol may have an additive or antagonistic effect against
cinnamaldehyde, both in liquid phase and possibly in vapour phase,
depending on the ratio of the two components. Of course, it is also noted that
throughout the sampling of vapour chambers at both concentrations, limonene
is >18% of the composition at all sampling points. Limonene is reported to
possess antimicrobial activity (van Vuuren and Viljoen 2007). Tak and Isman
(2017) demonstrated that the addition of limonene to cinnamaldehyde at a
ratio of 0.8 (w:w) caused synergistic activity, whilst Andrade-Ochoa et al.
(2018) found that limonene in equal parts with cinnamaldehyde produced
synergistic activity. However, to my knowledge no data is available to describe
the synergistic or antagonistic effects of combining limonene with
cinnamaldehyde at higher ratios. Therefore, when considering findings
presented in this chapter, it is difficult to attribute the antagonistic effects
observed in the data presented here to eucalyptol alone, when other minor
components may be contributing. Synergy can also be evaluated using other
methods including the checkerboard assay and fractional inhibitory
156
concentration (FIC) index, the E-test method or an immunometric
checkerboard assay with fluorescent output for real-time synergy analysis
(Langeveld et al. 2014).
In summary, despite cinnamaldehyde being reported previously in this thesis
(chapter 4) as the dominant compound within cinnamon bark EO liquid, the
findings from this chapter demonstrate that this is not reflected in the
composition of cinnamon bark EO in vapour phase. This study highlights the
importance of vapour composition analysis when the intended use of an EO is
in its vapour form, as composition of the liquid phase does not always reflect
the composition of the vapour. Eucalyptol is known to have the highest vapour
pressure of the components identified in cinnamon bark EO used here and
thus it often dominated the headspace of vapour chambers used in this study.
It is suggested from findings presented here that reduced anti-biofilm effects
exhibited in the vapour chamber containing a greater volume of EO is due to
this dominance of eucalyptol in the headspace. It is suggested that eucalyptol
may be having an antagonistic effect and inhibiting cinnamaldehyde from
exerting its known antimicrobial effects. MIC and MBC testing of components
alone and in combination in this chapter suggested that this is true, although
further investigations are needed to evaluate the effects of other minor
compounds found in cinnamon EO.
This study was the first to evaluate the headspace of vapour chambers used
to treat biofilms with EO vapour and puts forth a novel method of in situ
sampling to assess vapour composition using SIFT-MS. This method is of
particular importance as this chapter has highlighted the importance of using
a method that is capable of real time analysis in circumstances where vapour
157
composition is constantly evolving and where this varying composition of
vapour is critical in its effects. The findings in this chapter suggest that use of
pure components from EOs as antimicrobials may be beneficial, due to the
potential interference from other minor compounds and the risk of antagonistic
behaviour when part of the whole EO. However, if whole EO is to be used as
an antimicrobial, in either liquid or vapour applications, then analysis must be
carried out on the phase that it is intended to be used in, to fully understand
which constituents are responsible.


159
CHAPTER 7

161
7 DISINFECTANT POTENTIAL OF CINNAMON BARK
ESSENTIAL OIL
7.1 Introduction
EOs as antimicrobials, and their potential applications, are well described in
the literature and supported thus far in this thesis. Chapter 4 identified the
broad spectrum activity of several EOs and chapters 4-6 highlighted the
antimicrobial activity of cinnamon EO against P. aeruginosa, and its ability to
cause significant reduction in bacterial viability at low concentrations following
short contact times. The potential real-world application of EOs, and their use
as antimicrobials, was also briefly discussed in Chapter 1. Many of the studies
that look at EOs as antimicrobials have looked at their potential application in
the food industry (Chouhan et al. 2017). EOs have been used to delay spoilage
and improve aromatic qualities in vacuum packed meat and fish (Burt 2004);
in antimicrobial packaging films or coatings to reduce surface molds and
bacterial contamination (Rodríguez et al. 2007, Gómez-Estaca et al. 2010,
Sanla-Ead et al. 2011, Avila-Sosa et al. 2012, Alvarez et al. 2014,
Tongnuanchan and Benjakul 2014); applied to baked goods (Ju et al. 2018);
and in aquaculture to treat fresh water fish (Kačániová et al. 2017). EO
application has also been suggested in the cosmetic industry in mouth rinses
to protect against oral bacteria (Moon et al. 2011); as a topical antimicrobial
(May et al. 2000); and as wound disinfectants (Warnke et al. 2009). EOs have
also been suggested for use as disinfectants (Laird et al. 2012). A disinfectant
is an antimicrobial capable of interrupting an infection on contaminated
inanimate non-living objects (Presterl et al. 2019). In developing a new
162
disinfectant the British standards (BS EN) employ a 3 phase testing regimen
which first uses quantitative suspension tests without regard to specific
application (Gebel et al. 2013). This is followed by quantitative tests in both
suspensions and simulated practical testing within the laboratory, in conditions
representative of intended use; and finally field tests are carried out under
practical conditions (Gebel et al. 2013). Under European standards, BS EN
1040 covers phase 1, and BS EN 1276 and BS EN 13697 covers phase 2, for
development of an antibacterial disinfectant intended for food, industrial,
cosmetic and institutional areas (British Standards Institution 2009, 2015).
Phase 3 standards are yet to be developed for disinfectant testing (Sandle
2017). There are very few studies to date that investigate the potential of EOs
under these European standards of disinfection. Yangui et al. (2009) studied
the bactericidal and fungicidal activities of Pituranthos chloranthus EOs and to
study their potential use as powerful and natural disinfectant; Bouaziz et al.
(2009) looked at EOs from Salvia officinalis; Messager et al. (2005) assesses
the antibacterial activity of tea tree oil and tea tree oil containing products; and
Falcó et al. (2019) evaluated the sanitizing effects of 9 EOs.
To my knowledge there is currently no research that uses the European
standard BS EN 1276 to investigate cinnamon bark EO or its disinfection
potential compliant with these standards. Therefore, the aim of this chapter is
to evaluate cinnamon bark EO as a potential disinfectant against a panel of
bacteria described in the BS EN 1276 standard.
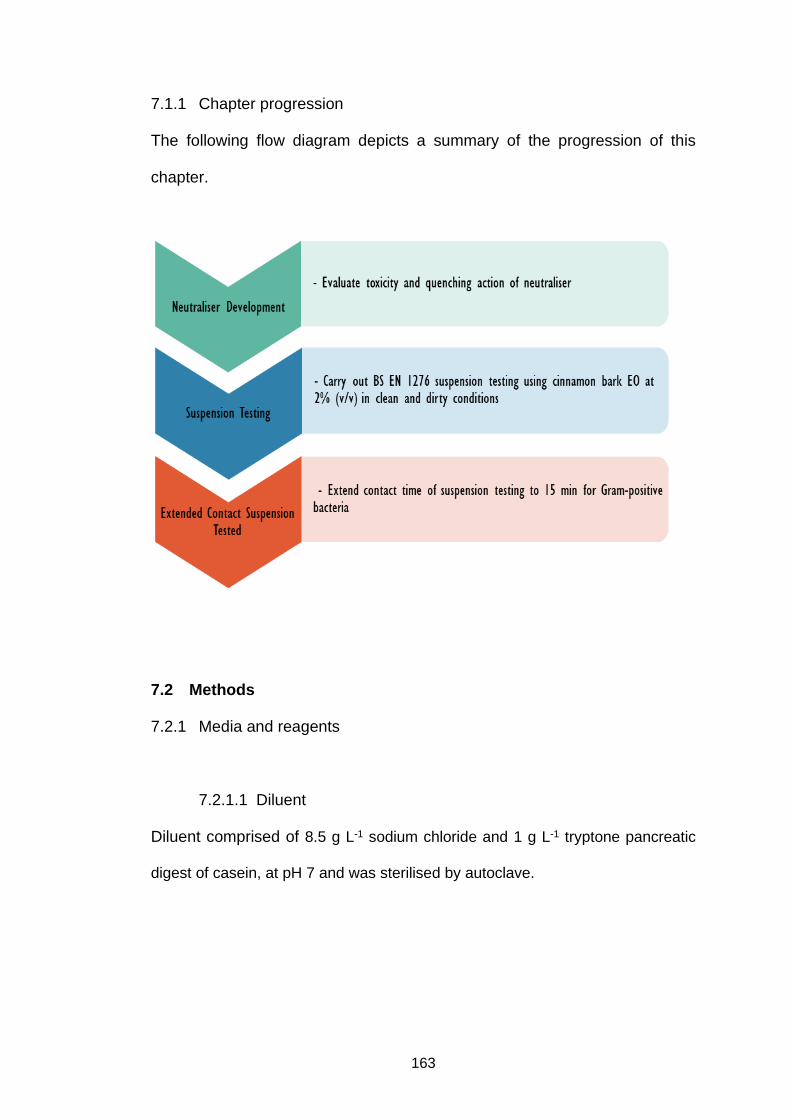
163
7.1.1 Chapter progression
The following flow diagram depicts a summary of the progression of this
chapter.
7.2 Methods
7.2.1 Media and reagents
7.2.1.1 Diluent
Diluent comprised of 8.5 g L-1 sodium chloride and 1 g L-1 tryptone pancreatic
digest of casein, at pH 7 and was sterilised by autoclave.
164
7.2.1.2 Disinfectant product
Cinnamon bark EO was diluted in water containing 0.5% (v/v) Tween 80 to
achieve a concentration of 2.5% (v/v). This solution was confirmed to stay in
a stable homogenous suspension for the duration of >2 h. The concentration
of EO was prepared at 1.25x final concentration to achieve 1x concentration
in test method. Disinfectant product was used within 1 h.
7.2.1.3 Interfering substance
Bovine serum albumin (BSA; Sigma Aldrich, Dorset, UK) was used as an
interfering substance as recommended by BS EN 1276. Testing was carried out
under both clean conditions (0.3 g L-1 BSA) and dirty conditions (3 g L-1). BSA
stock solutions were made up at 10x concentration, filter sterilised with 0.2 µM
filter and kept at 4°C until needed. Stock solutions were used within 1 month.
7.2.1.4 Neutraliser
A neutralising solution was based on the aldehyde neutraliser composition
recommended by BS EN 1276. Tween 80 (30 g L-1), lecithin (3 g L-1) and L-
histidine (1 g L-1) were added to phosphate buffer (34 g L-1 monopotassium
phosphate, pH 7.2) and sterilised by autoclaving. Neutraliser controls were
carried out to assess its toxicity against the test bacteria and its antimicrobial
quenching activity. All neutraliser validation testing was carried out at 20°C.
7.2.2 Test organisms and culture preparation
Test organism used in this chapter included Staphylococcus aureus (NCTC
12981), Pseudomonas aeruginosa (ATCC 15442), Escherichia coli (ATCC
165
10536) and Enterococcus hirae (ATCC 10541). Cultures were prepared as
described in BS EN 1276:2009.
7.2.2.1 Preparation of working culture
Frozen stocks of organisms were revived by streaking onto TSA agar plates
and incubating at 37°C for 24 h. After 24 h, a second subculture streak plate
was prepared in the same way. These plates were the working cultures from
which suspensions were made in broth.
7.2.2.2 Test suspension
For all organisms a test suspension was prepared by taking loopfuls of working
culture (section 7.2.1.1) and placing in 10 mL of diluent, in 100 mL flasks. The
flasks were vortexed for 1 min. This suspension was then adjusted using diluent
and a spectrophotometer at OD620nm, until number of cells was approximately 1.5-
5 x 10⁸ CFU mL-1. Suspensions were used within 2 h.
7.2.2.3 Validation suspension
A validation suspension was prepared from the test suspension (section
7.2.1.2). A 10-5 dilution of test suspension was diluted 1:3 in diluent to achieve
approximately 3.0 x 10² to 1.6 x 10³ CFU mL-1. Suspensions were used within
2 h.
7.2.3 Neutraliser validation
Two validation tests were performed in parallel to testing to ensure the
neutraliser used did not exert any lethal effects on that bacteria tested, and to
166
ensure that it quenched the antimicrobial activity of the disinfectant after the
required contact time. Validation was deemed successful if ≥50% of validation
suspension bacteria were viable following testing, as described by BS EN
1276.
7.2.3.1 Neutraliser toxicity
To ensure that the neutraliser had no bactericidal effects against test bacteria,
8 mL of neutraliser was added to 1 mL of water and 1 mL of validation
suspension. After 5 minutes of incubation, the solution was serially diluted in
sterile PBS and CFU mL-1 was calculated by spiral plating onto TSA and
incubating for 24 h at 37°C. Toxicity testing was carried out alongside each
replicate of suspension testing (N=3).
7.2.3.2 Neutraliser quenching
To ensure that the neutraliser sufficiently quenched the disinfectant product 1
mL water was mixed with 1 mL diluent, followed by the addition of 8 mL
disinfectant product. After 1 min of incubation, 1 mL of solution was removed
and added to 8 mL of neutraliser. Following a 5 min incubation period, 1 mL of
validation suspension was added, and the solution was left for 30 min, followed
by enumeration by spiral plating onto TSA and incubating for 24 h at 37°C.
Quenching testing was carried out alongside each replicate of suspension
testing (N=3).
167
7.2.4 Suspension testing
Suspension testing was carried out under both clean and dirty conditions. One
millilitre of interfering substance was mixed with 1 mL of test suspension.
Following a 2 min incubation, 8 mL of disinfectant product (2.5% v/v) was
added, and mixture was shaken. Final concentration of disinfectant was 2%
(v/v). After 5 min of contact, 1 mL was removed and transferred to a tube
containing 8 mL of neutralizer and 1 mL of water. After 5 min, the solution was
serially diluted, and bacteria were enumerated on TSA using a spiral plater.
Plates were incubated for 24 h at 37°C. As described by BS EN 1276, a
disinfectant is deemed successful when a 5 log reduction is achieved within 5
min of contact time.
A control test was carried out at the same time as suspension testing using
validation suspension, and water in place of disinfectant product, to verify that
suspension testing had no lethal effects on the bacteria. The control was
deemed successful if ≥50% of validation suspension bacteria were viable
following testing, as described by BS EN 1276. Each experiment had three
replicates and were carried out independently in triplicate.
7.2.5 Extended contact suspension testing
Extended contact time testing was carried out for Gram-positive bacteria;
Staphylococcus aureus (NCTC 12981), and Enterococcus hirae (ATCC
10541). The method was carried out as described in section 7.2.4, however,
disinfectant product was left for a total of 15 min contact time before solution
was neutralised. Each experiment had three replicates and were carried out
independently in triplicate.
168
7.2.6 Data analysis
Two-way ANOVA with Dunnett’s multiple comparisons were used to assess
significant differences in validation testing, whilst Two-way ANOVA was used
to evaluate significant differences in suspension testing.
7.3 Results
7.3.1 Neutraliser toxicity
Results from validation of neutraliser toxicity are shown in Table 7.1. The
neutraliser did not reduce the bacteria tested significantly (P>0.05) and did not
reduce the validation suspension by more than 50%, confirming that the
neutraliser was not toxic.
7.3.2 Neutraliser quenching
Results from validation of neutraliser quenching are shown in Table 7.2. The
neutraliser did not significantly reduce the bacteria tested (P>0.05), in either
clean or dirty conditions. The neutraliser did not reduce organisms more than
50%, confirming that the neutraliser was able to efficiently quench the effects
of cinnamon bark EO.
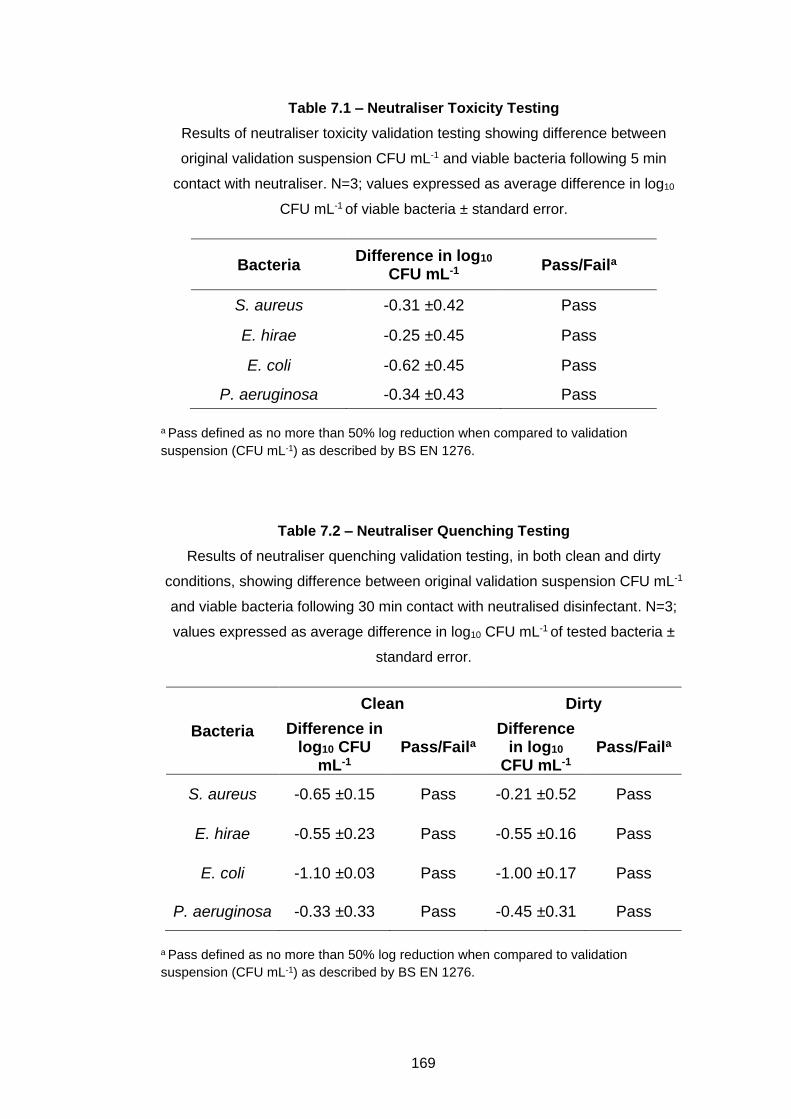
169
Table 7.1 – Neutraliser Toxicity Testing
Results of neutraliser toxicity validation testing showing difference between
original validation suspension CFU mL-1 and viable bacteria following 5 min
contact with neutraliser. N=3; values expressed as average difference in log10
CFU mL-1 of viable bacteria ± standard error.
Bacteria Difference in log10
CFU mL-1 Pass/Faila
S. aureus -0.31 ±0.42 Pass
E. hirae -0.25 ±0.45 Pass
E. coli -0.62 ±0.45 Pass
P. aeruginosa -0.34 ±0.43 Pass
a Pass defined as no more than 50% log reduction when compared to validation
suspension (CFU mL-1) as described by BS EN 1276.
Table 7.2 – Neutraliser Quenching Testing
Results of neutraliser quenching validation testing, in both clean and dirty
conditions, showing difference between original validation suspension CFU mL-1
and viable bacteria following 30 min contact with neutralised disinfectant. N=3;
values expressed as average difference in log10 CFU mL-1 of tested bacteria ±
standard error.
Bacteria
Clean Dirty
Difference in log10 CFU
mL-1 Pass/Faila
Difference in log10
CFU mL-1 Pass/Faila
S. aureus -0.65 ±0.15 Pass -0.21 ±0.52 Pass
E. hirae -0.55 ±0.23 Pass -0.55 ±0.16 Pass
E. coli -1.10 ±0.03 Pass -1.00 ±0.17 Pass
P. aeruginosa -0.33 ±0.33 Pass -0.45 ±0.31 Pass
a Pass defined as no more than 50% log reduction when compared to validation
suspension (CFU mL-1) as described by BS EN 1276.
170
7.3.3 Suspension testing
Results from suspension testing of cinnamon bark EO (2% v/v) are shown in
Figure 7.1. In both clean and dirty conditions, the control suspension was not
significantly reduced (P>0.05), and bacterial viability was greater than 50% of
the original validation suspension, confirming that the test method did not have
any lethal effects against the bacteria tested. Cinnamon bark EO (2% v/v) was
successful in significantly reducing E. coli (P<0.01) and P. aeruginosa
(P<0.05), in both clean and dirty conditions, by >5 log CFU mL-1. E. coli
showed a log reduction of 7.06 in both clean and dirty conditions, whilst P.
aeruginosa showed a 7.16 log reduction in both conditions. Although
cinnamon EO was able to significantly reduce S. aureus (P<0.001) and E.
hirae (P<0.05), it was unable to cause a greater than 5 log reduction for either
of these organisms within 5 min. In clean conditions S. aureus was reduced
2.23 log and E. hirae was reduced 0.71 log, in dirty conditions S. aureus was
reduced 1.02 log and E. hirae was reduced 0.46 log. BSA did not have any
significant effect on antimicrobial activity (P>0.05), for any of the testing
conditions.
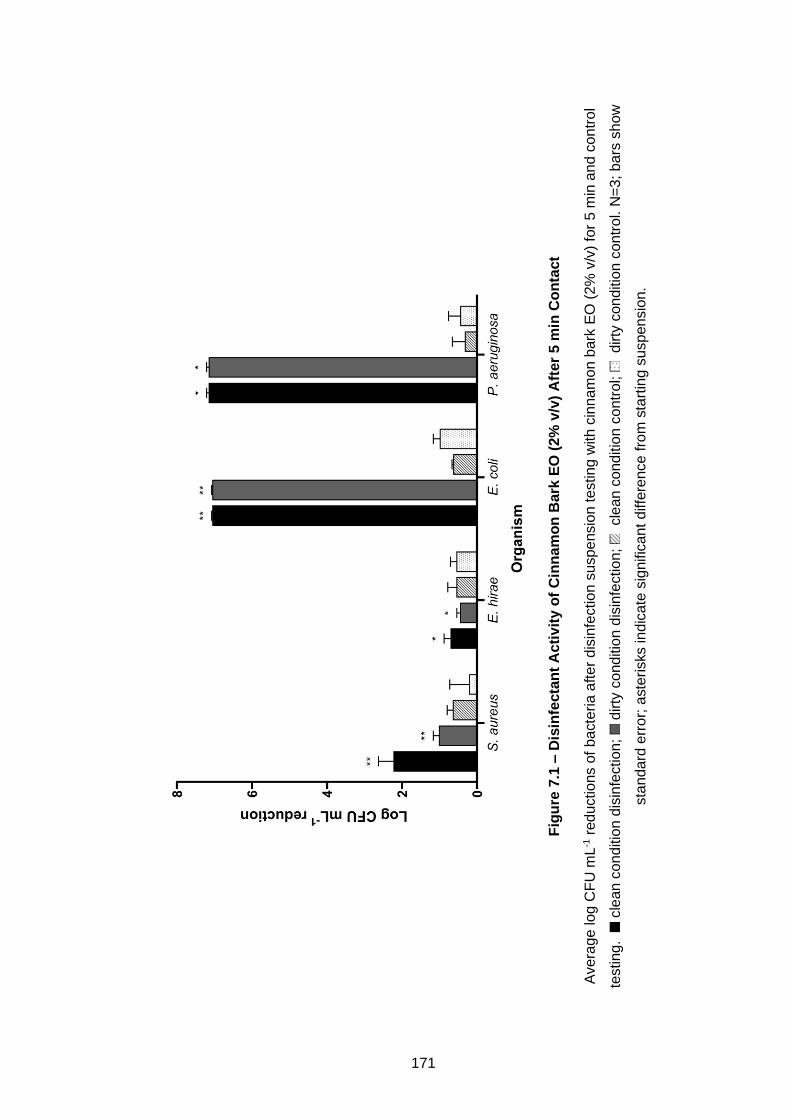
171
Fig
ure
7.1
– D
isin
fecta
nt
Ac
tiv
ity
of
Cin
na
mo
n B
ark
EO
(2
% v
/v)
Aft
er
5 m
in C
on
tact
Ave
rag
e log
CF
U m
L-1
red
uctio
ns o
f b
acte
ria a
fte
r d
isin
fectio
n s
uspe
nsio
n te
sting w
ith c
inn
am
on b
ark
EO
(2
% v
/v)
for
5 m
in a
nd
co
ntr
ol
testing
.
cle
an
co
nd
itio
n d
isin
fectio
n;
dirty
co
nd
itio
n d
isin
fectio
n;
cle
an
co
nd
itio
n c
ontr
ol;
d
irty
con
ditio
n c
ontr
ol. N
=3
; b
ars
sh
ow
sta
ndard
err
or;
aste
risks indic
ate
sig
nific
ant
diffe
rence
fro
m s
tart
ing s
uspensio
n.
172
7.3.4 Extended contact suspension testing
Results from suspension testing of cinnamon bark EO (2% v/v) are shown in
Figure 7.2. In both clean and dirty conditions, the control did not significantly
reduce the validation suspension (P>0.05), nor did it reduce bacteria by
greater than 50%.
Although cinnamon EO was able to significantly reduce S. aureus (P<0.001)
and E. hirae (P<0.05), it was unable to cause a greater than 5 log reduction
for either of these organisms within 15 min. In clean conditions S. aureus was
reduced 1.37 log and E. hirae was reduced 0.63 log, in dirty conditions S.
aureus was reduced 1.02 log and E. hirae was reduced 0.49 log. BSA did not
have any significant effect on antimicrobial activity (P>0.05), for any of the
testing conditions.
.
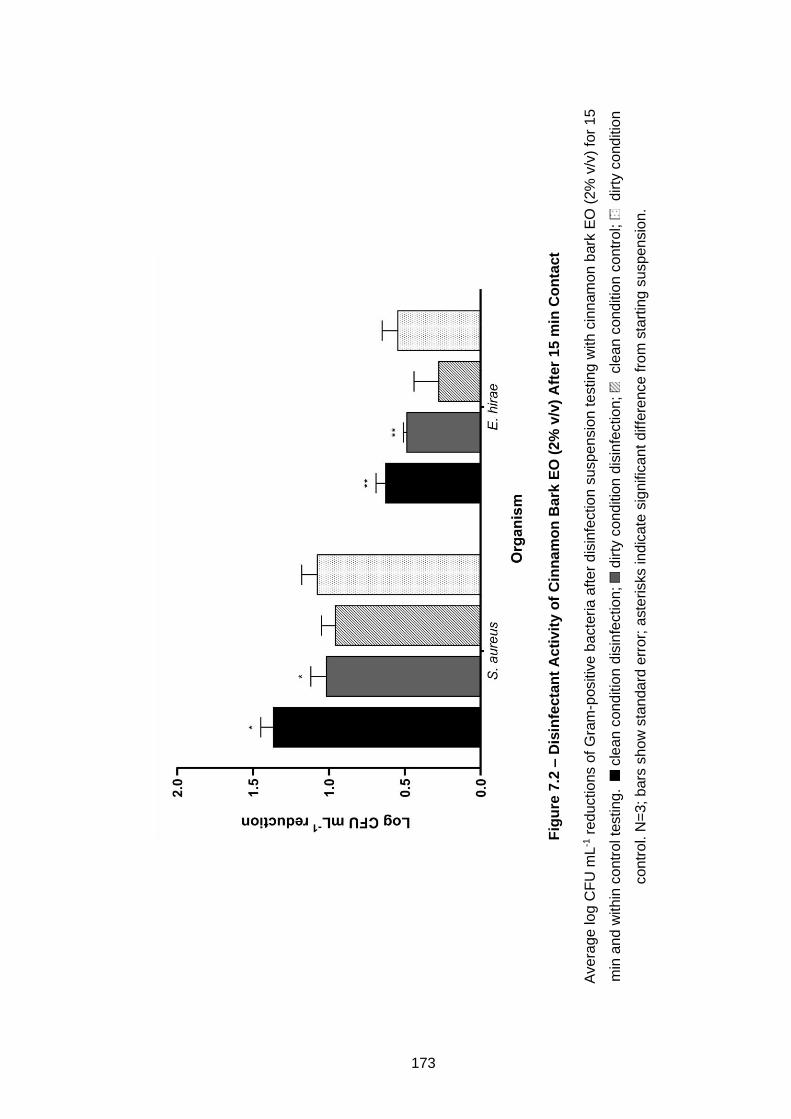
173
Fig
ure
7.2
– D
isin
fecta
nt
Ac
tiv
ity
of
Cin
na
mo
n B
ark
EO
(2
% v
/v)
Aft
er
15 m
in C
on
tact
Ave
rag
e log
CF
U m
L-1
red
uctio
ns o
f G
ram
-positiv
e b
acte
ria
afte
r d
isin
fectio
n s
uspe
nsio
n te
stin
g w
ith
cin
nam
on b
ark
EO
(2%
v/v
) fo
r 1
5
min
an
d w
ith
in c
ontr
ol te
stin
g.
cle
an
co
nd
itio
n d
isin
fectio
n;
dirty
co
nd
itio
n d
isin
fectio
n;
cle
an
con
ditio
n c
ontr
ol;
d
irty
co
nd
itio
n
contr
ol. N
=3;
bars
show
sta
ndard
err
or;
aste
risks indic
ate
sig
nific
ant
diffe
rence fro
m s
tart
ing s
uspensio
n.
174
7.4 Discussion
The potential real world application of EOs have been discussed previously in
this chapter introduction, and surface disinfection has been recognised as a
promising application. Previous chapters thus far have investigated the
antimicrobial activity of cinnamon bark EO, in liquid state, against a range of
planktonic bacteria and P. aeruginosa biofilms. Cinnamon EO exhibited
success against a broad range of both Gram-positive and Gram-negative
organisms, effectively inhibiting and killing at low concentrations, and reducing
bacteria by >5 log CFU mL-1. However, for an antimicrobial to be considered
for disinfection, it must comply with disinfection standards. Thus, this chapter
aimed to investigate cinnamon bark EO as a potential disinfectant using the
BS EN 1276 standards of disinfection (British Standards Institution 2009).
Cinnamon EO has shown broad spectrum activity against both Gram-negative
and Gram-positive bacteria (chapter 4) when using preliminary disc diffusion
assays. Drawing from previous chapter investigations, cinnamon EO was
tested in this chapter at a concentration of 2% (v/v), a concentration that was
proven to be successful against both planktonic bacteria and biofilms (chapter
4-6). At this concentration, cinnamon EO was able to reduce P. aeruginosa
broth cultures in time kill assays by >5 log within 2 min (chapter 4). BS EN
1276 stipulates that a successful disinfectant must achieve a 5 log reduction
in bacterial load within 5 min, however, the panel of bacteria that are described
includes both Gram-negative and Gram-positive bacteria.
BS EN 1276 also requires the use of interfering substances relative to the
intended use of the disinfectant. As the proposed usage of cinnamon EO in
this chapter was as a general purpose disinfectant to be used in food,
175
industrial, cosmetic and institutional areas, BSA was used as an interfering
substance, as recommended by BS EN 1276. The addition of BSA provides a
better representation of disinfection in the real world, as organic matter is often
found as an environmental contaminant, and evaluating cleaning agents in its
presence mimics practical applications (Vohra and Poxton 2011). Studies
have also shown that the presence of BSA quenched the activity of
antimicrobials (Bessems 1998) and offered bacteria a form of protection during
disinfectant challenges (Simões et al. 2006). In contrast to this, the present
study found that the presence of BSA, at both low (0.3 g L-1) and high
concentrations (3.0 g L-1), did not have a significant effect (P>0.05) on the
antimicrobial activity of cinnamon EO against any of the bacteria tested.
Cinnamon EO (2% v/v) successfully reduced P. aeruginosa and E. coli by 5
log, within 5 min contact time, however EO at this concentration was unable
to produce the same effects against S. aureus and E. hirae within 5 min.
Although many studies report that EOs are more effective against Gram-
positive bacteria (Zaika 1988, Bisignano et al. 2001, Nazzaro et al. 2013,
Chouhan et al. 2017, Man et al. 2019), conversely, several studies have
reported that EOs have superior efficacy against Gram-negative bacteria
(Prabuseenivasan et al. 2006, Lodhia et al. 2009, Lopez-Romero et al. 2015).
Furthermore, a comparable finding to those presented in this study was shown
by Mayaud et al. (2008), who found that Cinnamomum verum EO successfully
reduced Gram-negative bacteria, but when used to challenge Gram-positive
bacteria, higher concentrations and longer contact times were required.
176
Yangui et al. (2009) also found that higher concentrations of orange EOs were
required to achieve 5 log reductions in Gram-positive bacteria.
The reduced efficacy of cinnamon EO against Gram-positive bacteria,
compared to that of Gram-negative bacteria, may be due to the structure of
Gram-positive bacteria. Whilst Gram-negative bacteria may possess an
exterior lipopolysaccharide membrane, its adjacent peptidoglycan cell wall is
thin, only 7-8 nm, and lacks strength and rigidity (Shrivastava et al. 2007). In
contrast to this, Gram-positive bacteria have a much thicker peptidoglycan cell
wall which can be up to 80 nm thick, and has a 3-dimensional rigid structure
(Shrivastava et al. 2007). It has been previously discussed (chapter 4) that the
mode of action of cinnamon EO may lie in its hydrophobic characteristic. The
outer membrane possessed by Gram-negative bacteria is made up of
phospholipids, lipopolysaccharides and various regulatory channels (Nazzaro
et al. 2013), a feature which usually negates the passage of hydrophobic
substances due to the presence of hydrophilic porin channels (Lopez-Romero
et al. 2015). However, in the present study, Gram-negative bacteria were not
less susceptible to cinnamon EO. A possible explanation for the contradictory
reports of efficacy of oils against Gram-positive and Gram-negative bacteria
may be the antimicrobial constituents of the EO used. A feature of cinnamon
bark EO is that its main constituent is cinnamaldehyde, as reported previously
(chapter 4). Aldehydes are reported to exert bactericidal effects by disrupting
lipoproteins in the outer membrane (Remmal et al. 1993), and penetrating the
outer membrane leading to cell content disruption and leakage (Walsh et al.
1999), which is a likely explanation for the effects seen in this study.
177
To assess if contact time influenced efficacy, further investigations were
carried out to challenge the Gram-positive bacteria with cinnamon EO for an
extended contact time of 15 min. Despite this increased contact period,
cinnamon EO was unsuccessful in reducing both S. aureus and E. hirae by >5
log CFU mL-1. A possible explanation for this decreased antimicrobial activity
could be the presence of Tween 80 in the disinfectant product. Tween 80 is a
surfactant and was used in this study to produce an oil in water emulsion which
stayed homogenous throughout testing. It is reported that this emulsion of EO
and surfactant could be an antagonistic combination, as was seen by Ziani et
al. (2011), who found decreased antimicrobial activity of tea tree oil when
emulsified with Tween 80. Remmal et al. (1993) found that when using Tween
80 as a dispersal agent, antimicrobial activity of EOs was significantly reduced.
However, in contrast to this, Lu et al. (2018) reports that surfactants improve
the antimicrobial activity of EOs by increasing surface area, improving cell
membrane interactions, promoting targeted release, and providing
electrostatic interactions with the bacterial cell wall. The contradictory
evidence discussed here highlights the need for further investigations
regarding the interactions between EOs, and the detergents used with them,
to evaluate whether they are synergistic, antagonistic or additive.
In conclusion, this chapter aimed to investigate cinnamon bark EO as a
potential disinfectant and evaluate its compliance with European standard BS
EN 1276. To my knowledge, this study was the first to investigate cinnamon
bark EO as a disinfectant and evaluate its compliance with recognised
disinfectant standards. These standards required a disinfectant at this stage
of testing (phase 2, step 1) to achieve a 5 log reduction within 5 min of contact.
178
Cinnamon EO was compliant with this standard against Gram-negative
bacteria, though was unable to sufficiently reduce S. aureus and E. hirae after
5 min contact. Furthermore, an extended contact time of 15 min did not
improve the efficacy of the EO against Gram-positive organisms. Although this
may not be encouraging for the potential of cinnamon EO to be a stand-alone
disinfectant, the results reported here have highlighted the potential for
cinnamon EO to contribute to the cleaning regimes already used and that it
could prove to be an effective additional constituent in future disinfectants.
Within the methods used here, several potential reasons for reduced activity
have been identified, including the possible interference from surfactants
within emulsions used to produce homogenous disinfectant products
containing EO. It is suggested that further investigations are made to evaluate
disinfectant formulations which incorporate EOs, and ensure that the full
antimicrobial potential of these oils are reached without hindrance from
components which constitute the disinfectant. This study has provided a
preliminary investigation into the use of cinnamon EO as a disinfectant,
identifying its disinfectant activity against some but not all organisms, and
demonstrating that further testing is needed to include extended contact times.

179
CHAPTER 8

181
8 DISCUSSION AND FURTHER WORK
The main aim of this research was to contribute to the search for novel
antimicrobials, in response to the antimicrobial resistance (AMR) crisis being
faced on a global scale. Essential oils (EOs) are an underutilised natural
commodity, with recognised antimicrobial activity, and due to the vast selection
of these plant extracts, many of them remain under exploited. The data
presented in this thesis has further contributed to the current literature that
exists on EOs, and has broadened the knowledge surrounding antimicrobial
efficacy, potential applications and practical methods to utilise when
evaluating EOs. The research and methods presented in this thesis have a
wide spreading impact on many real life applications, for example: contributing
to current cleaning regimes; potentially improving the efficacy of existing
antimicrobials; and improving the methods utilised to assess essential oil liquid
and vapour, and other antimicrobials. The work presented in this thesis
provides a sound basis for further work and continuation of research into EOs
as antimicrobials. Further work could be carried out to evaluate the potential
of EOs to behave synergistically when in combination with antibiotics; to fully
explore their mode of action and exploit these findings to target problematic
bacteria; to investigate their toxicity in humans and include them in models of
biofilm growth that better mimic natural and human environments, and how the
surface on which bacteria grow impacts their tolerance to antimicrobials; and
to further utilise the pure compounds which compose EOs and how these
isolated constituents can be utilised.
182
EOs are extensively used across the globe with a multitude of uses, as
discussed elsewhere. At present, there are no legislations which require EO
manufacturers or distributers to confirm the purity and origin of essential oils,
if they are not intended for cosmetics, food or the animal nutrition market
(Barbieri and Borsotto 2018). This thesis has highlighted the critical
importance of analysing EOs before evaluation of their antimicrobial effects.
As was demonstrated here, EOs from the same plant species, but obtained
from different plant parts, can have very different compositions. It is clear from
the findings of chapter 4 and 7 that analysing the composition of EOs is
imperative for oils intended for antimicrobial or bioactive applications. Not only
do the composition of EOs in liquid state vary from batch to batch due to a
variety of factors, but the composition of the liquid state EO is not always
reflected when the EO is in its vapour state. Composition of EOs can also have
a significant effect on the antimicrobial efficacy of the oil. Data presented in
chapter 7 found that the cinnamon EO constituent eucalyptol seemed to have
an antagonistic effect on the activity of cinnamaldehyde, the suggested
dominant antimicrobial constituent of cinnamon EO. These findings suggest
that although the use of whole EO is often successful, some of the minor
components may inhibit the antimicrobial activity of other constituents.
Commercially, the intricate and complex composition of natural EOs is often
challenging to regulate and difficult to synthetically reproduce. Preliminary
results in this thesis indicates that cinnamaldehyde had a greater antimicrobial
effect than cinnamon EO. Therefore, it is suggested that further work be
carried out using isolated pure compounds from cinnamon EO, i.e.
cinnamaldehyde, to evaluate its antimicrobial efficacy alone.
183
The novel data presented in chapter 4 support the literature which indicate the
mode of action of cinnamon EO against bacteria, and that it is attributed to
membrane permeation. The research presented here suggests the ability of
cinnamon EO to penetrate the exterior barriers of bacteria, thus causing
disruptions in the membrane from which cell contents could leak. However,
this could also work to the advantage of many failing antimicrobials, which are
unable to penetrate these resistant bacteria, allowing a route of entry into the
cell and enabling them to exert their effects. Many studies have already looked
at interactions between essential oils and current antimicrobials, and found
that EOs have a synergistic effect when combined with antibiotics (Langeveld
et al. 2014). Magi et al. (2015) found that when in combination with carvacrol,
a component of essential oils, the MIC of erythromycin against erythromycin
resistant strains of Streptococci was reduced by up to 2048-fold. Nafis et al.
(2019) found that essential oil from Cannabis sativa decreased the MIC of
ciprofloxacin by 2- to 64-fold and decreased the MIC of fluconazole by 16-fold
when used in combination against Candida spp. Whilst synergy studies of
Cinnamomum species have been published (Yang et al. 2017, El Atki et al.
2019), studies using Cinnamomum zeylanicum are very limited (Utchariyakiat
et al. 2016). The promising results shown in these studies, combined with
those reported in this thesis, endorses the idea of using EOs to support the
current antimicrobial repertoire and combat AMR. The dramatic decrease in
production of new antibiotics warrants the enhancement of existing antibiotics
(Rogers et al. 2012). Therefore, further work is suggested to more extensively
184
evaluate the mode of action of cinnamon EO and investigate its potential to
increase the efficacy of existing antimicrobials.
The majority of persistent and untreatable infections are due to biofilm-forming
bacteria. One of the issues identified with testing for novel antimicrobials is the
failure to include bacteria in their biofilm state during testing (Cookson 2005).
Results from chapter 5 have shown liquid applications of cinnamon EO to be
highly effective against P. aeruginosa biofilms, which are usually known to be
robust and impenetrable to many antimicrobials. P. aeruginosa biofilms are
commonly implicated in persistent contamination sites associated with the
clinical environment. This organism is known to be found in many places that
common protocols either do not eradicate, or cannot reach, and thus it is
proposed that cinnamon EO could be used as an antimicrobial in many of the
sites that act as a reservoir for P. aeruginosa biofilms. Hard to reach reservoirs
of bacteria could be combatted by employing EOs in their vapour form to
maintain better contact with inaccessible places. The surface on which biofilms
are found is another important factor when considering anti-biofilm effects.
Chapter 5 observed differences in efficacy when biofilms were grown on
different surfaces, highlighting the importance of understanding the underlying
mechanics of biofilm formation and how this might affect treatment of these
organisms in situ. This difference in efficacy was also observed when treating
biofilms with EO vapour in chapter 6, where biofilms grown on stainless steel
were less susceptible than those grown on polycarbonate plastic. This data
further highlights the importance of surfaces when considering biofilm models
for antimicrobial testing. Although polycarbonate plastic and stainless steel are
185
surface materials commonly found in a wide range of locations, including
clinical environments, further work is suggested to look more extensively at a
wider range of surface materials and evaluate the impact they have on biofilm
growth and anti-biofilm efficacy.
EOs are extracted from plants, usually via steam distillation, and exist in a
liquid form. However, the constituents of these liquids are highly volatile and
thus, EOs are often utilised in their gaseous state. Novel experiments
presented in chapter 6 demonstrated that cinnamon EO vapour was capable
of reducing preformed mature biofilms by >5 log CFU mL-1 at concentrations
as low as 0.2 µL cm-3. Although it is acknowledged that further toxicity testing
is paramount to the use of EOs in human applications, the efficacy of
cinnamon EO vapour against P. aeruginosa biofilms shown here is important.
P. aeruginosa is implicated in many human diseases, especially recurrent
infections arising in cystic fibrosis (CF) patients, which are often caused by
biofilm-forming strains (Høiby et al. 2010). Treatment by inhalation of EOs has
been discussed in the literature (Blake and Raissy 2018) and cinnamon bark
EO has been suggested for treatment of respiratory pathogens (Singh et al.
1995, Inouye et al. 2001). However, to my knowledge, research presented in
this thesis was the first of its kind to assess the efficacy of cinnamon EO vapour
against a shear-flow model grown biofilm which could potentially be translated
to those biofilms growing within the human respiratory system. It is an
important consideration, when developing methods that are used to
investigate biofilms that an appropriate model of growth is used which reflects
the natural existence of bacteria. Sriramulu et al. (2005) developed a novel
186
biofilm model which mimics biofilm formation within a CF lung, and Crabbé et
al. (2017) investigated the efficacy of antibiotics against biofilms growing in a
3-dimensional lung epithelia model. Thus, if cinnamon EO is to be considered
as a potential treatment for respiratory infections, it is suggested that further
work be carried out to not only examine the toxicity of the EO but also its
efficacy in biofilm models which better mimic the human respiratory
environment.
Potential applications of EOs include that of disinfectant production. Data
presented in this thesis has shown cinnamon bark EO to be an effective
antimicrobial agent capable of rapid killing at low concentrations. Chapter 8
demonstrated that cinnamon bark EO was successful at reducing the viability
of Gram-negative bacteria within 5 min of contact. However, the EO at this
concentration was not efficient at eliminating Gram-positive bacteria, despite
testing with extended contact times of 15 min. However, not only did cinnamon
EO exceed the expected levels of disinfectant action against Gram-negative
bacteria, this thesis also showed that over a 24 h period, cinnamon EO
possessed the ability to inhibit and kill Gram-positive bacteria at very low
concentrations. Furthermore, the efficacy of cinnamon EO versus biofilm-state
bacteria is clear, and it has demonstrated strong anti-biofilm activities.
Therefore, there is a need to investigate the disinfectant potential of this oil
further, particularly in the area of surface disinfection and with a wide panel of
bacteria associated with food, clinical and non-clinical environments.
187
Methods used in this thesis, such as the development of the novel vapour
chamber and the use of SIFT-MS instrumentation, could be applied to many
different in vitro investigations, and should not be limited to work investigating
EOs. The chamber developed in this thesis can provide the means to carrying
out a plethora of biofilm treatments using any antimicrobial agent that exists in
a gaseous state. It facilitates the inclusion of biofilms grown using the CBR, an
important model of biofilm growth when considering anti-biofilm testing. In
combination with vapour analysis methods such as SIFT-MS, it enables real-
time analysis of the headspace within the chamber, and potential elucidation
of the mechanisms of action of antimicrobial vapours.
Overall, this thesis has demonstrated the strong antimicrobial efficacy of
cinnamon EO and warrants the continuation of investigations in vitro, to
evaluate its effects against a broader spectrum of biofilm forming bacteria. Not
only does this thesis highlight the importance of cinnamon EO, but it also
strengthens the rationale to continue testing other underexploited oils that are
yet to be investigated. Whilst more research is required before EOs are
considered safe for clinical and in vivo use, the work presented here strongly
suggests that work investigating the environmental application of EOs must
continue. When considering AMR, the data reported in this thesis provide
further evidence that EOs could prove to be a crucial addition in solutions to
combat the antibiotic resistance crisis. It has addressed the need for research
and development of novel antimicrobials, and end products that include
cinnamon EO could help improve sanitation and hygiene.

189
REFERENCES
Abdallah, M., Benoliel, C., Jama, C., Drider, D., Dhulster, P., and Chihib, N.-
E., 2014. Thermodynamic Prediction of Growth Temperature
Dependence in the Adhesion of Pseudomonas aeruginosa and
Staphylococcus aureus to Stainless Steel and Polycarbonate. Journal of
Food Protection, 77 (7), 1116–1126.
Adams, T.B., Cohen, S.M., Doull, J., Feron, V.J., Goodman, J.I., Marnett, L.J.,
Munro, I.C., Portoghese, P.S., Smith, R.L., Waddell, W.J., and Wagner,
B.M., 2004. The FEMA GRAS assessment of cinnamyl derivatives used
as flavor ingredients. Food and Chemical Toxicology, 42, 157–185.
Adukwu, E.C., Allen, S.C.H., and Phillips, C.A., 2012. The anti-biofilm activity
of lemongrass (Cymbopogon flexuosus) and grapefruit (Citrus paradisi)
essential oils against five strains of Staphylococcus aureus. Journal of
Applied Microbiology, 113 (5), 1217–1227.
Ahmed, M.N.A., 2013. Effects of escapin intermediate products (EIP-K) on
biofilms of Pseudomonas aeruginosa. Georgia State University.
Alanis, A.J., 2005. Resistance to antibiotics: Are we in the post-antibiotic era?
Archives of Medical Research, 36 (6), 697–705.
Ali, B., Al-Wabel, N.A., Shams, S., Ahamad, A., Khan, S.A., and Anwar, F.,
2015. Essential oils used in aromatherapy: A systemic review. Asian
Pacific Journal of Tropical Biomedicine, 5 (8), 601–611.
Alvarez, M. V., Ortega-Ramirez, L.A., Gutierrez-Pacheco, M.M., Bernal-
Mercado, A.T., Rodriguez-Garcia, I., Gonzalez-Aguilar, G.A., Ponce, A.,
Moreira, M. del R., Roura, S.I., and Ayala-Zavala, J.F., 2014. Oregano
essential oil-pectin edible films as anti-quorum sensing and food
antimicrobial agents. Frontiers in Microbiology, 5 (DEC), 1–7.
Aminov, R.I., 2010. A brief history of the antibiotic era: Lessons learned and
challenges for the future. Frontiers in Microbiology, 1 (DEC), 1–7.
190
Andrade-Ochoa, S., Sánchez-Aldana, D., Chacón-Vargas, K.F., Rivera-
Chavira, B.E., Sánchez-Torres, L.E., Camacho, A.D., Nogueda-Torres,
B., and Nevárez-Moorillón, G.V., 2018. Oviposition deterrent and
larvicidal and pupaecidal activity of seven essential oils and their major
components against Culex quinquefasciatus say (Diptera: Culicidae):
Synergism–antagonism effects. Insects, 9 (1), 1–17.
Anomaly, J., 2019. Antibiotics and Animal Agriculture. In: M. Selgelid, ed.
Ethics and Antimicrobial Resistance. New York: Springer.
Armbruster, C.R. and Parsek, M.R., 2018. New insight into the early stages of
biofilm formation. Proceedings of the National Academy of Sciences, 115
(17), 4317–4319.
Artini, M., Patsilinakos, A., Papa, R., Boović, M., Sabatino, M., Garzoli, S.,
Vrenna, G., Tilotta, M., Pepi, F., Ragno, R., and Selan, L., 2018.
Antimicrobial and antibiofilm activity and machine learning classification
analysis of essential oils from different mediterranean plants against
Pseudomonas aeruginosa. Molecules, 23 (2), 482.
Arunasri, K. and Mohan, S.V., 2019. Biofilms: Microbial Life on the Electrode
Surface. In: S.V. Mohan, S. Varjani, and A. Pandey, eds. Microbial
Electrochemical Technology. Elsevier B.V., 295–313.
Asbahani, A. El, Miladi, K., Badri, W., Sala, M., Addi, E.H.A., Casabianca, H.,
Mousadik, A. El, Hartmann, D., Jilale, A., Renaud, F.N.R., and Elaissari,
A., 2015. Essential oils: From extraction to encapsulation. International
Journal of Pharmaceutics, 483 (1–2), 220–243.
Asghari, F.B., Nikaeen, M., and Mirhendi, H., 2013. Rapid monitoring of
Pseudomonas aeruginosa in hospital water systems: A key priority in
prevention of nosocomial infection. FEMS Microbiology Letters, 343 (1),
77–81.
Aspelund, A.S., Sjöström, K., Liljequist, B.O., Mörgelin, M., Melander, E., and
Påhlman, L.I., 2016. Acetic acid as a decontamination method for sink

191
drains in a nosocomial outbreak of metallo-β-lactamase-producing
Pseudomonas aeruginosa. Journal of Hospital Infection, 94 (1), 13–20.
Astani, A., Reichling, J., and Schnitzler, P., 2011. Screening for antiviral
activities of isolated compounds from essential oils. Evidence-based
Complementary and Alternative Medicine, 2011, 1–7.
El Atki, Y., Aouam, I., El Kamari, F., Taroq, A., Nayme, K., Timinouni, M.,
Lyoussi, B., and Abdellaoui, A., 2019. Antibacterial activity of cinnamon
essential oils and their synergistic potential with antibiotics. Journal of
Advanced Pharmaceutical Technology & Research, 10 (2), 63.
Avila-Sosa, R., Palou, E., Jiménez Munguía, M.T., Nevárez-Moorillón, G.V.,
Navarro Cruz, A.R., and López-Malo, A., 2012. Antifungal activity by
vapor contact of essential oils added to amaranth, chitosan, or starch
edible films. International Journal of Food Microbiology, 153 (1–2), 66–
72.
Ayukekbong, J.A., Ntemgwa, M., and Atabe, A.N., 2017. The threat of
antimicrobial resistance in developing countries: Causes and control
strategies. Antimicrobial Resistance and Infection Control.
Azeredo, J., Azevedo, N.F., Briandet, R., Cerca, N., Coenye, T., Costa, A.R.,
Desvaux, M., Di Bonaventura, G., Hébraud, M., Jaglic, Z., Kačániová, M.,
Knøchel, S., Lourenço, A., Mergulhão, F., Meyer, R.L., Nychas, G.,
Simões, M., Tresse, O., and Sternberg, C., 2017. Critical review on biofilm
methods. Critical Reviews in Microbiology, 43 (3), 313–351.
Baker, J.H., 1984. Factors affecting the bacterial colonization of various
surfaces in a river. Canadian Journal of Microbiology, 30 (4), 511–515.
Barbieri, C. and Borsotto, P., 2018. Essential Oils: Market and legislation. In:
H.A. El-Shemy, ed. Potential of Essential Oils. InTech, 107–128.
Barnes, L.-M., Lo, M.F., Adams, M.R., and Chamberlain, A.H.L., 1999. Effect
of milk proteins on adhesion of bacteria to stainless steel surfaces.
Applied and Environmental Microbiology, 65 (10), 4543–4548.
192
Barreto, T.V. and Coelho, A.C.D., 2015. Distillation. In: Sugarcane:
Agricultural Production, Bioenergy and Ethanol. 341–363.
Baser, K.H.C. and Buchbauer, G., 2015. Handbook of essential oils: Science,
technology and applications. 2nd ed. Handbook of Essential Oils:
Science, Technology, and Applications. Florida: Taylor & Francis.
Bassolé, I.H.N. and Juliani, H.R., 2012. Essential oils in combination and their
antimicrobial properties. Molecules, 17 (4), 3989–4006.
Becerril, R., Nerín, C., and Gómez-Lus, R., 2012. Evaluation of Bacterial
Resistance to Essential Oils and Antibiotics After Exposure to Oregano
and Cinnamon Essential Oils. Foodborne Pathogens and Disease, 9 (8),
699–705.
Bédard, E., Prévost, M., and Déziel, E., 2016. Pseudomonas aeruginosa in
premise plumbing of large buildings. MicrobiologyOpen, 5 (6), 937–956.
Benzaid, C., Belmadani, A., Djeribi, R., and Rouabhia, M., 2019. The Effects
of Mentha × piperita essential oil on C. albicans growth, transition, biofilm
formation, and the expression of secreted aspartyl proteinases genes.
Antibiotics, 8 (1), 1–15.
Bessems, E., 1998. The effect of practical conditions on the efficacy of
disinfectants. In: International Biodeterioration and Biodegradation. 177–
183.
Bickers, D., Calow, P., Greim, H., Hanifin, J.M., Rogers, A.E., Saurat, J.H.,
Sipes, I.G., Smith, R.L., and Tagami, H., 2005. A toxicologic and
dermatologic assessment of cinnamyl alcohol, cinnamaldehyde and
cinnamic acid when used as fragrance ingredients. Food and Chemical
Toxicology, 43 (6), 799–836.
Bisignano, G., Laganà, M.G., Trombetta, D., Arena, S., Nostro, A., Uccella, N.,
Mazzanti, G., and Saija, A., 2001. In vitro antibacterial activity of some
aliphatic aldehydes from Olea europaea L. FEMS Microbiology Letters,
198 (1), 9–13.
193
Blair, J.M.A., Webber, M.A., Baylay, A.J., Ogbolu, D.O., and Piddock, L.J. V,
2015. Molecular mechanisms of antibiotic resistance. Nature Reviews
Microbiology, 13 (1), 42–51.
Blake, K. and Raissy, H., 2018. Inhaling essential oils: Purported benefits and
harms. Pediatric Allergy, Immunology, and Pulmonology, 30 (3), 186–
188.
Boire, N.A., 2013. Essential Oils and future antibiotics: New weapons against
emerging ‘superbugs’? Journal of Ancient Diseases & Preventive
Remedies, 1 (2), 1–5.
Bonomo, R.A. and Rossolini, G.M., 2008. Importance of antibiotic resistance
and resistance mechanisms. Expert Review of Anti-infective Therapy, 6
(5), 549–550.
De Bont, J.A.M., Van Dijken, J.P., and Harder, W., 1981. Dimethyl sulphoxide
and dimethyl sulphide as a carbon, sulphur and energy source for growth
of Hyphomicrobium spp. Journal of General Microbiology, 127 (2), 315–
323.
Bouaziz, M., Yangui, T., Sayadi, S., and Dhouib, A., 2009. Disinfectant
properties of essential oils from Salvia officinalis L. cultivated in Tunisia.
Food and Chemical Toxicology, 47 (11), 2755–2760.
Bouhdid, S., Abrini, J., Amensour, M., Zhiri, A., Espuny, M.J., and Manresa,
A., 2010. Functional and ultrastructural changes in Pseudomonas
aeruginosa and Staphylococcus aureus cells induced by Cinnamomum
verum essential oil. Journal of Applied Microbiology, 109 (4), 1139–1149.
Bowes, K.M. and Zheljazkov, V.D., 2019. Factors affecting yields and essential
oil quality of Ocimum sanctum L. and Ocimum basilicum L. cultivars.
Journal of the American Society for Horticultural Science, 129 (6), 789–
794.
Boyce, J.M., 2016. Modern technologies for improving cleaning and
disinfection of environmental surfaces in hospitals. Antimicrobial
194
Resistance and Infection Control, 5 (1), 1–10.
Brahmbhatt, H., Molnar, M., Pavi, V., and Rastijać, V., 2018. Synthesis,
characterization, antibacterial and antioxidant potency of N-substituted-2-
sulfanylidene-1,3-thiazolidin-4-one derivatives and QSAR study.
Medicinal Chemistry, 15.
Bravo Cadena, M., Preston, G.M., Van der Hoorn, R.A.L., Flanagan, N.A.,
Townley, H.E., and Thompson, I.P., 2018. Enhancing cinnamon essential
oil activity by nanoparticle encapsulation to control seed pathogens.
Industrial Crops and Products, 124, 755–764.
Brayton, C.F., 1986. Dimethyl sulfoxide (DMSO): a review. The Cornell
Veterinarian, 76 (1), 61–90.
British Standards Institution, 2009. Chemical disinfectants and antiseptics —
Quantitative suspension test for the evaluation of bactericidal activity of
chemical disinfectants and antiseptics used in food , industrial ,
institutional areas — Test method and requirements (phase 2, step 1).
European Committee for Standardization, (August), 1–48.
British Standards Institution, 2015. Chemical disinfectants and antiseptics —
Quantitative non-porous surface test for the evaluation of bactericidal
and/or fungicidal activity of chemical disinfectants used in food, industrial,
domestic and institutional areas — Test method and requirements.
European Committee for Standardization, 1–36.
Brnawi, W.I., Hettiarachchy, N.S., Horax, R., Kumar-Phillips, G., Seo, H.-S.,
and Marcy, J., 2018. Comparison of cinnamon essential oils from leaf and
bark with respect to antimicrobial activity and sensory acceptability in
strawberry shake. Journal of Food Science, 83 (2), 475–480.
Brochot, A., Guilbot, A., Haddioui, L., and Roques, C., 2017. Antibacterial,
antifungal, and antiviral effects of three essential oil blends.
MicrobiologyOpen, 6 (4), 1–6.
Brook, I., 1989. Inoculum effect. Reviews of Infectious Diseases, 11 (3), 361–
195
368.
Buckingham-Meyer, K., Goeres, D.M., and Hamilton, M.A., 2007. Comparative
evaluation of biofilm disinfectant efficacy tests. Journal of Microbiological
Methods, 70 (2), 236–244.
Buckle, J., 2015. Basic plant taxonomy, basic essential oil chemistry,
extraction, biosynthesis, and analysis. In: J. Buckle, ed. Clinical
Aromatherapy. Churchill Livingstone, 37–72.
Budzyńska, A., Wieckowska-Szakiel, M., Sadowska, B., Kalemba, D., and
Rózalska, B., 2011. Antibiofilm activity of selected plant essential oils and
their major components. Polish Journal of Microbiology, 60 (1), 35–41.
Burt, S., 2004. Essential oils: Their antibacterial properties and potential
applications in foods - A review. International Journal of Food
Microbiology, 94 (3), 223–253.
Butnariu, M. and Sarac, I., 2018. Essential oils from plants. Journal of
Biotechnology and Biomedical Science, 1 (4), 35–43.
Butt, A. and Khan, A., 2015. Antibiotic resistance of bacterial biofilms. Middle
East Journal of Business, 10 (4), 38–45.
Cai, Y., Strømme, M., and Welch, K., 2014. Bacteria viability assessment after
photocatalytic treatment. 3 Biotech, 4 (2), 149–157.
Cao, L., Si, J.Y., Liu, Y., Sun, H., Jin, W., Li, Z., Zhao, X.H., and Pan, R. Le,
2009. Essential oil composition, antimicrobial and antioxidant properties
of Mosla chinensis Maxim. Food Chemistry, 115 (3), 801–805.
Carpentier, B. and O.C., 1993. Biofilms and their consequences, with
particular reference to hygiene in food industry. Journal of Applied
Bacteriology, 75 (1971), 499–511.
Carson, C.F., Mee, B.J., and Riley, T. V, 2002. Mechanism of action of
Melaleuca alternifolia (tea tree) oil on Staphylococcus aureus determined
by time-kill, lysis, leakage, and salt tolerance assays and electron
196
microscopy. Antimicrobial Agents and Chemotherapy, 46 (6), 1914–1920.
CDC, 2018. Biggest Threats and Data [online]. Centre for Disease Control and
Prevention. Available from:
https://www.cdc.gov/drugresistance/biggest_threats.html [Accessed 1
May 2016].
Chouhan, S., Sharma, K., and Guleria, S., 2017. Antimicrobial activity of some
essential oils—Present status and future perspectives. Medicines, 4 (3),
58.
Ciofu, O. and Tolker-Nielsen, T., 2019. Tolerance and resistance of
Pseudomonas aeruginosa biofilms to antimicrobial agents— how P.
aeruginosa can escape antibiotics. Frontiers in Microbiology, 10 (May).
Clark, S., 2009. Handling, safety and practical applications for use of essential
oils. In: S. Clark, ed. Essential Chemistry for Aromatherapy. London:
Elsevier, 231–264.
Clinical and Laboratory Standards Institute, 1999. M26-A: Methods for
determining bactericidal activity of antimicrobial agents; approved
guideline. Clinical and Laboratory Standards Institute, 19 (18).
Clinical and Laboratory Standards Institute, 2012. M07-A9: Methods for
dilution antimicrobial susceptibility tests for bacteria that grow aerobically;
Approved Standard—Ninth Edition. Clinical and Laboratory Standards
Institute, 32 (2), 1–88.
Clinical and Laboratory Standards Institute, 2015. M02-A12: Performance
standards for antimicrobial disk susceptibility tests; approved standard—
twelfth edition. Clinical and Laboratory Standards Institute, 35 (M02-A12),
73.
Coenye, T. and Nelis, H.J., 2010. In vitro and in vivo model systems to study
microbial biofilm formation. Journal of Microbiological Methods, 83 (2),
89–105.
197
Connolly, M., Axtell, A., Hickey, S., Whalen, A., McNamara, L., Albright, D.,
Friedstat, J., and Goverman, J., 2017. Chemical burn From cinnamon oil.
Eplasty, 17, ic11.
Cookson, B., 2005. A review: Clinical significance of emergence of bacterial
antimicrobial resistance in the hospital environment. Journal of Applied
Microbiology, 99 (5), 989–996.
Cortés, M.E., Bonilla, J.C., and Sinisterra, R.D., 2011. Biofilm formation,
control and novel strategies for eradication. Science against microbial
pathogens: communicating current research and technological advances,
896–905.
Courtenay, M., Castro-Sanchez, E., Fitzpatrick, M., Gallagher, R., Lim, R., and
Morris, G., 2019. Tackling antimicrobial resistance 2019–2024 – The UK’s
five-year national action plan. Journal of Hospital Infection, 101 (4), 426–
427.
Cowan, M.M., 1999. Plant products as antimicrobial agents. Clinical
Microbiology Reviews, 12 (4), 564–82.
Cox, S.D. and Markham, J.L., 2007. Susceptibility and intrinsic tolerance of
Pseudomonas aeruginosa to selected plant volatile compounds. Journal
of Applied Microbiology, 103 (4), 930–936.
Crabbé, A., Liu, Y., Matthijs, N., Rigole, P., De La Fuente-Nùñez, C., Davis,
R., Ledesma, M.A., Sarker, S., Van Houdt, R., Hancock, R.E.W., Coenye,
T., and Nickerson, C.A., 2017. Antimicrobial efficacy against
Pseudomonas aeruginosa biofilm formation in a three-dimensional lung
epithelial model and the influence of fetal bovine serum. Scientific
Reports, 7 (March), 1–13.
Cui, H., Li, W., Li, C., Vittayapadung, S., and Lin, L., 2016. Liposome
containing cinnamon oil with antibacterial activity against methicillin-
resistant Staphylococcus aureus biofilm. Biofouling, 32 (2), 215–225.
Daubert, T.E. and Danner, R.P., 2013. Physical and thermodynamic
198
properties of pure chemicals: data compilation. Choice Reviews Online,
27 (06), 27-3319-27–3319.
Davies, D.G., 2011. Biofilm dispersion. In: H.-C. Flemming, J. Wingender, and
U. Szewzyk, eds. Biofilm highlights. London: Springer, 1–28.
Debabov, D., 2013. Antibiotic resistance: Origins, mechanisms, approaches
to counter. Applied Biochemistry and Microbiology, 49 (8), 665–671.
Department of Health, 2016. Antimicrobial resistance empirical and statistical
evidence-base. Public Health England, (September), 1–63.
Dhifi, W., Bellili, S., Jazi, S., Bahloul, N., and Mnif, W., 2016. Essential oils’
chemical characterization and investigation of some biological activities:
A critical review. Medicines, 3 (4), 25.
Di Domenico, E.G., Toma, L., Provot, C., Ascenzioni, F., Sperduti, I., Prignano,
G., Gallo, M.T., Pimpinelli, F., Bordignon, V., Bernardi, T., and Ensoli, F.,
2016. Development of an in vitro assay, based on the BioFilm Ring Test®,
for rapid profiling of biofilm-growing bacteria. Frontiers in Microbiology, 7,
1429.
Donlan, R.M., 2002. Biofilms: Microbial life on surfaces. Emerging Infectious
Diseases, 8 (9).
Doran, A.L., Morden, W.E., Dunn, K., and Edwards-Jones, V., 2009. Vapour-
phase activities of essential oils against antibiotic sensitive and resistant
bacteria including MRSA. Letters in Applied Microbiology, 48 (4), 387–
392.
Dunne, W.M., 2002. Bacterial adhesion: seen any good biofilms lately? Clinical
microbiology reviews, 15 (2), 155–66.
Eisenhut, M., 2007. The toxicity of essential oils. International Journal of
Infectious Diseases, 11 (4), 365.
Elias, S. and Banin, E., 2012. Multi-species biofilms: Living with friendly
neighbors. FEMS Microbiology Reviews, 36 (5), 990–1004.
199
Environmental Protection Agency, 2017. Methods and guidance for testing the
efficacy of antimicrobials against biofilm bacteria on hard, non-porous
surfaces [online]. EPA. Available from: https://www.epa.gov [Accessed 7
May 2018].
Eslahi, H., Fahimi, N., and Sardarian, A.R., 2017. Chemical composition of
essential oils. In: S.M.B. Hashemi, A.M. Khaneghah, and A. de S.
Sant’Ana, eds. Essential Oils in Food Processing: Chemistry, Safety and
Applications. John Wiley & Sons, Ltd, 119–171.
EUCAST, 2018. European committee on antimicrobial susceptibility testing
breakpoint tables for interpretation of MICs and zone diameters. The
European Committee on Antimicrobial Susceptibility Testing., (8), 0–77.
Evans, D.J., Allison, D.G., Brown, M.R.W., and Gilbert, P., 1991. Susceptibility
of Pseudomonas aeruginosa and Escherichia coli biofilms towards
ciprofloxacin: effect of specific growth rate. Journal of Antimicrobial
Chemotherapy, 27 (2), 177–184.
Fajardo, A., Martínez-Martín, N., Mercadillo, M., Galán, J.C., Ghysels, B.,
Matthijs, S., Cornelis, P., Wiehlmann, L., Tümmler, B., Baquero, F., and
Martínez, J.L., 2008. The neglected intrinsic resistome of bacterial
pathogens. PLoS ONE, 3 (2), e1619.
Falcó, I., Verdeguer, M., Aznar, R., Sánchez, G., and Randazzo, W., 2019.
Sanitizing food contact surfaces by the use of essential oils. Innovative
Food Science & Emerging Technologies, 51, 220–228.
Faleiro, M.., 2011. The mode of antibacterial action of essential oils. In: A.
Méndez-Vilas, ed. Science against microbial pathogens: communicating
current research and technological advances. Badajoz: Formatex
Research Center, 1143–1156.
Fazeli, H., Akbari, R., Moghim, S., Narimani, T., Arabestani, M.R., and
Ghoddousi, A.R., 2012. Pseudomonas aeruginosa infections in patients,
hospital means, and personnel’s specimens. Journal of Research in
200
Medical Sciences, 17 (4), 332–7.
FDA, 2019. U.S. Code of Federal Regulations 21 Food and Drugs [online].
Food and Drug Administration. Available from: https://www.ecfr.gov/cgi-
bin/text-
idx?SID=3572f80f5791a3590d21dd4b14b3932d&mc=true&node=se21.3
.182_120&rgn=div8 [Accessed 3 May 2019].
Feyaerts, A.F., Mathé, L., Luyten, W., De Graeve, S., Van Dyck, K., Broekx,
L., and Van Dijck, P., 2018. Essential oils and their components are a
class of antifungals with potent vapour-phase-mediated anti-Candida
activity. Scientific Reports, 8 (1), 3958.
Fine, D.H., Markowitz, K., Furgang, D., Goldsmith, D., Ricci-Nittel, D., Charles,
C.H., Peng, P., and Lynch, M.C., 2007. Effect of rinsing with an essential
oil–containing mouthrinse on subgingival periodontopathogens. Journal
of Periodontology, 78 (10), 1935–1942.
Firmino, D.F., Cavalcante, T.T.A., Gomes, G.A., Firmino, N.C.S., Rosa, L.D.,
De Carvalho, M.G., and Catunda, F.E.A., 2018. Antibacterial and
antibiofilm activities of Cinnamomum Sp. essential oil and
cinnamaldehyde: antimicrobial activities.
Fisher, K. and Phillips, C., 2009. The mechanism of action of a citrus oil blend
against Enterococcus faecium and Enterococcus faecalis. Journal of
Applied Microbiology, 106 (4), 1343–1349.
Flemming, H.-C., Neu, T.R., and Wozniak, D.J., 2007. The EPS matrix: the
‘house of biofilm cells’. Journal of Bacteriology, 189 (22), 7945–7.
Friedman, M., Henika, P.R., Levin, C.E., and Mandrell, R.E., 2004.
Antibacterial activities of plant essential oils and their components against
Escherichia coli O157:H7 and Salmonella enterica in apple juice. Journal
of Agricultural and Food Chemistry, 52 (19), 6042–6048.
Gebel, J., Exner, M., French, G., Chartier, Y., Christiansen, B., Gemein, S.,
Goroncy-Bermes, P., Hartemann, P., Heudorf, U., Kramer, A., Maillard,
201
J.-Y., Oltmanns, P., Rotter, M., and Sonntag, H.-G., 2013. The role of
surface disinfection in infection prevention. GMS Hygiene and Infection
Control, 8 (1), 1–12.
Gerdt, J.P. and Blackwell, H.E., 2014. Competition studies confirm two major
barriers that can preclude the spread of resistance to quorum-sensing
inhibitors in bacteria. ACS Chemical Biology, 9 (10), 2291–2299.
Ghabraie, M., Vu, K.D., Tata, L., Salmieri, S., and Lacroix, M., 2016.
Antimicrobial effect of essential oils in combinations against five bacteria
and their effect on sensorial quality of ground meat. LWT - Food Science
and Technology, 66, 332–339.
Gill, A.O., Delaquis, P., Russo, P., and Holley, R.A., 2002. Evaluation of
antilisterial action of cilantro oil on vacuum packed ham. International
Journal of Food Microbiology, 73 (1), 83–92.
Goeres, D.M., Loetterle, L.R., Hamilton, M.A., Murga, R., Kirby, D.W., and
Donlan, R.M., 2005. Statistical assessment of a laboratory method for
growing biofilms. Microbiology, 151 (3), 757–762.
Goldbeck, J.C., Victoria, F.N., Motta, A., Savegnago, L., Jacob, R.G., Perin,
G., Lenardão, E.J., and Padilha da Silva, W., 2014. Bioactivity and
morphological changes of bacterial cells after exposure to 3-(p-
chlorophenyl)thio citronellal. LWT - Food Science and Technology, 59
(2P1), 813–819.
Gómez-Estaca, J., López de Lacey, A., López-Caballero, M.E., Gómez-
Guillén, M.C., and Montero, P., 2010. Biodegradable gelatin-chitosan
films incorporated with essential oils as antimicrobial agents for fish
preservation. Food Microbiology, 27 (7), 889–896.
Goñi, P., López, P., Sánchez, C., Gómez-Lus, R., Becerril, R., and Nerín, C.,
2009. Antimicrobial activity in the vapour phase of a combination of
cinnamon and clove essential oils. Food Chemistry, 116 (4), 982–989.
Gould, I. m. and Bal, A. m., 2013. New antibiotic agents in the pipeline and
202
how they can help overcome microbial resistance. Virulence, 4 (2), 185–
191.
Govindasamy, R., Arumugam, S., and Simon, J.E., 2013. An assessment of
the essential oil and aromatic plant industry with a focus on africa. In: ACS
Symposium Series. 289–321.
Griffin, S.G., Markham, J.L., and Leach, D.N., 2000. An agar dilution method
for the determination of the minimum inhibitory concentration of essential
oils. Journal of Essential Oil Research, 12 (2), 249–255.
Guenther, E., 1948. The production of essential oils. In: E. Guenther, ed. The
Essential Oils Vol 1: History - Origin in Plants - Production - Analysis. New
York: van Nostrand Comapny, 85–218.
Guenther, E., 2013. Essential Oils: History, Origin in Plants, Production and
Analysis. Read Books Ltd.
Gupta, P. and Deka, S., 2018. The menace of antimicrobial resistance. Indian
Journal of Community Health, 30 (4), 317–322.
Guttenplan, S.B. and Kearns, D.B., 2013. Regulation of flagellar motility during
biofilm formation. FEMS Microbiology Reviews, 37 (6), 849–871.
Gyawali, R. and Ibrahim, S.A., 2014. Natural products as antimicrobial agents.
Food Control, 46 (2014), 412–429.
Hammer, K.A., Carson, C.F., Riley, T. V., and Nielsen, J.B., 2006. A review of
the toxicity of Melaleuca alternifolia (tea tree) oil. Food and Chemical
Toxicology, 44 (5), 616–625.
Hammer, K.A., Carson, C.F., and Riley, T. V, 1999. Antimicrobial activity of
essential oils and other plant extracts. Journal of Applied Microbiology, 86
(6), 985–90.
Harbarth, S., Balkhy, H.H., Goossens, H., Jarlier, V., Kluytmans, J.,
Laxminarayan, R., Saam, M., Van Belkum, A., and Pittet, D., 2015.
Antimicrobial resistance: One world, one fight! Antimicrobial Resistance
203
and Infection Control, 4 (1), 49.
Harmsen, M., Yang, L., Pamp, S.J., and Tolker-Nielsen, T., 2010. An update
on Pseudomonas aeruginosa biofilm formation, tolerance, and dispersal.
FEMS Immunology and Medical Microbiology, 59 (3), 253–268.
Hébert, C.D., Yuan, J., and Dieter, M.P., 1994. Comparison of the toxicity of
cinnamaldehyde when administered by microencapsulation in feed or by
corn oil gavage. Food and Chemical Toxicology, 32 (12), 1107–1115.
Helander, I.M. and Mattila-Sandholm, T., 2000. Fluorometric assessment of
Gram-negative bacterial permeabilization. Journal of Applied
Microbiology, 88 (2), 213–219.
Hems, R.S., Gulabivala, K., Ng, Y.-L., Ready, D., and Spratt, D.A., 2005. An
in vitro evaluation of the ability of ozone to kill a strain of Enterococcus
faecalis. International Endodontic Journal, 38 (1), 22–29.
Hengge, R., 2014. The general stress response in Gram-negative bacteria. In:
G. Storz and R. Hengge, eds. Bacterial Stress Responses. American
Society of Microbiology, 251–289.
Hense, B.A. and Schuster, M., 2015. Core Principles of Bacterial Autoinducer
Systems. Microbiology and Molecular Biology Reviews, 79 (1), 153–169.
HM Government, 2019. Tackling antimicrobial resistance 2019–2024: The
UK’s five-year national action plan [online]. Available from:
https://assets.publishing.service.gov.uk/government/uploads/system/upl
oads/attachment_data/file/784894/UK_AMR_5_year_national_action_pl
an.pdf.
Høiby, N., Ciofu, O., and Bjarnsholt, T., 2010. Pseudomonas aeruginosa
biofilms in cystic fibrosis. Future Microbiology, 5 (11), 1663–1674.
Holah, J.T. and Thorpe, R.H., 1990. Cleanability in relation to bacterial
retention on unused and abraded domestic sink materials. Journal of
Applied Bacteriology, 69 (4), 599–608.
204
Hoskovec, M., Grygarová, D., Cvačka, J., Streinz, L., Zima, J., Verevkin, S.P.,
and Koutek, B., 2005. Determining the vapour pressures of plant volatiles
from gas chromatographic retention data. Journal of Chromatography A,
1083 (1–2), 161–172.
Houdkova, M., Urbanova, K., Doskocil, I., Rondevaldova, J., Novy, P., Nguon,
S., Chrun, R., and Kokoska, L., 2018. In vitro growth-inhibitory effect of
Cambodian essential oils against pneumonia causing bacteria in liquid
and vapour phase and their toxicity to lung fibroblasts. South African
Journal of Botany, 118, 85–97.
Howe, R.A. and Andrews, J.M., 2012. BSAC standardized disc susceptibility
testing method (version 11). Journal of Antimicrobial Chemotherapy, 67
(12), 2783–2784.
Inouye, S., Takizawa, T., and Yamaguchi, H., 2001. Antibacterial activity of
essential oils and their major constituents against respiratory tract
pathogens by gaseous contact. The Journal of antimicrobial
chemotherapy, 47 (5), 565–573.
Janssen, A.M., Chin, N.L.J., Scheffer, J.J.C., and Svendsen, A.B., 1986.
Screening for antimicrobial activity of some essential oils by the agar
overlay technique - Statistics and correlations. Pharmaceutisch Weekblad
Scientific Edition, 8 (6), 289–292.
Jayawardena, B. and Smith, R.M., 2010. Superheated water extraction of
essential oils from cinnamomum zeylanicum (L.). Phytochemical
Analysis, 21 (5), 470–472.
Jenner, P.M., Hagan, E.C., Taylor, J.M., Cook, E.L., and Fitzhugh, O.G., 1964.
Food flavourings and compounds of related structure I. Acute oral toxicity.
Food and Cosmetics Toxicology, 2, 327–343.
Ji, H., Kim, H., Beuchat, L.R., and Ryu, J.-H.H., 2019. Synergistic antimicrobial
activities of essential oil vapours against Penicillium corylophilum on a
laboratory medium and beef jerky. International Journal of Food
205
Microbiology, 291, 104–110.
Jiao, Y., Cody, G.D., Harding, A.K., Wilmes, P., Schrenk, M., Wheeler, K.E.,
Banfield, J.F., and Thelen, M.P., 2010. Characterization of extracellular
polymeric substances from acidophilic microbial biofilms. Applied and
Environmental Microbiology, 76 (9), 2916–2922.
Jorgensen, J.H. and Ferraro, M.J., 2009. Antimicrobial susceptibility testing: a
review of general principles and contemporary practices. Medical
Microbiology, 49 (11), 1749–55.
Ju, J., Xu, X., Xie, Y., Guo, Y., Cheng, Y., Qian, H., and Yao, W., 2018.
Inhibitory effects of cinnamon and clove essential oils on mold growth on
baked foods. Food Chemistry, 240 (July 2017), 850–855.
Kačániová, M., Terentjeva, M., Vukovic, N., Puchalski, C., Roychoudhury, S.,
Kunová, S., Klūga, A., Tokár, M., Kluz, M., and Ivanišová, E., 2017. The
antioxidant and antimicrobial activity of essential oils against
Pseudomonas spp. isolated from fish. Saudi Pharmaceutical Journal, 25
(8), 1108–1116.
Kalia, M., Yadav, V.K., Singh, P.K., Sharma, D., Pandey, H., Narvi, S.S., and
Agarwal, V., 2015. Effect of cinnamon oil on quorum sensing-controlled
virulence factors and biofilm formation in Pseudomonas aeruginosa.
PLoS ONE, 10 (8).
Kaplan, J.B., 2010. Biofilm dispersal: Mechanisms, clinical implications, and
potential therapeutic uses. Journal of Dental Research, 89 (3), 205–218.
Kavanaugh, N.L. and Ribbeck, K., 2012. Selected antimicrobial essential oils
eradicate Pseudomonas spp. and Staphylococcus aureus biofilms.
Applied and Environmental Microbiology, 78 (11), 4057–4061.
Kazemi, M. and Mokhtariniya, S., 2016. Essential oil composition of bark of
Cinnamomum zeylanicum. Journal of Essential Oil Bearing Plants, 19 (3),
786–789.
206
Kerr, K.G. and Snelling, A.M., 2009. Pseudomonas aeruginosa: a formidable
and ever-present adversary. Journal of Hospital Infection, 73, 338–334.
KH, S., AA, A.I., TO, O., RA, R., and AJ, O., 2017. Bacterial contamination of
hospital surfaces according to material make, last time of contact and last
time of cleaning/disinfection. Journal of Bacteriology & Parasitology, 08
(03).
Kim, Y.G., Lee, J.H., Kim, S. Il, Baek, K.H., and Lee, J., 2015. Cinnamon bark
oil and its components inhibit biofilm formation and toxin production.
International Journal of Food Microbiology, 195, 30–39.
Kloucek, P., Smid, J., Frankova, A., Kokoska, L., Valterova, I., and Pavela, R.,
2012. Fast screening method for assessment of antimicrobial activity of
essential oils in vapor phase. Food Research International, 47 (2), 161–
165.
Kommerein, N., Doll, K., Stumpp, N.S., and Stiesch, M., 2018. Development
and characterization of an oral multispecies biofilm implant flow chamber
model. PLoS ONE, 13 (5), 1–15.
Kortright, K.E., Chan, B.K., Koff, J.L., and Turner, P.E., 2019. Phage therapy:
A renewed approach to combat antibiotic-resistant bacteria. Cell Host &
Microbe, 25 (2), 219–232.
Křůmal, K., Kubátková, N., Večeřa, Z., and Mikuška, P., 2015. Antimicrobial
properties and chemical composition of liquid and gaseous phases of
essential oils. Chemical Papers, 69 (8), 1084–1092.
Kuhn, D., Ziem, R., Scheibel, T., Buhl, B., Vettorello, G., Pacheco, L.A.,
Heidrich, D., Kauffmann, C., de Freitas, E.M., Ethur, E.M., and Hoehne,
L., 2019. Antibiofilm activity of the essential oil of Campomanesia aurea
O. Berg against microorganisms causing food borne diseases. LWT, 108,
247–252.
Lacko, M., Wang, N., Sovová, K., Pásztor, P., and Španěl, P., 2019. Addition
of a fast GC to SIFT-MS for analyses of individual monoterpenes in
207
mixtures. Atmospheric Measurement Techniques Discussions, 1–23.
Laird, K., Armitage, D., and Phillips, C., 2012. Reduction of surface
contamination and biofilms of Enterococcus sp. and Staphylococcus
aureus using a citrus-based vapour. Journal of Hospital Infection, 80 (1),
61–66.
Lakshminarayanan, R., Ye, E., Young, D.J., Li, Z., and Loh, X.J., 2018. Recent
advances in the development of antimicrobial nanoparticles for combating
resistant pathogens. Advanced Healthcare Materials, 7 (13).
Lalancette, C., Charron, D., Laferrière, C., Dolcé, P., Déziel, E., Prévost, M.,
and Bédard, E., 2017. Hospital drains as reservoirs of Pseudomonas
aeruginosa: multiple-locus variable-number of tandem repeats analysis
genotypes recovered from faucets, sink surfaces and patients.
Pathogens, 6 (3), 36.
Langeveld, W.T., Veldhuizen, E.J.A., and Burt, S.A., 2014. Synergy between
essential oil components and antibiotics: A review. Critical Reviews in
Microbiology, 40 (1), 76–94.
Ledwoch, K., Said, J., Norville, P., and Maillard, J. -Y., 2019. Artificial dry
surface biofilm models for testing the efficacy of cleaning and disinfection.
Letters in Applied Microbiology, 68 (4), 329–336.
Lee, G., Kim, Y., Kim, H., Beuchat, L.R., and Ryu, J.-H.H., 2018. Antimicrobial
activities of gaseous essential oils against Listeria monocytogenes on a
laboratory medium and radish sprouts. International Journal of Food
Microbiology, 265 (October 2017), 49–54.
Lee, M.S., Choi, J., Posadzki, P., and Ernst, E., 2012. Aromatherapy for health
care: An overview of systematic reviews. Maturitas.
Leggio, A., Leotta, V., Belsito, E.L., Di Gioia, M.L., Romio, E., Santoro, I.,
Taverna, D., Sindona, G., and Liguori, A., 2017. Aromatherapy:
Composition of the gaseous phase at equilibrium with liquid bergamot
essential oil. Chemistry Central Journal, 11 (1), 111.
208
Levy, S.B. and Bonnie, M., 2004. Antibacterial resistance worldwide: Causes,
challenges and responses. Nature Medicine, 10 (12S), S122–S129.
Li, J., Perdue, E.M., Pavlostathis, S.G., and Araujo, R., 1998. Physicochemical
properties of selected monoterpenes. Environment International, 24 (3),
353–358.
Li, X.Z., Zhang, L., and Poole, K., 1998. Role of the multidrug efflux systems
of Pseudomonas aeruginosa in organic solvent tolerance. Journal of
Bacteriology, 180 (11), 2987–2991.
Lin, P.-C., Lee, P.-H., Tseng, S.-J., Lin, Y.-M., Chen, S.-R., and Hou, W.-H.,
2019. Effects of aromatherapy on sleep quality: A systematic review and
meta-analysis. Complementary Therapies in Medicine, 45, 156–166.
Lobanovska, M. and Pilla, G., 2017. Penicillin’s discovery and antibiotic
resistance: Lessons for the future? Yale Journal of Biology and Medicine,
90 (1), 135–145.
Lodhia, M.H., Bhatt, K.R., and Thaker, V.S., 2009. Antibacterial activity of
essential oils from palmarosa, evening primrose, lavender and tuberose.
Indian Journal of Pharmaceutical Sciences, 71 (2), 134–6.
Lopez-Romero, J.C., González-Ríos, H., Borges, A., and Simões, M., 2015.
Antibacterial effects and mode of action of selected essential oils
components against Escherichia coli and Staphylococcus aureus.
Evidence-based complementary and alternative medicine : eCAM, 2015,
795435.
López, E.M., Vargas, G.P.V., Palou, E., and Malo, A.L., 2018. Penicillium
expansum inhibition on bread by lemongrass essential Oil in vapor phase.
Journal of Food Protection, 81 (3), 467–471.
López, P., Sánchez, C., Batlle, R., and Nerín, C., 2007. Vapor-phase activities
of cinnamon, thyme, and oregano essential oils and key constituents
against foodborne microorganisms. Journal of Agricultural and Food
Chemistry, 55 (11), 4348–4356.
209
Lu, W.C., Huang, D.W., Wang, C.C.R., Yeh, C.H., Tsai, J.C., Huang, Y.T., and
Li, P.H., 2018. Preparation, characterization, and antimicrobial activity of
nanoemulsions incorporating citral essential oil. Journal of Food and Drug
Analysis, 26 (1), 82–89.
Lüdecke, C., Jandt, K.D., Siegismund, D., Kujau, M.J., Zang, E., Rettenmayr,
M., Bossert, J., and Roth, M., 2014. Reproducible biofilm cultivation of
chemostat-grown Escherichia coli and investigation of bacterial adhesion
on biomaterials using a non-constant-depth film fermenter. PLoS ONE, 9
(1).
Macià, M.D., Rojo-Molinero, E., and Oliver, A., 2014. Antimicrobial
susceptibility testing in biofilm-growing bacteria. Clinical Microbiology and
Infection, 20 (10), 981–990.
Magi, G., Marini, E., and Facinelli, B., 2015. Antimicrobial activity of essential
oils and carvacrol, and synergy of carvacrol and erythromycin, against
clinical, erythromycin-resistant Group A Streptococci. Frontiers in
Microbiology, 6 (MAR), 1–7.
Magiorakos, A.P., Srinivasan, A., Carey, R.B., Carmeli, Y., Falagas, M.E.,
Giske, C.G., Harbarth, S., Hindler, J.F., Kahlmeter, G., Olsson-Liljequist,
B., Paterson, D.L., Rice, L.B., Stelling, J., Struelens, M.J., Vatopoulos, A.,
Weber, J.T., and Monnet, D.L., 2012. Multidrug-resistant, extensively
drug-resistant and pandrug-resistant bacteria: An international expert
proposal for interim standard definitions for acquired resistance. Clinical
Microbiology and Infection, 18 (3), 268–281.
Mah, T.-F.F.C.F.C. and O’Toole, G.A., 2001. Mechanisms of biofilm resistance
to antimicrobial agents. Trends in Microbiology, 9 (1), 34–39.
Maisanaba, S., Llana-Ruiz-Cabello, M., Gutiérrez-Praena, D., Pichardo, S.,
Puerto, M., Prieto, A.I., Jos, A., and Cameán, A.M., 2017. New advances
in active packaging incorporated with essential oils or their main
components for food preservation. Food Reviews International, 33 (5),
447–515.
210
Malic, S., Emanuel, C., Lewis, M.A., and Williams, D.W., 2013. Antimicrobial
activity of novel mouthrinses against planktonic cells and biofilms of
pathogenic microorganisms. Microbiology Discovery, 1 (1), 11.
Mallavarapu, G.R., Ramesh, S., Chandrasekhara, R.S., Rajeswara Rao, B.R.,
Kaul, P.N., and Bhattacharya, A.K., 1995. Investigation of the essential oil
of cinnamon leaf grown at Bangalore and Hyderabad. Flavour and
Fragrance Journal, 10 (4), 239–242.
Man, A., Santacroce, L., Jacob, R., Mare, A., and Man, L., 2019. Antimicrobial
activity of six essential oils against a group of human pathogens: A
comparative study. Pathogens, 8 (1), 15.
Mann, C.M. and Markham, J.L., 1998. A new method for determining the
minimum inhibitory concentration of essential oils. Journal of Applied
Microbiology, 84 (4), 538–544.
Manso, S., Pezo, D., Gómez-Lus, R., and Nerín, C., 2014. Diminution of
aflatoxin B1 production caused by an active packaging containing
cinnamon essential oil. Food Control, 45, 101–108.
Marino, M., Maifreni, M., Baggio, A., and Innocente, N., 2018. Inactivation of
foodborne bacteria biofilms by aqueous and gaseous ozone. Frontiers in
Microbiology, 9 (AUG), 1–12.
Markarian, S.A., Poladyan, A.A., Kirakosyan, G.R., Trchounian, A.A., and
Bagramyan, K.A., 2002. Effect of diethylsulphoxide on growth, survival
and ion exchange of Escherichia coli. Letters in Applied Microbiology, 34
(6), 417–421.
Martens, E. and Demain, A.L., 2017. An overview of the industrial aspects of
antibiotic discovery. In: Microbial Resources: From Functional Existence
in Nature to Applications. Academic Press, 149–168.
Maruzzella, J.C. and Sicurella, N.A., 1960. Antibacterial activity of essential oil
vapors. Journal of the American Pharmaceutical Association, 49 (11),
692–694.
211
May, J., Chan, C.H., King, A., Williams, L., and French, G.L., 2000. Time-kill
studies of tea tree oils on clinical isolates. The Journal of Antimicrobial
Chemotherapy, 45 (5), 639–643.
Mayaud, L., Carricajo, A., Zhiri, A., and Aubert, G., 2008. Comparison of
bacteriostatic and bactericidal activity of 13 essential oils against strains
with varying sensitivity to antibiotics. Letters in Applied Microbiology, 47
(3), 167–173.
Mayor, S., 2019. Doctors to get real time data to support antibiotic prescribing
and reduce resistance. BMJ (Clinical research ed.), 364, 406.
Mekonnen, A., Tesfaye, S., Christos, S.G., Dires, K., Zenebe, T., Zegeye, N.,
Shiferaw, Y., and Lulekal, E., 2019. Evaluation of skin irritation and acute
and subacute oral toxicity of Lavandula angustifolia essential oils in rabbit
and mice. Journal of Toxicology, 2019, 1–8.
Van Merode, A.E.J., Van Der Mei, H.C., Busscher, H.J., and Krom, B.P., 2006.
Influence of culture heterogeneity in cell surface charge on adhesion and
biofilm formation by Enterococcus faecalis. Journal of Bacteriology, 188
(7), 2421–2426.
Merritt, J.H., Kadouri, D.E., and O’Toole, G.A., 2011. Growing and analyzing
static biofilms. Current Protocols in Microbiology, (SUPPL. 22), 1–18.
Messager, S., Hammer, K.A., Carson, C.F., and Riley, T. V., 2005.
Assessment of the antibacterial activity of tea tree oil using the European
EN 1276 and EN 12054 standard suspension tests. Journal of Hospital
Infection, 59 (2), 113–125.
Michael, C.A., Dominey-Howes, D., Labbate, M., Maria, C., Elisabeth, J.,
Pitout, J., and Walsh, F., 2014. The antimicrobial resistance crisis:
causes, consequences, and management. Frontiers in Public Health, 2
(145), 1–8.
Miksusanti, M., Sri Laksmi Jenie, B., Pontjo Priosoeryanto, B., Syarief, R., and
Gatot, T.R., 2008. Mode of action Temu Kunci (Kaempferia pandurata)
212
essential oil on E. coli K1.1 cell determined by leakage of material cell and
salt tolerance assays. HAYATI Journal of Biosciences, 15 (2), 56–60.
Miller, S.I., 2016. Antibiotic resistance and regulation of the Gram-negative
bacterial outer membrane barrier by host innate immune molecules.
mBio, 7 (5), 1541–16.
Millezi, A.F., Piccoli, R.H., Oliveira, J.M., and Pereira, M.O., 2016. Anti-biofim
and antibacterial effect of essential oils and their major compounds.
Journal of Essential Oil Bearing Plants, 19 (3), 624–631.
Mittal, R.P., Rana, A., and Jaitak, V., 2019. Essential oils: An impending
substitute of synthetic antimicrobial agents to overcome antimicrobial
resistance. Current Drug Targets, 20 (6), 605–624.
Moat, J., Cargill, J., Shone, J., and Upton, M., 2009. Application of a novel
decontamination process using gaseous ozone. Canadian Journal of
Microbiology, 55 (8), 928–933.
Moon, S.E., Kim, H.Y., and Cha, J.D., 2011. Synergistic effect between clove
oil and its major compounds and antibiotics against oral bacteria. Archives
of Oral Biology, 56 (9), 907–916.
Mosselhy, D.A., He, W., Hynönen, U., Meng, Y., Mohammadi, P., Palva, A.,
Feng, Q., Hannula, S.P., Nordström, K., and Linder, M.B., 2018. Silica–
gentamicin nanohybrids: Combating antibiotic resistance, bacterial
biofilms, and in vivo toxicity. International Journal of Nanomedicine, 13,
7939–7957.
Mourey, A. and Canillac, N., 2002. Anti-Listeria monocytogenes activity of
essential oils components of conifers. Food Control, 13 (4–5), 289–292.
Mulani, M.S., Kamble, E.E., Kumkar, S.N., Tawre, M.S., and Pardesi, K.R.,
2019. Emerging strategies to combat ESKAPE pathogens in the era of
antimicrobial resistance: A review. Frontiers in Microbiology, 10, 539.
Muniesa, A., Escobar-Dodero, J., Silva, N., Henríquez, P., Bustos, P., Perez,
213
A.M., and Mardones, F.O., 2019. Effectiveness of disinfectant treatments
for inactivating Piscirickettsia salmonis. Preventive Veterinary Medicine,
167, 196–201.
Munita, J.M. and Arias, C.A., 2016. Mechanisms of antibiotic resistance. In: I.
Kudva, N. Cornick, P. Plummer, Q. Zhang, T. Nicholson, J. Bannantine,
and B. Bellaire, eds. Virulence Mechanisms of Bacterial Pathogens.
Murtey, M. Das and Ramasamy, P., 2016. Sample preparations for scanning
electron microscopy – Life sciences. In: M. Janecek, ed. Modern Electron
Microscopy in Physical and Life Sciences. InTech, 161–185.
Muzzarelli, L., Force, M., and Sebold, M., 2006. Aromatherapy and reducing
preprocedural anxiety: A controlled prospective study. Gastroenterology
Nursing, 29 (6), 466–471.
Nabavi, S.F., Di Lorenzo, A., Izadi, M., Sobarzo-Sánchez, E., Daglia, M., and
Nabavi, S.M., 2015. Antibacterial effects of cinnamon: from farm to food,
cosmetic and pharmaceutical industries. Nutrients, 7 (9), 7729–48.
Nafis, A., Kasrati, A., Jamali, C.A., Mezrioui, N., Setzer, W., Abbad, A., and
Hassani, L., 2019. Antioxidant activity and evidence for synergism of
Cannabis sativa (L.)essential oil with antimicrobial standards. Industrial
Crops and Products, 137, 396–400.
Narayanasamy, K., Elangovan, E., Keerthi, D., Jagadeeswari, S., Krithiga, B.,
Padmanabhan, V., and Periyasamy, S., 2019. Antimicrobial activity of
selected essential oils against antibiotic resistant organisms. Asian
Journal of Pharmacy and Pharmacology, 5 (3), 503–512.
Nath, S.S., Pandey, C., and Roy, D., 2012. A near fatal case of high dose
peppermint oil ingestion- Lessons learnt. Indian Journal of Anaesthesia,
56 (6), 582–584.
Nazzaro, F., Fratianni, F., Coppola, R., and De Feo, V., 2017. Essential oils
and antifungal activity. Pharmaceuticals, 10 (4), 1–20.
214
Nazzaro, F., Fratianni, F., D’Acierno, A., Coppola, R., Jesus Ayala-Zavala, F.,
Gomez da Cruz, A., and De Feo, V., 2019. Essential oils and microbial
communication. In: H. El-Shemy, ed. Essential Oils - Oils of Nature.
IntechOpen.
Nazzaro, F., Fratianni, F., De Martino, L., Coppola, R., and De Feo, V., 2013.
Effect of essential oils on pathogenic bacteria. Pharmaceuticals, 6 (12),
1451–1474.
Nedorostova, L., Kloucek, P., Kokoska, L., Stolcova, M., and Pulkrabek, J.,
2009. Antimicrobial properties of selected essential oils in vapour phase
against foodborne bacteria. Food Control, 20 (2), 157–160.
Niederman, M.S., 2005. Principles of appropriate antibiotic use. International
Journal of Antimicrobial Agents, 26 (3), 170–175.
Nikaido, H., 2009. Multidrug Resistance in Bacteria. Annual Review of
Biochemistry, 78 (1), 119–146.
Nostro, A., Marino, A., Blanco, A.R., Cellini, L., Di Giulio, M., Pizzimenti, F.,
Roccaro, A.S., and Bisignano, G., 2009. In vitro activity of carvacrol
against staphylococcal preformed biofilm by liquid and vapour contact.
Journal of Medical Microbiology, 58 (6), 791–797.
O’Neill, J., 2014. Review on antimicrobial resistance [online]. Available from:
https://amr-review.org/sites/default/files/AMR Review Paper - Tackling a
crisis for the health and wealth of nations_1.pdf.
O’Neill, J., 2016. Tackling drug-resistant infections globally: Final report and
recommendations [online]. Available from: https://amr-
review.org/sites/default/files/160518_Final paper_with cover.pdf.
O’Toole, G., Kaplan, H.B., and Kolter, R., 2000. Biofilm formation as microbial
development. Annual Review of Microbiology, 54 (1), 49–79.
O’Toole, G.A., 2003. To Build a Biofilm. Journal of Bacteriology, 185 (9), 2687–
2689.
215
Obama White House, 2015. President’s 2016 budget proposes historic
investment to combat antibiotic-resistant bacteria to protect public health
[online]. Available from: https://obamawhitehouse.archives.gov/the-
press-office/2015/01/27/fact-sheet-president-s-2016-budget-proposes-
historic-investment-combat-a [Accessed 9 Jun 2019].
Ojagh, S.M., Rezaei, M., Seyed, &, Razavi, H., and Razavi, S.H., 2014.
Improvement of the storage quality of frozen rainbow trout by chitosan
coating incorporated with cinnamon oil. Journal of Aquatic Food Product
Technology, 23 (2), 146–154.
Oliveira, F. de S., Freitas, T.S. de, Cruz, R.P. da, Costa, M. do S., Pereira,
R.L.S., Quintans-Júnior, L.J., Andrade, T. de A., Menezes, P. dos P.,
Sousa, B.M.H. de, Nunes, P.S., Serafini, M.R., Menezes, I.R.A. de,
Araújo, A.A. de S., and Coutinho, H.D.M., 2017. Evaluation of the
antibacterial and modulatory potential of α-bisabolol, β-cyclodextrin and
α-bisabolol/β-cyclodextrin complex. Biomedicine and Pharmacotherapy,
92, 1111–1118.
de Oliveira, P.F., Alves, J.M., Damasceno, J.L., Oliveira, R.A.M., Júnior Dias,
H., Crotti, A.E.M., and Tavares, D.C., 2015. Cytotoxicity screening of
essential oils in cancer cell lines. Brazilian Journal of Pharmacognosy, 25
(2), 183–188.
Otter, J.A., Yezli, S., Schouten, M.A., Van Zanten, A.R.H., Houmes-Zielman,
G., and Nohlmans-Paulssen, M.K., 2010. Hydrogen peroxide vapor
decontamination of an intensive care unit to remove environmental
reservoirs of multidrug-resistant gram-negative rods during an outbreak.
American Journal of Infection Control, 38 (9), 754–756.
Palmer, A.C. and Kishony, R., 2014. Opposing effects of target overexpression
reveal drug mechanisms. Nature Communications, 5, 1–8.
Palmer, J., Flint, S., and Brooks, J., 2007. Bacterial cell attachment, the
beginning of a biofilm. Journal of Industrial Microbiology and
Biotechnology, 34 (9), 577–588.
216
Pantanella, F., Valenti, P., Natalizi, T., Passeri, D., and Berlutti, F., 2013.
Analytical techniques to study microbial biofilm on abiotic surfaces: pros
and cons of the main techniques currently in use. Annali de Igiene, 25 (1),
31–42.
Paranagama, P.A., Wimalasena, S., Jayatilake, G.S., Jayawardena, A.L.,
Senanayake, U.M., and Mubarak, A.M., 2001. A comparison of essential
oil constituents of bark, leaf, root and fruit of cinnamon (cinnamomum
zeylanicum blume) grown in Sri Lanka. Journal of the National Science
Foundation of Sri Lanka, 29 (3–4), 147–153.
Park, J.B., Kang, J.H., and Song, K. Bin, 2018. Antibacterial activities of a
cinnamon essential oil with cetylpyridinium chloride emulsion against
Escherichia coli O157:H7 and Salmonella Typhimurium in basil leaves.
Food Science and Biotechnology, 27 (1), 47–55.
Pavithra, D. and Doble, M., 2008. Biofilm formation, bacterial adhesion and
host response on polymeric implants - Issues and prevention. Biomedical
Materials, 3 (3), SMI.
Pei, R., Zhou, F., Ji, B., and Xu, J., 2009. Evaluation of Combined Antibacterial
Effects of Eugenol, Cinnamaldehyde, Thymol, and Carvacrol against E.
coli with an Improved Method. Journal of Food Science, 74 (7), M379–
M383.
Pericolini, E., Colombari, B., Ferretti, G., Iseppi, R., Ardizzoni, A., Girardis, M.,
Sala, A., Peppoloni, S., and Blasi, E., 2018. Real-time monitoring of
Pseudomonas aeruginosa biofilm formation on endotracheal tubes in
vitro. BMC Microbiology, 18 (1), 84.
Perry, R.H., Perry, S., Green, D.W., and Maloney, J.O., 1997. Gasification, in:
R. H. Perry, (Ed.), Perry’s Chemical Engineers’ Handbook, 7th ed.
McGraw-Hill New York.
Peterson, E. and Kaur, P., 2018. Antibiotic resistance mechanisms in bacteria:
Relationships between resistance determinants of antibiotic producers,
217
environmental bacteria, and clinical pathogens. Frontiers in Microbiology,
9 (NOV), 1–21.
Petrachi, T., Resca, E., Piccinno, M.S., Biagi, F., Strusi, V., Dominici, M., and
Veronesi, E., 2017. An alternative approach to investigate biofilm in
medical devices: a feasibility study. International Journal of Environmental
Research and Public Health, 14 (12).
Petrova, O.E., Sauer, K., Opin, C., and Author, M., 2016. Escaping the biofilm
in more than one way: Desorption, detachment or dispersion. Current
Opinion in Microbiology, 30, 67–78.
Pope, D.C. and Oliver, W.T., 1966. Dimethyl sulfoxide (DMSO). Canadian
Journal of Comparative Medicine and Veterinary Science, 30 (1), 3–8.
Porter, N.G. and Wilkins, A.L., 1998. Chemical, physical and antimicrobial
properties of essential oils of Leptospermum scoparium and Kunzea
ericoides. Phytochemistry, 50 (3), 407–415.
Prabuseenivasan, S., Jayakumar, M., and Ignacimuthu, S., 2006. In vitro
antibacterial activity of some plant essential oils. BMC complementary
and alternative medicine, 6, 39.
Presterl, E., Diab-El Schahawi, M., Lusignani, L.S., Paula, H., and Reilly, J.S.,
2019. Reprocessing: Cleansing, Disinfection, Sterilization. In: E. Presterl,
M. Diab-El Schahawi, and J.S. Reilly, eds. Basic Microbiology and
Infection Control for Midwives. Cham: Springer International Publishing,
35–49.
Prestinaci, F., Pezzotti, P., and Pantosti, A., 2015. Antimicrobial resistance: a
global multifaceted phenomenon. Pathogens and Global Health, 109 (7),
309–318.
Priti, V. and Shridhar, P., 2012. Effect of essential oils on MDR pathogens: a
comparative study. Journal of Environmental Research and
Development, 6 (3), 462–466.
218
Public Health England, 2018. Research reveals levels of inappropriate
prescriptions in England [online]. PHE 2018. Available from:
https://www.gov.uk/government/news/research-reveals-levels-of-
inappropriate-prescriptions-in-england [Accessed 10 Jun 2019].
Puškárová, A., Bučková, M., Kraková, L., Pangallo, D., and Kozics, K., 2017.
The antibacterial and antifungal activity of six essential oils and their
cyto/genotoxicity to human HEL 12469 cells. Scientific Reports, 7 (1), 1–
11.
Quick, J., Cumley, N., Wearn, C.M., Niebel, M., Constantinidou, C., Thomas,
C.M., Pallen, M.J., Moiemen, N.S., Bamford, A., Oppenheim, B., and
Loman, N.J., 2014. Seeking the source of Pseudomonas aeruginosa
infections in a recently opened hospital: an observational study using
whole-genome sequencing. BMJ Open, 4 (e006278), 1–10.
Raina, V.K., Srivastava, S.K., Aggarwal, K.K., Ramesh, S., and Kumar, S.,
2001. Essential oil composition of Cinnamomum zeylanicum Blume
leaves from Little Andaman, India. Flavour and Fragrance Journal, 16 (5),
374–376.
Ranasinghe, P., Jayawardana, R., Galappaththy, P., Constantine, G.R., de
Vas Gunawardana, N., and Katulanda, P., 2012. Efficacy and safety of
‘true’ cinnamon (Cinnamomum zeylanicum) as a pharmaceutical agent in
diabetes: a systematic review and meta-analysis. Diabetic Medicine, 29
(12), 1480–1492.
Rather, M.A., Dar, B.A., Sofi, S.N., Bhat, B.A., and Qurishi, M.A., 2016.
Foeniculum vulgare: A comprehensive review of its traditional use,
phytochemistry, pharmacology, and safety. Arabian Journal of Chemistry,
9, S1574–S1583.
Reis, D. and Jones, T., 2017. Aromatherapy: Using essential oils as a
supportive therapy. Clinical Journal of Oncology Nursing, 21 (1), 16–19.
Reisner, A., Haagensen, J.A.J., Schembri, M.A., Zechner, E.L., and Molin, S.,
219
2003. Development and maturation of Escherichia coli K-12 biofilms.
Molecular microbiology, 48 (4), 933–46.
Remmal, A., Bouchikhi, T., Tantaoui-Elaraki, A., Ettayebi, M., Tantaoui-
Eraraki, A., and Ettayebi, M., 1993. Inhibition of antibacterial activity of
essential oils by tween 80 and ethanol in liquid medium. Journal de
Pharmacie de Belgique, 48 (5), 352–6.
Reyes-Jurado, F., Navarro-Cruz, A.R., Ochoa-Velasco, C.E., Palou, E.,
López-Malo, A., and Ávila-Sosa, R., 2019. Essential oils in vapor phase
as alternative antimicrobials: A review. Critical Reviews in Food Science
and Nutrition, 1–10.
Riddick, J.A., Bunger, W.B., and Sakano, T.K., 1986. Organic solvents:
physical properties and methods of purification. 4th ed. New York: John
Wiley and Sons.
Rodríguez, A., Batlle, R., and Nerín, C., 2007. The use of natural essential oils
as antimicrobial solutions in paper packaging. Part II. Progress in Organic
Coatings, 60 (1), 33–38.
Rogers, G.B., Carroll, M.P., and Bruce, K.D., 2012. Enhancing the utility of
existing antibiotics by targeting bacterial behaviour? British Journal of
Pharmacology, 165 (4), 845–857.
Romulo, A., Zuhud, E.A.M., Rondevaldova, J., and Kokoska, L., 2018.
Screening of in vitro antimicrobial activity of plants used in traditional
Indonesian medicine. Pharmaceutical Biology, 56 (1), 287–293.
Van Roon, A., Parsons, J.R., Te Kloeze, A.M., and Govers, H.A.J., 2005. Fate
and transport of monoterpenes through soils. Part I. Prediction of
temperature dependent soil fate model input-parameters. Chemosphere,
61 (5), 599–609.
Rosenblatt-Farrell, N., 2009. The landscape of antibiotic resistance.
Environmental Health Perspectives, 117 (6), A244-50.
220
Roshan, N., Hammer, K.A., and Riley, T. V., 2018. Non-conventional
antimicrobial and alternative therapies for the treatment of Clostridium
difficile infection. Anaerobe, 49, 103–111.
Sabaeifard, P., Abdi-Ali, A., Soudi, M.R., and Dinarvand, R., 2014.
Optimization of tetrazolium salt assay for Pseudomonas aeruginosa
biofilm using microtiter plate method. Journal of Microbiological Methods,
105, 134–140.
Sakkas, H., Gousia, P., Economou, V., Sakkas, V., Petsios, S., and
Papadopoulou, C., 2016. In vitro antimicrobial activity of five essential oils
on multi-drug resistant Gram-negative clinical isolates. Journal of
Intercultural Ethnopharmacology, 5 (3), 212.
Sambasivarao, D., Weiner, J.H., Kroger, A., and Goethe, J.W., 1991. Dimethyl
Sulfoxide Reductase of Escherichia coli: an investigation of function and
assembly by use of in vivo complementation. Journal of Bacteriology, 173
(19), 5935–5943.
Sandle, T., 2017. The European approach to disinfectant qualification. La
Vague, 52 (January), 45–48.
Sanla-Ead, N., Jangchud, A., Chonhenchob, V., and Suppakul, P., 2011.
Antimicrobial activity of cinnamaldehyde and eugenol and their activity
after incorporation into cellulose-based packaging films. Packaging
Technology and Science, 25 (1), 7–17.
Santajit, S. and Indrawattana, N., 2016. Mechanisms of antimicrobial
resistance in ESKAPE pathogens. BioMed Research International, 2016,
1–8.
Sarkic, A. and Stappen, I., 2018. Essential oils and their single compounds in
cosmetics—A critical review. Cosmetics, 5 (1), 11.
Saviuc, C.-M., Drumea, V., Olariu, L., Chifiriuc, M.-C., Bezirtzoglou, E., and
Lazăr, V., 2015. Essential oils with microbicidal and antibiofilm activity.
Current Pharmaceutical Biotechnology, 16 (2), 137–51.
221
Schmidt, M.G., Attaway, H.H., Sharpe, P.A., John, J., Sepkowitz, K.A.,
Morgan, A., Fairey, S.E., Singh, S., Steed, L.L., Cantey, J.R., Freeman,
K.D., Michels, H.T., and Salgado, C.D., 2012. Sustained reduction of
microbial burden on common hospital surfaces through introduction of
copper. Journal of Clinical Microbiology, 50 (7), 2217–2223.
Semeniuc, C.A., Pop, C.R., and Rotar, A.M., 2017. Antibacterial activity and
interactions of plant essential oil combinations against Gram-positive and
Gram-negative bacteria. Journal of Food and Drug Analysis, 25 (2), 403–
408.
Senatore, F., 2002. Influence of harvesting time on yield and composition of
the essential oil of a thyme (Thymus pulegioides L.) growing wild in
Campania (Southern Italy). Journal of Agricultural and Food Chemistry,
44 (5), 1327–1332.
Seo, H.S., Beuchat, L.R., Kim, H., and Ryu, J.H., 2015. Development of an
experimental apparatus and protocol for determining antimicrobial
activities of gaseous plant essential oils. International Journal of Food
Microbiology, 215, 95–100.
Shahina, Z., El-Ganiny, A.M., Minion, J., Whiteway, M., Sultana, T., and
Dahms, T.E.S., 2018. Cinnamomum zeylanicum bark essential oil
induces cell wall remodelling and spindle defects in Candida albicans.
Fungal Biology and Biotechnology, 5 (1), 3.
Shelobolina, E.S., Walker, D.K., Parker, A.E., Lust, D. V., Schultz, J.M., and
Dickerman, G.E., 2018. Inactivation of Pseudomonas aeruginosa biofilms
formed under high shear stress on various hydrophilic and hydrophobic
surfaces by a continuous flow of ozonated water. Biofouling, 34 (7), 826–
834.
Shrivastava, S., Bera, T., Roy, A., Singh, G., Ramachandrarao, P., and Dash,
D., 2007. Characterization of enhanced antibacterial effects of novel silver
nanoparticles. Nanotechnology, 18 (22).
222
Siebert, T.E., Solomon, M.R., Pollnitz, A.P., and Jeffery, D.W., 2010. Selective
determination of volatile sulfur compounds in wine by gas
chromatography with sulfur chemiluminescence detection. Journal of
Agricultural and Food Chemistry, 58 (17), 9454–9462.
Simões, M., Pereira, M.O., Machado, I., Simões, L.C., and Vieira, M.J., 2006.
Comparative antibacterial potential of selected aldehyde-based biocides
and surfactants against planktonic Pseudomonas fluorescens. Journal of
Industrial Microbiology and Biotechnology, 33 (9), 741–749.
Simpkin, V.L., Renwick, M.J., Kelly, R., and Mossialos, E., 2017. Incentivising
innovation in antibiotic drug discovery and development: progress,
challenges and next steps. The Journal of Antibiotics, 70, 1087–1096.
Singer, A.C., Shaw, H., Rhodes, V., and Hart, A., 2016. Review of
antimicrobial resistance in the environment and its relevance to
environmental regulators. Frontiers in Microbiology, 7.
Singh, H.B., Srivastava, M., Singh, A.B., and Srivastava, A.K., 1995.
Cinnamon bark oil, a potent fungitoxicant against fungi causing
respiratory tract mycoses. Allergy, 50 (12), 995–999.
Slade, E.A., Thorn, R.M.S., Lovering, A.M., Young, A., and Reynolds, D.M.,
2017. In vitro discrimination of wound-associated bacteria by volatile
compound profiling using selected ion flow tube-mass spectrometry.
Journal of Applied Microbiology, 123 (1), 233–245.
Smieszek, T., Pouwels, K.B., Christiaan, F., Dolk, K., Smith, D.R.M., Hopkins,
S., Sharland, M., Hay, A.D., Moore, M. V, and Robotham, J. V, 2018.
Potential for reducing inappropriate antibiotic prescribing in English
primary care. Journal of Antimicrobial Chemotherapy, 73 (S2), 36-43STO.
Smith, D. and Španěl, P., 2011. Ambient analysis of trace compounds in
gaseous media by SIFT-MS. Analyst, 136 (10), 2009–2032.
Solano, C., Echeverz, M., and Lasa, I., 2014. Biofilm dispersion and quorum
sensing. Current Opinion in Microbiology, 18 (1), 96–104.
223
Soni, R., Sharma, G., and Jasuja, N.D., 2016. Essential oil yield pattern and
antibacterial and insecticidal activities of Trachyspermum ammi and
Myristica fragrans. Scientifica, 2016, 1428194.
Španěl, P., Dryahina, K., and Smith, D., 2006. A general method for the
calculation of absolute trace gas concentrations in air and breath from
selected ion flow tube mass spectrometry data. International Journal of
Mass Spectrometry, 249 (250), 230–239.
Speight, J.G., 2019. Natural Gas - A Basic Handbook. 2nd ed. Oxford, UK:
Gulf Professional.
Sriramulu, D.D., Lünsdorf, H., Lam, J.S., and Römling, U., 2005. Microcolony
formation: A novel biofilm model of Pseudomonas aeruginosa for the
cystic fibrosis lung. Journal of Medical Microbiology, 54 (7), 667–676.
Stepanović, S., Vuković, D., Dakić, I., Savić, B., and Švabić-Vlahović, M.,
2000. A modified microtiter-plate test for quantification of staphylococcal
biofilm formation. Journal of Microbiological Methods, 40 (2), 175–179.
Stojanović, G., Jovanović, O., Petrović, G., Mitić, V., Jovanović, V.S., and
Jovanović, S., 2019. Composition of headspace volatiles and essential
oils of three Thymus species. Natural Product Communications, 9 (11).
Storer, M.K., Hibbard-Melles, K., Davis, B., and Scotter, J., 2011. Detection of
volatile compounds produced by microbial growth in urine by selected ion
flow tube mass spectrometry (SIFT-MS). Journal of Microbiological
Methods, 87 (1), 111–113.
Subhadra, B., Hwan Oh, M., and Hee Choi, C., 2016. Quorum sensing in
Acinetobacter: with special emphasis on antibiotic resistance, biofilm
formation and quorum quenching. AIMS Microbiology, 2 (1), 27–41.
Swamy, M.K., Akhtar, M.S., and Sinniah, U.R., 2016. Antimicrobial properties
of plant essential oils against human pathogens and their mode of action:
An updated review. Evidence-based Complementary and Alternative
Medicine, 2016, 1–58.
224
Tak, J.H. and Isman, M.B., 2017. Penetration-enhancement underlies synergy
of plant essential oil terpenoids as insecticides in the cabbage looper,
Trichoplusia ni. Scientific Reports, 7, 1–11.
Tangjitjaroenkun, J., Chavasiri, W., Thunyaharn, S., and Yompakdee, C.,
2012. Bactericidal effects and time-kill studies of the essential oil from the
fruits of Zanthoxylum limonella on multi-drug resistant bacteria. Journal of
Essential Oil Research, 24 (4), 363–370.
Tanwar, J., Das, S., Fatima, Z., and Hameed, S., 2014. Multidrug resistance:
An emerging crisis. Interdisciplinary Perspectives on Infectious Diseases,
2014, 1–7.
Tenover, F.C., 2006. Mechanisms of antimicrobial resistance in bacteria.
American Journal of Infection Control, 34 (5 SUPPL.).
Todd, J.D., Curson, A.R.J., Nikolaidou-Katsaraidou, N., Brearley, C.A.,
Watmough, N.J., Chan, Y., Page, P.C.B., Sun, L., and Johnston, A.W.B.,
2010. Molecular dissection of bacterial acrylate catabolism - unexpected
links with dimethylsulfoniopropionate catabolism and dimethyl sulfide
production. Environmental Microbiology, 12 (2), 327–343.
Tong, S., Pan, J., Lu, S., and Tang, J., 2018. Patient compliance with
antimicrobial drugs: A Chinese survey. American Journal of Infection
Control, 46 (4), e25–e29.
Tongnuanchan, P. and Benjakul, S., 2014. Essential oils: extraction,
bioactivities, and their uses for food preservation. Journal of Food
Science, 79 (7), 1231–1249.
Toyofuku, M., Inaba, T., Kiyokawa, T., Obana, N., Yawata, Y., and Nomura,
N., 2016. Environmental factors that shape biofilm formation. Bioscience,
Biotechnology, and Biochemistry, 80 (1), 7–12.
Tracanna, V., de Jong, A., Medema, M.H., and Kuipers, O.P., 2017. Mining
prokaryotes for antimicrobial compounds: from diversity to function.
FEMS Microbiology Reviews, 41 (3), 417–429.
225
Tyagi, A.K. and Malik, A., 2010a. Antimicrobial action of essential oil vapours
and negative air ions against Pseudomonas fluorescens. International
Journal of Food Microbiology, 143 (3), 205–210.
Tyagi, A.K. and Malik, A., 2010b. In situ SEM, TEM and AFM studies of the
antimicrobial activity of lemon grass oil in liquid and vapour phase against
Candida albicans. Micron, 41 (7), 797–805.
Tyagi, A.K. and Malik, A., 2011. Antimicrobial potential and chemical
composition of Eucalyptus globulus oil in liquid and vapour phase against
food spoilage microorganisms. Food Chemistry, 126 (1), 228–235.
Tzortzakis, N.G., 2008. Impact of cinnamon oil-enrichment on microbial
spoilage of fresh produce.
Ugur, A., Dagi, H., Ozturk, B., Tekin, G., and Findik, D., 2016. Assessment of
in vitro antibacterial activity and cytotoxicity effect of Nigella sativa oil.
Pharmacognosy Magazine, 12 (47), 471.
Umber, B.J., Shin, H.-W., Meinardi, S., Leu, S.-Y., Zaldivar, F., Cooper, D.M.,
and Blake, D.R., 2013. Gas signatures from Escherichia coli and
Escherichia coli-inoculated human whole blood. Clinical and Translational
Medicine, 2 (1), 13.
Utchariyakiat, I., Surassmo, S., Jaturanpinyo, M., Khuntayaporn, P., and
Chomnawang, M.T., 2016. Efficacy of cinnamon bark oil and
cinnamaldehyde on anti-multidrug resistant Pseudomonas aeruginosa
and the synergistic effects in combination with other antimicrobial agents.
BMC Complementary and Alternative Medicine, 16 (1), 158.
Veal, L., 1996. The potential effectiveness of essential oils as a Pediculus
humanus capitis. Complementary Therapies in Nursing and Midwifery, 2
(4).
Velázquez-Nuñez, M.J., Avila-Sosa, R., Palou, E., and López-Malo, A., 2013.
Antifungal activity of orange (Citrus sinensis var. Valencia) peel essential
oil applied by direct addition or vapor contact. Food Control, 31 (1), 1–4.
226
Ventola, C.L., 2015. The antibiotic resistance crisis: causes and threats. P&T
Journal, 40 (4), 277–83.
Vigan, M., 2010. Essential oils: Renewal of interest and toxicity. European
Journal of Dermatology, 20 (6), 685–692.
Vohra, P. and Poxton, I.R., 2011. Efficacy of decontaminants and disinfectants
against Clostridium difficile. Journal of Medical Microbiology, 60 (8),
1218–1224.
van Vuuren, S.F. and Viljoen, A.M., 2007. Antimicrobial activity of limonene
enantiomers and 1,8-cineole alone and in combination. Flavour and
Fragrance Journal, 22 (6), 540–544.
Wadhwani, T., Desai, K., Patel, D., Lawani, D., Bahaley, P., Joshi, P., Kothari
Citation Wadhwani, V.T., and Kothari, V., 2012. Effect of various solvents
on bacterial growth in context of determining MIC of various
antimicrobials. The Internet Journal of Microbiology, 7 (1).
Walsh, S.E., Maillard, J.Y., Simons, C., and Russell, A.D., 1999. Studies on
the mechanisms of the antibacterial action of ortho-phthalaldehyde.
Journal of Applied Microbiology, 87 (5), 702–710.
Wang, R., Wang, R., and Yang, B., 2009. Extraction of essential oils from five
cinnamon leaves and identification of their volatile compound
compositions. Innovative Food Science and Emerging Technologies, 10
(2), 289–292.
Wang, T., Smith, D., and Španěl, P., 2002. Selected ion flow tube studies of
the reactions of H3O+, NO+ and O2+ with the anaesthetic gases
halothane, isoflurane and sevoflurane. Rapid Communications in Mass
Spectrometry, 16 (19), 1860–1870.
Warnke, P.H., Becker, S.T., Podschun, R., Sivananthan, S., Springer, I.N.,
Russo, P.A.J., Wiltfang, J., Fickenscher, H., and Sherry, E., 2009. The
battle against multi-resistant strains: Renaissance of antimicrobial
essential oils as a promising force to fight hospital-acquired infections.
227
Journal of Cranio-Maxillofacial Surgery, 37 (7), 392–397.
Watson, F., Keevil, C.W., Wilks, S.A., and Chewins, J., 2018. Modelling
vaporised hydrogen peroxide efficacy against mono-species biofilms.
Scientific Reports, 8 (1).
Wen, P., Zhu, D.H., Wu, H., Zong, M.H., Jing, Y.R., and Han, S.Y., 2016.
Encapsulation of cinnamon essential oil in electrospun nanofibrous film
for active food packaging. Food Control, 59, 366–376.
Wentland, E.J., Stewart, P.S., Huang, C.T., and McFeters, G.A., 1996. Spatial
variations in growth rate within Klebsiella pneumoniae colonies and
biofilm. Biotechnology Progress, 12 (3), 316–321.
Whiley, H., Gaskin, S., Schroder, T., and Ross, K., 2018. Antifungal properties
of essential oils for improvement of indoor air quality: A review. Reviews
on Environmental Health, 33 (1), 63–76.
Williamson, K.S., Richards, L.A., Perez-Osorio, A.C., Pitts, B., McInnerney, K.,
Stewart, P.S., and Franklin, M.J., 2012. Heterogeneity in Pseudomonas
aeruginosa biofilms includes expression of ribosome hibernation factors
in the antibiotic-tolerant subpopulation and hypoxia-induced stress
response in the metabolically active population. Journal of Bacteriology,
194 (8), 2062–2073.
Wilson, C., Lukowicz, R., Merchant, S., Valquier-Flynn, H., Caballero, J.,
Sandoval, J., Okuom, M., Huber, C., Brooks, T.D., Wilson, E., Clement,
B., Wentworth, C.D., and Holmes, A.E., 2017. Quantitative and qualitative
assessment methods for biofilm growth: a mini-review. Journal of
Engineering and Technology, 6 (4).
Wolska, K.I., Grudniak, A.M., Rudnicka, Z., and Markowska, K., 2016. Genetic
control of bacterial biofilms. Journal of Applied Genetics, 57 (2), 225–238.
Wu, J., Liu, H., Ge, S., Wang, S., Qin, Z., Chen, L., Zheng, Q., Liu, Q., and
Zhang, Q., 2015. The preparation, characterization, antimicrobial stability
and in vitro release evaluation of fish gelatin films incorporated with
228
cinnamon essential oil nanoliposomes. Food Hydrocolloids, 43, 427–435.
Xing, Y., Li, X., Xu, Q., Yun, J., Lu, Y., and Tang, Y., 2011. Effects of chitosan
coating enriched with cinnamon oil on qualitative properties of sweet
pepper (Capsicum annuum L.). Food Chemistry, 124, 1443–1450.
Yang, S.K., Yusoff, K., Mai, C.W., Lim, W.M., Yap, W.S., Lim, S.H.E., and Lai,
K.S., 2017. Additivity vs. synergism: Investigation of the additive
interaction of cinnamon bark oil and meropenem in combinatory therapy.
Molecules, 22 (11).
Yangui, T., Bouaziz, M., Dhouib, A., and Sayadi, S., 2009. Potential use of
Tunisian Pituranthos chloranthus essential oils as a natural disinfectant.
Letters in Applied Microbiology, 48 (1), 112–117.
Yap, P.S.X., Yiap, B.C., Ping, H.C., and Lim, S.H.E., 2014. Essential Oils, A
New Horizon in Combating Bacterial Antibiotic Resistance. The Open
Microbiology Journal, 8 (1), 6–14.
Zabka, M., Pavela, R., and Prokinova, E., 2014. Antifungal activity and
chemical composition of twenty essential oils against significant indoor
and outdoor toxigenic and aeroallergenic fungi. Chemosphere, 112, 443–
448.
Zaika, L.L., 1988. Spices and herbs: Their antimicrobial activity and its
determination. Journal of Food Safety, 9 (2), 97–118.
Zaman, S. Bin, Hussain, A., Nye, R., Mehta, V., Taib Mamun, K., and Hossain,
N., 2017. A Review on antibiotic resistance: Alarm bells are ringing.
Cureus, 9 (6), 1–9.
Zhang, Y., Liu, X., Wang, Y., Jiang, P., and Quek, S., 2016. Antibacterial
activity and mechanism of cinnamon essential oil against Escherichia coli
and Staphylococcus aureus. Food Control, 59, 282–289.
Zheljazkov, V.D., Cantrell, C.L., Astatkie, T., and Jeliazkova, E., 2013.
Distillation time effect on lavender essential oil yield and composition.
229
Journal of Oleo Science, 62 (4), 195–9.
Ziani, K., Chang, Y., McLandsborough, L., and McClements, D.J., 2011.
Influence of surfactant charge on antimicrobial efficacy of surfactant-
stabilized thyme oil nanoemulsions. Journal of Agricultural and Food
Chemistry, 59 (11), 6247–6255.
Zouari-Bouassida, K., Trigui, M., Makni, S., Jlaiel, L., and Tounsi, S., 2018.
Seasonal variation in essential oils composition and the biological and
pharmaceutical protective effects of Mentha longifolia leaves grown in
Tunisia. BioMed Research International, 2018, 1–12.

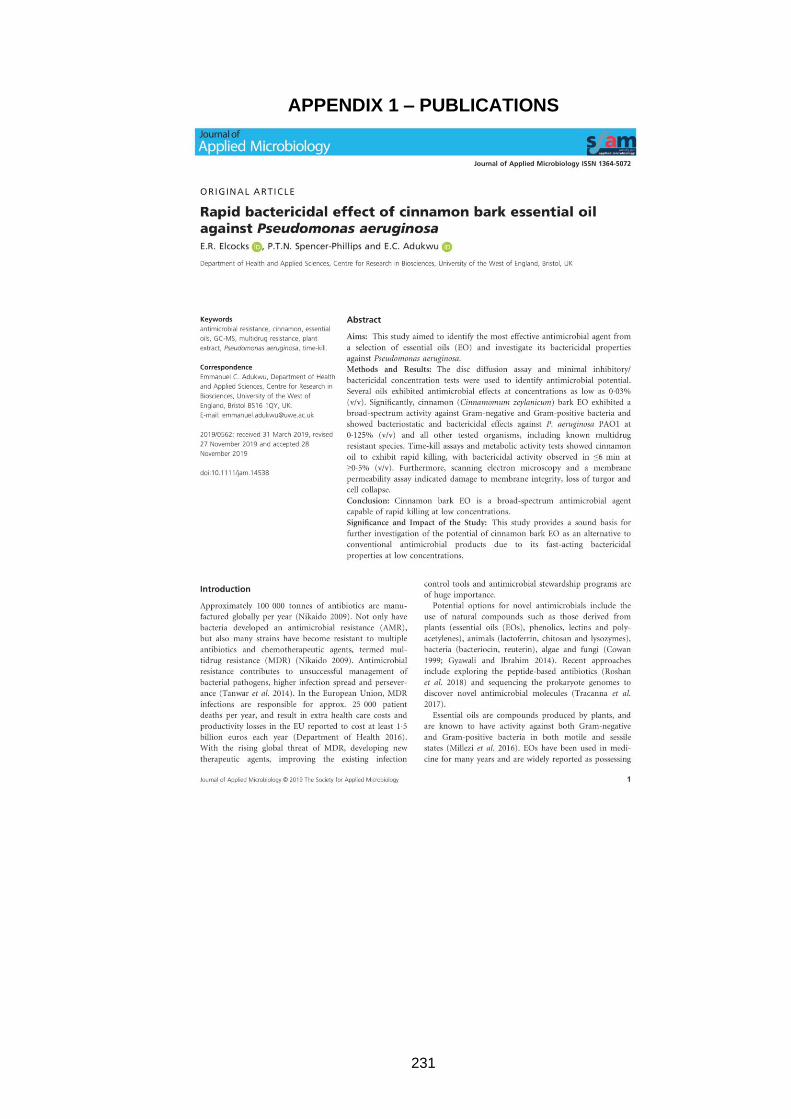
231
APPENDIX 1 – PUBLICATIONS

232
233
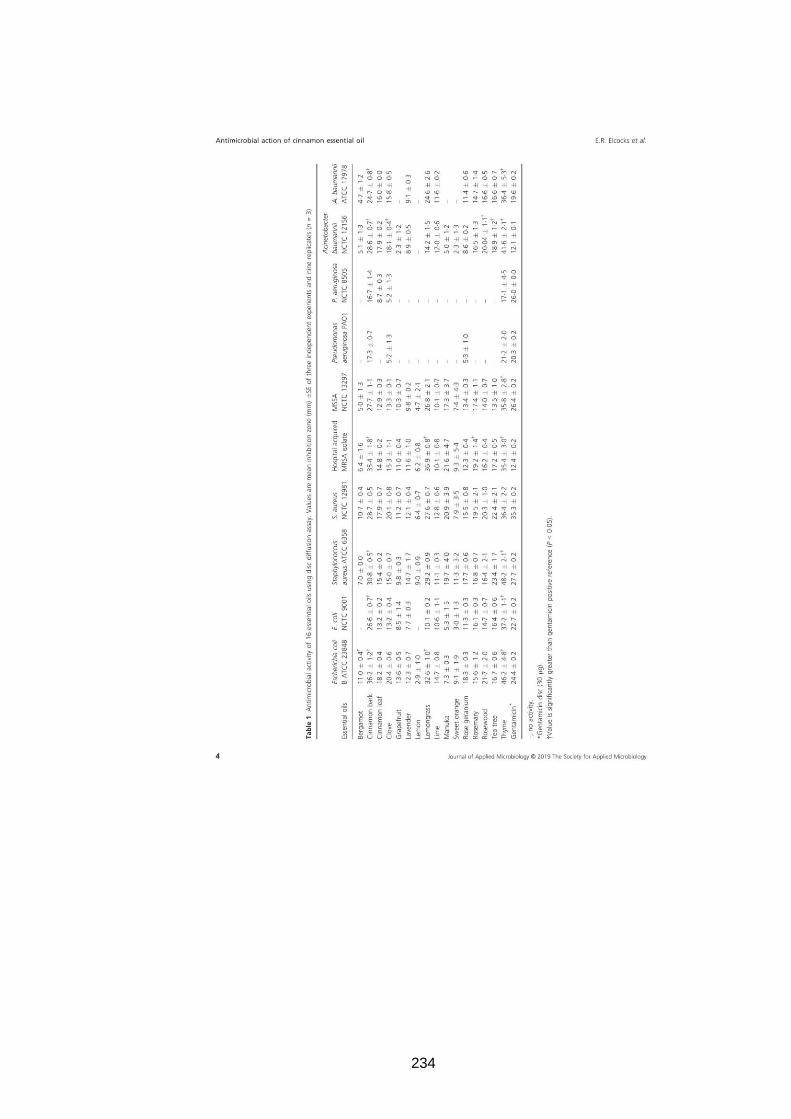
234
235
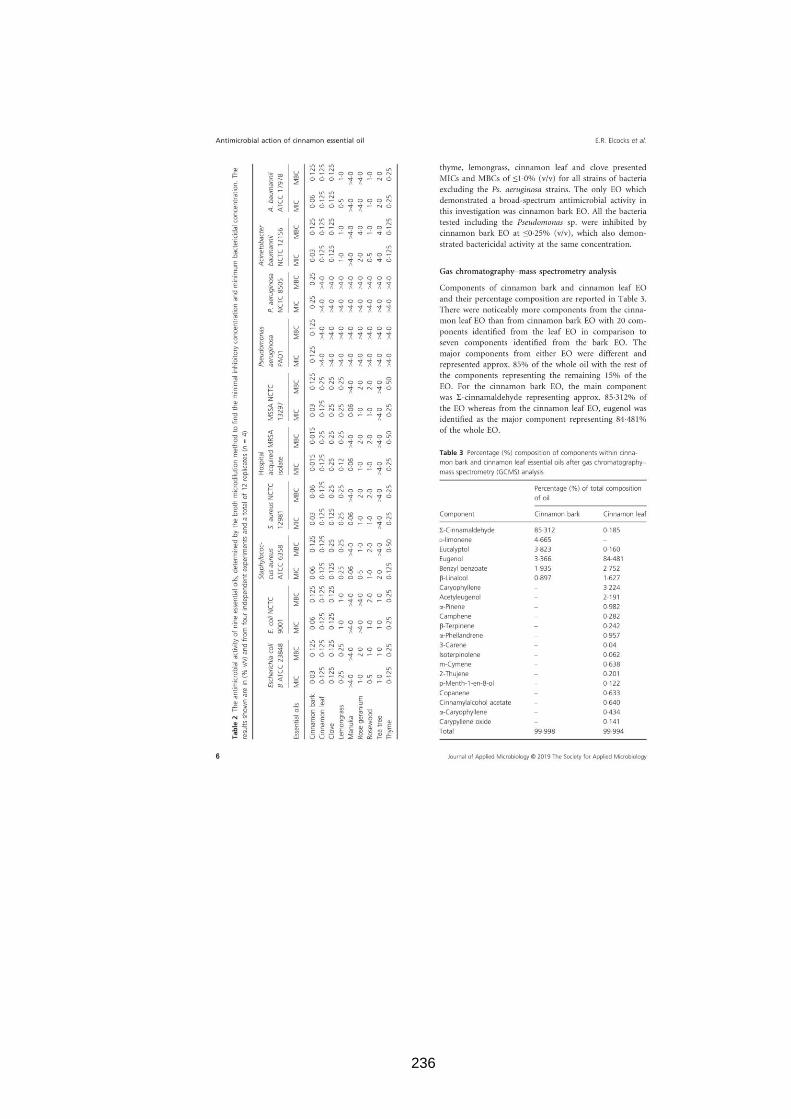
236
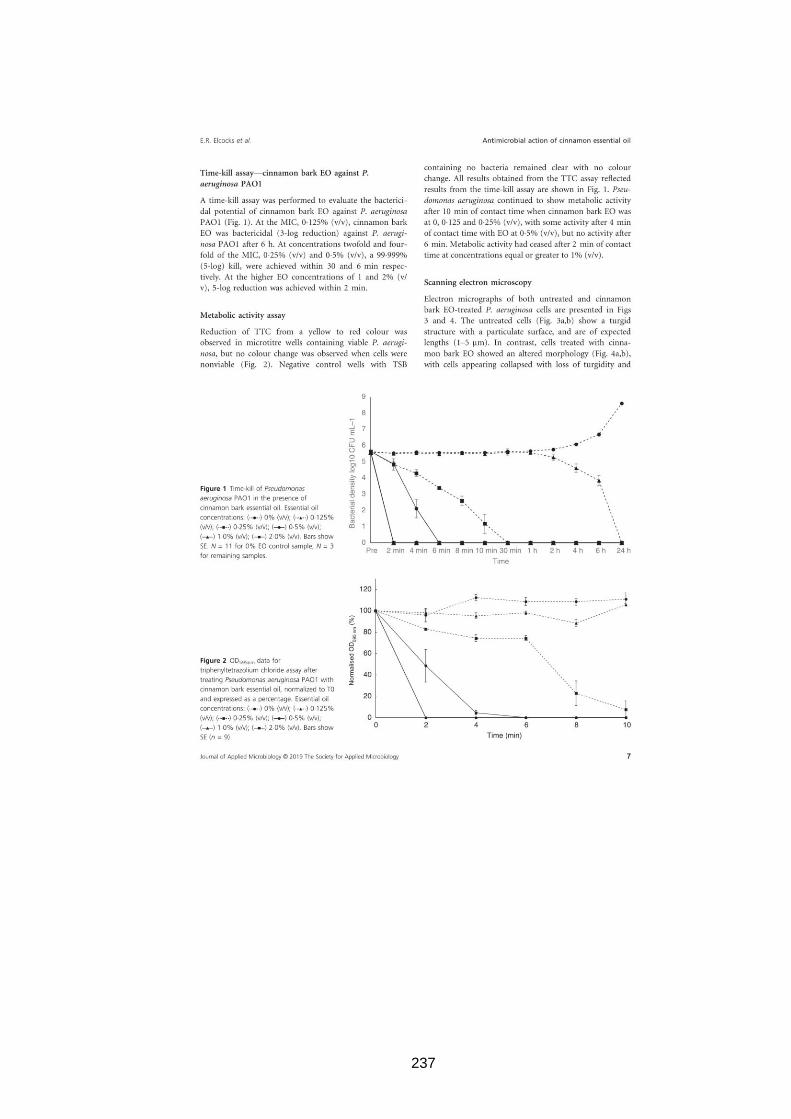
237
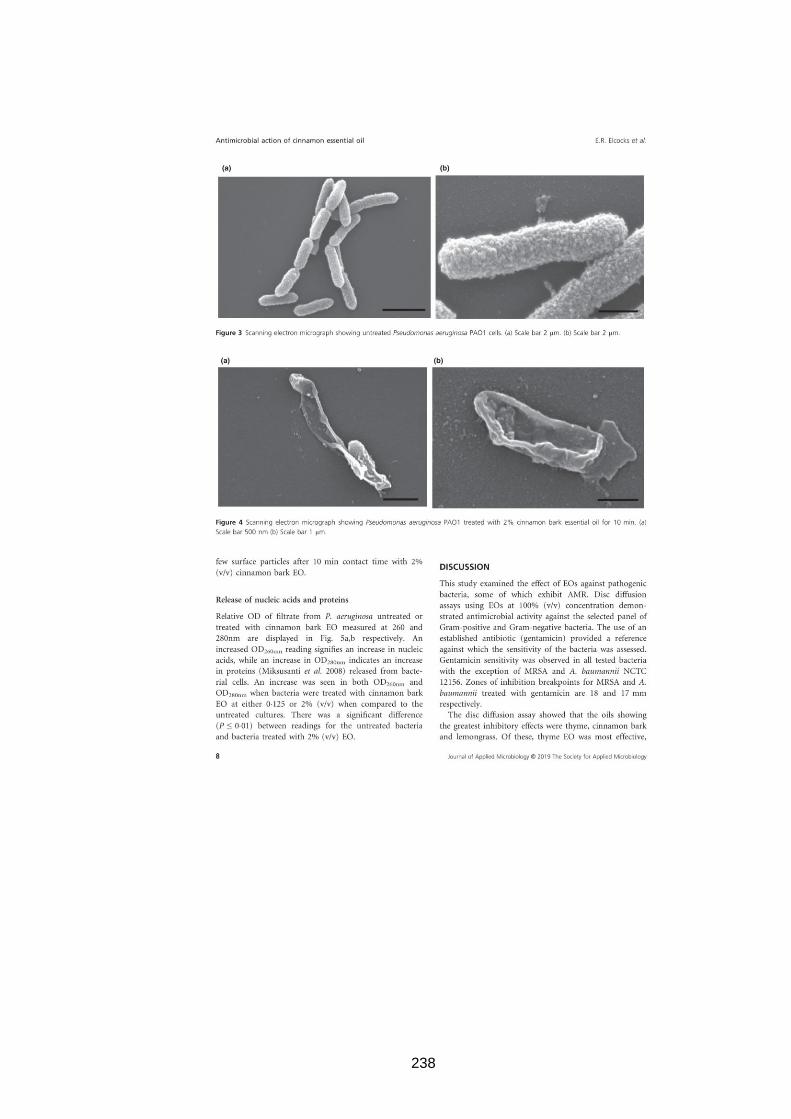
238

239
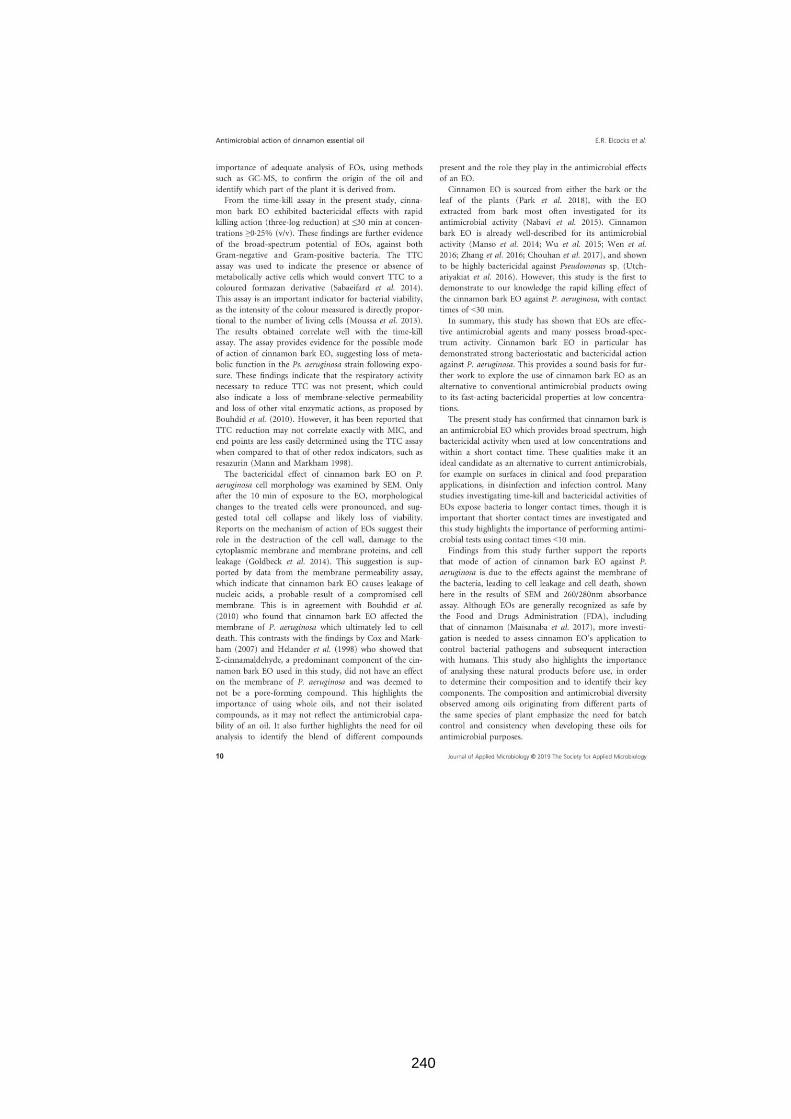
240
241
242
243


