Embed Size (px)
Citation preview
ACPD9, 18375–18416, 2009
Critical assessmentof vapour pressureestimation methods
M. H. Barley andG. McFiggans
Title Page
Abstract Introduction
Conclusions References
Tables Figures
J I
J I
Back Close
Full Screen / Esc
Printer-friendly Version
Interactive Discussion
Atmos. Chem. Phys. Discuss., 9, 18375–18416, 2009www.atmos-chem-phys-discuss.net/9/18375/2009/© Author(s) 2009. This work is distributed underthe Creative Commons Attribution 3.0 License.
AtmosphericChemistry
and PhysicsDiscussions
This discussion paper is/has been under review for the journal Atmospheric Chemistryand Physics (ACP). Please refer to the corresponding final paper in ACP if available.
The critical assessment of vapourpressure estimation methods for use inmodelling the formation of atmosphericorganic aerosolM. H. Barley and G. McFiggans
Centre for Atmospheric Sciences, School of Earth, Environmental and Atmospheric Science,University of Manchester, Manchester, UK
Received: 6 August 2009 – Accepted: 18 August 2009 – Published: 3 September 2009
Correspondence to: G. McFiggans ([email protected])
Published by Copernicus Publications on behalf of the European Geosciences Union.
18375
ACPD9, 18375–18416, 2009
Critical assessmentof vapour pressureestimation methods
M. H. Barley andG. McFiggans
Title Page
Abstract Introduction
Conclusions References
Tables Figures
J I
J I
Back Close
Full Screen / Esc
Printer-friendly Version
Interactive Discussion
Abstract
A selection of models for estimating vapour pressures have been tested against ex-perimental data for a set of compounds selected for their particular relevance to theformation of atmospheric aerosol by gas-liquid partitioning. The experimental vapourpressure data (all <100 Pa) of 45 multifunctional compounds provide a stringent test of5
the estimation techniques, with a recent complex group contribution method providingthe best overall results. The effect of errors in vapour pressures upon the formationof organic aerosol by gas-liquid partitioning in an atmospherically relevant exampleis also investigated. The mass of organic aerosol formed under typical atmosphericconditions was found to be very sensitive to the variation in vapour pressure values10
typically present when comparing estimation methods.
1 Introduction
The atmospheric aerosol is important for the understanding of climate change and forhuman health. The formation of condensed organic aerosol (OA) component massfrom volatile organic compounds (VOCs) in the atmosphere is frequently described15
by a gas-liquid partitioning model (Barley et al., 2009, and references therein, e.g.Pankow, 1994), in which vapour pressure is a primary determinant. To reliably modelthe formation of OA mass, accurate estimates of the vapour pressure for all the thou-sands of organic compounds at ambient temperatures are required.
Reliable experimental vapour pressure data for a wide range of compounds are avail-20
able from established databases (e.g. Dortmund Databank (DDB); www.ddbst.de/new/frame DDB.htm). However the vast majority of these data have been collected by or onbehalf of the chemical industry for chemical plant design improvement, with a particularemphasis on production and purification of products by distillation. Most of the data aretherefore collected for structurally simple compounds (particularly hydrocarbons) with25
intermediate vapour pressures (103–105 Pa) and few data are collected at pressures
18376
ACPD9, 18375–18416, 2009
Critical assessmentof vapour pressureestimation methods
M. H. Barley andG. McFiggans
Title Page
Abstract Introduction
Conclusions References
Tables Figures
J I
J I
Back Close
Full Screen / Esc
Printer-friendly Version
Interactive Discussion
<1 Pa. Most of the compounds found in the atmosphere will not have vapour pressuredata available in the standard databases. Those atmospheric compounds most likelyto condense into an aerosol will be relatively complex, high molecular weight (150–300) multifunctional compounds (Saxena and Hildemann, 1996) with ambient vapourpressures <0.1 Pa (Barsanti and Pankow, 2004); in many cases, orders of magnitude5
below 0.1 Pa. These compounds are very poorly represented in collections of exper-imental vapour pressure data and there are very few organic compounds for whichexperimental vapour pressure values have been measured below 0.01 Pa.
The aim of the current work is to evaluate a number of vapour pressure estimationtechniques against those reliable primary data of most relevance to prediction of vapour10
pressures of likely OA components. The sensitivity of OA formation to variation inestimated vapour pressure values will also be investigated
1.1 Experimental measurement of vapour pressures
The accurate experimental measurement of low (1–103 Pa) and very low (<1 Pa)vapour pressures is a significant challenge. The use of modern pressure gauges15
means that it is theoretically possible to use the static method down to very low pres-sures but adsorption of volatiles (especially water) onto the surface of the appara-tus and the presence of impurities in the sample make this method difficult to use inpractice at low pressures. Well established methods that do provide good results atlow pressures are the transpiration method (Verevkin et al., 2000) and Knudsen effu-20
sion (Dekruif and Vanginkel, 1977; Hallquist et al., 1997). In the transpiration methoda stream of inert gas (usually nitrogen) is used to slowly purge the headspace abovea sample of the compound. The material picked up by the stream of nitrogen is thentrapped (usually cryogenically) and determined after several hours purging. From themass of compound transferred by the flowing gas stream the vapour pressure can be25
calculated. Good results are claimed for this method down to 0.005 Pa (Verevkin et al.,2000). In Knudsen effusion a small sample is placed in a closed container with a smallhole in the side. The vapour in equilibrium with the sample (which is often a solid)
18377
ACPD9, 18375–18416, 2009
Critical assessmentof vapour pressureestimation methods
M. H. Barley andG. McFiggans
Title Page
Abstract Introduction
Conclusions References
Tables Figures
J I
J I
Back Close
Full Screen / Esc
Printer-friendly Version
Interactive Discussion
effuses out of the small hole into a vacuum. The rate of mass loss allows the cal-culation of the vapour pressure. For solid samples the experimental vapour pressure(sublimation pressure) needs to be corrected to a sub-cooled liquid vapour pressure(see below) before comparison with estimated values; or use in atmospheric models.The use of Knudsen effusion linked to mass-spectrometry (KEMS) is well established5
for the measurement of partial pressures above alloy and intermetallic systems at hightemperatures (Copland and Jacobson, 2001; Bencze et al., 2004); and has recentlybeen used for the determination of vapour pressures of organic compounds at am-bient temperatures (Booth et al., 2009). Within the atmospheric community severalmeasurements have been made at ambient temperatures on mono- and di-carboxylic10
acids using a variety of techniques based upon the rate of evaporation of a compoundunder controlled conditions (Bilde et al., 2003; Koponen et al., 2007; Tao and Mcmurry,1989; Cappa et al., 2007). However it is not clear at this time how these methodscompare to more established techniques such as transpiration and Knudsen effusion.
1.2 Estimation of vapour pressures15
Many methods for the estimation of vapour pressures have appeared in the literatureand they have been periodically reviewed (Poling et al., 2001). However most of themethods are aimed at the requirements of the chemical industry and typically providegood results for volatile fluids, particularly if an experimental boiling point is available.The databases used to develop these methods are heavily biased towards mono-20
functional (or indeed non-functional i.e. hydrocarbon) compounds with relatively fewexamples of bi- or multi-functional compounds present. Hence the estimation methodstend to work best for compounds with one (or zero) functional groups and the relativelyfew compounds with two or more functional groups may well end up as outliers unlessspecific provision is made by the model to accommodate them (e.g. by including in-25
teractions between functional groups). For some of the models, particularly the morecomplex group contribution methods, there is a significant danger of overfitting. Thiswould result in a model which makes good predictions for the compounds used to de-
18378
ACPD9, 18375–18416, 2009
Critical assessmentof vapour pressureestimation methods
M. H. Barley andG. McFiggans
Title Page
Abstract Introduction
Conclusions References
Tables Figures
J I
J I
Back Close
Full Screen / Esc
Printer-friendly Version
Interactive Discussion
velop the model (the training set) but has little predictive power for new compounds.This is a problem that is well understood by the chemometrics and cheminformaticscommunity (Faber and Rajko, 2007) and is a potential problem for any model witha large number of fitted parameters.
Furthermore few, if any, of the methods claim much accuracy below 100 Pa, and5
the errors increase significantly at lower pressures. Most of the estimation methodsreported in the literature require a normal boiling point (Tb) which, for multifunctionalcompounds, will usually have to be estimated. Hence many estimation methods havetwo parts: estimation of Tb, followed by extrapolation from Tb down to the temperatureof interest. For some of the compounds of atmospheric interest, the estimated Tb can10
be in excess of 700 K so a relatively small error in the slope of the line between Tband 25◦C can make a large difference to the predicted vapour pressures. Estimationmethods of this type that have been used within the atmospheric science communityinclude Tb estimation by the method of Nannoolal et al. (2004) (used in the E-AIMwebsite, www.aim.env.uea.ac.uk/aim/ddbst/pcalc main.php); and the older group con-15
tribution method of Stein and Brown (1994), used in both E-AIM and EPI-Suite (EPA,2009). This last method is a modification of the method of Joback and Reid (1987)which has recently been used in the study of Camredon and Aumont (2006). E-AIMprovides vapour pressure data either using Tb by Stein and Brown (1994) combinedwith the vapour pressure equation of Myrdal and Yalkowsky (1997); or with both Tb20
and vapour pressures estimated by the methods of Nannoolal et al. (2008) using theARTIST software from the DDB. Recently the E-AIM vapour pressure equation hasbeen changed to a variation on the Nannoolal et al. (2008) method developed by Molleret al. (2008). Camredon and Aumont (2006) reported use of the Myrdal and Yalkowsky(1997) equation while EPI-Suite uses a modified version of the Grain (1982) equation25
with a Fishtine factor (Lyman, 1985; Fishtine, 1963). Prediction of the absorptive par-titioning of large-numbers of compounds requires automation of the methods for theestimation of vapour pressures (Aumont et al., 2005; Johnson et al., 2006). EPI-Suitecan provide estimated boiling points and vapour pressures rapidly in batch mode using
18379
ACPD9, 18375–18416, 2009
Critical assessmentof vapour pressureestimation methods
M. H. Barley andG. McFiggans
Title Page
Abstract Introduction
Conclusions References
Tables Figures
J I
J I
Back Close
Full Screen / Esc
Printer-friendly Version
Interactive Discussion
SMILES strings (EPA, 2009) as input. However the vapour pressure equation used byEPI-Suite has limited ability to predict the slope of a vapour pressure curve with respectto temperature due to the small number of values (6 in total) that the Fishtine factor cantake. Also, apart from polyols, the application of the Fishtine factor to multifunctionalcompounds is undefined. In contrast the Nannoolal et al. (2004) method provides 130+5
group contributions plus group interactions (all derived from experimental data) to pre-dict the slope of the vapour pressure curve with temperature. A simplified form of theNannoolal et al. (2004) vapour pressure equation in which all group interactions weredropped and the number of structural groups used to describe a test set of multifunc-tional compounds was reduced from 50 to 15, is described below and tested against10
the other methods. This simplified equation retains the functional form with tempera-ture of the full method; while being both very easy to implement, and more resistant tothe dangers of overfitting.
Some recently reported estimation methods provide vapour pressure values at lowtemperature without using a boiling point. In this latter category there are a number of15
methods that have been developed specifically for compounds of atmospheric interest,although in some cases the range of functionality is limited. These include the estima-tion method of Capouet and Muller (2006) which uses the estimated vapour pressureof a homologous hydrocarbon which is then corrected for the functionality present; andthe group contribution method from Pankow and Asher (2008) specifically aimed at20
atmospherically important compounds.The selection of a vapour pressure estimation method for use in the modelling of
aerosol formation is always going to be a compromise between accuracy, complex-ity and coverage of all the required functional groups. Increasing the complexity ofa model by adding in more adjustable parameters to improve accuracy can result in25
overfitting if taken too far. It is clear that there is no general agreement as to thebest vapour pressure method to use for compounds of atmospheric interest. Clegget al. (2008) reviewed the predictions made by a wide range of vapour pressure esti-mation methods of a limited number of surrogate compounds of atmospheric interest
18380
ACPD9, 18375–18416, 2009
Critical assessmentof vapour pressureestimation methods
M. H. Barley andG. McFiggans
Title Page
Abstract Introduction
Conclusions References
Tables Figures
J I
J I
Back Close
Full Screen / Esc
Printer-friendly Version
Interactive Discussion
and showed that the methods could give very divergent predictions for the same com-pound. The current work specifically aims to identify the estimation method likely toprovide the most accurate vapour pressure predictions for the degradation productsof atmospheric volatile organic compound (VOC) oxidation, thereby providing a recom-mendation for the method most suitable for vapour pressure prediction for the purposes5
of ambient gas-particle partitioning. The sensitivity of aerosol formation to variation invapour pressure values will also be investigated. It is assumed that the organic com-pounds most likely to contribute to OA will be multifunctional and have low vapour pres-sures (<100 Pa) at ambient temperatures. This includes any components which maybe present in OA by virtue of properties or processes other than their low volatility (e.g.10
reversible or irreversible reactive uptake or significant condensed phase reactions).
2 Methodology
For this work only those estimation methods that do not require critical properties will beconsidered. Methods based on critical properties (such as corresponding states) cangive very good results for volatile fluids, particularly if experimental critical constants15
are available (Poling et al., 2001). It is unlikely that these methods can provide accu-rate results for the multifunctional compounds of interest here, where critical constantshave to be estimated, and the vapour pressure curve extrapolated over a massive tem-perature range (if Tb is about 700 K, the critical temperature, Tc, will be about 1000 K)to get to ambient temperatures.20
The bulk of this work will consider combined estimation methods where Tb is firstestimated and then a vapour pressure value at the required temperature is obtainedby extrapolation from Tb using a vapour pressure equation. To assess the accuracy ofthe vapour pressure equations it is necessary to use low or very low vapour pressuredata (below 100 Pa) to ensure a significant extrapolation from Tb. While vapour pres-25
sure data below 100 Pa are available for a range of multifunctional compounds, onlya small number (e.g. some diols, polyethers, anisaldehyde and glycerol) also have an
18381
ACPD9, 18375–18416, 2009
Critical assessmentof vapour pressureestimation methods
M. H. Barley andG. McFiggans
Title Page
Abstract Introduction
Conclusions References
Tables Figures
J I
J I
Back Close
Full Screen / Esc
Printer-friendly Version
Interactive Discussion
experimentally-determined Tb value. Unfortunately, it is therefore not possible to assessthe accuracy of the vapour pressure equations independently of Tb values using a di-verse set of multifunctional compounds. In this work, vapour pressure equations werefirst screened using low vapour pressure data for those multifunctional compounds forwhich experimental Tb values are available, supplemented by a more diverse set of ad-5
ditional compounds (mainly monofunctional); in combination referred to as Test Set 1.From this screening process, four independent equations were selected to be com-bined with three Tb estimation methods and evaluated against vapour pressure data for45 multifunctional compounds; referred to as Test Set 2.
The boiling point estimation methods selected were all group contribution methods10
mentioned in Sect. 1.2 and span a wide range of complexity. The simplest methodis that of Joback and Reid (1987) (JR method – 41 groups); the method of Stein andBrown (1994) (SB) is adapted from the JR method with additional groups (85 in total)and a correction for high boiling point values. The third method is that of Nannoolalet al. (2004) (N-Tb) which includes both primary and secondary groups along with15
group interactions (207 terms in total).
2.1 Selection of vapour pressure estimation methods
The number of vapour pressure equations reported in the literature that could be com-bined with estimated Tb values is large, although several equations are variations oneach other. Two vapour pressure equations that have been widely quoted in the envi-20
ronmental literature are the Grain-Watson (GW) equation (Lyman, 1985; Grain, 1982)and a simplified version quoted by Baum (1998). The GW equation has the form:
ln(p0i
)=
∆Svap
R
[1 −
(3 − 2Tp)m
Tp− 2m(3 − 2Tp)m−1 · ln(Tp)
]. (1)
Where Tp=T/Tb and m=0.4133−0.2575Tp. In this section calculated vapour pressures(p0i
)are in atmospheres, and T and Tb are the temperature and normal boiling point25
18382
ACPD9, 18375–18416, 2009
Critical assessmentof vapour pressureestimation methods
M. H. Barley andG. McFiggans
Title Page
Abstract Introduction
Conclusions References
Tables Figures
J I
J I
Back Close
Full Screen / Esc
Printer-friendly Version
Interactive Discussion
(both in K), respectively.The simplified expression from Baum is:
ln(p0i
)=
∆Svap
R
[1.8(Tb
T− 1)− 0.8 ln
Tb
T
]. (2)
Both expressions require a value for the latent entropy of vapourisation (∆Svap) at thenormal boiling point. This can be obtained from the latent enthalpy of vapourisation if5
it is known:
∆Svap =∆Hvap
Tb(3)
or can be estimated by a group contribution method: e.g. (Joback and Reid, 1987).
∆Hvap = 15.30 +∑i
NiHi , (4)
where NiHi are the contributions for each group (i ) and ∆Hvap is in kJ mol−1 (Poling10
et al., 2001).Alternatively, various expressions based upon Trouton’s Rule have been suggested
e.g. Lyman (1985) proposed:
∆Svap = KfR ln(82.06 · Tb) , (5)
where Kf is a structural factor of Fishtine (1963).15
The EPA software EPI-Suite uses the GW equation (Eq. 1) with a very similar ex-pression to the above for ∆Svap to calculate vapour pressure values. Unfortunatelythe Fishtine factor is only defined for a very limited range of functional groups and thisform of the expression may not work well for complex multifunctional compounds. Vet-ere (1995) has proposed equations for ∆Svap that are polynomials in Tb (Poling et al.,20
2001):
∆Svap = A + B log10(Tb) +CT 1.72
b
M. (6)
18383
ACPD9, 18375–18416, 2009
Critical assessmentof vapour pressureestimation methods
M. H. Barley andG. McFiggans
Title Page
Abstract Introduction
Conclusions References
Tables Figures
J I
J I
Back Close
Full Screen / Esc
Printer-friendly Version
Interactive Discussion
Where A, B and C take different values for hydrocarbons, alcohols/acids and all otherpolar compounds and M is the molecular weight (modified for halogen and phosphoruscompounds).
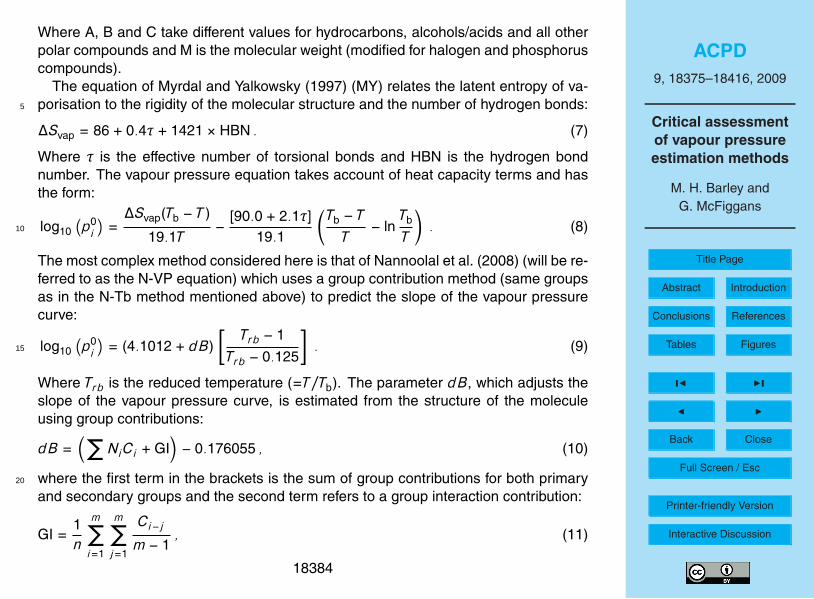
The equation of Myrdal and Yalkowsky (1997) (MY) relates the latent entropy of va-porisation to the rigidity of the molecular structure and the number of hydrogen bonds:5
∆Svap = 86 + 0.4τ + 1421 × HBN . (7)
Where τ is the effective number of torsional bonds and HBN is the hydrogen bondnumber. The vapour pressure equation takes account of heat capacity terms and hasthe form:
log10(p0i
)=
∆Svap(Tb − T )
19.1T− [90.0 + 2.1τ]
19.1
(Tb − T
T− ln
Tb
T
). (8)10
The most complex method considered here is that of Nannoolal et al. (2008) (will be re-ferred to as the N-VP equation) which uses a group contribution method (same groupsas in the N-Tb method mentioned above) to predict the slope of the vapour pressurecurve:
log10(p0i
)= (4.1012 + dB)
[Trb − 1
Trb − 0.125
]. (9)15
Where Trb is the reduced temperature (=T/Tb). The parameter dB, which adjusts theslope of the vapour pressure curve, is estimated from the structure of the moleculeusing group contributions:
dB =(∑
NiCi + GI)− 0.176055 , (10)
where the first term in the brackets is the sum of group contributions for both primary20
and secondary groups and the second term refers to a group interaction contribution:
GI =1n
m∑i=1
m∑j=1
Ci−j
m − 1, (11)
18384
ACPD9, 18375–18416, 2009
Critical assessmentof vapour pressureestimation methods
M. H. Barley andG. McFiggans
Title Page
Abstract Introduction
Conclusions References
Tables Figures
J I
J I
Back Close
Full Screen / Esc
Printer-friendly Version
Interactive Discussion
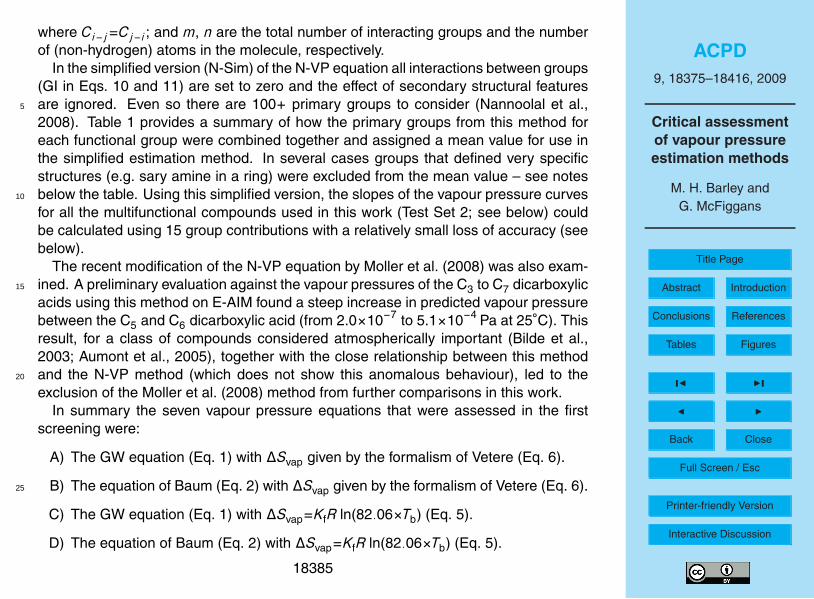
where Ci−j=Cj−i ; and m, n are the total number of interacting groups and the numberof (non-hydrogen) atoms in the molecule, respectively.
In the simplified version (N-Sim) of the N-VP equation all interactions between groups(GI in Eqs. 10 and 11) are set to zero and the effect of secondary structural featuresare ignored. Even so there are 100+ primary groups to consider (Nannoolal et al.,5
2008). Table 1 provides a summary of how the primary groups from this method foreach functional group were combined together and assigned a mean value for use inthe simplified estimation method. In several cases groups that defined very specificstructures (e.g. sary amine in a ring) were excluded from the mean value – see notesbelow the table. Using this simplified version, the slopes of the vapour pressure curves10
for all the multifunctional compounds used in this work (Test Set 2; see below) couldbe calculated using 15 group contributions with a relatively small loss of accuracy (seebelow).
The recent modification of the N-VP equation by Moller et al. (2008) was also exam-ined. A preliminary evaluation against the vapour pressures of the C3 to C7 dicarboxylic15
acids using this method on E-AIM found a steep increase in predicted vapour pressurebetween the C5 and C6 dicarboxylic acid (from 2.0×10⁻⁷ to 5.1×10⁻⁴ Pa at 25◦C). Thisresult, for a class of compounds considered atmospherically important (Bilde et al.,2003; Aumont et al., 2005), together with the close relationship between this methodand the N-VP method (which does not show this anomalous behaviour), led to the20
exclusion of the Moller et al. (2008) method from further comparisons in this work.In summary the seven vapour pressure equations that were assessed in the first
screening were:
A) The GW equation (Eq. 1) with ∆Svap given by the formalism of Vetere (Eq. 6).
B) The equation of Baum (Eq. 2) with ∆Svap given by the formalism of Vetere (Eq. 6).25
C) The GW equation (Eq. 1) with ∆Svap=KfR ln(82.06×Tb) (Eq. 5).
D) The equation of Baum (Eq. 2) with ∆Svap=KfR ln(82.06×Tb) (Eq. 5).
18385
ACPD9, 18375–18416, 2009
Critical assessmentof vapour pressureestimation methods
M. H. Barley andG. McFiggans
Title Page
Abstract Introduction
Conclusions References
Tables Figures
J I
J I
Back Close
Full Screen / Esc
Printer-friendly Version
Interactive Discussion
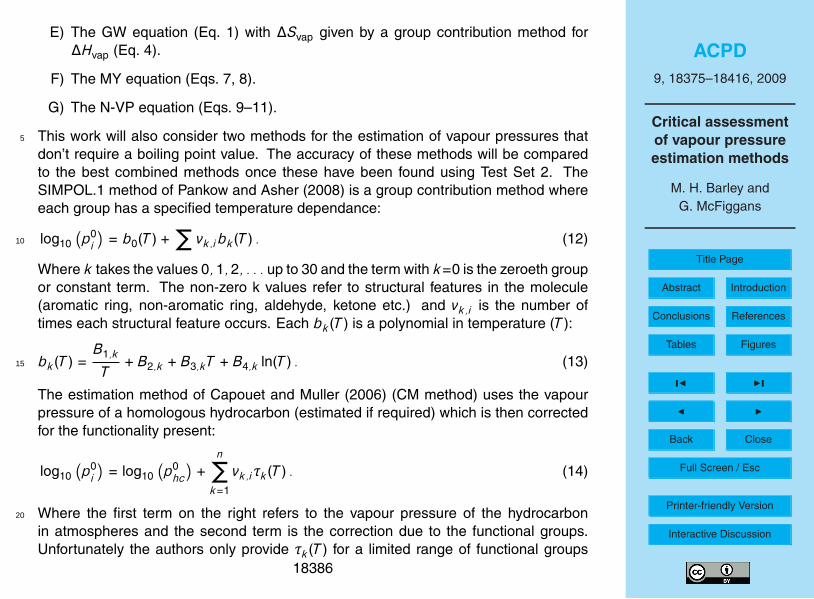
E) The GW equation (Eq. 1) with ∆Svap given by a group contribution method for∆Hvap (Eq. 4).
F) The MY equation (Eqs. 7, 8).
G) The N-VP equation (Eqs. 9–11).
This work will also consider two methods for the estimation of vapour pressures that5
don’t require a boiling point value. The accuracy of these methods will be comparedto the best combined methods once these have been found using Test Set 2. TheSIMPOL.1 method of Pankow and Asher (2008) is a group contribution method whereeach group has a specified temperature dependance:
log10(p0i
)= b0(T ) +
∑νk,ibk(T ) . (12)10
Where k takes the values 0,1,2, . . . up to 30 and the term with k=0 is the zeroeth groupor constant term. The non-zero k values refer to structural features in the molecule(aromatic ring, non-aromatic ring, aldehyde, ketone etc.) and νk,i is the number oftimes each structural feature occurs. Each bk(T ) is a polynomial in temperature (T ):
bk(T ) =B1,k
T+ B2,k + B3,kT + B4,k ln(T ) . (13)15
The estimation method of Capouet and Muller (2006) (CM method) uses the vapourpressure of a homologous hydrocarbon (estimated if required) which is then correctedfor the functionality present:
log10(p0i
)= log10
(p0hc
)+
n∑k=1
νk,iτk(T ) . (14)
Where the first term on the right refers to the vapour pressure of the hydrocarbon20
in atmospheres and the second term is the correction due to the functional groups.Unfortunately the authors only provide τk(T ) for a limited range of functional groups
18386
ACPD9, 18375–18416, 2009
Critical assessmentof vapour pressureestimation methods
M. H. Barley andG. McFiggans
Title Page
Abstract Introduction
Conclusions References
Tables Figures
J I
J I
Back Close
Full Screen / Esc
Printer-friendly Version
Interactive Discussion
(carbonyl, nitrate, hydroperoxy, hydroxyl, carboxylic acid and PAN) so this CM methodcould only be used on a small number of multifunctional compounds. SIMPOL.1 coversa wider range of functionality and a better comparison could be made with the otherestimation methods.
2.2 Selection of vapour pressure data5
Several sets of vapour pressure data have been collected by the atmospheric com-munity and used to develop estimation methods (Pankow and Asher, 2008; Asher andPankow, 2006; Camredon and Aumont, 2006; Capouet and Muller, 2006). Howeverthese sets often contain data from a mixture of sources, including secondary sourcesthat provide vapour pressure correlations rather than original experimental data. Sec-10
ondary sources typically provide little or no information about the primary data uponwhich the correlations are based. In the current work two sets of vapour pressure datawere collected solely from the primary literature.
Test Set 1 was used to choose the best vapour pressure equations from the seven(A to G) listed in Sect. 2.1, and the selected compounds had to meet the following15
criteria:
1) Experimental vapour pressure data at pressures below 40 Pa are available. Inmost cases several points collected as part of a set were required. A few valuesabove 40 Pa have been included.
2) An experimental melting point is available; either from the primary literature, or20
from the Detherm database (www.dechema.de/en/detherm.html), and demon-strates that the measurements in 1) were made on a liquid.
3) An experimental boiling point is available and in most cases is supported by atleast one set of experimental vapour pressure data approaching atmosphericpressure; or at least close to atmospheric pressure (>9×10⁴ Pa) so that the boil-25
ing point can be confidently obtained by extrapolation.
18387
ACPD9, 18375–18416, 2009
Critical assessmentof vapour pressureestimation methods
M. H. Barley andG. McFiggans
Title Page
Abstract Introduction
Conclusions References
Tables Figures
J I
J I
Back Close
Full Screen / Esc
Printer-friendly Version
Interactive Discussion
Members of this test set were selected with the aim of maximising the number offunctional groups represented. In general no more than two examples were used foreach functional group, although multifunctionality was counted separately (so thereare two alcohols, two diols and a triol in this test set). Very few multifunctional com-pounds have both well-established boiling points and experimentally determined very5
low-vapour pressure data so most members of this test set were mono-functional; twohydrocarbons were included for completeness.
The compounds of Test Set 1 are listed in Table 2 along with their vapour pres-sure data, normal boiling point and melting point. Data sources are provided inthe supplementary material (http://www.atmos-chem-phys-discuss.net/9/18375/2009/10
acpd-9-18375-2009-supplement.pdf).Compounds in Test Set 2, shown in Table 3, were used to test the accuracy of the
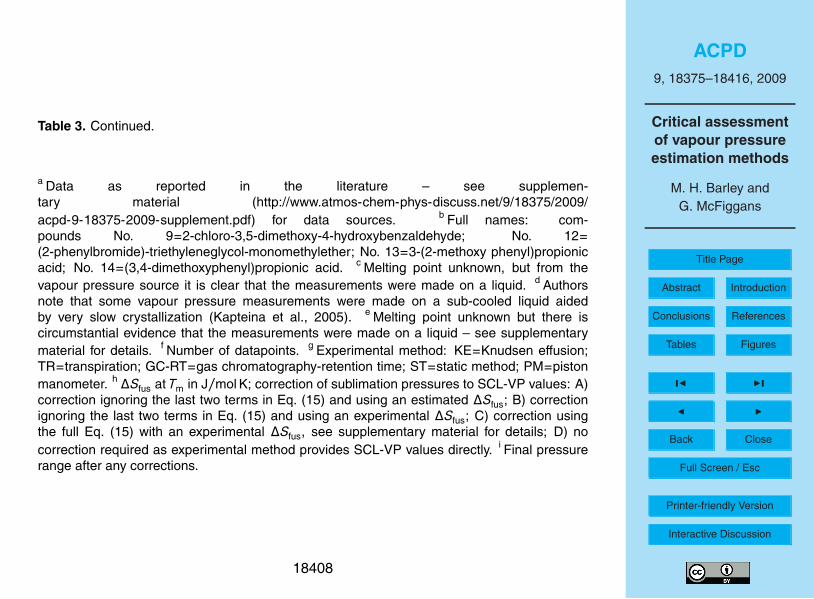
combined (Tb and vapour pressure equation) estimation methods when applied to mul-tifunctional compounds. In selecting experimental vapour pressure data for this test setthe following criteria were followed:15
1) The compounds must contain two or more functional groups. For the purposes ofthis work alkene and aromatic groups are not considered functional groups.
2) The vapour pressure data should consist of two or more consistent points below100 Pa.
3) The paper describing the measurement of the vapour pressures should make it20
clear that the measurements were done on a liquid. If there is any ambiguity orif it was clear that the measurements were made on a solid then an experimentalmelting point from a primary source is required.
4) If the compound is a solid at the temperature of measurement then either themelting point should be within 30 K of the measurement temperature or a reliable25
experimental value for the latent enthalpy (∆Hfus) or entropy (∆Sfus) of fusion atthe melting point should be available.
18388
ACPD9, 18375–18416, 2009
Critical assessmentof vapour pressureestimation methods
M. H. Barley andG. McFiggans
Title Page
Abstract Introduction
Conclusions References
Tables Figures
J I
J I
Back Close
Full Screen / Esc
Printer-friendly Version
Interactive Discussion
Using these criteria, data for 47 compounds were found in the primary literature. Twocompounds were eventually dropped because estimated predictions for these com-pounds were closely correlated to those for several other compounds. The 45 remain-ing compounds with their melting points and vapour pressure data (temperature andpressure ranges after correction) are listed in Table 3. Data sources for Table 3 are5
provided in the Supplementary material (http://www.atmos-chem-phys-discuss.net/9/18375/2009/acpd-9-18375-2009-supplement.pdf). In a few cases the authors repre-sent their data as a correlation, rather than quoting the measured raw data (e.g. Leiet al., 1999). In these cases each dataset is usually represented by two points at theextremes of the experimental temperature range. For those compounds where the10
vapour pressures quoted are that of the solid (see Table 3) the corresponding sub-cooled liquid vapour pressures (SCL-VP) were obtained by applying the correction ofPrausnitz et al. (1986):
ln(p0i
)= ln
(pSCL
)= ln
(pS)−
∆Sfus
R(1 − Tm/T ) −
∆Cp
RT(Tm − T ) +
∆Cp
Rln(Tm
T
). (15)
Where pSCL and pS are the SCL-VP and experimental solid (sublimation) vapour pres-15
sure (in atmospheres), respectively; ∆Sfus is the entropy of fusion; and ∆Cp is the bestestimate of the underlying change in heat capacity between the liquid and solid stateat the melting point, and Tm is the melting point temperature (used instead of the triplepoint temperature).
This correction has been discussed at some length by Capouet and Muller (2006)20
who pointed out that if Tm is close to the experimental temperature (T ) then the lasttwo terms in Eq. (15) tend to cancel. In this work, if T was within 30 K of Tm then it wasconsidered that the last two terms could be ignored and an estimated ∆Sfus (using themethod of Myrdal and Yalkowsky, 1997) could be used; though an experimental valuewas preferred if available. For those compounds where Tm−T was greater than 30 K,25
18389
ACPD9, 18375–18416, 2009
Critical assessmentof vapour pressureestimation methods
M. H. Barley andG. McFiggans
Title Page
Abstract Introduction
Conclusions References
Tables Figures
J I
J I
Back Close
Full Screen / Esc
Printer-friendly Version
Interactive Discussion
an experimentally derived ∆Sfus was required:
∆Sfus =∆Hfus
Tm, (16)
where ∆Hfus is the enthalpy of fusion and is usually obtained by differential scan-ning calorimetry. The heat capacity terms were also included with ∆Cp obtainedeither by a simple linear extrapolation of experimental heat capacity data for both5
the solid and liquid phase up to the melting point; or estimated from liquid heatcapacity values obtained using the group contribution method of Ruzicka and Do-malski (1993) and solid heat capacity data from the power law of Goodman et al.(2004). Details for all compounds requiring these corrections are provided inthe Supplementary material (http://www.atmos-chem-phys-discuss.net/9/18375/2009/10
acpd-9-18375-2009-supplement.pdf). In general the heat capacity correction was verysmall compared with the entropic term but for phloroglucinol and 2-hydroxybenzoic acidit is quite substantial; in part because of the high melting points of these substances.
3 Results
3.1 Evaluation of vapour pressure equations against Test Set 115
For each compound in Test Set 1 the predicted vapour pressure was calculated for eachpoint in the dataset. The deviation between the experimental vapour pressure (pexp)and the estimated vapour pressure (pest) was minimised for the dataset by changingthe normal boiling point value until the objective function (OF; see Eq. 17) was <10−5.
OF = 1 − 1n
n∑i=1
(pest
pexp
), (17)20
where the summation is over the n experimental points in the dataset for a compound.
18390
ACPD9, 18375–18416, 2009
Critical assessmentof vapour pressureestimation methods
M. H. Barley andG. McFiggans
Title Page
Abstract Introduction
Conclusions References
Tables Figures
J I
J I
Back Close
Full Screen / Esc
Printer-friendly Version
Interactive Discussion
The difference between the boiling point value required to fit the experimental vapourpressure and the true (experimental) boiling point is a measure of the accuracy ofextrapolation from the boiling point to the experimental temperatures and is recordedin Table 4 under ∆Tb for all seven methods.
Approach G (see Sect. 2.1), using the N-VP equation (Eqs. 9–11), gives the lowest5
standard deviation, while the smallest bias is provided by method D (vapour pressurecalculated using the Baum equation (Eq. 2) with ∆Svap from Eq. 5). The best threemethods with regard to bias are D, F and A; while the best three methods as judgedby scatter (standard deviation) are G ,F and B. This provided five methods that werebetter than the remaining two based on either bias or scatter. However the ∆Tb values10
of those methods using a common expression for ∆Svap with the GW equation (Eq. 1)or the Baum equation (Eq. 2) were very closely correlated. ∆Tb values calculated usingmethods A and B showed correlation coefficients ≥0.99, as did values from methodsC and D. There is no benefit in testing both Eqs. (1) and (2) against the multifunctionalcompounds. As the methods using Eq. (2) gave smaller standard deviations than the15
corresponding methods using Eq. (1) and the former is the simpler equation, the Baumequation (Eq. 2) was selected for further comparison and methods B, D, F and G werechosen to be evaluated against Test Set 2.
3.2 Evaluation against data for multifunctional compounds (Test Set 2)
The four estimation methods above were selected for their ability to extrapolate from20
normal boiling point down to around ambient temperatures. This section describesthe identification of the preferred combined method of estimating vapour pressures fora test set of multifunctional compounds (Test Set 2). These combined methods werethen compared to more recent methods that do not require a Tb value.
Normal boiling point (Tb) values were calculated by three methods for all 45 com-25
pounds. Values calculated by the N-Tb method were verified against the E-Aim web-site; those calculated using the SB method were verified against EPI-Suite and theJR values were verified against calculated data from Chem-Draw Ultra version 10.0
18391
ACPD9, 18375–18416, 2009
Critical assessmentof vapour pressureestimation methods
M. H. Barley andG. McFiggans
Title Page
Abstract Introduction
Conclusions References
Tables Figures
J I
J I
Back Close
Full Screen / Esc
Printer-friendly Version
Interactive Discussion
(Cambridgesoft, 2005). As the published descriptions of the latter two methods do notinclude all the groups required to cover the structural features for the 45 compoundsthese checks were useful for ensuring that the more complex functional groups (suchas carbonate) were represented in a way that was consistent with these readily avail-able implementations. Each set of Tb values were used as input for the prediction of5
vapour pressures at the experimental temperatures for each dataset. The accuracy ofthe prediction for each compound was summarised by calculating a mean bias error(MBE; see Camredon and Aumont, 2006, Eq. 18).
MBE =1n
n∑i=1
[log10 pest − log10 pexp] (18)
Where the summation is over all the datapoints for that compound. Hence a single10
parameter is calculated for each dataset independent of how many datapoints are inthe dataset. The MBE values are summarised for all 12 combined methods in Table 5along with the calculated means and standard deviation.
The different estimation methods are compared in Fig. 1 where the data in Table 5are summarised in box-whisker plots. In this plot (and the other figures) the central line15
of the box marks the median value with the upper and lower bounds of the box markingthe upper and lower quartiles, respectively. The notch indicates the 95% confidencelimit for the median value. Hence if the notches of two estimation methods don’t over-lap then the median values are different at the 95% confidence level. In this plot it isclear that the four methods that included the estimation of Tb using the JR group con-20
tribution method have a significantly different distribution from the other methods. TheJR method is consistently over-estimating Tb leading to a substantial underpredictionof vapour pressure. The most meaningful comparison is with EPI-Suite which uses theSB method which was in turn derived from the JR method but with a correction for hightemperature boiling points. This work shows that the correction introduced by Stein25
and Brown is definitely required for these low volatility multifunctional compounds.It is clear from Fig. 1 (and Table 5) that the combined method using the N-VP equa-
18392
ACPD9, 18375–18416, 2009
Critical assessmentof vapour pressureestimation methods
M. H. Barley andG. McFiggans
Title Page
Abstract Introduction
Conclusions References
Tables Figures
J I
J I
Back Close
Full Screen / Esc
Printer-friendly Version
Interactive Discussion
tion with Tb by N-Tb gives the most accurate values (based upon minimum standarddeviation in Table 5). However the MY vapour pressure equation provides similar levelsof scatter but with a small bias towards overestimating vapour pressures (in Fig. 1, thenotches for methods 1 and 10 partially overlap).
Figure 2 displays the results for those methods that didn’t require a Tb value: SIM-5
POL.1 and the CM method. The former method could be used on 36 of the 45 com-pounds (mainly resulting from a lack of group contributions for halogen, carbonate andnitrile) and gave results comparable with, but more scattered than, the N-VP equationwith Tb by N-Tb or SB. The CM method could only be used on 9 compounds (containingalcohol, carbonyl or acid groups) out of 45 and this small sample size is a contributory10
factor in the compact dimensions of the box-whisker in Fig. 1. This small sample sizelargely invalidates any direct comparisons with the scatter plots of the other methods.
Myrdal and Yalkowsky (1997) reported that their method (MY) fitted their experimen-tal database with an average factor error (as defined by Camredon and Aumont, 2006)of 1.62. Camredon and Aumont (2006) reported good results using the JR Tb estima-15
tion method with the MY vapour pressure equation, and did not report any significantbias in Tb from using the JR estimation method in contrast to the results noted above.This may be because most of the compounds in their database had experimental Tb val-ues below 550 K. They reported an average factor error of about 2 for all compoundsand 3 for di- and tri-functionalised compounds. Nannoolal et al. (2008) claim a very20
low average factor error (<1.1) for a test set of 396 compounds using N-VP equation.Pankow and Asher (2008) quote an average error factor of about 2.2 for the SIMPOL.1method. By contrast the average error factor for Test Set 2, calculated from the MBEvalues in Table 5, was 2.7 for Tb by N-Tb and vapour pressure estimated by the N-VPequation; 3.5 for Tb by N-Tb, with the MY vapour pressure equation; 5.2 for the SIM-25
POL.1 method; and 12.3 for Tb by JR coupled with the MY vapour pressure equation.These error factors are significantly higher than those quoted by the various authorsfor their respective methods and highlight how demanding the calculation of very lowvapour pressures for multifunctional compounds is for any estimation method. As dis-
18393
ACPD9, 18375–18416, 2009
Critical assessmentof vapour pressureestimation methods
M. H. Barley andG. McFiggans
Title Page
Abstract Introduction
Conclusions References
Tables Figures
J I
J I
Back Close
Full Screen / Esc
Printer-friendly Version
Interactive Discussion
cussed below the compounds in Test Set 2 are some 100–1000 times more volatilethan the compounds expected to condense into organic aerosol (OA) so these errorsare very likely to get worse when applied to atmospherically relevant partitioning.
Also in Fig. 2 a direct comparison is made between the simplified (N-Sim) and the full(N-VP) vapour pressure equation with Tb values provided by the N-Tb and SB methods.5
The N-Sim vapour pressure equation required 15 group contributions to cover the testset of multifunctional compounds (see Sect. 2.1 above). Despite this simplification, thescatter in the predictions only slightly increased (standard deviation increased by 0.05log units – see Table 5. For all compounds the simplified method gave vapour pressurepredictions within a factor of 3 of the N-VP method and for 80% of the compounds the10
agreement was within a factor of 2. This is a relatively small disagreement comparedwith the errors between the predicted and experimental vapour pressures reported inTable 5 and highlighted above.
4 The sensitivity of the partitioning of compounds into organic aerosol (OA) tovapour pressure values15
4.1 An atmospherically relevant example.
To represent the partitioning of semi-volatile organic compounds, it is convenient touse the volatility binning principle of Donahue et al. (2006) with the aim of modellingamounts of OA typical of moderately polluted ambient conditions (about 10 µg m−3 seetheir Fig. 1a). Donahue et al. (2006) relate the formation of OA to the volatility of the20
condensing species using a saturated vapour density derived from the vapour pressureof each component, i :
C∗i =
106Miγip0i
RT, (19)
18394
ACPD9, 18375–18416, 2009
Critical assessmentof vapour pressureestimation methods
M. H. Barley andG. McFiggans
Title Page
Abstract Introduction
Conclusions References
Tables Figures
J I
J I
Back Close
Full Screen / Esc
Printer-friendly Version
Interactive Discussion
where γi is the activity coefficient (here assumed to be unity), Mi is the molecularweight and p0
i is the saturated liquid vapour pressure in atmospheres (sub-cooled ifnecessary) of component i ; R is the gas constant (=8.2057×10⁻⁵ atm m3 mol−1 K) andthe resulting C∗
i value is in µg m−3. They propose binning the atmospheric compoundsbased upon the logarithm of their C∗
i value. In Fig. 1a of Donahue et al. (2006), where5
the formation of 10.6 µg m−3 of OA is modelled; components in bin 1 (log10 C∗i=1 or
C∗i=10) partition equally between the condensed and vapour phases. Components in
bin 2 remain largely in the vapour phase while those in bin 0 largely condense. Hencefor an example where 10.6 µg m−3 of OA is formed by partitioning then the maximumsensitivity of the amount of OA formed to vapour pressure values will be for those com-10
pounds in bins 0, +1 and +2. Compounds in higher bins only partition to a small extentand compounds in lower bins almost completely partition to the condensed phase sothe amount of OA formed will be relatively insensitive to changes in vapour pressuresfor these compounds. However if changes in vapour pressures result in compoundschanging bins, then a much greater impact upon the amount of OA formed can oc-15
cur. For example; if a compound in bin +3 (where it would have little impact uponthe amount of OA formed) has its vapour pressure reduced by a factor of 100 this willcause it to switch to bin +1 where it will have a large effect upon the amount of OAformed. It is clear from Fig. 1 and Table 5 that changes in vapour pressures sufficientto cause compounds to change bins are quite common among the compounds of Test20
Set 2, with a potentially substantial impact upon the amount of OA formed.The 45 multifunctional compounds can be assigned to bins using their C∗
i values ascalculated using Eq. (19). All calculations were performed at a temperature of 25◦C(298.15 K). Experimental vapour pressure data (subcooled liquid data where appropri-ate; see Table 3) was extrapolated/interpolated to 298.15 K by fitting to the two coeffi-25
cient Antoine equation:
ln(p0i
)= A + B/T . (20)
18395
ACPD9, 18375–18416, 2009
Critical assessmentof vapour pressureestimation methods
M. H. Barley andG. McFiggans
Title Page
Abstract Introduction
Conclusions References
Tables Figures
J I
J I
Back Close
Full Screen / Esc
Printer-friendly Version
Interactive Discussion
These values at 298.15 K will be referred to as “experimentally derived” vapour pres-sures and will form the base case for the partitioning calculations. C∗
i values werecalculated to give the following distribution of the 45 multifunctional compounds in theDonahue bins:
Bin +6, 3 compounds; +5, 9 compounds; +4, 12 compounds; +3, 9 compounds; +2,5
7 compounds; +1, 4 compounds; 0, 1 compound.Only one compound (phloroglucinol) is in bin 0, and 4 compounds (4-aminobenzoic
acid, 3-(3,4-dimethoxyphenyl)propionic acid, pimelic and glutaric acids) are in bin +1.For the example where 10.6 µg m−3 of OA is formed, only phloroglucinol would showa high proportion of condensation while the other four compounds would show roughly10
equal partitioning between the condensed and vapour phases. All compounds, outsideof these five, have been assigned to bins where only a small proportion (for many com-pounds, a very small proportion) of the compound would partition into the condensedphase. It should therefore be noted that the compounds of Test Set 2, despite their se-lection for multifunctionality and very low experimental vapour pressures, are still about15
100–1000 times more volatile than the compounds believed to form OA under typicalambient conditions.
4.2 Partitioning of multifunctional compounds into OA under typical ambientconditions: the effect of changes in vapour pressure values
The partitioning model follows the approach described in Barley et al. (2009). This20
approach is based upon earlier models, e.g. Pankow (1994) with modification. Thesemi-volatile compounds are partitioned according to their saturation concentration(C∗
i ) value:
C∗i =
106γip0i
RT. (21)
Where p0i is the saturated vapour pressure of component i in atmospheres; R, T and γi25
have the same meaning as in Eq. (19); C∗i is the saturation concentration in µmol m−3.
18396
ACPD9, 18375–18416, 2009
Critical assessmentof vapour pressureestimation methods
M. H. Barley andG. McFiggans
Title Page
Abstract Introduction
Conclusions References
Tables Figures
J I
J I
Back Close
Full Screen / Esc
Printer-friendly Version
Interactive Discussion
This can be converted to the C∗i (in µg m−3) described by Donahue (Eq. 19) by multi-
plying by Mi .The amount of condensed material (COA) is then calculated by summing over all
components i ensuring mole balance between the two phases for each componentconsidered. Defining a partitioning coefficient ξi for compound i given its saturation5
concentration C∗i (Eq. 21).
ξ1 =
(1 +
C∗i
COA
)−1
, (22)
where both C∗i and COA have units of µmol m−3. The total number of moles of organic
aerosol is the sum of the products of the individual component concentrations (Ci ) andtheir partitioning coefficient (ξi ):10
COA =∑i
Ciξi . (23)
This calculation provides the amount of each component in the condensed phase inµmol m−3 and is readily converted into mass based amounts by multiplying by the ap-propriate molecular weight. Summing the mass based condensed quantities for all thecompounds provides the total condensed OA in mass based units.15
In this example the C∗i for all 45 multifunctional compounds were calculated us-
ing Eq. (21) and experimentally derived vapour pressures at 298.15 K. All com-pounds were assigned the same individual component concentration (Ci ) and thiswas set to a value (0.02666 µmol m−3) such that the partitioning model converged(COA=0.062715 µmol m−3) to give 10.6 µg m−3 of OA. This formed the base case for20
the effect of changing vapour pressures on the partitioning of compounds to OA.If the partitioning calculation is redone with the experimentally derived vapour pres-
sures replaced by estimated values by one or more of the combined methods used inFig. 1 then the amount of predicted OA varies dramatically (between 0 and 110 µg m−3)
18397
ACPD9, 18375–18416, 2009
Critical assessmentof vapour pressureestimation methods
M. H. Barley andG. McFiggans
Title Page
Abstract Introduction
Conclusions References
Tables Figures
J I
J I
Back Close
Full Screen / Esc
Printer-friendly Version
Interactive Discussion
depending upon which estimation method is used. If the experimentally derived vapourpressures are all doubled the amount of predicted OA falls to zero (from 10.6 µg m−3).This demonstrates the sensitivity of OA formation to errors in estimated vapour pres-sures.
A large part of this extreme sensitivity of the amount of OA formed to the vapour5
pressure values used in the partitioning calculation is a reflection of the fact that thisset of multifunctional compounds is too volatile to consistently form atmosphericallyrelevant amounts of OA. A different approach is required to compare the effect of the12 vapour pressure estimation methods shown in Fig. 1 on the amount of OA formedin this example. The base case described above was repeatedly run with a single10
vapour pressure value replaced by an estimated value. This was performed for eachcompound in sequence to give a distribution of 45 OA masses that can then be repre-sented on a box-whisker plot. The results for all 12 estimation methods are shown inFig. 3. The striking feature about this plot is that despite the fact that only 1/45th of thetotal number of moles in the mixture is assigned the estimated vapour pressure, some15
compounds cause the predicted amount of OA to change by a factor of two or more;and this is true for all the estimation methods, even those that give the most accuratepredictions. In Fig. 3 the vast majority of compounds had little effect on the amountof OA formed because they are too volatile. This gives a very small box and a verysimilar distribution of outliers for all the estimation methods except those using Tb by20
the JR method. As mentioned above this method significantly overestimates Tb leadingto many compounds that would be assigned (on the basis of their experimentally de-rived vapour pressures) to bins too high to significantly impact upon the amount of OAformed moving two or more bins down into the range where they do significantly affectthe amount of OA predicted.25
To better differentiate between the methods that didn’t use Tb by the JR method, theresults for the 12 least volatile compounds, based upon their experimentally derivedvapour pressures (bins 0 to +2: see above) were replotted in Fig. 4. This plot doesallow some differentiation between the predictions of the non-Joback methods but also
18398
ACPD9, 18375–18416, 2009
Critical assessmentof vapour pressureestimation methods
M. H. Barley andG. McFiggans
Title Page
Abstract Introduction
Conclusions References
Tables Figures
J I
J I
Back Close
Full Screen / Esc
Printer-friendly Version
Interactive Discussion
emphasizes how important it is to obtain accurate vapour pressures for those com-pounds that are in the critical bins (in the example used here: bins 0 to +2) where ξi(see Eq. 22) is in the range 0.05–0.95.
5 Conclusions
The estimation methods reported in Nannoolal et al. (2004) and Nannoolal et al. (2008)5
predict the most accurate boiling points and vapour pressure values for this set of mul-tifunctional compounds. The good results found for their vapour pressure equation isprobably due to a combination of the functional form of the equation with the use ofa group contribution method for the slope of the vapour pressure line. The vapourpressure equation of Myrdal and Yalkowsky (1997) is the second best, while the Stein10
and Brown (1994) estimation method is second best for normal boiling points. A sim-plified form of the Nannoolal et al. (2008) vapour pressure equation has been testedagainst these multifunctional compounds and found to provide estimated values witha relatively small loss of accuracy compared to the full Nannoolal et al. (2008) equation.
The sensitivity of the amount of OA formed to the vapour pressure values used15
in the partitioning calculation was investigated for an atmospherically relevant exam-ple from the literature. It was found that despite the selection of the multifunctionalcompounds for their low vapour pressures they were still some 100–1000 times morevolatile than the compounds expected to contribute significantly to OA. The amountof OA predicted to form (and by extension it’s composition) was extremely sensitive to20
changes in vapour pressure values (especially for the least volatile components) typicalof the differences seen between estimation methods. The potential impact of errors inestimated vapour pressure values upon the amount and composition of predicted OAshould not be underestimated.
Acknowledgements. This work was carried out within the UK NERC-funded “QUantifying25
the Earth SysTem” (QUEST) project under the “QUest Aerosol and Atmospheric Chem-istry” (QUAAC) grant number NE/C001613/1) and EU-funded “European Integrated project
18399
ACPD9, 18375–18416, 2009
Critical assessmentof vapour pressureestimation methods
M. H. Barley andG. McFiggans
Title Page
Abstract Introduction
Conclusions References
Tables Figures
J I
J I
Back Close
Full Screen / Esc
Printer-friendly Version
Interactive Discussion
on Aerosol Cloud Climate and Air Quality interactions” (EUCAARI) under contract number036833-2.
References
Asher, W. E. and Pankow, J. F.: Vapor pressure prediction for alkenoic and aromatic organiccompounds by a UNIFAC-based group contribution method, Atmos. Environ., 40, 3588–5
3600, 2006. 18387Aumont, B., Szopa, S., and Madronich, S.: Modelling the evolution of organic carbon during its
gas-phase tropospheric oxidation: development of an explicit model based on a self gener-ating approach, Atmos. Chem. Phys., 5, 2497–2517, 2005,http://www.atmos-chem-phys.net/5/2497/2005/. 18379, 1838510
Barley, M., Topping, D. O., Jenkin, M. E., and McFiggans, G.: Sensitivities of the absorptivepartitioning model of secondary organic aerosol formation to the inclusion of water, Atmos.Chem. Phys., 9, 2919–2932, 2009,http://www.atmos-chem-phys.net/9/2919/2009/. 18376, 18396
Barsanti, K. C. and Pankow, J. F.: Thermodynamics of the formation of atmospheric organic15
particulate matter by accretion reactions – Part 1: aldehydes and ketones, Atmos. Environ.,38, 4371–4382, 2004. 18377
Baum, E. J.: Chemical Property Estimation-Theory and Application, Sect. 6.3., CRC Press,Boca Raton, FL, USA, 1998. 18382
Bencze, L., Raj, D. D., Kath, D., Oates, W. A., Singheiser, L., and Hilpert, K.: Thermodynamic20
properties and diffusion thermodynamic factors in B2-NiAl, Metall. Mater. Trans. B, 35, 867–876, 2004. 18378
Bilde, M., Svenningsson, B., Monster, J., and Rosenorn, T.: Even-odd alternation of evaporationrates and vapor pressures of C3-C9 dicarboxylic acid aerosols, Environ. Sci. Technol., 37,1371–1378, 2003. 18378, 1838525
Booth, A. M., Markus, T., McFiggans, G., Percival, C. J., Mcgillen, M. R., and Topping, D. O.:Design and construction of a simple Knudsen Effusion Mass Spectrometer (KEMS) systemfor vapour pressure measurements of low volatility organics, Atmos. Meas. Tech., 2, 355–361, 2009,http://www.atmos-meas-tech.net/2/355/2009/. 1837830
18400
ACPD9, 18375–18416, 2009
Critical assessmentof vapour pressureestimation methods
M. H. Barley andG. McFiggans
Title Page
Abstract Introduction
Conclusions References
Tables Figures
J I
J I
Back Close
Full Screen / Esc
Printer-friendly Version
Interactive Discussion
Cambridgesoft: ChemDraw Ultra version 10.0, Cambridge, MA, USA, 2005. 18392Camredon, M. and Aumont, B.: Assessment of vapor pressure estimation methods for sec-
ondary organic aerosol modeling, Atmos. Environ., 40, 2105–2116, 2006. 18379, 18387,18392, 18393
Capouet, M. and Muller, J. F.: A group contribution method for estimating the vapour pressures5
of α-pinene oxidation products, Atmos. Chem. Phys., 6, 1455–1467, 2006,http://www.atmos-chem-phys.net/6/1455/2006/. 18380, 18386, 18387, 18389
Cappa, C. D., Lovejoy, E. R., and Ravishankara, A. R.: Determination of evaporation ratesand vapor pressures of very low volatility compounds: A study of the C-4-C-10 and C-12dicarboxylic acids, J. Phys. Chem. A, 111, 3099–3109, 2007. 1837810
Clegg, S. L., Kleeman, M. J., Griffin, R. J., and Seinfeld, J. H.: Effects of uncertainties in thethermodynamic properties of aerosol components in an air quality model – Part 2: Predic-tions of the vapour pressures of organic compounds, Atmos. Chem. Phys., 8, 1087–1103,2008,http://www.atmos-chem-phys.net/8/1087/2008/. 1838015
Copland, E. H. and Jacobson, N. S.: Thermodynamic activity measurements with Knudsen cellmass spectrometry (KCMS or KEMS), Electrochem. Soc. – Interface, 6, 28–31, 2001. 18378
Dekruif, C. G. and Vanginkel, C. H. D.: Torsion-weighing effusion vapor-pressure measure-ments on organic-compounds, J. Chem. Thermodyn., 9, 725–730, 1977. 18377
Donahue, N. M., Robinson, A. L., Stanier, C. O., and Pandis, S. N.: Coupled partitioning,20
dilution, and chemical aging of semivolatile organics, Environ. Sci. Tech., 40, 2635–2643,2006. 18394, 18395
EPA: Estimation Programs Interface Suite for Microsoft Windows v3.2, United States Environ-mental Protection Agency, Washington, DC, USA, 2009. 18379, 18380
Faber, N. M. and Rajko, R.: How to avoid over-fitting in multivariate calibration – The conven-25
tional validation approach and an alternative, Anal. Chim. Acta, 595, 98–106, 2007. 18379Fishtine, S. H.: Reliable latent heats of vaporization, Ind. Eng. Chem., 55, 47–56, 1963. 18379,
18383Goodman, B. T., Wilding, W. V., Oscarson, J. L., and Rowley, R. L.: Use of the DIPPR database
for development of quantitative structure-property relationship correlations: Heat capacity of30
solid organic compounds, J. Chem. Eng. Data, 49, 24–31, 2004. 18390Grain, C. F.: Vapor Pressure, in: Handbook of Chemical Property Estimation Methods,
Chapt. 14, edited by: Lyman, W. J., Roehl, W. F., and Rosenblatt, D. H., McGraw Hill, London
18401
ACPD9, 18375–18416, 2009
Critical assessmentof vapour pressureestimation methods
M. H. Barley andG. McFiggans
Title Page
Abstract Introduction
Conclusions References
Tables Figures
J I
J I
Back Close
Full Screen / Esc
Printer-friendly Version
Interactive Discussion
and New York, 1982. 18379, 18382Hallquist, M., Wangberg, I., and Ljungstrom, E.: Atmospheric fate of carbonyl oxidation prod-
ucts originating from alpha-pinene and Delta(3)-carene: Determination of rate of reactionwith OH and NO3 radicals, UV absorption cross sections, and vapor pressures, Environ. Sci.Technol., 31, 3166–3172, 1997. 183775
Joback, K. G. and Reid, R. C.: Estimation of pure-component properties from group-contributions, Chem. Eng. Commun., 57, 233–243, 1987. 18379, 18382, 18383
Johnson, D., Utembe, S. R., and Jenkin, M. E.: Simulating the detailed chemical compositionof secondary organic aerosol formed on a regional scale during the TORCH 2003 campaignin the southern UK, Atmos. Chem. Phys., 6, 419–431, 2006,10
http://www.atmos-chem-phys.net/6/419/2006/. 18379Kapteina, S., Slowik, K., Verevkin, S. P., and Heintz, A.: Vapor pressures and vaporization
enthalpies of a series of ethanolamines, J. Chem. Eng. Data, 50(2), 398–402, 2005. 18408Koponen, I. K., Riipinen, I., Hienola, A., Kulmala, M., and Bilde, M.: Thermodynamic properties
of malonic, succinic, and glutaric acids: Evaporation rates and saturation vapor pressures,15
Environ. Sci. Technol., 41, 3926–3933, 2007. 18378Lei, Y. D., Wania, F., Shiu, W. Y., and Boocock, D. G. B.: Temperature dependent vapor pres-
sures of chlorinated catechols, syringols, and syringaldehydes, J. Chem. Eng. Data, 44,200–202, 1999. 18389
Lyman, W. J.: Environmental Exposure From Chemicals, Vol. 1, Chapt. 2., CRC Press, Boca20
Raton, FL, USA, 1985. 18379, 18382, 18383Moller, B., Rarey, J., and Ramjugernath, D.: Estimation of the vapour pressure of non-electrolyte
organic compounds via group contributions and group interactions, J. Mol. Liquids, 143, 52–63, 2008. 18379, 18385
Myrdal, P. B. and Yalkowsky, S. H.: Estimating pure component vapor pressures of complex25
organic molecules, Ind. Eng. Chem. Res., 36, 2494–2499, 1997. 18379, 18384, 18389,18393, 18399
Nannoolal, Y., Rarey, J., Ramjugernath, D., and Cordes, W.: Estimation of pure componentproperties Part 1, Estimation of the normal boiling point of non-electrolyte organic com-pounds via group contributions and group interactions, Fluid Phase Equilibr., 226, 45–63,30
2004. 18379, 18380, 18382, 18399Nannoolal, Y., Rarey, J., and Ramjugernath, D.: Estimation of pure component properties,
Part 3, Estimation of the vapor pressure of non-electrolyte organic compounds via group
18402
ACPD9, 18375–18416, 2009
Critical assessmentof vapour pressureestimation methods
M. H. Barley andG. McFiggans
Title Page
Abstract Introduction
Conclusions References
Tables Figures
J I
J I
Back Close
Full Screen / Esc
Printer-friendly Version
Interactive Discussion
contributions and group interactions, Fluid Phase Equilibr., 269, 117–133, 2008. 18379,18384, 18385, 18393, 18399, 18404
Pankow, J. F.: An absorption-model of gas-particle partitioning of organic-compounds in theatmosphere, Atmos. Environ., 28, 185–188, 1994. 18376, 18396
Pankow, J. F. and Asher, W. E.: SIMPOL.1: a simple group contribution method for predicting5
vapor pressures and enthalpies of vaporization of multifunctional organic compounds, At-mos. Chem. Phys., 8, 2773–2796, 2008,http://www.atmos-chem-phys.net/8/2773/2008/. 18380, 18386, 18387, 18393
Poling, B. E., Prausnitz, J. M., and O’Connell, J. P.: Properties of Gases and Liquids, Chapt. 7,McGraw-Hill, New York, NY, USA, 2001. 18378, 18381, 1838310
Prausnitz, J. M., Lichtenhaler, R. N., and de Azevedo, E. G.: Molecular Thermodynamics ofFluid-Phase Equilibria, 2nd Edn., Prentice-Hall, Englewood Cliffs, NJ, USA, 1986. 18389
Ruzicka, V. and Domalski, E. S.: Estimation of the heat-capacities of organic liquids as a func-tion of temperature using group additivity, 2. Compounds of carbon, hydrogen, halogens,nitrogen, oxygen, and sulfur, J. Phys. Chem. Ref. Data, 22, 619–657, 1993. 1839015
Saxena, P. and Hildemann, L. M.: Water-soluble organics in atmospheric particles: A criticalreview of the literature and application of thermodynamics to identify candidate compounds,J. Atmos. Chem., 24, 57–109, 1996. 18377
Stein, S. E. and Brown, R. L.: Estimation of normal boiling points from group contributions,J. Chem. Inf. Comp. Sci., 34, 581–587, 1994. 18379, 18382, 1839920
Tao, Y. and Mcmurry, P. H.: Vapor-pressures and surface free-energies of C14-C18 mono-carboxylic acids and C5-dicarboxylic and C6-dicarboxylic acids, Environ. Sci. Technol., 23,1519–1523, 1989. 18378
Verevkin, S. P., Wandschneider, D., and Heintz, A.: Determination of vaporization enthalpiesof selected linear and branched C-7, C-8, C-9, C-11, and C-12 monoolefin hydrocarbons25
from transpiration and correlation gas-chromatography methods, J. Chem. Eng. Data, 45,618–625, 2000. 18377
Vetere, A.: Methods to predict the vaporization enthalpies at the normal boiling temperature ofpure compounds revisited, Fluid Phase Equilibr., 106, 1–10, 1995. 18383
18403
ACPD9, 18375–18416, 2009
Critical assessmentof vapour pressureestimation methods
M. H. Barley andG. McFiggans
Title Page
Abstract Introduction
Conclusions References
Tables Figures
J I
J I
Back Close
Full Screen / Esc
Printer-friendly Version
Interactive Discussion
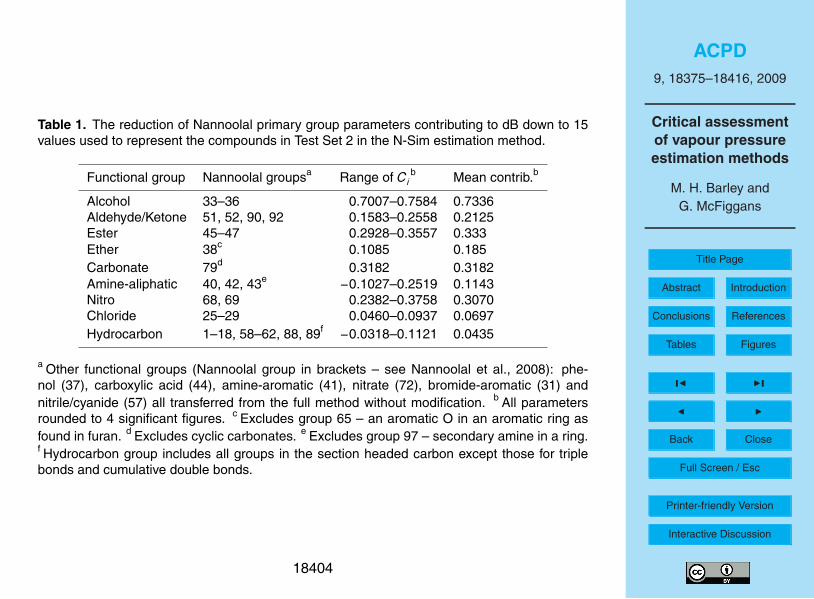
Table 1. The reduction of Nannoolal primary group parameters contributing to dB down to 15values used to represent the compounds in Test Set 2 in the N-Sim estimation method.
Functional group Nannoolal groupsa Range of Cib Mean contrib.b
Alcohol 33–36 0.7007–0.7584 0.7336Aldehyde/Ketone 51, 52, 90, 92 0.1583–0.2558 0.2125Ester 45–47 0.2928–0.3557 0.333Ether 38c 0.1085 0.185Carbonate 79d 0.3182 0.3182Amine-aliphatic 40, 42, 43e −0.1027–0.2519 0.1143Nitro 68, 69 0.2382–0.3758 0.3070Chloride 25–29 0.0460–0.0937 0.0697Hydrocarbon 1–18, 58–62, 88, 89f −0.0318–0.1121 0.0435
a Other functional groups (Nannoolal group in brackets – see Nannoolal et al., 2008): phe-nol (37), carboxylic acid (44), amine-aromatic (41), nitrate (72), bromide-aromatic (31) andnitrile/cyanide (57) all transferred from the full method without modification. b All parametersrounded to 4 significant figures. c Excludes group 65 – an aromatic O in an aromatic ring asfound in furan. d Excludes cyclic carbonates. e Excludes group 97 – secondary amine in a ring.f Hydrocarbon group includes all groups in the section headed carbon except those for triplebonds and cumulative double bonds.
18404
ACPD9, 18375–18416, 2009
Critical assessmentof vapour pressureestimation methods
M. H. Barley andG. McFiggans
Title Page
Abstract Introduction
Conclusions References
Tables Figures
J I
J I
Back Close
Full Screen / Esc
Printer-friendly Version
Interactive Discussion
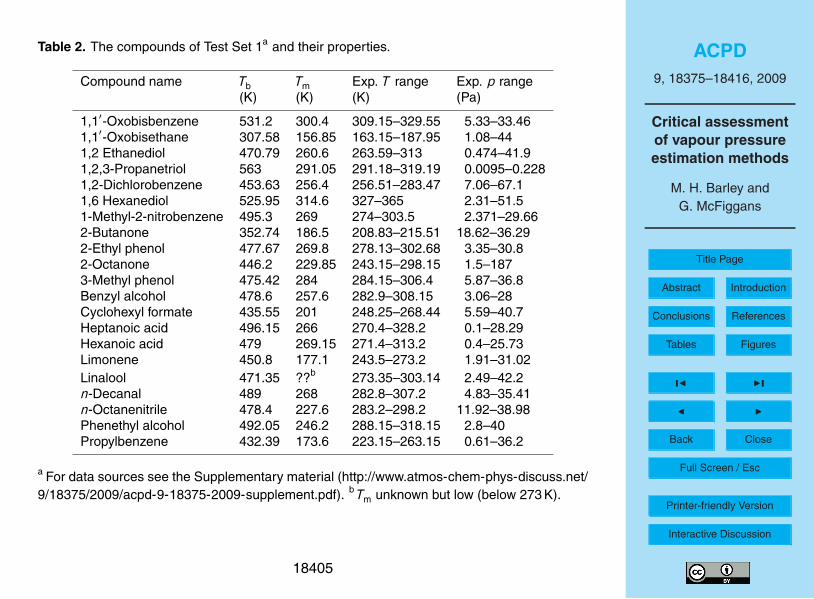
Table 2. The compounds of Test Set 1a and their properties.
Compound name Tb Tm Exp. T range Exp. p range(K) (K) (K) (Pa)
1,1′-Oxobisbenzene 531.2 300.4 309.15–329.55 5.33–33.461,1′-Oxobisethane 307.58 156.85 163.15–187.95 1.08–441,2 Ethanediol 470.79 260.6 263.59–313 0.474–41.91,2,3-Propanetriol 563 291.05 291.18–319.19 0.0095–0.2281,2-Dichlorobenzene 453.63 256.4 256.51–283.47 7.06–67.11,6 Hexanediol 525.95 314.6 327–365 2.31–51.51-Methyl-2-nitrobenzene 495.3 269 274–303.5 2.371–29.662-Butanone 352.74 186.5 208.83–215.51 18.62–36.292-Ethyl phenol 477.67 269.8 278.13–302.68 3.35–30.82-Octanone 446.2 229.85 243.15–298.15 1.5–1873-Methyl phenol 475.42 284 284.15–306.4 5.87–36.8Benzyl alcohol 478.6 257.6 282.9–308.15 3.06–28Cyclohexyl formate 435.55 201 248.25–268.44 5.59–40.7Heptanoic acid 496.15 266 270.4–328.2 0.1–28.29Hexanoic acid 479 269.15 271.4–313.2 0.4–25.73Limonene 450.8 177.1 243.5–273.2 1.91–31.02Linalool 471.35 ??b 273.35–303.14 2.49–42.2n-Decanal 489 268 282.8–307.2 4.83–35.41n-Octanenitrile 478.4 227.6 283.2–298.2 11.92–38.98Phenethyl alcohol 492.05 246.2 288.15–318.15 2.8–40Propylbenzene 432.39 173.6 223.15–263.15 0.61–36.2
a For data sources see the Supplementary material (http://www.atmos-chem-phys-discuss.net/9/18375/2009/acpd-9-18375-2009-supplement.pdf). b Tm unknown but low (below 273 K).
18405
ACPD9, 18375–18416, 2009
Critical assessmentof vapour pressureestimation methods
M. H. Barley andG. McFiggans
Title Page
Abstract Introduction
Conclusions References
Tables Figures
J I
J I
Back Close
Full Screen / Esc
Printer-friendly Version
Interactive Discussion
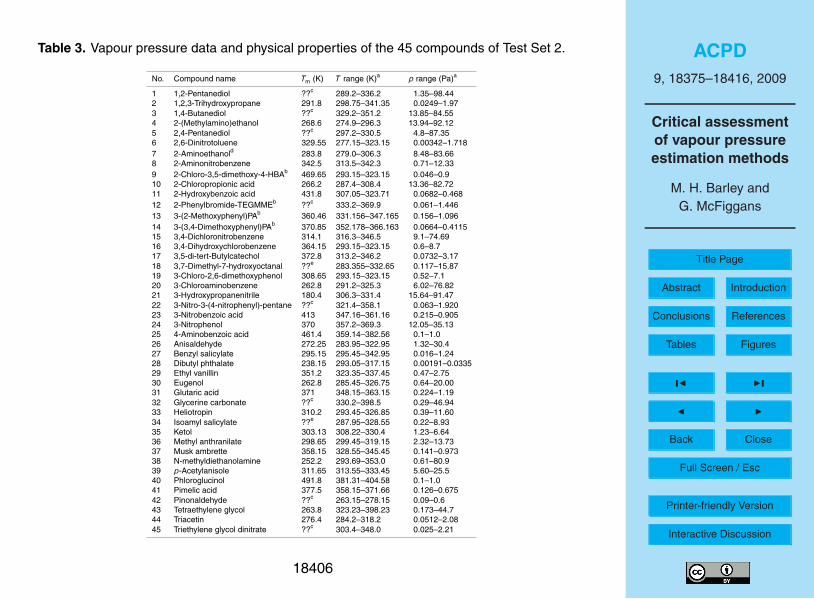
Table 3. Vapour pressure data and physical properties of the 45 compounds of Test Set 2.
No. Compound name Tm (K) T range (K)a p range (Pa)a
1 1,2-Pentanediol ??c 289.2–336.2 1.35–98.442 1,2,3-Trihydroxypropane 291.8 298.75–341.35 0.0249–1.973 1,4-Butanediol ??c 329.2–351.2 13.85–84.554 2-(Methylamino)ethanol 268.6 274.9–296.3 13.94–92.125 2,4-Pentanediol ??c 297.2–330.5 4.8–87.356 2,6-Dinitrotoluene 329.55 277.15–323.15 0.00342–1.7187 2-Aminoethanold 283.8 279.0–306.3 8.48–83.668 2-Aminonitrobenzene 342.5 313.5–342.3 0.71–12.339 2-Chloro-3,5-dimethoxy-4-HBAb 469.65 293.15–323.15 0.046–0.910 2-Chloropropionic acid 266.2 287.4–308.4 13.36–82.7211 2-Hydroxybenzoic acid 431.8 307.05–323.71 0.0682–0.46812 2-Phenylbromide-TEGMMEb ??c 333.2–369.9 0.061–1.44613 3-(2-Methoxyphenyl)PAb 360.46 331.156–347.165 0.156–1.09614 3-(3,4-Dimethoxyphenyl)PAb 370.85 352.178–366.163 0.0664–0.411515 3,4-Dichloronitrobenzene 314.1 316.3–346.5 9.1–74.6916 3,4-Dihydroxychlorobenzene 364.15 293.15–323.15 0.6–8.717 3,5-di-tert-Butylcatechol 372.8 313.2–346.2 0.0732–3.1718 3,7-Dimethyl-7-hydroxyoctanal ??e 283.355–332.65 0.117–15.8719 3-Chloro-2,6-dimethoxyphenol 308.65 293.15–323.15 0.52–7.120 3-Chloroaminobenzene 262.8 291.2–325.3 6.02–76.8221 3-Hydroxypropanenitrile 180.4 306.3–331.4 15.64–91.4722 3-Nitro-3-(4-nitrophenyl)-pentane ??c 321.4–358.1 0.063–1.92023 3-Nitrobenzoic acid 413 347.16–361.16 0.215–0.90524 3-Nitrophenol 370 357.2–369.3 12.05–35.1325 4-Aminobenzoic acid 461.4 359.14–382.56 0.1–1.026 Anisaldehyde 272.25 283.95–322.95 1.32–30.427 Benzyl salicylate 295.15 295.45–342.95 0.016–1.2428 Dibutyl phthalate 238.15 293.05–317.15 0.00191–0.033529 Ethyl vanillin 351.2 323.35–337.45 0.47–2.7530 Eugenol 262.8 285.45–326.75 0.64–20.0031 Glutaric acid 371 348.15–363.15 0.224–1.1932 Glycerine carbonate ??c 330.2–398.5 0.29–46.9433 Heliotropin 310.2 293.45–326.85 0.39–11.6034 Isoamyl salicylate ??e 287.95–328.55 0.22–8.9335 Ketol 303.13 308.22–330.4 1.23–6.6436 Methyl anthranilate 298.65 299.45–319.15 2.32–13.7337 Musk ambrette 358.15 328.55–345.45 0.141–0.97338 N-methyldiethanolamine 252.2 293.69–353.0 0.61–80.939 p-Acetylanisole 311.65 313.55–333.45 5.60–25.540 Phloroglucinol 491.8 381.31–404.58 0.1–1.041 Pimelic acid 377.5 358.15–371.66 0.126–0.67542 Pinonaldehyde ??c 263.15–278.15 0.09–0.643 Tetraethylene glycol 263.8 323.23–398.23 0.173–44.744 Triacetin 276.4 284.2–318.2 0.0512–2.0845 Triethylene glycol dinitrate ??c 303.4–348.0 0.025–2.21
18406
ACPD9, 18375–18416, 2009
Critical assessmentof vapour pressureestimation methods
M. H. Barley andG. McFiggans
Title Page
Abstract Introduction
Conclusions References
Tables Figures
J I
J I
Back Close
Full Screen / Esc
Printer-friendly Version
Interactive Discussion
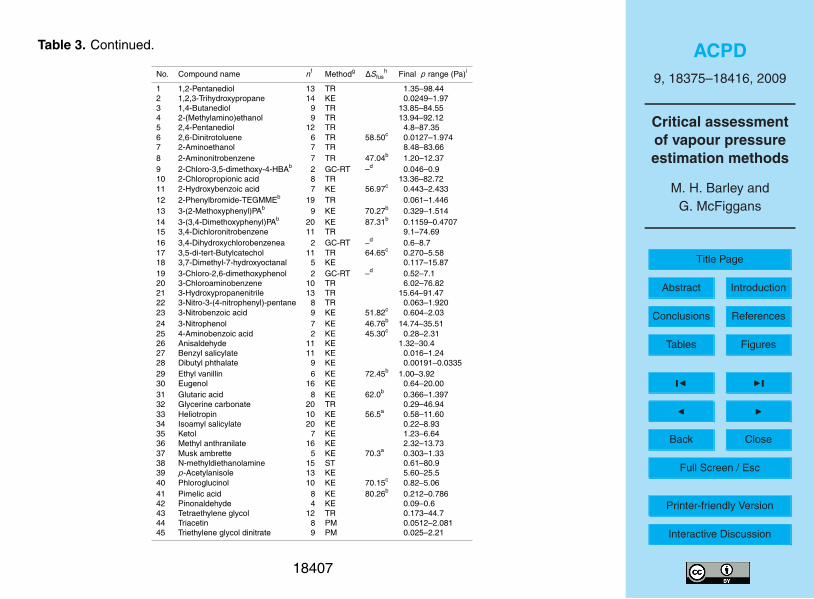
Table 3. Continued.
No. Compound name nf Methodg ∆Sfush Final p range (Pa)i
1 1,2-Pentanediol 13 TR 1.35–98.442 1,2,3-Trihydroxypropane 14 KE 0.0249–1.973 1,4-Butanediol 9 TR 13.85–84.554 2-(Methylamino)ethanol 9 TR 13.94–92.125 2,4-Pentanediol 12 TR 4.8–87.356 2,6-Dinitrotoluene 6 TR 58.50c 0.0127–1.9747 2-Aminoethanol 7 TR 8.48–83.668 2-Aminonitrobenzene 7 TR 47.04b 1.20–12.379 2-Chloro-3,5-dimethoxy-4-HBAb 2 GC-RT –d 0.046–0.910 2-Chloropropionic acid 8 TR 13.36–82.7211 2-Hydroxybenzoic acid 7 KE 56.97c 0.443–2.43312 2-Phenylbromide-TEGMMEb 19 TR 0.061–1.44613 3-(2-Methoxyphenyl)PAb 9 KE 70.27b 0.329–1.51414 3-(3,4-Dimethoxyphenyl)PAb 20 KE 87.31b 0.1159–0.470715 3,4-Dichloronitrobenzene 11 TR 9.1–74.6916 3,4-Dihydroxychlorobenzenea 2 GC-RT –d 0.6–8.717 3,5-di-tert-Butylcatechol 11 TR 64.65c 0.270–5.5818 3,7-Dimethyl-7-hydroxyoctanal 5 KE 0.117–15.8719 3-Chloro-2,6-dimethoxyphenol 2 GC-RT –d 0.52–7.120 3-Chloroaminobenzene 10 TR 6.02–76.8221 3-Hydroxypropanenitrile 13 TR 15.64–91.4722 3-Nitro-3-(4-nitrophenyl)-pentane 8 TR 0.063–1.92023 3-Nitrobenzoic acid 9 KE 51.82c 0.604–2.0324 3-Nitrophenol 7 KE 46.76b 14.74–35.5125 4-Aminobenzoic acid 2 KE 45.30c 0.28–2.3126 Anisaldehyde 11 KE 1.32–30.427 Benzyl salicylate 11 KE 0.016–1.2428 Dibutyl phthalate 9 KE 0.00191–0.033529 Ethyl vanillin 6 KE 72.45b 1.00–3.9230 Eugenol 16 KE 0.64–20.0031 Glutaric acid 8 KE 62.0b 0.366–1.39732 Glycerine carbonate 20 TR 0.29–46.9433 Heliotropin 10 KE 56.5a 0.58–11.6034 Isoamyl salicylate 20 KE 0.22–8.9335 Ketol 7 KE 1.23–6.6436 Methyl anthranilate 16 KE 2.32–13.7337 Musk ambrette 5 KE 70.3a 0.303–1.3338 N-methyldiethanolamine 15 ST 0.61–80.939 p-Acetylanisole 13 KE 5.60–25.540 Phloroglucinol 10 KE 70.15c 0.82–5.0641 Pimelic acid 8 KE 80.26b 0.212–0.78642 Pinonaldehyde 4 KE 0.09–0.643 Tetraethylene glycol 12 TR 0.173–44.744 Triacetin 8 PM 0.0512–2.08145 Triethylene glycol dinitrate 9 PM 0.025–2.21
18407
ACPD9, 18375–18416, 2009
Critical assessmentof vapour pressureestimation methods
M. H. Barley andG. McFiggans
Title Page
Abstract Introduction
Conclusions References
Tables Figures
J I
J I
Back Close
Full Screen / Esc
Printer-friendly Version
Interactive Discussion
Table 3. Continued.
a Data as reported in the literature – see supplemen-tary material (http://www.atmos-chem-phys-discuss.net/9/18375/2009/acpd-9-18375-2009-supplement.pdf) for data sources. b Full names: com-pounds No. 9=2-chloro-3,5-dimethoxy-4-hydroxybenzaldehyde; No. 12=(2-phenylbromide)-triethyleneglycol-monomethylether; No. 13=3-(2-methoxy phenyl)propionicacid; No. 14=(3,4-dimethoxyphenyl)propionic acid. c Melting point unknown, but from thevapour pressure source it is clear that the measurements were made on a liquid. d Authorsnote that some vapour pressure measurements were made on a sub-cooled liquid aidedby very slow crystallization (Kapteina et al., 2005). e Melting point unknown but there iscircumstantial evidence that the measurements were made on a liquid – see supplementarymaterial for details. f Number of datapoints. g Experimental method: KE=Knudsen effusion;TR=transpiration; GC-RT=gas chromatography-retention time; ST=static method; PM=pistonmanometer. h ∆Sfus at Tm in J/mol K; correction of sublimation pressures to SCL-VP values: A)correction ignoring the last two terms in Eq. (15) and using an estimated ∆Sfus; B) correctionignoring the last two terms in Eq. (15) and using an experimental ∆Sfus; C) correction usingthe full Eq. (15) with an experimental ∆Sfus, see supplementary material for details; D) nocorrection required as experimental method provides SCL-VP values directly. i Final pressurerange after any corrections.
18408
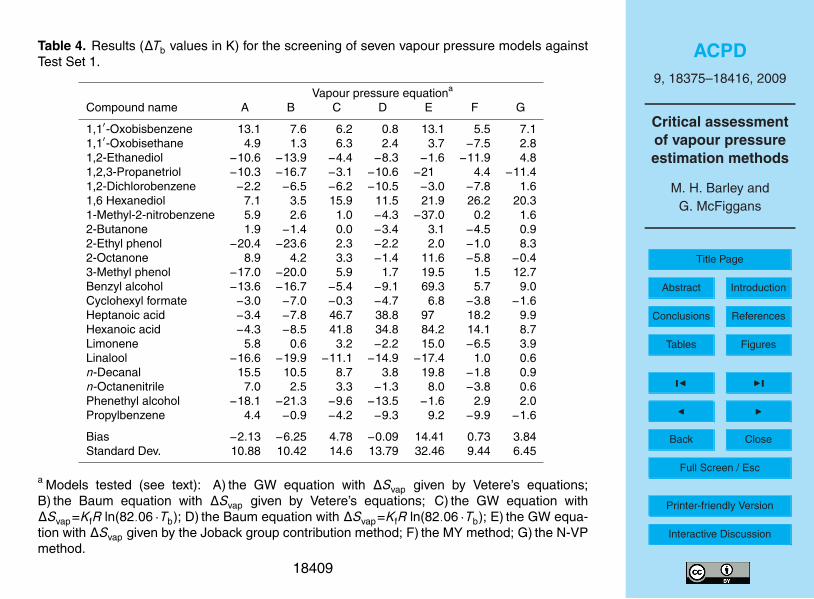
ACPD9, 18375–18416, 2009
Critical assessmentof vapour pressureestimation methods
M. H. Barley andG. McFiggans
Title Page
Abstract Introduction
Conclusions References
Tables Figures
J I
J I
Back Close
Full Screen / Esc
Printer-friendly Version
Interactive Discussion
Table 4. Results (∆Tb values in K) for the screening of seven vapour pressure models againstTest Set 1.
Vapour pressure equationa
Compound name A B C D E F G
1,1′-Oxobisbenzene 13.1 7.6 6.2 0.8 13.1 5.5 7.11,1′-Oxobisethane 4.9 1.3 6.3 2.4 3.7 −7.5 2.81,2-Ethanediol −10.6 −13.9 −4.4 −8.3 −1.6 −11.9 4.81,2,3-Propanetriol −10.3 −16.7 −3.1 −10.6 −21 4.4 −11.41,2-Dichlorobenzene −2.2 −6.5 −6.2 −10.5 −3.0 −7.8 1.61,6 Hexanediol 7.1 3.5 15.9 11.5 21.9 26.2 20.31-Methyl-2-nitrobenzene 5.9 2.6 1.0 −4.3 −37.0 0.2 1.62-Butanone 1.9 −1.4 0.0 −3.4 3.1 −4.5 0.92-Ethyl phenol −20.4 −23.6 2.3 −2.2 2.0 −1.0 8.32-Octanone 8.9 4.2 3.3 −1.4 11.6 −5.8 −0.43-Methyl phenol −17.0 −20.0 5.9 1.7 19.5 1.5 12.7Benzyl alcohol −13.6 −16.7 −5.4 −9.1 69.3 5.7 9.0Cyclohexyl formate −3.0 −7.0 −0.3 −4.7 6.8 −3.8 −1.6Heptanoic acid −3.4 −7.8 46.7 38.8 97 18.2 9.9Hexanoic acid −4.3 −8.5 41.8 34.8 84.2 14.1 8.7Limonene 5.8 0.6 3.2 −2.2 15.0 −6.5 3.9Linalool −16.6 −19.9 −11.1 −14.9 −17.4 1.0 0.6n-Decanal 15.5 10.5 8.7 3.8 19.8 −1.8 0.9n-Octanenitrile 7.0 2.5 3.3 −1.3 8.0 −3.8 0.6Phenethyl alcohol −18.1 −21.3 −9.6 −13.5 −1.6 2.9 2.0Propylbenzene 4.4 −0.9 −4.2 −9.3 9.2 −9.9 −1.6
Bias −2.13 −6.25 4.78 −0.09 14.41 0.73 3.84Standard Dev. 10.88 10.42 14.6 13.79 32.46 9.44 6.45
a Models tested (see text): A) the GW equation with ∆Svap given by Vetere’s equations;B) the Baum equation with ∆Svap given by Vetere’s equations; C) the GW equation with∆Svap=KfR ln(82.06 · Tb); D) the Baum equation with ∆Svap=KfR ln(82.06 · Tb); E) the GW equa-tion with ∆Svap given by the Joback group contribution method; F) the MY method; G) the N-VPmethod.
18409
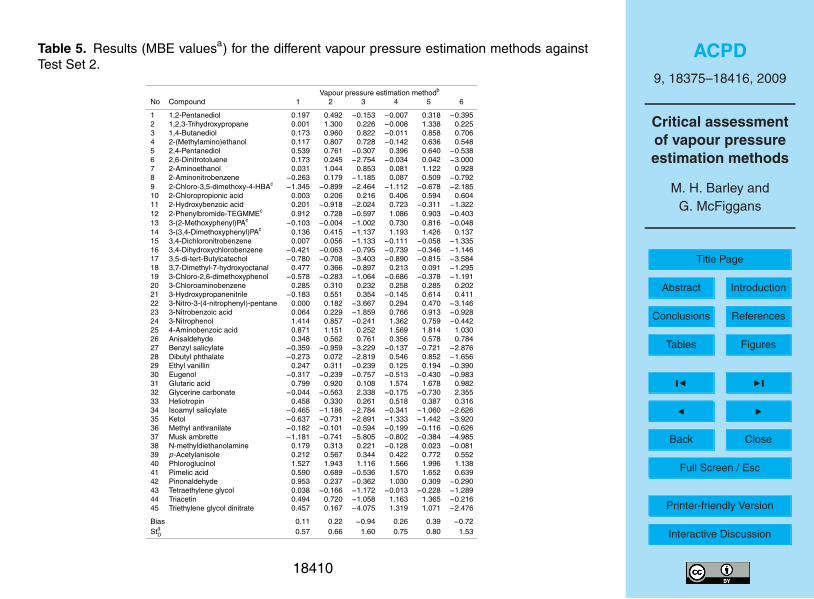
ACPD9, 18375–18416, 2009
Critical assessmentof vapour pressureestimation methods
M. H. Barley andG. McFiggans
Title Page
Abstract Introduction
Conclusions References
Tables Figures
J I
J I
Back Close
Full Screen / Esc
Printer-friendly Version
Interactive Discussion
Table 5. Results (MBE valuesa) for the different vapour pressure estimation methods againstTest Set 2.
Vapour pressure estimation methodb
No Compound 1 2 3 4 5 6
1 1,2-Pentanediol 0.197 0.492 −0.153 −0.007 0.318 −0.3952 1,2,3-Trihydroxypropane 0.001 1.300 0.226 −0.008 1.338 0.2253 1,4-Butanediol 0.173 0.960 0.822 −0.011 0.858 0.7064 2-(Methylamino)ethanol 0.117 0.807 0.728 −0.142 0.636 0.5485 2,4-Pentanediol 0.539 0.761 −0.307 0.396 0.640 −0.5386 2,6-Dinitrotoluene 0.173 0.245 −2.754 −0.034 0.042 −3.0007 2-Aminoethanol 0.031 1.044 0.853 0.081 1.122 0.9288 2-Aminonitrobenzene −0.263 0.179 −1.185 0.087 0.509 −0.7929 2-Chloro-3,5-dimethoxy-4-HBAc −1.345 −0.899 −2.464 −1.112 −0.678 −2.18510 2-Chloropropionic acid 0.003 0.206 0.216 0.406 0.594 0.60411 2-Hydroxybenzoic acid 0.201 −0.918 −2.024 0.723 −0.311 −1.32212 2-Phenylbromide-TEGMMEc 0.912 0.728 −0.597 1.086 0.903 −0.40313 3-(2-Methoxyphenyl)PAc −0.103 −0.004 −1.002 0.730 0.816 −0.04814 3-(3,4-Dimethoxyphenyl)PAc 0.136 0.415 −1.137 1.193 1.426 0.13715 3,4-Dichloronitrobenzene 0.007 0.056 −1.133 −0.111 −0.058 −1.33516 3,4-Dihydroxychlorobenzene −0.421 −0.063 −0.795 −0.739 −0.346 −1.14617 3,5-di-tert-Butylcatechol −0.780 −0.708 −3.403 −0.890 −0.815 −3.58418 3,7-Dimethyl-7-hydroxyoctanal 0.477 0.366 −0.897 0.213 0.091 −1.29519 3-Chloro-2,6-dimethoxyphenol −0.578 −0.283 −1.064 −0.686 −0.378 −1.19120 3-Chloroaminobenzene 0.285 0.310 0.232 0.258 0.285 0.20221 3-Hydroxypropanenitrile −0.183 0.551 0.354 −0.145 0.614 0.41122 3-Nitro-3-(4-nitrophenyl)-pentane 0.000 0.182 −3.667 0.294 0.470 −3.14623 3-Nitrobenzoic acid 0.064 0.229 −1.859 0.766 0.913 −0.92824 3-Nitrophenol 1.414 0.857 −0.241 1.362 0.759 −0.44225 4-Aminobenzoic acid 0.871 1.151 0.252 1.569 1.814 1.03026 Anisaldehyde 0.348 0.562 0.761 0.356 0.578 0.78427 Benzyl salicylate −0.359 −0.959 −3.229 −0.137 −0.721 −2.87628 Dibutyl phthalate −0.273 0.072 −2.819 0.546 0.852 −1.65629 Ethyl vanillin 0.247 0.311 −0.239 0.125 0.194 −0.39030 Eugenol −0.317 −0.239 −0.757 −0.513 −0.430 −0.98331 Glutaric acid 0.799 0.920 0.108 1.574 1.678 0.98232 Glycerine carbonate −0.044 −0.563 2.338 −0.175 −0.730 2.35533 Heliotropin 0.458 0.330 0.261 0.518 0.387 0.31634 Isoamyl salicylate −0.465 −1.186 −2.784 −0.341 −1.060 −2.62635 Ketol −0.637 −0.731 −2.891 −1.333 −1.442 −3.92036 Methyl anthranilate −0.182 −0.101 −0.594 −0.199 −0.116 −0.62637 Musk ambrette −1.181 −0.741 −5.805 −0.802 −0.384 −4.98538 N-methyldiethanolamine 0.179 0.313 0.221 −0.128 0.023 −0.08139 p-Acetylanisole 0.212 0.567 0.344 0.422 0.772 0.55240 Phloroglucinol 1.527 1.943 1.116 1.566 1.996 1.13841 Pimelic acid 0.590 0.689 −0.536 1.570 1.652 0.63942 Pinonaldehyde 0.953 0.237 −0.362 1.030 0.309 −0.29043 Tetraethylene glycol 0.038 −0.166 −1.172 −0.013 −0.228 −1.28944 Triacetin 0.494 0.720 −1.058 1.163 1.365 −0.21645 Triethylene glycol dinitrate 0.457 0.167 −4.075 1.319 1.071 −2.476
Bias 0.11 0.22 −0.94 0.26 0.39 −0.72StdD 0.57 0.66 1.60 0.75 0.80 1.53
18410
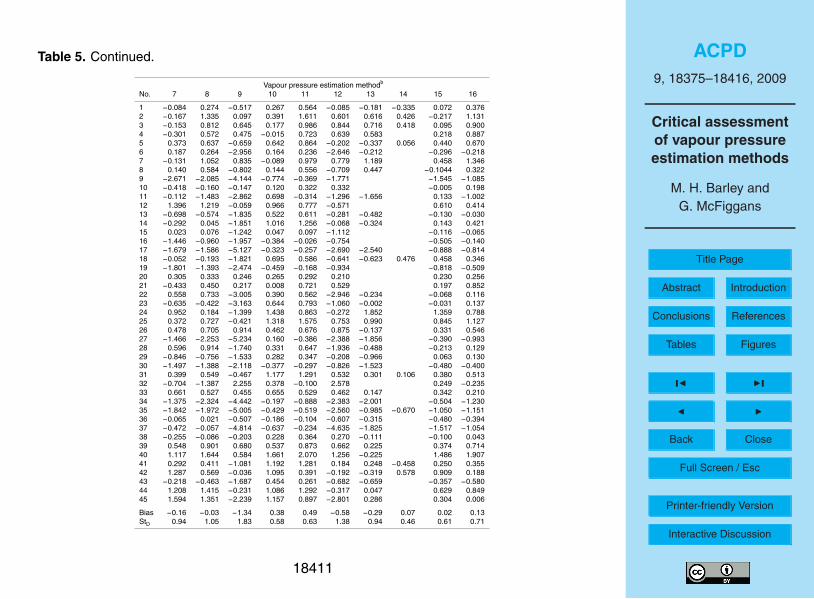
ACPD9, 18375–18416, 2009
Critical assessmentof vapour pressureestimation methods
M. H. Barley andG. McFiggans
Title Page
Abstract Introduction
Conclusions References
Tables Figures
J I
J I
Back Close
Full Screen / Esc
Printer-friendly Version
Interactive Discussion
Table 5. Continued.
Vapour pressure estimation methodb
No. 7 8 9 10 11 12 13 14 15 16
1 −0.084 0.274 −0.517 0.267 0.564 −0.085 −0.181 −0.335 0.072 0.3762 −0.167 1.335 0.097 0.391 1.611 0.601 0.616 0.426 −0.217 1.1313 −0.153 0.812 0.645 0.177 0.986 0.844 0.716 0.418 0.095 0.9004 −0.301 0.572 0.475 −0.015 0.723 0.639 0.583 0.218 0.8875 0.373 0.637 −0.659 0.642 0.864 −0.202 −0.337 0.056 0.440 0.6706 0.187 0.264 −2.956 0.164 0.236 −2.646 −0.212 −0.296 −0.2187 −0.131 1.052 0.835 −0.089 0.979 0.779 1.189 0.458 1.3468 0.140 0.584 −0.802 0.144 0.556 −0.709 0.447 −0.1044 0.3229 −2.671 −2.085 −4.144 −0.774 −0.369 −1.771 −1.545 −1.08510 −0.418 −0.160 −0.147 0.120 0.322 0.332 −0.005 0.19811 −0.112 −1.483 −2.862 0.698 −0.314 −1.296 −1.656 0.133 −1.00212 1.396 1.219 −0.059 0.966 0.777 −0.571 0.610 0.41413 −0.698 −0.574 −1.835 0.522 0.611 −0.281 −0.482 −0.130 −0.03014 −0.292 0.045 −1.851 1.016 1.256 −0.068 −0.324 0.143 0.42115 0.023 0.076 −1.242 0.047 0.097 −1.112 −0.116 −0.06516 −1.446 −0.960 −1.957 −0.384 −0.026 −0.754 −0.505 −0.14017 −1.679 −1.586 −5.127 −0.323 −0.257 −2.690 −2.540 −0.888 −0.81418 −0.052 −0.193 −1.821 0.695 0.586 −0.641 −0.623 0.476 0.458 0.34619 −1.801 −1.393 −2.474 −0.459 −0.168 −0.934 −0.818 −0.50920 0.305 0.333 0.246 0.265 0.292 0.210 0.230 0.25621 −0.433 0.450 0.217 0.008 0.721 0.529 0.197 0.85222 0.558 0.733 −3.005 0.390 0.562 −2.946 −0.234 −0.068 0.11623 −0.635 −0.422 −3.163 0.644 0.793 −1.060 −0.002 −0.031 0.13724 0.952 0.184 −1.399 1.438 0.863 −0.272 1.852 1.359 0.78825 0.372 0.727 −0.421 1.318 1.575 0.753 0.990 0.845 1.12726 0.478 0.705 0.914 0.462 0.676 0.875 −0.137 0.331 0.54627 −1.466 −2.253 −5.234 0.160 −0.386 −2.388 −1.856 −0.390 −0.99328 0.596 0.914 −1.740 0.331 0.647 −1.936 −0.488 −0.213 0.12929 −0.846 −0.756 −1.533 0.282 0.347 −0.208 −0.966 0.063 0.13030 −1.497 −1.388 −2.118 −0.377 −0.297 −0.826 −1.523 −0.480 −0.40031 0.399 0.549 −0.467 1.177 1.291 0.532 0.301 0.106 0.380 0.51332 −0.704 −1.387 2.255 0.378 −0.100 2.578 0.249 −0.23533 0.661 0.527 0.455 0.655 0.529 0.462 0.147 0.342 0.21034 −1.375 −2.324 −4.442 −0.197 −0.888 −2.383 −2.001 −0.504 −1.23035 −1.842 −1.972 −5.005 −0.429 −0.519 −2.560 −0.985 −0.670 −1.050 −1.15136 −0.065 0.021 −0.507 −0.186 −0.104 −0.607 −0.315 −0.480 −0.39437 −0.472 −0.057 −4.814 −0.637 −0.234 −4.635 −1.825 −1.517 −1.05438 −0.255 −0.086 −0.203 0.228 0.364 0.270 −0.111 −0.100 0.04339 0.548 0.901 0.680 0.537 0.873 0.662 0.225 0.374 0.71440 1.117 1.644 0.584 1.661 2.070 1.256 −0.225 1.486 1.90741 0.292 0.411 −1.081 1.192 1.281 0.184 0.248 −0.458 0.250 0.35542 1.287 0.569 −0.036 1.095 0.391 −0.192 −0.319 0.578 0.909 0.18843 −0.218 −0.463 −1.687 0.454 0.261 −0.682 −0.659 −0.357 −0.58044 1.208 1.415 −0.231 1.086 1.292 −0.317 0.047 0.629 0.84945 1.594 1.351 −2.239 1.157 0.897 −2.801 0.286 0.304 0.006
Bias −0.16 −0.03 −1.34 0.38 0.49 −0.58 −0.29 0.07 0.02 0.13StD 0.94 1.05 1.83 0.58 0.63 1.38 0.94 0.46 0.61 0.71
18411
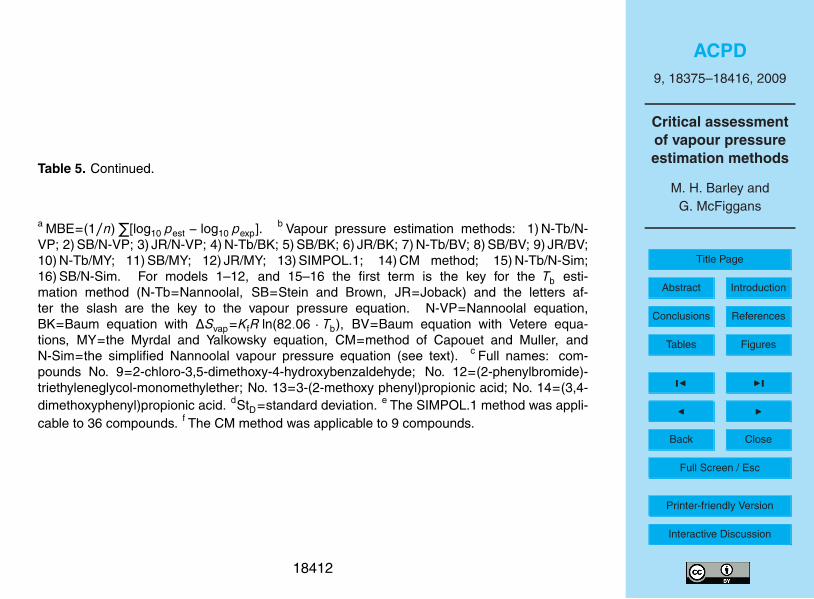
ACPD9, 18375–18416, 2009
Critical assessmentof vapour pressureestimation methods
M. H. Barley andG. McFiggans
Title Page
Abstract Introduction
Conclusions References
Tables Figures
J I
J I
Back Close
Full Screen / Esc
Printer-friendly Version
Interactive Discussion
Table 5. Continued.
a MBE=(1/n)∑
[log10 pest − log10 pexp]. b Vapour pressure estimation methods: 1) N-Tb/N-VP; 2) SB/N-VP; 3) JR/N-VP; 4) N-Tb/BK; 5) SB/BK; 6) JR/BK; 7) N-Tb/BV; 8) SB/BV; 9) JR/BV;10) N-Tb/MY; 11) SB/MY; 12) JR/MY; 13) SIMPOL.1; 14) CM method; 15) N-Tb/N-Sim;16) SB/N-Sim. For models 1–12, and 15–16 the first term is the key for the Tb esti-mation method (N-Tb=Nannoolal, SB=Stein and Brown, JR=Joback) and the letters af-ter the slash are the key to the vapour pressure equation. N-VP=Nannoolal equation,BK=Baum equation with ∆Svap=KfR ln(82.06 · Tb), BV=Baum equation with Vetere equa-tions, MY=the Myrdal and Yalkowsky equation, CM=method of Capouet and Muller, andN-Sim=the simplified Nannoolal vapour pressure equation (see text). c Full names: com-pounds No. 9=2-chloro-3,5-dimethoxy-4-hydroxybenzaldehyde; No. 12=(2-phenylbromide)-triethyleneglycol-monomethylether; No. 13=3-(2-methoxy phenyl)propionic acid; No. 14=(3,4-dimethoxyphenyl)propionic acid. dStD=standard deviation. e The SIMPOL.1 method was appli-cable to 36 compounds. f The CM method was applicable to 9 compounds.
18412
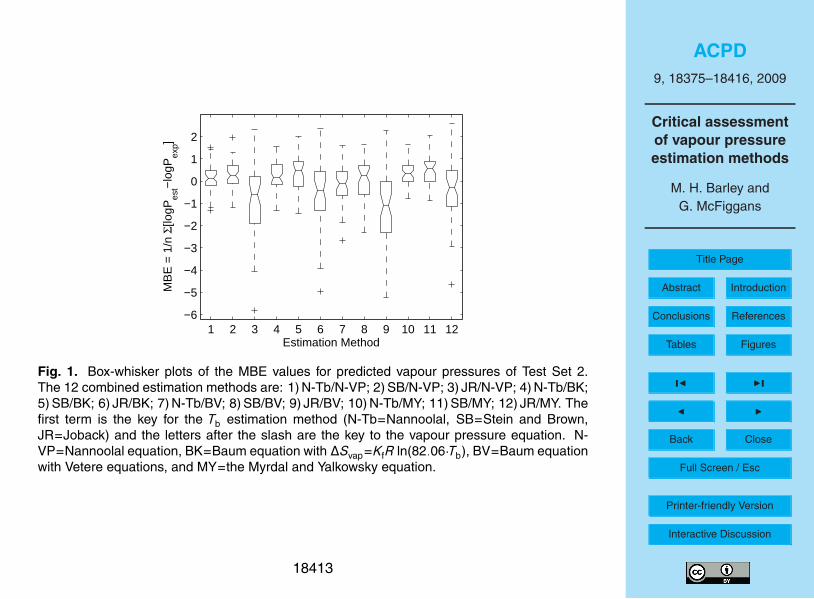
ACPD9, 18375–18416, 2009
Critical assessmentof vapour pressureestimation methods
M. H. Barley andG. McFiggans
Title Page
Abstract Introduction
Conclusions References
Tables Figures
J I
J I
Back Close
Full Screen / Esc
Printer-friendly Version
Interactive Discussion
1 2 3 4 5 6 7 8 9 10 11 12−6
−5
−4
−3
−2
−1
0
1
2
MB
E =
1/n
Σ[lo
gPes
t−lo
gPex
p]
Estimation Method
Fig. 1. Box-whisker plots of the MBE values for predicted vapour pressures of Test Set 2.The 12 combined estimation methods are: 1) N-Tb/N-VP; 2) SB/N-VP; 3) JR/N-VP; 4) N-Tb/BK;5) SB/BK; 6) JR/BK; 7) N-Tb/BV; 8) SB/BV; 9) JR/BV; 10) N-Tb/MY; 11) SB/MY; 12) JR/MY. Thefirst term is the key for the Tb estimation method (N-Tb=Nannoolal, SB=Stein and Brown,JR=Joback) and the letters after the slash are the key to the vapour pressure equation. N-VP=Nannoolal equation, BK=Baum equation with ∆Svap=KfR ln(82.06·Tb), BV=Baum equationwith Vetere equations, and MY=the Myrdal and Yalkowsky equation.
18413
ACPD9, 18375–18416, 2009
Critical assessmentof vapour pressureestimation methods
M. H. Barley andG. McFiggans
Title Page
Abstract Introduction
Conclusions References
Tables Figures
J I
J I
Back Close
Full Screen / Esc
Printer-friendly Version
Interactive Discussion
13 14 15 16 17 18
−2
−1
0
1
2
MB
E =
1/n
Σ[lo
gPes
t−lo
gPex
p]
Estimation Method
Fig. 2. Box-whisker plots of the MBE values for predicted vapour pressures of Test Set 2.The estimation methods shown here are: 13) SIMPOL.1; 14) The CM method; 15) N-Tb/N-Sim;16) SB/N-Sim; 17) N-Tb/N-VP; 18) SB/N-VP; For methods 15–18 the first term is the key for theTb estimation method (N-Tb=Nannoolal, SB=Stein and Brown) and the letters after the slashare the key to the vapour pressure equation. N-VP=Nannoolal equation, N-Sim=the simplifiedNannoolal vapour pressure equation (see text).
18414
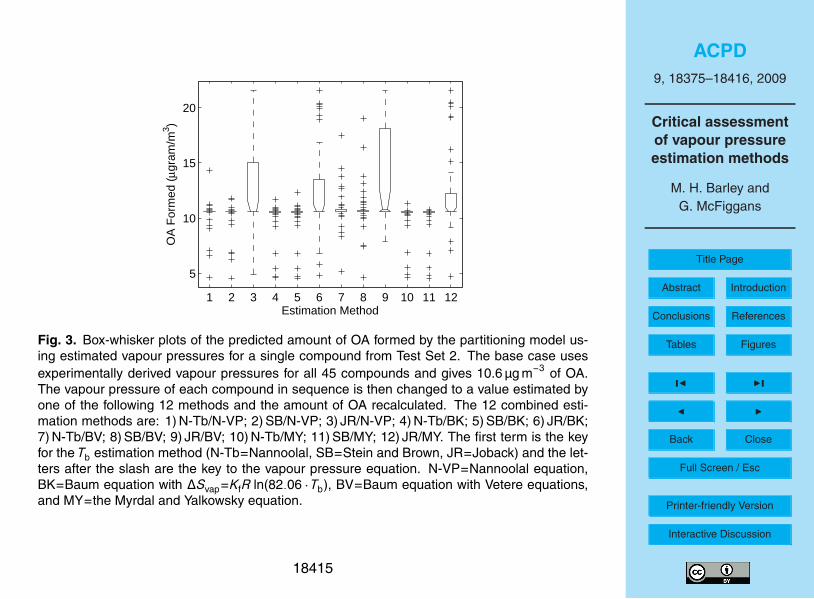
ACPD9, 18375–18416, 2009
Critical assessmentof vapour pressureestimation methods
M. H. Barley andG. McFiggans
Title Page
Abstract Introduction
Conclusions References
Tables Figures
J I
J I
Back Close
Full Screen / Esc
Printer-friendly Version
Interactive Discussion
1 2 3 4 5 6 7 8 9 10 11 12
5
10
15
20
OA
For
med
(μg
ram
/m3 )
Estimation Method
Fig. 3. Box-whisker plots of the predicted amount of OA formed by the partitioning model us-ing estimated vapour pressures for a single compound from Test Set 2. The base case usesexperimentally derived vapour pressures for all 45 compounds and gives 10.6 µg m−3 of OA.The vapour pressure of each compound in sequence is then changed to a value estimated byone of the following 12 methods and the amount of OA recalculated. The 12 combined esti-mation methods are: 1) N-Tb/N-VP; 2) SB/N-VP; 3) JR/N-VP; 4) N-Tb/BK; 5) SB/BK; 6) JR/BK;7) N-Tb/BV; 8) SB/BV; 9) JR/BV; 10) N-Tb/MY; 11) SB/MY; 12) JR/MY. The first term is the keyfor the Tb estimation method (N-Tb=Nannoolal, SB=Stein and Brown, JR=Joback) and the let-ters after the slash are the key to the vapour pressure equation. N-VP=Nannoolal equation,BK=Baum equation with ∆Svap=KfR ln(82.06 · Tb), BV=Baum equation with Vetere equations,and MY=the Myrdal and Yalkowsky equation.
18415
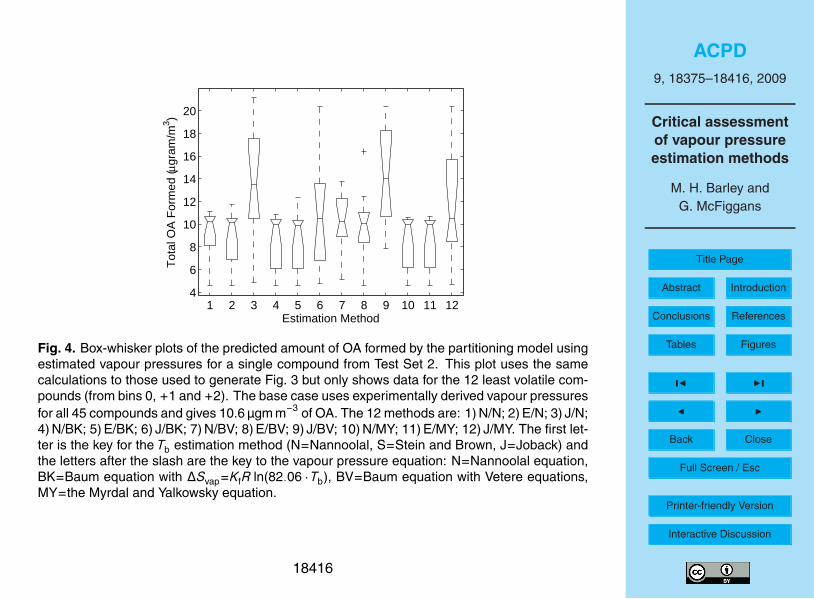
ACPD9, 18375–18416, 2009
Critical assessmentof vapour pressureestimation methods
M. H. Barley andG. McFiggans
Title Page
Abstract Introduction
Conclusions References
Tables Figures
J I
J I
Back Close
Full Screen / Esc
Printer-friendly Version
Interactive Discussion
1 2 3 4 5 6 7 8 9 10 11 124
6
8
10
12
14
16
18
20
Tot
al O
A F
orm
ed (μ
gram
/m3 )
Estimation Method
Fig. 4. Box-whisker plots of the predicted amount of OA formed by the partitioning model usingestimated vapour pressures for a single compound from Test Set 2. This plot uses the samecalculations to those used to generate Fig. 3 but only shows data for the 12 least volatile com-pounds (from bins 0, +1 and +2). The base case uses experimentally derived vapour pressuresfor all 45 compounds and gives 10.6 µgm m−3 of OA. The 12 methods are: 1) N/N; 2) E/N; 3) J/N;4) N/BK; 5) E/BK; 6) J/BK; 7) N/BV; 8) E/BV; 9) J/BV; 10) N/MY; 11) E/MY; 12) J/MY. The first let-ter is the key for the Tb estimation method (N=Nannoolal, S=Stein and Brown, J=Joback) andthe letters after the slash are the key to the vapour pressure equation: N=Nannoolal equation,BK=Baum equation with ∆Svap=KfR ln(82.06 · Tb), BV=Baum equation with Vetere equations,MY=the Myrdal and Yalkowsky equation.
18416


![Near-optimal response of instantaneous transpiration efficiency to vapour pressure deficit, temperature and [CO2] in cotton (Gossypium hirsutum L.)](https://img.dokumen.tips/doc/110x75/634d7a546b2f6dfefb0a5e40/near-optimal-response-of-instantaneous-transpiration-efficiency-to-vapour-pressure.jpg)