Embed Size (px)
Citation preview

i
بسم هللا الرحمن الرحيم
University of Khartoum
Faculty of Engineering
Mechanical Engineering Department
Gasoline Vapour Recovery
A thesis submitted in partial fulfillment of the requirements for the
degree of B.Sc. in Mechanical Engineering
Presented by:
1/Mohamed Ahmed Elsamani 2/ Mohamed Elfadil Elwadie
Supervised by:
Dr. Salah Ahmed Abdallah
August 2015

ii
Dedication
We dedicate this research with much love and
appreciation:
To the candles of our lives our beloved mothers who have
always been there for us.
To our fathers who have always been the brick walls on
whom we can lean and depend on forever.
To our brothers and sisters who mean the world to us.
To our friends, family, colleagues and teachers past and
present to everyone that we love.

iii
Acknowledgments
We would like to express my gratitude to all those who
gave us the possibility to complete this research .We
deeply indebted would like to express our great thanks to
our supervisor dr. Salah Ahmed Abdullah who helped,
stimulating suggestions and encouragement helped us
in all time of the research. His guidance, his support and
his great knowledge and experience have given us the real
accelerating power to complete this research .Of course we
can’t forget the great help and effort from Petronas &
HAM companies for advices and engineering works
.they were always cooperative and ready to help at any
time. They supported us all the way through. They
showed great care, interest and patience. Many thanks to
them.

iv
Abstract
Gasoline emissions in service station is one of the biggest issues that people are not
taking it under consideration especially in Sudan , because the rate of the gasoline
emissions are very high backs to the high temperature rates. Gasoline emissions should
also be taking seriously because the high value of gasoline. These emissions contribute to
the formation of smog and the control of these emissions has been applied internationally
for some years. Vapor recovery is the preferred control technology after prevention and
minimization.
The application of vapor recovery of gasoline in Sudan has never been used. Gasoline
loading data and vapor analyses date were used to determine the theoretical and
experimental filling emissions from underground tanks in three different service stations
in Khartoum:
1/Al-Oshra station.
2/Jabl Awleya station.
3/Dar AL Salam station.
The average evaporative emission per year in each station were (13800.04 liter/year),
(8822.02 liter/year) and (7825.46 liter/year) respectively.
From These values of gasoline emissions it shows that the economic losses are very high
with a range of 30000- 60000 SDG per year. So the application of Vapor recovery
System should be applied in Sudan to minimize the Gasoline losses in service stations.

v
Table of contents
Introduction ....................................................................................................................... 2
Literature review .............................................................................................................. 5
2.1 Introduction ............................................................................................................. 5
2.2 Evaporative emissions ............................................................................................. 9
2.2.1 Displacement emissions .................................................................................... 9
2.2.2 Breathing and withdrawal emissions .............................................................. 9
2.2.3 Filling emissions ................................................................................................ 9
2.4 Control of emissions .............................................................................................. 11
2.4.1 Emission prevention and minimization ........................................................ 11
2.4.2 Vapor recovery ............................................................................................... 12
3.1 Introduction ........................................................................................................... 25
3.2 Working loss .......................................................................................................... 25
Working losses occur when the vapor in the vapor space over the liquid is displaced
from the tank by the addition of organic liquid during tank filling. .............................. 25
3.3 Breathing loss......................................................................................................... 27
3.4 Assumptions & givens ........................................................................................... 32
3.5 Sample of calculations ........................................................................................... 32
3.5.1 Working loss .................................................................................................... 32
3.5.2 Breathing loss .................................................................................................. 33
4.1 Results ........................................................................................................................ 35
5.1 Conclusions ................................................................................................................ 38
5.2 Recommendations ..................................................................................................... 38
References ........................................................................................................................ 39
Appendix A ...................................................................................................................... 40

vi
List of abbreviations
BAT Best Available Technology/Technique
EPA Environmental Protection Agency
GLO Ground Level Ozone
PLV Preloading Vapor
POCP Photochemical Ozone Creation Potential
RVP Reid Vapor Pressure
TOMA Tropospheric Ozone Management
VOCs Volatile Organic Compounds
VRU Vapor Recovery Unit
UNECE United Nations Economic Commission for Europe

vii
List of Figures
Figure 2.1 typical gasoline distribution system. …………………………….……… 5
Figure 2.2 typical gasoline distribution system. ............................................................. 9
Figure 2.3 compression-refrigeration-absorption unit by Parker Hannifin ............. 13
Figure 2.4 compression-refrigeration-absorption by Rheem Superior ..................... 14
Figure 2.5 compression-refrigeration-condensation unit by GESCO ........................ 16
Figure 2.6 compression-refrigeration-condensation unit by VAPOREX .................. 17
Figure 2.7 refrigeration vapor recovery unit by Edwards .......................................... 19
Figure 2.8 Lean oil absorption system by Southwest Industries ................................ 20
Figure 2.9 Flow diagram of a membrane gasoline-vapor recovery unit suited to a
retail gasoline station tank vent. .................................................................................... 23

viii
List of tables
Table 2.1 typical gasoline vapor composition (only VOC)…………………………7
Table 4.1 comparison of results between the three service stations ………………35

1
Chapter one
Introduction

2
1.1 Introduction
Gasoline is a transparent, petroleum-derived liquid that is used primarily as a fuel in
internal combustion engines. It consists mostly of organic compounds obtained by the
fractional distillation of petroleum, enhanced with a variety of additives. A 42-gallon
barrel of crude oil yields about 19 gallons of gasoline, when processed in an oil refinery.
Gasoline, as used worldwide in the vast number of internal combustion engines used in
transport and industry, has a significant impact on the environment, both in local effects
(e.g., smog) and in global effects (e.g., effect on the climate). Gasoline may also enter the
environment uncombusted, as liquid and as vapors, from leakage and handling during
production, transport and delivery, from storage tanks, from spills, etc.
Volatile organic compounds (VOCs) are among the most common air pollutants emitted
by chemical process industries, and include hydrocarbons such as olefins, paraffin and
aromatics. VOCs adversely affect air quality as it is one of the precursors of ground level
ozone (GLO), the primary component of smog. It can also have a negative impact on
human health due to its toxicity. During gasoline storage and distribution, VOCs are
emitted due to evaporation, where the rate of evaporation depends on factors such as the
vapor pressure of the liquid, temperature and turbulence.
Besides being an environmental hazard, these fugitive VOCs emissions actually cost a lot
money. So by minimizing the escaped vapors from bulk storage at marketing depot and
the storage tank at service station we maximize the profits of the owners of the marketing
depot and the service station.
Vapor recovery of gasoline is used extensively in Europe and the United States of
America, with legislation to enforce its use. In Sudan little attention has been given to
VOC control in general, and the use of vapor recovery systems in particular.
The objectives of this dissertation are to:

3
Evaluate vapor recovery systems used in first world countries for the control of
VOC emissions from gasoline,
Determine evaporative losses from the storage tank at service station.
In this dissertation the evaluation of vapor recovery systems and related terminology was
conducted via a literature review and is presented in Chapter 2. Methodology and
calculation of losses from the storage tank at service station in Chapter 3, followed by a
discussion of the results in Chapter 4. Conclusions and recommendations are presented in
Chapter 5

4
Chapter two
Literature review

5
Literature review
2.1 Introduction
Gasoline is a commodity used worldwide. During its use, carbon dioxide, nitrous oxides
and hydrocarbons are emitted as a result of combustion processes taking place in a
vehicle. Further emissions, consisting of hydrocarbons, take place during the storage and
distribution of gasoline due to evaporation.
The hydrocarbons emitted during gasoline storage and distribution can be broadly
classified as volatile organic compounds (VOCs). VOCs make up a major class of air
pollutants and is a brad collective term for different organic compounds. These include
pure hydrocarbons, partially oxidized hydrocarbons and organics containing chlorine,
Sulphur and nitrogen; with most VOCs being toxic and/or carcinogenic (Jo and Song,
2001).
According to Jeffery (1998), there is some discrepancy in the definition of VOCs used in
international legislation. In the United States of America a VOC is defined as any
compound of carbon that participates in atmospheric photo chemical reaction, excluding
carbon monoxide, carbon dioxide, carbonic acid, metallic carbides and carbonates and
ammonium carbonate. The United Nations Economic Commission for Europe (UNECE)
classifies VOCs based on their photochemical ozone creation potential (POCP). POCP is
defined as the change in photo chemical ozone production due to change in emission of a
particular VOC and can be determined by photochemical model calculation or laboratory
experiments (Jeffery, 1998).
In the presence of sunlight, VOCs react with nitrogen oxides forming photochemical
oxidants such as ozone. Ground level ozone (GLO) is a major component in the
formation of smog, can migrate great distances and is a known greenhouse gas. Smog
also adversely affects human health, vegetation and materials. Although VOCs and
nitrogen oxides occur naturally, anthropogenic sources have greatly increased the
concentration in the atmosphere. According to Sangster (1991), VOC emissions originate
from:
Industrial and domestic solvents (40%);
Exhaust gases from motor vehicles (25%);

6
Evaporative and running losses from motor vehicles (10%);
Gasoline distribution (3%);
Vehicle refueling (2%);
Oil refining (3%); and
17% from other sources.
Although gasoline distribution and vehicle refueling contributes to only 5% of the total
VOC emissions, these emissions are concentrated at gasoline bulk storage facilities and
service station, highly frequented by people.
A typical gasoline distribution system is shown in Figure 2.1. In Sudan pipelines are
mainly used for the transportation of gasoline from product storage facilities at refineries
to bulk storage tanks at marketing depots. From the marketing depots road tankers are
used to transport the gasoline to the service stations.
Figure 2.1 typical gasoline distribution system.

7
The control of emissions that occur during the transportation of gasoline from bulk
storage facilities to the ultimate consumer is represented by three stages, namely (Figure
2.2):
Stage Ia involves the control of emissions that occur at facilities when road
tankers are loaded;
Stage Ib involves the control of emissions that occur when road tankers unload
into service station storage tanks; and
Stage II involves the control of emissions that are formed during vehicle
refueling.
During each of these stages evaporation losses occur, as shown in Figure 2.2.
Evaporation occurs whenever gasoline is introduced into a tank that has a vapor space
(Hadley et al., 1978). Unless the resultant vapor (a VOC/air mixture) is contained or
suppressed by some means, a loss of product results. The VOC composition of gasoline
vapor; gasoline being a mixture of compounds with different boiling points with the
tendency of the lower molecular weight compounds to evaporate; is shown in Table 2.1
(Hansen, 1996).
Table 2.1 Typical gasoline vapor composition (only VOC)
Compound Volume
Ethane Traces
Propane 1.5 %
Isobutene 8 %
n-Butane 10 %
Pentane 14 %
Benzene 5000 ppm
Hexane and others 6 %
TOTAL
(VOC only, remainder is air)
40 %

8

9
Figure 2.2
2.2 Evaporative emissions According to Hadley et al. (1978), the average emission from a typical European gasoline
storage and distribution system, as shown in Figure 2.2 is 0.56 volume % of the gasoline
distributed. Therefore, for every 1000 liters of gasoline distributed (that is, gasoline from
the bulk storage facilities to the remainder of the distribution system); 5.6 liters are lost to
the atmosphere through evaporative emissions. These emissions can be divided into four
types, namely displacement, breathing and withdrawal, filling and refueling emissions.
2.2.1 Displacement emissions Displacement emissions occur from fixed roof storage facilities (bulk storage tanks), as
well as underground service station tanks due to vapor displacement emissions from fixed
roof storage facilities account for0.14 % (vol.%) and from service station storage tanks
for 0.16 % of the total emissions losses (0.56%) from gasoline storage and distribution
systems (Hadley et al., 1978).
2.2.2 Breathing and withdrawal emissions Breathing emissions are caused by variations in tank contents, temperature and by
changes in barometric pressures that cause expansion and contraction to the liquid and
vapor in a tank. Withdrawal emissions occur when gasoline is pumped out of a storage
tank resulting in the intake of air through pressure/vacuum relief valves or vents. The
incoming air will dilute the VOC/air mixture previously contained in the tank, resulting
in an increase in evaporation to restore the equilibrium. Breathing and withdrawal
emissions from bulk storage tanks account for 0.02% and from service station storage
tanks for 0.01% of total emission losses. Breathing and withdrawal emissions from
tankers are not significant due to the relatively short transit times (Hadley et al., 1978).
2.2.3 Filling emissions Filling emissions occur when gasoline is transferred from storage tanks to road tankers.
Hadley et al. (1978) identified two types of vapor making up filling emissions, namely
preloading vapor (PLV) and evolution vapor (𝑉𝑒).
PLV is residual vapor originating from a tank’s previous contents, being displaced by
loading of the new product.

10
Evolution vapor (𝑉𝑒) evaporates from the product itself when it is being loaded. Petrol
can be loaded into a road tanker via top splash loading, submerged top loading or bottom
loading. Most 𝑉𝑒 evaporation takes place during splash loading when the turbulence in a
tank is at its peak.
2.2.4 Emissions from vehicle refueling
When a motor vehicle is being refueled at a service station the incoming gasoline
displaces the gasoline vapor in the fuel tank, causing it to escape into the atmosphere.
These emissions contribute to 0.18 volume % of the total emissions from gasoline storage
and distribution systems (Hadley et al., 1978).
2.3 Factors affecting evaporation
The main factors affecting evaporation are product (liquid gasoline) properties,
liquid/vapor interface areas and turbulence in the relevant liquid and vapor. Product
properties that play a role during evaporation are vapor pressure and temperature. The
higher either the vapor pressure and/or the temperature of a liquid, the higher the
expected rate of evaporation. The vapor pressure of a petroleum product can be
determined by using the Reid vapor pressure (RVP) method where RVP is also a generic
term used for gasoline volatility (EPA, 2003a). RVP is a standard laboratory method that
measures the Reid vapor pressure of a substance at a temperature of 100◦F, or 37.8 ◦C
(Hadley et al., 1978). The RVP is about 10% less than the true vapor pressure. Appendix
A shows a nomogram for the determination of true vapor pressure from RVP at any
temperature for different petroleum products (EPA, 2006b).
The rate of evaporation is also proportional to the area of the liquid/vapor interface. By
decreasing the liquid/vapor interface area, the amount of evaporation will decrease due to
the limited amount of vapor space above the liquid (Hadley et al., 1978).
Turbulence in the liquid and/or vapor will increase the rate of evaporation and reduces
the time necessary to reach 100% saturation in the vapor space via two mechanisms
(Hadley et al., 1978). When light hydrocarbons evaporate, the thin liquid surface layer
becomes momentarily deficient in these molecules, slowing the rate of evaporation.
However, when fresh gasoline is loaded, the light hydrocarbons move to this region via
diffusion and evaporation continues. This process is accelerated by mixing and/or
turbulence in the liquid.

11
In the vapor space above the liquid, the hydrocarbons molecules are heavier than air and
tend to accumulate as a layer just above the liquid surface, suppressing further
evaporation (Hadley et al., 1978). Turbulent movements in the vapor space cause by
thermal convection currents or pressure vacuum valve air intakes accelerate evaporation.
2.4 Control of emissions Emissions from gasoline storage and distribution systems can be controlled in four
methods. The methods are prevention, minimization, recovery and finally treatment. The
treatment will not be addressed in this dissertation.
2.4.1 Emission prevention and minimization The same techniques are followed in both the prevention and minimization of emissions.
These include decreasing the volatility of gasoline (by lowering RVP or introducing RVP
limits) and its temperature, vapor balancing, minimizing the liquid/vapor interface area
and reducing turbulence.
It is common practice in large parts of Europe and North America to blend gasoline to a
predetermined RVP limit, depending on the season (Kojima and Mayorga-Alba, 1998).
Although there has been a move in lowering the RVP limits generally, lower limits exist
to avoid combustion problems in motor vehicles (Hansen, 1996).
Lowering the temperature that gasoline is stored at will decrease the true vapor pressure
and therefore decrease the amount of evaporation. Methods in reducing gasoline
temperature include painting of storage tanks in sun reflecting colors (for example, silver
and white) and the use of underground storage tanks.
Vapor balancing involves a vapor retrieval system whereby vapor displaced from
tanks/tankers receiving gasoline is returned to the tanks/tankers delivering gasoline. For
example, vapor formed during vehicle refueling is rerouted back to the service station
storage tank. The liquid inside the service station storage tank will only evaporate until
the vapor in the air space above liquid reaches a certain pressure, therefore less
evaporation will occur due to the returned vapor (Jeffery, 1998).
The use of floating covers in storage tanks prevents contact between the product and air,
thereby decreasing the liquid/vapor interface area and therefor evaporation. According to
Hadley et al. (1978), this can reduce or even prevent displacement, withdrawal and
breathing emissions. As evaporation is either bottom or submerged top loading, instead of
top splash loading; will reduce turbulence and therefore evaporation.

12
2.4.2 Vapor recovery In this dissertation we are interested in the vapor recovery for underground tanks in
service stations. There are five vapor recovery systems, this section reviews the vapor
recovery systems applicable to bulk terminals and assesses the efficiency, reliability,
safety and manufacturing capacity of these systems.
2.4.2.1 Compression-Refrigeration-Absorption Systems
The compression-refrigeration-absorption vapor recovery system (CRA) is based
on the absorption of gasoline vapors under pressure with cool gasoline from storage. The
primary unit in CRA systems is the absorber with the remaining components serving to
condition the vapor and liquid entering the absorber, improve absorber efficiency, reduce
thermal losses, and/or improve system safety.
Figures 2.3 and 2.4 show two CRA vapor recovery systems. Incoming vapors are first
passed through a saturator where they are sprayed with fuel to insure that the
hydrocarbon concentration of the vapors is above the explosive level. This is done as a
safety measure to reduce the hazards of compressing hydrocarbon vapors.
The partially saturated vapors are then compressed and cooled prior to entering the
absorber. In the absorber the cooled, compressed vapors are contacted by chilled
gasoline drawn from product storage and are absorbed. The remaining air containing
only a small amount of hydrocarbons is vented from the top of the absorber and gasoline
enriched with light ends is withdrawn from the bottom of the absorber and returned to the
fuel storage tanks. The operating conditions in the absorber vary with the manufacturer,
and range from -10°F to ambient temperature and from 45 psig to 210 psig. Although
dependent on terminal operating schedules and vapor storage capacity.

13
Figure 2.3 compression-refrigeration-absorption unit by Parker Hannifin

14
Figure 2.4 compression-refrigeration-absorption by Rheem Superior
The vapor collection efficiency of a CRA vapor recovery unit is difficult to define due to
its dependency on inlet hydrocarbon concentration. The outlet hydrocarbon
concentration, however, is essentially fixed by the absorber operating conditions. Field
tests have shown it to range from 1% to 4.5%, by volume. Current CRA systems on the
market can surpass 90% recovery (if so required) for inlet hydrocarbon concentrations
GJ: greater than 20% by volume. One CRA unit supplies a booster compressor to achieve
90% recovery at lower inlet hydrocarbon concentrations.
2.4.2.2 Compression-Refrigeration-Condensation Systems
Compression-Refrigeration-Condensation vapor recovery systems (CRC) were
the first type utilized by the petroleum industry. They are based on the condensation of
hydrocarbon vapors by compression and refrigeration. Figures 2.5 and 2.6 show the flow
scheme of two CRC systems. Incoming vapors are first contacted with recovered product
in a saturator, and are saturated beyond the flammability range.
The saturated vapors are then compressed in a two-stage compressor with an
inter-cooler. Condensate is withdrawn from the inter-cooler prior to second stage
compression. The compressed vapors pass through a condenser where they are cooled,

15
condensed, and returned along with condensate from the inter-cooler to the gasoline
storage tank. Essentially, hydrocarbon-free air is vented from the top of the condenser.
Each manufacturer has minor variations from this basic flow scheme.
Operation conditions vary with the manufacturer, with temperatures ranging
from -10°F to 30°F and pressures ranging from 85 psig to 410 psig. Although dependent
on terminal operating schedules and vapor storage capacity.
The efficiencies of CRC vapor recovery units are not well documented and
difficult to define due to their dependency on inlet hydrocarbon concentrations. Data
from field tests indicate that CRC units can recover 96% of the hydrocarbons in saturated
gasoline vapors and 8870 to 90% of the hydrocarbons in sub saturated gasoline vapors
from bottom loading operations. Vendors claim that adjustments and optional equipment
can improve the efficiency of CRC systems to a minimum recovery of 94.

16
Figure 2.5 compression-refrigeration-condensation unit by GESCO

17
Figure 2.6 compression-refrigeration-condensation unit by VAPOREX

18
2.4.2.3 Refrigeration Systems
One of the vapor recovery systems is the straight refrigeration system, based on the
condensation of gasoline vapors by refrigeration at atmospheric pressure.
Figure 2.7 shows the flow scheme of such a system. Vapors displaced from the
terminal enter a horizontal fin-tube condenser where they are cooled to -100°F and
condensed. Because vapors are treated on demand, no vapor holder is required.
Condensate is withdrawn from the condenser bottom and the remaining air, containing
only a small amount of hydrocarbon, is vented from the condenser top. Cooling for the
condenser coils is supplied by a methyl chloride reservoir. A two-stage refrigeration unit
is used to refrigerate the stored brine solution to between -105°F a 125° F.
The vapor recovery efficiency of refrigeration systems is again dependent on the
hydrocarbon concentration of the inlet vapors. Field tests of a unit with a condenser
temperature of -100°F indicate the outlet hydrocarbon concentration is relatively fixed by
the condenser temperature at 0.6% to 2.6% by volume. Typical hydrocarbon recoveries
are 93% to 97% with recoveries reaching 99% for saturated inlet vapors.

19
Figure 2.7 refrigeration vapor recovery unit by Edwards
2.4.2.4 Lean oil absorption systems
The lean oil absorption (LOA) vapor recovery system is based on the absorption of
gasoline vapors into lean gasoline stripped of light ends.
Figure 2.8 is a flow scheme of a LOA vapor recovery system. Gasoline vapors
from the terminal are displaced through the packed absorber column where they are
absorbed by cascading lean gasoline (termed sponge oil or lean air at atmospheric
temperature and pressure. Stripped air is vented from the top of the absorber column.
The enriched gasoline is returned to storage. Lean gasoline for the absorber is generated
by heating gasoline from the storage tanks and evaporating off the light ends. The

20
separated light ends are compressed, condensed, and returned to storage, and the lean
gasoline is stored separately for use in the absorption column.
The vapor recovery efficiency of LOA systems is dependent on the liquid to
vapor ratio in the absorber and on the hydrocarbon content of the inlet vapors. The
manufacturer reports that normal practice is to adjust the lean oil feed rate to the absorber
such that the hydrocarbon content of the stripped air is 370 by volume. This corresponds
to a 907o or greater recovery for inlet hydrocarbon concentrations of 247° or greater.
Higher lean oil rates are used when improved recovery is required
Figure 2.8 Lean oil absorption system by Southwest Industries

21
2.4.2.5 Operating Reliability
The operating reliability of terminal vapor recovery systems is generally
good. The technology is proven through use by industry over two decades. Companies
using CRA and CRC units report average downtime for properly maintained units is
about one week per year. Freezing problems have occurred with CRA, CRC, and
refrigeration systems where the vapors are subject to temperatures below 32°F. Water
vapor contained in the air freezes in the system, hindering heat transfer and clogging
lines. The two solutions to this problem have been:
Include an automatic defrost cycle which shuts down part of the system during off
periods and allows for defrosting the iced sections.
Inject methanol into the system to lower the freezing point of the aqueous layer.
Both solutions to the icing problems generally work well, however, isolated problems
with icing still occur. Another major source of problems in CRA and CRC systems is the
gasoline vapor compressor. Compressors handling heterogeneous mixtures of air, light
hydrocarbons, and water vapor have maintenance problems in rotors and bearings
normally encountered with closed loop refrigerant compressors. There have also been
reports that some lean oil absorption units are experiencing problems in obtaining
adequately stripped lean oil feed to the absorber.
2.4.2.6 Safety
Safety is always of paramount importance in designing equipment to handle flammable
materials. The manufacturers of vapor recovery equipment have been conscious of this,
and have included safety features in their designs. ORC, and CRA units have potential
safety problems whenever explosive hydrocarbon mixtures are being stored and
processed. To eliminate the possibility of explosion, these units are generally equipped
with means to saturate the incoming vapor stream which raises the hydrocarbon content
above the explosive Refrigeration systems generally operate at temperatures which
explosions are a threat. CRA and CRC systems have the problem of compressing
hydrocarbon vapors. The adiabatic heat of compression increases the outlet gas
temperature to the point where it is much more easily ignited than is the cooler inlet
vapors. Compression ratios and the corresponding outlet gas temperatures must be
maintained at levels low enough to prevent excessive heating and spontaneous
combustion.
Another potential safety problem in systems employing vapor holders has been leakage
creating explosive mixtures in the air space above the diaphragm. Regularly maintained

22
and inspected diaphragms should pose no safety problems. Because these are largely
custom made, none of the vapor recovery systems currently have obtained Underwriters
Laboratory approval.
2.4.2.7 Manufacturing Capacity
The manufacturing capacity and installation time of the vapor recovery industry is
dependent on the availability of supplies, equipment, contractors, labor, and weather.
Recent estimates by the top eight manufacturers are that their yearly production rate is
four to five hundred units although this rate could be expanded if the need arises. CRA
and CRC manufacturers have a nine to twelve month delivery time, while manufacturers
of refrigeration and LOA, units report six month delivery times. These manufacturing
capacities and delivery times may be optimistic in light of the current economic situation
and material shortages.
2.4.2.8 Summary
The four major types of vapor recovery systems for terminals are compression-
refrigeration-absorption, compression refrigeration-condensation, straight refrigeration
and lean oil absorption. The technology of each system is well developed. Each of these
vapor recovery systems are capable of meeting 90% recovery although some may require
adjustments or additional equipment to meet 90% recovery on inlet streams having a very
low hydrocarbon concentration. The reliability of vapor recovery units for bulk terminals
is good and is continuously being improved. Future stream factors, assuming proper
maintenance should be in the 95% category
2.4.2.9 Membrane separation system
Beside all the previous vapor recovery systems. A simple and small vapor recovery
system has been made to do the exact work of separating the gasoline from the vapor
mixture with lower cost.it called membrane separation system.
In the last few years, several hundred retail gasoline stations have installed small
membrane systems to treat their tank vents. A flow scheme of this type of system is
shown in Figure 2.9. Air from the gas station dispenser is collected and sent to the
gasoline storage tank. When the pressure in the tank reaches a preset value, a pressure
switch activates a small compressor that draws off excess vapor-laden air. A portion of
the hydrocarbon vapors condense and is returned to the tank as a liquid. The remaining
hydrocarbons permeate the membrane and are returned to the tank as concentrated vapor.
Air, stripped of 95-99% of the hydrocarbons, is vented. In addition to eliminating

23
hydrocarbon emissions, the unit essentially pays for itself with the value of the recovered
gasoline.
Figure 2.9 Flow diagram of a membrane gasoline-vapor recovery unit suited to a retail gasoline station tank vent.
Typical systems are small, containing a single 1-2 m2 membrane module and costing
from $5,000 to 15,000. Several hundred, perhaps as many as1000 of these systems have
been installed around the world.

24
Chapter three
Methodology

25
Methodology
3.1 Introduction This chapter is structured in the theoretical evaporation emissions calculations, using
Sudan product (gasoline) data, are presented. Thereafter experimental evaporation
emissions for Sudan’s service stations are calculated in three different service stations
based on the gasoline consumption rate in each station. One with High consumption rate,
second with medium consumption rate and third with low consumption rate.
In Sudan there’s an Agreement between the petroleum companies and service provider in
which the amount of loss due evaporation must not exceed 0.3 in percentage and In case
of exceeding the company is obligated to compensate the difference.
Theoretical filling emission Calculations in Service station:
The theoretical evaporation emissions is calculated based on Equations found EPA
methodology using gasoline RVP (Reid vapor pressure), product temperature and vapor
characteristics . The Gasoline Produced in Sudan (Khartoum Refinery) has an average
Reid Vapor Pressure 8.3.
According to EPA (2006) the equations to estimate the working losses and breathing
losses from underground and aboveground gasoline storage tanks are
3.2 Working loss
Working losses occur when the vapor in the vapor space over the liquid is displaced from
the tank by the addition of organic liquid during tank filling.
The following equation was used for the estimation of working loss from underground
and aboveground gasoline storage tanks:
𝑊𝐿 = (0.0010) ∗ 𝑄 ∗ 𝑀𝑉 ∗ 𝑃𝑉𝐴 ∗ 𝐾𝑁 ∗ 𝐾𝑝 (3.1)
Where:
WL= storage tank working loss (lb. /year)
Q= annual net gasoline throughput (bbl. /year)

26
MV= gasoline vapor molecular weight (lb./lb.-mole)
PVA= vapor pressure at daily average liquid surface temperature (psia)
KN= working loss turnover (saturation) factor, dimensionless;
KP= working loss product factor, dimensionless;
0.0010= integrated conversion factor to yield the units of lb. /year for the working loss
Q = the annual net gasoline throughput.
MV= the gasoline vapor molecular weight (MV) was calculated by using equation (3.2)
MV = 63 + 0.1053 (T − 15.55) (3.2)
Where
T= site specific mean daily temperature during warm and cold season, respectively (oC)
PVA=the vapor pressure of gasoline at daily average liquid surface temperature was
calculated using appendix A
KN=the working loss turnover (saturation) factor (KN) was estimated from the following
USEPA model:
For turnovers per year (N) > 36
𝐾𝑁 = (180 + 𝑁)
6𝑁 (3.3)
For turnovers per year (N) ≤ 36
KN = 1
N=the turnover rate is estimated using equation (3.4).
N = 5.614 ∗Q1
VLX (3.4)
Where:
Q1= annual net gasoline throughput (bbl. /year)
27
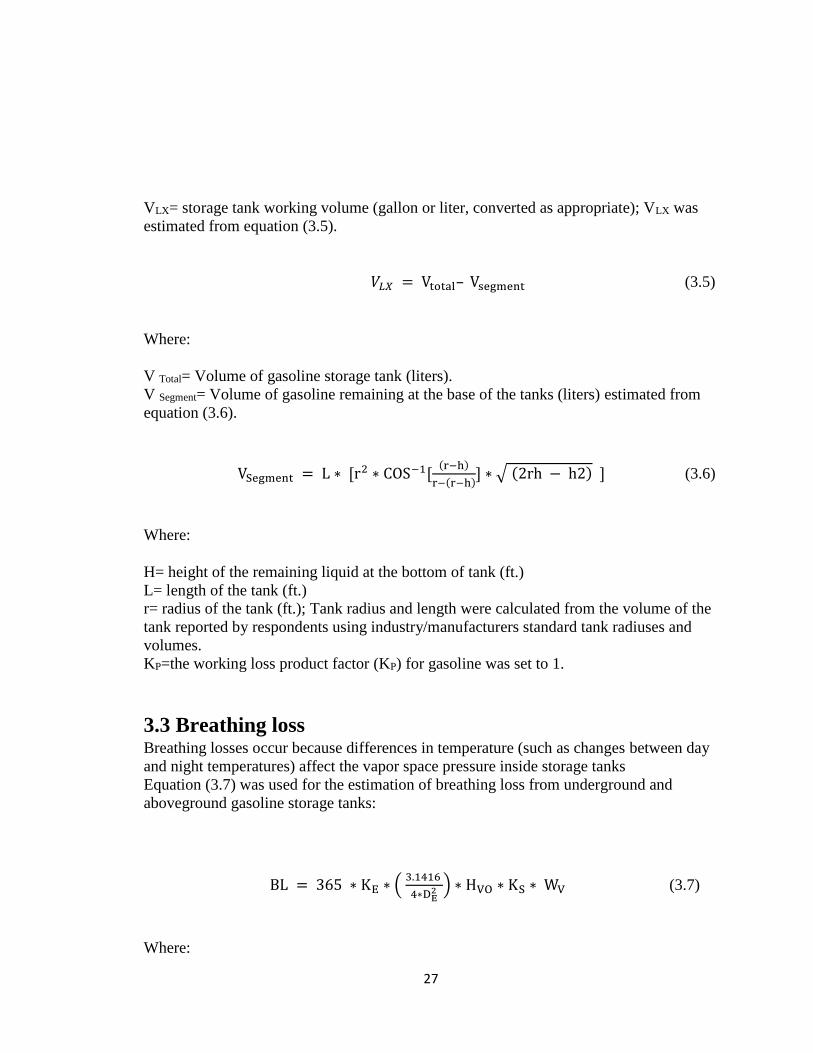
VLX= storage tank working volume (gallon or liter, converted as appropriate); VLX was
estimated from equation (3.5).
𝑉𝐿𝑋 = Vtotal– Vsegment (3.5)
Where:
V Total= Volume of gasoline storage tank (liters).
V Segment= Volume of gasoline remaining at the base of the tanks (liters) estimated from
equation (3.6).
VSegment = L ∗ [r2 ∗ COS−1[(r−h)
r−(r−h)] ∗ √ (2rh − h2) ] (3.6)
Where:
H= height of the remaining liquid at the bottom of tank (ft.)
L= length of the tank (ft.)
r= radius of the tank (ft.); Tank radius and length were calculated from the volume of the
tank reported by respondents using industry/manufacturers standard tank radiuses and
volumes.
KP=the working loss product factor (KP) for gasoline was set to 1.
3.3 Breathing loss Breathing losses occur because differences in temperature (such as changes between day
and night temperatures) affect the vapor space pressure inside storage tanks
Equation (3.7) was used for the estimation of breathing loss from underground and
aboveground gasoline storage tanks:
BL = 365 ∗ KE ∗ ( 3.1416
4∗DE2 ) ∗ HVO ∗ KS ∗ WV (3.7)
Where:

28
BL= storage tank breathing loss (lb. /year)
365= constant, the number of daily events in a year.
KE= vapor space expansion factor, dimensionless
3.1416= mathematical constant; the standard ratio of 22/7 for circle circumference to its
diameter
DE= effective tank diameter for horizontal tanks (ft.)
HVO= vapor space outage (ft.)
KS= vented vapor saturation factor, dimensionless
WV= gasoline vapor density (lb. /ft3)
KE=the vapor space expansion factor (KE) was calculated by using equation (3.8).
KE = ( ∆TV
TLA ) + (ΔPV − ΔPB) / (PA − PVA) (3.8)
Where:
KE= vapor space expansion factor, dimensionless
ΔTV= daily vapor temperature range (°R, Degrees Rankin)
TLA= daily average liquid surface temperature (°R)
ΔPV= daily vapor pressure range (psia)
ΔPB= breather vent pressure setting range (psia)
PA= atmospheric pressure (psia)
PVA= vapor pressure at daily average liquid surface temperature (psia)
ΔTV=the daily vapor temperature range (ΔTV) was calculated by using equation (3.9).
ΔTV = 0.72 ∗ ΔTA + ( 0.028 α ∗ I) (3.9)
Where:
ΔTV= daily vapor temperature range (°R)
ΔTA= daily ambient temperature range (°R); the daily ambient temperature range (ΔTA)
is the difference between the average maximum and average minimum ambient
temperatures during each season, as expressed by equation (3.10):
ΔTA = TAX − TAN (3.10)

29
Where:
TAX= daily average maximum ambient temperature (°R)
TAN= daily average minimum ambient temperature (°R)
α= tank paint solar absorbance, dimensionless; the tank paint solar absorbance (α) data
for aboveground tanks are provided by the USEPA. For underground tanks, this
parameter assumes the value of zero.
I= daily total solar insolation factor (Btu/ft2 d); the daily total insolation factor (I) data for
aboveground tanks are provided by the USEPA. For underground storage tanks, this
parameter assumes the value of zero.
TLA=the daily average liquid surface temperature (TLA) was calculated by using equation
(3.11):
TLA = ( 0.44 ∗ TAA) + (0.56 ∗ TB ) + ( 0.0079 ∗ α ∗ I) (3.11)
Where:
TLA= daily average liquid surface temperature (°R)
TAA= daily average ambient temperature (°R)
TB= liquid bulk temperature (°R)
α= tank paint solar absorbance, dimensionless
I= daily total solar insolation factor (Btu/ft2 d)
Daily average ambient temperature (TAA) was calculated by using equation (3.12):
TAA = (TAX + TAN)
2 (3.12)
Where:
TAX= daily average maximum ambient temperature (°R)
TAN= daily average minimum ambient temperature (°R)
𝑇𝐵 =for aboveground tanks, the liquid bulk temperature (TB) was calculated by using
equation (3.13), while for underground tanks, it was assumed to be equal to the average
underground temperature during the particular season.

30
TB = TAA + (6 α − 1 ) (3.13)
Where:
TAA= daily average ambient temperature (°R)
α= tank paint solar absorbance, dimensionless
ΔPV=the daily vapor pressure range (ΔPV) was calculated by using equation (3.14).
𝛥𝑃𝑉 = 𝑃𝑉𝑋 − 𝑃𝑉𝑁 (3.14)
Where:
ΔPV= daily vapor pressure range (psi)
PVX= vapor pressure at the daily maximum liquid surface temperature (psi)
PVN= vapor pressure at the daily minimum liquid surface temperature (psi)
ΔPB =the breather vent pressure setting range (ΔPB) was calculated by using equation
(3.15)
ΔPB = PBP − PBV (3.15)
Where:
ΔPB= breather vent pressure setting range (psi)
PBP= breather vent pressure setting (psi)
PBV= breather vent vacuum setting (psi)
PVA=the vapor pressure at daily average liquid surface temperature (PVA)
DE =the effective tank diameter was calculated by using equation (3.16).
DE = [L∗D
π
4
]−
1
2 (3.16)
Where:
DE= effective tank diameter (ft.)
L= length of the horizontal tank (ft.)

31
D= diameter of the horizontal tank (ft.)
HVO =the vapor space outage (HVO) for horizontal tanks is equal to half of the effective
tank height, calculated by using equation (3.17).
𝐻𝑉𝑂 = 𝐻𝐸
2 (3.17)
Where:
HE= effective height of horizontal tanks (ft.)
HE=the effective height of a horizontal tank (HE) corresponds to the height of a vertical
tank having the same volume as the horizontal tank in question; it was calculated using
equation (3.18).
𝐻𝐸 = 3.1416∗ D
4 (3.18)
Where:
D=is the diameter of the horizontal tank
KS=the vented vapor saturation factor (KS) was calculated by using equation (3.19).
𝐾𝑆 = 1
(1+0.053∗𝑃𝑉𝐴∗𝐻𝑉𝑂) (3.19)
Where:
PVA= vapor pressure at daily average liquid surface temperature (psi)
HVO= vapor space outage (ft.), the vapor space outage (HVO) was calculated by using
equation (3.17) above.
WV = the gasoline vapor density (WV) was calculated by using equation (3.20).
WV = MV ∗PVA
(R∗TLA) (3.20)

32
Where:
MV= gasoline vapor molecular weight (lb./lb.-mole), the gasoline vapor molecular weight
(MV) was calculated by using equation (3.2) above.
PVA= vapor pressure at daily average liquid surface temperature (psi)
R= ideal gas constant (10.731 psia ft3/lb.-mole °R)
TLA= daily average liquid surface temperature (°R), the daily average liquid surface
temperature (TLA) was calculated by using equation (3.11).
3.4 Assumptions & givens Site average daily temperature T=31.5 oC.
Effective height 𝐻𝐸=30 cm.
Vapor pressure at daily average liquid surface temperature 𝑷𝑽𝑨=49 kPa. (7.12 psi)
Gasoline vapor molecular weight MV=100.
Daily average maximum ambient temperature TAX =37 oC.
Daily average minimum ambient temperature TAN =26 oC.
PVX=8.63616 psi from Appendix A at TAX =37 oC.
PVN=6.062 psi from Appendix A at TAN =26 oC.
Tank paint solar absorbance α= 0, for underground tanks, this parameter assumes
the value of zero.
Breather vent pressure setting range ΔPB =0 in the absence of pressure and
vacuum vents, ΔPB assumes the value of zero.
Storage tank working volume VLX= 95% of VTotal
𝑉𝑇𝑜𝑡𝑎𝑙 for the three stations =45000 liters
The working loss product factor KP= 1.
R= ideal gas constant (10.731 psi ft3/lb.-mole °R)
3.5 Sample of calculations The calculation of working loss and breathing loss in the medium consumption rate
service station (Jabl Awleya)
3.5.1 Working loss
Q=409613.476 liter per year (25760 bbl. per year)
MV=100
𝑷𝑽𝑨=49 kPa. (7.12 psi)
KP= 1
VLX= 95% of 𝑉𝑇𝑜𝑡𝑎𝑙 =0.95*45000=427500 liters

33
Use equation (3.4) N=95
Use equation (3.3) 𝐾𝑁= 0.48
Use equation (3.1) WL= 5576.97 liter per year (8848.786 lb. per year)
3.5.2 Breathing loss
Use equation (3.14) ΔPV=2.5743 psi.
Use equation (3.12) TAA=31.5 oC (548.37 °R)
Use equation (3.13) 𝑇𝐵 =30.5 oC
Use equation (3.11) TLA≈31.5 oC
Use equation (3.10) ΔTA=19.8 oR
Use equation (3.9) ΔTV=14.256 oR
Use equation (3.20) WV = 0.12
Use equation (3.18) HE=7.98 ft.
Use equation (3.17) HVO =3.99 ft.
Use equation (3.19) KS=0.4
Use equation (3.16) DE =0.062 ft.
Use equation (3.8) KE=0.365
Use equation (3.7) BL= 3245.05 liter per year (5148.81 lb. per year)

34
Chapter four
Results & Discussion

35
4.1 Results
Our pervious calculations have been made to calculate the fuel emission in three different
service stations in Khartoum City. The three service stations with different consumption
rate in each station:
Al-Oshara station (high consumption rate).
Jabl Awleya station (medium consumption rate).
Dar AL Salam station (low consumption rate).
The calculations contain the measure of the working loss, the breathing loss,
total loss and the percentage of the total loss to the total volume in each service station to
compute the fuel losses per year.
Table 4.1 comparison of results between the three stations
Service Station
Working loss
Liter/year
Breathing
loss
Liter/year
Total loss
Liter/year
Number of
Filling liters
per year
Percentage
of the total
loss to
number of
filling liter
per year
1/ Al-Oshara 10554.99 3245.05 13800.04 7022231.263 0.196519%
2/ Jabl Awleya 5576.97 3245.05 8822.02 4096136.476 0.215374%
3/ Dar AL Salam 4580.41 3245.05 7825.46 1912000 0.409281%

36
The cost of the total loss of gasoline for the three service stations:
Al-Oshara 64446..187 SDG
Jabl Awleya 41198.8 SDG
Dar AL Salam 36544.9 SDG
4.2 Discussion
The breathing loss is constant for the three stations because it depends on the total
volume of the tank and their volume is constant
As we had mentioned before in chapter 3 that In Sudan there’s an Agreement between
the petroleum companies and service provider in which the amount of loss due
evaporation must not exceed 0.3 in percentage and In case of exceeding the company is
obligated to compensate the difference.
Our results showing that two of the three service stations is in the allowable range of the
0.3%, Al-Oshara and Jabl Awleya with 0.196519% and 0.215374% respectively.
The Third station Dar AL Salam with 0.409281% evaporation losses which exceed the
Limit of 0.3%. The service station owner must demand the company to compensate the
losses.

37
Chapter five
Conclusions & Recommendations
38
5.1 Conclusions
The evaporation loss from underground tanks in some service stations in Sudan is
about 0.41%.This is significantly higher that set by the petroleum companies and
stations provider (0.3%).
A loss percentage of 0.41% if gained means an annually saving of 36544 SDG
for a certain Service Station.
From the results we found that it is important to use vapor recovery system
VOC controls can take many forms and the type of control method used will be
determined by the characteristics of the VOC emissions. Minimization
techniques, such as the lowering of RVP, can be implemented but only to a
certain degree, as there is a lower limit with regard to petrol volatility. Vapor
recovery is the preferred technique for the control Of VOC emissions from petrol
storage and distribution systems. This also has added advantage Of monetary
savings from recovered petrol vapor. There are various VOC treatment
techniques, but this must only be used in situations were other control options are
not viable.
5.2 Recommendations
Install automatic Tank gauge system to eliminate the use to dip stick to minimize
the residual losses caused when we open the tank to measure the fuel volume.
Replace the splash loading method with submerged loading method. As
evaporation is a function of turbulence in liquid and/or vapor interface.
Evaporation reduction or recovery measures need to be developed, declared and
implemented.
Install simple and small membrane vapor recovery system

39
References
1. Cornelia Venter (2003) master of engineering dissertation “recovery of petrol
vapour at a bulk storage facility.
2. EPA (2003a) Volatility (RVP), Gasoline fuels, EPA,
http://www.epa.gov/otaq/volatility.htm
3. EPA (2006b) Emission Factor Documentation for AP-42 Section 7.1
4. EPA (1975) “ a study of vapor control methods for gasoline marketing operations
volume 1”
5. HADLEY PV, DEVOS F, ESTY W, GOMMEL PG, ISING U, LILIE RH,
VERBEEK GPM AND WILLIAMS LJ (1978) Hydrocarbon Emissions from
Gasoline Storage and DistributiN1 Systems, Report nr. 4178, CONCAWE, Haag.
6. HANSEN MR (1996) Hydrocarbon vapor emission reduction by recovery, Paper
presented at Danish Days in Ukraine conference, 5-9 February 1996. Kiev,
Ukraine.
7. JEFFERY K (1998) Bulk Liquids Vapor Control, Hazardous Cargo Bulletin. IIR
Publications, London.
8. JO W AND SONG K (2001) Exposure to volatile organic compounds for
individuals with occupations associated with potential exposure to motor vehicle
exhaust and/or gasoline vapor emissions, The Science of the Total Environment,
269, 25-37.
9. KOJIMA M AND MAYORGA-ALBA EO (1998) Cleaner Transportation Fuels
for Air Quality Management, Energy Issues, No. 13, July 1998, The World Bank,
http://www.worIdbank.org'htrnl/fpd/energy/enls13.pdf (23 October 2002).
10. K. Ohlrogge and J. Wind, “Method and Apparatus for reducing Emissions from
Breather-lined Storage Tanks, U.S. Patent 6,059,856 (May 2000).
11. SANGSTER A (1991) Vapor Recovery from Petrol Distribution, Petroleum
Review, March 1991, 45(530), 130-132, 134.
12. Statistics Canada http://www.statcan.gc.ca/pub/16-001-m/2012015/part-partie1-
eng.htm
13. Richard W. Baker Membrane Technology and Research, Inc. “MEMBRANES
FOR VAPOR/GAS SEPARATION”

40
Appendix A


