Embed Size (px)
Citation preview

University of Khartoum Graduate College
Medical & Health Studies Board
Evidence-based Approach for Applying Risk Management
Principles to Monitor the Quality of Pharmaceutical Products
By:
Amjad. M. Wedaa Idries B.Pharm, IDipMBA, FlstPM, PG Dip PH, MPH
user
Full Research
Thesis submitted in fulfillment of the requirement for the degree of Doctor of Philosophy
to Faculty of Pharmacy, University of Khartoum, Sudan
Supervisor: Professor/ Kamal E. Ibrahim
Professor of Pharmaceutical Chemistry

Page
2

Page
3
“The time is right now for a new framework on
Post Marketing Surveillance System”
Amjad Idries

Page
4
Statement of original authorship:
The work contained in this thesis wan not been previously submitted to meet requirements for
an award at this or any other higher education institute. To the best of my knowledge and belief,
the thesis contains no material previously published or written by another person except where
due reference is made.
Signature:
Amjad Mohammed Idries
Date:

Page
5
This work is dedicated to my father “my friend” for his nonstop support and to my compassionate mother “my teacher”
for everything; for the soles of “Ayman & Assad” as you inspired me to compensate the emptiness you left in my life.
This is for the joy of my life “Rend” and my wife for her patience and perseverance and to my friends my little brother
and sister.

Page
6
Contents Acknowledgements ................................................................................................................................... 10
List of Abbreviations .................................................................................................................................. 11
Abstract ........................................................................................................ Error! Bookmark not defined.
List of figures ............................................................................................................................................. 17
List of tables .............................................................................................................................................. 18
Chapter 1: Introduction and Literature review ............................................................................................. 19
Background ................................................................................................................................................ 19
Currently used quality monitoring systems .............................................................................................. 26
European Union (EU) ............................................................................................................................. 28
Studies done about the detection of substandard medicines .............................................................. 33
Chapter 2: Research methodologies & materials ......................................................................................... 35
Study purpose & objectives....................................................................................................................... 35
Study design and methodologies .............................................................................................................. 36
Health professionals’ survey ..................................................................................................................... 37
1.1 Selection of information providers ................................................................................................. 37
1.2 Questionnaires design ..................................................................................................................... 38
1.3 Medicines selection criteria ............................................................................................................ 39
Final selection of medicines to be surveyed ......................................................................................... 41
1.4 Study geographical area .................................................................................................................. 41
1.5 Study population ............................................................................................................................. 42
1.6 Sampling protocol ........................................................................................................................... 44
1.7 Data Management and Analysis Plan .............................................................................................. 45
Collection of samples for chemical analysis .............................................................................................. 45
Chemical analysis of selected medicines .................................................................................................. 50

Page
7
Bioequivalence study of 2 products of Glibenclamide tab 5 mg ............................................................... 64
Microbiological sensitivity test of Amoxicillin ........................................................................................... 74
Biological assay of 3 products of Ceftriaxone powder for injection 1 g .................................................... 79
Qualitative evaluation of reconstitution practices of Ceftriaxone powder for injection in Khartoum
teaching hospital 2010 .............................................................................................................................. 82
Chapter 3: Results ......................................................................................................................................... 84
Health professionals’ survey ..................................................................................................................... 85
The existence of substandard medicines problem ............................................................................... 87
1. Level of the problem ..................................................................................................................... 87
Effectiveness problems ......................................................................................................................... 88
Medicines which pharmacists and doctors complain about ................................................................. 92
Shifting practices patients from “Product A” to “Product B” ................................................................ 94
Trust of the professionals in local products as alternatives .................................................................. 99
Price as indicator of quality ................................................................................................................. 100
Relations with the regularity bodies ................................................................................................... 101
Comments of providers on the quality of medicines from particular origins ..................................... 102
Other specific indictors ....................................................................................................................... 103
1. Physical appearance problems ......................................................................................................... 103
2. Post Marketing Surveillance System ............................................................................................... 106
3. Medicines recall .............................................................................................................................. 108
4. Prioritization of pharmacological groups according to pharmacists ............................................... 110
1. Doctors’ awareness & knowledge about substandard medicines .................................................... 110
2. Insistence to prescribe particular trade products ............................................................................. 112
I. Other ........................................................................................................................................... 113
General discussion ............................................................................................................................... 114
Feedback about the quality ................................................................................................................. 118

Page
8
1. General ........................................................................................................................................ 119
2. Classification of the feedback based on providers type.............................................................. 120
3. Classification of providers answers about ineffectiveness ......................................................... 121
Collection of samples for chemical analysis ............................................................................................ 128
Sampling Quality Assurance ................................................................................................................ 128
Sample collection form........................................................................................................................ 128
Chemical analysis of selected medicines ................................................................................................ 136
Overall & detailed results .................................................................................................................... 137
Detailed results by generic .................................................................................................................. 138
Summery discussion ............................................................................................................................ 158
Bioequivalence study of 2 products of Glibenclamide tab 5 mg ............................................................. 161
The products ........................................................................................................................................ 161
The volunteers ..................................................................................................................................... 161
Pharmacokinetic analyses ................................................................................................................... 161
Area Under the Curve (AUC) ............................................................................................................... 162
Statistical analyses ............................................................................................................................... 163
Summery discussion ............................................................................................................................ 168
Microbiological sensitivity testing of Amoxicillin .................................................................................... 171
Sample characteristics ......................................................................................................................... 171
Follow-up of the patients .................................................................................................................... 172
Microbiological sensitivity ................................................................................................................... 173
Summery discussion ............................................................................................................................ 175
Biological assay of 3 products of Ceftriaxone powder for injection 1 g .................................................. 179
The products ........................................................................................................................................ 179
Statistical analysis ................................................................................................................................ 179
Results ................................................................................................................................................. 181

Page
9
Summery discussion ............................................................................................................................ 184
Rapid observational study about the reconstitution practice of Ceftriaxone powder for injection ...... 187
Effectiveness of Ceftriaxone ................................................................................................................ 187
Dissolution practices ........................................................................................................................... 187
Concurrent administration with Calcium incorporated products ....................................................... 187
Effect of origin on practice .................................................................................................................. 188
Chapter 4: Discussion .................................................................................................................................. 189
Summary about this chapter ................................................................................................................... 190
Medicines registration outcomes in Sudan: ............................................................................................ 195
Conclusion ................................................................................................................................................... 230
Recommendations ...................................................................................................................................... 231
Bibliography ................................................................................................................................................. 214
Annexes ....................................................................................................................................................... 223
Annex 1: Pharmacists questionnaire ....................................................................................................... 224
Annex 2: Doctors questionnaire .............................................................................................................. 229
Annex 3: Pilot study results ..................................................................................................................... 233
Annex 4: Samples information form ........................................................................................................ 238
Annex 5: Distribution of private retail pharmacies in Khartoum state ................................................... 241
Annex 6: Trade products selection process ............................................................................................ 242
Annex 7: Plan for medicines sample collection ....................................................................................... 253
Annex 8: Samples analysis form .............................................................................................................. 255
Annex 9: Amoxicillin Sensitivity Study ..................................................................................................... 259
Annex XXX Ranking outcome .................................................................................................................. 260
Glossary ....................................................................................................................................................... 278

Page
10
Acknowledgements
Someone may think that the truth is always in the outside and we have to go there and find it. Although
we adopt this approach in this study, it is very important to know that the truth is inside ourselves, are we
believed in our self or not to find it, this is the most important truth.
My great thank and respectfulness to my supervisor Professor. Kamal Eldien Eltayeb as he directed me
towards the right way and lightening my route, his support made the completion of this project a possible
reality. I would like to acknowledge and extend my heartfelt gratitude to Dr. Isameldien Mohammed
Abdalla for his support and encouragement in my career.
I would to thank all those who help me in doing this work; without them I could not have completed this
project. My thanks for Prof. For his valuable recommendation and guidance for my work and the advice
he never spare from me. Great thanks for Mr. Omer Mohammed from National Quality Control
Laboratory for his support in chemical analysis tests. I am thankful for Prof. XXX and for Khartoum
University Hospital family for their support and hospitality for the volunteers. My thanks for all of the
volunteers those express their support by enrolling in the study and their trust in me, this is really
appreciates. The thanks were extended to Aliaa Chain Pharmacies and Aliaa Company family for this
contribution in this research. I express my greetings to nursing staff in Khartoum Teaching Hospital for
their support in conducting some parts of this research within the hospital by their support.

Page
11
List of Abbreviations
ADRs Adverse Drug Reactions
API Active Pharmaceutical Ingredient
AUC Area Under the Curve
BNF British National Formulary
BP British Pharmacopeia
Cap Capsule
CMS Central Medical Supplies
Cmax Maximum Plasma Concentration
CI Confidence Interval
CV Coefficient of variation
DQRS Drug Quality Reporting System
EMA European Medicines Agency
EU European Union
FDA Food and Drug Administration
FMOH Federal Ministry of Health
GMP Good Manufacturing Practice
HACCP Hazard Analysis and Critical Control Point
HPLC High Performance Liquid Chromatography
ICH International Conference of Harmonization
Inj Injection
KAP Knowledge – Attitude - Practice
KE Elimination rate constant
LC Liquid Chromatography
LRTI Lower Respiratory Tract Infection
MA Marketing Authorization
MIC Minimum Inhibitory Concentration

Page
12
MRA Medicines Regulatory Authority
NGOs Non Governmental Organizations
NMPB National Medicines and Poisons Board
NMRA National Medicines Regulatory Authority
NQCL National Quality Control Laboratory
NSAIDs Non-Steroidal Anti Inflammatory Drugs
OTC Over The Counter
PHC Primary Health Care
PI Principal Investigator
PMS Post Marketing Surveillance
QA Quality Assurance
QC Quality Control
QRM Quality Risk Management
QRS Quality Re-evaluation System
SD Standard Deviation
Syr Syrup
Tab Tablet
Tmax Time to achieve Maximum Plasma Concentration
UoK University of Khartoum
URTI Upper Respiratory Tract Infection
USP United States Pharmacopeia
UV Ultra Violet
WHO World Health Organization

Page
13
Abstract
Background: According to WHO reports, low quality medicines represent about 10% of the
global pharmaceutical market of which about 40% were substandard medicines. Most of the
studies of quality of medicines recommend development of additional innovative techniques
to control the existence of substandard medicines in the market. In Sudan, the system
applied to detect substandard and/or counterfeit medicines is not effective enough. A round
9% of pharmaceutical products are reported to be substandard medicines. A strong post
marketing surveillance system would be a more powerful tool for detecting substandard
and/or counterfeit medicines and showing a true picture of the situation in Sudan.
Strengthening the system by applying risk-based model for supporting the decisions is
proven to be useful and possible approach. Setting: This study was conducted in Khartoum
city, Sudan. Objectives: this research aimed at developing risk-based quality monitoring
scheme or model for pharmaceutical products. The model should help medicines regulatory
authorities in resource limited settings to improve surveillance systems. The research will
provide a practical model for the expanding the existing surveillance system for quality check
of pharmaceuticals currently adopted in Sudan. Methods: different methods were used to
build this model. These include health professionals’ survey targeting the pharmacists and
physicians and chemical analysis of 30 medicines. Based on the outcomes of these sub-
studies, further experiments were conducted that include bioequivalence study of
Glibenclamide products, microbiological sensitivity test on Amoxicillin; biological assay of
three Ceftriaxone products and modeling process of data generated. Results: A model has

Page
14
been successfully formulated and adopted to improve the surveillance system. This model is
unique and it was the first time to develop such tool globally to help in indicating critical
information about the quality of medicines and associated hazard factors to its quality. The
model was designed as large and complex computerized system using Microsoft excel
program. A sample from the outcomes of the model was printed and attached in annex
number 9 for reference. The model was tested for its usefulness and effectiveness and the
results obtained showed potential applications of the system in improving the system. This
would include its use in the selection technique of products for inclusion in post-marketing
quality monitoring. It can also be applied to increase the detection rate of low quality
products. Using the developed model, the chance to detect substandard and/or counterfeit
products will be increased by about 30%. Conclusion: the outcome of this proposed
approach will enable the authorities to expand the input measures of its surveillance system
beyond quality to consider also the efficacy of medicines.

Page
15
الملخص العربي:
من إجمالي السوق العالمي لألدوية، وأن %10: رجوعاً لتقارير منظمة الصحة العالمية فإن األدوية المتدنية الجودة تمثل خلفية
من هذه األدوية هي أدوية ال تطابق المواصفات. الدراسات التي تمت في مجال جودة األدوية أوصت غالبيتها بضرورة 40%
فية أكثر إبتكاراً للحد من تواجد األدوية التي ال تطابق المواصفات في السوق. في السودان سنجد أن النظام تطوير تقنيات إضا
المعمول به غير فعال بدرجة كافية لإلستقصاء حول األدوية غير المطابقة للمواصفات وتلك المغشوشة. تشير التقارير إلي أن
ي فإن وجود نظام قوي لمراقبة الجودة يمكن ان يعد بمثابة أداة فاعلة إلحتواء من األدوية غير مطابقة للمواصفات. وبالتال 9%
هذه االدوية ولعكس الصورة الحقيقية للوضع في السوادن. إن تقوية النظام عبر تطبيق نموزج قائمة علي إدارة المخاطر في
أجريت هذه الدراسة في مدينة الخرطوم :دراسةال موقعدعم القرارات المتعلقة بالجودة أثبت فعاليته ونجاحه في هذا المجال.
: هذا البحث أجري بغرض تطوير نهج ونظام لمراقبة جودة المستحضرات الصيدالنية يعتمد في وضعه علي األهدافبالسودان.
ت الموارد أساس مرتبط بإدارة المخاطر. النموذج الذي تم إقتراحه سيساعد السلطات المعنية بالرقابة علي االدوية في الدول ذا
المحدودة في تطوير نظام رقابة الجودة عقب توزيع األدوية في األسواق. هذا البحث سيوفر نموزج تطبيقي لتوسيع نظام التأكد
: عدة طرق أستخدمت لبناء هذا النموذج وقد تضمن ذلك مسح للكوادر الصحية الوسائلمن جودة األدوية وتحليلها بعد التسويق.
إلي تحليل كيمائي لبعض االدوية. بناء علي نتائج هذين المكونين تم إجراء دراسات اخرى تضمنت في الخرطوم باإلضافة
دراسة لمقارنة اإلتاحة الحيوية لعقار الغليبنكالميد، دراسة حول حساسية بعض الميكروبات لعقار األموكسيسيللين، مقارنة
ذلك تم إستخدام نظام حاسوبي لوضع النموذج المقترح لمنتجات من عقار السفترايكسون بطرق بايولوجية باإلضافة إلي
: تم تطوير نموذج فعال لتطوير أنظمة مراقبة الجودة بإستخدام كافة المعلومات النتائجبإستخدام المعلومات التي تم توفيرها.
. النموذج يعد نظاماً المتاحة من مختلف المصادر سواء أن توفرت من مكونات هذه الدراسة أو البيانات والتقارير المتوفرة
متفرداً حيث أنه وألول مرة يتم إستخدام أداة بهذا المفهوم علي المستوي العالمي للمساعدة في التعرف علي عوامل اإلختطار
(. Microsoft Excel programالتي تؤثر علي جودة األدوية. تم تصميم النموذج علي شكل برنامج حاسوب كبير بإستخدام )
كمرجعية. تم اختبار مدى اإلستفادة من النموذج 9هذا البرنامج تمت طباعتها وإرفاقها في ملحق رقم عينة من مخرجات
وفعاليته مقارنة مع النتائج التي تم التحصل عليها من التجارب المشار إليها ومدى إمكانية إستخدامه في تطوير نظام لمراقبة
وية. هذا اإلختبار تضمن مدى مساهمة النموذج في طريقة إختيار االدوية التي الجودة والفعالية في المرحلة التي تلي تسويق األد
يتم تحليلها وكذلك مدى مساهمته في زيادة مقدرة النظام المعول به في التعرف علي األدوية متدنية الجودة. بإستخدام هذا
مقارنة بكفاءة النظام الحالي. %30ب النموذج، فان الفرصة في التعرف علي المنتجات المتدنية الجودة ستزيد بما يقار
: مخرجات هذا النهج الذي تم تطويره ستساعد السلطات المعنية في توسيع مقدراتها و عملها في مجال مراقبة االدوية الخالصة
لتضم محور الفعالية باالضافة لمحور الجودة.

Page
16
Keywords:
Substandard medicines – generics – post marketing surveillance - pharmaceutical product –
risk based model – low quality medicines – medicines regulatory authority – decision making
– chemical analysis – bioequivalence – microbiological assay – bioassay

Page
17
List of figures Figure 1: Distribution of doctors by specialties in the sample 86
Figure 2: Professionals’ evaluation - Level of the problem 87
Figure 3: Classification of complaints reported by pharmacists 88
Figure 4: Classification of therapeutic failure reports 91
Figure 5: Medicines with top complaints from pharmacists 92
Figure 66: Medicines with top complaints from doctors 93
Figure 7: Pharmacists shifting attitude 94
Figure 8: Doctors shifting attitude 97
Figure 9: Classification of physical appearance problems 105
Figure 10: Prioritization of pharmacological groups according to pharmacists’ feedback 110
Figure 11: Mean serum Glibenclamide levels versus time profile 165
Figure 12: Serum glucose level for test and reference products 167
Figure 13: Classification of patients using Amoxicillin products 172
Figure 14: Summery of growth inhibition after using Amoxicillin discs 174
Figure 15: Single dose-response curves for Ceftriaxone products against targeted organisms 182
Figure 16: Combined dose-response curves for Ceftriaxone products against targeted organisms 182
Figure 17: conceptual model of current PMS in Sudan 198
Figure 18: conceptual model of proposed expansion PMS in Sudan 203
Figure 19: Logic of building a general decision support model 213

Page
18
List of tables Table 11: Essential health indicators - Sudan 42
Table 2: generic medicines selected for chemical analysis 52
Table 3: Corresponding MIC for targeted microorganisms 80
Table 4: Overall summery of the feedback about surveyed generics 119
Table 5: Feedback about surveyed generics disaggregated by information provider 120
Table 6: Feedback about surveyed generics disaggregated by problem category 121
Table 7: Summery of primary selected medicines 122
Table 8: Finally selected generics for chemical analysis 136
Table 9: Overall results of chemical analysis 137
Table 10: Main pharmacokinetic parameters for test and reference products 164
Table 11: Summery of relative potencies and other parameters of Ceftriaxone products 181
Table 12: The major market indicators 192
Table 13: Major countries contributing to Sudan market 193
Table 14: Top 15 medicines in the market 2006 194

Page
19
Chapter 1: Introduction and Literature review
Background
The harmful and ethical implications of allowing low quality medicines to be available in the
market for human use are a non-debatable issue (TenHam, 1992). While in last decade there
was a great revolution in producing medicines; it is still valid that significant percentage of
medicines circulated in the global markets was of low quality either substandard or
counterfeit. Nevertheless, these low quality medicines could be considered as not available
for the effective and safe human use (WHO, 2007).
According to WHO: “Substandard drugs are genuine drug products which do not meet quality
specifications set for them” (WHO, 1997). The term substandard used to describe the quality
status of genuine drugs produced by legitimate manufacturers. Normally, for each drug
product the manufacturer produce it based on a set of quality standards or specifications.
Such specifications are also published in official pharmacopoeias such as the United States
Pharmacopoeia, the European Pharmacopoeia, and the WHO International Pharmacopoeia.
If a drug, upon laboratory testing is with accordance to the specifications so it claimed to be
complied and if fails to meet these specifications, then it is classified as a substandard drug
(Layloff, 1997).
Although WHO exert hard work and strategies to contain the problem of low quality
medicines still there is obvious confusion between the nature of substandard and

Page
20
counterfeit products (Pincock, 2003) (Yusufzai, 2002). Both types are critical and very
important issue to pay focused attention on it; still the control of counterfeit medicines is a
very complicated process. It includes multi-sectors collaboration and it entails direct criminal
control interventions so usually it needs special and complex management plans (Kopp,
2003). On the other hand, the nature of substandard medicines is clear forward issue, its
control involves fewer parties and it is usually under the direct responsibility of Medicines
Regularity Authorities “MRAs” in each country. It is usually a controllable problem and this
depends on the capacity and strength of MRAs in the country and how well prepared to
carry out this function. In fact many interventions could contribute directly to resolve this
problem, unlike the problem of counterfeiting which is illegal commerce that is very difficult
to be compact (Arya, 1995). The control of substandard medicines is generally stressed by
many factors; for example, these medicines are usually authorized products and are legal to
be sold for the public within the retail facilities. This is important fact as patients and even
pharmacy personnel can handle it as “safe and effective medicines” unless the authorities
state other notification. This in fact adds more responsibility and pressure on MRAs to detect
these medicines before it reaches the patients.
All of this raises many concerns about the strategies currently used on the ground to face
this problem (Thomas & others, 2003). This may include, but not only limited to, the
following:
- Development of more effective quality monitoring system;
- Improving the detection rate of substandard medicines;

Page
21
- Increasing the availability and sharing of information about the existence of
substandard medicines;
- The advance analysis of the detected cases (its nature, possibilities to be compact,
crosscutting factors lead to the incident and other data).
- Application of continuous improvement process of the system (through research and
development).
When we look into the current systems used to control substandard medicines in Sudan we
can realize the problems associated with considering these factors to improve the system.
The availability of data from previous activities is essential part of any proposed actions for
any problem solving scheme, as building any decision based on evidence become essential.
It is important also to evaluate the cause-effect relationships in these kinds of problems. This
could help the authorities to build effective strategies that are based on evidence of
interrelationships and how each part contribute to the problem and how that could be
managed and solved effectively.
The capacity of the regulatory authority in any country is the determinant factor that affects
the ability of the government to control the problem. In fact, the capacity of the “Quality
Control Laboratory, as one of the major components of the regularity authority, is
determinant key (WHO, 2006). This issue has been raised several times in the previous
period in Sudan. Many concerns were voiced out about the effectiveness and efficacy of the
laboratories to meet the services expected from it and also in comparison to the nature of
pharmaceuticals market in Sudan.

Page
22
Chemical analysis is usually one of the main and essential quality control tests that should be
conducted in order to assure the quality of different types of medicines (Layloff, 1997),
(WHO, 1991). In many countries, the chemical analysis department in the medicines
regulatory laboratories is essential part of the system and usually countries consider its
capacity development seriously as a part of the national priorities. The results of chemical
analysis and other analysis data should be combined and interpreted carefully; so as to
obtain authentic facts about the extent of any quality related problem (Harris, 2003).
Chemical analysis by its own is usually not sufficient indicator about the quality of medicines.
The data generated in this combined manner could point out some knowledge about what
are the factors leads to suspected results from the analysis. By considering this, the results
of the analysis will become supporting means to verify the quality suspected cases or could
be used to support regular and routine checks of medicines.
According to WHO reports, low quality medicines represents about 10% of the global
pharmaceutical market in which about 40% were substandard. When this fact is combined
with the picture about the size of pharmaceuticals market it became obvious how this
problem is triggering. Additional innovative techniques need to be developed to control the
existence of substandard medicines in the market (WHO, Counterfeit Medicines," fact sheet,
2006). The statistics in developing countries showed even more critical situation regarding
the existence of these medicines (Ravinetto, 2002 ). The degree to which these substandard
medicines exist in Sudan is very difficult to be concluded in one figure or in simple report.
This is due to the complicated detection mechanisms and not mentioning the concerns
about the quality of the data. The available reports may provide indicative information if it

Page
23
becomes more systemized, arranged and gathered. It will help the decision-makers to obtain
the true picture about cause-effect relationships that directly outline the situation in Sudan
regarding the problem of substandard medicines. Once more the capacity of the system is
major factor; because the information management in regulatory bodies in Sudan could be
considered as a weak point of the system (WHO, 2010).
Establishing Post Marketing Surveillance (PMS) System in many countries in collaboration
with WHO help these countries for better improvement of its regularity functions (WHO,
1997). PMS system considered as one of the important tools and methods to monitor the
quality of medicines and as strategy of choice to improve the quality of medicines (FDA,
2007). Usually two parts of the system, (Quality Assurance/Control “QA/QC” and Adverse
Drug Reactions “ADRs” monitoring) are implemented together for better results (WHO,
2002). But this usually depends on the capacity of each country in terms of human resources
and knowledge as well. In Sudan till this study there is no systemic widely established ADRs
monitoring at national or at sub-national levels. When we consider PMS system, the main
scope of the system is the observation and control of the authorized products “substandard”
in the direct way and non authorized low quality products “counterfeit” indirectly
(Fontanarosa PB, 2004).
In this system, the quality of any product could be surveyed by analyzing samples taken from
manufacturers and from the distribution chain either randomly or on purpose (based on
incidents reporting for suspected medicines). Quality tests in this system were performed to
ensure conformance to pharmacopoeial requirements (e.g., British Pharmacopoeia, U.S.

Page
24
Pharmacopeia, International Pharmacopoeia, etc.) or to the manufacturer’s specifications
where necessary or applicable (WHO, 2007).
Most of the studies that has been conducted in this area affirmed that the problem of
substandard medicines usually existed due to one of the major causes or all of them. In most
of the cases the problem was due to inadequate quality control/assurance measures during
the production and/or stability problem due to instable nature of the API and/or
inconvenient storage conditions of the final product (Nicholson, 2005), (USP, 2005).
The chemical contents of each medicine usually play important role in medicines
ineffectiveness problems. Because it indicates that the desired quantity of the medicine is
available or not as patient need it; and any interruption in this relationship could lead to
failure of therapeutic process (Watson, 2005). This is important because all treatment
hypnosis’s were based on producing certain and specific amount of the medication per unit
dosage form; which will be used for certain patient with specific needs; so any disturbance in
this balance could lead to failure of treatment.
The partnership models in detecting, analyzing and resolving the problem of substandard
medicines become fundamental (WHO, 1997), (USP, 2004). The extent to which the key
players; including communities, professionals and policy-makers from different sectors; are
involved in implementation of PMS system, this make it easier to get support and
collaboration in managing and compacting the existence of substandard medicines in the
country (WHO, 2003). In country like Sudan this concept is required; as there are several
contributing and limiting factors that affect the situation. For example; the vast area of
Sudan, differences in climatic conditions, economic situation and the great differences and

Page
25
diversities in cultures and believes among publics and even health workers; all of these limit
the ability of the authorities to respond alone for this problem. With no doubt, health care
professionals (pharmacists, doctors and others) are the major partners with potential
importance and roles in improving the detection of substandard medicines. Since this
category is well oriented and educated about this problem, they should be essential part of
any solution. This will add additional value for appreciating the detection of these medicines
before it reaches the patients. But at the same time any possible incorporation of these
professionals should consider their knowledge, attitude and practice towards the issue of
substandard medicines. This is important because how doctors and pharmacists act towards,
and deal with, substandard medicines, is the corn-stone in any solution could help in
improving the situation.
This research aimed to examine the potential solutions and practical models to expand
quality & efficacy monitoring of pharmaceutical products beyond chemical analysis. Through
assessing the existence of substandard medicines and its detection tools, this could provide
scientific approach for solving this problem (Taylor, Shakoor, & Behrens, 1997). The study
focused mainly on selecting medicines that circulated in the market and there are major
complaints about its quality and effectiveness. In this regard it is important to note that the
number of reported occurrences from health professionals about particular medications
may indicate not only the prevalence of the problem about it, but it may also reflects the
reporters' perceptions of the its importance, law enforcement issues surrounding the
medications, product's length of time in the market, and/or widespread use of the product.
The study used this concept in identifying the possible problems behind reported cases of

Page
26
suspected medicines. This approach was adopted as in many cases the results obtained from
chemical analysis tests weren’t somewhat enough to answer all of the complaints received
from the health professionals about the quality issues. This emphasizes the fact that
combining the interpretation of quality control results with other data about clinical or
therapeutic outcomes for any medicines could be of potential importance. It helps to include
or exclude any potential factors that contribute to treatment failure whether the product is
anti-infective, chronic disorder treatment or over the counter product. The study team
considered and adopts WHO definition of substandard as basic definition and the study
concepts was built on that. The study concentrates mainly on medicines available legally as
authorized products that obtained marketing authorization from the National Medicines and
Poisons Board “NMPB” (national regularity authority). The study doesn’t include the
counterfeit medicines that are not authorized to be marketed in Sudan.
Currently used quality monitoring systems
Officials in areas related to pharmaceutical services are focusing most of their efforts on
assuring the safety, efficacy and quality of pharmaceutical products. By reviewing the global
policy directions in most of the initiatives established during the last 2 decades, whether by
international agencies (like WHO) or by the relevant authorities within the countries, we
noticed the obvious focus on safety and efficacy as dimensions of importance as safety
always become first (Phanouvong, 2003), (WHO, 2006). The quality dimension gets the less
attention among the three areas not because of its less significance but most likely this was
related to its management system. This system relied greatly on the national authorities

Page
27
from one side and more the manufacturers on the other side. As part of quality monitoring
system, post-marketing surveillance (PMS) was not an exception of this observation. The
system gets less consideration among drug monitoring information systems. Unlike the
monitoring of Adverse Drug Reactions (ADRs) and other drugs associated harms which were
improved noticeably during the last 10 years; PMS was not a subject of major changes
towards more improvements in its process or outcomes during the same period. This is
principally true in Sudan as case under study in this review. However, there are some
individual and exceptional initiatives in some countries that aimed to improve the PMS and
to develop new approaches in the system. The justification for establishing post-marketing
quality surveillance in most countries was influenced by the fact that; the authorities have
mild influence on premarketing quality management which relies on the compliance of the
industry with quality assurance schemes. The need for strong post-marketing surveillance
was the driven force for all of these projects.
Systematic review of these projects will be explored below to compare different approaches
attempted in this area. The review mainly focused on what is currently implemented in key
members in the International Conference of Harmonization (ICH). This help, to great extend,
to inform the way in which this study was designed and the recommendations were
formulated to expand the system in Sudan and globally as well.

Page
28
European Union (EU)
It is known that EU Member States adopted the application of Mutual Recognition
Procedure for the provision of Marketing Authorization (MA) of pharmaceutical products
since 2005. This is usually coordinated by the European Medicines Agency “EMA” but the
authorities in each member state should issue the MA separately. Besides that, the
monitoring of the quality of any registered product is rests with the individual Member
States (EMA, 2011). But since the products should be registered using the same dossier, this
open important area for cooperation between the member states (OMCL, Co-operation in
Post-Marketing Surveillance of MRP/DCP-Products, 2006). The authorities created voluntary
surveillance scheme at the EU level in the field of independent official control of registered
products (OMCL, 2007). The main principles of this scheme:
Creation of optimal and cost-effective scheme through sharing the work i.e. by
reducing the duplication of tests and by testing shared products (different batches
from different states);
The voluntary surveillance could help the member states to share the test results,
which give the participants in this scheme broader and in-depth overview about the
quality of targeted products and give them the opportunity to get more focused
national surveillance activities
The design of the surveillance scheme under this initiative is risk based model (EMA, 2011).
It uses risk evaluation approaches for targeting medicinal products for surveillance testing
(EMA, 2008). The actual beginning of this scheme was in 2007 in a pilot phase. The most
remarkable outcome of implementing this risk-based approach is its use in the

Page
29
establishment of more “informed testing plans” (EMA, 2008). The new system enabled the
member states moving from the focus on generics towards more focusing on certain trades
with sufficient available evidences to justify these targeting decisions. By doing this, the
member states could avoid unnecessary tests and decrease the load on the individual
responsible laboratories. Moreover, the EU is now moving towards community based
feedback system and started to focus more on the community concerns about quality
aspects (EMA, 2011).
United States of America (USA) (FDA, 2006):
Food and Drug Administration (FDA) used what is currently known as Drug Quality Reporting
System (DQRS). In this system there are voluntary as well as mandatory reporting schemes
that enrich the data to contribute in what is called Quality Risk Management (QRM). This
basically used in premarketing phase of products’ lifecycle and then it was extended later to
involve the post-marketing phase as well. Based on the experience of FDA; it was clear that
in order to build a risk assessment model this may need many considerations to be included
in the assumptions to support this model. The decisions taken based on this model are
similar to other model known as “Problem Tree Model” in which different decision nodes
could be identified based on the anticipated risk(s) at each stage.
The principles of quality risk management include:
Evaluating the risk to quality that was based on scientific knowledge;
Proportional responses from the authorities (effort, formality, and documentation of
the quality risk management process) with the level of risk

Page
30
FDA currently include the QRM as part of its regulatory operations especially inspection and
assessment activities. This was considered for many reasons as this system assist in
allocating the resources and in prioritization of the activities. In addition to that it becomes
more uncomplicated to evaluate the significance of, for example, quality defects, potential
recalls, and inspectional findings. Many methods could be used under QRM, FDA relaying
more on Hazard Analysis and Critical Control Point (HACCP) methodology. The method
increasingly used in food industry and other industries (car, chemicals and aviation), now
extended to be applied in pharmaceutical industries. Specialists from different disciplines are
part of the implementation of this method and training of staff from the authorities and the
industry was considered before starting the system.
Japan (JPMA, 2011):
Japan, as one of founding members of ICH, re-established its modified monitoring system in
1996, known as Quality Re-evaluation System (QRS), earlier than any other country in ICH. It
was based on the idea that post-marketing surveillance should be able to gather and obtain
data required for re-evaluation applications. These applications usually came out from
different sources, including drug use-results surveys, specified drug-use surveys, and post-
marketing clinical trials. The system, which is similar to great extent to EU system, responds
to concerns about the quality from different sources. The system emphasizes more on the
role of the marketer in assuring the quality of their products during all of its lifecycle.
Focusing on formative case report formats, the system enables the authorities to build its re-
evaluation decisions based on evidence. The “accumulated knowledge” about the products
through this reporting mechanism becomes routine part of quality management system.

Page
31
Based on this policy, the dissolution test was proposed as a routine verification method and
since 1997 it improves to great extent the knowledge and decisions about the quality of
products marketed in Japan. This step was done to assure the quality of generic drugs by
confirming their equivalence to the original products (Adelman & Norris, 2002).
World Health Organization (WHO)
World Health Organization established many projects to strengthen the harmonization of
medicines registration and quality control; e.g. in Southern African Development Community
it established strong scheme in this area (WHO, 1999), (WHO, 2000) . Other similar project is
the development of Good Manufacturing Practices (GMP) and the training programs on
these guidelines. Strengthening the official medicines control laboratories in member states
was additional major element of quality assurance projects in which the organization has
clear inputs (WHO, 2002). In this regard it provided considerable amounts of international
chemical reference materials to selected laboratories in order to enhance their capacity to
carry the official tests (Kenyon, Kenyon, & Sibiya, 1994). In 2001 WHO with collaboration
with USP introduced the use of “Mini-Labs” in analyzing certain antimalarials used in Africa
(Ondari, 2003). The project respond to growing concerns about the quality of antimalarials
circulated in the market (Phanouvong, 2004), (Odili & others, 2006). This initiative drew the
attention back to the potential uses of basic tests of pharmaceutical products at different
sites in improving the capacity of regularity bodies. There was significant argument behind
the utilization of this approach to expand currently used quality surveillance and to the
practical way to involve health facilities in this scheme. On the other hand there are many
reservations about the drawbacks of using this technique in resource limited settings and in

Page
32
countries with huge health system especially at the primary care level (Sudan is clear
example).
Africa
In 2010 WHO published an overview of findings from 26 assessment reports of medicines
regulatory systems in sub-Saharan African countries (including Sudan). One of the
weaknesses identified by this review is the weak implementation of post-marketing
surveillance which was very poor (WHO, 2010).
The report stated: “Quality monitoring was not prioritized based on risk, but was generally
performed in case of complaints if at all”
In addition to that the report stated: “Fourteen of 26 NMRAs (54%) lacked a quality
monitoring programme altogether; 7 tested samples in case of complaints or in the
framework of specific programmes, and only 5 (19%) had a systematic approach”. These
findings are very important and remarkable.
The report recommends the following:
“A risk-based system of inspections and sampling should be in place to monitor the quality of
pharmaceutical products on the market. Manufacturers should be obliged to report
complaints and quality problems to the NMRA. An effective recall procedure should be in
place to remove defective products from the market”.

Page
33
Studies done about the detection of substandard medicines
Adequate review of the available documents and searching through the internet was
completed to find if any other similar studies were conducted within the same scope or
fieldwork of this study (expansion of post-marketing surveillance system). No similar study
found to be served as guidance for this study. Still there are other categories of studies that
are connected to the area of medicines quality assessment which were summarized below:
Study Title Review of Drug Quality in Asia with Focus on Anti-Infectives 2004 (USP, 2004)
Objectives
Reviews the drug quality based on the available information in 11 Asian countries with focus on anti-infective drugs in order to more fully understand the extent of the problem of poor drug quality
To identify gaps in quality assurance regionally and within countries and to point the way toward addressing the issues.
Results
The reported percentage of substandard/counterfeit drugs ranges from 2% to greater than 60%.
On average the availability of substandard medicines ranged from 8% in Vietnam up to 27% in Bangladesh.
Study Title In vitro evaluation of the quality of essential drugs on the Tanzanian market 2002 (Peter & Others, 2002)
Objectives
The study aims to evaluate the essential drug formulations in Tanzanian market that met potency requirements and yet had unsatisfactory in vitro availability as they were not robust enough to withstand storage under simulated tropical conditions.
Results
All formulations passed the pharmacopoeia requirements for the drug content.
Seven formulations failed to meet the USP 24 tolerance limits for dissolution.

Page
34
Study Title Pharmacopoeial quality of drugs supplied by Nigerian pharmacies (Taylor & Others, 2001)
Objectives To investigate the quality of different drugs obtained from retail
pharmacies in two urban areas of Nigeria, and, in instances of poor quality, to ascertain the reason why.
Results
279 (48%) samples did not comply with set Pharmacopoeial limits, and this proportion was uniform for the various types of drugs tested.
Some preparations contained no active ingredient, most had amounts just outside the Pharmacopoeial limits.
Study Title Assessment of the incidence of substandard drugs in developing countries (Taylor & others, 1997)
Objectives Evaluation of drugs quality in Nigeria & Thailand in control and
methodological manner
Results
The results indicate that 36.5% of the samples were substandard with respect to Pharmacopoeial limits.
Decomposition was the cause of poor quality in a number of the samples but overall, poor manufacturing appeared to be prevalent.
The analyses generated little evidence to indicate fraudulent manufacturing.
Treatment failure and drug-resistance are possible consequences of the use of substandard drugs.
No similar study has been conducted in Sudan and no available documents or data found
states that similar study done in the previous period in Sudan. In conclusion after this
review, building a post-marketing surveillance system for monitoring the quality of
pharmaceutical products is not new. Developed countries succeed to establish different
approaches and still they are in continuous research for more innovative models. The system
formulation varies depends on the objectives behind its establishment, but they all share the
same vision about the aim of the system. The review emphasizes the potential role of
partnerships in expanding the system and how it is used as possible sources for information.
Strengthening the system with analytical models (mainly risk-based model) for supporting
the decisions is useful and possible approach.

Page
35
Chapter 2: Research methodologies & materials
Study purpose & objectives
General:
The main aim of this study is to develop risk-based quality monitoring scheme of
pharmaceutical products. The scheme intended to be part of Post-marketing Surveillance
System used by the Federal Board of Medicines & Poisons in Sudan.
Specific objectives:
1. To understand the cause & effect relationships around substandard medicines in
Khartoum city and to illustrate the influence of this problem on the practice of health
professionals;
2. To analyze the knowledge, attitude and practice of pharmacists and doctors when they
are facing quality related problems, and how they deal usually with that;
3. To serve as random check to detect the existence of substandard medicines in Khartoum
city according to the feedback and surveillance of complaints emanated from health
professionals; and
4. To investigate factors affecting the quality of clinical outcomes of three generics in
Khartoum using different investigation methodologies

Page
36
Study design and methodologies
In this chapter an overview about the studies and experiments done under this research
will be described, this includes the materials used in each part. Since there are many parts
of this research done in linked manner, the illustration of the materials and method
under each part will be described separately. This includes:
1. Health professionals survey;
2. Collection of samples for chemical analysis;
3. Chemical analysis of selected medicines;
4. Bioequivalence study of 2 products of Glibenclamide tab 5 mg;
5. Microbiological sensitivity test of Amoxicillin;
6. Biological assay of 3 products of Ceftriaxone powder for injection 1 g; and
7. Qualitative evaluation of reconstitution practice of Ceftriaxone powder for
injection in Khartoum 2010

Page
37
Health professionals’ survey
The study methodology of this survey was formulated in order to get benefit from the
experience of health professionals who work in the field and have a good occurrence in
dealing with medicines (prescribing, dispensing and evaluating its effectiveness). The
study investigators decided to evaluate the quality of medicines which were circulated in
the pharmaceutical market in Khartoum. Due to many reasons it was not easy, and
complicated, to select the targeted medicines on which the study would focus. This
methodology principally relied on the feedback from doctors and pharmacists. With
special focus on their observations, their concerns and their comments on medicines they
have concerned about its quality and/or effectiveness. Later, and based on the results
obtained from the analysis of the feedback from health professionals, the investigators
decided which medicines should be subjected to pharmaceutical analysis and testing for
quality check.
1.1 Selection of information providers
1. Pharmacists:
The list of private retail pharmacies located in Khartoum state has been requested from
“Khartoum State Directorate of Pharmacy” and the sample determined according to this
list (please refer to sampling technique in the sampling protocol below).

Page
38
2. Doctors:
The list of doctors licensed to practice into private clinics in Khartoum state that issued by
“Khartoum State Ministry of Health” has been used to determine the sample of doctors
clinics in Khartoum city (please refer to sampling technique in the sampling protocol
below).
1.2 Questionnaires design
The opinions of doctors and pharmacists were collected using two different types of
questionnaires in the study:
1. Non-self administrative questionnaire designed for pharmacists. It was consisted of 23
questions that aimed to evaluate the knowledge, attitude and practice of pharmacists
towards low quality medicines. Beside that it was designed to collect their opinions about
the quality of certain medicines (please see annex 1).
2. Self administrative questionnaire designed for doctors. It was consisted of 20 questions
that aimed to evaluate the knowledge, attitude and practice of pharmacists towards low
quality medicines. Beside that it was designed to collect their opinions about the quality
of certain medicines (please see annex 2).
These two questionnaires have been discussed in organized group discussion to evaluate
its structure and to critically assess the questions included. According to the comments
and feedback from the participants some changes have been made and adopted by the
study supervisors. Then the questionnaires were tested in the field using random sample
of the target groups (10 pharmacists and 10 doctors). The data obtained from this pilot

Page
39
was analyzed and some amendments made in the questionnaires based the
recommendations of another group discussion conducted for this purpose.
NB: The results of the pilot study see annex 3.
1.3 Medicines selection criteria
The information providers were asked to provide their comments on certain medicines.
These were 20 generics selected based on certain criteria. The idea was to illustrate more
about how the health professionals evaluate the quality of medicines they use.
The selection criteria for choosing the surveyed medicines include:
1. Highly consumed medicines –was based on statistical report 2007 (FMOH,
2008);
2. Quality problems experienced in other countries; based on the literature review
including studies and reports from the authorities (Kopp, Counterfeiting: An
overview Counterfeiting: An overview of problems and of problems and
dangers, 2003) ;
3. All medicines selected were classified as essential medicines in Sudan based on
the Essential Medicines List 2005 (FMOH, 2006);
4. Therapeutically different medicines were selected among different
pharmacological groups and dosage forms; and
5. Considerations regarding health system indicators in Sudan; priority diseases
based on the statistical report 2007 from MOH (FMOH, 2008);

Page
40
1. Consumption:
According to the statistical reports; top 5 most consumed generics in 2007 were:
1. Amoxicillin;
2. Metronidazole;
3. Paracetamol;
4. Ampicillin + Cloxacillin;
5. Glibenclamide;
2. Experience in other countries:
Studies from other countries were reviewed and the following generics were reported in
many studies as involving quality problems:
1. Chloramphenicol inj;
2. Chloramphenicol cap/tab;
3. Gentamycin inj;
4. Cefuroxime sodium 750mg Vial;
5. Ciprofloxacin;
6. Methylergometrin;
7. Streptokinase;
3. Pharmacological Diversity:
By the end of the selection process 20 items has been selected from different 7
pharmacological groups in order to be surveyed using the questionnaire. This includes:
Anti-infectives, NSAIDs, Cardiovascular system, Endocrine system, Antihistamines and
Steroids.

Page
41
Final selection of medicines to be surveyed
Based on all of these factors, the following medicines were included in the
questionnaires:
Generics
1. Amoxicillin susp/cap 2. Co- trimoxazole
3. Ampiclox 4. Digoxin inj/tab
5. Artesunate 6. Ethinylestradiol/levonorgestrel
7. Aspirin 8. Furosemide
9. Atenolol tab 10. Glibenclamide tab
11. Carbimazole tab 12. Hydrocortisone
13. Cefuroxime sodium inj 14. Mefenamic Acid
15. Chloramphenicol cap/tab 16. Metronidazole susp/tab
17. Chlorphenarmine 18. Nifedipine
19. Ciprofloxacin tab 20. Paracetamol
1.4 Study geographical area
Sudan is one of the largest countries in the region and this vast area usually represents
enormous challenge for medicines regularity authority. The authority is mandated to
ensure that all populations in the country receive/use safe and effective pharmaceutical
products and of good quality. This is not in Sudan only but also in all over the world.
Khartoum is the capital and the main city in the country. It comprises about 13.5% of the
total populations in Sudan. Khartoum, Omdurman, Khartoum Bahri are the main cities
within the state; among which Khartoum include more than 35% of the population in the
state (CBS-Sudan, 2007). Studies indicated that the major health services for citizens in
Khartoum state and other country sites actually provided in Khartoum city (large number
of public and private health facilities). The patients’ frequency in Khartoum cities is the
highest among all cities in the country (FMOH, 2008). Khartoum city also host the core

Page
42
pharmaceutical activities in Sudan, as the headquarters of main organizations in
pharmacy sector are based in Khartoum city. This includes the National Medicines and
Poisons Board “medicines regularity authority”, Central Medical Supplies Corporation,
National Medicines Quality Control Laboratory, Federal Ministry of Health, some of local
pharmaceutical plants, 95% of medicines wholesalers. Due to all these facts, Khartoum
was selected as study site for this research.
Indicator Khartoum city Rest of Sudan
Total number of the population 3.4 million 36.7 million
% of the total population 08.6% 91.4%
Total patients frequency 19.3% 80.7%
Number of hospitals 09.1% 90.9%
Number of retail pharmacies 23.9% 76.1%
Number of private doctors clinics 25.4% 74.6% Table 11: Essential health indicators - Sudan
Source: FMOH Annual Health Statistics Report 2007
1.5 Study population
There are many players in Sudan Health System and they represent the main health
services/care providers in the system. They include:
1. The public sector:
- Primary health care facilities
- Health centers
- Hospitals
2. The private sector:
- Private clinics
- Private retail pharmacies
- Private hospitals
3. Non Governmental Organizations Sector.

Page
43
Statistically the private sector represents the major targeted sector for the provision of
health services (in Sudan as general and in Khartoum state in specific). As studies showed
this is due to inefficiency of the health services in the public sector as well as NGOs sector
(Shariff, 2004).
For that reason the study focused on the private sector in Khartoum city and it consider
the representation of the following categories:
1. Private clinics:
These clinics are usually under the authority of Khartoum State Ministry of Health
(Department of Private Curative Establishments). Each clinic should be licensed
for certain medical practitioner to be allowed for practicing.
This includes:
Specialists;
Registrars; and
General practitioners
2. Private retail pharmacies:
These pharmacies are also under the regulation of Pharmacy Directorate in
Khartoum State (Department of Pharmaceuticals Establishments). Similarly, each
pharmacy should be licensed for certain pharmacist to be allowed for practice. This
includes all registered pharmacists except those practicing less than 1 year after
graduation.

Page
44
1.6 Sampling protocol
1. Information provider:-
A. The purpose of sampling the information providers:
To get representative data regarding the opinions of health care professionals about the
problem of low quality medicines in Khartoum, how they evaluate the situation and how
they deal with it.
Sampling of the targeted groups:
First: Pharmacies
The list of private retail pharmacies located in Khartoum state (as per end of January
2007) has been requested from Pharmacy Directorate in Khartoum State and the sample
was determined and located according to this list. This list consisted of 789 retail
pharmacies in Khartoum state in which 328 were based in Khartoum city. According to
statistical sampling tables the sample size was estimated to include 75 sampling unit
(pharmacy). The sampling interval was calculated according to these figures to determine
the details of the sample. Then the first item in the list was selected as starting point and
the remaining units were determined based on the interval until the details of the sample
were completed.
Second: Clinics
The list of doctors licensed to practice in private clinics in Khartoum state (as per end of
January 2007) that issued by Khartoum State Ministry of Health was used to determine
the sample of clinics. This list consisted of 1015 private clinics in Khartoum state in which

Page
45
420 were based in Khartoum city and according to statistical sampling tables in this range
of population the sample size was estimated to include 95 sampling unit (clinic). The
sampling interval was calculated according to these figures to determine the details of
the sample. Then the first item in the list was selected as starting point and the remaining
units were determined based on the interval until the details of the sample were
completed.
1.7 Data Management and Analysis Plan
Data analysis process was done using mixed analysis methods according to the type of
data and the tool of data collection, but in general it was done using the following:
Manual analysis;
Computer programs e.g. SPSS and MS Excel
Collection of samples for chemical analysis
A. The purpose of samples:
The selection of medicines for this study was based on the feedback from the field
(pharmacists and doctors) as described above. The collection technique of medicines
sample considered the sampling methodology adopted to survey the health
professionals. The samples have been collected and then it was subjected to
pharmacopoeias quality control tests including physical and chemical tests.

Page
46
B. Sampling considerations:
This sampling methodology was used in order to verify the quality of medicines reported
in the feedback from the health professionals with concerns about its quality.
Accordingly, the sampling technique took into the considerations the following factors:
1. The sampling sites should be only within Khartoum city as study area;
2. The samples collected only from the retail private pharmacies within the
determined area;
3. The sampling technique took into consideration the differences between the
geographical areas within Khartoum;
The sampling method considered also the classification of pharmacies located in
household areas and that located near clinics and hospitals in the central areas of
Khartoum; and
4. The sampling method was based on collection process using the trade products
available in the market
C. Determination of sampling sites:
The availability of selected medicines was essential factor in this sampling methodology.
Accordingly, it was important to found the targeted trade product itself rather than to
focus on certain batch(s) of that trade product. Still whenever it was possible, the
collection concentrated on maximum of 2 batches of each trade product targeted. The
selection of the sites wasn’t based on the fixed number of pharmacies but the target was
to collect the required quantities with special consideration to the geographical areas and

Page
47
pharmacies classification as illustrated above (With conditional aspect regarding the total
number of collection sites which should not exceeded five sites in worst scenario).
D. Sample size:
The size of sample collected was determined according to the requirements of reference
pharmacopeia for the official tests. This done under the following guidelines:
For each solid dosage form products (tablets and capsules) minimum of 100 units
were collected from different sites;
For each injectable products minimum of 10 units were collected from different
sites; and
For each liquid dosage form products (suspension and syrups) minimum of 10 units
were collected from different sites
E. Storage of the samples:
After the collection process was completed, the samples were treated considering the
following points:
1. Each sample was stored with its prefilled “Sampling form-A”; (annex No 4);
2. The sample was labeled using small stickers containing the sample code;
3. Each sample was kept in storage conditions specified by the manufacturers;
4. The samples were stored in their original containers until the start of the next
procedure

Page
48
F. Coding system:
Due to the confidential nature of this part of the study, it was necessary to develop well
structured coding system that ensured the confidential identity of all entities under the
study. This coding system enabled only the study investigators to identify the trade
names or the manufacturers and even the analysts were not able to expose the identity
of any drug. This system based on the following:
1. Pharmacies & private clinics:
The codes consisted of serial numbering that used for each pharmacy or
clinic included in the sample. Any facility in the list has identity number that
pre-recorded in the questionnaire and the information provider wasn’t asked
to write or provide his/her name or his/her premises name or any other
identification data.
2. Generic name:
All generic names were ordered alphabetically and the coded according to its
order; for example:
(G06)
G for Generic as fixed letter and 06 for its order
3. Companies’ Code:
All companies (that own any product under testing) were ordered
alphabetically and coded according to its order; as example:
(C33)
C for Company as fixed letter and 33 for its order

Page
49
4. Trade Products Code:
The code of each trade name contains its company code, generic name code
and in addition to that trades was ordered alphabetically and coded
according to its order; as example:
(G06/C33/T14)
T for Trade name and 14 for its order within all trade names
5. Sample Code:
Each sample code contains all of the above codes in addition to its unique
number based on its order in collection process; as example:
(G06/C33/T14/S05)
S for Sample and 05 for its order in the collection process

Page
50
Chemical analysis of selected medicines
2.1 Quality control tests
After the completion of medicines selection process and samples collection, the samples
were subjected to general physiochemical analysis regarding its compliance with quality
requirements and specifications in the reference pharmacopeia. The process done in
collaborative approach between the study team, Faculty of Pharmacy – University of
Khartoum and National Quality Control Laboratory - Federal Board of Medicines and
Poisons. This collaboration remarkably has driven this study in effective way to address
the important issues and to concentrate on vital policy issues. Also this study benefit from
such collaboration, because there is different capacities in each laboratory (the University
& National labs) and this gave the opportunity to conduct different quality control tests in
both laboratories. This was reflected on the quality of the data obtained and the coverage
of all selected medicines included in the study.
2.2 Level 1 - Visual/physical inspection
The following indicate how this inspection process was done for the samples:
Physical quality check was completed for each batch/sample collected from the field
using standardized check list (for details see annex 8);
The integrity of packs, appearance of tablets, or other physical characteristics of the
dosage forms were visually being inspected and reported for each sample;

Page
51
Determination of remaining shelf-life, compliance with approved labeling, packaging, and
shipping instructions were all checked and verified by data obtained from “NMPB”;
The physical appearance of the dosage form (including its shape, size and color) were all
compared based on random selection process to ensure similarity of the samples
collected for each product;
Visual inspection was done to ensure that no breakdown, fragmentation, or cracks in the
collected dosage forms for all products collected;
The conditions of the primary and secondary packages for each sample were also
examined to ensure that there are no defects exist, beside that to make sure if there are
incomplete, damaged, or missed labels;
Random selection of samples among each trade product has been selected to compare
the outer package identity in terms of color, size and other physical factors.
2.3 Level 2 – Chemical Analysis
This level usually combined many types of testing methods to be under taken. But due to
the limited scope of this part of the research; only chemical assay of each product
under testing was conducted;
All of the collected samples were subjected to this level of assessment;
Analytical tests were performed according to the quality specifications in the monographs
of reference pharmacopeia with respect to each sample examined;

Page
52
The results of each sample were compared with the limits of contents in the reference
pharmacopeia to determine whether or not it complies with the standard
specifications;
Samples that failed to comply with the reference limits of content were subjected to
further assay tests up to 3 times to ensure the validity of the results;
Accordingly the study team decided to develop the analysis plan based on the capacity of
each laboratory and this result in the following:
Generics Dosage Form Assay Laboratory
Ciprofloxacin Tablet LC National Lab
Glibenclamide Tablet LC National Lab
Amoxicillin Capsule LC National Lab
Diclofenac Tablet LC National Lab
Ceftriaxone Injection UV University Lab
Paracetamol Tablet UV University Lab
Chlorphenarmine Tablet UV University Lab
Mefenamic Acid Tablet Titration University Lab
Aspirin Tablet Titration University Lab
Metronidazole Tablet Titration University Lab Table 2: generic medicines selected for chemical analysis
2.4 Samples retesting
This has been regarded as specific considerations for medicines that didn’t comply with
the requirements during the first round of analysis. Its purpose was to verify the failure
results for further assurance. After the determination of the medicines that fail the tests
the plan was developed, then:
- Additional samples (the same batch) were collected from the retail pharmacies
using the same method used before and this sample tested in the same way;

Page
53
- The results from each round of analysis compared with each other. The
comparisons were made to determine the type of problems that are possibly
affecting the results.
The forms used to collect these data (physical and chemical) were filled using the coding
system described before and it will be kept confidential as stated before
2.5 The materials used in chemical analysis
Absolute ethanol , acetone, acetonitrile HPLC, anhydrous acetic acid, ether, methanol HPLC,
potassium dihydrogen orthophosphate, orthophosphoric acid, sodium dihydrogen
orthophosphate, triethylamine.

Page
54
2.6 Methods of analysis
Serial Number 1
Generic Name Acetylsalicylic Acid
Dosage Form Tablet
Concentration 300 mg
Reference Pharmacopeia BP
Limits for Contents 95.0 to 105.0% of the stated amount
Chemical Analysis:
1. Procedures:
20 tablets were weighed and powdered. To a quantity of the powder containing
0.5 g of Acetylsalicylic Acid 30 ml of 0.5M sodium hydroxide was added. The
solution was boiled gently for 10 minutes and the excess of alkali was titrated
with 0.5M hydrochloric acid using phenol red solution as indicator. The
operation was Repeat without the substance under analysis. The calculation was
made and the quantity identified as 95.8 % of the stated concentration.
2. Modifications of the method:
None.
Serial Number 2
Generic Name Amoxicillin Trihydrate
Dosage Form Capsule
Concentration 500 mg
Reference Pharmacopeia BP
Limits for Contents 92.5 to 110.0% of the stated amount

Page
55
Chemical Analysis:
1. Procedures:
The analysis was conducted using liquid chromatography method. Mobile phase A
was prepared as follows: 1 ml of acetonitrile and 99 ml of a 25% v/v solution of
0.2M potassium dihydrogen orthophosphate was mixed and adjusted to pH 5.0
with 2M sodium hydroxide. Mobile phase B was prepared as follows: 20 ml of
acetonitrile and 80 ml of a 25% v/v solution of 0.2M potassium dihydrogen
orthophosphate was mixed and adjusted to pH 5.0 with 2M sodium hydroxide.
80 ml of mobile phase A was added to a quantity of the mixed contents of 20
capsules containing the equivalent of 60 mg of amoxicillin that shacked for 15
minutes. The resulted solution was mixed with the aid of ultrasound for 1
minute, and sufficient mobile phase A was added to produce 100 ml, the
resultant solution was mixed and filtered. 50 µl of this solution were injected.
0.070% w/v of amoxicillin trihydrate working standard (potency 100%) was mixed
in mobile phase A and 20 µl of this solution were injected. The calculation was
made and the quantity identified as 103.1 % of the stated concentration.
2. Modifications of the method:
None.

Page
56
Serial Number 3
Generic Name Ceftriaxone sodium
Dosage Form Powder for injection
Concentration 1 gm
Reference Pharmacopeia USP
Limits for Contents 92.0 to 108.0% of the stated amount
Chemical Analysis:
1. Procedures:
A quantity of powder containing 100 mg of Ceftriaxone sodium working standard
with potency 99.7% has been taken and dissolved in sufficient quantity of water
to produce a solution equivalent to 1% w/v of the working standard. Series of
dilution process has been done to produce other 6 different solutions in
concentrations 0.1%, 0.05%, 0.01%, 0.005%, 0.0025 and 0.001% (w/v) of the
working standard. The absorbance of the produced solutions was measured at
the maximum at 270. The absorption of each solution was plotted versus the
relevant concentration and the calibration cure then was drown. This process has
been repeated for 3 times to ensure the validation of the method, and the results
obtained were reproducible and relevant in linearity. A quantity of powder
containing 100 mg of the sampled powder containing Ceftriaxone sodium has
been taken and dissolved in sufficient quantity of water to produce a solution
equivalent to 1% w/v of Ceftriaxone sodium. The resulting solution was diluted to
produce solution equivalent to 0.01% w/v of Ceftriaxone sodium. The absorbance
of the produced solution was measured at the maximum at 270. The calculation
was made and the quantity identified as 103.8% % of the stated concentration.

Page
57
2. Modifications of the method:
The official method in the pharmacopeia for chemical assay of Ceftriaxone
chloride using HPLC analysis has been replaced by this especial method due to
difficulty to obtain all chemicals and reagents needed for Pharmacopoeial test.
Serial Number 4
Generic Name Chlorphenarmine Maleate
Dosage Form Tablet
Concentration 4 mg
Reference Pharmacopeia BP
Limits for Contents 92.5 to 107.5% of the stated amount
Chemical Analysis:
1. Procedures:
A quantity of the powder containing 3 mg of Chlorphenarmine Maleate was
weighted and shaken with 20 ml of 0.05M sulphuric acid for 5 minutes. 20 ml of
ether was added and shake carefully. The acid layer was filtered into a second
separating funnel, the ether layer was extracted with two 10-ml quantities of
0.05M sulphuric acid, each acid layer filtered into the second separating funnel
and the filter was washed with 0.05M sulphuric acid. The combined acid extracts
were washed to be made just alkaline to litmus paper with 1M sodium
hydroxide, and 2 ml in excess was added and the mixture was extracted with two
50 ml quantities of ether. Each ether extract was washed with the same 20 ml of
water and then extracted with successive quantities of 20, 20 and 5 ml of 0.25M
sulphuric acid. The combined acid extracts diluted to 50 ml with 0.25M sulphuric

Page
58
acid, 10 ml of this solution was diluted to 25 ml with 0.25M sulphuric acid and
the absorbance of the resulting solution was measured at maximum at 265 nm.
The calculation was made and the quantity identified as 95.6 % of the stated
concentration.
2. Modifications of the method:
None.
Serial Number 5
Generic Name Ciprofloxacin Hydrochloride
Dosage Form Tablet
Concentration 500 mg
Reference Pharmacopeia BP
Limits for Contents 95.0 to 105.0% of the stated amount
Chemical Analysis:
1. Procedures:
The mobile phase was prepared by adding a mixture of 13 volumes of acetonitrile
and 87 volumes of a 0.245% w/v solution of orthophosphoric acid and then the
pH has been adjusted to 3.0 with triethylamine. To a quantity of the powdered
tablets containing the equivalent of 2 g of ciprofloxacin 750 of the mobile phase
was added and the mixture then subjected to ultrasound for 20 minutes the
completed to 1000 ml using the mobile phase. The resulting solution was filtered
and the filtrate was diluted using sufficient quantity of the mobile phase to
produce solution with final concentration of 0.05% w/v of ciprofloxacin and 20 µl

Page
59
of this solution was injected. 20 µl of a solution containing 0.058% w/v of
ciprofloxacin hydrochloride working standard with a potency of 99.8% was
injected with the mobile phase. The calculation was made and the quantity
identified as 99.3 % of the stated concentration.
2. Modifications of the method:
None
Serial Number 6
Generic Name Diclofenac Sodium
Dosage Form Tablet
Concentration 25 mg
Reference Pharmacopeia BP
Limits for Contents 95.0 to 105.0% of the stated amount
Chemical Analysis:
1. Procedures:
The analysis was conducted using liquid chromatography method. The mobile
phase was prepared as follows: a mixture of 34 ml of a mixture of 34 ml of a 0.1%
w/v solution of orthophosphoric acid and a 0.16% w/v solution of sodium
dihydrogen orthophosphate were mixed and pH adjusted to 2.5, and added to 66
ml of methanol. 10 tablets of the product have been shaken with 700 ml of
methanol (50%) for 30 minutes with the aid of ultrasound. Sufficient mobile phase
was added to produce 1000 ml and then mixed, an aliquot centrifuged and the
supernatant liquid was filtered through a 0.45-µm filter. The filtrate was diluted
with the mobile phase to produce a solution containing 0.005% w/v of Diclofenac

Page
60
Sodium. 20 µl of this solution were injected. 0.005% w/v of Diclofenac sodium
working standard (potency 99.8%) in the mobile phase. 20 µl of this solution was
injected. The calculation was made and the quantity identified as 104.7 % of the
stated concentration.
2. Modifications of the method:
None
Serial Number 7
Generic Name Glibenclamide
Dosage Form Tablet
Concentration 500 mg
Reference Pharmacopeia BP
Limits for Contents Glibenclamide
Chemical Analysis:
1. Procedures:
The analysis was conducted using liquid chromatography method. The mobile
phase was prepared as follows: a mixture of 47 ml of acetonitrile and 53 ml of a
1.36% w/v solution of potassium dihydrogen orthophosphate previously adjusted
to pH 3.0 with orthophosphoric acid. Quantity of the powdered tablets containing
5 mg of Glibenclamide was mixed, with the aid of ultrasound, with a mixture of 2
ml of water and 20 ml of methanol until fully dispersed then filtered through a
0.2-µm membrane filter (Anatop LC is suitable). 20 µl of the resulting solution was
injected with mobile phase. 50 mg of Glibenclamide BPCRS dissolved in 10 ml of
methanol with the aid of ultrasound for 20 minutes, sufficient methanol was
added to produce 50 ml. 10 ml of this solution was diluted to 40 ml with methanol

Page
61
and 2 ml of water was added to 20 ml of this solution and then mixed. 20 µl of the
resulting solution was injected with mobile phase. The calculation was made and
the quantity identified as 95.3 % of the stated concentration.
2. Modifications of the method:
None
Serial Number 8
Generic Name Mefenamic Acid
Dosage Form Tablet
Concentration 500 mg
Reference Pharmacopeia BP
Limits for Contents 95.0 to 105.0% of the stated amount
Chemical Analysis:
1. Procedures:
Quantity of the powdered tablets containing 0.5 g of Mefenamic Acid was
dissolved in about 80 ml of warm absolute ethanol previously neutralized to
phenol red solution. The solution resulted was subjected to alternation between
heating and ultrasound to aid dissolution the cooled. Sufficient quantity of the
neutralized absolute ethanol was added to produce 100 ml; then mixed and
titrated with 0.1M sodium hydroxide VS using phenol red solution as indicator.
The calculation was made and the quantity identified as 99.4 % of the stated
concentration.
2. Modifications of the method:
None

Page
62
Serial Number 9
Generic Name Metronidazole
Dosage Form Tablet
Concentration 250 mg
Reference Pharmacopeia BP
Limits for Contents 95.0 to 105.0% of the stated amount
Chemical Analysis:
1. Procedures:
Quantity of the powder containing 0.2 g of Metronidazole was transferred to a
sintered-glass crucible and extracted with six 10 ml quantities of hot acetone and
the cooled. 50 ml of acetic anhydride and 0.1 ml of a 1% w/v solution of brilliant
green in anhydrous acetic acid was added to the combined extracts. The resulting
solution was titrated with 0.1M perchloric acid VS to a yellowish-green end point.
The operation was repeated without the powdered tablets and the difference was
calculated. The calculation was made and the quantity identified as 95.1% of the
stated concentration.
2. Modifications of the method:
None.

Page
63
Serial Number 10
Generic Name Paracetamol
Dosage Form Tablet
Concentration 500 mg
Reference Pharmacopeia BP
Limits for Contents 95.0 to 105.0% of the stated amount
Chemical Analysis:
1. Procedures:
Quantity of the powder containing 0.15 g of Paracetamol was added to 50 ml of
0.1M sodium hydroxide and diluted with 100 ml of water. The resulting
solution has been shaken for about 15 minutes and sufficient amount of water
was added to produce 200 ml then the solution was mixed and filtered. 10 ml
of the filtrate was diluted to 10 ml with water. 10 ml of the resulting solution
was added to 10 ml of 0.1M sodium hydroxide and diluted with water up to
100 ml. The absorbance of the resulting solution was measured at the
maximum at 257 nm. The calculation was made and the quantity identified as
98.4 % of the stated concentration.
2. Modifications of the method:
None.

Page
64
Bioequivalence study of 2 products of Glibenclamide tab 5 mg
4.1 Equipments and materials
5% dextrose IV solution in water, 0.9% sodium chloride IV solution in water, 10% dextrose
IV injection, heparinised blood containers, plane serum containers, QBC Horizon Model
755VES Centrifuge, non-volumetric pipettes, 5 ml Syringes, Accu-chek® Glucometer,
methanol, acetonitrile, dihydrogen, ortho-phosphate and ortho-phosphoric acid in
addition to water for analytical purpose.
4.2 Study rationale
This study designed to provide necessary information in order to evaluate the quality of
two Glibenclamide products available in the market to inform the decision makers about
the registration of this drug in Sudan.
4.3 Study objectives
To investigate factors affecting the quality of clinical outcomes of Glibenclamide in
Khartoum using different investigation methods; and
To estimate the bioavailability and to evaluate bioequivalence of a single dose of
the test formulation (containing Glibenclamide 5 mg tablet, manufactured by
company C06 - Sudan) and to compare it with a single dose of reference
formulation (containing Glibenclamide 5 mg tablet, manufactured by company
C09 - Germany) under fasting conditions.

Page
65
4.4 Study design & methods
WHO guidance on bioavailability and bioequivalence stated the following “Two medicinal
products are bioequivalent if they are pharmaceutically equivalent or pharmaceutical
alternatives AND if their bioavailability after administration in the same molar dose are
similar to such degree that their effects, with respect to both efficacy and safety, will be
essentially the same” (WHO, 2003).
This study intended to provide evidence for action; accordingly its design provided
comprehensive data and evidence. Comparative in-vivo bioavailability (bioequivalence)
study, in which Glibenclamide concentration in plasma was measured according to WHO
guidelines for bioavailability and bioequivalence studies as described below (WHO, 2003).
The study design benefited from the experience and guidance of other bodies as well
(FDA, 2000). In this study there are two formulations under investigation. The study was
designed basically as a comparative framework, so, single dose study was applied with a
two-period, two-sequence crossover design (as recommended for this kind of studies).
This was applied as two phases of treatment separated by 14 days as washing period.
The volunteers received a dose of 5 mg of Glibenclamide (from test and standard
products) under fasting conditions in two separate sessions using a randomized crossover
design. Plasma samples were obtained at selected times over 24 hours and stored frozen
until analyzed using basic HPLC technique. Pharmacokinetic parameters were compared
using the analysis of variance for a cross-over design and ratios of AUC24h and Cmax,
90% confidence intervals were obtained for summery of the results. Results were

Page
66
considered positively if the confidence intervals did not exceed the limits of acceptance
(80--120%) for AUC24h and Cmax.
4.5 Subjects
Most of the published studies in this area adopt sample size between 12 – 26 subjects
(depends on the variability of drug under study) and this number showed sufficient
statistical significant evidence (Buice, 2005). Accordingly, 12 Sudanese male/female
healthy volunteers were recruited in this study. The detailed process of selecting these
subjects followed the recommendations of Helsinki Declaration regarding the ethical
principles for medical research involving human subjects (WMA, 2008).
The following issues were considered while selecting the subjects:
All subjects were residents of Khartoum State;
6 males and 6 females were selected;
Females were not pregnant nor lactating;
The range of age was (≤18 to 55 ≥ years); and
The health status of the subjects was evaluated based on information obtained
from each volunteer regarding the following:
- Free from history of DM (both types)
- No smoking history
- No recent history of hospitalizations in the last 12 months

Page
67
Other health considerations which were verified for each volunteer and only those with
normal parameters for the following investigations were selected:
- ECGs
- Clinical blood chemistry
- Measuring Blood Pressure
- Subject has no evidence of burns
- No evidences for impaired renal or hepatic functions
As part of inclusion criteria, the volunteers during the study period (or within 1 month)
were not taking any of the following medicines: Allopurinol, Captopril, Enalapril,
Anticoagulants, coumarin or indandione derivative, Miconazole, Fluconazole, Appetite
suppressants, Corticosteroids thiazide Diuretics, Barbiturates, Beta-adrenergic blocking
agents, Cimetidine, Ranitidine, Fluoroquinolones, Quinine, Rifampin, Chloramphenicol,
NSAIDs, Sulfonamides or Hyperglycemia-causing agents (Katzung, 2001).
A check list was used to record the above information for each participant (for further
details of this check see annex XXX)
4.6 Sampling
4.6.1 Selection of the volunteers:
The selection process of the volunteers was aimed to minimize the variations between
the individuals participated in this study. Age, weight, gender and health status of the
participants all were taken into considerations. The recruitment of the subjects in this
study was on voluntary basis and all the ethical considerations were taken into account.
This process designed to avoid the selection bias of the subject as much as possible.

Page
68
Volunteers received a welcoming package to orient them about the study (its objectives,
methods, instructions for preparations, sample collection and other relevant
information). Besides that, they received basic information sheet about them to fill (for
more details see annex XXX).
4.6.2 Medicines selection criteria:
The process of selecting medicines for this part of the study was based principally on the
findings generated from part 1 and part 2 of medicines quality assessment. Selected
product under testing represented the main trade product which health professionals in
Khartoum were concerned about its quality in term of clinical outcomes. This was linked
to the results obtained from the laboratory analysis regarding the chemical contents. The
standard product was the originator’s product, as it has been normally associated with
good therapeutic outcomes (based on the feedback form part 1 of the study).
4.6.3 Study site:
The study was taken place in University of Khartoum Hospital after getting the permission
from the hospital administration. The hospital staffs were very cooperative and support
the provision of quality care for the participants and the collection and storage of the
samples.
4.7 Other considerations
The factors that expected to affect the study were considered and monitored carefully
during the study course. This includes environment, diet, fluids intake, physical conditions
and blood sampling scheme during the day (day or night). Standardized information

Page
69
sheet, annexXXX, was developed and distributed to all of the participants prior to the
starting date. This aimed to ensure the consistency of all affecting factors to minimize the
variations between subjects included and hence the results obtained.
4.8 Ethical considerations
This study was conducted by independent professionals from the academic sector
and was designed for scientific and academic purposes only. The investigators
express no conflict of interest in selecting the products or suppliers under testing.
The principal investigator was committed prior to start the study for his
responsibility to ensure the protection of the rights, safety and well-being of
subjects involved in this study. This was planned to be attained, among other
things, by reviewing, approving, and providing continuing review of this study
protocol and the methods and material used in obtaining and documenting
informed consent of the study subjects. The ethical approval has been obtained
from the National Board for Ethical Review of Health Research. In addition to that,
the study team included certified medical doctor in order to monitor the subjects
closely during their admission in the hospital.
All study subjects after receiving the information sheet and upon agreement to
taken part of the study; were asked to sign a consent form before considering
him/her as study subject. This was kept well with other confidential documents
under this study.

Page
70
4.9 Blood sampling scheme
The purpose of this proposed sampling scheme is to get representative samples of blood
concentration from selected subjects based on known pharmacokinetic properties of
Glibenclamide. This includes mainly the half-life that play critical role in determining the
elimination profile of Glibenclamide. Accordingly its dose response curve in addition to
the elapsed time to reach the maximum concentration (absorption and elimination
period) were the determinant factors for this sampling scheme (Meyer, Muller, Luus, &
Eckert, 1989).
The sampling period and schedule were determined to cover 24 hours following drug
administration. Blood samples (13 samples) were collected at 0.25, 0.50, 0.75, 1.0, 1.5,
2.0, 2.5, 3, 3.5, 4, 4.5, 6 and 24 hours after administration of the dose.
Using 5 ml syringes, the samples were transferred to heparinised tubes after labeling.
Each sample was then centrifuged for 5 minutes using regular centrifuge at 3000 rpm.
Serum was separated from the residual part and then transferred into 3 ml plain
containers. The samples were re-labeled using the final codes, carefully transported and
frozen up to the time of analysis based on the proposed schedule.
Parallel with the collection of blood sample, sample collectors used small amount of
blood (0.1 ml) to measure the glucose level in the sample using Accu-chek® Glucometer.
This provided additional useful data for the comparisons between the two products.

Page
71
4.10 Samples preparation and analysis
In order to analyze the collected samples, basic HPLC techniques were used to measure
targeted parameters. The analysis was done in collaboration with the Central Laboratory
in Faculty of Science – University of Khartoum.
4.10.1 Chromatographic conditions:
The method adopted for this process was developed by SD Rajendran and others with
some minor modifications as needed (Rajendran & others, 2005). The HPLC system
consisted of a Shimadzu LC-10AT liquid chromatographic pump, SIL-10a manual injector
and SPD-10A UV/Vis UV absorbance detector (Shimadzu, Kyoto, Japan). Data collection,
integration and calibration were accomplished using Class VP Chromatography Data
System Version 6.14 computer software (Shimadzu, Kyoto, Japan). The chromatographic
separations of Glibenclamide and internal standard (glimepride) were accomplished using
a 150 mm×4.6 mm ID Shim-Pack VP-ODS analytical column (SHIMADZU). A Guard-Pak
precolumn module (Phenomenex, USA) containing an ODS cartridge insert was placed
serially just before the analytical column. The mobile phase consisted of acetonitrile: 25
mM phosphate buffer (pH: 3.5) in a combination of 80:20 v/v. Before use the mobile
phase was degassed by passing it through a 0.22 μm filter. The mobile phase was pumped
at an isocratic flow rate of 1 ml/min at room temperature. The UV detection wave length
was set at 253 nm. The wave-length of 236 nm represented the UV maximum of
Glibenclamide in acetonitrile: water in 1:1 ratio.

Page
72
4.10.2 Assay procedure:
A stock solution representing 100 µg/ml of Glibenclamide was prepared in acetonitrile:
water in 1:1 ratio. These solutions were stored at -20 o until use. The working standard
solutions were prepared prior to use from the stock solution by sequential dilution with a
combination of acetonitrile: water in 90:10 ratio to yield final concentrations of 50, 100,
200, 400, and 500 ng/ml of Glibenclamide. The internal standard stock solution was
prepared by dissolving 1 mg of glimepride in 100 ml of acetonitrile: water in 1:1 ratio. This
solution was stored at -20 o until use. In a 2 ml microcentrifuge tube, 500 μl of serum was
added along with 500 μl of internal standard solution. The serum was precipitated by the
addition of 500 μl of methanol, and then the tubes were vortexed for 30 s and
centrifuged at 5000 g for 8 min. The supernatant was transferred to a clean, similarly
labeled tube and was subsequently re-centrifuged for 2 min. The resulted solution was
injected in to the HPLC.
4.10.3 Assay parameters:
The extraction efficiency was determined by comparing the peak area of known amounts
Glibenclamide (unextracted) in mobile phase directly injected to peak area of samples
containing the same amounts of Glibenclamide in plasma after extraction. Quantification
was based on calibration curves constructed using peak area ratios of drug to internal
standard vs. nominal concentration. The procedure was repeated on three separate days
to allow determination of inter-day precision and accuracy. Intra-day accuracy was
estimated based on the mean percentage error, and the inter-day accuracy was
calculated as the mean of the intra-day accuracy determinations. The precision,

Page
73
expressed as a percentage, was evaluated by calculating the intra- and inter-day relative
standard deviations. The standard drug solutions in varying concentrations ranging from
50 ng/ml to 500 ng/ml were examined by the assay procedure. The peak area was
calculated. The calibration curve was plotted using peak area vs. concentration of the
standard solutions.
4.11 Data Management and Analysis Plan
The data analysis process was done using mixed analysis methods according to the type
of data and the tool of data collection, but in general it was done using the following:
Manual analysis;
Computer programs e.g. SPSS and MS Excel

Page
74
Microbiological sensitivity test of Amoxicillin
Materials: Sterile throat swabs, Microscope slides, Bunsen burner, Inoculating loop, Blood
agar,
6.1 Study rationale
This study was designed to provide necessary information to evaluate the outcomes of
Amoxicillin available in the market to inform the decision-making about the registration
of this drug. This was especially planned to provide evidence to inform a comprehensive
policy directions to review Amoxicillin registration, uses and monitoring in the country.
The focus of this study is to investigate factors affecting the quality of clinical outcomes of
Amoxicillin in Khartoum using antimicrobial sensitivity approach.
6.2 Specific objectives
To investigate the incidence of microbial resistance for Amoxicillin using the
microbiological assay experiment on throat clinical isolates.
6.3 Study design
Study area: Khartoum city was divided into four geographical areas and the samples
divided between these areas.

Page
75
Study population: Targeted populations were selected and included based on the
following criteria:
Only patients living in Khartoum locality were considered in this study;
Patients approaching the private pharmacies in the study area were the only
targeted study population; and
Patients complaining from symptoms of upper respiratory tract infection asking
for treatment with or without a prescription.
Patients with the following criteria were excluded:
Recent administration of sub-optimal dose of antibiotics or incomplete treatment
duration within 2 weeks;
Recent use of antimicrobial treatment during the last 3 months (especially
cephalosporin derivatives);
Under 14 years and over 60 years of age;
Underlying diabetes;
History of recent hospitalization
6.4 Sample size
The purpose of sampling, in this part of the study, was to get rapid description of the
current situation regarding the incidence of resistance to Amoxicillin among targeted
population. In Sudan there is no drug utilization review completed recently to show any
data about the quantitative use of medicines in the country (uses, quantities, sources
...ect). Accordingly, for this study the sample size was determined using a technique of

Page
76
total coverage of eligible patients during 10 working days. Accordingly 102 samples were
collected from the study sites.
6.5 Sampling technique
Samples were obtained from patients approaching the retail pharmacies in Khartoum
city. Pharmacists working in the selected pharmacies were asked to collaborate with the
study team to identify the patients receiving Amoxicillin product (based on the inclusion
criteria as above). The pharmacists were trained on collecting the samples. Patients
selected as part of the study received verbal information about the study and its purpose.
They were informed about the reasons behind the request for biological samples from
their throat using a piece of swab. Upon acquiring the verbal consent from the patients,
disposable swaps were used to collect the throat sample from the patients and then
inculcated into 15-20 ml of Cary-Blair transport media. The samples stored at room
temperature at the collection site and then it was transported on daily basis to the
Central Laboratory in Faculty of Pharmacy or Faculty Science – University of Khartoum.
6.6 Preparation of blood agar media
The method adopted for this process was developed by Bendict L. and others with some
minor modifications as needed. Blood was drawn from sheep’s neck area which was
shaved and swabbed with iodine (Benedict & others, 1974). A venipuncture was
performed in the jugular vein using a 36-inch blood collection set. The blood was
collected in a Becton Dickinson Vacutainer bottle containing 1 ml of 5% SPS (Imada, India)
for each 100 ml of blood to be drawn. The bottle was inverted occasionally to facilitate

Page
77
mixing. The blood was stored at 4 C prior to use. Sterility testing was performed by
inoculating 5 ml of blood into two evacuated bottles. The bottles were then incubated at
37 C for 2 days and checked daily for visible evidence of microbial growth, prior to use.
15-ml sample of blood was used in performing a hematocrit and for sterility testing as
described previously. The blood was aseptically added to the cooled agar to give a final
concentration of 5%. Approximately 18 ml of blood agar was dispensed into sterile 100-
mm Petri dishes and allowed to harden. All prepared plates were stored at 4 C.
6.7 Preparation of bacterial isolates for sensitivity tests
Subcultures of collected Cary-Blair transport media was prepared by inoculating a sterile
loop. Each isolate was inoculated into 2 ml of Trypticase soy broth (BBL), and the turbidity
was adjusted to the barium sulphate standard used in the Kirby-Bauer method of
antibiotic susceptibility testing. A loopful from this broth was streaked onto the blood
agar plate for all samples. All plates were incubated at 37 C. Readings and monitoring of
the growth was done in a continuous process.
6.8 Data Management and Analysis Plan
The data analysis process was done using mixed analysis methods according to the type
of data and the tool of data collection, but in general it was done using the following:
Manual analysis;
Computer programs e.g. SPSS and MS Excel

Page
78
6.9 Ethical Considerations
This study was conducted by independent professionals from the academic sector
and was designed for scientific and academic purposes only. The investigators
express no conflict of interest doing this research.
The principal investigator was committed prior to start the study for his
responsibility to ensure the protection of the rights, safety and well-being of
subjects involved in this study. This was planned to be attained, among other
things, by reviewing, approving, and providing continuing review of this study
protocol and the methods and material used in obtaining and documenting
informed consent of the study subjects. The ethical approval has been obtained
from the National Board for Ethical Review of Health Research.
All study subjects after receiving the information verbally and upon agreement to
taken part of the study; were asked to sign a consent form before considering
him/her as study subject. This was kept well with other confidential documents
under this study.

Page
79
Biological assay of 3 products of Ceftriaxone powder for injection 1 g
Materials: Ceftriaxone powder for solution, nutrient agar, nutrient broth, standardized
suspensions of; Escherichia coli, Staphylococcus aureus and Klebsiella pneumoniae,
normal saline, cork-borer (no. 7), pipette and distilled non ionized water.
The experiment was conducted in Faculty of Science – University of Khartoum.
5.1 Procedure for microbial methods
Solutions of different concentrations from the powdered form of three products were
subjected to antimicrobial activity tests. The organisms used were of American Type
Culture Collection (ATCC). They were obtained from stock culture of National Sanitary
Laboratory and maintained on slang agar in a refrigerator. The organisms subject for the
tests were; Streptococcus pneumoniae ATCC25922 (S.p), Staphylococcus aureus
ATCC25923 (S.a) and Klebsiella pneumoniae ATCC35657 (K.p).
5.2 Preparation of culture media
The media used for antibacterial screening tests were nutrient agar and nutrient broth.
Twenty six grams of nutrient agar (from Scharlau Chemie, Spain) were suspended in one
liter of distilled water and heated on a boiling water bath to dissolve the media
completely and then divided into 20 ml portions in small vials. Thirteen grams of nutrient
broth (from Fine-Chem. LTD. India) were dissolved in one liter distilled water, heated on a
water bath to dissolve the media and divided into 10 ml portions in small vials. The

Page
80
prepared nutrient agar and nutrient broth media were sterilized by autoclaving at 121
degree (at atmospheric of 15 pounds) for 15 minutes.
5.3 Preparation of standard bacterial suspensions
Each 10 ml portions of sterilized nutrient broth were inculcated with loopful of each
bacterial slant agar culture and were incubated for 18-24 hours at room temperature.
10% dilution from each liquid culture was prepared in sterilized normal saline and kept in
a refrigerator.
5.4 Preparation of serial dilutions of extracts
Serial dilutions having the corresponding concentrations for the 1, 4 and 8 folds of
Minimum Inhibitory Concentration (MIC) of Ceftriaxone against the bacteria under
testing. In the table below the MIC for different bacteria was shown, this was used for the
serial dilution purposes (Palmer & others, 1995).
Organism MIC90 mg/ml
Streptococcus pneumoniae 0.060
Klebsiella pneumoniae 0.125
Staphylococcus aureus 4.000
Table 3: Corresponding MIC for targeted microorganisms
The equivalent amount of powder from different products was dissolved in distilled water
to obtain the required dilutions.

Page
81
5.5 Antibacterial assay
The cup-plate agar diffusion method adopted in this study was that of Murray and others
with some minor modifications to assess the antibacterial activity of the products [Ref31].
From each of the standard stock suspension 0.1 ml was thoroughly mixed with 20 ml of
sterile Petri dishes and left to solidify on a plain surface. Then, four cup-shape wells (10
mm diameter/each) were made in each plate using sterile cork-borer (no.7). The agar
discs were removed and the alternate cups were filled with 0.08 ml sample of each
concentration from the solution of one product at time. The forth alternate cup was filled
with the solvent used (water) for control purposes using sterile adjusted pipette. The
plates were then incubated in the upright position for 18-24 hours at room temperature.
Three replicates were carried out for each solution against each tested organisms. After
incubation periods, the inhibition zones diameters were measure and the mean value
were tabulated.
5.6 Data Management and Analysis Plan
The data analysis process was done using mixed analysis methods according to the type
of data and the tool of data collection, but in general it was done using the following:
Manual analysis;
Computer programs e.g. SPSS and MS Excel

Page
82
Qualitative evaluation of reconstitution practices of Ceftriaxone powder for
injection in Khartoum teaching hospital 2010
Materials: PowerPoint presentation, checklist
6.1 Study rationale
Some of available literature related to Ceftriaxone effectiveness considered the
reconstitution practices as essential factor that could play determinant effect on its
quality. Ceftriaxone has the tendency to formulate precipitation product if mixed with
any solutions containing salts of Calcium or Magnesium or any other trivalent cations
(Murney, 2008), (Hayward & others, 1996). Accordingly the reconstitution practices of
Ceftriaxone powder for injection in Khartoum hospitals need to be evaluated to figure out
whether or not it could contribute to poor quality and outcomes of Ceftriaxone injections.
6.2 Specific objectives
To evaluate the reconstitution practices of Ceftriaxone powder for injection by nurses in
Khartoum hospitals in 2010.
6.3 Study design
The study was designed as cross sectional study using qualitative approaches.
Study area: The study focus on Khartoum locality and hospitals for this locality were
included in this evaluation.

Page
83
Study population:
Selection of hospitals: As the study include qualitative component, only one hospital was
included in this study. In this case Khartoum Teaching Hospital was selected because it is
the largest hospital in the city.
6.4 Sample size
Based on the criteria above 22 nurses from both sexes attended the group discussion.
6.5 Sampling technique
Selection of nurses:
The selection of nurses was random; the announcement for the group discussion was
sent to Matron in each hospital ward. The Matron was asked to pick the first two nurses
complied with the criteria below and presented their interest to join the group. Targeted
nurses were selected and included based on the following criteria:
All nurses worked as fulltime in Khartoum Teaching Hospital;
The nurse should have at least two years working experience in the field;
One of the nurses from each ward should work for at least one year in the private
sector;
Both female and male nurses could be selected;
6.8 Data management
The data analysis process was done using manual analysis techniques for qualitative data.

Page
84
Chapter 3: Results

Page
85
Health professionals’ survey
For all of the following results, and in the processing of statistical analysis, the results were
considered statistically significant for a P value of less than 0.05. The 90% confidence
intervals of all parameters under testing were also estimated.
1. Sample size
Retail pharmacies Doctors Clinics
Total Number in the area 328 420
Sample Size 82 95
2. Classifications - pharmacies:
Response: The response rate among pharmacists is relatively higher than doctors. 100% of the targeted
pharmacists responded to the questionnaire while 78% of the doctors agreed to respond in
the questionnaires sent to them.
Area in Khartoum:
Area Pharmacies % (n=82)
Doctors % (n=95)
Centre – hospital street 10.1 47.3 Centre - other 17.7 8.8 East 17.7 8.8
South 45.6 25.3
Peripherals 8.9 9.9
Information providers - pharmacies: In the targeted pharmacies, the respondents whom were pharmacists represent about 92%
of the sample while other categories (including pharmacy assistants) represent the rest of the
sample.

Page
86
Pharmacy type:
The distribution of the pharmacies was relatively equal between the pharmacies in
household areas (50.6%) and that located near clinics and hospitals (49.4%).
Experience of information providers - pharmacies:
Experience % (n=82)
1 year – 2 years 31.6
3 years – 5 years 30.4
More than 5 year 38.0
Information providers - doctors:
Category % (n=95)
Specialists 56.0
Registrars 25.3
General physicians 18.7
Information providers specialty (n=95):
Figure 1: Distribution of doctors by specialties in the sample

Page
87
The existence of substandard medicines problem
About 80% of pharmacists believed there are substandard medicines available in the market
versus 70% of doctors. Pharmacists usually deal directly with medicines and gets direct
feedback from the patients about it unlike the doctors.
Response % of pharmacists N=82
% of doctors N=95
Yes 82.3 70.3
No 17.7 3.3
No Comment 0 4.4
1. Level of the problem
Figure 2: Professionals’ evaluation - Level of the problem
The great difference and variety in the results between pharmacists & doctors seems to be
due to differences in definition of (major/minor). The way the data was actually collected
may play obvious effect on how each profession define that. This one of known observations
about self versus non-self administrated questionnaires. For doctors the determination of
the meaning depends solely on the perception of the information provider rather than the

Page
88
standard definition in the study. This justification is clear when we consider the proportion
of doctors who don’t respond to this question.
Effectiveness problems
The aim of this part of the questionnaires is to assess, (based on professionals’ opinion), if
the problem of substandard medicines usually implies on ineffectiveness and/or therapeutic
failure problems that facing them. This may be direct observation from them and/or based
on patients’ monitoring and/or patients’ complaints.
A. Patients complaints to pharmacist about ineffective medicines:
Pharmacies type Yes No
All Pharmacies (collective) n=82 97.5 2.5
Households Area n=42 100 0
Near Clinics or Hospitals n=40 94.9 5.1
Figure 3: Classification of complaints reported by pharmacists

Page
89
Pharmacies type
Medicine itself
Patients related
No comment
All pharmacies (collective) n=82 31.6 65.8 0
Households area n=42 32.5 67.5 0
Near clinics or hospitals n=40 30.8 64.1 5.1
One of the pharmacists in the hospital street; who don’t receive any recent complaints from
the patients; refer to the fact that: “patients usually take their medicines as the doctor
prescribed it without any complaints, even if they complain at all they refer that most likely
to pharmacies near their residency”. This in fact was supported by the results obtained from
pharmacies located in household areas, as all of it without exception received complaints
from the patients.
On the other hand most of pharmacies, 66% of the total, refer the problems in these
complaints to factors related to the patients rather than to factors related to medicines
itself. The following summaries these mentioned factors:
1. Factors related to the administration method and its impact on effectiveness;
2. Factors related to the selection of right medicine for specific case (rational
prescribing or rational dispensing);
3. Factors related to subject-to-subject variability and different response for same
drug.

Page
90
B. Classifications of complaints:
Complaints % n=79
Symptoms not relieved 78.5
Alternative trade was not effective 38.0
Side effects 35.4
Physical appearance 8.9
Other 20.3
The above table indicates the frequency of receiving each category of complaints from the
patients. For example, 38% of pharmacies received complaints from the patients about
certain alternative trade they used instead of another trade they custom themselves to use
regularly. On the other hand, 35% of pharmacies receive complaints about side effects of
medicines. These results when combined with the other data and findings this will support
of considering the feedback from the patients, of special interest the feedback received by
pharmacies. They will be important source of information and one of the channels to detect
substandard medicines.
C. Therapeutic failures - doctors :
The table below showed the response for the question about the regularity of receiving
cases with treatment failure.
Category Yes always Not always No
All doctors (collective) n=95 14.3 60.4 3.3
Specialists n=53 15.7 60.8 2.0
Registrars n=24 17.4 56.5 4.3
General physicians n=18 5.9 64.7 5.9

Page
91
Unlike the pharmacists, 45 % of the doctors believed that the quality of medicines itself is
the major factor in cases in which there is therapeutic failure. This figure is critical as these
doctors assume that they prescribe the right medicines for right cases and the
administration of medicines was also perfect. If this is the case then the quality of medicines
will be the determinant factor for such failure reports.
Figure 4: Classification of therapeutic failure reports
Category Subjects variability Drugs quality
All Doctors (collective) n=95 20.9 45.1
Specialists n=53 21.6 41.2
Registrars n=24 21.7 52.2
General physicians n=18 20.9 45.1
Looking to the trend in the above table, registrars were more extreme than other categories
regarding the primary justification for cases with treatment failure.

Page
92
Medicines which pharmacists and doctors complain about
The following data represents the generics which health professionals complained about it
(either in terms of its quality, efficacy problems or complaints from the patients).
A. Pharmacists:
Figure 5: Medicines with top complaints from pharmacists
Other medicines:
Salbutamol, Nifedipine, Mefenamic Acid, Cephalexin, Multivitamins, Ampiclox, Omeprazole, Amox-clav and Clarithromycin
Pharmacological groups:
Groups % n=81
Anti-infectives 44.3
Respiratory tract 15.2
NSAIDs 7.6
Cardiovascular system 5.1
Endocrine 5.1
Anti-Malarial 3.8
Gastrointestinal tract 3.8
Blood preparations 2.5
Vitamins 1.3
Other 1.3

Page
93
Origin % n=81
Sudan 53.2
India 10.1
Some countries in Europe 10.1
Other Asian countries 6.3
Other Arab countries 5.1
Jordan 2.5
Syria 1.3
B. Doctors:
Figure 66: Medicines with top complaints from doctors
Other Medicines:
Carbamazepine, Cefuroxime, Diclofenac Na, Omeprazole, Prednisolone and Salbutamol
Pharmacological Groups % n=74
Anti-infectives 25.3
Cardiovascular system 5.5
Endocrine 5.5
Central Nervous system 2.2
Anti-Malarial 2.2
Gastrointestinal tract 1.1
NSAIDs 1.1
Other .1

Page
94
Shifting practices patients from “Product A” to “Product B”
This part of the results represents the major indicators that describe the practice and
attitude of health professionals when they take decisions to shift their patients from one
product to another and the criteria around their decision. The generics reported in shifting
process generally similar to those mentioned by the pharmacists’ response including
(Ciprofloxacin, Amoxicillin and other antibiotics).
A. Pharmacists:
Shifting attitudes:
Pharmacologically % n=71
Shifting within the same generics 54.4
Shifting not within the same generic but same group 13.9
Shifting not within the same generic and not same group 17.7
Figure 7: Pharmacists shifting attitude

Page
95
Most of the pharmacists (85%) experienced at least one shifting decision for one patient
from one product to another different product. Most of these decisions (54%) have been
taken to shift the treatment within the same generics using different trade product. In other
aspect, most of the shifting decisions (46%) include substitution of locally produced products
by other imported products. This is important findings as pharmacists stated different
attitude about their trust in the local products in comparison to low income countries
products (46% prefer the local products over products manufactured in low income
countries). Still in 40% of the decisions the shifts occur among products that manufactured
in low income countries. The issue of generics substitution is currently burning issue on the
agenda of global pharmaceutical sector as it has very critical impact on the shape of the
global markets (Meredith P. , 2003).
Generic names “Product A”:
Generic Name % n=71
Amoxicillin 27.8
Ciprofloxacin 12.7
Glibenclamide 11.4
Diclofenac 5.1
Amox-clav 3.8
Erythromycin 2.5
Cephalexin 2.5
Omeprazole 2.5
Ibuprofen 1.3
Other medicines 17.8
Other medicines:
Amilodipine, Aspirin, Atenolol, Hydrocortisone, Mefenamic Acid, Ranitidine,
Tetracycline, Lisinopril, Prednisolone and Laxative

Page
96
Generic names “Product B”:
Generic Name % n=71
Ciprofloxacin 15.2
Glibenclamide 11.4
Amox-clav 8.9
Azithromycin 8.9
Erythromycin 7.6
Amoxicillin 5.1
Diclofenac Na 3.8
Omeprazole 2.5
Other medicines:
Ampiclox, Ibuprofen, Amilodipine, Aspirin, Atenolol, Anti Flu, Ranitidine, Lisinopril
and Laxative
Origins of “Product A”:
Origin % n=71
Sudan 59.5
India 12.7
Other Arab countries 3.8
Europe 3.8
Jordan 2.5
Egypt 1.3
Other Asian countries 1.3
Syria 1.3
Origins of “Product B”:
Origin % n=71
Europe 27.8
Jordan 22.8
Sudan 20.3
Egypt 3.8
India 3.8
Other Arab countries 3.8
Other Asian countries 2.5
Syria 1.3

Page
97
B. Doctors:
Shifting attitudes:
Pharmacologically % n=36
Shifting within the same generics 85.7
Shifting not within the same generic but same group 9.5
Shifting not within the same generic and not same group 4.8
Figure 8: Doctors shifting attitude
Unlike the feedback obtained from the pharmacists, 86% of doctors took decisions to shift
their patients from one product to another product but within the same generic. It is also
clear that 84% of the decisions taken by the doctors to direct their patients from products
manufactured in low income countries to other manufactured in high income countries.

Page
98
Generic names “Product A”:
Generic name % n=36
Ceftriaxone 5.5
Ciprofloxacin 3.3
Amox-clav 2.2
Azithromycin 2.2
Other Antibiotics 3.3
Other medicines 3.3
No comments 19.8
Not applicable 75.1
Generic names “Product B”:
Generic Name % n=36
Ceftriaxone 6.6
Amox-clav 3.3
Ciprofloxacin 2.2
Other Antibiotics 2.2
Other medicines 2.2
No comments 24.2
Not applicable 53.8
Origins of “Product A”:
Origin % n=36
India 7.7
Sudan 5.5
Other Arab countries 3.3
Other Asian countries 2.2
Syria 1.1
No comments 19.8
Not applicable 57.3
Origins of “Product B”:
Origin % n=36
Europe 13.2
Other Arab countries 6.6
India 1.1
No comments 19.8
Not applicable 59.3

Page
99
Trust of the professionals in local products as alternatives
This component of the questionnaire addressing the concerns usually rose about the quality
of locally manufactured products, especially when compared with the imported products. In
few questions the information providers were asked to evaluate their trust and opinion
regarding the local production and whether or not they will use it as alternative if it is
available in the market. The results showed that 80% of the pharmacists trust the local
products versus only 55% of the surveyed doctors trust the local products and they used as
alternative.
In more depth analysis, it seems that the degree of trust is related to the experience of
information provider. Experienced professionals trust the local production more than the
younger professionals (whether pharmacists or doctors).
A. Pharmacists:
Category Yes No
All pharmacists (collective) n=82 79.7 16.5
1 year – 2 years (n=26) 72.0 24.0
3 years – 5 years (n=25) 79.2 16.7
More than 5 years (n=31) 86.7 10.0
B. Doctors:
Category Yes No No comments
All Doctors (collective) n=95 53.8 15.4 8.8
Specialists n=53 60.8 7.8 9.8
Registrars n=24 34.8 34.8 8.7
General physicians n=18 58.8 18.8 5.9

Page
10
0
Price as indicator of quality
“Product of high price usually has good quality than that of low price product”
This aphorism is not uncommon among health professionals; and it is associates usually with
the fevering one product over other products just according to this rule. The feedback from
pharmacists and doctors regarding this subject indicate that, pharmacists were divided in
their approaches as some were objectors, some agree totally while other agreed with some
reservations. On other hand 44% of the doctors believed the saying generally true “but not
always”.
A. Pharmacists:
Category Yes always Not always No
All pharmacists (collective) n=82 29.1 39.2 31.6
1 year – 2 years (n=26) 24.0 52.0 24.0
3 years – 5 years (n=25) 20.8 50.0 29.2
More than 5 years (n=31) 40.0 20.0 40.0
B. Doctors:
Category Yes always Not always No No comments
All Doctors (collective) n=95 17.6 44.0 1.0 5.5
Specialists n=53 17.6 41.2 13.7 5.9
Registrars n=24 8.7 54.2 8.7 8.7
General physicians n=18 29.4 41.2 5.9 0

Page
10
1
Relations with the regularity bodies
The role of pharmacy or health regularity bodies is very important and vital in the linkage
between the professional practitioners and the products they use during their work. The
feedback of the practitioners about the products efficacy, safety and quality should be
communicated with the authority. Still the final assessment of these products should be
referred to these bodies. Few proportion of health professionals (only 15% of pharmacists
and 10% of doctors) have been ever notified any complaints or reports to any regularity
body regarding medicines related problems. Upon surveying those who communicate with
the authorities regarding the response to their reports; the majority of the reporters
received no response to their reports.
Many of the information providers refer this probably due to:
- Inefficient complaints receiving and management system;
- Poor documentation system within the authorities;
- Weak decision making procedures
A. Notification of complains to any Regulatory Body regarding medicines related problem:
Ever notify Pharmacists n=82 Doctors n=95
Yes 15.2 9.9
No 79.7 50.5
No comment 5.1 12.1
B. If yes; what was the response:
Response Pharmacists Doctors
Prompt & good response 16.7 -
Delayed response - -
Weak response - -
No response 75.0 44.4
No comment 8.3 55.6

Page
10
2
Comments of providers on the quality of medicines from particular origins
This part of the questionnaires discussed the possible relation between the country of origin
and the quality of medicines. The information providers were asked to evaluate and
comment on products originated in different sources. This included Sudan, other low income
countries, high income countries and products manufactured by multinational industries;
this classification of countries was based on World Bank classifications (WB, 2007). They
were asked to classify products generally either of “good quality” or of “low quality” for
specified origins. This question reflected their impression about the relation between the
origin and the quality in their perception. 67% and 48% of pharmacists and doctors
respectively believed that products manufactured in low income countries were general
worse than that from high income countries and products from multinational companies. In
general 64% and 35% of pharmacists and doctors respectively believe that the locally
produced products are of good quality. With in-depth analysis, 46% of pharmacists and 30%
of doctors consider locally manufactured products are better in its quality than that
produced in low income countries. This again reflects the trust of health professionals in the
local production of pharmaceuticals.
A. General:
Product Type
Pharmacists
Good quality
Low quality
No comment
Original brand name (international Companies) 97.5 2.5 0
Generic product from high income countries 97.5 2.5 0
Generic product from low income countries 32.9 67.1 0
Generic product locally produced in Sudan 64.6 35.4 0

Page
10
3
Product type
Doctors
Good quality
Low quality
No comment
Original brand name (international companies) 56.0 0 16.5
Generic product from high income countries 50.5 202 19.8
Generic product from low income countries 5.5 48.4 18.7
Generic product locally produced in Sudan 35.2 16.5 20.9
B. Providers consider: “the locally produced products were better than that produced
in low income countries”
Pharmacists n=82 Doctors n=95
Local product is better than low income countries products
45.6 29.7
Other specific indictors
A. Pharmacists:
1. Physical appearance problems
Observing change in the physical appearance of pharmaceuticals is not uncommon
experience among the pharmacists. 99% of pharmacists experienced this problem at least
once during their practice and cross the sample taken all categories of pharmacists
experienced it equally. Amoxicillin & Multivitamins (especially capsules for both generics)
were the generics in which there is obvious problem. Most of the pharmacists notice distinct
physical changes in different dosage forms, whether this in the dosage unit and/or the inner
packages and/or outer packages. From the results it was very difficult to judge whether the
problem was mainly due to inappropriate storage conditions or it is related to poor

Page
10
4
manufacturing specifications. In general capsules as dosage form (soft gelatin & hard gelatin)
represents the major source of complaints under this heading.
Area type Yes
All pharmacies (collective) n=82 99.2%
Centre – hospital St (n=11) 100%
Centre - Other (n=14) 100%
East (n=14) 100%
South (n=36) 98.1%
Peripherals (n=7) 100%
Generic Names:
Generic Name % n=122
Multivitamins 21.1
Amoxicillin 17.1
Cough syrup 7.3
Ampiclox 4.9
Metronidazole 4.9
Chloroquine 4.1
Other antibiotics 4.1
Cephalexin 2.4
Azithromycin 2.4
Antihistamine 2.4
Mefenamic Acid 2.4
Other medicines:
Cotrimoxazole, Paracetamol, Diclofenac Na, Doxacycline, Tetracycline, Ar+SP, B6, Aspirin,
Benzyl penicillin, Anti Flu, Clarithromycin, Furosemide, Gentamycin, K-citrate, Ketotifen,
Metformin, Metoclopramide, Promethazine, Salbutamol, Timolol, Vit K

Page
10
5
Pharmacological groups:
Groups
% n=122
Anti-infectives 42.3
Vitamins 22.0
Respiratory tract 4.8
NSAIDs 7.3
Anti-malarial 4.9
Blood preparations 1.6
Cardiovascular system 0.8
Central nervous system 0.8
Dermatology 0.8
Other 7.3
Dosage Forms:
Figure 9: Classification of physical appearance problems
Observation source:
Observation source % n=122
Himself / Herself 91.9
Doctors 2.4
Patients 4.1
Other 0.8

Page
10
6
Problem classification:
Package type Problem % n=122
Stripe Contents leakage 20.3
Stripe Units missed 16.3
Bottle Separation or precipitation 16.3
Bottle Contents leakage 15.4
Stripe Units crashed 9.8
Other Color changes 4.9
Stripe Deformation 3.3
Bottle Color changes 2.4
Other Contents leakage 1.6
Stripe Color changes 0.8
Bottle Crashed 0.8
Other Crashed 0.8
Other Other 7.3
2. Post Marketing Surveillance System
Post-marketing surveillance system has been developed by the Federal Directorate of
Pharmacy in Sudan few years ago. Until this study was completed the system was well
established only at the federal level. “NMPB” distributed some promotional posters and
materials to raise the awareness about the existence of this system. The materials also
aimed to open a sort of communication channel with pharmacies and pharmacists. Only 23%
of surveyed pharmacies received these materials, and most of these pharmacies were
located in the hospital street and in the eastern areas in Khartoum (no materials seen in
other areas). Among different categories of pharmacists; those with more than 5 years of
experience and those having experience between 1-2 years know about the system more
than those in the range between 3-5 years of experience. Among pharmacists having
adequate information in general about the system; 57% of them think that the system is
effective and 22% have some concerns about the system efficacy.

Page
10
7
A. Availability of drug safety poster:
Area type Yes No
All pharmacies (collective) n=82 22.8 64.6
Centre – hospital St (n=11) 50.0 37.5
Centre - other (n=14) 28.6 64.3
East (n=14) 42.9 50.0
South (n=36) 11.1 69.4
Peripherals (n=7) 0 100
B. Awareness about post-marketing surveillance system:
Area type Yes No
All pharmacies (collective) n=82 41.8 57.0
Centre – hospital St (n=11) 50.0 50.0
Centre - other (n=14) 42.9 50.0
East (n=14) 50.0 50.0
South (n=36) 41.7 58.7
Peripherals (n=7) 14.3 85.7
Category Yes No
All pharmacists (collective) n=82 4.8 57.0
1 year – 2 years (n=26) 44.0 56.0
3 years – 5 years (n=25) 33.3 62.5
More than 5 years (n=31) 64.7 53.3
C. Comments on the usefulness of the system:
Efficacy Yes n=82
Effective 57.0
Partially effective 21.5
Not effective 16.5
Category Effective Partially Effective
Not Effective
All pharmacists (collective) n=82 57.0 21.5 16.5
1 year – 2 years (n=26) 60.0 24.0 12.0
3 years – 5 years (n=25) 58.3 25.0 12.5
More than 5 years (n=31) 53.3 16.7 23.3

Page
10
8
3. Medicines recall
Most of the surveyed pharmacies experienced recall process at least once in the last period.
All pharmacies in Hospital Street and those in the peripherals go through this process either
through Pharmacy Directorate or through direct contact with the concerned companies. In
27% of recall cases “no official letter” was received from “NMPB" (previously it was
Pharmacy Directorate which is the responsible body) to the pharmacies as endorsement to
carry out the recall procedure. Upon the revision of the records from Pharmacy Directorate
in comparison with the data obtained from the field, for 17% of the reported cases no
records have been found. This was very critical and significant data.
A. Dealing with recall process:
Area type Yes No
All pharmacies (collective) n=82 92.4 6.3
Centre – hospital St (n=11) 100.0 0
Centre - other (n=14) 92.9 7.1
East (n=14) 85.7 14.3
South (n=36) 91.7 5.6
Peripherals (n=7) 100.0 0
Recall
Yes No
Deal with physical problems 74.0 100.0
Not deal with physical problems 13.7 0
B. Reference from the authorities for approving the recall:
Efficacy Yes
With written letter 53.2
Without written letter 26.6
No comments 5.1

Page
10
9
C. Examples of medicines recalled recently:
Generic name % n=79
Cough syrup 40.5
Multivitamins 8.9
Ferrous preparation 8.9
Antihistamine 7.6
Aspirin 5.1
Ciprofloxacin 1.3
Other antibiotics 3.8
Other medicines 15.2
Other medicines:
Antacid, Bisacodyl, Chloramphenicol, Diclofenac, Indomethazine, Captopril, K-citrate, Metformin, Paracetamol and Salbutamol
Pharmacological Groups % n=79
Respiratory tract 41.8
NSAIDs 10.1
Blood preparations 8.9
Vitamins 8.9
Cardiovascular system 5.1
Anti-infectives 3.8
Other 10.2
Dosage Form % n=79
Liquids (syrup & suspension) 51.9
Tablet 25.3
Capsule 10.1
Parental 1.3
Other 2.5
Origin % n=79
EAU 41.8
Europe 10.1
Jordan 8.9
India 8.9
Sudan 7.6
Other Arab countries 11.4
Other 2.5

Page
11
0
4. Prioritization of pharmacological groups according to pharmacists
Pharmacists were asked about their prioritization for top 3 pharmacological groups they
think it represents the most essential groups in their pharmacies in terms of consumption,
importance and quality concerns. According to the results obtained; cardiovascular
medicines, anti-infective medicines and gastrointestinal medicines represents the main
groups. Pharmacists relatively prioritize these groups in their pharmacies and they think that
the government should consider it carefully in its quality assurance plans.
Figure 10: Prioritization of pharmacological groups according to pharmacists’ feedback
B. Doctors:
1. Doctors’ awareness & knowledge about substandard medicines
Some questions were asked to doctors for specific purposes; one of the questions designed
to evaluate the knowledge of doctors about the problem of substandard medicines and its
negative impacts. 40% of the doctors mentioned that the immediate effect of substandard

Page
11
1
medicines could lead to patient’s death. Same results to this one was also shown in another
survey done by press newsletter in India about this area (Castro, 2005). In general results
indicated that more educational interventions about substandard medicines should be
developed and implemented; that aimed to increase their awareness by the impact of
substandard medicines problem and how to deal with it (Palampur, 2003).
a) Substandard drawbacks:
What n=95 Yes No No comment
Additional cost for your patients 62.6 6.6 3.3
Prolong your patients’ illness 59.3 7.7 5.5
Could be contributed to drugs resistance 54.9 11.0 5.5
Decrease your patients trust on your practice 52.7 11.0 8.8
Could lead to patient death 38.5 24.5 9.9
All of these 30.8 - -
None of these 3.3 - -
b) Reasons to recall (withdrawal) medicines from the market:
The awareness of doctors about recall system and what are the reasons for it showed very
weak knowledge among them about it. Other suggested different reasons to take a recall
decision.
Why n=95 Yes No No comment
Chemical problems (active and in-active contents problems)
58.2 3.3 11.0
Changes in color 58.2 3.3 11.0
Fracture of tablets or capsules 54.9 5.5 12.1
Repeated doctors and or patients complaints
54.9 6.6 12.1

Page
11
2
2. Insistence to prescribe particular trade products
63% of doctors, particularly the specialists, report that they insist to prescribe certain trade
products to their patients. Most of them refer this to the successful experience with these
trades relative to other trades available in the market. On the other hand only 14% of
doctors refer this to the price considerations as factor that could influence their decision to
select certain reasonably affordable product.
Yes No No comment
All Doctors (collective) n=95 62.6 9.9 5.5
Specialists n=53 64.7 9.8 3.9
Registrars n=24 60.9 4.3 3.0
General physicians n=18 58.8 17.6 0
Reasons if he/she insists to prescribe certain medicines:
Why Yes No No comment
Success experience with those trades 50.5 21.1 2.2
Failure experience with other trades 18.7 44.0 2.2
Price considerations 14.3 48.4 2.2
Other 101 61.5 2.2
3. Availability versus Quality
“Available low quality drug is better than the drug is not available at all”
According to the results, 30% of the doctors agreed with the above concept. If no available
alternative they may prescribe low quality product to safe the patients. This result was
significant as many theories consider that low quality medicines could be regarded as not
available for effective and safe human use under any circumstances (MSH, 2001), (Videau,
2001). This result could be evaluated only under the personal experiences of doctors in
Sudan. Despite the fact this should be combined with consideration to that relatively there

Page
11
3
are small number of registered medicines in Sudan [around 3700 trades] (NMPB, Sudan -
National Medicines and Poisons Baord , 2010). This obviously affects the decisions of the
doctors because of small available options to take. One third of the doctors will go for the
unique drug drugs regardless its quality.
Category Yes No Some times No comment
All Doctors (collective) n=95 29.7 15.4 24.2 4.4
Specialists n=53 23.5 19.6 21.6 5.9
Registrars n=24 34.8 0 39.1 4.3
General Physicians n=18 41.2 23.5 11.8 0
I. Other
The problem of substandard medicines is worse in case of:
Type of medicines % n=95
OTC medicines 29.7
Rx medicines 28.6
Both types 4.4
No comment 11.0
Information sharing with pharmacists about quality:
Why Yes No No comment
All Doctors (collective) n=95 57.1 11.0 4.4
Specialists n=53 49.0 15.7 3.9
Registrars n=24 65.2 4.3 8.7
General physicians n=18 70.6 5.9 0

Page
11
4
General discussion
Despite the fact that medicines inspection function in Sudan was improved largely in last few
years, it is still true the unexpected failure of most inspectors to identify significantly
substandard products put in question the training programs and/or testing protocols. The
main concern whether these were adequate to build up the sufficient capacity for the
inspectors to gain the skills required (WHO, 1999).
It has been mentioned before, there is a post marketing surveillance system implemented
for registered medicines in Sudan. It aims to track different distribution channels of
medicines through the country. It was designed to consider differential factors that affect
the quality of marketed medicines. One of the basic conceptions for any PMS system, which
considered as important anchor, is the sampling technique or methodology regarding the
selection of targeted medicines or the collection of samples from the field. Both areas are
critical so as to ensure that a representative sample of targeted medicines was collected
from the distribution channels to support any future decision could be taken based on the
results.
There are different approaches worldwide considering the PMS system development and
some countries have unique system regarding the selection of medicines and its sample
collection; as examples:
In Australia complementary medicines and non-prescription drugs were routinely
examined based on the Pharmacovigilance reports obtained from the field (Fracchia
& others, 2000);

Page
11
5
In Malaysia all types of products were subjected to PMS analysis as the number of
medicines available in the market was limited and easy to be tracked regarding it
quality;
In Cyprus products containing sensitive substances, products used for serious
diseases and generic products posing interchangeability problems were considered
as the primary targets for the system;
In Cuba the PMS focuses on samples collected from manufacturers in connection
with GMP inspection, rather than on samples collected directly from the “market
base on the limited capacity of the quality control laboratory (USP, 2005).
It is valid that the conceptual believes of the medical professionals regarding the
substandard medicines affect to large extent the curative process in any medical field
(whether in the public or private sectors). Health professional believes could be of potential
importance as it has been driven from years of experience and repeated practical
knowledge. But this also could be of possible drawbacks effect on the health provision
process when these pre-judgments weren’t supported by evidence based indications (ICN,
2005). This survey aimed to express out the conceptual understanding of the health
professionals in Khartoum city regarding the issue of substandard medicines circulated in the
private market in Khartoum, and to link these thoughts to what was really taken place in the
marketed medicines. Results of this survey showed the major issues regarding the
professionals’ ideas and how they deal with the substandard medicines. It was obvious there
are different concepts regarding these issues among doctors surveyed and other significantly
different concepts among the pharmacists. One of the possible reasons for that could be

Page
11
6
referred to the basic educational background that allow the pharmacists to deal with
medicines objectively regarding its quality despite its sources of origin, its prices or any other
associated factors other than evidence based quality problems (Dodoo, 2007). This reflected
the needs for developing educational programs to address the problems of counterfeit and
substandard in the curriculums of pharmacy and medicines schools as part of essential
medicines concept. On the other hand the judgment of doctors regarding the quality of any
product used for the patients will be always concluded with slightly subjective evaluation
which could be generated from their experiences in the field. As an example for that the use
of substandard, narrow-spectrum antibiotics may lead practitioners to believe that the
medicines are ineffective, and unnecessarily prescribing new/more expensive broad-
spectrum antibiotic, which places additional financial pressures on the health care system
and the patient as well (Andreotti & Crea, 2005). Another example with similar scenario
applied for life saving drugs with narrow therapeutic index which were considered and taken
seriously for patients with ischemic heart diseases and other life threatening diseases (Das,
1992) (Reaney, 2005).
It was obtained from the results that 80% and 70% of pharmacists and doctors respectively
believes that there are substandard medicines available in the market. The awareness about
the impact of this problem and its effects was different among health professionals. The
educational background and the experience seem to play important role in these
differences. The message that may be conveyed from medical professionals to the public,
about the quality of medicines, sometimes become extremely misleading information and
affect the overall handling of this issue. Concepts linked the quality of medicines to its price

Page
11
7
and/or their origins are relevant in this case. It has been argued that increasing the
awareness about poor quality drugs may cause patients to worry excessively about whether
the medicines they are taking are genuine. On the other hand, lack of vigilance may generate
a lack of trust in both consumers and professionals. Still the question about this matter will
persist regarding the opinions to bring the issue of substandard medications to public
attention as an essential first step towards reinforcing current methods of surveillance, with
consideration to what extend this will affects the patients trust in the health system in
general.
Based on the results obtained it was clear that the complaints received by the pharmacists
from the patients were most likely due to factors related to the patients. Among the
complaints received by pharmacists; the utmost issue of the complaints from the patients
that they administer medicines that were not effective or, sometimes, the symptoms were
not relieved after using some medicines. Although this was subjective issue, but still his was
significant findings since that part of these medicines were medicines for chronic use e.g.
antihypertensive anti-diabetic medicines.

Page
11
8
Feedback about the quality
The following results obtained from the survey of health professionals. They were asked to
account if they have any quality concerns regarding the selected generic names (refer to
medicines selection criteria in pages 38&39). These results gives the overall summery of the
feedback about the following medicines:
1. Ciprofloxacin
2. Amoxicillin susp/cap
3. Paracetamol
4. Metronidazole
5. Glibenclamide
6. Mefenamic Acid
7. Artesunate + SP
8. Chlorphenarmine
9. Chlorphenarmine
10.Ampiclox
11.Aspirin
12.Ethinylestradiol/levonorgestrel
13.Carbimazole tab
14.Cefuroxime
15.Atenolol
16.Co- trimoxazole
17.Furosemide
18.Nifedipine
19.Chloramphenicol
20.Hydrocortisone
21.Digoxin

Page
11
9
1. General
Table 4: Overall summery of the feedback about surveyed generics
Order Generics Quality concerns
% Yes % No
1 Ciprofloxacin 46.8 50.4
2 Amoxicillin susp/cap 43.2 53.2
3 Paracetamol 41.7 53.2
4 Metronidazole susp/tab 39.6 56.8
5 Glibenclamide tab 35.3 57.6
6 Mefenamic Acid 31.7 57.6
7 Artesunate + SP 30.9 69.1
8 Chlorphenarmine 25.9 61.2
9 Ampiclox 26.6 69.1
10 Aspirin 24.5 69.8
11 Ethinylestradiol/levonorgestrel 22.3 59.0
12 Carbimazole tab 23.7 68.3
13 Cefuroxime Inj 23.7 69.1
14 Atenolol tab 21.6 71.2
15 Co- trimoxazole 16.5 69.8
16 Furosemide 15.8 69.1
17 Nifedipine 15.1 72.7
18 Chloramphenicol 13.7 79.1
19 Hydrocortisone 11.5 83.5
20 Digoxin Inj/tab 7.2 82.7
* n=117

Page
12
0
2. Classification of the feedback based on providers type
Table 5: Feedback about surveyed generics disaggregated by information provider
Order Generics Answering “Yes”
Pharmacists Doctors
1 Ciprofloxacin tab 43.6 50.8
2 Amoxicillin susp/cap 46.2 39.3
3 Paracetamol 43.6 39.3
4 Metronidazole susp/tab 37.2 42.6
5 Glibenclamide tab 38.5 31.1
6 Mefenamic Acid 28.2 36.1
7 Artesunate +SP 28.2 34.4
8 Ampiclox 21.8 32.8
9 Chlorphenarmine 26.9 24.6
10 Cefuroxime sodium Inj 19.2 29.5
11 Aspirin 25.6 23.0
12 Carbimazole tab 24.4 23.0
13 Atenolol tab 17.9 26.0
14 Ethinylestradiol/levonorgestrel 34.6 6.6
15 Co- trimoxazole 6.4 29.5
16 Furosemide 6.4 22.9
17 Nifedipine 12.8 18.0
18 Chloramphenicol 14.1 13.1
19 Hydrocortisone 5.1 19.7
20 Digoxin Inj/tab 6.4 8.3

Page
12
1
3. Classification of providers answers about ineffectiveness
Table 6: Feedback about surveyed generics disaggregated by problem category
Order Generics Answering the problem in
Drug itself patients
1 Co- trimoxazole 69.6 30.4
2 Nifedipine 66.7 28.6
3 Aspirin 64.7 35.3
4 Atenolol tab 63.3 30.0
5 Ciprofloxacin tab 60.0 39.6
6 Digoxin Inj/tab 60.0 40.0
7 Paracetamol 56.9 43.1
8 Furosemide 59.1 36.4
9 Mefenamic Acid 59.1 38.6
10 Hydrocortisone 56.3 43.8
11 Glibenclamide tab 55.1 44.9
12 Amoxicillin susp/cap 55.0 45.0
13 Carbimazole tab 54.5 42.4
14 Metronidazole susp/tab 52.7 45.5
15 Ampiclox Inj 51.4 45.9
16 Cefuroxime sodium Inj 48.5 51.5
17 Ethinylestradiol/levonorgestrel 48.4 51.6
18 Artesunate 46.5 53.9
19 Chlorphenarmine 44.4 55.6
20 Chloramphenicol 36.8 63.2

Page
12
2
Based on the above results which was obtained from the questionnaires; certain criteria
have been set to select particular medicines which will be the subject of Quality Control
laboratory analysis. The criteria set were as follows:
1. Top 10 generics (in %) that professionals concerns about it;
2. Feedback obtained from the professionals about specific medicines related
problems (Top 5 generics).
3. Distribution of selected medicines (the 15 generics from 1&2 above) in terms of
pharmacological groups, number of registered items per each generic, quantitative
assay methodology and type of dosage form;
4. Availability and possibility to access suitable analytical settings.
According to these criteria the following medicines came as a result if this appraisal:
Generics Dosage Assay Pharmacology Registered
Ciprofloxacin Tablet LC Antibiotic 32
Amoxicillin Capsule LC Antibiotic 48
Paracetamol Tablet UV NSAIDs 22
Metronidazole Tablet Titration Ant infective 18
Glibenclamide Tablet LC Endocrinology 18
Mefenamic Acid Tablet Titration NSAIDs 7
Artesunate +SP Tablet - Antimalarials 6
Chlorphenarmine Tablet UV Other 8
Ampiclox Capsule LC Antibiotic 12
Aspirin Tablet Titration NSAIDs 16
Cough Syrup Syrup - Other -
Erythromycin Tablet LC Antibiotic 13
Ceftriaxone Injection LC Antibiotic 12
Diclofenac Tablet Titration NSAIDs 28
Amox-clav Tablet LC Antibiotic 12 Table 7: Summery of primary selected medicines

Page
12
3
The screening process was made to select the final list of generic medicines. Based on that
10 generics were finally selected according to the above mentioned criteria as follows:
1. Ciprofloxacin
2. Aspirin
3. Metronidazole
4. Glibenclamide
5. Mefenamic Acid
6. Chlorphenarmine
7. Paracetamol
8. Diclofenac
9. Amoxicillin
10. Ceftriaxone
These 10 generics represent the core list for quality control analysis. The next step was the
selection of representative trade products registered in Sudan. The way the trades were
selected in this part developed to avoid any sort of bias so as to ensure the selection of
representative samples correspond to the situation as much as possible.
Based on the questionnaire analysis and upon the response of the targeted groups, it was
noted that the respondents sometimes relate and link the products quality by its countries
of origin. This observation was considered in order to select the sample of trade products
and also this could help in verifying the validity of this assumption.
In Sudan there are large number or registered source origins of pharmaceuticals that shaped
the market in Sudan. Based on that, the study team decided to categorize the countries of
origin based on the country income according to the World Bank reports (WB, 2007). This
assisted the investigators to systematize the sampling process.

Page
12
4
There are major classifications for countries income level according to World Bank reports
and this include:
1. High income countries.
2. Upper-middle income countries.
3. Lower-middle income countries.
4. Low income countries.
Countries of origin of selected generics were sorted out according to these classes, Annex no .6.
The following criteria were considered in the selection process:
1. Country income category;
2. Company of manufacturing and/or distribution;
3. Availability in other pharmaceutical dosage form;
4. Subjection of the trade product to Post Marketing Surveillance (PMS) analysis
process by pharmacy directorate;
5. If any, the results of PMS;
6. Actual availability of the products in the market;
7. Most likely used products in the market (pharmacies’ feedback);
According to this method 3 trade products were selected randomly for each generic with a
total of 30 trade products as follows:-

Page
12
5
Generic: Acetylsalicylic Acid
Concentration: 300 mg tablet
Trade Company Country of origin
Origin classification
Available in other form
PMS
G02C13T01 C13 Sudan Local Yes Yes/+
G02C17T02 C17 Lebanon Low income No Yes/-
G02C06T03 C06 Sudan Local Yes No
Generic: Amoxicillin Trihydrate
Concentration: 500 mg capsule
Trade Company Country of origin
Origin classification Available in other form
PMS
G01C03T01 C03 Sudan Local Yes No
G01C11T02 C11 India Low income Yes Yes/+
G01C21T03 C21 Jordan Higher-middle-income Yes No
Generic: Ceftriaxone sodium
Concentration: 1 & 0.5 gm powder for injection
Trade Company Country of
origin Origin classification
Available in other form
PMS
G03C10T02 C10 India Low income No No
G03C14T03 C14 Jordan Lower-middle-income Yes No
G03C20T01 C20 Switzerland High income Yes No
Generic: Chlorphenarmine Maleate
Concentration: 4 mg tablet
Trade Company Country of origin
Origin classification
Available in other form
PMS
G04C13T02 C13 Sudan Local No No
G04C15T01 C15 Sudan Local No No
G04C04T02 C04 Greece High income Yes No

Page
12
6
Generic: Ciprofloxacin
Concentration: 500 mg Tablet
Trade Company Country of
origin Origin
classification Available in other form
PMS
G05C03T03 C03 Sudan Local Yes NO
G05C19T02 C19 India Low income Yes NO
G05C20T01 C20 Switzerland High income Yes Yes/+
Generic: Diclofenac Sodium
Concentration: 25 mg Tablet
Trade Company Country of
origin Origin classification
Available in other form
PMS
G06C06T01 C06 Sudan Local NO NO
G06C14T03 C14 Jordan Lower-middle-income Yes NO
G06C20T02 C20 Switzerland High income NO NO
Generic: Glibenclamide
Concentration: 5 mg Tablet
Trade Company Country of origin
Origin classification
Available in other form
PMS
G07C06T01 C06 Sudan Local NO NO
G07C08T03 C08 Pakistan Low income NO NO
G07C09T02 C09 England High income NO NO
Generic: Mefenamic Acid
Concentration: 500 mg Tablet
Trade Company Country of origin
Origin classification
Available in other form
PMS
G08C06T01 C06 Sudan Local Yes NO
G08C08T03 C08 Pakistan Low income Yes Yes/+
G08C09T02 C09 KSA High income Yes NO

Page
12
7
Generic: Metronidazole
Concentration: 250 mg Tablet
Trade Company Country of origin
Origin classification Available in other form
PMS
G09C22T03 C22 Sudan Local No NO
G09C16T01 C25 Jordan Lower-middle-income Yes NO
G09C16T01 C16 KSA High income No NO
Generic: Paracetamol
Concentration: 500 mg Tablet
Trade Company Country of origin
Origin classification
Available in other form
PMS
G10C12T02 C12 Sudan Local No No
G10C02T03 C02 UAE High income Yes No
G10C07T01 C07 UK High income Yes No

Page
12
8
Collection of samples for chemical analysis
Sampling Quality Assurance
Sample collection process was considered as one of the critical steps in this study. For this
reason a set of measures have been taken and applied based on the sampling protocol
described previously.
The following measures were considered as quality assurance plan (Syhakhang & others,
2006). This included the following:
1. The sampling sites were only within Khartoum city;
2. The samples have been collected from the retail private pharmacies only;
3. The sampling technique considered different geographical areas;
4. The sampling process consider the following classification of locations:
Household areas.
Areas near clinics and hospitals.
5. The sampling process was based on the availability of the trade products
authorized to be available in the market;
6. The samples were stored as indicated by the supplier before, during and after
the laboratory analysis (USP, 2003).
Sample collection form
Pre-prepared sample collection form (see annex 7) was used to gather information about
each sample. This was done to ensure the traceability of each sample collected during the
whole process and to collect in-depth information regarding each samples. Accordingly

Page
12
9
the following information was generated from such analysis to get clear background
regarding each sample:
Distribution of sample:
By area:
Area % n=46
Centre – hospital Street 26.1%
Centre - other 4.3%
East 15.2%
South 37.0%
Peripherals 17.4%
By field:
Type % n=46
Household areas 30.4%
Near clinics or hospitals 69.6%
Trade products:
As it was mentioned that the availability of the selected medicines in the market was one
of the important factors that affect the process of sample collection process from the
retail pharmacies. It was planned to collect 30 different trade products, i.e. 3 trades per
each generic. The list of the trade medicines was obtained from the registration
department in National Medicines and Poisons Board as indictor for registration. But due
to many reasons the availability of the selected trades was not found as expected, so the
PIs decided to select alternative trades based on the same selection criteria described
earlier. Out of 30 pre-determined trades 3 were not available in the market at the time of

Page
13
0
sample collection and it was replaced randomly by other products within the same
selected generics.
Suppliers:
It is well understood that for each imported medicine there is a legally registered agent
should be responsible for the distribution that product in the market. Different original
oversees manufacturers could have the same distribution agent in Sudan. Accordingly, as
expected there was difference between the number of manufacturers and the agents in
the collected samples. The supplier classification was as follows:
Classification No
Manufacturers (importation) 15
Manufacturers (local) 7
Distribution agents 10
Dosage form & concentrations:
Form %
Tablet 82.6%
Capsule 8.7%
Injection 8.7%
Pharmacological groups:
The sample collected from different kinds of pharmacological groups, this includes the
following:
Group %
Anti-infectives 39.1%

Page
13
1
NSAIDs 41.3%
Anti diabetic 10.9%
Anti histamine 8.7%
Number of batches:
This part was also affected by the availability of each product in the market and the
distribution power of each product. It is generally noted highly consumed products were
characterized by the availability of several batches in the market and in different
geographical areas through the study area. The sampling protocol was built on that; one
batch for each trade product should be collected and on exceptions additional one could
be collected to complete the total sample required units (USP, 2006). The total number of
batches collected was 46, as on average one batch of each product was collected from
the field.
Shelf Life:
It is true that the quality of any product in the market could be affected directly or
indirectly by its remaining shelf life in addition to conditions under which the product was
stored (York, 1977), (Barmania, 1990).
Origin Median Minimum Maximum
Products from high income countries 34 Months 19 Months 53 Months
Products from low income countries 23 Months 2 Months 51 Months
Products locally produced in Sudan 18 Months 8 Months 33 Months
According to the results obtained during the sample collection process from the field it
was noted that:

Page
13
2
1. The maximum remaining shelf life was 53 months for a product produced in
Switzerland, and the minimum remaining period was 2 months for Indian and
Jordanian products;
2. The overall median remaining shelf life of the products in the market at the time
of sample collection was 21 months;
3. 75% of the products collected have remaining shelf live more than 33 months;
4. In 3 batches the manufacturing date wasn’t imprinted on the internal packages
2 batches were locally produced;
5. Imported products generally have longer remaining shelf life than that local
products;
6. The tablet dosage forms characterized by remaining shelf life longer than other
dosage forms
Source of origin:
Product type % n=46
Products from high income countries 39%
Products from low income countries 24%
Products locally produced in Sudan 37%
Registered shelf life:
Based on data obtained from “NMPB”, it has been found that (16%) of batches collected
from the market weren’t complied with the registered period in “NMPB”. The causes of
this observation weren’t clear. As example, some products were subjected to self life
expansion, so, 2 batches from the same product with different shelf lives could be

Page
13
3
available at the same time in the market. Still this indicates some degree of weaknesses in
the ability of the inspection system to detect such kind of practices.
Shelf life expansion:
Among the products collected from the field; 3 products were subjected to expansion of
the shelf life periods as requested from “NMPB”. Most of these products were
manufactured in high income countries in its origin.
Registration number:
FBPP as requirements was asking the manufactures to print the registration number
(product specific) on the outer package. Upon analysis, and on average, 46% samples
were distributed with pre-printed registration number.
Product with pre-printed registration number %
Products from high income countries 50%
Products from low income countries 73%
Products locally produced in Sudan 24%
Pre-marketing test:
The availability of reports regarding this part and according to “NMPB” was very limited
for products targeted in this study. Especially the products subjected to pre-marketing
test before its distribution in the market as pre-requisite for the first batch.
Post-marketing test:
According to “NMPB” reports regarding the products targeted in this study; (22%) of the
products under this study were subjected to post-marketing test considering different

Page
13
4
product batches. Among these it was reported that in (94%) of products results obtained
were satisfying the “NQCL” (NMPB, 2008).
Manufacturers storage conditions:
Each sample collected from the field was evaluated in terms of storage conditions
specified in its outer package collected using the following evaluation criteria:
1. Reach of children;
2. Temperature (degree or range);
3. Humidity (dry... etc).
4. Light (protection).
Although in some cases these criteria were not applied for some products, still the
indication of each specification for this issue is important.
Storage Conditions % of products
Reach of Children 60.9%
Temperature 67.4%
Humidity 37.0%
Light 32.9%
Brief physical description:
This part of the evaluation was based on the general comments regarding the physical
status of the products collected before it was stored in the laboratory to be subjected for
official analysis (physical and chemical). In general (4%) of the samples collected have

Page
13
5
clear physical problems, this was varied from one product to another and all of the
problems were identified in the solid forms.
Laboratory storage period:
Most of the samples were stored in the laboratory between the collection and the
analysis. The storage was done based on the manufacturers constructions regarding the
conditions required. This was considered so as to minimize that as possible confounding
factor of the results. This was based on the type of generic products as follows:
Generics No of days
Ciprofloxacin 36
Amoxicillin 33
Paracetamol 5
Metronidazole 13
Glibenclamide 32
Mefenamic Acid 11
Chlorphenarmine 12
Aspirin 13
Ceftriaxone 37
Diclofenac 35

Page
13
6
Chemical analysis of selected medicines
After the completion of medicines selection process and sample collection, the medicines
collected was subjected to different physiochemical tests regarding to evaluate its
compliance with quality requirements and specifications according to pharmacopeia. The
analysis done in collaborative manner between the study team, Faculty of Pharmacy –
University of Khartoum and National Quality Control Laboratory - Federal Board of
Pharmacy and Poisons. This study benefit also from such collaboration, because there is
different capacity in each laboratory and this provided the opportunity to conduct
different quality control tests in both organizations. This was reflected on the quality of
the data obtained and the coverage of all targeted tests.
The study team developed the analysis plan based on the available capacity in each
laboratory, this result in the following:
Generics Dosage Form Assay Laboratory
Ciprofloxacin Tablet LC National Lab
Glibenclamide Tablet LC National Lab
Amoxicillin Capsule LC National Lab
Diclofenac Tablet LC National Lab
Ceftriaxone Injection UV University Lab
Paracetamol Tablet UV University Lab
Chlorphenarmine Tablet UV University Lab
Mefenamic Acid Tablet Titration University Lab
Aspirin Tablet Titration University Lab
Metronidazole Tablet Titration University Lab Table 8: Finally selected generics for chemical analysis

Page
13
7
Due to the sensitivity of the following results will be presented in blind manner the same
prospect in which the laboratory analysis was conducted to shield the identity of the
products and its results.
Overall & detailed results
The following were the overall results obtained from the assay examination of targeted
medicines followed by detailed results.
Generic/Source Local Low income country High income country
Amoxicillin 103.1% 100.1% 100.2%
Comply Comply Comply
Aspirin 95.8% & 90.4% 92.7% NA
Comply & not comply Not comply NA
Ceftriaxone NA 99.1% & 103.8% 99.8%
NA Comply & comply Comply
Chlorphenarmine 95.6% 97.7% 98.9%
Comply Comply Comply
Ciprofloxacin 99.3% 93.8% 99.1%
Comply Not comply Comply
Diclofenac 98.5% 102.0% 104.7%
Comply Comply Comply
Glibenclamide 95.3% 97.8% 98.2%
Comply Comply Comply
Mefenamic Acid 99.4% 96.1% 104.7%
Comply Comply Comply
Metronidazole 95.1% 98.5% 98.2%
Comply Comply Comply
Paracetamol 98.4% 98.1% 99.1%
Comply Comply Comply Table 9: Overall results of chemical analysis

Page
13
8
Detailed results by generic
Results of Acetylsalicylic Acid
Serial number 1
Generic name Acetylsalicylic Acid
Product code G02C13T01
Origin Local product
Dosage form Tablet
Concentration 300 mg
Reference pharmacopeia BP
Limits of contents 95.0 to 105.0% of the stated amount
A. Physical properties:
Dosage form status Satisfactory
Packaging material status Damage in outer package
Leakage No leakage
Uniformity of color Satisfactory
B. Results and comments:
Physical properties Not comply with specifications
Chemical analysis Comply with specifications
Serial number 2
Generic name Acetylsalicylic Acid
Product code G02C06T03
Origin Local
Dosage form Tablet
Concentration 300 mg
Reference pharmacopeia BP
Limits of contents 95.0 to 105.0% of the stated amount
A. Physical properties:
Dosage form Status Satisfactory
Packaging material status Satisfactory
Leakage No leakage
Uniformity of color Satisfactory

Page
13
9
B. Results and comments:
Physical properties Comply with specifications
Chemical analysis Not comply with specifications
Serial number 3
Generic name Acetylsalicylic Acid
Product code G02C17T02
Origin Low income country
Dosage form Tablet
Concentration 100 mg
Reference pharmacopeia BP
Limits of contents 95.0 to 105.0% of the stated amount
A. Physical properties:
Dosage form Status Satisfactory
Packaging material status Damage in outer package
Leakage No leakage
Uniformity of color Satisfactory
B. Results and comments:
Physical properties Not comply with specifications
Chemical analysis Not comply with specifications
General comments:
Generic Aspirin 300/100 mg tab
- Doctors and pharmacists comparably have fewer concerns about its efficacy and quality comparing to other generics;
- Other studies indicated no significance instability problems if the storage conditions were adequate, however, upon poor conditions possible loss of chemical nature could be occurred (Nazerali & Hogerzeil, 1998);
- Considerable difference between manufacturers in terms of manufacturing specifications;
- Few trade options available in the market, diminutive shifting decisions

Page
14
0
Results of Amoxicillin Trihydrate:
Serial number 4
Generic name Amoxicillin Trihydrate
Product code G01C03T01
Origin Local
Dosage form Capsule
Concentration 500 mg
Reference pharmacopeia BP
Limits of contents 92.5 to 110.0% of the stated amount
A. Physical properties:
Dosage form status Satisfactory
Packaging material status Satisfactory
Leakage No leakage
Uniformity of color Satisfactory
B. Results and comments:
Physical properties Comply with specifications
Chemical analysis Comply with specifications
Serial number 5
Generic name Amoxicillin Trihydrate
Product code G01C11T02
Origin Low income country
Dosage form Capsule
Concentration 500 mg
Reference pharmacopeia BP
Limits for contents 92.5 to 110.0% of the stated amount
A. Physical properties:
Dosage form status Satisfactory
Packaging material status Satisfactory
Leakage No leakage
Uniformity of color Satisfactory

Page
14
1
C. Results and comments:
Physical properties Comply with specifications
Chemical analysis Comply with specifications
Serial number 6
Generic name Amoxicillin Trihydrate
Product code G01C21T03
Origin High income country
Dosage form Capsule
Concentration 500 mg
Reference pharmacopeia BP
Limits for contents 92.5 to 110.0% of the stated amount
A. Physical properties:
Dosage form status Satisfactory
Packaging material status Satisfactory
Leakage No leakage
Uniformity of color Satisfactory
B. Results and comments:
Physical properties Comply with specifications
Chemical analysis Comply with specifications
General comments:
Generic Amoxicillin 250 mg cap
- The second generic that health professionals widely complain its effectiveness; - Top generic that health professionals shift the patient from it to another antibiotic; - Questions regarding possibility of developing microbial resistance to this generic in
Sudan due to wide misuse; - Other studies indicate no significance instability problems (Nazerali & Hogerzeil,
1998); - Among highly consumed products in the market; - Expiry remaining period are satisfactory in general; - Significant physical appearance problems for most of the trade products

Page
14
2
Results of Ceftriaxone sodium:
Serial number 7
Generic name Ceftriaxone sodium
Product code G03C10T02
Origin Low income country
Dosage form Powder for injection
Concentration 1 gm
Reference pharmacopeia USP
Limits of contents 92.0 to 108.0% of the stated amount
A. Physical properties:
Dosage form status Satisfactory
Packaging material status Satisfactory
Leakage No Leakage
Uniformity of color Satisfactory
B. Results and comments:
Physical properties Comply with specifications
Chemical analysis Comply with specifications
Serial number 8
Generic name Ceftriaxone sodium
Product code G03C14T03
Origin High income country
Dosage form Powder for injection
Concentration 1 gm
Reference pharmacopeia USP
Limits of contents 92.0 to 108.0% of the stated amount
A. Physical properties:
Dosage form status Satisfactory
Packaging material status Satisfactory
Leakage No leakage
Uniformity of color Satisfactory

Page
14
3
B. Results and comments:
Physical properties Comply with specifications
Chemical analysis Comply with specifications
Serial number 9
Generic name Ceftriaxone sodium
Product code G03C20T01
Origin High income country
Dosage form Powder for injection
Concentration 1 gm
Reference pharmacopeia USP
Limits of contents 92.0 to 108.0% of the stated amount
A. Physical properties:
Dosage form status Satisfactory
Packaging material status Satisfactory
Leakage No leakage
Uniformity of color Satisfactory
B. Results and comments:
Physical properties Comply with specifications
Chemical analysis Comply with specifications
General comments:
Generic Ceftriaxone sodium 1g inj
- Doctors in particular were more complaining about its quality and efficacy; - The mostly likely generics that doctors take decisions to shift the patients’ treatment
either shift in trade products or to another different generic; - This generic wasn’t subjected to post marketing analysis in Sudan; - No local pharmaceutical manufacturers; - Most of the products available in the market have comparably less remaining shelf
life than other generics;

Page
14
4
Results of Chlorphenarmine Maleate:
Serial number 10
Generic name Chlorphenarmine Maleate
Product code G04C13T02
Origin Local
Dosage form Tablet
Concentration 4 mg
Reference pharmacopeia BP
Limits of contents 92.5 to 107.5% of the stated amount
A. Physical properties:
Dosage form status Satisfactory
Packaging material status Satisfactory
Leakage No leakage
Uniformity of color Satisfactory
B. Results and comments:
Physical properties Comply with specifications
Chemical analysis Comply with specifications
Serial number 11
Generic name Chlorphenarmine Maleate
Product code G04C15T01
Origin Low income country
Dosage form Tablet
Concentration 4 mg
Reference pharmacopeia BP
Limits of contents 92.5 to 107.5% of the stated amount
A. Physical properties:
Dosage form Status Satisfactory
Packaging material status Satisfactory
Leakage No leakage
Uniformity of color Satisfactory

Page
14
5
B. Results and comments:
Physical properties Comply with specifications
Chemical analysis Comply with specifications
Serial number 12
Generic name Chlorphenarmine Maleate
Product code G04C04T02
Origin High income country
Dosage form Tablet
Concentration 4 mg
Reference pharmacopeia BP
Limits of contents 92.5 to 107.5% of the stated amount
A. Physical properties:
Dosage form status Satisfactory
Packaging material status Satisfactory
Leakage No leakage
Uniformity of color Satisfactory
B. Results and Comments:
Physical properties Comply with specifications
Chemical analysis Comply with specifications
General comments:
Generic Chlorphenarmine Maleate 4 mg tab
- No direct health professionals’ complaints from this generic regarding the efficacy, nevertheless considerable physical problem cases have been recorded;
- Significant number of products has been recalled from the field in the last few years; - Most of the products characterized by long remaining shelf life

Page
14
6
Results of Ciprofloxacin Hydrochloride:
Serial number 13
Generic name Ciprofloxacin Hydrochloride
Product code G05C03T03
Origin Local
Dosage form Tablet
Concentration 500 mg
Reference pharmacopeia BP
Limits of contents 95.0 to 105.0% of the stated amount
A. Physical properties:
Dosage form status Satisfactory
Packaging material status Satisfactory
Leakage No leakage
Uniformity of color Satisfactory
B. Results and comments:
Physical properties Comply with specifications
Chemical analysis Comply with specifications
Serial number 14
Generic name Ciprofloxacin Hydrochloride
Product code G05C19T02
Origin Low income country
Dosage form Tablet
Concentration 500 mg
Reference pharmacopeia USP
Limits of contents 95.0 to 105.0% of the stated amount
A. Physical properties:
Dosage form status Satisfactory
Packaging material status Satisfactory
Leakage No leakage
Uniformity of color Satisfactory

Page
14
7
B. Results and comments:
Physical properties Comply with specifications
Chemical analysis Comply with specifications
Serial number 15
Generic name Ciprofloxacin Hydrochloride
Product code G05C20T01
Origin High income country
Dosage form Tablet
Concentration 500 mg
Reference pharmacopeia USP
Limits of contents 95.0 to 105.0% of the stated amount
A. Physical properties:
Dosage form status Satisfactory
Packaging material status Satisfactory
Leakage No leakage
Uniformity of color Satisfactory
B. Results and Comments:
Physical properties Comply with specifications
Chemical analysis Comply with specifications
General comments:
Generic Ciprofloxacin 500 mg tab
- The leading generic that health professionals have comments and complaints about its quality and efficacy;
- The second generic on which most of the shifting process were taken place among the decisions of doctors and pharmacists;
- Recent studies indicated the possibility of developing microbial resistance for some strains of susceptible bacteria (Seyoum & Blum, 2004), (Palmer & others, 1995);
- No physical problems usually associated with the products available in the market; - Some products have been withdrawn from the market based on post marketing
analysis results

Page
14
8
Results of Diclofenac Sodium:
Serial number 16
Generic name Diclofenac Sodium
Product code G06C06T01
Origin Local
Dosage form Tablet
Concentration 25 mg
Reference pharmacopeia BP
Limits of contents 95.0 to 105.0% of the stated amount
A. Physical properties:
Dosage form status Satisfactory
Packaging material status Satisfactory
Leakage No leakage
Uniformity of color Satisfactory
B. Results and comments:
Physical properties Comply with specifications
Chemical analysis Comply with specifications
Serial number 17
Generic name Diclofenac Sodium
Product code G06C14T03
Origin High income country
Dosage form Tablet
Concentration 25 mg
Reference pharmacopeia BP
Limits of contents 95.0 to 105.0% of the stated amount
A. Physical properties:
Dosage form Status Satisfactory
Packaging material status Satisfactory
Leakage No leakage
Uniformity of color Satisfactory

Page
14
9
B. Results and comments:
Physical properties Comply with specifications
Chemical analysis Comply with specifications
Serial number 18
Generic name Diclofenac Sodium
Product code G06C05T02
Origin High income country
Dosage form Tablet
Concentration 25 mg
Reference pharmacopeia BP
Limits of contents 95.0 to 105.0% of the stated amount
A. Physical properties:
Dosage form status Satisfactory
Packaging material status Satisfactory
Leakage No leakage
Uniformity of Colour Satisfactory
B. Results and comments:
Physical properties Comply with specifications
Chemical analysis Comply with specifications
General comments:
Generic Diclofenac Sodium 25 mg tab
- No serious concerns have been verified during this study regarding the quality of the available products in the market;
- Considerable number of pharmacists shifted their patients from one product to another;
- In products available in the market there is no clear physical problems documented

Page
15
0
Results of Glibenclamide:
Serial number 19
Generic name Glibenclamide
Product code G07C06T01
Origin Local
Dosage form Tablet
Concentration 500 mg
Reference pharmacopeia BP
Limits of contents Glibenclamide
A. Physical properties:
Dosage form status Satisfactory
Packaging material status Satisfactory
Leakage No leakage
Uniformity of color Satisfactory
B. Results and comments:
Physical properties Comply with specifications
Chemical analysis Comply with specifications
Serial number 20
Generic name Glibenclamide
Product code G07C08T03
Origin Low income country
Dosage form Tablet
Concentration 500 mg
Reference pharmacopeia BP
Limits of contents Glibenclamide
A. Physical properties:
Dosage form status Satisfactory
Packaging material status Satisfactory
Leakage No leakage
Uniformity of color Satisfactory

Page
15
1
B. Results and comments:
Physical properties Comply with specifications
Chemical analysis Comply with specifications
Serial number 21
Generic name Glibenclamide
Product code G07C09T02
Origin High income country
Dosage form Tablet
Concentration 500 mg
Reference pharmacopeia BP
Limits of contents Glibenclamide
A. Physical properties:
Dosage form status Satisfactory
Packaging material status Satisfactory
Leakage No leakage
Uniformity of colour Satisfactory
B. Results and comments:
Physical properties Comply with specifications
Chemical analysis Comply with specifications
General comments:
Generic Glibenclamide 5 mg tab
- Among highly argued chronically used products regarding the effectiveness of some products available in the market;
- Significant cases have been shifted from one product to another as a recommendation from pharmacists and doctors as well;
- No physical problems were defined in the market regarding the registered products

Page
15
2
Results of Mefenamic Acid:
Serial number 22
Generic name Mefenamic Acid
Product code G08C06T01
Origin Local
Dosage form Tablet
Concentration 500 mg
Reference pharmacopeia BP
Limits of contents 95.0 to 105.0% of the stated amount
A. Physical properties:
Dosage form status Satisfactory
Packaging material status Satisfactory
Leakage No leakage
Uniformity of color Satisfactory
B. Results and comments:
Physical properties Comply with specifications
Chemical analysis Comply with specifications
Serial number 23
Generic name Mefenamic Acid
Product code G08C08T03
Origin Low income country
Dosage form Tablet
Concentration 500 mg
Reference pharmacopeia BP
Limits of contents 95.0 to 105.0% of the stated amount
A. Physical properties:
Dosage form status Satisfactory
Packaging material status Satisfactory
Leakage No leakage
Uniformity of color Satisfactory

Page
15
3
B. Results and comments:
Physical properties Comply with specifications
Chemical analysis Comply with specifications
Serial number 24
Generic name Mefenamic Acid
Product code G08C09T02
Origin High income country
Dosage form Tablet
Concentration 500 mg
Reference pharmacopeia BP
Limits of contents 95.0 to 105.0% of the stated amount
A. Physical properties:
Dosage form status Satisfactory
Packaging material status Satisfactory
Leakage No leakage
Uniformity of color Satisfactory
B. Results and comments:
Physical properties Comply with specifications
Chemical analysis Comply with specifications
General comments:
Generic Mefenamic Acid 500 mg tab
- Moderate sort of problems have been associated with the efficacy of registered products in Sudan;
- In some of the available products in the market, physical changes have been experienced by some pharmacists;
- 2 batches from different manufacturers, available in the market, were detected that lack the identification of the expiry date

Page
15
4
Results of Metronidazole:
Serial number 25
Generic name Metronidazole
Product code G09C22T03
Origin Local
Dosage form Tablet
Concentration 250 mg
Reference pharmacopeia BP
Limits of contents 95.0 to 105.0% of the stated amount
A. Physical properties:
Dosage form status Satisfactory
Packaging material status Satisfactory
Leakage No leakage
Uniformity of color Satisfactory
B. Results and comments:
Physical properties Comply with specifications
Chemical analysis Comply with specifications
Serial number 26
Generic name Metronidazole
Product code G09C16T01
Origin High income country
Dosage form Tablet
Concentration 250 mg
Reference pharmacopeia BP
Limits of contents 95.0 to 105.0% of the stated amount
A. Physical properties:
Dosage form status Satisfactory
Packaging material status Satisfactory
Leakage No leakage
Uniformity of color Satisfactory

Page
15
5
B. Results and comments:
Physical properties Comply with specifications
Chemical analysis Comply with specifications
Serial number 27
Generic name Metronidazole
Product code G09C16T01
Origin High income country
Dosage form Tablet
Concentration 500 mg
Reference pharmacopeia BP
Limits of contents 95.0 to 105.0% of the stated amount
A. Physical properties:
Dosage form status Satisfactory
Packaging material status Satisfactory
Leakage No leakage
Uniformity of color Satisfactory
B. Results and comments:
Physical properties Comply with specifications
Chemical analysis Comply with specifications
General comments:
Generic Metronidazole 250 mg tab
- There were no major complaints about the efficacy of most available products in the market, however, there were significant patients complaints regarding the side effects of specific product comparing with other products;
- The packaging material used for some trade products available in the market hinder the possibility of observing physical appearance problems

Page
15
6
Results of Paracetamol:
Serial number 28
Generic name Paracetamol
Product code G10C12T02
Origin Local
Dosage form Tablet
Concentration 500 mg
Reference pharmacopeia BP
Limits of contents 95.0 to 105.0% of the stated amount
A. Physical properties:
Dosage form Status Satisfactory
Packaging material status Satisfactory
Leakage No leakage
Uniformity of color Satisfactory
B. Results and comments:
Physical properties Comply with specifications
Chemical analysis Comply with specifications
Serial number 29
Generic name Paracetamol
Product code G10C02T03
Origin High income country
Dosage form Tablet
Concentration 500 mg
Reference pharmacopeia BP
Limits of contents 95.0 to 105.0% of the stated amount
A. Physical properties:
Dosage form Status Satisfactory
Packaging material status Satisfactory
Leakage No leakage
Uniformity of color Satisfactory

Page
15
7
B. Results and comments:
Physical properties Comply with specifications
Chemical analysis Comply with specifications
Serial number 30
Generic name Paracetamol
Product code G10C07T01
Origin High income country
Dosage form Tablet
Concentration 500 mg
Reference pharmacopeia BP
Limits of contents 95.0 to 105.0% of the stated amount
A. Physical properties:
Dosage form Status Satisfactory
Packaging material status Satisfactory
Leakage No leakage
Uniformity of color Satisfactory
B. Results and comments:
Physical properties Comply with specifications
Chemical analysis Comply with specifications
General comments:
Generic Paracetamol 500mg tab
- Being OTC product made it difficult to the doctors to judge its efficacy and the feedback was mainly obtained from pharmacists;
- Over the available products in the market, specific products were identified by the patients as the “best quality” and the other were “lower in its quality”;
- Some physical appearance problems have been recorded many times for certain locally manufactured product
- Other similar study in Bangladesh showed comparable results (Saha, 1992)

Page
15
8
Summery discussion
The availability of data regarding the quantities of detected substandard medicines in the
market is essential information (Frempong, 2003). This is particularly important to assess
the situation in the country regarding the availability as one dimension of medicines
access model that supported by quality and accessibility for essential medicines (MSH,
2001). Despite that the private sector provides 70% of medicines in the market with
availability of more than 90% for medicines in retail pharmacies in Sudan (FMOH, 2007).
The outcomes from quality control tests could be considered as important tool to take
evidence-based decisions regarding the quality at any level of the supply chain (Seiter,
2005). This is especially true when we consider the great revolution in medicines
production capacity, QC management and the expanded needs for medicines. The QC
results, including chemical analysis results, should be used only as a tool to improve the
quality of circulated medicines through the implementation and enforcement of laws and
regulations (Jayasuriya, 1985). Usually the resulting data from QC alone were inadequate
for establishing direct linkage between the findings of QC analysis and the imposition of
regulatory sanctions to be applied (Editorial, 1997). This should be combined with other
different factors that lead to better understand the cause-effect relationships and to take
the right decisions based on that (Nicholson, 2005).
It is noted that many factors usually could affect the quality of available medicines in the
market (WHO, 2007). The possible relationships that should be considered:-
Pre-marketing surveillance test results;
Acceptability of the remaining shelf-life at time of receipt;

Page
15
9
The history of the drug and its agent at NQCL before distribution (satisfaction or
failure);
The quality status at time of collection in accordance to Pharmacopeia;
The quality at the end of the shelf-life;
Drugs most frequently failed the tests;
The lost of potency among the time;
In addition to all of these factors; another study indicated that there are possible effects
of the quality of starting materials and raw materials used in manufacturing medicines
and this issue should be considered when evaluating the quality of medicines especially
when proved to be substandard (WHO, 2003).
The quality of commercially available drugs varies greatly among countries and the focus
was on the more expensive brands. Substandard drugs found even among cheaper
products, because some manufacturers wish to avoid costly quality control and good
manufacturing practices (Ondari, 2003). Even in one study in India that comparing two
products within the same generics it has been found that the cheaper product was better
in its quality than that of the highest price which was almost doubled (USP, 2004). But we
should also note that when the prices of medicines are high and price differentials
between identical products exist there is a greater incentive for the consumer to seek
medicines outside the normal supply system. Poverty, then, is one of the major factors in
the production and consumption of substandard products (Dukes & other, 2003).
Despite that the statistics showed the facts that, even some of large multinational firms
could produce substandard medicines still there is continuous linkage between generic

Page
16
0
products or products manufactured by small businesses and low quality medicines. In fact
well-manufactured generics are of as high quality as well-manufactured branded
medicines (HAI, 2003). Recent different two studies in India and Bangladesh, regarding
the linkage between sources of origin and manufacturing sites capacity, indicated that
most of the substandard medicines were produced from small sized firms in both
countries. From the observations in both studies it seems that these manufacturers failed
frequently to meet the MRA standards in some areas (USP, 2004).

Page
16
1
Bioequivalence study of 2 products of Glibenclamide tab 5 mg
The products
Glibenclamide products included in this part are two products from part one & two of this
research in which was selected based on the approach described under chapter 2
(methods and materials, please refer to page 67). These are one product under the code
G07C09T02 which is the originator products and the other on is locally manufactured
product under the code G07C06T01.
The volunteers
Twelve healthy volunteers; 6 men and 6 women, aged between 20 years and 36 years,
and with a range of weight between 65 kg and 94 kg; were enrolled to participate in this
study.
Pharmacokinetic analyses
The following parameters will be presented and discussed below:
1. The maximum plasma concentration (Cmax) as indicator for absorption rate;
2. The time to reach the maximum plasma concentration (Tmax) as indictor for the
elimination rate;
3. The area under of curve (AUC) as it described the total amount of drugs
available in plasma after the administration of the dose;
4. The elimination half life time (T1/2) as indicator for the elimination;

Page
16
2
Area Under the Curve (AUC)
The area under the curve (AUC0-t) was calculated using the following formula:
AUC0-t =
The pharmacokinetic parameters were calculated as indicted before. Based on these
parameters the elimination rate constant (KE) was obtained using the following formula.
(KE) = 0.693 / T1/2
Based on the results obtained:
(KE) Average slope for test product 0.104
(KE) Average slope for reference product 0.194
Accordingly the elimination half life (T1/2) in hours for each product:
T1/2 of test product 6.663
T1/2 of reference product 3.572
The area under the curve to the last measurable concentration (AUC0-t) was estimated by
the linear trapezoidal rule. The area under the curve extrapolated to infinity (AUC0-∞) was
calculated by equation below.
(AUC0-∞) = AUC0-t + Ct / kE
* Where Ct is the last measured concentration

Page
16
3
The peak plasma concentration (Cmax) and equivalent time to peak concentration (tmax)
were determined directly using the data obtained from individual drug serum
concentration-time profiles.
Statistical analyses
Note: the statistical analysis of this data was done using SPSS 16
After obtaining AUC0-t, AUC0-∞, Cmax and Tmax from the data, these parameters were
further analyzed statistically as primary variables. This was basically carried out using the
variance analysis for cross-over design. The data from this processing was used to
evaluate the differences due to treatment, periods, sequences, and subjects. The AUC
and Cmax values were logarithmically transformed prior to the analysis. Paired samples
analysis was used to compare the results of Tmax of the test and the reference products.
The results were considered statistically significant for a P value of less than 0.05. The
90% confidence intervals of parameters under testing were also estimated.
The inter-subject variation of AUC0-t, AUC0-∞, and Cmax parameters was also obtained by
calculating the coefficient of variation (CV).
The results indicated that the mean “C max” of the test product is 2.508 compared to
2.526 the reference product. On other hand the “AUC0 - ∞” of test product is 3.511
compared to 4.572 the reference product.
Parameters Test product
Mean ± SD
Reference product
Mean ± SD
Intra- subject
CV%
C max - (μg/ml) 2.508 ± 0.104 3.526 ± 0.118 2.8%

Page
16
4
T max - (hrs) 1.639 ± 1.024 2.167 ± 1.275 63.9%
AUC0-6 - (μg.h/ml) 0.490 ± 0.188 0.638 ± 0.252 55.7%
AUC0 - ∞ - (μg.h/ml) 3.511 ± 0.153 4.572 ± 0.202 2.4%
Table 10: Main pharmacokinetic parameters for test and reference products
The table below show the time interval for each of the test and reference products to
reach the maximum concentration, the numbers showed the frequency of the volunteers.
Time interval (h) Test Reference
0,0 - 0,99 3 2
1,0 - 1,99 1 1
2,0 - 2,99 2 4
3,0 - 3,99 3 3
4.0 – 4.99 3 2
Figure 11 represents the mean serum Glibenclamide levels versus time profile following ingestion of a single dose of the test and reference tablet products to 12 healthy

Page
16
5
volunteers
Figure 11: Mean serum Glibenclamide levels versus time profile
The AUC0-6, AUC0-∞, Cmax, and Tmax, for each pair of products (test vs. reference) in this
study were statistically different (P<0.05), suggesting that the serum profiles generated
by reference tablets were relatively higher than those produced by the test product
(Table 10).
Moreover, 90% confidence intervals of the AUC0-6, AUC0-∞, and Cmax of the two
formulations in the study were not found to be within the relative bioavailability

Page
16
6
acceptable range of 80-125% (Table 10). Wilcoxon signed rank test showed distinct
difference between the untransformed values of Tmax of the test compared to the
reference products. The intra-subject CV for AUC0-6, AUC0-∞, and Cmax appeared to be
varied and relatively large for some AUC0-6 and Tmax.
With a difference of about 24% between the test product and the reference product, the
results indicate that the test product is not bioequivalent to reference product. The
results indicated that, the probability that the true ratios with respect to Cmax and AUC
are not acceptable in bio-equivalence range (which is 80% - 120%). It is therefore clear
that test product cannot be considered bio-equivalent to the reference product with
respect to the extent of absorption as measured by AUC. The fact that the two products
also differed with respect to Cmax which is probably due to differences in the extent of
absorption rather than the difference in the rate of absorption.
No hazardous side-effects or adverse reactions were noticed during the observation of
the volunteers; however, several of them experienced unpleasant symptoms relevant to
hypoglycemia. This was noticed in 2 volunteers after the test product and in 3 volunteers
after the reference product.
The figure below showed the serum glucose level versus time for test and reference
products.

Page
16
7
Figure 12: Serum glucose level for test and reference products

Page
16
8
Summery discussion
In part one of this research and according to the results obtained from both data
collection process and laboratory analysis, it was clear there are other reasons that
contributed to ineffectiveness problems associated with specific Glibenclamide product in
the market. This was reported as a problem in controlling blood glucose level among
patients using this product. Conceptually, any dosage form should contain the amount of
the drug equal to the dose necessary for clinical effectiveness. Along with that, the
dosage form also should have the ability to deliver this amount into the body in order to
ensure the achievement of the desire effects. For instance, the fulfilment of
Glibenclamide formulations in its chemical contents based on the requirements of
standard pharmacopeia is not a grantee for the effectiveness of Glibenclamide in
controlling blood glucose. Glibenclamide is an example of drugs with unique
characteristics regarding its high-quality formulations (Coppack & others, 1990). Some of
these specifications need to be considered carefully when describing the product as of
quality product, specifically talking about bioavailability of non-micronized formulations.
Glibenclamide is commonly used as a treatment of choice for type II diabetes mellitus.
Using Glibenclamide in controlling blood glucose level known to be effective and patients
using Glibenclamide products usually achieve satisfactory blood glucose level. However,
currently there are 16 different pharmaceutical formulations authorized and available in
Sudan and from different sources and very limited information about their bioavailability
is known (NMPB, 2010). Due to lack of information about the interchangeability of these

Page
16
9
products and lack of programs to inform and educate the patients; all of these highlight
the concerns about the effectiveness of these products in managing the disease in more
than (50,ooo) estimated cases of diabetes mellitus (type II) (FMOH, 2008). On the other
hand, Glibenclamide is example of medicines that chronically used; in which the feedback
from the patients and their doctors is highly important in order to evaluate the quality
and therapeutic outcomes of the available products in the market.
As stated by Meredith PA (Meredith P. , 1996): “For economic reasons, the use of generic
substitution is increasingly being supported by health authorities, ......., many developing
countries do not have the resources or expertise to carry out appropriate quality control
resulting in widespread distribution of substandard drugs, ........, a number of reports,
largely anecdotal, of treatment failure or increased adverse events after switching brands
have cast some doubts upon whether bioequivalence testing is sufficient in all cases.
These reports have covered cardiovascular, respiratory, hormonal, psychotropic,
anticonvulsant, anti-infective and anti-inflammatory drugs, ........, until such time as
means can be provided-first, to enforce internationally accepted production standards,
and second, to permit uniform testing of therapeutic agents-the safest clinical choice,
particularly in countries where registration requirements and quality control are minimal,
must remain the branded product”. On the other hand, Tschabitscher D and his
colleagues urged: “Since the introduction of generic drugs to the pharmaceutical market a
sometimes emotional debate exists whether they are well-investigated and of high
quality. There is some uncertainty about [whether evidence of bioequivalence is enough to
guarantee efficacy and safety of generic drugs]. Some physicians ask the question if

Page
17
0
competent authorities are able to ascertain that the pharmaceutical quality of generics is
acceptable. Doctors and patients sometimes are ill at ease about the interchangeability of
innovator and generic products......, the importance of bioequivalence studies is increasing
also due to the large growth of the production and consumption of generic products.....,
the registration of generic products does not demand complicated and expensive clinical
study contrary to original product. The comparison of the original and the generic product
via bioequivalence study is suggested as sufficient (Tschabitscher & others, 2008)
According to the results obtained both from the survey and from the laboratory analysis
in this research; the risks associated with weak formulations of Glibenclamide products is
the major cause behind the complaints reported about this drug. These observations and
feedback about the specific locally manufactured product support the complaints
received about the problem. It also supports the hypothesis behind the insufficiency of
chemical analysis alone to verify the quality as it was shown in this bioequivalence study.
Although, measuring the quality of pharmaceutical products was changed markedly in the
last decade, nevertheless, chemical content of pharmaceutical products alone is no
longer the most important indicator to measure the quality of some generics. As
evidences showed, other important indicators that should be considered when we
evaluate the quality of these drugs. The combined interpretation of QC results with data
from clinical trials and feedback about therapeutic outcomes, for any drug, become highly
important. This is particularly significant in order to include or exclude any potential risk
factors that contribute to treatment failure or poor clinical outcomes (WHO, 1998).

Page
17
1
Microbiological sensitivity testing of Amoxicillin
Sample characteristics
The total samples collected for this study were 102 specimens from 100 patients with
median age of 34 years (minimum of 6 years and maximum of 65 years).
% of patients % (± SD) Notes
% of patients using Amoxicillin as first
treatment for the current symptoms
64.3% (±2.6) -
% of patients used
other drug before
Amoxicillin
used other beta-
lactam antibiotics
44.5% (±3.2) 36 patients used other
drug before the
Amoxicillin Used other antibiotics 56.1% (±3.0)
Of the 102 cases the following table showed the distribution of the cases according to the
reason behind using the Amoxicillin:
Category of Patients % (± SD)
Patients took Amoxicillin based on doctor’s prescription 18.7 (±2.1)
Patients take Amoxicillin based on recommendation of the pharmacist 32.2 (±1.9)
Amoxicillin taken as requested by the patients themselves 49.1 (±1.8)

Page
17
2
Figure 13: Classification of patients using Amoxicillin products
Follow-up of the patients
5 days after each patient received his/her medication (appropriate Amoxicillin dosage
forms including capsules or suspension with different concentrations), the study team
called back all of the patients those gave their contact numbers in the pharmacies. The
purpose of these phone calls was to ask the patients about the following:
Completion of the treatment fully as prescribed;
Feeling about the relief of the symptoms
Patients’ indicator Results
Total number of patients with contact 86 patients
No. Patients responded 79 (91.9%)
No. Patients reported completion of the treatment 58 (93.4%)
% of patients feeling about the relief of the symptoms
Complete relief 22.7% (±2.1)
Partial relief 46.9% (±2.6)
No relief 30.4% (±1.8)

Page
17
3
Microbiological sensitivity
For the purpose of this study, no typology identification was carried out for the isolates
under testing. Rather the study team reported the presence or absence of microorganism
growth before adding the Amoxicillin disks. In addition to that, the number of isolates
with clear growth inhibition after the insertion of antibiotic disk was also reported. This
data was linked to the demographic data above.
Isolates % Notes
% of isolates with clear growth on agar
media before adding Amoxicillin disk
78.4%
(±2.1)
On 22 plates no growth was
detected
% of isolates with clear growth inhibition
after adding the disk
48.9%
(±2.1)
On 46 plates no clear growth
inhibition was seen
Patients category Total
Isolates
Clear Growth
(%)
Growth Inhibited
(%)
Total patient isolates 94 48 (51.1%) 46 (48.9%)
Patients using Amoxicillin as first
treatment 64 25 (39.1%) 39 (60.9%)
Amoxicillin taken without
professional advice 49 26 (53.1%) 23 (46.9%)
Patients feel complete or partial
relief 55
31 (56.4%) 24 (43.6%)
Patients feel no relief 24 2 (8.3%) 22 (91.7%)

Page
17
4
Figure 14: Summery of growth inhibition after using Amoxicillin discs

Page
17
5
Summery discussion
Amoxicillin in Sudan has unique characteristics which make any study about its use and its
quality is of considerable importance. These characteristics include the following:
1. Currently there are 77 products registered in Sudan between different dosage
forms and concentrations (NMPB, National Medicines and Poisons Board,
2010);
2. It is the forth generic in terms of quantity (collectively exported and
manufactured in the country) during the period 2006/2007 (FMOH, 2008);
3. It was among highly consumed products in the market, especially without
prescription, which reflects the wide use of this drug in the community (FMOH,
2008);
4. It is a “symbol of antibiotic” in the community and it is culturally considered as
one of the best accessible anti-infective drugs;
5. Based on the results obtained from part 1 of this research; it was the second
generic that health professionals widely complain its effectiveness;
6. Based on the results obtained from part 1 of this research; it was the top
generic that health professionals shift the patient from it to other antibiotics
On the contrary for the last two points, all assayed products were complying with
standard specifications in its chemical contents. Based on the findings revealed from the
primary investigation and analysis of targeted pharmaceutical products (among which
“three” Amoxicillin 500 mg capsule products were tested); the results didn’t respond to

Page
17
6
concerns reported about Amoxicillin products circulated in the market. Although the
products have been tested were chemically sounds but still they were clinically not
effective (based on feedback of health professionals’ survey). There are valid questions
regarding the possibility of developing microbial resistance to this generic in Sudan.
Taking into considerations the microbial resistance in such case is not an exclusive reason
for therapeutic failure, as bioavailability problems and lack of appropriate
use/administration may contribute also to these reported failures (Taylor & others, 1995).
Looking closely to the trend of Amoxicillin use both inside and outside the health system
in Sudan (prescription based versus OTC treatment), it indicate the extent to which
Amoxicillin is widely misused. Studies in Europe showed clear association between higher
consumption of antibiotics and the rate of microbial resistance to it (Stephanie & others,
2001). This was especially noticed among the highly consumed antibiotics in the
community similar to Amoxicillin in case of Sudan (WHO, 2009). In Sudan it is generally
noticed that Amoxicillin is commonly, and mainly, used in both pediatric and adult
patients for the treatment of upper and lower respiratory tract infections (U/LRTI), this
usually besides other indications. Many studies confirmed the increasing prevalence of
Streptococcus pneumoniae among patients with U/LRTI (beside other kinds of
microorganisms) (Leesik & others, 2006). These facts critically raise the question about
whether Amoxicillin is still an appropriate treatment of these kinds of infections. The
implications of answering this question have great impact both at macro and micro levels
in policy making process and at community level as well (Eerden & others, 2005).
Currently there is no specific study in Sudan that “linked the usage of Amoxicillin with its

Page
17
7
quality of effectiveness”; considering the large amount of Amoxicillin products consumed
over the country.
In general, scientists agreed that the resistance of bacteria to certain antibiotic(s) is a
matter of response from the bacteria towards the environmental changes due to the
existence of the antibiotic “resistance as biological response”. This is valid regardless
whether or not the antibiotic(s) were effective against the bacteria (Murray, 2007). This
point supports the hypothesis about the possible contribution of microbial resistance
against Amoxicillin. Upon the wide and extensive use of Amoxicillin in the community,
there is considerable possibility of emerging resistance to this drug among
microorganisms that were previously sensitive to it (Ball & others, 2002). Resistance for
beta lactam antibiotics (Amoxicillin one of this group) were traditionally being associated
with the bacteria that producing beta lactamase enzyme, as this leads to deactivation of
the drug by breaking the beta lactam ring in its structure “the active part of the structure”
(Katzung, 2001). Although the introduction of combination product, that include
Clavulonic Acid beside Amoxicillin, lead to dramatic change in overcoming this problem,
but still there is a wide use of Amoxicillin alone for treatment of some conditions. In
comparison, it is clear that the combination mentioned before is more effective than the
usage of Amoxicillin alone. However, due to some factors including the economic aspects
and the shape of the market in Sudan still we can observe the wide use of Amoxicillin in
different kinds of infections (especially in U/LRTI).
World Health Assembly Resolution in 1998 urged Member States to develop measures in
to compact the development of microbial resistance for antimicrobials (WHO, 2009).

Page
17
8
Countries were also encouraged to develop sustainable systems to detect resistant
pathogens, to monitor volumes and patterns of use of antimicrobials and the impact of
control measures. For further details, World Health Assembly Resolution in 2005 urged
Member States to “ensure the development of a coherent, comprehensive and
integrated national approach to implementing the strategy for containment of
antimicrobial resistance” and to “monitor regularly the use of antimicrobial agents and
the level of antimicrobial resistance in all relevant sectors” (WHO, 2009).
The above data gave clear indicators about the factors that may possibly influence the
development of bacterial resistance for Amoxicillin products. That is unnecessary be
linked to antibiotic use for viral respiratory infections as considered among the health
professionals. In fact misdiagnosis the conditions and its symptoms lead to empirical and
blind treatment of the case (in case of respiratory infections both viral and bacterial
agents can cause similar clinical symptoms). Among other factors the extensive use of
Amoxicillin and other similar products due to many reasons (e.g. patients’ pressure on
health professional to obtain rapid treatment for their disease) also played important
role. This was seen clearly in the results obtained from this study.
Based on the results generated from this study it becomes very obvious the needs to
develop structured protocol to assess the quality of Amoxicillin and other similar products
using microbiological assay approach. The step of this assay should be the starting point
for in-depth analysis that aims to identify the possible causes for the treatment failure in
patients using Amoxicillin and other similar products.

Page
17
9
Biological assay of 3 products of Ceftriaxone powder for injection 1 g
The products
Three products of Ceftriaxone sodium (1 gm powder for injection) were included in this
study. One of these is the originator’s product which is “Rocephin”, manufactured by Roche -
Switzerland, and for the purposes of this study it was selected as reference product. The
other two products were chosen basically in the first part of this research and were
continued to be the same subject in this part. The details of the products were
demonstrated in the table.
Trade Company Country of
origin Origin classification
G03C20T01 C20 Switzerland High income
G03C10T02 C10 India Low income
G03C14T03 C14 Jordan Lower-middle-income
Statistical analysis
The range of concentrations of each product was statistically satisfactory to produce wide
range of plotting points sufficient for producing clear statistical data. The concentrations
prepared and used in this assay include 0.125, 0.5, 1.0, 4.0, 16.0 and 32.0 mg/ml (according
to MIC of targeted bacteria, please see below). The assay was repeated using three
concentrations of each antibiotic by triplicates for each microorganism.
Organism MIC90 mg/ml
Streptococcus pneumoniae 0.060
Klebsiella pneumoniae 0.125
Staphylococcus aureus 4.000

Page
18
0
For the purpose of this analysis, the linearity and precision of the method used were all
determined. This was done by plotting the log-transformed concentrations of each product
against inhibition zone in mm. The data followed the linear statistical model which was
confirmed by the values of intercept and slope of the best straight line when applied in the
equation (y = b + mx, b is the y-intercept and m is the slope). The x-intercept (log10 mg/L)
and slope of the regression line with 95% confidence intervals (95% CI) were both calculated
and used for regression approach to analysis of to determine the statistical significance of
these variables.
The equivalencies of products under this experiment were concluded by comparing the
slope and intersect of each product using a symmetrical parallel-line assay. In this analysis,
and in accordance to the purpose of the study, potency was defined as the slope of the
linear regression and concentration. In this case and if we assume that the test products and
the innovator are equivalent, then the products must show a trend of parallel and overlaid
curve with the cure of the innovator. At the same time, when there are parallel curves but it
have different intercepts this may indicate the existence of same active ingredient but at
different concentration above or below that of the innovator product. The relative potency
for each product to the potency of the innovator was calculated using the distance between
the innovator line and that of the test product.
The response values (diameter of inhibition zones) were calculated using the standard
deviation and slope method and these were stated in term of means +/- the standard
deviations and with the calculated coefficients of variation. To test the accuracy of the test;
i.e. its ability to detect the differences in concentration significantly, standard curve was

Page
18
1
obtained by using different concentrations of Ceftriaxone working standard solution with
potency of 98.6%/L). This curve was compared with the curve of all products under assay.
Results
The table below shows the potency estimates and other parameters derived from linear
regression with their statistical comparison of test product versus innovator by Curve Fitting
Analysis
Product r2 Intercept ± SD P-value Slope ± SD P-value Potency estimate (%)
Organism: Staphylococcus aureus
G03C20T01 0.97 2.401 ± 0.205 0.000 0.027 0.000 100.0%
G03C10T02 0.91 2.223 ± 0.187 0.000 0.026 0.000 84.3%
G03C14T03 0.78 2.172 ± 0.164 0.000 0.027 0.000 70.%
Organism: Klebsiella pneumoniae
G03C20T01 0.97 2.198 ± 0.172 0.000 0.023 0.000 100.0%
G03C10T02 0.91 2.023 ± 0.124 0.000 0.025 0.000 89.4%
G03C14T03 0.78 2.089 ± 0.166 0.000 0.023 0.000 74.1%
Organism: Streptococcus pneumoniae
G03C20T01 0.41 2.351 ± 0.311 0.000 0.022 0.000 100.0%
G03C10T02 0.52 2.325 ± 0.324 0.000 0.024 0.000 51.4%
G03C14T03 0.48 2.305 ± 0.452 0.000 0.024 0.000 47.1%
Table 11: Summery of relative potencies and other parameters of Ceftriaxone products

Page
18
2
Figure 15: Single dose-response curves for Ceftriaxone products against targeted organisms
Figure 16: Combined dose-response curves for Ceftriaxone products against targeted organisms

Page
18
3
Figure 15 and 16 above shows the log concentration-response relationship and the best
straight line obtained from data from the microbiological assay of the innovator. The cases
for Klebsiella pneumoniae and Staphylococcus aureus showed a linear relationship between
the logarithm of the concentration (log10 mg/L) and the diameter (mm) of inhibition zones
with relatively high coefficients of determination (r2 ranging from 0.97 to 0.78) and
statistically significant intercept and slope (P < 0.001 by ANOVA). On the other hand the
results for Streptococcus pneumoniae showed different trends. The main observation from
the row data showed that the response of the organism (growth inhibition) was only
appeared at higher concentration. That was appeared at a concentration 32 times the MIC90
for this organism, i.e. 2mg/ml, and this observed for all products tested. This was significant
findings by its own under the fact that growth inhibition was expected to be at lower
concentrations than that.
Excluding the data of Streptococcus pneumoniae and considering the data from other
organisms, all of the products exhibited a different intercept (P < 0.005), the log
concentration-response relationship for one of the generics (G03C20T02) was parallel and
overlaid to innovator linear curve without significant difference (P < 0.005), while other
generic (G03C20T03) was parallel but not overlaid to innovator linear curve. These findings
signifying the facts that generic G03C20T02 and generic G03C20T03 had the same biologic
activity (potency). On the other hand generic G03C20T02 and generic G03C20T03 showed
relative estimated potency of 86.9% and 72.3% of the originator product respectively. All
these data indicate that generic G03C20T02 is pharmaceutically equivalent to the originator
product while generic G03C20T03 didn’t prove the same relation.

Page
18
4
Summery discussion
The results obtained from the chemical analysis tests, in part two of this study, weren’t
somewhat enough to answer the complaints from health professionals regarding the quality
issues around Ceftriaxone powder for injection (especially certain products). Although these
products complied with reference standard specifications in term of its chemical content
limits. But considerably there are major concerns about its quality and even the clinical
outcomes of these products. Ceftriaxone was the most generic in which the patients
experienced shifting decisions by their doctors, either to shift them to other trade products
or shift them to other different generics.
In this regard we have to consider the following facts:
1. All assayed products complied with reference standard specifications in its
chemical contents;
2. The products are in an injectable form, so we can assume its bioequivalence
because it isn’t expected to experienced bioavailability problems especially as
intravenous solution from
This will urge many questions regarding the reasons lead to these complaints and about that
specific product. No single reason before this study could be considered as evidence for the
primary cause of this observation.
As example, among the circulated Ceftriaxone products available in the market; there was
specific trade product represent one of the major concerns received during the first part of

Page
18
5
the study. This product was the main source of complaints and based on the results in this
part it is clear that it is not equivalent to the other products.
Equivalency of pharmaceutical products becomes essential and basic criteria for proving the
quality of any product (WHO, 1998). In general there are different methods could be used by
the regulatory authorities to evaluate this characteristic. This may include the in-vitro/in-vivo
bioavailability studies and other methods like bioassay. Using bioassay method is not new in
different pharmaceutical sciences; however, it was used limitedly, and mainly, for
pharmacokinetic studies (Simon & Yin, 1970). Late in 1980s the bioassay method has drew
the attention as possible tool for establishing scientific judgment about pharmaceutical
equivalence of certain categories of products like anti-infectives and vitamins (Humphrey &
Lightbown, 1992). The method could help significantly in obtaining more conclusions about
the similarity and the differences between products that supposed to contain similar and
equivalent active ingredient. This is especially true when we consider the fact that any
pharmaceutical formulation usually contains the active ingredient in addition to other
substances (e.g. preservatives, impurities, etc). In most of the cases these materials were not
considered in the assessment of the quality or the equivalency of generic products (Layloff,
1997).
Considering the critical importance of anti-infectives (especially Ceftriaxone) to public health
in Sudan, it is now become very essential to investigate the assumption about the
differences in therapeutic equivalent between the products available in the market. The
equivalence and potency of intravenous/parenteral generic products of Ceftriaxone, away
from clinical studies, can’t be evaluated by using the conventional physical and chemical

Page
18
6
methods only. It was proved that, after carrying out this study, using a well designed
microbiological bioassay this should help the authorities to do such kind of re-evaluations.
The statistical method adopted here was used for similar study done on other anti-infective
intravenous preparations (Zuluaga & others, 2009). Previously it was believed that agar-
diffusion assay is less reliable that other chemical methods (e.g. HPLC) because it implies on
wide sourcing of biological errors. Still this method is statistically suitable to be used in such
kind of studies (equivalence and potency evaluation studies). The logic behind the statistics
used in this study (and similar studies in general) was based on the assumption that: if two
Ceftriaxone products were equivalent to each other, so by obtaining two symmetrical and
straight parallel lines (plotting of the mean zone size against the logarithmic concentration),
then the relative potency of test product to the reference product could be derived by
calculating the distance between the two lines (Zuluaga & others, 2009). In the same time
these curves in their bioassay should not differ significantly from each other.
In conclusion, this simple method of analysis is very important for any regulatory authority
to be considered as routine process. The method showed many advantages as it allows
rapid, cost-saving, precise, and accurate determination of pharmaceutical equivalence of
drugs in pharmaceutical dosage-form. This in fact is one of the considerable innovations for
any quality monitoring system in the country related to injectable products.

Page
18
7
Rapid observational study about the reconstitution practice of Ceftriaxone
powder for injection
Effectiveness of Ceftriaxone
The participants see the drug and potent one and still effective as anti-infective. It is now the
drug of choice for many conditions and doctors start with it in many cases. Part of the
participants reported their observation about the efficacy of this drug, based on their
experience early at its introduction phase it was very effective compared to other generics.
But nowadays its efficacy started to decrease compared to that period. Some patients use
Ceftriaxone and it they were not getting better so doctors shift them to other drugs. This
shifting usually affects the psychological acceptance of the patients to their disease and they
see that as difficult to cure infection. The drug is highly available in the hospital and more
than 7 products usually used within the hospital from different origins.
Dissolution practices
There was common agreement between the nurses on how Ceftriaxone been reconstituted.
All of the nurses only use water for injection or sometimes they use normal saline IV fluids.
This point was agreed among all of the nurses participated in this session.
Concurrent administration with Calcium incorporated products
Despite the fact that the group came from different disciplines and with different years of
experience in both the public and the private sector, the information about the cautions in
mixing Ceftriaxone with Calcium (and other trivalent cations) is new to the entire group. One
of the participants report one incident of prescribing both items for one patient, but she

Page
18
8
couldn’t judge the therapeutic outcomes in this case and whether this affect the patients
cure or not. Another participant pointed the situations related to renal dysfunction patients
as they usually need anti-infectives and they also need Calcium Chloride. But this was not a
concurrent administration in one IV line, rather it is usually separate.
Effect of origin on practice
Nursing community has preferences regarding which products to use over the other. Certain
origins were used more frequently than others and this due to repeated experience with
patients taking that specific products compared with other patient those administering the
other products. Alternatives to preferred products usually give less therapeutic outcomes in
the patients. There was other dimension raised during the discussion about the economic
implications of using different products available in the market. The observation pointed out
the fact that, the most likely used products is that with medium price compared with other
products. 6 participants report their beliefs about the linkage between the sources of origin
and the quality of medicines. They stated that they don’t advice the patients to take any
drugs come for certain countries of origin.

Page
18
9
Chapter 4: Discussion

Page
19
0
Summary about this chapter
In the following chapter an overall discussion about the findings obtained different parts will
be combined in a way that informed the improvement of quality monitoring systems of
pharmaceuticals. This becomes essential in management science in which the use of
evidence in building any interventions becomes the important feature of successful
organizations. Moving from one strategy to another in any area usually needs supporting
and scientific justifications for that step. In this specific context the proposed strategy is
basically focus on how to move from testing a number of products blindly, towards more
informed testing schemes based on available data.
In this chapter we will examine the practical approach of this proposed strategy to use a risk
based post marketing surveillance system of medicines in Sudan. The strategy should inform
the way by which the authorities should select medicines for regular and regular checks. To
build such kind of systems this usually demands various kinds of information and data from
different sources. The diversity of the data is useful under such kind of operational
researches and its outcomes usually bring practical solutions. The data generated under this
research indicates useful information and outlines about how to select effective strategy to
improve the capacity of medicines regulatory authority to detect medicines of low quality.
With the diversity of data generated from this research, and even though the routine data
from the system, this should be a very helpful mean to enrich the decision taken at any level.
We will discuss in more details the shape and dynamics of the pharmaceuticals market in
Sudan with some description about the current system of Post-marketing surveillance in the

Page
19
1
country. Based on the findings obtained from this research a practical scheme will be
proposed to expand the PMS system. The applications of risk assessment/management
techniques in the areas relevant to quality management of pharmaceuticals will be discussed
in brief. This will provide the base for building the model for expanding the PMS system in
Sudan. The usefulness and expected applications of this model will be discussed later in this
chapter.
Since the focus of this study was on the system in Sudan, the following details applied on the
situation in Sudan. However, still the concept is valid to be applied in different settings.

Page
19
2
1- Pharmaceuticals market in Sudan
National Medicines and Poisons Board in Sudan is the responsible body for granting market
authorization of pharmaceuticals as a requirement for all medicines distributed in public and
private sector in Sudan. Based on recent statistics, end of 2010, there are about 3709
registered products in term of trade names that has been authorized [of which 11% were
locally produces]. Based on the regulations, the registration renewal is required for the
registered medicines every 5 years (NMPB, National Medicines and Poisons Board, 2010).
The table below indicates the major indicators of pharmaceutical market in Sudan at the
macro level (FMOH, 2007).
Table 12: The major market indicators
Indicator 2007 2006 2005 All values are in millions US$
Total Sudan market value (all sectors) 285 234 222
Total market growth 21% 5% 7%
Total medicines supply value (paid) 213 164 152
Public sector medicines supply value 49 39 41
Private sector medicines supply value 164 153 111
Local production share in paid market 24.9% 23.8% NA
CMS share in paid market 22.6% 19.3% 17.6%
The growth rate of the market in Sudan, especially after pace agreement, was very clear and
many of pharmaceuticals companies expanded (or plan to expand) its establishment into the
market not only in pharmaceuticals but also in other medical products.
The market in Sudan is favorable environment for generic pharmaceutical companies that
based mainly in low income countries (especially: India, China, Egypt, Jordan, Syria) that
represents significant figures in the market (see table below) (FMOH, 2007).

Page
19
3
Table 13: Major countries contributing to Sudan market
Country Share % Region
Egypt 7.8 Arab
India 6.1 Asia
United Kingdom 5.0 Europe
Switzerland 3.2 Europe
Jordan 3.0 Arab
Germany 2.8 Europe
China 2.0 Asia
Importers (agents) and local producers are the major players in private sector in Sudan in
addition to the direct (special) importation which represents only small part of the market in
this sector. The total importation in 2007 was about 104 million US$ (no noticeable growth
from 2005) by 77 agencies from 200 different companies and manufacturers. Sudan
pharmaceuticals market could be described generally as generic market, in which the
generic trades represents about 90-95% of the market in terms of items. More than 70% of
the total export value is from Arab and Asian countries and accordingly the total value of the
market is consider not large compare to the volume in term of quantities. As mentioned
before the local products represent about 11% of the total registered items (FMOH, 2008).
When we consider all of this it will become clearly obvious that most of the products
available in the market were imported from developing countries or countries with
economies in transition. It will be very important to the “NMPB” to increase its capacity to
detect and depict the existence of substandard medicines at different levels in the supply
chain especially before it reach the end users (patients) to ensure safe and effective use of
these medicines (Ratanawijitrasin & Wondemagegnehu, 2002).

Page
19
4
Statistics showed that among the top 15 medicines, that entered the market in Sudan 2007,
all items were in the national essential list of medicines in terms of generic names. But at the
same time and among the top 50 medicines 20% (10 items) were not essential medicines
and their major source in general is CMS. About 21% of the medicines supplied through the
public sector are locally produced (compare to 8% only the year before) (FMOH, 2008).
Table 14: Top 15 medicines in the market 2006
Medicines % of Share/Source
Generic Name Strength Dosage Form Agents CMS Local
1. Paracetamol 500 mg Tablet 7 4 89
2. Metronidazole 250 MG Tablet 2 10 88
3. Acetylsalicylic Acid 300 mg Tablet 1 27 72
4. Amoxicillin 250 MG Capsule 9 57 34
5. Diclofenac Sodium 25 mg Tablet 15 14 71
6. Ampicillin + Cloxacillin 500 MG Capsule 11 25 64
7. Chlorphenarmine Maleate 4 MG Tablet 4 15 81
8. Chloroquine 200 mg Tablet 0 0 100
9. Multivitamins & Minerals - Capsule 100 0 0
10. Folic Acid 5 MG Tablet 86 0 14
11. Amoxicillin 500 mg Capsule 15 20 65
12. Glibenclamide 5MG Tablet 48 4 48
13. Mebendazole 100 mg Tablet 4 4 92
14. Water for Injection - Injection 0 100 0
15. Ferrus salt 60-70mg Tablet 0 100 0

Page
19
5
Medicines registration outcomes in Sudan:
NMPB is the responsible body for issuing MA of different pharmaceutical products (beside
poisons) and it is supported by standing committee that delegated from to approve the
registration of human medicines (there is another committee for veterinary medicines). This
committee consists of many experts in different sectors in health and pharmacy that
approve or reject the submission request to register the pharmaceutical products. This is
based adopted and published requirements and measures which were available in the
department offices and on the federal pharmacy directorate web site. Up to this report
there are about 3709 registered medicines in term of trade names (register by trade name
using INN system). The following table summarized the registered items disaggregated by
therapeutic groups versus the dosage forms:
Pharmacological groups Solid oral
Parenteral Liquid oral
other large liquid
Topical Other Total %
Gastro-intestinal system 212 21 38 18 8 3 300 08.1
Cardiovascular system 360 14 0 9 0 0 383 10.3
Respiratory system 33 3 34 5 20 0 95 02.6
Central nervous system 347 42 47 11 3 0 450 12.1
Infections 518 236 225 46 92 0 1117 30.1
Endocrine system 154 36 10 5 14 0 219 5.9
Obstetrics, gynaecology, & urinary-tract disorders
25 14 1 4 4 3 51 01.4
Nutrition and blood 135 50 37 85 0 0 307 08.3
Musculoskeletal and joint diseases
199 28 19 18 32 0 296 08.0
Skin 7 3 6 25 119 0 160 04.3
Other 67 98 40 97 28 1 331 08.9
Total 2057 545 457 323 320 7 3709
% 55.5 14.7 12.3 08.7 08.6 00.2
Table 19: Summery table of registered products in Sudan

Page
19
6
2 - Current system of Post-marketing surveillance “PMS” in Sudan
The PMS system in Sudan is generally similar to many other systems in developing countries.
Its main component, and may be the only one, is the routine sampling and testing of the
authorized products distributed at different components of the supply chain. The following
described briefly the outlines of the system.
2-1 Selection of medicines
Medicines selected for analysis and testing under the current system usually determined
based on the following process:
1. Every month one pharmacological/therapeutic group normally targeted for testing
based on the classification of BNF;
2. 40% of registered products within each group were randomly selected to be the
major target for sample collection and the analysis. This usually represents 90% up
to 95% of monthly analysis plan of PMS;
3. The remaining share of the products subjected to testing usually represents the
items reported in the routine complaints receiving system. Normally assigned
committee is responsible for the determination of products to be tested under this
scheme out of all complaints received.
2-2 Complaint system
This system was established during 2006 and it used different communication tools including
a hotline phone number (free of charge) in addition to direct acceptance of reports. These
reports could arrive from different categories of the community including health
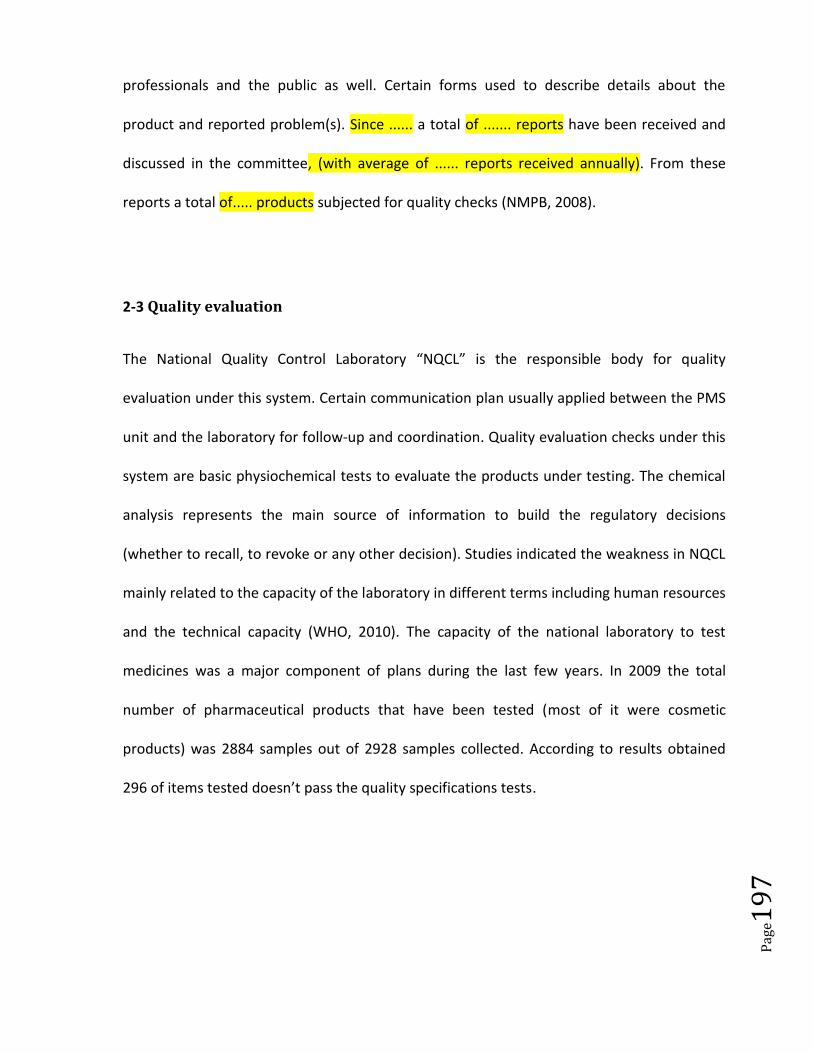
Page
19
7
professionals and the public as well. Certain forms used to describe details about the
product and reported problem(s). Since ...... a total of ....... reports have been received and
discussed in the committee, (with average of ...... reports received annually). From these
reports a total of..... products subjected for quality checks (NMPB, 2008).
2-3 Quality evaluation
The National Quality Control Laboratory “NQCL” is the responsible body for quality
evaluation under this system. Certain communication plan usually applied between the PMS
unit and the laboratory for follow-up and coordination. Quality evaluation checks under this
system are basic physiochemical tests to evaluate the products under testing. The chemical
analysis represents the main source of information to build the regulatory decisions
(whether to recall, to revoke or any other decision). Studies indicated the weakness in NQCL
mainly related to the capacity of the laboratory in different terms including human resources
and the technical capacity (WHO, 2010). The capacity of the national laboratory to test
medicines was a major component of plans during the last few years. In 2009 the total
number of pharmaceutical products that have been tested (most of it were cosmetic
products) was 2884 samples out of 2928 samples collected. According to results obtained
296 of items tested doesn’t pass the quality specifications tests.

Page
19
8
Figure 17: conceptual model of current PMS in Sudan
Looking at this system we can realize its passive nature, i.e. it depends basically on passive
approach in selecting medicines/products for testing. There are no active measures in its
components that adopt dynamic information to feedback the selection process of medicines
and/or the regulatory decisions.
Selection
Collection
Evaluation
Acceptability of results No Yes
Pharmacological
groups
Complaint reports
All of the supply
chain
Basic physiochemical tests
Regulatory
decisions

Page
19
9
2-4 Detection rate & outcomes of the system
On average, through the last 5 years, 9% of the tested items under this system were found
not complying with reference specifications and this was varies from one year to another.
The non-compliance problems vary in its nature ranging from small physical problems up to
critical chemical contents problems.
The following table indicates the summery of failed items per year:
Year Number tested % of non comply Notes
The following table summarizes the details of medicines recalled from the markets during the last three years (NMPB, 2010):
Pharmacological groups Solid oral
Parenteral Liquid oral
other large liquid
Topical Other Total %
Gastro-intestinal system 3 0 1 0 0 0 4 09.8
Cardiovascular system: 4 2 0 0 0 0 6 14.6
Respiratory system 0 0 2 0 0 0 2 04.9
Central nervous system 0 1 0 0 0 0 1 02.4
Infections 6 1 3 5 0 0 15 36.6
Endocrine system 4 0 0 0 0 0 4 09.8
Obstetrics, gynaecology, & urinary-tract disorders
0 0 0 0 0 0 0 00.00
Nutrition and blood 2 0 0 0 0 0 2 04.9
Musculoskeletal and joint diseases
3 1 1 0 0 2 7 17.1
Skin 0 0 0 0 0 0 0 00.00
Other 0 0 0 0 0 0 0 00.00
Total 22 5 7 5 0 2 41
% 53.7 12.2 17.1 12.2 00.00 04.9
Table 20: Summery table of recently recalled products

Page
20
0
The following table summarizes the details of medicines revoked from the markets during
the last three years (NMPB, 2010):
Pharmacological groups Solid oral
Parenteral Liquid oral
other large liquid
Topical Other Total %
Gastro-intestinal system 7 0 0 0 0 0 7 11.7
Cardiovascular system 7 0 0 0 0 0 7 11.7
Respiratory system 3 0 0 0 0 0 3 05.00
Central nervous system 1 0 0 0 0 0 1 01.7
Infections 10 1 0 2 0 0 13 21.7
Endocrine system 12 0 0 0 0 0 12 20.00
Obstetrics, gynaecology, & urinary-tract disorders
1 0 0 0 0 0 1 01.7
Nutrition and blood 0 0 0 0 0 0 0 0.00
Musculoskeletal and joint diseases
5 0 0 0 1 0 6 10.00
Skin 0 1 0 0 3 0 4 06.7
Other 4 0 0 0 0 2 6 10.00
Total 50 2 0 2 4 2 60
% 83.3 03.3 0.00 03.3 06.7 03.3
Table 21: Summery table of recently revoked products
Note: the products in table 20 & 21 were not necessarily similar to each other.
2-5 Awareness about the system
Getting back to the results obtained from health professionals’ survey we found that only
42% of the pharmacists aware about this system. This relatively equal among different
geographical areas surveyed, but it falls up to 14% in the peripheral areas in the city.
Considering the experience of pharmacists responded, those with experience more than 5
years have more knowledge about the system better than other groups (especially those
with 3-5 years of experience).

Page
20
1
Category Yes No
All pharmacists (collective) n=82 42.8 57.0
1 year – 2 years (n=26) 44.0 56.0
3 years – 5 years (n=25) 33.3 62.5
More than 5 years (n=31) 64.7 53.3
Among all of these pharmacists 38% have reservations about this system and its outcomes in
detecting the low quality medicines and how it responds to the challenges in the field.

Page
20
2
3 - Expansion of the PMS system
Considering many facts that affect the value of current PMS system (such as the broad area
in Sudan, capacity of NQCL and the limited financial resources) it become obvious that the
current system need to be improved in an innovative way. The following graphical model
indicates the suggested improvements of the system (compared to figure 17 of current
model) by introducing more methods and approaches to get better outcomes.
or both
Selection
Collection
Evaluation
Acceptability of results No Yes
Routine/ Risk
probability - passive
Complaint reports +
sentential surveillance
All of the supply
chain
Bioequivalence/interchangeability
Regulatory
decisions
Annual survey - Active
Biological/microbiological assays
Basic physiochemical tests
Mini labs
Acceptability of results
No Yes
Acceptability of results
No Yes
Re-scheduled in subsequent
evaluation plans
Re-evaluation in another
scheduled plan or special tests

Page
20
3
Figure 18: conceptual model of proposed expansion PMS in Sudan
According to the results obtained from previous study that investigated intensely the main
causes of substandard medicines problem, the results pointed out different forms of
problems with possibly different causes behind the detected cases. This started at the raw
materials selection, through the manufacturing process, distribution and up to the storage
(Nicholson, 2005). Accordingly, the way in which PMS system is designed should aim to
reduce the manufacturing and trading of substandard. This form of such kind of vigilance
should consider the process that checks the drug’s identity, chemical integrity, physical
stability, and biological activity, and exclude the possible damaging effects of inappropriate
handling, packaging, and storage (Ndomondo-Sigonda & others, 2000). On the other hand
the combined interpretation of quality control results with the clinical data or therapeutic
outcomes of any product under this proposed scheme will support the regulatory decisions
taken. This is particularly important in order to take overview picture for causes and effects
of any problem and to include or exclude any potential factors that contribute to observed
incident of substandard product.
Any strong PMS system should rely and based on strong drug monitoring information
systems (Forzley, 2006). This information system should be able to track the problems up to
patients’ level including the feedback from healthcare providers at different levels. For
example, the system should consider and monitor regularly the information about the
shifting practices of treatments. This indicates important information about the efficacy part
of any product under observation. With regard to the generics that usually included in the
process of shifting are generally similar to those tested under this research which indicates

Page
20
4
the importance and significance of this source of information. The proposed survey should
also be able to bring such kind of information. In other aspect, the information system
should differentiate between the complaints regarding the therapeutic process, that related
to adverse reactions/events and that related to use of generics or any other sort of
problems. By applying different reporting mechanisms the authorities will develop strong
accumulated knowledge about the products, its manufactures and its distributors; what we
can call “Product Profile”. This should become a routine part of quality management system
of pharmaceuticals products. Beside all of these, there are other potential sources of
information need to be collected and considered in taking the regularity decisions (not only
the results of PMS). This includes the following:
1. Pre-marketing surveillance test results;
2. Acceptability of the remaining shelf-life at time of receipt;
3. The history of the drug and its agent at NQCL before distribution;
4. The quality status at time of collection in accordance to Pharmacopeia;
5. The quality at the end of the shelf-life;
6. Drugs most frequently failed the tests;
7. The lost of potency among the time;
In this system the authorities should emphasize more on building the relations with health
professionals form different categories. The results shows that only 15% and 10% of
pharmacists and doctors respectively have ever notified the authorities by any information
related to medicines they deal with. Even those who ever notified the authorities, most of
them never received a feedback on their reports or notice any kind of action done as

Page
20
5
response to their reports (at least up to their knowledge). The role of pharmacy or health
regularity bodies is very important and vital in the linkage between the professional
practitioners and the products they use during their work. The feedback of the practitioners
about the products efficacy, safety and quality should be communicated effectively between
the two sides. Conducting the proposed survey “described in the above model” under the
umbrella of the “NMPB” (and the dissemination of annual reports based on this survey)
should help in building the trust of professional practitioners towards the authorities and it
will encourage them to report more frequently. This will have direct impact on improving
the detection rate of low quality products circulated in the market. The system in this part
should specify clearly the decision making mechanism related to the reported cases. This
should help the reporters to know exactly how their reports will be treated and they will
acknowledge the process the authorities take under this reporting mechanism.
Considering the critical importance of anti-infectives to public health in Sudan (FMOH, 2006),
it is now become very essential to investigate the problem around this therapeutic group as
special part of the PMS system “specialized surveillance”. All of the indicators from this
research pointed out the volume of problems around products under this group. It is not
only the resistance problems part but also its equivalence and other aspects. This proposed
system appreciates the importance of establishing a monitoring system of “antimicrobials
use” in the country including data about resistance (Blomberg, 2007). This system should
ensure the development of strong mechanism that aim to monitor regularly the use of
antimicrobial agents and the level of antimicrobial resistance in all relevant sectors.

Page
20
6
The reasons behind the recommendation to introduce the mini-labs strategy in this system
was principally due to the fact that it could provide an inexpensive, low technology, non-
laboratory-based testing option. It helps to assess product identity, disintegration, and drug
content, which is of value in resource-limited settings like Sudan. When it is used by skilled
persons, it provides an opportunity to identify substandard drugs in relatively inexpensive
and quick process which is combined with other methods (Wondemagegnehu, 1999).
The approach by which this system designed and proposed is strong because it responds to
problems that have been identified in most of PMS systems. In this regard the system will
help the authorities because it is characterized by the following:
1. It is an effective quality monitoring system that use effectively the available
resources;
2. It helps to increase the detection rate of substandard medicines;
3. It was based on improving the availability/sharing of information about the
substandard medicines, the detected cases and the explanations behind that;
4. It provide advance and in-depth analysis of the detected cases;
5. It applies continuous improvement process (through research and development).
It is important to notice that handling of medicines quality judgments need to be combined
with clinical outcomes analysis and ADRs surveillance and reporting. This should be a
significant measure in order to avoid any subjectivity in the reported cases which need to be
based on highly supported professionalism (Brewer & Colditz, 1999).

Page
20
7

Page
20
8
4 - Applications of risk assessment/management techniques
4.1 Theoretical background
When considering different risk analysis processes in any industry or services the risk
definition is important step in order to manage the risk under analysis. In general it is know
that risk defined as “combination of the probability of occurrence of harm and the severity of
that harm” (ICH, 2005). This definition found to be valid for all field or areas and it cover
wide range of risk categories including pharmaceuticals. In the context of medicines quality
when considering the sampling and testing schemes the event in this case is any non-
satisfactory testing outcome and the risk is sample selection that does not maximize the
possibility of identifying this an outcome. So by identifying the best way to discover this
“risk” the process will ensure the maximum detection rate of low quality products.
As discussed earlier we can find that many regulatory authorities started to apply the
concepts of risk management in its regulatory decisions. ICH member states started to apply
this concept few years ago and there are different guidelines about the application of this
technique in the area of medicines quality control and quality assurance. Its applications in
inspection and assessment activities had shown significant contribution in improving the
management systems that applied this approach. However, its use in post marketing phase
of products lifetime still limited and countries under process to develop and improve this
application.

Page
20
9
The following summarizes the experience of European Union countries about the usefulness
of this approach (EMA, 2011):
Risk management assisted in resources allocation among different activities including
inspection planning, inspection intensity and in assessment intensity;
It was useful in evaluating the significance of quality defects detected, evaluating the
possibilities for potential recalls and significance of inspectional findings of
manufacturing sites;
It helps the authorities to determine the appropriateness and type of post-inspection
regulatory follow-up;
In general, any quality risk management should be based on two fundamental principles.
First; scientific knowledge should be applied when evaluating the risk and this should be
linked to patient protection. Second; when decisions were taken to respond to identified
risk(s) the efforts in this management process should be proportionate with the level of risk
(Barone, 2008). The application of these principles in this research was considered as part of
an analytical approach used to arrive to the conclusions made.
It is a common proactive practice to use both formal and informal risk assessment tools;
both proven to be effective. The formal tools use well known techniques with more formal
and structured process. This may includes Preliminary Hazard Analysis technique, Risk
Ranking and Filtering technique and other techniques. The informal tools on the other hand
may use more routine data in building models that help the organization to identify the
potential risks in its systems. Whatever the tool used to evaluate the risk this should include
clear identification of the vulnerability of outcomes under evaluation. In this process key set

Page
21
0
of information need to be identified in any analysis. This includes information about the
vulnerability of different aspects in the system (go wrong) and the possibilities for a getting
that. In addition to this, the likelihood (probability) it will go wrong and the severity of that
(FDA, 1999). Under the area of medicines quality, the triggering factors that might put the
product under suspicious as substandard need to be identified. This process may include
qualitative and/or quantitative methods of relating the probability of occurrence and
severity of the risk if it happened. In other theories the use of “relative risk measure” to
combine multiple levels of severity and probability into an overall estimate of relative risk is
also acceptable (IEC, 2006). In this study the later technique was used to generate the model
for selecting and detecting more low quality medicines among the authorized products in
the system. The aim of any medicines authority, related to quality assurance, is to reduce
the risk to public health if low quality medicines find its way to the markets. Accordingly, the
purpose behind using this technique is to support the regularity authority in Sudan to make
best use of the routine sampling and testing plans to increase the detection rate of these
low quality medicines. The outcome of this process will help in selecting the products to be
tested each year using a risk ranking approach that takes account of the available
information to rank all categories of registered products.
4.2 Applications in quality monitoring
In EU countries the assessment of products to be included in post marketing evaluation for
quality monitoring adopts the same technique. The selection of products usually based on
the evaluation of a range of criteria that included, among others, therapeutic categories,
market availability, stability and manufacturing process, experience with products. The

Page
21
1
decision also combined these factors with some inputs from authorized staff in the regularly
authorities and the GMP inspectorates (EMA, 2008). This ranking process made by
considering the risk factors and its weight, then the selection of products for inclusion in any
analysis plans will be based on the assigned risk level. After the completion of the
assessment about the potential risk factors appeared in the analysis, these risk factors were
critically evaluated considering the probability of achieving unsatisfactory testing results and
the possible consequences of this outcome based on the profile of products under
evaluation. Then the products (or its categories) were ranked against these factors, and the
list of products to be tested every year should take account of this ranking. The important
part of this system is its simplicity as it use the already existing information from different
sources i.e. triangulation of available data (see model building section below for more
details).
Management decisions in monitoring the quality and efficacy of pharmaceutical products in
post marketing phase are usually difficult and complicated. The approach of using risk based
management of quality monitoring, as described above, is one of the possible tools that can
facilitate and support strong decision making process. Recently there was remarkable
growing use of descriptive and analytical models for decision making in health services
(Sanderson & Gruen, 2009). The models usually use the routine data and information
generated from within the systems in order to increase the efficiency and to support quality
improvement process. Different types of models could be used in this area depends on the
objectives of the process and the available data. Considering the context under this
research, risk-based model will be the most suitable and feasible approach.

Page
21
2
Below we will discuss the possible use of risk based descriptive and analytical model to
support the decisions related to monitoring the quality of medicines in post marketing
phase.

Page
21
3
5 - Logic of building the model
5.1 Theoretical background
The following graphical demonstration described the logic behind building any decision
support model (based on (Sanderson & Gruen, 2009))
Figure 19: Logic of building a general decision support model
Upon the application of this concept, the proposed model to improve the post marketing
surveillance of medicines was developed as described below. The general characteristics of
this model include:
The model came out of this process is basically a descriptive model in it nature,
however, and based on the robustness analysis of the model, this provide a very
strong starting point for advanced analytical model may be developed further in the
future;
Model world
observe
theorize/
understand
decide/
intervene
use to predict Build/ revise
model
explore
options
factors in
model factors outside model Real world

Page
21
4
The descriptive nature of the model is strong enough to show the relationships
between the cause and outcomes of PMS system currently taken place in Sudan;
The description generated from this model help greatly to build a hypothesis about
the most at risk items that should be the subject of further quality evaluation or
assessment (see details below);
This model includes a framework for risk management for pharmaceutical quality
which should contribute in more consistent and science-based decision-making;
It will support the establishment and vision of quality related practices, guidelines,
requirements and standards regarding the testing scheme of medicines in PMS
system.
5.2 Model building process
In all risk identification procedures the core concept is the prioritization of large number of
risk scenarios according to their individual contributions to the overall system risk (Yacov &
others, 2002). According to that the basic assumptions in this model were developed based
on the results generated from different components of this research. Besides that, the
researchers utilized other data from different sources to estimate the overall risk probability.
The following factors were considered in estimating the severity of risk of each category of
products:
1. Therapeutic groups
2. Dosage forms
3. Manufacturing origins

Page
21
5
1. Therapeutic groups: the following data was used to rank the risk associated with
different therapeutic groups
a) Feedback from health professionals about the probability of finding more items with
quality/efficacy problems in these groups; (research)
b) Feedback from health professionals about prioritization of these groups in contrast
to other groups; (research)
c) The statistics about physical problems have been experiences by the health
professionals; (research)
d) Statistics about the registered items in Sudan; (NMPB)
e) Statistic about recalled medicines; (NMPB)
f) Statistics about revoked medicines; (NMPB)
g) The final selection of medicines under this research; (research)
h) Outcomes from different tests and experiments; (research)
Note: All of these were generated from the previous parts of this research (research); in
addition to other sources of data from currently published reports by the “NMPB”.
2. Dosage forms: the following data was used to rank the dosage forms
- The statistics about physical problems have been experiences by the health
professionals; (research)
- Statistics about the registered items in Sudan; (NMPB)
- Statistic about recalled medicines; (NMPB)

Page
21
6
- Statistics about revoked medicines; (NMPB)
- The final selection of medicines under this research; (research)
- Outcomes from different tests and experiments; (research)
Note: All of these were generated from the previous parts of this research (research) in
addition to other sources of data from currently published reports by the “NMPB”.
3. Manufacturing origins: the following data was used to rank the origins of medicines
- Feedback from health professionals about probability of finding items with
quality/efficacy problems from certain origins; (research)
- Feedback from health professionals about shifting practices of products cross
different origins; (research)
- The statistics about physical problems have been experiences by the health
professionals; (research)
- Statistics about the registered items in Sudan; (NMPB)
- Statistic about recalled medicines; (NMPB)
- Statistics about revoked medicines; (NMPB)
- The final selection of medicines under this research; (research)
- Outcomes from different tests and experiments; (research)
Note: All of these were generated from the previous parts of this research (research) in
addition to other sources of data from currently published reports by the “NMPB”.

Page
21
7
To generate the probabilities related to the severity of risks for these 3 variables, the
calculations were built on the weighting methods against the total of events reported under
each variable considered (excel sheet for calculations in annex XXX).
The following are the outcome of this process:
Therapeutic groups Probabilities
Infections 0.376
Respiratory system 0.144
Cardiovascular system 0.119
Nutrition and blood 0.091
Endocrine system 0.077
Central nervous system 0.035
Gastro-intestinal system 0.035
Obstetrics, gynaecology, and urinary-tract disorders 0.013 Note: since no data available for the other therapeutic groups they were excluded from this process.
Dosage form Probabilities
Solid oral 0.756
other large liquid 0.136
Parenteral 0.080
Liquid oral 0.011
Topical 0.006
Origins Probabilities
Local 0.374
Low&mid income countries 0.373
high income countries 0.254 Note: results didn’t showed big differences between products produced locally or in low/middle income countries
In addition to these factors, it was fundamental in this process to consider the impact of
identified risks on the public health. Since this was difficult without a precise data, it was
decided to consider the “consumption rate” of the products as indicator for harm that may
result from each product. Based on this, products with high consumption rate expected to
entail more harm than products with low consumption rate. In this regard the eighty-twenty

Page
21
8
rule (80:20) was applied (Juran, 1970). The concept is simple, 20% of registered items
expected to have 80% of the market share and accordingly the expected harm represented
by this ration.
After obtaining these outcomes, the same approach was applied in large scale decision tree
(trail) that considered the different possible categories from the combinations of the 4
factors. The output of this process provides the primary data for the descriptive model. Then
the Risk Ranking and Filtering technique was used to obtain the final outcomes of the model
and this technique was found very useful to obtain the final results (MTC, 2010). The
statistical package used for this process was the Cumulative Sum Charts “ISO-7871” (ISO,
1997). The results of this process generate the model that could be used to support the
decision making to select specifically targeted medicines for quality checks based on the
anticipated risks (detailed model in annex XXX).
5.3 Main outcomes of this model
From the model we can notice the following:
1. There are 360 different possible categories of products could be targeted for any
quality monitoring scheme;
2. The final selection of medicines for evaluation in this research found to be within the
first 64 categories (this represents 17.5% of the total). Even more, all of the items that
were not complied with reference standards rest within the first 44 categories (it represents
11.20% of the total);

Page
21
9
3. From the outcomes below, we can see the huge difference between the top five and
the bottom five. In fact the probabilities in the first category are 21,400 times higher
than the least group;
4. The top 52 categories represents about 80% of the whole probabilities in the model
(i.e. by targeting these categories of medicines it may include 80% of the possibly low
quality products);
5. The following showed the main features and outcomes of the model:
Top five categories with highest probabilities
Therapeutic groups Dosage form Origin Consumption Rank
Infections solid-oral Local high consumption 8.505
Infections solid-oral Low&mid income countries high consumption 8.482
Infections solid-oral high income countries high consumption 5.776
Respiratory system solid-oral Local high consumption 3.257
Respiratory system solid-oral Low&mid income countries high consumption 3.249
Least five categories with the lowest probabilities
Therapeutic groups Dosage form Origin Consumption Rank
Obs, gyn and UT disorders Other high income countries low consumption 0.001
Skin topical high income countries low consumption 0.001
Obs, gyn and UT disorders* topical Local low consumption 0.001
Obs, gyn and UT disorders topical Low&mid income countries low consumption 0.001
Obs, gyn and UT disorders topical high income countries low consumption 0.001
* Obstetrics, gynecology, and urinary-tract disorders
5.4 Statistical analysis of the outcomes
The outcomes analysis showed considerable diversity of its main statistical tests (correlation
and significance). The following table summarizes these relations:

Page
22
0
Correlations
Risk Summery
Risk Pearson Correlation 1 .360
Sig. (2-tailed) .001
Summery Pearson Correlation .360 1
Sig. (2-tailed) .001
This summery showed moderate correlation relationship between the anticipated risk of
medicines category and the possibility of detecting (at least one) low quality product in that
group. The summery also showed that when the risk increased, there is proportional
increase of detected that product. Still there are some limitations of this model (based on
this statistics). This includes the following:
1. Data about the outcome summery are very limited in number as only 40 results
(outcomes) were used in this model. Nevertheless it also showed positive and
relatively significant correlation factor as indicated above. Using more data in the
future from the routine testing process should confirm the significance of using this
model;
2. The model gives same weight for all factors under analysis (therapeutic groups,
dosages ...etc) and doesn’t consider its importance against each other (its weights).
This is relatively an advance step in improving this model and it should be completed
when more data is available

Page
22
1

Page
22
2
6 - Usefulness of this model and approach
The model provided scientific approach in checking the quality of pharmaceuticals circulated
in the market. The proposed scheme to expand the quality/efficacy checks of medicines
proven to be a useful strategy to ensure the availability of effective products and of good
quality. This is new approach and it will help the decision-makers in a resources limited
settings, in which it is well understood the challenges to make choices, to support their
decisions.
By applying this approach the following factors need to be considered critically:
1. The market profiles of selected medicines is key determinant for the final
selection;
2. The capacity of the quality control laboratories as it is critical to inform the
selection process and the final decisions about the number to be picked under
each category of products;
3. The availability of adequate financial resources at different levels of the system
will limit the way by which the model is applied
Based on all of these points raised about this model we can see the usefulness of this
proposed approach in the following aspects:
6.1 Selection decisions of medicines for quality/efficacy checks

Page
22
3
The selection of products to be included in each annual programme should be based on
rigorous criteria that maximize the outcomes of the testing and evaluation process. Based on
this model the following selection protocol was proposed to be applied by the “NMPB”:
1. After the determination of the capacity of the authorized laboratories, the annual
plan for testing/evaluation should consider the ranking of different categories. The
selection of products for inclusion in any annual plans will be related to categories
those ranked highest on the list at the time the products are selected, which is
usually done in preceding year;
2. The selection mechanism may be done through two possible approaches:
- Starting to target the categories of products one by one depends on its rank; or
- Distributing the products in each month based on the weight of its categories (but
again based on its rank)
3. If two categories were similar in their expected risk probabilities we can use either
outranking technique or even swap technique (known statistical methods);
4. Products eligible for this selection process should be authorized at least two years
prior to its selection. This will ensure that the product completed the distribution
phase of its “product life” and the feedback from the system is sufficient for its
inclusion;
5. Consideration should be made for products that authorized more than two years ago
but which have never been tested. This indicate its market status (was not actually
marketed) and it should be excluded;

Page
22
4
6. The selection of products for inclusion in the annual plan that based on the proposed
risk ranking should at least make up to 90% of the total targeted products. The
remaining 10% may be allocated at random chance from the other categories outside
the model. This will depend on the capacity of the authorized laboratories;
7. The selection process should consider different information that gathered from
different sources to inform the evaluation plans. This include the following:
a) Experts’ opinion should be considered. For example the regular meeting of states
inspectors plus the establishment of advisory group for quality monitoring that
give its advice on the main test parameters in the product specifications;
b) Health priorities in the country from the routine morbidity and mortality data;
c) Bioequivalence information about the products (Midha & others, 2005);
d) Market information about the product including its distribution pattern;
e) Health and safety information about the product that indicate its impact on public
health;
f) Quality problems experienced in other countries and disseminated by the relevant
authorities;
g) The classification of medicines whether it is essential or not (based on the
National Essential Drug List);
h) The status of the remaining shelf life of selected products and if that is known to
affect the outcomes of the testing/evaluation;
8. Sampling sites should be selected based on evidences about the structure of
distribution channel in the country as two previous studied in Sudan provided
important data about the vulnerability of different parts of the distribution system in

Page
22
5
the country (Gamil, 2008). This should consider the climatic conditions, the equal
share of sampling load between states, availability of targeted product/batch, size of
the market, the clinical use of the product , etc;
9. As it was shown before, using questionnaire based-sampling of products this should
provide more in-depth understanding of the samples collected and other
related/associated factors;
10. Information should be sent in advanced to selected sampling sites to confirm the
availability and the market status of targeted products and this could be done using
any sort of data collection tool (i.e. questionnaires);
11. In addition to this process, the experience from other countries as we discussed
before, may help to improve the system:
i. In Australia complementary medicines and non-prescription drugs were
routinely examined based on the pharmacovigilance reports obtained from
the field
ii. In Cyprus products containing sensitive substances, products used for serious
diseases and generic products posing interchangeability problems were
considered as the primary targets for the system;
iii. In Cuba the PMS focuses on samples collected from manufacturers in
connection with GMP inspection, rather than on samples collected directly
from the “market based on the limited capacity of the quality control
laboratory

Page
22
6
6.2 Detection rate
As it was discussed before the adverse event the model tried to avoid in this case is the
failure to identify a non-satisfactory testing outcome of the products (in other terms filature
to detect the substandard drug). Accordingly, the other main use of this model is to
maximize the possibility of identifying such product. As it was seen before, by apply this
model practically the possibility of detecting 80% of low quality products will increased if the
program focused on testing the firs categories of the model. In other terms 11% of the
registered products represent the main source of substandard medicines in the system. This
is significant finding and it could help the authorities to increase the detection rate of these
low quality products.
In this regard, we should appreciate the role of the active surveillance in increasing the
detection rate of these products. The proposed expansion of PMS system was built on this
concept. By having more dynamic and active surveillance this will enable the interaction
between different part of the system. The information system will become more able to
indicate the potential problems and cases that may involve low quality products. The other
advantage of this active approach is the involvement of health professionals in efforts to
compact the problem of substandard medicines.
With no doubt, health care professionals are the major partners with potential importance
and roles in improving the detection of substandard medicines. Since this category is well

Page
22
7
oriented and educated about this problem, they should be essential part of any solution.
This will add additional value for appreciating the detection of these medicines before it
reaches the patients.
6.3 Improving the effectiveness of the system
The impact of substandard medicines on public health, resources utilization and its
economic impacts all of these drives the need for such kind of interventions and innovations.
The model provide good tool that help the development of effective plans that aim to
compact this problem and decrease its effects on public health. This approach was
considered effective for many reasons as it will assist in allocating the resources and in
prioritization of the activities. Besides that, the model will help in creating optimal and cost-
effective scheme for monitoring the quality/efficacy of pharmaceutical products.
To judge whether or not any system is effective or not, we should evaluate the system
against its objectives and whether or not these we achieved. Although the hypothesis about
the linkages between the model outcomes and the inputs need to be further studies, the
model indicate the possibility to improve the PMS system as shown above regarding the
selection process and the detection rate.
It will be highly recommended to observe the results of applying this approach after at least
5 years lifespan, as adequate data will be generated to develop more strong predictability
tool to detect the possibility of getting certain results. The range of results and the outcomes
anticipated from these results could inform more how the system dynamic showed
directions and trends of risks. When analyzing the results from the findings, and its

Page
22
8
associated factors, this should be very helpful for better understanding of the system. This
includes results about products that complied with specifications, products associated with
minor issues been identified, products found a out of specification and problems represent
critical health risks.
As it was discussed above, the proposed system will help the relevant authorities to respond
effectively to the concerns about the quality from different sources. This is important as the
issue of low quality medicines is of interest for different parties including the consumers as it
affects their cure and it has cost implications. The prescribers will be interested of effective
system as low quality products affect their patient trust and their expected clinical
outcomes. Besides that, the pharmaceutical companies will be concerned about the system
as they are considering very much the reputation of their companies and the general trust
on their products. Finally, the governments will highly appreciate effective stress in order to
ensure the protection of public health and prevention of increased public expenditure for
drugs (USP, 2004), (Bennett & others, 1999).

Page
22
9

Page
23
0
Conclusion
This research ended by creating a risk-based model of Post marketing Surveillance
System “PMS”;
The proposed model aimed to improve the way the quality of medicines could be
monitored. It is useful approach as it considered the risks associated with detecting
low quality products;
The model will enable the authorities to develop and apply dynamic and active
approach in tracing the quality and efficacy problems in circulated products in the
market;
The experiments and sub-studies done under this research contributed significantly
to strength the justifications for applying this model in this area. Compared to the
conventional model of PMS, this model is cost-effective approach need to be
considered in a resource limited settings in the developing countries;
The application of this model will not be effective without the active involvement of
health professionals form the healthcare field. This involvement will strengthen the
outcomes of the model and at the same time it will help the implementing bodies to
improve the model if the future;
This research is small scale project and due to that still there are some limitations
identified in its development. Still the findings showed statistically significant
outcomes for measures to improve the PMS system;
Further research and development efforts in this area need to be done in the future.

Page
23
1
Recommendations
1. “NMPB” may consider the application of the proposed model for quality risk management
in the practical field in the upcoming year to improve the post marketing system as key
part of medicines regulation;
2. Implementation of medicines selection protocol proposed by this study to improve the
outcomes of PMS system and to increase the detection rate of low quality medicines;
3. Development/enforcement of routine passive and active surveillance that bring more data
about quality from different sources;
4. “NMPB” should consider the improvement of drug monitoring information systems as
priority step. These systems should be able to track more problems in different levels;
5. Development of national database as central component for medicines quality
management information system to support the formulation of strategic policy and plan to
contain the incidence of low quality medicines;
6. “NMPB” should build strong relations with health professionals and should strength the
communication and feedback systems with them;
7. Responsible authorities should develop practical mechanism to monitor the use of
antimicrobial agents and the level of antimicrobial resistance in all relevant sectors;
8. Re-evaluating the outcomes of this model a 5 years after its implementation to assess its
effectiveness and the improvement plan;
9. Expanding the PMS to check the quality and efficacy beyond the physiochemical analysis to
include more tests including microbiological assay, bioassay, bioequivalence studies,
minilabs, dissolution test, etc as routine tests.

Page
23
2
10. Strengthening the capacity of National Quality Control Laboratory to implement the
proposed expansion plan of PMS by securing additional resources in terms of human
resources, capacity building programs, financial support and adequate workplace;
11. Development of educational programs targeting health professionals regarding the
management of low quality medicines including substandard and counterfeit products.
12. Doctors and pharmacists should report more about the medicines they deal with and they
should become the vigilant channels for counterfeit/substandard drugs;
13. “NMPB” or other relevant bodies should improve information dissemination to help in
educating the consumers to be a part of medicines quality management channels;
14. Conduction of in-depth studies about the use of Amoxicillin inside and outside the health
system in Sudan;
15. Further research is needed to assess the capacity of medicines regulatory system to identify
the gaps that affect the detection of substandard medicines before and after entering the
market and to develop an action plan to address these gaps;
16. More operational researches needed to determine the most effective regulatory
mechanisms to reduce the circulation of substandard drugs in order to reduce the harm
from substandard drugs

214
Page
21
4
Bibliography
Adelman, C., & Norris, J. (2002). 65. . Generic medicines are not substandard medicines. The
Lancet (359), 217-84.
Andreotti, F., & Crea, F. (2005). Substandard life-saving drugs: a global concern. European
Heart Journal (26), 858–860.
Arya, S. (1995). Inadvertent supply of substandard drugs. World Health Forum.
Ball, P., & others. (2002). Antibiotic therapy of community respiratory tract infections:
strategies for optimal outcomes and minimized resistance emergence. () 49,. Journal of
Antimicrobial Chemotherapy (90), 31-40.
Barmania, A. (1990). Expired medicines. Afr Med J , 78:218.
Barone, S. (2008). Programs in the Division of Risk Management and Surveillance. Food and
Drug Administration.
Benedict, L., & others. (1974). Use of Sodium Polyanethol Sulfonate in the Preparation of 5%
Sheep Blood Agar Plates. Applied Microbiology , 91-94.
Bennett, S., & others. (1999). Public-private roles in the pharmaceutical sector. World Health
Organization.
Blomberg, B. (2007). Antimicrobial resistance in bacterial infections in urban and rural
Tanzania. University of Bergen.
Brewer, T., & Colditz, G. (1999). Postmarketing surveillance and adverse drug reactions.
JAMA (281), 824-829.
Buice, R. G. (2005). Bioequivalence and In Vitro-In Vivo Correlations: Study Design & Data
Interpretation based on the Biopharmaceutic Classification System.
Castro, V. (2005). Fake medicines can kill-DOH. Retrieved January 2008, from Inquirer News
Service: www.inq7.net/lif/2002/jan/26/text/lif_8-1-p.htm.
CBS-Sudan. (2007). Report of National Census in Sudan 2005. Central Bureau Of Statistics -
Sudan.
Coppack, S., & others. (1990). Pharmacokinetic and pharmacodynamic studies of
glibenclamide in non-insulin dependent diabetes mellitus. Br. J. clin. Pharmac. (29), 673-684.
Das, K. (1992). Studies on the quality of marketed life-saving drugs. Dhaka: Jahangirnagar
University.
Dodoo, A. N. (2007). Development of educational Development of educational programmes
to address the problems of counterfeit and substandard medicines in curricula at pharmacy
schools. University of Ghana - Medical School.

215
Page
21
5
Dukes, M., & other. (2003). Drugs and Money (7 ed.). IOS Press & World Health
Organization.
Editorial. (1997). Quality control and essential drugs. Lancet , 350: 601.
Eerden, M. M., & others. (2005). Comparison between pathogen directed antibiotic
treatment and empirical broad spectrum antibiotic treatment in patients with community
acquired pneumonia: a prospective randomised study. Thorax (60), 672-678.
EMA. (2011). . Quality Risk Management (ICH Q9). European Medicines Agency.
EMA. (2011). Pharmaceutical Quality System (ICH Q10). European Medicines Agency.
EMA. (2011). Quality Risk Management (ICH Q9). European Medicines Agency.
EMA. (2008). Sampling and Testing of Centrally Authorized Products: Development of risk
based approach for the selection of products. European Medicines Agency.
EMA. (2008). Ten Years of Sampling and Testing of Centrally authorized Products. . European
Medicines Agency.
FDA. (2006). Guidance for Industry: Q9 Quality Risk Management. U.S. Department of Health
and Human Services. Food and Drug Administration.
FDA. (1999). Managing the Risks form Medical Products Use: Creating a Risk Management
Framework. Food and Drug Administration.
FDA. (2007, February). Report to Congress: reports on postmarketing studies. Retrieved from
www.fda.gov/cber/fdama/pstmrktfdama130.htm
FDA. (2000). Waiver of In Vivo Bioavailability and Bioequivalence Studies for Immediate-
Release Solid Oral Dosage Forms Based on a Biopharmaceutics Classification System. Food
and Drug Administration.
FMOH. (2006). 5 Years National Health Policy. Federal Ministry of Health – Sudan.
FMOH. (2008). Annual Pharmaceutical Statistical Report 2007. Federal Ministry of Health –
Sudan.
FMOH. (2006). Essential Medicines List 2005. Khartoum: Federal Ministry of Health.
FMOH. (2008). Health Statistics Report 2007. Federal Ministry of Health.
FMOH. (2007). Sudan National Pharmaceutical Sector; Northern Sudan. . Federal Ministry of
Health, Sudan.
Fontanarosa PB, e. a. (2004). Postmarketing surveillance - lack of vigilance, lack of trust.
JAMA , 292, 2647–2650.
Forzley, M. (2006). Combating Counterfeit Drugs: A Conceptual Paper for Effective
International Cooperation. World Health Organization.

216
Page
21
6
Fracchia, G., & others. (2000). Developing a national system for dealing with adverse events
following immunization. Bulletin of the World Health Organization , 2 (78), pp. 170-177.
Frempong, N. (2003). Dissemination of Information on Counterfeit and Substandard
Medicines to the Profession. Ministry of Health, Ghana.
Gamil, A.-A.-R. M. (2008). The Effects of Environmental Conditions of Sudan on the Stability
of Drug Products. Department of Pharmaceutical Chemistry. University of Khartoum.
HAI. (2003). Medicines Strategy: Prequalification of Generics. HAI Briefing Paper 56th World
Health Assembly. Health Action International.
Harris, D. C. (2003). Quantitative Chemical Analysis (6 ed.). New York: W.H. Freeman.
Hayward, C. J., & others. (1996). Investigation of Bioequivalence and Tolerability of
Intramuscular Ceftriaxone Injections by Using 1% Lidocaine, Buffered Lidocaine, and Sterile
Water Diluents. Antimicrobial Agents and Chemotherapy , 485–487.
Humphrey, J., & Lightbown, J. (1992). A general theory for plate assay of antibiotics with
some practical applications. J Gen Microbiol , 129-143.
ICH. (2005). Quality Risk Management. International Conference on Harmonization of
Technical Requirement for Registration of Pharmaceuticals for Human Use.
ICN. (2005). Targeting Counterfeit and Substandard Medicines. International Council of
Nurses.
IEC. (2006). Analysis techniques for system reliability Procedure for failure mode and effects
analysis (FMEA). International Electrotechnical Commission.
ISO. (1997). Cumulative sum charts - Guidance on quality control and data analysis using
CUSUM techniques. International Organization of Standardization.
Jayasuriya, D. (1985). Regulation of pharmaceuticals in developing countries. Geneva: World
Health Organization.
JPMA. (2011). Pharmaceutical Regulations in Japan: Post-marketing surveillance of Drugs.
Japan Pharmaceutical Manufacturers Association.
Juran, J. M. (1970). Quality Planning and Analysis. McGraw-Hill .
Katzung, B. G. (2001). Basic & Clinical Pharmacology. Lange Basic Science.
Kenyon, T. A., Kenyon, A. S., & Sibiya, T. (1994). Drug quality screening in developing
countries: Establishment of an appropriate laboratory in Swaziland. Bulletin of the World
Health Organization , 72, pp. 615–620.
Kopp, S. (2003). Counterfeiting: An overview Counterfeiting: An overview of problems and of
problems and dangers. Medicines Quality Assurance and Safety of Medicines. World Health
World Health Organization.

217
Page
21
7
Kopp, S. (2003). Counterfeiting: An overview of problems and dangers. Quality Assurance and
Safety:Medicines. World Health Organization.
Layloff, T. (1997). The importance of analytical procedures in regulatory control. WHO Drug
Information , Vol. 11 (No. 3), pp. 128-131.
Leesik, H., & others. (2006). Microbial pathogens of adult community-acquired pneumonia in
Southern Estonia. Medicina (Kaunas) .
Meredith, P. (2003). Bioequivalence and other unresolved issues in generic drug
substitution. Clinical Therapeutics , 25 (11), 2875-2890.
Meredith, P. (1996). Generic drugs. Therapeutic equivalence. Drug Safty , 4 (15), 233-42.
Meyer, H., Muller, F., Luus, H., & Eckert, H. (1989). Bio-availability of three formulations of
glibenclamide. SAMJ , 76 .
Midha, K., & others. (2005). The bioequivalence of highly variable drugs and drug products.
Int J Clin Pharmacol Ther , 10 (43), 485-98.
MSH. (2001). Ensuring Drug Product Quality: Strategies for Enhancing Access to Medicines
(SEAM). Targeting Improved Access. Management Sciences for Healt.
MTC. (2010). Risk Ranking and Filtering. Retrieved May 7, 2011, from Manufacturing
Technology Committee – Risk Management Working Group:
www.pqri.org/pdfs/MTC/Risk_Rank_Filter_Training_Guide.pdf
Murney, P. (2008, December). To mix or not to mix-compatibilities of parenteral drug
solutions. Retrieved July 23, 2009, from
www.australianprescriber.com/magazine/31/4/98/101.
Murray, P. R. (2007). Manual of Clinical Microbiology (9 ed.). ASM.
Nazerali, H., & Hogerzeil, H. V. (1998). The quality and stability of essential drugs in rural
Zimbabwe: controlled longitudinal study. British Medical Journal .
Ndomondo-Sigonda, M., & others. (2000). Quality Assurance: The Drug Inspection and
Testing Program. MSH SEAM Program.
Nicholson, J. (2005). Analysing the Reports on Counterfeit and Substandard Medicines .
World Health Organization.
Nicholson, J. (2005). Analysing the Reports on Counterfeit and Substandard Medicines. World
Health Organization.
NMPB. (2010). Retrieved March 2011, from National Medicines and Poisons Board:
www.nmpb.gov.sd
NMPB. (2010). Sudan - National Medicines and Poisons Baord . Retrieved 2011, from
www.nmpb.gov.sd

218
Page
21
8
NMPB. (2008). Unpublished report on routine quality monitoring. National Medicines and
Poisons Baord.
Odili, V. U., & others. (2006). Identification of Counterfeit Drugs by Community Pharmacists
in Lagos State. Tropical Journal of Pharmaceutical Research , 5 (1), 545-550.
OMCL. (2006). Co-operation in Post-Marketing Surveillance of MRP/DCP-Products. European
Directorate of the Quality of Medicines and HealthCare.
OMCL. (2007). General procedure for Sampling and Testing of Centrally Authorised Products.
European Directorate of the Quality of Medicines and HealthCare.
Ondari, C. (2003). The quality of antimalarials: study in selected African countries. World
Health Organization.
Palampur, A. (2003, August). Doctors’ collusion in sale of spurious medicines alleged.
Retrieved January 2008, from www.tribuneindia.com/2003/20030810/himachal.htm#1.
Palmer, S. M., & others. (1995). Bactericidal Killing Activities of Cefepime, Ceftazidime,
Cefotaxime, and Ceftriaxone against selected microorganisms in an In Vitro Infection Model.
Antimicrobial Agents and Chemotherapy , 1764–1771.
Peter, G., & Others. (2002). In vitro evaluation of the quality of essential drugs on the
Tanzanian market. Tropical Medicine and International Health , 7 (8), 701–707.
Phanouvong, S. (2004). Rapid Assessment of a Drug Quality Assurance Program and Drug
Quality Control Systems. The United States Pharmacopeial Convention.
Phanouvong, S. (2003). Registration, inspection and testing: how to prioritize? Drug Quality
and Information , pp. 10-12.
Pincock, S. (2003). WHO tries to tackle problem of counterfeit medicines in Asia. BMJ (327),
1126.
Rajendran, S., & others. (2005). HPLC method for the estimation of Glibenclamide in human
serum. Indian J Pharm Sci , 25, 12-19.
Ratanawijitrasin, S., & Wondemagegnehu, E. (2002). Effective Drug Regulation: A Multi-
Country Study. Geneva: World Health Organization.
Ravinetto, R. (2002 ). Keeping counterfeit and substandard drugs out of developing
countries. Proceedings of the Global Forum on Pharmaceutical Anti-Counterfeiting (pp. 22-
25). Geneva: Reconnaissance Intl.
Reaney, P. (2005, April). Substandard Drugs Threat to Heart Patients. Reuters NewMedia .
Saha, P. (1992). Quality of marketed OTC drugs in Bangladesh: paracetamol - a case study.
Dhaka: Jahangirnagar University.

219
Page
21
9
Sanderson, C., & Gruen, R. (2009). Analytical Models for Decision Makin. Open University
Press.
Seiter, A. (2005). Pharmaceuticals: Quality Assurance in the Distribution Chain. World Bank.
Seyoum, D., & Blum, N. (2004). Counterfeit and Substandard Drugs and the Problem of
Antimicrobial Drug Resistance. International Conference on Infectious Diseases. Cancun,
Mexico. Mexico.
Shariff, A. (2004). Status Report on Macroeconomics and Health Sector in Sudan. Federal
Ministry of Health.
Simon, H., & Yin, E. (1970). Microbioassay of antimicrobial agents. Appl Microbiol , 573-579.
Stephanie, J., & others. (2001). Resistant pneumococcal infections: the burden of disease and
challenges in monitoring and controlling antimicrobial resistance. Geneva: World Health
Organization.
Syhakhang, L., & others. (2006). The quality of drugs in private pharmacies in Lao PDR.
IHCAR, Karolinska Institute .
Taylor, R., & others. (1995). Drug quality, a contributor to drug resistance. Lancet (356), 122.
Taylor, R., & others. (1997). Assessment of the incidence of substandard drugs in developing
countries. Trop Med Intl Health , 9 (2), 839-45.
Taylor, R., & Others. (2001). Pharmacopoeial quality of drugs supplied by Nigerian
pharmacies. Lancet , 357, 1933–1936.
Taylor, R., Shakoor, O., & Behrens, R. (1997). Assessment of the incidence of substandard
drugs in developing countries. Trop Med Intl Health , 3 (9), 839-45.
TenHam, M. (1992). Counterfeit drugs: implications for health. Adverse Drug React Toxicol ,
59–65.
Thomas, S., & others. (2003). Counterfeit Pharmaceuticals: Current Status and Future
Projections. J Am Pharm Assoc , 710-718.
Tschabitscher, D., & others. (2008). Generic drugs: quality, efficacy, safety and
interchangeability. Wien Klin Wochenschr , 3-4 (120), 63-9.
USP. (2004, February). A Review of Drug Quality in Asia with Focus on Anti-Infectives. USP
Drug Quality and Information Program .
USP. (2004). Call for Action Against Poor-Quality Medicines in Asia. The United States
Pharmacopeial Convention.
USP. (2005). Ensuring The Quality of Medicines In low Income countries. The United States
Pharmacopeial Convention.

220
Page
22
0
USP. (2005). Ensuring the Quality of Medicines in Resource-limited Countries. United States
Pharmacopeia.
USP. (2006). Guidelines for Drug Sampling USP DQI Drug Quality Monitoring Program Use of
the Basic Tests at the Peripheral Level. nited States Pharmacopeial Convention.
USP. (2003). USP DQI Training Manual on Good Laboratory Practices, Basic Tests, and
Sampling Procedure. U.S. Pharmacopeia.
Videau, J. (2001). Making medicines safe (editorial). WHO Bulltine , p. 87.
Watson, D. G. (2005). Pharmaceutical Analysis: A Textbook for Pharmacy Students and
Pharmaceutical Chemists (2 ed.). Paperback, Churchill Livingstone.
WB. (2007). World Bank List of Economies. Retrieved July 2007, from
www://web.worldbank.org/website/external/datastatistics
WHO. (1999). Counterfeit drugs: Guidelines for the development of measures to combat
counterfeit drugs. WHO Department of Essential Drugs and Other Medicines. Geneva: World
Health Organization.
WHO. (2006, November 14). Retrieved from
www.who.int/medicines/services/counterfeit/impact/Impact.
WHO. (2010). Assessment of medicines regulatory systems in sub-Saharan African countries:
An overview of findings from 26 assessment reports. World Health Organization.
WHO. (2010). Assessment of medicines regulatory systems in sub-Saharan African countries:
An overview of findings from 26 assessment reports. Geneva: World Health Organization.
WHO. (1991). Basic Tests for Pharmaceutical Dosage Forms. Geneva: World Health
Organization.
WHO. (1997, November 28). Combating counterfeit drugs: a shared responsibility. Retrieved
2008, from www.who.int/archives/inf-pr-1997/en/pr97
WHO. (2009). Community-based surveillance of antimicrobial use and resistance in resource-
constrained settings. World Health Organization.
WHO. (2009). Community-Based Surveillance of Antimicrobial Use and Resistance in
Resource-Constrained Settings. Geneva: World Health Organization.
WHO. (1999). Counterfeit drugs: Guidelines for the development of measures to combat
counterfeit drugs. Essential Drugs and Medicines Policy. Geneva: World Health Organization.
WHO. (2000). Effective drug regulation - What can countries do? Essential Drug and
Medicines Policy. World Health Organization.
WHO. (2003). Effective Medicines Regulation: Ensuring Safety, Efficacy and Quality, WHO
Policy Perspective on Medicines. Geneva: World Health Organization.

221
Page
22
1
WHO. (2002). Fighting Poor-Quality Medicines for Poor People. Quality Assurance and
Safety: Medicines, Department of Essential Drugs and Medicines Policy. World Health World
Health Organization.
WHO. (1998). Marketing Authorization of Pharmaceutical Products with Special Reference to
Multisource (Generic) products. Geneva: World Health Organization.
WHO. (2006). Medicines Regulatory Authorities: Current Status and the Way Forward. World
Health Organization AFR.
WHO. (2007). Quality assurance of pharmaceuticals , 2nd updated edition (2 ed., Vol. 2).
Geneva: World Health Organization.
WHO. (2007). Quality assurance of pharmaceuticals: Meeting a major public health
challenge. The WHO Expert Committee on Specifications for Pharmaceutical Preparations.
World Health Organization.
WHO. (1997). The dangers of counterfeit and substandard active pharmaceutical
ingredients. WHO Drug Information , 11 (3), pp. 123-127.
WHO. (1997). The dangers of counterfeit and substandard active pharmaceutical
ingredients. WHO Drug Information , 11 (3), pp. 123-127.
WHO. (2002). The Importance of Pharmacovigilance. (Safety monitoring of medicinal
products). World Health Organization.
WHO. (2006). The safety of medicines in public health programmes: Pharmacovigilance an
essential tool. World Health Organization.
WHO. (2003). WHO Expert Committee on Specifications for Pharmaceutical Preparations.
Geneva: World Health Organization.
WHO. (2003). WHO Expert Committee on Specifications for Pharmaceutical Preparations.
Geneva: World Health Organization.
WMA. (2008). Declaration of Helsinki on Ethical Principles for Medical Research Involving
Human Subjects. World Medical Association.
Wondemagegnehu, E. (1999). Counterfeit and substandard drugs in Myanmar and Vietnam.
Report of a study carried out in cooperation with the governments of Myanmar and Vietnam.
Geneva: WHO.
Yacov, Y., & others. (2002). Risk Filtering, Ranking, and Management Framework Using
Hierarchial Holographic Modeling. Risk Analysis , 22 (2).
York, P. (1977). The shelf life of some antibiotic preparations stored under tropical
conditions. Pharmazie (31), 101-4.

222
Page
22
2
Zuluaga, A. F., & others. (2009). Application of microbiological assay to determine
pharmaceutical equivalence of generic intravenous antibiotics. BMC Clinical Pharmacology ,
6904-9-1.

223
Page
22
3
Annexes

224
Page
22
4
Annex 1: Pharmacists questionnaire بسم اهلل الرحمن الرحيم
Questionnaire on Medicines Quality for pharmacists
Date…………………………………….. City: …………….…………….…………….
State:-…………………………….……… Province:-………………….……………….
Area Type:-………..……………………………………………………….……………….
Code:-……………………………………………………………………….………………
Pharmacy name (optional):-………………………………...…………………………….
Information provider:- □ Pharmacist □ assistant □ other
Data collector:-…………………………………………………….…………………..
Substandard Medicines:-
That are medicines not comply with the specifications including the active ingredient content
هي االدوية التي تعتبر غير مطابقة للمواصفات بما فيها محتوى المادة الفعالة
1. Did you think that there is problem of substandard (low quality) medicines found in the medicines market in Sudan?
□ Yes □ No □ No comments
2. Did you think that it is major or minor problem?
□ Major □ Minor
3. Did you deal with patients Complaints for ineffective medicines(s)?
□ Yes □ No
4. If yes, did you think that the problem in the medicine itself or in the administration method (dosing, time, food interaction, etc)?
□ Majority in medicine itself □ Majority in Administration method

225
Page
22
5
5. What are the common Complaints did you receive?
□ Symptoms not relieved □ Side effects □ physical
appearance
□ Alternative medicine □ All of these □ other
6. What are the common medicine(s) that you have experienced patient(s) Complaints:-
Generic name…………………………………………………………….…………..
Trade Name…………………………………………………….…………………….
Company/Source……………………………………………...……………………..
7. Did you think that this company have quality problem regarding its remaining range of products?
□ Yes □ No □ No comments
8. Did you deal with medicine(s) have been physically changed?
□ Yes □ No
9. If yes, what are the medicines if you experienced these?
Generic Dosage Form Changes Notes Source
10. Did you have experience in shifting patient(s) from one product to another product (for same generic) because of uncontrolled patient(s) symptoms or complaints?
□ Yes □ No
11. If yes, in this case(s) what is the:

226
Page
22
6
Case (1):-
Patient was on Alternative Your comment
Generic name
Trade Name
Company
If the locally manufactured drug is available in the market did you recommend it for the patient in this case?
□ Yes □ No
Case (2):-
Patient was on Alternative Your comment
Generic name
Trade Name
Company
If the locally manufactured drug is available in the market did you recommend it for the patient in this case?
□ Yes □ No
12. Did you experienced if any: (your own observations) and/or (patients compliance) and/or (doctors comments) and/or (other college pharmacists) about the quality of the following generics regardless the trade name:-
* choose the number(s)
1- Your own observations 2- Patients compliance
3- Doctors comments 4- Other college pharmacists
Generics Yes No If yes from *
21. Amoxicillin susp/cap
22. Ampiclox inj
23. Artesonate
24. Aspirin
25. Atenolol tab
26. Carbimazole tab
27. Cefuroxime sodium inj
28. Chloramphenicol cap/tab
29. Chlorpheniramine
30. Ciprofloxacin tab
31. Co- trimoxazole
32. Digoxin inj/tab
33. Ethinylestradiol/levonorgestrel
34. Furosemide
35. Glibenclamide tab

227
Page
22
7
36. Hydrocortisone
37. Mefenamic Acid
38. Metronidazole susp/tab
39. Nifedipine
40. Paracetamol
13. From your experience what are the pharmacological groups (name 3) did you think that it should be monitored continually for its quality and you think that there are some problems in its medicines?
Groups Yes Why
Gastro-intestinal drugs
Cardiovascular drugs
Respiratory drugs
Central Nervous system drugs
Anti-infections drugs
Urinary tract drugs
Dermatological preparations
Nutrition and blood preparations
Obstetrics & gynecological drugs
14. Is the Drug Safety poster from pharmacy directorate availability?
□ Yes □ No
15. Are you familiar with the post marketing surveillance system in directorate of pharmacy?
□ Yes □ No □ No comments
16. If yes, what is your comment upon the efficacy of the system to monitor drugs quality?
□ Very effective □ partially effective □ not effective
17. Did you notify or report any compliance about drugs quality to the directorate of pharmacy?
□ Yes □ No □ No comments
18. If yes, what is the response did you find in this case if any? ………………………………………………………………………….....
……………………………………………………………………………..

228
Page
22
8
19. Did you deal with recall process done by one of the private companies (itself) in the market because of quality problems?
□ Yes □ No □ No comments
20. If yes in this case what is the:- Generic name………………………………………………………..
Trade Name………………………………………………………….
Company……………………………………………………………..
Batch No………………………………………………………………
21. Did this process is based on written letter from pharmacy directorate or just the company just recalls it by its self?
□ With written letter □ Without written letter □ No comments
22. "The cheap item considerably of less in quality than the expensive item for the same generic", how did you evaluate this?
□ yes, always true □ yes, but not always □ not true
23. How did you evaluate the following assuming all are available:-
Product type Good quality
Low quality
The Innovator Brand name for generic
Generic product from high income country for the same generic
Generic product from low income country for the same generic
Generic product Locally produced in Sudan for the same generic

229
Page
22
9
Annex 2: Doctors questionnaire
بسم اهلل الرحمن الرحيم
Questionnaire on Drugs Quality - Doctors
تواجدها في السودان هاجسًا يؤرق جميع العاملين في ومدى (Low Quality) الجودةظلت االدوية المتدنية الحقل الطبي وخاصة االطباء، هذا االستبيان يهدف الي تجميع معلومات حول اراء العاملين في الحقل الطبي
ومع فائق وذلك ضمن دراسة لنيل درجة الماجستير.)اطباء، صيادلة ومساعدين فنيين( في هذا الموضوع االحترام نقدر لك مساهمتك بالرائ في هذه القضية من خالل االجابة علي هذا االستبيان.
Information provider:- □ Specialist □ Registrar □ General Physician
□ I am sorry I couldn’t respond to this questionnaire
1. Do you think there is a problem of low quality (substandard) drugs found in the drugs market in Sudan?
□ Yes □ No □ No comments
2. Do you think that it is major or minor problem?
□ Major □ Minor
3. Do you experience therapeutic failure with some patients?
□ Yes always □ Not always □ No
4. If happened, do you think that the failure is due to the subjects’ variability or due to the quality of medicines?
□ Majority due to subjects’ variability □ Majority due to drugs quality
.What is the drug in this case (as example):-
Generic Name………………………………………………………….
5. For you substandard drugs:

230
Page
23
0
□Prolong your patients’ illness □ Yes □ No
□ Additional cost for your patients □ Yes □ No
□ Could be contributed to drugs resistance □ Yes □ No
□Decrease your patients trust on your practice □ Yes □ No
□ Could lead to patient death □ Yes □ No
□ All of these
□ None of these
6. Comparably where did you think that the effect of substandard medicines will be worse in case of…..
□ Over the Counter Drugs (OTC) OR □ Prescribed Drugs (Rx)
7. Are you sometimes insisting to prescribe certain trade names of drugs for the patients?
□ Yes □ No □ No comments
8. If yes, the reason is?
□ Success experience with those trades □Price considerations
□ Failure experience with other trades □ Other……………………..
9. Did you have experience in shifting patient(s) from one product to another product (for same generic) because of uncontrolled
patient(s) symptoms? □ Yes □ No
10. If yes, in this case(s) what is the:
Patient was on Alternative Your comment
Trade name

231
Page
23
1
11. Assuming that the locally produced drug is available in the market, did you recommend it for the patient in this case?
□ Yes □ No
12. "The cheap item considerably of less in quality than the expensive item for the same generic", how did you evaluate this?
□ yes, always true □ yes, but not always □ not true
13. Is it valid that for your patients “available low quality drug is better than that drug is not available at all”?
□ Yes □ No □ Some times it is true
14. Did you think that drugs should be recalled (withdrawal) from the market due to the following reasons?
□Chemical problems (active and in-active contents problems) □ Yes □ No
□Changes in color □ Yes □ No
□Fracture of tablets or capsules □ Yes □ No
□Repeated doctors and or patients complaints □ Yes □ No
15. Did you some times consult pharmacists about their view on the quality of certain drugs you want to prescribe?
□ Yes □ No
16. Did you have any observations and/or patients complaints about the quality of the following generics regardless the trade name:-
Generics Yes No
41. Amoxicillin susp/cap
42. Ampiclox
43. Artesunate

232
Page
23
2
44. Aspirin
45. Atenolol tab
46. Carbimazole tab
47. Cefuroxime sodium inj
48. Chloramphenicol cap/tab
49. Chlorpheniramine
50. Ciprofloxacin tab
51. Co- trimoxazole
52. Digoxin inj/tab
53. Ethinylestradiol/levonorgestrel
54. Furosemide
55. Glibenclamide tab
56. Hydrocortisone
57. Mefenamic Acid
58. Metronidazole susp/tab
59. Nifedipine
60. Paracetamol
61.
62.
17. How did you evaluate the following assuming all are available:-
Product type Good
quality Low
quality
Original Brand name (international Companies)
Generic product from high income countries
Generic product from low income countries
Generic product Locally produced in Sudan
18. Did you notify or report any compliance about drugs safety or quality for any regularity body?
□ Yes □ No
19. If yes; what is the drug, the problem and response in this case?
Drug Problem Response
Other
medicines
you note its
problem

233
Page
23
3
Annex 3: Pilot study results
Substandard Medicines Study in Sudan
Pilot Study – Outcomes summary
The objectives of the Summery report:-
1. To identify the suitability of the proposed questionnaires to collect the
needed data regarding the health workers directly deals with medicines
(opinions in marketed medicines).
2. To identify the most appropriate methodology of data selection and sample
identification and presentation.
The pilot study was done in 10 private pharmacies in Khartoum locality and the
sample was divided into the following categories:
Category Type No of pharmacies
Private pharmacy Housing Area 5
Private pharmacy Private Hospitals 2
Private pharmacy Near Hospitals OR Doctors Clinics 3
There is suggestion to include the public health facilities pharmacies in the survey
but there are some problems especially in the criteria to select and whether this
will affect the results or not.
Some notes from the pilot study:
1. There is some questions need to be reformulated to be clear (Q6, Q7)
2. There is need to introduce question about the observations of the
pharmacists regarding the physical changes in medicines that they have been
experienced in their work.
3. Doctor survey is seems to be difficult unless there is defined target doctors
and the strategy to get access to them.
4. There is need to introduce the option of no comments in some answers
options (Q6).
5. For deep analysis what type of data need to be concentrate on it?
6. To eliminate some of surveyed medicines and introduce another ones (e.g.
Artesunate + Nifedipine + Some injectables).

234
Page
23
4
Results:
This is only simple analysis for questions response without any interpretations of data or deep analysis:
Q1: The existence of substandard medicines in Sudan:-
Yes 90%
No 10%
Q2: To what extend:-
Major 22%
Minor 88%
Q3: Patient compliance of non effective medicine:-
Yes 100%
No 0
Q4: In his opinion the problem is in…...
Drug itself 25%
Administration method 75%
Q5: What are the medicines in this case?
Medicines Source Type of pharmacy Times
Amoxicillin Sudan Near Doctors Clinics 2
Amoxicillin CMS Housing Area 2
Artesunate CMS Near Hospital 1
Ciprofloxacin India Housing Area 1
Nifedipine Lebanon Private Hospital 1
Ibuprofen India Housing Area 1
Erythromycin Sudan Housing Area 1
Azithromycin Jordan Housing Area 1
Glibenclamide Sudan Private Hospital 1
Q6: The comment on the company products if have another quality problem:
Yes 33%
No 67%

235
Page
23
5
Q7: Opinion evaluation regarding sources of medicines:
Product Type Good Quality Low Quality
Innovator Brand 10% Zero
Generic from High Income countries 100% Zero
Generic from Low Income countries 30% 70%
Generic Locally produced 50% 50%
Q8: Replacing generic from brand X to brand Y:
Yes 90%
No 10%
Q9A: Cases representing answer of Q8:-
Generic Brand X Source Brand Y Source
Amoxicillin GMC Sudan Amipharma Sudan
Amoxicillin CMS - Amipharma Sudan
Amoxicillin Amipharma Sudan Clavox KSA
Ceftrixone CMS - Hikma Jordan
Cephalexin Shangahi Sudan Luka India
Simvastatin Blue Nile Sudan Pharmaline Lebanon
Glibenclamide Elie Sudan Euglycon UK
Erythromycin CMS - Amipharma Sudan
Ciprofloxacin - Sudan Mepha Switzerland
Ciprofloxacin - India Hikma Jordan
Omeprazole Gasec UAE Losec Switzerland
Amilodipine - India - Egypt
Q9B: Suggesting the locally produced medicine as alternative:
Yes 58%
No 42%

236
Page
23
6
Q10: Experience regarding quality problems:-
1- His own observations 2- Patients compliance
3- Doctors comments 4- other college pharmacists
Generics Yes Sources
63. Amoxicillin 80% 2 – 4 – 1
64. Metronidazole 70% 2 – 1
65. Paracetamol 70% 1 - 2
66. Ceftrixone sodium 60% 3
67. Ciprofloxacin tab 60%
68. Glibenclamide tab 60% 3 - 2 - 4
69. Carbimazole tab 40%
70. Aspirin 30% 2
71. Aminophyllin inj 10%
72. Ampiclox 10%
73. Atenolol tab 10%
74. Benzyl penicillin inj 10%
75. Digoxin inj/tab 10%
76. Adrenaline inj Zero
77. Chloramphenicol oral Zero
78. Chloramphenicol inj Zero
79. Ferrous Sulphate Zero
80. Gentamicin inj Zero
81. Hydrocortisone inj Zero
82. Methyl Ergometrine inj Zero
Q11: Pharmacological groups in priorities:
Groups Yes
Cardiovascular drugs 80%
Central Nervous system drugs 60%
Anti-infections drugs 50%
Gastro-intestinal drugs 30%
Respiratory drugs 30%
Nutrition and blood preparations 30%
Urinary tract drugs 20%
Dermatological preparations 0
Obstetrics & gynecological drugs 0

237
Page
23
7
Q12: Post marketing Surveillance system awareness:
Yes 40%
No 60%
Q13: If aware, his opinion:-
Very effective 40%
partially effective 50%
Not effective 10%
Q14: "The cheap item considerably of less in quality than the expensive item
for the same generic":-
yes, always true 10%
yes, but not always 60%
not true 30%
Q15: Report or compliance to pharmacy directorate:-
Yes 30%
No 70%
Q16: If yes, what is the medicines and what is the response:-
Medicines Response
Ibuprofen Not formal reporting
Seven Seas Not formal reporting
Q17: Dealing with company recall process:
Yes 70%
No 30%
Q18: What is the cases:-
Generic Trade Company Multivitamin Vitamax GSK
Vitamin B6 - SPIC / Dar Eldoa
Carbamazepine Epistron Siho
- Botelium Mepha
Cough Syrup Sedofan Julphar
Promethazine - (Jordan)
Sildenafil Agiel

238
Page
23
8
Annex 4: Samples information form
1- General & Primary Information
Date of collection……………….………… …………………………….
Area:
□ Khartoum Hospital street pharmacies.
□ Center of Khartoum pharmacies.
□ East areas pharmacies.
□ South areas pharmacies.
□ Peripheral
Field of samples □ Near Hospital □ Household Retail pharmacy
Sample code…………...………………………………………………………..
Company code………..…………..…………….……………………………...
Medicine trade name code…..……………………...……...….……………...
Medicine generic name……………………………………..………………...
Concentration…….……..……………………………………………………...
Dosage form □ Tablet □ Capsule □ Injection □ Suspension □ Syrup
Pharmacological group…………………...…………………………………...
Batch No…………………………………………….…………………………..
Date of receiving from the supplier……………..…………………………...
Manufacturing date………………..…………………….…………………….
Expiration date………………………..…………...……………..…………….
The remaining shelf-life at time of receiving…………..…………….……...
Quantity collected/units……………………………………………………...

239
Page
23
9
Retail price in SDG….………………………………………………………....
2- Other Information
Source of origin:- □ Multinational company □ High income country
□ Low income country □ Local
Did the manufacturer have GMP certificate □ Yes □ N0
Number of other products register for this company……………………...
Registered Shelf life in Drug Regulatory Authority……...………………...
Did this product subjected to shelf life expansion □ Yes □ N0
Did his batch subjected to pre-marketing test □ Yes □ N0
Did The government lab satisfy before distribution □ Yes □ N0
Did his batch subjected to post-marketing test □ Yes □ N0
Did product available in other form/concentration □ Yes □ N0 ………...
Date of importation……………………………………………………………
Mean of importation □ By Air □ By Sea
Imported quantity/units in 2007……………………………………………..
Product share in the market…………………………………………………..
Did this medicine on the national essential list □ Yes □ N0
Number of competitors (Foreign…………….….. Local…………………...)
Medicine Classification □ OTC □ Prescription

240
Page
24
0
3- Storage form
Manufacturer storage condition: …………………………………………………………………….
…………………………………………………………………………………………….…………………………
Brief physical/visual description before storage:
……………………………………………………………………………….…………………………………….
…………………………………………………………………………………………………..…………………
Date of storing in the laboratory………………………………………..……………….……….
Starting Date for analysis……………………………………………………………….…………….
Storage period…………………………………………………………………………..….……………

241
Page
24
1
Annex 5: Distribution of private retail pharmacies in Khartoum state
City Administration Unit Total number % of the Total
Per Unit Per City Per Unit Per City
Khartoum
Khartoum – Center 162
328
20
41%
Khartoum – East 47 6
El Shohada – Soba 42 5
El Azhari 14 2
El Nasser 13 2
El Kalaklat 50 6
Khartoum Bahri
Bahri 87
179
11
23% Bahri North 22 3
Eastern Nile 70 9
Omdurman
Omdurman 131
282
1
36%
Sothern City site 6 6
El Bokaa 46 3
El Ameer 27 3
El Thora 23 6
Karari 49 17

242
Page
24
2
Annex 6: Trade products selection process
Generic: Acetylsalicylic Acid Concentration: 300 mg Tablet
Trade Company
Country of Origin
Origin Classification
Available in other form
PMS
1. Aspicima Abd El Munim Sudan Local Yes Yes/+
2. Citypirin Adult City Pharma Sudan Local No Yes/+
3. Asprimax Climax Sudan Local No No
4. Eliprin Elie Sudan Local No No
5. Cafalgin Adult Humavite Sudan Local No No
6. Marwaprin Marwa Sudan Local No No
7. Samfpirin Salah Sudan Local Yes Yes/+
8. Asadin Chemical Sudan Local No No
9. Aspruna - Sudan Local No Yes/+
10. Aspro Bodrian Kenya Low income No No
11. Aspicot kerkisawi Lebanon Low income No Yes/-
12. Aspirin Development Germany High income Yes No
Mostly used
Mostly used

243
Page
24
3
Generic: Amoxicillin Trihydrate Concentration: 500 mg Capsule
Trade Company
Country of Origin
Origin Classification Available in other
form PMS
1. Cimoxil Abd Al Momin Sudan Local Yes No
2. Amixillin Amipharma Sudan Local Yes Yes/+
3. Epoxil Elie Sudan Local Yes No
4. Tauxil Sigma-Tau Sudan Local Yes No
5. Wafraxil Wafra Sudan Local Yes No
6. Amoxonil Shifa Sudan Local Yes No
7. G.M Amoxicillin GMC Sudan Local Yes No
8. Hipen Salmawit India Low income Yes Yes/+
9. Aramoxyl Samhar Syria Low income Yes No
10. Lamoxy Badr India Low income Yes No
11. Amoxydar Forte Kambal Jordan Lower-middle-income No No
12. Amoxicap - Malaysia Upper-middle-income Yes No
13. Moxen Hiba Cyprus High income Yes No
14. Amoxapen Siho Cyprus High income Yes No
Mostly used
Mostly used

244
Page
24
4
Generic: Ceftriaxone sodium Concentration: 0.5 gm Powder for injection
Trade Company
Country of Origin
Origin Classification Available in other form
PMS
1. Rozifine Mahadi Syria Low income Yes No
2. Rociflex El Hussein Syria Low income Yes No
3. Onecef Rahma India Low income No No
4. Samixon Pharma exier Jordan Lower-middle-income Yes No
5. Triaxone Kambal UAE High income Yes No
6. Rocephin Dal Switzerland High income Yes No
7. Mesporin Nabil Switzerland High income Yes No
Mostly used
Mostly used

245
Page
24
5
Generic: Chlorphenarmine Maleate Concentration: 4 mg Tablet
Trade Company
Country of Origin
Origin Classification Available in other
form PMS
1. Cimalurg Abd El Munim Sudan Local No No
2. Amihistin Amipharma Sudan Local Yes No
3. Citramin City Pharma Sudan Local No No
4. Epohist Elie Sudan Local No No
5. Marwastine Marwa Sudan Local No No
6. Wafrastin Wafra Sudan Local No No
7. Allerfin Pharma Jordan Lower-middle-income Yes No
8. Istamex El atlanti Greece High income Yes No
9. Chlorohistol Kambal UAE High income No No
Most used
Most used

246
Page
24
6
Generic: Ciprofloxacin Concentration: 500 mg Tablet
Trade Company
Country of Origin
Origin Classification Available in other
form PMS
1. Amiciprox Amipharma Sudan Local NO Yes/+
2. G.M Proxal GMC Sudan Local Yes NO
3. Ciproflex El Hussien Syria Low income NO NO
4. Roxin Dar Dawa Pakistan Low income Yes NO
5. Microflox Fast India Low income Yes NO
6. Ciprobid Salmawit India Low income Yes NO
7. Ciproquin Omdurman India Low income NO NO
8. Ciprolet Pharma care India Low income NO Yes/+
9. Ciplox Marwaco India Low income Yes NO
10. Ciprodar Kambal Jordan Lower-middle-income Yes NO
11. Ciprolon Pharma Exier Jordan Lower-middle-income Yes Yes/+
Most used
Most used
Most used

247
Page
24
7
12. Ciproflox Pharma Jordan Lower-middle-income NO NO
13. Siprobel Comprehensive Turkey Upper-middle-income NO NO
14. Bactiflox Nabil Switzerland High income Yes Yes/+
15. Ciprinol EPICO Slovenia High income Yes NO
16. Ladinin M&M Greece High income Yes NO
Most used

248
Page
24
8
Generic: Diclofenac Sodium Concentration: 25 mg Tablet
Trade Company
Country of Origin
Origin Classification Available in other
form PMS
1. Amifenac Amipharma
Sudan Local NO NO
2. Epofenac Elie
Sudan Local NO NO
3. G.M Diclofenac GMC
Sudan Local NO NO
4. Yesenac Shangahi
Sudan Local NO NO
5. Votrex Pharma Exier
Jordan Lower-middle-income Yes NO
6. Diclogesic Kambal
Jordan Lower-middle-income Yes NO
7. Olfen - 25 Nabil
Switzerland High income Yes NO
8. Voltaren Siusoba
Italy High income Yes NO
9. Taks Mabara
Cyprus High income NO NO
10. Remethan 25 Siho
Cyprus High income Yes NO
Mostly used
Mostly used
Most used
Mostly used

249
Page
24
9
Generic: Glibenclamide Concentration: 5 mg Tablet
Trade Company
Country of Origin
Origin Classification Available in other
form PMS
1. Cimanil Abd Munim Sudan Local NO NO
2. Epoclamide Elie Sudan Local NO NO
3. Wafranil Wafra Sudan Local NO NO
4. Glicon Dar Dawa Pakistan Low income NO NO
5. Glibamid Kerkisawi Lebanon Low income NO NO
6. Betanase Salmawit India Low income NO NO
7. Glibil Pharma exier Jordan Lower-middle-income NO NO
8. Glibesyn Kambal Cyprus High income NO NO
9. Gliban Mabara Cyprus High income NO NO
10. Glitisol 5 Siho Cyprus High income NO NO
11. Euglucon Dal Italy High income NO NO
12. Glibenclamide Dal England High income NO NO
Mostly used
Mostly used
Mostly used

250
Page
25
0
Generic: Mefenamic Acid Concentration: 500 mg Tablet
Trade Company
Country of Origin
Origin Classification Available in other
form PMS
1. G.M Menapon GMC Sudan Local Yes Yes/+
2. Elifan Elie Sudan Local Yes NO
3. Mefnac DS Dar Dawa Pakistan Low income Yes Yes/+
4. Pangesic Forte kanar Jordan Lower-middle-income Yes Yes/+
5. Fendol D.S Fast Jordan Lower-middle-income Yes Yes/+
6. Mafepain Dal KSA High income Yes NO
Mostly used
Mostly used
Mostly used

251
Page
25
1
Generic: Metronidazole Concentration: 250 mg Tablet
Trade Company
Country of Origin
Origin Classification Available in other
form PMS
1. Aminidazole Amipharma Sudan Local Yes Yes/+
2. Epindazole Elie
Sudan Local Yes
NO
3. G.M Metrozal GMC
Sudan Local Yes
NO
4. Marwazole Marwa
Sudan Local No NO
5. Yesazol Shangahi
Sudan Local No NO
6. Wafrazole Wafra
Sudan Local No NO
7. Metrozole Development Jordan Lower-middle-income Yes
NO
8. Nidazole Fast Jordan Lower-middle-income Yes
NO
9. Supplin Arabi Astoria High income No NO
Mostly used
Mostly used
Most used

252
Page
25
2
Generic: Paracetamol Concentration: 500 mg Tablet
Trade Company Country Classification Available in other PMS 1. Amidol Amipharma Sudan Local Yes No
2. Clmamol Climax
Sudan Local No No
3. Elidol Elie
Sudan Local No No
4. Citymol City Pharma
Sudan Local No No
5. G.M Paracetamol GMC
Sudan Local No No
6. Humadol Humavite
Sudan Local No No
7. Marwadol Marwa
Sudan Local Yes No
8. Wafradol Wafra
Sudan Local Yes No
9. Regamol Africa India Low income No No
10. Zerin Dar Dawa Bangladesh Low income No No
11. Dolomol Fast Jordan Lower-middle-income No No
12. Ultramol Rahma Syria Low income Yes No
13. Panadol Bodrian Ireland High income Yes No
14. Adol Kambal UAE High income Yes No
Mostly used
Mostly used
Mostly used
Mostly used

253
Page
25
3
Annex 7: Plan for medicines sample collection
Package A
Generics Product A - High Product B - Low Product C - Local
1. Amoxicillin
2. Paracetamol
3. Metronidazole
4. Glibenclamide
5. Diclofenac

254
Page
25
4
Package B
Generics Product A - High Product B - Low Product C - Local
1. Ciprofloxacin
2. Mefenamic Acid
3. Chlorphenarmine Maleate
4. Aspirin
5. Ceftriaxone

255
Page
25
5
Annex 8: Samples analysis form
Lab wok revision
Physical
Test Limits Results Comments
Unit dose per container □ The sample pass.
□ The sample fails.
Description □ The sample pass
□ The sample fails. Color and Uniformity of
Color
□ The sample pass
□ The sample fails.
Odor □ The sample pass
□ The sample fails.
Melting behavior
□ The sample pass
□ The sample fails.

256
Page
25
6
Water solubility □ The sample pass
□ The sample fails.
Chloroform solubility □ The sample pass
□ The sample fails.
Dissolution test □ The sample pass
□ The sample fails.
Disintegration test □ The sample pass
□ The sample fails.
Weight □ The sample pass
□ The sample fails.
Hardness □ The sample pass
□ The sample fails.
pH test □ The sample pass
□ The sample fails.
Optical rotation □ The sample pass
□ The sample fails.

257
Page
25
7
Uniformity of dosage units
□ The sample pass
□ The sample fails. Dosage form status
(Damage)
□ The sample pass
□ The sample fails. Packaging material
status
□ The sample pass
□ The sample fails.
Label □ The sample pass
□ The sample fails. Presence of
contamination
□ The sample pass
□ The sample fails.

258
Page
25
8
Chemical Tests
Test Limits Results
Identity test □ The sample pass
□ The sample fails. %of stated
concentration □ The sample pass
□ The sample fails.
Degradation □ The sample pass
□ The sample fails.
IR □ The sample pass
□ The sample fails.
TLC □ The sample pass
□ The sample fails.

259
Page
25
9
Annex 9: Amoxicillin Sensitivity Study
Sample collection form
Dear colleague,
Please note that, this form and the sample as well are targeting the patients those will take
Amoxicillin only as the main drug indicated for upper respiratory infections.
A am

260
Page
26
0
Annex XXX Ranking outcome
Therapeutic groups
Risk probability
Dosage form
Risk probability Origin
Risk probability
Consumption rate
Risk probability Overall risk Rank
Anti 0.376 solid-oral 0.756 Local 0.374 high consumption 0.8 0.08505 8.505
Anti 0.376 solid-oral 0.756 Low&mid income countries 0.373 high consumption 0.8 0.08482 8.482
Anti 0.376 solid-oral 0.756 high income countries 0.254 high consumption 0.8 0.05776 5.776
RT 0.144 solid-oral 0.756 Local 0.374 high consumption 0.8 0.03257 3.257
RT 0.144 solid-oral 0.756 Low&mid income countries 0.373 high consumption 0.8 0.03249 3.249
CVS 0.119 solid-oral 0.756 Local 0.374 high consumption 0.8 0.02692 2.692
CVS 0.119 solid-oral 0.756 Low&mid income countries 0.373 high consumption 0.8 0.02685 2.685
RT 0.144 solid-oral 0.756 high income countries 0.254 high consumption 0.8 0.02212 2.212
Anti 0.376 solid-oral 0.756 Local 0.374 low consumption 0.2 0.02126 2.126
Anti 0.376 solid-oral 0.756 Low&mid income countries 0.373 low consumption 0.2 0.02121 2.121
NUT 0.091 solid-oral 0.756 Local 0.374 high consumption 0.8 0.02058 2.058
NUT 0.091 solid-oral 0.756 Low&mid income countries 0.373 high consumption 0.8 0.02053 2.053
MUS 0.088 solid-oral 0.756 Local 0.374 high consumption 0.8 0.01991 1.991
MUS 0.088 solid-oral 0.756 Low&mid income countries 0.373 high consumption 0.8 0.01985 1.985
CVS 0.119 solid-oral 0.756 high income countries 0.254 high consumption 0.8 0.01828 1.828
END 0.077 solid-oral 0.756 Local 0.374 high consumption 0.8 0.01742 1.742
END 0.077 solid-oral 0.756 Low&mid income countries 0.373 high consumption 0.8 0.01737 1.737
Anti 0.376 liquid-oral 0.136 Local 0.374 high consumption 0.8 0.01530 1.530
Anti 0.376 liquid-oral 0.136 Low&mid income countries 0.373 high consumption 0.8 0.01526 1.526
Anti 0.376 solid-oral 0.756 high income countries 0.254 low consumption 0.2 0.01444 1.444
NUT 0.091 solid-oral 0.756 high income countries 0.254 high consumption 0.8 0.01398 1.398
MUS 0.088 solid-oral 0.756 high income countries 0.254 high consumption 0.8 0.01352 1.352
END 0.077 solid-oral 0.756 high income countries 0.254 high consumption 0.8 0.01183 1.183
Anti 0.376 liquid-oral 0.136 high income countries 0.254 high consumption 0.8 0.01039 1.039
Anti 0.376 small-parenteral 0.08 Local 0.374 high consumption 0.8 0.00900 0.900

261
Page
26
1
Anti 0.376 small-parenteral 0.08 Low&mid income countries 0.373 high consumption 0.8 0.00898 0.898
RT 0.144 solid-oral 0.756 Local 0.374 low consumption 0.2 0.00814 0.814
RT 0.144 solid-oral 0.756 Low&mid income countries 0.373 low consumption 0.2 0.00812 0.812
GIT 0.035 solid-oral 0.756 Local 0.374 high consumption 0.8 0.00792 0.792
CNS 0.035 solid-oral 0.756 Local 0.374 high consumption 0.8 0.00792 0.792
GIT 0.035 solid-oral 0.756 Low&mid income countries 0.373 high consumption 0.8 0.00790 0.790
CNS 0.035 solid-oral 0.756 Low&mid income countries 0.373 high consumption 0.8 0.00790 0.790
CVS 0.119 solid-oral 0.756 Local 0.374 low consumption 0.2 0.00673 0.673
CVS 0.119 solid-oral 0.756 Low&mid income countries 0.373 low consumption 0.2 0.00671 0.671
Anti 0.376 small-parenteral 0.08 high income countries 0.254 high consumption 0.8 0.00611 0.611
RT 0.144 liquid-oral 0.136 Local 0.374 high consumption 0.8 0.00586 0.586
RT 0.144 liquid-oral 0.136 Low&mid income countries 0.373 high consumption 0.8 0.00584 0.584
RT 0.144 solid-oral 0.756 high income countries 0.254 low consumption 0.2 0.00553 0.553
GIT 0.035 solid-oral 0.756 high income countries 0.254 high consumption 0.8 0.00538 0.538
CNS 0.035 solid-oral 0.756 high income countries 0.254 high consumption 0.8 0.00538 0.538
NUT 0.091 solid-oral 0.756 Local 0.374 low consumption 0.2 0.00515 0.515
NUT 0.091 solid-oral 0.756 Low&mid income countries 0.373 low consumption 0.2 0.00513 0.513
MUS 0.088 solid-oral 0.756 Local 0.374 low consumption 0.2 0.00498 0.498
MUS 0.088 solid-oral 0.756 Low&mid income countries 0.373 low consumption 0.2 0.00496 0.496
CVS 0.119 liquid-oral 0.136 Local 0.374 high consumption 0.8 0.00484 0.484
CVS 0.119 liquid-oral 0.136 Low&mid income countries 0.373 high consumption 0.8 0.00483 0.483
SKN 0.021 solid-oral 0.756 Local 0.374 high consumption 0.8 0.00475 0.475
SKN 0.021 solid-oral 0.756 Low&mid income countries 0.373 high consumption 0.8 0.00474 0.474
CVS 0.119 solid-oral 0.756 high income countries 0.254 low consumption 0.2 0.00457 0.457
END 0.077 solid-oral 0.756 Local 0.374 low consumption 0.2 0.00435 0.435
END 0.077 solid-oral 0.756 Low&mid income countries 0.373 low consumption 0.2 0.00434 0.434
RT 0.144 liquid-oral 0.136 high income countries 0.254 high consumption 0.8 0.00398 0.398

262
Page
26
2
Anti 0.376 liquid-oral 0.136 Local 0.374 low consumption 0.2 0.00382 0.382
Anti 0.376 liquid-oral 0.136 Low&mid income countries 0.373 low consumption 0.2 0.00381 0.381
NUT 0.091 liquid-oral 0.136 Local 0.374 high consumption 0.8 0.00370 0.370
NUT 0.091 liquid-oral 0.136 Low&mid income countries 0.373 high consumption 0.8 0.00369 0.369
MUS 0.088 liquid-oral 0.136 Local 0.374 high consumption 0.8 0.00358 0.358
MUS 0.088 liquid-oral 0.136 Low&mid income countries 0.373 high consumption 0.8 0.00357 0.357
NUT 0.091 solid-oral 0.756 high income countries 0.254 low consumption 0.2 0.00349 0.349
RT 0.144 small-parenteral 0.08 Local 0.374 high consumption 0.8 0.00345 0.345
RT 0.144 small-parenteral 0.08 Low&mid income countries 0.373 high consumption 0.8 0.00344 0.344
MUS 0.088 solid-oral 0.756 high income countries 0.254 low consumption 0.2 0.00338 0.338
CVS 0.119 liquid-oral 0.136 high income countries 0.254 high consumption 0.8 0.00329 0.329
SKN 0.021 solid-oral 0.756 high income countries 0.254 high consumption 0.8 0.00323 0.323
END 0.077 liquid-oral 0.136 Local 0.374 high consumption 0.8 0.00313 0.313
END 0.077 liquid-oral 0.136 Low&mid income countries 0.373 high consumption 0.8 0.00312 0.312
END 0.077 solid-oral 0.756 high income countries 0.254 low consumption 0.2 0.00296 0.296
OBS 0.013 solid-oral 0.756 Local 0.374 high consumption 0.8 0.00294 0.294
OBS 0.013 solid-oral 0.756 Low&mid income countries 0.373 high consumption 0.8 0.00293 0.293
CVS 0.119 small-parenteral 0.08 Local 0.374 high consumption 0.8 0.00285 0.285
CVS 0.119 small-parenteral 0.08 Low&mid income countries 0.373 high consumption 0.8 0.00284 0.284
Anti 0.376 liquid-oral 0.136 high income countries 0.254 low consumption 0.2 0.00260 0.260
NUT 0.091 liquid-oral 0.136 high income countries 0.254 high consumption 0.8 0.00251 0.251
MUS 0.088 liquid-oral 0.136 high income countries 0.254 high consumption 0.8 0.00243 0.243
RT 0.144 small-parenteral 0.08 high income countries 0.254 high consumption 0.8 0.00234 0.234
Anti 0.376 small-parenteral 0.08 Local 0.374 low consumption 0.2 0.00225 0.225

263
Page
26
3
Anti 0.376 small-parenteral 0.08 Low&mid income countries 0.373 low consumption 0.2 0.00224 0.224
NUT 0.091 small-parenteral 0.08 Local 0.374 high consumption 0.8 0.00218 0.218
NUT 0.091 small-parenteral 0.08 Low&mid income countries 0.373 high consumption 0.8 0.00217 0.217
END 0.077 liquid-oral 0.136 high income countries 0.254 high consumption 0.8 0.00213 0.213
MUS 0.088 small-parenteral 0.08 Local 0.374 high consumption 0.8 0.00211 0.211
MUS 0.088 small-parenteral 0.08 Low&mid income countries 0.373 high consumption 0.8 0.00210 0.210
OBS 0.013 solid-oral 0.756 high income countries 0.254 high consumption 0.8 0.00200 0.200
GIT 0.035 solid-oral 0.756 Local 0.374 low consumption 0.2 0.00198 0.198
CNS 0.035 solid-oral 0.756 Local 0.374 low consumption 0.2 0.00198 0.198
GIT 0.035 solid-oral 0.756 Low&mid income countries 0.373 low consumption 0.2 0.00197 0.197
CNS 0.035 solid-oral 0.756 Low&mid income countries 0.373 low consumption 0.2 0.00197 0.197
CVS 0.119 small-parenteral 0.08 high income countries 0.254 high consumption 0.8 0.00193 0.193
END 0.077 small-parenteral 0.08 Local 0.374 high consumption 0.8 0.00184 0.184
END 0.077 small-parenteral 0.08 Low&mid income countries 0.373 high consumption 0.8 0.00184 0.184
Anti 0.376 small-parenteral 0.08 high income countries 0.254 low consumption 0.2 0.00153 0.153
NUT 0.091 small-parenteral 0.08 high income countries 0.254 high consumption 0.8 0.00148 0.148
RT 0.144 liquid-oral 0.136 Local 0.374 low consumption 0.2 0.00146 0.146
RT 0.144 liquid-oral 0.136 Low&mid income countries 0.373 low consumption 0.2 0.00146 0.146
MUS 0.088 small-parenteral 0.08 high income countries 0.254 high consumption 0.8 0.00143 0.143
GIT 0.035 liquid-oral 0.136 Local 0.374 high consumption 0.8 0.00142 0.142

264
Page
26
4
CNS 0.035 liquid-oral 0.136 Local 0.374 high consumption 0.8 0.00142 0.142
GIT 0.035 liquid-oral 0.136 Low&mid income countries 0.373 high consumption 0.8 0.00142 0.142
CNS 0.035 liquid-oral 0.136 Low&mid income countries 0.373 high consumption 0.8 0.00142 0.142
GIT 0.035 solid-oral 0.756 high income countries 0.254 low consumption 0.2 0.00134 0.134
CNS 0.035 solid-oral 0.756 high income countries 0.254 low consumption 0.2 0.00134 0.134
END 0.077 small-parenteral 0.08 high income countries 0.254 high consumption 0.8 0.00125 0.125
Anti 0.376
other large-liquid 0.011 Local 0.374 high consumption 0.8 0.00124 0.124
Anti 0.376 other 0.011 Local 0.374 high consumption 0.8 0.00124 0.124
Anti 0.376
other large-liquid 0.011 Low&mid income countries 0.373 high consumption 0.8 0.00123 0.123
Anti 0.376 other 0.011 Low&mid income countries 0.373 high consumption 0.8 0.00123 0.123
CVS 0.119 liquid-oral 0.136 Local 0.374 low consumption 0.2 0.00121 0.121
CVS 0.119 liquid-oral 0.136 Low&mid income countries 0.373 low consumption 0.2 0.00121 0.121
SKN 0.021 solid-oral 0.756 Local 0.374 low consumption 0.2 0.00119 0.119
SKN 0.021 solid-oral 0.756 Low&mid income countries 0.373 low consumption 0.2 0.00118 0.118
RT 0.144 liquid-oral 0.136 high income countries 0.254 low consumption 0.2 0.00099 0.099
GIT 0.035 liquid-oral 0.136 high income countries 0.254 high consumption 0.8 0.00097 0.097
CNS 0.035 liquid-oral 0.136 high income countries 0.254 high consumption 0.8 0.00097 0.097
NUT 0.091 liquid-oral 0.136 Local 0.374 low consumption 0.2 0.00093 0.093
NUT 0.091 liquid-oral 0.136 Low&mid income countries 0.373 low consumption 0.2 0.00092 0.092
MUS 0.088 liquid-oral 0.136 Local 0.374 low consumption 0.2 0.00090 0.090
MUS 0.088 liquid-oral 0.136 Low&mid income countries 0.373 low consumption 0.2 0.00089 0.089
RT 0.144 small-parenteral 0.08 Local 0.374 low consumption 0.2 0.00086 0.086
RT 0.144 small-parenteral 0.08 Low&mid income countries 0.373 low consumption 0.2 0.00086 0.086

265
Page
26
5
SKN 0.021 liquid-oral 0.136 Local 0.374 high consumption 0.8 0.00085 0.085
SKN 0.021 liquid-oral 0.136 Low&mid income countries 0.373 high consumption 0.8 0.00085 0.085
Anti 0.376
other large-liquid 0.011 high income countries 0.254 high consumption 0.8 0.00084 0.084
Anti 0.376 other 0.011 high income countries 0.254 high consumption 0.8 0.00084 0.084
GIT 0.035 small-parenteral 0.08 Local 0.374 high consumption 0.8 0.00084 0.084
CNS 0.035 small-parenteral 0.08 Local 0.374 high consumption 0.8 0.00084 0.084
GIT 0.035 small-parenteral 0.08 Low&mid income countries 0.373 high consumption 0.8 0.00084 0.084
CNS 0.035 small-parenteral 0.08 Low&mid income countries 0.373 high consumption 0.8 0.00084 0.084
CVS 0.119 liquid-oral 0.136 high income countries 0.254 low consumption 0.2 0.00082 0.082
SKN 0.021 solid-oral 0.756 high income countries 0.254 low consumption 0.2 0.00081 0.081
END 0.077 liquid-oral 0.136 Local 0.374 low consumption 0.2 0.00078 0.078
END 0.077 liquid-oral 0.136 Low&mid income countries 0.373 low consumption 0.2 0.00078 0.078
OBS 0.013 solid-oral 0.756 Local 0.374 low consumption 0.2 0.00074 0.074
OBS 0.013 solid-oral 0.756 Low&mid income countries 0.373 low consumption 0.2 0.00073 0.073
CVS 0.119 small-parenteral 0.08 Local 0.374 low consumption 0.2 0.00071 0.071
CVS 0.119 small-parenteral 0.08 Low&mid income countries 0.373 low consumption 0.2 0.00071 0.071
Anti 0.376 topical 0.006 Local 0.374 high consumption 0.8 0.00067 0.067
Anti 0.376 topical 0.006 Low&mid income countries 0.373 high consumption 0.8 0.00067 0.067
NUT 0.091 liquid-oral 0.136 high income countries 0.254 low consumption 0.2 0.00063 0.063
MUS 0.088 liquid-oral 0.136 high income countries 0.254 low consumption 0.2 0.00061 0.061
RT 0.144 small-parenteral 0.08 high income countries 0.254 low consumption 0.2 0.00059 0.059
SKN 0.021 liquid-oral 0.136 high income countries 0.254 high consumption 0.8 0.00058 0.058

266
Page
26
6
GIT 0.035 small-parenteral 0.08 high income countries 0.254 high consumption 0.8 0.00057 0.057
CNS 0.035 small-parenteral 0.08 high income countries 0.254 high consumption 0.8 0.00057 0.057
NUT 0.091 small-parenteral 0.08 Local 0.374 low consumption 0.2 0.00054 0.054
NUT 0.091 small-parenteral 0.08 Low&mid income countries 0.373 low consumption 0.2 0.00054 0.054
END 0.077 liquid-oral 0.136 high income countries 0.254 low consumption 0.2 0.00053 0.053
OBS 0.013 liquid-oral 0.136 Local 0.374 high consumption 0.8 0.00053 0.053
OBS 0.013 liquid-oral 0.136 Low&mid income countries 0.373 high consumption 0.8 0.00053 0.053
MUS 0.088 small-parenteral 0.08 Local 0.374 low consumption 0.2 0.00053 0.053
MUS 0.088 small-parenteral 0.08 Low&mid income countries 0.373 low consumption 0.2 0.00053 0.053
SKN 0.021 small-parenteral 0.08 Local 0.374 high consumption 0.8 0.00050 0.050
SKN 0.021 small-parenteral 0.08 Low&mid income countries 0.373 high consumption 0.8 0.00050 0.050
OBS 0.013 solid-oral 0.756 high income countries 0.254 low consumption 0.2 0.00050 0.050
CVS 0.119 small-parenteral 0.08 high income countries 0.254 low consumption 0.2 0.00048 0.048
RT 0.144
other large-liquid 0.011 Local 0.374 high consumption 0.8 0.00047 0.047
RT 0.144 other 0.011 Local 0.374 high consumption 0.8 0.00047 0.047
RT 0.144
other large-liquid 0.011 Low&mid income countries 0.373 high consumption 0.8 0.00047 0.047
RT 0.144 other 0.011 Low&mid income countries 0.373 high consumption 0.8 0.00047 0.047
END 0.077 small-parenteral 0.08 Local 0.374 low consumption 0.2 0.00046 0.046

267
Page
26
7
END 0.077 small-parenteral 0.08 Low&mid income countries 0.373 low consumption 0.2 0.00046 0.046
Anti 0.376 topical 0.006 high income countries 0.254 high consumption 0.8 0.00046 0.046
CVS 0.119
other large-liquid 0.011 Local 0.374 high consumption 0.8 0.00039 0.039
CVS 0.119 other 0.011 Local 0.374 high consumption 0.8 0.00039 0.039
CVS 0.119
other large-liquid 0.011 Low&mid income countries 0.373 high consumption 0.8 0.00039 0.039
CVS 0.119 other 0.011 Low&mid income countries 0.373 high consumption 0.8 0.00039 0.039
NUT 0.091 small-parenteral 0.08 high income countries 0.254 low consumption 0.2 0.00037 0.037
OBS 0.013 liquid-oral 0.136 high income countries 0.254 high consumption 0.8 0.00036 0.036
MUS 0.088 small-parenteral 0.08 high income countries 0.254 low consumption 0.2 0.00036 0.036
GIT 0.035 liquid-oral 0.136 Local 0.374 low consumption 0.2 0.00036 0.036
CNS 0.035 liquid-oral 0.136 Local 0.374 low consumption 0.2 0.00036 0.036
GIT 0.035 liquid-oral 0.136 Low&mid income countries 0.373 low consumption 0.2 0.00036 0.036
CNS 0.035 liquid-oral 0.136 Low&mid income countries 0.373 low consumption 0.2 0.00036 0.036
SKN 0.021 small-parenteral 0.08 high income countries 0.254 high consumption 0.8 0.00034 0.034
RT 0.144
other large-liquid 0.011 high income countries 0.254 high consumption 0.8 0.00032 0.032
RT 0.144 other 0.011 high income countries 0.254 high consumption 0.8 0.00032 0.032
END 0.077 small-parenteral 0.08 high income countries 0.254 low consumption 0.2 0.00031 0.031
OBS 0.013 small-parenteral 0.08 Local 0.374 high consumption 0.8 0.00031 0.031
OBS 0.013 small-parenteral 0.08 Low&mid income countries 0.373 high consumption 0.8 0.00031 0.031

268
Page
26
8
Anti 0.376
other large-liquid 0.011 Local 0.374 low consumption 0.2 0.00031 0.031
Anti 0.376 other 0.011 Local 0.374 low consumption 0.2 0.00031 0.031
Anti 0.376
other large-liquid 0.011 Low&mid income countries 0.373 low consumption 0.2 0.00031 0.031
Anti 0.376 other 0.011 Low&mid income countries 0.373 low consumption 0.2 0.00031 0.031
NUT 0.091
other large-liquid 0.011 Local 0.374 high consumption 0.8 0.00030 0.030
NUT 0.091 other 0.011 Local 0.374 high consumption 0.8 0.00030 0.030
NUT 0.091
other large-liquid 0.011 Low&mid income countries 0.373 high consumption 0.8 0.00030 0.030
NUT 0.091 other 0.011 Low&mid income countries 0.373 high consumption 0.8 0.00030 0.030
MUS 0.088
other large-liquid 0.011 Local 0.374 high consumption 0.8 0.00029 0.029
MUS 0.088 other 0.011 Local 0.374 high consumption 0.8 0.00029 0.029
MUS 0.088
other large-liquid 0.011 Low&mid income countries 0.373 high consumption 0.8 0.00029 0.029
MUS 0.088 other 0.011 Low&mid income countries 0.373 high consumption 0.8 0.00029 0.029
CVS 0.119
other large-liquid 0.011 high income countries 0.254 high consumption 0.8 0.00027 0.027
CVS 0.119 other 0.011 high income countries 0.254 high consumption 0.8 0.00027 0.027
RT 0.144 topical 0.006 Local 0.374 high consumption 0.8 0.00026 0.026
RT 0.144 topical 0.006 Low&mid income countries 0.373 high consumption 0.8 0.00026 0.026
END 0.077 other large- 0.011 Local 0.374 high consumption 0.8 0.00025 0.025

269
Page
26
9
liquid
END 0.077 other 0.011 Local 0.374 high consumption 0.8 0.00025 0.025
END 0.077
other large-liquid 0.011 Low&mid income countries 0.373 high consumption 0.8 0.00025 0.025
END 0.077 other 0.011 Low&mid income countries 0.373 high consumption 0.8 0.00025 0.025
GIT 0.035 liquid-oral 0.136 high income countries 0.254 low consumption 0.2 0.00024 0.024
CNS 0.035 liquid-oral 0.136 high income countries 0.254 low consumption 0.2 0.00024 0.024
CVS 0.119 topical 0.006 Local 0.374 high consumption 0.8 0.00021 0.021
SKN 0.021 liquid-oral 0.136 Local 0.374 low consumption 0.2 0.00021 0.021
SKN 0.021 liquid-oral 0.136 Low&mid income countries 0.373 low consumption 0.2 0.00021 0.021
CVS 0.119 topical 0.006 Low&mid income countries 0.373 high consumption 0.8 0.00021 0.021
OBS 0.013 small-parenteral 0.08 high income countries 0.254 high consumption 0.8 0.00021 0.021
Anti 0.376
other large-liquid 0.011 high income countries 0.254 low consumption 0.2 0.00021 0.021
Anti 0.376 other 0.011 high income countries 0.254 low consumption 0.2 0.00021 0.021
GIT 0.035 small-parenteral 0.08 Local 0.374 low consumption 0.2 0.00021 0.021
CNS 0.035 small-parenteral 0.08 Local 0.374 low consumption 0.2 0.00021 0.021
GIT 0.035 small-parenteral 0.08 Low&mid income countries 0.373 low consumption 0.2 0.00021 0.021
CNS 0.035 small-parenteral 0.08 Low&mid income countries 0.373 low consumption 0.2 0.00021 0.021
NUT 0.091
other large-liquid 0.011 high income countries 0.254 high consumption 0.8 0.00020 0.020
NUT 0.091 other 0.011 high income countries 0.254 high consumption 0.8 0.00020 0.020
MUS 0.088 other 0.011 high income countries 0.254 high consumption 0.8 0.00020 0.020

270
Page
27
0
large-liquid
MUS 0.088 other 0.011 high income countries 0.254 high consumption 0.8 0.00020 0.020
RT 0.144 topical 0.006 high income countries 0.254 high consumption 0.8 0.00018 0.018
END 0.077
other large-liquid 0.011 high income countries 0.254 high consumption 0.8 0.00017 0.017
END 0.077 other 0.011 high income countries 0.254 high consumption 0.8 0.00017 0.017
Anti 0.376 topical 0.006 Local 0.374 low consumption 0.2 0.00017 0.017
Anti 0.376 topical 0.006 Low&mid income countries 0.373 low consumption 0.2 0.00017 0.017
NUT 0.091 topical 0.006 Local 0.374 high consumption 0.8 0.00016 0.016
NUT 0.091 topical 0.006 Low&mid income countries 0.373 high consumption 0.8 0.00016 0.016
MUS 0.088 topical 0.006 Local 0.374 high consumption 0.8 0.00016 0.016
MUS 0.088 topical 0.006 Low&mid income countries 0.373 high consumption 0.8 0.00016 0.016
SKN 0.021 liquid-oral 0.136 high income countries 0.254 low consumption 0.2 0.00015 0.015
CVS 0.119 topical 0.006 high income countries 0.254 high consumption 0.8 0.00015 0.015
GIT 0.035 small-parenteral 0.08 high income countries 0.254 low consumption 0.2 0.00014 0.014
CNS 0.035 small-parenteral 0.08 high income countries 0.254 low consumption 0.2 0.00014 0.014
END 0.077 topical 0.006 Local 0.374 high consumption 0.8 0.00014 0.014
END 0.077 topical 0.006 Low&mid income countries 0.373 high consumption 0.8 0.00014 0.014
OBS 0.013 liquid-oral 0.136 Local 0.374 low consumption 0.2 0.00013 0.013
OBS 0.013 liquid-oral 0.136 Low&mid income countries 0.373 low consumption 0.2 0.00013 0.013
SKN 0.021 small-parenteral 0.08 Local 0.374 low consumption 0.2 0.00013 0.013
SKN 0.021 small-parenteral 0.08 Low&mid income countries 0.373 low consumption 0.2 0.00013 0.013
RT 0.144
other large-liquid 0.011 Local 0.374 low consumption 0.2 0.00012 0.012

271
Page
27
1
RT 0.144 other 0.011 Local 0.374 low consumption 0.2 0.00012 0.012
RT 0.144
other large-liquid 0.011 Low&mid income countries 0.373 low consumption 0.2 0.00012 0.012
RT 0.144 other 0.011 Low&mid income countries 0.373 low consumption 0.2 0.00012 0.012
GIT 0.035
other large-liquid 0.011 Local 0.374 high consumption 0.8 0.00012 0.012
GIT 0.035 other 0.011 Local 0.374 high consumption 0.8 0.00012 0.012
CNS 0.035
other large-liquid 0.011 Local 0.374 high consumption 0.8 0.00012 0.012
CNS 0.035 other 0.011 Local 0.374 high consumption 0.8 0.00012 0.012
GIT 0.035
other large-liquid 0.011 Low&mid income countries 0.373 high consumption 0.8 0.00011 0.011
GIT 0.035 other 0.011 Low&mid income countries 0.373 high consumption 0.8 0.00011 0.011
CNS 0.035
other large-liquid 0.011 Low&mid income countries 0.373 high consumption 0.8 0.00011 0.011
CNS 0.035 other 0.011 Low&mid income countries 0.373 high consumption 0.8 0.00011 0.011
Anti 0.376 topical 0.006 high income countries 0.254 low consumption 0.2 0.00011 0.011
NUT 0.091 topical 0.006 high income countries 0.254 high consumption 0.8 0.00011 0.011
MUS 0.088 topical 0.006 high income countries 0.254 high consumption 0.8 0.00011 0.011
CVS 0.119
other large-liquid 0.011 Local 0.374 low consumption 0.2 0.00010 0.010
CVS 0.119 other 0.011 Local 0.374 low consumption 0.2 0.00010 0.010
CVS 0.119
other large-liquid 0.011 Low&mid income countries 0.373 low consumption 0.2 0.00010 0.010
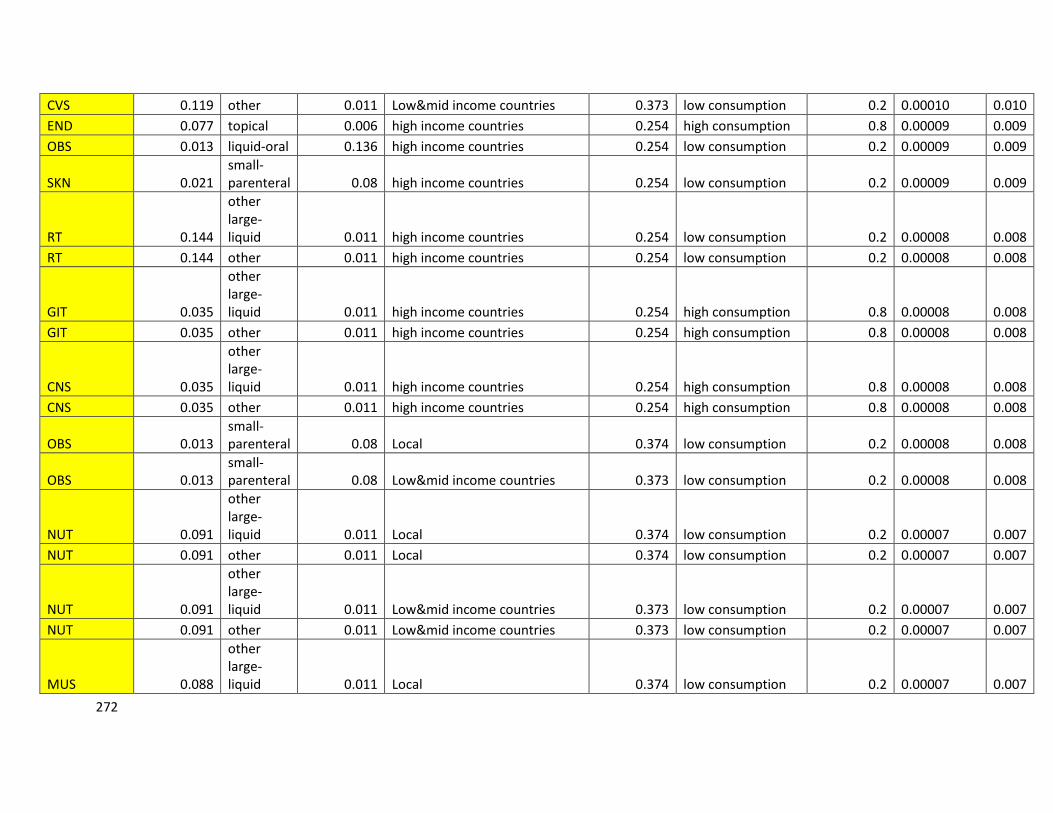
272
Page
27
2
CVS 0.119 other 0.011 Low&mid income countries 0.373 low consumption 0.2 0.00010 0.010
END 0.077 topical 0.006 high income countries 0.254 high consumption 0.8 0.00009 0.009
OBS 0.013 liquid-oral 0.136 high income countries 0.254 low consumption 0.2 0.00009 0.009
SKN 0.021 small-parenteral 0.08 high income countries 0.254 low consumption 0.2 0.00009 0.009
RT 0.144
other large-liquid 0.011 high income countries 0.254 low consumption 0.2 0.00008 0.008
RT 0.144 other 0.011 high income countries 0.254 low consumption 0.2 0.00008 0.008
GIT 0.035
other large-liquid 0.011 high income countries 0.254 high consumption 0.8 0.00008 0.008
GIT 0.035 other 0.011 high income countries 0.254 high consumption 0.8 0.00008 0.008
CNS 0.035
other large-liquid 0.011 high income countries 0.254 high consumption 0.8 0.00008 0.008
CNS 0.035 other 0.011 high income countries 0.254 high consumption 0.8 0.00008 0.008
OBS 0.013 small-parenteral 0.08 Local 0.374 low consumption 0.2 0.00008 0.008
OBS 0.013 small-parenteral 0.08 Low&mid income countries 0.373 low consumption 0.2 0.00008 0.008
NUT 0.091
other large-liquid 0.011 Local 0.374 low consumption 0.2 0.00007 0.007
NUT 0.091 other 0.011 Local 0.374 low consumption 0.2 0.00007 0.007
NUT 0.091
other large-liquid 0.011 Low&mid income countries 0.373 low consumption 0.2 0.00007 0.007
NUT 0.091 other 0.011 Low&mid income countries 0.373 low consumption 0.2 0.00007 0.007
MUS 0.088
other large-liquid 0.011 Local 0.374 low consumption 0.2 0.00007 0.007

273
Page
27
3
MUS 0.088 other 0.011 Local 0.374 low consumption 0.2 0.00007 0.007
MUS 0.088
other large-liquid 0.011 Low&mid income countries 0.373 low consumption 0.2 0.00007 0.007
MUS 0.088 other 0.011 Low&mid income countries 0.373 low consumption 0.2 0.00007 0.007
SKN 0.021
other large-liquid 0.011 Local 0.374 high consumption 0.8 0.00007 0.007
SKN 0.021 other 0.011 Local 0.374 high consumption 0.8 0.00007 0.007
SKN 0.021
other large-liquid 0.011 Low&mid income countries 0.373 high consumption 0.8 0.00007 0.007
SKN 0.021 other 0.011 Low&mid income countries 0.373 high consumption 0.8 0.00007 0.007
CVS 0.119
other large-liquid 0.011 high income countries 0.254 low consumption 0.2 0.00007 0.007
CVS 0.119 other 0.011 high income countries 0.254 low consumption 0.2 0.00007 0.007
RT 0.144 topical 0.006 Local 0.374 low consumption 0.2 0.00006 0.006
RT 0.144 topical 0.006 Low&mid income countries 0.373 low consumption 0.2 0.00006 0.006
END 0.077
other large-liquid 0.011 Local 0.374 low consumption 0.2 0.00006 0.006
END 0.077 other 0.011 Local 0.374 low consumption 0.2 0.00006 0.006
END 0.077
other large-liquid 0.011 Low&mid income countries 0.373 low consumption 0.2 0.00006 0.006
END 0.077 other 0.011 Low&mid income countries 0.373 low consumption 0.2 0.00006 0.006
GIT 0.035 topical 0.006 Local 0.374 high consumption 0.8 0.00006 0.006
CNS 0.035 topical 0.006 Local 0.374 high consumption 0.8 0.00006 0.006
GIT 0.035 topical 0.006 Low&mid income countries 0.373 high consumption 0.8 0.00006 0.006
CNS 0.035 topical 0.006 Low&mid income countries 0.373 high consumption 0.8 0.00006 0.006

274
Page
27
4
CVS 0.119 topical 0.006 Local 0.374 low consumption 0.2 0.00005 0.005
CVS 0.119 topical 0.006 Low&mid income countries 0.373 low consumption 0.2 0.00005 0.005
OBS 0.013 small-parenteral 0.08 high income countries 0.254 low consumption 0.2 0.00005 0.005
NUT 0.091
other large-liquid 0.011 high income countries 0.254 low consumption 0.2 0.00005 0.005
NUT 0.091 other 0.011 high income countries 0.254 low consumption 0.2 0.00005 0.005
MUS 0.088
other large-liquid 0.011 high income countries 0.254 low consumption 0.2 0.00005 0.005
MUS 0.088 other 0.011 high income countries 0.254 low consumption 0.2 0.00005 0.005
SKN 0.021
other large-liquid 0.011 high income countries 0.254 high consumption 0.8 0.00005 0.005
SKN 0.021 other 0.011 high income countries 0.254 high consumption 0.8 0.00005 0.005
RT 0.144 topical 0.006 high income countries 0.254 low consumption 0.2 0.00004 0.004
END 0.077
other large-liquid 0.011 high income countries 0.254 low consumption 0.2 0.00004 0.004
END 0.077 other 0.011 high income countries 0.254 low consumption 0.2 0.00004 0.004
OBS 0.013
other large-liquid 0.011 Local 0.374 high consumption 0.8 0.00004 0.004
OBS 0.013 other 0.011 Local 0.374 high consumption 0.8 0.00004 0.004
GIT 0.035 topical 0.006 high income countries 0.254 high consumption 0.8 0.00004 0.004
CNS 0.035 topical 0.006 high income countries 0.254 high consumption 0.8 0.00004 0.004
OBS 0.013
other large-liquid 0.011 Low&mid income countries 0.373 high consumption 0.8 0.00004 0.004
OBS 0.013 other 0.011 Low&mid income countries 0.373 high consumption 0.8 0.00004 0.004

275
Page
27
5
NUT 0.091 topical 0.006 Local 0.374 low consumption 0.2 0.00004 0.004
NUT 0.091 topical 0.006 Low&mid income countries 0.373 low consumption 0.2 0.00004 0.004
MUS 0.088 topical 0.006 Local 0.374 low consumption 0.2 0.00004 0.004
MUS 0.088 topical 0.006 Low&mid income countries 0.373 low consumption 0.2 0.00004 0.004
SKN 0.021 topical 0.006 Local 0.374 high consumption 0.8 0.00004 0.004
SKN 0.021 topical 0.006 Low&mid income countries 0.373 high consumption 0.8 0.00004 0.004
CVS 0.119 topical 0.006 high income countries 0.254 low consumption 0.2 0.00004 0.004
END 0.077 topical 0.006 Local 0.374 low consumption 0.2 0.00003 0.003
END 0.077 topical 0.006 Low&mid income countries 0.373 low consumption 0.2 0.00003 0.003
OBS 0.013
other large-liquid 0.011 high income countries 0.254 high consumption 0.8 0.00003 0.003
OBS 0.013 other 0.011 high income countries 0.254 high consumption 0.8 0.00003 0.003
GIT 0.035
other large-liquid 0.011 Local 0.374 low consumption 0.2 0.00003 0.003
GIT 0.035 other 0.011 Local 0.374 low consumption 0.2 0.00003 0.003
CNS 0.035
other large-liquid 0.011 Local 0.374 low consumption 0.2 0.00003 0.003
CNS 0.035 other 0.011 Local 0.374 low consumption 0.2 0.00003 0.003
GIT 0.035
other large-liquid 0.011 Low&mid income countries 0.373 low consumption 0.2 0.00003 0.003
GIT 0.035 other 0.011 Low&mid income countries 0.373 low consumption 0.2 0.00003 0.003
CNS 0.035
other large-liquid 0.011 Low&mid income countries 0.373 low consumption 0.2 0.00003 0.003
CNS 0.035 other 0.011 Low&mid income countries 0.373 low consumption 0.2 0.00003 0.003
NUT 0.091 topical 0.006 high income countries 0.254 low consumption 0.2 0.00003 0.003
MUS 0.088 topical 0.006 high income countries 0.254 low consumption 0.2 0.00003 0.003

276
Page
27
6
SKN 0.021 topical 0.006 high income countries 0.254 high consumption 0.8 0.00003 0.003
END 0.077 topical 0.006 high income countries 0.254 low consumption 0.2 0.00002 0.002
OBS 0.013 topical 0.006 Local 0.374 high consumption 0.8 0.00002 0.002
OBS 0.013 topical 0.006 Low&mid income countries 0.373 high consumption 0.8 0.00002 0.002
GIT 0.035
other large-liquid 0.011 high income countries 0.254 low consumption 0.2 0.00002 0.002
GIT 0.035 other 0.011 high income countries 0.254 low consumption 0.2 0.00002 0.002
CNS 0.035
other large-liquid 0.011 high income countries 0.254 low consumption 0.2 0.00002 0.002
CNS 0.035 other 0.011 high income countries 0.254 low consumption 0.2 0.00002 0.002
SKN 0.021
other large-liquid 0.011 Local 0.374 low consumption 0.2 0.00002 0.002
SKN 0.021 other 0.011 Local 0.374 low consumption 0.2 0.00002 0.002
SKN 0.021
other large-liquid 0.011 Low&mid income countries 0.373 low consumption 0.2 0.00002 0.002
SKN 0.021 other 0.011 Low&mid income countries 0.373 low consumption 0.2 0.00002 0.002
OBS 0.013 topical 0.006 high income countries 0.254 high consumption 0.8 0.00002 0.002
GIT 0.035 topical 0.006 Local 0.374 low consumption 0.2 0.00002 0.002
CNS 0.035 topical 0.006 Local 0.374 low consumption 0.2 0.00002 0.002
GIT 0.035 topical 0.006 Low&mid income countries 0.373 low consumption 0.2 0.00002 0.002
CNS 0.035 topical 0.006 Low&mid income countries 0.373 low consumption 0.2 0.00002 0.002
SKN 0.021
other large-liquid 0.011 high income countries 0.254 low consumption 0.2 0.00001 0.001
SKN 0.021 other 0.011 high income countries 0.254 low consumption 0.2 0.00001 0.001
OBS 0.013 other large- 0.011 Local 0.374 low consumption 0.2 0.00001 0.001

277
Page
27
7
liquid
OBS 0.013 other 0.011 Local 0.374 low consumption 0.2 0.00001 0.001
GIT 0.035 topical 0.006 high income countries 0.254 low consumption 0.2 0.00001 0.001
CNS 0.035 topical 0.006 high income countries 0.254 low consumption 0.2 0.00001 0.001
OBS 0.013
other large-liquid 0.011 Low&mid income countries 0.373 low consumption 0.2 0.00001 0.001
OBS 0.013 other 0.011 Low&mid income countries 0.373 low consumption 0.2 0.00001 0.001
SKN 0.021 topical 0.006 Local 0.374 low consumption 0.2 0.00001 0.001
SKN 0.021 topical 0.006 Low&mid income countries 0.373 low consumption 0.2 0.00001 0.001
OBS 0.013
other large-liquid 0.011 high income countries 0.254 low consumption 0.2 0.00001 0.001
OBS 0.013 other 0.011 high income countries 0.254 low consumption 0.2 0.00001 0.001
SKN 0.021 topical 0.006 high income countries 0.254 low consumption 0.2 0.00001 0.001
OBS 0.013 topical 0.006 Local 0.374 low consumption 0.2 0.00001 0.001
OBS 0.013 topical 0.006 Low&mid income countries 0.373 low consumption 0.2 0.00001 0.001
OBS 0.013 topical 0.006 high income countries 0.254 low consumption 0.2 0.00000 0.000

278
Page
27
8
Glossary
Some of the terms used within this repot were defined below based on the reference
definition for all terms.
1. Active Pharmaceutical Ingredient (API):
A substance or compound intended to be used in the manufacture of a
pharmaceutical product as a pharmacologically active compound (ingredient).
2. Adverse Drug Reactions (ADRs):
Any unwanted effect(s) produced by a drug that is harmful to the patient. Onset
may be sudden or develop over time.
3. Assay:
The monograph standard test, with associated method of analysis, which is
designed to determine the strength of a drug product
4. Basic Tests:
Simplified analytical tests that do not require complex methodologies and
equipment. Basic tests may be used to verify the identity of a drug or to ascertain
the absence of gross degradations or contamination.
5. Batch:
A defined quantity of starting material, packaging material, or product processed in
a single process or series of processes so that the product could be expected to be
homogeneous. In the case of continuous manufacture, the batch must correspond
to a de.ned fraction of the production, characterized by its intended homogeneity. A
batch may need to be divided into smaller batches, which are later combined to
form final homogeneous batch.
6. Batch Certificate:
A document containing information that is usually issued for each batch by the
manufacturer, or validated or issued by the competent authority of the exporting
country, particularly for vaccines, sera, and other biological products. The batch
certificate accompanies every major consignment.

279
Page
27
9
7. Batch Number:
A distinctive combination of numbers, letters, or both that specifically identifies a
batch on the labels, the batch records, and the certificate of analysis, etc.
8. Bioavailability:
The rate and extent of availability of an active ingredient from a dosage form as
measured by its concentration/time curve in the systemic circulation or its excretion
in the urine.
9. Bioequivalence:
Two pharmaceutical products are bioequivalent if they are pharmaceutically
equivalent, and their bioavailability, after administration in the same molar dose, is
similar to such a degree that their effects can be expected to be essentially the
same.
10. Certificate of Analysis:
Report of the analytical test results obtained, including the analysis conclusion of
the examination of a sample issued by the manufacturer, repackager or trader.
11. Counterfeit Drug:
A pharmaceutical product that is deliberately and fraudulently mislabeled with
respect to identity or source. Both branded and generic products can be
counterfeited. Counterfeit drugs can include products with the correct ingredients,
with the wrong ingredients, without active ingredients, with insufficient quantity of
active ingredients, or with fake packaging. A counterfeit drug can be a deliberate
imitation or a copy of a genuine product.
12. Disintegration:
The breaking up of a tablet or a capsule into granules or aggregates in an aqueous
fluid.
13. Dissolution:
The process by which a solid substance is separated into molecules or ions that
homogeneously disperses in an aqueous fluid to form a solution. The rate of
dissolution is determined by the interaction between the substance and the
medium.

280
Page
28
0
14. Dosage Form:
The form - tablet, capsule, injection - of a completed pharmaceutical preparation.
15. Dosage (or strength):
The content of the active ingredient per dosage unit is determined by the assay of
the specific monograph and expressed, generally, in milligrams or units per dosage
unit.
16. Drug:
Any substance or pharmaceutical product for human or veterinary use that is
intended to modify or explore physiological systems or pathological states for the
benefit of the recipient.
17. Drug Product:
A Finished dosage form (e.g., tablet, capsule, or solution) that contains a drug
substance generally, but not necessarily, in association with one or more other
ingredients.
18. Efficacy (of a Medicine or Treatment):
The maximum ability of a medicine or treatment to produce a result regardless of
dosage. A medicine passes efficacy trials if it is effective at the dose tested and
against the illness for which it is prescribed.
19. Essential Medicines:
Medicines that satisfy the priority health care needs of a population. Essential
medicines are selected with due regard for public health relevance, evidence of
efficacy and safety, and comparative cost-effectiveness. Essential medicines are
intended to be available within the context of functioning health systems at all times
in adequate amounts, in appropriate dosage forms, with assured quality and
adequate information, and at a price that individuals and communities can afford.
20. Expiry (or Expiration) Date:
The date up to which a product is expected to remain within specifications, if stored
correctly. Expiry date is established by the manufacturer for each batch by adding
the shelf-life period to the date of manufacture.

281
Page
28
1
21. Generic Drug:
A generic drug is the same as a brand name drug is dosage, safety, strength, how
it is taken, quality, performance, and intended use. Before a generic drug is
approved, an MRA should require many rigorous tests and procedures to assure
the generic drug can be substituted for a brand name drug.
22. Generic Name:
The approved or International Nonproprietary Name of a drug given by the World
Health Organization.
23. Generic Products:
A pharmaceutical product - usually intended to be interchangeable with the
innovator product - is usually manufactured without a license from the innovator
company and marketed after expiry of the patent or other exclusivity rights. The
term should not be confused with generic names for APIs.
24. Good Manufacturing Practices (GMP):
The part of quality assurance that ensures that pharmaceutical products are
consistently produced and controlled by the quality standards appropriate to their
intended use and as required by the marketing authorization. These standards
include criteria for personnel, facilities, equipment, materials, manufacturing
operations, labeling, packaging, quality control, and in most cases, stability testing.
25. Identity:
The correct chemical substance and formula of an active ingredient in a drug
product.
26. Identity Test:
The selected test in the monograph to verify that the API is correct for that drug
product.
27. International Nonproprietary Names:
International nonproprietary names facilitate the identification of pharmaceutical
substances or active pharmaceutical ingredients. Each INN is a unique name that
is globally recognized and is public property. A nonproprietary name is also known
as a generic name. Proposals for recommended international nonproprietary
names are submitted to the World Health Organization on a form provided by WHO

282
Page
28
2
by the purpose. The name used by the person discovering or first developing and
marketing a pharmaceutical substance shall be accepted, unless there are
compelling reasons to the contrary.
28. Label:
All finished drug products should be identified by labeling, as required by national
legislation, bearing at least the following information:
a) The name of the drug product.
b) A list of the active ingredients (if applicable, with the International Nonproprietary
Names), showing the amount of each active ingredient present, and a statement of
the net contents (number of dosage units, mass, or volume).
c) The batch number assigned by the manufacturer.
d) The expiry date and manufacturing date in un coded form.
e) Special storage conditions or handling precautions that may be necessary.
f) Directions for use, and any warnings or precautions that may be necessary.
g) The name and address of the manufacturer or the company or person responsible
for placing the product on the market.
29. Marketing Authorization:
An official document issued by a competent medicines regulatory authority for the
purpose of marketing or free distribution of a product after evaluation for safety,
efficacy and quality. The certificate must set out, among other things, the name of
the product, the pharmaceutical dosage form, the quantitative formula (including
excipients) per unit dose (using INN or national generic names where they exist),
the shelf-life and storage conditions, and packaging characteristics. The document
speci.es the information on which authorization is based. The license also contains
the product information approved for health professionals and the public, the sales
category, the name and address of the holder of the authorization, and the period
of validity of the authorization.
30. Medicines Regulatory Authority (MRA):
A national body that administers the full spectrum of regulatory activities associated
with pharmaceuticals, including at least all of the following functions: marketing
authorization of new products and variation of existing products; quality controlled
laboratory testing (although in some countries, the laboratory may not be part of the

283
Page
28
3
MRA); adverse drug reaction monitoring; provision of medicine information and
promotion of rational medicine use; good manufacturing practice inspections and
licensing of manufacturers, wholesalers, and distribution channels; enforcement of
operations; and monitoring of drug utilization.
31. Method Validation:
A demonstration of the suitability of the analytical procedure for its intended use.
The characteristics of the analytical procedures to be considered in method
validation are accuracy, precision, robustness, linearity and range, selectivity, limit
of detection, and limit of quantization.
32. Monograph:
A set of properly selected standardized tests with associated methods of analysis
that can be used to assess the integrity of drugs (including dosage forms) and
starting materials. These standards, when met, assure the quality of the drug with
respect to identity, purity, strength, packaging, storage, and labeling. Monographs
are published in pharmacopeia.
33. Over-the-Counter (OTC) Medicine:
Medicines that can be sold from licensed retail pharmacies or outlets without
professional supervision and without a physician’s prescription. OTC medicines are
considered safe and effective for use by the general public. OTC medicines are
suitable for self-medication for minor diseases and symptoms.
34. Pharmacopeia:
A book containing an official list of monographs and internationally acceptable
standards for the potency, purity, quality, packaging, and labeling of
pharmaceutical products. The major pharmacopeias in the world are the
International Pharmacopeia, the United States Pharmacopeia, the British
Pharmacopoeia, the Japanese Pharmacopeia and the European Pharmacopoeia.
Other countries have their own pharmacopeias.

284
Page
28
4
35. Pharmacovigilance:
All science and activities relating to the detection, assessment, understanding, and
prevention of adverse effects or other drug-related problems. In general,
Pharmacovigilance aims to reevaluate the safety and efficacy of pharmaceutical
product in the market. This encompasses spontaneous adverse drug reactions,
drug information reporting, promotion of rational use of drugs, risk management,
and crisis preparedness.
36. Post marketing Surveillance:
Monitoring the quality of drugs by inspection and laboratory testing to assure that
the storage is correct and that drugs are stable within their labeled shelf-life.
37. Potency:
The extent to which a drug contains the specified amount of the active ingredient.
38. Premarketing Surveillance:
Monitoring the quality of medicines by inspection and laboratory testing to assure
that medicines conform to the quality standards and specifications before their
marketing authorization.
39. Product Certificate:
A document containing the information set out in Form 5.1. The certificate is
validated and issued for a specific product by the competent authority of the
exporting country and intended for use by the competent authority in the importing
country, or, in the absence of such an authority, by the drug procurement authority.
40. Product Recall:
A process for withdrawing or removing a pharmaceutical product from the
distribution chain because of defects in the product or complaints of serious
adverse reactions to the product. A recall may be initiated by an MRA, a
manufacturer, or by an importer/distributor or a responsible agency.
41. Quality:
All characteristics—purity, strength, packaging, labeling—that allow the drug
product to deliver its intended treatment.

285
Page
28
5
42. Quality Assurance (QA):
All matters that individually or collectively influence the quality of a product. The
objective of QA is to ensure that pharmaceutical starting materials and
pharmaceutical products meet quality standards.
43. Quality Control (QC):
All measures taken—including setting specifications, sampling, testing, and
analytical clearance—to ensure that raw materials, intermediates, packaging
materials, and finished pharmaceutical products conform to established
specifications for identity, strength, purity, and other characteristics.
44. Recall:
The process of withdrawing a medicine from the market because of a quality,
safety, or efficacy problem.
45. Safety:
Not causing harm or injury, having a low incidence of adverse reactions and
significant side effects when adequate instructions for use are given, and having a
low potential for harm under conditions of widespread availability.
46. Sample:
A portion of material collected according to a de.ned sampling procedure. The size
of any sample should be sufficient to carry out all anticipated test procedures,
including all repetitions.
47. Sampling Procedure:
A detailed and complete sampling operation to be applied to a de.ned material for a
specific purpose. A detailed, written description of the sampling procedure is
provided as sampling protocol.
48. Shelf-Life:
The period of time during which a drug product, if stored correctly, is expected to
comply with the specification as determined by stability studies on a number of
batches of the product. The shelf-life establishes the expiry date of each batch.

286
Page
28
6
49. Specification:
A detailed document describing the requirements with which the pharmaceutical
products used or obtained during manufacture have to conform. Specifications
serve as a basis for quality evaluation.
50. Stability:
The ability of a pharmaceutical product to retain its chemical, physical,
microbiological, and biopharmaceutical properties within specified limits throughout
its shelf-life.
51. Standard:
A technical specification that addresses a business requirement, is implemented in
viable commercial products, and to the extent practical, complies with recognized
standards organizations such as (ISO).
52. Starting Material:
Any substance of de.ned quality used in the production of a pharmaceutical
product, excluding packaging material.
53. Substandard Drug:
A legal branded or generic drug that does not meet national or international
standards for quality, purity, strength, or packaging.
54. Validated Method:
A method of analytical performance demonstrated by experimental data that has
proven its suitability as analytical support of a specification proposed for particular
drug. The nature of the method and the type of drug test determine the
characteristics that should be considered to validate the method.


