Embed Size (px)
Citation preview
CHARLES UNIVERSITY
Faculty of Pharmacy in Hradec Kraacuteloveacute
Department of Pharmacology and Toxicology
UNIVERSITY OF PORTO
Faculty of Pharmacy
Department of Biological Sciences
OXIDATIVE STRESS BIOMARKERS OF THE ERYTHROCYTE
IN THE NEWBORN ndash A FOLLOW-UP STUDY
BIOMARKERY OXIDAČNIacuteHO STRESU ERYTROCYTŮ
U NOVOROZENCE ndash FOLLOW-UP STUDIE
Master thesisDiplomovaacute praacutece
Supervisor doc PharmDr Martina Čečkovaacute PhD
Consultants Susana Rocha PhD prof Alice Santos-Silva PhD
Porto 2018 Karoliacutena Zubataacute
ldquoI hereby declare that this diploma thesis is my original authorrsquos work I also certify that
I have acknowledged cited and properly listed all the used literal sources and materials
The thesis has not been used to obtain different or same degreerdquo
bdquoProhlašuji že tato praacutece je myacutem původniacutem autorskyacutem diacutelem Veškeraacute literatura a dalšiacute
zdroje z nichž jsem při zpracovaacuteniacute čerpala jsou uvedeny v seznamu použiteacute literatury
a v praacuteci řaacutedně citovaacuteny Tato praacutece nebyla použita k ziacuteskaacuteniacute jineacuteho či stejneacuteho titululdquo
helliphelliphelliphelliphelliphelliphelliphelliphelliphelliphelliphelliphelliphellip
Hradec Kraacuteloveacute 2018 Karoliacutena Zubataacute
ACKNOWLEDGEMENTS
I would like to express my gratitude to prof Alice Santos-Silva and her team for their
warm acceptance for being constantly positive cooperative and supportive during my
stint in their laboratory
My specials thanks belong to my Portuguese supervisor Dr Susana Rocha
who guided me through my first research experience taught me all the techniques
and answered numerous questions with infinite patience I really appreciate her care
and friendly attitude
I also wish to thank my Czech supervisor doc Martina Čečkovaacute for her support
and valuable suggestions on the content of the thesis
ABSTRACT
Charles University University of Porto
Faculty of Pharmacy in Hradec Kraacuteloveacute Faculty of Pharmacy
Department of Pharmacology and Toxicology Department of Biological Sciences
Student Karoliacutena Zubataacute
Supervisor doc PharmDr Martina Čečkovaacute PhD
Consultants Susana Rocha PhD prof Alice Santos-Silva PhD
Title of diploma thesis Oxidative stress biomarkers of the erythrocyte in the newborn
ndash a follow-up study
Increased levels of oxidative stress (OS) have been described in healthy full-term
newborns as a consequence of the drastic changes introduced by birth and by
the exposure to extrauterine environment Our intention was to examine the OS levels
in red blood cells (RBCs) of neonates and to further understand the changes
that the newborn organism undergoes with its newly-acquired autonomy as this
knowledge is limited and there are no reference values Umbilical cord blood samples
were collected from a small population of newborns (n = 8) and several hematological
and biochemistry parameters were evaluated Our experimental data consist of OS
biomarkers measurements performed in different fractions of blood (RBC membrane
total RBCs and plasma) membrane bound hemoglobin (MBH) lipid peroxidation (LPO)
quantification of catalase (CAT) and glutathione peroxidase (GPx) activities
determination of total antioxidant status (TAS) and quantification of total and oxidized
glutathione the same parameters were assessed after two months in the same subjects
(n = 8) using peripheral blood samples to obtain the follow-ups Hematological
and biochemistry data were in accordance with general knowledge and available
reference values Significant changes were recorded in five of our OS biomarkers
decrease in membrane LPO and MBH levels suggests that OS really fades with age We
recorded a significant decrease in GPx activity and an increase in CAT activity
which probably reflects different specialization of the enzymes and
the newbornacutes increasing autonomy With all the gathered data we could observe
the process of the newbornacutes adaptation to the outer world The most significant
contribution of this work are the new OS biomarkers reference values which to our
knowledge have not been published before However our population was small and only
half of the selected biomarkers displayed a significant change in the follow-ups two
months after birth Further studies are warranted to extend the knowledge in the field
of OS and its biomarkers because we believe that there is a great potential for them to be
used in clinical monitoring and diagnosis
keywords oxidative stress biomarker erythrocyte newborn
ABSTRAKT
Univerzita Karlova
Farmaceutickaacute fakulta v Hradci Kraacuteloveacute
Katedra farmakologie a toxikologie
University of Porto
Faculty of Pharmacy
Department of Biological Sciences
Student Karoliacutena Zubataacute
Školitel doc PharmDr Martina Čečkovaacute PhD
Konzultanti Susana Rocha PhD prof Alice Santos-Silva PhD
Naacutezev diplomoveacute praacutece Biomarkery oxidačniacuteho stresu erytrocytů u novorozence
ndash follow-up studie
Oxidačniacute stres (OS) byacutevaacute primaacuterně spojovaacuten s patologickyacutemi stavy byl však popsaacuten
i u zdravyacutech v termiacutenu narozenyacutech dětiacute a to v důsledku drastickyacutech změn kteryacutemi
organismus novorozence během a po porodu prochaacuteziacute Ciacutelem našiacute praacutece bylo pomociacute
vhodnyacutech biomarkerů proměřit hladiny OS v erytrocytech (RBC) novorozenců a přispět
k porozuměniacute toho jak se organismus adaptuje na vnějšiacute prostřediacute Tato problematika
neniacute plně prozkoumaacutena a chybiacute oficiaacutelniacute referenčniacute hodnoty Vzorky krve byly ziacuteskaacuteny
od maleacuteho počtu subjektů (n = 8) a to dvakraacutet ndash v den narozeniacute (pupečniacutekovaacute krev)
a po dvou měsiacuteciacutech jako follow-up vzorky (periferniacute krev) V nemocnici byla provedena
zaacutekladniacute hematologickaacute a biochemickaacute vyšetřeniacute naše experimentaacutelniacute data zahrnujiacute
proměřeniacute několika biomarkerů OS v různyacutech frakciacutech krve (RBC membraacuteny plasma
a celeacute RBC) membraacutenově vaacutezanyacute hemoglobin (MBH) peroxidace lipidů (LPO)
kvantifikace aktivity catalasy (CAT) a glutathion peroxidasy (GPx) stanoveniacute celkoveacute
antioxidačniacute kapacity (TAS) a celkoveacuteho a oxidovaneacuteho glutathionu Vyacutesledky
hematologickyacutech a biochemickyacutech vyšetřeniacute odpoviacutedajiacute znalostem o tomto teacutematu
i referenčniacutem hodnotaacutem Statisticky vyacuteznamneacute změny byly pozorovaacuteny u pěti z našich
biomarkerů pokles u membraacutenoveacute LPO a MBH poukazuje na to že OS s věkem
skutečně klesaacute Zaznamenali jsme pokles aktivity GPx a naacuterůst u CAT pravděpodobně
v důsledku lehce odlišnyacutech ciacutelů těchto enzymů a zvyšujiacuteciacute se autonomie dětskeacuteho
organismu Veškeraacute sesbiacuteranaacute a naměřenaacute dat poskytla dobreacute podklady pro studium
vyacutevoje a postupneacute adaptace dětskeacuteho organismu na okolniacute svět a působeniacute OS Největšiacutem
přiacutenosem teacuteto praacutece jsou naměřeneacute hodnoty OS biomarkerů ktereacute mohou byacutet orientačně
použity jako referenčniacute jelikož pokud je autorům znaacutemo jineacute zatiacutem nebyly publikovaacuteny
Počet vzorků byl však omezenyacute a pouze u poloviny vybranyacutech biomarkerů byla
zaznamenaacutena statisticky vyacuteznamnaacute změna novorozenec versus follow-up Dalšiacute vyacutezkum
je vyžadovaacuten pro prohloubeniacute znalostiacute o OS a jeho biomarkerech protože jak věřiacuteme
tyto informace a hodnoty by mohly byacutet s velkou vyacutehodou použiacutevaacuteny v klinickeacute praxi
(monitorovaacuteniacute diagnostika)
kliacutečovaacute slova oxidačniacute stres biomarker erytrocyt novorozenec
CONTENT
1 Introduction 1
11 Erythrocytes 2
111 Erythropoiesis 2
112 Structure 4
113 Function 6
114 Metabolism 7
115 Antioxidant capacity 7
12 Oxidative stress 15
121 Oxidants 15
122 Antioxidants 16
123 Mechanisms and consequences of oxidative damage 17
124 Oxidative stress amp erythrocytes 18
13 Specifics of newborns amp neonatal oxidative stress 19
131 Oxidative stress related diseases in newborns 20
2 Aims 22
3 Materials and methods 23
31 Population 23
32 Sample processing 23
33 Materials 24
331 Reagents 24
332 Consumables 25
333 Instruments 25
334 Software 25
34 Methods 25
341 General 25
342 Determination of total protein concentration 25
343 Membrane bound hemoglobin 26
344 Erythrocyte membrane lipid peroxidation 26
345 Quantification of catalase activity 27
346 Quantification of glutathione peroxidase activity 28
347 Determination of total antioxidant status 29
348 Quantification of total glutathione and oxidized glutathione 29
35 Statistical analysis 31
4 Results 32
41 Hematological data 32
42 Biochemical data 33
43 Oxidative stress biomarkers 34
431 RBC membranes 35
432 Total erythrocytes 36
433 Plasma 39
5 Discussion 40
51 Hematological data 40
52 Biochemical data 41
53 Oxidative stress biomarkers 43
6 Conclusion 46
7 List of abbreviations 47
8 Reference 49
1
1 INTRODUCTION
This project is a part of a long-standing research on oxidative stress (OS) in erythrocytes
carried out by Prof Alice Santos-Silva and Dr Susana Rocha
from the UCIBIO REQUIMTE Laboratory of Biochemistry Department of Biological
Sciences Faculty of Pharmacy Porto University The researchers from the Laboratory
of Biochemistry cover a range of areas (Hematology Immunology Clinical
Biochemistry and Molecular and Cell Biology) The major goal of their work being
ldquothe understanding of the cellular and molecular mechanisms underlying different
inflammatory conditions associated with physiological and pathological situations
that can trigger serious or fatal eventsrdquo (Anonymous c1996-2018)
In the present study we investigated the levels of OS in healthy full-term
newborns The birth itself has been proven to be a stressful event for the neonate since
after leaving the womb it faces a relatively hyperoxic environment which results
in an increased production of reactive oxygen species (ROS) The matter of interest is
how does the organism of the neonate copes and adapts to it (Friel et al 2004 Muller
1987 Ochoa et al 2003)
Although OS provokes a lot of discussion nowadays the attention is mainly paid
to its contributions to various disease processes We on the other hand wanted to focus
on physiological stress of the delivery and on the healthy newborns ability to adapt to it
As we were at the very beginning of the research our aim was to discover more
about the topic to test several basic methods to gather data and to contribute
to the current knowledge about the newborns biochemistry and antioxidant (AOX)
defense mechanisms This thesis should lay the foundations for the future research
2
11 Erythrocytes
Erythrocytes also known as red blood cells (RBC) are the most abundant of blood cells
comprising up to 45 of blood volume maintaining the vital function
of oxygen (O2)carbon dioxide (CO2) transporters by carrying the respiratory gases
from lungs to tissues and vice-versa (Gwaltney-Brant 2014)
111 Erythropoiesis
The average life-span of an erythrocyte in humans is 120 days To maintain the normal
count of these rapidly maturing cells a large number of RBCs needs to be synthesized
every day (around 1 of the RBCs meaning cca one billion of new cells)
Erythropoiesis a complex dynamic and well-regulated process allows their
replenishment (Hattangadi et al 2011)
In the fetus erythropoiesis begins in the liver during the early first trimester
which was preceded by extraembryonic erythropoiesis of the yolk sack RBC production
occurs in the liver through the rest of gestation although the production starts to diminish
during the second trimester as bone marrow erythropoiesis increases (the first
erythroblasts occur in the bone marrow at 8 to 9 weeks of gestation and the first area
of bone marrow appearance is near the clavicle) By the end of the third trimester almost
all erythropoiesis is localized in the bone marrow although other sites may be involved
(Richard A Polin 2017)
After birth erythropoiesis is restricted primarily to the bone marrow although
occasionally it may be found in the spleen or liver as well In adults extramedullary
hematopoiesis (EMH) may occur during hematological disorders when bone marrow
production is insufficient or ineffective Typical sites include liver spleen lymph nodes
paravertebral areas with the intra-spinal canal pre-sacral region nasopharynx
and paranasal sinuses as less common locations for EMH (Gwaltney-Brant 2014)
Bone marrow is protected by bone casing and composed of hematopoietic cells
adipose tissue and various supportive cells and tissues Its structural and blood flow
configurations including bone ndash bone marrow portal capillary systems provide
the appropriate environment for the proliferation differentiation and maturation
of cellular components of the blood Stromal stem cells are progenitors of adipocytes
3
skeletal tissue components (the hematopoiesis-supporting stroma osteoblasts
chondroblasts etc) and reticular cells that provide a structural support for the marrow
and secrete mediators essential for the maintenance differentiation and growth
of hematopoietic stem cells (Gwaltney-Brant 2014)
Hematopoietic cells are formed continuously from a small population
of pluripotent stem cells that are capable of self-renewal A regular hematopoietic stem
cell develops into a common lymphoid progenitor which lineage results in T B
and natural killer cells or follows a myeloid lineage and becomes a common myeloid
progenitor (CMP) giving rise to granulocytes macrophages megakaryocytes
and erythrocytes Differentiation of cells is a series of lineage restriction steps that results
in the progressive loss of differentiation potential to other cell lineages (Kondo 2010)
The pathway leading to mature erythrocytes (Figure 1) begins with hematopoietic
stem cell which later develops in CMP megakaryocyte-erythroid progenitor burst-
forming unit ndash erythroid (BFU-E) and colony-forming unit ndash erythroid (CFU-E)
CFU- E undergoes many substantial changes including a decrease in cell size chromatin
condensation and hemoglobinization leading up to its enucleation and expulsion of other
organelles resulting in formation of the reticulocyte and finally after additional cellular
remodeling and loss of organelles the mature erythrocyte (Bresnick et al 2018 Dzierzak
amp Philipsen 2013 Kondo 2010)
Figure 1 The pathway leading to mature erythrocytes Hematopoietic stem cell (HSC) can either
develop to lymphoid progenitor (resulting in lymphocytes and natural killers cells) or colony forming unit
ndash granulocyte erythrocyte megakaryocyte macrophage (CFU-GEMM) The CFU-GEMM can take
a pathway leading to platelets and white cells or to erythrocytes The latter continues as follows burst-
forming unit ndash erythroid (BFU-E) and colony-forming unit ndash erythroid (CFU-E) proerythroblast various
stages of normoblasts and finaly reticulocytes which mature into RBC Adapted from EpoMedicine 2016
(Anonymous c2016)
4
The process of erythropoiesis is regulated by various growth factors An exquisite
short-term control of the process is accomplished by the kidney-derived glycoprotein
hormone erythropoietin which production is induced by hypoxic conditions
and stimulates BFU-E cells Other growth factors include granulocyte-macrophage
colony-stimulating factor stem cell factors or interleukins (IL) IL-3 IL-6
IL- 9 and IL- 12 (Hattangadi et al 2011)
112 Structure
Red blood cells first appear in the circulation as reticulocytes that are enucleated cells
containing residual RNA and some mitochondria capable of oxidative respiration
In a healthy adult they make up 1 - 2 of the circulating RBCs while in neonates
the number is higher up to 25 - 65 but drops to normal values within two weeks
after birth Once 24h in circulation as the reticulocytes pass through the splenic vessels
and lose their organelles and RNA they mature into normal RBCs (Bukhari amp Zafar
2013 Gordon-Smith 2013)
Healthy mature erythrocytes are biconcave cells of approximately 75 to 87 μm
in diameter and 17 to 22 μm in thickness These structural proprieties allow the RBC
to accomplish its vital function 1) the flexible membrane composed of proteins
and lipids enables the erythrocyte to travel through the vascular system and deform
reversibly to squeeze into the smallest capillaries during microcirculation (2ndash3 μm
in diameter) and 2) the discocyte shape with a central depression on each side provides
a high surface-to-volume ratio that facilitates a rapid diffusion of the respiratory gases
to and from the cell (Diez-Silva et al 2010)
As already mentioned mature erythrocytes lack nucleus and most
of the organelles so that the maximum space in cytosol can be occupied by hemoglobin
an iron-containing biomolecule essential for gas transport
Hemoglobin
Hemoglobin (Hb) is the main protein component of the RBCs making up to 95 of their
dry content Hb is a tetramer of two α and two non-α globin chains each chain enclosing
one of the four heme groups HbA the most common type of Hb in healthy adults is
composed of two α chains and two β chains thus the tetramer can be represented as α2β2
5
whereas fetal hemoglobin HbF is known for its structure of α2γ2 containing a γ chain
that binds to the O2 molecule with greater affinity HbA2 α2δ2 is found in small amounts
in all adults (1 - 2 of all Hb molecules) but other variants of Hb exist and can be seen
mainly in various pathologies (Marengo-Rowe 2006)
Hb is synthesized during the RBC maturation process mitochondria produce
heme which then combines with the globin chains synthetized on the polyribosomes
Heme iron constantly undergoes a recycling loop after the destruction of the erythrocyte
so that it could be used again for new RBCs (Chung et al 2012)
Heme an iron-containing tetrapyrrole ring known as proto-porphyrin is
an essential prosthetic group of many biomolecules including Hb Four nitrogen atoms
within the ring coordinate with the central ion and there are methene bridges among
the four pyrrole rings Iron in heme is bound to a histidine (His) residue of the globin
chain and to O2 molecule that binds at other coordinated position of the ion its ferrous
state (Fe2+) allows a reversible binding to O2 while ferric state (Fe3+) in methemoglobin
(metHb) is unable to carry O2 (Capece et al 2006 Tsiftsoglou et al 2006)
RBC membrane
The flexibility of the RBCs is primarily attributed to the cell membrane as there are no
organelles and filaments inside the cell The RBC membrane is approximately 195
water (H2O) 395 protein 351 lipids and 58 carbohydrates It consists
of a cytoskeleton and an asymmetrical lipid bilayer tethered together via ldquoimmobilerdquo
macromolecular complexes centered on band-3 proteins at the spectrin-ankyrin binding
sites and via glycophorin at the actin junctional complexes The protein composition
determines the shape and flexibility of the RBC Transmembrane proteins usually have
both cytoplasmic and plasma domains The outer side includes binding sites for immune
complexes and the external parts of transmembrane channels and signaling proteins
The lipid bilayer includes various types of phospholipids sphingolipids cholesterol
and integral membrane proteins such as band-3 or glycophorin (Oliveira amp Saldanha
2009)
A significant feature of the lipid bilayer organization is that various phospholipids
are distributed asymmetrically following their different tasks and functions Thus
when a reorganization occurs it has an important signaling effect For example
phosphatidylserine (PS) which is normally localized in the inner layer of the bilayer can
6
set off RBC destruction by macrophages once the organization of the bilayer
is disrupted PS gets exposed at the cell surface and marks the RBC for phagocytosis (An
amp Mohandas 2008)
The cytoskeleton is composed principally of spectrin actin and its associated
proteins (tropomyosin tropomodulin adducin and dematin) protein 41R and ankyrin
(Li amp Lykotrafitis 2014 Lux 2016 Pandey amp Rizvi 2011)
113 Function
The primary purpose of the RBCs is to carry Hb and thus allow gas exchange of O2CO2
among lungs and tissues Besides that erythrocytes help to maintain the systemic
acidbase and osmotic equilibria participate in control of nitric oxide metabolism redox
regulation blood rheology and viscosity (Kuhn et al 2017) Lastly RBCs are equipped
with an effective AOX system that together with their natural ability to circulate through
the whole body makes them invaluable free radical (FR) scavengers they provide AOX
protection not only to themselves but also to other tissues and organs in the body (Pandey
amp Rizvi 2011)
Hemoglobin plays a crucial role as it carries O2 from lungs to tissues and takes
carbon dioxide back to lungs There after O2 binds to the first heme group in Hb its
configuration changes and the O2 affinity of the remaining hemes increases allowing
the tetramer to easily bind and carry four O2 molecules thus enabling each RBC to carry
over 1 billion O2 molecules Once the RBC reaches the tissue and the O2 is unloaded
globin chains rearrange and diminish the O2 affinity with the aid
of 23- diphosphoglycerate (23-DPG) (Kanias amp Acker 2010)
Concerning carbon dioxide transport CO2 diffuses from the intracellular space
into bloodrsquos two components plasma and erythrocytes Within the organism it is
transported in three different forms dissolved in solution buffered with H2O as carbonic
acid or bound to proteins particularly Hb After CO2 diffuses into the RBC it combines
with H2O to form carbonic acid during a reaction accelerated by carbonic anhydrase The
newly-emerged hydrogen ion of carbonic acid is accepted by the deoxyhemoglobin
(deoxyHb) and the remaining bicarbonate ion diffuses into the plasma via the chloride
shift mediated by protein band 3 Carbonic acid can be converted back to CO2 allowing
the gas to be exhaled Minor ways of CO2 disposal include its direct binding
7
to the deoxyHb forming carbamino-hemoglobin (20 of CO2 removal) and lastly
carbon dioxide can be carried to the lungs dissolved in plasma (5 of total CO2) (Arthurs
amp Sudhakar 2005 Geers amp Gros 2000)
114 Metabolism
Mature RBCs have a limited metabolic capacity since they lack nucleus and other
organelles particularly mitochondria The major source of energy is glucose that enters
the erythrocyte by facilitated diffusion independently of insulin It is then metabolized
by the anaerobic glycolytic Embden-Meyerhof pathway to lactate For each glucose
molecule that enters the pathway two molecules of adenosine triphosphate (ATP) are
generated Besides that reduced nicotinamide adenine dinucleotide phosphate (NADPH)
is generated which is essential for metHb reductase to keep the Hb in a reduced state
The obtained ATP molecules provide energy for maintenance of red cell volume shape
the membrane flexibility and for regulation of sodium-potassium pump The Luebering-
Rapoport bypass a side arm of the main pathway provides 23-DPG a molecule
necessary for regulating the Hb O2 affinity Only about 90 of glucose entering the RBC
is used to generate ATP through glycolysis and the remaining 10 is processed by
the hexose monophosphate shunt This alternative pathway generates NADPH molecules
that are later used for glutathione (GSH) reduction an important player in AOX
protection of the cell (Brown 1996 Hoffbrand amp Moss 2016 Pandey amp Rizvi 2011)
115 Antioxidant capacity
RBCs are extremely susceptible to oxidative damage for two main reasons 1) due to their
primary function as gas carriers they are constantly exposed to high levels of O2 and 2)
since mature erythrocytes are enucleated they are unable to synthesize new proteins
and enzymes for themselves Erythrocytes are not defenseless though They are equipped
with powerful AOX defense system that provides the needed protection both for them
and other cells and tissues as well This is the reason why RBCs by fulfilling their purpose
of gas transporters and by traveling through the organism serve as perfect scavengers
of free radicals (Cimen 2008)
There are enzymatic and non-enzymatic mechanisms in the RBCacutes AOX defense
system
8
Enzymatic
AOX enzymes detoxify reactive ROS by catalytically reducing or oxidizing the oxygen
intermediates to less harmful products Generally cytosolic superoxide dismutase (SOD)
provides the first line protection as it converts superoxide radical into less reactive
hydrogen peroxide (H2O2) The H2O2 can be then decomposed to O2 and H2O by either
catalase (CAT) glutathione peroxidase (GPx) or peroxiredoxin 2 (Prx2) (Culotta 2000)
Superoxide dismutase
SODs compose a family of oxidoreductase enzymes the role of which is to protect
the organism from ROS There are three known isoforms of SOD in mammals depending
on the protein fold and the metal cofactor SOD1 (CuZnSOD) SOD2 (MnSOD)
and SOD3 (extracellular SOD) (Fukai amp Ushio-Fukai 2011)
In erythrocytes cytosolic CuZnSOD plays an important role on the first line
of defense against ROS by catalyzing the dismutation of superoxide radical into harmless
O2 or H2O2 which is further decomposed to O2 and H2O (Fukai amp Ushio-Fukai 2011)
Eukaryotic SOD1 is described as a stable homodimer with the active sites oriented
on the opposite sides of its subunits The subunits are held together mainly by
hydrophobic and electrostatic interactions Each SOD1 monomer contains two metal
ions copper and zinc bound together by His side chain and by a secondary linkage
of hydrogen bond Both of the metal ions are believed to play important catalytic
and structural roles while copper is essential for the catalysis of the superoxide
dismutation zinc mostly plays a structural role and acts as a positive charge sink (Rakhit
amp Chakrabartty 2006 Tainer et al 1983)
Superoxide anion is one of the main ROS hence SOD1 key role in the cellacutes AOX
defense The enzyme formerly known as erythrocuprein catalyzes a reaction where two
superoxide molecules are turned into O2 and H2O by the ldquoping-pongrdquo mechanism first
superoxide is oxidized and the second is reduced in the disproportionation reaction
(Rakhit amp Chakrabartty 2006)
Catalase
Human CAT belongs to a large group of monofunctional heme-containing CATs
which are found in almost all aerobic organisms It is mostly an intracellular enzyme with
highest concentrations in RBCs and liver Under normal conditions RBCs contain
9
131ndash 271 μg CAT mg Hb CAT is a tetrameric protein composed of four subunits each
containing a Fe3+ heme group and a bound NADPH molecule that protects the enzyme
against oxidation and inactivation by its substrates Supposedly it does not take part
in the enzymatic activity of H2O2 dissociation (Aksoy et al 2004 Kodydkova et al
2014) When CAT is exposed to H2O2 for a long time the bound NADPH gets oxidized
and the activity of CAT fells to about one third of its initial activity (Kirkman et al 1987)
The enzyme has two different activity modes 1) catalytic activity the major one
of decomposition of H2O2 generated by dismutation of superoxide (catalyzed by SOD)
into H2O and O2 (α-phase) and 2) peroxidatic activity (β-phase) that involves H2O2
elimination by oxidizing alcohols formate or nitrate The catalytic reaction predominates
in higher H2O2 concentration (˃10-4 M) while below this concentration the peroxidatic
reaction dominates if there is an acceptable hydrogen donor (Mate et al 1999)
The main function of CAT is H2O2 removal by catalytically decomposing it
to H2O and O2 this enzyme is believed to take action mainly in removing higher
intracellular H2O2 concentrations while other AOX enzymes work under different
conditions GPx and Prx act at low H2O2 concentrations (Kodydkova et al 2014) It has
also been described that CAT is the major RBC defense enzyme against exogenous H2O2
and unlike other AOX enzymes is highly specific for H2O2 and thus does not participate
in detoxifying organic peroxides (Johnson et al 2010)
Glutathione peroxidase
Out of eight GPx recognized in mammals only GPx1 is present in the RBCs as
an intracellular cytosolic AOX enzyme GPx catalyzes the reduction of both H2O2
and organic hydroperoxides and peroxynitrites using GSH as a reducing agent (Brigelius-
Flohe amp Maiorino 2013)
GPx1 is a tetramer of four subunits of 21kDa each containing a selenocysteine
(Sec) It was described that GPx1 binds 10ndash15 of circulating Se (Zachara 2015) The
catalytic center is a tetrad formed by cysteine (Cys) glutamine tryptophan and aspargine
and the reactive Sec is surrounded by four arginines and a lysine of an adjacent subunit
Studies suggest that these residues are essential for binding the GSH The proposed
mechanism of the reaction is as follows (Figure 2) peroxide reduction involves formation
of selenic acid (Se-OH) at the selenol (Se-H) active site First molecule of GSH is used
for the reduction of the Se-OH forming glutathiolated selenol (Se-SG)
10
the selenadisulfide bond of which is afterwards reduced by the second GSH molecule
Active site of the enzyme is then restored and the newly emerged oxidized GSH (GSSG)
is regenerated to GSH by the action of glutathione reductase (GR) (Brigelius-Flohe amp
Maiorino 2013 Lubos et al 2011)
For some time GPx and CAT used to be considered as the major players
of the RBCacutes AOX defense system Nowadays as more knowledge has been gained
attention is paid to Prx2 as well and the function of each of the enzymes has been studied
in detail although the interplay among these three enzymes still requires more research
While CAT is believed to work mainly at higher concentrations GPx1 seems to be
effective at low H2O2 concentrations mostly of endogenous origin (Hb auto-oxidation)
This fact might be attributed to CAT having higher Km for H2O2 but according to Floheacute
(Floheacute 1982) since neither of the enzymes saturates with H2O2 the rate limiting step for
GPx1 is the recycling of GSH at high H2O2 concentrations (Low et al 2008 Rocha et al
2015)
Glutathione reductase
GR is an important component of the erythrocyteacutes AOX defense system as it protects
RBCacutes Hb enzymes and cell membranes against oxidative damage Unlike previously
described enzymes its effect is not pointed directly at ROS but it is an essential catalyst
of the reaction that recycles GSH (Chang et al 1978)
GR belongs to the family of flavoenzymes which contain either flavin adenine
dinucleotide (FAD) or flavin mononucleotide GR has a homodimeric structure with two
Figure 2 Reaction mechanism of GPx1 The active site of the enzyme (GPx-SeH) is oxidized
(GPx- SeOH) after its reaction with hydroperoxides (ROOH) Regeneration of the enzyme involves two
molecules of GSH The first molecule reduces the selenic acid in GPx-SeOH forming a glutathiolated
selenol (GPx- Se -SG) The disulfide bond is then reduced by the second GSH molecule yielding
regenerated enzyme (GPx-SeH) and oxidized glutathione (GSSG) Adapted from Lubos et al 2011
(Lubos et al 2011)
11
active sites and two FAD molecules incorporated in the subunits (Kamerbeek et al 2007)
The main function of the enzyme is to keep GSH in its reduced state
The two subunits are bond by a disulfide bridge There are two flexible NH2
residues arms with unknown role and the remaining residues are organized into four
domains in each subunit The first two of them bind FAD and NADPH molecules
respectively The catalytic center lies between the subunits and is shared by five domains
(four of one subunit a one of the other) which is quite unusual (Pai amp Schulz 1983)
The reaction is described to happen in two steps (equation 1) First the enzyme
(E) is reduced to its stable EH2 (reduced enzyme) form and NADPH is oxidized
to NADP Then EH2 forms a complex with GSSG later yielding in regenerated GSH
molecules and the enzyme (Pai amp Schulz 1983 Staal amp Veeger 1969)
H+ + NADPH + E hArr NADP+ + EH2
H2 + GSSG hArr2 GSH (equation 1)
Because of its close cooperation with NADPNADPH GR also regulates
the proper balance of NADP and NADPH in the hexose monophosphate shunt
of glycolysis (Pai amp Schulz 1983)
Peroxiredoxin 2
Prx family a group of H2O2 organic hydroperoxide and peroxynitrite reducing enzymes
is vastly distributed among various living organisms from anaerobes to humans Six
isoforms have been identified in mammals and human RBCs possess Prx1 Prx2
and Prx6 The levels of Prx2 (55mgml of packed RBC) by far exceed the other isoforms
it was even described that Prx2 is the third most abundant RBCacutes cytosolic protein
(following Hb and carbonic anhydrase) (Low et al 2008)
Prx2 formerly known as torin calpromotin NKEF-B HRPRP or band 8 is
an intracellular cytosolic enzyme the importance of which was only described
and grounded several years ago much later than that of previously presented enzymes
(CAT SOD GPxhellip) (Harris et al 2001 Manta et al 2009) To point out the crucial AOX
role of Prx2 in RBC the work by Lee et al showed that the RBCs from Prx2 knockout
mice proved to display a significantly shorter life span compared to wild type mice RBCs
12
as well as showing increased levels of oxidized proteins and Heinz bodies (Lee et al
2003)
All Prxs contain in their active site (Cys) the peroxidatic Cys (CysP) highly
specific for peroxides Subfamilies of the enzymes differ in the architecture of the active
site with Prx2 belonging to the Prx1 (typical 2-Cys Prx) subfamily (Peskin et al 2016)
In its functional state Prx2 appears as a homodimer with its subunits non-covalently
associated in a head to tail manner (Low et al 2008)
The peroxidase cycle of Prx2 starts with the reaction of CysP and the H2O2
generating a sulfonic acid (ndashSOH) which can either react with the resolving Cys on
the opposing chain of the dimer and form a disulfide bond (major pathway) or it can be
further oxidized by H2O2 to the sulfinic acid Hyperoxidation is not common in RBCs
though as sulfiredoxin manages to counteract the reaction (Cho et al 2010) The cycle is
completed by Prx2 regeneration by thioredoxin (Trx) and Trx reductase using NADPH
as a donor of reducing equivalents This has been accepted as a major mechanism but
redox reactions with other thiols have been described as well as in vitro recycling
of Prx2 by dithiothreitol as alternative pathways in the Prx2 cycle (Low et al 2008
Peskin et al 2016)
Quaternary structure of Prx2 has been studied and it has been shown
that the enzyme exists in various forms depending on the ionic strength protein
concentration pH phosphorylation and most importantly the redox state its minimal
functional unit monomer oxidizes into a disulfide-linked dimer upon reaction with H2O2
(Ogasawara et al 2012) During catalysis the homodimer is shifted into a doughnut-
shaped decamer a pentamer of dimers which immediately falls apart upon disulfide
formation The role of the transition is still unclear (Hall et al 2009) Prx2 is even
believed to form 12-decamer dodecahedron cage under certain conditions (Low et al
2008)
Prx2 has shown a remarkable sensitivity to extremely low concentrations of H2O2
proving to be oxidized even when CAT and GPx1 were active It has been suggested
that Prx2 detoxifies the RBC of the low endogenous levels of H2O2 similarly to GPx1
These two enzymes also share the ability to reduce hydroperoxides and peroxynitrites
(Low et al 2008 Rocha et al 2015) Another important role of Prx2 has been described
13
by Han et al Prxs containing 2-Cys residues act as molecular chaperons under increased
OS by binding to Hb and thus stabilizing it against oxidative damage (Han et al 2012)
Association with the membrane of RBCs has been described both under normal
conditions (cca 005 of Prx2) in hematological disorders and under OS (Rocha et al
2015)
Non-enzymatic
Apart from enzymatic mechanisms RBCs AOX defense system comprises of numerous
endogenous AOX molecules The major ones are GSH ascorbic acid and α- tocopherol
(Kuhn et al 2017 Pandey amp Rizvi 2011) Besides these carotenoids ubiquinone
melatonin uric acid ceruloplasmin transferrin or haptoglobulin are described to play
an important role as well (Cimen 2008)
Glutathione (GSHGSSG)
Structurally glutathione (L-γ-glutamyl-L-cysteinyl-glycine) is a thiol-containing
tripeptide of L-glutamate L-cysteine and L-glycine irreplaceable in RBCacutes defense
against ROS (Monostori et al 2009)
De novo synthesis of GSH is localized in the cytosol of all mammalian cells
including RBCs regardless of their limited biosynthetic capacity (Lu 2009) The
biosynthesis of GSH is described to happen in two steps 1) γ-glutamylcysteine is formed
from L-glutamate and cysteine in a reaction catalyzed by glutamate cysteine ligase and
2) the rate limiting step catalyzed by GSH synthetase adding glycine to the C-terminal
of γ-glutamylcysteine (Shan et al 2015)
The crucial role of GSH as a central redox agent lies in its nucleophilic character
The reduced form serves as a proton donor in several oxidation-reduction processes while
oxidizing itself into the oxidized form GSSG which is two GSH molecules bound
together by a S-S disulfide bond (Lu 2009 Zitka et al 2012) To maintain the redox state
of the cell and close the GSH cycle GSSG is regenerated back to GSH by GR using
NADPH as a proton donor (Shan et al 2015)
The process of GSH regeneration consists of four steps 1) glucose (Glc) is
transported through RBC membrane 2) Glc molecule is phosphorylated to glucose-6-
phosphate (G-6-P) by hexokinase 3) nicotinamide adenine dinucleotide phosphate
(NADP) is reduced to NADPH by G-6-P dehydrogenase and 6-phosphogluconate
14
dehydrogenase and 4) GSSG is reduced by GR utilizing NADPH resulting in two GSH
molecules (Kurata et al 2000)
Besides its well-known AOX role as a cofactor of GPx (Lu 2009) GSH also
serves as a direct scavenger of hydroxyl radicals and peroxinitrites (Griffith 1999 Wu et
al 2004) takes part in lipid peroxides detoxification (Raftos et al 2010) and helps to keep
the thiol groups of important RBCacutes structures in reduced state ( Hb enzymes
membraneshellip) (Lu 2009) GSH is also able to detoxify the RBC from xenobiotics by
forming a water-soluble conjugates that can be exported from the RBC and excreted
and it also serves as a Cys storage since extracellularly this amino-acid undergoes a rapid
auto-oxidation into cystine (Lu 2009) Not to forget its cooperation with other AOXs
molecules enabling their regeneration (eg ascorbate α-tocopherol) (Monostori et al
2009)
At all moments GSH is present in two forms as a reduced molecule (GSH)
and an oxidized form (GSSG) the amount of which is kept at low concentration (1100
to 11000) by the action of NADPH-dependent GR The GSSGGSH ratio is a valuable
indicator of cell functionality and the level of OS (Monostori et al 2009) To maintain
constant concentrations of GSH within the erythrocyte at sim23 mM the rate of synthesis
must equal the rate of its export in the form of GSH conjugates andor GSSG (Raftos et
al 2010) It was suggested that GSSG could leave the RBC in two ways ndash directly
through the cell membrane which can be damaged under OS conditions or by an active
MgATP-dependent transport both resulting in decreased GSH levels in OS associated
conditions (Pandey amp Rizvi 2011 Raftos et al 2010) as has been described
in Parkinsons disease liver disease cystic fibrosis sickle cell anemia AIDS cancer
heart attack stroke or diabetes (Pandey amp Rizvi 2011)
Ascorbatedehydroascorbate
Ascorbic acid also known as vitamin C is an essential hydrophilic vitamin which after
its intake from food is mostly localized in plasma where its serves as one of the most
important AOX (it directly protects against peroxidation of plasma low-density
lipoprotein (LDL)) Ascorbateacutes AOX activity is based on its ability to reversibly donate
one or two hydrogens and electrons to a variety of ROS thanks to its carbon-carbon
double bond and high reducing potential Newly emerged dehydroascorbate is taken up
by RBCacutes glucose transporter (GLUT1) and recycled The mechanism of the reduction is
15
GSH- and NADPH-dependent catalyzed by various enzymes (dehydroascorbate
reductase glutaredoxin thioredoxin etc) Once recycled ascorbate is trapped inside
the RBC and only very slowly diffuses back thus maintaining its plasma concentrations
It was suggested that ascorbate is more sensitive to oxidation by exogenous H2O2 than
GSH and α-tocopherol Although ascorbate does not directly protect the RBC membranes
from peroxidation it performs its function via the reduction of tocopheroxyl FR at
the aqueous-lipid interface of the membrane bilayer (May 1998)
α-tocopherol
In RBCs lipid-soluble α-tocopherol the most widely distributed AOX in nature acts as
a potent scavenger of peroxyl radicals to protect polyunsaturated fatty acids (PUFA)
of membranes from lipid peroxidation (LPO) (Pandey amp Rizvi 2011) α-tocopherol
intervenes in the propagation step during auto-oxidation of lipids It donates its phenolic
hydrogen atom to a peroxyl radical and thus converts it to less dangerous hydroperoxide
The newly formed tocopheroxyl radical is adequately stable to stop the reaction and can
leave the cycle by reacting with another peroxyl radical forming an inactive non-radical
product (Yamauc 1997) Ascorbate reduces the tocopheroxyl radical to regenerate
vitamin E (Niki 1987)
12 Oxidative stress
There are various definitions of the term bdquooxidative stressldquo Sies refers to it as
bdquoan imbalance between oxidants and antioxidants in favor of the oxidants potentially
leading to damagerdquo (Sies 1997)
121 Oxidants
Oxidants continuously attacking all cells living under aerobic conditions may be
of either endogenous or exogenous origin all together known as ROS There are two
types of ROS free radicals (molecules with unpaired electrons) and nonradicals (free
radicals that share their unpaired electrons) The ROS and their important equations are
depicted in Table 1 with the three major ROS being superoxide anion (O2-) hydroxyl
radical (OH) and H2O2
16
Table 1 Reactions of selected reactive oxygen species
Oxidant Formula Reaction equation
Superoxide anion O2- NADPH + 2O2 harr NADP+ + 2O2
- + H+
Hydrogen peroxide H2O2
2O2- + H+ rarrO2 + H2O2
HPX + H2O + O2 harr XAN + H2O2
XAN + H2O + O2 harr UA + H2O2
Hydroxyl radical OH Fe2+ + H2O2 rarr Fe3+ + OH- + OH
Peroxyl radical ROO R + O2 rarr ROO
NADPH nicotinamide adenine dinucleotide phosphate reduced form NADP+ nicotinamide adenine dinucleotide
phosphate oxidized form HPX hypoxanthine XAN xanthine UA uric acid
Adapted from Birben et al (Birben et al 2012)
Endogenous sources of ROS are the normal products of aerobic metabolism but
under pathological conditions their levels may rise Generally they are produced
in mitochondrial respiratory chain as byproducts of oxidative phosphorylation but
in other organelles as well in endoplasmic reticulum in peroxisomes (xanthine oxidase)
and during auto-oxidation process of small molecules (including Hb auto-oxidation) as
well as in immune reactions such as the respiratory burst of phagocytes
Exogenous sources include cigarette smoke ionizing radiation heavy metals ions
ozone exposure pollutants drugs and toxins including oxidizing disinfectants or
hyperoxia (Birben et al 2012 Pandey amp Rizvi 2010 Sarniak et al 2016)
122 Antioxidants
To compensate for the actions of oxidants organisms have integrated protective systems
of enzymatic and non-enzymatic AOXs to block the harmful effects of ROS AOXs can
be synthesized in vivo (eg GSH and SOD) or taken in from the diet
According to Gutteridge and Halliwell AOX is ldquoany substance that when present
at low concentrations compared with those of an oxidizable substrate significantly delays
or prevents oxidation of that substraterdquo (Halliwell 2007)
Generally there are two groups of AOX enzymatic and non-enzymatic ones
The three major classes of AOX enzymes are SODs CATs and GPxs (Sies 1997)
17
Ascorbic acid (vitamin C) α-tocopherol (vitamin E) GSH and carotenoids represent non-
enzymatic AOXs (Cimen 2008)
123 Mechanisms and consequences of oxidative damage
Due to the unpaired electrons ROS are highly reactive molecules and tend to attack
and alter the function of cellrsquos macromolecules - nucleic acids lipids and proteins
(Birben et al 2012)
PUFA residues of phospholipids are extremely susceptible to oxidation LPO
leads to formation of hydroperoxides that if not reduced by AOX enzymes break down
into reactive aldehyde products (eg 4-hydroxy-2-nonenal 4-hydroxy-2-hexenal
malondialdehyde (MDA) or acrolein) which have been proven to be mutagenic Besides
that LPO in general leads to loss of membrane fluidity and elasticity impaired cellular
functioning and even cell lysis (Catala 2009 Valko et al 2007)
Proteins can be damaged either by direct oxidation of their amino-acid residues
and cofactors or by secondary attack via LPO end-products The side chains of all amino-
acid residues of proteins are prone to oxidation by the action of ROS especially cysteine
Its oxidation may lead to the reversible formation of disulphide bridges between protein
thiol groups (ndashSH) and low molecular weight thiols in particular GSH
(S- glutathiolation) Such conformation changes may lead to decrease in enzyme activity
if the targeted amino-acid residues are close to active sites (Costa et al 2007 Valko et al
2007)
Oxidative damage has been proven to play an important role
in the etiopathogenesis of many common pathological conditions including neurological
disorders atherosclerosis hypertension ischemiaperfusion diabetes acute respiratory
distress syndrome idiopathic pulmonary fibrosis chronic obstructive pulmonary disease
or asthma (Birben et al 2012)
Although ROS are mostly regarded as toxic by-products of oxidative metabolism
and their participation in pathologic processes is indisputable low levels of these reactive
molecules are supposed to be essential for normal functioning of the organism Namely
they play a significant role in modulation of gene expression in cell signaling as second
messengers or in various immune reactions (phagocytosis inflammation) (Cimen 2008
Remacle et al 1994)
18
124 Oxidative stress amp erythrocytes
Erythrocytes are constantly exposed to risk of oxidative injury since incessant contact
with the O2 molecule and high content of Hb is inevitable for O2 carriers Even though
oxyhemoglobin (HbFe(II)O2-) is rather stable molecule its auto-oxidation (equation 2)
occurs up to a rate of 3 per day The process is characterized by a dissociation of the O2
molecule without an electron transfer to yield O2- and metHb (HbFe(III)) (Kanias amp
Acker 2010)
119867119887119865119890(119868119868)1198742119886119906119905119900119900119909119894119889119886119905119894119900119899rarr 119867119887119865119890(119868119868119868) + 1198742
minus (equation 2)
Both of these products under normal conditions are effectively detoxified
NADH-cytochrome b5ndashmetHb reductase reduces Hb to deoxyHb and ROS are eliminated
by AOX enzymes (Kanias amp Acker 2010)
When the capacity of the AOX enzymes (cytosolic SOD and CAT mostly) is
exceeded metHb can be oxidized to so called hemichromes which are precipitates
of denaturated Hb These structures have been known to covalently bind to cell
membrane resulting in clustering of integral membrane protein band 3 and interfering
with the integrity of the cytoskeleton Therefore membrane-bound hemoglobin (MBH)
has been suggested as a reliable marker of oxygen radical-induced injury to RBCs
(Sharma amp Premachandra 1991 Welbourn et al 2017)
Another widely used biomarker of RBCs OS namely of LPO is MDA content
This secondary oxidation product reacts with the free amino groups of proteins
and phospholipids which leads to structural modification inducing dysfunction
of various cell systems The bright side of the MDAacutes reactivity is that its reaction with
thiobarbituric acid (TBA) which yields a colored chromogen offers an easy way
to assess the OS of the cell Measurement of thiobarbituric reactive substances (TBARS)
has been considered as a reliable and easily reproducible biomarker of OS for many
years although a discussion about the low specificity of the test continues (Ayala et al
2014 Pandey amp Rizvi 2010 Rizvi amp Maurya 2007)
To evaluate the state and potential of OS in cells total antioxidant
status (TAS)capacity can be assessed From a number of methods the one developed by
Benzie and Strain stands out due to its simplicity and easy and reliable performance
19
The ferric reducing antioxidant power assay is measured as a reduction of ferric ion
ligand complex to intensely colored ferrous complex by all available AOXs in a sample
(Pandey amp Rizvi 2010)
13 Specifics of newborns amp neonatal oxidative stress
A newborn represents the culmination of various developmental steps from conception
through organogenesis to birth The composition of fetal blood changes significantly
during the second and third trimester preparing the fetus for birth and extrauterine
environment Mean Hb increases (from 90 plusmn 28 gdl at the age of 10 weeks to 165 plusmn
40 gdl at 39 weeks) the percentage of nucleated cells decreases (from 12 at 18 weeks
to 4 at 30 weeks) and large numbers of committed hematopoietic progenitors are found
circulating in the fetal blood (Lichtman et al 2016)
Birth introduces dramatic changes in the circulation and oxygenation as
the newborn undergoes the transition to a separate biological existence These events are
reflected in the composition of blood of the newborn during the first hours and days
of life there are rapid fluctuations in the quantities of all hematologic elements Studies
suggest that most of the measured parameters were highest on the first day of life
and declined thereafter (Esan 2016 Ogundeyi MM et al 2011)
Levels of cord blood Hb vary between approximately 165 and 170 gL depending
on the timing of cord clamping Later at around 8 weeks there is a progressive fall in Hb
levels to 100-110gL (or even lower in preterm infants which make them more
susceptible to iron and folate deficiency) followed by a recovery to 125gL at 6 months
Nucleated cells can be seen for first days in the blood film (longer in preterm infants)
The reticulocyte count which is initially up to 2-6 falls to 05 during a week due
to increased oxygenation of tissues which leads to suppression of erythropoiesis
The RBC count increases during the first day of life then it remains at that level for about
2 weeks and slowly declines afterwards The leukocyte count often fluctuates at all ages
but most significantly in infants Leukocytosis is typical at birth the range of normal
values is wide and the count slowly decreases until approximately 4 years of age (Esan
2016)
20
Considering OS birth itself is a stressful process for both mother and fetus
and delivery is a cause of hyperoxic challenge for the newborn (Friel et al 2004
Norishadkam et al 2017) The neonate is exposed to an environment that is relatively
hyperoxic (pO2 of 100 mm Hg) compared to the intrauterine one
(pO2 of 20 ndash 25 mm Hg) The increased O2 bioavailability leads to a greatly enhanced
generation of FR and OS (Perrone et al 2010 Tsukahara 2007)
Newborns especially preterm are particularly susceptible to the oxidative
damage for number of reasons structural and functional immaturity of organs
overloading of aerobic tissues metabolism with rapidly growing energy demand
the reduced ability to induce efficient homeostatic mechanisms The same goes for
neonatal RBCs increased release of transitional metals like free iron increased
production of superoxide radicals increased content of fatty acids and last but not least
lack of AOX systems (low enzyme activities such as GPx and SOD low content
of vitamin E and ascorbic acid) (Claster et al 1984 Perrone et al 2010) It was described
that at the end of pregnancy AOX enzymes are induced and the transfer of other AOX
molecules (vitamins E C β-carotenes ubiquinone) across the placenta is increased
during last days of gestation (Friel et al 2004 Torres-Cuevas et al 2017) however
the AOX systems only come to full maturity during the first year of life of the infant
(Norishadkam et al 2017)
131 Oxidative stress related diseases in newborns
Serious imbalance between the action of ROS and insufficient defensive mechanisms
which is even more likely to appear in preterm newborns not only leads to oxidative
damage but several secondary conditions are reported as well OS related neonatal
diseases include chronic lung diseases intraventricular hemorrhages of newborns
necrotizing enterocolitis (Norishadkam et al 2017 Perrone et al 2010)
bronchopulmonary dysplasia retinopathy of prematurity patent ductus arteriosus
periventricular leukomalacia respiratory distress syndrome intrauterine growth
retardation congenital malformation (Ozsurekci amp Aykac 2016)
There has been number of evidence that (neonatal) OS plays an important role
in various diseases yet very few OS markers have made it into routine clinical practice
This might be accounted to variety of reasons eg low specificity of methods
21
the properties of the oxidative modifications such as the lability of some structures or
their low abundance poses significant challenges to translate them into a high-
throughput cost-effective clinical diagnostic (Frijhoff et al 2015)
Further measurements and examination of OS biomarkers are required in order
for them to contribute to prediction of high-risk patients (Negi et al 2015) proper
diagnosis and earlyoptimal administration of effective pharmacotherapy
22
2 AIMS
Although there have been many publications concerning OS and mechanisms of AOX
defense very few or even none have dealt with the OS in erythrocytes of healthy
newborns specifically Therefore our aims were as follows
- to collect the physiological OS related values from healthy young individuals
(early infancy)
- to observe the changes of OS levels between newborn vs 2 months old babies
- to contribute to the knowledge on how healthy newborns adapt to ldquohyperoxic
challengerdquo caused by a sudden exposure to extrauterine environment and how
their AOX mechanism copes with it in time
23
3 MATERIALS AND METHODS
31 Population
The study was performed under the approval of the Ethics Committee of Centro Materno-
Infantil from Centro Hospitalar do Porto Portugal Blood samples were collected
from newborns after obtaining motheracutes informed consent to participate in the study
Umbilical cord blood (UCB) samples were collected at birth (n = 8) and after
2 months peripheral blood samples (n = 8) were collected from the subjects
There were 4 girls and 4 boys among the subjects of the study all of which were
full-term born by vaginal delivery to healthy mothers
Collection of samples was slightly complicated due to inevitable elimination
of several participants (health reasons) and due to temporarily restricted operation with
the collaborating hospital
32 Sample processing
Blood samples were delivered from the hospital and processed within 2 hours after their
collection in tubes with and without anticoagulant K3EDTA was used as
an anticoagulant
Our intention was to isolate several different fractions of each sample ndash whole
blood serum plasma RBC membranes and total erythrocytes Aliquots of these sample
fractions were stored at -80 degC until assayed
Serum was isolated from tubes without anticoagulant by centrifugation (1000 g
20 min room temperature (RT)) and used for biochemical parameters assessment
in an automated analyzer (Cobas Mira S Roche) using commercially available assay kits
uric acid (Uric Acid ver2 Roche Diagnostics) albumin (Albumin Plus Roche
Diagnostics) total (Bilirubin Total Gen3 Roche Diagnostics) direct (Bilirubin Direct
Roche Diagnostics) and indirect bilirubin gamma glutamyl transferase (γ-
Glutamyltransferase ver2 Roche Diagnostics) aspartate transaminase (Aspartate
24
Aminotransferase Test ASTL Roche Diagnostics) and alanine transaminase (Alanine
Aminotransferase Test ALTL Roche Diagnostics)
Erythrocyte leukocyte and reticulocyte count Hb concentration hematocrit
hematimetric indexes ndash mean cell volume (MCV) mean cell hemoglobin (MCH) mean
cell hemoglobin concentration (MCHC) ndash and red cell distribution width (RDW) were
measured using an automatic blood cell counter (Sysmex K1000 Sysmex)
Anticoagulated whole blood was centrifuged at 2000 g 20 min 4 ordmC and
afterwards plasma was aliquoted and stored Leukocytes were isolated from RBCs after
centrifugation on a double density gradient (Histopaque 1077 Histopaque 1119
700 g30 minRT)
RBCs were then washed with saline solution (NaCl 90 gL centrifuged at
1000 g5 min4 degC) and small portion was frozen as total erythrocyte aliquots Another
portion of these RBCs was mixed with HClO4 5 and following a centrifugation
(10000 g15 min 4 degC) aliquots for GSH measurements were prepared
The rest of the RBCs were submitted to hypotonic lysis according to Dodge et al
(Dodge et al 1963) in order to isolate membranes Obtained membrane suspensions were
carefully washed in 5mM pH8 phosphate buffer using phenylmethylsulfonylfluoride
(final concentration 01 mM) in the first two washes as a protease inhibitor
33 Materials
331 Reagents
From Sigma-Aldrich Triton X-100 Tiobarbituric acid Coomassie Brilliant Blue G-250
CAT from bovine liver purpald H2O2 30 GPx from bovine erythrocytes GSH (L-
glutathione reduced) GSSG (L-glutathione oxidized disodium salt) GR
from bakeracutes yeast ndash S cerevisiae β-nicotinamide adenine dinucleotide 2acute-phosphate
reduced tetrasodium salt hydrate (NADPH) Cumene hydroperoxide 55acute-dithiobis-2-
nitrobenzoic acid (DTNB) 2-vinylpyridine KHCO3 Iron(II) sulfate heptahydrate
Iron(III) chloride hexahydrate 246-Tris(2-pyridyl)-s-triazine (TPTZ)
From Merck ethanol methanol HClO4 70-72 Phosphoric acid 85 HCl 37 acetic
acid 100 KOH KIO4
25
From Panreac NaCl KH2PO4 K2HPO4 NaH2PO4 Na2HPO4 sodium acetate
From VWRChemicals n-butanol ethylenediamine tetraacetic acid (EDTA)
Bovine serum albumin (BSA) from Calbiochem and formaldehyde 365
from Chem- Lab
332 Consumables
96 wells plates Pauster Pipettes Micro-pipette Tips Eppendorf tubes etc
333 Instruments
Centrifuge (1580R GYROZEN) Micro-centrifuge (Heraeus Freco 21 Thermo
Scientific) Microplate reader (Power Wave XS Bio-Tek) Water bath (FALC) Vortex
(VELP Scientifica) Ultra-Low Temperature Freezer (MDF-U5386S Panasonic)
Fumehood (Industrial Laborum)
334 Software
KC junior (microplate reader software)
IBM SPSS (Statistics Package for Social Sciences) version 240
34 Methods
341 General
To be able to assess the changes of measured data credibly both samples of the same
subject ndash newborn and 2 months follow-up ndash were always assayed at the same time under
the same conditions
342 Determination of total protein concentration
The modified Bradford method was used to estimate the total protein concentration
of membrane and total erythrocyte samples (Bradford 1976)
26
The Bradfordacutes reagent (100 mg of Coomassie Brilliant Blue G-250 50 mL
of ethanol 95 100 mL of phosphoric acid 85) exists in two different color forms red
and blue The Reagentacutes binding to protein molecules is accompanied by its color change
and thus by a shift in absorption maximum (from 365 to 595 nm) The absorbance
at 595 nm is spectrophotometrically monitored (microplate reader) and compared with
a set of protein standard solutions
Membrane samples were diluted 1100 and the total erythrocytes ones 115000
The standard curve was obtained using a set of BSA standards (concentration
00 to 005 mgmL) An Internal Control (dilution 12000) was used to standardize
and validate the obtained data
343 Membrane bound hemoglobin
MBH was measured by spectrophotometry (microplate reader) in erythrocyte membrane
suspensions samples (Santos-Silva et al 1995)
Triton X-100 (5 wv in 5mM pH8 phosphate buffer) was added to the samples
for protein dissociation and the absorbance was measured at 415 nm (maximum Hb
absorbance) and at 700 nm (background absorbance) The MBH percentage was
estimated using the corrected absorbance value and total protein concentration
of the samples to normalize its percentage (equation 3)
MBH =A415 minus A700
[Total protein concentration] x 100 (equation 3)
344 Erythrocyte membrane lipid peroxidation
The TBARS test adapted from Mihara and Uchiyama (1977) was used to determine
the erythrocyte membrane LPO in membrane and plasma samples (Mihara amp Uchiyama
1978)
To assess the LPO of each sample the quantity of MDA and its precursors was
determined MDA is one of the main LPO products and the method makes use of its
reaction with TBA which results in a formation of a red colored chromogen adduct with
absorption maximum at 535 nm (Ayala et al 2014)
27
Membrane samples were incubated 10 min at RT with Triton X-100 20
to dissociate proteins The following procedure was the same for both membrane
and plasma samples H3PO4 10 (vv) and TBA 06 (mv) were added to the samples
the tubes were thoroughly homogenized and incubated on a boiling water bath for
45 minutes Afterwards samples were put on ice to cool down and n-butanol was added
to each tube to extract the TBA-MDA complex The organic layer was separated by
centrifugation (1000 g 2 min RT) and its absorbance was measured by
spectrophotometry at 535 nm
For RBC membrane samples the LPO was determined after correcting this value
with background absorbance (520 nm) and normalizing it with total protein concentration
for each sample For plasma samples we used directly the value of absorbance at 535 nm
345 Quantification of catalase activity
To determine the activity of CAT in membrane and total erythrocytes samples
a spectrophotometric method adapted from Johansson and Borg was performed
(Johansson amp Borg 1988)
The method is based upon the CAT peroxidatic activity the reaction
of the enzyme with a hydrogen donor (methanol) in the presence of optimal
concentration of H2O2 results in a formation of formaldehyde The latter forms a bicyclic
heterocycle with a chromogen 4-amino-3-hydrazino-5-mercapto-124-triazole
(Purpald) which upon oxidation changes from colorless to a purple compound with
absorption maximum at 540 nm (Figure 3) The absorbance was compared to a set
of standard formaldehyde solutions and its value was used to calculate the activity
of the enzyme
H2O2 + CH3OH + Purpald CATrarr CH2O + 2 H2O
Figure 3 Quantification of catalase activity Hydrogen peroxide (H2O2) reaction with methanol
(CH3OH) in the presence of catalase (CAT) yields formaldehyde (CH2O) and water (H2O) Formaldehyde
and Purpald form a compound which upon oxidation changes from colorless to purple Adapted
from Melo 2017 (Melo 2017)
The membrane samples were diluted 125 and total erythrocyte samples 110000
A set of standard formaldehyde solutions (0 ndash 75 uM) was prepared All samples
28
standards and the control were incubated with methanol and H2O2 350 mM
for 20 minutes then KOH 100 M (to stop the reaction) and Purpald (chromogen) were
added After 10 minutes of incubation KIO4 3000 mM (color amplifier) was added to all
wells and following a 5 minutes incubation the absorbance was measured at 540 nm A
CAT activity internal control was used to validate the results
The enzyme activity was determined by interpolation of the sample values
in the standard curve and by applying a formula (including normalization of the activity
by dividing by total protein concentration) as seen in equation 4
119862119886119905 119886119888119905119894119907119894119905119910 (119899119898119900119897119898119894119899119898119871119898119866119875119905) = 119891119900119903119898119886119897119889119890ℎ119910119889119890 119888119900119899119888119890119899119905119903119886119905119894119900119899 119909 (017002)
20 (min) 119909 119863 119865 119909
1
119875119905
(equation 4)
346 Quantification of glutathione peroxidase activity
The activity of GPx was measured in total erythrocyte samples by an indirect assay
adapted from Weydert amp Cullen (Weydert amp Cullen 2010)
This spectrophotometric method enables GPx activity quantifying through
the actions of other enzymes and cofactors that are necessary for its function
GPx catalyzes the reduction of various hydroperoxides (eg H2O2) to H2O via
oxidation of reduced GSH into its disulfide form GSSH GSSG is regenerated to GSH by
GR with consumption of NADPH The decrease of NADPH can be easily monitored
spectrophotometrically and is proportional to GPx activity
Samples were diluted 1200 and a set of standard GPx solutions
(0 ndash 1000 mUmL) was prepared as well as a GPx internal control to validate
the procedure GSHGR solution (with final well concentration 10 mM10 UmL)
and NADPH 02 mM (final well concentration) were added followed by 10 minutes
of incubation at 25 degC After adding the substrate cumene hydroperoxide 15 mM (final
well concentration) a kinetic absorbance reading was performed at 340 nm for 5 minutes
(30 seconds intervals) The value of GPx activity was obtained after interpolation
of the samples absorbance delta per minute in the standard curve and after normalizing
this value with the total protein concentration for each sample
29
347 Determination of total antioxidant status
To determine the TAS in both plasma and total erythrocyte samples the Ferric Reducing
Ability of Plasma (FRAP) Assay was used according to a method adapted from I F F
Benzie amp J J Strain (Benzie amp Strain 1996)
Ferric and ferrous ions can form a complex with TPTZ The ion ferric to ferrous
reduction can be monitored at low pH as a blue colored complex of Fe2+-TPTZ with
absorption maximum at 593 nm is formed By comparing the absorbance change
in samples with the absorbance in a set of standards of known concentration of ferrous
ion the FRAP values were determined
Total erythrocytes samples were diluted to 150 the plasma samples were applied
directly to the plate A set of standard solutions (ferrous ion concentrations 00 ndash 10 mM)
was prepared to obtain the standard curve A ferrous internal control ensured
the validation and standardization of the procedure
The FRAP reagent (acetate buffer 3000 mM + ferric ion 200 mM + TPTZ
100 mM 1011) was added to all the samples and the absorption at 0 min and 4 min was
measured spectrophotometrically at 37 ordmC After comparing the values with those
obtained from the standard curve total protein concentration was used to normalize
the values of TAS
348 Quantification of total glutathione and oxidized
glutathione
To determine the reduced glutathione (GSH)oxidized glutathione (GSSG) ratio total
GSH and GSSG were quantified in the total erythrocyte samples according to a method
adapted from Shaik amp Mehvar (Shaik amp Mehvar 2006) and from Griffith (Griffith 1980)
The principle of this spectrophotometric method is the enzymatic recycling
of GSH by GR with consumption of NADPH GSH oxidation by DTNB is accompanied
by formation of a yellow chromogen 5-thio-2-nitrobenzoic acid (TNB) the quantity
of which is monitored and thus total GSH amount is determined as these two values are
proportional (Figure 4)
30
Figure 4 Quantification of total glutathione and oxidized glutathione Glutathione (GSH) can reduce
different compounds including 55rsquo-dithiobis-(2-nitrobenzoic acid) (DTNB) while oxidizing itself
(GSTNB) This reaction yields a yellow chromogen 5-thio-2-nitrobenzoic acid (TNB) the amount
of which can be monitored as it amount is proportional to available GSH amount Oxidized glutathione
(GSSG) is regenerated by glutathione reductase (GR) in a nicotinamide adenine dinucleotide phosphate
(NADPH) consuming reaction 2-Vinylpyridine serves as a masking agent Adapted from Melo 2017
(Melo 2017)
GSSG quantification employs exactly the same principleprotocol that total GSH
with only one additional step to distinguish the GSSG in the total amount of GSH
an agent (2- Vinylpyridine) is used to mask reduced GSH (McGill amp Jaeschke 2015)
Total erythrocyte samples were diluted with HClO4 5 1250 and 150 for total
GSH and GSSG quantifications respectively Sets of standard GSH (0 ndash 150 uM)
and GSSG (0 ndash 80 uM) solutions were prepared Internal controls of GSH and GSSG
were used to validate the results
To neutralize the samples KHCO3 076 M was added to samplesinternal control
and standard solutions After centrifugation (16000 g 2 min 4 degC) the samples were
transferred to a 96 well plate and the reagent solution (240 μM NADPH 13 mM DTNB
final well concentration) was added to each well and the plate was incubated for 15 min
at 30 degC Afterwards GR (final well concentration of 2 UmL) was added and a kinetic
reading was performed at 412 nm for 3 minutes (30 seconds intervals) Values
of the slope were used plotted against the standard curve and finally normalized by
the total protein concentration for each sample to get the total GSH values The GSSG
quantification required a pre-incubation of the samples with 2-vinylpyridine (10 microL) for
1 h at 4 degC
31
35 Statistical analysis
For statistical analysis the Statistical Package for Social Sciences (IBM SPSS version
240 SPSS Inc) for Windows was used
Descriptive statistic tools were employed to characterize the data including
Shapiro-Wilk normality test As some of our data presented non-Gaussian distribution
we used the non-parametric Wilcoxon Signed-Rank Test for related samples to evaluate
the differences between the studied groups (baby at birth and in 2 months of age)
Spearmanrsquos rank correlation coefficient was used to assess relationships between sets
of data Data are presented as median (interquartile range) The level of significance (p)
was set at 005
32
4 RESULTS
The first task of our work was to obtain physiological data linked to OS These can be
divided into three groups hematological data biochemical data (both performed
in the hospital) and our own measurements of RBC-specific OS related values
(OS biomarkers)
Hematological and biochemistry tests were performed at birth (from UCB
samples) and then in two months (64 days in average peripheral blood samples)
Experimental values were obtained in our laboratory after receiving the follow-up
samples matching the newborn samples as the importance was given to having the same
assay conditions for both of the paired samples
To assess the relationships between different parameters Spearmans rank
correlation coefficient was used
41 Hematological data
RBC count Hb hematocrit MCV MCH MCHC RDW reticulocytes and leukocytes
count were measured
The results (Table 2) show that there was a significant difference (plt005)
between newborn and 2 months follow-up measurements in all examined parameters
Significant decrease was observed in the following indices RBCs Hb
hematocrit MCV MCH RDW reticulocytes and leukocyte count
These changes were expected and are in an accordance what was already known
(Esan 2016 Ogundeyi MM et al 2011 Soldin et al 2005)
Comparison of the follow-up samples with reference values shows that apart
from RDW all data fall into the reference range (Soldin et al 2005) Given references
relate to peripheral blood samples of males aged 61 d to lt181 d as in Pediatric
Reference Intervals (Soldin et al 2005)
33
Table 2 Hematological data of healthy newborns and of their 2 months follow-up
newborn 2 months old p
reference
value -
2 months
RBC [x1012L] 435 (421 - 457) 371 (354 - 385) 0012 367 - 461
Hemoglobin [gdL] 148 (149 - 159) 108 (107 - 117) 0012 105 - 130
Hematocrit [] 449 (434 - 468) 310 (305 - 355) 0012 305 - 377
MCV [fL] 103 (101 - 106) 847 (832 - 857) 0012 796 - 863
MCH [pg] 349 (336 - 352) 299 (293 - 305) 0012 276 - 299
MCHC [gdL] 338 (330 - 341) 354 (349 - 356) 0012 339 - 354
RDW [] 163 (163 - 173) 133 (128 - 137) 0012 135 - 153
Reticulocytes [x109L] 166 (162 - 193) 727 (576 - 110) 0017 370 - 104
Leukocytes [x109L] 160 (129 - 188) 84 (69 - 103) 0012 79 - 134 RBC red blood cell MCV mean cell volume MCH mean cell hemoglobin MCHC mean cell hemoglobin
concentration RDW red cell distribution width
Data are presented as median (inter ndash quartile range) values plt005 between newborn versus 2 months old groups
was considered statistically significant Wilcoxon Signed-Rank Test was used
Reference values were obtained from Pediatric Reference Intervals (Soldin et al 2005)
Positive and statistically significant correlations were found between
the gestational age and the count of leukocytes both in newborn and in 2 months samples
(r = 0766 p = 0027 n = 8 r = 0717 p = 0046 n = 8 respectively)
42 Biochemical data
Uric acid (UA) concentration bilirubin levels liver enzymes (gamma-glutamyl
transferase GGT aspartate aminotransferase AST alanine aminotransferase ALT)
and albumin concentration were quantified and calculated
The data can be seen in Table 3 Uric acid GGT AST ALT (and thus ASTALT
ratio) and albumin values changed significantly over two months A decrease was found
in UA GGT and albumin levels AST ALT and albumin levels showed a significant
increase
The follow-up (2 months old) values were compared with reference values and all
but direct bilirubin were within the reference range Reference values relate to peripheral
blood samples of infants aged approximately 2 months (the age intervals differ)
according to The Harriet Lane Handbook (Kahl amp Hughes 2017)
34
Table 3 Biochemical data of healthy newborns and of their 2 months follow-up
newborn 2 months old p
reference
value
2 months
Uric acid [mgdL] 485 (435 - 588) 260 (243 - 300) 0012 11 - 56
Total bilirubin [mgdL] 146 (123 - 165) 108 (045 - 159) 0208 ˂ 12
Direct bilirubin [mgdL] 058 (046 - 066) 040 (020 - 055) 0262 ˂ 02
Indirect bilirubin [mgdL] 090 (057 - 110) 068 (024 - 110) 0528 ˂ 10
GGT [UIL] 148 (91 - 203) 53 (33 - 111) 0025 80 - 900
AST [UIL] 285 (200 - 330) 375 (325 - 101) 0035 90 - 800
ALT [UIL] 105 (53 - 128) 280 (253 - 720) 0012 130 - 450
ASTALT 295 (235 - 338) 130 (085 - 153) 0011 07 - 18
Albumin [gdL] 384 (370 - 392) 414 (397 - 441) 0017 22 - 48 GGT gamma-glutamyl transferase AST aspartate aminotransferase ALT alanine aminotransferase
Data are presented as median (inter ndash quartile range) values plt005 between newborn versus 2 months old groups
was considered statistically significant Wilcoxon Signed-Rank Test was used
Reference values were obtained from The Harriet Lane Handbook (Kahl amp Hughes 2017)
43 Oxidative stress biomarkers
While assessing OS biomarkers we worked with different fractions of the blood samples
RBC membranes total erythrocyte and plasma
All the presented OS biomarkers data are values that were normalized by protein
concentration of each sample Mentioned reference values were obtained in previous
research and projects of our laboratory and belong to adult subjects so they only serve
as a rough comparison since they are biased by age and development
35
431 RBC membranes
Three tests were performed using erythrocyte membranes from our subjects Graphic
representation can be seen in Figure 5
MBH percentage decreased significantly from newborn to 2 months follow-up
reference range for adults is 052 - 097
Statistically significant positive correlations were found in newborns between
MBH and the following indices membranersquos CAT activity (r = 0810 p = 0015 n = 8)
total RBC GPx activity (r = 0810 p = 0015 n = 8) plasma LPO (r = 0778 p = 0023
n = 8) A negative statistically significant correlation was observed with GSHGSSG ratio
(r = -0762 p = 0028 n = 8)
Quantification of CAT activity in membranes contrary to our expectation has not
shown a significant difference between newborns and 2 months samples reference range
for adults is 65 - 571 nmolminmLmGPt
Statistically significant correlations were discovered in these cases membranersquos
CAT activity in newborns correlates positively with GPx activity in 2 months samples
(r = 0762 p = 0028 n = 8) and with plasma LPO in newborns (r = 0717 p = 0046
n = 8) and negatively with GSHGSSG ratio in newborns (r = -0762 p = 0028 n = 8)
LPO measured in RBC membranes seems to drop significantly after two months
and a tendency to decrease to common adult reference range (0012 - 0017 μMmGPt) is
clear Strength of this OS biomarker is also supported by statistically significant
Figure 5 Oxidative stress biomarkers - RBC membranes of healthy newborns and of their 2 months
follow-up MBH CAT LPO MBH membrane bound hemoglobin CAT catalase activity LPO lipid
peroxidation Data are presented as median (inter ndash quartile range) values plt005 between newborn
versus 2 months old groups was considered statistically significant Wilcoxon Signed-Rank Test was used
36
correlations a negative one was found between LPO 2 months and TAS 2 months
(r = - 0786 p = 0021 n = 8) a positive link was discovered between LPO in newborns
and CAT activity (measured in total erythrocytes 2 months) and GPx activity (newborn)
levels (r = 0738 p = 0037 n = 8 and r = 0762 p = 0028 n = 8 respectively) and
in the 2 months follow-up there was an interesting (positive) connection with
hematological indices RBC count and Hb in newborns (r = 0714 p = 0047
n = 8 and r = 0759 p = 0029 n = 8 respectively)
432 Total erythrocytes
Quantification of CAT activity of TAS and of GPx activity was performed using total
erythrocyte samples results are presented in Figure 6
Figure 6 Oxidative stress biomarkers ndash total erythrocytes of healthy newborns and of their 2 months
follow-up CAT TAS GPx CAT catalase activity TAS total antioxidant status GPx glutathione
peroxidase activity Data are presented as median (inter ndash quartile range) values plt005 between newborn
versus 2 months old groups was considered statistically significant Wilcoxon Signed-Rank Test was used
CAT activity showed an increase from newborns to 2 months follow-ups with
reference values being 181 ndash 275 nmolminmLmGPt Positive and statistically
significant correlation with gestational age was discovered in newborn samples
(r = 0766 p = 00278 n = 8) on the other hand in the follow-up samples it correlates
negatively and significantly with follow-up reticulocytes value (r = -0786 p = 0021
n = 8)
Despite our expectations TAS levels have not proven to change with statistical
significance both values met the reference range 0040 - 0056 mM However there are
some interesting correlations (statistically significant) 2 months TAS samples showed
37
a positive links to reticulocyte count in newborns (r = 0738 p = 0037 n = 8)
and to GSHGSSG ratio in 2 months samples (r = 0881 p = 0004 n = 8)
For GPx we recorded a significant decrease From values above the reference
range in the newborns the levels dropped 2 months after birth reference
515 - 887 mUmL
While still using the total erythrocytes fraction a set of tests to measure GSH
related values was carried out (Figure 7)
Figure 7 Oxidative stress biomarkers - total erythrocytes of healthy newborns and of their 2 months
follow-up glutathione GSH glutathione GSSG oxidized glutathione Data are presented as median
(inter ndash quartile range) values plt005 between newborn versus 2 months old groups was considered
statistically significant Wilcoxon Signed-Rank Test was used
38
None of the indices showed significant changes over the 2 months after birth All
the examined values (total glutathione oxidized glutathione reduced glutathione
and reducedoxidized glutathione ratio) were within the reference ranges total GSH
948 ndash 153 μM GSSG 119 ndash 194 μM reduced GSH 829 ndash 134 μM and GSHGSSG
689 ndash 697
Several statistically significant correlations support the data positive correlation
in newborns - total GSH and both reduced GSH and GSHGSSG (r = 0976 p lt 0001
n = 8 and r = 0762 p = 0028 n = 8 respectively) In 2 months samples there is
a connection between total GSH and reduced GSH (r = 0952 p lt 0001 n = 8) Oxidized
glutathione has a negative link to GSHGSSG both in newborns (r = -0738 p = 0037
n = 8) On the other hand GSHGSSG correlates positively with reduced GSH
in newborns as well (r = 0833 p = 0010 n = 8) All these connections are not surprising
since they only support the knowledge of GSH metabolism
More of novelty could be these reduced GSH in 2 months samples correlates
significantly and positively with the reticulocytes count in newborns and negatively with
the UA levels in newborns (r = -0810 p = 0015 n = 8 and r = -0735 p = 0038 n = 8
respectively) GSHGSSG ratio in newborns showed a negative link to plasma LPO
in newborns and a positive one to reticulocytes count in newborns (r = -0766 p = 0027
n = 8 and r = 0762 p = 0028 n = 8 respectively)
39
433 Plasma
LPO and TAS were determined in the plasma fraction of the samples Graphic
representation of the evolution of the values can be seen in Figure 8
Figure 8 Oxidative stress biomarkers ndash plasma of healthy newborns and of their 2 months
follow ndash up LPO TAS LPO lipid peroxidation TAS total antioxidant status Data are presented as
median (inter ndash quartile range) values plt005 between newborn versus 2 months old groups was
considered statistically significant Wilcoxon Signed-Rank Test was used
Contrary to LPO measured in membranes plasma LPO has not shown
a significant difference though a decrease was observed Both LPO plasma values seem
to be even lower than the reference ones reference for adults 0022 - 0043 μM
TAS decreases in time reference range being 028 - 040 mM
40
5 DISCUSSION
Erythrocytes cells responsible for O2CO2 transport in the human organism are
continuously exposed to ROS either from endogenous or exogenous origin Though they
are equipped with a powerful AOX defense system these mechanisms can get
overwhelmed on some occasions resulting in damage to both RBCs and other cells
and tissues A state when harmful pro-oxidants outweigh the AOX capacity and thus
disturb the balance is called OS The cause of OS is usually associated with various
pathologies and diseases but it has been documented in healthy newborns as well
Neonates after being suddenly exposed to relatively hyperoxic extrauterine environment
with their immature organisms working autonomously for the first time are extremely
susceptible to FR By evaluating reliable biomarkers of OS we can analyze how
the newborns cope with this newly acquired autonomy
In this study we present experimental data obtained by measurements of several
OS biomarkers we follow the changes in hematology and biochemistry of neonates
and with the support of correlations we estimate the connections and mechanisms among
various AOX agents focusing on the erythrocyte as a model of OS
51 Hematological data
Although basic hematology assays are carried out in every hospital laboratory on a daily
basis it is not very common to have them from healthy newborns right after birth
from the UCB But these values when compared with a follow-up assayed under
the same conditions give us a precious insight on how the biochemistry of a newborn
infant changes with age and the hematological values themselves are often required for
monitoring and diagnosis of a possible pathology
All the measured hematological parameters were found to be normal (Table 2)
and they correspond with common knowledge about the topic (Esan 2016 Ogundeyi
MM et al 2011 Soldin et al 2005) Overproduction of various blood elements
and substances is an important part of the organism preparing for being literally cut off
the mother All the components necessary for gas carriage as well as white cells
responsible for the so needed immunity exceed the counts that are usually found in older
41
children and adults Attention must be paid while comparing values with reference
ranges not only the age of an infant matters but also the type of collected blood ndash venous
versus UCB In our study newborn samples donrsquot have reference values to compare them
to as there are no official ranges for cord blood which is an improvement given to this
field of knowledge by this work Little insight can be seen from the work
of Catarino et al (Catarino et al 2009) who also evaluated UCB for several parameters
as we did plus they worked with a Portuguese population as well while our reference
values for 2 months samples come from American authors and population (Soldin et al
2005) A different set of reference ranges can be found in the work of Qaiser Sandila
Ahmed amp Kazmi (Qaiser et al 2009) who worked with Pakistani newborns measured
values are in accordance with our results Another study was conducted by Ogundeyi
MM et al in Nigeria The researches there worked with around 150 infants whose
samples of venous blood were taken at birth in 3 days and in 6 weeks of life Although
we cannot directly compare the values with our results the tendency of the indices
to drop in time is obvious and corresponds with our findings and general knowledge
(Ogundeyi MM et al 2011)
It was described that in the neonatal period the complete blood count highly
correlates with birth weight blood sampling site crying physical therapy mode
of delivery and gestational age (Esan 2016) In accordance we found a positive
correlation of gestational age (38-70 weeks) with the leukocytes count in our newborns
52 Biochemical data
Liver besides its metabolic and other functions is the principal detoxifying organ in
the human organism (Casas-Grajales amp Muriel 2015)
UA as powerful plasmatic AOX providing up to 60 of AOX capacity
of plasma (Fabbrini et al 2014) acts as a FR scavenger and chelator of transitional
meatal ions (Kang amp Ha 2014 Pasalic et al 2012) But the role of UA in the AOX
defense system is somehow dual while it neutralizes peroxynitrite and hydroxyl radicals
to inhibit protein nitration and LPO the reaction in which the UA is formed produces
ROS as by-products (Kang amp Ha 2014 Pasalic et al 2012) UA is the end product
of purine metabolism in humans the reaction being catalyzed by xanthine oxidase
42
hypoxanthine is oxidized to xanthine xanthine to UA In both reactions molecular O2 is
reduced and superoxide radical and H2O2 are formed (Casas-Grajales amp Muriel 2015)
In newborns it is normal that serum UA is increased Raivio stated that the mean
value in cord blood is 60 mgdL increases to 70 mgdL in the next 24h and decreases
to 35mgdL over next three days (Raivio 1976) High UA levels could be explained by
many morphological changes occurring in the blood of the neonate nuclei of the former
RBCs disappear polynuclear neutrophils predominance changes in favor
of lymphocytes total leukocyte count drops significantly which results in a large amount
of purines (Kingsbury amp Sedgwick 1917)
Bilirubin a natural AOX is well-known as the end product of heme metabolism
Heme is released from aging RBCs and in the turnover of heme-containing enzymes
Free-heme can be toxic though so a family of heme oxygenase enzymes degrades it
the heme ring is cleaved to form biliveridin which can be reduced to bilirubin
in the NADPH consuming reaction catalyzed by biliveridin reductase (Sedlak amp Snyder
2004) Bilirubin is toxic and insoluble and thus must be conjugated with glucuronic acid
before excretion into the bile Or bilirubin can be oxidized back to biliveridin while
reducing ROS This biliverdin ndash bilirubin cycle appears to affect OSndashinduced membrane
lipid degradation Although concentrations of bilirubin are relatively lower than the ones
of GSH the continuous recycling of biliverdin to bilirubin amplifies its effect by more
than 10 000 times and therefore even small increase in bilirubin levels could account for
a significant increase in its AOX potency (Marconi et al 2018)
A significant number of term and pre-term newborns display some level
of neonatal jaundice It is accompanied by an increase in serum of (unconjugated
indirect) bilirubin levels mostly caused by breakdown of RBCs Extremely high levels
of unconjugated bilirubin can be neurotoxic leading up to kernicterus but majority
of the jaundice cases a ldquophysiologic jaundicerdquo respond well to phototherapy which is
a gentle and effective way of reducing bilirubin levels (Mitra amp Rennie 2017 Sedlak amp
Snyder 2004)
Our results (Table 3) are in accordance with known reference ranges and follow
expected developmental tendencies in healthy term infants We recorded a significant
decrease in UA levels slight changes in liver enzymes levels that settle up at known
physiological values in follow-ups and significant increase of albumin Reshad et al
43
suggested that association between UCB albumin levels and the tendency to develop
significant neonatal hyperbilirubinemia in both term and preterm neonates could lead
to albuminacutes application as a marker in screening the newborn infants for possible
development of neonatal hyperbilirubinemia (Reshad et al 2016)
53 Oxidative stress biomarkers
The focus of our work was pointed towards the AOX capacity of RBCs Even though we
expected more of our biomarkers to document significant changes between newborn
versus follow-up the fact that several of them exhibited a significant difference despite
the small number of samples (n = 8) suggests that those biomarkers are strong
and reliable ones (MBH LPO membranes GPx CAT total erythrocytes plasma TAS)
(Figures 5 6 7 and 8)
Since no official reference values for OS biomarkers in newborns exist we could
only compare our follow-up data with experimental values obtained in previous research
of our laboratory from samples of adult individuals and there was no reference
for the newborn samples (from UCB)
In RBC membranes the decrease in the MBH and LPO (Figure 5) which are
generally believed to be good OS biomarkers (Ayala et al 2014 Pandey amp Rizvi 2010
Rizvi amp Maurya 2007 Sharma amp Premachandra 1991 Welbourn et al 2017)
corroborates the theory of the OS being at its highest right after birth reflecting
the sudden exposure to relatively hyperoxic environment (Perrone et al 2010) Contrary
to our expectations plasmatic TAS decreased (Figure 8) For a better explanation this
assay would probably need to be repeated to discover whether this preliminary result
would change with a larger number of samples or whether it would follow the same trend
(decreasing after birth) The latter option could represent a developmental stage in infant
where plasmatic TAS in 2 months of age is decreased and then increases with age
Strength of the MBH and LPO as biomarkers can be supported by several correlations
not only they correlate with each other but a negative link between LPO and total
erythrocytes TAS was found in the follow-up samples thus the lower the OS levels get
the higher the AOX capacity is Activity of GPx which decreased over 2 months after
birth also seems to have a significant positive correlation with the two biomarkers while
the other AOX enzyme CAT significantly increases (Figure 6) This observation could
44
be explained by the different targets of these enzymes Although both of them detoxify
the cell from H2O2 CAT is described to work at higher H2O2 concentrations of mostly
exogenous origin while GPx on the other hand catalyzes the decomposition of low
levels of endogenous H2O2 often generated by auto-oxidation of Hb (Rocha et al 2015)
The decrease of GPx activity could be explained by the newbornacutes adaptation to the outer
environment accompanied by the documented reduction of birth-related OS However
the newly acquired autonomy of the older infant brings along an increasing exposure
to various oxidants of exogenous origin Here supposedly CAT steps in to protect
the cells and thus its activity is increased
Although OS is usually related to pathological conditions many studies
(Norishadkam et al 2017 Ozsurekci amp Aykac 2016 Perrone et al 2010) including our
work show that it also accompanies a physiological event such as birth of a healthy
full- term baby Broader collection of physiological reference values for OS biomarkers
and proper knowledge of the mechanism behind them could help physicians
in the evaluation of development of newborns or early prediction of potential future
disorders
Nevertheless we cannot omit the role of these oxidative damage parameters
in various OS related diseases several of them were described in the literature chronic
lung diseases intraventricular hemorrhages of newborns necrotizing enterocolitis
(Norishadkam et al 2017 Perrone et al 2010) bronchopulmonary dysplasia retinopathy
of prematurity patent ductus arteriosus periventricular leukomalacia respiratory distress
syndrome intrauterine growth retardation congenital malformation (Ozsurekci amp Aykac
2016) Reference values of OS biomarkers could be a valuable source of information for
the diagnosis effective treatment and disease monitoring
Tsukahara also suggests that restoration of redox balance either by decreasing
exposure to ROS or by augmenting AOX capacity represent a promising way
of therapeutic intervention in OS related diseases Classic AOXs include tocopherols
carotenoids and ascorbate but it has been suggested that their effect is only symptomatic
since they scavenge already existing ROS and thus do not serve as a causal treatment
(Tsukahara 2007)
Several AOX strategies were involved in clinical trials in the pediatric field
including administration of corticosteroids for bronchial asthma and bacterial meningitis
45
melatonin for neonatal asphyxia and epilepsy tocopherols and ascorbates for endothelial
dysfunction in hyperlipidemia L-arginine for endothelial dysfunction in cardiac
transplantation folinic acid betaine and methylcobalamin for autism (Tsukahara 2007)
enteral glutamine and arginine for prevention of necrotizing enterocolitis epicatechin
(for blockage of peroxynitrite-mediated tyrosine nitration and peroxynitrite formation)
in ischemic proliferative diseases of the retina (Ozsurekci amp Aykac 2016) Some
favorable results of these strategies were described but still further studies with broader
population are required and as Tsukahara mentions other techniques for measurement
of OS status because the establishment of reference values for OS biomarkers is
paramount for these studies
Generally we believe that OS and its mechanisms need to be further explored
new studies conducted and data collected Our contribution despite the limited number
of subjects provides insight in the issue as we bring a number of reference values for OS
biomarkers in early infancy Portuguese individuals which to our knowledge have not
been described before
46
6 CONCLUSION
In the present work we focused on the study of OS in newborns with the aid
of appropriate biomarkers of OS focusing mainly on the erythrocyte
We obtained physiological OS-related data including complete blood count
general biochemical data and experimental values from a small population of Portuguese
healthy full-term newborns The sample collections occurred twice at birth
and in 2 months of age By observing how the values change newborn versus follow-up
we gained a good insight about the development of the infant
Both hematological and biochemical data follow the reference values
as anticipated Our experimental values support the theory of so called hyperoxic
challenge which induces high levels of OS in healthy neonates several of our biomarkers
recorded a significant change in OS levels MBH and LPO in membranes decreased as
well as GPx activity while CAT activity in total erythrocytes increased The first three
biomarkers document neonateacutes adaptation to the environment and CATTAS values
suggest autonomy development of the newborn who starts to encounter various
exogenous oxidants
As there are no official reference values for OS biomarkers in newborns our
results are a novelty and provide an invaluable progression in this field of knowledge
though our number of samples is small and further studies are warranted
OS has been linked with a number of pathological conditions both in newborns
and older individuals Proper knowledge of the mechanisms behind OS and oxidative
damage and large quantity of reliable data documenting the OS-related reference values
could be a precious tool in the assessment of human health and disease
47
7 LIST OF ABBREVIATIONS
OH hydroxyl radical
23-DPG 23-diphosphoglycerate
AIDS acquired immune deficiency syndrome
ALT alanine aminotransferase
AOX antioxidant
AST aspartate aminotransferase
ATP adenosine triphosphate
BFU-E burst-forming unit - erythroid
BSA bovine serum albumin
CAT catalase
CFU-E colony-forming unit - erythroid
CMP common myeloid progenitor
CO2 carbon dioxide
Cys cysteine
CysP peroxidatic cysteine
deoxyHb deoxyhemoglobin
DF dilution factor
DTNB 55acute-dithiobis-2-nitrobenzoic acid
EHM extramedullary hematopoiesis
FAD flavin adenine dinucleotide
FR free radicals
FRAP ferric reducing ability of plasma
G-6-P glucose-6-phosphate
GGT gamma-glutamyl transferase
Glc glucose
GLUT1 glucose transporter
GPx glutathione peroxidase
GR glutathione reductase
GSH glutathione
GSSG oxidized glutathione
H2O water
H2O2 hydrogen peroxide
Hb hemoglobin
His histidine
48
HPX hypoxanthine
IL interleukine
K3EDTA tripotassium ethylenediaminetetraacetic acid
Km Michaelis constant
LDL low-density lipoprotein
LPO lipid peroxidation
MBH membrane-bound hemoglobin
MCV mean cell volume
MCH mean cell hemoglobin
MCHC mean cell hemoglobin concentration
MDA malondialdehyde
metHb methemoglobin
NADP nicotinamide adenine dinucleotide phosphate
NADPH reduced nicotinamide adenine dinucleotide phosphate
O2 oxygen
O2ndash superoxide anion
OS oxidative stress
Prx peroxiredoxin
PS phosphatidylserine
PUFA polyunsaturated fatty acid
Purpald 4-amino-3-hydrazino-5-mercapto-124-triazole
RT room temperature
RBC red blood cells
RDW red cell distribution width
RNA ribonucleic acid
ROS reactive oxygen species
Sec selenocysteine
SOD superoxide dismutase
TBA thiobarbituric acid
TBARS thiobarbituric reactive substances
TNB 5-thio-2-nitrobenzoic acid
TPTZ 246-Tris(2-pyridyl)-s-triazine
Trx thioredoxin
UA uric acid
UCB umbilical cord blood
XAN xanthine
49
8 REFERENCES
Aksoy Y Balk M Oumlgus H Oumlzer N The Mechanism of Inhibition of Human Erythrocyte
Catalase by Azide Turkish Journal of Biology 200428(2-4)
An X Mohandas N Disorders of red cell membrane Br J Haematol 2008141(3)367-
75
Anonymous Erythropoiesis Simplified EpoMedicine c2016 [updated 201809012018-
09-01] Available from httpepomedicinecommedical-studentserythropoiesis-
simplified
Anonymous Reasearch areas Faculdade de Farmaacutecia da Universidade do Porto c1996-
2018 [updated 2017-08-042018-08-19] Available from
httpssigarraupptffupptWEB_BASEGERA_PAGINAp_pagina=pC3A1gina
20estC3A1tica20genC3A9rica20155
Arthurs G Sudhakar M Carbon dioxide transport Continuing Education in Anaesthesia
Critical Care amp Pain 20055(6)
Ayala A Munoz MF Arguelles S Lipid peroxidation production metabolism and
signaling mechanisms of malondialdehyde and 4-hydroxy-2-nonenal Oxid Med Cell
Longev 20142014360438
Benzie IF Strain JJ The ferric reducing ability of plasma (FRAP) as a measure of
antioxidant power the FRAP assay Anal Biochem 1996239(1)70-6
Birben E Sahiner UM Sackesen C Erzurum S Kalayci O Oxidative stress and
antioxidant defense World Allergy Organ J 20125(1)9-19
Bradford MM A rapid and sensitive method for the quantitation of microgram quantities
of protein utilizing the principle of protein-dye binding Anal Biochem 197672248-54
Bresnick EH Hewitt KJ Mehta C Keles S Paulson RF Johnson KD Mechanisms of
erythrocyte development and regeneration implications for regenerative medicine and
beyond Development 2018145(1)
50
Brigelius-Flohe R Maiorino M Glutathione peroxidases Biochim Biophys Acta
20131830(5)3289-303
Brown KA Erythrocyte Metabolism and Enzyme Defects Laboratory Medicine
199627(5)
Bukhari KT Zafar H Reference values of reticulocyte counts in five age groups of
healthy infants at Rawalpindi Pakistan J Pak Med Assoc 201363(9)1108-11
Capece L Marti MA Crespo A Doctorovich F Estrin DA Heme protein oxygen affinity
regulation exerted by proximal effects J Am Chem Soc 2006128(38)12455-61
Casas-Grajales S Muriel P Antioxidants in liver health World J Gastrointest Pharmacol
Ther 20156(3)59-72
Catala A Lipid peroxidation of membrane phospholipids generates hydroxy-alkenals and
oxidized phospholipids active in physiological andor pathological conditions Chem
Phys Lipids 2009157(1)1-11
Catarino C Rebelo I Belo L Rocha-Pereira P Rocha S Bayer Castro E et al
Erythrocyte changes in preeclampsia relationship between maternal and cord blood
erythrocyte damage J Perinat Med 200937(1)19-27
Cimen MY Free radical metabolism in human erythrocytes Clin Chim Acta
2008390(1-2)1-11
Claster S Chiu DT Quintanilha A Lubin B Neutrophils mediate lipid peroxidation in
human red cells Blood 198464(5)1079-84
Costa V Quintanilha A Moradas-Ferreira P Protein oxidation repair mechanisms and
proteolysis in Saccharomyces cerevisiae IUBMB Life 200759(4-5)293-8
Culotta VC Superoxide dismutase oxidative stress and cell metabolism Curr Top Cell
Regul 200036117-32
Diez-Silva M Dao M Han J Lim CT Suresh S Shape and Biomechanical
Characteristics of Human Red Blood Cells in Health and Disease MRS Bull
201035(5)382-8
51
Dodge JT Mitchell C Hanahan DJ The preparation and chemical characteristics of
hemoglobin-free ghosts of human erythrocytes Arch Biochem Biophys 1963100119-
30
Dzierzak E Philipsen S Erythropoiesis development and differentiation Cold Spring
Harb Perspect Med 20133(4)a011601
Esan A Hematological differences in newborn and aging a review study Hematol
Transfus Int J 20163(3)
Fabbrini E Serafini M Colic Baric I Hazen SL Klein S Effect of plasma uric acid on
antioxidant capacity oxidative stress and insulin sensitivity in obese subjects Diabetes
201463(3)976-81
Floheacute L Glutathione Peroxidase Brought into Focus In Pryor W editor Free Radicals
in Biology Academic Press 1982 p 223-54
Friel JK Friesen RW Harding SV Roberts LJ Evidence of oxidative stress in full-term
healthy infants Pediatr Res 200456(6)878-82
Frijhoff J Winyard PG Zarkovic N Davies SS Stocker R Cheng D et al Clinical
Relevance of Biomarkers of Oxidative Stress Antioxid Redox Signal 201523(14)1144-
70
Fukai T Ushio-Fukai M Superoxide dismutases role in redox signaling vascular
function and diseases Antioxid Redox Signal 201115(6)1583-606
Geers C Gros G Carbon dioxide transport and carbonic anhydrase in blood and muscle
Physiol Rev 200080(2)681-715
Gordon-Smith T Structure and function of red and white blood cells Medicine
2013193-9
Griffith OW Biologic and pharmacologic regulation of mammalian glutathione
synthesis Free Radic Biol Med 199927(9-10)922-35
Griffith OW Determination of glutathione and glutathione disulfide using glutathione
reductase and 2-vinylpyridine Anal Biochem 1980106(1)207-12
52
Gwaltney-Brant S Biomarkers in Toxicology In Gupta RC editor Biomarkers in
Toxicology2014
Hall A Karplus PA Poole LB Typical 2-Cys peroxiredoxins--structures mechanisms
and functions FEBS J 2009276(9)2469-77
Halliwell B Biochemistry of oxidative stress Biochem Soc Trans 200735(Pt 5)1147-
50
Han YH Kim SU Kwon TH Lee DS Ha HL Park DS et al Peroxiredoxin II is essential
for preventing hemolytic anemia from oxidative stress through maintaining hemoglobin
stability Biochem Biophys Res Commun 2012426(3)427-32
Harris JR Schroder E Isupov MN Scheffler D Kristensen P Littlechild JA et al
Comparison of the decameric structure of peroxiredoxin-II by transmission electron
microscopy and X-ray crystallography Biochim Biophys Acta 20011547(2)221-34
Hattangadi SM Wong P Zhang L Flygare J Lodish HF From stem cell to red cell
regulation of erythropoiesis at multiple levels by multiple proteins RNAs and chromatin
modifications Blood 2011118(24)6258-68
Hoffbrand VA Moss PAH Hoffbrandrsquos Essential Haematology2016
Chang JC van der Hoeven LH Haddox CH Glutathione reductase in the red blood cells
Ann Clin Lab Sci 19788(1)23-9
Cho CS Lee S Lee GT Woo HA Choi EJ Rhee SG Irreversible inactivation of
glutathione peroxidase 1 and reversible inactivation of peroxiredoxin II by H2O2 in red
blood cells Antioxid Redox Signal 201012(11)1235-46
Chung J Chen C Paw BH Heme metabolism and erythropoiesis Curr Opin Hematol
201219(3)156-62
Johansson LH Borg LA A spectrophotometric method for determination of catalase
activity in small tissue samples Anal Biochem 1988174(1)331-6
53
Johnson RM Ho YS Yu DY Kuypers FA Ravindranath Y Goyette GW The effects of
disruption of genes for peroxiredoxin-2 glutathione peroxidase-1 and catalase on
erythrocyte oxidative metabolism Free Radic Biol Med 201048(4)519-25
Kahl L Hughes H The Harriet Lane Handbook a manual for pediatric house officers
The Harriet Lane Handbook Mobile Medicine Series 21st ed Philadelphia Pa Elsevier
2017 p 1272
Kamerbeek NM van Zwieten R de Boer M Morren G Vuil H Bannink N et al
Molecular basis of glutathione reductase deficiency in human blood cells Blood
2007109(8)3560-6
Kang DH Ha SK Uric Acid Puzzle Dual Role as Anti-oxidantand Pro-oxidant
Electrolyte Blood Press 201412(1)1-6
Kanias T Acker JP Biopreservation of red blood cells--the struggle with hemoglobin
oxidation FEBS J 2010277(2)343-56
Kingsbury J Sedgwick JP The uric acid content of the blood of the new-borns The
Journal of Biological Chemistry 191731(1)261-8
Kirkman HN Galiano S Gaetani GF The function of catalase-bound NADPH J Biol
Chem 1987262(2)660-6
Kodydkova J Vavrova L Kocik M Zak A Human catalase its polymorphisms
regulation and changes of its activity in different diseases Folia Biol (Praha)
201460(4)153-67
Kondo M Lymphoid and myeloid lineage commitment in multipotent hematopoietic
progenitors Immunol Rev 2010238(1)37-46
Kuhn V Diederich L Keller TCSt Kramer CM Luckstadt W Panknin C et al Red
Blood Cell Function and Dysfunction Redox Regulation Nitric Oxide Metabolism
Anemia Antioxid Redox Signal 201726(13)718-42
Kurata M Suzuki M Agar N Glutathione Regeneration in Mammalian Erythrocytes
Comparative Haematology International 200010(2)
54
Lee TH Kim SU Yu SL Kim SH Park DS Moon HB et al Peroxiredoxin II is essential
for sustaining life span of erythrocytes in mice Blood 2003101(12)5033-8
Li H Lykotrafitis G Erythrocyte membrane model with explicit description of the lipid
bilayer and the spectrin network Biophys J 2014107(3)642-53
Lichtman M Prchal J Levi M Press O Burns L Caligiuri M Hematology of the Fetus
and Newborn In Edmonson K Lebowitz H editors Williams Hematology 9th ed USA
McGraw-Hill Education 2016
Low FM Hampton MB Winterbourn CC Peroxiredoxin 2 and peroxide metabolism in
the erythrocyte Antioxid Redox Signal 200810(9)1621-30
Lu SC Regulation of glutathione synthesis Mol Aspects Med 200930(1-2)42-59
Lubos E Loscalzo J Handy DE Glutathione peroxidase-1 in health and disease from
molecular mechanisms to therapeutic opportunities Antioxid Redox Signal
201115(7)1957-97
Lux SEt Anatomy of the red cell membrane skeleton unanswered questions Blood
2016127(2)187-99
Manta B Hugo M Ortiz C Ferrer-Sueta G Trujillo M Denicola A The peroxidase and
peroxynitrite reductase activity of human erythrocyte peroxiredoxin 2 Arch Biochem
Biophys 2009484(2)146-54
Marconi VC Duncan MS So-Armah K Re VL 3rd Lim JK Butt AA et al Bilirubin Is
Inversely Associated With Cardiovascular Disease Among HIV-Positive and HIV-
Negative Individuals in VACS (Veterans Aging Cohort Study) J Am Heart Assoc
20187(10)
Marengo-Rowe AJ Structure-function relations of human hemoglobins Proc (Bayl Univ
Med Cent) 200619(3)239-45
Mate MJ Ortiz-Lombardia M Marina A Fita I Crystallization and preliminary structural
results of catalase from human erythrocytes Acta Crystallogr D Biol Crystallogr
199955(Pt 5)1066-8
55
May JM Ascorbate function and metabolism in the human erythrocyte Front Biosci
19983d1-10
McGill MR Jaeschke H A direct comparison of methods used to measure oxidized
glutathione in biological samples 2-vinylpyridine and N-ethylmaleimide Toxicol Mech
Methods 201525(8)589-95
Melo DF Enzymatic mechanism of antioxidant defense in the erythrocyte ndash cytosol
versus membrane [Master thesis] Universidade do Porto 2017
Mihara M Uchiyama M Determination of malonaldehyde precursor in tissues by
thiobarbituric acid test Anal Biochem 197886(1)271-8
Mitra S Rennie J Neonatal jaundice aetiology diagnosis and treatment Br J Hosp Med
(Lond) 201778(12)699-704
Monostori P Wittmann G Karg E Turi S Determination of glutathione and glutathione
disulfide in biological samples an in-depth review J Chromatogr B Analyt Technol
Biomed Life Sci 2009877(28)3331-46
Muller DP Free radical problems of the newborn Proc Nutr Soc 198746(1)69-75
Negi R Pande D Karki K Kumar A Khanna RS Khanna HD A novel approach to study
oxidative stress in neonatal respiratory distress syndrome BBA Clin 2015365-9
Niki E Interaction of ascorbate and alpha-tocopherol Ann N Y Acad Sci 1987498186-
99
Norishadkam M Andishmand S Zavar Reza J Zare Sakhvidi MJ Hachesoo VR
Oxidative stress and DNA damage in the cord blood of preterm infants Mutat Res
201782420-4
Ogasawara Y Ohminato T Nakamura Y Ishii K Structural and functional analysis of
native peroxiredoxin 2 in human red blood cells Int J Biochem Cell Biol
201244(7)1072-7
56
Ogundeyi MM Olarewaju DM Njokanma OF Ogunlesi TA Haematological profile
of apparently healthy term babies aged one day three days and six weeks delivered in
Sagamu Nigeria Nigerian Journal of Paediatrics 201138(3)125-30
Ochoa JJ Ramirez-Tortosa MC Quiles JL Palomino N Robles R Mataix J et al
Oxidative stress in erythrocytes from premature and full-term infants during their first 72
h of life Free Radic Res 200337(3)317-22
Oliveira S Saldanha C An overview about erythrocyte membrane Clinical
Hemorheology and Microcirculation 200944(2010)
Ozsurekci Y Aykac K Oxidative Stress Related Diseases in Newborns Oxid Med Cell
Longev 201620162768365
Pai EF Schulz GE The catalytic mechanism of glutathione reductase as derived from x-
ray diffraction analyses of reaction intermediates J Biol Chem 1983258(3)1752-7
Pandey KB Rizvi SI Biomarkers of oxidative stress in red blood cells Biomed Pap Med
Fac Univ Palacky Olomouc Czech Repub 2011155(2)131-6
Pandey KB Rizvi SI Markers of oxidative stress in erythrocytes and plasma during aging
in humans Oxid Med Cell Longev 20103(1)2-12
Pasalic D Marinkovic N Feher-Turkovic L Uric acid as one of the important factors in
multifactorial disorders--facts and controversies Biochem Med (Zagreb) 201222(1)63-
75
Perrone S Negro S Tataranno ML Buonocore G Oxidative stress and antioxidant
strategies in newborns J Matern Fetal Neonatal Med 201023 Suppl 363-5
Peskin AV Pace PE Behring JB Paton LN Soethoudt M Bachschmid MM et al
Glutathionylation of the Active Site Cysteines of Peroxiredoxin 2 and Recycling by
Glutaredoxin J Biol Chem 2016291(6)3053-62
Qaiser DH Sandila MP Ahmed ST Kazmi T Haematological reference values for full-
term healthy newborns of Karachi Pakistan J Pak Med Assoc 200959(9)618-22
57
Raftos JE Whillier S Kuchel PW Glutathione synthesis and turnover in the human
erythrocyte alignment of a model based on detailed enzyme kinetics with experimental
data J Biol Chem 2010285(31)23557-67
Raivio KO Neonatal hyperuricemia J Pediatr 197688(4 Pt 1)625-30
Rakhit R Chakrabartty A Structure folding and misfolding of CuZn superoxide
dismutase in amyotrophic lateral sclerosis Biochim Biophys Acta 20061762(11-
12)1025-37
Remacle Ja Raes M Toussaint O Renard P Rao G Low levels of reactive oxygen
species as modulators of cell function Mutation Research 1994316103-22
Reshad M Ravichander B Raghuraman TS A study of cord blood albumin as a predictor
of significant neonatal hyperbilirubinemia in term and preterm neonates International
Journal of Research in Medical Sciences 20164(3)887-90
Richard A Polin SHA David Rowitch William E Benitz Fetal and Neonatal
Physiology Fetal and Neonatal Physiology 1 5th ed Philadelphia PA Elsevier 2017
Rizvi SI Maurya PK Markers of oxidative stress in erythrocytes during aging in humans
Ann N Y Acad Sci 20071100373-82
Rocha S Gomes D Lima M Bronze-da-Rocha E Santos-Silva A Peroxiredoxin 2
glutathione peroxidase and catalase in the cytosol and membrane of erythrocytes under
H2O2-induced oxidative stress Free Radic Res 201549(8)990-1003
Santos-Silva A Castro EM Teixeira NA Guerra FC Quintanilha A Altered erythrocyte
membrane band 3 profile as a marker in patients at risk for cardiovascular disease
Atherosclerosis 1995116(2)199-209
Sarniak A Lipinska J Tytman K Lipinska S Endogenous mechanisms of reactive
oxygen species (ROS) generation Postepy Hig Med Dosw (Online) 201670(0)1150-
65
Sedlak TW Snyder SH Bilirubin benefits cellular protection by a biliverdin reductase
antioxidant cycle Pediatrics 2004113(6)1776-82
58
Shaik IH Mehvar R Rapid determination of reduced and oxidized glutathione levels
using a new thiol-masking reagent and the enzymatic recycling method application to
the rat liver and bile samples Anal Bioanal Chem 2006385(1)105-13
Shan G Yang F Zhou L Tang T Okoro EU Yang H et al Increase in Blood Glutathione
and Erythrocyte Proteins Related to Glutathione Generation Reduction and Utilization in
African-American Old Women with Diabetes J Sci Technol Environ 20155(1)
Sharma R Premachandra BR Membrane-bound hemoglobin as a marker of oxidative
injury in adult and neonatal red blood cells Biochem Med Metab Biol 199146(1)33-
44
Sies H Oxidative stress oxidants and antioxidants Exp Physiol 199782(2)291-5
Soldin SJ Brugnara C Wong EC Pediatric References Intervals 5th ed United States
Washington DC AACC Press c2005 2005 257 p
Staal GE Veeger C The reaction mechanism of glutathione reductase from human
erythrocytes Biochim Biophys Acta 1969185(1)49-62
Tainer JA Getzoff ED Richardson JS Richardson DC Structure and mechanism of
copper zinc superoxide dismutase Nature 1983306(5940)284-7
Torres-Cuevas I Parra-Llorca A Sanchez-Illana A Nunez-Ramiro A Kuligowski J
Chafer-Pericas C et al Oxygen and oxidative stress in the perinatal period Redox Biol
201712674-81
Tsiftsoglou AS Tsamadou AI Papadopoulou LC Heme as key regulator of major
mammalian cellular functions molecular cellular and pharmacological aspects
Pharmacol Ther 2006111(2)327-45
Tsukahara H Biomarkers for oxidative stress clinical application in pediatric medicine
Curr Med Chem 200714(3)339-51
Valko M Leibfritz D Moncol J Cronin MT Mazur M Telser J Free radicals and
antioxidants in normal physiological functions and human disease Int J Biochem Cell
Biol 200739(1)44-84
59
Welbourn EM Wilson MT Yusof A Metodiev MV Cooper CE The mechanism of
formation structure and physiological relevance of covalent hemoglobin attachment to
the erythrocyte membrane Free Radic Biol Med 201710395-106
Weydert CJ Cullen JJ Measurement of superoxide dismutase catalase and glutathione
peroxidase in cultured cells and tissue Nat Protoc 20105(1)51-66
Wu G Fang YZ Yang S Lupton JR Turner ND Glutathione metabolism and its
implications for health J Nutr 2004134(3)489-92
Yamauc R Vitamine E Mechanism of Its Antioxidant Activity Food Sci Technol Int
19973(4)301-9
Zachara BA Selenium and selenium-dependent antioxidants in chronic kidney disease
Adv Clin Chem 201568131-51
Zitka O Skalickova S Gumulec J Masarik M Adam V Hubalek J et al Redox status
expressed as GSHGSSG ratio as a marker for oxidative stress in paediatric tumour
patients Oncol Lett 20124(6)1247-53

1
1 INTRODUCTION
This project is a part of a long-standing research on oxidative stress (OS) in erythrocytes
carried out by Prof Alice Santos-Silva and Dr Susana Rocha
from the UCIBIO REQUIMTE Laboratory of Biochemistry Department of Biological
Sciences Faculty of Pharmacy Porto University The researchers from the Laboratory
of Biochemistry cover a range of areas (Hematology Immunology Clinical
Biochemistry and Molecular and Cell Biology) The major goal of their work being
ldquothe understanding of the cellular and molecular mechanisms underlying different
inflammatory conditions associated with physiological and pathological situations
that can trigger serious or fatal eventsrdquo (Anonymous c1996-2018)
In the present study we investigated the levels of OS in healthy full-term
newborns The birth itself has been proven to be a stressful event for the neonate since
after leaving the womb it faces a relatively hyperoxic environment which results
in an increased production of reactive oxygen species (ROS) The matter of interest is
how does the organism of the neonate copes and adapts to it (Friel et al 2004 Muller
1987 Ochoa et al 2003)
Although OS provokes a lot of discussion nowadays the attention is mainly paid
to its contributions to various disease processes We on the other hand wanted to focus
on physiological stress of the delivery and on the healthy newborns ability to adapt to it
As we were at the very beginning of the research our aim was to discover more
about the topic to test several basic methods to gather data and to contribute
to the current knowledge about the newborns biochemistry and antioxidant (AOX)
defense mechanisms This thesis should lay the foundations for the future research
2
11 Erythrocytes
Erythrocytes also known as red blood cells (RBC) are the most abundant of blood cells
comprising up to 45 of blood volume maintaining the vital function
of oxygen (O2)carbon dioxide (CO2) transporters by carrying the respiratory gases
from lungs to tissues and vice-versa (Gwaltney-Brant 2014)
111 Erythropoiesis
The average life-span of an erythrocyte in humans is 120 days To maintain the normal
count of these rapidly maturing cells a large number of RBCs needs to be synthesized
every day (around 1 of the RBCs meaning cca one billion of new cells)
Erythropoiesis a complex dynamic and well-regulated process allows their
replenishment (Hattangadi et al 2011)
In the fetus erythropoiesis begins in the liver during the early first trimester
which was preceded by extraembryonic erythropoiesis of the yolk sack RBC production
occurs in the liver through the rest of gestation although the production starts to diminish
during the second trimester as bone marrow erythropoiesis increases (the first
erythroblasts occur in the bone marrow at 8 to 9 weeks of gestation and the first area
of bone marrow appearance is near the clavicle) By the end of the third trimester almost
all erythropoiesis is localized in the bone marrow although other sites may be involved
(Richard A Polin 2017)
After birth erythropoiesis is restricted primarily to the bone marrow although
occasionally it may be found in the spleen or liver as well In adults extramedullary
hematopoiesis (EMH) may occur during hematological disorders when bone marrow
production is insufficient or ineffective Typical sites include liver spleen lymph nodes
paravertebral areas with the intra-spinal canal pre-sacral region nasopharynx
and paranasal sinuses as less common locations for EMH (Gwaltney-Brant 2014)
Bone marrow is protected by bone casing and composed of hematopoietic cells
adipose tissue and various supportive cells and tissues Its structural and blood flow
configurations including bone ndash bone marrow portal capillary systems provide
the appropriate environment for the proliferation differentiation and maturation
of cellular components of the blood Stromal stem cells are progenitors of adipocytes
3
skeletal tissue components (the hematopoiesis-supporting stroma osteoblasts
chondroblasts etc) and reticular cells that provide a structural support for the marrow
and secrete mediators essential for the maintenance differentiation and growth
of hematopoietic stem cells (Gwaltney-Brant 2014)
Hematopoietic cells are formed continuously from a small population
of pluripotent stem cells that are capable of self-renewal A regular hematopoietic stem
cell develops into a common lymphoid progenitor which lineage results in T B
and natural killer cells or follows a myeloid lineage and becomes a common myeloid
progenitor (CMP) giving rise to granulocytes macrophages megakaryocytes
and erythrocytes Differentiation of cells is a series of lineage restriction steps that results
in the progressive loss of differentiation potential to other cell lineages (Kondo 2010)
The pathway leading to mature erythrocytes (Figure 1) begins with hematopoietic
stem cell which later develops in CMP megakaryocyte-erythroid progenitor burst-
forming unit ndash erythroid (BFU-E) and colony-forming unit ndash erythroid (CFU-E)
CFU- E undergoes many substantial changes including a decrease in cell size chromatin
condensation and hemoglobinization leading up to its enucleation and expulsion of other
organelles resulting in formation of the reticulocyte and finally after additional cellular
remodeling and loss of organelles the mature erythrocyte (Bresnick et al 2018 Dzierzak
amp Philipsen 2013 Kondo 2010)
Figure 1 The pathway leading to mature erythrocytes Hematopoietic stem cell (HSC) can either
develop to lymphoid progenitor (resulting in lymphocytes and natural killers cells) or colony forming unit
ndash granulocyte erythrocyte megakaryocyte macrophage (CFU-GEMM) The CFU-GEMM can take
a pathway leading to platelets and white cells or to erythrocytes The latter continues as follows burst-
forming unit ndash erythroid (BFU-E) and colony-forming unit ndash erythroid (CFU-E) proerythroblast various
stages of normoblasts and finaly reticulocytes which mature into RBC Adapted from EpoMedicine 2016
(Anonymous c2016)
4
The process of erythropoiesis is regulated by various growth factors An exquisite
short-term control of the process is accomplished by the kidney-derived glycoprotein
hormone erythropoietin which production is induced by hypoxic conditions
and stimulates BFU-E cells Other growth factors include granulocyte-macrophage
colony-stimulating factor stem cell factors or interleukins (IL) IL-3 IL-6
IL- 9 and IL- 12 (Hattangadi et al 2011)
112 Structure
Red blood cells first appear in the circulation as reticulocytes that are enucleated cells
containing residual RNA and some mitochondria capable of oxidative respiration
In a healthy adult they make up 1 - 2 of the circulating RBCs while in neonates
the number is higher up to 25 - 65 but drops to normal values within two weeks
after birth Once 24h in circulation as the reticulocytes pass through the splenic vessels
and lose their organelles and RNA they mature into normal RBCs (Bukhari amp Zafar
2013 Gordon-Smith 2013)
Healthy mature erythrocytes are biconcave cells of approximately 75 to 87 μm
in diameter and 17 to 22 μm in thickness These structural proprieties allow the RBC
to accomplish its vital function 1) the flexible membrane composed of proteins
and lipids enables the erythrocyte to travel through the vascular system and deform
reversibly to squeeze into the smallest capillaries during microcirculation (2ndash3 μm
in diameter) and 2) the discocyte shape with a central depression on each side provides
a high surface-to-volume ratio that facilitates a rapid diffusion of the respiratory gases
to and from the cell (Diez-Silva et al 2010)
As already mentioned mature erythrocytes lack nucleus and most
of the organelles so that the maximum space in cytosol can be occupied by hemoglobin
an iron-containing biomolecule essential for gas transport
Hemoglobin
Hemoglobin (Hb) is the main protein component of the RBCs making up to 95 of their
dry content Hb is a tetramer of two α and two non-α globin chains each chain enclosing
one of the four heme groups HbA the most common type of Hb in healthy adults is
composed of two α chains and two β chains thus the tetramer can be represented as α2β2
5
whereas fetal hemoglobin HbF is known for its structure of α2γ2 containing a γ chain
that binds to the O2 molecule with greater affinity HbA2 α2δ2 is found in small amounts
in all adults (1 - 2 of all Hb molecules) but other variants of Hb exist and can be seen
mainly in various pathologies (Marengo-Rowe 2006)
Hb is synthesized during the RBC maturation process mitochondria produce
heme which then combines with the globin chains synthetized on the polyribosomes
Heme iron constantly undergoes a recycling loop after the destruction of the erythrocyte
so that it could be used again for new RBCs (Chung et al 2012)
Heme an iron-containing tetrapyrrole ring known as proto-porphyrin is
an essential prosthetic group of many biomolecules including Hb Four nitrogen atoms
within the ring coordinate with the central ion and there are methene bridges among
the four pyrrole rings Iron in heme is bound to a histidine (His) residue of the globin
chain and to O2 molecule that binds at other coordinated position of the ion its ferrous
state (Fe2+) allows a reversible binding to O2 while ferric state (Fe3+) in methemoglobin
(metHb) is unable to carry O2 (Capece et al 2006 Tsiftsoglou et al 2006)
RBC membrane
The flexibility of the RBCs is primarily attributed to the cell membrane as there are no
organelles and filaments inside the cell The RBC membrane is approximately 195
water (H2O) 395 protein 351 lipids and 58 carbohydrates It consists
of a cytoskeleton and an asymmetrical lipid bilayer tethered together via ldquoimmobilerdquo
macromolecular complexes centered on band-3 proteins at the spectrin-ankyrin binding
sites and via glycophorin at the actin junctional complexes The protein composition
determines the shape and flexibility of the RBC Transmembrane proteins usually have
both cytoplasmic and plasma domains The outer side includes binding sites for immune
complexes and the external parts of transmembrane channels and signaling proteins
The lipid bilayer includes various types of phospholipids sphingolipids cholesterol
and integral membrane proteins such as band-3 or glycophorin (Oliveira amp Saldanha
2009)
A significant feature of the lipid bilayer organization is that various phospholipids
are distributed asymmetrically following their different tasks and functions Thus
when a reorganization occurs it has an important signaling effect For example
phosphatidylserine (PS) which is normally localized in the inner layer of the bilayer can
6
set off RBC destruction by macrophages once the organization of the bilayer
is disrupted PS gets exposed at the cell surface and marks the RBC for phagocytosis (An
amp Mohandas 2008)
The cytoskeleton is composed principally of spectrin actin and its associated
proteins (tropomyosin tropomodulin adducin and dematin) protein 41R and ankyrin
(Li amp Lykotrafitis 2014 Lux 2016 Pandey amp Rizvi 2011)
113 Function
The primary purpose of the RBCs is to carry Hb and thus allow gas exchange of O2CO2
among lungs and tissues Besides that erythrocytes help to maintain the systemic
acidbase and osmotic equilibria participate in control of nitric oxide metabolism redox
regulation blood rheology and viscosity (Kuhn et al 2017) Lastly RBCs are equipped
with an effective AOX system that together with their natural ability to circulate through
the whole body makes them invaluable free radical (FR) scavengers they provide AOX
protection not only to themselves but also to other tissues and organs in the body (Pandey
amp Rizvi 2011)
Hemoglobin plays a crucial role as it carries O2 from lungs to tissues and takes
carbon dioxide back to lungs There after O2 binds to the first heme group in Hb its
configuration changes and the O2 affinity of the remaining hemes increases allowing
the tetramer to easily bind and carry four O2 molecules thus enabling each RBC to carry
over 1 billion O2 molecules Once the RBC reaches the tissue and the O2 is unloaded
globin chains rearrange and diminish the O2 affinity with the aid
of 23- diphosphoglycerate (23-DPG) (Kanias amp Acker 2010)
Concerning carbon dioxide transport CO2 diffuses from the intracellular space
into bloodrsquos two components plasma and erythrocytes Within the organism it is
transported in three different forms dissolved in solution buffered with H2O as carbonic
acid or bound to proteins particularly Hb After CO2 diffuses into the RBC it combines
with H2O to form carbonic acid during a reaction accelerated by carbonic anhydrase The
newly-emerged hydrogen ion of carbonic acid is accepted by the deoxyhemoglobin
(deoxyHb) and the remaining bicarbonate ion diffuses into the plasma via the chloride
shift mediated by protein band 3 Carbonic acid can be converted back to CO2 allowing
the gas to be exhaled Minor ways of CO2 disposal include its direct binding
7
to the deoxyHb forming carbamino-hemoglobin (20 of CO2 removal) and lastly
carbon dioxide can be carried to the lungs dissolved in plasma (5 of total CO2) (Arthurs
amp Sudhakar 2005 Geers amp Gros 2000)
114 Metabolism
Mature RBCs have a limited metabolic capacity since they lack nucleus and other
organelles particularly mitochondria The major source of energy is glucose that enters
the erythrocyte by facilitated diffusion independently of insulin It is then metabolized
by the anaerobic glycolytic Embden-Meyerhof pathway to lactate For each glucose
molecule that enters the pathway two molecules of adenosine triphosphate (ATP) are
generated Besides that reduced nicotinamide adenine dinucleotide phosphate (NADPH)
is generated which is essential for metHb reductase to keep the Hb in a reduced state
The obtained ATP molecules provide energy for maintenance of red cell volume shape
the membrane flexibility and for regulation of sodium-potassium pump The Luebering-
Rapoport bypass a side arm of the main pathway provides 23-DPG a molecule
necessary for regulating the Hb O2 affinity Only about 90 of glucose entering the RBC
is used to generate ATP through glycolysis and the remaining 10 is processed by
the hexose monophosphate shunt This alternative pathway generates NADPH molecules
that are later used for glutathione (GSH) reduction an important player in AOX
protection of the cell (Brown 1996 Hoffbrand amp Moss 2016 Pandey amp Rizvi 2011)
115 Antioxidant capacity
RBCs are extremely susceptible to oxidative damage for two main reasons 1) due to their
primary function as gas carriers they are constantly exposed to high levels of O2 and 2)
since mature erythrocytes are enucleated they are unable to synthesize new proteins
and enzymes for themselves Erythrocytes are not defenseless though They are equipped
with powerful AOX defense system that provides the needed protection both for them
and other cells and tissues as well This is the reason why RBCs by fulfilling their purpose
of gas transporters and by traveling through the organism serve as perfect scavengers
of free radicals (Cimen 2008)
There are enzymatic and non-enzymatic mechanisms in the RBCacutes AOX defense
system
8
Enzymatic
AOX enzymes detoxify reactive ROS by catalytically reducing or oxidizing the oxygen
intermediates to less harmful products Generally cytosolic superoxide dismutase (SOD)
provides the first line protection as it converts superoxide radical into less reactive
hydrogen peroxide (H2O2) The H2O2 can be then decomposed to O2 and H2O by either
catalase (CAT) glutathione peroxidase (GPx) or peroxiredoxin 2 (Prx2) (Culotta 2000)
Superoxide dismutase
SODs compose a family of oxidoreductase enzymes the role of which is to protect
the organism from ROS There are three known isoforms of SOD in mammals depending
on the protein fold and the metal cofactor SOD1 (CuZnSOD) SOD2 (MnSOD)
and SOD3 (extracellular SOD) (Fukai amp Ushio-Fukai 2011)
In erythrocytes cytosolic CuZnSOD plays an important role on the first line
of defense against ROS by catalyzing the dismutation of superoxide radical into harmless
O2 or H2O2 which is further decomposed to O2 and H2O (Fukai amp Ushio-Fukai 2011)
Eukaryotic SOD1 is described as a stable homodimer with the active sites oriented
on the opposite sides of its subunits The subunits are held together mainly by
hydrophobic and electrostatic interactions Each SOD1 monomer contains two metal
ions copper and zinc bound together by His side chain and by a secondary linkage
of hydrogen bond Both of the metal ions are believed to play important catalytic
and structural roles while copper is essential for the catalysis of the superoxide
dismutation zinc mostly plays a structural role and acts as a positive charge sink (Rakhit
amp Chakrabartty 2006 Tainer et al 1983)
Superoxide anion is one of the main ROS hence SOD1 key role in the cellacutes AOX
defense The enzyme formerly known as erythrocuprein catalyzes a reaction where two
superoxide molecules are turned into O2 and H2O by the ldquoping-pongrdquo mechanism first
superoxide is oxidized and the second is reduced in the disproportionation reaction
(Rakhit amp Chakrabartty 2006)
Catalase
Human CAT belongs to a large group of monofunctional heme-containing CATs
which are found in almost all aerobic organisms It is mostly an intracellular enzyme with
highest concentrations in RBCs and liver Under normal conditions RBCs contain
9
131ndash 271 μg CAT mg Hb CAT is a tetrameric protein composed of four subunits each
containing a Fe3+ heme group and a bound NADPH molecule that protects the enzyme
against oxidation and inactivation by its substrates Supposedly it does not take part
in the enzymatic activity of H2O2 dissociation (Aksoy et al 2004 Kodydkova et al
2014) When CAT is exposed to H2O2 for a long time the bound NADPH gets oxidized
and the activity of CAT fells to about one third of its initial activity (Kirkman et al 1987)
The enzyme has two different activity modes 1) catalytic activity the major one
of decomposition of H2O2 generated by dismutation of superoxide (catalyzed by SOD)
into H2O and O2 (α-phase) and 2) peroxidatic activity (β-phase) that involves H2O2
elimination by oxidizing alcohols formate or nitrate The catalytic reaction predominates
in higher H2O2 concentration (˃10-4 M) while below this concentration the peroxidatic
reaction dominates if there is an acceptable hydrogen donor (Mate et al 1999)
The main function of CAT is H2O2 removal by catalytically decomposing it
to H2O and O2 this enzyme is believed to take action mainly in removing higher
intracellular H2O2 concentrations while other AOX enzymes work under different
conditions GPx and Prx act at low H2O2 concentrations (Kodydkova et al 2014) It has
also been described that CAT is the major RBC defense enzyme against exogenous H2O2
and unlike other AOX enzymes is highly specific for H2O2 and thus does not participate
in detoxifying organic peroxides (Johnson et al 2010)
Glutathione peroxidase
Out of eight GPx recognized in mammals only GPx1 is present in the RBCs as
an intracellular cytosolic AOX enzyme GPx catalyzes the reduction of both H2O2
and organic hydroperoxides and peroxynitrites using GSH as a reducing agent (Brigelius-
Flohe amp Maiorino 2013)
GPx1 is a tetramer of four subunits of 21kDa each containing a selenocysteine
(Sec) It was described that GPx1 binds 10ndash15 of circulating Se (Zachara 2015) The
catalytic center is a tetrad formed by cysteine (Cys) glutamine tryptophan and aspargine
and the reactive Sec is surrounded by four arginines and a lysine of an adjacent subunit
Studies suggest that these residues are essential for binding the GSH The proposed
mechanism of the reaction is as follows (Figure 2) peroxide reduction involves formation
of selenic acid (Se-OH) at the selenol (Se-H) active site First molecule of GSH is used
for the reduction of the Se-OH forming glutathiolated selenol (Se-SG)
10
the selenadisulfide bond of which is afterwards reduced by the second GSH molecule
Active site of the enzyme is then restored and the newly emerged oxidized GSH (GSSG)
is regenerated to GSH by the action of glutathione reductase (GR) (Brigelius-Flohe amp
Maiorino 2013 Lubos et al 2011)
For some time GPx and CAT used to be considered as the major players
of the RBCacutes AOX defense system Nowadays as more knowledge has been gained
attention is paid to Prx2 as well and the function of each of the enzymes has been studied
in detail although the interplay among these three enzymes still requires more research
While CAT is believed to work mainly at higher concentrations GPx1 seems to be
effective at low H2O2 concentrations mostly of endogenous origin (Hb auto-oxidation)
This fact might be attributed to CAT having higher Km for H2O2 but according to Floheacute
(Floheacute 1982) since neither of the enzymes saturates with H2O2 the rate limiting step for
GPx1 is the recycling of GSH at high H2O2 concentrations (Low et al 2008 Rocha et al
2015)
Glutathione reductase
GR is an important component of the erythrocyteacutes AOX defense system as it protects
RBCacutes Hb enzymes and cell membranes against oxidative damage Unlike previously
described enzymes its effect is not pointed directly at ROS but it is an essential catalyst
of the reaction that recycles GSH (Chang et al 1978)
GR belongs to the family of flavoenzymes which contain either flavin adenine
dinucleotide (FAD) or flavin mononucleotide GR has a homodimeric structure with two
Figure 2 Reaction mechanism of GPx1 The active site of the enzyme (GPx-SeH) is oxidized
(GPx- SeOH) after its reaction with hydroperoxides (ROOH) Regeneration of the enzyme involves two
molecules of GSH The first molecule reduces the selenic acid in GPx-SeOH forming a glutathiolated
selenol (GPx- Se -SG) The disulfide bond is then reduced by the second GSH molecule yielding
regenerated enzyme (GPx-SeH) and oxidized glutathione (GSSG) Adapted from Lubos et al 2011
(Lubos et al 2011)
11
active sites and two FAD molecules incorporated in the subunits (Kamerbeek et al 2007)
The main function of the enzyme is to keep GSH in its reduced state
The two subunits are bond by a disulfide bridge There are two flexible NH2
residues arms with unknown role and the remaining residues are organized into four
domains in each subunit The first two of them bind FAD and NADPH molecules
respectively The catalytic center lies between the subunits and is shared by five domains
(four of one subunit a one of the other) which is quite unusual (Pai amp Schulz 1983)
The reaction is described to happen in two steps (equation 1) First the enzyme
(E) is reduced to its stable EH2 (reduced enzyme) form and NADPH is oxidized
to NADP Then EH2 forms a complex with GSSG later yielding in regenerated GSH
molecules and the enzyme (Pai amp Schulz 1983 Staal amp Veeger 1969)
H+ + NADPH + E hArr NADP+ + EH2
H2 + GSSG hArr2 GSH (equation 1)
Because of its close cooperation with NADPNADPH GR also regulates
the proper balance of NADP and NADPH in the hexose monophosphate shunt
of glycolysis (Pai amp Schulz 1983)
Peroxiredoxin 2
Prx family a group of H2O2 organic hydroperoxide and peroxynitrite reducing enzymes
is vastly distributed among various living organisms from anaerobes to humans Six
isoforms have been identified in mammals and human RBCs possess Prx1 Prx2
and Prx6 The levels of Prx2 (55mgml of packed RBC) by far exceed the other isoforms
it was even described that Prx2 is the third most abundant RBCacutes cytosolic protein
(following Hb and carbonic anhydrase) (Low et al 2008)
Prx2 formerly known as torin calpromotin NKEF-B HRPRP or band 8 is
an intracellular cytosolic enzyme the importance of which was only described
and grounded several years ago much later than that of previously presented enzymes
(CAT SOD GPxhellip) (Harris et al 2001 Manta et al 2009) To point out the crucial AOX
role of Prx2 in RBC the work by Lee et al showed that the RBCs from Prx2 knockout
mice proved to display a significantly shorter life span compared to wild type mice RBCs
12
as well as showing increased levels of oxidized proteins and Heinz bodies (Lee et al
2003)
All Prxs contain in their active site (Cys) the peroxidatic Cys (CysP) highly
specific for peroxides Subfamilies of the enzymes differ in the architecture of the active
site with Prx2 belonging to the Prx1 (typical 2-Cys Prx) subfamily (Peskin et al 2016)
In its functional state Prx2 appears as a homodimer with its subunits non-covalently
associated in a head to tail manner (Low et al 2008)
The peroxidase cycle of Prx2 starts with the reaction of CysP and the H2O2
generating a sulfonic acid (ndashSOH) which can either react with the resolving Cys on
the opposing chain of the dimer and form a disulfide bond (major pathway) or it can be
further oxidized by H2O2 to the sulfinic acid Hyperoxidation is not common in RBCs
though as sulfiredoxin manages to counteract the reaction (Cho et al 2010) The cycle is
completed by Prx2 regeneration by thioredoxin (Trx) and Trx reductase using NADPH
as a donor of reducing equivalents This has been accepted as a major mechanism but
redox reactions with other thiols have been described as well as in vitro recycling
of Prx2 by dithiothreitol as alternative pathways in the Prx2 cycle (Low et al 2008
Peskin et al 2016)
Quaternary structure of Prx2 has been studied and it has been shown
that the enzyme exists in various forms depending on the ionic strength protein
concentration pH phosphorylation and most importantly the redox state its minimal
functional unit monomer oxidizes into a disulfide-linked dimer upon reaction with H2O2
(Ogasawara et al 2012) During catalysis the homodimer is shifted into a doughnut-
shaped decamer a pentamer of dimers which immediately falls apart upon disulfide
formation The role of the transition is still unclear (Hall et al 2009) Prx2 is even
believed to form 12-decamer dodecahedron cage under certain conditions (Low et al
2008)
Prx2 has shown a remarkable sensitivity to extremely low concentrations of H2O2
proving to be oxidized even when CAT and GPx1 were active It has been suggested
that Prx2 detoxifies the RBC of the low endogenous levels of H2O2 similarly to GPx1
These two enzymes also share the ability to reduce hydroperoxides and peroxynitrites
(Low et al 2008 Rocha et al 2015) Another important role of Prx2 has been described
13
by Han et al Prxs containing 2-Cys residues act as molecular chaperons under increased
OS by binding to Hb and thus stabilizing it against oxidative damage (Han et al 2012)
Association with the membrane of RBCs has been described both under normal
conditions (cca 005 of Prx2) in hematological disorders and under OS (Rocha et al
2015)
Non-enzymatic
Apart from enzymatic mechanisms RBCs AOX defense system comprises of numerous
endogenous AOX molecules The major ones are GSH ascorbic acid and α- tocopherol
(Kuhn et al 2017 Pandey amp Rizvi 2011) Besides these carotenoids ubiquinone
melatonin uric acid ceruloplasmin transferrin or haptoglobulin are described to play
an important role as well (Cimen 2008)
Glutathione (GSHGSSG)
Structurally glutathione (L-γ-glutamyl-L-cysteinyl-glycine) is a thiol-containing
tripeptide of L-glutamate L-cysteine and L-glycine irreplaceable in RBCacutes defense
against ROS (Monostori et al 2009)
De novo synthesis of GSH is localized in the cytosol of all mammalian cells
including RBCs regardless of their limited biosynthetic capacity (Lu 2009) The
biosynthesis of GSH is described to happen in two steps 1) γ-glutamylcysteine is formed
from L-glutamate and cysteine in a reaction catalyzed by glutamate cysteine ligase and
2) the rate limiting step catalyzed by GSH synthetase adding glycine to the C-terminal
of γ-glutamylcysteine (Shan et al 2015)
The crucial role of GSH as a central redox agent lies in its nucleophilic character
The reduced form serves as a proton donor in several oxidation-reduction processes while
oxidizing itself into the oxidized form GSSG which is two GSH molecules bound
together by a S-S disulfide bond (Lu 2009 Zitka et al 2012) To maintain the redox state
of the cell and close the GSH cycle GSSG is regenerated back to GSH by GR using
NADPH as a proton donor (Shan et al 2015)
The process of GSH regeneration consists of four steps 1) glucose (Glc) is
transported through RBC membrane 2) Glc molecule is phosphorylated to glucose-6-
phosphate (G-6-P) by hexokinase 3) nicotinamide adenine dinucleotide phosphate
(NADP) is reduced to NADPH by G-6-P dehydrogenase and 6-phosphogluconate
14
dehydrogenase and 4) GSSG is reduced by GR utilizing NADPH resulting in two GSH
molecules (Kurata et al 2000)
Besides its well-known AOX role as a cofactor of GPx (Lu 2009) GSH also
serves as a direct scavenger of hydroxyl radicals and peroxinitrites (Griffith 1999 Wu et
al 2004) takes part in lipid peroxides detoxification (Raftos et al 2010) and helps to keep
the thiol groups of important RBCacutes structures in reduced state ( Hb enzymes
membraneshellip) (Lu 2009) GSH is also able to detoxify the RBC from xenobiotics by
forming a water-soluble conjugates that can be exported from the RBC and excreted
and it also serves as a Cys storage since extracellularly this amino-acid undergoes a rapid
auto-oxidation into cystine (Lu 2009) Not to forget its cooperation with other AOXs
molecules enabling their regeneration (eg ascorbate α-tocopherol) (Monostori et al
2009)
At all moments GSH is present in two forms as a reduced molecule (GSH)
and an oxidized form (GSSG) the amount of which is kept at low concentration (1100
to 11000) by the action of NADPH-dependent GR The GSSGGSH ratio is a valuable
indicator of cell functionality and the level of OS (Monostori et al 2009) To maintain
constant concentrations of GSH within the erythrocyte at sim23 mM the rate of synthesis
must equal the rate of its export in the form of GSH conjugates andor GSSG (Raftos et
al 2010) It was suggested that GSSG could leave the RBC in two ways ndash directly
through the cell membrane which can be damaged under OS conditions or by an active
MgATP-dependent transport both resulting in decreased GSH levels in OS associated
conditions (Pandey amp Rizvi 2011 Raftos et al 2010) as has been described
in Parkinsons disease liver disease cystic fibrosis sickle cell anemia AIDS cancer
heart attack stroke or diabetes (Pandey amp Rizvi 2011)
Ascorbatedehydroascorbate
Ascorbic acid also known as vitamin C is an essential hydrophilic vitamin which after
its intake from food is mostly localized in plasma where its serves as one of the most
important AOX (it directly protects against peroxidation of plasma low-density
lipoprotein (LDL)) Ascorbateacutes AOX activity is based on its ability to reversibly donate
one or two hydrogens and electrons to a variety of ROS thanks to its carbon-carbon
double bond and high reducing potential Newly emerged dehydroascorbate is taken up
by RBCacutes glucose transporter (GLUT1) and recycled The mechanism of the reduction is
15
GSH- and NADPH-dependent catalyzed by various enzymes (dehydroascorbate
reductase glutaredoxin thioredoxin etc) Once recycled ascorbate is trapped inside
the RBC and only very slowly diffuses back thus maintaining its plasma concentrations
It was suggested that ascorbate is more sensitive to oxidation by exogenous H2O2 than
GSH and α-tocopherol Although ascorbate does not directly protect the RBC membranes
from peroxidation it performs its function via the reduction of tocopheroxyl FR at
the aqueous-lipid interface of the membrane bilayer (May 1998)
α-tocopherol
In RBCs lipid-soluble α-tocopherol the most widely distributed AOX in nature acts as
a potent scavenger of peroxyl radicals to protect polyunsaturated fatty acids (PUFA)
of membranes from lipid peroxidation (LPO) (Pandey amp Rizvi 2011) α-tocopherol
intervenes in the propagation step during auto-oxidation of lipids It donates its phenolic
hydrogen atom to a peroxyl radical and thus converts it to less dangerous hydroperoxide
The newly formed tocopheroxyl radical is adequately stable to stop the reaction and can
leave the cycle by reacting with another peroxyl radical forming an inactive non-radical
product (Yamauc 1997) Ascorbate reduces the tocopheroxyl radical to regenerate
vitamin E (Niki 1987)
12 Oxidative stress
There are various definitions of the term bdquooxidative stressldquo Sies refers to it as
bdquoan imbalance between oxidants and antioxidants in favor of the oxidants potentially
leading to damagerdquo (Sies 1997)
121 Oxidants
Oxidants continuously attacking all cells living under aerobic conditions may be
of either endogenous or exogenous origin all together known as ROS There are two
types of ROS free radicals (molecules with unpaired electrons) and nonradicals (free
radicals that share their unpaired electrons) The ROS and their important equations are
depicted in Table 1 with the three major ROS being superoxide anion (O2-) hydroxyl
radical (OH) and H2O2
16
Table 1 Reactions of selected reactive oxygen species
Oxidant Formula Reaction equation
Superoxide anion O2- NADPH + 2O2 harr NADP+ + 2O2
- + H+
Hydrogen peroxide H2O2
2O2- + H+ rarrO2 + H2O2
HPX + H2O + O2 harr XAN + H2O2
XAN + H2O + O2 harr UA + H2O2
Hydroxyl radical OH Fe2+ + H2O2 rarr Fe3+ + OH- + OH
Peroxyl radical ROO R + O2 rarr ROO
NADPH nicotinamide adenine dinucleotide phosphate reduced form NADP+ nicotinamide adenine dinucleotide
phosphate oxidized form HPX hypoxanthine XAN xanthine UA uric acid
Adapted from Birben et al (Birben et al 2012)
Endogenous sources of ROS are the normal products of aerobic metabolism but
under pathological conditions their levels may rise Generally they are produced
in mitochondrial respiratory chain as byproducts of oxidative phosphorylation but
in other organelles as well in endoplasmic reticulum in peroxisomes (xanthine oxidase)
and during auto-oxidation process of small molecules (including Hb auto-oxidation) as
well as in immune reactions such as the respiratory burst of phagocytes
Exogenous sources include cigarette smoke ionizing radiation heavy metals ions
ozone exposure pollutants drugs and toxins including oxidizing disinfectants or
hyperoxia (Birben et al 2012 Pandey amp Rizvi 2010 Sarniak et al 2016)
122 Antioxidants
To compensate for the actions of oxidants organisms have integrated protective systems
of enzymatic and non-enzymatic AOXs to block the harmful effects of ROS AOXs can
be synthesized in vivo (eg GSH and SOD) or taken in from the diet
According to Gutteridge and Halliwell AOX is ldquoany substance that when present
at low concentrations compared with those of an oxidizable substrate significantly delays
or prevents oxidation of that substraterdquo (Halliwell 2007)
Generally there are two groups of AOX enzymatic and non-enzymatic ones
The three major classes of AOX enzymes are SODs CATs and GPxs (Sies 1997)
17
Ascorbic acid (vitamin C) α-tocopherol (vitamin E) GSH and carotenoids represent non-
enzymatic AOXs (Cimen 2008)
123 Mechanisms and consequences of oxidative damage
Due to the unpaired electrons ROS are highly reactive molecules and tend to attack
and alter the function of cellrsquos macromolecules - nucleic acids lipids and proteins
(Birben et al 2012)
PUFA residues of phospholipids are extremely susceptible to oxidation LPO
leads to formation of hydroperoxides that if not reduced by AOX enzymes break down
into reactive aldehyde products (eg 4-hydroxy-2-nonenal 4-hydroxy-2-hexenal
malondialdehyde (MDA) or acrolein) which have been proven to be mutagenic Besides
that LPO in general leads to loss of membrane fluidity and elasticity impaired cellular
functioning and even cell lysis (Catala 2009 Valko et al 2007)
Proteins can be damaged either by direct oxidation of their amino-acid residues
and cofactors or by secondary attack via LPO end-products The side chains of all amino-
acid residues of proteins are prone to oxidation by the action of ROS especially cysteine
Its oxidation may lead to the reversible formation of disulphide bridges between protein
thiol groups (ndashSH) and low molecular weight thiols in particular GSH
(S- glutathiolation) Such conformation changes may lead to decrease in enzyme activity
if the targeted amino-acid residues are close to active sites (Costa et al 2007 Valko et al
2007)
Oxidative damage has been proven to play an important role
in the etiopathogenesis of many common pathological conditions including neurological
disorders atherosclerosis hypertension ischemiaperfusion diabetes acute respiratory
distress syndrome idiopathic pulmonary fibrosis chronic obstructive pulmonary disease
or asthma (Birben et al 2012)
Although ROS are mostly regarded as toxic by-products of oxidative metabolism
and their participation in pathologic processes is indisputable low levels of these reactive
molecules are supposed to be essential for normal functioning of the organism Namely
they play a significant role in modulation of gene expression in cell signaling as second
messengers or in various immune reactions (phagocytosis inflammation) (Cimen 2008
Remacle et al 1994)
18
124 Oxidative stress amp erythrocytes
Erythrocytes are constantly exposed to risk of oxidative injury since incessant contact
with the O2 molecule and high content of Hb is inevitable for O2 carriers Even though
oxyhemoglobin (HbFe(II)O2-) is rather stable molecule its auto-oxidation (equation 2)
occurs up to a rate of 3 per day The process is characterized by a dissociation of the O2
molecule without an electron transfer to yield O2- and metHb (HbFe(III)) (Kanias amp
Acker 2010)
119867119887119865119890(119868119868)1198742119886119906119905119900119900119909119894119889119886119905119894119900119899rarr 119867119887119865119890(119868119868119868) + 1198742
minus (equation 2)
Both of these products under normal conditions are effectively detoxified
NADH-cytochrome b5ndashmetHb reductase reduces Hb to deoxyHb and ROS are eliminated
by AOX enzymes (Kanias amp Acker 2010)
When the capacity of the AOX enzymes (cytosolic SOD and CAT mostly) is
exceeded metHb can be oxidized to so called hemichromes which are precipitates
of denaturated Hb These structures have been known to covalently bind to cell
membrane resulting in clustering of integral membrane protein band 3 and interfering
with the integrity of the cytoskeleton Therefore membrane-bound hemoglobin (MBH)
has been suggested as a reliable marker of oxygen radical-induced injury to RBCs
(Sharma amp Premachandra 1991 Welbourn et al 2017)
Another widely used biomarker of RBCs OS namely of LPO is MDA content
This secondary oxidation product reacts with the free amino groups of proteins
and phospholipids which leads to structural modification inducing dysfunction
of various cell systems The bright side of the MDAacutes reactivity is that its reaction with
thiobarbituric acid (TBA) which yields a colored chromogen offers an easy way
to assess the OS of the cell Measurement of thiobarbituric reactive substances (TBARS)
has been considered as a reliable and easily reproducible biomarker of OS for many
years although a discussion about the low specificity of the test continues (Ayala et al
2014 Pandey amp Rizvi 2010 Rizvi amp Maurya 2007)
To evaluate the state and potential of OS in cells total antioxidant
status (TAS)capacity can be assessed From a number of methods the one developed by
Benzie and Strain stands out due to its simplicity and easy and reliable performance
19
The ferric reducing antioxidant power assay is measured as a reduction of ferric ion
ligand complex to intensely colored ferrous complex by all available AOXs in a sample
(Pandey amp Rizvi 2010)
13 Specifics of newborns amp neonatal oxidative stress
A newborn represents the culmination of various developmental steps from conception
through organogenesis to birth The composition of fetal blood changes significantly
during the second and third trimester preparing the fetus for birth and extrauterine
environment Mean Hb increases (from 90 plusmn 28 gdl at the age of 10 weeks to 165 plusmn
40 gdl at 39 weeks) the percentage of nucleated cells decreases (from 12 at 18 weeks
to 4 at 30 weeks) and large numbers of committed hematopoietic progenitors are found
circulating in the fetal blood (Lichtman et al 2016)
Birth introduces dramatic changes in the circulation and oxygenation as
the newborn undergoes the transition to a separate biological existence These events are
reflected in the composition of blood of the newborn during the first hours and days
of life there are rapid fluctuations in the quantities of all hematologic elements Studies
suggest that most of the measured parameters were highest on the first day of life
and declined thereafter (Esan 2016 Ogundeyi MM et al 2011)
Levels of cord blood Hb vary between approximately 165 and 170 gL depending
on the timing of cord clamping Later at around 8 weeks there is a progressive fall in Hb
levels to 100-110gL (or even lower in preterm infants which make them more
susceptible to iron and folate deficiency) followed by a recovery to 125gL at 6 months
Nucleated cells can be seen for first days in the blood film (longer in preterm infants)
The reticulocyte count which is initially up to 2-6 falls to 05 during a week due
to increased oxygenation of tissues which leads to suppression of erythropoiesis
The RBC count increases during the first day of life then it remains at that level for about
2 weeks and slowly declines afterwards The leukocyte count often fluctuates at all ages
but most significantly in infants Leukocytosis is typical at birth the range of normal
values is wide and the count slowly decreases until approximately 4 years of age (Esan
2016)
20
Considering OS birth itself is a stressful process for both mother and fetus
and delivery is a cause of hyperoxic challenge for the newborn (Friel et al 2004
Norishadkam et al 2017) The neonate is exposed to an environment that is relatively
hyperoxic (pO2 of 100 mm Hg) compared to the intrauterine one
(pO2 of 20 ndash 25 mm Hg) The increased O2 bioavailability leads to a greatly enhanced
generation of FR and OS (Perrone et al 2010 Tsukahara 2007)
Newborns especially preterm are particularly susceptible to the oxidative
damage for number of reasons structural and functional immaturity of organs
overloading of aerobic tissues metabolism with rapidly growing energy demand
the reduced ability to induce efficient homeostatic mechanisms The same goes for
neonatal RBCs increased release of transitional metals like free iron increased
production of superoxide radicals increased content of fatty acids and last but not least
lack of AOX systems (low enzyme activities such as GPx and SOD low content
of vitamin E and ascorbic acid) (Claster et al 1984 Perrone et al 2010) It was described
that at the end of pregnancy AOX enzymes are induced and the transfer of other AOX
molecules (vitamins E C β-carotenes ubiquinone) across the placenta is increased
during last days of gestation (Friel et al 2004 Torres-Cuevas et al 2017) however
the AOX systems only come to full maturity during the first year of life of the infant
(Norishadkam et al 2017)
131 Oxidative stress related diseases in newborns
Serious imbalance between the action of ROS and insufficient defensive mechanisms
which is even more likely to appear in preterm newborns not only leads to oxidative
damage but several secondary conditions are reported as well OS related neonatal
diseases include chronic lung diseases intraventricular hemorrhages of newborns
necrotizing enterocolitis (Norishadkam et al 2017 Perrone et al 2010)
bronchopulmonary dysplasia retinopathy of prematurity patent ductus arteriosus
periventricular leukomalacia respiratory distress syndrome intrauterine growth
retardation congenital malformation (Ozsurekci amp Aykac 2016)
There has been number of evidence that (neonatal) OS plays an important role
in various diseases yet very few OS markers have made it into routine clinical practice
This might be accounted to variety of reasons eg low specificity of methods
21
the properties of the oxidative modifications such as the lability of some structures or
their low abundance poses significant challenges to translate them into a high-
throughput cost-effective clinical diagnostic (Frijhoff et al 2015)
Further measurements and examination of OS biomarkers are required in order
for them to contribute to prediction of high-risk patients (Negi et al 2015) proper
diagnosis and earlyoptimal administration of effective pharmacotherapy
22
2 AIMS
Although there have been many publications concerning OS and mechanisms of AOX
defense very few or even none have dealt with the OS in erythrocytes of healthy
newborns specifically Therefore our aims were as follows
- to collect the physiological OS related values from healthy young individuals
(early infancy)
- to observe the changes of OS levels between newborn vs 2 months old babies
- to contribute to the knowledge on how healthy newborns adapt to ldquohyperoxic
challengerdquo caused by a sudden exposure to extrauterine environment and how
their AOX mechanism copes with it in time
23
3 MATERIALS AND METHODS
31 Population
The study was performed under the approval of the Ethics Committee of Centro Materno-
Infantil from Centro Hospitalar do Porto Portugal Blood samples were collected
from newborns after obtaining motheracutes informed consent to participate in the study
Umbilical cord blood (UCB) samples were collected at birth (n = 8) and after
2 months peripheral blood samples (n = 8) were collected from the subjects
There were 4 girls and 4 boys among the subjects of the study all of which were
full-term born by vaginal delivery to healthy mothers
Collection of samples was slightly complicated due to inevitable elimination
of several participants (health reasons) and due to temporarily restricted operation with
the collaborating hospital
32 Sample processing
Blood samples were delivered from the hospital and processed within 2 hours after their
collection in tubes with and without anticoagulant K3EDTA was used as
an anticoagulant
Our intention was to isolate several different fractions of each sample ndash whole
blood serum plasma RBC membranes and total erythrocytes Aliquots of these sample
fractions were stored at -80 degC until assayed
Serum was isolated from tubes without anticoagulant by centrifugation (1000 g
20 min room temperature (RT)) and used for biochemical parameters assessment
in an automated analyzer (Cobas Mira S Roche) using commercially available assay kits
uric acid (Uric Acid ver2 Roche Diagnostics) albumin (Albumin Plus Roche
Diagnostics) total (Bilirubin Total Gen3 Roche Diagnostics) direct (Bilirubin Direct
Roche Diagnostics) and indirect bilirubin gamma glutamyl transferase (γ-
Glutamyltransferase ver2 Roche Diagnostics) aspartate transaminase (Aspartate
24
Aminotransferase Test ASTL Roche Diagnostics) and alanine transaminase (Alanine
Aminotransferase Test ALTL Roche Diagnostics)
Erythrocyte leukocyte and reticulocyte count Hb concentration hematocrit
hematimetric indexes ndash mean cell volume (MCV) mean cell hemoglobin (MCH) mean
cell hemoglobin concentration (MCHC) ndash and red cell distribution width (RDW) were
measured using an automatic blood cell counter (Sysmex K1000 Sysmex)
Anticoagulated whole blood was centrifuged at 2000 g 20 min 4 ordmC and
afterwards plasma was aliquoted and stored Leukocytes were isolated from RBCs after
centrifugation on a double density gradient (Histopaque 1077 Histopaque 1119
700 g30 minRT)
RBCs were then washed with saline solution (NaCl 90 gL centrifuged at
1000 g5 min4 degC) and small portion was frozen as total erythrocyte aliquots Another
portion of these RBCs was mixed with HClO4 5 and following a centrifugation
(10000 g15 min 4 degC) aliquots for GSH measurements were prepared
The rest of the RBCs were submitted to hypotonic lysis according to Dodge et al
(Dodge et al 1963) in order to isolate membranes Obtained membrane suspensions were
carefully washed in 5mM pH8 phosphate buffer using phenylmethylsulfonylfluoride
(final concentration 01 mM) in the first two washes as a protease inhibitor
33 Materials
331 Reagents
From Sigma-Aldrich Triton X-100 Tiobarbituric acid Coomassie Brilliant Blue G-250
CAT from bovine liver purpald H2O2 30 GPx from bovine erythrocytes GSH (L-
glutathione reduced) GSSG (L-glutathione oxidized disodium salt) GR
from bakeracutes yeast ndash S cerevisiae β-nicotinamide adenine dinucleotide 2acute-phosphate
reduced tetrasodium salt hydrate (NADPH) Cumene hydroperoxide 55acute-dithiobis-2-
nitrobenzoic acid (DTNB) 2-vinylpyridine KHCO3 Iron(II) sulfate heptahydrate
Iron(III) chloride hexahydrate 246-Tris(2-pyridyl)-s-triazine (TPTZ)
From Merck ethanol methanol HClO4 70-72 Phosphoric acid 85 HCl 37 acetic
acid 100 KOH KIO4
25
From Panreac NaCl KH2PO4 K2HPO4 NaH2PO4 Na2HPO4 sodium acetate
From VWRChemicals n-butanol ethylenediamine tetraacetic acid (EDTA)
Bovine serum albumin (BSA) from Calbiochem and formaldehyde 365
from Chem- Lab
332 Consumables
96 wells plates Pauster Pipettes Micro-pipette Tips Eppendorf tubes etc
333 Instruments
Centrifuge (1580R GYROZEN) Micro-centrifuge (Heraeus Freco 21 Thermo
Scientific) Microplate reader (Power Wave XS Bio-Tek) Water bath (FALC) Vortex
(VELP Scientifica) Ultra-Low Temperature Freezer (MDF-U5386S Panasonic)
Fumehood (Industrial Laborum)
334 Software
KC junior (microplate reader software)
IBM SPSS (Statistics Package for Social Sciences) version 240
34 Methods
341 General
To be able to assess the changes of measured data credibly both samples of the same
subject ndash newborn and 2 months follow-up ndash were always assayed at the same time under
the same conditions
342 Determination of total protein concentration
The modified Bradford method was used to estimate the total protein concentration
of membrane and total erythrocyte samples (Bradford 1976)
26
The Bradfordacutes reagent (100 mg of Coomassie Brilliant Blue G-250 50 mL
of ethanol 95 100 mL of phosphoric acid 85) exists in two different color forms red
and blue The Reagentacutes binding to protein molecules is accompanied by its color change
and thus by a shift in absorption maximum (from 365 to 595 nm) The absorbance
at 595 nm is spectrophotometrically monitored (microplate reader) and compared with
a set of protein standard solutions
Membrane samples were diluted 1100 and the total erythrocytes ones 115000
The standard curve was obtained using a set of BSA standards (concentration
00 to 005 mgmL) An Internal Control (dilution 12000) was used to standardize
and validate the obtained data
343 Membrane bound hemoglobin
MBH was measured by spectrophotometry (microplate reader) in erythrocyte membrane
suspensions samples (Santos-Silva et al 1995)
Triton X-100 (5 wv in 5mM pH8 phosphate buffer) was added to the samples
for protein dissociation and the absorbance was measured at 415 nm (maximum Hb
absorbance) and at 700 nm (background absorbance) The MBH percentage was
estimated using the corrected absorbance value and total protein concentration
of the samples to normalize its percentage (equation 3)
MBH =A415 minus A700
[Total protein concentration] x 100 (equation 3)
344 Erythrocyte membrane lipid peroxidation
The TBARS test adapted from Mihara and Uchiyama (1977) was used to determine
the erythrocyte membrane LPO in membrane and plasma samples (Mihara amp Uchiyama
1978)
To assess the LPO of each sample the quantity of MDA and its precursors was
determined MDA is one of the main LPO products and the method makes use of its
reaction with TBA which results in a formation of a red colored chromogen adduct with
absorption maximum at 535 nm (Ayala et al 2014)
27
Membrane samples were incubated 10 min at RT with Triton X-100 20
to dissociate proteins The following procedure was the same for both membrane
and plasma samples H3PO4 10 (vv) and TBA 06 (mv) were added to the samples
the tubes were thoroughly homogenized and incubated on a boiling water bath for
45 minutes Afterwards samples were put on ice to cool down and n-butanol was added
to each tube to extract the TBA-MDA complex The organic layer was separated by
centrifugation (1000 g 2 min RT) and its absorbance was measured by
spectrophotometry at 535 nm
For RBC membrane samples the LPO was determined after correcting this value
with background absorbance (520 nm) and normalizing it with total protein concentration
for each sample For plasma samples we used directly the value of absorbance at 535 nm
345 Quantification of catalase activity
To determine the activity of CAT in membrane and total erythrocytes samples
a spectrophotometric method adapted from Johansson and Borg was performed
(Johansson amp Borg 1988)
The method is based upon the CAT peroxidatic activity the reaction
of the enzyme with a hydrogen donor (methanol) in the presence of optimal
concentration of H2O2 results in a formation of formaldehyde The latter forms a bicyclic
heterocycle with a chromogen 4-amino-3-hydrazino-5-mercapto-124-triazole
(Purpald) which upon oxidation changes from colorless to a purple compound with
absorption maximum at 540 nm (Figure 3) The absorbance was compared to a set
of standard formaldehyde solutions and its value was used to calculate the activity
of the enzyme
H2O2 + CH3OH + Purpald CATrarr CH2O + 2 H2O
Figure 3 Quantification of catalase activity Hydrogen peroxide (H2O2) reaction with methanol
(CH3OH) in the presence of catalase (CAT) yields formaldehyde (CH2O) and water (H2O) Formaldehyde
and Purpald form a compound which upon oxidation changes from colorless to purple Adapted
from Melo 2017 (Melo 2017)
The membrane samples were diluted 125 and total erythrocyte samples 110000
A set of standard formaldehyde solutions (0 ndash 75 uM) was prepared All samples
28
standards and the control were incubated with methanol and H2O2 350 mM
for 20 minutes then KOH 100 M (to stop the reaction) and Purpald (chromogen) were
added After 10 minutes of incubation KIO4 3000 mM (color amplifier) was added to all
wells and following a 5 minutes incubation the absorbance was measured at 540 nm A
CAT activity internal control was used to validate the results
The enzyme activity was determined by interpolation of the sample values
in the standard curve and by applying a formula (including normalization of the activity
by dividing by total protein concentration) as seen in equation 4
119862119886119905 119886119888119905119894119907119894119905119910 (119899119898119900119897119898119894119899119898119871119898119866119875119905) = 119891119900119903119898119886119897119889119890ℎ119910119889119890 119888119900119899119888119890119899119905119903119886119905119894119900119899 119909 (017002)
20 (min) 119909 119863 119865 119909
1
119875119905
(equation 4)
346 Quantification of glutathione peroxidase activity
The activity of GPx was measured in total erythrocyte samples by an indirect assay
adapted from Weydert amp Cullen (Weydert amp Cullen 2010)
This spectrophotometric method enables GPx activity quantifying through
the actions of other enzymes and cofactors that are necessary for its function
GPx catalyzes the reduction of various hydroperoxides (eg H2O2) to H2O via
oxidation of reduced GSH into its disulfide form GSSH GSSG is regenerated to GSH by
GR with consumption of NADPH The decrease of NADPH can be easily monitored
spectrophotometrically and is proportional to GPx activity
Samples were diluted 1200 and a set of standard GPx solutions
(0 ndash 1000 mUmL) was prepared as well as a GPx internal control to validate
the procedure GSHGR solution (with final well concentration 10 mM10 UmL)
and NADPH 02 mM (final well concentration) were added followed by 10 minutes
of incubation at 25 degC After adding the substrate cumene hydroperoxide 15 mM (final
well concentration) a kinetic absorbance reading was performed at 340 nm for 5 minutes
(30 seconds intervals) The value of GPx activity was obtained after interpolation
of the samples absorbance delta per minute in the standard curve and after normalizing
this value with the total protein concentration for each sample
29
347 Determination of total antioxidant status
To determine the TAS in both plasma and total erythrocyte samples the Ferric Reducing
Ability of Plasma (FRAP) Assay was used according to a method adapted from I F F
Benzie amp J J Strain (Benzie amp Strain 1996)
Ferric and ferrous ions can form a complex with TPTZ The ion ferric to ferrous
reduction can be monitored at low pH as a blue colored complex of Fe2+-TPTZ with
absorption maximum at 593 nm is formed By comparing the absorbance change
in samples with the absorbance in a set of standards of known concentration of ferrous
ion the FRAP values were determined
Total erythrocytes samples were diluted to 150 the plasma samples were applied
directly to the plate A set of standard solutions (ferrous ion concentrations 00 ndash 10 mM)
was prepared to obtain the standard curve A ferrous internal control ensured
the validation and standardization of the procedure
The FRAP reagent (acetate buffer 3000 mM + ferric ion 200 mM + TPTZ
100 mM 1011) was added to all the samples and the absorption at 0 min and 4 min was
measured spectrophotometrically at 37 ordmC After comparing the values with those
obtained from the standard curve total protein concentration was used to normalize
the values of TAS
348 Quantification of total glutathione and oxidized
glutathione
To determine the reduced glutathione (GSH)oxidized glutathione (GSSG) ratio total
GSH and GSSG were quantified in the total erythrocyte samples according to a method
adapted from Shaik amp Mehvar (Shaik amp Mehvar 2006) and from Griffith (Griffith 1980)
The principle of this spectrophotometric method is the enzymatic recycling
of GSH by GR with consumption of NADPH GSH oxidation by DTNB is accompanied
by formation of a yellow chromogen 5-thio-2-nitrobenzoic acid (TNB) the quantity
of which is monitored and thus total GSH amount is determined as these two values are
proportional (Figure 4)
30
Figure 4 Quantification of total glutathione and oxidized glutathione Glutathione (GSH) can reduce
different compounds including 55rsquo-dithiobis-(2-nitrobenzoic acid) (DTNB) while oxidizing itself
(GSTNB) This reaction yields a yellow chromogen 5-thio-2-nitrobenzoic acid (TNB) the amount
of which can be monitored as it amount is proportional to available GSH amount Oxidized glutathione
(GSSG) is regenerated by glutathione reductase (GR) in a nicotinamide adenine dinucleotide phosphate
(NADPH) consuming reaction 2-Vinylpyridine serves as a masking agent Adapted from Melo 2017
(Melo 2017)
GSSG quantification employs exactly the same principleprotocol that total GSH
with only one additional step to distinguish the GSSG in the total amount of GSH
an agent (2- Vinylpyridine) is used to mask reduced GSH (McGill amp Jaeschke 2015)
Total erythrocyte samples were diluted with HClO4 5 1250 and 150 for total
GSH and GSSG quantifications respectively Sets of standard GSH (0 ndash 150 uM)
and GSSG (0 ndash 80 uM) solutions were prepared Internal controls of GSH and GSSG
were used to validate the results
To neutralize the samples KHCO3 076 M was added to samplesinternal control
and standard solutions After centrifugation (16000 g 2 min 4 degC) the samples were
transferred to a 96 well plate and the reagent solution (240 μM NADPH 13 mM DTNB
final well concentration) was added to each well and the plate was incubated for 15 min
at 30 degC Afterwards GR (final well concentration of 2 UmL) was added and a kinetic
reading was performed at 412 nm for 3 minutes (30 seconds intervals) Values
of the slope were used plotted against the standard curve and finally normalized by
the total protein concentration for each sample to get the total GSH values The GSSG
quantification required a pre-incubation of the samples with 2-vinylpyridine (10 microL) for
1 h at 4 degC
31
35 Statistical analysis
For statistical analysis the Statistical Package for Social Sciences (IBM SPSS version
240 SPSS Inc) for Windows was used
Descriptive statistic tools were employed to characterize the data including
Shapiro-Wilk normality test As some of our data presented non-Gaussian distribution
we used the non-parametric Wilcoxon Signed-Rank Test for related samples to evaluate
the differences between the studied groups (baby at birth and in 2 months of age)
Spearmanrsquos rank correlation coefficient was used to assess relationships between sets
of data Data are presented as median (interquartile range) The level of significance (p)
was set at 005
32
4 RESULTS
The first task of our work was to obtain physiological data linked to OS These can be
divided into three groups hematological data biochemical data (both performed
in the hospital) and our own measurements of RBC-specific OS related values
(OS biomarkers)
Hematological and biochemistry tests were performed at birth (from UCB
samples) and then in two months (64 days in average peripheral blood samples)
Experimental values were obtained in our laboratory after receiving the follow-up
samples matching the newborn samples as the importance was given to having the same
assay conditions for both of the paired samples
To assess the relationships between different parameters Spearmans rank
correlation coefficient was used
41 Hematological data
RBC count Hb hematocrit MCV MCH MCHC RDW reticulocytes and leukocytes
count were measured
The results (Table 2) show that there was a significant difference (plt005)
between newborn and 2 months follow-up measurements in all examined parameters
Significant decrease was observed in the following indices RBCs Hb
hematocrit MCV MCH RDW reticulocytes and leukocyte count
These changes were expected and are in an accordance what was already known
(Esan 2016 Ogundeyi MM et al 2011 Soldin et al 2005)
Comparison of the follow-up samples with reference values shows that apart
from RDW all data fall into the reference range (Soldin et al 2005) Given references
relate to peripheral blood samples of males aged 61 d to lt181 d as in Pediatric
Reference Intervals (Soldin et al 2005)
33
Table 2 Hematological data of healthy newborns and of their 2 months follow-up
newborn 2 months old p
reference
value -
2 months
RBC [x1012L] 435 (421 - 457) 371 (354 - 385) 0012 367 - 461
Hemoglobin [gdL] 148 (149 - 159) 108 (107 - 117) 0012 105 - 130
Hematocrit [] 449 (434 - 468) 310 (305 - 355) 0012 305 - 377
MCV [fL] 103 (101 - 106) 847 (832 - 857) 0012 796 - 863
MCH [pg] 349 (336 - 352) 299 (293 - 305) 0012 276 - 299
MCHC [gdL] 338 (330 - 341) 354 (349 - 356) 0012 339 - 354
RDW [] 163 (163 - 173) 133 (128 - 137) 0012 135 - 153
Reticulocytes [x109L] 166 (162 - 193) 727 (576 - 110) 0017 370 - 104
Leukocytes [x109L] 160 (129 - 188) 84 (69 - 103) 0012 79 - 134 RBC red blood cell MCV mean cell volume MCH mean cell hemoglobin MCHC mean cell hemoglobin
concentration RDW red cell distribution width
Data are presented as median (inter ndash quartile range) values plt005 between newborn versus 2 months old groups
was considered statistically significant Wilcoxon Signed-Rank Test was used
Reference values were obtained from Pediatric Reference Intervals (Soldin et al 2005)
Positive and statistically significant correlations were found between
the gestational age and the count of leukocytes both in newborn and in 2 months samples
(r = 0766 p = 0027 n = 8 r = 0717 p = 0046 n = 8 respectively)
42 Biochemical data
Uric acid (UA) concentration bilirubin levels liver enzymes (gamma-glutamyl
transferase GGT aspartate aminotransferase AST alanine aminotransferase ALT)
and albumin concentration were quantified and calculated
The data can be seen in Table 3 Uric acid GGT AST ALT (and thus ASTALT
ratio) and albumin values changed significantly over two months A decrease was found
in UA GGT and albumin levels AST ALT and albumin levels showed a significant
increase
The follow-up (2 months old) values were compared with reference values and all
but direct bilirubin were within the reference range Reference values relate to peripheral
blood samples of infants aged approximately 2 months (the age intervals differ)
according to The Harriet Lane Handbook (Kahl amp Hughes 2017)
34
Table 3 Biochemical data of healthy newborns and of their 2 months follow-up
newborn 2 months old p
reference
value
2 months
Uric acid [mgdL] 485 (435 - 588) 260 (243 - 300) 0012 11 - 56
Total bilirubin [mgdL] 146 (123 - 165) 108 (045 - 159) 0208 ˂ 12
Direct bilirubin [mgdL] 058 (046 - 066) 040 (020 - 055) 0262 ˂ 02
Indirect bilirubin [mgdL] 090 (057 - 110) 068 (024 - 110) 0528 ˂ 10
GGT [UIL] 148 (91 - 203) 53 (33 - 111) 0025 80 - 900
AST [UIL] 285 (200 - 330) 375 (325 - 101) 0035 90 - 800
ALT [UIL] 105 (53 - 128) 280 (253 - 720) 0012 130 - 450
ASTALT 295 (235 - 338) 130 (085 - 153) 0011 07 - 18
Albumin [gdL] 384 (370 - 392) 414 (397 - 441) 0017 22 - 48 GGT gamma-glutamyl transferase AST aspartate aminotransferase ALT alanine aminotransferase
Data are presented as median (inter ndash quartile range) values plt005 between newborn versus 2 months old groups
was considered statistically significant Wilcoxon Signed-Rank Test was used
Reference values were obtained from The Harriet Lane Handbook (Kahl amp Hughes 2017)
43 Oxidative stress biomarkers
While assessing OS biomarkers we worked with different fractions of the blood samples
RBC membranes total erythrocyte and plasma
All the presented OS biomarkers data are values that were normalized by protein
concentration of each sample Mentioned reference values were obtained in previous
research and projects of our laboratory and belong to adult subjects so they only serve
as a rough comparison since they are biased by age and development
35
431 RBC membranes
Three tests were performed using erythrocyte membranes from our subjects Graphic
representation can be seen in Figure 5
MBH percentage decreased significantly from newborn to 2 months follow-up
reference range for adults is 052 - 097
Statistically significant positive correlations were found in newborns between
MBH and the following indices membranersquos CAT activity (r = 0810 p = 0015 n = 8)
total RBC GPx activity (r = 0810 p = 0015 n = 8) plasma LPO (r = 0778 p = 0023
n = 8) A negative statistically significant correlation was observed with GSHGSSG ratio
(r = -0762 p = 0028 n = 8)
Quantification of CAT activity in membranes contrary to our expectation has not
shown a significant difference between newborns and 2 months samples reference range
for adults is 65 - 571 nmolminmLmGPt
Statistically significant correlations were discovered in these cases membranersquos
CAT activity in newborns correlates positively with GPx activity in 2 months samples
(r = 0762 p = 0028 n = 8) and with plasma LPO in newborns (r = 0717 p = 0046
n = 8) and negatively with GSHGSSG ratio in newborns (r = -0762 p = 0028 n = 8)
LPO measured in RBC membranes seems to drop significantly after two months
and a tendency to decrease to common adult reference range (0012 - 0017 μMmGPt) is
clear Strength of this OS biomarker is also supported by statistically significant
Figure 5 Oxidative stress biomarkers - RBC membranes of healthy newborns and of their 2 months
follow-up MBH CAT LPO MBH membrane bound hemoglobin CAT catalase activity LPO lipid
peroxidation Data are presented as median (inter ndash quartile range) values plt005 between newborn
versus 2 months old groups was considered statistically significant Wilcoxon Signed-Rank Test was used
36
correlations a negative one was found between LPO 2 months and TAS 2 months
(r = - 0786 p = 0021 n = 8) a positive link was discovered between LPO in newborns
and CAT activity (measured in total erythrocytes 2 months) and GPx activity (newborn)
levels (r = 0738 p = 0037 n = 8 and r = 0762 p = 0028 n = 8 respectively) and
in the 2 months follow-up there was an interesting (positive) connection with
hematological indices RBC count and Hb in newborns (r = 0714 p = 0047
n = 8 and r = 0759 p = 0029 n = 8 respectively)
432 Total erythrocytes
Quantification of CAT activity of TAS and of GPx activity was performed using total
erythrocyte samples results are presented in Figure 6
Figure 6 Oxidative stress biomarkers ndash total erythrocytes of healthy newborns and of their 2 months
follow-up CAT TAS GPx CAT catalase activity TAS total antioxidant status GPx glutathione
peroxidase activity Data are presented as median (inter ndash quartile range) values plt005 between newborn
versus 2 months old groups was considered statistically significant Wilcoxon Signed-Rank Test was used
CAT activity showed an increase from newborns to 2 months follow-ups with
reference values being 181 ndash 275 nmolminmLmGPt Positive and statistically
significant correlation with gestational age was discovered in newborn samples
(r = 0766 p = 00278 n = 8) on the other hand in the follow-up samples it correlates
negatively and significantly with follow-up reticulocytes value (r = -0786 p = 0021
n = 8)
Despite our expectations TAS levels have not proven to change with statistical
significance both values met the reference range 0040 - 0056 mM However there are
some interesting correlations (statistically significant) 2 months TAS samples showed
37
a positive links to reticulocyte count in newborns (r = 0738 p = 0037 n = 8)
and to GSHGSSG ratio in 2 months samples (r = 0881 p = 0004 n = 8)
For GPx we recorded a significant decrease From values above the reference
range in the newborns the levels dropped 2 months after birth reference
515 - 887 mUmL
While still using the total erythrocytes fraction a set of tests to measure GSH
related values was carried out (Figure 7)
Figure 7 Oxidative stress biomarkers - total erythrocytes of healthy newborns and of their 2 months
follow-up glutathione GSH glutathione GSSG oxidized glutathione Data are presented as median
(inter ndash quartile range) values plt005 between newborn versus 2 months old groups was considered
statistically significant Wilcoxon Signed-Rank Test was used
38
None of the indices showed significant changes over the 2 months after birth All
the examined values (total glutathione oxidized glutathione reduced glutathione
and reducedoxidized glutathione ratio) were within the reference ranges total GSH
948 ndash 153 μM GSSG 119 ndash 194 μM reduced GSH 829 ndash 134 μM and GSHGSSG
689 ndash 697
Several statistically significant correlations support the data positive correlation
in newborns - total GSH and both reduced GSH and GSHGSSG (r = 0976 p lt 0001
n = 8 and r = 0762 p = 0028 n = 8 respectively) In 2 months samples there is
a connection between total GSH and reduced GSH (r = 0952 p lt 0001 n = 8) Oxidized
glutathione has a negative link to GSHGSSG both in newborns (r = -0738 p = 0037
n = 8) On the other hand GSHGSSG correlates positively with reduced GSH
in newborns as well (r = 0833 p = 0010 n = 8) All these connections are not surprising
since they only support the knowledge of GSH metabolism
More of novelty could be these reduced GSH in 2 months samples correlates
significantly and positively with the reticulocytes count in newborns and negatively with
the UA levels in newborns (r = -0810 p = 0015 n = 8 and r = -0735 p = 0038 n = 8
respectively) GSHGSSG ratio in newborns showed a negative link to plasma LPO
in newborns and a positive one to reticulocytes count in newborns (r = -0766 p = 0027
n = 8 and r = 0762 p = 0028 n = 8 respectively)
39
433 Plasma
LPO and TAS were determined in the plasma fraction of the samples Graphic
representation of the evolution of the values can be seen in Figure 8
Figure 8 Oxidative stress biomarkers ndash plasma of healthy newborns and of their 2 months
follow ndash up LPO TAS LPO lipid peroxidation TAS total antioxidant status Data are presented as
median (inter ndash quartile range) values plt005 between newborn versus 2 months old groups was
considered statistically significant Wilcoxon Signed-Rank Test was used
Contrary to LPO measured in membranes plasma LPO has not shown
a significant difference though a decrease was observed Both LPO plasma values seem
to be even lower than the reference ones reference for adults 0022 - 0043 μM
TAS decreases in time reference range being 028 - 040 mM
40
5 DISCUSSION
Erythrocytes cells responsible for O2CO2 transport in the human organism are
continuously exposed to ROS either from endogenous or exogenous origin Though they
are equipped with a powerful AOX defense system these mechanisms can get
overwhelmed on some occasions resulting in damage to both RBCs and other cells
and tissues A state when harmful pro-oxidants outweigh the AOX capacity and thus
disturb the balance is called OS The cause of OS is usually associated with various
pathologies and diseases but it has been documented in healthy newborns as well
Neonates after being suddenly exposed to relatively hyperoxic extrauterine environment
with their immature organisms working autonomously for the first time are extremely
susceptible to FR By evaluating reliable biomarkers of OS we can analyze how
the newborns cope with this newly acquired autonomy
In this study we present experimental data obtained by measurements of several
OS biomarkers we follow the changes in hematology and biochemistry of neonates
and with the support of correlations we estimate the connections and mechanisms among
various AOX agents focusing on the erythrocyte as a model of OS
51 Hematological data
Although basic hematology assays are carried out in every hospital laboratory on a daily
basis it is not very common to have them from healthy newborns right after birth
from the UCB But these values when compared with a follow-up assayed under
the same conditions give us a precious insight on how the biochemistry of a newborn
infant changes with age and the hematological values themselves are often required for
monitoring and diagnosis of a possible pathology
All the measured hematological parameters were found to be normal (Table 2)
and they correspond with common knowledge about the topic (Esan 2016 Ogundeyi
MM et al 2011 Soldin et al 2005) Overproduction of various blood elements
and substances is an important part of the organism preparing for being literally cut off
the mother All the components necessary for gas carriage as well as white cells
responsible for the so needed immunity exceed the counts that are usually found in older
41
children and adults Attention must be paid while comparing values with reference
ranges not only the age of an infant matters but also the type of collected blood ndash venous
versus UCB In our study newborn samples donrsquot have reference values to compare them
to as there are no official ranges for cord blood which is an improvement given to this
field of knowledge by this work Little insight can be seen from the work
of Catarino et al (Catarino et al 2009) who also evaluated UCB for several parameters
as we did plus they worked with a Portuguese population as well while our reference
values for 2 months samples come from American authors and population (Soldin et al
2005) A different set of reference ranges can be found in the work of Qaiser Sandila
Ahmed amp Kazmi (Qaiser et al 2009) who worked with Pakistani newborns measured
values are in accordance with our results Another study was conducted by Ogundeyi
MM et al in Nigeria The researches there worked with around 150 infants whose
samples of venous blood were taken at birth in 3 days and in 6 weeks of life Although
we cannot directly compare the values with our results the tendency of the indices
to drop in time is obvious and corresponds with our findings and general knowledge
(Ogundeyi MM et al 2011)
It was described that in the neonatal period the complete blood count highly
correlates with birth weight blood sampling site crying physical therapy mode
of delivery and gestational age (Esan 2016) In accordance we found a positive
correlation of gestational age (38-70 weeks) with the leukocytes count in our newborns
52 Biochemical data
Liver besides its metabolic and other functions is the principal detoxifying organ in
the human organism (Casas-Grajales amp Muriel 2015)
UA as powerful plasmatic AOX providing up to 60 of AOX capacity
of plasma (Fabbrini et al 2014) acts as a FR scavenger and chelator of transitional
meatal ions (Kang amp Ha 2014 Pasalic et al 2012) But the role of UA in the AOX
defense system is somehow dual while it neutralizes peroxynitrite and hydroxyl radicals
to inhibit protein nitration and LPO the reaction in which the UA is formed produces
ROS as by-products (Kang amp Ha 2014 Pasalic et al 2012) UA is the end product
of purine metabolism in humans the reaction being catalyzed by xanthine oxidase
42
hypoxanthine is oxidized to xanthine xanthine to UA In both reactions molecular O2 is
reduced and superoxide radical and H2O2 are formed (Casas-Grajales amp Muriel 2015)
In newborns it is normal that serum UA is increased Raivio stated that the mean
value in cord blood is 60 mgdL increases to 70 mgdL in the next 24h and decreases
to 35mgdL over next three days (Raivio 1976) High UA levels could be explained by
many morphological changes occurring in the blood of the neonate nuclei of the former
RBCs disappear polynuclear neutrophils predominance changes in favor
of lymphocytes total leukocyte count drops significantly which results in a large amount
of purines (Kingsbury amp Sedgwick 1917)
Bilirubin a natural AOX is well-known as the end product of heme metabolism
Heme is released from aging RBCs and in the turnover of heme-containing enzymes
Free-heme can be toxic though so a family of heme oxygenase enzymes degrades it
the heme ring is cleaved to form biliveridin which can be reduced to bilirubin
in the NADPH consuming reaction catalyzed by biliveridin reductase (Sedlak amp Snyder
2004) Bilirubin is toxic and insoluble and thus must be conjugated with glucuronic acid
before excretion into the bile Or bilirubin can be oxidized back to biliveridin while
reducing ROS This biliverdin ndash bilirubin cycle appears to affect OSndashinduced membrane
lipid degradation Although concentrations of bilirubin are relatively lower than the ones
of GSH the continuous recycling of biliverdin to bilirubin amplifies its effect by more
than 10 000 times and therefore even small increase in bilirubin levels could account for
a significant increase in its AOX potency (Marconi et al 2018)
A significant number of term and pre-term newborns display some level
of neonatal jaundice It is accompanied by an increase in serum of (unconjugated
indirect) bilirubin levels mostly caused by breakdown of RBCs Extremely high levels
of unconjugated bilirubin can be neurotoxic leading up to kernicterus but majority
of the jaundice cases a ldquophysiologic jaundicerdquo respond well to phototherapy which is
a gentle and effective way of reducing bilirubin levels (Mitra amp Rennie 2017 Sedlak amp
Snyder 2004)
Our results (Table 3) are in accordance with known reference ranges and follow
expected developmental tendencies in healthy term infants We recorded a significant
decrease in UA levels slight changes in liver enzymes levels that settle up at known
physiological values in follow-ups and significant increase of albumin Reshad et al
43
suggested that association between UCB albumin levels and the tendency to develop
significant neonatal hyperbilirubinemia in both term and preterm neonates could lead
to albuminacutes application as a marker in screening the newborn infants for possible
development of neonatal hyperbilirubinemia (Reshad et al 2016)
53 Oxidative stress biomarkers
The focus of our work was pointed towards the AOX capacity of RBCs Even though we
expected more of our biomarkers to document significant changes between newborn
versus follow-up the fact that several of them exhibited a significant difference despite
the small number of samples (n = 8) suggests that those biomarkers are strong
and reliable ones (MBH LPO membranes GPx CAT total erythrocytes plasma TAS)
(Figures 5 6 7 and 8)
Since no official reference values for OS biomarkers in newborns exist we could
only compare our follow-up data with experimental values obtained in previous research
of our laboratory from samples of adult individuals and there was no reference
for the newborn samples (from UCB)
In RBC membranes the decrease in the MBH and LPO (Figure 5) which are
generally believed to be good OS biomarkers (Ayala et al 2014 Pandey amp Rizvi 2010
Rizvi amp Maurya 2007 Sharma amp Premachandra 1991 Welbourn et al 2017)
corroborates the theory of the OS being at its highest right after birth reflecting
the sudden exposure to relatively hyperoxic environment (Perrone et al 2010) Contrary
to our expectations plasmatic TAS decreased (Figure 8) For a better explanation this
assay would probably need to be repeated to discover whether this preliminary result
would change with a larger number of samples or whether it would follow the same trend
(decreasing after birth) The latter option could represent a developmental stage in infant
where plasmatic TAS in 2 months of age is decreased and then increases with age
Strength of the MBH and LPO as biomarkers can be supported by several correlations
not only they correlate with each other but a negative link between LPO and total
erythrocytes TAS was found in the follow-up samples thus the lower the OS levels get
the higher the AOX capacity is Activity of GPx which decreased over 2 months after
birth also seems to have a significant positive correlation with the two biomarkers while
the other AOX enzyme CAT significantly increases (Figure 6) This observation could
44
be explained by the different targets of these enzymes Although both of them detoxify
the cell from H2O2 CAT is described to work at higher H2O2 concentrations of mostly
exogenous origin while GPx on the other hand catalyzes the decomposition of low
levels of endogenous H2O2 often generated by auto-oxidation of Hb (Rocha et al 2015)
The decrease of GPx activity could be explained by the newbornacutes adaptation to the outer
environment accompanied by the documented reduction of birth-related OS However
the newly acquired autonomy of the older infant brings along an increasing exposure
to various oxidants of exogenous origin Here supposedly CAT steps in to protect
the cells and thus its activity is increased
Although OS is usually related to pathological conditions many studies
(Norishadkam et al 2017 Ozsurekci amp Aykac 2016 Perrone et al 2010) including our
work show that it also accompanies a physiological event such as birth of a healthy
full- term baby Broader collection of physiological reference values for OS biomarkers
and proper knowledge of the mechanism behind them could help physicians
in the evaluation of development of newborns or early prediction of potential future
disorders
Nevertheless we cannot omit the role of these oxidative damage parameters
in various OS related diseases several of them were described in the literature chronic
lung diseases intraventricular hemorrhages of newborns necrotizing enterocolitis
(Norishadkam et al 2017 Perrone et al 2010) bronchopulmonary dysplasia retinopathy
of prematurity patent ductus arteriosus periventricular leukomalacia respiratory distress
syndrome intrauterine growth retardation congenital malformation (Ozsurekci amp Aykac
2016) Reference values of OS biomarkers could be a valuable source of information for
the diagnosis effective treatment and disease monitoring
Tsukahara also suggests that restoration of redox balance either by decreasing
exposure to ROS or by augmenting AOX capacity represent a promising way
of therapeutic intervention in OS related diseases Classic AOXs include tocopherols
carotenoids and ascorbate but it has been suggested that their effect is only symptomatic
since they scavenge already existing ROS and thus do not serve as a causal treatment
(Tsukahara 2007)
Several AOX strategies were involved in clinical trials in the pediatric field
including administration of corticosteroids for bronchial asthma and bacterial meningitis
45
melatonin for neonatal asphyxia and epilepsy tocopherols and ascorbates for endothelial
dysfunction in hyperlipidemia L-arginine for endothelial dysfunction in cardiac
transplantation folinic acid betaine and methylcobalamin for autism (Tsukahara 2007)
enteral glutamine and arginine for prevention of necrotizing enterocolitis epicatechin
(for blockage of peroxynitrite-mediated tyrosine nitration and peroxynitrite formation)
in ischemic proliferative diseases of the retina (Ozsurekci amp Aykac 2016) Some
favorable results of these strategies were described but still further studies with broader
population are required and as Tsukahara mentions other techniques for measurement
of OS status because the establishment of reference values for OS biomarkers is
paramount for these studies
Generally we believe that OS and its mechanisms need to be further explored
new studies conducted and data collected Our contribution despite the limited number
of subjects provides insight in the issue as we bring a number of reference values for OS
biomarkers in early infancy Portuguese individuals which to our knowledge have not
been described before
46
6 CONCLUSION
In the present work we focused on the study of OS in newborns with the aid
of appropriate biomarkers of OS focusing mainly on the erythrocyte
We obtained physiological OS-related data including complete blood count
general biochemical data and experimental values from a small population of Portuguese
healthy full-term newborns The sample collections occurred twice at birth
and in 2 months of age By observing how the values change newborn versus follow-up
we gained a good insight about the development of the infant
Both hematological and biochemical data follow the reference values
as anticipated Our experimental values support the theory of so called hyperoxic
challenge which induces high levels of OS in healthy neonates several of our biomarkers
recorded a significant change in OS levels MBH and LPO in membranes decreased as
well as GPx activity while CAT activity in total erythrocytes increased The first three
biomarkers document neonateacutes adaptation to the environment and CATTAS values
suggest autonomy development of the newborn who starts to encounter various
exogenous oxidants
As there are no official reference values for OS biomarkers in newborns our
results are a novelty and provide an invaluable progression in this field of knowledge
though our number of samples is small and further studies are warranted
OS has been linked with a number of pathological conditions both in newborns
and older individuals Proper knowledge of the mechanisms behind OS and oxidative
damage and large quantity of reliable data documenting the OS-related reference values
could be a precious tool in the assessment of human health and disease
47
7 LIST OF ABBREVIATIONS
OH hydroxyl radical
23-DPG 23-diphosphoglycerate
AIDS acquired immune deficiency syndrome
ALT alanine aminotransferase
AOX antioxidant
AST aspartate aminotransferase
ATP adenosine triphosphate
BFU-E burst-forming unit - erythroid
BSA bovine serum albumin
CAT catalase
CFU-E colony-forming unit - erythroid
CMP common myeloid progenitor
CO2 carbon dioxide
Cys cysteine
CysP peroxidatic cysteine
deoxyHb deoxyhemoglobin
DF dilution factor
DTNB 55acute-dithiobis-2-nitrobenzoic acid
EHM extramedullary hematopoiesis
FAD flavin adenine dinucleotide
FR free radicals
FRAP ferric reducing ability of plasma
G-6-P glucose-6-phosphate
GGT gamma-glutamyl transferase
Glc glucose
GLUT1 glucose transporter
GPx glutathione peroxidase
GR glutathione reductase
GSH glutathione
GSSG oxidized glutathione
H2O water
H2O2 hydrogen peroxide
Hb hemoglobin
His histidine
48
HPX hypoxanthine
IL interleukine
K3EDTA tripotassium ethylenediaminetetraacetic acid
Km Michaelis constant
LDL low-density lipoprotein
LPO lipid peroxidation
MBH membrane-bound hemoglobin
MCV mean cell volume
MCH mean cell hemoglobin
MCHC mean cell hemoglobin concentration
MDA malondialdehyde
metHb methemoglobin
NADP nicotinamide adenine dinucleotide phosphate
NADPH reduced nicotinamide adenine dinucleotide phosphate
O2 oxygen
O2ndash superoxide anion
OS oxidative stress
Prx peroxiredoxin
PS phosphatidylserine
PUFA polyunsaturated fatty acid
Purpald 4-amino-3-hydrazino-5-mercapto-124-triazole
RT room temperature
RBC red blood cells
RDW red cell distribution width
RNA ribonucleic acid
ROS reactive oxygen species
Sec selenocysteine
SOD superoxide dismutase
TBA thiobarbituric acid
TBARS thiobarbituric reactive substances
TNB 5-thio-2-nitrobenzoic acid
TPTZ 246-Tris(2-pyridyl)-s-triazine
Trx thioredoxin
UA uric acid
UCB umbilical cord blood
XAN xanthine
49
8 REFERENCES
Aksoy Y Balk M Oumlgus H Oumlzer N The Mechanism of Inhibition of Human Erythrocyte
Catalase by Azide Turkish Journal of Biology 200428(2-4)
An X Mohandas N Disorders of red cell membrane Br J Haematol 2008141(3)367-
75
Anonymous Erythropoiesis Simplified EpoMedicine c2016 [updated 201809012018-
09-01] Available from httpepomedicinecommedical-studentserythropoiesis-
simplified
Anonymous Reasearch areas Faculdade de Farmaacutecia da Universidade do Porto c1996-
2018 [updated 2017-08-042018-08-19] Available from
httpssigarraupptffupptWEB_BASEGERA_PAGINAp_pagina=pC3A1gina
20estC3A1tica20genC3A9rica20155
Arthurs G Sudhakar M Carbon dioxide transport Continuing Education in Anaesthesia
Critical Care amp Pain 20055(6)
Ayala A Munoz MF Arguelles S Lipid peroxidation production metabolism and
signaling mechanisms of malondialdehyde and 4-hydroxy-2-nonenal Oxid Med Cell
Longev 20142014360438
Benzie IF Strain JJ The ferric reducing ability of plasma (FRAP) as a measure of
antioxidant power the FRAP assay Anal Biochem 1996239(1)70-6
Birben E Sahiner UM Sackesen C Erzurum S Kalayci O Oxidative stress and
antioxidant defense World Allergy Organ J 20125(1)9-19
Bradford MM A rapid and sensitive method for the quantitation of microgram quantities
of protein utilizing the principle of protein-dye binding Anal Biochem 197672248-54
Bresnick EH Hewitt KJ Mehta C Keles S Paulson RF Johnson KD Mechanisms of
erythrocyte development and regeneration implications for regenerative medicine and
beyond Development 2018145(1)
50
Brigelius-Flohe R Maiorino M Glutathione peroxidases Biochim Biophys Acta
20131830(5)3289-303
Brown KA Erythrocyte Metabolism and Enzyme Defects Laboratory Medicine
199627(5)
Bukhari KT Zafar H Reference values of reticulocyte counts in five age groups of
healthy infants at Rawalpindi Pakistan J Pak Med Assoc 201363(9)1108-11
Capece L Marti MA Crespo A Doctorovich F Estrin DA Heme protein oxygen affinity
regulation exerted by proximal effects J Am Chem Soc 2006128(38)12455-61
Casas-Grajales S Muriel P Antioxidants in liver health World J Gastrointest Pharmacol
Ther 20156(3)59-72
Catala A Lipid peroxidation of membrane phospholipids generates hydroxy-alkenals and
oxidized phospholipids active in physiological andor pathological conditions Chem
Phys Lipids 2009157(1)1-11
Catarino C Rebelo I Belo L Rocha-Pereira P Rocha S Bayer Castro E et al
Erythrocyte changes in preeclampsia relationship between maternal and cord blood
erythrocyte damage J Perinat Med 200937(1)19-27
Cimen MY Free radical metabolism in human erythrocytes Clin Chim Acta
2008390(1-2)1-11
Claster S Chiu DT Quintanilha A Lubin B Neutrophils mediate lipid peroxidation in
human red cells Blood 198464(5)1079-84
Costa V Quintanilha A Moradas-Ferreira P Protein oxidation repair mechanisms and
proteolysis in Saccharomyces cerevisiae IUBMB Life 200759(4-5)293-8
Culotta VC Superoxide dismutase oxidative stress and cell metabolism Curr Top Cell
Regul 200036117-32
Diez-Silva M Dao M Han J Lim CT Suresh S Shape and Biomechanical
Characteristics of Human Red Blood Cells in Health and Disease MRS Bull
201035(5)382-8
51
Dodge JT Mitchell C Hanahan DJ The preparation and chemical characteristics of
hemoglobin-free ghosts of human erythrocytes Arch Biochem Biophys 1963100119-
30
Dzierzak E Philipsen S Erythropoiesis development and differentiation Cold Spring
Harb Perspect Med 20133(4)a011601
Esan A Hematological differences in newborn and aging a review study Hematol
Transfus Int J 20163(3)
Fabbrini E Serafini M Colic Baric I Hazen SL Klein S Effect of plasma uric acid on
antioxidant capacity oxidative stress and insulin sensitivity in obese subjects Diabetes
201463(3)976-81
Floheacute L Glutathione Peroxidase Brought into Focus In Pryor W editor Free Radicals
in Biology Academic Press 1982 p 223-54
Friel JK Friesen RW Harding SV Roberts LJ Evidence of oxidative stress in full-term
healthy infants Pediatr Res 200456(6)878-82
Frijhoff J Winyard PG Zarkovic N Davies SS Stocker R Cheng D et al Clinical
Relevance of Biomarkers of Oxidative Stress Antioxid Redox Signal 201523(14)1144-
70
Fukai T Ushio-Fukai M Superoxide dismutases role in redox signaling vascular
function and diseases Antioxid Redox Signal 201115(6)1583-606
Geers C Gros G Carbon dioxide transport and carbonic anhydrase in blood and muscle
Physiol Rev 200080(2)681-715
Gordon-Smith T Structure and function of red and white blood cells Medicine
2013193-9
Griffith OW Biologic and pharmacologic regulation of mammalian glutathione
synthesis Free Radic Biol Med 199927(9-10)922-35
Griffith OW Determination of glutathione and glutathione disulfide using glutathione
reductase and 2-vinylpyridine Anal Biochem 1980106(1)207-12
52
Gwaltney-Brant S Biomarkers in Toxicology In Gupta RC editor Biomarkers in
Toxicology2014
Hall A Karplus PA Poole LB Typical 2-Cys peroxiredoxins--structures mechanisms
and functions FEBS J 2009276(9)2469-77
Halliwell B Biochemistry of oxidative stress Biochem Soc Trans 200735(Pt 5)1147-
50
Han YH Kim SU Kwon TH Lee DS Ha HL Park DS et al Peroxiredoxin II is essential
for preventing hemolytic anemia from oxidative stress through maintaining hemoglobin
stability Biochem Biophys Res Commun 2012426(3)427-32
Harris JR Schroder E Isupov MN Scheffler D Kristensen P Littlechild JA et al
Comparison of the decameric structure of peroxiredoxin-II by transmission electron
microscopy and X-ray crystallography Biochim Biophys Acta 20011547(2)221-34
Hattangadi SM Wong P Zhang L Flygare J Lodish HF From stem cell to red cell
regulation of erythropoiesis at multiple levels by multiple proteins RNAs and chromatin
modifications Blood 2011118(24)6258-68
Hoffbrand VA Moss PAH Hoffbrandrsquos Essential Haematology2016
Chang JC van der Hoeven LH Haddox CH Glutathione reductase in the red blood cells
Ann Clin Lab Sci 19788(1)23-9
Cho CS Lee S Lee GT Woo HA Choi EJ Rhee SG Irreversible inactivation of
glutathione peroxidase 1 and reversible inactivation of peroxiredoxin II by H2O2 in red
blood cells Antioxid Redox Signal 201012(11)1235-46
Chung J Chen C Paw BH Heme metabolism and erythropoiesis Curr Opin Hematol
201219(3)156-62
Johansson LH Borg LA A spectrophotometric method for determination of catalase
activity in small tissue samples Anal Biochem 1988174(1)331-6
53
Johnson RM Ho YS Yu DY Kuypers FA Ravindranath Y Goyette GW The effects of
disruption of genes for peroxiredoxin-2 glutathione peroxidase-1 and catalase on
erythrocyte oxidative metabolism Free Radic Biol Med 201048(4)519-25
Kahl L Hughes H The Harriet Lane Handbook a manual for pediatric house officers
The Harriet Lane Handbook Mobile Medicine Series 21st ed Philadelphia Pa Elsevier
2017 p 1272
Kamerbeek NM van Zwieten R de Boer M Morren G Vuil H Bannink N et al
Molecular basis of glutathione reductase deficiency in human blood cells Blood
2007109(8)3560-6
Kang DH Ha SK Uric Acid Puzzle Dual Role as Anti-oxidantand Pro-oxidant
Electrolyte Blood Press 201412(1)1-6
Kanias T Acker JP Biopreservation of red blood cells--the struggle with hemoglobin
oxidation FEBS J 2010277(2)343-56
Kingsbury J Sedgwick JP The uric acid content of the blood of the new-borns The
Journal of Biological Chemistry 191731(1)261-8
Kirkman HN Galiano S Gaetani GF The function of catalase-bound NADPH J Biol
Chem 1987262(2)660-6
Kodydkova J Vavrova L Kocik M Zak A Human catalase its polymorphisms
regulation and changes of its activity in different diseases Folia Biol (Praha)
201460(4)153-67
Kondo M Lymphoid and myeloid lineage commitment in multipotent hematopoietic
progenitors Immunol Rev 2010238(1)37-46
Kuhn V Diederich L Keller TCSt Kramer CM Luckstadt W Panknin C et al Red
Blood Cell Function and Dysfunction Redox Regulation Nitric Oxide Metabolism
Anemia Antioxid Redox Signal 201726(13)718-42
Kurata M Suzuki M Agar N Glutathione Regeneration in Mammalian Erythrocytes
Comparative Haematology International 200010(2)
54
Lee TH Kim SU Yu SL Kim SH Park DS Moon HB et al Peroxiredoxin II is essential
for sustaining life span of erythrocytes in mice Blood 2003101(12)5033-8
Li H Lykotrafitis G Erythrocyte membrane model with explicit description of the lipid
bilayer and the spectrin network Biophys J 2014107(3)642-53
Lichtman M Prchal J Levi M Press O Burns L Caligiuri M Hematology of the Fetus
and Newborn In Edmonson K Lebowitz H editors Williams Hematology 9th ed USA
McGraw-Hill Education 2016
Low FM Hampton MB Winterbourn CC Peroxiredoxin 2 and peroxide metabolism in
the erythrocyte Antioxid Redox Signal 200810(9)1621-30
Lu SC Regulation of glutathione synthesis Mol Aspects Med 200930(1-2)42-59
Lubos E Loscalzo J Handy DE Glutathione peroxidase-1 in health and disease from
molecular mechanisms to therapeutic opportunities Antioxid Redox Signal
201115(7)1957-97
Lux SEt Anatomy of the red cell membrane skeleton unanswered questions Blood
2016127(2)187-99
Manta B Hugo M Ortiz C Ferrer-Sueta G Trujillo M Denicola A The peroxidase and
peroxynitrite reductase activity of human erythrocyte peroxiredoxin 2 Arch Biochem
Biophys 2009484(2)146-54
Marconi VC Duncan MS So-Armah K Re VL 3rd Lim JK Butt AA et al Bilirubin Is
Inversely Associated With Cardiovascular Disease Among HIV-Positive and HIV-
Negative Individuals in VACS (Veterans Aging Cohort Study) J Am Heart Assoc
20187(10)
Marengo-Rowe AJ Structure-function relations of human hemoglobins Proc (Bayl Univ
Med Cent) 200619(3)239-45
Mate MJ Ortiz-Lombardia M Marina A Fita I Crystallization and preliminary structural
results of catalase from human erythrocytes Acta Crystallogr D Biol Crystallogr
199955(Pt 5)1066-8
55
May JM Ascorbate function and metabolism in the human erythrocyte Front Biosci
19983d1-10
McGill MR Jaeschke H A direct comparison of methods used to measure oxidized
glutathione in biological samples 2-vinylpyridine and N-ethylmaleimide Toxicol Mech
Methods 201525(8)589-95
Melo DF Enzymatic mechanism of antioxidant defense in the erythrocyte ndash cytosol
versus membrane [Master thesis] Universidade do Porto 2017
Mihara M Uchiyama M Determination of malonaldehyde precursor in tissues by
thiobarbituric acid test Anal Biochem 197886(1)271-8
Mitra S Rennie J Neonatal jaundice aetiology diagnosis and treatment Br J Hosp Med
(Lond) 201778(12)699-704
Monostori P Wittmann G Karg E Turi S Determination of glutathione and glutathione
disulfide in biological samples an in-depth review J Chromatogr B Analyt Technol
Biomed Life Sci 2009877(28)3331-46
Muller DP Free radical problems of the newborn Proc Nutr Soc 198746(1)69-75
Negi R Pande D Karki K Kumar A Khanna RS Khanna HD A novel approach to study
oxidative stress in neonatal respiratory distress syndrome BBA Clin 2015365-9
Niki E Interaction of ascorbate and alpha-tocopherol Ann N Y Acad Sci 1987498186-
99
Norishadkam M Andishmand S Zavar Reza J Zare Sakhvidi MJ Hachesoo VR
Oxidative stress and DNA damage in the cord blood of preterm infants Mutat Res
201782420-4
Ogasawara Y Ohminato T Nakamura Y Ishii K Structural and functional analysis of
native peroxiredoxin 2 in human red blood cells Int J Biochem Cell Biol
201244(7)1072-7
56
Ogundeyi MM Olarewaju DM Njokanma OF Ogunlesi TA Haematological profile
of apparently healthy term babies aged one day three days and six weeks delivered in
Sagamu Nigeria Nigerian Journal of Paediatrics 201138(3)125-30
Ochoa JJ Ramirez-Tortosa MC Quiles JL Palomino N Robles R Mataix J et al
Oxidative stress in erythrocytes from premature and full-term infants during their first 72
h of life Free Radic Res 200337(3)317-22
Oliveira S Saldanha C An overview about erythrocyte membrane Clinical
Hemorheology and Microcirculation 200944(2010)
Ozsurekci Y Aykac K Oxidative Stress Related Diseases in Newborns Oxid Med Cell
Longev 201620162768365
Pai EF Schulz GE The catalytic mechanism of glutathione reductase as derived from x-
ray diffraction analyses of reaction intermediates J Biol Chem 1983258(3)1752-7
Pandey KB Rizvi SI Biomarkers of oxidative stress in red blood cells Biomed Pap Med
Fac Univ Palacky Olomouc Czech Repub 2011155(2)131-6
Pandey KB Rizvi SI Markers of oxidative stress in erythrocytes and plasma during aging
in humans Oxid Med Cell Longev 20103(1)2-12
Pasalic D Marinkovic N Feher-Turkovic L Uric acid as one of the important factors in
multifactorial disorders--facts and controversies Biochem Med (Zagreb) 201222(1)63-
75
Perrone S Negro S Tataranno ML Buonocore G Oxidative stress and antioxidant
strategies in newborns J Matern Fetal Neonatal Med 201023 Suppl 363-5
Peskin AV Pace PE Behring JB Paton LN Soethoudt M Bachschmid MM et al
Glutathionylation of the Active Site Cysteines of Peroxiredoxin 2 and Recycling by
Glutaredoxin J Biol Chem 2016291(6)3053-62
Qaiser DH Sandila MP Ahmed ST Kazmi T Haematological reference values for full-
term healthy newborns of Karachi Pakistan J Pak Med Assoc 200959(9)618-22
57
Raftos JE Whillier S Kuchel PW Glutathione synthesis and turnover in the human
erythrocyte alignment of a model based on detailed enzyme kinetics with experimental
data J Biol Chem 2010285(31)23557-67
Raivio KO Neonatal hyperuricemia J Pediatr 197688(4 Pt 1)625-30
Rakhit R Chakrabartty A Structure folding and misfolding of CuZn superoxide
dismutase in amyotrophic lateral sclerosis Biochim Biophys Acta 20061762(11-
12)1025-37
Remacle Ja Raes M Toussaint O Renard P Rao G Low levels of reactive oxygen
species as modulators of cell function Mutation Research 1994316103-22
Reshad M Ravichander B Raghuraman TS A study of cord blood albumin as a predictor
of significant neonatal hyperbilirubinemia in term and preterm neonates International
Journal of Research in Medical Sciences 20164(3)887-90
Richard A Polin SHA David Rowitch William E Benitz Fetal and Neonatal
Physiology Fetal and Neonatal Physiology 1 5th ed Philadelphia PA Elsevier 2017
Rizvi SI Maurya PK Markers of oxidative stress in erythrocytes during aging in humans
Ann N Y Acad Sci 20071100373-82
Rocha S Gomes D Lima M Bronze-da-Rocha E Santos-Silva A Peroxiredoxin 2
glutathione peroxidase and catalase in the cytosol and membrane of erythrocytes under
H2O2-induced oxidative stress Free Radic Res 201549(8)990-1003
Santos-Silva A Castro EM Teixeira NA Guerra FC Quintanilha A Altered erythrocyte
membrane band 3 profile as a marker in patients at risk for cardiovascular disease
Atherosclerosis 1995116(2)199-209
Sarniak A Lipinska J Tytman K Lipinska S Endogenous mechanisms of reactive
oxygen species (ROS) generation Postepy Hig Med Dosw (Online) 201670(0)1150-
65
Sedlak TW Snyder SH Bilirubin benefits cellular protection by a biliverdin reductase
antioxidant cycle Pediatrics 2004113(6)1776-82
58
Shaik IH Mehvar R Rapid determination of reduced and oxidized glutathione levels
using a new thiol-masking reagent and the enzymatic recycling method application to
the rat liver and bile samples Anal Bioanal Chem 2006385(1)105-13
Shan G Yang F Zhou L Tang T Okoro EU Yang H et al Increase in Blood Glutathione
and Erythrocyte Proteins Related to Glutathione Generation Reduction and Utilization in
African-American Old Women with Diabetes J Sci Technol Environ 20155(1)
Sharma R Premachandra BR Membrane-bound hemoglobin as a marker of oxidative
injury in adult and neonatal red blood cells Biochem Med Metab Biol 199146(1)33-
44
Sies H Oxidative stress oxidants and antioxidants Exp Physiol 199782(2)291-5
Soldin SJ Brugnara C Wong EC Pediatric References Intervals 5th ed United States
Washington DC AACC Press c2005 2005 257 p
Staal GE Veeger C The reaction mechanism of glutathione reductase from human
erythrocytes Biochim Biophys Acta 1969185(1)49-62
Tainer JA Getzoff ED Richardson JS Richardson DC Structure and mechanism of
copper zinc superoxide dismutase Nature 1983306(5940)284-7
Torres-Cuevas I Parra-Llorca A Sanchez-Illana A Nunez-Ramiro A Kuligowski J
Chafer-Pericas C et al Oxygen and oxidative stress in the perinatal period Redox Biol
201712674-81
Tsiftsoglou AS Tsamadou AI Papadopoulou LC Heme as key regulator of major
mammalian cellular functions molecular cellular and pharmacological aspects
Pharmacol Ther 2006111(2)327-45
Tsukahara H Biomarkers for oxidative stress clinical application in pediatric medicine
Curr Med Chem 200714(3)339-51
Valko M Leibfritz D Moncol J Cronin MT Mazur M Telser J Free radicals and
antioxidants in normal physiological functions and human disease Int J Biochem Cell
Biol 200739(1)44-84
59
Welbourn EM Wilson MT Yusof A Metodiev MV Cooper CE The mechanism of
formation structure and physiological relevance of covalent hemoglobin attachment to
the erythrocyte membrane Free Radic Biol Med 201710395-106
Weydert CJ Cullen JJ Measurement of superoxide dismutase catalase and glutathione
peroxidase in cultured cells and tissue Nat Protoc 20105(1)51-66
Wu G Fang YZ Yang S Lupton JR Turner ND Glutathione metabolism and its
implications for health J Nutr 2004134(3)489-92
Yamauc R Vitamine E Mechanism of Its Antioxidant Activity Food Sci Technol Int
19973(4)301-9
Zachara BA Selenium and selenium-dependent antioxidants in chronic kidney disease
Adv Clin Chem 201568131-51
Zitka O Skalickova S Gumulec J Masarik M Adam V Hubalek J et al Redox status
expressed as GSHGSSG ratio as a marker for oxidative stress in paediatric tumour
patients Oncol Lett 20124(6)1247-53
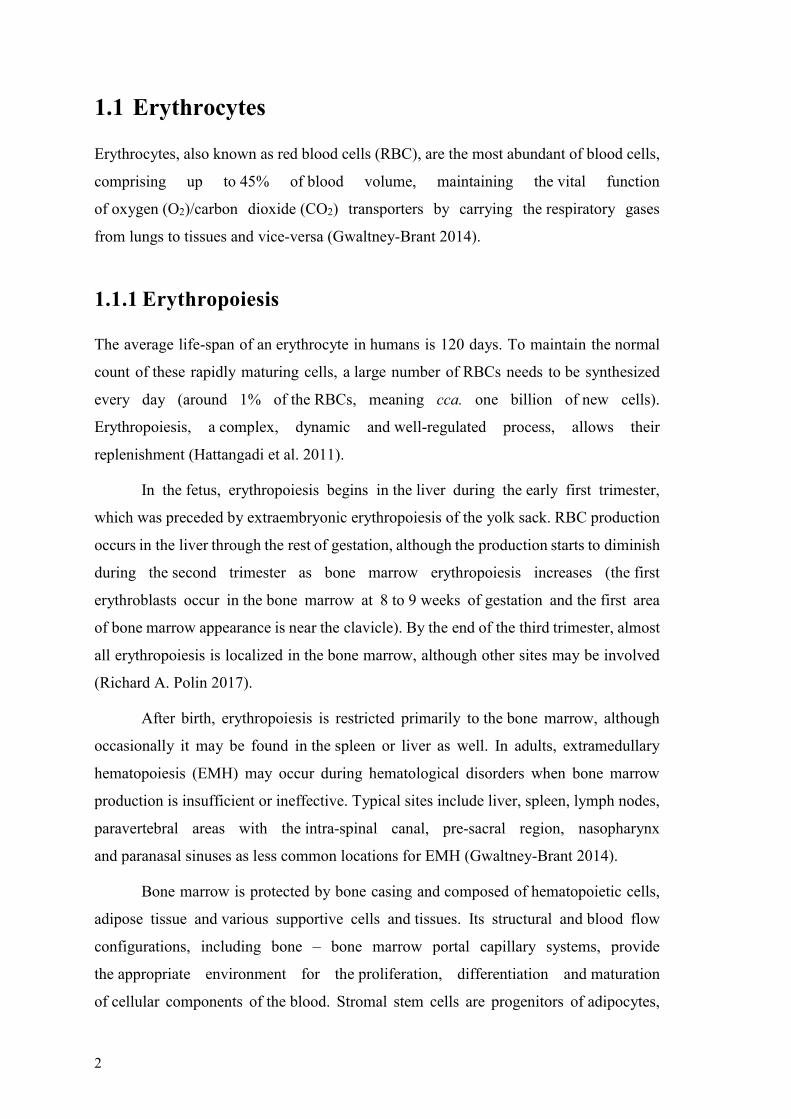
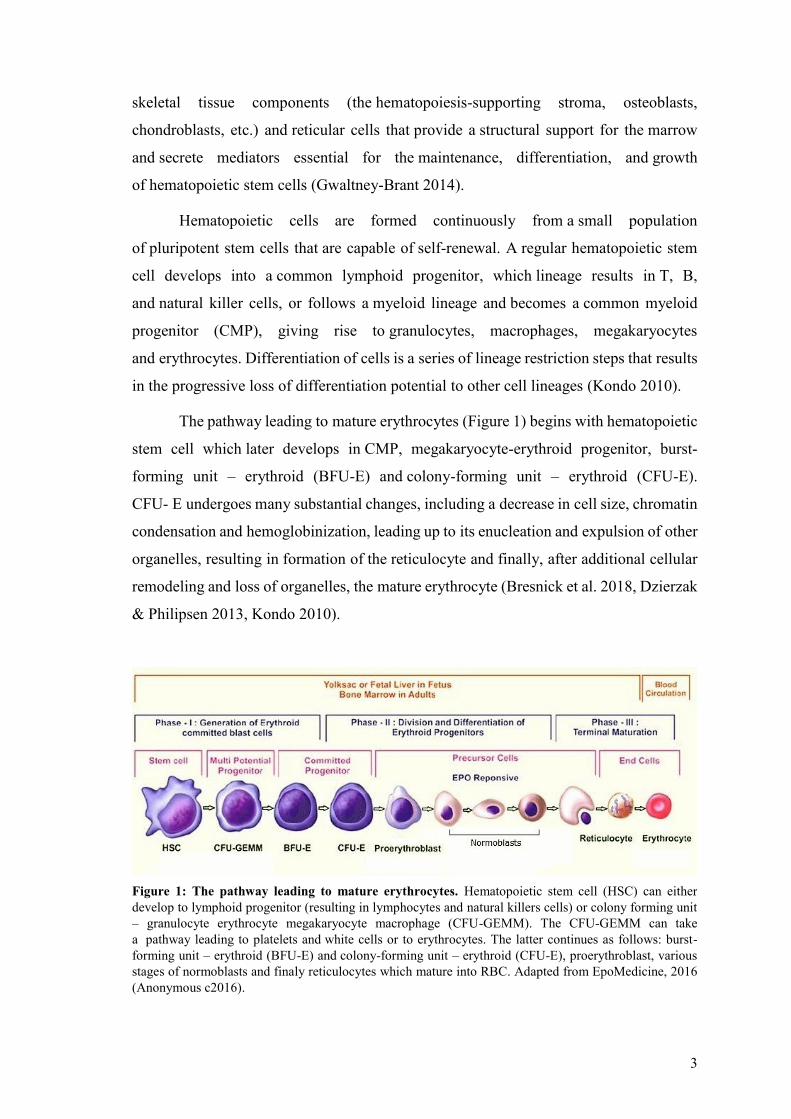
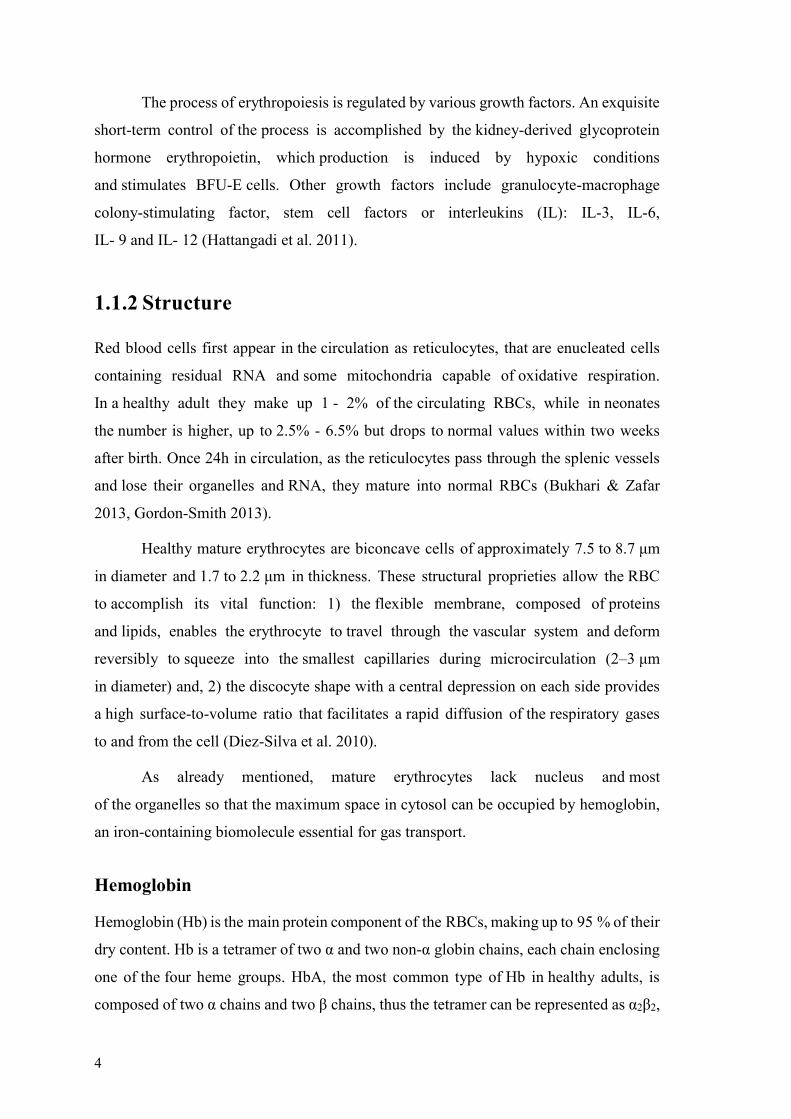
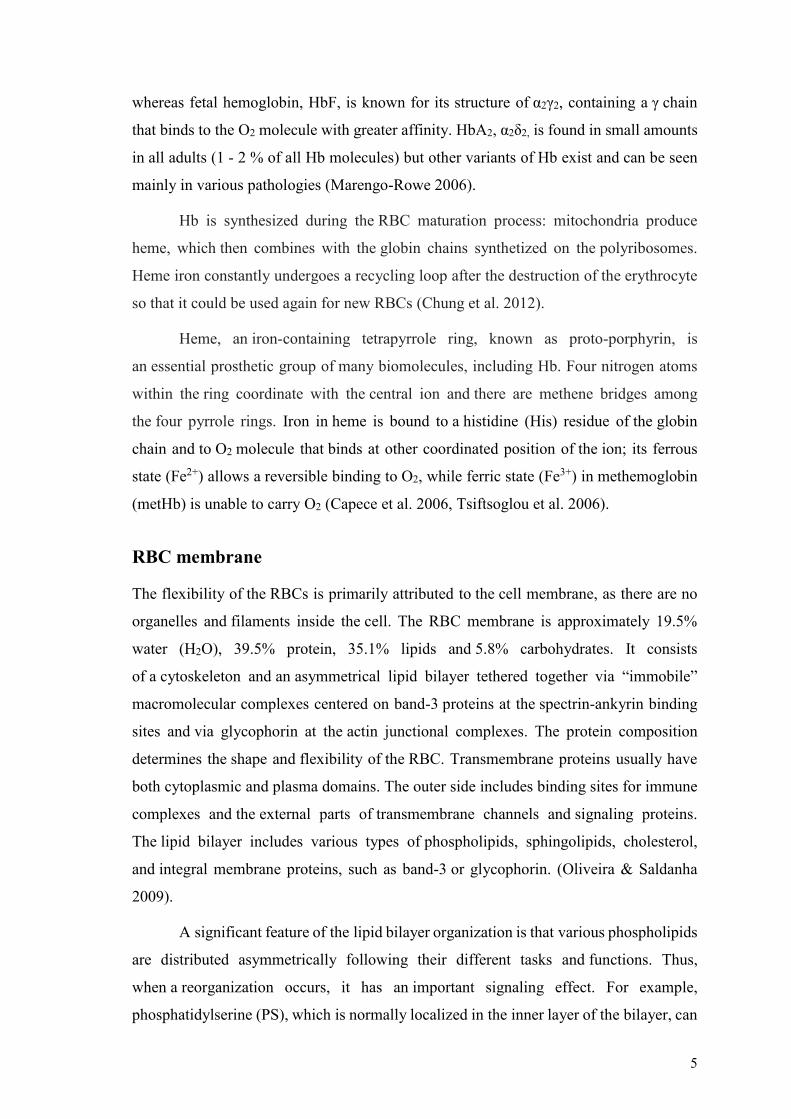
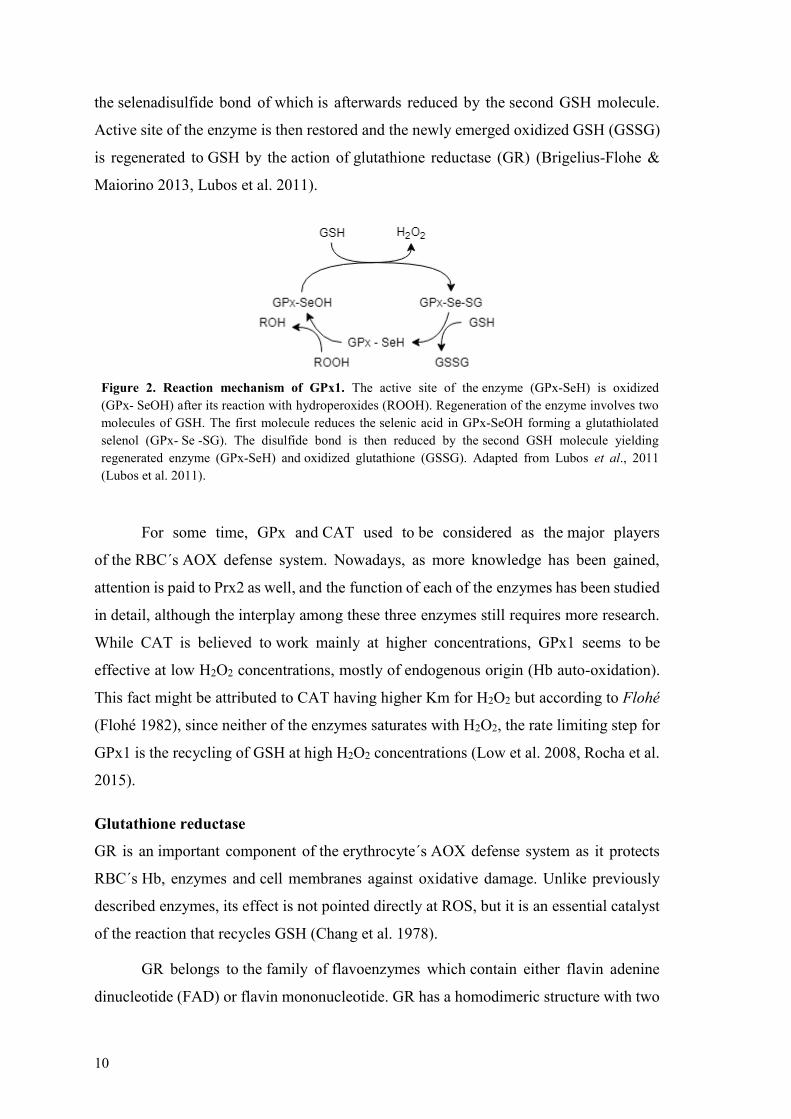
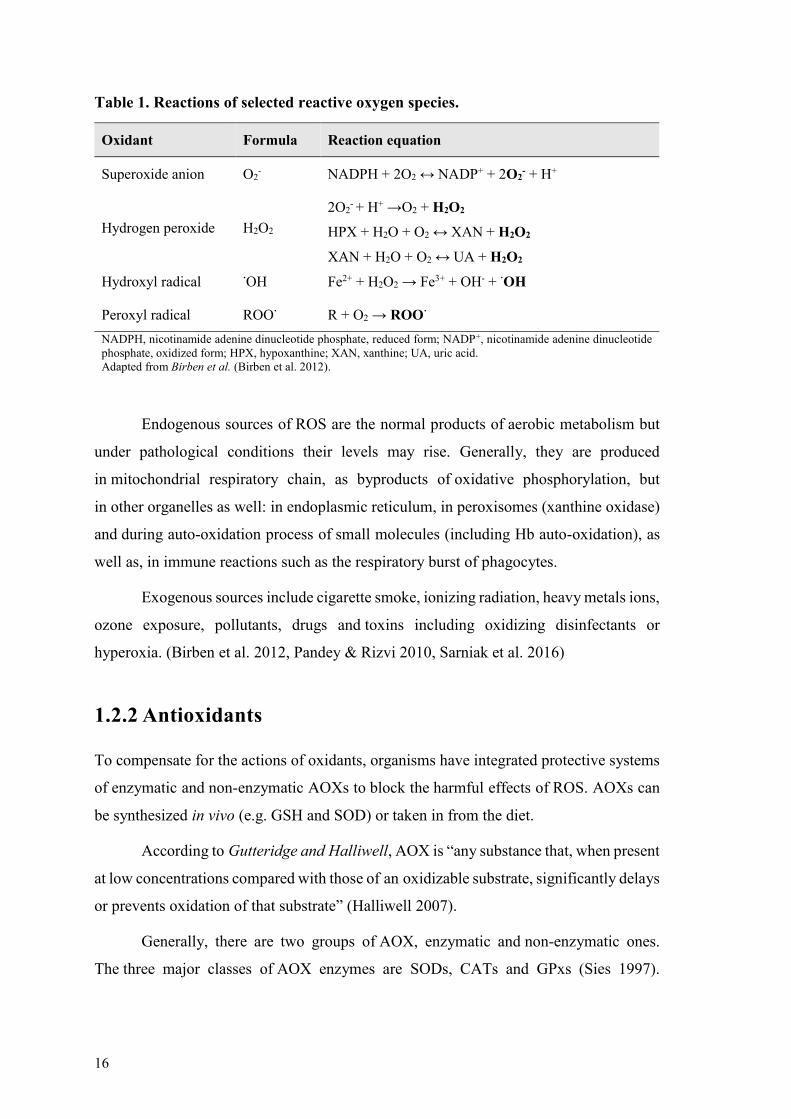
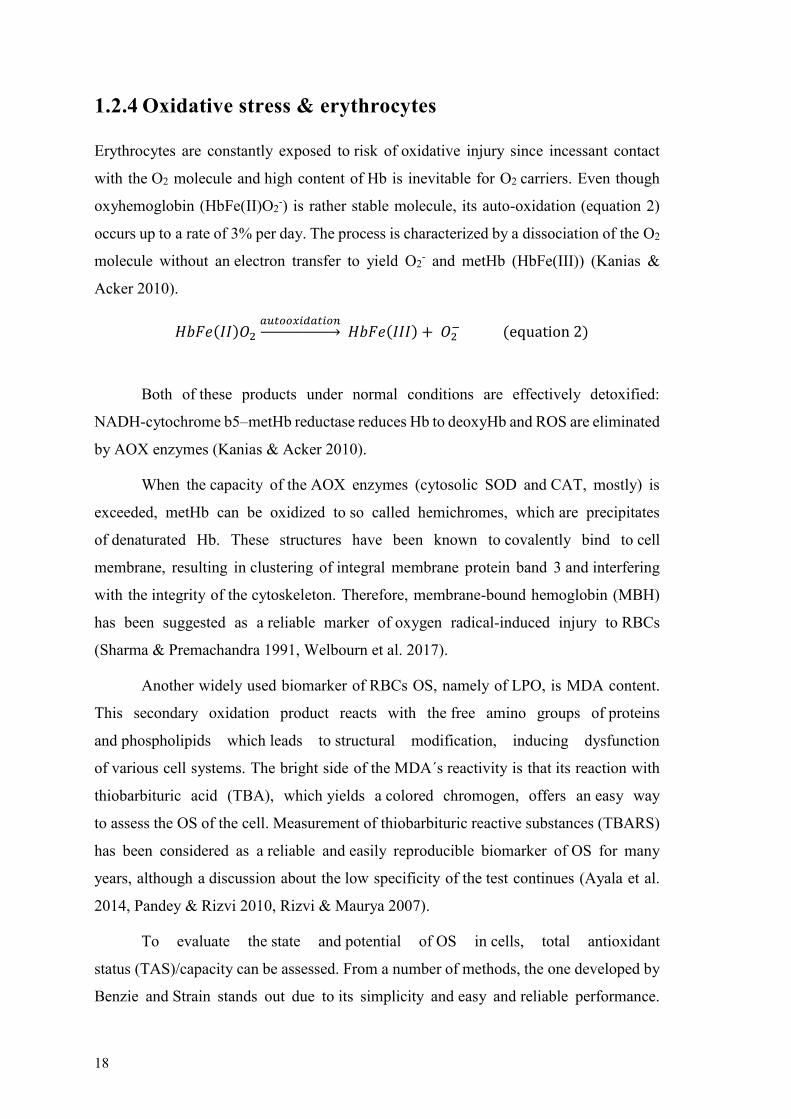
30
Figure 4 Quantification of total glutathione and oxidized glutathione Glutathione (GSH) can reduce
different compounds including 55rsquo-dithiobis-(2-nitrobenzoic acid) (DTNB) while oxidizing itself
(GSTNB) This reaction yields a yellow chromogen 5-thio-2-nitrobenzoic acid (TNB) the amount
of which can be monitored as it amount is proportional to available GSH amount Oxidized glutathione
(GSSG) is regenerated by glutathione reductase (GR) in a nicotinamide adenine dinucleotide phosphate
(NADPH) consuming reaction 2-Vinylpyridine serves as a masking agent Adapted from Melo 2017
(Melo 2017)
GSSG quantification employs exactly the same principleprotocol that total GSH
with only one additional step to distinguish the GSSG in the total amount of GSH
an agent (2- Vinylpyridine) is used to mask reduced GSH (McGill amp Jaeschke 2015)
Total erythrocyte samples were diluted with HClO4 5 1250 and 150 for total
GSH and GSSG quantifications respectively Sets of standard GSH (0 ndash 150 uM)
and GSSG (0 ndash 80 uM) solutions were prepared Internal controls of GSH and GSSG
were used to validate the results
To neutralize the samples KHCO3 076 M was added to samplesinternal control
and standard solutions After centrifugation (16000 g 2 min 4 degC) the samples were
transferred to a 96 well plate and the reagent solution (240 μM NADPH 13 mM DTNB
final well concentration) was added to each well and the plate was incubated for 15 min
at 30 degC Afterwards GR (final well concentration of 2 UmL) was added and a kinetic
reading was performed at 412 nm for 3 minutes (30 seconds intervals) Values
of the slope were used plotted against the standard curve and finally normalized by
the total protein concentration for each sample to get the total GSH values The GSSG
quantification required a pre-incubation of the samples with 2-vinylpyridine (10 microL) for
1 h at 4 degC
31
35 Statistical analysis
For statistical analysis the Statistical Package for Social Sciences (IBM SPSS version
240 SPSS Inc) for Windows was used
Descriptive statistic tools were employed to characterize the data including
Shapiro-Wilk normality test As some of our data presented non-Gaussian distribution
we used the non-parametric Wilcoxon Signed-Rank Test for related samples to evaluate
the differences between the studied groups (baby at birth and in 2 months of age)
Spearmanrsquos rank correlation coefficient was used to assess relationships between sets
of data Data are presented as median (interquartile range) The level of significance (p)
was set at 005
32
4 RESULTS
The first task of our work was to obtain physiological data linked to OS These can be
divided into three groups hematological data biochemical data (both performed
in the hospital) and our own measurements of RBC-specific OS related values
(OS biomarkers)
Hematological and biochemistry tests were performed at birth (from UCB
samples) and then in two months (64 days in average peripheral blood samples)
Experimental values were obtained in our laboratory after receiving the follow-up
samples matching the newborn samples as the importance was given to having the same
assay conditions for both of the paired samples
To assess the relationships between different parameters Spearmans rank
correlation coefficient was used
41 Hematological data
RBC count Hb hematocrit MCV MCH MCHC RDW reticulocytes and leukocytes
count were measured
The results (Table 2) show that there was a significant difference (plt005)
between newborn and 2 months follow-up measurements in all examined parameters
Significant decrease was observed in the following indices RBCs Hb
hematocrit MCV MCH RDW reticulocytes and leukocyte count
These changes were expected and are in an accordance what was already known
(Esan 2016 Ogundeyi MM et al 2011 Soldin et al 2005)
Comparison of the follow-up samples with reference values shows that apart
from RDW all data fall into the reference range (Soldin et al 2005) Given references
relate to peripheral blood samples of males aged 61 d to lt181 d as in Pediatric
Reference Intervals (Soldin et al 2005)
33
Table 2 Hematological data of healthy newborns and of their 2 months follow-up
newborn 2 months old p
reference
value -
2 months
RBC [x1012L] 435 (421 - 457) 371 (354 - 385) 0012 367 - 461
Hemoglobin [gdL] 148 (149 - 159) 108 (107 - 117) 0012 105 - 130
Hematocrit [] 449 (434 - 468) 310 (305 - 355) 0012 305 - 377
MCV [fL] 103 (101 - 106) 847 (832 - 857) 0012 796 - 863
MCH [pg] 349 (336 - 352) 299 (293 - 305) 0012 276 - 299
MCHC [gdL] 338 (330 - 341) 354 (349 - 356) 0012 339 - 354
RDW [] 163 (163 - 173) 133 (128 - 137) 0012 135 - 153
Reticulocytes [x109L] 166 (162 - 193) 727 (576 - 110) 0017 370 - 104
Leukocytes [x109L] 160 (129 - 188) 84 (69 - 103) 0012 79 - 134 RBC red blood cell MCV mean cell volume MCH mean cell hemoglobin MCHC mean cell hemoglobin
concentration RDW red cell distribution width
Data are presented as median (inter ndash quartile range) values plt005 between newborn versus 2 months old groups
was considered statistically significant Wilcoxon Signed-Rank Test was used
Reference values were obtained from Pediatric Reference Intervals (Soldin et al 2005)
Positive and statistically significant correlations were found between
the gestational age and the count of leukocytes both in newborn and in 2 months samples
(r = 0766 p = 0027 n = 8 r = 0717 p = 0046 n = 8 respectively)
42 Biochemical data
Uric acid (UA) concentration bilirubin levels liver enzymes (gamma-glutamyl
transferase GGT aspartate aminotransferase AST alanine aminotransferase ALT)
and albumin concentration were quantified and calculated
The data can be seen in Table 3 Uric acid GGT AST ALT (and thus ASTALT
ratio) and albumin values changed significantly over two months A decrease was found
in UA GGT and albumin levels AST ALT and albumin levels showed a significant
increase
The follow-up (2 months old) values were compared with reference values and all
but direct bilirubin were within the reference range Reference values relate to peripheral
blood samples of infants aged approximately 2 months (the age intervals differ)
according to The Harriet Lane Handbook (Kahl amp Hughes 2017)
34
Table 3 Biochemical data of healthy newborns and of their 2 months follow-up
newborn 2 months old p
reference
value
2 months
Uric acid [mgdL] 485 (435 - 588) 260 (243 - 300) 0012 11 - 56
Total bilirubin [mgdL] 146 (123 - 165) 108 (045 - 159) 0208 ˂ 12
Direct bilirubin [mgdL] 058 (046 - 066) 040 (020 - 055) 0262 ˂ 02
Indirect bilirubin [mgdL] 090 (057 - 110) 068 (024 - 110) 0528 ˂ 10
GGT [UIL] 148 (91 - 203) 53 (33 - 111) 0025 80 - 900
AST [UIL] 285 (200 - 330) 375 (325 - 101) 0035 90 - 800
ALT [UIL] 105 (53 - 128) 280 (253 - 720) 0012 130 - 450
ASTALT 295 (235 - 338) 130 (085 - 153) 0011 07 - 18
Albumin [gdL] 384 (370 - 392) 414 (397 - 441) 0017 22 - 48 GGT gamma-glutamyl transferase AST aspartate aminotransferase ALT alanine aminotransferase
Data are presented as median (inter ndash quartile range) values plt005 between newborn versus 2 months old groups
was considered statistically significant Wilcoxon Signed-Rank Test was used
Reference values were obtained from The Harriet Lane Handbook (Kahl amp Hughes 2017)
43 Oxidative stress biomarkers
While assessing OS biomarkers we worked with different fractions of the blood samples
RBC membranes total erythrocyte and plasma
All the presented OS biomarkers data are values that were normalized by protein
concentration of each sample Mentioned reference values were obtained in previous
research and projects of our laboratory and belong to adult subjects so they only serve
as a rough comparison since they are biased by age and development
35
431 RBC membranes
Three tests were performed using erythrocyte membranes from our subjects Graphic
representation can be seen in Figure 5
MBH percentage decreased significantly from newborn to 2 months follow-up
reference range for adults is 052 - 097
Statistically significant positive correlations were found in newborns between
MBH and the following indices membranersquos CAT activity (r = 0810 p = 0015 n = 8)
total RBC GPx activity (r = 0810 p = 0015 n = 8) plasma LPO (r = 0778 p = 0023
n = 8) A negative statistically significant correlation was observed with GSHGSSG ratio
(r = -0762 p = 0028 n = 8)
Quantification of CAT activity in membranes contrary to our expectation has not
shown a significant difference between newborns and 2 months samples reference range
for adults is 65 - 571 nmolminmLmGPt
Statistically significant correlations were discovered in these cases membranersquos
CAT activity in newborns correlates positively with GPx activity in 2 months samples
(r = 0762 p = 0028 n = 8) and with plasma LPO in newborns (r = 0717 p = 0046
n = 8) and negatively with GSHGSSG ratio in newborns (r = -0762 p = 0028 n = 8)
LPO measured in RBC membranes seems to drop significantly after two months
and a tendency to decrease to common adult reference range (0012 - 0017 μMmGPt) is
clear Strength of this OS biomarker is also supported by statistically significant
Figure 5 Oxidative stress biomarkers - RBC membranes of healthy newborns and of their 2 months
follow-up MBH CAT LPO MBH membrane bound hemoglobin CAT catalase activity LPO lipid
peroxidation Data are presented as median (inter ndash quartile range) values plt005 between newborn
versus 2 months old groups was considered statistically significant Wilcoxon Signed-Rank Test was used
36
correlations a negative one was found between LPO 2 months and TAS 2 months
(r = - 0786 p = 0021 n = 8) a positive link was discovered between LPO in newborns
and CAT activity (measured in total erythrocytes 2 months) and GPx activity (newborn)
levels (r = 0738 p = 0037 n = 8 and r = 0762 p = 0028 n = 8 respectively) and
in the 2 months follow-up there was an interesting (positive) connection with
hematological indices RBC count and Hb in newborns (r = 0714 p = 0047
n = 8 and r = 0759 p = 0029 n = 8 respectively)
432 Total erythrocytes
Quantification of CAT activity of TAS and of GPx activity was performed using total
erythrocyte samples results are presented in Figure 6
Figure 6 Oxidative stress biomarkers ndash total erythrocytes of healthy newborns and of their 2 months
follow-up CAT TAS GPx CAT catalase activity TAS total antioxidant status GPx glutathione
peroxidase activity Data are presented as median (inter ndash quartile range) values plt005 between newborn
versus 2 months old groups was considered statistically significant Wilcoxon Signed-Rank Test was used
CAT activity showed an increase from newborns to 2 months follow-ups with
reference values being 181 ndash 275 nmolminmLmGPt Positive and statistically
significant correlation with gestational age was discovered in newborn samples
(r = 0766 p = 00278 n = 8) on the other hand in the follow-up samples it correlates
negatively and significantly with follow-up reticulocytes value (r = -0786 p = 0021
n = 8)
Despite our expectations TAS levels have not proven to change with statistical
significance both values met the reference range 0040 - 0056 mM However there are
some interesting correlations (statistically significant) 2 months TAS samples showed
37
a positive links to reticulocyte count in newborns (r = 0738 p = 0037 n = 8)
and to GSHGSSG ratio in 2 months samples (r = 0881 p = 0004 n = 8)
For GPx we recorded a significant decrease From values above the reference
range in the newborns the levels dropped 2 months after birth reference
515 - 887 mUmL
While still using the total erythrocytes fraction a set of tests to measure GSH
related values was carried out (Figure 7)
Figure 7 Oxidative stress biomarkers - total erythrocytes of healthy newborns and of their 2 months
follow-up glutathione GSH glutathione GSSG oxidized glutathione Data are presented as median
(inter ndash quartile range) values plt005 between newborn versus 2 months old groups was considered
statistically significant Wilcoxon Signed-Rank Test was used
38
None of the indices showed significant changes over the 2 months after birth All
the examined values (total glutathione oxidized glutathione reduced glutathione
and reducedoxidized glutathione ratio) were within the reference ranges total GSH
948 ndash 153 μM GSSG 119 ndash 194 μM reduced GSH 829 ndash 134 μM and GSHGSSG
689 ndash 697
Several statistically significant correlations support the data positive correlation
in newborns - total GSH and both reduced GSH and GSHGSSG (r = 0976 p lt 0001
n = 8 and r = 0762 p = 0028 n = 8 respectively) In 2 months samples there is
a connection between total GSH and reduced GSH (r = 0952 p lt 0001 n = 8) Oxidized
glutathione has a negative link to GSHGSSG both in newborns (r = -0738 p = 0037
n = 8) On the other hand GSHGSSG correlates positively with reduced GSH
in newborns as well (r = 0833 p = 0010 n = 8) All these connections are not surprising
since they only support the knowledge of GSH metabolism
More of novelty could be these reduced GSH in 2 months samples correlates
significantly and positively with the reticulocytes count in newborns and negatively with
the UA levels in newborns (r = -0810 p = 0015 n = 8 and r = -0735 p = 0038 n = 8
respectively) GSHGSSG ratio in newborns showed a negative link to plasma LPO
in newborns and a positive one to reticulocytes count in newborns (r = -0766 p = 0027
n = 8 and r = 0762 p = 0028 n = 8 respectively)
39
433 Plasma
LPO and TAS were determined in the plasma fraction of the samples Graphic
representation of the evolution of the values can be seen in Figure 8
Figure 8 Oxidative stress biomarkers ndash plasma of healthy newborns and of their 2 months
follow ndash up LPO TAS LPO lipid peroxidation TAS total antioxidant status Data are presented as
median (inter ndash quartile range) values plt005 between newborn versus 2 months old groups was
considered statistically significant Wilcoxon Signed-Rank Test was used
Contrary to LPO measured in membranes plasma LPO has not shown
a significant difference though a decrease was observed Both LPO plasma values seem
to be even lower than the reference ones reference for adults 0022 - 0043 μM
TAS decreases in time reference range being 028 - 040 mM
40
5 DISCUSSION
Erythrocytes cells responsible for O2CO2 transport in the human organism are
continuously exposed to ROS either from endogenous or exogenous origin Though they
are equipped with a powerful AOX defense system these mechanisms can get
overwhelmed on some occasions resulting in damage to both RBCs and other cells
and tissues A state when harmful pro-oxidants outweigh the AOX capacity and thus
disturb the balance is called OS The cause of OS is usually associated with various
pathologies and diseases but it has been documented in healthy newborns as well
Neonates after being suddenly exposed to relatively hyperoxic extrauterine environment
with their immature organisms working autonomously for the first time are extremely
susceptible to FR By evaluating reliable biomarkers of OS we can analyze how
the newborns cope with this newly acquired autonomy
In this study we present experimental data obtained by measurements of several
OS biomarkers we follow the changes in hematology and biochemistry of neonates
and with the support of correlations we estimate the connections and mechanisms among
various AOX agents focusing on the erythrocyte as a model of OS
51 Hematological data
Although basic hematology assays are carried out in every hospital laboratory on a daily
basis it is not very common to have them from healthy newborns right after birth
from the UCB But these values when compared with a follow-up assayed under
the same conditions give us a precious insight on how the biochemistry of a newborn
infant changes with age and the hematological values themselves are often required for
monitoring and diagnosis of a possible pathology
All the measured hematological parameters were found to be normal (Table 2)
and they correspond with common knowledge about the topic (Esan 2016 Ogundeyi
MM et al 2011 Soldin et al 2005) Overproduction of various blood elements
and substances is an important part of the organism preparing for being literally cut off
the mother All the components necessary for gas carriage as well as white cells
responsible for the so needed immunity exceed the counts that are usually found in older
41
children and adults Attention must be paid while comparing values with reference
ranges not only the age of an infant matters but also the type of collected blood ndash venous
versus UCB In our study newborn samples donrsquot have reference values to compare them
to as there are no official ranges for cord blood which is an improvement given to this
field of knowledge by this work Little insight can be seen from the work
of Catarino et al (Catarino et al 2009) who also evaluated UCB for several parameters
as we did plus they worked with a Portuguese population as well while our reference
values for 2 months samples come from American authors and population (Soldin et al
2005) A different set of reference ranges can be found in the work of Qaiser Sandila
Ahmed amp Kazmi (Qaiser et al 2009) who worked with Pakistani newborns measured
values are in accordance with our results Another study was conducted by Ogundeyi
MM et al in Nigeria The researches there worked with around 150 infants whose
samples of venous blood were taken at birth in 3 days and in 6 weeks of life Although
we cannot directly compare the values with our results the tendency of the indices
to drop in time is obvious and corresponds with our findings and general knowledge
(Ogundeyi MM et al 2011)
It was described that in the neonatal period the complete blood count highly
correlates with birth weight blood sampling site crying physical therapy mode
of delivery and gestational age (Esan 2016) In accordance we found a positive
correlation of gestational age (38-70 weeks) with the leukocytes count in our newborns
52 Biochemical data
Liver besides its metabolic and other functions is the principal detoxifying organ in
the human organism (Casas-Grajales amp Muriel 2015)
UA as powerful plasmatic AOX providing up to 60 of AOX capacity
of plasma (Fabbrini et al 2014) acts as a FR scavenger and chelator of transitional
meatal ions (Kang amp Ha 2014 Pasalic et al 2012) But the role of UA in the AOX
defense system is somehow dual while it neutralizes peroxynitrite and hydroxyl radicals
to inhibit protein nitration and LPO the reaction in which the UA is formed produces
ROS as by-products (Kang amp Ha 2014 Pasalic et al 2012) UA is the end product
of purine metabolism in humans the reaction being catalyzed by xanthine oxidase
42
hypoxanthine is oxidized to xanthine xanthine to UA In both reactions molecular O2 is
reduced and superoxide radical and H2O2 are formed (Casas-Grajales amp Muriel 2015)
In newborns it is normal that serum UA is increased Raivio stated that the mean
value in cord blood is 60 mgdL increases to 70 mgdL in the next 24h and decreases
to 35mgdL over next three days (Raivio 1976) High UA levels could be explained by
many morphological changes occurring in the blood of the neonate nuclei of the former
RBCs disappear polynuclear neutrophils predominance changes in favor
of lymphocytes total leukocyte count drops significantly which results in a large amount
of purines (Kingsbury amp Sedgwick 1917)
Bilirubin a natural AOX is well-known as the end product of heme metabolism
Heme is released from aging RBCs and in the turnover of heme-containing enzymes
Free-heme can be toxic though so a family of heme oxygenase enzymes degrades it
the heme ring is cleaved to form biliveridin which can be reduced to bilirubin
in the NADPH consuming reaction catalyzed by biliveridin reductase (Sedlak amp Snyder
2004) Bilirubin is toxic and insoluble and thus must be conjugated with glucuronic acid
before excretion into the bile Or bilirubin can be oxidized back to biliveridin while
reducing ROS This biliverdin ndash bilirubin cycle appears to affect OSndashinduced membrane
lipid degradation Although concentrations of bilirubin are relatively lower than the ones
of GSH the continuous recycling of biliverdin to bilirubin amplifies its effect by more
than 10 000 times and therefore even small increase in bilirubin levels could account for
a significant increase in its AOX potency (Marconi et al 2018)
A significant number of term and pre-term newborns display some level
of neonatal jaundice It is accompanied by an increase in serum of (unconjugated
indirect) bilirubin levels mostly caused by breakdown of RBCs Extremely high levels
of unconjugated bilirubin can be neurotoxic leading up to kernicterus but majority
of the jaundice cases a ldquophysiologic jaundicerdquo respond well to phototherapy which is
a gentle and effective way of reducing bilirubin levels (Mitra amp Rennie 2017 Sedlak amp
Snyder 2004)
Our results (Table 3) are in accordance with known reference ranges and follow
expected developmental tendencies in healthy term infants We recorded a significant
decrease in UA levels slight changes in liver enzymes levels that settle up at known
physiological values in follow-ups and significant increase of albumin Reshad et al
43
suggested that association between UCB albumin levels and the tendency to develop
significant neonatal hyperbilirubinemia in both term and preterm neonates could lead
to albuminacutes application as a marker in screening the newborn infants for possible
development of neonatal hyperbilirubinemia (Reshad et al 2016)
53 Oxidative stress biomarkers
The focus of our work was pointed towards the AOX capacity of RBCs Even though we
expected more of our biomarkers to document significant changes between newborn
versus follow-up the fact that several of them exhibited a significant difference despite
the small number of samples (n = 8) suggests that those biomarkers are strong
and reliable ones (MBH LPO membranes GPx CAT total erythrocytes plasma TAS)
(Figures 5 6 7 and 8)
Since no official reference values for OS biomarkers in newborns exist we could
only compare our follow-up data with experimental values obtained in previous research
of our laboratory from samples of adult individuals and there was no reference
for the newborn samples (from UCB)
In RBC membranes the decrease in the MBH and LPO (Figure 5) which are
generally believed to be good OS biomarkers (Ayala et al 2014 Pandey amp Rizvi 2010
Rizvi amp Maurya 2007 Sharma amp Premachandra 1991 Welbourn et al 2017)
corroborates the theory of the OS being at its highest right after birth reflecting
the sudden exposure to relatively hyperoxic environment (Perrone et al 2010) Contrary
to our expectations plasmatic TAS decreased (Figure 8) For a better explanation this
assay would probably need to be repeated to discover whether this preliminary result
would change with a larger number of samples or whether it would follow the same trend
(decreasing after birth) The latter option could represent a developmental stage in infant
where plasmatic TAS in 2 months of age is decreased and then increases with age
Strength of the MBH and LPO as biomarkers can be supported by several correlations
not only they correlate with each other but a negative link between LPO and total
erythrocytes TAS was found in the follow-up samples thus the lower the OS levels get
the higher the AOX capacity is Activity of GPx which decreased over 2 months after
birth also seems to have a significant positive correlation with the two biomarkers while
the other AOX enzyme CAT significantly increases (Figure 6) This observation could
44
be explained by the different targets of these enzymes Although both of them detoxify
the cell from H2O2 CAT is described to work at higher H2O2 concentrations of mostly
exogenous origin while GPx on the other hand catalyzes the decomposition of low
levels of endogenous H2O2 often generated by auto-oxidation of Hb (Rocha et al 2015)
The decrease of GPx activity could be explained by the newbornacutes adaptation to the outer
environment accompanied by the documented reduction of birth-related OS However
the newly acquired autonomy of the older infant brings along an increasing exposure
to various oxidants of exogenous origin Here supposedly CAT steps in to protect
the cells and thus its activity is increased
Although OS is usually related to pathological conditions many studies
(Norishadkam et al 2017 Ozsurekci amp Aykac 2016 Perrone et al 2010) including our
work show that it also accompanies a physiological event such as birth of a healthy
full- term baby Broader collection of physiological reference values for OS biomarkers
and proper knowledge of the mechanism behind them could help physicians
in the evaluation of development of newborns or early prediction of potential future
disorders
Nevertheless we cannot omit the role of these oxidative damage parameters
in various OS related diseases several of them were described in the literature chronic
lung diseases intraventricular hemorrhages of newborns necrotizing enterocolitis
(Norishadkam et al 2017 Perrone et al 2010) bronchopulmonary dysplasia retinopathy
of prematurity patent ductus arteriosus periventricular leukomalacia respiratory distress
syndrome intrauterine growth retardation congenital malformation (Ozsurekci amp Aykac
2016) Reference values of OS biomarkers could be a valuable source of information for
the diagnosis effective treatment and disease monitoring
Tsukahara also suggests that restoration of redox balance either by decreasing
exposure to ROS or by augmenting AOX capacity represent a promising way
of therapeutic intervention in OS related diseases Classic AOXs include tocopherols
carotenoids and ascorbate but it has been suggested that their effect is only symptomatic
since they scavenge already existing ROS and thus do not serve as a causal treatment
(Tsukahara 2007)
Several AOX strategies were involved in clinical trials in the pediatric field
including administration of corticosteroids for bronchial asthma and bacterial meningitis
45
melatonin for neonatal asphyxia and epilepsy tocopherols and ascorbates for endothelial
dysfunction in hyperlipidemia L-arginine for endothelial dysfunction in cardiac
transplantation folinic acid betaine and methylcobalamin for autism (Tsukahara 2007)
enteral glutamine and arginine for prevention of necrotizing enterocolitis epicatechin
(for blockage of peroxynitrite-mediated tyrosine nitration and peroxynitrite formation)
in ischemic proliferative diseases of the retina (Ozsurekci amp Aykac 2016) Some
favorable results of these strategies were described but still further studies with broader
population are required and as Tsukahara mentions other techniques for measurement
of OS status because the establishment of reference values for OS biomarkers is
paramount for these studies
Generally we believe that OS and its mechanisms need to be further explored
new studies conducted and data collected Our contribution despite the limited number
of subjects provides insight in the issue as we bring a number of reference values for OS
biomarkers in early infancy Portuguese individuals which to our knowledge have not
been described before
46
6 CONCLUSION
In the present work we focused on the study of OS in newborns with the aid
of appropriate biomarkers of OS focusing mainly on the erythrocyte
We obtained physiological OS-related data including complete blood count
general biochemical data and experimental values from a small population of Portuguese
healthy full-term newborns The sample collections occurred twice at birth
and in 2 months of age By observing how the values change newborn versus follow-up
we gained a good insight about the development of the infant
Both hematological and biochemical data follow the reference values
as anticipated Our experimental values support the theory of so called hyperoxic
challenge which induces high levels of OS in healthy neonates several of our biomarkers
recorded a significant change in OS levels MBH and LPO in membranes decreased as
well as GPx activity while CAT activity in total erythrocytes increased The first three
biomarkers document neonateacutes adaptation to the environment and CATTAS values
suggest autonomy development of the newborn who starts to encounter various
exogenous oxidants
As there are no official reference values for OS biomarkers in newborns our
results are a novelty and provide an invaluable progression in this field of knowledge
though our number of samples is small and further studies are warranted
OS has been linked with a number of pathological conditions both in newborns
and older individuals Proper knowledge of the mechanisms behind OS and oxidative
damage and large quantity of reliable data documenting the OS-related reference values
could be a precious tool in the assessment of human health and disease
47
7 LIST OF ABBREVIATIONS
OH hydroxyl radical
23-DPG 23-diphosphoglycerate
AIDS acquired immune deficiency syndrome
ALT alanine aminotransferase
AOX antioxidant
AST aspartate aminotransferase
ATP adenosine triphosphate
BFU-E burst-forming unit - erythroid
BSA bovine serum albumin
CAT catalase
CFU-E colony-forming unit - erythroid
CMP common myeloid progenitor
CO2 carbon dioxide
Cys cysteine
CysP peroxidatic cysteine
deoxyHb deoxyhemoglobin
DF dilution factor
DTNB 55acute-dithiobis-2-nitrobenzoic acid
EHM extramedullary hematopoiesis
FAD flavin adenine dinucleotide
FR free radicals
FRAP ferric reducing ability of plasma
G-6-P glucose-6-phosphate
GGT gamma-glutamyl transferase
Glc glucose
GLUT1 glucose transporter
GPx glutathione peroxidase
GR glutathione reductase
GSH glutathione
GSSG oxidized glutathione
H2O water
H2O2 hydrogen peroxide
Hb hemoglobin
His histidine
48
HPX hypoxanthine
IL interleukine
K3EDTA tripotassium ethylenediaminetetraacetic acid
Km Michaelis constant
LDL low-density lipoprotein
LPO lipid peroxidation
MBH membrane-bound hemoglobin
MCV mean cell volume
MCH mean cell hemoglobin
MCHC mean cell hemoglobin concentration
MDA malondialdehyde
metHb methemoglobin
NADP nicotinamide adenine dinucleotide phosphate
NADPH reduced nicotinamide adenine dinucleotide phosphate
O2 oxygen
O2ndash superoxide anion
OS oxidative stress
Prx peroxiredoxin
PS phosphatidylserine
PUFA polyunsaturated fatty acid
Purpald 4-amino-3-hydrazino-5-mercapto-124-triazole
RT room temperature
RBC red blood cells
RDW red cell distribution width
RNA ribonucleic acid
ROS reactive oxygen species
Sec selenocysteine
SOD superoxide dismutase
TBA thiobarbituric acid
TBARS thiobarbituric reactive substances
TNB 5-thio-2-nitrobenzoic acid
TPTZ 246-Tris(2-pyridyl)-s-triazine
Trx thioredoxin
UA uric acid
UCB umbilical cord blood
XAN xanthine
49
8 REFERENCES
Aksoy Y Balk M Oumlgus H Oumlzer N The Mechanism of Inhibition of Human Erythrocyte
Catalase by Azide Turkish Journal of Biology 200428(2-4)
An X Mohandas N Disorders of red cell membrane Br J Haematol 2008141(3)367-
75
Anonymous Erythropoiesis Simplified EpoMedicine c2016 [updated 201809012018-
09-01] Available from httpepomedicinecommedical-studentserythropoiesis-
simplified
Anonymous Reasearch areas Faculdade de Farmaacutecia da Universidade do Porto c1996-
2018 [updated 2017-08-042018-08-19] Available from
httpssigarraupptffupptWEB_BASEGERA_PAGINAp_pagina=pC3A1gina
20estC3A1tica20genC3A9rica20155
Arthurs G Sudhakar M Carbon dioxide transport Continuing Education in Anaesthesia
Critical Care amp Pain 20055(6)
Ayala A Munoz MF Arguelles S Lipid peroxidation production metabolism and
signaling mechanisms of malondialdehyde and 4-hydroxy-2-nonenal Oxid Med Cell
Longev 20142014360438
Benzie IF Strain JJ The ferric reducing ability of plasma (FRAP) as a measure of
antioxidant power the FRAP assay Anal Biochem 1996239(1)70-6
Birben E Sahiner UM Sackesen C Erzurum S Kalayci O Oxidative stress and
antioxidant defense World Allergy Organ J 20125(1)9-19
Bradford MM A rapid and sensitive method for the quantitation of microgram quantities
of protein utilizing the principle of protein-dye binding Anal Biochem 197672248-54
Bresnick EH Hewitt KJ Mehta C Keles S Paulson RF Johnson KD Mechanisms of
erythrocyte development and regeneration implications for regenerative medicine and
beyond Development 2018145(1)
50
Brigelius-Flohe R Maiorino M Glutathione peroxidases Biochim Biophys Acta
20131830(5)3289-303
Brown KA Erythrocyte Metabolism and Enzyme Defects Laboratory Medicine
199627(5)
Bukhari KT Zafar H Reference values of reticulocyte counts in five age groups of
healthy infants at Rawalpindi Pakistan J Pak Med Assoc 201363(9)1108-11
Capece L Marti MA Crespo A Doctorovich F Estrin DA Heme protein oxygen affinity
regulation exerted by proximal effects J Am Chem Soc 2006128(38)12455-61
Casas-Grajales S Muriel P Antioxidants in liver health World J Gastrointest Pharmacol
Ther 20156(3)59-72
Catala A Lipid peroxidation of membrane phospholipids generates hydroxy-alkenals and
oxidized phospholipids active in physiological andor pathological conditions Chem
Phys Lipids 2009157(1)1-11
Catarino C Rebelo I Belo L Rocha-Pereira P Rocha S Bayer Castro E et al
Erythrocyte changes in preeclampsia relationship between maternal and cord blood
erythrocyte damage J Perinat Med 200937(1)19-27
Cimen MY Free radical metabolism in human erythrocytes Clin Chim Acta
2008390(1-2)1-11
Claster S Chiu DT Quintanilha A Lubin B Neutrophils mediate lipid peroxidation in
human red cells Blood 198464(5)1079-84
Costa V Quintanilha A Moradas-Ferreira P Protein oxidation repair mechanisms and
proteolysis in Saccharomyces cerevisiae IUBMB Life 200759(4-5)293-8
Culotta VC Superoxide dismutase oxidative stress and cell metabolism Curr Top Cell
Regul 200036117-32
Diez-Silva M Dao M Han J Lim CT Suresh S Shape and Biomechanical
Characteristics of Human Red Blood Cells in Health and Disease MRS Bull
201035(5)382-8
51
Dodge JT Mitchell C Hanahan DJ The preparation and chemical characteristics of
hemoglobin-free ghosts of human erythrocytes Arch Biochem Biophys 1963100119-
30
Dzierzak E Philipsen S Erythropoiesis development and differentiation Cold Spring
Harb Perspect Med 20133(4)a011601
Esan A Hematological differences in newborn and aging a review study Hematol
Transfus Int J 20163(3)
Fabbrini E Serafini M Colic Baric I Hazen SL Klein S Effect of plasma uric acid on
antioxidant capacity oxidative stress and insulin sensitivity in obese subjects Diabetes
201463(3)976-81
Floheacute L Glutathione Peroxidase Brought into Focus In Pryor W editor Free Radicals
in Biology Academic Press 1982 p 223-54
Friel JK Friesen RW Harding SV Roberts LJ Evidence of oxidative stress in full-term
healthy infants Pediatr Res 200456(6)878-82
Frijhoff J Winyard PG Zarkovic N Davies SS Stocker R Cheng D et al Clinical
Relevance of Biomarkers of Oxidative Stress Antioxid Redox Signal 201523(14)1144-
70
Fukai T Ushio-Fukai M Superoxide dismutases role in redox signaling vascular
function and diseases Antioxid Redox Signal 201115(6)1583-606
Geers C Gros G Carbon dioxide transport and carbonic anhydrase in blood and muscle
Physiol Rev 200080(2)681-715
Gordon-Smith T Structure and function of red and white blood cells Medicine
2013193-9
Griffith OW Biologic and pharmacologic regulation of mammalian glutathione
synthesis Free Radic Biol Med 199927(9-10)922-35
Griffith OW Determination of glutathione and glutathione disulfide using glutathione
reductase and 2-vinylpyridine Anal Biochem 1980106(1)207-12
52
Gwaltney-Brant S Biomarkers in Toxicology In Gupta RC editor Biomarkers in
Toxicology2014
Hall A Karplus PA Poole LB Typical 2-Cys peroxiredoxins--structures mechanisms
and functions FEBS J 2009276(9)2469-77
Halliwell B Biochemistry of oxidative stress Biochem Soc Trans 200735(Pt 5)1147-
50
Han YH Kim SU Kwon TH Lee DS Ha HL Park DS et al Peroxiredoxin II is essential
for preventing hemolytic anemia from oxidative stress through maintaining hemoglobin
stability Biochem Biophys Res Commun 2012426(3)427-32
Harris JR Schroder E Isupov MN Scheffler D Kristensen P Littlechild JA et al
Comparison of the decameric structure of peroxiredoxin-II by transmission electron
microscopy and X-ray crystallography Biochim Biophys Acta 20011547(2)221-34
Hattangadi SM Wong P Zhang L Flygare J Lodish HF From stem cell to red cell
regulation of erythropoiesis at multiple levels by multiple proteins RNAs and chromatin
modifications Blood 2011118(24)6258-68
Hoffbrand VA Moss PAH Hoffbrandrsquos Essential Haematology2016
Chang JC van der Hoeven LH Haddox CH Glutathione reductase in the red blood cells
Ann Clin Lab Sci 19788(1)23-9
Cho CS Lee S Lee GT Woo HA Choi EJ Rhee SG Irreversible inactivation of
glutathione peroxidase 1 and reversible inactivation of peroxiredoxin II by H2O2 in red
blood cells Antioxid Redox Signal 201012(11)1235-46
Chung J Chen C Paw BH Heme metabolism and erythropoiesis Curr Opin Hematol
201219(3)156-62
Johansson LH Borg LA A spectrophotometric method for determination of catalase
activity in small tissue samples Anal Biochem 1988174(1)331-6
53
Johnson RM Ho YS Yu DY Kuypers FA Ravindranath Y Goyette GW The effects of
disruption of genes for peroxiredoxin-2 glutathione peroxidase-1 and catalase on
erythrocyte oxidative metabolism Free Radic Biol Med 201048(4)519-25
Kahl L Hughes H The Harriet Lane Handbook a manual for pediatric house officers
The Harriet Lane Handbook Mobile Medicine Series 21st ed Philadelphia Pa Elsevier
2017 p 1272
Kamerbeek NM van Zwieten R de Boer M Morren G Vuil H Bannink N et al
Molecular basis of glutathione reductase deficiency in human blood cells Blood
2007109(8)3560-6
Kang DH Ha SK Uric Acid Puzzle Dual Role as Anti-oxidantand Pro-oxidant
Electrolyte Blood Press 201412(1)1-6
Kanias T Acker JP Biopreservation of red blood cells--the struggle with hemoglobin
oxidation FEBS J 2010277(2)343-56
Kingsbury J Sedgwick JP The uric acid content of the blood of the new-borns The
Journal of Biological Chemistry 191731(1)261-8
Kirkman HN Galiano S Gaetani GF The function of catalase-bound NADPH J Biol
Chem 1987262(2)660-6
Kodydkova J Vavrova L Kocik M Zak A Human catalase its polymorphisms
regulation and changes of its activity in different diseases Folia Biol (Praha)
201460(4)153-67
Kondo M Lymphoid and myeloid lineage commitment in multipotent hematopoietic
progenitors Immunol Rev 2010238(1)37-46
Kuhn V Diederich L Keller TCSt Kramer CM Luckstadt W Panknin C et al Red
Blood Cell Function and Dysfunction Redox Regulation Nitric Oxide Metabolism
Anemia Antioxid Redox Signal 201726(13)718-42
Kurata M Suzuki M Agar N Glutathione Regeneration in Mammalian Erythrocytes
Comparative Haematology International 200010(2)
54
Lee TH Kim SU Yu SL Kim SH Park DS Moon HB et al Peroxiredoxin II is essential
for sustaining life span of erythrocytes in mice Blood 2003101(12)5033-8
Li H Lykotrafitis G Erythrocyte membrane model with explicit description of the lipid
bilayer and the spectrin network Biophys J 2014107(3)642-53
Lichtman M Prchal J Levi M Press O Burns L Caligiuri M Hematology of the Fetus
and Newborn In Edmonson K Lebowitz H editors Williams Hematology 9th ed USA
McGraw-Hill Education 2016
Low FM Hampton MB Winterbourn CC Peroxiredoxin 2 and peroxide metabolism in
the erythrocyte Antioxid Redox Signal 200810(9)1621-30
Lu SC Regulation of glutathione synthesis Mol Aspects Med 200930(1-2)42-59
Lubos E Loscalzo J Handy DE Glutathione peroxidase-1 in health and disease from
molecular mechanisms to therapeutic opportunities Antioxid Redox Signal
201115(7)1957-97
Lux SEt Anatomy of the red cell membrane skeleton unanswered questions Blood
2016127(2)187-99
Manta B Hugo M Ortiz C Ferrer-Sueta G Trujillo M Denicola A The peroxidase and
peroxynitrite reductase activity of human erythrocyte peroxiredoxin 2 Arch Biochem
Biophys 2009484(2)146-54
Marconi VC Duncan MS So-Armah K Re VL 3rd Lim JK Butt AA et al Bilirubin Is
Inversely Associated With Cardiovascular Disease Among HIV-Positive and HIV-
Negative Individuals in VACS (Veterans Aging Cohort Study) J Am Heart Assoc
20187(10)
Marengo-Rowe AJ Structure-function relations of human hemoglobins Proc (Bayl Univ
Med Cent) 200619(3)239-45
Mate MJ Ortiz-Lombardia M Marina A Fita I Crystallization and preliminary structural
results of catalase from human erythrocytes Acta Crystallogr D Biol Crystallogr
199955(Pt 5)1066-8
55
May JM Ascorbate function and metabolism in the human erythrocyte Front Biosci
19983d1-10
McGill MR Jaeschke H A direct comparison of methods used to measure oxidized
glutathione in biological samples 2-vinylpyridine and N-ethylmaleimide Toxicol Mech
Methods 201525(8)589-95
Melo DF Enzymatic mechanism of antioxidant defense in the erythrocyte ndash cytosol
versus membrane [Master thesis] Universidade do Porto 2017
Mihara M Uchiyama M Determination of malonaldehyde precursor in tissues by
thiobarbituric acid test Anal Biochem 197886(1)271-8
Mitra S Rennie J Neonatal jaundice aetiology diagnosis and treatment Br J Hosp Med
(Lond) 201778(12)699-704
Monostori P Wittmann G Karg E Turi S Determination of glutathione and glutathione
disulfide in biological samples an in-depth review J Chromatogr B Analyt Technol
Biomed Life Sci 2009877(28)3331-46
Muller DP Free radical problems of the newborn Proc Nutr Soc 198746(1)69-75
Negi R Pande D Karki K Kumar A Khanna RS Khanna HD A novel approach to study
oxidative stress in neonatal respiratory distress syndrome BBA Clin 2015365-9
Niki E Interaction of ascorbate and alpha-tocopherol Ann N Y Acad Sci 1987498186-
99
Norishadkam M Andishmand S Zavar Reza J Zare Sakhvidi MJ Hachesoo VR
Oxidative stress and DNA damage in the cord blood of preterm infants Mutat Res
201782420-4
Ogasawara Y Ohminato T Nakamura Y Ishii K Structural and functional analysis of
native peroxiredoxin 2 in human red blood cells Int J Biochem Cell Biol
201244(7)1072-7
56
Ogundeyi MM Olarewaju DM Njokanma OF Ogunlesi TA Haematological profile
of apparently healthy term babies aged one day three days and six weeks delivered in
Sagamu Nigeria Nigerian Journal of Paediatrics 201138(3)125-30
Ochoa JJ Ramirez-Tortosa MC Quiles JL Palomino N Robles R Mataix J et al
Oxidative stress in erythrocytes from premature and full-term infants during their first 72
h of life Free Radic Res 200337(3)317-22
Oliveira S Saldanha C An overview about erythrocyte membrane Clinical
Hemorheology and Microcirculation 200944(2010)
Ozsurekci Y Aykac K Oxidative Stress Related Diseases in Newborns Oxid Med Cell
Longev 201620162768365
Pai EF Schulz GE The catalytic mechanism of glutathione reductase as derived from x-
ray diffraction analyses of reaction intermediates J Biol Chem 1983258(3)1752-7
Pandey KB Rizvi SI Biomarkers of oxidative stress in red blood cells Biomed Pap Med
Fac Univ Palacky Olomouc Czech Repub 2011155(2)131-6
Pandey KB Rizvi SI Markers of oxidative stress in erythrocytes and plasma during aging
in humans Oxid Med Cell Longev 20103(1)2-12
Pasalic D Marinkovic N Feher-Turkovic L Uric acid as one of the important factors in
multifactorial disorders--facts and controversies Biochem Med (Zagreb) 201222(1)63-
75
Perrone S Negro S Tataranno ML Buonocore G Oxidative stress and antioxidant
strategies in newborns J Matern Fetal Neonatal Med 201023 Suppl 363-5
Peskin AV Pace PE Behring JB Paton LN Soethoudt M Bachschmid MM et al
Glutathionylation of the Active Site Cysteines of Peroxiredoxin 2 and Recycling by
Glutaredoxin J Biol Chem 2016291(6)3053-62
Qaiser DH Sandila MP Ahmed ST Kazmi T Haematological reference values for full-
term healthy newborns of Karachi Pakistan J Pak Med Assoc 200959(9)618-22
57
Raftos JE Whillier S Kuchel PW Glutathione synthesis and turnover in the human
erythrocyte alignment of a model based on detailed enzyme kinetics with experimental
data J Biol Chem 2010285(31)23557-67
Raivio KO Neonatal hyperuricemia J Pediatr 197688(4 Pt 1)625-30
Rakhit R Chakrabartty A Structure folding and misfolding of CuZn superoxide
dismutase in amyotrophic lateral sclerosis Biochim Biophys Acta 20061762(11-
12)1025-37
Remacle Ja Raes M Toussaint O Renard P Rao G Low levels of reactive oxygen
species as modulators of cell function Mutation Research 1994316103-22
Reshad M Ravichander B Raghuraman TS A study of cord blood albumin as a predictor
of significant neonatal hyperbilirubinemia in term and preterm neonates International
Journal of Research in Medical Sciences 20164(3)887-90
Richard A Polin SHA David Rowitch William E Benitz Fetal and Neonatal
Physiology Fetal and Neonatal Physiology 1 5th ed Philadelphia PA Elsevier 2017
Rizvi SI Maurya PK Markers of oxidative stress in erythrocytes during aging in humans
Ann N Y Acad Sci 20071100373-82
Rocha S Gomes D Lima M Bronze-da-Rocha E Santos-Silva A Peroxiredoxin 2
glutathione peroxidase and catalase in the cytosol and membrane of erythrocytes under
H2O2-induced oxidative stress Free Radic Res 201549(8)990-1003
Santos-Silva A Castro EM Teixeira NA Guerra FC Quintanilha A Altered erythrocyte
membrane band 3 profile as a marker in patients at risk for cardiovascular disease
Atherosclerosis 1995116(2)199-209
Sarniak A Lipinska J Tytman K Lipinska S Endogenous mechanisms of reactive
oxygen species (ROS) generation Postepy Hig Med Dosw (Online) 201670(0)1150-
65
Sedlak TW Snyder SH Bilirubin benefits cellular protection by a biliverdin reductase
antioxidant cycle Pediatrics 2004113(6)1776-82
58
Shaik IH Mehvar R Rapid determination of reduced and oxidized glutathione levels
using a new thiol-masking reagent and the enzymatic recycling method application to
the rat liver and bile samples Anal Bioanal Chem 2006385(1)105-13
Shan G Yang F Zhou L Tang T Okoro EU Yang H et al Increase in Blood Glutathione
and Erythrocyte Proteins Related to Glutathione Generation Reduction and Utilization in
African-American Old Women with Diabetes J Sci Technol Environ 20155(1)
Sharma R Premachandra BR Membrane-bound hemoglobin as a marker of oxidative
injury in adult and neonatal red blood cells Biochem Med Metab Biol 199146(1)33-
44
Sies H Oxidative stress oxidants and antioxidants Exp Physiol 199782(2)291-5
Soldin SJ Brugnara C Wong EC Pediatric References Intervals 5th ed United States
Washington DC AACC Press c2005 2005 257 p
Staal GE Veeger C The reaction mechanism of glutathione reductase from human
erythrocytes Biochim Biophys Acta 1969185(1)49-62
Tainer JA Getzoff ED Richardson JS Richardson DC Structure and mechanism of
copper zinc superoxide dismutase Nature 1983306(5940)284-7
Torres-Cuevas I Parra-Llorca A Sanchez-Illana A Nunez-Ramiro A Kuligowski J
Chafer-Pericas C et al Oxygen and oxidative stress in the perinatal period Redox Biol
201712674-81
Tsiftsoglou AS Tsamadou AI Papadopoulou LC Heme as key regulator of major
mammalian cellular functions molecular cellular and pharmacological aspects
Pharmacol Ther 2006111(2)327-45
Tsukahara H Biomarkers for oxidative stress clinical application in pediatric medicine
Curr Med Chem 200714(3)339-51
Valko M Leibfritz D Moncol J Cronin MT Mazur M Telser J Free radicals and
antioxidants in normal physiological functions and human disease Int J Biochem Cell
Biol 200739(1)44-84
59
Welbourn EM Wilson MT Yusof A Metodiev MV Cooper CE The mechanism of
formation structure and physiological relevance of covalent hemoglobin attachment to
the erythrocyte membrane Free Radic Biol Med 201710395-106
Weydert CJ Cullen JJ Measurement of superoxide dismutase catalase and glutathione
peroxidase in cultured cells and tissue Nat Protoc 20105(1)51-66
Wu G Fang YZ Yang S Lupton JR Turner ND Glutathione metabolism and its
implications for health J Nutr 2004134(3)489-92
Yamauc R Vitamine E Mechanism of Its Antioxidant Activity Food Sci Technol Int
19973(4)301-9
Zachara BA Selenium and selenium-dependent antioxidants in chronic kidney disease
Adv Clin Chem 201568131-51
Zitka O Skalickova S Gumulec J Masarik M Adam V Hubalek J et al Redox status
expressed as GSHGSSG ratio as a marker for oxidative stress in paediatric tumour
patients Oncol Lett 20124(6)1247-53
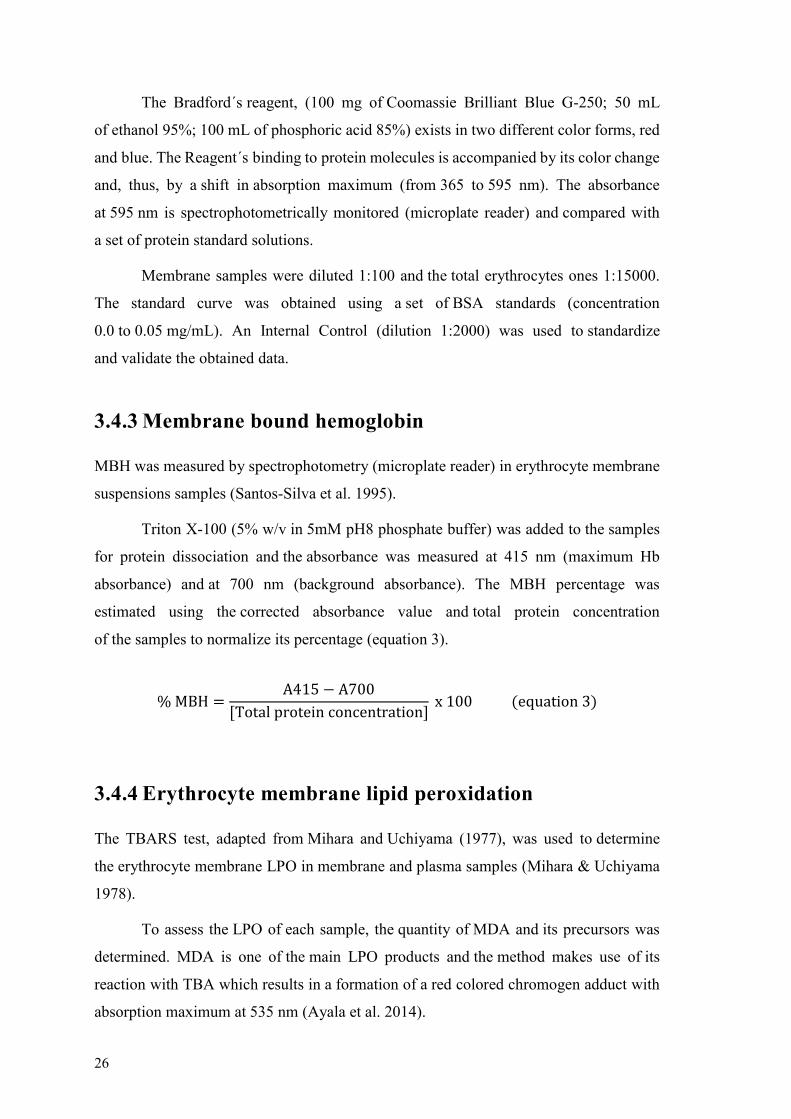
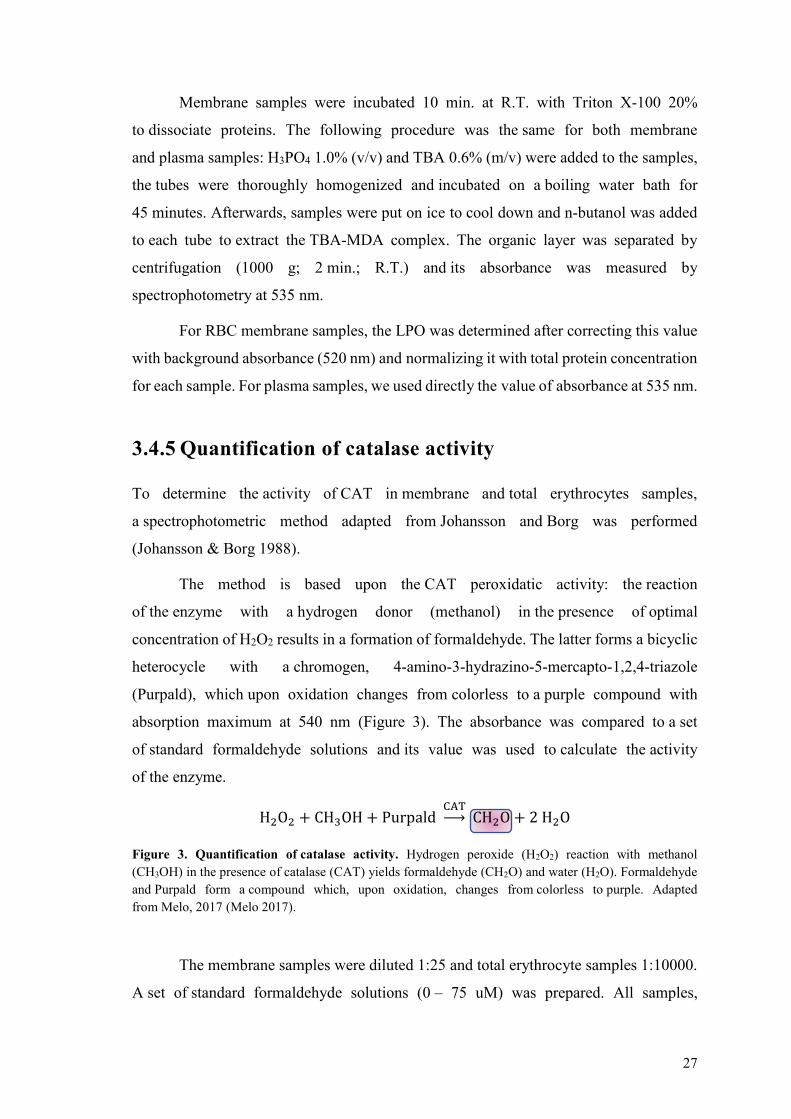
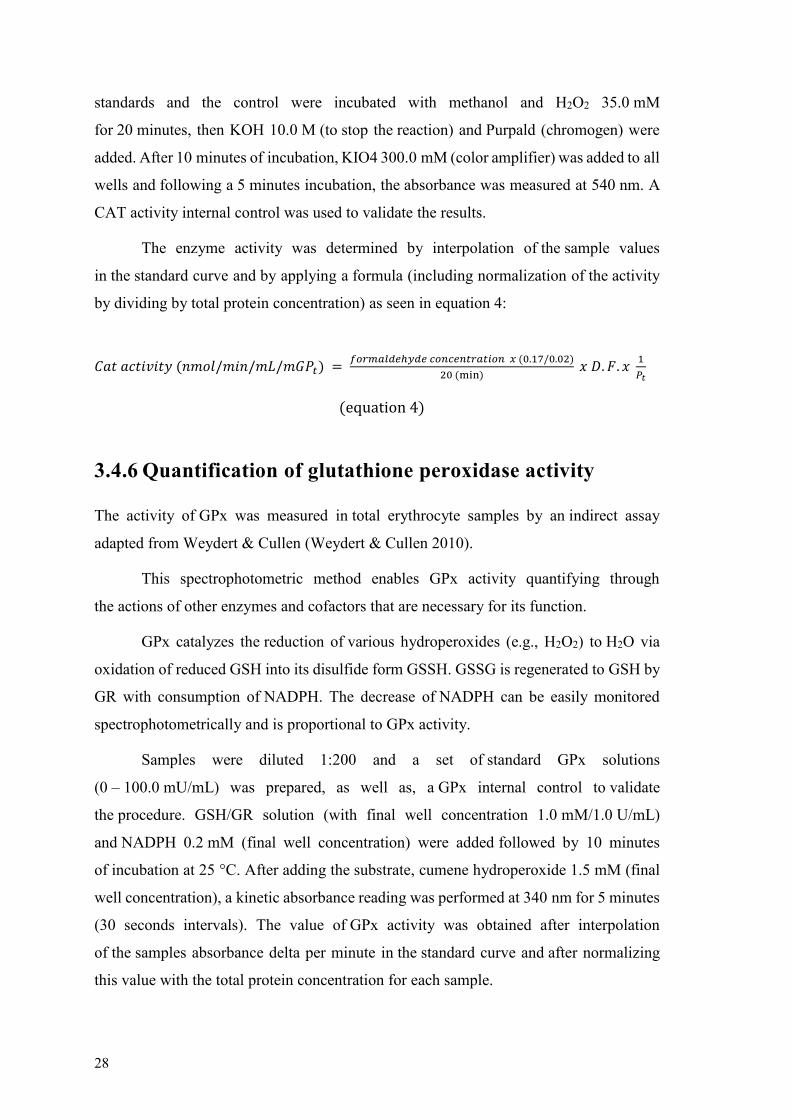
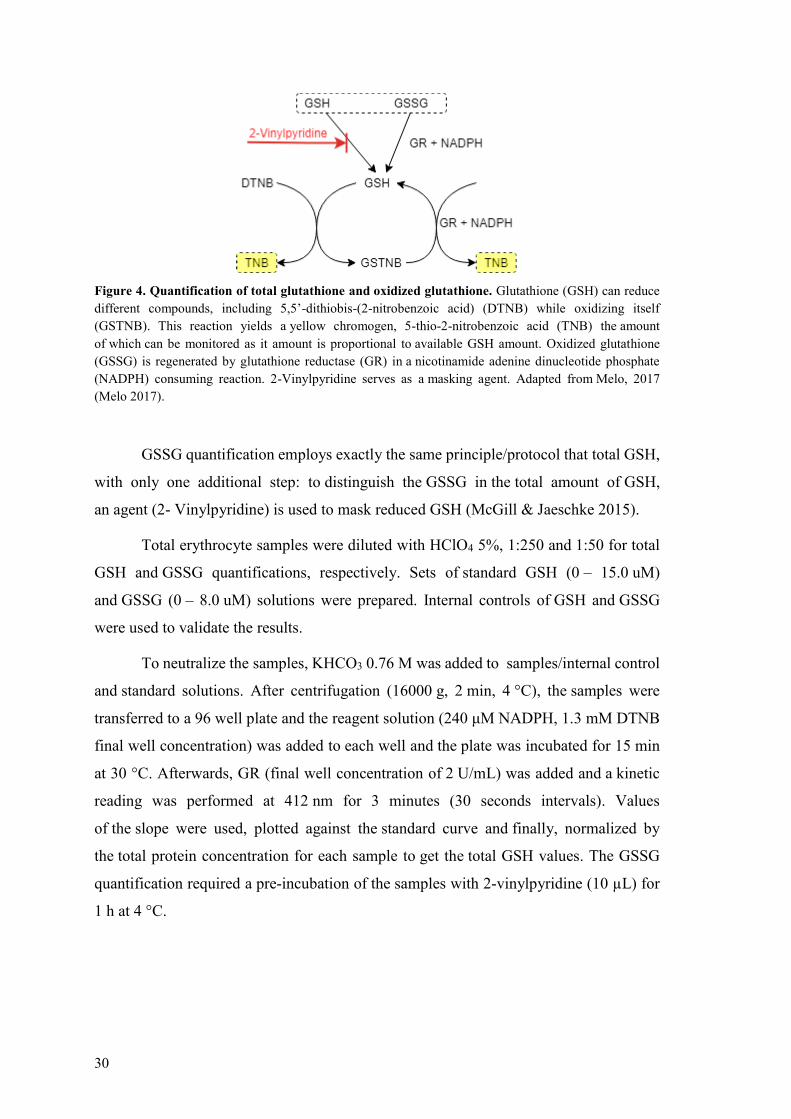
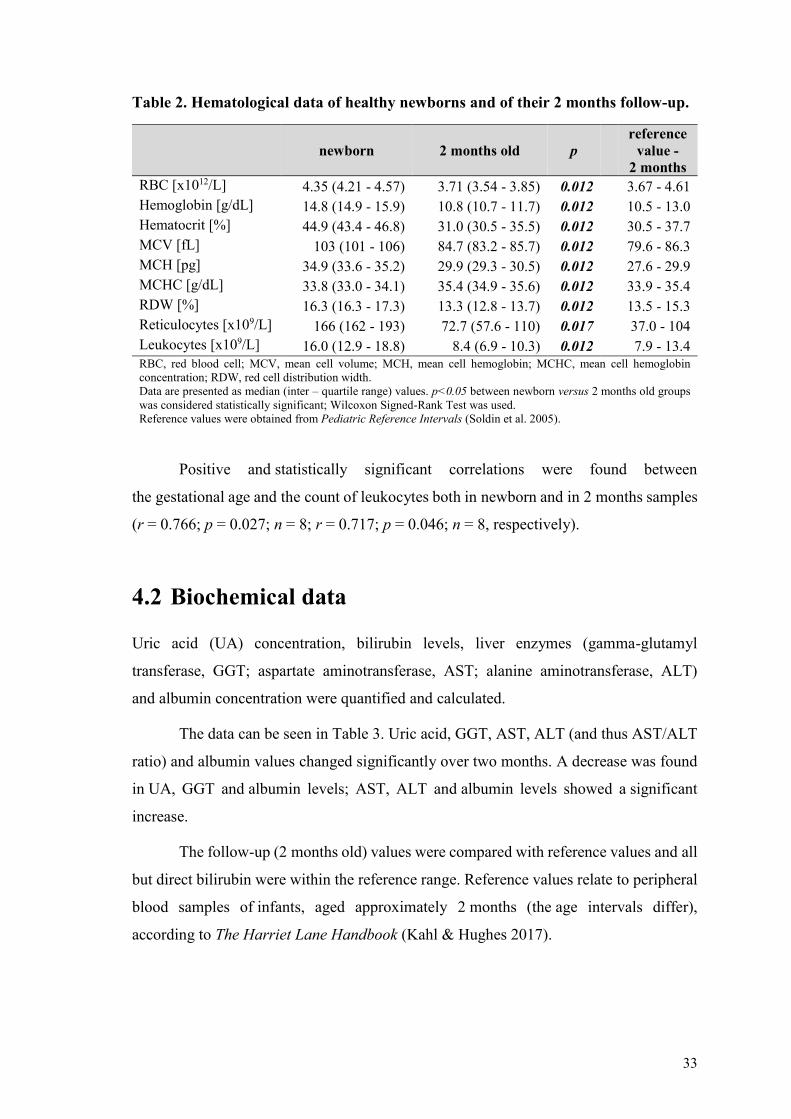
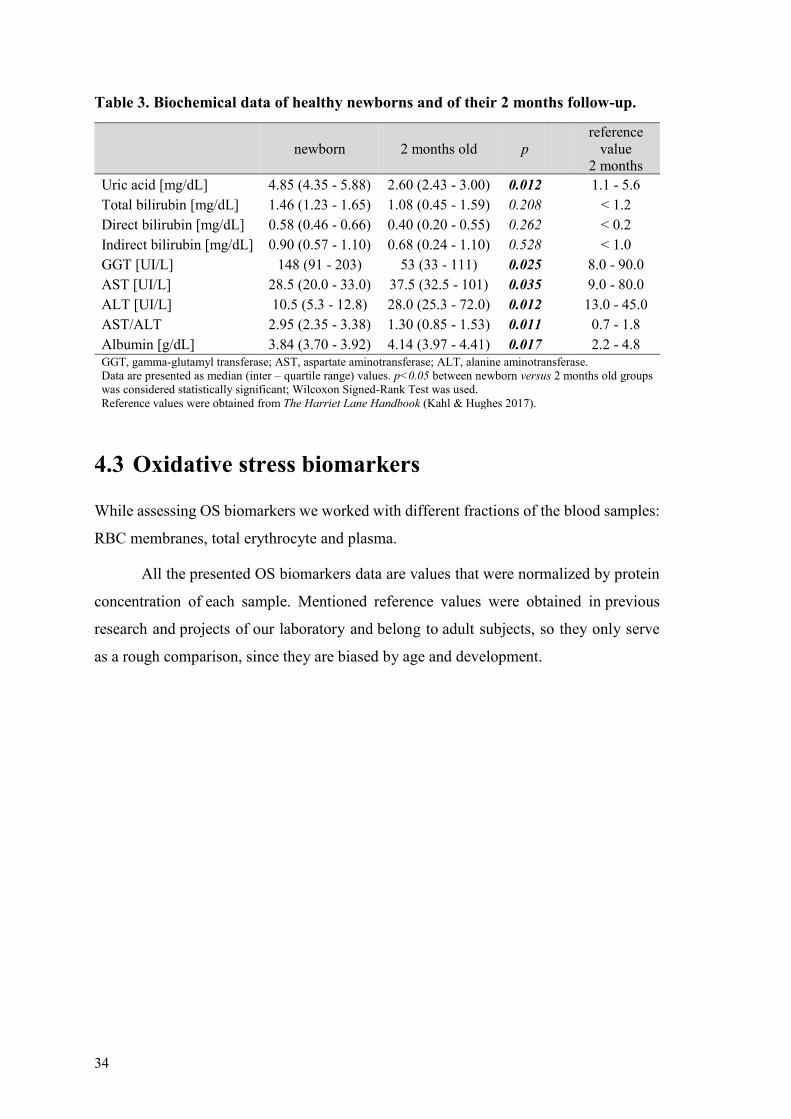
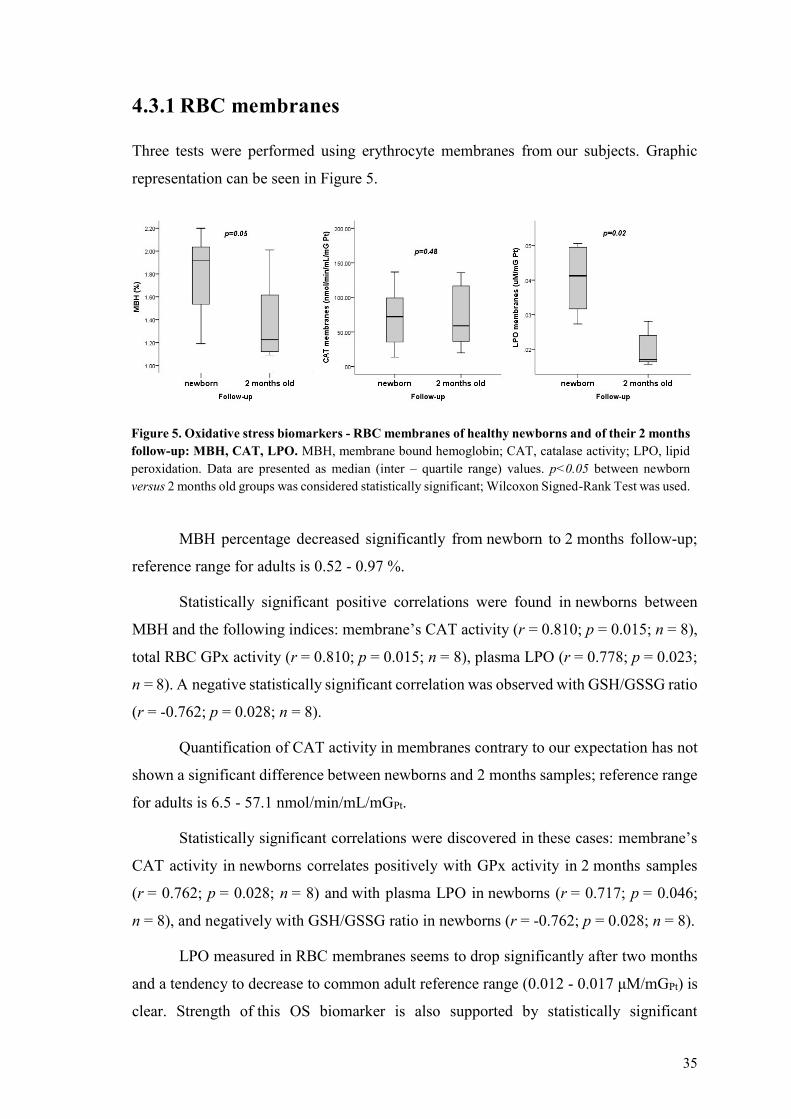
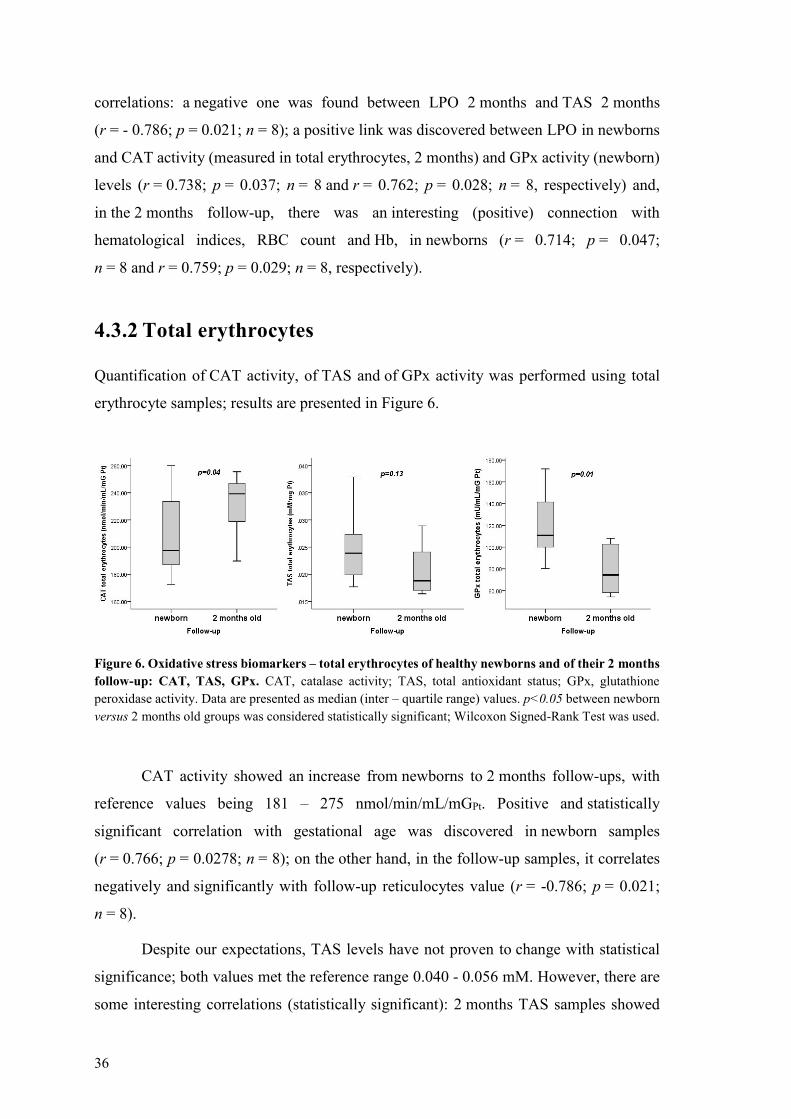
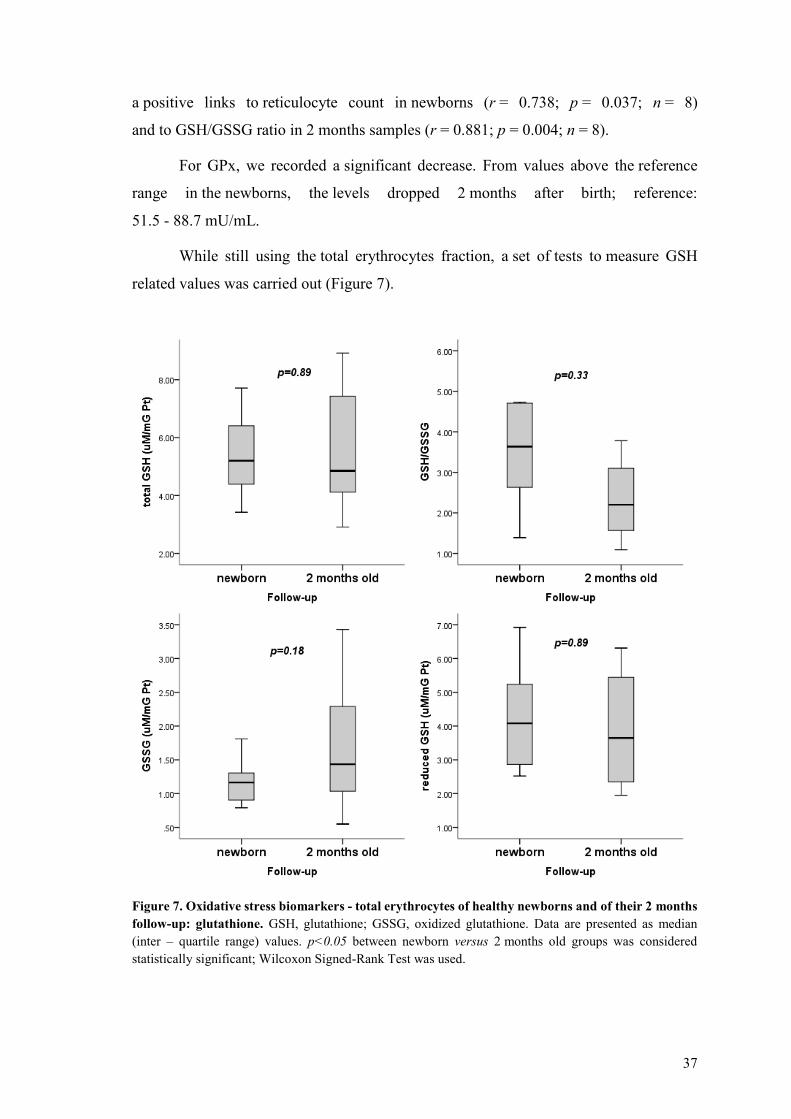
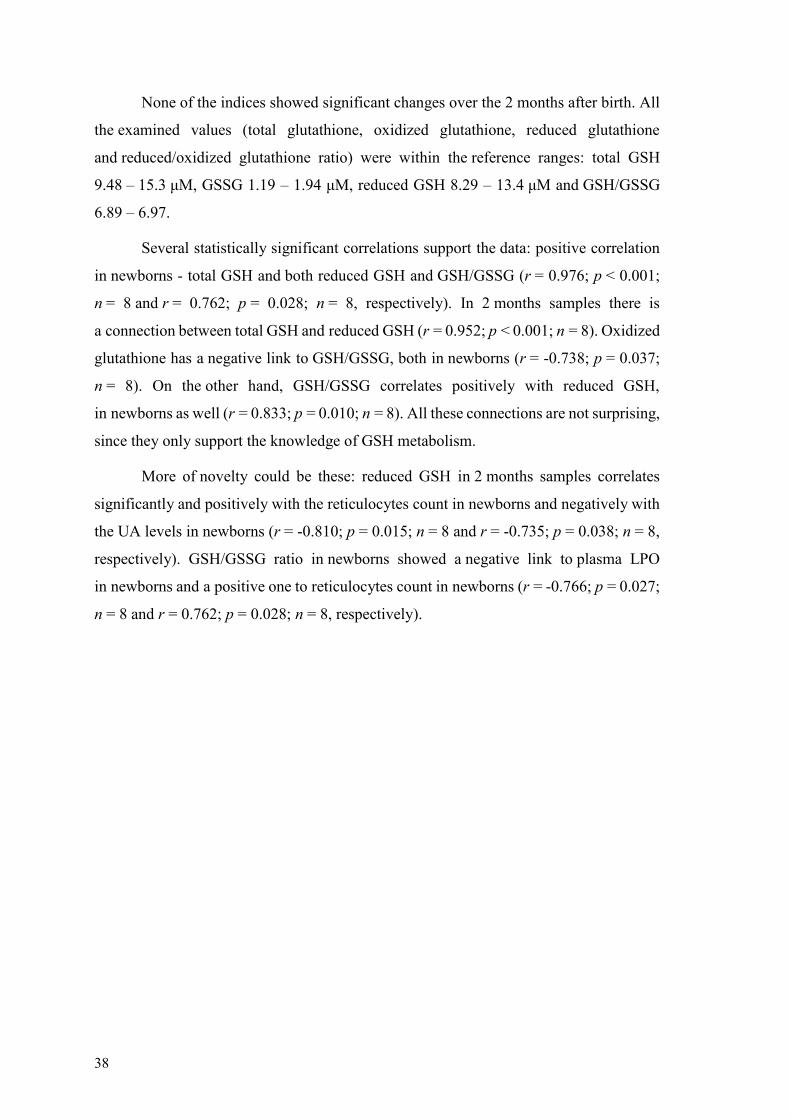
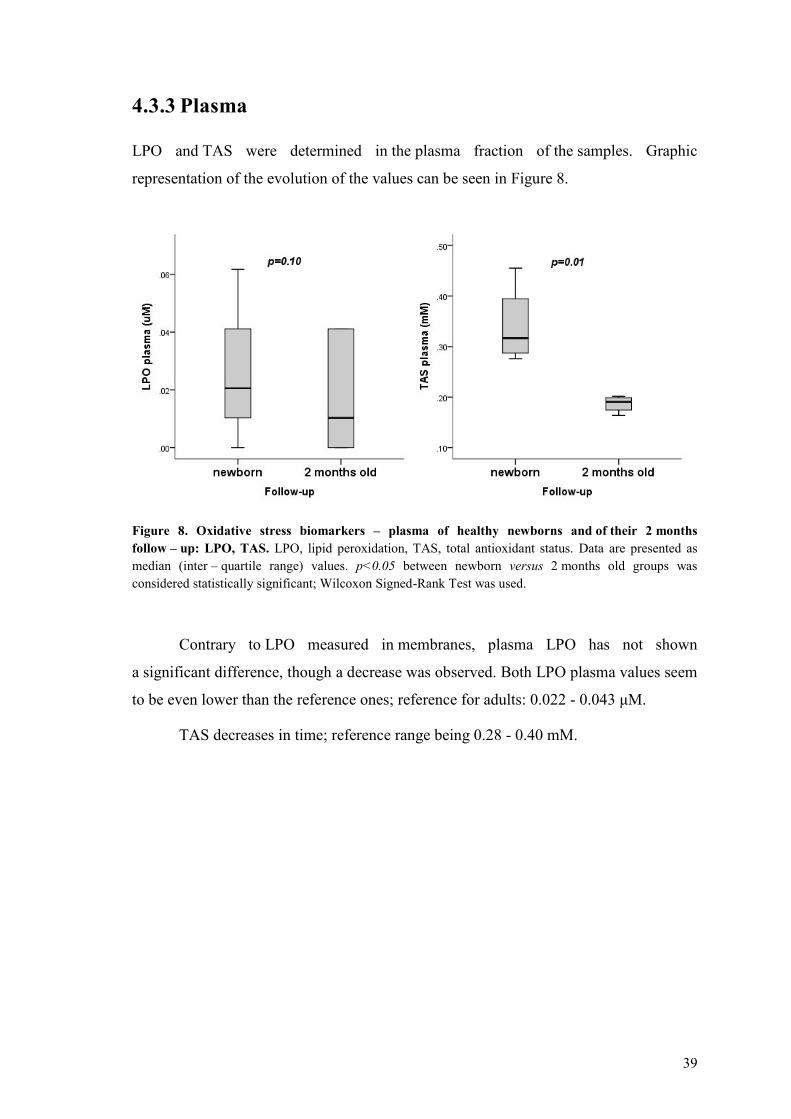
44
be explained by the different targets of these enzymes Although both of them detoxify
the cell from H2O2 CAT is described to work at higher H2O2 concentrations of mostly
exogenous origin while GPx on the other hand catalyzes the decomposition of low
levels of endogenous H2O2 often generated by auto-oxidation of Hb (Rocha et al 2015)
The decrease of GPx activity could be explained by the newbornacutes adaptation to the outer
environment accompanied by the documented reduction of birth-related OS However
the newly acquired autonomy of the older infant brings along an increasing exposure
to various oxidants of exogenous origin Here supposedly CAT steps in to protect
the cells and thus its activity is increased
Although OS is usually related to pathological conditions many studies
(Norishadkam et al 2017 Ozsurekci amp Aykac 2016 Perrone et al 2010) including our
work show that it also accompanies a physiological event such as birth of a healthy
full- term baby Broader collection of physiological reference values for OS biomarkers
and proper knowledge of the mechanism behind them could help physicians
in the evaluation of development of newborns or early prediction of potential future
disorders
Nevertheless we cannot omit the role of these oxidative damage parameters
in various OS related diseases several of them were described in the literature chronic
lung diseases intraventricular hemorrhages of newborns necrotizing enterocolitis
(Norishadkam et al 2017 Perrone et al 2010) bronchopulmonary dysplasia retinopathy
of prematurity patent ductus arteriosus periventricular leukomalacia respiratory distress
syndrome intrauterine growth retardation congenital malformation (Ozsurekci amp Aykac
2016) Reference values of OS biomarkers could be a valuable source of information for
the diagnosis effective treatment and disease monitoring
Tsukahara also suggests that restoration of redox balance either by decreasing
exposure to ROS or by augmenting AOX capacity represent a promising way
of therapeutic intervention in OS related diseases Classic AOXs include tocopherols
carotenoids and ascorbate but it has been suggested that their effect is only symptomatic
since they scavenge already existing ROS and thus do not serve as a causal treatment
(Tsukahara 2007)
Several AOX strategies were involved in clinical trials in the pediatric field
including administration of corticosteroids for bronchial asthma and bacterial meningitis
45
melatonin for neonatal asphyxia and epilepsy tocopherols and ascorbates for endothelial
dysfunction in hyperlipidemia L-arginine for endothelial dysfunction in cardiac
transplantation folinic acid betaine and methylcobalamin for autism (Tsukahara 2007)
enteral glutamine and arginine for prevention of necrotizing enterocolitis epicatechin
(for blockage of peroxynitrite-mediated tyrosine nitration and peroxynitrite formation)
in ischemic proliferative diseases of the retina (Ozsurekci amp Aykac 2016) Some
favorable results of these strategies were described but still further studies with broader
population are required and as Tsukahara mentions other techniques for measurement
of OS status because the establishment of reference values for OS biomarkers is
paramount for these studies
Generally we believe that OS and its mechanisms need to be further explored
new studies conducted and data collected Our contribution despite the limited number
of subjects provides insight in the issue as we bring a number of reference values for OS
biomarkers in early infancy Portuguese individuals which to our knowledge have not
been described before
46
6 CONCLUSION
In the present work we focused on the study of OS in newborns with the aid
of appropriate biomarkers of OS focusing mainly on the erythrocyte
We obtained physiological OS-related data including complete blood count
general biochemical data and experimental values from a small population of Portuguese
healthy full-term newborns The sample collections occurred twice at birth
and in 2 months of age By observing how the values change newborn versus follow-up
we gained a good insight about the development of the infant
Both hematological and biochemical data follow the reference values
as anticipated Our experimental values support the theory of so called hyperoxic
challenge which induces high levels of OS in healthy neonates several of our biomarkers
recorded a significant change in OS levels MBH and LPO in membranes decreased as
well as GPx activity while CAT activity in total erythrocytes increased The first three
biomarkers document neonateacutes adaptation to the environment and CATTAS values
suggest autonomy development of the newborn who starts to encounter various
exogenous oxidants
As there are no official reference values for OS biomarkers in newborns our
results are a novelty and provide an invaluable progression in this field of knowledge
though our number of samples is small and further studies are warranted
OS has been linked with a number of pathological conditions both in newborns
and older individuals Proper knowledge of the mechanisms behind OS and oxidative
damage and large quantity of reliable data documenting the OS-related reference values
could be a precious tool in the assessment of human health and disease
47
7 LIST OF ABBREVIATIONS
OH hydroxyl radical
23-DPG 23-diphosphoglycerate
AIDS acquired immune deficiency syndrome
ALT alanine aminotransferase
AOX antioxidant
AST aspartate aminotransferase
ATP adenosine triphosphate
BFU-E burst-forming unit - erythroid
BSA bovine serum albumin
CAT catalase
CFU-E colony-forming unit - erythroid
CMP common myeloid progenitor
CO2 carbon dioxide
Cys cysteine
CysP peroxidatic cysteine
deoxyHb deoxyhemoglobin
DF dilution factor
DTNB 55acute-dithiobis-2-nitrobenzoic acid
EHM extramedullary hematopoiesis
FAD flavin adenine dinucleotide
FR free radicals
FRAP ferric reducing ability of plasma
G-6-P glucose-6-phosphate
GGT gamma-glutamyl transferase
Glc glucose
GLUT1 glucose transporter
GPx glutathione peroxidase
GR glutathione reductase
GSH glutathione
GSSG oxidized glutathione
H2O water
H2O2 hydrogen peroxide
Hb hemoglobin
His histidine
48
HPX hypoxanthine
IL interleukine
K3EDTA tripotassium ethylenediaminetetraacetic acid
Km Michaelis constant
LDL low-density lipoprotein
LPO lipid peroxidation
MBH membrane-bound hemoglobin
MCV mean cell volume
MCH mean cell hemoglobin
MCHC mean cell hemoglobin concentration
MDA malondialdehyde
metHb methemoglobin
NADP nicotinamide adenine dinucleotide phosphate
NADPH reduced nicotinamide adenine dinucleotide phosphate
O2 oxygen
O2ndash superoxide anion
OS oxidative stress
Prx peroxiredoxin
PS phosphatidylserine
PUFA polyunsaturated fatty acid
Purpald 4-amino-3-hydrazino-5-mercapto-124-triazole
RT room temperature
RBC red blood cells
RDW red cell distribution width
RNA ribonucleic acid
ROS reactive oxygen species
Sec selenocysteine
SOD superoxide dismutase
TBA thiobarbituric acid
TBARS thiobarbituric reactive substances
TNB 5-thio-2-nitrobenzoic acid
TPTZ 246-Tris(2-pyridyl)-s-triazine
Trx thioredoxin
UA uric acid
UCB umbilical cord blood
XAN xanthine
49
8 REFERENCES
Aksoy Y Balk M Oumlgus H Oumlzer N The Mechanism of Inhibition of Human Erythrocyte
Catalase by Azide Turkish Journal of Biology 200428(2-4)
An X Mohandas N Disorders of red cell membrane Br J Haematol 2008141(3)367-
75
Anonymous Erythropoiesis Simplified EpoMedicine c2016 [updated 201809012018-
09-01] Available from httpepomedicinecommedical-studentserythropoiesis-
simplified
Anonymous Reasearch areas Faculdade de Farmaacutecia da Universidade do Porto c1996-
2018 [updated 2017-08-042018-08-19] Available from
httpssigarraupptffupptWEB_BASEGERA_PAGINAp_pagina=pC3A1gina
20estC3A1tica20genC3A9rica20155
Arthurs G Sudhakar M Carbon dioxide transport Continuing Education in Anaesthesia
Critical Care amp Pain 20055(6)
Ayala A Munoz MF Arguelles S Lipid peroxidation production metabolism and
signaling mechanisms of malondialdehyde and 4-hydroxy-2-nonenal Oxid Med Cell
Longev 20142014360438
Benzie IF Strain JJ The ferric reducing ability of plasma (FRAP) as a measure of
antioxidant power the FRAP assay Anal Biochem 1996239(1)70-6
Birben E Sahiner UM Sackesen C Erzurum S Kalayci O Oxidative stress and
antioxidant defense World Allergy Organ J 20125(1)9-19
Bradford MM A rapid and sensitive method for the quantitation of microgram quantities
of protein utilizing the principle of protein-dye binding Anal Biochem 197672248-54
Bresnick EH Hewitt KJ Mehta C Keles S Paulson RF Johnson KD Mechanisms of
erythrocyte development and regeneration implications for regenerative medicine and
beyond Development 2018145(1)
50
Brigelius-Flohe R Maiorino M Glutathione peroxidases Biochim Biophys Acta
20131830(5)3289-303
Brown KA Erythrocyte Metabolism and Enzyme Defects Laboratory Medicine
199627(5)
Bukhari KT Zafar H Reference values of reticulocyte counts in five age groups of
healthy infants at Rawalpindi Pakistan J Pak Med Assoc 201363(9)1108-11
Capece L Marti MA Crespo A Doctorovich F Estrin DA Heme protein oxygen affinity
regulation exerted by proximal effects J Am Chem Soc 2006128(38)12455-61
Casas-Grajales S Muriel P Antioxidants in liver health World J Gastrointest Pharmacol
Ther 20156(3)59-72
Catala A Lipid peroxidation of membrane phospholipids generates hydroxy-alkenals and
oxidized phospholipids active in physiological andor pathological conditions Chem
Phys Lipids 2009157(1)1-11
Catarino C Rebelo I Belo L Rocha-Pereira P Rocha S Bayer Castro E et al
Erythrocyte changes in preeclampsia relationship between maternal and cord blood
erythrocyte damage J Perinat Med 200937(1)19-27
Cimen MY Free radical metabolism in human erythrocytes Clin Chim Acta
2008390(1-2)1-11
Claster S Chiu DT Quintanilha A Lubin B Neutrophils mediate lipid peroxidation in
human red cells Blood 198464(5)1079-84
Costa V Quintanilha A Moradas-Ferreira P Protein oxidation repair mechanisms and
proteolysis in Saccharomyces cerevisiae IUBMB Life 200759(4-5)293-8
Culotta VC Superoxide dismutase oxidative stress and cell metabolism Curr Top Cell
Regul 200036117-32
Diez-Silva M Dao M Han J Lim CT Suresh S Shape and Biomechanical
Characteristics of Human Red Blood Cells in Health and Disease MRS Bull
201035(5)382-8
51
Dodge JT Mitchell C Hanahan DJ The preparation and chemical characteristics of
hemoglobin-free ghosts of human erythrocytes Arch Biochem Biophys 1963100119-
30
Dzierzak E Philipsen S Erythropoiesis development and differentiation Cold Spring
Harb Perspect Med 20133(4)a011601
Esan A Hematological differences in newborn and aging a review study Hematol
Transfus Int J 20163(3)
Fabbrini E Serafini M Colic Baric I Hazen SL Klein S Effect of plasma uric acid on
antioxidant capacity oxidative stress and insulin sensitivity in obese subjects Diabetes
201463(3)976-81
Floheacute L Glutathione Peroxidase Brought into Focus In Pryor W editor Free Radicals
in Biology Academic Press 1982 p 223-54
Friel JK Friesen RW Harding SV Roberts LJ Evidence of oxidative stress in full-term
healthy infants Pediatr Res 200456(6)878-82
Frijhoff J Winyard PG Zarkovic N Davies SS Stocker R Cheng D et al Clinical
Relevance of Biomarkers of Oxidative Stress Antioxid Redox Signal 201523(14)1144-
70
Fukai T Ushio-Fukai M Superoxide dismutases role in redox signaling vascular
function and diseases Antioxid Redox Signal 201115(6)1583-606
Geers C Gros G Carbon dioxide transport and carbonic anhydrase in blood and muscle
Physiol Rev 200080(2)681-715
Gordon-Smith T Structure and function of red and white blood cells Medicine
2013193-9
Griffith OW Biologic and pharmacologic regulation of mammalian glutathione
synthesis Free Radic Biol Med 199927(9-10)922-35
Griffith OW Determination of glutathione and glutathione disulfide using glutathione
reductase and 2-vinylpyridine Anal Biochem 1980106(1)207-12
52
Gwaltney-Brant S Biomarkers in Toxicology In Gupta RC editor Biomarkers in
Toxicology2014
Hall A Karplus PA Poole LB Typical 2-Cys peroxiredoxins--structures mechanisms
and functions FEBS J 2009276(9)2469-77
Halliwell B Biochemistry of oxidative stress Biochem Soc Trans 200735(Pt 5)1147-
50
Han YH Kim SU Kwon TH Lee DS Ha HL Park DS et al Peroxiredoxin II is essential
for preventing hemolytic anemia from oxidative stress through maintaining hemoglobin
stability Biochem Biophys Res Commun 2012426(3)427-32
Harris JR Schroder E Isupov MN Scheffler D Kristensen P Littlechild JA et al
Comparison of the decameric structure of peroxiredoxin-II by transmission electron
microscopy and X-ray crystallography Biochim Biophys Acta 20011547(2)221-34
Hattangadi SM Wong P Zhang L Flygare J Lodish HF From stem cell to red cell
regulation of erythropoiesis at multiple levels by multiple proteins RNAs and chromatin
modifications Blood 2011118(24)6258-68
Hoffbrand VA Moss PAH Hoffbrandrsquos Essential Haematology2016
Chang JC van der Hoeven LH Haddox CH Glutathione reductase in the red blood cells
Ann Clin Lab Sci 19788(1)23-9
Cho CS Lee S Lee GT Woo HA Choi EJ Rhee SG Irreversible inactivation of
glutathione peroxidase 1 and reversible inactivation of peroxiredoxin II by H2O2 in red
blood cells Antioxid Redox Signal 201012(11)1235-46
Chung J Chen C Paw BH Heme metabolism and erythropoiesis Curr Opin Hematol
201219(3)156-62
Johansson LH Borg LA A spectrophotometric method for determination of catalase
activity in small tissue samples Anal Biochem 1988174(1)331-6
53
Johnson RM Ho YS Yu DY Kuypers FA Ravindranath Y Goyette GW The effects of
disruption of genes for peroxiredoxin-2 glutathione peroxidase-1 and catalase on
erythrocyte oxidative metabolism Free Radic Biol Med 201048(4)519-25
Kahl L Hughes H The Harriet Lane Handbook a manual for pediatric house officers
The Harriet Lane Handbook Mobile Medicine Series 21st ed Philadelphia Pa Elsevier
2017 p 1272
Kamerbeek NM van Zwieten R de Boer M Morren G Vuil H Bannink N et al
Molecular basis of glutathione reductase deficiency in human blood cells Blood
2007109(8)3560-6
Kang DH Ha SK Uric Acid Puzzle Dual Role as Anti-oxidantand Pro-oxidant
Electrolyte Blood Press 201412(1)1-6
Kanias T Acker JP Biopreservation of red blood cells--the struggle with hemoglobin
oxidation FEBS J 2010277(2)343-56
Kingsbury J Sedgwick JP The uric acid content of the blood of the new-borns The
Journal of Biological Chemistry 191731(1)261-8
Kirkman HN Galiano S Gaetani GF The function of catalase-bound NADPH J Biol
Chem 1987262(2)660-6
Kodydkova J Vavrova L Kocik M Zak A Human catalase its polymorphisms
regulation and changes of its activity in different diseases Folia Biol (Praha)
201460(4)153-67
Kondo M Lymphoid and myeloid lineage commitment in multipotent hematopoietic
progenitors Immunol Rev 2010238(1)37-46
Kuhn V Diederich L Keller TCSt Kramer CM Luckstadt W Panknin C et al Red
Blood Cell Function and Dysfunction Redox Regulation Nitric Oxide Metabolism
Anemia Antioxid Redox Signal 201726(13)718-42
Kurata M Suzuki M Agar N Glutathione Regeneration in Mammalian Erythrocytes
Comparative Haematology International 200010(2)
54
Lee TH Kim SU Yu SL Kim SH Park DS Moon HB et al Peroxiredoxin II is essential
for sustaining life span of erythrocytes in mice Blood 2003101(12)5033-8
Li H Lykotrafitis G Erythrocyte membrane model with explicit description of the lipid
bilayer and the spectrin network Biophys J 2014107(3)642-53
Lichtman M Prchal J Levi M Press O Burns L Caligiuri M Hematology of the Fetus
and Newborn In Edmonson K Lebowitz H editors Williams Hematology 9th ed USA
McGraw-Hill Education 2016
Low FM Hampton MB Winterbourn CC Peroxiredoxin 2 and peroxide metabolism in
the erythrocyte Antioxid Redox Signal 200810(9)1621-30
Lu SC Regulation of glutathione synthesis Mol Aspects Med 200930(1-2)42-59
Lubos E Loscalzo J Handy DE Glutathione peroxidase-1 in health and disease from
molecular mechanisms to therapeutic opportunities Antioxid Redox Signal
201115(7)1957-97
Lux SEt Anatomy of the red cell membrane skeleton unanswered questions Blood
2016127(2)187-99
Manta B Hugo M Ortiz C Ferrer-Sueta G Trujillo M Denicola A The peroxidase and
peroxynitrite reductase activity of human erythrocyte peroxiredoxin 2 Arch Biochem
Biophys 2009484(2)146-54
Marconi VC Duncan MS So-Armah K Re VL 3rd Lim JK Butt AA et al Bilirubin Is
Inversely Associated With Cardiovascular Disease Among HIV-Positive and HIV-
Negative Individuals in VACS (Veterans Aging Cohort Study) J Am Heart Assoc
20187(10)
Marengo-Rowe AJ Structure-function relations of human hemoglobins Proc (Bayl Univ
Med Cent) 200619(3)239-45
Mate MJ Ortiz-Lombardia M Marina A Fita I Crystallization and preliminary structural
results of catalase from human erythrocytes Acta Crystallogr D Biol Crystallogr
199955(Pt 5)1066-8
55
May JM Ascorbate function and metabolism in the human erythrocyte Front Biosci
19983d1-10
McGill MR Jaeschke H A direct comparison of methods used to measure oxidized
glutathione in biological samples 2-vinylpyridine and N-ethylmaleimide Toxicol Mech
Methods 201525(8)589-95
Melo DF Enzymatic mechanism of antioxidant defense in the erythrocyte ndash cytosol
versus membrane [Master thesis] Universidade do Porto 2017
Mihara M Uchiyama M Determination of malonaldehyde precursor in tissues by
thiobarbituric acid test Anal Biochem 197886(1)271-8
Mitra S Rennie J Neonatal jaundice aetiology diagnosis and treatment Br J Hosp Med
(Lond) 201778(12)699-704
Monostori P Wittmann G Karg E Turi S Determination of glutathione and glutathione
disulfide in biological samples an in-depth review J Chromatogr B Analyt Technol
Biomed Life Sci 2009877(28)3331-46
Muller DP Free radical problems of the newborn Proc Nutr Soc 198746(1)69-75
Negi R Pande D Karki K Kumar A Khanna RS Khanna HD A novel approach to study
oxidative stress in neonatal respiratory distress syndrome BBA Clin 2015365-9
Niki E Interaction of ascorbate and alpha-tocopherol Ann N Y Acad Sci 1987498186-
99
Norishadkam M Andishmand S Zavar Reza J Zare Sakhvidi MJ Hachesoo VR
Oxidative stress and DNA damage in the cord blood of preterm infants Mutat Res
201782420-4
Ogasawara Y Ohminato T Nakamura Y Ishii K Structural and functional analysis of
native peroxiredoxin 2 in human red blood cells Int J Biochem Cell Biol
201244(7)1072-7
56
Ogundeyi MM Olarewaju DM Njokanma OF Ogunlesi TA Haematological profile
of apparently healthy term babies aged one day three days and six weeks delivered in
Sagamu Nigeria Nigerian Journal of Paediatrics 201138(3)125-30
Ochoa JJ Ramirez-Tortosa MC Quiles JL Palomino N Robles R Mataix J et al
Oxidative stress in erythrocytes from premature and full-term infants during their first 72
h of life Free Radic Res 200337(3)317-22
Oliveira S Saldanha C An overview about erythrocyte membrane Clinical
Hemorheology and Microcirculation 200944(2010)
Ozsurekci Y Aykac K Oxidative Stress Related Diseases in Newborns Oxid Med Cell
Longev 201620162768365
Pai EF Schulz GE The catalytic mechanism of glutathione reductase as derived from x-
ray diffraction analyses of reaction intermediates J Biol Chem 1983258(3)1752-7
Pandey KB Rizvi SI Biomarkers of oxidative stress in red blood cells Biomed Pap Med
Fac Univ Palacky Olomouc Czech Repub 2011155(2)131-6
Pandey KB Rizvi SI Markers of oxidative stress in erythrocytes and plasma during aging
in humans Oxid Med Cell Longev 20103(1)2-12
Pasalic D Marinkovic N Feher-Turkovic L Uric acid as one of the important factors in
multifactorial disorders--facts and controversies Biochem Med (Zagreb) 201222(1)63-
75
Perrone S Negro S Tataranno ML Buonocore G Oxidative stress and antioxidant
strategies in newborns J Matern Fetal Neonatal Med 201023 Suppl 363-5
Peskin AV Pace PE Behring JB Paton LN Soethoudt M Bachschmid MM et al
Glutathionylation of the Active Site Cysteines of Peroxiredoxin 2 and Recycling by
Glutaredoxin J Biol Chem 2016291(6)3053-62
Qaiser DH Sandila MP Ahmed ST Kazmi T Haematological reference values for full-
term healthy newborns of Karachi Pakistan J Pak Med Assoc 200959(9)618-22
57
Raftos JE Whillier S Kuchel PW Glutathione synthesis and turnover in the human
erythrocyte alignment of a model based on detailed enzyme kinetics with experimental
data J Biol Chem 2010285(31)23557-67
Raivio KO Neonatal hyperuricemia J Pediatr 197688(4 Pt 1)625-30
Rakhit R Chakrabartty A Structure folding and misfolding of CuZn superoxide
dismutase in amyotrophic lateral sclerosis Biochim Biophys Acta 20061762(11-
12)1025-37
Remacle Ja Raes M Toussaint O Renard P Rao G Low levels of reactive oxygen
species as modulators of cell function Mutation Research 1994316103-22
Reshad M Ravichander B Raghuraman TS A study of cord blood albumin as a predictor
of significant neonatal hyperbilirubinemia in term and preterm neonates International
Journal of Research in Medical Sciences 20164(3)887-90
Richard A Polin SHA David Rowitch William E Benitz Fetal and Neonatal
Physiology Fetal and Neonatal Physiology 1 5th ed Philadelphia PA Elsevier 2017
Rizvi SI Maurya PK Markers of oxidative stress in erythrocytes during aging in humans
Ann N Y Acad Sci 20071100373-82
Rocha S Gomes D Lima M Bronze-da-Rocha E Santos-Silva A Peroxiredoxin 2
glutathione peroxidase and catalase in the cytosol and membrane of erythrocytes under
H2O2-induced oxidative stress Free Radic Res 201549(8)990-1003
Santos-Silva A Castro EM Teixeira NA Guerra FC Quintanilha A Altered erythrocyte
membrane band 3 profile as a marker in patients at risk for cardiovascular disease
Atherosclerosis 1995116(2)199-209
Sarniak A Lipinska J Tytman K Lipinska S Endogenous mechanisms of reactive
oxygen species (ROS) generation Postepy Hig Med Dosw (Online) 201670(0)1150-
65
Sedlak TW Snyder SH Bilirubin benefits cellular protection by a biliverdin reductase
antioxidant cycle Pediatrics 2004113(6)1776-82
58
Shaik IH Mehvar R Rapid determination of reduced and oxidized glutathione levels
using a new thiol-masking reagent and the enzymatic recycling method application to
the rat liver and bile samples Anal Bioanal Chem 2006385(1)105-13
Shan G Yang F Zhou L Tang T Okoro EU Yang H et al Increase in Blood Glutathione
and Erythrocyte Proteins Related to Glutathione Generation Reduction and Utilization in
African-American Old Women with Diabetes J Sci Technol Environ 20155(1)
Sharma R Premachandra BR Membrane-bound hemoglobin as a marker of oxidative
injury in adult and neonatal red blood cells Biochem Med Metab Biol 199146(1)33-
44
Sies H Oxidative stress oxidants and antioxidants Exp Physiol 199782(2)291-5
Soldin SJ Brugnara C Wong EC Pediatric References Intervals 5th ed United States
Washington DC AACC Press c2005 2005 257 p
Staal GE Veeger C The reaction mechanism of glutathione reductase from human
erythrocytes Biochim Biophys Acta 1969185(1)49-62
Tainer JA Getzoff ED Richardson JS Richardson DC Structure and mechanism of
copper zinc superoxide dismutase Nature 1983306(5940)284-7
Torres-Cuevas I Parra-Llorca A Sanchez-Illana A Nunez-Ramiro A Kuligowski J
Chafer-Pericas C et al Oxygen and oxidative stress in the perinatal period Redox Biol
201712674-81
Tsiftsoglou AS Tsamadou AI Papadopoulou LC Heme as key regulator of major
mammalian cellular functions molecular cellular and pharmacological aspects
Pharmacol Ther 2006111(2)327-45
Tsukahara H Biomarkers for oxidative stress clinical application in pediatric medicine
Curr Med Chem 200714(3)339-51
Valko M Leibfritz D Moncol J Cronin MT Mazur M Telser J Free radicals and
antioxidants in normal physiological functions and human disease Int J Biochem Cell
Biol 200739(1)44-84
59
Welbourn EM Wilson MT Yusof A Metodiev MV Cooper CE The mechanism of
formation structure and physiological relevance of covalent hemoglobin attachment to
the erythrocyte membrane Free Radic Biol Med 201710395-106
Weydert CJ Cullen JJ Measurement of superoxide dismutase catalase and glutathione
peroxidase in cultured cells and tissue Nat Protoc 20105(1)51-66
Wu G Fang YZ Yang S Lupton JR Turner ND Glutathione metabolism and its
implications for health J Nutr 2004134(3)489-92
Yamauc R Vitamine E Mechanism of Its Antioxidant Activity Food Sci Technol Int
19973(4)301-9
Zachara BA Selenium and selenium-dependent antioxidants in chronic kidney disease
Adv Clin Chem 201568131-51
Zitka O Skalickova S Gumulec J Masarik M Adam V Hubalek J et al Redox status
expressed as GSHGSSG ratio as a marker for oxidative stress in paediatric tumour
patients Oncol Lett 20124(6)1247-53
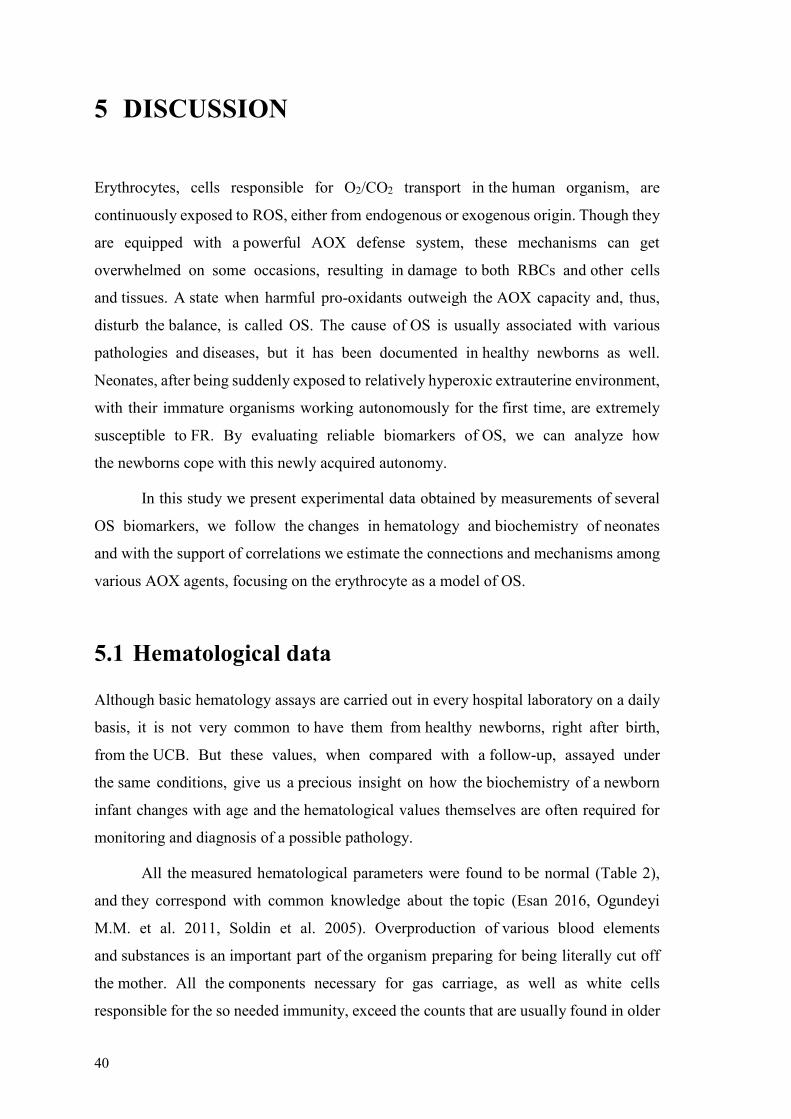
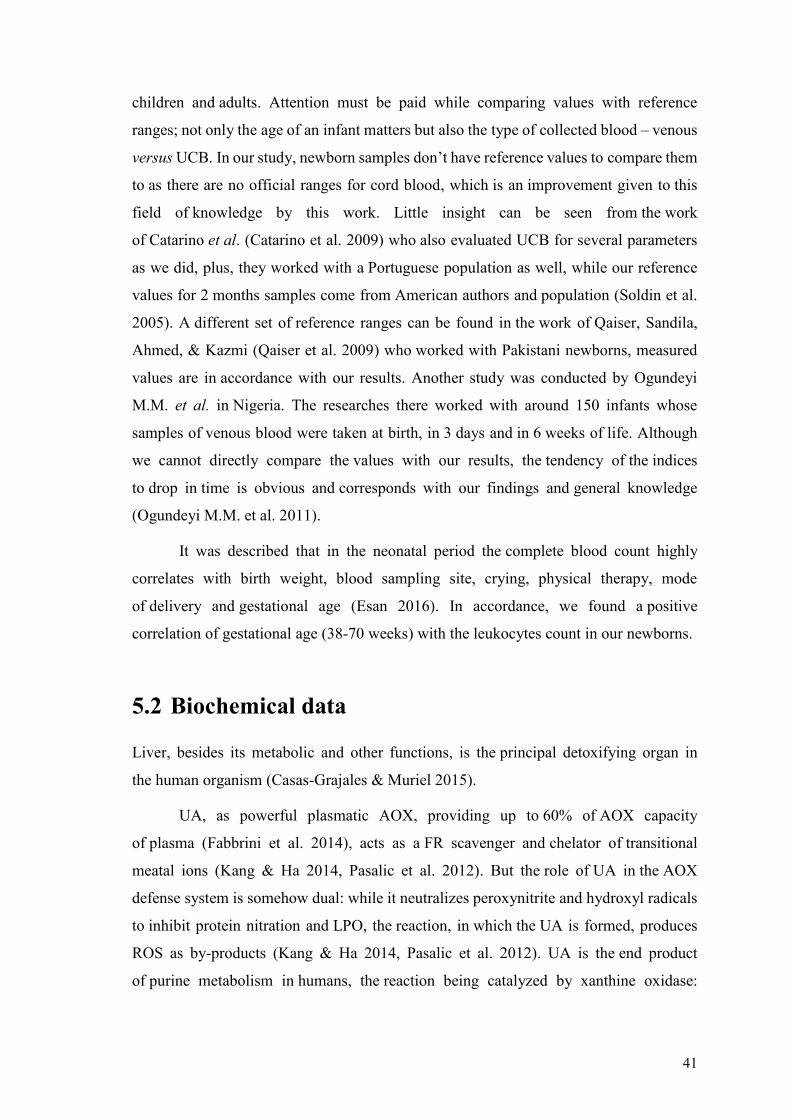
50
Brigelius-Flohe R Maiorino M Glutathione peroxidases Biochim Biophys Acta
20131830(5)3289-303
Brown KA Erythrocyte Metabolism and Enzyme Defects Laboratory Medicine
199627(5)
Bukhari KT Zafar H Reference values of reticulocyte counts in five age groups of
healthy infants at Rawalpindi Pakistan J Pak Med Assoc 201363(9)1108-11
Capece L Marti MA Crespo A Doctorovich F Estrin DA Heme protein oxygen affinity
regulation exerted by proximal effects J Am Chem Soc 2006128(38)12455-61
Casas-Grajales S Muriel P Antioxidants in liver health World J Gastrointest Pharmacol
Ther 20156(3)59-72
Catala A Lipid peroxidation of membrane phospholipids generates hydroxy-alkenals and
oxidized phospholipids active in physiological andor pathological conditions Chem
Phys Lipids 2009157(1)1-11
Catarino C Rebelo I Belo L Rocha-Pereira P Rocha S Bayer Castro E et al
Erythrocyte changes in preeclampsia relationship between maternal and cord blood
erythrocyte damage J Perinat Med 200937(1)19-27
Cimen MY Free radical metabolism in human erythrocytes Clin Chim Acta
2008390(1-2)1-11
Claster S Chiu DT Quintanilha A Lubin B Neutrophils mediate lipid peroxidation in
human red cells Blood 198464(5)1079-84
Costa V Quintanilha A Moradas-Ferreira P Protein oxidation repair mechanisms and
proteolysis in Saccharomyces cerevisiae IUBMB Life 200759(4-5)293-8
Culotta VC Superoxide dismutase oxidative stress and cell metabolism Curr Top Cell
Regul 200036117-32
Diez-Silva M Dao M Han J Lim CT Suresh S Shape and Biomechanical
Characteristics of Human Red Blood Cells in Health and Disease MRS Bull
201035(5)382-8
51
Dodge JT Mitchell C Hanahan DJ The preparation and chemical characteristics of
hemoglobin-free ghosts of human erythrocytes Arch Biochem Biophys 1963100119-
30
Dzierzak E Philipsen S Erythropoiesis development and differentiation Cold Spring
Harb Perspect Med 20133(4)a011601
Esan A Hematological differences in newborn and aging a review study Hematol
Transfus Int J 20163(3)
Fabbrini E Serafini M Colic Baric I Hazen SL Klein S Effect of plasma uric acid on
antioxidant capacity oxidative stress and insulin sensitivity in obese subjects Diabetes
201463(3)976-81
Floheacute L Glutathione Peroxidase Brought into Focus In Pryor W editor Free Radicals
in Biology Academic Press 1982 p 223-54
Friel JK Friesen RW Harding SV Roberts LJ Evidence of oxidative stress in full-term
healthy infants Pediatr Res 200456(6)878-82
Frijhoff J Winyard PG Zarkovic N Davies SS Stocker R Cheng D et al Clinical
Relevance of Biomarkers of Oxidative Stress Antioxid Redox Signal 201523(14)1144-
70
Fukai T Ushio-Fukai M Superoxide dismutases role in redox signaling vascular
function and diseases Antioxid Redox Signal 201115(6)1583-606
Geers C Gros G Carbon dioxide transport and carbonic anhydrase in blood and muscle
Physiol Rev 200080(2)681-715
Gordon-Smith T Structure and function of red and white blood cells Medicine
2013193-9
Griffith OW Biologic and pharmacologic regulation of mammalian glutathione
synthesis Free Radic Biol Med 199927(9-10)922-35
Griffith OW Determination of glutathione and glutathione disulfide using glutathione
reductase and 2-vinylpyridine Anal Biochem 1980106(1)207-12
52
Gwaltney-Brant S Biomarkers in Toxicology In Gupta RC editor Biomarkers in
Toxicology2014
Hall A Karplus PA Poole LB Typical 2-Cys peroxiredoxins--structures mechanisms
and functions FEBS J 2009276(9)2469-77
Halliwell B Biochemistry of oxidative stress Biochem Soc Trans 200735(Pt 5)1147-
50
Han YH Kim SU Kwon TH Lee DS Ha HL Park DS et al Peroxiredoxin II is essential
for preventing hemolytic anemia from oxidative stress through maintaining hemoglobin
stability Biochem Biophys Res Commun 2012426(3)427-32
Harris JR Schroder E Isupov MN Scheffler D Kristensen P Littlechild JA et al
Comparison of the decameric structure of peroxiredoxin-II by transmission electron
microscopy and X-ray crystallography Biochim Biophys Acta 20011547(2)221-34
Hattangadi SM Wong P Zhang L Flygare J Lodish HF From stem cell to red cell
regulation of erythropoiesis at multiple levels by multiple proteins RNAs and chromatin
modifications Blood 2011118(24)6258-68
Hoffbrand VA Moss PAH Hoffbrandrsquos Essential Haematology2016
Chang JC van der Hoeven LH Haddox CH Glutathione reductase in the red blood cells
Ann Clin Lab Sci 19788(1)23-9
Cho CS Lee S Lee GT Woo HA Choi EJ Rhee SG Irreversible inactivation of
glutathione peroxidase 1 and reversible inactivation of peroxiredoxin II by H2O2 in red
blood cells Antioxid Redox Signal 201012(11)1235-46
Chung J Chen C Paw BH Heme metabolism and erythropoiesis Curr Opin Hematol
201219(3)156-62
Johansson LH Borg LA A spectrophotometric method for determination of catalase
activity in small tissue samples Anal Biochem 1988174(1)331-6
53
Johnson RM Ho YS Yu DY Kuypers FA Ravindranath Y Goyette GW The effects of
disruption of genes for peroxiredoxin-2 glutathione peroxidase-1 and catalase on
erythrocyte oxidative metabolism Free Radic Biol Med 201048(4)519-25
Kahl L Hughes H The Harriet Lane Handbook a manual for pediatric house officers
The Harriet Lane Handbook Mobile Medicine Series 21st ed Philadelphia Pa Elsevier
2017 p 1272
Kamerbeek NM van Zwieten R de Boer M Morren G Vuil H Bannink N et al
Molecular basis of glutathione reductase deficiency in human blood cells Blood
2007109(8)3560-6
Kang DH Ha SK Uric Acid Puzzle Dual Role as Anti-oxidantand Pro-oxidant
Electrolyte Blood Press 201412(1)1-6
Kanias T Acker JP Biopreservation of red blood cells--the struggle with hemoglobin
oxidation FEBS J 2010277(2)343-56
Kingsbury J Sedgwick JP The uric acid content of the blood of the new-borns The
Journal of Biological Chemistry 191731(1)261-8
Kirkman HN Galiano S Gaetani GF The function of catalase-bound NADPH J Biol
Chem 1987262(2)660-6
Kodydkova J Vavrova L Kocik M Zak A Human catalase its polymorphisms
regulation and changes of its activity in different diseases Folia Biol (Praha)
201460(4)153-67
Kondo M Lymphoid and myeloid lineage commitment in multipotent hematopoietic
progenitors Immunol Rev 2010238(1)37-46
Kuhn V Diederich L Keller TCSt Kramer CM Luckstadt W Panknin C et al Red
Blood Cell Function and Dysfunction Redox Regulation Nitric Oxide Metabolism
Anemia Antioxid Redox Signal 201726(13)718-42
Kurata M Suzuki M Agar N Glutathione Regeneration in Mammalian Erythrocytes
Comparative Haematology International 200010(2)
54
Lee TH Kim SU Yu SL Kim SH Park DS Moon HB et al Peroxiredoxin II is essential
for sustaining life span of erythrocytes in mice Blood 2003101(12)5033-8
Li H Lykotrafitis G Erythrocyte membrane model with explicit description of the lipid
bilayer and the spectrin network Biophys J 2014107(3)642-53
Lichtman M Prchal J Levi M Press O Burns L Caligiuri M Hematology of the Fetus
and Newborn In Edmonson K Lebowitz H editors Williams Hematology 9th ed USA
McGraw-Hill Education 2016
Low FM Hampton MB Winterbourn CC Peroxiredoxin 2 and peroxide metabolism in
the erythrocyte Antioxid Redox Signal 200810(9)1621-30
Lu SC Regulation of glutathione synthesis Mol Aspects Med 200930(1-2)42-59
Lubos E Loscalzo J Handy DE Glutathione peroxidase-1 in health and disease from
molecular mechanisms to therapeutic opportunities Antioxid Redox Signal
201115(7)1957-97
Lux SEt Anatomy of the red cell membrane skeleton unanswered questions Blood
2016127(2)187-99
Manta B Hugo M Ortiz C Ferrer-Sueta G Trujillo M Denicola A The peroxidase and
peroxynitrite reductase activity of human erythrocyte peroxiredoxin 2 Arch Biochem
Biophys 2009484(2)146-54
Marconi VC Duncan MS So-Armah K Re VL 3rd Lim JK Butt AA et al Bilirubin Is
Inversely Associated With Cardiovascular Disease Among HIV-Positive and HIV-
Negative Individuals in VACS (Veterans Aging Cohort Study) J Am Heart Assoc
20187(10)
Marengo-Rowe AJ Structure-function relations of human hemoglobins Proc (Bayl Univ
Med Cent) 200619(3)239-45
Mate MJ Ortiz-Lombardia M Marina A Fita I Crystallization and preliminary structural
results of catalase from human erythrocytes Acta Crystallogr D Biol Crystallogr
199955(Pt 5)1066-8
55
May JM Ascorbate function and metabolism in the human erythrocyte Front Biosci
19983d1-10
McGill MR Jaeschke H A direct comparison of methods used to measure oxidized
glutathione in biological samples 2-vinylpyridine and N-ethylmaleimide Toxicol Mech
Methods 201525(8)589-95
Melo DF Enzymatic mechanism of antioxidant defense in the erythrocyte ndash cytosol
versus membrane [Master thesis] Universidade do Porto 2017
Mihara M Uchiyama M Determination of malonaldehyde precursor in tissues by
thiobarbituric acid test Anal Biochem 197886(1)271-8
Mitra S Rennie J Neonatal jaundice aetiology diagnosis and treatment Br J Hosp Med
(Lond) 201778(12)699-704
Monostori P Wittmann G Karg E Turi S Determination of glutathione and glutathione
disulfide in biological samples an in-depth review J Chromatogr B Analyt Technol
Biomed Life Sci 2009877(28)3331-46
Muller DP Free radical problems of the newborn Proc Nutr Soc 198746(1)69-75
Negi R Pande D Karki K Kumar A Khanna RS Khanna HD A novel approach to study
oxidative stress in neonatal respiratory distress syndrome BBA Clin 2015365-9
Niki E Interaction of ascorbate and alpha-tocopherol Ann N Y Acad Sci 1987498186-
99
Norishadkam M Andishmand S Zavar Reza J Zare Sakhvidi MJ Hachesoo VR
Oxidative stress and DNA damage in the cord blood of preterm infants Mutat Res
201782420-4
Ogasawara Y Ohminato T Nakamura Y Ishii K Structural and functional analysis of
native peroxiredoxin 2 in human red blood cells Int J Biochem Cell Biol
201244(7)1072-7
56
Ogundeyi MM Olarewaju DM Njokanma OF Ogunlesi TA Haematological profile
of apparently healthy term babies aged one day three days and six weeks delivered in
Sagamu Nigeria Nigerian Journal of Paediatrics 201138(3)125-30
Ochoa JJ Ramirez-Tortosa MC Quiles JL Palomino N Robles R Mataix J et al
Oxidative stress in erythrocytes from premature and full-term infants during their first 72
h of life Free Radic Res 200337(3)317-22
Oliveira S Saldanha C An overview about erythrocyte membrane Clinical
Hemorheology and Microcirculation 200944(2010)
Ozsurekci Y Aykac K Oxidative Stress Related Diseases in Newborns Oxid Med Cell
Longev 201620162768365
Pai EF Schulz GE The catalytic mechanism of glutathione reductase as derived from x-
ray diffraction analyses of reaction intermediates J Biol Chem 1983258(3)1752-7
Pandey KB Rizvi SI Biomarkers of oxidative stress in red blood cells Biomed Pap Med
Fac Univ Palacky Olomouc Czech Repub 2011155(2)131-6
Pandey KB Rizvi SI Markers of oxidative stress in erythrocytes and plasma during aging
in humans Oxid Med Cell Longev 20103(1)2-12
Pasalic D Marinkovic N Feher-Turkovic L Uric acid as one of the important factors in
multifactorial disorders--facts and controversies Biochem Med (Zagreb) 201222(1)63-
75
Perrone S Negro S Tataranno ML Buonocore G Oxidative stress and antioxidant
strategies in newborns J Matern Fetal Neonatal Med 201023 Suppl 363-5
Peskin AV Pace PE Behring JB Paton LN Soethoudt M Bachschmid MM et al
Glutathionylation of the Active Site Cysteines of Peroxiredoxin 2 and Recycling by
Glutaredoxin J Biol Chem 2016291(6)3053-62
Qaiser DH Sandila MP Ahmed ST Kazmi T Haematological reference values for full-
term healthy newborns of Karachi Pakistan J Pak Med Assoc 200959(9)618-22
57
Raftos JE Whillier S Kuchel PW Glutathione synthesis and turnover in the human
erythrocyte alignment of a model based on detailed enzyme kinetics with experimental
data J Biol Chem 2010285(31)23557-67
Raivio KO Neonatal hyperuricemia J Pediatr 197688(4 Pt 1)625-30
Rakhit R Chakrabartty A Structure folding and misfolding of CuZn superoxide
dismutase in amyotrophic lateral sclerosis Biochim Biophys Acta 20061762(11-
12)1025-37
Remacle Ja Raes M Toussaint O Renard P Rao G Low levels of reactive oxygen
species as modulators of cell function Mutation Research 1994316103-22
Reshad M Ravichander B Raghuraman TS A study of cord blood albumin as a predictor
of significant neonatal hyperbilirubinemia in term and preterm neonates International
Journal of Research in Medical Sciences 20164(3)887-90
Richard A Polin SHA David Rowitch William E Benitz Fetal and Neonatal
Physiology Fetal and Neonatal Physiology 1 5th ed Philadelphia PA Elsevier 2017
Rizvi SI Maurya PK Markers of oxidative stress in erythrocytes during aging in humans
Ann N Y Acad Sci 20071100373-82
Rocha S Gomes D Lima M Bronze-da-Rocha E Santos-Silva A Peroxiredoxin 2
glutathione peroxidase and catalase in the cytosol and membrane of erythrocytes under
H2O2-induced oxidative stress Free Radic Res 201549(8)990-1003
Santos-Silva A Castro EM Teixeira NA Guerra FC Quintanilha A Altered erythrocyte
membrane band 3 profile as a marker in patients at risk for cardiovascular disease
Atherosclerosis 1995116(2)199-209
Sarniak A Lipinska J Tytman K Lipinska S Endogenous mechanisms of reactive
oxygen species (ROS) generation Postepy Hig Med Dosw (Online) 201670(0)1150-
65
Sedlak TW Snyder SH Bilirubin benefits cellular protection by a biliverdin reductase
antioxidant cycle Pediatrics 2004113(6)1776-82
58
Shaik IH Mehvar R Rapid determination of reduced and oxidized glutathione levels
using a new thiol-masking reagent and the enzymatic recycling method application to
the rat liver and bile samples Anal Bioanal Chem 2006385(1)105-13
Shan G Yang F Zhou L Tang T Okoro EU Yang H et al Increase in Blood Glutathione
and Erythrocyte Proteins Related to Glutathione Generation Reduction and Utilization in
African-American Old Women with Diabetes J Sci Technol Environ 20155(1)
Sharma R Premachandra BR Membrane-bound hemoglobin as a marker of oxidative
injury in adult and neonatal red blood cells Biochem Med Metab Biol 199146(1)33-
44
Sies H Oxidative stress oxidants and antioxidants Exp Physiol 199782(2)291-5
Soldin SJ Brugnara C Wong EC Pediatric References Intervals 5th ed United States
Washington DC AACC Press c2005 2005 257 p
Staal GE Veeger C The reaction mechanism of glutathione reductase from human
erythrocytes Biochim Biophys Acta 1969185(1)49-62
Tainer JA Getzoff ED Richardson JS Richardson DC Structure and mechanism of
copper zinc superoxide dismutase Nature 1983306(5940)284-7
Torres-Cuevas I Parra-Llorca A Sanchez-Illana A Nunez-Ramiro A Kuligowski J
Chafer-Pericas C et al Oxygen and oxidative stress in the perinatal period Redox Biol
201712674-81
Tsiftsoglou AS Tsamadou AI Papadopoulou LC Heme as key regulator of major
mammalian cellular functions molecular cellular and pharmacological aspects
Pharmacol Ther 2006111(2)327-45
Tsukahara H Biomarkers for oxidative stress clinical application in pediatric medicine
Curr Med Chem 200714(3)339-51
Valko M Leibfritz D Moncol J Cronin MT Mazur M Telser J Free radicals and
antioxidants in normal physiological functions and human disease Int J Biochem Cell
Biol 200739(1)44-84
59
Welbourn EM Wilson MT Yusof A Metodiev MV Cooper CE The mechanism of
formation structure and physiological relevance of covalent hemoglobin attachment to
the erythrocyte membrane Free Radic Biol Med 201710395-106
Weydert CJ Cullen JJ Measurement of superoxide dismutase catalase and glutathione
peroxidase in cultured cells and tissue Nat Protoc 20105(1)51-66
Wu G Fang YZ Yang S Lupton JR Turner ND Glutathione metabolism and its
implications for health J Nutr 2004134(3)489-92
Yamauc R Vitamine E Mechanism of Its Antioxidant Activity Food Sci Technol Int
19973(4)301-9
Zachara BA Selenium and selenium-dependent antioxidants in chronic kidney disease
Adv Clin Chem 201568131-51
Zitka O Skalickova S Gumulec J Masarik M Adam V Hubalek J et al Redox status
expressed as GSHGSSG ratio as a marker for oxidative stress in paediatric tumour
patients Oncol Lett 20124(6)1247-53