Embed Size (px)
Citation preview

NOVEL APPROACHES TOWARDS ELECTROANALYSIS OF NATURAL
AND MODIFIED DNAS AND THEIR INTERACTIONS
Ph.D. Dissertation
JAN ŠPAČEK
Supervisor: Mgr. Luděk Havran, Dr. Brno, 2018

BIBLIOGRAPHIC ENTRY
Author: Mgr. Jan Špaček, Faculty of Science, Masaryk University,
National Centre for Bimolecular Research
Title of Dissertation: Novel approaches towards electroanalysis of natural and
modified DNAs and their interactions
Degree Programme: Biochemistry
Field of Study: Genomics and Proteomics
Supervisor: Mgr. Luděk Havran, Dr., Faculty of Science,
National Centre for Bimolecular Research
Academic year: 2017/2018
Number of pages: 124
Keywords: Electrochemistry, DNA, DNA labeling,
carbon electrode, mercury electrode

BIBLIOGRAFICKÝ ZÁZNAM
Autor: Mgr. Jan Špaček, Přírodovědecká fakulta, Masarykova univerzita
Národní centrum pro výzkum biomolekul
Název disertace: Nové přístupy k elektroanalýze přirozené a modifikované DNA
a jejich interakcí
Studijní program: Biochemie
Studijní obor: Genomika a proteomika
Školitel: Mgr. Luděk Havran, Dr., Přírodovědecká fakulta,
Masarykova univerzita, Národní centrum pro výzkum biomolekul
Akademický rok: 2017/2018
Počet stran: 124
Klíčová slova: Elektrochemie, DNA, značení DNA,
uhlíková elektroda, rtuťová elektroda

Abstract
This dissertation includes commentary of six studies published in electroanalytical peer
reviewed journals and mentions two yet unpublished projects. Presented results provide new
insights on electrochemistry of natural and modified DNA, including new analytical
applications. (1) A new method of electrochemical analysis of DNA-protein interactions,
named electrochemical “footprinting”, has been developed. The method is based on the reaction
between site specific enzymatically introduced azidophenyl-modified bases and phenyl- or
nitrophenylacetylene. When sequences containing the azidophenyl modifications are covered
by DNA-binding protein, reaction with phenyl- or nitrophenylacetylene cannot occur.
Information about DNA-protein interaction can be deduced from the difference between the
signals of DNA labels before and after click reaction. (2) Simple, low cost and fast protocol for
detection of PCR products is presented. The method is based on incorporation of biotin labeled
cytosine during the PCR, presence of which is manifested by detection of an electrochemically
active product of enzymatic reaction. This product is converted from electrochemically inactive
substrate by a streptavidin coupled enzyme, which is available only if the PCR product
containing biotin labels is present on the electrode surface. (3) Aside from fully natural DNA,
properties of DNA with modified bases were analyzed. We studied electrochemical and optical
activity of PCR products with polymerase-introduced 7-deaza purine bases. The study has
shown how substitution of N7 by C in 7-deazapurines affect stability of the DNA structure on
the electrode surface and it the solution. (4) Interactions of 7-deaza purine PCR products with
florescent dye SYBR green I were studied using fluorescence in solution and electrochemistry
on the surface of the pyrolytic graphite electrode. Obtained results has confirmed previous
hypothesis that 7-deazaguanine quenches fluorescence and our results suggested that SYBR
green I quenching can happen from remote sites by mechanism involving DNA-mediated
charge transfer. (5) Newly discovered DNA signals provided by DNA bases on the surface of
the pyrolytic graphite electrode were presented. It has been shown that electroreduction of DNA
bases is possible on the carbon electrodes; behavior previously observed only on mercury based
electrodes. This study also shows new oxidation signals which could be “switched on” by prior
reduction of the DNA bases and vice versa new reduction signals obtained by prior
electrooxidation. (6) Two step redox labeling of DNA through enzymatic introduction of
butylacrylate base modified nucleotides, followed by reaction with osmium tetroxide complex
is presented. Experimentally proven possibility of quantitative electroanalysis of unnatural base
pairs in plasmids isolated from semi-synthetic organism is mentioned and definition of life is
discussed.

Abstrakt
Tato disertační práce obsahuje komentáře šesti odborných prací publikovaných
v impaktovaných elektroanalytických časopisech a zmiňuje dva dosud nepublikované projekty.
Předkládané výsledky prezentují nové poznatky o elektrochemii přirozené a modifikované
DNA, včetně nových aplikací. (1) Nová metod umožňující studium DNA-protein interakcí,
nazvaná elektrochemický „footprinting“, je založená na reakci mezi enzymaticky zařazenou
bází značenou azidofenylovou skupinou a fenyl- nebo nitrofenylacetylénem. Tato „click“
reakce nemůže proběhnout v případě, že je azidofenylem modifikovaná báze překrytá DNA-
vázajícím proteinem. Z rozdílu mezi signály poskytovanými značkami před a po „click“ reakci
je možno odvodit informace o interakci DNA a proteinu. (2) Byla vyvinuta nenákladná technika
pro rychlou detekci přítomnosti PCR produktů. Metoda je založená na enzymatické inkorporaci
cytosinu značeného biotinem během PCR. Analýza přítomnosti PCR produktu (a tedy
zprostředkovaně hledané sekvence ve vzorku) je prováděna nepřímo pomocí detekce
elektrochemicky aktivního produktu enzymatické reakce. Tento produkt vzniká konverzí
substrátu na elektroaktivní produkt enzymem, který je při analýze přítomen jen tehdy, je-li na
povrchu elektrody přítomna DNA obsahující biotinu. (3) Elektrochemické vlastnosti DNA byly
studovány i v případě DNA s modifikovanými bázemi. Byla provedena detailní analýza
elektrochemických a optických vlastností PCR produktů obsahujících 7-deaza puriny. Bylo
zjištěno, jakým způsobem tyto modifikace ovlivňují elektrochemické chování a stabilitu
duplexu DNA na povrchu rtuťové elektrody a v roztoku. (4) S pomocí elektrochemických a
fluorescenčních metod byla zkoumána interakce PCR produktů modifikovaných 7-deaza
puriny s fluorescenčním barvivem SYBR green I. Získané výsledky potvrdily, že 7-
deazaguanin zháší fluorescenci barviva SYBR green I mechanismem pravděpodobně
zahrnujícím DNA zprostředkovaný přenos náboje. (5) Byly popsány nové signály poskytované
bázemi DNA na povrchu elektrod z pyrolytického uhlíku. Tato práce ukazuje, že i na povrchu
uhlíkových elektrod je možné provádět elektroredukci bází DNA, kterou bylo možno dříve
pozorovat pouze na elektrodách na bázi rtuti. Tato práce popisuje mnoho nových oxidačních
signálů vzniklých po předchozí redukci analyzované DNA, nebo naopak nové signály
vznikající redukcí elektrochemicky oxidovaných bází. (6) Dvoukroková příprava DNA
modifikované komplexy oxidu osmičelého je založena na enzymatické inkorporaci
butylakrylátem značených nukleotidů do DNA a jejich následné chemické modifikaci
komplexy oxidu osmičelého. Na závěr je zmíněna experimentálně potvrzená možnost
kvantitativní analýzy přítomnosti nepřirozených bází v plazmidech izolovaných ze semi-
syntetických organismů a je diskutována definice života.


© Jan Špaček, Masaryk University, 2018


“Our robot took the sentences from the textbooks and Wikipedia, combined them
together, and optimized it to produce an essay without understanding a thing. Surprisingly, it
wrote a better essay than most of the students.”
– N. Arai, 2017

15
Contents
Preface ...................................................................................................................................... 16
List of abbreviations ................................................................................................................. 17
1 Introduction ...................................................................................................................... 18
1.1 Electroanalytical chemistry ....................................................................................... 18
1.1.1 Historical overview ............................................................................................ 19
1.1.2 Electrodes and potential windows ...................................................................... 21
1.2 Electrochemical properties of natural nucleic acids .................................................. 21
1.2.1 Adsorption and adsorption transfer stripping of DNA ....................................... 21
1.2.2 DNA structure analysis with alternating current voltammetry .......................... 22
1.2.3 Redox signals of unlabeled NAs at mercury electrodes ..................................... 22
1.2.4 Redox signals of unlabeled NAs at carbon electrodes ....................................... 23
1.3 Electrochemical labeling of NAs ............................................................................... 24
1.3.1 Osmium tetroxide complexes ............................................................................. 25
1.3.2 Enzymatically introducible redox labels ............................................................ 26
1.3.3 Enzyme-linked DNA electroanalysis ................................................................. 28
2 Results and discussion ...................................................................................................... 28
2.1 Electrochemical DNA “footprinting” ........................................................................ 29
2.2 Enzyme-linked DNA ................................................................................................. 30
2.3 Electroanalysis of 7-deazapurine modified DNA ...................................................... 32
2.4 SYBR green interactions with 7-deazaG modified DNA .......................................... 33
2.5 Expanded potential window of pyrolytic graphite electrode ..................................... 34
2.6 Two step redox labeling of DNA with osmium tetroxide complex .......................... 37
2.7 Electrochemistry of unnatural base pairs ................................................................... 38
2.8 Defining and creating life .......................................................................................... 39
3 Summary .......................................................................................................................... 41
4 References ........................................................................................................................ 42
5 List of publications with specified contributions of the PhD candidate .......................... 49
6 List of conference contributions of PhD candidate .......................................................... 51
7 Appendix .......................................................................................................................... 53

16
Preface
I would like to thank Mgr. Luděk Havran, Dr. and
doc. RNDr. Miroslav Fojta, CSc. for advices and guidance, but mainly
for supporting me in a pursuit of new ideas.
17
List of abbreviations
A adenine
AC alternating current
ACV AC voltammetry
AdTS adsorptive transfer stripping
BA Butylacrylate
C cytosine
CA peak joint reduction signal of C and A
dNTP deoxynucleotide triphosphate
dNXTP base modified dNTP
dsDNA double stranded DNA
G guanine
HMDE hanging mercury drop electrode
mC 5-methylcytosine
N any NA base
NA Nucleic Acid
Os,L osmium tetroxide complex with nitrogenous ligand
PCR polymerase chain reaction
PeGE pencil graphite electrode
PEX primer extension
PGE pyrolytic graphite electrode
ssDNA single stranded DNA
T thymine
TdT terminal (deoxynucleotidyl) transferase
V Volt
W Triptophan
18
1 Introduction
Electrochemistry is a science about relations between chemical and electrical energy.
(O. Šulc, 1894 in ref.1)
1.1 Electroanalytical chemistry
Electroanalytical chemistry studies chemical reactions and physical phenomena
occurring at and near the working electrode / electrolyte interface by observing changes of the
current in response to the applied potential (voltammetry, potentiostatic measurement) or
changes in the potential, when the current is controlled (chronopotentiometric or galvanostatic
measurements). Electroactive chemical species or species exhibiting surface activity can be
studied using electrochemical methods. When suitable potential is applied, electroactive
species can exchange electrons with the working electrode: during reduction analyzed
chemical substance accepts electrons from the electrode, while opposite current is observed
during the oxidation. Faradaic currents, currents arising from direct reduction-oxidation
(redox) reactions, is only one of the components of the total current observed. Aside from
faradaic currents we can observe kinetic current components – currents arising from chemical
reactions on the electrode surface, or currents arising from adsorption/desorption or
reorientation of the species on the electrode surface. Above mentioned currents correspond to
the quantity of the species, while potential of observed signal indicates the identity of the
analyzed species.
Electroanalytical experiments are performed in an electrochemical cell consisting of
electrodes immersed in the electrolyte. The overall chemical reaction taking place in the cell
is made up of two separate half reactions, which describe real chemical changes at the two
electrodes in a two electrode system. Each half-reaction responds to the interfacial potential
difference at the corresponding electrode. While the focus of the experiment is on the
interface between working electrode and electrolyte, the other electrode, reference electrode,
must be present to complete the electric circuit. To eliminate unwanted contributions from the
other half reaction, reference electrode interface is made up of phases having constant
composition. For this reason its potential variations are minimized and we can observe (and
control) potential of working electrode with respect to the reference electrode.
When current is flowing in the two-electrode system electrochemical cell, there is a
potential drop between the reference electrode and the working electrode. This potential drop
(also ohmic drop) is affected by the electrolyte conductivity, the distance between the two
electrodes and the magnitude of the current. To eliminate undesirable effects of the ohmic
19
drop, the three-electrode system is used. In this system current flows and is measured
between working and counter (or auxiliary) electrode, while the potential is measured (and
controlled) with respect to the reference electrode. As auxiliary electrode any material could
be theoretically used, since its electrochemical properties do not affect the behavior of the
working electrode. To prevent influencing electrochemistry at the working electrode by
electrolyzed species diffused from chemically unstable auxiliary electrode, electrodes
composed of electrochemically stable materials such as platinum and glassy carbon, are used2.
All electroanalytical work described in this thesis was performed with three-electrode
systems. As working electrode carbon electrodes, namely pyrolytic graphite electrode in basal
orientation (PGE) and pencil graphite electrode, or hanging mercury drop electrode (HMDE)
were used. As reference electrode silver-silver chloride, separated from bulk electrolyte by
3M KCl salt bridge was used: (Ag/AgCl/KCl saturated solution in water; slash represents a
phase boundary). Platinum wire was used as an auxiliary electrode.
1.1.1 Historical overview
In the year 1959, Czech physical chemist Jaroslav Heyrovský received the Nobel Prize
for invention of the polarography. In the Czech science, electrochemistry is still the only
research field in which this most prestigious prize for science has been awarded1.
The following text briefly describes historical development in the field of
electrochemistry of nucleic acids (NAs) relevant to the work presented in this thesis.
Detailed reviews covering the development of the field of electrochemistry of NAs, can be
found in ref.3–7.
The electrochemistry of NAs was established and greatly developed thanks to
contributions of Czech scientists. In late 1950s, using a method developed by Jaroslav
Heyrovský, oscillographic polarography at controlled alternating current7, Emil Paleček
discovered that DNA is electrochemically active. First observed signals were attributed to the
bases A, C and G8,9. Paleček also described structural changes in the DNA, melting and
premelting of DNA and DNA polymorphy, using dropping mercury electrode10. Soon after
the Paleček’s discovery of electroactivity of NAs, Vladimír Vetterl discovered ability of NA
bases to associate at the electrode surface11. Carbon electrodes have been introduced for
analysis of NAs in late 1970s by Viktor Brabec and Glenn Dryhurst12,13, which led to detailed
description of behavior of NAs and their components, namely oxidation of G and A, on the
surface of the PGE14,15. In 1986 Paleček and Postbieglová have presented adsorption transfer
stripping technique, which increased the sensitivity and reduced the amount of material
required for the analysis16 (for detail description see chapter 1.2.1). Also in 1980s polymerase
chain reaction (PCR) was developed17 and chemically synthetized oligonucleosides became

20
available18, allowing for the first time to use well defined and pure DNA samples, which
facilitated further investigations in the field. Electrochemical labels were introduced to
increase sensitivity and selectivity of electrochemical sensing of the NAs. First DNA labels
were introduced in 1980s and were based on the osmium tetroxide complexes with
nitrogenous ligands19,20. Osmium labeling techniques were further developed and optimized
by Miroslav Fojta et al21 and are still an attractive option for DNA labeling today22. Another
approach towards DNA modification was used for the first time in 198123. It was based on
enzymatic introduction of base modified deoxynucloside triphosphates (dNTPs). A similar
technique for introduction of electrochemically active moieties was used by Miroslav Fojta in
cooperation with Michal Hocek24. For more details about the results of this ongoing
cooperation between Hocek’s and our lab see chapter 1.3. Aside from continuous
development of novel enzymatically introducible electrochemical NAs labels, our group lead
by Miroslav Fojta, studiesa basic electrochemical properties and biophysics of natural25,26 and
modified DNA27, investigates secondary structures of the DNA28. Based on aforementioned
findings, electrochemical sensors29 are being developed for detection of DNA30, detection of
DNA damage31–33, analysis of DNA hybridization6 and DNA-protein interactions34.
For almost forty years the electrochemistry of NAs was fringe subject predominantly
studied in Czech Republic. Through the 1990s till the present day the electrochemistry of NAs
became a booming field involving laboratories from all over the world5,35.
a Other research activities of Fojta’s group, namely research in the field of molecular oncology and development
of novel electrode materials are beyond the scope of this thesis.
21
1.1.2 Electrodes and potential windows
Potential window of most of the solid electrodes covers potentials from about -1 V to
+1 V35. Carbon electrodes can be used up to about +1.6 V. Above these potentials oxygen
evolution background discharge overlaps all analytically useful signals26,36. Potential window
of mercury electrodes usually spans between 0 and -2 V at neutral and weakly alkaline pH.
The potential window is limited by hydrogen evolution background discharge at negative
side. At mildly positive potentials, mercury is electrochemically dissolved37 and therefore
cannot be used. In general, mercury electrodes are more suitable for analysis of reduction,
while carbon and some solid metal electrodes are predominantly used to study oxidation
processes5,29. The atomically smooth and highly reproducible surfaces of liquid mercury is an
excellent tool in electrochemical analysis but it has been of little use in biosensors requiring
sturdy, easy to handle solid electrodes. Generally it has been accepted that the solid electrodes
cannot be used for analysis of NAs and other compounds reduction due to relatively low
hydrogen overvoltage35 (see chapter 2.5). Silver amalgam electrodes offer a compromise,
featuring solid non-toxic electrodes usable in the sensors, which could be used for analysis in
highly negative potentials to observe reduction and catalytic hydrogen evolution38.
1.2 Electrochemical properties of natural nucleic acids
1.2.1 Adsorption and adsorption transfer stripping of DNA
DNA strongly adsorbs onto the surfaces of carbon and mercury-based electrodes. Both
bases and sugar-phosphate backbone are responsible for the adsorption39. Hydrophobic
interactions between DNA bases and mercury electrode16 or PGE40 surfaces or adsorption
through the sugar-phosphate backbone in case of double stranded DNA (dsDNA)9,39, is strong
enough to withstand exchange of the media. This is utilized in a technique called adsorptive
transfer stripping (AdTS)16. This technique is based on adsorption of studied species from a
drop of sample solution onto the working electrode surface, wash off of non-adsorbed species
and transfer into the blank electrolyte where analysis is performed. There are multiple
advantages of the use of AdTS technique compared to the classical electroanalytical approach,
where the studied specie is diluted in the bulk of the background electrolyte. From the point of
view of a molecular biologist, the most important feature is the three orders of magnitude
reduction of the amount of experimental material – from milliliters of a bulk electrolyte to a
drop with a volume of few microliters. This makes the electrochemistry a relevant technique
for analysis of precious, hard to obtain biological samples. Other useful features of AdTS are
that solution from which the sample is adsorbed can have different chemical composition than
electrolyte and that studied species can be separated during the adsorption based on the
different affinity of the present molecules towards the electrode surface. Furthermore AdTS

22
allows to study the effect of electrode potential on the properties and interactions of the
adsorbed macromolecules16. Reduction and oxidation of NAs at mercury and carbon
electrodes proceeds in the adsorbed state. At negative potentials, the DNA can be reoriented
on the electrode surface39 due to repulsion between negatively charged electrode surface and
negatively charged sugar-phosphate backbone of the DNA, but it remains adsorbed at the
electrode surface even at highly negative potentials (up to -2 V). Products of the reduction
processes can be oxidized in following scans during cyclic voltammetry26,39.
1.2.2 DNA structure analysis with alternating current voltammetry
It is possible to study adsorption, desorption and reorientation of DNA on HMDE
using methods sensitive towards detection of changes in electrode capacity41. When
alternating current voltammetry (ACV) scan to negative potentials in weakly alkaline media is
performed, up to three distinct tensammetric signals, depending on DNA structure,
corresponding to DNA segments desorption/reorientation on the electrode surface could be
observed. The least negative signal (peak 1, around -1.2 V) corresponds to sugar-phosphate
backbone desorption. Desorption of the bases in single stranded DNA (ssDNA) regions
occurs at most negative potentials (peak 3, -1.4 V). The middle signal (peak 2, -1.3 V),
corresponds to reorientation of distorted regions of dsDNA which were adsorbed via bases
more firmly than intact B-DNA39. This technique was applied in a simple and sensitive
sensor for detection of DNA damage. The method was based on the appearance of
tensammetric peak 3 resulting from introduction of single strand scission into supercoiled
plasmids. Since it contains no free ends, scDNA cannot be extensively unwound on the
electrode surface, its bases remain hidden in the DNA double helix and therefore it does not
provide peak 3 on HMDE. Once a strand scission is introduced, the partial unwinding of the
plasmid DNA on HMDE can begin, which allows adsorption of bases onto the electrode
surface, detectable via the appearance of peak 3. Introduction of DNA strand breaks by
genotoxic substances or through physical damage can thus be observed31. ACV can also be
used for observation of changes in DNA structure stability due to introduction of base
modified nucleotides27 (see chapter 2.3).
1.2.3 Redox signals of unlabeled NAs at mercury electrodes
Due to range of their potential window mercury electrodes are well suited for
observation of reduction of NAs and their components. For a long period of time, mercury
electrodes were only electrodes types on which NA reduction was observed5. At the HMDE,
A and C residues in NAs undergo reduction at highly negative potentials, close to hydrogen
23
background discharge. The reduction of both bases occurs at very similar potential, providing
joint signal called peak CA42. Mechanism of G reduction has been suggested, involving
electrochemically generated H radicals at potentials more negative than about -1.6 V,
chemically reducing G to 7,8-dihydroguanine. The latter process does not provide faradaic
signals (no electrons are withdrawn from the electrode). The 7,8-dihydroG can be oxidized
back to G at about - 0.25 V while providing peak G43. This hypothesis seems to be more in
line with observed results, than previously proposed 2e-,2H+ reduction44 (see chapter 2.5).
Bases, nucleosides and nucleotides yield analogous signals as intact DNA, but usually at less
negative potentials5. Reduction of T and U was not observed at mercury electrodes in aqueous
solution. In aprotic acetonitrile or dimethylsulfoxide media bases T45 and U46 can be reduced
at highly negative potentials. Reduction of polyribouridic acid, but not polyT, was also
observed in nonaqueous solution47. Nevertheless, use of nonaqueous electrolyte is not suitable
for bioanalysis of samples which are usually prepared in water solutions.
Aside from analysis of canonical bases, 5-methylcytosine (mC) can be analyzed using
HMDE. DNA methylation is an important epigenetic mark and therefore suitable tools for mC
content analysis in the DNA are in demand. On HMDE mC provides reduction signal
practically at the same potential as C and therefore its signal is overlapped with CA peak,
making direct analysis in real DNA problematic. A possible solution is to use bisulfite
treatment before the electrochemical analysis. Bisulfite converts C, but not mC, to U. From
change of the CA peak size after bisulfite treatment, the level of C methylation in studied
sample could be assessed48.
1.2.4 Redox signals of unlabeled NAs at carbon electrodes
Carbon based electrodes are predominantly used to study DNA electrooxidation. G
and A oxidation signals (Gox and Aox, at about +1.1 V and +1.4 V) were for the first time
described in late 1970s49. Purine oxidation signals are still the most frequently utilized signals
provided by the DNA on carbon electrodes5,36. Oxidation of pyrimidine bases, which occurs
on carbon electrodes at even higher positive potentials, is problematic since their signals are
obscured by background anodic oxygen evolution36. Limits of the potential window of carbon
electrodes can be stretched by use of pulse methods such as SWV or DPV, yet even under
these settings oxidation signals of pyrimidines is at least partially overlapped by background
currents. It has been shown that on GCE simultaneous oxidation of all free DNA bases is
possible to observe, showing that one of the possible approaches towards electroanalysis of all
four DNA bases could be achieved using the DNA hydrolysis prior to the electrochemical
analysis50. Another approach for simultaneous detection and resolution of all 4 bases requires
nanostructure electrode modifications. With chemically reduced graphene oxide (CR-GO)
modified GCE direct oxidation of all four free DNA bases as well as their oxidation in ss and
24
dsDNA oligonucleotides has been observed. Authors attributed this to antifouling properties
of the CR-GO, favorable 3D structures formed by these nanostructures, high surface area and
to high electron transfer kinetics for bases oxidation51. It has been shown that direct analysis
of mC oxidation (mCox) is possible, but this signal is overlapped with Tox peak. T is normally
much more abundant than mC in natural sequences, therefore this approach of mC analysis is
problematic for real sample analysis, no matter how the sample or electrode is treated36.
Third approach towards simultaneous analysis and resolution of all DNA bases as well as mC
and U without need of DNA hydrolysis or electrode modification26 is described in more detail
in chapter 2.5.
1.3 Electrochemical labeling of NAs
All redox signals of natural DNA are irreversible and high negative or high positive
potentials need to be applied to obtain them5,26. Besides label-free detection, electroactive
chemical groups, which can be attached to the studied nucleic acids to serve as
electrochemical labels, are used to introduce new electrochemical properties with a goal of
increased DNA electroanalysis sensitivity and selectivity52,53. Electrochemical labels
oftentimes provide electrochemically reversible signals under mild conditions and allow
analysis of the studied – labeled – molecule in the presence of overabundant – unlabeled –
nucleic acids. Use of different labels enhance the choice of useful electrode materials, such as
gold, for construction of (bio)sensors. Gold electrodes are not very suitable for observation of
intrinsic DNA signals due to limited potential window, but are excellent for fabrication of
e.g., DNA hybridization sensors based on covalently attached thiolated oligonucleotide
probes54,55. Electrochemical labels are used in the DNA hybridization sensors56, sensors of
DNA damage32,57 and could provide valuable information about nucleic acids structure58 as
well as interaction with other molecules34. They can be introduced into the DNA either via
chemical modification of accessible reactive groups present in the DNA52,59, or through an
enzymatic incorporation of electrochemically modified nucleotide53. Another approach of
electrochemical label introduction is the use of noncovalent groove binding or intercalating
molecules. These have been shown to have rather low signal-to-noise ratio due to nonspecific
interactions of these molecules5. Although more specific noncovalent labels with higher
specificity towards dsDNA have been introduced60, noncovalent redox indicators61 are
considered to be beyond the scope of this thesis.
25
1.3.1 Osmium tetroxide complexes
Osmium tetroxide reacts with C=C double bonds, giving rise to osmic diesters which
are subsequently hydrolyzed into glycol moiety and osmate. It has been found that tertiary
amines such as 2,2’-bipyridine (bipy) and N,N,N’,N’-tetramethyl ethylenediamin (TEMED)
(generally “Os,L”, where L stands for the ligand) can stabilize the osmium glycolates by
coordination of the central Os atom 62. Complexes with Os(VIII),L can react with C=C double
bonds in nucleobases. Among NAs pyrimidines reaction with T has the fastest kinetics,
followed by mC and U, while reaction with C proceeds the least readily63. DNA purine bases
are almost unreactive64. Os(VIII),L can be used also for labeling of proteins, since it can react
with C=C double bond in tryptophan (W)65. In both cases the reactive residue has to be
accessible for reaction with Os(VIII),L to proceed. This fact can be used to study DNA
structures – only ssDNA regions or mismatched bases are being labeled58,64. Similarly the
reaction doesn’t occur when W is hidden due to the protein-protein interaction65. Analogous
Os(VI),L reagents (complexes of hexavalent osmium) do not attack nucleobases or W. Instead
they undergo condensation with cis-diols of sugars under anaerobic conditions. This could be
utilized for labeling of 3’- end of RNA molecules through the 3’-terminal ribose moiety66.
Os,L adducts are electrochemically active due to the Os central atom, which can
undergo several redox processes, giving rise to the analytical useful faradaic signals at
different working electrodes62. At carbon electrode osmium labeled DNA provides two
faradaic signals between 0.1 and -1 V22,67,68. Due to a potential difference between DNA-
Os,bipy adducts and free Os(VIII),bipy, it is possible to determine the labeled DNA in the
presence of unbound reagent. This allows utilization of a simple AdTS procedure to analyze
modification products directly in the reaction mixture. Labeled DNA is adsorbed at the PGE
electrode surface along with the unreacted Os(VIII),bipy reagent, after which the excess
reagent is washed away before the analysis67. The potential of Os,L depends on the nature of
nitrogenous ligand. Use of different ligands allows “tuning” the potentials of Os,L labels,
which could be used for “multicolor” DNA labeling. When the “multicolor” Os,L labeled
hybridization probes are used, parallel analysis of multiple DNA targets is possible21.
At mercury electrode, osmium modified DNA provides three reversible faradic peaks
between 0 and -1 V. The redox peak pair occurring at the least negative potentials, close to
mercury dissolution potentials, likely corresponds to formation of mercury compound. Other
two redox peak pairs appear due to due to redox transitions of Os moiety. The analytically
most useful signal provided on the mercury electrode appears close to hydrogen background
discharge. This signal occurs due to catalytic hydrogen evolution by Os,L. For this catalysis to
occur, mercury needs to be present at the interface62.
Due to the ease of introduction of Os,L labels to the DNA and Os.L to label only
ssDNA regions, the Os,L labels are used in hybridization assays52,55,69, to study the DNA
26
structure58,64 and to analyze the DNA damage33,70. Possibility of use of Os,L for detection of
DNA-protein interaction is discussed in chapter 2.6.
1.3.2 Enzymatically introducible redox labels
It has been found that DNA polymerases are promiscuous towards the base modified
dNTPs (dNXTPs, where X represents a label)23,53. Electrochemically modified dNXTPs can be
used as a substrate for production of modified DNA24,53. Template directed DNA polymerases
can be used either for primer extension reaction (PEX)71,72, PCR73 or Nicking Enzyme
Amplification Reaction74 (vide infra) to introduce multiple redox labels into the DNA.
Technique to enzymatically incorporate one labeled nucleotide in selected site in DNA strand
was developed75.
For sequence unspecific DNA labeling, terminal deoxynucleotidyl transferase also
known as terminal transferase (TdT)76 can be used. The terminal transferase, DNA
polymerase which does not use a template, can be used in a “tailing reaction”, to produce a
homopolymer of (modified) nucleotides, at 3’OH end of NA, using dNXTPs from the reaction
mixture22,56,77.
It has been found that as opposed to base modifications at other positions, base
modifications in position C5 in pyrimidines and C7 in 7-deazapurines are the best substrates
for the polymerases. Modifications at these positions do not affect Watson-Crick base pairing
and are located in major groove in the B-DNA, therefore out of all possible base modification
positions these affect the DNA structure and function to the lowest extent24,78. Chemical
synthesis of such dNXTPs is summarized in reference24.
In a close cooperation Hocek’s (Institute of Organic Chemistry and Biochemistry of
the CAS) our groups have introduced several electrochemical labels suitable for enzymatic
incorporation: Ferrocene79, aminophenyl and nitrophenyl80, Ru/Os(bpy)381, anthraquinone82,
benzofurazane83, azidophenyl84, methoxyphenol and dihydrobenzofuran71, and most recently
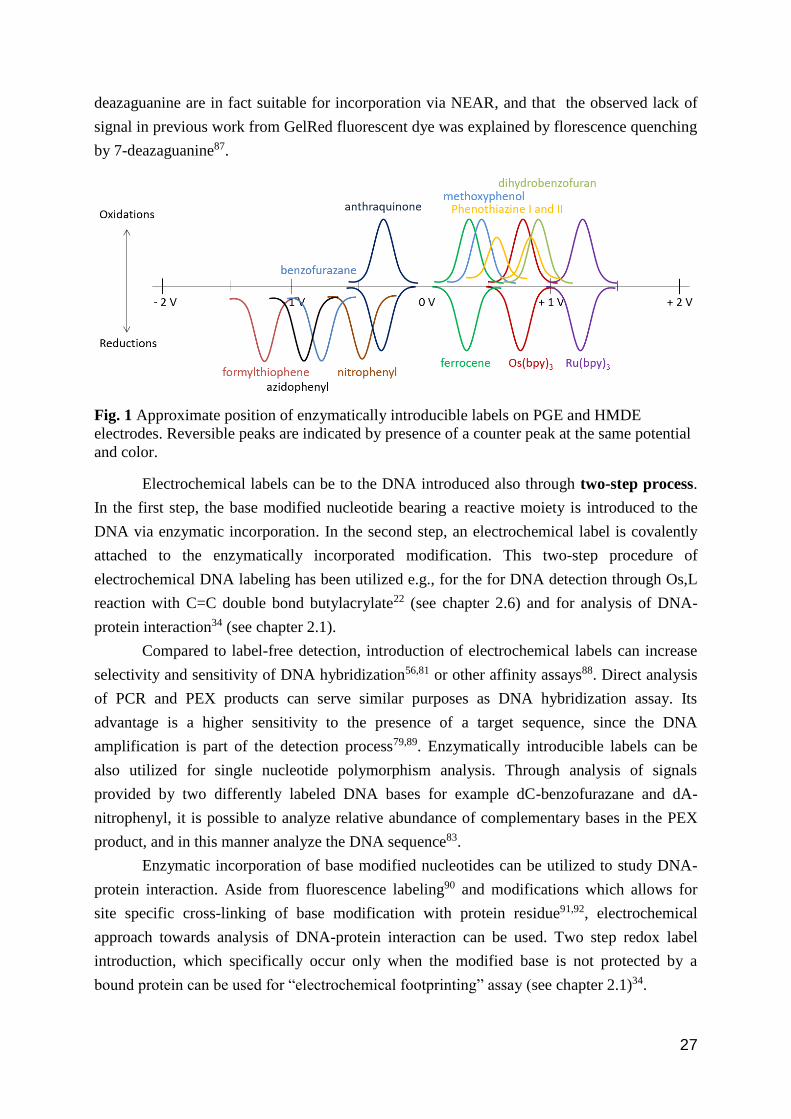
phenothiazine85. Peak positions (redox potentials) of abovementioned DNA redox labels are
indicted in the Fig.1.
For the synthesis of short modified nucleotides, Nicking Enzyme Amplification
Reaction (NEAR) can be used74,86,87. This isothermal approach utilize the presence of a
nicking enzyme in PEX reaction mix, which cleave newly synthesized short strand of
modified DNA at a specific position, leaving template/primer complex ready for another
PEX. This reaction leads to rapid synthesis of short modified ssDNA oligonucleotides. While
there have been reported successful NEAR reactions with 5-substituted pyrimidines86 and 7-
substitueted 7-deazaadenines74, 7-substitueted 7-deazaguanines were first reported as not
suitable for NEAR because there was no corresponding detectable product on the gel stained
by a fluorescence marker GelRed74. Later it has been found out that, 7-substitueted 7-
27
deazaguanine are in fact suitable for incorporation via NEAR, and that the observed lack of
signal in previous work from GelRed fluorescent dye was explained by florescence quenching
by 7-deazaguanine87.
Fig. 1 Approximate position of enzymatically introducible labels on PGE and HMDE
electrodes. Reversible peaks are indicated by presence of a counter peak at the same potential
and color.
Electrochemical labels can be to the DNA introduced also through two-step process.
In the first step, the base modified nucleotide bearing a reactive moiety is introduced to the
DNA via enzymatic incorporation. In the second step, an electrochemical label is covalently
attached to the enzymatically incorporated modification. This two-step procedure of
electrochemical DNA labeling has been utilized e.g., for the for DNA detection through Os,L
reaction with C=C double bond butylacrylate22 (see chapter 2.6) and for analysis of DNA-
protein interaction34 (see chapter 2.1).
Compared to label-free detection, introduction of electrochemical labels can increase
selectivity and sensitivity of DNA hybridization56,81 or other affinity assays88. Direct analysis
of PCR and PEX products can serve similar purposes as DNA hybridization assay. Its
advantage is a higher sensitivity to the presence of a target sequence, since the DNA
amplification is part of the detection process79,89. Enzymatically introducible labels can be
also utilized for single nucleotide polymorphism analysis. Through analysis of signals
provided by two differently labeled DNA bases for example dC-benzofurazane and dA-
nitrophenyl, it is possible to analyze relative abundance of complementary bases in the PEX
product, and in this manner analyze the DNA sequence83.
Enzymatic incorporation of base modified nucleotides can be utilized to study DNA-
protein interaction. Aside from fluorescence labeling90 and modifications which allows for
site specific cross-linking of base modification with protein residue91,92, electrochemical
approach towards analysis of DNA-protein interaction can be used. Two step redox label
introduction, which specifically occur only when the modified base is not protected by a
bound protein can be used for “electrochemical footprinting” assay (see chapter 2.1)34.
28
1.3.3 Enzyme-linked DNA electroanalysis
Enzyme-linked electrochemical detection is based on observation of enzymatic
transformation of a substrate. The advantage of this approach is that a single enzyme molecule
can convert large number molecules of a substrate, which amplify the signals size, compared
to direct redox of single DNA label. We can either observe increased concentration of the
electroactive products, or decrease in level of electroactive substrate. The most used
electrochemical biosensors on the world are based on the latter principle. The most common
glucose monitoring assay for observation of glucose in blood is based on observation of
oxygen consumption by enzyme glucose oxidize93. For electrochemical analysis of DNA, the
other approach, observation of increased concentration of electroactive product, is more
common and preferred.
Alkaline phosphatase catalyzes dephosphorylation of 1-naphthyl phosphate to
electroactive 1-naphthol30 or p-aminophenyl phosphate to electroactive p-aminophenol94, both
of which are detected through electrochemical oxidation. The alkaline phosphatase is
conjugated either with streptavidine30,95 or with anti-digoxigenin antibody94. This conjugate
can be attached to the biotinylated (or digoxigenin-labeled) probe which is used to detect
hybridization with target sequence captured on the electrode surface30. Different approach
utilizes target sequences captured on the magnetic beads95. In principle detection of an
electroactive product indicate presence of the enzyme, which can be present only when the
probe has been successfully hybridized with the target molecule. The same principle can be
used with different enzymes; horse radish peroxidase96 or previously mentioned glucose
oxidase97. Enzyme-linked DNA electroanalysis is further discussed in chapter 2.2.
2 Results and discussion
Results, which are going to be discussed here are included in the appendix and have been
published in scientific journals. Although all of the discussed results have been finished in the
practical sense we haven’t yet finalized two of the manuscripts. In one case, abstract
summarizing oral presentations from past conference is included instead (appendix 9). In the
second case intentionally short description devoted of all scientifically relevant details is
presented. Specification of my, contributions towards these two projects is indicated in the list
of conference contributions (section 6). Since discussion of relevant topics is a part of each
included publication, aside from brief summary of each published work, I will try to present
wider view indicating importance, potential applications and connections to other research
topics of the presented work, not mentioned in the published manuscripts.
I have decided also to include two articles, which have not been published in the peer
reviewed journals (one in the Czech and Slovak Linguistic review and one in Vesmír). Both
29
discuss the same topic of impossibility to objectively define life. I have decided to include
these articles which are not directly relevant to the topic of this thesis for two reasons. One
reason being that based on these articles Judit and Jiří Šponer invited us to collaborate on their
project of laboratory abiogenesis. Incidentally electrochemical method which we have
developed26 could play an important role in this project (further discussed in chapters 2.5 and
2.8). Second reason being that I believe that scientists should not only dedicate his or her time
to research, but also try to educate and engage public. Especially the article published in
Vesmír is an example of such public outreach.
2.1 Electrochemical DNA “footprinting”
J. Balintová, J. Špaček, R. Pohl, M. Brázdová, L. Havran, M. Fojta, M. Hocek, Azidophenyl
as a click-transformable redox label of DNA suitable for electrochemical detection of DNA-
protein interactions, Chemical Science 6 (2015) 575-587. Appendix 1
Standard footprinting protocols utilize cleaving agents to assess the sequence selectivity of
DNA-binding ligands (e.g. proteins). Only accessible DNA not protected by the bound
ligand(s) is cleaved and the cleavage pattern is then analyzed by electrophoresis98. Unlike the
classical footprinting approach, electrochemical “footprinting” does not use cleaving agent
nor gel electrophoresis. Electrochemical approach towards DNA-protein interaction is based
on two-step electrochemical labeling. In the discussed publication dNTPs modified with
azidophenyl group were enzymatically incorporated to specific sites of the DNA via the PEX.
The azide group provides signal at -0.9 V and can undergo click reaction with an acetylene
derivative, such as phenyl- or nitrophenylacetylene used in this work, under conditions close
to physiological. (“Click reactions” are high-yield chemical reactions with wide scope, are
stereospecific, simple to perform, and can be conducted in easily removable or benign
solvents99.) After click reaction the azidophenyl signal is lost in case of reaction with
phenylacetylene or is replaced by the signal corresponding to nitro group of the reacted
nitrophenylacetylene, that appears at potential -0.4 V. Silencing or potential switch of the
measured signal could be used to detect DNA – protein interaction in a site specific manner:
Click reaction can’t occur at sites which are protected/covered by bound proteins.
This arrangement allows one not only to detect whether the DNA-protein interaction has
occurred, but also by use of series of DNAs modified at different sites one can
electrochemically assess size of the binding site being in the direct contact with the protein.
Besides arrangement using protein binding and click probing in solution, the electrochemical
footprinting could be used as a tool to study DNA-protein interactions at the electrode surface.
The method has a potential to be used in high-throughput systems of ligands that interfere
with protein-DNA binding.
30
We have found that p53 protein has a higher affinity towards based modified DNA in
comparison to fully natural DNA (manuscript in preparation). Similar protein preference for
or in some cases against modified DNA could lead to false results. One should beware of this
possibility and pay attention to optimization of this method in comparison with other DNA
protein interaction assays such as electrophoretic shift assay100 or chromatin
immunoprecipitation101. Two step reaction of butylacrylate base modified DNA with Os,bipy
could also be potentially used for electrochemical “footprinting” (see chapter 2.6).
2.2 Enzyme-linked DNA
L. Hároníková, J. Špaček, M. Plucnara, P. Horáková, H. Pivoňková, L. Havran, A. Erdem and
M. Fojta, Enzyme-linked electrochemical detection of DNA fragments amplified by PCR in
the presence of a biotinylated deoxynucleoside triphosphate using disposable pencil graphite
electrodes, Monatsh Chem, 146 (2015) 849–855. Appendix 2
and
Oral presentation abstract: J. Špaček, M. Ženka, L. Haroníková, L. Havran, M. Fojta,
Enzymatic incorporation of biotin into DNA for DNA hybridization analysis and for DNA
detection, 2014, XIVth Moderní elektrochemické metody, Jetřichovice (CZ). Appendix 9
During internship in laboratory of Prof. Erdem in 2012, I have acquired skills for use of
pencil lead as a disposable working electrode (Pencil graphite electrode, PeGE) for
electroanalysis of the DNA. We have used these skills to develop two electrochemical assays
for DNA analysis: (1) For DNA hybridization analysis, probes with biotin-14-dC introduced
to 3’ OH end by terminal transferase were used102. (2) For the detection of PCR products
Deep Vent polymerase was used to incorporate biotin-14-dCTP during PCR30. In both cases
streptavidin-alkaline phosphatase conjugate was attached onto the incorporated biotin labels
and was used to catalyze dephosphorylation of 1-naphthyl phosphate to naphthol, signal of
which was measured. Compared to the second presented method, biotin incorporation during
the PCR has lower molar detection limits, but can suffer from false positive signals arising
from amplification of wrong sequence during the PCR. Method based on hybridization with
the biotin tailed probe, although with higher detection limit, can provide us with more
selective results.
Similar systems were used before for detection of DNA hybridization or DNA detection
using screen printed electrodes103, these two studies optimize the method for use with
disposable PeGE, maximum speed and cost-effectiveness. They are showing robustness of
previously described principle. Although sensors with much lower limits of DNA detection
and DNA hybridization detection have already been presented by other authors104,105, what is
needed to be pointed out is simplicity, speed and ultralow cost of our assays, which in all

31
named parameters rivals the most simple method for PCR product analysis – the agarose gel
electrophoresis.
The most striking difference between optimized technique used for the above mentioned
work and similar hybridization assays performed in laboratory of Arzum Erdem is the time
component and practical absence of nonspecific signals in our experiments. While in our
assays 60 seconds is used for DNA hybridization, 60 minutes were typical hybridization times
for experiments designed by A. Erdem in previous studies106. DNA and blocking proteins are
adsorbed onto the electrode surface through non-covalent interactions. These interactions are
strong enough to withstand the exchange of the media between subsequent steps (in case of
hybridization, the attachment of streptavidin-alkaline phosphatase conjugate through
immersion of its solution), but at the same time they are not permanent. System where
noncovalent (physical) adsorption occurs can reach equilibrium between adsorbed molecules
and molecules in the solution. This equilibrium is none the less dynamic, keeping adsorption
and desorption processes in balance. When prolonged periods of time are used for
hybridization in such system, the adsorbed molecules are inevitable going to be exchanged
with molecules present in the solution. The level of the exchange is determined by strength of
the adsorption and external physical phenomena – temperature and ionic strengths. As has
empirically been proven, time above several minutes leads to increase of nonspecific signal
due to adsorption of biotinylated probe onto vacated sites left at the surface after blocking
molecule desorptionb.
Recently, low cost biotechnological methods and devices have gained attention of
academia because of their potential for medical applications in the third world countries.
Ultralow cost, hand powered paper centrifuge helped with fast malaria diagnosis107 and
foldable paper microscope – Foldscope108 removed cost barriers and allowed new
opportunities for vast user base in education, field work, science and medicine. Presented
methods when adapted for use in combination with mobile phone based potentiostat109 and
with low cost DIY (do-it-yourself) PCR cycler110, could become very valuable tool in remote
regions or in garage laboratories to perform less costly, sequence specific analysis of PCR
products faster than conventional methods.
b The reason why this method was used with these extremely long times of adsorption and hybridization
steps was ‘because that’s how we have always done it’. During my internship in Izmir I have found that I don’t
prefer to work in laboratory, where traditions are honored and curious play with the system is prohibited ‘to save
time’. The attempt to save time, by doing what worked before, was precisely what wasted everyone’s time at the
end. In my experience the most valuable information can be gathered during the ‘play’ when I test the system
more or less randomly while breaking the rules, for example by, based on my intuition, changing multiple
parameters at the same time. I find the possibility of testing hypotheses made on spot very useful. Following
careful, by the book analytical work verify or falsify findings made in the previous ‘play phase’. Of course this
system of information gathering is best to be reserved for low cost fast experiments. (See section 2.5 for further
discussion of ‘research through play’)
32
These robust, fast and low cost methods we have presented can coexist with much more
sensitive sensors utilizing for example nanostructured graphene104,111 in the similar fashion as
simple electrophoretic methods are being used today along the modern next-generation
sequencing112,113. In cases when extremely low detection limits are not needed, researchers
prefer more user friendly, robust, low-cost, fast approaches. This is precisely the niche these
two presented methods are intended for.
2.3 Electroanalysis of 7-deazapurine modified DNA
Z. Dudová, J. Špaček, M. Tomaško, L. Havran, H. Pivoňková, M. Fojta, Electrochemical
behavior of 7-deazaguanine- and 7-deazaadenine-modified DNA at the hanging mercury drop
electrode, Monatsh Chem, 147 (2016) 3-11. Apendix 3
DNA samples with different levels of 7-deazauganine (G*) and 7-deazaadenine (A*)
modification content were prepared with PCR. In each reaction different ratios of dGTP to
dG*TP or dATP to dA*TP were used (total concentration of relevant dPuTP plus dPu*TP
was equal to each other dNTP in PCR mixture). We have found that presence of A*
modification does not much influence the electrochemical behavior of the DNA. The
exchange of N7 atom to (CH)7 group in A* does not influence reduction site of the base and
we have observed only marginal changes in the tensammetric signals, indicating increased
propensity towards surface denaturation with increased A* content. On the other hand we
observed decrease of G peak height proportional to the level of G* modification of PCR
products due to loss of corresponding redox site in G*. G* modification also led to changes in
DNA duplex stability. While in solution, the Tm was lowered proportionally with the
increased level of G* modification, on electrode surface tensammetric signal suggested that
G* modified DNA was relatively resistant against unwinding on the electrode surface. This
discrepancy between behavior in solution (lowered Tm) and on the electrode surface (higher
stability of duplex) was explained by absence of a hydrogen-bond acceptor in C7 position of
G* which is needed for a major groove cation-binding site, possibly thus affecting the
organization of salts and water in the major groove. This could negatively affect DNA duplex
stability in the solution. At the same time, changed hydration pattern could lead to different
mechanism of adsorption at the HMDE surface27.
HMDE can be used as a very sensitive tool for studies of the DNA structure42. As it has
been shown in discussed publication27, the analysis doesn’t have to be limited to unmodified
DNA. Interesting base modifications of the DNA have been introduced which are viable in
vivo. In one experiment the T was substituted in bacterial genome by 5-chlorouracil. This was
done through the deletion of T producing metabolic pathways while supply of T in
cultivation medium was over time substituted by supply of 5-chlorouracil. The bacterium
33
adapted through permanent evolutionary changes and was able to survive with genome which
contained 5-chlorouracil instead of T114. Another radical change in the DNA is introduction of
unnatural base pairs in semi-synthetic organisms115. Electrochemistry can provide valuable
insights how these modifications change the DNA biophysical properties. How does presence
of electronegative chlorine instead of methyl group in each T in the DNA affects the DNA
properties or how are these properties affected by point absence of Watson-Crick base pairing
in unnatural base pairs (UBPs)115? I personally would be very much interested in answering
these questions (see chapter 2.7).
Electrochemical approach can in some cases be more reliable tool for analysis of
biophysical properties of modified DNA than optical methods. It has been shown that G*
quenches fluorescence of certain luminophores, which hinders fluorescence techniques87,89.
Furthermore, empirically we have noticed that extinction coefficient of base modified DNA
especially when modified with aromatic groups can differ from the expected values.
2.4 SYBR green interactions with 7-deazaG modified DNA
Z. Dudová, J. Špaček, L. Havran, H. Pivoňková, M. Fojta, Interactions of fluorescent dye
SYBR Green I with natural and 7-deazaguanine-modified DNA studied by fluorescence and
electrochemical methods, Monatsh Chem, 147 (2016) 13-20. Appendix 4
We decided to further investigate mechanism of fluorescence quenching by 7-deazaG
described in previous experiments74,86,87. We used electrochemical oxidation on PGE in
combination with fluorescence spectroscopy to analyze interactions of SYBR green I (SG)
with G* modified DNA in comparison with fully natural DNA116. G* modified DNA was
prepared by PCR, using the same protocol as is described in previous chapter27. We have
confirmed that G* quenches the SG florescence. Both electrochemical and spectroscopic
results proved that SG shows practically the same affinity towards fully natural and G*-
modified DNA, yet the level of quenching was disproportionately high in cases of low levels
of G* modified DNA. Obtained results have led us to conclude that mechanism of the SG
quenching most likely involves DNA-mediated charge transfer117, causing the SG florescence
quenching from remote G* sites. Other possible hypotheses explaining unexpected level of
quenching: preferential binding of SG to G* modified sites or weaker overall binding towards
G* modified DNA, were falsified by results obtained from electrochemical.
The electroanalysis of DNA-SG interaction was hampered by the fact that the SG
signals were overlapped with DNA oxidation signals Gox and Aox. This is good example of
study, where our newly discovered method discussed in the following chapter26 would
increase amount of useful information, since the DNA reduction signals or signals resulting
from oxidation of reduced bases would not be overlapped with SG oxidation signals.
34
2.5 Expanded potential window of pyrolytic graphite electrode
J. Špaček, A. Daňhel, S. Hasoň, Miroslav Fojta, Label-free detection of canonical DNA bases,
uracil and 5-methylcytosine in DNA oligonucleotides using linear sweep voltammetry at a
pyrolytic graphite electrode, Electrochem. Commun., 82 (2017) 34-38. Appendix 5
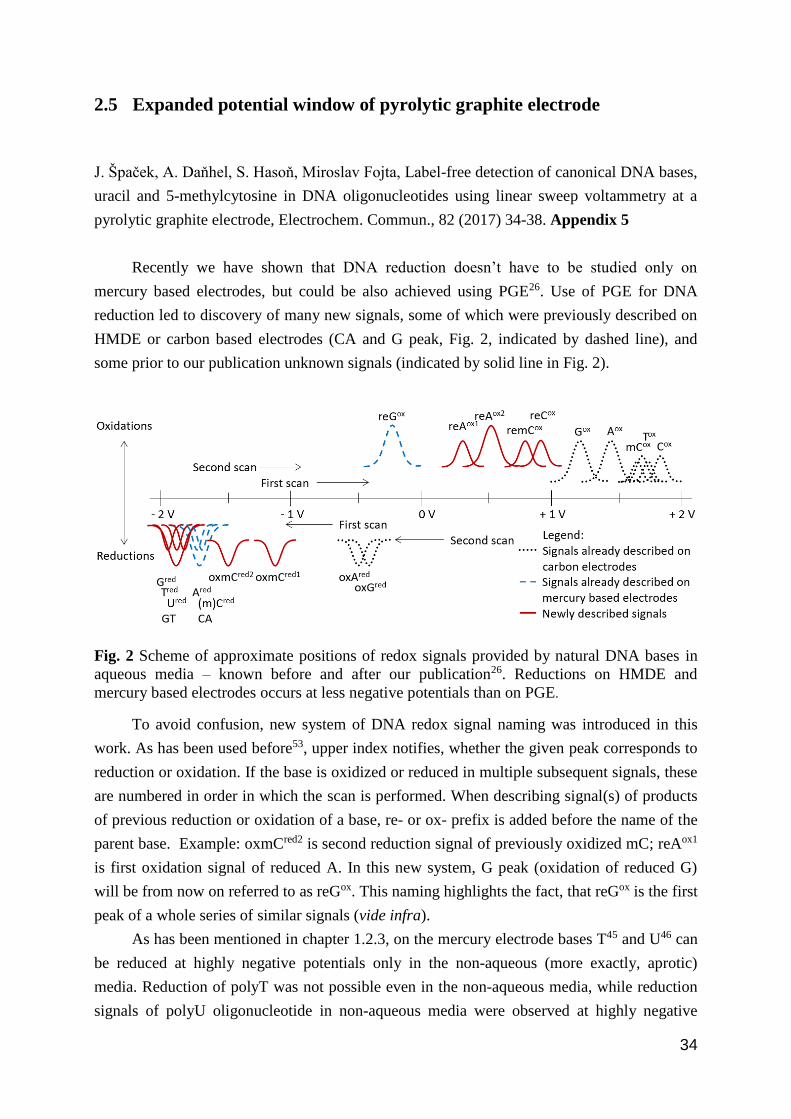
Recently we have shown that DNA reduction doesn’t have to be studied only on
mercury based electrodes, but could be also achieved using PGE26. Use of PGE for DNA
reduction led to discovery of many new signals, some of which were previously described on
HMDE or carbon based electrodes (CA and G peak, Fig. 2, indicated by dashed line), and
some prior to our publication unknown signals (indicated by solid line in Fig. 2).
Fig. 2 Scheme of approximate positions of redox signals provided by natural DNA bases in
aqueous media – known before and after our publication26. Reductions on HMDE and
mercury based electrodes occurs at less negative potentials than on PGE.
To avoid confusion, new system of DNA redox signal naming was introduced in this
work. As has been used before53, upper index notifies, whether the given peak corresponds to
reduction or oxidation. If the base is oxidized or reduced in multiple subsequent signals, these
are numbered in order in which the scan is performed. When describing signal(s) of products
of previous reduction or oxidation of a base, re- or ox- prefix is added before the name of the
parent base. Example: oxmCred2 is second reduction signal of previously oxidized mC; reAox1
is first oxidation signal of reduced A. In this new system, G peak (oxidation of reduced G)
will be from now on referred to as reGox. This naming highlights the fact, that reGox is the first
peak of a whole series of similar signals (vide infra).
As has been mentioned in chapter 1.2.3, on the mercury electrode bases T45 and U46 can
be reduced at highly negative potentials only in the non-aqueous (more exactly, aprotic)
media. Reduction of polyT was not possible even in the non-aqueous media, while reduction
signals of polyU oligonucleotide in non-aqueous media were observed at highly negative
35
potentials47. We have shown that PGE can have even wider useful potential window than
HMDE in negative potentials, allowing detection not only of the CA cathodic peak, but also
detection of direct reduction of G, T and U in joint GT peak (Gred, Ured and Tred, Fig. 2) in the
DNA in aqueous media. As it was described in case of HMDE, on PGE, when the cathodic
scan is reversed after sufficiently negative potentials, reGox corresponding to oxidation of 7,8-
dihydroG could be detected as well. The same principle applies also to the A, mC and C, all
of which when reduced first provide distinct anodic signals (Fig. 2, solid line, second anodic
scan). Electrooxidation of reduced forms of these bases occur at less extreme potentials than
in cases of direct oxidation, while retaining their relative positions: reGox < Gox, reAox1 and 2 <
Aox, remCox < mCox and reCox < Cox (Fig. 2). reTox peak is missing in this sequence on
purpose. T is reduced at more negative potentials than A, C, mC and G and therefore we can
decide not to “switch it on” by prior reduction. Reason why it could be useful to decide not to
switch on the reTox signals is discussed later. So far we are not sure if this sequential shift in
all the peak positions is a lucky coincidence, or if there is one common mechanism which is
causing this peak shift. Nonetheless the possibility of shifting DNA base oxidation signals of
all the bases by prior reduction could be useful when electrodes with narrower potential
windows than GCE are used (e.g. PGE, PeGE or screen printed electrodes). Another
important highlight is that due to the possibility of not switching on of reTox, remCox is not
overlapped with any other DNA signal (unlike in the case of peaks mCox, Tox and Cox). This
could be advantageous for determination of C methylation in the DNA. The reAox is split in to
two distinct signals, similarly as is the case in the other purine, which on HMDE also provides
split reGox peak, when the pH is below 6118.
Similarly as with the HMDE, with the PGE the scan up to approximately -1.7 V has to
be performed to observe the reGox signal. At these potentials G is reduced to 7,8-dihydroG
without appearance of any faradaic signal, which could be attributed to G reduction. When
scan to even more negative potentials is performed, we can observe reduction signal Gred at -
1.83V. If the anodic scan through Gred is performed, the redGox signal disappears26. This
indicate that G is first reduced chemically by electrochemically generated hydrogen radicals
to 7,8-dihydroG118, and this product can be further reduced at even more negative potential
through irreversible faradaic process. Absence of a faradaic peak during the reduction to 7,8-
dihydroG, contrasted with the possibility of observation of faradaic peak of further reduction
‘despite’ the hydrogen evolution, supports Daňhel’s et al. hypothesis about involvement of
electrochemically generated H radicals in this process118 as opposed to 2e-, 2H+
electrochemical reaction which was proposed before44.
Prior oxidation also changes electrochemical behavior of bases during cathodic scan in
similar fashion as was observed with the reverse process described above. When the base is
first oxidized, the original reduction signal is lost only to be replaced by reduction signals of
oxidized bases occurring at less extreme potentials. This allows selective switching on and off
of some DNA cathodic signals. Anodic scan over the Gox signal reveals sole Tred (or Ured) in
36
GT peak in subsequent cathodic scan; prior scan over anodic Aox unmasks Cred or mCred from
the cathodic CA peak. Instead of original Ared and Gred, both oxidized purines provide small
reduction signals at about -0.5 V (oxAred and oxGred, Fig. 2). Furthermore the mC behavior is
changed by anodic scanning beyond the Aox. Besides being unmasked in CA peak, it also
provides additional mC specific peak couple – oxmCred1 and oxmCred2 (Fig. 2), which are very
unlikely to be obtained on mercury based electrodes due to the mercury dissolution at positive
potentials. These mC peaks are again not overlapped with any other DNA signals and enable
yet another way how to directly electrochemically analyze mC in not hydrolyzed DNA
sample.
Taken together, we have made a breakthrough discovery in the field of electroanalysis
of DNA at carbon electrodes, showing that majority of useful DNA signals have not been
exploited prior to our observations. Second important point made by this publication is, that
PGE (and perhaps other carbon electrodes) can in principle be used at highly negative
potentials for analysis of other (bio)molecules.
Admittedly this was a proverbial “low hanging fruit”. The method does not require any
special treatment or approach. Everything needed to perform these experiments has been
known for over forty years49. Most likely explanation, why nobody has published these results
before is the fact, that they trusted previous observations in the literature, which indicate that
applicable potential window of carbon electrodes is only between approximately -1 and +2 V
(examples in reviews5,35).
Big advantage of using PGE is swiftness with which one can prepare fresh surface for a
new analysis26. When an experiment takes only two minutes from start to finish, there is very
low pressure against trying ideas, which are seemingly unlikely to work (in other words -
testing hypotheses contradicting current literature knowledge). This is precisely the situation,
where the “research through play” shows its importance (see note in chapter 8.2). “Serious
researchers” are perhaps less likely to try ideas disapproved by the literature.
By opening the second half of the potential window, the new field with other “low
hanging fruits” has been open. There are questions, answers to which would be interesting to
scientific community no matter if answered positively or negatively, for example: Can the
DNA adsorption/desorption and reorientation be studied on PGE in the same fashion as it is
on the HMDE39? And is the mechanism of base reduction the same on the HMDE and PGE?
This approach can also lead to potential applications like analysis of DNA methylation
and testing for presence of U or it can be used in combination with redox labels (see chapter
1.3.5 and 1.3.6). Use of signal “switching off” discussed above could be used to uncover
overlapped signals. An example from yet unpublished work is the oxidation signal provided
by unnatural base NaM119. Analysis of its presence in tRNA would be a valuable tool towards
development of semi-synthetic organisms. Unfortunately NaM oxidation peak is overlapped
by Aox. From the fact that dNaM does not provide reduction signal on HMDE, one can
assume that unlike Aox, NaMox would not be switched off by prior reduction and therefore

37
could be uncovered and quantitatively analyzed. Another application of newly developed
method could be its use in analysis of short RNA molecules created through chemical
processes simulating beginning of life (see chapter 2.8).
We are currently investigating mechanism of G oxidation which was very briefly
mentioned in above discussed publication26. It was believed by some authors120–122 that
appearance the split of Gox into two partially overlapped peaks signifies presence of G-
quadruplex. Based on our preliminary experiments and as is shown in discussed publication26,
this Gox peak separation was observed even with DNA sequences unable to form a G-
quadruplex. We have found that the split of Gox to up to 4 distinct oxidation signals depends
on the DNA sequence and never on the DNA secondary structures. Our experiments suggest
that these signals are related to G oligomerization processes, as has been noted by other
researchers123–125. We have tentatively concluded, that reason why in these publications120,122
(reviewed here121) Gox split peak was attributed to the G-quadruplex formation is the fact, that
control sequences, which does not form G-quadruplex, have not been studied.
2.6 Two step redox labeling of DNA with osmium tetroxide complex
P. Havranová-Vidláková, J. Špaček, L. Vítová, M. Hermanová, J. Dadová, V.
Raindlová, M. Hocek, M. Fojta, L. Havran, Butylacrylate-nucleobase Conjugates as Targets
for Two-step Redox Labeling of DNA with an Osmium Tetroxide Complex, Electroanalysis,
30 (2018) 2. Appendix 6
Butylacrylate (BA) was introduced into the DNA using either TdT or KOD XL,
creating dNBA tail-labeled or PEX products with BA labels in the dsDNA oligonucleotides
respectively. It has been shown that both these approaches are feasible and that Os,bipy
complex binds to BA C=C double bond in such prepared DNAs. In the dsDNA, Os,bipy binds
only to the BA moiety since other suitable C=C sites of natural bases are hidden inside the
DNA double helix. It has been shown that Os,bipy conjugates with different bases (T, U, A*
and BA modified bases) can be electrochemically distinguished based on the respective C=C
binding site, due different redox potentials of different conjugates22.
Similar two step DNA labeling technique (enzymatic introduction of base modified
nucleotides, followed by chemical modification of introduced reactive groups) was used
before for analysis of DNA – protein interaction34 (chapter 2.1). In theory, this approach could
also be used for DNA – protein interaction study in the electrochemical footprinting assay,
since the reaction with Os,bipy can be conducted under physiological conditions. Os,bipy has
been shown to react with exposed tryptophan in the proteins. In cases when the tryptophan
was hidden due to protein-protein interaction, the reaction of Os,bipy with tryptophan did not
occur65. Experiments with proteins suggest feasibility of electrochemical “footprinting” with
38
Os,bipy – DNA bases modified with BA hidden by bound protein would not be modified. Use
of two different approaches in tandem, DNA modified with azidophenyl reacting with phenyl-
or nitrophenylacetylene and BA reacting with Os,bipy, could mitigate the problem with
preferential binding of some proteins onto the modified DNA (in chapter 2.1). Both groups
significantly differ in their chemical compositions and structure (aromatic azidophenyl vs.
linear aliphatic BA) and therefore will likely affect the DNA – protein binding in different
ways. Smaller adducts such as methylacrylate, or other functional group containing C=C
double bond suitable for reaction with Os,bipy might be even more suitable for purpose of
electrochemical footprinting.
2.7 Electrochemistry of unnatural base pairs
In year 2014 Romesberg lab introduced a semi-synthetic organism (SSO) – organism
capable of replication of man-made unnatural base pair (UBP)119. Since then this group
further developed the methodology and produced fully viable organism capable of
transcription and translation of the information coded with UBPs to proteins containing coded
unnatural amino acids115,126. It is believed that this technology will revolutionize the field of
synthetic biology and is expected to find applications in basic and applied research,
pharmacology and other fields127. Further development, optimization and prospective
industrial applications of SSO technology will require a sensitive analytical method for UBP
detection. Currently used methods are either indirect and laborious (streptavidin gel shift
analysis of PCR amplified DNA with biotin modified dNaM analogue) or time consuming
and expensive (mass spectroscopy).
Details of following project are omitted intentionally.
We have developed an electroanalytical method which is, in its sensitivity, comparable
to mass spectrometry, while requiring considerably lower amounts of material per
measurement, and is even less financially costly than the gel shift analysis. Using blinded
samples containing in vivo prepared plasmid DNA with 1 UBP per plasmid (or less), we have
established that quantitative detection of 1 UBP per several thousands of natural bases is
possible, with accumulation from 2.5 µl of 10 ng/µl DNA sample. Electrochemical analysis of
UBP has relatively high throughput (one AdTS electroanalytical experiment takes about five
minutes) with a potential for further optimization to develop even swifter analysis.
Established sensitivity of our developed method is unprecedented in the field of
electroanalysis of labeled DNA, suggesting potential applications not only for further
development of SSO, but also to be used as an enzymatically introduced DNA label for
detection of DNA hybridization or DNA damage.
39
2.8 Defining and creating life
J. Špaček, Life Exists Only as a Concept, Czech and Slovak linguistic review, 1 (2014) 92-
105. Appendix 7
and
J. Špaček, Život je jen concept, Vesmír, 3 (2018) 97. Appendix 8
“Definitions tell us about the meanings of words in our language, as opposed to telling
us about the nature of the world. In the case of life, scientists are interested in the nature of
life; they are not interested in what the word "life" happens to mean in our language. What
we really need to focus on is coming up with an adequately general theory of living systems,
as opposed to a definition of life.” - Carol Cleland
Advancements in synthetic biology (see previous chapter) and recent successes in
experimental research of chemical abiogenesis128 brought back in light old philosophical
questions regarding the life129. What it is and how life differs from other complex chemical
reactions? Could life be objectively defined? And is it even meaningful to define life? If not,
how can one define biology, science about life, if life lacks any meaningful definition? As
could be deduced from the Carol Cleland quote, any scientifically meaningful definition has
to be based on the underlying theory or hypothesis130. In its absence the definition is just a
culturally based concept.
I have made a conclusion131,132 that defining life in a meaningful way that is compatible
with current advancements in understanding of early life evolution, synthetic biology and
general artificial intelligence is least to say problematic due to the absence of any underlying
theory. Separating life and non-life could hinder research in these fields by providing
cognitive barriers. Defining life incorrectly or at all could also lead to ethical issues and safety
hazards. While genetically modified organisms are currently being handled with extreme
precaution dictated by law, there exist no regulations for synthetic evolving replicators133 or
general artificial intelligence134. Both of these examples (besides being still theoretical,
although in opinion of experts probably not for long135) are sources of potential risks which
until recently were expected from living organisms only. Regulations in these fields should be
established in advance based on sound philosophy and rigorous science and not on outdated
believes and traditions.
Due to the absence of any positive life theory or at least viable hypothesis, it is
important to notice that null life hypothesis hasn’t yet been disapproved. Scientists and
philosophers should therefore operate with the fact that so far, based on the latest scientific
advancements, there are no objective differences between living and non-living systems,
which could be used to formulate any underlying life hypothesis. In my opinion life definition
can be selected based on anyone’s taste, since these definitions are mere representation of his
40
subjective beliefs, at the same time lack of underlying life theory and the significance of this
fact should acknowledged.
My involvement in this topic was initiated by an invitation to give a talk at
“Symposium Informational fundamentals of life: genomes and languages” by E. Trifonov.
The invitation was based on the heated discussion on this topic which we held at the
Trifonov’s lectures (to dismay of other lecture attendees). The topic of the talk, “Life Exists
Only as a Concept” (later published as an article in a special conference issue of Czech and
Slovak linguistic review131), was inspired by my interest in synthetic biology,
nanotechnology, artificial intelligence, life origin and philosophy of science. Popular version
of this article/talk was later published in Czech popular science magazine Vesmír132 and
popular science blog osel.cz. Based on article in Vesmír, Judit and Jiří Šponer have send us an
invitation for cooperation on their project in which they will attempt to perform laboratory
abiogenesis – creation of RNA molecules, which can self-replicate and undergo evolution128.
Incidentally electrochemical analysis of unlabeled nucleic acids we have developed26 could be
suitable for analysis of relatively short RNA sequences with non-enzymatic origin. Life origin
and early life evolution are for long time my passions. I would be very glad if methods we
have developed, could contribute towards the Šponers’ research128.
41
3 Summary
We have developed new methods for electroanalysis of natural and modified DNA and
for analysis of DNA-protein interactions.
For over forty years it was believed that only positive and mildly negative potentials can
be used for DNA electroanalysis on the pyrolytic graphite electrode. We have for the first
time shown that highly negative potentials could be used to obtain analytically useful
reduction signals of bases in the DNA. Through the use of broader potential window we have
described DNA redox peaks previously observed only on mercury electrode or not at all.
We have optimized enzyme-linked electrochemical assays for DNA sensing and DNA
hybridization for use with disposable PeGE. These optimized assays provide very low cost
and fast approach towards DNA analysis.
Effects on the biophysical properties of DNA to which 7-deaza modified purine bases has
been introduced have been studied. Obtained results indicate that 7-deazaguanine quenches
fluorescence through a mechanism of charge transfer through the DNA. By affecting the
organization of salts and water in the major groove, 7-deazaG presence in the DNA is
responsible for lowering the stability of the DNA duplex in solution, while at the same time
impedes DNA unwinding on the surface of the mercury electrode.
We have developed new method for two step DNA labeling, based on the enzymatic
introduction of butylacrylate base modified nucleotides, which are in the second step modified
by osmium tetroxide complexes.
Similar two-step process has been used for electroanalytical DNA-protein interaction.
Enzymatically introduced azidophenyl undergoes reaction with phenyl- or
nitrophenylacetylene only when modified sequence is not protected by bound protein.
Finally project on electroanalysis of the unnatural bases used for creation of semi-
synthetic organism has been shortly introduced.
Aside from electrochemistry of DNA, my personal interests in early life evolution and its
definition are reflected in the last chapter of the discussion. This personal interest will likely
influence my future carrier choices. I would like to use electrochemistry as one of tools for
investigation of chemically arising RNA molecules and genomes of semi-synthetic organisms
with expanded genetic code. The field of electrochemistry of nucleic acids is traditionally
closely linked with the Czech research. I’m proud about my contribution to this field.

42
4 References
1. Jindra, J. Dějiny elektrochemie v českých zemích 1882–1989 - Jiří Jindra | KOSMAS.cz
- vaše internetové knihkupectví. (Libri, 2009).
2. Bard, A. J. & Faulkner, L. R. Electrochemical methods: fundamentals and applications.
JohnWilley Sons 2nd editio, (2001).
3. Palecek, E. Past, present and future of nucleic acids electrochemistry. Talanta 56, 809–
819 (2002).
4. Paleček, E. Fifty Years of Nucleic Acid Electrochemistry. Electroanalysis 21, 239–251
(2009).
5. Palecek, E. & Bartosik, M. Electrochemistry of nucleic acids. Chem Rev 112, 3427–
3481 (2012).
6. Palecek, E. & Fojta, M. Detecting DNA hybridization and damage. Anal. Chem. 73,
74a–83a (2001).
7. Paleček, E. & Heyrovský, M. 75 Let osciolografické Polarografie J. Heyrovského a
současná chronopotenciometrie konstantním proudem. Chem. List. 111, 71–91 (2017).
8. Palecek, E. Oscillographic Polarography of Highly Polymerized Deoxyribonucleic
Acid. Nature 188, 656–657 (1960).
9. Palecek, E., Fojta, M., Jelen, F. & Vetterl, V. Electrochemical analysis of nucleic acids.
Encycl. Electrochem. Electrochem. 9, 365–429 (2002).
10. Paleček, E. Polarographic behaviour of native and denatured deoxyribonucleic acids. J.
Mol. Biol. 20, 263–281 (1966).
11. Vetterl, V. Adsorption of DNA components on the mercury electrode. Experientia 9–
11 (1965).
12. Brabec, V. & Dryhurst, G. Electrochemical behavior of natural and biosynthetic
polynucleotides at the pyrolytic graphite electrode A new probe for studies of
polynucleotide structure and reactions. J. Electroanal. Chem. 161–173 (1978).
13. Brabec, V. Nucleic-Acid Analysis by Voltammetry at Carbon Electrodes.
Bioelectrochemistry Bioenerg. 8, 437–449 (1981).
14. Goyal, R. N. & Dryhurst, G. Redox Chemistry of Guanine and 8-Oxyguanine and a
Comparison of the Peroxidase-Catalyzed and Electrochemical Oxidation of 8-
Oxyguanine. J. Electroanal. Chem. 135, 75–91 (1982).
15. Brabec, V. & Dryhurst, G. Electrochemical Oxidation of Polyadenylic-Acid at
Graphite Electrodes. J. Electroanal. Chem. 91, 219–229 (1978).
16. Paleček, E. & Postbieglová, I. Adsorptive stripping voltammetry of biomacromolecules
with transfer of the adsorbed layer. J. Electroanal. Chem. 214, 359–371 (1986).
17. Mullis, K., Faloona, F., Scharf, S., Saiki, R., Horn, G., Erlich, H. Specific enzymatic
amplification of DNA in vitro - the polymerase chain-reaction. Cold Spring Harb.
Symp. Quant. Biol. LI, 263–273 (1986).
18. Itakura, K., Rossi, J. J. & Wallace, R. B. Synthesis and Use of Synthetic
Oligonucleotides. Annu. Rev. Biochem. 53, 323–356 (1984).
19. Lukasavo, E., Jelen, F. & Palecek, E. Electrochemistry of Osmium — Nucleic Acid
Complexes : A Probe for Single-Stranded and Distorted Double-Stranded Regions in
DNA. Gen. Physiol. Biophys. 1, 53–70 (1982).
20. Palecek, E., Lukasova, E., Jelen, F. & Vojtiskova, M. Electrochemical Analysis of
Polynucleotides. Bioelectrochemistry Bioenerg. 8, 497–506 (1981).
21. Fojta, M., Kostecka, P., Trefulka, M., Havran, L. & Palecek, E. ‘Multicolor’
electrochemical labeling of DNA hybridization probes with osmium tetroxide
complexes. Anal Chem 79, 1022–1029 (2007).
22. Havranová-Vidláková, P. et al. Butylacrylate-nucleobase Conjugates as Targets for
43
Two-step Redox Labeling of DNA with an Osmium Tetroxide Complex.
Electroanalysis 30, 371–377 (2018).
23. Langer, P. R., Waldrop, A. A. & Ward, D. C. Enzymatic synthesis of biotin-labeled
polynucleotides: novel nucleic acid affinity probes. Proc. Natl. Acad. Sci. 78, 6633–
6637 (1981).
24. Hocek, M. & Fojta, M. Cross-coupling reactions of nucleoside triphosphates followed
by polymerase incorporation. Construction and applications of base-functionalized
nucleic acids. Org Biomol Chem 6, 2233–2241 (2008).
25. Fojta, M. Mercury Electrodes in Nucleic Acid Electrochemistry: Sensitive Analytical
Tools and Probes of DNA Structure. A Review. Collect. Czechoslov. Chem. Commun.
69, 715–747 (2004).
26. Špaček, J., Daňhel, A., Hasoň, S. & Fojta, M. Label-free detection of canonical DNA
bases, uracil and 5-methylcytosine in DNA oligonucleotides using linear sweep
voltammetry at a pyrolytic graphite electrode. Electrochem Commun. 82, 34–38
(2017).
27. Dudova, Z. et al. Electrochemical behavior of 7-deazaguanine- and 7-deazaadenine-
modified DNA at the hanging mercury drop electrode. Monatshefte Fur Chemie 147,
3–11 (2016).
28. Vidlakova, P. et al. G-quadruplex-based structural transitions in 15-mer DNA
oligonucleotides varying in lengths of internal oligo(dG) stretches detected by
voltammetric techniques. Anal Bioanal Chem 407, 5817–5826 (2015).
29. Palecek, E. & Fojta, M. Electrochemical DNA Sensors. in Bioelectronics 127–192
(Wiley-VCH Verlag GmbH & Co. KGaA, 2005). doi:10.1002/352760376X.ch5
30. Haronikova, L. et al. Enzyme-linked electrochemical detection of DNA fragments
amplified by PCR in the presence of a biotinylated deoxynucleoside triphosphate using
disposable pencil graphite electrodes. Monatshefte Fur Chemie 146, 849–855 (2015).
31. Fojta, M. & Palecek, E. Supercoiled DNA-modified mercury electrode: A highly
sensitive tool for the detection of DNA damage. Anal. Chim. Acta 342, 1–12 (1997).
32. Fojta, M., Daňhel, A., Havran, L. & Vyskočil, V. Recent progress in electrochemical
sensors and assays for DNA damage and repair. Trends Anal. Chem. 79, 160–167
(2016).
33. Havran, L., Vacek, J., Cahova, K. & Fojta, M. Sensitive voltammetric detection of
DNA damage at carbon electrodes using DNA repair enzymes and an electroactive
osmium marker. Anal Bioanal Chem 391, 1751–1758 (2008).
34. Balintova, J. et al. Azidophenyl as a click-transformable redox label of DNA suitable
for electrochemical detection of DNA-protein interactions. Chem. Sci. 6, 575–587
(2015).
35. Palecek, E. & Jelen, F. Electrochemistry of Nucleic Acids. Electrochem. Nucleic Acids
Proteins Towar. Electrochem. Sensors Genomics Proteomics 1, 73–173 (2005).
36. Brotons, A., Vidal-Iglesias, F. J., Solla-Gullon, J. & Iniesta, J. Carbon materials for the
electrooxidation of nucleobases, nucleosides and nucleotides toward cytosine
methylation detection: a review. Anal. Methods 8, 702–715 (2016).
37. Barek, J. et al. Nontraditional electrode materials in environmental analysis of
biologically active organic compounds. Electroanalysis 19, 2003–2014 (2007).
38. Yosypchuk, B., Heyrovský, M., Palecek, E. & Novotný, L. Use of Solid Amalgam
Electrodes in Nucleic Acid Analysis. Electroanalysis 14, 1488–1493 (2002).
39. Brabec, V. & Paleček, E. Adsorption of single‐stranded and double‐helical
polynucleotides on the mercury electrode. Biopolymers 11, 2577–2589 (1972).
40. Brabec, V. & Dryhurst, G. Electrochemical Behavior of Natural and Biosynthetic
Polynucleotides at Pyrolytic-Graphite Electrode a New Probe for Studies of
44
Polynucleotide Structure and Reactions. J. Electroanal. Chem. 89, 161–173 (1978).
41. Fojta, M. Mercury electrodes in nucleic acid electrochemistry: Sensitive analytical
tools and probes of DNA structure. A review. Collect. Czechoslov. Chem. Commun. 69,
715–747 (2004).
42. Fojta, M., Jelen, F., Havran, L. & Palecek, E. Electrochemical Stripping Techniques in
Analysis of Nucleic Acids andtheir Constituents. Curr. Anal. Chem. 250–262 (2008).
43. Danhel, A., Havran, L., Trnkova, L. & Fojta, M. Hydrogen Evolution Facilitates
Reduction of DNA Guanine Residues at the Hanging Mercury Drop Electrode:
Evidence for a Chemical Mechanism. Electroanalysis 28, 2785–2790 (2016).
44. Studnickova, M., Trnkova, L., Zetek, J. & Glatz, Z. Reduction of Guanosine at a
Mercury-Electrode. Bioelectrochemistry Bioenerg. 21, 83–86 (1989).
45. Cummings, T. E. & Elving, P. J. Electrochemical Reduction of Thymine in Dimethyl-
Sulfoxide Auto-Protonation of the Radical-Anion and Reduced Free-Radical. J.
Electroanal. Chem. 102, 237–248 (1979).
46. Cummings, T. E. & Elving, P. J. Electrochemical Reduction of Uracil in Dimethyl-
Sulfoxide - Autoprotonation of Anion Radical. J. Electroanal. Chem. 94, 123–145
(1978).
47. Brabec, V. & Glezers, V. Polarographic Reducibility of Polyribouridytic Acid. Gen.
Physiol. Biophys 2, 193–199 (1983).
48. Bartosik, M., Fojta, M. & Palecek, E. Electrochemical detection of 5-methylcytosine in
bisulfite-treated DNA. Electrochim. Acta 78, 75–81 (2012).
49. Brabec, V. Nucleic acid analysis by voltammetry at carbon electrodes. J. Electroanal.
Chem. 128, 437–449 (1981).
50. Oliveira-Brett, A. M., Piedade, J. A., Silva, L. A. & Diculescu, V. C. Voltammetric
determination of all DNA nucleotides. Anal Biochem 332, 321–329 (2004).
51. Zhou, M., Zhai, Y. M. & Dong, S. J. Electrochemical Sensing and Biosensing Platform
Based on Chemically Reduced Graphene Oxide. Anal. Chem. 81, 5603–5613 (2009).
52. Fojta, M., Kostečka, P., Trefulka, M., Havran, L. & Paleček, E. ‘Multicolor’
Electrochemical Labeling of DNA Hybridization Probes with Osmium Tetroxide
Complexes. Anal Chem 79, 1022–1029 (2007).
53. Hocek, M. & Fojta, M. Nucleobase modification as redox DNA labelling for
electrochemical detection. Chem. Soc. Rev. 40, 5802–5814 (2011).
54. Jacobsen, M. & Flechsig, G. U. Hybridization Detection of Osmium Tetroxide
Bipyridine-Labeled DNA and RNA on Heated Gold Wire Electrodes. Electroanalysis
25, 373–379 (2013).
55. Flechsig, G. U. & Reske, T. Electrochemical detection of DNA hybridization by means
of osmium tetroxide complexes and protective oligonucleotides. Anal. Chem. 79,
2125–2130 (2007).
56. Horakova, P. et al. Tail-labelling of DNA probes using modified deoxynucleotide
triphosphates and terminal deoxynucleotidyl transferase. Application in
electrochemical DNA hybridization and protein-DNA binding assays. Org Biomol
Chem 9, 1366–1371 (2011).
57. Fojta, M. Electrochemical Sensors for DNA Interactions and Damage. Electroanalysis
14, 1449–1463 (2002).
58. Paleček, E. Probing DNA structure with osmium tetroxide complexes in vitro. Methods
Enzymol. 212, 139–155 (1992).
59. Trefulka, M. et al. Voltammetry of osmium end-labeled oligodeoxynucleotides at
carbon, mercury, and gold electrodes. Electroanalysis 19, 1334–1338 (2007).
60. Gebala, M., Stoica, L., Neugebauer, S. & Schuhmann, W. Label-Free Detection of
DNA Hybridization in Presence of Intercalators Using Electrochemical Impedance

45
Spectroscopy. Electroanalysis 21, 325–331 (2009).
61. Labuda, J. et al. Electrochemical nucleic acid-based biosensors: Concepts, terms, and
methodology (IUPAC Technical Report). Pure Appl. Chem. 82, 1161–1187 (2010).
62. Fojta, M., Kostecka, P., Pivonkova, H., Horakova, P. & Havran, L. Osmium Tetroxide
Complexes as Versatile Tools for Structure Probing and Electrochemical Analysis of
Biopolymers. Curr. Anal. Chem. 7, 35–50 (2011).
63. Reske, T., Surkus, A.-E., Duwensee, H. & Flechsig, G.-U. Kinetics of the labeling
reactions of thymine, cytosine and uracil with osmium tetroxide bipyridine. Microchim.
Acta 166, 197–201 (2009).
64. Jelen, F., Karlovsky, P., Makaturova, E., Pecinka, P. & Palecek, E. Osmium tetroxide
reactivity of DNA bases in nucleotide sequencing and probing of DNA structure. Gen.
Physiol. Biophys. 10, 461–473 (1991).
65. Fojta, M. et al. Osmium Tetroxide, 2,2′-Bipyridine: Electroactive Marker for Probing
Accessibility of Tryptophan Residues in Proteins. Anal. Chem. 80, 4598–4605 (2008).
66. Trefulka, M., Bartošík, M. & Paleček, E. Facile end-labeling of RNA with electroactive
Os(VI) complexes. Electrochem. commun. 12, 1760–1763 (2010).
67. Fojta, M., Havran, L., Kizek, R. & Billova, S. Voltammetric microanalysis of DNA
adducts with osmium tetroxide,2,2’-bipyridine using a pyrolytic graphite electrode.
Talanta 56, 867–874 (2002).
68. Trefulka, M. et al. Voltammetry of Osmium End-Labeled Oligodeoxynucleotides at
Carbon, Mercury, and Gold Electrodes. Electroanalysis 19, 1334–1338 (2007).
69. Paleček, E., Fojta, M. & Jelen, F. New approaches in the development of DNA sensors:
hybridization and electrochemical detection of DNA and RNA at two different
surfaces. Bioelectrochemistry 56, 85–90 (2002).
70. Bartošík, M. et al. Detection of abasic sites in DNA by electrochemical,
immunoelectrochemical and acoustic methods using OsO4, 2,2′-bipyridine as a probe
for unpaired thymine residues. Electroanalysis 21, 295–302 (2009).
71. Simonova, A. et al. Methoxyphenol and dihydrobenzofuran as oxidizable labels for
electrochemical detection of DNA. Chempluschem 79, 1703–1712 (2014).
72. Riedl, J. et al. Tetrathiafulvalene-Labelled Nucleosides and Nucleoside Triphosphates:
Synthesis, Electrochemistry and the Scope of Their Polymerase Incorporation into
DNA. European J. Org. Chem. 2009, 3519–3525 (2009).
73. Čapek, P. et al. An Efficient Method for the Construction of Functionalized DNA
Bearing Amino Acid Groups through Cross-Coupling Reactions of Nucleoside
Triphosphates Followed by Primer Extension or PCR. Chem. - A Eur. J. 13, 6196–6203
(2007).
74. Menova, P., Raindlova, V. & Hocek, M. Scope and Limitations of the Nicking Enzyme
Amplification Reaction for the Synthesis of Base-Modified Oligonucleotides and
Primers for PCR. Bioconjug. Chem. 24, 1081–1093 (2013).
75. Menova, P. et al. Polymerase synthesis of oligonucleotides containing a single
chemically modified nucleobase for site-specific redox labelling. Chem. Commun. 49,
4652–4654 (2013).
76. Motea, E. A. & Berdis, A. J. Terminal deoxynucleotidyl transferase: The story of a
misguided DNA polymerase. Biochimica et Biophysica Acta - Proteins and Proteomics
1804, 1151–1166 (2010).
77. Anne, A., Bonnaudat, C., Demaille, C. & Wang, K. Enzymatic redox 3’-end-labeling
of DNA oligonucleotide monolayers on gold surfaces using terminal deoxynucleotidyl
transferase (TdT)-mediated single base extension. J Am Chem Soc 129, 2734–2735
(2007).
78. Jäger, S. & Famulok, M. Generation and Enzymatic Amplification of High-Density
46
Functionalized DNA Double Strands. Angew. Chemie Int. Ed. 43, 3337–3340 (2004).
79. Brazdilova, P. et al. Ferrocenylethynyl derivatives of nucleoside triphosphates:
synthesis, incorporation, electrochemistry, and bioanalytical applications. Chemistry
(Easton). 13, 9527–9533 (2007).
80. Cahova, H. et al. Aminophenyl- and nitrophenyl-labeled nucleoside triphosphates:
synthesis, enzymatic incorporation, and electrochemical detection. Angew Chem Int Ed
Engl 47, 2059–2062 (2008).
81. Vrabel, M. et al. Base-Modified DNA Labeled by [Ru(bpy)(3)](2+) and
[Os(bpy)(3)](2+) Complexes: Construction by Polymerase Incorporation of Modified
Nucleoside Triphosphates, Electrochemical and Luminescent Properties, and
Applications. Chem. Eur. J. 15, 1144–1154 (2009).
82. Balintova, J. et al. Anthraquinone as a Redox Label for DNA: Synthesis, Enzymatic
Incorporation, and Electrochemistry of Anthraquinone-Modified Nucleosides,
Nucleotides, and DNA. Chem. Eur. J. 17, 14063–14073 (2011).
83. Balintova, J. et al. Benzofurazane as a new redox label for electrochemical detection of
DNA: towards multipotential redox coding of DNA bases. Chemistry (Easton). 19,
12720–12731 (2013).
84. Danhel, A. et al. Voltammetric analysis of 5-(4-Azidophenyl)-2′-deoxycytidine
nucleoside and azidophenyl-labelled single- and double-stranded DNAs. Electrochim.
Acta 215, 72–83 (2016).
85. Simonova, A., Havran, L., Pohl, R., Fojta, M. & Hocek, M. Phenothiazine-linked
nucleosides and nucleotides for redox labelling of DNA. Org Biomol Chem (2017).
doi:10.1039/c7ob01439b
86. Menova, P. & Hocek, M. Preparation of short cytosine-modified oligonucleotides by
nicking enzyme amplification reaction. Chem. Commun. 48, 6921–6923 (2012).
87. Menova, P. et al. Fluorescence Quenching in Oligonucleotides Containing 7-
Substituted 7-Deazaguanine Bases Prepared by the Nicking Enzyme Amplification
Reaction. Bioconjug. Chem. 26, 361–366 (2015).
88. Němcová, K. et al. Electrochemical detection of DNA binding by tumor suppressor
p53 protein using osmium-labeled oligonucleotide probes and catalytic hydrogen
evolution at the mercury electrode. Anal. Bioanal. Chem. 406, 5843–5852 (2014).
89. Pivonkova, H., Horakova, P., Fojtova, M. & Fojta, M. Direct Voltammetric Analysis of
DNA Modified with Enzymatically Incorporated 7-Deazapurines. Anal. Chem. 82,
6807–6813 (2010).
90. Riedl, J. et al. Labelling of nucleosides and oligonucleotides by solvatochromic 4-
aminophthalimide fluorophore for studying DNA–protein interactions. Chem. Sci. 3,
2797 (2012).
91. Dadova, J. et al. Vinylsulfonamide and acrylamide modification of DNA for cross-
linking with proteins. Angew Chem Int Ed Engl 52, 10515–10518 (2013).
92. Dadova, J. et al. Azidopropylvinylsulfonamide as a New Bifunctional Click Reagent
for Bioorthogonal Conjugations: Application for DNA-Protein Cross-Linking. Chem.
Eur. J. 21, 16091–16102 (2015).
93. Heller, A. & Feldman, B. Electrochemical glucose sensors and their applications in
diabetes management. Chem. Rev. 108, 2482–2505 (2008).
94. Walter, A., Wu, J., Flechsig, G. U., Haake, D. A. & Wang, J. Redox cycling amplified
electrochemical detection of DNA hybridization: application to pathogen E. coli
bacterial RNA. Anal Chim Acta 689, 29–33 (2011).
95. Stejskalová, E., Horáková, P., Vacek, J., Bowater, R. P. & Fojta, M. Enzyme-linked
electrochemical DNA ligation assay using magnetic beads. Anal. Bioanal. Chem. 406,
4129–4136 (2014).
47
96. Rochelet, M. et al. A thin layer-based amperometric enzyme immunoassay for the
rapid and sensitive diagnosis of respiratory syncytial virus infections. Talanta 100,
139–144 (2012).
97. Hajdukiewicz, J., Boland, S., Kavanagh, P. & Leech, D. An enzyme-amplified
amperometric DNA hybridisation assay using DNA immobilised in a
carboxymethylated dextran film anchored to a graphite surface. Biosens. Bioelectron.
25, 1037–1042 (2010).
98. Hampshire, A. J., Rusling, D. A., Broughton-Head, V. J. & Fox, K. R. Footprinting: A
method for determining the sequence selectivity, affinity and kinetics of DNA-binding
ligands. Methods 42, 128–140 (2007).
99. Kolb, H. C., Finn, M. G. & Sharpless, K. B. Click Chemistry: Diverse Chemical
Function from a Few Good Reactions. Angew. Chemie - Int. Ed. 40, 2004–2021 (2001).
100. Garner, M. M. & Revzin, A. A gel electrophoresis method for quantifying the binding
of proteins to specific DNA regions: application to components of the Escherichia coli
lactose operon regulatory system. Nucleic Acids Res. 9, 3047–3060 (1981).
101. Orlando, V. Mapping chromosomal proteins in vivo by formaldehyde-crosslinked-
chromatin immunoprecipitation. Trends Biochem. Sci. 25, 99–104 (2000).
102. Špaček, J., Zenka, M., Hároníkova, L., Havran, L. & Fojta, M. Enzymatic
incorporation of biotin into DNA for DNA hybridization analysis and for DNA
detection. in Moderní elektrochemické metody XXXIV. (eds. Navratil, T., Fojta, M. &
Peckova, K.) XXXIV., 193–196 (Best servis, Ústí nad Labem, 2014).
103. Horakova-Brazdilova, P., Fojtova, M., Vytras, K. & Fojta, M. Enzyme-linked
electrochemical detection of PCR-amplified nucleotide sequences using disposable
screen-printed sensors. Applications in gene expression monitoring. Sensors 8, 193–
210 (2008).
104. Dubuisson, E., Yang, Z. & Loh, K. P. Optimizing label-free DNA electrical detection
on graphene platform. Anal Chem 83, 2452–2460 (2011).
105. Rafique, B., Iqbal, M., Mehmood, T. & Shaheen, M. A. Electrochemical DNA
biosensors: a review. Sens. Rev. SR-08-2017-0156 (2018). doi:10.1108/SR-08-2017-
0156
106. Muti, M., Sharma, S., Erdem, A. & Papakonstantinou, P. Electrochemical monitoring
of nucleic acid hybridization by single-use graphene oxide-based sensor.
Electroanalysis 23, 272–279 (2011).
107. Bhamla, M. S. et al. Hand-powered ultralow-cost paper centrifuge. Nat. Biomed. Eng.
1, 1–7 (2016).
108. Cybulski, J. S., Clements, J. & Prakash, M. Foldscope: Origami-Based Paper
Microscope. PLoS One 9, (2014).
109. Sun, A., Wambach, T., Venkatesh, A. G. & Hall, D. A. A Low-Cost Smartphone-Based
Electrochemical Biosensor for Point-of-Care Diagnostics. IEEE Biomed. Circuits Syst.
Conf. Healthc. Technol. [proceedings]. IEEE Biomed. Circuits Syst. Conf. 2014, 312–
315 (2014).
110. Ledford, H. Garage biotech: Life hackers. Nature 467, 650–652 (2010).
111. Zhou, M., Zhai, Y. & Dong, S. Electrochemical Sensing and Biosensing Platform
Based on Chemically Reduced Graphene Oxide. Anal. Chem. 81, 5603–5613 (2009).
112. Shendure, J. & Ji, H. Next-generation DNA sequencing. Nat. Biotechnol. 26, 1135–
1145 (2008).
113. McIntyre, A. B. R. et al. Nanopore sequencing in microgravity. Npj Microgravity 2,
(2016).
114. Marlière, P. et al. Chemical Evolution of a Bacterium’s Genome. Angew. Chemie Int.
Ed. 50, 7109–7114 (2011).
48
115. Zhang, Y. et al. A semi-synthetic organism that stores and retrieves increased genetic
information. Nature 551, 644–647 (2017).
116. Dudova, Z., Spacek, J., Havran, L., Pivonkova, H. & Fojta, M. Interactions of
fluorescent dye SYBR Green I with natural and 7-deazaguanine-modified DNA studied
by fluorescence and electrochemical methods. Monatshefte Fur Chemie 147, 13–20
(2016).
117. Genereux, J. C., Boal, A. K. & Barton, J. K. DNA-Mediated Charge Transport in
Redox Sensing and Signaling. J. Am. Chem. Soc. 132, 891–905 (2010).
118. Daňhel, A., Havran, L., Trnková, L. & Fojta, M. Hydrogen Evolution Facilitates
Reduction of DNA Guanine Residues at the Hanging Mercury Drop Electrode:
Evidence for a Chemical Mechanism. Electroanalysis 28, 2785–2790 (2016).
119. Malyshev, D. A. et al. A semi-synthetic organism with an expanded genetic alphabet.
Nature 509, 385–388 (2014).
120. Pontinha, A. D. R., Chiorcea-Paquim, A. M., Eritja, R. & Oliveira-Brett, A. M.
Quadruplex Nanostructures of d(TGGGGT): Influence of Sodium and Potassium Ions.
Anal. Chem. 86, 5851–5857 (2014).
121. Chiorcea-Paquim, A. M., Eritja, R. & Oliveira-Brett, A. M. Electrochemical and AFM
characterization of G-quadruplex electrochemical biosensors and applications. Journal
of Nucleic Acids 2018, 1–20 (2018).
122. Chiorcea-Paquim, A.-M., Pontinha, A. D. R. & Oliveira-Brett, A. M. Time-dependent
polyguanylic acid structural modifications. Electrochem. commun. 45, 71–74 (2014).
123. Dryhurst, G. & Pace, G. F. Electrochemical Oxidation of Guanine at the Pyrolytic
Graphite Electrode. J. Electrochem. Soc. 117, 1259 (1970).
124. Subramanian, P. & Dryhurst, G. Electrochemical Oxidation of Guanosine - Formation
of Some Novel Guanine Oligonucleosides. J. Electroanal. Chem. 224, 137–162 (1987).
125. Boussicault, F. & Robert, M. Electron transfer in DNA and in DNA-related biological
processes. Electrochemical insights. Chem Rev 108, 2622–2645 (2008).
126. Zhang, Y. et al. A semisynthetic organism engineered for the stable expansion of the
genetic alphabet. Proc Natl Acad Sci U S A (2017). doi:10.1073/pnas.1616443114
127. Malyshev, D. A. & Romesberg, F. E. The expanded genetic alphabet. Angew Chem Int
Ed Engl 54, 11930–11944 (2015).
128. Sponer, J. E., Sponer, J. & Di Mauro, E. New evolutionary insights into the non-
enzymatic origin of RNA oligomers. Wiley Interdiscip. Rev. 8, (2017).
129. Trifonov, E. N. Author Response Definition of Life: Navigation through Uncertainties.
J. Biomol. Struct. Dyn. 29, 647–650 (2012).
130. Cleland, C. E. & Chyba, C. F. Defining ‘Life’. Orig. Life Evol. Biosph. 32, 387–393
(2002).
131. Spacek, J. Life Exists Only as a Concept. Czech Slovak Linguist. Rev. 92–105 (2014).
132. Špaček, J. Život je jen koncept. Vesmír 3, 147–150 (2018).
133. Aguilar, W., Santamaría-Bonfil, G., Froese, T. & Gershenson, C. The past, present, and
future of artificial life. Front. Robot. AI 1, 1–15 (2014).
134. Amodei, D. et al. Concrete Problems in AI Safety. arXiv arXiv:1606.06565 (2016).
135. Grace, K., Salvatier, J., Dafoe, A., Zhang, B. & Evans, O. When Will AI Exceed
Human Performance? Evidence from AI Experts.
136. Malyshev, D. A. et al. A semi-synthetic organism with an expanded genetic alphabet.
Nature 509, 385–388 (2014).

49
5 List of publications with specified contributions of the PhD
candidate
Listed publications are included as numbered appendices at the end of the thesis.
Appendix 1
J. Balintová, J. Špaček, R. Pohl, M. Brázdová, L. Havran, M. Fojta, M. Hocek, Azidophenyl
as a click-transformable redox label of DNA suitable for electrochemical detection of DNA-
protein interactions, Chemical Science 6 (2015) 575-587.
I have proposed an idea of the “electrochemical footprinting” technique, which is essential
part of this publication.
Appendix 2
L. Hároníková, J. Špaček, M. Plucnara, P. Horáková, H. Pivoňková, L. Havran, A. Erdem
and M. Fojta, Enzyme-linked electrochemical detection of DNA fragments amplified by PCR
in the presence of a biotinylated deoxynucleoside triphosphate using disposable pencil
graphite electrodes, Monatsh Chem, 146 (2015) 849–855.
I have optimized method for fast enzyme-linked electroanalysis during and after my internship
with Prof. A. Erdem in Turkey, which has been adjusted to suit the goal of this work. I have
helped L. Hároníková with experiment design and instructed her about practical aspects of
the electroanalysis.
Appendix 3
Z. Dudová, J. Špaček, M. Tomaško, L. Havran, H. Pivoňková, M. Fojta, Electrochemical
behavior of 7-deazaguanine- and 7-deazaadenine-modified DNA at the hanging mercury drop
electrode, Monatsh Chem, 147 (2016) 3-11.
I have performed the ACV electrochemical experiments presented in this work.
Appendix 4
Z. Dudová, J. Špaček, L. Havran, H. Pivoňková, M. Fojta, Interactions of fluorescent dye
SYBR Green I with natural and 7-deazaguanine-modified DNA studied by fluorescence and
electrochemical methods, Monatsh Chem, 147 (2016) 13-20.
I have helped to design and performed the spectrophotometric experiments presented in this
work.
50
Appendix 5
J. Špaček, A. Daňhel, S. Hasoň, Miroslav Fojta, Label-free detection of canonical DNA
bases, uracil and 5-methylcytosine in DNA oligonucleotides using linear sweep voltammetry
at a pyrolytic graphite electrode, Electrochem commun, 82 (2017) 34-38.
Aleš Daňhel has discovered possibility of analysis of CA peak using PGE. This inspired me to
perform detail study of behavior of DNA at PGE in wide range of potentials, which lead to
breakthrough discoveries presented in this work. I have designed and performed all
experiments, analyzed the data, prepared figures and written the first draft of the manuscript.
Other authors helped me with preparation of the final version of the manuscript. I am
corresponding author of this work. For this work I have been awarded 2018 Methrom prize
for the best publication of young electroanalytical chemists.
Appendix 6
P. Havranová-Vidláková, J. Špaček, L. Vítová, M. Hermanová, J. Dadová, V. Raindlová, M.
Hocek, M. Fojta, L. Havran, Butylacrylate-nucleobase Conjugates as Targets for Two-step
Redox Labeling of DNA with an Osmium Tetroxide Complex, Electroanalysis,
I have performed PAGE analysis of terminal transferase labeled DNA oligonuleotides.
Appendix 7
J. Špaček, Life Exists Only as a Concept, Czech and Slovak linguistic review, 1 (2014) 92-
105.
I have been asked to write this publication for a special issue of Czech and Slovak linguistic
review, summarizing contributions of speakers of 2014 Symposium Informational
fundamentals of life: genomes and languages. Miroslav Fojta has kindly helped me by
proofreading. I have written popular version of this article, Život je jen concept, Vesmír, 3
(2018) 97, which is included as an appendix 8.
All coauthors have been notified and agree with the extent of my contributions as described.
51
6 List of conference contributions of PhD candidate
2013, Oral presentation: J. Špaček, A. Silber, L. Havran and M. Fojta, Enzyme-linked
Electrochemical Detection of DNA Hybridization at the Surface of Pencil Graphite Electrode,
XXXIIIrd Moderní electrochemické metody, Jetřichovice (CZ)
2013, Poster: J. Špaček, E. Eksin G. Congur, L. Havran, P. Horáková, A. Erdem, M. Fojta
Utilization of Controlled Length Homopolymer Tails Synthesised by Terminal
Deoxyribonucleic Transferase for Electrochemical Detection and DNA Manipulation
Bioelectrochemistry, 12th Topical Meeting “Bioelectrochemistry 2013” in Bochum
(Germany)
2013, Oral presentation: J. Špaček, E. Eksin G. Congur, L. Havran, A. Erdem, M. Fojta, Fast
Detection of DNA Hybridization Using Enzyme-linked Assay at the Surface of the Pencil
Graphite Electrode, SYLICA Workshop on electrochemical analysis of biomolecules and its
applications in diagnostics, Brno (CZ)
2014, Invited speaker, oral presentation: J. Špaček, What is the difference between living and
inanimate objects, Symposium Informational fundamentals of life: genomes and languages,
UP Olomouc (CZ)
2014, Oral presentation: J. Špaček, L. Havran, M. Fojta, Oxidation of long DNA
homopolymer tails on graphite electrodes, 47th Heyrovsky Discussion, Třešť (CZ)
Appendix 9
2014, Oral presentation: J. Špaček, M. Ženka, L. Haroníková, L. Havran, M. Fojta, Enzymatic
incorporation of biotin into DNA for DNA hybridization analysis and for DNA detection,
XIVth Moderní elektrochemické metody, Jetřichovice (CZ)
My contributions towards the yet unpublished part of this presentation (DNA hybridization
assay): Based on previously published work101 and my experience from the Turkish
internship, I have optimized the method and design all the experiments. I have prepared the
figures based on Miroslav Fojta’s specifications.
2014, Poster: J. Špaček, L. Havran, M. Fojta, Controlled length homopolymer tailing with
electrochemically labeled nucleotides, 65th Annual Meeting of the International Society of
Electrochemistry, Lausanne (Swiss)
52
2015, Oral presentation: J. Špaček, K. Cahová, L. Havran, M. Fojta, Possibility of using
purine oxidation signals for DNA sequence analysis, XVth Moderní elektrochemické metody,
Jetřichovice (CZ)
2015, Oral presentation: J. Špaček, M. Fojta, Tailing with the terminal transferase: more than
DNA labeling, SYLICA Workshop on electrochemical analysis of biomolecules and its
applications in diagnostics, Brno
2016, Oral presentation: J. Špaček, Synthetic biology introduces new base pairs to analyze,
XVIth Moderní elektrochemické metody, Jetřichovice (CZ)
2017, Oral presentation: J. Špaček, Y. Zhang, F. Romesberg, M. Fojta, Electrochemical
analysis of unnatural base pair content in DNA prepared in semi-synthetic organism, CEITEC
PhD retreat conference, Telč (CZ)
Appendix 10
2017, Oral presentation: J. Špaček, Y. Zhang, F. Romesberg, M. Fojta, Detection of brand
new unnatural base pairs in in vivo prepared plasmid DNA by electrochemistry with the good
old hanging mercury drop electrode, XVIIth Symposium on Chemistry of Nucleic Acid
Components, Český Krumlov (CZ)
In the year 2014 I have decided to make preliminary electroanalysis of commercially
available unnatural nucleosides used in 2014 Nature publication136. Based on these
preliminary results, I have initiated cooperation with Synthorx (spin off company co-founded
by F. Romesberg). In this first phase of the collaboration I have optimized sensitivity of
electroanalysis using synthetic oligonucleotides with UBP content provided by Synthorx. This
collaboration was halted for over a year due to inability of Synthorx and Technology Transfer
Office of Masaryk University to establish a compromise over intellectual property, which led
to ending cooperation with Synthorx. The collaboration continued directly with Romesberg
Lab. During this time I have further developed the method and showed that it is possible to
quantitatively detect presence of less than single unnatural base pair per in vivo prepared
plasmids (received as blinded samples from Y. Zhang) and that we can distinguish between
dTPT3 and d5SICS unnatural bases. Hence this method has become very attractive for
Romesberg’s team.
Luděk Havran has proposed and consulted with me the approach towards the monomer
analysis – which measurements should be included. Miroslav Fojta has provided valuable
suggestion towards creation of the yet to be finished manuscript and helped me to establish
the connection between our and Romesberg lab.
53
7 Appendix
Appendix 1
J. Balintová, J. Špaček, R. Pohl, et al,
Chemical Science 6 (2015), 575-587.
Appendix 2
L. Hároníková, J. Špaček, M. Plucnara, P.,
Monatsh Chem, 146 (2015), 849–855.
Appendix 3
Z. Dudová, J. Špaček, M. Tomaško, et al,
Monatsh Chem, 147 (2016), 3-11.
Appendix 4
Z. Dudová, J. Špaček, L. Havran, et al,
Monatsh Chem, 147 (2016), 13-20.
Appendix 5
J. Špaček, A. Daňhel, S. Hasoň, Miroslav Fojta,
Electrochem commun, 82 (2017), 34-38.
Appendix 6
P. Havranová-Vidláková, J. Špaček, L. Vítová, et al,
Electroanalysis, 30 (2018), 371-377.
Appendix 7
J. Špaček,
Czech and Slovak linguistic review, 1 (2014), 92-105
Appendix 8
J. Špaček,
Vesmír, 3 (2018), 146-149
Appendix 9
J. Špaček, M. Ženka, L. Haroníková, L. Havran, M. Fojta, 2014
Oral presentation abstract, XIVth Moderní elektrochemické metody

Azidophenyl as a click-transformable redox label ofDNA suitable for electrochemical detection ofDNA–protein interactions†
Jana Balintova,a Jan Spacek,b Radek Pohl,a Marie Brazdova,b Ludek Havran,bc
Miroslav Fojta*bc and Michal Hocek*ad
New redox labelling of DNA by an azido group which can be chemically transformed to nitrophenyltriazole
or silenced to phenyltriazole was developed and applied to the electrochemical detection of DNA–protein
interactions. 5-(4-Azidophenyl)-20-deoxycytidine and 7-(4-azidophenyl)-7-deaza-20-deoxyadenosinenucleosides were prepared by aqueous-phase Suzuki cross-coupling and converted to nucleoside
triphosphates (dNTPs) which served as substrates for incorporation into DNA by DNA polymerase. The
azidophenyl-modified nucleotides and azidophenyl-modified DNA gave a strong signal in voltammetric
studies, at �0.9 V, due to reduction of the azido function. The Cu-catalyzed click reaction of
azidophenyl-modified nucleosides or azidophenyl-modified DNA with 4-nitrophenylacetylene gave
nitrophenyl-substituted triazoles, exerting a reduction peak at �0.4 V under voltammetry, whereas the
click reaction with phenylacetylene gave electrochemically silent phenyltriazoles. The transformation of
the azidophenyl label to nitrophenyltriazole was used for electrochemical detection of DNA–protein
interactions (p53 protein) since only those azidophenyl groups in the parts of the DNA not shielded by
the bound p53 protein were transformed to nitrophenyltriazoles, whereas those covered by the protein
were not.
Introduction
Electrochemical detection of redox-labelled DNA1 is an alter-native to uorescence techniques for DNA sequencing anddiagnostics. However, despite the extensive research andnumber of available oxidizable or reducible labels,2 the redoxlabelling of DNA oen suffers from problems with sensitivity,stability and cross-reactivity of the labels. On the other hand,the use of several labels offers access to direct redox coding ofDNA.3 To the best of our knowledge, applications of redoxlabelling and electrochemistry for studying DNA–protein inter-actions are still relatively scarce, limited to techniques based onchanges in DNA-mediated charge transfer upon the proteinbinding (developed by J. K. Barton’s group4) and our recent
studies utilizing immunoprecipitation at magnetic beads.5
Most known methods for detection and footprinting of thoseinteractions6 are based on specic enzymatic or chemicalcleavage of DNA.7
Copper(I)-catalyzed azide–alkyne cycloaddition (CuAAC orclick reaction) is one of the most important bioorthogonalreactions8 and has been widely used for modications ofoligonucleotides (ONs) and DNA.9 Due to better compatibilitywith phosphoramidite synthesis, triphosphorylation and poly-merase incorporations, base-modied nucleotides bearing anacetylene are typically incorporated into ON or DNA and arethen clicked with an azido-derivative of the other component.10
Only recently, 5-azidomethyl-dUTP has been synthesized andused for metabolic labelling through polymerase incorporationand click reaction with a uorescent acetylene.11 We haveenvisaged the azido group12 as a new redox label suitable forelectrochemical detection but also transformable to anotherredox label through the click reaction.
Results and discussionSynthesis of modied nucleosides and triphosphates
Our strategy for the synthesis of labelled ONs and DNA relied onpolymerase-catalyzed incorporations13 of base-modied nucle-otides. The modied dNTPs, required as substrates, are avail-able through triphosphorylation of modied nucleosides. The
aInstitute of Organic Chemistry and Biochemistry, Academy of Sciences of the Czech
Republic, Gilead & IOCB Research Center, Flemingovo nam. 2, CZ-16610 Prague 6,
Czech Republic. E-mail: [email protected] of Biophysics, v.v.i. Academy of Sciences of the Czech Republic, Kralovopolska
135, 61265 Brno, Czech Republic. E-mail: [email protected] European Institute of Technology, Masaryk University, Kamenice 753/5, CZ-
625 00 Brno, Czech RepublicdDepartment of Organic Chemistry, Faculty of Science, Charles University in Prague,
Hlavova 8, CZ-12843 Prague 2, Czech Republic
† Electronic supplementary information (ESI) available: Additional gures ofPAGE analyses of PEX experiments, additional electrochemistry gures, copiesof MALDI spectra, copies of NMR spectra. See DOI: 10.1039/c4sc01906g
Cite this: Chem. Sci., 2015, 6, 575
Received 26th June 2014Accepted 9th September 2014
DOI: 10.1039/c4sc01906g
www.rsc.org/chemicalscience
This journal is © The Royal Society of Chemistry 2015 Chem. Sci., 2015, 6, 575–587 | 575
ChemicalScience
EDGE ARTICLE
Ope
n A
cces
s A
rtic
le. P
ublis
hed
on 1
6 Se
ptem
ber
2014
. Dow
nloa
ded
on 1
2/06
/201
7 11
:30:
11.
Thi
s ar
ticle
is li
cens
ed u
nder
a C
reat
ive
Com
mon
s A
ttrib
utio
n 3.
0 U
npor
ted
Lic
ence
.
View Article OnlineView Journal | View Issue
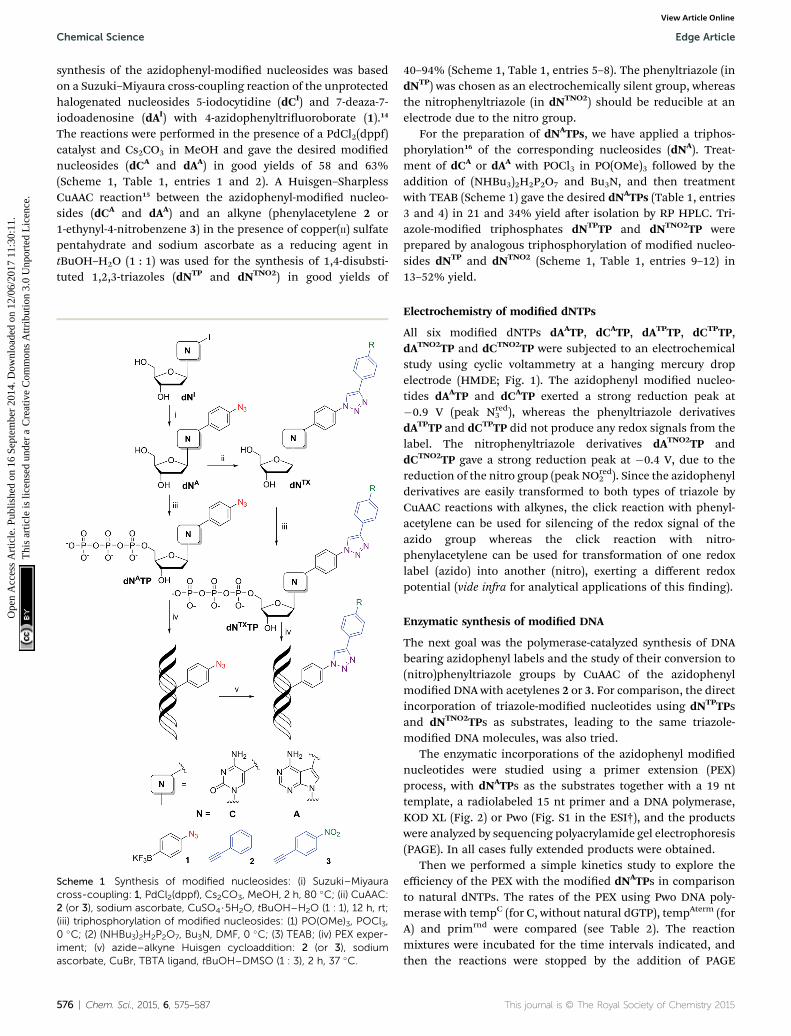
synthesis of the azidophenyl-modied nucleosides was basedon a Suzuki–Miyaura cross-coupling reaction of the unprotectedhalogenated nucleosides 5-iodocytidine (dCI) and 7-deaza-7-iodoadenosine (dAI) with 4-azidophenyltriuoroborate (1).14
The reactions were performed in the presence of a PdCl2(dppf)catalyst and Cs2CO3 in MeOH and gave the desired modiednucleosides (dCA and dAA) in good yields of 58 and 63%(Scheme 1, Table 1, entries 1 and 2). A Huisgen–SharplessCuAAC reaction15 between the azidophenyl-modied nucleo-sides (dCA and dAA) and an alkyne (phenylacetylene 2 or1-ethynyl-4-nitrobenzene 3) in the presence of copper(II) sulfatepentahydrate and sodium ascorbate as a reducing agent intBuOH–H2O (1 : 1) was used for the synthesis of 1,4-disubsti-tuted 1,2,3-triazoles (dNTP and dNTNO2) in good yields of
40–94% (Scheme 1, Table 1, entries 5–8). The phenyltriazole (indNTP) was chosen as an electrochemically silent group, whereasthe nitrophenyltriazole (in dNTNO2) should be reducible at anelectrode due to the nitro group.
For the preparation of dNATPs, we have applied a triphos-phorylation16 of the corresponding nucleosides (dNA). Treat-ment of dCA or dAA with POCl3 in PO(OMe)3 followed by theaddition of (NHBu3)2H2P2O7 and Bu3N, and then treatmentwith TEAB (Scheme 1) gave the desired dNATPs (Table 1, entries3 and 4) in 21 and 34% yield aer isolation by RP HPLC. Tri-azole-modied triphosphates dNTPTP and dNTNO2TP wereprepared by analogous triphosphorylation of modied nucleo-sides dNTP and dNTNO2 (Scheme 1, Table 1, entries 9–12) in13–52% yield.
Electrochemistry of modied dNTPs
All six modied dNTPs dAATP, dCATP, dATPTP, dCTPTP,dATNO2TP and dCTNO2TP were subjected to an electrochemicalstudy using cyclic voltammetry at a hanging mercury dropelectrode (HMDE; Fig. 1). The azidophenyl modied nucleo-tides dAATP and dCATP exerted a strong reduction peak at�0.9 V (peak Nred
3 ), whereas the phenyltriazole derivativesdATPTP and dCTPTP did not produce any redox signals from thelabel. The nitrophenyltriazole derivatives dATNO2TP anddCTNO2TP gave a strong reduction peak at �0.4 V, due to thereduction of the nitro group (peak NOred
2 ). Since the azidophenylderivatives are easily transformed to both types of triazole byCuAAC reactions with alkynes, the click reaction with phenyl-acetylene can be used for silencing of the redox signal of theazido group whereas the click reaction with nitro-phenylacetylene can be used for transformation of one redoxlabel (azido) into another (nitro), exerting a different redoxpotential (vide infra for analytical applications of this nding).
Enzymatic synthesis of modied DNA
The next goal was the polymerase-catalyzed synthesis of DNAbearing azidophenyl labels and the study of their conversion to(nitro)phenyltriazole groups by CuAAC of the azidophenylmodied DNA with acetylenes 2 or 3. For comparison, the directincorporation of triazole-modied nucleotides using dNTPTPsand dNTNO2TPs as substrates, leading to the same triazole-modied DNA molecules, was also tried.
The enzymatic incorporations of the azidophenyl modiednucleotides were studied using a primer extension (PEX)process, with dNATPs as the substrates together with a 19 nttemplate, a radiolabeled 15 nt primer and a DNA polymerase,KOD XL (Fig. 2) or Pwo (Fig. S1 in the ESI†), and the productswere analyzed by sequencing polyacrylamide gel electrophoresis(PAGE). In all cases fully extended products were obtained.
Then we performed a simple kinetics study to explore theefficiency of the PEX with the modied dNATPs in comparisonto natural dNTPs. The rates of the PEX using Pwo DNA poly-merase with tempC (for C, without natural dGTP), tempAterm (forA) and primrnd were compared (see Table 2). The reactionmixtures were incubated for the time intervals indicated, andthen the reactions were stopped by the addition of PAGE
Scheme 1 Synthesis of modified nucleosides: (i) Suzuki–Miyauracross-coupling: 1, PdCl2(dppf), Cs2CO3, MeOH, 2 h, 80 �C; (ii) CuAAC:2 (or 3), sodium ascorbate, CuSO4$5H2O, tBuOH–H2O (1 : 1), 12 h, rt;(iii) triphosphorylation of modified nucleosides: (1) PO(OMe)3, POCl3,0 �C; (2) (NHBu3)2H2P2O7, Bu3N, DMF, 0 �C; (3) TEAB; (iv) PEX exper-iment; (v) azide–alkyne Huisgen cycloaddition: 2 (or 3), sodiumascorbate, CuBr, TBTA ligand, tBuOH–DMSO (1 : 3), 2 h, 37 �C.
576 | Chem. Sci., 2015, 6, 575–587 This journal is © The Royal Society of Chemistry 2015
Chemical Science Edge Article
Ope
n A
cces
s A
rtic
le. P
ublis
hed
on 1
6 Se
ptem
ber
2014
. Dow
nloa
ded
on 1
2/06
/201
7 11
:30:
11.
Thi
s ar
ticle
is li
cens
ed u
nder
a C
reat
ive
Com
mon
s A
ttrib
utio
n 3.
0 U
npor
ted
Lic
ence
.View Article Online
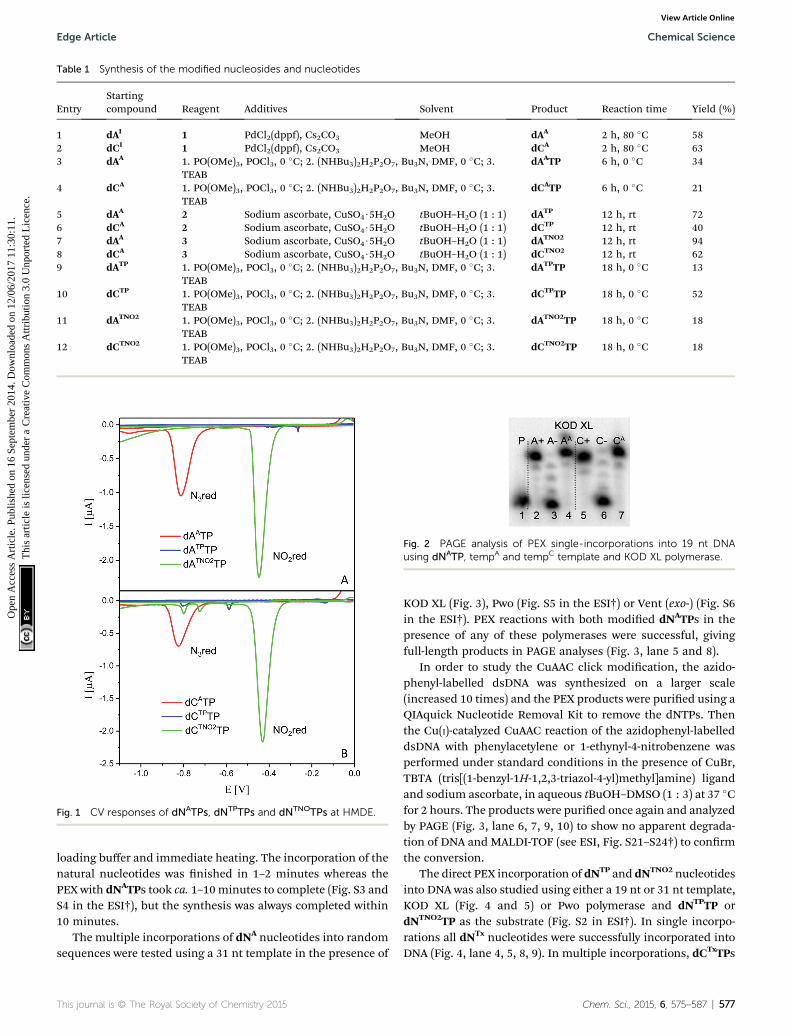
loading buffer and immediate heating. The incorporation of thenatural nucleotides was nished in 1–2 minutes whereas thePEX with dNATPs took ca. 1–10minutes to complete (Fig. S3 andS4 in the ESI†), but the synthesis was always completed within10 minutes.
The multiple incorporations of dNA nucleotides into randomsequences were tested using a 31 nt template in the presence of
KOD XL (Fig. 3), Pwo (Fig. S5 in the ESI†) or Vent (exo-) (Fig. S6in the ESI†). PEX reactions with both modied dNATPs in thepresence of any of these polymerases were successful, givingfull-length products in PAGE analyses (Fig. 3, lane 5 and 8).
In order to study the CuAAC click modication, the azido-phenyl-labelled dsDNA was synthesized on a larger scale(increased 10 times) and the PEX products were puried using aQIAquick Nucleotide Removal Kit to remove the dNTPs. Thenthe Cu(I)-catalyzed CuAAC reaction of the azidophenyl-labelleddsDNA with phenylacetylene or 1-ethynyl-4-nitrobenzene wasperformed under standard conditions in the presence of CuBr,TBTA (tris[(1-benzyl-1H-1,2,3-triazol-4-yl)methyl]amine) ligandand sodium ascorbate, in aqueous tBuOH–DMSO (1 : 3) at 37 �Cfor 2 hours. The products were puried once again and analyzedby PAGE (Fig. 3, lane 6, 7, 9, 10) to show no apparent degrada-tion of DNA and MALDI-TOF (see ESI, Fig. S21–S24†) to conrmthe conversion.
The direct PEX incorporation of dNTP and dNTNO2 nucleotidesinto DNA was also studied using either a 19 nt or 31 nt template,KOD XL (Fig. 4 and 5) or Pwo polymerase and dNTPTP ordNTNO2TP as the substrate (Fig. S2 in ESI†). In single incorpo-rations all dNTx nucleotides were successfully incorporated intoDNA (Fig. 4, lane 4, 5, 8, 9). In multiple incorporations, dCTxTPs
Table 1 Synthesis of the modified nucleosides and nucleotides
EntryStartingcompound Reagent Additives Solvent Product Reaction time Yield (%)
1 dAI 1 PdCl2(dppf), Cs2CO3 MeOH dAA 2 h, 80 �C 582 dCI 1 PdCl2(dppf), Cs2CO3 MeOH dCA 2 h, 80 �C 633 dAA 1. PO(OMe)3, POCl3, 0 �C; 2. (NHBu3)2H2P2O7, Bu3N, DMF, 0 �C; 3.
TEABdAATP 6 h, 0 �C 34
4 dCA 1. PO(OMe)3, POCl3, 0 �C; 2. (NHBu3)2H2P2O7, Bu3N, DMF, 0 �C; 3.TEAB
dCATP 6 h, 0 �C 21
5 dAA 2 Sodium ascorbate, CuSO4$5H2O tBuOH–H2O (1 : 1) dATP 12 h, rt 726 dCA 2 Sodium ascorbate, CuSO4$5H2O tBuOH–H2O (1 : 1) dCTP 12 h, rt 407 dAA 3 Sodium ascorbate, CuSO4$5H2O tBuOH–H2O (1 : 1) dATNO2 12 h, rt 948 dCA 3 Sodium ascorbate, CuSO4$5H2O tBuOH–H2O (1 : 1) dCTNO2 12 h, rt 629 dATP 1. PO(OMe)3, POCl3, 0 �C; 2. (NHBu3)2H2P2O7, Bu3N, DMF, 0 �C; 3.
TEABdATPTP 18 h, 0 �C 13
10 dCTP 1. PO(OMe)3, POCl3, 0 �C; 2. (NHBu3)2H2P2O7, Bu3N, DMF, 0 �C; 3.TEAB
dCTPTP 18 h, 0 �C 52
11 dATNO2 1. PO(OMe)3, POCl3, 0 �C; 2. (NHBu3)2H2P2O7, Bu3N, DMF, 0 �C; 3.TEAB
dATNO2TP 18 h, 0 �C 18
12 dCTNO2 1. PO(OMe)3, POCl3, 0 �C; 2. (NHBu3)2H2P2O7, Bu3N, DMF, 0 �C; 3.TEAB
dCTNO2TP 18 h, 0 �C 18
Fig. 1 CV responses of dNATPs, dNTPTPs and dNTNOTPs at HMDE.
Fig. 2 PAGE analysis of PEX single-incorporations into 19 nt DNAusing dNATP, tempA and tempC template and KOD XL polymerase.
This journal is © The Royal Society of Chemistry 2015 Chem. Sci., 2015, 6, 575–587 | 577
Edge Article Chemical Science
Ope
n A
cces
s A
rtic
le. P
ublis
hed
on 1
6 Se
ptem
ber
2014
. Dow
nloa
ded
on 1
2/06
/201
7 11
:30:
11.
Thi
s ar
ticle
is li
cens
ed u
nder
a C
reat
ive
Com
mon
s A
ttrib
utio
n 3.
0 U
npor
ted
Lic
ence
.View Article Online
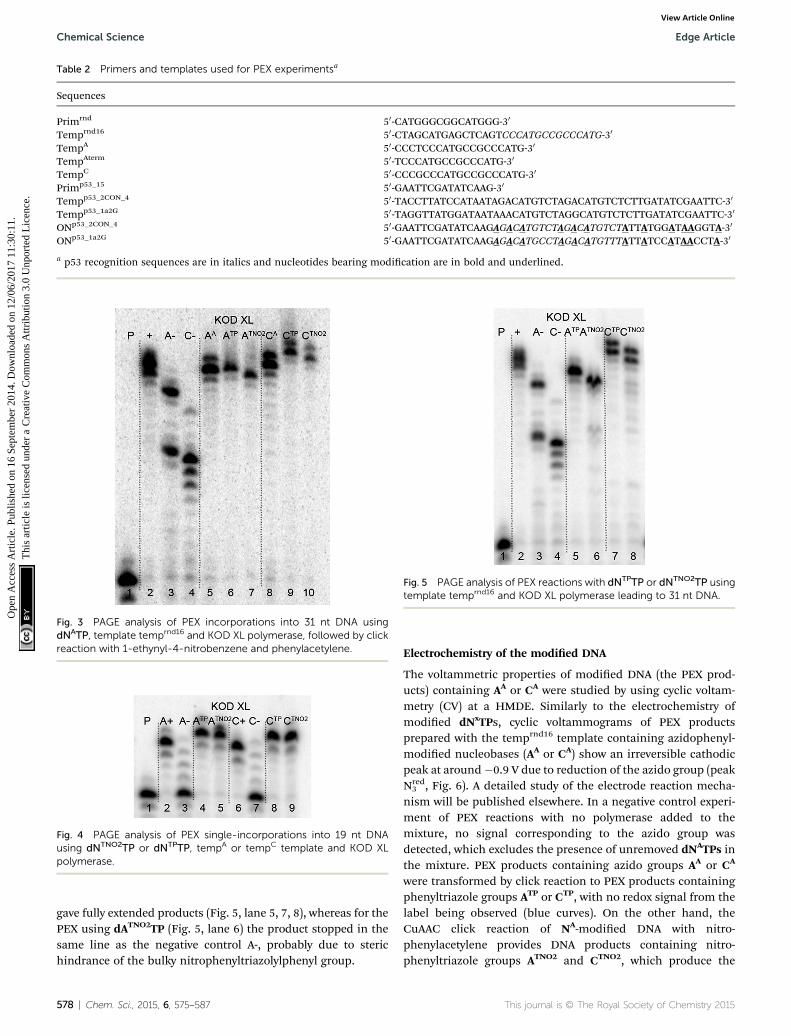
gave fully extended products (Fig. 5, lane 5, 7, 8), whereas for thePEX using dATNO2TP (Fig. 5, lane 6) the product stopped in thesame line as the negative control A-, probably due to sterichindrance of the bulky nitrophenyltriazolylphenyl group.
Electrochemistry of the modied DNA
The voltammetric properties of modied DNA (the PEX prod-ucts) containing AA or CA were studied by using cyclic voltam-metry (CV) at a HMDE. Similarly to the electrochemistry ofmodied dNxTPs, cyclic voltammograms of PEX productsprepared with the temprnd16 template containing azidophenyl-modied nucleobases (AA or CA) show an irreversible cathodicpeak at around�0.9 V due to reduction of the azido group (peakNred3 , Fig. 6). A detailed study of the electrode reaction mecha-
nism will be published elsewhere. In a negative control experi-ment of PEX reactions with no polymerase added to themixture, no signal corresponding to the azido group wasdetected, which excludes the presence of unremoved dNATPs inthe mixture. PEX products containing azido groups AA or CA
were transformed by click reaction to PEX products containingphenyltriazole groups ATP or CTP, with no redox signal from thelabel being observed (blue curves). On the other hand, theCuAAC click reaction of NA-modied DNA with nitro-phenylacetylene provides DNA products containing nitro-phenyltriazole groups ATNO2 and CTNO2, which produce the
Table 2 Primers and templates used for PEX experimentsa
Sequences
Primrnd 50-CATGGGCGGCATGGG-30
Temprnd16 50-CTAGCATGAGCTCAGTCCCATGCCGCCCATG-30
TempA 50-CCCTCCCATGCCGCCCATG-30
TempAterm 50-TCCCATGCCGCCCATG-30
TempC 50-CCCGCCCATGCCGCCCATG-30
Primp53_15 50-GAATTCGATATCAAG-30
Tempp53_2CON_4 50-TACCTTATCCATAATAGACATGTCTAGACATGTCTCTTGATATCGAATTC-30
Tempp53_1a2G 50-TAGGTTATGGATAATAAACATGTCTAGGCATGTCTCTTGATATCGAATTC-30
ONp53_2CON_4 50-GAATTCGATATCAAGAGACATGTCTAGACATGTCTATTATGGATAAGGTA-30
ONp53_1a2G 50-GAATTCGATATCAAGAGACATGCCTAGACATGTTTATTATCCATAACCTA-30
a p53 recognition sequences are in italics and nucleotides bearing modication are in bold and underlined.
Fig. 3 PAGE analysis of PEX incorporations into 31 nt DNA usingdNATP, template temprnd16 and KOD XL polymerase, followed by clickreaction with 1-ethynyl-4-nitrobenzene and phenylacetylene.
Fig. 4 PAGE analysis of PEX single-incorporations into 19 nt DNAusing dNTNO2TP or dNTPTP, tempA or tempC template and KOD XLpolymerase.
Fig. 5 PAGE analysis of PEX reactions with dNTPTP or dNTNO2TP usingtemplate temprnd16 and KOD XL polymerase leading to 31 nt DNA.
578 | Chem. Sci., 2015, 6, 575–587 This journal is © The Royal Society of Chemistry 2015
Chemical Science Edge Article
Ope
n A
cces
s A
rtic
le. P
ublis
hed
on 1
6 Se
ptem
ber
2014
. Dow
nloa
ded
on 1
2/06
/201
7 11
:30:
11.
Thi
s ar
ticle
is li
cens
ed u
nder
a C
reat
ive
Com
mon
s A
ttrib
utio
n 3.
0 U
npor
ted
Lic
ence
.View Article Online
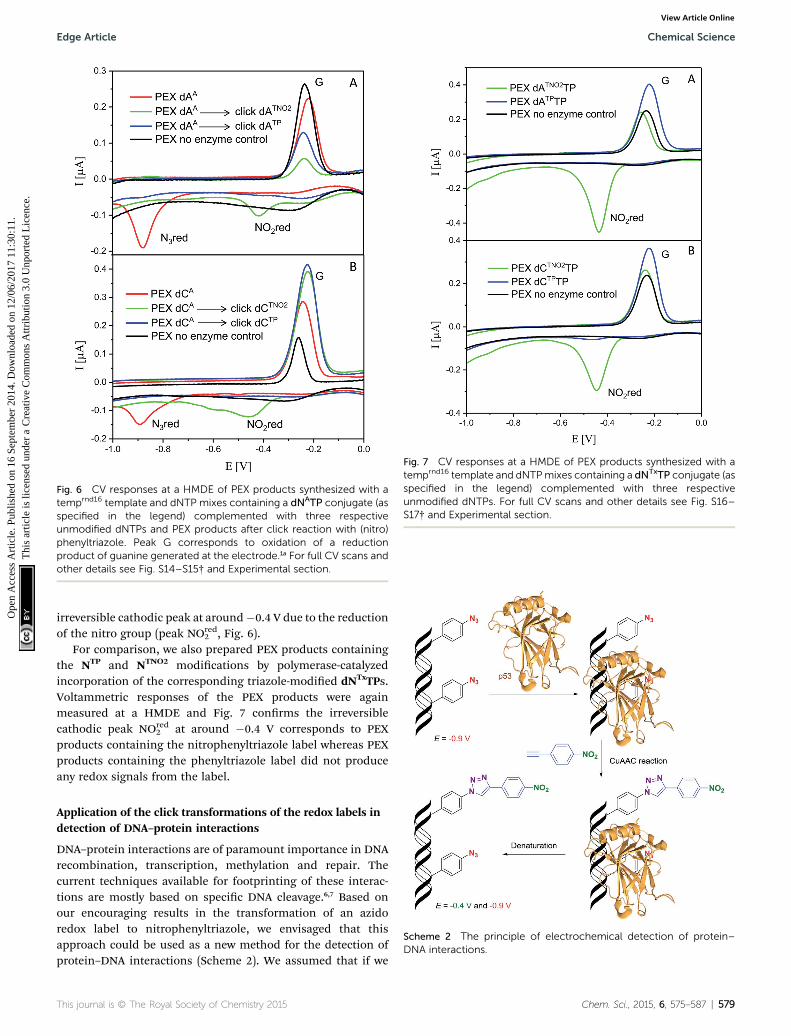
irreversible cathodic peak at around�0.4 V due to the reductionof the nitro group (peak NOred
2 , Fig. 6).For comparison, we also prepared PEX products containing
the NTP and NTNO2 modications by polymerase-catalyzedincorporation of the corresponding triazole-modied dNTxTPs.Voltammetric responses of the PEX products were againmeasured at a HMDE and Fig. 7 conrms the irreversiblecathodic peak NOred
2 at around �0.4 V corresponds to PEXproducts containing the nitrophenyltriazole label whereas PEXproducts containing the phenyltriazole label did not produceany redox signals from the label.
Application of the click transformations of the redox labels indetection of DNA–protein interactions
DNA–protein interactions are of paramount importance in DNArecombination, transcription, methylation and repair. Thecurrent techniques available for footprinting of these interac-tions are mostly based on specic DNA cleavage.6,7 Based onour encouraging results in the transformation of an azidoredox label to nitrophenyltriazole, we envisaged that thisapproach could be used as a new method for the detection ofprotein–DNA interactions (Scheme 2). We assumed that if we
Fig. 6 CV responses at a HMDE of PEX products synthesized with atemprnd16 template and dNTP mixes containing a dNATP conjugate (asspecified in the legend) complemented with three respectiveunmodified dNTPs and PEX products after click reaction with (nitro)phenyltriazole. Peak G corresponds to oxidation of a reductionproduct of guanine generated at the electrode.1a For full CV scans andother details see Fig. S14–S15† and Experimental section.
Fig. 7 CV responses at a HMDE of PEX products synthesized with atemprnd16 template and dNTPmixes containing a dNTxTP conjugate (asspecified in the legend) complemented with three respectiveunmodified dNTPs. For full CV scans and other details see Fig. S16–S17† and Experimental section.
Scheme 2 The principle of electrochemical detection of protein–DNA interactions.
This journal is © The Royal Society of Chemistry 2015 Chem. Sci., 2015, 6, 575–587 | 579
Edge Article Chemical Science
Ope
n A
cces
s A
rtic
le. P
ublis
hed
on 1
6 Se
ptem
ber
2014
. Dow
nloa
ded
on 1
2/06
/201
7 11
:30:
11.
Thi
s ar
ticle
is li
cens
ed u
nder
a C
reat
ive
Com
mon
s A
ttrib
utio
n 3.
0 U
npor
ted
Lic
ence
.View Article Online
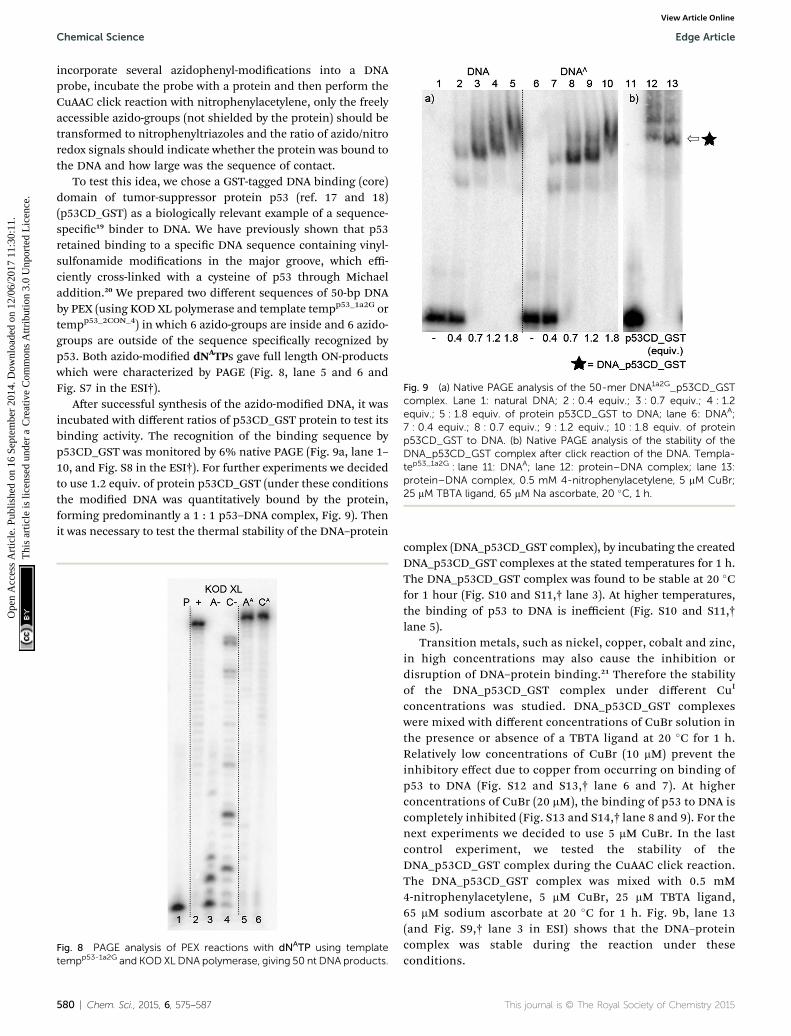
incorporate several azidophenyl-modications into a DNAprobe, incubate the probe with a protein and then perform theCuAAC click reaction with nitrophenylacetylene, only the freelyaccessible azido-groups (not shielded by the protein) should betransformed to nitrophenyltriazoles and the ratio of azido/nitroredox signals should indicate whether the protein was bound tothe DNA and how large was the sequence of contact.
To test this idea, we chose a GST-tagged DNA binding (core)domain of tumor-suppressor protein p53 (ref. 17 and 18)(p53CD_GST) as a biologically relevant example of a sequence-specic19 binder to DNA. We have previously shown that p53retained binding to a specic DNA sequence containing vinyl-sulfonamide modications in the major groove, which effi-ciently cross-linked with a cysteine of p53 through Michaeladdition.20 We prepared two different sequences of 50-bp DNAby PEX (using KOD XL polymerase and template tempp53_1a2G ortempp53_2CON_4) in which 6 azido-groups are inside and 6 azido-groups are outside of the sequence specically recognized byp53. Both azido-modied dNATPs gave full length ON-productswhich were characterized by PAGE (Fig. 8, lane 5 and 6 andFig. S7 in the ESI†).
Aer successful synthesis of the azido-modied DNA, it wasincubated with different ratios of p53CD_GST protein to test itsbinding activity. The recognition of the binding sequence byp53CD_GST was monitored by 6% native PAGE (Fig. 9a, lane 1–10, and Fig. S8 in the ESI†). For further experiments we decidedto use 1.2 equiv. of protein p53CD_GST (under these conditionsthe modied DNA was quantitatively bound by the protein,forming predominantly a 1 : 1 p53–DNA complex, Fig. 9). Thenit was necessary to test the thermal stability of the DNA–protein
complex (DNA_p53CD_GST complex), by incubating the createdDNA_p53CD_GST complexes at the stated temperatures for 1 h.The DNA_p53CD_GST complex was found to be stable at 20 �Cfor 1 hour (Fig. S10 and S11,† lane 3). At higher temperatures,the binding of p53 to DNA is inefficient (Fig. S10 and S11,†lane 5).
Transition metals, such as nickel, copper, cobalt and zinc,in high concentrations may also cause the inhibition ordisruption of DNA–protein binding.21 Therefore the stabilityof the DNA_p53CD_GST complex under different CuI
concentrations was studied. DNA_p53CD_GST complexeswere mixed with different concentrations of CuBr solution inthe presence or absence of a TBTA ligand at 20 �C for 1 h.Relatively low concentrations of CuBr (10 mM) prevent theinhibitory effect due to copper from occurring on binding ofp53 to DNA (Fig. S12 and S13,† lane 6 and 7). At higherconcentrations of CuBr (20 mM), the binding of p53 to DNA iscompletely inhibited (Fig. S13 and S14,† lane 8 and 9). For thenext experiments we decided to use 5 mM CuBr. In the lastcontrol experiment, we tested the stability of theDNA_p53CD_GST complex during the CuAAC click reaction.The DNA_p53CD_GST complex was mixed with 0.5 mM4-nitrophenylacetylene, 5 mM CuBr, 25 mM TBTA ligand,65 mM sodium ascorbate at 20 �C for 1 h. Fig. 9b, lane 13(and Fig. S9,† lane 3 in ESI) shows that the DNA–proteincomplex was stable during the reaction under theseconditions.
Fig. 8 PAGE analysis of PEX reactions with dNATP using templatetempp53-1a2G and KODXL DNA polymerase, giving 50 nt DNA products.
Fig. 9 (a) Native PAGE analysis of the 50-mer DNA1a2G_p53CD_GSTcomplex. Lane 1: natural DNA; 2 : 0.4 equiv.; 3 : 0.7 equiv.; 4 : 1.2equiv.; 5 : 1.8 equiv. of protein p53CD_GST to DNA; lane 6: DNAA;7 : 0.4 equiv.; 8 : 0.7 equiv.; 9 : 1.2 equiv.; 10 : 1.8 equiv. of proteinp53CD_GST to DNA. (b) Native PAGE analysis of the stability of theDNA_p53CD_GST complex after click reaction of the DNA. Templa-tep53_1a2G : lane 11: DNAA; lane 12: protein–DNA complex; lane 13:protein–DNA complex, 0.5 mM 4-nitrophenylacetylene, 5 mM CuBr;25 mM TBTA ligand, 65 mM Na ascorbate, 20 �C, 1 h.
580 | Chem. Sci., 2015, 6, 575–587 This journal is © The Royal Society of Chemistry 2015
Chemical Science Edge Article
Ope
n A
cces
s A
rtic
le. P
ublis
hed
on 1
6 Se
ptem
ber
2014
. Dow
nloa
ded
on 1
2/06
/201
7 11
:30:
11.
Thi
s ar
ticle
is li
cens
ed u
nder
a C
reat
ive
Com
mon
s A
ttrib
utio
n 3.
0 U
npor
ted
Lic
ence
.View Article Online
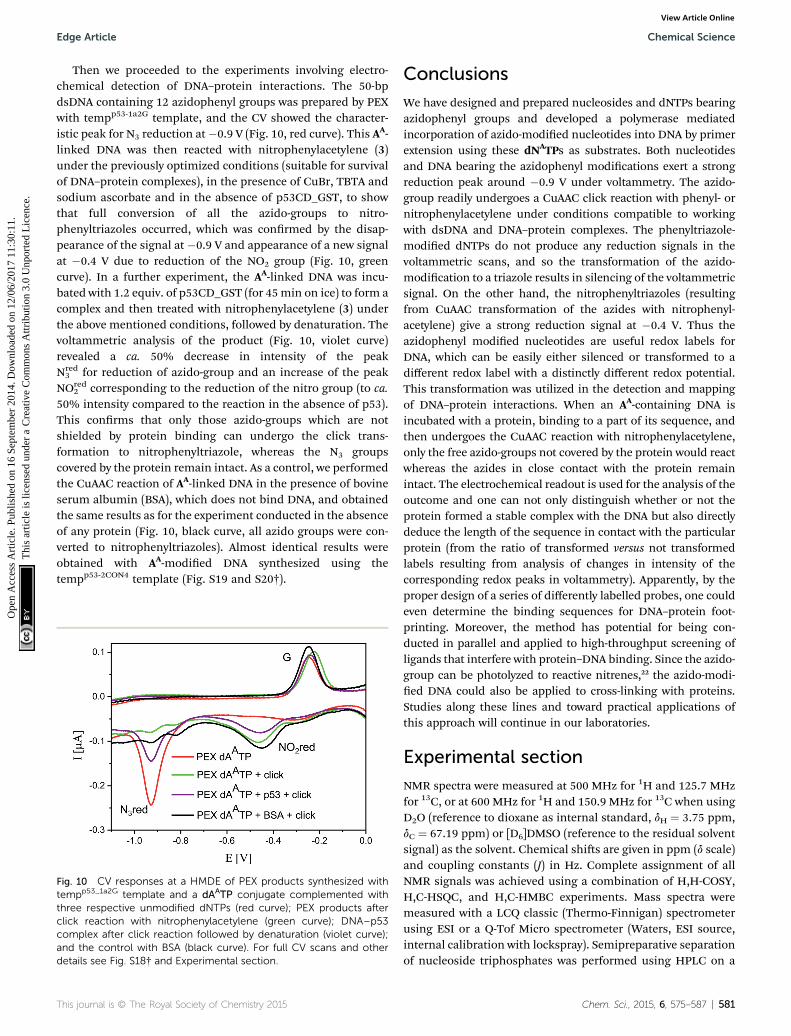
Then we proceeded to the experiments involving electro-chemical detection of DNA–protein interactions. The 50-bpdsDNA containing 12 azidophenyl groups was prepared by PEXwith tempp53-1a2G template, and the CV showed the character-istic peak for N3 reduction at�0.9 V (Fig. 10, red curve). This AA-linked DNA was then reacted with nitrophenylacetylene (3)under the previously optimized conditions (suitable for survivalof DNA–protein complexes), in the presence of CuBr, TBTA andsodium ascorbate and in the absence of p53CD_GST, to showthat full conversion of all the azido-groups to nitro-phenyltriazoles occurred, which was conrmed by the disap-pearance of the signal at �0.9 V and appearance of a new signalat �0.4 V due to reduction of the NO2 group (Fig. 10, greencurve). In a further experiment, the AA-linked DNA was incu-bated with 1.2 equiv. of p53CD_GST (for 45min on ice) to form acomplex and then treated with nitrophenylacetylene (3) underthe above mentioned conditions, followed by denaturation. Thevoltammetric analysis of the product (Fig. 10, violet curve)revealed a ca. 50% decrease in intensity of the peakNred3 for reduction of azido-group and an increase of the peak
NOred2 corresponding to the reduction of the nitro group (to ca.
50% intensity compared to the reaction in the absence of p53).This conrms that only those azido-groups which are notshielded by protein binding can undergo the click trans-formation to nitrophenyltriazole, whereas the N3 groupscovered by the protein remain intact. As a control, we performedthe CuAAC reaction of AA-linked DNA in the presence of bovineserum albumin (BSA), which does not bind DNA, and obtainedthe same results as for the experiment conducted in the absenceof any protein (Fig. 10, black curve, all azido groups were con-verted to nitrophenyltriazoles). Almost identical results wereobtained with AA-modied DNA synthesized using thetempp53-2CON4 template (Fig. S19 and S20†).
Conclusions
We have designed and prepared nucleosides and dNTPs bearingazidophenyl groups and developed a polymerase mediatedincorporation of azido-modied nucleotides into DNA by primerextension using these dNATPs as substrates. Both nucleotidesand DNA bearing the azidophenyl modications exert a strongreduction peak around �0.9 V under voltammetry. The azido-group readily undergoes a CuAAC click reaction with phenyl- ornitrophenylacetylene under conditions compatible to workingwith dsDNA and DNA–protein complexes. The phenyltriazole-modied dNTPs do not produce any reduction signals in thevoltammetric scans, and so the transformation of the azido-modication to a triazole results in silencing of the voltammetricsignal. On the other hand, the nitrophenyltriazoles (resultingfrom CuAAC transformation of the azides with nitrophenyl-acetylene) give a strong reduction signal at �0.4 V. Thus theazidophenyl modied nucleotides are useful redox labels forDNA, which can be easily either silenced or transformed to adifferent redox label with a distinctly different redox potential.This transformation was utilized in the detection and mappingof DNA–protein interactions. When an AA-containing DNA isincubated with a protein, binding to a part of its sequence, andthen undergoes the CuAAC reaction with nitrophenylacetylene,only the free azido-groups not covered by the protein would reactwhereas the azides in close contact with the protein remainintact. The electrochemical readout is used for the analysis of theoutcome and one can not only distinguish whether or not theprotein formed a stable complex with the DNA but also directlydeduce the length of the sequence in contact with the particularprotein (from the ratio of transformed versus not transformedlabels resulting from analysis of changes in intensity of thecorresponding redox peaks in voltammetry). Apparently, by theproper design of a series of differently labelled probes, one couldeven determine the binding sequences for DNA–protein foot-printing. Moreover, the method has potential for being con-ducted in parallel and applied to high-throughput screening ofligands that interfere with protein–DNA binding. Since the azido-group can be photolyzed to reactive nitrenes,22 the azido-modi-ed DNA could also be applied to cross-linking with proteins.Studies along these lines and toward practical applications ofthis approach will continue in our laboratories.
Experimental section
NMR spectra were measured at 500 MHz for 1H and 125.7 MHzfor 13C, or at 600 MHz for 1H and 150.9 MHz for 13C when usingD2O (reference to dioxane as internal standard, dH ¼ 3.75 ppm,dC ¼ 67.19 ppm) or [D6]DMSO (reference to the residual solventsignal) as the solvent. Chemical shis are given in ppm (d scale)and coupling constants (J) in Hz. Complete assignment of allNMR signals was achieved using a combination of H,H-COSY,H,C-HSQC, and H,C-HMBC experiments. Mass spectra weremeasured with a LCQ classic (Thermo-Finnigan) spectrometerusing ESI or a Q-Tof Micro spectrometer (Waters, ESI source,internal calibration with lockspray). Semipreparative separationof nucleoside triphosphates was performed using HPLC on a
Fig. 10 CV responses at a HMDE of PEX products synthesized withtempp53_1a2G template and a dAATP conjugate complemented withthree respective unmodified dNTPs (red curve); PEX products afterclick reaction with nitrophenylacetylene (green curve); DNA–p53complex after click reaction followed by denaturation (violet curve);and the control with BSA (black curve). For full CV scans and otherdetails see Fig. S18† and Experimental section.
This journal is © The Royal Society of Chemistry 2015 Chem. Sci., 2015, 6, 575–587 | 581
Edge Article Chemical Science
Ope
n A
cces
s A
rtic
le. P
ublis
hed
on 1
6 Se
ptem
ber
2014
. Dow
nloa
ded
on 1
2/06
/201
7 11
:30:
11.
Thi
s ar
ticle
is li
cens
ed u
nder
a C
reat
ive
Com
mon
s A
ttrib
utio
n 3.
0 U
npor
ted
Lic
ence
.View Article Online
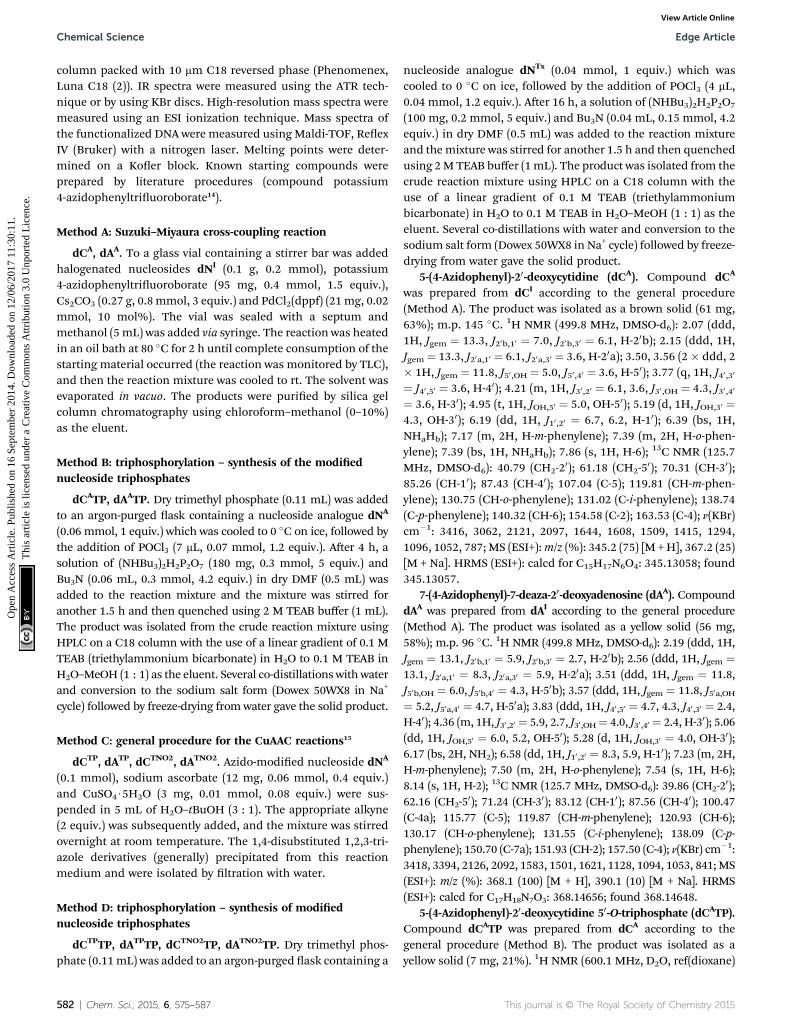
column packed with 10 mm C18 reversed phase (Phenomenex,Luna C18 (2)). IR spectra were measured using the ATR tech-nique or by using KBr discs. High-resolution mass spectra weremeasured using an ESI ionization technique. Mass spectra ofthe functionalized DNA were measured using Maldi-TOF, ReexIV (Bruker) with a nitrogen laser. Melting points were deter-mined on a Koer block. Known starting compounds wereprepared by literature procedures (compound potassium4-azidophenyltriuoroborate14).
Method A: Suzuki–Miyaura cross-coupling reaction
dCA, dAA. To a glass vial containing a stirrer bar was addedhalogenated nucleosides dNI (0.1 g, 0.2 mmol), potassium4-azidophenyltriuoroborate (95 mg, 0.4 mmol, 1.5 equiv.),Cs2CO3 (0.27 g, 0.8 mmol, 3 equiv.) and PdCl2(dppf) (21mg, 0.02mmol, 10 mol%). The vial was sealed with a septum andmethanol (5 mL) was added via syringe. The reaction was heatedin an oil bath at 80 �C for 2 h until complete consumption of thestarting material occurred (the reaction was monitored by TLC),and then the reaction mixture was cooled to rt. The solvent wasevaporated in vacuo. The products were puried by silica gelcolumn chromatography using chloroform–methanol (0–10%)as the eluent.
Method B: triphosphorylation – synthesis of the modiednucleoside triphosphates
dCATP, dAATP. Dry trimethyl phosphate (0.11 mL) was addedto an argon-purged ask containing a nucleoside analogue dNA
(0.06 mmol, 1 equiv.) which was cooled to 0 �C on ice, followed bythe addition of POCl3 (7 mL, 0.07 mmol, 1.2 equiv.). Aer 4 h, asolution of (NHBu3)2H2P2O7 (180 mg, 0.3 mmol, 5 equiv.) andBu3N (0.06 mL, 0.3 mmol, 4.2 equiv.) in dry DMF (0.5 mL) wasadded to the reaction mixture and the mixture was stirred foranother 1.5 h and then quenched using 2 M TEAB buffer (1 mL).The product was isolated from the crude reaction mixture usingHPLC on a C18 column with the use of a linear gradient of 0.1 MTEAB (triethylammonium bicarbonate) in H2O to 0.1 M TEAB inH2O–MeOH (1 : 1) as the eluent. Several co-distillations with waterand conversion to the sodium salt form (Dowex 50WX8 in Na+
cycle) followed by freeze-drying from water gave the solid product.
Method C: general procedure for the CuAAC reactions15
dCTP, dATP, dCTNO2, dATNO2. Azido-modied nucleoside dNA
(0.1 mmol), sodium ascorbate (12 mg, 0.06 mmol, 0.4 equiv.)and CuSO4$5H2O (3 mg, 0.01 mmol, 0.08 equiv.) were sus-pended in 5 mL of H2O–tBuOH (3 : 1). The appropriate alkyne(2 equiv.) was subsequently added, and the mixture was stirredovernight at room temperature. The 1,4-disubstituted 1,2,3-tri-azole derivatives (generally) precipitated from this reactionmedium and were isolated by ltration with water.
Method D: triphosphorylation – synthesis of modiednucleoside triphosphates
dCTPTP, dATPTP, dCTNO2TP, dATNO2TP. Dry trimethyl phos-phate (0.11mL) was added to an argon-purged ask containing a
nucleoside analogue dNTx (0.04 mmol, 1 equiv.) which wascooled to 0 �C on ice, followed by the addition of POCl3 (4 mL,0.04 mmol, 1.2 equiv.). Aer 16 h, a solution of (NHBu3)2H2P2O7
(100 mg, 0.2 mmol, 5 equiv.) and Bu3N (0.04 mL, 0.15 mmol, 4.2equiv.) in dry DMF (0.5 mL) was added to the reaction mixtureand the mixture was stirred for another 1.5 h and then quenchedusing 2M TEAB buffer (1mL). The product was isolated from thecrude reaction mixture using HPLC on a C18 column with theuse of a linear gradient of 0.1 M TEAB (triethylammoniumbicarbonate) in H2O to 0.1 M TEAB in H2O–MeOH (1 : 1) as theeluent. Several co-distillations with water and conversion to thesodium salt form (Dowex 50WX8 in Na+ cycle) followed by freeze-drying from water gave the solid product.
5-(4-Azidophenyl)-20-deoxycytidine (dCA). Compound dCA
was prepared from dCI according to the general procedure(Method A). The product was isolated as a brown solid (61 mg,63%); m.p. 145 �C. 1H NMR (499.8 MHz, DMSO-d6): 2.07 (ddd,1H, Jgem ¼ 13.3, J20b,10 ¼ 7.0, J20b,30 ¼ 6.1, H-20b); 2.15 (ddd, 1H,Jgem ¼ 13.3, J20a,10 ¼ 6.1, J20a,30 ¼ 3.6, H-20a); 3.50, 3.56 (2� ddd, 2� 1H, Jgem ¼ 11.8, J50,OH ¼ 5.0, J50,40 ¼ 3.6, H-50); 3.77 (q, 1H, J40,30¼ J40,50 ¼ 3.6, H-40); 4.21 (m, 1H, J30,20 ¼ 6.1, 3.6, J30,OH ¼ 4.3, J30,40¼ 3.6, H-30); 4.95 (t, 1H, JOH,50 ¼ 5.0, OH-50); 5.19 (d, 1H, JOH,30 ¼4.3, OH-30); 6.19 (dd, 1H, J10,20 ¼ 6.7, 6.2, H-10); 6.39 (bs, 1H,NHaHb); 7.17 (m, 2H, H-m-phenylene); 7.39 (m, 2H, H-o-phen-ylene); 7.39 (bs, 1H, NHaHb); 7.86 (s, 1H, H-6); 13C NMR (125.7MHz, DMSO-d6): 40.79 (CH2-20); 61.18 (CH2-50); 70.31 (CH-30);85.26 (CH-10); 87.43 (CH-40); 107.04 (C-5); 119.81 (CH-m-phen-ylene); 130.75 (CH-o-phenylene); 131.02 (C-i-phenylene); 138.74(C-p-phenylene); 140.32 (CH-6); 154.58 (C-2); 163.53 (C-4); n(KBr)cm�1: 3416, 3062, 2121, 2097, 1644, 1608, 1509, 1415, 1294,1096, 1052, 787; MS (ESI+):m/z (%): 345.2 (75) [M +H], 367.2 (25)[M + Na]. HRMS (ESI+): calcd for C15H17N6O4: 345.13058; found345.13057.
7-(4-Azidophenyl)-7-deaza-20-deoxyadenosine (dAA). CompounddAA was prepared from dAI according to the general procedure(Method A). The product was isolated as a yellow solid (56 mg,58%); m.p. 96 �C. 1H NMR (499.8 MHz, DMSO-d6): 2.19 (ddd, 1H,Jgem ¼ 13.1, J20b,10 ¼ 5.9, J20b,30 ¼ 2.7, H-20b); 2.56 (ddd, 1H, Jgem ¼13.1, J20a,10 ¼ 8.3, J20a,30 ¼ 5.9, H-20a); 3.51 (ddd, 1H, Jgem ¼ 11.8,J50b,OH ¼ 6.0, J50b,40 ¼ 4.3, H-50b); 3.57 (ddd, 1H, Jgem ¼ 11.8, J50a,OH¼ 5.2, J50a,40 ¼ 4.7, H-50a); 3.83 (ddd, 1H, J40,50 ¼ 4.7, 4.3, J40,30 ¼ 2.4,H-40); 4.36 (m, 1H, J30,20 ¼ 5.9, 2.7, J30,OH¼ 4.0, J30,40 ¼ 2.4, H-30); 5.06(dd, 1H, JOH,50 ¼ 6.0, 5.2, OH-50); 5.28 (d, 1H, JOH,30 ¼ 4.0, OH-30);6.17 (bs, 2H, NH2); 6.58 (dd, 1H, J10,20 ¼ 8.3, 5.9, H-10); 7.23 (m, 2H,H-m-phenylene); 7.50 (m, 2H, H-o-phenylene); 7.54 (s, 1H, H-6);8.14 (s, 1H, H-2); 13C NMR (125.7 MHz, DMSO-d6): 39.86 (CH2-20);62.16 (CH2-50); 71.24 (CH-30); 83.12 (CH-10); 87.56 (CH-40); 100.47(C-4a); 115.77 (C-5); 119.87 (CH-m-phenylene); 120.93 (CH-6);130.17 (CH-o-phenylene); 131.55 (C-i-phenylene); 138.09 (C-p-phenylene); 150.70 (C-7a); 151.93 (CH-2); 157.50 (C-4); n(KBr) cm�1:3418, 3394, 2126, 2092, 1583, 1501, 1621, 1128, 1094, 1053, 841;MS(ESI+): m/z (%): 368.1 (100) [M + H], 390.1 (10) [M + Na]. HRMS(ESI+): calcd for C17H18N7O3: 368.14656; found 368.14648.
5-(4-Azidophenyl)-20-deoxycytidine 50-O-triphosphate (dCATP).Compound dCATP was prepared from dCA according to thegeneral procedure (Method B). The product was isolated as ayellow solid (7 mg, 21%). 1H NMR (600.1 MHz, D2O, ref(dioxane)
582 | Chem. Sci., 2015, 6, 575–587 This journal is © The Royal Society of Chemistry 2015
Chemical Science Edge Article
Ope
n A
cces
s A
rtic
le. P
ublis
hed
on 1
6 Se
ptem
ber
2014
. Dow
nloa
ded
on 1
2/06
/201
7 11
:30:
11.
Thi
s ar
ticle
is li
cens
ed u
nder
a C
reat
ive
Com
mon
s A
ttrib
utio
n 3.
0 U
npor
ted
Lic
ence
.View Article Online
¼ 3.75 ppm): 2.36 (ddd, 1H, Jgem ¼ 14.2, J20b,10 ¼ 7.3, J20b,30 ¼ 6.4,H-20b); 2.43 (ddd, 1H, Jgem ¼ 14.2, J20a,10 ¼ 6.3, J20a,30 ¼ 3.6, H-20a);4.13 (m, 1H, H-50b); 4.19 (m, 2H, H-40,50a); 4.63 (dt, 1H, J30,20 ¼ 6.4,3.6, J30,40 ¼ 3.6, H-30); 6.35 (dd, 1H, J10,20 ¼ 7.3, 6.3, H-10); 7.21 (m,2H, H-m-phenylene); 7.45 (m, 2H, H-o-phenylene); 7.77 (s, 1H, H-6); 13C NMR (150.9 MHz, D2O, ref(dioxane) ¼ 69.3 ppm): 41.66(CH2-20); 67.86 (d, JC,P¼ 5.8, CH2-50); 73.15 (CH-30); 88.26 (d, JC,P¼8.8, CH-40); 88.61 (CH-10); 112.85 (C-5); 122.47 (CH-m-phenylene);131.41 (C-i-phenylene); 133.67 (CH-o-phenylene); 142.47 (CH-6);142.99 (C-p-phenylene); 159.87 (C-2); 167.48 (C-4); 31P{1H} NMR(202.3 MHz, D2O): �21.47 (dd, J ¼ 20.1, 16.3, Pb); �10.68 (d, J ¼20.1, Pa); �5.50 (d, J ¼ 16.3, Pg); MS (ESI�): m/z (%): 503.3 (100)[M � H2PO3], 525.2 (75) [M � H � H2PO3 + Na], 583.3 (10) [M �H]. HRMS (ESI�): calcd for C15H18N6O13P3: 583.01502; found583.01516.
7-(4-Azidophenyl)-7-deaza-20-deoxyadenosine 50-O-triphos-phate (dAATP). Compound dAATP was prepared from dAA
according to the general procedure (Method B). The productwas isolated as a yellow solid (13 mg, 34%). 1H NMR (600.1MHz, D2O, ref(dioxane)¼ 3.75 ppm): 2.48 (ddd, 1H, Jgem ¼ 14.0,J20b,10 ¼ 6.3, J20b,30 ¼ 3.3, H-20b); 2.75 (ddd, 1H, Jgem ¼ 14.0, J20a,10¼ 7.9, J20a,30 ¼ 6.4, H-20a); 4.12 (ddd, 1H, Jgem ¼ 11.3, JH,P ¼ 5.5,J50b,40 ¼ 4.2, H-50b); 4.19 (ddd, 1H, Jgem ¼ 11.3, JH,P ¼ 6.5, J50a,40 ¼4.2, H-50a); 4.24 (td, 1H, J40,50 ¼ 4.2, J40,30 ¼ 3.3, H-40); 4.79 (dt, 1H,J30,20 ¼ 6.4, 3.3, J30,40 ¼ 3.3, H-30); 6.70 (dd, 1H, J10,20 ¼ 7.9, 6.3, H-10); 7.21 (m, 2H, H-m-phenylene); 7.54 (s, 1H, H-6); 7.55 (m, 2H,H-o-phenylene); 8.18 (s, 1H, H-2); 13C NMR (150.9 MHz, D2O,ref(dioxane) ¼ 69.3 ppm): 40.99 (CH2-20); 68.16 (d, JC,P ¼ 5.5,CH2-50); 73.81 (CH-30); 85.46 (CH-10); 87.90 (d, JC,P ¼ 9.0, CH-40);103.81 (C-4a); 120.34 (C-5); 122.26 (CH-m-phenylene); 122.92(CH-6); 132.98 (C-i-phenylene); 133.00 (CH-o-phenylene); 141.81(C-p-phenylene); 152.69 (C-7a); 154.23 (CH-2); 160.11 (C-4); 31P{1H} NMR (202.3 MHz, D2O): �21.44 (bdd, J ¼ 19.6, 18.3, Pb);�10.39 (d, J ¼ 19.6, Pa); �5.60 (bd, J ¼ 18.3, Pg); MS (ESI�): m/z(%): 526.3 (100) [M�H2PO3], 548.3 (100) [M�H�H2PO3 + Na],606.3 (5) [M�H], 628.3 (15) [M� 2H + Na]. HRMS (ESI�): calcdfor C17H19N7O12P3: 606.03100; found 606.03103.
5-[4-(4-Phenyl-1,2,3-triazol-1-yl)phenyl]-20-deoxycytidine (dCTP).Compound dCTP was prepared from dCA according to the generalprocedure (Method C). The product was isolated as a green solid(26 mg, 40%); m.p. > 300 �C. 1H NMR (499.8 MHz, DMSO-d6, t ¼100 �C): 2.15 (ddd, 1H, Jgem¼ 13.3, J20b,30 ¼ 6.7, J20b,10 ¼ 6.4, H-20b);2.26 (ddd, 1H, Jgem ¼ 13.3, J20a,10 ¼ 6.4, J20a,30 ¼ 4.0, H-20a); 3.58,3.64 (2� bddd, 2� 1H, Jgem ¼ 12.0, J50,OH ¼ 4.6, J50,40 ¼ 3.8, H-50);3.84 (q, 1H, J40,30 ¼ J40,50 ¼ 3.8, H-40); 4.28 (m, 1H, H-30); 4.59 (bs,1H, OH-50); 4.85 (bs, 1H, OH-30); 6.23 (t, 1H, J10,20 ¼ 6.4, H-10); 6.55(bs, 2H, NH2); 7.39 (m, 1H, H-p-Ph); 7.50 (m, 2H, H-m-Ph); 7.59 (m,2H, H-o-phenylene); 7.92 (s, 1H, H-6); 7.96 (m, 2H, H-o-Ph); 8.00(m, 2H, H-m-phenylene); 9.12 (s, 1H, H-5-triazole); 13C NMR (125.7MHz, DMSO-d6, t ¼ 100 �C): 40.52 (CH2-20); 61.01 (CH2-50); 70.00(CH-30); 85.34 (CH-10); 87.25 (CH-40); 106.60 (C-5); 119.06 (CH-5-triazole); 120.30 (CH-m-phenylene); 125.24 (CH-o-Ph); 127.86 (CH-p-Ph); 128.56 (CH-m-Ph); 130.06 (CH-o-phenylene); 130.13 (C-i-Ph);134.33 (C-i-phenylene); 135.73 (C-p-phenylene); 140.29 (CH-6);147.22 (C-4-triazole); 154.01 (C-2); 163.20 (C-4); n(KBr) cm�1: 3464,3363, 1647, 1482, 1457, 1411, 1353, 1254, 1187, 1096, 1042, 1026,956; MS (ESI+): m/z (%): 447.3 (10) [M + H], 469.3 (100) [M + Na].
HRMS (ESI+): calcd for C23H22N6O4Na: 469.15947; found469.15920.
7-[4-(4-Phenyl-1,2,3-triazol-1-yl)phenyl]-7-deaza-20-deoxy-adenosine (dATP). Compound dATP was prepared from dAA
according to the general procedure (Method C). The productwas isolated as a yellow solid (34 mg, 72%); m.p. > 300 �C. 1HNMR (499.8 MHz, DMSO-d6, t ¼ 100 �C): 2.30 (ddd, 1H, Jgem ¼13.2, J20b,10 ¼ 6.1, J20b,30 ¼ 3.1, H-20b); 2.60 (ddd, 1H, Jgem ¼ 13.2,J20a,10 ¼ 7.7, J20a,30 ¼ 6.1, H-20a); 3.60, 3.66 (2 � bdt, 2 � 1H, Jgem¼ 11.7, J50,OH ¼ J50,40 ¼ 4.5, H-50); 3.90 (td, 1H, J40,50 ¼ 4.5, J40,30 ¼3.0, H-40); 4.43 (bm, 1H, H-30); 4.64 (bs, 1H, OH-50); 4.92 (bs, 1H,OH-30); 5.91 (bs, 2H, NH2); 6.52 (dd, 1H, J10,20 ¼ 7.7, 6.1, H-10);7.39 (m, 1H, H-p-Ph); 7.51 (m, 2H, H-m-Ph); 7.58 (s, 1H, H-6);7.72 (m, 2H, H-o-phenylene); 7.97 (m, 2H, H-o-Ph); 8.04 (m, 2H,H-m-phenylene); 8.20 (bs, 1H, H-2); 9.13 (bs, 1H, H-5-triazole);13C NMR (125.7 MHz, DMSO-d6, t ¼ 100 �C): 39.70 (CH2-20);61.86 (CH2-50); 70.82 (CH-30); 83.11 (CH-10); 87.27 (CH-40); 100.50(C-4a); 114.99 (C-5); 119.13 (CH-5-triazole); 120.31 (CH-m-phenylene); 121.01 (CH-6); 125.23 (CH-o-Ph); 127.83 (CH-p-Ph);128.56 (CH-m-Ph); 129.43 (CH-o-phenylene); 130.19 (C-i-Ph);134.78 (C-i-phenylene); 135.21 (C-p-phenylene); 147.18 (C-4-tri-azole); 150.58 (C-7a); 151.50 (CH-2); 157.12 (C-4); n(KBr) cm�1:3437, 1657, 1626, 1536, 1483, 1461, 1095, 1048, 1027, 960, 798;MS (ESI+): m/z (%): 470.3 (90) [M + H], 492.3 (100) [M + Na].HRMS (ESI+): calcd for C25H24N7O3: 470.19351; found470.19342.
5-[4-(4-(4-Nitrophenyl)-1,2,3-triazol-1-yl)phenyl]-20-deoxy-cytidine (dCTNO2). Compound dCTNO2 was prepared from dCA
according to the general procedure (Method C). The productwas isolated as a red solid (30 mg, 62%); m.p. 230 �C. 1H NMR(600.1 MHz, DMSO-d6): 2.12 (bdt, 1H, Jgem ¼ 13.3, J20b,30 ¼ J20b,10¼ 6.3, H-20b); 2.19 (bddd, 1H, Jgem ¼ 13.3, J20a,10 ¼ 6.3, J20a,30 ¼3.5, H-20a); 3.53, 3.60 (2 � bdt, 2 � 1H, Jgem ¼ 11.9, J50,OH ¼ J50,40¼ 4.5, H-50); 3.80 (btd, 1H, J40,50 ¼ 4.5, J40,30 ¼ 3.2, H-40); 4.25 (m,1H, H-30); 5.00 (bt, 1H, JOH,5' ¼ 4.5, OH-50); 4.25 (bd, 1H, JOH,5' ¼3.6, OH-30); 6.22 (t, 1H, J10,20 ¼ 6.3, H-10); 6.68 (bs, 2H, NH2); 7.61(m, 2H, H-o-phenylene); 8.00 (s, 1H, H-6); 8.02 (m, 2H, H-m-phenylene); 8.23 (m, 2H, H-o-C6H4NO2); 8.40 (m, 2H, H-m-C6H4NO2); 9.62 (s, 1H, H-5-triazole); 13C NMR (150.9 MHz,DMSO-d6): 40.86 (CH2-20); 61.13 (CH2-50); 70.23 (CH-30); 85.49(CH-10); 87.25 (CH-40); 106.50 (C-5); 120.65 (CH-m-phenylene);121.80 (CH-5-triazole); 124.73 (CH-m-C6H4NO2); 126.37 (CH-o-C6H4NO2); 130.72 (CH-o-phenylene); 134.89 (C-i-phenylene);135.74 (C-p-phenylene); 136.78 (C-i-C6H4NO2); 140.82 (CH-6);145.67 (C-4-triazole); 147.10 (C-p-C6H4NO2); 154.44 (C-2); 163.40(C-4); (KBr) cm�1: 3454, 3320, 3206, 1657, 1643, 1606, 1519,1481, 1411, 1341, 1289, 1180, 1108, 1033, 855, 786, 636, 526; MS(ESI+): m/z (%): 514.3 (100) [M + H]. HRMS (ESI+): calcd forC23H21N7O6Na: 514.14455; found 514.14447.
7-[4-(4-(4-Nitrophenyl)-1,2,3-triazol-1-yl)phenyl]-7-deaza-20-deoxyadenosine (dATNO2). Compound dATNO2 was preparedfrom dAA according to the general procedure (Method C). Theproduct was isolated as a red solid (53 mg, 94%); m.p. 200 �C.1H NMR (600.1 MHz, DMSO-d6): 2.24 (ddd, 1H, Jgem ¼ 13.3,J20b,10 ¼ 6.0, J20b,30 ¼ 2.7, H-20b); 2.59 (bddd, 1H, Jgem ¼ 13.2, J20a,10¼ 8.1, J20a,30 ¼ 5.9, H-20a); 3.53, 3.60 (2 � bdt, 2 � 1H, Jgem ¼11.6, J50,OH¼ J50,40 ¼ 4.5, H-50); 3.86 (td, 1H, J40,50 ¼ 4.5, J40,30 ¼ 2.6,
This journal is © The Royal Society of Chemistry 2015 Chem. Sci., 2015, 6, 575–587 | 583
Edge Article Chemical Science
Ope
n A
cces
s A
rtic
le. P
ublis
hed
on 1
6 Se
ptem
ber
2014
. Dow
nloa
ded
on 1
2/06
/201
7 11
:30:
11.
Thi
s ar
ticle
is li
cens
ed u
nder
a C
reat
ive
Com
mon
s A
ttrib
utio
n 3.
0 U
npor
ted
Lic
ence
.View Article Online

H-40); 4.39 (m, 1H, H-30); 5.04 (bt, 1H, JOH,50 ¼ 4.5, OH-50); 5.30(bd, 1H, JOH,50 ¼ 4.1, OH-30); 6.48 (bs, 2H, NH2); 6.63 (dd, 1H,J10,20 ¼ 8.1, 6.00, H-10); 7.71 (s, 1H, H-6); 7.73 (m, 2H, H-o-phenylene); 8.07 (m, 2H, H-m-phenylene); 8.24 (m, 2H, H-o-C6H4NO2); 8.40 (m, 2H, H-m-C6H4NO2); 9.63 (s, 1H, H-5-tri-azole); 13C NMR (150.9 MHz, DMSO-d6): 39.56 (CH2-20); 62.10(CH2-50); 71.18 (CH-30); 83.17 (CH-10); 87.62 (CH-40); 101.14 (C-4a); 115.80 (C-5); 120.71 (CH-m-phenylene); 121.80 (CH-5-tri-azole); 124.17 (CH-6); 124.72 (CH-m-C6H4NO2); 126.32 (CH-o-C6H4NO2); 129.93 (CH-o-phenylene); 135.17 (C-i,p-phenylene);136.80 (C-i-C6H4NO2); 145.61 (C-4-triazole); 147.06 (C-p-C6H4NO2); 150.52 (C-7a); 151.97 (CH-2); 157.34 (C-4); n(KBr)/cm�1: 3440, 1657, 1625, 1607, 1589, 1536, 1517, 1481, 1466,1408, 1342, 1289, 1107, 1067, 1038, 854, 796; MS (ESI+):m/z (%):515.3 (100) [M + H]. HRMS (ESI+): calcd for C25H23N8O5:515.17859; found 515.17839.
5-[4-(4-Phenyl-1,2,3-triazol-1-yl)phenyl]-20-deoxycytidine 50-O-triphosphate (dCTPTP). Compound dCTPTP was preparedfrom dCTP according to the general procedure (Method D). Theproduct was isolated as a white solid (14 mg, 52%).1H NMR(600.1 MHz, D2O, ref(dioxane) ¼ 3.75 ppm): 2.34 (ddd, 1H, Jgem¼ 14.1, J20b,10 ¼ 7.1, J20b,30 ¼ 6.5, H-20b); 2.46 (ddd, 1H, Jgem ¼14.1, J20a,10 ¼ 6.3, J20a,30 ¼ 3.6, H-20a); 4.18–4.26 (bm, 3H, H-40,50);4.63 (dt, 1H, J30,20 ¼ 6.5, 3.6, J30,40 ¼ 3.6, H-30); 6.24 (dd, 1H, J10,20 ¼7.1, 6.3, H-10); 7.42 (m, 1H, H-p-Ph); 7.49 (m, 2H, H-m-Ph); 7.55(m, 2H, H-o-phenylene); 7.77 (s, 1H, H-6); 7.79 (m, 2H, H-m-phenylene); 7.80 (m, 2H, H-o-Ph); 8.75 (s, 1H, H-5-triazole); 13CNMR (150.9 MHz, D2O, ref(dioxane) ¼ 69.3 ppm): 42.09(CH2-20); 67.93 (d, JC,P ¼ 4.7, CH2-50); 73.21 (CH-30); 88.37 (d, JC,P¼ 8.5, CH-40); 89.03 (CH-10); 111.70 (C-5); 122.96 (CH-5-triazole);123.95 (CH-m-phenylene); 128.38 (CH-o-Ph); 131.60 (CH-p-Ph);131.78 (C-i-Ph); 131.93 (CH-m-Ph); 133.18 (CH-o-phenylene);135.91 (C-i-phenylene); 138.68 (C-p-phenylene); 142.82 (CH-6);150.76 (C-4-triazole); 159.42 (C-2); 166.71 (C-4); 31P{1H} NMR(202.3 MHz, D2O):�21.56 (bm, Pb);�10.69 (bm, Pa);�6.88 (bm,Pg); MS (ESI�): m/z (%): 525.3 (60) [M � H3P2O6], 605.3 (100) [M� H2PO3], 627.2 (90) [M � H � H2PO3 + Na], 685.3 (5) [M � H].HRMS (ESI�): calcd for C23H24N6O13P3: 685.06197; found685.06211.
7-[4-(4-Phenyl-1,2,3-triazol-1-yl)phenyl]-7-deaza-20-deoxy-adenosine 50-O-triphosphate (dATPTP). Compound dATPTP wasprepared from dATP according to the general procedure(Method D). The product was isolated as a white solid (4 mg,13%). 1H NMR (600.1 MHz, D2O, ref(dioxane) ¼ 3.75 ppm): 2.45(ddd, 1H, Jgem¼ 13.8, J20b,10 ¼ 6.1, J20b,30 ¼ 3.0, H-20b); 2.72 (bddd,1H, Jgem ¼ 13.8, J20a,10 ¼ 7.8, J20a,30 ¼ 6.4, H-20a); 4.11, 4.17 (2 �bm, 2 � 1H, H-50); 4.23 (bm, 1H, H-40); 4.77 (bm, 1H, H-30); 6.38(bdd, 1H, J10,20 ¼ 7.8, 6.1, H-10); 7.32 (m, 2H, H-m-Ph); 7.35 (m,1H, H-p-Ph); 7.47 (s, 1H, H-6); 7.48 (m, 2H, H-o-phenylene); 7.52(m, 2H, H-o-Ph); 7.58 (m, 2H, H-m-phenylene); 8.02 (s, 1H, H-2);8.51 (s, 1H, H-5-triazole); 13C NMR (150.9MHz, D2O, ref(dioxane)¼ 69.3 ppm): 40.77 (CH2-20); 68.21 (d, JC,P ¼ 4.4, CH2-50); 73.74(CH-30); 85.34 (CH-10); 87.76 (d, JC,P ¼ 7.5, CH-40); 103.15 (C-4a);119.37 (C-5); 122.25 (CH-5-triazole); 123.32 (CH-6); 123.45 (CH-m-phenylene); 127.73 (CH-o-Ph); 131.21 (C-i-Ph); 131.43 (CH-p-Ph); 131.58 (CH-m-Ph); 132.00 (CH-o-phenylene); 137.05 (C-i-phenylene); 137.46 (C-p-phenylene); 150.47 (C-4-triazole);
152.63 (C-7a); 153.90 (CH-2); 159.59 (C-4); 31P{1H} NMR (202.3MHz, D2O): �21.23 (bs, Pb); �10.32 (bs, Pa); �5.44 (bs, Pg); MS(ESI�): m/z (%): 548.3 (100) [M � H3P2O6], 628.3 (55) [M �H2PO3], 650.3 (50) [M � H � H2PO3 + Na], 708.3 (10) [M � H].HRMS (ESI�): calcd for C25H25N7O12P3: 708.07795; found708.07822.
5-[4-(4-(4-Nitrophenyl)-1,2,3-triazol-1-yl)phenyl]-20-deoxy-cytidine 50-O-triphosphate (dCTNO2TP). Compound dCTNO2TPwas prepared from dCTNO2 according to the general procedure(Method D). The product was isolated as a brown solid (2.5 mg,18%). 1H NMR (600.1 MHz, D2O, ref(dioxane) ¼ 3.75 ppm): 2.36(ddd, 1H, Jgem ¼ 14.1, J20b,10 ¼ 7.0, J20b,30 ¼ 6.4, H-20b); 2.48 (ddd,1H, Jgem ¼ 14.1, J20a,10 ¼ 6.3, J20a,30 ¼ 3.9, H-20a); 4.20–4.29 (bm,3H, H-40,50); 4.66 (m, 1H, H-30); 6.27 (dd, 1H, J10,20 ¼ 7.0, 6.3, H-10); 7.55 (m, 2H, H-o-phenylene); 7.840 (m, 2H, H-m-phenylene);7.843 (s, 1H, H-6); 7.99 (m, 2H, H-o-C6H4NO2); 8.28 (m, 2H, H-m-C6H4NO2); 8.98 (s, 1H, H-5-triazole); 13C NMR (150.9 MHz, D2O,ref(dioxane) ¼ 69.3 ppm): 42.19 (CH2-20); 67.81 (d, JC,P ¼ 4.6,CH2-50); 72.98 (CH-30); 88.42 (d, JC,P ¼ 8.8, CH-40); 88.94 (CH-10);111.79 (C-5); 124.06 (CH-m-phenylene); 124.49 (CH-5-triazole);127.21 (CH-m-C6H4NO2); 129.05 (CH-o-C6H4NO2); 133.38 (CH-o-phenylene); 136.19 (C-i-phenylene); 138.52, 138.55 (C-i-C6H4NO2, C-p-phenylene); 142.94 (CH-6); 148.76 (C-4-triazole);149.81 (C-i-C6H4NO2); 159.54 (C-2); 166.82 (C-4); 31P{1H} NMR(202.3 MHz, D2O): �21.23 (bm, Pb); �10.67 (bd, J ¼ 16.8, Pa);�5.47 (bd, J ¼ 19.1, Pg); MS (ESI�): m/z (%): 570.3 (80) [M �H3P2O6], 650.2 (95) [M � H2PO3], 672.2 (100) [M � H � H2PO3 +Na], 731.2 (10) [M � H]. HRMS (ESI�): calcd for C23H23N7O15P3:730.04705; found 730.04741.
7-[4-(4-(4-Nitrophenyl)-1,2,3-triazol-1-yl)phenyl]-7-deaza-20-deoxyadenosine 50-O-triphosphate (dATNO2TP). CompounddATNO2TP was prepared from dATNO2 according to the generalprocedure (Method D). The product was isolated as a brownsolid (5.5 mg, 18%). 1H NMR (600.1 MHz, D2O, ref(dioxane) ¼3.75 ppm): 2.51 (ddd, 1H, Jgem¼ 13.8, J20b,10 ¼ 6.3, J20b,30 ¼ 3.5, H-2'b); 2.68 (bddd, 1H, Jgem ¼ 13.8, J20a,10 ¼ 7.7, J20a,30 ¼ 6.4, H-20a);4.17, 4.22 (2 � bm, 2 � 1H, H-50); 4.25 (bm, 1H, H-40); 4.79 (m,1H, H-30); 6.34 (bdd, 1H, J10,20 ¼ 7.7, 6.3, H-10); 7.22 (m, 2H, H-o-phenylene); 7.37 (m, 2H, H-m-phenylene); 7.40 (s, 1H, H-6); 7.50(m, 2H, H-o-C6H4NO2); 7.79 (m, 2H, H-m-C6H4NO2); 7.91 (s, 1H,H-2); 8.51 (s, 1H, H-5-triazole); 13C NMR (150.9 MHz, D2O,ref(dioxane) ¼ 69.3 ppm: 41.26 (CH2-20); 68.29 (d, JC,P ¼ 5.7,CH2-50); 73.85 (CH-30); 85.34 (CH-10); 87.82 (d, JC,P ¼ 8.8, CH-40);102.57 (C-4a); 119.07 (C-5); 122.64 (CH-m-phenylene); 123.26(CH-5-triazole); 123.47 (CH-6); 126.24 (CH-m-C6H4NO2); 128.20(CH-o-C6H4NO2); 131.54 (CH-o-phenylene); 136.61 (C-i-phenyl-ene); 136.66 (C-p-phenylene); 137.50 (C-i-C6H4NO2); 148.34 (C-4-triazole); 148.85 (C-p-C6H4NO2); 152.27 (C-7a); 153.51 (CH-2);159.14 (C-4); 31P{1H} NMR (202.4 MHz, D2O): �21.39 (bm, Pb);�10.87 (d, J ¼ 18.2, Pa); �6.25 (bd, J ¼ 15.5, Pg); MS (ESI�): m/z(%) 593.3 (50) [M�H3P2O6], 673.3 (100) [M�H2PO3], 695.3 (90)[M � H � H2PO3 + Na], 753.3 (5) [M � H]. HRMS (ESI�): calcdfor C25H24N8O14P3: 753.06303; found 753.06312.
Primer extension experiment. The reaction mixture (20 mL)contained DNA polymerase [KOD XL, Pwo, Vent (exo-)], primer(0.15 mM), template (0.23 mM) and natural and modied dNTPs(0.2 mM) in a reaction buffer. The primer was labeled by use of
584 | Chem. Sci., 2015, 6, 575–587 This journal is © The Royal Society of Chemistry 2015
Chemical Science Edge Article
Ope
n A
cces
s A
rtic
le. P
ublis
hed
on 1
6 Se
ptem
ber
2014
. Dow
nloa
ded
on 1
2/06
/201
7 11
:30:
11.
Thi
s ar
ticle
is li
cens
ed u
nder
a C
reat
ive
Com
mon
s A
ttrib
utio
n 3.
0 U
npor
ted
Lic
ence
.View Article Online
[g32P]-ATP according to standard techniques. The reactionmixtures were incubated for 15–40 min at 60 �C and analysed byPAGE.
Kinetics of PEX (Fig. S3 and S4†). PEX reaction mixtures thatincluded Pwo DNA polymerase, and tempC and tempAterm astemplates were incubated for specic time intervals (0.1–10min), and then the reaction was stopped by addition of a PAGEloading buffer and immediate heating.
Click reaction of the PEX product DNA.23 (Fig. 2) dsDNAobtained by the PEX experiments was puried using QiagenNucleotide Removal Kit purication columns. A solution of theCu(I) catalyst (10 mM) was freshly prepared just before thereaction by mixing CuBr (1 mL, 50 mM in DMSO–tBuOH 3 : 1),TBTA ligand (4 mL, 100 mM in DMSO–tBuOH 3 : 1) and DMSO–tBuOH 3 : 1 (3 mL). To the DNA solution (50 mL, 50 ng mL�1), asolution of acetylene (phenylacetylene or 1-ethynyl-4-nitroben-zene) (30 mL, 10 mM in DMSO), sodium ascorbate (2 mL, 5 mMin water), pre-complexed Cu(I) and 10 mL DMSO–tBuOH 3 : 1were added. Themixture was incubated for 2 h at 37 �C and with500 rpm stirring. Aer the reaction, the crude mixture waspuried once again and then was desalted using dialysismembranes (Millipore).
Binding study using p53CD_GST protein: native analysis ofreaction mixtures with different p53CD_GST/DNA ratios. Thereaction mixture (100 mL) contained primer (prim15, 10 mL, 3mM), template (templatep53_1a2G/tempp53_2CON_4, 12 mL, 3 mM),KOD XL DNA polymerase (1 mL, 2.5 U ml�1) and dNTPs (either allnatural or 3 natural and 1 modied, 5 mL, 4 mM) in KOD XLreaction buffer (10 mL) supplied by the manufacturer. Primerswere labelled on their 50-end by use of [g32P]-ATP according tostandard techniques. The reaction mixture was incubated for 45min at 60 �C in a thermal cycler and puried using a QIAquickNucleotide Removal Kit (Qiagen). The PEX-product was elutedfrom the column using H2O (pH 7.7, 50 mL). The reactionmixtures for p53CD_GST protein binding (10 mL) were preparedfrom the puried PEX-product (5 mL, 10 ng ml�1), 50 mM KCl, 5mM tris pH 7.6 and p53CD_GST stock solution (750 ng ml�1, 25mMHepes pH 7.6, 200mMKCl, 10% glycerol, 0.1 mMPPh3; 0.4,0.7, 1.2, 1.7 equiv.). A control sample was prepared analogouslywithout p53CD_GST. All samples were incubated for 45 min onice, then glycerol was added (60%, 2 mL) and a part of thereaction mixture (3 mL) was separated by use of a 6% nativePAGE (acrylamide/bisacrylamide 37.5 : 1; 4 �C, 400 V/2.5 hours).Visualization was performed using phosphoimaging (Fig. 9a,Fig. S8†).
Thermal stability of protein–DNA complexes (Fig. S10 andS11†). The reaction mixtures for p53CD_GST protein binding(40 mL) were prepared from the puried PEX-product (20 mL,10 ng ml�1), 50 mM KCl, 5 mM tris pH 7.6 and p53CD_GSTstock solution (750 ng ml�1, 25 mM Hepes pH 7.6, 200 mMKCl, 10% glycerol, 0.1 mM PPh3; 1.2 equiv.). A control samplewas prepared analogously without p53CD_GST. Samples wereincubated for 45 min on ice and then were divided into fourvials and exposed to four different temperatures (0 �C, 20 �C,37 �C, 50 �C) for 1 hour, then glycerol was added (60%, 2 mL)and a part of the reaction mixture (3 mL) was separated by useof a 6% native PAGE (acrylamide/bisacrylamide 37.5 : 1; 4 �C,
400 V/2.5 hours). Visualization was performed usingphosphoimaging.
CuI concentration dependence of the stability of theprotein–DNA complexes (Fig. S12 and S13†). The reactionmixtures for p53CD_GST protein binding (80 mL) were preparedfrom the puried PEX-product (40 mL, 10 ng ml�1), 50 mM KCl, 5mM tris pH 7.6 and p53CD_GST stock solution (750 ng ml�1, 25mMHepes pH 7.6, 200 mM KCl, 10% glycerol, 0.1 mM PPh3; 1.2equiv.). A control sample was prepared analogously withoutp53CD_GST. Samples were incubated for 45 min on ice andthen were divided into eight vials and were incubated withvarious concentration of CuBr (5 mM, 10 mM, 20 mM) with/without the presence of the ligand TBTA at 20 �C for 1 h, thenglycerol was added (60%, 2 mL) and a part of the reactionmixture (3 mL) was separated by use of a 6% native PAGE(acrylamide/bisacrylamide 37.5 : 1; 4 �C, 400 V/2.5 hours).Visualization was performed using phosphoimaging.
Stability of the protein–DNA complex aer click reaction ofthe DNA (Fig. 9b and S9†). The reaction mixtures forp53CD_GST protein binding (10 mL) were prepared from thepuried PEX-product (5 mL, 10 ng ml�1), 50 mM KCl, 5 mM trispH 7.6 and p53CD_GST stock solution (750 ng ml�1, 25 mMHepes pH 7.6, 200 mM KCl, 10% glycerol, 0.1 mM PPh3; 1.2equiv.). A control sample was prepared analogously withoutp53CD_GST. The samples were incubated for 45 min on ice andthen 4-nitrophenylacetylene (10 mM in MeOH, 0.75 mL), CuBr(100 mM in DMSO–tBuOH 3 : 1, 0.75 mL), TBTA (1 mM in DMSO–tBuOH 3 : 1, 0.4 mL), sodium ascorbate (5 mM in water, 0.2 mL),KCl (50 mM, 1.5 mL) and tris (5 mM, pH 7.6, 1.5 mL) were addedand the reaction mixture was incubated at 20 �C for 1 h. Thenglycerol was added (60%, 2 mL) and a part of the reactionmixture (3 mL) was separated by use of a 6% native PAGE(acrylamide/bisacrylamide 37.5 : 1; 4 �C, 400 V/2.5 hours).Visualization was performed using phosphoimaging. For theelectrochemical measurements we applied the same conditionsdescribed above but in higher scale (increased 5 times), usingthree parallel samples for exact comparison (DNA mixed withbinding protein, control sample – DNA mixed with BSA). BSAwas used as control protein.
Electrochemical analysis. Nucleosides, dNTPs and otherbuilding blocks were analyzed using conventional in situ cyclicvoltammetry (CV). The PEX products were analyzed using ex situ(adsorptive transfer stripping, AdTS) CV or square-wave vol-tammetry (SWV). The PEX products (puried in their single-stranded form using streptavidin-coated magnetic beads or intheir double-stranded forms using a Qiagen NucleotideRemoval Kit) were accumulated at the surface of a workingelectrode (hanging mercury drop electrode, HMDE) for 60 s,from 5 mL aliquots containing 0.2 M NaCl. The electrode wasthen rinsed with deionized water and placed into a electro-chemical cell. CV settings: scan rate 1 V s�1, initial potential 0.0V, for switching potentials see gure legends. SWV settings:initial potential 0 V, for nal potentials see gure legends;frequency 200 Hz, amplitude 50mV. Background electrolyte: 0.5M ammonium formate, 0.05 M sodium phosphate, pH 6.9. Allmeasurements were performed at room temperature using anAutolab analyzer (Eco Chemie, The Netherlands) in connection
This journal is © The Royal Society of Chemistry 2015 Chem. Sci., 2015, 6, 575–587 | 585
Edge Article Chemical Science
Ope
n A
cces
s A
rtic
le. P
ublis
hed
on 1
6 Se
ptem
ber
2014
. Dow
nloa
ded
on 1
2/06
/201
7 11
:30:
11.
Thi
s ar
ticle
is li
cens
ed u
nder
a C
reat
ive
Com
mon
s A
ttrib
utio
n 3.
0 U
npor
ted
Lic
ence
.View Article Online
with VA-stand 663 (Metrohm, Herisau, Switzerland). The three-electrode system was used with a Ag/AgCl/3 M KCl electrode as areference and platinum wire as an auxiliary electrode.Measurements of reduction signals were performed aerdeaeration of the solution by argon purging.
Acknowledgements
This work was supported by institutional support from theAcademy of Sciences of the Czech Republic (RVO 61388963 and68081707), by the Czech Science Foundation (P206/12/G151)and by Gilead Sciences, Inc.
Notes and references
1 (a) E. Palecek, F. Jelen in Electrochemistry of nucleic acids andproteins: Towards electrochemical sensors for genomics andproteomics, ed. E. Palecek, F. Scheller, J. Wang, Elsevier,Amsterdam, 2005, pp. 74–174; (b) J. Wang, inElectrochemistry of nucleic acids and proteins: Towardselectrochemical sensors for genomics and proteomics, ed. E.Palecek, F. Scheller, J. Wang, Elsevier, Amsterdam, 2005,pp. 175–194; (c) E. Palecek and M. Bartosik, Chem. Rev.,2012, 112, 3427–3481.
2 (a) M. Hocek and M. Fojta, Chem. Soc. Rev., 2011, 40, 5802–5814; (b) P. Brazdilova, M. Vrabel, R. Pohl, H. Pivonkova,L. Havran, M. Hocek and M. Fojta, Chem.–Eur. J., 2007, 13,9527–9533; (c) H. Cahova, L. Havran, P. Brazdilova,H. Pivonkova, R. Pohl, M. Fojta and M. Hocek, Angew.Chem., Int. Ed., 2008, 47, 2059–2062; (d) J. Balintova,R. Pohl, P. Horakova, P. Vidlakova, L. Havran, M. Fojta andM. Hocek, Chem.–Eur. J., 2011, 17, 14063–14073; (e)H. Macıckova-Cahova, R. Pohl, P. Horakova, L. Havran,J. Spacek, M. Fojta and M. Hocek, Chem.–Eur. J., 2011, 17,5833–5841; (f) V. Raindlova, R. Pohl, B. Klepetarova,L. Havran, E. Simkova, P. Horakova, H. Pivonkova, M. Fojtaand M. Hocek, ChemPlusChem, 2012, 77, 652–662.
3 (a) M. Vrabel, P. Horakova, H. Pivonkova, L. Kalachova,H. Cernocka, H. Cahova, R. Pohl, P. Sebest, L. Havran,M. Hocek and M. Fojta, Chem.–Eur. J., 2009, 15, 1144–1154;(b) J. Balintova, M. Plucnara, P. Vidlakova, R. Pohl,L. Havran, M. Fojta and M. Hocek, Chem.–Eur. J., 2013, 19,12720–12731.
4 (a) A. A. Gorodetsky, M. C. Buzzeo and J. K. Barton,Bioconjugate Chem., 2008, 19, 2285–2296; (b) H. F. Wang,N. B. Muren, D. Ordinario, A. A. Gorodetsky, J. K. Bartonand C. Nuckolls, Chem. Sci., 2012, 3, 62–65.
5 (a) P. Horakova, H. Macickova-Cahova, H. Pivonkova,J. Spacek, L. Havran, M. Hocek and M. Fojta, Org. Biomol.Chem., 2011, 9, 1366–1371; (b) K. Nemcova, P. Sebest,L. Havran, P. Orsag, M. Fojta and H. Pivonkova, Anal.Bioanal. Chem., 2014, 406, 5843–5852.
6 Review: B. Dey, S. Thukral, S. Krishnan, M. Chakrobarty,S. Gupta, C. Manghani and V. Rani, Mol. Cell. Biochem.,2012, 365, 279–299.
7 (a) D. J. Galas and A. Schmitz, Nucleic Acids Res., 1978, 5,3157–3170; (b) R. Sandaltzopoulos and P. B. Becker, Nucleic
Acids Res., 1994, 22, 1511–1512; (c) M. J. Storek, A. Suciuand G. L. Verdine, Org. Lett., 2002, 4, 3867–3869; (d)M. J. Storek, A. Ernst and G. L. Verdine, Nat. Biotechnol.,2002, 20, 183–186.
8 (a) Review: H. C. Kolb, M. G. Finn and K. B. Sharpless, Angew.Chem., Int. Ed., 2001, 40, 2004–2021; (b) D. K. Scraon,J. E. Taylor, M. F. Mahon, J. S. Fossey and T. D. James, J.Org. Chem., 2008, 73, 2871–2874; (c) F. Himo, T. Lovell,R. Hilgraf, V. V. Rostovtsev, L. Noodleman, K. B. Sharplessand V. V. Fokin, J. Am. Chem. Soc., 2005, 127, 210–216.
9 (a) Review: A. H. El-Sagheer and T. Brown, Chem. Soc. Rev.,2010, 39, 1388–1405; (b) J. Gierlich, G. A. Burley,P. M. E. Gramlich, D. M. Hammond and T. Carell, Org.Lett., 2006, 8, 3639–3642; (c) A. H. El-Sagheer and T. Brown,Chem. Commun., 2011, 47, 12057–12058.
10 (a) P. M. E. Gramlich, C. T. Wirges, A. Manetto and T. Carell,Angew. Chem., Int. Ed., 2008, 47, 8350–8358; (b)P. M. E. Gramlich, S. Warncke, J. Gierlich and T. Carell,Angew. Chem., Int. Ed., 2008, 47, 3442–3444; (c) F. Seela,V. R. Sirivolu and P. Chittepu, Bioconjugate Chem., 2008,19, 211–224; (d) F. Seela and V. R. Sirivolu, Org. Biomol.Chem., 2008, 6, 1674–1687; (e) K. Gutschmiedl, D. Fazioand T. Carell, Chem.–Eur. J., 2010, 16, 6877–6883; (f)S. A. Ingale and F. Seela, J. Org. Chem., 2013, 78, 3394–3399.
11 A. B. Neef and N. W. Luedtke, ChemBioChem, 2014, 15, 789–793.
12 Review on chemistry of azides: S. Brase, C. Gil, K. Knepperand V. Zimmermann, Angew. Chem., Int. Ed., 2005, 44,5188–5240.
13 Selected examples on polymerase incorporations of base-modied dNTPs: (a) S. Jager, G. Rasched, H. Kornreich-Leshem, M. Engeser, O. Thum and M. Famulok, J. Am.Chem. Soc., 2005, 127, 15071–15082; (b) S. Obeid,M. Yulikow, G. Jeschke and A. Marx, Angew. Chem., Int. Ed.,2008, 47, 6782–6785; (c) N. Ramsay, A.-S. Jemth, A. Brown,N. Crampton, P. Dear and P. Holliger, J. Am. Chem. Soc.,2010, 132, 5096–5104; (d) A. Baccaro and A. Marx, Chem.–Eur. J., 2010, 16, 218–226; (e) P. Kielkowski, H. Macıckova-Cahova, R. Pohl and M. Hocek, Angew. Chem., Int. Ed.,2011, 50, 8727–8730; (f) P. Menova and M. Hocek, Chem.Commun., 2012, 48, 6921–6923; (g) A. Baccaro, A.-L. Steckand A. Marx, Angew. Chem., Int. Ed., 2012, 51, 254–257; (h)M. Hollenstein, Chem.–Eur. J., 2012, 18, 13320–13330; (i)J. Riedl, R. Pohl, N. P. Ernsting, P. Orsag, M. Fojta andM. Hocek, Chem. Sci., 2012, 3, 2797–2806; (j) S. Obeid,H. Busskamp, W. Welte, K. Diederichs and A. Marx, J. Am.Chem. Soc., 2013, 135, 15667–15669; (k) Z. Vanıkova andM. Hocek, Angew. Chem., Int. Ed., 2014, 53, 6734–6737; (l)P. Kielkowski, J. Fanfrlık and M. Hocek, Angew. Chem., Int.Ed., 2014, 53, 7552–7555.
14 Y. A. Cho, D. Kim, H. R. Ahn, B. Canturk, G. A. Molander andJ. Ham, Org. Lett., 2009, 11, 4330–4333.
15 For related CuAAC reactions of 2-azidopurines, see: L. Cosyn,K. K. Palaniappan, S.-K. Kim, H. T. Duong, Z.-G. Gao,K. A. Jacobson and S. van Calenbergh, J. Med. Chem., 2006,49, 7373–7383.
586 | Chem. Sci., 2015, 6, 575–587 This journal is © The Royal Society of Chemistry 2015
Chemical Science Edge Article
Ope
n A
cces
s A
rtic
le. P
ublis
hed
on 1
6 Se
ptem
ber
2014
. Dow
nloa
ded
on 1
2/06
/201
7 11
:30:
11.
Thi
s ar
ticle
is li
cens
ed u
nder
a C
reat
ive
Com
mon
s A
ttrib
utio
n 3.
0 U
npor
ted
Lic
ence
.View Article Online
16 T. Kovacs and L. Otvos, Tetrahedron Lett., 1988, 29, 4525–4528.
17 (a) G. Matlashewski, P. Lamb, D. Pim, J. Peacock,L. Crawford and S. Benchimol, EMBO J., 1984, 3, 3257–3262; (b) M. Isobe, B. S. Emanuel, D. Givol, M. Oren andC. M. Croce, Nature, 1986, 320, 84–85; (c) S. E. Kern,K. W. Kinzler, A. Bruskin, D. Jarosz, P. Friedman, C. Privesand B. Vogelstein, Science, 1991, 252, 1708–1711; (d)O. W. McBride, D. Merry and D. Givol, Proc. Natl. Acad. Sci.U. S. A., 1986, 83, 130–134.
18 For expression of p53, see: (a) M. Brazdova, J. Palecek,D. I. Cherny, S. Billova, M. Fojta, P. Pecinka, B. Vojtesek,T. M. Jovin and E. Palecek, Nucleic Acids Res., 2002, 30,4966–4974; (b) M. Fojta, H. Pivonkova, M. Brazdova,K. Nemcova, J. Palecek and B. Vojtesek, Eur. J. Biochem.,2004, 271, 3865–3876; (c) C. Klein, G. Georges,K.-P. Kunkele, R. Huber, R. A. Engh and S. Hansen, J. Biol.Chem., 2001, 276, 37390–37401; (d) J. Buzek, L. Latonen,S. Kurki, K. Peltonen and M. Laiho, Nucleic Acids Res.,2002, 30, 2340–2348; (e) V. Tichy, L. Navratilova,M. Adamik, M. Fojta and M. Brazdova, Biochem. Biophys.Res. Commun., 2013, 433, 445–449; (f) M. Brazdova,
L. Navratilova, V. Tichy, K. Nemcova, M. Lexa, R. Hrstka,P. Pecinka, M. Adamik, B. Vojtesek, E. Palecek, W. Deppertand M. Fojta, PLoS One, 2013, 8, e59567.
19 (a) W. S. El-Deiry, S. E. Kern, J. A. Pietenpol, K. W. Kinzlerand B. Vogelstein, Nat. Genet., 1992, 1, 45–49; (b) Y. Wang,J. F. Schwedes, D. Parks, K. Mann and P. Tegtmeyer, Mol.Cell. Biol., 1995, 15, 2157–2165; (c) J. L. Kaar, N. Basse,A. C. Joerger, E. Stephens, T. J. Rutherford andA. R. Fersht, Protein Sci., 2010, 19, 2267–2278.
20 J. Dadova, P. Orsag, R. Pohl, M. Brazdova, M. Fojta andM. Hocek, Angew. Chem., Int. Ed., 2013, 52, 10515–10518.
21 (a) E. Palecek, M. Brazdova, H. Cernocka, D. Vlk, V. Brazdaand B. Vojtesek, Oncogene, 1999, 18, 3617–3625; (b)G. W. Verhaegh, M. J. Richard and P. Hainaut, Mol. Cell.Biol., 1997, 17, 5699–5706.
22 (a) J. Sumranjit and S. J. Chung, Molecules, 2013, 18, 10425–10451; (b) S.-W. Yang and H. A. Nash, Proc. Natl. Acad. Sci. U.S. A., 1994, 91, 12183–12187; (c) R. K. Evans and B. E. Haley,Biochemistry, 1987, 26, 269–276.
23 P. Menova, V. Raindlova and M. Hocek, Bioconjugate Chem.,2013, 24, 1081–1093.
This journal is © The Royal Society of Chemistry 2015 Chem. Sci., 2015, 6, 575–587 | 587
Edge Article Chemical Science
Ope
n A
cces
s A
rtic
le. P
ublis
hed
on 1
6 Se
ptem
ber
2014
. Dow
nloa
ded
on 1
2/06
/201
7 11
:30:
11.
Thi
s ar
ticle
is li
cens
ed u
nder
a C
reat
ive
Com
mon
s A
ttrib
utio
n 3.
0 U
npor
ted
Lic
ence
.View Article Online


ORIGINAL PAPER
Enzyme-linked electrochemical detection of DNA fragmentsamplified by PCR in the presence of a biotinylateddeoxynucleoside triphosphate using disposablepencil graphite electrodes
Lucia Haronıkova • Jan Spacek • Medard Plucnara •
Petra Horakova • Hana Pivonkova • Ludek Havran •
Arzum Erdem • Miroslav Fojta
Received: 6 December 2014 / Accepted: 2 February 2015 / Published online: 24 February 2015
� Springer-Verlag Wien 2015
Abstract In this report, we present a simple electro-
chemical detection protocol for the detection of specific
PCR-amplified DNA fragments, based on incorporation of
biotin tags into DNA amplicons during PCR run in the
presence of a biotinylated nucleoside triphosphate. For
detection, an enzyme-linked electrochemical system in-
volving streptavidin–alkaline phosphatase conjugate
attached to the biotinylated DNA, adsorbed at the surface
of a disposable pencil graphite electrode, is used. The en-
zyme converts an inactive indicator, 1-naphthyl phosphate,
into electrochemically oxidizable indicator 1-naphthol that
is subsequently detected. Excellent selectivity of this fast,
facile, and inexpensive analysis not requiring any sophis-
ticated electrode modification and its applicability for off-
line monitoring of DNA amplification is demonstrated.
Applications of the technique include detection of the
presence of specific nucleotide sequences in biological
samples, such as sequences related to pathogenic mi-
croorganism or transgenes.
Graphical abstract
0.0 0.3 0.6 0.90
20
40
60
80
100
0.0 0.1 0.2 0.3 0.4 0.50
10
20
30
E/V
N
N
E/V
I/μA
I/μA
E/V
Keywords Enzymes � Nucleic acids � Voltammetry
Introduction
Polymerase chain reaction (PCR) represents one of the key
tools of current molecular biology and biomedicine (re-
viewed in [1]). Various modes of the technique have found
applications both in basic research and in diagnostic
practice, being routinely utilized for the amplification and
detection of DNA of diverse pathogens or transgenes in
genetically modified organisms, for genetic screening such
as single nucleotide polymorphism typing, as well as, in
connection with reverse transcription, for the monitoring of
gene expression. Along with the classical gel elec-
trophoresis assays and quantitative real-time PCR
approaches based on fluorescence detection, various elec-
trochemical approaches are being developed for
applications in PCR-based assays. The latter techniques
employ various detection principles, including label-free
DNA detection based on electrochemical oxidation of
guanine or adenine bases in the amplified DNA [2–4],
impedimetric detection of PCR products at the electrode
L. Haronıkova � J. Spacek � M. Plucnara � P. Horakova �H. Pivonkova � L. Havran � M. Fojta (&)
Institute of Biophysics, Academy of Sciences of the Czech
Republic, v.v.i., Kralovopolska 135, 612 65 Brno,
Czech Republic
e-mail: [email protected]
J. Spacek � M. Fojta
Central European Institute of Technology, Masaryk University,
Kamenice 753/5, 625 00 Brno, Czech Republic
A. Erdem
Analytical Chemistry Department, Faculty of Pharmacy,
Ege University, Bornova, 35100 Izmir, Turkey
123
Monatsh Chem (2015) 146:849–855
DOI 10.1007/s00706-015-1436-5
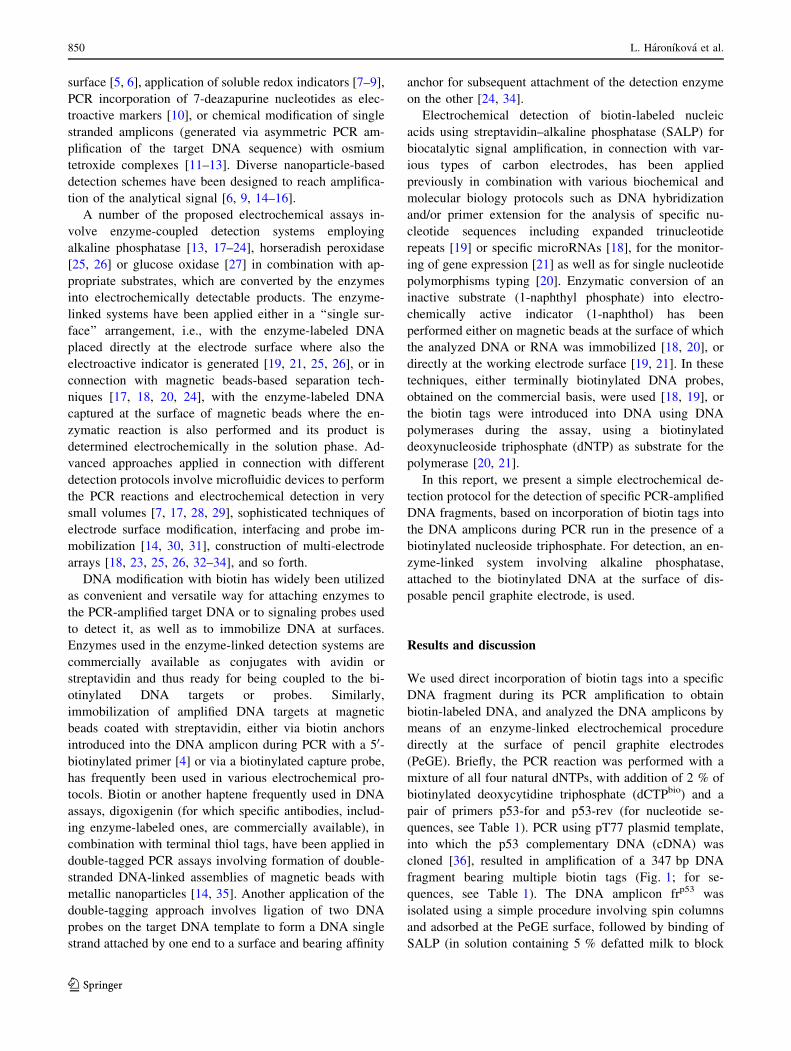
surface [5, 6], application of soluble redox indicators [7–9],
PCR incorporation of 7-deazapurine nucleotides as elec-
troactive markers [10], or chemical modification of single
stranded amplicons (generated via asymmetric PCR am-
plification of the target DNA sequence) with osmium
tetroxide complexes [11–13]. Diverse nanoparticle-based
detection schemes have been designed to reach amplifica-
tion of the analytical signal [6, 9, 14–16].
A number of the proposed electrochemical assays in-
volve enzyme-coupled detection systems employing
alkaline phosphatase [13, 17–24], horseradish peroxidase
[25, 26] or glucose oxidase [27] in combination with ap-
propriate substrates, which are converted by the enzymes
into electrochemically detectable products. The enzyme-
linked systems have been applied either in a ‘‘single sur-
face’’ arrangement, i.e., with the enzyme-labeled DNA
placed directly at the electrode surface where also the
electroactive indicator is generated [19, 21, 25, 26], or in
connection with magnetic beads-based separation tech-
niques [17, 18, 20, 24], with the enzyme-labeled DNA
captured at the surface of magnetic beads where the en-
zymatic reaction is also performed and its product is
determined electrochemically in the solution phase. Ad-
vanced approaches applied in connection with different
detection protocols involve microfluidic devices to perform
the PCR reactions and electrochemical detection in very
small volumes [7, 17, 28, 29], sophisticated techniques of
electrode surface modification, interfacing and probe im-
mobilization [14, 30, 31], construction of multi-electrode
arrays [18, 23, 25, 26, 32–34], and so forth.
DNA modification with biotin has widely been utilized
as convenient and versatile way for attaching enzymes to
the PCR-amplified target DNA or to signaling probes used
to detect it, as well as to immobilize DNA at surfaces.
Enzymes used in the enzyme-linked detection systems are
commercially available as conjugates with avidin or
streptavidin and thus ready for being coupled to the bi-
otinylated DNA targets or probes. Similarly,
immobilization of amplified DNA targets at magnetic
beads coated with streptavidin, either via biotin anchors
introduced into the DNA amplicon during PCR with a 50-biotinylated primer [4] or via a biotinylated capture probe,
has frequently been used in various electrochemical pro-
tocols. Biotin or another haptene frequently used in DNA
assays, digoxigenin (for which specific antibodies, includ-
ing enzyme-labeled ones, are commercially available), in
combination with terminal thiol tags, have been applied in
double-tagged PCR assays involving formation of double-
stranded DNA-linked assemblies of magnetic beads with
metallic nanoparticles [14, 35]. Another application of the
double-tagging approach involves ligation of two DNA
probes on the target DNA template to form a DNA single
strand attached by one end to a surface and bearing affinity
anchor for subsequent attachment of the detection enzyme
on the other [24, 34].
Electrochemical detection of biotin-labeled nucleic
acids using streptavidin–alkaline phosphatase (SALP) for
biocatalytic signal amplification, in connection with var-
ious types of carbon electrodes, has been applied
previously in combination with various biochemical and
molecular biology protocols such as DNA hybridization
and/or primer extension for the analysis of specific nu-
cleotide sequences including expanded trinucleotide
repeats [19] or specific microRNAs [18], for the monitor-
ing of gene expression [21] as well as for single nucleotide
polymorphisms typing [20]. Enzymatic conversion of an
inactive substrate (1-naphthyl phosphate) into electro-
chemically active indicator (1-naphthol) has been
performed either on magnetic beads at the surface of which
the analyzed DNA or RNA was immobilized [18, 20], or
directly at the working electrode surface [19, 21]. In these
techniques, either terminally biotinylated DNA probes,
obtained on the commercial basis, were used [18, 19], or
the biotin tags were introduced into DNA using DNA
polymerases during the assay, using a biotinylated
deoxynucleoside triphosphate (dNTP) as substrate for the
polymerase [20, 21].
In this report, we present a simple electrochemical de-
tection protocol for the detection of specific PCR-amplified
DNA fragments, based on incorporation of biotin tags into
the DNA amplicons during PCR run in the presence of a
biotinylated nucleoside triphosphate. For detection, an en-
zyme-linked system involving alkaline phosphatase,
attached to the biotinylated DNA at the surface of dis-
posable pencil graphite electrode, is used.
Results and discussion
We used direct incorporation of biotin tags into a specific
DNA fragment during its PCR amplification to obtain
biotin-labeled DNA, and analyzed the DNA amplicons by
means of an enzyme-linked electrochemical procedure
directly at the surface of pencil graphite electrodes
(PeGE). Briefly, the PCR reaction was performed with a
mixture of all four natural dNTPs, with addition of 2 % of
biotinylated deoxycytidine triphosphate (dCTPbio) and a
pair of primers p53-for and p53-rev (for nucleotide se-
quences, see Table 1). PCR using pT77 plasmid template,
into which the p53 complementary DNA (cDNA) was
cloned [36], resulted in amplification of a 347 bp DNA
fragment bearing multiple biotin tags (Fig. 1; for se-
quences, see Table 1). The DNA amplicon frp53 was
isolated using a simple procedure involving spin columns
and adsorbed at the PeGE surface, followed by binding of
SALP (in solution containing 5 % defatted milk to block
850 L. Haronıkova et al.
123
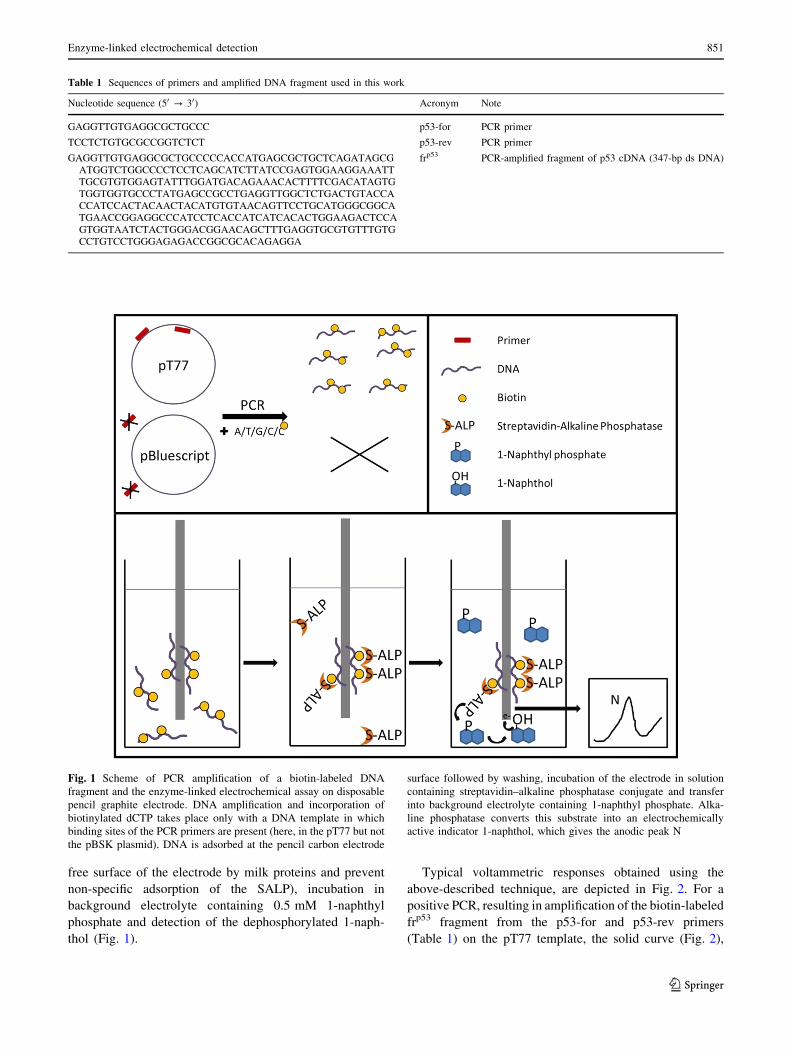
free surface of the electrode by milk proteins and prevent
non-specific adsorption of the SALP), incubation in
background electrolyte containing 0.5 mM 1-naphthyl
phosphate and detection of the dephosphorylated 1-naph-
thol (Fig. 1).
Typical voltammetric responses obtained using the
above-described technique, are depicted in Fig. 2. For a
positive PCR, resulting in amplification of the biotin-labeled
frp53 fragment from the p53-for and p53-rev primers
(Table 1) on the pT77 template, the solid curve (Fig. 2),
Table 1 Sequences of primers and amplified DNA fragment used in this work
Nucleotide sequence (50 ? 30) Acronym Note
GAGGTTGTGAGGCGCTGCCC p53-for PCR primer
TCCTCTGTGCGCCGGTCTCT p53-rev PCR primer
GAGGTTGTGAGGCGCTGCCCCCACCATGAGCGCTGCTCAGATAGCGATGGTCTGGCCCCTCCTCAGCATCTTATCCGAGTGGAAGGAAATTTGCGTGTGGAGTATTTGGATGACAGAAACACTTTTCGACATAGTGTGGTGGTGCCCTATGAGCCGCCTGAGGTTGGCTCTGACTGTACCACCATCCACTACAACTACATGTGTAACAGTTCCTGCATGGGCGGCATGAACCGGAGGCCCATCCTCACCATCATCACACTGGAAGACTCCAGTGGTAATCTACTGGGACGGAACAGCTTTGAGGTGCGTGTTTGTGCCTGTCCTGGGAGAGACCGGCGCACAGAGGA
frp53 PCR-amplified fragment of p53 cDNA (347-bp ds DNA)
Fig. 1 Scheme of PCR amplification of a biotin-labeled DNA
fragment and the enzyme-linked electrochemical assay on disposable
pencil graphite electrode. DNA amplification and incorporation of
biotinylated dCTP takes place only with a DNA template in which
binding sites of the PCR primers are present (here, in the pT77 but not
the pBSK plasmid). DNA is adsorbed at the pencil carbon electrode
surface followed by washing, incubation of the electrode in solution
containing streptavidin–alkaline phosphatase conjugate and transfer
into background electrolyte containing 1-naphthyl phosphate. Alka-
line phosphatase converts this substrate into an electrochemically
active indicator 1-naphthol, which gives the anodic peak N
Enzyme-linked electrochemical detection 851
123
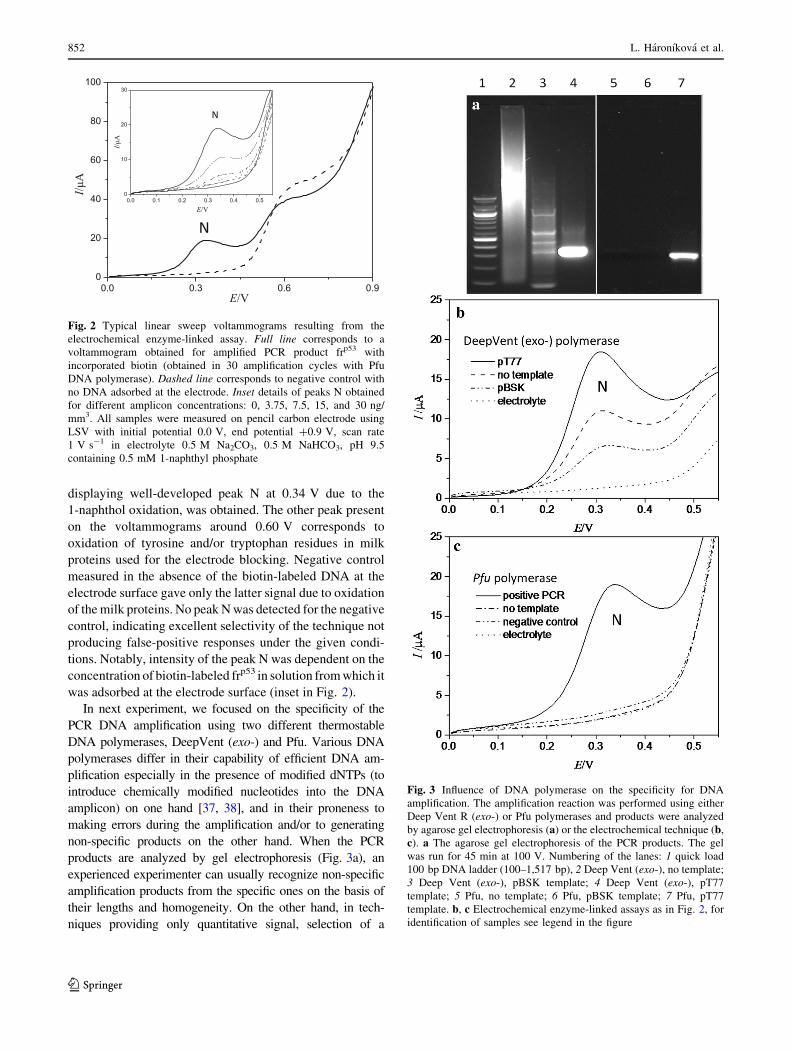
displaying well-developed peak N at 0.34 V due to the
1-naphthol oxidation, was obtained. The other peak present
on the voltammograms around 0.60 V corresponds to
oxidation of tyrosine and/or tryptophan residues in milk
proteins used for the electrode blocking. Negative control
measured in the absence of the biotin-labeled DNA at the
electrode surface gave only the latter signal due to oxidation
of themilk proteins. No peak Nwas detected for the negative
control, indicating excellent selectivity of the technique not
producing false-positive responses under the given condi-
tions. Notably, intensity of the peak N was dependent on the
concentration of biotin-labeled frp53 in solution fromwhich it
was adsorbed at the electrode surface (inset in Fig. 2).
In next experiment, we focused on the specificity of the
PCR DNA amplification using two different thermostable
DNA polymerases, DeepVent (exo-) and Pfu. Various DNA
polymerases differ in their capability of efficient DNA am-
plification especially in the presence of modified dNTPs (to
introduce chemically modified nucleotides into the DNA
amplicon) on one hand [37, 38], and in their proneness to
making errors during the amplification and/or to generating
non-specific products on the other hand. When the PCR
products are analyzed by gel electrophoresis (Fig. 3a), an
experienced experimenter can usually recognize non-specific
amplification products from the specific ones on the basis of
their lengths and homogeneity. On the other hand, in tech-
niques providing only quantitative signal, selection of a
0.0 0.3 0.6 0.90
20
40
60
80
100
0.0 0.1 0.2 0.3 0.4 0.50
10
20
30
E/V
N
N
E/V
I/μA
I/μA
E/V
Fig. 2 Typical linear sweep voltammograms resulting from the
electrochemical enzyme-linked assay. Full line corresponds to a
voltammogram obtained for amplified PCR product frp53 with
incorporated biotin (obtained in 30 amplification cycles with Pfu
DNA polymerase). Dashed line corresponds to negative control with
no DNA adsorbed at the electrode. Inset details of peaks N obtained
for different amplicon concentrations: 0, 3.75, 7.5, 15, and 30 ng/
mm3. All samples were measured on pencil carbon electrode using
LSV with initial potential 0.0 V, end potential ?0.9 V, scan rate
1 V s-1 in electrolyte 0.5 M Na2CO3, 0.5 M NaHCO3, pH 9.5
containing 0.5 mM 1-naphthyl phosphate
Fig. 3 Influence of DNA polymerase on the specificity for DNA
amplification. The amplification reaction was performed using either
Deep Vent R (exo-) or Pfu polymerases and products were analyzed
by agarose gel electrophoresis (a) or the electrochemical technique (b,c). a The agarose gel electrophoresis of the PCR products. The gel
was run for 45 min at 100 V. Numbering of the lanes: 1 quick load
100 bp DNA ladder (100–1,517 bp), 2 Deep Vent (exo-), no template;
3 Deep Vent (exo-), pBSK template; 4 Deep Vent (exo-), pT77
template; 5 Pfu, no template; 6 Pfu, pBSK template; 7 Pfu, pT77
template. b, c Electrochemical enzyme-linked assays as in Fig. 2, for
identification of samples see legend in the figure
852 L. Haronıkova et al.
123
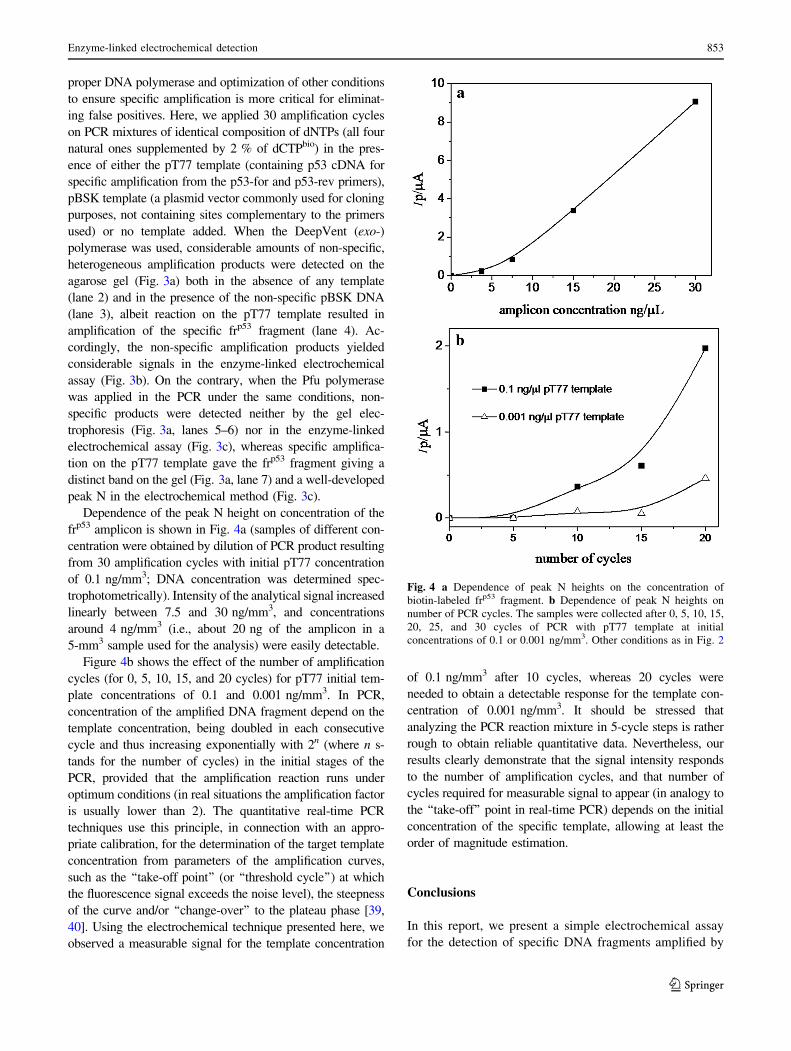
proper DNA polymerase and optimization of other conditions
to ensure specific amplification is more critical for eliminat-
ing false positives. Here, we applied 30 amplification cycles
on PCR mixtures of identical composition of dNTPs (all four
natural ones supplemented by 2 % of dCTPbio) in the pres-
ence of either the pT77 template (containing p53 cDNA for
specific amplification from the p53-for and p53-rev primers),
pBSK template (a plasmid vector commonly used for cloning
purposes, not containing sites complementary to the primers
used) or no template added. When the DeepVent (exo-)
polymerase was used, considerable amounts of non-specific,
heterogeneous amplification products were detected on the
agarose gel (Fig. 3a) both in the absence of any template
(lane 2) and in the presence of the non-specific pBSK DNA
(lane 3), albeit reaction on the pT77 template resulted in
amplification of the specific frp53 fragment (lane 4). Ac-
cordingly, the non-specific amplification products yielded
considerable signals in the enzyme-linked electrochemical
assay (Fig. 3b). On the contrary, when the Pfu polymerase
was applied in the PCR under the same conditions, non-
specific products were detected neither by the gel elec-
trophoresis (Fig. 3a, lanes 5–6) nor in the enzyme-linked
electrochemical assay (Fig. 3c), whereas specific amplifica-
tion on the pT77 template gave the frp53 fragment giving a
distinct band on the gel (Fig. 3a, lane 7) and a well-developed
peak N in the electrochemical method (Fig. 3c).
Dependence of the peak N height on concentration of the
frp53 amplicon is shown in Fig. 4a (samples of different con-
centration were obtained by dilution of PCR product resulting
from 30 amplification cycles with initial pT77 concentration
of 0.1 ng/mm3; DNA concentration was determined spec-
trophotometrically). Intensity of the analytical signal increased
linearly between 7.5 and 30 ng/mm3, and concentrations
around 4 ng/mm3 (i.e., about 20 ng of the amplicon in a
5-mm3 sample used for the analysis) were easily detectable.
Figure 4b shows the effect of the number of amplification
cycles (for 0, 5, 10, 15, and 20 cycles) for pT77 initial tem-
plate concentrations of 0.1 and 0.001 ng/mm3. In PCR,
concentration of the amplified DNA fragment depend on the
template concentration, being doubled in each consecutive
cycle and thus increasing exponentially with 2n (where n s-
tands for the number of cycles) in the initial stages of the
PCR, provided that the amplification reaction runs under
optimum conditions (in real situations the amplification factor
is usually lower than 2). The quantitative real-time PCR
techniques use this principle, in connection with an appro-
priate calibration, for the determination of the target template
concentration from parameters of the amplification curves,
such as the ‘‘take-off point’’ (or ‘‘threshold cycle’’) at which
the fluorescence signal exceeds the noise level), the steepness
of the curve and/or ‘‘change-over’’ to the plateau phase [39,
40]. Using the electrochemical technique presented here, we
observed a measurable signal for the template concentration
of 0.1 ng/mm3 after 10 cycles, whereas 20 cycles were
needed to obtain a detectable response for the template con-
centration of 0.001 ng/mm3. It should be stressed that
analyzing the PCR reaction mixture in 5-cycle steps is rather
rough to obtain reliable quantitative data. Nevertheless, our
results clearly demonstrate that the signal intensity responds
to the number of amplification cycles, and that number of
cycles required for measurable signal to appear (in analogy to
the ‘‘take-off’’ point in real-time PCR) depends on the initial
concentration of the specific template, allowing at least the
order of magnitude estimation.
Conclusions
In this report, we present a simple electrochemical assay
for the detection of specific DNA fragments amplified by
Fig. 4 a Dependence of peak N heights on the concentration of
biotin-labeled frp53 fragment. b Dependence of peak N heights on
number of PCR cycles. The samples were collected after 0, 5, 10, 15,
20, 25, and 30 cycles of PCR with pT77 template at initial
concentrations of 0.1 or 0.001 ng/mm3. Other conditions as in Fig. 2
Enzyme-linked electrochemical detection 853
123
PCR in the presence of a biotinylated dNTP. Biotin labels
introduced into the DNA by the DNA polymerase serve as
affinity adaptors for the attachment of streptavidin–alkaline
phosphatase conjugate. The enzyme is used to produce an
electroactive indicator, 1-naphthol, through enzymatic hy-
drolysis of its inactive phosphoester. The enzyme-linked
electrochemical detection system works well at the surface
of pencil graphite electrode, onto which the DNA amplicon
is adsorbed without any pretreatment or specific modifi-
cation of the electrode. The detection procedure (except the
PCR amplification) consists of several simple steps, each
taking from 1 to 5 min. These features make the assay
simple, cheap, and widely accessible. We demonstrate
excellent selectivity of the analysis, showing no non-
specific signals provided that the selectivity is ensured in
the amplification reaction, and its applicability for off-line
monitoring of DNA amplification. Applications of the
technique include detection of the presence of specific
nucleotide sequences in biological samples, such as se-
quences related to pathogenic microorganism or
transgenes, representing typical examples.
Experimental
Primers for PCR amplification were obtained from VBC
Biotech (Austria); for sequences, see Table 1. Plasmids
pBSK and pT77, the latter bearing wild type p53 cDNA
[36], were isolated from E. coli cells by Plasmid Purifica-
tion Kit (Qiagen, UK). Pfu DNA polymerase and
streptavidin-alkaline phosphatase were purchased from
Promega (UK), Deep Vent (exo-) from New England
Biolabs (UK), unmodified nucleoside triphosphates
(dNTPs) and 1-naphthyl phosphate from Sigma (USA), and
biotinylated deoxycytidine triphosphate (Biotin-16-dCTP,
abbreviated as dCTPbio in this paper) from Invitrogen
(UK). Other chemicals were of analytical grade.
PCR with biotinylated dCTP
Amplification of the frp53 fragment was carried out in
50-mm3 reaction mixtures containing primers p53-for and
p53-rev (0.25 lM each), Pfu DNA polymerase (0.3 U), Pfu
DNA polymerase buffer, dNTPs (100 lM of each supple-
mented by 2 % of biotinylated dCTP). pT77 template and
pBSK template was at the final concentration of 0.01 ng/
mm3. PCR involved 30 cycles (if not stated otherwise)
(denaturation 95 �C at 90 s, annealing 71.4 �C at 60 s,
polymerization 72 �C at 60 s). PCR products were con-
trolled using electrophoresis on agarose gel and stained by
GelRed (Biotium, UK).
Preparation of samples for measurement
The amplified PCR products were purified by QIAquick
PCR Purification Kit (Qiagen, UK), and the concentration
of the cleaned product was measured using Nanodrop UV/
Vis spectrometer (Thermo Scientific, USA). Target DNA
in 0.3 M NaCl solution was adsorbed onto the pencil gra-
phite electrode surface (Tombow Pencil, Japan) for 5 min,
rinsed in 1 9 phosphate buffered saline (137 mM NaCl,
2.7 mM KCl, 10 mM Na/K phosphate pH 7.4; PBS) and
incubated in streptavidin–alkaline phosphatase solution
(20-times diluted stock in 5 % defatted milk) for 1 min,
rinsed again in 1 9 PBS and placed into background
electrolyte containing 0.5 mM 1-naphthyl phosphate,
0.5 M Na2CO3, 0.5 M NaHCO3, pH 9.5.
Enzyme-linked electrochemical assay
After 60-s incubation of the electrode in background
electrolyte containing the substrate, electroactive product
1-naphthol was detected by linear sweep voltammetry with
initial potential 0 V, end potential ?0.9 V, scan rate 1 V/s.
Measurements were performed on AUTOLAB analyzer
with GPES 4.9007 software package (EcoChemie, the
Netherlands) in connection with a VA-Stand 663
(Metrohm, Herisau, Switzerland) in a three-electrode setup
(with the pencil electrode as working electrode,
Ag|AgCl|3 M KCl as reference, and platinum wire as
counter electrode).
Acknowledgments This work was supported by the Czech Science
Foundation (Grant P206/11/1638 to M. F. and P206/11/P739 to P. H.)
and by the ASCR (RVO 68081707). A. E and M. F acknowledges to
the grant of international joint project through between Turkish Sci-
entific and Technological Research Council and the ASCR
(TUBITAK Project No. 111T050).
References
1. Ishmael FT, Stellato C (2008) Ann Allergy Asthma Immunol
101:437
2. Ozkan D, Erdem A, Kara P, Kerman K, Meric B, Hassmann J,
Ozsoz M (2002) Anal Chem 74:5931
3. Erdem A, Ariksoysal DO, Karadeniz H, Kara P, Sengonul A,
Sayiner AA, Ozsoz M (2005) Electrochem Commun 7:815
4. Hason S, Pivonkova H, Vetterl V, Fojta M (2008) Anal Chem
80:2391
5. Topkaya SN, Kosova B, Ozsoz M (2014) Clin Chim Acta
429:134
6. Zhou N, Yang T, Jiang C, Du M, Jiao K (2009) Talanta 77:1021
7. Fang TH, Ramalingam N, Dong X-D, Ngin TS, Zeng X, Kuan
ATL, Huat EYP, Gong H-Q (2009) Biosens Bioelectron 24:2131
8. Lin L, Chen J, Lin Q, Chen W, Chen J, Yao H, Liu A, Lin X,
Chen Y (2010) Talanta 80:2113
9. Wu G, Wang Z, Zhang H, Yang N, Du J, Lu X, Kang J (2009)
Nucleosides. Nucleotides Nucleic Acids 28:1051
854 L. Haronıkova et al.
123
10. Pivonkova H, Horakova P, Fojtova M, Fojta M (2010) Anal
Chem 82:6807
11. Mix M, Reske T, Duwensee H, Flechsig G-U (2009) Electro-
analysis 21:826
12. Mix M, Rueger J, Krueger S, Broer I, Flechsig G-U (2012)
Electrochem Commun 22:137
13. Walter A, Wu J, Flechsig G-U, Haake DA, Wang J (2011) Anal
Chim Acta 689:29
14. de Oliveira Marques PRB, Lermo A, Campoy S, Yamanaka H,
Barbe J, Alegret S, Pividori MI (2009) Anal Chem 81:1332
15. Ozsoz M, Erdem A, Kerman K, Ozkan D, Tugrul B, Topcuoglu
N, Ekren H, Taylan M (2003) Anal Chem 75:2181
16. Singh R, Verma R, Sumana G, Srivastava AK, Sood S, Gupta
RK, Malhotra BD (2012) Bioelectrochemistry 86:30
17. Berti F, Laschi S, Palchetti I, Rossier JS, Reymond F, Mascini M,
Marrazza G (2009) Talanta 77:971
18. Erdem A, Congur G, Eksin E (2013) Sens Actuators, B 188:1089
19. Fojta M, Brazdilova P, Cahova K, Pecinka P (2006) Electro-
analysis 18:141
20. Horakova P, Simkova E, Vychodilova Z, Brazdova M, Fojta M
(2009) Electroanalysis 21:1723
21. Horakova-Brazdilova P, Fojtova M, Vytras K, Fojta M (2008)
Sensors 8:193
22. Li Q, Cheng W, Zhang D, Yu T, Yin Y, Ju H, Ding S (2012) Int J
Electrochem Sci 7:844
23. Rochelet-Dequaire M, Djellouli N, Limoges B, Brossier P (2009)
Analyst 134:349
24. Stejskalova E, Horakova P, Vacek J, Bowater RP, Fojta M (2014)
Anal Bioanal Chem 406:4129
25. Liu G, Lao R, Xu L, Xu Q, Li L, Zhang M, Shen H, Mathur S,
Fan C, Song S (2011) Sensors 11:8018
26. Rochelet M, Solanas S, Grossiord C, Marechal P, Resa C, Vi-
enney F, Barranger C, Joannes M (2012) Talanta 100:139
27. Hajdukiewicz J, Boland S, Kavanagh P, Leech D (2010) Biosens
Bioelectron 25:1037
28. Ferguson BS, Buchsbaum SF, Wu T-T, Hsieh K, Xiao Y, Sun R,
Soh HT (2011) J Am Chem Soc 133:9129
29. Luo J, Fang X, Ye D, Li H, Chen H, Zhang S, Kong J (2014)
Biosens Bioelectron 60:84
30. Barrios Eguiluz KI, Salazar-Banda GR, Funes-Huacca ME, Al-
berice JV, Carrilho E, Spinola Machado SA, Avaca LA (2009)
Analyst 134:314
31. Qi X, Gao H, Zhang Y, Wang X, Chen Y, Sun W (2012) Bio-
electrochemistry 88:42
32. Elsholz B, Nitsche A, Achenbach J, Ellerbrok H, Blohm L, Al-
bers J, Pauli G, Hintsche R, Woerl R (2009) Biosens Bioelectron
24:1737
33. Henry OYF, Acero Sanchez JL, Latta D, O’Sullivan CK (2009)
Biosens Bioelectron 24:2064
34. Wan Y, Zhang J, Liu G, Pan D, Wang L, Song S, Fan C (2009)
Biosens Bioelectron 24:1209
35. Liebana S, Lermo A, Campoy S, Barbe J, Alegret S, Isabel
Pividori M (2009) Anal Chem 81:5812
36. Hupp TR, Meek DV, Midgley CA, Lane DP (1992) Cell 71:875
37. Anderson JP, Angerer B, Loeb LA (2005) Biotechniques 38:257
38. Raindlova V, Pohl R, Sanda M, Hocek M (2010) Angew Chem
Int Ed 49:1064
39. Tichopad A, Didier A, Pfaffl MW (2004) Mol Cell Probes 18:45
40. Tichopad A, Dilger M, Schwarz G, Pfaffl MW (2003) Nucleic
Acids Res 31:20
Enzyme-linked electrochemical detection 855
123

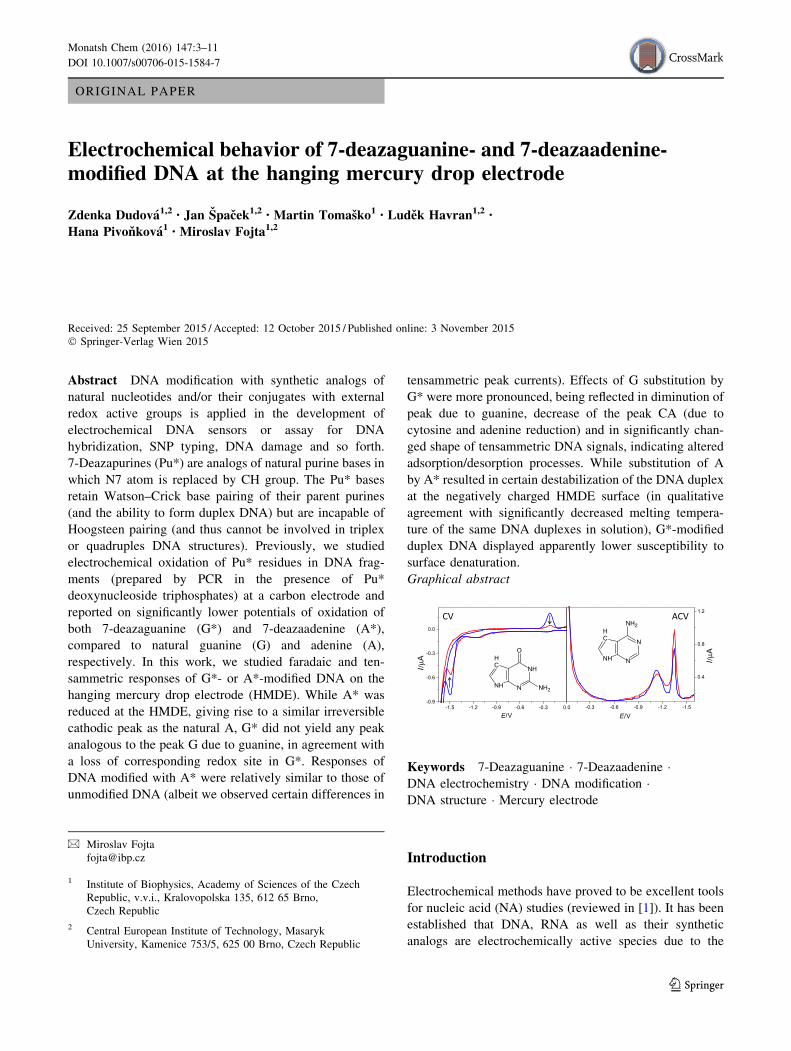
ORIGINAL PAPER
Electrochemical behavior of 7-deazaguanine- and 7-deazaadenine-modified DNA at the hanging mercury drop electrode
Zdenka Dudova1,2 • Jan Spacek1,2 • Martin Tomasko1 • Ludek Havran1,2 •
Hana Pivonkova1 • Miroslav Fojta1,2
Received: 25 September 2015 / Accepted: 12 October 2015 / Published online: 3 November 2015
� Springer-Verlag Wien 2015
Abstract DNA modification with synthetic analogs of
natural nucleotides and/or their conjugates with external
redox active groups is applied in the development of
electrochemical DNA sensors or assay for DNA
hybridization, SNP typing, DNA damage and so forth.
7-Deazapurines (Pu*) are analogs of natural purine bases in
which N7 atom is replaced by CH group. The Pu* bases
retain Watson–Crick base pairing of their parent purines
(and the ability to form duplex DNA) but are incapable of
Hoogsteen pairing (and thus cannot be involved in triplex
or quadruples DNA structures). Previously, we studied
electrochemical oxidation of Pu* residues in DNA frag-
ments (prepared by PCR in the presence of Pu*
deoxynucleoside triphosphates) at a carbon electrode and
reported on significantly lower potentials of oxidation of
both 7-deazaguanine (G*) and 7-deazaadenine (A*),
compared to natural guanine (G) and adenine (A),
respectively. In this work, we studied faradaic and ten-
sammetric responses of G*- or A*-modified DNA on the
hanging mercury drop electrode (HMDE). While A* was
reduced at the HMDE, giving rise to a similar irreversible
cathodic peak as the natural A, G* did not yield any peak
analogous to the peak G due to guanine, in agreement with
a loss of corresponding redox site in G*. Responses of
DNA modified with A* were relatively similar to those of
unmodified DNA (albeit we observed certain differences in
tensammetric peak currents). Effects of G substitution by
G* were more pronounced, being reflected in diminution of
peak due to guanine, decrease of the peak CA (due to
cytosine and adenine reduction) and in significantly chan-
ged shape of tensammetric DNA signals, indicating altered
adsorption/desorption processes. While substitution of A
by A* resulted in certain destabilization of the DNA duplex
at the negatively charged HMDE surface (in qualitative
agreement with significantly decreased melting tempera-
ture of the same DNA duplexes in solution), G*-modified
duplex DNA displayed apparently lower susceptibility to
surface denaturation.
Graphical abstract
-1.5 -1.2 -0.9 -0.6 -0.3 0.0-0.9
-0.6
-0.3
0.0
E/V E/V-0.3 -0.6 -0.9 -1.2 -1.5
0.4
0.8
1.2
N
N
NH
CH
NH2
N
NH
NH
CH
NH2
O
VCAVC
I / µA I / µ
A
Keywords 7-Deazaguanine � 7-Deazaadenine �DNA electrochemistry � DNA modification �DNA structure � Mercury electrode
Introduction
Electrochemical methods have proved to be excellent tools
for nucleic acid (NA) studies (reviewed in [1]). It has been
established that DNA, RNA as well as their synthetic
analogs are electrochemically active species due to the
& Miroslav Fojta
1 Institute of Biophysics, Academy of Sciences of the Czech
Republic, v.v.i., Kralovopolska 135, 612 65 Brno,
Czech Republic
2 Central European Institute of Technology, Masaryk
University, Kamenice 753/5, 625 00 Brno, Czech Republic
123
Monatsh Chem (2016) 147:3–11
DOI 10.1007/s00706-015-1584-7

presence of nucleobase residues, some of which can be
electrochemically reduced (at mercury-based electrodes) or
oxidized (usually at carbon electrodes). In addition, char-
acteristic tensammetric (adsorption/desorption) signals of
nucleic acids can be observed at the negatively charged
mercury electrodes [1, 2]. Electrochemical responses of
NAs are sensitive to changes in the DNA structure (which
applies particularly to those measured at the mercury and
some types of amalgam or mercury film electrodes [3, 4]),
making it possible to detect not only DNA denaturation,
but also more subtle structural changes such as those
related to DNA superhelicity [5], formation of single- or
double-strand breaks [6] and so forth, using solely intrinsic
DNA signals. Other structural transitions, involving for-
mation of DNA triple helices [7] or quadruplexes [8, 9],
have recently been detected using label-free electrochem-
ical methods as well.
In addition to applications of the label-free DNA elec-
trochemistry, various techniques of DNA labeling with
redox active groups have been introduced to improve
analytical performance of the electrochemical techniques
in specific situations. For example, selective modification
of unpaired or mispaired thymine residues in DNA with
oxoosmium complexes (reviewed in [10]) was successfully
applied to improve sensitivity of DNA damage detection
with carbon electrodes [11], to detect single-base mis-
matches [12], DNA hybridization [13], or DNA–protein
interactions [14]. Other types of redox labels were intro-
duced into DNA via synthesis of base-modified
deoxynucleoside triphosphates and incorporation of corre-
sponding nucleotides into DNA by DNA polymerases
(reviewed in [15]; more recently introduced labels include,
e.g., benzofurazane [16] or azidophenyl [17]). Electro-
chemical responses due to reduction or oxidation of the
extra conjugate groups enhance the palette of analytically
useful signals of the modified nucleosides or nucleotides as
well as the modified DNAs, which offers applications
particularly in analyzing nucleotide sequences, including
SNP typing. Various labels can be independently detected
due to sufficiently different redox potentials from those of
natural DNA bases as well as from each other. In addition,
in some cases the resolution can be improved via electro-
chemical [18, 19] or chemical [17] transformation of the
label(s) incorporated in DNA.
Besides redox labels attached to the nucleobases as
external conjugate groups, we recently studied [20, 21]
electrochemical oxidation of 7-deazapurines (Pu*) at a
pyrolytic graphite electrode. These analogs of natural
purines (Pu), having the N7 atom replaced by CH group
(Fig. 1), retain Watson–Crick base pairing of the ‘‘parent’’
purine bases, but cannot form Hoogsteen base pairs [22].
The incapability of Hoogsteen pairing prevents Pu*-mod-
ified DNA from forming multistranded DNA structures
such as triplexes or quadruplexes, which is utilized in some
PCR applications (e.g., with G-rich sequences in which the
quadruplex formation could affect the amplification pro-
cess). We showed that both 7-deazaguanine (G*) and
7-deazaadenine (A*) [20], as well as their 7-substituted
derivatives [21], are electrochemically oxidized at poten-
tials by 200–300 mV less positive than their corresponding
natural nucleobases. Especially G*, the oxidation potential
of which is less positive than that of any natural DNA
component, was reported as a useful independently
detectable DNA label. Electrochemical monitoring of PCR
amplification of DNA fragments modified with G* via its
electrooxidation was demonstrated as a potent alternative
overcoming limitations of fluorescence techniques arising
from fluorescence quenching by G* [20, 23].
In this paper, we study electrochemical behavior of G*-
or A*-modified DNAs at the hanging mercury drop elec-
trode (HMDE) and show specific effects of the substitution
of natural Pu residues by the Pu* ones on both faradaic and
tensammetric DNA responses, as well as on the apparent
susceptibility of the modified DNA duplexes to surface
denaturation.
Results and discussion
The 347-bp DNA fragments modified by Pu* nucleotides
to various extents were prepared by PCR amplification in
the presence of deoxynucleotide triphosphate mixtures
containing corresponding percentage (0, 25, 50, 75, or
100 %) of G* or A*, while keeping total (G ? G*) or
(A ? A*) concentration constant and equal to the con-
centration of each of the remaining natural dNTPs (i.e.,
dCTP, dTTP, and the one of dPuTPs which was not sub-
stituted in the given sample series by its 7-deaza analog).
Such prepared samples were studied using cyclic voltam-
metry (CV; to investigate faradaic redox processes) or
N N
N N
O
NH2R
N N
CH
N
NH2
RN N
N N
NH2
R
N N
CH
N
O
NH2R
guanine 7-deazaguanine
adenine 7-deazaadenine
116 6
78
78
Fig. 1 Structure of natural purines and 7-deazapurine bases. Boxes
indicate corresponding redox centers (see text)
4 Z. Dudova et al.
123
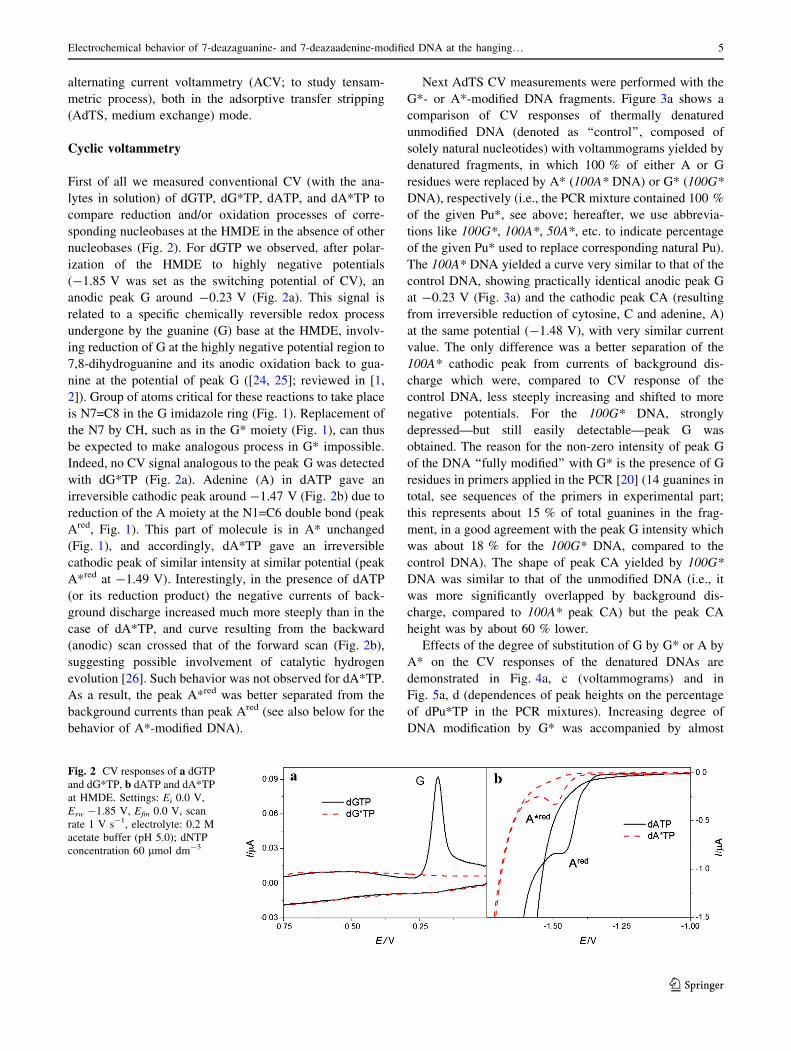
alternating current voltammetry (ACV; to study tensam-
metric process), both in the adsorptive transfer stripping
(AdTS, medium exchange) mode.
Cyclic voltammetry
First of all we measured conventional CV (with the ana-
lytes in solution) of dGTP, dG*TP, dATP, and dA*TP to
compare reduction and/or oxidation processes of corre-
sponding nucleobases at the HMDE in the absence of other
nucleobases (Fig. 2). For dGTP we observed, after polar-
ization of the HMDE to highly negative potentials
(-1.85 V was set as the switching potential of CV), an
anodic peak G around -0.23 V (Fig. 2a). This signal is
related to a specific chemically reversible redox process
undergone by the guanine (G) base at the HMDE, involv-
ing reduction of G at the highly negative potential region to
7,8-dihydroguanine and its anodic oxidation back to gua-
nine at the potential of peak G ([24, 25]; reviewed in [1,
2]). Group of atoms critical for these reactions to take place
is N7=C8 in the G imidazole ring (Fig. 1). Replacement of
the N7 by CH, such as in the G* moiety (Fig. 1), can thus
be expected to make analogous process in G* impossible.
Indeed, no CV signal analogous to the peak G was detected
with dG*TP (Fig. 2a). Adenine (A) in dATP gave an
irreversible cathodic peak around -1.47 V (Fig. 2b) due to
reduction of the A moiety at the N1=C6 double bond (peak
Ared, Fig. 1). This part of molecule is in A* unchanged
(Fig. 1), and accordingly, dA*TP gave an irreversible
cathodic peak of similar intensity at similar potential (peak
A*red at -1.49 V). Interestingly, in the presence of dATP
(or its reduction product) the negative currents of back-
ground discharge increased much more steeply than in the
case of dA*TP, and curve resulting from the backward
(anodic) scan crossed that of the forward scan (Fig. 2b),
suggesting possible involvement of catalytic hydrogen
evolution [26]. Such behavior was not observed for dA*TP.
As a result, the peak A*red was better separated from the
background currents than peak Ared (see also below for the
behavior of A*-modified DNA).
Next AdTS CV measurements were performed with the
G*- or A*-modified DNA fragments. Figure 3a shows a
comparison of CV responses of thermally denatured
unmodified DNA (denoted as ‘‘control’’, composed of
solely natural nucleotides) with voltammograms yielded by
denatured fragments, in which 100 % of either A or G
residues were replaced by A* (100A* DNA) or G* (100G*
DNA), respectively (i.e., the PCR mixture contained 100 %
of the given Pu*, see above; hereafter, we use abbrevia-
tions like 100G*, 100A*, 50A*, etc. to indicate percentage
of the given Pu* used to replace corresponding natural Pu).
The 100A* DNA yielded a curve very similar to that of the
control DNA, showing practically identical anodic peak G
at -0.23 V (Fig. 3a) and the cathodic peak CA (resulting
from irreversible reduction of cytosine, C and adenine, A)
at the same potential (-1.48 V), with very similar current
value. The only difference was a better separation of the
100A* cathodic peak from currents of background dis-
charge which were, compared to CV response of the
control DNA, less steeply increasing and shifted to more
negative potentials. For the 100G* DNA, strongly
depressed—but still easily detectable—peak G was
obtained. The reason for the non-zero intensity of peak G
of the DNA ‘‘fully modified’’ with G* is the presence of G
residues in primers applied in the PCR [20] (14 guanines in
total, see sequences of the primers in experimental part;
this represents about 15 % of total guanines in the frag-
ment, in a good agreement with the peak G intensity which
was about 18 % for the 100G* DNA, compared to the
control DNA). The shape of peak CA yielded by 100G*
DNA was similar to that of the unmodified DNA (i.e., it
was more significantly overlapped by background dis-
charge, compared to 100A* peak CA) but the peak CA
height was by about 60 % lower.
Effects of the degree of substitution of G by G* or A by
A* on the CV responses of the denatured DNAs are
demonstrated in Fig. 4a, c (voltammograms) and in
Fig. 5a, d (dependences of peak heights on the percentage
of dPu*TP in the PCR mixtures). Increasing degree of
DNA modification by G* was accompanied by almost
Fig. 2 CV responses of a dGTPand dG*TP, b dATP and dA*TP
at HMDE. Settings: Ei 0.0 V,
Esw -1.85 V, Efin 0.0 V, scan
rate 1 V s-1, electrolyte: 0.2 M
acetate buffer (pH 5.0); dNTP
concentration 60 lmol dm-3
Electrochemical behavior of 7-deazaguanine- and 7-deazaadenine-modified DNA at the hanging… 5
123
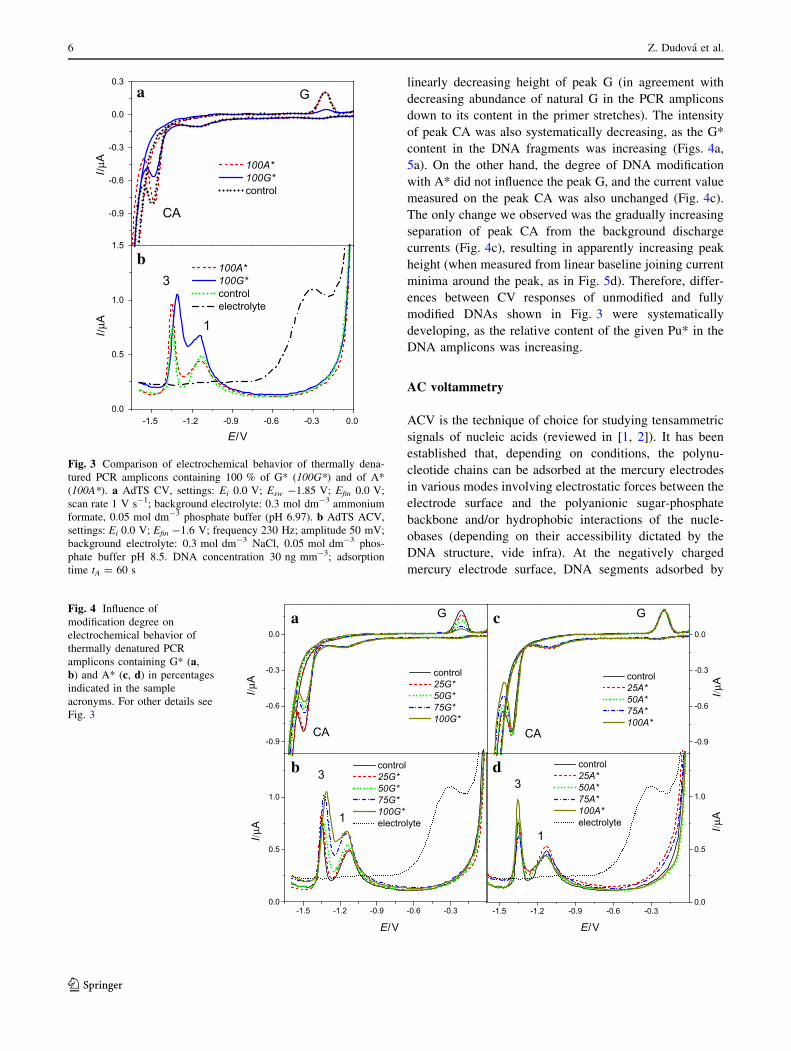
linearly decreasing height of peak G (in agreement with
decreasing abundance of natural G in the PCR amplicons
down to its content in the primer stretches). The intensity
of peak CA was also systematically decreasing, as the G*
content in the DNA fragments was increasing (Figs. 4a,
5a). On the other hand, the degree of DNA modification
with A* did not influence the peak G, and the current value
measured on the peak CA was also unchanged (Fig. 4c).
The only change we observed was the gradually increasing
separation of peak CA from the background discharge
currents (Fig. 4c), resulting in apparently increasing peak
height (when measured from linear baseline joining current
minima around the peak, as in Fig. 5d). Therefore, differ-
ences between CV responses of unmodified and fully
modified DNAs shown in Fig. 3 were systematically
developing, as the relative content of the given Pu* in the
DNA amplicons was increasing.
AC voltammetry
ACV is the technique of choice for studying tensammetric
signals of nucleic acids (reviewed in [1, 2]). It has been
established that, depending on conditions, the polynu-
cleotide chains can be adsorbed at the mercury electrodes
in various modes involving electrostatic forces between the
electrode surface and the polyanionic sugar-phosphate
backbone and/or hydrophobic interactions of the nucle-
obases (depending on their accessibility dictated by the
DNA structure, vide infra). At the negatively charged
mercury electrode surface, DNA segments adsorbed by
-0.9
-0.6
-0.3
0.0
0.3
100A*100G* control
-1.5 -1.2 -0.9 -0.6 -0.3 0.00.0
0.5
1.0
1.5
100A*100G* control electrolyte
I / µA
I / µA
E/V
a
b
G
CA
1
3
Fig. 3 Comparison of electrochemical behavior of thermally dena-
tured PCR amplicons containing 100 % of G* (100G*) and of A*
(100A*). a AdTS CV, settings: Ei 0.0 V; Esw -1.85 V; Efin 0.0 V;
scan rate 1 V s-1; background electrolyte: 0.3 mol dm-3 ammonium
formate, 0.05 mol dm-3 phosphate buffer (pH 6.97). b AdTS ACV,
settings: Ei 0.0 V; Efin -1.6 V; frequency 230 Hz; amplitude 50 mV;
background electrolyte: 0.3 mol dm-3 NaCl, 0.05 mol dm-3 phos-
phate buffer pH 8.5. DNA concentration 30 ng mm-3; adsorption
time tA = 60 s
-1.5 -1.2 -0.9 -0.6 -0.30.0
0.5
1.0
control25G*50G*75G*100G* electrolyte
-0.9
-0.6
-0.3
0.0
control25G*50G*75G*100G*
-0.9
-0.6
-0.3
0.0
control25A*50A*75A*100A*
-1.5 -1.2 -0.9 -0.6 -0.30.0
0.5
1.0
control25A* 50A* 75A* 100A* electrolyte
a
b
c
d
G G
CA CA
33
11
I/ µA
I/ µA
I/ µA
I/ µA
E/V E/V
Fig. 4 Influence of
modification degree on
electrochemical behavior of
thermally denatured PCR
amplicons containing G* (a,b) and A* (c, d) in percentages
indicated in the sample
acronyms. For other details see
Fig. 3
6 Z. Dudova et al.
123
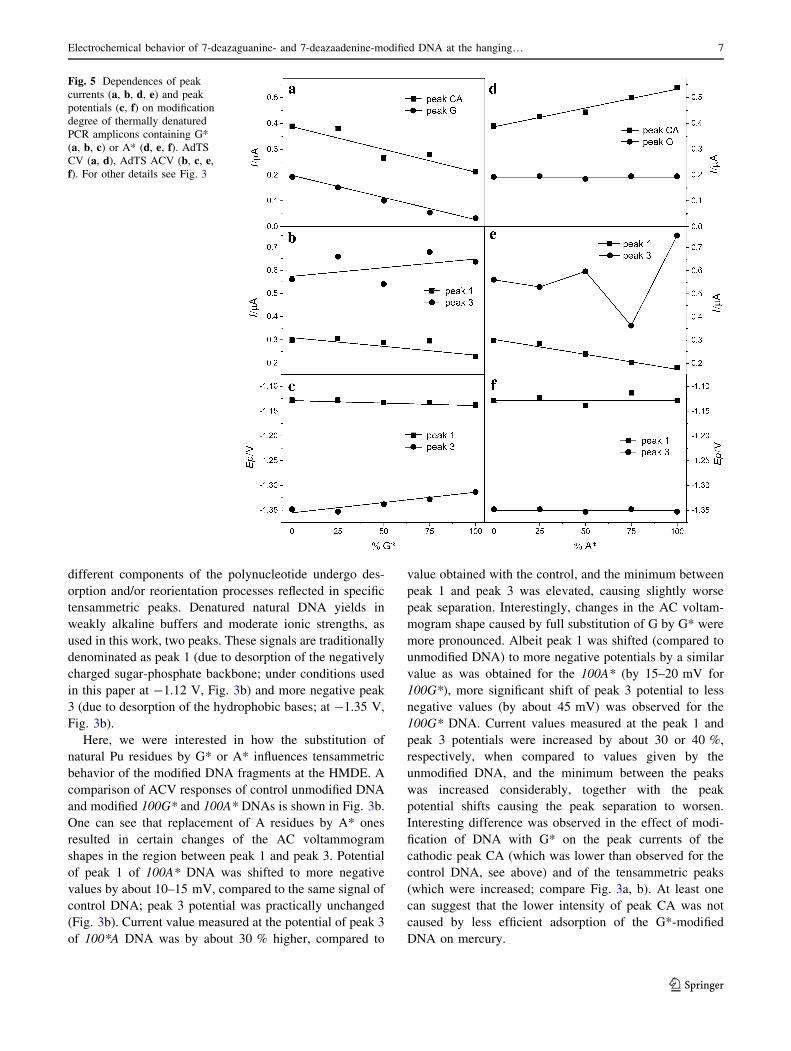
different components of the polynucleotide undergo des-
orption and/or reorientation processes reflected in specific
tensammetric peaks. Denatured natural DNA yields in
weakly alkaline buffers and moderate ionic strengths, as
used in this work, two peaks. These signals are traditionally
denominated as peak 1 (due to desorption of the negatively
charged sugar-phosphate backbone; under conditions used
in this paper at -1.12 V, Fig. 3b) and more negative peak
3 (due to desorption of the hydrophobic bases; at -1.35 V,
Fig. 3b).
Here, we were interested in how the substitution of
natural Pu residues by G* or A* influences tensammetric
behavior of the modified DNA fragments at the HMDE. A
comparison of ACV responses of control unmodified DNA
and modified 100G* and 100A* DNAs is shown in Fig. 3b.
One can see that replacement of A residues by A* ones
resulted in certain changes of the AC voltammogram
shapes in the region between peak 1 and peak 3. Potential
of peak 1 of 100A* DNA was shifted to more negative
values by about 10–15 mV, compared to the same signal of
control DNA; peak 3 potential was practically unchanged
(Fig. 3b). Current value measured at the potential of peak 3
of 100*A DNA was by about 30 % higher, compared to
value obtained with the control, and the minimum between
peak 1 and peak 3 was elevated, causing slightly worse
peak separation. Interestingly, changes in the AC voltam-
mogram shape caused by full substitution of G by G* were
more pronounced. Albeit peak 1 was shifted (compared to
unmodified DNA) to more negative potentials by a similar
value as was obtained for the 100A* (by 15–20 mV for
100G*), more significant shift of peak 3 potential to less
negative values (by about 45 mV) was observed for the
100G* DNA. Current values measured at the peak 1 and
peak 3 potentials were increased by about 30 or 40 %,
respectively, when compared to values given by the
unmodified DNA, and the minimum between the peaks
was increased considerably, together with the peak
potential shifts causing the peak separation to worsen.
Interesting difference was observed in the effect of modi-
fication of DNA with G* on the peak currents of the
cathodic peak CA (which was lower than observed for the
control DNA, see above) and of the tensammetric peaks
(which were increased; compare Fig. 3a, b). At least one
can suggest that the lower intensity of peak CA was not
caused by less efficient adsorption of the G*-modified
DNA on mercury.
Fig. 5 Dependences of peak
currents (a, b, d, e) and peak
potentials (c, f) on modification
degree of thermally denatured
PCR amplicons containing G*
(a, b, c) or A* (d, e, f). AdTSCV (a, d), AdTS ACV (b, c, e,f). For other details see Fig. 3
Electrochemical behavior of 7-deazaguanine- and 7-deazaadenine-modified DNA at the hanging… 7
123

Further, Fig. 4b, d shows effects of the percentage of
substitution of G and A with G* and A*, respectively, on
the measured AC voltammograms. Figure 5b, e shows
corresponding dependences of peak heights on the modi-
fication degree, and analogous dependences of peak
potentials are shown in Fig. 5c, f. As described above for
the faradaic CV responses, effects of increasing percentage
of either of the Pu* residues were systematic, reflected in
gradual changes in the shape of voltammograms as well as
peak potential and peak current values. Only dependences
of the peak 3 heights on the modification degree (measured
from lines joining current minima around the peaks) fol-
lowed rather complicated trends (Fig. 5c for G* and 5e for
A*), which was at least partly caused by changes of the
current value corresponding to minimum between the
peaks.
Effects of DNA structure
Electrochemical responses ofDNAat themercury electrodes
exhibit a remarkable sensitivity to DNA structure (reviewed
in [1, 2]). The main contribution to differences between
polarographic and voltammetric signals of native (double-
stranded, ds) DNA on one hand and those of denatured
(single-stranded, ss) DNA comes from different accessibil-
ities of nucleobases. In the native DNA, the base residues are
hidden in the interior of the DNA double helix and thus
cannot communicate freely with the electrode, while in
denatured DNA the bases are freely accessible and are
preferentially adsorbed at the hydrophobic mercury surface
[1]. This facilitates redox processes of bases in ssDNA,
compared to dsDNA (this effect is especially marked in the
cathodic peak CA because the reduction sites in cytosine and
adenine are directly involved in theWatson–Crick hydrogen
bonding, while the redox site of G is partially accessible via
the major grove of the duplex DNA [1, 2]). Similarly, the
tensammetric DNA peaks respond to changes in DNA
structure. It has also been shown that duplexDNApossessing
free strand ends, such as linearDNA fragments studied in this
work, undergo slow unwinding at the negatively charged
HMDE surface in a narrow potential region around-1.2 V,
while outside this region the structure of DNA adsorbed at
the surface is conserved (reviewed in [1, 2]). Accordingly,
ssDNA-specific peaks (peak CA, peak 3) appear when
potential of HMDE with adsorbed dsDNA is scanned suffi-
ciently slowly from positive to negative values (because
potentials of these peaks are more negative than the poten-
tials causing the DNA unwinding) and their intensities
depend on the extent of DNA surface denaturation. Thus,
under certain conditions (such as those used in the following
experiments, Fig. 6) it is possible to study susceptibility of
theDNA to this process viameasuring changes in intensity of
the ssDNA-specific signals.
Figure 6a, c shows comparison of AC voltammograms
of native and denatured forms of control unmodified DNA
with voltammograms obtained for 100G* DNA (Fig. 6a) or
100A* DNA (Fig. 6c). Peak 3 of denatured 100A* DNA
was about 1.42-fold higher than peak 3 of the same but
native DNA, while analogous peak height ratio obtained
for the unmodified denatured/native DNA was 1.61. Based
on this difference one can suggest that a higher fraction of
the 100A* dsDNA was denatured at the electrode surface,
Fig. 6 Comparison of
electrochemical responses of
native and thermally denatured
PCR amplicons containing
100 % of G* (a, b) or 100 % of
A* (c, d). AdTS ACV responses
(a, c), AdTS CV responses (b,d). For other details see Fig. 3
8 Z. Dudova et al.
123
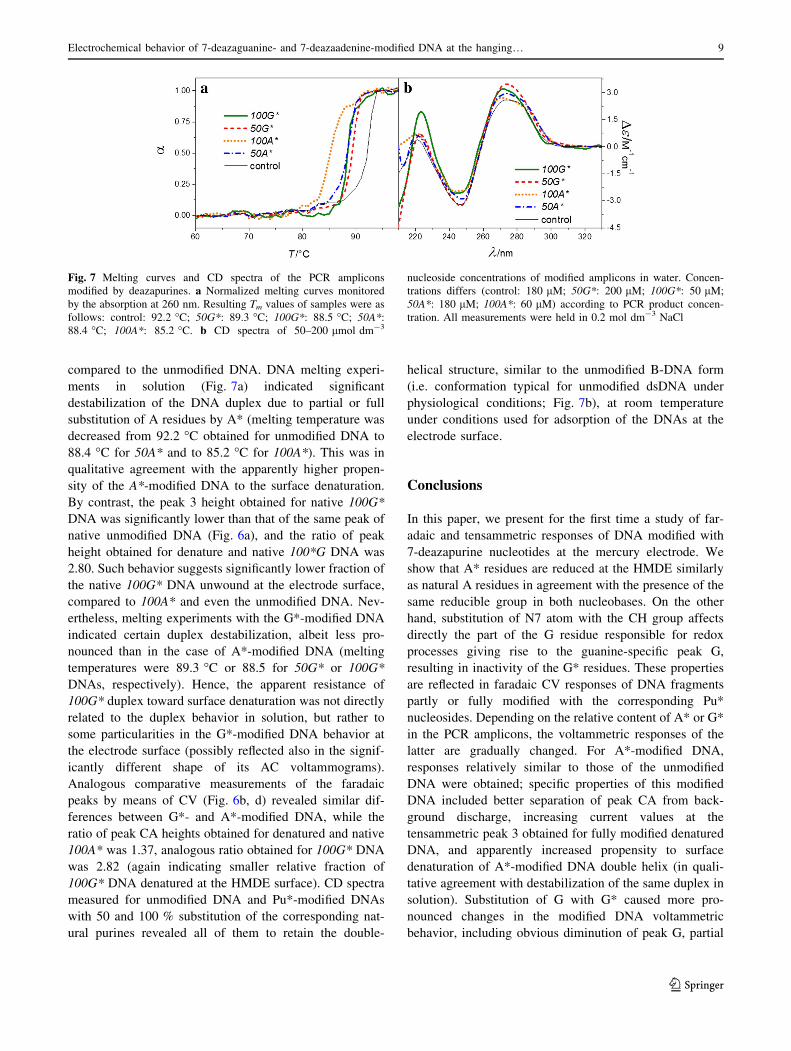
compared to the unmodified DNA. DNA melting experi-
ments in solution (Fig. 7a) indicated significant
destabilization of the DNA duplex due to partial or full
substitution of A residues by A* (melting temperature was
decreased from 92.2 �C obtained for unmodified DNA to
88.4 �C for 50A* and to 85.2 �C for 100A*). This was in
qualitative agreement with the apparently higher propen-
sity of the A*-modified DNA to the surface denaturation.
By contrast, the peak 3 height obtained for native 100G*
DNA was significantly lower than that of the same peak of
native unmodified DNA (Fig. 6a), and the ratio of peak
height obtained for denature and native 100*G DNA was
2.80. Such behavior suggests significantly lower fraction of
the native 100G* DNA unwound at the electrode surface,
compared to 100A* and even the unmodified DNA. Nev-
ertheless, melting experiments with the G*-modified DNA
indicated certain duplex destabilization, albeit less pro-
nounced than in the case of A*-modified DNA (melting
temperatures were 89.3 �C or 88.5 for 50G* or 100G*
DNAs, respectively). Hence, the apparent resistance of
100G* duplex toward surface denaturation was not directly
related to the duplex behavior in solution, but rather to
some particularities in the G*-modified DNA behavior at
the electrode surface (possibly reflected also in the signif-
icantly different shape of its AC voltammograms).
Analogous comparative measurements of the faradaic
peaks by means of CV (Fig. 6b, d) revealed similar dif-
ferences between G*- and A*-modified DNA, while the
ratio of peak CA heights obtained for denatured and native
100A* was 1.37, analogous ratio obtained for 100G* DNA
was 2.82 (again indicating smaller relative fraction of
100G* DNA denatured at the HMDE surface). CD spectra
measured for unmodified DNA and Pu*-modified DNAs
with 50 and 100 % substitution of the corresponding nat-
ural purines revealed all of them to retain the double-
helical structure, similar to the unmodified B-DNA form
(i.e. conformation typical for unmodified dsDNA under
physiological conditions; Fig. 7b), at room temperature
under conditions used for adsorption of the DNAs at the
electrode surface.
Conclusions
In this paper, we present for the first time a study of far-
adaic and tensammetric responses of DNA modified with
7-deazapurine nucleotides at the mercury electrode. We
show that A* residues are reduced at the HMDE similarly
as natural A residues in agreement with the presence of the
same reducible group in both nucleobases. On the other
hand, substitution of N7 atom with the CH group affects
directly the part of the G residue responsible for redox
processes giving rise to the guanine-specific peak G,
resulting in inactivity of the G* residues. These properties
are reflected in faradaic CV responses of DNA fragments
partly or fully modified with the corresponding Pu*
nucleosides. Depending on the relative content of A* or G*
in the PCR amplicons, the voltammetric responses of the
latter are gradually changed. For A*-modified DNA,
responses relatively similar to those of the unmodified
DNA were obtained; specific properties of this modified
DNA included better separation of peak CA from back-
ground discharge, increasing current values at the
tensammetric peak 3 obtained for fully modified denatured
DNA, and apparently increased propensity to surface
denaturation of A*-modified DNA double helix (in quali-
tative agreement with destabilization of the same duplex in
solution). Substitution of G with G* caused more pro-
nounced changes in the modified DNA voltammetric
behavior, including obvious diminution of peak G, partial
Fig. 7 Melting curves and CD spectra of the PCR amplicons
modified by deazapurines. a Normalized melting curves monitored
by the absorption at 260 nm. Resulting Tm values of samples were as
follows: control: 92.2 �C; 50G*: 89.3 �C; 100G*: 88.5 �C; 50A*:
88.4 �C; 100A*: 85.2 �C. b CD spectra of 50–200 lmol dm-3
nucleoside concentrations of modified amplicons in water. Concen-
trations differs (control: 180 lM; 50G*: 200 lM; 100G*: 50 lM;
50A*: 180 lM; 100A*: 60 lM) according to PCR product concen-
tration. All measurements were held in 0.2 mol dm-3 NaCl
Electrochemical behavior of 7-deazaguanine- and 7-deazaadenine-modified DNA at the hanging… 9
123

decrease of peak CA (although the C ? A content in the
modified DNA was unaltered), significantly changed
adsorption/desorption behavior reflected in potential shifts
of the tensammetric peaks accompanied by changes in the
overall shape of the AC voltammogram, and apparently
decreased susceptibility of fully G*-modified DNA duplex
at the electrode surface. Such specific behavior is inter-
esting in relation to previous studies of C:G* pairing in G*-
modified DNA duplexes [22], which, considering altered
electronic properties of the G* heterocycle and a loss of a
major groove cation-binding site due to replacement of N7
by CH, suggested that this modification could affect the
organization of salts and water in the major groove of
duplex DNA. These effects can be expected to influence
also the behavior of G*-modified DNA at the electrically
charged surface. Thus, particularly the properties of the
G*-modified DNA appear to be worth further investigation,
which is currently in progress and will be published
elsewhere.
Materials and methods
Synthetic ODNs (see below) were purchased from VBC
biotech. Plasmid pT77 bearing wild-type p53 cDNA insert
[27] (used as template for PCR amplification of the 347-bp
fragment) was isolated from E. coli cells using Qiagen
Plasmid Purification Kit. Plasmid pT77 was linearized with
EcoRI restrictase (NEB). Pfu DNA Polymerase was pur-
chased from Promega (U.S.), unmodified nucleoside
triphosphates (dATP, dTTP, dCTP and dGTP), 7-deaza-
dGTP (dG*TP), and 7-deaza-dATP (dA*TP) from Jena
Bioscience. Other chemicals were of analytical grade.
Preparative PCR
Linearized pT77 template (500 ng) was mixed with p53-
for (50-GAGGTTGTGAGGCGCTGCCC-30) and p53-rev
(50-TCCTCTGTGCGCCGGTCTCT-30) primers
(0.5 lmol dm-3 each), Pfu DNA Polymerase (3 U) and a
mix of dTTP and dCTP (125 lmol dm-3 each) in total
volume of 100 mm3. dG*TP or dA*TP was added to the
mixture in various ratios with dGTP or dATP, respectively;
total concentration of (dG*TP ? dGTP) or (dA*TP ? -
dA*TP) was always 125 lmol dm-3. The PCR involved
30 cycles (denaturation 95 �C/90 s, annealing 60 �C/120 s,
polymerization 72 �C/180 s) and was run on C1000
Thermal Cycler (BioRad). The PCR products were purified
using QIAquick PCR Purification Kit (Qiagen) and their
concentrations were determined spectrophotometrically
using NanoDrop ND-1000 Spectrophotometer (NanoDrop
Technologies, U.S.).
Voltammetric measurements
Voltammetric measurements were performed using Autolab
(EcoChemie, Utrecht, The Netherlands) connected to a
three-electrode system involving hanging mercury drop
electrode (HMDE) as a working electrode, Ag/AgCl/
3 mol dm-3 KCl electrode as a reference and platinum wire
as an auxiliary electrode. All measurements were carried out
at room temperature and after deaeration with argon.
Cyclic voltammetry (CV) was measured at
0.2 mol dm-3 acetate buffer, pH 5.0 or 0.3 mol dm-3
ammonium formate, pH 6.97; initial potential (Ei), 0.0 V;
switching potential (Esw), -1.85 V; final potential (Efin),
0.0 V; scan rate, 1 Vs-1. Repeatability of this measure-
ment was 9.5 %.
Alternating current voltammetry (ACV) was performed in
0.3 mol dm-3 NaCl ? 0.05 mol dm-3 phosphate buffer, pH
8.5; Ei, 0.0 V; Efin, -1.6 V; frequency, 230 Hz; amplitude,
50 mV. RSD of the voltammetric measurement was 3.4 %.
Adsorptive transfer stripping procedure
DNA (26.2 lmol dm-3*30 ng mm-3) was adsorbed at
electrode surface from a 4 mm3 drop of solution containing
0.2 mol dm-3 NaCl, the adsorption time (tA) was 60 s. The
DNA-modified electrode was then washed by distilled
water and transferred into background electrolyte in a
voltammetric cell.
CD spectroscopy and melting curve analysis
Before the measurements, the samples of the PCR products
were denatured (10 min at 90 �C) in water, then left to cooldown to room temperature. CD spectra were measured at
0 �C using 1-cm pathlength Hellma cells, placed in a
thermostatted holder of Jasco J-815 dichrograph (Tokyo,
Japan). DNA concentrations were 50–200 lmol dm-3 (see
Fig. 7). Circular dichroism was expressed as the difference
in the molar absorption of the right-handed and left-handed
circularly polarized light, De, in unit of mol-1 dm3 cm-1.
The molarity (mol dm-3) was related to nucleosides.
Melting curves were monitored by the absorption in
260 nm at Varian Cary 4000 UV–Vis spectrophotometer
(Mulgrave, Victoria, Australia). Samples were the same as
in CD spectroscopy. Melting curves were normalized in a
range between native and denatured state of amplicons, a,nondimensional value.
10 Z. Dudova et al.
123

Acknowledgments Financial support from project OPVK CZ.1.07/
2.3.00/30.0019, Czech Science Foundation (Grant P206/11/1638 to
M.F. and P206/12/2378 to L.H.) and ASCR (RVO 68081707) is
acknowledged.
References
1. Palecek E, Bartosik M (2012) Chem Rev 112:3427
2. Fojta M, Jelen F, Havran L, Palecek E (2008) Curr Anal Chem
4:250
3. Fadrna R, Kucharikova-Cahova K, Havran L, Yosypchuk B,
Fojta M (2005) Electroanalysis 17:452
4. Kubicarova T, Fojta M, Vidic J, Havran L, Palecek E (2000)
Electroanalysis 12:1422
5. Fojta M, Bowater RP, Stankova V, Havran L, Lilley DMJ,
Palecek E (1998) Biochemistry 37:4853
6. Fojta M, Kubicarova T, Paleaek E (1999) Electroanalysis
11:1005
7. Cai XH, Rivas G, Shirashi H, Farias P, Wang J, Tomschik M,
Jelen F, Palecek E (1997) Anal Chim Acta 344:65
8. Chiorcea-Paquim A-M, Oliveira-Brett AM (2014) Electrochim
Acta 126:162
9. Vidlakova P, Pivonkova H, Kejnovska I, Trnkova L, Vorlickova
M, Fojta M, Havran L (2015) Anal Bioanal Chem 407:5817
10. Fojta M, Kostecka P, Pivonkova H, Horakova P, Havran L (2011)
Curr Anal Chem 7:35
11. Havran L, Vacek J, Cahova K, Fojta M (2008) Anal Bioanal
Chem 391:1751
12. Kostecka P, Havran L, Bittova M, Pivonkova H, Fojta M (2011)
Anal Bioanal Chem 400:197
13. Jacobsen M, Flechsig G-U (2013) Electroanalysis 25:373
14. Nemcova K, Sebest P, Havran L, Orsag P, Fojta M, Pivonkova H
(2014) Anal Bioanal Chem 406:5843
15. Hocek M, Fojta M (2011) Chem Soc Rev 40:5802
16. Balintova J, Plucnara M, Vidlakova P, Pohl R, Havran L, Fojta
M, Hocek M (2013) Chem Eur J 19:12720
17. Balintova J, Spacek J, Pohl R, Brazdova M, Havran L, Fojta M,
Hocek M (2015) Chem Sci 6:575
18. Vidlakova P, Pivonkova H, Fojta M, Havran L (2015) Monatsh
Chem 146:839
19. Balintova J, Pohl R, Horakova P, Vidlakova P, Havran L, Fojta
M, Hocek M (2011) Chem Eur J 17:14063
20. Pivonkova H, Horakova P, Fojtova M, Fojta M (2010) Anal
Chem 82:6807
21. Vrabel M, Horakova P, Pivonkova H, Kalachova L, Cernocka H,
Cahova H, Pohl R, Sebest P, Havran L, Hocek M, Fojta M (2009)
Chem Eur J 15:1144
22. Ganguly M, Wang F, Kaushik M, Stone MP, Marky LA, Gold B
(2007) Nucleic Acids Res 35:6181
23. Dudova Z, Spacek J, Havran L, Pivonkova H, Fojta M (2015)
Monatsh Chem. doi:10.1007/s00706-015-1578-5
24. Studnickova M, Trnkova L, Zetek J, Glatz Z (1989) Bioelec-
trochem Bioenerg 21:83
25. Trnkova L, Studnickova M, Palecek E (1980) Bioelectrochem
Bioenerg 7:643
26. Horakova P, Tesnohlidkova L, Havran L, Vidlakova P, Pivon-
kova H, Fojta M (2010) Anal Chem 82:2969
27. Hupp TR, Meek DW, Midgley CA, Lane DP (1992) Cell 71:875
Electrochemical behavior of 7-deazaguanine- and 7-deazaadenine-modified DNA at the hanging… 11
123


ORIGINAL PAPER
Interactions of fluorescent dye SYBR Green I with naturaland 7-deazaguanine-modified DNA studied by fluorescenceand electrochemical methods
Zdenka Dudova1 • Jan Spacek1,2 • Ludek Havran1,2 • Hana Pivonkova1 •
Miroslav Fojta1,2
Received: 18 September 2015 / Accepted: 5 October 2015 / Published online: 17 November 2015
� Springer-Verlag Wien 2015
Abstract SYBR Green I (SG) is a fluorescent dye applied
in various techniques of DNA analysis, including fluores-
cent staining of electrophoretic gels, quantitative
polymerase chain reaction, etc. SG binds selectively to
double-stranded DNA via intercalation and minor groove
interactions, resulting in a considerable enhancement of
fluorescence of the dye. Modification of DNA by partial or
full replacement of natural purine nucleobase guanine
(G) with its synthetic analog 7-deazaguanine (G*) or its
derivatives was shown to cause the SG fluorescence
quenching. In this paper, we present a comparative study of
interactions of SG with natural DNA fragments and with
DNA fragments modified with G* by means of fluores-
cence and electrochemical methods. Competition between
unmodified (forming strongly fluorescent complex with
SG) and fully G*-modified (not contributing significantly
to overall fluorescence signal) DNA fragments for the dye
was studied via changes in the fluorescence intensity. In
addition, association interactions of natural or G*-modified
DNA with SG in solution were monitored by adsorptive
transfer stripping square wave voltammetry at a pyrolytic
graphite electrode using a signal of SG electrooxidation.
We show that SG binds both natural and G*-modified DNA
with similar apparent affinity and selectivity for the double-
stranded DNA.
Graphical abstract
0.8 1.0 1.3
0
10
20
30
40
I/µA
E/V
voltammetry
Keywords DNA � 7-Deazaguanine � PCR �Fluorescence � Quenching � DNA interaction �DNA modification � Electrochemical oxidation �Graphite electrode
Introduction
Fluorescent dyes are used in molecular biology for analytic
and diagnostic applications such as detection of nucleic acids
in gels [1, 2], in solution [3, 4], in the determination of
nuclease or telomerase activities [5, 6], in fluorescence
imaging techniques [7], in flow cytometry [8–10], in real-
time polymerase chain reaction (PCR) [11, 12], as well as in
biochip applications [13]. These applications are based on
the use of different fluorescent probes that can interact with
macromolecules and sensitize them for spectroscopic stud-
ies. Photo-excitable dyes like ethidium bromide [14, 15],
pico green [16], acridine and stilbene [17], pyrene [18],
anthracene, or coumarin [19, 20] and their DNA-binding
properties have intensively been studied in this respect.
SYBR Green I (SG, Fig. 1) is one of these fluorescent dyes
which has the ability to increase fluorescence brightness
& Miroslav Fojta
1 Institute of Biophysics, Academy of Sciences of the Czech
Republic, v.v.i., Kralovopolska 135, 612 65 Brno,
Czech Republic
2 Central European Institute of Technology, Masaryk
University, Kamenice 753/5, 625 00 Brno, Czech Republic
123
Monatsh Chem (2016) 147:13–20
DOI 10.1007/s00706-015-1578-5

upon its interaction with double-stranded (ds) DNA up to
1000-fold [3, 21]. SG binds selectively to the dsDNA by
various modes: at low SG:DNA ratios, intercalation is the
predominant binding mode while at higher ratios groove
minor binding gains importance [21], with contribution from
electrostatic stabilization [22]. Interactions of fluorescent
dyes with nucleobases and their analogs in aqueous solutions
can result in fluorescence quenching. In these processes,
intramolecular photoinduced electron transfer plays a crucial
role, which is among others dependent on the oxidation and
reduction potential values of the nucleobases and the dyes
[23]. Some of these substances (including SG [24] or
ethidium [24, 25]) or chemically related compounds (e.g.,
wedelolactone [26]) also exhibit analytically useful elec-
trochemical activity, which can be utilized in
electrochemical assays of interactions of these substances
with DNA and in applications of them as non-covalent redox
indicators of DNA structure (reviewed in [27]).
7-Deazaguanine (G*) is an unnatural analog of purine
nucleobase guanine (Fig. 1) in which N7 atom is replaced by
CHgroup (Fig. 1). G* thus loses a hydrogen-bond acceptor in
this positionwhich is needed forHoogsteen base pairing and a
major groove cation-binding site which could affect the
organization of salts and water in the major groove [28]. Such
features of G* have been used for comparative studies of
G-quadruplexes [29] and triplexes [30], for the formation of
which the Hoogsteen pairing is prerequisite. G* (as well as its
7-substituted derivatives [31]) incorporated in DNA has been
shown to quench strongly the fluorescence of several fluo-
rescence dyes used for analytical purposes mentioned above,
including SG [32], ethidium [14, 33], or GelRed [31]. Pre-
viously, we studied [32, 34] electrochemical properties of G*
and found it to produce a specific oxidation signal at a gra-
phite electrode, the potential of which was by about 300 mV
less positive than the oxidation peak of natural guanine
(which is the lowest among natural nucleosides [35]). These
properties make G* a potent electroactive marker for DNA
efficiently incorporable by PCR [32].
In this work, we studied interactions of SG with natural
DNA and with DNA in which guanine nucleobases were
replaced by 7-deazaguanine. Using fluorescence and elec-
trochemical methods, we show that the apparent affinity of
SG binding to ds DNA is not significantly affected by the
substitution of G with G*, and that the structure selectivity
of SG (i.e., binding preference for the native ds DNA) is
retained in the G*-modified DNA.
Results and discussion
Fluorescence experiments
Previous studies [32] revealed quenching effect of G*
incorporated into DNA on the fluorescence of SG–DNA
complexes. Here, we prepared 374-bp fragments with vari-
ous levels of substitution of G by G* using PCR in the
presence of deoxynucleotide triphosphates (dNTPs) con-
taining various ratios of dG*TP/dGTP (keeping total
concentration of both dNTPs constant and equal to con-
centration of each of remaining three natural dNTPs, i.e.,
dATP, dCTP, and dTTP). Results of fluorescence mea-
surements with samples containing 0.05 lg cm-3
(0.15 lmol dm-3 when expressed in concentration of
nucleotides) DNA and 20 nmol dm-3 SG (corresponding to
one molecule of SG per 7–8 nucleotides) showed a steep
decrease of the fluorescence intensity with increasing pro-
portion of G* present in the DNA amplicon. Figure 2 shows
that 25 % of G* (25G*; further we use analogous abbrevi-
ations for DNA prepared in the given percentage of dG*TP,
e.g., 0G*, 100G*, etc.) caused the fluorescence decrease to
30 % of value obtained for the 0G* DNA. For 50G* DNA
the fluorescence signal was decreased to 13 % and only
negligible fluorescence was detected for DNA with 75G*
DNA and for fully modified 100G* DNA fragment. (It
should be noted that even in the 100G*DNA fragment there
are natural G:C pairs present in terminal regions spanning
the PCR primers [32], featuring about 11 % of the total ds
amplicon length, but even in these regions G*:C pairs occur
due to G* incorporation into the newly synthesized strand;
see sequences of primers in experimental part).
a b c
Fig. 1 Structure of SG (a),7-deazaguanine (b), andguanine (c)
14 Z. Dudova et al.
123
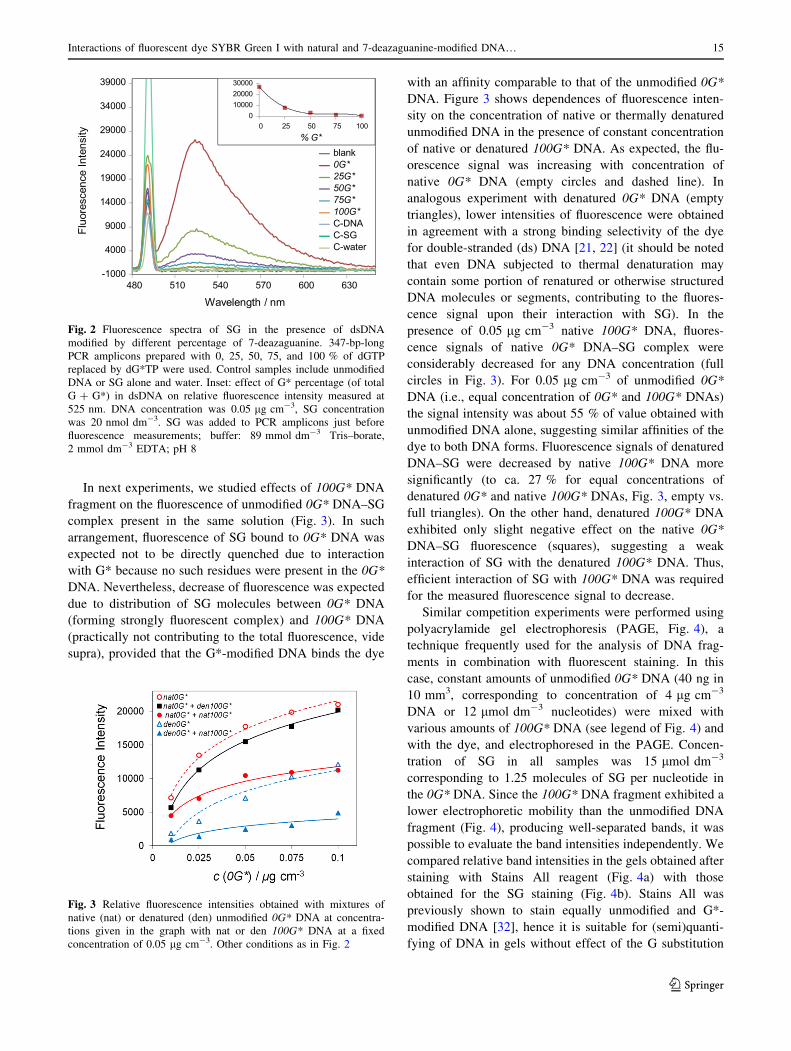
In next experiments, we studied effects of 100G* DNA
fragment on the fluorescence of unmodified 0G* DNA–SG
complex present in the same solution (Fig. 3). In such
arrangement, fluorescence of SG bound to 0G* DNA was
expected not to be directly quenched due to interaction
with G* because no such residues were present in the 0G*
DNA. Nevertheless, decrease of fluorescence was expected
due to distribution of SG molecules between 0G* DNA
(forming strongly fluorescent complex) and 100G* DNA
(practically not contributing to the total fluorescence, vide
supra), provided that the G*-modified DNA binds the dye
with an affinity comparable to that of the unmodified 0G*
DNA. Figure 3 shows dependences of fluorescence inten-
sity on the concentration of native or thermally denatured
unmodified DNA in the presence of constant concentration
of native or denatured 100G* DNA. As expected, the flu-
orescence signal was increasing with concentration of
native 0G* DNA (empty circles and dashed line). In
analogous experiment with denatured 0G* DNA (empty
triangles), lower intensities of fluorescence were obtained
in agreement with a strong binding selectivity of the dye
for double-stranded (ds) DNA [21, 22] (it should be noted
that even DNA subjected to thermal denaturation may
contain some portion of renatured or otherwise structured
DNA molecules or segments, contributing to the fluores-
cence signal upon their interaction with SG). In the
presence of 0.05 lg cm-3 native 100G* DNA, fluores-
cence signals of native 0G* DNA–SG complex were
considerably decreased for any DNA concentration (full
circles in Fig. 3). For 0.05 lg cm-3 of unmodified 0G*
DNA (i.e., equal concentration of 0G* and 100G* DNAs)
the signal intensity was about 55 % of value obtained with
unmodified DNA alone, suggesting similar affinities of the
dye to both DNA forms. Fluorescence signals of denatured
DNA–SG were decreased by native 100G* DNA more
significantly (to ca. 27 % for equal concentrations of
denatured 0G* and native 100G* DNAs, Fig. 3, empty vs.
full triangles). On the other hand, denatured 100G* DNA
exhibited only slight negative effect on the native 0G*
DNA–SG fluorescence (squares), suggesting a weak
interaction of SG with the denatured 100G* DNA. Thus,
efficient interaction of SG with 100G* DNA was required
for the measured fluorescence signal to decrease.
Similar competition experiments were performed using
polyacrylamide gel electrophoresis (PAGE, Fig. 4), a
technique frequently used for the analysis of DNA frag-
ments in combination with fluorescent staining. In this
case, constant amounts of unmodified 0G* DNA (40 ng in
10 mm3, corresponding to concentration of 4 lg cm-3
DNA or 12 lmol dm-3 nucleotides) were mixed with
various amounts of 100G* DNA (see legend of Fig. 4) and
with the dye, and electrophoresed in the PAGE. Concen-
tration of SG in all samples was 15 lmol dm-3
corresponding to 1.25 molecules of SG per nucleotide in
the 0G* DNA. Since the 100G* DNA fragment exhibited a
lower electrophoretic mobility than the unmodified DNA
fragment (Fig. 4), producing well-separated bands, it was
possible to evaluate the band intensities independently. We
compared relative band intensities in the gels obtained after
staining with Stains All reagent (Fig. 4a) with those
obtained for the SG staining (Fig. 4b). Stains All was
previously shown to stain equally unmodified and G*-
modified DNA [32], hence it is suitable for (semi)quanti-
fying of DNA in gels without effect of the G substitution
-1000
4000
9000
14000
19000
24000
29000
34000
39000
480 510 540 570 600 630
ytisnetnIecnecseroulF
Wavelength / nm
blank0G*25G*50G*75G*100G*C-DNAC-SGC-water
0100002000030000
0 25 50 75 100% G*
Fig. 2 Fluorescence spectra of SG in the presence of dsDNA
modified by different percentage of 7-deazaguanine. 347-bp-long
PCR amplicons prepared with 0, 25, 50, 75, and 100 % of dGTP
replaced by dG*TP were used. Control samples include unmodified
DNA or SG alone and water. Inset: effect of G* percentage (of total
G ? G*) in dsDNA on relative fluorescence intensity measured at
525 nm. DNA concentration was 0.05 lg cm-3, SG concentration
was 20 nmol dm-3. SG was added to PCR amplicons just before
fluorescence measurements; buffer: 89 mmol dm-3 Tris–borate,
2 mmol dm-3 EDTA; pH 8
Fig. 3 Relative fluorescence intensities obtained with mixtures of
native (nat) or denatured (den) unmodified 0G* DNA at concentra-
tions given in the graph with nat or den 100G* DNA at a fixed
concentration of 0.05 lg cm-3. Other conditions as in Fig. 2
Interactions of fluorescent dye SYBR Green I with natural and 7-deazaguanine-modified DNA… 15
123
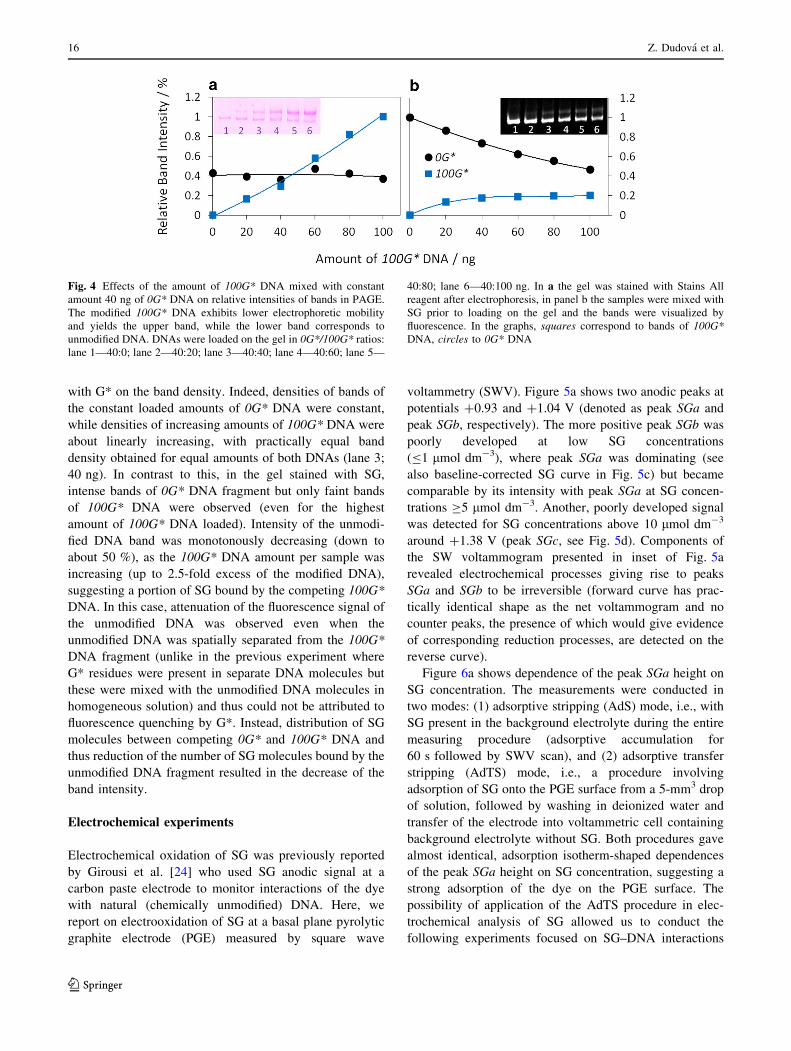
with G* on the band density. Indeed, densities of bands of
the constant loaded amounts of 0G* DNA were constant,
while densities of increasing amounts of 100G* DNA were
about linearly increasing, with practically equal band
density obtained for equal amounts of both DNAs (lane 3;
40 ng). In contrast to this, in the gel stained with SG,
intense bands of 0G* DNA fragment but only faint bands
of 100G* DNA were observed (even for the highest
amount of 100G* DNA loaded). Intensity of the unmodi-
fied DNA band was monotonously decreasing (down to
about 50 %), as the 100G* DNA amount per sample was
increasing (up to 2.5-fold excess of the modified DNA),
suggesting a portion of SG bound by the competing 100G*
DNA. In this case, attenuation of the fluorescence signal of
the unmodified DNA was observed even when the
unmodified DNA was spatially separated from the 100G*
DNA fragment (unlike in the previous experiment where
G* residues were present in separate DNA molecules but
these were mixed with the unmodified DNA molecules in
homogeneous solution) and thus could not be attributed to
fluorescence quenching by G*. Instead, distribution of SG
molecules between competing 0G* and 100G* DNA and
thus reduction of the number of SG molecules bound by the
unmodified DNA fragment resulted in the decrease of the
band intensity.
Electrochemical experiments
Electrochemical oxidation of SG was previously reported
by Girousi et al. [24] who used SG anodic signal at a
carbon paste electrode to monitor interactions of the dye
with natural (chemically unmodified) DNA. Here, we
report on electrooxidation of SG at a basal plane pyrolytic
graphite electrode (PGE) measured by square wave
voltammetry (SWV). Figure 5a shows two anodic peaks at
potentials ?0.93 and ?1.04 V (denoted as peak SGa and
peak SGb, respectively). The more positive peak SGb was
poorly developed at low SG concentrations
(B1 lmol dm-3), where peak SGa was dominating (see
also baseline-corrected SG curve in Fig. 5c) but became
comparable by its intensity with peak SGa at SG concen-
trations C5 lmol dm-3. Another, poorly developed signal
was detected for SG concentrations above 10 lmol dm-3
around ?1.38 V (peak SGc, see Fig. 5d). Components of
the SW voltammogram presented in inset of Fig. 5a
revealed electrochemical processes giving rise to peaks
SGa and SGb to be irreversible (forward curve has prac-
tically identical shape as the net voltammogram and no
counter peaks, the presence of which would give evidence
of corresponding reduction processes, are detected on the
reverse curve).
Figure 6a shows dependence of the peak SGa height on
SG concentration. The measurements were conducted in
two modes: (1) adsorptive stripping (AdS) mode, i.e., with
SG present in the background electrolyte during the entire
measuring procedure (adsorptive accumulation for
60 s followed by SWV scan), and (2) adsorptive transfer
stripping (AdTS) mode, i.e., a procedure involving
adsorption of SG onto the PGE surface from a 5-mm3 drop
of solution, followed by washing in deionized water and
transfer of the electrode into voltammetric cell containing
background electrolyte without SG. Both procedures gave
almost identical, adsorption isotherm-shaped dependences
of the peak SGa height on SG concentration, suggesting a
strong adsorption of the dye on the PGE surface. The
possibility of application of the AdTS procedure in elec-
trochemical analysis of SG allowed us to conduct the
following experiments focused on SG–DNA interactions
Fig. 4 Effects of the amount of 100G* DNA mixed with constant
amount 40 ng of 0G* DNA on relative intensities of bands in PAGE.
The modified 100G* DNA exhibits lower electrophoretic mobility
and yields the upper band, while the lower band corresponds to
unmodified DNA. DNAs were loaded on the gel in 0G*/100G* ratios:
lane 1—40:0; lane 2—40:20; lane 3—40:40; lane 4—40:60; lane 5—
40:80; lane 6—40:100 ng. In a the gel was stained with Stains All
reagent after electrophoresis, in panel b the samples were mixed with
SG prior to loading on the gel and the bands were visualized by
fluorescence. In the graphs, squares correspond to bands of 100G*
DNA, circles to 0G* DNA
16 Z. Dudova et al.
123

Fig. 5 Electrochemical analysis of SG and mixtures/complex of SG
with dsDNA using SWV at PGE in 0.2 mol dm-3 acetate buffer, pH
5. a AdS SW voltammograms of of SG at different concentrations
(0.5, 1.0, 10, and 20 lmol dm-3). Inset shows net SW voltammogram
and both forward and backward components to demonstrate irre-
versibility of the SG oxidation process. b AdTS SW voltammograms
(before and after background subtraction) of SG, ds 0G* DNA and ds
100G* DNA. c–d Baseline-corrected sections of AdTS SW voltam-
mograms of SG, dsDNAs (100G* or 0G*) and their
mixtures/complexes with SG (1 lmol dm-3 in c and 20 lmol dm-3
in d). DNA concentration was always 15 lg cm-3, adsorption time
tA = 60 s. For sample assignment, see legends in the figure
Fig. 6 a Dependence of the height of peak SGa on SG concentration
measured by AdS (squares) and AdTS (circles) SWV at PGE.
b Dependence of the height of peak SGa on SG concentration
measured by AdTS SWV at PGE in the absence of DNA (circles), in
the presence of 0G* DNA (squares) and in the presence of 100G*
DNA (triangles); DNA concentration was always 15 lg cm-3, other
conditions as in Fig. 5
Interactions of fluorescent dye SYBR Green I with natural and 7-deazaguanine-modified DNA… 17
123
with series of small-volume samples in the medium
exchange mode.
Electrochemical analysis of natural DNA with carbon
electrodes is usually based on measuring oxidation signals
of purine nucleobases [35]. As shown in Fig. 5b, voltam-
mogram obtained with 0G* DNA displayed two anodic
signals, one at ?1.04 V (peak Gox due to guanine oxida-
tion) and the other at ?1.35 V (peak Aox corresponding to
oxidation of adenine). Previously, we have reported [32] on
electrochemical oxidation of 7-deazapurines and showed
that G* is oxidized at a potential considerably less positive
than potential of oxidation of natural G. Accordingly, the
100G* DNA produces, in addition to the peak Aox due to
natural adenine, an anodic peak G*ox around ?0.73 V due
to oxidation of the G* residues (Fig. 5b; a small peak Gox
observed with 100G* DNA originates from G residues
present in the PCR primers, vide supra).
Further, we compared electrochemical responses of SG
with those of 0G* and 100G* DNAs to identify signals
useful for studies of the SG–DNA interactions. For this
purpose, we used AdTS SWV analysis of samples con-
taining 15 lg cm-3 of either 0G* or 100G* DNA and
various concentrations of SG (i.e., DNA and the dye were
co-adsorbed at the surface). Unfortunately, potential of
peak Gox coincided with that of peak SGb, and it was
possible to measure peak Gox in the presence of only small
concentrations of SG (such as 1 lmol dm-3, as shown in
Fig. 5c). At higher concentrations of SG (such as
20 lmol dm-3, Fig. 5d), the peak Gox was completely
overlapped by the SG signals. Similarly, peak Aox could be
measured in the presence of 1 lmol dm-3 SG but inter-
fered with peak SGc when SG concentration was
20 lmol dm-3. This precluded us from using the natural
DNA signal in the interaction studies. Although the peak
G*ox yielded by the 100G* DNA was positioned outside
the potential region of the SG signal (Fig. 5b–d), it was
strongly depressed in the presence of higher SG concen-
trations (Fig. 5d) probably due to a strong adsorption of the
dye at the electrode (vide supra), preventing the DNA from
accumulating at the electrode. Analogous experiments
involving pre-accumulation of either of the DNA samples
at the PGE, followed by exposure to SG solutions, revealed
an easy displacement of DNA by the strongly adsorbing
dye (not shown).
Nevertheless, the above experiments showed a consid-
erable effect of the presence of DNA in mixture with small
concentrations of SG on the height of the peak SGa (and
SGb). For example, for 1 lmol dm-3 SG (corresponding to
1 SG molecule per 22–23 base pairs in 15 lg cm-3 DNA)
the peak SGa disappeared in the presence of DNA
(Fig. 5c). Dependences of the peak SGa height on SG
concentration measured in the presence of 15 lg cm-3
DNA (i.e., titration curves of DNA by SG), when compared
to concentration dependence of the SG alone (Fig. 6b),
showed strong depression of the peak height between 1 and
3 lmol dm-3 SG followed by gradual S-shaped increase of
the signal intensity, with inflection points around
10 lmol dm-3 SG. Such shape of the dependences sug-
gests association interaction of the dye with DNA, resulting
in decrease of the activity of free SG in solution with
concomitant decrease of the voltammetric signal (similar
behavior was previously observed for other DNA-binding
substances, e.g., doxorubicin [36] or wedelolactone [26]).
The apparent equivalence point, represented by the
inflection on the titration curves, corresponded to about one
molecule of SG per 2–3 base pairs (in a good agreement
with binding curves measured through relative fluorescence
intensity, which showed inflection point at SG:bp ratio
around 1 [21]). Notably, both 0G* and 100G* DNAs gave
similar titration curves, suggesting similar apparent affini-
ties of the dye to both DNA forms.
Taken together, results in this work suggest similar
affinities of SG to both unmodified and G*-modified DNA.
Previous studies performed with DNA partially (to various
extents) modified with G* revealed a strong quenching of
DNA–SG fluorescence in electrophoretic gels and in real-
time PCR reactions [32]. Figure 2 in this paper shows that
decrease of the fluorescence signal is remarkably stronger
than proportional to fraction of dG*TP present in PCR
mixture used for preparations of the fragment (decrease by
70 and 87 % for 25 and 50 % dG*TP, respectively). Since
we did not observe [32] any significant preference for G*
incorporation in PCR reactions (as concluded from relative
intensities of G- or G*-specific voltammetric peaks Gox and
G*ox, respectively [32]), we suppose that relative abun-
dance of G and G* in the PCR amplicons was given by
their ratio in the PCR mixture. Hence, the super-propor-
tional quenching effect may in principle be caused either
by (1) preferential binding of SG at sites adjacent to G*:C
base pairs, (2) a weaker overall binding of the dye to
partially modified DNA (this would not be related to
quenching by G* as such but rather to formation of lower
number of the fluorescent complexes), or (3) quenching by
G* from remote sites via mechanism involving DNA-me-
diated charge transfer [15]. The option (3) is, in the context
of this work, only speculative; nevertheless, our experi-
ments excluded both significantly preferential and
significantly weaker binding of SG to G*-modified DNA.
Fluorescence measurements with mixed solutions of natu-
ral and fully G*-substituted DNA fragments (which were
supposed not to interact closely with each other but rep-
resent independent, not communicating binding substrates
for the dye) revealed competition of these fragments for
SG, resulting in decrease of the fluorescence signal of the
unmodified DNA (Fig. 3). Decrease of the fluorescence
with the 0G* DNA due to the presence of 100G* DNA was
18 Z. Dudova et al.
123

observed even in the electrophoretic experiments, where
the two DNA forms were spatially separated from each
other. Moreover, denatured 100G* DNA was a remarkably
weaker competitor than the same but native DNA, sug-
gesting analogous structure selectivity of SG binding to
100G* DNA, as was reported for the natural DNA [21, 22].
Conclusions
In this paper, we studied for the first time interactions of
the fluorescent dye SG with DNA modified with 7-deaza-
guanine in comparison with SG interactions with DNA
composed of solely natural nucleobases. While the fluo-
rescence experiments were used for indirect assessment of
SG binding to the G*-modified DNA via measuring
decrease of 0G* DNA fluorescence signal upon competi-
tion with 100G* DNA for the dye, electrochemical analysis
allowed us to study the DNA–SG interaction using an
analytical signal which was not affected by the nucleobase
type. Even when coincidence of the SG oxidation peaks
with oxidation signals of natural purines (together with a
strong adsorption of the dye onto the electrode) made the
latter signals impossible to measure at higher concentra-
tions of the dye (Fig. 6), we successfully used AdTS SWV
technique for monitoring changes of free SG activity in
solution upon interaction with DNA. Results of these
electrochemical measurements confirmed comparably
efficient binding of SG to both unmodified and fully G*-
substituted DNA.
Materials and methods
Materials
Synthetic ODNs (see below) were purchased from VBC
Biotech. Plasmid pT77 bearing wild-type p53 cDNA insert
[37] (used as template for PCR amplification of the 347-bp
fragment) was isolated from E. coli cells using Qiagen
Plasmid Purification Kit. Plasmid pT77 was linearized with
EcoR I restrictase (NEB). Pfu DNA Polymerase was pur-
chased from Promega (USA), unmodified nucleoside
triphosphates (dATP, dTTP, dCTP and dGTP), SG (N0,N0-dimethyl-N-[4-[(E)-(3-methyl-1,3-benzothiazol-2-ylidene)
methyl]-1-phenylquinolin-1-ium-2-yl]-N-propylpropane-
1,3-diamine) and Stains All reagent (1-ethyl-2-[3-(1-
ethylnaphtho[1,2-d]thiazolin-2-ylidene)-2-methylpropenyl]
naphtho[1,2-d]thiazolium bromide, 3,30-diethyl-9-methyl-
4,5,40,50-dibenzothiacarbocyanine) from Sigma, 7-deaza-
dGTP (dG*TP) from Jena Bioscience. Other chemicals
were of analytical grade. The stock solution concentration
(8.6 mmol dm-3) of SG was determined by
spectrophotometry of appropriately diluted solution using
the extinction coefficient of e495 = 73,000 mol-1 -
dm3 cm-1 in 10 mmol dm-3 Tris, 1 mmol dm-3 EDTA
buffer pH 7.5 [21].
Preparative PCR
Linearized pT77 template (500 ng) was mixed with p53-for
(50-GAGGTTGTGAGGCGCTGCCC-30) and p53-rev
(50-TCCTCTGTGCGCCGGTCTCT-30) primers (0.5 lmol
dm-3 each), PfuDNA Polymerase (3 U) and a mix of dATP,
dTTP and dCTP (125 lmol dm-3 each) in total volume of
100 mm3. dG*TP was added to the mixture in various ratios
with dGTP (see Results and Discussion), total concentration
of dG*TP ? dGTP was 125 lmol dm-3. The PCR involved
30 cycles (denaturation 95 �C/15 s, annealing 55 �C/30 s,
polymerization 72 �C/60 s) and was run on C1000 Thermal
Cycler (BioRad). The PCR products were purified using
QIAquick PCR Purification Kit (Qiagen) and their concen-
trations were determined spectrophotometrically using
NanoDrop ND-1000 Spectrophotometer (NanoDrop Tech-
nologies, U.S.).
Spectrofluorimetry
Fluorescence measurements were performed in 1 9 TBE
buffer (89 mmol dm-3 Tris–borate, 2 mmol dm-3 EDTA;
pH 8) on PC1 spectrofluorimeter (ISS, USA) at room
temperature. All measurements were performed with DNA
concentrations given in ‘‘Results and discussion’’ and
20 nmol dm-3 SG, excitation wavelength of SG was
490 nm and the fluorescence was monitored over the
wavelength range 480–650 nm.
Native PAGE
The PCR products were pre-stained with 15 lmol dm-3
SG and mixed with loading buffer (10 mmol dm-3 TRIS
pH 7.6; 60 mmol dm-3 EDTA; 60 % glycerol; 0.03 %
bromophenol blue) then subjected to electrophoresis in
4.5 % native gel containing 1 9 TBE buffer
(89 mmol dm-3 Tris–borate, 2 mmol dm-3 EDTA; pH 8).
PAGE was run at 120 V at room temperature for 90 min in
1x TBE. Polyacrylamide gels which were stained with SG
were visualized using LAS-3000 (FUJIFILM Corporation),
those stained with the Stains All reagent were scanned.
ImageJ free software was used for measuring band inten-
sity in the gels (http://imagej.nih.gov/).
Square wave voltammetry (SWV)
Voltammetric measurements were performed using Auto-
lab (EcoChemie, Utrecht, Netherlands) connected to a
Interactions of fluorescent dye SYBR Green I with natural and 7-deazaguanine-modified DNA… 19
123

three-electrode system involving homemade pyrolytic
graphite electrode (PGE) as working electrode, Ag/AgCl/
3 mol dm-3 KCl electrode as a reference and platinum
wire as an auxiliary electrode. All measurements were
carried out at room temperature on air. Surface of the PGE
was renewed by peeling-off the surface layer as described
previously [38]. SWV conditions were following: initial
potential -1.0 V; end potential ?1.6 V; pulse amplitude
50 mV; frequency 200 Hz; potential step 5 mV.
Adsorptive transfer stripping procedure
SG and/or DNA was adsorbed at fresh electrode surface
from a 5 mm3 drop of solution containing 0.2 mol dm-3
NaCl, the adsorption time (tA) was 60 s. The DNA-modi-
fied electrode was then washed by distilled water and
transferred into background electrolyte in a voltammetric
cell.
Acknowledgments This work was supported by the Czech Science
Foundation (grant P206/11/1638 to M. F. and P206/12/2378 to L. H.)
and by the ASCR (RVO 68081707).
References
1. Jin X, Dong F, Singer VL (1996) FASEB J 10:751
2. Kiltie AE, Ryan AJ (1997) Nucl Acids Res 25:2945
3. Vitzthum F, Geiger G, Bisswanger H, Brunner H, Bernhagen J
(1999) Anal Biochem 276:59
4. Rengarajan K, Cristol SM, Mehta M, Nickerson JM (2002) Mol
Vis 8:416
5. Iida R, Yasuda T, Tsubota E, Nakashima Y, Sawazaki K,
Aoyama M, Matsuki T, Kishi K (1998) Electrophoresis 19:2416
6. Wege H, Chui MS, Le HT, Tran JM, Zern MA (2003) Nucl Acids
Res 31:e3
7. Iwabuchi S, Muramatsu H, Chiba N, Kinjo Y, Murakami Y,
Sakaguchi T, Yokoyama K, Tamiya E (1997) Nucl Acids Res
25:1662
8. Brussaard CPD, Marie D, Bratbak G (2000) J Virol Methods
85:175
9. Tamburini S, Foladori P, Ferrentino G, Spilimbergo S, Jousson O
(2014) J Appl Microbiol 117:440
10. Qu LL, Li YQ, Zheng B, He CY, He L, Li YX (2009) Chem J
Chin Univ 30:1121
11. Wittwer CT, Ririe KM, Andrew RV, David DA, Gundry RA,
Balis UJ (1997) Biotechniques 22:176
12. Simpson D, Feeney S, Boyle C, Stitt A (2000) Mol Vis 6:178
13. Balsam J, Rasooly R, Bruck HA, Rasooly A (2014) Biosens
Bioelectron 51:1
14. Latimer LJP, Lee JS (1991) J Biol Chem 266:13849
15. Kelley SO, Barton JK (1998) Chem Biol 5:413
16. Noothi SK, Kombrabail M, Rao BJ, Krishnamoorthy G (2010) J
Fluoresc 20:37
17. Fukui K, Tanaka K (1998) Angew Chem Int Edit 37:158
18. Manoharan M, Tivel KL, Zhao M, Nafisi K, Netzel TL (1995) J
Phys Chem 99:17461
19. Kang HK, Shin EJ, Shim SC (1992) J Photoch Photobio B 13:19
20. Melavanki RM, Patil NR, Patil HD, Kusanur RA, Kadadevara-
math JS (2011) Indian J Pure Appl Phys 49:748
21. Zipper H, Brunner H, Bernhagen J, Vitzthum F (2004) Nucl
Acids Res 32:e103
22. Dragan AI, Pavlovic R, McGivney JB, Casas-Finet JR, Bishop
ES, Strouse RJ, Schenerman MA, Geddes CD (2012) J Fluoresc
22:1189
23. Seidel CAM, Schulz A, Sauer MHM (1996) J Phys Chem
100:5541
24. Ioannou AK, Alexiadou DK, Kouidou SA, Voulgaropoulos AN,
Girousi ST (2010) Anal Chim Acta 657:163
25. Oliveira SCB, Nascimento VB (2013) Electroanalysis 25:2117
26. Cerven J, Havran L, Pecinka P, Fojta M (2015) Electroanalysis.
doi:10.1002/elan.201500177
27. Fojta M, Havran L, Pivonkova H, Horakova P, Hocek M (2011)
Curr Org Chem 15:2936
28. Ganguly M, Wang F, Kaushik M, Stone MP, Marky LA, Gold B
(2007) Nucl Acids Res 35:6181
29. Gros J, Rosu F, Amrane S, De Cian A, Gabelica V, Lacroix L,
Mergny JL (2007) Nucl Acids Res 35:3064
30. Palecek E (1991) Crit Rev Biochem Mol 26:151
31. Menova P, Dziuba D, Gueixens-Gallardo P, Jurkiewicz P, Hof M,
Hocek M (2015) Bioconjugate Chem 26:361
32. Pivonkova H, Horakova P, Fojtova M, Fojta M (2010) Anal
Chem 82:6807
33. Li H, Peng XH, Seela F (2004) Bioorg Med Chem Lett 14:6031
34. Vrabel M, Horakova P, Pivonkova H, Kalachova L, Cernocka H,
Cahova H, Pohl R, Sebest P, Havran L, Hocek M, Fojta M (2009)
Chem Eur J 15:1144
35. Palecek E, Bartosik M (2012) Chem Rev 112:3427
36. Vacek J, Havran L, Fojta M (2009) Electroanalysis 21:2139
37. Hupp TR, Meek DW, Midgley CA, Lane DP (1992) Cell 71:875
38. Fojta M, Havran L, Kizek R, Billova S (2002) Talanta 56:867
20 Z. Dudova et al.
123
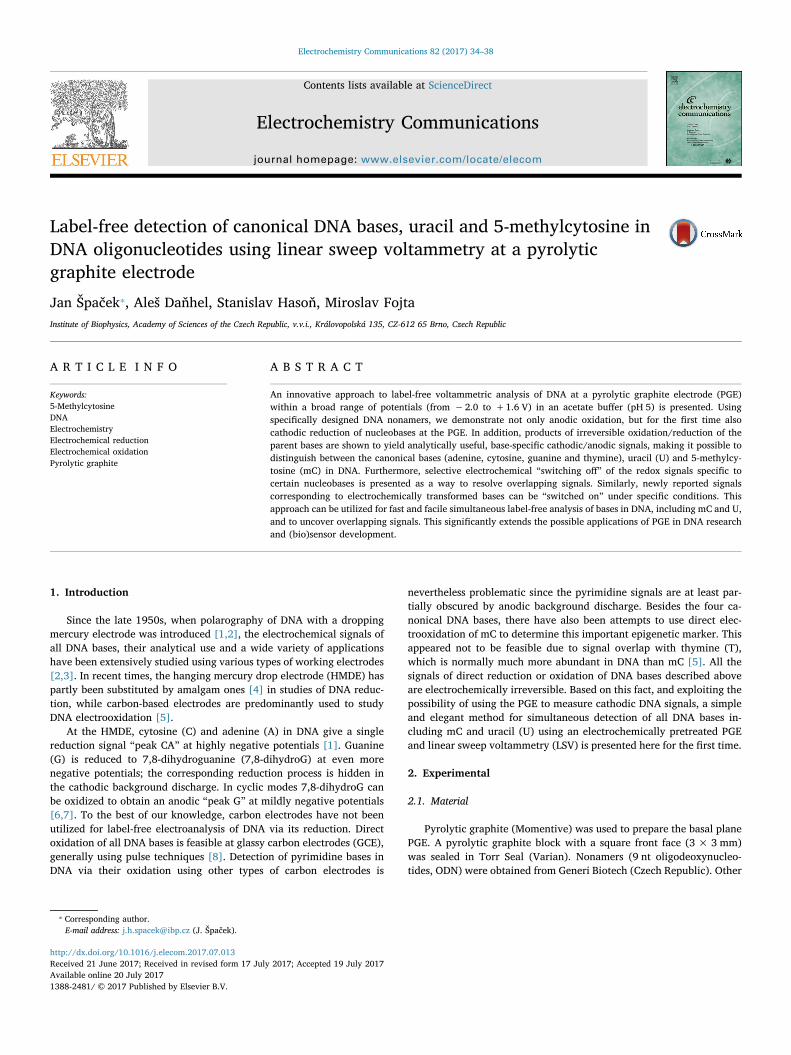
Contents lists available at ScienceDirect
Electrochemistry Communications
journal homepage: www.elsevier.com/locate/elecom
Label-free detection of canonical DNA bases, uracil and 5-methylcytosine inDNA oligonucleotides using linear sweep voltammetry at a pyrolyticgraphite electrode
Jan Špaček⁎, Aleš Daňhel, Stanislav Hasoň, Miroslav FojtaInstitute of Biophysics, Academy of Sciences of the Czech Republic, v.v.i., Královopolská 135, CZ-612 65 Brno, Czech Republic
A R T I C L E I N F O
Keywords:5-MethylcytosineDNAElectrochemistryElectrochemical reductionElectrochemical oxidationPyrolytic graphite
A B S T R A C T
An innovative approach to label-free voltammetric analysis of DNA at a pyrolytic graphite electrode (PGE)within a broad range of potentials (from −2.0 to +1.6 V) in an acetate buffer (pH 5) is presented. Usingspecifically designed DNA nonamers, we demonstrate not only anodic oxidation, but for the first time alsocathodic reduction of nucleobases at the PGE. In addition, products of irreversible oxidation/reduction of theparent bases are shown to yield analytically useful, base-specific cathodic/anodic signals, making it possible todistinguish between the canonical bases (adenine, cytosine, guanine and thymine), uracil (U) and 5-methylcy-tosine (mC) in DNA. Furthermore, selective electrochemical “switching off” of the redox signals specific tocertain nucleobases is presented as a way to resolve overlapping signals. Similarly, newly reported signalscorresponding to electrochemically transformed bases can be “switched on” under specific conditions. Thisapproach can be utilized for fast and facile simultaneous label-free analysis of bases in DNA, including mC and U,and to uncover overlapping signals. This significantly extends the possible applications of PGE in DNA researchand (bio)sensor development.
1. Introduction
Since the late 1950s, when polarography of DNA with a droppingmercury electrode was introduced [1,2], the electrochemical signals ofall DNA bases, their analytical use and a wide variety of applicationshave been extensively studied using various types of working electrodes[2,3]. In recent times, the hanging mercury drop electrode (HMDE) haspartly been substituted by amalgam ones [4] in studies of DNA reduc-tion, while carbon-based electrodes are predominantly used to studyDNA electrooxidation [5].
At the HMDE, cytosine (C) and adenine (A) in DNA give a singlereduction signal “peak CA” at highly negative potentials [1]. Guanine(G) is reduced to 7,8-dihydroguanine (7,8-dihydroG) at even morenegative potentials; the corresponding reduction process is hidden inthe cathodic background discharge. In cyclic modes 7,8-dihydroG canbe oxidized to obtain an anodic “peak G” at mildly negative potentials[6,7]. To the best of our knowledge, carbon electrodes have not beenutilized for label-free electroanalysis of DNA via its reduction. Directoxidation of all DNA bases is feasible at glassy carbon electrodes (GCE),generally using pulse techniques [8]. Detection of pyrimidine bases inDNA via their oxidation using other types of carbon electrodes is
nevertheless problematic since the pyrimidine signals are at least par-tially obscured by anodic background discharge. Besides the four ca-nonical DNA bases, there have also been attempts to use direct elec-trooxidation of mC to determine this important epigenetic marker. Thisappeared not to be feasible due to signal overlap with thymine (T),which is normally much more abundant in DNA than mC [5]. All thesignals of direct reduction or oxidation of DNA bases described aboveare electrochemically irreversible. Based on this fact, and exploiting thepossibility of using the PGE to measure cathodic DNA signals, a simpleand elegant method for simultaneous detection of all DNA bases in-cluding mC and uracil (U) using an electrochemically pretreated PGEand linear sweep voltammetry (LSV) is presented here for the first time.
2. Experimental
2.1. Material
Pyrolytic graphite (Momentive) was used to prepare the basal planePGE. A pyrolytic graphite block with a square front face (3 × 3 mm)was sealed in Torr Seal (Varian). Nonamers (9 nt oligodeoxynucleo-tides, ODN) were obtained from Generi Biotech (Czech Republic). Other
http://dx.doi.org/10.1016/j.elecom.2017.07.013Received 21 June 2017; Received in revised form 17 July 2017; Accepted 19 July 2017
⁎ Corresponding author.E-mail address: [email protected] (J. Špaček).
Electrochemistry Communications 82 (2017) 34–38
Available online 20 July 20171388-2481/ © 2017 Published by Elsevier B.V.
MARK
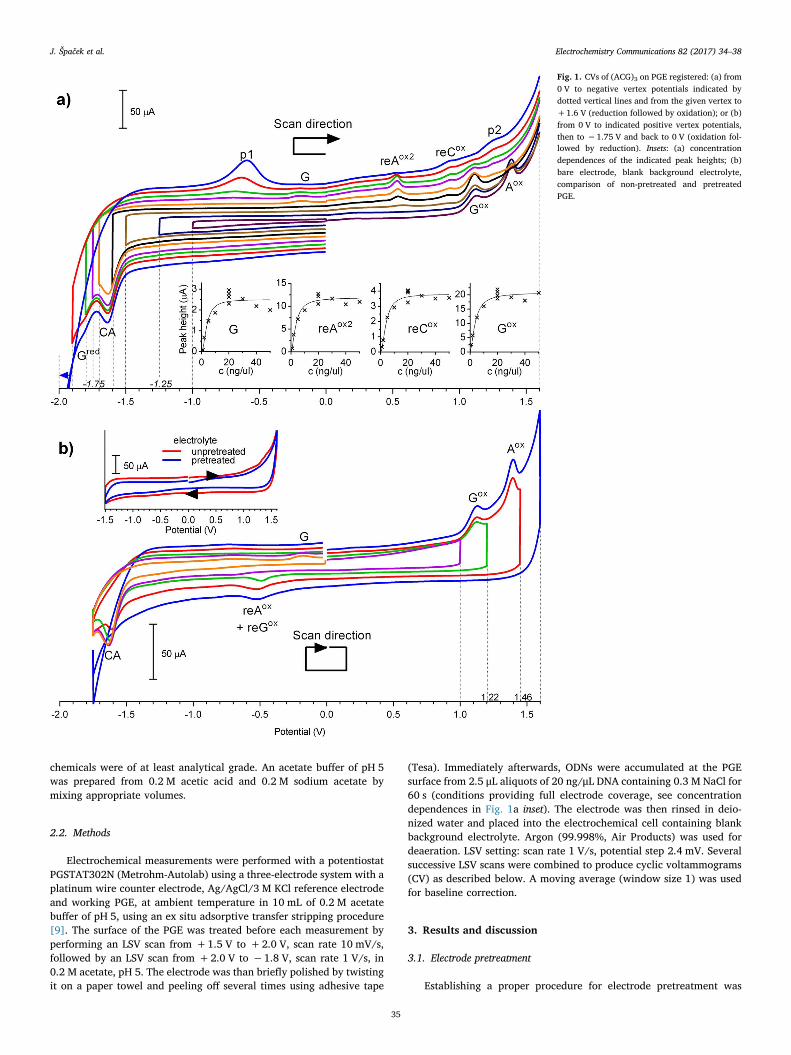
chemicals were of at least analytical grade. An acetate buffer of pH 5was prepared from 0.2 M acetic acid and 0.2 M sodium acetate bymixing appropriate volumes.
2.2. Methods
Electrochemical measurements were performed with a potentiostatPGSTAT302N (Metrohm-Autolab) using a three-electrode system with aplatinum wire counter electrode, Ag/AgCl/3 M KCl reference electrodeand working PGE, at ambient temperature in 10 mL of 0.2 M acetatebuffer of pH 5, using an ex situ adsorptive transfer stripping procedure[9]. The surface of the PGE was treated before each measurement byperforming an LSV scan from +1.5 V to +2.0 V, scan rate 10 mV/s,followed by an LSV scan from +2.0 V to −1.8 V, scan rate 1 V/s, in0.2 M acetate, pH 5. The electrode was than briefly polished by twistingit on a paper towel and peeling off several times using adhesive tape
(Tesa). Immediately afterwards, ODNs were accumulated at the PGEsurface from 2.5 μL aliquots of 20 ng/μL DNA containing 0.3 M NaCl for60 s (conditions providing full electrode coverage, see concentrationdependences in Fig. 1a inset). The electrode was then rinsed in deio-nized water and placed into the electrochemical cell containing blankbackground electrolyte. Argon (99.998%, Air Products) was used fordeaeration. LSV setting: scan rate 1 V/s, potential step 2.4 mV. Severalsuccessive LSV scans were combined to produce cyclic voltammograms(CV) as described below. A moving average (window size 1) was usedfor baseline correction.
3. Results and discussion
3.1. Electrode pretreatment
Establishing a proper procedure for electrode pretreatment was
Fig. 1. CVs of (ACG)3 on PGE registered: (a) from0 V to negative vertex potentials indicated bydotted vertical lines and from the given vertex to+1.6 V (reduction followed by oxidation); or (b)from 0 V to indicated positive vertex potentials,then to −1.75 V and back to 0 V (oxidation fol-lowed by reduction). Insets: (a) concentrationdependences of the indicated peak heights; (b)bare electrode, blank background electrolyte,comparison of non-pretreated and pretreatedPGE.
J. Špaček et al. Electrochemistry Communications 82 (2017) 34–38
35

critical to make it operate in both negative and positive potential re-gions. When an untreated PGE electrode was used, broad electrodeoxidation signals appeared in the blank background electrolyte at po-sitive potentials (around +1.1 V and +1.3 V, inset in Fig. 1b). Appli-cation of highly positive potentials (up to +2.0 V) followed by a scan tohighly negative potentials (as low as −2.0 V) and then mechanicalpretreatment (for details see Section 2.2) resulted in a clean surfacegiving a smooth background electrolyte response suitable for measuringall the analytical signals described below. At the same time, the surfaceof a PGE prepared in this way exhibited strong DNA adsorption,forming a stable layer resisting application of potentials relevant for allthe electrochemical processes involved in the proposed analyticalscheme.
3.2. Reduction of DNA bases and oxidation of their reduction products
The cathodic peak CA due to reduction of C and A (which to datehas only been detected with mercury-based electrodes at around−1.45 V [1,2]) was observed at the PGE at around −1.64 V (Fig. 1).The relative heights of this peak correlated with the C + A content ofthe ODNs; e.g. peak CA of (ACG)3 was approximately twice as high asthat for (ATG)3 or (AUG)3 (Fig. 2a) and was not observed in a DNAsequence lacking C and A (GTG)3 (Fig. 2c and d). At even more negativepotentials we observed cathodic signals specific to ODNs containing G(peak Gred at−1.81 V in (AGC)3 or (GCG)3), or T (peak Tred at−1.80 Vin (ATA)3) (Figs. 1a, 2c). In ODNs containing both T and G these signalsmerged to form a joint peak GT at −1.83 V (Fig. 2c). In addition to thecanonical DNA bases, U also produced a cathodic signal, peak Ured at−1.79 V, which merged with peak Gred in (AUG)3. Observation of thispeak was possible after oxidatively switching off the peak Gred, re-sulting in unmasking of the U-specific peak (see below) (Fig. 2b). This isthe first direct observation of cathodic signals of G, T and U in DNA inaqueous media (previous studies revealed electroreduction of free T andU bases at HMDE in dimethylsulfoxide at much more negative poten-tials (T around −2.4 V [10] and U at −2.3 V [11])).
As well as direct electroreduction of the bases at the PGE, we alsoobserved signals due to oxidation of their reduction products. In thisrespect G displayed similar behavior to that observed previously withmercury-based electrodes [12]: when the negative vertex potential wasset within the range between −1.7 and −1.9 V, the anodic peak G wasobserved at −0.25 V (Fig. 1). Notably, the maximum height of thispeak G, ascribed to oxidation of 7,8-dihydroG generated in the negativepotential range, was observed for vertex potentials less negative thanthe potential of peak Gred. Such behavior suggests that the reductionprocess connected with the latter signal was not a prerequisite for peakG to appear. Notably, scanning to −2.0 V over the peak Gred led to theloss of peak G, probably due to further reduction of the 7,8-dihydroG(Fig. 1a), the formation of which may thus involve a chemical stepinvolving hydrogen radicals generated at the PGE, similar to that re-cently proposed for the HMDE [12].
Products of the electroreduction of C and A yielded specific anodicsignals, a peak reCox at +0.9 V and peaks reAox1 and reAox2 at +0.41and +0.55 V, respectively. As is evident from Figs. 1a and 2a, thesepeaks were only present in voltammograms of sequences containing therelevant bases if the negative vertex potential was set “after” the peakCA (Fig. 1b). Like peak G, when the cathodic scan continued to−2.0 V,the reAox1 and reAox2 signals were diminished (Fig. 1a). By contrast,peak reCox resisted such treatment, indicating that the diminution ofpeaks corresponding to G or A reduction products were not due tomassive desorption of DNA at negative potentials.
Furthermore, the ODN (AmCG)3 containing mC instead of C pro-duced, after reduction in a negative scan to ≤−1.6 V, a distinct anodicpeak remCox at +0.84 V (Fig. 2a) i.e., well separated from the peakreCox, allowing a distinction to be made between the two bases viadetection of their reduction products (which was not possible via theirdirect reduction [13]). The intensity of the peak reCox correlated well
with relative mC content in the adsorbed DNA (Fig. 2a). Like the peakreCox, scanning to −2.0 V did not lead to the loss of peak remCox.
Peaks p1 and p2 (Figs. 1a, 2a and c) were observed in the presenceof DNA when potentials more negative than −1.7 V were applied.These signals showed no specificity to the base composition or sequenceof the ODNs applied, nor interferences with specific analytical signalsmeasured under optimum conditions. Identification of the corre-sponding processes is out of the scope of this communication and willbe presented elsewhere.
3.3. Oxidation of DNA bases and reduction of their oxidation products
As reported many times previously (reviewed in e.g. [5]), G and A inDNA give specific oxidation signals Gox and Aox. Under the conditionsused in this report, these peaks were observed at +1.12 and +1.40 V,respectively (Figs. 1 and 2b). In specific cases G gives two separateoxidation signals; here the peak Gox splitting was observed for (GCG)3and (GTG)3 ODNs (Fig. 2d). The more positive peak (Gol) has pre-viously been ascribed to oligomerization of G radical species and sub-sequent oxidation of the oligomers (at the level of G base or nucleoside[14,15]). In DNA the G oxidation peak splitting appears to be related tocertain sequence contexts and/or formation of certain secondarystructures such as G-quadruplexes [16] (a systematic study of thesephenomena is in progress and will be published elsewhere as a separatereport). Cathodic reduction of A and G due to exposure to potentialsmore negative than −1.7 V resulted in a diminution of the corre-sponding oxidation peaks (Fig. 1a and 2c), in agreement with theelectrochemical transformation of the parent purines into electro-chemically distinct products (see Section 3.2).
When (GCG)3 or (GTG)3 adsorbed at the PGE were exposed to+1.22 V in the first anodic scan, the peak Gred at about −1.8 V insubsequent cathodic scan and the anodic peak G peak at −0.25 Vdisappeared. Instead, the product of the primary G oxidation gave acathodic peak oxGred at −0.48 V (Fig. 2d). Analogous signals weredescribed previously on PGE with guanosine [15] and guanine [17](both at more negative potentials) but to date not for G in DNA.Switching off the cathodic peak Gred in the first scan to potentials of atleast +1.22 V revealed peaks Tred or Ured and allowed their in-dependent detection in sequences containing either of these pyr-imidines together with G (see also Section 3.2, Fig. 2b).
Similarly, when PGE modified with DNA was first polarized up to+1.46 V (potential sufficient to oxidize both G and A), the signal of Areduction disappeared (e.g., ODN (ATG)3, Fig. 2b). The same applies tothe contribution from the A reduction current to the peak CA, allowingindependent detection of C via its reduction ((ACG)3, Fig. 2b and d).Instead, a small peak oxAred corresponding to reduction of the A oxi-dation product appeared close to peak oxGred at −0.56 V (Fig. 2d; asignal analogous to the peak oxAred was previously reported withadenosine [18]). ODNs with both G and A under the same conditionsgave a broad joint peak (oxAred + oxGred) at −0.50 V while both peaksAred and Gred were eliminated (Fig. 2b). A signal due to C oxidationcould not be directly observed under our conditions. Nevertheless,when C-containing ODNs were first exposed to +1.6 V, the cathodicpeak Cred in the subsequent cathodic scan disappeared (Fig. 1b). Thus Cis oxidized at PGE at similar potentials as previously reported with aglassy carbon electrode [8], but the corresponding signal is hidden inthe background discharge.
The signal corresponding to direct oxidation of mC can be observedat +1.54 V [19], close to the potential of oxidation of T, making it inprinciple impossible to detect mC in natural DNA sequences containingT (data not shown). When oligonucleotide (AmCG)3 was reducedwithout a prior anodic scan, the mC reduction signal was merged withAred, exhibiting the same behavior as C (in agreement with a previousstudy using HMDE [13]). However, when ODN (AmCG)3 was exposedto +1.46 V in the first anodic scan, mC yielded three distinct signals inthe subsequent cathodic scan (Fig. 2b). The most negative signal
J. Špaček et al. Electrochemistry Communications 82 (2017) 34–38
36
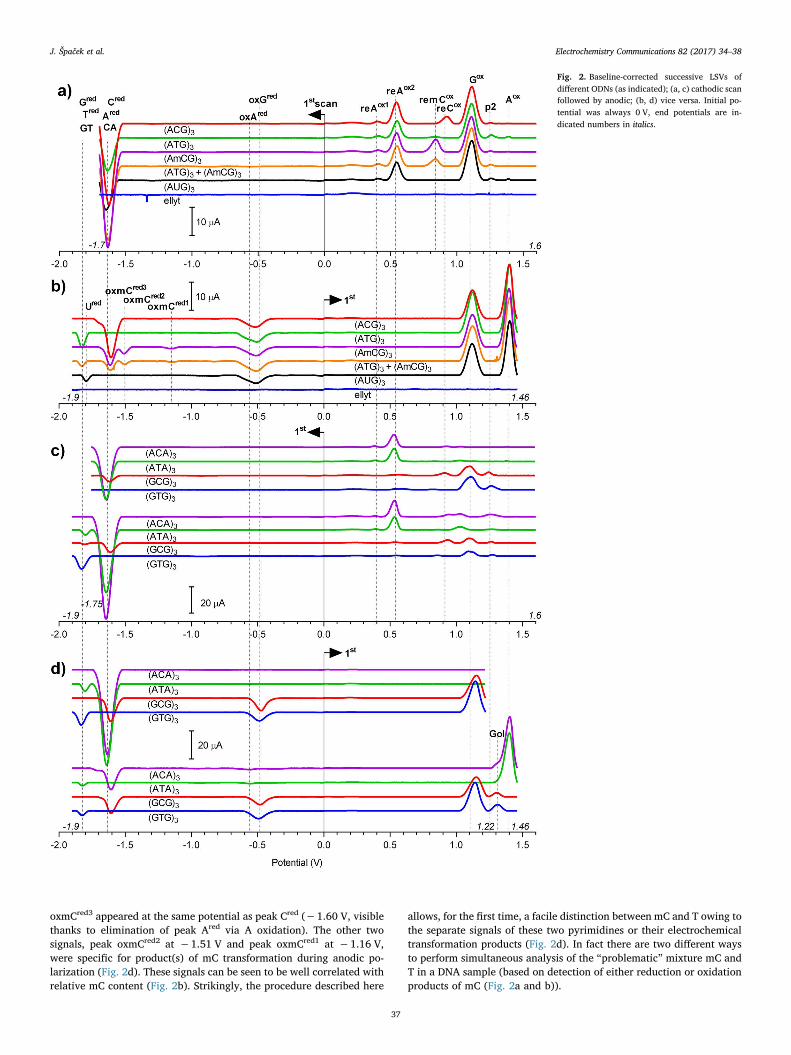
oxmCred3 appeared at the same potential as peak Cred (−1.60 V, visiblethanks to elimination of peak Ared via A oxidation). The other twosignals, peak oxmCred2 at −1.51 V and peak oxmCred1 at −1.16 V,were specific for product(s) of mC transformation during anodic po-larization (Fig. 2d). These signals can be seen to be well correlated withrelative mC content (Fig. 2b). Strikingly, the procedure described here
allows, for the first time, a facile distinction between mC and T owing tothe separate signals of these two pyrimidines or their electrochemicaltransformation products (Fig. 2d). In fact there are two different waysto perform simultaneous analysis of the “problematic” mixture mC andT in a DNA sample (based on detection of either reduction or oxidationproducts of mC (Fig. 2a and b)).
Fig. 2. Baseline-corrected successive LSVs ofdifferent ODNs (as indicated); (a, c) cathodic scanfollowed by anodic; (b, d) vice versa. Initial po-tential was always 0 V, end potentials are in-dicated numbers in italics.
J. Špaček et al. Electrochemistry Communications 82 (2017) 34–38
37

4. Conclusion
This study shows that specific electrochemical signals related toindividual DNA bases can be obtained at the PGE, due either to irre-versible reduction or oxidation of the parent bases or due to oxidationor reduction (respectively) of the products of the former primaryelectrochemical transformations. Moreover, irreversible reduction oroxidation of some of the bases can be used to selectively switch off theirsignals, thereby unmasking signals specific to other bases at close po-tentials. In this way, all of the canonical DNA bases, as well as the rarebut biologically important bases mC and U, can be analyzed in thepresence of the other bases in oligonucleotides.
Up to now, the reduction of DNA bases has usually been studied atthe HMDE (using peaks CA and G). Thanks to the surprisingly wideuseful potential window of the PGE we demonstrate for the first timethe possibility of measuring these signals at a carbon electrode andidentify new base-specific cathodic signals, namely peaks Gred, Tred andUred, tentatively ascribed to reduction of the respective bases. Whilesignals due to reduction or oxidation of the parent bases occur at re-latively extreme potentials, those corresponding to oxidation of thebase reduction products, or vice versa, are found at less positive or lessnegative potentials. Thus the latter could potentially be used for DNAanalysis using electrodes with narrower potential windows, such aspencil graphite electrodes.
In this communication we have limited ourselves to presenting theproof of principle of our novel approach to DNA analysis using a gra-phite electrode, as described above. Further studies are needed toclarify the mechanisms of nucleobase redox processes on the PGE (thesemay be different in DNA compared with the monomeric DNA compo-nents). Other questions to be answered include, e.g., whether thesesignals can also be observed on other (e.g. graphene modified) carbonelectrodes; how useful the selective switching off of certain signalscould be in combination with electrochemical labels; and what are theapplication areas of this inherently facile electrochemical approach.
Acknowledgments
This work has been supported by a Czech Science Foundation pro-ject reg. no. 16-01625S; and by the SYMBIT project reg. no. CZ.02.1.01/0.0/0.0/15_003/0000477 financed from the ERDF.
References
[1] E. Palecek, Oscillographic polarography of highly polymerized deoxyribonucleicacid, Nature 188 (1960) 656–657.
[2] E. Palecek, M. Bartosik, Electrochemistry of nucleic acids, Chem. Rev. 112 (2012)3427–3481.
[3] E. Palecek, F. Jelen, Electrochemistry of nucleic acids, in electrochemistry of nucleicacids and proteins: towards electrochemical sensors for genomics and proteomics,Perspect. Bioanal. 1 (2005) 73–173.
[4] J. Barek, J. Fischer, T. Navratil, K. Peckova, B. Yosypchuk, J. Zima, Nontraditionalelectrode materials in environmental analysis of biologically active organic com-pounds, Electroanalysis 19 (2007) 2003–2014.
[5] A. Brotons, F.J. Vidal-Iglesias, J. Solla-Gullon, J. Iniesta, Carbon materials for theelectrooxidation of nucleobases, nucleosides and nucleotides toward cytosine me-thylation detection: a review, Anal. Methods 8 (2016) 702–715.
[6] F. Jelen, E. Palecek, Chemically reversible electroreduction of guanine in a poly-nucleotide chain, Biophys. Chem. 24 (1986) 285–290.
[7] M. Fojta, A. Danhel, L. Havran, V. Vyskocil, Recent progress in electrochemicalsensors and assays for DNA damage and repair, TrAC Trends Anal. Chem. 79 (2016)160–167.
[8] A.M. Oliveira-Brett, J.A. Piedade, L.A. Silva, V.C. Diculescu, Voltammetric de-termination of all DNA nucleotides, Anal. Biochem. 332 (2004) 321–329.
[9] E. Palecek, Biopolymer-modified electrodes in the voltammetric determination ofDNA and protein, Anal. Chim. Acta 273 (1993) 175–186.
[10] T.E. Cummings, P.J. Elving, Electrochemical reduction of thymine in dimethyl-sulfoxide auto-protonation of the radical-anion and reduced free-radical, J.Electroanal. Chem. 102 (1979) 237–248.
[11] T.E. Cummings, P.J. Elving, Electrochemical reduction of uracil in dimethyl-sulf-oxide - autoprotonation of anion radical, J. Electroanal. Chem. 94 (1978) 123–145.
[12] A. Danhel, L. Havran, L. Trnkova, M. Fojta, Hydrogen evolution facilitates reductionof DNA guanine residues at the hanging mercury drop electrode: evidence for achemical mechanism, Electroanalysis 28 (2016) 2785–2790.
[13] M. Bartosik, M. Fojta, E. Palecek, Electrochemical detection of 5-methylcytosine inbisulfite-treated DNA, Electrochim. Acta 78 (2012) 75–81.
[14] Q. Li, C. Batchelor-McAuley, R.G. Compton, Electrochemical oxidation of guanine:electrode reaction mechanism and tailoring carbon electrode surfaces to switchbetween adsorptive and diffusional responses, J. Phys. Chem. B 114 (2010)7423–7428.
[15] P. Subramanian, G. Dryhurst, Electrochemical oxidation of guanosine - formation ofsome novel guanine oligonucleosides, J. Electroanal. Chem. 224 (1987) 137–162.
[16] A.D.R. Pontinha, A.M. Chiorcea-Paquim, R. Eritja, A.M. Oliveira-Brett, Quadruplexnanostructures of d(TGGGGT): influence of sodium and potassium ions, Anal.Chem. 86 (2014) 5851–5857.
[17] R.N. Goyal, G. Dryhurst, Redox chemistry of guanine and 8-oxyguanine and acomparison of the peroxidase-catalyzed and electrochemical oxidation of 8-oxy-guanine, J. Electroanal. Chem. 135 (1982) 75–91.
[18] R.N. Goyal, A. Sangal, Electrochemical investigations of adenosine at solid elec-trodes, J. Electroanal. Chem. 521 (2002) 72–80.
[19] A. Brotons, I. Sanjuán, C.W. Foster, C.E. Banks, F.J. Vidal-Iglesias, J. Solla-Gullón,J. Iniesta, A facile and cost-effective electroanalytical strategy for the quantificationof deoxyguanosine and deoxyadenosine in oligonucleotides using screen-printedgraphite electrodes, Electroanalysis 28 (2016) 3066–3074.
J. Špaček et al. Electrochemistry Communications 82 (2017) 34–38
38

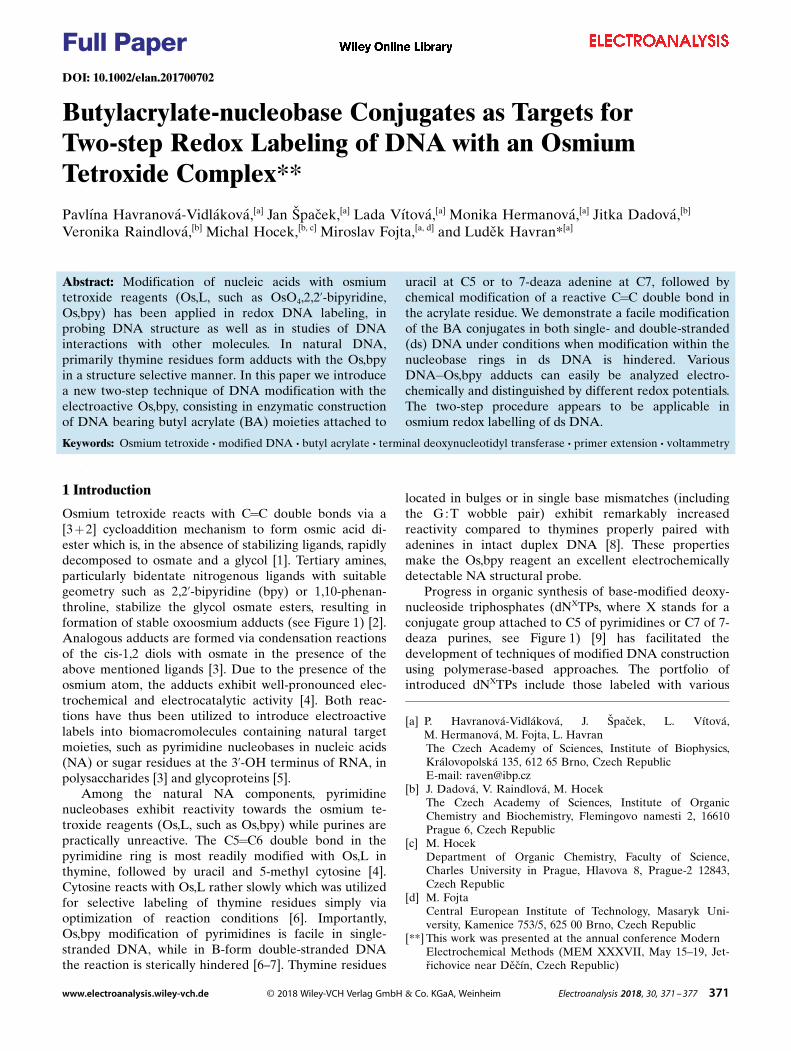
123456789
10111213141516171819202122232425262728293031323334353637383940414243444546474849505152535455565758
DOI: 10.1002/elan.201700702
Butylacrylate-nucleobase Conjugates as Targets forTwo-step Redox Labeling of DNA with an OsmiumTetroxide Complex**Pavlına Havranova-Vidlakova,[a] Jan Spacek,[a] Lada Vıtova,[a] Monika Hermanova,[a] Jitka Dadova,[b]
Veronika Raindlova,[b] Michal Hocek,[b, c] Miroslav Fojta,[a, d] and Ludek Havran*[a]
Abstract: Modification of nucleic acids with osmiumtetroxide reagents (Os,L, such as OsO4,2,2’-bipyridine,Os,bpy) has been applied in redox DNA labeling, inprobing DNA structure as well as in studies of DNAinteractions with other molecules. In natural DNA,primarily thymine residues form adducts with the Os,bpyin a structure selective manner. In this paper we introducea new two-step technique of DNA modification with theelectroactive Os,bpy, consisting in enzymatic constructionof DNA bearing butyl acrylate (BA) moieties attached to
uracil at C5 or to 7-deaza adenine at C7, followed bychemical modification of a reactive C=C double bond inthe acrylate residue. We demonstrate a facile modificationof the BA conjugates in both single- and double-stranded(ds) DNA under conditions when modification within thenucleobase rings in ds DNA is hindered. VariousDNA�Os,bpy adducts can easily be analyzed electro-chemically and distinguished by different redox potentials.The two-step procedure appears to be applicable inosmium redox labelling of ds DNA.
Keywords: Osmium tetroxide · modified DNA · butyl acrylate · terminal deoxynucleotidyl transferase · primer extension · voltammetry
1 Introduction
Osmium tetroxide reacts with C=C double bonds via a[3+2] cycloaddition mechanism to form osmic acid di-ester which is, in the absence of stabilizing ligands, rapidlydecomposed to osmate and a glycol [1]. Tertiary amines,particularly bidentate nitrogenous ligands with suitablegeometry such as 2,2’-bipyridine (bpy) or 1,10-phenan-throline, stabilize the glycol osmate esters, resulting information of stable oxoosmium adducts (see Figure 1) [2].Analogous adducts are formed via condensation reactionsof the cis-1,2 diols with osmate in the presence of theabove mentioned ligands [3]. Due to the presence of theosmium atom, the adducts exhibit well-pronounced elec-trochemical and electrocatalytic activity [4]. Both reac-tions have thus been utilized to introduce electroactivelabels into biomacromolecules containing natural targetmoieties, such as pyrimidine nucleobases in nucleic acids(NA) or sugar residues at the 3’-OH terminus of RNA, inpolysaccharides [3] and glycoproteins [5].
Among the natural NA components, pyrimidinenucleobases exhibit reactivity towards the osmium te-troxide reagents (Os,L, such as Os,bpy) while purines arepractically unreactive. The C5=C6 double bond in thepyrimidine ring is most readily modified with Os,L inthymine, followed by uracil and 5-methyl cytosine [4].Cytosine reacts with Os,L rather slowly which was utilizedfor selective labeling of thymine residues simply viaoptimization of reaction conditions [6]. Importantly,Os,bpy modification of pyrimidines is facile in single-stranded DNA, while in B-form double-stranded DNAthe reaction is sterically hindered [6–7]. Thymine residues
located in bulges or in single base mismatches (includingthe G: T wobble pair) exhibit remarkably increasedreactivity compared to thymines properly paired withadenines in intact duplex DNA [8]. These propertiesmake the Os,bpy reagent an excellent electrochemicallydetectable NA structural probe.
Progress in organic synthesis of base-modified deoxy-nucleoside triphosphates (dNXTPs, where X stands for aconjugate group attached to C5 of pyrimidines or C7 of 7-deaza purines, see Figure 1) [9] has facilitated thedevelopment of techniques of modified DNA constructionusing polymerase-based approaches. The portfolio ofintroduced dNXTPs include those labeled with various
[a] P. Havranov�-Vidl�kov�, J. Spacek, L. V�tov�,M. Hermanov�, M. Fojta, L. HavranThe Czech Academy of Sciences, Institute of Biophysics,Kr�lovopolsk� 135, 612 65 Brno, Czech RepublicE-mail: [email protected]
[b] J. Dadov�, V. Raindlov�, M. HocekThe Czech Academy of Sciences, Institute of OrganicChemistry and Biochemistry, Flemingovo namesti 2, 16610Prague 6, Czech Republic
[c] M. HocekDepartment of Organic Chemistry, Faculty of Science,Charles University in Prague, Hlavova 8, Prague-2 12843,Czech Republic
[d] M. FojtaCentral European Institute of Technology, Masaryk Uni-versity, Kamenice 753/5, 625 00 Brno, Czech Republic
[**] This work was presented at the annual conference ModernElectrochemical Methods (MEM XXXVII, May 15–19, Jet-richovice near Dec�n, Czech Republic)
Full Paper
www.electroanalysis.wiley-vch.de � 2018 Wiley-VCH Verlag GmbH & Co. KGaA, Weinheim Electroanalysis 2018, 30, 371 – 377 371
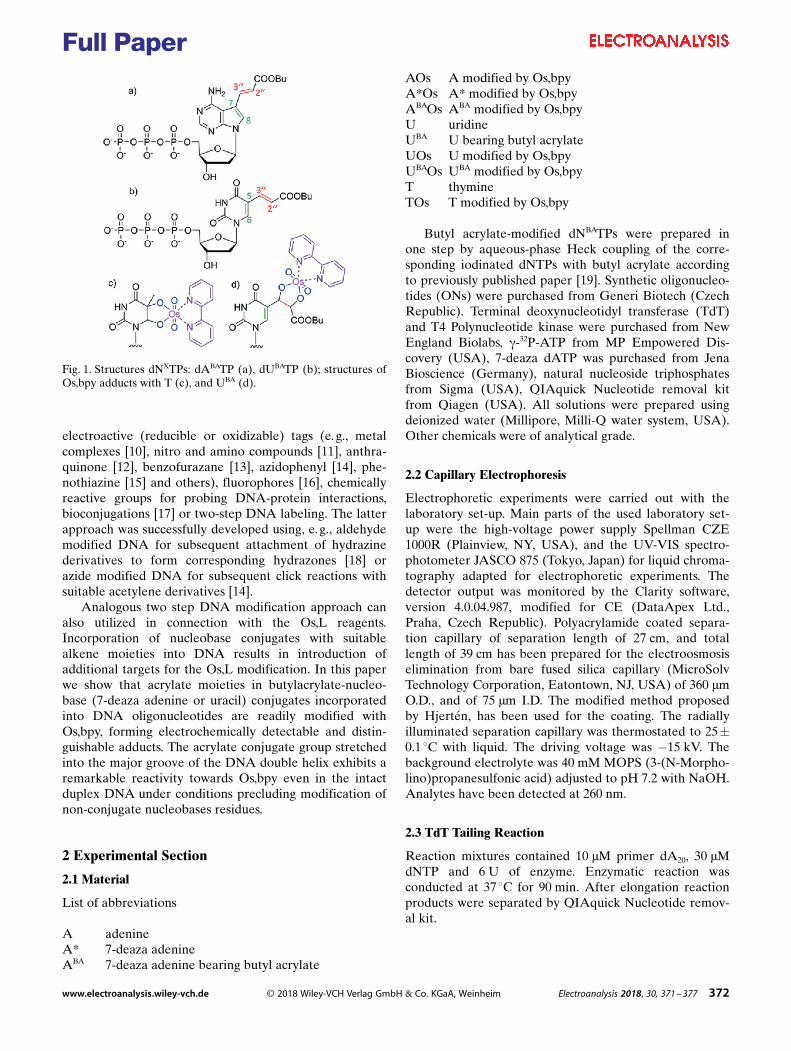
123456789
10111213141516171819202122232425262728293031323334353637383940414243444546474849505152535455565758
electroactive (reducible or oxidizable) tags (e. g., metalcomplexes [10], nitro and amino compounds [11], anthra-quinone [12], benzofurazane [13], azidophenyl [14], phe-nothiazine [15] and others), fluorophores [16], chemicallyreactive groups for probing DNA-protein interactions,bioconjugations [17] or two-step DNA labeling. The latterapproach was successfully developed using, e.g., aldehydemodified DNA for subsequent attachment of hydrazinederivatives to form corresponding hydrazones [18] orazide modified DNA for subsequent click reactions withsuitable acetylene derivatives [14].
Analogous two step DNA modification approach canalso utilized in connection with the Os,L reagents.Incorporation of nucleobase conjugates with suitablealkene moieties into DNA results in introduction ofadditional targets for the Os,L modification. In this paperwe show that acrylate moieties in butylacrylate-nucleo-base (7-deaza adenine or uracil) conjugates incorporatedinto DNA oligonucleotides are readily modified withOs,bpy, forming electrochemically detectable and distin-guishable adducts. The acrylate conjugate group stretchedinto the major groove of the DNA double helix exhibits aremarkable reactivity towards Os,bpy even in the intactduplex DNA under conditions precluding modification ofnon-conjugate nucleobases residues.
2 Experimental Section
2.1 Material
List of abbreviations
A adenineA* 7-deaza adenineABA 7-deaza adenine bearing butyl acrylate
AOs A modified by Os,bpyA*Os A* modified by Os,bpyABAOs ABA modified by Os,bpyU uridineUBA U bearing butyl acrylateUOs U modified by Os,bpyUBAOs UBA modified by Os,bpyT thymineTOs T modified by Os,bpy
Butyl acrylate-modified dNBATPs were prepared inone step by aqueous-phase Heck coupling of the corre-sponding iodinated dNTPs with butyl acrylate accordingto previously published paper [19]. Synthetic oligonucleo-tides (ONs) were purchased from Generi Biotech (CzechRepublic). Terminal deoxynucleotidyl transferase (TdT)and T4 Polynucleotide kinase were purchased from NewEngland Biolabs, g-32P-ATP from MP Empowered Dis-covery (USA), 7-deaza dATP was purchased from JenaBioscience (Germany), natural nucleoside triphosphatesfrom Sigma (USA), QIAquick Nucleotide removal kitfrom Qiagen (USA). All solutions were prepared usingdeionized water (Millipore, Milli-Q water system, USA).Other chemicals were of analytical grade.
2.2 Capillary Electrophoresis
Electrophoretic experiments were carried out with thelaboratory set-up. Main parts of the used laboratory set-up were the high-voltage power supply Spellman CZE1000R (Plainview, NY, USA), and the UV-VIS spectro-photometer JASCO 875 (Tokyo, Japan) for liquid chroma-tography adapted for electrophoretic experiments. Thedetector output was monitored by the Clarity software,version 4.0.04.987, modified for CE (DataApex Ltd.,Praha, Czech Republic). Polyacrylamide coated separa-tion capillary of separation length of 27 cm, and totallength of 39 cm has been prepared for the electroosmosiselimination from bare fused silica capillary (MicroSolvTechnology Corporation, Eatontown, NJ, USA) of 360 mmO.D., and of 75 mm I.D. The modified method proposedby Hjerten, has been used for the coating. The radiallyilluminated separation capillary was thermostated to 25�0.1 8C with liquid. The driving voltage was �15 kV. Thebackground electrolyte was 40 mM MOPS (3-(N-Morpho-lino)propanesulfonic acid) adjusted to pH 7.2 with NaOH.Analytes have been detected at 260 nm.
2.3 TdT Tailing Reaction
Reaction mixtures contained 10 mM primer dA20, 30 mMdNTP and 6 U of enzyme. Enzymatic reaction wasconducted at 37 8C for 90 min. After elongation reactionproducts were separated by QIAquick Nucleotide remov-al kit.
Fig. 1. Structures dNXTPs: dABATP (a), dUBATP (b); structures ofOs,bpy adducts with T (c), and UBA (d).
Full Paper
www.electroanalysis.wiley-vch.de � 2018 Wiley-VCH Verlag GmbH & Co. KGaA, Weinheim Electroanalysis 2018, 30, 371 – 377 372
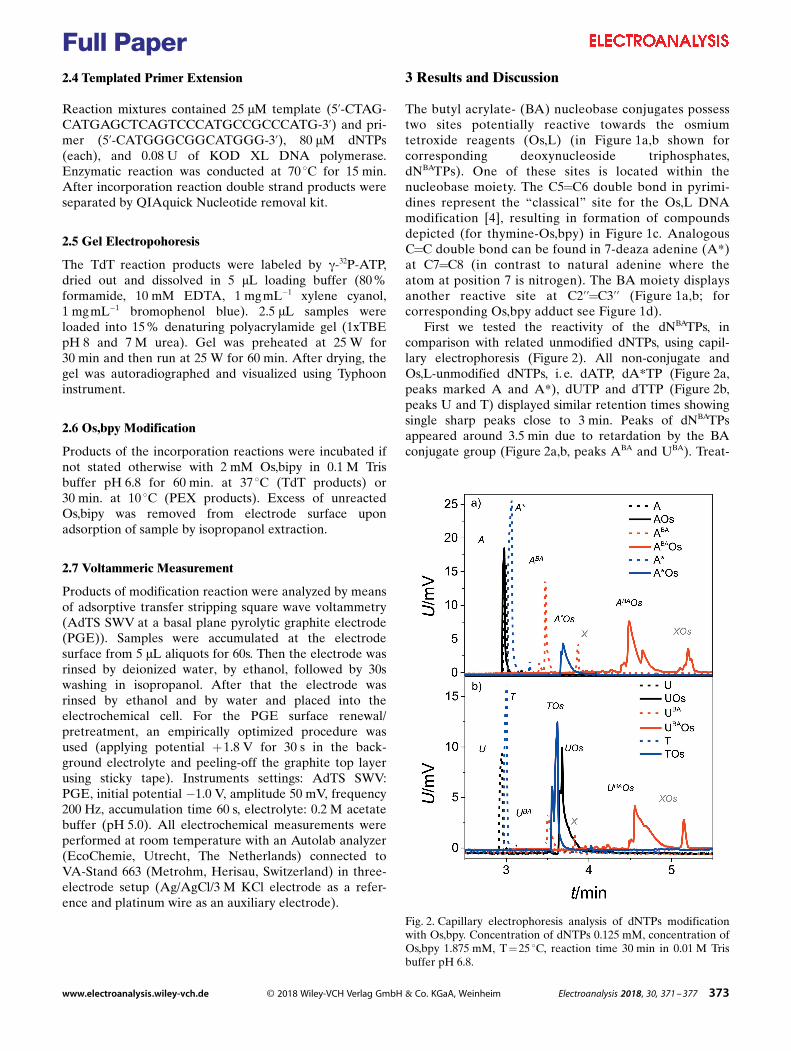
123456789
10111213141516171819202122232425262728293031323334353637383940414243444546474849505152535455565758
2.4 Templated Primer Extension
Reaction mixtures contained 25 mM template (5’-CTAG-CATGAGCTCAGTCCCATGCCGCCCATG-3’) and pri-mer (5’-CATGGGCGGCATGGG-3’), 80 mM dNTPs(each), and 0.08 U of KOD XL DNA polymerase.Enzymatic reaction was conducted at 70 8C for 15 min.After incorporation reaction double strand products wereseparated by QIAquick Nucleotide removal kit.
2.5 Gel Electropohoresis
The TdT reaction products were labeled by g-32P-ATP,dried out and dissolved in 5 mL loading buffer (80 %formamide, 10 mM EDTA, 1 mg mL�1 xylene cyanol,1 mg mL�1 bromophenol blue). 2.5 mL samples wereloaded into 15% denaturing polyacrylamide gel (1xTBEpH 8 and 7 M urea). Gel was preheated at 25 W for30 min and then run at 25 W for 60 min. After drying, thegel was autoradiographed and visualized using Typhooninstrument.
2.6 Os,bpy Modification
Products of the incorporation reactions were incubated ifnot stated otherwise with 2 mM Os,bipy in 0.1 M Trisbuffer pH 6.8 for 60 min. at 37 8C (TdT products) or30 min. at 10 8C (PEX products). Excess of unreactedOs,bipy was removed from electrode surface uponadsorption of sample by isopropanol extraction.
2.7 Voltammeric Measurement
Products of modification reaction were analyzed by meansof adsorptive transfer stripping square wave voltammetry(AdTS SWV at a basal plane pyrolytic graphite electrode(PGE)). Samples were accumulated at the electrodesurface from 5 mL aliquots for 60s. Then the electrode wasrinsed by deionized water, by ethanol, followed by 30swashing in isopropanol. After that the electrode wasrinsed by ethanol and by water and placed into theelectrochemical cell. For the PGE surface renewal/pretreatment, an empirically optimized procedure wasused (applying potential +1.8 V for 30 s in the back-ground electrolyte and peeling-off the graphite top layerusing sticky tape). Instruments settings: AdTS SWV:PGE, initial potential �1.0 V, amplitude 50 mV, frequency200 Hz, accumulation time 60 s, electrolyte: 0.2 M acetatebuffer (pH 5.0). All electrochemical measurements wereperformed at room temperature with an Autolab analyzer(EcoChemie, Utrecht, The Netherlands) connected toVA-Stand 663 (Metrohm, Herisau, Switzerland) in three-electrode setup (Ag/AgCl/3 M KCl electrode as a refer-ence and platinum wire as an auxiliary electrode).
3 Results and Discussion
The butyl acrylate- (BA) nucleobase conjugates possesstwo sites potentially reactive towards the osmiumtetroxide reagents (Os,L) (in Figure 1a,b shown forcorresponding deoxynucleoside triphosphates,dNBATPs). One of these sites is located within thenucleobase moiety. The C5=C6 double bond in pyrimi-dines represent the “classical” site for the Os,L DNAmodification [4], resulting in formation of compoundsdepicted (for thymine-Os,bpy) in Figure 1c. AnalogousC=C double bond can be found in 7-deaza adenine (A*)at C7=C8 (in contrast to natural adenine where theatom at position 7 is nitrogen). The BA moiety displaysanother reactive site at C2’’=C3’’ (Figure 1a,b; forcorresponding Os,bpy adduct see Figure 1d).
First we tested the reactivity of the dNBATPs, incomparison with related unmodified dNTPs, using capil-lary electrophoresis (Figure 2). All non-conjugate andOs,L-unmodified dNTPs, i. e. dATP, dA*TP (Figure 2a,peaks marked A and A*), dUTP and dTTP (Figure 2b,peaks U and T) displayed similar retention times showingsingle sharp peaks close to 3 min. Peaks of dNBATPsappeared around 3.5 min due to retardation by the BAconjugate group (Figure 2a,b, peaks ABA and UBA). Treat-
Fig. 2. Capillary electrophoresis analysis of dNTPs modificationwith Os,bpy. Concentration of dNTPs 0.125 mM, concentration ofOs,bpy 1.875 mM, T=25 8C, reaction time 30 min in 0.01 M Trisbuffer pH 6.8.
Full Paper
www.electroanalysis.wiley-vch.de � 2018 Wiley-VCH Verlag GmbH & Co. KGaA, Weinheim Electroanalysis 2018, 30, 371 – 377 373
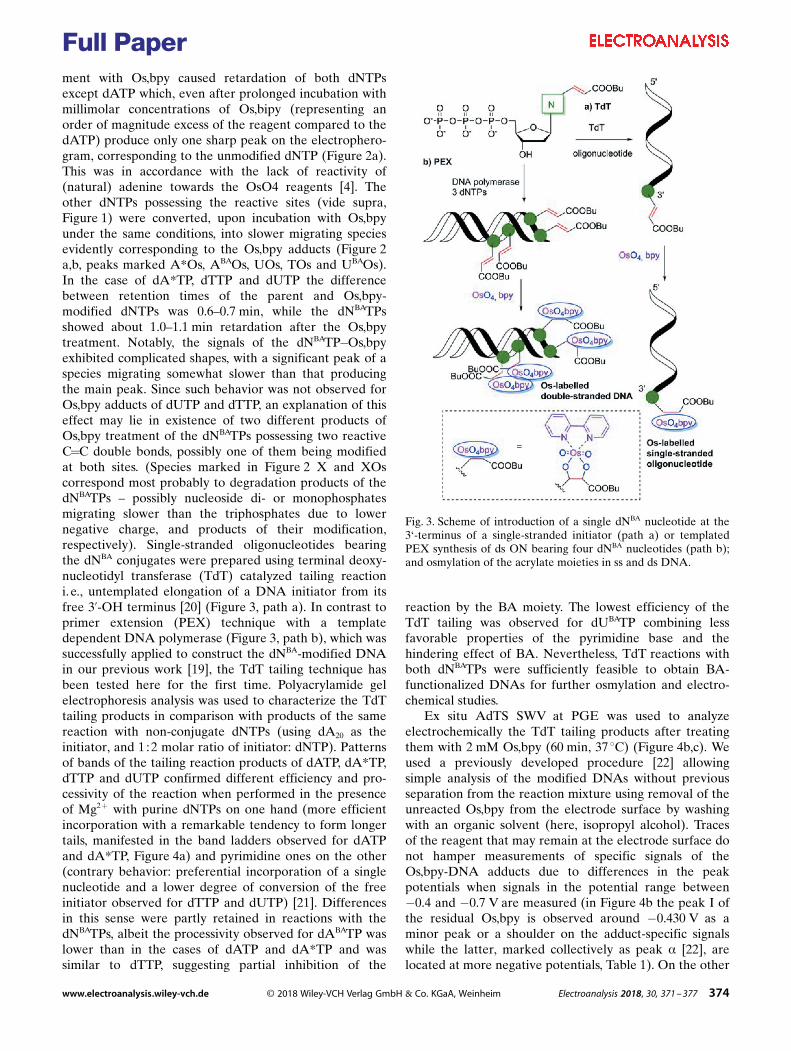
123456789
10111213141516171819202122232425262728293031323334353637383940414243444546474849505152535455565758
ment with Os,bpy caused retardation of both dNTPsexcept dATP which, even after prolonged incubation withmillimolar concentrations of Os,bipy (representing anorder of magnitude excess of the reagent compared to thedATP) produce only one sharp peak on the electrophero-gram, corresponding to the unmodified dNTP (Figure 2a).This was in accordance with the lack of reactivity of(natural) adenine towards the OsO4 reagents [4]. Theother dNTPs possessing the reactive sites (vide supra,Figure 1) were converted, upon incubation with Os,bpyunder the same conditions, into slower migrating speciesevidently corresponding to the Os,bpy adducts (Figure 2a,b, peaks marked A*Os, ABAOs, UOs, TOs and UBAOs).In the case of dA*TP, dTTP and dUTP the differencebetween retention times of the parent and Os,bpy-modified dNTPs was 0.6–0.7 min, while the dNBATPsshowed about 1.0–1.1 min retardation after the Os,bpytreatment. Notably, the signals of the dNBATP�Os,bpyexhibited complicated shapes, with a significant peak of aspecies migrating somewhat slower than that producingthe main peak. Since such behavior was not observed forOs,bpy adducts of dUTP and dTTP, an explanation of thiseffect may lie in existence of two different products ofOs,bpy treatment of the dNBATPs possessing two reactiveC=C double bonds, possibly one of them being modifiedat both sites. (Species marked in Figure 2 X and XOscorrespond most probably to degradation products of thedNBATPs – possibly nucleoside di- or monophosphatesmigrating slower than the triphosphates due to lowernegative charge, and products of their modification,respectively). Single-stranded oligonucleotides bearingthe dNBA conjugates were prepared using terminal deoxy-nucleotidyl transferase (TdT) catalyzed tailing reactioni. e., untemplated elongation of a DNA initiator from itsfree 3’-OH terminus [20] (Figure 3, path a). In contrast toprimer extension (PEX) technique with a templatedependent DNA polymerase (Figure 3, path b), which wassuccessfully applied to construct the dNBA-modified DNAin our previous work [19], the TdT tailing technique hasbeen tested here for the first time. Polyacrylamide gelelectrophoresis analysis was used to characterize the TdTtailing products in comparison with products of the samereaction with non-conjugate dNTPs (using dA20 as theinitiator, and 1 :2 molar ratio of initiator: dNTP). Patternsof bands of the tailing reaction products of dATP, dA*TP,dTTP and dUTP confirmed different efficiency and pro-cessivity of the reaction when performed in the presenceof Mg2+ with purine dNTPs on one hand (more efficientincorporation with a remarkable tendency to form longertails, manifested in the band ladders observed for dATPand dA*TP, Figure 4a) and pyrimidine ones on the other(contrary behavior: preferential incorporation of a singlenucleotide and a lower degree of conversion of the freeinitiator observed for dTTP and dUTP) [21]. Differencesin this sense were partly retained in reactions with thedNBATPs, albeit the processivity observed for dABATP waslower than in the cases of dATP and dA*TP and wassimilar to dTTP, suggesting partial inhibition of the
reaction by the BA moiety. The lowest efficiency of theTdT tailing was observed for dUBATP combining lessfavorable properties of the pyrimidine base and thehindering effect of BA. Nevertheless, TdT reactions withboth dNBATPs were sufficiently feasible to obtain BA-functionalized DNAs for further osmylation and electro-chemical studies.
Ex situ AdTS SWV at PGE was used to analyzeelectrochemically the TdT tailing products after treatingthem with 2 mM Os,bpy (60 min, 37 8C) (Figure 4b,c). Weused a previously developed procedure [22] allowingsimple analysis of the modified DNAs without previousseparation from the reaction mixture using removal of theunreacted Os,bpy from the electrode surface by washingwith an organic solvent (here, isopropyl alcohol). Tracesof the reagent that may remain at the electrode surface donot hamper measurements of specific signals of theOs,bpy-DNA adducts due to differences in the peakpotentials when signals in the potential range between�0.4 and �0.7 V are measured (in Figure 4b the peak I ofthe residual Os,bpy is observed around �0.430 V as aminor peak or a shoulder on the adduct-specific signalswhile the latter, marked collectively as peak a [22], arelocated at more negative potentials, Table 1). On the other
Fig. 3. Scheme of introduction of a single dNBA nucleotide at the3�-terminus of a single-stranded initiator (path a) or templatedPEX synthesis of ds ON bearing four dNBA nucleotides (path b);and osmylation of the acrylate moieties in ss and ds DNA.
Full Paper
www.electroanalysis.wiley-vch.de � 2018 Wiley-VCH Verlag GmbH & Co. KGaA, Weinheim Electroanalysis 2018, 30, 371 – 377 374
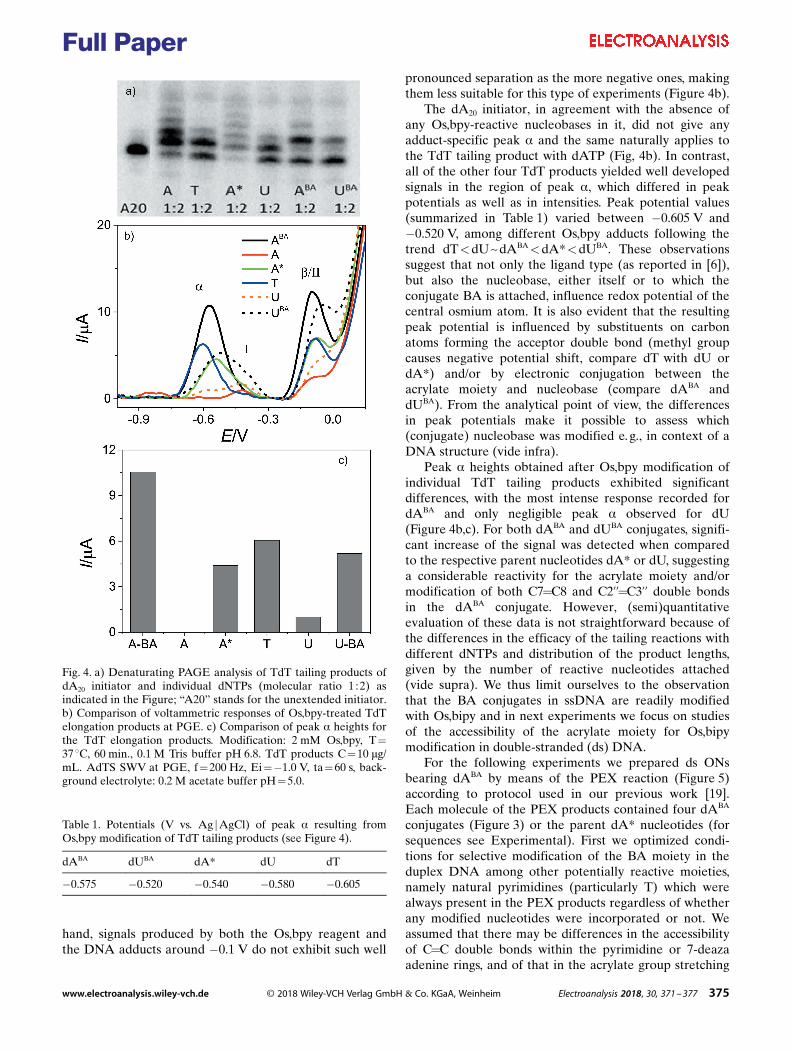
123456789
10111213141516171819202122232425262728293031323334353637383940414243444546474849505152535455565758
hand, signals produced by both the Os,bpy reagent andthe DNA adducts around �0.1 V do not exhibit such well
pronounced separation as the more negative ones, makingthem less suitable for this type of experiments (Figure 4b).
The dA20 initiator, in agreement with the absence ofany Os,bpy-reactive nucleobases in it, did not give anyadduct-specific peak a and the same naturally applies tothe TdT tailing product with dATP (Fig, 4b). In contrast,all of the other four TdT products yielded well developedsignals in the region of peak a, which differed in peakpotentials as well as in intensities. Peak potential values(summarized in Table 1) varied between �0.605 V and�0.520 V, among different Os,bpy adducts following thetrend dT<dU~dABA<dA*<dUBA. These observationssuggest that not only the ligand type (as reported in [6]),but also the nucleobase, either itself or to which theconjugate BA is attached, influence redox potential of thecentral osmium atom. It is also evident that the resultingpeak potential is influenced by substituents on carbonatoms forming the acceptor double bond (methyl groupcauses negative potential shift, compare dT with dU ordA*) and/or by electronic conjugation between theacrylate moiety and nucleobase (compare dABA anddUBA). From the analytical point of view, the differencesin peak potentials make it possible to assess which(conjugate) nucleobase was modified e. g., in context of aDNA structure (vide infra).
Peak a heights obtained after Os,bpy modification ofindividual TdT tailing products exhibited significantdifferences, with the most intense response recorded fordABA and only negligible peak a observed for dU(Figure 4b,c). For both dABA and dUBA conjugates, signifi-cant increase of the signal was detected when comparedto the respective parent nucleotides dA* or dU, suggestinga considerable reactivity for the acrylate moiety and/ormodification of both C7=C8 and C2’’=C3’’ double bondsin the dABA conjugate. However, (semi)quantitativeevaluation of these data is not straightforward because ofthe differences in the efficacy of the tailing reactions withdifferent dNTPs and distribution of the product lengths,given by the number of reactive nucleotides attached(vide supra). We thus limit ourselves to the observationthat the BA conjugates in ssDNA are readily modifiedwith Os,bipy and in next experiments we focus on studiesof the accessibility of the acrylate moiety for Os,bipymodification in double-stranded (ds) DNA.
For the following experiments we prepared ds ONsbearing dABA by means of the PEX reaction (Figure 5)according to protocol used in our previous work [19].Each molecule of the PEX products contained four dABA
conjugates (Figure 3) or the parent dA* nucleotides (forsequences see Experimental). First we optimized condi-tions for selective modification of the BA moiety in theduplex DNA among other potentially reactive moieties,namely natural pyrimidines (particularly T) which werealways present in the PEX products regardless of whetherany modified nucleotides were incorporated or not. Weassumed that there may be differences in the accessibilityof C=C double bonds within the pyrimidine or 7-deazaadenine rings, and of that in the acrylate group stretching
Fig. 4. a) Denaturating PAGE analysis of TdT tailing products ofdA20 initiator and individual dNTPs (molecular ratio 1 :2) asindicated in the Figure; “A20” stands for the unextended initiator.b) Comparison of voltammetric responses of Os,bpy-treated TdTelongation products at PGE. c) Comparison of peak a heights forthe TdT elongation products. Modification: 2 mM Os,bpy, T=37 8C, 60 min., 0.1 M Tris buffer pH 6.8. TdT products C=10 mg/mL. AdTS SWV at PGE, f=200 Hz, Ei=�1.0 V, ta=60 s, back-ground electrolyte: 0.2 M acetate buffer pH= 5.0.
Table 1. Potentials (V vs. Ag jAgCl) of peak a resulting fromOs,bpy modification of TdT tailing products (see Figure 4).
dABA dUBA dA* dU dT
�0.575 �0.520 �0.540 �0.580 �0.605
Full Paper
www.electroanalysis.wiley-vch.de � 2018 Wiley-VCH Verlag GmbH & Co. KGaA, Weinheim Electroanalysis 2018, 30, 371 – 377 375
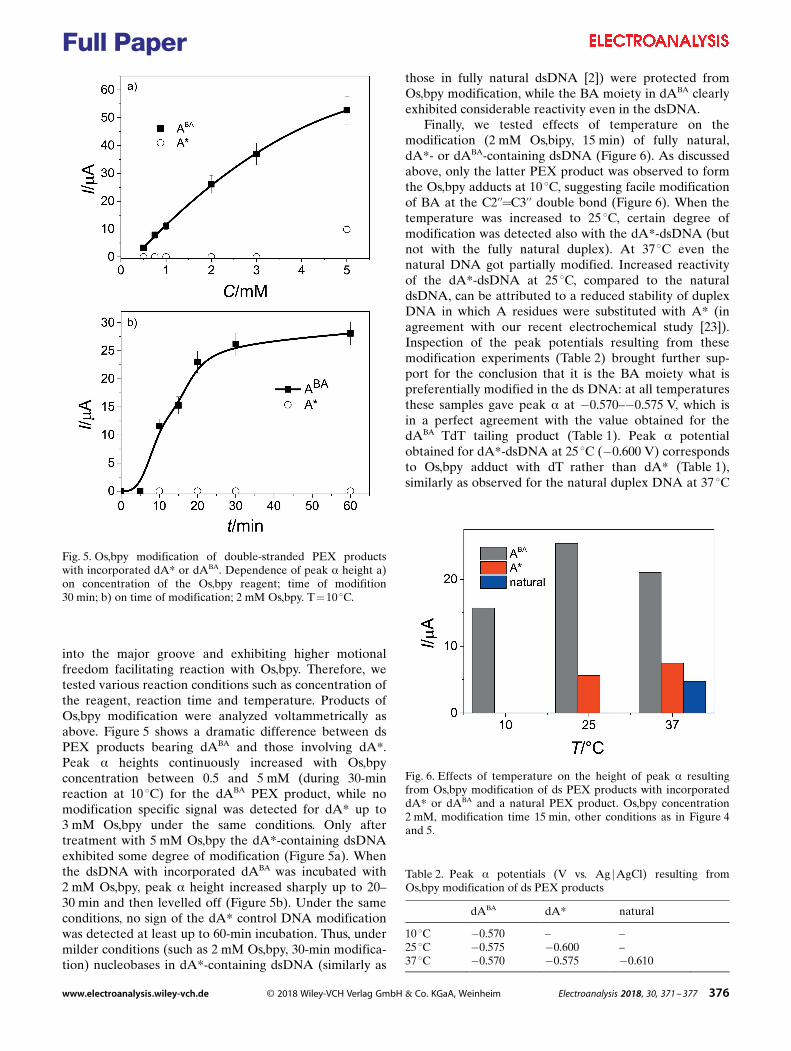
123456789
10111213141516171819202122232425262728293031323334353637383940414243444546474849505152535455565758
into the major groove and exhibiting higher motionalfreedom facilitating reaction with Os,bpy. Therefore, wetested various reaction conditions such as concentration ofthe reagent, reaction time and temperature. Products ofOs,bpy modification were analyzed voltammetrically asabove. Figure 5 shows a dramatic difference between dsPEX products bearing dABA and those involving dA*.Peak a heights continuously increased with Os,bpyconcentration between 0.5 and 5 mM (during 30-minreaction at 10 8C) for the dABA PEX product, while nomodification specific signal was detected for dA* up to3 mM Os,bpy under the same conditions. Only aftertreatment with 5 mM Os,bpy the dA*-containing dsDNAexhibited some degree of modification (Figure 5a). Whenthe dsDNA with incorporated dABA was incubated with2 mM Os,bpy, peak a height increased sharply up to 20–30 min and then levelled off (Figure 5b). Under the sameconditions, no sign of the dA* control DNA modificationwas detected at least up to 60-min incubation. Thus, undermilder conditions (such as 2 mM Os,bpy, 30-min modifica-tion) nucleobases in dA*-containing dsDNA (similarly as
those in fully natural dsDNA [2]) were protected fromOs,bpy modification, while the BA moiety in dABA clearlyexhibited considerable reactivity even in the dsDNA.
Finally, we tested effects of temperature on themodification (2 mM Os,bipy, 15 min) of fully natural,dA*- or dABA-containing dsDNA (Figure 6). As discussedabove, only the latter PEX product was observed to formthe Os,bpy adducts at 10 8C, suggesting facile modificationof BA at the C2’’=C3’’ double bond (Figure 6). When thetemperature was increased to 25 8C, certain degree ofmodification was detected also with the dA*-dsDNA (butnot with the fully natural duplex). At 37 8C even thenatural DNA got partially modified. Increased reactivityof the dA*-dsDNA at 25 8C, compared to the naturaldsDNA, can be attributed to a reduced stability of duplexDNA in which A residues were substituted with A* (inagreement with our recent electrochemical study [23]).Inspection of the peak potentials resulting from thesemodification experiments (Table 2) brought further sup-port for the conclusion that it is the BA moiety what ispreferentially modified in the ds DNA: at all temperaturesthese samples gave peak a at �0.570–�0.575 V, which isin a perfect agreement with the value obtained for thedABA TdT tailing product (Table 1). Peak a potentialobtained for dA*-dsDNA at 25 8C (�0.600 V) correspondsto Os,bpy adduct with dT rather than dA* (Table 1),similarly as observed for the natural duplex DNA at 37 8C
Fig. 5. Os,bpy modification of double-stranded PEX productswith incorporated dA* or dABA. Dependence of peak a height a)on concentration of the Os,bpy reagent; time of modifition30 min; b) on time of modification; 2 mM Os,bpy. T=10 8C.
Fig. 6. Effects of temperature on the height of peak a resultingfrom Os,bpy modification of ds PEX products with incorporateddA* or dABA and a natural PEX product. Os,bpy concentration2 mM, modification time 15 min, other conditions as in Figure 4and 5.
Table 2. Peak a potentials (V vs. Ag jAgCl) resulting fromOs,bpy modification of ds PEX products
dABA dA* natural
10 8C �0.570 – –25 8C �0.575 �0.600 –37 8C �0.570 �0.575 �0.610
Full Paper
www.electroanalysis.wiley-vch.de � 2018 Wiley-VCH Verlag GmbH & Co. KGaA, Weinheim Electroanalysis 2018, 30, 371 – 377 376
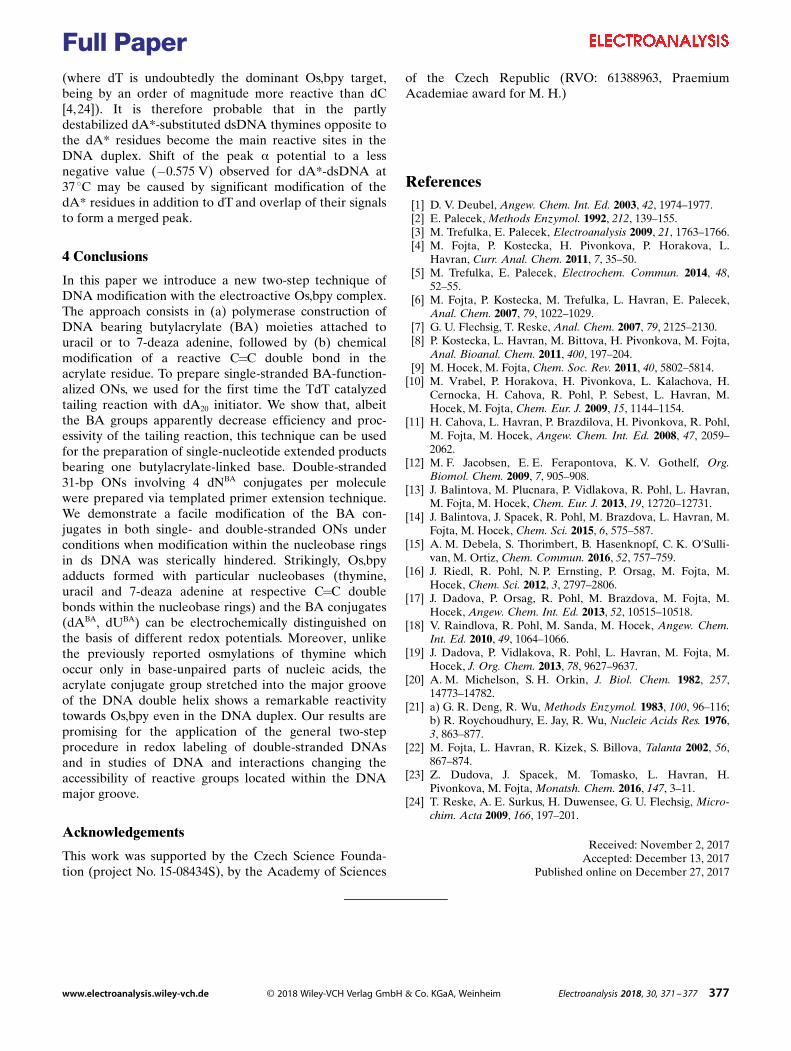
123456789
10111213141516171819202122232425262728293031323334353637383940414243444546474849505152535455565758
(where dT is undoubtedly the dominant Os,bpy target,being by an order of magnitude more reactive than dC[4, 24]). It is therefore probable that in the partlydestabilized dA*-substituted dsDNA thymines opposite tothe dA* residues become the main reactive sites in theDNA duplex. Shift of the peak a potential to a lessnegative value (�0.575 V) observed for dA*-dsDNA at37 8C may be caused by significant modification of thedA* residues in addition to dT and overlap of their signalsto form a merged peak.
4 Conclusions
In this paper we introduce a new two-step technique ofDNA modification with the electroactive Os,bpy complex.The approach consists in (a) polymerase construction ofDNA bearing butylacrylate (BA) moieties attached touracil or to 7-deaza adenine, followed by (b) chemicalmodification of a reactive C=C double bond in theacrylate residue. To prepare single-stranded BA-function-alized ONs, we used for the first time the TdT catalyzedtailing reaction with dA20 initiator. We show that, albeitthe BA groups apparently decrease efficiency and proc-essivity of the tailing reaction, this technique can be usedfor the preparation of single-nucleotide extended productsbearing one butylacrylate-linked base. Double-stranded31-bp ONs involving 4 dNBA conjugates per moleculewere prepared via templated primer extension technique.We demonstrate a facile modification of the BA con-jugates in both single- and double-stranded ONs underconditions when modification within the nucleobase ringsin ds DNA was sterically hindered. Strikingly, Os,bpyadducts formed with particular nucleobases (thymine,uracil and 7-deaza adenine at respective C=C doublebonds within the nucleobase rings) and the BA conjugates(dABA, dUBA) can be electrochemically distinguished onthe basis of different redox potentials. Moreover, unlikethe previously reported osmylations of thymine whichoccur only in base-unpaired parts of nucleic acids, theacrylate conjugate group stretched into the major grooveof the DNA double helix shows a remarkable reactivitytowards Os,bpy even in the DNA duplex. Our results arepromising for the application of the general two-stepprocedure in redox labeling of double-stranded DNAsand in studies of DNA and interactions changing theaccessibility of reactive groups located within the DNAmajor groove.
Acknowledgements
This work was supported by the Czech Science Founda-tion (project No. 15-08434S), by the Academy of Sciences
of the Czech Republic (RVO: 61388963, PraemiumAcademiae award for M. H.)
References[1] D. V. Deubel, Angew. Chem. Int. Ed. 2003, 42, 1974–1977.[2] E. Palecek, Methods Enzymol. 1992, 212, 139–155.[3] M. Trefulka, E. Palecek, Electroanalysis 2009, 21, 1763–1766.[4] M. Fojta, P. Kostecka, H. Pivonkova, P. Horakova, L.
Havran, Curr. Anal. Chem. 2011, 7, 35–50.[5] M. Trefulka, E. Palecek, Electrochem. Commun. 2014, 48,
52–55.[6] M. Fojta, P. Kostecka, M. Trefulka, L. Havran, E. Palecek,
Anal. Chem. 2007, 79, 1022–1029.[7] G. U. Flechsig, T. Reske, Anal. Chem. 2007, 79, 2125–2130.[8] P. Kostecka, L. Havran, M. Bittova, H. Pivonkova, M. Fojta,
Anal. Bioanal. Chem. 2011, 400, 197–204.[9] M. Hocek, M. Fojta, Chem. Soc. Rev. 2011, 40, 5802–5814.
[10] M. Vrabel, P. Horakova, H. Pivonkova, L. Kalachova, H.Cernocka, H. Cahova, R. Pohl, P. Sebest, L. Havran, M.Hocek, M. Fojta, Chem. Eur. J. 2009, 15, 1144–1154.
[11] H. Cahova, L. Havran, P. Brazdilova, H. Pivonkova, R. Pohl,M. Fojta, M. Hocek, Angew. Chem. Int. Ed. 2008, 47, 2059–2062.
[12] M. F. Jacobsen, E. E. Ferapontova, K. V. Gothelf, Org.Biomol. Chem. 2009, 7, 905–908.
[13] J. Balintova, M. Plucnara, P. Vidlakova, R. Pohl, L. Havran,M. Fojta, M. Hocek, Chem. Eur. J. 2013, 19, 12720–12731.
[14] J. Balintova, J. Spacek, R. Pohl, M. Brazdova, L. Havran, M.Fojta, M. Hocek, Chem. Sci. 2015, 6, 575–587.
[15] A. M. Debela, S. Thorimbert, B. Hasenknopf, C. K. O’Sulli-van, M. Ortiz, Chem. Commun. 2016, 52, 757–759.
[16] J. Riedl, R. Pohl, N. P. Ernsting, P. Orsag, M. Fojta, M.Hocek, Chem. Sci. 2012, 3, 2797–2806.
[17] J. Dadova, P. Orsag, R. Pohl, M. Brazdova, M. Fojta, M.Hocek, Angew. Chem. Int. Ed. 2013, 52, 10515–10518.
[18] V. Raindlova, R. Pohl, M. Sanda, M. Hocek, Angew. Chem.Int. Ed. 2010, 49, 1064–1066.
[19] J. Dadova, P. Vidlakova, R. Pohl, L. Havran, M. Fojta, M.Hocek, J. Org. Chem. 2013, 78, 9627–9637.
[20] A. M. Michelson, S. H. Orkin, J. Biol. Chem. 1982, 257,14773–14782.
[21] a) G. R. Deng, R. Wu, Methods Enzymol. 1983, 100, 96–116;b) R. Roychoudhury, E. Jay, R. Wu, Nucleic Acids Res. 1976,3, 863–877.
[22] M. Fojta, L. Havran, R. Kizek, S. Billova, Talanta 2002, 56,867–874.
[23] Z. Dudova, J. Spacek, M. Tomasko, L. Havran, H.Pivonkova, M. Fojta, Monatsh. Chem. 2016, 147, 3–11.
[24] T. Reske, A. E. Surkus, H. Duwensee, G. U. Flechsig, Micro-chim. Acta 2009, 166, 197–201.
Received: November 2, 2017Accepted: December 13, 2017
Published online on December 27, 2017
Full Paper
www.electroanalysis.wiley-vch.de � 2018 Wiley-VCH Verlag GmbH & Co. KGaA, Weinheim Electroanalysis 2018, 30, 371 – 377 377


ABSTRACTWe have a good understanding of life on a molecular
level, we have synthesized life from simple molecules
and we are searching for extraterrestrial life, yet we
still are not sure what life is. Over a hundred different
definitions of this concept have been published
over the last hundred years, yet none has been
generally accepted. The lack of consensus on a life
definition is not a coincidence. Our inability to create
an acceptable definition of life reflects life’s key
attribute: its nonexistence as a natural kind.
KEYWORDSDefinition, Life, Life origin, Natural kind, Organic
chemistry, Synthetic life
93
Jan ŠpačekLife Exists Only as a Concept
DEFINING DEFINITIONSThe concepts which are to be defined can be for our purposes divided into two categories: concepts which can be defined by definitions based exclusively on a theory or a set of theories (theoretical definitions) and concepts which cannot be defined in this fashion because it is logically impossible to define such a concept using theories. We can use light as an example of a concept which is defined by a theoretical definition. Light is an electromagnetic radiation visible to the human eye. Light is therefore based on a theory of electromagnetism and on a set of theories regarding human sight. This definition could be regarded as somewhat fuzzy due to the imprecision regarding both extreme borders of the electromagnetic wave length spectrum, but the fuzziness of this concept arises from technical problems with variations in human physiology and not from the intrinsic impossibility of formulation of theories about this concept.
If we attempt to define, for example, the range of monochromatic spectrum of the color orange (in other words – if we try to find where the red/orange and orange/yellow borders are in the rainbow), we would find that every culture and every individual has a different view regarding this concept. Actually, up until the 15th century, the concept of an orange color did not exist in Europe and was referred to as yellow-red. There is not

C Z E C H A N D SLOVA K L I N GU IS T I C R E V I E W 1/ 2014 9 4
any objective quality which could justify the exclusion of the orange color from the light spectrum and it is logically impossible to formulate any theory regarding the orange color. We can conclude that our inability to formulate any theoretical definition regarding the concept of the orange color reflects the nonexistence of a natural category of the color orange. In other words, this concept does not exist as a natural kind (Bird, 2012).
To say that the concept of the orange color does not exist as a natural kind is not equivalent to saying that the orange color does not exist. The orange color exists as part of the electromagnetic spectrum which we decided to name orange on purely subjective reasons. The main point is that the definition of the color orange, or the need for this concept, will always be subjective.
Both of these examples are parts of the continuous spectrum. Only the concept of light has, however, an objective quality (current human physiology) which enables us to clearly separate it from the rest of the electromagnetic spectrum. It is also important to note that the usefulness of the definition does not say anything about the existence of the defined object as a natural kind.
As we can see in the example of the color orange (and others in Table 1), concepts which cannot be formulated using a theoretical definitions are based on cultural, historical and linguistic circumstances. Different cultures can perceive these concepts differently or they do not have to have them at all, regardless of their state of knowledge.
Table 1: Difference between theoretical and culturrally based definitions
Definitions based on theory (i. e. theoretical definitions)
Culturally based definitions
Cannot be proved, can be falsified – are testable
Can be proved (usually by circular argument), cannot be falsified –
therefore are not testable
Tries to reflect objective realityAre used for concepts which do not
have to be related to natural
If there are two theoretical definitions defining the same concept, at least one
of them is incorrect
Many culturally based definitions defining the same concept can exist in
parallel

95
Theoretical definitions can be supported by evidence and logic
Evidence and logic are not relevant for culturally based definitions
Theoretical definitions are only as good as the theory they are based on. They
provide us with the latest scientific representation of nature.
The majority of commonly used concepts could not be defined by
theoretical definitions.
Culturally based definitions could be useful to convey meaning between
people. They tell us about the cultural background of the definer instead of
telling us anything about the nature of the universe.
Examples of theoretical definitions
Examples of culturally based definitions:
- Planck units (length, time, weight) are defined by the fundamental properties
of physics
- Unit kilogram defined as the weight of a reference metal cylinder stored in
France
- The amount of matter can be currently defined as the number of particles
- Mol if defined as the number of particles equivalent to 12 grams of
carbon isotope 12C
THE CONCEPT OF LIFEAlthough the concept of life is often used, attempts to define life are problematic. “Life definitionists have too often been careless: they have constantly mixed folk intuitions with scientific considerations” (Machery, 2012). If we decide to define life as a folk concept, we would find it as meaningless as defining the color orange. On the other hand, any objective definition would have to be based on a theory or a set of theories which we do not have and therefore it is impossible. The option which is frequently (and perhaps unknowingly) chosen by life definitionists is to find the least scientifically objectionable culturally based definition.
Any definition of life has to be based on assumptions. The first thing we have to assume is that we already know enough about life to be able to formulate a definition about it. An extremely good example showing the impossibility of producing a theoretical definition of water before we know its molecular structure has been made. It has been said that we still do not know enough about life to be able to define it (Cleland, 2002). This was
C Z E C H A N D SLOVA K L I N GU IS T I C R E V I E W 1/ 2014 9 6
a very valid argument but it could be refuted by paraphrasing Feynman: if we can create it, we can understand it. As of the year 2002, we are officially able to create life in a laboratory: an In vitro synthesis of a living virus has been made (Cello, 2002), followed 6 years later by a chemical synthesis of the entire genome of modified bacteria M. genitalium (Gibson, 2008), with the parent of this bacteria having been said to have been a computer. Currently, a project to create a fully artificial yeast genome is underway (syntheticyeast.org) and the first of yeast artificial chromosomes has already been made (Annaluru, 2014).
The next assumption is that the domains Bacteria, Archaea, Eukaryotes and perhaps Viruses (Nasir, 2012) represent life. All living things share an exclusive quality or a set of exclusive qualities. These qualities are the same regardless of the complexity of the particular species. Based on these similar qualities, we can formulate a theory of life on Earth which should be at least a subset of life in general (which could possibly include artificial and extraterrestrial life).
A number of scientists have already made these or similar assumptions before postulating their versions of a life definition of which 123 have been summarized by Popa (2004, p. 197-205). None of these definitions have been universally accepted which has led to a generation of additional, possibly less refutable definitions. By analyzing the frequency of words used in these definitions, a new definition was constructed: “Life is self-reproduction with variation” (Trifonov, 2011). Although I and many others do not agree with the method of ‘voting’ used to produce a new definition (summarized in Trifonov, 2012), I found this definition the most appealing because of its minimalistic elegance. The main reason for choosing this definition over others was my subjective cultural background, which is all the justification a culturally based definition needs. Unless stated otherwise, I would therefore consider life to be “self-reproduction with variations” (Trifonov, 2011).
EXPERIMENTAL PARTThis part attempts to illustrate the fuzziness of the line between life and non-life and the interchangeability of those two states in certain systems.
LIFE NON-LIFE SWITCH EXPERIMENTViroids are small RNA molecules with the genome size of few hundred nucleotides which do not carry any genes and their life cycle is bound to the life of the host plant species. Since these molecules fit our definition of ‘self-reproduction with variations’ (Trifonov 2011), they are considered the simplest living system. The following experiment is meant
97
as a thought experiment, although there is no technical reason why someone should not succeed if he or she decides to perform this experiment in a laboratory.
It is possible to synthetize viroids in vitro (and thus create life) but instead of its original sequence we can insert a non-natural ribonucleotide (such as X1, Malyshev, 2014) somewhere in the nonessential position in its sequence. This synthetic ribonucleotide is well accepted by natural enzymes (they can incorporate it into DNA or RNA with a similar efficiency as a natural nucleotide) but it does not pair with any other natural nucleotide (Malyshev 2014). Upon infection of the plant cell with this modified viroid, the replication would begin as with a normal viroid molecule and proceed until it reaches the point where X was inserted. In this location the replication would stop because RNA polymerase would not be able to add a complementary nucleotide, as no nucleotide of this kind is available in the cell. Since the modified viroid molecule is not capable of reproduction, it does not fit our life definition. In this example, the difference between life and non-life depends on one synthetic ribonucleotide. It can be argued that this synthetic nucleotide “neutered” the RNA molecule.
Furthermore, we could prepare a growth medium of the host plant cells with another unnatural nucleotide, YTP, which is a synthetic ribonucleotide triphosphate complementary to X (Malyshev 2014). If we infect these cells with a viroid modified with X, we would discover that this time it completes its replication without any problems because now, instead of stopping at the positions of a synthetic nucleotide, its synthetic counterpart will be inserted. In this scenario, the same molecule which we declared to be non-life previously, is now by definition living – it would be capable of self-reproduction with inevitable variations.
If we decide to exclude viruses and viroids from the category of life, due to their lack of metabolism, we can perform a very similar experiment with in silico prepared, a chemically generated genome of bacteria Mycoplasma genitalium (Gibson 2010), with dX - dY pairs inserted in the non-coding regions. The bacteria would be able to run its metabolism, but unless we add dYTP and dXTP in the medium it would not be able to replicate (Malyshev 2014) and therefore it would be considered non-life.
It can be seen that the same molecule or bacteria can be labeled as life or non-life and a switch can be made between those two states by adding or extracting synthetic nucleotides from its environment.
We could solve this problem by adding the word ‘potential’ into the life definition: life is a potential of self-reproduction with variation. We would need, however, to call all
1 X and Y, simply said, stand for synthetic bases NaM and 5SICS respectively. These artificial bases can be enzymatically incorporated into DNA or RNA. Deoxyribonucleotide triphosphate or ribonucleotide triphosphates of these bases ((d)XTP or (d)YTP) are used as a substrates for DNA or RNA polymerization.
C Z E C H A N D SLOVA K L I N GU IS T I C R E V I E W 1/ 2014 9 8
DNA or RNA sequences life (or by taking the argument ad absurdum, any possible object) since it is theoretically possible to create such a system in which these molecules (or any other object) would trigger its imperfect (i.e., “with variations”) replication.
LIFE NON-LIFE BORDER ON THE SIMPLE SIDEThere was recently a report on the successful creation of long RNA molecules in conditions simulating the natural environment of a young Earth. Formamide based chemistry which leads to the production of long RNA molecules also leads to the production of at least two amino acids: glycine and alanine (di Mauro, 2014) which are likely to be the first amino acids utilized for the first peptide synthesis (Trifonov, 2009). These experiments indicate that when the right conditions are met, the long RNA molecules are produced as a chemical necessity (the same chemical necessity which dictates that oxygen will react with ethanol when the temperature rises above the ignition point). Di Mauro’s work, which is closing on to the creation of self-reproducing molecules with variation (Trifonov, 2011), suggests a question. How does one pinpoint the state of a molecule which represents first life and which RNA molecule is the last abiotic ancestor? Is first life the RNA molecule which was created as a chemical necessity even before it was replicated first? The argument supporting this opinion would be that this molecule can eventually replicate itself. Or should we count as first life the RNA molecule already containing a mutation? What reasons could undoubtedly justify placing a border between life and non-life on the simple side?
Upon close inspection it is apparent that the life – non-life separation is meaningless at the simplest molecular scale no matter where we decide to place the separation point between lifeless chemistry and life. This meaninglessness has been carried on smoothly, however, as the first replicating molecules became more and more complex over nearly 4 billion years of evolution. A meaningful separation between life and non-life at some precise point during its emergence and over its following evolution to current life forms is unlikely. Di Mauro (2013) concludes that “life, as definable Aristotelian or Kantian Category, does not exist.”
THE LIFE NON-LIFE BORDER ON THE COMPLEX SIDEOver 3 million people have been born using the in vitro fertilization technique (IVF) which relies on in vitro embryo selection. Currently, in vitro selection during IVF is focused on maximizing the likelihood of a successful pregnancy and occasional selection against genetic diseases (Wang, 2011). There are already parents seeking, however,
9 9
a preimplantation genetic diagnostic purely to select the sex of their offspring (Sharp, 2010). It is easy to imagine that with improved and cheaper diagnostic techniques, parents will be likely to select their offspring as ‘better’. And ‘better’ will always depend on cultural opinions. Selection against alleles which are linked to civilization diseases is the logical continuation of current trends of selection against genetic disorders and with technological advances this selection can smoothly progress from therapeutic use to child enhancement.
As a thought experiment, imagine a scenario where all children are born as designed babies and each allele carefully selected or designed to fit the parents’ ideas. Or even further, imagine that each new child would have all their chromosomes designed in a computer and assembled in vitro in similar fashion as it has already been done with a yeast chromosome (Annaluru, 2014). Since a culturally based variation with an economically driven selection would no longer be considered Darwinian evolution, such a civilization could in general no longer be considered life by the definitions which are based on Darwinian evolution. Should we consider, however, the population of culturally-selected computer-made creatures to be alive?
Furthermore, what if, instead of printing the DNA of their offspring, some civilization in a galaxy far, far away with a few million years of scientific knowledge ahead of ours has been printing digital information not in DNA, but on some other medium which would be read not by protein-based enzymes, but by other types of nanotechnological machines? Would they be creating non-living machines or living ones? What definition would allow you to call a human-selected computer-designed sterile human population living?
VITALISTIC PRECEDENTThe concept of organic chemistry is tightly bound to the vitalistic theory. Prior to the year 1828, substances could be neatly separated into two categories: those which could be synthesized in a laboratory, and those which could be created only with the contribution of living organisms. It was believed that organisms held “a vital force” which was crucial for the chemical synthesis of organic material (Bechtel, 1998). The definition of organic substance was therefore based on the theory of its supposed vitalistic origin.2
2 Although author of this paper regards biological vitalism to be pseudoscientific, unfalsifiable and without explanatory power, we would like to point out that chemical vitalism should not be confused with biological vitalism. The latter was based on the need to define itself towards the mechanicism of the 18th century. Most biologist vitalistic authors postulated a hypothetical natural power or some forming principle. The modern equivalent of this power is not necessarily a miracle, but, for example information- a historical memory, stored in DNA

C Z E C H A N D SLOVA K L I N GU IS T I C R E V I E W 1/ 2014 10 0
This view began to change when Wohler synthesized urea in the year 1828. We are currently aware that, at least in principle, all known organic compounds could be synthesized without the contribution of living organisms. The field of organic chemistry did not perish because of the absence of by-the-vitalistic-definition of organic molecules. Chemists have instead conveniently changed the definition of organic chemistry. Instead of a theoretical definition (based on the vitalism theory stating that all organic compounds are made with the contribution of a vital force), organic chemistry now uses a culturally based definition which could be approximated as ‘all carbon containing molecules with many exceptions’. It is currently impossible to formulate a theoretical definition of organic chemistry, because it is not a natural kind. If someone has decided to formulate a new definition of organic chemistry, one would be faced with very similar problems as if he/she tried to define life: Where to draw the line? Why not include silicon or germanium polymers in the current definition? How many aromatic rings shall I condense before I transform an organic molecule into an inorganic graphene sheet? How does the difference in the physical properties between silane and methane relate to their organic – inorganic status? Organic molecules are inseparable from the rest of the chemical spectrum by any testable quality.
We can draw a close-fitting parallel between the concept of life and the concept of organic chemistry (Table 2). The main difference in understanding those two concepts is that scientists do not bother to refine the definition of organic chemistry any longer.
Table 2: Parallels between concept of organic chemistry and concept of life
Vitalistic definition of organic chemistry
Definition of life
First theoretical definition
Organic compounds require a miraculous vital force to be
synthetized
Life is a miracle – God created each an individual kind.
and its interpretation by the body. (More in Radl. E.: Dějiny biologických teoríí novověku I., II. , Academia, 2006 and Markoš A.: Readers of the Book of Life. Oxford University Press, 2002). (Editor´s comment)
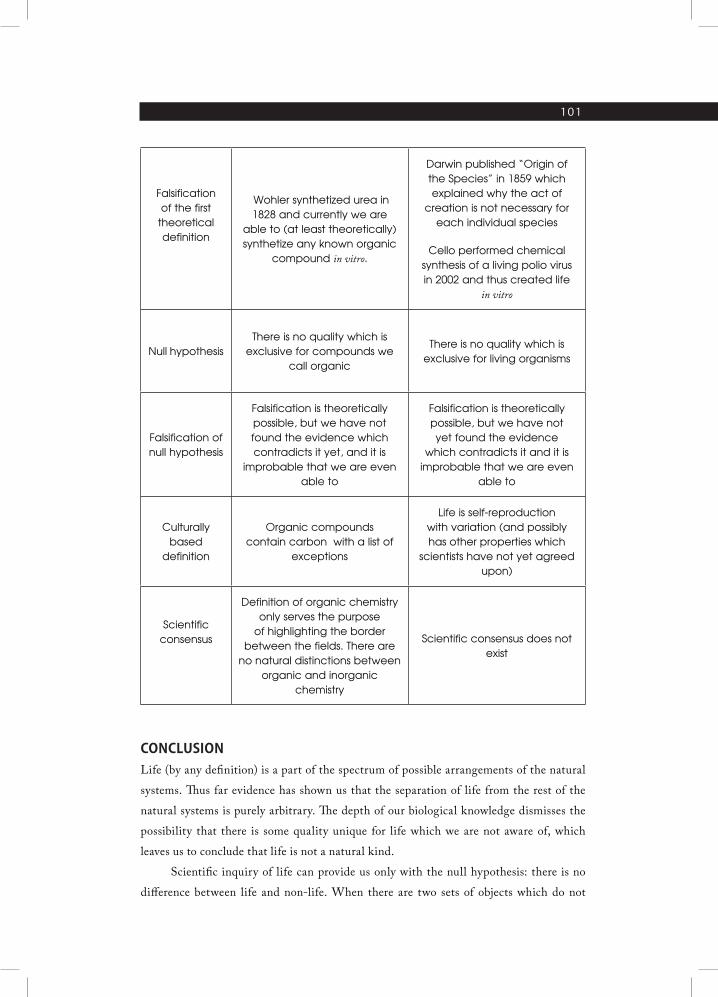
101
Falsification of the first theoretical definition
Wohler synthetized urea in 1828 and currently we are
able to (at least theoretically) synthetize any known organic
compound in vitro.
Darwin published “Origin of the Species” in 1859 which explained why the act of
creation is not necessary for each individual species
Cello performed chemical synthesis of a living polio virus in 2002 and thus created life
in vitro
Null hypothesisThere is no quality which is
exclusive for compounds we call organic
There is no quality which is exclusive for living organisms
Falsification of null hypothesis
Falsification is theoretically possible, but we have not found the evidence which contradicts it yet, and it is
improbable that we are even able to
Falsification is theoretically possible, but we have not yet found the evidence
which contradicts it and it is improbable that we are even
able to
Culturally based
definition
Organic compounds contain carbon with a list of
exceptions
Life is self-reproduction with variation (and possibly has other properties which
scientists have not yet agreed upon)
Scientific consensus
Definition of organic chemistry only serves the purpose
of highlighting the border between the fields. There are
no natural distinctions between organic and inorganic
chemistry
Scientific consensus does not exist
CONCLUSIONLife (by any definition) is a part of the spectrum of possible arrangements of the natural systems. Thus far evidence has shown us that the separation of life from the rest of the natural systems is purely arbitrary. The depth of our biological knowledge dismisses the possibility that there is some quality unique for life which we are not aware of, which leaves us to conclude that life is not a natural kind.
Scientific inquiry of life can provide us only with the null hypothesis: there is no difference between life and non-life. When there are two sets of objects which do not

C Z E C H A N D SLOVA K L I N GU IS T I C R E V I E W 1/ 2014 102
have any objective difference between them, we can conclude that these sets are equal. Therefore, the scientific definition of life after the application of Occam’s razor is: “Life does not exist in nature”.
It is important not to confuse this scientific concept of life with a culturally based one. We can still choose to call some systems as life, but we should bear in mind that unless we find evidence to claim otherwise, this concept is merely a cultural construct and cannot be defined objectively. The knowledge that life is purely a cultural concept is also important from an ethical point of view. Suppose that Human Brain Projects provides us with enough information to create the simulation of an artificial intelligence. The assumption that we are somehow intrinsically better than AI because of our “life” could lead to the unethical treatment of the AI. On the other hand, the same assumption could lead us to underestimate the risks from AI.
A good hypothesis can be used to generate predictions. Based on the presented null hypothesis of life I can predict, that in vitro creation of the entire functional cell by simple chemistry is possible. I predict that fields of molecular biology and nano-engineering are going to merge into one and that biological robots are going to be qualitatively indistinguishable from their synthetic counterparts. I predict that our cultural perception of the distinction between life and nonlife is going to be less and less obvious with the advent of synthetic biology, artificial intelligence and advanced robotics.
Accepting life non-existence is the next step in our unpopular journey from the anthropocentric view of the universe.
NOTES FOR A BETTER UNDERSTANDINGThere is a whole class of ideas which could be judged by the same logic as presented for the case of life. An example would be the question as to “Do mammals exist?” (D. Dennett, 2003) If it is true that the mother of a mammal has to also be a mammal, than there is either an infinite number of mammals (which is false) or there are none. We know, of course, that there are mammals. And we can easily define them. Any definition which we decide to give to this group of animals is going, however, to only be a culturally based, fuzzy definition and anyone who decides to question it would be able to find its flaws and logical fallacies. We are never going to be able to create a “mammalian theory” and we can conclude that (notwithstanding its usefulness) this category is a human-made, non-natural category without clear borders. In this paper, I went to great length to point out the reasons why life is qualitatively as nonexistent as mammals are. I am not trying to say

103
that the concept of life is nonexistent. How we perceive nature and how we categorize it does not have to reflect how nature works.
The same reasoning used in this paper for “life”, can also show us why we are never going to have a theory of consciousness or why we will never be able to declare what is human with a scientific degree of certainty.

C Z E C H A N D SLOVA K L I N GU IS T I C R E V I E W 1/ 2014 10 4
REFERENCES
ARTICLES IN JOURNALSAnnaluru, N. et al (2014): Total Synthesis of a Functional Designer
Eukaryotic Chromosome. Science, 344, p. 55–58.
Cello, J. and Paul, A. V. and Wimmer, E. (2002): Chemical
Synthesis of Poliovirus cDNA: Generation of Infectious Virus in the
Absence of Natural Template. Science, 297, p. 1016–1018.
Cleland, C. E. and Chyba, C. F. (2002): Defining ‘Life’. Origins
of Life and Evolution of the Biosphere, 32, p. 387–393.
Di Mauro, E. (2014): The path to life’s origins. Remaining hurdles.
Journal of Biomolecular Structure and Dynamics, 32, p. 512–522.
Gibson, D. et al (2008): Complete Chemical Synthesis, Assembly, and Cloning
of a Mycoplasma genitalium Genome. Science, 319, p. 1215–1220.
Machery, E. (2012): Why I stopped worrying about the definition of
life... and why you should as well. Synthese, 185, p. 145–164.
Malyshev et al (2014): A semi-synthetic organism with an
expanded genetic alphabet. Nature, 509, p. 385–388.
Nasir, A., Kim, N. K., and Anolles, G. C. (2012): Giant viruses coexisted with the
cellular ancestors and represent a distinct supergroup along with superkingdoms
Archaea, Bacteria and Eukarya. BMC Evolutionary Biology, 12, p. 156–174.
Sharp, R. R. et al (2010): Moral attitudes and beliefs among couples pursuing
PGD for sex selection. Reproductive BioMedicine Online, 21, p. 838–847.
Trifonov, E. (2009): The origin of the genetic code and of the earliest
oligopeptides. Research in Microbiolog, 160, 481–486.
Trifonov, E. (2011): Vocabulary of Definitions of Life Suggests a Definition.
Journal of Biomolecular Structure & Dynamics, 29, p. 259–266.
Trifonov, E. (2012): Definition of Life: Navigation through Uncertainties.
Journal of Biomolecular Structure &Dynamic, 29, p. 647–650.
Wang, S. X. Y. (2011): The Past, Present, and Future of Embryo Selection in
In Vitro Fertilization. Yale Journal of Biology and Medicine, 84, 487–490.
105
BOOKSPopa, R. (2004): Between Necessity and Probability: Searching
for the Definition and Origin of Life. Springer.
INTERNET REFERENCESBechtel, W. and Richardson, R. C., (1998): Vitalism. In: Craig, E.
(Ed.), Routledge Encyclopedia of Philosophy. London: http://www.
rep.routledge.com/article/Q109 (access 15 September 2014).
Bird, Alexander and Tobin, Emma, “Natural Kinds”, The Stanford
Encyclopedia of Philosophy, http://plato.stanford.edu/archives/
win2012/entries/natural-kinds/ (Winter 2012 Edition)
Dennett, D. (2003): Freedoms Evolves: Free Will, Determinism and
Evolution, The Distinguished Science Lecture Series http://lectures.
skeptic.com/71522693?autoplay=1 (access 12 November)
AFFILIATION
Jan Špaček
Institute of Biophysics and Biochemistry of the AS CR, v.v.i.,
Královopolská 135, 612 65 Brno, Czech Republic,
E-mail: [email protected]

146 Vesmír 97, březen 2018 www.vesmir.cz 147
téma — vznik života
JeronIMo cello spolu s dalšími dvěma kolegy v roce 2002 syntetizoval genom polioviru. Tak ukázal, že je možné vytvářet, podle většiny současných defi-nic, život.
O osm let později tým Craiga Ventera provedl chemickou syntézu a sestavení
životaschopného genomu bakterie podle biologické předlohy a v roce 2016 se pochlu-bil sestavením minimální funkční bakterie, která měla pro přehlednost pořadí genů na chromozomu uspořádané do bloků podle jejich metabolických funkcí. Projekt mající za cíl syntetizovat všechny chromozomy kvasinky je v plném proudu a v roce 2016 odstartoval projekt, který si klade za cíl syntetizovat lidský genom.
V roce 2017 Yorke Zhang s kolegy dosáhl cíle, o nějž tým Flyoda Romsberga usiloval posledních dvacet let. Rozšířili genetickou abecedu o dvě další písmena tvořící nový, plně funkční pár bází DNA, schopných informaci nejen uchovávat, ale také přepisovat do proteinů s obsa-hem nepřirozených aminokyselin. Po bezmála čtyřech miliardách let evoluce na Zemi existuje semisyntetický organis-mus, který využívá tři plně funkční páry genetické abecedy namísto standardních dvou.
Kromě vytváření syntetických genomů a semisyntetických organismů se v součas-nosti objevují snahy o replikování vzniku procesu života na Zemi. Manželé Šponerovi z Biofyzikálního ústavu Akademie věd se v současnosti snaží provést laboratorní abio-genezi. Z jednoduchých látek a za podmínek,
které se s nejvyšší pravděpodobností vysky-tovaly na mladé Zemi před necelými čtyřmi miliardami let, chtějí nechat vzniknout první sebereplikující molekuly RNA. Podle dosavadních výsledků z jiných laboratoří má tento projekt velkou šanci na úspěch. (Pozn. red.: Viz také článek Preludium o sop-kách, bombardování Země a formamidech na s. 140.)
Na rok 2019 je plánováno vypuštění tele-skopu Jamese Webba, jehož posláním bude mimo jiné analýza atmosfér exoplanet za účelem pátrání po stopách mimozemského života. Na základě pozorování Keplerova te-leskopu se odhaduje počet planet v obyvatel-ných zónách hvězd v naší galaxii na 40 mili-ard. Takto vysoký odhad dodává optimismus lidem pátrajícím nejen po mimozemském životě, ale i po mimozemské inteligenci.
Není ovšem vyloučeno, že první setkání s cizí inteligencí neohlásí astronomové, ale IT specialisté. Rychlé pokroky v oblas-ti strojového učení pomocí neuronových
sítí mohou vést k vzniku všeobecné umělé inteligence. Vincent Müller a Nick Bostrom v roce 2016 na základě rozsáhlého průzkumu názorů odborníků v oboru došli k závěru, že v příštích dvaceti letech je zhruba pade-sátiprocentní šance na vytvoření stroje překonávajícího lidský intelekt v jakémkoliv úkolu.
Současný pokrok v mnoha oborech vědy znovu nutí filozofy k otevření otázky, co je to život. Přestože nyní o životě víme více než kdy dříve, stále neexistuje shoda na jeho jedné univerzální definici. Tato neshoda vychází z faktu, že život není přírodní kategorie. Rozdělení objektů na živé a neživé je totiž zastaralý koncept (více v rozšířené verzi článku na vesmir.cz).
JE ŽIVOT PříRODNí KATEGORIE?V současnosti existuje přes sto různých definic života publikovaných v odborných časopisech. Zdá se, že každý, kdo se tímto problémem zabýval, se rozhodl formulovat definici života jinak. Neshoda mezi vědci poukazuje na skutečnost, že žádná z publi-kovaných definic doposud neprošla úspěšně verifikačním procesem a nebyla všeobecně přijata. Dosavadní neexistence definice života může naznačovat, že život přírodní kategorií není.
Následující text ukazuje, co v současnosti o životě víme, jaké faktory by se měly zo-hlednit při formulaci jeho definice a zdali je vůbec možné teorii života formulovat.
Vzhledem k tomu, že není možné smy-sluplně psát o konceptu, který jsem ještě nedefinoval, budu vycházet z definice, kterou na základě analýzy předchozích definic předložil Edward Trifonov: život je replikace s variací. Výběr této definice není podpořen žádnými důkazy – pouze se mi zdá být výstižná a přitažlivá díky své minimalistické eleganci. (Kdyby existova-ly objektivní důvody pro preferenci jedné z mnoha známých definic, pak by vůbec nemusel existovat tento článek.) Nicméně většina výroků v následujícím textu zůstává
pravdivých, i když život definujeme jakou-koliv jinou z publikovaných definic.
VZNIK ŽIVOTA V LABORATOřIProblémem vzniku života na Zemi se v pa-desátých letech minulého století zabýval Stanley Miller. Jeho slavný experiment, kdy zahříval báň s vodou v atmosféře z metanu, amoniaku a vodíku, v níž probí-haly elektrické výboje, vedl ke spontánní produkci několika aminokyselin. Tento experiment dokládal, že složité organické molekuly mohou spontánně vznikat z jed-noduchých reaktantů. Podobné experi-menty, v nichž byla zvolena atmosféra lépe odrážející naše současné představy o stavu Země před vznikem života, rovněž vedly k syntéze základních kamenů nezbytných pro život.
Čeští vědci v roce 2016 publikovali, jak se z formamidu (látky vznikající reakcí me-tanu, oxidu uhelnatého a dusíku v prebio-tické atmosféře) po zásahu laserem formují všechny báze vyskytující se v RNA. Prudké zahřátí formamidu laserem na mnohatisí-cové teploty mělo simulovat podmínky po impaktu meteoru.
Rovněž v roce 2014 byla publikována práce z laboratoře profesora Ernesta Di Maura, ukazující, že za podmínek pravděpodobně panujících na naší Zemi před 4 miliardami let dochází k samovolnému vzniku dlou-hých řetězců ribonukleové kyseliny z forma-midu ve vodě.
Di Mauro použil místo vysokých tep-lot, které by vedly k rozpadu vznikajících řetězců RNA, katalýzu minerálními látkami běžně se vyskytujícími na Zemi. Při těchto reakcích současně spontánně vznikají i aminokyseliny s hlavním zastoupením glycinu a alaninu, což jsou pravděpodobně stavební kameny prvních peptidů. Dnes to
vypadá, že je jen otázkou času, kdy v labora-toři vzniknou první molekuly RNA schop-né replikace. A přesně toho se nyní snaží dosáhnout manželé Šponerovi (viz článek na s. 140).
Vznik života se s nejvyšší pravděpodob-ností řídí stejnými fyzikálními zákony jako kterákoliv jiná chemická reakce. Zbytek příběhu, tedy nárůst komplexity od prvních
jednoduchých RNA replikátorů až po dnešní faunu a flóru, je velice dobře vysvětlen pro-cesem evoluce.
Otázkou zůstává, co tvoří hranici mezi chemií a životem. Odkdy můžeme o moleku-lách nebo systémech mluvit jako o živých?
PřEPíNáNí MEZI ŽIVýM A NEŽIVýMNásledující experiment je pouze myšlenko-vý, ale není mi znám důvod, proč by nešel fyzicky provést. Jeho účelem je získat pod-klad k dalšímu přemýšlení o definici života:
Na rozdíl od předchozího pokusu, kde byly nastaveny pouze počáteční podmínky, a če-kali jsme, zda se život spontánně vyvine, u tohoto experimentu si konkrétního zá-stupce života syntetizujeme cíleně. Podobně to učinil Jeronimo Cello se syntézou virové DNA viru způsobujícího dětskou obrnu.
Pro náš myšlenkový experiment si jako zástupce života zvolíme viroidy, které se v přírodě vyskytují pouze jako molekuly
RNA, takže po jejich laboratorní syntéze jsou zcela nerozeznatelné od svých „divoce žijících“ protějšků.
Při syntéze ale uděláme drobnou změnu. Na jedno místo v jejich genomu umístíme syntetický pár bází z dílny již zmíněné-ho Floyda Romsberga. Takto připravená molekula po infekci rostlinných buněk bude nefunkční. Její replikace sice začne, ale poběží pouze do místa, kde se nachází syntetický pár bází. Replikace se zde zastaví kvůli tomu, že hostitelská polymeráza nebude mít k dispozici komplementární syntetické ribonukleosidtrifosfáty (mole-kuly využívané polymerázami pro syntézu RNA viroidu). Protože viroid není schopen replikace, můžeme jej označit za neživý. Když ale úplně stejnou molekulou RNA viroidu infikujeme rostlinné buňky, které obsahují ribonukleosidtrifosfáty syntetic-kých bází, pak dojde ke kompletní replikaci a tento viroid obsahující syntetický pár bází můžeme označit za živý.
Jsou tedy tyto viroidy živé, nebo neživé předtím, než se rozhodneme, které buňky s nimi budeme infikovat? Může být jedna a tatáž molekula zároveň živá, i neživá?
Vidíme, že označení živé se nevztahuje k žádné fyzické vlastnosti zmiňovaných viroidů, ale pouze k samotnému procesu re-plikace (který je v přírodě vždy spojený s jis-tou mírou nepřesnosti, vedoucí v průběhu
mnoha generací a ve spojení se selekcí k evoluci).
Kromě toho jestliže zvolíme definici života, podle níž jsou živé jen systémy schopné re-plikace, pak by podle této de-finice nebyl živý ani poslední jedinec pohlavně se rozmno-žujícího druhu. Absence part-nera znemožňuje rozmnožení
(což je analogie k nepříhodným podmínkám pro viroid) a v konečném důsledku definice života, které se opírají o evoluci, nezahrnují neplodné jedince mezi živé systémy.
Je tedy možné formulovat definici života, která by zahrnovala i neplodné jedince? O to se pokusil Hans Hateren a definici života formuloval jako schopnost aktivně reagovat na změny v prostředí, a to buď chováním, nebo evolucí. Kromě toho že ani tato definice nemůže říct, jestli je viroid s nepřirozeným párem bází živý nebo ne, dříve než zvolíme, které buňky s ním budeme infikovat, tak naráží na problém, kam zařadit počítačové programy.
ŽIVé PROGRAMyExponenciální nárůst výkonu počítačů a čím dál tím komplexnější pochopení bio-logie na molekulární úrovni nám umožní v blízké budoucnosti simulovat organis-my v počítači. Openworm.org je velice zajímavý projekt, který má za cíl vytvořit
„otázkou zůstává, co tvoří hranici mezi chemií a životem. od kdy můžeme o molekulách nebo systémech mluvit jako o živých?“
Život je jen konceptživot je uměle vytvořená kategorie. snažit se dělit systémy na živé a neživé nemá jiné než kulturně- -historické opodstatnění a snaha o vytvoření všeobecně přijatelné definice života je předem odsouzená k nezdaru kvůli nemožnosti formulace teorie života.
text Jan šPaČek
MGR. Jan šPaČek (*1986) vystudoval obor molekulární biologie a genetika na Masarykově univerzitě. v současné době se v rámci doktorského studia (program genomika a proteomika) zabývá elektrochemií nukleových kyselin v biofyzikálním ústavu Av čr a středoevropském technologickém institutu (CeteiC Mu).
Pokud je P špatně,tak budu smutný.
Nepřeji si být smutný. Proto je P správně.
Zdroj: https://www.smbc-comics.com, zveřejněno se svolením autora
„Má smysl rozlišovat mezi živou a neživou molekulou, zvláště když totožná molekula může podle současných definic patřit do obou kategorií současně?“
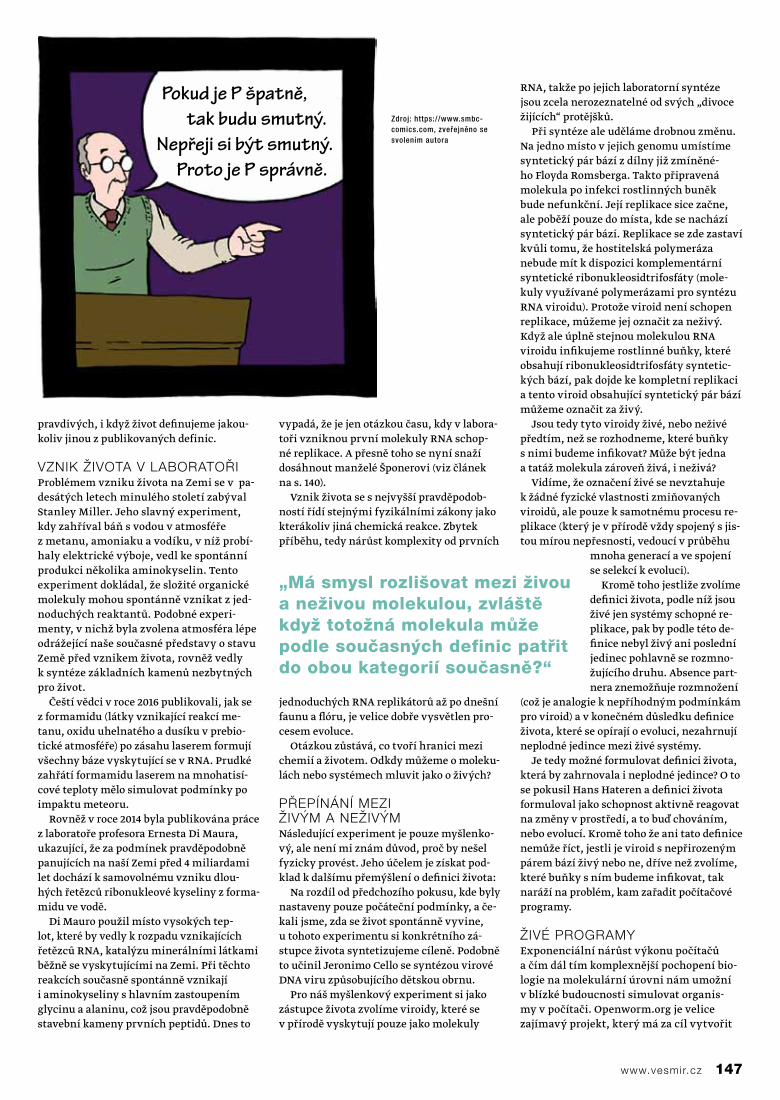
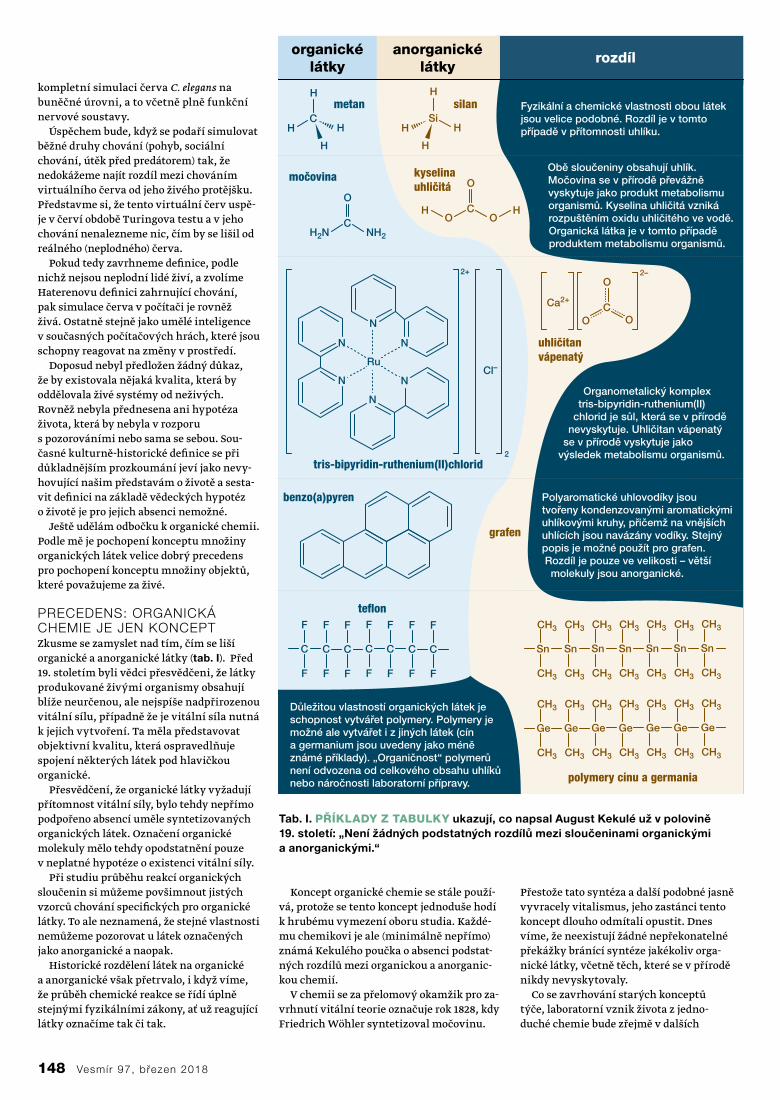
148 Vesmír 97, březen 2018 www.vesmir.cz 149
kompletní simulaci červa C. elegans na buněčné úrovni, a to včetně plně funkční nervové soustavy.
Úspěchem bude, když se podaří simulovat běžné druhy chování (pohyb, sociální chování, útěk před predátorem) tak, že nedokážeme najít rozdíl mezi chováním virtuálního červa od jeho živého protějšku. Představme si, že tento virtuální červ uspě-je v červí obdobě Turingova testu a v jeho chování nenalezneme nic, čím by se lišil od reálného (neplodného) červa.
Pokud tedy zavrhneme definice, podle nichž nejsou neplodní lidé živí, a zvolíme Haterenovu definici zahrnující chování, pak simulace červa v počítači je rovněž živá. Ostatně stejně jako umělé inteligence v současných počítačových hrách, které jsou schopny reagovat na změny v prostředí.
Doposud nebyl předložen žádný důkaz, že by existovala nějaká kvalita, která by oddělovala živé systémy od neživých. Rovněž nebyla přednesena ani hypotéza života, která by nebyla v rozporu s pozorováními nebo sama se sebou. Sou-časné kulturně-historické definice se při důkladnějším prozkoumání jeví jako nevy-hovující našim představám o životě a sesta-vit definici na základě vědeckých hypotéz o životě je pro jejich absenci nemožné.
Ještě udělám odbočku k organické chemii. Podle mě je pochopení konceptu množiny organických látek velice dobrý precedens pro pochopení konceptu množiny objektů, které považujeme za živé.
PRECEDENS: ORGANICKá CHEMIE JE JEN KONCEPTZkusme se zamyslet nad tím, čím se liší organické a anorganické látky (tab. I). Před 19. stoletím byli vědci přesvědčeni, že látky produkované živými organismy obsahují blíže neurčenou, ale nejspíše nadpřirozenou vitální sílu, případně že je vitální síla nutná k jejich vytvoření. Ta měla představovat objektivní kvalitu, která ospravedlňuje spojení některých látek pod hlavičkou organické.
Přesvědčení, že organické látky vyžadují přítomnost vitální síly, bylo tehdy nepřímo podpořeno absencí uměle syntetizovaných organických látek. Označení organické molekuly mělo tehdy opodstatnění pouze v neplatné hypotéze o existenci vitální síly.
Při studiu průběhu reakcí organických sloučenin si můžeme povšimnout jistých vzorců chování specifických pro organické látky. To ale neznamená, že stejné vlastnosti nemůžeme pozorovat u látek označených jako anorganické a naopak.
Historické rozdělení látek na organické a anorganické však přetrvalo, i když víme, že průběh chemické reakce se řídí úplně stejnými fyzikálními zákony, ať už reagující látky označíme tak či tak.
Koncept organické chemie se stále použí-vá, protože se tento koncept jednoduše hodí k hrubému vymezení oboru studia. Každé-mu chemikovi je ale (minimálně nepřímo) známá Kekulého poučka o absenci podstat-ných rozdílů mezi organickou a anorganic-kou chemií.
V chemii se za přelomový okamžik pro za-vrhnutí vitální teorie označuje rok 1828, kdy Friedrich Wöhler syntetizoval močovinu.
Přestože tato syntéza a další podobné jasně vyvracely vitalismus, jeho zastánci tento koncept dlouho odmítali opustit. Dnes víme, že neexistují žádné nepřekonatelné překážky bránící syntéze jakékoliv orga-nické látky, včetně těch, které se v přírodě nikdy nevyskytovaly.
Co se zavrhování starých konceptů týče, laboratorní vznik života z jedno-duché chemie bude zřejmě v dalších
Zhang Y. et al.: A semi-synthetic organism that stores and retrieves increased genetic information, Nature 551, 2017.
Šponer J. E. et al.: Emergence of the First Catalytic Oligonucleotides in a Formamide-Based Origin Scenario, Chem. Eur. J. 22, 3572–3586, 2016.
Müller V. C. et al.: Future Progress in Artificial Intelligence: A Survey of Expert Opinion, vol. 376. Springer, Cham 2016.
K dalšímu čtení…
Tab. I. PŘíklaDy Z tabulky ukazují, co napsal august kekulé už v polovině 19. století: „není žádných podstatných rozdílů mezi sloučeninami organickými a anorganickými.“
C
H
HH
H
H
HH
H
Si
CH2N NH2
OHH C
O O
O
C
O
OO
2–
Ca2+
Ru
N
N
N
N
N
N
2+
2
Cl–
C
F
F
C
F
F
C
F
F
C
F
F
C
F
F
C
F
F
C
F
F
Sn
CH3
CH3
Sn
CH3
CH3
Sn
CH3
CH3
Sn
CH3
CH3
Sn
CH3
CH3
Sn
CH3
CH3
Sn
CH3
CH3
Ge
CH3
CH3
Ge
CH3
CH3
Ge
CH3
CH3
Ge
CH3
CH3
Ge
CH3
CH3
Ge
CH3
CH3
Ge
CH3
CH3
Fyzikální a chemické vlastnosti obou látek jsou velice podobné. Rozdíl je v tomto případě v přítomnosti uhlíku.
Obě sloučeniny obsahují uhlík. Močovina se v přírodě převážně vyskytuje jako produkt metabolismu organismů. Kyselina uhličitá vzniká rozpuštěním oxidu uhličitého ve vodě. Organická látka je v tomto případě produktem metabolismu organismů.
Organometalický komplex tris-bipyridin-ruthenium(II)
chlorid je sůl, která se v přírodě nevyskytuje. Uhličitan vápenatý
se v přírodě vyskytuje jako výsledek metabolismu organismů.
Polyaromatické uhlovodíky jsou tvořeny kondenzovanými aromatickými uhlíkovými kruhy, přičemž na vnějších uhlících jsou navázány vodíky. Stejný popis je možné použít pro grafen. Rozdíl je pouze ve velikosti – větší molekuly jsou anorganické.
Důležitou vlastností organických látek je schopnost vytvářet polymery. Polymery je možné ale vytvářet i z jiných látek (cín a germanium jsou uvedeny jako méně známé příklady). „Organičnost“ polymerů není odvozena od celkového obsahu uhlíků nebo náročnosti laboratorní přípravy.
rozdíl
metan silan
močovina kyselinauhličitá
uhličitanvápenatý
tris-bipyridin-ruthenium(II)chlorid
grafen
benzo(a)pyren
teflon
polymery cínu a germania
organickélátky
anorganickélátky
generacích vnímán podobně jako Wöhlerova syntéza močoviny. Syntetická biolo-gie umožní de novo vytváření známých organismů nebo vytváření zcela nových replikujících se systémů, na které evoluce na Zemi nepřišla.
NEDěLIT ŽIVé A NEŽIVéPrvní replikující se molekula RNA se od nereplikujících, samovolně vznikajících RNA molekul mohla lišit jednoduchou konformační, sekvenční nebo jinou spon-tánně vznikající změnou. Nejúspěšnější potomek první replikující se molekuly obsahoval zase jinou drobnou změnu, která mu zajišťovala větší úspěšnost při replika-ci. Zbytek příběhu je už všem dobře známý příběh evoluce. V celé dlouhé sérii rodičů a potomků nenalezneme ostrou hranici, kde bychom mohli prohlásit: rodič je prebiotic-ký, potomek je živý.
Co se existence života v reálném světě týče, tak zastávám nulovou hypotézu. Tedy že neexistuje žádná objektivní kvalita nebo soubor kvalit, které by odlišovaly živé systé-my od neživých.
V souladu s vědeckou metodou je tato hypotéza platná, dokud se nenalezne důkaz, který ji vyvrací. Tvrzení opaku, tedy to, že taková kvalita existuje, je pozitivní tvrzení zatížené důkazním břemenem. Jestliže neexistuje kvalita, která by vydělovala mno-žinu živých objektů, pak můžeme udělat závěr: buď jsou všechny objekty živé, nebo můžeme správně použít Occamovu břitvu a říct, že dělit objekty na živé a neživé nemá smysl.
Dobrá hypotéza se pozná i podle toho, jestli nabízí předpovědi, na jejichž základě je možné ji testovat. Některé z předpovědí odvozené z nulové hypotézy života tedy jsou: (1) Při výběru správných vstupních podmí-nek dojde ke spontánnímu vzniku replikují-cích se molekul RNA.(2) Vytvoření funkční buňky z jednoduché chemie je sice složitý, ale splnitelný úkol.(3) Molekulární robotika a molekulární bio-logie se budou úzce prolínat a bude čím dál tím těžší rozlišit biologického robota od jeho syntetického protějšku na základě pozorová-ní jejich chování.(4) S nástupem syntetické biologie, umělé inteligence a pokročilé (nano)robotiky bude
stále obtížnější pochopit rozdíly mezi živým a neživým.
Jsem přesvědčený, že nulová hypotéza o neexistenci života má vyšší prediktivní potenciál než jakákoliv hypotéza o ži-votě. Naopak setrvávat v představě, že život má zvláštní atributy, by mohlo mít negativní dopad na uvažování o etických či bezpečnostních otázkách. Je možné, že v příštích dvaceti letech nástupce progra-mu AlphaZero dosáhne všeobecné superin-teligence zahrnující model vlastní exis-tence. Představa, že my jsme na rozdíl od programu živí, by na jednu stranu mohla vést k podcenění rizik spojených s obec-nou umělou inteligencí z důvodu ignoro-vání hrozeb, které očekáváme pouze od živých bytostí, na druhou stranu by mohla vést k neetickému zacházení s umělou inteligencí.
Uvědomění si, že označení „život“ ne-přináší žádnou zázračnou kvalitu, může pomoci lidem, aby si uvědomili, že neexis-tuje důvod, proč by nešly uspořádat atomy do struktur, které jsou schopny nás výrazně překonat v jakémkoliv směru.
Co tedy jsme, když odborně vzato nejsme živí? Jsme komplexní molekulární stroje vytvořené procesem evoluce, které si uvě-domují svou vlastní existenci a nyní poprvé získávající schopnosti se cíleně opravovat a upravovat na molekulární úrovni.
Přijmutí neexistence života jakožto pří-rodní kategorie je další krok na naší nepopu-lární cestě z antropocentrického pohledu na realitu. l
Článek byl inspirovaný příspěvkem J. Špačka: Life exists only as a concept, Czech and Slovak Linguistic Review 1, 92–105, 2014.
Jak odstranit 700 km vzduchu
inzerce
Data z družice Landsat před korekcí atmosférických podmínek v softwaru ENVI (vlevo) a po provedení korekce (vpravo).
I v geoinformatice se při získávání dat potýkáme s různými nepřesnostmi, zaviněnými nedokonalostí našich měřidel a senzorů. Nejsnadněji si to můžeme představit u družicových snímků, které jsou snímány z výšky přibližně 700 km. Taková masa vzduchu mezi snímačem a zemským povrchem má na výsledný snímek značný vliv. Světlo různých vlnových délek je molekulami vzduchu pohlcováno jinak a pokud chceme snímky dále analyzovat, je nutné provést příslušné korekce.
Tyto korekce mohou vycházet z obecného modelu atmosférických podmínek, ale také mohou zpracovávat každý snímek zvlášť a do výpočtu zahrnout stav atmosféry v okamžiku pořízení snímku. Do takových analýz pak vstupují veličiny, jako je poloha slunce, stav atmosféry, přítomnost a množství aerosolů a vodních par, rozptyl, viditelnost a mnoho dalších.
Díky těmto úpravám nakonec získáme velmi podrobný snímek, ze kterého dokážeme identifikovat druh vegetace či dokonce nerostu.
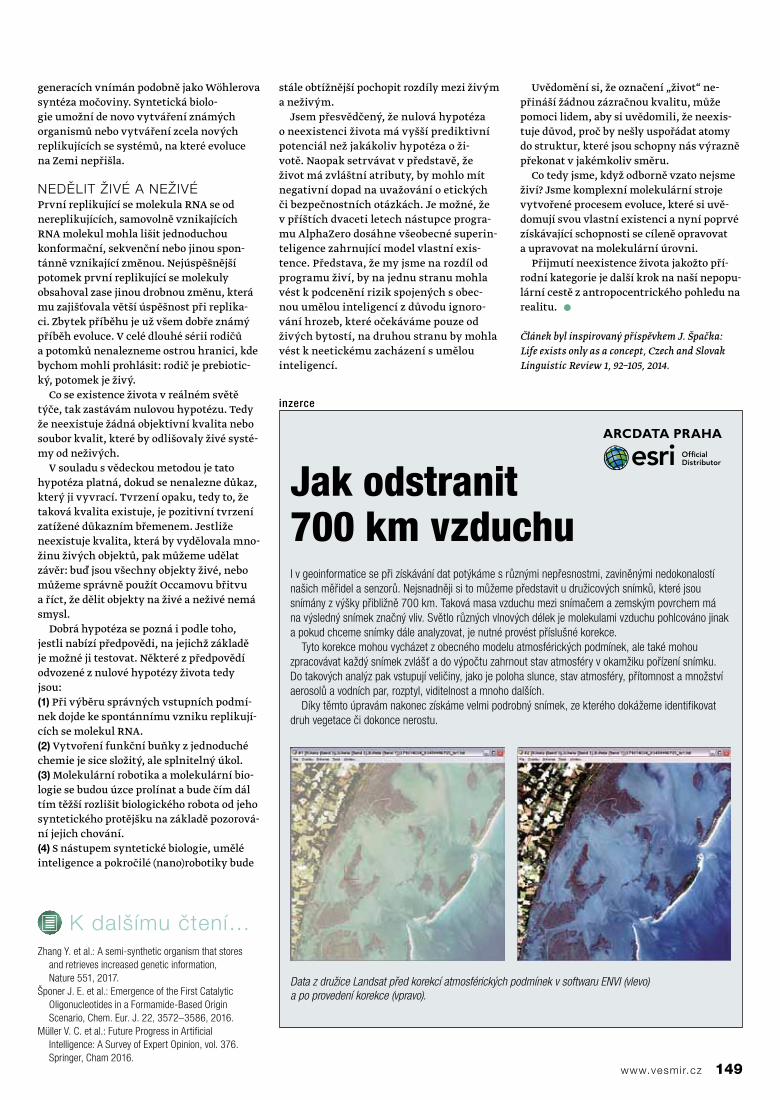
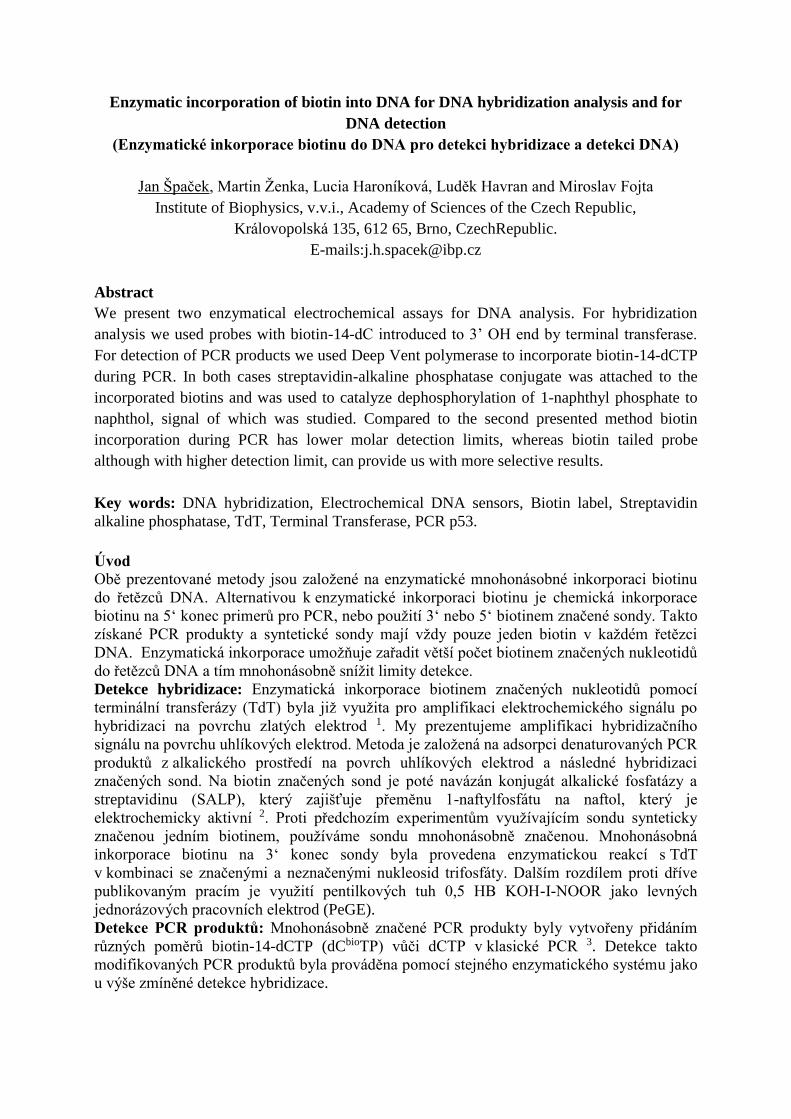
Enzymatic incorporation of biotin into DNA for DNA hybridization analysis and for
DNA detection
(Enzymatické inkorporace biotinu do DNA pro detekci hybridizace a detekci DNA)
Jan Špaček, Martin Ženka, Lucia Haroníková, Luděk Havran and Miroslav Fojta
Institute of Biophysics, v.v.i., Academy of Sciences of the Czech Republic,
Královopolská 135, 612 65, Brno, CzechRepublic.
E-mails:[email protected]
Abstract
We present two enzymatical electrochemical assays for DNA analysis. For hybridization
analysis we used probes with biotin-14-dC introduced to 3’ OH end by terminal transferase.
For detection of PCR products we used Deep Vent polymerase to incorporate biotin-14-dCTP
during PCR. In both cases streptavidin-alkaline phosphatase conjugate was attached to the
incorporated biotins and was used to catalyze dephosphorylation of 1-naphthyl phosphate to
naphthol, signal of which was studied. Compared to the second presented method biotin
incorporation during PCR has lower molar detection limits, whereas biotin tailed probe
although with higher detection limit, can provide us with more selective results.
Key words: DNA hybridization, Electrochemical DNA sensors, Biotin label, Streptavidin
alkaline phosphatase, TdT, Terminal Transferase, PCR p53.
Úvod Obě prezentované metody jsou založené na enzymatické mnohonásobné inkorporaci biotinu
do řetězců DNA. Alternativou k enzymatické inkorporaci biotinu je chemická inkorporace
biotinu na 5‘ konec primerů pro PCR, nebo použití 3‘ nebo 5‘ biotinem značené sondy. Takto
získané PCR produkty a syntetické sondy mají vždy pouze jeden biotin v každém řetězci
DNA. Enzymatická inkorporace umožňuje zařadit větší počet biotinem značených nukleotidů
do řetězců DNA a tím mnohonásobně snížit limity detekce.
Detekce hybridizace: Enzymatická inkorporace biotinem značených nukleotidů pomocí
terminální transferázy (TdT) byla již využita pro amplifikaci elektrochemického signálu po
hybridizaci na povrchu zlatých elektrod 1. My prezentujeme amplifikaci hybridizačního
signálu na povrchu uhlíkových elektrod. Metoda je založená na adsorpci denaturovaných PCR
produktů z alkalického prostředí na povrch uhlíkových elektrod a následné hybridizaci
značených sond. Na biotin značených sond je poté navázán konjugát alkalické fosfatázy a
streptavidinu (SALP), který zajišťuje přeměnu 1-naftylfosfátu na naftol, který je
elektrochemicky aktivní 2. Proti předchozím experimentům využívajícím sondu synteticky
značenou jedním biotinem, používáme sondu mnohonásobně značenou. Mnohonásobná
inkorporace biotinu na 3‘ konec sondy byla provedena enzymatickou reakcí s TdT
v kombinaci se značenými a neznačenými nukleosid trifosfáty. Dalším rozdílem proti dříve
publikovaným pracím je využití pentilkových tuh 0,5 HB KOH-I-NOOR jako levných
jednorázových pracovních elektrod (PeGE).
Detekce PCR produktů: Mnohonásobně značené PCR produkty byly vytvořeny přidáním
různých poměrů biotin-14-dCTP (dCbioTP) vůči dCTP v klasické PCR 3. Detekce takto
modifikovaných PCR produktů byla prováděna pomocí stejného enzymatického systému jako
u výše zmíněné detekce hybridizace.
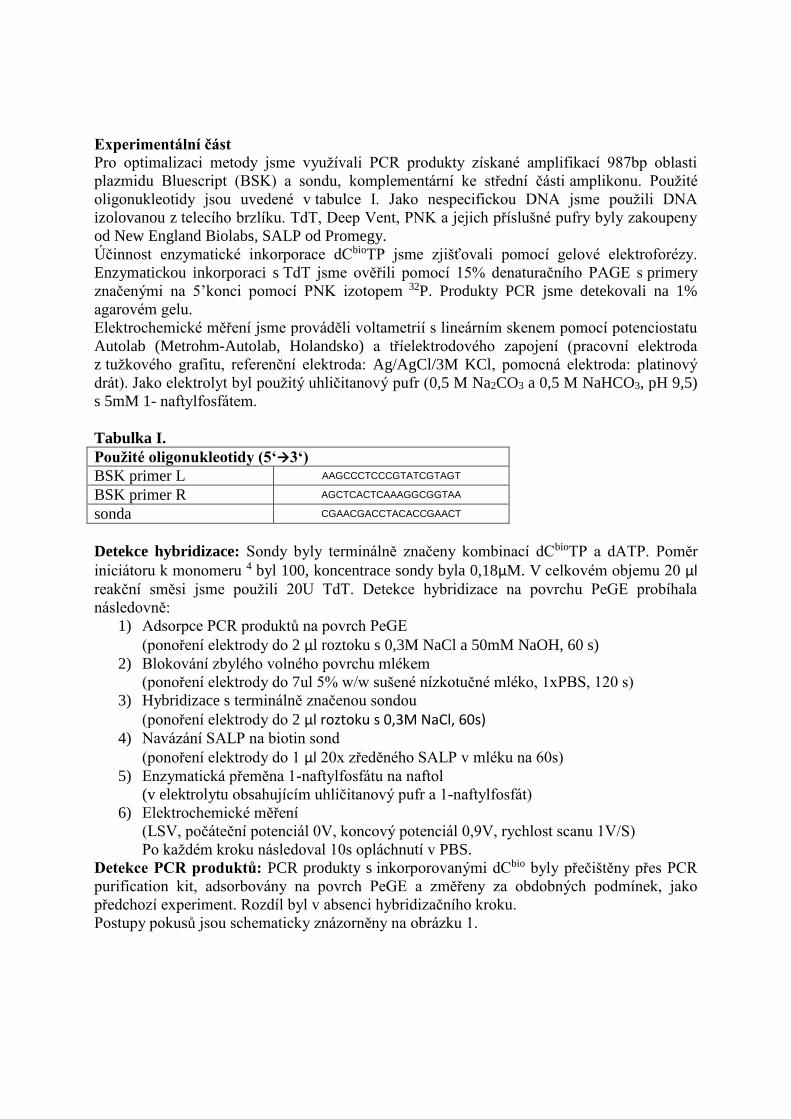
Experimentální část
Pro optimalizaci metody jsme využívali PCR produkty získané amplifikací 987bp oblasti
plazmidu Bluescript (BSK) a sondu, komplementární ke střední části amplikonu. Použité
oligonukleotidy jsou uvedené v tabulce I. Jako nespecifickou DNA jsme použili DNA
izolovanou z telecího brzlíku. TdT, Deep Vent, PNK a jejich příslušné pufry byly zakoupeny
od New England Biolabs, SALP od Promegy.
Účinnost enzymatické inkorporace dCbioTP jsme zjišťovali pomocí gelové elektroforézy.
Enzymatickou inkorporaci s TdT jsme ověřili pomocí 15% denaturačního PAGE s primery
značenými na 5’konci pomocí PNK izotopem 32P. Produkty PCR jsme detekovali na 1%
agarovém gelu.
Elektrochemické měření jsme prováděli voltametrií s lineárním skenem pomocí potenciostatu
Autolab (Metrohm-Autolab, Holandsko) a tříelektrodového zapojení (pracovní elektroda
z tužkového grafitu, referenční elektroda: Ag/AgCl/3M KCl, pomocná elektroda: platinový
drát). Jako elektrolyt byl použitý uhličitanový pufr (0,5 M Na2CO3 a 0,5 M NaHCO3, pH 9,5)
s 5mM 1- naftylfosfátem.
Tabulka I.
Použité oligonukleotidy (5‘3‘)
BSK primer L AAGCCCTCCCGTATCGTAGT
BSK primer R AGCTCACTCAAAGGCGGTAA
sonda CGAACGACCTACACCGAACT
Detekce hybridizace: Sondy byly terminálně značeny kombinací dCbioTP a dATP. Poměr
iniciátoru k monomeru 4 byl 100, koncentrace sondy byla 0,18μM. V celkovém objemu 20 μl reakční směsi jsme použili 20U TdT. Detekce hybridizace na povrchu PeGE probíhala
následovně:
1) Adsorpce PCR produktů na povrch PeGE
(ponoření elektrody do 2 μl roztoku s 0,3M NaCl a 50mM NaOH, 60 s)
2) Blokování zbylého volného povrchu mlékem
(ponoření elektrody do 7ul 5% w/w sušené nízkotučné mléko, 1xPBS, 120 s)
3) Hybridizace s terminálně značenou sondou
(ponoření elektrody do 2 μl roztoku s 0,3M NaCl, 60s) 4) Navázání SALP na biotin sond
(ponoření elektrody do 1 μl 20x zředěného SALP v mléku na 60s)
5) Enzymatická přeměna 1-naftylfosfátu na naftol
(v elektrolytu obsahujícím uhličitanový pufr a 1-naftylfosfát)
6) Elektrochemické měření
(LSV, počáteční potenciál 0V, koncový potenciál 0,9V, rychlost scanu 1V/S)
Po každém kroku následoval 10s opláchnutí v PBS.
Detekce PCR produktů: PCR produkty s inkorporovanými dCbio byly přečištěny přes PCR
purification kit, adsorbovány na povrch PeGE a změřeny za obdobných podmínek, jako
předchozí experiment. Rozdíl byl v absenci hybridizačního kroku.
Postupy pokusů jsou schematicky znázorněny na obrázku 1.
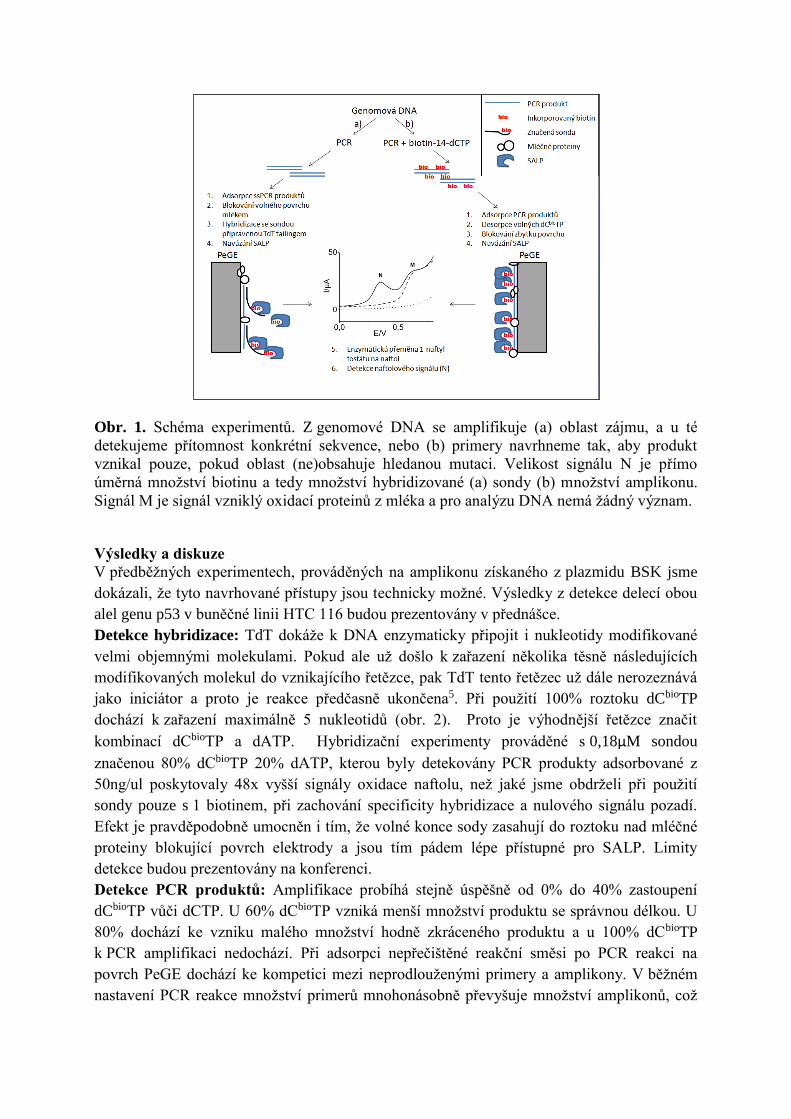
Obr. 1. Schéma experimentů. Z genomové DNA se amplifikuje (a) oblast zájmu, a u té
detekujeme přítomnost konkrétní sekvence, nebo (b) primery navrhneme tak, aby produkt
vznikal pouze, pokud oblast (ne)obsahuje hledanou mutaci. Velikost signálu N je přímo
úměrná množství biotinu a tedy množství hybridizované (a) sondy (b) množství amplikonu.
Signál M je signál vzniklý oxidací proteinů z mléka a pro analýzu DNA nemá žádný význam.
Výsledky a diskuze
V předběžných experimentech, prováděných na amplikonu získaného z plazmidu BSK jsme
dokázali, že tyto navrhované přístupy jsou technicky možné. Výsledky z detekce delecí obou
alel genu p53 v buněčné linii HTC 116 budou prezentovány v přednášce.
Detekce hybridizace: TdT dokáže k DNA enzymaticky připojit i nukleotidy modifikované
velmi objemnými molekulami. Pokud ale už došlo k zařazení několika těsně následujících
modifikovaných molekul do vznikajícího řetězce, pak TdT tento řetězec už dále nerozeznává
jako iniciátor a proto je reakce předčasně ukončena5. Při použití 100% roztoku dCbioTP
dochází k zařazení maximálně 5 nukleotidů (obr. 2). Proto je výhodnější řetězce značit
kombinací dCbioTP a dATP. Hybridizační experimenty prováděné s 0,18μM sondou
značenou 80% dCbioTP 20% dATP, kterou byly detekovány PCR produkty adsorbované z
50ng/ul poskytovaly 48x vyšší signály oxidace naftolu, než jaké jsme obdrželi při použití
sondy pouze s 1 biotinem, při zachování specificity hybridizace a nulového signálu pozadí.
Efekt je pravděpodobně umocněn i tím, že volné konce sody zasahují do roztoku nad mléčné
proteiny blokující povrch elektrody a jsou tím pádem lépe přístupné pro SALP. Limity
detekce budou prezentovány na konferenci.
Detekce PCR produktů: Amplifikace probíhá stejně úspěšně od 0% do 40% zastoupení
dCbioTP vůči dCTP. U 60% dCbioTP vzniká menší množství produktu se správnou délkou. U
80% dochází ke vzniku malého množství hodně zkráceného produktu a u 100% dCbioTP
k PCR amplifikaci nedochází. Při adsorpci nepřečištěné reakční směsi po PCR reakci na
povrch PeGE dochází ke kompetici mezi neprodlouženými primery a amplikony. V běžném
nastavení PCR reakce množství primerů mnohonásobně převyšuje množství amplikonů, což

rapidně snižuje citlivost metody. Po přečištění PCR produktů přes PCR purification kit od
firmy Qiagen jsme získali signály naftolu v desítkách μA z 50 ng/ul roztoku amplikonů a
nulový signál u kontroly bez templátové DNA, která simulovala neproběhnutí reakce. Našim
cílem je optimalizovat množství použitých primerů tak, aby nebylo nutné používat purifikační
kit (což je krok, který zvyšuje nákladnost a prodlužuje jinak velice rychlý proces).
Obr. 2. Značení sondy různým zastoupením dCbioTP vůči dATP v reakci s TdT a použití
takto značených sond pro detekci hybridizace. Vzorek kontrola odpovídá vzorku 10%
připravenému bez TdT. Koncentrace sondy při hybridizaci byla 0,18μM. (a) detekce
hybridizace na povrchu PeGE. Větší počet dCbio v řetězci odpovídá větším naftolovým
signálům. (b) Na obrázku z PAGE vidíme, že TdT nezvládá připojit více, než 5 následných
dCbio. Při vyšším zastoupení modifikovaných nukleotidů dochází k předčasné terminaci
řetězce a tím pádem k zařazení nižšího počtu biotinů na jednu sondu.
Závěr
Srovnání s předchozími experimenty, které využívaly sondy, nebo PCR produkty značené
pouze jedním biotinem na řetězec DNA jsme potvrdili, že enzymatická mnohonásobná
inkorporace biotinu do řetězců DNA zvyšuje citlivost detekce hybridizace a stanovení DNA.
U detekce hybridizace je nutné najít optimum mezi absolutním počtem přidaných biotinů na
jednu sondu, které jsou úměrné velikosti signálu a zhoršením hybridizace způsobené změnou
kinetiky hybridizace sond s dlouhými značenými řetězci na 3‘ konci. Podobně je nutné zvolit
optimum u PCR. Zvetšení procenta dCbioTP v reakci zvyšuje limity detekce značené DNA,
ale hodně velké zastoupení dCbioTP znemožňuje amplifikaci DNA. Modifikaci elektrod a
elektrochemické měření jsme optimalizovali na velice krátký čas – dohromady 7 minut od
získání PCR produktů.

Kombinace levných jednorázových elektrod, specificity a rychlého času detekce je ideálem
pro biosenzory používané v klinické praxi.
Poděkování
Tato práce vznikla s podporou projektů GAČR (P206/12/2378 a P206/11/1638).
Literatura
1. Wan, Y.; Xu, H.; Su, Y.; Zhu, X.; Song, S.; Fan, C. Biosens Bioelectron 2013, 41, 526-
531.
2. Horakova-Brazdilova, P.; Fojtova, M.; Vytras, K.; Fojta, M. Sensors 2008, 8, 193-210.
3. Diamandis, E. P.; Christopoulos, T. K. Clinical Chemistry 1991, 37, 625-636.
4. Chang, L. M.; Bollum, F. J. CRC Crit Rev Biochem 1986, 21, 27-52.
5. Flickinger, J. L.; Gebeyehu, G.; Buchman, G.; Haces, A.; Rashtchian, A. Nucleic Acids
Res 1992, 20, 2382.