Embed Size (px)
Citation preview
Citation: Kulkarni, J.R.; Kulkarni,
S.S.; Inamdar, M.U.; Tamhankar,
N.M.; Waghmare, S.B.; Thombare,
K.R.; Mhetre, P.S.; Khatavkar, T.;
Panse, Y.; Patwardhan, A.; et al.
“Satark”: Landslide Prediction
System over Western Ghats of India.
Land 2022, 11, 689. https://doi.org/
10.3390/land11050689
Academic Editor: Domenico
Calcaterra
Received: 28 March 2022
Accepted: 1 May 2022
Published: 5 May 2022
Publisher’s Note: MDPI stays neutral
with regard to jurisdictional claims in
published maps and institutional affil-
iations.
Copyright: © 2022 by the authors.
Licensee MDPI, Basel, Switzerland.
This article is an open access article
distributed under the terms and
conditions of the Creative Commons
Attribution (CC BY) license (https://
creativecommons.org/licenses/by/
4.0/).
land
Article
“Satark”: Landslide Prediction System over Western Ghatsof IndiaJeevan R. Kulkarni 1,*, Sneha S. Kulkarni 1, Mitali U. Inamdar 1, Nitin M. Tamhankar 1, Spandan B. Waghmare 1,Kiran R. Thombare 1, Paresh S. Mhetre 1, Tanuja Khatavkar 1, Yashodhan Panse 1, Amey Patwardhan 1,Yogini Soman 1, Prasad Bhagat 1, Sumit Bhale 1, Mayuresh G. Prabhune 1 and Vinay Kumar 2
1 Center for Citizen Science, Pankaj Park, Pune 411033, India; [email protected] (S.S.K.);[email protected] (M.U.I.); [email protected] (N.M.T.); [email protected] (S.B.W.);[email protected] (K.R.T.); [email protected] (P.S.M.); [email protected] (T.K.);[email protected] (Y.P.); [email protected] (A.P.); [email protected] (Y.S.);[email protected] (P.B.); [email protected] (S.B.); [email protected] (M.G.P.)
2 Department of Physics and Geophysics, Texas A&M University, Kingsville, TX 78363, USA;[email protected]
* Correspondence: [email protected]
Abstract: Mountains on the west coast of India are known as the Western Ghat (WG). The WGregion has a landslide (LS) susceptibility index of four and is prone to LSs in the monsoon seasondue to rainfall activity. The LS study focuses on the area between 15.5–20.5◦ N, 72.5–77.0◦ E in theMaharashtra state. A catalog of 115 LS events in the study area has been prepared by collecting LSdata for 17 years (2000–2016) from various sources. The area from the windward to the leewardside of the WG mountains is divided into three regions: (1) the windward region (72.5–73.4◦ E)(90 km width), (2) the immediate lee side (ILS) (73.40–74.20◦ E) (80 km width), and (3) distant lee side(DLS) (74.2–77.0◦ E) (280 km width). The Center for Citizen Science (CCS), Pune, India, developedthe LS-predicting model “Satark” using data from satellites, the India Meteorological Departmentweather forecasts, radar products, synoptic conditions, and atmospheric sounding data from theWyoming site for inferring conditions for a hydraulic jump on the WG. The model validation for the5 years (2017–2021) showed a reasonably good Heidke skill score of 0.44. The model showed 76.5%success in LS prediction 1 day in advance. It is the first attempt of this kind in the Indian region.
Keywords: landslide; mountain range; monsoon season
1. Introduction
Landslide (LS) is a general term that includes: (1) downhill movement of pebbles,stones of small to bigger sizes from hillslopes, (2) rockslide, (3) rock-fall, and (4) debrisflow. Landslides (LSs) occur at many places in the Western Ghat (WG) mountain regions ofMaharashtra state in India (Figure 1) in the summer monsoon (June–September) season. Theword “Ghat” is in local Indian languages and has three meanings. These are (1) approachingthe road to the river with stony steps, (2) roads in mountain areas, and (3) mountains. Whenit is used in the sense of a road in the mountain area, the name of the city is prefixed withit, indicating the road connecting to that city. The word “Ghat” is used as an adjective formountains on the west coast of India, referred to as “Western Ghat (WG)”.
In the past, information about LS events remained confined to the local areas andhence has missed the attention of the people at large. On 30 July 2014, an LS occurred inthe village of Malin (19.16◦ N, 73.68◦ E) in the Ambegaon taluka of the Pune district inMaharashtra, India [1–3]. The author of [4] reported in his blog that it was the second-worstLS of the year till that date. Malin is about 150 km from Pune (18.5◦ N, 73.8◦ E) city. TheMalin LS wiped out the whole village except a primary school with a cement concretestructure. The LS at Malin occurred early in the morning while residents were in a deep
Land 2022, 11, 689. https://doi.org/10.3390/land11050689 https://www.mdpi.com/journal/land

Land 2022, 11, 689 2 of 23
sleep. A total of 151 people were killed. In addition to the reported deaths, a total of160 people were believed to be buried under the debris. Accumulated rainfall of 215 mmwas recorded over the area in the 7 days prior to the incident. The incident was widelyreported in the press and electronic media.
Land 2021, 10, x FOR PEER REVIEW 2 of 24
Figure 1. Map of India inset map of Maharashtra state in India. The dotted line in the north‐south
direction is the WG mountain line. The meteorological subdivisions in the state of Maharashtra are
denoted by (1) Konkan on the west coast, (2) Madhya Maharashtra on the leeward side of the WG,
(3) Marathwada, and (4) Vidarbha. The west coast offshore trough (WCT) and southerly location of
the monsoon trough (MT) are indicated by numbers 5 and 6, respectively. The location of Mumbai
on the west coast in the Konkan subdivision is shown by an open circle.
In the past, information about LS events remained confined to the local areas and
hence has missed the attention of the people at large. On 30 July 2014, an LS occurred in
the village of Malin (19.16° N, 73.68° E) in the Ambegaon taluka of the Pune district in
Maharashtra, India [1–3]. The author of [4] reported in his blog that it was the second‐
worst LS of the year till that date. Malin is about 150 km from Pune (18.5° N, 73.8° E) city.
The Malin LS wiped out the whole village except a primary school with a cement concrete
structure. The LS at Malin occurred early in the morning while residents were in a deep
sleep. A total of 151 people were killed. In addition to the reported deaths, a total of 160
people were believed to be buried under the debris. Accumulated rainfall of 215 mm was
recorded over the area in the 7 days prior to the incident. The incident was widely re‐
ported in the press and electronic media.
Figure 1. Map of India inset map of Maharashtra state in India. The dotted line in the north-southdirection is the WG mountain line. The meteorological subdivisions in the state of Maharashtra aredenoted by (1) Konkan on the west coast, (2) Madhya Maharashtra on the leeward side of the WG,(3) Marathwada, and (4) Vidarbha. The west coast offshore trough (WCT) and southerly location ofthe monsoon trough (MT) are indicated by numbers 5 and 6, respectively. The location of Mumbai onthe west coast in the Konkan subdivision is shown by an open circle.
In the WG mountain region, LS events are found to occur even with one-day veryextreme rainfall activity. As per the India Meteorological Department’s (IMD) definition,the term “extreme” is used if the rainfall in a 24-h period is more than 200 mm. There isno category in the IMD classification for one-day rainfall of more than 200 mm. Here, wedefine the “high rainfall” category if the 1-day rainfall is 300 mm and more or accumulatedin a 7-day period. A large number of deaths and losses occurred in the past in high rainfallevents. The two events worth quoting in this category are (1) the Ghatkopar (19.08◦ N,72.91◦ E) LS event on 12 July 2000. Ghatkopar is a suburb in the thickly populated city
Land 2022, 11, 689 3 of 23
of Mumbai. Mumbai is the capital city of the state of Maharashtra. The 24-h rainfall was350 mm. A total of 78 people died. (2) The Jui (18.0◦ N, 73.4◦ E) LS event on 25 June 2005.Jui is a village in Mahad district on the west coast of Maharashtra. The 16-h rainfall was476.02 mm. In this LS event, three villages in the surrounding area were completely buried.The number of reported human deaths was 48. These are two representative examples ofdisastrous LS events which occurred due to high rainfalls before the Malin 30 July 2014 LSevent. However, such LS events were overlooked by the citizens, media, and governmentauthorities and did not attract serious attention from the geological and meteorologicalcommunity in India. Therefore, studies regarding LSs over the WG region are almostnon-existent before the Malin event.
The Malin LS event drew people’s attention from different sections of society, includingprint and electronic media, geologists, and meteorologists. The reasons are improvementin communication systems and increased awareness about the severe losses of human livesand materials. After the Malin incident, the Geological Survey of India (GSI) initiated anaction to identify LS-prone sites in the WG [5]. The Malin LS event was an eye-openerfor taking a serious note about the impacts of LS events. It raised concerns about thesafety of the people residing in such LS-prone areas. In recent times, in the monsoonseason, the frequency of extreme events has increased due to climate change impact [6].Further, vulnerable LS-prone areas have increased many times in the WG region due toincreased anthropogenic activities, such as deforestation, improper land use planning,and road and building constructions on hillslopes. These have exposed people residingin such vulnerable areas to more losses and deaths in recent times. As a consequence,demand arose in all the sections of society for identifying LS-prone areas and, if possible,an early warning system of LS occurrences over the WG region. The early warning systemis considered to be a proactive measure in reducing the death toll by evacuating the peoplestaying in vulnerable areas.
The factors which drive LSs are grouped into two categories. These are (1) prepara-tory variables and (2) dynamic triggering. The preparatory variables include topography,tectonics, the geological history of the region, land use, anthropogenic activities such asdeforestation, terracing of the hills for agriculture, and construction activity. The con-struction activity is a continuous process required to develop the roads, railway tracks,and dams in the mountainous areas in the WG region. The dynamic triggering variablesinclude heavy rainfall, earthquake, and coastal erosion [7]. The scale of damages by anearthquake is very large, and an LS is a small part of the total damages by the earthquake.The earthquake phenomenon shows no regularity and is therefore impossible to predictwell in advance. The LS events occur due to coastal erosion during the landfall of a cyclonicstorm on the coast. The cyclonic systems form over the Indian region in pre-monsoon(April–May), sometimes in the early part of June, and post-monsoon (October–November)seasons. Therefore, in non-seismic and non-cyclonic conditions, rainfall activity in themonsoon season is the most common trigger responsible for LS occurrences in a largenumber and at many locations in the WG region.
The author of [8] speculated the relationship between rainfall and the triggering of ashallow LS. Interestingly, in the present study region, apart from the term high rainfall, wedefine the term “medium rainfall” as the accumulated rainfall of the order of 50–100 mmin a week’s period. LSs occur in high as well as in medium rainfall conditions. Themechanisms that drive an LS and operate in these two rainfall regimes are: (a) in highrainfall cases, the rainwater percolates in the soil layer covering rock. After soil saturationby rainwater, some rainwater drains out through the channels in the rocks and soil cover.In some cases, if the channels on the surface are open, then rainwater drains out easily,forming waterfalls. Percolated rainwater to the bottom of the soil layer forms a thin layerof mud between the rock’s surface and soil resting on the rock. This decreases the frictionalforce between the two. The frictional force keeps the layer of deep soil in stable conditionson the surface of the rock. The shear strength at a point on the slope depends upon (1) thecohesive force of the material and (2) the total stress on the hillslope, which is proportional

Land 2022, 11, 689 4 of 23
to the weight of pore-water [7]. When the total weight of a volume of saturated soil exceedsthe shear strength of rock, a sliding force is generated, overcoming the geological resistingforce to trigger an LS. Another factor contributing the slope stability is the vegetation cover.High rainfall areas are favourable for the thick and widespread vegetation cover. The deepsoil layer supports thick and widespread vegetation cover comprising tall trees whoseroots go deep inside the soil layer. The thick vegetation and roots of big trees hold the soiltogether in stable conditions against the sliding force. At Malin, the soil thickness was 10 m.An important factor that was responsible for the LS in the Malin case was the terracingof the hillslope for agriculture activity. The soil and rocky material after terracing weredumped on the slopes. This choked the natural drainage channels and caused obstructionsto the free flow of the rainwater. All the rainwater percolated in the soil 10 m deep. Thisdestabilized the slope, resulting in the LS. The (b) LS occurrence in medium rainfall regime:As per the IMD classification, India is divided into 36 meteorological subdivisions (Figure 2).The meteorological subdivisions of Madhya Maharashtra (MM) and Marathwada (MDA)lie on the leeward side of the WG mountains (Figure 1). Monsoon seasonal rainfalls inthese subdivisions are low of the order of 500–600 mm. These areas have low vegetationcover and have vegetation of shallow shrub types. The soil layer is thin, and therefore theroots of shallow shrubs extend only in the upper layers of the soil. The rainfalls of the orderof 50–100 mm occur in the weekly period under favorable synoptic conditions in thesesubdivisions. As the soil layer is thin, very little rainwater is absorbed into the soil. Mostof the rainwater flows downward on the surface of the mountain slope. The material onthe slopes is loose and unconsolidated. The downward moving rainwater on the slopecarries these materials with it, resulting in shallow LSs. However, these types of shallowLSs are not disastrous. If the rocky and soil materials fall on roads, they cause temporaryroad blockages.
Land 2021, 10, x FOR PEER REVIEW 5 of 24
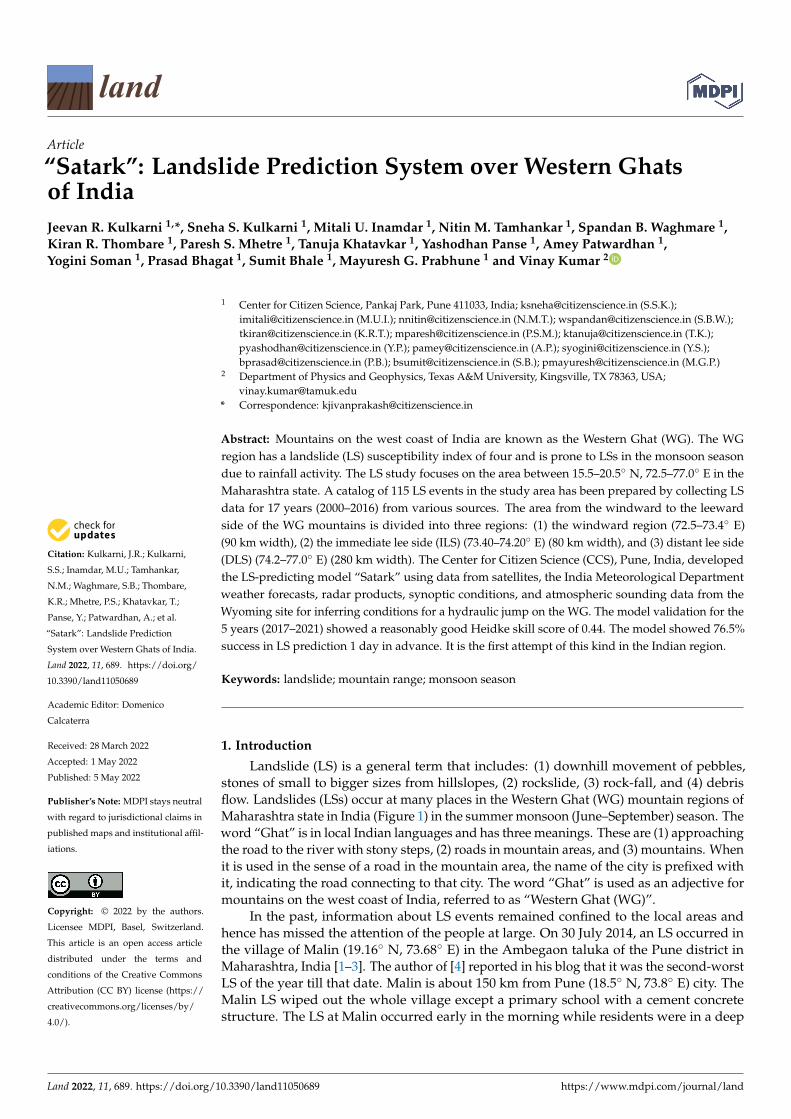
Figure 2. Thirty‐six meteorological subdivisions of India.
The author of [9] introduced the term “rainfall‐intensity‐duration (RID)” for trigger‐
ing an LS. Since then, RID has been considered a useful parameter for predicting LS oc‐
currence. The author of [10] identified RID for debris flow in the central Santa Cruz Moun‐
tains, California. The authors of [7] developed a real‐time warning system for issuing
warnings of LSs for the San Francisco Bay region using the RID method based on empiri‐
cal and analytical relationships between rainfall and LS occurrence. They reported that
the threshold of antecedent rainfall was 250 to 400 mm for the occurrence of an LS in the
San Francisco Bay region.
The author of [11] studied 73 global LS events to determine the relationship between
the RID and LSs. The authors of [12] developed RID thresholds for the Puerto Rico region.
The authors of [13] estimated the RID threshold for the North Island of New Zealand. The
authors of [14] used the RID method for predicting an LS in areas of the Himalayas of
Nepal. The author of [15] used RID thresholds for LS occurrences in the Garhwal Hima‐
layas region of India. The authors of [16] used the RID method for LS predictions over
central and southern Europe.
The authors of [17] prepared a global LS susceptibility map based on indices derived
from six parameters, viz. (1) slope, (2) soil type, (3) soil texture, (4) elevation, (5) land
cover, and (6) drainage density. Their map shows that the WG region has a high suscep‐
tibility index. The authors of [18] prepared the global LS atlas (GLC) using three years
(2003, 2007, and 2008) of LS data. They classified all the LS events on scales ranging from
1 to 5. Scale 1 indicates the types of LS that occur at single locations and on small slopes,
and scale 5 indicates the types of LS that occur at steep slopes and multiple sites causing
numerous fatalities. As per [18]’s study, India, among other Asian countries, has a large
number of LS occurrences and fatalities for all the years considered. India lies in the top‐
ranked countries based on a number of LS‐related fatalities. Further, they reported that
the catalogue could be further improved by integrating LS inventory studies at the re‐
gional levels.
Figure 2. Thirty-six meteorological subdivisions of India.
The author of [9] introduced the term “rainfall-intensity-duration (RID)” for triggeringan LS. Since then, RID has been considered a useful parameter for predicting LS occurrence.The author of [10] identified RID for debris flow in the central Santa Cruz Mountains,

Land 2022, 11, 689 5 of 23
California. The authors of [7] developed a real-time warning system for issuing warningsof LSs for the San Francisco Bay region using the RID method based on empirical and ana-lytical relationships between rainfall and LS occurrence. They reported that the thresholdof antecedent rainfall was 250 to 400 mm for the occurrence of an LS in the San FranciscoBay region.
The author of [11] studied 73 global LS events to determine the relationship betweenthe RID and LSs. The authors of [12] developed RID thresholds for the Puerto Rico region.The authors of [13] estimated the RID threshold for the North Island of New Zealand. Theauthors of [14] used the RID method for predicting an LS in areas of the Himalayas of Nepal.The author of [15] used RID thresholds for LS occurrences in the Garhwal Himalayas regionof India. The authors of [16] used the RID method for LS predictions over central andsouthern Europe.
The authors of [17] prepared a global LS susceptibility map based on indices derivedfrom six parameters, viz. (1) slope, (2) soil type, (3) soil texture, (4) elevation, (5) land cover,and (6) drainage density. Their map shows that the WG region has a high susceptibilityindex. The authors of [18] prepared the global LS atlas (GLC) using three years (2003,2007, and 2008) of LS data. They classified all the LS events on scales ranging from 1 to5. Scale 1 indicates the types of LS that occur at single locations and on small slopes,and scale 5 indicates the types of LS that occur at steep slopes and multiple sites causingnumerous fatalities. As per [18]’s study, India, among other Asian countries, has a largenumber of LS occurrences and fatalities for all the years considered. India lies in thetop-ranked countries based on a number of LS-related fatalities. Further, they reportedthat the catalogue could be further improved by integrating LS inventory studies at theregional levels.
However, studies regarding LSs over the WG region are few, except for [1,2,4,19–21].The lack of studies may be attributed to (1) LS events occurring mostly at isolated remotelocations that go unreported and occur only in monsoon season. This has developed a lackof seriousness toward such incidents in Indian society. (2) LS events are mostly scaled 1,meaning occurring over small slopes and at isolated sites. (3) Media reporting tends to bebiased toward LSs with human casualties [22]. (4) In India, studies related to LS events donot come under the roof of one department of government agencies as they occur due tocombined meteorological and geological forcings. Therefore, neither the IMD nor India’sgeological department has a dedicated group or unit to systematically gather and archiveLS data and predict LS activity. In India, a good number of LS studies are carried out in thegeography and geological departments of universities, however, these are scattered. Thestudies regarding predictions of LS events are lacking in India.
From the past data, it is noticed that LSs in the WG area occur in monsoon seasonduring persistent high rainfall episodes for a week’s period. The thresholds of rainfalls aredifferent for different locations. With the establishment of monsoon circulation over India,persistent rainfall for the period of a week and more occur due to conducive synoptic systems.
After the launch of the Tropical Rainfall Measurement Mission (TRMM) satellite inthe year 1997, the rainfall data over the tropical region became available to researchers.TRMM Multi-satellite Precipitation Analysis (TMPA) rainfall data at 0.250 × 0.250 3-hintervals have shown promise in predicting LS events using satellite rainfall data. Theauthors of [23–26] developed an algorithm for LS predictions using LS susceptibility andsatellite-derived rainfalls. The authors of [27] created an online decision support system forforecasting potential LS activity in near real time, termed “Landslide Hazard Assessmentfor Situational Awareness”.
The fatalities and damages in the Malin landslide incident prompted the necessity ofidentifying the hotspots of LSs over the WG region and developing a real-time forecastingsystem to help the disaster management authority of the state government. LS forecasts onspecific LS locations are much more useful to the disaster mitigating authority for takingprecautionary actions. The preventive actions include pre-warning, waking residents living
Land 2022, 11, 689 6 of 23
in vulnerable areas regarding the forthcoming disaster, and mass evacuation from thedanger spots.
Internationally, interest in quantifying LS risk has been developed since the activityinitiated by the International Association of Engineering Geology (IAEG) Commissionon LSs to compile a list of worldwide LS events for the UNESCO annual summary ofinformation on natural disasters in 1971 [22]. Asia records the highest number of LSs, anda substantial number in the Himalayan region [22], and the next region is the WG in India.Considering the societal requirement, and as per [18]’s recommendation that LS studies onthe regional scale are required, an inventory of LSs over the WG region is prepared usingpast data for the period of 2000–2016. A prediction system for LS occurrences in the WGregion of Maharashtra was developed using the data of LSs and rainfalls for the period from2000 to 2016. The system has been in operation since June 2017 under the name “Satark”.Satark is a word in the local language “Marathi” meaning “vigilant”. The LS forecasts areuploaded in real-time on the internet site www.satarkindia.wordpress.com, accessed on1 April 2022, for societal and governmental use. The initial results were presented at theNational Space Science Symposium held in 2015 [28].
The first objective of the paper is to present LS inventory over the WG region. Thisdata may find a place in [18] Global Landslide Catalog (GLC). The second objective of thepaper is to present the real-time LS forecasting system “Satark” developed by CCS. To thebest of our knowledge, this is the first effort of its kind in the Indian region.
The paper is divided into five sections. The geological conditions and rainfall distri-butions are important features of LS events. Section 2 describes these features of the WGregion. Section 3 describes the materials and methods used in the study. Section 4 providesan inventory of the LS events that occurred over the region. It also presents the “Satark” LSprediction system. Conclusions are given in Section 5.
2. Geology and Rainfall Features of the WG Region2.1. Geology of the WG Region
The WG mountains are also locally known as “Sahyadri”. The WG mountains runnorth to south, parallel to the western coast of the Indian peninsula through six statesconsisting of Gujrat, Maharashtra, Goa, Karnataka, Kerala, Tamilnadu, and ending at thesouthern tip of India. The part of the WG in Maharashtra state is known as the Konkan.The central part of the WG lies in Karnataka state and is known as the Kanara, and thesouthern part lies in Kerala state and is known as the Malabar Coast.
Figure 3 shows the topography of the study area. The contours of the heights of themountain peaks are given in meters. The WG mountains have mean heights of 800–1000 mabove mean sea level (amsl) parallel to the west coast of India. The mountain range is at adistance of approximately 50 km from the coast. The narrow strip along the coast wherethe surface heights are low is the Konkan and Goa meteorological subdivision (shown by23 in Figure 2).
Four subdivisions lie in the state of Maharashtra. These are: Konkan, MM, MDA, andVidarbha. The MM, MDA, and Vidarbha subdivisions of Maharashtra state lie on the leeside of the WG (Figures 1 and 2 shown by 24, 25, and 26). The mean sea elevation of leeside subdivisions is around 600 m amsl. This plateau region is part of a larger plateau ofpeninsular India referred to the as “Deccan Plateau”. The WG separates the plateau from anarrow coastal strip along the Arabian Sea (AS). The WG mountains rise abruptly from thecoastal strip as an escarpment of variable height. The WG mountain range is approximately1600 km in length and covers an area of 160,000 km2. The slope of the mountains graduallyincreases from north to south. At some locations, mountain ranges radiate from the WGand spread in the southeast direction. Small hillocks are in the coastal city of Mumbai(19.07◦ N, 72.87◦ E, Figure 1).
Land 2022, 11, 689 7 of 23
Land 2021, 10, x FOR PEER REVIEW 7 of 24
an inventory of the LS events that occurred over the region. It also presents the “Satark”
LS prediction system. Conclusions are given in Section 5.
2. Geology and Rainfall Features of the WG Region
2.1. Geology of the WG Region
The WG mountains are also locally known as “Sahyadri”. The WG mountains run
north to south, parallel to the western coast of the Indian peninsula through six states
consisting of Gujrat, Maharashtra, Goa, Karnataka, Kerala, Tamilnadu, and ending at the
southern tip of India. The part of the WG in Maharashtra state is known as the Konkan.
The central part of the WG lies in Karnataka state and is known as the Kanara, and the
southern part lies in Kerala state and is known as the Malabar Coast.
Figure 3 shows the topography of the study area. The contours of the heights of the
mountain peaks are given in meters. The WG mountains have mean heights of 800–1000
m above mean sea level (amsl) parallel to the west coast of India. The mountain range is
at a distance of approximately 50 km from the coast. The narrow strip along the coast
where the surface heights are low is the Konkan and Goa meteorological subdivision
(shown by 23 in Figure 2).
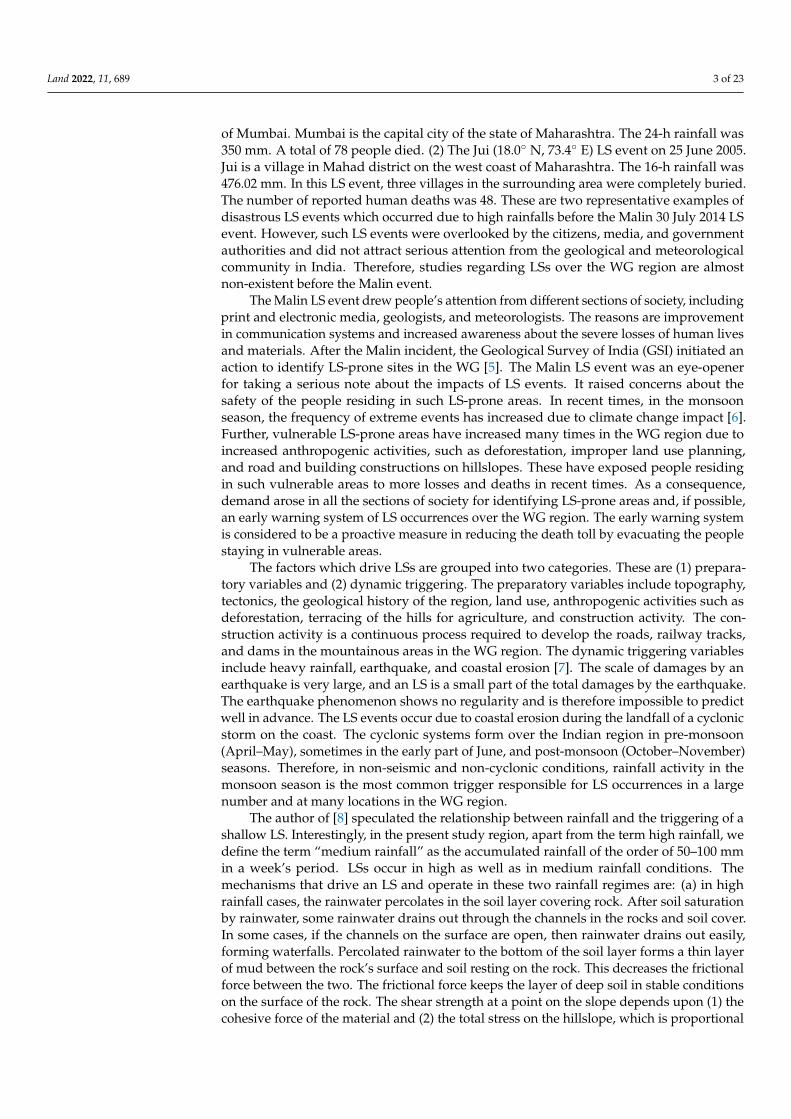
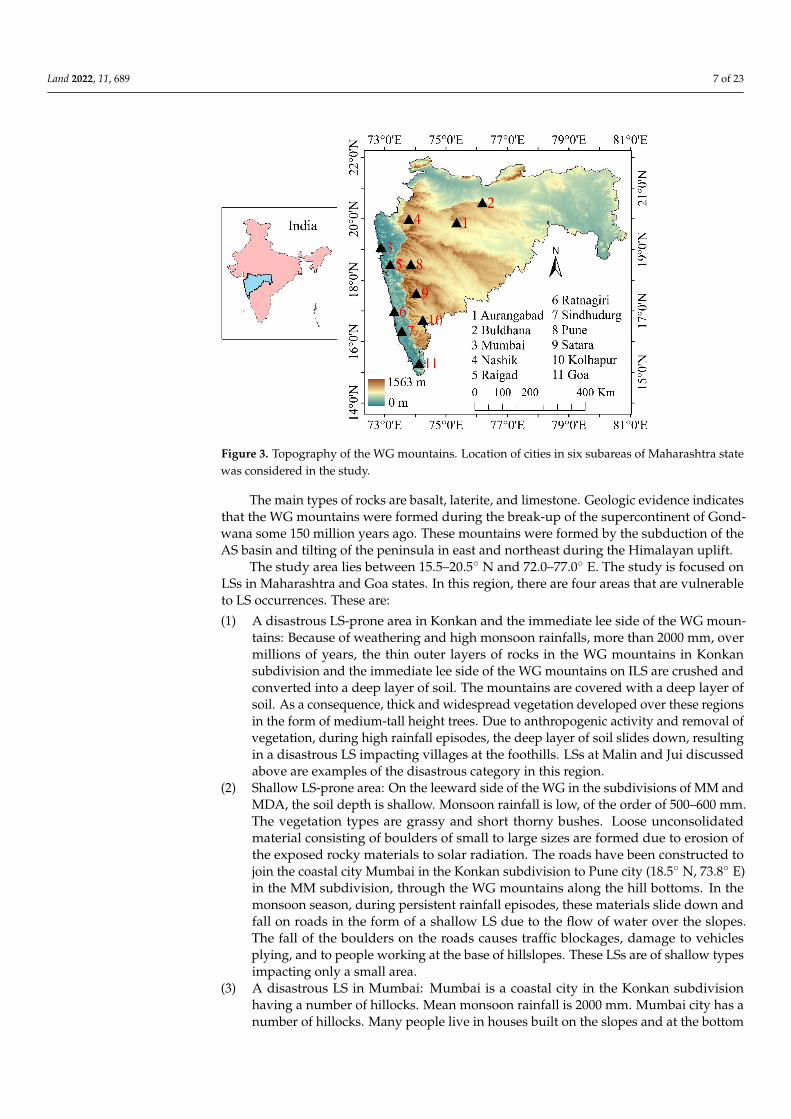
Figure 3. Topography of the WG mountains. Location of cities in six subareas of Maharashtra state
was considered in the study.
Four subdivisions lie in the state of Maharashtra. These are: Konkan, MM, MDA, and
Vidarbha. The MM, MDA, and Vidarbha subdivisions of Maharashtra state lie on the lee
side of the WG (Figures 1 and 2 shown by 24, 25, and 26). The mean sea elevation of lee
side subdivisions is around 600 m amsl. This plateau region is part of a larger plateau of
peninsular India referred to the as “Deccan Plateau”. The WG separates the plateau from
a narrow coastal strip along the Arabian Sea (AS). The WG mountains rise abruptly from
the coastal strip as an escarpment of variable height. The WG mountain range is approxi‐
mately 1600 km in length and covers an area of 160,000 km2. The slope of the mountains
gradually increases from north to south. At some locations, mountain ranges radiate from
the WG and spread in the southeast direction. Small hillocks are in the coastal city of
Mumbai (19.07° N, 72.87° E, Figure 1).
The main types of rocks are basalt, laterite, and limestone. Geologic evidence indi‐
cates that the WG mountains were formed during the break‐up of the supercontinent of
Gondwana some 150 million years ago. These mountains were formed by the subduction
Figure 3. Topography of the WG mountains. Location of cities in six subareas of Maharashtra statewas considered in the study.
The main types of rocks are basalt, laterite, and limestone. Geologic evidence indicatesthat the WG mountains were formed during the break-up of the supercontinent of Gond-wana some 150 million years ago. These mountains were formed by the subduction of theAS basin and tilting of the peninsula in east and northeast during the Himalayan uplift.
The study area lies between 15.5–20.5◦ N and 72.0–77.0◦ E. The study is focused onLSs in Maharashtra and Goa states. In this region, there are four areas that are vulnerableto LS occurrences. These are:
(1) A disastrous LS-prone area in Konkan and the immediate lee side of the WG moun-tains: Because of weathering and high monsoon rainfalls, more than 2000 mm, overmillions of years, the thin outer layers of rocks in the WG mountains in Konkansubdivision and the immediate lee side of the WG mountains on ILS are crushed andconverted into a deep layer of soil. The mountains are covered with a deep layer ofsoil. As a consequence, thick and widespread vegetation developed over these regionsin the form of medium-tall height trees. Due to anthropogenic activity and removal ofvegetation, during high rainfall episodes, the deep layer of soil slides down, resultingin a disastrous LS impacting villages at the foothills. LSs at Malin and Jui discussedabove are examples of the disastrous category in this region.
(2) Shallow LS-prone area: On the leeward side of the WG in the subdivisions of MM andMDA, the soil depth is shallow. Monsoon rainfall is low, of the order of 500–600 mm.The vegetation types are grassy and short thorny bushes. Loose unconsolidatedmaterial consisting of boulders of small to large sizes are formed due to erosion ofthe exposed rocky materials to solar radiation. The roads have been constructed tojoin the coastal city Mumbai in the Konkan subdivision to Pune city (18.5◦ N, 73.8◦ E)in the MM subdivision, through the WG mountains along the hill bottoms. In themonsoon season, during persistent rainfall episodes, these materials slide down andfall on roads in the form of a shallow LS due to the flow of water over the slopes.The fall of the boulders on the roads causes traffic blockages, damage to vehiclesplying, and to people working at the base of hillslopes. These LSs are of shallow typesimpacting only a small area.
(3) A disastrous LS in Mumbai: Mumbai is a coastal city in the Konkan subdivisionhaving a number of hillocks. Mean monsoon rainfall is 2000 mm. Mumbai city has anumber of hillocks. Many people live in houses built on the slopes and at the bottom

Land 2022, 11, 689 8 of 23
of hillocks. Due to vibrations of construction activity, and the anthropogenic activityof removing vegetation, the rocks on the hillocks have become brittle and are crushedinto fragments of stones of small to large sizes. In the monsoon season, during highrainfall episodes, the fragments of rocks are detached from rocks. These slide downon hillslopes and hit the roofs of the hutments. The human settlements on the slopeand at foothills in Mumbai city are vulnerable to the risk of LSs in monsoon season.As many people have built houses on the slopes and at the foothills of the hillocks,the death toll becomes significant in LS events. The disastrous LS event discussedabove, at Ghatkopar, a suburb of Mumbai, is an example of this type of LS.
(4) Disastrous LS events on the Konkan railway track: In recent times (in the last50–60 years), LS-prone areas have developed along the railway track connectingMumbai to Kerala through the WG mountains called “Konkan Railway”. Many tun-nels were dug to lay the railway track by blasting explosives. The rocks have becomebrittle due to the impact of the explosives. This loose material is vulnerable to slidingdown during high rainfall episodes. The Konkan railway track has been turned into asusceptive area for occurrences of LS activity. LS activity causes disruption of rail androad traffic.
For the detailed analysis, the study area is divided into six subareas in the subdivi-sions of Konkan, MM, and MDA. The WG mountains do not extend up to the Vidarbharegion; therefore, LS activity is low in the Vidarbha subarea, so it is not considered in thepresent study.
2.2. Rainfall
Ninety percent of annual rainfalls in Konkan, MM, and MDA subdivisions occur inmonsoon season (June–September) only. Mean rainfalls over Konkan, MM, and MDA are2389.9, 579.4, and 695.1 mm, respectively [29]. The low rainfalls over MM and MD aredue to the fact that these subdivisions lie on the lee side of the WG. These subdivisionsare also termed rain-shadow subdivisions. On the windward side, rainfalls increase withheight, attaining the highest values at the mountain tops [30]. The stationary gentle forcedascent of moisture-laden south-westerly monsoon winds over the windward side of theWG is conducive to the formation of clouds and rainfall on the windward side and on themountain tops.
Mean monthly rainfalls (mm) in the four monsoon months, June, July, August, andSeptember, in these three subdivisions, are Konkan: 685.0, 879.0, 537.3, and 323.1; MM:126.7, 182.2, 131.0, and 142.4; and MDA: 139.7, 184.2, 169.7, and 195.8, respectively [29].In all these subdivisions, rainfalls are higher in the month of July. June is the month ofthe onset of monsoon season and September is the month of the withdrawal of monsoonseason. Episodes of high rainfall activity also occur in the months of June and September,which are conducive for LS occurrences.
Indian monsoon circulation has certain features which are seen on daily weather charts.These are termed as stationary features. The stationary features comprise the monsoontrough (MT), surface high-pressure area at Mascarene (20.0◦ S, 57.0◦ E) island, called“Mascarene high”, westerly low-level jet at 850 hPa level (LLJ), high-pressure area at 200 hPalevel over the Tibet (29.6◦ N, 91.1◦ E) region, called “Tibetan high”, and tropical easterlyjet at 150 hPa level (TEZ). These stationary components maintain the mean monsooncirculation [31]. The MT is an elongated low-pressure area that extends from heat, lowover Pakistan to the head Bay of Bengal (BoB). Southward migration of the MT resultsinactive/vigorous rainfall activity over major parts of India [30].
The major rain-producing systems over India during the summer monsoon seasonare the monsoon trough (MT) and the low-pressure systems (LPS) [30]. A trough of lowpressure is developed along the west coast of India due to the interaction of monsoonwesterly winds and the WG orography [32]. This is termed “West coast off-shore Trough”or simply as “West coast Trough (WCT)” (Figure 1). The term LPS is the general term thatincludes monsoon low (L), depression (D), deep depression (DD), cyclonic storm (C), and
Land 2022, 11, 689 9 of 23
severe cyclonic storm (SCS). As per the IMD definition, surface pressure area is termed as“L” if the wind speed around it is less than or equal to 17 knots (nautical miles per hour),a “D” if the wind speed is 18–33 knots, “DD” if the wind speed is 34–49 knots, “C” if thewind speed is 50–64 knots, and “SCS” if the wind speed is more than 64 knots. Lows anddepressions produce rainfall over wide areas of the country. Cyclonic circulation (Cycir) isa synoptic scale monsoon circulation feature identified by the cyclonic wind field, in thelower, middle, or upper troposphere. The vertical extent of cycir is limited to a few layers.Cycirs provide upward vertical velocities to monsoon air mass for cloud development and,in turn, for rainfall activity.
The authors of [33] showed that the probability of getting intense rainfall along thewest coast of India is maximum between 14–16◦ N and near 19◦ N. Thus, the study area liesin the high probability zone of intense rainfall activity as per [33]’s study. The boundarylayer over the west coast region is warm and moist throughout the day. This sustainsthe convection for a longer time, which results in high rainfall. The flow is convectivelyunstable, so gentle lift by orography is sufficient to release the instability. The authorsof [34] showed that the rainfall over the Konkan area is initially triggered over coastalterrain as deep convective echoes. When these echoes age and weaken, they transform intostratiform systems which last for longer times. These stratiform systems travel eastwardstowards the leeside of the WG to produce continuous moderate rainfalls over the MM andMDA regions.
Winds are westerly in the surface layer. These strengthen with height and establishinto a strong wind regime at the 850 hPa level, termed as low-level jet (LLJ). Winds weakenabove this height and become easterlies above the 500 hPa level. The strong vertical shearexists in the horizontal winds [30]. The vertical wind shear plays an important role in (1) theinteraction among the clouds to grow from small to large sizes [35], (2) the organization oftropical convection [36], and (3) the development of stratiform precipitation system fromthe convective system [37].
The area from the windward to the leeward side of the WG mountains is dividedinto three regions. The three regions are delineated as: (1) windward region (72.5–73.4◦E)(90 km width), (2) immediate lee side (ILS) of the WG mountains (73.40–74.20◦E) (80 kmwidth), and (3) distant lee side (DLS) of WG mountains (74.2–77.0◦E) (280 km width) [38].The air experiences vertical lift referred to as “hydraulic jump (HJ)” after crossing the WGmountains on the ILS of the WG [38]. HJ is conducive to convection and the formation ofconvective clouds on ILS of the WG mountains. Mean rainfall in monsoon season on ILSside is about 2000 mm and on the DLH side is about 500–600 mm. The ILS region is partof the MM subdivision. Thus, the subdivision MM is comprised of two dissimilar rainfallregimes, viz. a high rainfall regime on the west side (ILS side of the WG mountains) and alow rainfall regime on the east side (DLS of the WG mountains).
3. Materials and Methods
For the model development, archived TMPA rainfall data with spatial resolution0.250 × 0.250 degrees (250 × 250 m) have been used to compute cumulative rainfalls foreach location at the LS-prone sites. The IMD publishes the Indian Daily Weather Report(IDWR), which provides descriptions of synoptic systems present on every day. The IDWRdata for the period 2000–2016 have been used to get large scale synoptic systems prevailingprior to LS events. The IMD issues medium-range (10-day period) and short-range (3-dayperiod) rainfall forecasts over the Indian region using numerical models (www.imd.gov.in,accessed on 1 April 2022). These have been used in real time to anticipate the occurrencesof persistent high rainfall activity over the study area. An “S” band doppler radar is inoperation by the IMD at Mumbai (19.1◦ N, 72.8◦ E Figure 1). There is another radar atPanjim (15.5◦ N, 73.8◦ E) in the state of Goa, on the Indian west coast region, south ofMumbai, at a distance of approximately 600 km. Both these radars cover most of the studyarea. The radar products’, viz. spatial and vertical reflectivities, surface rainfall intensities(SRI) are used to get spatial and temporal distributions of convection and rainfalls at a high
Land 2022, 11, 689 10 of 23
temporal resolution (every 11 min) over the study area and to supplement the rainfallsestimated from the satellite and inferred empirically from synoptic-LPS systems.
Persistent high rainfalls on the ILS region are due to convection generated by the HJphenomenon [38]. The HJ is estimated using the Froude (Fr) number. Fr = U/(NH). It is theratio of zonal wind speed (U) to the product of Brunt Vaisala frequency (N) and the height
of the mountain (H) [38]. N is estimated using standard formula N =√
g dθθ dz . Daily values
of potential temperature θ and gradient of potential temperature dθ/dz were computedusing Mumbai radiosonde data available on the Wyoming site. The mean height of theWestern Ghat mountains have been taken as 1000 m to estimate the potential temperatureat the mean height of the Western Ghat mountains. If Fr ≥1, then wind flows over themountain and experiences HJ. If Fr < 1, the winds go around the mountain. The height ofmountain H at each LS site on the ILS area varies between 800–1200 m above mean sea level.The value of N is of the order of 0.01 s−1. The wind speed required to obtain Fr > 1 for theserepresentative values of N and H is 20 ms−1. Daily Fr values were estimated using dailyradiosonde data for the period 2000–2016 of stations Mumbai and Goa from the Wyomingsite (http://weather.uwyo.edu/upperair/sounding.html, accessed on 1 April 2022) (from1 June 2000 to 30 September 2016) for the model development and (from 1 June 2017 to2021) for the period of 2017–2021 for real-time LS predictions.
The Center for Citizen Science (CCS) is a non-governmental organization establishedin Pune, India, involving citizens in scientific data collection to foster scientific researchto address societal problems. The CCS installed 10 ordinary rain gauges in villages in theareas near to LS-prone sites in Raigad–Ratnagiri subareas in the WG region in 2021 in themonsoon season. Daily rainfall data in the monsoon season of 2021 from these rain gaugesare ingested into the LS prediction system “Satark” developed by the CCS in the 2021monsoon season. The LS predictions are made available to the public and media throughthe website www.satarkindia.wordpress.com, accessed on 1 April 2022.
LS Prediction Model
It is seen that the maximum frequency of LS events is on the ILS of the WG moun-tains. High rainfalls over this region occur due to the hydraulic jump (HJ) phenomenon.Occurrence of HJ depends on the Froude number (Fr). Values of Fr are considered forestimating the probabilities of LS occurrences along with the IMD medium-, short-rangeweather forecasts, radar reflectivity data, and synoptic weather conditions.
The cumulative rainfalls curves are taken as reference curves for initiating predictionsof LSs for those locations. The forecast system operates in three stages.
Stage 1 Watch: If the IMD forecast charts show presence of transient systems, southerlyposition of MT, an increase in rainfall over the LS-prone areas for the ensuing 7 days, andif Fr > 1, then the “watch” stage is invoked. The people in the area are sensitized to keepwatch on the rainfall intensity and duration. The rainfall at LS locations from TRMM ismonitored continuously.
Stage 2 Alert: If the IMD synoptic charts show presence and westward movementsof transient systems and arrival of the systems near to the north of the Maharashtra state,southward displacement of MT, Fr > 1, and cumulative rainfalls for 3 days are higher thanthe reference cumulative rainfalls, then the “Alert” stage is invoked. The people in area areinformed to be ready for moving out from their houses in LS areas.
Stage 3 Warning: If the high rainfalls persist for the next 3 days and cumulativerainfalls at LS locations are more than the reference values, then the prediction of LS iscontinued. Then, LS forecasts are given for the next day. The people in the areas aresuggested to move to safe shelter locations with essential material to survive for a few daystill the debris/stony materials fallen due to an LS are removed.
The real-time LS forecasts have been in operation in monsoon season for 5 years since2017 and the forecasts are uploaded on the site (www.satarkindia.wordpress.com, accessedon 1 April 2022) for societal and state government disaster management call. The disaster
Land 2022, 11, 689 11 of 23
management department of the government of Maharashtra has started taking note of LSpredictions since 2018.
4. Results4.1. Inventory of the LandslidesSpatial and Temporal Distribution
A catalogue of landslide events provides spatial distribution of the LS. It forms thebasis for estimation of human and economic losses and is useful as a basis for developingreal-time prediction system. Such an inventory is not complete because all the events do notget recorded, therefore, there are limitations in the completeness of such an inventory [17].Inventory on the local scale has important usage as it provides information on the potentialLS threats locally.
The LS data are collected from various sources, which include press reports, mediareports, local contacts, government machinery, etc. The authors of [39] introduced a metric“confidence limit” for the identification of location of the landslides. All the LS sites needto have exact latitudes/longitudes for high confidence in the locations. All the LS sitespresented in the study are with the exact latitude/longitudes, indicating high confidence.
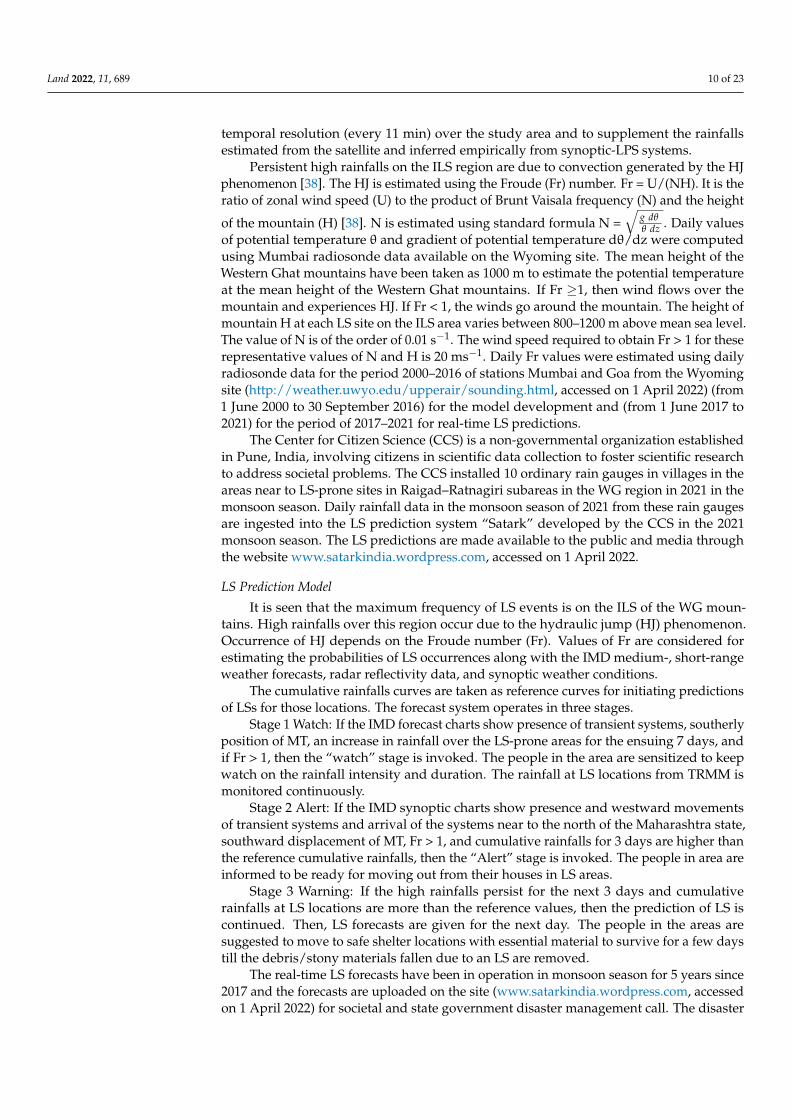
The locations of LS events are referred to by the cities, towns, or villages near to thatlocation. Figure 4 shows the locations (cities, towns, villages) of the LS which occurred inthe past in the state of Maharashtra. The study area is divided in to 6 subareas and namedafter the cities prominent in those areas (Figure 3). The subareas are numbered as per theirlocations in north–south direction. The subarea spans 1 degree east–west, south–north fromthe prominent city in that subarea. Tables 1–6 give locations of LSs in these subareas. Thelocations of the LS sites in the subareas are indicated by the words “windward” “immediatelee side (ILS)” and “distant lee side (DLS)“of the WG mountains. The subareas are:
Land 2021, 10, x FOR PEER REVIEW 13 of 24
(6) Sindhudurg (16.3°N, 73.5°E) and Goa (15.4° N, 73.8° E) (Table 6). This subarea lies
in the Konkan and Goa meteorological subdivision along the west coast of India. There
are 17 LS‐prone sites in this subarea. These are: (1) Gaganbawda Ghat, (2) Bhuibawada
Ghat, (3) Karul, (4) Vaibhavwadi Phonda Ghat, (5) Malusare, (6) Bijwas, (7) Devli, (8) Kasal
Karle wadi, (9) Amrad Ghat, (10) Sawantwadi, (11) Insuli Ghat, (12) Pedne, (13) Pargad
Namkhol, (14) Amboli Ghat (15) Chorla Ghat, (16) Chandgad, and (17) Malwan. There are
15 LS‐prone sites on the ILS and 2 sites on the DLS of the WG mountains. The lati‐
tudes/longitudes of these LS‐prone sites in this subarea are given in Table 6.
Figure 4. Locations (cities, towns, villages) of LS in the state of Maharashtra.
Table 1. Locations of LS‐prone sites in the Aurangabad region. The words windward, ILS and
DLS indicate the locations of LS sites on the windward, immediate leeward and distant leeward
sites, of the WG mountains, respectively.
No. Site and location in
Bracket Latitude N Longitude E
1 Ajanta caves (DLS) 20°33′6.84″ 75°4′13.26″
2 Ellora caves (DLS) 20°1′32.88″ 75°10′40.8″
Table 2. Locations of LS‐prone sites in the Nashik subregion. The words windward, ILS and DLS
indicate the locations of LS sites on the windward, immediate leeward and distant leeward sites, of
the WG mountains, respectively.
No. Site and Location in
Bracket Latitude N Longitude E
1 Saptshrungi (ILS) 20°18’0” 73°54’0”
2 Ambe Ghat (DLS) 18°6’0” 75°18’0”
3 Savil Ghat (ILS) 17°54’0” 74°18’0”
4 Bhuwan Ghat (ILS) 17°48’0” 74°12’0”
5 Pimplegaon Joga (ILS) 19°18’0” 73°54’0”
6 Ambit Ghat (DLS) 18°6’0” 75°18’0”
7 Rajur Ghat (ILS) 19°12’0” 73°48’0”
8 Pelhar (ILS) 17°42’0” 74°6’0”
Figure 4. Locations (cities, towns, villages) of LS in the state of Maharashtra.
Table 1. Locations of LS-prone sites in the Aurangabad region. The words windward, ILS and DLSindicate the locations of LS sites on the windward, immediate leeward and distant leeward sites, ofthe WG mountains, respectively.
No. Site and Location in Bracket Latitude N Longitude E
1 Ajanta caves (DLS) 20◦33′6.84′′ 75◦4′13.26′′
2 Ellora caves (DLS) 20◦1′32.88′′ 75◦10′40.8′′
Land 2022, 11, 689 12 of 23
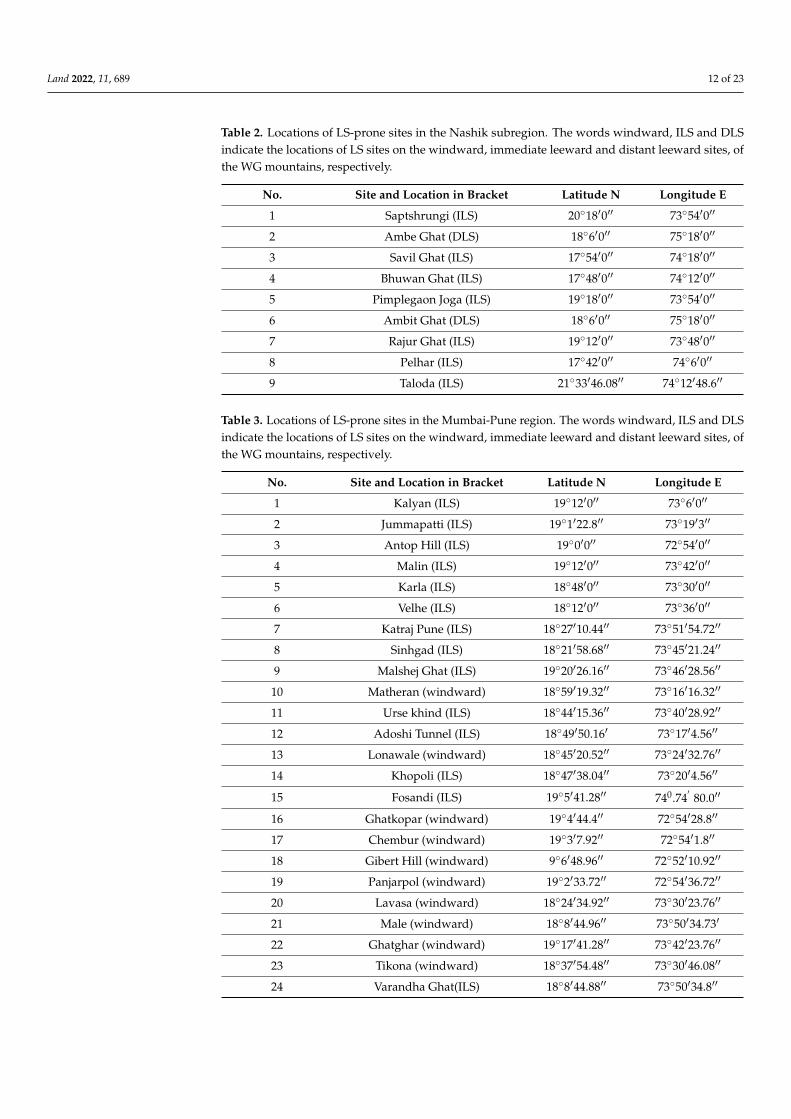
Table 2. Locations of LS-prone sites in the Nashik subregion. The words windward, ILS and DLSindicate the locations of LS sites on the windward, immediate leeward and distant leeward sites, ofthe WG mountains, respectively.
No. Site and Location in Bracket Latitude N Longitude E
1 Saptshrungi (ILS) 20◦18′0′′ 73◦54′0′′
2 Ambe Ghat (DLS) 18◦6′0′′ 75◦18′0′′
3 Savil Ghat (ILS) 17◦54′0′′ 74◦18′0′′
4 Bhuwan Ghat (ILS) 17◦48′0′′ 74◦12′0′′
5 Pimplegaon Joga (ILS) 19◦18′0′′ 73◦54′0′′
6 Ambit Ghat (DLS) 18◦6′0′′ 75◦18′0′′
7 Rajur Ghat (ILS) 19◦12′0′′ 73◦48′0′′
8 Pelhar (ILS) 17◦42′0′′ 74◦6′0′′
9 Taloda (ILS) 21◦33′46.08′′ 74◦12′48.6′′
Table 3. Locations of LS-prone sites in the Mumbai-Pune region. The words windward, ILS and DLSindicate the locations of LS sites on the windward, immediate leeward and distant leeward sites, ofthe WG mountains, respectively.
No. Site and Location in Bracket Latitude N Longitude E
1 Kalyan (ILS) 19◦12′0′′ 73◦6′0′′
2 Jummapatti (ILS) 19◦1′22.8′′ 73◦19′3′′
3 Antop Hill (ILS) 19◦0′0′′ 72◦54′0′′
4 Malin (ILS) 19◦12′0′′ 73◦42′0′′
5 Karla (ILS) 18◦48′0′′ 73◦30′0′′
6 Velhe (ILS) 18◦12′0′′ 73◦36′0′′
7 Katraj Pune (ILS) 18◦27′10.44′′ 73◦51′54.72′′
8 Sinhgad (ILS) 18◦21′58.68′′ 73◦45′21.24′′
9 Malshej Ghat (ILS) 19◦20′26.16′′ 73◦46′28.56′′
10 Matheran (windward) 18◦59′19.32′′ 73◦16′16.32′′
11 Urse khind (ILS) 18◦44′15.36′′ 73◦40′28.92′′
12 Adoshi Tunnel (ILS) 18◦49′50.16′ 73◦17′4.56′′
13 Lonawale (windward) 18◦45′20.52′′ 73◦24′32.76′′
14 Khopoli (ILS) 18◦47′38.04′′ 73◦20′4.56′′
15 Fosandi (ILS) 19◦5′41.28′′ 740.74′
80.0′′
16 Ghatkopar (windward) 19◦4′44.4′′ 72◦54′28.8′′
17 Chembur (windward) 19◦3′7.92′′ 72◦54′1.8′′
18 Gibert Hill (windward) 9◦6′48.96′′ 72◦52′10.92′′
19 Panjarpol (windward) 19◦2′33.72′′ 72◦54′36.72′′
20 Lavasa (windward) 18◦24′34.92′′ 73◦30′23.76′′
21 Male (windward) 18◦8′44.96′′ 73◦50′34.73′
22 Ghatghar (windward) 19◦17′41.28′′ 73◦42′23.76′′
23 Tikona (windward) 18◦37′54.48′′ 73◦30′46.08′′
24 Varandha Ghat(ILS) 18◦8′44.88′′ 73◦50′34.8′′
Land 2022, 11, 689 13 of 23
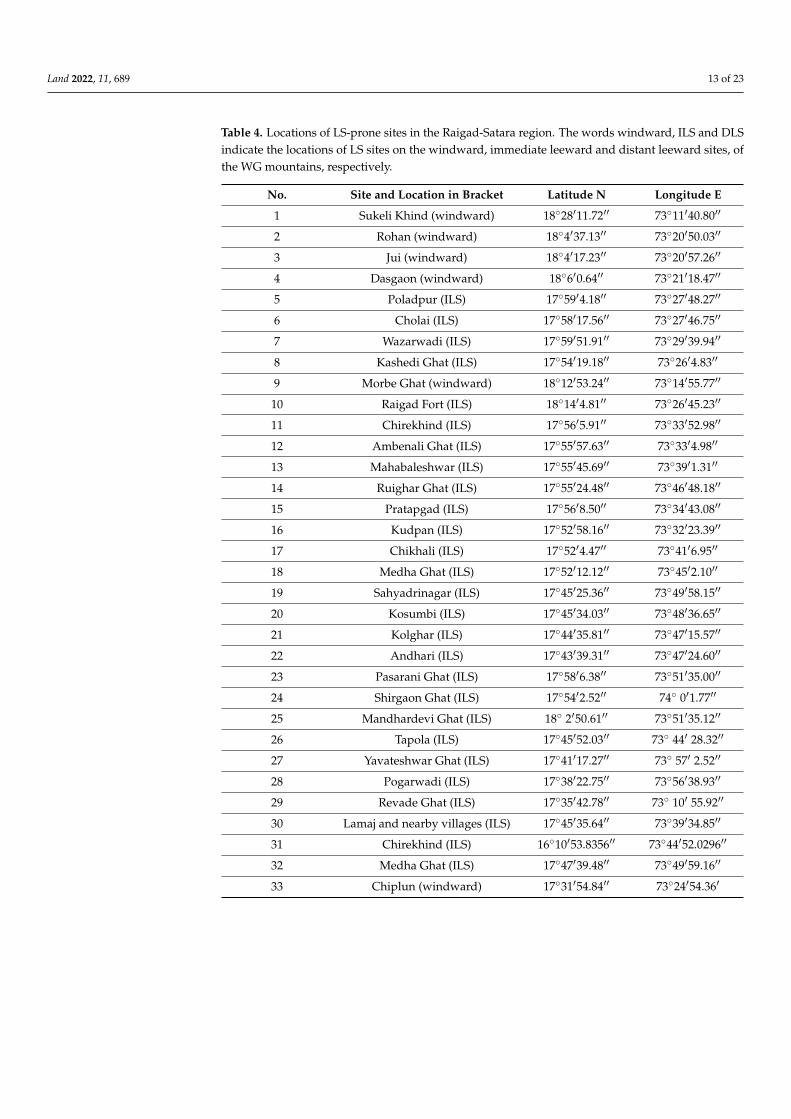
Table 4. Locations of LS-prone sites in the Raigad-Satara region. The words windward, ILS and DLSindicate the locations of LS sites on the windward, immediate leeward and distant leeward sites, ofthe WG mountains, respectively.
No. Site and Location in Bracket Latitude N Longitude E
1 Sukeli Khind (windward) 18◦28′11.72′′ 73◦11′40.80′′
2 Rohan (windward) 18◦4′37.13′′ 73◦20′50.03′′
3 Jui (windward) 18◦4′17.23′′ 73◦20′57.26′′
4 Dasgaon (windward) 18◦6′0.64′′ 73◦21′18.47′′
5 Poladpur (ILS) 17◦59′4.18′′ 73◦27′48.27′′
6 Cholai (ILS) 17◦58′17.56′′ 73◦27′46.75′′
7 Wazarwadi (ILS) 17◦59′51.91′′ 73◦29′39.94′′
8 Kashedi Ghat (ILS) 17◦54′19.18′′ 73◦26′4.83′′
9 Morbe Ghat (windward) 18◦12′53.24′′ 73◦14′55.77′′
10 Raigad Fort (ILS) 18◦14′4.81′′ 73◦26′45.23′′
11 Chirekhind (ILS) 17◦56′5.91′′ 73◦33′52.98′′
12 Ambenali Ghat (ILS) 17◦55′57.63′′ 73◦33′4.98′′
13 Mahabaleshwar (ILS) 17◦55′45.69′′ 73◦39′1.31′′
14 Ruighar Ghat (ILS) 17◦55′24.48′′ 73◦46′48.18′′
15 Pratapgad (ILS) 17◦56′8.50′′ 73◦34′43.08′′
16 Kudpan (ILS) 17◦52′58.16′′ 73◦32′23.39′′
17 Chikhali (ILS) 17◦52′4.47′′ 73◦41′6.95′′
18 Medha Ghat (ILS) 17◦52′12.12′′ 73◦45′2.10′′
19 Sahyadrinagar (ILS) 17◦45′25.36′′ 73◦49′58.15′′
20 Kosumbi (ILS) 17◦45′34.03′′ 73◦48′36.65′′
21 Kolghar (ILS) 17◦44′35.81′′ 73◦47′15.57′′
22 Andhari (ILS) 17◦43′39.31′′ 73◦47′24.60′′
23 Pasarani Ghat (ILS) 17◦58′6.38′′ 73◦51′35.00′′
24 Shirgaon Ghat (ILS) 17◦54′2.52′′ 74◦ 0′1.77′′
25 Mandhardevi Ghat (ILS) 18◦ 2′50.61′′ 73◦51′35.12′′
26 Tapola (ILS) 17◦45′52.03′′ 73◦ 44′ 28.32′′
27 Yavateshwar Ghat (ILS) 17◦41′17.27′′ 73◦ 57′ 2.52′′
28 Pogarwadi (ILS) 17◦38′22.75′′ 73◦56′38.93′′
29 Revade Ghat (ILS) 17◦35′42.78′′ 73◦ 10′ 55.92′′
30 Lamaj and nearby villages (ILS) 17◦45′35.64′′ 73◦39′34.85′′
31 Chirekhind (ILS) 16◦10′53.8356′′ 73◦44′52.0296′′
32 Medha Ghat (ILS) 17◦47′39.48′′ 73◦49′59.16′′
33 Chiplun (windward) 17◦31′54.84′′ 73◦24′54.36′

Land 2022, 11, 689 14 of 23
Table 5. Landslide-prone sites: Ratnagiri Kolhapur region. Th e words windward, ILS and DLSindicate the locations of LS sites on the windward, immediate leeward and distant leeward sites, ofthe WG mountains, respectively.
Sr. No. Site and Location in Bracket Latitude Longitude
1 Madangad (ILS) 17◦59′0.63′′ N 73◦14′59.86′′ E
2 Kelwat Ghat (ILS) 17◦57′36.54′′ N 73◦16′45.11′′ E
3 Chinchali Ghat ILS 18◦ 1′52.37′′ N 73◦17′11.99′′ E
4 Sarang (ILS) 17◦48′33.12′′ N 73◦10′15.61′′ E
5 Dapoli (winward) 17◦45′31.99′′ N 73◦11′11.55′′ E
6 Harnai Road (windward) 17◦48′23.57′′ N 73◦ 6′26.88′′ E
7 Dabhol (windward) 17◦35′18.45′′ N 73◦10′32.20′′ E
8 Khed (windward) 17◦43′10.39′′ N 73◦23′48.53′′ E
9 Bhoste Ghat (windward) 17◦42′9.86′′ N 73◦24′25.92′′ E
10 Raghuveer Ghat (ILS) 17◦41′59.12′′ N 73◦35′43.88′′ E
11 Tulashi Bk (windward) 17◦52′10.33′′ N 73◦23′23.96′′ E
12 Gowalkot (ILS) 17◦32′44.65′′ N 73◦29′15.71′′ E
13 Chinchghari (ILS) 17◦29′38.11′′ N 73◦34′5.09′′ E
14 Kumbharli Ghat (ILS) 17◦23′29.98′′ N 73◦40′33.16′′ E
15 Kumbharkhani (ILS) 17◦13′9.43′′ N 73◦30′41.19′′ E
16 Sangmeshwar (ILS) 73◦27′33.68′′ E 73◦33′18.22′′ E
17 Manjare (ILS) 17◦11′27.57′′ N 73◦26′8.82′′ E
18 Pangri Ghat (ILS) 17◦3′28.71′′ N 73◦28′2.26′′ E
19 Kurdhunda (ILS) 17◦9′21.12′′ N 73◦29′51.21′′ E
20 Kondye (ILS) 17◦11′20.79′′ N 73◦27′33.68′′ E
21 Kolambe (ILS) 17◦7′29.00′′ N 73◦30′10.65′′ E
22 Pethkilla (windward) 16◦59′41.36′′ N 73◦16′43.49′′ E
23 Pomendi Ghat (windward) 16◦58′42.03′′ N 73◦22′5.33′′ E
24 Ratnagiri (windward) 16◦59′28.47′′ N 73◦18′41.50′′ E
25 Amba Ghat (ILS) 16◦59′50.58′′ N 73◦46′28.47′′ E
26 Wakurde Yelapur Khind(windword) 17◦3′34.96′′ N 74◦1′16.91′′ E
27 Aini (windward) 16◦21′53.33′′ N 74◦2′52.40′′ E
28 Karul Ghat (ILS) 16◦30′42.02′′ N 73◦48′6.83′′ E
29 Mahad (windward) 18◦4′59.49′′ N 73◦25′20.40′′ E
30 Varkude Yelapa (ILS) 16◦51′8.64′′ N 74◦34′53.4′′ E
Table 6. Landslide-prone sites: Sindhudurg-Goa subarea. The words windward, ILS and DLS indicatethe locations of LS sites on the windward, immediate leeward and distant leeward sides, of the WGmountains, respectively.
Sr. No. Site and Location in Bracket Latitude Longitude
1 Gaganbawada Ghat (ILS) 16◦33′27.61′′ N 73◦49′32.31′′ E
2 Bhuibawada Ghat (ILS) 16◦33′48.70′′ N 73◦47′55.66′′ E
3 Karul Ghat (ILS) 16◦30′42.02′′ N 73◦48′6.83′′ E
4 Vaibhavwadi (ILS) 16◦29′47.01′′ N 73◦44′45.39′′ E

Land 2022, 11, 689 15 of 23
Table 6. Cont.
Sr. No. Site and Location in Bracket Latitude Longitude
5 Phonda Ghat (ILS) 16◦21′30.13′′ N 73◦50′49.36′′ E
6 Malsure (ILS) 16◦10′19.03′′ N 73◦30′6.37′′ E
7 Bilwas (ILS) 16◦ 7′13.31′′ N 73◦31′15.42′′ E
8 Devali (ILS) 16◦ 1′39.58′′ N 73◦30′0.63′′ E
9 Kasal Karlewadi Amrad Ghat (ILS) 16◦11′32.17′′ N 73◦43′15.68′′ E
10 Sawantwadi (ILS) 15◦54′12.18′′ N 73◦48′57.22′′ E
11 Insuli Ghat (ILS) 15◦52′21.26′′ N 73◦50′12.58′′ E
12 Pedane (ILS) 15◦42′57.65′′ N 73◦47′33.82′′ E
13 Pargad Namkhol Road (DLS) 15◦49′28.14′′ N 74◦ 2′56.40′′ E
14 Amboli Ghat (ILS) 15◦57′1.13′′ N 73◦59′50.66′′ E
15 Chorla Ghat (DLS) 15◦38′59.31′′ N 74◦ 7′6.69′′ E
16 Chandgad (ILS) 15◦56′44.14′′ N 74◦10′31.17′′ E
17 Malwan (ILS) 16◦3′47.16′′ N 73◦28′15.96′′ E
(1) Aurangabad (19.8◦ N, 75.3◦ E) (Table 1). This subarea is in the MDA subdivision.There are two LS-prone sites in this region. These are: (1) Ajanta caves and (2) Ellora caves.Both these sites lie in the DLS of the WG mountains. The latitudes/longitudes of theseLS-prone sites in this subarea are given in the Table 1.
(2) Nashik (19.9◦ N, 73.9◦ E) (Table 2). This subarea lies in the MM subdivision. Thereare nine LS-prone sites in this region. These sites are: (1) Saptshrungi, (2) Ambe Ghat,(3) Savil Ghat, (4) Bhuwan Ghat, (5) Pimplegaon Joga, (6) Ambit Ghat, (7) Rajur Ghat,(8) Pelhar, and (9) Taloda. The latitudes/longitudes of these LS-prone sites in this subareaare given in the Table 2. There are seven sites on the ILS and two on the DLS of theWG mountains.
(3) Mumbai-Pune (Table 3). Mumbai lies in the Konkan meteorological subdivision andPune lies in the MM subdivision. Though the two cities are in two different meteorologicalsubdivisions, they are considered to form a single subarea as these two cities are connectedby the road and railway through the WG mountains. The road and railway tracks areadjacent to hillslopes. When LS events occur on hillslopes, the material/debris fall onthe roads and railway tracks connecting the two cities. There are 24 LS-prone sites in thisregion. These are: (1) Kalyan, (2) Ghatkopar, (3) Gilbert hill, (4) Chembur, and (5) Antophill. These sites are in the suburban areas of Mumbai city and on the windward side of theWG mountains. (6) Jummapatti, (7) Malshej Ghat, (8) Matheran, (9) Urse khind, (10) Adoshitunnel, (11) Lonawle, (12) Khopoli (13) Karla, and (14) Lavasa. These LS sites are on theroad connecting the two cities and on the windward of the WG mountains. (15) Malin,(16) Velhe, (17) Katraj, (18) Sinhgad, (19) Fosandi, (20) Panjarpol, (21) Male, (22) Ghatghar,(23) Tikona, and (24) Varandha Ghat. These sites are on the ILS of the WG mountains.There are 14 sites on the windward side and 10 sites on the ILS of the WG mountains. Thelatitudes/longitudes of these LS-prone sites in this subarea are given in the Table 3.
(4) Raigad (18.5◦ N 73.2◦ E) and Satara (17.6◦ N, 74.0◦ E) (Table 4). Raigad lies inthe Konkan subdivision and Satara lies in the MM subdivision. These two cities lie onthe west and east side of the WG mountains near to each other. There are 33 LS-pronesites in this region. These are: (1) Sukeli Khind, (2) Rohan, (3) Jui, (4) Dasgaon, (5) Po-ladpur, (6) Cholai, (7) Wazarwadi, (8) Kashedi Ghat, (9) Morbe Ghat, (10) Raigad Fort,(11) Chirekhind, (12) Ambenali Ghat, (13) Mahabaleshwar, (14) Righar Ghat, (15) Prat-apgad, (16) Kudpan, (17) Kosumbi, (18) Chikhali, (19) Medha Ghat, (20) Sahyadrinagar,(21) Kolghar, (22) Andhari, (23) Pasarani Ghat, (24) Shirgaon Ghat, (25) Mandhardevi Ghat,(26) Tapola, (27) Yavateshwar Ghat, (28) Pogarwadi, (29) Revade Ghat, (30) Lamaj, (31) Chire
Land 2022, 11, 689 16 of 23
khind, (32) Medha Ghat, and (33) Chiplun. There are 6 sites on the windward side and27 sites on the ILS of the WG mountains. The latitudes/longitudes of these LS-prone sitesin this subarea are given in Table 4.
(5) Ratnagiri (16.9◦ N, 73.3◦ E) and Kolhapur (16.7◦ N, 74.2◦ E) (Table 5). Ratnagiri liesin the Konkan subdivision and Kolhapur lies in the MM subdivision. Geographically, thesetwo stations have similar weather characteristics, hence, these are clubbed together as a onesubarea. There are 30 LS-prone sites in this subarea. These are: (1) Madangad, (2) KelwatGhat, (3) Chichali Ghat, (4) Sarang, (5) Dapoli, (6) Harnai road, (7) Dabhol, (8) Khed,(9) Bhoste Ghat, (10) Raghuveer Ghat, (11) Tulshai, (12) Gowalkot, (13) Chinchghari,(14) Kumbharli Ghat, (15) Kumbharkhani, (16) Sangmeshwar, (17) Manjare, (18) Pan-gri Ghat, (19) Kurdhunda, (20) Kondye, (21) Kolambe, (22) Peth killa, (23) Pomendi Ghat,(24) Ratnagiri, (25) Amba Ghat, (26) Wakurde Yelapur khind, (27) Aini, (28) Karul Ghat,(29) Mahad, and (30) Varkude Yelapa. There are 12 sites on the windward side and 18 siteson the ILS of the WG mountains. The latitudes/longitudes of these LS-prone sites in thissubarea are given in Table 5).
(6) Sindhudurg (16.3◦N, 73.5◦E) and Goa (15.4◦ N, 73.8◦ E) (Table 6). This subarea liesin the Konkan and Goa meteorological subdivision along the west coast of India. There are17 LS-prone sites in this subarea. These are: (1) Gaganbawda Ghat, (2) Bhuibawada Ghat,(3) Karul, (4) Vaibhavwadi Phonda Ghat, (5) Malusare, (6) Bijwas, (7) Devli, (8) Kasal Karlewadi, (9) Amrad Ghat, (10) Sawantwadi, (11) Insuli Ghat, (12) Pedne, (13) Pargad Namkhol,(14) Amboli Ghat (15) Chorla Ghat, (16) Chandgad, and (17) Malwan. There are 15 LS-pronesites on the ILS and 2 sites on the DLS of the WG mountains. The latitudes/longitudes ofthese LS-prone sites in this subarea are given in Table 6.
The spatial distribution of LS-prone sites shows 31 on the windward side, 80 are onthe ILS and 6 on the DLS of the WG mountains. Percentagewise, the LS spatial distribu-tion shows 26.5% on the windward side, 68.4% on the ILS, and 5.1% on the DLS of theWG mountains.
4.2. LS Prediction Model “Satark”4.2.1. Statistics of LS Events
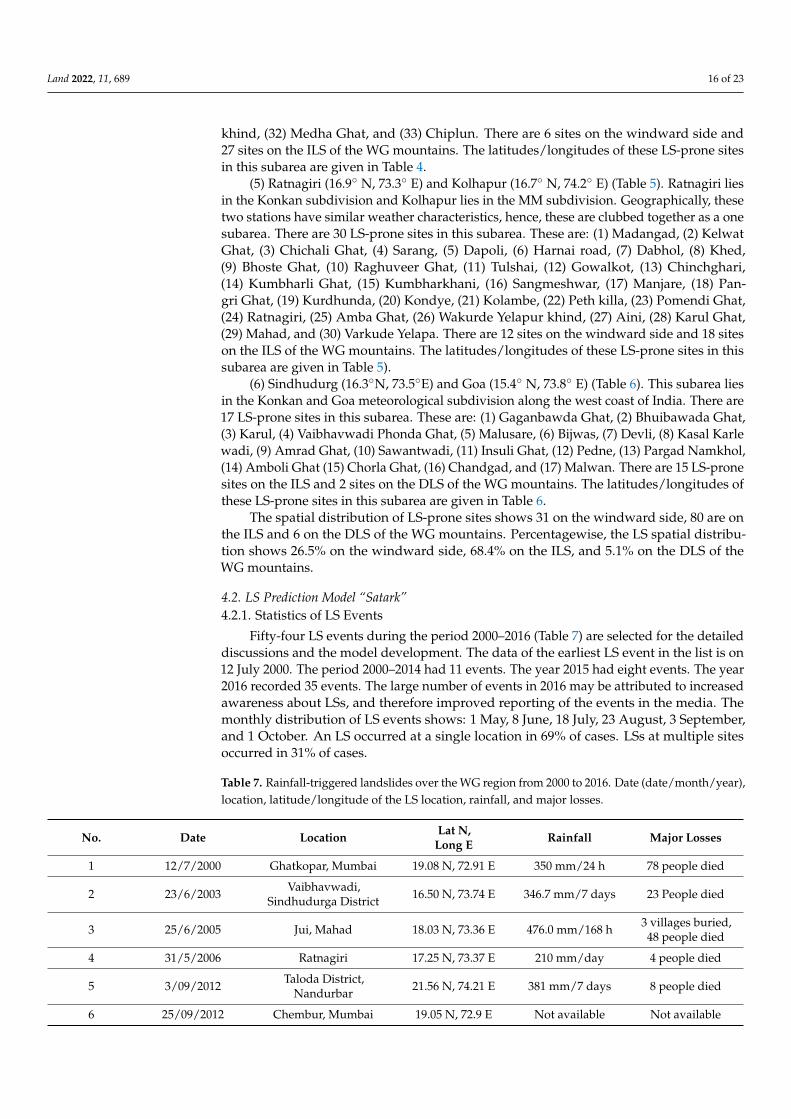
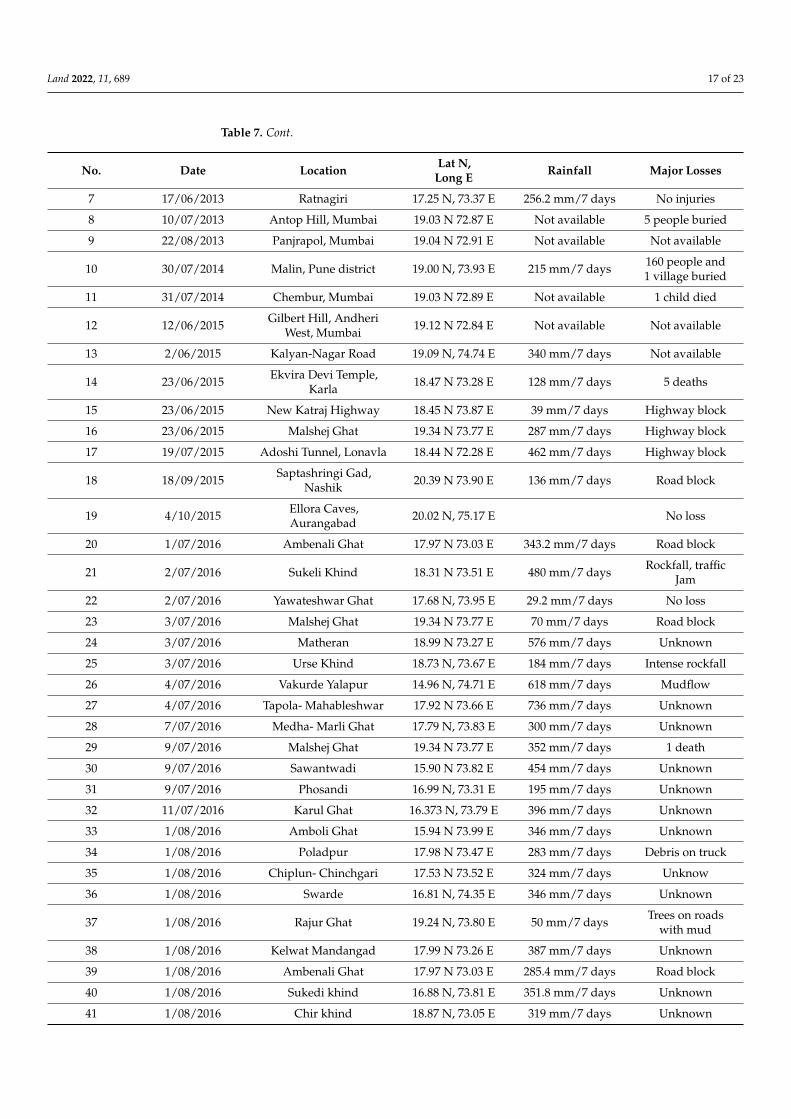
Fifty-four LS events during the period 2000–2016 (Table 7) are selected for the detaileddiscussions and the model development. The data of the earliest LS event in the list is on12 July 2000. The period 2000–2014 had 11 events. The year 2015 had eight events. The year2016 recorded 35 events. The large number of events in 2016 may be attributed to increasedawareness about LSs, and therefore improved reporting of the events in the media. Themonthly distribution of LS events shows: 1 May, 8 June, 18 July, 23 August, 3 September,and 1 October. An LS occurred at a single location in 69% of cases. LSs at multiple sitesoccurred in 31% of cases.
Table 7. Rainfall-triggered landslides over the WG region from 2000 to 2016. Date (date/month/year),location, latitude/longitude of the LS location, rainfall, and major losses.
No. Date Location Lat N,Long E Rainfall Major Losses
1 12/7/2000 Ghatkopar, Mumbai 19.08 N, 72.91 E 350 mm/24 h 78 people died
2 23/6/2003 Vaibhavwadi,Sindhudurga District 16.50 N, 73.74 E 346.7 mm/7 days 23 People died
3 25/6/2005 Jui, Mahad 18.03 N, 73.36 E 476.0 mm/168 h 3 villages buried,48 people died
4 31/5/2006 Ratnagiri 17.25 N, 73.37 E 210 mm/day 4 people died
5 3/09/2012 Taloda District,Nandurbar 21.56 N, 74.21 E 381 mm/7 days 8 people died
6 25/09/2012 Chembur, Mumbai 19.05 N, 72.9 E Not available Not available
Land 2022, 11, 689 17 of 23
Table 7. Cont.
No. Date Location Lat N,Long E Rainfall Major Losses
7 17/06/2013 Ratnagiri 17.25 N, 73.37 E 256.2 mm/7 days No injuries
8 10/07/2013 Antop Hill, Mumbai 19.03 N 72.87 E Not available 5 people buried
9 22/08/2013 Panjrapol, Mumbai 19.04 N 72.91 E Not available Not available
10 30/07/2014 Malin, Pune district 19.00 N, 73.93 E 215 mm/7 days 160 people and1 village buried
11 31/07/2014 Chembur, Mumbai 19.03 N 72.89 E Not available 1 child died
12 12/06/2015 Gilbert Hill, AndheriWest, Mumbai 19.12 N 72.84 E Not available Not available
13 2/06/2015 Kalyan-Nagar Road 19.09 N, 74.74 E 340 mm/7 days Not available
14 23/06/2015 Ekvira Devi Temple,Karla 18.47 N 73.28 E 128 mm/7 days 5 deaths
15 23/06/2015 New Katraj Highway 18.45 N 73.87 E 39 mm/7 days Highway block
16 23/06/2015 Malshej Ghat 19.34 N 73.77 E 287 mm/7 days Highway block
17 19/07/2015 Adoshi Tunnel, Lonavla 18.44 N 72.28 E 462 mm/7 days Highway block
18 18/09/2015 Saptashringi Gad,Nashik 20.39 N 73.90 E 136 mm/7 days Road block
19 4/10/2015 Ellora Caves,Aurangabad 20.02 N, 75.17 E No loss
20 1/07/2016 Ambenali Ghat 17.97 N 73.03 E 343.2 mm/7 days Road block
21 2/07/2016 Sukeli Khind 18.31 N 73.51 E 480 mm/7 days Rockfall, trafficJam
22 2/07/2016 Yawateshwar Ghat 17.68 N, 73.95 E 29.2 mm/7 days No loss
23 3/07/2016 Malshej Ghat 19.34 N 73.77 E 70 mm/7 days Road block
24 3/07/2016 Matheran 18.99 N 73.27 E 576 mm/7 days Unknown
25 3/07/2016 Urse Khind 18.73 N, 73.67 E 184 mm/7 days Intense rockfall
26 4/07/2016 Vakurde Yalapur 14.96 N, 74.71 E 618 mm/7 days Mudflow
27 4/07/2016 Tapola- Mahableshwar 17.92 N 73.66 E 736 mm/7 days Unknown
28 7/07/2016 Medha- Marli Ghat 17.79 N, 73.83 E 300 mm/7 days Unknown
29 9/07/2016 Malshej Ghat 19.34 N 73.77 E 352 mm/7 days 1 death
30 9/07/2016 Sawantwadi 15.90 N 73.82 E 454 mm/7 days Unknown
31 9/07/2016 Phosandi 16.99 N, 73.31 E 195 mm/7 days Unknown
32 11/07/2016 Karul Ghat 16.373 N, 73.79 E 396 mm/7 days Unknown
33 1/08/2016 Amboli Ghat 15.94 N 73.99 E 346 mm/7 days Unknown
34 1/08/2016 Poladpur 17.98 N 73.47 E 283 mm/7 days Debris on truck
35 1/08/2016 Chiplun- Chinchgari 17.53 N 73.52 E 324 mm/7 days Unknow
36 1/08/2016 Swarde 16.81 N, 74.35 E 346 mm/7 days Unknown
37 1/08/2016 Rajur Ghat 19.24 N, 73.80 E 50 mm/7 days Trees on roadswith mud
38 1/08/2016 Kelwat Mandangad 17.99 N 73.26 E 387 mm/7 days Unknown
39 1/08/2016 Ambenali Ghat 17.97 N 73.03 E 285.4 mm/7 days Road block
40 1/08/2016 Sukedi khind 16.88 N, 73.81 E 351.8 mm/7 days Unknown
41 1/08/2016 Chir khind 18.87 N, 73.05 E 319 mm/7 days Unknown
Land 2022, 11, 689 18 of 23
Table 7. Cont.
No. Date Location Lat N,Long E Rainfall Major Losses
42 1/08/2016 Mandherdevi, Bhor 17.68 N 73.99 E 30.2 mm/7 days No loss
43 2/08/2016 Saptashringi, Nashik 20.39 N 73.90 E 10 mm/7 days Loose soil, rockson road
44 2/08/2016 Chorla Ghat 15.64 N, 74.11 E 469 mm/7 days Unknown
45 4/08/2016 Karlewadi 18.40 N, 74.68 E 248 mm/7 days Rocks on houses
46 4/08/2016 Malshej Ghat 19.34 N 73.77 E 298.1 mm/7 days Unknown
47 4/08/2016 Lavasa, Pune 18.40 N 73.51 E 542 mm/7 days Unknown
48 4/08/2016 Varandha Ghat, Bhor 18.11 N 73.66 E 249 mm/7 days Unknown
49 6/08/2016 Kelghar, Satara 17.69 N 74.06 E 713 mm/7 days Unknown
50 6/08/2016 Ambenali Ghat 17.97 N 73.03 E >500 mm/7 days Road block
51 6/08/2016 Kashedi Ghat 17.90 N 73.43 E 600 mm/7 days Unknown
52 7/08/2016 Gaganbawda Ghat 16.54 N 73.83 E 543 mm/7 days Unknown
53 7/08/2016 Bhuiwada 19.00 N 72.85 E 358 mm/7 days Unknown
54 7/08/2016 Karul Ghat 16.37 N, 73.79 E 419 mm/7 days Unknown
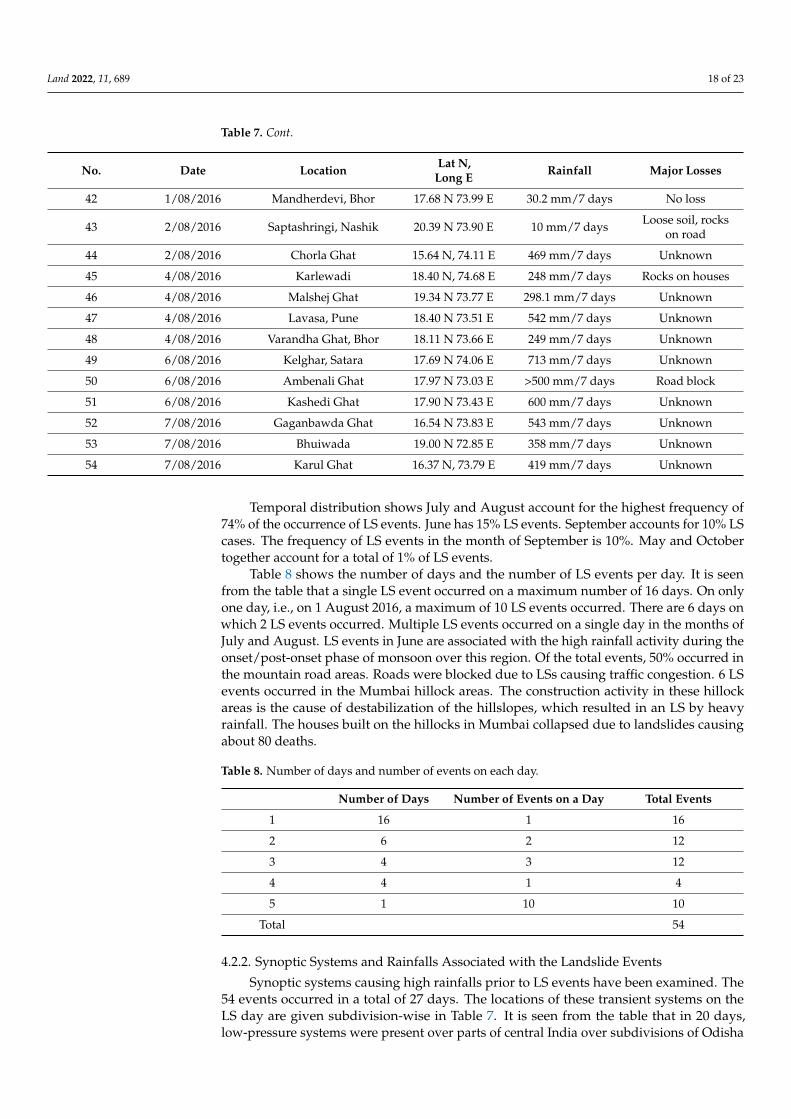
Temporal distribution shows July and August account for the highest frequency of74% of the occurrence of LS events. June has 15% LS events. September accounts for 10% LScases. The frequency of LS events in the month of September is 10%. May and Octobertogether account for a total of 1% of LS events.
Table 8 shows the number of days and the number of LS events per day. It is seenfrom the table that a single LS event occurred on a maximum number of 16 days. On onlyone day, i.e., on 1 August 2016, a maximum of 10 LS events occurred. There are 6 days onwhich 2 LS events occurred. Multiple LS events occurred on a single day in the months ofJuly and August. LS events in June are associated with the high rainfall activity during theonset/post-onset phase of monsoon over this region. Of the total events, 50% occurred inthe mountain road areas. Roads were blocked due to LSs causing traffic congestion. 6 LSevents occurred in the Mumbai hillock areas. The construction activity in these hillockareas is the cause of destabilization of the hillslopes, which resulted in an LS by heavyrainfall. The houses built on the hillocks in Mumbai collapsed due to landslides causingabout 80 deaths.
Table 8. Number of days and number of events on each day.
Number of Days Number of Events on a Day Total Events
1 16 1 16
2 6 2 12
3 4 3 12
4 4 1 4
5 1 10 10
Total 54
4.2.2. Synoptic Systems and Rainfalls Associated with the Landslide Events
Synoptic systems causing high rainfalls prior to LS events have been examined. The54 events occurred in a total of 27 days. The locations of these transient systems on theLS day are given subdivision-wise in Table 7. It is seen from the table that in 20 days,low-pressure systems were present over parts of central India over subdivisions of Odisha
Land 2022, 11, 689 19 of 23
and Madhya Pradesh. On only two occasions, LSs occurred during the monsoon depressionperiod and only once in deep depression and cyclone periods. Interestingly, the west coasttrough was present on 21 days of LS events. On 14 days, cycir occurred, and on 15 days,HJ occurred. Thus, a low-pressure system over central India, west coast trough, cycir overcentral India, and HJ are important synoptic features found during LS events over theWG mountains.
4.2.3. Cumulative Rainfall Distribution
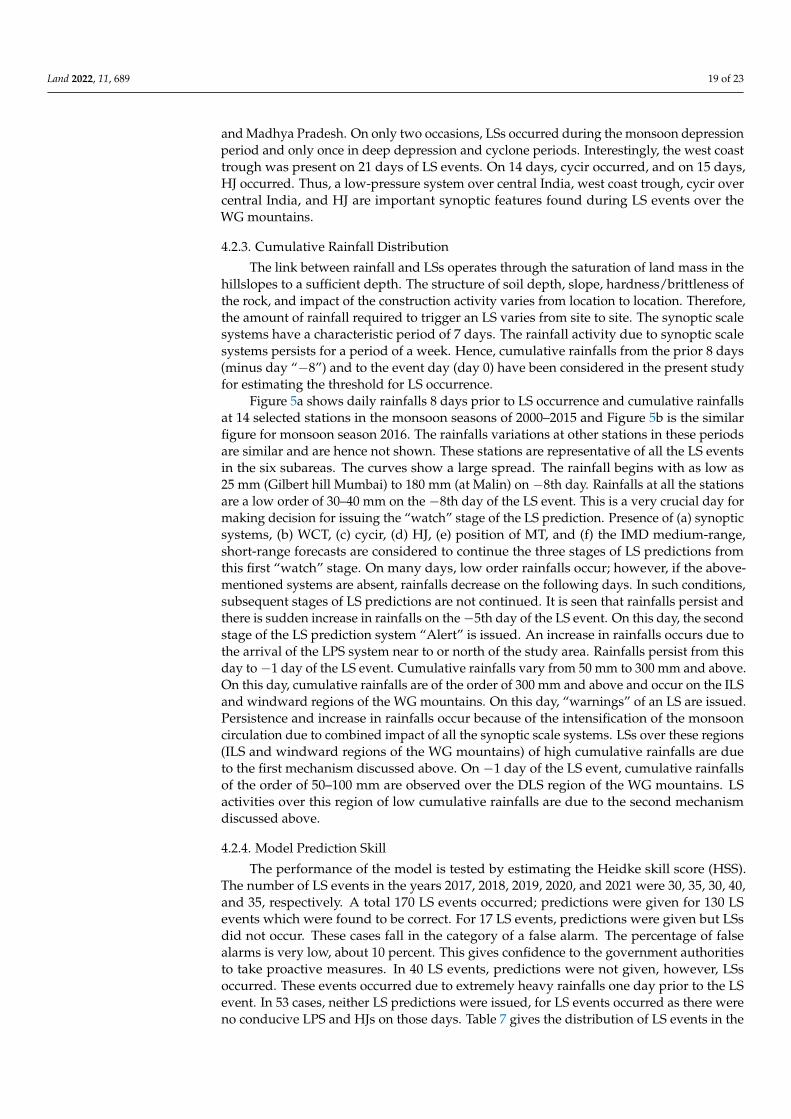
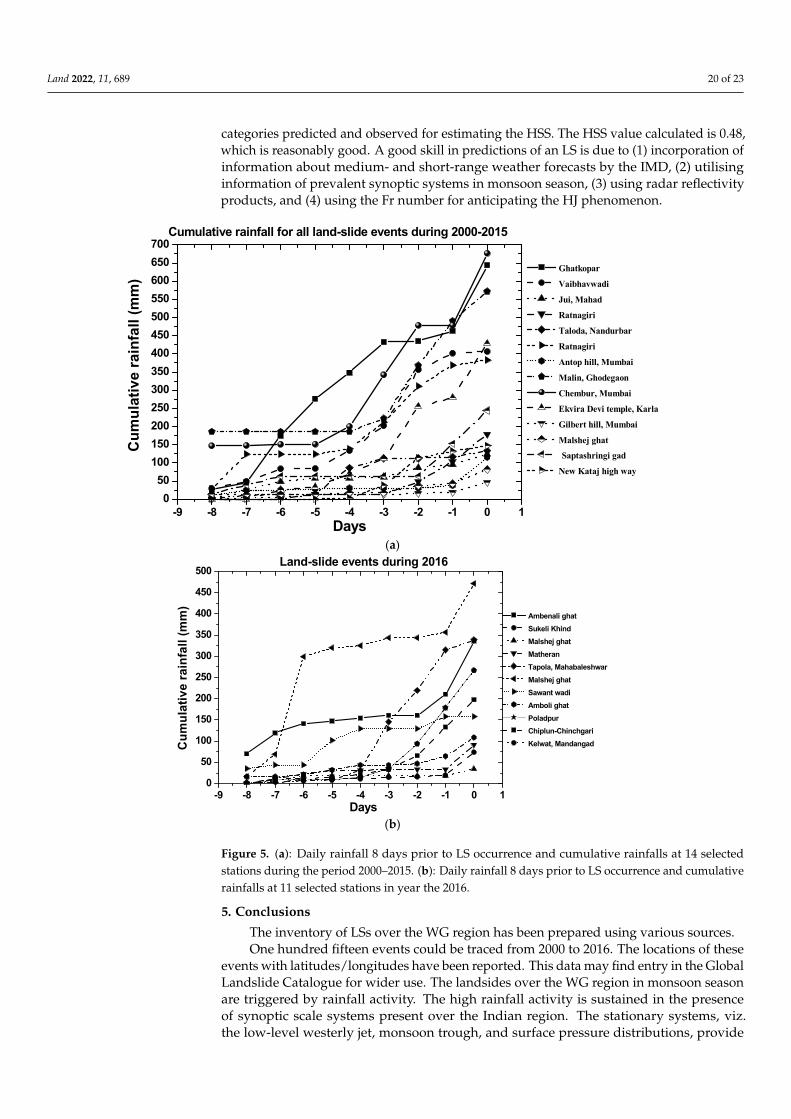
The link between rainfall and LSs operates through the saturation of land mass in thehillslopes to a sufficient depth. The structure of soil depth, slope, hardness/brittleness ofthe rock, and impact of the construction activity varies from location to location. Therefore,the amount of rainfall required to trigger an LS varies from site to site. The synoptic scalesystems have a characteristic period of 7 days. The rainfall activity due to synoptic scalesystems persists for a period of a week. Hence, cumulative rainfalls from the prior 8 days(minus day “−8”) and to the event day (day 0) have been considered in the present studyfor estimating the threshold for LS occurrence.
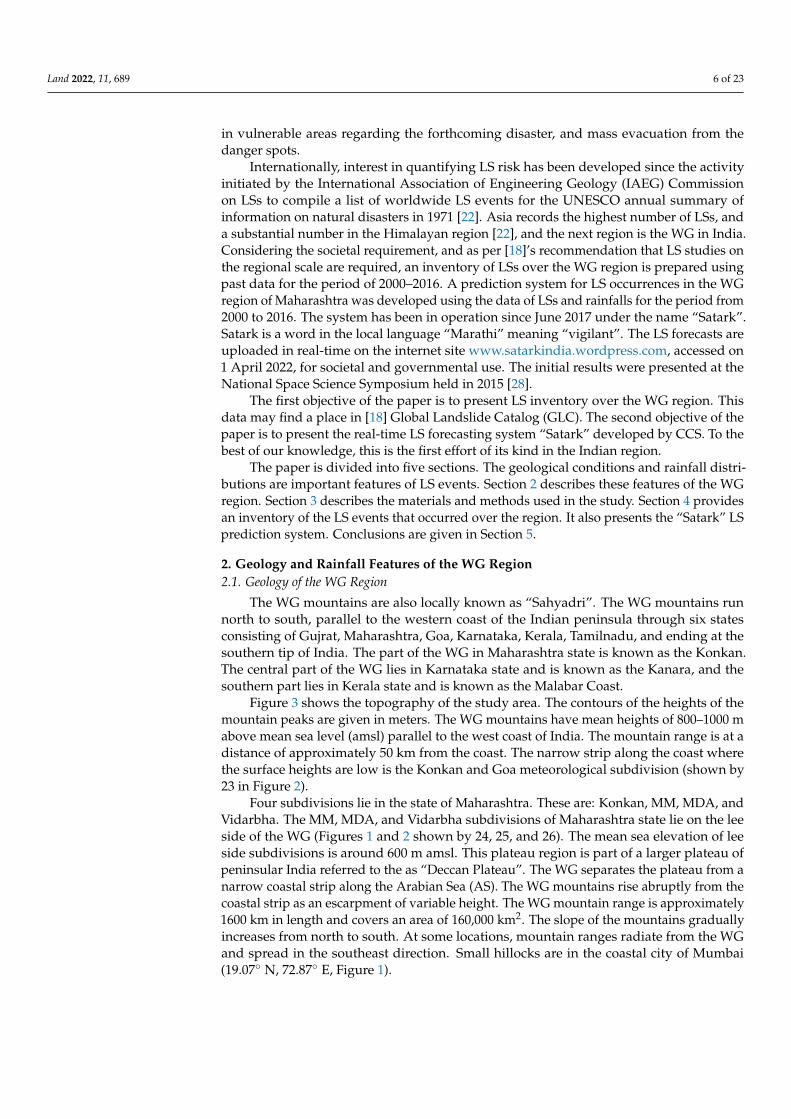
Figure 5a shows daily rainfalls 8 days prior to LS occurrence and cumulative rainfallsat 14 selected stations in the monsoon seasons of 2000–2015 and Figure 5b is the similarfigure for monsoon season 2016. The rainfalls variations at other stations in these periodsare similar and are hence not shown. These stations are representative of all the LS eventsin the six subareas. The curves show a large spread. The rainfall begins with as low as25 mm (Gilbert hill Mumbai) to 180 mm (at Malin) on −8th day. Rainfalls at all the stationsare a low order of 30–40 mm on the −8th day of the LS event. This is a very crucial day formaking decision for issuing the “watch” stage of the LS prediction. Presence of (a) synopticsystems, (b) WCT, (c) cycir, (d) HJ, (e) position of MT, and (f) the IMD medium-range,short-range forecasts are considered to continue the three stages of LS predictions fromthis first “watch” stage. On many days, low order rainfalls occur; however, if the above-mentioned systems are absent, rainfalls decrease on the following days. In such conditions,subsequent stages of LS predictions are not continued. It is seen that rainfalls persist andthere is sudden increase in rainfalls on the−5th day of the LS event. On this day, the secondstage of the LS prediction system “Alert” is issued. An increase in rainfalls occurs due tothe arrival of the LPS system near to or north of the study area. Rainfalls persist from thisday to−1 day of the LS event. Cumulative rainfalls vary from 50 mm to 300 mm and above.On this day, cumulative rainfalls are of the order of 300 mm and above and occur on the ILSand windward regions of the WG mountains. On this day, “warnings” of an LS are issued.Persistence and increase in rainfalls occur because of the intensification of the monsooncirculation due to combined impact of all the synoptic scale systems. LSs over these regions(ILS and windward regions of the WG mountains) of high cumulative rainfalls are dueto the first mechanism discussed above. On −1 day of the LS event, cumulative rainfallsof the order of 50–100 mm are observed over the DLS region of the WG mountains. LSactivities over this region of low cumulative rainfalls are due to the second mechanismdiscussed above.
4.2.4. Model Prediction Skill
The performance of the model is tested by estimating the Heidke skill score (HSS).The number of LS events in the years 2017, 2018, 2019, 2020, and 2021 were 30, 35, 30, 40,and 35, respectively. A total 170 LS events occurred; predictions were given for 130 LSevents which were found to be correct. For 17 LS events, predictions were given but LSsdid not occur. These cases fall in the category of a false alarm. The percentage of falsealarms is very low, about 10 percent. This gives confidence to the government authoritiesto take proactive measures. In 40 LS events, predictions were not given, however, LSsoccurred. These events occurred due to extremely heavy rainfalls one day prior to the LSevent. In 53 cases, neither LS predictions were issued, for LS events occurred as there wereno conducive LPS and HJs on those days. Table 7 gives the distribution of LS events in the
Land 2022, 11, 689 20 of 23
categories predicted and observed for estimating the HSS. The HSS value calculated is 0.48,which is reasonably good. A good skill in predictions of an LS is due to (1) incorporation ofinformation about medium- and short-range weather forecasts by the IMD, (2) utilisinginformation of prevalent synoptic systems in monsoon season, (3) using radar reflectivityproducts, and (4) using the Fr number for anticipating the HJ phenomenon.
Land 2021, 10, x FOR PEER REVIEW 21 of 24
-9 -8 -7 -6 -5 -4 -3 -2 -1 0 10
50
100
150
200
250
300
350
400
450
500
550
600
650
700
Ghatkopar
Vaibhavwadi
Jui, Mahad
Ratnagiri
Taloda, Nandurbar
Ratnagiri
Antop hill, Mumbai
Malin, Ghodegaon
Chembur, Mumbai
Ekvira Devi temple, Karla
Gilbert hill, Mumbai
Malshej ghat
Saptashringi gad
New Kataj high way
Cu
mu
lati
ve r
ain
fall
(m
m)
Days
Cumulative rainfall for all land-slide events during 2000-2015
(a)
-9 -8 -7 -6 -5 -4 -3 -2 -1 0 10
50
100
150
200
250
300
350
400
450
500
Ambenali ghat
Sukeli Khind
Malshej ghat
Matheran
Tapola, Mahabaleshwar
Malshej ghat
Sawant wadi
Amboli ghat
Poladpur
Chiplun-Chinchgari
Kelwat, Mandangad
Cu
mu
lati
ve
rain
fall
(m
m)
Days
Land-slide events during 2016
(b)
Figure 5. (a): Daily rainfall 8 days prior to LS occurrence and cumulative rainfalls at 14 selected
stations during the period 2000–2015. (b): Daily rainfall 8 days prior to LS occurrence and cumula‐
tive rainfalls at 11 selected stations in year the 2016.
4.2.4. Model Prediction Skill
The performance of the model is tested by estimating the Heidke skill score (HSS).
The number of LS events in the years 2017, 2018, 2019, 2020, and 2021 were 30, 35, 30, 40,
and 35, respectively. A total 170 LS events occurred; predictions were given for 130 LS
events which were found to be correct. For 17 LS events, predictions were given but LSs
did not occur. These cases fall in the category of a false alarm. The percentage of false
alarms is very low, about 10 percent. This gives confidence to the government authorities
to take proactive measures. In 40 LS events, predictions were not given, however, LSs
occurred. These events occurred due to extremely heavy rainfalls one day prior to the LS
event. In 53 cases, neither LS predictions were issued, for LS events occurred as there were
no conducive LPS and HJs on those days. Table 7 gives the distribution of LS events in the
Figure 5. (a): Daily rainfall 8 days prior to LS occurrence and cumulative rainfalls at 14 selectedstations during the period 2000–2015. (b): Daily rainfall 8 days prior to LS occurrence and cumulativerainfalls at 11 selected stations in year the 2016.
5. Conclusions
The inventory of LSs over the WG region has been prepared using various sources.One hundred fifteen events could be traced from 2000 to 2016. The locations of these
events with latitudes/longitudes have been reported. This data may find entry in the GlobalLandslide Catalogue for wider use. The landsides over the WG region in monsoon seasonare triggered by rainfall activity. The high rainfall activity is sustained in the presenceof synoptic scale systems present over the Indian region. The stationary systems, viz.the low-level westerly jet, monsoon trough, and surface pressure distributions, provide
Land 2022, 11, 689 21 of 23
the moisture advection over the WG region. The flow is inertially unstable. The slowascent of the moisture-laden westerly winds provides additional upward motion and therelease of instability for the growth of the clouds. The convection is sustained due to moistboundary layer. All these factors contribute towards sustained high rainfall activity overthe WG region. This causes wetting of the deep soil layer conducive for the slope instability.Though overall geology is the same over the region, there are differences in the preparatoryvariables from location to location. Therefore, there is no unique threshold value for theregion as a whole. Cumulative rainfall curves have been found for different locationsfor forecast purposes. The study area is of the WG mountains, from west–east, and isdivided into three regions: (a) windward, (b) immediate lee side of the WG mountains(ILS), and (c) distant lee side (DLS) of the WG mountains. The cumulative rainfalls ofthe order of 300 m and above trigger landslides over the windward and immediate leeside of the WG mountains. The maximum number of LSs occurred on the ILS area of theWG mountains. These landslides are disastrous. The cumulative rainfalls of the order of100 mm trigger landslides over the distant lee side of the WG mountains. These landslidesare mostly shallow.
The forecast system operates in three stages. If forecast charts of the IMD show theformation of LPS, and associated increase in rainfall over the landslide-prone areas forthe ensuing 7 days, and westerly winds at the 850 hPa level are higher than 20 m/s, thenthe “watch” stage is invoked. The rainfall at LS locations from the TRMM is monitoredcontinuously. If cumulative rainfall for the next 3 days becomes higher than the referencevalue, then the “alert” stage is invoked. The people in the area are advised to keep watch ofthe rainfall intensity and duration. If the high rainfall persists for the next two–three daysand the accumulated rainfall crosses the reference value, the “warning” stage is invoked. Ifthe rainfall persists for one more day, then LSs predictions are given for the next day. Theoperational forecasts of LSs were given for five monsoon seasons 2017–2021. The forecastsskill HSS showed a value of 0.48, which is reasonably good. However, those landslideevents which occurred due to extremely heavy rainfalls (one-day rainfall of the order of300–400 mm) could not be predicted as there are no predictions of such rainfalls by theIMD or any other meteorological agency in the world. The study is important as it is thefirst attempt of this kind over the Indian region. The study suggests that automatic raingauges should be installed at all the landslide-prone areas which will help in monitoringreal-time rainfall intensity to give a landslide forecast some hours in advance. This willincrease the forecast skill.
Author Contributions: Conceptualisation, J.R.K. and M.G.P.; methodology, J.R.K. and S.S.K.; soft-ware, S.S.K.; validation, S.S.K. and V.K.; formal analysis, V.K. and S.S.K.; investigation, M.U.I., N.M.T.,S.B.W., K.R.T., P.S.M.,T.K., Y.P., A.P., Y.S., P.B., S.B., M.G.P.; resources, V.K.; data curation, M.U.I.,N.M.T., S.B.W., K.R.T., P.S.M., T.K., Y.P., A.P., Y.S., P.B., S.B., M.G.P.; writing, J.R.K.; writing—reviewand editing, V.K.; visualisation, S.S.K., M.U.I.; supervision, M.G.P.; project administration, J.R.K,M.G.P. and V.K.; funding acquisition, V.K. All authors have read and agreed to the published versionof the manuscript.
Funding: This research received no external funding.
Data Availability Statement: All the data supporting reported results can be found, including linksto publicly archived datasets analysed or generated during the study, at www.satarkindia.wordpress.com, accessed on 1 April 2022.
Acknowledgments: In the “Satark” LS prediction system, medium- and short-range forecasts ofthe IMD have been used. The IMD radar products available on the internet site www.imd.gov.in,accessed on 1 April 2022, have been used in the study to understand the spatial structure of theconvection over the WG mountain and lee side regions. The authors acknowledge the IMD for thesame. The sounding data of the Mumbai and Goa stations have been taken for HJ calculations fromthe University of Wyoming. The authors express their sincere thanks to the University of Wyomingfor the sounding data. The CCS volunteers have set up ordinary rain gauges at 10 locations in the

Land 2022, 11, 689 22 of 23
immediate lee side of the WG in the 2021 monsoon season. The authors acknowledge the supportfrom the CCS volunteers for collecting the rainfall and LS data used in the study.
Conflicts of Interest: The authors declare no conflict of interest.
References1. Singh, T.N.; Singh, R.; Singh, B.; Sharma, L.K.; Singh, R.; Ansari, M.K. Investigations and stability analyses of Malin village
landslide of Pune district, Maharashtra, India. Nat. Hazards 2016, 81, 2019–2030. [CrossRef]2. Ramasamy, S.M.; Muthukumar, M.; Subagunasekar, M. Malin-Maharashtra landslides: A disaster triggered by tectonics and
anthropogenic phenomenon. Curr. Sci. 2015, 108, 1428–1430.3. Ering, P.; Kulkarni, R.; Kolekar, Y.; Dasaka, S.M.; Babu, G.L.S. Forensic analysis of Malin landslide in India International
Symposium on Geohazards and Geomechanics (ISGG2015). IOP Publ. IOP Conf. Ser. Earth Environ. Sci. 2015, 26, 012040.[CrossRef]
4. Dave-Peteley, N. The Churning Inside the Earth. 2014. Available online: Blogs.agu.org/laandslideblog/2014/07/31/landslide-engulf-malin-village.html (accessed on 29 April 2022).
5. Indian Express. 2014. Available online: Indianexpress.com/article/India/India-news/malin-landslide-pune-village-live-under-danger-290397 (accessed on 30 April 2022).
6. Goswami, V.; Venugopal, D.; Sengupta, M.; Madhusudan, S.; Xavier, P.K. Increasing Trend of Extreme Rain Events Over India in aWarming Environment. Science 2006, 314, 1442–1445. [CrossRef]
7. Keefer, D.K.; Wilson, R.C.; Mark, R.K.; Brabb, E.E.; Brown, W.M., III; Ellen, S.D.; Harp, E.L.; Wieczorek, G.F.; Alger, C.S.;Zatkin, R.S. Real-time landslide warning during heavy rainfall. Science 1987, 238, 921–925. [CrossRef]
8. Campbell, R.H. Soil Slips, Debris Flows, and Rainstorms in the Santa Monica Mountains and Vicinity, Southern California. Ph.D.Thesis, U.S. Government Publishing Office, Washington, DC, USA, 1975.
9. Starkel, L. The role of extreme meteorological events in the shaping of mountain relief. Geogr. Pol. 1979, 41, 13–20.10. Wieczorek, G.F. Effect of rainfall intensity and duration on debris flows in central Santa Cruz Mountains, California. In Debris
flows/Avalanches: Process, Recognition and Mitigation: Geological Society of America, Reviews in Engineering Geology; Costa, J.E.,Wieeczorek, G.F., Eds.; Geological Society of America: Boulder, CO, USA, 1987; Volume 7, pp. 93–104.
11. Caine, N. The rainfall intensity-duration control of shallow landslides and debris flows. Geogr. Ann. 1990, 62A, 23–27.12. Larsen, M.C.; Simon, A. A rainfall intensity duration threshold for landslides in a humid-tropical environment. Geogr. Ann. Ser. A
Phys. Geogr. 1993, 75, 13–23. [CrossRef]13. Glade, T.; Crozier, M.; Smith, P. Applying probability determination to refine landslide-triggering rainfall threshold using an
empirical “Antecedent Daily Rainfall Model”. Pure Appl. Geophys. 2000, 157, 1059–1079. [CrossRef]14. Gabet, E.; Burbank, J.D.W.; Putkonen, J.K.; Pratt-Sitaula, B.A.; Ojha, T. Rainfall thresholds for land sliding in the Himalayas of
Nepal. Geomorphology 2004, 63, 131–143. [CrossRef]15. Kuthari, S. Establishing Precipitation Thresholds for Landslide Initiation Along with Slope Characterisation Using GIS Based
Modelling. Ph.D. Thesis, ITC, Enschede, The Netherlands, 2007.16. Guzzetti, F.; Peruccacci, S.; Rossi, M.; Stark, C.P. The rainfall thresholds for initiation of landslides in central and southern. Eur.
Meteorol. Atmos. Phys. 2007, 98, 239–267. [CrossRef]17. Kirschbaum, D.B.; Adler, R.; Hong, Y.; Lerner-Lam, A. Evaluation of a preliminary satellite-based landslide hazard algorithm
using global landslide inventories. Nat. Hazards Earth Syst. Sci. 2009, 9, 673–686. [CrossRef]18. Kirschbaum, D.B.; Adler, R.; Hong, Y.; Hill, S.; Lerner-Lam, A. A global landslide catalog for hazard applications: Method, results,
and limitations. Nat. Hazards 2010, 52, 561–575. [CrossRef]19. Nagarajan, R.; Mukherjee, A.; Roy, A.; Khire, M.V. Temporal remote sensing data and GIS application in landslide hazard zonation
of part of Western Ghat, India. Remote Sens. 1998, 19, 573–585. [CrossRef]20. Nagarajan, R.; Roy, A.; Kumar, R.V.; Mukherjee, A.; Khire, M. Landslide hazard susceptibility mapping based on terrain and
climatic factors for tropical monsoon regions. Bull. Eng. Geol. Environ. 2000, 58, 275–287. [CrossRef]21. Thigale, S.S.; Umrikar, B. Disastrous landslide episode of July 2005 in the Konkan plain of Maharashtra, India with special
reference to tectonic control and hydrothermal anomaly. Curr. Sci. 2007, 92, 383–386.22. Froude, M.J.; Peteley, D.N. Global fatal landslide occurrence from 2004 to 2016. Nat. Hazards Earth Syst. Sci. 2018, 18, 2161–2181.
[CrossRef]23. Hong, Y.; Adler, R.; Huffman, G. Evaluation of the potential of NASA multi-satellite precipitation analysis in global landslide
hazard assessment. Geog. Res. Lett. 2006, 33, L22402. [CrossRef]24. Hong, Y.; Adler, R.; Huffman, G. Use of satellite Remote Sensing data in the mapping of Global Landslide Susceptibility. J. Nat.
Hazard 2007, 43, 245–256. [CrossRef]25. Hong, Y.; Adler, R.; Huffman, G. An experimental Global Prediction System for Rainfall-Triggered landslides Using satellite
Remote Sensing and Geospatial datasets. IEEE Trans. GeoSci. Remote 2007, 45, 1671–1680. [CrossRef]26. Hong, Y.; Adler, R.; Huffman, G. Satellite Remote sensing for Landslide Monitoring on a Global basis. Am. Geophys. Union EOS
2007, 88, 357–358. [CrossRef]

Land 2022, 11, 689 23 of 23
27. Kirschbaum, D.B.; Stanley, T.; Simmons, J. A dynamic landslide hazard assessment system for Central America and Hispaniola.Nat. Hazards Earth Syst. Sci. Discuss. 2015, 3, 2847–2882. [CrossRef]
28. NSS 31st National Space Science Symposium, 13–16 April 2015. 2015. Available online: https://www.isro.gov.in/update/30-jan-2019/national-space-science-syposium-nsss-%E2%80%93-2019 (accessed on 29 April 2022).
29. Kothawale, D.R.; Rajeevan, M. Monthly, Seasonal and Annual Rainfall Time Series for All-India, Homogeneous Regions and MeteorologicalSubdivisions: 1871–2016; IITM Research Report No. RR-138; IITM: Tamil Nadu, India, 2017; pp. 1–164.
30. Rao, Y.P. Southwest Monsoon. In Meteorological Monograph, no. 1/1976; India Meteorological Department: New Delhi, India,1976; p. 367.
31. Krishnamurti, T.N.; Bhalme, H.N. Oscillations of a monsoon system. Part I. Observational aspects. J. Atmos. Sci. 1976, 33,1937–1954. [CrossRef]
32. Grossman, R.L.; Durran, D.R. Interaction of low-level flow with the Western Ghat mountains and offshore convection in thesummer monsoon. Mon. Weather. Rev. 1984, 112, 652–672. [CrossRef]
33. Francis, P.A.; Gadgil, S. Intense rainfall over the west coast of India. Meteorol. Atmos. Phys. 2006, 94, 27–42. [CrossRef]34. Medina, S.; Houze, R.A., Jr.; Kumar, A.; Niyogi, D. Summer monsoon convection in the Himalayan region: Terrain and land
convection. Q. J. Royal Meteorol Soc. 2010, 136, 593–616.35. LeMone, M.A. The influence of vertical wind shear on the diameter of cumulus clouds in CCOPE. Mon. Weather Rev. 1989, 117,
1480–1491. [CrossRef]36. LeMone, M.A.; Zipser, E.J.; Trier, S.B. The role of environmental shear and thermodynamic conditions in determining the structure
and evolution of mesoscale convective system during TOGA COARE. J. Atmos. Sci. 1998, 55, 3493–3518. [CrossRef]37. Schumacher, C.; Houze, R. Stratiform rain in the tropics as seen by the TRMM precipitation radar. J. Clim. 2003, 16, 1739–1756.
[CrossRef]38. Kulkarni, J.R.; Deshpande, N.R.; Morwal, S.B.; Kothawale, D.R.; Narkhedkar, S.G.; Kumar, V. Hydraulic Jump: The cause of heavy
rainfall on the immediate lee side of the Western Ghats in Maharashtra State of India. Int. J. Clim. 2021. [CrossRef]39. Kirschbaum, D.B.; Adler, R.; Hong, Y.; Kumar, S.; Peters-Lidard, C.; Lerner-Lam, A. Advances in landslide nowcasting: Evaluation
of a global and regional modelling approach. Environ. Earth Sci. 2012, 66, 1683–1696. [CrossRef]