Embed Size (px)
Citation preview

Landslide monitoring by using ground-based SAR interferometry:
an example of application to the Tessina landslide in Italy
Dario Tarchi a, Nicola Casagli b,*, Riccardo Fanti b, David D. Leva a, Guido Luzi c,Alessandro Pasuto d, Massimiliano Pieraccini c, Sandro Silvano d
aInstitute for the Protection and Security of the Citizen (IPSC), Humanitarian Security Unit (HSU), Ispra, ItalybEarth Sciences Department, University of Firenze, Florence, Italy
cDepartment of Electronics and Telecommunications, University of Firenze, Florence, ItalydNational Research Council, Institute for Hydro-geological Protection, Padua, Italy
Received 7 January 2002; received in revised form 29 May 2002; accepted 8 July 2002
Abstract
An innovative technique, based on radar interferometry and implemented using ground-based instrumentation, has been
applied for monitoring the Tessina landslide (Italy, Belluno). The technique has allowed us to derive multitemporal surface
deformation maps of the entire depletion zone of the landslide with a high spatial resolution and accuracy. The portable device
used in this application is known as Linear SAR (LISA), and it is able to provide measurements at 17 GHz with a synthetic
aperture of up to 2.8 m. The results have been validated by comparing the recorded pixel displacements with independent
measurements carried out by a motorized theodolite and Electronic Distance Meter (EDM) on two benchmarks.
D 2002 Elsevier Science B.V. All rights reserved.
Keywords: Landslide; Remote sensing; Monitoring; Radar
1. Introduction
In many parts of the world, landslides affect urban
areas or anthropogenic activities and because of the
difficulties in putting into effect countermeasures in
terms of stabilization works, such situation frequently
determines a forced ‘‘cohabitation’’ of people with risk
conditions. In order to keep an adequate safety level in
those situations where human life or relevant property
and infrastructures are exposed, an optimal risk man-
agement requires warning systems based on the real-
time acquisition of reliable data resulting from perma-
nent monitoring instrumentation. Especially during
alarm events, in difficult operational conditions, the
real-time availability of data is fundamental to predict
the short-term evolution of movements and, conse-
quently, to define risk scenarios. Among the parameters
that can define the behaviour of a mass movement and
forecast its short-term evolution, the superficial mor-
phological changes of the detachment and accumula-
tion areas are particularly significant. Generally,
ground surface monitoring techniques provide infor-
mation on a determined number of points within the
landslide area, both in the cases of geotechnical mon-
itoring (clinometers, extensometers, distometers, etc.)
and of GPS or conventional topographic survey (Kea-
0013-7952/02/$ - see front matter D 2002 Elsevier Science B.V. All rights reserved.
PII: S0013 -7952 (02 )00196 -5
* Corresponding author. Fax: +39-55-275-6296.
E-mail address: [email protected] (N. Casagli).
www.elsevier.com/locate/enggeo
Engineering Geology 68 (2003) 15–30

ton and DeGraff, 1996; Mikkelsen, 1996; Allaway et
al., 1998; Coe et al., 2000; Gili et al., 2000; Angeli et al.,
2000).
Even if single-point data are accurate and taken
particularly in significant areas (landslide crown,
depletion zone, accumulation zone, etc.), they cannot
be considered inferable to the whole landslide area.
This is particularly important in large-size landslides
or complex slope movements, which are characterized
by different movement patterns. To get rid of such a
strongly limiting characteristic, the topographic and/or
instrumental measurements are usually carried out on
extensive and complex monitoring networks. Never-
theless, these conventional monitoring techniques
cannot give a detailed spatially extensive information
and cannot be employed for those landslide sectors
which are at high risk or not accessible.
The synthetic aperture radar (SAR) technology,
implemented through either spaceborne or ground-
based sensors, has demonstrated its capability in the
assessment of ground surface displacement fields over
wide areas (Gabriel et al., 1989;Massonnet et al., 1993,
1995; Zebker et al., 1994; Carnec et al., 1995). In
particular, it allows the detection, with high precision,
of the displacement components along the sensor–
target line of sight (LOS). The potentiality of ground-
based SAR interferometry for monitoring landslide
displacements has been explored by the authors in the
framework of a research program funded by the Italian
Space Agency (ASI) and the National Research Coun-
cil (CNR). In order to test the technique in the field, a
number of experimental campaigns have been carried
out on a variety of ground movements with different
kinematics and materials involved. A first application
on the Ruinon rock slide (Italy, Valtellina) has been
published by the authors (Atzeni et al., 2001, in press;
Tarchi et al., in preparation). This paper presents the
results of a ground-based radar campaign carried out
between the 25th of September and the 13th of October
2000 on the Tessina earth slide in the Italian Eastern
Alps.
2. Ground-based differential SAR interferometry
The proposed technique provides a remotely
sensed measurement of ground displacements. It is
able to supply a deformation field of the ground
portion in the field of view of the measurement tool,
without the necessity of positioning targets on the
ground and without any physical contact with the
slope (Tarchi et al., 1997). This technique is based on
SAR (Curlander and McDonough, 1991) and on
interferometric techniques (InSAR), originally devel-
oped for earth observation from satellites (Zebker and
Goldstein, 1986). InSAR is based on the quantitative
comparison of the phase information between two
radar acquisitions of the same scenario. Using a pair
of complex SAR images, where the former and the
latter are referred to as master (m) and slave (s)
images, respectively, an interferogram (I) is formed
according to the following relationship:
Iðk; lÞ ¼ mðk; lÞsðk; lÞ* ð1Þ
where * indicates the conjugate.
In the general case, which is the usual one for
satellite observations, the two acquisitions are taken
from slightly different positions and in different
moments of time, the phase of each pixel of the
interferogram, referred to as interferometric phase,
contains different contributions as follows:. Topographic effect. This contribution relates to
the height of the portion of terrain corresponding to a
pixel in the interferogram. The InSAR application
aimed to derive a Digital Elevation Model (DEM) of
the imaged area exploits this effect. Such an effect
originates from the slightly different position of
acquisition of the two images. Consequently, it dis-
appears for image pairs taken exactly from the same
position (zero baseline).. Dielectric effect. This contribution relates to the
phase shift induced both by the propagation through
the atmosphere and by the dielectric properties of the
reflecting targets. Usual assumption is that dielectric
characteristics are similar for both acquisitions and
have no impact on the interferometric phase. This
cannot be assumed to have general validity and
deserves a specific analysis taking into account the
relevant conditions during each acquisition and in the
time span between them.. Displacements of the mapped terrain. The phase of
each pixel of the single SAR image contains informa-
tion about the absolute distance along the line of sight
(LOS) of the system between the sensor and the portion
of terrain corresponding to the pixel. When terrain
displacements occur in the time span between the pair
D. Tarchi et al. / Engineering Geology 68 (2003) 15–3016

of SAR acquisitions, the interferometric phase will
vary accordingly. The InSAR application aimed at
retrieving displacements patterns on the imaged area
exploits this effect. Obviously, such an effect does not
appear if the pair of images is acquired at the same time.
Assuming a negligible or moderate impact of
dielectric effects on the interferometric phase, the
possibility to discriminate between the two remaining
contributions relies on an appropriate choice of the
acquisition parameters in order to cancel out one of
the effects and to retain the other one. The ideal set-up
for the derivation of DEM needs the acquisition of
both images from different positions but during the
same satellite pass, as recently done during the Shuttle
Radar Topography Mission (SRTM) NASA mission.
On the other hand, in order to derive displacement
patterns, the acquisitions need to be taken at different
moments of time but exactly repeating the same orbit
(zero baseline). In practice, this is hardly ever the case
and two different methods have been proposed in
order to obtain a ‘‘topography-free’’ interferogram
whose phase can be directly related to terrain move-
ments. The former, referred to as three-pass interfer-
ometry (Gabriel et al., 1989; Zebker et al., 1994) uses
a third image. The latter, referred to as DEM extrac-
tion method (Rosen et al., 2000), generates a synthetic
interferogram by using an existing DEM of the
observed area and the precise knowledge of the
trajectories (orbital parameters) of the sensor during
the acquisition of the paired images. This specific
application of InSAR is usually referred to as Differ-
ential InSAR (DInSAR).
On the other hand, with a ground-based platform,
the ideal condition of zero baseline can usually be
achieved and a couple of images are sufficient to
generate a topography-free interferogram and, finally,
to derive information on displacements. For the sake
of simplicity, we will refer to this specific application
of InSAR using ground-based systems as Ground-
Based Differential InSAR (GB-DInSAR).
Independently, both of the platform and of the
specific method, whenever the application of GB-
DInSAR is the monitoring of movement, the final
product can be referred to as a displacement map
having the following general characteristics:
� measured displacements refer to the component of
the real displacement along the line of sight of the
SAR system and to the time span between the
acquisitions of the SAR images;� spatial resolutions equal to those of the original
SAR images; the resolution could degrade if spatial
averaging is applied at some step of the processing
chain.
Although several examples of application of DIn-
SAR using spaceborne data to landslides are available
in the scientific literature (Achache et al., 1995; Prati
et al., 1995; Fruneau et al., 1996; Carnec et al., 1996;
Singhroy et al., 1998; Rott and Siegel, 1999; Rott et
al., 1999; Kimura and Yamaguchi, 2000; Singhroy
and Mattar, 2000; Refice et al., 2000; Ferretti et al.,
2001), the sensors actually available pose a number of
challenges for its operational use.
The main limits, due to both satellite parameters
and intrinsic constraints of the DInSAR technique, are
discussed by Wasowski and Gostelow (1999) and can
be summarized as follows:
(a) Acquisition geometry: the typical incidence angle
and the orbital trajectory allow an acceptable
sensitivity to vertical and across-azimuth (approx-
imately east–west) displacement components only;
(b) Geometrical distortions: SAR images are intrinsi-
cally affected by prospective deformations (fore-
shortening, layover, shadowing) strongly limiting
the observation of landslides on steep slopes or
into narrow valleys; these limitations can only be
partially removed by processing both ascending
and descending data acquisitions;
(c) Spatial resolution: the resolutions of available
satellites now range between 15 and 30 m;
RADARSAT is able to acquire 10� 9 m data
but only on demand; in any case, these resolutions
are suitable only for large-scale slope movements;
(d) Revisiting time: 35 days for ERS, 24 for
RADARSAT, 44 for JERS; in any case, the
temporal coverage is not suitable for monitoring
high deformation rates;
(e) Temporal decorrelation: changes in the observed
area usually degrade the quality of the interfero-
gram and can prevent the application of the
technique. This is usually the case of densely
vegetated areas where sliding phenomena often
occur; in general, the loss of coherence is related
to the time span between the acquisitions.
D. Tarchi et al. / Engineering Geology 68 (2003) 15–30 17

The use of a ground-based radar allows us to
overcome most of the limits linked to spaceborne
interferometry to overcome and provide the necessary
flexibility in order to accomplish the extreme varia-
bility, in terms of size, movement mechanism, dis-
placement rate, water content, state and distribution of
activity, which intrinsically characterizes slope pro-
cesses. In fact, such an approach makes possible to
change the observation parameters (such as the dis-
tance from the target, the frequency of observation,
the length of synthetic aperture, the angle of inci-
dence, the revisiting time) in order to adapt them to
every particular case.
On the other hand, a ground-based system suffers
from different limitations, such as the possibility to
cover only areas of limited extension (about 100,000
m2 from a mean distance of 1 km) and the necessity of
a location having a suitable visibility of the area under
test. In addition, due to the fact that the system should
be fixed in a stable position during the acquisition and
to the limited extension of the synthetic aperture, the
spatial resolution in azimuth depends both on the
distance from the sensor and on the lateral displace-
ment with respect to the sensor location. It should also
be noted that the obtained azimuth resolution is far
from being the optimum (i.e., the one obtained with a
synthetic aperture equals to the footprint of the anten-
nas at near range). However, although the obtained
azimuth resolution is typically a couple of order of
magnitude lower than the optimal one, it is usually
enough for monitoring landslide movements.
3. The Tessina landslide
The Tessina landslide, located in the NE Italian
Alps near the city of Belluno, was first triggered in
October 1960 (Pasuto et al., 1992; Angeli et al., 1994,
2000; Mantovani et al., 2000a,b). It is a complex
landslide with a source area affected by roto-transla-
tional slides which develop downhill into a mud flow
through a steep channel. The landslide developed in
the Tessina valley between altitudes of 1220 and 625
m a.s.l., with a total longitudinal extension of nearly 3
km, a maximum width of about 500 m and a total
volume of about 7 million m3. The mud flow
skimmed over the village of Funes and stretched
downhill as far as the village of Lamosano (Fig. 1).
The landslide involves the Flysch Formation
(Lower Eocene), which consists of alternated marly-
argillaceous and calcarenite layers, with a total thick-
ness ranging from about 1000 to 1200 m. This
formation makes up the impermeable bedrock of the
entire sliding area and crops out at the foot of Mt.
Teverone, which is mainly made up of Fadalto Lime-
stones (Upper Cretaceous).
During the 1960s, several reactivations involving
about 5 million m3 of material, caused the filling of
the Tessina valley. These movements seriously endan-
gered the village of Funes, which is situated on a steep
ridge originally quite high above the river bed, but
now nearly at the same level as the mud flow.
The April 1992 reactivation of the landslide posed
a high risk to the villages of Lamosano and Funes,
resulting in their temporary evacuation. The move-
ment initiated in the upper part of the depletion zone
as a rotational slide, with a 20- to 30-m-deep failure
surface, affecting also the flysch bedrock and involv-
ing about 1 million m3 of rock and earth. The land-
slide movement continued until June 1992, causing
the mobilization of a total volume of about 2 million
m3. The displaced material initially reached the upper
accumulation zone (Fig. 1) and then was channeled,
giving rise to a series of earth flows which converged
into the main mud flow in the lower part of the slope.
Following this major landslide reactivation, the
Italian Ministry for Civil Protection assigned funds
for works to be carried out on a short and medium-
term basis, in order to safeguard residential areas, as
well as for the installation of a permanent monitoring
and an early-warning system. The system, established
by the National Research Council (Angeli et al.,
1994), consists of an arrangement of sensors and
measuring instruments, including two multiple-base
wire extensometers, a topographic system with an
automatic landmark detector for measuring the surface
movements of 30 benchmarks (Figs. 1 and 2). Two
alarm units, one comprising three directional bars and
an ultrasonic echometer, the other with two directional
bars and an echometer, were installed on the body of
the mud flow, uphill the villages of Funes and
Lamosano. Three videocameras were also installed
aimed at recording the slide movements in the areas
considered as the most critical, i.e., the upper accu-
mulation and the two areas uphill from Funes and
Lamosano. The control centre, situated inside the
D. Tarchi et al. / Engineering Geology 68 (2003) 15–3018

Fig. 1. Plan of the Tessina landslide showing the installed monitoring systems and longitudinal geological section highlighting the main
geological units. Legend of the section: (1) main flow body; (2) rotational slides; (3) scree slope; (4) folded and fractured flysch; (5) Flysch
Formation (Lower Eocene); (6) Fadalto Limestone (Upper Cretaceous) (after Angeli et al., 2000).
D. Tarchi et al. / Engineering Geology 68 (2003) 15–30 19

Town Hall of Chies d’Alpago in Lamosano, received
data from the peripheral stations to which the sensors
are connected. The system is currently operating for
early-warning purposes, and it is associated to a Civil
Protection plan, which includes the evacuation of the
population from the residential areas in case of danger.
The depletion zone of the landslide was chosen as
target for radar observations. This area is constantly
active, and it is characterized by the presence of three
main scarps (Fig. 2). Global landslide reactivations in
the past have always been induced by mass move-
ments in this area; for this reason, its control is of
crucial importance in the framework of the early-
warning system. Fig. 2 shows, through different
symbols, the average displacement rates recorded at
30 benchmarks during the last year. The most active
sector, with displacements of over 1 m/year, is
located within the main scarp, where the material
slides intermittently towards the upper accumulation
zone (Fig. 1). The highest velocities (up to several
decimeters per hour) have been recorded in corre-
spondence of the superficial earth flows within this
sector.
4. Materials, methods and measurement campaign
The ground-based SAR apparatus used in this
application is a portable device, called Linear SAR
(LISA) designed and implemented by the Joint
Research Centre (Rudolf et al., 1999; Tarchi et al.,
1997, 1999, 2000a,b). The LISA system is composed
of the following main components (Fig. 3):
� a microwave system, constituted by a continuous-
wave stepped-frequency (CW-SF) radar, based on a
Fig. 2. Plan of the depletion zone showing the landslide main scarps, the location of the radar and of the topographic system, the position of the
benchmarks and their average rate of movement over the last year.
D. Tarchi et al. / Engineering Geology 68 (2003) 15–3020

network analyzer (NWA) with a signal source
between 30 kHz to 6 GHz; a coherent conversion
module makes it possible to extend the operating
frequencies up to 17 GHz;� a mechanical component formed by a straight rail
2.8 m long, with a motorized sled hosting the radar
antennas, whose movement is controlled via a
linear positioner.
The measurement campaign on the Tessina land-
slide was carried out between the 25th of September
and the 13th of October 2000. The instrumentation
was installed at an elevation of 997.3 m a.s.l., in a
stable area on the opposite slope in front of the
depletion zone, which was completely visible at an
average distance of 500 m (Fig. 2).
The arrangement of the instrumentation in the field
is shown in Fig. 4. The rail was mounted on a
concrete wall, and the electronic apparatuses for
acquisition and visualization were placed in an exist-
ing building hosting the topographic monitoring sys-
tem described in the previous section. The instrument
employed in these measurements has been designed in
order to make the installation as easy as possible,
taking into account the typical conditions of operation
for the proposed application. The installation of the
system, including preliminary calibration measure-
ments, typically requires few hours.
Fig. 5 shows the scenario observed by the radar
instrument, corresponding to the upper part of the
landslide (zone of depletion and part of the upper
accumulation zone). Each white dot in the figure
Fig. 4. Field set-up of the instrumentation in the test site and detail of the motorized sled with the antennas. The topographic station has been
used for validating radar measures on a number of selected benchmarks.
Fig. 3. Technical scheme of the LISA system. Network Analyzer
(NWA); transmitting antenna (Tx); receiving antenna (Rx).
D. Tarchi et al. / Engineering Geology 68 (2003) 15–30 21

indicates a benchmark, whose position is measured,
with millimetric accuracy, every 4 h, by the motorized
theodolite and the Electronic Distance Meter (EDM)
of the topographic system.
Radar observations were carried out in the fre-
quency band 16.70–16.78 GHz with steps of 100 kHz
and VV polarization, for a total of 801 frequency
points. The transmitted power was 25 dBm (approx-
imately 300 mW). The antenna synthesis was ob-
tained by moving the antenna’s sled, at azimuth steps
of 6 mm along a 2.4-m synthetic aperture, for a total
of 401 azimuth points (Table 1).
Under these operational conditions the spatial
resolution in range is approximately 2 m. Azimuth
resolution is not constant over the area imaged, as it
varies approximately between 0.5 and 3.75 m with a
value of about 2 m at the centre. The theoretical limit
for the system precision in LOS displacement detec-
tion is about 0.5 mm (corresponding to a phase shift
of 20j at the operating frequencies).
Data acquisitions were exactly repeated from the
same position, at intervals of about 14 min. In all, a
total of approximately 400 raw data sets, arranged in a
number of continuous sequences, were collected.
The data processing chain includes different steps.
First, each set of raw data is calibrated, using a
single reference calibration procedure derived from
measurements at a fixed point (Wiesbeck and Kahny,
1991). Then calibrated data are focused using a time
domain SAR processor specially tailored for such
application (Fortuny and Sieber, 1994). This algo-
rithm has been developed to approach efficiently the
special case where the azimuth extent of the desired
image is much larger than the synthetic aperture. In
this situation, memory requirements may become too
demanding, thus preventing the use of other SAR
Table 1
Summary of the main operational parameters of the radar measure-
ment campaign
Frequency band 16.70–16.78 GHz
Frequency step 100 kHz
Frequency points 801
Aperture 2.40 m
Azimuth step 6 mm
Azimuth points 401
Polarization VV
Transmitted power (approximate) 25 dBm
Target distance (average) 500 m
Spatial resolution (range) 2 m
Spatial resolution (cross range) 2 m
Measuring time per image ca. 14 min
Total time interval 15 days
Number of collected images ca. 400
Fig. 5. Photo of the target scene (depletion zone of the Tessina landslide) with the position of the optical benchmarks. The two benchmarks
labeled 610 and 611 are included in the zone affected by displacements during the radar campaign.
D. Tarchi et al. / Engineering Geology 68 (2003) 15–3022

focusing algorithms, such as range migration and
chirp scaling algorithms (Carrara et al., 1995). In
addition, the focusing can be performed on an
arbitrary set of points, with a negligible impact on
the computational time. Such a feature allows to
easily incorporate the information on the local top-
ography. Resulting images can be directly referred to
an existing DEM of the area under test facilitating
the analysis of the results. In this way also, the
comparison with ground truth data is simplified
because a defined point in the scenario can be easily
located in the image with a similar accuracy to that
of the available DEM. The grid of points has to be
chosen in order to guarantee an appropriate over-
sampling.
Finally, from each pair of images an interferogram
is generated according to Eq. (1). An additional step is
also applied in order to mask out pixels, where the
phase measurement cannot be considered reliable.
This has been accomplished through the complex
coherence, defined according to the following rela-
tionship:
c ¼ E½ms*�ffiffiffiffiffiffiffiffiffiffiffiffiffiffiffiffiffiffiffiffiffiffiffiffiffiffiffiffiffiffiffiffiE½AmA2�E½AsA2�
q ð2Þ
where m is the master image, s the slave image, * and
E[#] indicates the conjugate and the mathematical
expectation, respectively.
For a given set of images, the first one is identified
as the master and a sequence of coherence maps is
generated as the slave varies along the images se-
quence. The temporal evolution of the coherence is
then analysed in order to retain only the pixels whose
coherence is always above a specified threshold.
5. Discussion of results and validation
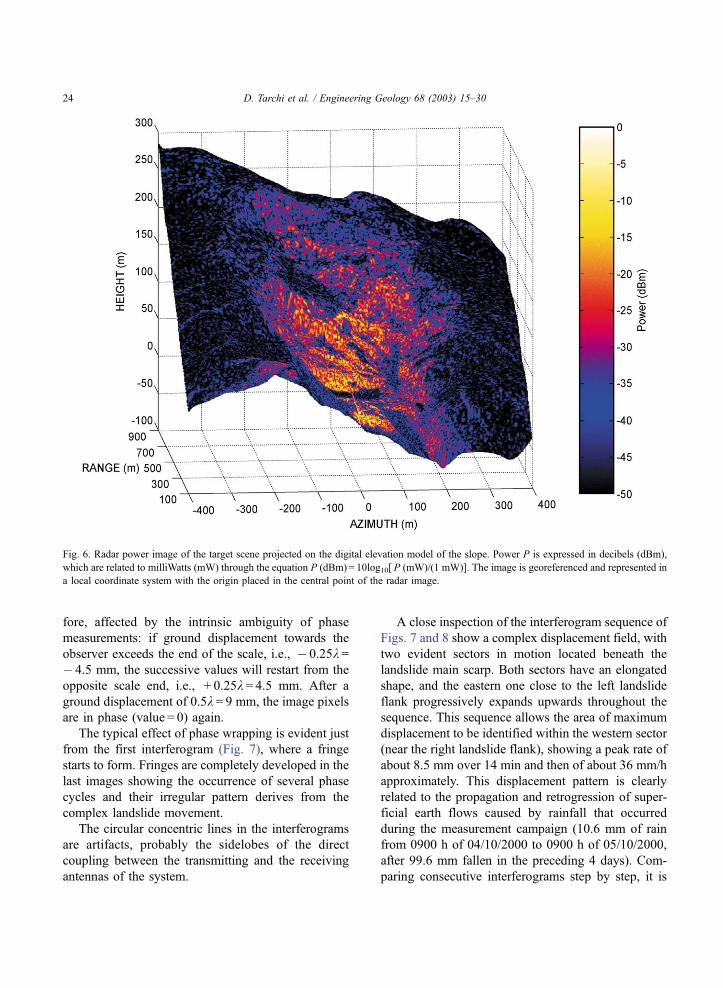
A radar power image of the target scene, projected
on the DEM, is shown in Fig. 6 and can be compared
with the photo of Fig. 5. It is possible to appreciate
how the highest reflectivity (light colors) comes from
the bare or scarcely vegetated soil (e.g., grass, low
shrubs). The boundaries of those zones with a high
reflectivity closely correspond to the vegetation limit.
Densely vegetated areas, with trees or dense shrubs,
have a low reflectivity and are represented with dark
colors in the image.
Due to the short time interval between acquisi-
tions (14 min), the variation of the ground dielectric
constants can be neglected and the phase difference,
Dw, is translated into ground displacements in the
LOS direction, Dr, according to the following rela-
tionship:
Dr ¼ k4p
Dw ð3Þ
When particular atmospheric events occur during this
interval, data are carefully checked and eventually
discarded when these effects are not negligible.
A sequence of eight interferograms, covering a
time span of 2 and 45 min (between 0000 and 0245
h GMT+1 of 05/10/2000) is shown in Figs. 7 and 8.
The interferograms refer to the same master image.
They have been processed on the DEM and areas of
low coherence masked out. In order to facilitate their
interpretation, the projection onto a horizontal plane is
displayed.
The color scale of the interferograms expresses the
phase difference converted to millimeters according to
Eq. (3), which in turn directly corresponds to ground
movements in the LOS direction. Negative values
indicate a distance reduction, i.e., a movement
towards the observer. The fact that only the compo-
nent of the displacement along the LOS can be
measured deserves additional comments. The geo-
metrical arrangement of the GB-InSAR is very differ-
ent from that of spaceborne observations, and the
orientation of the LOS is strongly dependent on the
local topography. On the other hand, when a detailed
DEM is available, the LOS orientation with respect to
a specified direction, for instance, the local slope
direction, can be precisely computed. The angles
between the LOS and the local slope direction have
been calculated for every pixel of the whole image.
Moreover, the topographic system provides an inde-
pendent assessment of the movement directions of the
benchmarks. The angles between these directions and
the local LOS direction have been assessed for every
benchmark; the results show that at least the 60% of
the movement is along the LOS.
It has to be pointed out that the phase values have
not been unwrapped. Deformation values are, there-
D. Tarchi et al. / Engineering Geology 68 (2003) 15–30 23
fore, affected by the intrinsic ambiguity of phase
measurements: if ground displacement towards the
observer exceeds the end of the scale, i.e., � 0.25k=� 4.5 mm, the successive values will restart from the
opposite scale end, i.e., + 0.25k = 4.5 mm. After a
ground displacement of 0.5k = 9 mm, the image pixels
are in phase (value = 0) again.
The typical effect of phase wrapping is evident just
from the first interferogram (Fig. 7), where a fringe
starts to form. Fringes are completely developed in the
last images showing the occurrence of several phase
cycles and their irregular pattern derives from the
complex landslide movement.
The circular concentric lines in the interferograms
are artifacts, probably the sidelobes of the direct
coupling between the transmitting and the receiving
antennas of the system.
A close inspection of the interferogram sequence of
Figs. 7 and 8 show a complex displacement field, with
two evident sectors in motion located beneath the
landslide main scarp. Both sectors have an elongated
shape, and the eastern one close to the left landslide
flank progressively expands upwards throughout the
sequence. This sequence allows the area of maximum
displacement to be identified within the western sector
(near the right landslide flank), showing a peak rate of
about 8.5 mm over 14 min and then of about 36 mm/h
approximately. This displacement pattern is clearly
related to the propagation and retrogression of super-
ficial earth flows caused by rainfall that occurred
during the measurement campaign (10.6 mm of rain
from 0900 h of 04/10/2000 to 0900 h of 05/10/2000,
after 99.6 mm fallen in the preceding 4 days). Com-
paring consecutive interferograms step by step, it is
Fig. 6. Radar power image of the target scene projected on the digital elevation model of the slope. Power P is expressed in decibels (dBm),
which are related to milliWatts (mW) through the equation P (dBm) = 10log10[ P (mW)/(1 mW)]. The image is georeferenced and represented in
a local coordinate system with the origin placed in the central point of the radar image.
D. Tarchi et al. / Engineering Geology 68 (2003) 15–3024

Fig. 7. Sequence of interferograms between the 00:00 and the 02:27 of the 05/10/2000. The time elapsed from the start of the sequence
(reference image) is shown on the topright of each interferogram.
D. Tarchi et al. / Engineering Geology 68 (2003) 15–30 25

possible to follow the landslide evolution in detail. The
distribution of activity of the landslide maintains the
same displacement pattern throughout the sequence,
showing constant displacement rates over the inves-
tigated time span.
Only two benchmarks, labeled 610 and 611 in
Figs. 2 and 5, were positioned inside the sectors
which moved during the radar measurements. The
comparison between the results of radar and optical
measurements on benchmarks 610 and 611 are plotted
in Figs. 9 and 10, respectively. In both cases, we
located the pixel containing the benchmark, and we
considered the same pixel in the series of successive
interferograms, extracting and unwrapping the dis-
placement history of what is hosted in an individual
sampling cell. Due to the presence of time spans with
missing SAR acquisitions, optical data have been
utilized to correctly unwrap radar measurements.
The curves in Fig. 9 refers to the benchmark 610
and show a nearly constant displacement rate of about
Fig. 8. Last interferogram after 2 h and 45 min from the start of the sequence (02:45 h of 05/10/2000).
D. Tarchi et al. / Engineering Geology 68 (2003) 15–3026

11.7 mm/h over a total time interval of 48 h. The plot
shows a very close agreement between the two
independent techniques with a maximum discrepancy
lower than 3.0 mm.
Benchmark 611 (Fig. 10) turned out to be not clear,
being located in an area of quite low coherence. In
addition, the optical measurements are affected by a
systematic error probably due to daily temperature
effects. For this reason, the optical data have been in-
terpolated in Fig. 10 in order to make a direct compar-
ison with radar observation possible. The interpolated
data show a total displacement of 9 mm over 48 h,
Fig. 10. Cumulated displacements measured by the EDM at benchmark 611 compared with radar displacements in the corresponding pixel
(from the 12:02 h of 04/10/2000 and the 12:02 h of 06/10/2000, GMT+ 1).
Fig. 9. Cumulated displacements measured by the EDM at benchmark 610 compared with radar displacements in the corresponding pixel (from
the 12:02 h of 04/10/2000 and the 12:02 h of 06/10/2000, GMT+ 1).
D. Tarchi et al. / Engineering Geology 68 (2003) 15–30 27

corresponding to a mean velocity of 0.35 mm/h. Des-
pite this low displacement rate and the low coherence,
in this case also, the radar observations show a very
similar trend, with discrepancies limited within 3 mm.
Data concerning benchmark 610 have been also
exploited to further assess the accuracy of the radar
method. In particular, the standard deviation of the
difference between optical and radar measurements
has been calculated, after resampling on an appropri-
ate finer grid. The resulting value of 1.7 mm can be
considered the accuracy of the radar interferometry
method in the detection of surface displacements
under the adopted operational conditions.
6. Conclusions
The application of the ground-based SAR interfer-
ometry to the Tessina landslide has been implemented
by using portable field instrumentation that can be
installed in a very short time (few hours). Derived data
have shown the evolution of ground movements
almost over the entire depletion zone of the landslide.
Displacement rates up to about 1 m/day have been
assessed with a millimetric accuracy and a pixel
resolution of approximately 2� 2 m.
Through the continuous monitoring of slope move-
ments, the proposed technique has allowed us to
derive real-time maps showing the deformation field
of those landslide sectors characterized by a good
radar reflectivity and coherence (i.e., scarcely vege-
tated areas). These deformation maps represent a tool
for the interpretation of landslide kinematics and
short-term evolution, providing data for an accurate
analysis of temporal and spatial displacement fields.
This aspect is the main element of scientific interest in
terms of pure research on landslide kinematics
because, compared to conventional monitoring meth-
ods, the collected information allows a more direct
interpretation of the movement mechanism to be
established. Besides this general scientific interest,
the technique has very promising perspectives for
operational applications. Thanks to its noninvasive
character it is well suited for monitoring ‘‘sensitive’’
areas such as unstable urban zones and cultural
heritage sites, and it is particularly useful for monitor-
ing emergency situations due to the ease of its
installation and maintenance.
In particular, the tests carried out on the Tessina
landslide provide an operational comparison between
the ground-based interferometry and a traditional topo-
graphic system, showing that the precision of both
techniques is almost the same. The proposed technique
presents, however, a series of major advantages:
(a) it is a completely remote sensing method and it
does not need benchmarks to be installed over the
target area;
(b) it is more robust because it does not seem to be
influenced by daily temperature disturbances
affecting the electronic distance meter;
(c) it provides a really distributed information over
large landslide sectors; and
(d) its cost and time of installation are comparable to
those of an automatic topographic system.
Further applications of ground-based radars, which
will be explored in the future, concern the possibility
of a remote sensing production of high-resolution
digital terrain models, as currently done by space-
borne SAR interferometry, and the determination of
the soil moisture, by combing information on SAR
reflectivity and coherence to obtain an interferometric
signature of the terrain.
Acknowledgements
Research on the applicability of ground-based SAR
for landslide monitoring is funded by the Italian Space
Agency (ASI) and by the National Research Council
Group for Hydro-Geological Disaster Prevention
(CNR–GNDCI) supported by the Department of
Civil Protection of the Italian Government. In
particular, this activity is part of the ASI Programme
‘‘Remote-sensing techniques for monitoring land-
slide’’, AMHARAL Project ‘‘Analytical methods for
the definition of hazard areas for rainfall induced
landslides’’. Part of the activity has been developed
within the GNDCI–MOGEM Project ‘‘Monitoring
high risk slope movements’’. Both projects are
coordinated by Prof. Paolo Canuti at the University
of Firenze. We would like to thank Dr. Gareth Lewis
for revising the manuscript, Mr. Marco Basso for the
LISA installation and maintenance, and Mr. Paolo
Farina for the help in data processing and editing. We
D. Tarchi et al. / Engineering Geology 68 (2003) 15–3028

would also like to thank the anonymous referees for
their fruitful comments.
References
Achache, J., Fruneau, B., Delacourt, C., 1995. Applicability of SAR
interferometry for operational monitoring of landslides. Proc.
2nd ERS Applications Workshop, London, 165–168.
Allaway, A., Merrett, P.J., Eyre, J.M., Stead, D., 1998. The Appli-
cation Of GPS In Monitoring Landslide Movements. Proc. 8th
IAEG Congress. Balkema, Rotterdam, pp. 1633–1640.
Angeli, M.G., Gasparetto, P., Menotti, R.M., Pasuto, A., Silvano, S.,
1994. A system of monitoring and warning in a complex land-
slide in Northeastern Italy. Landslide News 8, 12–15.
Angeli, M.G., Pasuto, A., Silvano, S., 2000. A critical review of
landslide monitoring experiences. Eng. Geol. 55, 133–147.
Atzeni, C., Basso, M., Canuti, P., Casagli, N., Leva, D., Luzi, G.,
Moretti, S., Pieraccini, M., Sieber, A.J., Tarchi, D., 2001.
Ground-based radar interferometry for landslide monitoring
and control. Proc. ISSMGE Field Workshop on Landslides
and Natural/Cultural Heritage, Trabzon (Turkey). ISSMGE
TC-11, Kyoto, pp. 195–209.
Atzeni, C., Canuti, P., Casagli, N., Leva, D., Luzi, G., Moretti, S.,
Pieraccini, M., Sieber, A.J., Tarchi, D., in press. A portable
device for landslide monitoring using radar interferometry.
Landslide News.
Carnec, C., King, C., Massonnet, D., 1995. Measurement of land
subsidence by means of differential SAR interferometry. Proc.
5th Int. Symp. on Land Subsidence (FISOLS95), pp. 139–148.
Carnec, C., Massonnet, D., King, C., 1996. Two examples of the
application of SAR interferometry to sites of small extent. Geo-
phys. Res. Lett. 23, 3579–3582.
Carrara, W.G., Goodman, R.S., Majeswski, R.M., 1995. Spotlight
Synthetic Aperture Radar: Signal Processing Algorithms. Artech
House, Boston (MA, USA), 554 pp.
Coe, J.A., Godt, J.W., Ellis, W.L., Savage, W.Z., Savage, J.E.,
Powers, P.S., Varnes, D.J., Tachker, P., 2000. Preliminary inter-
pretation of seasonal movement of the Slumgullion landslide as
determined from GPS observations, July 1998– July 1999.
USGS Open-File Report, 00-102.
Curlander, J.C., McDonough, R.N., 1991. Synthetic Aperture Ra-
dar: Systems and Signal Processing. Wiley, New York, 672 pp.
Ferretti, A., Prati, C., Rocca, F., 2001. Permanent scatterers in SAR
interferometry. IEEE Trans. Geosci. Remote Sens. 39 (1), 8–20.
Fortuny, J., Sieber, A.J., 1994. Fast algorithm for a near-field syn-
thetic aperture radar processor. IEEE Trans. Antennas Propag.
42, 1458–1460.
Fruneau, B., Achache, J., Delacourt, C., 1996. Observation and
modeling of the Saint-Etienne-de-Tinee landslide using SAR
interferometry. Tectophysics 265, 181–190.
Gabriel, A.K., Goldstein, R.M., Zebker, H.A., 1989. Mapping small
elevation changes over large areas: differential radar interfero-
metry. J. Geophys. Res. 94 (B7), 9183–9191.
Gili, J.A., Corominas, J., Rius, J., 2000. Using global positioning
system techniques in landslide monitoring. Eng. Geol. 55,
167–192.
Keaton, J.R., DeGraff, J.V., 1996. Surface observation and geologic
mapping. Landslides. Investigation and Mitigation. U.S. Trans-
port. Res. Boards Special Report, vol. 176. National Academy
of Sciences, Washington, pp. 178–230.
Kimura, H., Yamaguchi, Y., 2000. Detection of landslide areas us-
ing radar interferometry. Photogr. Eng. Remote Sens. 66 (3),
337–344.
Mantovani, F., Pasuto, A., Silvano, S., Zannoni, A., 2000a. Collect-
ing data to define future hazard scenarios of the Tessina land-
slide. Int. J. Appl. Earth Obs. Geoinf. 2 (1), 33–40.
Mantovani, F., Pasuto, A., Silvano, S., 2000b. Recent landslide
studies in the eastern Dolomites (Italian Alps) aiming at the
definition of related hazard. J. Nepal Geol. Soc. 22, 471–480.
Massonnet, D., Rossi, M., Carmona, C., Adragna, F., Peltzer, G.,
Feigl, K., Rabaute, T., 1993. The displacement field of the
Landers earthquake mapped by radar interferometry. Nature
364, 138–142.
Massonnet, D., Briole, P., Arnaud, A., 1995. Deflation ofMount Etna
monitored by space radar interferometry. Nature 375, 567–570.
Mikkelsen, P.E., 1996. Field instrumentation. Landslides. Investiga-
tion and Mitigation. U.S. Transportation Research Boards Spe-
cial Report, vol. 247. National Academy Press, Washington, DC,
pp. 278–315.
Pasuto, A., Silvano, S., Bozzo, G.P., 1992. The Tessina landslide
(Belluno, Italy). Proc. 1st European Intensive Course on Applied
Geomorphology. Universita degli Studi di Modena, pp. 63–69.
Prati, C., Rocca, F., Monti Guarnieri, A., 1995. Monitoring surface
deformations with SAR interferometry. Proc. Int. Symp. on Ret-
rieval of Bio and Geophysical Parameters from SAR Data for
Land Applications. ESA-CNES, Toulouse, pp. 467 –472
October.
Refice, A., Bovenga, F., Wasowski, J., Guerriero, L., 2000. Use of
InSAR data for landslide monitoring: a case study from southern
Italy. Proc. IGARSS 2000, Hawaii, pp. 2504–2505.
Rosen, P.A., Hensley, S., Joughin, I.R., Li, F.K., Madsen, S.N.,
Rodriguez, E., Goldstein, R.M., 2000. Synthetic aperture radar
interferometry. Proc. I.E.E.E. 88 (3), 333–382.
Rott, H., Siegel, A., 1999. Analysis of mass movements in Alpine
Terrain by means of SAR interferometry. Proc. IGARSS’99,
Hamburg, pp. 1939–1993.
Rott, H., Scheuchel, B., Siegel, A., 1999. Monitoring very slow
slope movements by means of SAR interferometry: a case study
from mass waste above a reservior in the Otztal Alps, Austria.
Geophys. Res. Lett. 26 (11), 1629–1632.
Rudolf, H., Leva, D., Tarchi, D., Sieber, A.J., 1999.Amobile and ver-
satile SAR system. Proc. IGARSS’99, Hamburg, pp. 592–594.
Singhroy, V., Mattar, K., 2000. SAR image techniques for map-
ping areas of landslides. Proc. ISPRS 2000, Amsterdam,
pp. 1395–1402.
Singhroy, V., Mattar, K., Gray, L., 1998. Landslide characterization
in Canada using interferometric SAR and combined SAR and
TM images. Adv. Space Res. 2 (3), 465–476.
Tarchi, D. Casagli, N., Atzeni, C., Canuti, P., Leva, D., Luzi, G.,
Moretti, S., Pieraccini, M., Sieber, A.J., in preparation. Monitor-
ing landslide displacements by using ground-based differential
SAR interferometry: application to the Ruinon landslide in the
Italian Alps. Submitted to J. Geophys. Res.
D. Tarchi et al. / Engineering Geology 68 (2003) 15–30 29

Tarchi, D., Ohlmer, E., Sieber, A.J., 1997. Monitoring of structural
changes by radar interferometry. Res. Nondestruct. Eval. 9,
213–225.
Tarchi, D., Rudolf, H., Luzi, G., Chiarantini, L., Coppo, P., Sieber,
A.J., 1999. SAR interferometry for structural changes detection:
a demonstration test on a dam. Proc. IGARSS’99, Hamburg,
pp. 1522–1524.
Tarchi, D., Leva, D., Sieber, A.J., 2000a. SAR Interferometric tech-
niques from ground based system for the monitoring of land-
slides. Proc. IGARSS 2000, Hawaii, pp. 2756–2758.
Tarchi, D., Rudolf, H., Pieraccini, M., Atzeni, C., 2000b. Remote
monitoring of buildings using a ground-based SAR: applica-
tion to cultural heritage survey. Int. J. Remote Sens. 21 (18),
3545–3551.
Wasowski, J., Gostelow, P., 1999. Engineering geology landslide
investigations and SAR interferometry. Proceedings of FRINGE
1999, Liege, Belgium (http://www.esrin.esa.it/fringe99).
Wiesbeck, W., Kahny, D., 1991. Single reference three target cali-
bration and error correction for monostatic polarimetric free
space measurements. Proc. I.E.E.E. 79, 1551–1558.
Zebker, H.A., Goldstein, R.M., 1986. Topographic mapping from
interferometric synthetic aperture radar observations. J. Geo-
phys. Res. 91, 4993–4999.
Zebker, H., Rosen, P., Goldstein, R., Gabriel, A., Werner, C., 1994.
On the derivation of coseismic displacement fields using differ-
ential radar interferometry: the Landers earthquake. J. Geophys.
Res. 99, 19617–19634.
D. Tarchi et al. / Engineering Geology 68 (2003) 15–3030


