Embed Size (px)
Citation preview
For Photovoltaics2014-2018
GLOBALMARKETOUTLOOK
Supported by:


For Photovoltaics2014-2018
GLOBALMARKETOUTLOOK

Principal authors and analysts: Gaëtan Masson (iCARES Consulting), Sinead Orlandi, Manoël Rekinger
Publication coordination: Benjamin Fontaine, Sinead Orlandi
External contributors: AECEA, APERe, APESF, APISOLAR, APREN, assoRinnovabili, Australian PV Association, BPVA, BSWSolar,CANSIA, CREIA, CRES, CZEPHO, Danish PV Association, EDORA, ENERPLAN, Fronius, GENSED, GIFI, Goldbeck, HELAPCO,Holland Solar, HUPIA, IEA-PVPS, JPEA, KOPIA, Martifer, PV AUSTRIA, PV Russia, PV Poland, PV Vlaanderen, RenewableAssociation of Israel, RPIA, RTS Corporation, SAPI, SAPVIA, SASIA, SEIA, SEMI Taiwan, SolarMax, SolarTrade Association,SunEdison, Swissolar, TOTAL, UNEF, Wacker, ZSFI
Editor: Tom Rowe
Design: Onehemisphere, Sweden
Images: iStock.com/CaiaImage (cover), REC – Renewable Energy Corporation ASA (page 8), Sharp (page 10), ENEL (page 12),First Solar (page 14), First Solar (page 16), Kyocera Fineceramics, Stromaufwart Photovoltaik GmbH (page 26), Sharp (page 48),JA Solar (page 54).
Supported by: Intersolar Europe
Solar irradiation world map has been derived from the SolarGIS database: http://solargis.info (© 2014 GeoModel Solar)
Disclaimer: Please note that all historical figures provided in this brochure are valid at the time of publication and will be revisedwhen new and proven figures are available. All forecast figures are based on EPIA knowledge at the time of publication. Pleasealso note that forecast figures have been rounded.
EPIA’s methodology includes only systems connected to the grid and not those that have been installed but not yet connected.The difference between installations and systems connected to the grid can be quite significant in some cases. Installed capacityconsiders all photovoltaic technologies.
EPIA • GLOBAL MARKET OUTLOOK FOR PHOTOVOLTAICS 2014-2018 • 5
FOREWORD
Dear EPIA Members, Dear Friends of EPIA,
Since its creation in 1985, EPIA – the European Photovoltaic Industry Association – has experienced greatchanges and challenges. Just like the solar photovoltaic (PV) industry. Only a niche market a few yearsago, PV is now becoming a mainstream electricity provider, changing the way the world is powered.As the voice of photovoltaics in Europe, EPIA is leading the way to this energy transition.
To ensure PV gets favourable and sustainable framework conditions, EPIA is intensively engagingin the European decision making process on all relevant regulations shaping the energy sector. EPIA isalso proactively engaging on key issues for the future development of PV, such as the energy marketdesign and the integration of PV into the electricity grid. Our profound intelligence work on these issuesis further reinforcing the PV sector’s credibility and our ability to secure a sustainable developmentpathway for PV.
Over the years, EPIA has established itself as an opinion leader and a credible information hub onmarkets and policy, reinforcing its key role in the European energy sector. The 2014 edition of ourflagship report “Global Market Outlook for Photovoltaics”, with comprehensive historical market data,five-year forecasts for the main global markets under different policy assumptions, hopefully not toooptimistic, as well as an analysis of the role that PV is playing in the European energy system, will onceagain be an indispensable tool for the global PV sector and energy stakeholders alike.
Even during a difficult period of industry consolidation and economic crisis, PV installations saw anotherrecord-year in 2013: at least 38.4 GW of newly-added capacity around the globe, and almost 11GW in Europe. While the latter figure represents a significant decrease compared to the year before, itshould however be put into perspective. In 2013, apart from wind, no other source of electricityreached the levels of new installations that PV did in Europe. Some, such as gas, even experiencednegative net numbers, with more capacity decommissioned than installed.
This proves, if need be, that solar photovoltaics is on the way to becoming a major part of the electricitysystem, delivering clean, safe and affordable energy to the greater number all around the globe.
The energy transition is underway, let’s embrace it!
Enjoy your reading.Best regards,
Oliver SchäferEPIA President

EPIA • GLOBAL MARKET OUTLOOK FOR PHOTOVOLTAICS 2014-2018 • 7
TABLE OF CONTENTS
Foreword 5
1. INTRODUCTION 8
2. METHODOLOGY AND SCENARIOS 12
1. Installations and connections 142. The role of off-grid installations 143. AC-DC numbers: Counting comparable numbers 15
3. MARKET EVOLUTION 16
A. Historical PV market development 171. World cumulative installed capacity 172. World PV market development 183. European market development 21
B. The market in Europe in 2013 and the forecast until 2018 251. Relevant European markets in 2013 252. Segmentation 283. Forecasts of PV in Europe until 2018 304. 2020 potential and targets in the EU 335. Medium-term scenario for 2030: How much can PV contribute to a binding 2030 target? 356. Support schemes in Europe and prospects for PV 36
C. The global market in 2013 and the forecast until 2018 371. Global PV market growth 372. Global PV capacity 383. Forecasts until 2018 394. Forecasts per segment 435. Future prospects for market development 46
4. PHOTOVOLTAICS IN THE ENERGY SECTOR 48
A. Positioning PV in the electricity generations mix 491. PV positioning in 2013 492. Historical PV positioning 513. Share of PV in the EU 28 524. PV and the electricity system 53
5. CONCLUSION 54
Glossary 56List of figures and tables 57

INTRODUCTION1
EPIA • GLOBAL MARKET OUTLOOK FOR PHOTOVOLTAICS 2014-2018 • 9
1. INTRODUCTION
With at least 38.4 gigawatts (GW) of newly-installed solar photovoltaic (PV) capacityworldwide and a global cumulative installed capacity of 138.9 GW, 2013 was another historicyear for solar PV technology.
Compared to the two previous years, where installed capacity hovered only slightly above 30 GWannually, the PV market progressed remarkably in 2013. Despite this, the global PV market is at a turningpoint which will have profound implications in the future. For the first time in more than a decade, theEuropean PV market was no longer the top regional PV market in the world. Asia surpassed Europe ina dramatic way, representing around 56% of the world PV market in 2013. This Asian progressoccurred in parallel with the relative decline in Europe already observed in 2012. Vigorous growthin non-European markets kept global PV development on an upward trajectory and largely compensatedfor the European slowdown.
EPIA’s major findings for 2013 include:
• At least 38.4 GW of PV systems were installed globally in 2013, up from 30 GW in 2012; PVremains, after hydro and wind power, the third most important renewable energy source in termsof globally installed capacity
• Almost 11 GW of PV capacity were connected to the grid in Europe in 2013, compared to17.7 GW in 2012 and more than 22.4 GW in 2011
• For the first time since 2003 Europe lost its leadership to Asia in terms of new installations
• China was the top market in 2013 with 11.8 GW of which 500 MW represent off-grid systems.Statistics released in May 2014 report that the country may have installed an additional 1.1 GWon top of the 11.8 GW estimated by EPIA. Since it is unsure whether these installations wereconnected to the grid EPIA did not take them into account. China was followed by Japan with6.9 GW and the USA with 4.8 GW.
• Germany was the top European market with 3.3 GW. Several other European markets exceededthe one GW mark: the UK (1.5 GW), Italy (1.4 GW), Romania (1.1 GW) and Greece (1.04 GW)
• Several European markets that performed well in the past went down in 2013, a consequence ofpolitical decisions to reduce PV incentives, Belgian installations went from 600 megawatts (MW)to 215 MW, French went from 1,115 MW to 613 MW, and Danish went down from 300 to around200 MW
• Aside from the significant decline in Germany and Italy, the size of the remaining European PV marketwas stable, with around 6 GW per year in the last three years
• Outside Europe, several markets continued to grow at a reasonable pace: India with 1,115 MW,Korea with 442 MW, Thailand with 317 MW, Canada with 444 MW and many others
1. INTRODUCTION
Changing regional trends, new market leaders
Europe’s role as the unquestioned leader in the PV market has come to an end. While Europe accountedfor 74% of the world’s new PV installations in 2011, and even around 55% the year after, the regiononly represented 29% of the world’s new PV installations in 2013. That said, various markets inEurope still have strong and almost untapped potential for significant PV growth in the coming years.
In 2013, growth came mainly from Asian countries and especially China and Japan, which nowrank as the first and second global markets respectively. Markets in the Americas grew less quickly thanexpected, but growth was observed in the USA, Canada and Mexico. In other regions of the world,interest in PV has not yet translated into significant market development.
Increasing competitiveness
PV markets in Europe and around the world continued to make rapid progress toward competitivenessin the electricity sector in 2013. Strong PV technology price decreases and electricity prices on the risehave helped drive momentum toward “dynamic grid parity” - when the savings in electricity cost and/orthe revenues generated by selling PV electricity on the market are equal to or higher than the long-termcost of installing and financing a PV system. Competitivenes is being reached progressively in somemarket segments of several EU countries.
10 • EPIA • GLOBAL MARKET OUTLOOK FOR PHOTOVOLTAICS 2014-2018
1. INTRODUCTION
EPIA • GLOBAL MARKET OUTLOOK FOR PHOTOVOLTAICS 2014-2018 • 11
PV as a policy-driven market
In most countries however, PV remains a policy-driven market. The introduction, modification or phasing-out of national support schemes, which heavily impact the development of PV markets and industriesin these countries, also significantly influence EPIA’s forecasts and scenarios. Indeed, declining politicalsupport for PV has led to reduced markets in several European countries (Germany, Italy, Belgium,France and Spain for instance) while the implementation of new feed-in tariff policies has led to a dramaticincrease of the markets in other countries (such as China and Japan).
PV in the electricity mix
For the third year in a row, PV in 2013 was amongst the two most installed sources of electricityin the European Union. While wind energy exceeded PV in 2013 by some hundreds of MW, these twosources of electricity are the clear leaders of new generation sources of installations. PV now covers 3%of the electricity demand and 6% of the peak electricity demand in Europe. As the share of PV in theelectricity mix increases, grid and market integration challenges are becoming more and more importantfor the future development of PV.
METHODOLOGYAND SCENARIOS 2
EPIA • GLOBAL MARKET OUTLOOK FOR PHOTOVOLTAICS 2014-2018 • 13
2. METHODOLOGY AND SCENARIOS
Forecasting PV market evolution has become more complex than it was in the past. The PV market isclearly driven by policy, but as we are now in an era of energy market integration, the market potentialof PV also depends on electricity savings and/or potential sales on the wholesale electricity market.While EPIA’s latest analyses indicate that in 2014 a part of the European market will still be driven byincentives, several key markets are already entering the transition phase from an investor-driven marketto a market driven by savings on the energy bill through self-consumption in the construction segment(residential, commercial and industrial).
In addition, economic uncertainty in several European countries has in some cases led policymakers tomake decisions that have a negative effect on the PV market, such as imposing retrospective measures.These decisions severely erode investor confidence even as PV technology and competitiveness improve– slowing market development in a way that is not easily predictable. In 2013, several retrospectivemeasures were taken, severely damaging the reputation of PV. Moreover, such measures harm thecredibility of the countries beyond PV, affecting their whole financing sector.
In March 2014, EPIA completed an extensive data-collection exercise from a highly representative sampleof the PV industry, electric utilities, national associations and energy agencies. Based on the cross-checking of data and the consolidation of complementary market projection methods, EPIA has derivedthree scenarios for the future development of PV markets:
• The High Scenario assumes the continuation, adjustment or introduction of adequate supportmechanisms, accompanied by a strong political will to consider PV as a major power source inthe coming years. Achieving this will also require removing unnecessary administrative barriersand streamlining grid connection procedures. Although market booms caused by inadequatesupport mechanisms are less likely to happen because of the growing exchange of best practiceswhen designing support policies, they can still be observed in some cases.
• The Low Scenario assumes rather pessimistic market behaviour with no major reinforcement oradequate replacement of existing support mechanisms, or a strong decrease/limitation of existingschemes, or no adequate policies. In this scenario, it is assumed that in countries close totransition, markets significantly slow down when Feed-in Tariffs (FiTs) are phased out.
• The Medium Scenario weights the two previous scenarios according to the probability ofachieving them. This new scenario defines the most probable market development forecast,according to the information available in March 2014.
Under these three scenarios, this report analyses the historical development of the PV market and itspotential for the future. Based on a bottom-up approach at country level, it presents aggregated figuresand scenarios. In this approach, consolidated forecasts should be understood as a range of possiblePV market developments, with a high probability between the Low Scenario as the lower boundary andthe High Scenario as the top of the range. Lower or higher forecasts are of course possible as the historyof PV market development has shown, although with a lower likelihood.
2. METHODOLOGY AND SCENARIOS
Installations and connections
EPIA’s methodology includes only systems connected to the grid and not those that have been installedbut not yet connected. Therefore, the cumulative installed capacity refers to installations that can makea real contribution to meeting energy demand. This also reflects both the energy system point of viewand the regulatory point of view, as PV electricity tariffs are paid only to systems that are connected andproducing electricity. The difference between installations and systems connected to the grid can bequite significant in some cases, as was detailed in previous editions of the “Global Market Outlook”.
The role of off-grid installations
Long before PV became a reliable source of power connected to the grid, it was largely used to provideelectricity in remote areas that lay out of the reach of electricity grids. While off-grid systems in Europeaccount for less than 1% of the installed PV capacity, they represent a significant power source in otherparts of the world. For this reason, off-grid systems are also taken into account in the total installedcapacity. In the USA, off-grid systems represented 10% of the overall market in 2009 and declined sincethen. In Australia and South Korea, dozens of megawatts of off-grid capacity are installed every yearand are accordingly taken into account in the total installed capacity in those countries. In countriessuch as India or Peru, the development of PV in the coming years could originate at least partially fromhybrid systems and micro-grid applications. In that respect the notion of on-grid or off-grid installationscould be more difficult to assess outside Europe.
14 • EPIA • GLOBAL MARKET OUTLOOK FOR PHOTOVOLTAICS 2014-2018
AC-DC numbers: counting comparable numbers
PV panels generate direct-current (DC) electricity; electricity systems are based on alternating-current(AC) electricity. Most countries refer to installed PV systems by counting DC power, but some report ACpower. The major difference lies in the small percentage of energy lost during the DC-AC conversion inthe inverters and the inverter parameters, which could deliver non-comparable data. This report presentsdata as they are produced by national authorities to ensure the compatibility of historical data, whateverthe conventions used. However, in the case of countries reporting AC power, this report also calculatesDC power numbers. All forecasts and consolidated data are presented in DC power, while electricityproduction data must consider AC power. In such cases, a realistic loss during conversion is assumed.In Europe, Spain falls into this category. Canada and Japan, amongst others are also reporting (at leastpartially for the latter) in AC.
EPIA • GLOBAL MARKET OUTLOOK FOR PHOTOVOLTAICS 2014-2018 • 15
2. METHODOLOGY AND SCENARIOS
MARKETEVOLUTION3
EPIA • GLOBAL MARKET OUTLOOK FOR PHOTOVOLTAICS 2014-2018 • 17
3. MARKET EVOLUTION
A. HISTORICAL PV MARKET DEVELOPMENT
The PV market has grown over the past decade at a remarkable rate – even during difficult economictimes – and is on the way to becoming a major source of power generation for the world. After recordgrowth in 2011, the global PV market stabilised in 2012, and grew again significantly in 2013.
1. World cumulative installed capacity
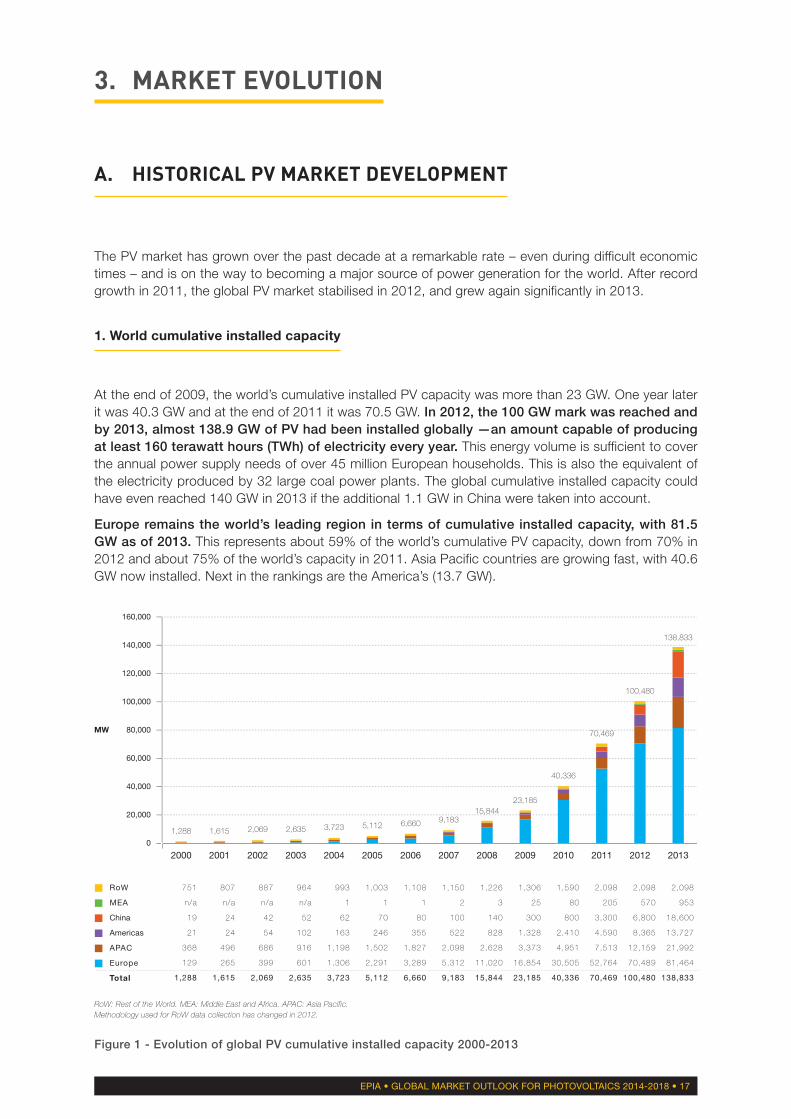
At the end of 2009, the world’s cumulative installed PV capacity was more than 23 GW. One year laterit was 40.3 GW and at the end of 2011 it was 70.5 GW. In 2012, the 100 GW mark was reached andby 2013, almost 138.9 GW of PV had been installed globally —an amount capable of producingat least 160 terawatt hours (TWh) of electricity every year. This energy volume is sufficient to coverthe annual power supply needs of over 45 million European households. This is also the equivalent ofthe electricity produced by 32 large coal power plants. The global cumulative installed capacity couldhave even reached 140 GW in 2013 if the additional 1.1 GW in China were taken into account.
Europe remains the world’s leading region in terms of cumulative installed capacity, with 81.5GW as of 2013. This represents about 59% of the world’s cumulative PV capacity, down from 70% in2012 and about 75% of the world’s capacity in 2011. Asia Pacific countries are growing fast, with 40.6GW now installed. Next in the rankings are the America’s (13.7 GW).
RoW
MEA
China
Americas
APAC
Europe
Total
2,098
953
18,600
13,727
21,992
81,464
138,833
2,098
570
6,800
8,365
12,159
70,489
100,480
2,098
205
3,300
4,590
7,513
52,764
70,469
1,590
80
800
2,410
4,951
30,505
40,336
1,306
25
300
1,328
3,373
16,854
23,185
1,226
3
140
828
2,628
11,020
15,844
1,150
2
100
522
2,098
5,312
9,183
1,108
1
80
355
1,827
3,289
6,660
1,003
1
70
246
1,502
2,291
5,112
993
1
62
163
1,198
1,306
3,723
964
n/a
52
102
916
601
2,635
887
n/a
42
54
686
399
2,069
807
n/a
24
24
496
265
1,615
751
n/a
19
21
368
129
1,288
Figure 1 - Evolution of global PV cumulative installed capacity 2000-2013
0
20,000
40,000
60,000
80,000
100,000
120,000
140,000
160,000
MW
1,288 1,615 2,069 2,635 3,723 5,112 6,660 9,18315,844
23,185
40,336
70,469
100,480
138,833
2000 2001 2002 2003 2004 2005 2006 2007 2008 2009 2010 2011 2012 2013
RoW: Rest of the World. MEA: Middle East and Africa. APAC: Asia Pacific.Methodology used for RoW data collection has changed in 2012.
3. MARKET EVOLUTION
18 • EPIA • GLOBAL MARKET OUTLOOK FOR PHOTOVOLTAICS 2014-2018
Many of the markets outside the EU - in particular the USA or India - have tapped only a very small partof their enormous potential. In 2013, Asian countries took the lead and started to develop faster thantraditional European markets. Several countries from large Sunbelt regions like Africa, the Middle East,South East Asia and Latin America are on the brink of starting their development. The cumulativeinstalled capacity outside Europe almost doubled from 30 GW as of 2012 to close to 60 GW in2013, demonstrating the ongoing rebalancing between Europe and the rest of the world and moreclosely reflecting the patterns in electricity consumption.
2. World PV market development
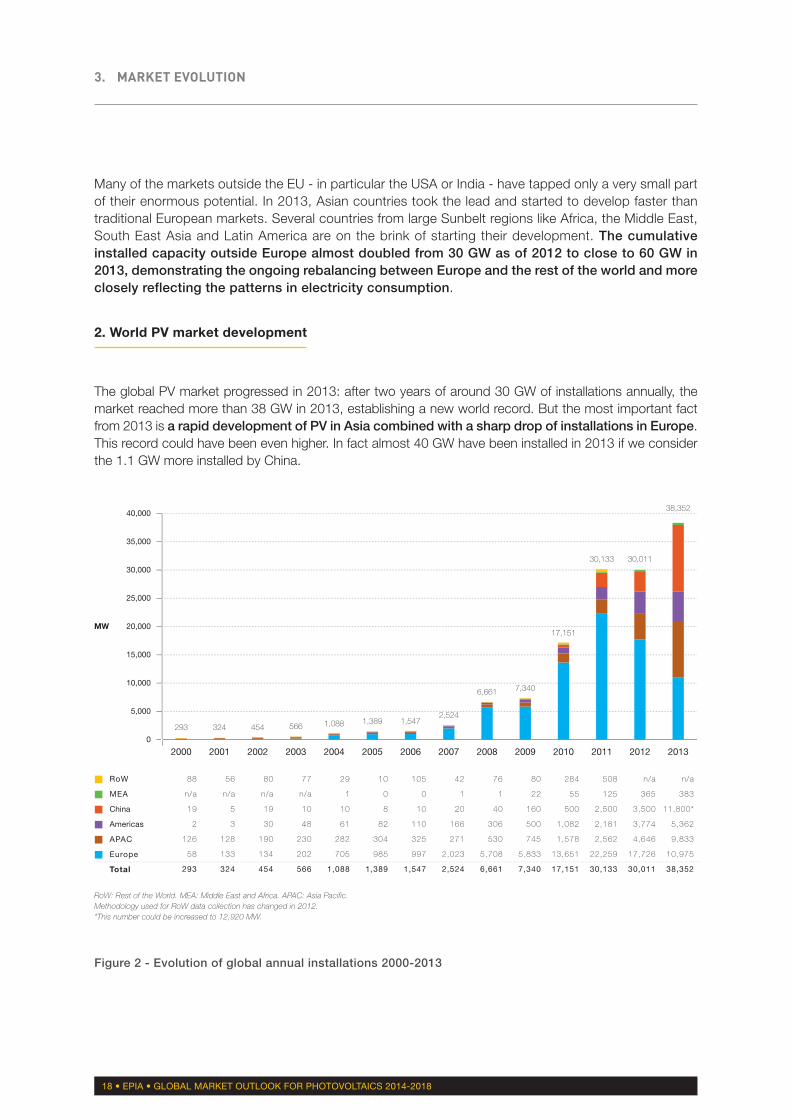
The global PV market progressed in 2013: after two years of around 30 GW of installations annually, themarket reached more than 38 GW in 2013, establishing a new world record. But the most important factfrom 2013 is a rapid development of PV in Asia combined with a sharp drop of installations in Europe.This record could have been even higher. In fact almost 40 GW have been installed in 2013 if we considerthe 1.1 GW more installed by China.
RoW
MEA
China
Americas
APAC
Europe
Total
n/a
383
11,800*
5,362
9,833
10,975
38,352
n/a
365
3,500
3,774
4,646
17,726
30,011
508
125
2,500
2,181
2,562
22,259
30,133
284
55
500
1,082
1,578
13,651
17,151
80
22
160
500
745
5,833
7,340
76
1
40
306
530
5,708
6,661
42
1
20
166
271
2,023
2,524
105
0
10
110
325
997
1,547
10
0
8
82
304
985
1,389
29
1
10
61
282
705
1,088
77
n/a
10
48
230
202
566
80
n/a
19
30
190
134
454
56
n/a
5
3
128
133
324
88
n/a
19
2
126
58
293
Figure 2 - Evolution of global annual installations 2000-2013
0
5,000
10,000
15,000
20,000
25,000
30,000
35,000
40,000
MW
293 324 454 566 1,088 1,389 1,5472,524
6,661 7,340
17,151
30,133 30,011
38,352
2000 2001 2002 2003 2004 2005 2006 2007 2008 2009 2010 2011 2012 2013
RoW: Rest of the World. MEA: Middle East and Africa. APAC: Asia Pacific.Methodology used for RoW data collection has changed in 2012.*This number could be increased to 12,920 MW.
EPIA • GLOBAL MARKET OUTLOOK FOR PHOTOVOLTAICS 2014-2018 • 19
3. MARKET EVOLUTION
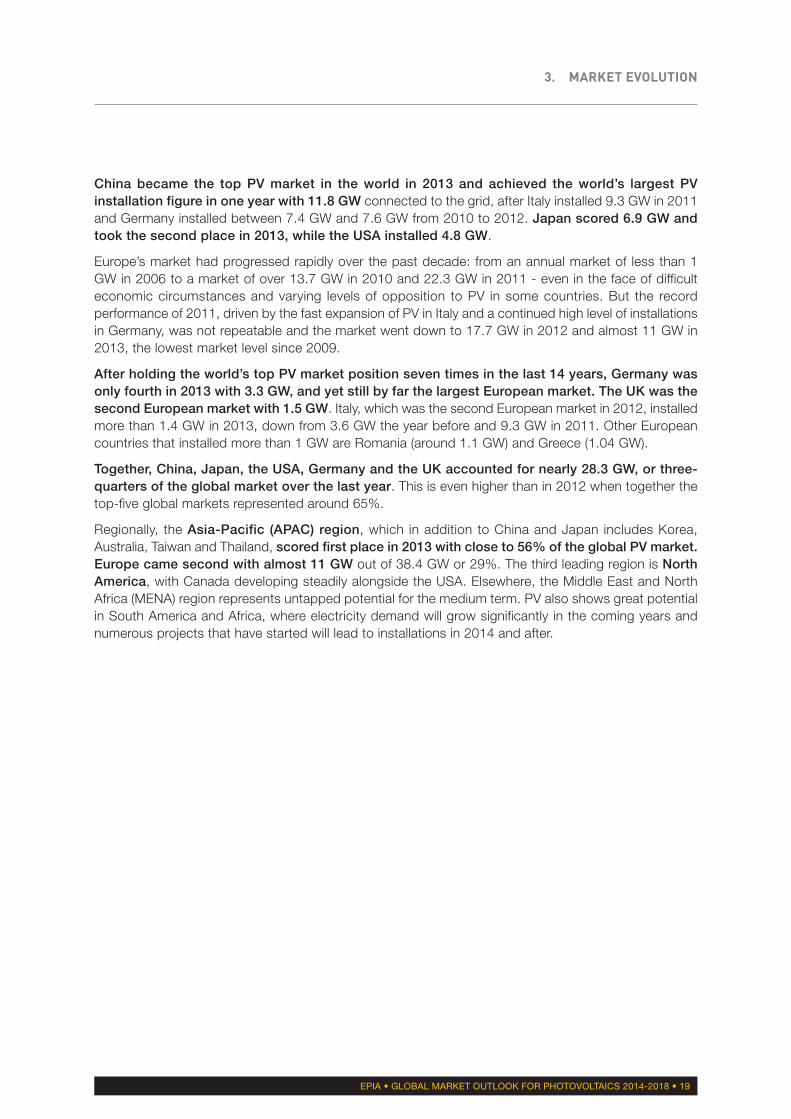
China became the top PV market in the world in 2013 and achieved the world’s largest PVinstallation figure in one year with 11.8 GW connected to the grid, after Italy installed 9.3 GW in 2011and Germany installed between 7.4 GW and 7.6 GW from 2010 to 2012. Japan scored 6.9 GW andtook the second place in 2013, while the USA installed 4.8 GW.
Europe’s market had progressed rapidly over the past decade: from an annual market of less than 1GW in 2006 to a market of over 13.7 GW in 2010 and 22.3 GW in 2011 - even in the face of difficulteconomic circumstances and varying levels of opposition to PV in some countries. But the recordperformance of 2011, driven by the fast expansion of PV in Italy and a continued high level of installationsin Germany, was not repeatable and the market went down to 17.7 GW in 2012 and almost 11 GW in2013, the lowest market level since 2009.
After holding the world’s top PV market position seven times in the last 14 years, Germany wasonly fourth in 2013 with 3.3 GW, and yet still by far the largest European market. The UK was thesecond European market with 1.5 GW. Italy, which was the second European market in 2012, installedmore than 1.4 GW in 2013, down from 3.6 GW the year before and 9.3 GW in 2011. Other Europeancountries that installed more than 1 GW are Romania (around 1.1 GW) and Greece (1.04 GW).
Together, China, Japan, the USA, Germany and the UK accounted for nearly 28.3 GW, or three-quarters of the global market over the last year. This is even higher than in 2012 when together thetop-five global markets represented around 65%.
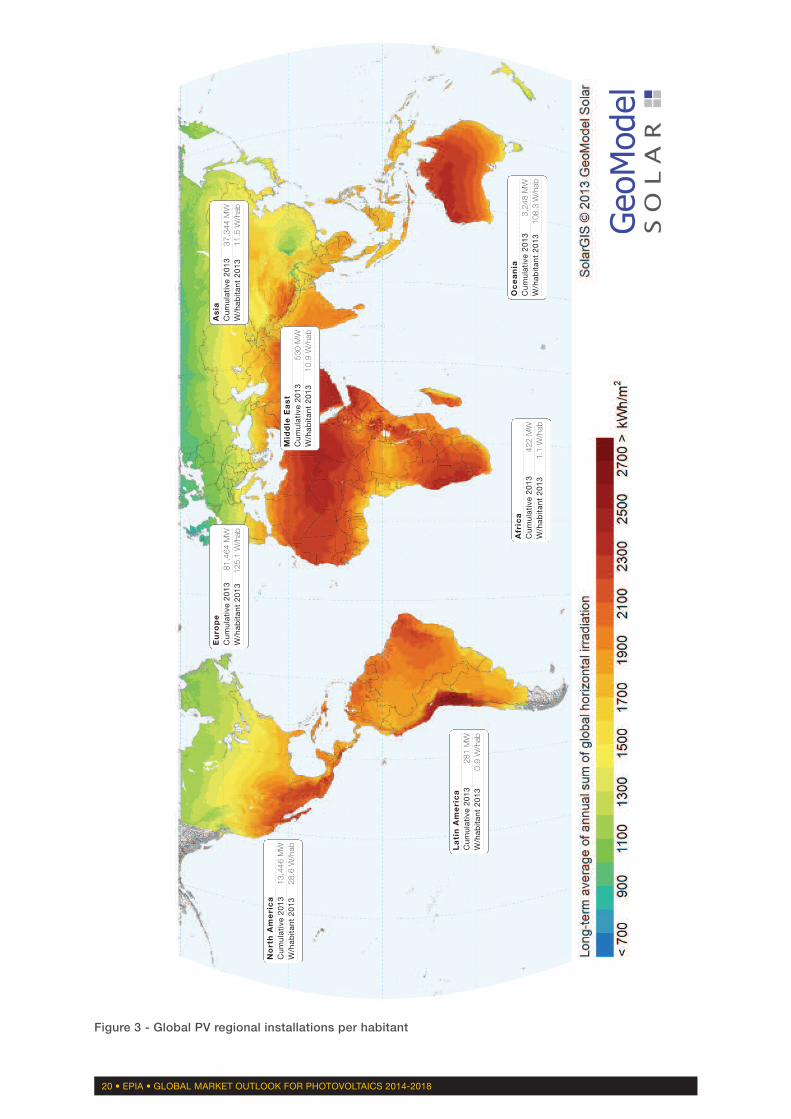
Regionally, the Asia-Pacific (APAC) region, which in addition to China and Japan includes Korea,Australia, Taiwan and Thailand, scored first place in 2013 with close to 56% of the global PV market.Europe came second with almost 11 GW out of 38.4 GW or 29%. The third leading region is NorthAmerica, with Canada developing steadily alongside the USA. Elsewhere, the Middle East and NorthAfrica (MENA) region represents untapped potential for the medium term. PV also shows great potentialin South America and Africa, where electricity demand will grow significantly in the coming years andnumerous projects that have started will lead to installations in 2014 and after.
20 • EPIA • GLOBAL MARKET OUTLOOK FOR PHOTOVOLTAICS 2014-2018
North America
Cum
ulative 2013
W/habitant 2013
13,446 M
W28.6 W
/hab Latin America
Cum
ulative 2013
W/habitant 2013
281 M
W0.9 W
/hab
Africa
Cum
ulative 2013
W/habitant 2013
422 M
W1.1 W
/hab
Middle East
Cum
ulative 2013
W/habitant 2013
530 M
W10.9 W
/hab
Oceania
Cum
ulative 2013
W/habitant 2013
3,248 M
W10
8.3 W/hab
Europe
Cum
ulative 2013
W/habitant 2013
81,464 M
W12
5.1 W/hab
Asia
Cum
ulative 2013
W/habitant 2013
37,344 M
W11.5 W
/hab
Figure 3 - Global PV regional installations per habitant
3. MARKET EVOLUTION
EPIA • GLOBAL MARKET OUTLOOK FOR PHOTOVOLTAICS 2014-2018 • 21
3. European market development
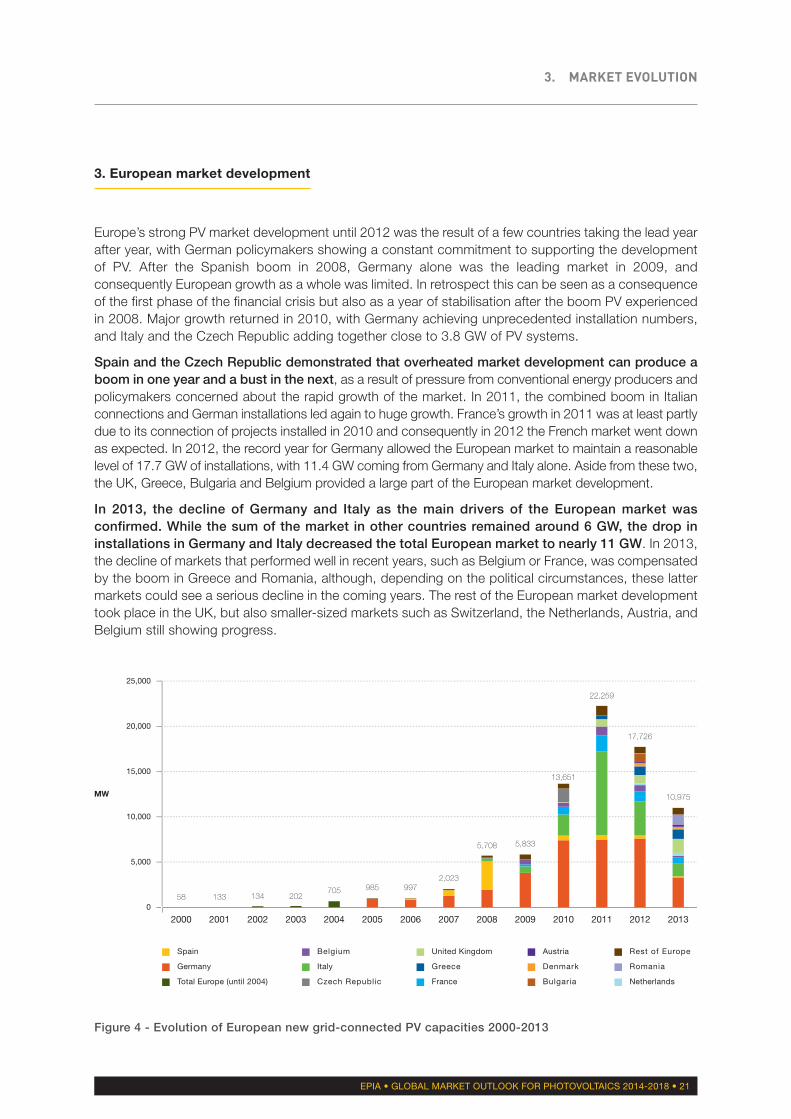
Europe’s strong PV market development until 2012 was the result of a few countries taking the lead yearafter year, with German policymakers showing a constant commitment to supporting the developmentof PV. After the Spanish boom in 2008, Germany alone was the leading market in 2009, andconsequently European growth as a whole was limited. In retrospect this can be seen as a consequenceof the first phase of the financial crisis but also as a year of stabilisation after the boom PV experiencedin 2008. Major growth returned in 2010, with Germany achieving unprecedented installation numbers,and Italy and the Czech Republic adding together close to 3.8 GW of PV systems.
Spain and the Czech Republic demonstrated that overheated market development can produce aboom in one year and a bust in the next, as a result of pressure from conventional energy producers andpolicymakers concerned about the rapid growth of the market. In 2011, the combined boom in Italianconnections and German installations led again to huge growth. France’s growth in 2011 was at least partlydue to its connection of projects installed in 2010 and consequently in 2012 the French market went downas expected. In 2012, the record year for Germany allowed the European market to maintain a reasonablelevel of 17.7 GW of installations, with 11.4 GW coming from Germany and Italy alone. Aside from these two,the UK, Greece, Bulgaria and Belgium provided a large part of the European market development.
In 2013, the decline of Germany and Italy as the main drivers of the European market wasconfirmed. While the sum of the market in other countries remained around 6 GW, the drop ininstallations in Germany and Italy decreased the total European market to nearly 11 GW. In 2013,the decline of markets that performed well in recent years, such as Belgium or France, was compensatedby the boom in Greece and Romania, although, depending on the political circumstances, these lattermarkets could see a serious decline in the coming years. The rest of the European market developmenttook place in the UK, but also smaller-sized markets such as Switzerland, the Netherlands, Austria, andBelgium still showing progress.
Spain
Germany
Total Europe (until 2004)
Belgium
Italy
Czech Republic
United Kingdom
Greece
France
Austria
Denmark
Bulgaria
Rest of Europe
Romania
Netherlands
Figure 4 - Evolution of European new grid-connected PV capacities 2000-2013
0
5,000
10,000
15,000
20,000
25,000
MW
58 133 134 202705 985 997
2,023
5,708 5,833
13,651
22,259
17,726
10,975
2000 2001 2002 2003 2004 2005 2006 2007 2008 2009 2010 2011 2012 2013
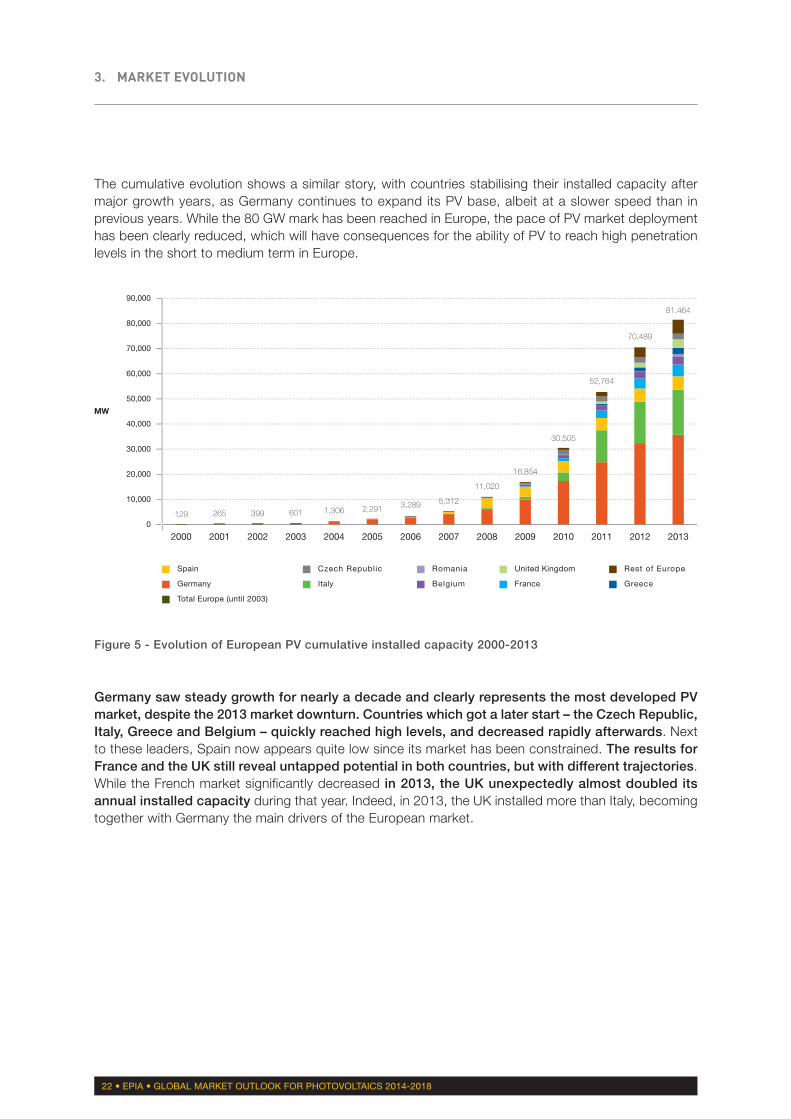
The cumulative evolution shows a similar story, with countries stabilising their installed capacity aftermajor growth years, as Germany continues to expand its PV base, albeit at a slower speed than inprevious years. While the 80 GW mark has been reached in Europe, the pace of PV market deploymenthas been clearly reduced, which will have consequences for the ability of PV to reach high penetrationlevels in the short to medium term in Europe.
3. MARKET EVOLUTION
22 • EPIA • GLOBAL MARKET OUTLOOK FOR PHOTOVOLTAICS 2014-2018
Germany saw steady growth for nearly a decade and clearly represents the most developed PVmarket, despite the 2013 market downturn. Countries which got a later start – the Czech Republic,Italy, Greece and Belgium – quickly reached high levels, and decreased rapidly afterwards. Nextto these leaders, Spain now appears quite low since its market has been constrained. The results forFrance and the UK still reveal untapped potential in both countries, but with different trajectories.While the French market significantly decreased in 2013, the UK unexpectedly almost doubled itsannual installed capacity during that year. Indeed, in 2013, the UK installed more than Italy, becomingtogether with Germany the main drivers of the European market.
Figure 5 - Evolution of European PV cumulative installed capacity 2000-2013
0
10,000
20,000
30,000
40,000
50,000
60,000
70,000
80,000
90,000
MW
129 265 399 601 1,306 2,291 3,289 5,312
11,020
16,854
30,505
52,764
70,489
81,464
2000 2001 2002 2003 2004 2005 2006 2007 2008 2009 2010 2011 2012 2013
Spain
Germany
Total Europe (until 2003)
Czech Republic
Italy
United Kingdom
France
Rest of Europe
Greece
Romania
Belgium
Europe’s PV development was unrivalled for a decade until 2013. The USA and Japan, once PV pioneers,used to be behind Europe in terms of PV penetration, yet China has reached their level with just a fewyears of fast development. Apart from Australia, the rest of the world scores quite low in terms of PVpenetration, although in many countries there remains great untapped potential, especially in the Sunbelt.
For the most part, the development of PV has until now corresponded with economic development;after taking root in OECD countries (Europe, North America, Japan, Australia), it has started to reachemerging countries. While the BRIC countries score low as a bloc, China and India will lead Braziland possibly Russia by example. Africa scores last on the development list, though projects are pilingup fast.
3. MARKET EVOLUTION
EPIA • GLOBAL MARKET OUTLOOK FOR PHOTOVOLTAICS 2014-2018 • 23

EPIA • GLOBAL MARKET OUTLOOK FOR PHOTOVOLTAICS 2014-2018 • 24
72
28
207
98
0.1
2
2
0.7
0.3
2
0.2
56
54
40
0.02
26
103
97
4
92
0.2
14
5
AustriaBelgiumBulgariaCroatiaCyprusCzech RepublicDenmarkEstoniaFinlandFranceGermanyGreeceHungaryIrelandItalyLatvia
Market2012 (MW)
17568384307116316001,1157,604912803,7590
Cumulative2012(MW)
3632,7681,0100172,0873320114,06032,4111,53612316,4791
Market2013(MW)
25021510201588216006133,30410431001,4480
Cumulative2013(MW)
6132,9831,02020322,1755480114,67335,7152,57922317,9281
W/habitant2013
72268140528207980.127143622920.72940.3
LithuaniaLuxembourgMaltaNetherlandsNorwayPolandPortugalRomaniaSlovakiaSloveniaSpainSwedenSwitzerlandTurkeyUkraineUnited Kingdom
Market2012(MW)
6041950470461512233282265130925
Cumulative2012(MW)
6301636007242515232015,22122437123261,829
Market2013(MW)
00730501361,1000111181830062901546
Cumulative2013(MW)
63023665072781,1515242125,34040737186163,375
W/habitant2013
25654400.020.22654971031164920.21453
Figure 6 - European PV installations per habitant
>750 W/habitant
500-750 W/habitant
350-500 W/habitant
200-350 W/habitant
100-200 W/habitant
50-100 W/habitant
10-50 W/habitant
1-10 W/habitant
0-1 W/habitant
N/A
Legend
Country regional data must be considered an approximation.
EPIA • GLOBAL MARKET OUTLOOK FOR PHOTOVOLTAICS 2014-2018 • 25
B. THE MARKET IN EUROPE IN 2013 AND THE FORECAST UNTIL 2018
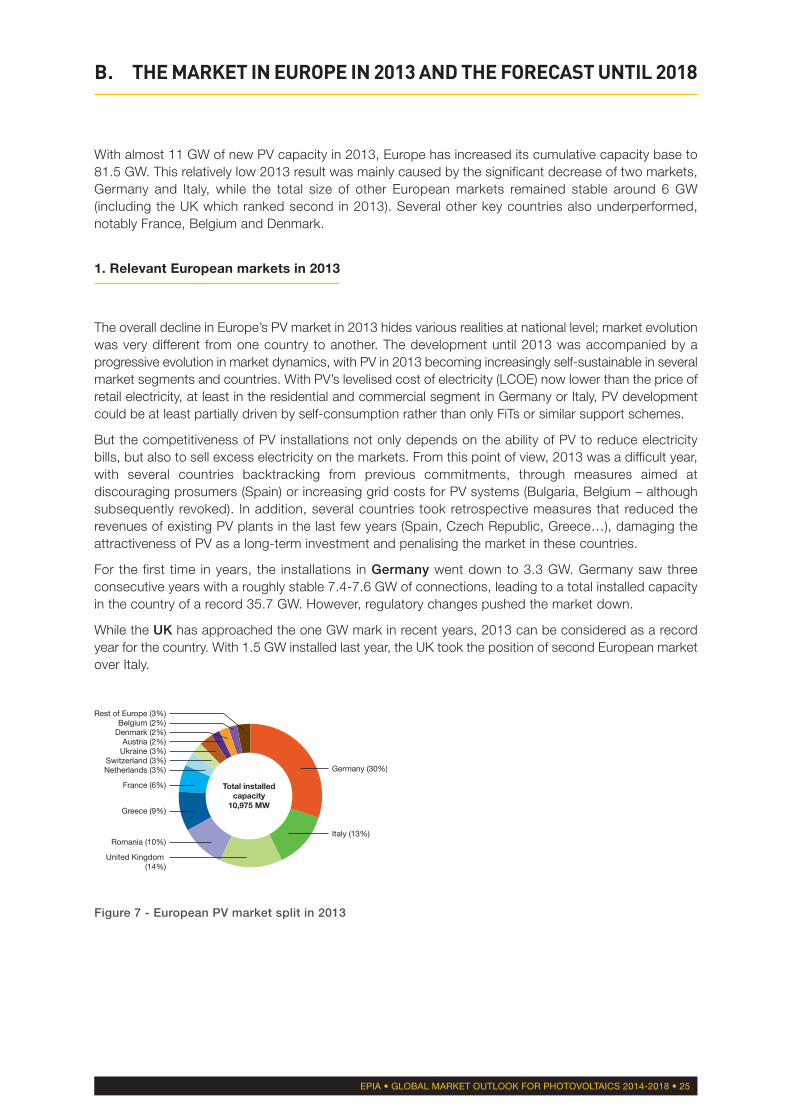
With almost 11 GW of new PV capacity in 2013, Europe has increased its cumulative capacity base to81.5 GW. This relatively low 2013 result was mainly caused by the significant decrease of two markets,Germany and Italy, while the total size of other European markets remained stable around 6 GW(including the UK which ranked second in 2013). Several other key countries also underperformed,notably France, Belgium and Denmark.
1. Relevant European markets in 2013
The overall decline in Europe’s PV market in 2013 hides various realities at national level; market evolutionwas very different from one country to another. The development until 2013 was accompanied by aprogressive evolution in market dynamics, with PV in 2013 becoming increasingly self-sustainable in severalmarket segments and countries. With PV’s levelised cost of electricity (LCOE) now lower than the price ofretail electricity, at least in the residential and commercial segment in Germany or Italy, PV developmentcould be at least partially driven by self-consumption rather than only FiTs or similar support schemes.
But the competitiveness of PV installations not only depends on the ability of PV to reduce electricitybills, but also to sell excess electricity on the markets. From this point of view, 2013 was a difficult year,with several countries backtracking from previous commitments, through measures aimed atdiscouraging prosumers (Spain) or increasing grid costs for PV systems (Bulgaria, Belgium – althoughsubsequently revoked). In addition, several countries took retrospective measures that reduced therevenues of existing PV plants in the last few years (Spain, Czech Republic, Greece…), damaging theattractiveness of PV as a long-term investment and penalising the market in these countries.
For the first time in years, the installations in Germany went down to 3.3 GW. Germany saw threeconsecutive years with a roughly stable 7.4-7.6 GW of connections, leading to a total installed capacityin the country of a record 35.7 GW. However, regulatory changes pushed the market down.
While the UK has approached the one GW mark in recent years, 2013 can be considered as a recordyear for the country. With 1.5 GW installed last year, the UK took the position of second European marketover Italy.
Figure 7 - European PV market split in 2013
Rest of Europe (3%)
Total installedcapacity
10,975 MW
Denmark (2%)Belgium (2%)
Austria (2%)Ukraine (3%)
Switzerland (3%)Netherlands (3%)
France (6%)
Greece (9%)
Romania (10%)
United Kingdom (14%)
Germany (30%)
Italy (13%)

26 • EPIA • GLOBAL MARKET OUTLOOK FOR PHOTOVOLTAICS 2014-2018
3. MARKET EVOLUTION
In Italy, 1.4 GW of PV were connected to the grid in 2013, a sharp decrease compared to 2011 and2012, causing it to lose the second place position it held for some years. In fact, after the rush of 2011and 2012, the Italian market has dropped down to a level that nevertheless remains the third highest inEurope. Having reached a financial cap for FiTs, the Italian market is now experiencing the transition tothe post-FiT era with a substantial market level decrease.
Other European markets together represented roughly the same level of installations as in 2011 and2012, but the countries that significantly contributed were rather different from one year to another. In2013, two countries installed slightly more than 1 GW of PV: after several years of expectations, Romaniainstalled around 1.1 GW in only one year, a fast development level that is probably not going to bemaintained there. A vigorous market saw Greece cross the one GW mark again with 1.04 GW installed,but without clear perspectives for 2014.
Amongst the countries that installed at least 1 GW in the last few years, France disappointed with only613 MW installed in 2013, a sharp decline compared to 2011 and 2012, due to political uncertainty anda lack of political will to develop PV. In addition, government decisions to hastily freeze or reduce supportmechanisms as well as opposition from the main conventional stakeholders led to a negative image ofPV technology in the public eye. With 613 MW of PV in 2013, the country is still performing at rather lowlevels compared to the largest European markets and below 2011 when it scored 1.77 GW. While thegovernment reconfirmed in 2013 its will to allow 1 GW of new capacity be installed every year, theconstraints on market development remain significant.
3. MARKET EVOLUTION
EPIA • GLOBAL MARKET OUTLOOK FOR PHOTOVOLTAICS 2014-2018 • 27
Denmark had been one of the surprises of the year 2012 with 316 MW, but the boom was stopped in2013 by a change in the net-metering policy: the compensation period which was an entire year in 2012was reduced to an hour, reducing the attractiveness of PV in this country. Nevertheless the market levelestablished itself at 216 MW. Austria installed around 250 MW and Switzerland 300 MW, in a growingmarket. The net-metering system in the Netherlands performed quite well and the country installedaround 305 MW of new PV installations in 2013.
Belgium installed only 215 MW in 2013, after having reached high levels in 2011 and 2012, in a contextof strong political concern over the cost of support schemes and long discussions about retrospectivemeasures and additional grid fees for prosumers. Bulgaria experienced a boom in 2012, with a total of843 MW installed before the government reacted with harsh retroactive measures to slow the marketgrowth. The consequence in 2013 was clear with the country’s market slowing down to only 10 MW.The Czech Republic’s boom is a story from the past and the market only reached 88 MW in 2013,significantly below the 2012 level when 116 MW were installed. Some countries, notably Poland, failedto fulfil expectations in 2013 and the prospects for 2014 remain weak, despite some potential.
In the Spanish context of economic crisis, huge overcapacities in the electricity sector and strongopposition to PV from the authorities and some electricity stakeholders, the decisions taken in 2013resulted in a reduction of the market to a very low level. Only 118 MW were connected to the grid in 2013in a country which has the potential to be among the European leaders. The long-expected net-meteringscheme was never introduced and the self-consumption policy that was presented in 2013 will not allowPV to develop in the coming years: the levy imposed on prosumers, combined with dissuasive tariffs forgrid connection, appears to be the most constraining regulation in Europe for self-consumption.
Ukraine’s PV development continued in 2013 with 290 MW installed, a level that can be compared to2011 and 2012. The turmoil in the country didn’t really affect the market in 2013 but could be muchmore damaging in 2014, especially in the Crimea, where the Ukrainian government stopped supportschemes due to the geopolitical crisis. Slovakia, which experienced a relative boom at the end of 2011and the first semester of 2012, went down to zero in 2013. Slovenia, which grew over several yearsand installed 122 MW in 2012, went down in 2013 to 11 MW.
The development level in Russia remained quite low with only a few MW installed and few prospects inthe short term. Sweden has seen several MW installed each year (18 MW in 2013) but without significantpolicies and prospects.
Turkey remained quite low at around 6 MW despite its potential, but the situation could change in 2014.Several other countries have reported some MW installed but without representing any significant changeat European market level.
3. MARKET EVOLUTION
28 • EPIA • GLOBAL MARKET OUTLOOK FOR PHOTOVOLTAICS 2014-2018
2. Segmentation
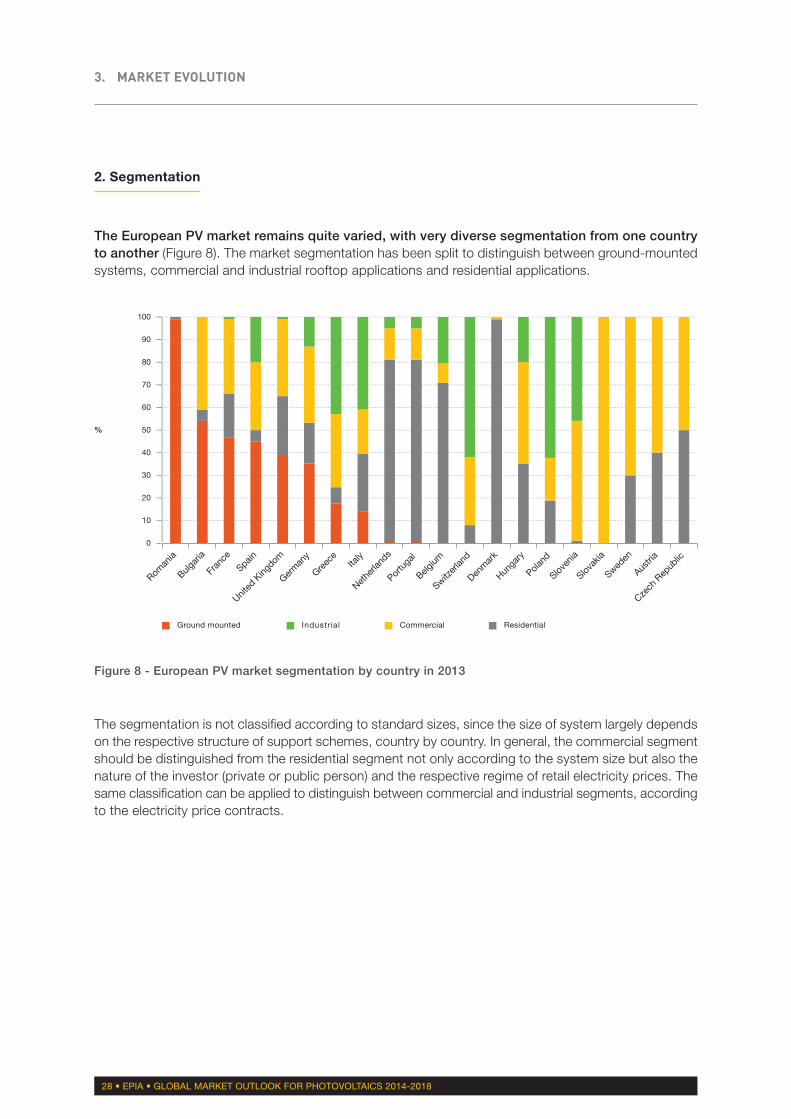
The European PV market remains quite varied, with very diverse segmentation from one countryto another (Figure 8). The market segmentation has been split to distinguish between ground-mountedsystems, commercial and industrial rooftop applications and residential applications.
The segmentation is not classified according to standard sizes, since the size of system largely dependson the respective structure of support schemes, country by country. In general, the commercial segmentshould be distinguished from the residential segment not only according to the system size but also thenature of the investor (private or public person) and the respective regime of retail electricity prices. Thesame classification can be applied to distinguish between commercial and industrial segments, accordingto the electricity price contracts.
Figure 8 - European PV market segmentation by country in 2013
0
10
20
30
40
50
60
70
80
90
100
%
Roman
ia
Bulgar
ia
Fran
ce
Spain
United
King
dom
Germ
any
Greec
eIta
ly
Nethe
rland
s
Portu
gal
Belgium
Switzer
land
Denm
ark
Hunga
ry
Poland
Sloven
ia
Slovak
ia
Sweden
Austri
a
Czech
Rep
ublic
Ground mounted Industrial Commercial Residential

3. MARKET EVOLUTION
EPIA • GLOBAL MARKET OUTLOOK FOR PHOTOVOLTAICS 2014-2018 • 29
Market segmentation in Europe evolved in 2013 compared to previous years. Given the 2012 and2013 changes in regulatory frameworks, the ground-mounted segment was expected to decline inEurope in 2013. This was not the case and ground-mounted plants represented a higher share of areduced market in 2013. Overall a very large share of the market in Europe is still concentrated inthe commercial and industrial rooftop segments; this trend will continue, based on the foreseenevolution of the legal framework. The residential segment has developed very rapidly in somecountries, such as Belgium (where 1 out of 13 households are now equipped with a PV system),Denmark, Greece and the UK.
Figure 9 - European PV market segmentation in 2012 and 2013
Total installedcapacity
17,726 MW
2012
Ground mounted(28%)
Industrial (19%)
Residential (21%)
Commercial (32%)
Total installedcapacity
10,975 MW
Ground mounted(34%)
Industrial (17%)
Residential (22%)
Commercial (27%)
2013
Figure 10 - European PV cumulative capacity segmentation by country in 2013
0
10
20
30
40
50
60
70
80
90
100
%
Roman
ia
Bulgar
ia
Spain
Poland
United
King
dom
Czech
Rep
ublic
Fran
ce
Germ
any
Italy
Greec
e
Sloven
ia
Nethe
rland
s
Austri
a
Belgium
Switzer
land
Denm
ark
Hunga
ry
Portu
gal
Slovak
ia
Sweden
Ground mounted Industrial Commercial Residential

3. MARKET EVOLUTION
30 • EPIA • GLOBAL MARKET OUTLOOK FOR PHOTOVOLTAICS 2014-2018
The top five countries per segment show the relative domination of the largest markets (Germany, Italy,UK and France).
3. Forecasts of PV in Europe until 2018
Forecasts for PV installations in the previous edition of the Global Market Outlook proved to be correct.The 2013 global market figure of 38.4 GW indeed represents the average from the Low Scenario (28GW) and the High Scenario (48 GW) in last year’s edition.
The European PV market peaked in 2011 with more than 22 GW installed. Such a high level was notsustainable and the market went down to 17.7 GW in 2012. The 2013 market declined further to nearly11 GW, which is the lowest level since 2009 in Europe. While the market slowdown in Germany and Italywas predictable and expected, the stability of the rest of Europe (considered as a whole) should not bemisinterpreted. What could appear at first sight as a sign of more sustainable market development in thesecountries is revealed as something different after an in-depth examination of the remaining 5-6 GW. Eachyear, some markets boomed before experiencing a bust in the following years, and the market was shored-up by different countries every year. The picture is clearer when looking at the countries that installed closeto or at least 1 GW each year (outside of the top two countries); in 2011, Belgium, France, and the UK; in2012, France again, the UK, Greece and Bulgaria; in 2013, Italy and Greece again, and Romania.
Figure 11 - Top 5 European markets per segment in 2013
Residential
Rest of Europe(25%)
Netherlands (10%)
Denmark (9%)
Germany (24%)
Italy (15%)
United Kingdom(17%)
Total installedcapacity
2,415 MW
Commercial
Rest of Europe(16%)
Italy (9%)
Greece (11%)
France (8%)
Germany (38%)
United Kingdom(18%)
Total installedcapacity
2,963 MW
Industrial
Rest of Europe(9%)
Switzerland (10%)
Germany (23%)
Belgium (2%) Italy (32%)
Greece (24%)
Total installedcapacity
1,866 MW
Ground mounted
Rest of Europe(9%)
France (9%)
United Kingdom(16%)
Italy (5%) Germany (31%)
Romania (30%)
Total installedcapacity
3,731 MW
3. MARKET EVOLUTION
EPIA • GLOBAL MARKET OUTLOOK FOR PHOTOVOLTAICS 2014-2018 • 31
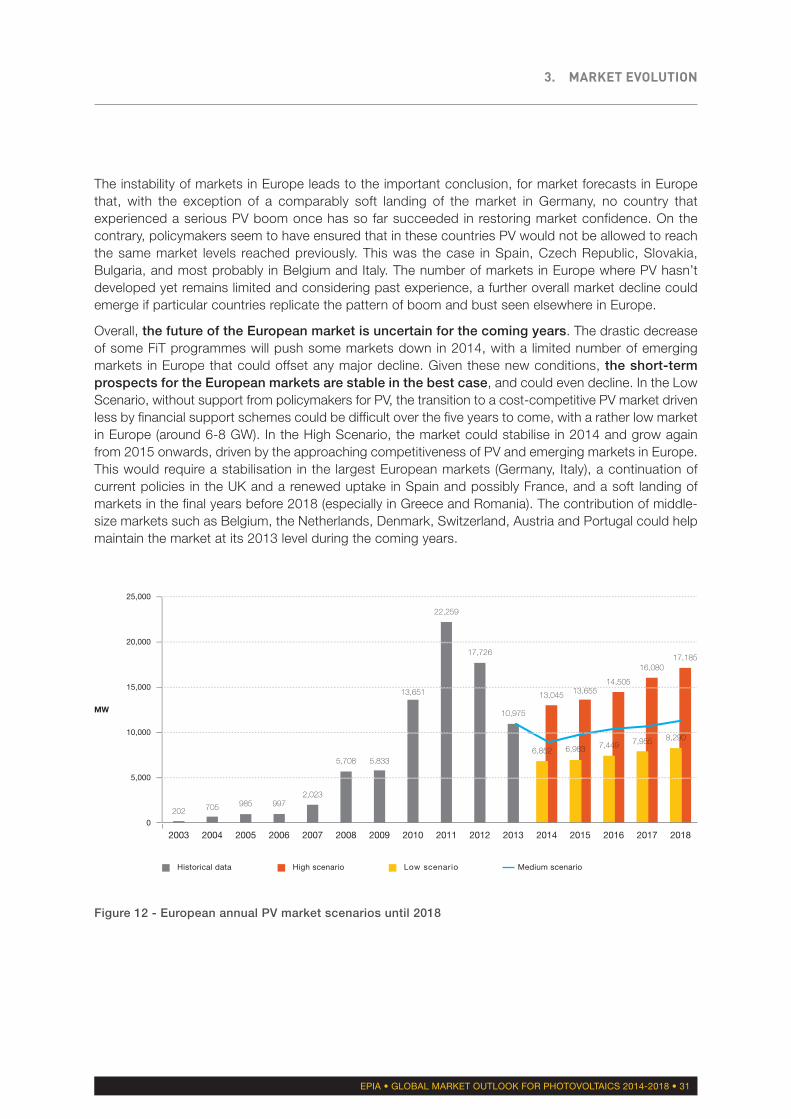
The instability of markets in Europe leads to the important conclusion, for market forecasts in Europethat, with the exception of a comparably soft landing of the market in Germany, no country thatexperienced a serious PV boom once has so far succeeded in restoring market confidence. On thecontrary, policymakers seem to have ensured that in these countries PV would not be allowed to reachthe same market levels reached previously. This was the case in Spain, Czech Republic, Slovakia,Bulgaria, and most probably in Belgium and Italy. The number of markets in Europe where PV hasn’tdeveloped yet remains limited and considering past experience, a further overall market decline couldemerge if particular countries replicate the pattern of boom and bust seen elsewhere in Europe.
Overall, the future of the European market is uncertain for the coming years. The drastic decreaseof some FiT programmes will push some markets down in 2014, with a limited number of emergingmarkets in Europe that could offset any major decline. Given these new conditions, the short-termprospects for the European markets are stable in the best case, and could even decline. In the LowScenario, without support from policymakers for PV, the transition to a cost-competitive PV market drivenless by financial support schemes could be difficult over the five years to come, with a rather low marketin Europe (around 6-8 GW). In the High Scenario, the market could stabilise in 2014 and grow againfrom 2015 onwards, driven by the approaching competitiveness of PV and emerging markets in Europe.This would require a stabilisation in the largest European markets (Germany, Italy), a continuation ofcurrent policies in the UK and a renewed uptake in Spain and possibly France, and a soft landing ofmarkets in the final years before 2018 (especially in Greece and Romania). The contribution of middle-size markets such as Belgium, the Netherlands, Denmark, Switzerland, Austria and Portugal could helpmaintain the market at its 2013 level during the coming years.
Figure 12 - European annual PV market scenarios until 2018
0
5,000
10,000
15,000
20,000
25,000
MW
202 705 985 997
2003 2004 2005 2006 2007 2008 2009 2010 2011 2012 2013 2014 2015 2016 2017 2018
2,023
5,708 5,833
13,651
22,259
17,726
13,045
6,852
13,655
6,983
14,505
7,449
16,080
7,955
17,185
8,290
10,975
High scenario Low scenarioHistorical data Medium scenario

3. MARKET EVOLUTION
32 • EPIA • GLOBAL MARKET OUTLOOK FOR PHOTOVOLTAICS 2014-2018
In the highest probability situation, 2014 will see a new market decline in Europe that could limitthe amount of new connections to around 8-9 GW, while competitive PV in several key countriescould help maintain the market at around 10-12 GW in the second part of the decade.
The total installed capacity in Europe could reach between 119 and 156 GW in 2018, starting from 81.5GW at the end of 2013. In the best case, the 100 GW mark could be reached by 2015 in Europe.
The countries where PV has not developed until now will be interesting to follow in the coming years,because of their untapped potential but also for the unique opportunity to witness a different marketdevelopment than what was experienced until now in most European countries. The history of PVproves that a stable policy framework using support schemes in a sustainable way increasesmarket confidence. Poland, Croatia, Hungary and to a lesser extent Ireland could develop in the comingyears in various forms. Outside of the European Union, Turkey and some Balkan states will become focalpoints. Amongst the “old” markets, the rebirth of France, at the heart of the European grid, should becarefully followed and encouraged in a way that suits the specifics of this country. In a similar way, PVwill not redevelop in Spain unless solutions can be found to the relative isolation of the country from agrid perspective. Finally, the concept of prosumers seems to increasingly generate interest, but itsmaterialisation in real markets remains unsure, depending also on regulatory frameworkconditions, including the allocation of charges and taxes. In 2013, the sum of installations thatwere at least partially driven by self-consumption in Europe amounted to over 2 GW. The questionis how fast prosumers will become central actors of PV development in Europe.
Figure 13 - European cumulative PV market scenarios until 2018
0
20,000
40,000
60,000
80,000
100,000
120,000
140,000
160,000
180,000
MW
2003 2004 2005 2006 2007 2008 2009 2010 2011 2012 2013 2014 2015 2016 2017 2018
601 1,306 2,291 3,289 5,31211,020
16,854
30,505
52,764
70,489
94,509
108,164
122,669
138,749
155,934
81,464
88,31695,299
102,748110,703
118,993
High scenario Low scenarioHistorical data Medium scenario

3. MARKET EVOLUTION
EPIA • GLOBAL MARKET OUTLOOK FOR PHOTOVOLTAICS 2014-2018 • 33
4. 2020 potential and targets in the EU
Potential vs. market reality for PV deployment in the EU
EPIA’s report “Connecting the Sun: Solar photovoltaics on the road to large-scale grid integration”,published in 2012, identifies several possible PV deployment scenarios to 2020 and 2030 that representthe technology’s potential in line with the current economic and regulatory environment.
• The Baseline scenario envisages a 4% share of the electricity demand in the EU provided by PVin 2020. This represents about 130 GW of cumulative capacity by 2020. In 2030, PV couldrepresent up to 10% of the electricity demand.
• The Accelerated scenario, with PV meeting 8% of the demand, represents about 200 GW ofcumulative capacity by 2020. In 2030, PV could target up to 15% of the electricity demand.
EPIA has compared various PV market forecasts until 2018 against the two scenarios developed in the“Connecting the Sun” report as described above, as well as the NREAPs:
• The Low Global Market Outlook Scenario for PV until 2018 that used to be aligned with the4% target (Connecting the Sun’s Baseline scenario) appears now to be slightly higher. Thisrepresents a rather stable perspective compared to previous EPIA forecasts. Thus, it looksreasonable to expect that 4-5% penetration for PV could be reached even in the low growth case
• The High Global Market Outlook Scenario for PV until 2018 appears increasingly unlikely tobe fully realised. While this scenario of reaching 8% by 2020 looked coherent and in line withoptimistic market expectations, the current political backlash has led to a revision of this objectivedownwards to around 7%. Reaching a substantially higher share would require a real paradigmshift in the way PV is supported and incentivised, even after cost-competitiveness is reached inmany countries and market segments. It is clear today that more ambitious scenarios are notrealistic options anymore and would require tremendous market developments, currentlyunsupported by public policies in Europe
• The NREAPs as devised in 2009 are far from the reality of today’s PV market. Apart from Germanyand Greece (which defined ambitious targets), market evolution in most countries could easilyovertake the action plans. Future expectations largely reflect the current balance of installations,with Germany and Italy dominating the market. In the EU forecasts, the NREAPs targets with theintermediary value for 2015 have been taken into account. The extent to which they haveunderestimated the market developments from 2012 and even 2013 is obvious (Figure 14)

3. MARKET EVOLUTION
34 • EPIA • GLOBAL MARKET OUTLOOK FOR PHOTOVOLTAICS 2014-2018
Cumulativeinstalledcapacity in 2013613 2,983 1,020 20 2,175 548 4,673 35,715 2,579 22 17,928 665 7 278 1,151 524 212 5,340 40 3,375 99 79,964
NREAPs’ 2020 target for PV
322 1,340 303 52 1,695 6 4,860 51,753 2,200 63 8,000 722 2720 260 300 139 8,367 8 2,680 308 84,381
Necessaryyearly marketuntil 2020
n/a n/a n/a 4.5 n/a n/a 26.7 2,291.2 n/a 5.9 n/a 8.1 n/a 63.1 n/a n/a n/a 432.5 n/a n/a 29.9 630.9
Target reached in…
reached in 2012reached in 2011 reached in 2012 2014-2015reached in 2010 reached in 2010 2014-2015 2014-2015reached in 2013 2014-2015reached in 2011 2014-2015reached in 2012 2016-20202014-2015reached in 2011 reached in 2012 2016-2020reached in 2011 reached in 2013 2016-20202014-2015
Market in 2011
92 996 135 - 12 9.6 1,777 7,485 426 2.0 9,251 58 1.3 38 1.6 321 43 472 4 813 24 21,961
Market in 2012
175 683 843 - 116 316 1,115 7,604 912 8 3,759 195 4 70 46 15 122 332 8 925 17 17,265
Market in 2013
250 215 10 20 88 216 613 3,304 1,043 10 1,448 305 1 36 1,100 0 11 118 18 1,546 42 10,395
Austria Belgium BulgariaCroatia Czech Republic DenmarkFrance Germany Greece Hungary Italy Netherlands Poland Portugal*Romania Slovakia Slovenia Spain Sweden United Kingdom Rest of EU 28Total EU 28
Target already reached in 2010-2013: Country has significantly underestimated PV’s potential.Target to be reached by 2014-2015: Country has underestimated PV’s potential.Target to be reached by 2016-2020: Country has either properly estimated PV’s potential (Germany) or has set measures constraining the market to meet the set targetnot earlier than 2020.
Source: European Commission, DG Energy, Transparency Platform
* In April 2013, a revised Renewable Energy Action Plan - REAP (2009/28/EC Directive) was published, adjusting the 2020 targets for each technology. For solar, the installed capacity target was reducedfrom 1500 MW to 720 MW.
Table 1 - NREAPs vs. reality of PV markets in the EU 28
The following table details for most EU markets the cumulative installed capacity at the end of 2013, theofficial National Renewable Energy Action Plan (NREAP) target for PV by 2020 and the necessary yearlymarket to reach this 2020 target (linear projection).
3. MARKET EVOLUTION
EPIA • GLOBAL MARKET OUTLOOK FOR PHOTOVOLTAICS 2014-2018 • 35
5. Medium-term scenario for 2030: How much can PV contribute to a binding 2030 target?
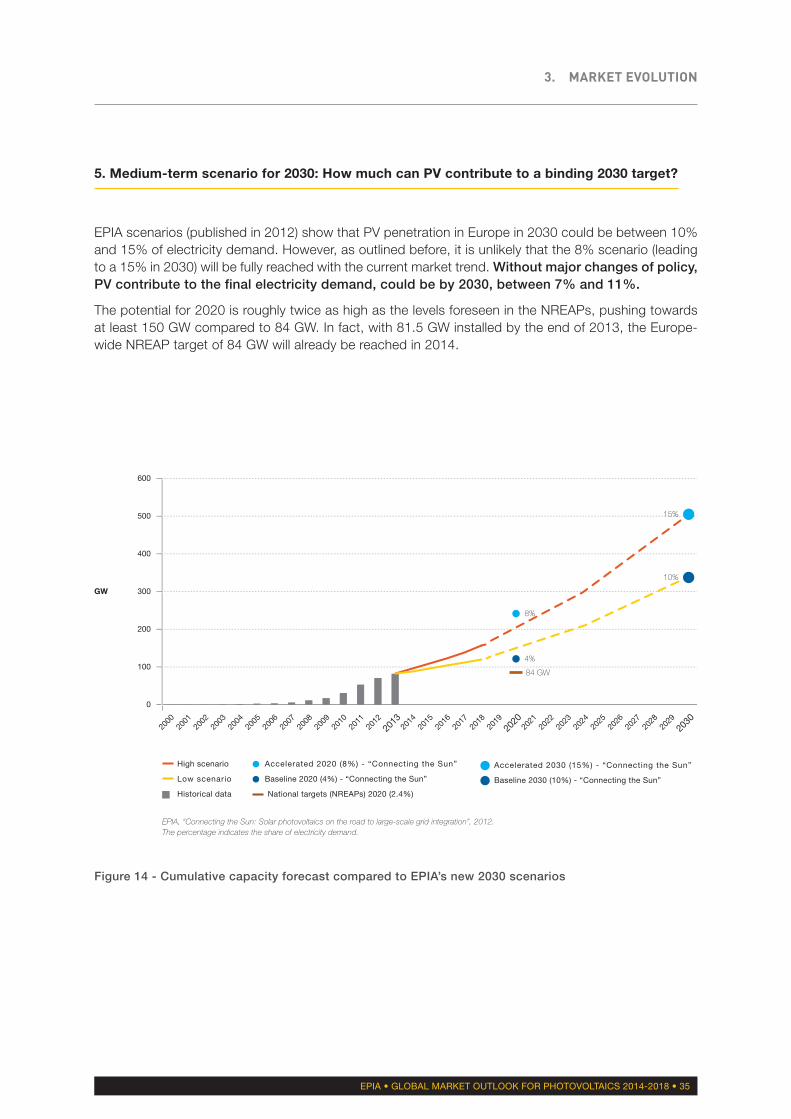
EPIA scenarios (published in 2012) show that PV penetration in Europe in 2030 could be between 10%and 15% of electricity demand. However, as outlined before, it is unlikely that the 8% scenario (leadingto a 15% in 2030) will be fully reached with the current market trend. Without major changes of policy,PV contribute to the final electricity demand, could be by 2030, between 7% and 11%.
The potential for 2020 is roughly twice as high as the levels foreseen in the NREAPs, pushing towardsat least 150 GW compared to 84 GW. In fact, with 81.5 GW installed by the end of 2013, the Europe-wide NREAP target of 84 GW will already be reached in 2014.
Figure 14 - Cumulative capacity forecast compared to EPIA’s new 2030 scenarios
0
100
200
300
400
500
600
GW
4%
84 GW
8%
2000
2001
2002
2003
2004
2005
2006
2007
2008
2009
2010
2011
2012
2013
2014
2015
2016
2017
2018
2019
2020
2021
2022
2023
2024
2025
2026
2027
2028
2029
2030
10%
15%
High scenario
Low scenario
Historical data
Accelerated 2030 (15%) - “Connecting the Sun”
Baseline 2020 (4%) - “Connecting the Sun”
Accelerated 2020 (8%) - “Connecting the Sun”
Baseline 2030 (10%) - “Connecting the Sun”
National targets (NREAPs) 2020 (2.4%)
EPIA, “Connecting the Sun: Solar photovoltaics on the road to large-scale grid integration”, 2012.The percentage indicates the share of electricity demand.
3. MARKET EVOLUTION
36 • EPIA • GLOBAL MARKET OUTLOOK FOR PHOTOVOLTAICS 2014-2018
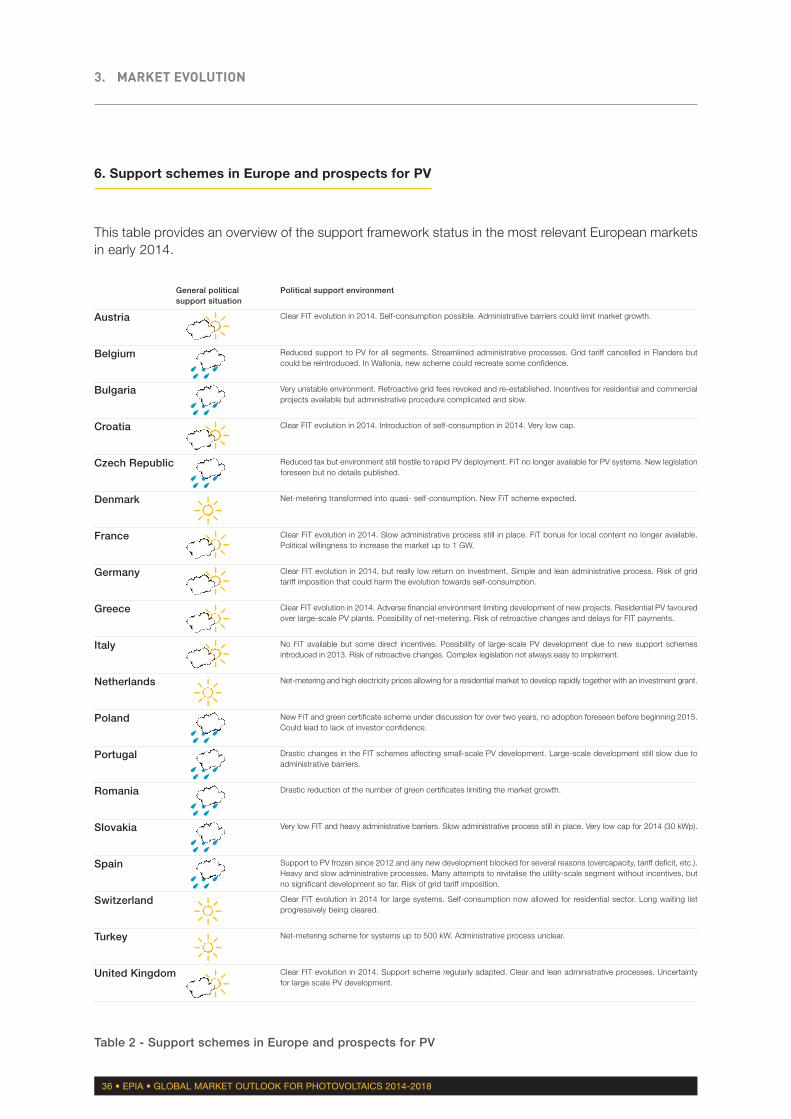
6. Support schemes in Europe and prospects for PV
This table provides an overview of the support framework status in the most relevant European marketsin early 2014.
Political support environment
Clear FIT evolution in 2014. Self-consumption possible. Administrative barriers could limit market growth.
Reduced support to PV for all segments. Streamlined administrative processes. Grid tariff cancelled in Flanders butcould be reintroduced. In Wallonia, new scheme could recreate some confidence.
Very unstable environment. Retroactive grid fees revoked and re-established. Incentives for residential and commercialprojects available but administrative procedure complicated and slow.
Clear FIT evolution in 2014. Introduction of self-consumption in 2014. Very low cap.
Reduced tax but environment still hostile to rapid PV deployment. FiT no longer available for PV systems. New legislationforeseen but no details published.
Net-metering transformed into quasi- self-consumption. New FiT scheme expected.
Clear FiT evolution in 2014. Slow administrative process still in place. FiT bonus for local content no longer available.Political willingness to increase the market up to 1 GW.
Clear FIT evolution in 2014, but really low return on investment. Simple and lean administrative process. Risk of gridtariff imposition that could harm the evolution towards self-consumption.
Clear FIT evolution in 2014. Adverse financial environment limiting development of new projects. Residential PV favouredover large-scale PV plants. Possibility of net-metering. Risk of retroactive changes and delays for FIT payments.
No FiT available but some direct incentives. Possibility of large-scale PV development due to new support schemesintroduced in 2013. Risk of retroactive changes. Complex legislation not always easy to implement.
Net-metering and high electricity prices allowing for a residential market to develop rapidly together with an investment grant.
New FiT and green certificate scheme under discussion for over two years, no adoption foreseen before beginning 2015.Could lead to lack of investor confidence.
Drastic changes in the FIT schemes affecting small-scale PV development. Large-scale development still slow due toadministrative barriers.
Drastic reduction of the number of green certificates limiting the market growth.
Very low FIT and heavy administrative barriers. Slow administrative process still in place. Very low cap for 2014 (30 kWp).
Support to PV frozen since 2012 and any new development blocked for several reasons (overcapacity, tariff deficit, etc.).Heavy and slow administrative processes. Many attempts to revitalise the utility-scale segment without incentives, butno significant development so far. Risk of grid tariff imposition.
Clear FIT evolution in 2014 for large systems. Self-consumption now allowed for residential sector. Long waiting listprogressively being cleared.
Net-metering scheme for systems up to 500 kW. Administrative process unclear.
Clear FIT evolution in 2014. Support scheme regularly adapted. Clear and lean administrative processes. Uncertaintyfor large scale PV development.
General political support situation
Austria
Belgium
Bulgaria
Croatia
Czech Republic
Denmark
France
Germany
Greece
Italy
Netherlands
Poland
Portugal
Romania
Slovakia
Spain
Switzerland
Turkey
United Kingdom
Table 2 - Support schemes in Europe and prospects for PV
3. MARKET EVOLUTION
EPIA • GLOBAL MARKET OUTLOOK FOR PHOTOVOLTAICS 2014-2018 • 37
C. THE GLOBAL MARKET IN 2013 AND FORECAST UNTIL 2018
1. Global PV market growth
While European electricity demand is stagnating, this is not the case globally and PV growth will continueto be driven by local and global energy demand. The fastest PV growth is expected to continue inChina and South-East Asia in general, with Latin America, the MENA countries and Indiafollowing. The PV potential of the Sunbelt countries – where PV can already compete with dieselgenerators for peak power generation without financial support – could range from 60 to 250 GW by2020, and from 260 to 1,100 GW in 2030. And with the faster than expected price decrease in PVtechnology that the industry experienced in recent years, even more countries will see PV as acompetitive energy source before the end of this decade.
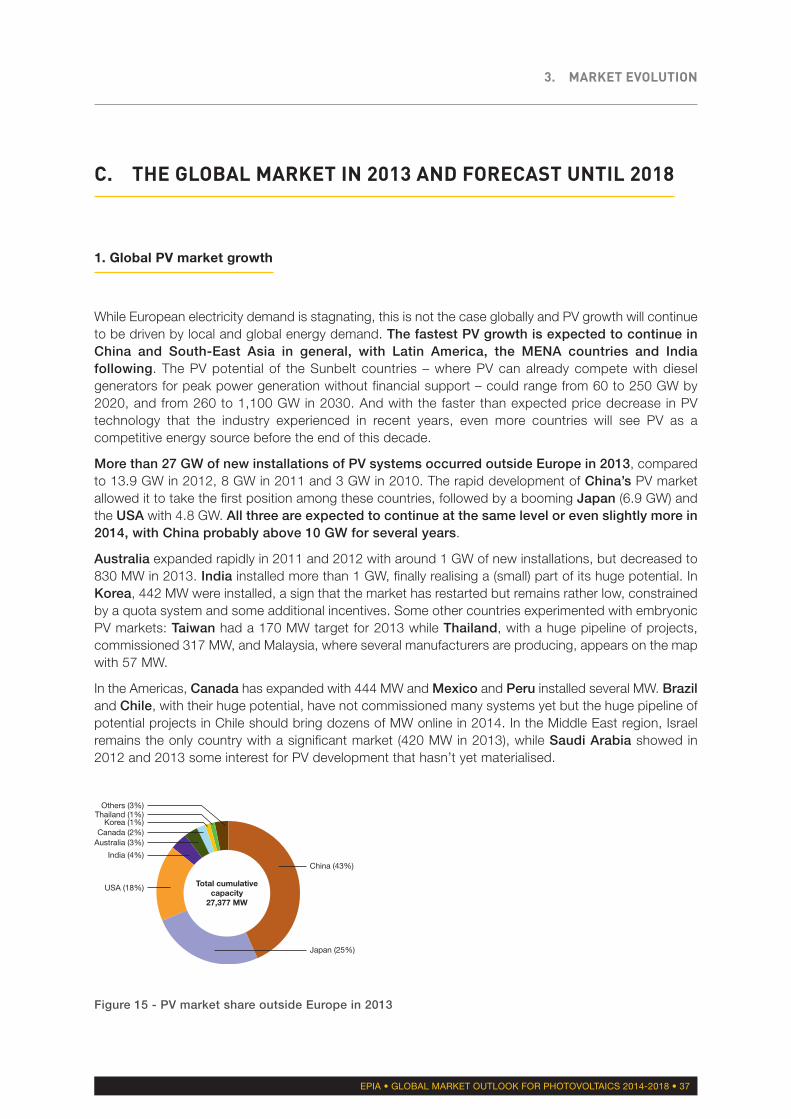
More than 27 GW of new installations of PV systems occurred outside Europe in 2013, comparedto 13.9 GW in 2012, 8 GW in 2011 and 3 GW in 2010. The rapid development of China’s PV marketallowed it to take the first position among these countries, followed by a booming Japan (6.9 GW) andthe USA with 4.8 GW. All three are expected to continue at the same level or even slightly more in2014, with China probably above 10 GW for several years.
Australia expanded rapidly in 2011 and 2012 with around 1 GW of new installations, but decreased to830 MW in 2013. India installed more than 1 GW, finally realising a (small) part of its huge potential. InKorea, 442 MW were installed, a sign that the market has restarted but remains rather low, constrainedby a quota system and some additional incentives. Some other countries experimented with embryonicPV markets: Taiwan had a 170 MW target for 2013 while Thailand, with a huge pipeline of projects,commissioned 317 MW, and Malaysia, where several manufacturers are producing, appears on the mapwith 57 MW.
In the Americas, Canada has expanded with 444 MW and Mexico and Peru installed several MW. Braziland Chile, with their huge potential, have not commissioned many systems yet but the huge pipeline ofpotential projects in Chile should bring dozens of MW online in 2014. In the Middle East region, Israelremains the only country with a significant market (420 MW in 2013), while Saudi Arabia showed in2012 and 2013 some interest for PV development that hasn’t yet materialised.
Figure 15 - PV market share outside Europe in 2013
Others (3%)
Total cumulativecapacity
27,377 MW
Thailand (1%)Korea (1%)
Canada (2%)Australia (3%)
India (4%)
USA (18%)
China (43%)
Japan (25%)
3. MARKET EVOLUTION
38 • EPIA • GLOBAL MARKET OUTLOOK FOR PHOTOVOLTAICS 2014-2018
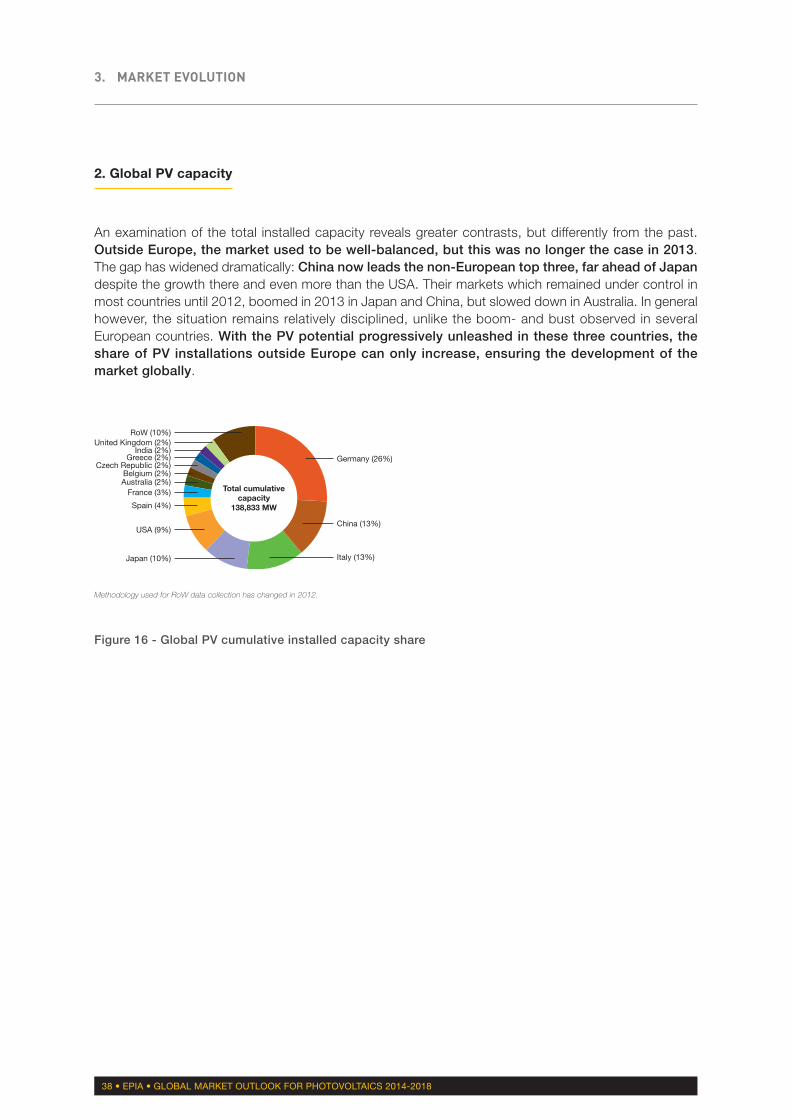
2. Global PV capacity
An examination of the total installed capacity reveals greater contrasts, but differently from the past.Outside Europe, the market used to be well-balanced, but this was no longer the case in 2013.The gap has widened dramatically: China now leads the non-European top three, far ahead of Japandespite the growth there and even more than the USA. Their markets which remained under control inmost countries until 2012, boomed in 2013 in Japan and China, but slowed down in Australia. In generalhowever, the situation remains relatively disciplined, unlike the boom- and bust observed in severalEuropean countries. With the PV potential progressively unleashed in these three countries, theshare of PV installations outside Europe can only increase, ensuring the development of themarket globally.
Figure 16 - Global PV cumulative installed capacity share
RoW (10%)
Total cumulativecapacity
138,833 MW
United Kingdom (2%)India (2%)
Greece (2%)Czech Republic (2%)
Belgium (2%)Australia (2%)
France (3%)
Spain (4%)
USA (9%)
Japan (10%)
Germany (26%)
China (13%)
Italy (13%)
Methodology used for RoW data collection has changed in 2012.
3. MARKET EVOLUTION
EPIA • GLOBAL MARKET OUTLOOK FOR PHOTOVOLTAICS 2014-2018 • 39
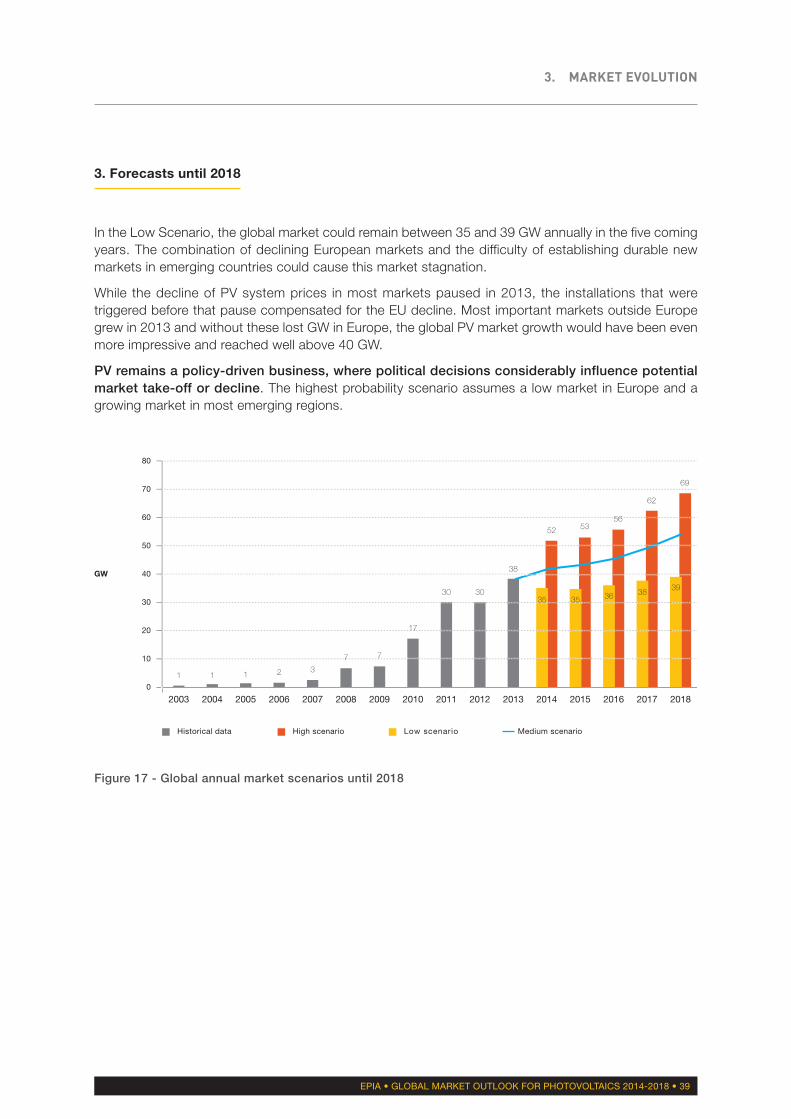
3. Forecasts until 2018
In the Low Scenario, the global market could remain between 35 and 39 GW annually in the five comingyears. The combination of declining European markets and the difficulty of establishing durable newmarkets in emerging countries could cause this market stagnation.
While the decline of PV system prices in most markets paused in 2013, the installations that weretriggered before that pause compensated for the EU decline. Most important markets outside Europegrew in 2013 and without these lost GW in Europe, the global PV market growth would have been evenmore impressive and reached well above 40 GW.
PV remains a policy-driven business, where political decisions considerably influence potentialmarket take-off or decline. The highest probability scenario assumes a low market in Europe and agrowing market in most emerging regions.
Figure 17 - Global annual market scenarios until 2018
0
10
20
30
40
50
60
70
80
GW
1 1 1 2
2003 2004 2005 2006 2007 2008 2009 2010 2011 2012 2013 2014 2015 2016 2017 2018
3
7 7
17
30 30
52
35
53
35
56
36
62
38
69
39
38
High scenario Low scenarioHistorical data Medium scenario
3. MARKET EVOLUTION
40 • EPIA • GLOBAL MARKET OUTLOOK FOR PHOTOVOLTAICS 2014-2018
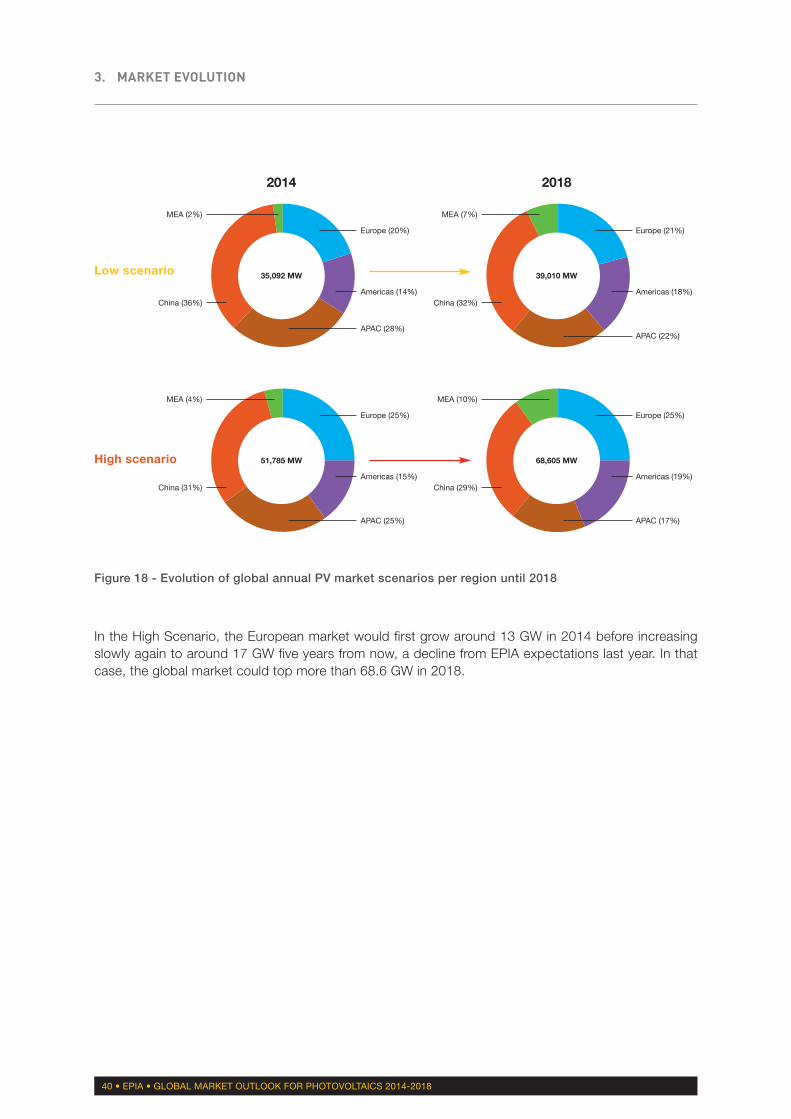
In the High Scenario, the European market would first grow around 13 GW in 2014 before increasingslowly again to around 17 GW five years from now, a decline from EPIA expectations last year. In thatcase, the global market could top more than 68.6 GW in 2018.
Figure 18 - Evolution of global annual PV market scenarios per region until 2018
2014
MEA (2%)
China (36%)
Europe (20%)
APAC (28%)
Americas (14%)
35,092 MW
2018
MEA (7%)
China (32%)
Europe (21%)
APAC (22%)
Americas (18%)
39,010 MW
MEA (4%)
China (31%)
Europe (25%)
APAC (25%)
Americas (15%)
51,785 MW
MEA (10%)
China (29%)
Europe (25%)
APAC (17%)
Americas (19%)
68,605 MW
Low scenario
High scenario

3. MARKET EVOLUTION
EPIA • GLOBAL MARKET OUTLOOK FOR PHOTOVOLTAICS 2014-2018 • 41
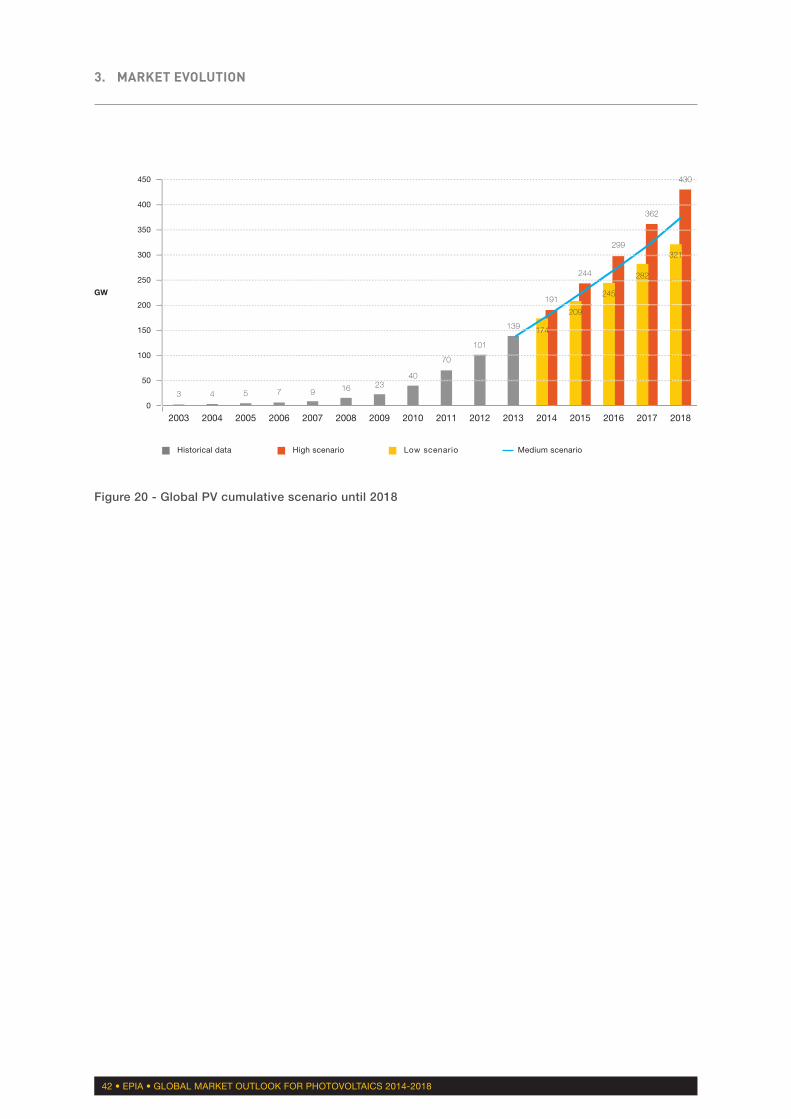
The Asia-Pacific region, including China, should represent a major share of PV installations in the comingyears. In the best case, the world could run up to 430.3 GW of PV systems five years from now,compared to 138.9 GW at the end of 2013.
Figure 19 - Evolution of global PV cumulative installed capacity per region until 2018
2014
MEA (1%)
Americas (11%)
APAC (19%)
China (18%) Europe (51%)
173,948 MW
2018
MEA (3%)RoW (1%)
APAC (20%)
China (25%) Europe (37%)
Americas (14%)
321,400 MW
MEA (2%)RoW (1%)
Americas (11%)
APAC (18%)
China (18%) Europe (50%)
190,641 MW
MEA (5%)RoW (1%)
APAC (19%)
China (24%) Europe (36%)
Americas (15%)
430,301 MW
Low scenario
High scenario
Methodology used for RoW data collection has changed in 2012.
3. MARKET EVOLUTION
42 • EPIA • GLOBAL MARKET OUTLOOK FOR PHOTOVOLTAICS 2014-2018
Figure 20 - Global PV cumulative scenario until 2018
0
50
100
150
200
250
300
350
400
450
GW
3 4 5 7
2003 2004 2005 2006 2007 2008 2009 2010 2011 2012 2013 2014 2015 2016 2017 2018
9 16 2340
70
101
174
191
209
244
245
299
282
362
321
430
139
High scenario Low scenarioHistorical data Medium scenario
3. MARKET EVOLUTION
EPIA • GLOBAL MARKET OUTLOOK FOR PHOTOVOLTAICS 2014-2018 • 43
4. Forecasts per segment
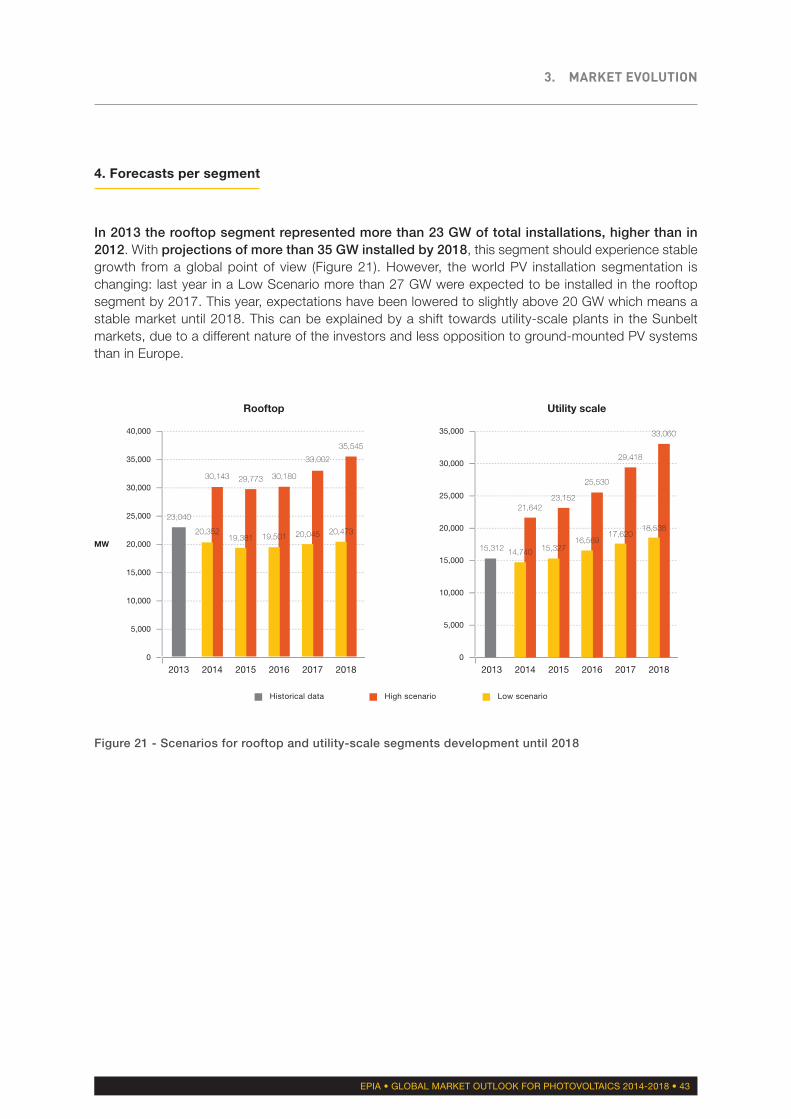
In 2013 the rooftop segment represented more than 23 GW of total installations, higher than in2012. With projections of more than 35 GW installed by 2018, this segment should experience stablegrowth from a global point of view (Figure 21). However, the world PV installation segmentation ischanging: last year in a Low Scenario more than 27 GW were expected to be installed in the rooftopsegment by 2017. This year, expectations have been lowered to slightly above 20 GW which means astable market until 2018. This can be explained by a shift towards utility-scale plants in the Sunbeltmarkets, due to a different nature of the investors and less opposition to ground-mounted PV systemsthan in Europe.
Figure 21 - Scenarios for rooftop and utility-scale segments development until 2018
0
5,000
10,000
15,000
20,000
25,000
30,000
35,000
40,000
MW
23,040
30,143 29,773 30,180
2013 2014 2015 2016 2017 2018
33,002
35,545
Rooftop
20,35219,381 19,501 20,045 20,473
High scenario Low scenarioHistorical data
0
5,000
10,000
15,000
20,000
25,000
30,000
35,000
15,312
21,64223,152
25,530
2013 2014 2015 2016 2017 2018
29,418
33,060
Utility scale
14,740 15,32716,569
17,62018,538
3. MARKET EVOLUTION
44 • EPIA • GLOBAL MARKET OUTLOOK FOR PHOTOVOLTAICS 2014-2018
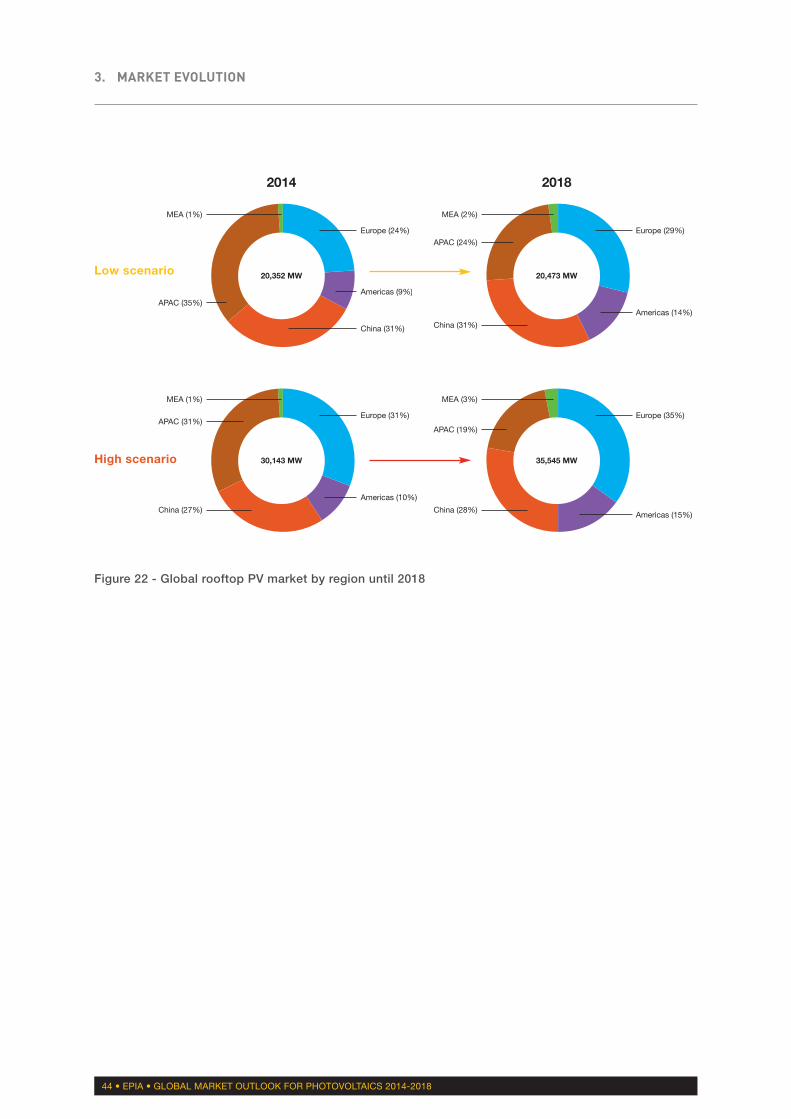
Figure 22 - Global rooftop PV market by region until 2018
MEA (1%)
APAC (35%)
Europe (24%)
China (31%)
Americas (9%)
20,352 MW
2014 2018
MEA (2%)
APAC (24%)
China (31%)
Europe (29%)
Americas (14%)
20,473 MW
MEA (1%)
APAC (31%)
China (27%)
Europe (31%)
Americas (10%)
30,143 MW
MEA (3%)
APAC (19%)
China (28%)
Europe (35%)
Americas (15%)
35,545 MW
Low scenario
High scenario
3. MARKET EVOLUTION
EPIA • GLOBAL MARKET OUTLOOK FOR PHOTOVOLTAICS 2014-2018 • 45
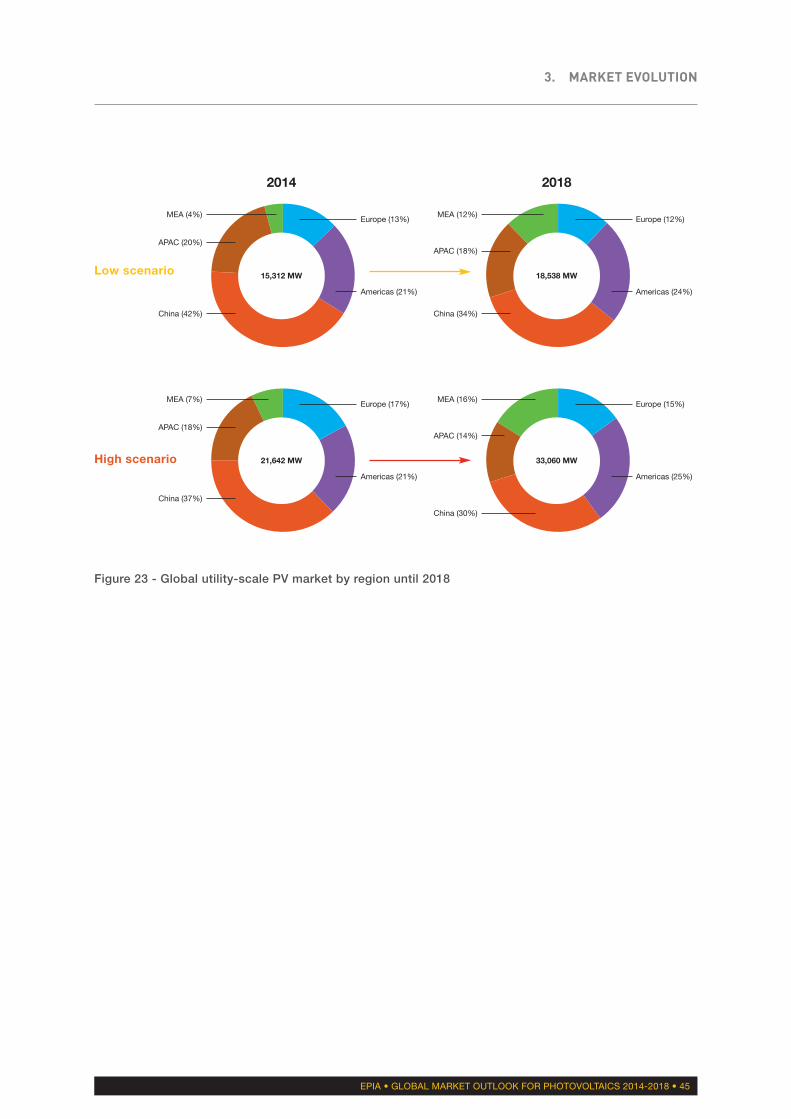
Figure 23 - Global utility-scale PV market by region until 2018
2014
MEA (4%)
APAC (20%)
China (42%)
Europe (13%)
Americas (21%)
15,312 MW
2018
MEA (12%)
APAC (18%)
China (34%)
Europe (12%)
Americas (24%)
18,538 MW
MEA (7%)
APAC (18%)
China (37%)
Europe (17%)
Americas (21%)
21,642 MW
MEA (16%)
APAC (14%)
China (30%)
Europe (15%)
Americas (25%)
33,060 MW
Low scenario
High scenario
3. MARKET EVOLUTION
46 • EPIA • GLOBAL MARKET OUTLOOK FOR PHOTOVOLTAICS 2014-2018
5. Future prospects for market development
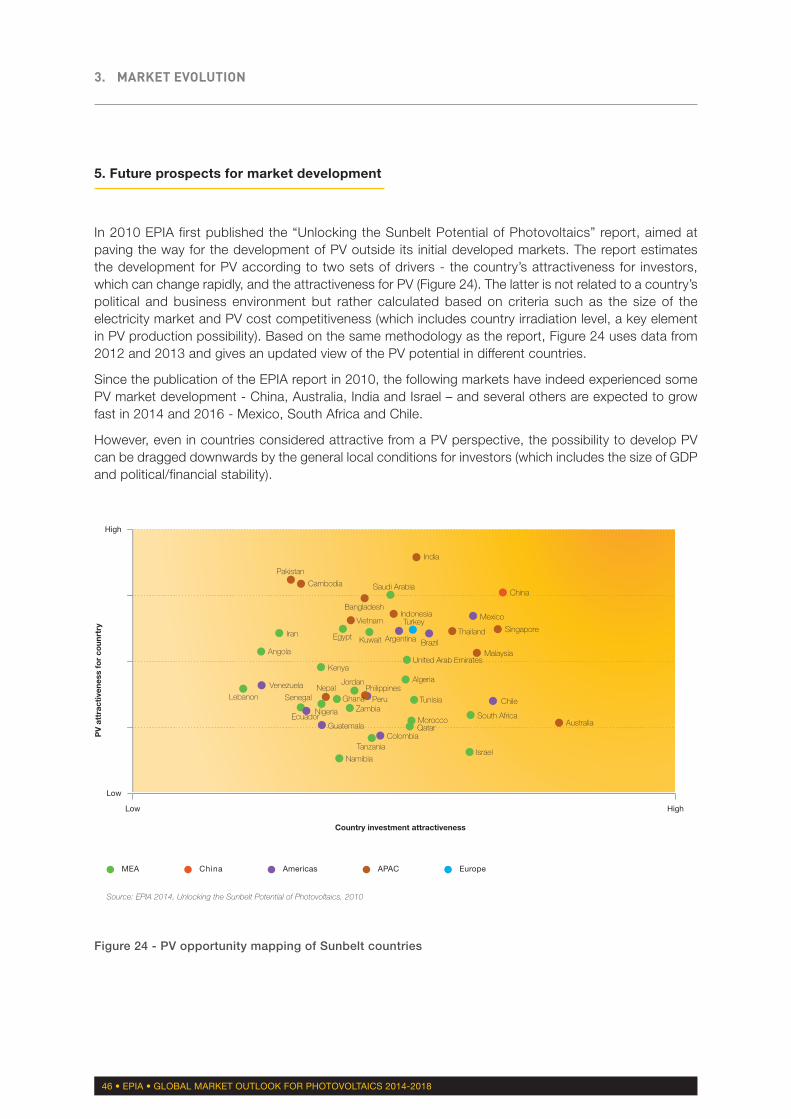
In 2010 EPIA first published the “Unlocking the Sunbelt Potential of Photovoltaics” report, aimed atpaving the way for the development of PV outside its initial developed markets. The report estimatesthe development for PV according to two sets of drivers - the country’s attractiveness for investors,which can change rapidly, and the attractiveness for PV (Figure 24). The latter is not related to a country’spolitical and business environment but rather calculated based on criteria such as the size of theelectricity market and PV cost competitiveness (which includes country irradiation level, a key elementin PV production possibility). Based on the same methodology as the report, Figure 24 uses data from2012 and 2013 and gives an updated view of the PV potential in different countries.
Since the publication of the EPIA report in 2010, the following markets have indeed experienced somePV market development - China, Australia, India and Israel – and several others are expected to growfast in 2014 and 2016 - Mexico, South Africa and Chile.
However, even in countries considered attractive from a PV perspective, the possibility to develop PVcan be dragged downwards by the general local conditions for investors (which includes the size of GDPand political/financial stability).
Figure 24 - PV opportunity mapping of Sunbelt countries
Low
High
PV
att
ract
iven
ess
for
coun
rtry
Low
Country investment attractiveness
High
Iran
Angola
Tunisia
Algeria
Senegal
Nigeria
Ghana
Jordan
Zambia
Tanzania
Lebanon
United Arab Emirates
Namibia
Kenya
QatarMorocco
Israel
South Africa
Egypt Kuwait
Saudi Arabia
Venezuela
EcuadorGuatemala
Colombia
Chile
Mexico
Argentina Brazil
Peru
Pakistan
Cambodia
Malaysia
Thailand
PhilippinesNepal
IndonesiaVietnam
Bangladesh
Singapore
Australia
China
India
Turkey
Source: EPIA 2014, Unlocking the Sunbelt Potential of Photovoltaics, 2010
MEA China Americas APAC Europe
PHOTOVOLTAICSIN THE ENERGYSECTOR
4
EPIA • GLOBAL MARKET OUTLOOK FOR PHOTOVOLTAICS 2014-2018 • 49
4. PHOTOVOLTAICS IN THE ENERGY SECTOR
A. POSITIONING PV IN THE ELECTRICITY GENERATION MIX
1. PV positioning in 2013
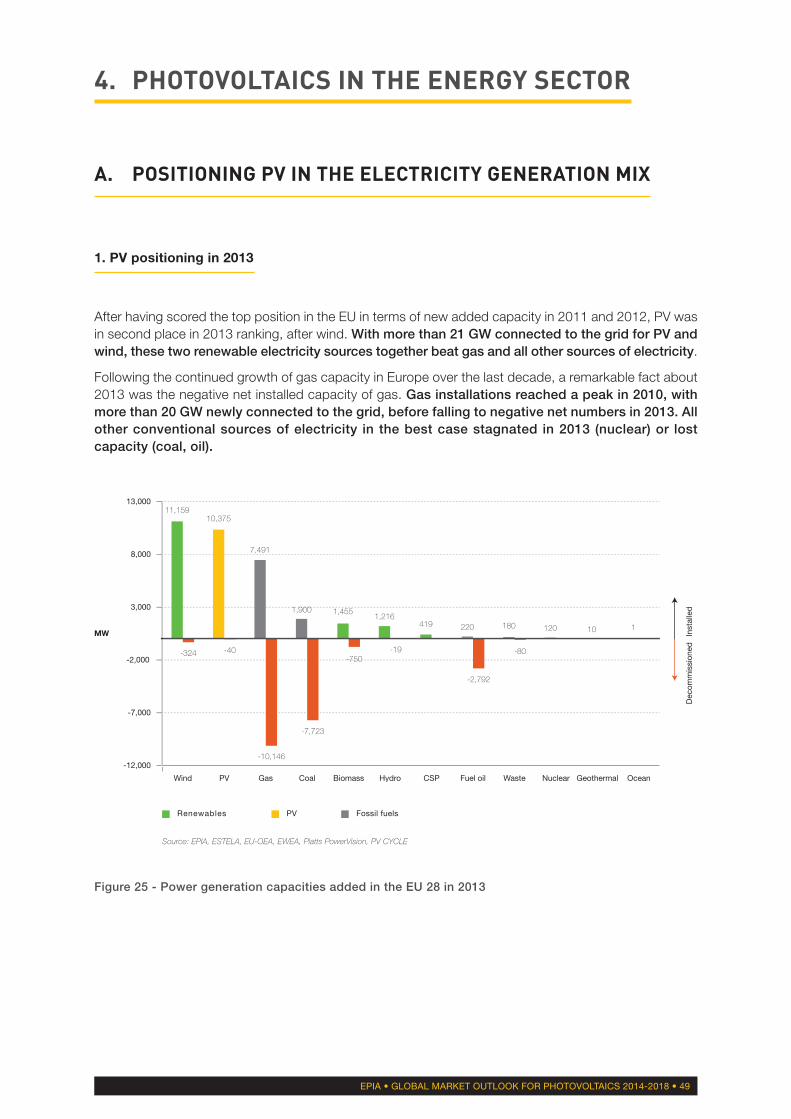
After having scored the top position in the EU in terms of new added capacity in 2011 and 2012, PV wasin second place in 2013 ranking, after wind. With more than 21 GW connected to the grid for PV andwind, these two renewable electricity sources together beat gas and all other sources of electricity.
Following the continued growth of gas capacity in Europe over the last decade, a remarkable fact about2013 was the negative net installed capacity of gas. Gas installations reached a peak in 2010, withmore than 20 GW newly connected to the grid, before falling to negative net numbers in 2013. Allother conventional sources of electricity in the best case stagnated in 2013 (nuclear) or lostcapacity (coal, oil).
Figure 25 - Power generation capacities added in the EU 28 in 2013
-12,000
-7,000
-2,000
3,000
8,000
13,000
MW
11,15910,375
7,491
1,900 1,4551,216
419 220 180 120 10 1
-324 -40
-10,146
-7,723
-750-19
-2,792
-80
Wind PV Gas Coal Biomass Hydro CSP Fuel oil Waste Nuclear Geothermal Ocean
Inst
alle
dD
ecom
mis
sion
ed
Source: EPIA, ESTELA, EU-OEA, EWEA, Platts PowerVision, PV CYCLE
PVRenewables Fossil fuels
4. PHOTOVOLTAICS IN THE ENERGY SECTOR
50 • EPIA • GLOBAL MARKET OUTLOOK FOR PHOTOVOLTAICS 2014-2018
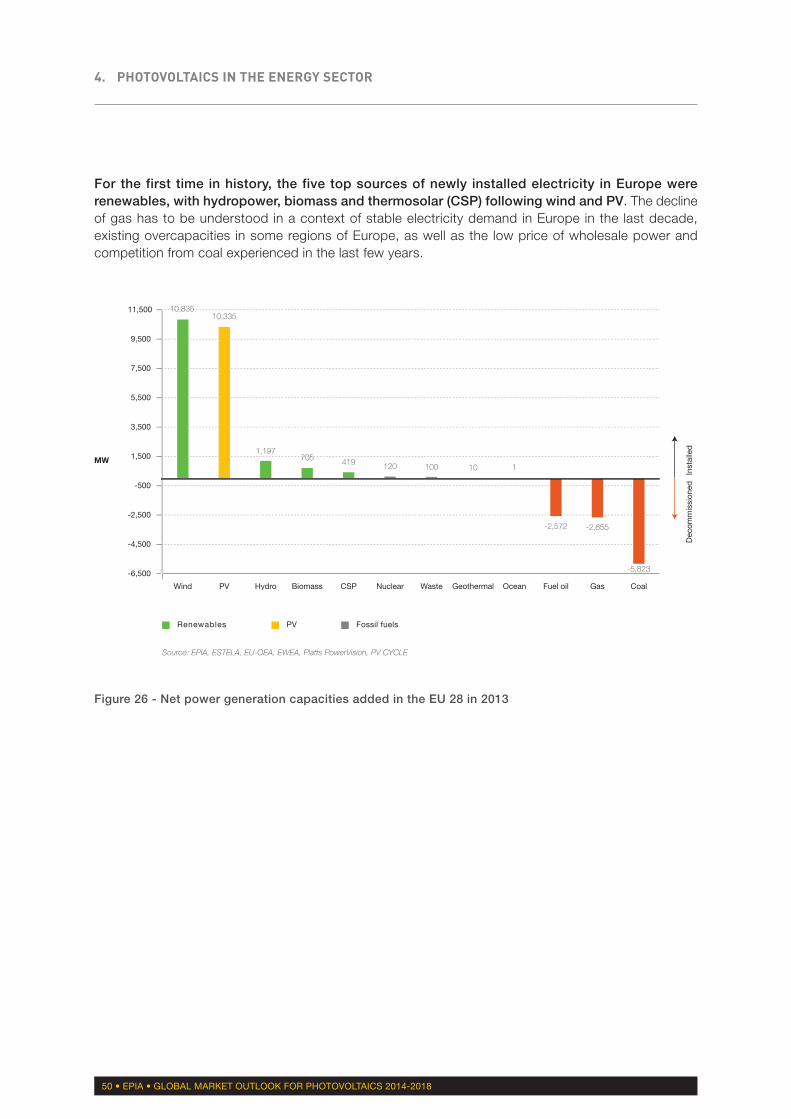
Figure 26 - Net power generation capacities added in the EU 28 in 2013
-6,500
-4,500
-2,500
-500
1,500
3,500
5,500
7,500
9,500
11,500
MW
10,83510,335
1,197705 419 120 100 10 1
-2,572 -2,655
-5,823
Wind PV Hydro Biomass CSP Nuclear Waste Geothermal Ocean Fuel oil Gas Coal
Inst
alle
dD
ecom
mis
sion
ed
Source: EPIA, ESTELA, EU-OEA, EWEA, Platts PowerVision, PV CYCLE
PVRenewables Fossil fuels
For the first time in history, the five top sources of newly installed electricity in Europe wererenewables, with hydropower, biomass and thermosolar (CSP) following wind and PV. The declineof gas has to be understood in a context of stable electricity demand in Europe in the last decade,existing overcapacities in some regions of Europe, as well as the low price of wholesale power andcompetition from coal experienced in the last few years.
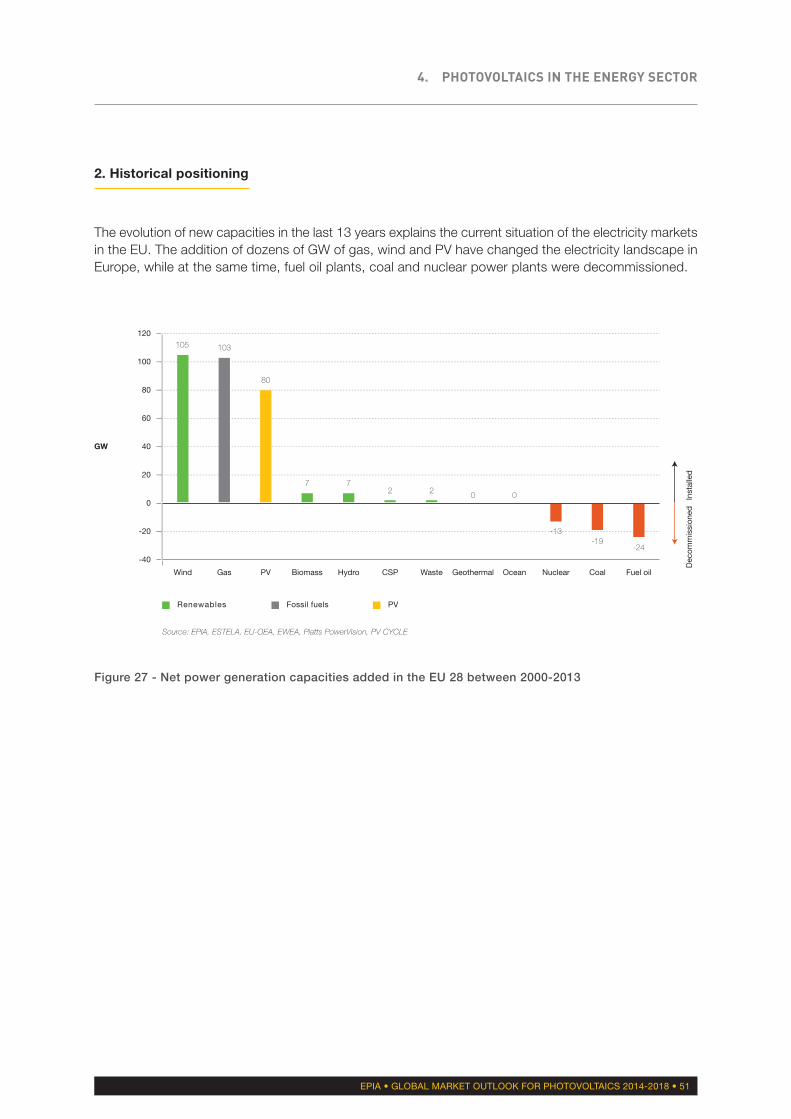
4. PHOTOVOLTAICS IN THE ENERGY SECTOR
2. Historical positioning
The evolution of new capacities in the last 13 years explains the current situation of the electricity marketsin the EU. The addition of dozens of GW of gas, wind and PV have changed the electricity landscape inEurope, while at the same time, fuel oil plants, coal and nuclear power plants were decommissioned.
EPIA • GLOBAL MARKET OUTLOOK FOR PHOTOVOLTAICS 2014-2018 • 51
Figure 27 - Net power generation capacities added in the EU 28 between 2000-2013
-40
-20
0
20
40
60
80
100
120
GW
105 103
80
7 72 2
0 0
-13-19
-24
Wind Gas PV Biomass Hydro CSP Waste Geothermal Ocean Nuclear Coal Fuel oil
Inst
alle
dD
ecom
mis
sion
ed
Source: EPIA, ESTELA, EU-OEA, EWEA, Platts PowerVision, PV CYCLE
PVRenewables Fossil fuels
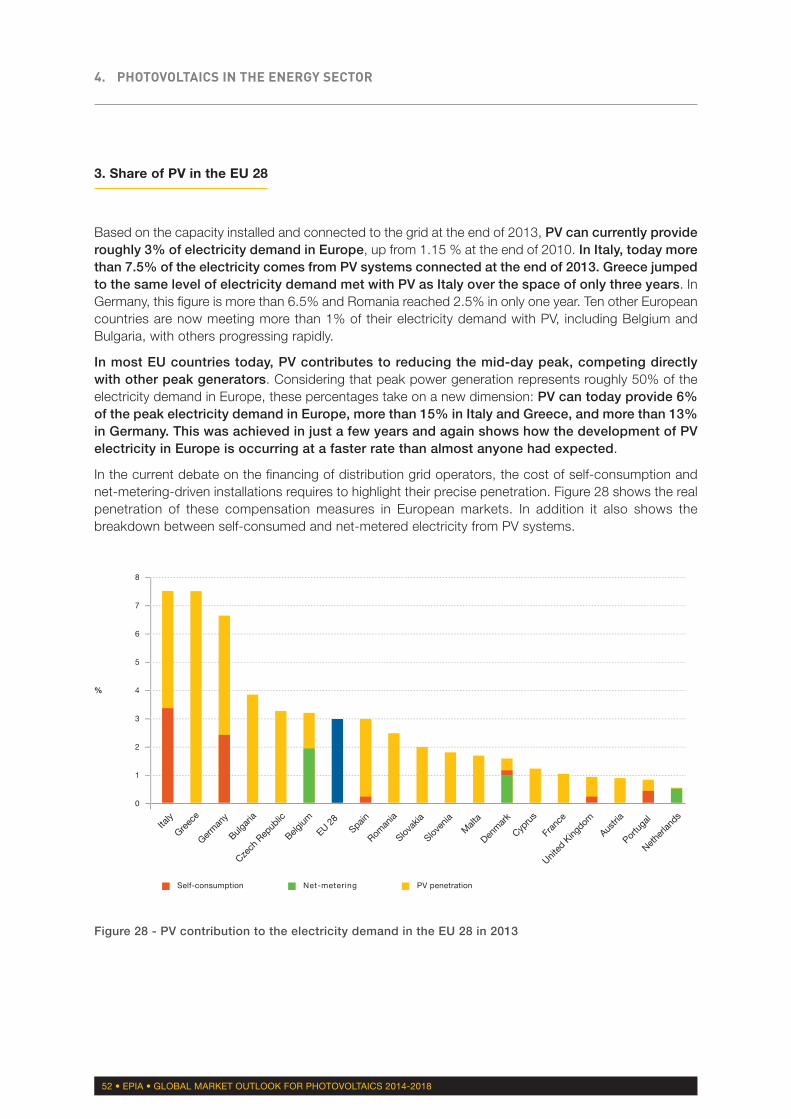
4. PHOTOVOLTAICS IN THE ENERGY SECTOR
52 • EPIA • GLOBAL MARKET OUTLOOK FOR PHOTOVOLTAICS 2014-2018
3. Share of PV in the EU 28
Based on the capacity installed and connected to the grid at the end of 2013, PV can currently provideroughly 3% of electricity demand in Europe, up from 1.15 % at the end of 2010. In Italy, today morethan 7.5% of the electricity comes from PV systems connected at the end of 2013. Greece jumpedto the same level of electricity demand met with PV as Italy over the space of only three years. InGermany, this figure is more than 6.5% and Romania reached 2.5% in only one year. Ten other Europeancountries are now meeting more than 1% of their electricity demand with PV, including Belgium andBulgaria, with others progressing rapidly.
In most EU countries today, PV contributes to reducing the mid-day peak, competing directlywith other peak generators. Considering that peak power generation represents roughly 50% of theelectricity demand in Europe, these percentages take on a new dimension: PV can today provide 6%of the peak electricity demand in Europe, more than 15% in Italy and Greece, and more than 13%in Germany. This was achieved in just a few years and again shows how the development of PVelectricity in Europe is occurring at a faster rate than almost anyone had expected.
In the current debate on the financing of distribution grid operators, the cost of self-consumption andnet-metering-driven installations requires to highlight their precise penetration. Figure 28 shows the realpenetration of these compensation measures in European markets. In addition it also shows thebreakdown between self-consumed and net-metered electricity from PV systems.
Figure 28 - PV contribution to the electricity demand in the EU 28 in 2013
0
1
2
3
4
5
6
7
8
%
Italy
Greec
e
Germ
any
Bulgar
ia
Czech
Rep
ublic
Belgium
Spain
EU 28
Roman
ia
Slovak
ia
Sloven
iaM
alta
Denm
ark
Cypru
s
Fran
ce
United
King
dom
Austri
a
Portu
gal
Nethe
rland
s
Self-consumption Net-metering PV penetration
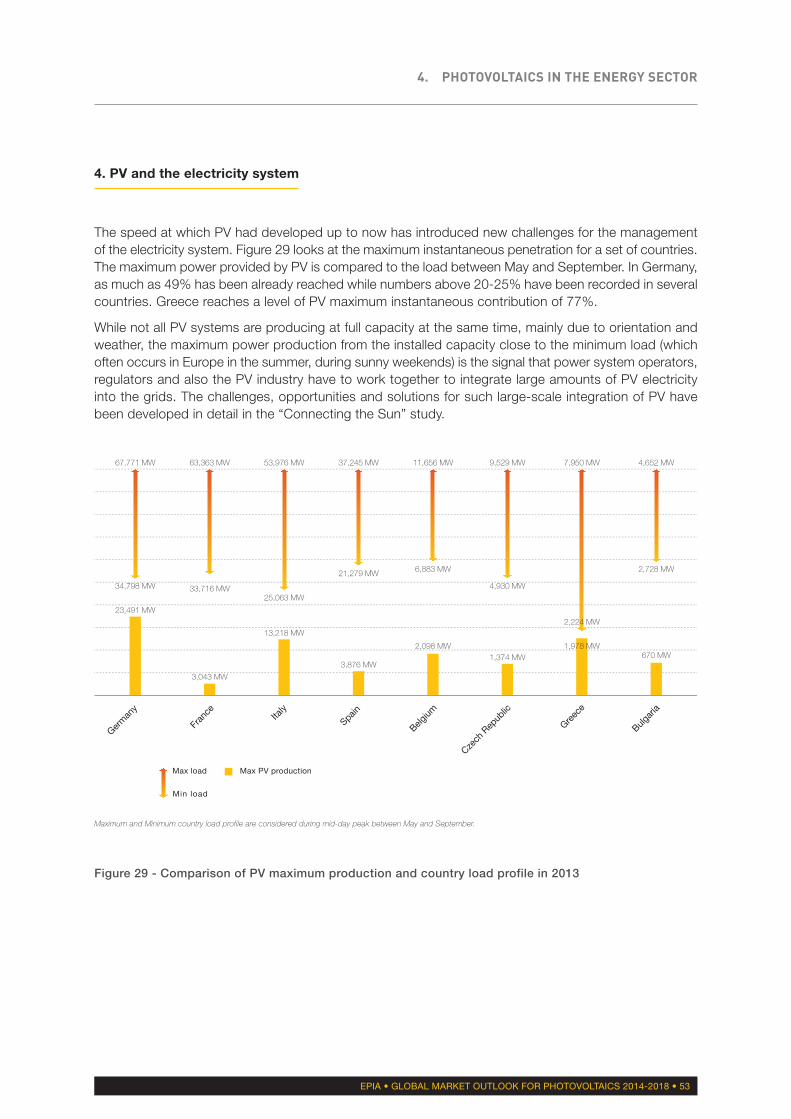
4. PHOTOVOLTAICS IN THE ENERGY SECTOR
4. PV and the electricity system
The speed at which PV had developed up to now has introduced new challenges for the managementof the electricity system. Figure 29 looks at the maximum instantaneous penetration for a set of countries.The maximum power provided by PV is compared to the load between May and September. In Germany,as much as 49% has been already reached while numbers above 20-25% have been recorded in severalcountries. Greece reaches a level of PV maximum instantaneous contribution of 77%.
While not all PV systems are producing at full capacity at the same time, mainly due to orientation andweather, the maximum power production from the installed capacity close to the minimum load (whichoften occurs in Europe in the summer, during sunny weekends) is the signal that power system operators,regulators and also the PV industry have to work together to integrate large amounts of PV electricityinto the grids. The challenges, opportunities and solutions for such large-scale integration of PV havebeen developed in detail in the “Connecting the Sun” study.
EPIA • GLOBAL MARKET OUTLOOK FOR PHOTOVOLTAICS 2014-2018 • 53
Figure 29 - Comparison of PV maximum production and country load profile in 2013
Germ
any
Fran
ce Italy
Spain
Belgium
Czech
Rep
ublic
Greec
e
Bulgar
ia
67,771 MW 63,363 MW 53,976 MW 37,245 MW 11,656 MW 9,529 MW 7,950 MW 4,652 MW
34,798 MW 33,716 MW25,063 MW
21,279 MW 6,883 MW
4,930 MW
2,224 MW
2,728 MW
23,491 MW
3,043 MW
13,218 MW
3,876 MW
2,098 MW1,374 MW
1,978 MW670 MW
Max load
Min load
Max PV production
Maximum and Minimum country load profile are considered during mid-day peak between May and September.
CONCLUSION5
After many years of growth and innovation, the PV industry is again going through a challengingperiod, with shifting market dynamics and a different geographical focus. In Europe, changingpolitical support has created a climate of uncertainty that will hamper the re-development of thePV market. But outside Europe, the potential for growth remains intact and the various projectsappearing in dozens of countries could transform into real market take-off.
Going forward, the key issues that will play a role in determining how market evolution takes place include:
• Policy: The PV market remains in most countries a policy-driven market, as shown by thesignificant market decrease in countries where harmful and retrospective political measures havebeen taken. However, with the right decisions creating smart and sustainable supportschemes for PV, markets can continue to grow in a number of countries
• Competitiveness: In some countries in some segments, PV is already competitive with other powersources in terms of levelised cost of electricity. In other countries, it is rapidly moving towardscost-competitiveness. Grid and market integration challenges should be addressed withoutdelay in order not to further hamper future PV development
• Industry consolidation: With a global PV modules overcapacity that is less acute than one or two yearsago, prices have stabilised in 2013 and the return to profitability should allow companies to investagain. This could in return lead to prices of new technology declining in the coming years andnew markets opening for PV
The enormous potential of solar PV and its benefits for society are more obvious than ever. PV isbecoming a mainstream player within the power system. Under all scenarios, PV will continue toincrease its share of the energy mix in Europe and around the world, increasingly delivering clean,safe, affordable and decentralised electricity to people.
5. CONCLUSION
EPIA • GLOBAL MARKET OUTLOOK FOR PHOTOVOLTAICS 2014-2018 • 55
Alternating Current (AC): Electric current that periodically reverses its direction of flows - 50 times persecond (Hz) for Europe, China, East Japan among others and 60 times per second for the USA, WestJapan, Brazil. Solar PV power must be converted from DC (see below) to AC using a power inverter.
Connected capacity: Refers to generating power systems (e.g. PV generators) that have been installedand allowed to inject electricity into the grid. The connected capacity can be expressed in AC or DCaccording to the country.
Direct Current (DC): Electric current that flows only in one direction. Solar PV power starts as DC andis normally converted to AC using a power inverter.
Feed-in Tariff (FiT): Policy mechanism created and regulated by government to promote investment inRES (e.g. PV technology). Under FiT schemes renewable electricity producers are offered long-termcontracts under which a guaranteed fixed amount of money is paid to them, usually by the utility provider(national or local), for the energy fed into the grid. The FiT rate is typically set above market rates,offsetting inherent risks in renewable energy production.
GDP: Gross Domestic Product
Green Certificate (GC): Tradable certificate that represents the environmental or social benefits of (green)electricity generated from RES such as PV. Green certificates can be purchased both from electricityproducers and consumers as a proof of producing or consuming renewable electricity.
Installed capacity: Refers to generating power systems put in place but awaiting the approval of the gridoperator to inject electricity into the grid. It should not be confused with connected capacity (see above).
LCOE: Levelised Cost of Electricity. It represents the cost per kWh of electricity and covers all investmentand operational costs over the system lifetime, including the fuels consumed and replacement of equipment.
Load: Amount of electric power delivered or required at a specific point or points on a system.
Maximum load: The highest amount of electric power delivered or required at any specific point orpoints on a system.
Minimum load: The lowest amount of electric power delivered or required at any specific point or pointson a system.
Net metering: Compensation scheme that allows electricity consumers to reduce their electricity billsby giving them credit for the electricity produced by their PV system over a certain period of time (usuallyone year).
Self-consumption: Possibility for any kind of electricity producer to directly use/consume part or all ofthe electricity produced at the same location (on-site consumption), instantaneously.
56 • EPIA • GLOBAL MARKET OUTLOOK FOR PHOTOVOLTAICS 2014-2018
GLOSSARY
Figure 1 Evolution of global PV cumulative installed capacity 2000-2013 17Figure 2 Evolution of global PV annual installations 2000-2013 18Figure 3 Global PV regional installations per habitant 20Figure 4 Evolution of European new grid-connected PV capacities 2000-2013 21Figure 5 Evolution of European PV cumulative installed capacity 2000-2013 22Figure 6 European PV installations per habitant 24Figure 7 European PV market split in 2013 25Figure 8 European PV market segmentation by country in 2013 28Figure 9 European PV market segmentation in 2012 and 2013 29Figure 10 European PV cumulative capacity segmentation by country in 2013 29Figure 11 Top 5 European residential PV markets in 2013 30Figure 12 European annual PV market scenarios until 2018 31Figure 13 European cumulative PV market scenarios until 2018 32Figure 14 Cumulative capacity forecast compared to EPIA’s new 2030 scenarios 35Figure 15 PV market share outside Europe in 2013 37Figure 16 Global PV cumulative installed capacity share 38Figure 17 Global annual PV market scenarios until 2018 39Figure 18 Evolution of global annual PV market scenarios per region until 2018 40Figure 19 Evolution of global PV cumulative installed capacity per region until 2018 41Figure 20 Global PV cumulative scenario until 2018 42Figure 21 Scenarios for rooftop and utility-scale segments development until 2018 43Figure 22 Global rooftop PV market by region until 2018 44Figure 23 Global utility-scale PV market by region until 2018 45Figure 24 PV opportunity mapping of Sunbelt countries 46Figure 25 Power generation capacities added in the EU 28 in 2013 49Figure 26 Net power generation capacities added in the EU 28 in 2013 50Figure 27 Net power generation capacities added in the EU 28 between 2000-2013 51Figure 28 PV contribution to the electricity demand in the EU 28 in 2013 52Figure 29 Comparison of PV maximum production and country load profile in 2013 53
Table 1 NREAPs vs. reality of PV markets in the EU 28 34Table 2 Support schemes in Europe and prospects for PV 36
LIST OF FIGURES AND TABLES
EPIA • GLOBAL MARKET OUTLOOK FOR PHOTOVOLTAICS 2014-2018 • 57

EPIA – the European Photovoltaic Industry Association – is the voice ofphotovoltaics in Europe, with Members active along the whole solar PV valuechain and in neighbouring business sectors. EPIA’s mission is to promote PVelectricity in the European market and to give its global membership a strongand unique voice towards European decision makers.
ISBN 9789082228403

European Photovoltaic Industry AssociationRue d’Arlon 69-71,1040 Brussels, BelgiumT +32 2 709 55 20F +32 2 725 32 [email protected] - www.epia.org
ISBN 9789082228403
© EPIA a.i.s.b.l. - www.epia.org - Printed on environmentally friendly paper - 05/14


