Embed Size (px)
Citation preview

Equity Market OutlookJune 2021
Source: 1Bloomberg. GARP: Growth at Reasonable PriceDisclaimer: The information provided herein may include statements/data of future expectations that are based on current views and assumptions and involves known and unknown risks and uncertainties that could cause actual results, performance or events to differ materially from those expressed or implied.
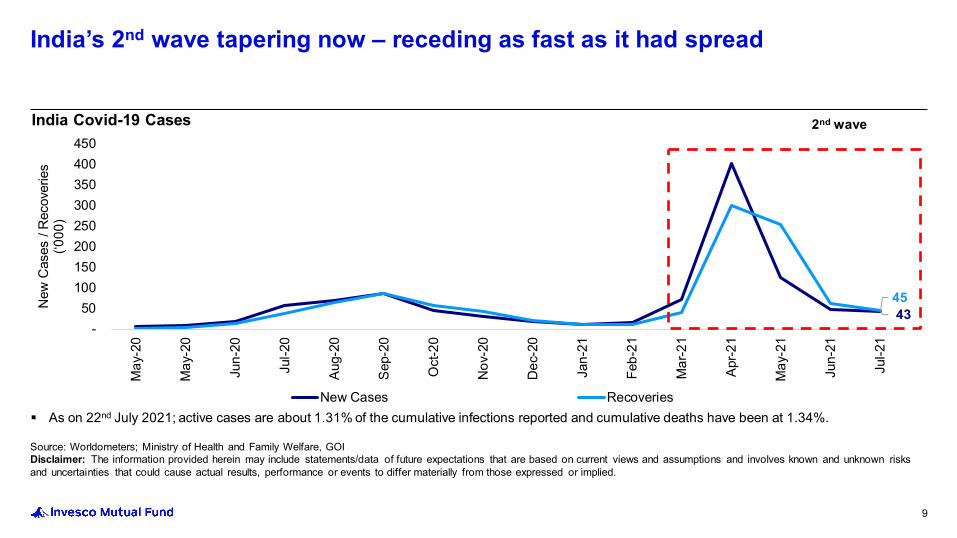
Second wave of infection, though still underway, has receded as rapidly as it spread. Improved vaccination and more pragmatic approach by governments resulted in shallower impact to economic activity.
We believe that the Indian economy should witness a recovery in 2021, albeit of a slightly lower intensity than before the onset of the second wave and accelerate there after. India is well-positioned to commence on a new economic upcycle over the next few years implying broad-based improvement across a variety of industries.
Consumption will take precedence over savings as real interest rates turn negative; manufacturing sector to continue building on its recovery, while services will be more back ended.
Mild inflation expectations, in the initial growth phase of under-utilized capacity, may offer a conducive environment for corporates to improve profits, leading to an earnings upgrade cycle.
Valuations of leading indices, adjusted for lower cost of capital, in-line with long term average – making risk-reward in the markets more evenly balanced. Mid/small cap valuations at a premium to large cap peers; need a strong earnings cycle to drive incremental gains; stock selection key.
Scare to global growth due to delta variant of the COVID – 19 keeps us vigilant for risks emerging at the margin. Recent collapse in US 10-yr yield curve to below the 1.2%1 handle being an indicator of the same.
We prefer a pro-cyclical outlook as GARP opportunities emerge. We maintain our over-weight positions to financials, consumer discretionary and industrials sectors. We also like technology for its earnings resilience but have moderated our stance, of past 6-9 months, as valuations have re-rated.
An economic recovery along with an earnings upgrade cycle can offer more upside to equities in general, with a better participation from the broader markets, offering a good opportunity to invest for the long term.
2
Equity market outlook

3
Global Macro

13.80%
8.10%7.90%
8.70%
-10%-5%0%5%
10%15%20%25%30%
Jan-
07O
ct-0
7Ju
l-08
Apr-0
9Ja
n-10
Oct
-10
Jul-1
1Ap
r-12
Jan-
13O
ct-1
3Ju
l-14
Apr-1
5Ja
n-16
Oct
-16
Jul-1
7Ap
r-18
Jan-
19O
ct-1
9Ju
l-20
Apr-2
1
% (Y
oY)
US Europe Japan UK
0
5,000
10,000
15,000
20,000
25,000
30,000
2008
2009
2010
2011
2012
2013
2014
2015
2016
2017
2018
2019
2020
2021
Billio
ns U
SD
Fed BoJ ECB
Since Feb 2020, +$9.2 T in balance sheet assets
Fed: +$3.8T
BoJ: +$1.1T
ECB: +$4.1T
Source: Invesco. Fed: Federal Bank, BoJ: Bank Of Japan, ECB: European Central Bank. GFC: Global Financial Crisis. Data as at 30 June 2021
Large-Scale Asset Purchases Continue to Support RecoveryMajor Central Bank Balance Sheets, Total Assets
Money Supply Growth across Major Developed Economies, % yoyBase Effect Catching Up, Yet Elevated
4
Emergency monetary programs led to broad money growth
Combined monetary stimulus of 3 central banks, to alleviate pandemic pangs, is almost 11% of Global GDP, compared to about 6% during GFC. The coordination amongst the banks was high and implementation was swift. Loose monetary policies still prevail.
Source: Invesco Ltd. For illustrative purposes only.
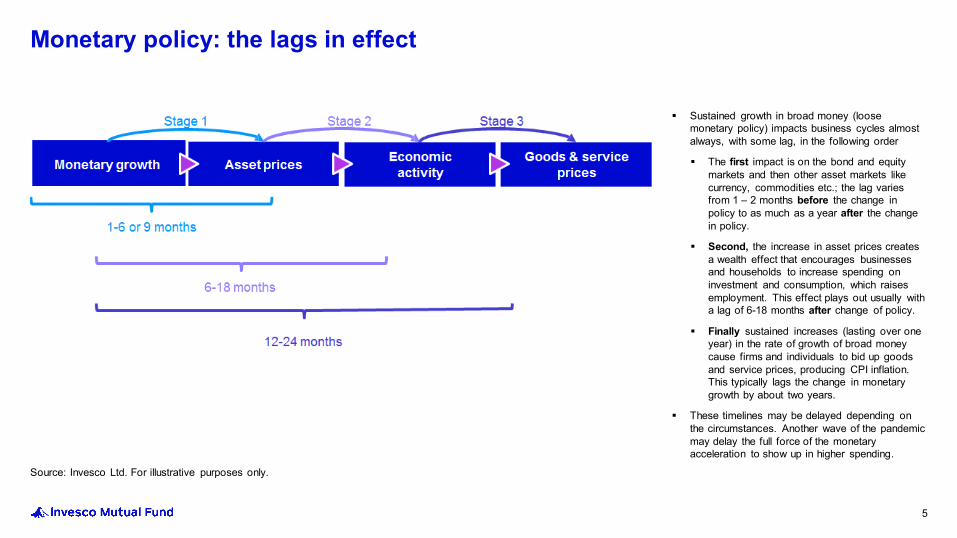
Sustained growth in broad money (loose monetary policy) impacts business cycles almost always, with some lag, in the following order
The first impact is on the bond and equity markets and then other asset markets like currency, commodities etc.; the lag varies from 1 – 2 months before the change in policy to as much as a year after the change in policy.
Second, the increase in asset prices creates a wealth effect that encourages businesses and households to increase spending on investment and consumption, which raises employment. This effect plays out usually with a lag of 6-18 months after change of policy.
Finally sustained increases (lasting over one year) in the rate of growth of broad money cause firms and individuals to bid up goods and service prices, producing CPI inflation. This typically lags the change in monetary growth by about two years.
These timelines may be delayed depending on the circumstances. Another wave of the pandemic may delay the full force of the monetary acceleration to show up in higher spending.
5
Monetary policy: the lags in effect
Source: Invesco Ltd. Data as at 28 June 2021
6
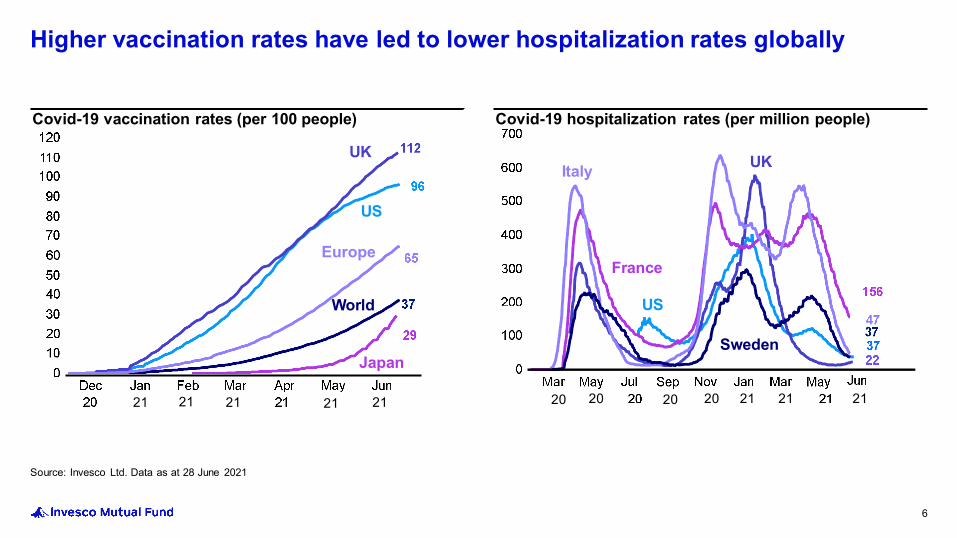
Higher vaccination rates have led to lower hospitalization rates globally
Covid-19 vaccination rates (per 100 people)
UK
US
Europe
World
Japan
Covid-19 hospitalization rates (per million people)
UK
US
Italy
Sweden
France
21 21 21 21 21 21 21 2120202020
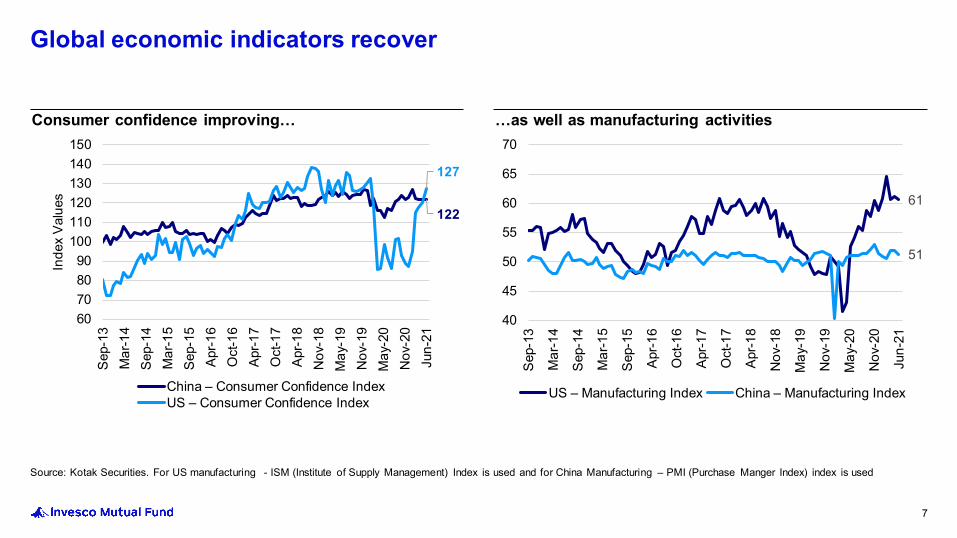
Source: Kotak Securities. For US manufacturing - ISM (Institute of Supply Management) Index is used and for China Manufacturing – PMI (Purchase Manger Index) index is used
122
127
60708090
100110120130140150
Sep-
13M
ar-1
4Se
p-14
Mar
-15
Sep-
15Ap
r-16
Oct
-16
Apr-1
7O
ct-1
7Ap
r-18
Nov
-18
May
-19
Nov
-19
May
-20
Nov
-20
Jun-
21
Inde
x Va
lues
China – Consumer Confidence IndexUS – Consumer Confidence Index
Consumer confidence improving…
61
51
40
45
50
55
60
65
70
Sep-
13
Mar
-14
Sep-
14
Mar
-15
Sep-
15
Apr-1
6
Oct
-16
Apr-1
7
Oct
-17
Apr-1
8
Nov
-18
May
-19
Nov
-19
May
-20
Nov
-20
Jun-
21
US – Manufacturing Index China – Manufacturing Index
…as well as manufacturing activities
7
Global economic indicators recover

8
Indian Macro
Source: Worldometers; Ministry of Health and Family Welfare, GOIDisclaimer: The information provided herein may include statements/data of future expectations that are based on current views and assumptions and involves known and unknown risks and uncertainties that could cause actual results, performance or events to differ materially from those expressed or implied.
43 45
- 50
100 150 200 250 300 350 400 450
May
-20
May
-20
Jun-
20
Jul-2
0
Aug-
20
Sep-
20
Oct
-20
Nov
-20
Dec
-20
Jan-
21
Feb-
21
Mar
-21
Apr-2
1
May
-21
Jun-
21
Jul-2
1
New
Cas
es /
Rec
over
ies
(‘000
)
New Cases Recoveries
India Covid-19 Cases
9
India’s 2nd wave tapering now – receding as fast as it had spread
2nd wave
As on 22nd July 2021; active cases are about 1.31% of the cumulative infections reported and cumulative deaths have been at 1.34%.
0.4% 1.3%
5.9%
13.5%18.1%
29.2%
34.8%
0.0% 0.3% 1.0%3.0%
4.8%6.3%
9.2%3.6
10.5
50.8
89.9
61.1
119.7
79.8
0
20
40
60
80
100
120
140
0%
7%
14%
21%
28%
35%
42%
31-Jan-21 28-Feb-21 31-Mar-21 30-Apr-21 31-May-21 30-Jun-21 20-Jul-21
Milli
on
% o
f elig
ible
pop
ulatio
n va
ccin
ated
1st Dose (LHS) 2nd Dose (LHS) Vaccination administered (mn) (RHS)
Source: Kotak Institutional Equities. 1Kotak Institutional Equities estimates. 2only if J&J uses Biological E supplies for India. Data as on 20th July 2021
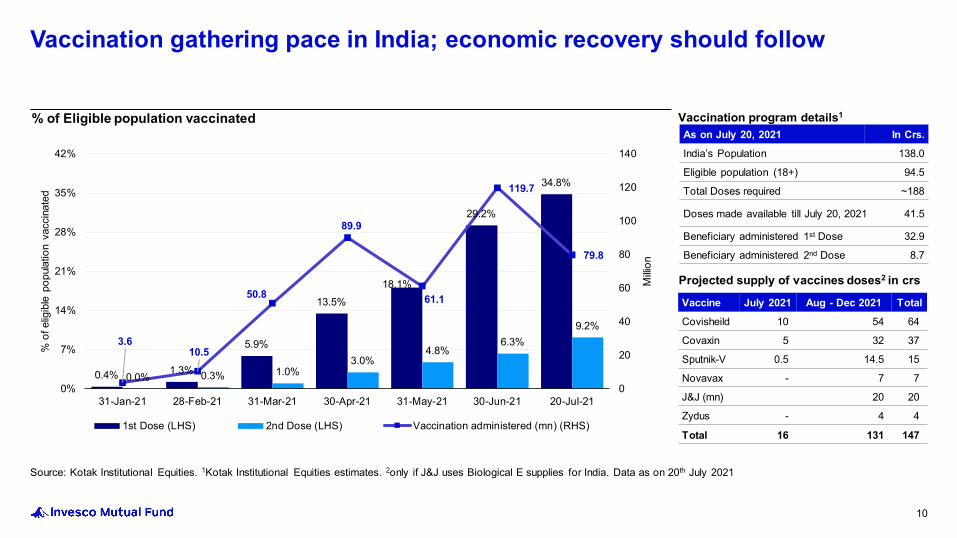
% of Eligible population vaccinated
Projected supply of vaccines doses2 in crs
10
Vaccination gathering pace in India; economic recovery should follow
Vaccine July 2021 Aug - Dec 2021 TotalCovisheild 10 54 64
Covaxin 5 32 37
Sputnik-V 0.5 14.5 15
Novavax - 7 7
J&J (mn) 20 20
Zydus - 4 4
Total 16 131 147
As on July 20, 2021 In Crs.India’s Population 138.0
Eligible population (18+) 94.5
Total Doses required ~188
Doses made available till July 20, 2021 41.5
Beneficiary administered 1st Dose 32.9
Beneficiary administered 2nd Dose 8.7
Vaccination program details1
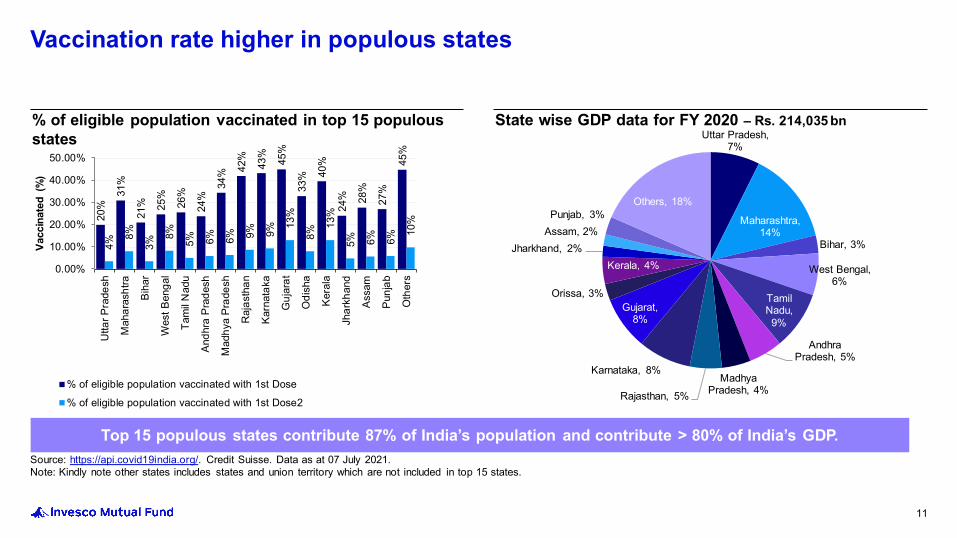
Source: https://api.covid19india.org/. Credit Suisse. Data as at 07 July 2021. Note: Kindly note other states includes states and union territory which are not included in top 15 states.
20%
31%
21% 25
%
26%
24%
34% 42
%
43%
45%
33% 40
%
24% 28
%
27%
45%
4%
8%
3%
8%
5% 6% 6% 9% 9%
13%
8%
13%
5% 6% 6%
10%
0.00%
10.00%
20.00%
30.00%
40.00%
50.00%
Utta
r Pra
desh
Mah
aras
htra
Biha
r
Wes
t Ben
gal
Tam
il N
adu
Andh
ra P
rade
sh
Mad
hya
Prad
esh
Raj
asth
an
Karn
atak
a
Guj
arat
Odi
sha
Kera
la
Jhar
khan
d
Assa
m
Punj
ab
Oth
ers
Vacc
inat
ed (
%)
% of eligible population vaccinated with 1st Dose
% of eligible population vaccinated with 1st Dose2
% of eligible population vaccinated in top 15 populous states Uttar Pradesh,
7%
Maharashtra, 14%
Bihar, 3%
West Bengal, 6%
Tamil Nadu, 9%
Andhra Pradesh, 5%
Madhya Pradesh, 4%Rajasthan, 5%
Karnataka, 8%
Gujarat, 8%
Orissa, 3%
Kerala, 4%Jharkhand, 2%
Assam, 2%Punjab, 3%
Others, 18%
State wise GDP data for FY 2020 – Rs. 214,035 bn
11
Vaccination rate higher in populous states
Top 15 populous states contribute 87% of India’s population and contribute > 80% of India’s GDP.
Source: Spark Capital
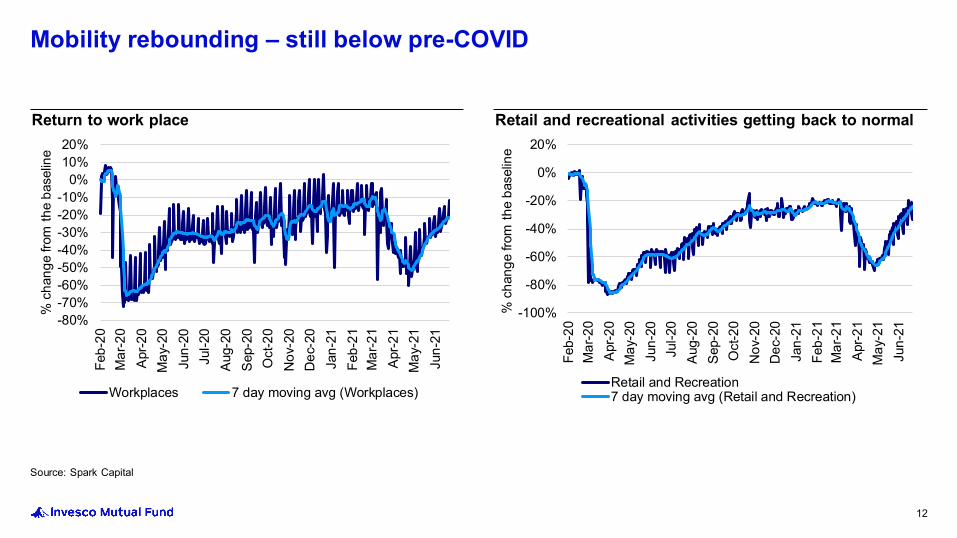
Return to work place Retail and recreational activities getting back to normal
12
Mobility rebounding – still below pre-COVID
-80%-70%-60%-50%-40%-30%-20%-10%
0%10%20%
Feb-
20M
ar-2
0Ap
r-20
May
-20
Jun-
20Ju
l-20
Aug-
20Se
p-20
Oct
-20
Nov
-20
Dec
-20
Jan-
21Fe
b-21
Mar
-21
Apr-2
1M
ay-2
1Ju
n-21
% c
hang
e fro
m th
e ba
selin
e
Workplaces 7 day moving avg (Workplaces)
-100%
-80%
-60%
-40%
-20%
0%
20%
Feb-
20M
ar-2
0Ap
r-20
May
-20
Jun-
20Ju
l-20
Aug-
20Se
p-20
Oct
-20
Nov
-20
Dec
-20
Jan-
21Fe
b-21
Mar
-21
Apr-2
1M
ay-2
1Ju
n-21
% c
hang
e fro
m th
e ba
selin
e
Retail and Recreation7 day moving avg (Retail and Recreation)
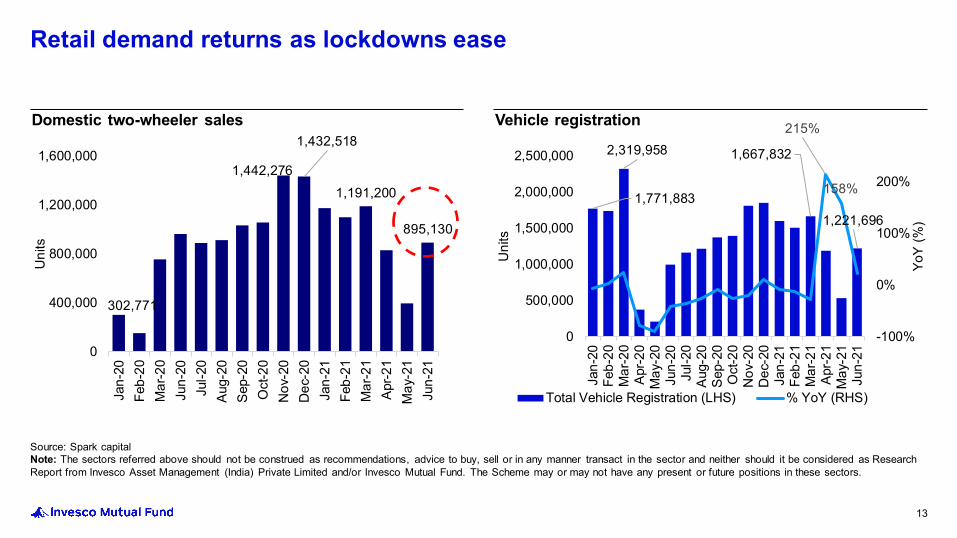
Source: Spark capitalNote: The sectors referred above should not be construed as recommendations, advice to buy, sell or in any manner transact in the sector and neither should it be considered as Research Report from Invesco Asset Management (India) Private Limited and/or Invesco Mutual Fund. The Scheme may or may not have any present or future positions in these sectors.
302,771
1,442,276
1,432,518
1,191,200
895,130
0
400,000
800,000
1,200,000
1,600,000
Jan-
20Fe
b-20
Mar
-20
Jun-
20Ju
l-20
Aug-
20Se
p-20
Oct
-20
Nov
-20
Dec
-20
Jan-
21Fe
b-21
Mar
-21
Apr-2
1M
ay-2
1Ju
n-21
Uni
ts
Domestic two-wheeler sales
1,771,883
2,319,958 1,667,832
1,221,696
215%
158%
-100%
0%
100%
200%
0
500,000
1,000,000
1,500,000
2,000,000
2,500,000
Jan-
20Fe
b-20
Mar
-20
Apr-2
0M
ay-2
0Ju
n-20
Jul-2
0Au
g-20
Sep-
20O
ct-2
0N
ov-2
0D
ec-2
0Ja
n-21
Feb-
21M
ar-2
1Ap
r-21
May
-21
Jun-
21
YoY
(%)
Uni
ts
Total Vehicle Registration (LHS) % YoY (RHS)
Vehicle registration
13
Retail demand returns as lockdowns ease
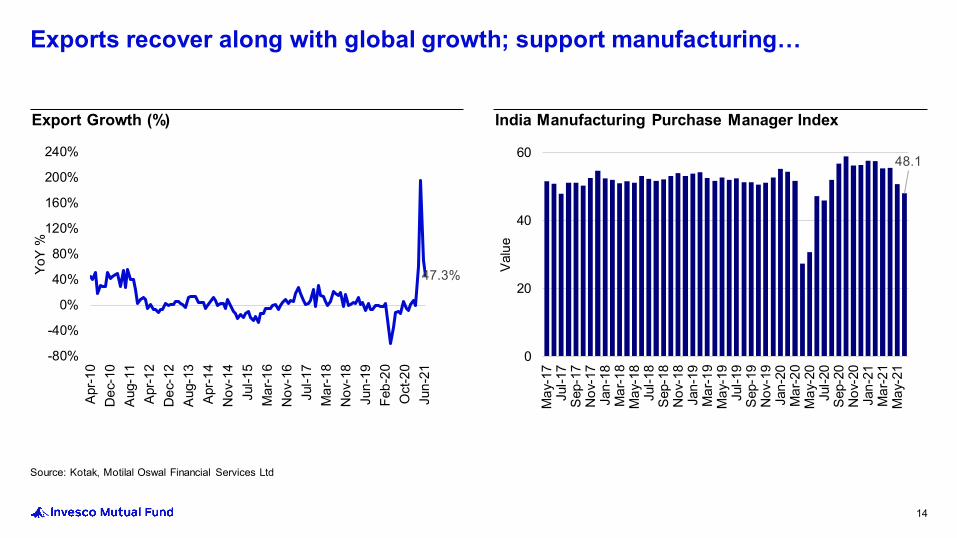
47.3%
-80%
-40%
0%
40%
80%
120%
160%
200%
240%
Apr-1
0D
ec-1
0Au
g-11
Apr-1
2D
ec-1
2Au
g-13
Apr-1
4N
ov-1
4Ju
l-15
Mar
-16
Nov
-16
Jul-1
7M
ar-1
8N
ov-1
8Ju
n-19
Feb-
20O
ct-2
0Ju
n-21
YoY
%
48.1
0
20
40
60
May
-17
Jul-1
7Se
p-17
Nov
-17
Jan-
18M
ar-1
8M
ay-1
8Ju
l-18
Sep-
18N
ov-1
8Ja
n-19
Mar
-19
May
-19
Jul-1
9Se
p-19
Nov
-19
Jan-
20M
ar-2
0M
ay-2
0Ju
l-20
Sep-
20N
ov-2
0Ja
n-21
Mar
-21
May
-21
Valu
e
Source: Kotak, Motilal Oswal Financial Services Ltd
Export Growth (%) India Manufacturing Purchase Manager Index
14
Exports recover along with global growth; support manufacturing…
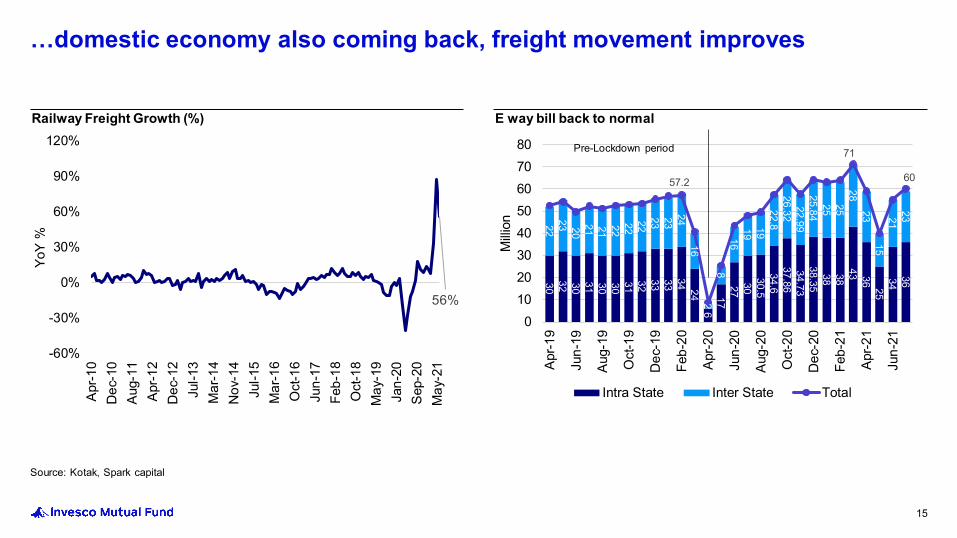
56%
-60%
-30%
0%
30%
60%
90%
120%
Apr-1
0D
ec-1
0Au
g-11
Apr-1
2D
ec-1
2Ju
l-13
Mar
-14
Nov
-14
Jul-1
5M
ar-1
6O
ct-1
6Ju
n-17
Feb-
18O
ct-1
8M
ay-1
9Ja
n-20
Sep-
20M
ay-2
1
YoY
%
3032 30 31 30 30 31 32 33 33 34 24
617
2730
30.534.6
37.8634.73
38.3538 38
43 36 253436
2223 2021 21 222222
23 2324
162
816
19 1922.8
26.3222.99
25.8425 25
2823
1521
23
57.2
71
60
01020304050607080
Apr-1
9
Jun-
19
Aug-
19
Oct
-19
Dec
-19
Feb-
20
Apr-2
0
Jun-
20
Aug-
20
Oct
-20
Dec
-20
Feb-
21
Apr-2
1
Jun-
21
Milli
on
Intra State Inter State Total
Source: Kotak, Spark capital
Railway Freight Growth (%) E way bill back to normal
15
…domestic economy also coming back, freight movement improves
Pre-Lockdown period

Source: Morgan Stanley, Bloomberg
7.27%
3.00%
5.00%
7.00%
9.00%
11.00%
Aug-
10M
ay-1
1Ja
n-12
Sep-
12M
ay-1
3Ja
n-14
Sep-
14M
ay-1
5Ja
n-16
Sep-
16M
ay-1
7Ja
n-18
Sep-
18M
ay-1
9Ja
n-20
Sep-
20M
ay-2
1
% o
f GD
P
Fiscal Deficit (12 months trailing)
250
350
450
550
650
Sep-
11Fe
b-12
Jul-1
2D
ec-1
2M
ay-1
3O
ct-1
3M
ar-1
4Au
g-14
Dec
-14
May
-15
Oct
-15
Mar
-16
Aug-
16Ja
n-17
Jun-
17O
ct-1
7M
ar-1
8Au
g-18
Jan-
19Ju
n-19
Nov
-19
Apr-2
0Au
g-20
Jan-
21Ju
n-21
USD
Bn
609
Foreign Exchange Reserves (USD bn)
16
Key macro indicators healthy
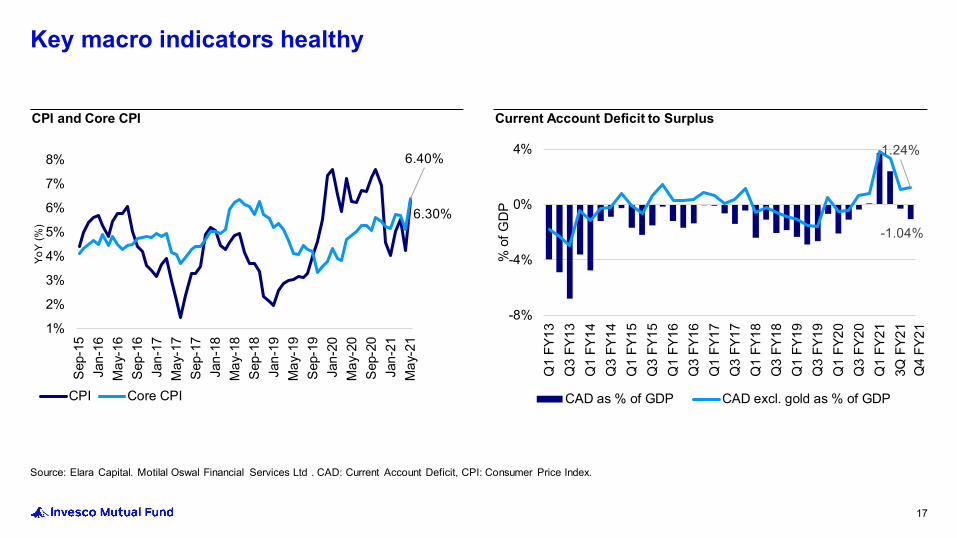
Source: Elara Capital. Motilal Oswal Financial Services Ltd . CAD: Current Account Deficit, CPI: Consumer Price Index.
6.40%
1%
2%
3%
4%
5%
6%
7%
8%
Sep-
15Ja
n-16
May
-16
Sep-
16Ja
n-17
May
-17
Sep-
17Ja
n-18
May
-18
Sep-
18Ja
n-19
May
-19
Sep-
19Ja
n-20
May
-20
Sep-
20Ja
n-21
May
-21
YoY
(%)
CPI Core CPI
6.30%
CPI and Core CPI
-1.04%
1.24%
-8%
-4%
0%
4%
Q1
FY13
Q3
FY13
Q1
FY14
Q3
FY14
Q1
FY15
Q3
FY15
Q1
FY16
Q3
FY16
Q1
FY17
Q3
FY17
Q1
FY18
Q3
FY18
Q1
FY19
Q3
FY19
Q1
FY20
Q3
FY20
Q1
FY21
3Q F
Y21
% o
f GD
P
CAD as % of GDP CAD excl. gold as % of GDP
Current Account Deficit to Surplus
17
Key macro indicators healthy
Q4
FY21
14.40%
12.50%
2.41%
1.64% 1.65%
2.49%
1%
2%
2%
3%
3%
7%
10%
13%
16%
FY05
FY06
FY07
FY08
FY09
FY10
FY11
FY12
FY13
FY14
FY15
FY16
FY17
FY18
FY19
FY20
FY21
FY22
BE
% o
f GD
P
% o
f GD
P
Revex (LHS) Capex (RHS)
The fiscal stimulus in FY09 was Revex-led while Capex was a
casualty
The fiscal stimulus in FY22 is Capex-led
2.59%
6.57%
9.50%
6.80%
FY05
FY06
FY07
FY08
FY09
FY10
FY11
FY12
FY13
FY14
FY15
FY16
FY17
FY18
FY19
FY20
FY21
FY22
BE
Fisc
al d
efic
it (%
of G
DP)
Source: Spark Capital. Revex: Revenue Expenditure. Capex: Capital Expenditure. BE: Budget estimatesDisclaimer: The information provided herein may include statements/data of future expectations that are based on current views and assumptions and involves known and unknown risks and uncertainties that could cause actual results, performance or events to differ materially from those expressed or implied.
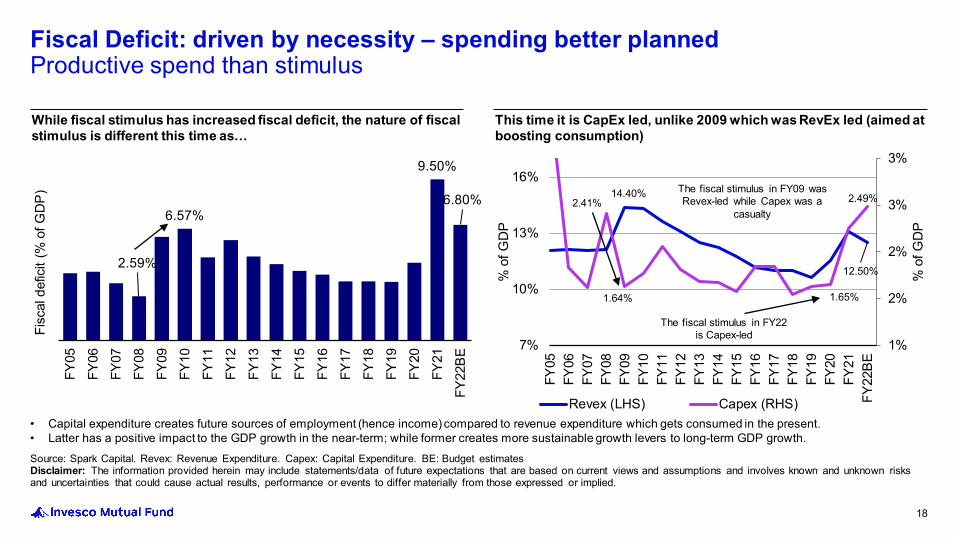
While fiscal stimulus has increased fiscal deficit, the nature of fiscal stimulus is different this time as…
This time it is CapEx led, unlike 2009 which was RevEx led (aimed at boosting consumption)
18
Fiscal Deficit: driven by necessity – spending better plannedProductive spend than stimulus
• Capital expenditure creates future sources of employment (hence income) compared to revenue expenditure which gets consumed in the present.• Latter has a positive impact to the GDP growth in the near-term; while former creates more sustainable growth levers to long-term GDP growth.

Source: Elara Capital; NFSA: National Food Security Act, 2013; IPDS: Integrated Power Development Scheme; DDUGY: Deen Dayal Upadhyaya Gram Jyoti Yojana; SAUBHAGYA: Pradhan Mantri Sahaj Bijli Har Ghar Yojana. Note: Above table includes those key schemes that had quantifiable monetary impact and which account to ~93% of total amount announced.
Fiscal Deficit: measured spendsEconomic relief package necessary to alleviate 2nd wave pandemic stress
19
Scheme Amount (INR bn) Remarks
Loan Guarantee Scheme for COVID Affected Sectors 1,100 Includes INR 500bn for the health sector and INR 600bn for other sectors. Interest rate capped at 7.95% for health sector and 8.25% for other sectors
Emergency Credit Line Guarantee Scheme (ECLGS) 1,500 ECLGS given as part of Atmanirbhar Bharat Package has been extended by another INR 1.5tn. Overall cap of admissible guarantee has been raised from INR 3.0tn to INR 4.5tn.
Free foodgrains under Pradhan Mantri Garib Kalyan Yojana (PMGKY) 938.69 Scheme relaunched in May 2021 to ensure food security of poor and vulnerable.
5kg of food grains will be provided free of cost to NFSA beneficiaries over May-November 2021.
New Scheme for Public Health 150 The scheme is focused on short-term emergency preparedness with special emphasis on children and paediatric care & beds.
Boost for Project Exports through NEIA 330 Extra corpus to be provided to National Export Insurance Account (NEIA) to underwrite INR 330bn worth of project exports over five years
Boost to Export Insurance Cover 880 Government has announced additional equity infusion in Export Credit Guarantee Corp over five years to bolster exports insurance cover by INR 880bn.
Reforms Based Result Linked Power Distribution Scheme (Budget Announcement) 976.31
INR 3.03tn for a revamped reforms-based, results-linked power distribution scheme. Of this, the Centre’s share would be INR 976.31bn. Ongoing works of IPDS, DDUGJY and SAUBHAGYA will be merged. States have already been allowed additional borrowing for four years of up to 0.5% of gross state domestic product annually (INR 1.05 for FY22) subject to carrying out specified power sector reforms.
Total 6,286.93
Total economic announcements worth INR 6.3 trillion, the actual impact to government’s balance sheet is only INR 1.4 trillion.
10.32%
5.82%
4%5%6%7%8%9%
10%11%12%13%
Dec
-19
Feb-
20
Apr-2
0
Jun-
20
Aug-
20
Oct
-20
Dec
-20
Feb-
21
Apr-2
1
Jun-
21
YoY
(%)
Deposit Credit
12.48%
10.67%5%
9%
13%
17%
21%
25%
Dec
-19
Feb-
20
Apr-2
0
Jun-
20
Aug-
20
Oct
-20
Dec
-20
Feb-
21
Apr-2
1
Jun-
21
YoY
(%)
Cash in circulation Broad money
Source: Axis Capital
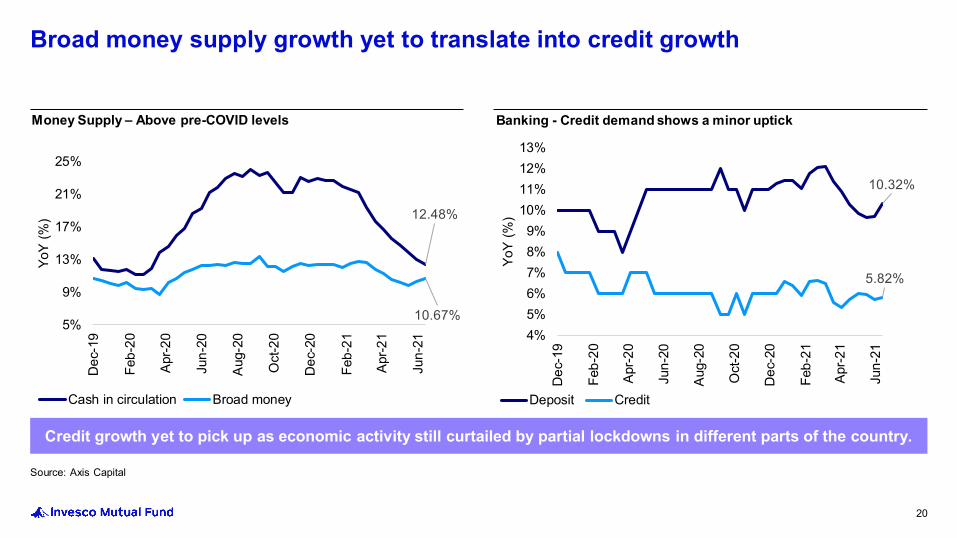
Banking - Credit demand shows a minor uptickMoney Supply – Above pre-COVID levels
20
Broad money supply growth yet to translate into credit growth
Credit growth yet to pick up as economic activity still curtailed by partial lockdowns in different parts of the country.
Source: Spark Capital. 1Estimates.Disclaimer: The information provided herein may include statements/data of future expectations that are based on current views and assumptions and involves known and unknown risks and uncertainties that could cause actual results, performance or events to differ materially from those expressed or implied.
-1.3
7.16.60%
3%
4%
5%
6%
7%
8%
-4.0-2.00.02.04.06.08.0
10.0
Apr-1
5
Apr-1
6
Apr-1
7
Apr-1
8
Apr-1
9
Apr-2
0
Apr-2
1
%Rs.
Tril
lion
Net liquidity (Rs tn) Call money rate (%) - RHS
Banking system is sitting on over Rs. 5.6tn surplus liquidity
-1.50%-3.00%-2.00%-1.00%0.00%1.00%2.00%3.00%4.00%5.00%6.00%7.00%
Nov
-12
Jun-
13Ja
n-14
Aug-
14M
ar-1
5O
ct-1
5M
ay-1
6D
ec-1
6Ju
l-17
Feb-
18Se
p-18
Apr-1
9N
ov-1
9Ju
n-20
Jan-
21Au
g-21
Mar
-22
Rea
l Int
eres
t Rat
e (S
BI 1
yea
r dep
osit
rate
–In
flatio
n)
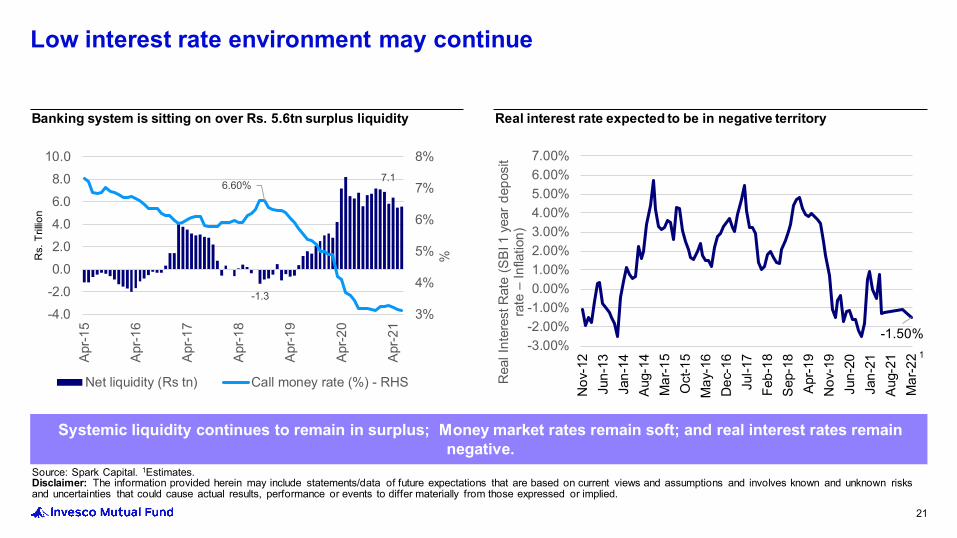
Real interest rate expected to be in negative territory
21
Low interest rate environment may continue
1
Systemic liquidity continues to remain in surplus; Money market rates remain soft; and real interest rates remain negative.
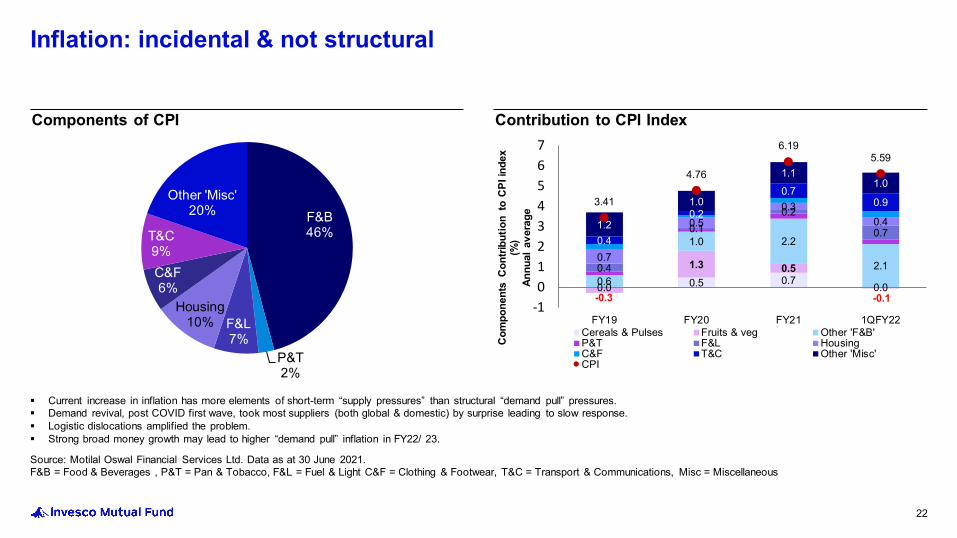
Source: Motilal Oswal Financial Services Ltd. Data as at 30 June 2021. F&B = Food & Beverages , P&T = Pan & Tobacco, F&L = Fuel & Light C&F = Clothing & Footwear, T&C = Transport & Communications, Misc = Miscellaneous
Components of CPI Contribution to CPI Index
22
Inflation: incidental & not structural
F&B46%
P&T2%
F&L7%
Housing10%
C&F6%
T&C9%
Other 'Misc'20%
0.0 0.5 0.7 0.0 -0.3
1.3 0.5
-0.1 0.6
1.0 2.2
2.10.4
0.10.2
0.7
0.7
0.50.3
0.4
0.4
0.2
0.70.9
1.2
1.0
1.11.0
3.41
4.76
6.195.59
-101234567
FY19 FY20 FY21 1QFY22
Com
pone
nts
Con
tribu
tion
to C
PI in
dex
(%)
Annu
al a
vera
ge
Cereals & Pulses Fruits & veg Other 'F&B'P&T F&L HousingC&F T&C Other 'Misc'CPI
Current increase in inflation has more elements of short-term “supply pressures” than structural “demand pull” pressures. Demand revival, post COVID first wave, took most suppliers (both global & domestic) by surprise leading to slow response. Logistic dislocations amplified the problem. Strong broad money growth may lead to higher “demand pull” inflation in FY22/ 23.
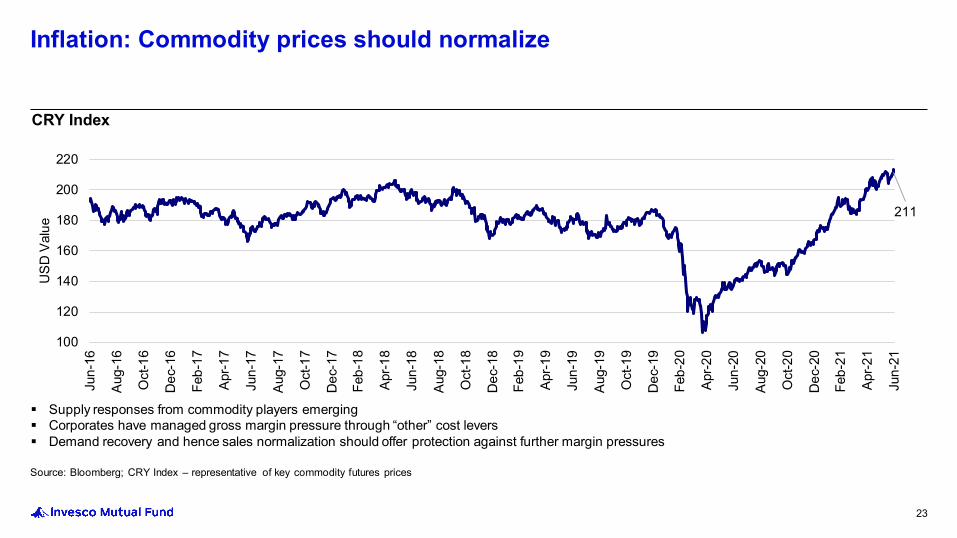
Source: Bloomberg; CRY Index – representative of key commodity futures prices
211
100
120
140
160
180
200
220
Jun-
16
Aug-
16
Oct
-16
Dec
-16
Feb-
17
Apr-1
7
Jun-
17
Aug-
17
Oct
-17
Dec
-17
Feb-
18
Apr-1
8
Jun-
18
Aug-
18
Oct
-18
Dec
-18
Feb-
19
Apr-1
9
Jun-
19
Aug-
19
Oct
-19
Dec
-19
Feb-
20
Apr-2
0
Jun-
20
Aug-
20
Oct
-20
Dec
-20
Feb-
21
Apr-2
1
Jun-
21
USD
Val
ue
CRY Index
23
Inflation: Commodity prices should normalize
Supply responses from commodity players emerging Corporates have managed gross margin pressure through “other” cost levers Demand recovery and hence sales normalization should offer protection against further margin pressures
Past performance may or may not be sustained in future. Source: Spark Capital. Time frame: 20 years since 2001.Disclaimer: The above simulation is for illustrative purpose only and should not be construed as a promise on minimum returns and safeguard of capital. Invesco Asset Management (India) Private Limited/Invesco Mutual Fund is not guaranteeing or promising or forecasting any returns.
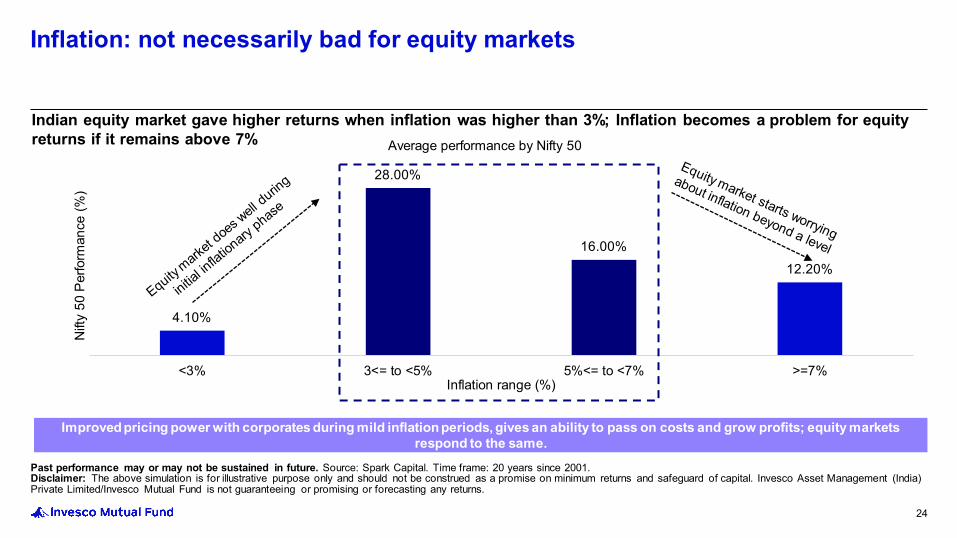
4.10%
28.00%
16.00%12.20%
<3% 3<= to <5% 5%<= to <7% >=7%
Nift
y 50
Per
form
ance
(%)
Inflation range (%)
Average performance by Nifty 50
Indian equity market gave higher returns when inflation was higher than 3%; Inflation becomes a problem for equity returns if it remains above 7%
24
Inflation: not necessarily bad for equity markets
Improved pricing power with corporates during mild inflation periods, gives an ability to pass on costs and grow profits; equity markets respond to the same.

25
Outlook
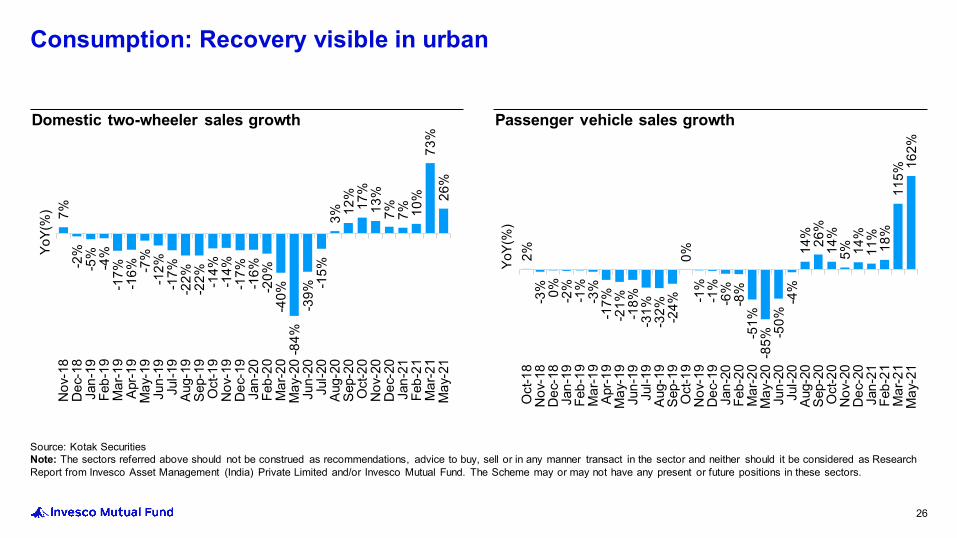
Source: Kotak SecuritiesNote: The sectors referred above should not be construed as recommendations, advice to buy, sell or in any manner transact in the sector and neither should it be considered as Research Report from Invesco Asset Management (India) Private Limited and/or Invesco Mutual Fund. The Scheme may or may not have any present or future positions in these sectors.
Domestic two-wheeler sales growth Passenger vehicle sales growth
26
Consumption: Recovery visible in urban7%
-2%
-5%
-4%
-17%
-16% -7
%-1
2%-1
7%-2
2%-2
2% -14%
-14%
-17%
-16%
-20%
-40%
-84%
-39%
-15%
3% 12%
17%
13%
7% 7% 10%
73%
26%
Nov
-18
Dec
-18
Jan-
19Fe
b-19
Mar
-19
Apr-1
9M
ay-1
9Ju
n-19
Jul-1
9Au
g-19
Sep-
19O
ct-1
9N
ov-1
9D
ec-1
9Ja
n-20
Feb-
20M
ar-2
0M
ay-2
0Ju
n-20
Jul-2
0Au
g-20
Sep-
20O
ct-2
0N
ov-2
0D
ec-2
0Ja
n-21
Feb-
21M
ar-2
1M
ay-2
1
YoY(
%)
2%-3
% 0% -2%
-1%
-3%
-17%
-21%
-18%
-31%
-32% -24%
0%-1
%-1
%-6
%-8
%-5
1%-8
5% -50%
-4%
14% 26%
14%
5% 14%
11%
18%
115%
162%
Oct
-18
Nov
-18
Dec
-18
Jan-
19Fe
b-19
Mar
-19
Apr-1
9M
ay-1
9Ju
n-19
Jul-1
9Au
g-19
Sep-
19O
ct-1
9N
ov-1
9D
ec-1
9Ja
n-20
Feb-
20M
ar-2
0M
ay-2
0Ju
n-20
Jul-2
0Au
g-20
Sep-
20O
ct-2
0N
ov-2
0D
ec-2
0Ja
n-21
Feb-
21M
ar-2
1M
ay-2
1
YoY(
%)
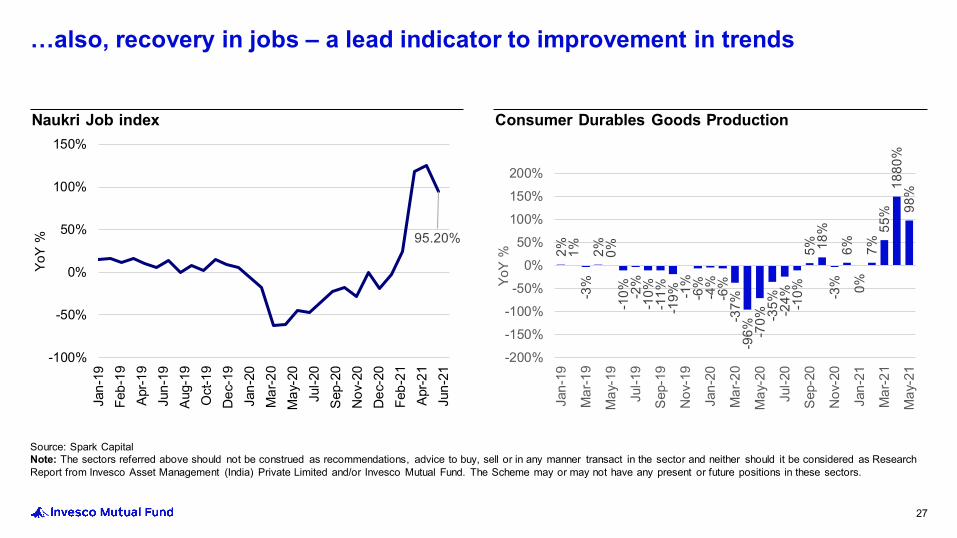
Source: Spark CapitalNote: The sectors referred above should not be construed as recommendations, advice to buy, sell or in any manner transact in the sector and neither should it be considered as Research Report from Invesco Asset Management (India) Private Limited and/or Invesco Mutual Fund. The Scheme may or may not have any present or future positions in these sectors.
95.20%
-100%
-50%
0%
50%
100%
150%
Jan-
19Fe
b-19
Apr-1
9Ju
n-19
Aug-
19O
ct-1
9D
ec-1
9Ja
n-20
Mar
-20
May
-20
Jul-2
0Se
p-20
Nov
-20
Dec
-20
Feb-
21Ap
r-21
Jun-
21
YoY
%
Naukri Job index
2% 1%-3
%2% 0%
-10% -2
%-1
0%-1
1%-1
9% -1%
-6%
-4%
-6%
-37%
-96% -7
0% -35% -24% -10%
5% 18%
-3%
6%0%
7%55
%18
80%
98%
-200%
-150%
-100%
-50%
0%
50%
100%
150%
200%
Jan-
19
Mar
-19
May
-19
Jul-1
9
Sep-
19
Nov
-19
Jan-
20
Mar
-20
May
-20
Jul-2
0
Sep-
20
Nov
-20
Jan-
21
Mar
-21
May
-21
YoY
%
Consumer Durables Goods Production
27
…also, recovery in jobs – a lead indicator to improvement in trends
2.22
6.56% 0.00
2.00
4.00
0%10%20%30%
FY10
FY11
FY12
FY13
FY14
FY15
FY16
FY17
FY18
FY19
FY20
FY21
E
Rs.
Tril
lion
% Y
oY
Incremental Agri GDP (Rs. tn) - RHS Nominal Agri GDP growth (%, yoy) (LHS)
5.69%
7.00%
0%5%
10%15%
Feb-
15
Jul-1
5
Nov
-15
Apr-1
6
Sep-
16
Feb-
17
Jul-1
7
Dec
-17
May
-18
Oct
-18
Mar
-19
Aug-
19
Jan-
20
Jun-
20
Nov
-20
Mar
-21
%
Rural wage growth: Non agricultural Rural wage growth: Agricultural
-5%
22%
2%
14%
1%10%
11%
-10%0%
10%20%30%
FY05
FY06
FY07
FY08
FY09
FY10
FY11
FY12
FY13
FY14
FY15
FY16
FY17
FY18
FY19
FY20
FY21
E
Farm
inco
me
grow
th
(%,Y
oY)
Source: Spark CapitalDisclaimer: The information provided herein may include statements/data of future expectations that are based on current views and assumptions and involves known and unknown risks and uncertainties that could cause actual results, performance or events to differ materially from those expressed or implied.
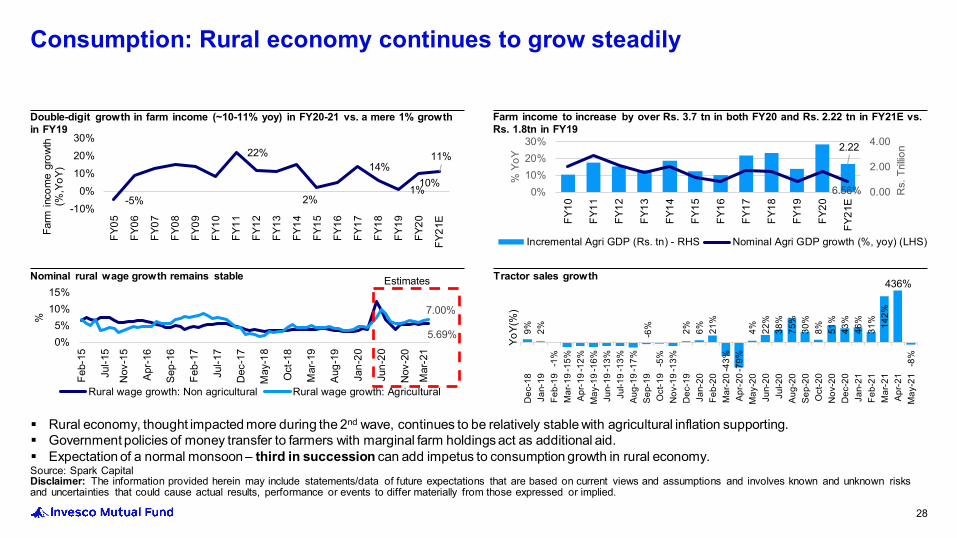
Consumption: Rural economy continues to grow steadily
Double-digit growth in farm income (~10-11% yoy) in FY20-21 vs. a mere 1% growth in FY19
Nominal rural wage growth remains stable Tractor sales growth
28
Rural economy, thought impacted more during the 2nd wave, continues to be relatively stable with agricultural inflation supporting. Government policies of money transfer to farmers with marginal farm holdings act as additional aid. Expectation of a normal monsoon – third in succession can add impetus to consumption growth in rural economy.
Farm income to increase by over Rs. 3.7 tn in both FY20 and Rs. 2.22 tn in FY21E vs. Rs. 1.8tn in FY19
Estimates
9% 2%-1
%-1
5%-1
2%-1
6%-1
3%-1
3%-1
7%-6
%-5
%-1
3%2% 6% 21
%-4
3%-7
9%4% 22
%38
%75
%30
%8% 51
%43
%46
%31
% 142%
-8%
Dec
-18
Jan-
19Fe
b-19
Mar
-19
Apr
-19
May
-19
Jun-
19Ju
l-19
Aug
-19
Sep
-19
Oct
-19
Nov
-19
Dec
-19
Jan-
20Fe
b-20
Mar
-20
Apr
-20
May
-20
Jun-
20Ju
l-20
Aug
-20
Sep
-20
Oct
-20
Nov
-20
Dec
-20
Jan-
21Fe
b-21
Mar
-21
Apr
-21
May
-21
YoY(
%)
436%

Source: Motilal Oswal Financial Services Ltd. DAM Capital Advisors Limited. P: Provisional, BE: Budget Estimates. EPC: Engineering, Procurement and Construction. MHCV: Medium and heavy commercial vehicle.
83 90 89 87 88 88 88 88 86 86 88 87 88 88 84
17 10 11 13 12 12 12 12 14 14 12 13 12 12 16
FY08
FY09
FY10
FY11
FY12
FY13
FY14
FY15
FY16
FY17
FY18
FY19
FY20
FY21
(P)
FY22
BE
%
Revenue spending Capital spending
Capital spending is budgeted to rise as a % of total spending in FY22BE
29
Investments: Government pushBudget’s increased spend in infrastructure sector
Break-up of Capex in key sectors
(INR trn)
FY21BE
FY21RE
FY22BE
YoY growth
(%)Key Beneficiaries
Roads1.6 1.7 1.8 8% Road EPC, Cement, MHCV
Trucks, Construction equipment Railways
1.6 1.6 2.2 34%Rolling stock manufacturers and
its Financiers, Rail EPC companies
Defence1.1 1.3 1.4 0% Local defense equipment
manufacturersWater – Jal Jeevan Mission 0.3 0.2 0.6 253%
EPC contractors, Ductile iron pipes,
PVC pipes Department of Economic affairs – – 0.4 – –
Housing0.8 0.8 0.8 5%
Affordable Real estate developers,
Cement, Steel, EPC companies Other Sectors (Power, Energy and Petroleum)
3.1 2.9 3.1 6% –

24%
18%
17%
12%
8%
7%3%
3%3%2% 1%
1%Energy
Roads
Urban
Railways
Irrigation
Rural Infra
Social infra
Digital Infra
Industrial infra
Agri and food processinginfra
~INR 111 Lakh crores
31%
18%15%
12%
10%
9%1%
1%2%
Power
Roads and Bridges
Urban
Telecommunication
Railways
Irrigation
Ports
Airports
Others
~INR 57 lakh crores
Source: Report of the Task Force Department of Economic Affairs Ministry of Finance Government of India- Volume II.Disclaimer: The data on this slide is just to explain the thrust towards infrastructure sector and should not be construed as recommendations, advice to buy, sell or in any manner transact in these sectors and neither should it be considered as Research Report from Invesco Asset Management (India) Private Limited and/or Invesco Mutual Fund. Schemes of Invesco Mutual Fund may or may not have any present or future positions in these sectors.
FY2013-2019 FY2020-2025
30
Investments: Government pushIncreased spend coupled with facilitating private sector participation
The National Infrastructure Pipeline (NIP) is government’s effort to augment India's infrastructure through an identified investment of INR 111 Lakh crores between FY 2020-25.
Source: Spark Capital. PLI: Product Linked IncentiveNote: The sectors referred above should not be construed as recommendations, advice to buy, sell or in any manner transact in the sector and neither should it be considered as Research Report from Invesco Asset Management (India) Private Limited and/or Invesco Mutual Fund. The Scheme may or may not have any present or future positions in these sectors.
Source: Spark Capita 31
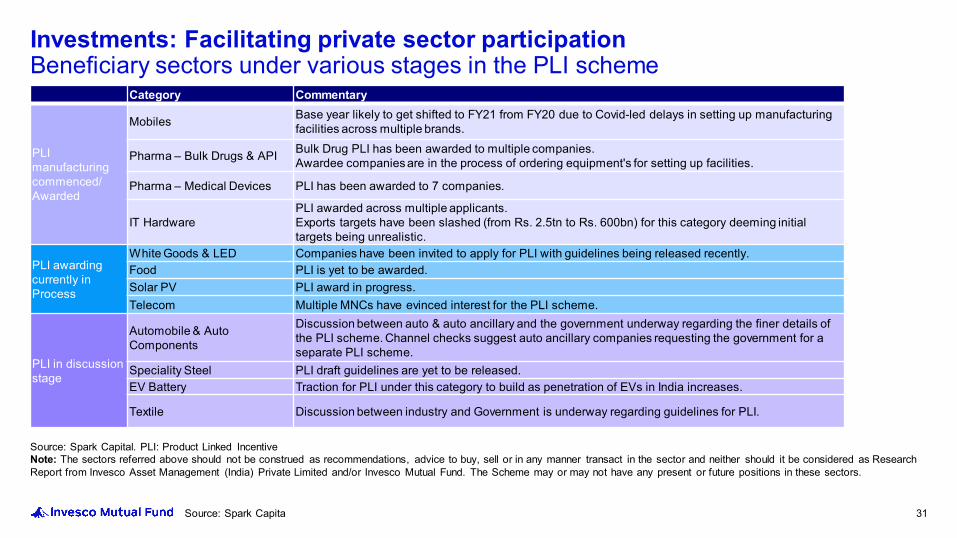
Investments: Facilitating private sector participation Beneficiary sectors under various stages in the PLI scheme
Category Commentary
PLI manufacturingcommenced/Awarded
Mobiles Base year likely to get shifted to FY21 from FY20 due to Covid-led delays in setting up manufacturing facilities across multiple brands.
Pharma – Bulk Drugs & API Bulk Drug PLI has been awarded to multiple companies. Awardee companies are in the process of ordering equipment's for setting up facilities.
Pharma – Medical Devices PLI has been awarded to 7 companies.
IT HardwarePLI awarded across multiple applicants. Exports targets have been slashed (from Rs. 2.5tn to Rs. 600bn) for this category deeming initialtargets being unrealistic.
PLI awardingcurrently inProcess
White Goods & LED Companies have been invited to apply for PLI with guidelines being released recently.Food PLI is yet to be awarded. Solar PV PLI award in progress.Telecom Multiple MNCs have evinced interest for the PLI scheme.
PLI in discussion stage
Automobile & AutoComponents
Discussion between auto & auto ancillary and the government underway regarding the finer details of the PLI scheme. Channel checks suggest auto ancillary companies requesting the government for a separate PLI scheme.
Speciality Steel PLI draft guidelines are yet to be released. EV Battery Traction for PLI under this category to build as penetration of EVs in India increases.
Textile Discussion between industry and Government is underway regarding guidelines for PLI.
Source: Press Information Bureau – Government of India
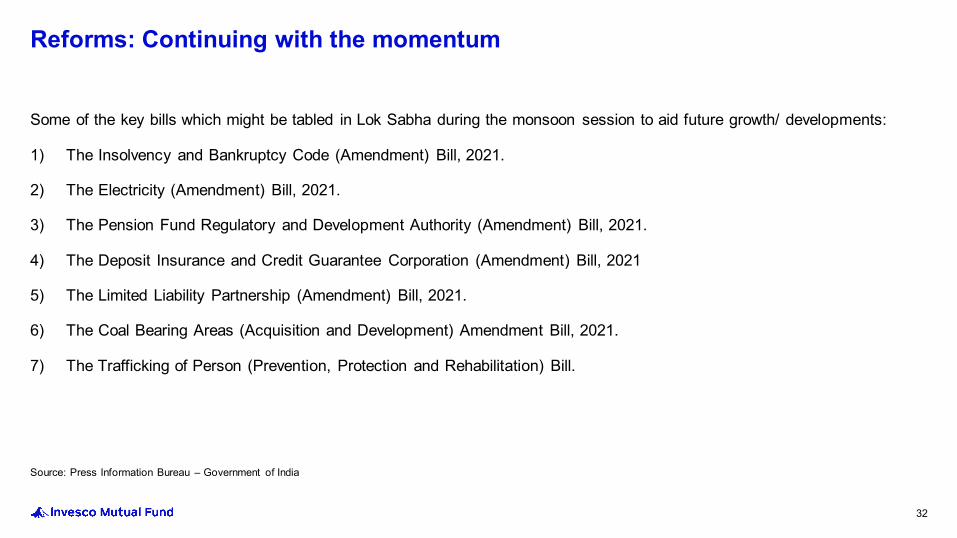
Some of the key bills which might be tabled in Lok Sabha during the monsoon session to aid future growth/ developments:
1) The Insolvency and Bankruptcy Code (Amendment) Bill, 2021.
2) The Electricity (Amendment) Bill, 2021.
3) The Pension Fund Regulatory and Development Authority (Amendment) Bill, 2021.
4) The Deposit Insurance and Credit Guarantee Corporation (Amendment) Bill, 2021
5) The Limited Liability Partnership (Amendment) Bill, 2021.
6) The Coal Bearing Areas (Acquisition and Development) Amendment Bill, 2021.
7) The Trafficking of Person (Prevention, Protection and Rehabilitation) Bill.
32
Reforms: Continuing with the momentum
Source: Spark capital. Data as at 30 June 2021.Disclaimer: The purpose of above charts is to explain how various monetary parameters may have a positive impact on the overall economy. The information provided herein is not sufficient and shouldn’t be used for the development or implementation of an investment strategy.
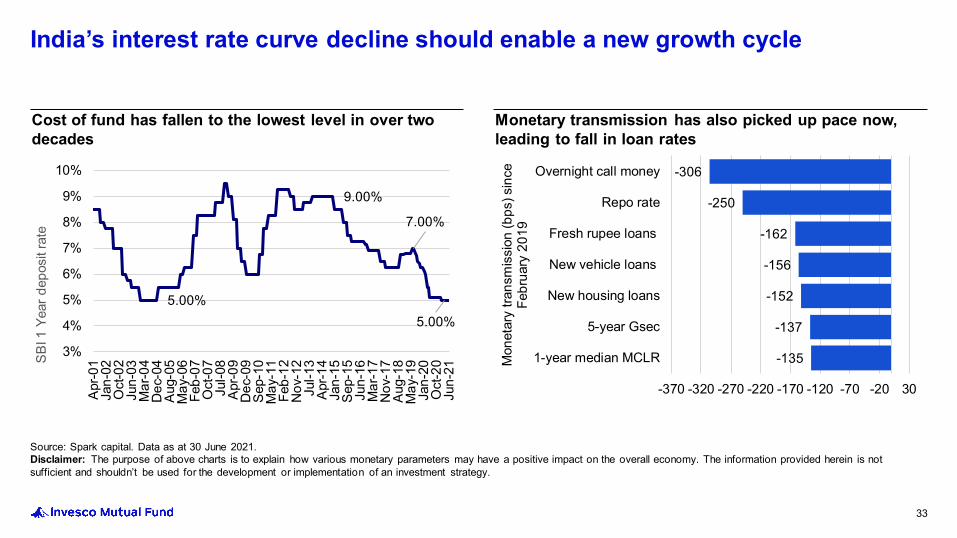
Cost of fund has fallen to the lowest level in over two decades
Monetary transmission has also picked up pace now, leading to fall in loan rates
33
India’s interest rate curve decline should enable a new growth cycle
5.00%
9.00%
7.00%
5.00%
3%
4%
5%
6%
7%
8%
9%
10%
Apr-0
1Ja
n-02
Oct
-02
Jun-
03M
ar-0
4D
ec-0
4Au
g-05
May
-06
Feb-
07O
ct-0
7Ju
l-08
Apr-0
9D
ec-0
9Se
p-10
May
-11
Feb-
12N
ov-1
2Ju
l-13
Apr-1
4Ja
n-15
Sep-
15Ju
n-16
Mar
-17
Nov
-17
Aug-
18M
ay-1
9Ja
n-20
Oct
-20
Jun-
21
SBI 1
Yea
r dep
osit
rate
-135
-137
-152
-156
-162
-250
-306
-370 -320 -270 -220 -170 -120 -70 -20 30
1-year median MCLR
5-year Gsec
New housing loans
New vehicle loans
Fresh rupee loans
Repo rate
Overnight call money
Mon
etar
y tra
nsm
issi
on (b
ps) s
ince
Fe
brua
ry 2
019
6.00%
-2.10%
-10%-5%0%5%
10%15%20%25%30%35%40%
Jul-0
3Ju
l-04
Jul-0
5Ju
l-06
Jun-
07Ju
n-08
Jun-
09Ju
n-10
Jun-
11Ju
n-12
Jun-
13Ju
n-14
Jun-
15M
ay-1
6M
ay-1
7M
ay-1
8M
ay-1
9M
ay-2
0M
ay-2
1
Gro
wth
(%)
Credit Growth (%) Nominal GDP Growth
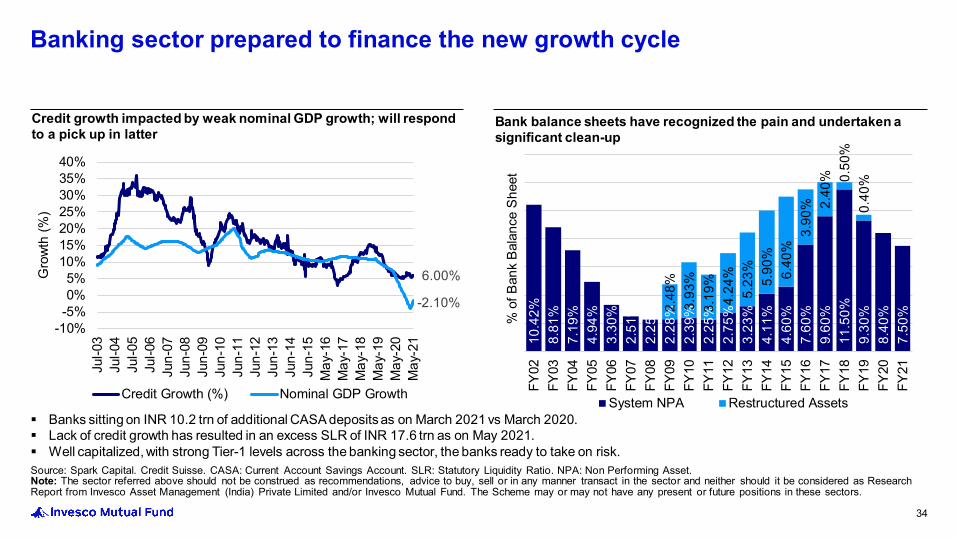
Source: Spark Capital. Credit Suisse. CASA: Current Account Savings Account. SLR: Statutory Liquidity Ratio. NPA: Non Performing Asset.Note: The sector referred above should not be construed as recommendations, advice to buy, sell or in any manner transact in the sector and neither should it be considered as Research Report from Invesco Asset Management (India) Private Limited and/or Invesco Mutual Fund. The Scheme may or may not have any present or future positions in these sectors.
Credit growth impacted by weak nominal GDP growth; will respond to a pick up in latter
Bank balance sheets have recognized the pain and undertaken a significant clean-up
34
Banking sector prepared to finance the new growth cycle
10.4
2%8.
81%
7.19
%4.
94%
3.30
%2.
51%
2.25
%2.
28%
2.39
%2.
25%
2.75
%3.
23%
4.11
%4.
60%
7.60
%9.
60%
11.5
0%9.
30%
8.40
%7.
50%2.
48%
3.93
%3.
19%
4.24
%5.
23%
5.90
%6.
40%
3.90
% 2.40
% 0.50
%0.
40%
FY02
FY03
FY04
FY05
FY06
FY07
FY08
FY09
FY10
FY11
FY12
FY13
FY14
FY15
FY16
FY17
FY18
FY19
FY20
FY21
% o
f Ban
k Ba
lanc
e Sh
eet
System NPA Restructured Assets Banks sitting on INR 10.2 trn of additional CASA deposits as on March 2021 vs March 2020. Lack of credit growth has resulted in an excess SLR of INR 17.6 trn as on May 2021. Well capitalized, with strong Tier-1 levels across the banking sector, the banks ready to take on risk.

35
Earnings & Valuations
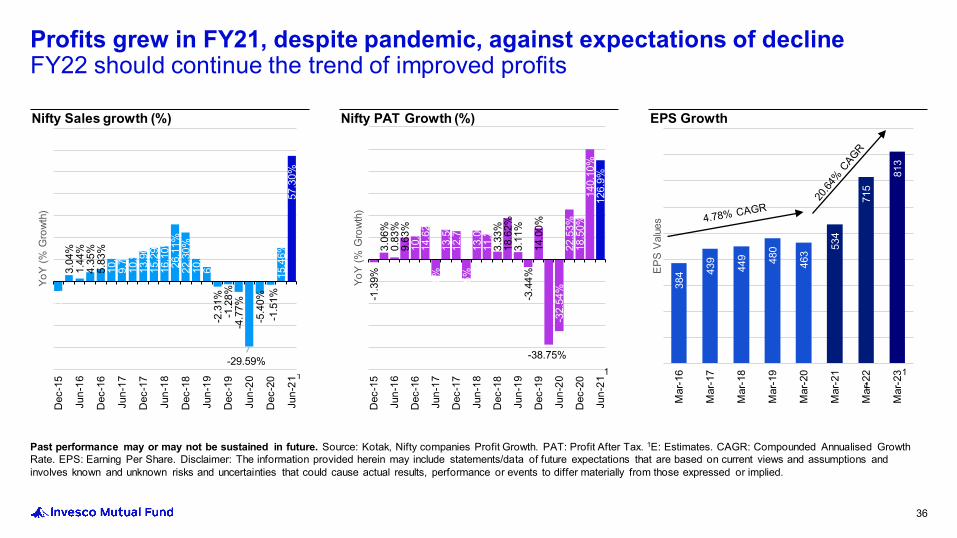
Past performance may or may not be sustained in future. Source: Kotak, Nifty companies Profit Growth. PAT: Profit After Tax. 1E: Estimates. CAGR: Compounded Annualised Growth Rate. EPS: Earning Per Share. Disclaimer: The information provided herein may include statements/data of future expectations that are based on current views and assumptions and involves known and unknown risks and uncertainties that could cause actual results, performance or events to differ materially from those expressed or implied.
-4.1
7%3.
04%
1.44
%4.
35%
5.83
%10
.31%
9.72
%10
.90%
13.9
0%15
.29%
16.1
0%26
.11%
22.3
0%10
.43%
6.72
%-2
.31%
-1.2
8%-4
.77%
-29.59%
-5.4
0%-1
.51%
15.4
6%57
.30%
Dec
-15
Jun-
16
Dec
-16
Jun-
17
Dec
-17
Jun-
18
Dec
-18
Jun-
19
Dec
-19
Jun-
20
Dec
-20
Jun-
21
YoY
(% G
rowt
h)
1
Nifty Sales growth (%)
-1.3
9%3.
06%
0.83
%9.
63%
10.4
3%14
.62%
-7.5
5%13
.50%
12.7
0%-8
.85%
13.0
0%11
.23%
3.33
%18
.62%
3.11
%-3
.44%
14.0
0%
-38.75%
-32.
54%
22.5
3%18
.50%
140.
10%
126.
9%
Dec
-15
Jun-
16
Dec
-16
Jun-
17
Dec
-17
Jun-
18
Dec
-18
Jun-
19
Dec
-19
Jun-
20
Dec
-20
Jun-
21
YoY
(% G
rowt
h)1
Nifty PAT Growth (%)
384 43
9
449 48
0
463 53
4
715
813
Mar
-16
Mar
-17
Mar
-18
Mar
-19
Mar
-20
Mar
-21
Mar
-22
Mar
-23
EPS
Value
s
11
EPS Growth
36
Profits grew in FY21, despite pandemic, against expectations of declineFY22 should continue the trend of improved profits
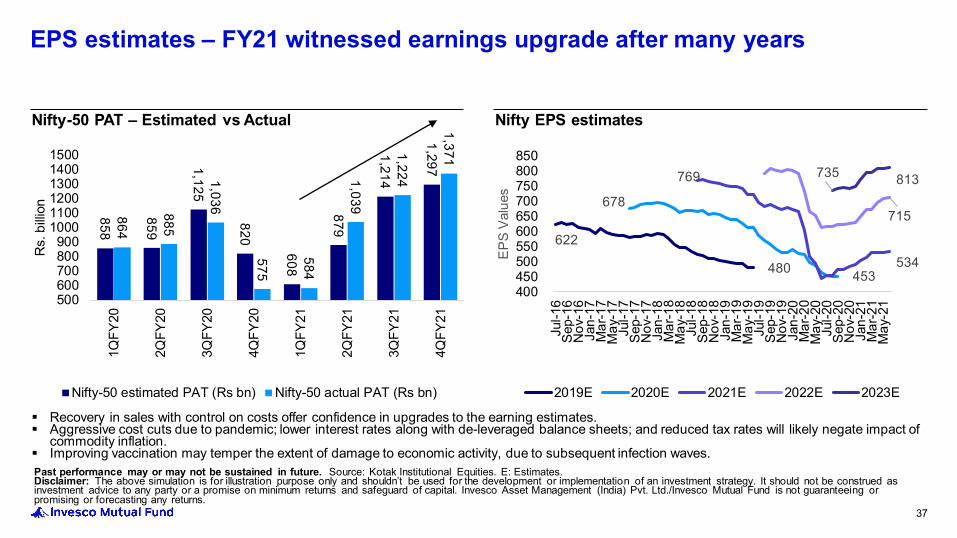
Past performance may or may not be sustained in future. Source: Kotak Institutional Equities. E: Estimates.Disclaimer: The above simulation is for illustration purpose only and shouldn’t be used for the development or implementation of an investment strategy. It should not be construed as investment advice to any party or a promise on minimum returns and safeguard of capital. Invesco Asset Management (India) Pvt. Ltd./Invesco Mutual Fund is not guaranteeing or promising or forecasting any returns.
Nifty-50 PAT – Estimated vs Actual Nifty EPS estimates
37
EPS estimates – FY21 witnessed earnings upgrade after many years
858
859
1,125
820
608
879
1,214
1,297
864
885
1,036
575
584
1,039
1,224
1,371
500600700800900
100011001200130014001500
1QFY
20
2QFY
20
3QFY
20
4QFY
20
1QFY
21
2QFY
21
3QFY
21
4QFY
21
Rs.
billi
on
Nifty-50 estimated PAT (Rs bn) Nifty-50 actual PAT (Rs bn)
622
480
678
453
769
534
715
735 813
400 450 500 550 600 650 700 750 800 850
Jul-1
6Se
p-16
Nov
-16
Jan-
17M
ar-1
7M
ay-1
7Ju
l-17
Sep-
17N
ov-1
7Ja
n-18
Mar
-18
May
-18
Jul-1
8Se
p-18
Nov
-18
Jan-
19M
ar-1
9M
ay-1
9Ju
l-19
Sep-
19N
ov-1
9Ja
n-20
Mar
-20
May
-20
Jul-2
0Se
p-20
Nov
-20
Jan-
21M
ar-2
1M
ay-2
1
EPS
Valu
es
2019E 2020E 2021E 2022E 2023E
Recovery in sales with control on costs offer confidence in upgrades to the earning estimates. Aggressive cost cuts due to pandemic; lower interest rates along with de-leveraged balance sheets; and reduced tax rates will likely negate impact of
commodity inflation. Improving vaccination may temper the extent of damage to economic activity, due to subsequent infection waves.
Past performance may or may not be sustained in future.Source: MOSL / Bloomberg, Invesco Asset Management (India) Research, Bloomberg. PER: Price to Earning Ratio. TTM: Trailing Twelve Months. Data as on 30 June 2021Disclaimer: The above simulation is for illustration purpose only and shouldn’t be used for the development or implementation of an investment strategy. It should not be construed as investment advice to any party or a promise on minimum returns and safeguard of capital. Invesco Asset Management (India) Pvt. Ltd./Invesco Mutual Fund is not guaranteeing or promising or forecasting any returns.
30.07
10
15
20
25
30
35
Jan-
10
Aug-
10
Mar
-11
Oct
-11
May
-12
Dec
-12
Jun-
13
Jan-
14
Aug-
14
Mar
-15
Oct
-15
Apr-1
6
Nov
-16
Jun-
17
Jan-
18
Aug-
18
Feb-
19
Sep-
19
Apr-2
0
Nov
-20
Jun-
21
Valu
es
Average since January 2010 : 22.78x
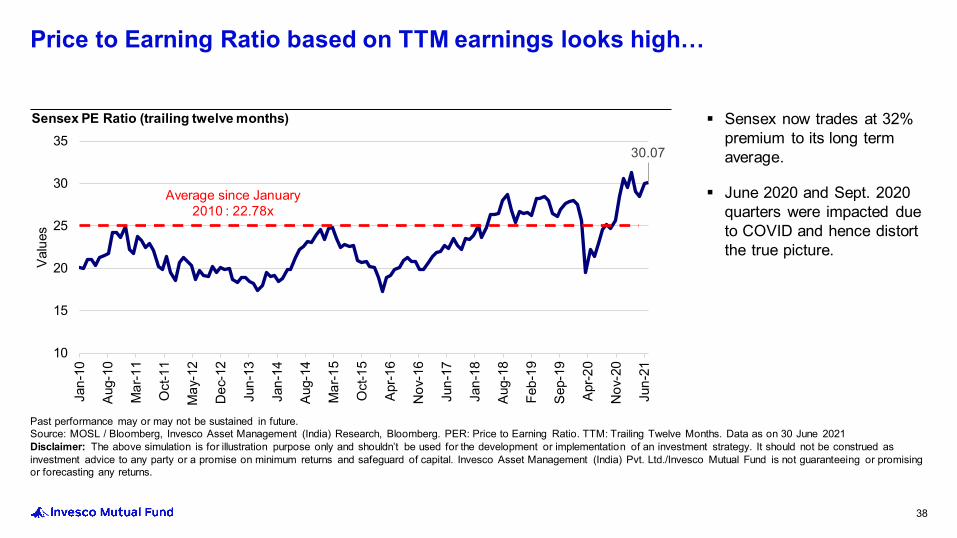
Sensex PE Ratio (trailing twelve months) Sensex now trades at 32% premium to its long term average.
June 2020 and Sept. 2020 quarters were impacted due to COVID and hence distort the true picture.
38
Price to Earning Ratio based on TTM earnings looks high…
Past performance may or may not be sustained in future.Source: Bloomberg, Invesco Asset Management (India) Research, Bloomberg. PE: Price to Earning- 1 Year forward PE. Data as on 30 June 2021Disclaimer: The above simulation is for illustration purpose only and shouldn’t be used for the development or implementation of an investment strategy. It should not be construed as investment advice to any party or a promise on minimum returns and safeguard of capital. Invesco Asset Management (India) Pvt. Ltd./Invesco Mutual Fund is not guaranteeing or promising or forecasting any returns.
20.98
1012141618202224262830
Jan-
10
Jan-
11
Feb-
12
Feb-
13
Mar
-14
Mar
-15
Apr-1
6
Apr-1
7
May
-18
May
-19
Jun-
20
Jun-
21
Pric
e to
ear
n ra
tio
Average since January 2010 : 17.75x
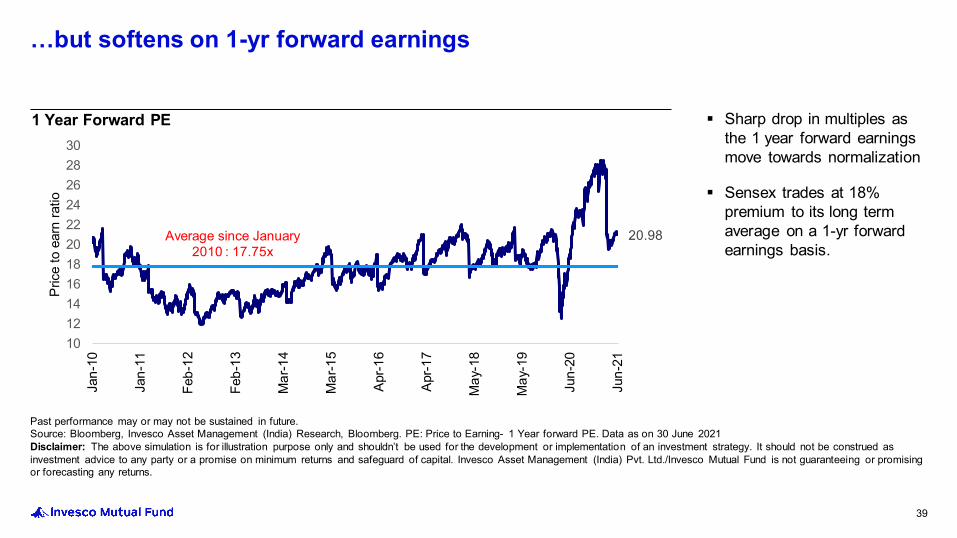
1 Year Forward PE
39
…but softens on 1-yr forward earnings
Sharp drop in multiples as the 1 year forward earnings move towards normalization
Sensex trades at 18% premium to its long term average on a 1-yr forward earnings basis.
Past performance may or may not be sustained in future.Source: MOSL / Bloomberg, Invesco Asset Management (India) Research, Bloomberg. PE: Price to Earning. Data as on 30 June 2021.Note: The purpose of above chart is only to explain the valuation which are currently trading at premium, but when compared to interest rate looks reasonable. The information alone is not sufficient and shouldn’t be used for the development or implementation of an investment strategy. It should not be construed as investment advice to any party.
3.33%
6.05%
3.00%
4.00%
5.00%
6.00%
7.00%
8.00%
9.00%
10.00%
Jan-
10Se
p-10
May
-11
Jan-
12Se
p-12
May
-13
Jan-
14Se
p-14
May
-15
Jan-
16Se
p-16
May
-17
Jan-
18O
ct-1
8Ju
n-19
Feb-
20O
ct-2
0Ju
n-21
%
Earnings Yield 10 Year G-sec
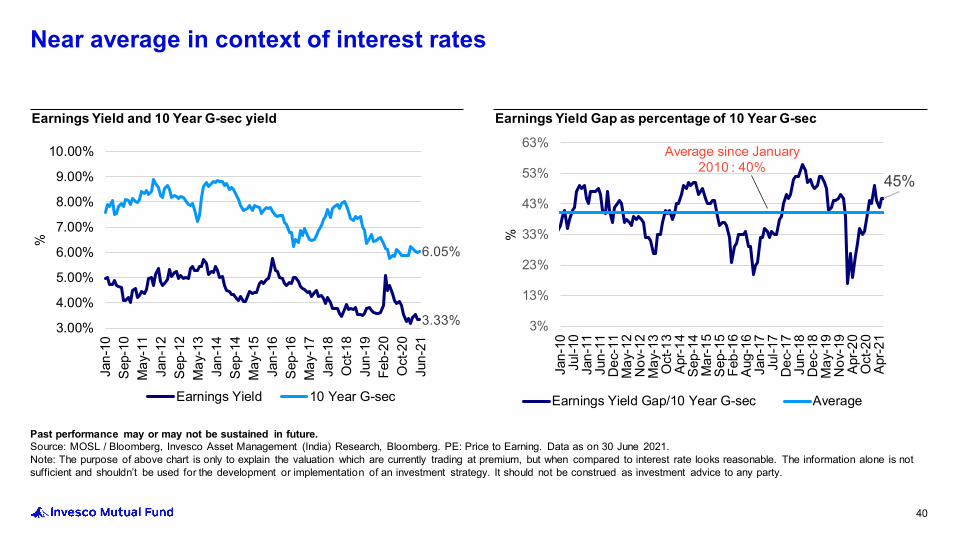
Earnings Yield and 10 Year G-sec yield
45%
3%
13%
23%
33%
43%
53%
63%
Jan-
10Ju
l-10
Jan-
11Ju
n-11
Dec
-11
May
-12
Nov
-12
May
-13
Oct
-13
Apr-1
4Se
p-14
Mar
-15
Sep-
15Fe
b-16
Aug-
16Ja
n-17
Jul-1
7D
ec-1
7Ju
n-18
Dec
-18
May
-19
Nov
-19
Apr-2
0O
ct-2
0Ap
r-21
%
Earnings Yield Gap/10 Year G-sec Average
Earnings Yield Gap as percentage of 10 Year G-sec
40
Near average in context of interest rates
Average since January 2010 : 40%
3.3
1.7
2.2
2.7
3.2
3.7
4.2
Dec
-15
Aug-
16
Mar
-17
Oct
-17
May
-18
Jan-
19
Aug-
19
Mar
-20
Oct
-20
Jun-
21
PB
Price to Book Average
Average since January 2016: 2.86
11.92
8
9
10
11
12
13
14
15
Dec
-15
Aug-
16
Mar
-17
Oct
-17
May
-18
Jan-
19
Aug-
19
Mar
-20
Oct
-20
Jun-
21
RO
E
ROE Average
Average since January 2016: 12.16
Past performance may or may not be sustained in future.Source: Bloomberg. ROE: Return on Equity.Note: The above chart is for illustration purpose only and shouldn’t be used for the development or implementation of an investment strategy. It should not be construed as investment advice to any party or construed as a promise on minimum returns and safeguard of capital. Invesco Asset Management (India) Pvt. Ltd./Invesco Mutual Fund is not guaranteeing or promising or forecasting any returns.
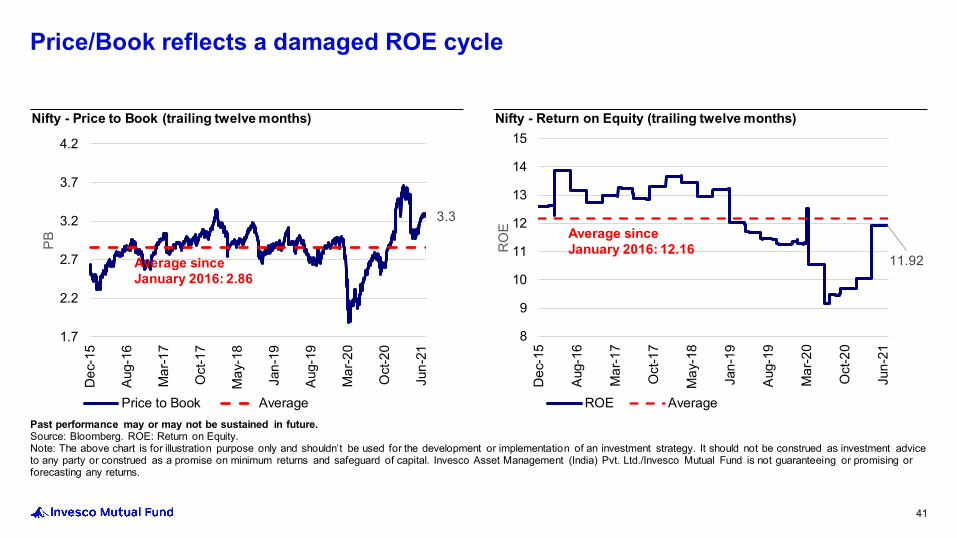
Nifty - Price to Book (trailing twelve months) Nifty - Return on Equity (trailing twelve months)
41
Price/Book reflects a damaged ROE cycle
Past performance may or may not be sustained in future. Source: Invesco Asset Management (India) Research, Bloomberg, Data as on 30 June 2021. Note: Valuations are based on FY21 Price to Earning Multiple. The above chart is for illustration purpose only and shouldn’t be used for the development or implementation of an investment strategy. It should not be construed as investment advice to any party or construed as a promise on minimum returns and safeguard of capital. Invesco Asset Management (India) Pvt. Ltd./Invesco Mutual Fund is not guaranteeing or promising or forecasting any returns.
21.24
0.00
5.00
10.00
15.00
20.00
25.00
30.00
35.00
Jan-
06
Oct
-06
Aug-
07
Jun-
08
Apr-0
9
Jan-
10
Nov
-10
Sep-
11
Jul-1
2
Apr-1
3
Feb-
14
Dec
-14
Oct
-15
Jul-1
6
May
-17
Mar
-18
Jan-
19
Oct
-19
Aug-
20
Jun-
21
PE
15 Years Average: 16
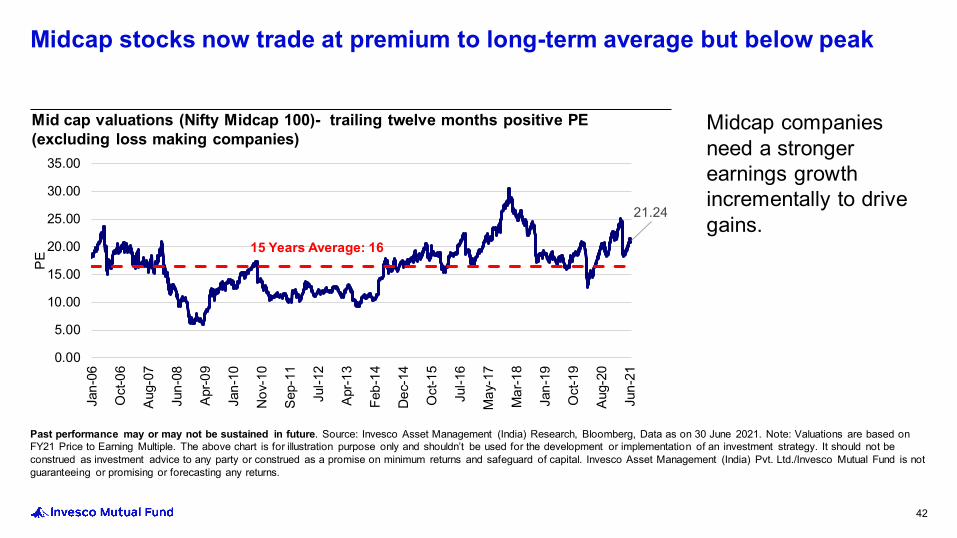
Mid cap valuations (Nifty Midcap 100)- trailing twelve months positive PE (excluding loss making companies)
Midcap companies need a stronger earnings growth incrementally to drive gains.
42
Midcap stocks now trade at premium to long-term average but below peak
0 20 40 605 years average PE level as at 30 June 2021
0 20 40 605 years average PE level as at 31 Jan 2018
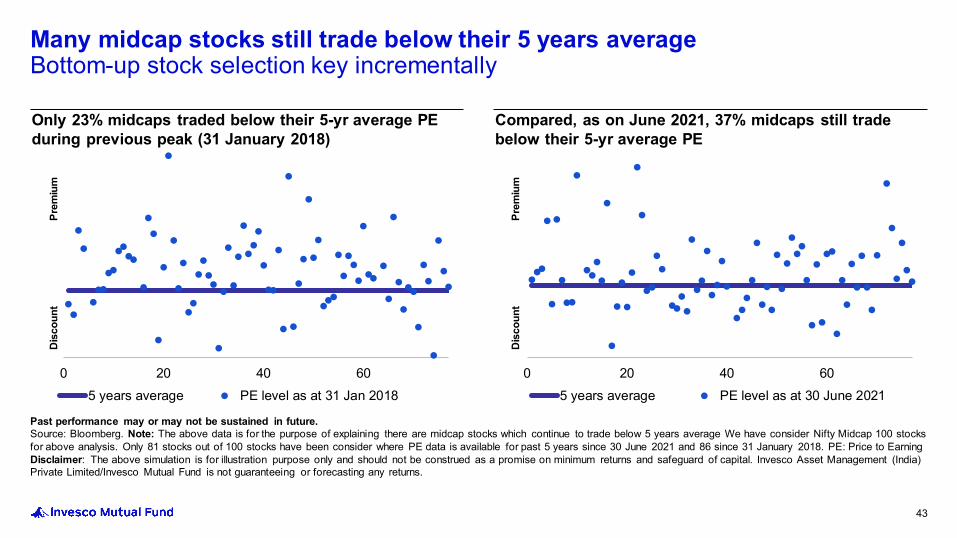
Past performance may or may not be sustained in future.Source: Bloomberg. Note: The above data is for the purpose of explaining there are midcap stocks which continue to trade below 5 years average We have consider Nifty Midcap 100 stocks for above analysis. Only 81 stocks out of 100 stocks have been consider where PE data is available for past 5 years since 30 June 2021 and 86 since 31 January 2018. PE: Price to EarningDisclaimer: The above simulation is for illustration purpose only and should not be construed as a promise on minimum returns and safeguard of capital. Invesco Asset Management (India) Private Limited/Invesco Mutual Fund is not guaranteeing or forecasting any returns.
Only 23% midcaps traded below their 5-yr average PE during previous peak (31 January 2018)
Compared, as on June 2021, 37% midcaps still trade below their 5-yr average PE
43
Many midcap stocks still trade below their 5 years averageBottom-up stock selection key incrementally
Prem
ium
Dis
coun
t
Prem
ium
Dis
coun
t
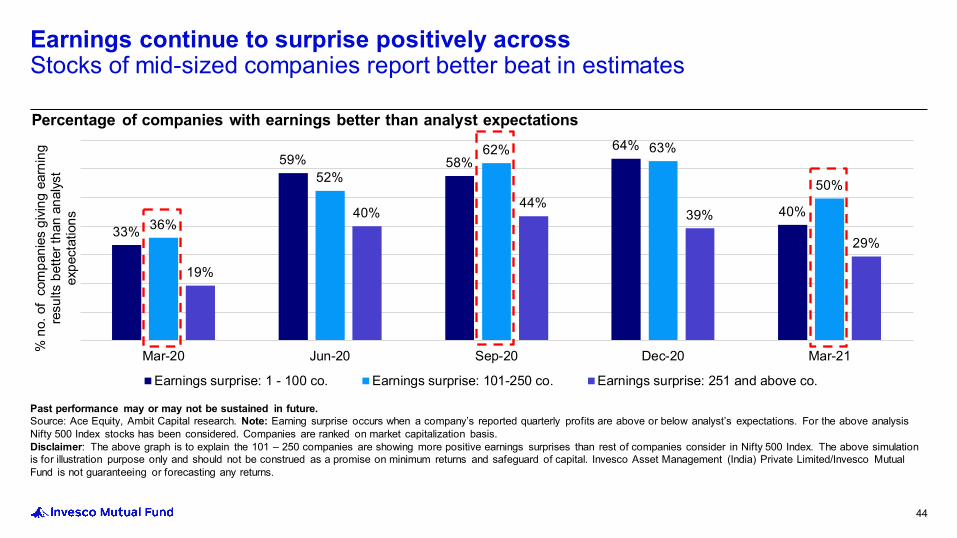
Past performance may or may not be sustained in future.Source: Ace Equity, Ambit Capital research. Note: Earning surprise occurs when a company’s reported quarterly profits are above or below analyst’s expectations. For the above analysis Nifty 500 Index stocks has been considered. Companies are ranked on market capitalization basis.Disclaimer: The above graph is to explain the 101 – 250 companies are showing more positive earnings surprises than rest of companies consider in Nifty 500 Index. The above simulation is for illustration purpose only and should not be construed as a promise on minimum returns and safeguard of capital. Invesco Asset Management (India) Private Limited/Invesco Mutual Fund is not guaranteeing or forecasting any returns.
33%
59% 58%64%
40%36%
52%
62% 63%
50%
19%
40%44%
39%
29%
Mar-20 Jun-20 Sep-20 Dec-20 Mar-21% n
o. o
f co
mpa
nies
givi
ng e
arni
ng
resu
lts b
ette
r tha
n an
alys
t ex
pect
atio
ns
Earnings surprise: 1 - 100 co. Earnings surprise: 101-250 co. Earnings surprise: 251 and above co.
Percentage of companies with earnings better than analyst expectations
44
Earnings continue to surprise positively across Stocks of mid-sized companies report better beat in estimates
Source: 1Bloomberg. GARP: Growth at Reasonable PriceDisclaimer: The information provided herein may include statements/data of future expectations that are based on current views and assumptions and involves known and unknown risks and uncertainties that could cause actual results, performance or events to differ materially from those expressed or implied.
Second wave of infection, though still underway, has receded as rapidly as it spread. Improved vaccination and more pragmatic approach by governments resulted in shallower impact to economic activity.
We believe that the Indian economy should witness a recovery in 2021, albeit of a slightly lower intensity than before the onset of the second wave and accelerate there after. India is well-positioned to commence on a new economic upcycle over the next few years implying broad-based improvement across a variety of industries.
Consumption will take precedence over savings as real interest rates turn negative; manufacturing sector to continue building on its recovery, while services will be more back ended.
Mild inflation expectations, in the initial growth phase of under-utilized capacity, may offer a conducive environment for corporates to improve profits, leading to an earnings upgrade cycle.
Valuations of leading indices, adjusted for lower cost of capital, in-line with long term average – making risk-reward in the markets more evenly balanced. Mid/small cap valuations at a premium to large cap peers; need a strong earnings cycle to drive incremental gains; stock selection key.
Scare to global growth due to delta variant of the COVID – 19 keeps us vigilant for risks emerging at the margin. Recent collapse in US 10-yr yield curve to below the 1.2%1 handle being an indicator of the same.
We prefer a pro-cyclical outlook as GARP opportunities emerge. We maintain our over-weight positions to financials, consumer discretionary and industrials sectors. We also like technology for its earnings resilience but have moderated our stance, of past 6-9 months, as valuations have re-rated.
An economic recovery along with an earnings upgrade cycle can offer more upside to equities in general, with a better participation from the broader markets, offering a good opportunity to invest for the long term.
45
Equity market outlook
Disclaimer: This presentation is for information purposes only and is not an offer to sell or a solicitation to buy any mutual fund units/securities. The information alone is not sufficient and shouldn’t be used for the development or implementation of an investment strategy. It should not be construed as investment advice to any party. All opinions, figures, charts/graphs and data included in this presentation are as on date and are subject to change without notice. The sectors referred in this presentation are for illustrative purposes only and should not be construed as recommendations from Invesco Asset Management (India) Private Limited and/or Invesco Mutual Fund. Schemes of Invesco Mutual Fund may or may not have any present or future positions in these sectors. The content of this document is intended solely for the use of the addressee. If you are not the addressee or the person responsible for delivering it to the addressee, any disclosure, copying, distribution or any action taken or omitted to be taken in reliance on it is prohibited and may be unlawful. The data used in this presentation is obtained by Invesco Asset Management (India) Private Limited from the sources which it considers reliable. While utmost care has been exercised while preparing this document, Invesco Asset Management (India) Private Limited does not warrant the completeness or accuracy of the information and disclaims all liabilities, losses and damages arising out of the use of this information. Neither Invesco Asset Management (India) Private Limited nor any person connected with it accepts any liability arising from the use of this information. The recipient(s) before acting on any information herein should make his/their own investigation and seek appropriate professional advice.
Mutual Fund investments are subject to market risks, read all scheme related documents carefully.
46
Disclaimer


Get in touch
Corporate Office:Invesco Asset Management (India) Private Limited2101 A, 21st Floor, A- Wing, Marathon Futurex, N.M. Joshi Marg, Lower Parel, Mumbai – 400 013+91 22 67310000 F +91 22 23019422
To invest:Call 1800-209-0007 ∆ sms ‘Invest’ to 56677Invest Online www.invescomutualfund.com


