Embed Size (px)
Citation preview
1 Invesco Markets III plc
Invesco Markets III plc (an umbrella investment company with variable capital and segregated liability
between its funds incorporated with limited liability in Ireland under registration
number 352941)
ANNUAL REPORT AND AUDITED FINANCIAL STATEMENTS
For the financial year ended 30 September 2020
2 Invesco Markets III plc
Table of Contents
Pages
General Information 4-5
Investment Policy and Description of the Funds 6-7
Investment Manager’s Report 8-12
Directors’ Report 13-24
Report of the Depositary to the Shareholders 25
Independent Auditors’ Report to the Shareholders 26-30
Schedule of Investments 31-109
Statement of Financial Position as at 30 September 2020 110-113
Statement of Financial Position as at 30 September 2019 114-117
Statement of Comprehensive Income for financial year ended 30 September 2020 118-121
Statement of Comprehensive Income for financial year ended 30 September 2019 122-125
Statement of Changes in Net Assets Attributable to Holders of Redeemable
Participating Shares for financial year ended 30 September 2020 126-129
Statement of Changes in Net Assets Attributable to Holders of Redeemable
Participating Shares for financial year ended 30 September 2019 130-133
Notes to the Financial Statements 134-165
US Equity ETFs
Invesco EQQQ NASDAQ-100 UCITS ETF
Schedule of Investments 31 Statement of Changes in Composition of the Portfolio 166
Invesco FTSE RAFI US 1000 UCITS ETF
Schedule of Investments 34 Statement of Changes in Composition of the Portfolio 167
Invesco Dynamic US Market UCITS ETF*
Schedule of Investments N/A Statement of Changes in Composition of the Portfolio 168
Invesco S&P 500 High Dividend Low Volatility
UCITS ETF
Schedule of Investments F
50 Statement of Changes in Composition of the Portfolio 169
Invesco S&P 500 VEQTOR UCITS ETF*
Schedule of Investments
N/A Statement of Changes in Composition of the Portfolio 170
Invesco S&P 500 QVM UCITS ETF
Schedule of Investments
52 Statement of Changes in Composition of the Portfolio 171
Intelligent Access ETFs
Invesco Global Buyback Achievers UCITS
ETF
Schedule of Investments 55 Statement of Changes in Composition of the Portfolio 172
Global ETFs
Invesco FTSE RAFI Europe Mid-Small UCITS
ETF*
Schedule of Investments N/A Statement of Changes in Composition of the Portfolio 173
Invesco FTSE RAFI All-World 3000 UCITS ETF
Schedule of Investments 61 Statement of Changes in Composition of the Portfolio 174
*Fund closed during the financial year, refer to note 19 of the financial statements.
3 Invesco Markets III plc
Table of Contents (continued)
Global ETFs (continued)
Invesco FTSE RAFI Emerging Markets UCITS
ETF
Schedule of Investments 80 Statement of Changes in Composition of the Portfolio 175
Invesco FTSE RAFI Europe UCITS ETF
Schedule of Investments 86 Statement of Changes in Composition of the Portfolio 176
Invesco EURO STOXX High Dividend Low
Volatility UCITS ETF
Schedule of Investments 95 Statement of Changes in Composition of the Portfolio 177
Invesco FTSE Emerging Markets High Dividend
Low Volatility UCITS ETF
Schedule of Investments 97 Statement of Changes in Composition of the Portfolio 178
Country Specified ETFs
Invesco FTSE RAFI UK 100 UCITS ETF
Schedule of Investments 100 Statement of Changes in Composition of the Portfolio 179
Fixed Income ETFs
Invesco EuroMTS Cash 3 Months UCITS ETF
Schedule of Investments 103 Statement of Changes in Composition of the Portfolio 180
Invesco US High Yield Fallen Angels UCITS ETF
Schedule of Investments 105 Statement of Changes in Composition of the Portfolio 181
Additional Information (Unaudited)
Remuneration Policy 182
PEA Eligibility (Plan d'Epargne en Actions) 182
Securities Financing Transactions Regulation 182
UK Reporting 183
4 Invesco Markets III plc
General Information
Invesco Markets III plc (the “Company”) was incorporated on 5 February 2002 and is established as an open-ended investment company with variable capital
(“OEIC”) under the laws of Ireland as a public limited company pursuant to the Companies Act 2014, registration number 352941, the European Communities
(Undertakings for Collective Investment in Transferable Securities) Regulations, 2011 (as amended) and the Central Bank (Supervision and Enforcement) Act
2013 (Section 48(1)) (Undertakings for Collective Investment in Transferable Securities) (Amendment) Regulations 2019 (the "Central Bank UCITS
Regulations"). As at 30 September 2020, thirteen active funds of the Company had been established (each a “Fund” and together the “Funds”). Invesco
Dynamic US Market UCITS ETF, Invesco S&P 500 VEQTOR UCITS ETF and Invesco FTSE RAFI Europe Mid-Small UCITS ETF closed on 12 February
2020. The list of current Funds is as follows;
US Equity ETFs Invesco EQQQ NASDAQ-100 UCITS ETF
Invesco FTSE RAFI US 1000 UCITS ETF
Invesco S&P 500 High Dividend Low Volatility UCITS ETF
Invesco S&P 500 QVM UCITS ETF
Intelligent Access ETFs Invesco Global Buyback Achievers UCITS ETF
Global ETFs Invesco FTSE RAFI All-World 3000 UCITS ETF
Invesco FTSE RAFI Emerging Markets UCITS ETF
Invesco FTSE RAFI Europe UCITS ETF
Invesco EURO STOXX High Dividend Low Volatility UCITS ETF
Invesco FTSE Emerging Markets High Dividend Low Volatility UCITS ETF
Country Specified ETFs Invesco FTSE RAFI UK 100 UCITS ETF
Fixed Income ETFs Invesco EuroMTS Cash 3 Months UCITS ETF
Invesco US High Yield Fallen Angels UCITS ETF
5 Invesco Markets III plc
General Information (continued)
Board of Directors: Registered Office:
Feargal Dempsey (Irish)* Central Quay
Anne-Marie King (Irish)** Riverside IV
Gary Buxton (British/Irish)** Sir John Rogerson’s Quay
Barry McGrath (Irish)* Dublin 2
* Independent non-executive director Ireland
** Non-executive director
Investment Manager: Manager:
Invesco Capital Management LLC Invesco Investment Management Limited
3500 Lacey Road Central Quay
Suite 700 Downers Grove Riverside IV
Illinois 60515 Sir John Rogerson’s Quay
United States Dublin 2
Ireland
Independent Auditors: Administrator, Registrar and Transfer Agent:
Chartered Accountants and Statutory Auditors BNY Mellon Fund Services (Ireland) Designated Activity Company
PricewaterhouseCoopers One Dockland Central
One Spencer Dock Guild Street
North Wall Quay International Financial Services Centre
Dublin 1 Dublin 1
Ireland Ireland
Secretary: Depositary:
MFD Secretaries Limited The Bank of New York Mellon SA/NV, Dublin Branch***
32 Molesworth Street Riverside Two
Dublin 2 Sir John Rogerson’s Quay
D02 Y512 Dublin 2
Ireland D02 KV60
Ireland
Legal Advisers to the Company: Sub - Custodian:
Arthur Cox The Bank of New York Mellon
Ten Earlsfort Terrace 240 Greenwich Street
Dublin 2 New York, NY 10286
D02 T380 United States
Ireland
*** Effective 1 December 2019, BNY Mellon Trust Company (Ireland) Limited merged into The Bank of New York Mellon SA/NV, which itself is a wholly
owned subsidiary of The Bank of New York Mellon (the “Merger”). Following the Merger, The Bank of New York Mellon SA/NV, Dublin Branch, will be
the entity, which will provide trustee, depositary and/or custody services to the Company.
6 Invesco Markets III plc
Investment Policy and Description of the Funds
Investment Strategy for the Financial Year
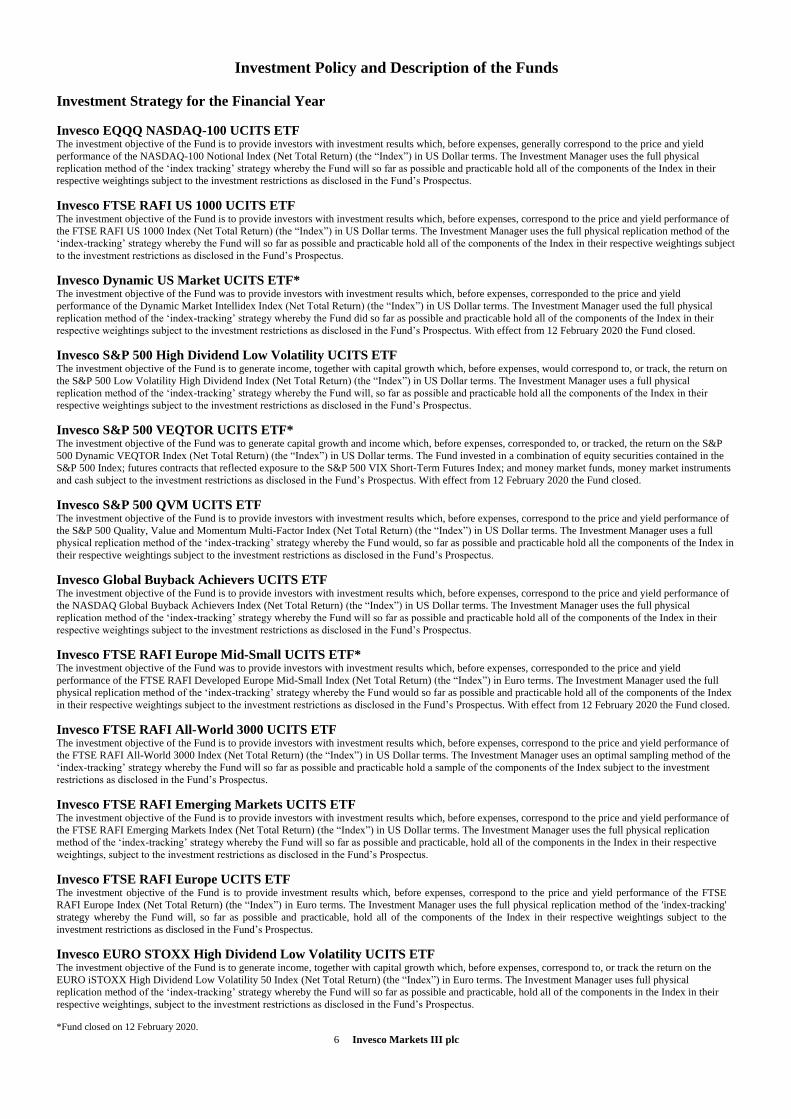
Invesco EQQQ NASDAQ-100 UCITS ETF The investment objective of the Fund is to provide investors with investment results which, before expenses, generally correspond to the price and yield
performance of the NASDAQ-100 Notional Index (Net Total Return) (the “Index”) in US Dollar terms. The Investment Manager uses the full physical
replication method of the ‘index tracking’ strategy whereby the Fund will so far as possible and practicable hold all of the components of the Index in their
respective weightings subject to the investment restrictions as disclosed in the Fund’s Prospectus.
Invesco FTSE RAFI US 1000 UCITS ETF The investment objective of the Fund is to provide investors with investment results which, before expenses, correspond to the price and yield performance of
the FTSE RAFI US 1000 Index (Net Total Return) (the “Index”) in US Dollar terms. The Investment Manager uses the full physical replication method of the
‘index-tracking’ strategy whereby the Fund will so far as possible and practicable hold all of the components of the Index in their respective weightings subject
to the investment restrictions as disclosed in the Fund’s Prospectus.
Invesco Dynamic US Market UCITS ETF* The investment objective of the Fund was to provide investors with investment results which, before expenses, corresponded to the price and yield
performance of the Dynamic Market Intellidex Index (Net Total Return) (the “Index”) in US Dollar terms. The Investment Manager used the full physical
replication method of the ‘index-tracking’ strategy whereby the Fund did so far as possible and practicable hold all of the components of the Index in their
respective weightings subject to the investment restrictions as disclosed in the Fund’s Prospectus. With effect from 12 February 2020 the Fund closed.
Invesco S&P 500 High Dividend Low Volatility UCITS ETF The investment objective of the Fund is to generate income, together with capital growth which, before expenses, would correspond to, or track, the return on
the S&P 500 Low Volatility High Dividend Index (Net Total Return) (the “Index”) in US Dollar terms. The Investment Manager uses a full physical
replication method of the ‘index-tracking’ strategy whereby the Fund will, so far as possible and practicable hold all the components of the Index in their
respective weightings subject to the investment restrictions as disclosed in the Fund’s Prospectus.
Invesco S&P 500 VEQTOR UCITS ETF* The investment objective of the Fund was to generate capital growth and income which, before expenses, corresponded to, or tracked, the return on the S&P
500 Dynamic VEQTOR Index (Net Total Return) (the “Index”) in US Dollar terms. The Fund invested in a combination of equity securities contained in the
S&P 500 Index; futures contracts that reflected exposure to the S&P 500 VIX Short-Term Futures Index; and money market funds, money market instruments
and cash subject to the investment restrictions as disclosed in the Fund’s Prospectus. With effect from 12 February 2020 the Fund closed.
Invesco S&P 500 QVM UCITS ETF
The investment objective of the Fund is to provide investors with investment results which, before expenses, correspond to the price and yield performance of
the S&P 500 Quality, Value and Momentum Multi-Factor Index (Net Total Return) (the “Index”) in US Dollar terms. The Investment Manager uses a full
physical replication method of the ‘index-tracking’ strategy whereby the Fund would, so far as possible and practicable hold all the components of the Index in
their respective weightings subject to the investment restrictions as disclosed in the Fund’s Prospectus.
Invesco Global Buyback Achievers UCITS ETF The investment objective of the Fund is to provide investors with investment results which, before expenses, correspond to the price and yield performance of
the NASDAQ Global Buyback Achievers Index (Net Total Return) (the “Index”) in US Dollar terms. The Investment Manager uses the full physical
replication method of the ‘index-tracking’ strategy whereby the Fund will so far as possible and practicable hold all of the components of the Index in their
respective weightings subject to the investment restrictions as disclosed in the Fund’s Prospectus.
Invesco FTSE RAFI Europe Mid-Small UCITS ETF* The investment objective of the Fund was to provide investors with investment results which, before expenses, corresponded to the price and yield
performance of the FTSE RAFI Developed Europe Mid-Small Index (Net Total Return) (the “Index”) in Euro terms. The Investment Manager used the full
physical replication method of the ‘index-tracking’ strategy whereby the Fund would so far as possible and practicable hold all of the components of the Index
in their respective weightings subject to the investment restrictions as disclosed in the Fund’s Prospectus. With effect from 12 February 2020 the Fund closed.
Invesco FTSE RAFI All-World 3000 UCITS ETF The investment objective of the Fund is to provide investors with investment results which, before expenses, correspond to the price and yield performance of
the FTSE RAFI All-World 3000 Index (Net Total Return) (the “Index”) in US Dollar terms. The Investment Manager uses an optimal sampling method of the
‘index-tracking’ strategy whereby the Fund will so far as possible and practicable hold a sample of the components of the Index subject to the investment
restrictions as disclosed in the Fund’s Prospectus.
Invesco FTSE RAFI Emerging Markets UCITS ETF The investment objective of the Fund is to provide investors with investment results which, before expenses, correspond to the price and yield performance of
the FTSE RAFI Emerging Markets Index (Net Total Return) (the “Index”) in US Dollar terms. The Investment Manager uses the full physical replication
method of the ‘index-tracking’ strategy whereby the Fund will so far as possible and practicable, hold all of the components in the Index in their respective
weightings, subject to the investment restrictions as disclosed in the Fund’s Prospectus.
Invesco FTSE RAFI Europe UCITS ETF The investment objective of the Fund is to provide investment results which, before expenses, correspond to the price and yield performance of the FTSE
RAFI Europe Index (Net Total Return) (the “Index”) in Euro terms. The Investment Manager uses the full physical replication method of the 'index-tracking'
strategy whereby the Fund will, so far as possible and practicable, hold all of the components of the Index in their respective weightings subject to the
investment restrictions as disclosed in the Fund’s Prospectus.
Invesco EURO STOXX High Dividend Low Volatility UCITS ETF The investment objective of the Fund is to generate income, together with capital growth which, before expenses, correspond to, or track the return on the
EURO iSTOXX High Dividend Low Volatility 50 Index (Net Total Return) (the “Index”) in Euro terms. The Investment Manager uses full physical
replication method of the ‘index-tracking’ strategy whereby the Fund will so far as possible and practicable, hold all of the components in the Index in their
respective weightings, subject to the investment restrictions as disclosed in the Fund’s Prospectus.
*Fund closed on 12 February 2020.
7 Invesco Markets III plc
Investment Policy and Description of the Funds (continued)
Investment Strategy for the Financial Year (continued)
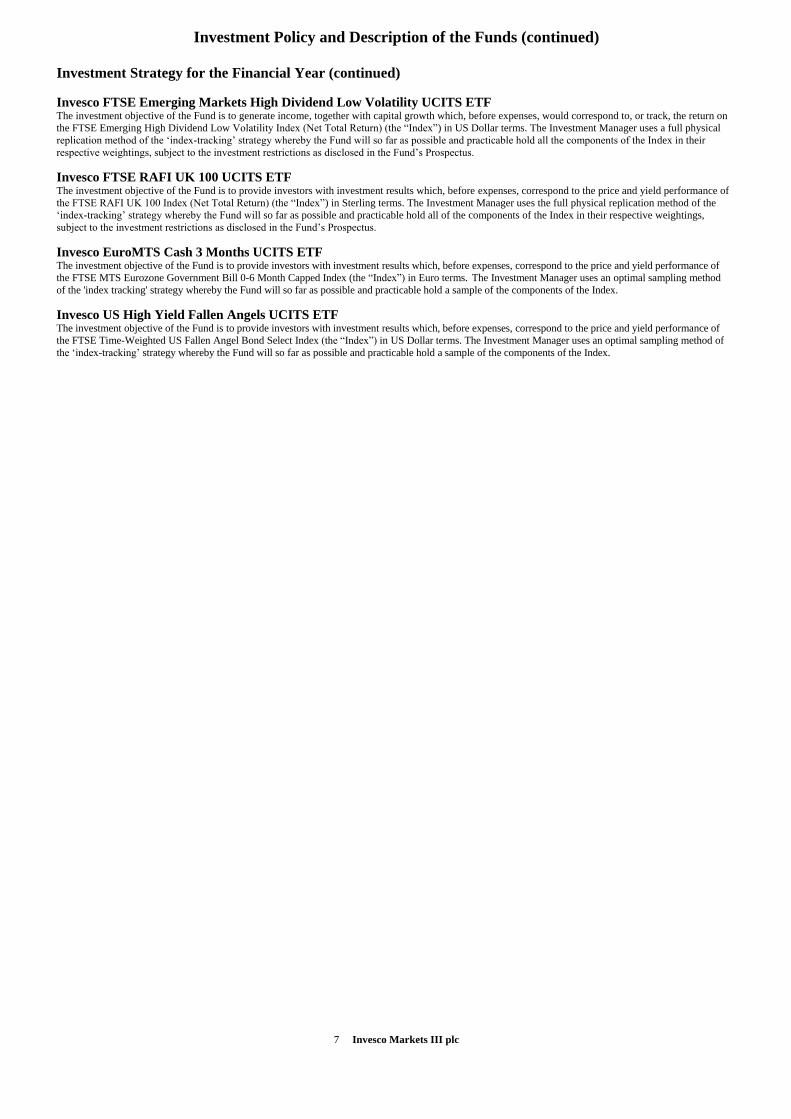
Invesco FTSE Emerging Markets High Dividend Low Volatility UCITS ETF The investment objective of the Fund is to generate income, together with capital growth which, before expenses, would correspond to, or track, the return on
the FTSE Emerging High Dividend Low Volatility Index (Net Total Return) (the “Index”) in US Dollar terms. The Investment Manager uses a full physical
replication method of the ‘index-tracking’ strategy whereby the Fund will so far as possible and practicable hold all the components of the Index in their
respective weightings, subject to the investment restrictions as disclosed in the Fund’s Prospectus.
Invesco FTSE RAFI UK 100 UCITS ETF The investment objective of the Fund is to provide investors with investment results which, before expenses, correspond to the price and yield performance of
the FTSE RAFI UK 100 Index (Net Total Return) (the “Index”) in Sterling terms. The Investment Manager uses the full physical replication method of the
‘index-tracking’ strategy whereby the Fund will so far as possible and practicable hold all of the components of the Index in their respective weightings,
subject to the investment restrictions as disclosed in the Fund’s Prospectus.
Invesco EuroMTS Cash 3 Months UCITS ETF The investment objective of the Fund is to provide investors with investment results which, before expenses, correspond to the price and yield performance of
the FTSE MTS Eurozone Government Bill 0-6 Month Capped Index (the “Index”) in Euro terms. The Investment Manager uses an optimal sampling method
of the 'index tracking' strategy whereby the Fund will so far as possible and practicable hold a sample of the components of the Index.
Invesco US High Yield Fallen Angels UCITS ETF The investment objective of the Fund is to provide investors with investment results which, before expenses, correspond to the price and yield performance of
the FTSE Time-Weighted US Fallen Angel Bond Select Index (the “Index”) in US Dollar terms. The Investment Manager uses an optimal sampling method of
the ‘index-tracking’ strategy whereby the Fund will so far as possible and practicable hold a sample of the components of the Index.
8 Invesco Markets III plc
Investment Manager’s Report
Performance Analysis
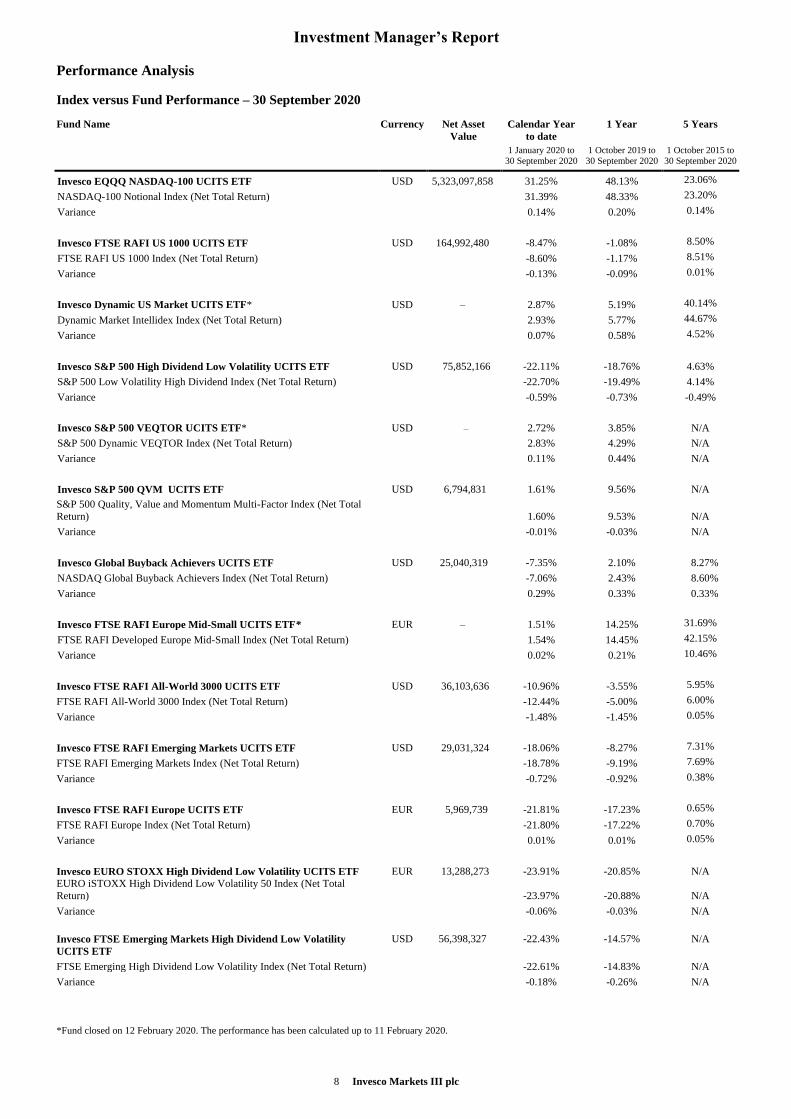
Index versus Fund Performance – 30 September 2020
Fund Name Currency Net Asset
Value
Calendar Year
to date
1 Year 5 Years
1 January 2020 to
30 September 2020
1 October 2019 to
30 September 2020
1 October 2015 to
30 September 2020
Invesco EQQQ NASDAQ-100 UCITS ETF USD 5,323,097,858 31.25% 48.13% 23.06% NASDAQ-100 Notional Index (Net Total Return) 31.39% 48.33% 23.20% Variance 0.14% 0.20% 0.14%
Invesco FTSE RAFI US 1000 UCITS ETF USD 164,992,480 -8.47% -1.08% 8.50% FTSE RAFI US 1000 Index (Net Total Return) -8.60% -1.17% 8.51% Variance -0.13% -0.09% 0.01%
Invesco Dynamic US Market UCITS ETF* USD – 2.87% 5.19% 40.14% Dynamic Market Intellidex Index (Net Total Return) 2.93% 5.77% 44.67% Variance 0.07% 0.58% 4.52%
Invesco S&P 500 High Dividend Low Volatility UCITS ETF USD 75,852,166 -22.11% -18.76% 4.63%
S&P 500 Low Volatility High Dividend Index (Net Total Return) -22.70% -19.49% 4.14%
Variance -0.59% -0.73% -0.49%
Invesco S&P 500 VEQTOR UCITS ETF* USD – 2.72% 3.85% N/A
S&P 500 Dynamic VEQTOR Index (Net Total Return) 2.83% 4.29% N/A
Variance 0.11% 0.44% N/A
Invesco S&P 500 QVM UCITS ETF USD 6,794,831 1.61% 9.56% N/A
S&P 500 Quality, Value and Momentum Multi-Factor Index (Net Total
Return) 1.60% 9.53% N/A
Variance -0.01% -0.03% N/A
Invesco Global Buyback Achievers UCITS ETF USD 25,040,319 -7.35% 2.10% 8.27%
NASDAQ Global Buyback Achievers Index (Net Total Return) -7.06% 2.43% 8.60%
Variance 0.29% 0.33% 0.33%
Invesco FTSE RAFI Europe Mid-Small UCITS ETF* EUR – 1.51% 14.25% 31.69% FTSE RAFI Developed Europe Mid-Small Index (Net Total Return) 1.54% 14.45% 42.15% Variance 0.02% 0.21% 10.46%
Invesco FTSE RAFI All-World 3000 UCITS ETF USD 36,103,636 -10.96% -3.55% 5.95% FTSE RAFI All-World 3000 Index (Net Total Return) -12.44% -5.00% 6.00% Variance -1.48% -1.45% 0.05%
Invesco FTSE RAFI Emerging Markets UCITS ETF USD 29,031,324 -18.06% -8.27% 7.31% FTSE RAFI Emerging Markets Index (Net Total Return) -18.78% -9.19% 7.69% Variance -0.72% -0.92% 0.38%
Invesco FTSE RAFI Europe UCITS ETF EUR 5,969,739 -21.81% -17.23% 0.65% FTSE RAFI Europe Index (Net Total Return) -21.80% -17.22% 0.70% Variance 0.01% 0.01% 0.05%
Invesco EURO STOXX High Dividend Low Volatility UCITS ETF EUR 13,288,273 -23.91% -20.85% N/A
EURO iSTOXX High Dividend Low Volatility 50 Index (Net Total
Return) -23.97% -20.88% N/A
Variance -0.06% -0.03% N/A
Invesco FTSE Emerging Markets High Dividend Low Volatility
UCITS ETF
USD 56,398,327 -22.43% -14.57% N/A
FTSE Emerging High Dividend Low Volatility Index (Net Total Return) -22.61% -14.83% N/A
Variance -0.18% -0.26% N/A
*Fund closed on 12 February 2020. The performance has been calculated up to 11 February 2020.
9 Invesco Markets III plc
Investment Manager’s Report (continued)
Performance Analysis (continued)
Index versus Fund Performance – 30 September 2020 (continued)
Fund Name Currency Net Asset
Value
Calendar Year to
date
1 Year 5 Years
1 January 2020 to
30 September 2020
1 October 2019 to
30 September 2020
1 October 2015 to
30 September 2020
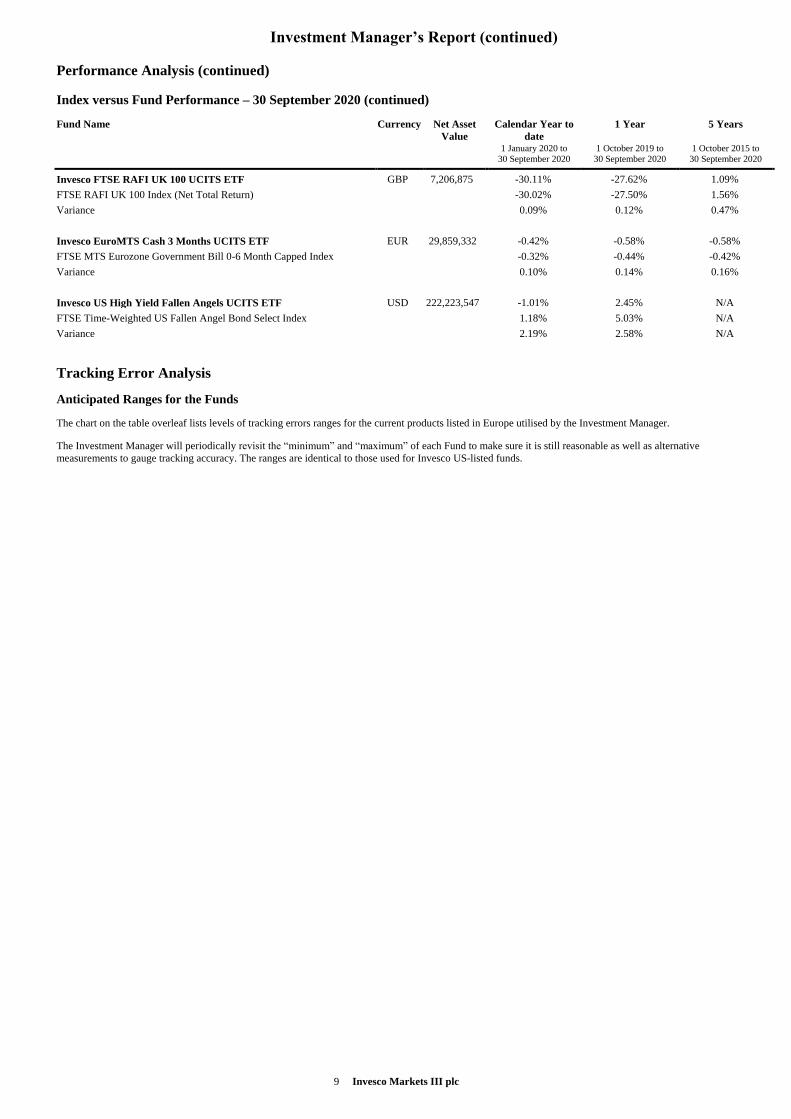
Invesco FTSE RAFI UK 100 UCITS ETF GBP 7,206,875 -30.11% -27.62% 1.09% FTSE RAFI UK 100 Index (Net Total Return) -30.02% -27.50% 1.56% Variance 0.09% 0.12% 0.47%
Invesco EuroMTS Cash 3 Months UCITS ETF EUR 29,859,332 -0.42% -0.58% -0.58% FTSE MTS Eurozone Government Bill 0-6 Month Capped Index -0.32% -0.44% -0.42% Variance 0.10% 0.14% 0.16%
Invesco US High Yield Fallen Angels UCITS ETF USD 222,223,547 -1.01% 2.45% N/A
FTSE Time-Weighted US Fallen Angel Bond Select Index 1.18% 5.03% N/A
Variance 2.19% 2.58% N/A
Tracking Error Analysis
Anticipated Ranges for the Funds
The chart on the table overleaf lists levels of tracking errors ranges for the current products listed in Europe utilised by the Investment Manager.
The Investment Manager will periodically revisit the “minimum” and “maximum” of each Fund to make sure it is still reasonable as well as alternative
measurements to gauge tracking accuracy. The ranges are identical to those used for Invesco US-listed funds.
10 Invesco Markets III plc
Investment Manager’s Report (continued)
Tracking Error Analysis (continued)
Acceptable Ranges for the Funds
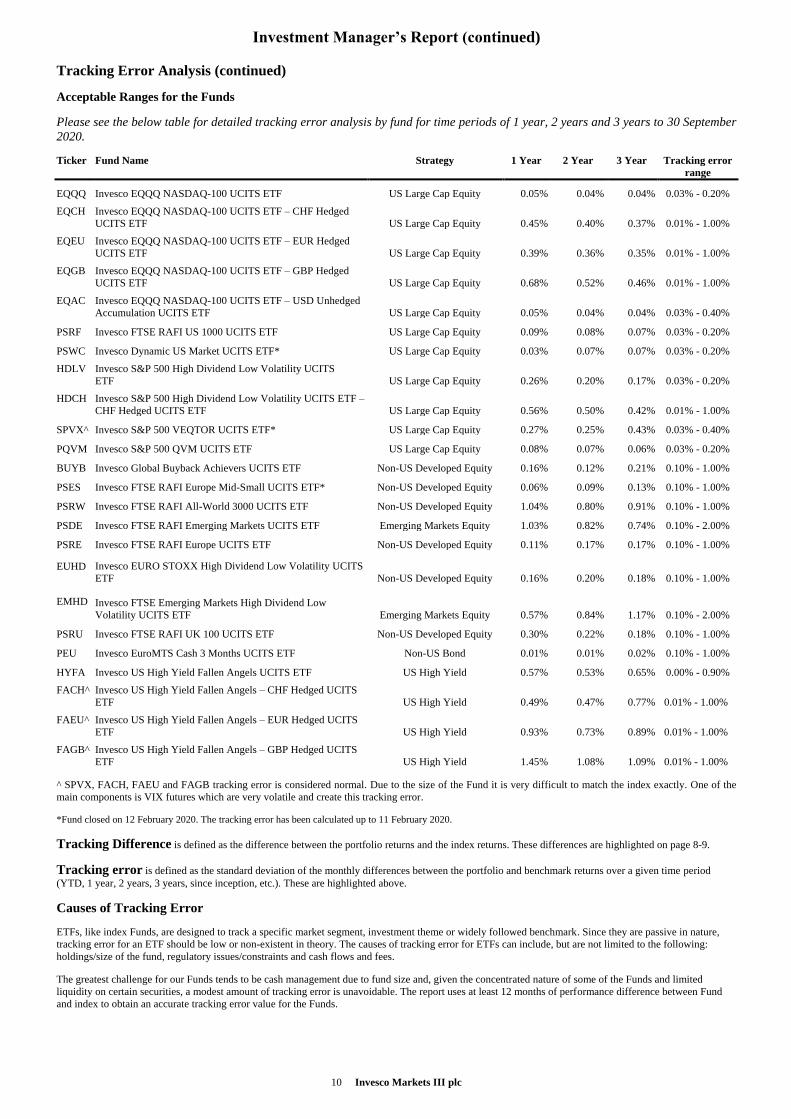
Please see the below table for detailed tracking error analysis by fund for time periods of 1 year, 2 years and 3 years to 30 September
2020.
Ticker Fund Name Strategy 1 Year 2 Year 3 Year Tracking error
range
EQQQ Invesco EQQQ NASDAQ-100 UCITS ETF US Large Cap Equity 0.05% 0.04% 0.04% 0.03% - 0.20%
EQCH Invesco EQQQ NASDAQ-100 UCITS ETF – CHF Hedged
UCITS ETF US Large Cap Equity 0.45% 0.40% 0.37% 0.01% - 1.00%
EQEU Invesco EQQQ NASDAQ-100 UCITS ETF – EUR Hedged
UCITS ETF US Large Cap Equity 0.39% 0.36% 0.35% 0.01% - 1.00%
EQGB Invesco EQQQ NASDAQ-100 UCITS ETF – GBP Hedged
UCITS ETF US Large Cap Equity 0.68% 0.52% 0.46% 0.01% - 1.00%
EQAC Invesco EQQQ NASDAQ-100 UCITS ETF – USD Unhedged
Accumulation UCITS ETF US Large Cap Equity 0.05% 0.04% 0.04% 0.03% - 0.40%
PSRF Invesco FTSE RAFI US 1000 UCITS ETF US Large Cap Equity 0.09% 0.08% 0.07% 0.03% - 0.20%
PSWC Invesco Dynamic US Market UCITS ETF* US Large Cap Equity 0.03% 0.07% 0.07% 0.03% - 0.20%
HDLV Invesco S&P 500 High Dividend Low Volatility UCITS
ETF US Large Cap Equity 0.26% 0.20% 0.17% 0.03% - 0.20%
HDCH Invesco S&P 500 High Dividend Low Volatility UCITS ETF –
CHF Hedged UCITS ETF US Large Cap Equity 0.56% 0.50% 0.42% 0.01% - 1.00%
SPVX^ Invesco S&P 500 VEQTOR UCITS ETF* US Large Cap Equity 0.27% 0.25% 0.43% 0.03% - 0.40%
PQVM Invesco S&P 500 QVM UCITS ETF US Large Cap Equity 0.08% 0.07% 0.06% 0.03% - 0.20%
BUYB Invesco Global Buyback Achievers UCITS ETF Non-US Developed Equity 0.16% 0.12% 0.21% 0.10% - 1.00%
PSES Invesco FTSE RAFI Europe Mid-Small UCITS ETF* Non-US Developed Equity 0.06% 0.09% 0.13% 0.10% - 1.00%
PSRW Invesco FTSE RAFI All-World 3000 UCITS ETF Non-US Developed Equity 1.04% 0.80% 0.91% 0.10% - 1.00%
PSDE Invesco FTSE RAFI Emerging Markets UCITS ETF Emerging Markets Equity 1.03% 0.82% 0.74% 0.10% - 2.00%
PSRE Invesco FTSE RAFI Europe UCITS ETF Non-US Developed Equity 0.11% 0.17% 0.17% 0.10% - 1.00%
EUHD Invesco EURO STOXX High Dividend Low Volatility UCITS
ETF Non-US Developed Equity 0.16% 0.20% 0.18% 0.10% - 1.00%
EMHD Invesco FTSE Emerging Markets High Dividend Low
Volatility UCITS ETF
Emerging Markets Equity 0.57% 0.84% 1.17%
0.10% - 2.00%
PSRU Invesco FTSE RAFI UK 100 UCITS ETF Non-US Developed Equity 0.30% 0.22% 0.18% 0.10% - 1.00%
PEU Invesco EuroMTS Cash 3 Months UCITS ETF Non-US Bond 0.01% 0.01% 0.02% 0.10% - 1.00%
HYFA Invesco US High Yield Fallen Angels UCITS ETF US High Yield 0.57% 0.53% 0.65% 0.00% - 0.90%
FACH^ Invesco US High Yield Fallen Angels – CHF Hedged UCITS
ETF US High Yield 0.49% 0.47% 0.77% 0.01% - 1.00%
FAEU^ Invesco US High Yield Fallen Angels – EUR Hedged UCITS
ETF US High Yield 0.93% 0.73% 0.89% 0.01% - 1.00%
FAGB^ Invesco US High Yield Fallen Angels – GBP Hedged UCITS
ETF US High Yield 1.45% 1.08% 1.09% 0.01% - 1.00%
^ SPVX, FACH, FAEU and FAGB tracking error is considered normal. Due to the size of the Fund it is very difficult to match the index exactly. One of the
main components is VIX futures which are very volatile and create this tracking error.
*Fund closed on 12 February 2020. The tracking error has been calculated up to 11 February 2020.
Tracking Difference is defined as the difference between the portfolio returns and the index returns. These differences are highlighted on page 8-9.
Tracking error is defined as the standard deviation of the monthly differences between the portfolio and benchmark returns over a given time period
(YTD, 1 year, 2 years, 3 years, since inception, etc.). These are highlighted above.
Causes of Tracking Error
ETFs, like index Funds, are designed to track a specific market segment, investment theme or widely followed benchmark. Since they are passive in nature,
tracking error for an ETF should be low or non-existent in theory. The causes of tracking error for ETFs can include, but are not limited to the following:
holdings/size of the fund, regulatory issues/constraints and cash flows and fees.
The greatest challenge for our Funds tends to be cash management due to fund size and, given the concentrated nature of some of the Funds and limited
liquidity on certain securities, a modest amount of tracking error is unavoidable. The report uses at least 12 months of performance difference between Fund
and index to obtain an accurate tracking error value for the Funds.
11 Invesco Markets III plc
Investment Manager’s Report (continued)
Tracking Error Analysis (continued)
Tracking Error Exception
At the direction of the Board of the Company, we have been providing a quarterly tracking error analysis using the tracking error ranges noted as a reference
point. The Investment Manager will periodically revisit the “minimum” and “maximum” of each Fund to make sure it is still appropriate as well as alternative
measurements to gauge tracking accuracy.
Correlation Analysis
Correlation represents the relationship between two or more variables with a value assigned between 1 and -1. Correlation is the degree to which these
variables are observed to move together: if they move in the same direction, there is positive correlation; if they move in opposite directions, there is negative
correlation. A value of 1 indicates they are perfectly correlated and a value of -1, means they are exact opposites. The calculated value usually falls somewhere
in between indicating the degree of linear dependence between the variables. The closer the coefficient is to either 1 or -1, the stronger or weaker the
correlation between the variables (in this case the Fund and index).
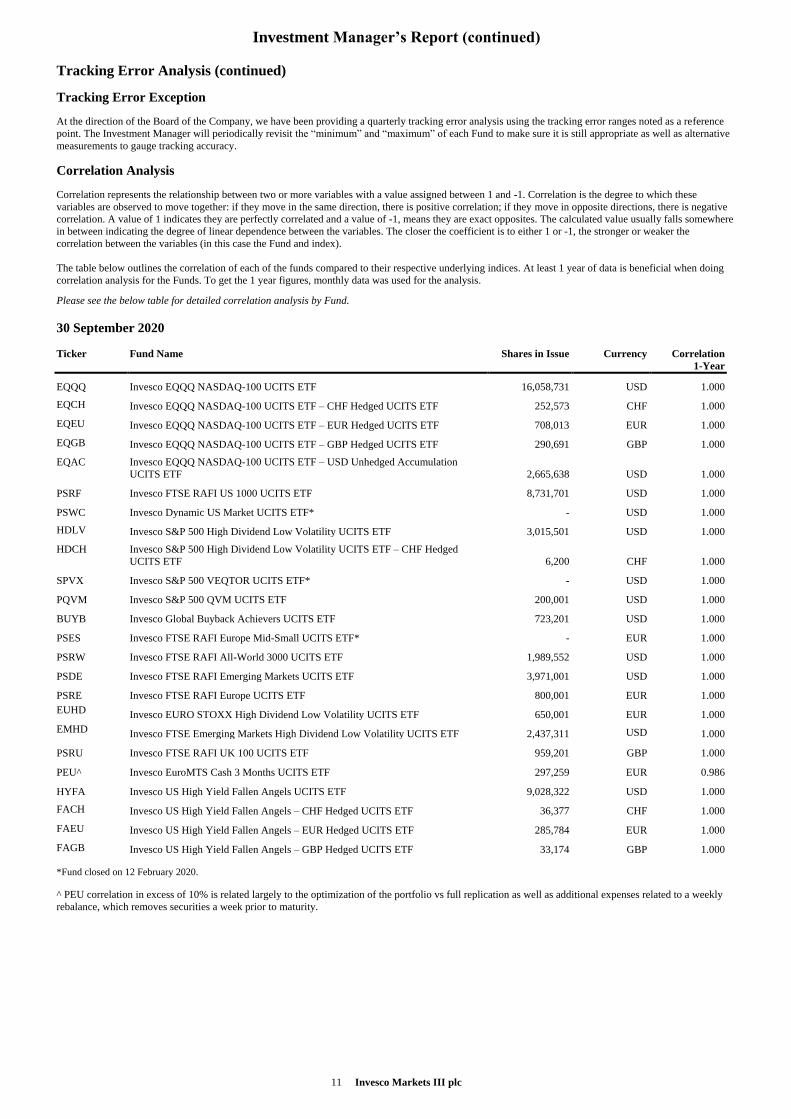
The table below outlines the correlation of each of the funds compared to their respective underlying indices. At least 1 year of data is beneficial when doing
correlation analysis for the Funds. To get the 1 year figures, monthly data was used for the analysis.
Please see the below table for detailed correlation analysis by Fund.
30 September 2020
Ticker
Fund Name
Shares in Issue
Currency
Correlation
1-Year
EQQQ Invesco EQQQ NASDAQ-100 UCITS ETF 16,058,731 USD 1.000 EQCH Invesco EQQQ NASDAQ-100 UCITS ETF – CHF Hedged UCITS ETF 252,573 CHF 1.000 EQEU Invesco EQQQ NASDAQ-100 UCITS ETF – EUR Hedged UCITS ETF 708,013 EUR 1.000 EQGB Invesco EQQQ NASDAQ-100 UCITS ETF – GBP Hedged UCITS ETF 290,691 GBP 1.000 EQAC Invesco EQQQ NASDAQ-100 UCITS ETF – USD Unhedged Accumulation
UCITS ETF 2,665,638 USD 1.000
PSRF Invesco FTSE RAFI US 1000 UCITS ETF 8,731,701 USD 1.000
PSWC Invesco Dynamic US Market UCITS ETF* - USD 1.000 HDLV Invesco S&P 500 High Dividend Low Volatility UCITS ETF 3,015,501 USD 1.000 HDCH Invesco S&P 500 High Dividend Low Volatility UCITS ETF – CHF Hedged
UCITS ETF 6,200 CHF 1.000
SPVX Invesco S&P 500 VEQTOR UCITS ETF* - USD 1.000
PQVM Invesco S&P 500 QVM UCITS ETF 200,001 USD 1.000
BUYB Invesco Global Buyback Achievers UCITS ETF 723,201 USD 1.000
PSES Invesco FTSE RAFI Europe Mid-Small UCITS ETF* - EUR 1.000
PSRW Invesco FTSE RAFI All-World 3000 UCITS ETF 1,989,552 USD 1.000
PSDE Invesco FTSE RAFI Emerging Markets UCITS ETF 3,971,001 USD 1.000
PSRE Invesco FTSE RAFI Europe UCITS ETF 800,001 EUR 1.000 EUHD Invesco EURO STOXX High Dividend Low Volatility UCITS ETF 650,001 EUR 1.000 EMHD Invesco FTSE Emerging Markets High Dividend Low Volatility UCITS ETF 2,437,311 USD 1.000
PSRU Invesco FTSE RAFI UK 100 UCITS ETF 959,201 GBP 1.000
PEU^ Invesco EuroMTS Cash 3 Months UCITS ETF 297,259 EUR 0.986
HYFA Invesco US High Yield Fallen Angels UCITS ETF 9,028,322 USD 1.000 FACH Invesco US High Yield Fallen Angels – CHF Hedged UCITS ETF 36,377 CHF 1.000 FAEU Invesco US High Yield Fallen Angels – EUR Hedged UCITS ETF 285,784 EUR 1.000 FAGB Invesco US High Yield Fallen Angels – GBP Hedged UCITS ETF 33,174 GBP 1.000
*Fund closed on 12 February 2020.
^ PEU correlation in excess of 10% is related largely to the optimization of the portfolio vs full replication as well as additional expenses related to a weekly
rebalance, which removes securities a week prior to maturity.
12 Invesco Markets III plc
Investment Manager’s Report (continued)
Commentary on Performance
We didn’t envisage the global pandemic that dominated 2020. Even so, we had some successes and cyclical assets did well. We expect that to continue
in 2021, vaccines willing.
A year ago, we worried that economic and profit growth could falter but remained cautiously optimistic about equities and real estate. We didn’t foresee a
global pandemic that would cause a deep recession, nor did we envision that a sitting US president would refuse to concede a clear defeat.
It should then be no surprise that defensive assets such as precious metals and government bonds did well in 2020. More surprising is that equities and
industrial metals also had a good year. The 17.5% USD total return on our Neutral portfolio in 2019 (17.4% in local currency) was followed by 12.6% in 2020
(9.9%). The Neutral portfolio is a static mix of global cash, fixed income, equity, real estate and commodity assets.
As always, bad news sells. Just as US-China trade tensions dominated the most-read stories in 2019, it was Covid-19 that dominated our thoughts during 2020.
Except for one story about the US election, the virus dominated.
To underline what a strange year it was, despite the focus on the pandemic (and a large sell-off in February/March), equities were the best performing asset
class in 2020 (+16.8% in USD). Commodities was the worst group with a loss of 23.7%. However, delving into regional and sub-group detail gives some
interesting results, with Chinese equities at the top of the list (+29.7% in USD according to MSCI), followed by precious metals (+23.0%). The oil price slump
caused energy to be at the bottom of the pile with a loss of 46.3%. Asset selection was more important in 2020 than in 2019.
Currency movements were an important factor in the poor performance of some Emerging Market assets: Brazil, Russia and Turkey all saw sizeable double-
digit currency declines versus the US dollar, for example. And this in a year of dollar weakness (J.P. Morgan’s nominal broad effective index for USD fell
3.1% in 2020).
Indeed, the weakness of the South African rand (-4.8% in 2020) turned the strong performance of South African government debt (+8.6% in local currency)
into poor performance when measured in USD (pulling South Africa down to 31st out of the 35 government bond markets in our universe).
As usual, we believe the main driver of returns will be the economic cycle but, for once, that may depend upon science. If all goes well with vaccine
programmes, 2021 should be a year of strong economic growth, which should favour cyclical assets. It should also bring the greatest relief to those countries
that have struggled with the pandemic, which is one reason we favour European assets.
Invesco Capital Management LLC
7 January 2021
13 Invesco Markets III plc
Directors’ Report for the financial year ended 30 September 2020
The Directors submit their annual report together with the audited financial statements for the financial year ended 30 September 2020.
Statement of Directors’ Responsibilities The Directors are responsible for preparing the Directors’ Report and the financial statements in accordance with Irish law.
Irish company law requires the Directors to prepare financial statements for each financial year which give a true and fair view of the state of affairs of the
Company and of the profit or loss of the Company for that period. In preparing those financial statements, the Directors are required to:
select suitable accounting policies and then apply them consistently;
make judgements and estimates that are reasonable and prudent;
state whether the financial statements have been prepared in accordance with Irish law and accounting standards issued by the Financial Reporting
Council, including FRS102 “The Financial Reporting Standards applicable in the UK and Republic of Ireland” (Generally Accepted Accounting
Principles in Ireland), subject to any material departures from those standards being disclosed and explained in the notes to the financial statements;
and;
prepare the financial statements on a going concern basis unless it is inappropriate to presume that the Company will continue in business.
The Directors are responsible for preparing the Directors’ report and the financial statements in accordance with Irish law and accounting standards issued by
the Financial Reporting Council, including FRS102 “The Financial Reporting Standards applicable in the UK and Republic of Ireland” (Generally Accepted
Accounting Principles in Ireland). The Directors confirm that they have complied with the above requirements in preparing the financial statements in
accordance with applicable Irish Law and generally accepted accounting principles in Ireland.
The Company’s business activities, together with the factors likely to affect its future development, performance and position are set out in the Investment
Manager's Report. The financial position of the Company is described in the financial statements on pages 110-113. In addition, the Investment Manager's
Report sets out the objectives of each Fund and the outlook for the Funds. The Company has considerable assets under management with minimal to moderate
levels of tracking error. As a consequence, the Directors believe that the Company is well placed to manage its business successfully.
The Directors have a reasonable expectation that the Company has adequate resources to continue in operational existence for the foreseeable future. Thus they
continue to adopt the going concern basis of accounting in preparing the annual financial statements.
The Directors are responsible for keeping adequate accounting records that are sufficient to:
correctly record and explain the transactions of the company;
enable, at any time, the assets, liabilities, financial position and profit or loss of the company to be determined with reasonable accuracy; and
enable the directors to ensure that the financial statements comply with the Companies Act 2014 and enable those financial statements to be
audited.
The Directors believe that they have complied with the requirements of Section 281 to 285 of the Companies Act 2014 with regard to accounting records by
engaging the services of an Administrator employing personnel with appropriate expertise and adequate resources to provide the Company’s finance function.
The Directors are also responsible for safeguarding the assets of the company and hence for taking reasonable steps for the prevention and detection of fraud
and other irregularities.
The Directors acknowledge that they are responsible for securing the Company’s compliance with the relevant obligations as set out in Section 225 of the
Companies Act 2014.
The Directors confirm that:
1) A compliance policy document has been drawn up that sets out policies, that in our opinion are appropriate to the Company, respecting compliance
by the Company with its relevant obligations;
2) appropriate arrangements or structures are in place that are, in our opinion, designed to secure material compliance with the Company's relevant
obligations, and;
3) during the financial year, the arrangements or structures referred to in (2) have been reviewed.
The Directors believe that they have complied with the requirements of Section 330 of the Companies Act 2014 as follows:
so far as the Directors are aware, there is no relevant audit information of which the Company’s statutory auditors are unaware, and
the Directors have taken all the steps that they ought to have taken as directors in order to make himself or herself aware of any relevant audit
information and to establish that the Company’s statutory auditors are aware of that information.
The Company has appointed Invesco Investment Management Limited (“the Manager”) as manager of the Company who has, in turn delegated certain duties
to the Investment Manager, Invesco Capital Management LLC (the “Investment Manager”) and the Administrator, BNY Mellon Fund Services (Ireland)
Designated Activity Company (the “Administrator”). The Company has appointed Bank of New York Mellon SA/NV, Dublin Branch (the “Depositary”) to
act as Depositary of the Company’s assets.
The measures taken by the Directors to secure compliance with the Company’s obligations to keep proper accounting records include the use of appropriate
systems and procedures and the employment of competent persons. The accounting records are retained at the office of the Administrator at One Dockland
Central, Guild Street, International Financial Services Centre, Dublin 1.
The Financial Statements are published on the https://etf.invesco.com website. The Directors and Invesco UK Services Limited are responsible for the
maintenance and integrity of the financial information included on this website. Legislation in the Republic of Ireland governing the presentation and
dissemination of the Financial Statements may differ from legislation in other jurisdictions.
Corporate Governance Statement
The European Communities (Directive 2006/46/EC) Regulations (S.I. 450 of 2009 and S.I. 83 of 2010) (the “Regulations”) requires the inclusion of a
corporate governance statement in the Directors’ Report.
General Principles and Compliance
Responsibility for good governance lies with the Board. The governance framework of the Company reflects the fact that, as a collective investment scheme, it
has no employees and outsources investment management and administration.
Irish Fund Governance Code
The Board is committed to maintaining the highest standards of corporate governance and is accountable to shareholders for the governance of the Company’s
affairs. The Company fully complies with the voluntary Corporate Governance Code for Irish Collective Investment Schemes, issued by Irish Funds (the “IF
14 Invesco Markets III plc
Directors’ Report for the financial year ended 30 September 2020 (continued)
Corporate Governance Statement (continued)
Code”). The IF Code is available at www.irishfunds.ie. The directors are responsible for the maintenance and integrity of the corporate and financial
information included on the company’s website. Legislation in the Republic of Ireland governing the preparation and dissemination of financial statements
may differ from legislation in other jurisdictions.
The Company is also subject to corporate governance practices imposed by:
(i) The Companies Act 2014 (as amended) (the “Companies Act”) which is available for inspection at the registered office of the Company and
may also be obtained at: www.irishstatutebook.ie;
(ii) The Constitutional Documents of the Company which are available for inspection at the registered office of the Company at 32 Molesworth
Street, Dublin 2, Ireland and at the Companies Registration Office in Ireland;
(iii) The Central Bank of Ireland in the Central Bank UCITS Regulations which can be obtained from the website at: www.centralbank.ie;
(iv) Deutsche Börse through the trading model of XETRA for shares (including ETFs) which can be obtained from the Deutsche Börse website at:
www.deutscheboerse.com; and
(v) The Irish Stock Exchange (“ISE”) trading as Euronext Dublin continuing obligations requirements for open ended Funds which can be
obtained from the ISE website at: www.ise.ie
(vi) The Swiss Stock Exchange ("SIX") continuing obligations requirements for Investment Funds which can be obtained from the SIX website at:
www.sixswiss-exchange.com; and
(vii) The Italian Stock Exchange ("Borsa Italiana") continuing obligations requirements for ETFs which can be obtained from the Borsa Italiana
website at www.borsaitaliana.it; and
(viii) The French Stock Exchange ("NYSE Euronext Paris") continuing obligations requirements for ETFs which can be obtained from the NYSE
Euronext Paris website at https://www.euronext.com/en/markets/paris.
By virtue of the listing on the ISE, certain Funds are admitted to trading on the London Stock Exchange ("LSE") on a "cross listing" basis. In the context,
however, of corporate governance, the Funds are not subject to the listing requirements of the London Stock Exchange but instead comply with those of the
ISE. In respect of Funds admitted to trading on Xetra, SIX, Borsa Italiana or NYSE Paris Euronext, the Funds are listed directly with the exchanges and are
required to comply with the listing requirements of the local jurisdiction.
Composition of the Board and Succession Planning
The IF Code requires a majority of the Board to be non-executive directors, at least one of whom should be an independent non-executive director. The IF
Code does not require the Chairman to be independent. As the IF Code has been tailored specifically for collective investment schemes, the Board has resolved
to follow the IF Code in this regard. The Board comprises four Directors, all of whom are non-executive, two of whom are considered independent. Three of
the Directors are Irish residents (including both Independent Non-executive Directors) and are therefore reasonably available to meet the Central Bank at short
notice, if so required. The Directors have a range of relevant financial, operational and investment management skills and experience relevant to the direction
and control of the Company. Details of the Directors’ skills and experience can be found in their individual biographies on page 16.
Barry McGrath has acted as the Company’s Chairman since 6 April 2019, succeeding Graeme Proudfoot. The Board considers that Mr McGrath provides it
with effective leadership, ensures that critical discussions take place; objective decisions are made and that third parties are appropriately challenged. He also
promotes effective communication between members of the Board.
Directors’ Independence
As it is tailored specifically for collective investment schemes, the Board considers that the independence criteria specified in the IF Code to be appropriate for
the purposes of determining the independence of Directors. The Board has considered the independence of Barry McGrath and Feargal Dempsey and, in
addition to meeting the criteria for independence laid down by the IF Code, is satisfied that the actions of these Directors on behalf of the Company
demonstrate that they remain independent.
As an investment company, the relationship between the Board and the Manager is such that the Board does not consider it necessary to nominate a senior
independent director, other than the Chairman. All the Directors are available to shareholders if they have concerns when contact through the normal channels
of Chairman, Manager or Company Secretary has failed to resolve or for which such contact is inappropriate.
The Board recognises the importance of ensuring that all Directors are able to allocate sufficient time to the Company in order to discharge their
responsibilities effectively. As part of the selection and appointment process, potential Directors are provided with an assessment of the time commitment
expected (including an estimate of the time required for additional or ad hoc matters) to undertake the requirements of the role. Potential Directors are required
to confirm that they have sufficient time to undertake the requirements of the role and to disclose all other significant commitments they have. Once Directors
are appointed to the Board, they must disclose any changes to their significant commitments as and when they arise. As part of the 2018 Directors’
Performance Evaluation, Directors confirmed that they continue to have sufficient time to act as Directors of the Company. The significant commitments of the
Directors can be found in their individual biographies on page 16.
Appointment, Re-election and Tenure of Directors The Board is responsible for reviewing the size, structure and composition of the Board and considering any changes or new appointments.
The Board has formulated a formal, rigorous and transparent procedure for the selection and appointment of any new Director to the Board. The Board may
appoint an external search consultancy to identify potential candidates. However, to date the Board has been able to identify the most appropriate candidates to
join the Board through its own selection process and has therefore not considered it necessary to appoint an external search consultancy. Appointments to the
Board are subject to the approval of the Central Bank of Ireland.
The Directors do not have a formal service contract with the Company. Directors’ terms and conditions of appointment are set out in letters of appointment,
which are available for inspection at the registered office of the Company and will be available at the Annual General Meeting (“AGM”).
Board Changes
Details of the Directors’ skills and experience can be found in their individual biographies on page 16.
15 Invesco Markets III plc
Directors’ Report for the financial year ended 30 September 2020 (continued)
Corporate Governance Statement (continued)
Board Diversity
The Board considers that diversity in its membership is beneficial and therefore seeks to ensure that the Board’s size, structure and composition, including
skills, knowledge, experience and diversity is sufficient for the effective direction and control of the Company. However, as the Board is committed to
appointing the most appropriate candidates as Directors of the Company, it has not set any measurable objectives in respect of this policy.
Chief Executive
The Company is an externally managed investment company without any employees. Therefore, the Board does not consider it appropriate to appoint a Chief
Executive.
The Secretary
The Board has direct access to the advice and services of the Company Secretary, MFD Secretaries Limited, which is responsible for ensuring that the Board
and Committee procedures are followed and compliant with applicable rules and regulations. The Company Secretary is also responsible to the Board for
ensuring timely delivery of information and reports and that the statutory obligations of the Company are met. Additionally, the Company Secretary is
responsible for advising the Board through the Chairman on all governance matters.
Annual General Meeting (AGM)
The Notice of the AGM of the Company, which is to be held on 26 March 2021, will be sent to shareholders in due course. The Board urges all shareholders to
vote in favour of these resolutions by returning their completed voting papers. The following summarises the current business of the forthcoming AGM of the
Company:
Ordinary Resolutions
Resolution 1 is for shareholders to receive this Annual Financial Report;
Resolution 2 is to re-appoint the auditors and to authorise the Directors to determine the auditors’ remuneration. PricewaterhouseCoopers has expressed
willingness to continue to hold office until the conclusion of the next annual general meeting of the Company.
More detail in relation to each resolution (including any further business that may be approved by the Board for shareholder consideration at the AGM) will be
included in the Notice of the AGM.
Directors’ Remuneration
The Board as a whole reviews Directors’ remuneration, having agreed that a separate remuneration committee is not appropriate for a Company of this size and
nature. The Directors seek advice from the Secretary, when considering the level of Directors’ fees. The Board’s policy is that the remuneration of Independent
Non-Executive Directors should be fair and reasonable in relation to the time commitment and responsibilities of the Directors. The amount of Directors’ fees
paid during the financial year ended 30 September 2020 can be found in Note 12 to the financial statements.
Conflicts of Interest
A Director must avoid a situation where he or she has an interest that conflicts with the Company’s interests. In any matter for consideration before the Board
where a Director believes that a conflict may arise affecting him or her, unless otherwise generally agreed in accordance with the provisions of the Companies
Act 2014, he or she shall disclose such conflict to the Board before the issue is considered by the Board. The Directors have the authority to authorise potential
conflicts of interest. Firstly, only Directors who have no interest in the matter being considered are able to take the relevant decision, and secondly, in taking
the decision the Directors must act in a way they consider, in good faith, will be most likely to promote the Company’s success.
The Directors have declared any potential conflicts of interest to the Company.
Directors’ Development
Prior to his or her appointment each new Director is fully briefed as to his or her responsibilities and is continually updated throughout his or her office on
industry and regulatory matters. The Manager and Board have a programme of induction training for newly appointed Directors. They have also put
arrangements in place to address the ongoing development requirements of Directors, which includes regular briefings from, amongst others, key members of
the Manager’s staff, auditors, investment strategists, trustees and legal advisors regarding any proposed product developments or changes in laws or regulations
that could affect the Company.
Board and Directors’ Performance Evaluation
IF Code requires the Board to undertake a review of the overall performance of the Board and that of any individual Directors annually with a formal
documented review taking place at least once every three years. In 2018, the Board carried out a formal documented review of the performance of the Board as
a whole, individual members and the performance of the Chairman.
The findings indicated that the Directors individually, and the Board as a whole, continued to function efficiently, that the composition of the Board is
appropriately aligned to the Company’s activities and that the Directors are able to effectively discharge their responsibilities to the Company and its
Shareholders.
Board Responsibilities
The Board is responsible for the Company’s overall direction and strategy and to this end it reserves the decision making power on issues such as the
determination of medium and long term goals, reviewing managerial performance, organisational structure and capital needs and commitments to achieve the
Company’s strategic goals. To achieve these responsibilities, the Board meets at least quarterly to review the operations of the Company, address matters of
strategic importance and to receive reports from the Manager, the Administrator and the Depositary. However, a Director or the Secretary may, on the
requisition of a Director, at any time summon a meeting of the Directors. Additional ad hoc meetings are convened as required. The Board is supplied with
information in a timely manner and in a form and of a quality appropriate to enable it to discharge its duties.
The Board also approves the Prospectus, circulars to shareholders, listing particulars and other relevant legal documentation. A formal schedule of matters
specifically reserved for decision by the Board has been defined. The Directors also have access to the advice and services of the Secretary, external counsel
and the resources of the Investment Manager should they be needed. Where necessary, in the furtherance of their duties, the Board and individual Directors
may seek independent professional advice at the expense of the Company. Any Director who resigns their position is obliged, if appropriate to confirm to the
Board and the Central Bank of Ireland that the resignation is not connected with any issues with or claims against the Company. Furthermore, any Director
who has concerns about the running of the Company or a proposed course of action may provide a written statement to the Chairman outlining his concerns for
circulation to the Board or alternatively may have his concerns formally recorded in the minutes of a Board meeting.
Decisions arising at any meeting of the Directors are determined by a majority of votes. In the case of an equality of votes, the Chairman has a second or
casting vote. The quorum necessary for the transaction of business at a meeting of the Directors is two.
The Company has maintained appropriate Directors’ and officiers’ liability insurance cover throughout the financial year.
16 Invesco Markets III plc
Directors’ Report for the financial year ended 30 September 2020 (continued)
Corporate Governance Statement (continued)
Directors’ Biographies
Feargal Dempsey – Independent Non –Executive Director
Mr Dempsey is an independent director and consultant to the ETF industry and serves on the boards of several management company and fund boards. He has
held senior positions at Barclays Global Investors/BlackRock including Head of Product Strategy iShares EMEA, Head of Product Structuring iShares EMEA
and Head of Product Governance. Previously he has also served as Head of Legal to ETF Securities and as a senior lawyer in Pioneer Investments.
Mr Dempsey holds a BA(Hons) and an LLB(Hons) from University College Galway and was admitted to the Roll of Solicitors in Ireland in 1996 and to the
England and Wales Law Society in 2005. He has served on the legal and regulatory committee of the IFIA and the ETF Working Group at EFAMA.
Mr. Dempsey was appointed to the Board with effective date 2 May 2018.
Anne-Marie King – Non –Executive Director
Ms. King is the Head of Cross Border Governance for EMEA, responsible for developing a consistent and coherent governance and oversight framework for
Invesco’s regulated fund management company activities across EMEA, with specific responsibility for Invesco’s Dublin and Luxembourg based entities. Ms.
King is a Director of Invesco Management S.A. and Chair of Invesco Investment Management Limited. She is also a Director of a number of Invesco
promoted funds.
Ms. King joined Invesco (then known as Investment Fund Administrators Limited, a fully owned subsidiary of GT Asset Management Ireland Limited) in
September 1994, as a member of the Client Services department. Since then Ms. King has undertaken a number of varied and progressive roles within Invesco
including: Finance, Investment Administration, Business Development and Transfer Agency. Before assuming her current position in 2013, Ms. King was
Head of Cross Border Transfer Agency with full responsibility for transfer agency operational, control and oversight functions and the related project and
product implementation. She graduated from Dublin Business School in 1998 and is a fellow of the Chartered Association of Certified Accountants.
Gary Buxton – Non –Executive Director
Gary Buxton, Head of EMEA ETFs for Invesco is responsible for Product and Sales Strategy, Product Implementation and Capital Markets in EMEA, having
joined Invesco in August 2017 on its acquisition of Source.
He joined Source as a founder of the business in 2008 as the Chief Operating Officer and was responsible for Product, Trading, Technology and Risk
Management. From 2008 to 2012 and from 2015 to 2017 Mr Buxton was also the Chief Financial Officer of Source. Prior to starting Source, Mr Buxton was a
director in the Hedge Fund division of Merrill Lynch where his role focused on product development. Mr Buxton started his career at Deloitte in London and is
a qualified Chartered Accountant (FCA). Mr Buxton is a Director of Invesco Markets PLC, Invesco Markets II PLC, Invesco Markets III PLC, Short-Term
Investments Company (Global Series) PLC, Invesco Investment Management Limited and Invesco UK Services Limited. Mr Buxton is a British and Irish
national.
Barry McGrath – Independent Non-Executive Director
Mr. McGrath is an independent director and consultant to a number of Irish funds. Prior to this, he was Head of the Investment Funds Group in Maples and
Calder's Dublin office and a global equity partner of the Group from 2008-2017. He specialised in financial services law. He was previously a senior partner
with a large Irish corporate law firm. Barry is a graduate of University College Dublin.
He is recommended by a number of directories, including the 2008 editions of Chambers Global, IFLR1000, PLC Which Lawyer? The Legal 500 and
Chambers Europe. Barry is a graduate of University College Dublin. Barry has made frequent contributions to investment fund publications and is a regular
speaker at both international conferences and domestic seminars, including Irish Funds (formerly Irish Funds Industry Association) events. He has been a
recent contributor of articles to The Lawyer, HFM Week and Hedge Week. Barry was formerly a member of the Alternative Investment Committee of Irish
Funds and is currently a member of the Counsel of Irish Funds.
Internal Control and Risk Management The Company’s risk assessment and the way in which significant risks are identified and managed is a key area of focus for the Board. The Board has
undertaken a robust assessment of the risks to the Company, both in respect of its operations and longer term viability. This assessment took into consideration
the controls exercised by the Board and its delegates, the Manager and other service providers.
The Board is responsible for ensuring that the Company maintains a sound system of internal control to mitigate risk and safeguard shareholders’ investments
and the Company’s assets. The effectiveness of the Company’s system on internal controls, including financial, operational and compliance and risk
management systems is reviewed at least annually. The management and administration of the Company is delegated to the Manager, Investment Manager,
Administrator and Depositary, all of whom maintain their own systems of internal controls and the Board receives regular reports from the internal audit,
independent risk and compliance teams of these service providers, as required, to enable the effectiveness of the Company’s system of internal controls to be
assessed. It is not necessary for the Company to have its own internal audit function because all of the management and administration of the Company is
delegated to the Manager, Investment Manager, Administrator and Depositary. The Board recognises that these control systems can only be designed to
manage rather than eliminate the risk of failure to achieve fund objectives, and to provide reasonable, but not absolute, assurance against material misstatement
or loss, and relies on the operating controls established by the service providers.
The Board is also responsible for ensuring that financial information published or used within the business is reliable, and for regularly monitoring compliance
with regulations governing the operation of the Company. The Board reviews the effectiveness of the internal control systems on an ongoing basis to identify,
evaluate and manage the Company’s significant risks. As part of this process, there are procedures designed to capture and evaluate any failings or weaknesses.
Should a case be categorised by the Board as significant, procedures exist to ensure that necessary action is taken to remedy the failings. The Board is not
aware of any significant failings or weaknesses in internal control arising in the period under review.
The Company does not have any employees and therefore it does not have a “Whistleblowing” policy. However, the Manager has a “Whistleblowing” policy
under which its staff, in confidence, may raise concerns about possible improprieties in matters of financial reporting or other matters in so far as they may
affect the Company.
During the financial year ended 30 September 2020, the Board was responsible for the approval of the annual financial statements as set out in the Statement of
Directors’ Responsibilities. It is a statutory requirement that the annual financial statements are audited by one or more persons empowered to audit accounts in
accordance with the Irish Companies Acts and in this regard the Board, on the Company’s behalf, engages the auditor.
17 Invesco Markets III plc
Directors’ Report for the financial year ended 30 September 2020 (continued)
Corporate Governance Statement (continued)
Internal Control and Risk Management (continued)
The annual financial statements of the Company are produced by the Administrator, reviewed by the Manager, then presented to the Board. As part of its
review procedures the Board receives presentations from relevant parties including consideration of Irish accounting standards and their impact on the annual
financial statements, and presentations and reports on the audit process.
Once the annual financial statements are approved by the Board of Directors, the annual financial statements are filed with the Central Bank of Ireland, the
Irish Stock Exchange and the UK Listing Authority, the German Federal Financial Supervisory Authority (BaFin), the Swiss Financial Market Supervisory
authority (FINMA), French Financial Markets Authority (AMF), Italian Commissione Nazionale per le Società la Borsa (CONSOB), and the Netherlands
Authority for Financial Markets (AFM).
Shareholder Relations Shareholder relations are given high priority by the Board and the Manager. Direct contact with shareholders is usually through the Manager who then reports
back to the Directors and this is normally the main forum through which the Directors develop an understanding of the views of major shareholders. However,
the Directors are always available to discuss any concerns or views of shareholders. The Company also communicates to shareholders through the annual and
half-yearly financial reports, which aim to provide shareholders with a full understanding of the Company’s activities and its results. This information is
supplemented by the daily calculation of the NAV of the Company’s shares, which is published via the London Stock Exchange and daily factsheets and other
documentation and news placed on the Company’s website at https://etf.invesco.com. All shareholders are encouraged to attend the AGM to discuss the
business tabled and to exercise their voting rights. The Company announces the result of resolutions proposed at general meetings but does not make the full
details of voting available on its website. Shareholders wishing to lodge questions in advance of the AGM are invited to do so, either on the reverse of the proxy
card, via the Company’s website or in writing to the Company Secretary at the address given on page 5. The directors are responsible for the maintenance and
integrity of the corporate and financial information included on the company’s website. Legislation in the Republic of Ireland governing the preparation and
dissemination of financial statements may differ from legislation in other jurisdictions.
Shareholder Meetings and Rights attaching to Shares The convening and conduct of shareholders’ meetings are governed by the Articles of Association of the Company (the “Articles”) and the Irish Companies
Acts. Although the Directors may convene an extraordinary general meeting of the Company at any time, the Directors were required to convene the first
AGM of the Company within eighteen months of incorporation and each subsequent AGM thereafter must be within fifteen months of the date of the previous
AGM provided that an AGM is held once in each year within six months of the financial year end of the Company. Shareholders representing not less than
one-tenth of the paid up share capital of the Company may also request the Directors to convene a shareholders’ meeting. At least twenty one clear days’ notice
of every AGM and any meeting convened for the passing of a special resolution must be given to shareholders and fourteen days’ notice must be given in the
case of any other general meeting, unless the Auditors and all the shareholders of the Company entitled to attend and vote thereat, agree to shorter notice.
Two shareholders present either in person or by proxy constitutes a quorum at a general meeting. The share capital of the Company is divided into different
classes of shares and the Irish Companies Acts and the Articles of Association provide that the quorum for a general meeting convened to consider any
alteration to the rights attached to any class of shares, is two or more shareholders present in person or by proxy, holding or representing by proxy at least one
third of the issued shares of the relevant class.
Every holder of participating shares or non-participating shares present, in person or by proxy, who votes on a show of hands is entitled to one vote. On a poll,
every holder of participating shares present, in person or by proxy, is entitled to one vote in respect of each share held by him and every holder of non-
participating shares is entitled to one vote in respect of all non-participating shares held by him. At any general meeting, a resolution put to the vote of the
meeting is decided on a show of hands unless, before or upon the declaration of the result of the show of hands, a poll is demanded by the chairman of the
general meeting, or by at least five shareholders present having the right to vote at such meeting, or any holder or holders of participating shares present, in
person or by proxy, representing at least one tenth of the shares in issue having the right to vote at such meeting.
Shareholders may resolve to sanction an ordinary resolution or special resolution at a shareholders’ meeting. Alternatively, a resolution in writing signed by all
of the shareholders for the time being entitled to attend and vote on such resolution at a general meeting, will be valid and effective for all purposes as if the
resolution had been passed at a general meeting of the Company duly convened and held and may consist of several documents in like form, each signed by
one or more shareholders. An ordinary resolution of the Company (or of the shareholders of a particular class of shares) requires a simple majority of the votes
cast by the shareholders voting, in person or by proxy, at the meeting at which the resolution is proposed.
A special resolution of the Company (or of the shareholders of a particular class of shares) requires a majority of not less than three quarters of the votes cast
by the shareholders present, in person or by proxy, and voting in general meeting in order to pass a special resolution including a resolution to amend the
Articles.
Review of the Business and Future Developments The Company is structured as an umbrella fund which may comprise one or more Funds. The Company may at any time establish new classes of shares within
a Fund as well as new Funds. Any new Fund will require the prior approval of the Central Bank of Ireland and the establishment of any new class of shares
must be notified in advance to the Central Bank of Ireland.
A review of market activities and strategy for the Funds can be found in the Investment Policy and Description of the Fund on pages 6 and 7. The Company's
strategy for generating value over time is set out in the investment objectives of each of the individual Funds. As ETFs, the Funds should preserve their value
in line with the relevant exchanges. The Funds have procedures in place to minimise tracking errors, as detailed in the Investment Manager's report on pages 8
to 12. Any alteration to the investment objectives set out in the supplemental prospectuses of the Funds (as summarised in the Investment Manager's report
above) are subject to prior approval by the shareholders of such Fund.
Principal Activities Please see Investment Policy and Description of the Fund on pages 6 and 7 for investment objectives.
Risk Management Objectives and Policies Investment in the Company carries with it a degree of risk including, but not limited to, the risks referred to in note 14 of these financial statements.
18 Invesco Markets III plc
Directors’ Report for the financial year ended 30 September 2020 (continued)
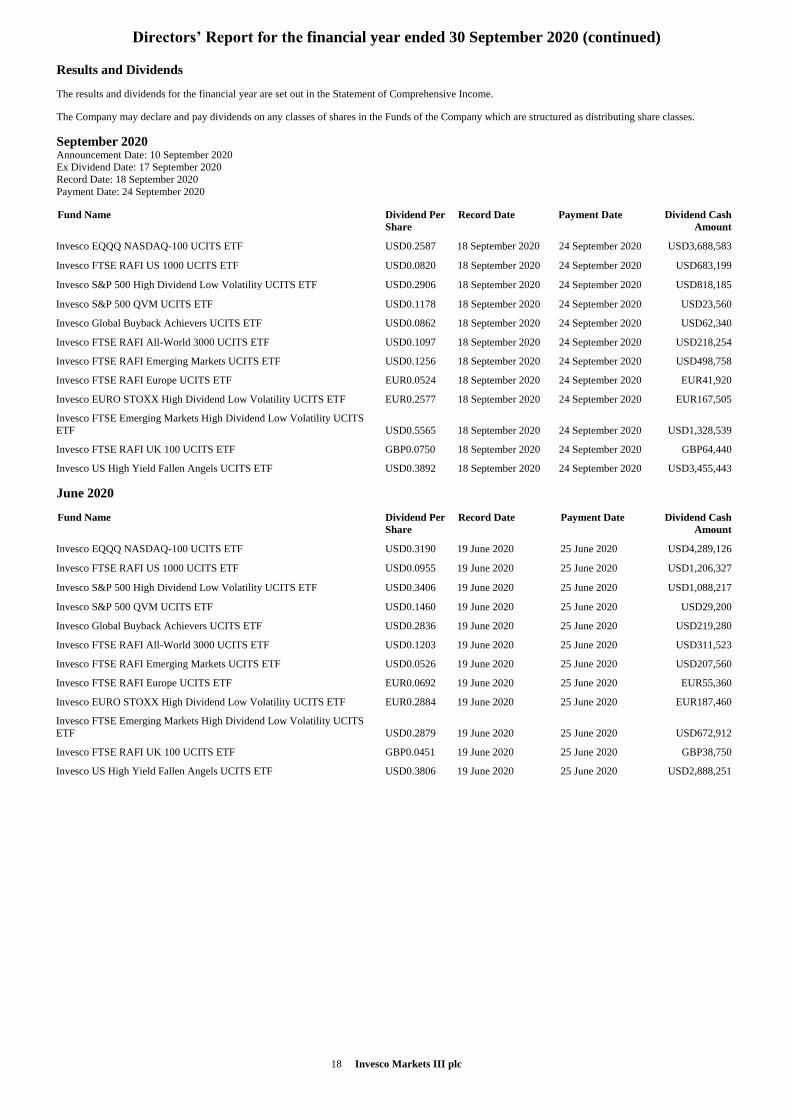
Results and Dividends
The results and dividends for the financial year are set out in the Statement of Comprehensive Income.
The Company may declare and pay dividends on any classes of shares in the Funds of the Company which are structured as distributing share classes.
September 2020 Announcement Date: 10 September 2020
Ex Dividend Date: 17 September 2020
Record Date: 18 September 2020
Payment Date: 24 September 2020
Fund Name Dividend Per
Share
Record Date Payment Date Dividend Cash
Amount
Invesco EQQQ NASDAQ-100 UCITS ETF USD0.2587 18 September 2020 24 September 2020 USD3,688,583
Invesco FTSE RAFI US 1000 UCITS ETF USD0.0820 18 September 2020 24 September 2020 USD683,199
Invesco S&P 500 High Dividend Low Volatility UCITS ETF USD0.2906 18 September 2020 24 September 2020 USD818,185
Invesco S&P 500 QVM UCITS ETF USD0.1178 18 September 2020 24 September 2020 USD23,560
Invesco Global Buyback Achievers UCITS ETF USD0.0862 18 September 2020 24 September 2020 USD62,340
Invesco FTSE RAFI All-World 3000 UCITS ETF USD0.1097 18 September 2020 24 September 2020 USD218,254
Invesco FTSE RAFI Emerging Markets UCITS ETF USD0.1256 18 September 2020 24 September 2020 USD498,758
Invesco FTSE RAFI Europe UCITS ETF EUR0.0524 18 September 2020 24 September 2020 EUR41,920
Invesco EURO STOXX High Dividend Low Volatility UCITS ETF EUR0.2577 18 September 2020 24 September 2020 EUR167,505
Invesco FTSE Emerging Markets High Dividend Low Volatility UCITS
ETF USD0.5565 18 September 2020 24 September 2020 USD1,328,539
Invesco FTSE RAFI UK 100 UCITS ETF GBP0.0750 18 September 2020 24 September 2020 GBP64,440
Invesco US High Yield Fallen Angels UCITS ETF USD0.3892 18 September 2020 24 September 2020 USD3,455,443
June 2020
Fund Name Dividend Per
Share
Record Date Payment Date Dividend Cash
Amount
Invesco EQQQ NASDAQ-100 UCITS ETF USD0.3190 19 June 2020 25 June 2020 USD4,289,126
Invesco FTSE RAFI US 1000 UCITS ETF USD0.0955 19 June 2020 25 June 2020 USD1,206,327
Invesco S&P 500 High Dividend Low Volatility UCITS ETF USD0.3406 19 June 2020 25 June 2020 USD1,088,217
Invesco S&P 500 QVM UCITS ETF USD0.1460 19 June 2020 25 June 2020 USD29,200
Invesco Global Buyback Achievers UCITS ETF USD0.2836 19 June 2020 25 June 2020 USD219,280
Invesco FTSE RAFI All-World 3000 UCITS ETF USD0.1203 19 June 2020 25 June 2020 USD311,523
Invesco FTSE RAFI Emerging Markets UCITS ETF USD0.0526 19 June 2020 25 June 2020 USD207,560
Invesco FTSE RAFI Europe UCITS ETF EUR0.0692 19 June 2020 25 June 2020 EUR55,360
Invesco EURO STOXX High Dividend Low Volatility UCITS ETF EUR0.2884 19 June 2020 25 June 2020 EUR187,460
Invesco FTSE Emerging Markets High Dividend Low Volatility UCITS
ETF USD0.2879 19 June 2020 25 June 2020 USD672,912
Invesco FTSE RAFI UK 100 UCITS ETF GBP0.0451 19 June 2020 25 June 2020 GBP38,750
Invesco US High Yield Fallen Angels UCITS ETF USD0.3806 19 June 2020 25 June 2020 USD2,888,251
19 Invesco Markets III plc
Directors’ Report for the financial year ended 30 September 2020 (continued)
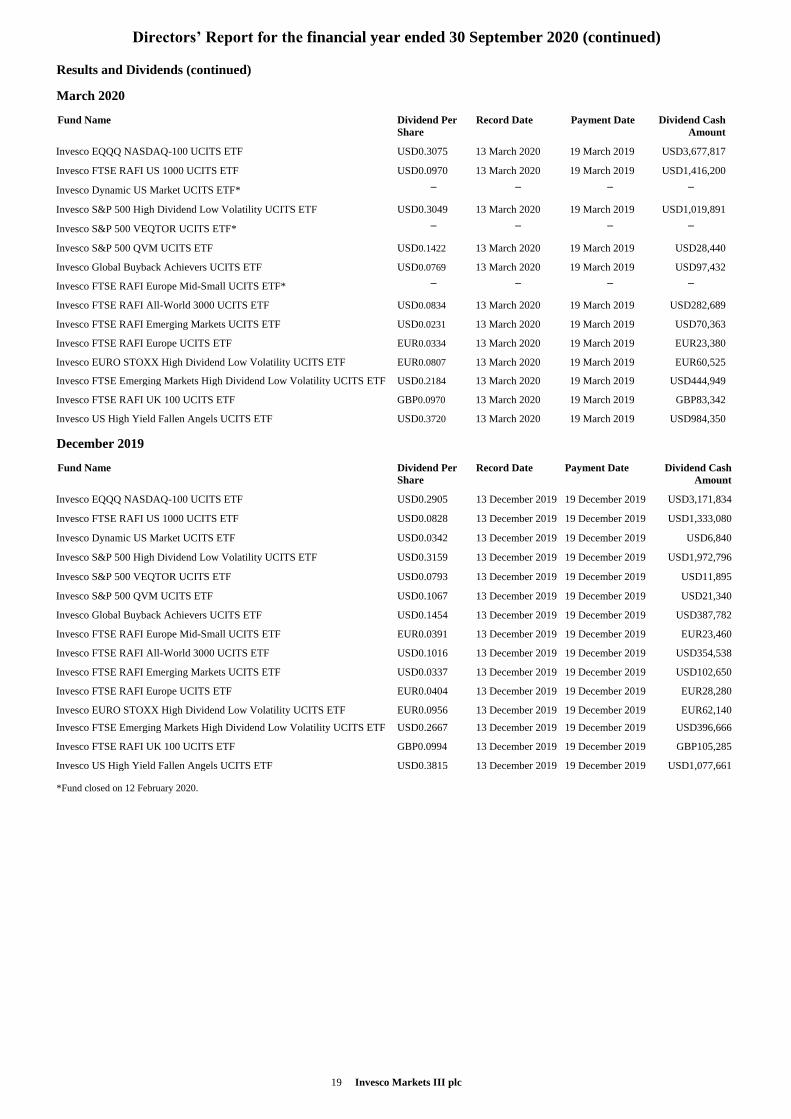
Results and Dividends (continued)
March 2020
Fund Name Dividend Per
Share
Record Date Payment Date Dividend Cash
Amount
Invesco EQQQ NASDAQ-100 UCITS ETF USD0.3075 13 March 2020 19 March 2019 USD3,677,817
Invesco FTSE RAFI US 1000 UCITS ETF USD0.0970 13 March 2020 19 March 2019 USD1,416,200
Invesco Dynamic US Market UCITS ETF* – – – –
Invesco S&P 500 High Dividend Low Volatility UCITS ETF USD0.3049 13 March 2020 19 March 2019 USD1,019,891
Invesco S&P 500 VEQTOR UCITS ETF* – – – –
Invesco S&P 500 QVM UCITS ETF USD0.1422 13 March 2020 19 March 2019 USD28,440
Invesco Global Buyback Achievers UCITS ETF USD0.0769 13 March 2020 19 March 2019 USD97,432
Invesco FTSE RAFI Europe Mid-Small UCITS ETF* – – – –
Invesco FTSE RAFI All-World 3000 UCITS ETF USD0.0834 13 March 2020 19 March 2019 USD282,689
Invesco FTSE RAFI Emerging Markets UCITS ETF USD0.0231 13 March 2020 19 March 2019 USD70,363
Invesco FTSE RAFI Europe UCITS ETF EUR0.0334 13 March 2020 19 March 2019 EUR23,380
Invesco EURO STOXX High Dividend Low Volatility UCITS ETF EUR0.0807 13 March 2020 19 March 2019 EUR60,525
Invesco FTSE Emerging Markets High Dividend Low Volatility UCITS ETF USD0.2184 13 March 2020 19 March 2019 USD444,949
Invesco FTSE RAFI UK 100 UCITS ETF GBP0.0970 13 March 2020 19 March 2019 GBP83,342
Invesco US High Yield Fallen Angels UCITS ETF USD0.3720 13 March 2020 19 March 2019 USD984,350
December 2019
Fund Name Dividend Per
Share
Record Date Payment Date Dividend Cash
Amount
Invesco EQQQ NASDAQ-100 UCITS ETF USD0.2905 13 December 2019 19 December 2019 USD3,171,834
Invesco FTSE RAFI US 1000 UCITS ETF USD0.0828 13 December 2019 19 December 2019 USD1,333,080
Invesco Dynamic US Market UCITS ETF USD0.0342 13 December 2019 19 December 2019 USD6,840
Invesco S&P 500 High Dividend Low Volatility UCITS ETF USD0.3159 13 December 2019 19 December 2019 USD1,972,796
Invesco S&P 500 VEQTOR UCITS ETF USD0.0793 13 December 2019 19 December 2019 USD11,895
Invesco S&P 500 QVM UCITS ETF USD0.1067 13 December 2019 19 December 2019 USD21,340
Invesco Global Buyback Achievers UCITS ETF USD0.1454 13 December 2019 19 December 2019 USD387,782
Invesco FTSE RAFI Europe Mid-Small UCITS ETF EUR0.0391 13 December 2019 19 December 2019 EUR23,460
Invesco FTSE RAFI All-World 3000 UCITS ETF USD0.1016 13 December 2019 19 December 2019 USD354,538
Invesco FTSE RAFI Emerging Markets UCITS ETF USD0.0337 13 December 2019 19 December 2019 USD102,650
Invesco FTSE RAFI Europe UCITS ETF EUR0.0404 13 December 2019 19 December 2019 EUR28,280
Invesco EURO STOXX High Dividend Low Volatility UCITS ETF EUR0.0956 13 December 2019 19 December 2019 EUR62,140
Invesco FTSE Emerging Markets High Dividend Low Volatility UCITS ETF USD0.2667 13 December 2019 19 December 2019 USD396,666
Invesco FTSE RAFI UK 100 UCITS ETF GBP0.0994 13 December 2019 19 December 2019 GBP105,285
Invesco US High Yield Fallen Angels UCITS ETF USD0.3815 13 December 2019 19 December 2019 USD1,077,661
*Fund closed on 12 February 2020.
20 Invesco Markets III plc
Directors’ Report for the financial year ended 30 September 2020 (continued)
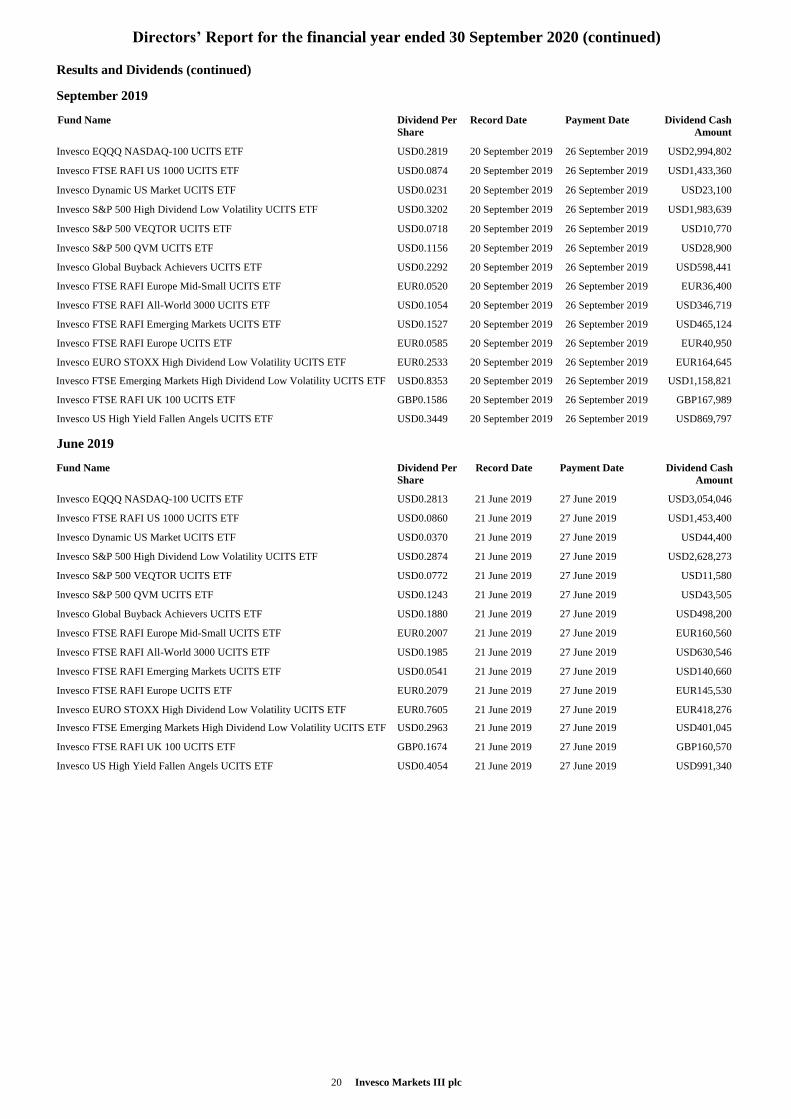
Results and Dividends (continued)
September 2019
Fund Name Dividend Per
Share
Record Date Payment Date Dividend Cash
Amount
Invesco EQQQ NASDAQ-100 UCITS ETF USD0.2819 20 September 2019 26 September 2019 USD2,994,802
Invesco FTSE RAFI US 1000 UCITS ETF USD0.0874 20 September 2019 26 September 2019 USD1,433,360
Invesco Dynamic US Market UCITS ETF USD0.0231 20 September 2019 26 September 2019 USD23,100
Invesco S&P 500 High Dividend Low Volatility UCITS ETF USD0.3202 20 September 2019 26 September 2019 USD1,983,639
Invesco S&P 500 VEQTOR UCITS ETF USD0.0718 20 September 2019 26 September 2019 USD10,770
Invesco S&P 500 QVM UCITS ETF USD0.1156 20 September 2019 26 September 2019 USD28,900
Invesco Global Buyback Achievers UCITS ETF USD0.2292 20 September 2019 26 September 2019 USD598,441
Invesco FTSE RAFI Europe Mid-Small UCITS ETF EUR0.0520 20 September 2019 26 September 2019 EUR36,400
Invesco FTSE RAFI All-World 3000 UCITS ETF USD0.1054 20 September 2019 26 September 2019 USD346,719
Invesco FTSE RAFI Emerging Markets UCITS ETF USD0.1527 20 September 2019 26 September 2019 USD465,124
Invesco FTSE RAFI Europe UCITS ETF EUR0.0585 20 September 2019 26 September 2019 EUR40,950
Invesco EURO STOXX High Dividend Low Volatility UCITS ETF EUR0.2533 20 September 2019 26 September 2019 EUR164,645
Invesco FTSE Emerging Markets High Dividend Low Volatility UCITS ETF USD0.8353 20 September 2019 26 September 2019 USD1,158,821
Invesco FTSE RAFI UK 100 UCITS ETF GBP0.1586 20 September 2019 26 September 2019 GBP167,989
Invesco US High Yield Fallen Angels UCITS ETF USD0.3449 20 September 2019 26 September 2019 USD869,797
June 2019
Fund Name Dividend Per
Share
Record Date Payment Date
Dividend Cash
Amount
Invesco EQQQ NASDAQ-100 UCITS ETF USD0.2813 21 June 2019 27 June 2019 USD3,054,046
Invesco FTSE RAFI US 1000 UCITS ETF USD0.0860 21 June 2019 27 June 2019 USD1,453,400
Invesco Dynamic US Market UCITS ETF USD0.0370 21 June 2019 27 June 2019 USD44,400
Invesco S&P 500 High Dividend Low Volatility UCITS ETF USD0.2874 21 June 2019 27 June 2019 USD2,628,273
Invesco S&P 500 VEQTOR UCITS ETF USD0.0772 21 June 2019 27 June 2019 USD11,580
Invesco S&P 500 QVM UCITS ETF USD0.1243 21 June 2019 27 June 2019 USD43,505
Invesco Global Buyback Achievers UCITS ETF USD0.1880 21 June 2019 27 June 2019 USD498,200
Invesco FTSE RAFI Europe Mid-Small UCITS ETF EUR0.2007 21 June 2019 27 June 2019 EUR160,560
Invesco FTSE RAFI All-World 3000 UCITS ETF USD0.1985 21 June 2019 27 June 2019 USD630,546
Invesco FTSE RAFI Emerging Markets UCITS ETF USD0.0541 21 June 2019 27 June 2019 USD140,660
Invesco FTSE RAFI Europe UCITS ETF EUR0.2079 21 June 2019 27 June 2019 EUR145,530
Invesco EURO STOXX High Dividend Low Volatility UCITS ETF EUR0.7605 21 June 2019 27 June 2019 EUR418,276
Invesco FTSE Emerging Markets High Dividend Low Volatility UCITS ETF USD0.2963 21 June 2019 27 June 2019 USD401,045
Invesco FTSE RAFI UK 100 UCITS ETF GBP0.1674 21 June 2019 27 June 2019 GBP160,570
Invesco US High Yield Fallen Angels UCITS ETF USD0.4054 21 June 2019 27 June 2019 USD991,340
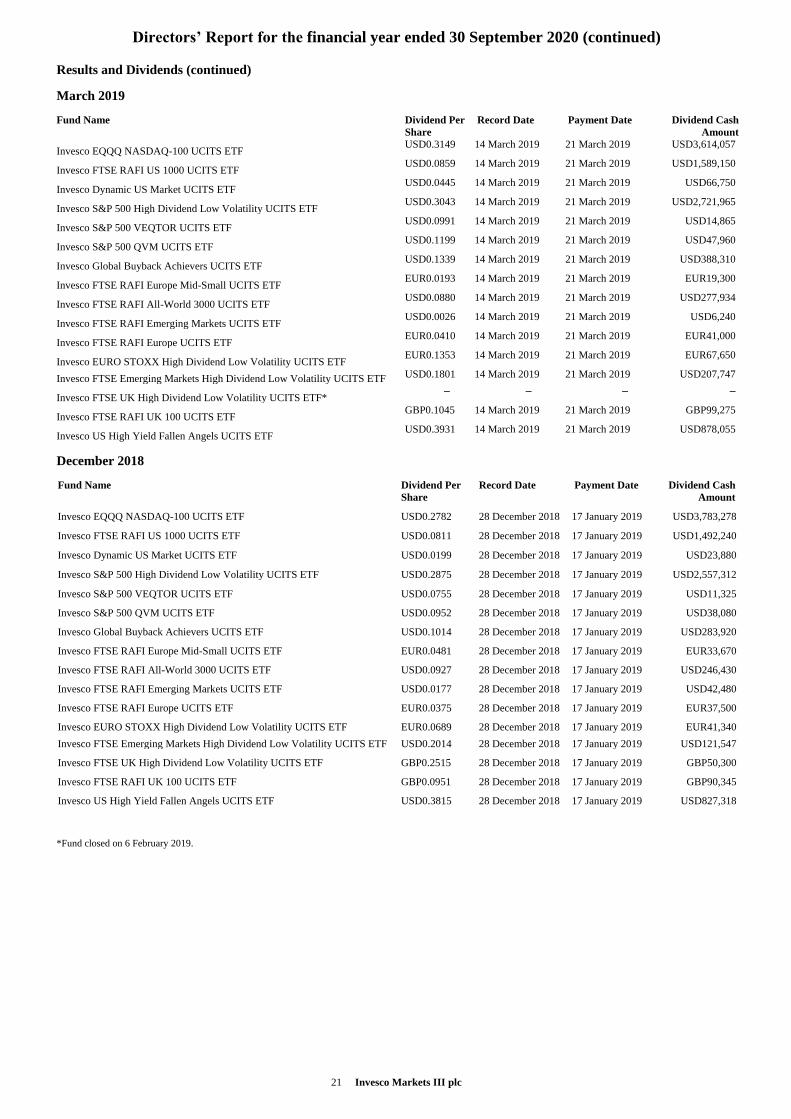
21 Invesco Markets III plc
Directors’ Report for the financial year ended 30 September 2020 (continued)
Results and Dividends (continued)
March 2019
Fund Name Dividend Per
Share
Record Date Payment Date
Dividend Cash
Amount
Invesco EQQQ NASDAQ-100 UCITS ETF USD0.3149 14 March 2019 21 March 2019 USD3,614,057
Invesco FTSE RAFI US 1000 UCITS ETF USD0.0859 14 March 2019 21 March 2019 USD1,589,150
Invesco Dynamic US Market UCITS ETF USD0.0445 14 March 2019 21 March 2019 USD66,750
Invesco S&P 500 High Dividend Low Volatility UCITS ETF USD0.3043 14 March 2019 21 March 2019 USD2,721,965
Invesco S&P 500 VEQTOR UCITS ETF USD0.0991 14 March 2019 21 March 2019 USD14,865
Invesco S&P 500 QVM UCITS ETF USD0.1199 14 March 2019 21 March 2019 USD47,960
Invesco Global Buyback Achievers UCITS ETF USD0.1339 14 March 2019 21 March 2019 USD388,310
Invesco FTSE RAFI Europe Mid-Small UCITS ETF EUR0.0193 14 March 2019 21 March 2019 EUR19,300
Invesco FTSE RAFI All-World 3000 UCITS ETF USD0.0880 14 March 2019 21 March 2019 USD277,934
Invesco FTSE RAFI Emerging Markets UCITS ETF USD0.0026 14 March 2019 21 March 2019 USD6,240
Invesco FTSE RAFI Europe UCITS ETF EUR0.0410 14 March 2019 21 March 2019 EUR41,000
Invesco EURO STOXX High Dividend Low Volatility UCITS ETF EUR0.1353 14 March 2019 21 March 2019 EUR67,650
Invesco FTSE Emerging Markets High Dividend Low Volatility UCITS ETF USD0.1801 14 March 2019 21 March 2019 USD207,747
Invesco FTSE UK High Dividend Low Volatility UCITS ETF* – – – –
Invesco FTSE RAFI UK 100 UCITS ETF GBP0.1045 14 March 2019 21 March 2019 GBP99,275
Invesco US High Yield Fallen Angels UCITS ETF USD0.3931 14 March 2019 21 March 2019 USD878,055
December 2018
Fund Name Dividend Per
Share
Record Date Payment Date Dividend Cash
Amount
Invesco EQQQ NASDAQ-100 UCITS ETF USD0.2782 28 December 2018 17 January 2019 USD3,783,278
Invesco FTSE RAFI US 1000 UCITS ETF USD0.0811 28 December 2018 17 January 2019 USD1,492,240
Invesco Dynamic US Market UCITS ETF USD0.0199 28 December 2018 17 January 2019 USD23,880
Invesco S&P 500 High Dividend Low Volatility UCITS ETF USD0.2875 28 December 2018 17 January 2019 USD2,557,312
Invesco S&P 500 VEQTOR UCITS ETF USD0.0755 28 December 2018 17 January 2019 USD11,325
Invesco S&P 500 QVM UCITS ETF USD0.0952 28 December 2018 17 January 2019 USD38,080
Invesco Global Buyback Achievers UCITS ETF USD0.1014 28 December 2018 17 January 2019 USD283,920
Invesco FTSE RAFI Europe Mid-Small UCITS ETF EUR0.0481 28 December 2018 17 January 2019 EUR33,670
Invesco FTSE RAFI All-World 3000 UCITS ETF USD0.0927 28 December 2018 17 January 2019 USD246,430
Invesco FTSE RAFI Emerging Markets UCITS ETF USD0.0177 28 December 2018 17 January 2019 USD42,480
Invesco FTSE RAFI Europe UCITS ETF EUR0.0375 28 December 2018 17 January 2019 EUR37,500
Invesco EURO STOXX High Dividend Low Volatility UCITS ETF EUR0.0689 28 December 2018 17 January 2019 EUR41,340
Invesco FTSE Emerging Markets High Dividend Low Volatility UCITS ETF USD0.2014 28 December 2018 17 January 2019 USD121,547
Invesco FTSE UK High Dividend Low Volatility UCITS ETF GBP0.2515 28 December 2018 17 January 2019 GBP50,300
Invesco FTSE RAFI UK 100 UCITS ETF GBP0.0951 28 December 2018 17 January 2019 GBP90,345
Invesco US High Yield Fallen Angels UCITS ETF USD0.3815 28 December 2018 17 January 2019 USD827,318
*Fund closed on 6 February 2019.
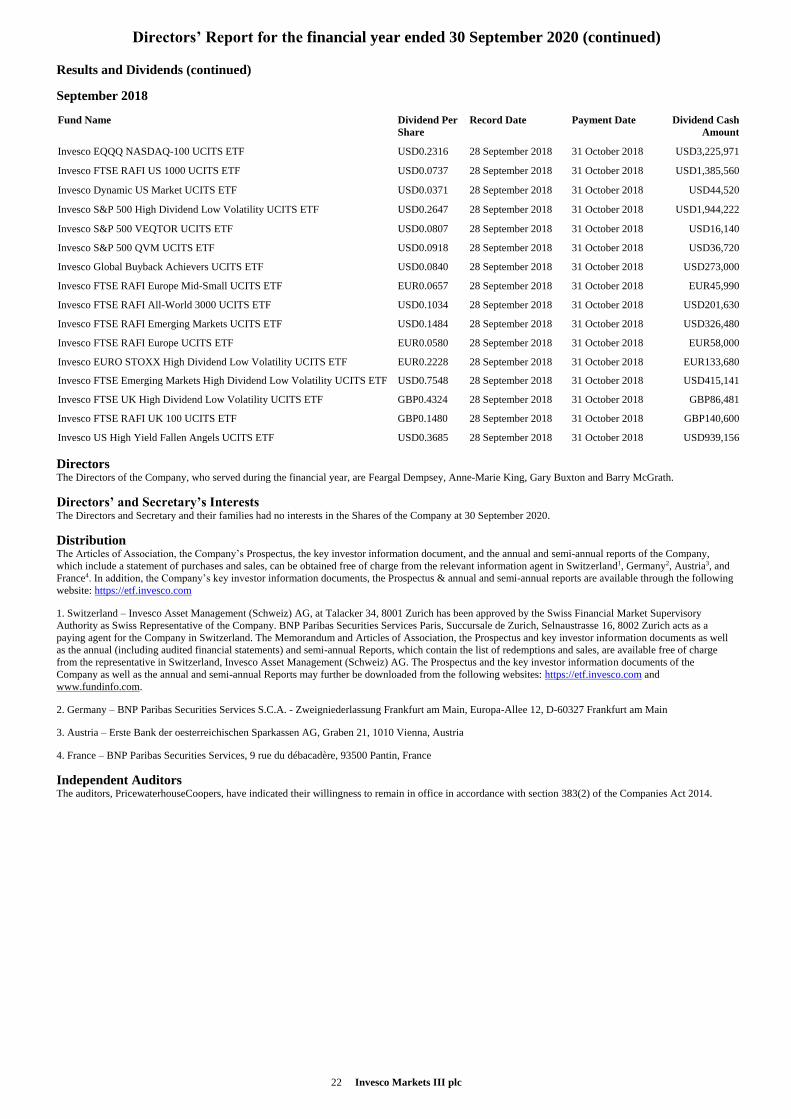
22 Invesco Markets III plc
Directors’ Report for the financial year ended 30 September 2020 (continued)
Results and Dividends (continued)
September 2018
Fund Name Dividend Per
Share
Record Date Payment Date Dividend Cash
Amount
Invesco EQQQ NASDAQ-100 UCITS ETF USD0.2316 28 September 2018 31 October 2018 USD3,225,971
Invesco FTSE RAFI US 1000 UCITS ETF USD0.0737 28 September 2018 31 October 2018 USD1,385,560
Invesco Dynamic US Market UCITS ETF USD0.0371 28 September 2018 31 October 2018 USD44,520
Invesco S&P 500 High Dividend Low Volatility UCITS ETF USD0.2647 28 September 2018 31 October 2018 USD1,944,222
Invesco S&P 500 VEQTOR UCITS ETF USD0.0807 28 September 2018 31 October 2018 USD16,140
Invesco S&P 500 QVM UCITS ETF USD0.0918 28 September 2018 31 October 2018 USD36,720
Invesco Global Buyback Achievers UCITS ETF USD0.0840 28 September 2018 31 October 2018 USD273,000
Invesco FTSE RAFI Europe Mid-Small UCITS ETF EUR0.0657 28 September 2018 31 October 2018 EUR45,990
Invesco FTSE RAFI All-World 3000 UCITS ETF USD0.1034 28 September 2018 31 October 2018 USD201,630
Invesco FTSE RAFI Emerging Markets UCITS ETF USD0.1484 28 September 2018 31 October 2018 USD326,480
Invesco FTSE RAFI Europe UCITS ETF EUR0.0580 28 September 2018 31 October 2018 EUR58,000
Invesco EURO STOXX High Dividend Low Volatility UCITS ETF EUR0.2228 28 September 2018 31 October 2018 EUR133,680
Invesco FTSE Emerging Markets High Dividend Low Volatility UCITS ETF USD0.7548 28 September 2018 31 October 2018 USD415,141
Invesco FTSE UK High Dividend Low Volatility UCITS ETF GBP0.4324 28 September 2018 31 October 2018 GBP86,481
Invesco FTSE RAFI UK 100 UCITS ETF GBP0.1480 28 September 2018 31 October 2018 GBP140,600
Invesco US High Yield Fallen Angels UCITS ETF USD0.3685 28 September 2018 31 October 2018 USD939,156
Directors The Directors of the Company, who served during the financial year, are Feargal Dempsey, Anne-Marie King, Gary Buxton and Barry McGrath.
Directors’ and Secretary’s Interests The Directors and Secretary and their families had no interests in the Shares of the Company at 30 September 2020.
Distribution The Articles of Association, the Company’s Prospectus, the key investor information document, and the annual and semi-annual reports of the Company,
which include a statement of purchases and sales, can be obtained free of charge from the relevant information agent in Switzerland1, Germany2, Austria3, and
France4. In addition, the Company’s key investor information documents, the Prospectus & annual and semi-annual reports are available through the following
website: https://etf.invesco.com
1. Switzerland – Invesco Asset Management (Schweiz) AG, at Talacker 34, 8001 Zurich has been approved by the Swiss Financial Market Supervisory
Authority as Swiss Representative of the Company. BNP Paribas Securities Services Paris, Succursale de Zurich, Selnaustrasse 16, 8002 Zurich acts as a
paying agent for the Company in Switzerland. The Memorandum and Articles of Association, the Prospectus and key investor information documents as well
as the annual (including audited financial statements) and semi-annual Reports, which contain the list of redemptions and sales, are available free of charge
from the representative in Switzerland, Invesco Asset Management (Schweiz) AG. The Prospectus and the key investor information documents of the
Company as well as the annual and semi-annual Reports may further be downloaded from the following websites: https://etf.invesco.com and
www.fundinfo.com.
2. Germany – BNP Paribas Securities Services S.C.A. - Zweigniederlassung Frankfurt am Main, Europa-Allee 12, D-60327 Frankfurt am Main
3. Austria – Erste Bank der oesterreichischen Sparkassen AG, Graben 21, 1010 Vienna, Austria
4. France – BNP Paribas Securities Services, 9 rue du débacadère, 93500 Pantin, France
Independent Auditors The auditors, PricewaterhouseCoopers, have indicated their willingness to remain in office in accordance with section 383(2) of the Companies Act 2014.
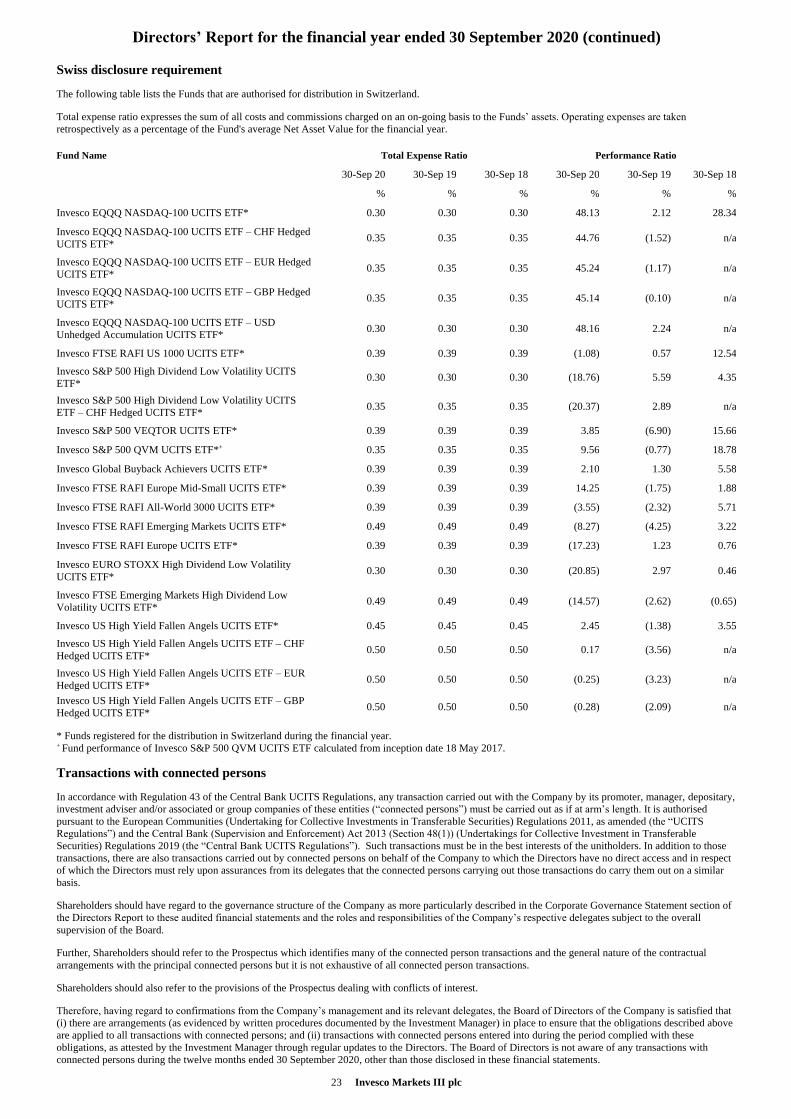
23 Invesco Markets III plc
Directors’ Report for the financial year ended 30 September 2020 (continued)
Swiss disclosure requirement
The following table lists the Funds that are authorised for distribution in Switzerland.
Total expense ratio expresses the sum of all costs and commissions charged on an on-going basis to the Funds’ assets. Operating expenses are taken
retrospectively as a percentage of the Fund's average Net Asset Value for the financial year.
Fund Name Total Expense Ratio Performance Ratio
30-Sep 20 30-Sep 19 30-Sep 18 30-Sep 20 30-Sep 19 30-Sep 18
% % % % % %
Invesco EQQQ NASDAQ-100 UCITS ETF* 0.30 0.30 0.30 48.13 2.12 28.34
Invesco EQQQ NASDAQ-100 UCITS ETF – CHF Hedged
UCITS ETF* 0.35 0.35 0.35 44.76 (1.52) n/a
Invesco EQQQ NASDAQ-100 UCITS ETF – EUR Hedged
UCITS ETF* 0.35 0.35 0.35 45.24 (1.17) n/a
Invesco EQQQ NASDAQ-100 UCITS ETF – GBP Hedged
UCITS ETF* 0.35 0.35 0.35 45.14 (0.10) n/a
Invesco EQQQ NASDAQ-100 UCITS ETF – USD
Unhedged Accumulation UCITS ETF* 0.30 0.30 0.30 48.16 2.24 n/a
Invesco FTSE RAFI US 1000 UCITS ETF* 0.39 0.39 0.39 (1.08) 0.57 12.54
Invesco S&P 500 High Dividend Low Volatility UCITS
ETF* 0.30 0.30 0.30 (18.76) 5.59 4.35
Invesco S&P 500 High Dividend Low Volatility UCITS
ETF – CHF Hedged UCITS ETF* 0.35 0.35 0.35 (20.37) 2.89 n/a
Invesco S&P 500 VEQTOR UCITS ETF* 0.39 0.39 0.39 3.85 (6.90) 15.66
Invesco S&P 500 QVM UCITS ETF*+ 0.35 0.35 0.35 9.56 (0.77) 18.78
Invesco Global Buyback Achievers UCITS ETF* 0.39 0.39 0.39 2.10 1.30 5.58
Invesco FTSE RAFI Europe Mid-Small UCITS ETF* 0.39 0.39 0.39 14.25 (1.75) 1.88
Invesco FTSE RAFI All-World 3000 UCITS ETF* 0.39 0.39 0.39 (3.55) (2.32) 5.71
Invesco FTSE RAFI Emerging Markets UCITS ETF* 0.49 0.49 0.49 (8.27) (4.25) 3.22
Invesco FTSE RAFI Europe UCITS ETF* 0.39 0.39 0.39 (17.23) 1.23 0.76
Invesco EURO STOXX High Dividend Low Volatility
UCITS ETF* 0.30 0.30 0.30 (20.85) 2.97 0.46
Invesco FTSE Emerging Markets High Dividend Low
Volatility UCITS ETF* 0.49 0.49 0.49 (14.57) (2.62) (0.65)
Invesco US High Yield Fallen Angels UCITS ETF* 0.45 0.45 0.45 2.45 (1.38) 3.55 Invesco US High Yield Fallen Angels UCITS ETF – CHF
Hedged UCITS ETF* 0.50 0.50 0.50 0.17 (3.56) n/a
Invesco US High Yield Fallen Angels UCITS ETF – EUR
Hedged UCITS ETF* 0.50 0.50 0.50 (0.25) (3.23) n/a
Invesco US High Yield Fallen Angels UCITS ETF – GBP
Hedged UCITS ETF* 0.50 0.50 0.50 (0.28) (2.09) n/a
* Funds registered for the distribution in Switzerland during the financial year. + Fund performance of Invesco S&P 500 QVM UCITS ETF calculated from inception date 18 May 2017.
Transactions with connected persons
In accordance with Regulation 43 of the Central Bank UCITS Regulations, any transaction carried out with the Company by its promoter, manager, depositary,
investment adviser and/or associated or group companies of these entities (“connected persons”) must be carried out as if at arm’s length. It is authorised
pursuant to the European Communities (Undertaking for Collective Investments in Transferable Securities) Regulations 2011, as amended (the “UCITS
Regulations”) and the Central Bank (Supervision and Enforcement) Act 2013 (Section 48(1)) (Undertakings for Collective Investment in Transferable
Securities) Regulations 2019 (the “Central Bank UCITS Regulations”). Such transactions must be in the best interests of the unitholders. In addition to those
transactions, there are also transactions carried out by connected persons on behalf of the Company to which the Directors have no direct access and in respect
of which the Directors must rely upon assurances from its delegates that the connected persons carrying out those transactions do carry them out on a similar
basis.
Shareholders should have regard to the governance structure of the Company as more particularly described in the Corporate Governance Statement section of
the Directors Report to these audited financial statements and the roles and responsibilities of the Company’s respective delegates subject to the overall
supervision of the Board.
Further, Shareholders should refer to the Prospectus which identifies many of the connected person transactions and the general nature of the contractual
arrangements with the principal connected persons but it is not exhaustive of all connected person transactions.
Shareholders should also refer to the provisions of the Prospectus dealing with conflicts of interest.
Therefore, having regard to confirmations from the Company’s management and its relevant delegates, the Board of Directors of the Company is satisfied that
(i) there are arrangements (as evidenced by written procedures documented by the Investment Manager) in place to ensure that the obligations described above
are applied to all transactions with connected persons; and (ii) transactions with connected persons entered into during the period complied with these
obligations, as attested by the Investment Manager through regular updates to the Directors. The Board of Directors is not aware of any transactions with
connected persons during the twelve months ended 30 September 2020, other than those disclosed in these financial statements.
24 Invesco Markets III plc
Directors’ Report for the financial year ended 30 September 2020 (continued)
Transactions with connected persons (continued)
Note 12 details related party transactions in the period as required by accounting standards generally accepted in Ireland (“FRS 102”). However, shareholders
should understand that not all “connected persons” are related parties as such latter expression is defined by FRS 102.
In response to the CBI publishing the Central Bank (Supervision and Enforcement) Act 2013 (Section 48(1)) Investor Money Regulations 2015 for Fund
Service Providers (the “Investor Money Regulations” or “IMR”) in March 2015 (effective from 1 July 2016), the Company has undertaken, together with BNY
Mellon Fund Services (Ireland) Designated Activity Company a review of the way in which subscription, distribution and redemption monies are channelled to
and from the Company. As a result of this review, subscription and redemptions monies have been (effective from 1 July 2016), channelled through an
umbrella cash collection account in the name of the Company and, in respect of any sub-funds considered to be highly leveraged, sub-fund cash collection
accounts in the name of the relevant sub-fund(s). Pending issue of the shares and/or payment of subscription proceeds to an account in the name of the
Company or the relevant sub-fund(s), and pending payment of redemption proceeds or distributions, the relevant investor will be an unsecured creditor of the
relevant sub-fund in respect of amounts paid by or due to it.
Significant Events during the financial year
Effective 1 December 2019, BNY Mellon Trust Company (Ireland) Limited merged into The Bank of New York Mellon SA/NV, which itself is a wholly
owned subsidiary of The Bank of New York Mellon (the “Merger”). Following the Merger, The Bank of New York Mellon SA/NV, Dublin Branch, will be
the entity, which will provide trustee, depositary and/or custody services to the Company.
An updated Prospectus was issued on 12 February 2020. The changes since last Prospectus include:
Depositary name change.
Updating of Directors names and profiles.
New text under Depositary section, appointment of local agents, securities lending/ SFTR, benchmark administrators on the ESMA register.
Under Generic Risk new text on the UK’s future relationship with the EU, European Market Infrastructure Regulation on OTC contracts and
insertion of text in relation to the European Benchmarks Regulation.
Effective 12 February 2020 the following funds closed:
Invesco Dynamic US Market UCITS ETF
Invesco S&P 500 VEQTOR UCITS ETF
Invesco FTSE RAFI Europe Mid-Small UCITS ETF
Managing the risks presented by the outbreak of Coronavirus
The spread of a new coronavirus (COVID-19) disease has caused significant volatility within the global economy and financial markets. To date, the primary
focus of our response has been threefold:
to ensure the health and safety of our employees;
to preserve our ability to serve our clients; and
to appropriately manage client assets in a highly dynamic market environment.
The directors of Invesco Investment Management Limited are actively monitoring the situation and, with the support of the investment manager, continue to
manage the Fund’s assets within its investment and risk parameters that have been established. The Directors will continue to review the situation in order to
navigate through this period of heightened uncertainty.
Brexit
The UK left the EU on 31 January 2020, an event commonly referred to as Brexit. The Manager does not believe that Brexit presents significant issues that
cannot be mitigated. The Manager is part of a global group and has been committed for many years to meeting clients needs across Europe in both EU and
non-EU countries. The change in the UK’s status from an EU to a non-EU country has not changed the group’s focus or commitment to serve its clients across
Europe. The Manager is monitoring developments closely, through a Brexit steering committee to ensure that the impact on clients and the Company is
minimal.
Apart from the above there were no other significant events during the financial year that require disclosure in the financial statements.
Significant Events After the Financial Year End
A table showing the net movement on subscriptions/(redemptions) from 1 October 2020 to 7 January 2021 for each sub-fund can be seen on Note 22 on page
165 of these financial statements.
There were no other significant events after the financial year end that require disclosure in the financial statements.
On behalf of the Board
______________________________ ________________________________ Director: Director:
25 Invesco Markets III plc
Report of the Depositary to the Shareholders
For the period from 1 October 2019 to 30 September 2020 (the “Period”)
The Bank of New York Mellon SA/NV, Dublin Branch (formerly BNY Mellon Trust Company (Ireland) Limited), (the “Depositary” “us”, “we”, or “our”),
has enquired into the conduct of Invesco Markets III plc (the “Company”) for the Period ended 30 September 2020, in its capacity as depositary to the
Company.
This report including the opinion has been prepared for and solely for the shareholders in the Company, in accordance with our role as depositary to the
Company and for no other purpose. We do not, in giving this opinion, accept or assume responsibility for any other purpose or to any other person to whom
this report is shown.
Responsibilities of the Depositary
Our duties and responsibilities are outlined in Regulation 34 of the European Communities (Undertaking for Collective Investments in Transferable Securities)
Regulations 2011 (S.I No 352 OF 2011), as amended (the "Regulations").
Our report shall state whether, in our opinion, the Company has been managed in that period in accordance with the provisions of the Company’s constitutional
documentation and the Regulations. It is the overall responsibility of the Company to comply with these provisions. If the Company has not been so managed,
we as depositary must state in what respects it has not been so managed and the steps which we have taken in respect thereof.
Basis of Depositary Opinion
The Depositary conducts such reviews as it, in its reasonable opinion, considers necessary in order to comply with its duties and to ensure that, in all material
respects, the Company has been managed (i) in accordance with the limitations imposed on its investment and borrowing powers by the provisions of its
constitutional documentation and the appropriate regulations and (ii) otherwise in accordance with the Company’s constitutional documentation and the
appropriate regulations.
Opinion
In our opinion, the Company has been managed during the Period, in all material respects:
(i) in accordance with the limitations imposed on the investment and borrowing powers of the Company by the constitutional documentation and by the
Regulations; and
(ii) otherwise in accordance with the provisions of the constitutional documentation and the Regulations.
__________________________
For and on behalf of The Bank of New York Mellon SA/NV, Dublin Branch,
Riverside Two,
Sir John Rogerson’s Quay,
Grand Canal Dock,
Dublin 2
Ireland.
25 January 2021
Independent auditors’ report to the members of Invesco Markets III plc Report on the audit of the financial statements
Opinion
In our opinion, Invesco Markets III plc’s financial statements:
• give a true and fair view of the Company’s and Funds’ assets, liabilities and financial position as at 30 September 2020 and of their results for the year then ended;
• have been properly prepared in accordance with Generally Accepted Accounting Practice in Ireland (accounting standards issued by the Financial Reporting Council of the UK, including Financial Reporting Standard 102 “The Financial Reporting Standard applicable in the UK and Republic of Ireland” and Irish law); and
• have been properly prepared in accordance with the requirements of the Companies Act 2014 and the European Communities (Undertakings for Collective Investment in Transferable Securities) Regulations 2011 (as amended).
We have audited the financial statements, included within the Annual Report and Audited Financial Statements, which comprise:
• the Statement of Financial Position as at 30 September 2020;
• the Statement of Comprehensive Income for the year then ended;
• the Statement of Changes in Net Assets Attributable to Holders of Redeemable Participating Shares for the year then ended;
• the Schedule of Investments for each of the Funds as at 30 September 2020; and
• the notes to the financial statements for the Company and for each of its Funds, which include a description of the significant accounting policies.
Our opinion is consistent with our reporting to the Board of Directors.
Basis for opinion
We conducted our audit in accordance with International Standards on Auditing (Ireland) (“ISAs (Ireland)”) and applicable law.
Our responsibilities under ISAs (Ireland) are further described in the Auditors’ responsibilities for the audit of the financial statements section of our report. We believe that the audit evidence we have obtained is sufficient and appropriate to provide a basis for our opinion.
Independence
We remained independent of the Company in accordance with the ethical requirements that are relevant to our audit of the financial statements in Ireland, which includes IAASA’s Ethical Standard as applicable to listed public interest entities, and we have fulfilled our other ethical responsibilities in accordance with these requirements.
To the best of our knowledge and belief, we declare that non-audit services prohibited by IAASA’s Ethical Standard were not provided to the Company.
Other than those disclosed in note 12, we have provided no non-audit services to the Company in the period from 1 October 2019 to 30 September 2020.
Our audit approach
Overview
Materiality
• Overall materiality: 50 basis points of Net Assets Value ("NAV") at 30 September 2020 for each of the Company’s Funds. For Invesco Dynamic US Market UCITS ETF, Invesco S&P 500 Veqtor UCITS ETF and Invesco FTSE RAFI Europe Mid-Small UCITS ETF which terminated during the year, our materiality was based on the average NAV of each Fund for the period.
Audit scope
• The Company is an open-ended investment company with variable capital and engages Invesco Investment Management Limited (the “Manager”) to manage certain duties and responsibilities with regards to the day-to-day management of the Company. We tailored the scope of our audit taking into account the types of investments within the Funds, the involvement of the third parties referred to below, the accounting processes and controls, and the industry in which the Company operates. We look at each of the Funds at an individual level.
Key audit matters • Existence of financial assets at fair value through profit or loss and financial liabilities
at fair value through profit or loss (accounting policy 2 b, notes 5 &14). • Valuation of financial assets at fair value through profit or loss and financial liabilities
at fair value through profit or loss (accounting policy 2 b, notes 5 & 14). The scope of our audit As part of designing our audit, we determined materiality and assessed the risks of material misstatement in the financial statements. In particular, we looked at where the directors made subjective judgements, for example the selection of pricing sources to value the investment portfolio. As in all of our audits, we also addressed the risk of management override of internal controls, including evaluating whether there was evidence of bias by the directors that represented a risk of material misstatement due to fraud. Key audit matters Key audit matters are those matters that, in the auditors’ professional judgement, were of most significance in the audit of the financial statements of the current period and include the most significant assessed risks of material misstatement (whether or not due to fraud) identified by the auditors, including those which had the greatest effect on: the overall audit strategy; the allocation of resources in the audit; and directing the efforts of the engagement team. These matters, and any comments we make on the results of our procedures thereon, were addressed in the context of our audit of the financial statements as a whole, and in forming our opinion thereon, and we do not provide a separate opinion on these matters. This is not a complete list of all risks identified by our audit.
Key audit matter How our audit addressed the key audit matter
Existence of financial assets at fair value through profit or loss and financial liabilities at fair value through profit or loss (accounting policy 2 b, notes 5 &14) The financial assets at fair value through profit or loss and financial liabilities at fair value through profit or loss included in the Statement of Financial Position of each Fund are held in the Fund's name at 30 September 2020. We focused on this area because it represents the principal element of the financial statements.
We obtained independent confirmation from the Depositary and counterparties of the investment portfolios held at 30 September 2020, agreeing the amounts held to the accounting records of each Fund.
Valuation of financial assets at fair value through profit or loss and financial liabilities at fair value through profit or loss (accounting policy 2 b, notes 5 & 14) The financial assets at fair value through profit or loss and financial liabilities at fair value through profit or loss included in the Statement of Financial Position of each Fund at 30 September 2020 are valued at fair value in line with Generally Accepted Accounting Practice in Ireland. We focused on this area because it represents the principal element of the financial statements.
We tested the valuation of the investment portfolios of each Fund by independently agreeing the valuation of investments to third party vendor sources.
How we tailored the audit scope
We tailored the scope of our audit to ensure that we performed enough work to be able to give an opinion on the financial statements as a whole, taking into account the structure of the Company, the accounting processes and controls, and the industry in which it operates.
As at 30 September 2020 there are 13 active Funds and 3 terminated Funds. The Company's Statement of Financial Position, Statement of Comprehensive Income, and Statement of Changes in Net Assets Attributable to Holders of Redeemable Participating Shares are an aggregation of the positions and results of the Funds.
The directors control the affairs of the Company and are responsible for the overall investment policy which is determined by them. The Company engages the Manager to manage certain duties and responsibilities with regards to the day to day management of the Company. The Manager has delegated certain responsibilities to Invesco Capital Management LLC (the ‘Investment Manager’) and to BNY Mellon Fund Services (Ireland) Designated Activity Company (the ‘Administrator’). The financial statements, which remain the responsibility of the directors, are prepared on their behalf by the Administrator. The Company has appointed The Bank of New York Mellon SA/NV, Dublin Branch (the “Depositary”) to act as Depositary of the Company’s assets. In establishing the overall approach to our audit we assessed the risk of material misstatement at a Fund level, taking into account the nature, likelihood and potential magnitude of any misstatement. As part of our risk assessment, we considered the Company’s interaction with the Administrator, and we assessed the control environment in place at the Administrator.
Materiality
The scope of our audit was influenced by our application of materiality. We set certain quantitative thresholds for materiality. These, together with qualitative considerations, helped us to determine the scope of our audit and the nature, timing and extent of our audit procedures on the individual financial statement line items and disclosures and in evaluating the effect of misstatements, both individually and in aggregate on the financial statements as a whole.
Based on our professional judgement, we determined materiality for the financial statements of each of the Company’s Funds as follows:
Overall materiality and how we determined it
50 basis points (2019: 50 basis points) of Net Assets Value ("NAV") at 30 September 2020 for each of the Company’s Funds. For Invesco Dynamic US Market UCITS ETF, Invesco S&P 500 Veqtor UCITS ETF and Invesco FTSE RAFI Europe Mid-Small UCITS ETF which terminated during the year, our materiality was based on the average NAV of each Fund for the period.
Rationale for benchmark applied
We have applied this benchmark because the main objective of the Company is to provide investors with a total return at a Fund level, taking account of the capital and income returns.
We agreed with the Board of Directors that we would report to them misstatements identified during our audit above 5 basis points of each Fund’s NAV, for NAV per share impacting differences (2019: 5 basis points of each Fund’s NAV, for NAV per share impacting differences) as well as misstatements below that amount that, in our view, warranted reporting for qualitative reasons.
Conclusions relating to going concern
We have nothing to report in respect of the following matters in relation to which ISAs (Ireland) require us to report to you where:
• the directors’ use of the going concern basis of accounting in the preparation of the financial statements is not appropriate; or
• the directors have not disclosed in the financial statements any identified material uncertainties that may cast significant doubt about the Company’s and Funds’ ability to continue to adopt the going concern basis of accounting for a period of at least twelve months from the date when the financial statements are authorised for issue.
However, because not all future events or conditions can be predicted, this statement is not a guarantee as to the Company’s and Funds’ ability to continue as going concerns.
Reporting on other information
The other information comprises all of the information in the Annual Report and Audited Financial Statements other than the financial statements and our auditors’ report thereon. The directors are responsible for the other information. Our opinion on the financial statements does not cover the other information and, accordingly, we do not express an audit opinion or, except to the extent otherwise explicitly stated in this report, any form of assurance thereon. In connection with our audit of the financial statements, our responsibility is to read the other information and, in doing so, consider
whether the other information is materially inconsistent with the financial statements or our knowledge obtained in the audit, or otherwise appears to be materially misstated. If we identify an apparent material inconsistency or material misstatement, we are required to perform procedures to conclude whether there is a material misstatement of the financial statements or a material misstatement of the other information. If, based on the work we have performed, we conclude that there is a material misstatement of this other information, we are required to report that fact. We have nothing to report based on these responsibilities.
With respect to the Directors’ Report, we also considered whether the disclosures required by the Companies Act 2014 have been included.
Based on the responsibilities described above and our work undertaken in the course of the audit, ISAs (Ireland) and the Companies Act 2014 require us to also report certain opinions and matters as described below:
Directors’ Report
• In our opinion, based on the work undertaken in the course of the audit, the information given in the Directors’ Report for the year ended 30 September 2020 is consistent with the financial statements and has been prepared in accordance with applicable legal requirements.
• Based on our knowledge and understanding of the Company and its environment obtained in the course of the audit, we have not identified any material misstatements in the Directors’ Report.
Corporate governance statement
• In our opinion, based on the work undertaken in the course of the audit of the financial statements, the description of the main features of the internal control and risk management systems in relation to the financial reporting process included in the Corporate Governance Statement, is consistent with the financial statements and has been prepared in accordance with section 1373(2)(c) of the Companies Act 2014.
• Based on our knowledge and understanding of the Company and its environment obtained in the course of the audit of the financial statements, we have not identified material misstatements in the description of the main features of the internal control and risk management systems in relation to the financial reporting process included in the Corporate Governance Statement.
• In our opinion, based on the work undertaken during the course of the audit of the financial statements, the information required by section 1373(2)(a),(b),(e) and (f) of the Companies Act 2014 and regulation 6 of the European Union (Disclosure of Non-Financial and Diversity Information by certain large undertakings and groups) Regulations 2017 is contained in the Corporate Governance Statement.
Responsibilities for the financial statements and the audit
Responsibilities of the directors for the financial statements
As explained more fully in the Statement of Directors’ Responsibilities set out on page 13, the directors are responsible for the preparation of the financial statements in accordance with the applicable framework and for being satisfied that they give a true and fair view.
The directors are also responsible for such internal control as they determine is necessary to enable the preparation of financial statements that are free from material misstatement, whether due to fraud or error.
In preparing the financial statements, the directors are responsible for assessing the Company’s and Funds’ ability to continue as going concerns, disclosing as applicable, matters related to going concern and using the going concern basis of accounting unless the directors either intend to liquidate the Company or to cease operations, or have no realistic alternative but to do so.
Auditors’ responsibilities for the audit of the financial statements
Our objectives are to obtain reasonable assurance about whether the financial statements as a whole are free from material misstatement, whether due to fraud or error, and to issue an auditors’ report that includes our opinion. Reasonable assurance is a high level of assurance, but is not a guarantee that an audit conducted in accordance with ISAs (Ireland) will always detect a material misstatement when it exists. Misstatements can arise from fraud or error and are considered material if, individually or in the aggregate, they could reasonably be expected to influence the economic decisions of users taken on the basis of these financial statements.
A further description of our responsibilities for the audit of the financial statements is located on the IAASA website at:
https://www.iaasa.ie/getmedia/b2389013-1cf6-458b-9b8f-a98202dc9c3a/Description_of_auditors_responsibilities_for_audit.pdf.
This description forms part of our auditors’ report.
Use of this report
This report, including the opinions, has been prepared for and only for the Company’s members as a body in accordance with section 391 of the Companies Act 2014 and for no other purpose. We do not, in giving these opinions, accept or assume responsibility for any other purpose or to any other person to whom this report is shown or into whose hands it may come save where expressly agreed by our prior consent in writing.
Other required reporting
Companies Act 2014 opinions on other matters
• We have obtained all the information and explanations which we consider necessary for the purposes of our audit.
• In our opinion the accounting records of the Company were sufficient to permit the financial statements to be readily and properly audited.
• The financial statements are in agreement with the accounting records.
Companies Act 2014 exception reporting
Directors’ remuneration and transactions
Under the Companies Act 2014 we are required to report to you if, in our opinion, the disclosures of directors’ remuneration and transactions specified by sections 305 to 312 of that Act have not been made. We have no exceptions to report arising from this responsibility.
Appointment
We were appointed by the directors on 5 February 2002 to audit the financial statements for the year ended 30 September 2002 and subsequent financial periods. The period of total uninterrupted engagement is 19 years, covering the years ended 30 September 2002 to 30 September 2020.
Olivia Hayden for and on behalf of PricewaterhouseCoopers Chartered Accountants and Statutory Audit Firm Cork 25 January 2021
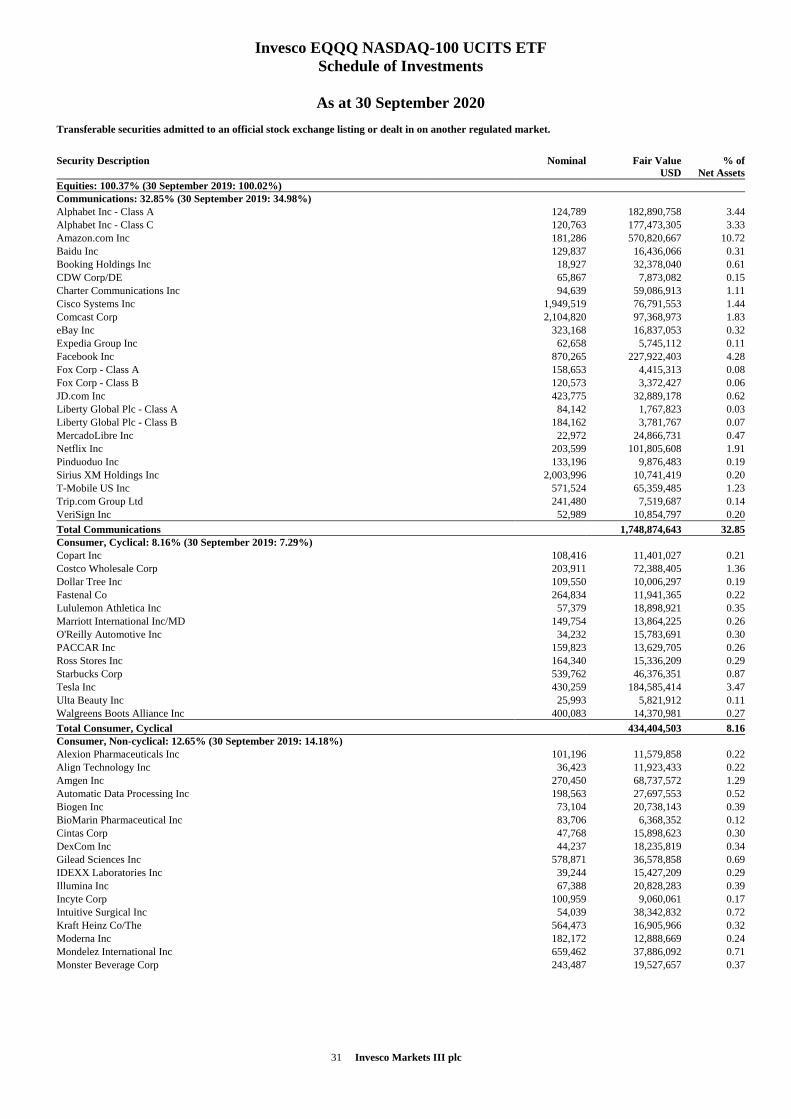
31 Invesco Markets III plc
Invesco EQQQ NASDAQ-100 UCITS ETF
Schedule of Investments
As at 30 September 2020
Transferable securities admitted to an official stock exchange listing or dealt in on another regulated market.
Security Description
Nominal Fair Value
USD
% of
Net Assets
Equities: 100.37% (30 September 2019: 100.02%)
Communications: 32.85% (30 September 2019: 34.98%)
Alphabet Inc - Class A 124,789 182,890,758 3.44
Alphabet Inc - Class C 120,763 177,473,305 3.33
Amazon.com Inc 181,286 570,820,667 10.72
Baidu Inc 129,837 16,436,066 0.31
Booking Holdings Inc 18,927 32,378,040 0.61
CDW Corp/DE 65,867 7,873,082 0.15
Charter Communications Inc 94,639 59,086,913 1.11
Cisco Systems Inc 1,949,519 76,791,553 1.44
Comcast Corp 2,104,820 97,368,973 1.83
eBay Inc 323,168 16,837,053 0.32
Expedia Group Inc 62,658 5,745,112 0.11
Facebook Inc 870,265 227,922,403 4.28
Fox Corp - Class A 158,653 4,415,313 0.08
Fox Corp - Class B 120,573 3,372,427 0.06
JD.com Inc 423,775 32,889,178 0.62
Liberty Global Plc - Class A 84,142 1,767,823 0.03
Liberty Global Plc - Class B 184,162 3,781,767 0.07
MercadoLibre Inc 22,972 24,866,731 0.47
Netflix Inc 203,599 101,805,608 1.91
Pinduoduo Inc 133,196 9,876,483 0.19
Sirius XM Holdings Inc 2,003,996 10,741,419 0.20
T-Mobile US Inc 571,524 65,359,485 1.23
Trip.com Group Ltd 241,480 7,519,687 0.14
VeriSign Inc 52,989 10,854,797 0.20
Total Communications 1,748,874,643 32.85
Consumer, Cyclical: 8.16% (30 September 2019: 7.29%)
Copart Inc 108,416 11,401,027 0.21
Costco Wholesale Corp 203,911 72,388,405 1.36
Dollar Tree Inc 109,550 10,006,297 0.19
Fastenal Co 264,834 11,941,365 0.22
Lululemon Athletica Inc 57,379 18,898,921 0.35
Marriott International Inc/MD 149,754 13,864,225 0.26
O'Reilly Automotive Inc 34,232 15,783,691 0.30
PACCAR Inc 159,823 13,629,705 0.26
Ross Stores Inc 164,340 15,336,209 0.29
Starbucks Corp 539,762 46,376,351 0.87
Tesla Inc 430,259 184,585,414 3.47
Ulta Beauty Inc 25,993 5,821,912 0.11
Walgreens Boots Alliance Inc 400,083 14,370,981 0.27
Total Consumer, Cyclical 434,404,503 8.16
Consumer, Non-cyclical: 12.65% (30 September 2019: 14.18%)
Alexion Pharmaceuticals Inc 101,196 11,579,858 0.22
Align Technology Inc 36,423 11,923,433 0.22
Amgen Inc 270,450 68,737,572 1.29
Automatic Data Processing Inc 198,563 27,697,553 0.52
Biogen Inc 73,104 20,738,143 0.39
BioMarin Pharmaceutical Inc 83,706 6,368,352 0.12
Cintas Corp 47,768 15,898,623 0.30
DexCom Inc 44,237 18,235,819 0.34
Gilead Sciences Inc 578,871 36,578,858 0.69
IDEXX Laboratories Inc 39,244 15,427,209 0.29
Illumina Inc 67,388 20,828,283 0.39
Incyte Corp 100,959 9,060,061 0.17
Intuitive Surgical Inc 54,039 38,342,832 0.72
Kraft Heinz Co/The 564,473 16,905,966 0.32
Moderna Inc 182,172 12,888,669 0.24
Mondelez International Inc 659,462 37,886,092 0.71
Monster Beverage Corp 243,487 19,527,657 0.37
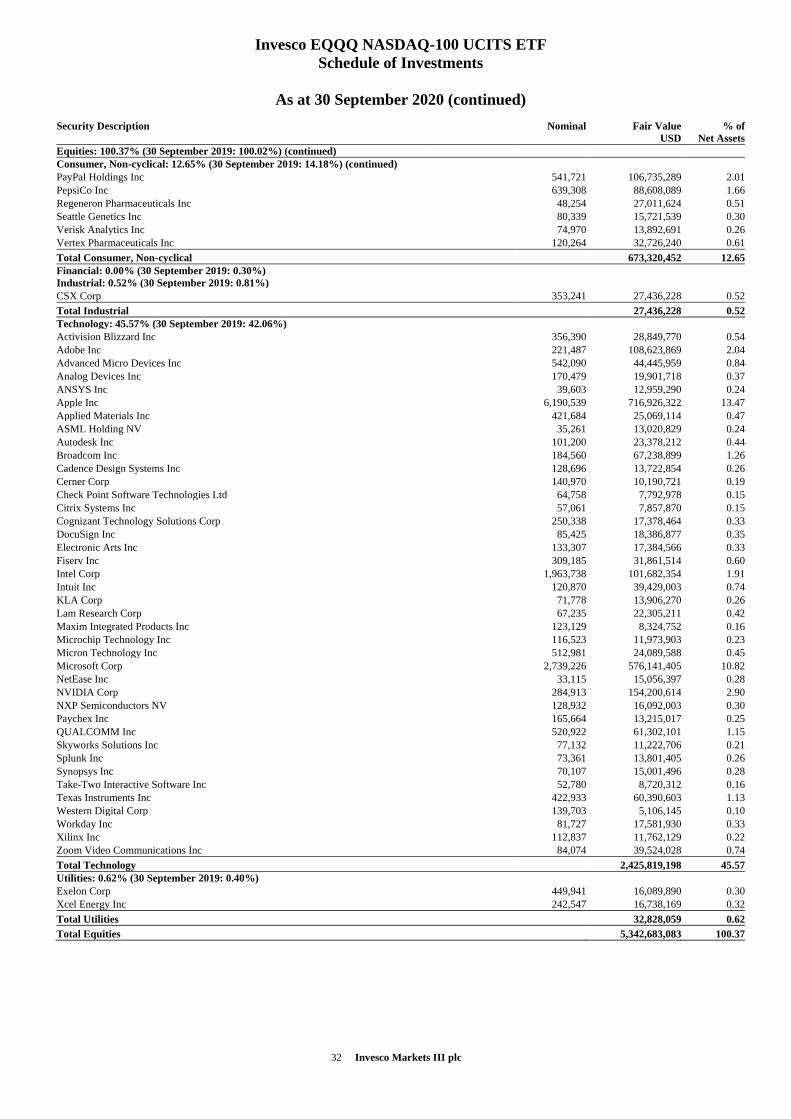
32 Invesco Markets III plc
Invesco EQQQ NASDAQ-100 UCITS ETF
Schedule of Investments
As at 30 September 2020 (continued)
Security Description
Nominal Fair Value
USD
% of
Net Assets
Equities: 100.37% (30 September 2019: 100.02%) (continued)
Consumer, Non-cyclical: 12.65% (30 September 2019: 14.18%) (continued)
PayPal Holdings Inc 541,721 106,735,289 2.01
PepsiCo Inc 639,308 88,608,089 1.66
Regeneron Pharmaceuticals Inc 48,254 27,011,624 0.51
Seattle Genetics Inc 80,339 15,721,539 0.30
Verisk Analytics Inc 74,970 13,892,691 0.26
Vertex Pharmaceuticals Inc 120,264 32,726,240 0.61
Total Consumer, Non-cyclical 673,320,452 12.65
Financial: 0.00% (30 September 2019: 0.30%)
Industrial: 0.52% (30 September 2019: 0.81%)
CSX Corp 353,241 27,436,228 0.52
Total Industrial 27,436,228 0.52
Technology: 45.57% (30 September 2019: 42.06%)
Activision Blizzard Inc 356,390 28,849,770 0.54
Adobe Inc 221,487 108,623,869 2.04
Advanced Micro Devices Inc 542,090 44,445,959 0.84
Analog Devices Inc 170,479 19,901,718 0.37
ANSYS Inc 39,603 12,959,290 0.24
Apple Inc 6,190,539 716,926,322 13.47
Applied Materials Inc 421,684 25,069,114 0.47
ASML Holding NV 35,261 13,020,829 0.24
Autodesk Inc 101,200 23,378,212 0.44
Broadcom Inc 184,560 67,238,899 1.26
Cadence Design Systems Inc 128,696 13,722,854 0.26
Cerner Corp 140,970 10,190,721 0.19
Check Point Software Technologies Ltd 64,758 7,792,978 0.15
Citrix Systems Inc 57,061 7,857,870 0.15
Cognizant Technology Solutions Corp 250,338 17,378,464 0.33
DocuSign Inc 85,425 18,386,877 0.35
Electronic Arts Inc 133,307 17,384,566 0.33
Fiserv Inc 309,185 31,861,514 0.60
Intel Corp 1,963,738 101,682,354 1.91
Intuit Inc 120,870 39,429,003 0.74
KLA Corp 71,778 13,906,270 0.26
Lam Research Corp 67,235 22,305,211 0.42
Maxim Integrated Products Inc 123,129 8,324,752 0.16
Microchip Technology Inc 116,523 11,973,903 0.23
Micron Technology Inc 512,981 24,089,588 0.45
Microsoft Corp 2,739,226 576,141,405 10.82
NetEase Inc 33,115 15,056,397 0.28
NVIDIA Corp 284,913 154,200,614 2.90
NXP Semiconductors NV 128,932 16,092,003 0.30
Paychex Inc 165,664 13,215,017 0.25
QUALCOMM Inc 520,922 61,302,101 1.15
Skyworks Solutions Inc 77,132 11,222,706 0.21
Splunk Inc 73,361 13,801,405 0.26
Synopsys Inc 70,107 15,001,496 0.28
Take-Two Interactive Software Inc 52,780 8,720,312 0.16
Texas Instruments Inc 422,933 60,390,603 1.13
Western Digital Corp 139,703 5,106,145 0.10
Workday Inc 81,727 17,581,930 0.33
Xilinx Inc 112,837 11,762,129 0.22
Zoom Video Communications Inc 84,074 39,524,028 0.74
Total Technology 2,425,819,198 45.57
Utilities: 0.62% (30 September 2019: 0.40%)
Exelon Corp 449,941 16,089,890 0.30
Xcel Energy Inc 242,547 16,738,169 0.32
Total Utilities 32,828,059 0.62
Total Equities 5,342,683,083 100.37
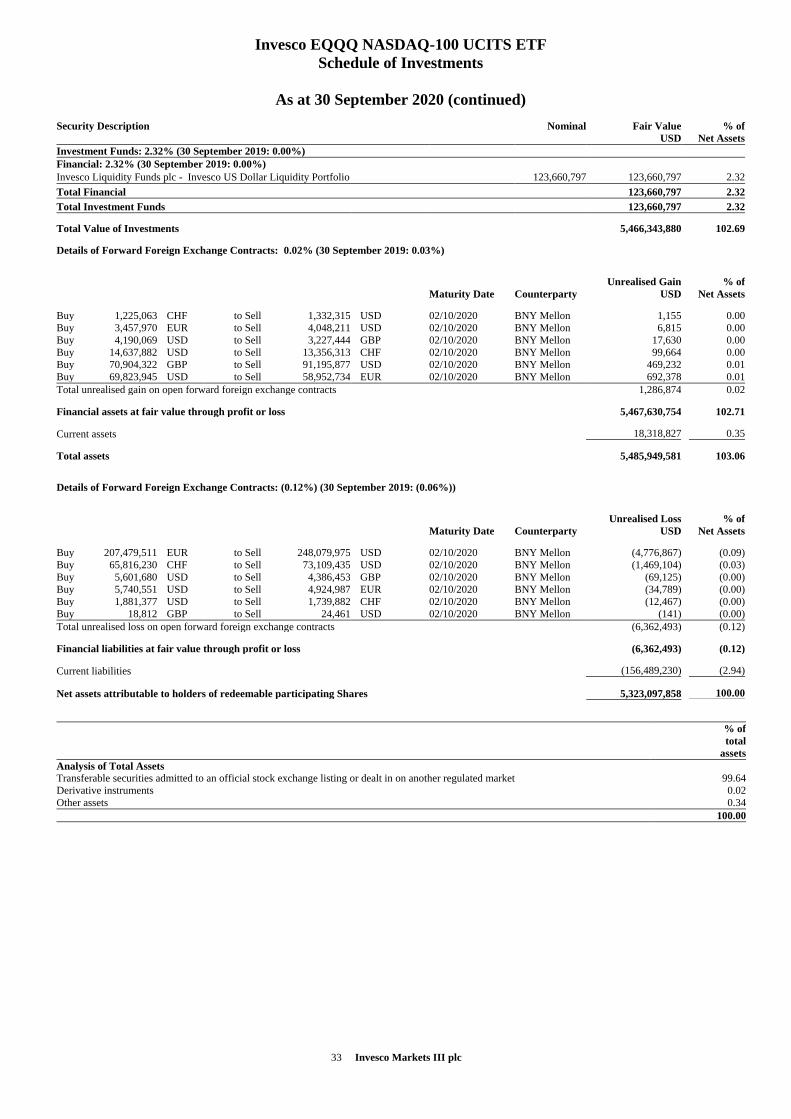
33 Invesco Markets III plc
Invesco EQQQ NASDAQ-100 UCITS ETF
Schedule of Investments
As at 30 September 2020 (continued)
Security Description
Nominal Fair Value
USD
% of
Net Assets
Investment Funds: 2.32% (30 September 2019: 0.00%)
Financial: 2.32% (30 September 2019: 0.00%)
Invesco Liquidity Funds plc - Invesco US Dollar Liquidity Portfolio 123,660,797 123,660,797 2.32
Total Financial 123,660,797 2.32
Total Investment Funds 123,660,797 2.32
Total Value of Investments 5,466,343,880 102.69
Details of Forward Foreign Exchange Contracts: 0.02% (30 September 2019: 0.03%)
Maturity Date Counterparty
Unrealised Gain
USD
% of
Net Assets
Buy 1,225,063 CHF to Sell 1,332,315 USD 02/10/2020 BNY Mellon 1,155 0.00
Buy 3,457,970 EUR to Sell 4,048,211 USD 02/10/2020 BNY Mellon 6,815 0.00
Buy 4,190,069 USD to Sell 3,227,444 GBP 02/10/2020 BNY Mellon 17,630 0.00
Buy 14,637,882 USD to Sell 13,356,313 CHF 02/10/2020 BNY Mellon 99,664 0.00
Buy 70,904,322 GBP to Sell 91,195,877 USD 02/10/2020 BNY Mellon 469,232 0.01
Buy 69,823,945 USD to Sell 58,952,734 EUR 02/10/2020 BNY Mellon 692,378 0.01
Total unrealised gain on open forward foreign exchange contracts 1,286,874 0.02
Financial assets at fair value through profit or loss 5,467,630,754 102.71
Current assets 18,318,827 0.35
Total assets 5,485,949,581 103.06
Details of Forward Foreign Exchange Contracts: (0.12%) (30 September 2019: (0.06%))
Maturity Date Counterparty
Unrealised Loss
USD
% of
Net Assets
Buy 207,479,511 EUR to Sell 248,079,975 USD 02/10/2020 BNY Mellon (4,776,867) (0 .09)
Buy 65,816,230 CHF to Sell 73,109,435 USD 02/10/2020 BNY Mellon (1,469,104) (0 .03)
Buy 5,601,680 USD to Sell 4,386,453 GBP 02/10/2020 BNY Mellon (69,125) (0 .00)
Buy 5,740,551 USD to Sell 4,924,987 EUR 02/10/2020 BNY Mellon (34,789) (0 .00)
Buy 1,881,377 USD to Sell 1,739,882 CHF 02/10/2020 BNY Mellon (12,467) (0 .00)
Buy 18,812 GBP to Sell 24,461 USD 02/10/2020 BNY Mellon (141) (0 .00)
Total unrealised loss on open forward foreign exchange contracts (6,362,493) (0 .12)
Financial liabilities at fair value through profit or loss (6,362,493) (0 .12)
Current liabilities (156,489,230) (2.94)
Net assets attributable to holders of redeemable participating Shares 5,323,097,858 100.00
% of
total
assets
Analysis of Total Assets
Transferable securities admitted to an official stock exchange listing or dealt in on another regulated market 99.64
Derivative instruments 0.02
Other assets 0.34
100.00
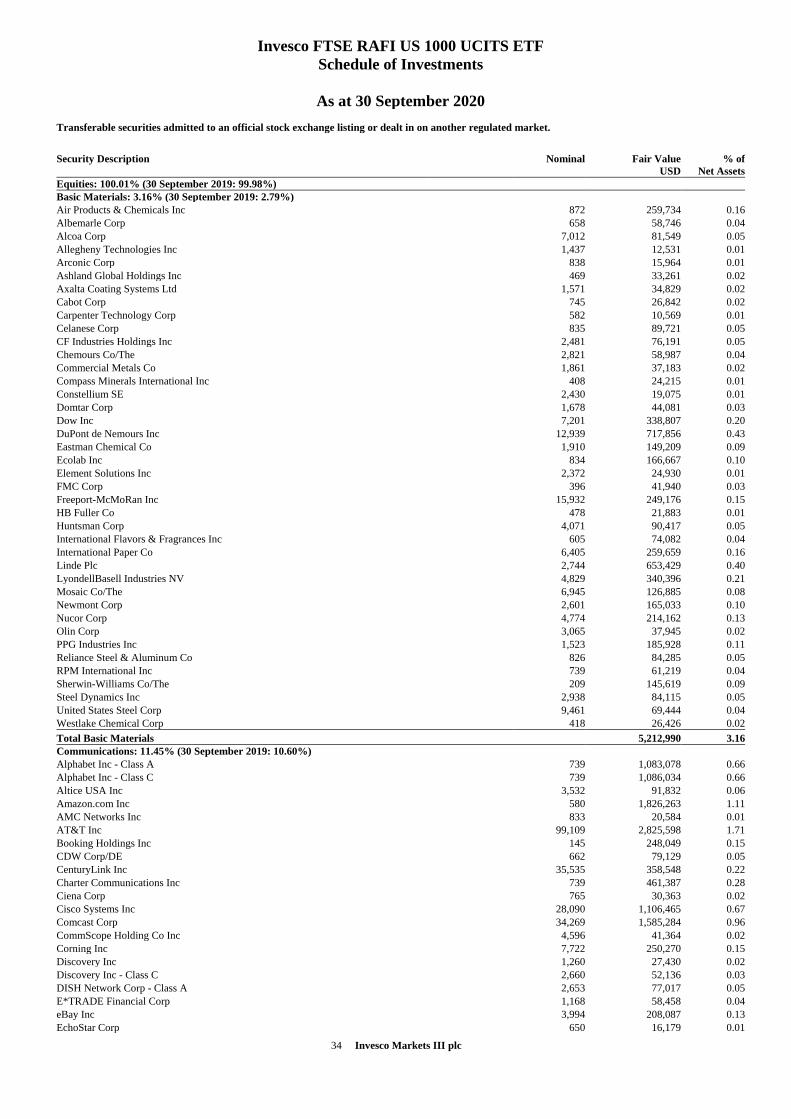
34 Invesco Markets III plc
Invesco FTSE RAFI US 1000 UCITS ETF
Schedule of Investments
As at 30 September 2020
Transferable securities admitted to an official stock exchange listing or dealt in on another regulated market.
Security Description
Nominal Fair Value
USD
% of
Net Assets
Equities: 100.01% (30 September 2019: 99.98%)
Basic Materials: 3.16% (30 September 2019: 2.79%)
Air Products & Chemicals Inc 872 259,734 0.16
Albemarle Corp 658 58,746 0.04
Alcoa Corp 7,012 81,549 0.05
Allegheny Technologies Inc 1,437 12,531 0.01
Arconic Corp 838 15,964 0.01
Ashland Global Holdings Inc 469 33,261 0.02
Axalta Coating Systems Ltd 1,571 34,829 0.02
Cabot Corp 745 26,842 0.02
Carpenter Technology Corp 582 10,569 0.01
Celanese Corp 835 89,721 0.05
CF Industries Holdings Inc 2,481 76,191 0.05
Chemours Co/The 2,821 58,987 0.04
Commercial Metals Co 1,861 37,183 0.02
Compass Minerals International Inc 408 24,215 0.01
Constellium SE 2,430 19,075 0.01
Domtar Corp 1,678 44,081 0.03
Dow Inc 7,201 338,807 0.20
DuPont de Nemours Inc 12,939 717,856 0.43
Eastman Chemical Co 1,910 149,209 0.09
Ecolab Inc 834 166,667 0.10
Element Solutions Inc 2,372 24,930 0.01
FMC Corp 396 41,940 0.03
Freeport-McMoRan Inc 15,932 249,176 0.15
HB Fuller Co 478 21,883 0.01
Huntsman Corp 4,071 90,417 0.05
International Flavors & Fragrances Inc 605 74,082 0.04
International Paper Co 6,405 259,659 0.16
Linde Plc 2,744 653,429 0.40
LyondellBasell Industries NV 4,829 340,396 0.21
Mosaic Co/The 6,945 126,885 0.08
Newmont Corp 2,601 165,033 0.10
Nucor Corp 4,774 214,162 0.13
Olin Corp 3,065 37,945 0.02
PPG Industries Inc 1,523 185,928 0.11
Reliance Steel & Aluminum Co 826 84,285 0.05
RPM International Inc 739 61,219 0.04
Sherwin-Williams Co/The 209 145,619 0.09
Steel Dynamics Inc 2,938 84,115 0.05
United States Steel Corp 9,461 69,444 0.04
Westlake Chemical Corp 418 26,426 0.02
Total Basic Materials 5,212,990 3.16
Communications: 11.45% (30 September 2019: 10.60%)
Alphabet Inc - Class A 739 1,083,078 0.66
Alphabet Inc - Class C 739 1,086,034 0.66
Altice USA Inc 3,532 91,832 0.06
Amazon.com Inc 580 1,826,263 1.11
AMC Networks Inc 833 20,584 0.01
AT&T Inc 99,109 2,825,598 1.71
Booking Holdings Inc 145 248,049 0.15
CDW Corp/DE 662 79,129 0.05
CenturyLink Inc 35,535 358,548 0.22
Charter Communications Inc 739 461,387 0.28
Ciena Corp 765 30,363 0.02
Cisco Systems Inc 28,090 1,106,465 0.67
Comcast Corp 34,269 1,585,284 0.96
CommScope Holding Co Inc 4,596 41,364 0.02
Corning Inc 7,722 250,270 0.15
Discovery Inc 1,260 27,430 0.02
Discovery Inc - Class C 2,660 52,136 0.03
DISH Network Corp - Class A 2,653 77,017 0.05
E*TRADE Financial Corp 1,168 58,458 0.04
eBay Inc 3,994 208,087 0.13
EchoStar Corp 650 16,179 0.01
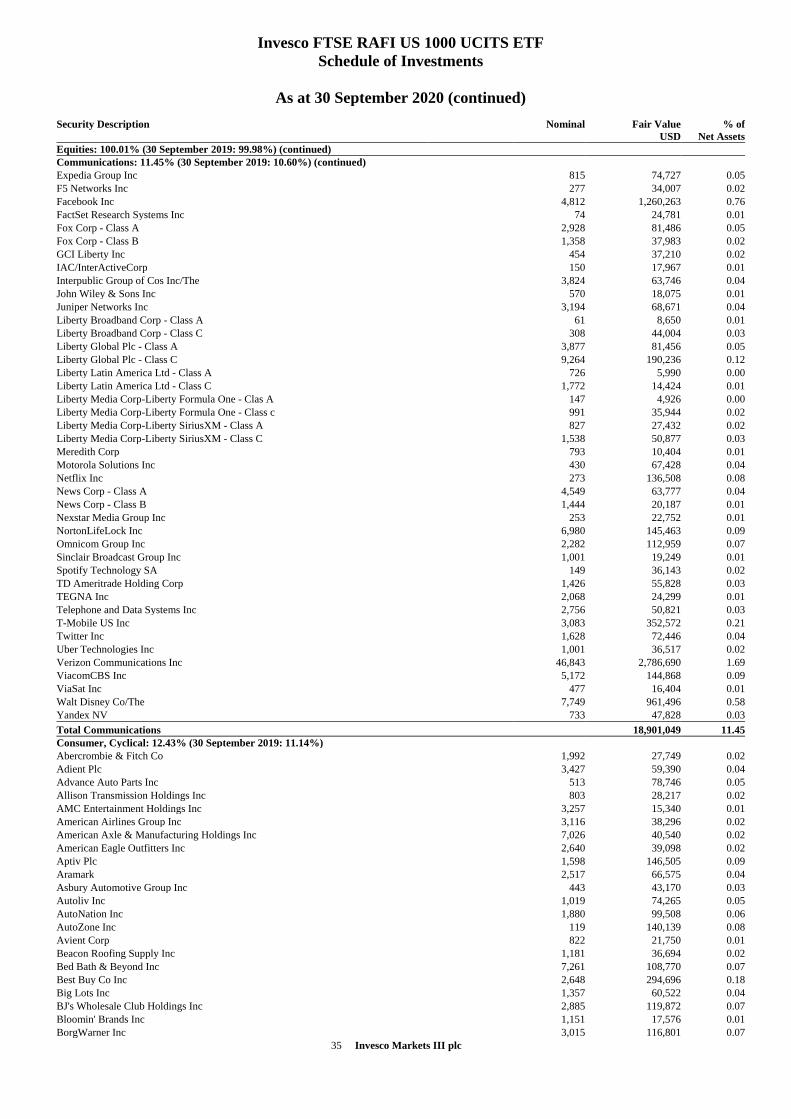
35 Invesco Markets III plc
Invesco FTSE RAFI US 1000 UCITS ETF
Schedule of Investments
As at 30 September 2020 (continued)
Security Description
Nominal Fair Value
USD
% of
Net Assets
Equities: 100.01% (30 September 2019: 99.98%) (continued)
Communications: 11.45% (30 September 2019: 10.60%) (continued)
Expedia Group Inc 815 74,727 0.05
F5 Networks Inc 277 34,007 0.02
Facebook Inc 4,812 1,260,263 0.76
FactSet Research Systems Inc 74 24,781 0.01
Fox Corp - Class A 2,928 81,486 0.05
Fox Corp - Class B 1,358 37,983 0.02
GCI Liberty Inc 454 37,210 0.02
IAC/InterActiveCorp 150 17,967 0.01
Interpublic Group of Cos Inc/The 3,824 63,746 0.04
John Wiley & Sons Inc 570 18,075 0.01
Juniper Networks Inc 3,194 68,671 0.04
Liberty Broadband Corp - Class A 61 8,650 0.01
Liberty Broadband Corp - Class C 308 44,004 0.03
Liberty Global Plc - Class A 3,877 81,456 0.05
Liberty Global Plc - Class C 9,264 190,236 0.12
Liberty Latin America Ltd - Class A 726 5,990 0.00
Liberty Latin America Ltd - Class C 1,772 14,424 0.01
Liberty Media Corp-Liberty Formula One - Clas A 147 4,926 0.00
Liberty Media Corp-Liberty Formula One - Class c 991 35,944 0.02
Liberty Media Corp-Liberty SiriusXM - Class A 827 27,432 0.02
Liberty Media Corp-Liberty SiriusXM - Class C 1,538 50,877 0.03
Meredith Corp 793 10,404 0.01
Motorola Solutions Inc 430 67,428 0.04
Netflix Inc 273 136,508 0.08
News Corp - Class A 4,549 63,777 0.04
News Corp - Class B 1,444 20,187 0.01
Nexstar Media Group Inc 253 22,752 0.01
NortonLifeLock Inc 6,980 145,463 0.09
Omnicom Group Inc 2,282 112,959 0.07
Sinclair Broadcast Group Inc 1,001 19,249 0.01
Spotify Technology SA 149 36,143 0.02
TD Ameritrade Holding Corp 1,426 55,828 0.03
TEGNA Inc 2,068 24,299 0.01
Telephone and Data Systems Inc 2,756 50,821 0.03
T-Mobile US Inc 3,083 352,572 0.21
Twitter Inc 1,628 72,446 0.04
Uber Technologies Inc 1,001 36,517 0.02
Verizon Communications Inc 46,843 2,786,690 1.69
ViacomCBS Inc 5,172 144,868 0.09
ViaSat Inc 477 16,404 0.01
Walt Disney Co/The 7,749 961,496 0.58
Yandex NV 733 47,828 0.03
Total Communications 18,901,049 11.45
Consumer, Cyclical: 12.43% (30 September 2019: 11.14%)
Abercrombie & Fitch Co 1,992 27,749 0.02
Adient Plc 3,427 59,390 0.04
Advance Auto Parts Inc 513 78,746 0.05
Allison Transmission Holdings Inc 803 28,217 0.02
AMC Entertainment Holdings Inc 3,257 15,340 0.01
American Airlines Group Inc 3,116 38,296 0.02
American Axle & Manufacturing Holdings Inc 7,026 40,540 0.02
American Eagle Outfitters Inc 2,640 39,098 0.02
Aptiv Plc 1,598 146,505 0.09
Aramark 2,517 66,575 0.04
Asbury Automotive Group Inc 443 43,170 0.03
Autoliv Inc 1,019 74,265 0.05
AutoNation Inc 1,880 99,508 0.06
AutoZone Inc 119 140,139 0.08
Avient Corp 822 21,750 0.01
Beacon Roofing Supply Inc 1,181 36,694 0.02
Bed Bath & Beyond Inc 7,261 108,770 0.07
Best Buy Co Inc 2,648 294,696 0.18
Big Lots Inc 1,357 60,522 0.04
BJ's Wholesale Club Holdings Inc 2,885 119,872 0.07
Bloomin' Brands Inc 1,151 17,576 0.01
BorgWarner Inc 3,015 116,801 0.07
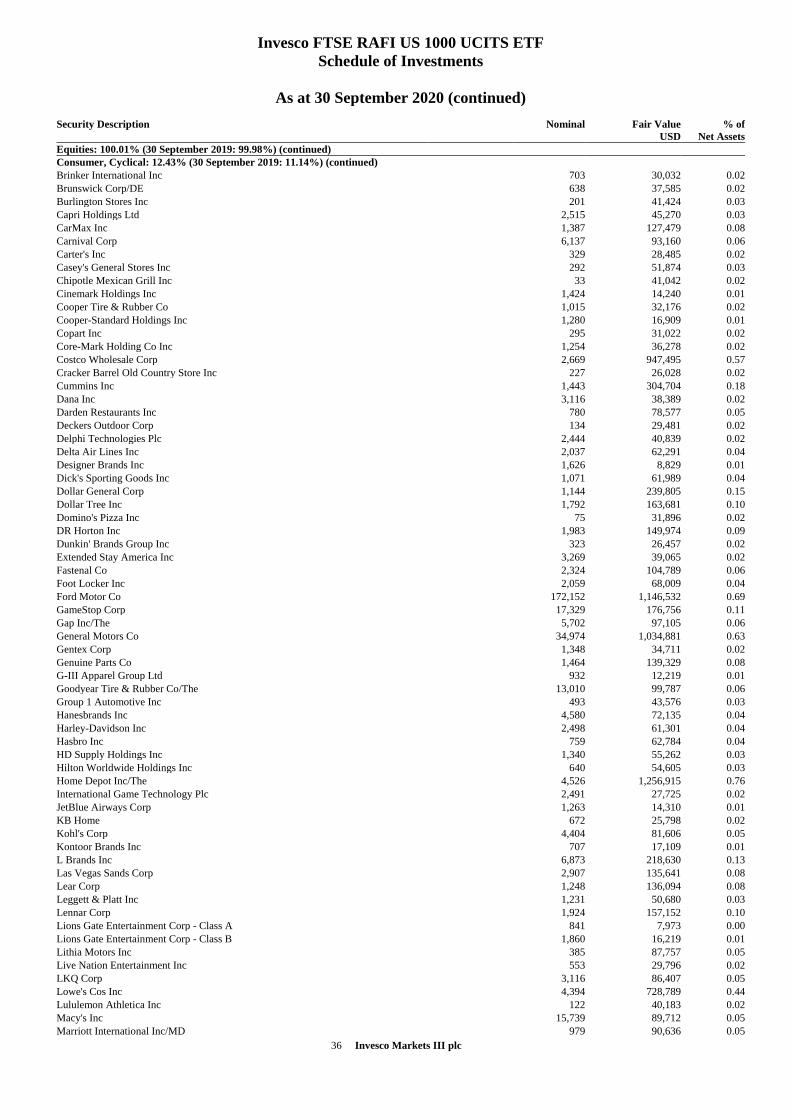
36 Invesco Markets III plc
Invesco FTSE RAFI US 1000 UCITS ETF
Schedule of Investments
As at 30 September 2020 (continued)
Security Description
Nominal Fair Value
USD
% of
Net Assets
Equities: 100.01% (30 September 2019: 99.98%) (continued)
Consumer, Cyclical: 12.43% (30 September 2019: 11.14%) (continued)
Brinker International Inc 703 30,032 0.02
Brunswick Corp/DE 638 37,585 0.02
Burlington Stores Inc 201 41,424 0.03
Capri Holdings Ltd 2,515 45,270 0.03
CarMax Inc 1,387 127,479 0.08
Carnival Corp 6,137 93,160 0.06
Carter's Inc 329 28,485 0.02
Casey's General Stores Inc 292 51,874 0.03
Chipotle Mexican Grill Inc 33 41,042 0.02
Cinemark Holdings Inc 1,424 14,240 0.01
Cooper Tire & Rubber Co 1,015 32,176 0.02
Cooper-Standard Holdings Inc 1,280 16,909 0.01
Copart Inc 295 31,022 0.02
Core-Mark Holding Co Inc 1,254 36,278 0.02
Costco Wholesale Corp 2,669 947,495 0.57
Cracker Barrel Old Country Store Inc 227 26,028 0.02
Cummins Inc 1,443 304,704 0.18
Dana Inc 3,116 38,389 0.02
Darden Restaurants Inc 780 78,577 0.05
Deckers Outdoor Corp 134 29,481 0.02
Delphi Technologies Plc 2,444 40,839 0.02
Delta Air Lines Inc 2,037 62,291 0.04
Designer Brands Inc 1,626 8,829 0.01
Dick's Sporting Goods Inc 1,071 61,989 0.04
Dollar General Corp 1,144 239,805 0.15
Dollar Tree Inc 1,792 163,681 0.10
Domino's Pizza Inc 75 31,896 0.02
DR Horton Inc 1,983 149,974 0.09
Dunkin' Brands Group Inc 323 26,457 0.02
Extended Stay America Inc 3,269 39,065 0.02
Fastenal Co 2,324 104,789 0.06
Foot Locker Inc 2,059 68,009 0.04
Ford Motor Co 172,152 1,146,532 0.69
GameStop Corp 17,329 176,756 0.11
Gap Inc/The 5,702 97,105 0.06
General Motors Co 34,974 1,034,881 0.63
Gentex Corp 1,348 34,711 0.02
Genuine Parts Co 1,464 139,329 0.08
G-III Apparel Group Ltd 932 12,219 0.01
Goodyear Tire & Rubber Co/The 13,010 99,787 0.06
Group 1 Automotive Inc 493 43,576 0.03
Hanesbrands Inc 4,580 72,135 0.04
Harley-Davidson Inc 2,498 61,301 0.04
Hasbro Inc 759 62,784 0.04
HD Supply Holdings Inc 1,340 55,262 0.03
Hilton Worldwide Holdings Inc 640 54,605 0.03
Home Depot Inc/The 4,526 1,256,915 0.76
International Game Technology Plc 2,491 27,725 0.02
JetBlue Airways Corp 1,263 14,310 0.01
KB Home 672 25,798 0.02
Kohl's Corp 4,404 81,606 0.05
Kontoor Brands Inc 707 17,109 0.01
L Brands Inc 6,873 218,630 0.13
Las Vegas Sands Corp 2,907 135,641 0.08
Lear Corp 1,248 136,094 0.08
Leggett & Platt Inc 1,231 50,680 0.03
Lennar Corp 1,924 157,152 0.10
Lions Gate Entertainment Corp - Class A 841 7,973 0.00
Lions Gate Entertainment Corp - Class B 1,860 16,219 0.01
Lithia Motors Inc 385 87,757 0.05
Live Nation Entertainment Inc 553 29,796 0.02
LKQ Corp 3,116 86,407 0.05
Lowe's Cos Inc 4,394 728,789 0.44
Lululemon Athletica Inc 122 40,183 0.02
Macy's Inc 15,739 89,712 0.05
Marriott International Inc/MD 979 90,636 0.05
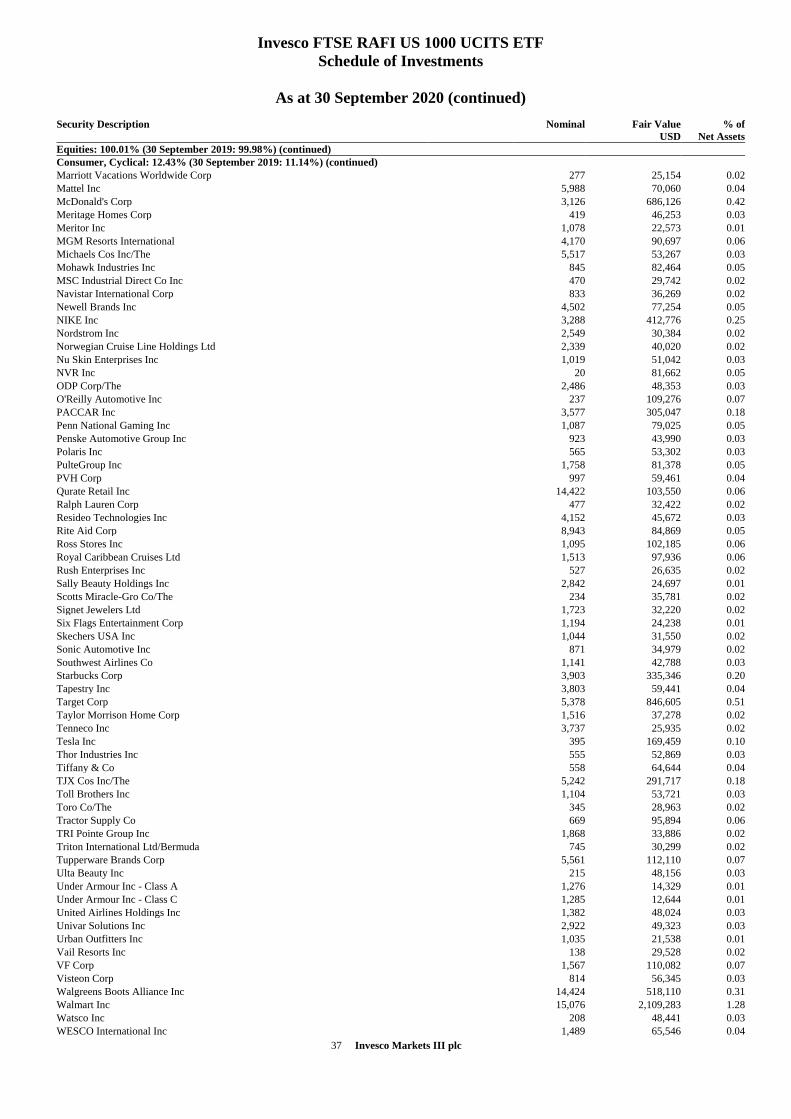
37 Invesco Markets III plc
Invesco FTSE RAFI US 1000 UCITS ETF
Schedule of Investments
As at 30 September 2020 (continued)
Security Description
Nominal Fair Value
USD
% of
Net Assets
Equities: 100.01% (30 September 2019: 99.98%) (continued)
Consumer, Cyclical: 12.43% (30 September 2019: 11.14%) (continued)
Marriott Vacations Worldwide Corp 277 25,154 0.02
Mattel Inc 5,988 70,060 0.04
McDonald's Corp 3,126 686,126 0.42
Meritage Homes Corp 419 46,253 0.03
Meritor Inc 1,078 22,573 0.01
MGM Resorts International 4,170 90,697 0.06
Michaels Cos Inc/The 5,517 53,267 0.03
Mohawk Industries Inc 845 82,464 0.05
MSC Industrial Direct Co Inc 470 29,742 0.02
Navistar International Corp 833 36,269 0.02
Newell Brands Inc 4,502 77,254 0.05
NIKE Inc 3,288 412,776 0.25
Nordstrom Inc 2,549 30,384 0.02
Norwegian Cruise Line Holdings Ltd 2,339 40,020 0.02
Nu Skin Enterprises Inc 1,019 51,042 0.03
NVR Inc 20 81,662 0.05
ODP Corp/The 2,486 48,353 0.03
O'Reilly Automotive Inc 237 109,276 0.07
PACCAR Inc 3,577 305,047 0.18
Penn National Gaming Inc 1,087 79,025 0.05
Penske Automotive Group Inc 923 43,990 0.03
Polaris Inc 565 53,302 0.03
PulteGroup Inc 1,758 81,378 0.05
PVH Corp 997 59,461 0.04
Qurate Retail Inc 14,422 103,550 0.06
Ralph Lauren Corp 477 32,422 0.02
Resideo Technologies Inc 4,152 45,672 0.03
Rite Aid Corp 8,943 84,869 0.05
Ross Stores Inc 1,095 102,185 0.06
Royal Caribbean Cruises Ltd 1,513 97,936 0.06
Rush Enterprises Inc 527 26,635 0.02
Sally Beauty Holdings Inc 2,842 24,697 0.01
Scotts Miracle-Gro Co/The 234 35,781 0.02
Signet Jewelers Ltd 1,723 32,220 0.02
Six Flags Entertainment Corp 1,194 24,238 0.01
Skechers USA Inc 1,044 31,550 0.02
Sonic Automotive Inc 871 34,979 0.02
Southwest Airlines Co 1,141 42,788 0.03
Starbucks Corp 3,903 335,346 0.20
Tapestry Inc 3,803 59,441 0.04
Target Corp 5,378 846,605 0.51
Taylor Morrison Home Corp 1,516 37,278 0.02
Tenneco Inc 3,737 25,935 0.02
Tesla Inc 395 169,459 0.10
Thor Industries Inc 555 52,869 0.03
Tiffany & Co 558 64,644 0.04
TJX Cos Inc/The 5,242 291,717 0.18
Toll Brothers Inc 1,104 53,721 0.03
Toro Co/The 345 28,963 0.02
Tractor Supply Co 669 95,894 0.06
TRI Pointe Group Inc 1,868 33,886 0.02
Triton International Ltd/Bermuda 745 30,299 0.02
Tupperware Brands Corp 5,561 112,110 0.07
Ulta Beauty Inc 215 48,156 0.03
Under Armour Inc - Class A 1,276 14,329 0.01
Under Armour Inc - Class C 1,285 12,644 0.01
United Airlines Holdings Inc 1,382 48,024 0.03
Univar Solutions Inc 2,922 49,323 0.03
Urban Outfitters Inc 1,035 21,538 0.01
Vail Resorts Inc 138 29,528 0.02
VF Corp 1,567 110,082 0.07
Visteon Corp 814 56,345 0.03
Walgreens Boots Alliance Inc 14,424 518,110 0.31
Walmart Inc 15,076 2,109,283 1.28
Watsco Inc 208 48,441 0.03
WESCO International Inc 1,489 65,546 0.04
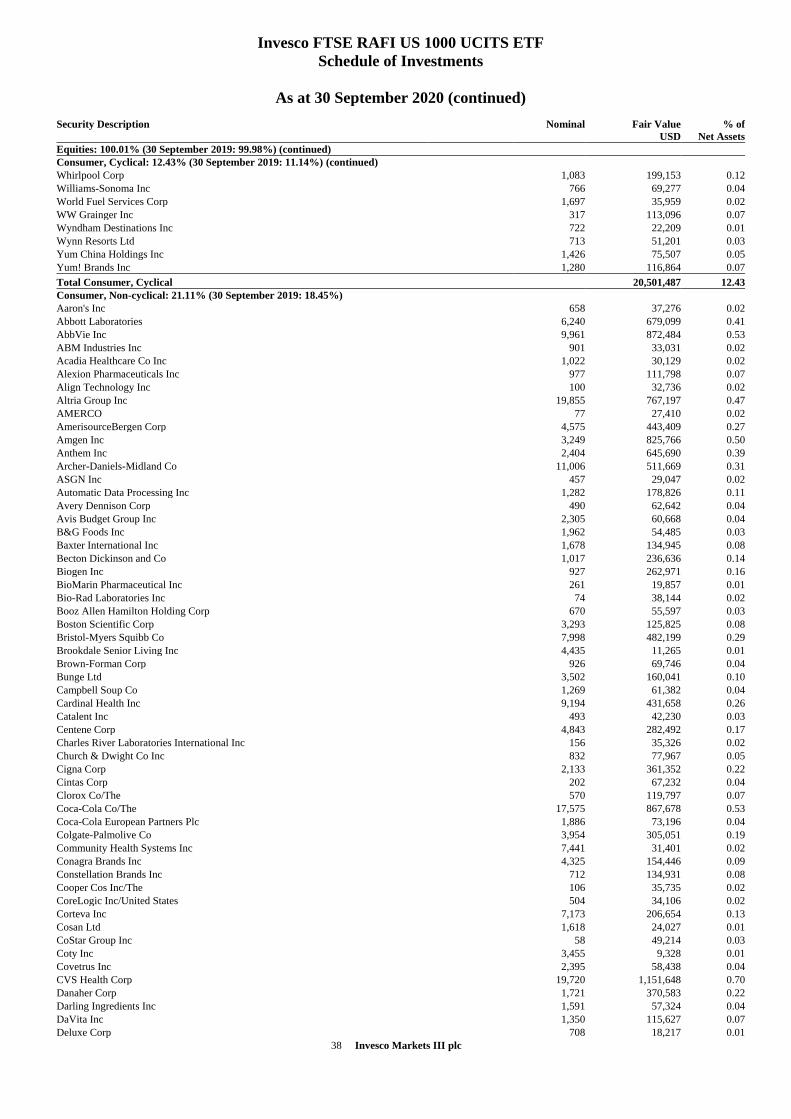
38 Invesco Markets III plc
Invesco FTSE RAFI US 1000 UCITS ETF
Schedule of Investments
As at 30 September 2020 (continued)
Security Description
Nominal Fair Value
USD
% of
Net Assets
Equities: 100.01% (30 September 2019: 99.98%) (continued)
Consumer, Cyclical: 12.43% (30 September 2019: 11.14%) (continued)
Whirlpool Corp 1,083 199,153 0.12
Williams-Sonoma Inc 766 69,277 0.04
World Fuel Services Corp 1,697 35,959 0.02
WW Grainger Inc 317 113,096 0.07
Wyndham Destinations Inc 722 22,209 0.01
Wynn Resorts Ltd 713 51,201 0.03
Yum China Holdings Inc 1,426 75,507 0.05
Yum! Brands Inc 1,280 116,864 0.07
Total Consumer, Cyclical 20,501,487 12.43
Consumer, Non-cyclical: 21.11% (30 September 2019: 18.45%)
Aaron's Inc 658 37,276 0.02
Abbott Laboratories 6,240 679,099 0.41
AbbVie Inc 9,961 872,484 0.53
ABM Industries Inc 901 33,031 0.02
Acadia Healthcare Co Inc 1,022 30,129 0.02
Alexion Pharmaceuticals Inc 977 111,798 0.07
Align Technology Inc 100 32,736 0.02
Altria Group Inc 19,855 767,197 0.47
AMERCO 77 27,410 0.02
AmerisourceBergen Corp 4,575 443,409 0.27
Amgen Inc 3,249 825,766 0.50
Anthem Inc 2,404 645,690 0.39
Archer-Daniels-Midland Co 11,006 511,669 0.31
ASGN Inc 457 29,047 0.02
Automatic Data Processing Inc 1,282 178,826 0.11
Avery Dennison Corp 490 62,642 0.04
Avis Budget Group Inc 2,305 60,668 0.04
B&G Foods Inc 1,962 54,485 0.03
Baxter International Inc 1,678 134,945 0.08
Becton Dickinson and Co 1,017 236,636 0.14
Biogen Inc 927 262,971 0.16
BioMarin Pharmaceutical Inc 261 19,857 0.01
Bio-Rad Laboratories Inc 74 38,144 0.02
Booz Allen Hamilton Holding Corp 670 55,597 0.03
Boston Scientific Corp 3,293 125,825 0.08
Bristol-Myers Squibb Co 7,998 482,199 0.29
Brookdale Senior Living Inc 4,435 11,265 0.01
Brown-Forman Corp 926 69,746 0.04
Bunge Ltd 3,502 160,041 0.10
Campbell Soup Co 1,269 61,382 0.04
Cardinal Health Inc 9,194 431,658 0.26
Catalent Inc 493 42,230 0.03
Centene Corp 4,843 282,492 0.17
Charles River Laboratories International Inc 156 35,326 0.02
Church & Dwight Co Inc 832 77,967 0.05
Cigna Corp 2,133 361,352 0.22
Cintas Corp 202 67,232 0.04
Clorox Co/The 570 119,797 0.07
Coca-Cola Co/The 17,575 867,678 0.53
Coca-Cola European Partners Plc 1,886 73,196 0.04
Colgate-Palmolive Co 3,954 305,051 0.19
Community Health Systems Inc 7,441 31,401 0.02
Conagra Brands Inc 4,325 154,446 0.09
Constellation Brands Inc 712 134,931 0.08
Cooper Cos Inc/The 106 35,735 0.02
CoreLogic Inc/United States 504 34,106 0.02
Corteva Inc 7,173 206,654 0.13
Cosan Ltd 1,618 24,027 0.01
CoStar Group Inc 58 49,214 0.03
Coty Inc 3,455 9,328 0.01
Covetrus Inc 2,395 58,438 0.04
CVS Health Corp 19,720 1,151,648 0.70
Danaher Corp 1,721 370,583 0.22
Darling Ingredients Inc 1,591 57,324 0.04
DaVita Inc 1,350 115,627 0.07
Deluxe Corp 708 18,217 0.01
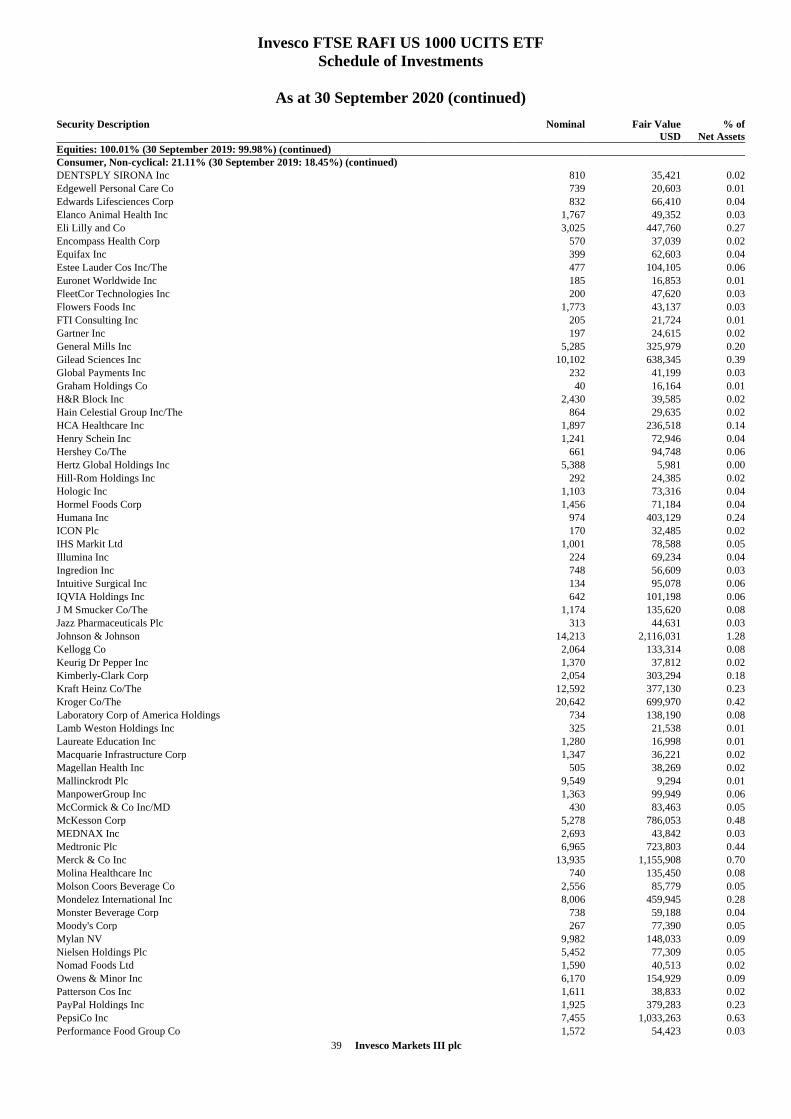
39 Invesco Markets III plc
Invesco FTSE RAFI US 1000 UCITS ETF
Schedule of Investments
As at 30 September 2020 (continued)
Security Description
Nominal Fair Value
USD
% of
Net Assets
Equities: 100.01% (30 September 2019: 99.98%) (continued)
Consumer, Non-cyclical: 21.11% (30 September 2019: 18.45%) (continued)
DENTSPLY SIRONA Inc 810 35,421 0.02
Edgewell Personal Care Co 739 20,603 0.01
Edwards Lifesciences Corp 832 66,410 0.04
Elanco Animal Health Inc 1,767 49,352 0.03
Eli Lilly and Co 3,025 447,760 0.27
Encompass Health Corp 570 37,039 0.02
Equifax Inc 399 62,603 0.04
Estee Lauder Cos Inc/The 477 104,105 0.06
Euronet Worldwide Inc 185 16,853 0.01
FleetCor Technologies Inc 200 47,620 0.03
Flowers Foods Inc 1,773 43,137 0.03
FTI Consulting Inc 205 21,724 0.01
Gartner Inc 197 24,615 0.02
General Mills Inc 5,285 325,979 0.20
Gilead Sciences Inc 10,102 638,345 0.39
Global Payments Inc 232 41,199 0.03
Graham Holdings Co 40 16,164 0.01
H&R Block Inc 2,430 39,585 0.02
Hain Celestial Group Inc/The 864 29,635 0.02
HCA Healthcare Inc 1,897 236,518 0.14
Henry Schein Inc 1,241 72,946 0.04
Hershey Co/The 661 94,748 0.06
Hertz Global Holdings Inc 5,388 5,981 0.00
Hill-Rom Holdings Inc 292 24,385 0.02
Hologic Inc 1,103 73,316 0.04
Hormel Foods Corp 1,456 71,184 0.04
Humana Inc 974 403,129 0.24
ICON Plc 170 32,485 0.02
IHS Markit Ltd 1,001 78,588 0.05
Illumina Inc 224 69,234 0.04
Ingredion Inc 748 56,609 0.03
Intuitive Surgical Inc 134 95,078 0.06
IQVIA Holdings Inc 642 101,198 0.06
J M Smucker Co/The 1,174 135,620 0.08
Jazz Pharmaceuticals Plc 313 44,631 0.03
Johnson & Johnson 14,213 2,116,031 1.28
Kellogg Co 2,064 133,314 0.08
Keurig Dr Pepper Inc 1,370 37,812 0.02
Kimberly-Clark Corp 2,054 303,294 0.18
Kraft Heinz Co/The 12,592 377,130 0.23
Kroger Co/The 20,642 699,970 0.42
Laboratory Corp of America Holdings 734 138,190 0.08
Lamb Weston Holdings Inc 325 21,538 0.01
Laureate Education Inc 1,280 16,998 0.01
Macquarie Infrastructure Corp 1,347 36,221 0.02
Magellan Health Inc 505 38,269 0.02
Mallinckrodt Plc 9,549 9,294 0.01
ManpowerGroup Inc 1,363 99,949 0.06
McCormick & Co Inc/MD 430 83,463 0.05
McKesson Corp 5,278 786,053 0.48
MEDNAX Inc 2,693 43,842 0.03
Medtronic Plc 6,965 723,803 0.44
Merck & Co Inc 13,935 1,155,908 0.70
Molina Healthcare Inc 740 135,450 0.08
Molson Coors Beverage Co 2,556 85,779 0.05
Mondelez International Inc 8,006 459,945 0.28
Monster Beverage Corp 738 59,188 0.04
Moody's Corp 267 77,390 0.05
Mylan NV 9,982 148,033 0.09
Nielsen Holdings Plc 5,452 77,309 0.05
Nomad Foods Ltd 1,590 40,513 0.02
Owens & Minor Inc 6,170 154,929 0.09
Patterson Cos Inc 1,611 38,833 0.02
PayPal Holdings Inc 1,925 379,283 0.23
PepsiCo Inc 7,455 1,033,263 0.63
Performance Food Group Co 1,572 54,423 0.03
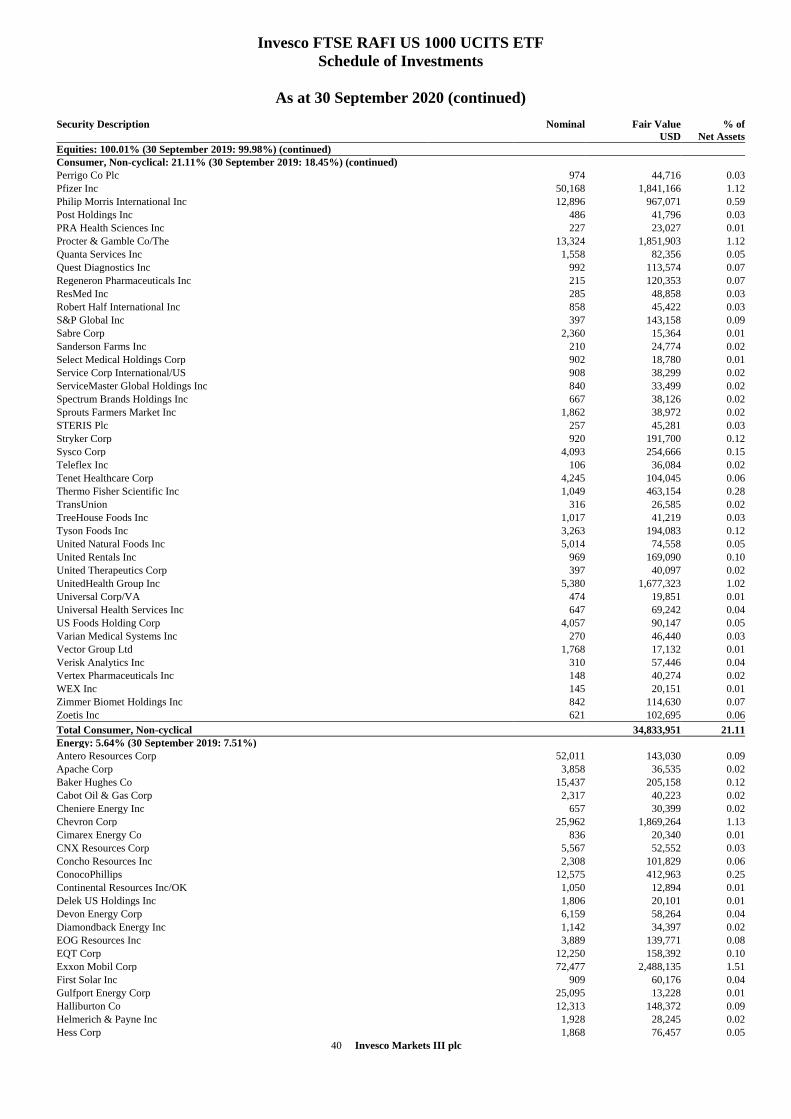
40 Invesco Markets III plc
Invesco FTSE RAFI US 1000 UCITS ETF
Schedule of Investments
As at 30 September 2020 (continued)
Security Description
Nominal Fair Value
USD
% of
Net Assets
Equities: 100.01% (30 September 2019: 99.98%) (continued)
Consumer, Non-cyclical: 21.11% (30 September 2019: 18.45%) (continued)
Perrigo Co Plc 974 44,716 0.03
Pfizer Inc 50,168 1,841,166 1.12
Philip Morris International Inc 12,896 967,071 0.59
Post Holdings Inc 486 41,796 0.03
PRA Health Sciences Inc 227 23,027 0.01
Procter & Gamble Co/The 13,324 1,851,903 1.12
Quanta Services Inc 1,558 82,356 0.05
Quest Diagnostics Inc 992 113,574 0.07
Regeneron Pharmaceuticals Inc 215 120,353 0.07
ResMed Inc 285 48,858 0.03
Robert Half International Inc 858 45,422 0.03
S&P Global Inc 397 143,158 0.09
Sabre Corp 2,360 15,364 0.01
Sanderson Farms Inc 210 24,774 0.02
Select Medical Holdings Corp 902 18,780 0.01
Service Corp International/US 908 38,299 0.02
ServiceMaster Global Holdings Inc 840 33,499 0.02
Spectrum Brands Holdings Inc 667 38,126 0.02
Sprouts Farmers Market Inc 1,862 38,972 0.02
STERIS Plc 257 45,281 0.03
Stryker Corp 920 191,700 0.12
Sysco Corp 4,093 254,666 0.15
Teleflex Inc 106 36,084 0.02
Tenet Healthcare Corp 4,245 104,045 0.06
Thermo Fisher Scientific Inc 1,049 463,154 0.28
TransUnion 316 26,585 0.02
TreeHouse Foods Inc 1,017 41,219 0.03
Tyson Foods Inc 3,263 194,083 0.12
United Natural Foods Inc 5,014 74,558 0.05
United Rentals Inc 969 169,090 0.10
United Therapeutics Corp 397 40,097 0.02
UnitedHealth Group Inc 5,380 1,677,323 1.02
Universal Corp/VA 474 19,851 0.01
Universal Health Services Inc 647 69,242 0.04
US Foods Holding Corp 4,057 90,147 0.05
Varian Medical Systems Inc 270 46,440 0.03
Vector Group Ltd 1,768 17,132 0.01
Verisk Analytics Inc 310 57,446 0.04
Vertex Pharmaceuticals Inc 148 40,274 0.02
WEX Inc 145 20,151 0.01
Zimmer Biomet Holdings Inc 842 114,630 0.07
Zoetis Inc 621 102,695 0.06
Total Consumer, Non-cyclical 34,833,951 21.11
Energy: 5.64% (30 September 2019: 7.51%)
Antero Resources Corp 52,011 143,030 0.09
Apache Corp 3,858 36,535 0.02
Baker Hughes Co 15,437 205,158 0.12
Cabot Oil & Gas Corp 2,317 40,223 0.02
Cheniere Energy Inc 657 30,399 0.02
Chevron Corp 25,962 1,869,264 1.13
Cimarex Energy Co 836 20,340 0.01
CNX Resources Corp 5,567 52,552 0.03
Concho Resources Inc 2,308 101,829 0.06
ConocoPhillips 12,575 412,963 0.25
Continental Resources Inc/OK 1,050 12,894 0.01
Delek US Holdings Inc 1,806 20,101 0.01
Devon Energy Corp 6,159 58,264 0.04
Diamondback Energy Inc 1,142 34,397 0.02
EOG Resources Inc 3,889 139,771 0.08
EQT Corp 12,250 158,392 0.10
Exxon Mobil Corp 72,477 2,488,135 1.51
First Solar Inc 909 60,176 0.04
Gulfport Energy Corp 25,095 13,228 0.01
Halliburton Co 12,313 148,372 0.09
Helmerich & Payne Inc 1,928 28,245 0.02
Hess Corp 1,868 76,457 0.05
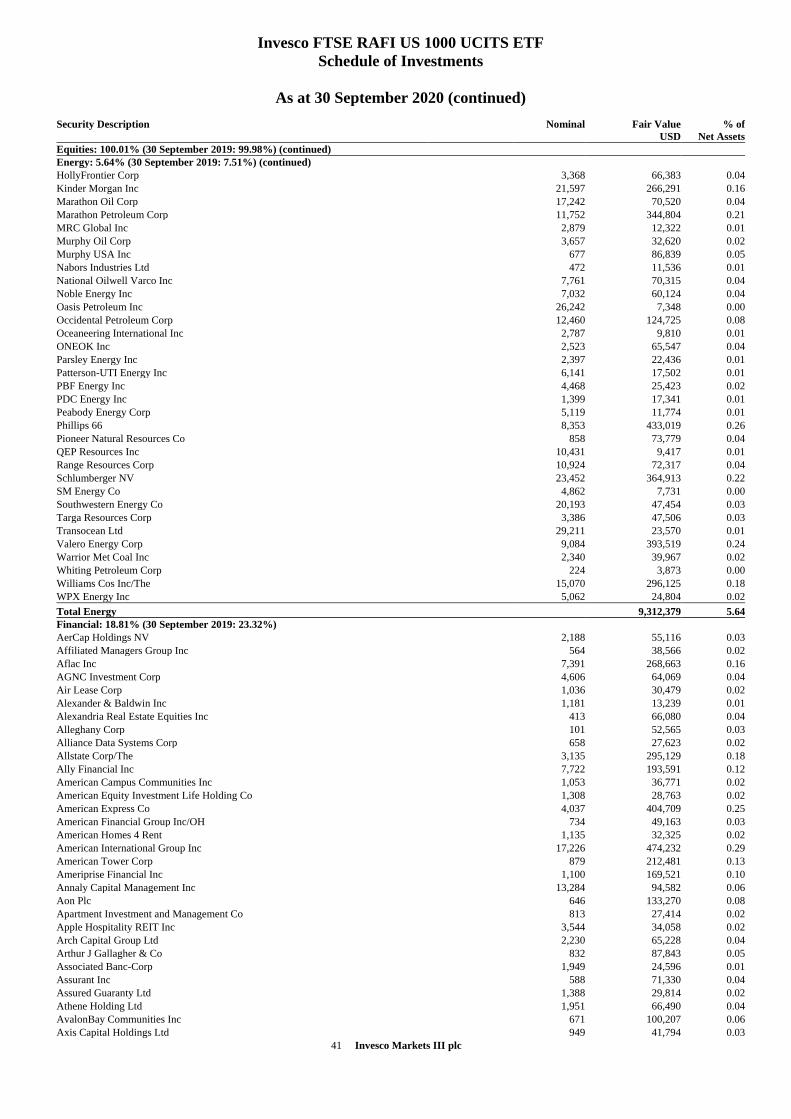
41 Invesco Markets III plc
Invesco FTSE RAFI US 1000 UCITS ETF
Schedule of Investments
As at 30 September 2020 (continued)
Security Description
Nominal Fair Value
USD
% of
Net Assets
Equities: 100.01% (30 September 2019: 99.98%) (continued)
Energy: 5.64% (30 September 2019: 7.51%) (continued)
HollyFrontier Corp 3,368 66,383 0.04
Kinder Morgan Inc 21,597 266,291 0.16
Marathon Oil Corp 17,242 70,520 0.04
Marathon Petroleum Corp 11,752 344,804 0.21
MRC Global Inc 2,879 12,322 0.01
Murphy Oil Corp 3,657 32,620 0.02
Murphy USA Inc 677 86,839 0.05
Nabors Industries Ltd 472 11,536 0.01
National Oilwell Varco Inc 7,761 70,315 0.04
Noble Energy Inc 7,032 60,124 0.04
Oasis Petroleum Inc 26,242 7,348 0.00
Occidental Petroleum Corp 12,460 124,725 0.08
Oceaneering International Inc 2,787 9,810 0.01
ONEOK Inc 2,523 65,547 0.04
Parsley Energy Inc 2,397 22,436 0.01
Patterson-UTI Energy Inc 6,141 17,502 0.01
PBF Energy Inc 4,468 25,423 0.02
PDC Energy Inc 1,399 17,341 0.01
Peabody Energy Corp 5,119 11,774 0.01
Phillips 66 8,353 433,019 0.26
Pioneer Natural Resources Co 858 73,779 0.04
QEP Resources Inc 10,431 9,417 0.01
Range Resources Corp 10,924 72,317 0.04
Schlumberger NV 23,452 364,913 0.22
SM Energy Co 4,862 7,731 0.00
Southwestern Energy Co 20,193 47,454 0.03
Targa Resources Corp 3,386 47,506 0.03
Transocean Ltd 29,211 23,570 0.01
Valero Energy Corp 9,084 393,519 0.24
Warrior Met Coal Inc 2,340 39,967 0.02
Whiting Petroleum Corp 224 3,873 0.00
Williams Cos Inc/The 15,070 296,125 0.18
WPX Energy Inc 5,062 24,804 0.02
Total Energy 9,312,379 5.64
Financial: 18.81% (30 September 2019: 23.32%)
AerCap Holdings NV 2,188 55,116 0.03
Affiliated Managers Group Inc 564 38,566 0.02
Aflac Inc 7,391 268,663 0.16
AGNC Investment Corp 4,606 64,069 0.04
Air Lease Corp 1,036 30,479 0.02
Alexander & Baldwin Inc 1,181 13,239 0.01
Alexandria Real Estate Equities Inc 413 66,080 0.04
Alleghany Corp 101 52,565 0.03
Alliance Data Systems Corp 658 27,623 0.02
Allstate Corp/The 3,135 295,129 0.18
Ally Financial Inc 7,722 193,591 0.12
American Campus Communities Inc 1,053 36,771 0.02
American Equity Investment Life Holding Co 1,308 28,763 0.02
American Express Co 4,037 404,709 0.25
American Financial Group Inc/OH 734 49,163 0.03
American Homes 4 Rent 1,135 32,325 0.02
American International Group Inc 17,226 474,232 0.29
American Tower Corp 879 212,481 0.13
Ameriprise Financial Inc 1,100 169,521 0.10
Annaly Capital Management Inc 13,284 94,582 0.06
Aon Plc 646 133,270 0.08
Apartment Investment and Management Co 813 27,414 0.02
Apple Hospitality REIT Inc 3,544 34,058 0.02
Arch Capital Group Ltd 2,230 65,228 0.04
Arthur J Gallagher & Co 832 87,843 0.05
Associated Banc-Corp 1,949 24,596 0.01
Assurant Inc 588 71,330 0.04
Assured Guaranty Ltd 1,388 29,814 0.02
Athene Holding Ltd 1,951 66,490 0.04
AvalonBay Communities Inc 671 100,207 0.06
Axis Capital Holdings Ltd 949 41,794 0.03
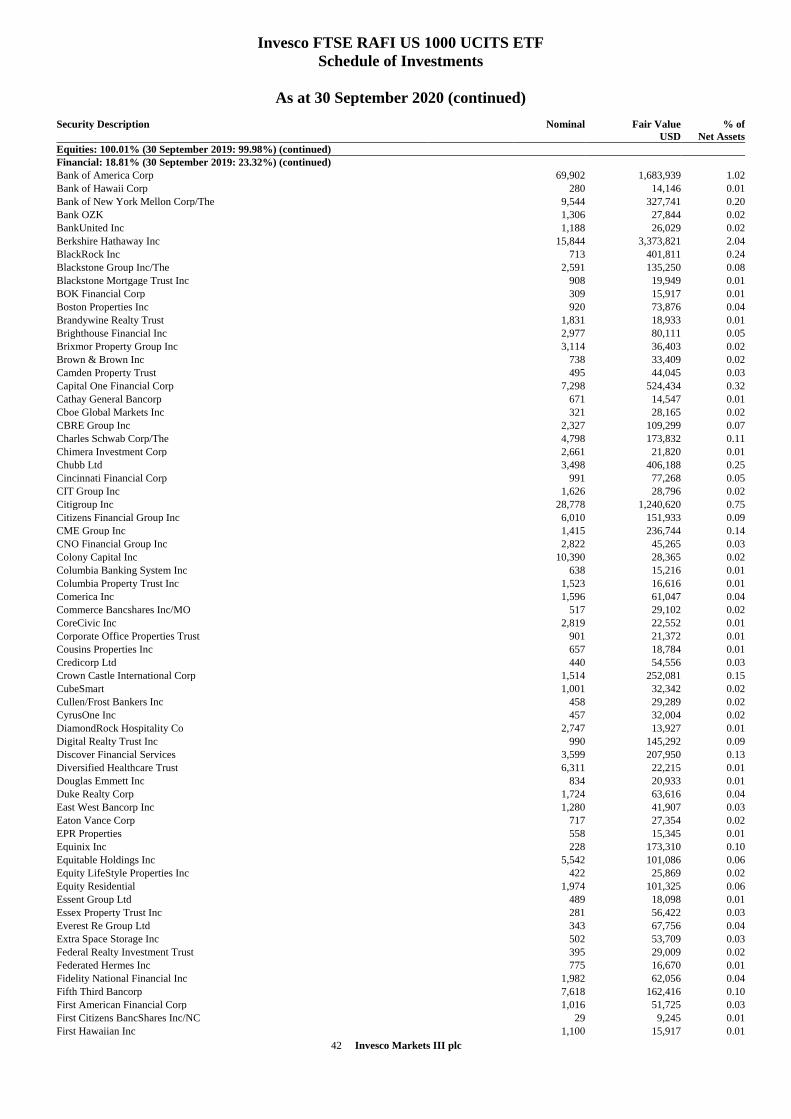
42 Invesco Markets III plc
Invesco FTSE RAFI US 1000 UCITS ETF
Schedule of Investments
As at 30 September 2020 (continued)
Security Description
Nominal Fair Value
USD
% of
Net Assets
Equities: 100.01% (30 September 2019: 99.98%) (continued)
Financial: 18.81% (30 September 2019: 23.32%) (continued)
Bank of America Corp 69,902 1,683,939 1.02
Bank of Hawaii Corp 280 14,146 0.01
Bank of New York Mellon Corp/The 9,544 327,741 0.20
Bank OZK 1,306 27,844 0.02
BankUnited Inc 1,188 26,029 0.02
Berkshire Hathaway Inc 15,844 3,373,821 2.04
BlackRock Inc 713 401,811 0.24
Blackstone Group Inc/The 2,591 135,250 0.08
Blackstone Mortgage Trust Inc 908 19,949 0.01
BOK Financial Corp 309 15,917 0.01
Boston Properties Inc 920 73,876 0.04
Brandywine Realty Trust 1,831 18,933 0.01
Brighthouse Financial Inc 2,977 80,111 0.05
Brixmor Property Group Inc 3,114 36,403 0.02
Brown & Brown Inc 738 33,409 0.02
Camden Property Trust 495 44,045 0.03
Capital One Financial Corp 7,298 524,434 0.32
Cathay General Bancorp 671 14,547 0.01
Cboe Global Markets Inc 321 28,165 0.02
CBRE Group Inc 2,327 109,299 0.07
Charles Schwab Corp/The 4,798 173,832 0.11
Chimera Investment Corp 2,661 21,820 0.01
Chubb Ltd 3,498 406,188 0.25
Cincinnati Financial Corp 991 77,268 0.05
CIT Group Inc 1,626 28,796 0.02
Citigroup Inc 28,778 1,240,620 0.75
Citizens Financial Group Inc 6,010 151,933 0.09
CME Group Inc 1,415 236,744 0.14
CNO Financial Group Inc 2,822 45,265 0.03
Colony Capital Inc 10,390 28,365 0.02
Columbia Banking System Inc 638 15,216 0.01
Columbia Property Trust Inc 1,523 16,616 0.01
Comerica Inc 1,596 61,047 0.04
Commerce Bancshares Inc/MO 517 29,102 0.02
CoreCivic Inc 2,819 22,552 0.01
Corporate Office Properties Trust 901 21,372 0.01
Cousins Properties Inc 657 18,784 0.01
Credicorp Ltd 440 54,556 0.03
Crown Castle International Corp 1,514 252,081 0.15
CubeSmart 1,001 32,342 0.02
Cullen/Frost Bankers Inc 458 29,289 0.02
CyrusOne Inc 457 32,004 0.02
DiamondRock Hospitality Co 2,747 13,927 0.01
Digital Realty Trust Inc 990 145,292 0.09
Discover Financial Services 3,599 207,950 0.13
Diversified Healthcare Trust 6,311 22,215 0.01
Douglas Emmett Inc 834 20,933 0.01
Duke Realty Corp 1,724 63,616 0.04
East West Bancorp Inc 1,280 41,907 0.03
Eaton Vance Corp 717 27,354 0.02
EPR Properties 558 15,345 0.01
Equinix Inc 228 173,310 0.10
Equitable Holdings Inc 5,542 101,086 0.06
Equity LifeStyle Properties Inc 422 25,869 0.02
Equity Residential 1,974 101,325 0.06
Essent Group Ltd 489 18,098 0.01
Essex Property Trust Inc 281 56,422 0.03
Everest Re Group Ltd 343 67,756 0.04
Extra Space Storage Inc 502 53,709 0.03
Federal Realty Investment Trust 395 29,009 0.02
Federated Hermes Inc 775 16,670 0.01
Fidelity National Financial Inc 1,982 62,056 0.04
Fifth Third Bancorp 7,618 162,416 0.10
First American Financial Corp 1,016 51,725 0.03
First Citizens BancShares Inc/NC 29 9,245 0.01
First Hawaiian Inc 1,100 15,917 0.01
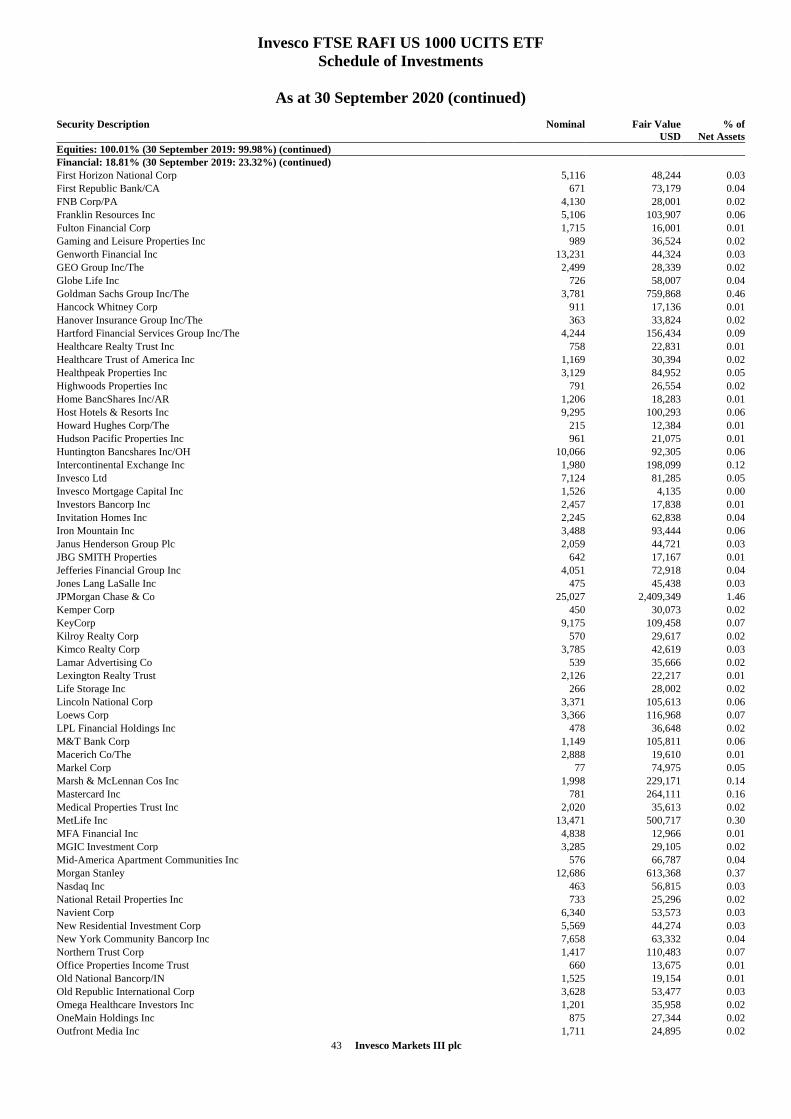
43 Invesco Markets III plc
Invesco FTSE RAFI US 1000 UCITS ETF
Schedule of Investments
As at 30 September 2020 (continued)
Security Description
Nominal Fair Value
USD
% of
Net Assets
Equities: 100.01% (30 September 2019: 99.98%) (continued)
Financial: 18.81% (30 September 2019: 23.32%) (continued)
First Horizon National Corp 5,116 48,244 0.03
First Republic Bank/CA 671 73,179 0.04
FNB Corp/PA 4,130 28,001 0.02
Franklin Resources Inc 5,106 103,907 0.06
Fulton Financial Corp 1,715 16,001 0.01
Gaming and Leisure Properties Inc 989 36,524 0.02
Genworth Financial Inc 13,231 44,324 0.03
GEO Group Inc/The 2,499 28,339 0.02
Globe Life Inc 726 58,007 0.04
Goldman Sachs Group Inc/The 3,781 759,868 0.46
Hancock Whitney Corp 911 17,136 0.01
Hanover Insurance Group Inc/The 363 33,824 0.02
Hartford Financial Services Group Inc/The 4,244 156,434 0.09
Healthcare Realty Trust Inc 758 22,831 0.01
Healthcare Trust of America Inc 1,169 30,394 0.02
Healthpeak Properties Inc 3,129 84,952 0.05
Highwoods Properties Inc 791 26,554 0.02
Home BancShares Inc/AR 1,206 18,283 0.01
Host Hotels & Resorts Inc 9,295 100,293 0.06
Howard Hughes Corp/The 215 12,384 0.01
Hudson Pacific Properties Inc 961 21,075 0.01
Huntington Bancshares Inc/OH 10,066 92,305 0.06
Intercontinental Exchange Inc 1,980 198,099 0.12
Invesco Ltd 7,124 81,285 0.05
Invesco Mortgage Capital Inc 1,526 4,135 0.00
Investors Bancorp Inc 2,457 17,838 0.01
Invitation Homes Inc 2,245 62,838 0.04
Iron Mountain Inc 3,488 93,444 0.06
Janus Henderson Group Plc 2,059 44,721 0.03
JBG SMITH Properties 642 17,167 0.01
Jefferies Financial Group Inc 4,051 72,918 0.04
Jones Lang LaSalle Inc 475 45,438 0.03
JPMorgan Chase & Co 25,027 2,409,349 1.46
Kemper Corp 450 30,073 0.02
KeyCorp 9,175 109,458 0.07
Kilroy Realty Corp 570 29,617 0.02
Kimco Realty Corp 3,785 42,619 0.03
Lamar Advertising Co 539 35,666 0.02
Lexington Realty Trust 2,126 22,217 0.01
Life Storage Inc 266 28,002 0.02
Lincoln National Corp 3,371 105,613 0.06
Loews Corp 3,366 116,968 0.07
LPL Financial Holdings Inc 478 36,648 0.02
M&T Bank Corp 1,149 105,811 0.06
Macerich Co/The 2,888 19,610 0.01
Markel Corp 77 74,975 0.05
Marsh & McLennan Cos Inc 1,998 229,171 0.14
Mastercard Inc 781 264,111 0.16
Medical Properties Trust Inc 2,020 35,613 0.02
MetLife Inc 13,471 500,717 0.30
MFA Financial Inc 4,838 12,966 0.01
MGIC Investment Corp 3,285 29,105 0.02
Mid-America Apartment Communities Inc 576 66,787 0.04
Morgan Stanley 12,686 613,368 0.37
Nasdaq Inc 463 56,815 0.03
National Retail Properties Inc 733 25,296 0.02
Navient Corp 6,340 53,573 0.03
New Residential Investment Corp 5,569 44,274 0.03
New York Community Bancorp Inc 7,658 63,332 0.04
Northern Trust Corp 1,417 110,483 0.07
Office Properties Income Trust 660 13,675 0.01
Old National Bancorp/IN 1,525 19,154 0.01
Old Republic International Corp 3,628 53,477 0.03
Omega Healthcare Investors Inc 1,201 35,958 0.02
OneMain Holdings Inc 875 27,344 0.02
Outfront Media Inc 1,711 24,895 0.02
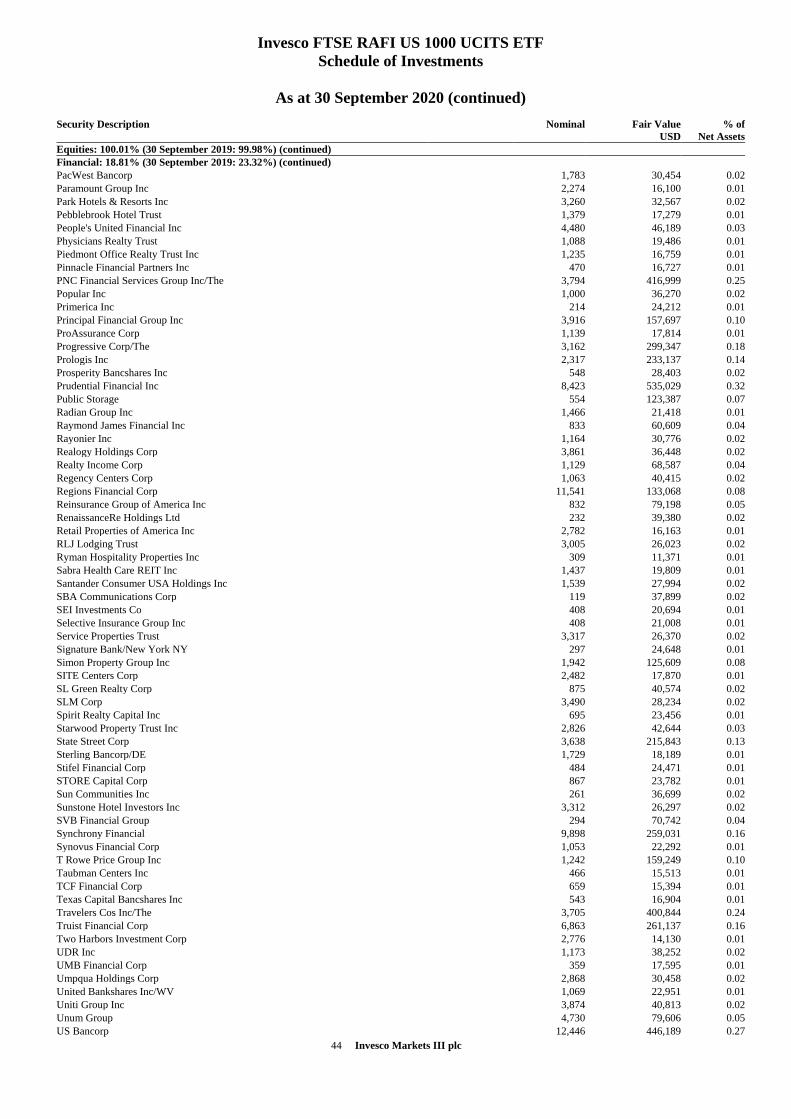
44 Invesco Markets III plc
Invesco FTSE RAFI US 1000 UCITS ETF
Schedule of Investments
As at 30 September 2020 (continued)
Security Description
Nominal Fair Value
USD
% of
Net Assets
Equities: 100.01% (30 September 2019: 99.98%) (continued)
Financial: 18.81% (30 September 2019: 23.32%) (continued)
PacWest Bancorp 1,783 30,454 0.02
Paramount Group Inc 2,274 16,100 0.01
Park Hotels & Resorts Inc 3,260 32,567 0.02
Pebblebrook Hotel Trust 1,379 17,279 0.01
People's United Financial Inc 4,480 46,189 0.03
Physicians Realty Trust 1,088 19,486 0.01
Piedmont Office Realty Trust Inc 1,235 16,759 0.01
Pinnacle Financial Partners Inc 470 16,727 0.01
PNC Financial Services Group Inc/The 3,794 416,999 0.25
Popular Inc 1,000 36,270 0.02
Primerica Inc 214 24,212 0.01
Principal Financial Group Inc 3,916 157,697 0.10
ProAssurance Corp 1,139 17,814 0.01
Progressive Corp/The 3,162 299,347 0.18
Prologis Inc 2,317 233,137 0.14
Prosperity Bancshares Inc 548 28,403 0.02
Prudential Financial Inc 8,423 535,029 0.32
Public Storage 554 123,387 0.07
Radian Group Inc 1,466 21,418 0.01
Raymond James Financial Inc 833 60,609 0.04
Rayonier Inc 1,164 30,776 0.02
Realogy Holdings Corp 3,861 36,448 0.02
Realty Income Corp 1,129 68,587 0.04
Regency Centers Corp 1,063 40,415 0.02
Regions Financial Corp 11,541 133,068 0.08
Reinsurance Group of America Inc 832 79,198 0.05
RenaissanceRe Holdings Ltd 232 39,380 0.02
Retail Properties of America Inc 2,782 16,163 0.01
RLJ Lodging Trust 3,005 26,023 0.02
Ryman Hospitality Properties Inc 309 11,371 0.01
Sabra Health Care REIT Inc 1,437 19,809 0.01
Santander Consumer USA Holdings Inc 1,539 27,994 0.02
SBA Communications Corp 119 37,899 0.02
SEI Investments Co 408 20,694 0.01
Selective Insurance Group Inc 408 21,008 0.01
Service Properties Trust 3,317 26,370 0.02
Signature Bank/New York NY 297 24,648 0.01
Simon Property Group Inc 1,942 125,609 0.08
SITE Centers Corp 2,482 17,870 0.01
SL Green Realty Corp 875 40,574 0.02
SLM Corp 3,490 28,234 0.02
Spirit Realty Capital Inc 695 23,456 0.01
Starwood Property Trust Inc 2,826 42,644 0.03
State Street Corp 3,638 215,843 0.13
Sterling Bancorp/DE 1,729 18,189 0.01
Stifel Financial Corp 484 24,471 0.01
STORE Capital Corp 867 23,782 0.01
Sun Communities Inc 261 36,699 0.02
Sunstone Hotel Investors Inc 3,312 26,297 0.02
SVB Financial Group 294 70,742 0.04
Synchrony Financial 9,898 259,031 0.16
Synovus Financial Corp 1,053 22,292 0.01
T Rowe Price Group Inc 1,242 159,249 0.10
Taubman Centers Inc 466 15,513 0.01
TCF Financial Corp 659 15,394 0.01
Texas Capital Bancshares Inc 543 16,904 0.01
Travelers Cos Inc/The 3,705 400,844 0.24
Truist Financial Corp 6,863 261,137 0.16
Two Harbors Investment Corp 2,776 14,130 0.01
UDR Inc 1,173 38,252 0.02
UMB Financial Corp 359 17,595 0.01
Umpqua Holdings Corp 2,868 30,458 0.02
United Bankshares Inc/WV 1,069 22,951 0.01
Uniti Group Inc 3,874 40,813 0.02
Unum Group 4,730 79,606 0.05
US Bancorp 12,446 446,189 0.27
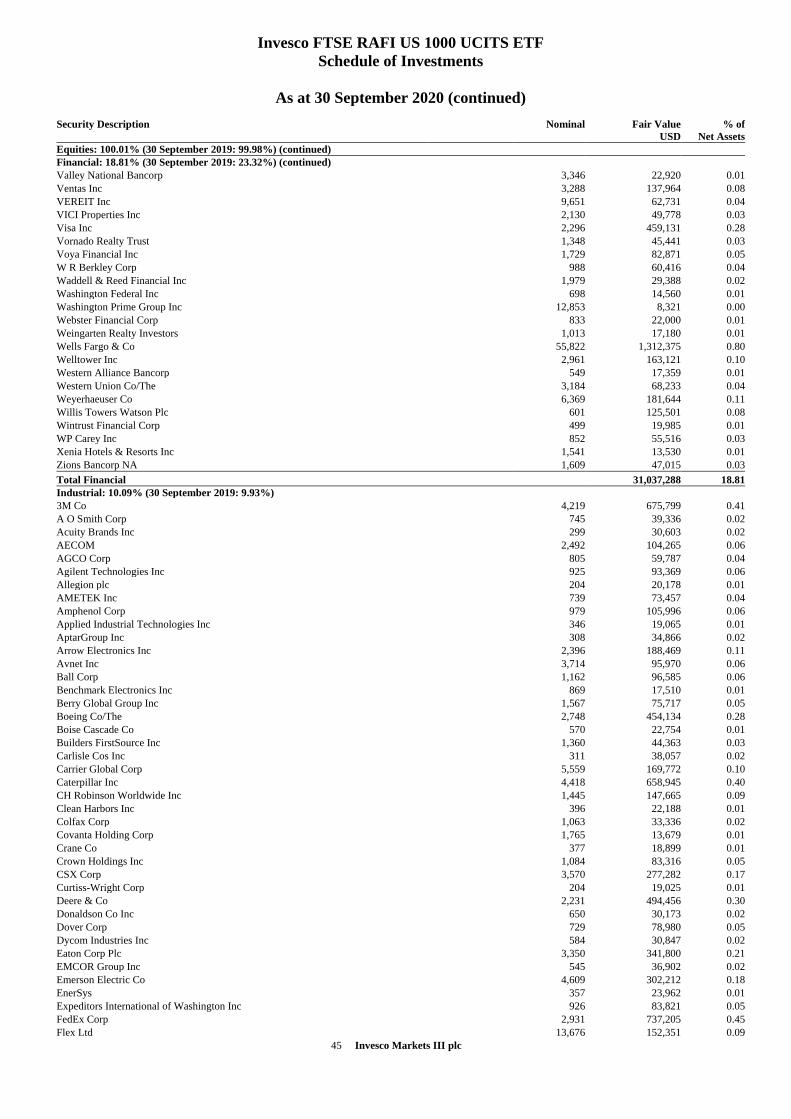
45 Invesco Markets III plc
Invesco FTSE RAFI US 1000 UCITS ETF
Schedule of Investments
As at 30 September 2020 (continued)
Security Description
Nominal Fair Value
USD
% of
Net Assets
Equities: 100.01% (30 September 2019: 99.98%) (continued)
Financial: 18.81% (30 September 2019: 23.32%) (continued)
Valley National Bancorp 3,346 22,920 0.01
Ventas Inc 3,288 137,964 0.08
VEREIT Inc 9,651 62,731 0.04
VICI Properties Inc 2,130 49,778 0.03
Visa Inc 2,296 459,131 0.28
Vornado Realty Trust 1,348 45,441 0.03
Voya Financial Inc 1,729 82,871 0.05
W R Berkley Corp 988 60,416 0.04
Waddell & Reed Financial Inc 1,979 29,388 0.02
Washington Federal Inc 698 14,560 0.01
Washington Prime Group Inc 12,853 8,321 0.00
Webster Financial Corp 833 22,000 0.01
Weingarten Realty Investors 1,013 17,180 0.01
Wells Fargo & Co 55,822 1,312,375 0.80
Welltower Inc 2,961 163,121 0.10
Western Alliance Bancorp 549 17,359 0.01
Western Union Co/The 3,184 68,233 0.04
Weyerhaeuser Co 6,369 181,644 0.11
Willis Towers Watson Plc 601 125,501 0.08
Wintrust Financial Corp 499 19,985 0.01
WP Carey Inc 852 55,516 0.03
Xenia Hotels & Resorts Inc 1,541 13,530 0.01
Zions Bancorp NA 1,609 47,015 0.03
Total Financial 31,037,288 18.81
Industrial: 10.09% (30 September 2019: 9.93%)
3M Co 4,219 675,799 0.41
A O Smith Corp 745 39,336 0.02
Acuity Brands Inc 299 30,603 0.02
AECOM 2,492 104,265 0.06
AGCO Corp 805 59,787 0.04
Agilent Technologies Inc 925 93,369 0.06
Allegion plc 204 20,178 0.01
AMETEK Inc 739 73,457 0.04
Amphenol Corp 979 105,996 0.06
Applied Industrial Technologies Inc 346 19,065 0.01
AptarGroup Inc 308 34,866 0.02
Arrow Electronics Inc 2,396 188,469 0.11
Avnet Inc 3,714 95,970 0.06
Ball Corp 1,162 96,585 0.06
Benchmark Electronics Inc 869 17,510 0.01
Berry Global Group Inc 1,567 75,717 0.05
Boeing Co/The 2,748 454,134 0.28
Boise Cascade Co 570 22,754 0.01
Builders FirstSource Inc 1,360 44,363 0.03
Carlisle Cos Inc 311 38,057 0.02
Carrier Global Corp 5,559 169,772 0.10
Caterpillar Inc 4,418 658,945 0.40
CH Robinson Worldwide Inc 1,445 147,665 0.09
Clean Harbors Inc 396 22,188 0.01
Colfax Corp 1,063 33,336 0.02
Covanta Holding Corp 1,765 13,679 0.01
Crane Co 377 18,899 0.01
Crown Holdings Inc 1,084 83,316 0.05
CSX Corp 3,570 277,282 0.17
Curtiss-Wright Corp 204 19,025 0.01
Deere & Co 2,231 494,456 0.30
Donaldson Co Inc 650 30,173 0.02
Dover Corp 729 78,980 0.05
Dycom Industries Inc 584 30,847 0.02
Eaton Corp Plc 3,350 341,800 0.21
EMCOR Group Inc 545 36,902 0.02
Emerson Electric Co 4,609 302,212 0.18
EnerSys 357 23,962 0.01
Expeditors International of Washington Inc 926 83,821 0.05
FedEx Corp 2,931 737,205 0.45
Flex Ltd 13,676 152,351 0.09
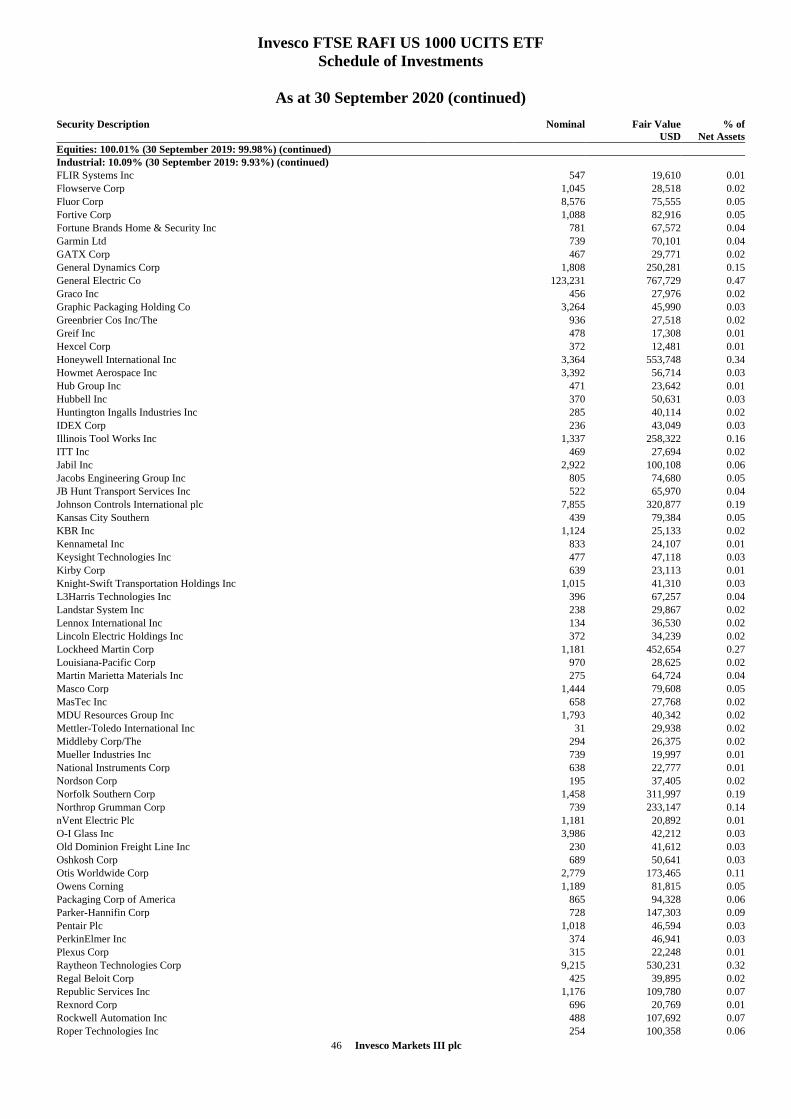
46 Invesco Markets III plc
Invesco FTSE RAFI US 1000 UCITS ETF
Schedule of Investments
As at 30 September 2020 (continued)
Security Description
Nominal Fair Value
USD
% of
Net Assets
Equities: 100.01% (30 September 2019: 99.98%) (continued)
Industrial: 10.09% (30 September 2019: 9.93%) (continued)
FLIR Systems Inc 547 19,610 0.01
Flowserve Corp 1,045 28,518 0.02
Fluor Corp 8,576 75,555 0.05
Fortive Corp 1,088 82,916 0.05
Fortune Brands Home & Security Inc 781 67,572 0.04
Garmin Ltd 739 70,101 0.04
GATX Corp 467 29,771 0.02
General Dynamics Corp 1,808 250,281 0.15
General Electric Co 123,231 767,729 0.47
Graco Inc 456 27,976 0.02
Graphic Packaging Holding Co 3,264 45,990 0.03
Greenbrier Cos Inc/The 936 27,518 0.02
Greif Inc 478 17,308 0.01
Hexcel Corp 372 12,481 0.01
Honeywell International Inc 3,364 553,748 0.34
Howmet Aerospace Inc 3,392 56,714 0.03
Hub Group Inc 471 23,642 0.01
Hubbell Inc 370 50,631 0.03
Huntington Ingalls Industries Inc 285 40,114 0.02
IDEX Corp 236 43,049 0.03
Illinois Tool Works Inc 1,337 258,322 0.16
ITT Inc 469 27,694 0.02
Jabil Inc 2,922 100,108 0.06
Jacobs Engineering Group Inc 805 74,680 0.05
JB Hunt Transport Services Inc 522 65,970 0.04
Johnson Controls International plc 7,855 320,877 0.19
Kansas City Southern 439 79,384 0.05
KBR Inc 1,124 25,133 0.02
Kennametal Inc 833 24,107 0.01
Keysight Technologies Inc 477 47,118 0.03
Kirby Corp 639 23,113 0.01
Knight-Swift Transportation Holdings Inc 1,015 41,310 0.03
L3Harris Technologies Inc 396 67,257 0.04
Landstar System Inc 238 29,867 0.02
Lennox International Inc 134 36,530 0.02
Lincoln Electric Holdings Inc 372 34,239 0.02
Lockheed Martin Corp 1,181 452,654 0.27
Louisiana-Pacific Corp 970 28,625 0.02
Martin Marietta Materials Inc 275 64,724 0.04
Masco Corp 1,444 79,608 0.05
MasTec Inc 658 27,768 0.02
MDU Resources Group Inc 1,793 40,342 0.02
Mettler-Toledo International Inc 31 29,938 0.02
Middleby Corp/The 294 26,375 0.02
Mueller Industries Inc 739 19,997 0.01
National Instruments Corp 638 22,777 0.01
Nordson Corp 195 37,405 0.02
Norfolk Southern Corp 1,458 311,997 0.19
Northrop Grumman Corp 739 233,147 0.14
nVent Electric Plc 1,181 20,892 0.01
O-I Glass Inc 3,986 42,212 0.03
Old Dominion Freight Line Inc 230 41,612 0.03
Oshkosh Corp 689 50,641 0.03
Otis Worldwide Corp 2,779 173,465 0.11
Owens Corning 1,189 81,815 0.05
Packaging Corp of America 865 94,328 0.06
Parker-Hannifin Corp 728 147,303 0.09
Pentair Plc 1,018 46,594 0.03
PerkinElmer Inc 374 46,941 0.03
Plexus Corp 315 22,248 0.01
Raytheon Technologies Corp 9,215 530,231 0.32
Regal Beloit Corp 425 39,895 0.02
Republic Services Inc 1,176 109,780 0.07
Rexnord Corp 696 20,769 0.01
Rockwell Automation Inc 488 107,692 0.07
Roper Technologies Inc 254 100,358 0.06
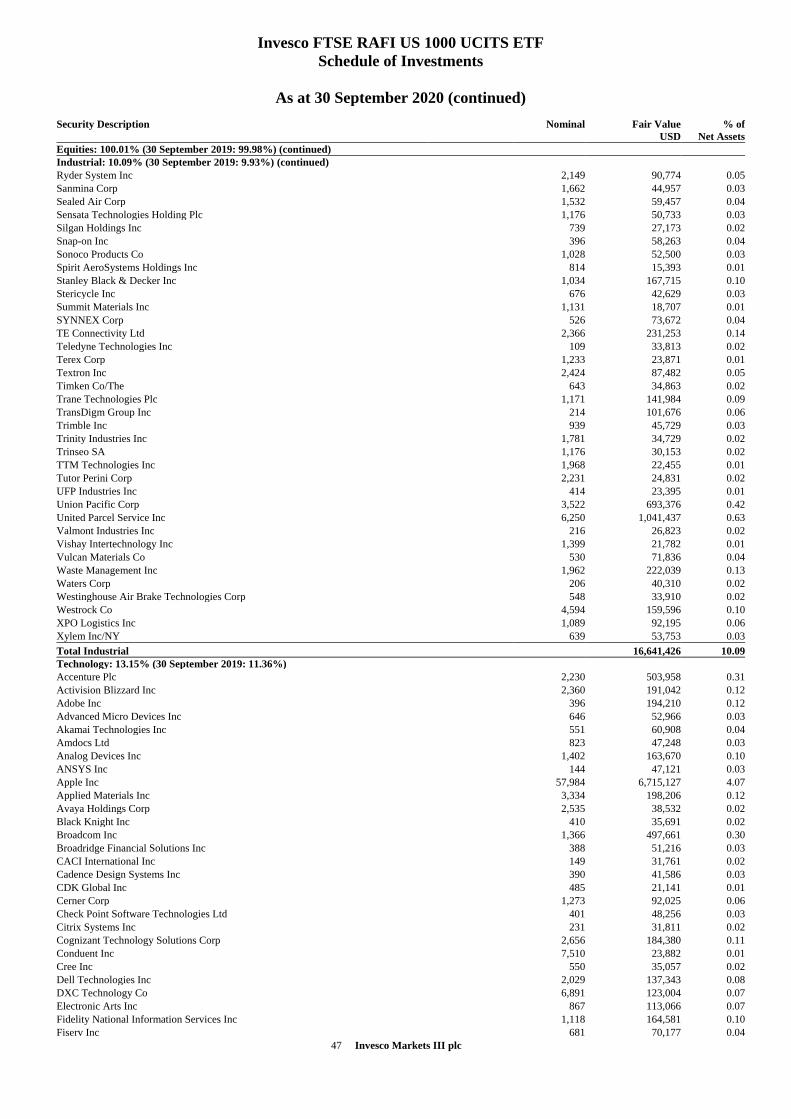
47 Invesco Markets III plc
Invesco FTSE RAFI US 1000 UCITS ETF
Schedule of Investments
As at 30 September 2020 (continued)
Security Description
Nominal Fair Value
USD
% of
Net Assets
Equities: 100.01% (30 September 2019: 99.98%) (continued)
Industrial: 10.09% (30 September 2019: 9.93%) (continued)
Ryder System Inc 2,149 90,774 0.05
Sanmina Corp 1,662 44,957 0.03
Sealed Air Corp 1,532 59,457 0.04
Sensata Technologies Holding Plc 1,176 50,733 0.03
Silgan Holdings Inc 739 27,173 0.02
Snap-on Inc 396 58,263 0.04
Sonoco Products Co 1,028 52,500 0.03
Spirit AeroSystems Holdings Inc 814 15,393 0.01
Stanley Black & Decker Inc 1,034 167,715 0.10
Stericycle Inc 676 42,629 0.03
Summit Materials Inc 1,131 18,707 0.01
SYNNEX Corp 526 73,672 0.04
TE Connectivity Ltd 2,366 231,253 0.14
Teledyne Technologies Inc 109 33,813 0.02
Terex Corp 1,233 23,871 0.01
Textron Inc 2,424 87,482 0.05
Timken Co/The 643 34,863 0.02
Trane Technologies Plc 1,171 141,984 0.09
TransDigm Group Inc 214 101,676 0.06
Trimble Inc 939 45,729 0.03
Trinity Industries Inc 1,781 34,729 0.02
Trinseo SA 1,176 30,153 0.02
TTM Technologies Inc 1,968 22,455 0.01
Tutor Perini Corp 2,231 24,831 0.02
UFP Industries Inc 414 23,395 0.01
Union Pacific Corp 3,522 693,376 0.42
United Parcel Service Inc 6,250 1,041,437 0.63
Valmont Industries Inc 216 26,823 0.02
Vishay Intertechnology Inc 1,399 21,782 0.01
Vulcan Materials Co 530 71,836 0.04
Waste Management Inc 1,962 222,039 0.13
Waters Corp 206 40,310 0.02
Westinghouse Air Brake Technologies Corp 548 33,910 0.02
Westrock Co 4,594 159,596 0.10
XPO Logistics Inc 1,089 92,195 0.06
Xylem Inc/NY 639 53,753 0.03
Total Industrial 16,641,426 10.09
Technology: 13.15% (30 September 2019: 11.36%)
Accenture Plc 2,230 503,958 0.31
Activision Blizzard Inc 2,360 191,042 0.12
Adobe Inc 396 194,210 0.12
Advanced Micro Devices Inc 646 52,966 0.03
Akamai Technologies Inc 551 60,908 0.04
Amdocs Ltd 823 47,248 0.03
Analog Devices Inc 1,402 163,670 0.10
ANSYS Inc 144 47,121 0.03
Apple Inc 57,984 6,715,127 4.07
Applied Materials Inc 3,334 198,206 0.12
Avaya Holdings Corp 2,535 38,532 0.02
Black Knight Inc 410 35,691 0.02
Broadcom Inc 1,366 497,661 0.30
Broadridge Financial Solutions Inc 388 51,216 0.03
CACI International Inc 149 31,761 0.02
Cadence Design Systems Inc 390 41,586 0.03
CDK Global Inc 485 21,141 0.01
Cerner Corp 1,273 92,025 0.06
Check Point Software Technologies Ltd 401 48,256 0.03
Citrix Systems Inc 231 31,811 0.02
Cognizant Technology Solutions Corp 2,656 184,380 0.11
Conduent Inc 7,510 23,882 0.01
Cree Inc 550 35,057 0.02
Dell Technologies Inc 2,029 137,343 0.08
DXC Technology Co 6,891 123,004 0.07
Electronic Arts Inc 867 113,066 0.07
Fidelity National Information Services Inc 1,118 164,581 0.10
Fiserv Inc 681 70,177 0.04
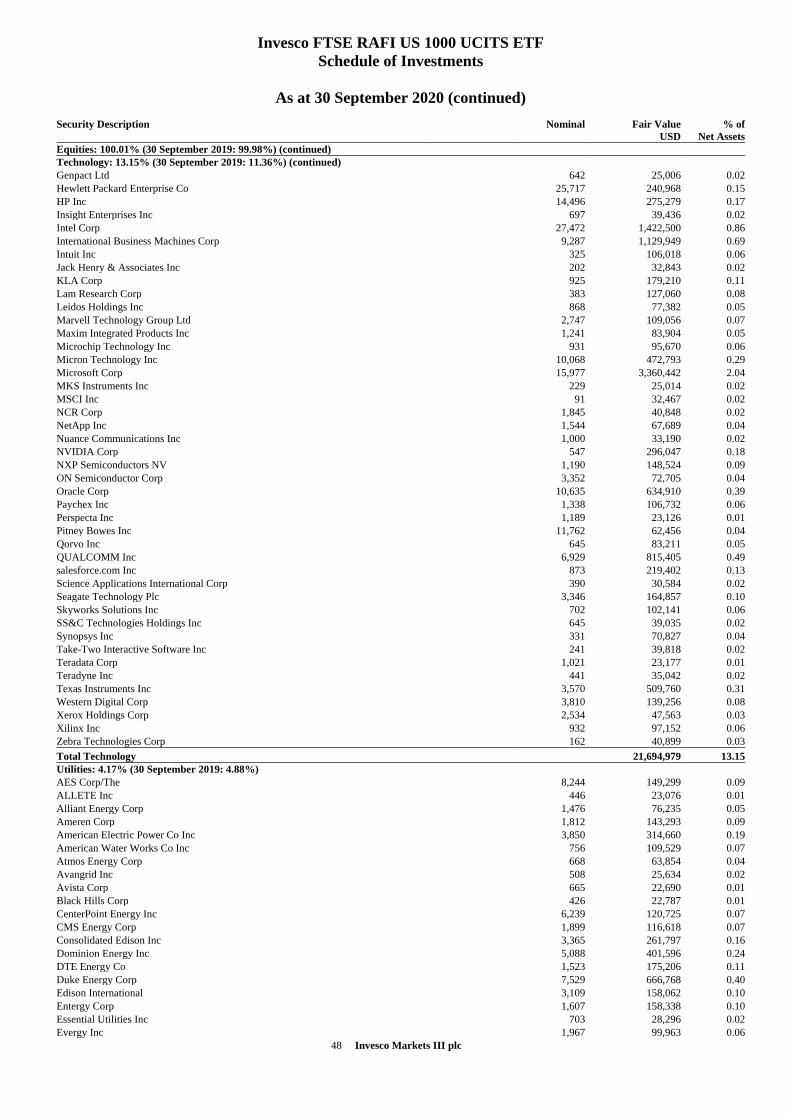
48 Invesco Markets III plc
Invesco FTSE RAFI US 1000 UCITS ETF
Schedule of Investments
As at 30 September 2020 (continued)
Security Description
Nominal Fair Value
USD
% of
Net Assets
Equities: 100.01% (30 September 2019: 99.98%) (continued)
Technology: 13.15% (30 September 2019: 11.36%) (continued)
Genpact Ltd 642 25,006 0.02
Hewlett Packard Enterprise Co 25,717 240,968 0.15
HP Inc 14,496 275,279 0.17
Insight Enterprises Inc 697 39,436 0.02
Intel Corp 27,472 1,422,500 0.86
International Business Machines Corp 9,287 1,129,949 0.69
Intuit Inc 325 106,018 0.06
Jack Henry & Associates Inc 202 32,843 0.02
KLA Corp 925 179,210 0.11
Lam Research Corp 383 127,060 0.08
Leidos Holdings Inc 868 77,382 0.05
Marvell Technology Group Ltd 2,747 109,056 0.07
Maxim Integrated Products Inc 1,241 83,904 0.05
Microchip Technology Inc 931 95,670 0.06
Micron Technology Inc 10,068 472,793 0.29
Microsoft Corp 15,977 3,360,442 2.04
MKS Instruments Inc 229 25,014 0.02
MSCI Inc 91 32,467 0.02
NCR Corp 1,845 40,848 0.02
NetApp Inc 1,544 67,689 0.04
Nuance Communications Inc 1,000 33,190 0.02
NVIDIA Corp 547 296,047 0.18
NXP Semiconductors NV 1,190 148,524 0.09
ON Semiconductor Corp 3,352 72,705 0.04
Oracle Corp 10,635 634,910 0.39
Paychex Inc 1,338 106,732 0.06
Perspecta Inc 1,189 23,126 0.01
Pitney Bowes Inc 11,762 62,456 0.04
Qorvo Inc 645 83,211 0.05
QUALCOMM Inc 6,929 815,405 0.49
salesforce.com Inc 873 219,402 0.13
Science Applications International Corp 390 30,584 0.02
Seagate Technology Plc 3,346 164,857 0.10
Skyworks Solutions Inc 702 102,141 0.06
SS&C Technologies Holdings Inc 645 39,035 0.02
Synopsys Inc 331 70,827 0.04
Take-Two Interactive Software Inc 241 39,818 0.02
Teradata Corp 1,021 23,177 0.01
Teradyne Inc 441 35,042 0.02
Texas Instruments Inc 3,570 509,760 0.31
Western Digital Corp 3,810 139,256 0.08
Xerox Holdings Corp 2,534 47,563 0.03
Xilinx Inc 932 97,152 0.06
Zebra Technologies Corp 162 40,899 0.03
Total Technology 21,694,979 13.15
Utilities: 4.17% (30 September 2019: 4.88%)
AES Corp/The 8,244 149,299 0.09
ALLETE Inc 446 23,076 0.01
Alliant Energy Corp 1,476 76,235 0.05
Ameren Corp 1,812 143,293 0.09
American Electric Power Co Inc 3,850 314,660 0.19
American Water Works Co Inc 756 109,529 0.07
Atmos Energy Corp 668 63,854 0.04
Avangrid Inc 508 25,634 0.02
Avista Corp 665 22,690 0.01
Black Hills Corp 426 22,787 0.01
CenterPoint Energy Inc 6,239 120,725 0.07
CMS Energy Corp 1,899 116,618 0.07
Consolidated Edison Inc 3,365 261,797 0.16
Dominion Energy Inc 5,088 401,596 0.24
DTE Energy Co 1,523 175,206 0.11
Duke Energy Corp 7,529 666,768 0.40
Edison International 3,109 158,062 0.10
Entergy Corp 1,607 158,338 0.10
Essential Utilities Inc 703 28,296 0.02
Evergy Inc 1,967 99,963 0.06
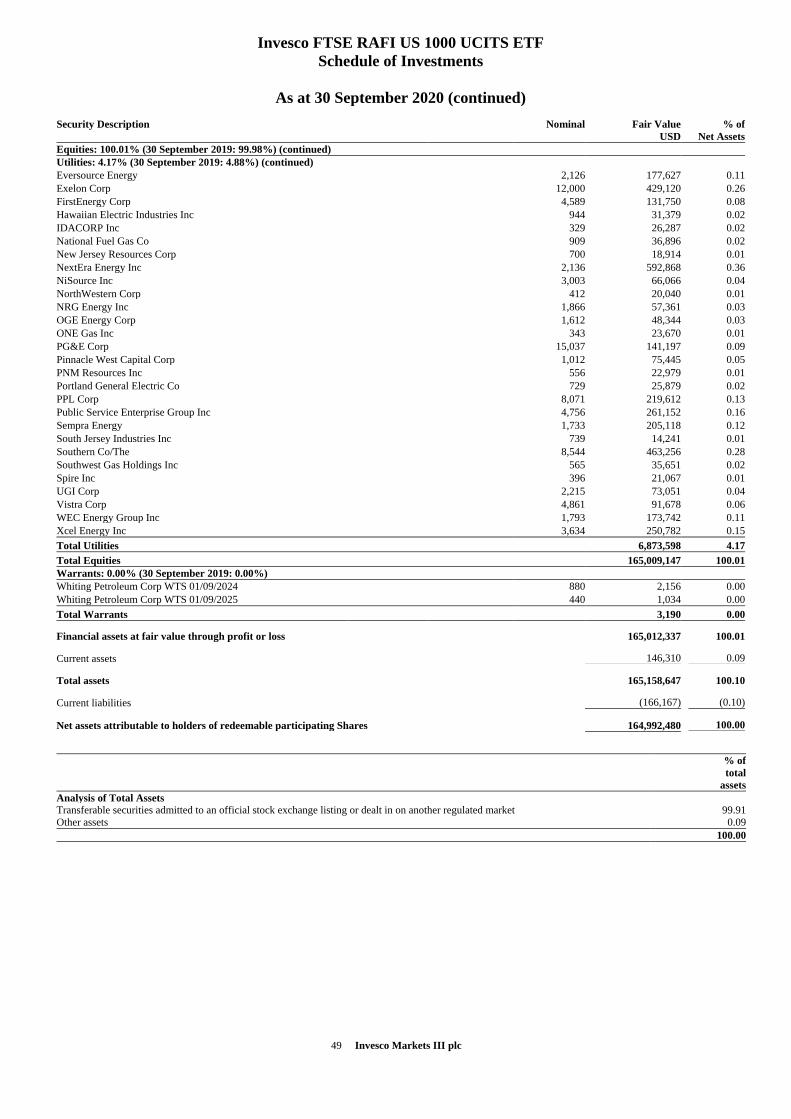
49 Invesco Markets III plc
Invesco FTSE RAFI US 1000 UCITS ETF
Schedule of Investments
As at 30 September 2020 (continued)
Security Description
Nominal Fair Value
USD
% of
Net Assets
Equities: 100.01% (30 September 2019: 99.98%) (continued)
Utilities: 4.17% (30 September 2019: 4.88%) (continued)
Eversource Energy 2,126 177,627 0.11
Exelon Corp 12,000 429,120 0.26
FirstEnergy Corp 4,589 131,750 0.08
Hawaiian Electric Industries Inc 944 31,379 0.02
IDACORP Inc 329 26,287 0.02
National Fuel Gas Co 909 36,896 0.02
New Jersey Resources Corp 700 18,914 0.01
NextEra Energy Inc 2,136 592,868 0.36
NiSource Inc 3,003 66,066 0.04
NorthWestern Corp 412 20,040 0.01
NRG Energy Inc 1,866 57,361 0.03
OGE Energy Corp 1,612 48,344 0.03
ONE Gas Inc 343 23,670 0.01
PG&E Corp 15,037 141,197 0.09
Pinnacle West Capital Corp 1,012 75,445 0.05
PNM Resources Inc 556 22,979 0.01
Portland General Electric Co 729 25,879 0.02
PPL Corp 8,071 219,612 0.13
Public Service Enterprise Group Inc 4,756 261,152 0.16
Sempra Energy 1,733 205,118 0.12
South Jersey Industries Inc 739 14,241 0.01
Southern Co/The 8,544 463,256 0.28
Southwest Gas Holdings Inc 565 35,651 0.02
Spire Inc 396 21,067 0.01
UGI Corp 2,215 73,051 0.04
Vistra Corp 4,861 91,678 0.06
WEC Energy Group Inc 1,793 173,742 0.11
Xcel Energy Inc 3,634 250,782 0.15
Total Utilities 6,873,598 4.17
Total Equities 165,009,147 100.01
Warrants: 0.00% (30 September 2019: 0.00%)
Whiting Petroleum Corp WTS 01/09/2024 880 2,156 0.00
Whiting Petroleum Corp WTS 01/09/2025 440 1,034 0.00
Total Warrants 3,190 0.00
Financial assets at fair value through profit or loss 165,012,337 100.01
Current assets 146,310 0.09
Total assets 165,158,647 100.10
Current liabilities (166,167) (0.10)
Net assets attributable to holders of redeemable participating Shares 164,992,480 100.00
% of
total
assets
Analysis of Total Assets
Transferable securities admitted to an official stock exchange listing or dealt in on another regulated market 99.91
Other assets 0.09
100.00
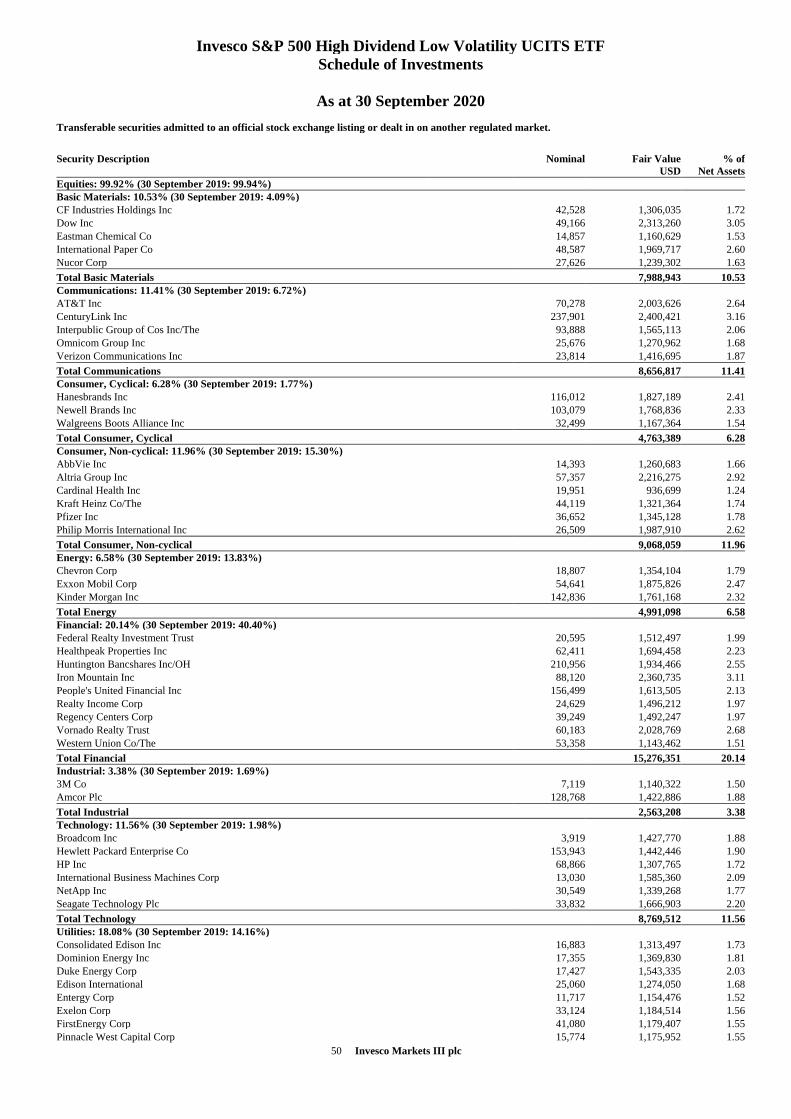
50 Invesco Markets III plc
Invesco S&P 500 High Dividend Low Volatility UCITS ETF
Schedule of Investments
As at 30 September 2020
Transferable securities admitted to an official stock exchange listing or dealt in on another regulated market.
Security Description
Nominal Fair Value
USD
% of
Net Assets
Equities: 99.92% (30 September 2019: 99.94%)
Basic Materials: 10.53% (30 September 2019: 4.09%)
CF Industries Holdings Inc 42,528 1,306,035 1.72
Dow Inc 49,166 2,313,260 3.05
Eastman Chemical Co 14,857 1,160,629 1.53
International Paper Co 48,587 1,969,717 2.60
Nucor Corp 27,626 1,239,302 1.63
Total Basic Materials 7,988,943 10.53
Communications: 11.41% (30 September 2019: 6.72%)
AT&T Inc 70,278 2,003,626 2.64
CenturyLink Inc 237,901 2,400,421 3.16
Interpublic Group of Cos Inc/The 93,888 1,565,113 2.06
Omnicom Group Inc 25,676 1,270,962 1.68
Verizon Communications Inc 23,814 1,416,695 1.87
Total Communications 8,656,817 11.41
Consumer, Cyclical: 6.28% (30 September 2019: 1.77%)
Hanesbrands Inc 116,012 1,827,189 2.41
Newell Brands Inc 103,079 1,768,836 2.33
Walgreens Boots Alliance Inc 32,499 1,167,364 1.54
Total Consumer, Cyclical 4,763,389 6.28
Consumer, Non-cyclical: 11.96% (30 September 2019: 15.30%)
AbbVie Inc 14,393 1,260,683 1.66
Altria Group Inc 57,357 2,216,275 2.92
Cardinal Health Inc 19,951 936,699 1.24
Kraft Heinz Co/The 44,119 1,321,364 1.74
Pfizer Inc 36,652 1,345,128 1.78
Philip Morris International Inc 26,509 1,987,910 2.62
Total Consumer, Non-cyclical 9,068,059 11.96
Energy: 6.58% (30 September 2019: 13.83%)
Chevron Corp 18,807 1,354,104 1.79
Exxon Mobil Corp 54,641 1,875,826 2.47
Kinder Morgan Inc 142,836 1,761,168 2.32
Total Energy 4,991,098 6.58
Financial: 20.14% (30 September 2019: 40.40%)
Federal Realty Investment Trust 20,595 1,512,497 1.99
Healthpeak Properties Inc 62,411 1,694,458 2.23
Huntington Bancshares Inc/OH 210,956 1,934,466 2.55
Iron Mountain Inc 88,120 2,360,735 3.11
People's United Financial Inc 156,499 1,613,505 2.13
Realty Income Corp 24,629 1,496,212 1.97
Regency Centers Corp 39,249 1,492,247 1.97
Vornado Realty Trust 60,183 2,028,769 2.68
Western Union Co/The 53,358 1,143,462 1.51
Total Financial 15,276,351 20.14
Industrial: 3.38% (30 September 2019: 1.69%)
3M Co 7,119 1,140,322 1.50
Amcor Plc 128,768 1,422,886 1.88
Total Industrial 2,563,208 3.38
Technology: 11.56% (30 September 2019: 1.98%)
Broadcom Inc 3,919 1,427,770 1.88
Hewlett Packard Enterprise Co 153,943 1,442,446 1.90
HP Inc 68,866 1,307,765 1.72
International Business Machines Corp 13,030 1,585,360 2.09
NetApp Inc 30,549 1,339,268 1.77
Seagate Technology Plc 33,832 1,666,903 2.20
Total Technology 8,769,512 11.56
Utilities: 18.08% (30 September 2019: 14.16%)
Consolidated Edison Inc 16,883 1,313,497 1.73
Dominion Energy Inc 17,355 1,369,830 1.81
Duke Energy Corp 17,427 1,543,335 2.03
Edison International 25,060 1,274,050 1.68
Entergy Corp 11,717 1,154,476 1.52
Exelon Corp 33,124 1,184,514 1.56
FirstEnergy Corp 41,080 1,179,407 1.55
Pinnacle West Capital Corp 15,774 1,175,952 1.55
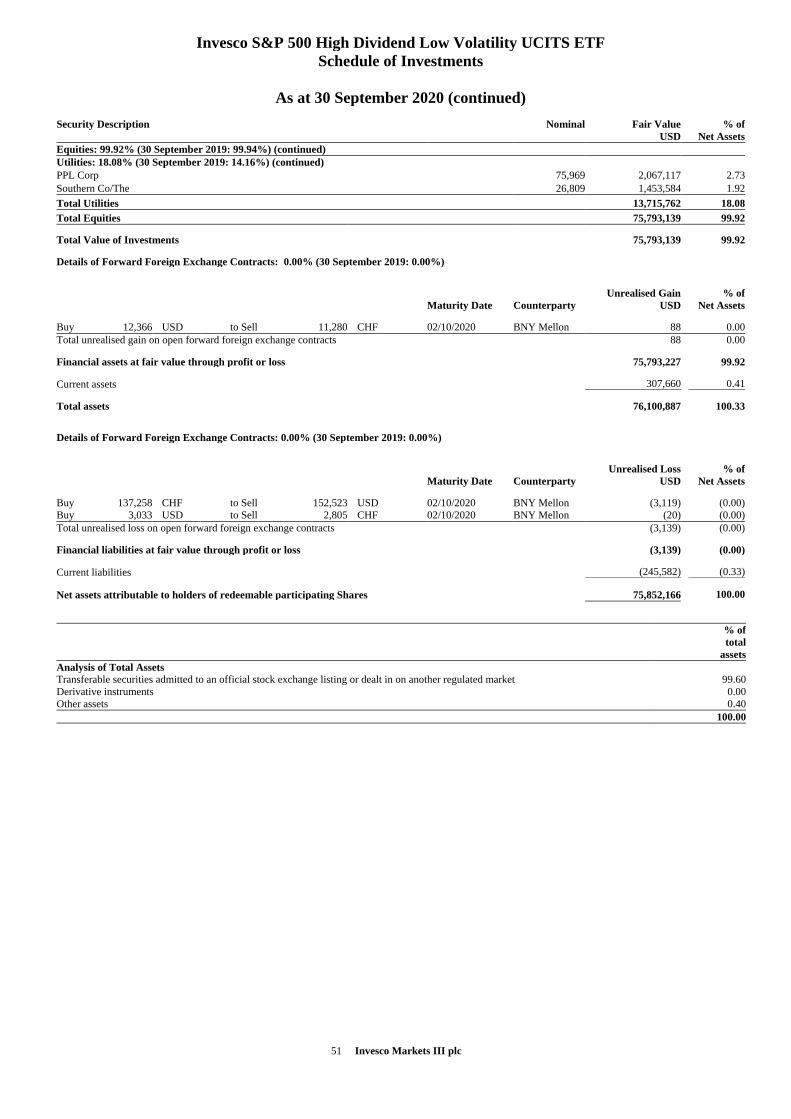
51 Invesco Markets III plc
Invesco S&P 500 High Dividend Low Volatility UCITS ETF
Schedule of Investments
As at 30 September 2020 (continued)
Security Description
Nominal Fair Value
USD
% of
Net Assets
Equities: 99.92% (30 September 2019: 99.94%) (continued)
Utilities: 18.08% (30 September 2019: 14.16%) (continued)
PPL Corp 75,969 2,067,117 2.73
Southern Co/The 26,809 1,453,584 1.92
Total Utilities 13,715,762 18.08
Total Equities 75,793,139 99.92
Total Value of Investments 75,793,139 99.92
Details of Forward Foreign Exchange Contracts: 0.00% (30 September 2019: 0.00%)
Maturity Date Counterparty
Unrealised Gain
USD
% of
Net Assets
Buy 12,366 USD to Sell 11,280 CHF 02/10/2020 BNY Mellon 88 0.00
Total unrealised gain on open forward foreign exchange contracts 88 0.00
Financial assets at fair value through profit or loss 75,793,227 99.92
Current assets 307,660 0.41
Total assets 76,100,887 100.33
Details of Forward Foreign Exchange Contracts: 0.00% (30 September 2019: 0.00%)
Maturity Date Counterparty
Unrealised Loss
USD
% of
Net Assets
Buy 137,258 CHF to Sell 152,523 USD 02/10/2020 BNY Mellon (3,119) (0 .00)
Buy 3,033 USD to Sell 2,805 CHF 02/10/2020 BNY Mellon (20) (0 .00)
Total unrealised loss on open forward foreign exchange contracts (3,139) (0 .00)
Financial liabilities at fair value through profit or loss (3,139) (0 .00)
Current liabilities (245,582) (0.33)
Net assets attributable to holders of redeemable participating Shares 75,852,166 100.00
% of
total
assets
Analysis of Total Assets
Transferable securities admitted to an official stock exchange listing or dealt in on another regulated market 99.60
Derivative instruments 0.00
Other assets 0.40
100.00
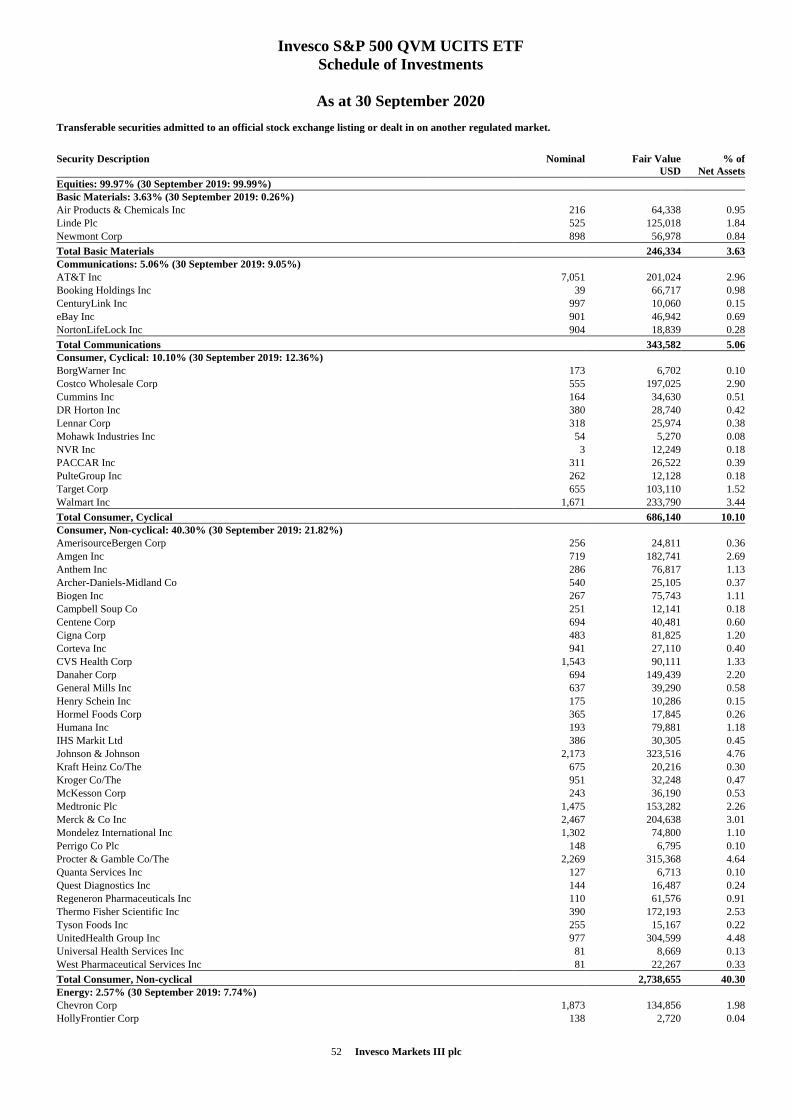
52 Invesco Markets III plc
Invesco S&P 500 QVM UCITS ETF
Schedule of Investments
As at 30 September 2020
Transferable securities admitted to an official stock exchange listing or dealt in on another regulated market.
Security Description
Nominal Fair Value
USD
% of
Net Assets
Equities: 99.97% (30 September 2019: 99.99%)
Basic Materials: 3.63% (30 September 2019: 0.26%)
Air Products & Chemicals Inc 216 64,338 0.95
Linde Plc 525 125,018 1.84
Newmont Corp 898 56,978 0.84
Total Basic Materials 246,334 3.63
Communications: 5.06% (30 September 2019: 9.05%)
AT&T Inc 7,051 201,024 2.96
Booking Holdings Inc 39 66,717 0.98
CenturyLink Inc 997 10,060 0.15
eBay Inc 901 46,942 0.69
NortonLifeLock Inc 904 18,839 0.28
Total Communications 343,582 5.06
Consumer, Cyclical: 10.10% (30 September 2019: 12.36%)
BorgWarner Inc 173 6,702 0.10
Costco Wholesale Corp 555 197,025 2.90
Cummins Inc 164 34,630 0.51
DR Horton Inc 380 28,740 0.42
Lennar Corp 318 25,974 0.38
Mohawk Industries Inc 54 5,270 0.08
NVR Inc 3 12,249 0.18
PACCAR Inc 311 26,522 0.39
PulteGroup Inc 262 12,128 0.18
Target Corp 655 103,110 1.52
Walmart Inc 1,671 233,790 3.44
Total Consumer, Cyclical 686,140 10.10
Consumer, Non-cyclical: 40.30% (30 September 2019: 21.82%)
AmerisourceBergen Corp 256 24,811 0.36
Amgen Inc 719 182,741 2.69
Anthem Inc 286 76,817 1.13
Archer-Daniels-Midland Co 540 25,105 0.37
Biogen Inc 267 75,743 1.11
Campbell Soup Co 251 12,141 0.18
Centene Corp 694 40,481 0.60
Cigna Corp 483 81,825 1.20
Corteva Inc 941 27,110 0.40
CVS Health Corp 1,543 90,111 1.33
Danaher Corp 694 149,439 2.20
General Mills Inc 637 39,290 0.58
Henry Schein Inc 175 10,286 0.15
Hormel Foods Corp 365 17,845 0.26
Humana Inc 193 79,881 1.18
IHS Markit Ltd 386 30,305 0.45
Johnson & Johnson 2,173 323,516 4.76
Kraft Heinz Co/The 675 20,216 0.30
Kroger Co/The 951 32,248 0.47
McKesson Corp 243 36,190 0.53
Medtronic Plc 1,475 153,282 2.26
Merck & Co Inc 2,467 204,638 3.01
Mondelez International Inc 1,302 74,800 1.10
Perrigo Co Plc 148 6,795 0.10
Procter & Gamble Co/The 2,269 315,368 4.64
Quanta Services Inc 127 6,713 0.10
Quest Diagnostics Inc 144 16,487 0.24
Regeneron Pharmaceuticals Inc 110 61,576 0.91
Thermo Fisher Scientific Inc 390 172,193 2.53
Tyson Foods Inc 255 15,167 0.22
UnitedHealth Group Inc 977 304,599 4.48
Universal Health Services Inc 81 8,669 0.13
West Pharmaceutical Services Inc 81 22,267 0.33
Total Consumer, Non-cyclical 2,738,655 40.30
Energy: 2.57% (30 September 2019: 7.74%)
Chevron Corp 1,873 134,856 1.98
HollyFrontier Corp 138 2,720 0.04

53 Invesco Markets III plc
Invesco S&P 500 QVM UCITS ETF
Schedule of Investments
As at 30 September 2020 (continued)
Security Description
Nominal Fair Value
USD
% of
Net Assets
Equities: 99.97% (30 September 2019: 99.99%) (continued)
Energy: 2.57% (30 September 2019: 7.74%) (continued)
Phillips 66 390 20,218 0.30
Valero Energy Corp 394 17,068 0.25
Total Energy 174,862 2.57
Financial: 7.59% (30 September 2019: 18.07%)
Allstate Corp/The 359 33,796 0.50
Ameriprise Financial Inc 142 21,884 0.32
Assurant Inc 66 8,007 0.12
Cboe Global Markets Inc 114 10,002 0.15
Citizens Financial Group Inc 402 10,163 0.15
CME Group Inc 345 57,722 0.85
Digital Realty Trust Inc 288 42,267 0.62
Hartford Financial Services Group Inc/The 313 11,537 0.17
Intercontinental Exchange Inc 542 54,227 0.80
M&T Bank Corp 125 11,511 0.17
MetLife Inc 762 28,324 0.42
Nasdaq Inc 112 13,744 0.20
Progressive Corp/The 581 55,003 0.81
Prologis Inc 731 73,553 1.08
Raymond James Financial Inc 115 8,367 0.12
Regions Financial Corp 921 10,619 0.15
SVB Financial Group 63 15,159 0.22
Synchrony Financial 512 13,399 0.20
T Rowe Price Group Inc 227 29,106 0.43
Unum Group 181 3,046 0.04
Vornado Realty Trust 135 4,551 0.07
Total Financial 515,987 7.59
Industrial: 4.36% (30 September 2019: 8.69%)
Eaton Corp Plc 396 40,404 0.60
Howmet Aerospace Inc 334 5,584 0.08
Jacobs Engineering Group Inc 179 16,606 0.24
Johnson Controls International plc 888 36,275 0.53
Keysight Technologies Inc 195 19,262 0.28
Lockheed Martin Corp 294 112,684 1.66
Old Dominion Freight Line Inc 117 21,168 0.31
Packaging Corp of America 90 9,814 0.15
Rockwell Automation Inc 119 26,261 0.39
Westrock Co 243 8,442 0.12
Total Industrial 296,500 4.36
Technology: 26.36% (30 September 2019: 21.11%)
Activision Blizzard Inc 854 69,131 1.02
Apple Inc 3,642 421,780 6.21
Cognizant Technology Solutions Corp 517 35,890 0.53
Intel Corp 5,028 260,350 3.83
Leidos Holdings Inc 147 13,105 0.19
Maxim Integrated Products Inc 313 21,162 0.31
Micron Technology Inc 1,060 49,778 0.73
Microsoft Corp 1,632 343,259 5.05
NVIDIA Corp 751 406,456 5.98
Oracle Corp 2,105 125,669 1.85
Seagate Technology Plc 308 15,175 0.23
Skyworks Solutions Inc 177 25,753 0.38
Xerox Holdings Corp 185 3,472 0.05
Total Technology 1,790,980 26.36
Utilities: 0.00% (30 September 2019: 0.89%)
Total Equities 6,793,040 99.97
Financial assets at fair value through profit or loss 6,793,040 99.97
Current assets 4,070 0.06
Total assets 6,797,110 100.03
Current liabilities (2,279) (0.03)
Net assets attributable to holders of redeemable participating Shares 6,794,831 100.00
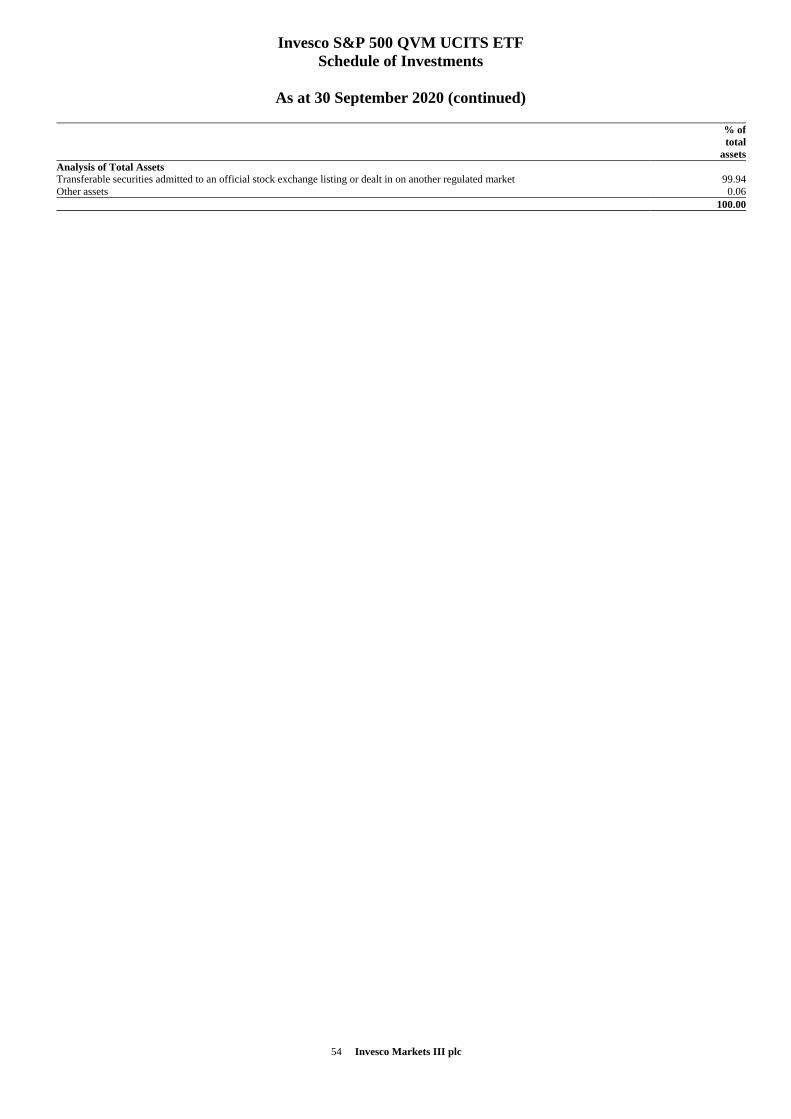
54 Invesco Markets III plc
Invesco S&P 500 QVM UCITS ETF
Schedule of Investments
As at 30 September 2020 (continued)
% of
total
assets
Analysis of Total Assets
Transferable securities admitted to an official stock exchange listing or dealt in on another regulated market 99.94
Other assets 0.06
100.00
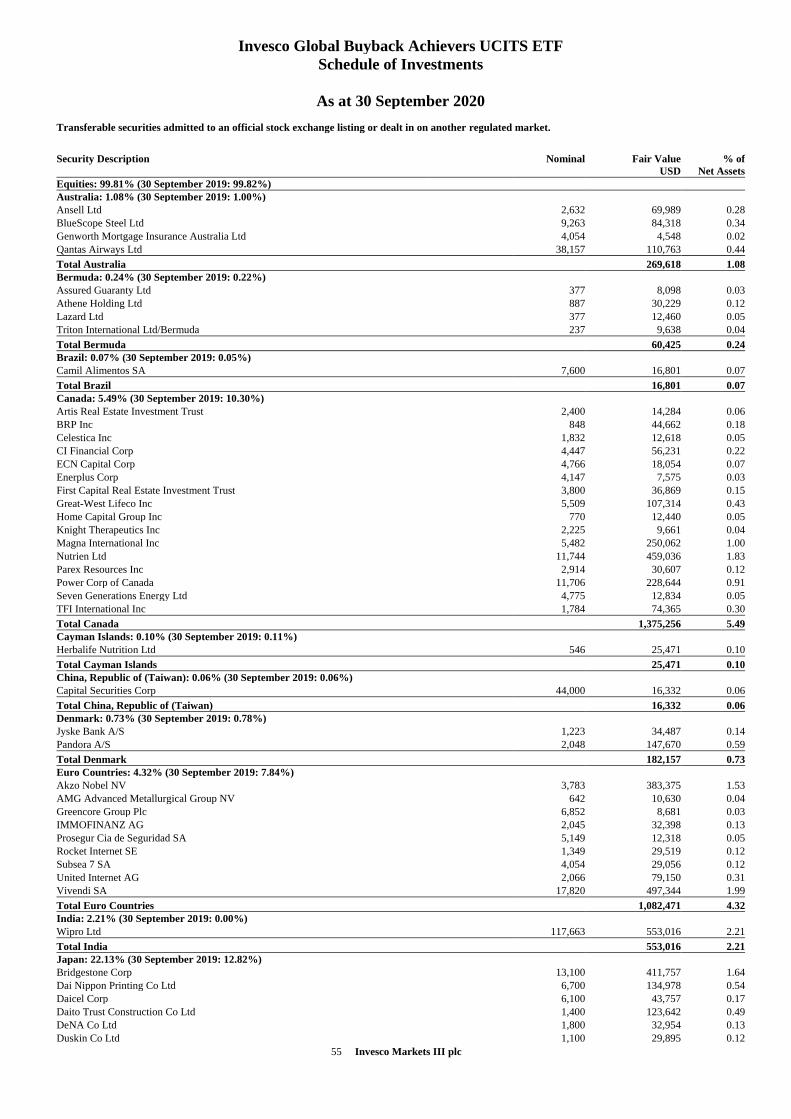
55 Invesco Markets III plc
Invesco Global Buyback Achievers UCITS ETF
Schedule of Investments
As at 30 September 2020
Transferable securities admitted to an official stock exchange listing or dealt in on another regulated market.
Security Description
Nominal Fair Value
USD
% of
Net Assets
Equities: 99.81% (30 September 2019: 99.82%)
Australia: 1.08% (30 September 2019: 1.00%)
Ansell Ltd 2,632 69,989 0.28
BlueScope Steel Ltd 9,263 84,318 0.34
Genworth Mortgage Insurance Australia Ltd 4,054 4,548 0.02
Qantas Airways Ltd 38,157 110,763 0.44
Total Australia 269,618 1.08
Bermuda: 0.24% (30 September 2019: 0.22%)
Assured Guaranty Ltd 377 8,098 0.03
Athene Holding Ltd 887 30,229 0.12
Lazard Ltd 377 12,460 0.05
Triton International Ltd/Bermuda 237 9,638 0.04
Total Bermuda 60,425 0.24
Brazil: 0.07% (30 September 2019: 0.05%)
Camil Alimentos SA 7,600 16,801 0.07
Total Brazil 16,801 0.07
Canada: 5.49% (30 September 2019: 10.30%)
Artis Real Estate Investment Trust 2,400 14,284 0.06
BRP Inc 848 44,662 0.18
Celestica Inc 1,832 12,618 0.05
CI Financial Corp 4,447 56,231 0.22
ECN Capital Corp 4,766 18,054 0.07
Enerplus Corp 4,147 7,575 0.03
First Capital Real Estate Investment Trust 3,800 36,869 0.15
Great-West Lifeco Inc 5,509 107,314 0.43
Home Capital Group Inc 770 12,440 0.05
Knight Therapeutics Inc 2,225 9,661 0.04
Magna International Inc 5,482 250,062 1.00
Nutrien Ltd 11,744 459,036 1.83
Parex Resources Inc 2,914 30,607 0.12
Power Corp of Canada 11,706 228,644 0.91
Seven Generations Energy Ltd 4,775 12,834 0.05
TFI International Inc 1,784 74,365 0.30
Total Canada 1,375,256 5.49
Cayman Islands: 0.10% (30 September 2019: 0.11%)
Herbalife Nutrition Ltd 546 25,471 0.10
Total Cayman Islands 25,471 0.10
China, Republic of (Taiwan): 0.06% (30 September 2019: 0.06%)
Capital Securities Corp 44,000 16,332 0.06
Total China, Republic of (Taiwan) 16,332 0.06
Denmark: 0.73% (30 September 2019: 0.78%)
Jyske Bank A/S 1,223 34,487 0.14
Pandora A/S 2,048 147,670 0.59
Total Denmark 182,157 0.73
Euro Countries: 4.32% (30 September 2019: 7.84%)
Akzo Nobel NV 3,783 383,375 1.53
AMG Advanced Metallurgical Group NV 642 10,630 0.04
Greencore Group Plc 6,852 8,681 0.03
IMMOFINANZ AG 2,045 32,398 0.13
Prosegur Cia de Seguridad SA 5,149 12,318 0.05
Rocket Internet SE 1,349 29,519 0.12
Subsea 7 SA 4,054 29,056 0.12
United Internet AG 2,066 79,150 0.31
Vivendi SA 17,820 497,344 1.99
Total Euro Countries 1,082,471 4.32
India: 2.21% (30 September 2019: 0.00%)
Wipro Ltd 117,663 553,016 2.21
Total India 553,016 2.21
Japan: 22.13% (30 September 2019: 12.82%)
Bridgestone Corp 13,100 411,757 1.64
Dai Nippon Printing Co Ltd 6,700 134,978 0.54
Daicel Corp 6,100 43,757 0.17
Daito Trust Construction Co Ltd 1,400 123,642 0.49
DeNA Co Ltd 1,800 32,954 0.13
Duskin Co Ltd 1,100 29,895 0.12
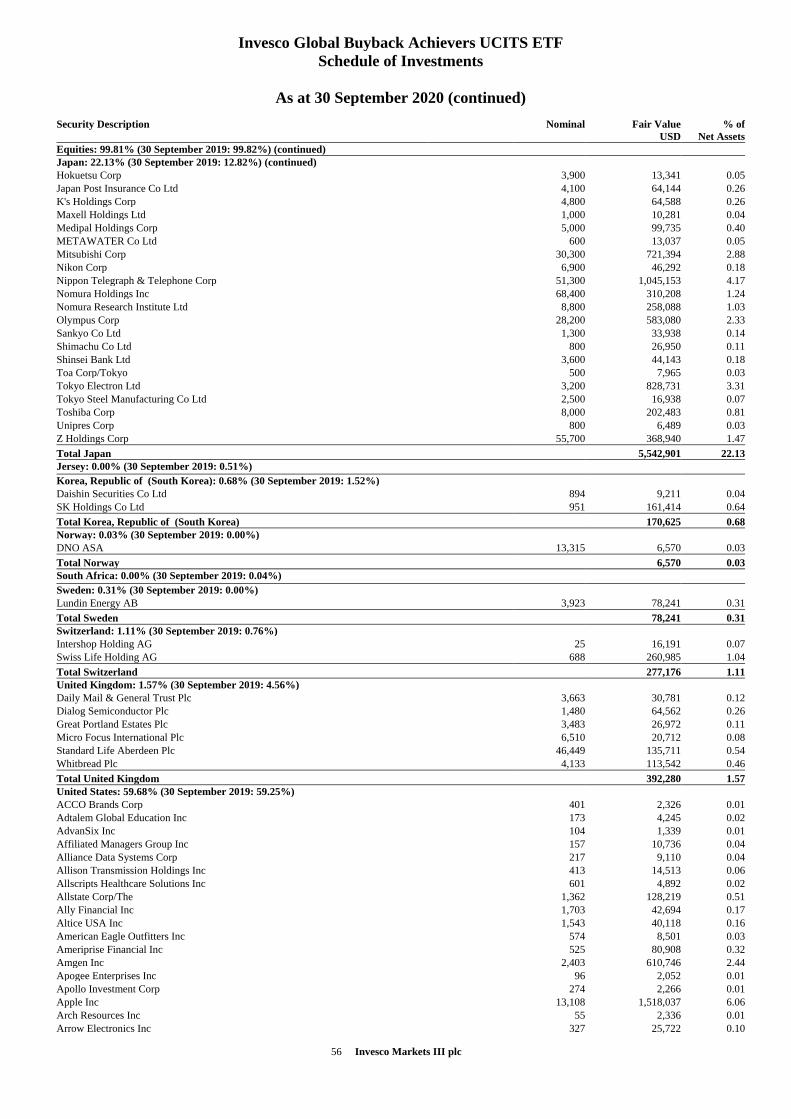
56 Invesco Markets III plc
Invesco Global Buyback Achievers UCITS ETF
Schedule of Investments
As at 30 September 2020 (continued)
Security Description
Nominal Fair Value
USD
% of
Net Assets
Equities: 99.81% (30 September 2019: 99.82%) (continued)
Japan: 22.13% (30 September 2019: 12.82%) (continued)
Hokuetsu Corp 3,900 13,341 0.05
Japan Post Insurance Co Ltd 4,100 64,144 0.26
K's Holdings Corp 4,800 64,588 0.26
Maxell Holdings Ltd 1,000 10,281 0.04
Medipal Holdings Corp 5,000 99,735 0.40
METAWATER Co Ltd 600 13,037 0.05
Mitsubishi Corp 30,300 721,394 2.88
Nikon Corp 6,900 46,292 0.18
Nippon Telegraph & Telephone Corp 51,300 1,045,153 4.17
Nomura Holdings Inc 68,400 310,208 1.24
Nomura Research Institute Ltd 8,800 258,088 1.03
Olympus Corp 28,200 583,080 2.33
Sankyo Co Ltd 1,300 33,938 0.14
Shimachu Co Ltd 800 26,950 0.11
Shinsei Bank Ltd 3,600 44,143 0.18
Toa Corp/Tokyo 500 7,965 0.03
Tokyo Electron Ltd 3,200 828,731 3.31
Tokyo Steel Manufacturing Co Ltd 2,500 16,938 0.07
Toshiba Corp 8,000 202,483 0.81
Unipres Corp 800 6,489 0.03
Z Holdings Corp 55,700 368,940 1.47
Total Japan 5,542,901 22.13
Jersey: 0.00% (30 September 2019: 0.51%)
Korea, Republic of (South Korea): 0.68% (30 September 2019: 1.52%)
Daishin Securities Co Ltd 894 9,211 0.04
SK Holdings Co Ltd 951 161,414 0.64
Total Korea, Republic of (South Korea) 170,625 0.68
Norway: 0.03% (30 September 2019: 0.00%)
DNO ASA 13,315 6,570 0.03
Total Norway 6,570 0.03
South Africa: 0.00% (30 September 2019: 0.04%)
Sweden: 0.31% (30 September 2019: 0.00%)
Lundin Energy AB 3,923 78,241 0.31
Total Sweden 78,241 0.31
Switzerland: 1.11% (30 September 2019: 0.76%)
Intershop Holding AG 25 16,191 0.07
Swiss Life Holding AG 688 260,985 1.04
Total Switzerland 277,176 1.11
United Kingdom: 1.57% (30 September 2019: 4.56%)
Daily Mail & General Trust Plc 3,663 30,781 0.12
Dialog Semiconductor Plc 1,480 64,562 0.26
Great Portland Estates Plc 3,483 26,972 0.11
Micro Focus International Plc 6,510 20,712 0.08
Standard Life Aberdeen Plc 46,449 135,711 0.54
Whitbread Plc 4,133 113,542 0.46
Total United Kingdom 392,280 1.57
United States: 59.68% (30 September 2019: 59.25%)
ACCO Brands Corp 401 2,326 0.01
Adtalem Global Education Inc 173 4,245 0.02
AdvanSix Inc 104 1,339 0.01
Affiliated Managers Group Inc 157 10,736 0.04
Alliance Data Systems Corp 217 9,110 0.04
Allison Transmission Holdings Inc 413 14,513 0.06
Allscripts Healthcare Solutions Inc 601 4,892 0.02
Allstate Corp/The 1,362 128,219 0.51
Ally Financial Inc 1,703 42,694 0.17
Altice USA Inc 1,543 40,118 0.16
American Eagle Outfitters Inc 574 8,501 0.03
Ameriprise Financial Inc 525 80,908 0.32
Amgen Inc 2,403 610,746 2.44
Apogee Enterprises Inc 96 2,052 0.01
Apollo Investment Corp 274 2,266 0.01
Apple Inc 13,108 1,518,037 6.06
Arch Resources Inc 55 2,336 0.01
Arrow Electronics Inc 327 25,722 0.10
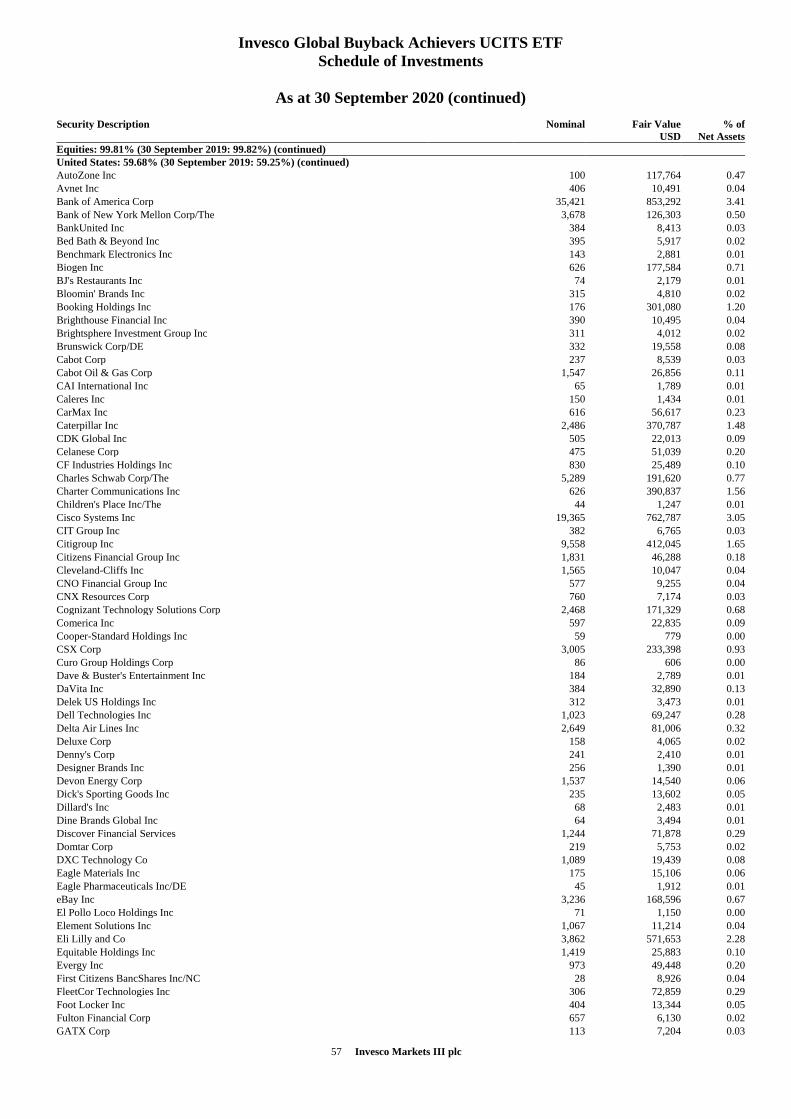
57 Invesco Markets III plc
Invesco Global Buyback Achievers UCITS ETF
Schedule of Investments
As at 30 September 2020 (continued)
Security Description
Nominal Fair Value
USD
% of
Net Assets
Equities: 99.81% (30 September 2019: 99.82%) (continued)
United States: 59.68% (30 September 2019: 59.25%) (continued)
AutoZone Inc 100 117,764 0.47
Avnet Inc 406 10,491 0.04
Bank of America Corp 35,421 853,292 3.41
Bank of New York Mellon Corp/The 3,678 126,303 0.50
BankUnited Inc 384 8,413 0.03
Bed Bath & Beyond Inc 395 5,917 0.02
Benchmark Electronics Inc 143 2,881 0.01
Biogen Inc 626 177,584 0.71
BJ's Restaurants Inc 74 2,179 0.01
Bloomin' Brands Inc 315 4,810 0.02
Booking Holdings Inc 176 301,080 1.20
Brighthouse Financial Inc 390 10,495 0.04
Brightsphere Investment Group Inc 311 4,012 0.02
Brunswick Corp/DE 332 19,558 0.08
Cabot Corp 237 8,539 0.03
Cabot Oil & Gas Corp 1,547 26,856 0.11
CAI International Inc 65 1,789 0.01
Caleres Inc 150 1,434 0.01
CarMax Inc 616 56,617 0.23
Caterpillar Inc 2,486 370,787 1.48
CDK Global Inc 505 22,013 0.09
Celanese Corp 475 51,039 0.20
CF Industries Holdings Inc 830 25,489 0.10
Charles Schwab Corp/The 5,289 191,620 0.77
Charter Communications Inc 626 390,837 1.56
Children's Place Inc/The 44 1,247 0.01
Cisco Systems Inc 19,365 762,787 3.05
CIT Group Inc 382 6,765 0.03
Citigroup Inc 9,558 412,045 1.65
Citizens Financial Group Inc 1,831 46,288 0.18
Cleveland-Cliffs Inc 1,565 10,047 0.04
CNO Financial Group Inc 577 9,255 0.04
CNX Resources Corp 760 7,174 0.03
Cognizant Technology Solutions Corp 2,468 171,329 0.68
Comerica Inc 597 22,835 0.09
Cooper-Standard Holdings Inc 59 779 0.00
CSX Corp 3,005 233,398 0.93
Curo Group Holdings Corp 86 606 0.00
Dave & Buster's Entertainment Inc 184 2,789 0.01
DaVita Inc 384 32,890 0.13
Delek US Holdings Inc 312 3,473 0.01
Dell Technologies Inc 1,023 69,247 0.28
Delta Air Lines Inc 2,649 81,006 0.32
Deluxe Corp 158 4,065 0.02
Denny's Corp 241 2,410 0.01
Designer Brands Inc 256 1,390 0.01
Devon Energy Corp 1,537 14,540 0.06
Dick's Sporting Goods Inc 235 13,602 0.05
Dillard's Inc 68 2,483 0.01
Dine Brands Global Inc 64 3,494 0.01
Discover Financial Services 1,244 71,878 0.29
Domtar Corp 219 5,753 0.02
DXC Technology Co 1,089 19,439 0.08
Eagle Materials Inc 175 15,106 0.06
Eagle Pharmaceuticals Inc/DE 45 1,912 0.01
eBay Inc 3,236 168,596 0.67
El Pollo Loco Holdings Inc 71 1,150 0.00
Element Solutions Inc 1,067 11,214 0.04
Eli Lilly and Co 3,862 571,653 2.28
Equitable Holdings Inc 1,419 25,883 0.10
Evergy Inc 973 49,448 0.20
First Citizens BancShares Inc/NC 28 8,926 0.04
FleetCor Technologies Inc 306 72,859 0.29
Foot Locker Inc 404 13,344 0.05
Fulton Financial Corp 657 6,130 0.02
GATX Corp 113 7,204 0.03
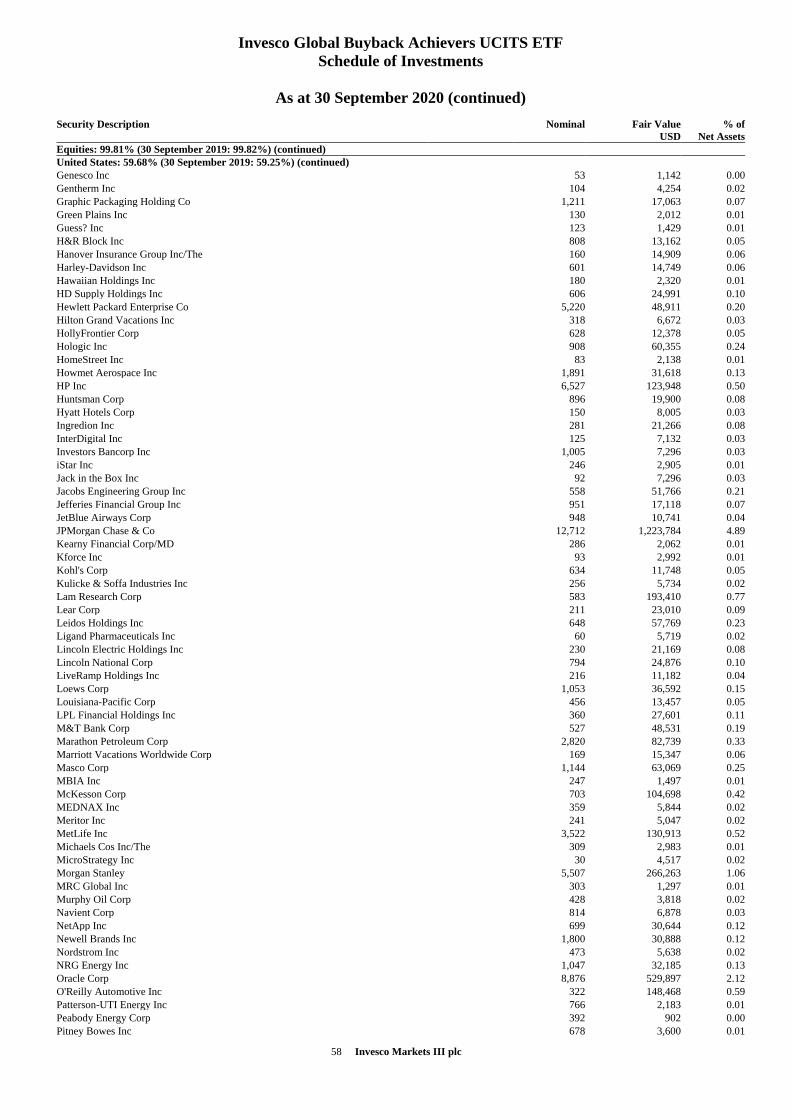
58 Invesco Markets III plc
Invesco Global Buyback Achievers UCITS ETF
Schedule of Investments
As at 30 September 2020 (continued)
Security Description
Nominal Fair Value
USD
% of
Net Assets
Equities: 99.81% (30 September 2019: 99.82%) (continued)
United States: 59.68% (30 September 2019: 59.25%) (continued)
Genesco Inc 53 1,142 0.00
Gentherm Inc 104 4,254 0.02
Graphic Packaging Holding Co 1,211 17,063 0.07
Green Plains Inc 130 2,012 0.01
Guess? Inc 123 1,429 0.01
H&R Block Inc 808 13,162 0.05
Hanover Insurance Group Inc/The 160 14,909 0.06
Harley-Davidson Inc 601 14,749 0.06
Hawaiian Holdings Inc 180 2,320 0.01
HD Supply Holdings Inc 606 24,991 0.10
Hewlett Packard Enterprise Co 5,220 48,911 0.20
Hilton Grand Vacations Inc 318 6,672 0.03
HollyFrontier Corp 628 12,378 0.05
Hologic Inc 908 60,355 0.24
HomeStreet Inc 83 2,138 0.01
Howmet Aerospace Inc 1,891 31,618 0.13
HP Inc 6,527 123,948 0.50
Huntsman Corp 896 19,900 0.08
Hyatt Hotels Corp 150 8,005 0.03
Ingredion Inc 281 21,266 0.08
InterDigital Inc 125 7,132 0.03
Investors Bancorp Inc 1,005 7,296 0.03
iStar Inc 246 2,905 0.01
Jack in the Box Inc 92 7,296 0.03
Jacobs Engineering Group Inc 558 51,766 0.21
Jefferies Financial Group Inc 951 17,118 0.07
JetBlue Airways Corp 948 10,741 0.04
JPMorgan Chase & Co 12,712 1,223,784 4.89
Kearny Financial Corp/MD 286 2,062 0.01
Kforce Inc 93 2,992 0.01
Kohl's Corp 634 11,748 0.05
Kulicke & Soffa Industries Inc 256 5,734 0.02
Lam Research Corp 583 193,410 0.77
Lear Corp 211 23,010 0.09
Leidos Holdings Inc 648 57,769 0.23
Ligand Pharmaceuticals Inc 60 5,719 0.02
Lincoln Electric Holdings Inc 230 21,169 0.08
Lincoln National Corp 794 24,876 0.10
LiveRamp Holdings Inc 216 11,182 0.04
Loews Corp 1,053 36,592 0.15
Louisiana-Pacific Corp 456 13,457 0.05
LPL Financial Holdings Inc 360 27,601 0.11
M&T Bank Corp 527 48,531 0.19
Marathon Petroleum Corp 2,820 82,739 0.33
Marriott Vacations Worldwide Corp 169 15,347 0.06
Masco Corp 1,144 63,069 0.25
MBIA Inc 247 1,497 0.01
McKesson Corp 703 104,698 0.42
MEDNAX Inc 359 5,844 0.02
Meritor Inc 241 5,047 0.02
MetLife Inc 3,522 130,913 0.52
Michaels Cos Inc/The 309 2,983 0.01
MicroStrategy Inc 30 4,517 0.02
Morgan Stanley 5,507 266,263 1.06
MRC Global Inc 303 1,297 0.01
Murphy Oil Corp 428 3,818 0.02
Navient Corp 814 6,878 0.03
NetApp Inc 699 30,644 0.12
Newell Brands Inc 1,800 30,888 0.12
Nordstrom Inc 473 5,638 0.02
NRG Energy Inc 1,047 32,185 0.13
Oracle Corp 8,876 529,897 2.12
O'Reilly Automotive Inc 322 148,468 0.59
Patterson-UTI Energy Inc 766 2,183 0.01
Peabody Energy Corp 392 902 0.00
Pitney Bowes Inc 678 3,600 0.01
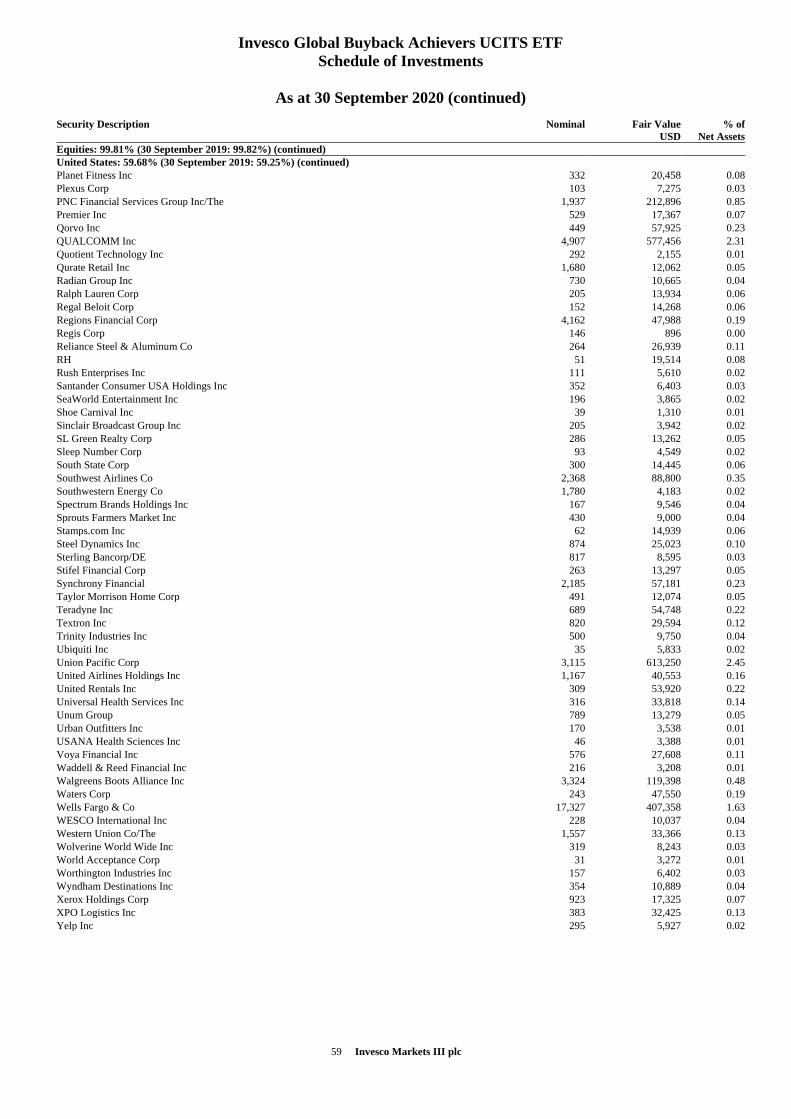
59 Invesco Markets III plc
Invesco Global Buyback Achievers UCITS ETF
Schedule of Investments
As at 30 September 2020 (continued)
Security Description
Nominal Fair Value
USD
% of
Net Assets
Equities: 99.81% (30 September 2019: 99.82%) (continued)
United States: 59.68% (30 September 2019: 59.25%) (continued)
Planet Fitness Inc 332 20,458 0.08
Plexus Corp 103 7,275 0.03
PNC Financial Services Group Inc/The 1,937 212,896 0.85
Premier Inc 529 17,367 0.07
Qorvo Inc 449 57,925 0.23
QUALCOMM Inc 4,907 577,456 2.31
Quotient Technology Inc 292 2,155 0.01
Qurate Retail Inc 1,680 12,062 0.05
Radian Group Inc 730 10,665 0.04
Ralph Lauren Corp 205 13,934 0.06
Regal Beloit Corp 152 14,268 0.06
Regions Financial Corp 4,162 47,988 0.19
Regis Corp 146 896 0.00
Reliance Steel & Aluminum Co 264 26,939 0.11
RH 51 19,514 0.08
Rush Enterprises Inc 111 5,610 0.02
Santander Consumer USA Holdings Inc 352 6,403 0.03
SeaWorld Entertainment Inc 196 3,865 0.02
Shoe Carnival Inc 39 1,310 0.01
Sinclair Broadcast Group Inc 205 3,942 0.02
SL Green Realty Corp 286 13,262 0.05
Sleep Number Corp 93 4,549 0.02
South State Corp 300 14,445 0.06
Southwest Airlines Co 2,368 88,800 0.35
Southwestern Energy Co 1,780 4,183 0.02
Spectrum Brands Holdings Inc 167 9,546 0.04
Sprouts Farmers Market Inc 430 9,000 0.04
Stamps.com Inc 62 14,939 0.06
Steel Dynamics Inc 874 25,023 0.10
Sterling Bancorp/DE 817 8,595 0.03
Stifel Financial Corp 263 13,297 0.05
Synchrony Financial 2,185 57,181 0.23
Taylor Morrison Home Corp 491 12,074 0.05
Teradyne Inc 689 54,748 0.22
Textron Inc 820 29,594 0.12
Trinity Industries Inc 500 9,750 0.04
Ubiquiti Inc 35 5,833 0.02
Union Pacific Corp 3,115 613,250 2.45
United Airlines Holdings Inc 1,167 40,553 0.16
United Rentals Inc 309 53,920 0.22
Universal Health Services Inc 316 33,818 0.14
Unum Group 789 13,279 0.05
Urban Outfitters Inc 170 3,538 0.01
USANA Health Sciences Inc 46 3,388 0.01
Voya Financial Inc 576 27,608 0.11
Waddell & Reed Financial Inc 216 3,208 0.01
Walgreens Boots Alliance Inc 3,324 119,398 0.48
Waters Corp 243 47,550 0.19
Wells Fargo & Co 17,327 407,358 1.63
WESCO International Inc 228 10,037 0.04
Western Union Co/The 1,557 33,366 0.13
Wolverine World Wide Inc 319 8,243 0.03
World Acceptance Corp 31 3,272 0.01
Worthington Industries Inc 157 6,402 0.03
Wyndham Destinations Inc 354 10,889 0.04
Xerox Holdings Corp 923 17,325 0.07
XPO Logistics Inc 383 32,425 0.13
Yelp Inc 295 5,927 0.02
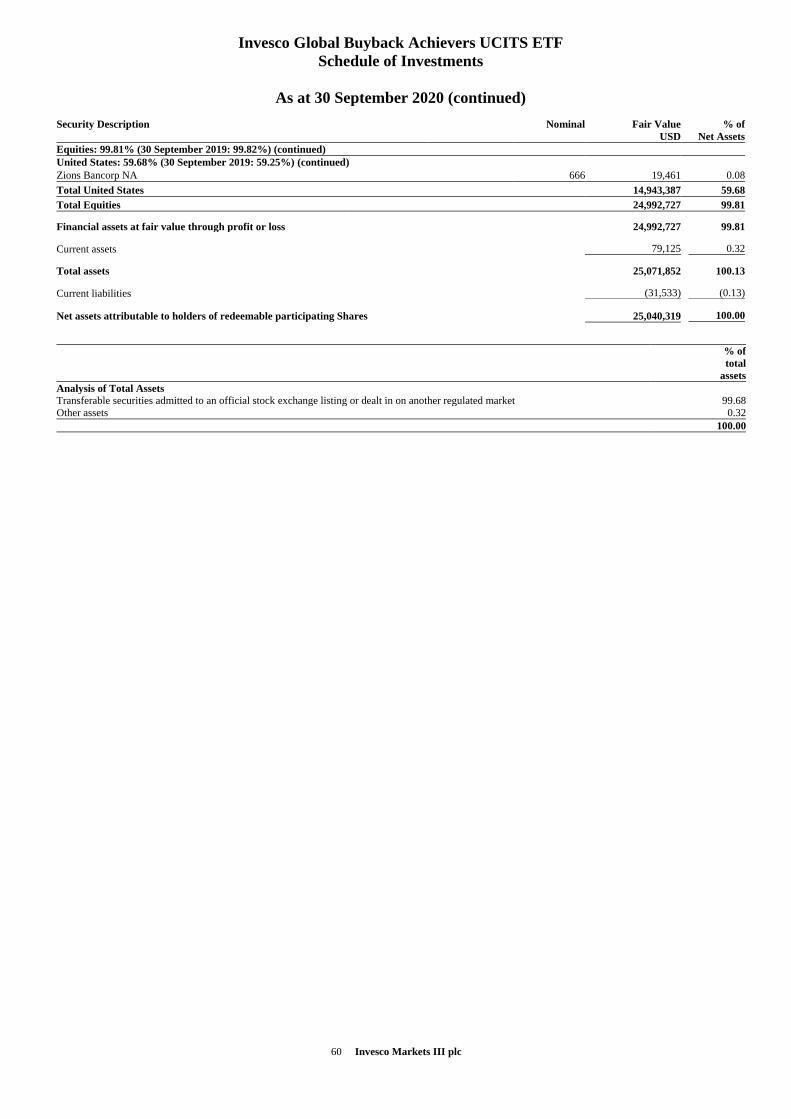
60 Invesco Markets III plc
Invesco Global Buyback Achievers UCITS ETF
Schedule of Investments
As at 30 September 2020 (continued)
Security Description
Nominal Fair Value
USD
% of
Net Assets
Equities: 99.81% (30 September 2019: 99.82%) (continued)
United States: 59.68% (30 September 2019: 59.25%) (continued)
Zions Bancorp NA 666 19,461 0.08
Total United States 14,943,387 59.68
Total Equities 24,992,727 99.81
Financial assets at fair value through profit or loss 24,992,727 99.81
Current assets 79,125 0.32
Total assets 25,071,852 100.13
Current liabilities (31,533) (0.13)
Net assets attributable to holders of redeemable participating Shares 25,040,319 100.00
% of
total
assets
Analysis of Total Assets
Transferable securities admitted to an official stock exchange listing or dealt in on another regulated market 99.68
Other assets 0.32
100.00
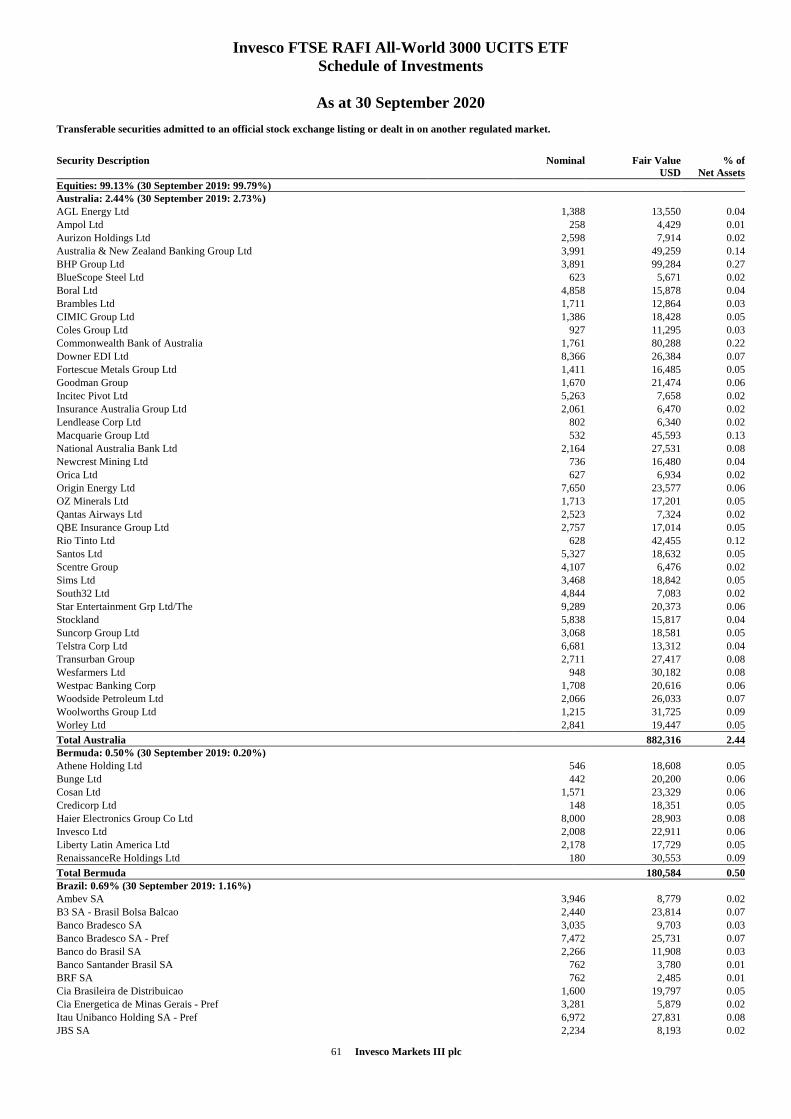
61 Invesco Markets III plc
Invesco FTSE RAFI All-World 3000 UCITS ETF
Schedule of Investments
As at 30 September 2020
Transferable securities admitted to an official stock exchange listing or dealt in on another regulated market.
Security Description
Nominal Fair Value
USD
% of
Net Assets
Equities: 99.13% (30 September 2019: 99.79%)
Australia: 2.44% (30 September 2019: 2.73%)
AGL Energy Ltd 1,388 13,550 0.04
Ampol Ltd 258 4,429 0.01
Aurizon Holdings Ltd 2,598 7,914 0.02
Australia & New Zealand Banking Group Ltd 3,991 49,259 0.14
BHP Group Ltd 3,891 99,284 0.27
BlueScope Steel Ltd 623 5,671 0.02
Boral Ltd 4,858 15,878 0.04
Brambles Ltd 1,711 12,864 0.03
CIMIC Group Ltd 1,386 18,428 0.05
Coles Group Ltd 927 11,295 0.03
Commonwealth Bank of Australia 1,761 80,288 0.22
Downer EDI Ltd 8,366 26,384 0.07
Fortescue Metals Group Ltd 1,411 16,485 0.05
Goodman Group 1,670 21,474 0.06
Incitec Pivot Ltd 5,263 7,658 0.02
Insurance Australia Group Ltd 2,061 6,470 0.02
Lendlease Corp Ltd 802 6,340 0.02
Macquarie Group Ltd 532 45,593 0.13
National Australia Bank Ltd 2,164 27,531 0.08
Newcrest Mining Ltd 736 16,480 0.04
Orica Ltd 627 6,934 0.02
Origin Energy Ltd 7,650 23,577 0.06
OZ Minerals Ltd 1,713 17,201 0.05
Qantas Airways Ltd 2,523 7,324 0.02
QBE Insurance Group Ltd 2,757 17,014 0.05
Rio Tinto Ltd 628 42,455 0.12
Santos Ltd 5,327 18,632 0.05
Scentre Group 4,107 6,476 0.02
Sims Ltd 3,468 18,842 0.05
South32 Ltd 4,844 7,083 0.02
Star Entertainment Grp Ltd/The 9,289 20,373 0.06
Stockland 5,838 15,817 0.04
Suncorp Group Ltd 3,068 18,581 0.05
Telstra Corp Ltd 6,681 13,312 0.04
Transurban Group 2,711 27,417 0.08
Wesfarmers Ltd 948 30,182 0.08
Westpac Banking Corp 1,708 20,616 0.06
Woodside Petroleum Ltd 2,066 26,033 0.07
Woolworths Group Ltd 1,215 31,725 0.09
Worley Ltd 2,841 19,447 0.05
Total Australia 882,316 2.44
Bermuda: 0.50% (30 September 2019: 0.20%)
Athene Holding Ltd 546 18,608 0.05
Bunge Ltd 442 20,200 0.06
Cosan Ltd 1,571 23,329 0.06
Credicorp Ltd 148 18,351 0.05
Haier Electronics Group Co Ltd 8,000 28,903 0.08
Invesco Ltd 2,008 22,911 0.06
Liberty Latin America Ltd 2,178 17,729 0.05
RenaissanceRe Holdings Ltd 180 30,553 0.09
Total Bermuda 180,584 0.50
Brazil: 0.69% (30 September 2019: 1.16%)
Ambev SA 3,946 8,779 0.02
B3 SA - Brasil Bolsa Balcao 2,440 23,814 0.07
Banco Bradesco SA 3,035 9,703 0.03
Banco Bradesco SA - Pref 7,472 25,731 0.07
Banco do Brasil SA 2,266 11,908 0.03
Banco Santander Brasil SA 762 3,780 0.01
BRF SA 762 2,485 0.01
Cia Brasileira de Distribuicao 1,600 19,797 0.05
Cia Energetica de Minas Gerais - Pref 3,281 5,879 0.02
Itau Unibanco Holding SA - Pref 6,972 27,831 0.08
JBS SA 2,234 8,193 0.02
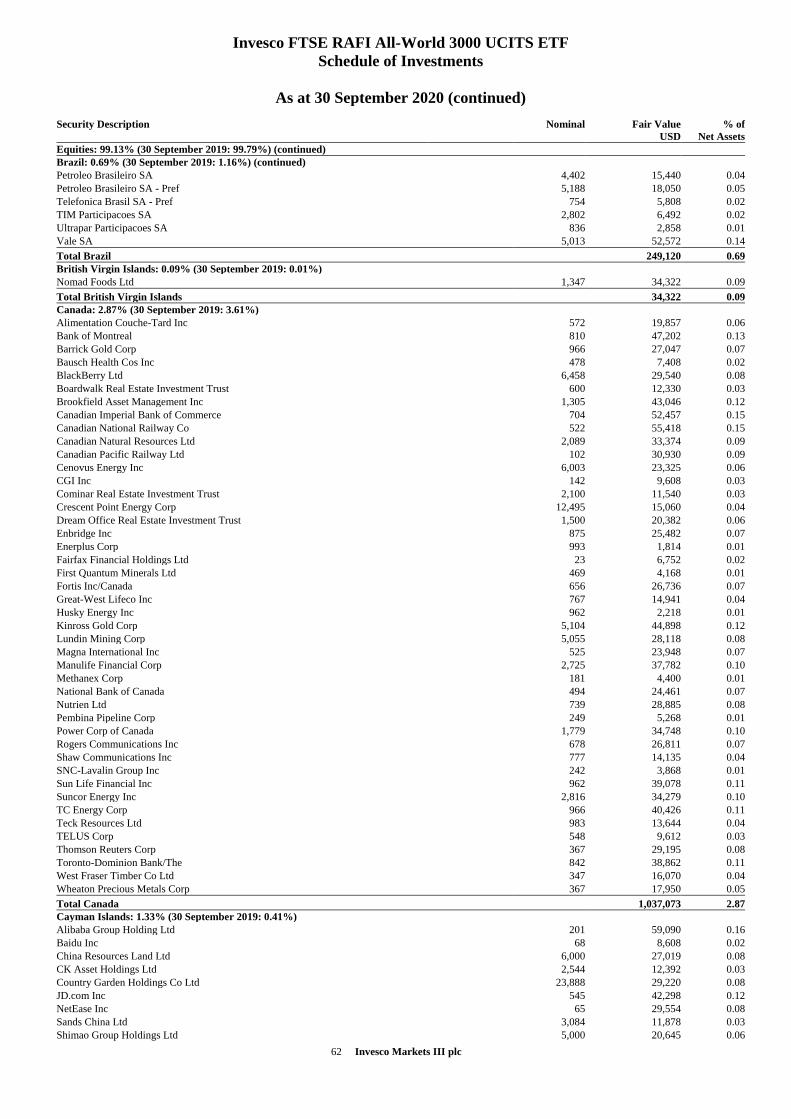
62 Invesco Markets III plc
Invesco FTSE RAFI All-World 3000 UCITS ETF
Schedule of Investments
As at 30 September 2020 (continued)
Security Description
Nominal Fair Value
USD
% of
Net Assets
Equities: 99.13% (30 September 2019: 99.79%) (continued)
Brazil: 0.69% (30 September 2019: 1.16%) (continued)
Petroleo Brasileiro SA 4,402 15,440 0.04
Petroleo Brasileiro SA - Pref 5,188 18,050 0.05
Telefonica Brasil SA - Pref 754 5,808 0.02
TIM Participacoes SA 2,802 6,492 0.02
Ultrapar Participacoes SA 836 2,858 0.01
Vale SA 5,013 52,572 0.14
Total Brazil 249,120 0.69
British Virgin Islands: 0.09% (30 September 2019: 0.01%)
Nomad Foods Ltd 1,347 34,322 0.09
Total British Virgin Islands 34,322 0.09
Canada: 2.87% (30 September 2019: 3.61%)
Alimentation Couche-Tard Inc 572 19,857 0.06
Bank of Montreal 810 47,202 0.13
Barrick Gold Corp 966 27,047 0.07
Bausch Health Cos Inc 478 7,408 0.02
BlackBerry Ltd 6,458 29,540 0.08
Boardwalk Real Estate Investment Trust 600 12,330 0.03
Brookfield Asset Management Inc 1,305 43,046 0.12
Canadian Imperial Bank of Commerce 704 52,457 0.15
Canadian National Railway Co 522 55,418 0.15
Canadian Natural Resources Ltd 2,089 33,374 0.09
Canadian Pacific Railway Ltd 102 30,930 0.09
Cenovus Energy Inc 6,003 23,325 0.06
CGI Inc 142 9,608 0.03
Cominar Real Estate Investment Trust 2,100 11,540 0.03
Crescent Point Energy Corp 12,495 15,060 0.04
Dream Office Real Estate Investment Trust 1,500 20,382 0.06
Enbridge Inc 875 25,482 0.07
Enerplus Corp 993 1,814 0.01
Fairfax Financial Holdings Ltd 23 6,752 0.02
First Quantum Minerals Ltd 469 4,168 0.01
Fortis Inc/Canada 656 26,736 0.07
Great-West Lifeco Inc 767 14,941 0.04
Husky Energy Inc 962 2,218 0.01
Kinross Gold Corp 5,104 44,898 0.12
Lundin Mining Corp 5,055 28,118 0.08
Magna International Inc 525 23,948 0.07
Manulife Financial Corp 2,725 37,782 0.10
Methanex Corp 181 4,400 0.01
National Bank of Canada 494 24,461 0.07
Nutrien Ltd 739 28,885 0.08
Pembina Pipeline Corp 249 5,268 0.01
Power Corp of Canada 1,779 34,748 0.10
Rogers Communications Inc 678 26,811 0.07
Shaw Communications Inc 777 14,135 0.04
SNC-Lavalin Group Inc 242 3,868 0.01
Sun Life Financial Inc 962 39,078 0.11
Suncor Energy Inc 2,816 34,279 0.10
TC Energy Corp 966 40,426 0.11
Teck Resources Ltd 983 13,644 0.04
TELUS Corp 548 9,612 0.03
Thomson Reuters Corp 367 29,195 0.08
Toronto-Dominion Bank/The 842 38,862 0.11
West Fraser Timber Co Ltd 347 16,070 0.04
Wheaton Precious Metals Corp 367 17,950 0.05
Total Canada 1,037,073 2.87
Cayman Islands: 1.33% (30 September 2019: 0.41%)
Alibaba Group Holding Ltd 201 59,090 0.16
Baidu Inc 68 8,608 0.02
China Resources Land Ltd 6,000 27,019 0.08
CK Asset Holdings Ltd 2,544 12,392 0.03
Country Garden Holdings Co Ltd 23,888 29,220 0.08
JD.com Inc 545 42,298 0.12
NetEase Inc 65 29,554 0.08
Sands China Ltd 3,084 11,878 0.03
Shimao Group Holdings Ltd 5,000 20,645 0.06
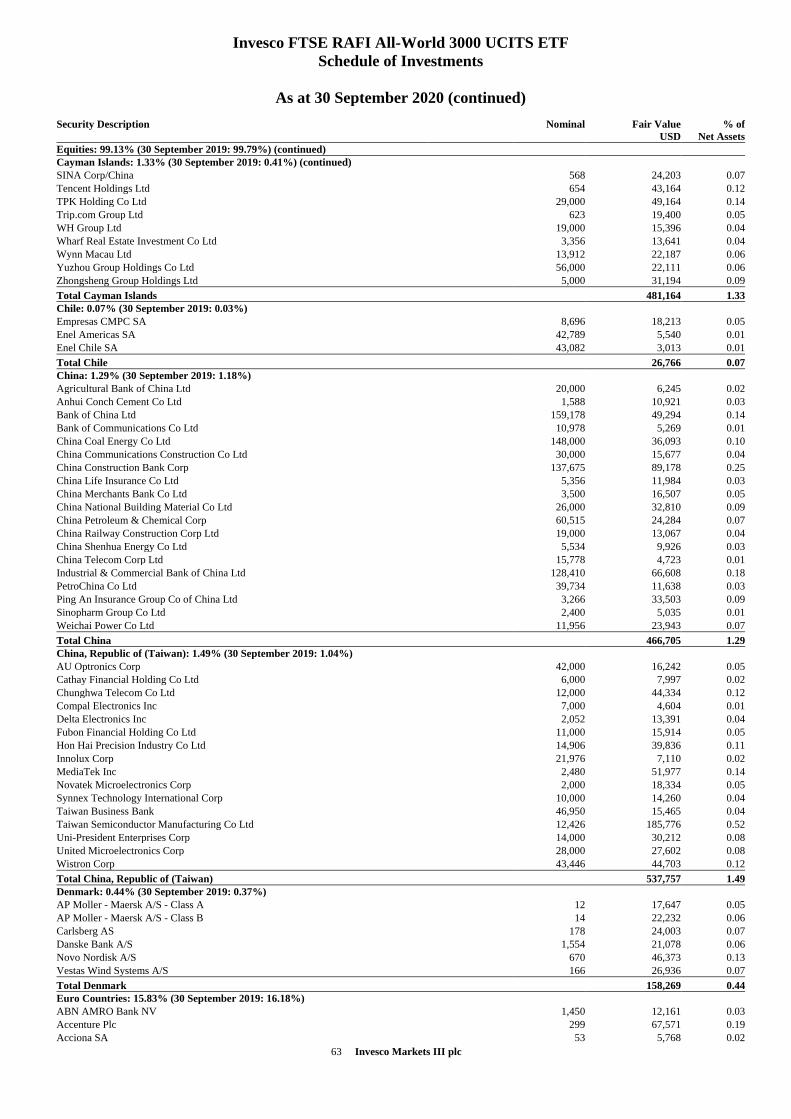
63 Invesco Markets III plc
Invesco FTSE RAFI All-World 3000 UCITS ETF
Schedule of Investments
As at 30 September 2020 (continued)
Security Description
Nominal Fair Value
USD
% of
Net Assets
Equities: 99.13% (30 September 2019: 99.79%) (continued)
Cayman Islands: 1.33% (30 September 2019: 0.41%) (continued)
SINA Corp/China 568 24,203 0.07
Tencent Holdings Ltd 654 43,164 0.12
TPK Holding Co Ltd 29,000 49,164 0.14
Trip.com Group Ltd 623 19,400 0.05
WH Group Ltd 19,000 15,396 0.04
Wharf Real Estate Investment Co Ltd 3,356 13,641 0.04
Wynn Macau Ltd 13,912 22,187 0.06
Yuzhou Group Holdings Co Ltd 56,000 22,111 0.06
Zhongsheng Group Holdings Ltd 5,000 31,194 0.09
Total Cayman Islands 481,164 1.33
Chile: 0.07% (30 September 2019: 0.03%)
Empresas CMPC SA 8,696 18,213 0.05
Enel Americas SA 42,789 5,540 0.01
Enel Chile SA 43,082 3,013 0.01
Total Chile 26,766 0.07
China: 1.29% (30 September 2019: 1.18%)
Agricultural Bank of China Ltd 20,000 6,245 0.02
Anhui Conch Cement Co Ltd 1,588 10,921 0.03
Bank of China Ltd 159,178 49,294 0.14
Bank of Communications Co Ltd 10,978 5,269 0.01
China Coal Energy Co Ltd 148,000 36,093 0.10
China Communications Construction Co Ltd 30,000 15,677 0.04
China Construction Bank Corp 137,675 89,178 0.25
China Life Insurance Co Ltd 5,356 11,984 0.03
China Merchants Bank Co Ltd 3,500 16,507 0.05
China National Building Material Co Ltd 26,000 32,810 0.09
China Petroleum & Chemical Corp 60,515 24,284 0.07
China Railway Construction Corp Ltd 19,000 13,067 0.04
China Shenhua Energy Co Ltd 5,534 9,926 0.03
China Telecom Corp Ltd 15,778 4,723 0.01
Industrial & Commercial Bank of China Ltd 128,410 66,608 0.18
PetroChina Co Ltd 39,734 11,638 0.03
Ping An Insurance Group Co of China Ltd 3,266 33,503 0.09
Sinopharm Group Co Ltd 2,400 5,035 0.01
Weichai Power Co Ltd 11,956 23,943 0.07
Total China 466,705 1.29
China, Republic of (Taiwan): 1.49% (30 September 2019: 1.04%)
AU Optronics Corp 42,000 16,242 0.05
Cathay Financial Holding Co Ltd 6,000 7,997 0.02
Chunghwa Telecom Co Ltd 12,000 44,334 0.12
Compal Electronics Inc 7,000 4,604 0.01
Delta Electronics Inc 2,052 13,391 0.04
Fubon Financial Holding Co Ltd 11,000 15,914 0.05
Hon Hai Precision Industry Co Ltd 14,906 39,836 0.11
Innolux Corp 21,976 7,110 0.02
MediaTek Inc 2,480 51,977 0.14
Novatek Microelectronics Corp 2,000 18,334 0.05
Synnex Technology International Corp 10,000 14,260 0.04
Taiwan Business Bank 46,950 15,465 0.04
Taiwan Semiconductor Manufacturing Co Ltd 12,426 185,776 0.52
Uni-President Enterprises Corp 14,000 30,212 0.08
United Microelectronics Corp 28,000 27,602 0.08
Wistron Corp 43,446 44,703 0.12
Total China, Republic of (Taiwan) 537,757 1.49
Denmark: 0.44% (30 September 2019: 0.37%)
AP Moller - Maersk A/S - Class A 12 17,647 0.05
AP Moller - Maersk A/S - Class B 14 22,232 0.06
Carlsberg AS 178 24,003 0.07
Danske Bank A/S 1,554 21,078 0.06
Novo Nordisk A/S 670 46,373 0.13
Vestas Wind Systems A/S 166 26,936 0.07
Total Denmark 158,269 0.44
Euro Countries: 15.83% (30 September 2019: 16.18%)
ABN AMRO Bank NV 1,450 12,161 0.03
Accenture Plc 299 67,571 0.19
Acciona SA 53 5,768 0.02
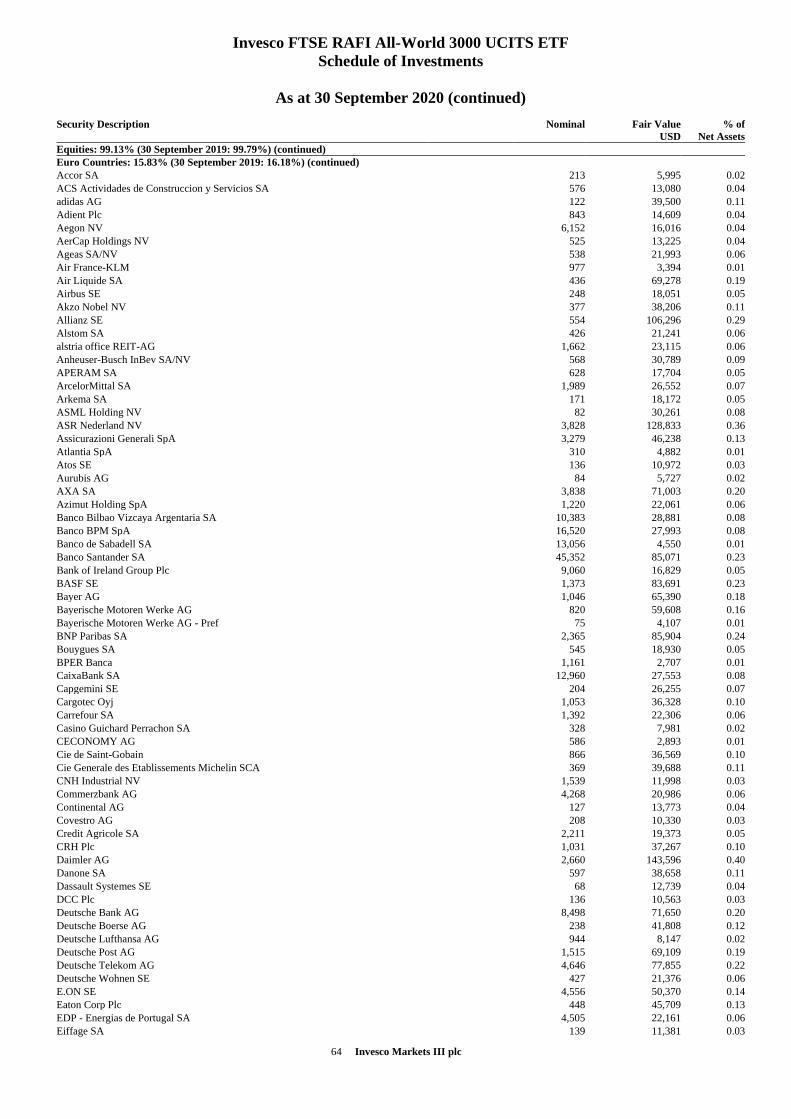
64 Invesco Markets III plc
Invesco FTSE RAFI All-World 3000 UCITS ETF
Schedule of Investments
As at 30 September 2020 (continued)
Security Description
Nominal Fair Value
USD
% of
Net Assets
Equities: 99.13% (30 September 2019: 99.79%) (continued)
Euro Countries: 15.83% (30 September 2019: 16.18%) (continued)
Accor SA 213 5,995 0.02
ACS Actividades de Construccion y Servicios SA 576 13,080 0.04
adidas AG 122 39,500 0.11
Adient Plc 843 14,609 0.04
Aegon NV 6,152 16,016 0.04
AerCap Holdings NV 525 13,225 0.04
Ageas SA/NV 538 21,993 0.06
Air France-KLM 977 3,394 0.01
Air Liquide SA 436 69,278 0.19
Airbus SE 248 18,051 0.05
Akzo Nobel NV 377 38,206 0.11
Allianz SE 554 106,296 0.29
Alstom SA 426 21,241 0.06
alstria office REIT-AG 1,662 23,115 0.06
Anheuser-Busch InBev SA/NV 568 30,789 0.09
APERAM SA 628 17,704 0.05
ArcelorMittal SA 1,989 26,552 0.07
Arkema SA 171 18,172 0.05
ASML Holding NV 82 30,261 0.08
ASR Nederland NV 3,828 128,833 0.36
Assicurazioni Generali SpA 3,279 46,238 0.13
Atlantia SpA 310 4,882 0.01
Atos SE 136 10,972 0.03
Aurubis AG 84 5,727 0.02
AXA SA 3,838 71,003 0.20
Azimut Holding SpA 1,220 22,061 0.06
Banco Bilbao Vizcaya Argentaria SA 10,383 28,881 0.08
Banco BPM SpA 16,520 27,993 0.08
Banco de Sabadell SA 13,056 4,550 0.01
Banco Santander SA 45,352 85,071 0.23
Bank of Ireland Group Plc 9,060 16,829 0.05
BASF SE 1,373 83,691 0.23
Bayer AG 1,046 65,390 0.18
Bayerische Motoren Werke AG 820 59,608 0.16
Bayerische Motoren Werke AG - Pref 75 4,107 0.01
BNP Paribas SA 2,365 85,904 0.24
Bouygues SA 545 18,930 0.05
BPER Banca 1,161 2,707 0.01
CaixaBank SA 12,960 27,553 0.08
Capgemini SE 204 26,255 0.07
Cargotec Oyj 1,053 36,328 0.10
Carrefour SA 1,392 22,306 0.06
Casino Guichard Perrachon SA 328 7,981 0.02
CECONOMY AG 586 2,893 0.01
Cie de Saint-Gobain 866 36,569 0.10
Cie Generale des Etablissements Michelin SCA 369 39,688 0.11
CNH Industrial NV 1,539 11,998 0.03
Commerzbank AG 4,268 20,986 0.06
Continental AG 127 13,773 0.04
Covestro AG 208 10,330 0.03
Credit Agricole SA 2,211 19,373 0.05
CRH Plc 1,031 37,267 0.10
Daimler AG 2,660 143,596 0.40
Danone SA 597 38,658 0.11
Dassault Systemes SE 68 12,739 0.04
DCC Plc 136 10,563 0.03
Deutsche Bank AG 8,498 71,650 0.20
Deutsche Boerse AG 238 41,808 0.12
Deutsche Lufthansa AG 944 8,147 0.02
Deutsche Post AG 1,515 69,109 0.19
Deutsche Telekom AG 4,646 77,855 0.22
Deutsche Wohnen SE 427 21,376 0.06
E.ON SE 4,556 50,370 0.14
Eaton Corp Plc 448 45,709 0.13
EDP - Energias de Portugal SA 4,505 22,161 0.06
Eiffage SA 139 11,381 0.03
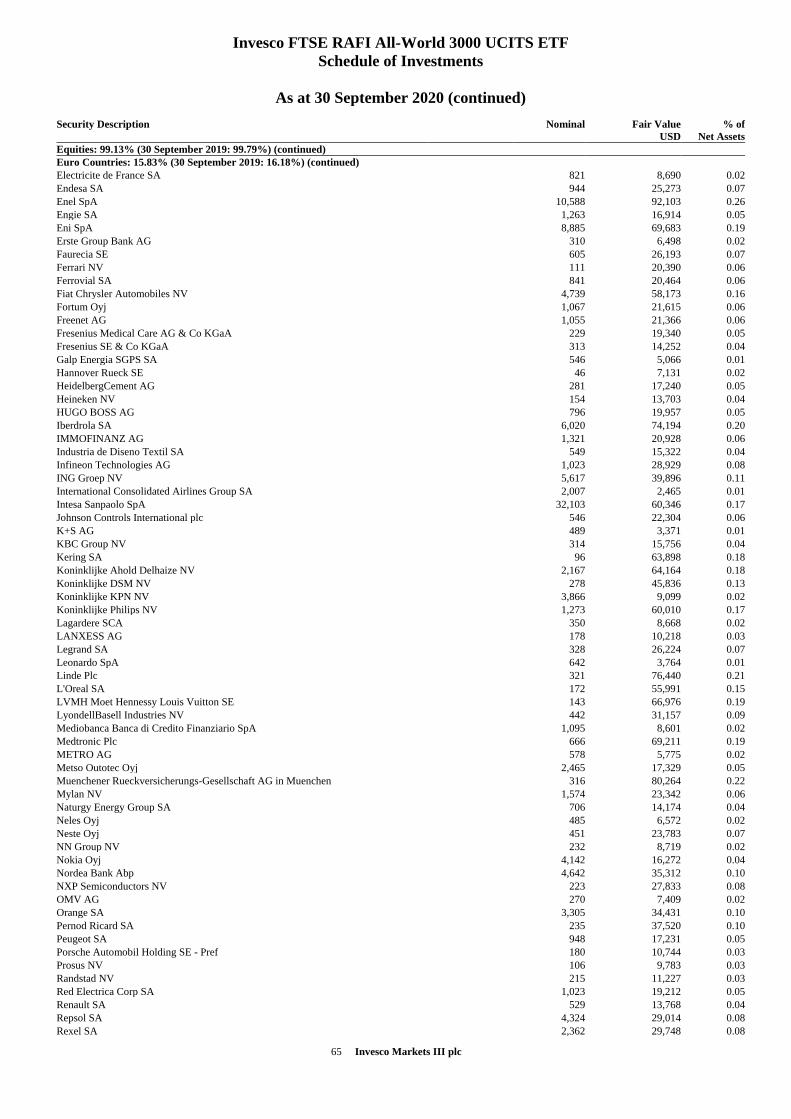
65 Invesco Markets III plc
Invesco FTSE RAFI All-World 3000 UCITS ETF
Schedule of Investments
As at 30 September 2020 (continued)
Security Description
Nominal Fair Value
USD
% of
Net Assets
Equities: 99.13% (30 September 2019: 99.79%) (continued)
Euro Countries: 15.83% (30 September 2019: 16.18%) (continued)
Electricite de France SA 821 8,690 0.02
Endesa SA 944 25,273 0.07
Enel SpA 10,588 92,103 0.26
Engie SA 1,263 16,914 0.05
Eni SpA 8,885 69,683 0.19
Erste Group Bank AG 310 6,498 0.02
Faurecia SE 605 26,193 0.07
Ferrari NV 111 20,390 0.06
Ferrovial SA 841 20,464 0.06
Fiat Chrysler Automobiles NV 4,739 58,173 0.16
Fortum Oyj 1,067 21,615 0.06
Freenet AG 1,055 21,366 0.06
Fresenius Medical Care AG & Co KGaA 229 19,340 0.05
Fresenius SE & Co KGaA 313 14,252 0.04
Galp Energia SGPS SA 546 5,066 0.01
Hannover Rueck SE 46 7,131 0.02
HeidelbergCement AG 281 17,240 0.05
Heineken NV 154 13,703 0.04
HUGO BOSS AG 796 19,957 0.05
Iberdrola SA 6,020 74,194 0.20
IMMOFINANZ AG 1,321 20,928 0.06
Industria de Diseno Textil SA 549 15,322 0.04
Infineon Technologies AG 1,023 28,929 0.08
ING Groep NV 5,617 39,896 0.11
International Consolidated Airlines Group SA 2,007 2,465 0.01
Intesa Sanpaolo SpA 32,103 60,346 0.17
Johnson Controls International plc 546 22,304 0.06
K+S AG 489 3,371 0.01
KBC Group NV 314 15,756 0.04
Kering SA 96 63,898 0.18
Koninklijke Ahold Delhaize NV 2,167 64,164 0.18
Koninklijke DSM NV 278 45,836 0.13
Koninklijke KPN NV 3,866 9,099 0.02
Koninklijke Philips NV 1,273 60,010 0.17
Lagardere SCA 350 8,668 0.02
LANXESS AG 178 10,218 0.03
Legrand SA 328 26,224 0.07
Leonardo SpA 642 3,764 0.01
Linde Plc 321 76,440 0.21
L'Oreal SA 172 55,991 0.15
LVMH Moet Hennessy Louis Vuitton SE 143 66,976 0.19
LyondellBasell Industries NV 442 31,157 0.09
Mediobanca Banca di Credito Finanziario SpA 1,095 8,601 0.02
Medtronic Plc 666 69,211 0.19
METRO AG 578 5,775 0.02
Metso Outotec Oyj 2,465 17,329 0.05
Muenchener Rueckversicherungs-Gesellschaft AG in Muenchen 316 80,264 0.22
Mylan NV 1,574 23,342 0.06
Naturgy Energy Group SA 706 14,174 0.04
Neles Oyj 485 6,572 0.02
Neste Oyj 451 23,783 0.07
NN Group NV 232 8,719 0.02
Nokia Oyj 4,142 16,272 0.04
Nordea Bank Abp 4,642 35,312 0.10
NXP Semiconductors NV 223 27,833 0.08
OMV AG 270 7,409 0.02
Orange SA 3,305 34,431 0.10
Pernod Ricard SA 235 37,520 0.10
Peugeot SA 948 17,231 0.05
Porsche Automobil Holding SE - Pref 180 10,744 0.03
Prosus NV 106 9,783 0.03
Randstad NV 215 11,227 0.03
Red Electrica Corp SA 1,023 19,212 0.05
Renault SA 529 13,768 0.04
Repsol SA 4,324 29,014 0.08
Rexel SA 2,362 29,748 0.08
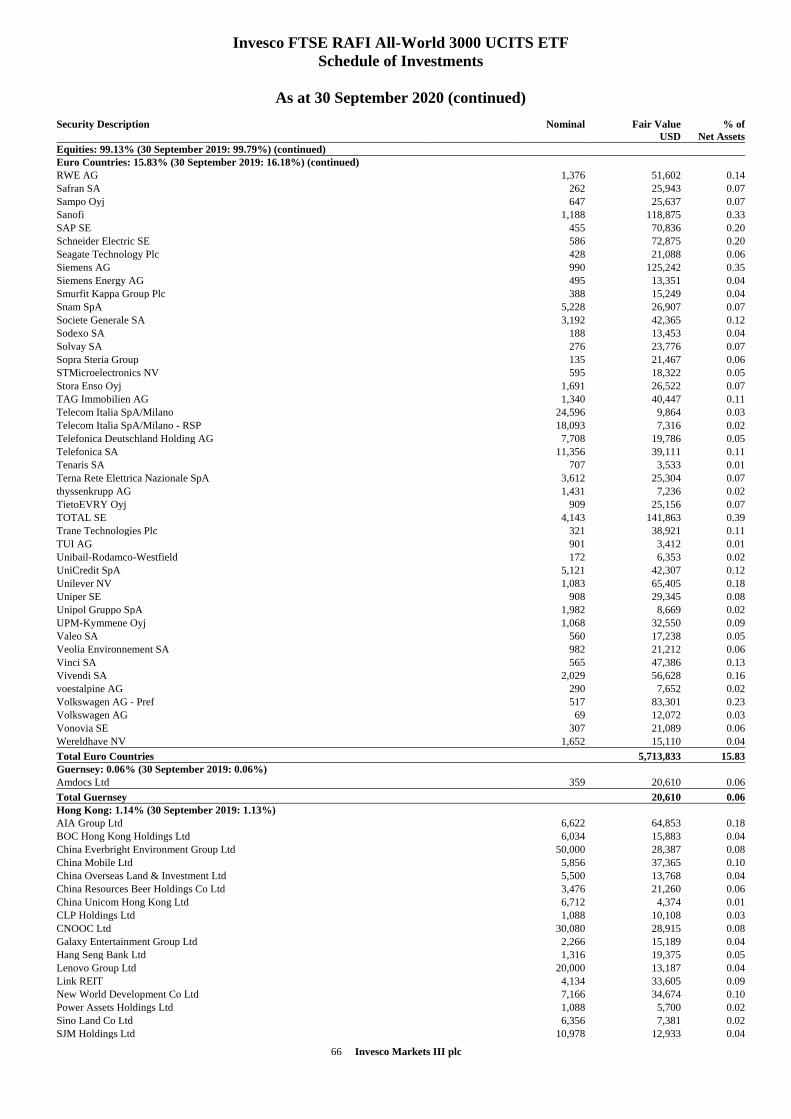
66 Invesco Markets III plc
Invesco FTSE RAFI All-World 3000 UCITS ETF
Schedule of Investments
As at 30 September 2020 (continued)
Security Description
Nominal Fair Value
USD
% of
Net Assets
Equities: 99.13% (30 September 2019: 99.79%) (continued)
Euro Countries: 15.83% (30 September 2019: 16.18%) (continued)
RWE AG 1,376 51,602 0.14
Safran SA 262 25,943 0.07
Sampo Oyj 647 25,637 0.07
Sanofi 1,188 118,875 0.33
SAP SE 455 70,836 0.20
Schneider Electric SE 586 72,875 0.20
Seagate Technology Plc 428 21,088 0.06
Siemens AG 990 125,242 0.35
Siemens Energy AG 495 13,351 0.04
Smurfit Kappa Group Plc 388 15,249 0.04
Snam SpA 5,228 26,907 0.07
Societe Generale SA 3,192 42,365 0.12
Sodexo SA 188 13,453 0.04
Solvay SA 276 23,776 0.07
Sopra Steria Group 135 21,467 0.06
STMicroelectronics NV 595 18,322 0.05
Stora Enso Oyj 1,691 26,522 0.07
TAG Immobilien AG 1,340 40,447 0.11
Telecom Italia SpA/Milano 24,596 9,864 0.03
Telecom Italia SpA/Milano - RSP 18,093 7,316 0.02
Telefonica Deutschland Holding AG 7,708 19,786 0.05
Telefonica SA 11,356 39,111 0.11
Tenaris SA 707 3,533 0.01
Terna Rete Elettrica Nazionale SpA 3,612 25,304 0.07
thyssenkrupp AG 1,431 7,236 0.02
TietoEVRY Oyj 909 25,156 0.07
TOTAL SE 4,143 141,863 0.39
Trane Technologies Plc 321 38,921 0.11
TUI AG 901 3,412 0.01
Unibail-Rodamco-Westfield 172 6,353 0.02
UniCredit SpA 5,121 42,307 0.12
Unilever NV 1,083 65,405 0.18
Uniper SE 908 29,345 0.08
Unipol Gruppo SpA 1,982 8,669 0.02
UPM-Kymmene Oyj 1,068 32,550 0.09
Valeo SA 560 17,238 0.05
Veolia Environnement SA 982 21,212 0.06
Vinci SA 565 47,386 0.13
Vivendi SA 2,029 56,628 0.16
voestalpine AG 290 7,652 0.02
Volkswagen AG - Pref 517 83,301 0.23
Volkswagen AG 69 12,072 0.03
Vonovia SE 307 21,089 0.06
Wereldhave NV 1,652 15,110 0.04
Total Euro Countries 5,713,833 15.83
Guernsey: 0.06% (30 September 2019: 0.06%)
Amdocs Ltd 359 20,610 0.06
Total Guernsey 20,610 0.06
Hong Kong: 1.14% (30 September 2019: 1.13%)
AIA Group Ltd 6,622 64,853 0.18
BOC Hong Kong Holdings Ltd 6,034 15,883 0.04
China Everbright Environment Group Ltd 50,000 28,387 0.08
China Mobile Ltd 5,856 37,365 0.10
China Overseas Land & Investment Ltd 5,500 13,768 0.04
China Resources Beer Holdings Co Ltd 3,476 21,260 0.06
China Unicom Hong Kong Ltd 6,712 4,374 0.01
CLP Holdings Ltd 1,088 10,108 0.03
CNOOC Ltd 30,080 28,915 0.08
Galaxy Entertainment Group Ltd 2,266 15,189 0.04
Hang Seng Bank Ltd 1,316 19,375 0.05
Lenovo Group Ltd 20,000 13,187 0.04
Link REIT 4,134 33,605 0.09
New World Development Co Ltd 7,166 34,674 0.10
Power Assets Holdings Ltd 1,088 5,700 0.02
Sino Land Co Ltd 6,356 7,381 0.02
SJM Holdings Ltd 10,978 12,933 0.04
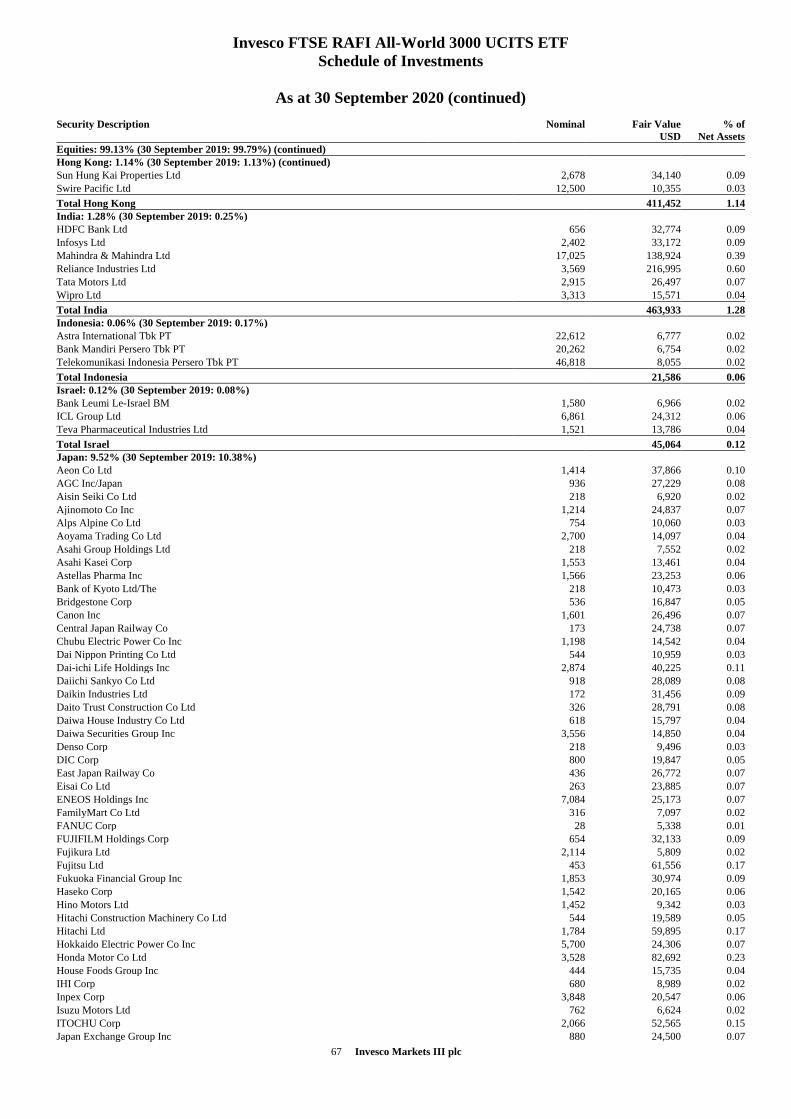
67 Invesco Markets III plc
Invesco FTSE RAFI All-World 3000 UCITS ETF
Schedule of Investments
As at 30 September 2020 (continued)
Security Description
Nominal Fair Value
USD
% of
Net Assets
Equities: 99.13% (30 September 2019: 99.79%) (continued)
Hong Kong: 1.14% (30 September 2019: 1.13%) (continued)
Sun Hung Kai Properties Ltd 2,678 34,140 0.09
Swire Pacific Ltd 12,500 10,355 0.03
Total Hong Kong 411,452 1.14
India: 1.28% (30 September 2019: 0.25%)
HDFC Bank Ltd 656 32,774 0.09
Infosys Ltd 2,402 33,172 0.09
Mahindra & Mahindra Ltd 17,025 138,924 0.39
Reliance Industries Ltd 3,569 216,995 0.60
Tata Motors Ltd 2,915 26,497 0.07
Wipro Ltd 3,313 15,571 0.04
Total India 463,933 1.28
Indonesia: 0.06% (30 September 2019: 0.17%)
Astra International Tbk PT 22,612 6,777 0.02
Bank Mandiri Persero Tbk PT 20,262 6,754 0.02
Telekomunikasi Indonesia Persero Tbk PT 46,818 8,055 0.02
Total Indonesia 21,586 0.06
Israel: 0.12% (30 September 2019: 0.08%)
Bank Leumi Le-Israel BM 1,580 6,966 0.02
ICL Group Ltd 6,861 24,312 0.06
Teva Pharmaceutical Industries Ltd 1,521 13,786 0.04
Total Israel 45,064 0.12
Japan: 9.52% (30 September 2019: 10.38%)
Aeon Co Ltd 1,414 37,866 0.10
AGC Inc/Japan 936 27,229 0.08
Aisin Seiki Co Ltd 218 6,920 0.02
Ajinomoto Co Inc 1,214 24,837 0.07
Alps Alpine Co Ltd 754 10,060 0.03
Aoyama Trading Co Ltd 2,700 14,097 0.04
Asahi Group Holdings Ltd 218 7,552 0.02
Asahi Kasei Corp 1,553 13,461 0.04
Astellas Pharma Inc 1,566 23,253 0.06
Bank of Kyoto Ltd/The 218 10,473 0.03
Bridgestone Corp 536 16,847 0.05
Canon Inc 1,601 26,496 0.07
Central Japan Railway Co 173 24,738 0.07
Chubu Electric Power Co Inc 1,198 14,542 0.04
Dai Nippon Printing Co Ltd 544 10,959 0.03
Dai-ichi Life Holdings Inc 2,874 40,225 0.11
Daiichi Sankyo Co Ltd 918 28,089 0.08
Daikin Industries Ltd 172 31,456 0.09
Daito Trust Construction Co Ltd 326 28,791 0.08
Daiwa House Industry Co Ltd 618 15,797 0.04
Daiwa Securities Group Inc 3,556 14,850 0.04
Denso Corp 218 9,496 0.03
DIC Corp 800 19,847 0.05
East Japan Railway Co 436 26,772 0.07
Eisai Co Ltd 263 23,885 0.07
ENEOS Holdings Inc 7,084 25,173 0.07
FamilyMart Co Ltd 316 7,097 0.02
FANUC Corp 28 5,338 0.01
FUJIFILM Holdings Corp 654 32,133 0.09
Fujikura Ltd 2,114 5,809 0.02
Fujitsu Ltd 453 61,556 0.17
Fukuoka Financial Group Inc 1,853 30,974 0.09
Haseko Corp 1,542 20,165 0.06
Hino Motors Ltd 1,452 9,342 0.03
Hitachi Construction Machinery Co Ltd 544 19,589 0.05
Hitachi Ltd 1,784 59,895 0.17
Hokkaido Electric Power Co Inc 5,700 24,306 0.07
Honda Motor Co Ltd 3,528 82,692 0.23
House Foods Group Inc 444 15,735 0.04
IHI Corp 680 8,989 0.02
Inpex Corp 3,848 20,547 0.06
Isuzu Motors Ltd 762 6,624 0.02
ITOCHU Corp 2,066 52,565 0.15
Japan Exchange Group Inc 880 24,500 0.07
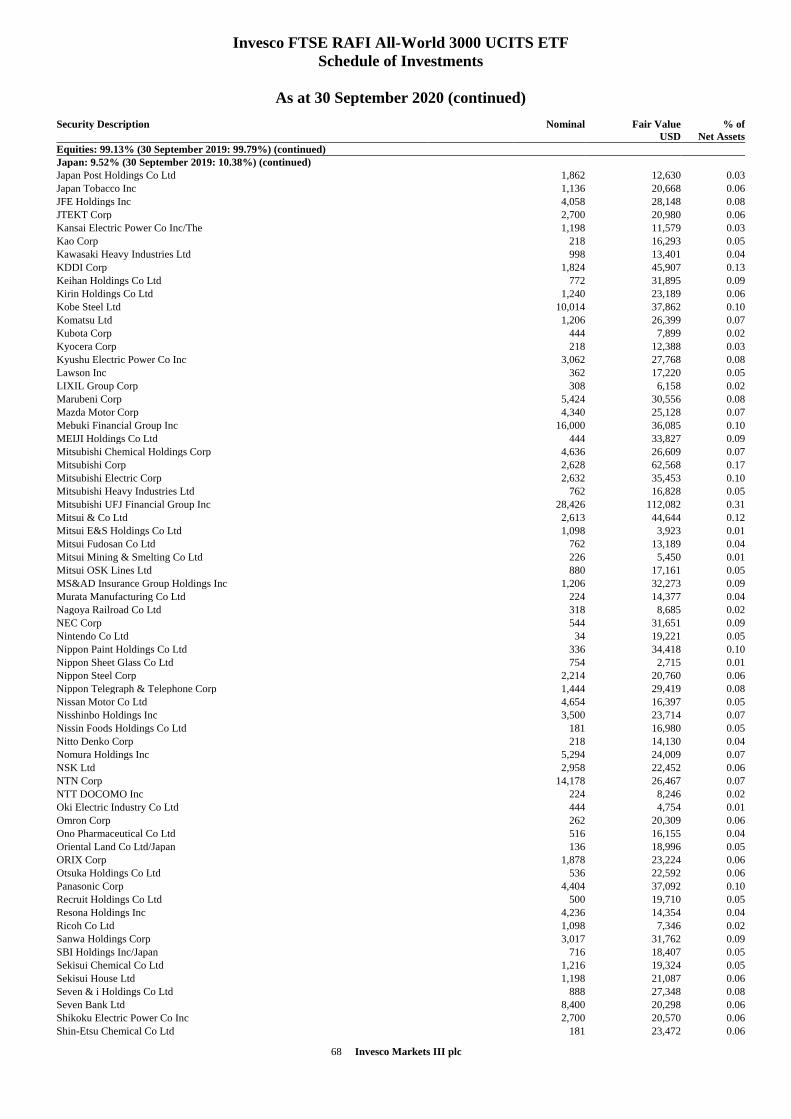
68 Invesco Markets III plc
Invesco FTSE RAFI All-World 3000 UCITS ETF
Schedule of Investments
As at 30 September 2020 (continued)
Security Description
Nominal Fair Value
USD
% of
Net Assets
Equities: 99.13% (30 September 2019: 99.79%) (continued)
Japan: 9.52% (30 September 2019: 10.38%) (continued)
Japan Post Holdings Co Ltd 1,862 12,630 0.03
Japan Tobacco Inc 1,136 20,668 0.06
JFE Holdings Inc 4,058 28,148 0.08
JTEKT Corp 2,700 20,980 0.06
Kansai Electric Power Co Inc/The 1,198 11,579 0.03
Kao Corp 218 16,293 0.05
Kawasaki Heavy Industries Ltd 998 13,401 0.04
KDDI Corp 1,824 45,907 0.13
Keihan Holdings Co Ltd 772 31,895 0.09
Kirin Holdings Co Ltd 1,240 23,189 0.06
Kobe Steel Ltd 10,014 37,862 0.10
Komatsu Ltd 1,206 26,399 0.07
Kubota Corp 444 7,899 0.02
Kyocera Corp 218 12,388 0.03
Kyushu Electric Power Co Inc 3,062 27,768 0.08
Lawson Inc 362 17,220 0.05
LIXIL Group Corp 308 6,158 0.02
Marubeni Corp 5,424 30,556 0.08
Mazda Motor Corp 4,340 25,128 0.07
Mebuki Financial Group Inc 16,000 36,085 0.10
MEIJI Holdings Co Ltd 444 33,827 0.09
Mitsubishi Chemical Holdings Corp 4,636 26,609 0.07
Mitsubishi Corp 2,628 62,568 0.17
Mitsubishi Electric Corp 2,632 35,453 0.10
Mitsubishi Heavy Industries Ltd 762 16,828 0.05
Mitsubishi UFJ Financial Group Inc 28,426 112,082 0.31
Mitsui & Co Ltd 2,613 44,644 0.12
Mitsui E&S Holdings Co Ltd 1,098 3,923 0.01
Mitsui Fudosan Co Ltd 762 13,189 0.04
Mitsui Mining & Smelting Co Ltd 226 5,450 0.01
Mitsui OSK Lines Ltd 880 17,161 0.05
MS&AD Insurance Group Holdings Inc 1,206 32,273 0.09
Murata Manufacturing Co Ltd 224 14,377 0.04
Nagoya Railroad Co Ltd 318 8,685 0.02
NEC Corp 544 31,651 0.09
Nintendo Co Ltd 34 19,221 0.05
Nippon Paint Holdings Co Ltd 336 34,418 0.10
Nippon Sheet Glass Co Ltd 754 2,715 0.01
Nippon Steel Corp 2,214 20,760 0.06
Nippon Telegraph & Telephone Corp 1,444 29,419 0.08
Nissan Motor Co Ltd 4,654 16,397 0.05
Nisshinbo Holdings Inc 3,500 23,714 0.07
Nissin Foods Holdings Co Ltd 181 16,980 0.05
Nitto Denko Corp 218 14,130 0.04
Nomura Holdings Inc 5,294 24,009 0.07
NSK Ltd 2,958 22,452 0.06
NTN Corp 14,178 26,467 0.07
NTT DOCOMO Inc 224 8,246 0.02
Oki Electric Industry Co Ltd 444 4,754 0.01
Omron Corp 262 20,309 0.06
Ono Pharmaceutical Co Ltd 516 16,155 0.04
Oriental Land Co Ltd/Japan 136 18,996 0.05
ORIX Corp 1,878 23,224 0.06
Otsuka Holdings Co Ltd 536 22,592 0.06
Panasonic Corp 4,404 37,092 0.10
Recruit Holdings Co Ltd 500 19,710 0.05
Resona Holdings Inc 4,236 14,354 0.04
Ricoh Co Ltd 1,098 7,346 0.02
Sanwa Holdings Corp 3,017 31,762 0.09
SBI Holdings Inc/Japan 716 18,407 0.05
Sekisui Chemical Co Ltd 1,216 19,324 0.05
Sekisui House Ltd 1,198 21,087 0.06
Seven & i Holdings Co Ltd 888 27,348 0.08
Seven Bank Ltd 8,400 20,298 0.06
Shikoku Electric Power Co Inc 2,700 20,570 0.06
Shin-Etsu Chemical Co Ltd 181 23,472 0.06
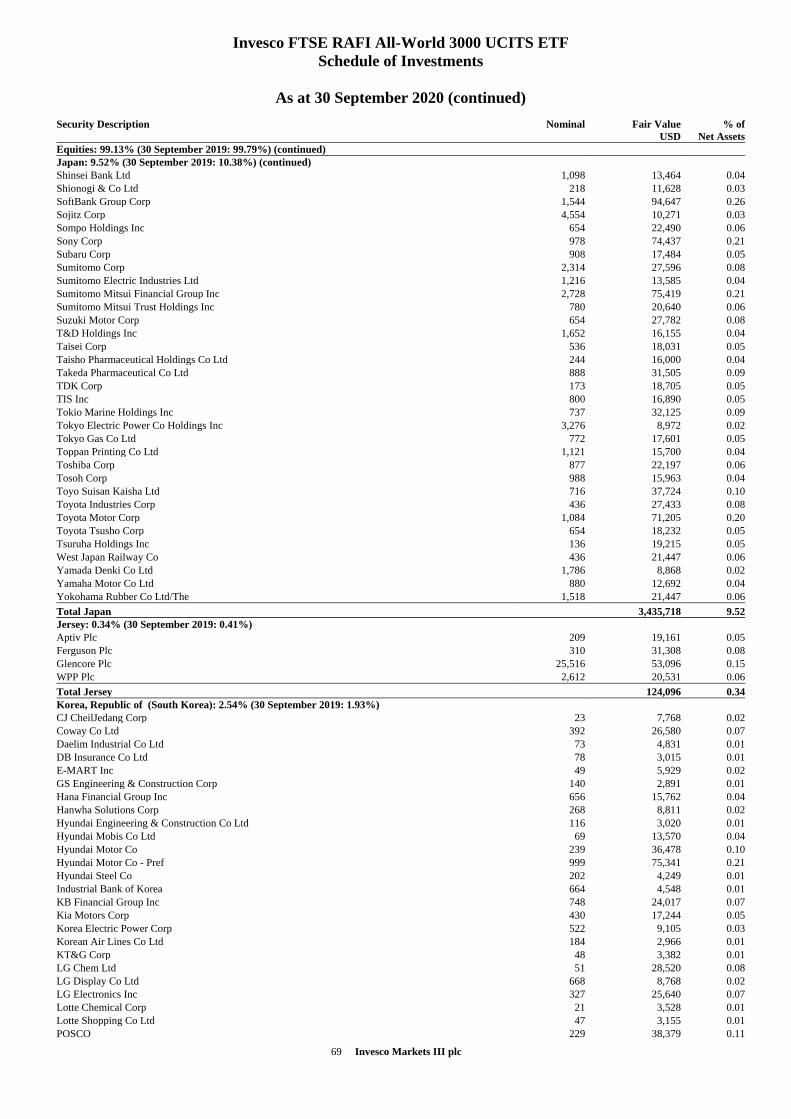
69 Invesco Markets III plc
Invesco FTSE RAFI All-World 3000 UCITS ETF
Schedule of Investments
As at 30 September 2020 (continued)
Security Description
Nominal Fair Value
USD
% of
Net Assets
Equities: 99.13% (30 September 2019: 99.79%) (continued)
Japan: 9.52% (30 September 2019: 10.38%) (continued)
Shinsei Bank Ltd 1,098 13,464 0.04
Shionogi & Co Ltd 218 11,628 0.03
SoftBank Group Corp 1,544 94,647 0.26
Sojitz Corp 4,554 10,271 0.03
Sompo Holdings Inc 654 22,490 0.06
Sony Corp 978 74,437 0.21
Subaru Corp 908 17,484 0.05
Sumitomo Corp 2,314 27,596 0.08
Sumitomo Electric Industries Ltd 1,216 13,585 0.04
Sumitomo Mitsui Financial Group Inc 2,728 75,419 0.21
Sumitomo Mitsui Trust Holdings Inc 780 20,640 0.06
Suzuki Motor Corp 654 27,782 0.08
T&D Holdings Inc 1,652 16,155 0.04
Taisei Corp 536 18,031 0.05
Taisho Pharmaceutical Holdings Co Ltd 244 16,000 0.04
Takeda Pharmaceutical Co Ltd 888 31,505 0.09
TDK Corp 173 18,705 0.05
TIS Inc 800 16,890 0.05
Tokio Marine Holdings Inc 737 32,125 0.09
Tokyo Electric Power Co Holdings Inc 3,276 8,972 0.02
Tokyo Gas Co Ltd 772 17,601 0.05
Toppan Printing Co Ltd 1,121 15,700 0.04
Toshiba Corp 877 22,197 0.06
Tosoh Corp 988 15,963 0.04
Toyo Suisan Kaisha Ltd 716 37,724 0.10
Toyota Industries Corp 436 27,433 0.08
Toyota Motor Corp 1,084 71,205 0.20
Toyota Tsusho Corp 654 18,232 0.05
Tsuruha Holdings Inc 136 19,215 0.05
West Japan Railway Co 436 21,447 0.06
Yamada Denki Co Ltd 1,786 8,868 0.02
Yamaha Motor Co Ltd 880 12,692 0.04
Yokohama Rubber Co Ltd/The 1,518 21,447 0.06
Total Japan 3,435,718 9.52
Jersey: 0.34% (30 September 2019: 0.41%)
Aptiv Plc 209 19,161 0.05
Ferguson Plc 310 31,308 0.08
Glencore Plc 25,516 53,096 0.15
WPP Plc 2,612 20,531 0.06
Total Jersey 124,096 0.34
Korea, Republic of (South Korea): 2.54% (30 September 2019: 1.93%)
CJ CheilJedang Corp 23 7,768 0.02
Coway Co Ltd 392 26,580 0.07
Daelim Industrial Co Ltd 73 4,831 0.01
DB Insurance Co Ltd 78 3,015 0.01
E-MART Inc 49 5,929 0.02
GS Engineering & Construction Corp 140 2,891 0.01
Hana Financial Group Inc 656 15,762 0.04
Hanwha Solutions Corp 268 8,811 0.02
Hyundai Engineering & Construction Co Ltd 116 3,020 0.01
Hyundai Mobis Co Ltd 69 13,570 0.04
Hyundai Motor Co 239 36,478 0.10
Hyundai Motor Co - Pref 999 75,341 0.21
Hyundai Steel Co 202 4,249 0.01
Industrial Bank of Korea 664 4,548 0.01
KB Financial Group Inc 748 24,017 0.07
Kia Motors Corp 430 17,244 0.05
Korea Electric Power Corp 522 9,105 0.03
Korean Air Lines Co Ltd 184 2,966 0.01
KT&G Corp 48 3,382 0.01
LG Chem Ltd 51 28,520 0.08
LG Display Co Ltd 668 8,768 0.02
LG Electronics Inc 327 25,640 0.07
Lotte Chemical Corp 21 3,528 0.01
Lotte Shopping Co Ltd 47 3,155 0.01
POSCO 229 38,379 0.11
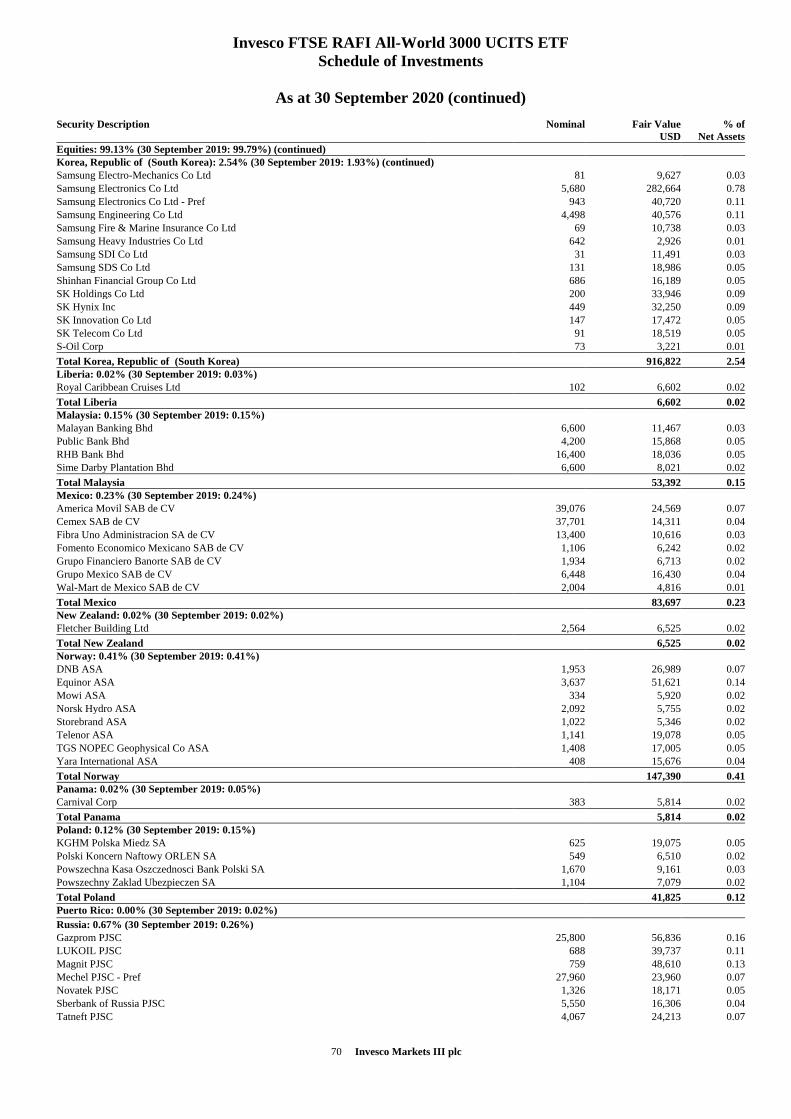
70 Invesco Markets III plc
Invesco FTSE RAFI All-World 3000 UCITS ETF
Schedule of Investments
As at 30 September 2020 (continued)
Security Description
Nominal Fair Value
USD
% of
Net Assets
Equities: 99.13% (30 September 2019: 99.79%) (continued)
Korea, Republic of (South Korea): 2.54% (30 September 2019: 1.93%) (continued)
Samsung Electro-Mechanics Co Ltd 81 9,627 0.03
Samsung Electronics Co Ltd 5,680 282,664 0.78
Samsung Electronics Co Ltd - Pref 943 40,720 0.11
Samsung Engineering Co Ltd 4,498 40,576 0.11
Samsung Fire & Marine Insurance Co Ltd 69 10,738 0.03
Samsung Heavy Industries Co Ltd 642 2,926 0.01
Samsung SDI Co Ltd 31 11,491 0.03
Samsung SDS Co Ltd 131 18,986 0.05
Shinhan Financial Group Co Ltd 686 16,189 0.05
SK Holdings Co Ltd 200 33,946 0.09
SK Hynix Inc 449 32,250 0.09
SK Innovation Co Ltd 147 17,472 0.05
SK Telecom Co Ltd 91 18,519 0.05
S-Oil Corp 73 3,221 0.01
Total Korea, Republic of (South Korea) 916,822 2.54
Liberia: 0.02% (30 September 2019: 0.03%)
Royal Caribbean Cruises Ltd 102 6,602 0.02
Total Liberia 6,602 0.02
Malaysia: 0.15% (30 September 2019: 0.15%)
Malayan Banking Bhd 6,600 11,467 0.03
Public Bank Bhd 4,200 15,868 0.05
RHB Bank Bhd 16,400 18,036 0.05
Sime Darby Plantation Bhd 6,600 8,021 0.02
Total Malaysia 53,392 0.15
Mexico: 0.23% (30 September 2019: 0.24%)
America Movil SAB de CV 39,076 24,569 0.07
Cemex SAB de CV 37,701 14,311 0.04
Fibra Uno Administracion SA de CV 13,400 10,616 0.03
Fomento Economico Mexicano SAB de CV 1,106 6,242 0.02
Grupo Financiero Banorte SAB de CV 1,934 6,713 0.02
Grupo Mexico SAB de CV 6,448 16,430 0.04
Wal-Mart de Mexico SAB de CV 2,004 4,816 0.01
Total Mexico 83,697 0.23
New Zealand: 0.02% (30 September 2019: 0.02%)
Fletcher Building Ltd 2,564 6,525 0.02
Total New Zealand 6,525 0.02
Norway: 0.41% (30 September 2019: 0.41%)
DNB ASA 1,953 26,989 0.07
Equinor ASA 3,637 51,621 0.14
Mowi ASA 334 5,920 0.02
Norsk Hydro ASA 2,092 5,755 0.02
Storebrand ASA 1,022 5,346 0.02
Telenor ASA 1,141 19,078 0.05
TGS NOPEC Geophysical Co ASA 1,408 17,005 0.05
Yara International ASA 408 15,676 0.04
Total Norway 147,390 0.41
Panama: 0.02% (30 September 2019: 0.05%)
Carnival Corp 383 5,814 0.02
Total Panama 5,814 0.02
Poland: 0.12% (30 September 2019: 0.15%)
KGHM Polska Miedz SA 625 19,075 0.05
Polski Koncern Naftowy ORLEN SA 549 6,510 0.02
Powszechna Kasa Oszczednosci Bank Polski SA 1,670 9,161 0.03
Powszechny Zaklad Ubezpieczen SA 1,104 7,079 0.02
Total Poland 41,825 0.12
Puerto Rico: 0.00% (30 September 2019: 0.02%)
Russia: 0.67% (30 September 2019: 0.26%)
Gazprom PJSC 25,800 56,836 0.16
LUKOIL PJSC 688 39,737 0.11
Magnit PJSC 759 48,610 0.13
Mechel PJSC - Pref 27,960 23,960 0.07
Novatek PJSC 1,326 18,171 0.05
Sberbank of Russia PJSC 5,550 16,306 0.04
Tatneft PJSC 4,067 24,213 0.07
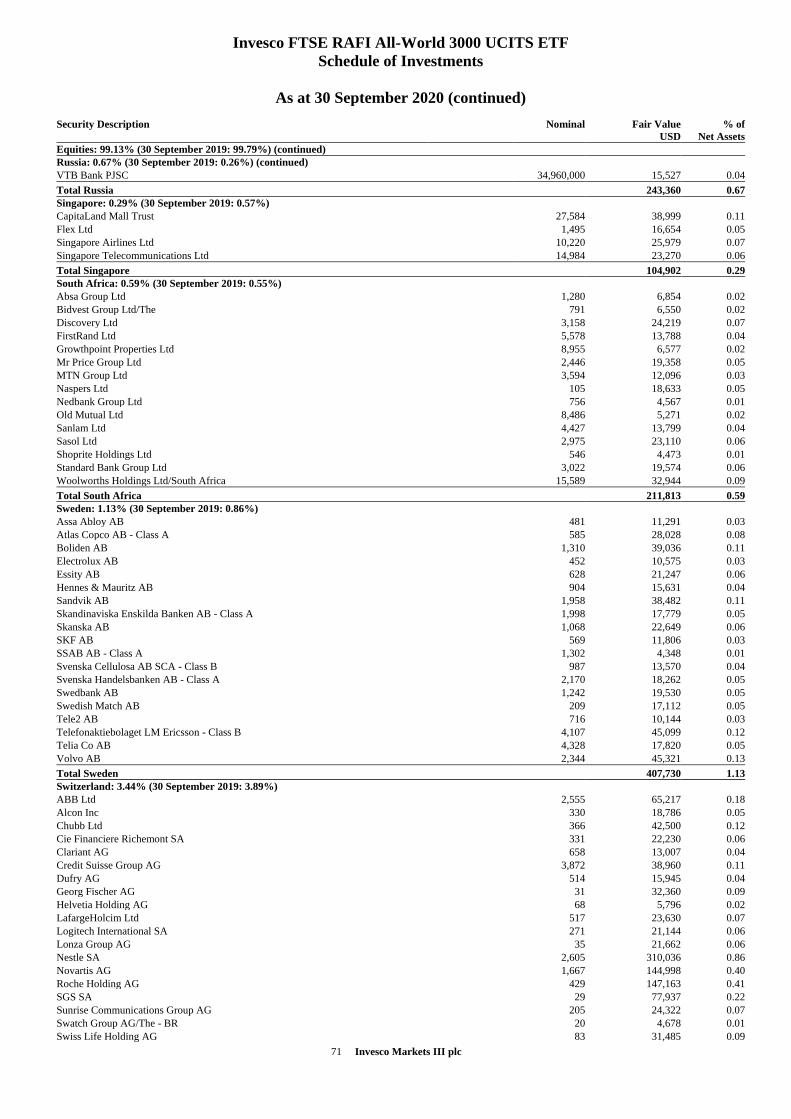
71 Invesco Markets III plc
Invesco FTSE RAFI All-World 3000 UCITS ETF
Schedule of Investments
As at 30 September 2020 (continued)
Security Description
Nominal Fair Value
USD
% of
Net Assets
Equities: 99.13% (30 September 2019: 99.79%) (continued)
Russia: 0.67% (30 September 2019: 0.26%) (continued)
VTB Bank PJSC 34,960,000 15,527 0.04
Total Russia 243,360 0.67
Singapore: 0.29% (30 September 2019: 0.57%)
CapitaLand Mall Trust 27,584 38,999 0.11
Flex Ltd 1,495 16,654 0.05
Singapore Airlines Ltd 10,220 25,979 0.07
Singapore Telecommunications Ltd 14,984 23,270 0.06
Total Singapore 104,902 0.29
South Africa: 0.59% (30 September 2019: 0.55%)
Absa Group Ltd 1,280 6,854 0.02
Bidvest Group Ltd/The 791 6,550 0.02
Discovery Ltd 3,158 24,219 0.07
FirstRand Ltd 5,578 13,788 0.04
Growthpoint Properties Ltd 8,955 6,577 0.02
Mr Price Group Ltd 2,446 19,358 0.05
MTN Group Ltd 3,594 12,096 0.03
Naspers Ltd 105 18,633 0.05
Nedbank Group Ltd 756 4,567 0.01
Old Mutual Ltd 8,486 5,271 0.02
Sanlam Ltd 4,427 13,799 0.04
Sasol Ltd 2,975 23,110 0.06
Shoprite Holdings Ltd 546 4,473 0.01
Standard Bank Group Ltd 3,022 19,574 0.06
Woolworths Holdings Ltd/South Africa 15,589 32,944 0.09
Total South Africa 211,813 0.59
Sweden: 1.13% (30 September 2019: 0.86%)
Assa Abloy AB 481 11,291 0.03
Atlas Copco AB - Class A 585 28,028 0.08
Boliden AB 1,310 39,036 0.11
Electrolux AB 452 10,575 0.03
Essity AB 628 21,247 0.06
Hennes & Mauritz AB 904 15,631 0.04
Sandvik AB 1,958 38,482 0.11
Skandinaviska Enskilda Banken AB - Class A 1,998 17,779 0.05
Skanska AB 1,068 22,649 0.06
SKF AB 569 11,806 0.03
SSAB AB - Class A 1,302 4,348 0.01
Svenska Cellulosa AB SCA - Class B 987 13,570 0.04
Svenska Handelsbanken AB - Class A 2,170 18,262 0.05
Swedbank AB 1,242 19,530 0.05
Swedish Match AB 209 17,112 0.05
Tele2 AB 716 10,144 0.03
Telefonaktiebolaget LM Ericsson - Class B 4,107 45,099 0.12
Telia Co AB 4,328 17,820 0.05
Volvo AB 2,344 45,321 0.13
Total Sweden 407,730 1.13
Switzerland: 3.44% (30 September 2019: 3.89%)
ABB Ltd 2,555 65,217 0.18
Alcon Inc 330 18,786 0.05
Chubb Ltd 366 42,500 0.12
Cie Financiere Richemont SA 331 22,230 0.06
Clariant AG 658 13,007 0.04
Credit Suisse Group AG 3,872 38,960 0.11
Dufry AG 514 15,945 0.04
Georg Fischer AG 31 32,360 0.09
Helvetia Holding AG 68 5,796 0.02
LafargeHolcim Ltd 517 23,630 0.07
Logitech International SA 271 21,144 0.06
Lonza Group AG 35 21,662 0.06
Nestle SA 2,605 310,036 0.86
Novartis AG 1,667 144,998 0.40
Roche Holding AG 429 147,163 0.41
SGS SA 29 77,937 0.22
Sunrise Communications Group AG 205 24,322 0.07
Swatch Group AG/The - BR 20 4,678 0.01
Swiss Life Holding AG 83 31,485 0.09
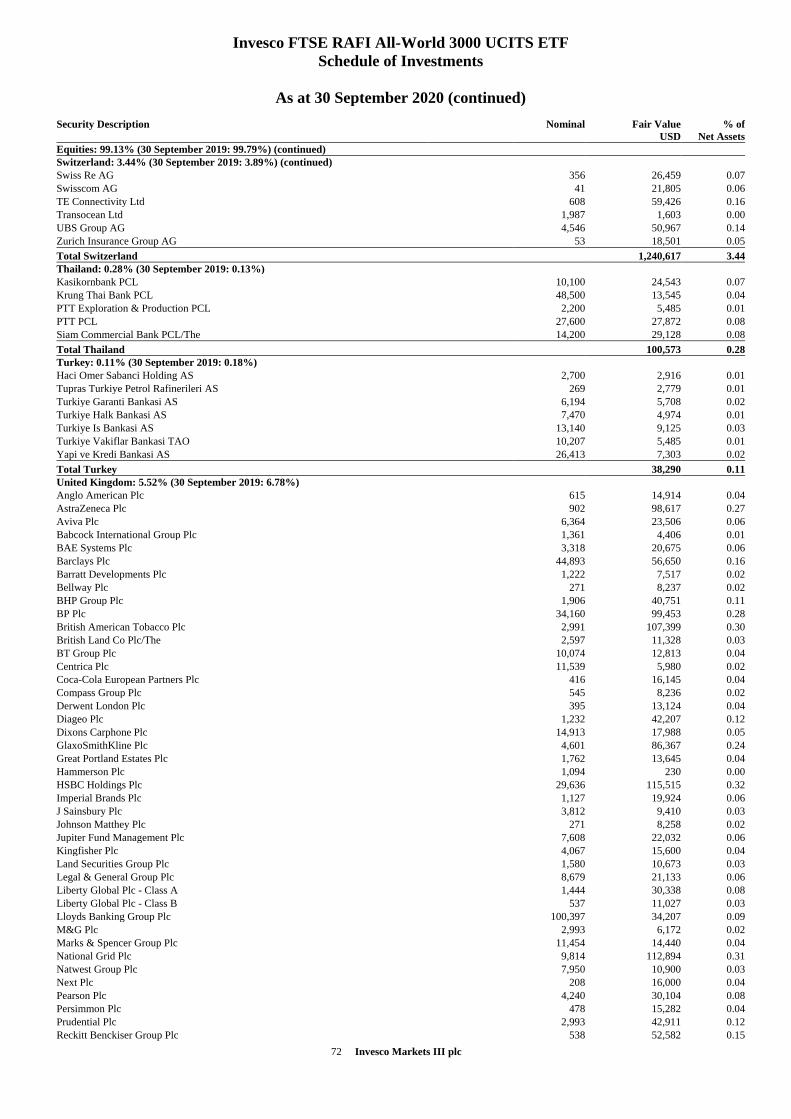
72 Invesco Markets III plc
Invesco FTSE RAFI All-World 3000 UCITS ETF
Schedule of Investments
As at 30 September 2020 (continued)
Security Description
Nominal Fair Value
USD
% of
Net Assets
Equities: 99.13% (30 September 2019: 99.79%) (continued)
Switzerland: 3.44% (30 September 2019: 3.89%) (continued)
Swiss Re AG 356 26,459 0.07
Swisscom AG 41 21,805 0.06
TE Connectivity Ltd 608 59,426 0.16
Transocean Ltd 1,987 1,603 0.00
UBS Group AG 4,546 50,967 0.14
Zurich Insurance Group AG 53 18,501 0.05
Total Switzerland 1,240,617 3.44
Thailand: 0.28% (30 September 2019: 0.13%)
Kasikornbank PCL 10,100 24,543 0.07
Krung Thai Bank PCL 48,500 13,545 0.04
PTT Exploration & Production PCL 2,200 5,485 0.01
PTT PCL 27,600 27,872 0.08
Siam Commercial Bank PCL/The 14,200 29,128 0.08
Total Thailand 100,573 0.28
Turkey: 0.11% (30 September 2019: 0.18%)
Haci Omer Sabanci Holding AS 2,700 2,916 0.01
Tupras Turkiye Petrol Rafinerileri AS 269 2,779 0.01
Turkiye Garanti Bankasi AS 6,194 5,708 0.02
Turkiye Halk Bankasi AS 7,470 4,974 0.01
Turkiye Is Bankasi AS 13,140 9,125 0.03
Turkiye Vakiflar Bankasi TAO 10,207 5,485 0.01
Yapi ve Kredi Bankasi AS 26,413 7,303 0.02
Total Turkey 38,290 0.11
United Kingdom: 5.52% (30 September 2019: 6.78%)
Anglo American Plc 615 14,914 0.04
AstraZeneca Plc 902 98,617 0.27
Aviva Plc 6,364 23,506 0.06
Babcock International Group Plc 1,361 4,406 0.01
BAE Systems Plc 3,318 20,675 0.06
Barclays Plc 44,893 56,650 0.16
Barratt Developments Plc 1,222 7,517 0.02
Bellway Plc 271 8,237 0.02
BHP Group Plc 1,906 40,751 0.11
BP Plc 34,160 99,453 0.28
British American Tobacco Plc 2,991 107,399 0.30
British Land Co Plc/The 2,597 11,328 0.03
BT Group Plc 10,074 12,813 0.04
Centrica Plc 11,539 5,980 0.02
Coca-Cola European Partners Plc 416 16,145 0.04
Compass Group Plc 545 8,236 0.02
Derwent London Plc 395 13,124 0.04
Diageo Plc 1,232 42,207 0.12
Dixons Carphone Plc 14,913 17,988 0.05
GlaxoSmithKline Plc 4,601 86,367 0.24
Great Portland Estates Plc 1,762 13,645 0.04
Hammerson Plc 1,094 230 0.00
HSBC Holdings Plc 29,636 115,515 0.32
Imperial Brands Plc 1,127 19,924 0.06
J Sainsbury Plc 3,812 9,410 0.03
Johnson Matthey Plc 271 8,258 0.02
Jupiter Fund Management Plc 7,608 22,032 0.06
Kingfisher Plc 4,067 15,600 0.04
Land Securities Group Plc 1,580 10,673 0.03
Legal & General Group Plc 8,679 21,133 0.06
Liberty Global Plc - Class A 1,444 30,338 0.08
Liberty Global Plc - Class B 537 11,027 0.03
Lloyds Banking Group Plc 100,397 34,207 0.09
M&G Plc 2,993 6,172 0.02
Marks & Spencer Group Plc 11,454 14,440 0.04
National Grid Plc 9,814 112,894 0.31
Natwest Group Plc 7,950 10,900 0.03
Next Plc 208 16,000 0.04
Pearson Plc 4,240 30,104 0.08
Persimmon Plc 478 15,282 0.04
Prudential Plc 2,993 42,911 0.12
Reckitt Benckiser Group Plc 538 52,582 0.15
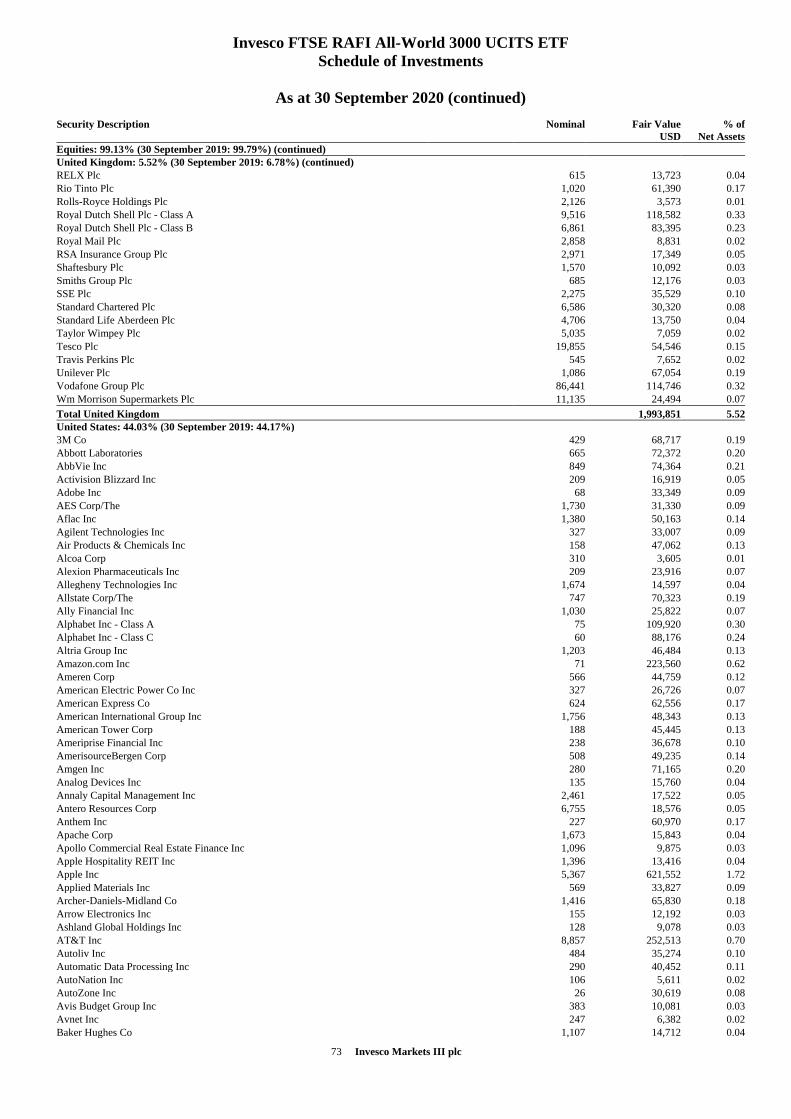
73 Invesco Markets III plc
Invesco FTSE RAFI All-World 3000 UCITS ETF
Schedule of Investments
As at 30 September 2020 (continued)
Security Description
Nominal Fair Value
USD
% of
Net Assets
Equities: 99.13% (30 September 2019: 99.79%) (continued)
United Kingdom: 5.52% (30 September 2019: 6.78%) (continued)
RELX Plc 615 13,723 0.04
Rio Tinto Plc 1,020 61,390 0.17
Rolls-Royce Holdings Plc 2,126 3,573 0.01
Royal Dutch Shell Plc - Class A 9,516 118,582 0.33
Royal Dutch Shell Plc - Class B 6,861 83,395 0.23
Royal Mail Plc 2,858 8,831 0.02
RSA Insurance Group Plc 2,971 17,349 0.05
Shaftesbury Plc 1,570 10,092 0.03
Smiths Group Plc 685 12,176 0.03
SSE Plc 2,275 35,529 0.10
Standard Chartered Plc 6,586 30,320 0.08
Standard Life Aberdeen Plc 4,706 13,750 0.04
Taylor Wimpey Plc 5,035 7,059 0.02
Tesco Plc 19,855 54,546 0.15
Travis Perkins Plc 545 7,652 0.02
Unilever Plc 1,086 67,054 0.19
Vodafone Group Plc 86,441 114,746 0.32
Wm Morrison Supermarkets Plc 11,135 24,494 0.07
Total United Kingdom 1,993,851 5.52
United States: 44.03% (30 September 2019: 44.17%)
3M Co 429 68,717 0.19
Abbott Laboratories 665 72,372 0.20
AbbVie Inc 849 74,364 0.21
Activision Blizzard Inc 209 16,919 0.05
Adobe Inc 68 33,349 0.09
AES Corp/The 1,730 31,330 0.09
Aflac Inc 1,380 50,163 0.14
Agilent Technologies Inc 327 33,007 0.09
Air Products & Chemicals Inc 158 47,062 0.13
Alcoa Corp 310 3,605 0.01
Alexion Pharmaceuticals Inc 209 23,916 0.07
Allegheny Technologies Inc 1,674 14,597 0.04
Allstate Corp/The 747 70,323 0.19
Ally Financial Inc 1,030 25,822 0.07
Alphabet Inc - Class A 75 109,920 0.30
Alphabet Inc - Class C 60 88,176 0.24
Altria Group Inc 1,203 46,484 0.13
Amazon.com Inc 71 223,560 0.62
Ameren Corp 566 44,759 0.12
American Electric Power Co Inc 327 26,726 0.07
American Express Co 624 62,556 0.17
American International Group Inc 1,756 48,343 0.13
American Tower Corp 188 45,445 0.13
Ameriprise Financial Inc 238 36,678 0.10
AmerisourceBergen Corp 508 49,235 0.14
Amgen Inc 280 71,165 0.20
Analog Devices Inc 135 15,760 0.04
Annaly Capital Management Inc 2,461 17,522 0.05
Antero Resources Corp 6,755 18,576 0.05
Anthem Inc 227 60,970 0.17
Apache Corp 1,673 15,843 0.04
Apollo Commercial Real Estate Finance Inc 1,096 9,875 0.03
Apple Hospitality REIT Inc 1,396 13,416 0.04
Apple Inc 5,367 621,552 1.72
Applied Materials Inc 569 33,827 0.09
Archer-Daniels-Midland Co 1,416 65,830 0.18
Arrow Electronics Inc 155 12,192 0.03
Ashland Global Holdings Inc 128 9,078 0.03
AT&T Inc 8,857 252,513 0.70
Autoliv Inc 484 35,274 0.10
Automatic Data Processing Inc 290 40,452 0.11
AutoNation Inc 106 5,611 0.02
AutoZone Inc 26 30,619 0.08
Avis Budget Group Inc 383 10,081 0.03
Avnet Inc 247 6,382 0.02
Baker Hughes Co 1,107 14,712 0.04
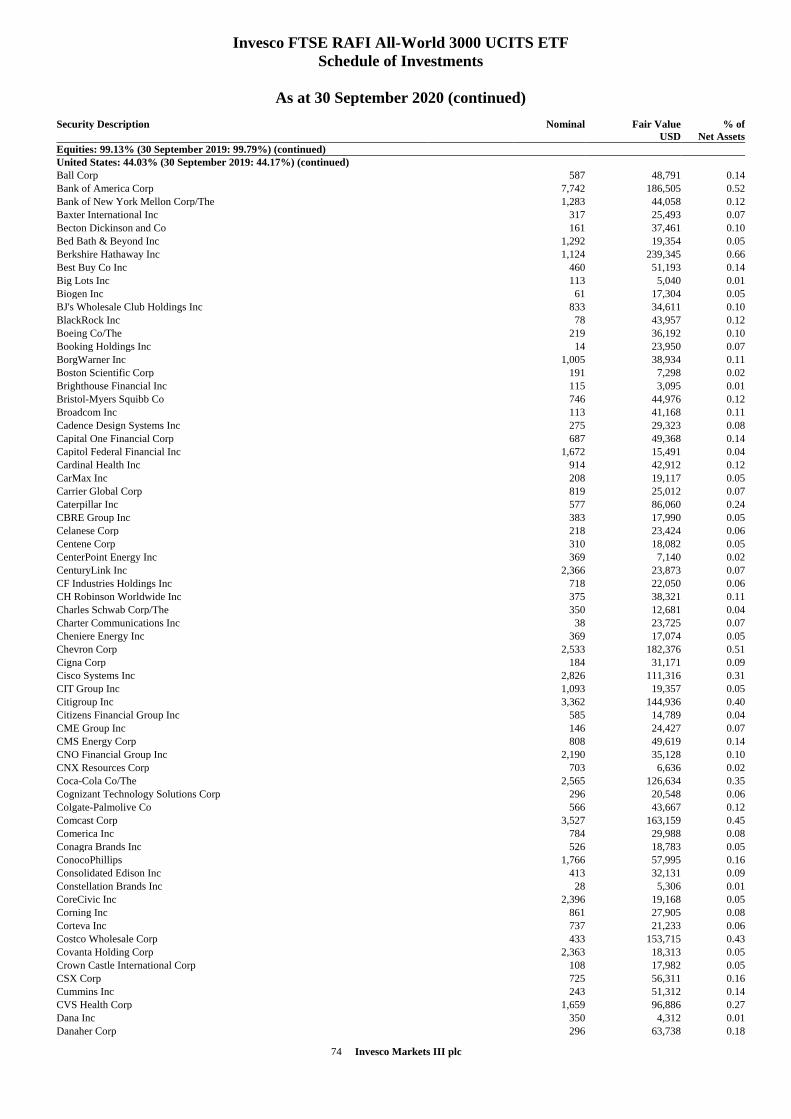
74 Invesco Markets III plc
Invesco FTSE RAFI All-World 3000 UCITS ETF
Schedule of Investments
As at 30 September 2020 (continued)
Security Description
Nominal Fair Value
USD
% of
Net Assets
Equities: 99.13% (30 September 2019: 99.79%) (continued)
United States: 44.03% (30 September 2019: 44.17%) (continued)
Ball Corp 587 48,791 0.14
Bank of America Corp 7,742 186,505 0.52
Bank of New York Mellon Corp/The 1,283 44,058 0.12
Baxter International Inc 317 25,493 0.07
Becton Dickinson and Co 161 37,461 0.10
Bed Bath & Beyond Inc 1,292 19,354 0.05
Berkshire Hathaway Inc 1,124 239,345 0.66
Best Buy Co Inc 460 51,193 0.14
Big Lots Inc 113 5,040 0.01
Biogen Inc 61 17,304 0.05
BJ's Wholesale Club Holdings Inc 833 34,611 0.10
BlackRock Inc 78 43,957 0.12
Boeing Co/The 219 36,192 0.10
Booking Holdings Inc 14 23,950 0.07
BorgWarner Inc 1,005 38,934 0.11
Boston Scientific Corp 191 7,298 0.02
Brighthouse Financial Inc 115 3,095 0.01
Bristol-Myers Squibb Co 746 44,976 0.12
Broadcom Inc 113 41,168 0.11
Cadence Design Systems Inc 275 29,323 0.08
Capital One Financial Corp 687 49,368 0.14
Capitol Federal Financial Inc 1,672 15,491 0.04
Cardinal Health Inc 914 42,912 0.12
CarMax Inc 208 19,117 0.05
Carrier Global Corp 819 25,012 0.07
Caterpillar Inc 577 86,060 0.24
CBRE Group Inc 383 17,990 0.05
Celanese Corp 218 23,424 0.06
Centene Corp 310 18,082 0.05
CenterPoint Energy Inc 369 7,140 0.02
CenturyLink Inc 2,366 23,873 0.07
CF Industries Holdings Inc 718 22,050 0.06
CH Robinson Worldwide Inc 375 38,321 0.11
Charles Schwab Corp/The 350 12,681 0.04
Charter Communications Inc 38 23,725 0.07
Cheniere Energy Inc 369 17,074 0.05
Chevron Corp 2,533 182,376 0.51
Cigna Corp 184 31,171 0.09
Cisco Systems Inc 2,826 111,316 0.31
CIT Group Inc 1,093 19,357 0.05
Citigroup Inc 3,362 144,936 0.40
Citizens Financial Group Inc 585 14,789 0.04
CME Group Inc 146 24,427 0.07
CMS Energy Corp 808 49,619 0.14
CNO Financial Group Inc 2,190 35,128 0.10
CNX Resources Corp 703 6,636 0.02
Coca-Cola Co/The 2,565 126,634 0.35
Cognizant Technology Solutions Corp 296 20,548 0.06
Colgate-Palmolive Co 566 43,667 0.12
Comcast Corp 3,527 163,159 0.45
Comerica Inc 784 29,988 0.08
Conagra Brands Inc 526 18,783 0.05
ConocoPhillips 1,766 57,995 0.16
Consolidated Edison Inc 413 32,131 0.09
Constellation Brands Inc 28 5,306 0.01
CoreCivic Inc 2,396 19,168 0.05
Corning Inc 861 27,905 0.08
Corteva Inc 737 21,233 0.06
Costco Wholesale Corp 433 153,715 0.43
Covanta Holding Corp 2,363 18,313 0.05
Crown Castle International Corp 108 17,982 0.05
CSX Corp 725 56,311 0.16
Cummins Inc 243 51,312 0.14
CVS Health Corp 1,659 96,886 0.27
Dana Inc 350 4,312 0.01
Danaher Corp 296 63,738 0.18

75 Invesco Markets III plc
Invesco FTSE RAFI All-World 3000 UCITS ETF
Schedule of Investments
As at 30 September 2020 (continued)
Security Description
Nominal Fair Value
USD
% of
Net Assets
Equities: 99.13% (30 September 2019: 99.79%) (continued)
United States: 44.03% (30 September 2019: 44.17%) (continued)
Darden Restaurants Inc 957 96,408 0.27
Darling Ingredients Inc 308 11,097 0.03
DaVita Inc 296 25,352 0.07
Deere & Co 220 48,759 0.13
Delek US Holdings Inc 235 2,616 0.01
Dell Technologies Inc 208 14,080 0.04
Devon Energy Corp 545 5,156 0.01
Diamondback Energy Inc 663 19,970 0.06
Discover Financial Services 424 24,499 0.07
Discovery Inc 702 15,283 0.04
Dollar General Corp 85 17,818 0.05
Dollar Tree Inc 231 21,100 0.06
Dominion Energy Inc 249 19,654 0.05
Dover Corp 218 23,618 0.07
Dow Inc 737 34,676 0.10
DR Horton Inc 179 13,538 0.04
DTE Energy Co 365 41,990 0.12
Duke Energy Corp 684 60,575 0.17
DuPont de Nemours Inc 737 40,889 0.11
DXC Technology Co 454 8,104 0.02
E*TRADE Financial Corp 455 22,773 0.06
Eastman Chemical Co 69 5,390 0.01
eBay Inc 566 29,489 0.08
Edison International 286 14,540 0.04
Electronic Arts Inc 135 17,605 0.05
Eli Lilly and Co 514 76,082 0.21
Emerson Electric Co 761 49,899 0.14
Encompass Health Corp 173 11,242 0.03
Entergy Corp 428 42,171 0.12
EOG Resources Inc 261 9,380 0.03
EQT Corp 2,818 36,437 0.10
Equity Residential 270 13,859 0.04
Essential Utilities Inc 568 22,862 0.06
Exelon Corp 1,565 55,964 0.15
Expeditors International of Washington Inc 234 21,182 0.06
Exxon Mobil Corp 5,424 186,206 0.52
F5 Networks Inc 611 75,012 0.21
Facebook Inc 479 125,450 0.35
FedEx Corp 308 77,468 0.21
Fifth Third Bancorp 1,069 22,791 0.06
FirstEnergy Corp 887 25,466 0.07
Fluor Corp 276 2,432 0.01
Ford Motor Co 13,143 87,532 0.24
Fortive Corp 196 14,937 0.04
Fox Corp - Class A 269 7,486 0.02
Franklin Resources Inc 1,277 25,987 0.07
Freeport-McMoRan Inc 1,564 24,461 0.07
Gap Inc/The 350 5,960 0.02
General Dynamics Corp 288 39,868 0.11
General Electric Co 13,068 81,414 0.23
General Mills Inc 698 43,053 0.12
General Motors Co 2,655 78,561 0.22
Genuine Parts Co 249 23,697 0.07
Genworth Financial Inc 2,841 9,517 0.03
GEO Group Inc/The 1,413 16,023 0.04
Gilead Sciences Inc 838 52,953 0.15
Goldman Sachs Group Inc/The 427 85,814 0.24
Goodyear Tire & Rubber Co/The 349 2,677 0.01
Halliburton Co 807 9,724 0.03
Harley-Davidson Inc 155 3,804 0.01
Hartford Financial Services Group Inc/The 658 24,254 0.07
HCA Healthcare Inc 250 31,170 0.09
Healthpeak Properties Inc 330 8,959 0.02
Henry Schein Inc 377 22,160 0.06
Hershey Co/The 67 9,604 0.03
Hess Corp 566 23,166 0.06
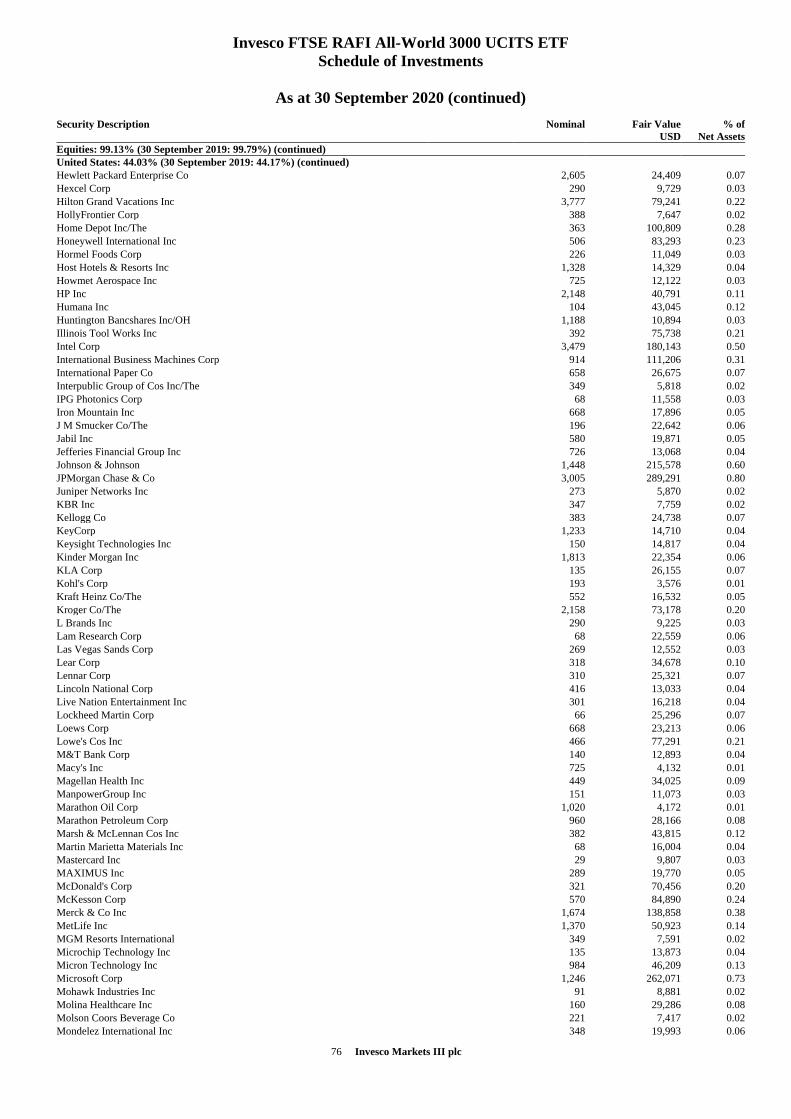
76 Invesco Markets III plc
Invesco FTSE RAFI All-World 3000 UCITS ETF
Schedule of Investments
As at 30 September 2020 (continued)
Security Description
Nominal Fair Value
USD
% of
Net Assets
Equities: 99.13% (30 September 2019: 99.79%) (continued)
United States: 44.03% (30 September 2019: 44.17%) (continued)
Hewlett Packard Enterprise Co 2,605 24,409 0.07
Hexcel Corp 290 9,729 0.03
Hilton Grand Vacations Inc 3,777 79,241 0.22
HollyFrontier Corp 388 7,647 0.02
Home Depot Inc/The 363 100,809 0.28
Honeywell International Inc 506 83,293 0.23
Hormel Foods Corp 226 11,049 0.03
Host Hotels & Resorts Inc 1,328 14,329 0.04
Howmet Aerospace Inc 725 12,122 0.03
HP Inc 2,148 40,791 0.11
Humana Inc 104 43,045 0.12
Huntington Bancshares Inc/OH 1,188 10,894 0.03
Illinois Tool Works Inc 392 75,738 0.21
Intel Corp 3,479 180,143 0.50
International Business Machines Corp 914 111,206 0.31
International Paper Co 658 26,675 0.07
Interpublic Group of Cos Inc/The 349 5,818 0.02
IPG Photonics Corp 68 11,558 0.03
Iron Mountain Inc 668 17,896 0.05
J M Smucker Co/The 196 22,642 0.06
Jabil Inc 580 19,871 0.05
Jefferies Financial Group Inc 726 13,068 0.04
Johnson & Johnson 1,448 215,578 0.60
JPMorgan Chase & Co 3,005 289,291 0.80
Juniper Networks Inc 273 5,870 0.02
KBR Inc 347 7,759 0.02
Kellogg Co 383 24,738 0.07
KeyCorp 1,233 14,710 0.04
Keysight Technologies Inc 150 14,817 0.04
Kinder Morgan Inc 1,813 22,354 0.06
KLA Corp 135 26,155 0.07
Kohl's Corp 193 3,576 0.01
Kraft Heinz Co/The 552 16,532 0.05
Kroger Co/The 2,158 73,178 0.20
L Brands Inc 290 9,225 0.03
Lam Research Corp 68 22,559 0.06
Las Vegas Sands Corp 269 12,552 0.03
Lear Corp 318 34,678 0.10
Lennar Corp 310 25,321 0.07
Lincoln National Corp 416 13,033 0.04
Live Nation Entertainment Inc 301 16,218 0.04
Lockheed Martin Corp 66 25,296 0.07
Loews Corp 668 23,213 0.06
Lowe's Cos Inc 466 77,291 0.21
M&T Bank Corp 140 12,893 0.04
Macy's Inc 725 4,132 0.01
Magellan Health Inc 449 34,025 0.09
ManpowerGroup Inc 151 11,073 0.03
Marathon Oil Corp 1,020 4,172 0.01
Marathon Petroleum Corp 960 28,166 0.08
Marsh & McLennan Cos Inc 382 43,815 0.12
Martin Marietta Materials Inc 68 16,004 0.04
Mastercard Inc 29 9,807 0.03
MAXIMUS Inc 289 19,770 0.05
McDonald's Corp 321 70,456 0.20
McKesson Corp 570 84,890 0.24
Merck & Co Inc 1,674 138,858 0.38
MetLife Inc 1,370 50,923 0.14
MGM Resorts International 349 7,591 0.02
Microchip Technology Inc 135 13,873 0.04
Micron Technology Inc 984 46,209 0.13
Microsoft Corp 1,246 262,071 0.73
Mohawk Industries Inc 91 8,881 0.02
Molina Healthcare Inc 160 29,286 0.08
Molson Coors Beverage Co 221 7,417 0.02
Mondelez International Inc 348 19,993 0.06
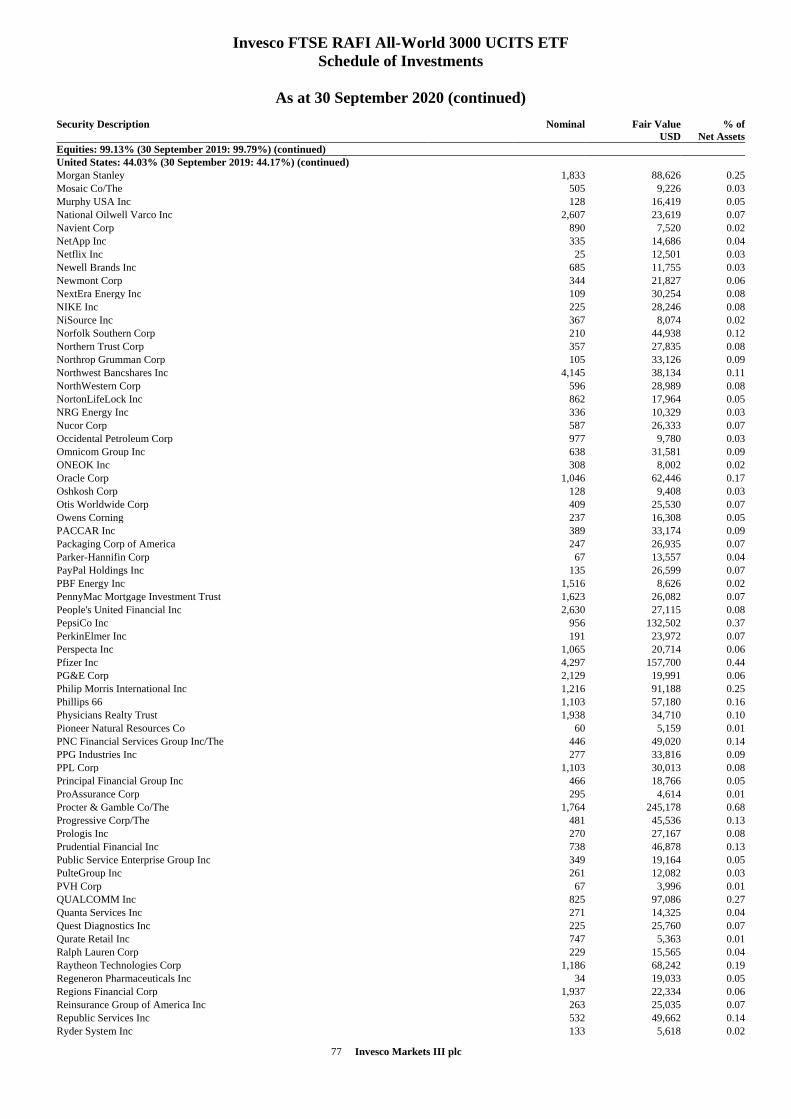
77 Invesco Markets III plc
Invesco FTSE RAFI All-World 3000 UCITS ETF
Schedule of Investments
As at 30 September 2020 (continued)
Security Description
Nominal Fair Value
USD
% of
Net Assets
Equities: 99.13% (30 September 2019: 99.79%) (continued)
United States: 44.03% (30 September 2019: 44.17%) (continued)
Morgan Stanley 1,833 88,626 0.25
Mosaic Co/The 505 9,226 0.03
Murphy USA Inc 128 16,419 0.05
National Oilwell Varco Inc 2,607 23,619 0.07
Navient Corp 890 7,520 0.02
NetApp Inc 335 14,686 0.04
Netflix Inc 25 12,501 0.03
Newell Brands Inc 685 11,755 0.03
Newmont Corp 344 21,827 0.06
NextEra Energy Inc 109 30,254 0.08
NIKE Inc 225 28,246 0.08
NiSource Inc 367 8,074 0.02
Norfolk Southern Corp 210 44,938 0.12
Northern Trust Corp 357 27,835 0.08
Northrop Grumman Corp 105 33,126 0.09
Northwest Bancshares Inc 4,145 38,134 0.11
NorthWestern Corp 596 28,989 0.08
NortonLifeLock Inc 862 17,964 0.05
NRG Energy Inc 336 10,329 0.03
Nucor Corp 587 26,333 0.07
Occidental Petroleum Corp 977 9,780 0.03
Omnicom Group Inc 638 31,581 0.09
ONEOK Inc 308 8,002 0.02
Oracle Corp 1,046 62,446 0.17
Oshkosh Corp 128 9,408 0.03
Otis Worldwide Corp 409 25,530 0.07
Owens Corning 237 16,308 0.05
PACCAR Inc 389 33,174 0.09
Packaging Corp of America 247 26,935 0.07
Parker-Hannifin Corp 67 13,557 0.04
PayPal Holdings Inc 135 26,599 0.07
PBF Energy Inc 1,516 8,626 0.02
PennyMac Mortgage Investment Trust 1,623 26,082 0.07
People's United Financial Inc 2,630 27,115 0.08
PepsiCo Inc 956 132,502 0.37
PerkinElmer Inc 191 23,972 0.07
Perspecta Inc 1,065 20,714 0.06
Pfizer Inc 4,297 157,700 0.44
PG&E Corp 2,129 19,991 0.06
Philip Morris International Inc 1,216 91,188 0.25
Phillips 66 1,103 57,180 0.16
Physicians Realty Trust 1,938 34,710 0.10
Pioneer Natural Resources Co 60 5,159 0.01
PNC Financial Services Group Inc/The 446 49,020 0.14
PPG Industries Inc 277 33,816 0.09
PPL Corp 1,103 30,013 0.08
Principal Financial Group Inc 466 18,766 0.05
ProAssurance Corp 295 4,614 0.01
Procter & Gamble Co/The 1,764 245,178 0.68
Progressive Corp/The 481 45,536 0.13
Prologis Inc 270 27,167 0.08
Prudential Financial Inc 738 46,878 0.13
Public Service Enterprise Group Inc 349 19,164 0.05
PulteGroup Inc 261 12,082 0.03
PVH Corp 67 3,996 0.01
QUALCOMM Inc 825 97,086 0.27
Quanta Services Inc 271 14,325 0.04
Quest Diagnostics Inc 225 25,760 0.07
Qurate Retail Inc 747 5,363 0.01
Ralph Lauren Corp 229 15,565 0.04
Raytheon Technologies Corp 1,186 68,242 0.19
Regeneron Pharmaceuticals Inc 34 19,033 0.05
Regions Financial Corp 1,937 22,334 0.06
Reinsurance Group of America Inc 263 25,035 0.07
Republic Services Inc 532 49,662 0.14
Ryder System Inc 133 5,618 0.02
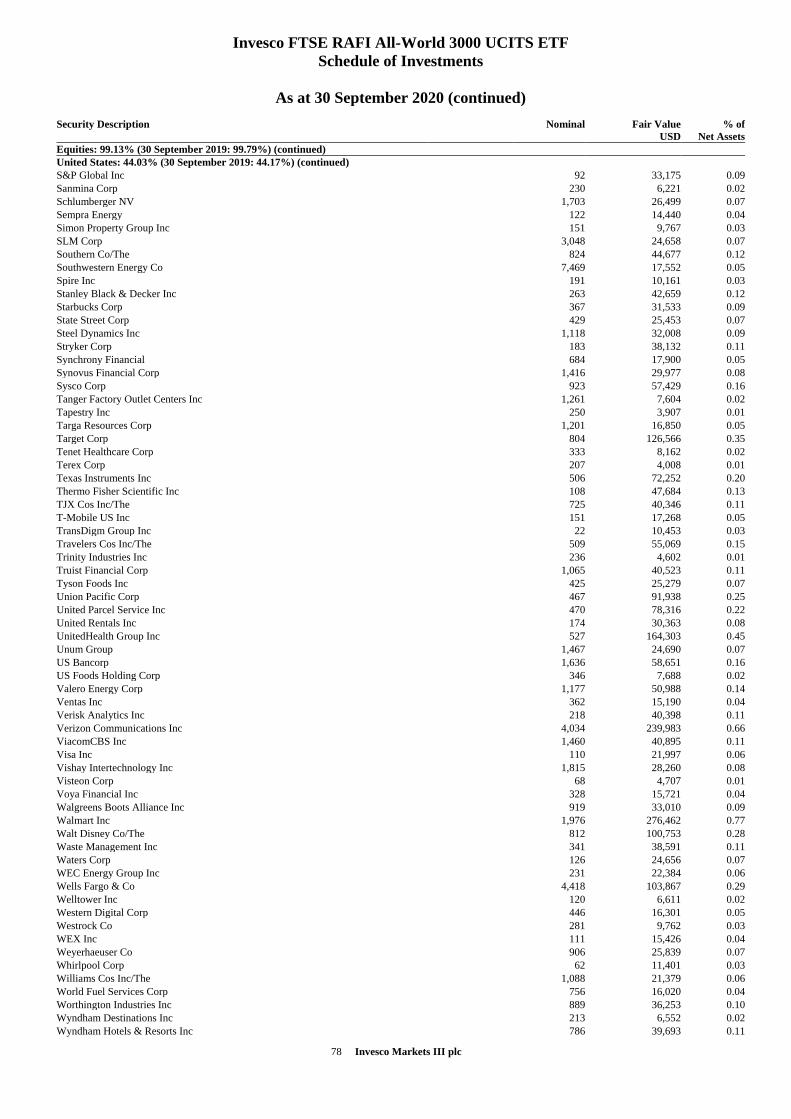
78 Invesco Markets III plc
Invesco FTSE RAFI All-World 3000 UCITS ETF
Schedule of Investments
As at 30 September 2020 (continued)
Security Description
Nominal Fair Value
USD
% of
Net Assets
Equities: 99.13% (30 September 2019: 99.79%) (continued)
United States: 44.03% (30 September 2019: 44.17%) (continued)
S&P Global Inc 92 33,175 0.09
Sanmina Corp 230 6,221 0.02
Schlumberger NV 1,703 26,499 0.07
Sempra Energy 122 14,440 0.04
Simon Property Group Inc 151 9,767 0.03
SLM Corp 3,048 24,658 0.07
Southern Co/The 824 44,677 0.12
Southwestern Energy Co 7,469 17,552 0.05
Spire Inc 191 10,161 0.03
Stanley Black & Decker Inc 263 42,659 0.12
Starbucks Corp 367 31,533 0.09
State Street Corp 429 25,453 0.07
Steel Dynamics Inc 1,118 32,008 0.09
Stryker Corp 183 38,132 0.11
Synchrony Financial 684 17,900 0.05
Synovus Financial Corp 1,416 29,977 0.08
Sysco Corp 923 57,429 0.16
Tanger Factory Outlet Centers Inc 1,261 7,604 0.02
Tapestry Inc 250 3,907 0.01
Targa Resources Corp 1,201 16,850 0.05
Target Corp 804 126,566 0.35
Tenet Healthcare Corp 333 8,162 0.02
Terex Corp 207 4,008 0.01
Texas Instruments Inc 506 72,252 0.20
Thermo Fisher Scientific Inc 108 47,684 0.13
TJX Cos Inc/The 725 40,346 0.11
T-Mobile US Inc 151 17,268 0.05
TransDigm Group Inc 22 10,453 0.03
Travelers Cos Inc/The 509 55,069 0.15
Trinity Industries Inc 236 4,602 0.01
Truist Financial Corp 1,065 40,523 0.11
Tyson Foods Inc 425 25,279 0.07
Union Pacific Corp 467 91,938 0.25
United Parcel Service Inc 470 78,316 0.22
United Rentals Inc 174 30,363 0.08
UnitedHealth Group Inc 527 164,303 0.45
Unum Group 1,467 24,690 0.07
US Bancorp 1,636 58,651 0.16
US Foods Holding Corp 346 7,688 0.02
Valero Energy Corp 1,177 50,988 0.14
Ventas Inc 362 15,190 0.04
Verisk Analytics Inc 218 40,398 0.11
Verizon Communications Inc 4,034 239,983 0.66
ViacomCBS Inc 1,460 40,895 0.11
Visa Inc 110 21,997 0.06
Vishay Intertechnology Inc 1,815 28,260 0.08
Visteon Corp 68 4,707 0.01
Voya Financial Inc 328 15,721 0.04
Walgreens Boots Alliance Inc 919 33,010 0.09
Walmart Inc 1,976 276,462 0.77
Walt Disney Co/The 812 100,753 0.28
Waste Management Inc 341 38,591 0.11
Waters Corp 126 24,656 0.07
WEC Energy Group Inc 231 22,384 0.06
Wells Fargo & Co 4,418 103,867 0.29
Welltower Inc 120 6,611 0.02
Western Digital Corp 446 16,301 0.05
Westrock Co 281 9,762 0.03
WEX Inc 111 15,426 0.04
Weyerhaeuser Co 906 25,839 0.07
Whirlpool Corp 62 11,401 0.03
Williams Cos Inc/The 1,088 21,379 0.06
World Fuel Services Corp 756 16,020 0.04
Worthington Industries Inc 889 36,253 0.10
Wyndham Destinations Inc 213 6,552 0.02
Wyndham Hotels & Resorts Inc 786 39,693 0.11
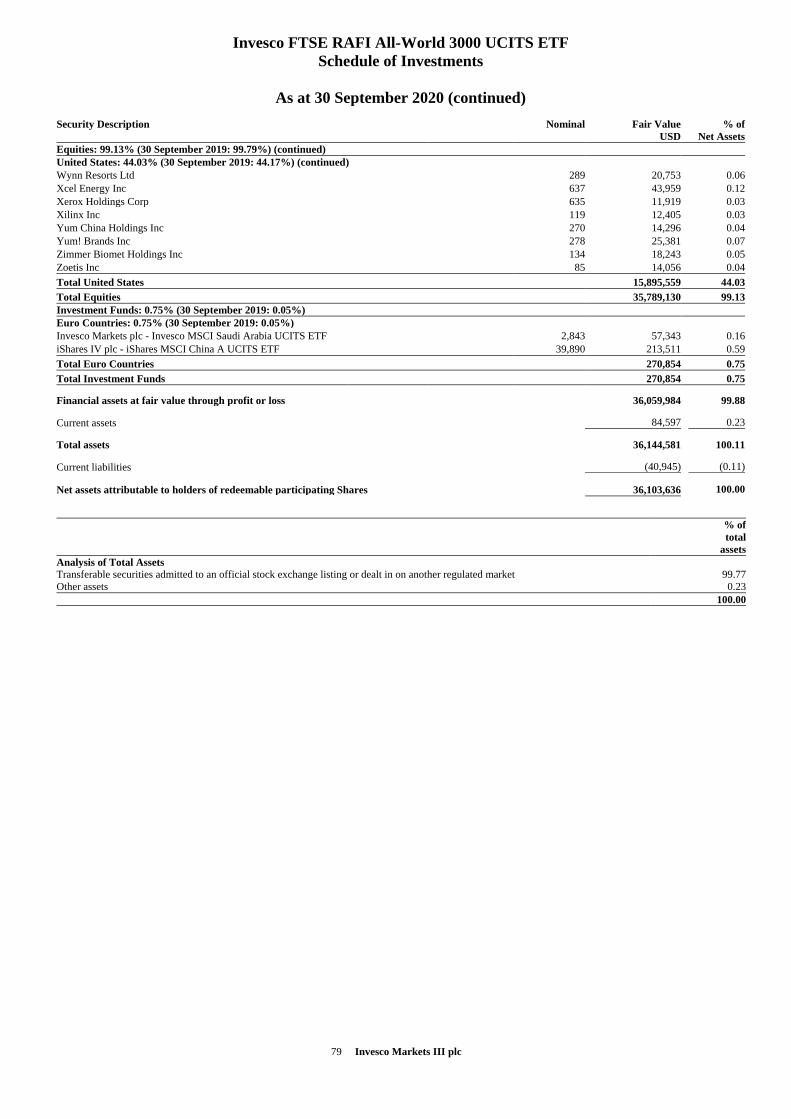
79 Invesco Markets III plc
Invesco FTSE RAFI All-World 3000 UCITS ETF
Schedule of Investments
As at 30 September 2020 (continued)
Security Description
Nominal Fair Value
USD
% of
Net Assets
Equities: 99.13% (30 September 2019: 99.79%) (continued)
United States: 44.03% (30 September 2019: 44.17%) (continued)
Wynn Resorts Ltd 289 20,753 0.06
Xcel Energy Inc 637 43,959 0.12
Xerox Holdings Corp 635 11,919 0.03
Xilinx Inc 119 12,405 0.03
Yum China Holdings Inc 270 14,296 0.04
Yum! Brands Inc 278 25,381 0.07
Zimmer Biomet Holdings Inc 134 18,243 0.05
Zoetis Inc 85 14,056 0.04
Total United States 15,895,559 44.03
Total Equities 35,789,130 99.13
Investment Funds: 0.75% (30 September 2019: 0.05%)
Euro Countries: 0.75% (30 September 2019: 0.05%)
Invesco Markets plc - Invesco MSCI Saudi Arabia UCITS ETF 2,843 57,343 0.16
iShares IV plc - iShares MSCI China A UCITS ETF 39,890 213,511 0.59
Total Euro Countries 270,854 0.75
Total Investment Funds 270,854 0.75
Financial assets at fair value through profit or loss 36,059,984 99.88
Current assets 84,597 0.23
Total assets 36,144,581 100.11
Current liabilities (40,945) (0.11)
Net assets attributable to holders of redeemable participating Shares 36,103,636 100.00
% of
total
assets
Analysis of Total Assets
Transferable securities admitted to an official stock exchange listing or dealt in on another regulated market 99.77
Other assets 0.23
100.00
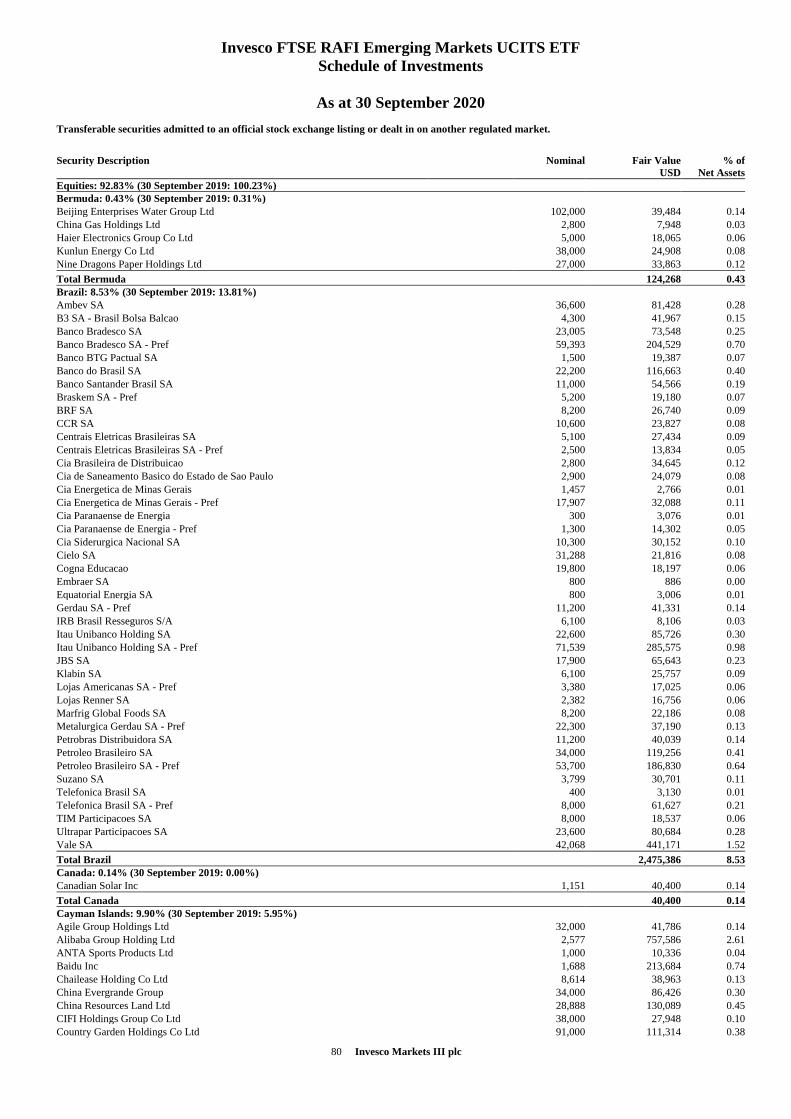
80 Invesco Markets III plc
Invesco FTSE RAFI Emerging Markets UCITS ETF
Schedule of Investments
As at 30 September 2020
Transferable securities admitted to an official stock exchange listing or dealt in on another regulated market.
Security Description
Nominal Fair Value
USD
% of
Net Assets
Equities: 92.83% (30 September 2019: 100.23%)
Bermuda: 0.43% (30 September 2019: 0.31%)
Beijing Enterprises Water Group Ltd 102,000 39,484 0.14
China Gas Holdings Ltd 2,800 7,948 0.03
Haier Electronics Group Co Ltd 5,000 18,065 0.06
Kunlun Energy Co Ltd 38,000 24,908 0.08
Nine Dragons Paper Holdings Ltd 27,000 33,863 0.12
Total Bermuda 124,268 0.43
Brazil: 8.53% (30 September 2019: 13.81%)
Ambev SA 36,600 81,428 0.28
B3 SA - Brasil Bolsa Balcao 4,300 41,967 0.15
Banco Bradesco SA 23,005 73,548 0.25
Banco Bradesco SA - Pref 59,393 204,529 0.70
Banco BTG Pactual SA 1,500 19,387 0.07
Banco do Brasil SA 22,200 116,663 0.40
Banco Santander Brasil SA 11,000 54,566 0.19
Braskem SA - Pref 5,200 19,180 0.07
BRF SA 8,200 26,740 0.09
CCR SA 10,600 23,827 0.08
Centrais Eletricas Brasileiras SA 5,100 27,434 0.09
Centrais Eletricas Brasileiras SA - Pref 2,500 13,834 0.05
Cia Brasileira de Distribuicao 2,800 34,645 0.12
Cia de Saneamento Basico do Estado de Sao Paulo 2,900 24,079 0.08
Cia Energetica de Minas Gerais 1,457 2,766 0.01
Cia Energetica de Minas Gerais - Pref 17,907 32,088 0.11
Cia Paranaense de Energia 300 3,076 0.01
Cia Paranaense de Energia - Pref 1,300 14,302 0.05
Cia Siderurgica Nacional SA 10,300 30,152 0.10
Cielo SA 31,288 21,816 0.08
Cogna Educacao 19,800 18,197 0.06
Embraer SA 800 886 0.00
Equatorial Energia SA 800 3,006 0.01
Gerdau SA - Pref 11,200 41,331 0.14
IRB Brasil Resseguros S/A 6,100 8,106 0.03
Itau Unibanco Holding SA 22,600 85,726 0.30
Itau Unibanco Holding SA - Pref 71,539 285,575 0.98
JBS SA 17,900 65,643 0.23
Klabin SA 6,100 25,757 0.09
Lojas Americanas SA - Pref 3,380 17,025 0.06
Lojas Renner SA 2,382 16,756 0.06
Marfrig Global Foods SA 8,200 22,186 0.08
Metalurgica Gerdau SA - Pref 22,300 37,190 0.13
Petrobras Distribuidora SA 11,200 40,039 0.14
Petroleo Brasileiro SA 34,000 119,256 0.41
Petroleo Brasileiro SA - Pref 53,700 186,830 0.64
Suzano SA 3,799 30,701 0.11
Telefonica Brasil SA 400 3,130 0.01
Telefonica Brasil SA - Pref 8,000 61,627 0.21
TIM Participacoes SA 8,000 18,537 0.06
Ultrapar Participacoes SA 23,600 80,684 0.28
Vale SA 42,068 441,171 1.52
Total Brazil 2,475,386 8.53
Canada: 0.14% (30 September 2019: 0.00%)
Canadian Solar Inc 1,151 40,400 0.14
Total Canada 40,400 0.14
Cayman Islands: 9.90% (30 September 2019: 5.95%)
Agile Group Holdings Ltd 32,000 41,786 0.14
Alibaba Group Holding Ltd 2,577 757,586 2.61
ANTA Sports Products Ltd 1,000 10,336 0.04
Baidu Inc 1,688 213,684 0.74
Chailease Holding Co Ltd 8,614 38,963 0.13
China Evergrande Group 34,000 86,426 0.30
China Resources Land Ltd 28,888 130,089 0.45
CIFI Holdings Group Co Ltd 38,000 27,948 0.10
Country Garden Holdings Co Ltd 91,000 111,314 0.38
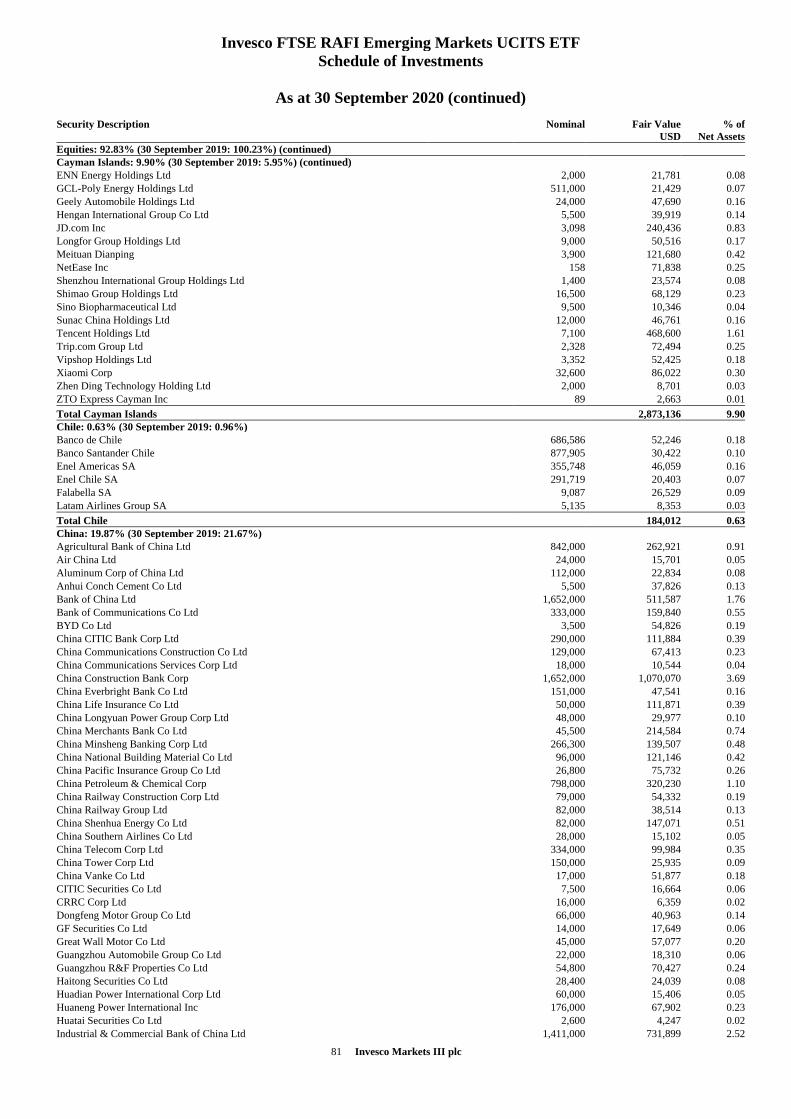
81 Invesco Markets III plc
Invesco FTSE RAFI Emerging Markets UCITS ETF
Schedule of Investments
As at 30 September 2020 (continued)
Security Description
Nominal Fair Value
USD
% of
Net Assets
Equities: 92.83% (30 September 2019: 100.23%) (continued)
Cayman Islands: 9.90% (30 September 2019: 5.95%) (continued)
ENN Energy Holdings Ltd 2,000 21,781 0.08
GCL-Poly Energy Holdings Ltd 511,000 21,429 0.07
Geely Automobile Holdings Ltd 24,000 47,690 0.16
Hengan International Group Co Ltd 5,500 39,919 0.14
JD.com Inc 3,098 240,436 0.83
Longfor Group Holdings Ltd 9,000 50,516 0.17
Meituan Dianping 3,900 121,680 0.42
NetEase Inc 158 71,838 0.25
Shenzhou International Group Holdings Ltd 1,400 23,574 0.08
Shimao Group Holdings Ltd 16,500 68,129 0.23
Sino Biopharmaceutical Ltd 9,500 10,346 0.04
Sunac China Holdings Ltd 12,000 46,761 0.16
Tencent Holdings Ltd 7,100 468,600 1.61
Trip.com Group Ltd 2,328 72,494 0.25
Vipshop Holdings Ltd 3,352 52,425 0.18
Xiaomi Corp 32,600 86,022 0.30
Zhen Ding Technology Holding Ltd 2,000 8,701 0.03
ZTO Express Cayman Inc 89 2,663 0.01
Total Cayman Islands 2,873,136 9.90
Chile: 0.63% (30 September 2019: 0.96%)
Banco de Chile 686,586 52,246 0.18
Banco Santander Chile 877,905 30,422 0.10
Enel Americas SA 355,748 46,059 0.16
Enel Chile SA 291,719 20,403 0.07
Falabella SA 9,087 26,529 0.09
Latam Airlines Group SA 5,135 8,353 0.03
Total Chile 184,012 0.63
China: 19.87% (30 September 2019: 21.67%)
Agricultural Bank of China Ltd 842,000 262,921 0.91
Air China Ltd 24,000 15,701 0.05
Aluminum Corp of China Ltd 112,000 22,834 0.08
Anhui Conch Cement Co Ltd 5,500 37,826 0.13
Bank of China Ltd 1,652,000 511,587 1.76
Bank of Communications Co Ltd 333,000 159,840 0.55
BYD Co Ltd 3,500 54,826 0.19
China CITIC Bank Corp Ltd 290,000 111,884 0.39
China Communications Construction Co Ltd 129,000 67,413 0.23
China Communications Services Corp Ltd 18,000 10,544 0.04
China Construction Bank Corp 1,652,000 1,070,070 3.69
China Everbright Bank Co Ltd 151,000 47,541 0.16
China Life Insurance Co Ltd 50,000 111,871 0.39
China Longyuan Power Group Corp Ltd 48,000 29,977 0.10
China Merchants Bank Co Ltd 45,500 214,584 0.74
China Minsheng Banking Corp Ltd 266,300 139,507 0.48
China National Building Material Co Ltd 96,000 121,146 0.42
China Pacific Insurance Group Co Ltd 26,800 75,732 0.26
China Petroleum & Chemical Corp 798,000 320,230 1.10
China Railway Construction Corp Ltd 79,000 54,332 0.19
China Railway Group Ltd 82,000 38,514 0.13
China Shenhua Energy Co Ltd 82,000 147,071 0.51
China Southern Airlines Co Ltd 28,000 15,102 0.05
China Telecom Corp Ltd 334,000 99,984 0.35
China Tower Corp Ltd 150,000 25,935 0.09
China Vanke Co Ltd 17,000 51,877 0.18
CITIC Securities Co Ltd 7,500 16,664 0.06
CRRC Corp Ltd 16,000 6,359 0.02
Dongfeng Motor Group Co Ltd 66,000 40,963 0.14
GF Securities Co Ltd 14,000 17,649 0.06
Great Wall Motor Co Ltd 45,000 57,077 0.20
Guangzhou Automobile Group Co Ltd 22,000 18,310 0.06
Guangzhou R&F Properties Co Ltd 54,800 70,427 0.24
Haitong Securities Co Ltd 28,400 24,039 0.08
Huadian Power International Corp Ltd 60,000 15,406 0.05
Huaneng Power International Inc 176,000 67,902 0.23
Huatai Securities Co Ltd 2,600 4,247 0.02
Industrial & Commercial Bank of China Ltd 1,411,000 731,899 2.52
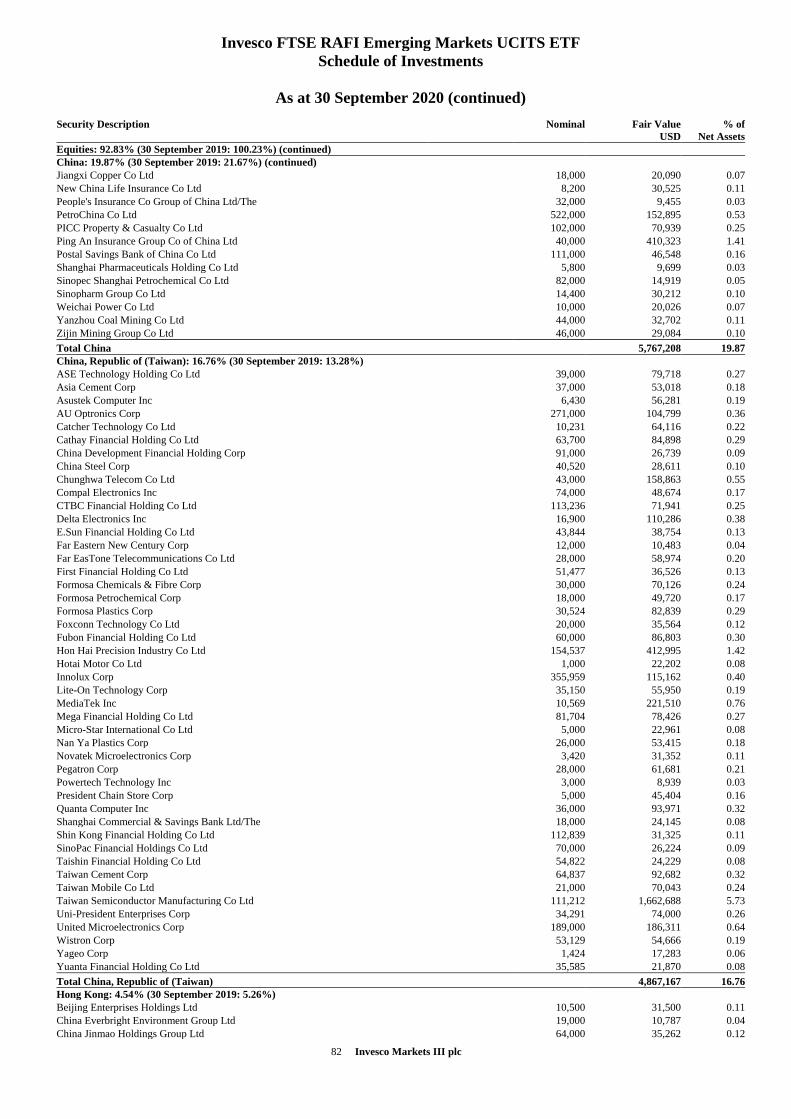
82 Invesco Markets III plc
Invesco FTSE RAFI Emerging Markets UCITS ETF
Schedule of Investments
As at 30 September 2020 (continued)
Security Description
Nominal Fair Value
USD
% of
Net Assets
Equities: 92.83% (30 September 2019: 100.23%) (continued)
China: 19.87% (30 September 2019: 21.67%) (continued)
Jiangxi Copper Co Ltd 18,000 20,090 0.07
New China Life Insurance Co Ltd 8,200 30,525 0.11
People's Insurance Co Group of China Ltd/The 32,000 9,455 0.03
PetroChina Co Ltd 522,000 152,895 0.53
PICC Property & Casualty Co Ltd 102,000 70,939 0.25
Ping An Insurance Group Co of China Ltd 40,000 410,323 1.41
Postal Savings Bank of China Co Ltd 111,000 46,548 0.16
Shanghai Pharmaceuticals Holding Co Ltd 5,800 9,699 0.03
Sinopec Shanghai Petrochemical Co Ltd 82,000 14,919 0.05
Sinopharm Group Co Ltd 14,400 30,212 0.10
Weichai Power Co Ltd 10,000 20,026 0.07
Yanzhou Coal Mining Co Ltd 44,000 32,702 0.11
Zijin Mining Group Co Ltd 46,000 29,084 0.10
Total China 5,767,208 19.87
China, Republic of (Taiwan): 16.76% (30 September 2019: 13.28%)
ASE Technology Holding Co Ltd 39,000 79,718 0.27
Asia Cement Corp 37,000 53,018 0.18
Asustek Computer Inc 6,430 56,281 0.19
AU Optronics Corp 271,000 104,799 0.36
Catcher Technology Co Ltd 10,231 64,116 0.22
Cathay Financial Holding Co Ltd 63,700 84,898 0.29
China Development Financial Holding Corp 91,000 26,739 0.09
China Steel Corp 40,520 28,611 0.10
Chunghwa Telecom Co Ltd 43,000 158,863 0.55
Compal Electronics Inc 74,000 48,674 0.17
CTBC Financial Holding Co Ltd 113,236 71,941 0.25
Delta Electronics Inc 16,900 110,286 0.38
E.Sun Financial Holding Co Ltd 43,844 38,754 0.13
Far Eastern New Century Corp 12,000 10,483 0.04
Far EasTone Telecommunications Co Ltd 28,000 58,974 0.20
First Financial Holding Co Ltd 51,477 36,526 0.13
Formosa Chemicals & Fibre Corp 30,000 70,126 0.24
Formosa Petrochemical Corp 18,000 49,720 0.17
Formosa Plastics Corp 30,524 82,839 0.29
Foxconn Technology Co Ltd 20,000 35,564 0.12
Fubon Financial Holding Co Ltd 60,000 86,803 0.30
Hon Hai Precision Industry Co Ltd 154,537 412,995 1.42
Hotai Motor Co Ltd 1,000 22,202 0.08
Innolux Corp 355,959 115,162 0.40
Lite-On Technology Corp 35,150 55,950 0.19
MediaTek Inc 10,569 221,510 0.76
Mega Financial Holding Co Ltd 81,704 78,426 0.27
Micro-Star International Co Ltd 5,000 22,961 0.08
Nan Ya Plastics Corp 26,000 53,415 0.18
Novatek Microelectronics Corp 3,420 31,352 0.11
Pegatron Corp 28,000 61,681 0.21
Powertech Technology Inc 3,000 8,939 0.03
President Chain Store Corp 5,000 45,404 0.16
Quanta Computer Inc 36,000 93,971 0.32
Shanghai Commercial & Savings Bank Ltd/The 18,000 24,145 0.08
Shin Kong Financial Holding Co Ltd 112,839 31,325 0.11
SinoPac Financial Holdings Co Ltd 70,000 26,224 0.09
Taishin Financial Holding Co Ltd 54,822 24,229 0.08
Taiwan Cement Corp 64,837 92,682 0.32
Taiwan Mobile Co Ltd 21,000 70,043 0.24
Taiwan Semiconductor Manufacturing Co Ltd 111,212 1,662,688 5.73
Uni-President Enterprises Corp 34,291 74,000 0.26
United Microelectronics Corp 189,000 186,311 0.64
Wistron Corp 53,129 54,666 0.19
Yageo Corp 1,424 17,283 0.06
Yuanta Financial Holding Co Ltd 35,585 21,870 0.08
Total China, Republic of (Taiwan) 4,867,167 16.76
Hong Kong: 4.54% (30 September 2019: 5.26%)
Beijing Enterprises Holdings Ltd 10,500 31,500 0.11
China Everbright Environment Group Ltd 19,000 10,787 0.04
China Jinmao Holdings Group Ltd 64,000 35,262 0.12
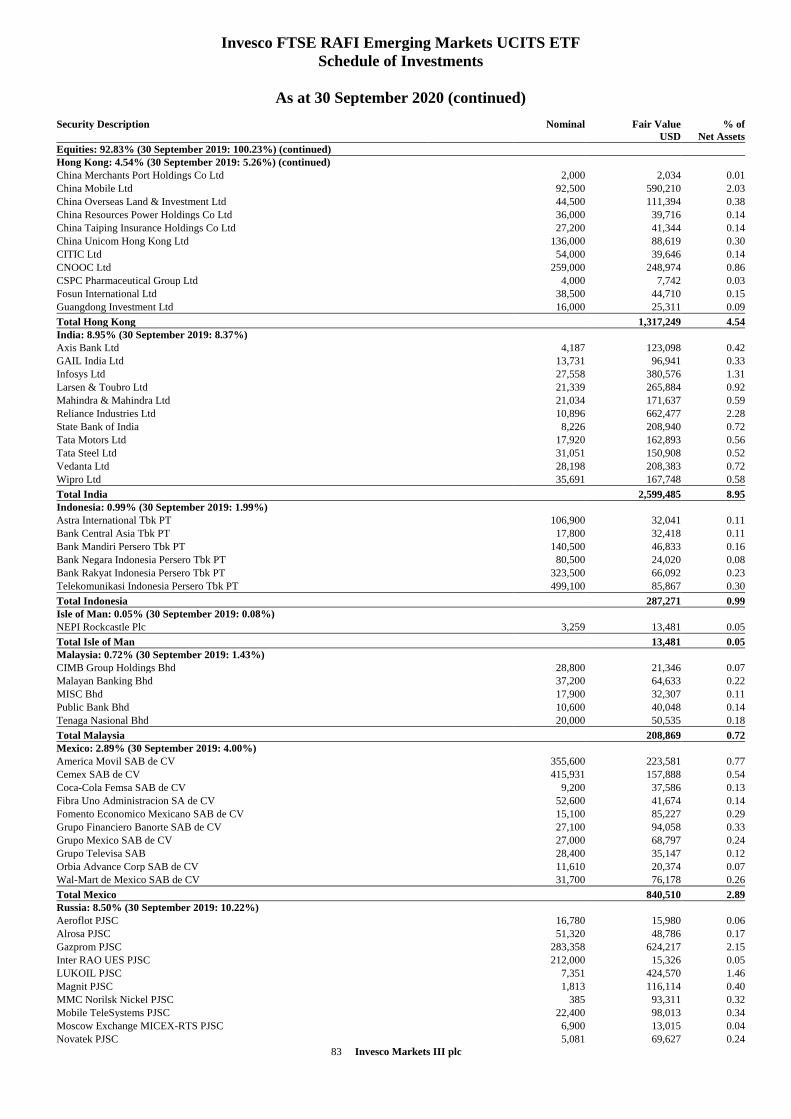
83 Invesco Markets III plc
Invesco FTSE RAFI Emerging Markets UCITS ETF
Schedule of Investments
As at 30 September 2020 (continued)
Security Description
Nominal Fair Value
USD
% of
Net Assets
Equities: 92.83% (30 September 2019: 100.23%) (continued)
Hong Kong: 4.54% (30 September 2019: 5.26%) (continued)
China Merchants Port Holdings Co Ltd 2,000 2,034 0.01
China Mobile Ltd 92,500 590,210 2.03
China Overseas Land & Investment Ltd 44,500 111,394 0.38
China Resources Power Holdings Co Ltd 36,000 39,716 0.14
China Taiping Insurance Holdings Co Ltd 27,200 41,344 0.14
China Unicom Hong Kong Ltd 136,000 88,619 0.30
CITIC Ltd 54,000 39,646 0.14
CNOOC Ltd 259,000 248,974 0.86
CSPC Pharmaceutical Group Ltd 4,000 7,742 0.03
Fosun International Ltd 38,500 44,710 0.15
Guangdong Investment Ltd 16,000 25,311 0.09
Total Hong Kong 1,317,249 4.54
India: 8.95% (30 September 2019: 8.37%)
Axis Bank Ltd 4,187 123,098 0.42
GAIL India Ltd 13,731 96,941 0.33
Infosys Ltd 27,558 380,576 1.31
Larsen & Toubro Ltd 21,339 265,884 0.92
Mahindra & Mahindra Ltd 21,034 171,637 0.59
Reliance Industries Ltd 10,896 662,477 2.28
State Bank of India 8,226 208,940 0.72
Tata Motors Ltd 17,920 162,893 0.56
Tata Steel Ltd 31,051 150,908 0.52
Vedanta Ltd 28,198 208,383 0.72
Wipro Ltd 35,691 167,748 0.58
Total India 2,599,485 8.95
Indonesia: 0.99% (30 September 2019: 1.99%)
Astra International Tbk PT 106,900 32,041 0.11
Bank Central Asia Tbk PT 17,800 32,418 0.11
Bank Mandiri Persero Tbk PT 140,500 46,833 0.16
Bank Negara Indonesia Persero Tbk PT 80,500 24,020 0.08
Bank Rakyat Indonesia Persero Tbk PT 323,500 66,092 0.23
Telekomunikasi Indonesia Persero Tbk PT 499,100 85,867 0.30
Total Indonesia 287,271 0.99
Isle of Man: 0.05% (30 September 2019: 0.08%)
NEPI Rockcastle Plc 3,259 13,481 0.05
Total Isle of Man 13,481 0.05
Malaysia: 0.72% (30 September 2019: 1.43%)
CIMB Group Holdings Bhd 28,800 21,346 0.07
Malayan Banking Bhd 37,200 64,633 0.22
MISC Bhd 17,900 32,307 0.11
Public Bank Bhd 10,600 40,048 0.14
Tenaga Nasional Bhd 20,000 50,535 0.18
Total Malaysia 208,869 0.72
Mexico: 2.89% (30 September 2019: 4.00%)
America Movil SAB de CV 355,600 223,581 0.77
Cemex SAB de CV 415,931 157,888 0.54
Coca-Cola Femsa SAB de CV 9,200 37,586 0.13
Fibra Uno Administracion SA de CV 52,600 41,674 0.14
Fomento Economico Mexicano SAB de CV 15,100 85,227 0.29
Grupo Financiero Banorte SAB de CV 27,100 94,058 0.33
Grupo Mexico SAB de CV 27,000 68,797 0.24
Grupo Televisa SAB 28,400 35,147 0.12
Orbia Advance Corp SAB de CV 11,610 20,374 0.07
Wal-Mart de Mexico SAB de CV 31,700 76,178 0.26
Total Mexico 840,510 2.89
Russia: 8.50% (30 September 2019: 10.22%)
Aeroflot PJSC 16,780 15,980 0.06
Alrosa PJSC 51,320 48,786 0.17
Gazprom PJSC 283,358 624,217 2.15
Inter RAO UES PJSC 212,000 15,326 0.05
LUKOIL PJSC 7,351 424,570 1.46
Magnit PJSC 1,813 116,114 0.40
MMC Norilsk Nickel PJSC 385 93,311 0.32
Mobile TeleSystems PJSC 22,400 98,013 0.34
Moscow Exchange MICEX-RTS PJSC 6,900 13,015 0.04
Novatek PJSC 5,081 69,627 0.24
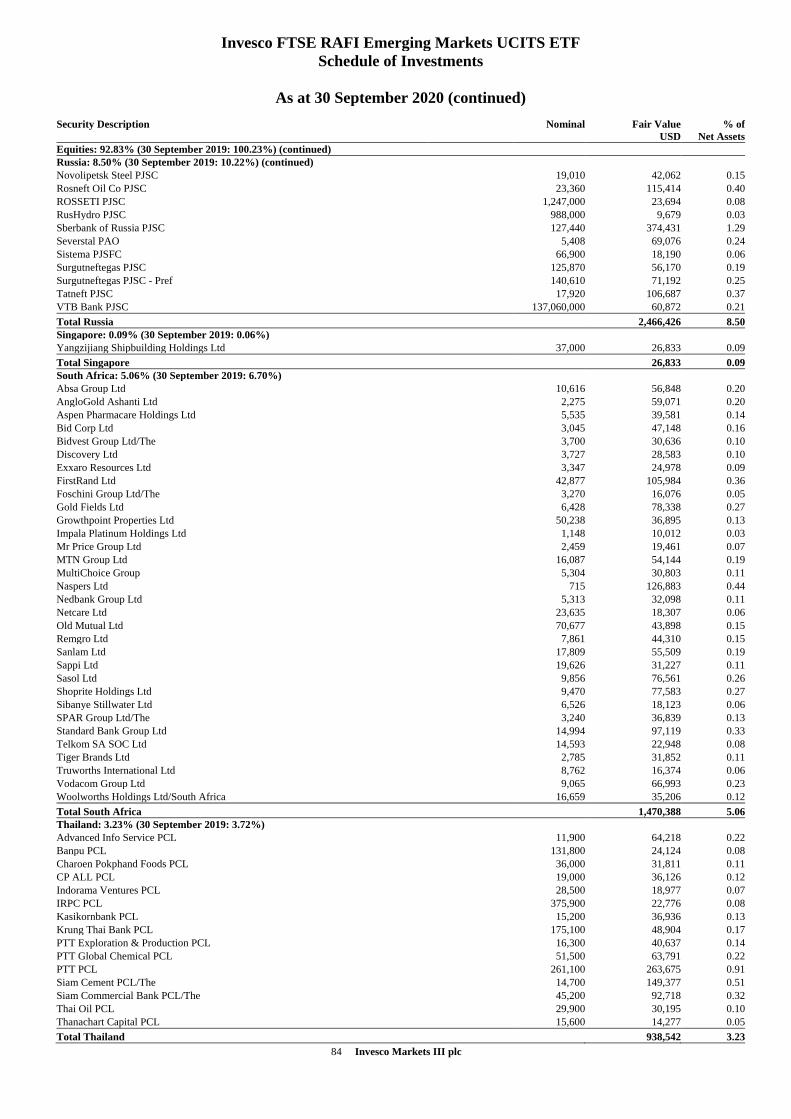
84 Invesco Markets III plc
Invesco FTSE RAFI Emerging Markets UCITS ETF
Schedule of Investments
As at 30 September 2020 (continued)
Security Description
Nominal Fair Value
USD
% of
Net Assets
Equities: 92.83% (30 September 2019: 100.23%) (continued)
Russia: 8.50% (30 September 2019: 10.22%) (continued)
Novolipetsk Steel PJSC 19,010 42,062 0.15
Rosneft Oil Co PJSC 23,360 115,414 0.40
ROSSETI PJSC 1,247,000 23,694 0.08
RusHydro PJSC 988,000 9,679 0.03
Sberbank of Russia PJSC 127,440 374,431 1.29
Severstal PAO 5,408 69,076 0.24
Sistema PJSFC 66,900 18,190 0.06
Surgutneftegas PJSC 125,870 56,170 0.19
Surgutneftegas PJSC - Pref 140,610 71,192 0.25
Tatneft PJSC 17,920 106,687 0.37
VTB Bank PJSC 137,060,000 60,872 0.21
Total Russia 2,466,426 8.50
Singapore: 0.09% (30 September 2019: 0.06%)
Yangzijiang Shipbuilding Holdings Ltd 37,000 26,833 0.09
Total Singapore 26,833 0.09
South Africa: 5.06% (30 September 2019: 6.70%)
Absa Group Ltd 10,616 56,848 0.20
AngloGold Ashanti Ltd 2,275 59,071 0.20
Aspen Pharmacare Holdings Ltd 5,535 39,581 0.14
Bid Corp Ltd 3,045 47,148 0.16
Bidvest Group Ltd/The 3,700 30,636 0.10
Discovery Ltd 3,727 28,583 0.10
Exxaro Resources Ltd 3,347 24,978 0.09
FirstRand Ltd 42,877 105,984 0.36
Foschini Group Ltd/The 3,270 16,076 0.05
Gold Fields Ltd 6,428 78,338 0.27
Growthpoint Properties Ltd 50,238 36,895 0.13
Impala Platinum Holdings Ltd 1,148 10,012 0.03
Mr Price Group Ltd 2,459 19,461 0.07
MTN Group Ltd 16,087 54,144 0.19
MultiChoice Group 5,304 30,803 0.11
Naspers Ltd 715 126,883 0.44
Nedbank Group Ltd 5,313 32,098 0.11
Netcare Ltd 23,635 18,307 0.06
Old Mutual Ltd 70,677 43,898 0.15
Remgro Ltd 7,861 44,310 0.15
Sanlam Ltd 17,809 55,509 0.19
Sappi Ltd 19,626 31,227 0.11
Sasol Ltd 9,856 76,561 0.26
Shoprite Holdings Ltd 9,470 77,583 0.27
Sibanye Stillwater Ltd 6,526 18,123 0.06
SPAR Group Ltd/The 3,240 36,839 0.13
Standard Bank Group Ltd 14,994 97,119 0.33
Telkom SA SOC Ltd 14,593 22,948 0.08
Tiger Brands Ltd 2,785 31,852 0.11
Truworths International Ltd 8,762 16,374 0.06
Vodacom Group Ltd 9,065 66,993 0.23
Woolworths Holdings Ltd/South Africa 16,659 35,206 0.12
Total South Africa 1,470,388 5.06
Thailand: 3.23% (30 September 2019: 3.72%)
Advanced Info Service PCL 11,900 64,218 0.22
Banpu PCL 131,800 24,124 0.08
Charoen Pokphand Foods PCL 36,000 31,811 0.11
CP ALL PCL 19,000 36,126 0.12
Indorama Ventures PCL 28,500 18,977 0.07
IRPC PCL 375,900 22,776 0.08
Kasikornbank PCL 15,200 36,936 0.13
Krung Thai Bank PCL 175,100 48,904 0.17
PTT Exploration & Production PCL 16,300 40,637 0.14
PTT Global Chemical PCL 51,500 63,791 0.22
PTT PCL 261,100 263,675 0.91
Siam Cement PCL/The 14,700 149,377 0.51
Siam Commercial Bank PCL/The 45,200 92,718 0.32
Thai Oil PCL 29,900 30,195 0.10
Thanachart Capital PCL 15,600 14,277 0.05
Total Thailand 938,542 3.23
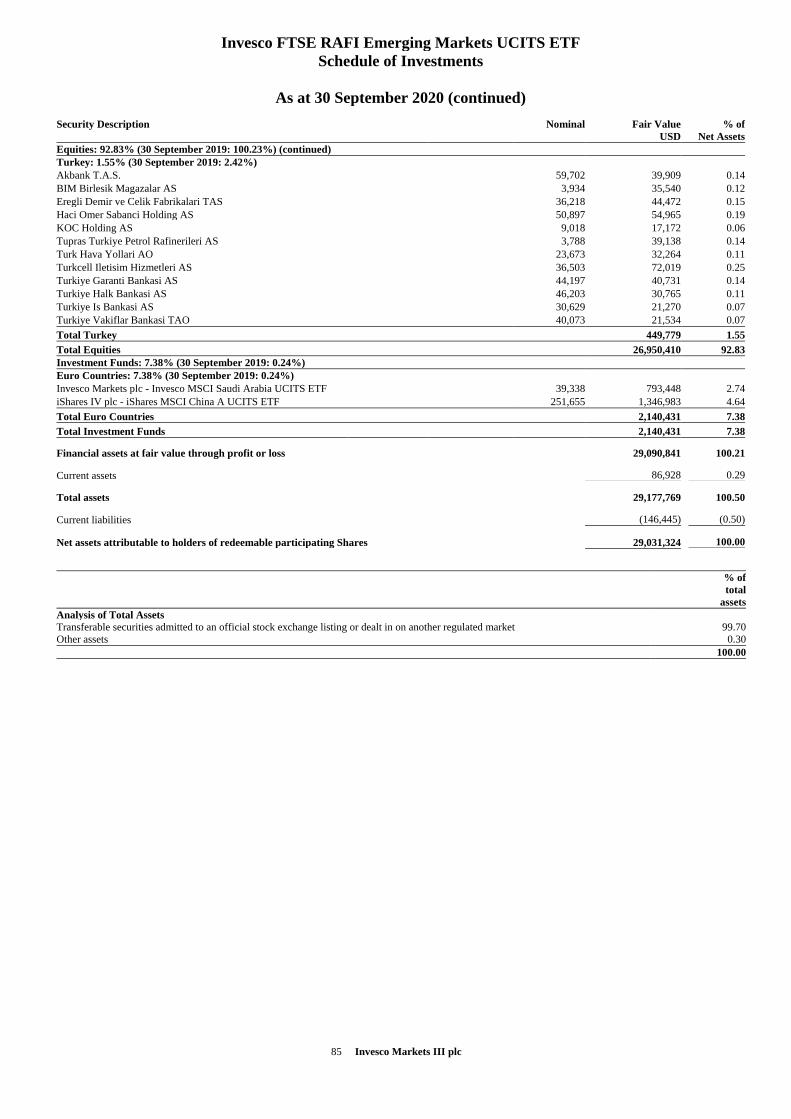
85 Invesco Markets III plc
Invesco FTSE RAFI Emerging Markets UCITS ETF
Schedule of Investments
As at 30 September 2020 (continued)
Security Description
Nominal Fair Value
USD
% of
Net Assets
Equities: 92.83% (30 September 2019: 100.23%) (continued)
Turkey: 1.55% (30 September 2019: 2.42%)
Akbank T.A.S. 59,702 39,909 0.14
BIM Birlesik Magazalar AS 3,934 35,540 0.12
Eregli Demir ve Celik Fabrikalari TAS 36,218 44,472 0.15
Haci Omer Sabanci Holding AS 50,897 54,965 0.19
KOC Holding AS 9,018 17,172 0.06
Tupras Turkiye Petrol Rafinerileri AS 3,788 39,138 0.14
Turk Hava Yollari AO 23,673 32,264 0.11
Turkcell Iletisim Hizmetleri AS 36,503 72,019 0.25
Turkiye Garanti Bankasi AS 44,197 40,731 0.14
Turkiye Halk Bankasi AS 46,203 30,765 0.11
Turkiye Is Bankasi AS 30,629 21,270 0.07
Turkiye Vakiflar Bankasi TAO 40,073 21,534 0.07
Total Turkey 449,779 1.55
Total Equities 26,950,410 92.83
Investment Funds: 7.38% (30 September 2019: 0.24%)
Euro Countries: 7.38% (30 September 2019: 0.24%)
Invesco Markets plc - Invesco MSCI Saudi Arabia UCITS ETF 39,338 793,448 2.74
iShares IV plc - iShares MSCI China A UCITS ETF 251,655 1,346,983 4.64
Total Euro Countries 2,140,431 7.38
Total Investment Funds 2,140,431 7.38
Financial assets at fair value through profit or loss 29,090,841 100.21
Current assets 86,928 0.29
Total assets 29,177,769 100.50
Current liabilities (146,445) (0.50)
Net assets attributable to holders of redeemable participating Shares 29,031,324 100.00
% of
total
assets
Analysis of Total Assets
Transferable securities admitted to an official stock exchange listing or dealt in on another regulated market 99.70
Other assets 0.30
100.00
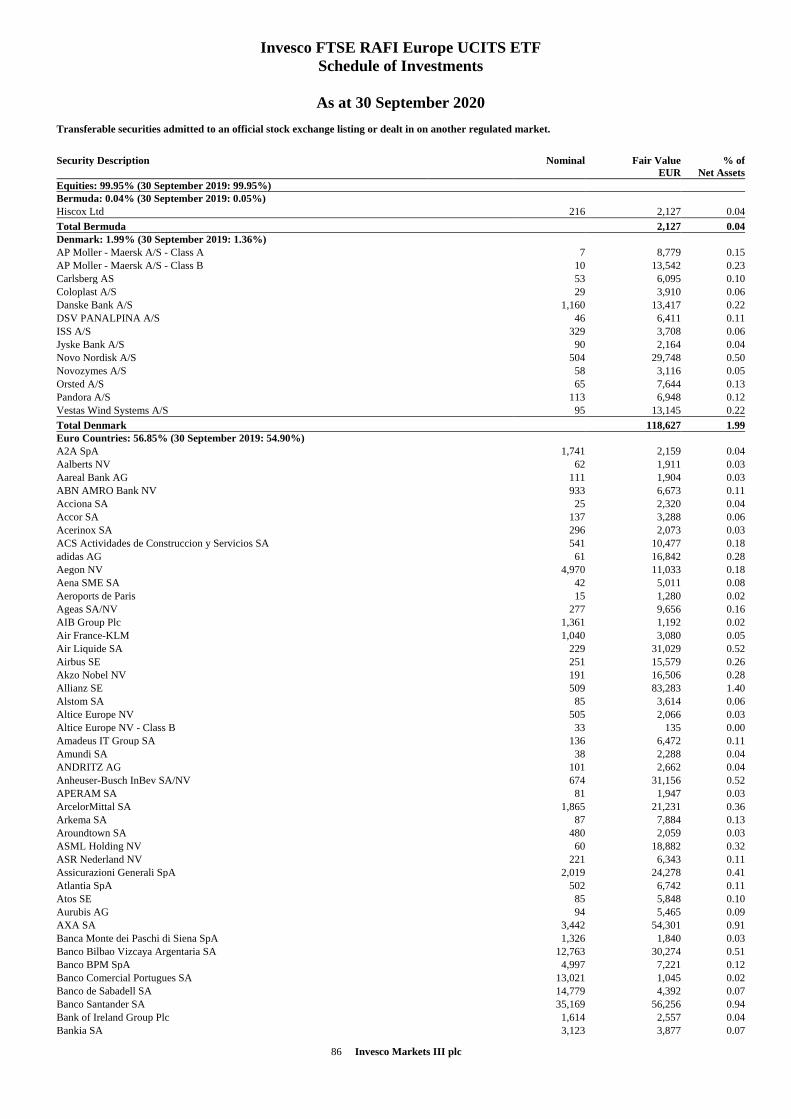
86 Invesco Markets III plc
Invesco FTSE RAFI Europe UCITS ETF
Schedule of Investments
As at 30 September 2020
Transferable securities admitted to an official stock exchange listing or dealt in on another regulated market.
Security Description
Nominal Fair Value
EUR
% of
Net Assets
Equities: 99.95% (30 September 2019: 99.95%)
Bermuda: 0.04% (30 September 2019: 0.05%)
Hiscox Ltd 216 2,127 0.04
Total Bermuda 2,127 0.04
Denmark: 1.99% (30 September 2019: 1.36%)
AP Moller - Maersk A/S - Class A 7 8,779 0.15
AP Moller - Maersk A/S - Class B 10 13,542 0.23
Carlsberg AS 53 6,095 0.10
Coloplast A/S 29 3,910 0.06
Danske Bank A/S 1,160 13,417 0.22
DSV PANALPINA A/S 46 6,411 0.11
ISS A/S 329 3,708 0.06
Jyske Bank A/S 90 2,164 0.04
Novo Nordisk A/S 504 29,748 0.50
Novozymes A/S 58 3,116 0.05
Orsted A/S 65 7,644 0.13
Pandora A/S 113 6,948 0.12
Vestas Wind Systems A/S 95 13,145 0.22
Total Denmark 118,627 1.99
Euro Countries: 56.85% (30 September 2019: 54.90%)
A2A SpA 1,741 2,159 0.04
Aalberts NV 62 1,911 0.03
Aareal Bank AG 111 1,904 0.03
ABN AMRO Bank NV 933 6,673 0.11
Acciona SA 25 2,320 0.04
Accor SA 137 3,288 0.06
Acerinox SA 296 2,073 0.03
ACS Actividades de Construccion y Servicios SA 541 10,477 0.18
adidas AG 61 16,842 0.28
Aegon NV 4,970 11,033 0.18
Aena SME SA 42 5,011 0.08
Aeroports de Paris 15 1,280 0.02
Ageas SA/NV 277 9,656 0.16
AIB Group Plc 1,361 1,192 0.02
Air France-KLM 1,040 3,080 0.05
Air Liquide SA 229 31,029 0.52
Airbus SE 251 15,579 0.26
Akzo Nobel NV 191 16,506 0.28
Allianz SE 509 83,283 1.40
Alstom SA 85 3,614 0.06
Altice Europe NV 505 2,066 0.03
Altice Europe NV - Class B 33 135 0.00
Amadeus IT Group SA 136 6,472 0.11
Amundi SA 38 2,288 0.04
ANDRITZ AG 101 2,662 0.04
Anheuser-Busch InBev SA/NV 674 31,156 0.52
APERAM SA 81 1,947 0.03
ArcelorMittal SA 1,865 21,231 0.36
Arkema SA 87 7,884 0.13
Aroundtown SA 480 2,059 0.03
ASML Holding NV 60 18,882 0.32
ASR Nederland NV 221 6,343 0.11
Assicurazioni Generali SpA 2,019 24,278 0.41
Atlantia SpA 502 6,742 0.11
Atos SE 85 5,848 0.10
Aurubis AG 94 5,465 0.09
AXA SA 3,442 54,301 0.91
Banca Monte dei Paschi di Siena SpA 1,326 1,840 0.03
Banco Bilbao Vizcaya Argentaria SA 12,763 30,274 0.51
Banco BPM SpA 4,997 7,221 0.12
Banco Comercial Portugues SA 13,021 1,045 0.02
Banco de Sabadell SA 14,779 4,392 0.07
Banco Santander SA 35,169 56,256 0.94
Bank of Ireland Group Plc 1,614 2,557 0.04
Bankia SA 3,123 3,877 0.07
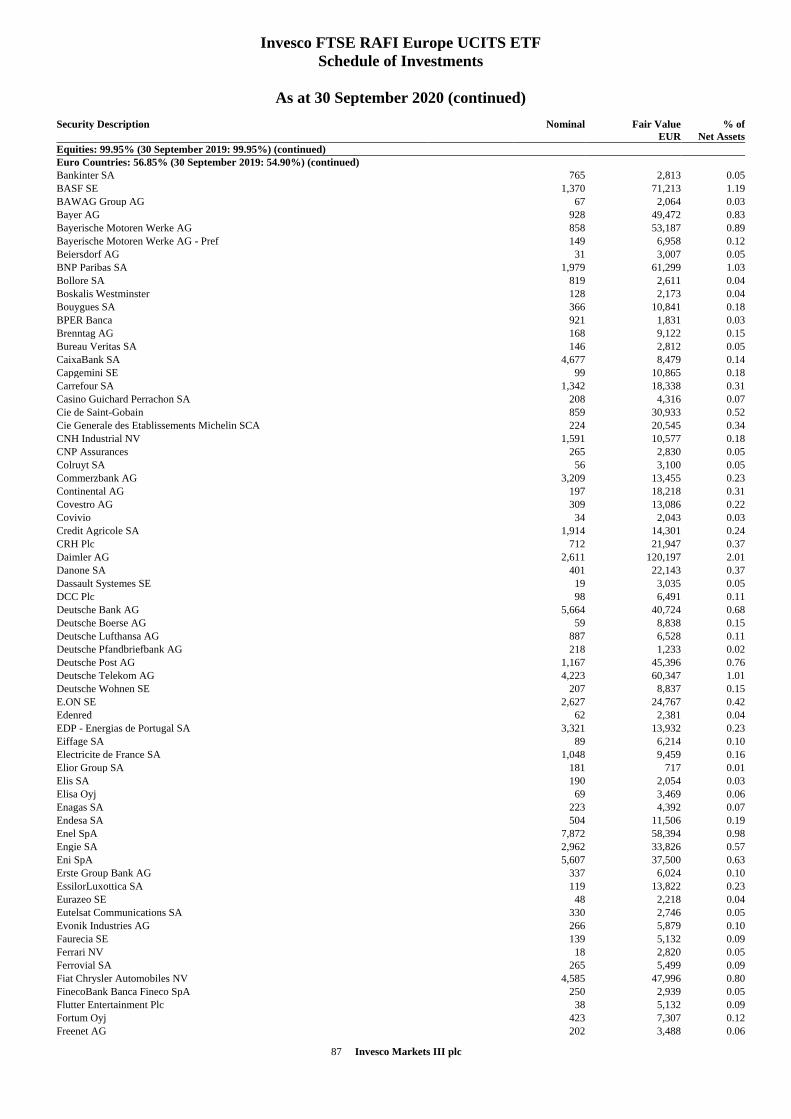
87 Invesco Markets III plc
Invesco FTSE RAFI Europe UCITS ETF
Schedule of Investments
As at 30 September 2020 (continued)
Security Description
Nominal Fair Value
EUR
% of
Net Assets
Equities: 99.95% (30 September 2019: 99.95%) (continued)
Euro Countries: 56.85% (30 September 2019: 54.90%) (continued)
Bankinter SA 765 2,813 0.05
BASF SE 1,370 71,213 1.19
BAWAG Group AG 67 2,064 0.03
Bayer AG 928 49,472 0.83
Bayerische Motoren Werke AG 858 53,187 0.89
Bayerische Motoren Werke AG - Pref 149 6,958 0.12
Beiersdorf AG 31 3,007 0.05
BNP Paribas SA 1,979 61,299 1.03
Bollore SA 819 2,611 0.04
Boskalis Westminster 128 2,173 0.04
Bouygues SA 366 10,841 0.18
BPER Banca 921 1,831 0.03
Brenntag AG 168 9,122 0.15
Bureau Veritas SA 146 2,812 0.05
CaixaBank SA 4,677 8,479 0.14
Capgemini SE 99 10,865 0.18
Carrefour SA 1,342 18,338 0.31
Casino Guichard Perrachon SA 208 4,316 0.07
Cie de Saint-Gobain 859 30,933 0.52
Cie Generale des Etablissements Michelin SCA 224 20,545 0.34
CNH Industrial NV 1,591 10,577 0.18
CNP Assurances 265 2,830 0.05
Colruyt SA 56 3,100 0.05
Commerzbank AG 3,209 13,455 0.23
Continental AG 197 18,218 0.31
Covestro AG 309 13,086 0.22
Covivio 34 2,043 0.03
Credit Agricole SA 1,914 14,301 0.24
CRH Plc 712 21,947 0.37
Daimler AG 2,611 120,197 2.01
Danone SA 401 22,143 0.37
Dassault Systemes SE 19 3,035 0.05
DCC Plc 98 6,491 0.11
Deutsche Bank AG 5,664 40,724 0.68
Deutsche Boerse AG 59 8,838 0.15
Deutsche Lufthansa AG 887 6,528 0.11
Deutsche Pfandbriefbank AG 218 1,233 0.02
Deutsche Post AG 1,167 45,396 0.76
Deutsche Telekom AG 4,223 60,347 1.01
Deutsche Wohnen SE 207 8,837 0.15
E.ON SE 2,627 24,767 0.42
Edenred 62 2,381 0.04
EDP - Energias de Portugal SA 3,321 13,932 0.23
Eiffage SA 89 6,214 0.10
Electricite de France SA 1,048 9,459 0.16
Elior Group SA 181 717 0.01
Elis SA 190 2,054 0.03
Elisa Oyj 69 3,469 0.06
Enagas SA 223 4,392 0.07
Endesa SA 504 11,506 0.19
Enel SpA 7,872 58,394 0.98
Engie SA 2,962 33,826 0.57
Eni SpA 5,607 37,500 0.63
Erste Group Bank AG 337 6,024 0.10
EssilorLuxottica SA 119 13,822 0.23
Eurazeo SE 48 2,218 0.04
Eutelsat Communications SA 330 2,746 0.05
Evonik Industries AG 266 5,879 0.10
Faurecia SE 139 5,132 0.09
Ferrari NV 18 2,820 0.05
Ferrovial SA 265 5,499 0.09
Fiat Chrysler Automobiles NV 4,585 47,996 0.80
FinecoBank Banca Fineco SpA 250 2,939 0.05
Flutter Entertainment Plc 38 5,132 0.09
Fortum Oyj 423 7,307 0.12
Freenet AG 202 3,488 0.06
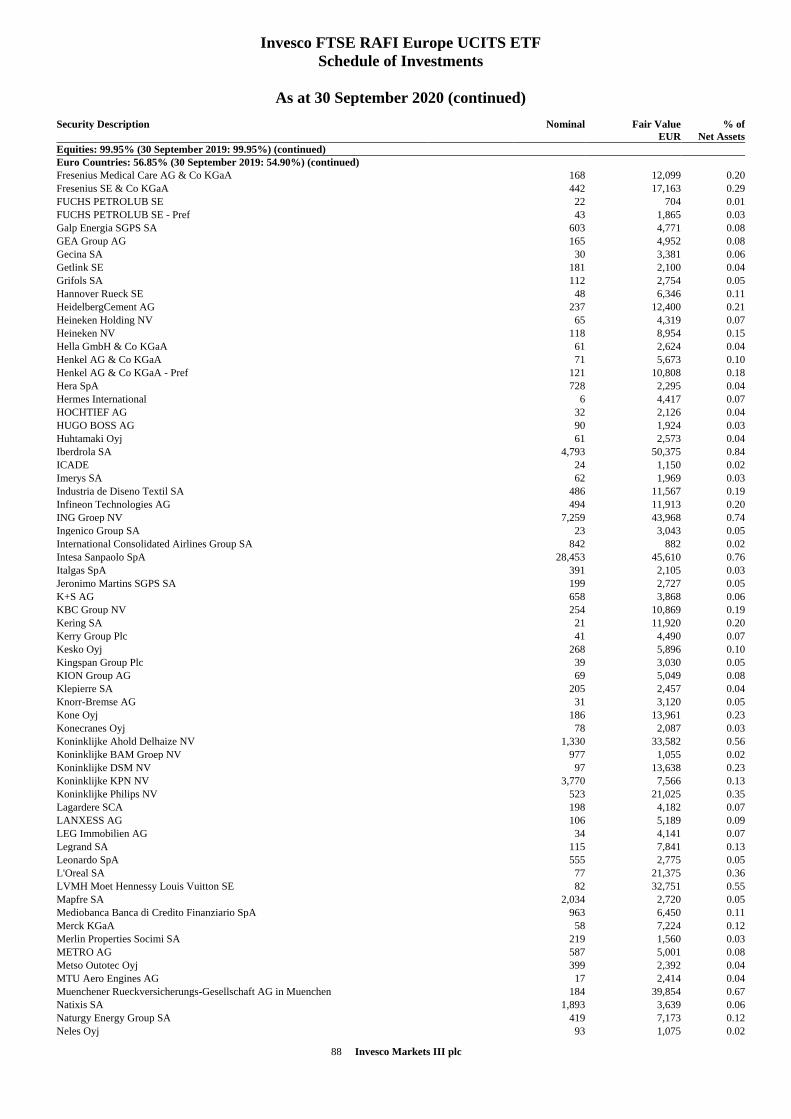
88 Invesco Markets III plc
Invesco FTSE RAFI Europe UCITS ETF
Schedule of Investments
As at 30 September 2020 (continued)
Security Description
Nominal Fair Value
EUR
% of
Net Assets
Equities: 99.95% (30 September 2019: 99.95%) (continued)
Euro Countries: 56.85% (30 September 2019: 54.90%) (continued)
Fresenius Medical Care AG & Co KGaA 168 12,099 0.20
Fresenius SE & Co KGaA 442 17,163 0.29
FUCHS PETROLUB SE 22 704 0.01
FUCHS PETROLUB SE - Pref 43 1,865 0.03
Galp Energia SGPS SA 603 4,771 0.08
GEA Group AG 165 4,952 0.08
Gecina SA 30 3,381 0.06
Getlink SE 181 2,100 0.04
Grifols SA 112 2,754 0.05
Hannover Rueck SE 48 6,346 0.11
HeidelbergCement AG 237 12,400 0.21
Heineken Holding NV 65 4,319 0.07
Heineken NV 118 8,954 0.15
Hella GmbH & Co KGaA 61 2,624 0.04
Henkel AG & Co KGaA 71 5,673 0.10
Henkel AG & Co KGaA - Pref 121 10,808 0.18
Hera SpA 728 2,295 0.04
Hermes International 6 4,417 0.07
HOCHTIEF AG 32 2,126 0.04
HUGO BOSS AG 90 1,924 0.03
Huhtamaki Oyj 61 2,573 0.04
Iberdrola SA 4,793 50,375 0.84
ICADE 24 1,150 0.02
Imerys SA 62 1,969 0.03
Industria de Diseno Textil SA 486 11,567 0.19
Infineon Technologies AG 494 11,913 0.20
ING Groep NV 7,259 43,968 0.74
Ingenico Group SA 23 3,043 0.05
International Consolidated Airlines Group SA 842 882 0.02
Intesa Sanpaolo SpA 28,453 45,610 0.76
Italgas SpA 391 2,105 0.03
Jeronimo Martins SGPS SA 199 2,727 0.05
K+S AG 658 3,868 0.06
KBC Group NV 254 10,869 0.19
Kering SA 21 11,920 0.20
Kerry Group Plc 41 4,490 0.07
Kesko Oyj 268 5,896 0.10
Kingspan Group Plc 39 3,030 0.05
KION Group AG 69 5,049 0.08
Klepierre SA 205 2,457 0.04
Knorr-Bremse AG 31 3,120 0.05
Kone Oyj 186 13,961 0.23
Konecranes Oyj 78 2,087 0.03
Koninklijke Ahold Delhaize NV 1,330 33,582 0.56
Koninklijke BAM Groep NV 977 1,055 0.02
Koninklijke DSM NV 97 13,638 0.23
Koninklijke KPN NV 3,770 7,566 0.13
Koninklijke Philips NV 523 21,025 0.35
Lagardere SCA 198 4,182 0.07
LANXESS AG 106 5,189 0.09
LEG Immobilien AG 34 4,141 0.07
Legrand SA 115 7,841 0.13
Leonardo SpA 555 2,775 0.05
L'Oreal SA 77 21,375 0.36
LVMH Moet Hennessy Louis Vuitton SE 82 32,751 0.55
Mapfre SA 2,034 2,720 0.05
Mediobanca Banca di Credito Finanziario SpA 963 6,450 0.11
Merck KGaA 58 7,224 0.12
Merlin Properties Socimi SA 219 1,560 0.03
METRO AG 587 5,001 0.08
Metso Outotec Oyj 399 2,392 0.04
MTU Aero Engines AG 17 2,414 0.04
Muenchener Rueckversicherungs-Gesellschaft AG in Muenchen 184 39,854 0.67
Natixis SA 1,893 3,639 0.06
Naturgy Energy Group SA 419 7,173 0.12
Neles Oyj 93 1,075 0.02
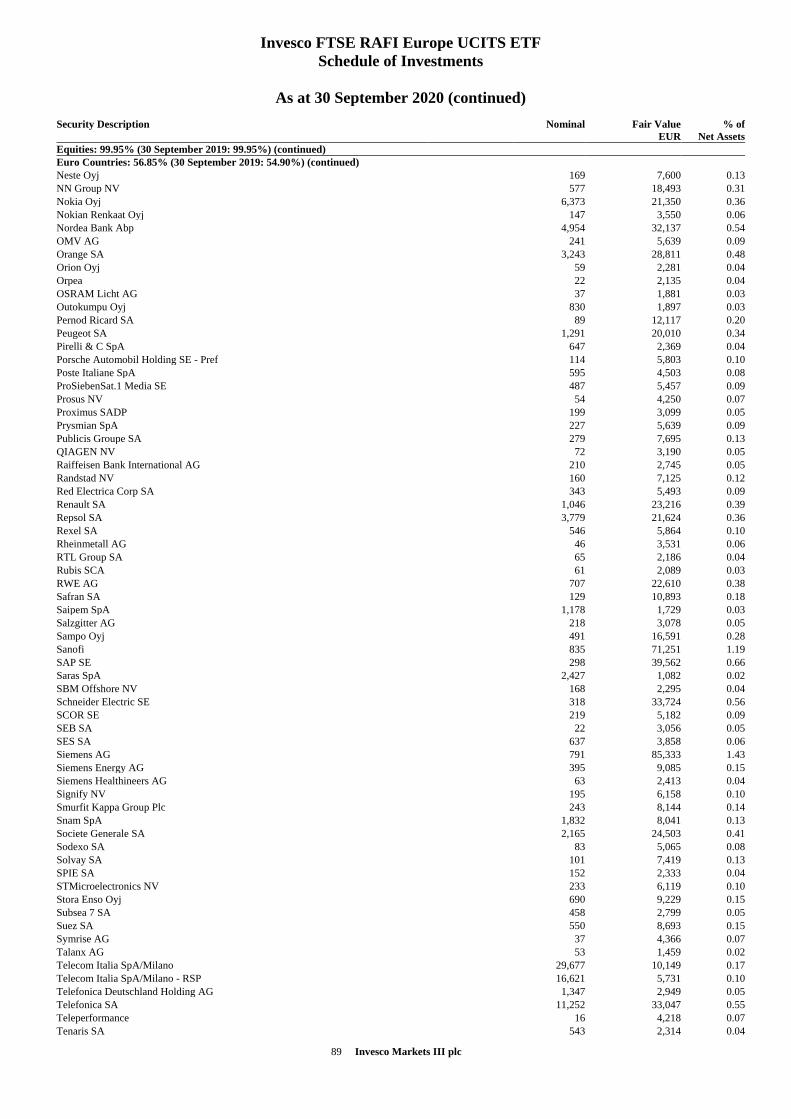
89 Invesco Markets III plc
Invesco FTSE RAFI Europe UCITS ETF
Schedule of Investments
As at 30 September 2020 (continued)
Security Description
Nominal Fair Value
EUR
% of
Net Assets
Equities: 99.95% (30 September 2019: 99.95%) (continued)
Euro Countries: 56.85% (30 September 2019: 54.90%) (continued)
Neste Oyj 169 7,600 0.13
NN Group NV 577 18,493 0.31
Nokia Oyj 6,373 21,350 0.36
Nokian Renkaat Oyj 147 3,550 0.06
Nordea Bank Abp 4,954 32,137 0.54
OMV AG 241 5,639 0.09
Orange SA 3,243 28,811 0.48
Orion Oyj 59 2,281 0.04
Orpea 22 2,135 0.04
OSRAM Licht AG 37 1,881 0.03
Outokumpu Oyj 830 1,897 0.03
Pernod Ricard SA 89 12,117 0.20
Peugeot SA 1,291 20,010 0.34
Pirelli & C SpA 647 2,369 0.04
Porsche Automobil Holding SE - Pref 114 5,803 0.10
Poste Italiane SpA 595 4,503 0.08
ProSiebenSat.1 Media SE 487 5,457 0.09
Prosus NV 54 4,250 0.07
Proximus SADP 199 3,099 0.05
Prysmian SpA 227 5,639 0.09
Publicis Groupe SA 279 7,695 0.13
QIAGEN NV 72 3,190 0.05
Raiffeisen Bank International AG 210 2,745 0.05
Randstad NV 160 7,125 0.12
Red Electrica Corp SA 343 5,493 0.09
Renault SA 1,046 23,216 0.39
Repsol SA 3,779 21,624 0.36
Rexel SA 546 5,864 0.10
Rheinmetall AG 46 3,531 0.06
RTL Group SA 65 2,186 0.04
Rubis SCA 61 2,089 0.03
RWE AG 707 22,610 0.38
Safran SA 129 10,893 0.18
Saipem SpA 1,178 1,729 0.03
Salzgitter AG 218 3,078 0.05
Sampo Oyj 491 16,591 0.28
Sanofi 835 71,251 1.19
SAP SE 298 39,562 0.66
Saras SpA 2,427 1,082 0.02
SBM Offshore NV 168 2,295 0.04
Schneider Electric SE 318 33,724 0.56
SCOR SE 219 5,182 0.09
SEB SA 22 3,056 0.05
SES SA 637 3,858 0.06
Siemens AG 791 85,333 1.43
Siemens Energy AG 395 9,085 0.15
Siemens Healthineers AG 63 2,413 0.04
Signify NV 195 6,158 0.10
Smurfit Kappa Group Plc 243 8,144 0.14
Snam SpA 1,832 8,041 0.13
Societe Generale SA 2,165 24,503 0.41
Sodexo SA 83 5,065 0.08
Solvay SA 101 7,419 0.13
SPIE SA 152 2,333 0.04
STMicroelectronics NV 233 6,119 0.10
Stora Enso Oyj 690 9,229 0.15
Subsea 7 SA 458 2,799 0.05
Suez SA 550 8,693 0.15
Symrise AG 37 4,366 0.07
Talanx AG 53 1,459 0.02
Telecom Italia SpA/Milano 29,677 10,149 0.17
Telecom Italia SpA/Milano - RSP 16,621 5,731 0.10
Telefonica Deutschland Holding AG 1,347 2,949 0.05
Telefonica SA 11,252 33,047 0.55
Teleperformance 16 4,218 0.07
Tenaris SA 543 2,314 0.04
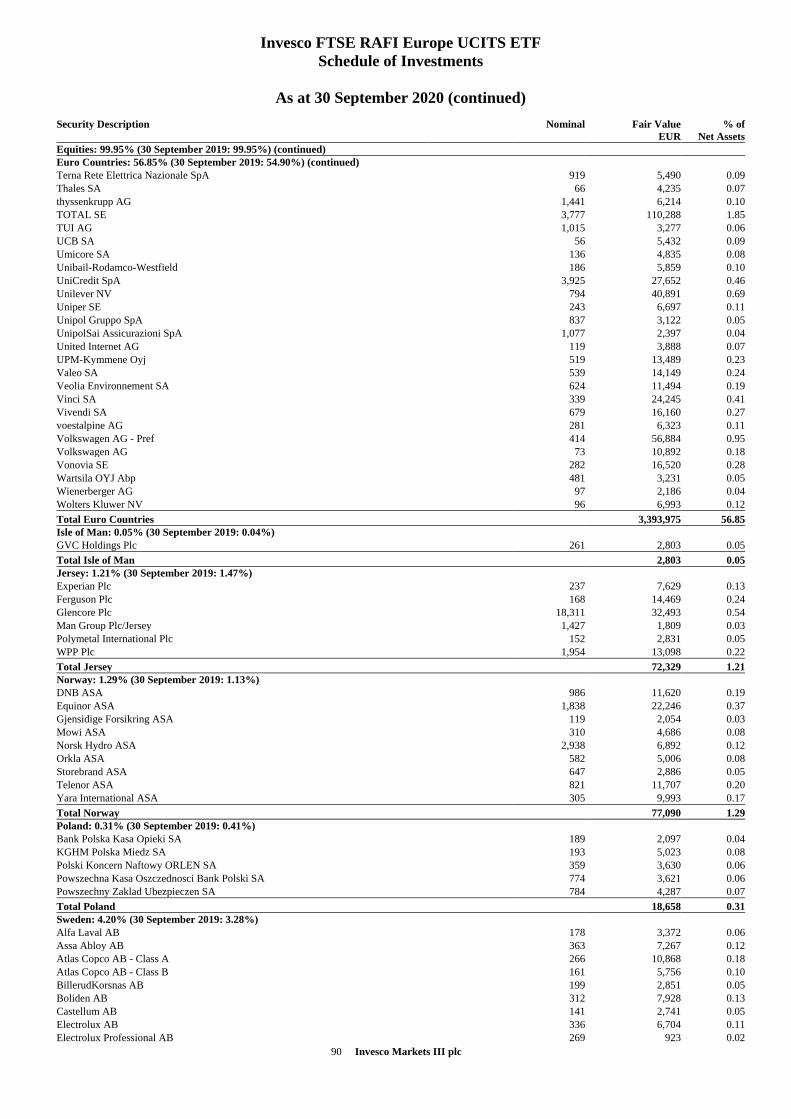
90 Invesco Markets III plc
Invesco FTSE RAFI Europe UCITS ETF
Schedule of Investments
As at 30 September 2020 (continued)
Security Description
Nominal Fair Value
EUR
% of
Net Assets
Equities: 99.95% (30 September 2019: 99.95%) (continued)
Euro Countries: 56.85% (30 September 2019: 54.90%) (continued)
Terna Rete Elettrica Nazionale SpA 919 5,490 0.09
Thales SA 66 4,235 0.07
thyssenkrupp AG 1,441 6,214 0.10
TOTAL SE 3,777 110,288 1.85
TUI AG 1,015 3,277 0.06
UCB SA 56 5,432 0.09
Umicore SA 136 4,835 0.08
Unibail-Rodamco-Westfield 186 5,859 0.10
UniCredit SpA 3,925 27,652 0.46
Unilever NV 794 40,891 0.69
Uniper SE 243 6,697 0.11
Unipol Gruppo SpA 837 3,122 0.05
UnipolSai Assicurazioni SpA 1,077 2,397 0.04
United Internet AG 119 3,888 0.07
UPM-Kymmene Oyj 519 13,489 0.23
Valeo SA 539 14,149 0.24
Veolia Environnement SA 624 11,494 0.19
Vinci SA 339 24,245 0.41
Vivendi SA 679 16,160 0.27
voestalpine AG 281 6,323 0.11
Volkswagen AG - Pref 414 56,884 0.95
Volkswagen AG 73 10,892 0.18
Vonovia SE 282 16,520 0.28
Wartsila OYJ Abp 481 3,231 0.05
Wienerberger AG 97 2,186 0.04
Wolters Kluwer NV 96 6,993 0.12
Total Euro Countries 3,393,975 56.85
Isle of Man: 0.05% (30 September 2019: 0.04%)
GVC Holdings Plc 261 2,803 0.05
Total Isle of Man 2,803 0.05
Jersey: 1.21% (30 September 2019: 1.47%)
Experian Plc 237 7,629 0.13
Ferguson Plc 168 14,469 0.24
Glencore Plc 18,311 32,493 0.54
Man Group Plc/Jersey 1,427 1,809 0.03
Polymetal International Plc 152 2,831 0.05
WPP Plc 1,954 13,098 0.22
Total Jersey 72,329 1.21
Norway: 1.29% (30 September 2019: 1.13%)
DNB ASA 986 11,620 0.19
Equinor ASA 1,838 22,246 0.37
Gjensidige Forsikring ASA 119 2,054 0.03
Mowi ASA 310 4,686 0.08
Norsk Hydro ASA 2,938 6,892 0.12
Orkla ASA 582 5,006 0.08
Storebrand ASA 647 2,886 0.05
Telenor ASA 821 11,707 0.20
Yara International ASA 305 9,993 0.17
Total Norway 77,090 1.29
Poland: 0.31% (30 September 2019: 0.41%)
Bank Polska Kasa Opieki SA 189 2,097 0.04
KGHM Polska Miedz SA 193 5,023 0.08
Polski Koncern Naftowy ORLEN SA 359 3,630 0.06
Powszechna Kasa Oszczednosci Bank Polski SA 774 3,621 0.06
Powszechny Zaklad Ubezpieczen SA 784 4,287 0.07
Total Poland 18,658 0.31
Sweden: 4.20% (30 September 2019: 3.28%)
Alfa Laval AB 178 3,372 0.06
Assa Abloy AB 363 7,267 0.12
Atlas Copco AB - Class A 266 10,868 0.18
Atlas Copco AB - Class B 161 5,756 0.10
BillerudKorsnas AB 199 2,851 0.05
Boliden AB 312 7,928 0.13
Castellum AB 141 2,741 0.05
Electrolux AB 336 6,704 0.11
Electrolux Professional AB 269 923 0.02
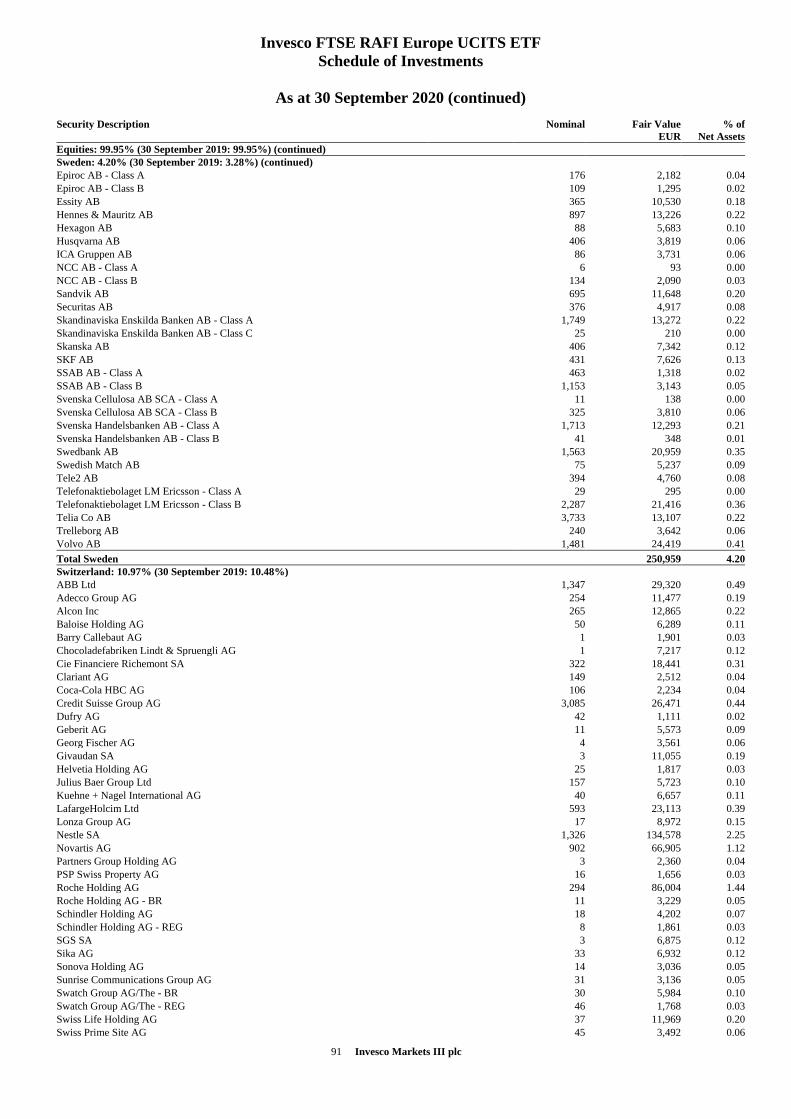
91 Invesco Markets III plc
Invesco FTSE RAFI Europe UCITS ETF
Schedule of Investments
As at 30 September 2020 (continued)
Security Description
Nominal Fair Value
EUR
% of
Net Assets
Equities: 99.95% (30 September 2019: 99.95%) (continued)
Sweden: 4.20% (30 September 2019: 3.28%) (continued)
Epiroc AB - Class A 176 2,182 0.04
Epiroc AB - Class B 109 1,295 0.02
Essity AB 365 10,530 0.18
Hennes & Mauritz AB 897 13,226 0.22
Hexagon AB 88 5,683 0.10
Husqvarna AB 406 3,819 0.06
ICA Gruppen AB 86 3,731 0.06
NCC AB - Class A 6 93 0.00
NCC AB - Class B 134 2,090 0.03
Sandvik AB 695 11,648 0.20
Securitas AB 376 4,917 0.08
Skandinaviska Enskilda Banken AB - Class A 1,749 13,272 0.22
Skandinaviska Enskilda Banken AB - Class C 25 210 0.00
Skanska AB 406 7,342 0.12
SKF AB 431 7,626 0.13
SSAB AB - Class A 463 1,318 0.02
SSAB AB - Class B 1,153 3,143 0.05
Svenska Cellulosa AB SCA - Class A 11 138 0.00
Svenska Cellulosa AB SCA - Class B 325 3,810 0.06
Svenska Handelsbanken AB - Class A 1,713 12,293 0.21
Svenska Handelsbanken AB - Class B 41 348 0.01
Swedbank AB 1,563 20,959 0.35
Swedish Match AB 75 5,237 0.09
Tele2 AB 394 4,760 0.08
Telefonaktiebolaget LM Ericsson - Class A 29 295 0.00
Telefonaktiebolaget LM Ericsson - Class B 2,287 21,416 0.36
Telia Co AB 3,733 13,107 0.22
Trelleborg AB 240 3,642 0.06
Volvo AB 1,481 24,419 0.41
Total Sweden 250,959 4.20
Switzerland: 10.97% (30 September 2019: 10.48%)
ABB Ltd 1,347 29,320 0.49
Adecco Group AG 254 11,477 0.19
Alcon Inc 265 12,865 0.22
Baloise Holding AG 50 6,289 0.11
Barry Callebaut AG 1 1,901 0.03
Chocoladefabriken Lindt & Spruengli AG 1 7,217 0.12
Cie Financiere Richemont SA 322 18,441 0.31
Clariant AG 149 2,512 0.04
Coca-Cola HBC AG 106 2,234 0.04
Credit Suisse Group AG 3,085 26,471 0.44
Dufry AG 42 1,111 0.02
Geberit AG 11 5,573 0.09
Georg Fischer AG 4 3,561 0.06
Givaudan SA 3 11,055 0.19
Helvetia Holding AG 25 1,817 0.03
Julius Baer Group Ltd 157 5,723 0.10
Kuehne + Nagel International AG 40 6,657 0.11
LafargeHolcim Ltd 593 23,113 0.39
Lonza Group AG 17 8,972 0.15
Nestle SA 1,326 134,578 2.25
Novartis AG 902 66,905 1.12
Partners Group Holding AG 3 2,360 0.04
PSP Swiss Property AG 16 1,656 0.03
Roche Holding AG 294 86,004 1.44
Roche Holding AG - BR 11 3,229 0.05
Schindler Holding AG 18 4,202 0.07
Schindler Holding AG - REG 8 1,861 0.03
SGS SA 3 6,875 0.12
Sika AG 33 6,932 0.12
Sonova Holding AG 14 3,036 0.05
Sunrise Communications Group AG 31 3,136 0.05
Swatch Group AG/The - BR 30 5,984 0.10
Swatch Group AG/The - REG 46 1,768 0.03
Swiss Life Holding AG 37 11,969 0.20
Swiss Prime Site AG 45 3,492 0.06
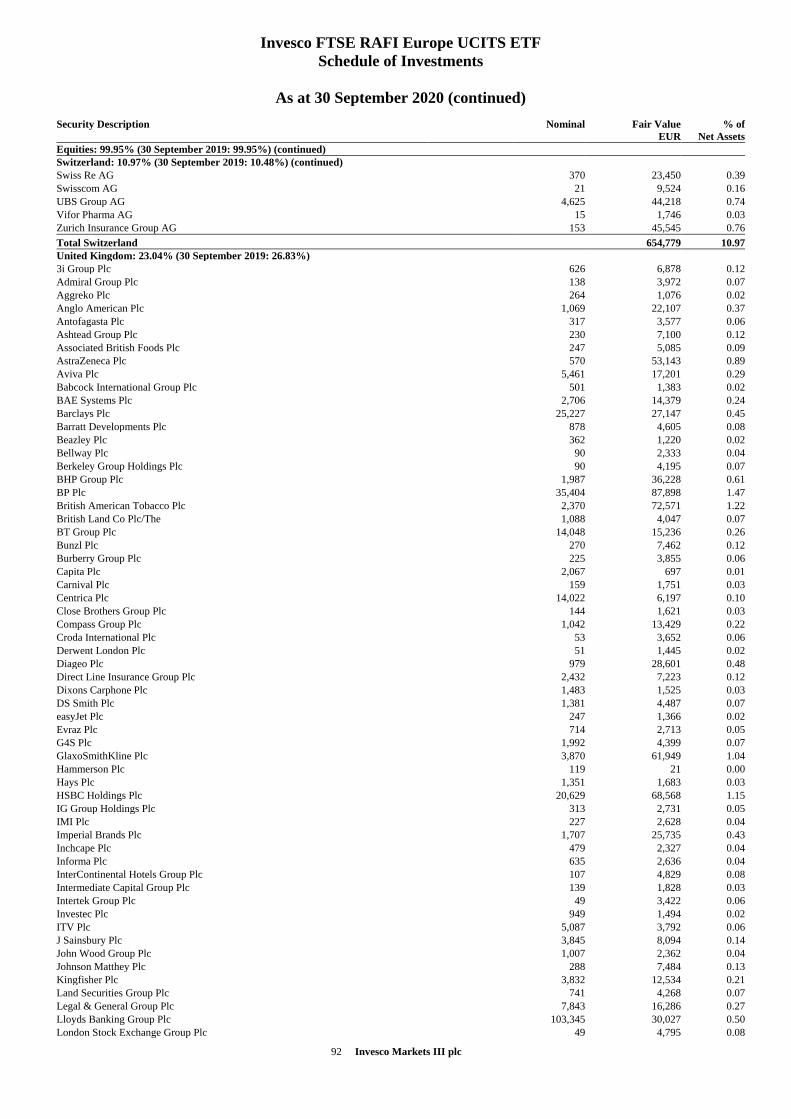
92 Invesco Markets III plc
Invesco FTSE RAFI Europe UCITS ETF
Schedule of Investments
As at 30 September 2020 (continued)
Security Description
Nominal Fair Value
EUR
% of
Net Assets
Equities: 99.95% (30 September 2019: 99.95%) (continued)
Switzerland: 10.97% (30 September 2019: 10.48%) (continued)
Swiss Re AG 370 23,450 0.39
Swisscom AG 21 9,524 0.16
UBS Group AG 4,625 44,218 0.74
Vifor Pharma AG 15 1,746 0.03
Zurich Insurance Group AG 153 45,545 0.76
Total Switzerland 654,779 10.97
United Kingdom: 23.04% (30 September 2019: 26.83%)
3i Group Plc 626 6,878 0.12
Admiral Group Plc 138 3,972 0.07
Aggreko Plc 264 1,076 0.02
Anglo American Plc 1,069 22,107 0.37
Antofagasta Plc 317 3,577 0.06
Ashtead Group Plc 230 7,100 0.12
Associated British Foods Plc 247 5,085 0.09
AstraZeneca Plc 570 53,143 0.89
Aviva Plc 5,461 17,201 0.29
Babcock International Group Plc 501 1,383 0.02
BAE Systems Plc 2,706 14,379 0.24
Barclays Plc 25,227 27,147 0.45
Barratt Developments Plc 878 4,605 0.08
Beazley Plc 362 1,220 0.02
Bellway Plc 90 2,333 0.04
Berkeley Group Holdings Plc 90 4,195 0.07
BHP Group Plc 1,987 36,228 0.61
BP Plc 35,404 87,898 1.47
British American Tobacco Plc 2,370 72,571 1.22
British Land Co Plc/The 1,088 4,047 0.07
BT Group Plc 14,048 15,236 0.26
Bunzl Plc 270 7,462 0.12
Burberry Group Plc 225 3,855 0.06
Capita Plc 2,067 697 0.01
Carnival Plc 159 1,751 0.03
Centrica Plc 14,022 6,197 0.10
Close Brothers Group Plc 144 1,621 0.03
Compass Group Plc 1,042 13,429 0.22
Croda International Plc 53 3,652 0.06
Derwent London Plc 51 1,445 0.02
Diageo Plc 979 28,601 0.48
Direct Line Insurance Group Plc 2,432 7,223 0.12
Dixons Carphone Plc 1,483 1,525 0.03
DS Smith Plc 1,381 4,487 0.07
easyJet Plc 247 1,366 0.02
Evraz Plc 714 2,713 0.05
G4S Plc 1,992 4,399 0.07
GlaxoSmithKline Plc 3,870 61,949 1.04
Hammerson Plc 119 21 0.00
Hays Plc 1,351 1,683 0.03
HSBC Holdings Plc 20,629 68,568 1.15
IG Group Holdings Plc 313 2,731 0.05
IMI Plc 227 2,628 0.04
Imperial Brands Plc 1,707 25,735 0.43
Inchcape Plc 479 2,327 0.04
Informa Plc 635 2,636 0.04
InterContinental Hotels Group Plc 107 4,829 0.08
Intermediate Capital Group Plc 139 1,828 0.03
Intertek Group Plc 49 3,422 0.06
Investec Plc 949 1,494 0.02
ITV Plc 5,087 3,792 0.06
J Sainsbury Plc 3,845 8,094 0.14
John Wood Group Plc 1,007 2,362 0.04
Johnson Matthey Plc 288 7,484 0.13
Kingfisher Plc 3,832 12,534 0.21
Land Securities Group Plc 741 4,268 0.07
Legal & General Group Plc 7,843 16,286 0.27
Lloyds Banking Group Plc 103,345 30,027 0.50
London Stock Exchange Group Plc 49 4,795 0.08
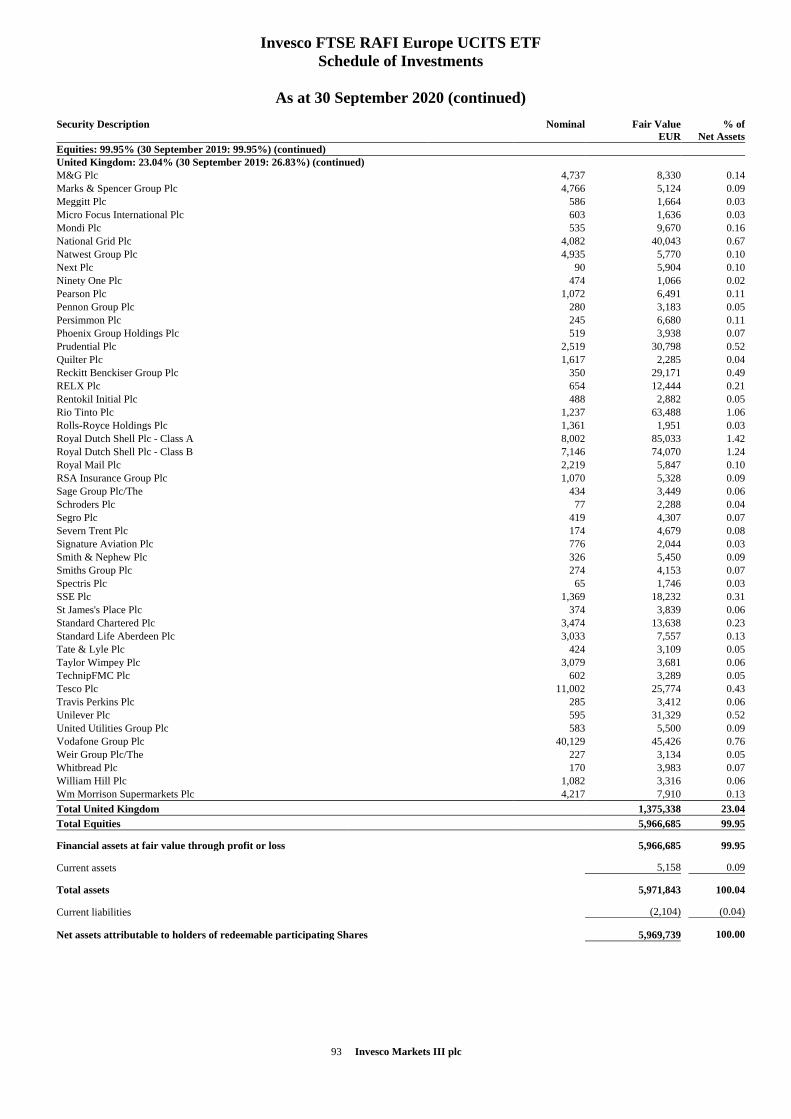
93 Invesco Markets III plc
Invesco FTSE RAFI Europe UCITS ETF
Schedule of Investments
As at 30 September 2020 (continued)
Security Description
Nominal Fair Value
EUR
% of
Net Assets
Equities: 99.95% (30 September 2019: 99.95%) (continued)
United Kingdom: 23.04% (30 September 2019: 26.83%) (continued)
M&G Plc 4,737 8,330 0.14
Marks & Spencer Group Plc 4,766 5,124 0.09
Meggitt Plc 586 1,664 0.03
Micro Focus International Plc 603 1,636 0.03
Mondi Plc 535 9,670 0.16
National Grid Plc 4,082 40,043 0.67
Natwest Group Plc 4,935 5,770 0.10
Next Plc 90 5,904 0.10
Ninety One Plc 474 1,066 0.02
Pearson Plc 1,072 6,491 0.11
Pennon Group Plc 280 3,183 0.05
Persimmon Plc 245 6,680 0.11
Phoenix Group Holdings Plc 519 3,938 0.07
Prudential Plc 2,519 30,798 0.52
Quilter Plc 1,617 2,285 0.04
Reckitt Benckiser Group Plc 350 29,171 0.49
RELX Plc 654 12,444 0.21
Rentokil Initial Plc 488 2,882 0.05
Rio Tinto Plc 1,237 63,488 1.06
Rolls-Royce Holdings Plc 1,361 1,951 0.03
Royal Dutch Shell Plc - Class A 8,002 85,033 1.42
Royal Dutch Shell Plc - Class B 7,146 74,070 1.24
Royal Mail Plc 2,219 5,847 0.10
RSA Insurance Group Plc 1,070 5,328 0.09
Sage Group Plc/The 434 3,449 0.06
Schroders Plc 77 2,288 0.04
Segro Plc 419 4,307 0.07
Severn Trent Plc 174 4,679 0.08
Signature Aviation Plc 776 2,044 0.03
Smith & Nephew Plc 326 5,450 0.09
Smiths Group Plc 274 4,153 0.07
Spectris Plc 65 1,746 0.03
SSE Plc 1,369 18,232 0.31
St James's Place Plc 374 3,839 0.06
Standard Chartered Plc 3,474 13,638 0.23
Standard Life Aberdeen Plc 3,033 7,557 0.13
Tate & Lyle Plc 424 3,109 0.05
Taylor Wimpey Plc 3,079 3,681 0.06
TechnipFMC Plc 602 3,289 0.05
Tesco Plc 11,002 25,774 0.43
Travis Perkins Plc 285 3,412 0.06
Unilever Plc 595 31,329 0.52
United Utilities Group Plc 583 5,500 0.09
Vodafone Group Plc 40,129 45,426 0.76
Weir Group Plc/The 227 3,134 0.05
Whitbread Plc 170 3,983 0.07
William Hill Plc 1,082 3,316 0.06
Wm Morrison Supermarkets Plc 4,217 7,910 0.13
Total United Kingdom 1,375,338 23.04
Total Equities 5,966,685 99.95
Financial assets at fair value through profit or loss 5,966,685 99.95
Current assets 5,158 0.09
Total assets 5,971,843 100.04
Current liabilities (2,104) (0.04)
Net assets attributable to holders of redeemable participating Shares 5,969,739 100.00

94 Invesco Markets III plc
Invesco FTSE RAFI Europe UCITS ETF
Schedule of Investments
As at 30 September 2020 (continued)
% of
total
assets
Analysis of Total Assets
Transferable securities admitted to an official stock exchange listing or dealt in on another regulated market 99.91
Other assets 0.09
100.00
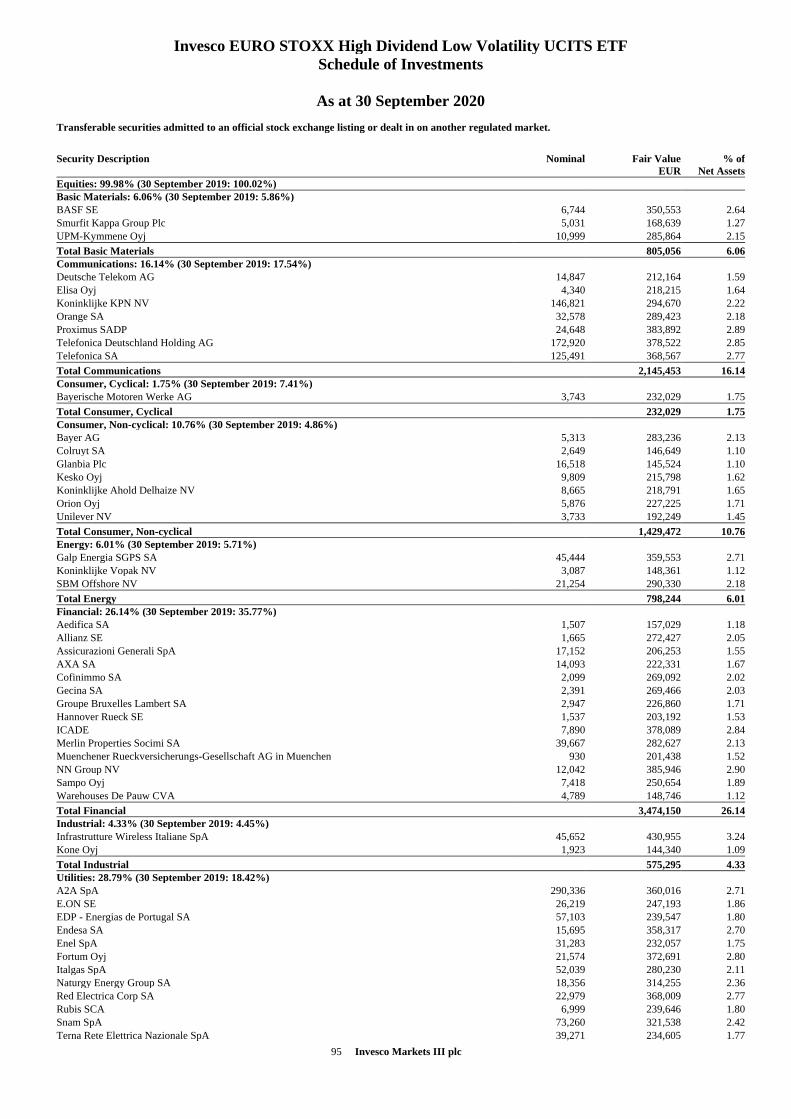
95 Invesco Markets III plc
Invesco EURO STOXX High Dividend Low Volatility UCITS ETF
Schedule of Investments
As at 30 September 2020
Transferable securities admitted to an official stock exchange listing or dealt in on another regulated market.
Security Description
Nominal Fair Value
EUR
% of
Net Assets
Equities: 99.98% (30 September 2019: 100.02%)
Basic Materials: 6.06% (30 September 2019: 5.86%)
BASF SE 6,744 350,553 2.64
Smurfit Kappa Group Plc 5,031 168,639 1.27
UPM-Kymmene Oyj 10,999 285,864 2.15
Total Basic Materials 805,056 6.06
Communications: 16.14% (30 September 2019: 17.54%)
Deutsche Telekom AG 14,847 212,164 1.59
Elisa Oyj 4,340 218,215 1.64
Koninklijke KPN NV 146,821 294,670 2.22
Orange SA 32,578 289,423 2.18
Proximus SADP 24,648 383,892 2.89
Telefonica Deutschland Holding AG 172,920 378,522 2.85
Telefonica SA 125,491 368,567 2.77
Total Communications 2,145,453 16.14
Consumer, Cyclical: 1.75% (30 September 2019: 7.41%)
Bayerische Motoren Werke AG 3,743 232,029 1.75
Total Consumer, Cyclical 232,029 1.75
Consumer, Non-cyclical: 10.76% (30 September 2019: 4.86%)
Bayer AG 5,313 283,236 2.13
Colruyt SA 2,649 146,649 1.10
Glanbia Plc 16,518 145,524 1.10
Kesko Oyj 9,809 215,798 1.62
Koninklijke Ahold Delhaize NV 8,665 218,791 1.65
Orion Oyj 5,876 227,225 1.71
Unilever NV 3,733 192,249 1.45
Total Consumer, Non-cyclical 1,429,472 10.76
Energy: 6.01% (30 September 2019: 5.71%)
Galp Energia SGPS SA 45,444 359,553 2.71
Koninklijke Vopak NV 3,087 148,361 1.12
SBM Offshore NV 21,254 290,330 2.18
Total Energy 798,244 6.01
Financial: 26.14% (30 September 2019: 35.77%)
Aedifica SA 1,507 157,029 1.18
Allianz SE 1,665 272,427 2.05
Assicurazioni Generali SpA 17,152 206,253 1.55
AXA SA 14,093 222,331 1.67
Cofinimmo SA 2,099 269,092 2.02
Gecina SA 2,391 269,466 2.03
Groupe Bruxelles Lambert SA 2,947 226,860 1.71
Hannover Rueck SE 1,537 203,192 1.53
ICADE 7,890 378,089 2.84
Merlin Properties Socimi SA 39,667 282,627 2.13
Muenchener Rueckversicherungs-Gesellschaft AG in Muenchen 930 201,438 1.52
NN Group NV 12,042 385,946 2.90
Sampo Oyj 7,418 250,654 1.89
Warehouses De Pauw CVA 4,789 148,746 1.12
Total Financial 3,474,150 26.14
Industrial: 4.33% (30 September 2019: 4.45%)
Infrastrutture Wireless Italiane SpA 45,652 430,955 3.24
Kone Oyj 1,923 144,340 1.09
Total Industrial 575,295 4.33
Utilities: 28.79% (30 September 2019: 18.42%)
A2A SpA 290,336 360,016 2.71
E.ON SE 26,219 247,193 1.86
EDP - Energias de Portugal SA 57,103 239,547 1.80
Endesa SA 15,695 358,317 2.70
Enel SpA 31,283 232,057 1.75
Fortum Oyj 21,574 372,691 2.80
Italgas SpA 52,039 280,230 2.11
Naturgy Energy Group SA 18,356 314,255 2.36
Red Electrica Corp SA 22,979 368,009 2.77
Rubis SCA 6,999 239,646 1.80
Snam SpA 73,260 321,538 2.42
Terna Rete Elettrica Nazionale SpA 39,271 234,605 1.77
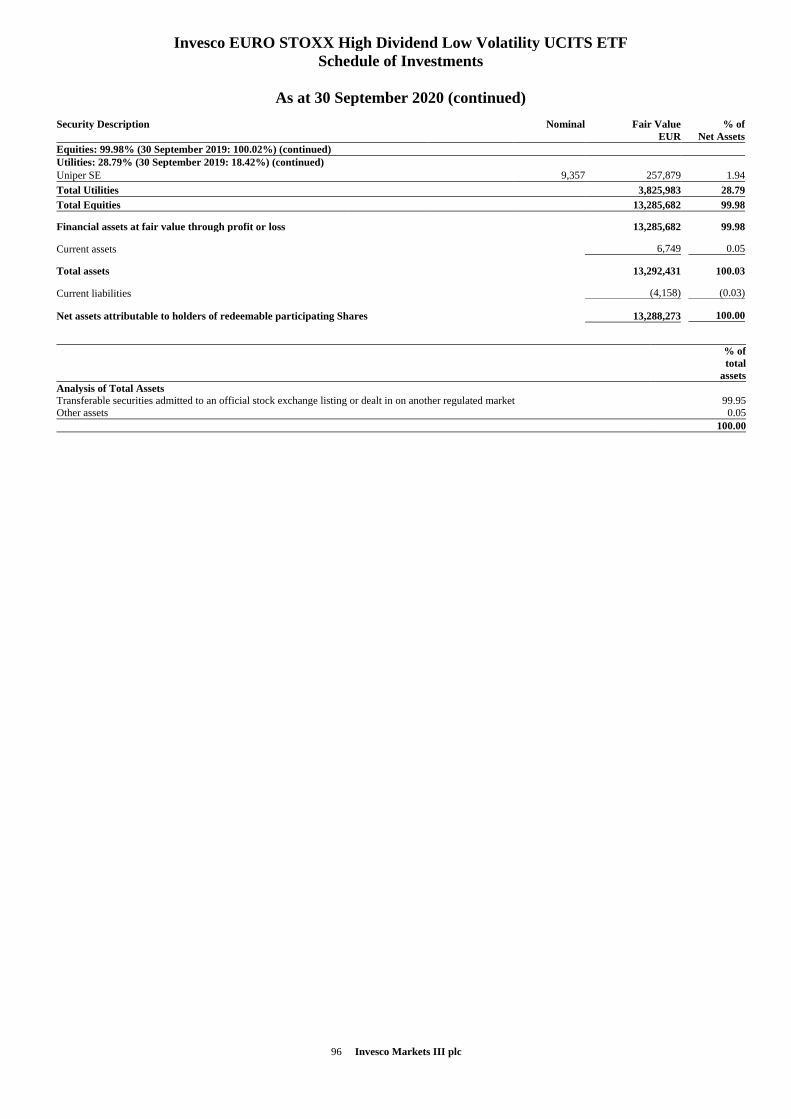
96 Invesco Markets III plc
Invesco EURO STOXX High Dividend Low Volatility UCITS ETF
Schedule of Investments
As at 30 September 2020 (continued)
Security Description
Nominal Fair Value
EUR
% of
Net Assets
Equities: 99.98% (30 September 2019: 100.02%) (continued)
Utilities: 28.79% (30 September 2019: 18.42%) (continued)
Uniper SE 9,357 257,879 1.94
Total Utilities 3,825,983 28.79
Total Equities 13,285,682 99.98
Financial assets at fair value through profit or loss 13,285,682 99.98
Current assets 6,749 0.05
Total assets 13,292,431 100.03
Current liabilities (4,158) (0.03)
Net assets attributable to holders of redeemable participating Shares 13,288,273 100.00
% of
total
assets
Analysis of Total Assets
Transferable securities admitted to an official stock exchange listing or dealt in on another regulated market 99.95
Other assets 0.05
100.00
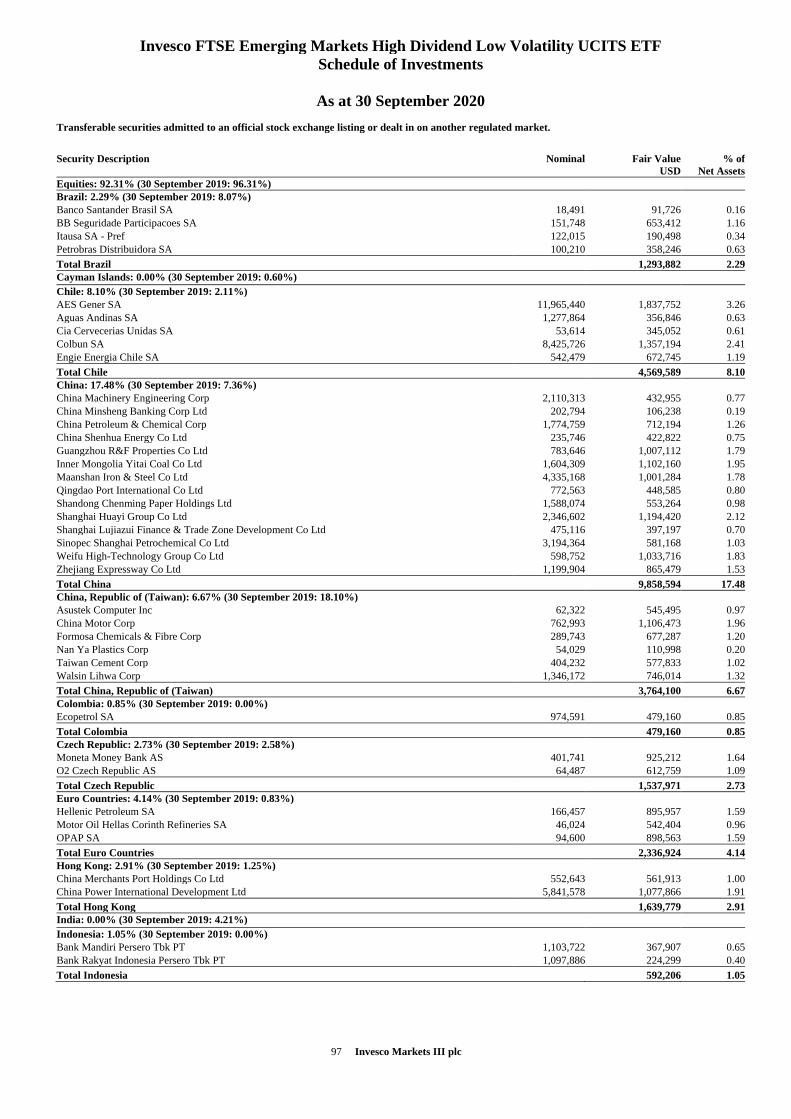
97 Invesco Markets III plc
Invesco FTSE Emerging Markets High Dividend Low Volatility UCITS ETF
Schedule of Investments
As at 30 September 2020
Transferable securities admitted to an official stock exchange listing or dealt in on another regulated market.
Security Description
Nominal Fair Value
USD
% of
Net Assets
Equities: 92.31% (30 September 2019: 96.31%)
Brazil: 2.29% (30 September 2019: 8.07%)
Banco Santander Brasil SA 18,491 91,726 0.16
BB Seguridade Participacoes SA 151,748 653,412 1.16
Itausa SA - Pref 122,015 190,498 0.34
Petrobras Distribuidora SA 100,210 358,246 0.63
Total Brazil 1,293,882 2.29
Cayman Islands: 0.00% (30 September 2019: 0.60%)
Chile: 8.10% (30 September 2019: 2.11%)
AES Gener SA 11,965,440 1,837,752 3.26
Aguas Andinas SA 1,277,864 356,846 0.63
Cia Cervecerias Unidas SA 53,614 345,052 0.61
Colbun SA 8,425,726 1,357,194 2.41
Engie Energia Chile SA 542,479 672,745 1.19
Total Chile 4,569,589 8.10
China: 17.48% (30 September 2019: 7.36%)
China Machinery Engineering Corp 2,110,313 432,955 0.77
China Minsheng Banking Corp Ltd 202,794 106,238 0.19
China Petroleum & Chemical Corp 1,774,759 712,194 1.26
China Shenhua Energy Co Ltd 235,746 422,822 0.75
Guangzhou R&F Properties Co Ltd 783,646 1,007,112 1.79
Inner Mongolia Yitai Coal Co Ltd 1,604,309 1,102,160 1.95
Maanshan Iron & Steel Co Ltd 4,335,168 1,001,284 1.78
Qingdao Port International Co Ltd 772,563 448,585 0.80
Shandong Chenming Paper Holdings Ltd 1,588,074 553,264 0.98
Shanghai Huayi Group Co Ltd 2,346,602 1,194,420 2.12
Shanghai Lujiazui Finance & Trade Zone Development Co Ltd 475,116 397,197 0.70
Sinopec Shanghai Petrochemical Co Ltd 3,194,364 581,168 1.03
Weifu High-Technology Group Co Ltd 598,752 1,033,716 1.83
Zhejiang Expressway Co Ltd 1,199,904 865,479 1.53
Total China 9,858,594 17.48
China, Republic of (Taiwan): 6.67% (30 September 2019: 18.10%)
Asustek Computer Inc 62,322 545,495 0.97
China Motor Corp 762,993 1,106,473 1.96
Formosa Chemicals & Fibre Corp 289,743 677,287 1.20
Nan Ya Plastics Corp 54,029 110,998 0.20
Taiwan Cement Corp 404,232 577,833 1.02
Walsin Lihwa Corp 1,346,172 746,014 1.32
Total China, Republic of (Taiwan) 3,764,100 6.67
Colombia: 0.85% (30 September 2019: 0.00%)
Ecopetrol SA 974,591 479,160 0.85
Total Colombia 479,160 0.85
Czech Republic: 2.73% (30 September 2019: 2.58%)
Moneta Money Bank AS 401,741 925,212 1.64
O2 Czech Republic AS 64,487 612,759 1.09
Total Czech Republic 1,537,971 2.73
Euro Countries: 4.14% (30 September 2019: 0.83%)
Hellenic Petroleum SA 166,457 895,957 1.59
Motor Oil Hellas Corinth Refineries SA 46,024 542,404 0.96
OPAP SA 94,600 898,563 1.59
Total Euro Countries 2,336,924 4.14
Hong Kong: 2.91% (30 September 2019: 1.25%)
China Merchants Port Holdings Co Ltd 552,643 561,913 1.00
China Power International Development Ltd 5,841,578 1,077,866 1.91
Total Hong Kong 1,639,779 2.91
India: 0.00% (30 September 2019: 4.21%)
Indonesia: 1.05% (30 September 2019: 0.00%)
Bank Mandiri Persero Tbk PT 1,103,722 367,907 0.65
Bank Rakyat Indonesia Persero Tbk PT 1,097,886 224,299 0.40
Total Indonesia 592,206 1.05
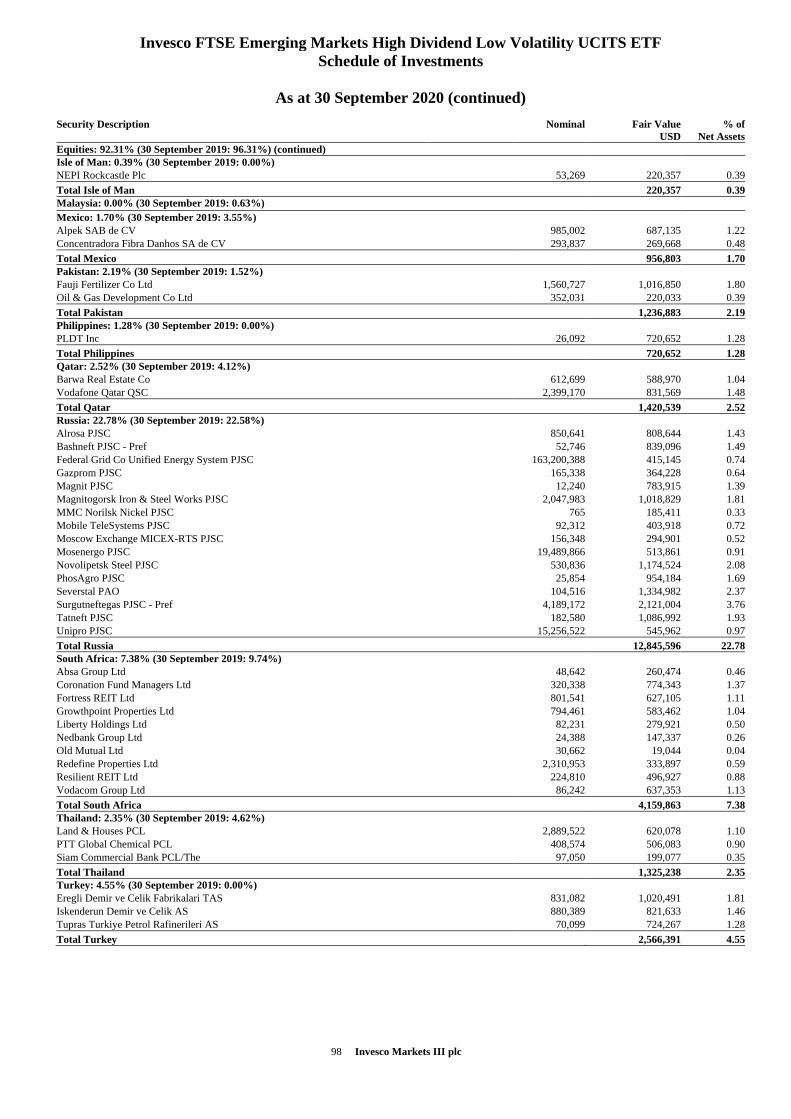
98 Invesco Markets III plc
Invesco FTSE Emerging Markets High Dividend Low Volatility UCITS ETF
Schedule of Investments
As at 30 September 2020 (continued)
Security Description
Nominal Fair Value
USD
% of
Net Assets
Equities: 92.31% (30 September 2019: 96.31%) (continued)
Isle of Man: 0.39% (30 September 2019: 0.00%)
NEPI Rockcastle Plc 53,269 220,357 0.39
Total Isle of Man 220,357 0.39
Malaysia: 0.00% (30 September 2019: 0.63%)
Mexico: 1.70% (30 September 2019: 3.55%)
Alpek SAB de CV 985,002 687,135 1.22
Concentradora Fibra Danhos SA de CV 293,837 269,668 0.48
Total Mexico 956,803 1.70
Pakistan: 2.19% (30 September 2019: 1.52%)
Fauji Fertilizer Co Ltd 1,560,727 1,016,850 1.80
Oil & Gas Development Co Ltd 352,031 220,033 0.39
Total Pakistan 1,236,883 2.19
Philippines: 1.28% (30 September 2019: 0.00%)
PLDT Inc 26,092 720,652 1.28
Total Philippines 720,652 1.28
Qatar: 2.52% (30 September 2019: 4.12%)
Barwa Real Estate Co 612,699 588,970 1.04
Vodafone Qatar QSC 2,399,170 831,569 1.48
Total Qatar 1,420,539 2.52
Russia: 22.78% (30 September 2019: 22.58%)
Alrosa PJSC 850,641 808,644 1.43
Bashneft PJSC - Pref 52,746 839,096 1.49
Federal Grid Co Unified Energy System PJSC 163,200,388 415,145 0.74
Gazprom PJSC 165,338 364,228 0.64
Magnit PJSC 12,240 783,915 1.39
Magnitogorsk Iron & Steel Works PJSC 2,047,983 1,018,829 1.81
MMC Norilsk Nickel PJSC 765 185,411 0.33
Mobile TeleSystems PJSC 92,312 403,918 0.72
Moscow Exchange MICEX-RTS PJSC 156,348 294,901 0.52
Mosenergo PJSC 19,489,866 513,861 0.91
Novolipetsk Steel PJSC 530,836 1,174,524 2.08
PhosAgro PJSC 25,854 954,184 1.69
Severstal PAO 104,516 1,334,982 2.37
Surgutneftegas PJSC - Pref 4,189,172 2,121,004 3.76
Tatneft PJSC 182,580 1,086,992 1.93
Unipro PJSC 15,256,522 545,962 0.97
Total Russia 12,845,596 22.78
South Africa: 7.38% (30 September 2019: 9.74%)
Absa Group Ltd 48,642 260,474 0.46
Coronation Fund Managers Ltd 320,338 774,343 1.37
Fortress REIT Ltd 801,541 627,105 1.11
Growthpoint Properties Ltd 794,461 583,462 1.04
Liberty Holdings Ltd 82,231 279,921 0.50
Nedbank Group Ltd 24,388 147,337 0.26
Old Mutual Ltd 30,662 19,044 0.04
Redefine Properties Ltd 2,310,953 333,897 0.59
Resilient REIT Ltd 224,810 496,927 0.88
Vodacom Group Ltd 86,242 637,353 1.13
Total South Africa 4,159,863 7.38
Thailand: 2.35% (30 September 2019: 4.62%)
Land & Houses PCL 2,889,522 620,078 1.10
PTT Global Chemical PCL 408,574 506,083 0.90
Siam Commercial Bank PCL/The 97,050 199,077 0.35
Total Thailand 1,325,238 2.35
Turkey: 4.55% (30 September 2019: 0.00%)
Eregli Demir ve Celik Fabrikalari TAS 831,082 1,020,491 1.81
Iskenderun Demir ve Celik AS 880,389 821,633 1.46
Tupras Turkiye Petrol Rafinerileri AS 70,099 724,267 1.28
Total Turkey 2,566,391 4.55
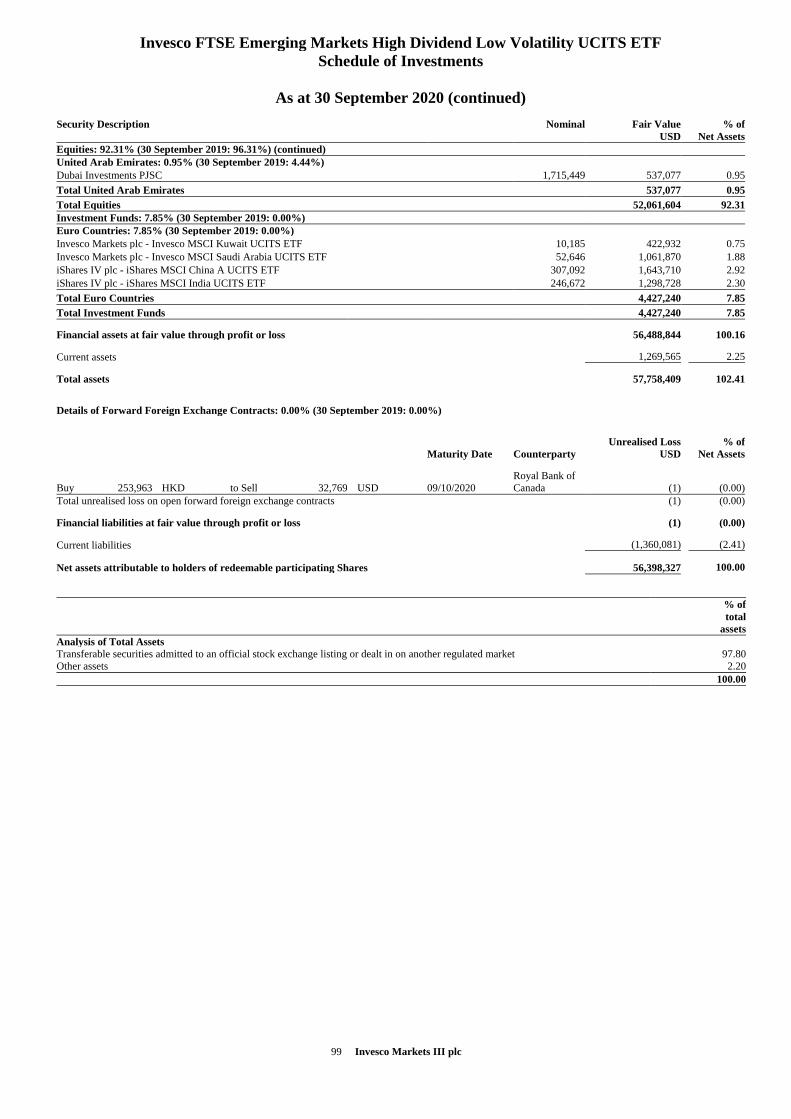
99 Invesco Markets III plc
Invesco FTSE Emerging Markets High Dividend Low Volatility UCITS ETF
Schedule of Investments
As at 30 September 2020 (continued)
Security Description
Nominal Fair Value
USD
% of
Net Assets
Equities: 92.31% (30 September 2019: 96.31%) (continued)
United Arab Emirates: 0.95% (30 September 2019: 4.44%)
Dubai Investments PJSC 1,715,449 537,077 0.95
Total United Arab Emirates 537,077 0.95
Total Equities 52,061,604 92.31
Investment Funds: 7.85% (30 September 2019: 0.00%)
Euro Countries: 7.85% (30 September 2019: 0.00%)
Invesco Markets plc - Invesco MSCI Kuwait UCITS ETF 10,185 422,932 0.75
Invesco Markets plc - Invesco MSCI Saudi Arabia UCITS ETF 52,646 1,061,870 1.88
iShares IV plc - iShares MSCI China A UCITS ETF 307,092 1,643,710 2.92
iShares IV plc - iShares MSCI India UCITS ETF 246,672 1,298,728 2.30
Total Euro Countries 4,427,240 7.85
Total Investment Funds 4,427,240 7.85
Financial assets at fair value through profit or loss 56,488,844 100.16
Current assets 1,269,565 2.25
Total assets 57,758,409 102.41
Details of Forward Foreign Exchange Contracts: 0.00% (30 September 2019: 0.00%)
Maturity Date Counterparty
Unrealised Loss
USD
% of
Net Assets
Buy 253,963 HKD to Sell 32,769 USD 09/10/2020
Royal Bank of
Canada (1) (0 .00)
Total unrealised loss on open forward foreign exchange contracts (1) (0 .00)
Financial liabilities at fair value through profit or loss (1) (0 .00)
Current liabilities (1,360,081) (2.41)
Net assets attributable to holders of redeemable participating Shares 56,398,327 100.00
% of
total
assets
Analysis of Total Assets
Transferable securities admitted to an official stock exchange listing or dealt in on another regulated market 97.80
Other assets 2.20
100.00
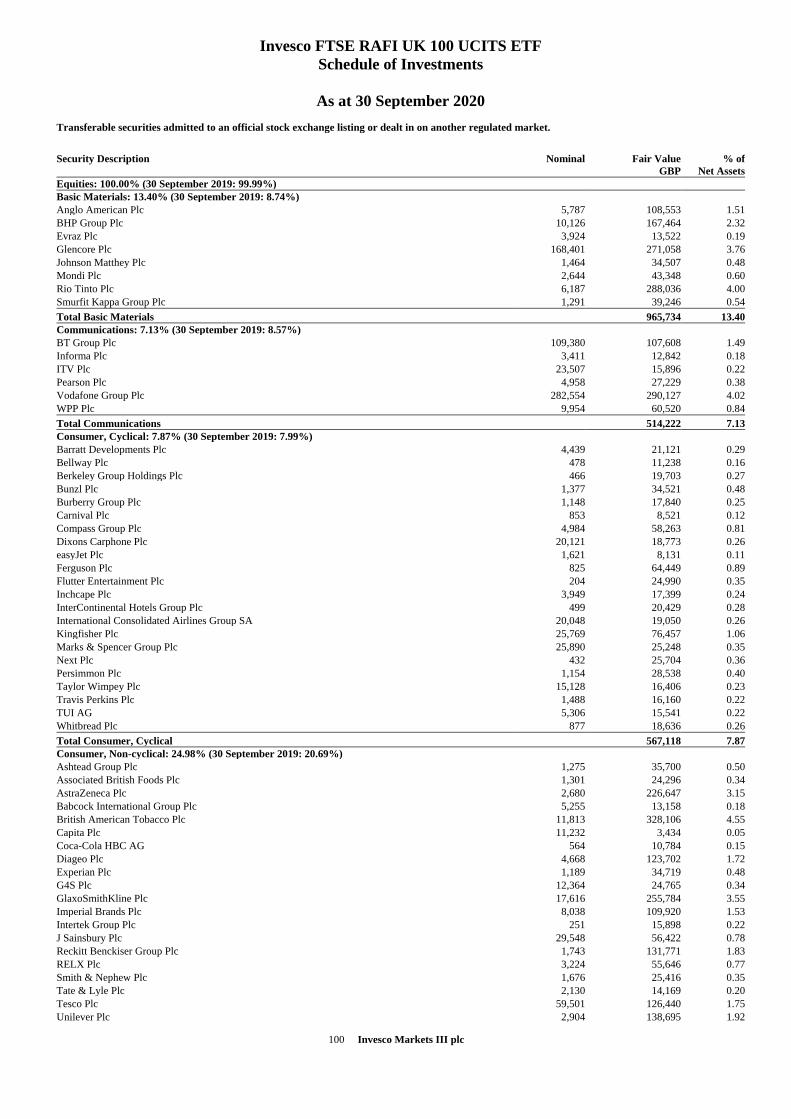
100 Invesco Markets III plc
Invesco FTSE RAFI UK 100 UCITS ETF
Schedule of Investments
As at 30 September 2020
Transferable securities admitted to an official stock exchange listing or dealt in on another regulated market.
Security Description
Nominal Fair Value
GBP
% of
Net Assets
Equities: 100.00% (30 September 2019: 99.99%)
Basic Materials: 13.40% (30 September 2019: 8.74%)
Anglo American Plc 5,787 108,553 1.51
BHP Group Plc 10,126 167,464 2.32
Evraz Plc 3,924 13,522 0.19
Glencore Plc 168,401 271,058 3.76
Johnson Matthey Plc 1,464 34,507 0.48
Mondi Plc 2,644 43,348 0.60
Rio Tinto Plc 6,187 288,036 4.00
Smurfit Kappa Group Plc 1,291 39,246 0.54
Total Basic Materials 965,734 13.40
Communications: 7.13% (30 September 2019: 8.57%)
BT Group Plc 109,380 107,608 1.49
Informa Plc 3,411 12,842 0.18
ITV Plc 23,507 15,896 0.22
Pearson Plc 4,958 27,229 0.38
Vodafone Group Plc 282,554 290,127 4.02
WPP Plc 9,954 60,520 0.84
Total Communications 514,222 7.13
Consumer, Cyclical: 7.87% (30 September 2019: 7.99%)
Barratt Developments Plc 4,439 21,121 0.29
Bellway Plc 478 11,238 0.16
Berkeley Group Holdings Plc 466 19,703 0.27
Bunzl Plc 1,377 34,521 0.48
Burberry Group Plc 1,148 17,840 0.25
Carnival Plc 853 8,521 0.12
Compass Group Plc 4,984 58,263 0.81
Dixons Carphone Plc 20,121 18,773 0.26
easyJet Plc 1,621 8,131 0.11
Ferguson Plc 825 64,449 0.89
Flutter Entertainment Plc 204 24,990 0.35
Inchcape Plc 3,949 17,399 0.24
InterContinental Hotels Group Plc 499 20,429 0.28
International Consolidated Airlines Group SA 20,048 19,050 0.26
Kingfisher Plc 25,769 76,457 1.06
Marks & Spencer Group Plc 25,890 25,248 0.35
Next Plc 432 25,704 0.36
Persimmon Plc 1,154 28,538 0.40
Taylor Wimpey Plc 15,128 16,406 0.23
Travis Perkins Plc 1,488 16,160 0.22
TUI AG 5,306 15,541 0.22
Whitbread Plc 877 18,636 0.26
Total Consumer, Cyclical 567,118 7.87
Consumer, Non-cyclical: 24.98% (30 September 2019: 20.69%)
Ashtead Group Plc 1,275 35,700 0.50
Associated British Foods Plc 1,301 24,296 0.34
AstraZeneca Plc 2,680 226,647 3.15
Babcock International Group Plc 5,255 13,158 0.18
British American Tobacco Plc 11,813 328,106 4.55
Capita Plc 11,232 3,434 0.05
Coca-Cola HBC AG 564 10,784 0.15
Diageo Plc 4,668 123,702 1.72
Experian Plc 1,189 34,719 0.48
G4S Plc 12,364 24,765 0.34
GlaxoSmithKline Plc 17,616 255,784 3.55
Imperial Brands Plc 8,038 109,920 1.53
Intertek Group Plc 251 15,898 0.22
J Sainsbury Plc 29,548 56,422 0.78
Reckitt Benckiser Group Plc 1,743 131,771 1.83
RELX Plc 3,224 55,646 0.77
Smith & Nephew Plc 1,676 25,416 0.35
Tate & Lyle Plc 2,130 14,169 0.20
Tesco Plc 59,501 126,440 1.75
Unilever Plc 2,904 138,695 1.92
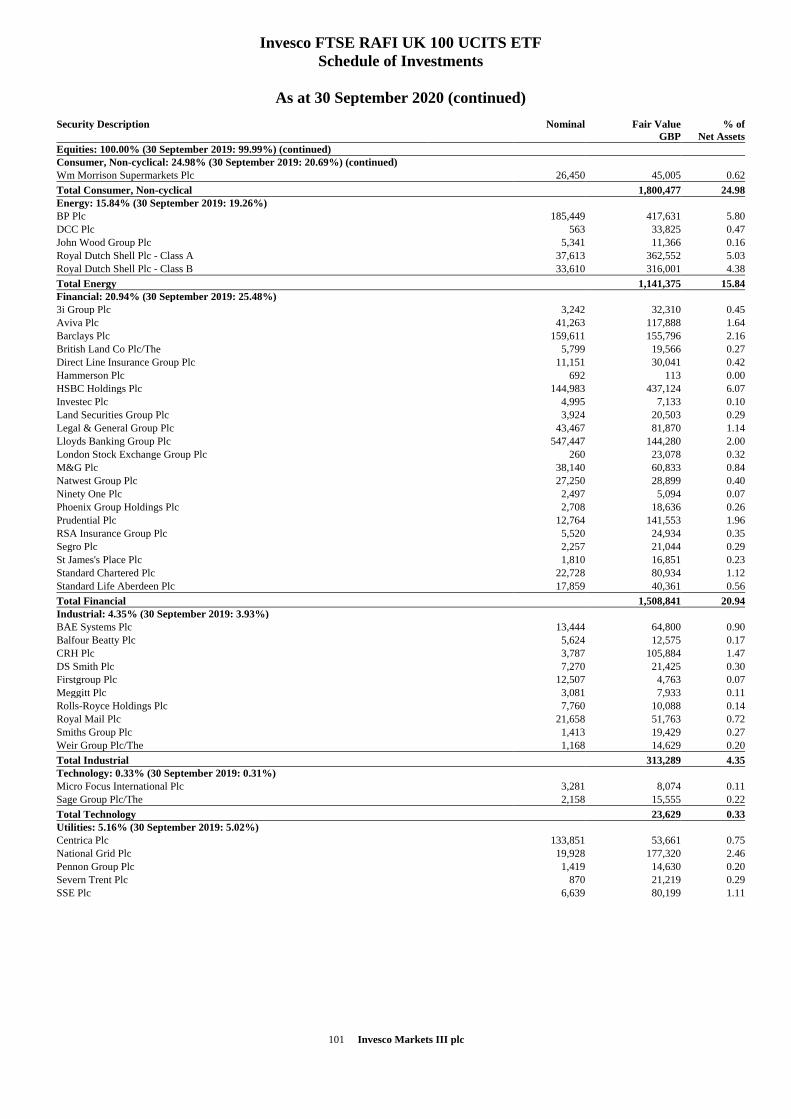
101 Invesco Markets III plc
Invesco FTSE RAFI UK 100 UCITS ETF
Schedule of Investments
As at 30 September 2020 (continued)
Security Description
Nominal Fair Value
GBP
% of
Net Assets
Equities: 100.00% (30 September 2019: 99.99%) (continued)
Consumer, Non-cyclical: 24.98% (30 September 2019: 20.69%) (continued)
Wm Morrison Supermarkets Plc 26,450 45,005 0.62
Total Consumer, Non-cyclical 1,800,477 24.98
Energy: 15.84% (30 September 2019: 19.26%)
BP Plc 185,449 417,631 5.80
DCC Plc 563 33,825 0.47
John Wood Group Plc 5,341 11,366 0.16
Royal Dutch Shell Plc - Class A 37,613 362,552 5.03
Royal Dutch Shell Plc - Class B 33,610 316,001 4.38
Total Energy 1,141,375 15.84
Financial: 20.94% (30 September 2019: 25.48%)
3i Group Plc 3,242 32,310 0.45
Aviva Plc 41,263 117,888 1.64
Barclays Plc 159,611 155,796 2.16
British Land Co Plc/The 5,799 19,566 0.27
Direct Line Insurance Group Plc 11,151 30,041 0.42
Hammerson Plc 692 113 0.00
HSBC Holdings Plc 144,983 437,124 6.07
Investec Plc 4,995 7,133 0.10
Land Securities Group Plc 3,924 20,503 0.29
Legal & General Group Plc 43,467 81,870 1.14
Lloyds Banking Group Plc 547,447 144,280 2.00
London Stock Exchange Group Plc 260 23,078 0.32
M&G Plc 38,140 60,833 0.84
Natwest Group Plc 27,250 28,899 0.40
Ninety One Plc 2,497 5,094 0.07
Phoenix Group Holdings Plc 2,708 18,636 0.26
Prudential Plc 12,764 141,553 1.96
RSA Insurance Group Plc 5,520 24,934 0.35
Segro Plc 2,257 21,044 0.29
St James's Place Plc 1,810 16,851 0.23
Standard Chartered Plc 22,728 80,934 1.12
Standard Life Aberdeen Plc 17,859 40,361 0.56
Total Financial 1,508,841 20.94
Industrial: 4.35% (30 September 2019: 3.93%)
BAE Systems Plc 13,444 64,800 0.90
Balfour Beatty Plc 5,624 12,575 0.17
CRH Plc 3,787 105,884 1.47
DS Smith Plc 7,270 21,425 0.30
Firstgroup Plc 12,507 4,763 0.07
Meggitt Plc 3,081 7,933 0.11
Rolls-Royce Holdings Plc 7,760 10,088 0.14
Royal Mail Plc 21,658 51,763 0.72
Smiths Group Plc 1,413 19,429 0.27
Weir Group Plc/The 1,168 14,629 0.20
Total Industrial 313,289 4.35
Technology: 0.33% (30 September 2019: 0.31%)
Micro Focus International Plc 3,281 8,074 0.11
Sage Group Plc/The 2,158 15,555 0.22
Total Technology 23,629 0.33
Utilities: 5.16% (30 September 2019: 5.02%)
Centrica Plc 133,851 53,661 0.75
National Grid Plc 19,928 177,320 2.46
Pennon Group Plc 1,419 14,630 0.20
Severn Trent Plc 870 21,219 0.29
SSE Plc 6,639 80,199 1.11
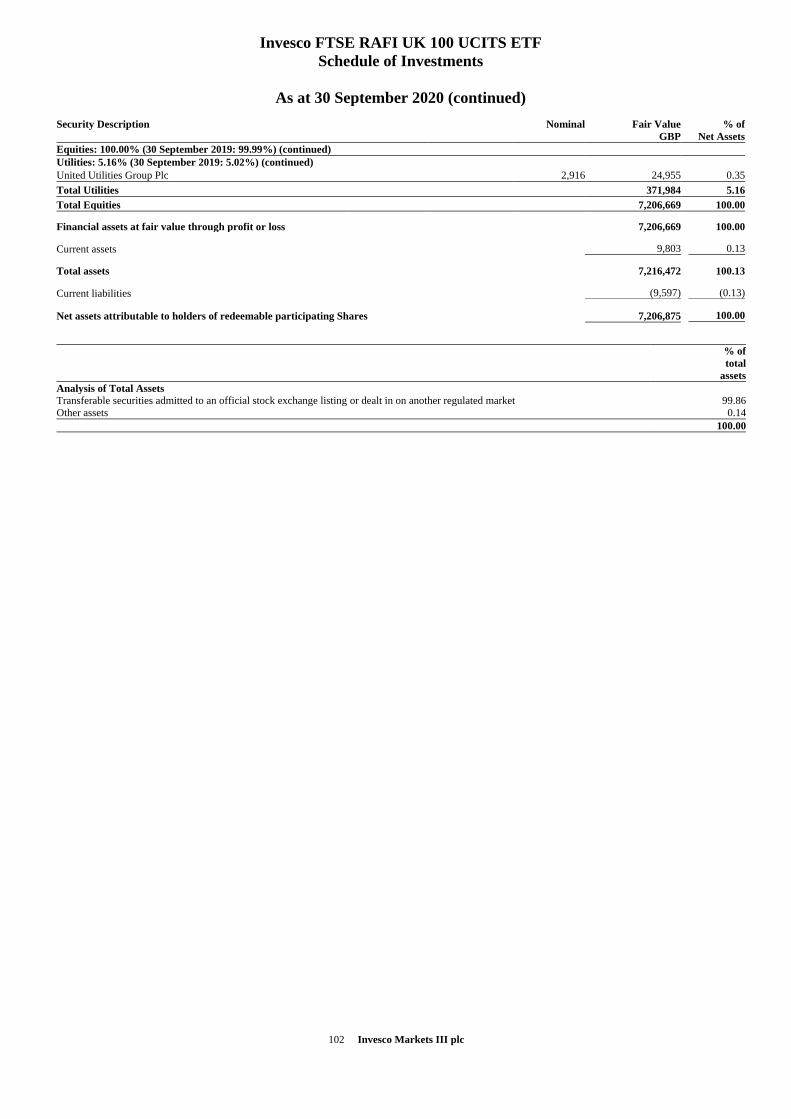
102 Invesco Markets III plc
Invesco FTSE RAFI UK 100 UCITS ETF
Schedule of Investments
As at 30 September 2020 (continued)
Security Description
Nominal Fair Value
GBP
% of
Net Assets
Equities: 100.00% (30 September 2019: 99.99%) (continued)
Utilities: 5.16% (30 September 2019: 5.02%) (continued)
United Utilities Group Plc 2,916 24,955 0.35
Total Utilities 371,984 5.16
Total Equities 7,206,669 100.00
Financial assets at fair value through profit or loss 7,206,669 100.00
Current assets 9,803 0.13
Total assets 7,216,472 100.13
Current liabilities (9,597) (0.13)
Net assets attributable to holders of redeemable participating Shares 7,206,875 100.00
% of
total
assets
Analysis of Total Assets
Transferable securities admitted to an official stock exchange listing or dealt in on another regulated market 99.86
Other assets 0.14
100.00
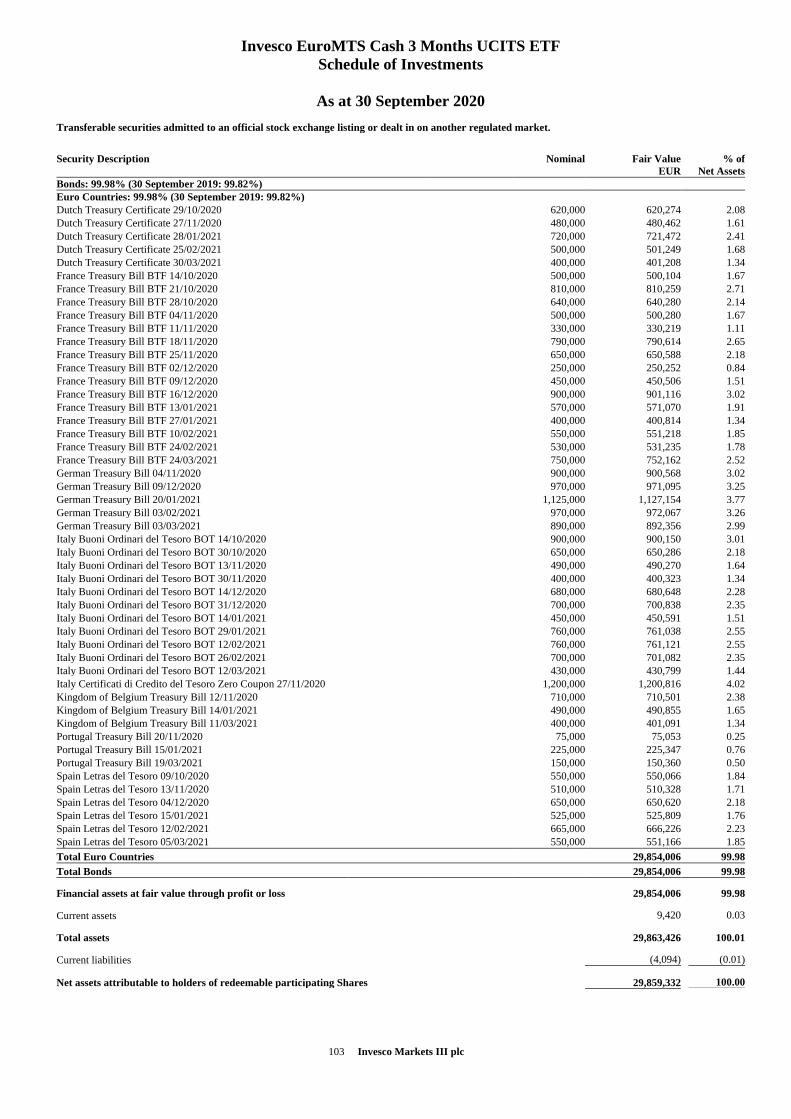
103 Invesco Markets III plc
Invesco EuroMTS Cash 3 Months UCITS ETF
Schedule of Investments
As at 30 September 2020
Transferable securities admitted to an official stock exchange listing or dealt in on another regulated market.
Security Description
Nominal Fair Value
EUR
% of
Net Assets
Bonds: 99.98% (30 September 2019: 99.82%)
Euro Countries: 99.98% (30 September 2019: 99.82%)
Dutch Treasury Certificate 29/10/2020 620,000 620,274 2.08
Dutch Treasury Certificate 27/11/2020 480,000 480,462 1.61
Dutch Treasury Certificate 28/01/2021 720,000 721,472 2.41
Dutch Treasury Certificate 25/02/2021 500,000 501,249 1.68
Dutch Treasury Certificate 30/03/2021 400,000 401,208 1.34
France Treasury Bill BTF 14/10/2020 500,000 500,104 1.67
France Treasury Bill BTF 21/10/2020 810,000 810,259 2.71
France Treasury Bill BTF 28/10/2020 640,000 640,280 2.14
France Treasury Bill BTF 04/11/2020 500,000 500,280 1.67
France Treasury Bill BTF 11/11/2020 330,000 330,219 1.11
France Treasury Bill BTF 18/11/2020 790,000 790,614 2.65
France Treasury Bill BTF 25/11/2020 650,000 650,588 2.18
France Treasury Bill BTF 02/12/2020 250,000 250,252 0.84
France Treasury Bill BTF 09/12/2020 450,000 450,506 1.51
France Treasury Bill BTF 16/12/2020 900,000 901,116 3.02
France Treasury Bill BTF 13/01/2021 570,000 571,070 1.91
France Treasury Bill BTF 27/01/2021 400,000 400,814 1.34
France Treasury Bill BTF 10/02/2021 550,000 551,218 1.85
France Treasury Bill BTF 24/02/2021 530,000 531,235 1.78
France Treasury Bill BTF 24/03/2021 750,000 752,162 2.52
German Treasury Bill 04/11/2020 900,000 900,568 3.02
German Treasury Bill 09/12/2020 970,000 971,095 3.25
German Treasury Bill 20/01/2021 1,125,000 1,127,154 3.77
German Treasury Bill 03/02/2021 970,000 972,067 3.26
German Treasury Bill 03/03/2021 890,000 892,356 2.99
Italy Buoni Ordinari del Tesoro BOT 14/10/2020 900,000 900,150 3.01
Italy Buoni Ordinari del Tesoro BOT 30/10/2020 650,000 650,286 2.18
Italy Buoni Ordinari del Tesoro BOT 13/11/2020 490,000 490,270 1.64
Italy Buoni Ordinari del Tesoro BOT 30/11/2020 400,000 400,323 1.34
Italy Buoni Ordinari del Tesoro BOT 14/12/2020 680,000 680,648 2.28
Italy Buoni Ordinari del Tesoro BOT 31/12/2020 700,000 700,838 2.35
Italy Buoni Ordinari del Tesoro BOT 14/01/2021 450,000 450,591 1.51
Italy Buoni Ordinari del Tesoro BOT 29/01/2021 760,000 761,038 2.55
Italy Buoni Ordinari del Tesoro BOT 12/02/2021 760,000 761,121 2.55
Italy Buoni Ordinari del Tesoro BOT 26/02/2021 700,000 701,082 2.35
Italy Buoni Ordinari del Tesoro BOT 12/03/2021 430,000 430,799 1.44
Italy Certificati di Credito del Tesoro Zero Coupon 27/11/2020 1,200,000 1,200,816 4.02
Kingdom of Belgium Treasury Bill 12/11/2020 710,000 710,501 2.38
Kingdom of Belgium Treasury Bill 14/01/2021 490,000 490,855 1.65
Kingdom of Belgium Treasury Bill 11/03/2021 400,000 401,091 1.34
Portugal Treasury Bill 20/11/2020 75,000 75,053 0.25
Portugal Treasury Bill 15/01/2021 225,000 225,347 0.76
Portugal Treasury Bill 19/03/2021 150,000 150,360 0.50
Spain Letras del Tesoro 09/10/2020 550,000 550,066 1.84
Spain Letras del Tesoro 13/11/2020 510,000 510,328 1.71
Spain Letras del Tesoro 04/12/2020 650,000 650,620 2.18
Spain Letras del Tesoro 15/01/2021 525,000 525,809 1.76
Spain Letras del Tesoro 12/02/2021 665,000 666,226 2.23
Spain Letras del Tesoro 05/03/2021 550,000 551,166 1.85
Total Euro Countries 29,854,006 99.98
Total Bonds 29,854,006 99.98
Financial assets at fair value through profit or loss 29,854,006 99.98
Current assets 9,420 0.03
Total assets 29,863,426 100.01
Current liabilities (4,094) (0.01)
Net assets attributable to holders of redeemable participating Shares 29,859,332 100.00
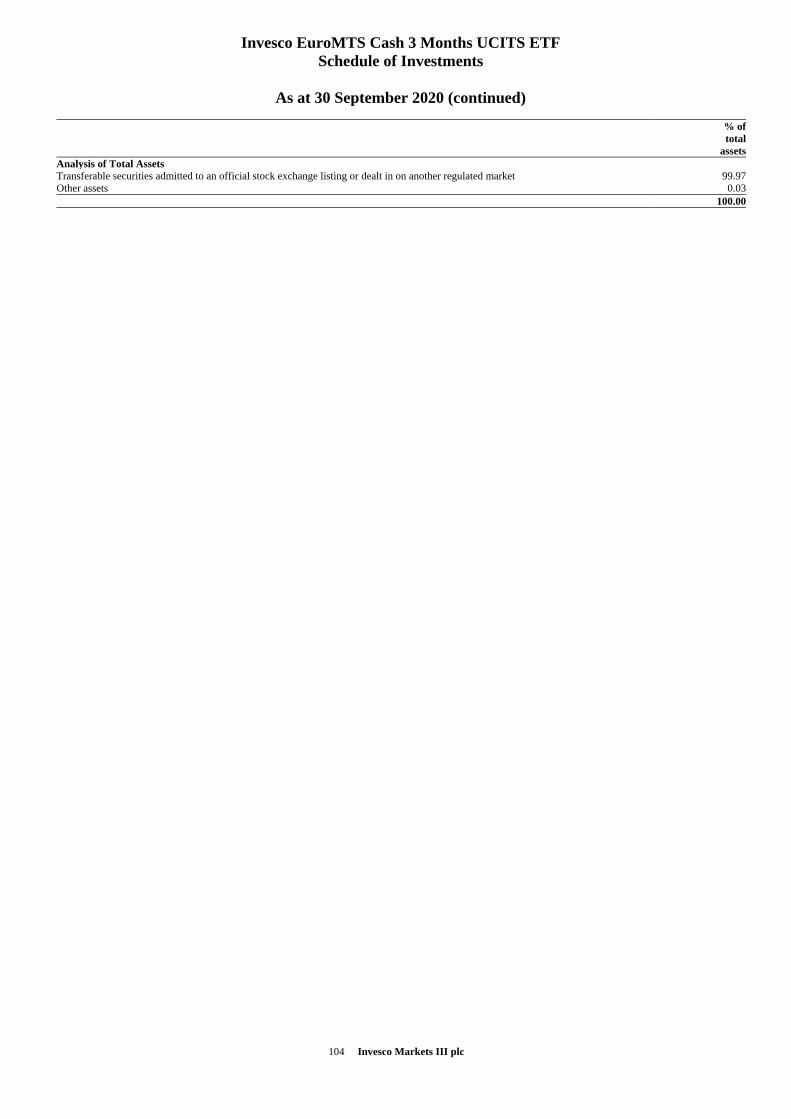
104 Invesco Markets III plc
Invesco EuroMTS Cash 3 Months UCITS ETF
Schedule of Investments
As at 30 September 2020 (continued)
% of
total
assets
Analysis of Total Assets
Transferable securities admitted to an official stock exchange listing or dealt in on another regulated market 99.97
Other assets 0.03
100.00
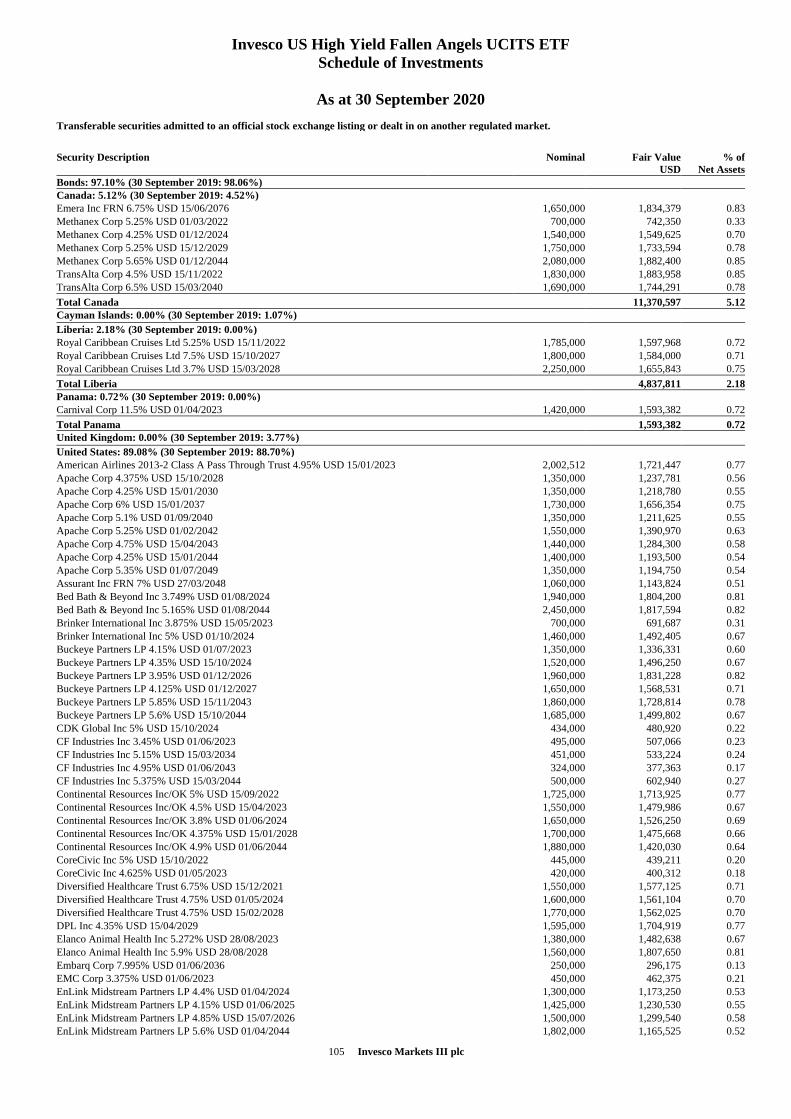
105 Invesco Markets III plc
Invesco US High Yield Fallen Angels UCITS ETF
Schedule of Investments
As at 30 September 2020
Transferable securities admitted to an official stock exchange listing or dealt in on another regulated market.
Security Description
Nominal Fair Value
USD
% of
Net Assets
Bonds: 97.10% (30 September 2019: 98.06%)
Canada: 5.12% (30 September 2019: 4.52%)
Emera Inc FRN 6.75% USD 15/06/2076 1,650,000 1,834,379 0.83
Methanex Corp 5.25% USD 01/03/2022 700,000 742,350 0.33
Methanex Corp 4.25% USD 01/12/2024 1,540,000 1,549,625 0.70
Methanex Corp 5.25% USD 15/12/2029 1,750,000 1,733,594 0.78
Methanex Corp 5.65% USD 01/12/2044 2,080,000 1,882,400 0.85
TransAlta Corp 4.5% USD 15/11/2022 1,830,000 1,883,958 0.85
TransAlta Corp 6.5% USD 15/03/2040 1,690,000 1,744,291 0.78
Total Canada 11,370,597 5.12
Cayman Islands: 0.00% (30 September 2019: 1.07%)
Liberia: 2.18% (30 September 2019: 0.00%)
Royal Caribbean Cruises Ltd 5.25% USD 15/11/2022 1,785,000 1,597,968 0.72
Royal Caribbean Cruises Ltd 7.5% USD 15/10/2027 1,800,000 1,584,000 0.71
Royal Caribbean Cruises Ltd 3.7% USD 15/03/2028 2,250,000 1,655,843 0.75
Total Liberia 4,837,811 2.18
Panama: 0.72% (30 September 2019: 0.00%)
Carnival Corp 11.5% USD 01/04/2023 1,420,000 1,593,382 0.72
Total Panama 1,593,382 0.72
United Kingdom: 0.00% (30 September 2019: 3.77%)
United States: 89.08% (30 September 2019: 88.70%)
American Airlines 2013-2 Class A Pass Through Trust 4.95% USD 15/01/2023 2,002,512 1,721,447 0.77
Apache Corp 4.375% USD 15/10/2028 1,350,000 1,237,781 0.56
Apache Corp 4.25% USD 15/01/2030 1,350,000 1,218,780 0.55
Apache Corp 6% USD 15/01/2037 1,730,000 1,656,354 0.75
Apache Corp 5.1% USD 01/09/2040 1,350,000 1,211,625 0.55
Apache Corp 5.25% USD 01/02/2042 1,550,000 1,390,970 0.63
Apache Corp 4.75% USD 15/04/2043 1,440,000 1,284,300 0.58
Apache Corp 4.25% USD 15/01/2044 1,400,000 1,193,500 0.54
Apache Corp 5.35% USD 01/07/2049 1,350,000 1,194,750 0.54
Assurant Inc FRN 7% USD 27/03/2048 1,060,000 1,143,824 0.51
Bed Bath & Beyond Inc 3.749% USD 01/08/2024 1,940,000 1,804,200 0.81
Bed Bath & Beyond Inc 5.165% USD 01/08/2044 2,450,000 1,817,594 0.82
Brinker International Inc 3.875% USD 15/05/2023 700,000 691,687 0.31
Brinker International Inc 5% USD 01/10/2024 1,460,000 1,492,405 0.67
Buckeye Partners LP 4.15% USD 01/07/2023 1,350,000 1,336,331 0.60
Buckeye Partners LP 4.35% USD 15/10/2024 1,520,000 1,496,250 0.67
Buckeye Partners LP 3.95% USD 01/12/2026 1,960,000 1,831,228 0.82
Buckeye Partners LP 4.125% USD 01/12/2027 1,650,000 1,568,531 0.71
Buckeye Partners LP 5.85% USD 15/11/2043 1,860,000 1,728,814 0.78
Buckeye Partners LP 5.6% USD 15/10/2044 1,685,000 1,499,802 0.67
CDK Global Inc 5% USD 15/10/2024 434,000 480,920 0.22
CF Industries Inc 3.45% USD 01/06/2023 495,000 507,066 0.23
CF Industries Inc 5.15% USD 15/03/2034 451,000 533,224 0.24
CF Industries Inc 4.95% USD 01/06/2043 324,000 377,363 0.17
CF Industries Inc 5.375% USD 15/03/2044 500,000 602,940 0.27
Continental Resources Inc/OK 5% USD 15/09/2022 1,725,000 1,713,925 0.77
Continental Resources Inc/OK 4.5% USD 15/04/2023 1,550,000 1,479,986 0.67
Continental Resources Inc/OK 3.8% USD 01/06/2024 1,650,000 1,526,250 0.69
Continental Resources Inc/OK 4.375% USD 15/01/2028 1,700,000 1,475,668 0.66
Continental Resources Inc/OK 4.9% USD 01/06/2044 1,880,000 1,420,030 0.64
CoreCivic Inc 5% USD 15/10/2022 445,000 439,211 0.20
CoreCivic Inc 4.625% USD 01/05/2023 420,000 400,312 0.18
Diversified Healthcare Trust 6.75% USD 15/12/2021 1,550,000 1,577,125 0.71
Diversified Healthcare Trust 4.75% USD 01/05/2024 1,600,000 1,561,104 0.70
Diversified Healthcare Trust 4.75% USD 15/02/2028 1,770,000 1,562,025 0.70
DPL Inc 4.35% USD 15/04/2029 1,595,000 1,704,919 0.77
Elanco Animal Health Inc 5.272% USD 28/08/2023 1,380,000 1,482,638 0.67
Elanco Animal Health Inc 5.9% USD 28/08/2028 1,560,000 1,807,650 0.81
Embarq Corp 7.995% USD 01/06/2036 250,000 296,175 0.13
EMC Corp 3.375% USD 01/06/2023 450,000 462,375 0.21
EnLink Midstream Partners LP 4.4% USD 01/04/2024 1,300,000 1,173,250 0.53
EnLink Midstream Partners LP 4.15% USD 01/06/2025 1,425,000 1,230,530 0.55
EnLink Midstream Partners LP 4.85% USD 15/07/2026 1,500,000 1,299,540 0.58
EnLink Midstream Partners LP 5.6% USD 01/04/2044 1,802,000 1,165,525 0.52
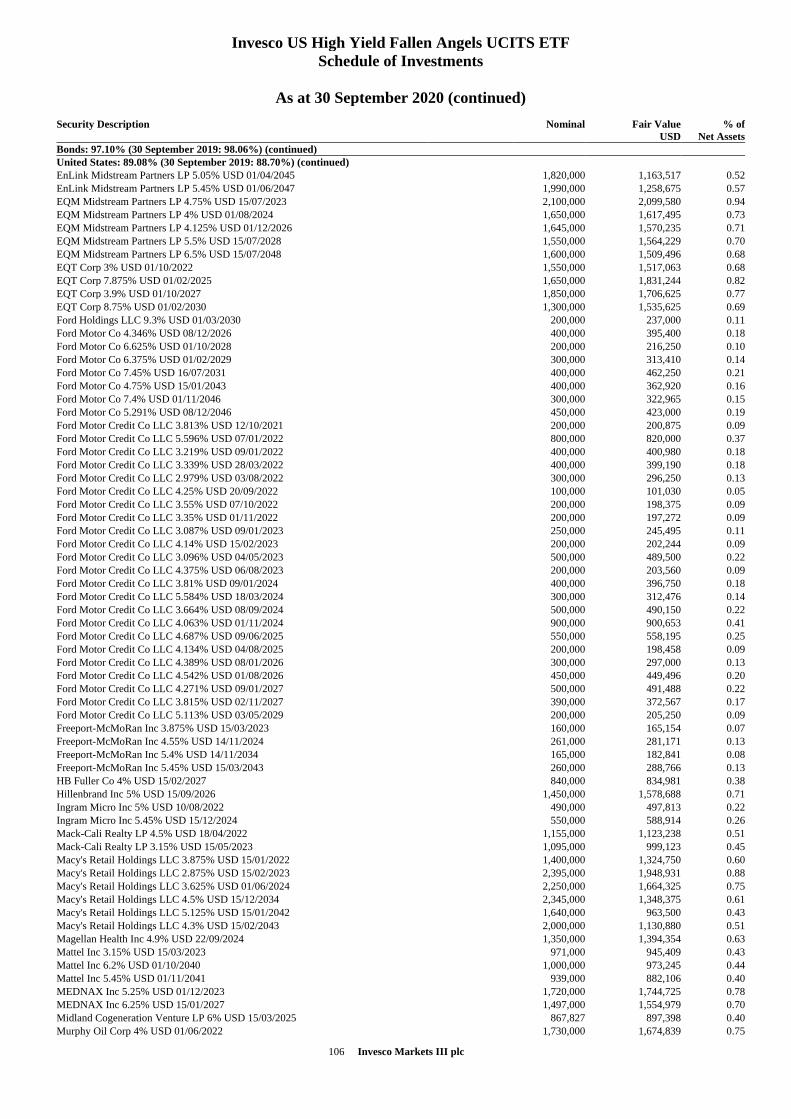
106 Invesco Markets III plc
Invesco US High Yield Fallen Angels UCITS ETF
Schedule of Investments
As at 30 September 2020 (continued)
Security Description
Nominal Fair Value
USD
% of
Net Assets
Bonds: 97.10% (30 September 2019: 98.06%) (continued)
United States: 89.08% (30 September 2019: 88.70%) (continued)
EnLink Midstream Partners LP 5.05% USD 01/04/2045 1,820,000 1,163,517 0.52
EnLink Midstream Partners LP 5.45% USD 01/06/2047 1,990,000 1,258,675 0.57
EQM Midstream Partners LP 4.75% USD 15/07/2023 2,100,000 2,099,580 0.94
EQM Midstream Partners LP 4% USD 01/08/2024 1,650,000 1,617,495 0.73
EQM Midstream Partners LP 4.125% USD 01/12/2026 1,645,000 1,570,235 0.71
EQM Midstream Partners LP 5.5% USD 15/07/2028 1,550,000 1,564,229 0.70
EQM Midstream Partners LP 6.5% USD 15/07/2048 1,600,000 1,509,496 0.68
EQT Corp 3% USD 01/10/2022 1,550,000 1,517,063 0.68
EQT Corp 7.875% USD 01/02/2025 1,650,000 1,831,244 0.82
EQT Corp 3.9% USD 01/10/2027 1,850,000 1,706,625 0.77
EQT Corp 8.75% USD 01/02/2030 1,300,000 1,535,625 0.69
Ford Holdings LLC 9.3% USD 01/03/2030 200,000 237,000 0.11
Ford Motor Co 4.346% USD 08/12/2026 400,000 395,400 0.18
Ford Motor Co 6.625% USD 01/10/2028 200,000 216,250 0.10
Ford Motor Co 6.375% USD 01/02/2029 300,000 313,410 0.14
Ford Motor Co 7.45% USD 16/07/2031 400,000 462,250 0.21
Ford Motor Co 4.75% USD 15/01/2043 400,000 362,920 0.16
Ford Motor Co 7.4% USD 01/11/2046 300,000 322,965 0.15
Ford Motor Co 5.291% USD 08/12/2046 450,000 423,000 0.19
Ford Motor Credit Co LLC 3.813% USD 12/10/2021 200,000 200,875 0.09
Ford Motor Credit Co LLC 5.596% USD 07/01/2022 800,000 820,000 0.37
Ford Motor Credit Co LLC 3.219% USD 09/01/2022 400,000 400,980 0.18
Ford Motor Credit Co LLC 3.339% USD 28/03/2022 400,000 399,190 0.18
Ford Motor Credit Co LLC 2.979% USD 03/08/2022 300,000 296,250 0.13
Ford Motor Credit Co LLC 4.25% USD 20/09/2022 100,000 101,030 0.05
Ford Motor Credit Co LLC 3.55% USD 07/10/2022 200,000 198,375 0.09
Ford Motor Credit Co LLC 3.35% USD 01/11/2022 200,000 197,272 0.09
Ford Motor Credit Co LLC 3.087% USD 09/01/2023 250,000 245,495 0.11
Ford Motor Credit Co LLC 4.14% USD 15/02/2023 200,000 202,244 0.09
Ford Motor Credit Co LLC 3.096% USD 04/05/2023 500,000 489,500 0.22
Ford Motor Credit Co LLC 4.375% USD 06/08/2023 200,000 203,560 0.09
Ford Motor Credit Co LLC 3.81% USD 09/01/2024 400,000 396,750 0.18
Ford Motor Credit Co LLC 5.584% USD 18/03/2024 300,000 312,476 0.14
Ford Motor Credit Co LLC 3.664% USD 08/09/2024 500,000 490,150 0.22
Ford Motor Credit Co LLC 4.063% USD 01/11/2024 900,000 900,653 0.41
Ford Motor Credit Co LLC 4.687% USD 09/06/2025 550,000 558,195 0.25
Ford Motor Credit Co LLC 4.134% USD 04/08/2025 200,000 198,458 0.09
Ford Motor Credit Co LLC 4.389% USD 08/01/2026 300,000 297,000 0.13
Ford Motor Credit Co LLC 4.542% USD 01/08/2026 450,000 449,496 0.20
Ford Motor Credit Co LLC 4.271% USD 09/01/2027 500,000 491,488 0.22
Ford Motor Credit Co LLC 3.815% USD 02/11/2027 390,000 372,567 0.17
Ford Motor Credit Co LLC 5.113% USD 03/05/2029 200,000 205,250 0.09
Freeport-McMoRan Inc 3.875% USD 15/03/2023 160,000 165,154 0.07
Freeport-McMoRan Inc 4.55% USD 14/11/2024 261,000 281,171 0.13
Freeport-McMoRan Inc 5.4% USD 14/11/2034 165,000 182,841 0.08
Freeport-McMoRan Inc 5.45% USD 15/03/2043 260,000 288,766 0.13
HB Fuller Co 4% USD 15/02/2027 840,000 834,981 0.38
Hillenbrand Inc 5% USD 15/09/2026 1,450,000 1,578,688 0.71
Ingram Micro Inc 5% USD 10/08/2022 490,000 497,813 0.22
Ingram Micro Inc 5.45% USD 15/12/2024 550,000 588,914 0.26
Mack-Cali Realty LP 4.5% USD 18/04/2022 1,155,000 1,123,238 0.51
Mack-Cali Realty LP 3.15% USD 15/05/2023 1,095,000 999,123 0.45
Macy's Retail Holdings LLC 3.875% USD 15/01/2022 1,400,000 1,324,750 0.60
Macy's Retail Holdings LLC 2.875% USD 15/02/2023 2,395,000 1,948,931 0.88
Macy's Retail Holdings LLC 3.625% USD 01/06/2024 2,250,000 1,664,325 0.75
Macy's Retail Holdings LLC 4.5% USD 15/12/2034 2,345,000 1,348,375 0.61
Macy's Retail Holdings LLC 5.125% USD 15/01/2042 1,640,000 963,500 0.43
Macy's Retail Holdings LLC 4.3% USD 15/02/2043 2,000,000 1,130,880 0.51
Magellan Health Inc 4.9% USD 22/09/2024 1,350,000 1,394,354 0.63
Mattel Inc 3.15% USD 15/03/2023 971,000 945,409 0.43
Mattel Inc 6.2% USD 01/10/2040 1,000,000 973,245 0.44
Mattel Inc 5.45% USD 01/11/2041 939,000 882,106 0.40
MEDNAX Inc 5.25% USD 01/12/2023 1,720,000 1,744,725 0.78
MEDNAX Inc 6.25% USD 15/01/2027 1,497,000 1,554,979 0.70
Midland Cogeneration Venture LP 6% USD 15/03/2025 867,827 897,398 0.40
Murphy Oil Corp 4% USD 01/06/2022 1,730,000 1,674,839 0.75
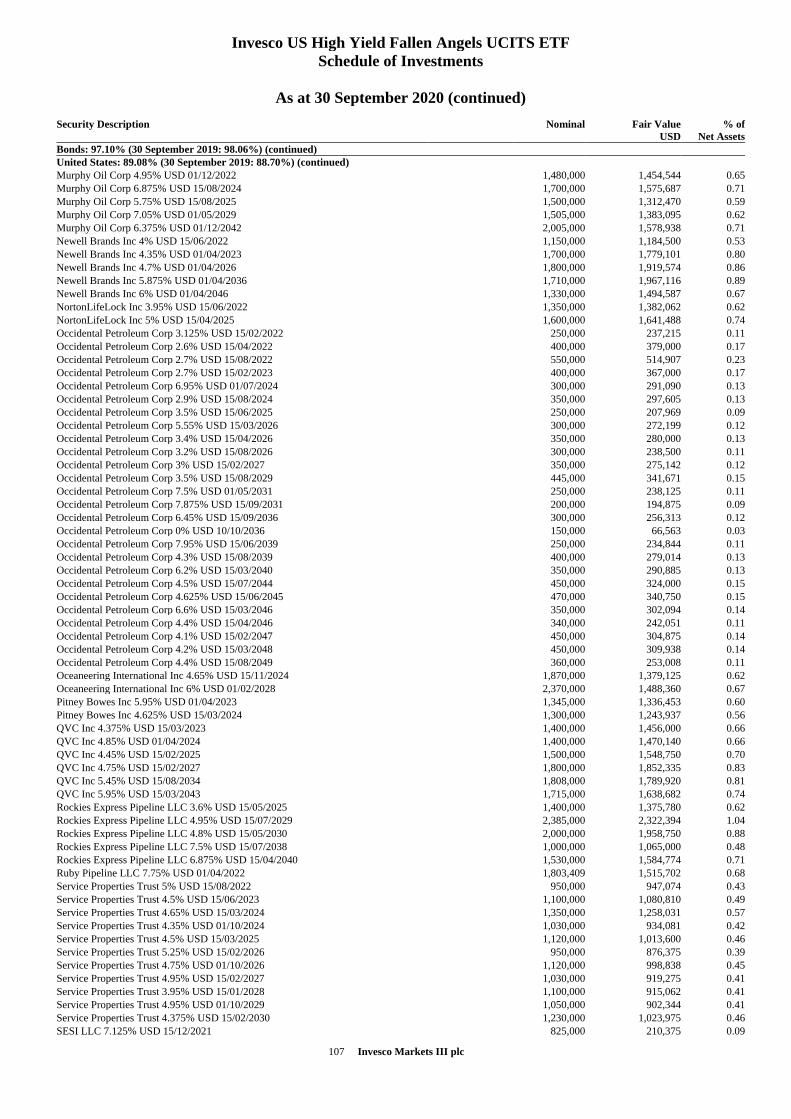
107 Invesco Markets III plc
Invesco US High Yield Fallen Angels UCITS ETF
Schedule of Investments
As at 30 September 2020 (continued)
Security Description
Nominal Fair Value
USD
% of
Net Assets
Bonds: 97.10% (30 September 2019: 98.06%) (continued)
United States: 89.08% (30 September 2019: 88.70%) (continued)
Murphy Oil Corp 4.95% USD 01/12/2022 1,480,000 1,454,544 0.65
Murphy Oil Corp 6.875% USD 15/08/2024 1,700,000 1,575,687 0.71
Murphy Oil Corp 5.75% USD 15/08/2025 1,500,000 1,312,470 0.59
Murphy Oil Corp 7.05% USD 01/05/2029 1,505,000 1,383,095 0.62
Murphy Oil Corp 6.375% USD 01/12/2042 2,005,000 1,578,938 0.71
Newell Brands Inc 4% USD 15/06/2022 1,150,000 1,184,500 0.53
Newell Brands Inc 4.35% USD 01/04/2023 1,700,000 1,779,101 0.80
Newell Brands Inc 4.7% USD 01/04/2026 1,800,000 1,919,574 0.86
Newell Brands Inc 5.875% USD 01/04/2036 1,710,000 1,967,116 0.89
Newell Brands Inc 6% USD 01/04/2046 1,330,000 1,494,587 0.67
NortonLifeLock Inc 3.95% USD 15/06/2022 1,350,000 1,382,062 0.62
NortonLifeLock Inc 5% USD 15/04/2025 1,600,000 1,641,488 0.74
Occidental Petroleum Corp 3.125% USD 15/02/2022 250,000 237,215 0.11
Occidental Petroleum Corp 2.6% USD 15/04/2022 400,000 379,000 0.17
Occidental Petroleum Corp 2.7% USD 15/08/2022 550,000 514,907 0.23
Occidental Petroleum Corp 2.7% USD 15/02/2023 400,000 367,000 0.17
Occidental Petroleum Corp 6.95% USD 01/07/2024 300,000 291,090 0.13
Occidental Petroleum Corp 2.9% USD 15/08/2024 350,000 297,605 0.13
Occidental Petroleum Corp 3.5% USD 15/06/2025 250,000 207,969 0.09
Occidental Petroleum Corp 5.55% USD 15/03/2026 300,000 272,199 0.12
Occidental Petroleum Corp 3.4% USD 15/04/2026 350,000 280,000 0.13
Occidental Petroleum Corp 3.2% USD 15/08/2026 300,000 238,500 0.11
Occidental Petroleum Corp 3% USD 15/02/2027 350,000 275,142 0.12
Occidental Petroleum Corp 3.5% USD 15/08/2029 445,000 341,671 0.15
Occidental Petroleum Corp 7.5% USD 01/05/2031 250,000 238,125 0.11
Occidental Petroleum Corp 7.875% USD 15/09/2031 200,000 194,875 0.09
Occidental Petroleum Corp 6.45% USD 15/09/2036 300,000 256,313 0.12
Occidental Petroleum Corp 0% USD 10/10/2036 150,000 66,563 0.03
Occidental Petroleum Corp 7.95% USD 15/06/2039 250,000 234,844 0.11
Occidental Petroleum Corp 4.3% USD 15/08/2039 400,000 279,014 0.13
Occidental Petroleum Corp 6.2% USD 15/03/2040 350,000 290,885 0.13
Occidental Petroleum Corp 4.5% USD 15/07/2044 450,000 324,000 0.15
Occidental Petroleum Corp 4.625% USD 15/06/2045 470,000 340,750 0.15
Occidental Petroleum Corp 6.6% USD 15/03/2046 350,000 302,094 0.14
Occidental Petroleum Corp 4.4% USD 15/04/2046 340,000 242,051 0.11
Occidental Petroleum Corp 4.1% USD 15/02/2047 450,000 304,875 0.14
Occidental Petroleum Corp 4.2% USD 15/03/2048 450,000 309,938 0.14
Occidental Petroleum Corp 4.4% USD 15/08/2049 360,000 253,008 0.11
Oceaneering International Inc 4.65% USD 15/11/2024 1,870,000 1,379,125 0.62
Oceaneering International Inc 6% USD 01/02/2028 2,370,000 1,488,360 0.67
Pitney Bowes Inc 5.95% USD 01/04/2023 1,345,000 1,336,453 0.60
Pitney Bowes Inc 4.625% USD 15/03/2024 1,300,000 1,243,937 0.56
QVC Inc 4.375% USD 15/03/2023 1,400,000 1,456,000 0.66
QVC Inc 4.85% USD 01/04/2024 1,400,000 1,470,140 0.66
QVC Inc 4.45% USD 15/02/2025 1,500,000 1,548,750 0.70
QVC Inc 4.75% USD 15/02/2027 1,800,000 1,852,335 0.83
QVC Inc 5.45% USD 15/08/2034 1,808,000 1,789,920 0.81
QVC Inc 5.95% USD 15/03/2043 1,715,000 1,638,682 0.74
Rockies Express Pipeline LLC 3.6% USD 15/05/2025 1,400,000 1,375,780 0.62
Rockies Express Pipeline LLC 4.95% USD 15/07/2029 2,385,000 2,322,394 1.04
Rockies Express Pipeline LLC 4.8% USD 15/05/2030 2,000,000 1,958,750 0.88
Rockies Express Pipeline LLC 7.5% USD 15/07/2038 1,000,000 1,065,000 0.48
Rockies Express Pipeline LLC 6.875% USD 15/04/2040 1,530,000 1,584,774 0.71
Ruby Pipeline LLC 7.75% USD 01/04/2022 1,803,409 1,515,702 0.68
Service Properties Trust 5% USD 15/08/2022 950,000 947,074 0.43
Service Properties Trust 4.5% USD 15/06/2023 1,100,000 1,080,810 0.49
Service Properties Trust 4.65% USD 15/03/2024 1,350,000 1,258,031 0.57
Service Properties Trust 4.35% USD 01/10/2024 1,030,000 934,081 0.42
Service Properties Trust 4.5% USD 15/03/2025 1,120,000 1,013,600 0.46
Service Properties Trust 5.25% USD 15/02/2026 950,000 876,375 0.39
Service Properties Trust 4.75% USD 01/10/2026 1,120,000 998,838 0.45
Service Properties Trust 4.95% USD 15/02/2027 1,030,000 919,275 0.41
Service Properties Trust 3.95% USD 15/01/2028 1,100,000 915,062 0.41
Service Properties Trust 4.95% USD 01/10/2029 1,050,000 902,344 0.41
Service Properties Trust 4.375% USD 15/02/2030 1,230,000 1,023,975 0.46
SESI LLC 7.125% USD 15/12/2021 825,000 210,375 0.09
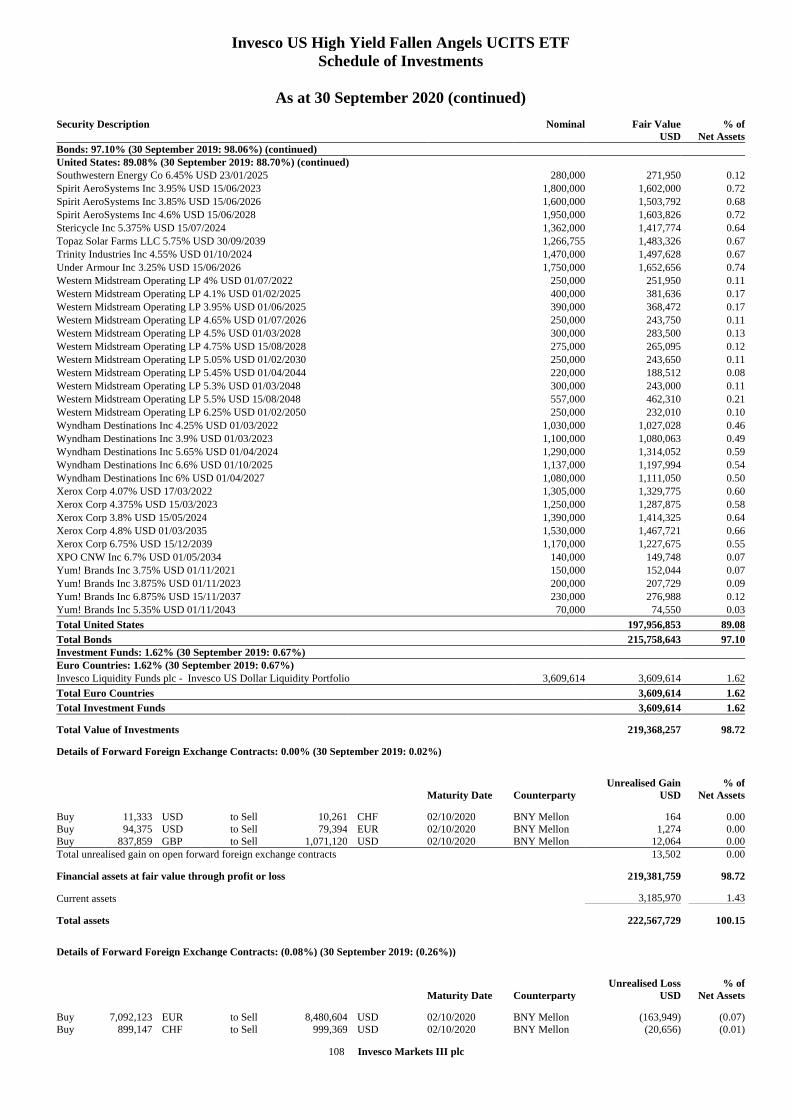
108 Invesco Markets III plc
Invesco US High Yield Fallen Angels UCITS ETF
Schedule of Investments
As at 30 September 2020 (continued)
Security Description
Nominal Fair Value
USD
% of
Net Assets
Bonds: 97.10% (30 September 2019: 98.06%) (continued)
United States: 89.08% (30 September 2019: 88.70%) (continued)
Southwestern Energy Co 6.45% USD 23/01/2025 280,000 271,950 0.12
Spirit AeroSystems Inc 3.95% USD 15/06/2023 1,800,000 1,602,000 0.72
Spirit AeroSystems Inc 3.85% USD 15/06/2026 1,600,000 1,503,792 0.68
Spirit AeroSystems Inc 4.6% USD 15/06/2028 1,950,000 1,603,826 0.72
Stericycle Inc 5.375% USD 15/07/2024 1,362,000 1,417,774 0.64
Topaz Solar Farms LLC 5.75% USD 30/09/2039 1,266,755 1,483,326 0.67
Trinity Industries Inc 4.55% USD 01/10/2024 1,470,000 1,497,628 0.67
Under Armour Inc 3.25% USD 15/06/2026 1,750,000 1,652,656 0.74
Western Midstream Operating LP 4% USD 01/07/2022 250,000 251,950 0.11
Western Midstream Operating LP 4.1% USD 01/02/2025 400,000 381,636 0.17
Western Midstream Operating LP 3.95% USD 01/06/2025 390,000 368,472 0.17
Western Midstream Operating LP 4.65% USD 01/07/2026 250,000 243,750 0.11
Western Midstream Operating LP 4.5% USD 01/03/2028 300,000 283,500 0.13
Western Midstream Operating LP 4.75% USD 15/08/2028 275,000 265,095 0.12
Western Midstream Operating LP 5.05% USD 01/02/2030 250,000 243,650 0.11
Western Midstream Operating LP 5.45% USD 01/04/2044 220,000 188,512 0.08
Western Midstream Operating LP 5.3% USD 01/03/2048 300,000 243,000 0.11
Western Midstream Operating LP 5.5% USD 15/08/2048 557,000 462,310 0.21
Western Midstream Operating LP 6.25% USD 01/02/2050 250,000 232,010 0.10
Wyndham Destinations Inc 4.25% USD 01/03/2022 1,030,000 1,027,028 0.46
Wyndham Destinations Inc 3.9% USD 01/03/2023 1,100,000 1,080,063 0.49
Wyndham Destinations Inc 5.65% USD 01/04/2024 1,290,000 1,314,052 0.59
Wyndham Destinations Inc 6.6% USD 01/10/2025 1,137,000 1,197,994 0.54
Wyndham Destinations Inc 6% USD 01/04/2027 1,080,000 1,111,050 0.50
Xerox Corp 4.07% USD 17/03/2022 1,305,000 1,329,775 0.60
Xerox Corp 4.375% USD 15/03/2023 1,250,000 1,287,875 0.58
Xerox Corp 3.8% USD 15/05/2024 1,390,000 1,414,325 0.64
Xerox Corp 4.8% USD 01/03/2035 1,530,000 1,467,721 0.66
Xerox Corp 6.75% USD 15/12/2039 1,170,000 1,227,675 0.55
XPO CNW Inc 6.7% USD 01/05/2034 140,000 149,748 0.07
Yum! Brands Inc 3.75% USD 01/11/2021 150,000 152,044 0.07
Yum! Brands Inc 3.875% USD 01/11/2023 200,000 207,729 0.09
Yum! Brands Inc 6.875% USD 15/11/2037 230,000 276,988 0.12
Yum! Brands Inc 5.35% USD 01/11/2043 70,000 74,550 0.03
Total United States 197,956,853 89.08
Total Bonds 215,758,643 97.10
Investment Funds: 1.62% (30 September 2019: 0.67%)
Euro Countries: 1.62% (30 September 2019: 0.67%)
Invesco Liquidity Funds plc - Invesco US Dollar Liquidity Portfolio 3,609,614 3,609,614 1.62
Total Euro Countries 3,609,614 1.62
Total Investment Funds 3,609,614 1.62
Total Value of Investments 219,368,257 98.72
Details of Forward Foreign Exchange Contracts: 0.00% (30 September 2019: 0.02%)
Maturity Date Counterparty
Unrealised Gain
USD
% of
Net Assets
Buy 11,333 USD to Sell 10,261 CHF 02/10/2020 BNY Mellon 164 0 .00
Buy 94,375 USD to Sell 79,394 EUR 02/10/2020 BNY Mellon 1,274 0 .00
Buy 837,859 GBP to Sell 1,071,120 USD 02/10/2020 BNY Mellon 12,064 0 .00
Total unrealised gain on open forward foreign exchange contracts 13,502 0 .00
Financial assets at fair value through profit or loss 219,381,759 98.72
Current assets 3,185,970 1.43
Total assets 222,567,729 100.15
Details of Forward Foreign Exchange Contracts: (0.08%) (30 September 2019: (0.26%))
Maturity Date Counterparty
Unrealised Loss
USD
% of
Net Assets
Buy 7,092,123 EUR to Sell 8,480,604 USD 02/10/2020 BNY Mellon (163,949) (0 .07)
Buy 899,147 CHF to Sell 999,369 USD 02/10/2020 BNY Mellon (20,656) (0 .01)
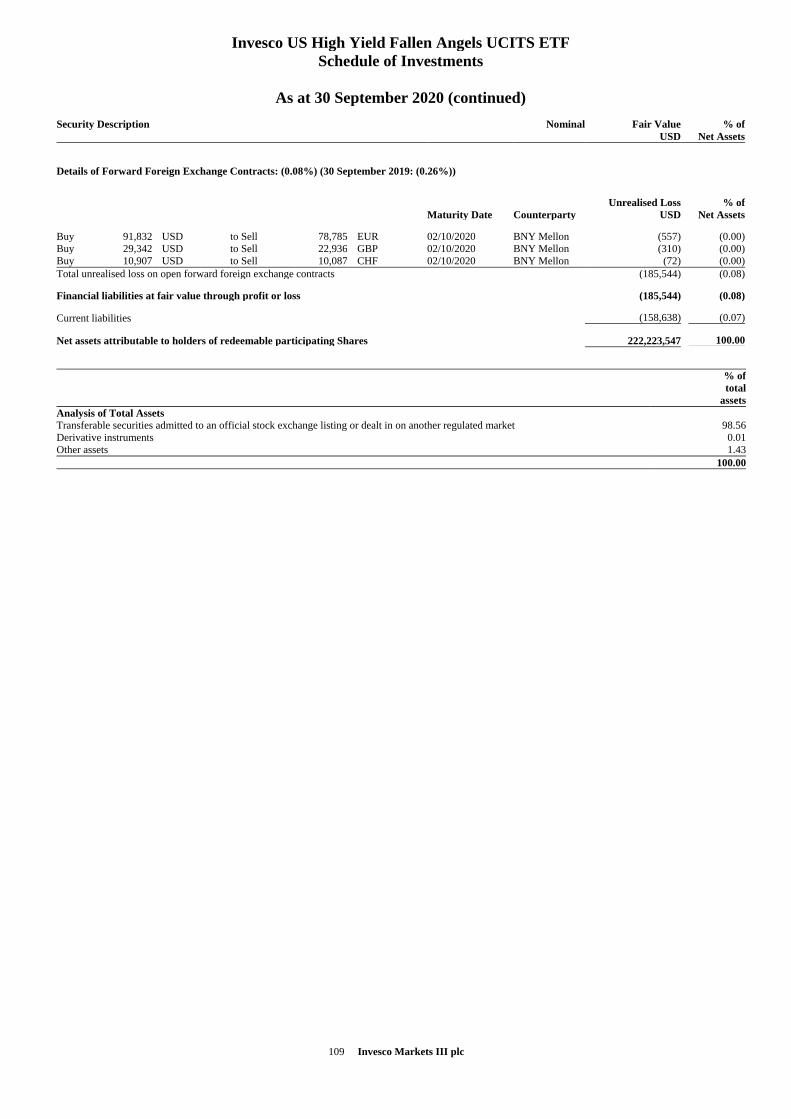
109 Invesco Markets III plc
Invesco US High Yield Fallen Angels UCITS ETF
Schedule of Investments
As at 30 September 2020 (continued)
Security Description
Nominal Fair Value
USD
% of
Net Assets
Details of Forward Foreign Exchange Contracts: (0.08%) (30 September 2019: (0.26%))
Maturity Date Counterparty
Unrealised Loss
USD
% of
Net Assets
Buy 91,832 USD to Sell 78,785 EUR 02/10/2020 BNY Mellon (557) (0 .00)
Buy 29,342 USD to Sell 22,936 GBP 02/10/2020 BNY Mellon (310) (0 .00)
Buy 10,907 USD to Sell 10,087 CHF 02/10/2020 BNY Mellon (72) (0 .00)
Total unrealised loss on open forward foreign exchange contracts (185,544) (0 .08)
Financial liabilities at fair value through profit or loss (185,544) (0 .08)
Current liabilities (158,638) (0.07)
Net assets attributable to holders of redeemable participating Shares 222,223,547 100.00
% of
total
assets
Analysis of Total Assets
Transferable securities admitted to an official stock exchange listing or dealt in on another regulated market 98.56
Derivative instruments 0.01
Other assets 1.43
100.00
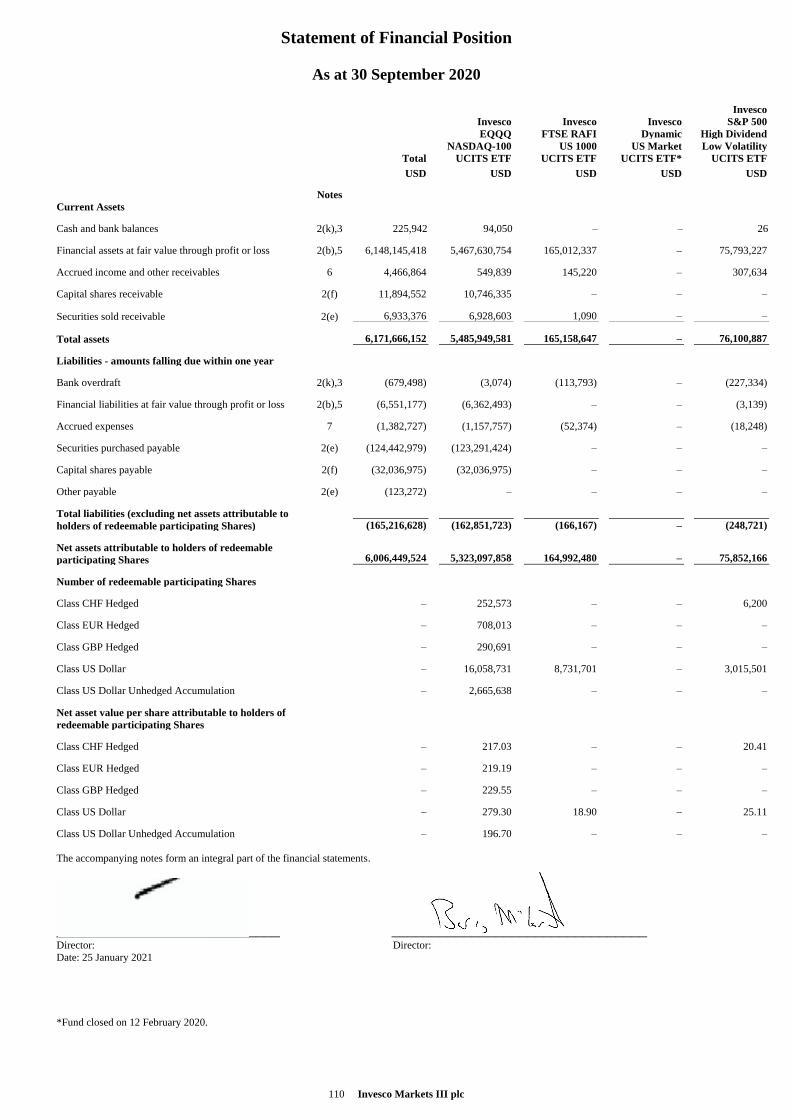
Statement of Financial Position
110 Invesco Markets III plc
As at 30 September 2020
Invesco
Invesco Invesco Invesco S&P 500
EQQQ FTSE RAFI Dynamic High Dividend
NASDAQ-100 US 1000 US Market Low Volatility
Total UCITS ETF UCITS ETF UCITS ETF* UCITS ETF
USD USD USD USD USD
Notes
Current Assets
Cash and bank balances 2(k),3 225,942 94,050 – – 26
Financial assets at fair value through profit or loss 2(b),5 6,148,145,418 5,467,630,754 165,012,337 – 75,793,227
Accrued income and other receivables 6 4,466,864 549,839 145,220 – 307,634
Capital shares receivable 2(f) 11,894,552 10,746,335 – – –
Securities sold receivable 2(e) 6,933,376 6,928,603 1,090 – –
Total assets 6,171,666,152 5,485,949,581 165,158,647 – 76,100,887
Liabilities - amounts falling due within one year
Bank overdraft 2(k),3 (679,498) (3,074) (113,793) – (227,334)
Financial liabilities at fair value through profit or loss 2(b),5 (6,551,177) (6,362,493) – – (3,139)
Accrued expenses 7 (1,382,727) (1,157,757) (52,374) – (18,248)
Securities purchased payable 2(e) (124,442,979) (123,291,424) – – –
Capital shares payable 2(f) (32,036,975) (32,036,975) – – –
Other payable 2(e) (123,272) – – – –
Total liabilities (excluding net assets attributable to
holders of redeemable participating Shares) (165,216,628) (162,851,723) (166,167) – (248,721)
Net assets attributable to holders of redeemable
participating Shares 6,006,449,524 5,323,097,858 164,992,480 – 75,852,166
Number of redeemable participating Shares
Class CHF Hedged – 252,573 – – 6,200
Class EUR Hedged – 708,013 – – –
Class GBP Hedged – 290,691 – – –
Class US Dollar – 16,058,731 8,731,701 – 3,015,501
Class US Dollar Unhedged Accumulation – 2,665,638 – – –
Net asset value per share attributable to holders of
redeemable participating Shares
Class CHF Hedged – 217.03 – – 20.41
Class EUR Hedged – 219.19 – – –
Class GBP Hedged – 229.55 – – –
Class US Dollar – 279.30 18.90 – 25.11
Class US Dollar Unhedged Accumulation – 196.70 – – –
The accompanying notes form an integral part of the financial statements.
____________________________ ________________________________ Director: Director:
Date: 25 January 2021
*Fund closed on 12 February 2020.
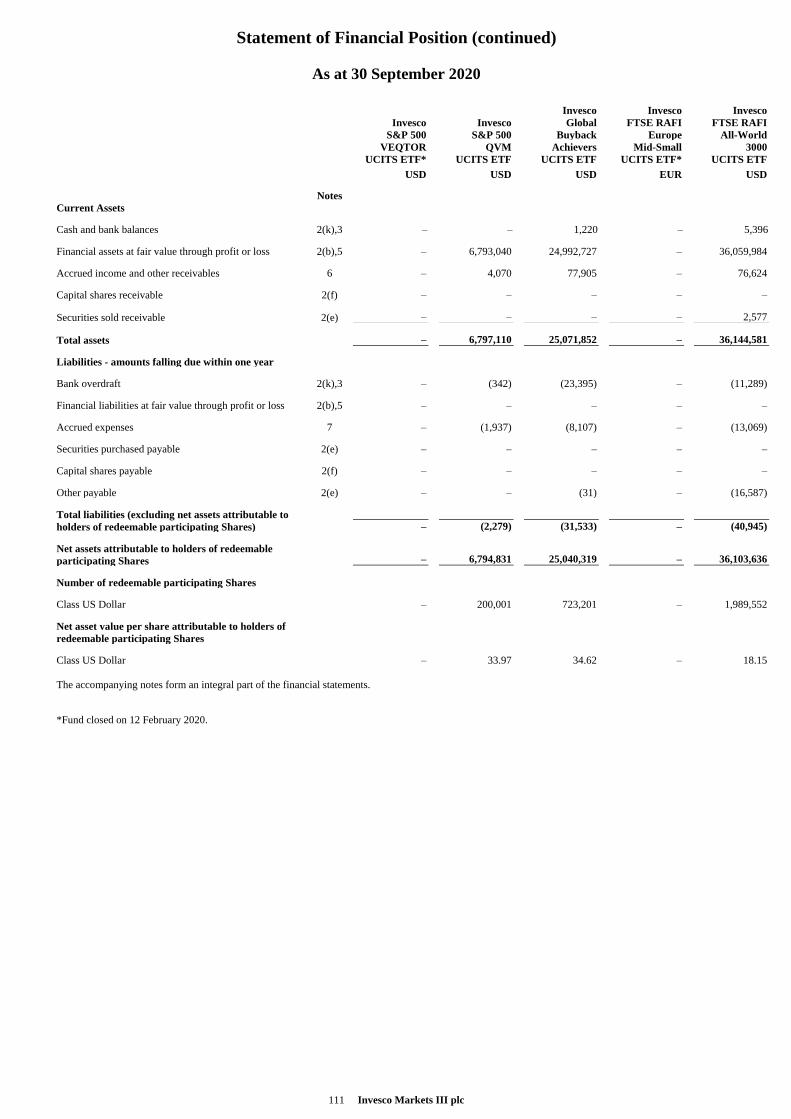
Statement of Financial Position (continued)
111 Invesco Markets III plc
As at 30 September 2020
Invesco Invesco Invesco
Invesco Invesco Global FTSE RAFI FTSE RAFI
S&P 500 S&P 500 Buyback Europe All-World
VEQTOR QVM Achievers Mid-Small 3000
UCITS ETF* UCITS ETF UCITS ETF UCITS ETF* UCITS ETF
USD USD USD EUR USD
Notes
Current Assets
Cash and bank balances 2(k),3 – – 1,220 – 5,396
Financial assets at fair value through profit or loss 2(b),5 – 6,793,040 24,992,727 – 36,059,984
Accrued income and other receivables 6 – 4,070 77,905 – 76,624
Capital shares receivable 2(f) – – – – –
Securities sold receivable 2(e) – – – – 2,577
Total assets – 6,797,110 25,071,852 – 36,144,581
Liabilities - amounts falling due within one year
Bank overdraft 2(k),3 – (342) (23,395) – (11,289)
Financial liabilities at fair value through profit or loss 2(b),5 – – – – –
Accrued expenses 7 – (1,937) (8,107) – (13,069)
Securities purchased payable 2(e) – – – – –
Capital shares payable 2(f) – – – – –
Other payable 2(e) – – (31) – (16,587)
Total liabilities (excluding net assets attributable to
holders of redeemable participating Shares) – (2,279) (31,533) – (40,945)
Net assets attributable to holders of redeemable
participating Shares – 6,794,831 25,040,319 – 36,103,636
Number of redeemable participating Shares
Class US Dollar – 200,001 723,201 – 1,989,552
Net asset value per share attributable to holders of
redeemable participating Shares
Class US Dollar – 33.97 34.62 – 18.15
The accompanying notes form an integral part of the financial statements.
*Fund closed on 12 February 2020.
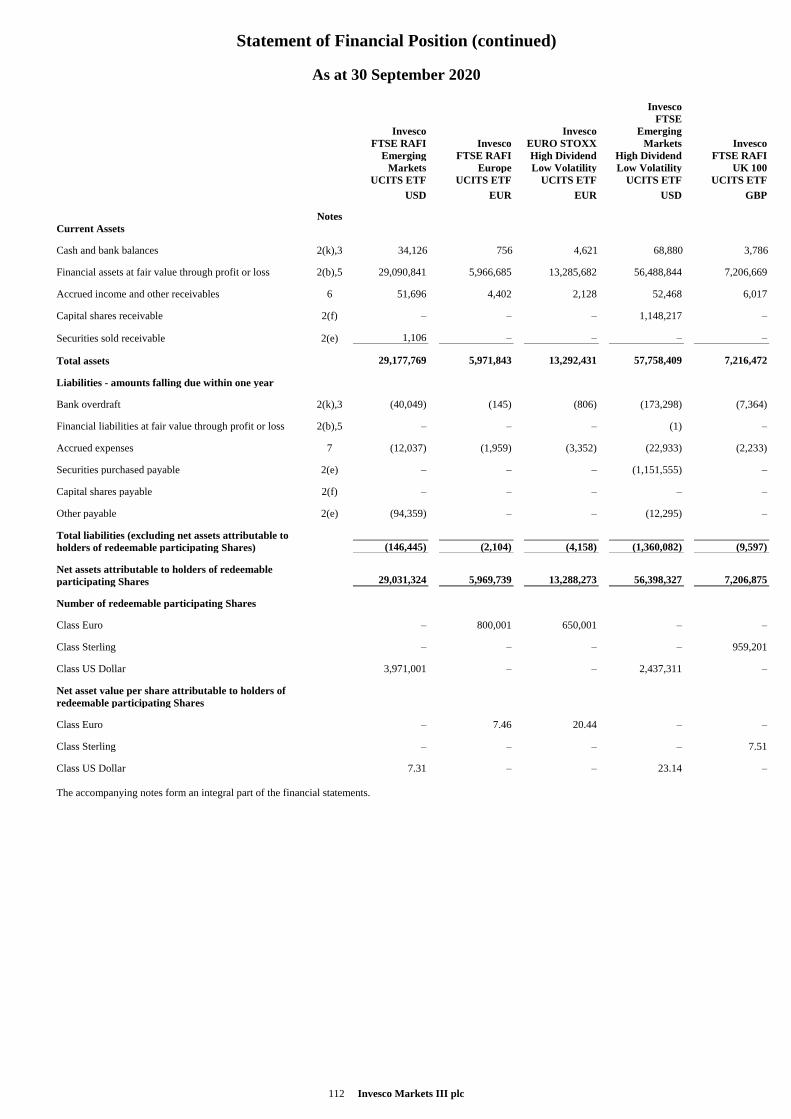
Statement of Financial Position (continued)
112 Invesco Markets III plc
As at 30 September 2020
Invesco
Invesco Invesco
FTSE
Emerging
FTSE RAFI Invesco EURO STOXX Markets Invesco
Emerging FTSE RAFI High Dividend High Dividend FTSE RAFI
Markets Europe Low Volatility Low Volatility UK 100
UCITS ETF UCITS ETF UCITS ETF UCITS ETF UCITS ETF
USD EUR EUR USD GBP
Notes
Current Assets
Cash and bank balances 2(k),3 34,126 756 4,621 68,880 3,786
Financial assets at fair value through profit or loss 2(b),5 29,090,841 5,966,685 13,285,682 56,488,844 7,206,669
Accrued income and other receivables 6 51,696 4,402 2,128 52,468 6,017
Capital shares receivable 2(f) – – – 1,148,217 –
Securities sold receivable 2(e) 1,106 – – – –
Total assets 29,177,769 5,971,843 13,292,431 57,758,409 7,216,472
Liabilities - amounts falling due within one year
Bank overdraft 2(k),3 (40,049) (145) (806) (173,298) (7,364)
Financial liabilities at fair value through profit or loss 2(b),5 – – – (1) –
Accrued expenses 7 (12,037) (1,959) (3,352) (22,933) (2,233)
Securities purchased payable 2(e) – – – (1,151,555) –
Capital shares payable 2(f) – – – – –
Other payable 2(e) (94,359) – – (12,295) –
Total liabilities (excluding net assets attributable to
holders of redeemable participating Shares) (146,445) (2,104) (4,158) (1,360,082) (9,597)
Net assets attributable to holders of redeemable
participating Shares 29,031,324 5,969,739 13,288,273 56,398,327 7,206,875
Number of redeemable participating Shares
Class Euro – 800,001 650,001 – –
Class Sterling – – – – 959,201
Class US Dollar 3,971,001 – – 2,437,311 –
Net asset value per share attributable to holders of
redeemable participating Shares
Class Euro – 7.46 20.44 – –
Class Sterling – – – – 7.51
Class US Dollar 7.31 – – 23.14 –
The accompanying notes form an integral part of the financial statements.
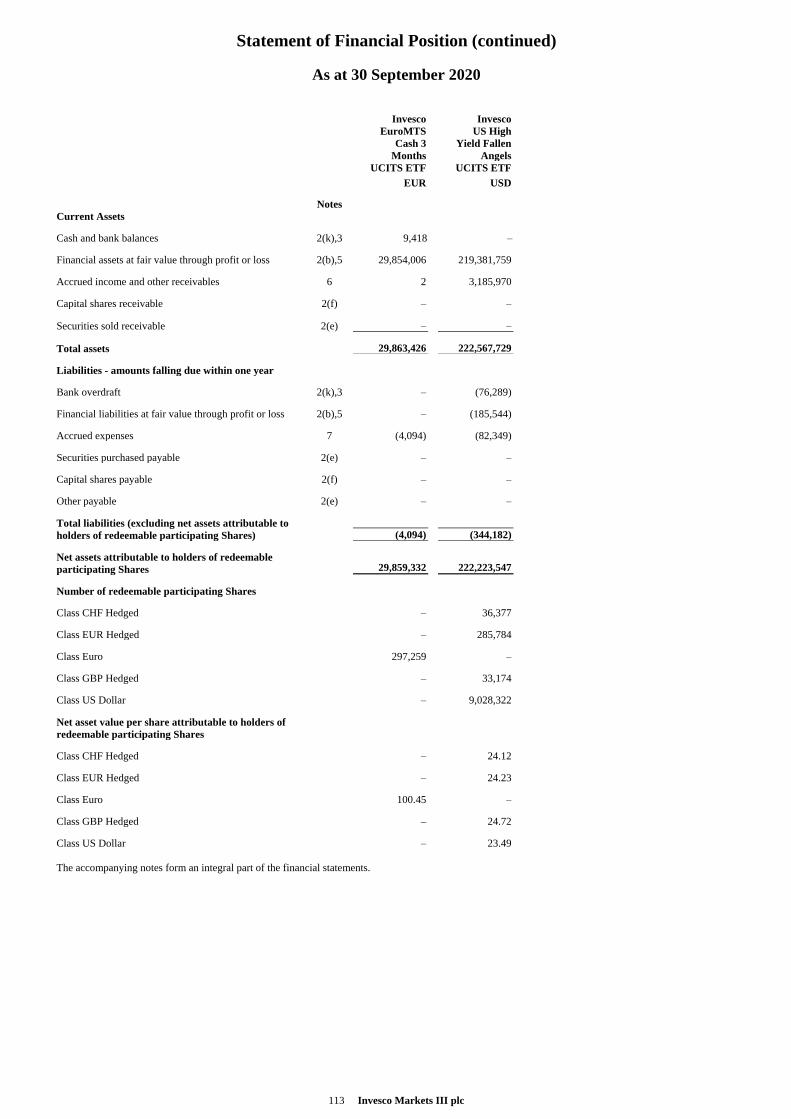
Statement of Financial Position (continued)
113 Invesco Markets III plc
As at 30 September 2020
Invesco Invesco
EuroMTS US High
Cash 3 Yield Fallen
Months Angels
UCITS ETF UCITS ETF
EUR USD
Notes
Current Assets
Cash and bank balances 2(k),3 9,418 –
Financial assets at fair value through profit or loss 2(b),5 29,854,006 219,381,759
Accrued income and other receivables 6 2 3,185,970
Capital shares receivable 2(f) – –
Securities sold receivable 2(e) – –
Total assets 29,863,426 222,567,729
Liabilities - amounts falling due within one year
Bank overdraft 2(k),3 – (76,289)
Financial liabilities at fair value through profit or loss 2(b),5 – (185,544)
Accrued expenses 7 (4,094) (82,349)
Securities purchased payable 2(e) – –
Capital shares payable 2(f) – –
Other payable 2(e) – –
Total liabilities (excluding net assets attributable to
holders of redeemable participating Shares) (4,094) (344,182)
Net assets attributable to holders of redeemable
participating Shares 29,859,332 222,223,547
Number of redeemable participating Shares
Class CHF Hedged – 36,377
Class EUR Hedged – 285,784
Class Euro 297,259 –
Class GBP Hedged – 33,174
Class US Dollar – 9,028,322
Net asset value per share attributable to holders of
redeemable participating Shares
Class CHF Hedged – 24.12
Class EUR Hedged – 24.23
Class Euro 100.45 –
Class GBP Hedged – 24.72
Class US Dollar – 23.49
The accompanying notes form an integral part of the financial statements.
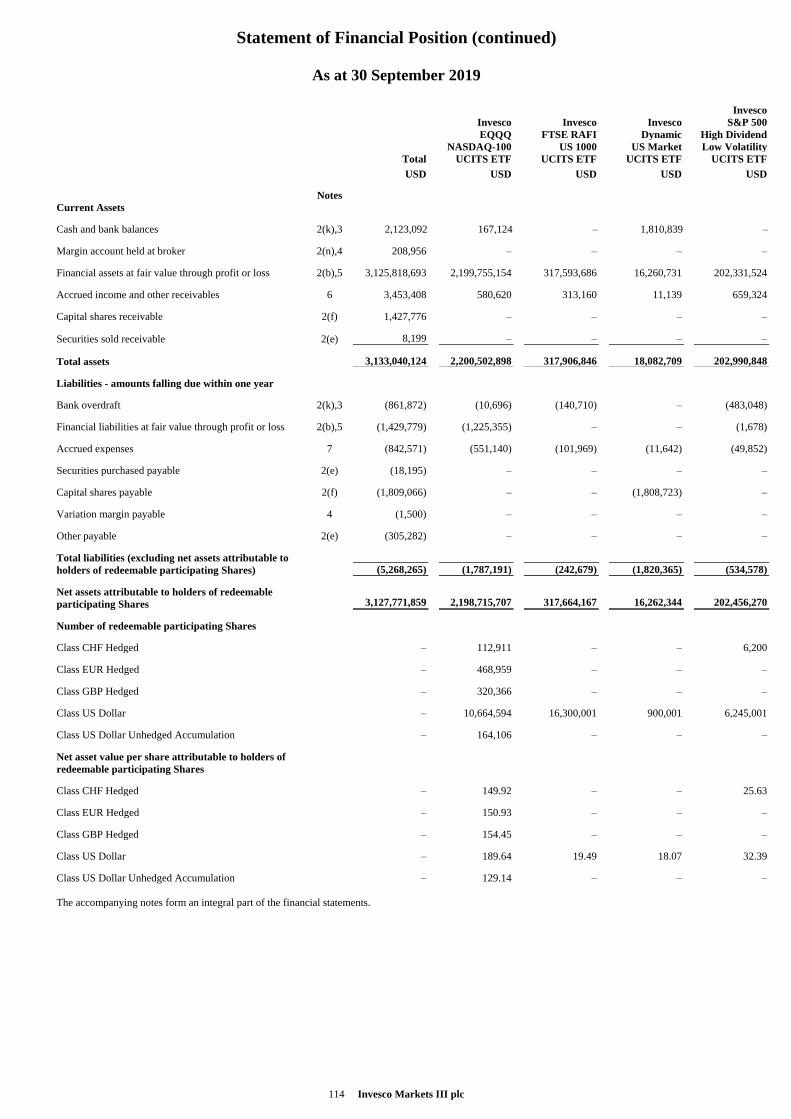
Statement of Financial Position (continued)
114 Invesco Markets III plc
As at 30 September 2019
Invesco
Invesco Invesco Invesco S&P 500
EQQQ FTSE RAFI Dynamic High Dividend
NASDAQ-100 US 1000 US Market Low Volatility
Total UCITS ETF UCITS ETF UCITS ETF UCITS ETF
USD USD USD USD USD
Notes
Current Assets
Cash and bank balances 2(k),3 2,123,092 167,124 – 1,810,839 –
Margin account held at broker 2(n),4 208,956 – – – –
Financial assets at fair value through profit or loss 2(b),5 3,125,818,693 2,199,755,154 317,593,686 16,260,731 202,331,524
Accrued income and other receivables 6 3,453,408 580,620 313,160 11,139 659,324
Capital shares receivable 2(f) 1,427,776 – – – –
Securities sold receivable 2(e) 8,199 – – – –
Total assets 3,133,040,124 2,200,502,898 317,906,846 18,082,709 202,990,848
Liabilities - amounts falling due within one year
Bank overdraft 2(k),3 (861,872) (10,696) (140,710) – (483,048)
Financial liabilities at fair value through profit or loss 2(b),5 (1,429,779) (1,225,355) – – (1,678)
Accrued expenses 7 (842,571) (551,140) (101,969) (11,642) (49,852)
Securities purchased payable 2(e) (18,195) – – – –
Capital shares payable 2(f) (1,809,066) – – (1,808,723) –
Variation margin payable 4 (1,500) – – – –
Other payable 2(e) (305,282) – – – –
Total liabilities (excluding net assets attributable to
holders of redeemable participating Shares) (5,268,265) (1,787,191) (242,679) (1,820,365) (534,578)
Net assets attributable to holders of redeemable
participating Shares 3,127,771,859 2,198,715,707 317,664,167 16,262,344 202,456,270
Number of redeemable participating Shares
Class CHF Hedged – 112,911 – – 6,200
Class EUR Hedged – 468,959 – – –
Class GBP Hedged – 320,366 – – –
Class US Dollar – 10,664,594 16,300,001 900,001 6,245,001
Class US Dollar Unhedged Accumulation – 164,106 – – –
Net asset value per share attributable to holders of
redeemable participating Shares
Class CHF Hedged – 149.92 – – 25.63
Class EUR Hedged – 150.93 – – –
Class GBP Hedged – 154.45 – – –
Class US Dollar – 189.64 19.49 18.07 32.39
Class US Dollar Unhedged Accumulation – 129.14 – – –
The accompanying notes form an integral part of the financial statements.
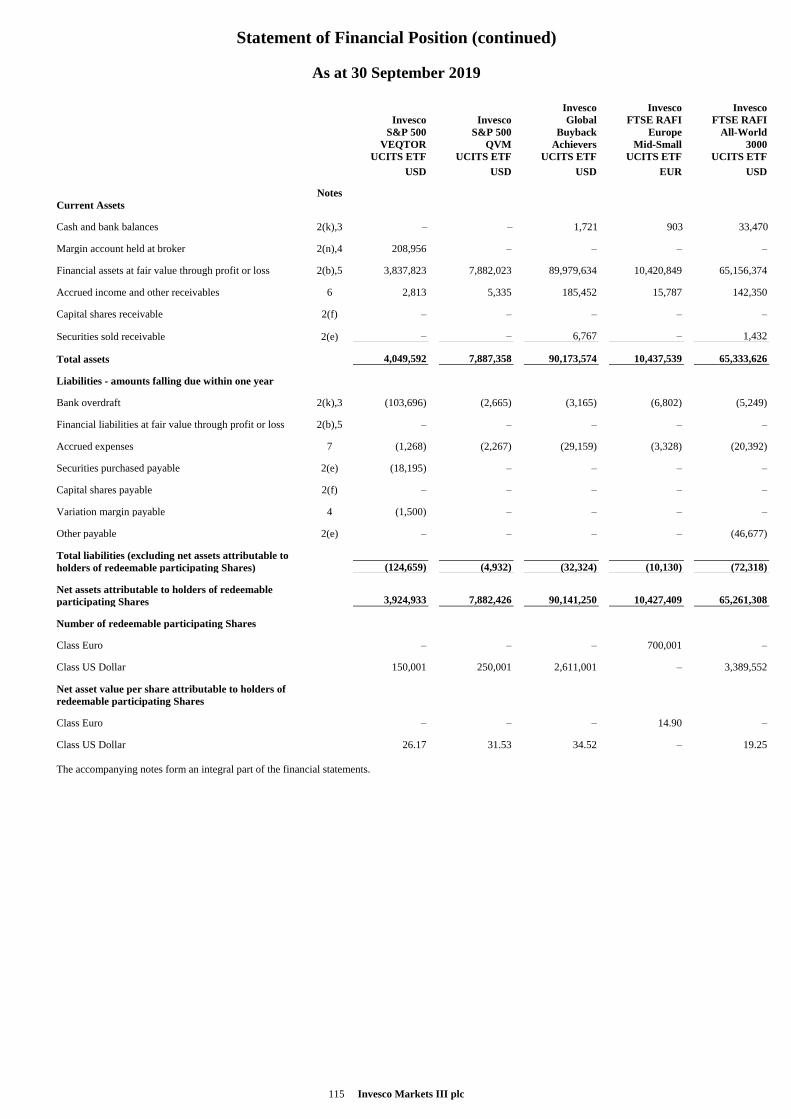
Statement of Financial Position (continued)
115 Invesco Markets III plc
As at 30 September 2019
Invesco Invesco Invesco
Invesco Invesco Global FTSE RAFI FTSE RAFI
S&P 500 S&P 500 Buyback Europe All-World
VEQTOR QVM Achievers Mid-Small 3000
UCITS ETF UCITS ETF UCITS ETF UCITS ETF UCITS ETF
USD USD USD EUR USD
Notes
Current Assets
Cash and bank balances 2(k),3 – – 1,721 903 33,470
Margin account held at broker 2(n),4 208,956 – – – –
Financial assets at fair value through profit or loss 2(b),5 3,837,823 7,882,023 89,979,634 10,420,849 65,156,374
Accrued income and other receivables 6 2,813 5,335 185,452 15,787 142,350
Capital shares receivable 2(f) – – – – –
Securities sold receivable 2(e) – – 6,767 – 1,432
Total assets 4,049,592 7,887,358 90,173,574 10,437,539 65,333,626
Liabilities - amounts falling due within one year
Bank overdraft 2(k),3 (103,696) (2,665) (3,165) (6,802) (5,249)
Financial liabilities at fair value through profit or loss 2(b),5 – – – – –
Accrued expenses 7 (1,268) (2,267) (29,159) (3,328) (20,392)
Securities purchased payable 2(e) (18,195) – – – –
Capital shares payable 2(f) – – – – –
Variation margin payable 4 (1,500) – – – –
Other payable 2(e) – – – – (46,677)
Total liabilities (excluding net assets attributable to
holders of redeemable participating Shares) (124,659) (4,932) (32,324) (10,130) (72,318)
Net assets attributable to holders of redeemable
participating Shares 3,924,933 7,882,426 90,141,250 10,427,409 65,261,308
Number of redeemable participating Shares
Class Euro – – – 700,001 –
Class US Dollar 150,001 250,001 2,611,001 – 3,389,552
Net asset value per share attributable to holders of
redeemable participating Shares
Class Euro – – – 14.90 –
Class US Dollar 26.17 31.53 34.52 – 19.25
The accompanying notes form an integral part of the financial statements.
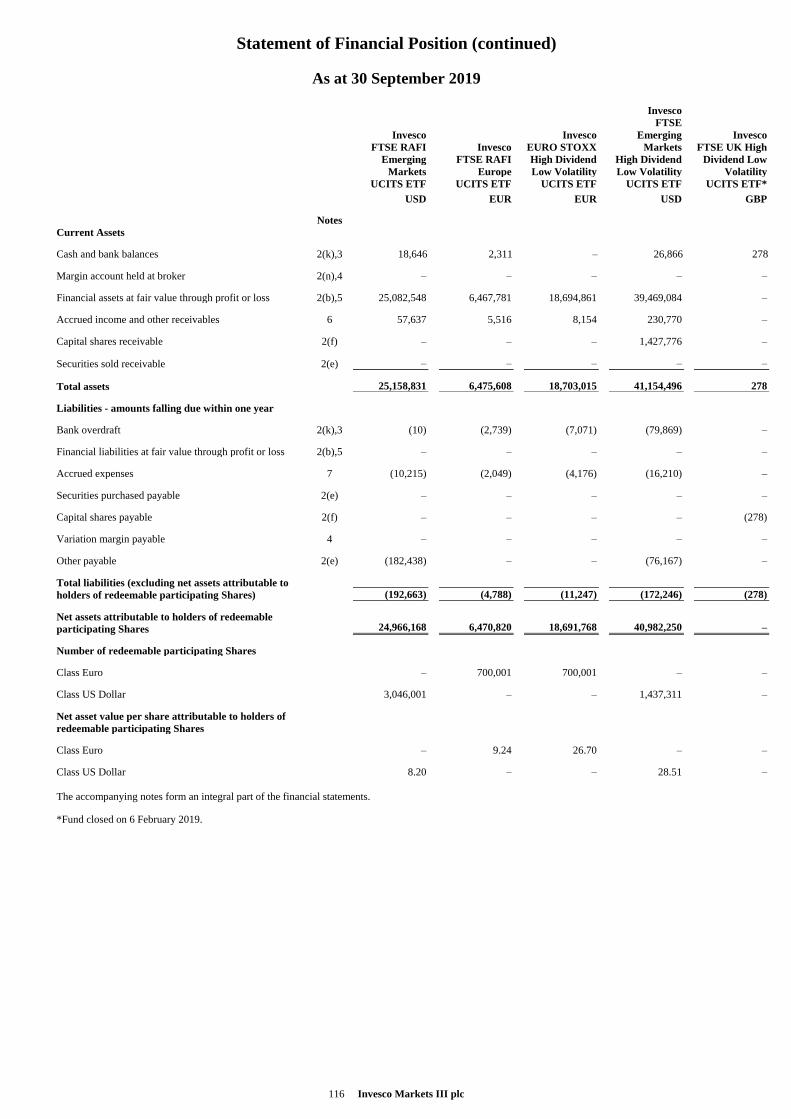
Statement of Financial Position (continued)
116 Invesco Markets III plc
As at 30 September 2019
Invesco
Invesco Invesco
FTSE
Emerging Invesco
FTSE RAFI Invesco EURO STOXX Markets FTSE UK High
Emerging FTSE RAFI High Dividend High Dividend Dividend Low
Markets Europe Low Volatility Low Volatility Volatility
UCITS ETF UCITS ETF UCITS ETF UCITS ETF UCITS ETF*
USD EUR EUR USD GBP
Notes
Current Assets
Cash and bank balances 2(k),3 18,646 2,311 – 26,866 278
Margin account held at broker 2(n),4 – – – – –
Financial assets at fair value through profit or loss 2(b),5 25,082,548 6,467,781 18,694,861 39,469,084 –
Accrued income and other receivables 6 57,637 5,516 8,154 230,770 –
Capital shares receivable 2(f) – – – 1,427,776 –
Securities sold receivable 2(e) – – – – –
Total assets 25,158,831 6,475,608 18,703,015 41,154,496 278
Liabilities - amounts falling due within one year
Bank overdraft 2(k),3 (10) (2,739) (7,071) (79,869) –
Financial liabilities at fair value through profit or loss 2(b),5 – – – – –
Accrued expenses 7 (10,215) (2,049) (4,176) (16,210) –
Securities purchased payable 2(e) – – – – –
Capital shares payable 2(f) – – – – (278)
Variation margin payable 4 – – – – –
Other payable 2(e) (182,438) – – (76,167) –
Total liabilities (excluding net assets attributable to
holders of redeemable participating Shares) (192,663) (4,788) (11,247) (172,246) (278)
Net assets attributable to holders of redeemable
participating Shares 24,966,168 6,470,820 18,691,768 40,982,250 –
Number of redeemable participating Shares
Class Euro – 700,001 700,001 – –
Class US Dollar 3,046,001 – – 1,437,311 –
Net asset value per share attributable to holders of
redeemable participating Shares
Class Euro – 9.24 26.70 – –
Class US Dollar 8.20 – – 28.51 –
The accompanying notes form an integral part of the financial statements.
*Fund closed on 6 February 2019.
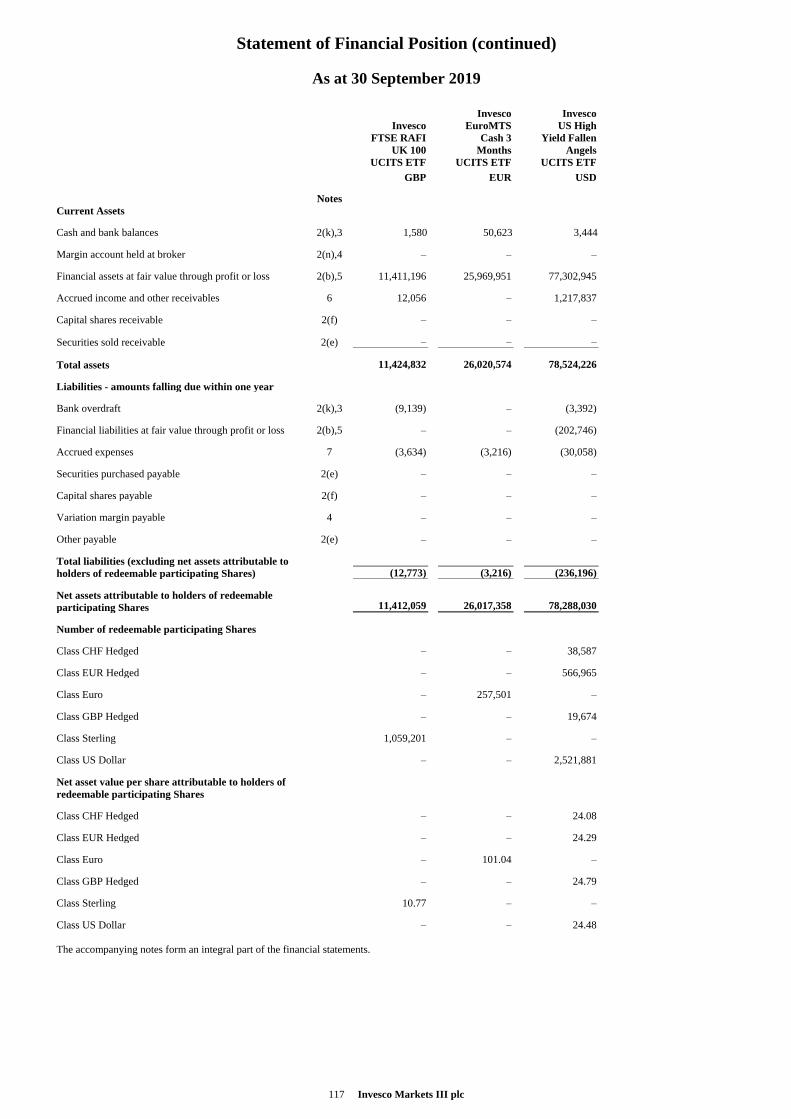
Statement of Financial Position (continued)
117 Invesco Markets III plc
As at 30 September 2019
Invesco Invesco
Invesco EuroMTS US High
FTSE RAFI Cash 3 Yield Fallen
UK 100 Months Angels
UCITS ETF UCITS ETF UCITS ETF
GBP EUR USD
Notes
Current Assets
Cash and bank balances 2(k),3 1,580 50,623 3,444
Margin account held at broker 2(n),4 – – –
Financial assets at fair value through profit or loss 2(b),5 11,411,196 25,969,951 77,302,945
Accrued income and other receivables 6 12,056 – 1,217,837
Capital shares receivable 2(f) – – –
Securities sold receivable 2(e) – – –
Total assets 11,424,832 26,020,574 78,524,226
Liabilities - amounts falling due within one year
Bank overdraft 2(k),3 (9,139) – (3,392)
Financial liabilities at fair value through profit or loss 2(b),5 – – (202,746)
Accrued expenses 7 (3,634) (3,216) (30,058)
Securities purchased payable 2(e) – – –
Capital shares payable 2(f) – – –
Variation margin payable 4 – – –
Other payable 2(e) – – –
Total liabilities (excluding net assets attributable to
holders of redeemable participating Shares) (12,773) (3,216) (236,196)
Net assets attributable to holders of redeemable
participating Shares 11,412,059 26,017,358 78,288,030
Number of redeemable participating Shares
Class CHF Hedged – – 38,587
Class EUR Hedged – – 566,965
Class Euro – 257,501 –
Class GBP Hedged – – 19,674
Class Sterling 1,059,201 – –
Class US Dollar – – 2,521,881
Net asset value per share attributable to holders of
redeemable participating Shares
Class CHF Hedged – – 24.08
Class EUR Hedged – – 24.29
Class Euro – 101.04 –
Class GBP Hedged – – 24.79
Class Sterling 10.77 – –
Class US Dollar – – 24.48
The accompanying notes form an integral part of the financial statements.
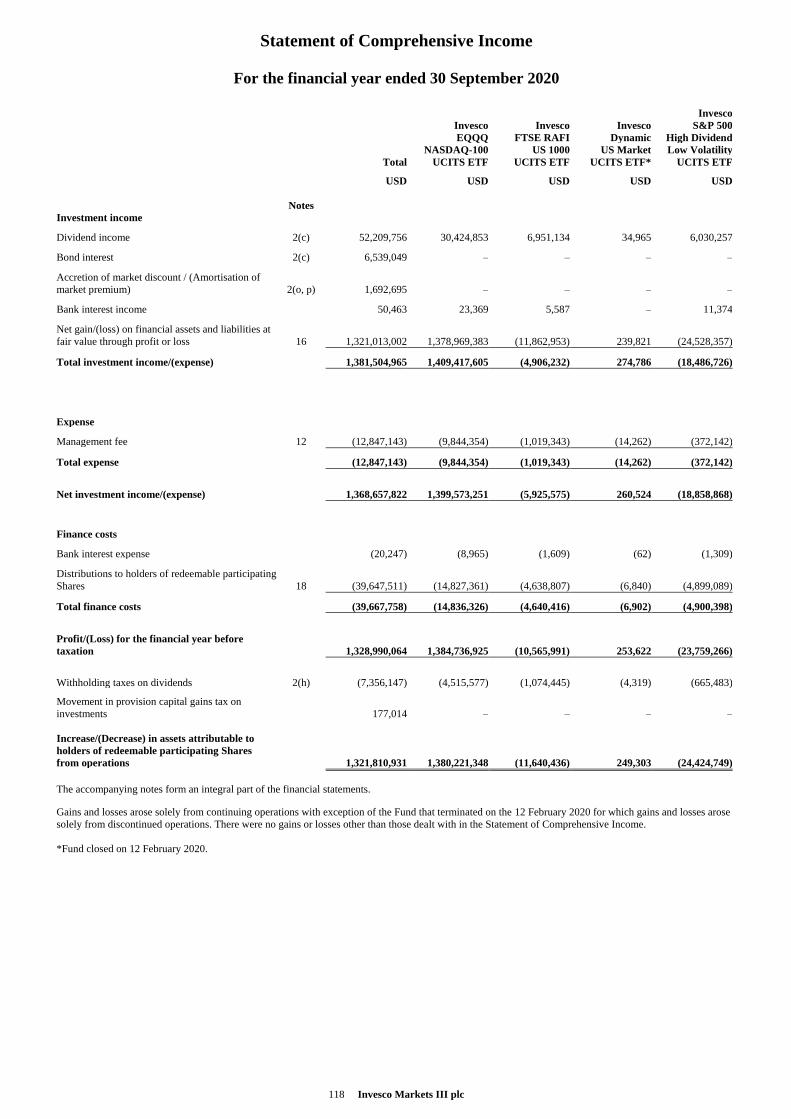
Statement of Comprehensive Income
118 Invesco Markets III plc
For the financial year ended 30 September 2020
Invesco
Invesco Invesco Invesco S&P 500
EQQQ FTSE RAFI Dynamic High Dividend
NASDAQ-100 US 1000 US Market Low Volatility
Total UCITS ETF UCITS ETF UCITS ETF* UCITS ETF
USD
USD
USD
USD
USD
Notes
Investment income
Dividend income 2(c) 52,209,756 30,424,853 6,951,134 34,965 6,030,257
Bond interest 2(c) 6,539,049 – – – –
Accretion of market discount / (Amortisation of
market premium) 2(o, p) 1,692,695 – – – –
Bank interest income 50,463 23,369 5,587 – 11,374
Net gain/(loss) on financial assets and liabilities at
fair value through profit or loss 16 1,321,013,002 1,378,969,383 (11,862,953) 239,821 (24,528,357)
Total investment income/(expense) 1,381,504,965 1,409,417,605 (4,906,232) 274,786 (18,486,726)
Expense
Management fee 12 (12,847,143) (9,844,354) (1,019,343) (14,262) (372,142)
Total expense (12,847,143) (9,844,354) (1,019,343) (14,262) (372,142)
Net investment income/(expense) 1,368,657,822 1,399,573,251 (5,925,575) 260,524 (18,858,868)
Finance costs
Bank interest expense (20,247) (8,965) (1,609) (62) (1,309)
Distributions to holders of redeemable participating
Shares 18 (39,647,511) (14,827,361) (4,638,807) (6,840) (4,899,089)
Total finance costs (39,667,758) (14,836,326) (4,640,416) (6,902) (4,900,398)
Profit/(Loss) for the financial year before
taxation 1,328,990,064 1,384,736,925 (10,565,991) 253,622 (23,759,266)
Withholding taxes on dividends 2(h) (7,356,147) (4,515,577) (1,074,445) (4,319) (665,483)
Movement in provision capital gains tax on
investments 2(p) 177,014 – – – –
Increase/(Decrease) in assets attributable to
holders of redeemable participating Shares
from operations 1,321,810,931 1,380,221,348 (11,640,436) 249,303 (24,424,749)
The accompanying notes form an integral part of the financial statements.
Gains and losses arose solely from continuing operations with exception of the Fund that terminated on the 12 February 2020 for which gains and losses arose
solely from discontinued operations. There were no gains or losses other than those dealt with in the Statement of Comprehensive Income.
*Fund closed on 12 February 2020.
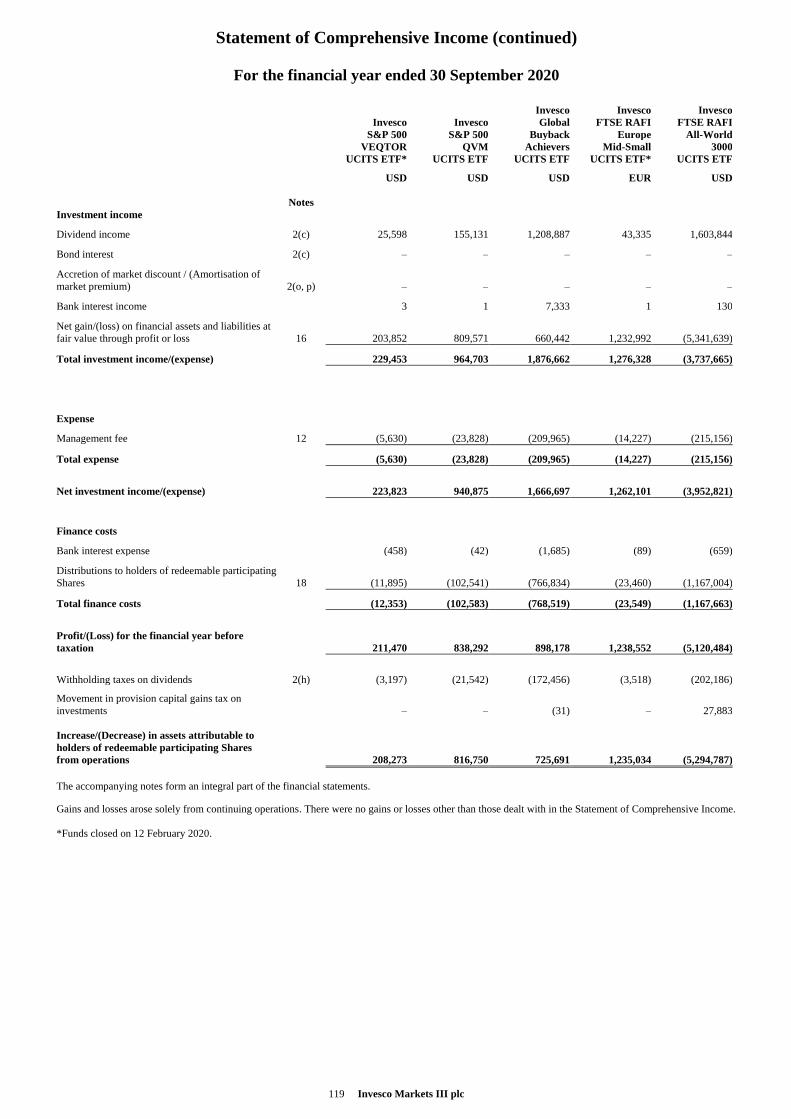
Statement of Comprehensive Income (continued)
119 Invesco Markets III plc
For the financial year ended 30 September 2020
Invesco Invesco Invesco
Invesco Invesco Global FTSE RAFI FTSE RAFI
S&P 500 S&P 500 Buyback Europe All-World
VEQTOR QVM Achievers Mid-Small 3000
UCITS ETF* UCITS ETF UCITS ETF UCITS ETF* UCITS ETF
USD
USD
USD
EUR
USD
Notes
Investment income
Dividend income 2(c) 25,598 155,131 1,208,887 43,335 1,603,844
Bond interest 2(c) – – – – –
Accretion of market discount / (Amortisation of
market premium) 2(o, p) – – – – –
Bank interest income 3 1 7,333 1 130
Net gain/(loss) on financial assets and liabilities at
fair value through profit or loss 16 203,852 809,571 660,442 1,232,992 (5,341,639)
Total investment income/(expense) 229,453 964,703 1,876,662 1,276,328 (3,737,665)
Expense
Management fee 12 (5,630) (23,828) (209,965) (14,227) (215,156)
Total expense (5,630) (23,828) (209,965) (14,227) (215,156)
Net investment income/(expense) 223,823 940,875 1,666,697 1,262,101 (3,952,821)
Finance costs
Bank interest expense (458) (42) (1,685) (89) (659)
Distributions to holders of redeemable participating
Shares 18 (11,895) (102,541) (766,834) (23,460) (1,167,004)
Total finance costs (12,353) (102,583) (768,519) (23,549) (1,167,663)
Profit/(Loss) for the financial year before
taxation 211,470 838,292 898,178 1,238,552 (5,120,484)
Withholding taxes on dividends 2(h) (3,197) (21,542) (172,456) (3,518) (202,186)
Movement in provision capital gains tax on
investments 2(p) – – (31) – 27,883
Increase/(Decrease) in assets attributable to
holders of redeemable participating Shares
from operations 208,273 816,750 725,691 1,235,034 (5,294,787)
The accompanying notes form an integral part of the financial statements.
Gains and losses arose solely from continuing operations. There were no gains or losses other than those dealt with in the Statement of Comprehensive Income.
*Funds closed on 12 February 2020.
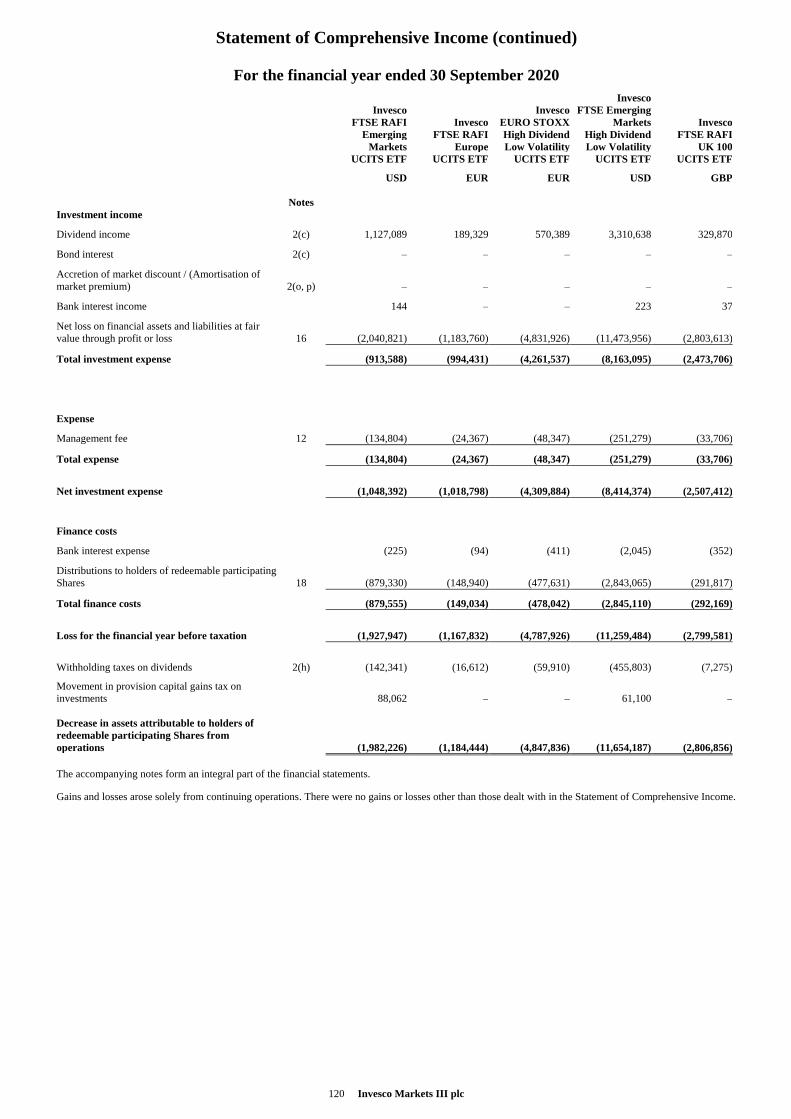
Statement of Comprehensive Income (continued)
120 Invesco Markets III plc
For the financial year ended 30 September 2020
Invesco
Invesco Invesco FTSE Emerging
FTSE RAFI Invesco EURO STOXX Markets Invesco
Emerging FTSE RAFI High Dividend High Dividend FTSE RAFI
Markets Europe Low Volatility Low Volatility UK 100
UCITS ETF UCITS ETF UCITS ETF UCITS ETF UCITS ETF
USD
EUR
EUR
USD
GBP
Notes
Investment income
Dividend income 2(c) 1,127,089 189,329 570,389 3,310,638 329,870
Bond interest 2(c) – – – – –
Accretion of market discount / (Amortisation of
market premium) 2(o, p) – – – – –
Bank interest income 144 – – 223 37
Net loss on financial assets and liabilities at fair
value through profit or loss 16 (2,040,821) (1,183,760) (4,831,926) (11,473,956) (2,803,613)
Total investment expense (913,588) (994,431) (4,261,537) (8,163,095) (2,473,706)
Expense
Management fee 12 (134,804) (24,367) (48,347) (251,279) (33,706)
Total expense (134,804) (24,367) (48,347) (251,279) (33,706)
Net investment expense (1,048,392) (1,018,798) (4,309,884) (8,414,374) (2,507,412)
Finance costs
Bank interest expense (225) (94) (411) (2,045) (352)
Distributions to holders of redeemable participating
Shares 18 (879,330) (148,940) (477,631) (2,843,065) (291,817)
Total finance costs (879,555) (149,034) (478,042) (2,845,110) (292,169)
Loss for the financial year before taxation (1,927,947) (1,167,832) (4,787,926) (11,259,484) (2,799,581)
Withholding taxes on dividends 2(h) (142,341) (16,612) (59,910) (455,803) (7,275)
Movement in provision capital gains tax on
investments 2(p) 88,062 – – 61,100 –
Decrease in assets attributable to holders of
redeemable participating Shares from
operations (1,982,226) (1,184,444) (4,847,836) (11,654,187) (2,806,856)
The accompanying notes form an integral part of the financial statements.
Gains and losses arose solely from continuing operations. There were no gains or losses other than those dealt with in the Statement of Comprehensive Income.
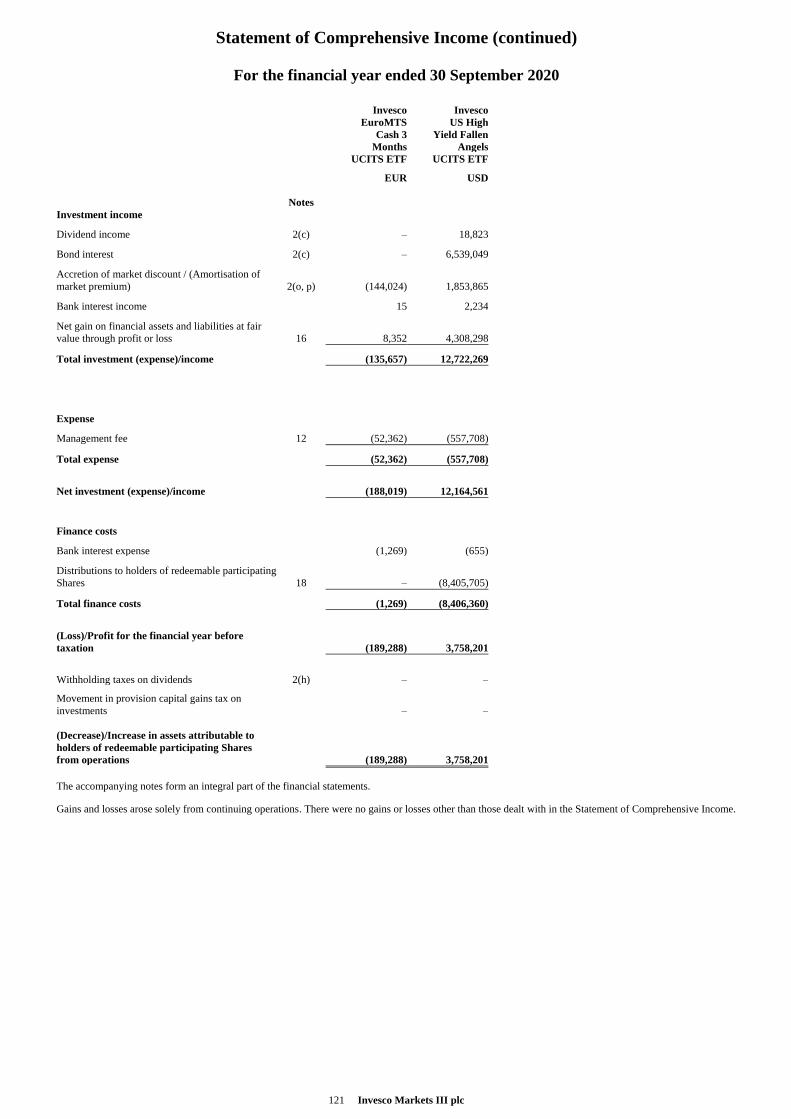
Statement of Comprehensive Income (continued)
121 Invesco Markets III plc
For the financial year ended 30 September 2020
Invesco Invesco
EuroMTS US High
Cash 3 Yield Fallen
Months Angels
UCITS ETF UCITS ETF
EUR
USD
Notes
Investment income
Dividend income 2(c) – 18,823
Bond interest 2(c) – 6,539,049
Accretion of market discount / (Amortisation of
market premium) 2(o, p) (144,024) 1,853,865
Bank interest income 15 2,234
Net gain on financial assets and liabilities at fair
value through profit or loss 16 8,352 4,308,298
Total investment (expense)/income (135,657) 12,722,269
Expense
Management fee 12 (52,362) (557,708)
Total expense (52,362) (557,708)
Net investment (expense)/income (188,019) 12,164,561
Finance costs
Bank interest expense (1,269) (655)
Distributions to holders of redeemable participating
Shares 18 – (8,405,705)
Total finance costs (1,269) (8,406,360)
(Loss)/Profit for the financial year before
taxation (189,288) 3,758,201
Withholding taxes on dividends 2(h) – –
Movement in provision capital gains tax on
investments 2(p) – –
(Decrease)/Increase in assets attributable to
holders of redeemable participating Shares
from operations (189,288) 3,758,201
The accompanying notes form an integral part of the financial statements.
Gains and losses arose solely from continuing operations. There were no gains or losses other than those dealt with in the Statement of Comprehensive Income.
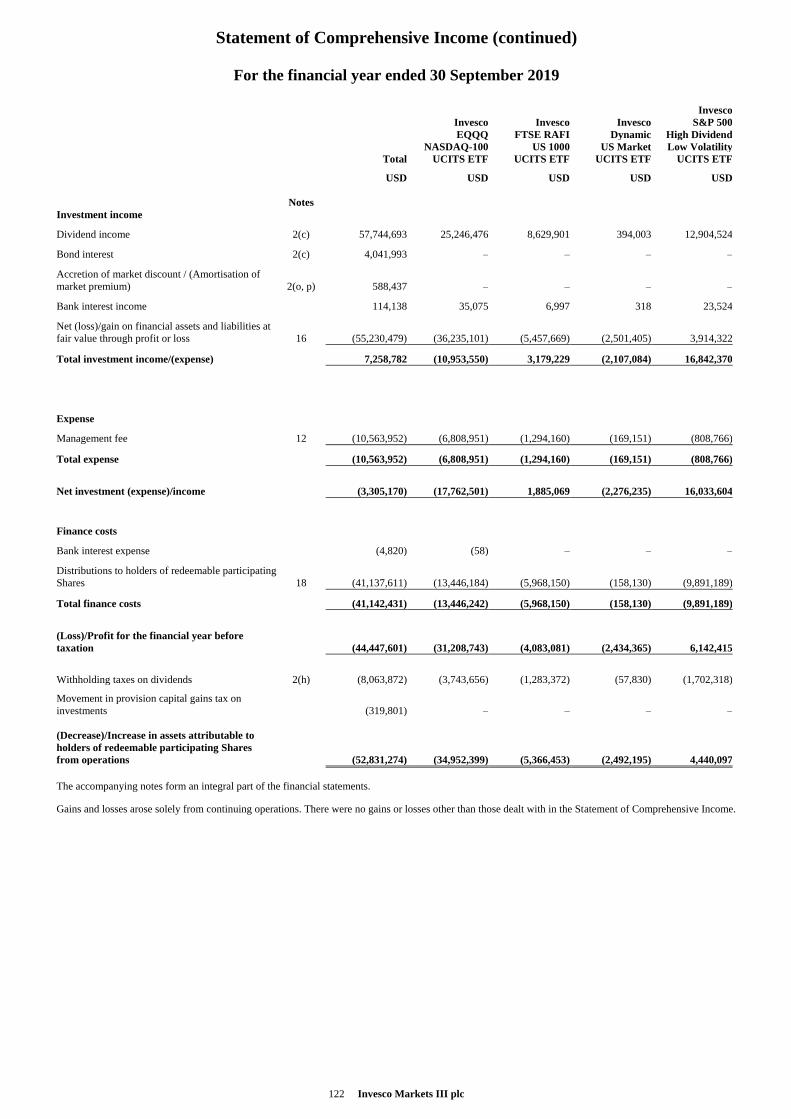
Statement of Comprehensive Income (continued)
122 Invesco Markets III plc
For the financial year ended 30 September 2019
Invesco
Invesco Invesco Invesco S&P 500
EQQQ FTSE RAFI Dynamic High Dividend
NASDAQ-100 US 1000 US Market Low Volatility
Total UCITS ETF UCITS ETF UCITS ETF UCITS ETF
USD
USD
USD
USD
USD
Notes
Investment income
Dividend income 2(c) 57,744,693 25,246,476 8,629,901 394,003 12,904,524
Bond interest 2(c) 4,041,993 – – – –
Accretion of market discount / (Amortisation of
market premium) 2(o, p) 588,437 – – – –
Bank interest income 114,138 35,075 6,997 318 23,524
Net (loss)/gain on financial assets and liabilities at
fair value through profit or loss 16 (55,230,479) (36,235,101) (5,457,669) (2,501,405) 3,914,322
Total investment income/(expense) 7,258,782 (10,953,550) 3,179,229 (2,107,084) 16,842,370
Expense
Management fee 12 (10,563,952) (6,808,951) (1,294,160) (169,151) (808,766)
Total expense (10,563,952) (6,808,951) (1,294,160) (169,151) (808,766)
Net investment (expense)/income (3,305,170) (17,762,501) 1,885,069 (2,276,235) 16,033,604
Finance costs
Bank interest expense (4,820) (58) – – –
Distributions to holders of redeemable participating
Shares 18 (41,137,611) (13,446,184) (5,968,150) (158,130) (9,891,189)
Total finance costs (41,142,431) (13,446,242) (5,968,150) (158,130) (9,891,189)
(Loss)/Profit for the financial year before
taxation (44,447,601) (31,208,743) (4,083,081) (2,434,365) 6,142,415
Withholding taxes on dividends 2(h) (8,063,872) (3,743,656) (1,283,372) (57,830) (1,702,318)
Movement in provision capital gains tax on
investments 2(p) (319,801) – – – –
(Decrease)/Increase in assets attributable to
holders of redeemable participating Shares
from operations (52,831,274) (34,952,399) (5,366,453) (2,492,195) 4,440,097
The accompanying notes form an integral part of the financial statements.
Gains and losses arose solely from continuing operations. There were no gains or losses other than those dealt with in the Statement of Comprehensive Income.
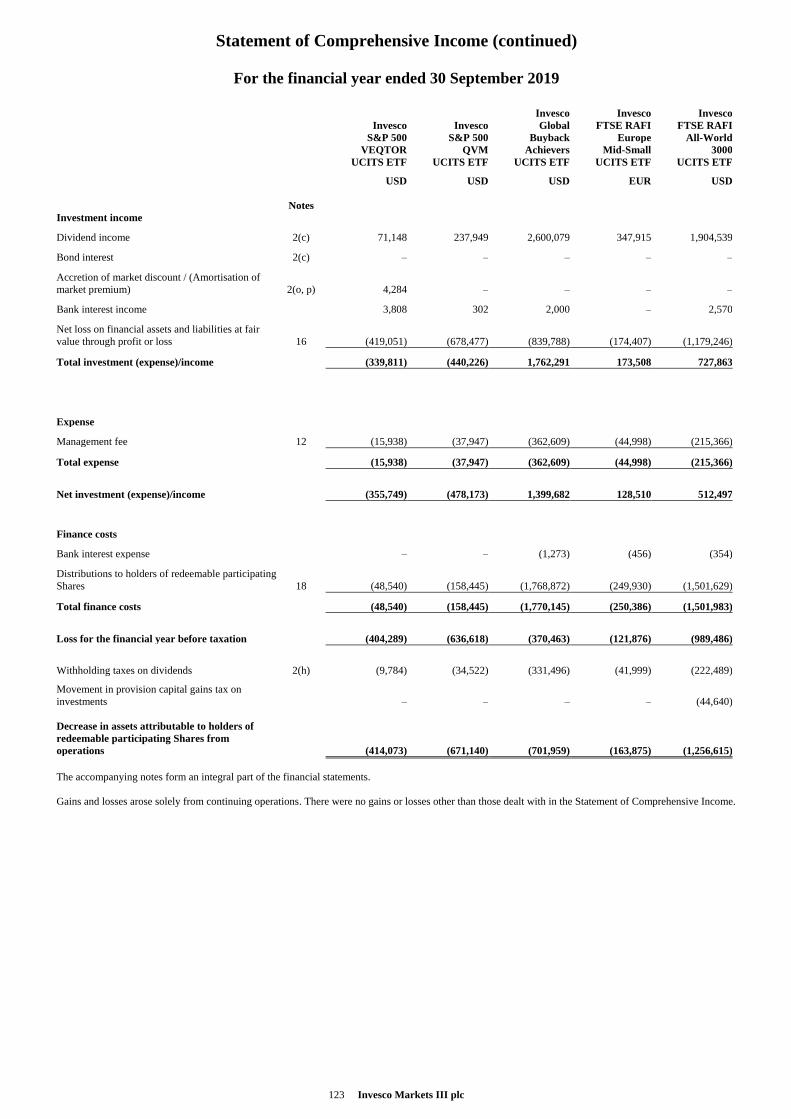
Statement of Comprehensive Income (continued)
123 Invesco Markets III plc
For the financial year ended 30 September 2019
Invesco Invesco Invesco
Invesco Invesco Global FTSE RAFI FTSE RAFI
S&P 500 S&P 500 Buyback Europe All-World
VEQTOR QVM Achievers Mid-Small 3000
UCITS ETF UCITS ETF UCITS ETF UCITS ETF UCITS ETF
USD
USD
USD
EUR
USD
Notes
Investment income
Dividend income 2(c) 71,148 237,949 2,600,079 347,915 1,904,539
Bond interest 2(c) – – – – –
Accretion of market discount / (Amortisation of
market premium) 2(o, p) 4,284 – – – –
Bank interest income 3,808 302 2,000 – 2,570
Net loss on financial assets and liabilities at fair
value through profit or loss 16 (419,051) (678,477) (839,788) (174,407) (1,179,246)
Total investment (expense)/income (339,811) (440,226) 1,762,291 173,508 727,863
Expense
Management fee 12 (15,938) (37,947) (362,609) (44,998) (215,366)
Total expense (15,938) (37,947) (362,609) (44,998) (215,366)
Net investment (expense)/income (355,749) (478,173) 1,399,682 128,510 512,497
Finance costs
Bank interest expense – – (1,273) (456) (354)
Distributions to holders of redeemable participating
Shares 18 (48,540) (158,445) (1,768,872) (249,930) (1,501,629)
Total finance costs (48,540) (158,445) (1,770,145) (250,386) (1,501,983)
Loss for the financial year before taxation (404,289) (636,618) (370,463) (121,876) (989,486)
Withholding taxes on dividends 2(h) (9,784) (34,522) (331,496) (41,999) (222,489)
Movement in provision capital gains tax on
investments 2(p) – – – – (44,640)
Decrease in assets attributable to holders of
redeemable participating Shares from
operations (414,073) (671,140) (701,959) (163,875) (1,256,615)
The accompanying notes form an integral part of the financial statements.
Gains and losses arose solely from continuing operations. There were no gains or losses other than those dealt with in the Statement of Comprehensive Income.
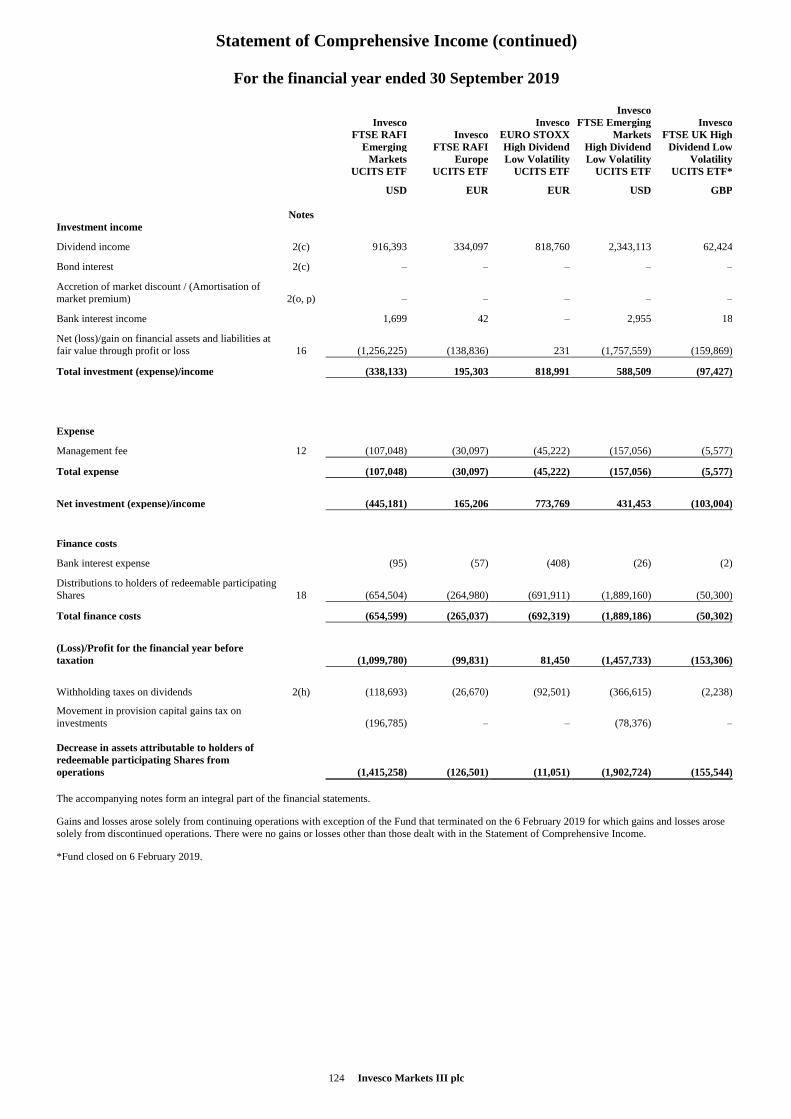
Statement of Comprehensive Income (continued)
124 Invesco Markets III plc
For the financial year ended 30 September 2019
Invesco
Invesco Invesco FTSE Emerging Invesco
FTSE RAFI Invesco EURO STOXX Markets FTSE UK High
Emerging FTSE RAFI High Dividend High Dividend Dividend Low
Markets Europe Low Volatility Low Volatility Volatility
UCITS ETF UCITS ETF UCITS ETF UCITS ETF UCITS ETF*
USD
EUR
EUR
USD
GBP
Notes
Investment income
Dividend income 2(c) 916,393 334,097 818,760 2,343,113 62,424
Bond interest 2(c) – – – – –
Accretion of market discount / (Amortisation of
market premium) 2(o, p) – – – – –
Bank interest income 1,699 42 – 2,955 18
Net (loss)/gain on financial assets and liabilities at
fair value through profit or loss 16 (1,256,225) (138,836) 231 (1,757,559) (159,869)
Total investment (expense)/income (338,133) 195,303 818,991 588,509 (97,427)
Expense
Management fee 12 (107,048) (30,097) (45,222) (157,056) (5,577)
Total expense (107,048) (30,097) (45,222) (157,056) (5,577)
Net investment (expense)/income (445,181) 165,206 773,769 431,453 (103,004)
Finance costs
Bank interest expense (95) (57) (408) (26) (2)
Distributions to holders of redeemable participating
Shares 18 (654,504) (264,980) (691,911) (1,889,160) (50,300)
Total finance costs (654,599) (265,037) (692,319) (1,889,186) (50,302)
(Loss)/Profit for the financial year before
taxation (1,099,780) (99,831) 81,450 (1,457,733) (153,306)
Withholding taxes on dividends 2(h) (118,693) (26,670) (92,501) (366,615) (2,238)
Movement in provision capital gains tax on
investments 2(p) (196,785) – – (78,376) –
Decrease in assets attributable to holders of
redeemable participating Shares from
operations (1,415,258) (126,501) (11,051) (1,902,724) (155,544)
The accompanying notes form an integral part of the financial statements.
Gains and losses arose solely from continuing operations with exception of the Fund that terminated on the 6 February 2019 for which gains and losses arose
solely from discontinued operations. There were no gains or losses other than those dealt with in the Statement of Comprehensive Income.
*Fund closed on 6 February 2019.
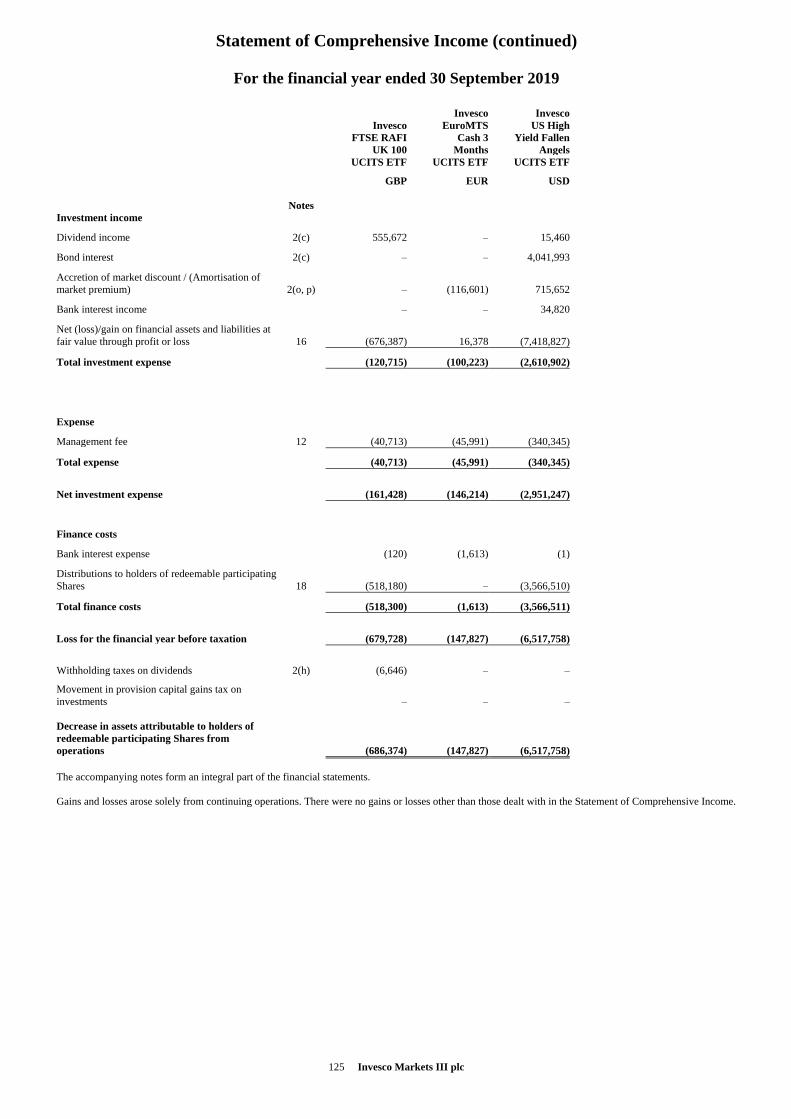
Statement of Comprehensive Income (continued)
125 Invesco Markets III plc
For the financial year ended 30 September 2019
Invesco Invesco
Invesco EuroMTS US High
FTSE RAFI Cash 3 Yield Fallen
UK 100 Months Angels
UCITS ETF UCITS ETF UCITS ETF
GBP
EUR
USD
Notes
Investment income
Dividend income 2(c) 555,672 – 15,460
Bond interest 2(c) – – 4,041,993
Accretion of market discount / (Amortisation of
market premium) 2(o, p) – (116,601) 715,652
Bank interest income – – 34,820
Net (loss)/gain on financial assets and liabilities at
fair value through profit or loss 16 (676,387) 16,378 (7,418,827)
Total investment expense (120,715) (100,223) (2,610,902)
Expense
Management fee 12 (40,713) (45,991) (340,345)
Total expense (40,713) (45,991) (340,345)
Net investment expense (161,428) (146,214) (2,951,247)
Finance costs
Bank interest expense (120) (1,613) (1)
Distributions to holders of redeemable participating
Shares 18 (518,180) – (3,566,510)
Total finance costs (518,300) (1,613) (3,566,511)
Loss for the financial year before taxation (679,728) (147,827) (6,517,758)
Withholding taxes on dividends 2(h) (6,646) – –
Movement in provision capital gains tax on
investments 2(p) – – –
Decrease in assets attributable to holders of
redeemable participating Shares from
operations (686,374) (147,827) (6,517,758)
The accompanying notes form an integral part of the financial statements.
Gains and losses arose solely from continuing operations. There were no gains or losses other than those dealt with in the Statement of Comprehensive Income.
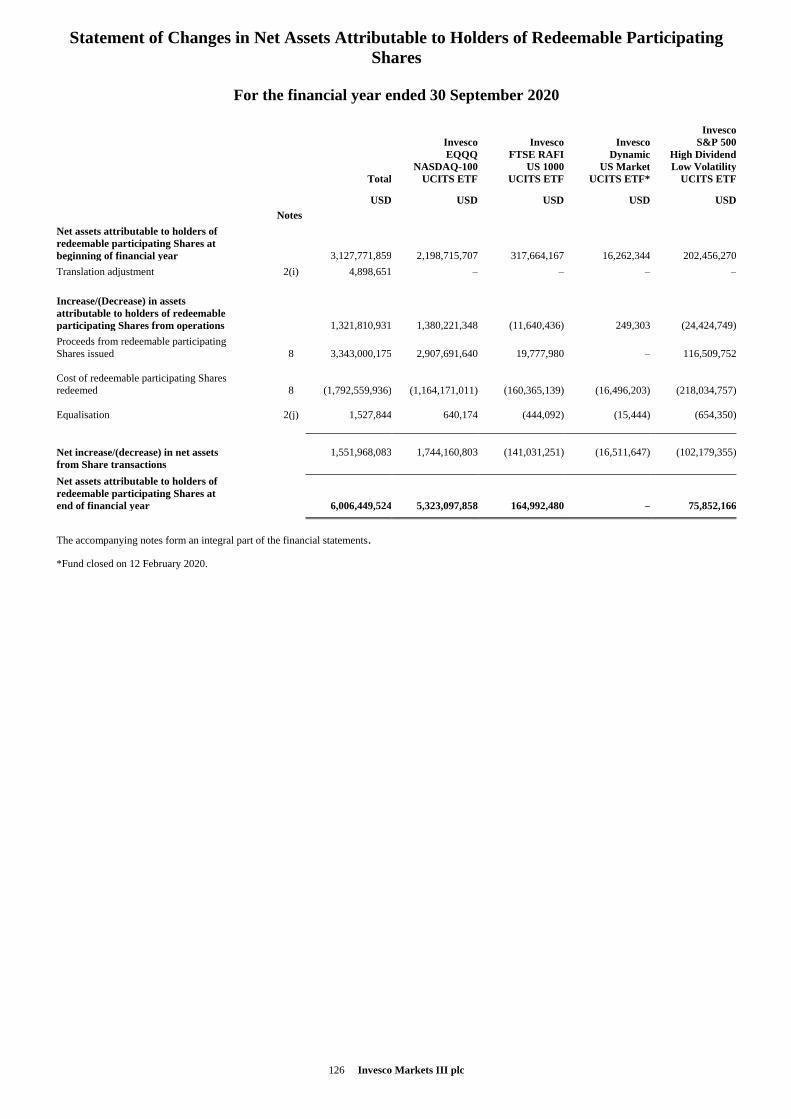
Statement of Changes in Net Assets Attributable to Holders of Redeemable Participating
Shares
126 Invesco Markets III plc
For the financial year ended 30 September 2020
Invesco
Invesco Invesco Invesco S&P 500
EQQQ FTSE RAFI Dynamic High Dividend
NASDAQ-100 US 1000 US Market Low Volatility
Total UCITS ETF UCITS ETF UCITS ETF* UCITS ETF
USD USD USD USD USD
Notes
Net assets attributable to holders of
redeemable participating Shares at
beginning of financial year 3,127,771,859 2,198,715,707 317,664,167 16,262,344 202,456,270
Translation adjustment 2(i) 4,898,651 – – – –
Increase/(Decrease) in assets
attributable to holders of redeemable
participating Shares from operations 1,321,810,931 1,380,221,348 (11,640,436) 249,303 (24,424,749)
Proceeds from redeemable participating
Shares issued 8 3,343,000,175 2,907,691,640 19,777,980 – 116,509,752
Cost of redeemable participating Shares
redeemed 8 (1,792,559,936) (1,164,171,011) (160,365,139) (16,496,203) (218,034,757)
Equalisation 2(j) 1,527,844 640,174 (444,092) (15,444) (654,350)
Net increase/(decrease) in net assets
from Share transactions 1,551,968,083 1,744,160,803 (141,031,251) (16,511,647) (102,179,355)
Net assets attributable to holders of
redeemable participating Shares at
end of financial year 6,006,449,524 5,323,097,858 164,992,480 – 75,852,166
The accompanying notes form an integral part of the financial statements.
*Fund closed on 12 February 2020.
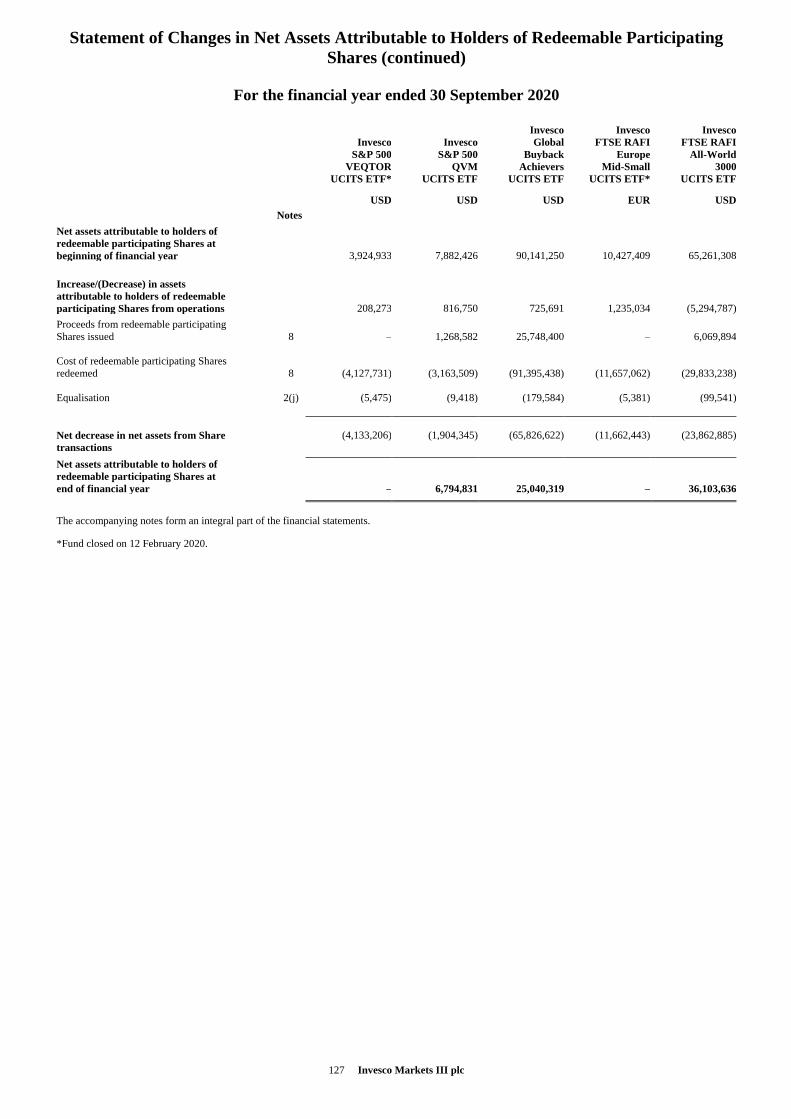
Statement of Changes in Net Assets Attributable to Holders of Redeemable Participating
Shares (continued)
127 Invesco Markets III plc
For the financial year ended 30 September 2020
Invesco Invesco Invesco
Invesco Invesco Global FTSE RAFI FTSE RAFI
S&P 500 S&P 500 Buyback Europe All-World
VEQTOR QVM Achievers Mid-Small 3000
UCITS ETF* UCITS ETF UCITS ETF UCITS ETF* UCITS ETF
USD USD USD EUR USD
Notes
Net assets attributable to holders of
redeemable participating Shares at
beginning of financial year 3,924,933 7,882,426 90,141,250 10,427,409 65,261,308
Increase/(Decrease) in assets
attributable to holders of redeemable
participating Shares from operations 208,273 816,750 725,691 1,235,034 (5,294,787)
Proceeds from redeemable participating
Shares issued 8 – 1,268,582 25,748,400 – 6,069,894
Cost of redeemable participating Shares
redeemed 8 (4,127,731) (3,163,509) (91,395,438) (11,657,062) (29,833,238)
Equalisation 2(j) (5,475) (9,418) (179,584) (5,381) (99,541)
Net decrease in net assets from Share
transactions (4,133,206) (1,904,345) (65,826,622) (11,662,443) (23,862,885)
Net assets attributable to holders of
redeemable participating Shares at
end of financial year – 6,794,831 25,040,319 – 36,103,636
The accompanying notes form an integral part of the financial statements.
*Fund closed on 12 February 2020.
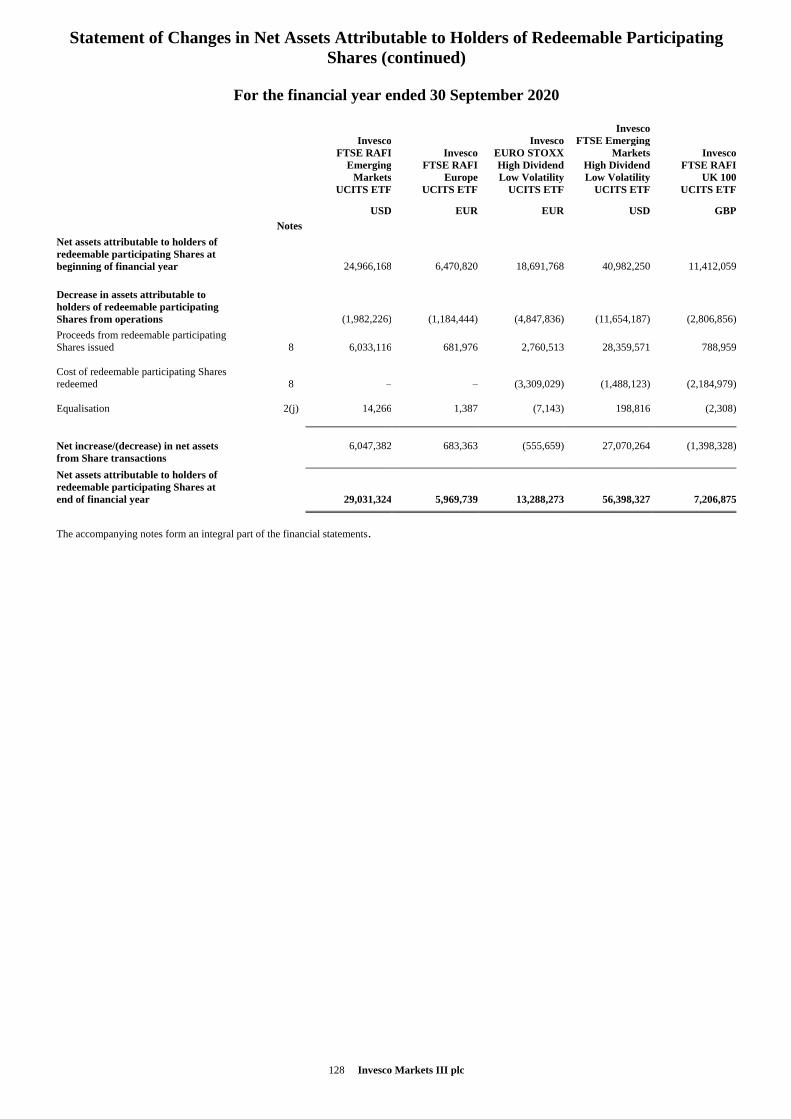
Statement of Changes in Net Assets Attributable to Holders of Redeemable Participating
Shares (continued)
128 Invesco Markets III plc
For the financial year ended 30 September 2020
Invesco
Invesco Invesco FTSE Emerging
FTSE RAFI Invesco EURO STOXX Markets Invesco
Emerging FTSE RAFI High Dividend High Dividend FTSE RAFI
Markets Europe Low Volatility Low Volatility UK 100
UCITS ETF UCITS ETF UCITS ETF UCITS ETF UCITS ETF
USD EUR EUR USD GBP
Notes
Net assets attributable to holders of
redeemable participating Shares at
beginning of financial year 24,966,168 6,470,820 18,691,768 40,982,250 11,412,059
Decrease in assets attributable to
holders of redeemable participating
Shares from operations (1,982,226) (1,184,444) (4,847,836) (11,654,187) (2,806,856)
Proceeds from redeemable participating
Shares issued 8 6,033,116 681,976 2,760,513 28,359,571 788,959
Cost of redeemable participating Shares
redeemed 8 – – (3,309,029) (1,488,123) (2,184,979)
Equalisation 2(j) 14,266 1,387 (7,143) 198,816 (2,308)
Net increase/(decrease) in net assets
from Share transactions 6,047,382 683,363 (555,659) 27,070,264 (1,398,328)
Net assets attributable to holders of
redeemable participating Shares at
end of financial year 29,031,324 5,969,739 13,288,273 56,398,327 7,206,875
The accompanying notes form an integral part of the financial statements.
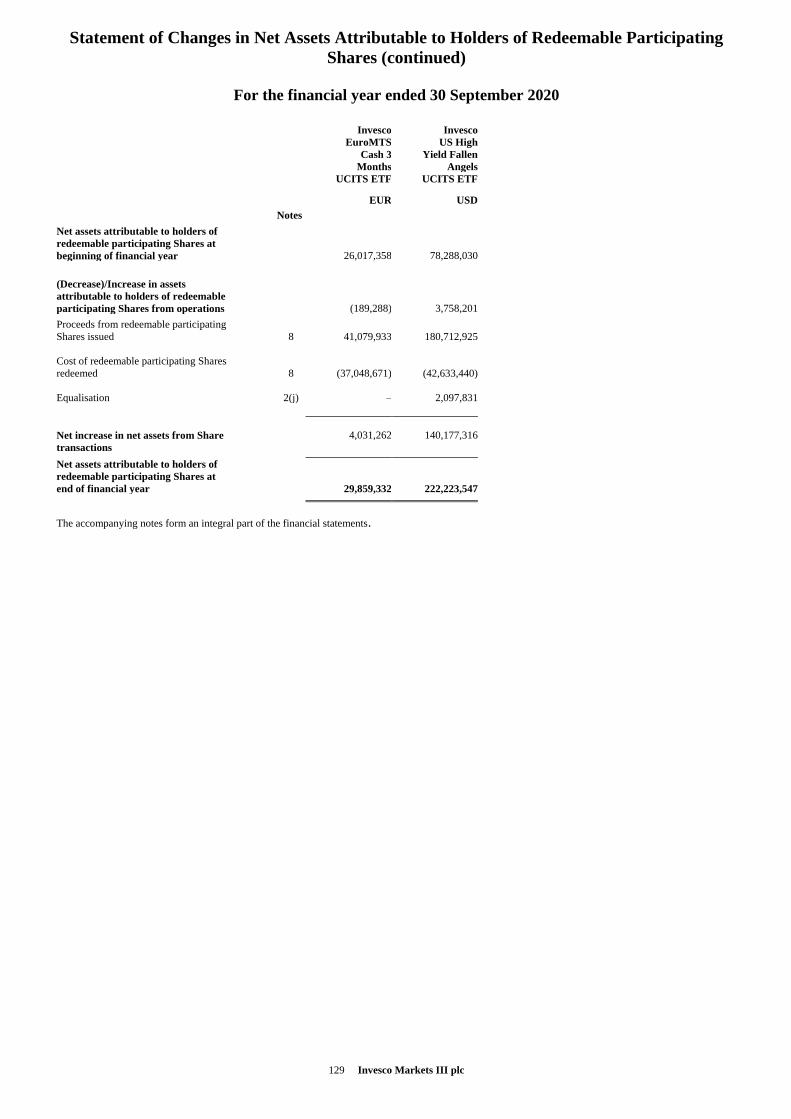
Statement of Changes in Net Assets Attributable to Holders of Redeemable Participating
Shares (continued)
129 Invesco Markets III plc
For the financial year ended 30 September 2020
Invesco Invesco
EuroMTS US High
Cash 3 Yield Fallen
Months Angels
UCITS ETF UCITS ETF
EUR USD
Notes
Net assets attributable to holders of
redeemable participating Shares at
beginning of financial year 26,017,358 78,288,030
(Decrease)/Increase in assets
attributable to holders of redeemable
participating Shares from operations (189,288) 3,758,201
Proceeds from redeemable participating
Shares issued 8 41,079,933 180,712,925
Cost of redeemable participating Shares
redeemed 8 (37,048,671) (42,633,440)
Equalisation 2(j) – 2,097,831
Net increase in net assets from Share
transactions 4,031,262 140,177,316
Net assets attributable to holders of
redeemable participating Shares at
end of financial year 29,859,332 222,223,547
The accompanying notes form an integral part of the financial statements.
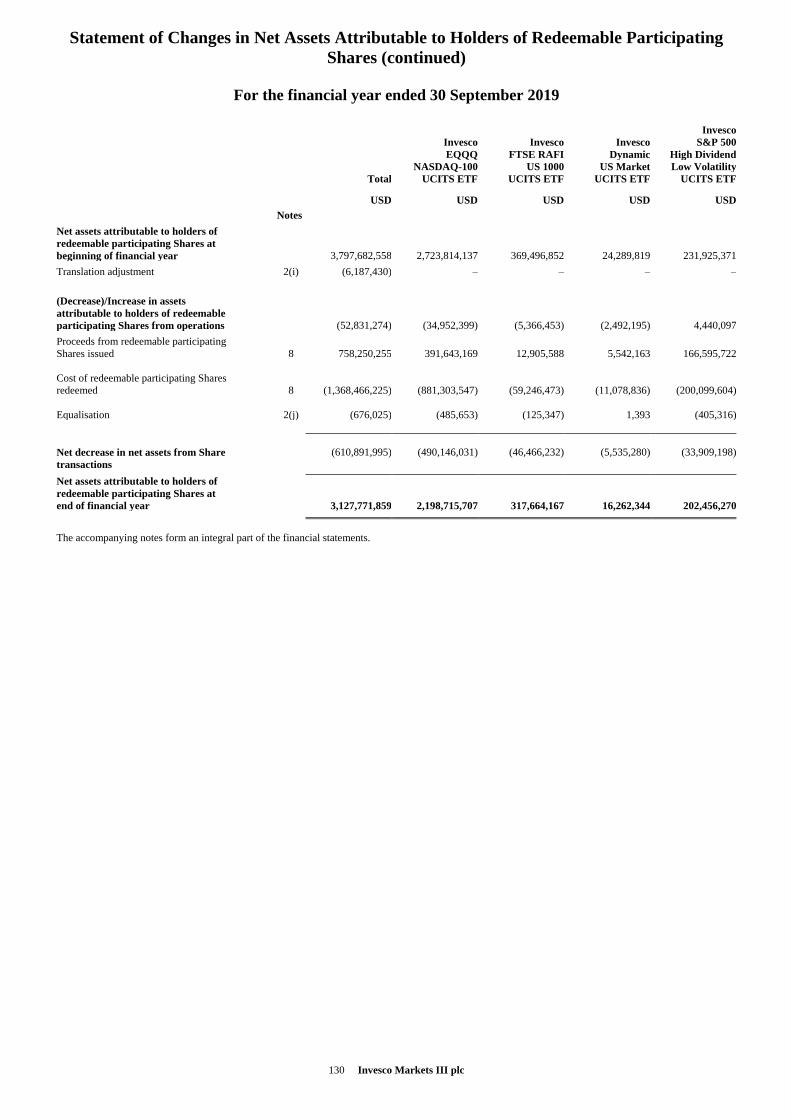
Statement of Changes in Net Assets Attributable to Holders of Redeemable Participating
Shares (continued)
130 Invesco Markets III plc
For the financial year ended 30 September 2019
Invesco
Invesco Invesco Invesco S&P 500
EQQQ FTSE RAFI Dynamic High Dividend
NASDAQ-100 US 1000 US Market Low Volatility
Total UCITS ETF UCITS ETF UCITS ETF UCITS ETF
USD USD USD USD USD
Notes
Net assets attributable to holders of
redeemable participating Shares at
beginning of financial year 3,797,682,558 2,723,814,137 369,496,852 24,289,819 231,925,371
Translation adjustment 2(i) (6,187,430) – – – –
(Decrease)/Increase in assets
attributable to holders of redeemable
participating Shares from operations (52,831,274) (34,952,399) (5,366,453) (2,492,195) 4,440,097
Proceeds from redeemable participating
Shares issued 8 758,250,255 391,643,169 12,905,588 5,542,163 166,595,722
Cost of redeemable participating Shares
redeemed 8 (1,368,466,225) (881,303,547) (59,246,473) (11,078,836) (200,099,604)
Equalisation 2(j) (676,025) (485,653) (125,347) 1,393 (405,316)
Net decrease in net assets from Share
transactions (610,891,995) (490,146,031) (46,466,232) (5,535,280) (33,909,198)
Net assets attributable to holders of
redeemable participating Shares at
end of financial year 3,127,771,859 2,198,715,707 317,664,167 16,262,344 202,456,270
The accompanying notes form an integral part of the financial statements.
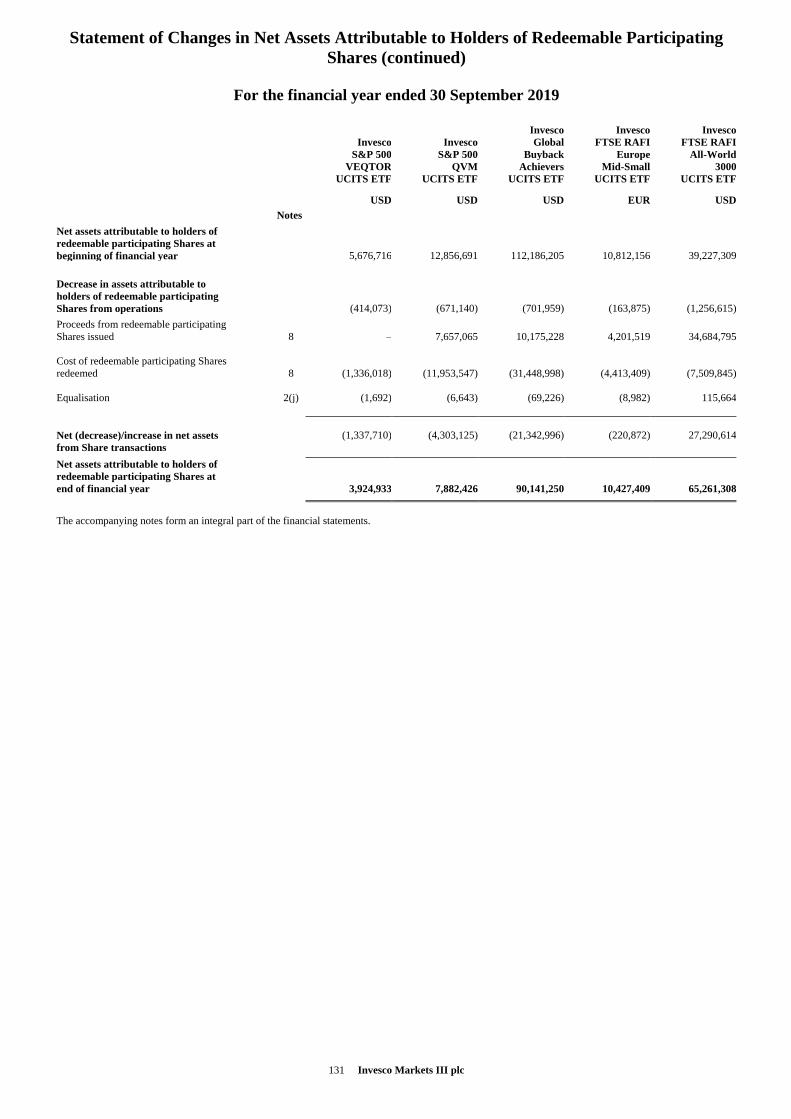
Statement of Changes in Net Assets Attributable to Holders of Redeemable Participating
Shares (continued)
131 Invesco Markets III plc
For the financial year ended 30 September 2019
Invesco Invesco Invesco
Invesco Invesco Global FTSE RAFI FTSE RAFI
S&P 500 S&P 500 Buyback Europe All-World
VEQTOR QVM Achievers Mid-Small 3000
UCITS ETF UCITS ETF UCITS ETF UCITS ETF UCITS ETF
USD USD USD EUR USD
Notes
Net assets attributable to holders of
redeemable participating Shares at
beginning of financial year 5,676,716 12,856,691 112,186,205 10,812,156 39,227,309
Decrease in assets attributable to
holders of redeemable participating
Shares from operations (414,073) (671,140) (701,959) (163,875) (1,256,615)
Proceeds from redeemable participating
Shares issued 8 – 7,657,065 10,175,228 4,201,519 34,684,795
Cost of redeemable participating Shares
redeemed 8 (1,336,018) (11,953,547) (31,448,998) (4,413,409) (7,509,845)
Equalisation 2(j) (1,692) (6,643) (69,226) (8,982) 115,664
Net (decrease)/increase in net assets
from Share transactions (1,337,710) (4,303,125) (21,342,996) (220,872) 27,290,614
Net assets attributable to holders of
redeemable participating Shares at
end of financial year 3,924,933 7,882,426 90,141,250 10,427,409 65,261,308
The accompanying notes form an integral part of the financial statements.
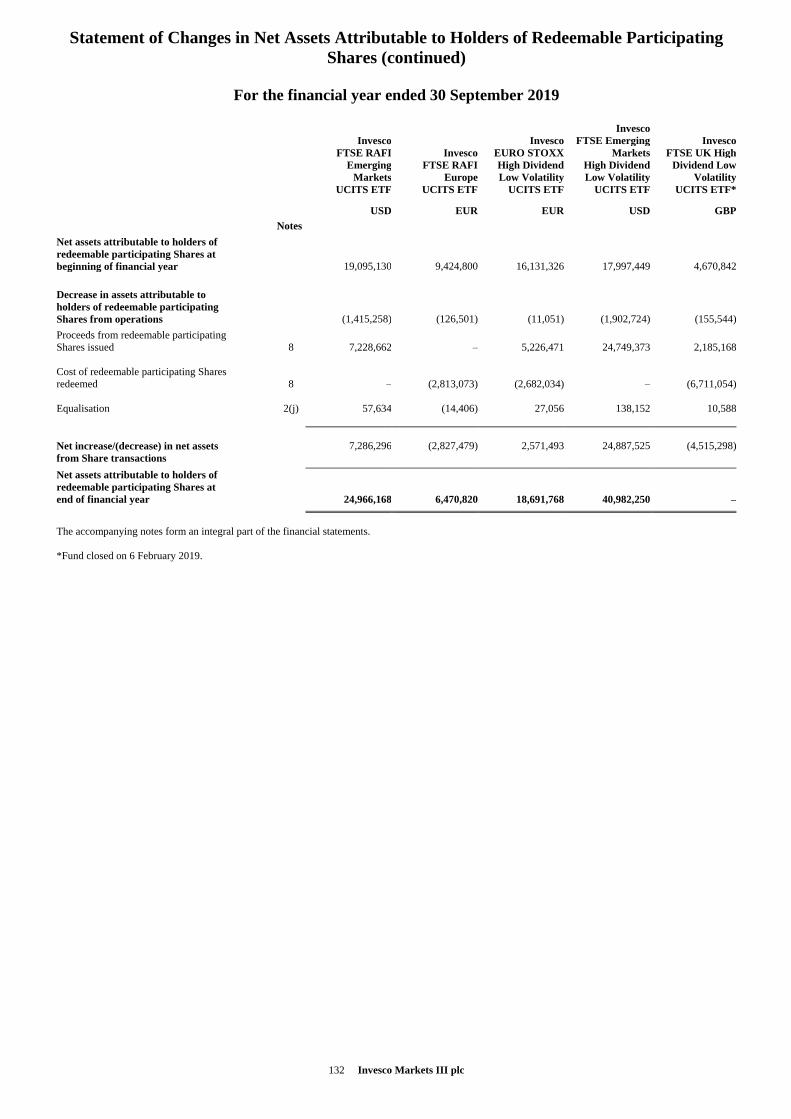
Statement of Changes in Net Assets Attributable to Holders of Redeemable Participating
Shares (continued)
132 Invesco Markets III plc
For the financial year ended 30 September 2019
Invesco
Invesco Invesco FTSE Emerging Invesco
FTSE RAFI Invesco EURO STOXX Markets FTSE UK High
Emerging FTSE RAFI High Dividend High Dividend Dividend Low
Markets Europe Low Volatility Low Volatility Volatility
UCITS ETF UCITS ETF UCITS ETF UCITS ETF UCITS ETF*
USD EUR EUR USD GBP
Notes
Net assets attributable to holders of
redeemable participating Shares at
beginning of financial year 19,095,130 9,424,800 16,131,326 17,997,449 4,670,842
Decrease in assets attributable to
holders of redeemable participating
Shares from operations (1,415,258) (126,501) (11,051) (1,902,724) (155,544)
Proceeds from redeemable participating
Shares issued 8 7,228,662 – 5,226,471 24,749,373 2,185,168
Cost of redeemable participating Shares
redeemed 8 – (2,813,073) (2,682,034) – (6,711,054)
Equalisation 2(j) 57,634 (14,406) 27,056 138,152 10,588
Net increase/(decrease) in net assets
from Share transactions 7,286,296 (2,827,479) 2,571,493 24,887,525 (4,515,298)
Net assets attributable to holders of
redeemable participating Shares at
end of financial year 24,966,168 6,470,820 18,691,768 40,982,250 –
The accompanying notes form an integral part of the financial statements.
*Fund closed on 6 February 2019.
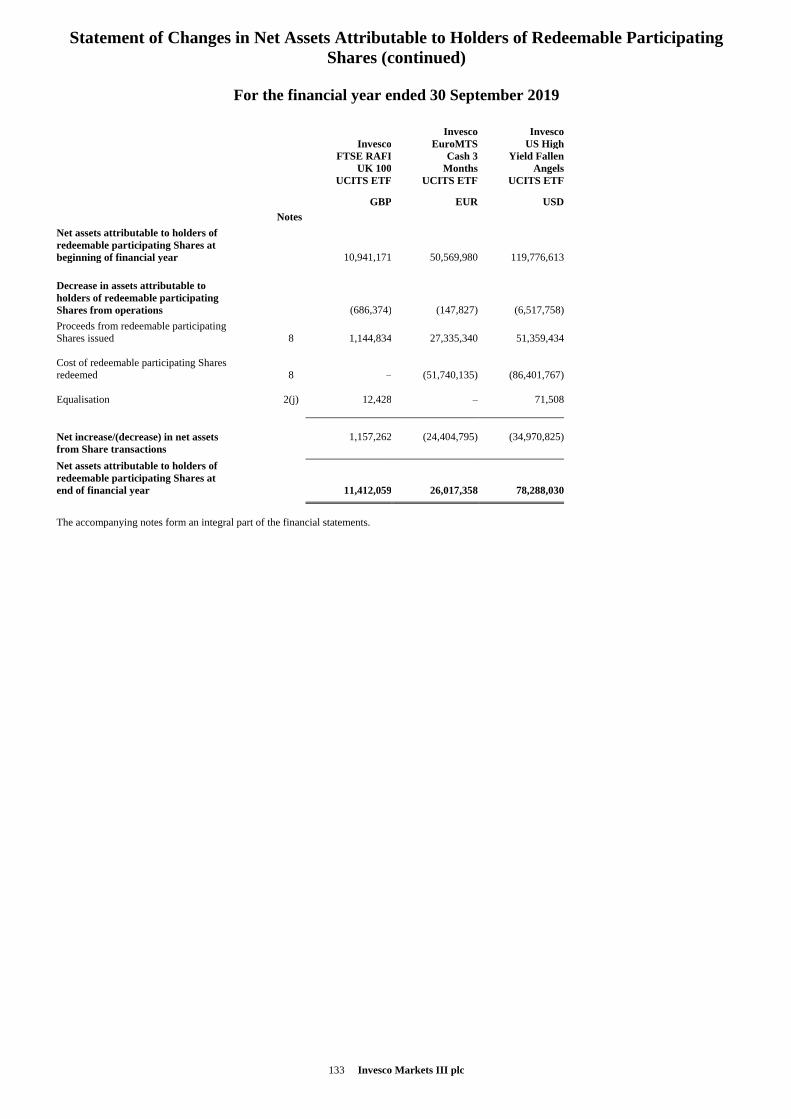
Statement of Changes in Net Assets Attributable to Holders of Redeemable Participating
Shares (continued)
133 Invesco Markets III plc
For the financial year ended 30 September 2019
Invesco Invesco
Invesco EuroMTS US High
FTSE RAFI Cash 3 Yield Fallen
UK 100 Months Angels
UCITS ETF UCITS ETF UCITS ETF
GBP EUR USD
Notes
Net assets attributable to holders of
redeemable participating Shares at
beginning of financial year 10,941,171 50,569,980 119,776,613
Decrease in assets attributable to
holders of redeemable participating
Shares from operations (686,374) (147,827) (6,517,758)
Proceeds from redeemable participating
Shares issued 8 1,144,834 27,335,340 51,359,434
Cost of redeemable participating Shares
redeemed 8 – (51,740,135) (86,401,767)
Equalisation 2(j) 12,428 – 71,508
Net increase/(decrease) in net assets
from Share transactions 1,157,262 (24,404,795) (34,970,825)
Net assets attributable to holders of
redeemable participating Shares at
end of financial year 11,412,059 26,017,358 78,288,030
The accompanying notes form an integral part of the financial statements.
Notes to the Financial Statements
134 Invesco Markets III plc
1. Establishment
The Company is an open-ended investment company with variable capital incorporated in Ireland, on 5 February 2002 with limited liability pursuant to the
Companies Act 2014. The Company was authorised on 13 September 2002 by the Central Bank of Ireland and is now regulated by the Central Bank of Ireland
as an Undertaking for Collective Investments in Transferable Securities, a “UCITS”. It is authorised pursuant to the European Communities (Undertaking for
Collective Investments in Transferable Securities) Regulations 2011, as amended (the “UCITS Regulations”) and the Central Bank (Supervision and
Enforcement) Act 2013 (Section 48(1)) (Undertakings for Collective Investment in Transferable Securities) (Amendment) Regulations 2019 (the “Central
Bank UCITS Regulations”).
The Company has segregated liability between its Funds. Accordingly, each Fund is treated as bearing its own liabilities exclusively from its own assets.
The Company is structured as an umbrella fund which may comprise one or more Funds. The Company may at any time establish new classes of shares within
a Fund as well as new Funds. Any new Fund will require the prior approval of the Central Bank of Ireland and the establishment of any new class of shares
must be notified in advance to the Central Bank of Ireland. As at 30 September 2020 the Company has thirteen active Funds. Invesco Dynamic US Market
UCITS ETF, Invesco S&P 500 VEQTOR UCITS ETF and Invesco FTSE RAFI Europe Mid-Small UCITS ETF closed on 12 February 2020.
Objectives Please refer to the Investment Policy and Description of the Fund on pages 6 and 7 where the objectives of each Fund are listed.
2. Significant Accounting Policies
(a) Basis of Preparation
The financial statements are prepared in accordance with Financial Reporting Standard (“FRS”) 102, the financial reporting standard applicable in the United
Kingdom and Republic of Ireland and Irish statute comprising the Companies Act 2014, the UCITS Regulations and the Central Bank UCITS Regulations. The
financial statements are prepared under FRS 102 which present a true and fair view are those standards promulgated by the Institute of Chartered Accountants
in Ireland (the “Institute”) and the Company’s Acts and issued by the Financial Reporting Council (“FRC”).
The financial statements have been prepared under the historical cost convention as modified by the revaluation of financial assets and financial liabilities held
at fair value through profit or loss. The preparation of financial statements requires management to make certain estimates and assumptions that may affect the
amounts reported in the financial statements and related notes. Actual results may differ from the estimates and differences could be material.
The format and certain wordings of the financial statements have been adapted from those contained in Irish statute so that, in the opinion of the Directors, they
more appropriately reflect the nature of the Company’s business as an Investment Fund.
The financial statements for the Company have been prepared on a going concern basis.
The Company has availed of the exemption available to open-ended investment Funds that hold a substantial proportion of highly liquid and fair valued
investments under Section 7 of FRS 102 and is not presenting cash flow statements.
(b) Financial assets and financial liabilities at fair value through profit or loss
Classification The Funds have classified all investments into the fair value through profit or loss category. This has two sub-categories: (1) financial assets and liabilities held
for trading and (2) those designated by management at fair value through profit or loss. Financial assets or liabilities held for trading are acquired or incurred
principally for the purposes of selling or repurchasing in the short term. All investments held in the Company are classified as held for trading.
Recognition/Derecognition Purchases and sales of investments are recognised on the trade date being the date on which the Company commits to purchase or sell the investment.
Investments are derecognised when the rights to receive cash flows from the investments have expired or the Company has transferred substantially all risks
and rewards of ownership. Realised gains and losses on disposals are calculated using the first in first out method (“FIFO”) and are reflected as net gains/losses
on financial assets/liabilities at fair value through profit or loss in the Statement of Comprehensive Income.
Initial Measurement of Investments Financial assets and financial liabilities at fair value through profit or loss are initially recognised at fair value. Transaction costs are expensed in the Statement
of Comprehensive Income. Gains and losses arising from changes in the fair value of the financial assets or financial liabilities at fair value through profit or
loss category are presented in the Statement of Comprehensive Income in the period in which they arise.
Valuation of Investments The estimation of fair value, after initial recognition, is determined as follows:
(i) Listed Investments
The value of an Investment which is quoted, listed or normally dealt in on a Regulated Market shall be the closing sale price on such Regulated Market as at
the Valuation Point or the last traded price when no closing sale price is available. Invesco Markets III plc can invest in short-term liquidity funds. See note 14
for detail of these.
(ii) Futures Contracts
Derivative financial instruments are initially recognized at cost and subsequently are re-measured at fair value. Market values are obtained from quoted market
prices and exchange rates. All derivatives are carried in assets when amounts are receivable by the Fund and in liabilities when amounts are payable by the
Fund. Changes in market values of future contracts are included in note 16.
(iii) Bonds
The Fund utilises the closing mid price at the year end date for Bonds where the closing mid price falls within the bid-ask spread. In circumstances where the
closing mid price is not within the bid-ask spread, management will determine the point within the bid-ask spread that is most representative of fair value.
Notes to the Financial Statements (continued)
135 Invesco Markets III plc
2. Significant Accounting Policies (continued)
(b) Financial assets and financial liabilities at fair value through profit or loss (continued)
Valuation of Investments (continued) (iv) Forward Foreign Exchange Contracts
The unrealised gain or loss on open forward foreign exchange contracts is calculated as the difference between the contracted rate and the rate to close out the
contract and is disclosed in the Statement of Financial Position. Realised gains or losses include net results on contracts which have been settled or offset on
other contracts and are recorded in the Statement of Operations and Changes in Net Assets. The unrealized appreciation/(depreciation) is disclosed in the
Statement of Financial Position under “Unrealised gain/(loss) on forward foreign exchange contracts”. Realised gains/(losses) and changes in unrealised
appreciation/(depreciation) as a result thereof are included in the Statement of Operations and Changes in Net Assets respectively under “Net realised
gain/(loss) on investments, derivatives and foreign currencies and other” and “Net change in unrealised appreciation/(depreciation) on forward foreign
exchange contracts”. Changes in the realised/unrealised value of forward foreign exchange contracts are included in note 16.
(c) Income from Investments
(i) Dividend Income
Dividends are credited to the Statement of Comprehensive Income on the dates on which the relevant securities are listed as “ex-dividend”. Dividend income is
shown gross of any non-recoverable withholding taxes, which are disclosed separately in the Statement of Comprehensive Income, and net of any tax credits.
Recoverable taxes if any are accounted for on a cash receipts basis.
(ii) Bond Interest
Interest income on securities is accrued on a daily basis and recognised in the Statement of Comprehensive Income. Interest income on securities includes
interest and discount earned (net of premium), which is the difference between the face value and the original cost, including original issue discount. Accretion
of market discount/Amortisation of market premium can be seen on a separate line on the Statement of Comprehensive Income.
(d) Expense Recognition
All expenses are recognised in the Statement of Comprehensive Income on an accruals basis, with the exception of transaction charges relating to the
acquisition and realisation of investments which are charged when incurred. Bank interest expense is accrued on a daily basis.
(e) Receivables and Payables
Receivables are non-derivative financial assets with fixed or determinable payments that are not quoted in an active market. Receivables are recognised
initially at fair value plus transaction costs that are directly attributable to their acquisition origination. They are subsequently measured at amortised cost using
the effective interest method, less provision for impairment. The carrying amount of other receivables approximates to their fair values.
Payables are recognised initially at fair value and subsequently stated at amortised cost, using the effective interest method. The difference between the
proceeds and the amount payable is recognised over the period of the payable. The carrying amount of payables approximates to their fair values.
Securities sold receivable and securities purchased payable represent receivables for securities sold and payables for securities purchased that have been
contracted for but not yet settled or delivered on the Statement of Financial Position date respectively.
(f) Redeemable Participating Shares
The Net Asset Value per share is computed for each dealing day. The price at which shares are allotted or redeemed is calculated with reference to the Net
Asset Value per share as at the close of business on the relevant dealing day in accordance with the prospectus of the Company, as amended.
Redeemable participating Shares are redeemable at the shareholder’s option and are classified as financial liabilities. The distribution on these shares is
recognised in the Statement of Comprehensive Income as finance costs.
The redeemable participating Shares can be redeemed at any time for cash equal to a proportionate share of the net asset value. The redeemable participating
Share is carried at the redemption amount that is payable at the Statement of Financial Position date if the shareholder exercised its right to put the share back
into the Company.
The fair value of the financial liability for the redeemable participating Shares is the redemption amount per share, calculated as the Net Asset Value per share
less any associated duties and charges and any redemption dividend which is payable on the Shares redeemed.
Capital shares receivable and capital shares payable represent receivables for shares sold and payables for shares purchased that have been contracted for but
not yet settled or delivered on the Statement of Financial Position date respectively.
(g) Dividends to Redeemable Participating Shareholders
Dividends payable to holders of redeemable participating Shares are classified as finance costs in the Statement of Comprehensive Income.
(h) Taxation
Under current law and practice the Company qualifies as an investment undertaking as defined in Section 739B of the Taxes Consolidation Act, 1997, as
amended. On that basis, it is not chargeable to Irish tax on its income or gains.
However, Irish tax may arise on the happening of a “chargeable event”. A chargeable event includes any distribution payments to shareholders, any
encashment, redemption, cancellation or transfer of shares and the holding of shares at the end of each eight year beginning with the acquisition of such shares.
No Irish tax will arise on the Company in respect of chargeable events in respect of:
a) A Shareholder who is neither Irish resident nor ordinarily resident in Ireland for tax purposes, at the time of the chargeable event, provided appropriate valid
declarations in accordance with the provisions of the Taxes Consolidation Act, 1997, as amended, are held by the Company or Company has been authorised
by the Irish Revenue to make gross payments in the absence of appropriate declarations; and
b) Certain exempted Irish tax resident shareholders who have provided the Company with the necessary signed statutory declarations.
Dividends, interest and capital gains (if any) received on investments made by the Company may be subject to withholding taxes imposed by the country from
which the investment income/gains are received and such taxes may not be recoverable by the Company or its shareholders.
Notes to the Financial Statements (continued)
136 Invesco Markets III plc
2. Significant Accounting Policies (continued)
(h) Taxation (continued)
The Finance Act 2010 provides that the Revenue Commissioners may grant approval for investment funds marketed outside of Ireland to make payments to
non-resident investors without deduction of Irish tax where no relevant declaration is in place, subject to meeting the “equivalent measures”. A company
wishing to receive approval must apply in writing to the Revenue Commissioners, confirming compliance with the relevant conditions.
(i) Foreign Currency
Items included in the Company’s financial statements are measured using the currency of the primary economic environment in which it operates ("the
functional currency"). This is US Dollar, which reflects the fact that the Company’s investor base is located in the United States.
(i) Functional and Presentation Currency
The Funds have US Dollar as their functional and presentation currency apart from the following:
Fund Currency Fund Currency
Invesco FTSE RAFI Europe Mid-Small UCITS ETF EUR Invesco FTSE RAFI UK 100 UCITS ETF GBP
Invesco FTSE RAFI Europe UCITS ETF EUR Invesco EuroMTS Cash 3 Months UCITS ETF EUR
Invesco EURO STOXX High Dividend Low Volatility UCITS ETF EUR
For the purpose of combining the Financial Statements of the Funds to arrive at Total Company figures (required under Irish Company Law), the amounts in
the Funds' Statement of Financial Position have been translated to US Dollar at the exchange rate ruling at 30 September 2020. The Statement of
Comprehensive Income and proceeds from subscriptions and amounts paid on redemptions of redeemable participating Shares are translated at the average
rates prevailing at the date of the transactions. For rates of exchange please see note 17. The notional foreign exchange loss of USD4,898,651 (2019: loss of
USD(6,187,430)) is due to the use of average rates as stated above and the difference in opening and closing rates in translation of opening net assets. This
notional foreign exchange adjustment has no impact on the Net Asset Value of the individual Funds.
(ii) Transactions and Balances
Foreign currency transactions are translated into the functional currency using the exchange rates prevailing at the dates of the transactions. Foreign currency
assets and liabilities are translated into the functional currency using the exchange rate prevailing at the Statement of Financial Position date. Foreign exchange
gains and losses arising from translation are included in the Statement of Comprehensive Income.
Foreign exchange gains and losses relating to cash and cash equivalents are presented in the Statement of Comprehensive Income within ‘Net gain/loss on
financial assets and liabilities at fair value through profit or loss’. Foreign exchange gains and losses relating to the financial assets and liabilities carried at fair
value through profit or loss are presented in the Statement of Comprehensive Income within ‘Net gain/loss on financial assets and liabilities at fair value
through profit or loss’.
(j) Equalisation
An equalisation account is maintained by each Fund so that the amount distributed on all classes of Shares will be the same for all shares of the same type,
notwithstanding different dates of issue. A sum equal to that part of the issue price of a Share which reflects income (if any) accrued up to the date of issue will
be deemed to be an equalisation payment. It will be treated as repaid to Shareholders with the first distribution or accumulation for the relevant Fund to which
the Shareholder is entitled in the same accounting period as that in which the shares are issued. Equalisation will not be operated in respect of the first issue of
Shares by a Fund.
(k) Cash and Cash Equivalents
Cash and cash equivalents include cash in hand and other short-term highly liquid investments with original maturities of three months or less. Bank overdrafts
are included in liabilities on the Statement of Financial Position.
(l) Transaction Fees
Transaction fees are costs incurred to acquire financial assets or liabilities at fair value through profit or loss. They include fees and commissions paid to
agents, advisers, brokers and dealers. Transaction fees, when incurred, are immediately recognised in profit or loss as an expense.
(m) Cash Collateral Held
Cash collateral provided by each Fund is identified in the Statement of Financial Position as cash collateral held and is not included as a component of cash and
cash equivalents. For collateral other than cash, if the party to whom the collateral is provided has the right by contract or custom to sell or repledge the
collateral, the Fund classifies that asset in its Statement of Financial Position separately from other assets and identifies the asset as pledged collateral. Where
the party to whom the collateral is provided does not have the right to sell or repledge, a disclosure of the collateral provided is made in the notes to the
financial statements. Any obligation arising from collateral received is measured at the fair value of the amount required to settle the obligation and separately
identified in the Statement of Financial Position. There was no cash collateral held at 30 September 2020 and 30 September 2019.
(n) Margin Account Held at Broker
Cash collateral provided by/payable to each Fund in relation to futures contracts is identified in the Statement of Financial Position as margin cash held at
broker and is not included as a component of cash and cash equivalents.
(o) Amortisation and Accretion of Market Investments
Amortisation/Accretion of Premium/Discount was disclosed under the Investment Income section on the Statement of Comprehensive Income. Amortisation is
the process of decreasing the book value of a bond purchased at a premium until the book value was equal to the par value at the time of maturity. As the book
value is reduced, it is accounted for as a reduction in total investment income. Accretion is the process of writing up the book value of a bond purchased at a
discount. As the book value is increased, it is accounted for as an increase in total investment income. The Amortisation/Accretion approached provides a
consistent accounting treatment over the life of bond-like assets of the capital gain or loss associated with holding these assets.
Notes to the Financial Statements (continued)
137 Invesco Markets III plc
2. Significant Accounting Policies (continued)
(p) Capital Gains Tax
In September 2016, Brazil’s Department of Federal Revenue updated Ireland’s status for Brazilian tax purposes, and included Ireland on their list of countries
classified as low tax jurisdictions. This resulted in the asset and wealth management industry having to consider whether funds should accrue for potential
Brazilian capital gains tax exposures (“CGT”) on unrealised gains on their holdings. Four of the Funds in Invesco Markets III plc had exposure to Brazilian
investments as at 30 September 2020 – Invesco Global Buyback Achievers UCITS ETF, Invesco RAFI All World 3000 UCITS ETF, Invesco FTSE RAFI
Emerging Markets UCITS ETF and Invesco FTSE Emerging Markets High Dividend Low Volatility UCITS ETF. Please refer to the Statement of
Comprehensive Income.
3. Cash
The Fund’s cash balances are maintained in an interest-bearing account with the sub-custodian of the Company, The Bank of New York Mellon
(Luxembourg). These cash balances are held in the name of Bank of New York Mellon SA/NV, Dublin Branch (formerly BNY Mellon Trust Company
(Ireland) Limited), the Depositary.
Cash and other liquid assets with a maturity of less than 3 months will be valued at their face value with interest accrued.
4. Margin Accounts
Margin accounts represent the exchange-traded futures contracts' margin deposits amounts held with brokers.
5. Financial Assets and Liabilities at Fair Value Through Profit or Loss
The following tables list the financial assets and financial liabilities at fair value through profit or loss by asset type for the financial year ended 30 September
2020 and 30 September 2019 respectively.
30 September 2020 0 Invesco
0 Invesco Invesco Invesco S&P 500 Invesco
0 EQQQ FTSE RAFI Dynamic High Dividend S&P 500
0 NASDAQ-100 US 1000 US Market Low Volatility VEQTOR
0 Total UCITS ETF UCITS ETF UCITS ETF* UCITS ETF UCITS ETF*
0 USD USD USD USD USD USD
Equities 5,761,965,560 5,342,683,083 165,009,147 – 75,793,139 –
Bonds 250,767,268 – – – – –
Investment Funds 134,108,936 123,660,797 – – – –
Warrants 3,190 – 3,190 – – –
Forward Foreign Exchange
Contracts (5,250,713) (5,075,619) – – (3,051) –
Total 6,141,594,241 5,461,268,261 165,012,337 – 75,790,088 –
30 September 2020 0 Invesco Invesco Invesco Invesco
0 Invesco Global FTSE RAFI FTSE RAFI FTSE RAFI Invesco
0 S&P 500 Buyback Europe All-World Emerging FTSE RAFI
0 QVM Achievers Mid-Small 3000 Markets Europe
0 UCITS ETF UCITS ETF UCITS ETF* UCITS ETF UCITS ETF UCITS ETF
0 USD USD EUR USD USD EUR
Equities 6,793,040 24,992,727 – 35,789,130 26,950,410 5,966,685
Investment Funds – – – 270,854 2,140,431 –
Total 6,793,040 24,992,727 – 36,059,984 29,090,841 5,966,685
30 September 2020 Invesco 0 Invesco FTSE Emerging Invesco Invesco
0 EURO STOXX Markets Invesco EuroMTS US High
0 High Dividend High Dividend FTSE RAFI Cash 3 Yield Fallen
0 Low Volatility Low Volatility UK 100 Months Angels
0 UCITS ETF UCITS ETF UCITS ETF UCITS ETF UCITS ETF
0 EUR USD GBP EUR USD
Equities 13,285,682 52,061,604 7,206,669 – –
Bonds – – – 29,854,006 215,758,643
Investment Funds – 4,427,240 – – 3,609,614
Forward Foreign Exchange
Contracts – (1) – – (172,042)
Total 13,285,682 56,488,843 7,206,669 29,854,006 219,196,215
*Fund closed on 12 February 2020.
Notes to the Financial Statements (continued)
138 Invesco Markets III plc
5. Financial Assets and Liabilities at Fair Value Through Profit or Loss (continued)
30 September 2019 0 Invesco
0 Invesco Invesco Invesco S&P 500 Invesco
0 EQQQ FTSE RAFI Dynamic High Dividend S&P 500
0 NASDAQ-100 US 1000 US Market Low Volatility VEQTOR
0 Total UCITS ETF UCITS ETF UCITS ETF UCITS ETF UCITS ETF
0 USD USD USD USD USD USD
Equities 3,019,499,016 2,199,144,571 317,593,686 16,260,677 202,331,524 3,836,765
Bonds 105,079,716 – – – – –
Investment Funds 616,276 – – 54 – –
Futures Contracts 1,058 – – – – 1,058
Forward Foreign Exchange
Contracts (807,152) (614,772) – – (1,678) –
Total 3,124,388,914 2,198,529,799 317,593,686 16,260,731 202,329,846 3,837,823
30 September 2019 0 Invesco Invesco Invesco Invesco
0 Invesco Global FTSE RAFI FTSE RAFI FTSE RAFI Invesco
0 S&P 500 Buyback Europe All-World Emerging FTSE RAFI
0 QVM Achievers Mid-Small 3000 Markets Europe
0 UCITS ETF UCITS ETF UCITS ETF UCITS ETF UCITS ETF UCITS ETF
0 USD USD EUR USD USD EUR
Equities 7,882,023 89,979,634 10,419,554 65,125,239 25,022,325 6,467,781
Investment Funds – – 1,295 31,135 60,223 –
Total 7,882,023 89,979,634 10,420,849 65,156,374 25,082,548 6,467,781
30 September 2019 Invesco 0 Invesco FTSE Emerging Invesco Invesco Invesco
0 EURO STOXX Markets FTSE UK High Invesco EuroMTS US High
0 High Dividend High Dividend Dividend Low FTSE RAFI Cash 3 Yield Fallen
0 Low Volatility Low Volatility Volatility UK 100 Months Angels
0 UCITS ETF UCITS ETF UCITS ETF* UCITS ETF UCITS ETF UCITS ETF
0 EUR USD GBP GBP EUR USD
Equities 18,694,861 39,469,084 – 11,411,196 – –
Bonds – – – – 25,969,951 76,767,449
Investment Funds – – – – – 523,452
Forward Foreign Exchange
Contracts – – – – – (190,702)
Total 18,694,861 39,469,084 – 11,411,196 25,969,951 77,100,199
*Fund closed on 6 February 2019.
6. Accrued Income and Other Receivables
30 September 2020 0 Invesco
0 Invesco Invesco Invesco S&P 500 Invesco
0 EQQQ FTSE RAFI Dynamic High Dividend S&P 500
0 NASDAQ-100 US 1000 US Market Low Volatility VEQTOR
0 Total UCITS ETF UCITS ETF UCITS ETF* UCITS ETF UCITS ETF* 0 USD USD USD USD USD USD
Dividend income receivable 1,281,558 549,839 145,220 – 307,634 –
Interest income receivable 3,185,306 – – – – –
Total 4,466,864 549,839 145,220 – 307,634 –
30 September 2020 0 Invesco Invesco Invesco Invesco
0 Invesco Global FTSE RAFI FTSE RAFI FTSE RAFI Invesco
0 S&P 500 Buyback Europe All-World Emerging FTSE RAFI
0 QVM Achievers Mid-Small 3000 Markets Europe
0 UCITS ETF UCITS ETF UCITS ETF* UCITS ETF UCITS ETF UCITS ETF 0 USD USD EUR USD USD EUR
Dividend income receivable 4,070 77,905 – 76,624 51,696 4,402
Total 4,070 77,905 – 76,624 51,696 4,402
Notes to the Financial Statements (continued)
139 Invesco Markets III plc
6. Accrued Income and Other Receivables (continued)
30 September 2020 Invesco 0 Invesco FTSE Emerging Invesco Invesco
0 EURO STOXX Markets Invesco EuroMTS US High
0 High Dividend High Dividend FTSE RAFI Cash 3 Yield Fallen
0 Low Volatility Low Volatility UK 100 Months Angels
0 UCITS ETF UCITS ETF UCITS ETF UCITS ETF UCITS ETF 0 EUR USD GBP EUR USD
Dividend income receivable 2,128 52,468 6,017 2 664
Interest income receivable – – – – 3,185,306
Total 2,128 52,468 6,017 2 3,185,970
*Fund closed on 12 February 2020.
30 September 2019 0 Invesco
0 Invesco Invesco Invesco S&P 500 Invesco
0 EQQQ FTSE RAFI Dynamic High Dividend S&P 500
0 NASDAQ-100 US 1000 US Market Low Volatility VEQTOR
0 Total UCITS ETF UCITS ETF UCITS ETF UCITS ETF UCITS ETF 0 USD USD USD USD USD USD
Dividend income receivable 2,235,571 580,620 313,160 11,139 659,324 2,813
Interest income receivable 1,217,837 – – – – –
Total 3,453,408 580,620 313,160 11,139 659,324 2,813
30 September 2019 0 Invesco Invesco Invesco Invesco
0 Invesco Global FTSE RAFI FTSE RAFI FTSE RAFI Invesco
0 S&P 500 Buyback Europe All-World Emerging FTSE RAFI
0 QVM Achievers Mid-Small 3000 Markets Europe
0 UCITS ETF UCITS ETF UCITS ETF UCITS ETF UCITS ETF UCITS ETF 0 USD USD EUR USD USD EUR
Dividend income receivable 5,335 185,452 15,787 142,350 57,637 5,516
Total 5,335 185,452 15,787 142,350 57,637 5,516
30 September 2019 Invesco 0 Invesco FTSE Emerging Invesco Invesco Invesco
0 EURO STOXX Markets FTSE UK High Invesco EuroMTS US High
0 High Dividend High Dividend Dividend Low FTSE RAFI Cash 3 Yield Fallen
0 Low Volatility Low Volatility Volatility UK 100 Months Angels
0 UCITS ETF UCITS ETF UCITS ETF* UCITS ETF UCITS ETF UCITS ETF 0 EUR USD GBP GBP EUR USD
Dividend income receivable 8,154 230,770 – 12,056 – –
Interest income receivable – – – – – 1,217,837
Total 8,154 230,770 – 12,056 – 1,217,837
*Fund closed on 6 February 2019.
7. Accrued Expenses
0
0 Invesco
0 Invesco Invesco Invesco S&P 500 Invesco
0 EQQQ FTSE RAFI Dynamic High Dividend S&P 500
0 NASDAQ-100 US 1000 US Market Low Volatility VEQTOR
30 September 2020 Total UCITS ETF UCITS ETF UCITS ETF* UCITS ETF UCITS ETF*
0 USD USD USD USD USD USD
Management Fee (1,382,727) (1,157,757) (52,374) – (18,248) –
Total (1,382,727) (1,157,757) (52,374) – (18,248) –
0
0 Invesco Invesco Invesco Invesco
0 Invesco Global FTSE RAFI FTSE RAFI FTSE RAFI Invesco
0 S&P 500 Buyback Europe All-World Emerging FTSE RAFI
0 QVM Achievers Mid-Small 3000 Markets Europe
30 September 2020 UCITS ETF UCITS ETF UCITS ETF* UCITS ETF UCITS ETF UCITS ETF
0 USD USD EUR USD USD EUR
Management Fee (1,937) (8,107) – (13,069) (12,037) (1,959)
Total (1,937) (8,107) – (13,069) (12,037) (1,959)
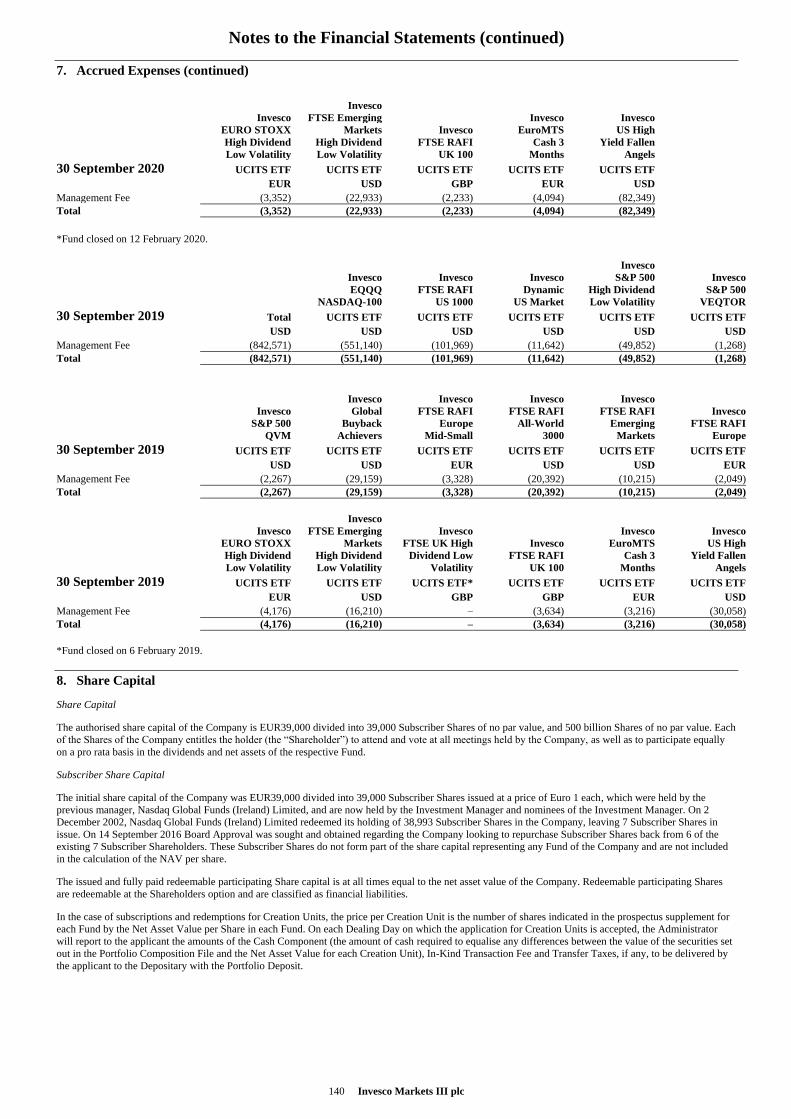
Notes to the Financial Statements (continued)
140 Invesco Markets III plc
7. Accrued Expenses (continued)
0 Invesco
0 Invesco FTSE Emerging Invesco Invesco
0 EURO STOXX Markets Invesco EuroMTS US High
0 High Dividend High Dividend FTSE RAFI Cash 3 Yield Fallen
0 Low Volatility Low Volatility UK 100 Months Angels
30 September 2020 UCITS ETF UCITS ETF UCITS ETF UCITS ETF UCITS ETF
0 EUR USD GBP EUR USD
Management Fee (3,352) (22,933) (2,233) (4,094) (82,349)
Total (3,352) (22,933) (2,233) (4,094) (82,349)
*Fund closed on 12 February 2020.
0
0 Invesco
0 Invesco Invesco Invesco S&P 500 Invesco
0 EQQQ FTSE RAFI Dynamic High Dividend S&P 500
0 NASDAQ-100 US 1000 US Market Low Volatility VEQTOR
30 September 2019 Total UCITS ETF UCITS ETF UCITS ETF UCITS ETF UCITS ETF
0 USD USD USD USD USD USD
Management Fee (842,571) (551,140) (101,969) (11,642) (49,852) (1,268)
Total (842,571) (551,140) (101,969) (11,642) (49,852) (1,268)
0
0 Invesco Invesco Invesco Invesco
0 Invesco Global FTSE RAFI FTSE RAFI FTSE RAFI Invesco
0 S&P 500 Buyback Europe All-World Emerging FTSE RAFI
0 QVM Achievers Mid-Small 3000 Markets Europe
30 September 2019 UCITS ETF UCITS ETF UCITS ETF UCITS ETF UCITS ETF UCITS ETF
0 USD USD EUR USD USD EUR
Management Fee (2,267) (29,159) (3,328) (20,392) (10,215) (2,049)
Total (2,267) (29,159) (3,328) (20,392) (10,215) (2,049)
0 Invesco
0 Invesco FTSE Emerging Invesco Invesco Invesco
0 EURO STOXX Markets FTSE UK High Invesco EuroMTS US High
0 High Dividend High Dividend Dividend Low FTSE RAFI Cash 3 Yield Fallen
0 Low Volatility Low Volatility Volatility UK 100 Months Angels
30 September 2019 UCITS ETF UCITS ETF UCITS ETF* UCITS ETF UCITS ETF UCITS ETF
0 EUR USD GBP GBP EUR USD
Management Fee (4,176) (16,210) – (3,634) (3,216) (30,058)
Total (4,176) (16,210) – (3,634) (3,216) (30,058)
*Fund closed on 6 February 2019.
8. Share Capital
Share Capital
The authorised share capital of the Company is EUR39,000 divided into 39,000 Subscriber Shares of no par value, and 500 billion Shares of no par value. Each
of the Shares of the Company entitles the holder (the “Shareholder”) to attend and vote at all meetings held by the Company, as well as to participate equally
on a pro rata basis in the dividends and net assets of the respective Fund.
Subscriber Share Capital
The initial share capital of the Company was EUR39,000 divided into 39,000 Subscriber Shares issued at a price of Euro 1 each, which were held by the
previous manager, Nasdaq Global Funds (Ireland) Limited, and are now held by the Investment Manager and nominees of the Investment Manager. On 2
December 2002, Nasdaq Global Funds (Ireland) Limited redeemed its holding of 38,993 Subscriber Shares in the Company, leaving 7 Subscriber Shares in
issue. On 14 September 2016 Board Approval was sought and obtained regarding the Company looking to repurchase Subscriber Shares back from 6 of the
existing 7 Subscriber Shareholders. These Subscriber Shares do not form part of the share capital representing any Fund of the Company and are not included
in the calculation of the NAV per share.
The issued and fully paid redeemable participating Share capital is at all times equal to the net asset value of the Company. Redeemable participating Shares
are redeemable at the Shareholders option and are classified as financial liabilities.
In the case of subscriptions and redemptions for Creation Units, the price per Creation Unit is the number of shares indicated in the prospectus supplement for
each Fund by the Net Asset Value per Share in each Fund. On each Dealing Day on which the application for Creation Units is accepted, the Administrator
will report to the applicant the amounts of the Cash Component (the amount of cash required to equalise any differences between the value of the securities set
out in the Portfolio Composition File and the Net Asset Value for each Creation Unit), In-Kind Transaction Fee and Transfer Taxes, if any, to be delivered by
the applicant to the Depositary with the Portfolio Deposit.
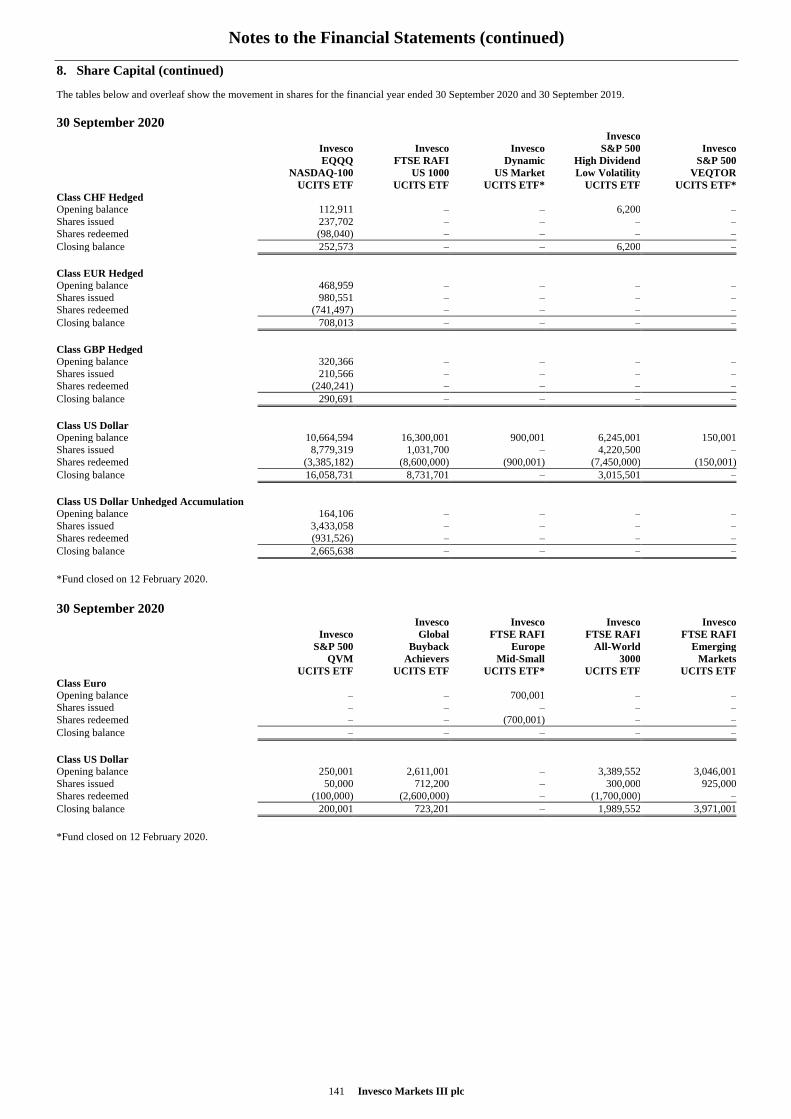
Notes to the Financial Statements (continued)
141 Invesco Markets III plc
8. Share Capital (continued)
The tables below and overleaf show the movement in shares for the financial year ended 30 September 2020 and 30 September 2019.
30 September 2020 0 Invesco
0 Invesco Invesco Invesco S&P 500 Invesco
0 EQQQ FTSE RAFI Dynamic High Dividend S&P 500
0 NASDAQ-100 US 1000 US Market Low Volatility VEQTOR
0 UCITS ETF UCITS ETF UCITS ETF* UCITS ETF UCITS ETF* Class CHF Hedged
Opening balance 112,911 – – 6,200 –
Shares issued 237,702 – – – –
Shares redeemed (98,040) – – – –
Closing balance 252,573 – – 6,200 –
Class EUR Hedged
Opening balance 468,959 – – – –
Shares issued 980,551 – – – –
Shares redeemed (741,497) – – – –
Closing balance 708,013 – – – –
Class GBP Hedged
Opening balance 320,366 – – – –
Shares issued 210,566 – – – –
Shares redeemed (240,241) – – – –
Closing balance 290,691 – – – –
Class US Dollar
Opening balance 10,664,594 16,300,001 900,001 6,245,001 150,001
Shares issued 8,779,319 1,031,700 – 4,220,500 –
Shares redeemed (3,385,182) (8,600,000) (900,001) (7,450,000) (150,001)
Closing balance 16,058,731 8,731,701 – 3,015,501 –
Class US Dollar Unhedged Accumulation
Opening balance 164,106 – – – –
Shares issued 3,433,058 – – – –
Shares redeemed (931,526) – – – –
Closing balance 2,665,638 – – – –
*Fund closed on 12 February 2020.
30 September 2020 0 Invesco Invesco Invesco Invesco
0 Invesco Global FTSE RAFI FTSE RAFI FTSE RAFI
0 S&P 500 Buyback Europe All-World Emerging
0 QVM Achievers Mid-Small 3000 Markets
0 UCITS ETF UCITS ETF UCITS ETF* UCITS ETF UCITS ETF Class Euro
Opening balance – – 700,001 – –
Shares issued – – – – –
Shares redeemed – – (700,001) – –
Closing balance – – – – –
Class US Dollar
Opening balance 250,001 2,611,001 – 3,389,552 3,046,001
Shares issued 50,000 712,200 – 300,000 925,000
Shares redeemed (100,000) (2,600,000) – (1,700,000) –
Closing balance 200,001 723,201 – 1,989,552 3,971,001
*Fund closed on 12 February 2020.
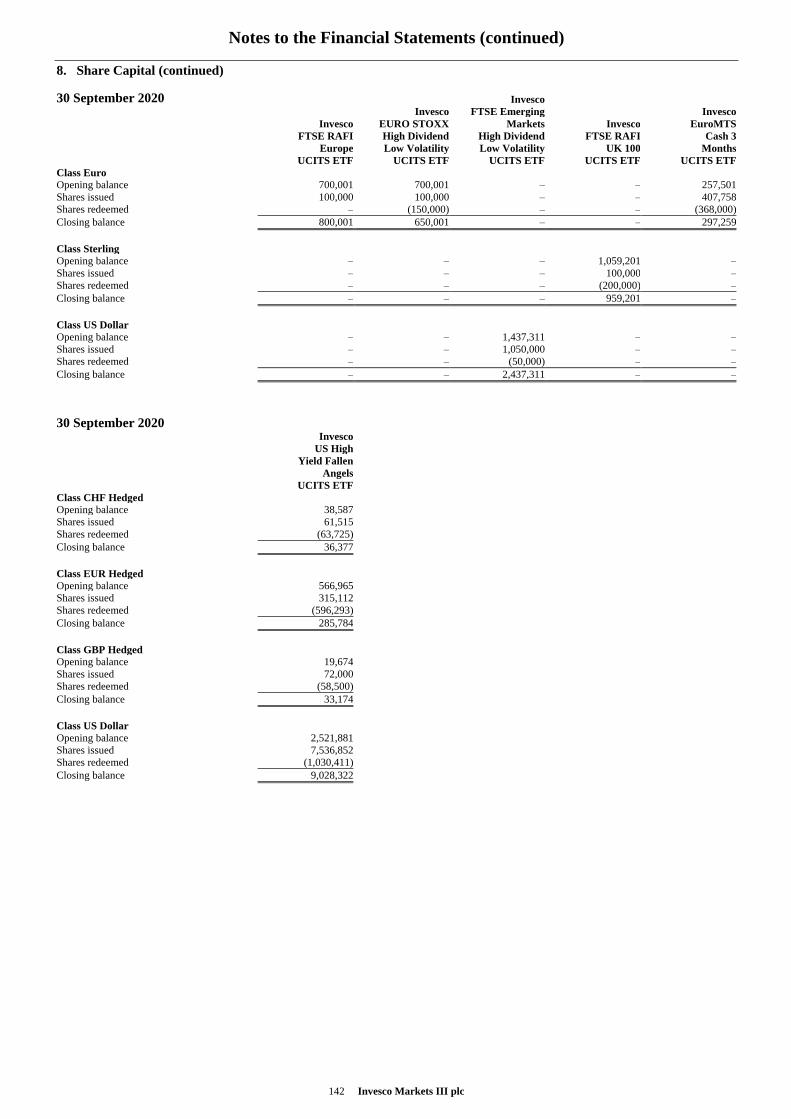
Notes to the Financial Statements (continued)
142 Invesco Markets III plc
8. Share Capital (continued)
30 September 2020 Invesco 0 Invesco FTSE Emerging Invesco
0 Invesco EURO STOXX Markets Invesco EuroMTS
0 FTSE RAFI High Dividend High Dividend FTSE RAFI Cash 3
0 Europe Low Volatility Low Volatility UK 100 Months
0 UCITS ETF UCITS ETF UCITS ETF UCITS ETF UCITS ETF Class Euro
Opening balance 700,001 700,001 – – 257,501
Shares issued 100,000 100,000 – – 407,758
Shares redeemed – (150,000) – – (368,000)
Closing balance 800,001 650,001 – – 297,259
Class Sterling
Opening balance – – – 1,059,201 –
Shares issued – – – 100,000 –
Shares redeemed – – – (200,000) –
Closing balance – – – 959,201 –
Class US Dollar
Opening balance – – 1,437,311 – –
Shares issued – – 1,050,000 – –
Shares redeemed – – (50,000) – –
Closing balance – – 2,437,311 – –
30 September 2020 0 Invesco
0 US High
0 Yield Fallen
0 Angels
0 UCITS ETF Class CHF Hedged
Opening balance 38,587
Shares issued 61,515
Shares redeemed (63,725)
Closing balance 36,377
Class EUR Hedged
Opening balance 566,965
Shares issued 315,112
Shares redeemed (596,293)
Closing balance 285,784
Class GBP Hedged
Opening balance 19,674
Shares issued 72,000
Shares redeemed (58,500)
Closing balance 33,174
Class US Dollar
Opening balance 2,521,881
Shares issued 7,536,852
Shares redeemed (1,030,411)
Closing balance 9,028,322
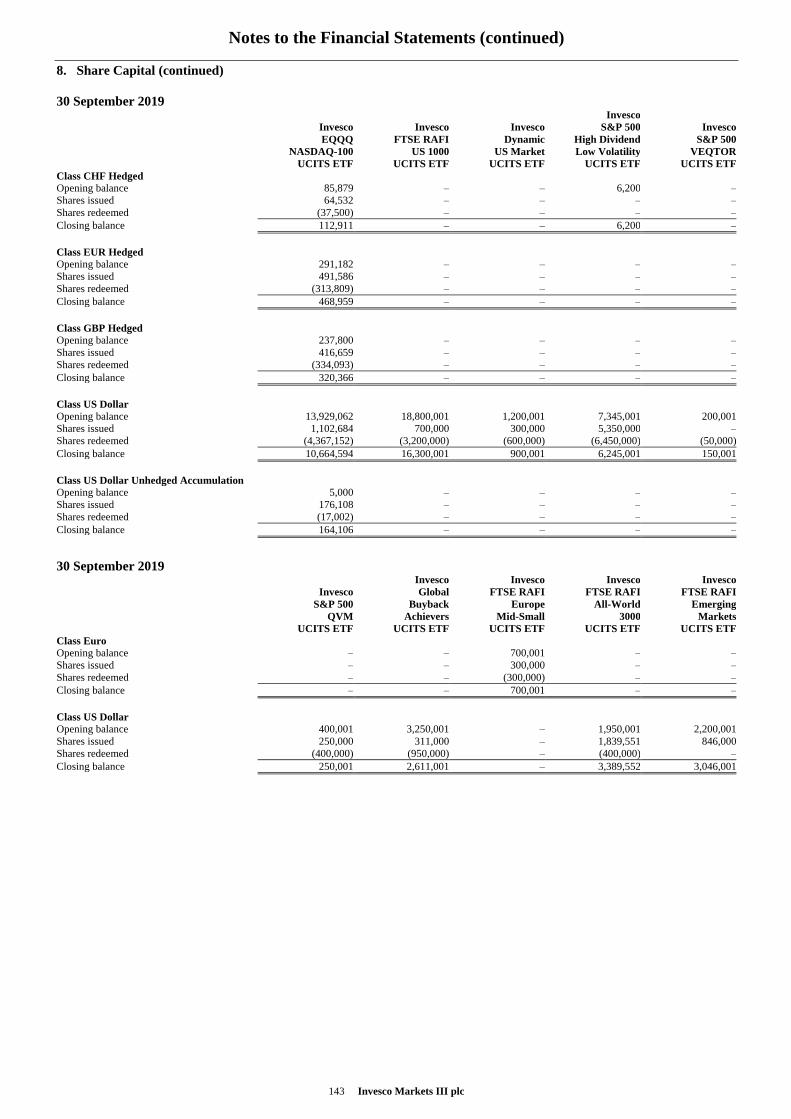
Notes to the Financial Statements (continued)
143 Invesco Markets III plc
8. Share Capital (continued)
30 September 2019 0 Invesco
0 Invesco Invesco Invesco S&P 500 Invesco
0 EQQQ FTSE RAFI Dynamic High Dividend S&P 500
0 NASDAQ-100 US 1000 US Market Low Volatility VEQTOR
0 UCITS ETF UCITS ETF UCITS ETF UCITS ETF UCITS ETF Class CHF Hedged
Opening balance 85,879 – – 6,200 –
Shares issued 64,532 – – – –
Shares redeemed (37,500) – – – –
Closing balance 112,911 – – 6,200 –
Class EUR Hedged
Opening balance 291,182 – – – –
Shares issued 491,586 – – – –
Shares redeemed (313,809) – – – –
Closing balance 468,959 – – – –
Class GBP Hedged
Opening balance 237,800 – – – –
Shares issued 416,659 – – – –
Shares redeemed (334,093) – – – –
Closing balance 320,366 – – – –
Class US Dollar
Opening balance 13,929,062 18,800,001 1,200,001 7,345,001 200,001
Shares issued 1,102,684 700,000 300,000 5,350,000 –
Shares redeemed (4,367,152) (3,200,000) (600,000) (6,450,000) (50,000)
Closing balance 10,664,594 16,300,001 900,001 6,245,001 150,001
Class US Dollar Unhedged Accumulation
Opening balance 5,000 – – – –
Shares issued 176,108 – – – –
Shares redeemed (17,002) – – – –
Closing balance 164,106 – – – –
30 September 2019 0 Invesco Invesco Invesco Invesco
0 Invesco Global FTSE RAFI FTSE RAFI FTSE RAFI
0 S&P 500 Buyback Europe All-World Emerging
0 QVM Achievers Mid-Small 3000 Markets
0 UCITS ETF UCITS ETF UCITS ETF UCITS ETF UCITS ETF Class Euro
Opening balance – – 700,001 – –
Shares issued – – 300,000 – –
Shares redeemed – – (300,000) – –
Closing balance – – 700,001 – –
Class US Dollar
Opening balance 400,001 3,250,001 – 1,950,001 2,200,001
Shares issued 250,000 311,000 – 1,839,551 846,000
Shares redeemed (400,000) (950,000) – (400,000) –
Closing balance 250,001 2,611,001 – 3,389,552 3,046,001
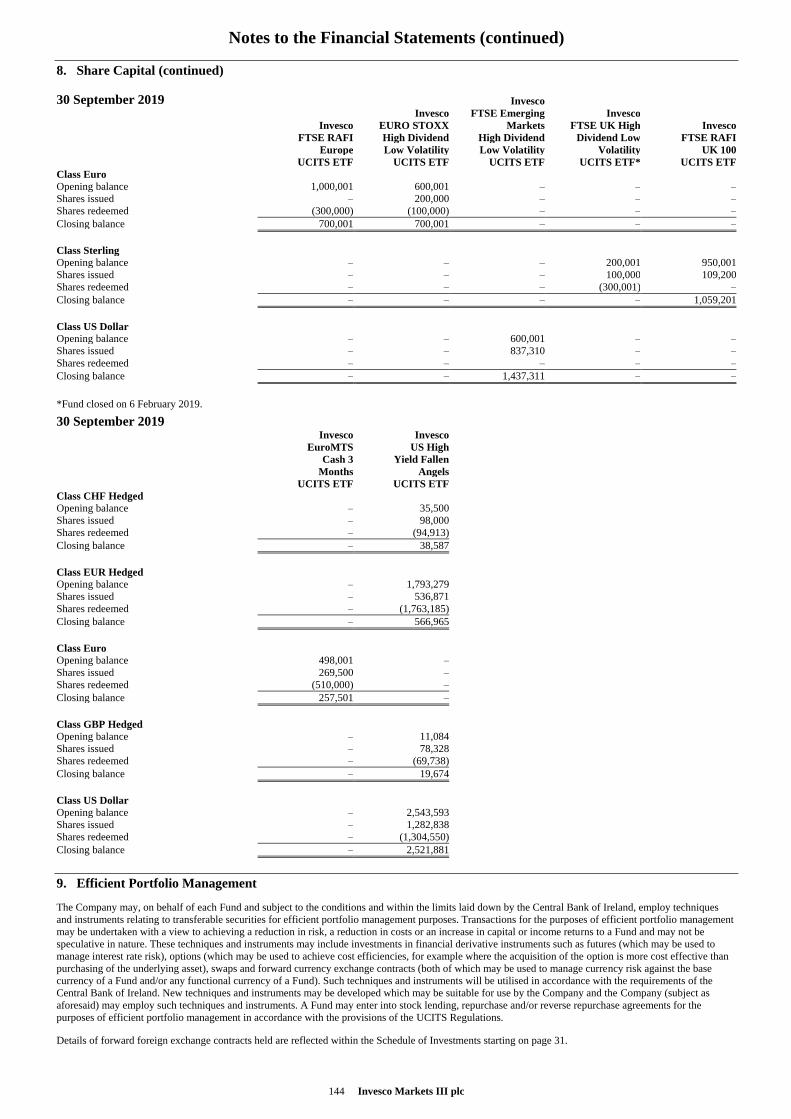
Notes to the Financial Statements (continued)
144 Invesco Markets III plc
8. Share Capital (continued)
30 September 2019 Invesco 0 Invesco FTSE Emerging Invesco
0 Invesco EURO STOXX Markets FTSE UK High Invesco
0 FTSE RAFI High Dividend High Dividend Dividend Low FTSE RAFI
0 Europe Low Volatility Low Volatility Volatility UK 100
0 UCITS ETF UCITS ETF UCITS ETF UCITS ETF* UCITS ETF Class Euro
Opening balance 1,000,001 600,001 – – –
Shares issued – 200,000 – – –
Shares redeemed (300,000) (100,000) – – –
Closing balance 700,001 700,001 – – –
Class Sterling
Opening balance – – – 200,001 950,001
Shares issued – – – 100,000 109,200
Shares redeemed – – – (300,001) –
Closing balance – – – – 1,059,201
Class US Dollar
Opening balance – – 600,001 – –
Shares issued – – 837,310 – –
Shares redeemed – – – – –
Closing balance – – 1,437,311 – –
*Fund closed on 6 February 2019.
30 September 2019 0 Invesco Invesco
0 EuroMTS US High
0 Cash 3 Yield Fallen
0 Months Angels
0 UCITS ETF UCITS ETF Class CHF Hedged
Opening balance – 35,500
Shares issued – 98,000
Shares redeemed – (94,913)
Closing balance – 38,587
Class EUR Hedged
Opening balance – 1,793,279
Shares issued – 536,871
Shares redeemed – (1,763,185)
Closing balance – 566,965
Class Euro
Opening balance 498,001 –
Shares issued 269,500 –
Shares redeemed (510,000) –
Closing balance 257,501 –
Class GBP Hedged
Opening balance – 11,084
Shares issued – 78,328
Shares redeemed – (69,738)
Closing balance – 19,674
Class US Dollar
Opening balance – 2,543,593
Shares issued – 1,282,838
Shares redeemed – (1,304,550)
Closing balance – 2,521,881
9. Efficient Portfolio Management
The Company may, on behalf of each Fund and subject to the conditions and within the limits laid down by the Central Bank of Ireland, employ techniques
and instruments relating to transferable securities for efficient portfolio management purposes. Transactions for the purposes of efficient portfolio management
may be undertaken with a view to achieving a reduction in risk, a reduction in costs or an increase in capital or income returns to a Fund and may not be
speculative in nature. These techniques and instruments may include investments in financial derivative instruments such as futures (which may be used to
manage interest rate risk), options (which may be used to achieve cost efficiencies, for example where the acquisition of the option is more cost effective than
purchasing of the underlying asset), swaps and forward currency exchange contracts (both of which may be used to manage currency risk against the base
currency of a Fund and/or any functional currency of a Fund). Such techniques and instruments will be utilised in accordance with the requirements of the
Central Bank of Ireland. New techniques and instruments may be developed which may be suitable for use by the Company and the Company (subject as
aforesaid) may employ such techniques and instruments. A Fund may enter into stock lending, repurchase and/or reverse repurchase agreements for the
purposes of efficient portfolio management in accordance with the provisions of the UCITS Regulations.
Details of forward foreign exchange contracts held are reflected within the Schedule of Investments starting on page 31.
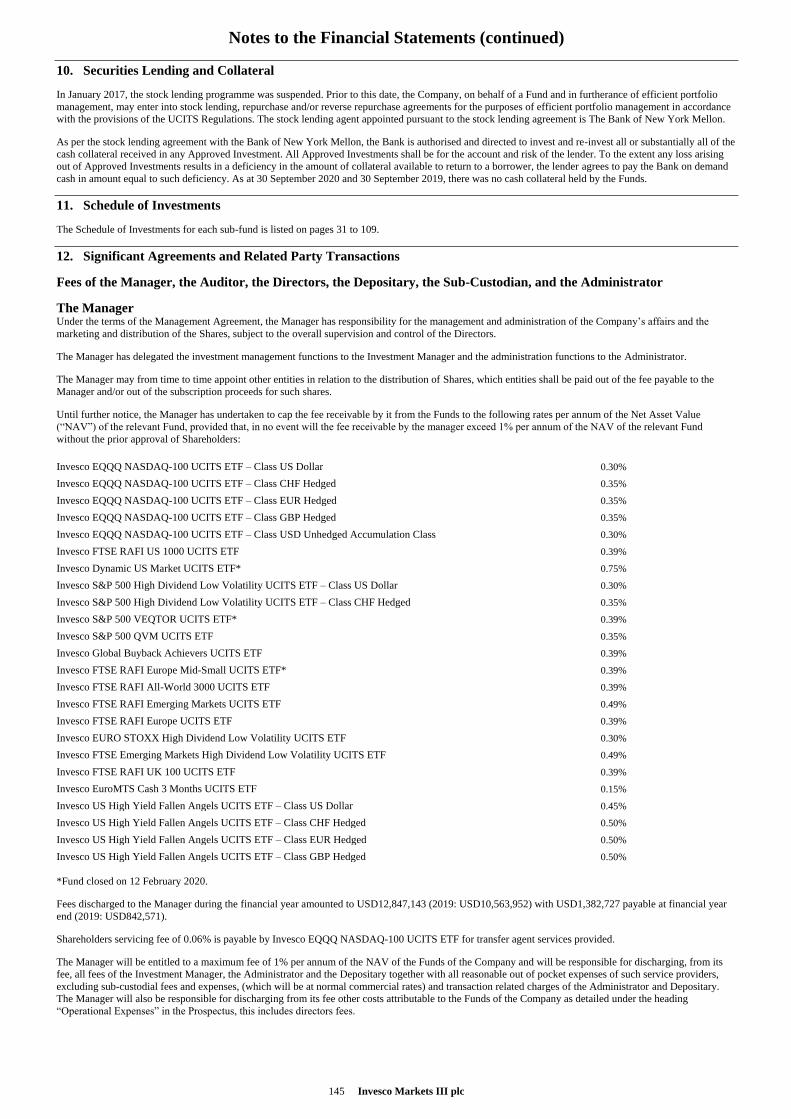
Notes to the Financial Statements (continued)
145 Invesco Markets III plc
10. Securities Lending and Collateral
In January 2017, the stock lending programme was suspended. Prior to this date, the Company, on behalf of a Fund and in furtherance of efficient portfolio
management, may enter into stock lending, repurchase and/or reverse repurchase agreements for the purposes of efficient portfolio management in accordance
with the provisions of the UCITS Regulations. The stock lending agent appointed pursuant to the stock lending agreement is The Bank of New York Mellon.
As per the stock lending agreement with the Bank of New York Mellon, the Bank is authorised and directed to invest and re-invest all or substantially all of the
cash collateral received in any Approved Investment. All Approved Investments shall be for the account and risk of the lender. To the extent any loss arising
out of Approved Investments results in a deficiency in the amount of collateral available to return to a borrower, the lender agrees to pay the Bank on demand
cash in amount equal to such deficiency. As at 30 September 2020 and 30 September 2019, there was no cash collateral held by the Funds.
11. Schedule of Investments
The Schedule of Investments for each sub-fund is listed on pages 31 to 109.
12. Significant Agreements and Related Party Transactions
Fees of the Manager, the Auditor, the Directors, the Depositary, the Sub-Custodian, and the Administrator
The Manager Under the terms of the Management Agreement, the Manager has responsibility for the management and administration of the Company’s affairs and the
marketing and distribution of the Shares, subject to the overall supervision and control of the Directors.
The Manager has delegated the investment management functions to the Investment Manager and the administration functions to the Administrator.
The Manager may from time to time appoint other entities in relation to the distribution of Shares, which entities shall be paid out of the fee payable to the
Manager and/or out of the subscription proceeds for such shares.
Until further notice, the Manager has undertaken to cap the fee receivable by it from the Funds to the following rates per annum of the Net Asset Value
(“NAV”) of the relevant Fund, provided that, in no event will the fee receivable by the manager exceed 1% per annum of the NAV of the relevant Fund
without the prior approval of Shareholders:
Invesco EQQQ NASDAQ-100 UCITS ETF – Class US Dollar 0.30%
Invesco EQQQ NASDAQ-100 UCITS ETF – Class CHF Hedged 0.35%
Invesco EQQQ NASDAQ-100 UCITS ETF – Class EUR Hedged 0.35%
Invesco EQQQ NASDAQ-100 UCITS ETF – Class GBP Hedged 0.35%
Invesco EQQQ NASDAQ-100 UCITS ETF – Class USD Unhedged Accumulation Class 0.30%
Invesco FTSE RAFI US 1000 UCITS ETF 0.39%
Invesco Dynamic US Market UCITS ETF* 0.75%
Invesco S&P 500 High Dividend Low Volatility UCITS ETF – Class US Dollar 0.30%
Invesco S&P 500 High Dividend Low Volatility UCITS ETF – Class CHF Hedged 0.35%
Invesco S&P 500 VEQTOR UCITS ETF* 0.39%
Invesco S&P 500 QVM UCITS ETF 0.35%
Invesco Global Buyback Achievers UCITS ETF 0.39%
Invesco FTSE RAFI Europe Mid-Small UCITS ETF* 0.39%
Invesco FTSE RAFI All-World 3000 UCITS ETF 0.39%
Invesco FTSE RAFI Emerging Markets UCITS ETF 0.49%
Invesco FTSE RAFI Europe UCITS ETF 0.39%
Invesco EURO STOXX High Dividend Low Volatility UCITS ETF 0.30%
Invesco FTSE Emerging Markets High Dividend Low Volatility UCITS ETF 0.49%
Invesco FTSE RAFI UK 100 UCITS ETF 0.39%
Invesco EuroMTS Cash 3 Months UCITS ETF 0.15%
Invesco US High Yield Fallen Angels UCITS ETF – Class US Dollar 0.45%
Invesco US High Yield Fallen Angels UCITS ETF – Class CHF Hedged 0.50%
Invesco US High Yield Fallen Angels UCITS ETF – Class EUR Hedged 0.50%
Invesco US High Yield Fallen Angels UCITS ETF – Class GBP Hedged 0.50%
*Fund closed on 12 February 2020.
Fees discharged to the Manager during the financial year amounted to USD12,847,143 (2019: USD10,563,952) with USD1,382,727 payable at financial year
end (2019: USD842,571).
Shareholders servicing fee of 0.06% is payable by Invesco EQQQ NASDAQ-100 UCITS ETF for transfer agent services provided.
The Manager will be entitled to a maximum fee of 1% per annum of the NAV of the Funds of the Company and will be responsible for discharging, from its
fee, all fees of the Investment Manager, the Administrator and the Depositary together with all reasonable out of pocket expenses of such service providers,
excluding sub-custodial fees and expenses, (which will be at normal commercial rates) and transaction related charges of the Administrator and Depositary.
The Manager will also be responsible for discharging from its fee other costs attributable to the Funds of the Company as detailed under the heading
“Operational Expenses” in the Prospectus, this includes directors fees.
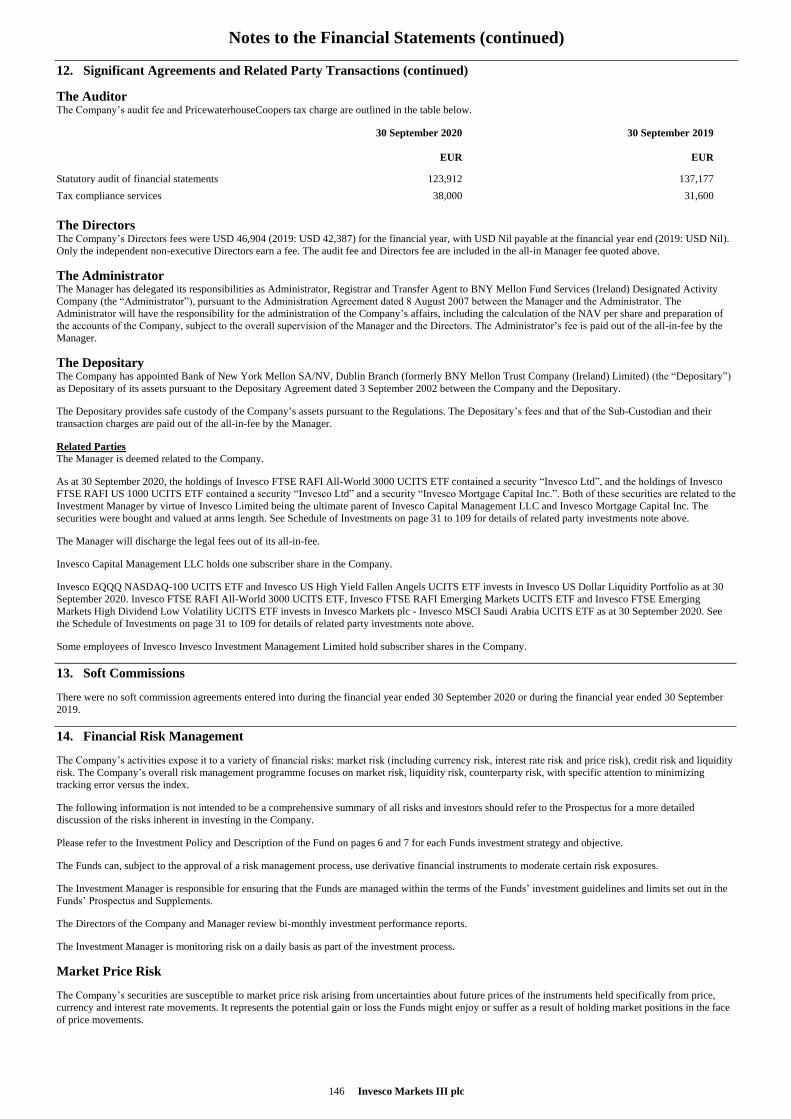
Notes to the Financial Statements (continued)
146 Invesco Markets III plc
12. Significant Agreements and Related Party Transactions (continued)
The Auditor The Company’s audit fee and PricewaterhouseCoopers tax charge are outlined in the table below.
30 September 2020 30 September 2019
EUR EUR
Statutory audit of financial statements 123,912 137,177
Tax compliance services 38,000 31,600
The Directors The Company’s Directors fees were USD 46,904 (2019: USD 42,387) for the financial year, with USD Nil payable at the financial year end (2019: USD Nil).
Only the independent non-executive Directors earn a fee. The audit fee and Directors fee are included in the all-in Manager fee quoted above.
The Administrator The Manager has delegated its responsibilities as Administrator, Registrar and Transfer Agent to BNY Mellon Fund Services (Ireland) Designated Activity
Company (the “Administrator”), pursuant to the Administration Agreement dated 8 August 2007 between the Manager and the Administrator. The
Administrator will have the responsibility for the administration of the Company’s affairs, including the calculation of the NAV per share and preparation of
the accounts of the Company, subject to the overall supervision of the Manager and the Directors. The Administrator’s fee is paid out of the all-in-fee by the
Manager.
The Depositary The Company has appointed Bank of New York Mellon SA/NV, Dublin Branch (formerly BNY Mellon Trust Company (Ireland) Limited) (the “Depositary”)
as Depositary of its assets pursuant to the Depositary Agreement dated 3 September 2002 between the Company and the Depositary.
The Depositary provides safe custody of the Company’s assets pursuant to the Regulations. The Depositary’s fees and that of the Sub-Custodian and their
transaction charges are paid out of the all-in-fee by the Manager.
Related Parties
The Manager is deemed related to the Company.
As at 30 September 2020, the holdings of Invesco FTSE RAFI All-World 3000 UCITS ETF contained a security “Invesco Ltd”, and the holdings of Invesco
FTSE RAFI US 1000 UCITS ETF contained a security “Invesco Ltd” and a security “Invesco Mortgage Capital Inc.”. Both of these securities are related to the
Investment Manager by virtue of Invesco Limited being the ultimate parent of Invesco Capital Management LLC and Invesco Mortgage Capital Inc. The
securities were bought and valued at arms length. See Schedule of Investments on page 31 to 109 for details of related party investments note above.
The Manager will discharge the legal fees out of its all-in-fee.
Invesco Capital Management LLC holds one subscriber share in the Company.
Invesco EQQQ NASDAQ-100 UCITS ETF and Invesco US High Yield Fallen Angels UCITS ETF invests in Invesco US Dollar Liquidity Portfolio as at 30
September 2020. Invesco FTSE RAFI All-World 3000 UCITS ETF, Invesco FTSE RAFI Emerging Markets UCITS ETF and Invesco FTSE Emerging
Markets High Dividend Low Volatility UCITS ETF invests in Invesco Markets plc - Invesco MSCI Saudi Arabia UCITS ETF as at 30 September 2020. See
the Schedule of Investments on page 31 to 109 for details of related party investments note above.
Some employees of Invesco Invesco Investment Management Limited hold subscriber shares in the Company.
13. Soft Commissions
There were no soft commission agreements entered into during the financial year ended 30 September 2020 or during the financial year ended 30 September
2019.
14. Financial Risk Management
The Company’s activities expose it to a variety of financial risks: market risk (including currency risk, interest rate risk and price risk), credit risk and liquidity
risk. The Company’s overall risk management programme focuses on market risk, liquidity risk, counterparty risk, with specific attention to minimizing
tracking error versus the index.
The following information is not intended to be a comprehensive summary of all risks and investors should refer to the Prospectus for a more detailed
discussion of the risks inherent in investing in the Company.
Please refer to the Investment Policy and Description of the Fund on pages 6 and 7 for each Funds investment strategy and objective.
The Funds can, subject to the approval of a risk management process, use derivative financial instruments to moderate certain risk exposures.
The Investment Manager is responsible for ensuring that the Funds are managed within the terms of the Funds’ investment guidelines and limits set out in the
Funds’ Prospectus and Supplements.
The Directors of the Company and Manager review bi-monthly investment performance reports.
The Investment Manager is monitoring risk on a daily basis as part of the investment process.
Market Price Risk
The Company’s securities are susceptible to market price risk arising from uncertainties about future prices of the instruments held specifically from price,
currency and interest rate movements. It represents the potential gain or loss the Funds might enjoy or suffer as a result of holding market positions in the face
of price movements.
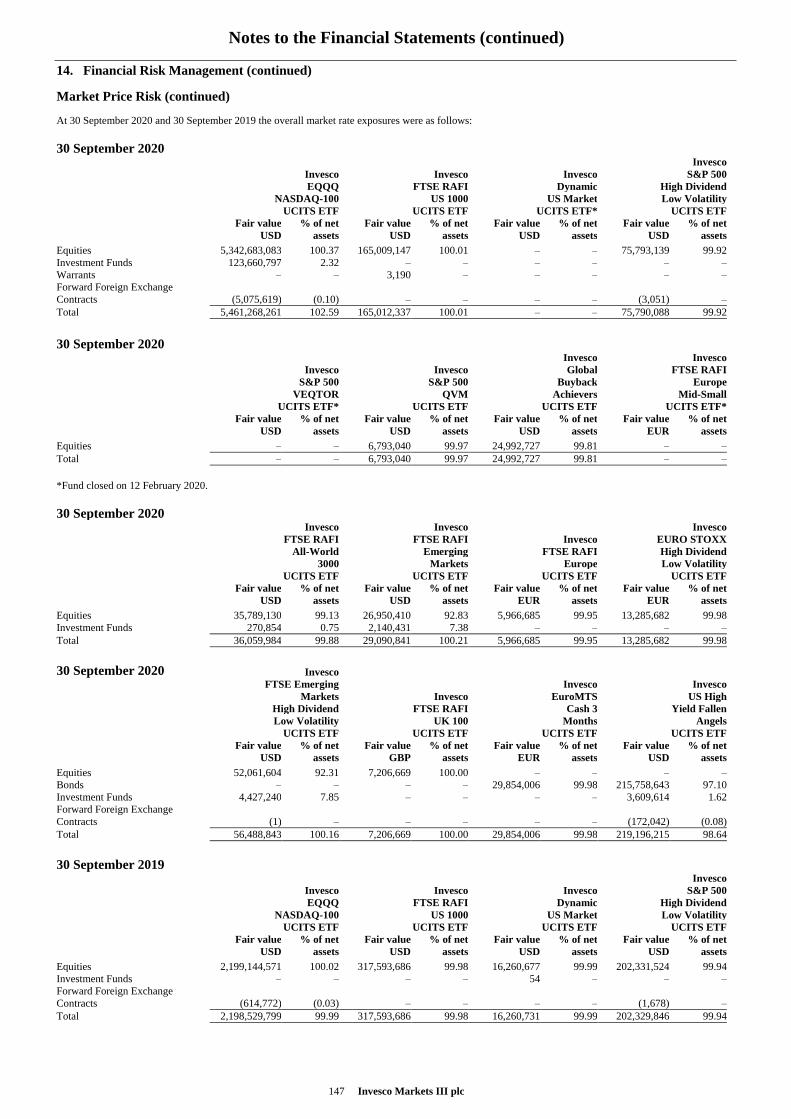
Notes to the Financial Statements (continued)
147 Invesco Markets III plc
14. Financial Risk Management (continued)
Market Price Risk (continued)
At 30 September 2020 and 30 September 2019 the overall market rate exposures were as follows:
30 September 2020 0 Invesco
0 Invesco Invesco Invesco S&P 500
0 EQQQ FTSE RAFI Dynamic High Dividend
0 NASDAQ-100 US 1000 US Market Low Volatility
0 UCITS ETF UCITS ETF UCITS ETF* UCITS ETF Fair value % of net Fair value % of net Fair value % of net Fair value % of net
USD assets USD assets USD assets USD assets
Equities 5,342,683,083 100.37 165,009,147 100.01 – – 75,793,139 99.92
Investment Funds 123,660,797 2.32 – – – – – –
Warrants – – 3,190 – – – – –
Forward Foreign Exchange
Contracts (5,075,619) (0.10) – – – – (3,051) –
Total 5,461,268,261 102.59 165,012,337 100.01 – – 75,790,088 99.92
30 September 2020 0 Invesco Invesco
0 Invesco Invesco Global FTSE RAFI
0 S&P 500 S&P 500 Buyback Europe
0 VEQTOR QVM Achievers Mid-Small
0 UCITS ETF* UCITS ETF UCITS ETF UCITS ETF* Fair value % of net Fair value % of net Fair value % of net Fair value % of net
USD assets USD assets USD assets EUR assets
Equities – – 6,793,040 99.97 24,992,727 99.81 – –
Total – – 6,793,040 99.97 24,992,727 99.81 – –
*Fund closed on 12 February 2020.
30 September 2020 0 Invesco Invesco Invesco
0 FTSE RAFI FTSE RAFI Invesco EURO STOXX
0 All-World Emerging FTSE RAFI High Dividend
0 3000 Markets Europe Low Volatility
0 UCITS ETF UCITS ETF UCITS ETF UCITS ETF Fair value % of net Fair value % of net Fair value % of net Fair value % of net
USD assets USD assets EUR assets EUR assets
Equities 35,789,130 99.13 26,950,410 92.83 5,966,685 99.95 13,285,682 99.98
Investment Funds 270,854 0.75 2,140,431 7.38 – – – –
Total 36,059,984 99.88 29,090,841 100.21 5,966,685 99.95 13,285,682 99.98
30 September 2020 Invesco 0 FTSE Emerging Invesco Invesco
0 Markets Invesco EuroMTS US High
0 High Dividend FTSE RAFI Cash 3 Yield Fallen
0 Low Volatility UK 100 Months Angels
0 UCITS ETF UCITS ETF UCITS ETF UCITS ETF Fair value % of net Fair value % of net Fair value % of net Fair value % of net
USD assets GBP assets EUR assets USD assets
Equities 52,061,604 92.31 7,206,669 100.00 – – – –
Bonds – – – – 29,854,006 99.98 215,758,643 97.10
Investment Funds 4,427,240 7.85 – – – – 3,609,614 1.62
Forward Foreign Exchange
Contracts (1) – – – – – (172,042) (0.08)
Total 56,488,843 100.16 7,206,669 100.00 29,854,006 99.98 219,196,215 98.64
30 September 2019 0 Invesco
0 Invesco Invesco Invesco S&P 500
0 EQQQ FTSE RAFI Dynamic High Dividend
0 NASDAQ-100 US 1000 US Market Low Volatility
0 UCITS ETF UCITS ETF UCITS ETF UCITS ETF Fair value % of net Fair value % of net Fair value % of net Fair value % of net
USD assets USD assets USD assets USD assets
Equities 2,199,144,571 100.02 317,593,686 99.98 16,260,677 99.99 202,331,524 99.94
Investment Funds – – – – 54 – – –
Forward Foreign Exchange
Contracts (614,772) (0.03) – – – – (1,678) –
Total 2,198,529,799 99.99 317,593,686 99.98 16,260,731 99.99 202,329,846 99.94
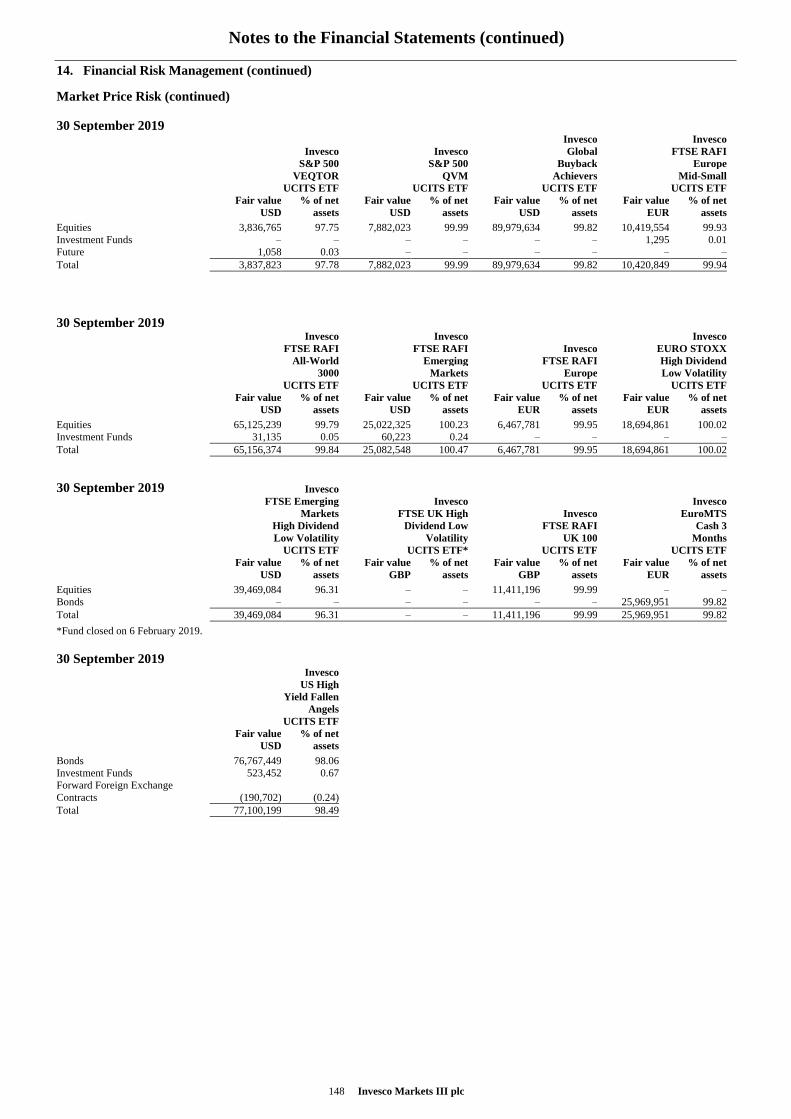
Notes to the Financial Statements (continued)
148 Invesco Markets III plc
14. Financial Risk Management (continued)
Market Price Risk (continued)
30 September 2019 0 Invesco Invesco
0 Invesco Invesco Global FTSE RAFI
0 S&P 500 S&P 500 Buyback Europe
0 VEQTOR QVM Achievers Mid-Small
0 UCITS ETF UCITS ETF UCITS ETF UCITS ETF Fair value % of net Fair value % of net Fair value % of net Fair value % of net
USD assets USD assets USD assets EUR assets
Equities 3,836,765 97.75 7,882,023 99.99 89,979,634 99.82 10,419,554 99.93
Investment Funds – – – – – – 1,295 0.01
Future 1,058 0.03 – – – – – –
Total 3,837,823 97.78 7,882,023 99.99 89,979,634 99.82 10,420,849 99.94
30 September 2019 0 Invesco Invesco Invesco
0 FTSE RAFI FTSE RAFI Invesco EURO STOXX
0 All-World Emerging FTSE RAFI High Dividend
0 3000 Markets Europe Low Volatility
0 UCITS ETF UCITS ETF UCITS ETF UCITS ETF Fair value % of net Fair value % of net Fair value % of net Fair value % of net
USD assets USD assets EUR assets EUR assets
Equities 65,125,239 99.79 25,022,325 100.23 6,467,781 99.95 18,694,861 100.02
Investment Funds 31,135 0.05 60,223 0.24 – – – –
Total 65,156,374 99.84 25,082,548 100.47 6,467,781 99.95 18,694,861 100.02
30 September 2019 Invesco 0 FTSE Emerging Invesco Invesco
0 Markets FTSE UK High Invesco EuroMTS
0 High Dividend Dividend Low FTSE RAFI Cash 3
0 Low Volatility Volatility UK 100 Months
0 UCITS ETF UCITS ETF* UCITS ETF UCITS ETF Fair value % of net Fair value % of net Fair value % of net Fair value % of net
USD assets GBP assets GBP assets EUR assets
Equities 39,469,084 96.31 – – 11,411,196 99.99 – –
Bonds – – – – – – 25,969,951 99.82
Total 39,469,084 96.31 – – 11,411,196 99.99 25,969,951 99.82
*Fund closed on 6 February 2019.
30 September 2019 0 Invesco
0 US High
0 Yield Fallen
0 Angels
0 UCITS ETF Fair value % of net
USD assets
Bonds 76,767,449 98.06
Investment Funds 523,452 0.67
Forward Foreign Exchange
Contracts (190,702) (0.24)
Total 77,100,199 98.49
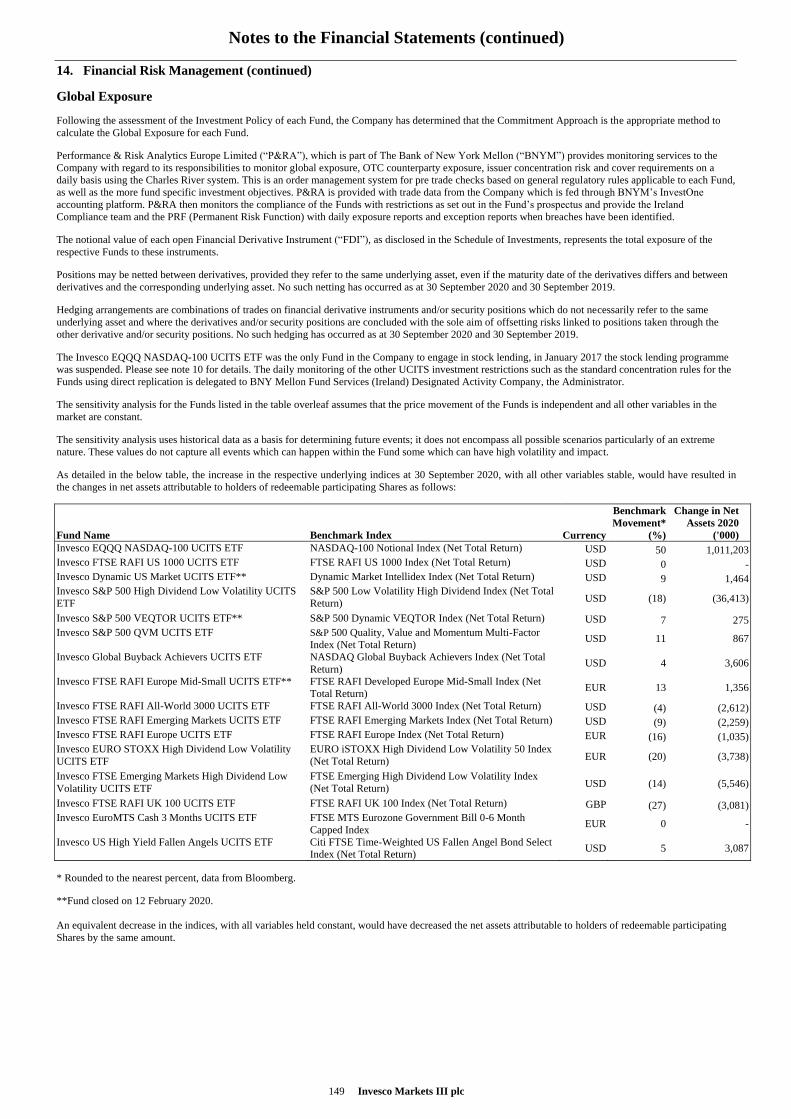
Notes to the Financial Statements (continued)
149 Invesco Markets III plc
14. Financial Risk Management (continued)
Global Exposure
Following the assessment of the Investment Policy of each Fund, the Company has determined that the Commitment Approach is the appropriate method to
calculate the Global Exposure for each Fund.
Performance & Risk Analytics Europe Limited (“P&RA”), which is part of The Bank of New York Mellon (“BNYM”) provides monitoring services to the
Company with regard to its responsibilities to monitor global exposure, OTC counterparty exposure, issuer concentration risk and cover requirements on a
daily basis using the Charles River system. This is an order management system for pre trade checks based on general regulatory rules applicable to each Fund,
as well as the more fund specific investment objectives. P&RA is provided with trade data from the Company which is fed through BNYM’s InvestOne
accounting platform. P&RA then monitors the compliance of the Funds with restrictions as set out in the Fund’s prospectus and provide the Ireland
Compliance team and the PRF (Permanent Risk Function) with daily exposure reports and exception reports when breaches have been identified.
The notional value of each open Financial Derivative Instrument (“FDI”), as disclosed in the Schedule of Investments, represents the total exposure of the
respective Funds to these instruments.
Positions may be netted between derivatives, provided they refer to the same underlying asset, even if the maturity date of the derivatives differs and between
derivatives and the corresponding underlying asset. No such netting has occurred as at 30 September 2020 and 30 September 2019.
Hedging arrangements are combinations of trades on financial derivative instruments and/or security positions which do not necessarily refer to the same
underlying asset and where the derivatives and/or security positions are concluded with the sole aim of offsetting risks linked to positions taken through the
other derivative and/or security positions. No such hedging has occurred as at 30 September 2020 and 30 September 2019.
The Invesco EQQQ NASDAQ-100 UCITS ETF was the only Fund in the Company to engage in stock lending, in January 2017 the stock lending programme
was suspended. Please see note 10 for details. The daily monitoring of the other UCITS investment restrictions such as the standard concentration rules for the
Funds using direct replication is delegated to BNY Mellon Fund Services (Ireland) Designated Activity Company, the Administrator.
The sensitivity analysis for the Funds listed in the table overleaf assumes that the price movement of the Funds is independent and all other variables in the
market are constant.
The sensitivity analysis uses historical data as a basis for determining future events; it does not encompass all possible scenarios particularly of an extreme
nature. These values do not capture all events which can happen within the Fund some which can have high volatility and impact.
As detailed in the below table, the increase in the respective underlying indices at 30 September 2020, with all other variables stable, would have resulted in
the changes in net assets attributable to holders of redeemable participating Shares as follows:
Fund Name Benchmark Index Currency
Benchmark
Movement*
(%)
Change in Net
Assets 2020
('000)
Invesco EQQQ NASDAQ-100 UCITS ETF NASDAQ-100 Notional Index (Net Total Return) USD 50 1,011,203 Invesco FTSE RAFI US 1000 UCITS ETF FTSE RAFI US 1000 Index (Net Total Return) USD 0 - Invesco Dynamic US Market UCITS ETF** Dynamic Market Intellidex Index (Net Total Return) USD 9 1,464 Invesco S&P 500 High Dividend Low Volatility UCITS
ETF
S&P 500 Low Volatility High Dividend Index (Net Total
Return) USD (18) (36,413)
Invesco S&P 500 VEQTOR UCITS ETF** S&P 500 Dynamic VEQTOR Index (Net Total Return) USD 7 275 Invesco S&P 500 QVM UCITS ETF S&P 500 Quality, Value and Momentum Multi-Factor
Index (Net Total Return) USD 11 867
Invesco Global Buyback Achievers UCITS ETF NASDAQ Global Buyback Achievers Index (Net Total
Return) USD 4 3,606
Invesco FTSE RAFI Europe Mid-Small UCITS ETF** FTSE RAFI Developed Europe Mid-Small Index (Net
Total Return) EUR 13 1,356
Invesco FTSE RAFI All-World 3000 UCITS ETF FTSE RAFI All-World 3000 Index (Net Total Return) USD (4) (2,612) Invesco FTSE RAFI Emerging Markets UCITS ETF FTSE RAFI Emerging Markets Index (Net Total Return) USD (9) (2,259) Invesco FTSE RAFI Europe UCITS ETF FTSE RAFI Europe Index (Net Total Return) EUR (16) (1,035) Invesco EURO STOXX High Dividend Low Volatility
UCITS ETF
EURO iSTOXX High Dividend Low Volatility 50 Index
(Net Total Return) EUR (20) (3,738)
Invesco FTSE Emerging Markets High Dividend Low
Volatility UCITS ETF
FTSE Emerging High Dividend Low Volatility Index
(Net Total Return) USD (14) (5,546)
Invesco FTSE RAFI UK 100 UCITS ETF FTSE RAFI UK 100 Index (Net Total Return) GBP (27) (3,081) Invesco EuroMTS Cash 3 Months UCITS ETF FTSE MTS Eurozone Government Bill 0-6 Month
Capped Index EUR 0 -
Invesco US High Yield Fallen Angels UCITS ETF Citi FTSE Time-Weighted US Fallen Angel Bond Select
Index (Net Total Return) USD 5 3,087
* Rounded to the nearest percent, data from Bloomberg.
**Fund closed on 12 February 2020.
An equivalent decrease in the indices, with all variables held constant, would have decreased the net assets attributable to holders of redeemable participating
Shares by the same amount.
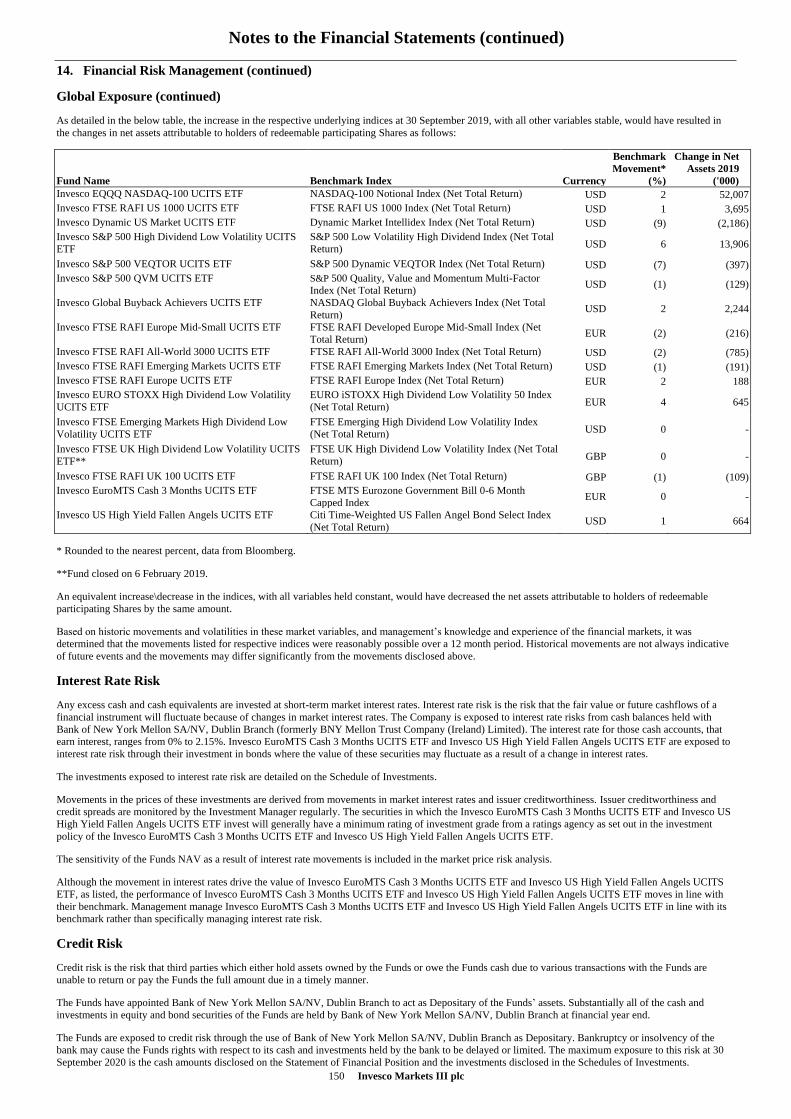
Notes to the Financial Statements (continued)
150 Invesco Markets III plc
14. Financial Risk Management (continued)
Global Exposure (continued)
As detailed in the below table, the increase in the respective underlying indices at 30 September 2019, with all other variables stable, would have resulted in
the changes in net assets attributable to holders of redeemable participating Shares as follows:
Fund Name Benchmark Index Currency
Benchmark
Movement*
(%)
Change in Net
Assets 2019 ('000)
Invesco EQQQ NASDAQ-100 UCITS ETF NASDAQ-100 Notional Index (Net Total Return) USD 2 52,007
Invesco FTSE RAFI US 1000 UCITS ETF FTSE RAFI US 1000 Index (Net Total Return) USD 1 3,695
Invesco Dynamic US Market UCITS ETF Dynamic Market Intellidex Index (Net Total Return) USD (9) (2,186)
Invesco S&P 500 High Dividend Low Volatility UCITS
ETF
S&P 500 Low Volatility High Dividend Index (Net Total
Return) USD 6 13,906
Invesco S&P 500 VEQTOR UCITS ETF S&P 500 Dynamic VEQTOR Index (Net Total Return) USD (7) (397)
Invesco S&P 500 QVM UCITS ETF S&P 500 Quality, Value and Momentum Multi-Factor
Index (Net Total Return) USD (1) (129)
Invesco Global Buyback Achievers UCITS ETF NASDAQ Global Buyback Achievers Index (Net Total
Return) USD 2 2,244
Invesco FTSE RAFI Europe Mid-Small UCITS ETF FTSE RAFI Developed Europe Mid-Small Index (Net
Total Return) EUR (2) (216)
Invesco FTSE RAFI All-World 3000 UCITS ETF FTSE RAFI All-World 3000 Index (Net Total Return) USD (2) (785)
Invesco FTSE RAFI Emerging Markets UCITS ETF FTSE RAFI Emerging Markets Index (Net Total Return) USD (1) (191)
Invesco FTSE RAFI Europe UCITS ETF FTSE RAFI Europe Index (Net Total Return) EUR 2 188
Invesco EURO STOXX High Dividend Low Volatility
UCITS ETF
EURO iSTOXX High Dividend Low Volatility 50 Index
(Net Total Return) EUR 4 645
Invesco FTSE Emerging Markets High Dividend Low
Volatility UCITS ETF
FTSE Emerging High Dividend Low Volatility Index
(Net Total Return) USD 0 -
Invesco FTSE UK High Dividend Low Volatility UCITS
ETF**
FTSE UK High Dividend Low Volatility Index (Net Total
Return) GBP 0 -
Invesco FTSE RAFI UK 100 UCITS ETF FTSE RAFI UK 100 Index (Net Total Return) GBP (1) (109)
Invesco EuroMTS Cash 3 Months UCITS ETF FTSE MTS Eurozone Government Bill 0-6 Month
Capped Index EUR 0 -
Invesco US High Yield Fallen Angels UCITS ETF Citi Time-Weighted US Fallen Angel Bond Select Index
(Net Total Return) USD 1 664
* Rounded to the nearest percent, data from Bloomberg.
**Fund closed on 6 February 2019.
An equivalent increase\decrease in the indices, with all variables held constant, would have decreased the net assets attributable to holders of redeemable
participating Shares by the same amount.
Based on historic movements and volatilities in these market variables, and management’s knowledge and experience of the financial markets, it was
determined that the movements listed for respective indices were reasonably possible over a 12 month period. Historical movements are not always indicative
of future events and the movements may differ significantly from the movements disclosed above.
Interest Rate Risk
Any excess cash and cash equivalents are invested at short-term market interest rates. Interest rate risk is the risk that the fair value or future cashflows of a
financial instrument will fluctuate because of changes in market interest rates. The Company is exposed to interest rate risks from cash balances held with
Bank of New York Mellon SA/NV, Dublin Branch (formerly BNY Mellon Trust Company (Ireland) Limited). The interest rate for those cash accounts, that
earn interest, ranges from 0% to 2.15%. Invesco EuroMTS Cash 3 Months UCITS ETF and Invesco US High Yield Fallen Angels UCITS ETF are exposed to
interest rate risk through their investment in bonds where the value of these securities may fluctuate as a result of a change in interest rates.
The investments exposed to interest rate risk are detailed on the Schedule of Investments.
Movements in the prices of these investments are derived from movements in market interest rates and issuer creditworthiness. Issuer creditworthiness and
credit spreads are monitored by the Investment Manager regularly. The securities in which the Invesco EuroMTS Cash 3 Months UCITS ETF and Invesco US
High Yield Fallen Angels UCITS ETF invest will generally have a minimum rating of investment grade from a ratings agency as set out in the investment
policy of the Invesco EuroMTS Cash 3 Months UCITS ETF and Invesco US High Yield Fallen Angels UCITS ETF.
The sensitivity of the Funds NAV as a result of interest rate movements is included in the market price risk analysis.
Although the movement in interest rates drive the value of Invesco EuroMTS Cash 3 Months UCITS ETF and Invesco US High Yield Fallen Angels UCITS
ETF, as listed, the performance of Invesco EuroMTS Cash 3 Months UCITS ETF and Invesco US High Yield Fallen Angels UCITS ETF moves in line with
their benchmark. Management manage Invesco EuroMTS Cash 3 Months UCITS ETF and Invesco US High Yield Fallen Angels UCITS ETF in line with its
benchmark rather than specifically managing interest rate risk.
Credit Risk
Credit risk is the risk that third parties which either hold assets owned by the Funds or owe the Funds cash due to various transactions with the Funds are
unable to return or pay the Funds the full amount due in a timely manner.
The Funds have appointed Bank of New York Mellon SA/NV, Dublin Branch to act as Depositary of the Funds’ assets. Substantially all of the cash and
investments in equity and bond securities of the Funds are held by Bank of New York Mellon SA/NV, Dublin Branch at financial year end.
The Funds are exposed to credit risk through the use of Bank of New York Mellon SA/NV, Dublin Branch as Depositary. Bankruptcy or insolvency of the
bank may cause the Funds rights with respect to its cash and investments held by the bank to be delayed or limited. The maximum exposure to this risk at 30
September 2020 is the cash amounts disclosed on the Statement of Financial Position and the investments disclosed in the Schedules of Investments.
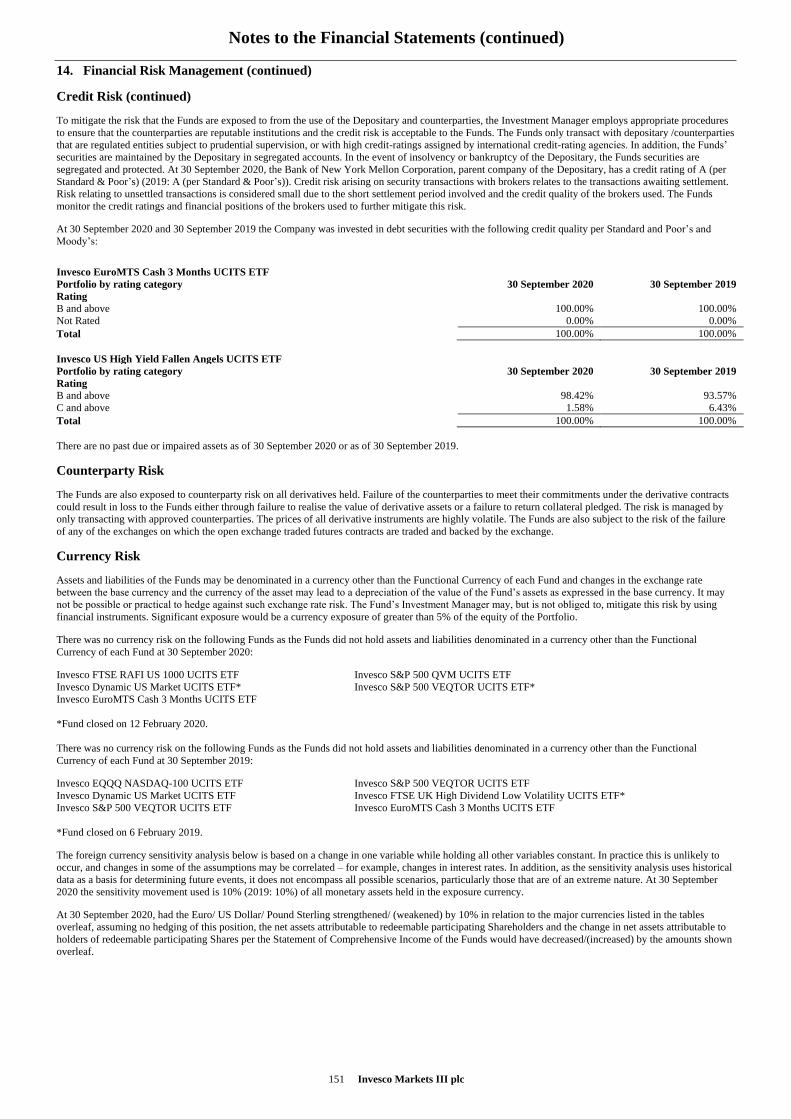
Notes to the Financial Statements (continued)
151 Invesco Markets III plc
14. Financial Risk Management (continued)
Credit Risk (continued)
To mitigate the risk that the Funds are exposed to from the use of the Depositary and counterparties, the Investment Manager employs appropriate procedures
to ensure that the counterparties are reputable institutions and the credit risk is acceptable to the Funds. The Funds only transact with depositary /counterparties
that are regulated entities subject to prudential supervision, or with high credit-ratings assigned by international credit-rating agencies. In addition, the Funds’
securities are maintained by the Depositary in segregated accounts. In the event of insolvency or bankruptcy of the Depositary, the Funds securities are
segregated and protected. At 30 September 2020, the Bank of New York Mellon Corporation, parent company of the Depositary, has a credit rating of A (per
Standard & Poor’s) (2019: A (per Standard & Poor’s)). Credit risk arising on security transactions with brokers relates to the transactions awaiting settlement.
Risk relating to unsettled transactions is considered small due to the short settlement period involved and the credit quality of the brokers used. The Funds
monitor the credit ratings and financial positions of the brokers used to further mitigate this risk.
At 30 September 2020 and 30 September 2019 the Company was invested in debt securities with the following credit quality per Standard and Poor’s and
Moody’s:
Invesco EuroMTS Cash 3 Months UCITS ETF
Portfolio by rating category 30 September 2020 30 September 2019
Rating
B and above 100.00% 100.00%
Not Rated 0.00% 0.00%
Total 100.00% 100.00%
Invesco US High Yield Fallen Angels UCITS ETF
Portfolio by rating category 30 September 2020 30 September 2019
Rating
B and above 98.42% 93.57%
C and above 1.58% 6.43%
Total 100.00% 100.00%
There are no past due or impaired assets as of 30 September 2020 or as of 30 September 2019.
Counterparty Risk
The Funds are also exposed to counterparty risk on all derivatives held. Failure of the counterparties to meet their commitments under the derivative contracts
could result in loss to the Funds either through failure to realise the value of derivative assets or a failure to return collateral pledged. The risk is managed by
only transacting with approved counterparties. The prices of all derivative instruments are highly volatile. The Funds are also subject to the risk of the failure
of any of the exchanges on which the open exchange traded futures contracts are traded and backed by the exchange.
Currency Risk
Assets and liabilities of the Funds may be denominated in a currency other than the Functional Currency of each Fund and changes in the exchange rate
between the base currency and the currency of the asset may lead to a depreciation of the value of the Fund’s assets as expressed in the base currency. It may
not be possible or practical to hedge against such exchange rate risk. The Fund’s Investment Manager may, but is not obliged to, mitigate this risk by using
financial instruments. Significant exposure would be a currency exposure of greater than 5% of the equity of the Portfolio.
There was no currency risk on the following Funds as the Funds did not hold assets and liabilities denominated in a currency other than the Functional
Currency of each Fund at 30 September 2020:
Invesco FTSE RAFI US 1000 UCITS ETF Invesco S&P 500 QVM UCITS ETF
Invesco Dynamic US Market UCITS ETF* Invesco S&P 500 VEQTOR UCITS ETF*
Invesco EuroMTS Cash 3 Months UCITS ETF
*Fund closed on 12 February 2020.
There was no currency risk on the following Funds as the Funds did not hold assets and liabilities denominated in a currency other than the Functional
Currency of each Fund at 30 September 2019:
Invesco EQQQ NASDAQ-100 UCITS ETF Invesco S&P 500 VEQTOR UCITS ETF
Invesco Dynamic US Market UCITS ETF Invesco FTSE UK High Dividend Low Volatility UCITS ETF*
Invesco S&P 500 VEQTOR UCITS ETF Invesco EuroMTS Cash 3 Months UCITS ETF
*Fund closed on 6 February 2019.
The foreign currency sensitivity analysis below is based on a change in one variable while holding all other variables constant. In practice this is unlikely to
occur, and changes in some of the assumptions may be correlated – for example, changes in interest rates. In addition, as the sensitivity analysis uses historical
data as a basis for determining future events, it does not encompass all possible scenarios, particularly those that are of an extreme nature. At 30 September
2020 the sensitivity movement used is 10% (2019: 10%) of all monetary assets held in the exposure currency.
At 30 September 2020, had the Euro/ US Dollar/ Pound Sterling strengthened/ (weakened) by 10% in relation to the major currencies listed in the tables
overleaf, assuming no hedging of this position, the net assets attributable to redeemable participating Shareholders and the change in net assets attributable to
holders of redeemable participating Shares per the Statement of Comprehensive Income of the Funds would have decreased/(increased) by the amounts shown
overleaf.
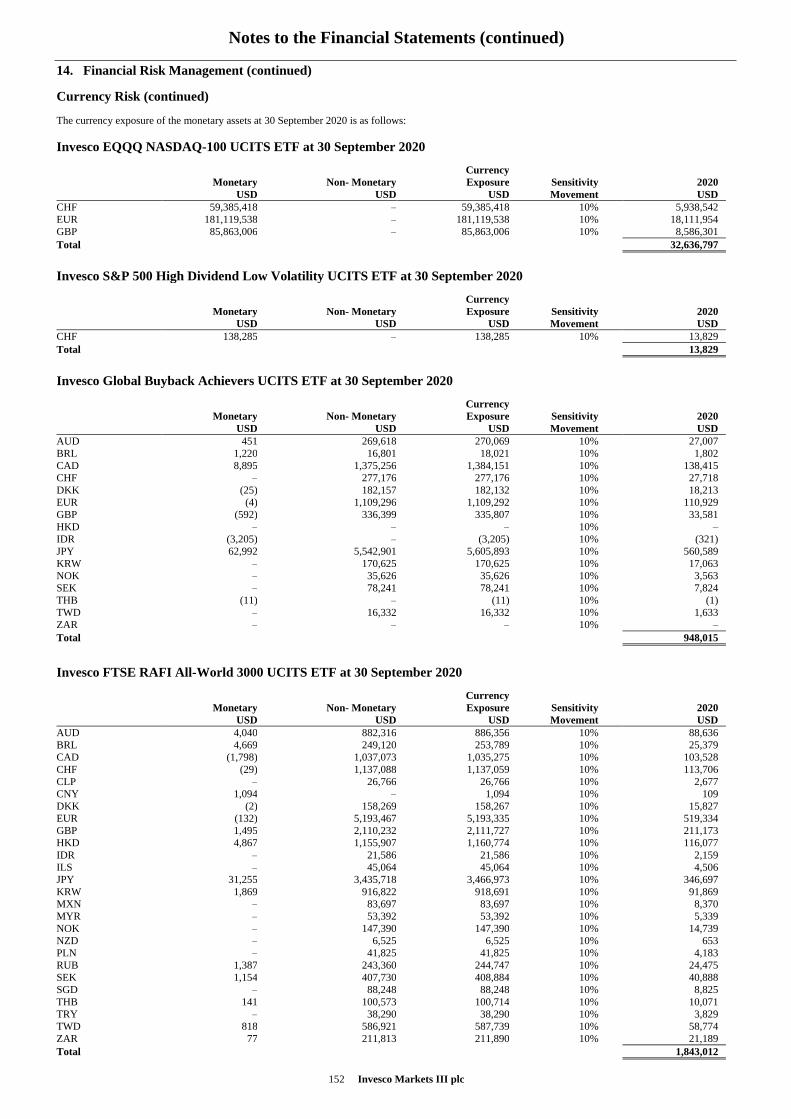
Notes to the Financial Statements (continued)
152 Invesco Markets III plc
14. Financial Risk Management (continued)
Currency Risk (continued)
The currency exposure of the monetary assets at 30 September 2020 is as follows:
Invesco EQQQ NASDAQ-100 UCITS ETF at 30 September 2020
Monetary
USD
Non- Monetary
USD
Currency
Exposure
USD
Sensitivity
Movement
2020
USD
CHF 59,385,418 – 59,385,418 10% 5,938,542
EUR 181,119,538 – 181,119,538 10% 18,111,954
GBP 85,863,006 – 85,863,006 10% 8,586,301
Total 32,636,797
Invesco S&P 500 High Dividend Low Volatility UCITS ETF at 30 September 2020
Monetary
USD
Non- Monetary
USD
Currency
Exposure
USD
Sensitivity
Movement
2020
USD
CHF 138,285 – 138,285 10% 13,829
Total 13,829
Invesco Global Buyback Achievers UCITS ETF at 30 September 2020
Monetary
USD
Non- Monetary
USD
Currency
Exposure
USD
Sensitivity
Movement
2020
USD
AUD 451 269,618 270,069 10% 27,007
BRL 1,220 16,801 18,021 10% 1,802
CAD 8,895 1,375,256 1,384,151 10% 138,415
CHF – 277,176 277,176 10% 27,718
DKK (25) 182,157 182,132 10% 18,213
EUR (4) 1,109,296 1,109,292 10% 110,929
GBP (592) 336,399 335,807 10% 33,581
HKD – – – 10% –
IDR (3,205) – (3,205) 10% (321)
JPY 62,992 5,542,901 5,605,893 10% 560,589
KRW – 170,625 170,625 10% 17,063
NOK – 35,626 35,626 10% 3,563
SEK – 78,241 78,241 10% 7,824
THB (11) – (11) 10% (1)
TWD – 16,332 16,332 10% 1,633
ZAR – – – 10% –
Total 948,015
Invesco FTSE RAFI All-World 3000 UCITS ETF at 30 September 2020
Monetary
USD
Non- Monetary
USD
Currency
Exposure
USD
Sensitivity
Movement
2020
USD
AUD 4,040 882,316 886,356 10% 88,636
BRL 4,669 249,120 253,789 10% 25,379
CAD (1,798) 1,037,073 1,035,275 10% 103,528
CHF (29) 1,137,088 1,137,059 10% 113,706
CLP – 26,766 26,766 10% 2,677
CNY 1,094 – 1,094 10% 109
DKK (2) 158,269 158,267 10% 15,827
EUR (132) 5,193,467 5,193,335 10% 519,334
GBP 1,495 2,110,232 2,111,727 10% 211,173
HKD 4,867 1,155,907 1,160,774 10% 116,077
IDR – 21,586 21,586 10% 2,159
ILS – 45,064 45,064 10% 4,506
JPY 31,255 3,435,718 3,466,973 10% 346,697
KRW 1,869 916,822 918,691 10% 91,869
MXN – 83,697 83,697 10% 8,370
MYR – 53,392 53,392 10% 5,339
NOK – 147,390 147,390 10% 14,739
NZD – 6,525 6,525 10% 653
PLN – 41,825 41,825 10% 4,183
RUB 1,387 243,360 244,747 10% 24,475
SEK 1,154 407,730 408,884 10% 40,888
SGD – 88,248 88,248 10% 8,825
THB 141 100,573 100,714 10% 10,071
TRY – 38,290 38,290 10% 3,829
TWD 818 586,921 587,739 10% 58,774
ZAR 77 211,813 211,890 10% 21,189
Total 1,843,012
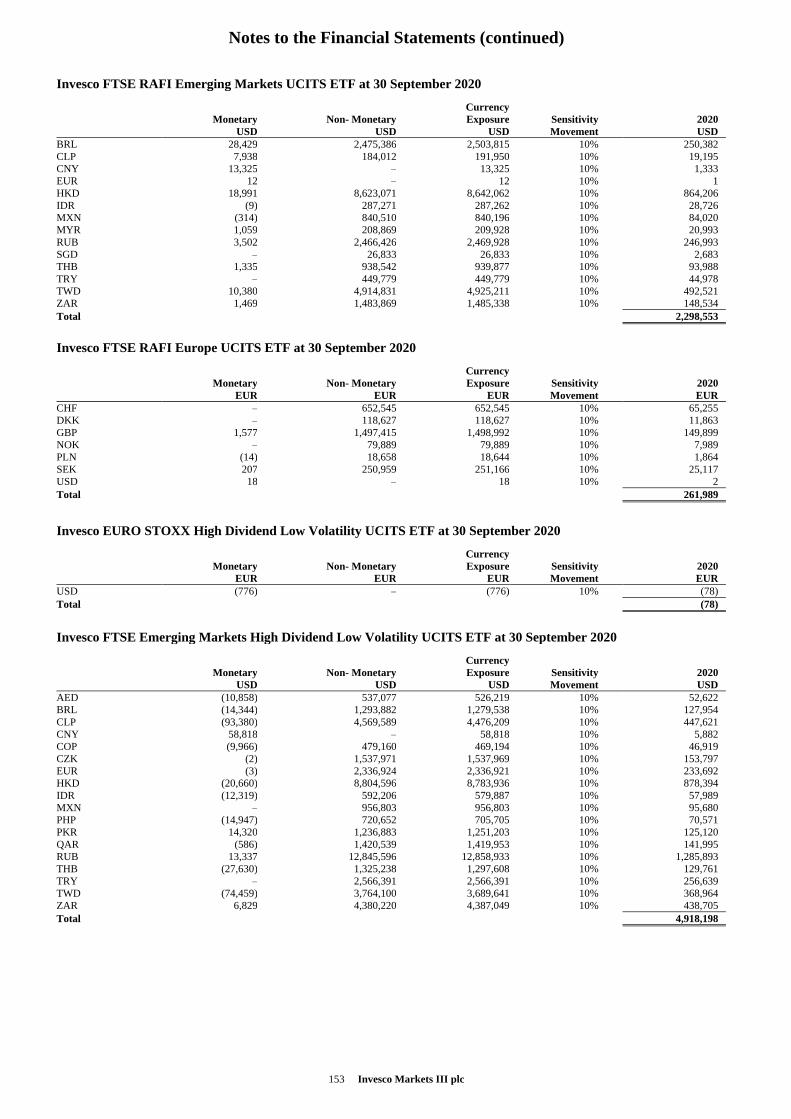
Notes to the Financial Statements (continued)
153 Invesco Markets III plc
Invesco FTSE RAFI Emerging Markets UCITS ETF at 30 September 2020
Monetary
USD
Non- Monetary
USD
Currency
Exposure
USD
Sensitivity
Movement
2020
USD
BRL 28,429 2,475,386 2,503,815 10% 250,382
CLP 7,938 184,012 191,950 10% 19,195
CNY 13,325 – 13,325 10% 1,333
EUR 12 – 12 10% 1
HKD 18,991 8,623,071 8,642,062 10% 864,206
IDR (9) 287,271 287,262 10% 28,726
MXN (314) 840,510 840,196 10% 84,020
MYR 1,059 208,869 209,928 10% 20,993
RUB 3,502 2,466,426 2,469,928 10% 246,993
SGD – 26,833 26,833 10% 2,683
THB 1,335 938,542 939,877 10% 93,988
TRY – 449,779 449,779 10% 44,978
TWD 10,380 4,914,831 4,925,211 10% 492,521
ZAR 1,469 1,483,869 1,485,338 10% 148,534
Total 2,298,553
Invesco FTSE RAFI Europe UCITS ETF at 30 September 2020
Monetary
EUR
Non- Monetary
EUR
Currency
Exposure
EUR
Sensitivity
Movement
2020
EUR
CHF – 652,545 652,545 10% 65,255
DKK – 118,627 118,627 10% 11,863
GBP 1,577 1,497,415 1,498,992 10% 149,899
NOK – 79,889 79,889 10% 7,989
PLN (14) 18,658 18,644 10% 1,864
SEK 207 250,959 251,166 10% 25,117
USD 18 – 18 10% 2
Total 261,989
Invesco EURO STOXX High Dividend Low Volatility UCITS ETF at 30 September 2020
Monetary
EUR
Non- Monetary
EUR
Currency
Exposure
EUR
Sensitivity
Movement
2020
EUR
USD (776) – (776) 10% (78)
Total (78)
Invesco FTSE Emerging Markets High Dividend Low Volatility UCITS ETF at 30 September 2020
Monetary
USD
Non- Monetary
USD
Currency
Exposure
USD
Sensitivity
Movement
2020
USD
AED (10,858) 537,077 526,219 10% 52,622
BRL (14,344) 1,293,882 1,279,538 10% 127,954
CLP (93,380) 4,569,589 4,476,209 10% 447,621
CNY 58,818 – 58,818 10% 5,882
COP (9,966) 479,160 469,194 10% 46,919
CZK (2) 1,537,971 1,537,969 10% 153,797
EUR (3) 2,336,924 2,336,921 10% 233,692
HKD (20,660) 8,804,596 8,783,936 10% 878,394
IDR (12,319) 592,206 579,887 10% 57,989
MXN – 956,803 956,803 10% 95,680
PHP (14,947) 720,652 705,705 10% 70,571
PKR 14,320 1,236,883 1,251,203 10% 125,120
QAR (586) 1,420,539 1,419,953 10% 141,995
RUB 13,337 12,845,596 12,858,933 10% 1,285,893
THB (27,630) 1,325,238 1,297,608 10% 129,761
TRY – 2,566,391 2,566,391 10% 256,639
TWD (74,459) 3,764,100 3,689,641 10% 368,964
ZAR 6,829 4,380,220 4,387,049 10% 438,705
Total 4,918,198
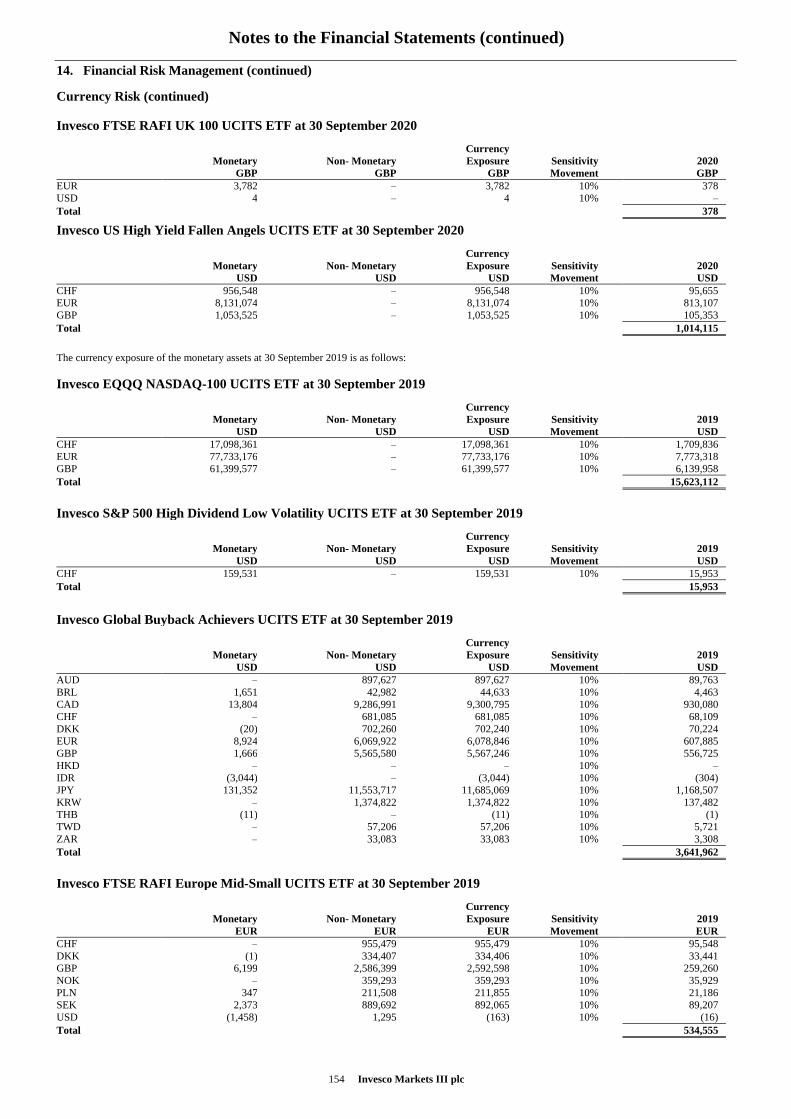
Notes to the Financial Statements (continued)
154 Invesco Markets III plc
14. Financial Risk Management (continued)
Currency Risk (continued)
Invesco FTSE RAFI UK 100 UCITS ETF at 30 September 2020
Monetary
GBP
Non- Monetary
GBP
Currency
Exposure
GBP
Sensitivity
Movement
2020
GBP
EUR 3,782 – 3,782 10% 378
USD 4 – 4 10% –
Total 378
Invesco US High Yield Fallen Angels UCITS ETF at 30 September 2020
Monetary
USD
Non- Monetary
USD
Currency
Exposure
USD
Sensitivity
Movement
2020
USD
CHF 956,548 – 956,548 10% 95,655
EUR 8,131,074 – 8,131,074 10% 813,107
GBP 1,053,525 – 1,053,525 10% 105,353
Total 1,014,115
The currency exposure of the monetary assets at 30 September 2019 is as follows:
Invesco EQQQ NASDAQ-100 UCITS ETF at 30 September 2019
Monetary
USD
Non- Monetary
USD
Currency
Exposure
USD
Sensitivity
Movement
2019
USD
CHF 17,098,361 – 17,098,361 10% 1,709,836
EUR 77,733,176 – 77,733,176 10% 7,773,318
GBP 61,399,577 – 61,399,577 10% 6,139,958
Total 15,623,112
Invesco S&P 500 High Dividend Low Volatility UCITS ETF at 30 September 2019
Monetary
USD
Non- Monetary
USD
Currency
Exposure
USD
Sensitivity
Movement
2019
USD
CHF 159,531 – 159,531 10% 15,953
Total 15,953
Invesco Global Buyback Achievers UCITS ETF at 30 September 2019
Monetary
USD
Non- Monetary
USD
Currency
Exposure
USD
Sensitivity
Movement
2019
USD
AUD – 897,627 897,627 10% 89,763
BRL 1,651 42,982 44,633 10% 4,463
CAD 13,804 9,286,991 9,300,795 10% 930,080
CHF – 681,085 681,085 10% 68,109
DKK (20) 702,260 702,240 10% 70,224
EUR 8,924 6,069,922 6,078,846 10% 607,885
GBP 1,666 5,565,580 5,567,246 10% 556,725
HKD – – – 10% –
IDR (3,044) – (3,044) 10% (304)
JPY 131,352 11,553,717 11,685,069 10% 1,168,507
KRW – 1,374,822 1,374,822 10% 137,482
THB (11) – (11) 10% (1)
TWD – 57,206 57,206 10% 5,721
ZAR – 33,083 33,083 10% 3,308
Total 3,641,962
Invesco FTSE RAFI Europe Mid-Small UCITS ETF at 30 September 2019
Monetary
EUR
Non- Monetary
EUR
Currency
Exposure
EUR
Sensitivity
Movement
2019
EUR
CHF – 955,479 955,479 10% 95,548
DKK (1) 334,407 334,406 10% 33,441
GBP 6,199 2,586,399 2,592,598 10% 259,260
NOK – 359,293 359,293 10% 35,929
PLN 347 211,508 211,855 10% 21,186
SEK 2,373 889,692 892,065 10% 89,207
USD (1,458) 1,295 (163) 10% (16)
Total 534,555
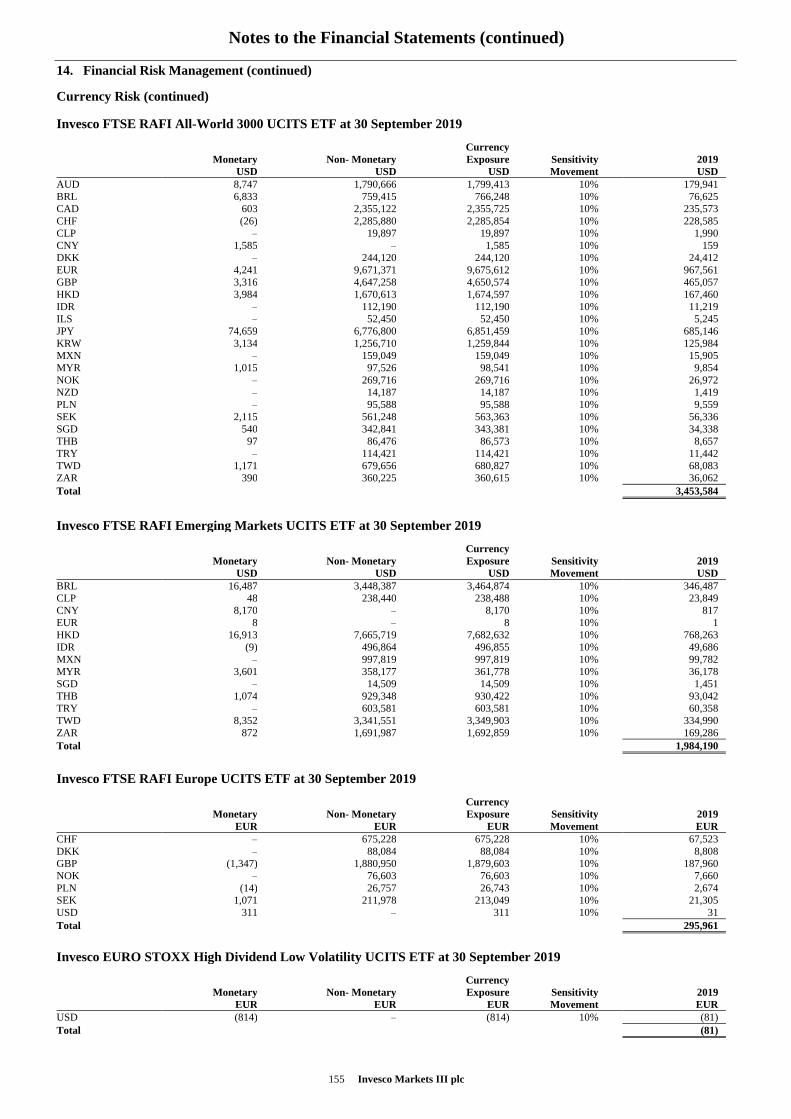
Notes to the Financial Statements (continued)
155 Invesco Markets III plc
14. Financial Risk Management (continued)
Currency Risk (continued)
Invesco FTSE RAFI All-World 3000 UCITS ETF at 30 September 2019
Monetary
USD
Non- Monetary
USD
Currency
Exposure
USD
Sensitivity
Movement
2019
USD
AUD 8,747 1,790,666 1,799,413 10% 179,941
BRL 6,833 759,415 766,248 10% 76,625
CAD 603 2,355,122 2,355,725 10% 235,573
CHF (26) 2,285,880 2,285,854 10% 228,585
CLP – 19,897 19,897 10% 1,990
CNY 1,585 – 1,585 10% 159
DKK – 244,120 244,120 10% 24,412
EUR 4,241 9,671,371 9,675,612 10% 967,561
GBP 3,316 4,647,258 4,650,574 10% 465,057
HKD 3,984 1,670,613 1,674,597 10% 167,460
IDR – 112,190 112,190 10% 11,219
ILS – 52,450 52,450 10% 5,245
JPY 74,659 6,776,800 6,851,459 10% 685,146
KRW 3,134 1,256,710 1,259,844 10% 125,984
MXN – 159,049 159,049 10% 15,905
MYR 1,015 97,526 98,541 10% 9,854
NOK – 269,716 269,716 10% 26,972
NZD – 14,187 14,187 10% 1,419
PLN – 95,588 95,588 10% 9,559
SEK 2,115 561,248 563,363 10% 56,336
SGD 540 342,841 343,381 10% 34,338
THB 97 86,476 86,573 10% 8,657
TRY – 114,421 114,421 10% 11,442
TWD 1,171 679,656 680,827 10% 68,083
ZAR 390 360,225 360,615 10% 36,062
Total 3,453,584
Invesco FTSE RAFI Emerging Markets UCITS ETF at 30 September 2019
Monetary
USD
Non- Monetary
USD
Currency
Exposure
USD
Sensitivity
Movement
2019
USD
BRL 16,487 3,448,387 3,464,874 10% 346,487
CLP 48 238,440 238,488 10% 23,849
CNY 8,170 – 8,170 10% 817
EUR 8 – 8 10% 1
HKD 16,913 7,665,719 7,682,632 10% 768,263
IDR (9) 496,864 496,855 10% 49,686
MXN – 997,819 997,819 10% 99,782
MYR 3,601 358,177 361,778 10% 36,178
SGD – 14,509 14,509 10% 1,451
THB 1,074 929,348 930,422 10% 93,042
TRY – 603,581 603,581 10% 60,358
TWD 8,352 3,341,551 3,349,903 10% 334,990
ZAR 872 1,691,987 1,692,859 10% 169,286
Total 1,984,190
Invesco FTSE RAFI Europe UCITS ETF at 30 September 2019
Monetary
EUR
Non- Monetary
EUR
Currency
Exposure
EUR
Sensitivity
Movement
2019
EUR
CHF – 675,228 675,228 10% 67,523
DKK – 88,084 88,084 10% 8,808
GBP (1,347) 1,880,950 1,879,603 10% 187,960
NOK – 76,603 76,603 10% 7,660
PLN (14) 26,757 26,743 10% 2,674
SEK 1,071 211,978 213,049 10% 21,305
USD 311 – 311 10% 31
Total 295,961
Invesco EURO STOXX High Dividend Low Volatility UCITS ETF at 30 September 2019
Monetary
EUR
Non- Monetary
EUR
Currency
Exposure
EUR
Sensitivity
Movement
2019
EUR
USD (814) – (814) 10% (81)
Total (81)
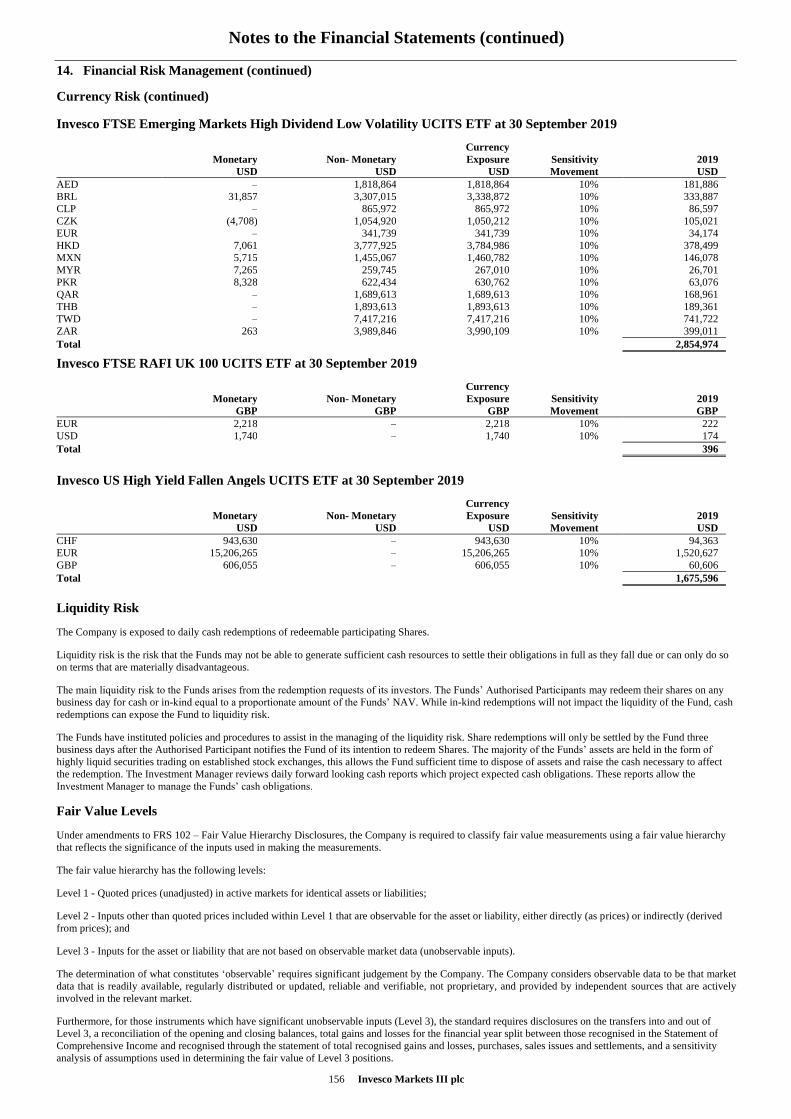
Notes to the Financial Statements (continued)
156 Invesco Markets III plc
14. Financial Risk Management (continued)
Currency Risk (continued)
Invesco FTSE Emerging Markets High Dividend Low Volatility UCITS ETF at 30 September 2019
Monetary
USD
Non- Monetary
USD
Currency
Exposure
USD
Sensitivity
Movement
2019
USD
AED – 1,818,864 1,818,864 10% 181,886
BRL 31,857 3,307,015 3,338,872 10% 333,887
CLP – 865,972 865,972 10% 86,597
CZK (4,708) 1,054,920 1,050,212 10% 105,021
EUR – 341,739 341,739 10% 34,174
HKD 7,061 3,777,925 3,784,986 10% 378,499
MXN 5,715 1,455,067 1,460,782 10% 146,078
MYR 7,265 259,745 267,010 10% 26,701
PKR 8,328 622,434 630,762 10% 63,076
QAR – 1,689,613 1,689,613 10% 168,961
THB – 1,893,613 1,893,613 10% 189,361
TWD – 7,417,216 7,417,216 10% 741,722
ZAR 263 3,989,846 3,990,109 10% 399,011
Total 2,854,974
Invesco FTSE RAFI UK 100 UCITS ETF at 30 September 2019
Monetary
GBP
Non- Monetary
GBP
Currency
Exposure
GBP
Sensitivity
Movement
2019
GBP
EUR 2,218 – 2,218 10% 222
USD 1,740 – 1,740 10% 174
Total 396
Invesco US High Yield Fallen Angels UCITS ETF at 30 September 2019
Monetary
USD
Non- Monetary
USD
Currency
Exposure
USD
Sensitivity
Movement
2019
USD
CHF 943,630 – 943,630 10% 94,363
EUR 15,206,265 – 15,206,265 10% 1,520,627
GBP 606,055 – 606,055 10% 60,606
Total 1,675,596
Liquidity Risk
The Company is exposed to daily cash redemptions of redeemable participating Shares.
Liquidity risk is the risk that the Funds may not be able to generate sufficient cash resources to settle their obligations in full as they fall due or can only do so
on terms that are materially disadvantageous.
The main liquidity risk to the Funds arises from the redemption requests of its investors. The Funds’ Authorised Participants may redeem their shares on any
business day for cash or in-kind equal to a proportionate amount of the Funds’ NAV. While in-kind redemptions will not impact the liquidity of the Fund, cash
redemptions can expose the Fund to liquidity risk.
The Funds have instituted policies and procedures to assist in the managing of the liquidity risk. Share redemptions will only be settled by the Fund three
business days after the Authorised Participant notifies the Fund of its intention to redeem Shares. The majority of the Funds’ assets are held in the form of
highly liquid securities trading on established stock exchanges, this allows the Fund sufficient time to dispose of assets and raise the cash necessary to affect
the redemption. The Investment Manager reviews daily forward looking cash reports which project expected cash obligations. These reports allow the
Investment Manager to manage the Funds’ cash obligations.
Fair Value Levels
Under amendments to FRS 102 – Fair Value Hierarchy Disclosures, the Company is required to classify fair value measurements using a fair value hierarchy
that reflects the significance of the inputs used in making the measurements.
The fair value hierarchy has the following levels:
Level 1 - Quoted prices (unadjusted) in active markets for identical assets or liabilities;
Level 2 - Inputs other than quoted prices included within Level 1 that are observable for the asset or liability, either directly (as prices) or indirectly (derived
from prices); and
Level 3 - Inputs for the asset or liability that are not based on observable market data (unobservable inputs).
The determination of what constitutes ‘observable’ requires significant judgement by the Company. The Company considers observable data to be that market
data that is readily available, regularly distributed or updated, reliable and verifiable, not proprietary, and provided by independent sources that are actively
involved in the relevant market.
Furthermore, for those instruments which have significant unobservable inputs (Level 3), the standard requires disclosures on the transfers into and out of
Level 3, a reconciliation of the opening and closing balances, total gains and losses for the financial year split between those recognised in the Statement of
Comprehensive Income and recognised through the statement of total recognised gains and losses, purchases, sales issues and settlements, and a sensitivity
analysis of assumptions used in determining the fair value of Level 3 positions.
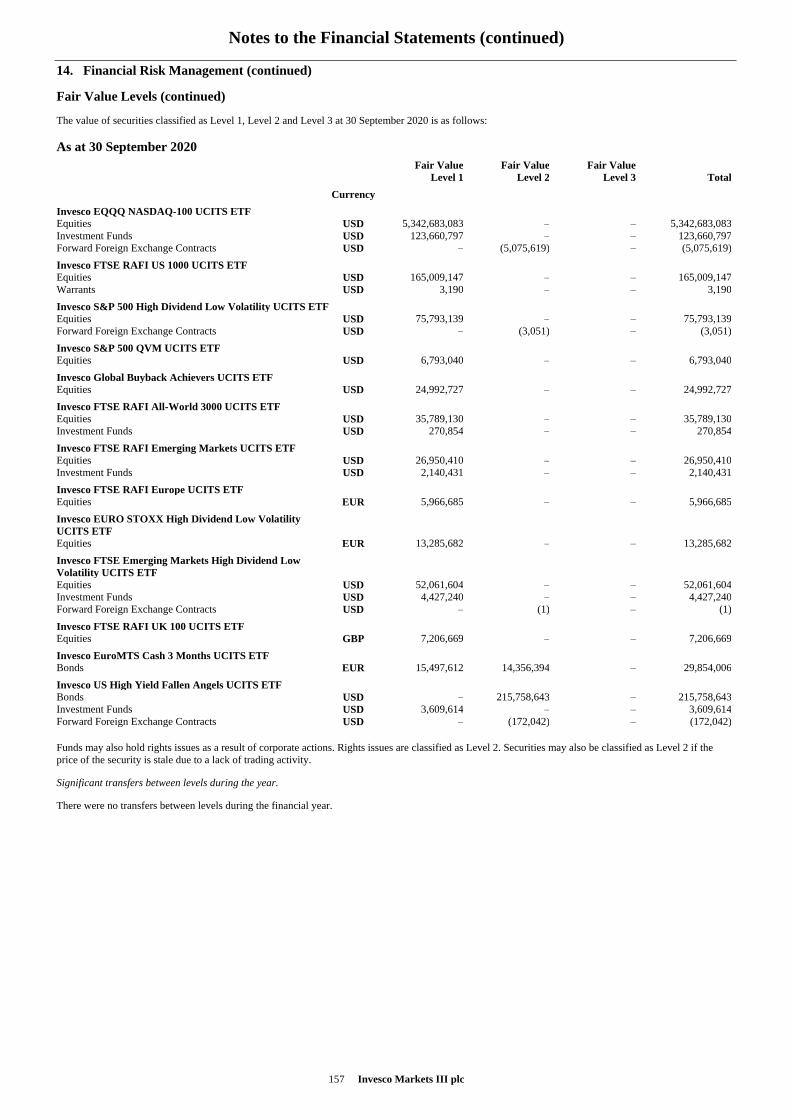
Notes to the Financial Statements (continued)
157 Invesco Markets III plc
14. Financial Risk Management (continued)
Fair Value Levels (continued)
The value of securities classified as Level 1, Level 2 and Level 3 at 30 September 2020 is as follows:
As at 30 September 2020
Fair Value
Level 1
Fair Value
Level 2
Fair Value
Level 3 Total
Currency
Invesco EQQQ NASDAQ-100 UCITS ETF
Equities USD 5,342,683,083 – – 5,342,683,083
Investment Funds USD 123,660,797 – – 123,660,797
Forward Foreign Exchange Contracts USD – (5,075,619) – (5,075,619)
Invesco FTSE RAFI US 1000 UCITS ETF
Equities USD 165,009,147 – – 165,009,147
Warrants USD 3,190 – – 3,190
Invesco S&P 500 High Dividend Low Volatility UCITS ETF
Equities USD 75,793,139 – – 75,793,139
Forward Foreign Exchange Contracts USD – (3,051) – (3,051)
Invesco S&P 500 QVM UCITS ETF
Equities USD 6,793,040 – – 6,793,040
Invesco Global Buyback Achievers UCITS ETF
Equities USD 24,992,727 – – 24,992,727
Invesco FTSE RAFI All-World 3000 UCITS ETF
Equities USD 35,789,130 – – 35,789,130
Investment Funds USD 270,854 – – 270,854
Invesco FTSE RAFI Emerging Markets UCITS ETF
Equities USD 26,950,410 – – 26,950,410
Investment Funds USD 2,140,431 – – 2,140,431
Invesco FTSE RAFI Europe UCITS ETF
Equities EUR 5,966,685 – – 5,966,685
Invesco EURO STOXX High Dividend Low Volatility
UCITS ETF
Equities EUR 13,285,682 – – 13,285,682
Invesco FTSE Emerging Markets High Dividend Low
Volatility UCITS ETF
Equities USD 52,061,604 – – 52,061,604
Investment Funds USD 4,427,240 – – 4,427,240
Forward Foreign Exchange Contracts USD – (1) – (1)
Invesco FTSE RAFI UK 100 UCITS ETF
Equities GBP 7,206,669 – – 7,206,669
Invesco EuroMTS Cash 3 Months UCITS ETF
Bonds EUR 15,497,612 14,356,394 – 29,854,006
Invesco US High Yield Fallen Angels UCITS ETF
Bonds USD – 215,758,643 – 215,758,643
Investment Funds USD 3,609,614 – – 3,609,614
Forward Foreign Exchange Contracts USD – (172,042) – (172,042)
Funds may also hold rights issues as a result of corporate actions. Rights issues are classified as Level 2. Securities may also be classified as Level 2 if the
price of the security is stale due to a lack of trading activity.
Significant transfers between levels during the year.
There were no transfers between levels during the financial year.
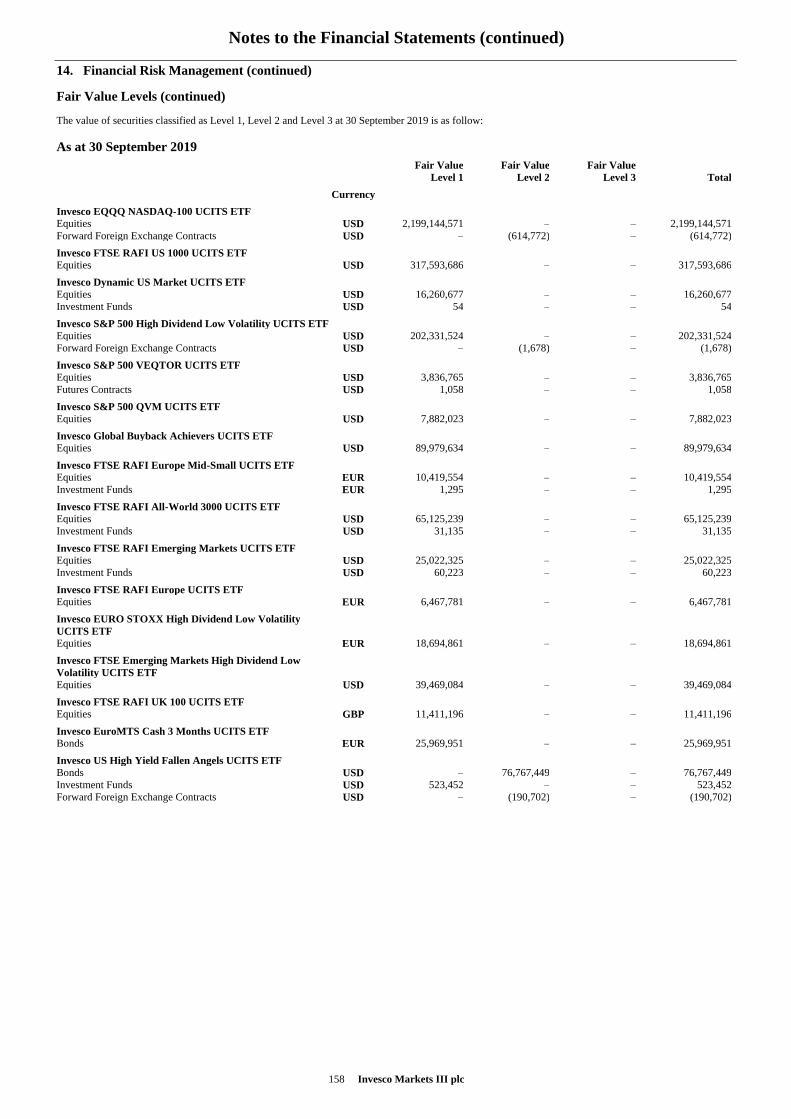
Notes to the Financial Statements (continued)
158 Invesco Markets III plc
14. Financial Risk Management (continued)
Fair Value Levels (continued)
The value of securities classified as Level 1, Level 2 and Level 3 at 30 September 2019 is as follow:
As at 30 September 2019
Fair Value
Level 1
Fair Value
Level 2
Fair Value
Level 3 Total
Currency
Invesco EQQQ NASDAQ-100 UCITS ETF
Equities USD 2,199,144,571 – – 2,199,144,571
Forward Foreign Exchange Contracts USD – (614,772) – (614,772)
Invesco FTSE RAFI US 1000 UCITS ETF
Equities USD 317,593,686 – – 317,593,686
Invesco Dynamic US Market UCITS ETF
Equities USD 16,260,677 – – 16,260,677
Investment Funds USD 54 – – 54
Invesco S&P 500 High Dividend Low Volatility UCITS ETF
Equities USD 202,331,524 – – 202,331,524
Forward Foreign Exchange Contracts USD – (1,678) – (1,678)
Invesco S&P 500 VEQTOR UCITS ETF
Equities USD 3,836,765 – – 3,836,765
Futures Contracts USD 1,058 – – 1,058
Invesco S&P 500 QVM UCITS ETF
Equities USD 7,882,023 – – 7,882,023
Invesco Global Buyback Achievers UCITS ETF
Equities USD 89,979,634 – – 89,979,634
Invesco FTSE RAFI Europe Mid-Small UCITS ETF
Equities EUR 10,419,554 – – 10,419,554
Investment Funds EUR 1,295 – – 1,295
Invesco FTSE RAFI All-World 3000 UCITS ETF
Equities USD 65,125,239 – – 65,125,239
Investment Funds USD 31,135 – – 31,135
Invesco FTSE RAFI Emerging Markets UCITS ETF
Equities USD 25,022,325 – – 25,022,325
Investment Funds USD 60,223 – – 60,223
Invesco FTSE RAFI Europe UCITS ETF
Equities EUR 6,467,781 – – 6,467,781
Invesco EURO STOXX High Dividend Low Volatility
UCITS ETF
Equities EUR 18,694,861 – – 18,694,861
Invesco FTSE Emerging Markets High Dividend Low
Volatility UCITS ETF
Equities USD 39,469,084 – – 39,469,084
Invesco FTSE RAFI UK 100 UCITS ETF
Equities GBP 11,411,196 – – 11,411,196
Invesco EuroMTS Cash 3 Months UCITS ETF
Bonds EUR 25,969,951 – – 25,969,951
Invesco US High Yield Fallen Angels UCITS ETF
Bonds USD – 76,767,449 – 76,767,449
Investment Funds USD 523,452 – – 523,452
Forward Foreign Exchange Contracts USD – (190,702) – (190,702)
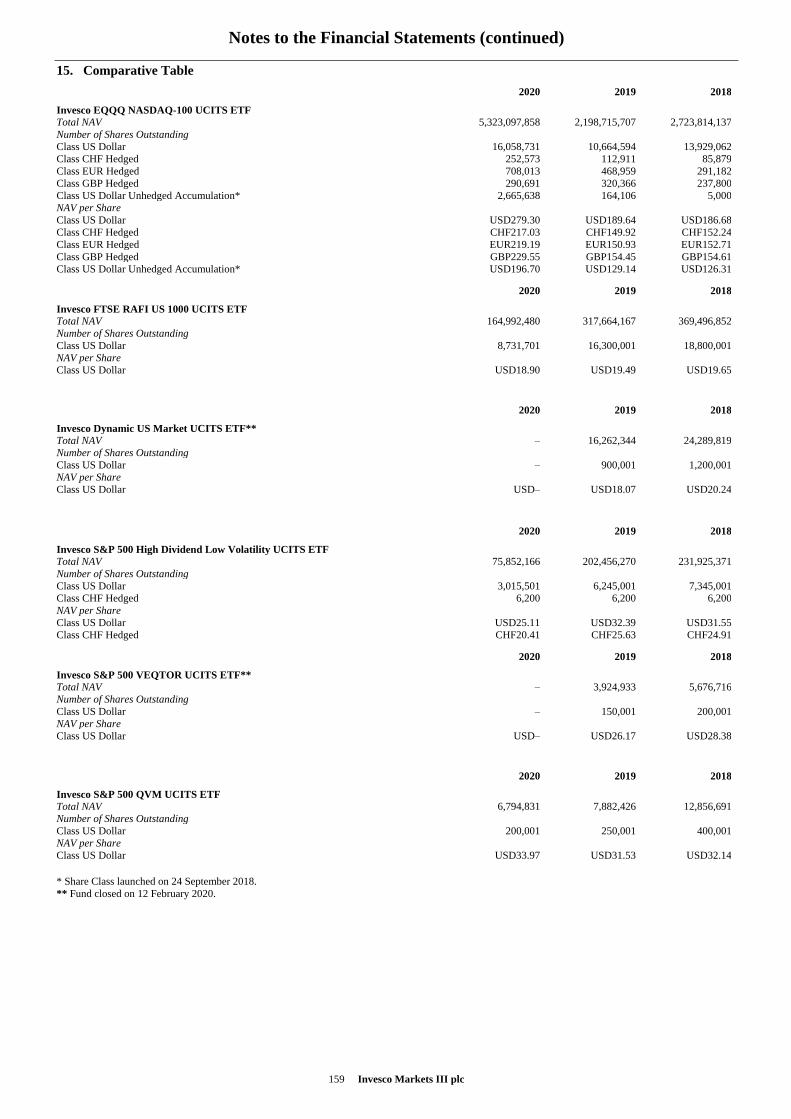
Notes to the Financial Statements (continued)
159 Invesco Markets III plc
15. Comparative Table
2020 2019 2018
Invesco EQQQ NASDAQ-100 UCITS ETF Total NAV 5,323,097,858 2,198,715,707 2,723,814,137
Number of Shares Outstanding
Class US Dollar 16,058,731 10,664,594 13,929,062
Class CHF Hedged 252,573 112,911 85,879
Class EUR Hedged 708,013 468,959 291,182
Class GBP Hedged 290,691 320,366 237,800
Class US Dollar Unhedged Accumulation* 2,665,638 164,106 5,000
NAV per Share
Class US Dollar USD279.30 USD189.64 USD186.68
Class CHF Hedged CHF217.03 CHF149.92 CHF152.24
Class EUR Hedged EUR219.19 EUR150.93 EUR152.71
Class GBP Hedged GBP229.55 GBP154.45 GBP154.61
Class US Dollar Unhedged Accumulation* USD196.70 USD129.14 USD126.31
2020 2019 2018
Invesco FTSE RAFI US 1000 UCITS ETF Total NAV 164,992,480 317,664,167 369,496,852
Number of Shares Outstanding
Class US Dollar 8,731,701 16,300,001 18,800,001
NAV per Share
Class US Dollar USD18.90 USD19.49 USD19.65
2020 2019 2018
Invesco Dynamic US Market UCITS ETF** Total NAV – 16,262,344 24,289,819
Number of Shares Outstanding
Class US Dollar – 900,001 1,200,001
NAV per Share
Class US Dollar USD– USD18.07 USD20.24
2020 2019 2018
Invesco S&P 500 High Dividend Low Volatility UCITS ETF Total NAV 75,852,166 202,456,270 231,925,371
Number of Shares Outstanding
Class US Dollar 3,015,501 6,245,001 7,345,001
Class CHF Hedged 6,200 6,200 6,200
NAV per Share
Class US Dollar USD25.11 USD32.39 USD31.55
Class CHF Hedged CHF20.41 CHF25.63 CHF24.91
2020 2019 2018
Invesco S&P 500 VEQTOR UCITS ETF** Total NAV – 3,924,933 5,676,716
Number of Shares Outstanding
Class US Dollar – 150,001 200,001
NAV per Share
Class US Dollar USD– USD26.17 USD28.38
2020 2019 2018
Invesco S&P 500 QVM UCITS ETF Total NAV 6,794,831 7,882,426 12,856,691
Number of Shares Outstanding
Class US Dollar 200,001 250,001 400,001
NAV per Share
Class US Dollar USD33.97 USD31.53 USD32.14
* Share Class launched on 24 September 2018.
** Fund closed on 12 February 2020.
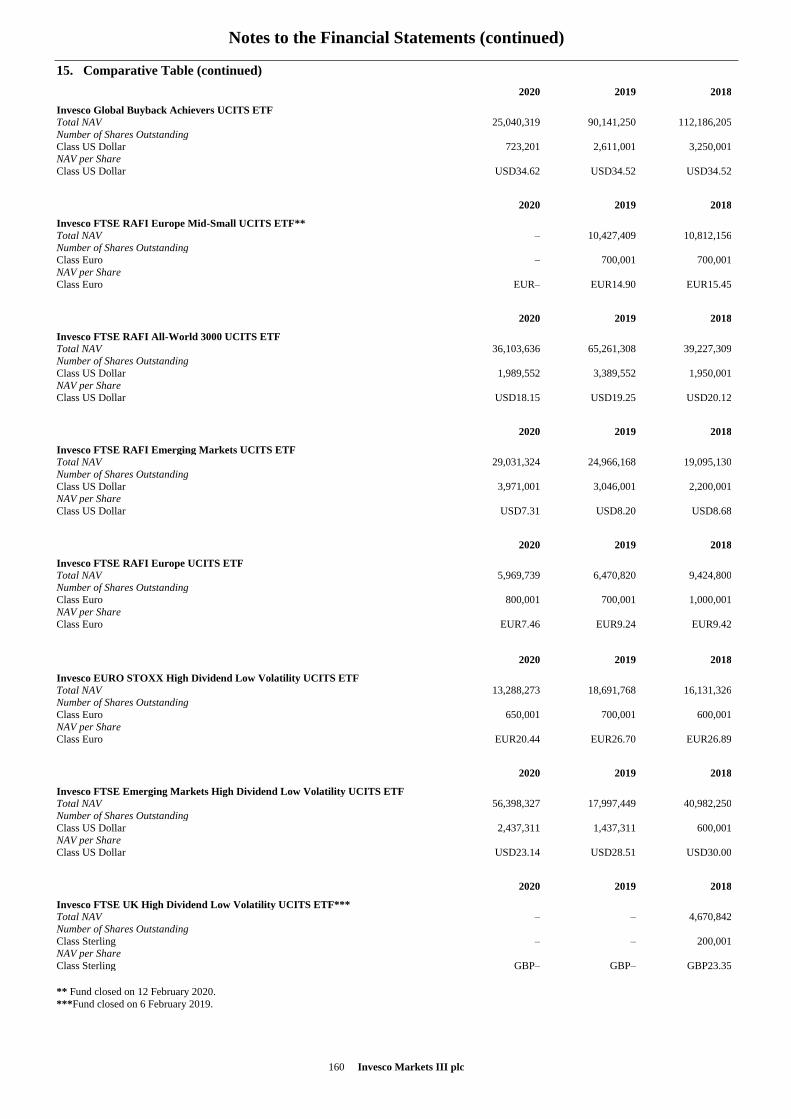
Notes to the Financial Statements (continued)
160 Invesco Markets III plc
15. Comparative Table (continued)
2020 2019 2018
Invesco Global Buyback Achievers UCITS ETF Total NAV 25,040,319 90,141,250 112,186,205
Number of Shares Outstanding
Class US Dollar 723,201 2,611,001 3,250,001
NAV per Share
Class US Dollar USD34.62 USD34.52 USD34.52
2020 2019 2018
Invesco FTSE RAFI Europe Mid-Small UCITS ETF** Total NAV – 10,427,409 10,812,156
Number of Shares Outstanding
Class Euro – 700,001 700,001
NAV per Share
Class Euro EUR– EUR14.90 EUR15.45
2020 2019 2018
Invesco FTSE RAFI All-World 3000 UCITS ETF Total NAV 36,103,636 65,261,308 39,227,309
Number of Shares Outstanding
Class US Dollar 1,989,552 3,389,552 1,950,001
NAV per Share
Class US Dollar USD18.15 USD19.25 USD20.12
2020 2019 2018
Invesco FTSE RAFI Emerging Markets UCITS ETF Total NAV 29,031,324 24,966,168 19,095,130
Number of Shares Outstanding
Class US Dollar 3,971,001 3,046,001 2,200,001
NAV per Share
Class US Dollar USD7.31 USD8.20 USD8.68
2020 2019 2018
Invesco FTSE RAFI Europe UCITS ETF Total NAV 5,969,739 6,470,820 9,424,800
Number of Shares Outstanding
Class Euro 800,001 700,001 1,000,001
NAV per Share
Class Euro EUR7.46 EUR9.24 EUR9.42
2020 2019 2018
Invesco EURO STOXX High Dividend Low Volatility UCITS ETF Total NAV 13,288,273 18,691,768 16,131,326
Number of Shares Outstanding
Class Euro 650,001 700,001 600,001
NAV per Share
Class Euro EUR20.44 EUR26.70 EUR26.89
2020 2019 2018
Invesco FTSE Emerging Markets High Dividend Low Volatility UCITS ETF Total NAV 56,398,327 17,997,449 40,982,250
Number of Shares Outstanding
Class US Dollar 2,437,311 1,437,311 600,001
NAV per Share
Class US Dollar USD23.14 USD28.51 USD30.00
2020 2019 2018
Invesco FTSE UK High Dividend Low Volatility UCITS ETF*** Total NAV – – 4,670,842
Number of Shares Outstanding
Class Sterling – – 200,001
NAV per Share
Class Sterling GBP– GBP– GBP23.35
** Fund closed on 12 February 2020.
***Fund closed on 6 February 2019.
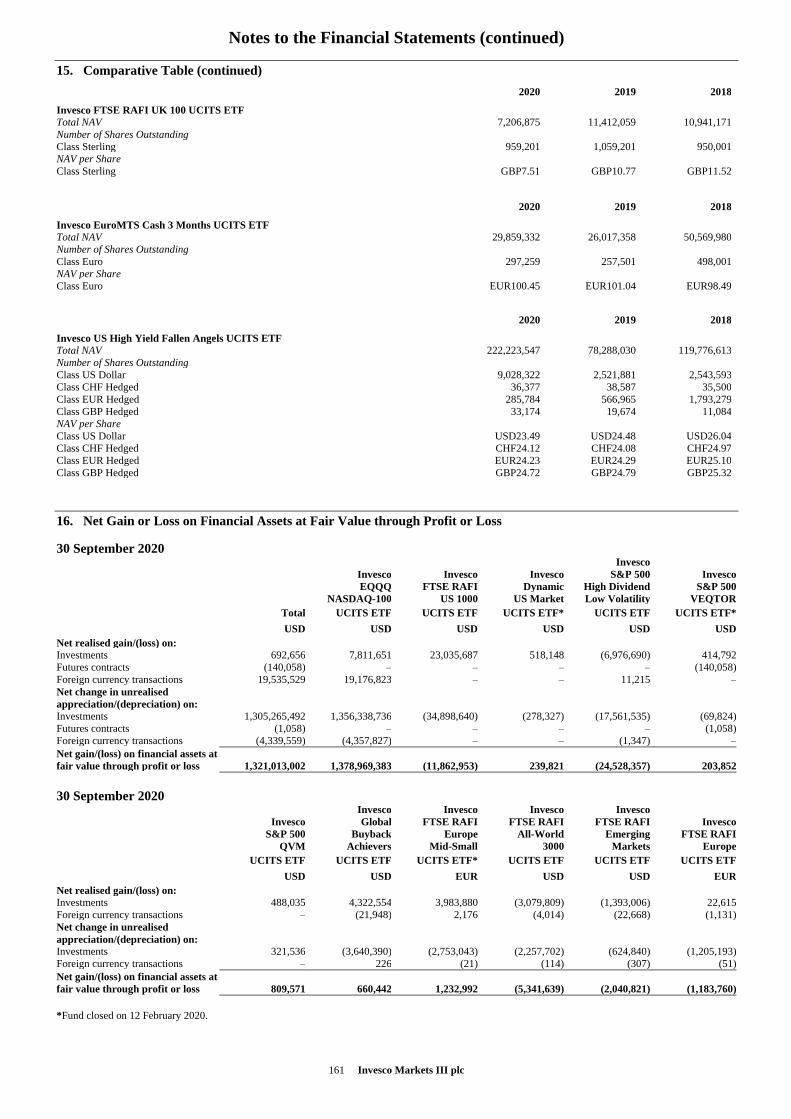
Notes to the Financial Statements (continued)
161 Invesco Markets III plc
15. Comparative Table (continued)
2020 2019 2018
Invesco FTSE RAFI UK 100 UCITS ETF Total NAV 7,206,875 11,412,059 10,941,171
Number of Shares Outstanding
Class Sterling 959,201 1,059,201 950,001
NAV per Share
Class Sterling GBP7.51 GBP10.77 GBP11.52
2020 2019 2018
Invesco EuroMTS Cash 3 Months UCITS ETF Total NAV 29,859,332 26,017,358 50,569,980
Number of Shares Outstanding
Class Euro 297,259 257,501 498,001
NAV per Share
Class Euro EUR100.45 EUR101.04 EUR98.49
2020 2019 2018
Invesco US High Yield Fallen Angels UCITS ETF Total NAV 222,223,547 78,288,030 119,776,613
Number of Shares Outstanding
Class US Dollar 9,028,322 2,521,881 2,543,593
Class CHF Hedged 36,377 38,587 35,500
Class EUR Hedged 285,784 566,965 1,793,279
Class GBP Hedged 33,174 19,674 11,084
NAV per Share
Class US Dollar USD23.49 USD24.48 USD26.04
Class CHF Hedged CHF24.12 CHF24.08 CHF24.97
Class EUR Hedged EUR24.23 EUR24.29 EUR25.10
Class GBP Hedged GBP24.72 GBP24.79 GBP25.32
16. Net Gain or Loss on Financial Assets at Fair Value through Profit or Loss
30 September 2020
0 Invesco
0 Invesco Invesco Invesco S&P 500 Invesco
0 EQQQ FTSE RAFI Dynamic High Dividend S&P 500
0 NASDAQ-100 US 1000 US Market Low Volatility VEQTOR
0 Total UCITS ETF UCITS ETF UCITS ETF* UCITS ETF UCITS ETF*
0 USD USD USD USD USD USD
Net realised gain/(loss) on:
Investments 692,656 7,811,651 23,035,687 518,148 (6,976,690) 414,792
Futures contracts (140,058) – – – – (140,058)
Foreign currency transactions 19,535,529 19,176,823 – – 11,215 –
Net change in unrealised
appreciation/(depreciation) on:
Investments 1,305,265,492 1,356,338,736 (34,898,640) (278,327) (17,561,535) (69,824)
Futures contracts (1,058) – – – – (1,058)
Foreign currency transactions (4,339,559) (4,357,827) – – (1,347) –
Net gain/(loss) on financial assets at
fair value through profit or loss 1,321,013,002 1,378,969,383 (11,862,953) 239,821 (24,528,357) 203,852
30 September 2020
0 Invesco Invesco Invesco Invesco
0 Invesco Global FTSE RAFI FTSE RAFI FTSE RAFI Invesco
0 S&P 500 Buyback Europe All-World Emerging FTSE RAFI
0 QVM Achievers Mid-Small 3000 Markets Europe
0 UCITS ETF UCITS ETF UCITS ETF* UCITS ETF UCITS ETF UCITS ETF
0 USD USD EUR USD USD EUR
Net realised gain/(loss) on:
Investments 488,035 4,322,554 3,983,880 (3,079,809) (1,393,006) 22,615
Foreign currency transactions – (21,948) 2,176 (4,014) (22,668) (1,131)
Net change in unrealised
appreciation/(depreciation) on:
Investments 321,536 (3,640,390) (2,753,043) (2,257,702) (624,840) (1,205,193)
Foreign currency transactions – 226 (21) (114) (307) (51)
Net gain/(loss) on financial assets at
fair value through profit or loss 809,571 660,442 1,232,992 (5,341,639) (2,040,821) (1,183,760)
*Fund closed on 12 February 2020.
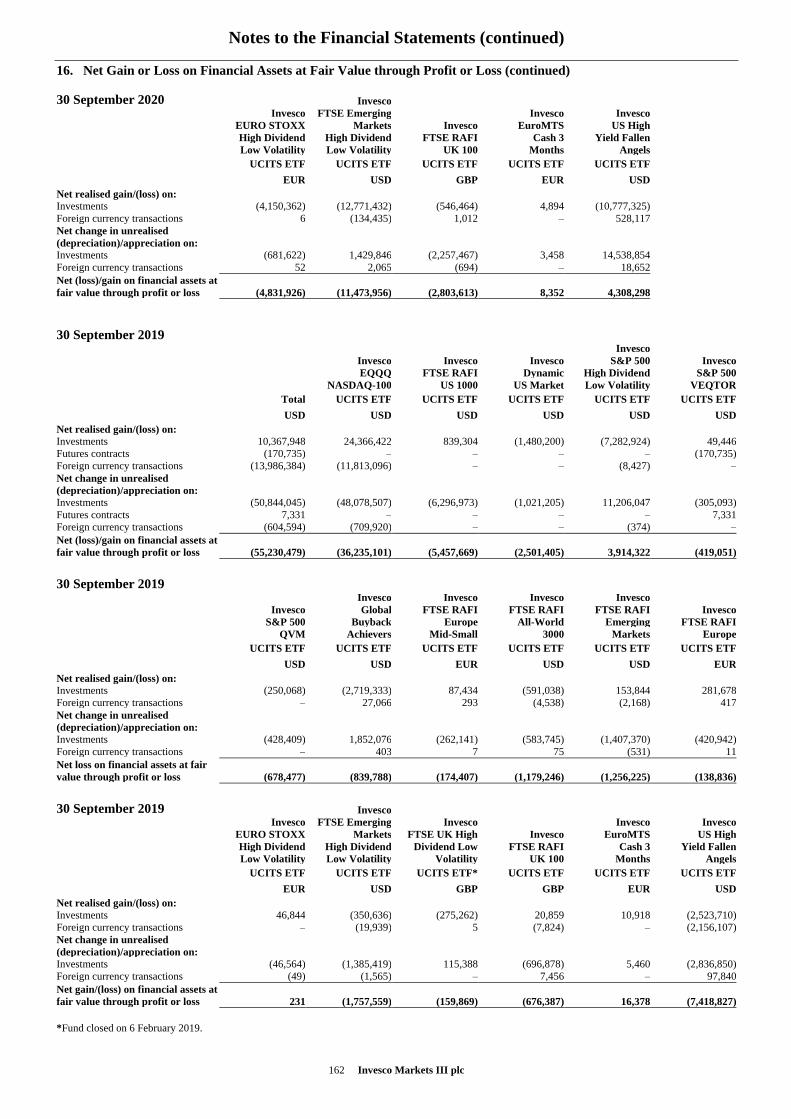
Notes to the Financial Statements (continued)
162 Invesco Markets III plc
16. Net Gain or Loss on Financial Assets at Fair Value through Profit or Loss (continued)
30 September 2020 Invesco
0 Invesco FTSE Emerging Invesco Invesco
0 EURO STOXX Markets Invesco EuroMTS US High
0 High Dividend High Dividend FTSE RAFI Cash 3 Yield Fallen
0 Low Volatility Low Volatility UK 100 Months Angels
0 UCITS ETF UCITS ETF UCITS ETF UCITS ETF UCITS ETF
0 EUR USD GBP EUR USD
Net realised gain/(loss) on:
Investments (4,150,362) (12,771,432) (546,464) 4,894 (10,777,325)
Foreign currency transactions 6 (134,435) 1,012 – 528,117
Net change in unrealised
(depreciation)/appreciation on:
Investments (681,622) 1,429,846 (2,257,467) 3,458 14,538,854
Foreign currency transactions 52 2,065 (694) – 18,652
Net (loss)/gain on financial assets at
fair value through profit or loss (4,831,926) (11,473,956) (2,803,613) 8,352 4,308,298
30 September 2019
0 Invesco
0 Invesco Invesco Invesco S&P 500 Invesco
0 EQQQ FTSE RAFI Dynamic High Dividend S&P 500
0 NASDAQ-100 US 1000 US Market Low Volatility VEQTOR
0 Total UCITS ETF UCITS ETF UCITS ETF UCITS ETF UCITS ETF
0 USD USD USD USD USD USD
Net realised gain/(loss) on:
Investments 10,367,948 24,366,422 839,304 (1,480,200) (7,282,924) 49,446
Futures contracts (170,735) – – – – (170,735)
Foreign currency transactions (13,986,384) (11,813,096) – – (8,427) –
Net change in unrealised
(depreciation)/appreciation on:
Investments (50,844,045) (48,078,507) (6,296,973) (1,021,205) 11,206,047 (305,093)
Futures contracts 7,331 – – – – 7,331
Foreign currency transactions (604,594) (709,920) – – (374) –
Net (loss)/gain on financial assets at
fair value through profit or loss (55,230,479) (36,235,101) (5,457,669) (2,501,405) 3,914,322 (419,051)
30 September 2019
0 Invesco Invesco Invesco Invesco
0 Invesco Global FTSE RAFI FTSE RAFI FTSE RAFI Invesco
0 S&P 500 Buyback Europe All-World Emerging FTSE RAFI
0 QVM Achievers Mid-Small 3000 Markets Europe
0 UCITS ETF UCITS ETF UCITS ETF UCITS ETF UCITS ETF UCITS ETF
0 USD USD EUR USD USD EUR
Net realised gain/(loss) on:
Investments (250,068) (2,719,333) 87,434 (591,038) 153,844 281,678
Foreign currency transactions – 27,066 293 (4,538) (2,168) 417
Net change in unrealised
(depreciation)/appreciation on:
Investments (428,409) 1,852,076 (262,141) (583,745) (1,407,370) (420,942)
Foreign currency transactions – 403 7 75 (531) 11
Net loss on financial assets at fair
value through profit or loss (678,477) (839,788) (174,407) (1,179,246) (1,256,225) (138,836)
30 September 2019 Invesco
0 Invesco FTSE Emerging Invesco Invesco Invesco
0 EURO STOXX Markets FTSE UK High Invesco EuroMTS US High
0 High Dividend High Dividend Dividend Low FTSE RAFI Cash 3 Yield Fallen
0 Low Volatility Low Volatility Volatility UK 100 Months Angels
0 UCITS ETF UCITS ETF UCITS ETF* UCITS ETF UCITS ETF UCITS ETF
0 EUR USD GBP GBP EUR USD
Net realised gain/(loss) on:
Investments 46,844 (350,636) (275,262) 20,859 10,918 (2,523,710)
Foreign currency transactions – (19,939) 5 (7,824) – (2,156,107)
Net change in unrealised
(depreciation)/appreciation on:
Investments (46,564) (1,385,419) 115,388 (696,878) 5,460 (2,836,850)
Foreign currency transactions (49) (1,565) – 7,456 – 97,840
Net gain/(loss) on financial assets at
fair value through profit or loss 231 (1,757,559) (159,869) (676,387) 16,378 (7,418,827)
*Fund closed on 6 February 2019.
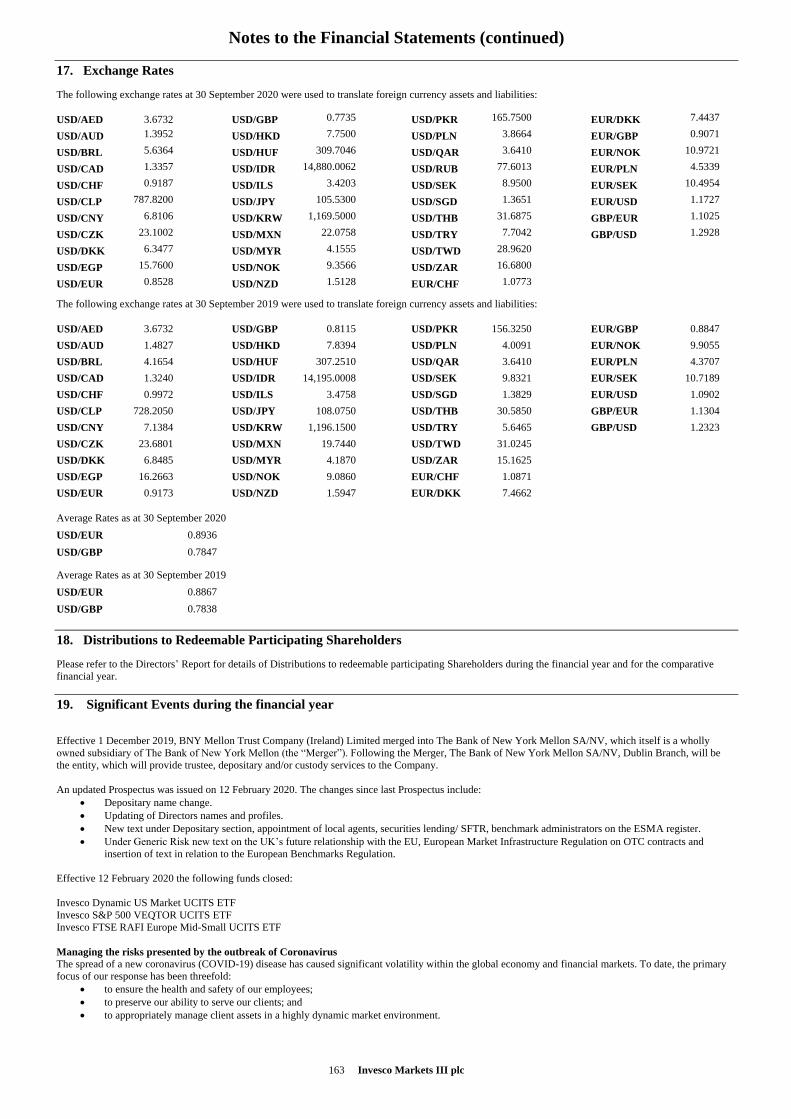
Notes to the Financial Statements (continued)
163 Invesco Markets III plc
17. Exchange Rates
The following exchange rates at 30 September 2020 were used to translate foreign currency assets and liabilities:
USD/AED 3.6732 USD/GBP 0.7735 USD/PKR 165.7500 EUR/DKK 7.4437
USD/AUD 1.3952 USD/HKD 7.7500 USD/PLN 3.8664 EUR/GBP 0.9071
USD/BRL 5.6364 USD/HUF 309.7046 USD/QAR 3.6410 EUR/NOK 10.9721
USD/CAD 1.3357 USD/IDR 14,880.0062 USD/RUB 77.6013 EUR/PLN 4.5339
USD/CHF 0.9187 USD/ILS 3.4203 USD/SEK 8.9500 EUR/SEK 10.4954
USD/CLP 787.8200 USD/JPY 105.5300 USD/SGD 1.3651 EUR/USD 1.1727
USD/CNY 6.8106 USD/KRW 1,169.5000 USD/THB 31.6875 GBP/EUR 1.1025
USD/CZK 23.1002 USD/MXN 22.0758 USD/TRY 7.7042 GBP/USD 1.2928
USD/DKK 6.3477 USD/MYR 4.1555 USD/TWD 28.9620
USD/EGP 15.7600 USD/NOK 9.3566 USD/ZAR 16.6800
USD/EUR 0.8528 USD/NZD 1.5128 EUR/CHF 1.0773
The following exchange rates at 30 September 2019 were used to translate foreign currency assets and liabilities:
USD/AED 3.6732 USD/GBP 0.8115 USD/PKR 156.3250 EUR/GBP 0.8847
USD/AUD 1.4827 USD/HKD 7.8394 USD/PLN 4.0091 EUR/NOK 9.9055
USD/BRL 4.1654 USD/HUF 307.2510 USD/QAR 3.6410 EUR/PLN 4.3707
USD/CAD 1.3240 USD/IDR 14,195.0008 USD/SEK 9.8321 EUR/SEK 10.7189
USD/CHF 0.9972 USD/ILS 3.4758 USD/SGD 1.3829 EUR/USD 1.0902
USD/CLP 728.2050 USD/JPY 108.0750 USD/THB 30.5850 GBP/EUR 1.1304
USD/CNY 7.1384 USD/KRW 1,196.1500 USD/TRY 5.6465 GBP/USD 1.2323
USD/CZK 23.6801 USD/MXN 19.7440 USD/TWD 31.0245
USD/DKK 6.8485 USD/MYR 4.1870 USD/ZAR 15.1625
USD/EGP 16.2663 USD/NOK 9.0860 EUR/CHF 1.0871
USD/EUR 0.9173 USD/NZD 1.5947 EUR/DKK 7.4662
Average Rates as at 30 September 2020
USD/EUR 0.8936
USD/GBP 0.7847
Average Rates as at 30 September 2019
USD/EUR 0.8867
USD/GBP 0.7838
18. Distributions to Redeemable Participating Shareholders
Please refer to the Directors’ Report for details of Distributions to redeemable participating Shareholders during the financial year and for the comparative
financial year.
19. Significant Events during the financial year
Effective 1 December 2019, BNY Mellon Trust Company (Ireland) Limited merged into The Bank of New York Mellon SA/NV, which itself is a wholly
owned subsidiary of The Bank of New York Mellon (the “Merger”). Following the Merger, The Bank of New York Mellon SA/NV, Dublin Branch, will be
the entity, which will provide trustee, depositary and/or custody services to the Company.
An updated Prospectus was issued on 12 February 2020. The changes since last Prospectus include:
Depositary name change.
Updating of Directors names and profiles.
New text under Depositary section, appointment of local agents, securities lending/ SFTR, benchmark administrators on the ESMA register.
Under Generic Risk new text on the UK’s future relationship with the EU, European Market Infrastructure Regulation on OTC contracts and
insertion of text in relation to the European Benchmarks Regulation.
Effective 12 February 2020 the following funds closed:
Invesco Dynamic US Market UCITS ETF
Invesco S&P 500 VEQTOR UCITS ETF
Invesco FTSE RAFI Europe Mid-Small UCITS ETF
Managing the risks presented by the outbreak of Coronavirus
The spread of a new coronavirus (COVID-19) disease has caused significant volatility within the global economy and financial markets. To date, the primary
focus of our response has been threefold:
to ensure the health and safety of our employees;
to preserve our ability to serve our clients; and
to appropriately manage client assets in a highly dynamic market environment.
Notes to the Financial Statements (continued)
164 Invesco Markets III plc
19. Significant Events during the financial year (continued)
The directors of Invesco Investment Management Limited are actively monitoring the situation and, with the support of the investment manager, continue to
manage the Fund’s assets within its investment and risk parameters that have been established. The Directors will continue to review the situation in order to
navigate through this period of heightened uncertainty.
Brexit
The UK left the EU on 31 January 2020, an event commonly referred to as Brexit. The Manager does not believe that Brexit presents significant issues that
cannot be mitigated. The Manager is part of a global group and has been committed for many years to meeting clients needs across Europe in both EU and
non-EU countries. The change in the UK’s status from an EU to a non-EU country has not changed the group’s focus or commitment to serve its clients across
Europe. The Manager is monitoring developments closely, through a Brexit steering committee to ensure that the impact on clients and the Company is
minimal.
Apart from the above there were no other significant events during the financial year that require disclosure in the financial statements.
20. Segregated Liability
The Company has adopted segregated liability between its Funds. This ensures that the liabilities incurred on behalf of a Fund will generally be discharged
solely out of the assets of that Fund and there generally can be no recourse to the other Funds to satisfy those liabilities. Notwithstanding the foregoing there
can be no assurance that, should an action be brought against the Company in a court in another jurisdiction, the segregated nature of the Funds would
necessarily be upheld.
21. Reconciliation to the published Net Asset Value
The Funds below have exposure to Brazilian equities. In accordance with FRS 102, the Funds must recognise a provision for potential capital gains tax payable
taking into consideration the unrealised positions and capital gains tax payments not reflected in the financial statements at the 30 September 2019 financial
statements. These adjustments have led to the below difference between the NAV per unit as recorded in the financial statements and the published NAV per
unit.
Invesco FTSE RAFI
All-World 3000
UCITS ETF
Invesco FTSE RAFI
Emerging Markets
UCITS ETF
Invesco FTSE
Emerging Markets
High Dividend Low
Volatility UCITS
ETF
30 September 2020 USD USD USD
Net Assets Attributable to Equity Holders in accordance with FRS 102 36,103,636 29,031,324 56,398,327
Add: capital gains tax adjustments 14,755 75,486 9,836
Published Net Assets Attributable to Equity Holders 36,118,391 29,106,810 56,408,163
NAV per unit in accordance with FRS 102 18.15 7.31 23.14
Published NAV per unit 18.15 7.33 23.14
Invesco FTSE RAFI
All-World
3000
UCITS ETF
Invesco FTSE RAFI
Emerging
Markets
UCITS ETF
Invesco FTSE
Emerging Markets
High Dividend Low
Volatility
UCITS ETF
30 September 2019 USD USD USD
Net Assets Attributable to Equity Holders in accordance with FRS 102 65,261,308 24,966,168 40,982,250
Add: capital gains tax adjustments 37,342 136,829 60,934
Published Net Assets Attributable to Equity Holders 65,298,650 25,102,997 41,043,184
NAV per unit in accordance with FRS 102 19.25 8.20 28.51
Published NAV per unit 19.26 8.24 28.56
Invesco EQQQ NASDAQ - 100 UCITS ETF has adjustments to the NAV for capital shares receivable and capital shares payable amounts booked by Transfer
Agency on 30 September 2020.
Invesco EQQQ
NASDAQ – 100
UCITS ETF
30 September 2020 USD
Net Assets Attributable to Equity Holders in accordance with FRS 102 5,323,097,858
Less: capital shares receivable adjustments (9,000,600)
Add: capital shares payable adjustments 23,363,978
Published Net Assets Attributable to Equity Holders 5,337,461,236
NAV per unit in accordance with FRS 102 265.49 Published NAV per unit 266.20
Notes to the Financial Statements (continued)
165 Invesco Markets III plc
22. Significant Events after the financial year end date
From 1 October 2020 to 7 January 2021, the net movement on subscriptions/(redemptions) for each sub-fund was as follows:
Fund Name Currency Net movement on
Subscriptions/(Redemptions) from 1 October
2020 to 7 January 2021
Invesco EQQQ NASDAQ-100 UCITS ETF USD (629,579,493)
Invesco FTSE RAFI US 1000 UCITS ETF USD 5,610,966
Invesco S&P 500 High Dividend Low Volatility UCITS ETF USD (6,893,148)
Invesco S&P 500 QVM UCITS ETF USD -
Invesco Global Buyback Achievers UCITS ETF USD (1,910,034)
Invesco FTSE RAFI All-World 3000 UCITS ETF USD (13,251,550)
Invesco FTSE RAFI Emerging Markets UCITS ETF USD 3,294,732
Invesco FTSE RAFI Europe UCITS ETF EUR (1,729,588)
Invesco EURO STOXX High Dividend Low Volatility UCITS
ETF
EUR -
Invesco FTSE Emerging Markets High Dividend Low Volatility
UCITS ETF
USD 1,269,807
Invesco FTSE RAFI UK 100 UCITS ETF GBP (818,025)
Invesco EuroMTS Cash 3 Months UCITS ETF EUR (1,124,445)
Invesco US High Yield Fallen Angels UCITS ETF USD 118,215,582
There were no significant events after the financial year end date that required to be disclosed in the financial statements.
23. Transaction Fees
Transaction fees incurred by the Funds relating to purchase or sale of transferable securities, money market instruments, derivatives or other eligible assets are
mainly composed of Depositary fees. Transaction fees are included in the transaction price used to calculate the realised and unrealised gain or loss on
securities.
Fund Currency Transaction Fees Invesco EQQQ NASDAQ-100 UCITS ETF USD 97,309
Invesco FTSE RAFI US 1000 UCITS ETF USD 30,100
Invesco Dynamic US Market UCITS ETF* USD 2,015
Invesco S&P 500 High Dividend Low Volatility UCITS ETF USD 73,044
Invesco S&P 500 VEQTOR UCITS ETF* USD 3,436
Invesco S&P 500 QVM UCITS ETF USD 1,804
Invesco Global Buyback Achievers UCITS ETF USD 49,144
Invesco FTSE RAFI Europe Mid-Small UCITS ETF* EUR 3,599
Invesco FTSE RAFI All-World 3000 UCITS ETF USD 22,624
Invesco FTSE RAFI Emerging Markets UCITS ETF USD 31,051
Invesco FTSE RAFI Europe UCITS ETF EUR 2,801
Invesco EURO STOXX High Dividend Low Volatility UCITS ETF EUR 32,471
Invesco FTSE Emerging Markets High Dividend Low Volatility UCITS ETF USD 153,194
Invesco FTSE RAFI UK 100 UCITS ETF GBP 9,218
Invesco EuroMTS Cash 3 Months UCITS ETF EUR -
Invesco US High Yield Fallen Angels UCITS ETF USD -
*Fund closed on 12 February 2020.
For the financial year ended 30 September 2019 these transactions costs amount to:
Fund Currency Transaction Fees Invesco EQQQ NASDAQ-100 UCITS ETF USD 89,349
Invesco FTSE RAFI US 1000 UCITS ETF USD 24,328
Invesco Dynamic US Market UCITS ETF USD 29,521
Invesco S&P 500 High Dividend Low Volatility UCITS ETF USD 104,311
Invesco S&P 500 VEQTOR UCITS ETF USD 7,245
Invesco S&P 500 QVM UCITS ETF USD 3,747
Invesco Global Buyback Achievers UCITS ETF USD 80,176
Invesco FTSE RAFI Europe Mid-Small UCITS ETF EUR 14,661
Invesco FTSE RAFI All-World 3000 UCITS ETF USD 37,411
Invesco FTSE RAFI Emerging Markets UCITS ETF USD 16,800
Invesco FTSE RAFI Europe UCITS ETF EUR 3,088
Invesco EURO STOXX High Dividend Low Volatility UCITS ETF EUR 25,275
Invesco FTSE Emerging Markets High Dividend Low Volatility UCITS ETF USD 82,400
Invesco FTSE UK High Dividend Low Volatility UCITS ETF* GBP 12,808
Invesco FTSE RAFI UK 100 UCITS ETF GBP 12,898
Invesco EuroMTS Cash 3 Months UCITS ETF EUR -
Invesco US High Yield Fallen Angels UCITS ETF USD 244
*Fund closed on 6 February 2019.
24. Approval of Financial Statements
The Directors approved the financial statements on 25 January 2021.
Statement of Changes in Composition of Portfolio (Unaudited)
for the financial year ended 30 September 2020
Invesco EQQQ NASDAQ-100 UCITS ETF
The Central Bank of Ireland requires a schedule of material changes in the composition of the portfolio during the financial year. These are defined as
aggregate purchases of a security exceeding one per cent of the total value of purchases for the financial year and aggregate disposals greater than one per cent
of the total value of sales. Where the number of purchases/sales transactions exceeding 1% of the total value of purchases/sales for the financial year is less
than 20, then a minimum of 20 purchases/sales will be disclosed.
166 Invesco Markets III plc
Purchases
Security Description Nominal Cost
USD
Apple Inc 1,667,648 305,784,956
Microsoft Corp 1,543,691 281,110,017
Amazon.com Inc 103,307 256,649,057
Facebook Inc 491,769 107,172,645
Alphabet Inc - Class A 73,007 100,269,600
Alphabet Inc - Class C 68,867 94,666,334
Intel Corp 1,168,116 65,012,957
NVIDIA Corp 172,681 60,716,848
Tesla Inc 112,578 58,777,726
Comcast Corp 1,267,598 53,203,971
Adobe Inc 132,679 51,540,161
Netflix Inc 122,780 50,795,987
PepsiCo Inc 381,344 50,672,659
Cisco Systems Inc 1,160,011 49,557,427
PayPal Holdings Inc 324,200 45,890,992
T-Mobile US Inc 423,738 41,589,711
Costco Wholesale Corp 122,790 38,674,641
Amgen Inc 160,664 37,040,198
Broadcom Inc 111,078 33,846,268
Texas Instruments Inc 256,217 32,029,134
Charter Communications Inc 56,126 29,609,399
Sales
Security Description Nominal Proceeds
USD
Apple Inc 611,061 133,746,670
Microsoft Corp 622,051 108,946,240
Amazon.com Inc 39,794 89,810,291
Alphabet Inc - Class C 31,418 43,704,088
Facebook Inc 199,590 43,055,848
Alphabet Inc - Class A 21,509 30,166,700
Intel Corp 374,703 21,592,716
Celgene Corp 195,680 21,146,195
NVIDIA Corp 48,655 16,185,116
PepsiCo Inc 111,407 15,028,389
Adobe Inc 39,436 15,016,809
Comcast Corp 360,985 14,894,847
Cisco Systems Inc 341,383 14,834,193
Netflix Inc 34,849 14,286,318
Tesla Inc 24,837 14,053,266
PayPal Holdings Inc 93,335 13,170,981
CoStar Group Inc 16,894 11,866,620
Amgen Inc 48,644 11,176,630
Costco Wholesale Corp 35,063 10,992,568
Charter Communications Inc 19,997 10,459,605
Texas Instruments Inc 79,929 9,837,334
Statement of Changes in Composition of Portfolio (Unaudited)
for the financial year ended 30 September 2020
Invesco FTSE RAFI US 1000 UCITS ETF
The Central Bank of Ireland requires a schedule of material changes in the composition of the portfolio during the financial year. These are defined as
aggregate purchases of a security exceeding one per cent of the total value of purchases for the financial year and aggregate disposals greater than one per cent
of the total value of sales. Where the number of purchases/sales transactions exceeding 1% of the total value of purchases/sales for the financial year is less
than 20, then a minimum of 20 purchases/sales will be disclosed.
167 Invesco Markets III plc
Purchases
Security Description Nominal Cost
USD
Exxon Mobil Corp 45,830 1,647,235
Apple Inc 4,584 856,161
Pfizer Inc 25,741 791,473
Chevron Corp 10,985 774,039
Verizon Communications Inc 10,450 588,265
Amazon.com Inc 271 552,591
Wells Fargo & Co 18,356 552,018
Walgreens Boots Alliance Inc 11,777 543,031
CVS Health Corp 9,035 517,197
UnitedHealth Group Inc 2,138 499,432
AT&T Inc 14,500 480,425
Microsoft Corp 2,647 465,345
Berkshire Hathaway Inc 2,161 450,206
JPMorgan Chase & Co 3,736 412,829
Ford Motor Co 74,726 391,254
3M Co 2,942 390,213
Cisco Systems Inc 9,869 379,911
DuPont de Nemours Inc 10,295 364,286
General Motors Co 16,400 353,264
Johnson & Johnson 2,491 342,229
Sales
Security Description Nominal Proceeds
USD
Apple Inc 33,188 9,402,338
Microsoft Corp 27,970 4,749,910
AT&T Inc 111,335 3,477,706
Berkshire Hathaway Inc 15,901 3,205,016
Exxon Mobil Corp 66,958 3,116,428
JPMorgan Chase & Co 30,106 3,034,662
Verizon Communications Inc 46,323 2,663,792
Chevron Corp 24,873 2,272,456
Procter & Gamble Co/The 18,601 2,230,009
Walmart Inc 17,190 2,124,316
Johnson & Johnson 14,001 2,043,583
Bank of America Corp 70,357 1,844,192
Pfizer Inc 46,933 1,758,653
General Electric Co 231,622 1,700,888
Intel Corp 30,316 1,620,187
Wells Fargo & Co 54,305 1,611,538
Amazon.com Inc 596 1,588,610
Citigroup Inc 29,286 1,581,416
UnitedHealth Group Inc 5,169 1,525,862
Comcast Corp 36,320 1,491,551
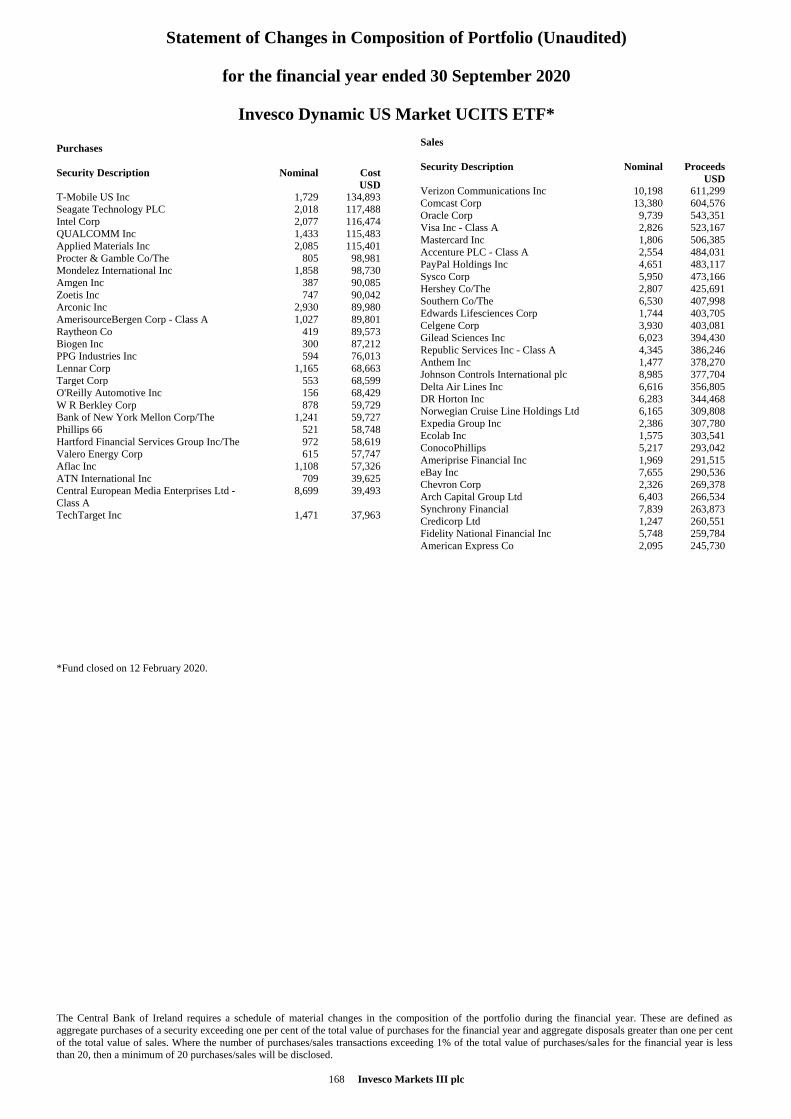
Statement of Changes in Composition of Portfolio (Unaudited)
for the financial year ended 30 September 2020
Invesco Dynamic US Market UCITS ETF*
The Central Bank of Ireland requires a schedule of material changes in the composition of the portfolio during the financial year. These are defined as
aggregate purchases of a security exceeding one per cent of the total value of purchases for the financial year and aggregate disposals greater than one per cent
of the total value of sales. Where the number of purchases/sales transactions exceeding 1% of the total value of purchases/sales for the financial year is less
than 20, then a minimum of 20 purchases/sales will be disclosed.
168 Invesco Markets III plc
Purchases
Security Description Nominal Cost
USD
T-Mobile US Inc 1,729 134,893
Seagate Technology PLC 2,018 117,488
Intel Corp 2,077 116,474
QUALCOMM Inc 1,433 115,483
Applied Materials Inc 2,085 115,401
Procter & Gamble Co/The 805 98,981
Mondelez International Inc 1,858 98,730
Amgen Inc 387 90,085
Zoetis Inc 747 90,042
Arconic Inc 2,930 89,980
AmerisourceBergen Corp - Class A 1,027 89,801
Raytheon Co 419 89,573
Biogen Inc 300 87,212
PPG Industries Inc 594 76,013
Lennar Corp 1,165 68,663
Target Corp 553 68,599
O'Reilly Automotive Inc 156 68,429
W R Berkley Corp 878 59,729
Bank of New York Mellon Corp/The 1,241 59,727
Phillips 66 521 58,748
Hartford Financial Services Group Inc/The 972 58,619
Valero Energy Corp 615 57,747
Aflac Inc 1,108 57,326
ATN International Inc 709 39,625
Central European Media Enterprises Ltd -
Class A
8,699 39,493
TechTarget Inc 1,471 37,963
*Fund closed on 12 February 2020.
Sales
Security Description Nominal Proceeds
USD
Verizon Communications Inc 10,198 611,299
Comcast Corp 13,380 604,576
Oracle Corp 9,739 543,351
Visa Inc - Class A 2,826 523,167
Mastercard Inc 1,806 506,385
Accenture PLC - Class A 2,554 484,031
PayPal Holdings Inc 4,651 483,117
Sysco Corp 5,950 473,166
Hershey Co/The 2,807 425,691
Southern Co/The 6,530 407,998
Edwards Lifesciences Corp 1,744 403,705
Celgene Corp 3,930 403,081
Gilead Sciences Inc 6,023 394,430
Republic Services Inc - Class A 4,345 386,246
Anthem Inc 1,477 378,270
Johnson Controls International plc 8,985 377,704
Delta Air Lines Inc 6,616 356,805
DR Horton Inc 6,283 344,468
Norwegian Cruise Line Holdings Ltd 6,165 309,808
Expedia Group Inc 2,386 307,780
Ecolab Inc 1,575 303,541
ConocoPhillips 5,217 293,042
Ameriprise Financial Inc 1,969 291,515
eBay Inc 7,655 290,536
Chevron Corp 2,326 269,378
Arch Capital Group Ltd 6,403 266,534
Synchrony Financial 7,839 263,873
Credicorp Ltd 1,247 260,551
Fidelity National Financial Inc 5,748 259,784
American Express Co 2,095 245,730
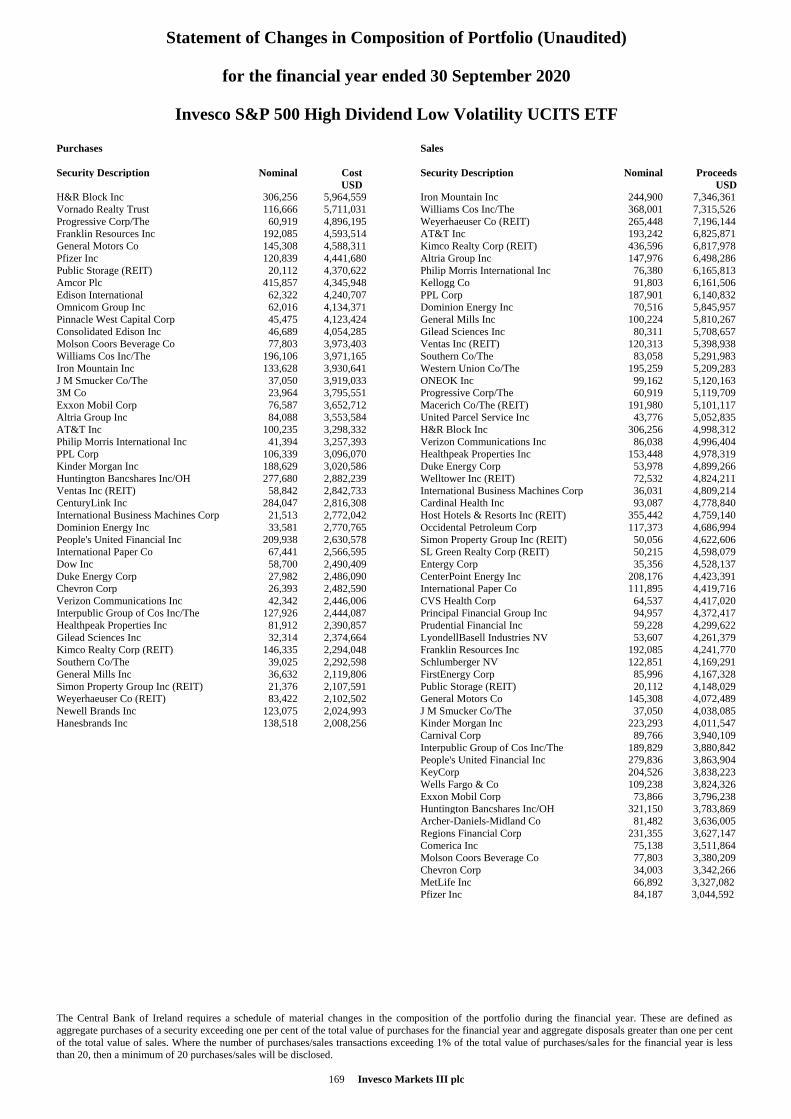
Statement of Changes in Composition of Portfolio (Unaudited)
for the financial year ended 30 September 2020
Invesco S&P 500 High Dividend Low Volatility UCITS ETF
The Central Bank of Ireland requires a schedule of material changes in the composition of the portfolio during the financial year. These are defined as
aggregate purchases of a security exceeding one per cent of the total value of purchases for the financial year and aggregate disposals greater than one per cent
of the total value of sales. Where the number of purchases/sales transactions exceeding 1% of the total value of purchases/sales for the financial year is less
than 20, then a minimum of 20 purchases/sales will be disclosed.
169 Invesco Markets III plc
Purchases
Security Description Nominal Cost
USD
H&R Block Inc 306,256 5,964,559
Vornado Realty Trust 116,666 5,711,031
Progressive Corp/The 60,919 4,896,195
Franklin Resources Inc 192,085 4,593,514
General Motors Co 145,308 4,588,311
Pfizer Inc 120,839 4,441,680
Public Storage (REIT) 20,112 4,370,622
Amcor Plc 415,857 4,345,948
Edison International 62,322 4,240,707
Omnicom Group Inc 62,016 4,134,371
Pinnacle West Capital Corp 45,475 4,123,424
Consolidated Edison Inc 46,689 4,054,285
Molson Coors Beverage Co 77,803 3,973,403
Williams Cos Inc/The 196,106 3,971,165
Iron Mountain Inc 133,628 3,930,641
J M Smucker Co/The 37,050 3,919,033
3M Co 23,964 3,795,551
Exxon Mobil Corp 76,587 3,652,712
Altria Group Inc 84,088 3,553,584
AT&T Inc 100,235 3,298,332
Philip Morris International Inc 41,394 3,257,393
PPL Corp 106,339 3,096,070
Kinder Morgan Inc 188,629 3,020,586
Huntington Bancshares Inc/OH 277,680 2,882,239
Ventas Inc (REIT) 58,842 2,842,733
CenturyLink Inc 284,047 2,816,308
International Business Machines Corp 21,513 2,772,042
Dominion Energy Inc 33,581 2,770,765
People's United Financial Inc 209,938 2,630,578
International Paper Co 67,441 2,566,595
Dow Inc 58,700 2,490,409
Duke Energy Corp 27,982 2,486,090
Chevron Corp 26,393 2,482,590
Verizon Communications Inc 42,342 2,446,006
Interpublic Group of Cos Inc/The 127,926 2,444,087
Healthpeak Properties Inc 81,912 2,390,857
Gilead Sciences Inc 32,314 2,374,664
Kimco Realty Corp (REIT) 146,335 2,294,048
Southern Co/The 39,025 2,292,598
General Mills Inc 36,632 2,119,806
Simon Property Group Inc (REIT) 21,376 2,107,591
Weyerhaeuser Co (REIT) 83,422 2,102,502
Newell Brands Inc 123,075 2,024,993
Hanesbrands Inc 138,518 2,008,256
Sales
Security Description Nominal Proceeds
USD
Iron Mountain Inc 244,900 7,346,361
Williams Cos Inc/The 368,001 7,315,526
Weyerhaeuser Co (REIT) 265,448 7,196,144
AT&T Inc 193,242 6,825,871
Kimco Realty Corp (REIT) 436,596 6,817,978
Altria Group Inc 147,976 6,498,286
Philip Morris International Inc 76,380 6,165,813
Kellogg Co 91,803 6,161,506
PPL Corp 187,901 6,140,832
Dominion Energy Inc 70,516 5,845,957
General Mills Inc 100,224 5,810,267
Gilead Sciences Inc 80,311 5,708,657
Ventas Inc (REIT) 120,313 5,398,938
Southern Co/The 83,058 5,291,983
Western Union Co/The 195,259 5,209,283
ONEOK Inc 99,162 5,120,163
Progressive Corp/The 60,919 5,119,709
Macerich Co/The (REIT) 191,980 5,101,117
United Parcel Service Inc 43,776 5,052,835
H&R Block Inc 306,256 4,998,312
Verizon Communications Inc 86,038 4,996,404
Healthpeak Properties Inc 153,448 4,978,319
Duke Energy Corp 53,978 4,899,266
Welltower Inc (REIT) 72,532 4,824,211
International Business Machines Corp 36,031 4,809,214
Cardinal Health Inc 93,087 4,778,840
Host Hotels & Resorts Inc (REIT) 355,442 4,759,140
Occidental Petroleum Corp 117,373 4,686,994
Simon Property Group Inc (REIT) 50,056 4,622,606
SL Green Realty Corp (REIT) 50,215 4,598,079
Entergy Corp 35,356 4,528,137
CenterPoint Energy Inc 208,176 4,423,391
International Paper Co 111,895 4,419,716
CVS Health Corp 64,537 4,417,020
Principal Financial Group Inc 94,957 4,372,417
Prudential Financial Inc 59,228 4,299,622
LyondellBasell Industries NV 53,607 4,261,379
Franklin Resources Inc 192,085 4,241,770
Schlumberger NV 122,851 4,169,291
FirstEnergy Corp 85,996 4,167,328
Public Storage (REIT) 20,112 4,148,029
General Motors Co 145,308 4,072,489
J M Smucker Co/The 37,050 4,038,085
Kinder Morgan Inc 223,293 4,011,547
Carnival Corp 89,766 3,940,109
Interpublic Group of Cos Inc/The 189,829 3,880,842
People's United Financial Inc 279,836 3,863,904
KeyCorp 204,526 3,838,223
Wells Fargo & Co 109,238 3,824,326
Exxon Mobil Corp 73,866 3,796,238
Huntington Bancshares Inc/OH 321,150 3,783,869
Archer-Daniels-Midland Co 81,482 3,636,005
Regions Financial Corp 231,355 3,627,147
Comerica Inc 75,138 3,511,864
Molson Coors Beverage Co 77,803 3,380,209
Chevron Corp 34,003 3,342,266
MetLife Inc 66,892 3,327,082
Pfizer Inc 84,187 3,044,592
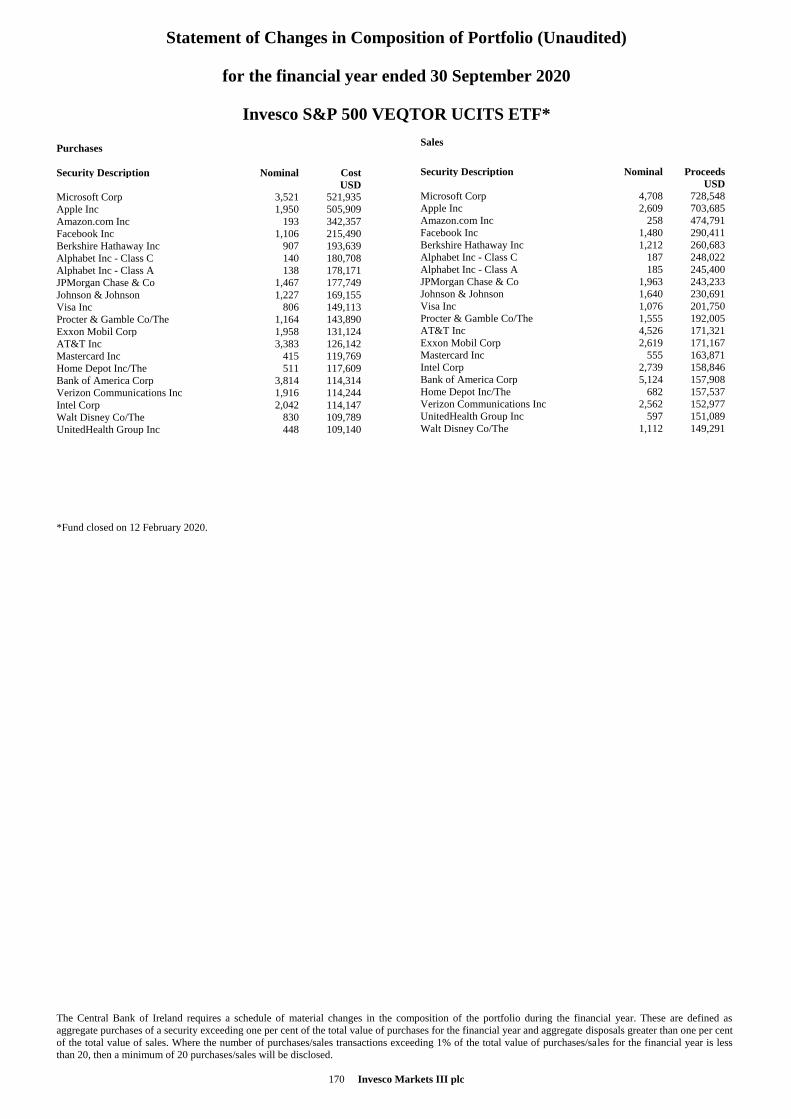
Statement of Changes in Composition of Portfolio (Unaudited)
for the financial year ended 30 September 2020
Invesco S&P 500 VEQTOR UCITS ETF*
The Central Bank of Ireland requires a schedule of material changes in the composition of the portfolio during the financial year. These are defined as
aggregate purchases of a security exceeding one per cent of the total value of purchases for the financial year and aggregate disposals greater than one per cent
of the total value of sales. Where the number of purchases/sales transactions exceeding 1% of the total value of purchases/sales for the financial year is less
than 20, then a minimum of 20 purchases/sales will be disclosed.
170 Invesco Markets III plc
Purchases
Security Description Nominal Cost
USD
Microsoft Corp 3,521 521,935
Apple Inc 1,950 505,909
Amazon.com Inc 193 342,357
Facebook Inc 1,106 215,490
Berkshire Hathaway Inc 907 193,639
Alphabet Inc - Class C 140 180,708
Alphabet Inc - Class A 138 178,171
JPMorgan Chase & Co 1,467 177,749
Johnson & Johnson 1,227 169,155
Visa Inc 806 149,113
Procter & Gamble Co/The 1,164 143,890
Exxon Mobil Corp 1,958 131,124
AT&T Inc 3,383 126,142
Mastercard Inc 415 119,769
Home Depot Inc/The 511 117,609
Bank of America Corp 3,814 114,314
Verizon Communications Inc 1,916 114,244
Intel Corp 2,042 114,147
Walt Disney Co/The 830 109,789
UnitedHealth Group Inc 448 109,140
*Fund closed on 12 February 2020.
Sales
Security Description Nominal Proceeds
USD
Microsoft Corp 4,708 728,548
Apple Inc 2,609 703,685
Amazon.com Inc 258 474,791
Facebook Inc 1,480 290,411
Berkshire Hathaway Inc 1,212 260,683
Alphabet Inc - Class C 187 248,022
Alphabet Inc - Class A 185 245,400
JPMorgan Chase & Co 1,963 243,233
Johnson & Johnson 1,640 230,691
Visa Inc 1,076 201,750
Procter & Gamble Co/The 1,555 192,005
AT&T Inc 4,526 171,321
Exxon Mobil Corp 2,619 171,167
Mastercard Inc 555 163,871
Intel Corp 2,739 158,846
Bank of America Corp 5,124 157,908
Home Depot Inc/The 682 157,537
Verizon Communications Inc 2,562 152,977
UnitedHealth Group Inc 597 151,089
Walt Disney Co/The 1,112 149,291
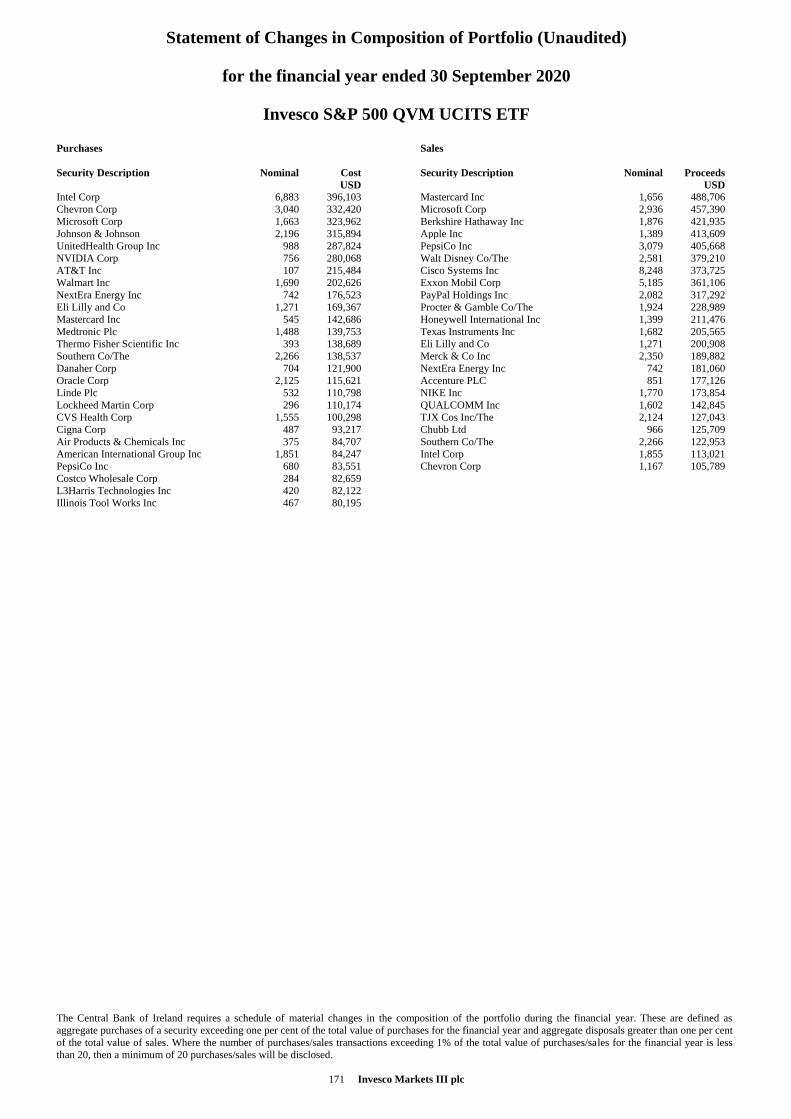
Statement of Changes in Composition of Portfolio (Unaudited)
for the financial year ended 30 September 2020
Invesco S&P 500 QVM UCITS ETF
The Central Bank of Ireland requires a schedule of material changes in the composition of the portfolio during the financial year. These are defined as
aggregate purchases of a security exceeding one per cent of the total value of purchases for the financial year and aggregate disposals greater than one per cent
of the total value of sales. Where the number of purchases/sales transactions exceeding 1% of the total value of purchases/sales for the financial year is less
than 20, then a minimum of 20 purchases/sales will be disclosed.
171 Invesco Markets III plc
Purchases
Security Description Nominal Cost
USD
Intel Corp 6,883 396,103
Chevron Corp 3,040 332,420
Microsoft Corp 1,663 323,962
Johnson & Johnson 2,196 315,894
UnitedHealth Group Inc 988 287,824
NVIDIA Corp 756 280,068
AT&T Inc 107 215,484
Walmart Inc 1,690 202,626
NextEra Energy Inc 742 176,523
Eli Lilly and Co 1,271 169,367
Mastercard Inc 545 142,686
Medtronic Plc 1,488 139,753
Thermo Fisher Scientific Inc 393 138,689
Southern Co/The 2,266 138,537
Danaher Corp 704 121,900
Oracle Corp 2,125 115,621
Linde Plc 532 110,798
Lockheed Martin Corp 296 110,174
CVS Health Corp 1,555 100,298
Cigna Corp 487 93,217
Air Products & Chemicals Inc 375 84,707
American International Group Inc 1,851 84,247
PepsiCo Inc 680 83,551
Costco Wholesale Corp 284 82,659
L3Harris Technologies Inc 420 82,122
Illinois Tool Works Inc 467 80,195
Sales
Security Description Nominal Proceeds
USD
Mastercard Inc 1,656 488,706
Microsoft Corp 2,936 457,390
Berkshire Hathaway Inc 1,876 421,935
Apple Inc 1,389 413,609
PepsiCo Inc 3,079 405,668
Walt Disney Co/The 2,581 379,210
Cisco Systems Inc 8,248 373,725
Exxon Mobil Corp 5,185 361,106
PayPal Holdings Inc 2,082 317,292
Procter & Gamble Co/The 1,924 228,989
Honeywell International Inc 1,399 211,476
Texas Instruments Inc 1,682 205,565
Eli Lilly and Co 1,271 200,908
Merck & Co Inc 2,350 189,882
NextEra Energy Inc 742 181,060
Accenture PLC 851 177,126
NIKE Inc 1,770 173,854
QUALCOMM Inc 1,602 142,845
TJX Cos Inc/The 2,124 127,043
Chubb Ltd 966 125,709
Southern Co/The 2,266 122,953
Intel Corp 1,855 113,021
Chevron Corp 1,167 105,789
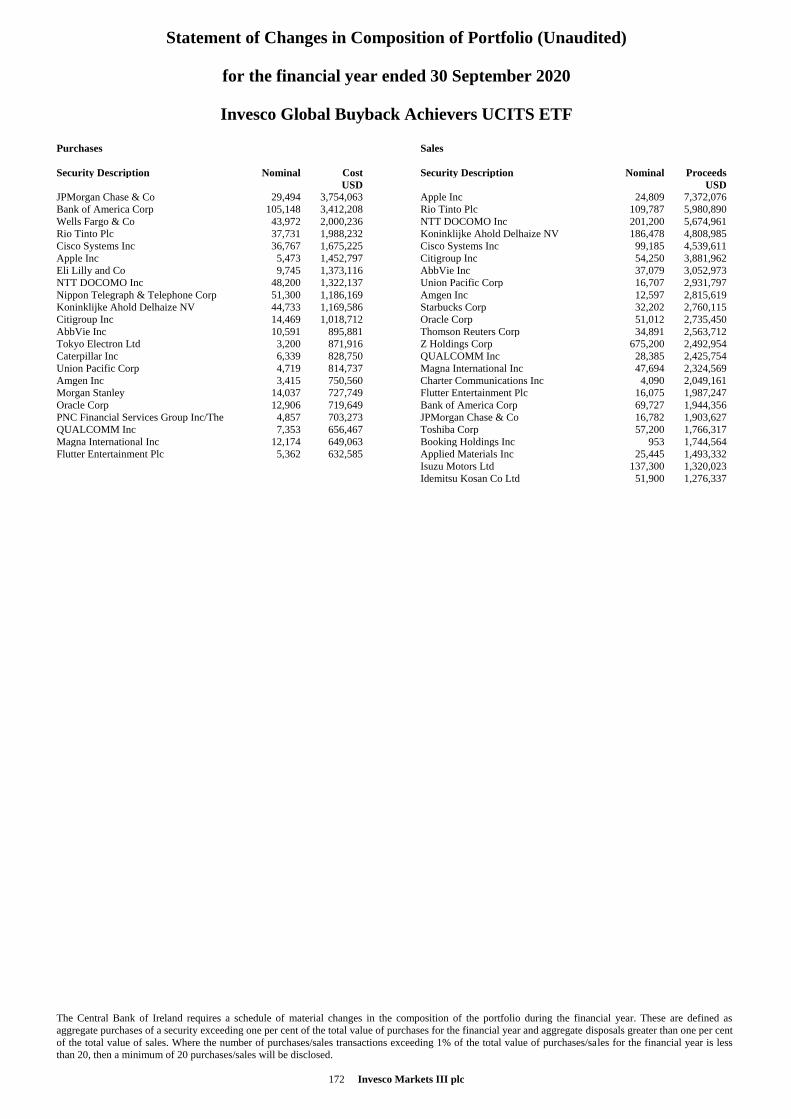
Statement of Changes in Composition of Portfolio (Unaudited)
for the financial year ended 30 September 2020
Invesco Global Buyback Achievers UCITS ETF
The Central Bank of Ireland requires a schedule of material changes in the composition of the portfolio during the financial year. These are defined as
aggregate purchases of a security exceeding one per cent of the total value of purchases for the financial year and aggregate disposals greater than one per cent
of the total value of sales. Where the number of purchases/sales transactions exceeding 1% of the total value of purchases/sales for the financial year is less
than 20, then a minimum of 20 purchases/sales will be disclosed.
172 Invesco Markets III plc
Purchases
Security Description Nominal Cost
USD
JPMorgan Chase & Co 29,494 3,754,063
Bank of America Corp 105,148 3,412,208
Wells Fargo & Co 43,972 2,000,236
Rio Tinto Plc 37,731 1,988,232
Cisco Systems Inc 36,767 1,675,225
Apple Inc 5,473 1,452,797
Eli Lilly and Co 9,745 1,373,116
NTT DOCOMO Inc 48,200 1,322,137
Nippon Telegraph & Telephone Corp 51,300 1,186,169
Koninklijke Ahold Delhaize NV 44,733 1,169,586
Citigroup Inc 14,469 1,018,712
AbbVie Inc 10,591 895,881
Tokyo Electron Ltd 3,200 871,916
Caterpillar Inc 6,339 828,750
Union Pacific Corp 4,719 814,737
Amgen Inc 3,415 750,560
Morgan Stanley 14,037 727,749
Oracle Corp 12,906 719,649
PNC Financial Services Group Inc/The 4,857 703,273
QUALCOMM Inc 7,353 656,467
Magna International Inc 12,174 649,063
Flutter Entertainment Plc 5,362 632,585
Sales
Security Description Nominal Proceeds
USD
Apple Inc 24,809 7,372,076
Rio Tinto Plc 109,787 5,980,890
NTT DOCOMO Inc 201,200 5,674,961
Koninklijke Ahold Delhaize NV 186,478 4,808,985
Cisco Systems Inc 99,185 4,539,611
Citigroup Inc 54,250 3,881,962
AbbVie Inc 37,079 3,052,973
Union Pacific Corp 16,707 2,931,797
Amgen Inc 12,597 2,815,619
Starbucks Corp 32,202 2,760,115
Oracle Corp 51,012 2,735,450
Thomson Reuters Corp 34,891 2,563,712
Z Holdings Corp 675,200 2,492,954
QUALCOMM Inc 28,385 2,425,754
Magna International Inc 47,694 2,324,569
Charter Communications Inc 4,090 2,049,161
Flutter Entertainment Plc 16,075 1,987,247
Bank of America Corp 69,727 1,944,356
JPMorgan Chase & Co 16,782 1,903,627
Toshiba Corp 57,200 1,766,317
Booking Holdings Inc 953 1,744,564
Applied Materials Inc 25,445 1,493,332
Isuzu Motors Ltd 137,300 1,320,023
Idemitsu Kosan Co Ltd 51,900 1,276,337
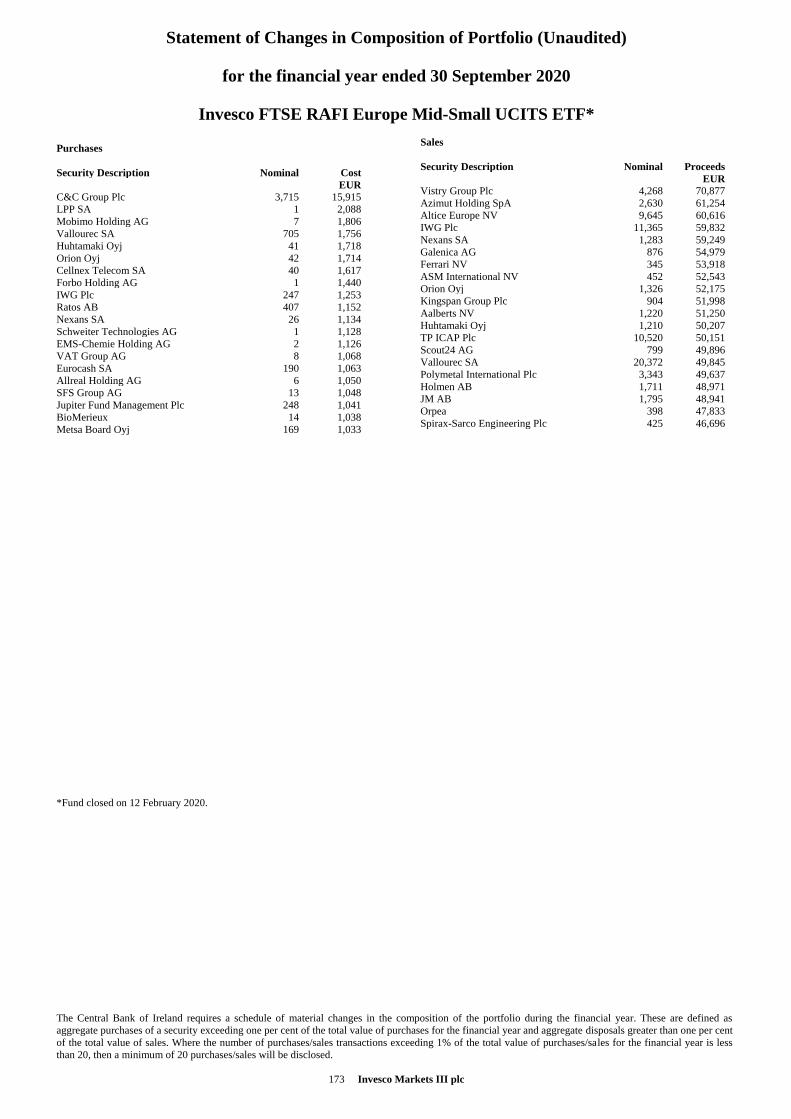
Statement of Changes in Composition of Portfolio (Unaudited)
for the financial year ended 30 September 2020
Invesco FTSE RAFI Europe Mid-Small UCITS ETF*
The Central Bank of Ireland requires a schedule of material changes in the composition of the portfolio during the financial year. These are defined as
aggregate purchases of a security exceeding one per cent of the total value of purchases for the financial year and aggregate disposals greater than one per cent
of the total value of sales. Where the number of purchases/sales transactions exceeding 1% of the total value of purchases/sales for the financial year is less
than 20, then a minimum of 20 purchases/sales will be disclosed.
173 Invesco Markets III plc
Purchases
Security Description Nominal Cost
EUR
C&C Group Plc 3,715 15,915
LPP SA 1 2,088
Mobimo Holding AG 7 1,806
Vallourec SA 705 1,756
Huhtamaki Oyj 41 1,718
Orion Oyj 42 1,714
Cellnex Telecom SA 40 1,617
Forbo Holding AG 1 1,440
IWG Plc 247 1,253
Ratos AB 407 1,152
Nexans SA 26 1,134
Schweiter Technologies AG 1 1,128
EMS-Chemie Holding AG 2 1,126
VAT Group AG 8 1,068
Eurocash SA 190 1,063
Allreal Holding AG 6 1,050
SFS Group AG 13 1,048
Jupiter Fund Management Plc 248 1,041
BioMerieux 14 1,038
Metsa Board Oyj 169 1,033
*Fund closed on 12 February 2020.
Sales
Security Description Nominal Proceeds
EUR
Vistry Group Plc 4,268 70,877
Azimut Holding SpA 2,630 61,254
Altice Europe NV 9,645 60,616
IWG Plc 11,365 59,832
Nexans SA 1,283 59,249
Galenica AG 876 54,979
Ferrari NV 345 53,918
ASM International NV 452 52,543
Orion Oyj 1,326 52,175
Kingspan Group Plc 904 51,998
Aalberts NV 1,220 51,250
Huhtamaki Oyj 1,210 50,207
TP ICAP Plc 10,520 50,151
Scout24 AG 799 49,896
Vallourec SA 20,372 49,845
Polymetal International Plc 3,343 49,637
Holmen AB 1,711 48,971
JM AB 1,795 48,941
Orpea 398 47,833
Spirax-Sarco Engineering Plc 425 46,696
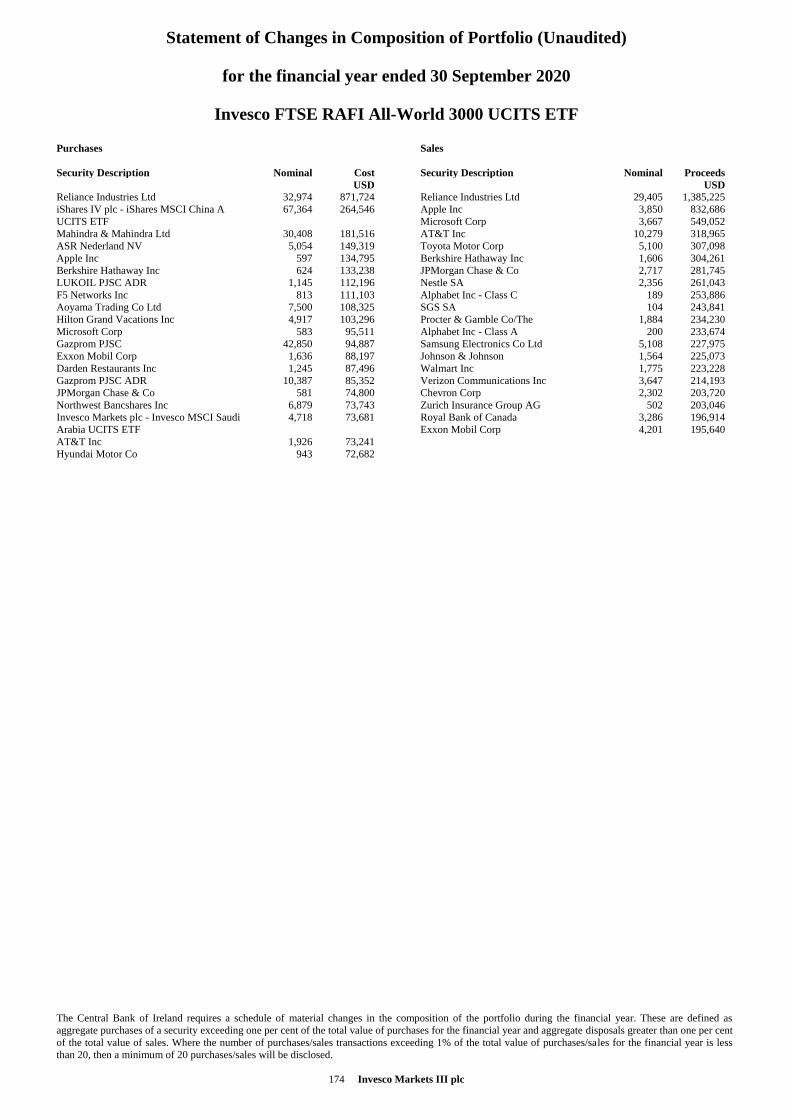
Statement of Changes in Composition of Portfolio (Unaudited)
for the financial year ended 30 September 2020
Invesco FTSE RAFI All-World 3000 UCITS ETF
The Central Bank of Ireland requires a schedule of material changes in the composition of the portfolio during the financial year. These are defined as
aggregate purchases of a security exceeding one per cent of the total value of purchases for the financial year and aggregate disposals greater than one per cent
of the total value of sales. Where the number of purchases/sales transactions exceeding 1% of the total value of purchases/sales for the financial year is less
than 20, then a minimum of 20 purchases/sales will be disclosed.
174 Invesco Markets III plc
Purchases
Security Description Nominal Cost
USD
Reliance Industries Ltd 32,974 871,724
iShares IV plc - iShares MSCI China A
UCITS ETF
67,364 264,546
Mahindra & Mahindra Ltd 30,408 181,516
ASR Nederland NV 5,054 149,319
Apple Inc 597 134,795
Berkshire Hathaway Inc 624 133,238
LUKOIL PJSC ADR 1,145 112,196
F5 Networks Inc 813 111,103
Aoyama Trading Co Ltd 7,500 108,325
Hilton Grand Vacations Inc 4,917 103,296
Microsoft Corp 583 95,511
Gazprom PJSC 42,850 94,887
Exxon Mobil Corp 1,636 88,197
Darden Restaurants Inc 1,245 87,496
Gazprom PJSC ADR 10,387 85,352
JPMorgan Chase & Co 581 74,800
Northwest Bancshares Inc 6,879 73,743
Invesco Markets plc - Invesco MSCI Saudi
Arabia UCITS ETF
4,718 73,681
AT&T Inc 1,926 73,241
Hyundai Motor Co 943 72,682
Sales
Security Description Nominal Proceeds
USD
Reliance Industries Ltd 29,405 1,385,225
Apple Inc 3,850 832,686
Microsoft Corp 3,667 549,052
AT&T Inc 10,279 318,965
Toyota Motor Corp 5,100 307,098
Berkshire Hathaway Inc 1,606 304,261
JPMorgan Chase & Co 2,717 281,745
Nestle SA 2,356 261,043
Alphabet Inc - Class C 189 253,886
SGS SA 104 243,841
Procter & Gamble Co/The 1,884 234,230
Alphabet Inc - Class A 200 233,674
Samsung Electronics Co Ltd 5,108 227,975
Johnson & Johnson 1,564 225,073
Walmart Inc 1,775 223,228
Verizon Communications Inc 3,647 214,193
Chevron Corp 2,302 203,720
Zurich Insurance Group AG 502 203,046
Royal Bank of Canada 3,286 196,914
Exxon Mobil Corp 4,201 195,640
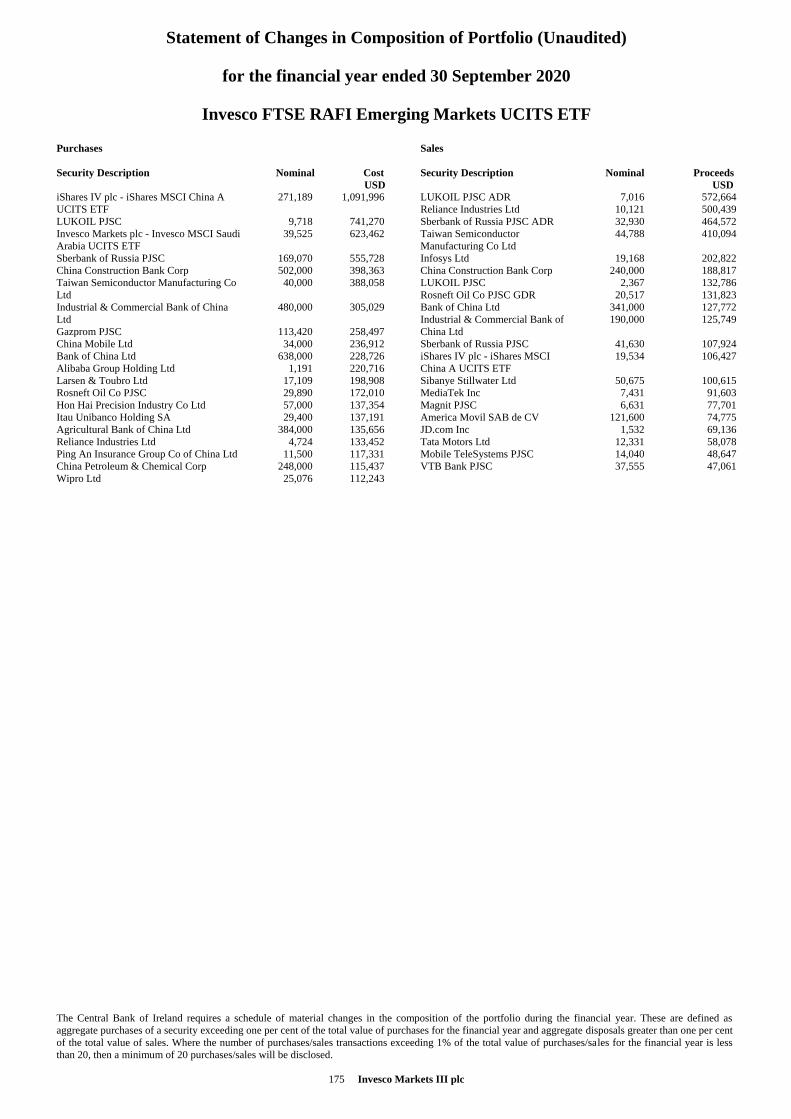
Statement of Changes in Composition of Portfolio (Unaudited)
for the financial year ended 30 September 2020
Invesco FTSE RAFI Emerging Markets UCITS ETF
The Central Bank of Ireland requires a schedule of material changes in the composition of the portfolio during the financial year. These are defined as
aggregate purchases of a security exceeding one per cent of the total value of purchases for the financial year and aggregate disposals greater than one per cent
of the total value of sales. Where the number of purchases/sales transactions exceeding 1% of the total value of purchases/sales for the financial year is less
than 20, then a minimum of 20 purchases/sales will be disclosed.
175 Invesco Markets III plc
Purchases
Security Description Nominal Cost
USD
iShares IV plc - iShares MSCI China A
UCITS ETF
271,189 1,091,996
LUKOIL PJSC 9,718 741,270
Invesco Markets plc - Invesco MSCI Saudi
Arabia UCITS ETF
39,525 623,462
Sberbank of Russia PJSC 169,070 555,728
China Construction Bank Corp 502,000 398,363
Taiwan Semiconductor Manufacturing Co
Ltd
40,000 388,058
Industrial & Commercial Bank of China
Ltd
480,000 305,029
Gazprom PJSC 113,420 258,497
China Mobile Ltd 34,000 236,912
Bank of China Ltd 638,000 228,726
Alibaba Group Holding Ltd 1,191 220,716
Larsen & Toubro Ltd 17,109 198,908
Rosneft Oil Co PJSC 29,890 172,010
Hon Hai Precision Industry Co Ltd 57,000 137,354
Itau Unibanco Holding SA 29,400 137,191
Agricultural Bank of China Ltd 384,000 135,656
Reliance Industries Ltd 4,724 133,452
Ping An Insurance Group Co of China Ltd 11,500 117,331
China Petroleum & Chemical Corp 248,000 115,437
Wipro Ltd 25,076 112,243
Sales
Security Description Nominal Proceeds
USD
LUKOIL PJSC ADR 7,016 572,664
Reliance Industries Ltd 10,121 500,439
Sberbank of Russia PJSC ADR 32,930 464,572
Taiwan Semiconductor
Manufacturing Co Ltd
44,788 410,094
Infosys Ltd 19,168 202,822
China Construction Bank Corp 240,000 188,817
LUKOIL PJSC 2,367 132,786
Rosneft Oil Co PJSC GDR 20,517 131,823
Bank of China Ltd 341,000 127,772
Industrial & Commercial Bank of
China Ltd
190,000 125,749
Sberbank of Russia PJSC 41,630 107,924
iShares IV plc - iShares MSCI
China A UCITS ETF
19,534 106,427
Sibanye Stillwater Ltd 50,675 100,615
MediaTek Inc 7,431 91,603
Magnit PJSC 6,631 77,701
America Movil SAB de CV 121,600 74,775
JD.com Inc 1,532 69,136
Tata Motors Ltd 12,331 58,078
Mobile TeleSystems PJSC 14,040 48,647
VTB Bank PJSC 37,555 47,061
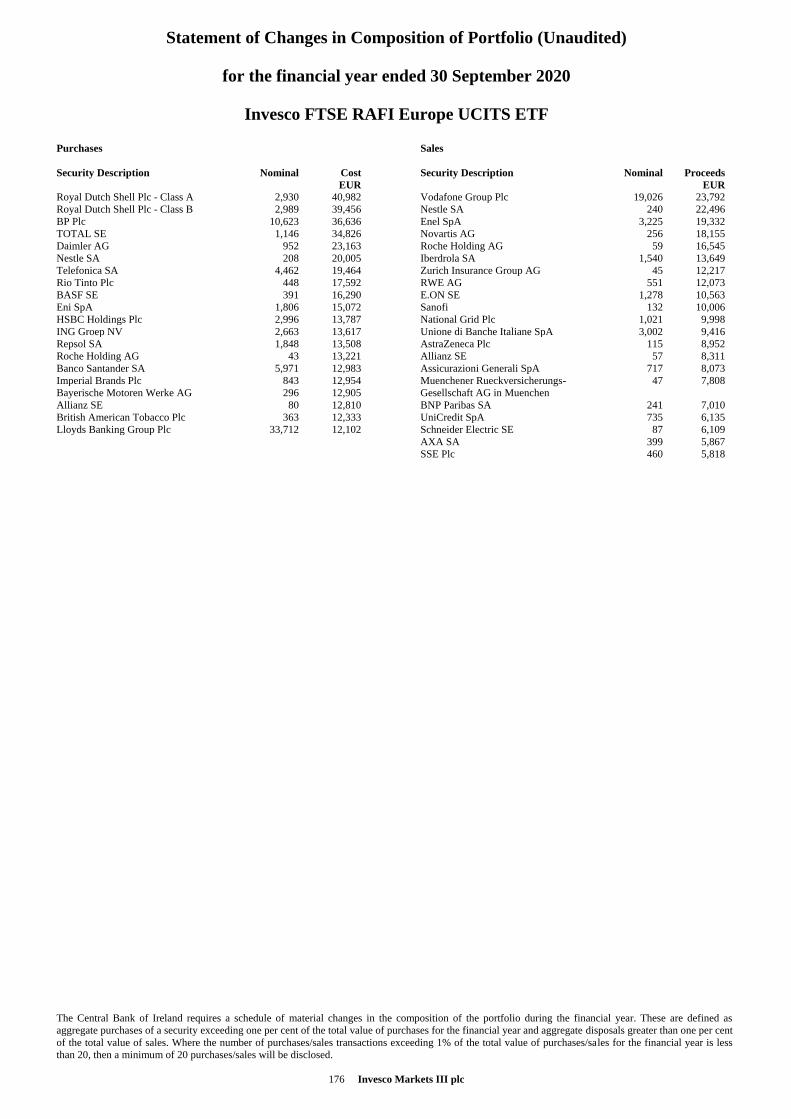
Statement of Changes in Composition of Portfolio (Unaudited)
for the financial year ended 30 September 2020
Invesco FTSE RAFI Europe UCITS ETF
The Central Bank of Ireland requires a schedule of material changes in the composition of the portfolio during the financial year. These are defined as
aggregate purchases of a security exceeding one per cent of the total value of purchases for the financial year and aggregate disposals greater than one per cent
of the total value of sales. Where the number of purchases/sales transactions exceeding 1% of the total value of purchases/sales for the financial year is less
than 20, then a minimum of 20 purchases/sales will be disclosed.
176 Invesco Markets III plc
Purchases
Security Description Nominal Cost
EUR
Royal Dutch Shell Plc - Class A 2,930 40,982
Royal Dutch Shell Plc - Class B 2,989 39,456
BP Plc 10,623 36,636
TOTAL SE 1,146 34,826
Daimler AG 952 23,163
Nestle SA 208 20,005
Telefonica SA 4,462 19,464
Rio Tinto Plc 448 17,592
BASF SE 391 16,290
Eni SpA 1,806 15,072
HSBC Holdings Plc 2,996 13,787
ING Groep NV 2,663 13,617
Repsol SA 1,848 13,508
Roche Holding AG 43 13,221
Banco Santander SA 5,971 12,983
Imperial Brands Plc 843 12,954
Bayerische Motoren Werke AG 296 12,905
Allianz SE 80 12,810
British American Tobacco Plc 363 12,333
Lloyds Banking Group Plc 33,712 12,102
Sales
Security Description Nominal Proceeds
EUR
Vodafone Group Plc 19,026 23,792
Nestle SA 240 22,496
Enel SpA 3,225 19,332
Novartis AG 256 18,155
Roche Holding AG 59 16,545
Iberdrola SA 1,540 13,649
Zurich Insurance Group AG 45 12,217
RWE AG 551 12,073
E.ON SE 1,278 10,563
Sanofi 132 10,006
National Grid Plc 1,021 9,998
Unione di Banche Italiane SpA 3,002 9,416
AstraZeneca Plc 115 8,952
Allianz SE 57 8,311
Assicurazioni Generali SpA 717 8,073
Muenchener Rueckversicherungs-
Gesellschaft AG in Muenchen
47 7,808
BNP Paribas SA 241 7,010
UniCredit SpA 735 6,135
Schneider Electric SE 87 6,109
AXA SA 399 5,867
SSE Plc 460 5,818
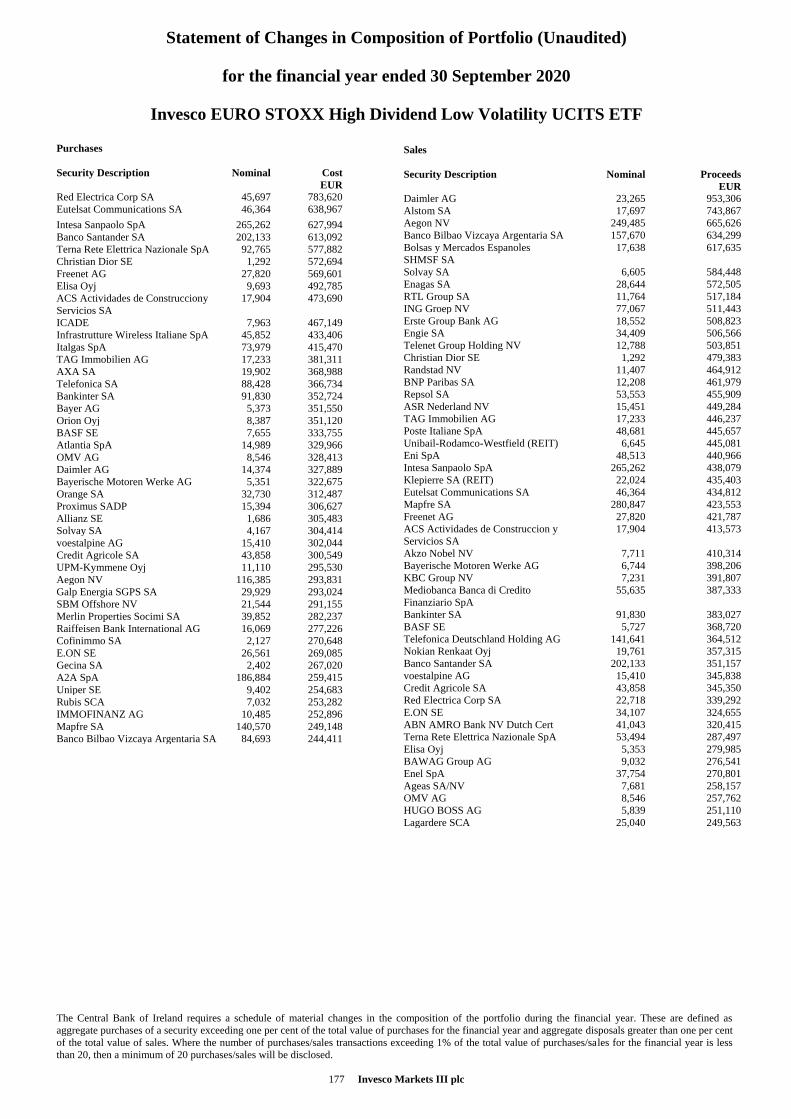
Statement of Changes in Composition of Portfolio (Unaudited)
for the financial year ended 30 September 2020
Invesco EURO STOXX High Dividend Low Volatility UCITS ETF
The Central Bank of Ireland requires a schedule of material changes in the composition of the portfolio during the financial year. These are defined as
aggregate purchases of a security exceeding one per cent of the total value of purchases for the financial year and aggregate disposals greater than one per cent
of the total value of sales. Where the number of purchases/sales transactions exceeding 1% of the total value of purchases/sales for the financial year is less
than 20, then a minimum of 20 purchases/sales will be disclosed.
177 Invesco Markets III plc
Purchases
Security Description Nominal Cost
EUR
Red Electrica Corp SA 45,697 783,620
Eutelsat Communications SA 46,364 638,967
Intesa Sanpaolo SpA 265,262 627,994
Banco Santander SA 202,133 613,092
Terna Rete Elettrica Nazionale SpA 92,765 577,882
Christian Dior SE 1,292 572,694
Freenet AG 27,820 569,601
Elisa Oyj 9,693 492,785
ACS Actividades de Construcciony
Servicios SA
17,904 473,690
ICADE 7,963 467,149
Infrastrutture Wireless Italiane SpA 45,852 433,406
Italgas SpA 73,979 415,470
TAG Immobilien AG 17,233 381,311
AXA SA 19,902 368,988
Telefonica SA 88,428 366,734
Bankinter SA 91,830 352,724
Bayer AG 5,373 351,550
Orion Oyj 8,387 351,120
BASF SE 7,655 333,755
Atlantia SpA 14,989 329,966
OMV AG 8,546 328,413
Daimler AG 14,374 327,889
Bayerische Motoren Werke AG 5,351 322,675
Orange SA 32,730 312,487
Proximus SADP 15,394 306,627
Allianz SE 1,686 305,483
Solvay SA 4,167 304,414
voestalpine AG 15,410 302,044
Credit Agricole SA 43,858 300,549
UPM-Kymmene Oyj 11,110 295,530
Aegon NV 116,385 293,831
Galp Energia SGPS SA 29,929 293,024
SBM Offshore NV 21,544 291,155
Merlin Properties Socimi SA 39,852 282,237
Raiffeisen Bank International AG 16,069 277,226
Cofinimmo SA 2,127 270,648
E.ON SE 26,561 269,085
Gecina SA 2,402 267,020
A2A SpA 186,884 259,415
Uniper SE 9,402 254,683
Rubis SCA 7,032 253,282
IMMOFINANZ AG 10,485 252,896
Mapfre SA 140,570 249,148
Banco Bilbao Vizcaya Argentaria SA 84,693 244,411
Sales
Security Description Nominal Proceeds
EUR
Daimler AG 23,265 953,306
Alstom SA 17,697 743,867
Aegon NV 249,485 665,626
Banco Bilbao Vizcaya Argentaria SA 157,670 634,299
Bolsas y Mercados Espanoles
SHMSF SA
17,638 617,635
Solvay SA 6,605 584,448
Enagas SA 28,644 572,505
RTL Group SA 11,764 517,184
ING Groep NV 77,067 511,443
Erste Group Bank AG 18,552 508,823
Engie SA 34,409 506,566
Telenet Group Holding NV 12,788 503,851
Christian Dior SE 1,292 479,383
Randstad NV 11,407 464,912
BNP Paribas SA 12,208 461,979
Repsol SA 53,553 455,909
ASR Nederland NV 15,451 449,284
TAG Immobilien AG 17,233 446,237
Poste Italiane SpA 48,681 445,657
Unibail-Rodamco-Westfield (REIT) 6,645 445,081
Eni SpA 48,513 440,966
Intesa Sanpaolo SpA 265,262 438,079
Klepierre SA (REIT) 22,024 435,403
Eutelsat Communications SA 46,364 434,812
Mapfre SA 280,847 423,553
Freenet AG 27,820 421,787
ACS Actividades de Construccion y
Servicios SA
17,904 413,573
Akzo Nobel NV 7,711 410,314
Bayerische Motoren Werke AG 6,744 398,206
KBC Group NV 7,231 391,807
Mediobanca Banca di Credito
Finanziario SpA
55,635 387,333
Bankinter SA 91,830 383,027
BASF SE 5,727 368,720
Telefonica Deutschland Holding AG 141,641 364,512
Nokian Renkaat Oyj 19,761 357,315
Banco Santander SA 202,133 351,157
voestalpine AG 15,410 345,838
Credit Agricole SA 43,858 345,350
Red Electrica Corp SA 22,718 339,292
E.ON SE 34,107 324,655
ABN AMRO Bank NV Dutch Cert 41,043 320,415
Terna Rete Elettrica Nazionale SpA 53,494 287,497
Elisa Oyj 5,353 279,985
BAWAG Group AG 9,032 276,541
Enel SpA 37,754 270,801
Ageas SA/NV 7,681 258,157
OMV AG 8,546 257,762
HUGO BOSS AG 5,839 251,110
Lagardere SCA 25,040 249,563
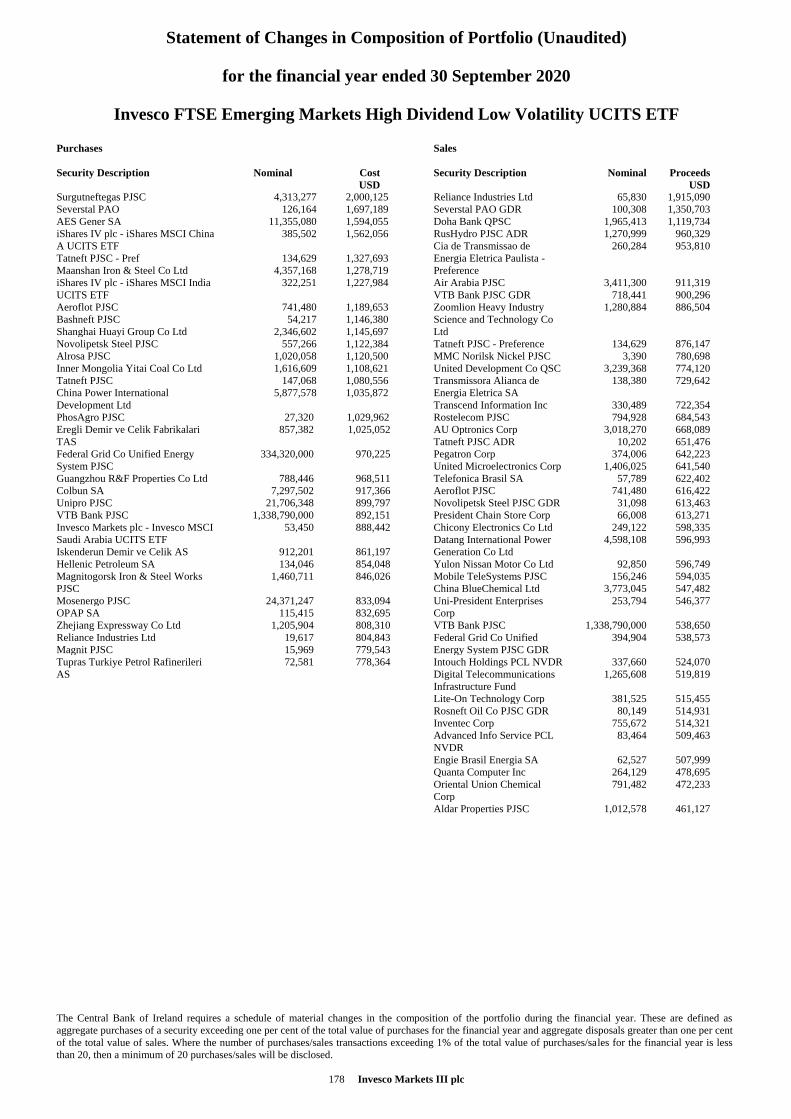
Statement of Changes in Composition of Portfolio (Unaudited)
for the financial year ended 30 September 2020
Invesco FTSE Emerging Markets High Dividend Low Volatility UCITS ETF
The Central Bank of Ireland requires a schedule of material changes in the composition of the portfolio during the financial year. These are defined as
aggregate purchases of a security exceeding one per cent of the total value of purchases for the financial year and aggregate disposals greater than one per cent
of the total value of sales. Where the number of purchases/sales transactions exceeding 1% of the total value of purchases/sales for the financial year is less
than 20, then a minimum of 20 purchases/sales will be disclosed.
178 Invesco Markets III plc
Purchases
Security Description Nominal Cost
USD
Surgutneftegas PJSC 4,313,277 2,000,125
Severstal PAO 126,164 1,697,189
AES Gener SA 11,355,080 1,594,055
iShares IV plc - iShares MSCI China
A UCITS ETF
385,502 1,562,056
Tatneft PJSC - Pref 134,629 1,327,693
Maanshan Iron & Steel Co Ltd 4,357,168 1,278,719
iShares IV plc - iShares MSCI India
UCITS ETF
322,251 1,227,984
Aeroflot PJSC 741,480 1,189,653
Bashneft PJSC 54,217 1,146,380
Shanghai Huayi Group Co Ltd 2,346,602 1,145,697
Novolipetsk Steel PJSC 557,266 1,122,384
Alrosa PJSC 1,020,058 1,120,500
Inner Mongolia Yitai Coal Co Ltd 1,616,609 1,108,621
Tatneft PJSC 147,068 1,080,556
China Power International
Development Ltd
5,877,578 1,035,872
PhosAgro PJSC 27,320 1,029,962
Eregli Demir ve Celik Fabrikalari
TAS
857,382 1,025,052
Federal Grid Co Unified Energy
System PJSC
334,320,000 970,225
Guangzhou R&F Properties Co Ltd 788,446 968,511
Colbun SA 7,297,502 917,366
Unipro PJSC 21,706,348 899,797
VTB Bank PJSC 1,338,790,000 892,151
Invesco Markets plc - Invesco MSCI
Saudi Arabia UCITS ETF
53,450 888,442
Iskenderun Demir ve Celik AS 912,201 861,197
Hellenic Petroleum SA 134,046 854,048
Magnitogorsk Iron & Steel Works
PJSC
1,460,711 846,026
Mosenergo PJSC 24,371,247 833,094
OPAP SA 115,415 832,695
Zhejiang Expressway Co Ltd 1,205,904 808,310
Reliance Industries Ltd 19,617 804,843
Magnit PJSC 15,969 779,543
Tupras Turkiye Petrol Rafinerileri
AS
72,581 778,364
Sales
Security Description Nominal Proceeds
USD
Reliance Industries Ltd 65,830 1,915,090
Severstal PAO GDR 100,308 1,350,703
Doha Bank QPSC 1,965,413 1,119,734
RusHydro PJSC ADR 1,270,999 960,329
Cia de Transmissao de
Energia Eletrica Paulista -
Preference
260,284 953,810
Air Arabia PJSC 3,411,300 911,319
VTB Bank PJSC GDR 718,441 900,296
Zoomlion Heavy Industry
Science and Technology Co
Ltd
1,280,884 886,504
Tatneft PJSC - Preference 134,629 876,147
MMC Norilsk Nickel PJSC 3,390 780,698
United Development Co QSC 3,239,368 774,120
Transmissora Alianca de
Energia Eletrica SA
138,380 729,642
Transcend Information Inc 330,489 722,354
Rostelecom PJSC 794,928 684,543
AU Optronics Corp 3,018,270 668,089
Tatneft PJSC ADR 10,202 651,476
Pegatron Corp 374,006 642,223
United Microelectronics Corp 1,406,025 641,540
Telefonica Brasil SA 57,789 622,402
Aeroflot PJSC 741,480 616,422
Novolipetsk Steel PJSC GDR 31,098 613,463
President Chain Store Corp 66,008 613,271
Chicony Electronics Co Ltd 249,122 598,335
Datang International Power
Generation Co Ltd
4,598,108 596,993
Yulon Nissan Motor Co Ltd 92,850 596,749
Mobile TeleSystems PJSC 156,246 594,035
China BlueChemical Ltd 3,773,045 547,482
Uni-President Enterprises
Corp
253,794 546,377
VTB Bank PJSC 1,338,790,000 538,650
Federal Grid Co Unified
Energy System PJSC GDR
394,904 538,573
Intouch Holdings PCL NVDR 337,660 524,070
Digital Telecommunications
Infrastructure Fund
1,265,608 519,819
Lite-On Technology Corp 381,525 515,455
Rosneft Oil Co PJSC GDR 80,149 514,931
Inventec Corp 755,672 514,321
Advanced Info Service PCL
NVDR
83,464 509,463
Engie Brasil Energia SA 62,527 507,999
Quanta Computer Inc 264,129 478,695
Oriental Union Chemical
Corp
791,482 472,233
Aldar Properties PJSC 1,012,578 461,127
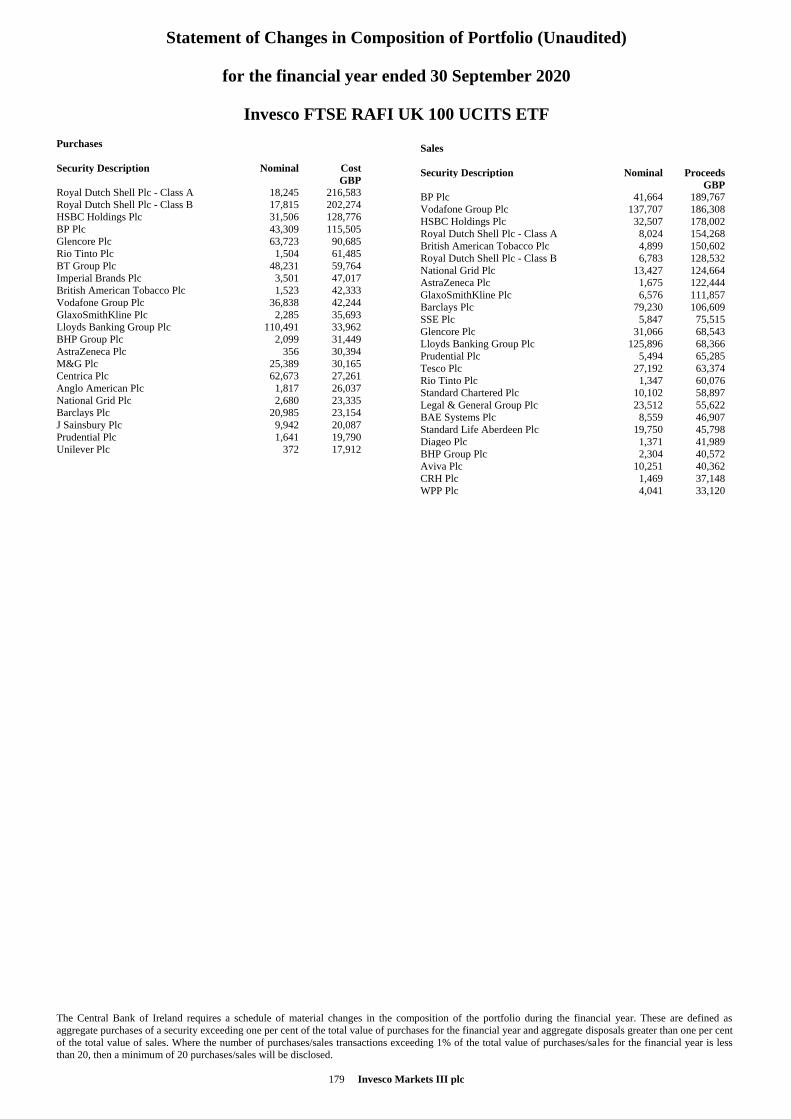
Statement of Changes in Composition of Portfolio (Unaudited)
for the financial year ended 30 September 2020
Invesco FTSE RAFI UK 100 UCITS ETF
The Central Bank of Ireland requires a schedule of material changes in the composition of the portfolio during the financial year. These are defined as
aggregate purchases of a security exceeding one per cent of the total value of purchases for the financial year and aggregate disposals greater than one per cent
of the total value of sales. Where the number of purchases/sales transactions exceeding 1% of the total value of purchases/sales for the financial year is less
than 20, then a minimum of 20 purchases/sales will be disclosed.
179 Invesco Markets III plc
Purchases
Security Description Nominal Cost
GBP
Royal Dutch Shell Plc - Class A 18,245 216,583
Royal Dutch Shell Plc - Class B 17,815 202,274
HSBC Holdings Plc 31,506 128,776
BP Plc 43,309 115,505
Glencore Plc 63,723 90,685
Rio Tinto Plc 1,504 61,485
BT Group Plc 48,231 59,764
Imperial Brands Plc 3,501 47,017
British American Tobacco Plc 1,523 42,333
Vodafone Group Plc 36,838 42,244
GlaxoSmithKline Plc 2,285 35,693
Lloyds Banking Group Plc 110,491 33,962
BHP Group Plc 2,099 31,449
AstraZeneca Plc 356 30,394
M&G Plc 25,389 30,165
Centrica Plc 62,673 27,261
Anglo American Plc 1,817 26,037
National Grid Plc 2,680 23,335
Barclays Plc 20,985 23,154
J Sainsbury Plc 9,942 20,087
Prudential Plc 1,641 19,790
Unilever Plc 372 17,912
Sales
Security Description Nominal Proceeds
GBP
BP Plc 41,664 189,767
Vodafone Group Plc 137,707 186,308
HSBC Holdings Plc 32,507 178,002
Royal Dutch Shell Plc - Class A 8,024 154,268
British American Tobacco Plc 4,899 150,602
Royal Dutch Shell Plc - Class B 6,783 128,532
National Grid Plc 13,427 124,664
AstraZeneca Plc 1,675 122,444
GlaxoSmithKline Plc 6,576 111,857
Barclays Plc 79,230 106,609
SSE Plc 5,847 75,515
Glencore Plc 31,066 68,543
Lloyds Banking Group Plc 125,896 68,366
Prudential Plc 5,494 65,285
Tesco Plc 27,192 63,374
Rio Tinto Plc 1,347 60,076
Standard Chartered Plc 10,102 58,897
Legal & General Group Plc 23,512 55,622
BAE Systems Plc 8,559 46,907
Standard Life Aberdeen Plc 19,750 45,798
Diageo Plc 1,371 41,989
BHP Group Plc 2,304 40,572
Aviva Plc 10,251 40,362
CRH Plc 1,469 37,148
WPP Plc 4,041 33,120
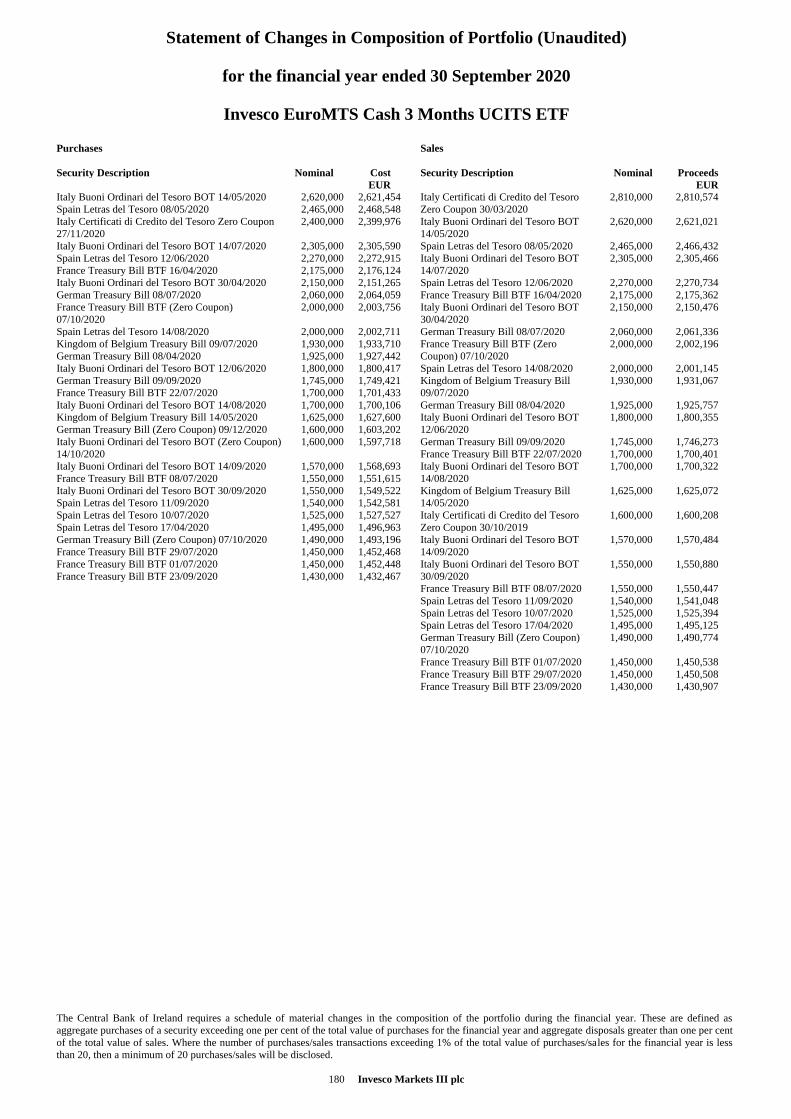
Statement of Changes in Composition of Portfolio (Unaudited)
for the financial year ended 30 September 2020
Invesco EuroMTS Cash 3 Months UCITS ETF
The Central Bank of Ireland requires a schedule of material changes in the composition of the portfolio during the financial year. These are defined as
aggregate purchases of a security exceeding one per cent of the total value of purchases for the financial year and aggregate disposals greater than one per cent
of the total value of sales. Where the number of purchases/sales transactions exceeding 1% of the total value of purchases/sales for the financial year is less
than 20, then a minimum of 20 purchases/sales will be disclosed.
180 Invesco Markets III plc
Purchases
Security Description Nominal Cost
EUR
Italy Buoni Ordinari del Tesoro BOT 14/05/2020 2,620,000 2,621,454
Spain Letras del Tesoro 08/05/2020 2,465,000 2,468,548
Italy Certificati di Credito del Tesoro Zero Coupon
27/11/2020
2,400,000 2,399,976
Italy Buoni Ordinari del Tesoro BOT 14/07/2020 2,305,000 2,305,590
Spain Letras del Tesoro 12/06/2020 2,270,000 2,272,915
France Treasury Bill BTF 16/04/2020 2,175,000 2,176,124
Italy Buoni Ordinari del Tesoro BOT 30/04/2020 2,150,000 2,151,265
German Treasury Bill 08/07/2020 2,060,000 2,064,059
France Treasury Bill BTF (Zero Coupon)
07/10/2020
2,000,000 2,003,756
Spain Letras del Tesoro 14/08/2020 2,000,000 2,002,711
Kingdom of Belgium Treasury Bill 09/07/2020 1,930,000 1,933,710
German Treasury Bill 08/04/2020 1,925,000 1,927,442
Italy Buoni Ordinari del Tesoro BOT 12/06/2020 1,800,000 1,800,417
German Treasury Bill 09/09/2020 1,745,000 1,749,421
France Treasury Bill BTF 22/07/2020 1,700,000 1,701,433
Italy Buoni Ordinari del Tesoro BOT 14/08/2020 1,700,000 1,700,106
Kingdom of Belgium Treasury Bill 14/05/2020 1,625,000 1,627,600
German Treasury Bill (Zero Coupon) 09/12/2020 1,600,000 1,603,202
Italy Buoni Ordinari del Tesoro BOT (Zero Coupon)
14/10/2020
1,600,000 1,597,718
Italy Buoni Ordinari del Tesoro BOT 14/09/2020 1,570,000 1,568,693
France Treasury Bill BTF 08/07/2020 1,550,000 1,551,615
Italy Buoni Ordinari del Tesoro BOT 30/09/2020 1,550,000 1,549,522
Spain Letras del Tesoro 11/09/2020 1,540,000 1,542,581
Spain Letras del Tesoro 10/07/2020 1,525,000 1,527,527
Spain Letras del Tesoro 17/04/2020 1,495,000 1,496,963
German Treasury Bill (Zero Coupon) 07/10/2020 1,490,000 1,493,196
France Treasury Bill BTF 29/07/2020 1,450,000 1,452,468
France Treasury Bill BTF 01/07/2020 1,450,000 1,452,448
France Treasury Bill BTF 23/09/2020 1,430,000 1,432,467
Sales
Security Description Nominal Proceeds
EUR
Italy Certificati di Credito del Tesoro
Zero Coupon 30/03/2020
2,810,000 2,810,574
Italy Buoni Ordinari del Tesoro BOT
14/05/2020
2,620,000 2,621,021
Spain Letras del Tesoro 08/05/2020 2,465,000 2,466,432
Italy Buoni Ordinari del Tesoro BOT
14/07/2020
2,305,000 2,305,466
Spain Letras del Tesoro 12/06/2020 2,270,000 2,270,734
France Treasury Bill BTF 16/04/2020 2,175,000 2,175,362
Italy Buoni Ordinari del Tesoro BOT
30/04/2020
2,150,000 2,150,476
German Treasury Bill 08/07/2020 2,060,000 2,061,336
France Treasury Bill BTF (Zero
Coupon) 07/10/2020
2,000,000 2,002,196
Spain Letras del Tesoro 14/08/2020 2,000,000 2,001,145
Kingdom of Belgium Treasury Bill
09/07/2020
1,930,000 1,931,067
German Treasury Bill 08/04/2020 1,925,000 1,925,757
Italy Buoni Ordinari del Tesoro BOT
12/06/2020
1,800,000 1,800,355
German Treasury Bill 09/09/2020 1,745,000 1,746,273
France Treasury Bill BTF 22/07/2020 1,700,000 1,700,401
Italy Buoni Ordinari del Tesoro BOT
14/08/2020
1,700,000 1,700,322
Kingdom of Belgium Treasury Bill
14/05/2020
1,625,000 1,625,072
Italy Certificati di Credito del Tesoro
Zero Coupon 30/10/2019
1,600,000 1,600,208
Italy Buoni Ordinari del Tesoro BOT
14/09/2020
1,570,000 1,570,484
Italy Buoni Ordinari del Tesoro BOT
30/09/2020
1,550,000 1,550,880
France Treasury Bill BTF 08/07/2020 1,550,000 1,550,447
Spain Letras del Tesoro 11/09/2020 1,540,000 1,541,048
Spain Letras del Tesoro 10/07/2020 1,525,000 1,525,394
Spain Letras del Tesoro 17/04/2020 1,495,000 1,495,125
German Treasury Bill (Zero Coupon)
07/10/2020
1,490,000 1,490,774
France Treasury Bill BTF 01/07/2020 1,450,000 1,450,538
France Treasury Bill BTF 29/07/2020 1,450,000 1,450,508
France Treasury Bill BTF 23/09/2020 1,430,000 1,430,907
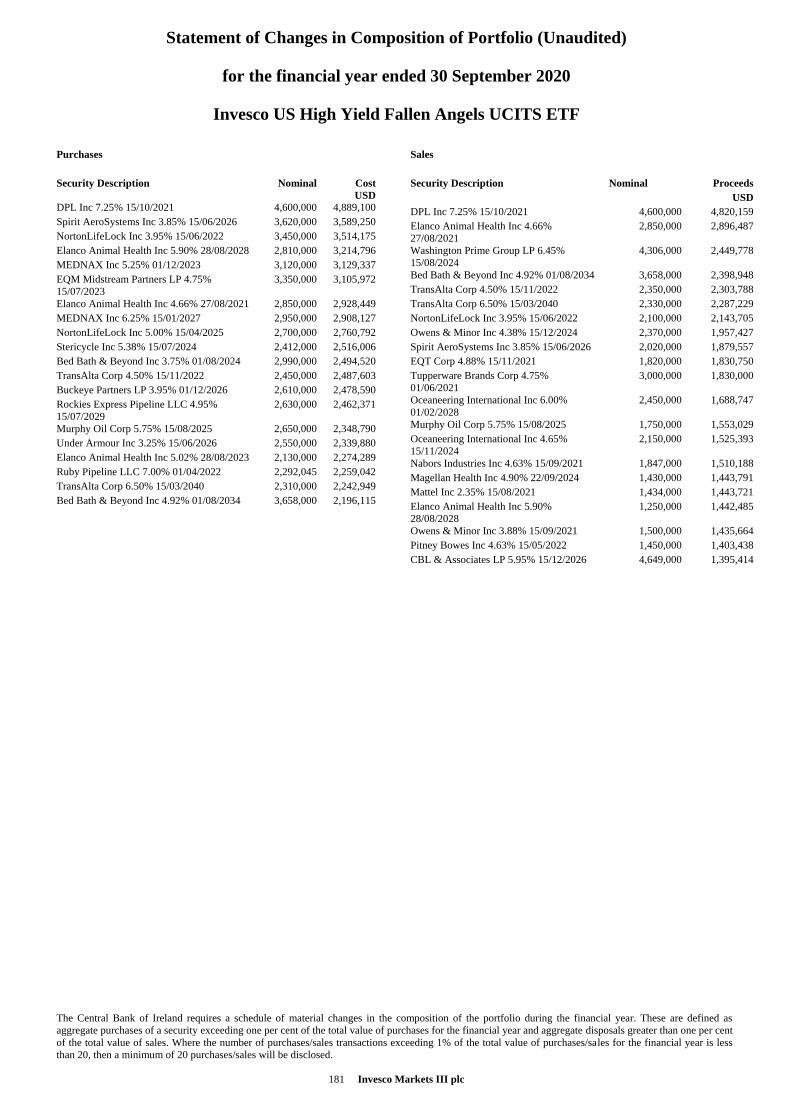
Statement of Changes in Composition of Portfolio (Unaudited)
for the financial year ended 30 September 2020
Invesco US High Yield Fallen Angels UCITS ETF
The Central Bank of Ireland requires a schedule of material changes in the composition of the portfolio during the financial year. These are defined as
aggregate purchases of a security exceeding one per cent of the total value of purchases for the financial year and aggregate disposals greater than one per cent
of the total value of sales. Where the number of purchases/sales transactions exceeding 1% of the total value of purchases/sales for the financial year is less
than 20, then a minimum of 20 purchases/sales will be disclosed.
181 Invesco Markets III plc
Purchases
Security Description Nominal Cost
USD
DPL Inc 7.25% 15/10/2021 4,600,000 4,889,100
Spirit AeroSystems Inc 3.85% 15/06/2026 3,620,000 3,589,250
NortonLifeLock Inc 3.95% 15/06/2022 3,450,000 3,514,175
Elanco Animal Health Inc 5.90% 28/08/2028 2,810,000 3,214,796
MEDNAX Inc 5.25% 01/12/2023 3,120,000 3,129,337
EQM Midstream Partners LP 4.75%
15/07/2023
3,350,000 3,105,972
Elanco Animal Health Inc 4.66% 27/08/2021 2,850,000 2,928,449
MEDNAX Inc 6.25% 15/01/2027 2,950,000 2,908,127
NortonLifeLock Inc 5.00% 15/04/2025 2,700,000 2,760,792
Stericycle Inc 5.38% 15/07/2024 2,412,000 2,516,006
Bed Bath & Beyond Inc 3.75% 01/08/2024 2,990,000 2,494,520
TransAlta Corp 4.50% 15/11/2022 2,450,000 2,487,603
Buckeye Partners LP 3.95% 01/12/2026 2,610,000 2,478,590
Rockies Express Pipeline LLC 4.95%
15/07/2029
2,630,000 2,462,371
Murphy Oil Corp 5.75% 15/08/2025 2,650,000 2,348,790
Under Armour Inc 3.25% 15/06/2026 2,550,000 2,339,880
Elanco Animal Health Inc 5.02% 28/08/2023 2,130,000 2,274,289
Ruby Pipeline LLC 7.00% 01/04/2022 2,292,045 2,259,042
TransAlta Corp 6.50% 15/03/2040 2,310,000 2,242,949
Bed Bath & Beyond Inc 4.92% 01/08/2034 3,658,000 2,196,115
Sales
Security Description Nominal Proceeds
USD
DPL Inc 7.25% 15/10/2021 4,600,000 4,820,159
Elanco Animal Health Inc 4.66%
27/08/2021
2,850,000 2,896,487
Washington Prime Group LP 6.45%
15/08/2024
4,306,000 2,449,778
Bed Bath & Beyond Inc 4.92% 01/08/2034 3,658,000 2,398,948
TransAlta Corp 4.50% 15/11/2022 2,350,000 2,303,788
TransAlta Corp 6.50% 15/03/2040 2,330,000 2,287,229
NortonLifeLock Inc 3.95% 15/06/2022 2,100,000 2,143,705
Owens & Minor Inc 4.38% 15/12/2024 2,370,000 1,957,427
Spirit AeroSystems Inc 3.85% 15/06/2026 2,020,000 1,879,557
EQT Corp 4.88% 15/11/2021 1,820,000 1,830,750
Tupperware Brands Corp 4.75%
01/06/2021
3,000,000 1,830,000
Oceaneering International Inc 6.00%
01/02/2028
2,450,000 1,688,747
Murphy Oil Corp 5.75% 15/08/2025 1,750,000 1,553,029
Oceaneering International Inc 4.65%
15/11/2024
2,150,000 1,525,393
Nabors Industries Inc 4.63% 15/09/2021 1,847,000 1,510,188
Magellan Health Inc 4.90% 22/09/2024 1,430,000 1,443,791
Mattel Inc 2.35% 15/08/2021 1,434,000 1,443,721
Elanco Animal Health Inc 5.90%
28/08/2028
1,250,000 1,442,485
Owens & Minor Inc 3.88% 15/09/2021 1,500,000 1,435,664
Pitney Bowes Inc 4.63% 15/05/2022 1,450,000 1,403,438
CBL & Associates LP 5.95% 15/12/2026 4,649,000 1,395,414
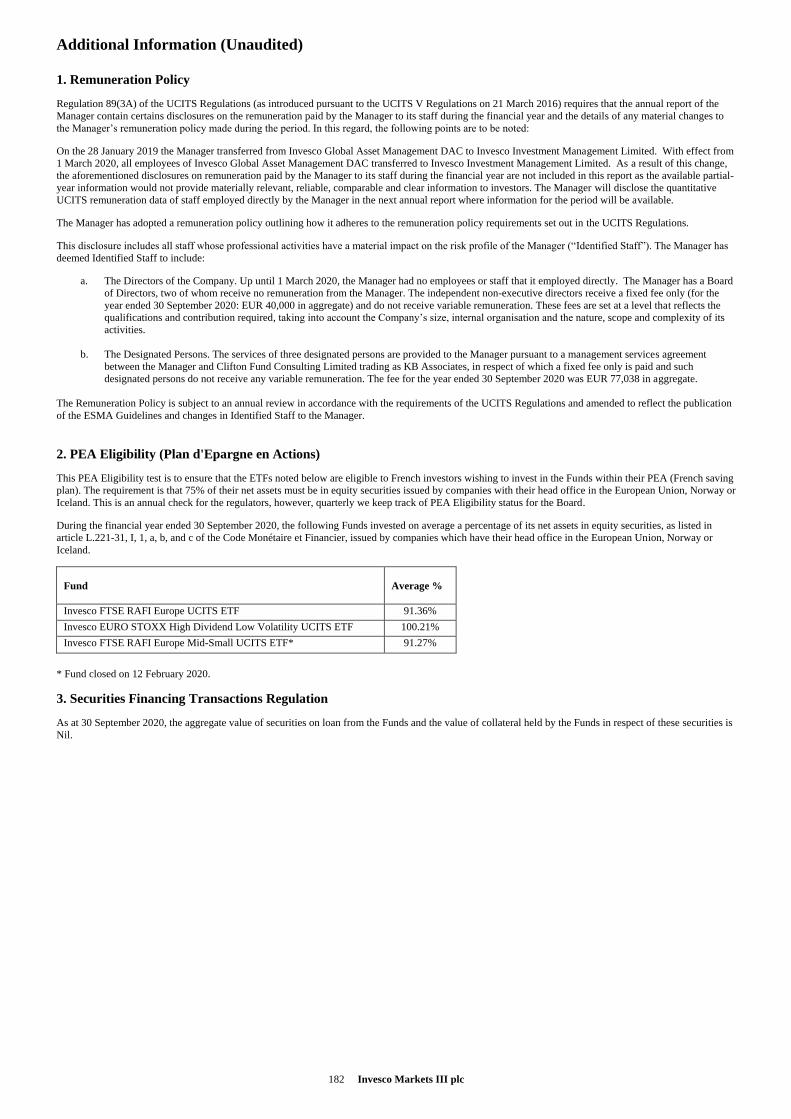
182 Invesco Markets III plc
Additional Information (Unaudited)
1. Remuneration Policy
Regulation 89(3A) of the UCITS Regulations (as introduced pursuant to the UCITS V Regulations on 21 March 2016) requires that the annual report of the
Manager contain certains disclosures on the remuneration paid by the Manager to its staff during the financial year and the details of any material changes to
the Manager’s remuneration policy made during the period. In this regard, the following points are to be noted:
On the 28 January 2019 the Manager transferred from Invesco Global Asset Management DAC to Invesco Investment Management Limited. With effect from
1 March 2020, all employees of Invesco Global Asset Management DAC transferred to Invesco Investment Management Limited. As a result of this change,
the aforementioned disclosures on remuneration paid by the Manager to its staff during the financial year are not included in this report as the available partial-
year information would not provide materially relevant, reliable, comparable and clear information to investors. The Manager will disclose the quantitative
UCITS remuneration data of staff employed directly by the Manager in the next annual report where information for the period will be available.
The Manager has adopted a remuneration policy outlining how it adheres to the remuneration policy requirements set out in the UCITS Regulations.
This disclosure includes all staff whose professional activities have a material impact on the risk profile of the Manager (“Identified Staff”). The Manager has
deemed Identified Staff to include:
a. The Directors of the Company. Up until 1 March 2020, the Manager had no employees or staff that it employed directly. The Manager has a Board
of Directors, two of whom receive no remuneration from the Manager. The independent non-executive directors receive a fixed fee only (for the
year ended 30 September 2020: EUR 40,000 in aggregate) and do not receive variable remuneration. These fees are set at a level that reflects the
qualifications and contribution required, taking into account the Company’s size, internal organisation and the nature, scope and complexity of its
activities.
b. The Designated Persons. The services of three designated persons are provided to the Manager pursuant to a management services agreement
between the Manager and Clifton Fund Consulting Limited trading as KB Associates, in respect of which a fixed fee only is paid and such
designated persons do not receive any variable remuneration. The fee for the year ended 30 September 2020 was EUR 77,038 in aggregate.
The Remuneration Policy is subject to an annual review in accordance with the requirements of the UCITS Regulations and amended to reflect the publication
of the ESMA Guidelines and changes in Identified Staff to the Manager.
2. PEA Eligibility (Plan d'Epargne en Actions)
This PEA Eligibility test is to ensure that the ETFs noted below are eligible to French investors wishing to invest in the Funds within their PEA (French saving
plan). The requirement is that 75% of their net assets must be in equity securities issued by companies with their head office in the European Union, Norway or
Iceland. This is an annual check for the regulators, however, quarterly we keep track of PEA Eligibility status for the Board.
During the financial year ended 30 September 2020, the following Funds invested on average a percentage of its net assets in equity securities, as listed in
article L.221-31, I, 1, a, b, and c of the Code Monétaire et Financier, issued by companies which have their head office in the European Union, Norway or
Iceland.
Fund
Average %
Invesco FTSE RAFI Europe UCITS ETF 91.36%
Invesco EURO STOXX High Dividend Low Volatility UCITS ETF 100.21%
Invesco FTSE RAFI Europe Mid-Small UCITS ETF* 91.27%
* Fund closed on 12 February 2020.
3. Securities Financing Transactions Regulation
As at 30 September 2020, the aggregate value of securities on loan from the Funds and the value of collateral held by the Funds in respect of these securities is
Nil.
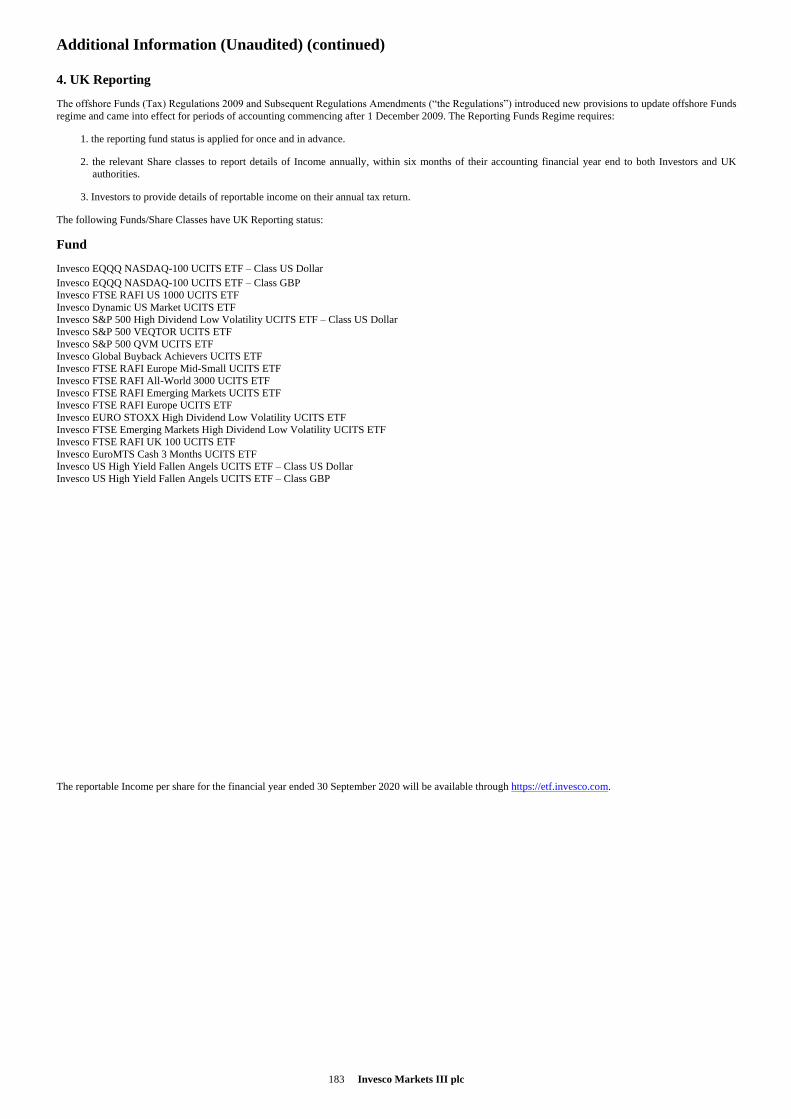
183 Invesco Markets III plc
Additional Information (Unaudited) (continued)
4. UK Reporting
The offshore Funds (Tax) Regulations 2009 and Subsequent Regulations Amendments (“the Regulations”) introduced new provisions to update offshore Funds
regime and came into effect for periods of accounting commencing after 1 December 2009. The Reporting Funds Regime requires:
1. the reporting fund status is applied for once and in advance.
2. the relevant Share classes to report details of Income annually, within six months of their accounting financial year end to both Investors and UK
authorities.
3. Investors to provide details of reportable income on their annual tax return.
The following Funds/Share Classes have UK Reporting status:
Fund
Invesco EQQQ NASDAQ-100 UCITS ETF – Class US Dollar
Invesco EQQQ NASDAQ-100 UCITS ETF – Class GBP
Invesco FTSE RAFI US 1000 UCITS ETF
Invesco Dynamic US Market UCITS ETF
Invesco S&P 500 High Dividend Low Volatility UCITS ETF – Class US Dollar
Invesco S&P 500 VEQTOR UCITS ETF
Invesco S&P 500 QVM UCITS ETF
Invesco Global Buyback Achievers UCITS ETF
Invesco FTSE RAFI Europe Mid-Small UCITS ETF
Invesco FTSE RAFI All-World 3000 UCITS ETF
Invesco FTSE RAFI Emerging Markets UCITS ETF
Invesco FTSE RAFI Europe UCITS ETF
Invesco EURO STOXX High Dividend Low Volatility UCITS ETF
Invesco FTSE Emerging Markets High Dividend Low Volatility UCITS ETF
Invesco FTSE RAFI UK 100 UCITS ETF
Invesco EuroMTS Cash 3 Months UCITS ETF
Invesco US High Yield Fallen Angels UCITS ETF – Class US Dollar
Invesco US High Yield Fallen Angels UCITS ETF – Class GBP
The reportable Income per share for the financial year ended 30 September 2020 will be available through https://etf.invesco.com.


