Embed Size (px)
Citation preview
1
CAMBODIA DEVELOPMENT REVIEW VOLUME 16, ISSUE 1, JANUARY-MARCH 2012
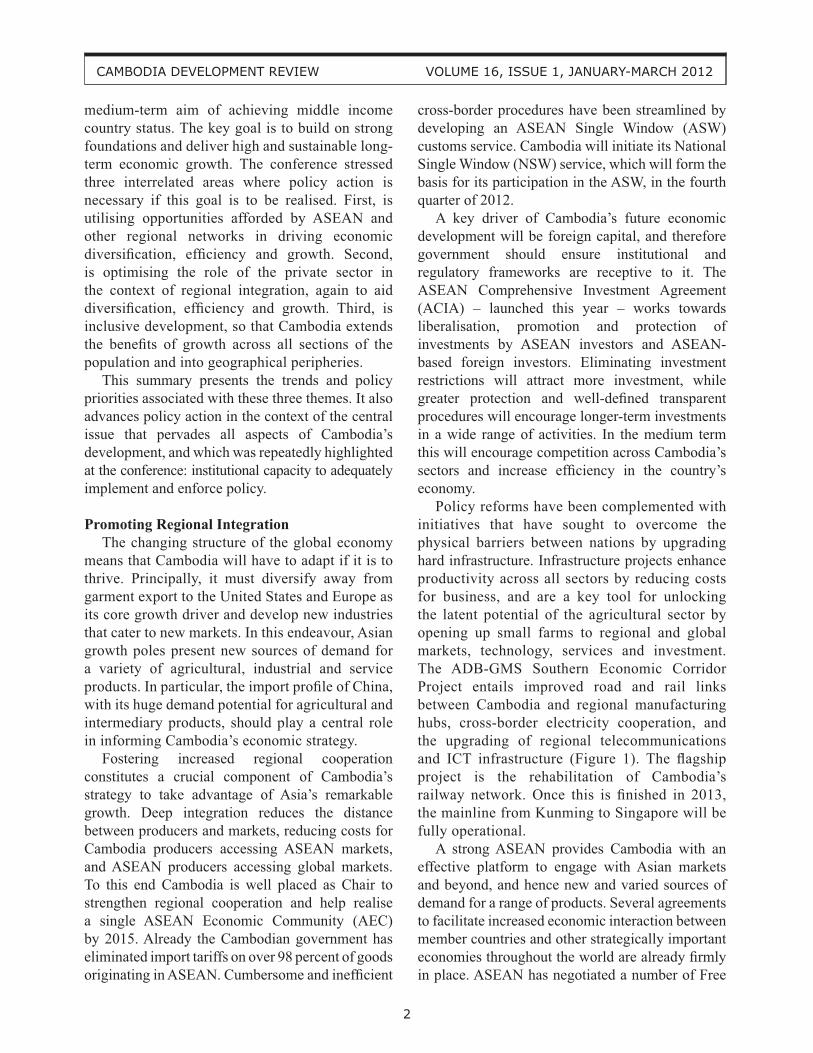
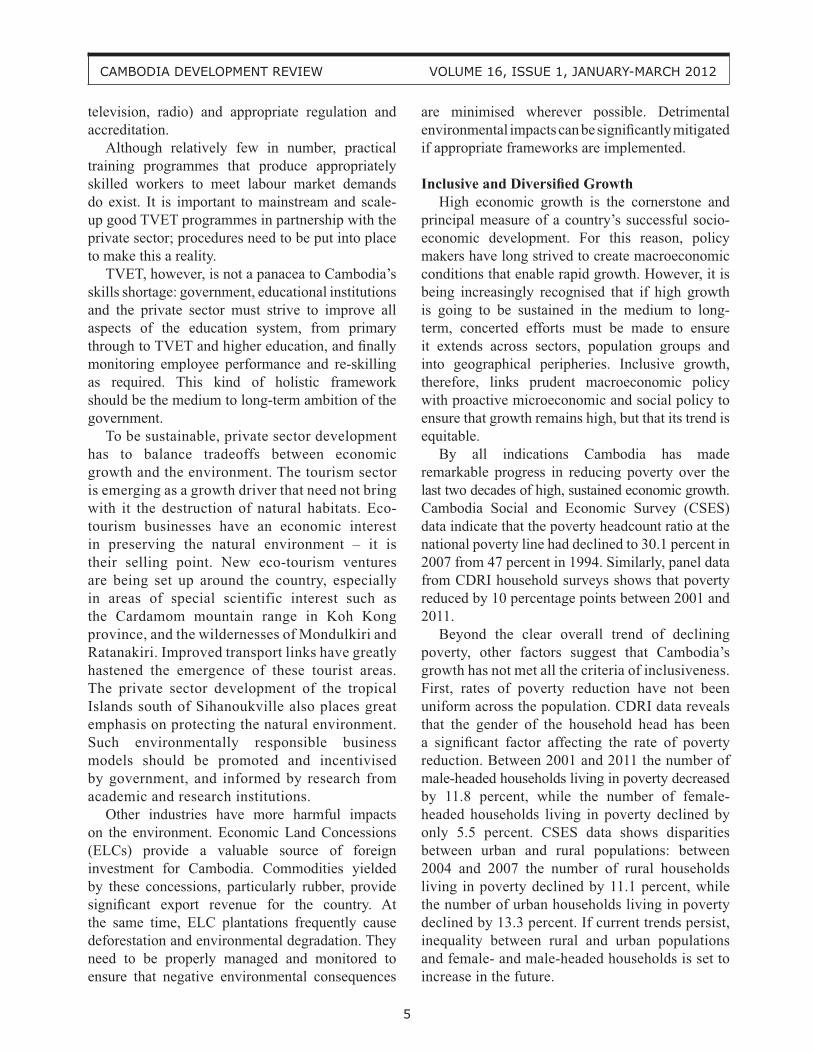
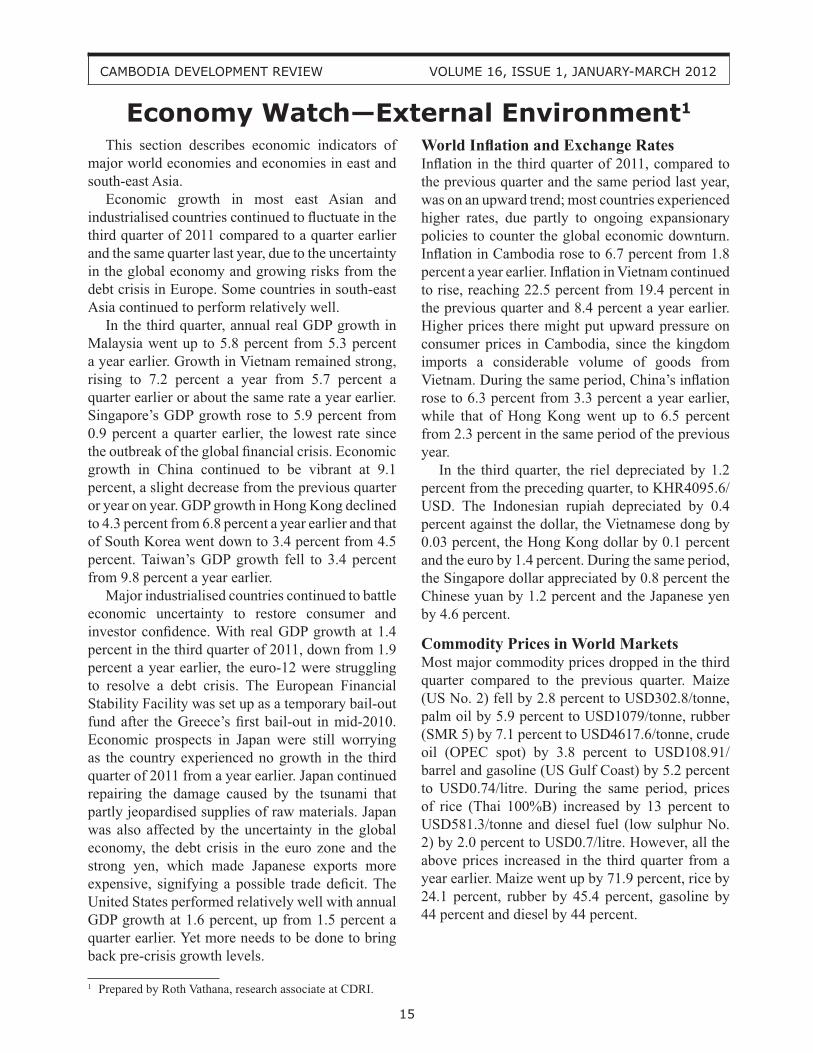
The sixth annual Cambodia Outlook Conference, a partnership between CDRI and ANZ Royal Bank, took place on 16 February 2012 in Phnom Penh. Senior representatives of government, the private sector, development partners, the research community and civil society came together to discuss Cambodia’s Priorities for Inclusive Growth, Regional Integration and ASEAN Leadership – How to Achieve Them. In his opening address, Prime Minister Hun Sen noted the timeliness of the conference’s theme – just before Cambodia assumes the ASEAN Chair, and highlighted its important role in informing policy priorities for the year ahead. This paper provides an overview of salient issues which emerged during sessions, identifying key areas where government action should be focused in 2012. Presentations from the Outlook Conference are accessible on CDRI’s website at www.cdri.org.kh.
2012 has the potential to be the most fruitful of recent years for Cambodia. GDP grew by almost 7 percent in 2011, and is predicted to maintain this rate in 2012. The economy’s core growth sectors, agriculture, industry and tourism, are performing strongly and construction, which suffered greatest during the global financial crisis, also seems to be on the mend. In addition, this year Cambodia takes the chair of ASEAN and with it the opportunity to shape and strengthen an increasingly influential and important regional institution. At this important juncture, the Cambodia Outlook Conference assessed the opportunities and challenges that lie on the road to the government’s
ISSN 1560-7607 / ISBN 978-99950-52-05-8
AMBODIADEVELOPMENT REVIEWC
A Publication of CDRI—Cambodia’s leading independent
development policy research institute
VOLUME 16, ISSUE 1 JANUARY-MARCH 2012 $4.00
In This IssueCambodia in 2012: Key Trends and Policy Priorities
from the Cambodia Outlook Conference .................... 1Mismatch between Local Needs and District
Councillors’ Perceptions of Development Priorities: Results from the 2011 Dissemination Workshop ....... 8
A Review of SME Financing Activities in Cambodia 11Economy Watch—External Environment .................. 15Economy Watch—Domestic Performance ................. 17CDRI Update .............................................................. 24
CAMBODIA IN 2012: KEY TRENDS AND POLICY PRIORITIES FROM THE CAMBODIA
OUTLOOK CONFERENCE1
1 This article, by Mr B. C. R. Flower, UCL PhD student and CDRI research intern, is based on the presentations made at the 2012 Cambodia Outlook Conference, 16 February 2012, Hotel Le Royal, Phnom Penh. Conference presentations and policy briefs are available at www.cdri.org.kh.
Prime Minister Hun Sen delivering the keynote address at the opening ceremony of the 2012 Cambodia Outlook Conference, Phnom Penh, February 2012
2
CAMBODIA DEVELOPMENT REVIEW VOLUME 16, ISSUE 1, JANUARY-MARCH 2012
medium-term aim of achieving middle income country status. The key goal is to build on strong foundations and deliver high and sustainable long-term economic growth. The conference stressed three interrelated areas where policy action is necessary if this goal is to be realised. First, is utilising opportunities afforded by ASEAN and other regional networks in driving economic diversification, efficiency and growth. Second, is optimising the role of the private sector in the context of regional integration, again to aid diversification, efficiency and growth. Third, is inclusive development, so that Cambodia extends the benefits of growth across all sections of the population and into geographical peripheries. This summary presents the trends and policy priorities associated with these three themes. It also advances policy action in the context of the central issue that pervades all aspects of Cambodia’s development, and which was repeatedly highlighted at the conference: institutional capacity to adequately implement and enforce policy.
Promoting Regional Integration The changing structure of the global economy means that Cambodia will have to adapt if it is to thrive. Principally, it must diversify away from garment export to the United States and Europe as its core growth driver and develop new industries that cater to new markets. In this endeavour, Asian growth poles present new sources of demand for a variety of agricultural, industrial and service products. In particular, the import profile of China, with its huge demand potential for agricultural and intermediary products, should play a central role in informing Cambodia’s economic strategy. Fostering increased regional cooperation constitutes a crucial component of Cambodia’s strategy to take advantage of Asia’s remarkable growth. Deep integration reduces the distance between producers and markets, reducing costs for Cambodia producers accessing ASEAN markets, and ASEAN producers accessing global markets. To this end Cambodia is well placed as Chair to strengthen regional cooperation and help realise a single ASEAN Economic Community (AEC) by 2015. Already the Cambodian government has eliminated import tariffs on over 98 percent of goods originating in ASEAN. Cumbersome and inefficient
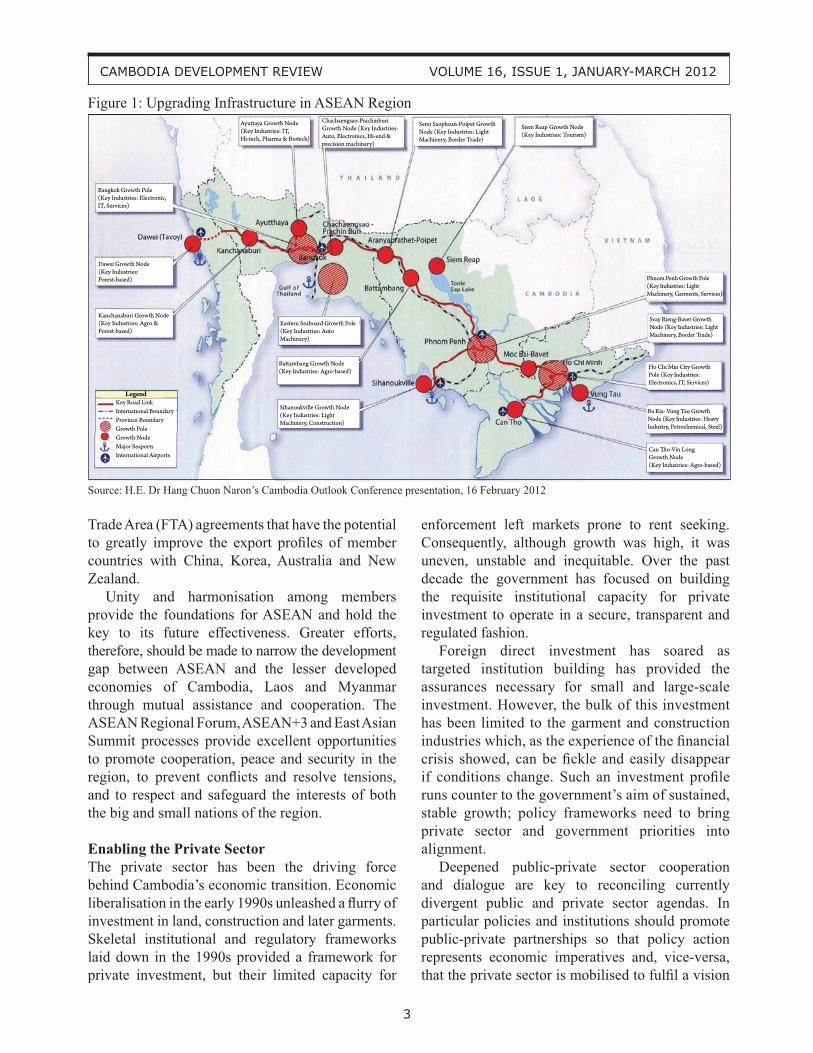
cross-border procedures have been streamlined by developing an ASEAN Single Window (ASW) customs service. Cambodia will initiate its National Single Window (NSW) service, which will form the basis for its participation in the ASW, in the fourth quarter of 2012. A key driver of Cambodia’s future economic development will be foreign capital, and therefore government should ensure institutional and regulatory frameworks are receptive to it. The ASEAN Comprehensive Investment Agreement (ACIA) – launched this year – works towards liberalisation, promotion and protection of investments by ASEAN investors and ASEAN-based foreign investors. Eliminating investment restrictions will attract more investment, while greater protection and well-defined transparent procedures will encourage longer-term investments in a wide range of activities. In the medium term this will encourage competition across Cambodia’s sectors and increase efficiency in the country’s economy. Policy reforms have been complemented with initiatives that have sought to overcome the physical barriers between nations by upgrading hard infrastructure. Infrastructure projects enhance productivity across all sectors by reducing costs for business, and are a key tool for unlocking the latent potential of the agricultural sector by opening up small farms to regional and global markets, technology, services and investment. The ADB-GMS Southern Economic Corridor Project entails improved road and rail links between Cambodia and regional manufacturing hubs, cross-border electricity cooperation, and the upgrading of regional telecommunications and ICT infrastructure (Figure 1). The flagship project is the rehabilitation of Cambodia’s railway network. Once this is finished in 2013, the mainline from Kunming to Singapore will be fully operational. A strong ASEAN provides Cambodia with an effective platform to engage with Asian markets and beyond, and hence new and varied sources of demand for a range of products. Several agreements to facilitate increased economic interaction between member countries and other strategically important economies throughout the world are already firmly in place. ASEAN has negotiated a number of Free
3
CAMBODIA DEVELOPMENT REVIEW VOLUME 16, ISSUE 1, JANUARY-MARCH 2012
Trade Area (FTA) agreements that have the potential to greatly improve the export profiles of member countries with China, Korea, Australia and New Zealand. Unity and harmonisation among members provide the foundations for ASEAN and hold the key to its future effectiveness. Greater efforts, therefore, should be made to narrow the development gap between ASEAN and the lesser developed economies of Cambodia, Laos and Myanmar through mutual assistance and cooperation. The ASEAN Regional Forum, ASEAN+3 and East Asian Summit processes provide excellent opportunities to promote cooperation, peace and security in the region, to prevent conflicts and resolve tensions, and to respect and safeguard the interests of both the big and small nations of the region.
Enabling the Private SectorThe private sector has been the driving force behind Cambodia’s economic transition. Economic liberalisation in the early 1990s unleashed a flurry of investment in land, construction and later garments. Skeletal institutional and regulatory frameworks laid down in the 1990s provided a framework for private investment, but their limited capacity for
enforcement left markets prone to rent seeking. Consequently, although growth was high, it was uneven, unstable and inequitable. Over the past decade the government has focused on building the requisite institutional capacity for private investment to operate in a secure, transparent and regulated fashion. Foreign direct investment has soared as targeted institution building has provided the assurances necessary for small and large-scale investment. However, the bulk of this investment has been limited to the garment and construction industries which, as the experience of the financial crisis showed, can be fickle and easily disappear if conditions change. Such an investment profile runs counter to the government’s aim of sustained, stable growth; policy frameworks need to bring private sector and government priorities into alignment. Deepened public-private sector cooperation and dialogue are key to reconciling currently divergent public and private sector agendas. In particular policies and institutions should promote public-private partnerships so that policy action represents economic imperatives and, vice-versa, that the private sector is mobilised to fulfil a vision
Figure 1: Upgrading Infrastructure in ASEAN Region
Legend
Source: H.E. Dr Hang Chuon Naron’s Cambodia Outlook Conference presentation, 16 February 2012
4
CAMBODIA DEVELOPMENT REVIEW VOLUME 16, ISSUE 1, JANUARY-MARCH 2012
of diversified, sustainable inclusive growth and regional integration. Cambodia must work with regional powers to create an institutional and regulatory environment that enables the private sector to flourish in an era of increasing regional cooperation. In turn, the private sector must utilise the opportunities of increased regional interconnectivity cooperation afforded by a strong ASEAN. For Cambodia, ASEAN facilitates the deepening and widening of production and distribution networks, thus enhancing efficiency, spurring innovation and expanding markets for private sector actors. Several countries in the region, notably Malaysia, Singapore and Thailand, now boast companies that have been able to take advantage of the economic growth and integration occurring in ASEAN to become multinationals. With sound policy and commitment, Cambodia will hopefully follow suit. If the Cambodian private sector is to join the ASEAN business elite, it must develop a better understanding of the competitive and comparative strengths of its economy and play to them. Research is of fundamental importance in overcoming information deficiencies that limit the scope for private sector-enhancing policy. Cambodia’s network of academic and research institutions must be mobilised to assess the constraints facing Cambodian businesses in accessing intra-regional economic networks. The research must be policy focused and utilise a subsector-based analytical framework. A binding constraint to increasing productivity in the private sector is an under and inappropriately skilled workforce. Equipping Cambodians with the right skills will help to diversify the economy away from its narrow economic base and provide employment opportunities in industries such as agro-processing, non-garment manufacturing and a range of services. It will also provide employment opportunities across sectors where potential poverty impacts are significant. An appropriately skilled workforce would also increase the ability of industry and government to respond rapidly to future crises by re-skilling or up-skilling. To deliver an appropriately skilled workforce, policy needs to be pragmatic and representative of economic realities. Inefficient information transfers result in sub-optimal labour market efficiency, and
are at the root of the current skills-needs mismatch. There is a lack of understanding about labour market systems within Cambodia’s workforce, a lack of information for youth, parents and job seekers, and a lack of institutional mechanisms to coordinate between policy-makers and business leaders. Policies should focus on eliminating information asymmetries in the labour market. For example, mechanisms to provide more internship opportunities and practical work experience, such as study tours, would enable young people to familiarise themselves with skills that would enhance their employability. Managing expectations and perceptions of family members who make decisions around education and investment in education is also important. This will prevent potentially scarce family resources being wasted on pursuits that will pay limited dividends in terms of future earnings. Effective and dynamic public-private sector cooperation is essential in increasing Cambodia’s capacity to successfully implement Technical and Vocational Education and Training (TVET) programmes. TVET provides the workforce with the technical and vocational skills necessary to drive and diversify Cambodia’s economy; it is a bridge for young people to enter employment by gaining skills that employers need. It is thus important that private sector needs are represented in TVET curricula, and frameworks that facilitate this kind of cooperation are developed. Public-private partnerships in TVET could provide Cambodia with a great competitive advantage in the region. The country’s strategic placement at the heart of ASEAN could yield world class ASEAN technical training facilities if regional knowledge networks are effectively harnessed. Currently there are major constraints that limit the effectiveness of TVET. These include funding issues, lack of teaching facilities, a limited pool of qualified teachers/trainers and a lack of coordination in providing private sector guest teachers/trainers. The overriding constraint is simply a lack of capacity to implement TVET in a form and at a scale that can truly impact on the skills deficit in the Cambodian labour market. There is also a perception among the population that TVET courses are not prestigious and are for blue-collar workers. This perception must be rectified through marketing (newspapers,
5
CAMBODIA DEVELOPMENT REVIEW VOLUME 16, ISSUE 1, JANUARY-MARCH 2012
television, radio) and appropriate regulation and accreditation. Although relatively few in number, practical training programmes that produce appropriately skilled workers to meet labour market demands do exist. It is important to mainstream and scale-up good TVET programmes in partnership with the private sector; procedures need to be put into place to make this a reality. TVET, however, is not a panacea to Cambodia’s skills shortage: government, educational institutions and the private sector must strive to improve all aspects of the education system, from primary through to TVET and higher education, and finally monitoring employee performance and re-skilling as required. This kind of holistic framework should be the medium to long-term ambition of the government. To be sustainable, private sector development has to balance tradeoffs between economic growth and the environment. The tourism sector is emerging as a growth driver that need not bring with it the destruction of natural habitats. Eco-tourism businesses have an economic interest in preserving the natural environment – it is their selling point. New eco-tourism ventures are being set up around the country, especially in areas of special scientific interest such as the Cardamom mountain range in Koh Kong province, and the wildernesses of Mondulkiri and Ratanakiri. Improved transport links have greatly hastened the emergence of these tourist areas. The private sector development of the tropical Islands south of Sihanoukville also places great emphasis on protecting the natural environment. Such environmentally responsible business models should be promoted and incentivised by government, and informed by research from academic and research institutions. Other industries have more harmful impacts on the environment. Economic Land Concessions (ELCs) provide a valuable source of foreign investment for Cambodia. Commodities yielded by these concessions, particularly rubber, provide significant export revenue for the country. At the same time, ELC plantations frequently cause deforestation and environmental degradation. They need to be properly managed and monitored to ensure that negative environmental consequences
are minimised wherever possible. Detrimental environmental impacts can be significantly mitigated if appropriate frameworks are implemented.
Inclusive and Diversified Growth High economic growth is the cornerstone and principal measure of a country’s successful socio-economic development. For this reason, policy makers have long strived to create macroeconomic conditions that enable rapid growth. However, it is being increasingly recognised that if high growth is going to be sustained in the medium to long-term, concerted efforts must be made to ensure it extends across sectors, population groups and into geographical peripheries. Inclusive growth, therefore, links prudent macroeconomic policy with proactive microeconomic and social policy to ensure that growth remains high, but that its trend is equitable. By all indications Cambodia has made remarkable progress in reducing poverty over the last two decades of high, sustained economic growth. Cambodia Social and Economic Survey (CSES) data indicate that the poverty headcount ratio at the national poverty line had declined to 30.1 percent in 2007 from 47 percent in 1994. Similarly, panel data from CDRI household surveys shows that poverty reduced by 10 percentage points between 2001 and 2011. Beyond the clear overall trend of declining poverty, other factors suggest that Cambodia’s growth has not met all the criteria of inclusiveness. First, rates of poverty reduction have not been uniform across the population. CDRI data reveals that the gender of the household head has been a significant factor affecting the rate of poverty reduction. Between 2001 and 2011 the number of male-headed households living in poverty decreased by 11.8 percent, while the number of female-headed households living in poverty declined by only 5.5 percent. CSES data shows disparities between urban and rural populations: between 2004 and 2007 the number of rural households living in poverty declined by 11.1 percent, while the number of urban households living in poverty declined by 13.3 percent. If current trends persist, inequality between rural and urban populations and female- and male-headed households is set to increase in the future.
6
CAMBODIA DEVELOPMENT REVIEW VOLUME 16, ISSUE 1, JANUARY-MARCH 2012
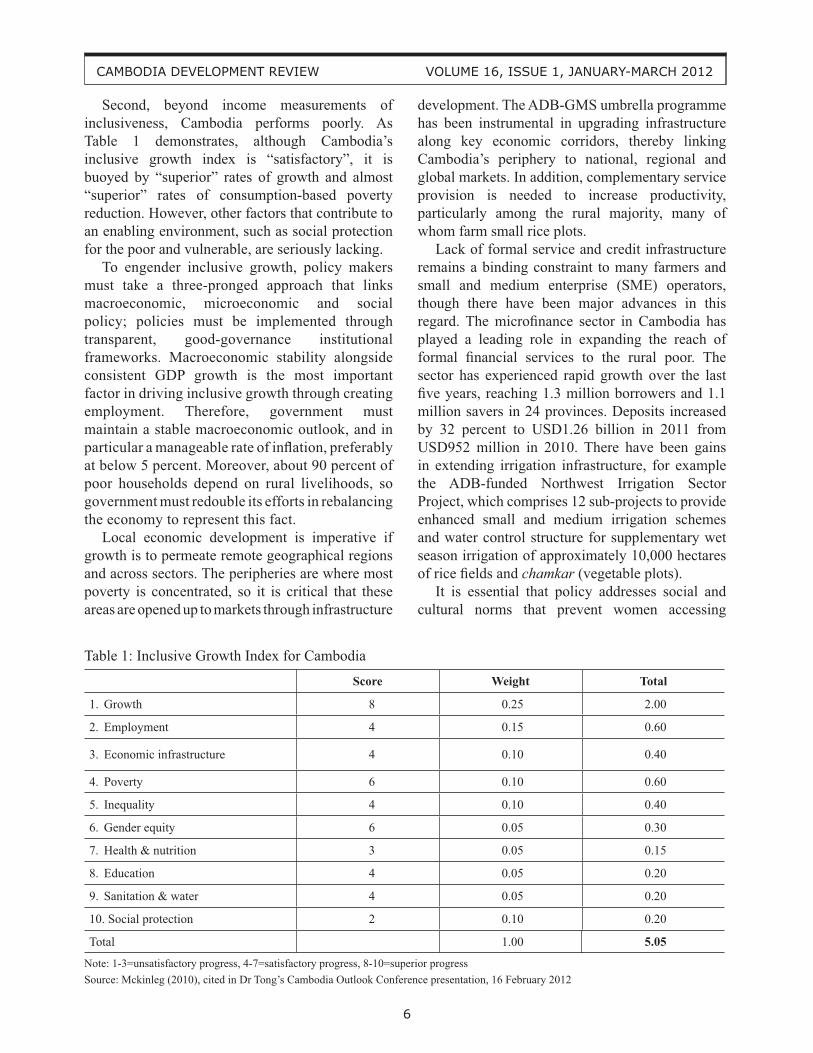
Second, beyond income measurements of inclusiveness, Cambodia performs poorly. As Table 1 demonstrates, although Cambodia’s inclusive growth index is “satisfactory”, it is buoyed by “superior” rates of growth and almost “superior” rates of consumption-based poverty reduction. However, other factors that contribute to an enabling environment, such as social protection for the poor and vulnerable, are seriously lacking. To engender inclusive growth, policy makers must take a three-pronged approach that links macroeconomic, microeconomic and social policy; policies must be implemented through transparent, good-governance institutional frameworks. Macroeconomic stability alongside consistent GDP growth is the most important factor in driving inclusive growth through creating employment. Therefore, government must maintain a stable macroeconomic outlook, and in particular a manageable rate of inflation, preferably at below 5 percent. Moreover, about 90 percent of poor households depend on rural livelihoods, so government must redouble its efforts in rebalancing the economy to represent this fact. Local economic development is imperative if growth is to permeate remote geographical regions and across sectors. The peripheries are where most poverty is concentrated, so it is critical that these areas are opened up to markets through infrastructure
development. The ADB-GMS umbrella programme has been instrumental in upgrading infrastructure along key economic corridors, thereby linking Cambodia’s periphery to national, regional and global markets. In addition, complementary service provision is needed to increase productivity, particularly among the rural majority, many of whom farm small rice plots. Lack of formal service and credit infrastructure remains a binding constraint to many farmers and small and medium enterprise (SME) operators, though there have been major advances in this regard. The microfinance sector in Cambodia has played a leading role in expanding the reach of formal financial services to the rural poor. The sector has experienced rapid growth over the last five years, reaching 1.3 million borrowers and 1.1 million savers in 24 provinces. Deposits increased by 32 percent to USD1.26 billion in 2011 from USD952 million in 2010. There have been gains in extending irrigation infrastructure, for example the ADB-funded Northwest Irrigation Sector Project, which comprises 12 sub-projects to provide enhanced small and medium irrigation schemes and water control structure for supplementary wet season irrigation of approximately 10,000 hectares of rice fields and chamkar (vegetable plots). It is essential that policy addresses social and cultural norms that prevent women accessing
Table 1: Inclusive Growth Index for Cambodia
Score Weight Total
Growth1. 8 0.25 2.00
Employment 2. 4 0.15 0.60
Economic infrastructure3. 4 0.10 0.40
Poverty 4. 6 0.10 0.60
Inequality 5. 4 0.10 0.40
Gender equity 6. 6 0.05 0.30
Health & nutrition 7. 3 0.05 0.15
Education 8. 4 0.05 0.20
Sanitation & water 9. 4 0.05 0.20
10. Social protection 2 0.10 0.20
Total 1.00 5.05
Note: 1-3=unsatisfactory progress, 4-7=satisfactory progress, 8-10=superior progress Source: Mckinleg (2010), cited in Dr Tong’s Cambodia Outlook Conference presentation, 16 February 2012
7
CAMBODIA DEVELOPMENT REVIEW VOLUME 16, ISSUE 1, JANUARY-MARCH 2012
economic opportunities, such as employment, credit and services. A core component of the Ministry of Women’s Affairs (MoWA) Neary Rattanak III strategic plan is developing national policies to promote gender equity in economic opportunities. The programme aims to effect changes in cultural models of gender that favour men’s participation in some economic activities, for example purchasing and inheriting property, by promoting policies that remove barriers to women’s participation throughout the economy. As regards social policy, Cambodia lags far behind many countries in the region when it comes to healthcare, nutrition, education and social protection. Lack of social protection and healthcare services negatively affects rates of growth, and contributes to a trend of growth that is not inclusive: poor households that are constantly battling to meet basic daily needs are rarely productive, but rather teeter on the edge of survival in a cycle of poverty. There is no wide-reaching state administered social protection system in Cambodia, despite civil society‘s efforts in providing social support mechanisms for the most vulnerable, and development partners’ support of specific projects. Reliance on development partners and civil society means that progress in this area has lacked continuity and has been largely shaped by the varied agendas of an array of different organisations. Recently the government has developed National Social Protection Strategy (NSPS) 2011-15, a comprehensive plan to address the dearth of social protection in the country. The NSPS framework streamlines existing social programmes under a broader framework that will protect the poor and vulnerable, especially those living in female-headed households, and facilitate their integration into productive economic activity. This includes social safety nets to reduce poverty and food insecurity, and schemes to improve nutrition, maternal and child health and promote education. Government should work hard to ensure the effective delivery and implementation of these reforms.
Conclusion: Redressing the Policy-Institutions Mismatch At the heart of Cambodia’s ability to realise inclusive, diversified and therefore sustained growth
is the issue of institutional capacity and governance. The government has developed and deployed a number of innovative policy frameworks that greatly work towards its goal of sustainable growth – the problem lies in effectively implementing them. A mismatch between institutions and policy can hinder inclusive development. Nowhere is this more evident than in the land sector. Land is particularly important to poor households because it can be combined with labour, their primary asset, to generate capital. Therefore secure land rights are a prerequisite for inclusive growth. But while policy frameworks legally recognise land, the institutions that enforce them have not developed at the same pace. This has resulted in a high volume of land conflicts and a backlog of cases at Cadastral Commissions, undermining perceptions of tenure security and constraining economic participation. A particular point of contention has been the management of Economic Land Concessions (ELCs). While again there are policies and regulatory frameworks for allocating and monitoring ELCs, in some cases these have not been followed and land use is of sub-optimal efficiency. As a result, local households’ participation in capital generating activities has been constrained. Reforms of local institutions that play a key role in households’ day to day lives are also important for equitable socioeconomic development. The government’s de-concentration and decentralisation reforms have worked towards reforming commune councils with a view to making them more gender equitable, efficient and transparent in providing services and administrating the local populace. Much has been done over the past decade to strengthen the country’s institutions, but there is still much to do. Hence, while 2012 brings great opportunities to realise a stable, equitable and prosperous Cambodia, the omnipresent constraint of institutional capacity remains. It is essential that government and development partners continue to prioritise this issue and coordinate resources to remove this core constraint. Once these are redressed, Cambodia can expect to reap the benefits of stronger economic ties with regional partners and beyond, and induce a trend of growth that is diversified, equitable and sustainable.
8
CAMBODIA DEVELOPMENT REVIEW VOLUME 16, ISSUE 1, JANUARY-MARCH 2012
Introduction As part of the dissemination of its research findings and a way to meaningfully engage a broad range of stakeholders, CDRI’s Democratic Governance and Public Sector Reform (DGPSR) Programme organised the third Dissemination Workshop in October 2011 to discuss and seek recommendations regarding the progress and challenges of Decentralisation and Deconcentration (D&D) Reform. Attended by approximately 300 participants—central and local government officials, representatives from NGOs, civil society organisations and the private sector—the workshop entailed panel and group discussions on commune, district and provincial councils’ governance and development planning. A remarkable result from the discussions was the marked mismatch between local needs as articulated by commune councillors and the priority development needs perceived by district councillors. This article discusses this mismatch: section 1 describes commune councils’ on-the-ground needs, section 2 looks at district councils’ development agenda and why their priorities differ from those of commune councils, and section 3 presents some implications deriving from the mismatch.
On-the-ground Situation and Needs Raised by Commune Councils Commune councillors reported that basic social services such as education and healthcare are the most immediate needs in their areas of jurisdiction, followed by natural resources management, environment protection and gender issues. Commune councils have achieved a lot in the education sector. Through the Commune Committee for Women and Children (CCWC), the councils have collaborated with schools by regularly collecting data on and monitoring the school attendance and
drop-out rates of children aged 3-6 years, and encouraging those who have dropped out to return to school. They have also promoted the importance of education among parents, and financially supported poor children to attend school. As a result, more children have been able to go to school and dropout rates have declined. However, some problems remain, including the absenteeism of teachers and lack of schools and community kindergartens. Health services provision and healthcare facilities have also been improved through the commune councils’ efforts. For example, they have promoted information among parents on child vaccinations, constructed special maternity waiting/recovery rooms for women, and disseminated advice on antenatal care specifically to encourage women to have routine health checks and give birth at health centres. As a result, maternal and child mortality rates have gradually decreased. Those living in remote areas, however, still face many health challenges. Lack of medicine, medical equipment and trained clinicians, the few and distant health centres, and violation of medical ethics make it difficult for people to access medical care when they are seriously ill or when women suffer post-natal complications. The commune councils have brought the priority needs of their constituencies to the attention of the district councils and line departments. To improve education, for instance, they have called for the construction of more public community kindergartens, primary and junior high schools, especially in remote areas, and asked line departments and NGOs to help strengthen the availability and commitment of teaching staff. For better community healthcare, the commune councils have requested that one local health centre be provided in each commune/sangkat and that health staff be on standby, have better work ethics in terms of offering a public service and being helpful to patients. They have also asked line departments to run more education campaigns on maternal and child health so that good health practices can be
Mismatch between Local Needs and District Councillors’ Perceptions of Development Priorities: Results from the 2011 Dissemination Workshop1
1 This article is prepared by Kruy Virak, research associate, and Pak Kimchoeun, senior research fellow, with contributions from other staff of the Democratic Governance and Public Sector Reform Programme, CDRI.
9
CAMBODIA DEVELOPMENT REVIEW VOLUME 16, ISSUE 1, JANUARY-MARCH 2012
better and more widely promoted and awareness raised. In response to concerns about natural resources and environment matters, the commune councils have disseminated information on the law and associated legal documents to raise their constituents’ awareness of these issues. However, land grabbing, illegal fishing and encroachment onto flooded land, forest and river banks have been rampant. These activities have caused flooding and depleted forest and fishery resources, affecting community livelihoods. Yet all the commune councils could do was just report the offences to line departments, leaving councillors frustrated by the lack of financial resources and authority to intervene, especially when they had received numerous complaints. What the commune councils need then is the necessary mandate to intervene in natural resource and environment issues that affect their constituents’ well-being. As for raising the profile of women in local governance, despite the integration of gender issues into planning, dissemination of information and monitoring and evaluation, a lot remains to be done. For example, the number of girls attending school has been shrinking – the higher the grade, the fewer the number of female students; girls’ responsibility for household chores and parents’ perception of the importance of a daughter’s education were reported to be the main reasons behind this. There continues to be a shortage of women in local politics, especially in decision-making and high ranking positions. Men generally do not support or encourage their wives to work outside the home, let alone enter local politics. Moreover, the opportunities for women to participate in local politics are largely restricted by the political party list quota. To address these issues, the commune councillors expect the district councillors and line departments to first, help with developing the capacity of the CCWC; second, simplify legal procedures to create space within the budget to accommodate expenditure on addressing women’s issues; and third, be more active and supportive by sending technical officials to participate in CCWC committee meetings.
Development Agenda of Provincial/District Councils Although most of the commune councils’ needs and expectations of the district councils are valid, there is little the latter can do to respond effectively
to the demands made upon them. The first three-year Implementation Plan (IP3) of the 10-year National Programme for Sub-national Democratic Development 2010-19 (NP-SNDD) stipulates that the District Council is the institution responsible for local services delivery and providing support to commune councils. However, the district councillors’ perceptions of development priorities showed otherwise. Although commune council development plans have been incorporated into the district councils’ five-year development plan and three-year rolling investment programme, the district councils have prioritised mainly physical infrastructure, specifically rural road construction, relegating as a secondary concern the much needed non-physical infrastructure such as the health and education services and facilities requested by the communes. The disparity between district and commune councils’ development priorities has happened for a number of reasons. First, financial constraints appear to be one of the main problems that district councils face. So far they have not been allocated any budget from central government to finance their local development agenda, except for minor development funds and some support from the District Initiative (DI) Project2. The IP3 stipulates that sub-national administrations, including district councils, are not eligible for their District/Municipal (D/M) Fund until the requisite five-year development plan and three-year rolling programme are underway (RGC 2009; Pak et al. 2011). Second, that the roles and responsibilities of the commune and district councils are poorly defined seems to be a contributing factor to the differing development priorities in local planning. District councillors have not yet assumed the new mandate for district councils as outlined in the IP3, and still cling to an “outmoded” mindset concerning their roles and responsibilities, accountability line and attitude towards the communes. They defended their development priorities, saying there was nothing wrong with their focus on road construction as the inter-commune scope of their responsibilities is 2 The District Initiative Project to support districts was
established by the MoI in 2006 with assistance from the Project to Support Democratic Development through Decentralisation and Deconcentration and the Natural Resource Management and Livelihood Project (NCDD 2009). Each district receives USD20,000-30,000 a year for local and inter-commune development (interview with NCDD official, 18 May 2011).
10
CAMBODIA DEVELOPMENT REVIEW VOLUME 16, ISSUE 1, JANUARY-MARCH 2012
much broader than that of the commune councillors who have only their constituents to look after. The district officials also perceived that the delivery of basic social services such as health and education is within line office and line departments’ mandates, not the district councils’. Institutionally, although district officials were elected by the commune councils in 2009, the district officials’ “old mentality” about their downward accountability line has remained unchanged. This observation has been validated by CDRI’s 2011 special survey report on local officials’ understanding of the many aspects3 of D&D Reform (Chheat et al. 2011). The report suggests that instead of being accountable to the communes who elected them to office, the districts see themselves as being downwardly accountable to the people and upwardly accountable to central government, especially the Ministry of Interior (MoI) (ibid.). Likewise, as raised during the workshop discussions, when asked who they are accountable to in their roles and responsibilities the district councillors responded that they are downwardly accountable to citizens and upwardly accountable to provincial and central government. This claim is not surprising if we look at the historical development of the country’s public administration. Historically, Cambodia’s administrative system has been extremely centralised and hierarchical until at least the 1993 election (Kim & Öjendal 2008). District officials thus developed a strong sense of hierarchy and were accountable mainly to provincial authorities and the ruling party (ibid.), whereas downward accountability of the district to the commune has been almost absent. Kim and Öjendal’s (ibid.) study confirms these roles of the districts, noting that 81.81 percent of district officials think they have authority over the communes, while only 2.59 percent believe they are subordinate to the communes (ibid: 27). It was also observed that the communes had demanded (i) that the districts pay attention to local needs for service delivery, and (ii) wider development strategies to contribute better to rural development (ibid; 27; Kim & Öjendal 2006). The lack of communication between commune and district councils makes it hard for them to reconcile their differing development agendas. This
3 These aspects include accountability, fiscal assignment, services delivery, division of labour between communes and districts, gender issues, unified administration and overall reform.
is also confirmed by the 2011 survey report and recent study on decentralisation at district/municipal level (Chheat et al. 2011; Pak et al. 2011): both observe that communication between these two tiers of local government is still very limited. Overall, the absence of district councils’ development budget for both local development and support for the communes, poor communication and unclear institutional provision of roles and responsibilities between the communes and districts are what constitute the mismatch in local development priorities. This then raises the question of the potential implications of this mismatch.
Implications for Future Development Lack of clarity about the commune and district councils’ roles, responsibilities and accountability line, limited budget and poor communication in development planning will likely have the following implications for future development. District councils’ inability to access permanent development budget because they lack financial resources to implement their five-year development plan and three-year rolling programme in order to be eligible for the D/M Fund implies there is dire need for the D/M Fund to be secured in a way that allows district councils to fulfil their expected roles as stipulated in IP3 of NP-SNDD 2010-19. The absence of a development budget for the district councils also implies that the transfer of functions and resources from national to local level remains an issue. The availability of a development budget for the district councils and their ability to take on the clear set of roles and responsibilities assigned by central government are interdependent. More specifically, the district councils cannot carry out their mandated functions effectively unless the D/M Fund is made available. District councillors’ administrative and management capacity needs to be developed so they can fulfil their roles in regulating and coordinating the delivery of basic services and extending support to the communes. The absence of a clear division of roles and responsibilities and accountability line between the district and commune councils implies the following (Chheat et al. 2011). First, the slow process of functional reassignment—councils are waiting to be assigned clear roles and responsibilities from central government—will continue to constrain district and
Continued on page 23
11
CAMBODIA DEVELOPMENT REVIEW VOLUME 16, ISSUE 1, JANUARY-MARCH 2012
Background and Objectives of the Study The Cambodian government has adopted policy measures to support and promote small and medium scale enterprises (SMEs). This is because the sector is considered critical to boosting and maintaining growth momentum in the country’s economy given its dominant stake in terms of the number of firms and its potential to generate employment (SME Sub-committee 2005). Guided by the government’s Rectangular Strategy in which the promotion of SMEs is a cornerstone of private sector development, the SME Sub-committee was created to formulate, in collaboration with development partners, the SME Development Framework as the road map to guide the setting up of SMEs2 nationwide. The objective of this framework is to promote SME development through (i) improving regulatory and legal framework, (ii) facilitating access to finance, (iii) diversifying and coordinating SME support activities, and (iv) harmonising policy. This report focuses on SME access to finance. It specifically aims to review the limitations of SME financing programmes, particularly since the inception of the SME Development Framework in 2005. The rest of this paper is organised as follows. Proposed actions within the SME Development Framework to improve SME access to finance are outlined in section two. Section three presents a brief literature review on constraints to SME financing and an overview of the situation of SME financing and limitations in Cambodia. Section four describes the progress towards improving SME financing within the SME Development Framework. The conclusion is presented and recommendations to
smooth the way for SME development are drawn in section five.
SME Development Framework Proposed Actions for Improved SME Access to Finance To improve SME access to finance for working capital and investment, the SME Development Framework addresses four main issues:
• Collateral and land titling: Secured Transactions Law is expected to enable banks to use movable assets as collateral; expediting and reducing the costs of land titling are considered essential to improving the use of land as collateral.
• Leasing finance3: Absence of specific legal framework for SME leasing finance prevents banks and financial institutions from operating leasing facilities for SMEs.
• Credit information sharing: High risk lending environment in Cambodia is significantly linked with the absence of a formal credit information sharing system, inducing banks to use collateral to reduce the risk of asymmetric information. An improved system is expected to encourage all banks to join the voluntary credit information system.
• Simplified accounting: Simplified financial reporting systems and guidelines developed by the National Accounting Council (NAC) enable SMEs to better record and provide comprehensive information required by banks. Training and dissemination programmes for SMEs are conducted by the Ministry of Economy and Finance (MEF).
To enhance the dialogue between government and the private sector, the Working Group on Manufacturing and SME was established to work with the SME Sub-committee. Coordinated by the SME Secretariat4, the sub-committee and the working group share the same work plan in which SMEs’ insufficient collateral and limited capacity to prepare a feasible business plan are the key issues addressed to improve SME access to finance. Thus, the proposed activities of the SME Secretariat are to set up an SME and bank forum, train SME operators on financial management and business planning, diversify financial instruments and design a range of simplified finance and accounting systems for SMEs.
A Review of SME Financing Activities in Cambodia1
1 This article is prepared by Keo Socheat, research associate, Poverty, Agriculture and Rural Development Programme, CDRI.
2 The SME Development Framework categorises enterprises by the number of full-time employees (micro: <10; small: 10-50; medium: 51-100), or assets excluding land (micro: <USD50,000; small: USD50,000-250,000; medium: USD250,000-500,000).
3 Leasing finance enables an enterprise to hire and eventually purchase essential equipment, i.e. fixed assets.
4 The SME Secretariat was established by the SME Sub-committee to provide an inter-ministerial coordinating mechanism to implement the SME Development Framework and its “road map” for promoting SME development.
12
CAMBODIA DEVELOPMENT REVIEW VOLUME 16, ISSUE 1, JANUARY-MARCH 2012
Overview of the Financial Sector, SME Financing and LimitationsLiterature Review The complicated bank procedures, high interest rates and restrictions imposed by short term loans5 that characterise the financial sector in developing economies such as Cambodia could result from banks hedging against potential risks due to information asymmetries (Beck & Asli 2006; Beck 2007). Alternatively, banks ration (limit) the amount of credit extended at a certain interest rate with fixed collateral requirements and repayment terms (Petrick 2004). In Cambodia, Oum et al. (2011) argue that the absence of a guarantee scheme and mechanism to reduce risk to banks has led to approximately 96 percent of applications for bank and micro-finance (MFI) loans being collateral-based. This confirms that banks use collateral requirements to ration credit to SMEs; just over one quarter of the firms surveyed in the study (ibid.) reported that they could not expand their business due to insufficient financing. It is clear then that despite efforts made by government, access to finance remains a key constraint to SME development.
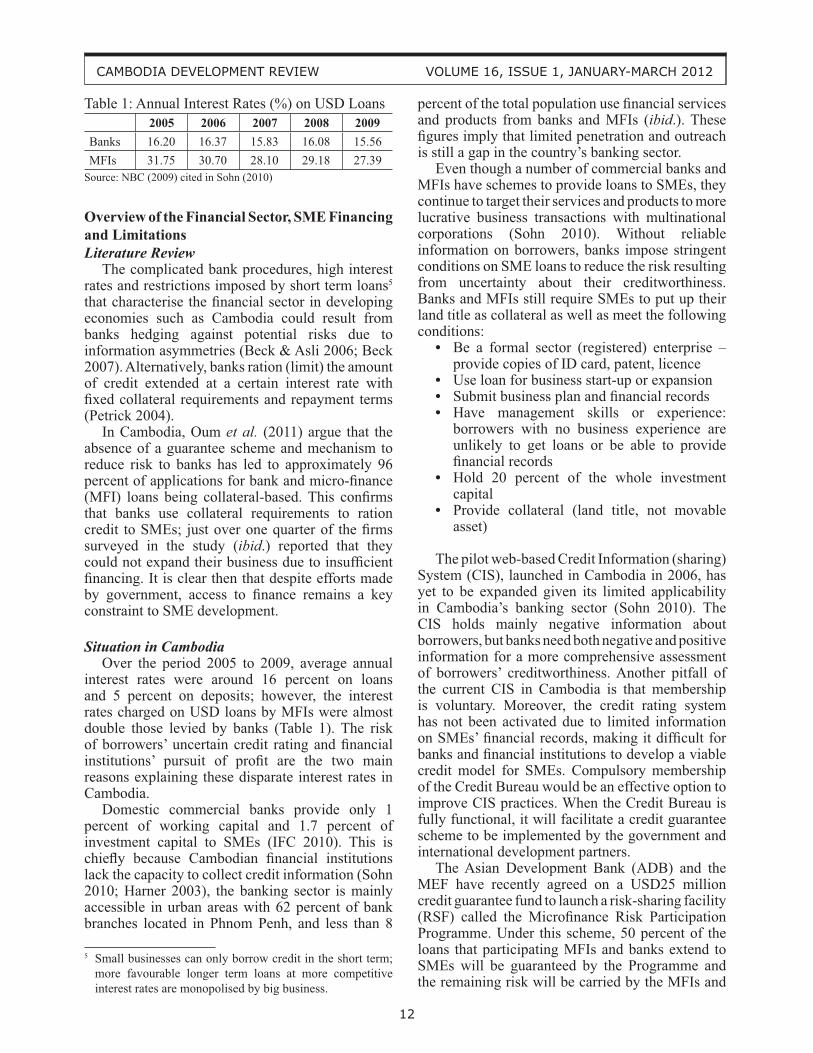
Situation in Cambodia Over the period 2005 to 2009, average annual interest rates were around 16 percent on loans and 5 percent on deposits; however, the interest rates charged on USD loans by MFIs were almost double those levied by banks (Table 1). The risk of borrowers’ uncertain credit rating and financial institutions’ pursuit of profit are the two main reasons explaining these disparate interest rates in Cambodia. Domestic commercial banks provide only 1 percent of working capital and 1.7 percent of investment capital to SMEs (IFC 2010). This is chiefly because Cambodian financial institutions lack the capacity to collect credit information (Sohn 2010; Harner 2003), the banking sector is mainly accessible in urban areas with 62 percent of bank branches located in Phnom Penh, and less than 8
percent of the total population use financial services and products from banks and MFIs (ibid.). These figures imply that limited penetration and outreach is still a gap in the country’s banking sector. Even though a number of commercial banks and MFIs have schemes to provide loans to SMEs, they continue to target their services and products to more lucrative business transactions with multinational corporations (Sohn 2010). Without reliable information on borrowers, banks impose stringent conditions on SME loans to reduce the risk resulting from uncertainty about their creditworthiness. Banks and MFIs still require SMEs to put up their land title as collateral as well as meet the following conditions:
• Be a formal sector (registered) enterprise – provide copies of ID card, patent, licence
• Use loan for business start-up or expansion • Submit business plan and financial records• Have management skills or experience:
borrowers with no business experience are unlikely to get loans or be able to provide financial records
• Hold 20 percent of the whole investment capital
• Provide collateral (land title, not movable asset)
The pilot web-based Credit Information (sharing) System (CIS), launched in Cambodia in 2006, has yet to be expanded given its limited applicability in Cambodia’s banking sector (Sohn 2010). The CIS holds mainly negative information about borrowers, but banks need both negative and positive information for a more comprehensive assessment of borrowers’ creditworthiness. Another pitfall of the current CIS in Cambodia is that membership is voluntary. Moreover, the credit rating system has not been activated due to limited information on SMEs’ financial records, making it difficult for banks and financial institutions to develop a viable credit model for SMEs. Compulsory membership of the Credit Bureau would be an effective option to improve CIS practices. When the Credit Bureau is fully functional, it will facilitate a credit guarantee scheme to be implemented by the government and international development partners. The Asian Development Bank (ADB) and the MEF have recently agreed on a USD25 million credit guarantee fund to launch a risk-sharing facility (RSF) called the Microfinance Risk Participation Programme. Under this scheme, 50 percent of the loans that participating MFIs and banks extend to SMEs will be guaranteed by the Programme and the remaining risk will be carried by the MFIs and
Table 1: Annual Interest Rates (%) on USD Loans 2005 2006 2007 2008 2009
Banks 16.20 16.37 15.83 16.08 15.56MFIs 31.75 30.70 28.10 29.18 27.39
Source: NBC (2009) cited in Sohn (2010)
5 Small businesses can only borrow credit in the short term; more favourable longer term loans at more competitive interest rates are monopolised by big business.
13
CAMBODIA DEVELOPMENT REVIEW VOLUME 16, ISSUE 1, JANUARY-MARCH 2012
banks6. Loans, however, will still be subject to the standard documentation required by participating MFIs and banks because borrowers’ capacity to prepare proper financial statements and business plans is considered to be a determinant of successful RSFs in other developing countries.
Revisiting SME Development Framework Significant progress has been achieved by the government towards improving SME financing within the SME Development Framework, as summarised below:
• A simplified financial reporting template for SMEs has been issued by the National Accounting Council which also provides a training programme for accounting professionals and SMEs.
• New annual tax declaration forms and guidelines for filing tax returns have been issued by the Tax Department.
• Secured Transaction Law was enacted in 2007 in an attempt to establish an effective mechanism for collateral-based loans.
• Law on Financial Leasing was approved in 2009 to create an enabling framework for banks to provide financial leasing services to SMEs with limited collateral.
• The Prakas on the Utilisation and Protection of Credit Information was issued by the National Bank of Cambodia. With this prakas in place, commercial and specialised banks are authorised to conduct financial leasing business under the Law on Financial Leasing.
However, a large proportion (around 72 percent) of Cambodian enterprises are family businesses with one to three employees/workers (NIS 2009). Of 505,134 enterprises, around 3.5 percent were registered at the Ministry of Commerce in 2011 (NIS 2012). This means the majority of enterprises are in the informal sector, effectively preventing them from accessing finance because banks and MFIs require SMEs to have legal status to be eligible to apply for a loan. The primary reason for SMEs maintaining their informal status is the perception that standard accounting practices are complicated and unnecessary (IFC 2010). Besides this, some SMEs intend to keep informal financial records
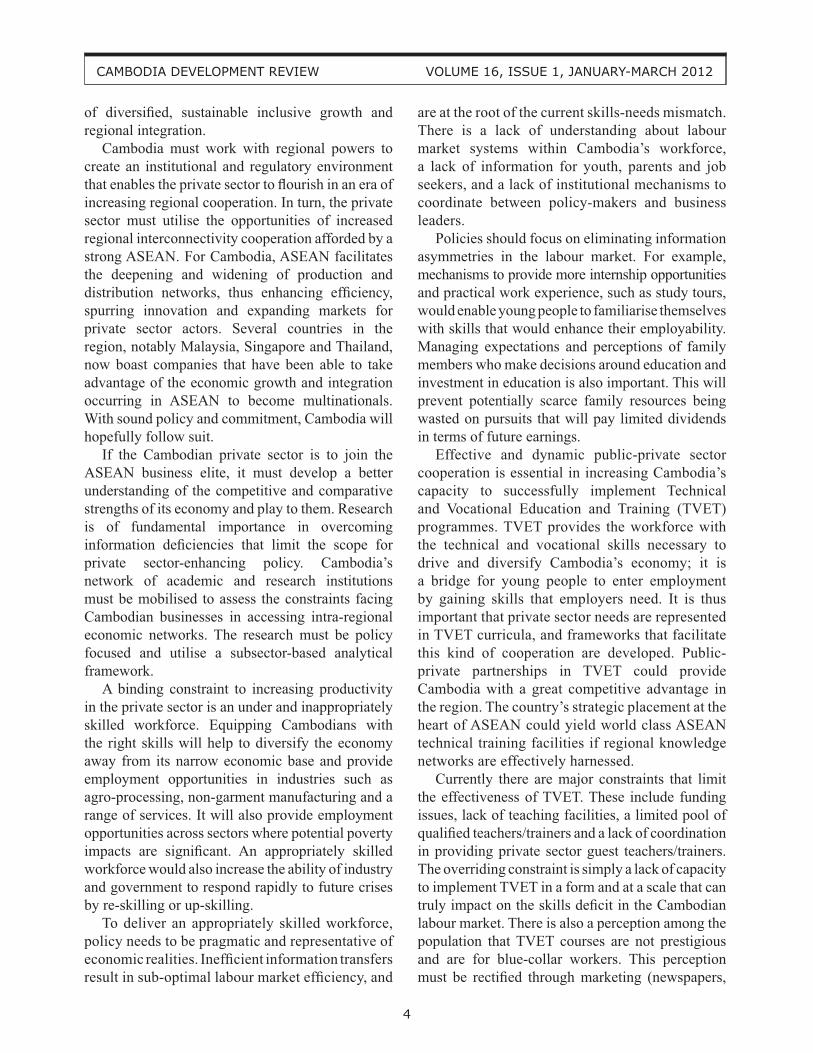
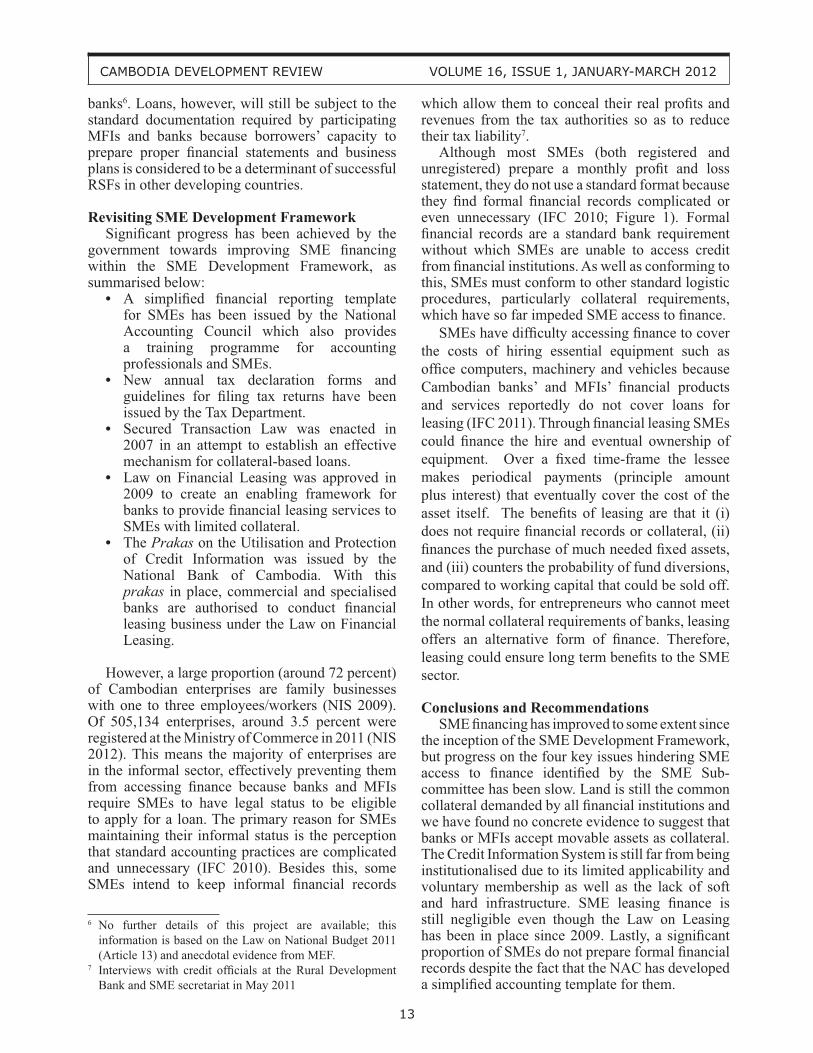
which allow them to conceal their real profits and revenues from the tax authorities so as to reduce their tax liability7. Although most SMEs (both registered and unregistered) prepare a monthly profit and loss statement, they do not use a standard format because they find formal financial records complicated or even unnecessary (IFC 2010; Figure 1). Formal financial records are a standard bank requirement without which SMEs are unable to access credit from financial institutions. As well as conforming to this, SMEs must conform to other standard logistic procedures, particularly collateral requirements, which have so far impeded SME access to finance. SMEs have difficulty accessing finance to cover the costs of hiring essential equipment such as office computers, machinery and vehicles because Cambodian banks’ and MFIs’ financial products and services reportedly do not cover loans for leasing (IFC 2011). Through financial leasing SMEs could finance the hire and eventual ownership of equipment. Over a fixed time-frame the lessee makes periodical payments (principle amount plus interest) that eventually cover the cost of the asset itself. The benefits of leasing are that it (i) does not require financial records or collateral, (ii) finances the purchase of much needed fixed assets, and (iii) counters the probability of fund diversions, compared to working capital that could be sold off. In other words, for entrepreneurs who cannot meet the normal collateral requirements of banks, leasing offers an alternative form of finance. Therefore, leasing could ensure long term benefits to the SME sector.
Conclusions and Recommendations SME financing has improved to some extent since the inception of the SME Development Framework, but progress on the four key issues hindering SME access to finance identified by the SME Sub-committee has been slow. Land is still the common collateral demanded by all financial institutions and we have found no concrete evidence to suggest that banks or MFIs accept movable assets as collateral. The Credit Information System is still far from being institutionalised due to its limited applicability and voluntary membership as well as the lack of soft and hard infrastructure. SME leasing finance is still negligible even though the Law on Leasing has been in place since 2009. Lastly, a significant proportion of SMEs do not prepare formal financial records despite the fact that the NAC has developed a simplified accounting template for them.
6 No further details of this project are available; this information is based on the Law on National Budget 2011 (Article 13) and anecdotal evidence from MEF.
7 Interviews with credit officials at the Rural Development Bank and SME secretariat in May 2011
14
CAMBODIA DEVELOPMENT REVIEW VOLUME 16, ISSUE 1, JANUARY-MARCH 2012
The main barriers to SMEs’ ability to access finance that stem from their bad practices are the lack of accounting standards and informal status. The government has already addressed these issues in the SME Development Framework by adopting a phased plan and strategy, so there is need for additional commitment to encourage more enterprises to adopt formal status through registration and standardising their management systems and financial records. This is the first priority for the government in responding to the demand-side factors that hinder SME access to finance. Specific measures to encourage SMEs to adopt formal status and management systems are beyond the scope of this report. To fully institutionalise the credit guarantee system for SMEs, the government should develop essential infrastructure, both hard—a national credit bureau in charge of collecting and managing credit-rating information throughout the country, and financial support from the government to guarantee funds, and soft— legal frameworks and human resources for the implementation of a credit guarantee scheme for SMEs. As SMEs in Cambodia become corporatised with a standard financial management system, and financial institutions have increased knowledge of financial markets, the mismatch in the demand and supply of funding for SMEs will gradually reduce.
ReferencesBeck, T. & D.K. Asli (2006), “Small and Medium-
Sized Enterprises: Access to Finance as a Growth Constraints”, Journal of Banking and Finance, Vol.30 (11), pp. 2931-2943
Beck, T. (2007), “Financing Constraints of SMEs in Developing Countries: Evidence, Determinants and Solution,” http://arno.uvt.nl/
Figure 1: Financial Management of 120 Surveyed SMEs
63.04%15.22%
13.04%
8.696%
monthly income loss statement
Financial Management
monthly cashflow budget planbalance sheet
Source: Tong (2011)
show.cgi?fid=95654 (accessed 27 June 2011)Brother Investment Group (2010), Banking Sector
in Cambodia (Phnom Penh: BIG Co., Ltd.)http://www.big.com.kh/download/Banking%20
Sector%20in%20Cambodia.pdf (accessed 2 May 2011)
Harner, S. M. (2003), Financing SMEs in Cambodia: Why do Banks Find it so Difficult?
http:/ /www.ifc.org/ifcext/mekongpsdf.nsf/AttachmentsByTitle/PSDP+14/$FILE/PSDP-No-14-EN.pdf (accessed 2 May 2011)
IFC (2010), “Understanding the Cambodian Small and Medium Enterprise Needs for Financial Services and Products” (Phnom Penh: International Financial Corporation)
National Bank of Cambodia (2008), Annual Report 2008 (Phnom Penh: NBC)
National Bank of Cambodia (2009), Annual Supervision Report 2009 (Phnom Penh: NBC)
NIS (2009), Nation-wide Establishment Listing of Cambodia 2009 (Phnom Penh: NIS)
NIS (2012), Economic Census of Cambodia 2011 (Phnom Penh: NIS)
Oum, S., C. Harvie & D. Narjoko (eds.) (2011), “Small and Medium Enterprises’ Access to Finance in Selected East Asian Economies”, ERIA Research Project 2010, No. 11 (Jakarta: ERIA)
Petrick, M. (2004), “Farm Investment, Credit Rationing and Governmentally Promoted Credit Access in Poland: A Cross-Sectional Study”, Food Policy, Vol.9, pp. 275–294
Saing C.H. (2009), “Trade Competitiveness of SMEs: Importance of Finance and Policy Options/Government Roles”, ARTNeT GMS Notes No.1,
h t t p : / / w w w. u n e s c a p . o rg / t i d / a r t n e t / m t g /ARTNeT%20GMS%20Notes%20No%201-%20Hang.pdf (accessed 27 June 2011)
SME Sub-committee (2005), Small and Medium Development Framework
http://www.usaid.gov/kh/documents/SME_Devel_Framework_English_Final_2005.pdf (accessed 2 May 2011)
SME Sub-committee (2006), Annual Report (Phnom Penh: SME Sub-committee)
Sohn, W. (2010), Promoting Low-cost for Small and Medium-sized Enterprises and Rice Mills (Korea: KDI)
Tong K. (2011), “Survey on Impact of the Global Financial and Economic Crisis on Employment in Cambodia” (Phnom Penh: CDRI)
World Bank (2010), Cambodia Agribusiness Access to Finance Project: concept stage
http://siteresources.worldbank.org/INTGENDER/Resources/Liberia_PID.pdf (accessed 30 June 2011)
15
CAMBODIA DEVELOPMENT REVIEW VOLUME 16, ISSUE 1, JANUARY-MARCH 2012
Economy Watch—External Environment1
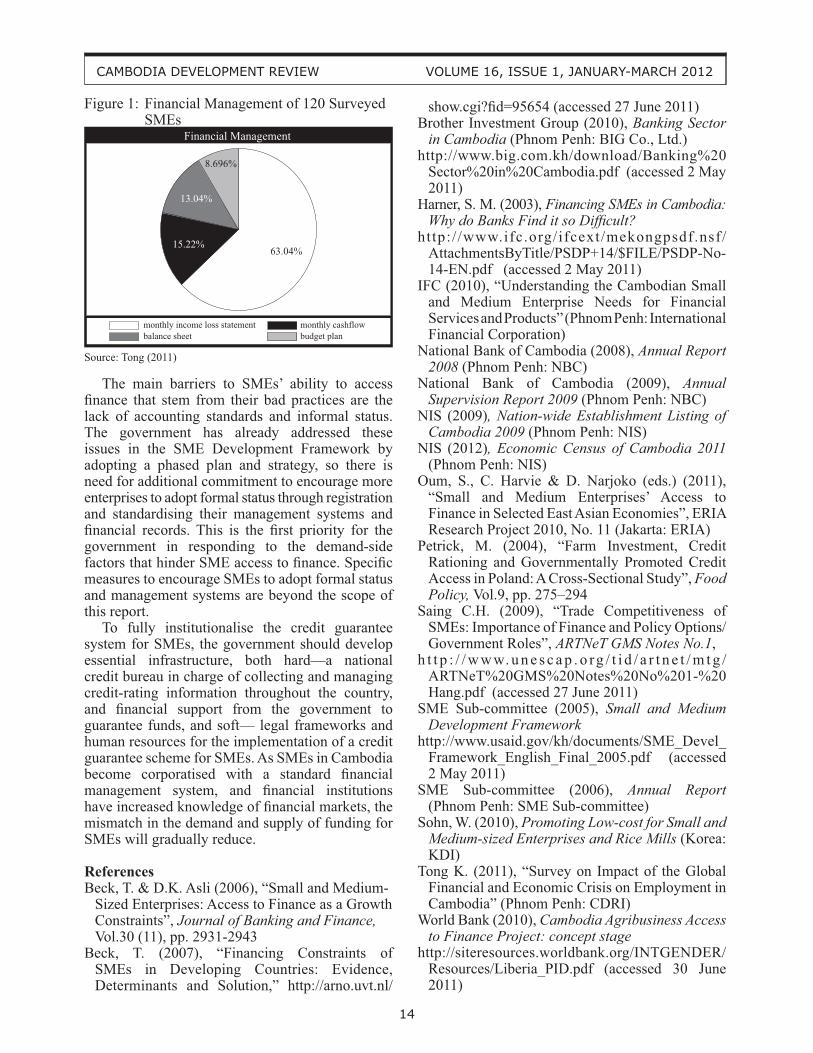
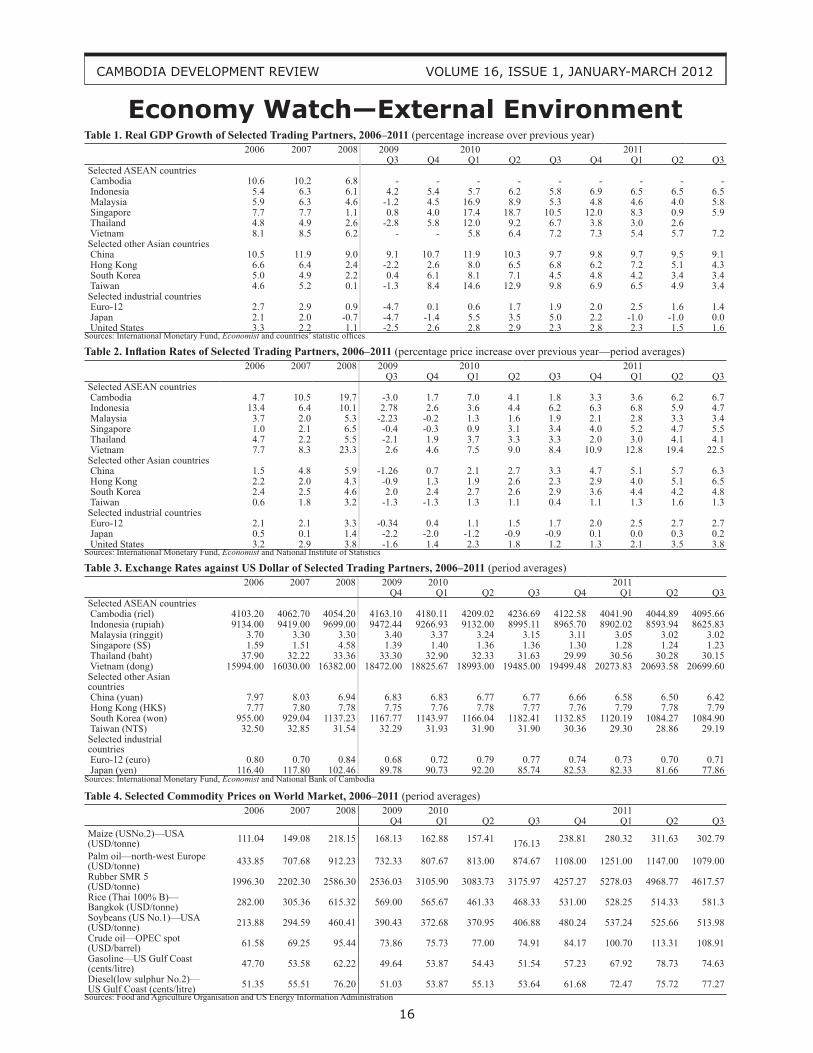
This section describes economic indicators of major world economies and economies in east and south-east Asia. Economic growth in most east Asian and industrialised countries continued to fluctuate in the third quarter of 2011 compared to a quarter earlier and the same quarter last year, due to the uncertainty in the global economy and growing risks from the debt crisis in Europe. Some countries in south-east Asia continued to perform relatively well. In the third quarter, annual real GDP growth in Malaysia went up to 5.8 percent from 5.3 percent a year earlier. Growth in Vietnam remained strong, rising to 7.2 percent a year from 5.7 percent a quarter earlier or about the same rate a year earlier. Singapore’s GDP growth rose to 5.9 percent from 0.9 percent a quarter earlier, the lowest rate since the outbreak of the global financial crisis. Economic growth in China continued to be vibrant at 9.1 percent, a slight decrease from the previous quarter or year on year. GDP growth in Hong Kong declined to 4.3 percent from 6.8 percent a year earlier and that of South Korea went down to 3.4 percent from 4.5 percent. Taiwan’s GDP growth fell to 3.4 percent from 9.8 percent a year earlier. Major industrialised countries continued to battle economic uncertainty to restore consumer and investor confidence. With real GDP growth at 1.4 percent in the third quarter of 2011, down from 1.9 percent a year earlier, the euro-12 were struggling to resolve a debt crisis. The European Financial Stability Facility was set up as a temporary bail-out fund after the Greece’s first bail-out in mid-2010. Economic prospects in Japan were still worrying as the country experienced no growth in the third quarter of 2011 from a year earlier. Japan continued repairing the damage caused by the tsunami that partly jeopardised supplies of raw materials. Japan was also affected by the uncertainty in the global economy, the debt crisis in the euro zone and the strong yen, which made Japanese exports more expensive, signifying a possible trade deficit. The United States performed relatively well with annual GDP growth at 1.6 percent, up from 1.5 percent a quarter earlier. Yet more needs to be done to bring back pre-crisis growth levels.
World Inflation and Exchange RatesInflation in the third quarter of 2011, compared to the previous quarter and the same period last year, was on an upward trend; most countries experienced higher rates, due partly to ongoing expansionary policies to counter the global economic downturn. Inflation in Cambodia rose to 6.7 percent from 1.8 percent a year earlier. Inflation in Vietnam continued to rise, reaching 22.5 percent from 19.4 percent in the previous quarter and 8.4 percent a year earlier. Higher prices there might put upward pressure on consumer prices in Cambodia, since the kingdom imports a considerable volume of goods from Vietnam. During the same period, China’s inflation rose to 6.3 percent from 3.3 percent a year earlier, while that of Hong Kong went up to 6.5 percent from 2.3 percent in the same period of the previous year. In the third quarter, the riel depreciated by 1.2 percent from the preceding quarter, to KHR4095.6/USD. The Indonesian rupiah depreciated by 0.4 percent against the dollar, the Vietnamese dong by 0.03 percent, the Hong Kong dollar by 0.1 percent and the euro by 1.4 percent. During the same period, the Singapore dollar appreciated by 0.8 percent the Chinese yuan by 1.2 percent and the Japanese yen by 4.6 percent.
Commodity Prices in World Markets Most major commodity prices dropped in the third quarter compared to the previous quarter. Maize (US No. 2) fell by 2.8 percent to USD302.8/tonne, palm oil by 5.9 percent to USD1079/tonne, rubber (SMR 5) by 7.1 percent to USD4617.6/tonne, crude oil (OPEC spot) by 3.8 percent to USD108.91/barrel and gasoline (US Gulf Coast) by 5.2 percent to USD0.74/litre. During the same period, prices of rice (Thai 100%B) increased by 13 percent to USD581.3/tonne and diesel fuel (low sulphur No. 2) by 2.0 percent to USD0.7/litre. However, all the above prices increased in the third quarter from a year earlier. Maize went up by 71.9 percent, rice by 24.1 percent, rubber by 45.4 percent, gasoline by 44 percent and diesel by 44 percent.
1 Prepared by Roth Vathana, research associate at CDRI.
16
CAMBODIA DEVELOPMENT REVIEW VOLUME 16, ISSUE 1, JANUARY-MARCH 2012
Economy Watch—External EnvironmentTable 1. Real GDP Growth of Selected Trading Partners, 2006–2011 (percentage increase over previous year)
2006 2007 2008 2009 2010 2011Q3 Q4 Q1 Q2 Q3 Q4 Q1 Q2 Q3
Selected ASEAN countries Cambodia 10.6 10.2 6.8 - - - - - - - - - Indonesia 5.4 6.3 6.1 4.2 5.4 5.7 6.2 5.8 6.9 6.5 6.5 6.5 Malaysia 5.9 6.3 4.6 -1.2 4.5 16.9 8.9 5.3 4.8 4.6 4.0 5.8 Singapore 7.7 7.7 1.1 0.8 4.0 17.4 18.7 10.5 12.0 8.3 0.9 5.9 Thailand 4.8 4.9 2.6 -2.8 5.8 12.0 9.2 6.7 3.8 3.0 2.6 Vietnam 8.1 8.5 6.2 - - 5.8 6.4 7.2 7.3 5.4 5.7 7.2Selected other Asian countries China 10.5 11.9 9.0 9.1 10.7 11.9 10.3 9.7 9.8 9.7 9.5 9.1 Hong Kong 6.6 6.4 2.4 -2.2 2.6 8.0 6.5 6.8 6.2 7.2 5.1 4.3 South Korea 5.0 4.9 2.2 0.4 6.1 8.1 7.1 4.5 4.8 4.2 3.4 3.4 Taiwan 4.6 5.2 0.1 -1.3 8.4 14.6 12.9 9.8 6.9 6.5 4.9 3.4Selected industrial countries Euro-12 2.7 2.9 0.9 -4.7 0.1 0.6 1.7 1.9 2.0 2.5 1.6 1.4 Japan 2.1 2.0 -0.7 -4.7 -1.4 5.5 3.5 5.0 2.2 -1.0 -1.0 0.0 United States 3.3 2.2 1.1 -2.5 2.6 2.8 2.9 2.3 2.8 2.3 1.5 1.6
Sources: International Monetary Fund, Economist and countries’ statistic offices
Table 2. Inflation Rates of Selected Trading Partners, 2006–2011 (percentage price increase over previous year—period averages)2006 2007 2008 2009 2010 2011
Q3 Q4 Q1 Q2 Q3 Q4 Q1 Q2 Q3Selected ASEAN countries Cambodia 4.7 10.5 19.7 -3.0 1.7 7.0 4.1 1.8 3.3 3.6 6.2 6.7 Indonesia 13.4 6.4 10.1 2.78 2.6 3.6 4.4 6.2 6.3 6.8 5.9 4.7 Malaysia 3.7 2.0 5.3 -2.23 -0.2 1.3 1.6 1.9 2.1 2.8 3.3 3.4 Singapore 1.0 2.1 6.5 -0.4 -0.3 0.9 3.1 3.4 4.0 5.2 4.7 5.5 Thailand 4.7 2.2 5.5 -2.1 1.9 3.7 3.3 3.3 2.0 3.0 4.1 4.1 Vietnam 7.7 8.3 23.3 2.6 4.6 7.5 9.0 8.4 10.9 12.8 19.4 22.5Selected other Asian countries China 1.5 4.8 5.9 -1.26 0.7 2.1 2.7 3.3 4.7 5.1 5.7 6.3 Hong Kong 2.2 2.0 4.3 -0.9 1.3 1.9 2.6 2.3 2.9 4.0 5.1 6.5 South Korea 2.4 2.5 4.6 2.0 2.4 2.7 2.6 2.9 3.6 4.4 4.2 4.8 Taiwan 0.6 1.8 3.2 -1.3 -1.3 1.3 1.1 0.4 1.1 1.3 1.6 1.3Selected industrial countries Euro-12 2.1 2.1 3.3 -0.34 0.4 1.1 1.5 1.7 2.0 2.5 2.7 2.7 Japan 0.5 0.1 1.4 -2.2 -2.0 -1.2 -0.9 -0.9 0.1 0.0 0.3 0.2 United States 3.2 2.9 3.8 -1.6 1.4 2.3 1.8 1.2 1.3 2.1 3.5 3.8
Sources: International Monetary Fund, Economist and National Institute of Statistics
Table 3. Exchange Rates against US Dollar of Selected Trading Partners, 2006–2011 (period averages) 2006 2007 2008 2009 2010 2011
Q4 Q1 Q2 Q3 Q4 Q1 Q2 Q3Selected ASEAN countries Cambodia (riel) 4103.20 4062.70 4054.20 4163.10 4180.11 4209.02 4236.69 4122.58 4041.90 4044.89 4095.66 Indonesia (rupiah) 9134.00 9419.00 9699.00 9472.44 9266.93 9132.00 8995.11 8965.70 8902.02 8593.94 8625.83 Malaysia (ringgit) 3.70 3.30 3.30 3.40 3.37 3.24 3.15 3.11 3.05 3.02 3.02 Singapore (S$) 1.59 1.51 4.58 1.39 1.40 1.36 1.36 1.30 1.28 1.24 1.23 Thailand (baht) 37.90 32.22 33.36 33.30 32.90 32.33 31.63 29.99 30.56 30.28 30.15 Vietnam (dong) 15994.00 16030.00 16382.00 18472.00 18825.67 18993.00 19485.00 19499.48 20273.83 20693.58 20699.60Selected other Asian countries China (yuan) 7.97 8.03 6.94 6.83 6.83 6.77 6.77 6.66 6.58 6.50 6.42 Hong Kong (HK$) 7.77 7.80 7.78 7.75 7.76 7.78 7.77 7.76 7.79 7.78 7.79 South Korea (won) 955.00 929.04 1137.23 1167.77 1143.97 1166.04 1182.41 1132.85 1120.19 1084.27 1084.90 Taiwan (NT$) 32.50 32.85 31.54 32.29 31.93 31.90 31.90 30.36 29.30 28.86 29.19Selected industrial countries Euro-12 (euro) 0.80 0.70 0.84 0.68 0.72 0.79 0.77 0.74 0.73 0.70 0.71 Japan (yen) 116.40 117.80 102.46 89.78 90.73 92.20 85.74 82.53 82.33 81.66 77.86
Sources: International Monetary Fund, Economist and National Bank of Cambodia
Table 4. Selected Commodity Prices on World Market, 2006–2011 (period averages) 2006 2007 2008 2009 2010 2011
Q4 Q1 Q2 Q3 Q4 Q1 Q2 Q3Maize (USNo.2)—USA (USD/tonne) 111.04 149.08 218.15 168.13 162.88 157.41 176.13 238.81 280.32 311.63 302.79
Palm oil—north-west Europe (USD/tonne) 433.85 707.68 912.23 732.33 807.67 813.00 874.67 1108.00 1251.00 1147.00 1079.00Rubber SMR 5 (USD/tonne) 1996.30 2202.30 2586.30 2536.03 3105.90 3083.73 3175.97 4257.27 5278.03 4968.77 4617.57Rice (Thai 100% B)—Bangkok (USD/tonne) 282.00 305.36 615.32 569.00 565.67 461.33 468.33 531.00 528.25 514.33 581.3Soybeans (US No.1)—USA (USD/tonne) 213.88 294.59 460.41 390.43 372.68 370.95 406.88 480.24 537.24 525.66 513.98Crude oil—OPEC spot (USD/barrel) 61.58 69.25 95.44 73.86 75.73 77.00 74.91 84.17 100.70 113.31 108.91Gasoline—US Gulf Coast (cents/litre) 47.70 53.58 62.22 49.64 53.87 54.43 51.54 57.23 67.92 78.73 74.63Diesel(low sulphur No.2)—US Gulf Coast (cents/litre) 51.35 55.51 76.20 51.03 53.87 55.13 53.64 61.68 72.47 75.72 77.27
Sources: Food and Agriculture Organisation and US Energy Information Administration
17
CAMBODIA DEVELOPMENT REVIEW VOLUME 16, ISSUE 1, JANUARY-MARCH 2012
Economy Watch—Domestic Performance1
Main Economic Activities Despite the worst floods in a decade, which destroyed paddy fields in various parts of the country, and uncertainty in the global economy, economic outcomes of the kingdom were largely positive in 2011, growth of gross domestic product being predicted as 6-7 percent. Fixed assets of private investment projects approved in the third quarter of 2011 totalled USD2748.9 m, a 4.0 percent increase from a quarter earlier or 752.9 percent year on year. Further signs of recovery were seen in industry, where investment approvals accelerated by 499.2 percent compared to the preceding quarter or 5493.4 percent year on year. Investment in garments increased by 1.2 percent from the previous quarter to USD109.7 m, partly due to the sluggish growth in the US and EU consumer markets. Fixed asset investment in services dropped by 88.2 percent from the previous quarter to USD264.1 m. The decrease came despite increases in the number of foreign visitors (15.4 percent from a quarter earlier). Investment projects approved in agriculture went up by 100 percent from a quarter earlier to USD6.9 m. There were also signs of recovery in real estate, the total value of approved construction projects reaching USD247.4 m, a 219.7 percent increase from a quarter earlier or 215.6 percent year on year. The total trade volume in the third quarter rose by 8.2 percent compared to the preceding quarter or 24.8 percent year on year, to USD2218.7 m. Total exports reached USD1455.6 m, of which garments made up 88.3 percent. Major export destinations included the US, EU, ASEAN, and Japan. Compared to the previous quarter, exports to the US increased by 32.7 percent (16.4 percent year on year) to USD619.4 m, to the EU by 31.8 percent (66.0 percent year on year) to USD397.5 m, to ASEAN by 12.0 percent (62.1 percent year on year) to USD4.7 m, to Japan by 55.0 percent (70.2 percent year on year) to USD43.4 m. Rubber exports continued to be vibrant, growing by 15.4 percent from the previous quarter or 121 percent year on year, to USD56.1 m. Despite strong exports, there were clear indications that Cambodia needs to diversify its export markets and products to guard against risks from competition from other
developing countries and economic downturn in major markets. Expanding exports to China through bilateral and regional trade agreements is an option Cambodia could further explore. In the same period, total imports decreased by 17.0 percent from the previous quarter to USD763.1 m; imports of gasoline dropped by 4.0 percent to USD73.8 m and of diesel by 8.4 percent to USD118.9 m. Cambodia achieved a trade surplus of USD692.5 m, a 224.6 percent increase from the preceding quarter or 120.4 percent year on year. Public Finance In the second quarter, total government revenue increased by 11.6 percent from a quarter earlier or 16.6 percent year on year, to KHR1564.3 bn, of which 99.9 percent was current revenue. Tax revenue rose by 19.7 percent from the preceding quarter to KHR1367.5 bn, while non-tax revenue dropped by 17.3 percent to KHR195.5 bn. During the same period, total expenditure went up by 41.0 percent to KHR2025.2 bn, of which current expenditure was 64.4 percent. Expenditure on wages increased by 32.5 percent to KHR531.6 bn, subsidies and social assistance by 75.1 percent to KHR450.9 bn and other current expenditure by 61.6 percent to KHR321.7 bn.
Inflation and Foreign Exchange Rates In the third quarter, inflation (all items) in Phnom Penh was up by 6.7 percent from the same period of 2010. The prices of food and non-alcoholic beverages were up by 8.2 percent and that of transportation by 8.7 percent. The riel depreciated by 1.3 percent to KHR4095.7/USD, 1.1 percent to KHR135.2 per Thai baht and 1.0 percent to KHR19.8 per 100 Vietnamese dong. Gold rose by 12.7 percent from the previous quarter or 38.4 percent year on year to USD204.6/chi. The price of diesel fuel went up by 3.0 percent to KHR4924.5/litre and of gasoline by 3.6 percent to KHR5248.4/litre.
Monetary Developments In the second quarter of 2011, total liquidity increased by 8.5 percent from the previous quarter to KHR22,007.6 bn, of which net foreign assets were 82.2 percent. Net domestic assets rose by 22.1 percent or 119 percent year on year to 1 Prepared by Roth Vathana, research associate, Ourn Vimoil
and Pon Dorina, research assistants, at CDRI.
18
CAMBODIA DEVELOPMENT REVIEW VOLUME 16, ISSUE 1, JANUARY-MARCH 2012
KHR3907.7 bn. During the same period, money grew by 1.2 percent to KHR3539.8 bn and quasi-money by 10.1 percent to KHR18,467 bn.
Poverty Situation The regular survey conducted by the Cambodia Development Resource Institute produced mixed trends for the daily earnings of vulnerable workers. The real daily earnings of eight vulnerable groups (garment workers, porters, unskilled and skilled construction workers, cyclo drivers, moto-taxi drivers, waitresses and scavengers) increased in the year to November 2011; however, during the same period the real daily earnings of small vegetable sellers and rice-field workers declined. The real average daily earnings of garment workers, who have contributed significantly to rural poverty reduction, rose by 10 percent to 8572 riels in November, from 7781 riels in the same month of 2010, the result of an increase in garment exports and more investment in this area. The survey revealed that their average daily spending increased from 4539 to 5014 riels, an 11 percent increase due to an increase in prices. The average garment worker rents a house with three people; 82 percent of the people sharing their accommodation are from the same village as the interviewees. The real earnings of scavengers averaged 10,289 riels per day, a 55 percent increase from a year earlier and a 35 percent from August 2011. By contrast, 60 percent of scavengers interviewed said that there was a slide in rubbish prices, while only 30 percent said there was a rise. Moreover, the
sources of rubbish also declined, according to 70 percent of interviewees. Motorcycle-taxi drivers’ daily income went up 26 percent in a year, from 10,278 riels to 12,971 riels. All of the interviewees were the breadwinner in their families, which averaged five members. Only 3 percent said that their income could support their family and 97 percent said it was just a subsidiary income. Of the motor-taxi drivers interviewed, 50 percent were aged between 40 and 50 years. The survey found that daily earnings of skilled construction workers rose by 23 percent to 14,930 riels, the highest figure since the survey began in 2004. This resulted from more construction activities. While working in Phnom Penh, 95 percent of the workers stayed at the construction site. Among vulnerable worker groups, porters had the third highest income, KHR11,490/day. In November of 2010 they could earn only KHR9965/day. They were the group that spent the most for daily consumption and were the most in debt, an average of 1,490,000 riels for the 18 percent of interviewees in debt. While other groups enjoyed an increase in daily earnings, small vegetable sellers and rice-field workers encountered a drop in income. Small vegetable traders’ earnings contracted by 20 percent from a year earlier, from KHR8821/day to KHR7077/day. The majority of the interviewed small vegetable traders perceived an increase in the number of sellers over the last three months. In addition, their daily consumption rose to 4126 riels, up 0.7 percent from a year earlier or 0.5 percent
from August 2011. They needed an average capital of 63,625 riels per day to run their businesses.
Rice-field workers, who were happy with a rise of income in previous surveys, experienced a decline from 4912 riels a year earlier to 4552 riels. Of the interviewees, 65 percent have no agricultural land, 32 percent less than a hectare and 3 percent more than a hectare. Thirty-five percent were optimistic that their earnings would increase in the next quarter, while 30 percent said they would decline.
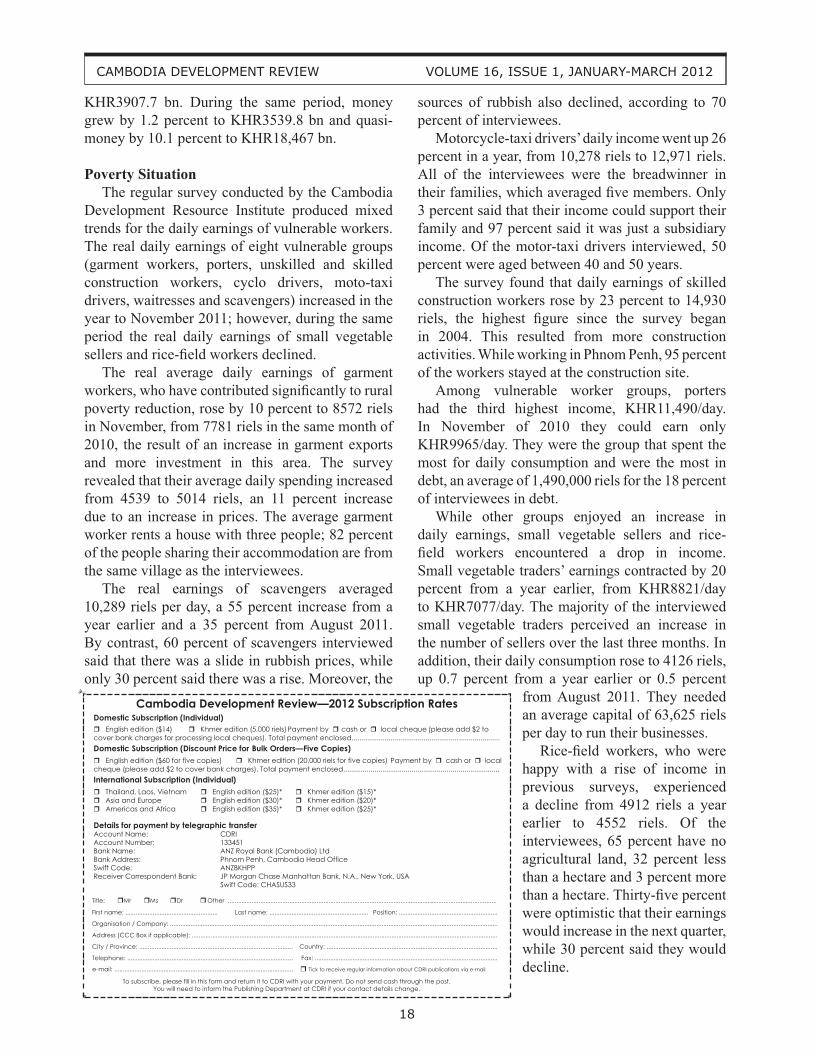
Cambodia Development Review—2012 Subscription Rates Domestic Subscription (Individual)
English edition ($14) Khmer edition (5,000 riels) Payment by cash or local cheque (please add $2 to cover bank charges for processing local cheques). Total payment enclosed............................................................................Domestic Subscription (Discount Price for Bulk Orders—Five Copies)
English edition ($60 for five copies) Khmer edition (20,000 riels for five copies) Payment by cash or local cheque (please add $2 to cover bank charges). Total payment enclosed................................................................................ International Subscription (Individual)
Thailand, Laos, Vietnam English edition ($25)* Khmer edition ($15)* Asia and Europe English edition ($30)* Khmer edition ($20)* Americas and Africa English edition ($35)* Khmer edition ($25)*
Title: Mr Ms Dr Other ..............................................................................................................................................................
First name: ...................................................... Last name: .......................................................... Position: ..........................................................
Organisation / Company: ................................................................................................................................................................................................
Address (CCC Box if applicable): ...................................................................................................................................................................................
City / Province: .......................................................................................... Country: ....................................................................................................
Telephone: ................................................................................................. Fax: ...........................................................................................................
e-mail: ......................................................................................................... Tick to receive regular information about CDRI publications via e-mail
To subscribe, please fill in this form and return it to CDRI with your payment. Do not send cash through the post. You will need to inform the Publishing Department at CDRI if your contact details change.
Details for payment by telegraphic transferAccount Name: CDRIAccount Number: 133451Bank Name: ANZ Royal Bank (Cambodia) Ltd Bank Address: Phnom Penh, Cambodia Head OfficeSwift Code: ANZBKHPPReceiver Correspondent Bank: JP Morgan Chase Manhattan Bank, N.A., New York, USA Swift Code: CHASUS33
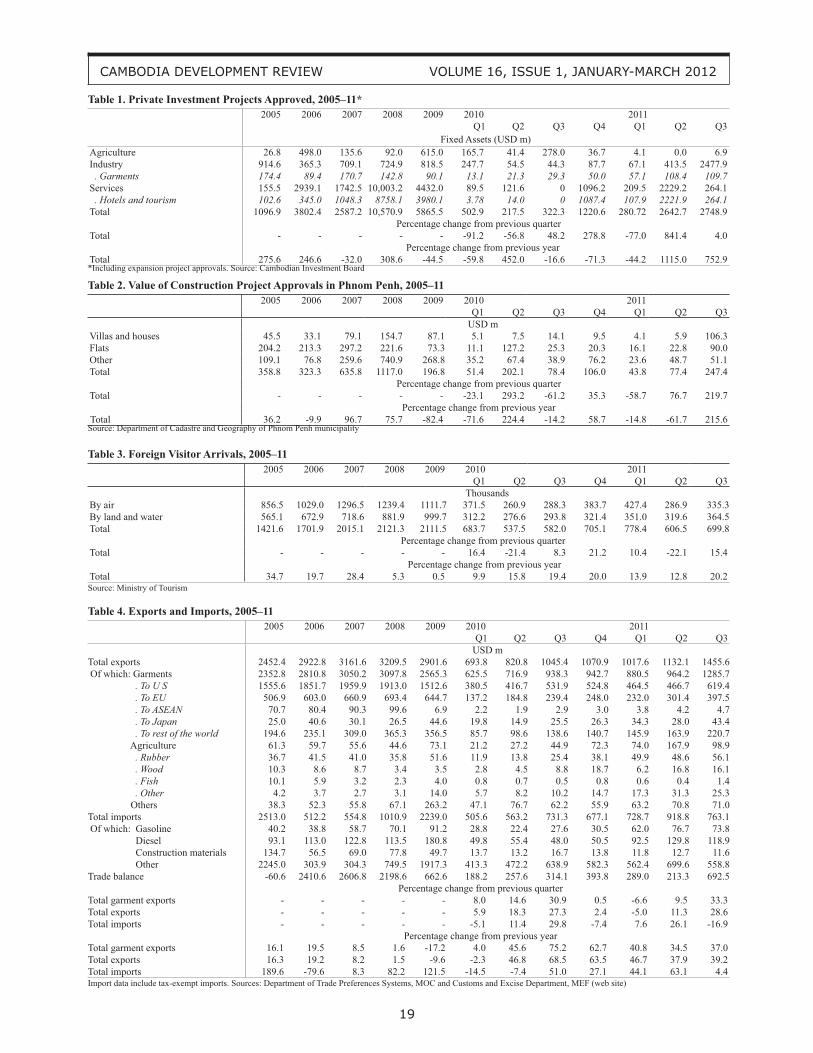
19
CAMBODIA DEVELOPMENT REVIEW VOLUME 16, ISSUE 1, JANUARY-MARCH 2012
Table 1. Private Investment Projects Approved, 2005–11* 2005 2006 2007 2008 2009 2010 2011
Q1 Q2 Q3 Q4 Q1 Q2 Q3Fixed Assets (USD m)
Agriculture 26.8 498.0 135.6 92.0 615.0 165.7 41.4 278.0 36.7 4.1 0.0 6.9Industry 914.6 365.3 709.1 724.9 818.5 247.7 54.5 44.3 87.7 67.1 413.5 2477.9 . Garments 174.4 89.4 170.7 142.8 90.1 13.1 21.3 29.3 50.0 57.1 108.4 109.7Services 155.5 2939.1 1742.5 10,003.2 4432.0 89.5 121.6 0 1096.2 209.5 2229.2 264.1 . Hotels and tourism 102.6 345.0 1048.3 8758.1 3980.1 3.78 14.0 0 1087.4 107.9 2221.9 264.1Total 1096.9 3802.4 2587.2 10,570.9 5865.5 502.9 217.5 322.3 1220.6 280.72 2642.7 2748.9
Percentage change from previous quarterTotal - - - - - -91.2 -56.8 48.2 278.8 -77.0 841.4 4.0
Percentage change from previous yearTotal 275.6 246.6 -32.0 308.6 -44.5 -59.8 452.0 -16.6 -71.3 -44.2 1115.0 752.9*Including expansion project approvals. Source: Cambodian Investment Board
Table 2. Value of Construction Project Approvals in Phnom Penh, 2005–11 2005 2006 2007 2008 2009 2010 2011
Q1 Q2 Q3 Q4 Q1 Q2 Q3USD m
Villas and houses 45.5 33.1 79.1 154.7 87.1 5.1 7.5 14.1 9.5 4.1 5.9 106.3Flats 204.2 213.3 297.2 221.6 73.3 11.1 127.2 25.3 20.3 16.1 22.8 90.0Other 109.1 76.8 259.6 740.9 268.8 35.2 67.4 38.9 76.2 23.6 48.7 51.1Total 358.8 323.3 635.8 1117.0 196.8 51.4 202.1 78.4 106.0 43.8 77.4 247.4
Percentage change from previous quarterTotal - - - - - -23.1 293.2 -61.2 35.3 -58.7 76.7 219.7
Percentage change from previous year Total 36.2 -9.9 96.7 75.7 -82.4 -71.6 224.4 -14.2 58.7 -14.8 -61.7 215.6Source: Department of Cadastre and Geography of Phnom Penh municipality
Table 3. Foreign Visitor Arrivals, 2005–112005 2006 2007 2008 2009 2010 2011
Q1 Q2 Q3 Q4 Q1 Q2 Q3Thousands
By air 856.5 1029.0 1296.5 1239.4 1111.7 371.5 260.9 288.3 383.7 427.4 286.9 335.3By land and water 565.1 672.9 718.6 881.9 999.7 312.2 276.6 293.8 321.4 351.0 319.6 364.5Total 1421.6 1701.9 2015.1 2121.3 2111.5 683.7 537.5 582.0 705.1 778.4 606.5 699.8
Percentage change from previous quarterTotal - - - - - 16.4 -21.4 8.3 21.2 10.4 -22.1 15.4
Percentage change from previous yearTotal 34.7 19.7 28.4 5.3 0.5 9.9 15.8 19.4 20.0 13.9 12.8 20.2Source: Ministry of Tourism
Table 4. Exports and Imports, 2005–112005 2006 2007 2008 2009 2010 2011
Q1 Q2 Q3 Q4 Q1 Q2 Q3USD m
Total exports 2452.4 2922.8 3161.6 3209.5 2901.6 693.8 820.8 1045.4 1070.9 1017.6 1132.1 1455.6 Of which: Garments 2352.8 2810.8 3050.2 3097.8 2565.3 625.5 716.9 938.3 942.7 880.5 964.2 1285.7 . To U S 1555.6 1851.7 1959.9 1913.0 1512.6 380.5 416.7 531.9 524.8 464.5 466.7 619.4 . To EU 506.9 603.0 660.9 693.4 644.7 137.2 184.8 239.4 248.0 232.0 301.4 397.5 . To ASEAN 70.7 80.4 90.3 99.6 6.9 2.2 1.9 2.9 3.0 3.8 4.2 4.7 . To Japan 25.0 40.6 30.1 26.5 44.6 19.8 14.9 25.5 26.3 34.3 28.0 43.4 . To rest of the world 194.6 235.1 309.0 365.3 356.5 85.7 98.6 138.6 140.7 145.9 163.9 220.7Of which: Agriculture 61.3 59.7 55.6 44.6 73.1 21.2 27.2 44.9 72.3 74.0 167.9 98.9 . Rubber 36.7 41.5 41.0 35.8 51.6 11.9 13.8 25.4 38.1 49.9 48.6 56.1 . Wood 10.3 8.6 8.7 3.4 3.5 2.8 4.5 8.8 18.7 6.2 16.8 16.1 . Fish 10.1 5.9 3.2 2.3 4.0 0.8 0.7 0.5 0.8 0.6 0.4 1.4 . Other 4.2 3.7 2.7 3.1 14.0 5.7 8.2 10.2 14.7 17.3 31.3 25.3Of which: Others 38.3 52.3 55.8 67.1 263.2 47.1 76.7 62.2 55.9 63.2 70.8 71.0Total imports 2513.0 512.2 554.8 1010.9 2239.0 505.6 563.2 731.3 677.1 728.7 918.8 763.1 Of which: Gasoline 40.2 38.8 58.7 70.1 91.2 28.8 22.4 27.6 30.5 62.0 76.7 73.8Of which: Diesel 93.1 113.0 122.8 113.5 180.8 49.8 55.4 48.0 50.5 92.5 129.8 118.9Of which: Construction materials 134.7 56.5 69.0 77.8 49.7 13.7 13.2 16.7 13.8 11.8 12.7 11.6Of which: Other 2245.0 303.9 304.3 749.5 1917.3 413.3 472.2 638.9 582.3 562.4 699.6 558.8Trade balance -60.6 2410.6 2606.8 2198.6 662.6 188.2 257.6 314.1 393.8 289.0 213.3 692.5
Percentage change from previous quarterTotal garment exports - - - - - 8.0 14.6 30.9 0.5 -6.6 9.5 33.3Total exports - - - - - 5.9 18.3 27.3 2.4 -5.0 11.3 28.6Total imports - - - - - -5.1 11.4 29.8 -7.4 7.6 26.1 -16.9
Percentage change from previous yearTotal garment exports 16.1 19.5 8.5 1.6 -17.2 4.0 45.6 75.2 62.7 40.8 34.5 37.0Total exports 16.3 19.2 8.2 1.5 -9.6 -2.3 46.8 68.5 63.5 46.7 37.9 39.2Total imports 189.6 -79.6 8.3 82.2 121.5 -14.5 -7.4 51.0 27.1 44.1 63.1 4.4Import data include tax-exempt imports. Sources: Department of Trade Preferences Systems, MOC and Customs and Excise Department, MEF (web site)
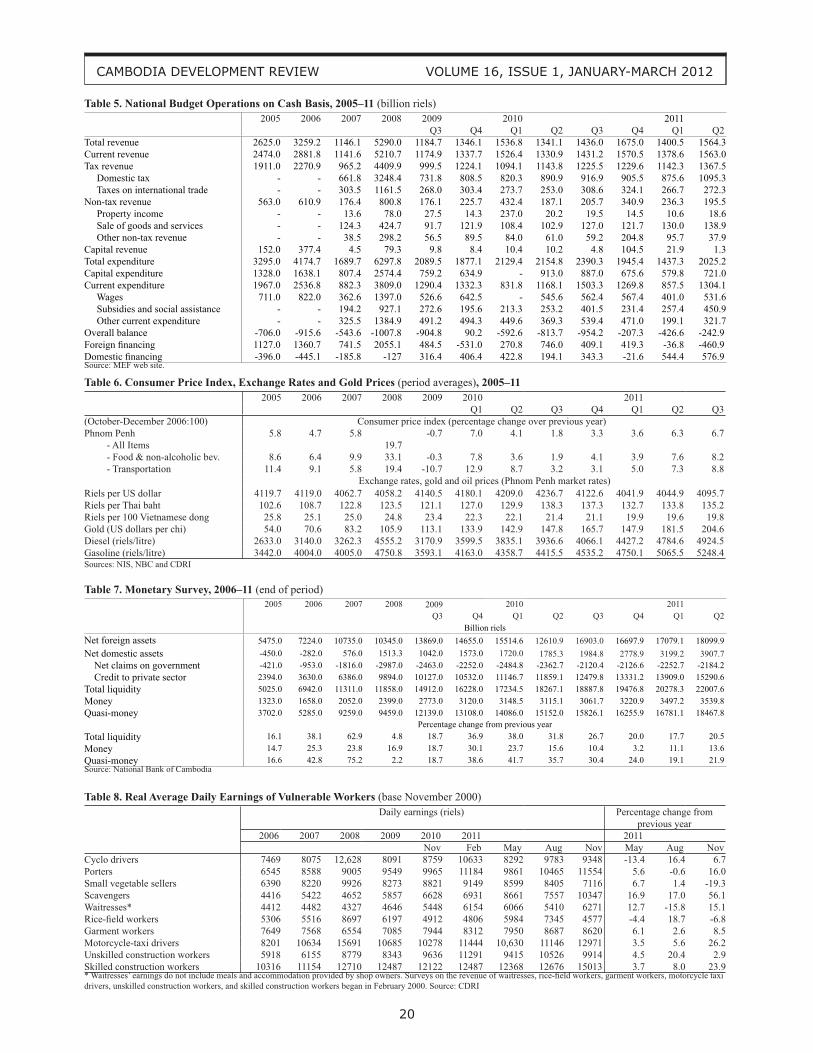
20
CAMBODIA DEVELOPMENT REVIEW VOLUME 16, ISSUE 1, JANUARY-MARCH 2012
Table 5. National Budget Operations on Cash Basis, 2005–11 (billion riels)2005 2006 2007 2008 2009 2010 2011
Q3 Q4 Q1 Q2 Q3 Q4 Q1 Q2Total revenue 2625.0 3259.2 1146.1 5290.0 1184.7 1346.1 1536.8 1341.1 1436.0 1675.0 1400.5 1564.3Current revenue 2474.0 2881.8 1141.6 5210.7 1174.9 1337.7 1526.4 1330.9 1431.2 1570.5 1378.6 1563.0Tax revenue 1911.0 2270.9 965.2 4409.9 999.5 1224.1 1094.1 1143.8 1225.5 1229.6 1142.3 1367.5 Domestic tax - - 661.8 3248.4 731.8 808.5 820.3 890.9 916.9 905.5 875.6 1095.3 Taxes on international trade - - 303.5 1161.5 268.0 303.4 273.7 253.0 308.6 324.1 266.7 272.3Non-tax revenue 563.0 610.9 176.4 800.8 176.1 225.7 432.4 187.1 205.7 340.9 236.3 195.5 Property income - - 13.6 78.0 27.5 14.3 237.0 20.2 19.5 14.5 10.6 18.6 Sale of goods and services - - 124.3 424.7 91.7 121.9 108.4 102.9 127.0 121.7 130.0 138.9 Other non-tax revenue - - 38.5 298.2 56.5 89.5 84.0 61.0 59.2 204.8 95.7 37.9Capital revenue 152.0 377.4 4.5 79.3 9.8 8.4 10.4 10.2 4.8 104.5 21.9 1.3Total expenditure 3295.0 4174.7 1689.7 6297.8 2089.5 1877.1 2129.4 2154.8 2390.3 1945.4 1437.3 2025.2Capital expenditure 1328.0 1638.1 807.4 2574.4 759.2 634.9 - 913.0 887.0 675.6 579.8 721.0Current expenditure 1967.0 2536.8 882.3 3809.0 1290.4 1332.3 831.8 1168.1 1503.3 1269.8 857.5 1304.1 Wages 711.0 822.0 362.6 1397.0 526.6 642.5 - 545.6 562.4 567.4 401.0 531.6 Subsidies and social assistance - - 194.2 927.1 272.6 195.6 213.3 253.2 401.5 231.4 257.4 450.9 Other current expenditure - - 325.5 1384.9 491.2 494.3 449.6 369.3 539.4 471.0 199.1 321.7Overall balance -706.0 -915.6 -543.6 -1007.8 -904.8 90.2 -592.6 -813.7 -954.2 -207.3 -426.6 -242.9Foreign financing 1127.0 1360.7 741.5 2055.1 484.5 -531.0 270.8 746.0 409.1 419.3 -36.8 -460.9Domestic financing -396.0 -445.1 -185.8 -127 316.4 406.4 422.8 194.1 343.3 -21.6 544.4 576.9Source: MEF web site.
Table 6. Consumer Price Index, Exchange Rates and Gold Prices (period averages), 2005–112005 2006 2007 2008 2009 2010 2011
Q1 Q2 Q3 Q4 Q1 Q2 Q3(October-December 2006:100) Consumer price index (percentage change over previous year)Phnom Penh - All Items
5.8 4.7 5.819.7
-0.7 7.0 4.1 1.8 3.3 3.6 6.3 6.7
- Food & non-alcoholic bev. 8.6 6.4 9.9 33.1 -0.3 7.8 3.6 1.9 4.1 3.9 7.6 8.2 - Transportation 11.4 9.1 5.8 19.4 -10.7 12.9 8.7 3.2 3.1 5.0 7.3 8.8
Exchange rates, gold and oil prices (Phnom Penh market rates)Riels per US dollar 4119.7 4119.0 4062.7 4058.2 4140.5 4180.1 4209.0 4236.7 4122.6 4041.9 4044.9 4095.7Riels per Thai baht 102.6 108.7 122.8 123.5 121.1 127.0 129.9 138.3 137.3 132.7 133.8 135.2Riels per 100 Vietnamese dong 25.8 25.1 25.0 24.8 23.4 22.3 22.1 21.4 21.1 19.9 19.6 19.8Gold (US dollars per chi) 54.0 70.6 83.2 105.9 113.1 133.9 142.9 147.8 165.7 147.9 181.5 204.6Diesel (riels/litre) 2633.0 3140.0 3262.3 4555.2 3170.9 3599.5 3835.1 3936.6 4066.1 4427.2 4784.6 4924.5Gasoline (riels/litre) 3442.0 4004.0 4005.0 4750.8 3593.1 4163.0 4358.7 4415.5 4535.2 4750.1 5065.5 5248.4Sources: NIS, NBC and CDRI
Table 7. Monetary Survey, 2006–11 (end of period)2005 2006 2007 2008 2009 2010 2011
Q3 Q4 Q1 Q2 Q3 Q4 Q1 Q2Billion riels
Net foreign assets 5475.0 7224.0 10735.0 10345.0 13869.0 14655.0 15514.6 12610.9 16903.0 16697.9 17079.1 18099.9Net domestic assets -450.0 -282.0 576.0 1513.3 1042.0 1573.0 1720.0 1785.3 1984.8 2778.9 3199.2 3907.7 Net claims on government -421.0 -953.0 -1816.0 -2987.0 -2463.0 -2252.0 -2484.8 -2362.7 -2120.4 -2126.6 -2252.7 -2184.2 Credit to private sector 2394.0 3630.0 6386.0 9894.0 10127.0 10532.0 11146.7 11859.1 12479.8 13331.2 13909.0 15290.6Total liquidity 5025.0 6942.0 11311.0 11858.0 14912.0 16228.0 17234.5 18267.1 18887.8 19476.8 20278.3 22007.6Money 1323.0 1658.0 2052.0 2399.0 2773.0 3120.0 3148.5 3115.1 3061.7 3220.9 3497.2 3539.8Quasi-money 3702.0 5285.0 9259.0 9459.0 12139.0 13108.0 14086.0 15152.0 15826.1 16255.9 16781.1 18467.8
Percentage change from previous yearTotal liquidity 16.1 38.1 62.9 4.8 18.7 36.9 38.0 31.8 26.7 20.0 17.7 20.5Money 14.7 25.3 23.8 16.9 18.7 30.1 23.7 15.6 10.4 3.2 11.1 13.6Quasi-money 16.6 42.8 75.2 2.2 18.7 38.6 41.7 35.7 30.4 24.0 19.1 21.9Source: National Bank of Cambodia
Table 8. Real Average Daily Earnings of Vulnerable Workers (base November 2000) Daily earnings (riels) Percentage change from
previous year2006 2007 2008 2009 2010 2011 2011
Nov Feb May Aug Nov May Aug NovCyclo drivers 7469 8075 12,628 8091 8759 10633 8292 9783 9348 -13.4 16.4 6.7Porters 6545 8588 9005 9549 9965 11184 9861 10465 11554 5.6 -0.6 16.0Small vegetable sellers 6390 8220 9926 8273 8821 9149 8599 8405 7116 6.7 1.4 -19.3Scavengers 4416 5422 4652 5857 6628 6931 8661 7557 10347 16.9 17.0 56.1Waitresses* 4412 4482 4327 4646 5448 6154 6066 5410 6271 12.7 -15.8 15.1Rice-field workers 5306 5516 8697 6197 4912 4806 5984 7345 4577 -4.4 18.7 -6.8Garment workers 7649 7568 6554 7085 7944 8312 7950 8687 8620 6.1 2.6 8.5 Motorcycle-taxi drivers 8201 10634 15691 10685 10278 11444 10,630 11146 12971 3.5 5.6 26.2Unskilled construction workers 5918 6155 8779 8343 9636 11291 9415 10526 9914 4.5 20.4 2.9Skilled construction workers 10316 11154 12710 12487 12122 12487 12368 12676 15013 3.7 8.0 23.9* Waitresses’ earnings do not include meals and accommodation provided by shop owners. Surveys on the revenue of waitresses, rice-field workers, garment workers, motorcycle taxi drivers, unskilled construction workers, and skilled construction workers began in February 2000. Source: CDRI
21
CAMBODIA DEVELOPMENT REVIEW VOLUME 16, ISSUE 1, JANUARY-MARCH 2012
Continued from page 24 CDRI Update
22
CAMBODIA DEVELOPMENT REVIEW VOLUME 16, ISSUE 1, JANUARY-MARCH 2012
1 REDD (Reducing emissions from deforestation and forest degradation) + includes conservation, sustainable manage-ment of forests and enhancement of forest carbon stocks.
23
CAMBODIA DEVELOPMENT REVIEW VOLUME 16, ISSUE 1, JANUARY-MARCH 2012
Continued from page 10 Mismatch between ...commune councils’ ability to implement their plans and deliver basic services. Second, district and commune officials’ understanding of the Organic Law and related regulations is rather limited; they should therefore be provided with capacity building and further information on the Organic Law and IP3 so as to better manage mixed and differing expectations and improve their understanding of their roles and responsibilities until clear guidelines from the government become available. Third, it is uncertain whether the pending establishment of the Associations4 of Sub-national Councils will bring the commune and district councils closer and help bridge the differing development needs and communication gaps, thus making their work more coordinated and responsive to local needs.
ReferencesCDRI (2011), Report on the Dissemination
Workshop to Share and Seek Recommendations among Stakeholders regarding Progress and Challenges of D&D Reforms, October 2011 (Phnom Penh: CDRI)
Chheat Sreang, Lun Pide, Kim Sedara, Heng Seiha, Sok Sethea & Chhoun Nareth (2011), “A Baseline Survey of Sub-national Government: Towards a Better Understanding of Decentralisation and Deconcentration in Cambodia”, Special Report No. 12 (Phnom Penh: CDRI)
4 At the 7th Workshop of the National League for Commune/Sangkat Councils held on 29 November 2011, it was agreed to establish two Associations of Sub-national Councils – one for the capital and provincial councils and the other for district, municipal/khan and commune/sangkat councils.
Ministry of Interior (2011), 7th Workshop of the National League for Commune/Sangkat Council, November 2011 (Phnom Penh: MoI)
NCDD (2009), “2007 Guidelines on District Initiative Project Implementation” (Khmer version) http://www.ncdd.gov.kh/km/resources/documents/manual-a-guidelines/doc_view/225-2007-guideline-on-district-initiative-project-implementationkh?tmpl=component&format=raw, last updated in 2009
Öjendal, Joakim & Kim Sedara (2008), “A Background Study on the District Office’s Role and Potential Facing the Deconcentration and Decentralisation Reform” (Phnom Penh: CDRI unpublished)
Öjendal, Joakim & Kim Sedara (2006), “Korob, Kaud, Klach: In Search of Agency in Rural Cambodia”, Journal of Southeast Asia Studies, 37 (3), pp. 507-526
Pak Kimchoeun, Thon Vimealea & Kruy Virak (2011), “Decentralisation at the Municipal, District and Khan Level: A Quick Review of Progress”, Cambodia Development Review, 15 (2), pp8
Royal Government of Cambodia (2009), Prakas No. 4275 BRK on the Establishment and the Functioning of the Women’s and Children’s Consultative Committees at Capital, Provincial, Municipal, District and Khan Councils (Phnom Penh: MoI)
Royal Government of Cambodia (2010), Prakas No. 2417 on the Preparation of the Development Plan and Three-Year Rolling Plan of the Capital, Provinces, Municipalities, Districts and Khans (Phnom Penh: MoI)
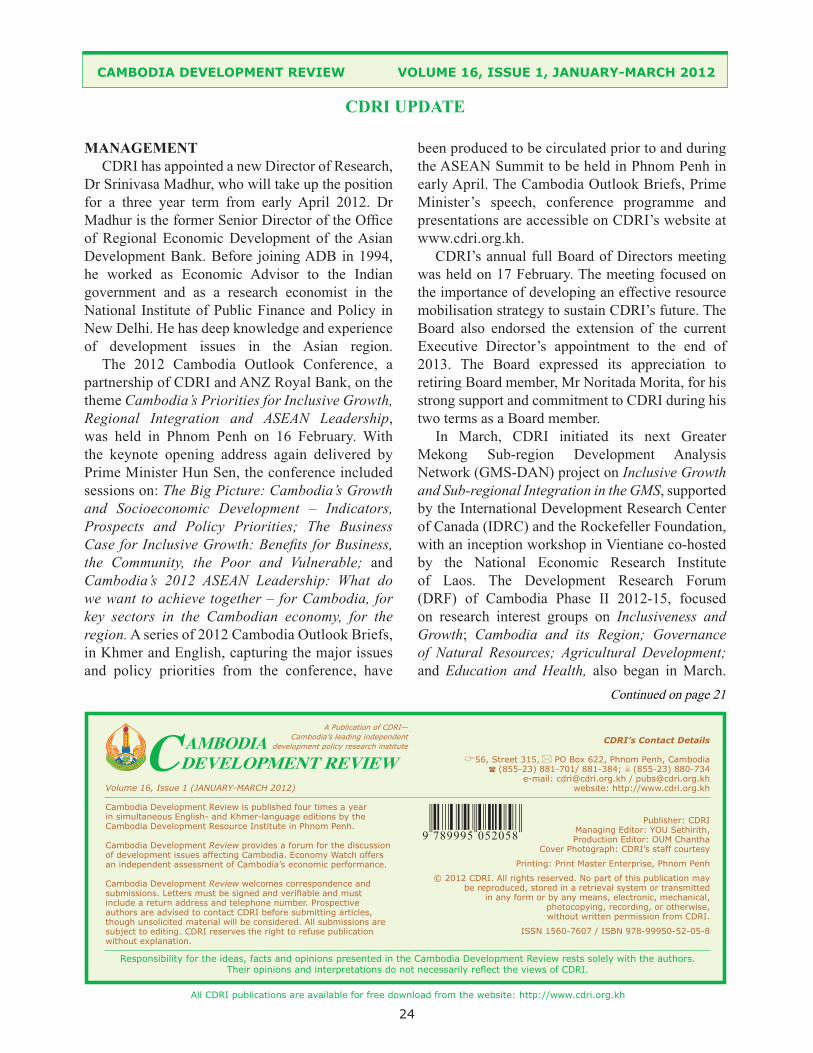
24
CAMBODIA DEVELOPMENT REVIEW VOLUME 16, ISSUE 1, JANUARY-MARCH 2012CAMBODIA DEVELOPMENT REVIEW VOLUME 16, ISSUE 1, JANUARY-MARCH 2012
CDRI UPDATE
Continued on page 21
All CDRI publications are available for free download from the website: http://www.cdri.org.kh
Volume 16, Issue 1 (JANUARY-MARCH 2012)
Cambodia Development Review is published four times a year in simultaneous English- and Khmer-language editions by the Cambodia Development Resource Institute in Phnom Penh.
Cambodia Development Review provides a forum for the discussion of development issues affecting Cambodia. Economy Watch offers an independent assessment of Cambodia’s economic performance.
Cambodia Development Review welcomes correspondence and submissions. Letters must be signed and verifiable and must include a return address and telephone number. Prospective authors are advised to contact CDRI before submitting articles, though unsolicited material will be considered. All submissions are subject to editing. CDRI reserves the right to refuse publication without explanation.
CDRI’s Contact Details
� 56, Street 315, � PO Box 622, Phnom Penh, Cambodia� (855-23) 881-701/ 881-384; � (855-23) 880-734
e-mail: [email protected] / [email protected] website: http://www.cdri.org.kh
Publisher: CDRIManaging Editor: YOU Sethirith, Production Editor: OUM Chantha
Cover Photograph: CDRI’s staff courtesy
Printing: Print Master Enterprise, Phnom Penh
© 2012 CDRI. All rights reserved. No part of this publication may be reproduced, stored in a retrieval system or transmitted
in any form or by any means, electronic, mechanical, photocopying, recording, or otherwise, without written permission from CDRI.
ISSN 1560-7607 / ISBN 978-99950-52-05-8
Responsibility for the ideas, facts and opinions presented in the Cambodia Development Review rests solely with the authors. Their opinions and interpretations do not necessarily reflect the views of CDRI.
A Publication of CDRI—Cambodia’s leading independent
development policy research institute
9 789995 052058


