Embed Size (px)
Citation preview

MEXICO OUTLOOK Current situation and challenges
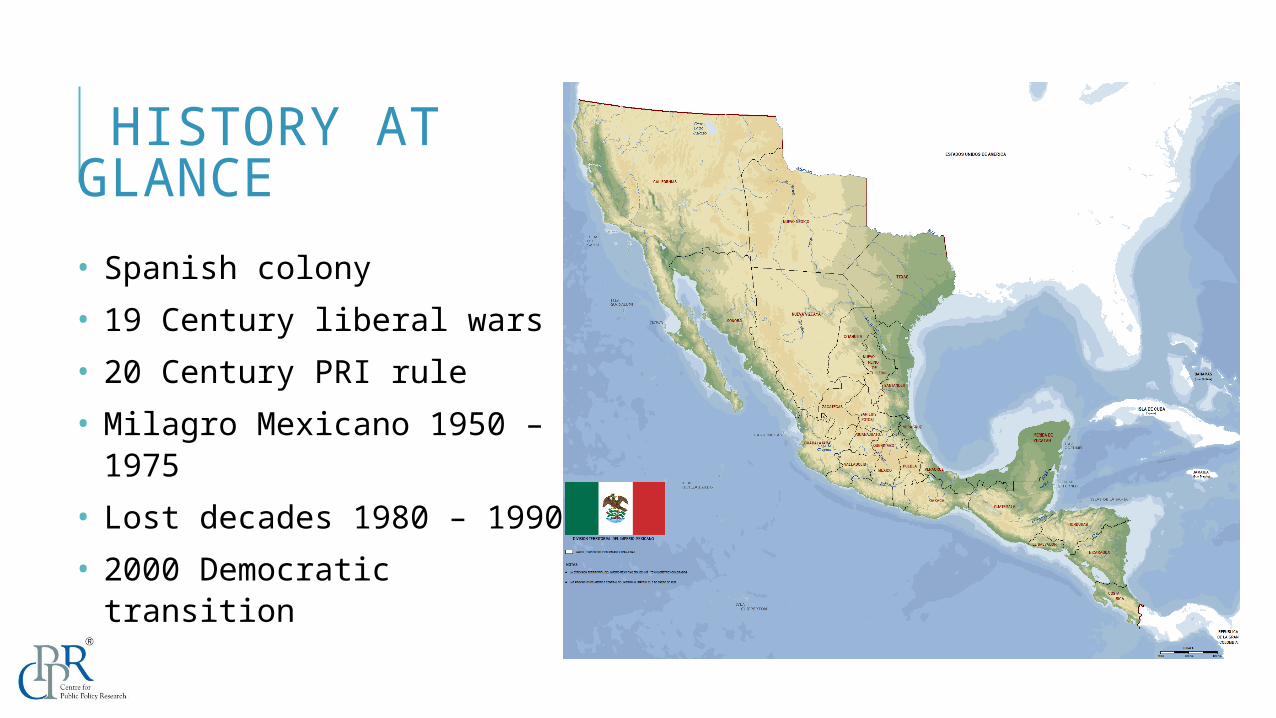
HISTORY AT GLANCE• Spanish colony• 19 Century liberal wars• 20 Century PRI rule • Milagro Mexicano 1950 – 1975
• Lost decades 1980 – 1990• 2000 Democratic transition
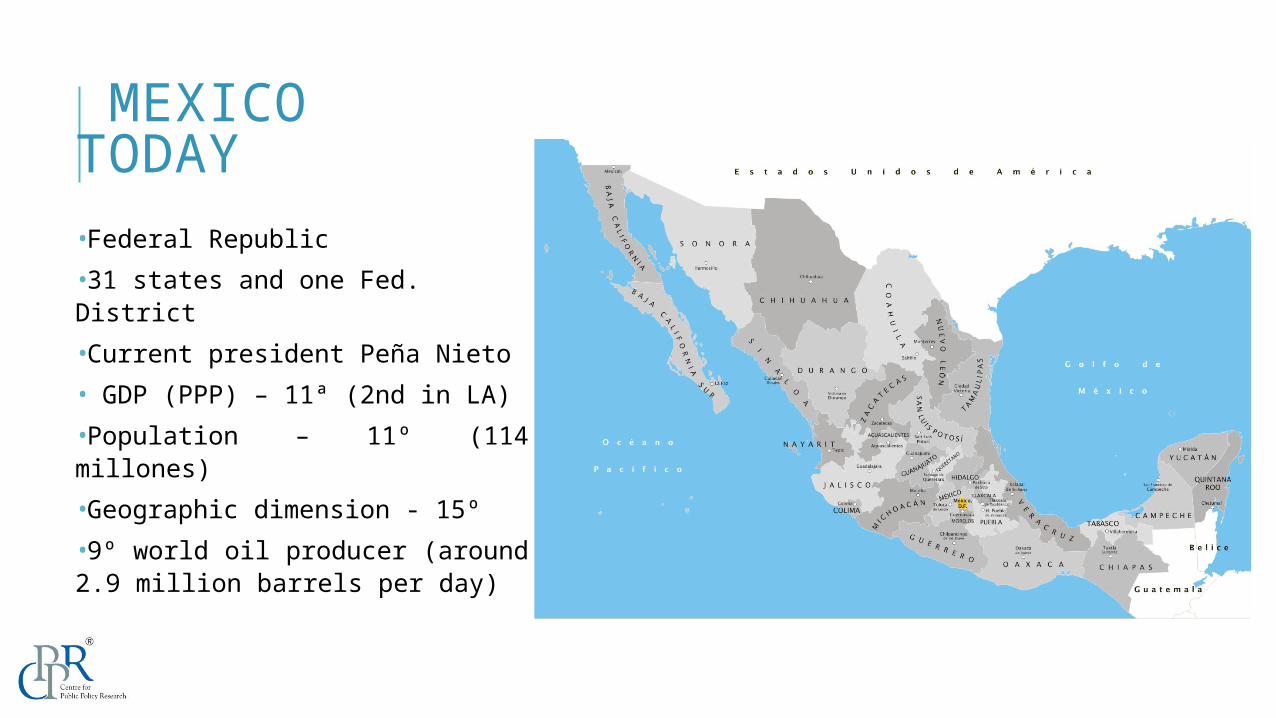
MEXICO TODAY •Federal Republic•31 states and one Fed. District•Current president Peña Nieto• GDP (PPP) – 11ª (2nd in LA)•Population – 11º (114 millones)•Geographic dimension - 15º •9º world oil producer (around 2.9 million barrels per day)
POLITICS The return of the PRI
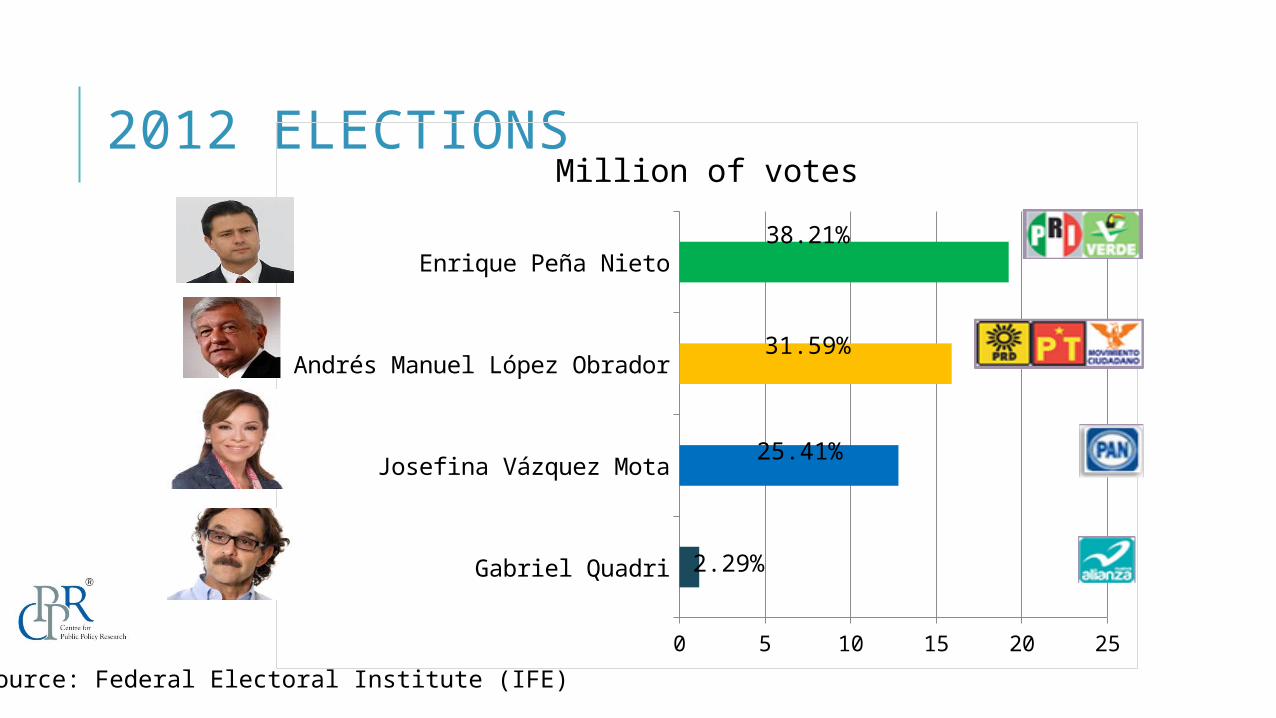
2012 ELECTIONS
Gabriel Quadri
Josefina Vázquez Mota
Andrés Manuel López Obrador
Enrique Peña Nieto
0 5 10 15 20 25
Million of votes38.21%
31.59%
25.41%
2.29%
Source: Federal Electoral Institute (IFE)

2012 ELECTIONS
PRI43%
PAN23%
PRD21%
PVEM6%
MC3%
PT3%
PRI42%
PAN30%
PRD17%
PVEM5%
PT 4%
Congress SenateS/ Grupo. 2%NA 2%
500 seats total 128 seats totalSource: Federal Electoral Institute (IFE)
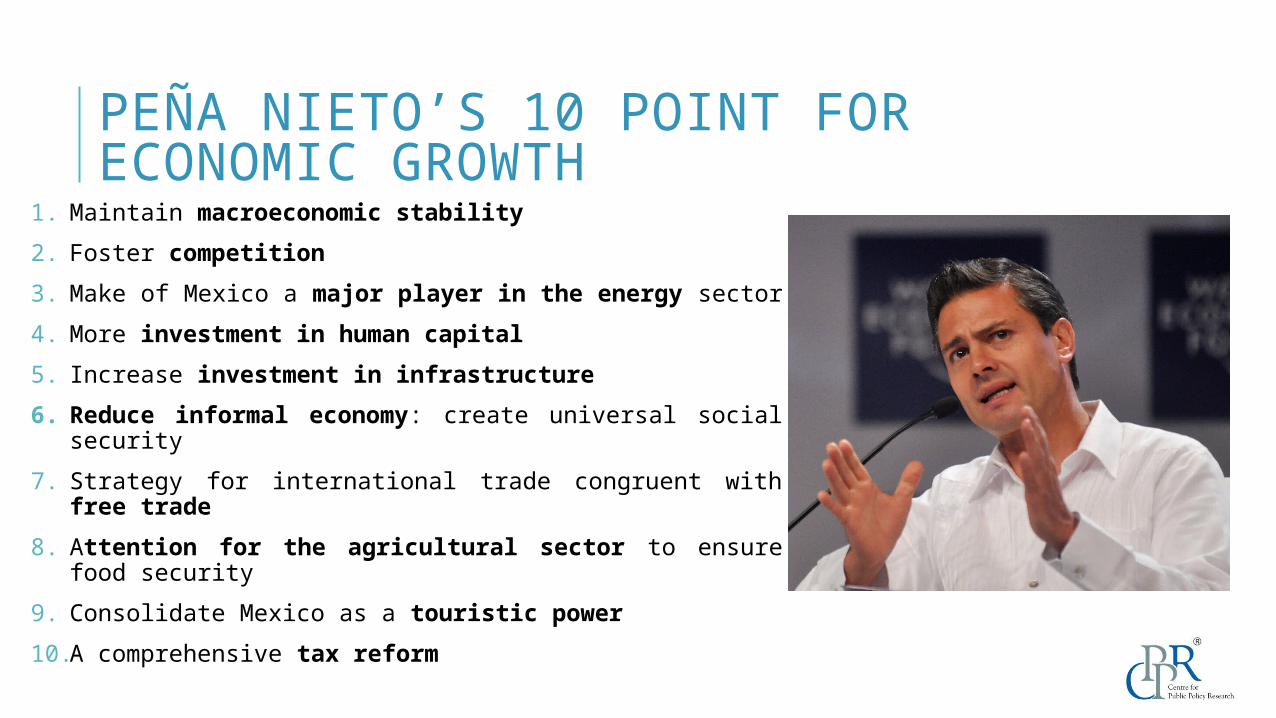
PEÑA NIETO’S 10 POINT FOR ECONOMIC GROWTH
1. Maintain macroeconomic stability2. Foster competition3. Make of Mexico a major player in the energy sector 4. More investment in human capital5. Increase investment in infrastructure6. Reduce informal economy: create universal social
security7. Strategy for international trade congruent with
free trade 8. Attention for the agricultural sector to ensure
food security9. Consolidate Mexico as a touristic power10.A comprehensive tax reform
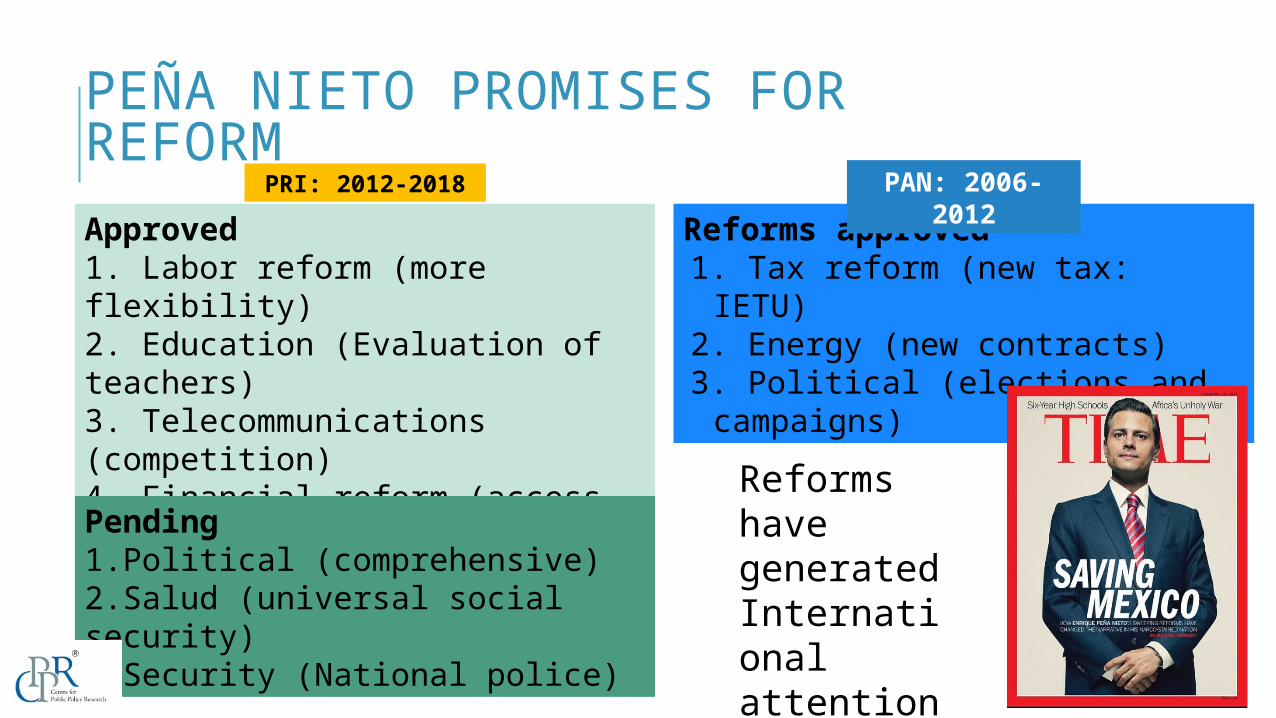
PEÑA NIETO PROMISES FOR REFORMApproved 1. Labor reform (more flexibility)2. Education (Evaluation of teachers)3. Telecommunications (competition)4. Financial reform (access to credit)5. Tax reform (increase in taxes)6. Energy (Open sector)
Reforms approved 1. Tax reform (new tax: IETU)
2. Energy (new contracts)3. Political (elections and campaigns)
PAN: 2006-2012
PRI: 2012-2018
Pending1.Political (comprehensive)2.Salud (universal social security)3.Security (National police)
Reforms have generated International attention

ECONOMY An international comparison
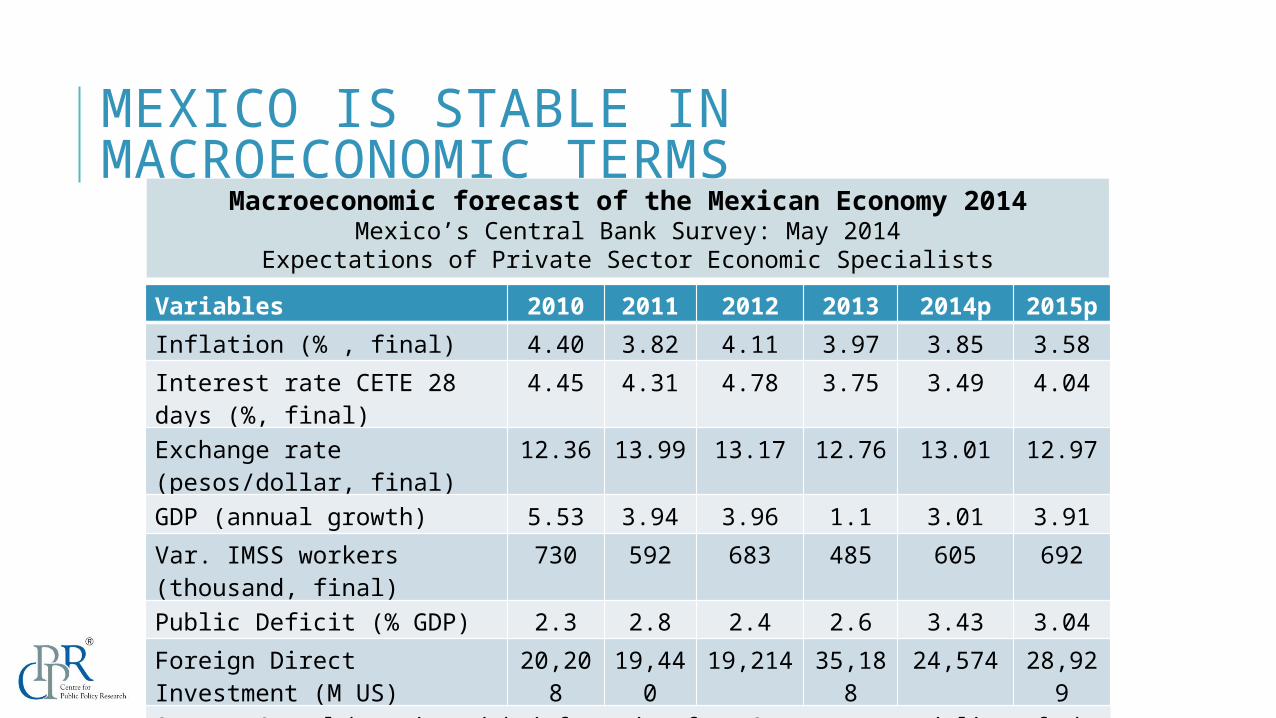
MEXICO IS STABLE IN MACROECONOMIC TERMS
Macroeconomic forecast of the Mexican Economy 2014Mexico’s Central Bank Survey: May 2014
Expectations of Private Sector Economic SpecialistsVariables 2010 2011 2012 2013 2014p 2015pInflation (% , final) 4.40 3.82 4.11 3.97 3.85 3.58Interest rate CETE 28 days (%, final)
4.45 4.31 4.78 3.75 3.49 4.04
Exchange rate (pesos/dollar, final)
12.36 13.99 13.17 12.76 13.01 12.97
GDP (annual growth) 5.53 3.94 3.96 1.1 3.01 3.91Var. IMSS workers (thousand, final)
730 592 683 485 605 692
Public Deficit (% GDP) 2.3 2.8 2.4 2.6 3.43 3.04Foreign Direct Investment (M US)
20,208
19,440
19,214 35,188
24,574 28,929
Source: Own elaboration with information from Survey to specialist of the private sector, May 2014, Mexico’s Central Bank
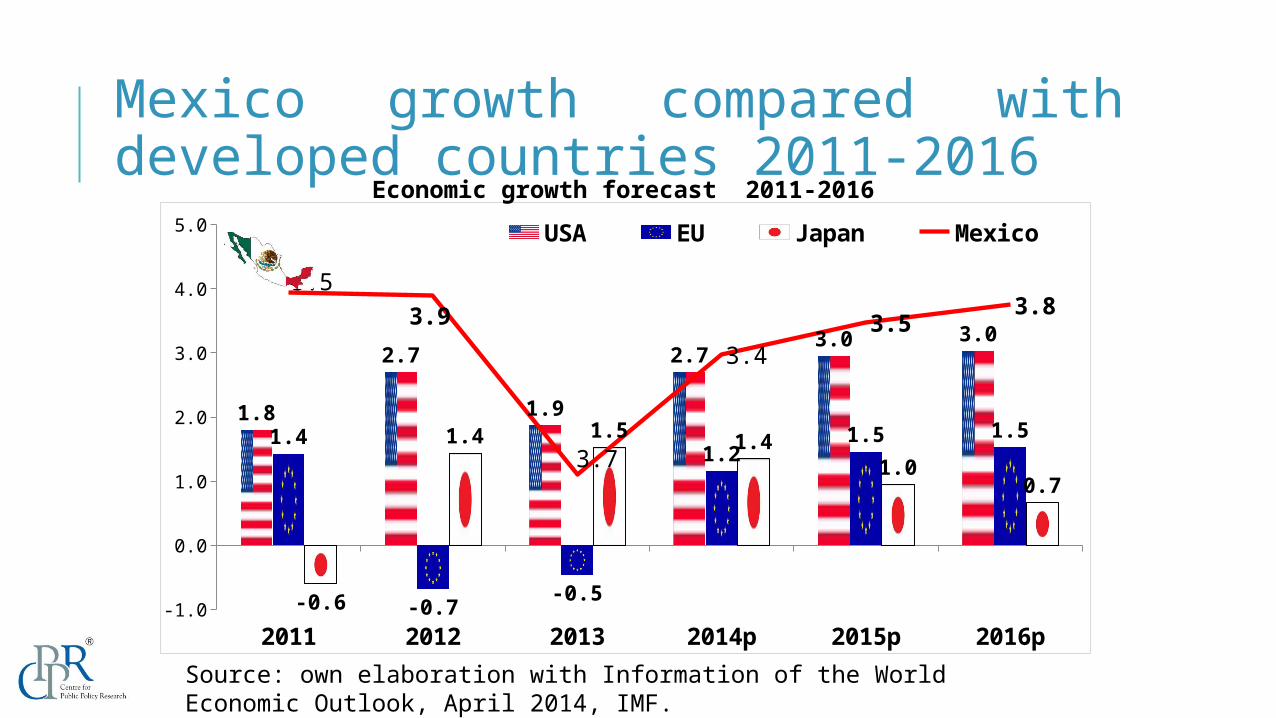
Mexico growth compared with developed countries 2011-2016
2011 2012 2013 2014p 2015p 2016p-1.0
0.0
1.0
2.0
3.0
4.0
5.0
1.8
2.7
1.9
2.7 3.0 3.0
1.4
-0.7 -0.5
1.21.5 1.5
-0.6
1.4 1.5 1.41.0
0.7
5.53.9
3.7
3.43.5 3.8
USA EU Japan Mexico
Source: own elaboration with Information of the World Economic Outlook, April 2014, IMF.
Economic growth forecast 2011-2016
9º in World1º in LA
9º in World1º in LAC
18º in the World
2º in LA
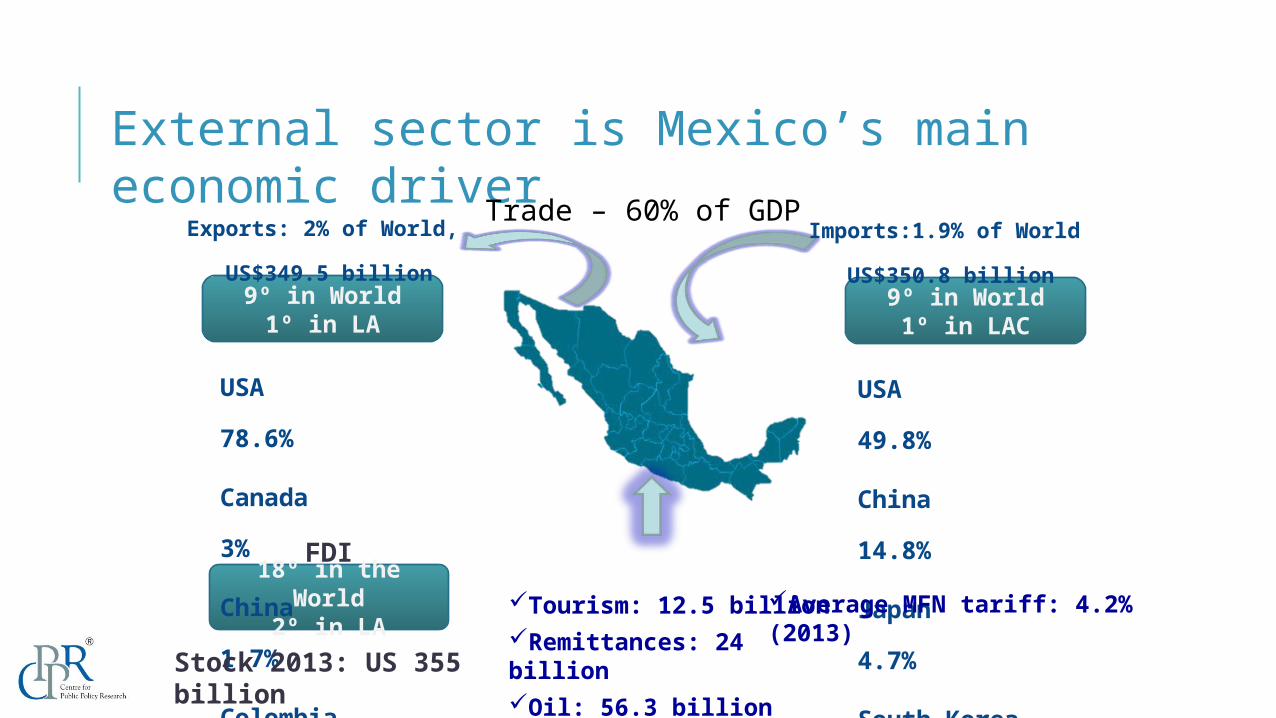
External sector is Mexico’s main economic driver
Exports: 2% of World,
US$349.5 billion
USA
78.6%
Canada
3%
China
1.7%
Colombia
1.6%
USA
49.8%
China
14.8%
Japan
4.7%
South Korea
3.9%
FDIAverage MFN tariff: 4.2% (2013)
Tourism: 12.5 billionRemittances: 24 billionOil: 56.3 billion
Imports:1.9% of World
US$350.8 billion
Trade – 60% of GDP
Stock 2013: US 355 billion
1980
1982
1984
1986
1988
1990
1992
1994
1996
1998
2000
2002
2004
2006
2008
2010
2012
10%
20%
30%
40%
50%
60%
70%
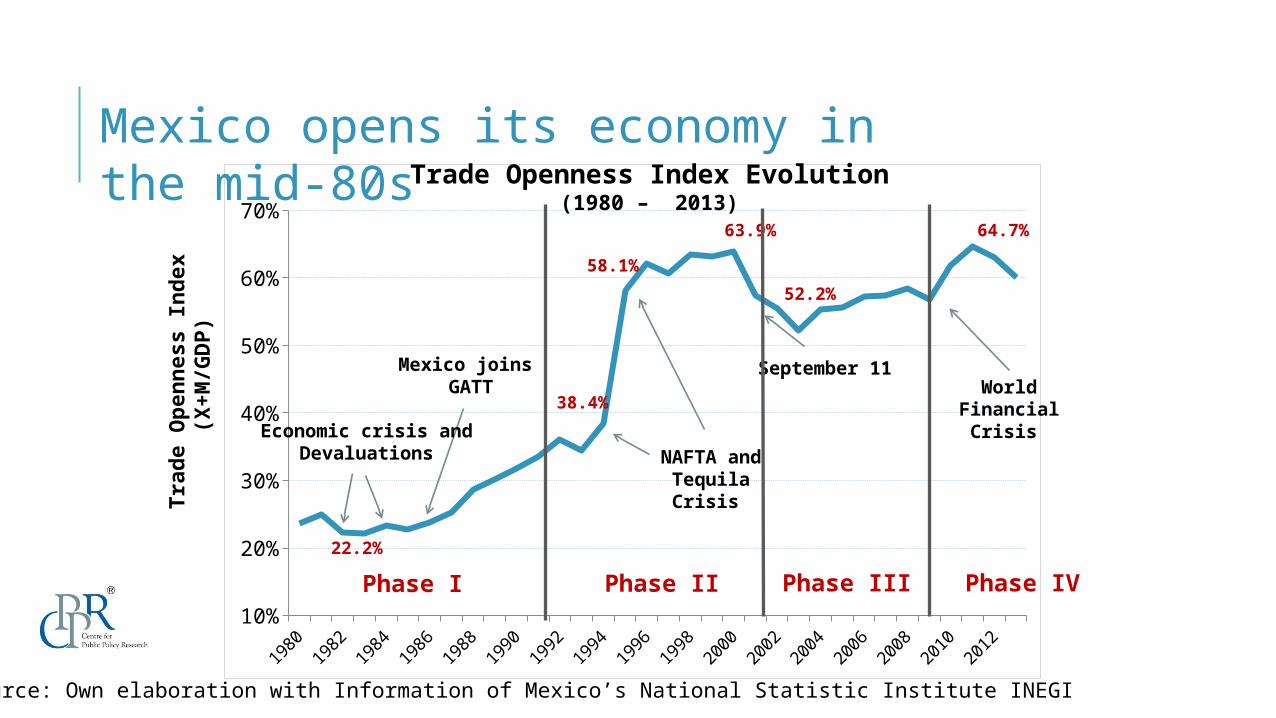
Phase II22.2%
NAFTA and Tequila Crisis
September 11
52.2%
World Financial Crisis
Mexico joins GATT
Source: Own elaboration with Information of Mexico’s National Statistic Institute INEGI
Economic crisis andDevaluations
Trad
e Op
enne
ss I
ndex
(X+M/
GDP)
Phase I
64.7%63.9%
58.1%
38.4%
Trade Openness Index Evolution(1980 – 2013)
Phase III Phase IV
Mexico opens its economy in the mid-80s
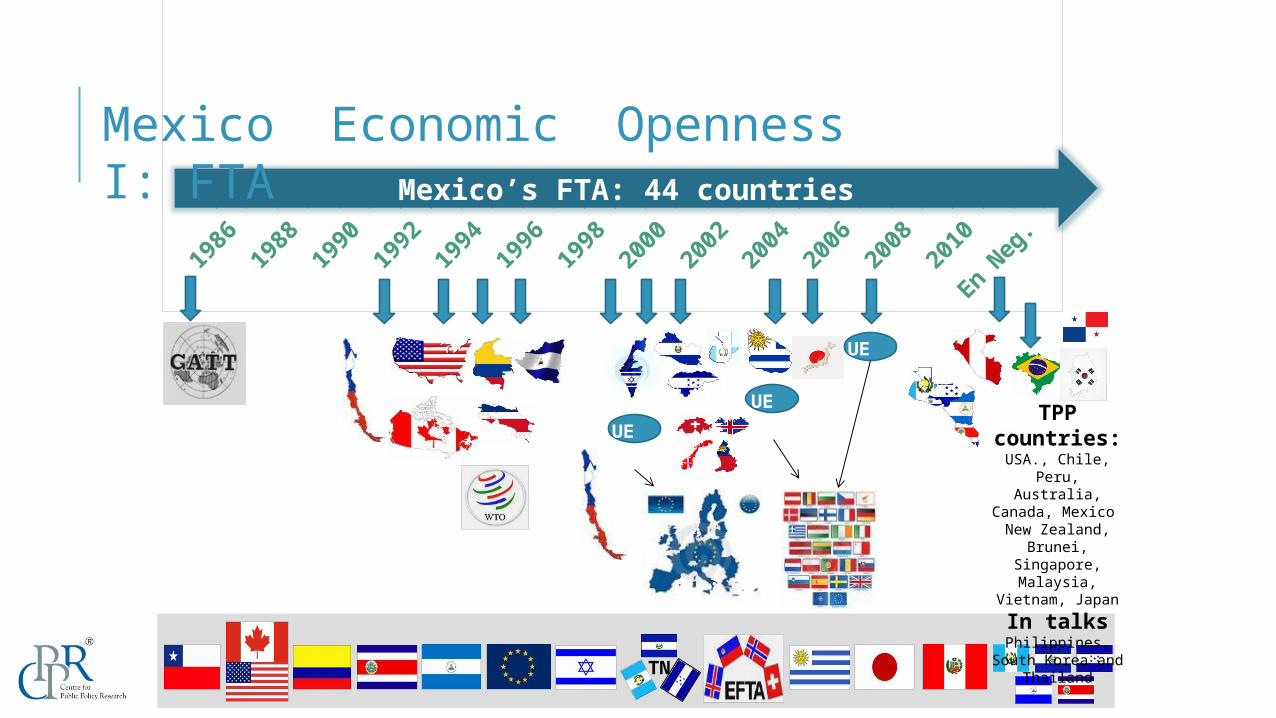
Mexico’s FTA: 44 countries
UE 25UE
15
UE 27
TN
TPP countries:USA., Chile,
Peru, Australia,
Canada, Mexico New Zealand,
Brunei,Singapore, Malaysia,
Vietnam, JapanIn talksPhilippines,
South Korea and Thailand
Mexico Economic Openness I: FTA
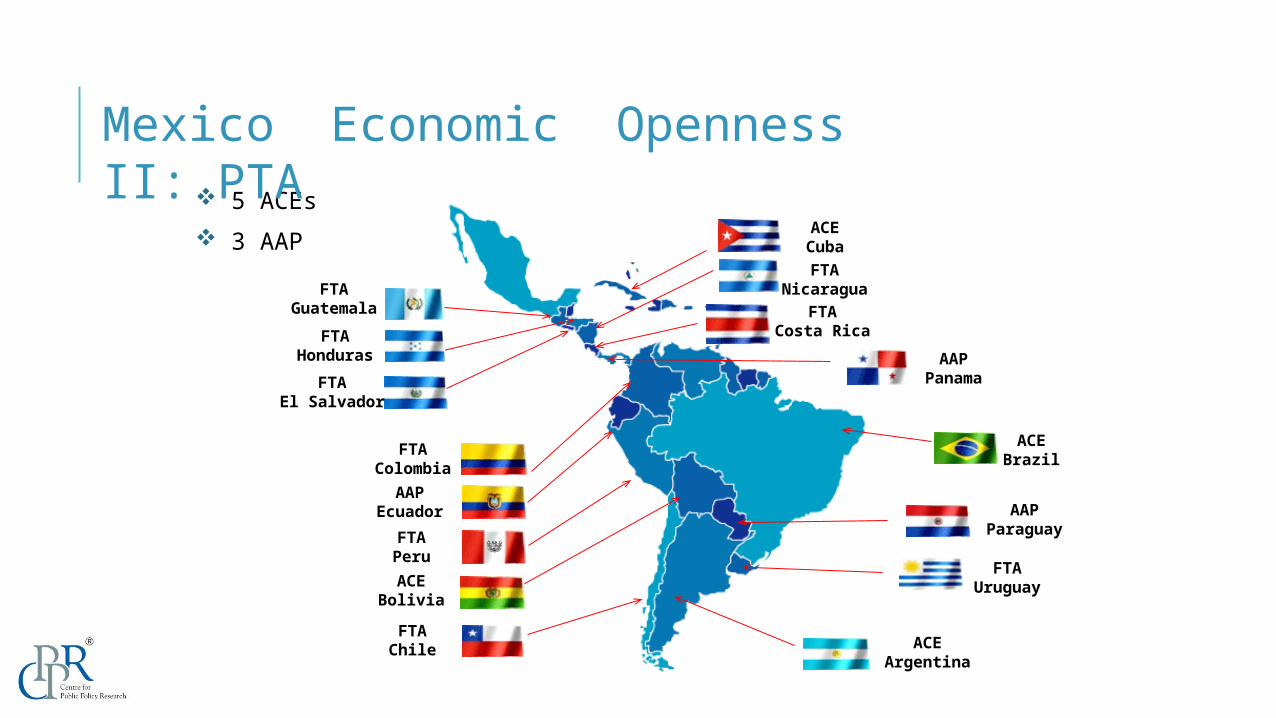
ACECuba
FTAHonduras
FTAGuatemala
FTAEl Salvador
FTAColombia
FTANicaragua
FTACosta Rica
AAPPanama
AAPEcuador
FTAPeruACE
BoliviaFTA
Chile
ACEBrazil
AAPParaguay
ACEArgentina
FTAUruguay
5 ACEs 3 AAP
Mexico Economic Openness II: PTA
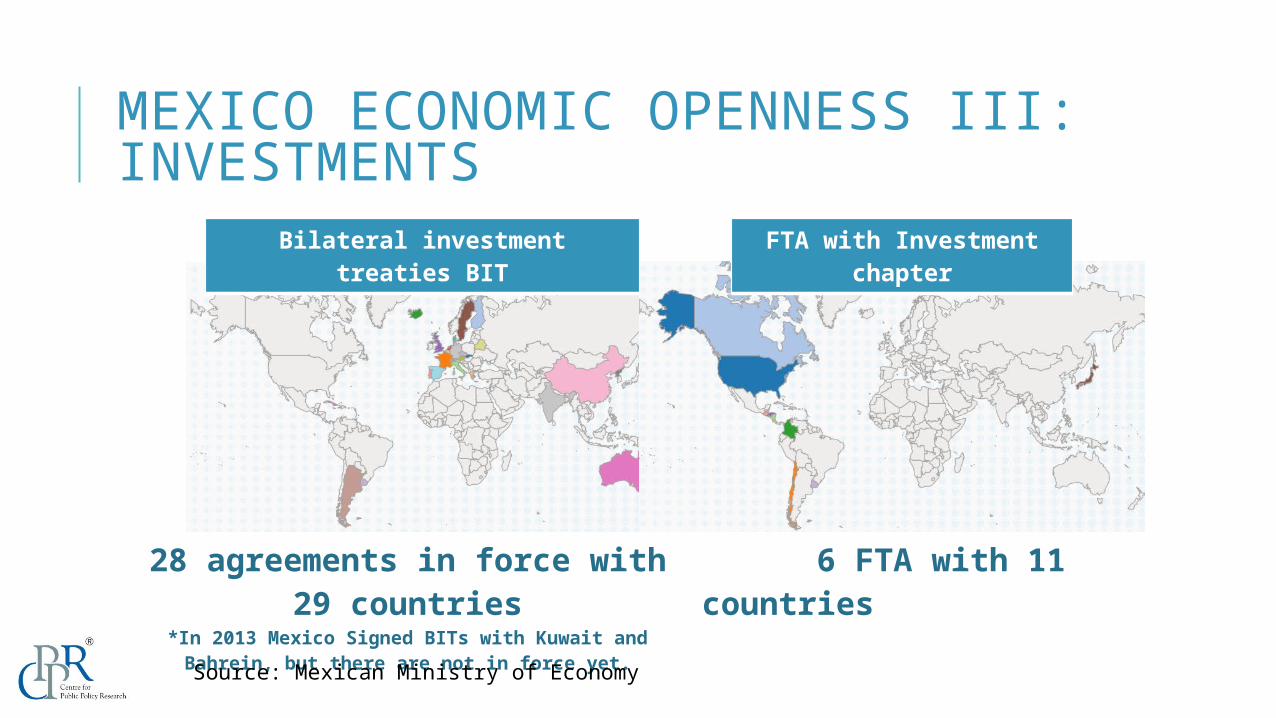
Bilateral investment treaties BIT
FTA with Investment chapter
28 agreements in force with 29 countries
*In 2013 Mexico Signed BITs with Kuwait and Bahrein, but there are not in force yet.
6 FTA with 11 countries
Source: Mexican Ministry of Economy
MEXICO ECONOMIC OPENNESS III: INVESTMENTS

MEXICO’S EXPORTS HAVE ALSO CHANGED
0%
10%
20%30%
40%
50%60%
70%80%
90%
100%Structure of Mexico’s exports
ManufacturesExtractiveAgricultural productsOil
Source: Own elaboration with Information of Mexico’s National Statistic Institute INEGI
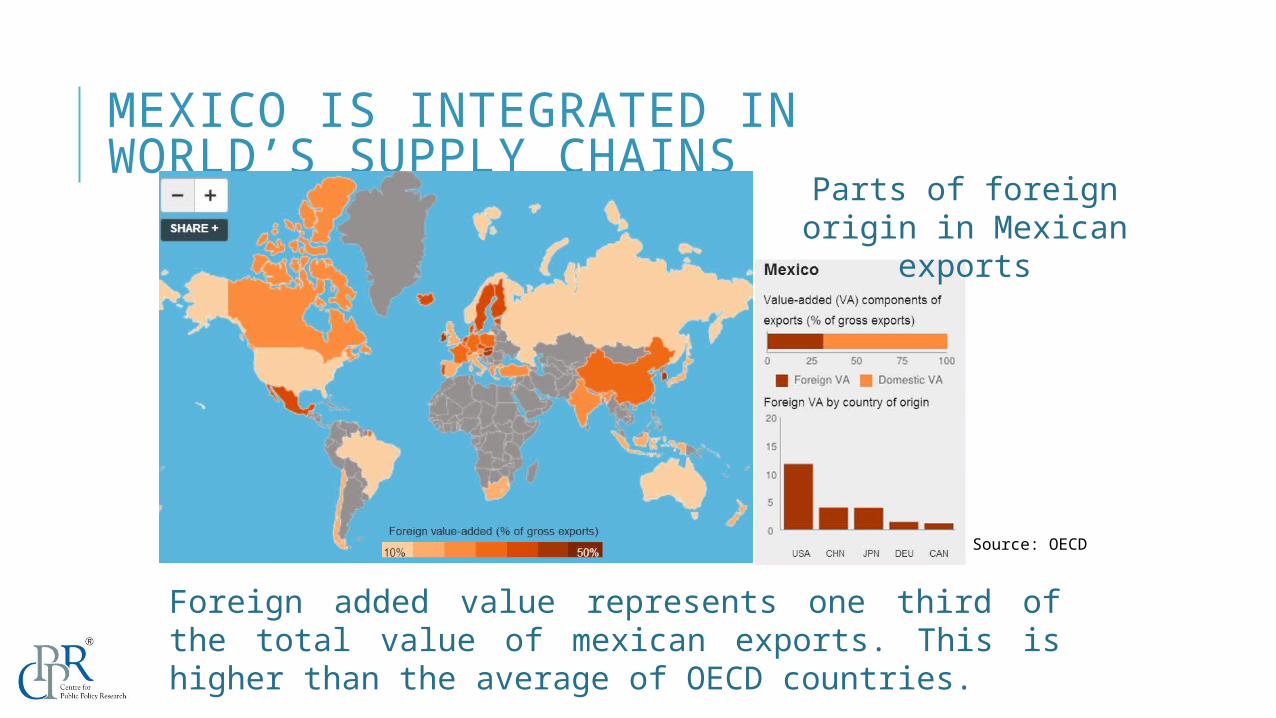
MEXICO IS INTEGRATED IN WORLD’S SUPPLY CHAINS
Source: OECD
Parts of foreign origin in Mexican
exports
Foreign added value represents one third of the total value of mexican exports. This is higher than the average of OECD countries.
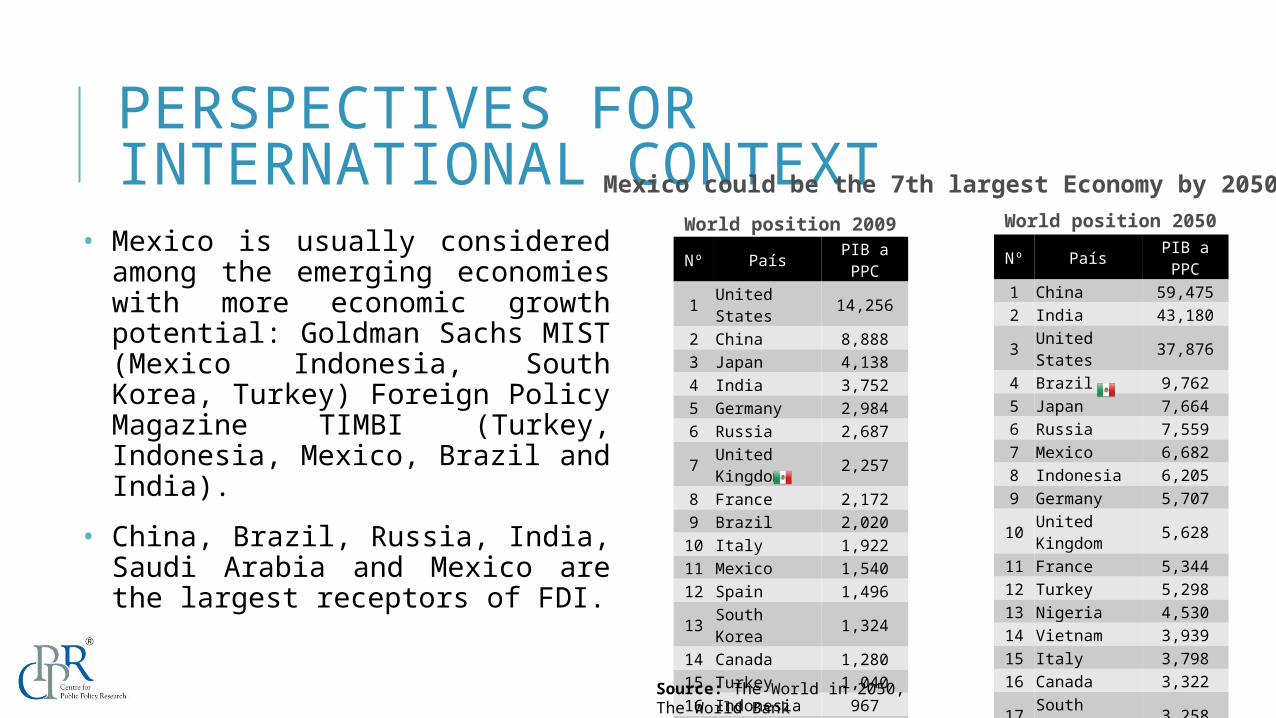
PERSPECTIVES FOR INTERNATIONAL CONTEXT
• Mexico is usually considered among the emerging economies with more economic growth potential: Goldman Sachs MIST (Mexico Indonesia, South Korea, Turkey) Foreign Policy Magazine TIMBI (Turkey, Indonesia, Mexico, Brazil and India).
• China, Brazil, Russia, India, Saudi Arabia and Mexico are the largest receptors of FDI.
Nº País PIB a PPC
1 United States 14,256
2 China 8,888 3 Japan 4,138 4 India 3,752 5 Germany 2,984 6 Russia 2,687
7 United Kingdom 2,257
8 France 2,172 9 Brazil 2,020 10 Italy 1,922 11 Mexico 1,540 12 Spain 1,496
13 South Korea 1,324
14 Canada 1,280 15 Turkey 1,040 16 Indonesia 967 17 Australia 858
18 Saudi Arabia 595
19 Argentina 586
20 South Africa 508
Nº País PIB a PPC
1 China 59,475 2 India 43,180
3 United States 37,876
4 Brazil 9,762 5 Japan 7,664 6 Russia 7,559 7 Mexico 6,682 8 Indonesia 6,205 9 Germany 5,707
10 United Kingdom 5,628
11 France 5,344 12 Turkey 5,298 13 Nigeria 4,530 14 Vietnam 3,939 15 Italy 3,798 16 Canada 3,322
17 South Korea 3,258
18 Spain 3,195
19 Saudi Arabia 3,039
20 Argentina 2,549
Mexico could be the 7th largest Economy by 2050World position 2009 World position 2050
Source: The World in 2050, The World Bank
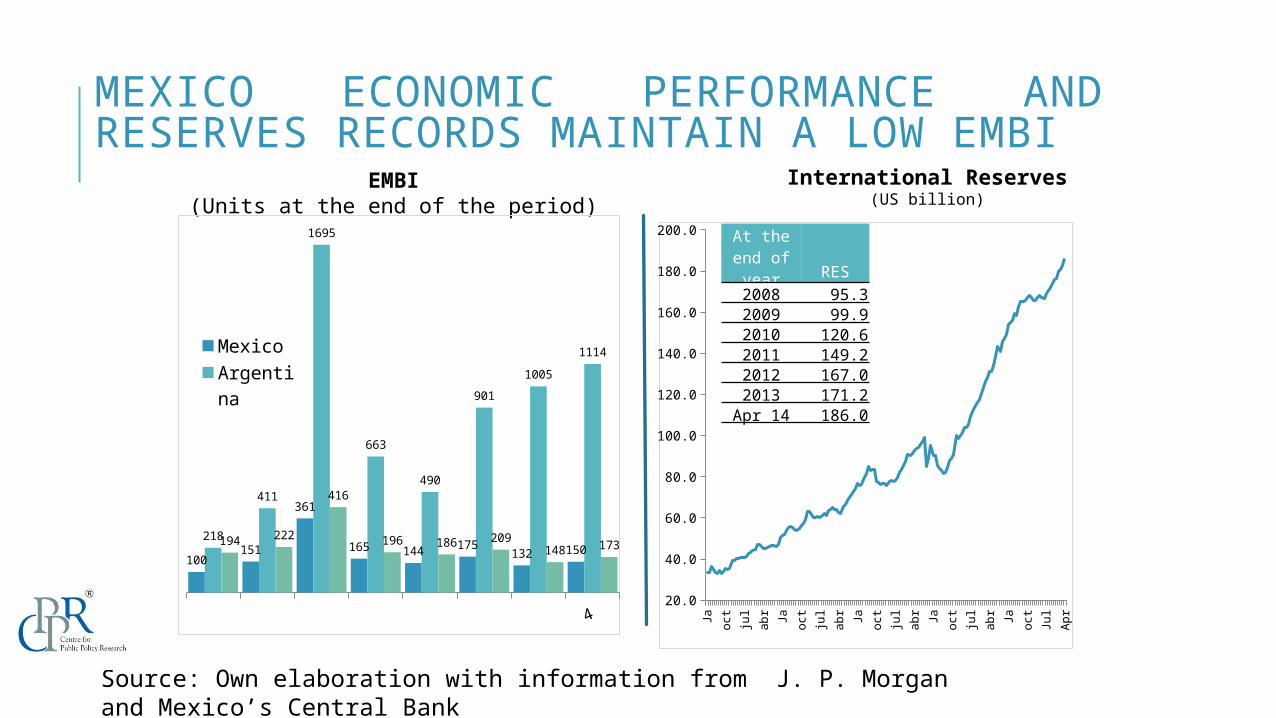
MEXICO ECONOMIC PERFORMANCE AND RESERVES RECORDS MAINTAIN A LOW EMBI
EMBI(Units at the end of the period)
Ja oct
jul
abr Ja oct
jul
abr Ja oct
jul
abr Ja oct
jul
abr Ja oct
Jul
Apr
20.0
40.0
60.0
80.0
100.0
120.0
140.0
160.0
180.0
200.0
International Reserves(US billion)
4
100151
361
165 144 175 132 150218
411
1695
663
490
9011005
1114
194 222
416
196 186 209148 173
MexicoArgentina
At the end of year RES2008 95.32009 99.92010 120.62011 149.22012 167.02013 171.2
Apr 14 186.0
Source: Own elaboration with information from J. P. Morgan and Mexico’s Central Bank

MEXICO HAS A YOUNG POPULATION AND THE GROWTH OF THE LABOR FORCE IS AMONG THE LARGEST
Source: Mexican National Institute of Statitstics INEGI and Jack A. Goldstone “Rise of TIMBIs” in Foreing Policy, December 2, 2011.
Labor force growth rate (population
between 15 and 59 years) 1959=100
More than 56% of the population is younger than 30 yearsIn the next 30 years the labor force will reach its maximum which represents a demographic bonus

33 40 48 53 57América Latina, 2012
Mexico is relatively well positioned in international competitive indexes: Global Competitiveness Index
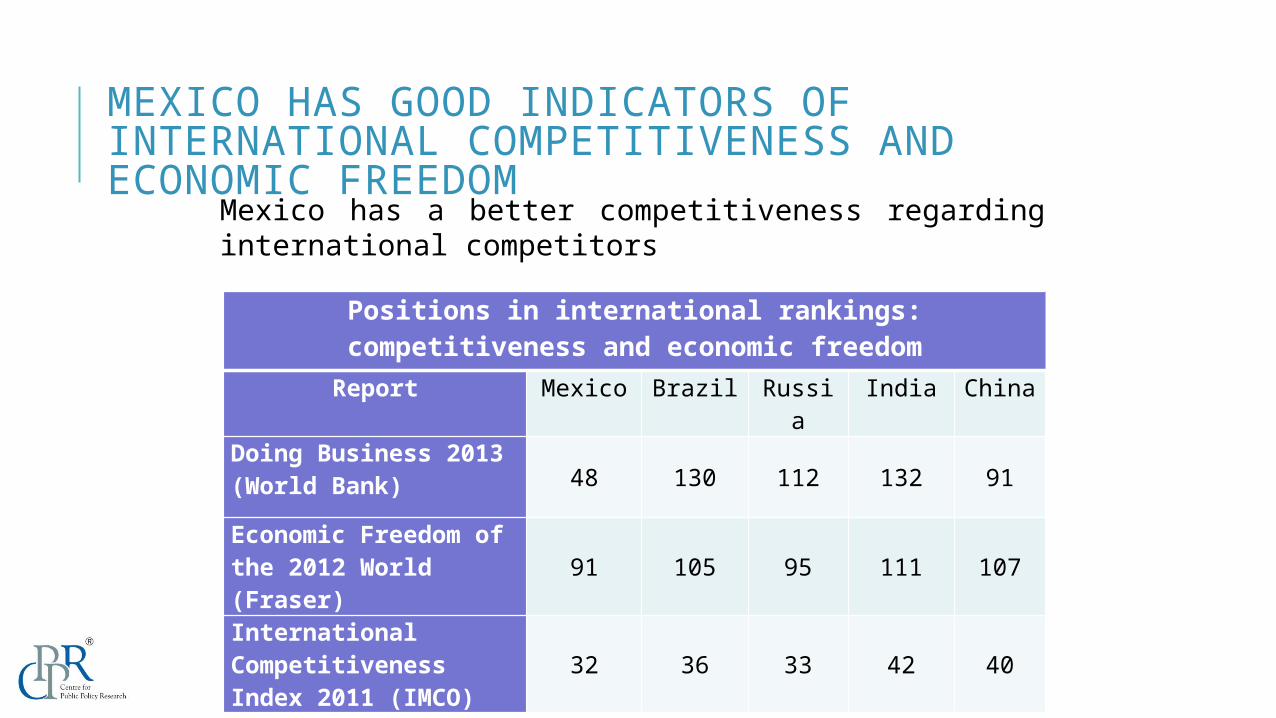
MEXICO HAS GOOD INDICATORS OF INTERNATIONAL COMPETITIVENESS AND ECONOMIC FREEDOM
23
Positions in international rankings: competitiveness and economic freedom
Report Mexico Brazil Russia
India China
Doing Business 2013(World Bank) 48 130 112 132 91
Economic Freedom of the 2012 World (Fraser)
91 105 95 111 107
International Competitiveness Index 2011 (IMCO)
32 36 33 42 40
Mexico has a better competitiveness regarding international competitors
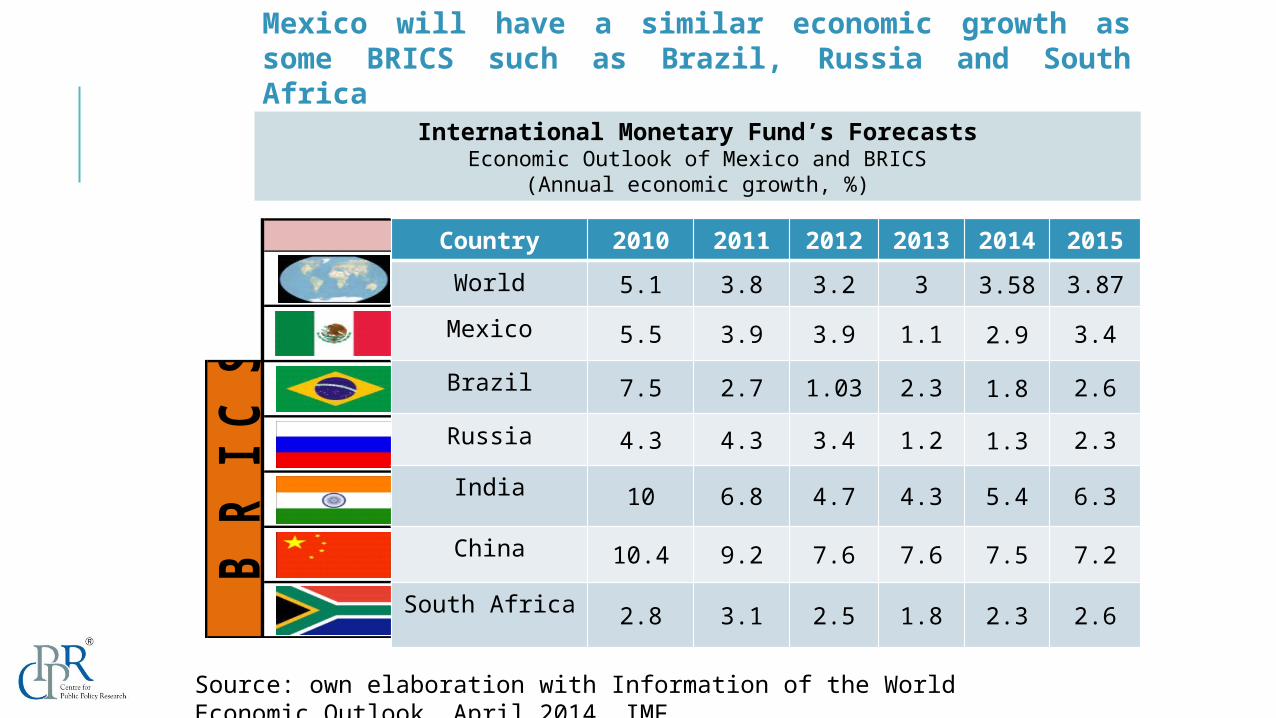
Mexico will have a similar economic growth as some BRICS such as Brazil, Russia and South Africa
2010 2011 2012p 2013pProducción M undial 5.3 3.9 3.5 4.1
M éxico 5.5 4.0 3.6 3.7
Brasil 7.5 2.7 3.0 4.1
Rusia 4.3 4.3 4.0 3.9
India 10.6 7.2 6.9 7.3
China 10.4 9.2 8.2 8.8
Sudáfrica 2.9 3.1 2.7 3.4Fuente: Elaboración propia con datos de Perspectivas de la Econom ía M undial, abril 2012, FM I
PaísB
R I C
SCountry 2010 2011 2012 2013 2014 2015World 5.1 3.8 3.2 3 3.58 3.87Mexico 5.5 3.9 3.9 1.1 2.9 3.4Brazil 7.5 2.7 1.03 2.3 1.8 2.6Russia 4.3 4.3 3.4 1.2 1.3 2.3India 10 6.8 4.7 4.3 5.4 6.3
China 10.4 9.2 7.6 7.6 7.5 7.2
South Africa 2.8 3.1 2.5 1.8 2.3 2.6
International Monetary Fund’s ForecastsEconomic Outlook of Mexico and BRICS
(Annual economic growth, %)
Source: own elaboration with Information of the World Economic Outlook, April 2014, IMF.

Challenges The external sector is not enough
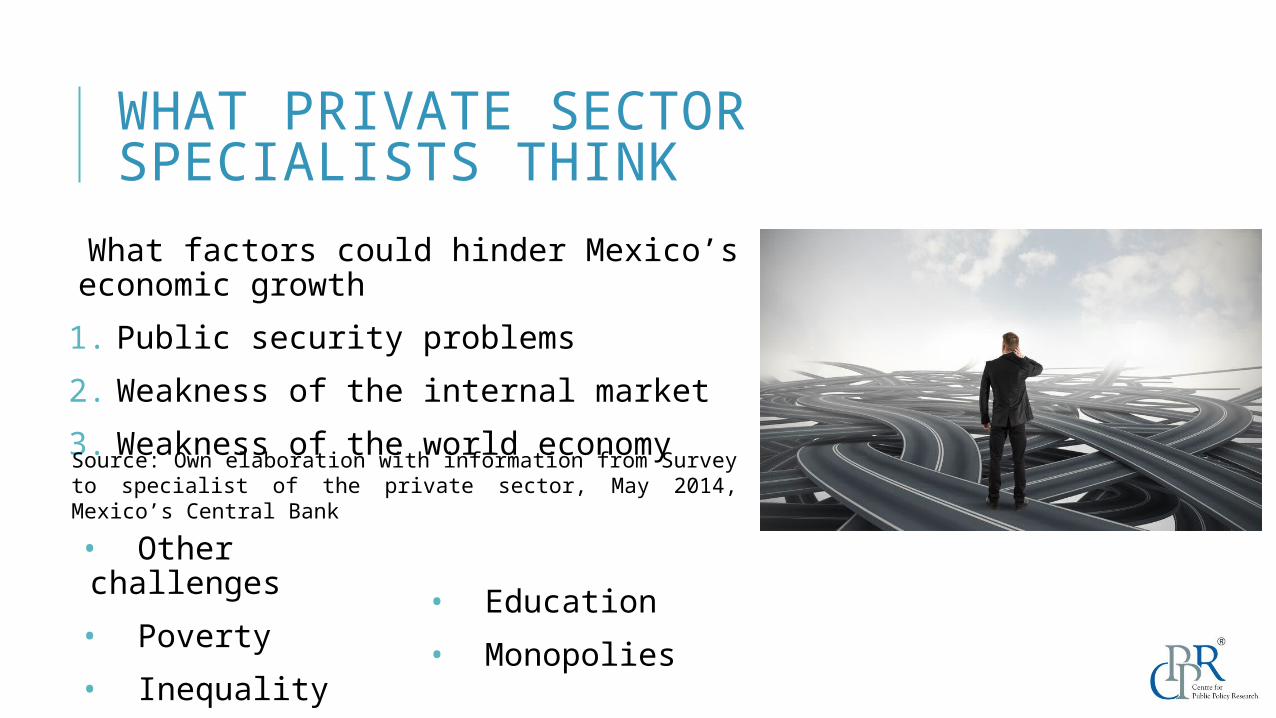
WHAT PRIVATE SECTOR SPECIALISTS THINK
What factors could hinder Mexico’s economic growth 1. Public security problems2. Weakness of the internal market3. Weakness of the world economySource: Own elaboration with information from Survey to specialist of the private sector, May 2014, Mexico’s Central Bank• Other challenges • Poverty• Inequality
• Education• Monopolies
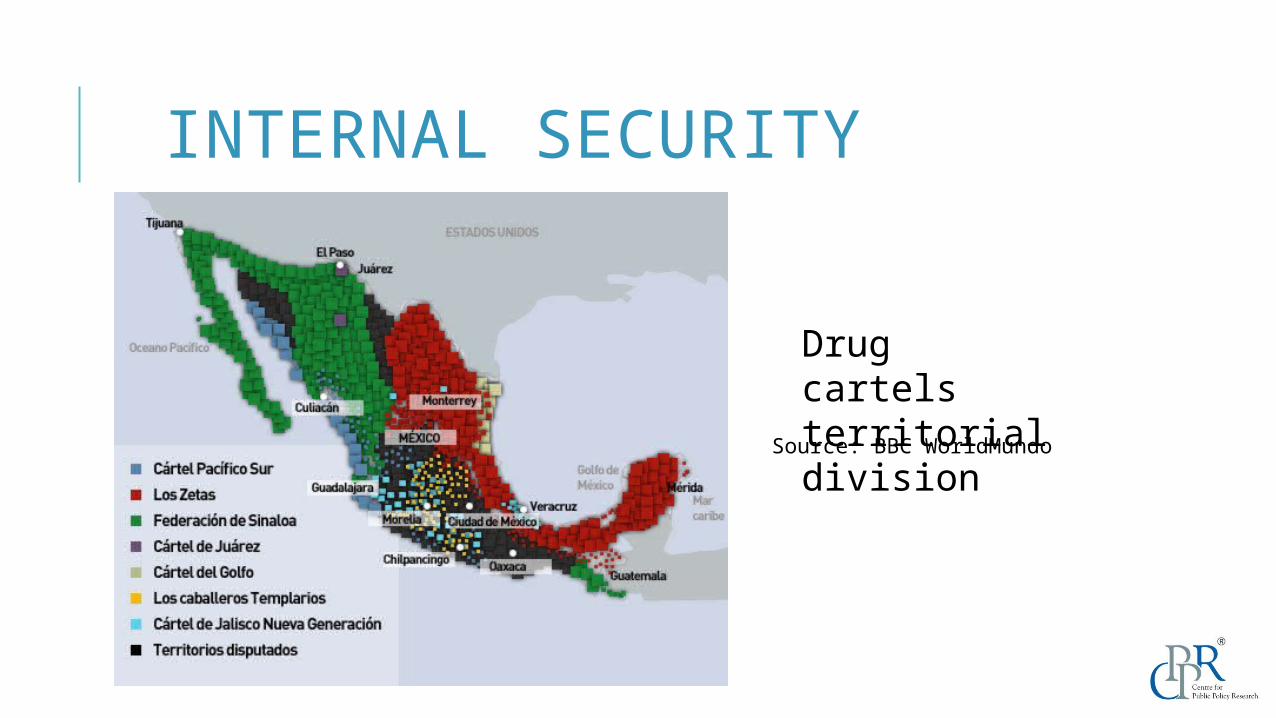
INTERNAL SECURITY
Drug cartels territorial division
Source: BBC WorldMundo
27
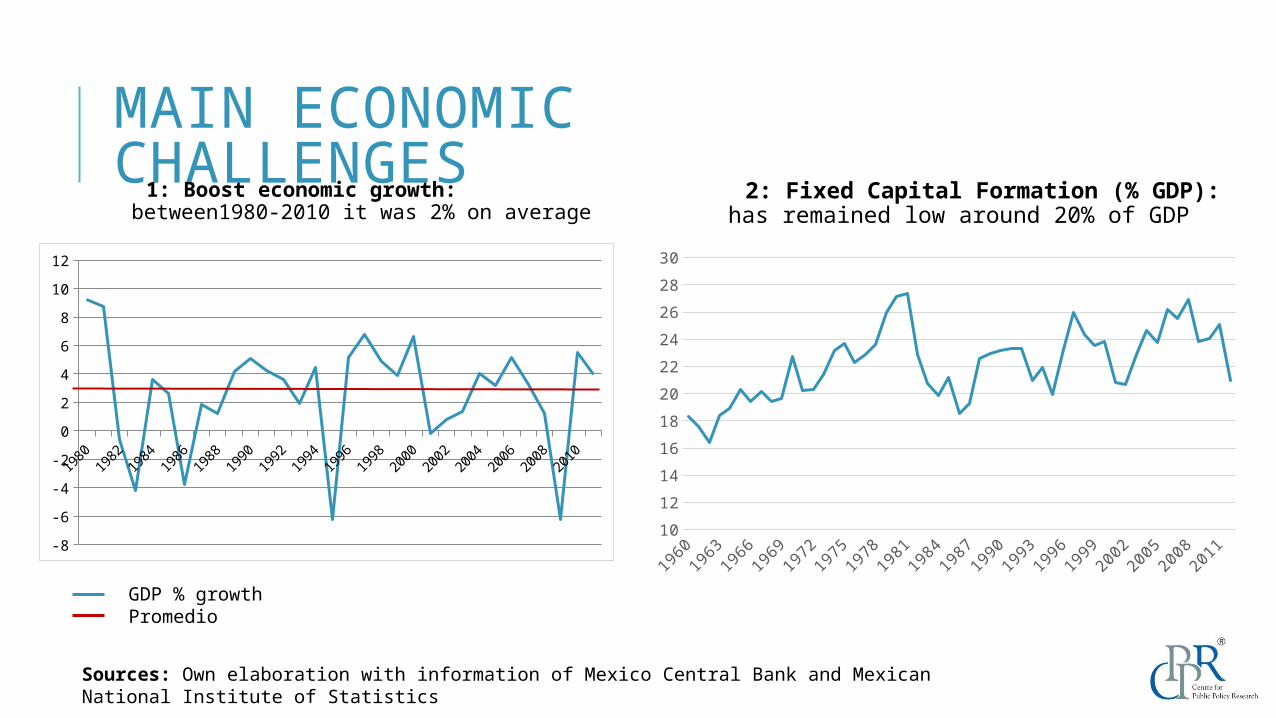
MAIN ECONOMIC CHALLENGES 1: Boost economic growth: between1980-2010 it was 2% on average
1980198
2198
4198
6198
8199
0199
2199
4199
6199
8200
0200
2200
4200
6200
8201
0
-8-6-4-202468
1012
GDP % growthPromedio
Sources: Own elaboration with information of Mexico Central Bank and Mexican National Institute of Statistics
1012141618202224262830
2: Fixed Capital Formation (% GDP): has remained low around 20% of GDP
MAIN ECONOMIC CHALLENGES II
29
11.21.41.61.8
22.22.42.62.8
3
Sources: Own elaboration with information of Mexican National Institute of Statistics INEGI
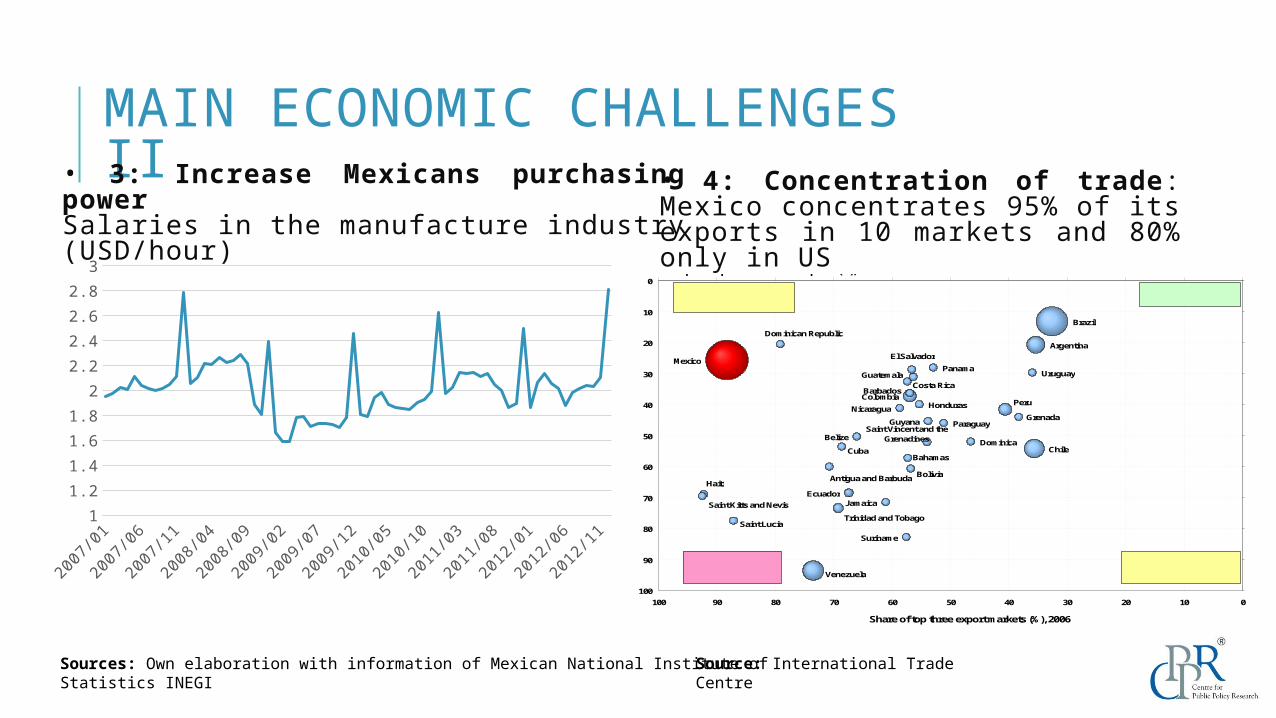
• 4: Concentration of trade: Mexico concentrates 95% of its exports in 10 markets and 80% only in US
Source: International Trade Centre
• 3: Increase Mexicans purchasing powerSalaries in the manufacture industry (USD/hour)
GrenadaSaint Vincent and the
Grenadines
Saint Kitts and Nevis
Dominica
Antigua and Barbuda
Saint Lucia
Belize
Barbados
Guyana
Haiti
Nicaragua
Panama
Suriname
Honduras
El Salvador
Paraguay
Jamaica
BahamasCuba
Guatemala Uruguay
Bolivia
Dominican Republic
Costa Rica
Ecuador
Trinidad and Tobago
PeruColombia
Argentina
Chile
Venezuela
Brazil
Mexico
0
10
20
30
40
50
60
70
80
90
1000102030405060708090100
Share of top three export markets (%), 2006
High product concentrationLow market concentration
Low product andmarket concentration
High product andmarket concentration
Low product concentrationHigh market concentration
Share of top three products in total exports (%), 2006
✓ ✗
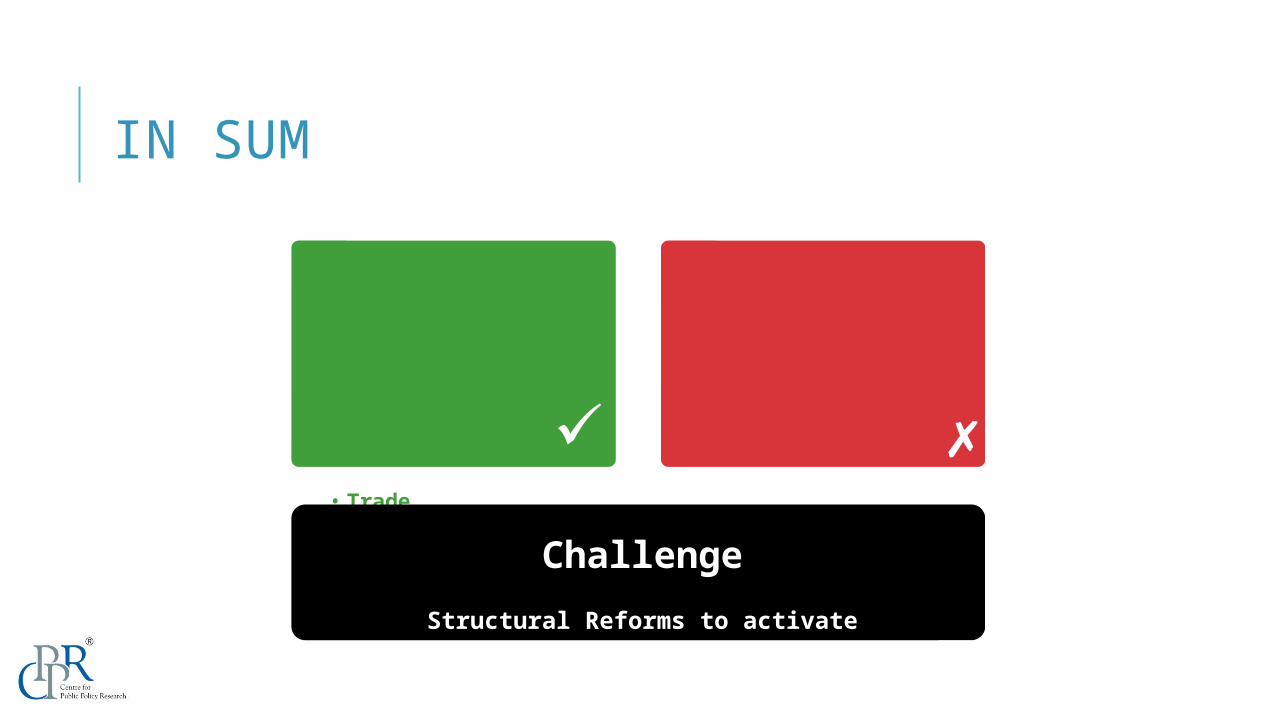
IN SUM
30
Strengths Weaknesses• Macroeconomic stability
• Competitiveness
• Trade
• High vulnerability of external sector
• Insufficient economic growth
ChallengeStructural Reforms to activate
internal market


