Embed Size (px)
Citation preview

FACTBase Bulletin 31
June 2013
1
Perth’s global connectivity in energy
Kirsten Martinus
Introduction
Cities and their global socio-economic influence have long been of interest to researchers and policy-makers. Geddes’ book Cities in Evolution (1915) first defined world cities according to cultural evolution and economic openness, then Hall’s The World Cities (1966, 1984) added the multitude of roles and functions that these places contribute to all aspects of policy, finance, trade, culture, entertainment, science and technology. By the 1990s, the term ‘global cities’ emerged (Sassen, 1991) describing a hierarchy of strategic transnational networks. The cities at the top of this hierarchy were viewed as global ‘command centres’ concentrating world financial, political and production power.
Over the past decade or so, a considerable body of work has focused on the role of advanced producer service (APS) 1 firms in linking together cities in the world economy (Beaverstock, Smith & Taylor, 2000; Taylor, 2001). These firms are critical not only to flows of finance, information and people, but also have considerable political and economic influence. Detailed analysis of the structure and linkages of these firms has paved the way for analysis that identifies hierarchies of nodes and networks within the global economy. Led by a group at Loughborough University in the United Kingdom, cities have been ranked according to their position in the network, with only two Australian cities – Sydney and Melbourne - identified as genuinely ‘global’ centres (‘Alpha cities’), with Perth and Brisbane identified as second tier or ‘Beta cities’ (GaWC, 2013).
Using APS to benchmark cities is logical, being strongly seated in observations of economic restructuring from the 1980s with the rise of services and decline of manufacturing (Sassen, 1990; Castells, 1991). At the same time, however, looking only at APS may overlook the important role that other sectors play in integrating cities into the global economy. Indeed, Australia’s links with the global economy have traditionally come from quite different sectors to the ‘classical’ global cities such as New York, Tokyo and London, with natural resources being critical (Tonts, Martinus & Plummer, 2013).
This FACTBase Bulletin explores an alternative landscape of power and influence based on the location decisions of multinational organisations in the Energy sector and, in particular, focuses on where Perth lies within this global network. The analysis reveals a different line-up of cities contributing to more subtle, but perhaps just as powerful, set of forces operating in within the global economy.
1 APS include firms engaged in accountancy, advertising, insurance, management consulting, banking/finance and commercial law.

FACTBase Bulletin 31
June 2013
2
Method
The Platts list of the world’s 100 largest energy companies provided the initial database on which the analysis presented here is based. All global offices of these companies were recorded and ranked (0-5) depending on their level of importance. The direction of reporting relationships between offices was also recorded to ascertain the level of autonomy and influence of a given location. Overall, this database provided a measure of strategic global importance of every office to each multinational energy company, and the hierarchical structure of the energy city network. It should be emphasized that, given the methods used here and the sensitivity of the network calculations, the relative position of cities within the network should be seen as a broad indicator of its situation within the global network, rather than has a hard and fast ‘league ladder’.
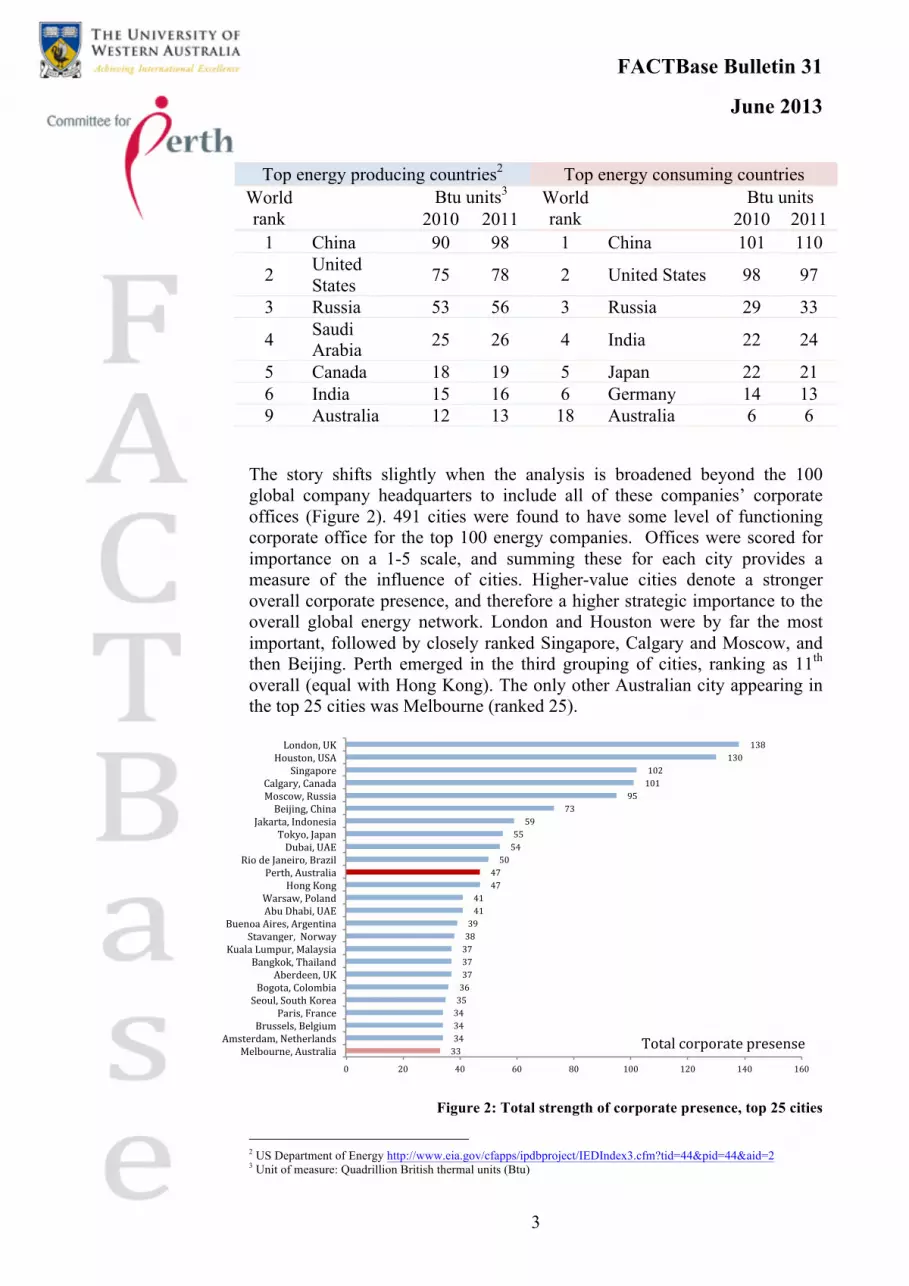
An overview of energy landscape Amongst the top 100 energy companies globally, the cities with the most corporate headquarters are Calgary (Canada) and Moscow (Russia) at equal first, Houston (USA) at second, followed closely by Beijing and then Tokyo (Figure 1). According to the US Department of Energy (Table 1), these cities are located in countries known for being major energy producers (Canada, USA, Russia and China) as well as major energy consumers (China, USA, Russia and Japan). There are also significant clusters of cities with corporate energy headquarters in the USA (west coast, east coast and mid-west), South America (Brazil), Western Europe (Germany, England, Spain and The Netherlands), Eastern Europe (Poland, Hungary and Kazakhstan) and South-East Asia (India and China). Perth is not particularly significant with its one headquarter located a long way from the nearest cluster in South-East Asia.
Figure1: Locations of energy corporation global headquarters
Table 1: Top energy producing and consuming countries
FACTBase Bulletin 31
June 2013
3
Top energy producing countries2 Top energy consuming countries World rank Btu units3 World
rank Btu units 2010 2011 2010 2011
1 China 90 98 1 China 101 110
2 United States 75 78 2 United States 98 97
3 Russia 53 56 3 Russia 29 33
4 Saudi Arabia 25 26 4 India 22 24
5 Canada 18 19 5 Japan 22 21 6 India 15 16 6 Germany 14 13 9 Australia 12 13 18 Australia 6 6
The story shifts slightly when the analysis is broadened beyond the 100 global company headquarters to include all of these companies’ corporate offices (Figure 2). 491 cities were found to have some level of functioning corporate office for the top 100 energy companies. Offices were scored for importance on a 1-5 scale, and summing these for each city provides a measure of the influence of cities. Higher-value cities denote a stronger overall corporate presence, and therefore a higher strategic importance to the overall global energy network. London and Houston were by far the most important, followed by closely ranked Singapore, Calgary and Moscow, and then Beijing. Perth emerged in the third grouping of cities, ranking as 11th overall (equal with Hong Kong). The only other Australian city appearing in the top 25 cities was Melbourne (ranked 25).
Figure 2: Total strength of corporate presence, top 25 cities
2 US Department of Energy http://www.eia.gov/cfapps/ipdbproject/IEDIndex3.cfm?tid=44&pid=44&aid=2 3 Unit of measure: Quadrillion British thermal units (Btu)
33 34 34 34 35 36 37 37 37 38 39 41 41
47 47 50 54 55 59
73 95
101 102
130 138
0 20 40 60 80 100 120 140 160
Melbourne, Australia Amsterdam, Netherlands
Brussels, Belgium Paris, France
Seoul, South Korea Bogota, Colombia
Aberdeen, UK Bangkok, Thailand
Kuala Lumpur, Malaysia Stavanger, Norway
Buenoa Aires, Argentina Abu Dhabi, UAE Warsaw, Poland
Hong Kong Perth, Australia
Rio de Janeiro, Brazil Dubai, UAE
Tokyo, Japan Jakarta, Indonesia
Beijing, China Moscow, Russia Calgary, Canada
Singapore Houston, USA London, UK
Total corporate presense

FACTBase Bulletin 31
June 2013
4
Analysis of spatial connectivity of energy corporations In understanding the importance of cities within the global energy network, the significance of each office and the global reporting relationships were recorded. Directionality is assigned to the data to account for communication flows (inflows and outflows) from progressively smaller offices to corporate headquarters. Put another way, if an office in Perth reported to a regional headquarters in Singapore then this is reported as an ‘outflow’, while an office in, say, Malaysia reporting to an office in Perth would be recorded as an ‘inflow’.
The interaction between the cities is evident in the world map in Figure 3, with colours and groups roughly forming regional territories. The colour of each circle is a city’s regional territory and arrows indicate the direction of local information flows. From this, we can see the key energy territorial units are the Americas (light blue), Middle East/Africa (medium green), Asia/Oceania (dark green) and Europe (dark blue). Cities coloured differently to the territory they are located in are either: 1) too insignificant in the network to be assigned a territory (e.g., cities in pink, yellow, etc); or 2) have high significance outside of their own territorial unit (i.e., Tokyo is light blue, indicating its strong corporate energy relationship to the Americas). Perth appears moderately influential within the energy network, with connections largely associated with its own territorial unit of Asia/Oceania.
Figure 3: Total network of top 100 Platts energy corporations
The position of Perth, along with in- and out- information flows, are highlighted in red in Figure 4. Notwithstanding its high connectivity across the whole Asia/Oceania region, Perth has particularly strong connections with Tokyo, Kuala Lumpur, Hong Kong, Singapore, Bangkok, Seoul and Beijing. It also links directly to Western Europe and USA through the highly

FACTBase Bulletin 31
June 2013
5
connected cities of Paris and Houston and lesser-linked cities of Vienna, El Dorado and San Antonio.
Figure 4: Perth’s connectivity in total energy network
Analysis of network inflows and outflows of information provides insight into the differences in influence and control of the energy landscape by regional territories and individual cities. In the context of incoming connections (Figure 5), the top 25 cities are dominated by Western Europe (9 of the 25 cities or 36%) and Asia/Oceania (6 cities or 24%). However, the importance of Western Europe in the energy landscape declines sharply to 12% (three cities) in the top 25 cities of outgoing connections (Figure 6). As such, there appears to be greater equality in regional influence in terms of network outflows amongst the regional units of Eastern Europe (16%), South America (16%), Middle East/Africa (24%) and Asia/Oceania (24%).

FACTBase Bulletin 31
June 2013
6
Figure 5: Top 25 cities ranked by incoming connections
Figure 6: Top 25 cities ranked by outgoing connections
Perth’s presence in the top 25 cities for both incoming and outgoing connections suggests it is prominent in the overall connectivity of the energy network. However, its inflows at 18 (ranked 15th) are 59% less than that of the highest ranked cities. Similarly, in terms of outflows at 11 (ranked 12th) are 70% less than that of the highest ranked cities. This wide gap implies that
13
14
14
15
16
17
17
17
18
18
18
19
19
19
20
24
25
26
27
28
30
39
42
61
61
11
10
13
5
13
2
3
6
0
1
11
4
5
13
6
24
11
17
0
7
9
20
10
27
27
0 10 20 30 40 50 60 70
Bogota, Colombia Hong Kong Cairo, Egypt
Seoul, South Korea Dubai, UAE
Hague, The Netherlands Barcelona, Spain Madrid, Spain Berkshire, UK Bilboa, Spain
Perth, Australia Rome, Italy
Vienna, Austria Calgary, Canada New Delhi, India
Singapore Budapest, Hungary
Rio de Janeiro, Brazil Körfez, Turkey Tokyo, Japan Paris, France
Moscow, Russia Beijing, China Houston, USA London, UK
Total connection strength
Strength of outgoing connections
Strength of incoming connections
2 7 8 9
30 4
7 10
13 14
42 8
13 18
25 9
14 16
19 3
26 39
24 61 61
9 9 9 9 9 10 10 10 10 10 10 11 11 11 11
13 13 13 13 14
17 20
24 27 27
0 10 20 30 40 50 60 70
Bratislava, Slovakia Buenos Aires, Argentina
Bangkok, Thailand Abu Dhabi, UAE Paris, France Lagos, Nigeria Algiers, Algeria
Mexico City, Mexico Brussels, Belgium
Hong Kong Beijing, China Tripoli, Libya
Bogota, Colombia Perth, Australia
Budapest, Hungary Warsaw, Poland
Cairo, Egypt Dubai, UAE
Calgary, Canada Jakarta, Indo
Rio de Janeiro, Brazil Moscow, Russia
Singapore Houston, USA London, UK
Total connection strength
Strength of outgoing connections
Strength of incoming connections
FACTBase Bulletin 31
June 2013
7
the position of cities must be viewed in the context of relative magnitudes of influence and control, not just rank.
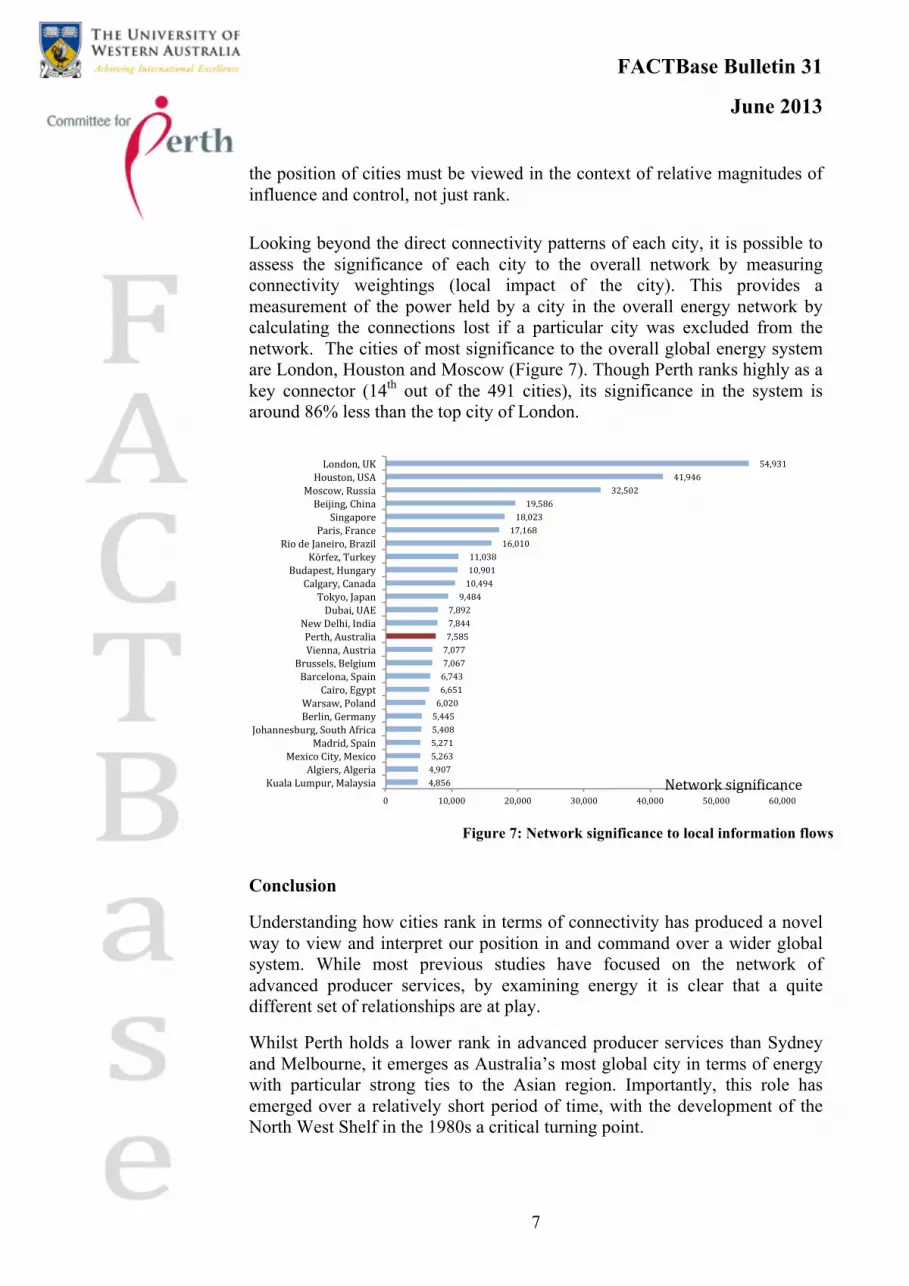
Looking beyond the direct connectivity patterns of each city, it is possible to assess the significance of each city to the overall network by measuring connectivity weightings (local impact of the city). This provides a measurement of the power held by a city in the overall energy network by calculating the connections lost if a particular city was excluded from the network. The cities of most significance to the overall global energy system are London, Houston and Moscow (Figure 7). Though Perth ranks highly as a key connector (14th out of the 491 cities), its significance in the system is around 86% less than the top city of London.
Figure 7: Network significance to local information flows
Conclusion
Understanding how cities rank in terms of connectivity has produced a novel way to view and interpret our position in and command over a wider global system. While most previous studies have focused on the network of advanced producer services, by examining energy it is clear that a quite different set of relationships are at play.
Whilst Perth holds a lower rank in advanced producer services than Sydney and Melbourne, it emerges as Australia’s most global city in terms of energy with particular strong ties to the Asian region. Importantly, this role has emerged over a relatively short period of time, with the development of the North West Shelf in the 1980s a critical turning point.
4,856 4,907 5,263 5,271 5,408 5,445 6,020 6,651 6,743 7,067 7,077 7,585 7,844 7,892 9,484 10,494 10,901 11,038
16,010 17,168 18,023 19,586
32,502 41,946
54,931
0 10,000 20,000 30,000 40,000 50,000 60,000
Kuala Lumpur, Malaysia Algiers, Algeria
Mexico City, Mexico Madrid, Spain
Johannesburg, South Africa Berlin, Germany Warsaw, Poland
Cairo, Egypt Barcelona, Spain Brussels, Belgium Vienna, Austria Perth, Australia New Delhi, India
Dubai, UAE Tokyo, Japan
Calgary, Canada Budapest, Hungary
Körfez, Turkey Rio de Janeiro, Brazil
Paris, France Singapore
Beijing, China Moscow, Russia Houston, USA London, UK
Network signi\icance

FACTBase Bulletin 31
June 2013
8
In terms of wider policy significance, this preliminary analysis has a number of potential implications. Firstly, it offers insights into the cities with which we most interact, not in traditional trade terms, but in terms of power and influence. Secondly, it provides clues as to the potential sources of investment and strategic partnerships that might benefit Perth. Thirdly, given that the city is embedded within a global labour market that is highly competitive, it demonstrates where we might locate the talent that enables Perth to maximize its advantages in the energy economy. Finally, it demonstrates the extent to which Perth has successfully integrated with the global economy, not simply as a provider of energy, but as a decision-making hub.
References Beaverstock, J., Smith, R. & Taylor, P. (2000) World-city network: a new metageography? Annuals of the Association of American Geographers, 90(1), 123-134.
Castells, M. (1991) The Informational City: Economic Restructuring and Urban-Regional Process. Blackwell: Oxford.
Derudder, B. and Hennemann (2012) An alternative approach to the calculation and analysis of connectivity in the world city network. GaWC Research Bulletin 401.
Fiott, D. (2009) China’s PLAN: securing supplies and sailing into blue waters? Madariaga Papers, 2(6).
GaWC (2013) GaWC Research Bulletins. Available at: http://www.lboro.ac.uk/gawc/publicat.html
Geddes, P. (1915) Cities in Evolution. London: Williams and Norgate.
Hall, P. (1966) The World Cities. London: Weidenfeld and Nicolson.
Hall, P. (1984) The World Cities. 3rd edition. New York: St. Martin's Press.
Sassen, S. (1990) Economic restructuring and the American city. Annual Review of Sociology, 16, 465-490.
Sassen, S. (1991) The Global City. Princeton: Princeton University Press.
Taylor, P. (2001) Specification of the world city network. Geographical Analysis, 33(2), 181-194.
Tonts, M., Martinus, K. & Plummer, P. (2013, in press) Regional development, redistribution and the extraction of mineral resources: The Western Australian Goldfields as a resource bank. Applied Geography, http://dx.doi.org/10.1016/j.apgeog.2013.03.004
FACTBase Bulletin 31
June 2013
9
About FACTBase
The FACTBase project is a joint venture between the University of Western Australia and the Committee for Perth, an influential member-based organisation driven by a diverse assembly of Perth’s leaders. Members collaborate with business, government and community groups to actively improve the liveability of our city, resulting in a real and enduring contribution to Perth and the metropolitan area.
One of the only broad-reaching projects of its kind to be undertaken in the southern hemisphere, FACTBase condenses the plethora of databases and studies on the subject of liveability and analyse what’s happening in Perth through words, maps and graphs.
About the Author
Kirsten Martinus is an Assistant Professor of Human Geography at The University of Western Australia.
Copyright
This paper is copyright of The University of Western Australia and the Committee for Perth. While we encourage its use, it should be referenced as:
Martinus, K. (2013) Perth’s global connectivity in energy, FACTBase Bulletin No. 31, The University of Western Australia and Committee for Perth, Perth.
Contacts For further information on the FACTBase project contact: Marion Fulker, CEO, Committee for Perth 0419 048 665 or [email protected] Dr Kirsten Martinus, Assistant Professor - Human Geography, School of Earth and Environment, The University of Western Australia 0431 435 602 or [email protected] Committee for Perth Research work commissioned by the Committee for Perth is funded entirely through the contribution of our members. Our Foundation Members are: Foundation Members Alcoa ANZ Bankwest BHP Billiton Chevron Ernst & Young
Herbert Smith Freehills Rio Tinto Shell Wesfarmers The West Australian Woodside

FACTBase Bulletin 31
June 2013
10
A full list of Committee for Perth members is available at www.committeeforperth.com.au.


