Embed Size (px)
Citation preview

Tania Ziegler, Rotem Shneor, Karsten Wenzlaff, Krishnamurthy Suresh, Felipe Ferri de Camargo Paes, Leyla Mammadova, Charles Wanga, Neha Kekre, Stanley Mutinda, Britney Wanxin Wang, Cecilia López Closs, Bryan Zhang, Hannah Forbes, Erika Soki, Nafis Alam and Chris Knaup.
Global Alternative Finance Market Benchmarking
The
Report
2nd
June 2021
In partnership with: With support of:

The 2nd Global Alternative Finance Market
Benchmarking ReportTania Ziegler, Rotem Shneor, Karsten Wenzlaff, Krishnamurthy Suresh, Felipe Ferri de Camargo Paes,
Leyla Mammadova, Charles Wanga, Neha Kekre, Stanley Mutinda, Britney Wanxin Wang, Cecilia López Closs, Bryan Zhang, Hannah Forbes, Erika Soki, Nafis Alam and Chris Knaup.
Table of Contents
Forewords .......................................................................................................................................5
A Note from the Editors ......................................................................................................... 10
Research Team ...........................................................................................................................11
Acknowledgements ................................................................................................................14
Executive Summary ............................................................................................................... 25
Chapter 1: The Global Alternative Finance Ecosystem .........................................30Introduction .................................................................................................................................. ......................... 30Methodology ......................................................................................................................................................... 32The Size and Growth of the Global Alternative Finance Market ................................................. 35Market Dynamics .................................................................................................................................................51Financial Inclusion ............................................................................................................................................... 54Risk & Regulations ............................................................................................................................................... 58Predictors of Market Development ........................................................................................................... 62
Chapter 2: A Regional Discussion on Europe & the United Kingdom ...........70Total Regional Volume ....................................................................................................................................... 70Market Dynamics ................................................................................................................................................ 79Institutionalisation .............................................................................................................................................. 84Internationalisation ............................................................................................................................................ 85Financial Inclusion ............................................................................................................................................... 87Risk & Regulations ............................................................................................................................................... 90
Chapter 3: A Regional Discussion on Asia Pacific ...................................................99Total Regional Volume ....................................................................................................................................... 99Market Dynamics ............................................................................................................................................. 106Institutionalisation ........................................................................................................................................... 108Internationalisation ......................................................................................................................................... 109Financial Inclusion .............................................................................................................................................110Risk and Regulations ........................................................................................................................................113
Chapter 4: A Discussion on China ...................................................................................119Total Regional Volume .....................................................................................................................................119Market Dynamics ............................................................................................................................................. 120
Chapter 5: A Regional Discussion on the Americas ............................................. 122A Discussion on the United States & Canada ..................................................................................... 122Alternative Finance in Latin America & the Caribbean (LAC) .................................................... 129Market Dynamics ............................................................................................................................................. 140Financial Inclusion .............................................................................................................................................145Risk & Regulations ............................................................................................................................................ 148

Chapter 6: A Regional Discussion on the Middle East and North Africa ... 153Introduction .................................................................................................................................. ...................... 153Total Regional Volume .................................................................................................................................... 153Market Dynamics ............................................................................................................................................. 159Institutionalisation ........................................................................................................................................... 159Internationalisation ......................................................................................................................................... 160Financial Inclusion ............................................................................................................................................ 160Risks and Regulations ..................................................................................................................................... 162
Chapter 7: A Regional Discussion on Sub-Saharan Africa ................................ 165Introduction .................................................................................................................................. ...................... 165Total Volume by Year ...................................................................................................................................... 165Foreign and Domestic Alternative Finance Platforms in SSA ..................................................... 166Total Volume by Model ...................................................................................................................................167Institutionalisation ........................................................................................................................................... 172Internationalisation ......................................................................................................................................... 173Financial Inclusion .............................................................................................................................................174Risk & Regulations .............................................................................................................................................176
Endnotes ..................................................................................................................................... 182
Appendix ....................................................................................................................................190
Forewords
5
Forewords
The mission of the Cambridge Centre for Alternative Finance to address the knowledge gaps left by a rapidly evolving alternative finance landscape is even more relevant today than when the Centre started this important work in 2015. The COVID-19 pandemic, and related public policy responses, has rapidly changed the context in which financial technology firms operate and the associated risks and opportunities for funders, fundraisers, regulators and policy makers. For this reason, we amended our original timeline to be able to present two years of data, collected and analysed between July 2020 and May 2021. It is our hope that this work will provide timely, credible data that shines a light on the performance and contribution of this sector prior to and during COVID-19 and will bring forward tangible insights that can aid the decision-making of market participants, regulators, and related stakeholders.
The 2nd Global Alternative Finance Market Benchmarking Report contributes 2019 and 2020 data, collected from financial technology firms that undertake Digital Lending and Digital Capital Raising activities, to our globally comparable panel database on alternative finance. The data shows that alternative finance volumes globally (excluding China) continued to show strong growth reaching a record high of $113 billion dollars in 2020. Given the devastating impacts of economic lockdowns on Micro, Small and Medium-sized Enterprises (MSMEs) globally, it was further encouraging to see the share of alternative finance volumes raised by businesses increase by 51% year-on-year to record $53 billion in 2020; increasing the share of alternative finance volumes raised by businesses from 38% in 2019 to 47% in 2020.
The development of the alternative finance market globally continues to be uneven, with noteworthy gains in the United States, Latin America and the Caribbean and Sub-Saharan Africa but declines in People’s Republic of China, Asia-Pacific (excluding China) and Middle-East and North Africa. An enabling regulatory environment remains a critical factor for the success of this sector, with the majority of responding firms citing changes in regulation as their highest perceived risk. Differential performance of this sector across markets allows us to compare policy and regulatory approaches by region- particularly relevant given the global nature of alternative finance. This study found that in 2020 multi-jurisdictional firms were responsible for 44% of global alternative finance volumes.
I would like to thank our research partner, Agder University, as well the UK Foreign, Commonwealth and Development Office (FCDO), Invesco, The Inter-American Development Bank (IDB) and The Asian Development Bank Institute (ADBI) for their generous financial support for this project.
Dr Robert WardropDirectorCambridge Centre for Alternative Finance
The 2nd Global Alternative Finance Market Benchmarking Report
6
Public interest in alternative finance continues to grow especially in periods of uncertainty as those which continue to unravel following the global COVID-19 pandemic. This period has influenced individuals and businesses in many aspects of our daily lives and work, both raising concerns and creating opportunities for renewal and innovation. Financial markets in general, and alternative finance in particular, are of no exception.
The current global alternative finance benchmarking report represents a unique and insightful research into the development of alternative finance during the past two years. It shows ways in which the industry’s development has been influenced by COVID, as well as aspects in which it has been resilient in the face of COVID. Overall, it is impressive to note that the industry maintains its growth in a majority of markets while exhibiting flexibility in realigning itself with emerging needs and conditions.
We at the University of Agder’s School of Business and Law maintain our commitment to the research of this fascinating industry and its impact on multiple stakeholders at the local, national, regional, and international levels. Our Center for Crowdfunding Research is an internationally recognized knowledge hub maintaining a wide network of collaborations with academia, industry, and government entities in Norway and abroad.
As in previous years, we continue our close cooperation with the University of Cambridge Center for Alternative Finance through the co-production of the global alternative finance industry report. This partnership has produced a series of impactful publications and events and is based on common aspirations for excellence and leadership in scholarly work on alternative finance.
We continue our strong commitment to this important line of work and look forward to following its development through ever more ambitious research.
Dr. Kristin WallevikDeanSchool of Business and LawUniversity of Agder

Forewords
7
This 2nd Global Alternative Finance Benchmarking Study illustrates the global explosion of financial technology. Around the world, FinTech is blowing apart traditional ways of banking, investing and raising finance. FinTech can increase access to vital finance for vulnerable populations. In 2020 international remittances processed via mobile money increased by 65%. These new technologies provide huge opportunities and rewards for FinTech pioneers and for investors and countries in search of growth. But FinTech brings new hurdles to overcome. As innovation continues to move at pace, it is crucial that regulators, policy makers and industry work together to ensure it is done in a secure way that protects consumers and encourages competition. We are working to address this with our international partners.
The UK has more than 10 per cent of the global market share in FinTech. It is a national success story that is central to the Chancellor’s aim to make the UK the most open, and dynamic place in the world to operate a financial services business.
But FinTech will also be an increasingly important engine for growth in developing and emerging economies. Which is why the Foreign, Commonwealth & Development Office supports the Cambridge Centre for Alternative Finance to deliver technical assistance using insights from studies like this to help policymakers, regulators, and industry to navigate the digital transformation of the global financial system.
The report confirms that the United Kingdom continues to be a global epicentre of fintech development and growth. It shows how the UK FinTech sector grew from $4.9bn in 2015 to $12.6bn in 2020.
The report also plots strong growth in FinTech across Sub-Saharan Africa, Asia-Pacific, and the Middle East and North Africa. FinTech delivered $10.7bn of finance across these three regions last year, of which $4.5bn was accessed by businesses.
While COVID-19 has subdued the growth of FinTech in some areas, and reversed gains in others, we are also encouraging signs of its resilience in Indonesia, Vietnam, Thailand, Kenya, and South Africa.
The study reveals the important role of FinTech in extending finance to women and lays bare how fragile these gains can be. In 2019, businesses run by women raised $84bn from FinTech platforms globally. This declined to $37bn in 2020. While this decline happened within the context of a global pandemic, and an overall decline in China’s share of the global fintech market, it highlights the continued need for policy, regulation and development initiatives that prioritise the financing of female entrepreneurs.
FinTech clearly has a huge role to play in helping individuals and economies to grow their way out of poverty, and the UK government is committed to accelerating that growth.
James Duddridge MPThe UK’s Minister for AfricaForeign, Commonwealth & Development Office (FCDO)

The 2nd Global Alternative Finance Market Benchmarking Report
8
Invesco is proud to be a sponsor of the ongoing research published by the Cambridge Center for Alternative Finance. This is the second Global Alternative Finance Report Invesco has had the opportunity to be involved with, and the insights that are presented provide key indicators of spaces that we continue to monitor as our industry experiences fundamental business and operational disruptions imposed by technological advancements.
2020 was a year like no other. World economies were tested with the onset of the global Covid-19 pandemic; the result of which were a series of unprecedented and disparate actions and reactions including the complete shutdown of entire countries creating ripple effects in financial markets that are still being felt today. While the pandemic challenged the core of several industries, it also provided noteworthy moments in financial markets and accelerated interest in new opportunities particularly in the cryptocurrency and digital asset spaces.
While the focus of this report is specifically on the global classic alternative finance activities related to lending and capital raising, such as P2P/Marketplace Consumer Lending and Balance-sheet Business Lending models, we are beginning to see the convergence and intersection of threads of a completely new landscape in alternative finance via digital assets and decentralized finance. As we continue to monitor how these two spaces shape the competitive landscape in relation to one another, the trends provided in this report become increasingly relevant as proof points to incorporate into the signals to guide the actions of traditional asset management. For example, we recently read headlines that El Salvador made the decision to accept bitcoin as legal tender. This decision opens entire new opportunities that we also believe will eventually also play a factor in the alternative finance space.
The information in the report provides a global view and regional nuances in key geographic markets where we operate. From a global perspective, the continued contraction of activity in China and the growth of institutional investment are of particular interest as both are key areas of focus for Invesco. The observation of overall contraction of alternative finance volume in 2020, with data points showing growth in key European economies including the UK, Germany, and France, signals that the growth in alternative finance is not just a passing fad, but a steadily growing sustained evolution even in difficult times. Additionally, this year Invesco announced the expansion of activities into Africa as a key growth region, a strategic decision also supported by information illustrated in the report of the rapid growth of alternative finance activities.
As the financial services landscape morphs and evolves, we intend to strengthen our relationship with academic institutions such as Cambridge among other external ecosystem members. As always, Invesco appreciates the quality and consistency of research, and commend the research team’s dedication to pursuing and delivering updated insights despite the challenges and circumstances presented by the pandemic. Invesco continues to pursue our commitment to becoming the most client centric asset manager, and our journey is made possible through access to best in-class knowledge and partnerships like the one we have with the Cambridge Center for Alternative Finance.
Dave DowsettGlobal Head of Technology Strategy & InnovationInvesco
Forewords
9
This Second Global Alternative Finance Market Benchmarking Report continues the success of the first global report and the three consecutive editions of The Americas Alternative Finance Benchmarking Report. We have supported the University of Cambridge Centre for Alternative Finance (CCAF) research on the Fintech ecosystem for six years now. The social and economic effects of COVID-19 created a social and economic burden for Latin America and the Caribbean (LAC), and governments answered to the challenges with various policies, including enabling Fintech models in some jurisdictions. Fintech appears as a solution for financing Micro, Small, and Medium Enterprises that otherwise would not receive any financial services because of risk perceptions. In Chapter 4: A Regional Discussion on the Americas, the reader will find new exciting data series and analysis that confirm the former assertion, and more: steady growth of alternative finance amid the challenging times and restrictions imposed by COVID-19, and the potential for fintech platforms in financing MSMEs all across the region.
Results from the Region: During the last couple of years (2019-2020) the alternative finance (AF) ecosystem in Latin America and the Caribbean grew up reaching $5.27 billion in originations for 2020, representing a growth of 9.1% compared to 2019 ($4.83 billion) but a stunning 191% when compared with 2018 ($1.81 billion). Brazil leads the region with $3.37 billion in 2020, 60% of the total. Second place in size is Chile ($803.6m, 11%), followed by Mexico ($547.9m, 7%), and Colombia ($341.7, 6.5%).
On the other hand, the LAC AF ecosystem increased the share of business finance to reach 86% in 2020 from 60% in 2018. Alternative finance business-oriented funding grew 260% compared with 2018, from $1.08 billion to more than $4.45 billion. Balance-Sheet Business Lending is the most used model in LAC to finance businesses with a total volume of more than $3 billion. Invoice trading explains an additional $1 billion of the total volume. Brazil and Chile, respectively, lead the volumes for these models in the region. AF platforms appear to be a feasible alternative to finance the Micro, Small, and Medium Enterprises, 95% of their business clients.
More interestingly, Alternative Finance works as a tool for financial Inclusion in other ways. Although 78% of fundraisers had an account in the financial system, they used AF as their primary funding source. As in the past editions of the study, we gathered numbers on gender; female fundraisers share decreased from 34% (2018) to 22% (2020), while female funders increased slightly from 22% to 23%.
Regulatory risks remain ranked as the highest risk perceived by platforms in the region. Again, 44% of the platforms consider that a regulatory change is the most relevant risk, followed by customer fraud (29%) and cyber-security breaches (25%). Interestingly, countries with regulatory advancements related to AF: Fintech (Brazil and Mexico) and Factoring (Chile) have been growing in volume significantly more than others who are just recently implementing or issuing regulations (Colombia, Peru). Furthermore, new AF regulations or rules were issued in Brazil, Colombia, Ecuador, Mexico, Peru, among other jurisdictions. Also, the implementation of three regulatory sandboxes in Brazil (central bank, securities, and insurance supervisors), a new version for the sandbox regulation in Colombia, the implementation of the sandbox in Mexico, and the start for innovation hubs in Central American countries occurred during 2019 and 2020. Most of these advances had the support of IDB through FintechLAC. IDB published recent studies on regulatory innovations, including one on multi-jurisdictional regulatory sandboxes.
Finally, the Second Global Alternative Finance Market Benchmarking Report constitutes part of IDB Group’s “Vision 2025, Reinvest in the Americas” from several standing points: MSME financing gap, promotion of a digital economy, and the prioritization of gender. These topics are integrated with the efforts of FintechLAC, the first and only public-private group for the Fintech ecosystem in LAC.
We hope the readers use the valuable data and information in the text, compare our region with others in the world, and understand that more actions should be taken by public and private actors of the ecosystem to grow. This effort will soon be complemented with a deep-dive in which more than 550 MSMEs, who were financed by AF platforms allowed us to compile data on their characteristics.
Juan Antonio KettererConnectivity, Markets, and Finance Division ChiefInter-American Development Bank

The 2nd Global Alternative Finance Market Benchmarking Report
10
A Note from the Editors
The alternative finance industry has weathered significant challenges since its birth. These range from establishing its position vis-à-vis the well-entrenched existing financial sector, negotiating regulatory amendments for better accommodating innovative business models, wining the heart and trust of would-be fundraisers and funders, as well as surviving a global plague that have stressed commercial activities in a variety of sectors throughout the world.
The current report is a testimony for the resilience of the alternative finance industry in face of all adversity. Specifically, when excluding the Chinese outlier, the global alternative finance industry has maintained healthy growth during both 2019 and 2020. Indicating that it has played a supporting role in helping stakeholders through the challenges that unfolded with the COVID-19 outbreak. In this respect, we see ample evidence of flexible and creative responses by industry players to both the challenges and opportunities that have emerged in the past two years.
Moreover, the current report highlights the unique circumstances and developments observed in different regions, which vary significantly in terms of their international exposure, regulatory evolution, business model compositions, degrees of engagement of institutional vs. retail funders, and the extent to which actors helped improve financial inclusion. Despite these differences, we also show that across countries, alternative finance development is supported by favorable macro environments characterized by higher levels of economic development, regulatory adequacy for alternative finance models, prevalence of general societal trust, and availability of relevant skills in the population.
Many markets remain at early stages of industry development, still negotiating their place in a wider economic context vis-à-vis traditional industry players, regulators, and prospective users of platform services. It remains to be seen whether the facts and figures documented represent the birth pains and blessings of a new industry, or whether they are part of a temporary development that can help reshape an old one, and continue to follow the extent to which alternative finance delivers on its promises of greater financial democracy in the long run.
Accordingly, it remains paramount that we continue to follow these developments and report them to the benefits of all stakeholders in the free and transparent way in which we have they have been done under the roof of the Cambridge Center for Alternative Finance. We are grateful to all research partners, platform respondents, and industry organizations that have contributed to the creation of this report under challenging conditions. We hope you find it helpful and insightful and invite you to participate in future data collections underlying this and similar reports.
Sincerely,
Tania Ziegler Rotem Shneor Karsten Wenzlaff

Research Team
11
Research Team
EDITORS & AUTHORS
Tania Ziegler Tania is Head of Global Benchmarking at the Cambridge Centre for Alternative Finance and manages the Centre’s industry facing research activities. She has authored over 25 industry reports and contributed to numerous academic and working papers since joining the CCAF. Tania is an expert on SME finance and leads the Centre’s work on ‘SME Access to Finance in LATAM’. Tania completed an MSc at the London School of Economics, and a BA at Loyola College Maryland. Tania is a 2010 Fulbright Scholar.
Rotem ShneorRotem is an associate professor at the University of Agder’s School of Business and Law in Norway and leads its Crowdfunding Research Center (www.crowdfunding-research.org). He is also an affiliate researcher at the Cambridge University Center for Alternative Finance and co-author to its annual industry reports. He co-founded and currently serves on the board of the Norwegian Crowdfunding Association. Rotem has published in a wide range of academic journals, trade magazines, and contributed several chapters to edited book volumes. He is also lead editor and author of a popular book on Advances in Crowdfunding Research and Practice.
Karsten Wenzlaff Karsten is a Research Affiliate at the at the Cambridge Centre for Alternative Finance. His research focus is on FinTech Self-Regulation, Civic Crowdfunding, Corporate Crowdfunding and Public-Private Partnerships in Alternative Finance. He teaches at the University of Hamburg at the Chair for Digital Markets and in the Cambridge Fintech Regulation and Financial Innovation Course at the Judge Business School of the University of Cambridge. In 2008 he received an MPhil in International Relations with a thesis on international financial regulation from the University of Cambridge. Since 2013, he supported the CCAF on the Alternative Finance Benchmarking Report, editing the European Alternative Finance Benchmarking Report since 2017 and editor of the Global Alternative Finance Benchmarking Report since 2018. In 2020, he became part of the Centre’s COVID-19 Response Team.
CO-AUTHORS & RESEARCH TEAM
Krishnamurthy Suresh Krish is a Market Researcher for Asia-Pacific region at the CCAF. Prior to joining CCAF, he was working with the Indian Institute of Management (IIM) Bangalore, India. His research interests lie in the areas of small and medium enterprise (SME) financing, new and alternative financing models for startups and SMEs, as well as regulatory frameworks. He was a visiting fellow (Pavate fellow) at the Cambridge Judge Business School in 2018.
Felipe Ferri de Camargo Paes Felipe is a Research Associate at the CCAF, he works with the Global Benchmark team, leads the work on ‘SME Access to Finance in LATAM’ and participated in the development of the CCAF Alternative Finance Atlas. He pursued his bachelor’s in mechanical engineering in Brazil and a master’s in management at the School of Economics at the University of Coimbra (FEUC) in Portugal with a focus on sharing economy macro economy effects in Lisbon.

The 2nd Global Alternative Finance Market Benchmarking Report
12
Leyla Mammadova Leyla is a Research Associate at CCAF and holds a PhD degree at Loughborough University in P2P (peer-to-peer) Lending. Her research investigates in credit risk and the future potential of digital lending market. She studied MSc in Finance and Investment at Bristol University and also worked for the Central Bank of Azerbaijan Republic as a Financial Researcher
Charles Wanga Charles is a Market Researcher, Sub Saharan Africa at CCAF since May 2020. Prior to joining CCAF, he was a Partner at Foresight Survey and Digital Solutions and he has also worked as a Research Manager at InterMedia Survey Institute, a global research consultancy. He holds a Bachelor of Science (Statistics) from the University of Nairobi and is pursuing a Master of Science (Social Statistics) from the same university.
Neha Kekre Neha has been a Research Associate at the CCAF since May 2020. Before joining the CCAF, she pursued her Masters in Regulatory Governance from Tata Institute of Social Sciences, Mumbai. Her master’s thesis focused on identifying the regulatory issues of peer-to-peer lending entities in India. She holds an undergraduate degree in Computer Science Engineering. Her academic pursuits have developed her research interests towards fintech and financial regulation (especially in the credit markets), understanding the interaction of alternative finance with the traditional financial systems and exploring the gaps therein.
Stanley MutindaStanley is a Market Researcher for MENA-MED at the CCAF. Prior to joining CCAF, he worked on various research projects at Busara Centre for Behavioral Economics and BFA Global. Previously, he worked for DataFirst Research Services housed at the University of Cape Town, South Africa, Ericsson, and Equity Bank Ltd, Kenya. He holds a Master’s degree in Development Economics from the University of Cape Town, South Africa and a Bachelor of Economics degree from the University of Nairobi, Kenya.
Britney Wanxin WangBritney is a Research Associate at Imperial College Business School and the Cambridge Centre for Alternative Finance (CCAF). She received her PhD from Imperial College London, and her BBA in Finance and Accounting with a Minor in Mathematics from the University of Hong Kong SAR. Her primary research interests include IT-enabled novel finance models, particularly online crowdfunding, and marketing/finance interface. Britney is currently the data lead in the global benchmarking research project and has co-authored several global and regional benchmark reports published by CCAF.
Cecilia López Closs Cecilia holds a BA on Business Administration from the Universidad Paraguayo Alemana (UPA). In 2019, she joined the CCAF as part of their Global Internship Programme. She aspires to continue learning about Fintech and the positive impact it can have on financial inclusion in developing countries, such as Paraguay.
Bryan Zheng Zhang Bryan is the Executive Director and a Co-Founder of the Cambridge Centre for Alternative Finance (CCAF). He has been researching the UK alternative finance market since 2013 and co-authored more than 35 high impact reports on financial innovation and regulatory innovation globally.
Hannah Forbes Hannah is a Research Associate at the CCAF and has a PhD in Crowd Innovation. Her research is within the democratisation of capital for start-ups with a focus on equity and rewards-based crowdfunding. She is also the Founder of The Funding Crowd, a UK-based crowdfunding consultancy, that supports businesses in raising finance through alternative models.
Research Team
13
Erika SokiErika holds a Masters degree from the Brazilian National School of Public Administration, where she developed research on SME financial inclusion and the perspectives of fintech players entering the Brazilian SME credit market. She has served as a civil servant at the Brazilian public sector for over a decade, where, prior to dedicating to research on financial inclusion, Erika worked extensively in international affairs, as advisor to the Central Bank Governor, and as officer for cooperation projects in central banking and financial regulation issues. She has also acted at local government level as head strategic management advisor, prior to joining the Central Bank staff
Nafis AlamProf Alam is currently working as a Professor of Finance and Head of School of Accounting and Finance at Asia Pacific University of Technology and Innovation (APU). He is also a research affiliate of Cambridge Centre for Alternative Finance (CCAF) at Judge Business School, University of Cambridge and contributes to global reports on Alternative Finance. Prof Alam works closely with the financial services industry in the Southeast Asia region and consult them on FinTech and Financial regulations. He can be followed at https://twitter.com/nafisalam
Chris Knaup Chris is a Research Associate at the Cambridge Centre for Alternative Finance. Prior to CCAF he worked as a mid-market technology investment banker in London. Chris holds a distinction in an MSc in Economics & Finance from the University of Bristol and has completed a first-class BEng in Engineering from the University of Sheffield with a year abroad in Singapore.

The 2nd Global Alternative Finance Market Benchmarking Report
14
Acknowledgements
We would like to thank the following individuals for their contribution and considerable support throughout the data collection, analysis and writing of this report: Gianluca Quaranta (Crowdfunding Cloud), Nicholas Drury (CCAF), Yassar Nasser (CCAF), Patrick Conteh (CCAF), Alexander Reviakin (CCAF), Qiran Ju (Imperial), Zihao Han (Imperial), Anton Dek (CCAF) and Yue Wu (CCAF) for their considerable research support throughout the data collection, analysis and writing up process.
We would also like to thank Raghavendra Rau, Robert Wardrop and Herman Smit for their counsel and guidance throughout this study.
We would like to extend our utmost gratitude to our research partners from across the globe. Without the help of these organizations, our survey dissemination would not have been possible:
Peter Renton (LendIt), Andrew Dix (CrowdfundInsider), Janine Hirt (Innovate Finance), Takeshi Kito (Japan FinTech Association), Leah Callon-Butler (GIFT), Sebastian Resano (GIFT), Shakila Kerre (FSDA),Elizabeth Howard (Africa Crowdfunding Association), Craig Asano (NCFA Canada), Susanne Chishti (FinTech Circle), Mercy Simorangkir (AFTECH), Nameer Khan (MENA FinTech Association), Chia Hock Lai (Singapore FinTech Association), Pauline Theobald Wray (Expand Research-BCG), Aaron Block (Expand Research-BCG), Stijn van der Krogt (Universidad Paraguayo Alemana), Olayinka David-West (Lagos Business School), Gabrielle Inzirillo (Plug and Play), Tal Schwartz (Canadian Lenders Association), Gary Schwartz (Canadian Lenders Association), Tom Hill (EY), Angel Sierra (FinTech Chile), Augusto Santos (Portugal FinTech), Matthew Pinter (Crowdfunding Institute of Australia), Simon Clegg (New Zealand Crowdfunding Association), , Natalia Pinzon (Asociacion FinTech Guatemala), Mariano F. Biocca (Camara Argentina de FinTech), Jorge Reyes (Ecuador FinTech), Maria Laura Cuya (FinTech Peru), Brian Tang (Hong Kong SAR FinTech Association), Thalia Sanae Waga (ABFintechs), Alessandro Lerro (Italian Equity Crowdfunding Association), Segun Aina (FinTech Association of Nigeria), Nattha Sirithanapisarn (Thai FinTech Association), Bruce Davis (UKCFA), Mike Carter (36H-Innovate Finance), Erick Rincon Cardenas (Colombia FinTech / Alianza Ibero-America), Kartik Varma (TechStars), Daniela Rocha Gil (Colombia FinTech), Cinthia Facciuto (Camara FinTech Paraguay), Francisco Mere (FinTech Mexico), Tulga Sukhdorj (Mongolian FinTech Association), Louise Garbo (Swedish FinTech Association), Christian Fae (Digital Finance Forum), Antonina Olecka (Swiss Finance and Technology Association), Alex Scandurra (Stone & Chalk), Shan Luo (FinTech Space), Josue Toho (Africa FinTech Forum), Carlos Valderrama (Legal Paradox), Ignacio Esteban Carballo (UCA), Owolabi Taiwo (Africa FinTech Network), Alex Sea (Africa FinTech Forum), Dumisani Dube (FinMark Trust), Kgomotso Tolamo (FinMark Trust) ,Eladio Delgado (Spanish Crowdlending Association), Florence de Maupeou (Financement Participatif France), Dr. Simon Amrei (Swiss Lending Association), Thomas Moth (Wirtschaftskammer Österreich), Miguel Armaza (Wharton FinTech), Zianah Muddu (Financial Technology Service Provider Association Uganda, Africa Fintech Network), Nazek Khatib (FinTech Galaxy), David Charlet (Anacofi), Euna Cook (PeopleFund, South Korea) and Lito Villanueva (FintechAlliance.ph)
In addition, we would like to thank the following organisations for their assistance in data collection and verification across Europe: European Centre for Alternative Finance at the University of Utrecht, Copenhagen FinTech, Finance Estonia, University of Hamburg Digital Markets Chair, Bundesverband Crowdfunding, the Nordic Crowdfunding Association, Crowd-Fund-Port Interreg Central Europe, Bulgarian Fintech Association and the Romanian Fintech Association.
We would also like to thank the following individuals for their guidance throughout this research program. They are Ronald Kleverlaan (ECAF), Dr. Vytautas Šenavičius (the Lithuanian P2P Lending Association) and Dr. Pawee Jenweeranon (Thammasat University).

Acknowledgements
15
We are very thankful to Louise Smith for designing the report, Karen Farnell for proof reading, Charles Goldsmith, Neil Jessiman and Philippa Coney for press and communications support, and Yvona Duncan and Kate Belger for their administrative support.
Finally, The Cambridge Centre for Alternative Finance would also like to express our gratitude to the UK Foreign, Commonwealth and Development Office (FCDO), Invesco, the Inter-American Development Bank, and the Asian Development Bank Institute for their financial support of this study. We would like to particularly thank Kim Bromley, Kathryn White and Shakira Birtwhistle at the FCDO, Bradley Bell of Invesco, and Juan Ketterer and Diego Mauricio Herrera Falla of the Inter-American Development Bank Institute for making this research possible.
We would like to thank our industry research partners from organizations across the globe who kindly disseminated the survey and provided much appreciated assistance to our study:
FACFAC

The 2nd Global Alternative Finance Market Benchmarking Report
16
We thank the following alternative finance platforms for participating and contributing to this study:
Acknowledgements
17
The 2nd Global Alternative Finance Market Benchmarking Report
18

Acknowledgements
19

The 2nd Global Alternative Finance Market Benchmarking Report
20
Acknowledgements
21
The 2nd Global Alternative Finance Market Benchmarking Report
22
Acknowledgements
23

The 2nd Global Alternative Finance Market Benchmarking Report
24
Executive Summary
25
Executive Summary
Since 2015, the Cambridge Centre for Alternative Finance (CCAF) has tracked and analysed the development of the global online alternative finance industry. In a typical year, CCAF data collection covers the preceding year. However, the COVID-19 pandemic presented a unique set of challenges which heightened the need to provide timely data to inform industry responses, evidence-based regulation and policymaking. To this end, this Global Alternative Finance Benchmarking Report presents two years of data – 2019 and 2020, collected and analysed by our research team between July 2020 and May 2021. By presenting market data for both years, this report can provide a clearer picture of the impact of COVID-19 on digital lending and digital capital raising activities around the world.
In total, 821 firms provided 2019 data, while 703 firms reported on their 2020 activity via our global benchmarking survey. These survey responses translate to 1,801 firm-level observations for 2019 and 1,660 firm-level observations for 2020, given firms that operate in multiple jurisdictions (sometimes via a separate entity) report their activities in each market individually.
When breaking down the survey sample by region, the 2019 data includes 631 firm-level observations in Europe, 108 in China, 359 in Asia Pacific (APAC) (excluding China), 258 in Latin America and the Caribbean (LAC), 78 in the Middle East and North Africa (MENA), 206 in Sub-Saharan Africa (SSA), 82 in the US and Canada, and 79 platforms in the UK. In 2020, this data sample includes 654 firm-level observations in Europe, 53 in China, 342 in APAC (excluding China), 205 in LAC, 76 in MENA, 191 in SSA, 72 in the US and Canada, and 67 firms in the UK.
In 2019, 15% of respondents, or 126 unique firms, reported operating in two or more countries. In 2020, the share of multi-jurisdictional firms increased to 17% of respondents but reduced in absolute terms to 118 unique firms. These multi-jurisdictional firms tend to be more established and facilitate a significant amount of online alternative financing activities – contributing 47% of total global market volume in 2019 and 44% of the global market volume in 2020.
Global Highlights
• China dominated the global online alternative finance market up until 2018. However, local market developments and regulatory changes have led to a considerable decline in volumes and its global market share. In 2019, the Chinese market accounted for 48% of the global volume, and in 2020 for only 1%. Accordingly, when Chinese volumes are included in our global analysis, total global market volume has notably decreased, falling 42% in 2019 and a further 35% in 2020 – from $304.5 billion in 2018 to $176 billion in 2019 and $114 billion in 2020.
• When we exclude the Chinese market from our analysis, it emerges that global online alternative finance market has grown consistently over the past three years. Global volumes (excluding China) rose by 3% from $89 billion in 2018 to $91 billion in 2019. And in 2020, despite COVID-19, the global market volume rose a further 24% year-on-year to reach $113 billion.
• The largest business model globally in 2019, when excluding China, P2P/Marketplace Consumer Lending remained the largest model type, with a total volume of $33.6 billion, accounting for 37% of the total global volume in 2019. In 2020, though still the largest single model, growth slowed down substantially, accounting for a total volume of $34.7 billion, or 31% of global market share.
• Accordingly, in 2020, the largest regional alternative market was the United States and Canada ($73.93 billion) with the US being the largest national market with $73.62 billion, which accounted for 65% of global online alternative finance market volume. This is followed by the UK ($12.64 billion), Europe excluding the UK ($10.12 billion), the Asia Pacific excluding China ($8.90 billion), LAC ($5.27 billion), SSA ($1.22 billion), China ($1.16 billion) and MENA ($0.59 billion).
The 2nd Global Alternative Finance Market Benchmarking Report
26
• With on-balance sheet activities on the rise, and their relative dominance in the United States and Canada, it is not surprising to see that Balance Sheet Business Lending (excluding China) reported the second highest transaction volumes for both years among all models, with $19 billion in 2019 and $28 billion in 2020. Interestingly, the research has noted that 16% of firms who previously operated only a P2P/Marketplace model now engaged in on-balance sheet activities.
• The Donation-based Crowdfunding model has experienced exponential growth, accounting for $7 billion globally in 2020. The leap in annual growth of 160% between 2019 and 2020, can be attributed largely to the flurry of COVID-19 related charitable, community and health-related online fundraising activities around the world.
• Market concentration globally as measured by the Herfindahl-Hirschman Index (HHI), for the aggregate alternative finance market remains relatively low. However, when measuring the HHI for specific alternative finance business models, the analysis suggested that seven out of ten online alternative models have experienced increased market concentration in 2020 compared to 2019. P2P/Marketplace Business Lending, Balance Sheet Business Lending, and P2P/Marketplace Consumer Lending showed the greatest increases in market concentration.
• In 2020, that volume of online alternative finance (excluding China) that went to micro, small and medium-sized enterprises (MSMEs) rose substantially. In 2019, global online alternative finance for business accounted for $35 billion, up 13% year-on-year and in 2020, increased significantly further by 51% year-on-year to $53 billion. By way of comparison, in 2019, business funding was 38% of the total volume, while in 2020 business funding accounted for 47% of the total volume.
• As with previous years, online alternative funding for businesses overwhelmingly stemmed from Debt-based models, with $32.8 billion of debt finance raised in 2019 (or 96% of all business funding) and $49.6 billion raised in 2020 (94%). Equity-based models contributed $1.5 billion in 2019 and $2.2 billion in 2020 (3% in 2019 and 4% in 2020). Non-investment models accounted for $533 million in 2019 and $744 million in 2020.
• The highest MSME finance volumes were recorded in the US ($15.4 billion in 2019; $32 billion in 2020), the UK ($6.5 billion in 2019; $6.4 billion in 2020) and Europe ($4.3 billion in 2019; $5.2 billion in 2020). LAC alternative finance firms raised $4 billion for businesses in 2019 and $4.5 billion in 2020. In 2020 alone, just over 85% of all alternative finance volumes in LAC can be attributed to MSME financing. The Asia-Pacific region (excluding China) raised $4.3 billion for businesses in 2019 and $4.21 billion in 2020, reporting a decrease in volume for the first time after five years of continuous growth.
• Institutional funding plays an important role in the functioning of the online alternative finance market, and increasingly so within the context of COVID-19. Based on data provided by 58% of the firm-level observations, we found that in 2019, approximately $28.5 billion of the market volume was financed by institutional investors, accounting for 16% of the entire global volume for that year. In 2020, based on 60% of the firm-level observations, approximately $43.6 billion of the market volume was financed by institutional investors, which represented 42% of the entire global volume. This represents a 53% year-on-year growth in the volume of institutional funding.
• Overall, Debt-based models make up the highest proportion of institutional funding, with most Debt-based models having more than two thirds of their total finance provided by institutional investors. P2P/Marketplace and Balance Sheet Business Lending firms reported the highest growth in terms of institutional funding volumes, and accounted for $13 billion and $21.2 billion in 2020, respectively. Geographically speaking, platforms in the US & Canada reported the highest level of institutionalised funding both in 2019 (74%) and 2020 (98%). In regions such as APAC and LAC, companies reported a yearly decrease in institutional investment. APAC firms reported a decrease from 61% ($3.47 billion) in 2019 to 55% ($2.93 billion) in 2020, whilst LAC reported a decrease from $3.16 billion in 2019 to that of $2.93 billion in 2020.
• When considering the banking status of borrowers, on balance, alternative finance activities remain heavily skewed towards catering for those individuals and customers which are already banked. Crowd-led Microfinance, unsurprisingly, is the only exception with 72% of clients categorised as unbanked, and 27% as underbanked.

Executive Summary
27
• The P2P/Marketplace and Balance Sheet Consumer Lending models both saw slightly elevated instances of underbanked clients (25% and 20%, respectively). Lending models that focus on serving business clients have a slightly higher proportion of underbanked clients, though again the predominant client base is that of banked customers. 30% of clients in the P2P/Marketplace Business Lending were categorised as underbanked, 27% for Balance Sheet Business Lending and 27% from Invoice Trading.
• Geographically, online alternative finance firms in the UK primarily cater to banked customers (96%), with only 4% being identified as underbanked. Other regions with significantly high levels of banked customers were LAC (86%) and MENA (83%). In contrast, FinTech activities in SSA are showing their potential to improve access to finance for underserved groups, with respondents across the region indicating that approximately 49% of their customer base could be described as unbanked, and a further 48% as underbanked. Though still predominantly catering to banked customers, firms across the Asia Pacific reported that 51% of their clients were underbanked, with a further 4% unbanked.
• Surveyed firms have provided information on the gender distribution of both their funders and their fundraisers. Overall, the percentage of female fundraisers has only slightly increased from 37.8% in 2019 to 38.9% in 2020. However, the percentage of female fundraisers of alternative finance activities in four of seven regions increased from 2019 to 2020: APAC (23% to 24%), Europe (26% to 34%), SSA (47% to 54%), and the UK (47% to 59%). However, activities in the US and Canada (55% to 37%), LAC (43% to 22%) and MENA (34% to 30%) all denoted a decline in the percentage of female fundraisers who utilised online alternative finance.
• Female market participation differs widely across alternative finance models as well. For most models, female participation, whether as a fundraiser or funder continued to be below 40% and saw further declines during 2020. When reviewing Debt and Equity-based models, eight of eleven models reported catering to a lower percentage of female fundraisers in 2020, with P2P/Marketplace Consumer Lending reporting the largest drop in the share of female fundraisers from 61% in 2019 to 35% in 2020. However, Donation-based Crowdfunding had the highest number of female fundraisers at 63% across the models surveyed.
• When considering key risks to firm operations, for a majority of respondents, a change in regulation is perceived as the greatest potential risk. These concerns were especially prominent in firms offering services relating to P2P/Marketplace Consumer Lending (50%), Balance Sheet Consumer Lending (52%), and Invoice Trading (50%), where at least half of the respondents perceived this to be high risk. In addition, customer fraud is ranked as a major concern for firms in Invoice Trading (58%), P2P/Marketplace Property Lending (42%), and Balance Sheet Consumer Lending (41%).
Regional Highlights
Europe
• From 2013 to 2019 the European online alternative finance market volume (including the UK) grew consistently from $1.5 billion in 2013 to $23.2 billion in 2019. However, 2020 saw a drop in overall market volume to $22.6 billion, representing the first decrease in market volume since 2013.
• The UK accounted for 56% of the European market in terms of volume. The UK online alternative finance industry reported consistent annual growth in market volume over the past five years, growing from $4.9 billion in 2015 to $12.6 billion in 2020 and, despite the challenges brought by COVID-19 and other factors, the UK online alternative finance market grew from $11 billion in 2019 to $12.6 billion in 2020.
• When excluding the UK, European market volumes declined more substantively from 2019 to 2020, reporting a $2.3 billion reduction, from $12.2 billion in 2019 to $9.9 billion in 2020. When considering market volume at a country level, some countries bucked the overall European trend and grew between 2019 and 2020. These included Germany ($1.42 billion to $1.48 billion), France ($1.32 billion to $1.66 billion) and Italy ($1.55 billion to $1.86 billion).

The 2nd Global Alternative Finance Market Benchmarking Report
28
APAC
• Online alternative finance firms facilitated over $18.5 billion in total funding during 2019 and 2020, nearly 38% more than the total volume recorded from 2013 to 2018. In 2019, the market reached a peak volume of $9.5 billion and the market then saw a decline of 7% between 2019 and 2020, which can be attributed to lower marketplace lending activities in the region as a result of the COVID-19 pandemic.
• The overall market declined in 2020, mainly driven by declines in lending in South and Central Asia, which reported a reduction of 40% in activity, amounting to $1.9 billion in 2020. Similarly, Oceania saw a decline of 9% in market volume.
• However, both East Asia and South-East Asia recorded an increase in market activities and continued to grow despite the challenges of COVID-19. Consequently, East Asia ($2.9 billion) and South-East Asia ($2.7 billion) were the largest markets in the Asia-Pacific region (excluding China) for 2020.
The Americas
• In 2019, the region reported a total online alternative finance volume of $56.7 billion, which rose to $79 billion in 2020, a 40% year-on-year increase. The US became the largest market in the world in 2020 with 65% of the global market share. The total US volume reached $73.62 billion in 2020, growing 43% year-on-year from $51.52 billion in 2019. The US market contributed nearly 93% of the overall activities in the Americas in 2020.
• Despite its dominance in the region, its relative importance declined by 3% between 2018 and 2020. This was mainly due to the increased share of alternative finance volumes in LAC countries, led by Brazil.
• After surpassing the $1 billion threshold in 2018, LAC saw a growth of 167% in alternative finance volumes between 2018 and 2019, amounting to $4.83 billion. Between 2019 and 2020, albeit growing more modestly by 9%, volumes reached $5.27 billion in total.
• A distinctive feature of the LAC alternative finance market is that the vast majority of sectoral activities cater primarily to MSMEs, with over 85% of the 2020 total volume going to businesses across the region ($4.5 billion).
Middle East and North Africa
• The MENA region has experienced an impressive growth in online alternative finance activities between 2013 and 2018. In this period, the region’s total alternative finance volume grew from $36 million to $802 million. However, over the past two years, the region has seen a decline in online alternative finance volumes. Between 2018 and 2019, the total funds raised in the region declined by 6% from $802 million in 2018 to $764 million in 2019, with a further 22% year-on-year decline recoded in 2020 to reach $595 million.
Sub-Saharan Africa
• In 2019, the total online alternative finance volume in SSA reached $1.1 billion, a significant increase of 429% from 2018. This is the first time that the region has surpassed the one-billion threshold.
• Continued growth was achieved in 2020, though at a more modest pace – with 10% growth recorded in 2020, reaching a total of $1.2 billion.
Technical note: We present the data provided by respondents to our survey. However, it is worth noting that portions of the decline in volume reported for certain regions during the last two years can be explained by the inability of close to 200 platforms that have provided data for the 2018 survey, to do the same for 2019 and 2020, despite maintaining their operations. This is particularly evident in Europe, APAC, and MENA. Hence, decline in these regions should be viewed with caution as it is likely to be overestimated due to non-response of certain platforms.
The 2nd Global Alternative Finance Market Benchmarking Report
29
1. The Global Alternative Finance Ecosystem

30
Chapter 1: The Global Alternative Finance Ecosystem
Chapter 1: The Global Alternative Finance Ecosystem
Introduction
Research Rationale and Objectives
This report is the second in our series of global alternative finance ecosystem benchmarking studies. Since 2015, the Cambridge Centre for Alternative Finance (CCAF), together with our global and regional network of research partners, has tracked the development of online alternative finance industry with particular emphasis on Digital Lending and Digital Capital Raising activities. The creation of readily comparable time-series data on a global level has allowed for researchers, policymakers, regulatory authorities and a variety of interested stakeholders to understand how this ecosystem has emerged, grown, and evolved over time.
When we published our first Global Alternative Finance report which presented 2018 year data, it was not clear how COVID-19 would affect FinTech firms and the customers they service. In a typical year, CCAF data collection covers the preceding year. However, the COVID-19 pandemic presented the research team with new and unforeseen challenges when collecting 2019 annual data. In the first instance, numerous FinTech firms were in the throes of dealing with the pandemic, contending with operational challenges, whilst also trying to service new and existing clients within a capricious financial environment. It was a challenging request to seek substantive 2019 data points at that juncture. As a result, the CCAF, alongside the World Bank and World Economic Forum launched a Global Rapid Assessment study with the purpose of quickly identifying key pain points and resiliencies born out of the first months of the pandemic. This study allowed us to understand some of the dynamic shifts occurring within the Digital Lending and Digital Capital Raising space and inform our time-series data in a more appropriate fashion.
To this end, this Global Alternative Finance Benchmarking Report presents two years of data – 2019 and 2020. By collecting firm-level data
for both years, the research team could provide a clearer picture of the impact of COVID-19 during 2020 and examine whether the trends observed throughout our time-series data collection still hold true. In particular, we examined if COVID-19 had impacted lending and capital raising transaction volumes and growth in ways which deviated substantively from historic trends. And where such deviations exist, had these changes been felt uniformly across the globe, or is there market bifurcation at a regional or business model level?
This report combines regional analysis with a discussion of global trends, highlighting how some developments are universal while others are specific to a certain context. The regions and jurisdictions covered in this study include: The Asia Pacific and China; the United States of America and Canada; Latin America and the Caribbean; Continental Europe and the UK; the Middle East and North Africa; and Sub-Saharan Africa. Data covered in this report is inclusive of 2019 and 2020, with data analysis occurring in March-May 2021. Data collection commenced in July 2020 and ended in March 2021.
Terminology:
This report focuses narrowly on alternative finance models as they relate to digital lending and digital capital raising activities. Though a somewhat amorphous term, at its core, ‘alternative finance’ includes digital finance activities that have emerged outside of the incumbent banking systems and traditional capital markets and occur online. In particular, these online alternative finance ecosystem comprises of various lending, investment, and non-investment models that enable individuals, businesses, and other entities to raise funds via an online digital marketplace. As the ecosystem has evolved, clear model types have emerged and become more delineated and sophisticated. As such, the CCAF has adopted a taxonomy of 16 models that can be broadly divided into Debt, Equity, and Non-investment models.
The 2nd Global Alternative Finance Market Benchmarking Report
31
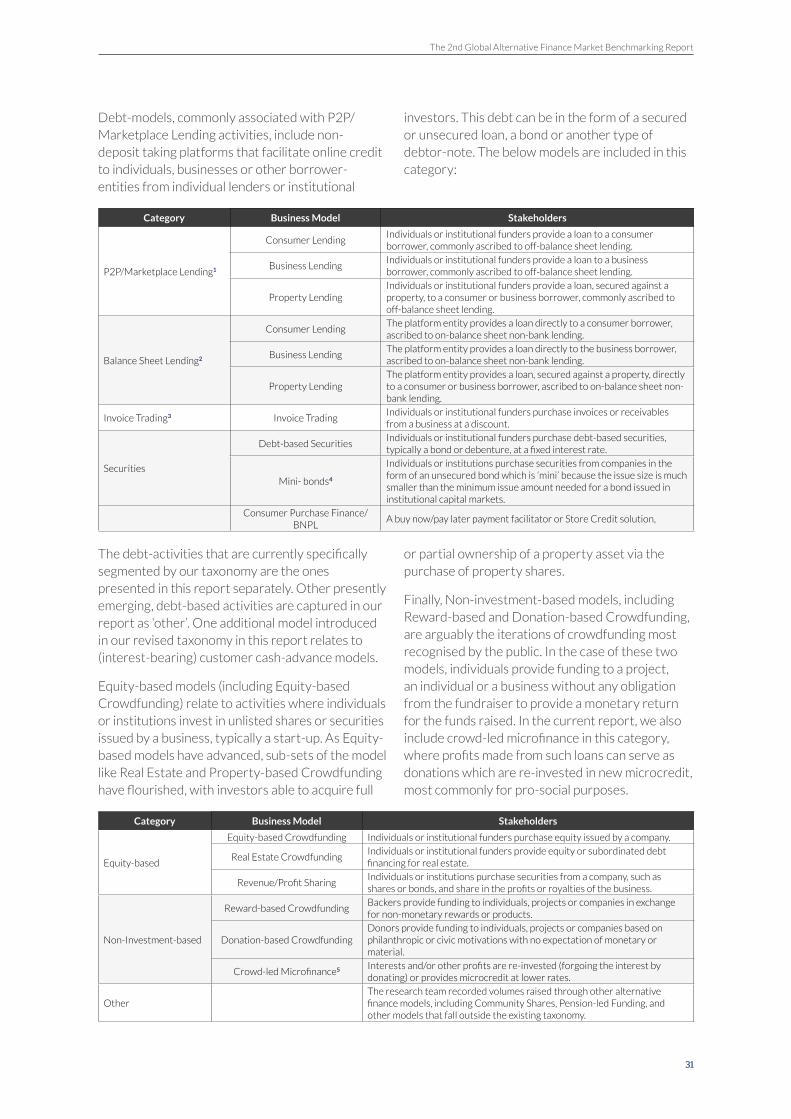
Debt-models, commonly associated with P2P/Marketplace Lending activities, include non-deposit taking platforms that facilitate online credit to individuals, businesses or other borrower-entities from individual lenders or institutional
investors. This debt can be in the form of a secured or unsecured loan, a bond or another type of debtor-note. The below models are included in this category:
Category Business Model Stakeholders
P2P/Marketplace Lending1
Consumer LendingIndividuals or institutional funders provide a loan to a consumer borrower, commonly ascribed to off-balance sheet lending.
Business LendingIndividuals or institutional funders provide a loan to a business borrower, commonly ascribed to off-balance sheet lending.
Property LendingIndividuals or institutional funders provide a loan, secured against a property, to a consumer or business borrower, commonly ascribed to off-balance sheet lending.
Balance Sheet Lending2
Consumer LendingThe platform entity provides a loan directly to a consumer borrower, ascribed to on-balance sheet non-bank lending.
Business LendingThe platform entity provides a loan directly to the business borrower, ascribed to on-balance sheet non-bank lending.
Property LendingThe platform entity provides a loan, secured against a property, directly to a consumer or business borrower, ascribed to on-balance sheet non-bank lending.
Invoice Trading3 Invoice TradingIndividuals or institutional funders purchase invoices or receivables from a business at a discount.
Securities
Debt-based SecuritiesIndividuals or institutional funders purchase debt-based securities, typically a bond or debenture, at a fixed interest rate.
Mini- bonds4
Individuals or institutions purchase securities from companies in the form of an unsecured bond which is ‘mini’ because the issue size is much smaller than the minimum issue amount needed for a bond issued in institutional capital markets.
Consumer Purchase Finance/BNPL
A buy now/pay later payment facilitator or Store Credit solution,
The debt-activities that are currently specifically segmented by our taxonomy are the ones presented in this report separately. Other presently emerging, debt-based activities are captured in our report as ‘other’. One additional model introduced in our revised taxonomy in this report relates to (interest-bearing) customer cash-advance models.
Equity-based models (including Equity-based Crowdfunding) relate to activities where individuals or institutions invest in unlisted shares or securities issued by a business, typically a start-up. As Equity-based models have advanced, sub-sets of the model like Real Estate and Property-based Crowdfunding have flourished, with investors able to acquire full
or partial ownership of a property asset via the purchase of property shares.
Finally, Non-investment-based models, including Reward-based and Donation-based Crowdfunding, are arguably the iterations of crowdfunding most recognised by the public. In the case of these two models, individuals provide funding to a project, an individual or a business without any obligation from the fundraiser to provide a monetary return for the funds raised. In the current report, we also include crowd-led microfinance in this category, where profits made from such loans can serve as donations which are re-invested in new microcredit, most commonly for pro-social purposes.
Category Business Model Stakeholders
Equity-based
Equity-based Crowdfunding Individuals or institutional funders purchase equity issued by a company.
Real Estate CrowdfundingIndividuals or institutional funders provide equity or subordinated debt financing for real estate.
Revenue/Profit SharingIndividuals or institutions purchase securities from a company, such as shares or bonds, and share in the profits or royalties of the business.
Non-Investment-based
Reward-based CrowdfundingBackers provide funding to individuals, projects or companies in exchange for non-monetary rewards or products.
Donation-based CrowdfundingDonors provide funding to individuals, projects or companies based on philanthropic or civic motivations with no expectation of monetary or material.
Crowd-led Microfinance5 Interests and/or other profits are re-invested (forgoing the interest by donating) or provides microcredit at lower rates.
OtherThe research team recorded volumes raised through other alternative finance models, including Community Shares, Pension-led Funding, and other models that fall outside the existing taxonomy.

32
Chapter 1: The Global Alternative Finance Ecosystem
MethodologyThe following section outlines key aspects and considerations relating to the methodological procedures and practices in the current study, including data sources, data collection procedures, data handling, and quality control.
Data Sources: The primary data reported comes from the Alternative Finance Industry Benchmarking Survey, which is distributed annually by the CCAF. This 34-question survey was distributed as a stand-alone online survey (covering 2019 and 2020 data collection) and an additional survey module appended to the Global COVID-19 FinTech Market Rapid Assessment Survey (covering 2019).
This survey captured data from active alternative finance platforms that fell within the above-outlined taxonomy. The list of platforms was compiled based upon the following sources:
• Previous study respondents and participants
• Firm lists provided by research partners
• List of additional firms compiled through desk-based research, to include new platforms not identified in the previous sources
Overall, data from 821 unique firms were captured for 2019, translating to 1,801 firm-level observations6 globally. For 2020, the unique firms captured dropped to 703, with 1,660 firm-level observations. When compared to the 2018 panel, the research team observed a substantive drop in unique firms which responded to the survey. In 2018, 1,227 unique firms contributed just over 2,300 observations, a drop of 406 firms. When accounting for the further drop in 2020, the research team notes a panel decrease of 524. In addition to the firms that responded to the Global Alternative Finance Benchmark Survey, web-scraping was also used to get the most up-to-date transaction volumes for a limited number of key platforms. This was carried out within the research centre using widely available Python web-scraping libraries and was relevant to 6 unique firms.
When we consider observations by region, the 2019 data includes 631 firm-level observations in Europe, 108 in China, 359 in the Asia-Pacific region (excluding China), 258 in Latin America and the Caribbean, 78 in the Middle East and North Africa, 206 in SSA, 82 in the US and Canada, and 79 platforms in the UK.
In 2020, this changes to 654 firm-level observations in Europe, 53 in China, 342 in the Asia-Pacific region (excluding China), 205 in Latin America and the Caribbean, 76 in the Middle East and North Africa, 191 in SSA, 72 in the US and Canada, and 67 platforms in the UK.
With respect to observation changes noted, respondents provided annual data at platform-country level, accounting in some instances for multiple observations at a jurisdiction level. This allowed us to better capture volumes from domestic and international platforms operating in a country.
It is note-worthy to point out that when we consider these multi-jurisdictional platforms (firms with substantive operations in two or more countries/jurisdictions), their activity has also declined markedly against the 2018 panel. In 2018, 47% of firms were operating in at least two or more countries. However, by 2019, our data indicates that only 15% (or 126 unique firms) were multi-jurisdictional operators. In 2020, 17% of the panel (or 118 firms) were multi-jurisdictional. This is a considerable shift in the historical trends we have observed, where historically (or pre-pandemic) firms were actively pursuing a more international strategy. We suggest that this trend can be explained by several reasons: first, greater regulatory clarity causes platforms to reconsider certain market operations. Second, COVID-19 caused platforms to reduce operational risks through concentration in fewer markets or when scaling overseas operations during times of greater uncertainty. And finally, there is a certain degree of non-repeat responses from internationally active platforms in the current data collection against previous years.7
It should be noted, however, that when considering the volumes attributed to multi-jurisdictional firms, in 2019 47% of global volumes derived from multi-jurisdictional firms, and 44% in 2020. Therefore, though operationally there are fewer unique firm respondents that are multi-jurisdictional, those that are, enjoy considerable market share.
Over the past seven years, the CCAF has maintained a global database of active firms and contacts to facilitate our research. We have also kept track of platforms that have ceased operations, suspended activities (sometimes temporarily) or
The 2nd Global Alternative Finance Market Benchmarking Report
33
transitioned/pivoted into other fields/traditional finance, as well as examples of mergers within the industry. As a result of the pandemic, more attention was placed to ensure that the same panel of participating firms from each region was captured in the 2018 dataset. For the most part, this occurred. However, when considering the 2018 panel, there were 320 Chinese-based firms and 418 rest-of-world firms which were not captured this year. The 320 firm drop in China relates specifically to regulatory mandate changes which have forced closures and effectively rendered ‘P2P’ lending activities unlawful.
One constraint that the research team faced in their 2019 and 2020 data collection, related to the fact that much of this data collection occurred during the global pandemic, with many firms unable to contribute to the study due to the inherent operational challenges presented by the pandemic. The outstanding 418 firms were those that declined to respond due to operational limitations as a result of the pandemic8, those which suspended their operations, and/or those that merged with another firm and hence surveyed as one rather than separate entries. In a few cases where platform non-participation led to a significant impact on reported volumes, these were reported and clearly indicated under the relevant regional review sections.
At the same time, the 2020 data includes data reported from 305 platforms that have not responded in the 2018 survey, either because they have only been established in the period between 2018-2020, or because they had chosen not to participate in previous year’s studies.
Data Collection
The Global Alternative Finance Benchmarking Survey consisted of 34 questions, including both single and multiple response questions, relating to platform operations and performance in 2019 and 2020. This year’s survey consisted of five parts covering: fundraisers; funders; platform structure and strategy; risks and regulations; and financial inclusion9. The structured nature of the survey allowed platforms to provide comprehensive, precise, and cohesive self-reported data.
Many of the questions remained the same as those used in the previous year to ensure that longitudinal/time-series analysis was possible,
especially with respect to questions relating to total transaction volumes. Platforms were also presented with a series of non-compulsory questions which built on key research themes identified in last year’s report.
To more accurately attribute fundraiser volumes, platforms were able to report model-level activities and volumes on a per country basis. Subsequently, firms could more accurately describe their operations, especially where activities occurred outside of their domestic market.
Invitations for survey participation were sent by members of the research team directly to platforms, published on targeted social media groups, and distributed via research partners through their own independent networks (such as industry associations, partner research institutions, etc.). Survey invitations were distributed in the form of personalised email communications, direct messages via social media and telephone calls to platform management. The research partners were instrumental in identifying appropriate alternative finance platforms across the region, promoting the survey and serving as advisors to the core research team. The survey was distributed in English, French, Spanish, Portuguese, German, Russian, Mandarin-Chinese, Korean, Japanese, Bahasa Indonesia, Thai and Vietnamese.
The survey was hosted on a dedicated site, with submissions accessible only to the principal researchers involved in this project. Once the data set was collected, any discrepancies such as misattributed volumes and anomalous figures were cross-checked through direct contact with the platforms.
Quality Control and Data Handling:
Sanitation and verification were conducted between March and May 2021. In cases where the survey could not obtain primary data (or where there were discrepancies in reported data), the research team consulted secondary data sets to inform the research and asked for additional or clarifying data directly from the platform.
The research team anonymised and sanitised data prior to analysis. All personal data was stripped and securely removed from the database. As platforms reported figures in their local currency, the data analysis team converted all local currencies into

34
Chapter 1: The Global Alternative Finance Ecosystem
USD for the relevant year.10 This was done using the historical average annual rate for 2019 and 2020, respectively.
In previous years, the currency rate volatility between major currencies was moderate. 2020 saw heavy currency fluctuations, especially between currencies in Asia, South America and Africa against the US-Dollar. Some countries which had their currency pegged against the US-Dollar or the Euro were required to move their currency pegs. Therefore, local currency volumes in 2020 expressed in US-Dollar terms may be slightly lower in the year-on-year change between 2019 and 2020 if the local currency depreciated. The research team has commented on the impact of this currency effect in the regional chapters. Nevertheless, as the aim of this report is to measure the economic performance of alternative finance markets and models in a comparative perspective, using a consistent currency was the preferred methodology. As such, all findings are presented in USD, using historic rates.
For all average data points, the team applied weightings by transaction volume per observation and significant outliers were removed. In most cases, data was only reported if there were a minimum of 10 observations by country and model.
In other cases, special consideration was made based on the specific country and model under consideration where such threshold was less relevant (i.e., the case of relatively small countries). Additionally, the research team conducted an additional market competition analysis using the Herfindahl-Hirschman Index (HHI) for assessing the market concentration levels of the alternative finance volumes at global, regional, and important business model levels.11
At completion, the data was encrypted and stored for retrieval exclusively for the use of this project. Throughout the analysis process, explanations are suggested for identified trends and survey results. Whenever necessary, abnormal deviations in identified trends vis-à-vis our previous report was principally explained by situations where specific platforms either contributed to last year’s research but did not participate again this year, or participated this year but did not contribute in the previous year.
Throughout the report composition process, both analyses and write-up were subjected to extensive peer-reviewing within the research team. Whenever necessary, additional external reviews of certain sections were also conducted to further ensure quality of reporting.
Guarantee fund helps to secure investments in Africa and Asia during the pandemic Markus Schwaninger, CFO, Ecoligo GmbH (equity-based platform; Germany, Vietnam, Kenya, Ghana, Thailand, Costa Rica, and the Philippines)
When the COVID-19 pandemic began, equity-based investment slowed. Amid uncertainty, people were hesitant to invest. We are convinced that the effects of delays in payments should not be felt by the investors on our platform. To protect them from delayed payments which may result from circumstances such as the pandemic, we began a Guarantee Fund. The fund was started with the capital of our platform Ecoligo: our commitment to facilitating climate investments at a time when we need to reduce global CO2 emissions as fast as possible. This resulted in nearly three times the investment volume of 2019, suggesting that such protection mechanisms can transform green alternative finance markets.

The 2nd Global Alternative Finance Market Benchmarking Report
35
The Size and Growth of the Global Alternative Finance Market
Figure 1.1: Total Global Alternative Finance Volume 2015 - 2020, USD
Since 2015, online alternative finance actors have provided financing to individuals and businesses across the globe in a myriad of ways. However, market development followed very different paths in China and the rest of the world in a manner which severely distorts reality when data is aggregated together on a global level. Here, while the rest of the world follow a steady and gradual growth trajectory, China has experienced a quick and dramatic cycle of boom and bust.
In the earlier years, the role of the Chinese P2P lending industry served as a substantive and indeed dominant driver of total transaction volume, making up the largest market shares and growing at a considerable pace. Yet, since regulatory changes were introduced in 2018, the prominence of the Chinese lending marketplace has considerably decreased. Accordingly, when lumped together, the total alternative finance volumes derived from digital lending and capital raising FinTechs globally amounted to $176 billion in 2019 and $114 billion in 2020.
This represents a significant global level decline driven by the decrease in volume from China, accounting for a 42% reduction in global volumes occurring between 2018 and 2019, and a further 35% decline recorded between 2019 and 2020.
In 2017, China accounted for 86% of the total market. In 2019, the Chinese market only accounted for 48% of the global volume, and in 2020 for less than 1% of the market, when the Chinese lending market shrank to a small fraction of its former self. As such, the Chinese experience represents a cautionary tale about both the importance of regulation in market development, as well as the substantial implications of both excessively
permissive and excessively restrictive regimes. And so, we do ourselves a disservice if we do not exclude this behemoth outlier when evaluating the impact of FinTech activities on a global context in the longer-term.Therefore, it is important to examine the global online alternative finance market more holistically by taking into account the drastic decline of the Chinese P2P lending market over the last two years.
Figure 1.2: Global Alternative Finance Volume (excluding China) 2017-2020, USD
When observing the rest of the world, total transaction volumes attributed to alternative finance platforms actually had continued to increase in the last two years even against the backdrop of COVID-19. From 2018 to 2019, the global volumes (excluding China) rose by 3% from $89 billion to $91 billion. From 2019 to 2020, the volume rose by 24% to $113 billion. To contextualise the global volumes reported in 2019, it is worth reminding the reader that this less than robust growth rate may be reflective of data-collection difficulties exacerbated by COVID-19. As noted in the methodology, data collection for the 2019 year occurred in 2020.
Throughout the year, many FinTech platforms across the globe experienced challenges stemming from the pandemic. Though this study captured a
10050
200150
300
250
400
450
350
0
139
44
2015
290
47
2016
305
89
2018
419
60
2017
176
91
2019
114113
2020
Bill
ion
s
Total Volume (excluding China) Total Volume (including China)
0
40
100
20
60
140120
80
2017
60
2018
89
2020
113
2019
91
Bill
ion
s

36
Chapter 1: The Global Alternative Finance Ecosystem
magnitude of players still active in the ecosystem, because of firm suspension or a general inability to participate at similar levels to previous years, the 2019 figures likely represent a more conservative annual volume.
When considering the year 2020, transaction-level data suggested the alternative finance market continues to grow despite the pandemic. As shown in our Global COVID-19 FinTech Market Rapid Assessment Study12 , most FinTech activity verticals saw significant growth across the globe in the first and second quarter of 2020. However, an early assessment of Digital Lending activity suggested an annual decline.
This study provided a rapid impression on how transaction values had been impacted within the first 6 months of 2020 as impacted by COVID-19. Firms were asked to provide directional indicators on their experienced change in value against the same period in 2019. On balance, firms attributed to the Digital Lending vertical indicated a net-decline when comparing H1-2020 to H1-2019.
When examined further, the absolute values collected in the Global Benchmark Survey demonstrated that the initial stagnation experienced within the first two quarters of 2020 is not reflective of the full-year data. In fact, most markets have since recovered – with the second half of 2020 making up for the initial market upheaval experienced in the first half.
Total Volume by Region
Figure 1.3: Market Share of Alternative Finance Activity by Region
Table 1.1: Market Share of Alternative Finance Market by Region, 2018-2020
2018 2019 2020
Region Total Volume Market Share (%) Total Volume Market Share (%) Total Volume Market Share (%)
APAC $6,173,183,410 2% $9,541,822,124 5% $8,911,183,422 8%
China $215,396,387,691 71% $84,346,675,112 48% $1,161,105,257 1%
Europe $7,730,584,934 3% $12,233,219,605 7% $9,940,940,894 9%
LAC $1,806,937,802 0.6% $4,833,142,985 3% $5,274,457,369 5%
MENA $800,545,330 0.3% $763,896,349 0.4% $594,755,996 0.5%
SSA $209,142,111 0.1% $1,105,847,839 0.6% $1,215,799,093 1%
UK $10,367,889,668 3% $11,015,704,173 6% $12,642,678,927 11%
USA & Canada $62,047,079,229 20% $51,871,355,441 30% $73,929,869,084 65%
TOTAL $304,531,750,175 100% $175,711,663,628 100% $113,670,790,043 100%
The decline of the Chinese market can most acutely be seen when considering its decline in market-share over time. Having historically accounted for the lion’s share of market activity, by 2020 the once outlier accounted for just over 1% of global volumes.
With the decline of the Chinese market, market dynamics have shifted, with the United States and Canada amounting to 65% of global market volumes, and the United Kingdom accounting for
just over 11%. When comparing 2019 to 2020, other regional developments begin to emerge, suggesting that COVID-19 has impacted the various geographies observed in different ways.
For instance, the volume in the Asia-Pacific and Europe increased from 2018 to 2019, but then decreased from 2019 to 2020. While it is unclear if the recorded declines in these regions are real declines or camouflaging small actual changes in volumes between 2019 and 2020 (as over 100
70%
100%
50%
80%
60%
90%
40%
30%
20%
10%
0%2019
48%
7%
30%
6%
5%
3%
0.6%
2020
8%
9%5%
65%
11%1%
1%
2018
71%
20%
3%
2%
1%
3%
APAC China Europe LAC
USA & Canada SSA UK
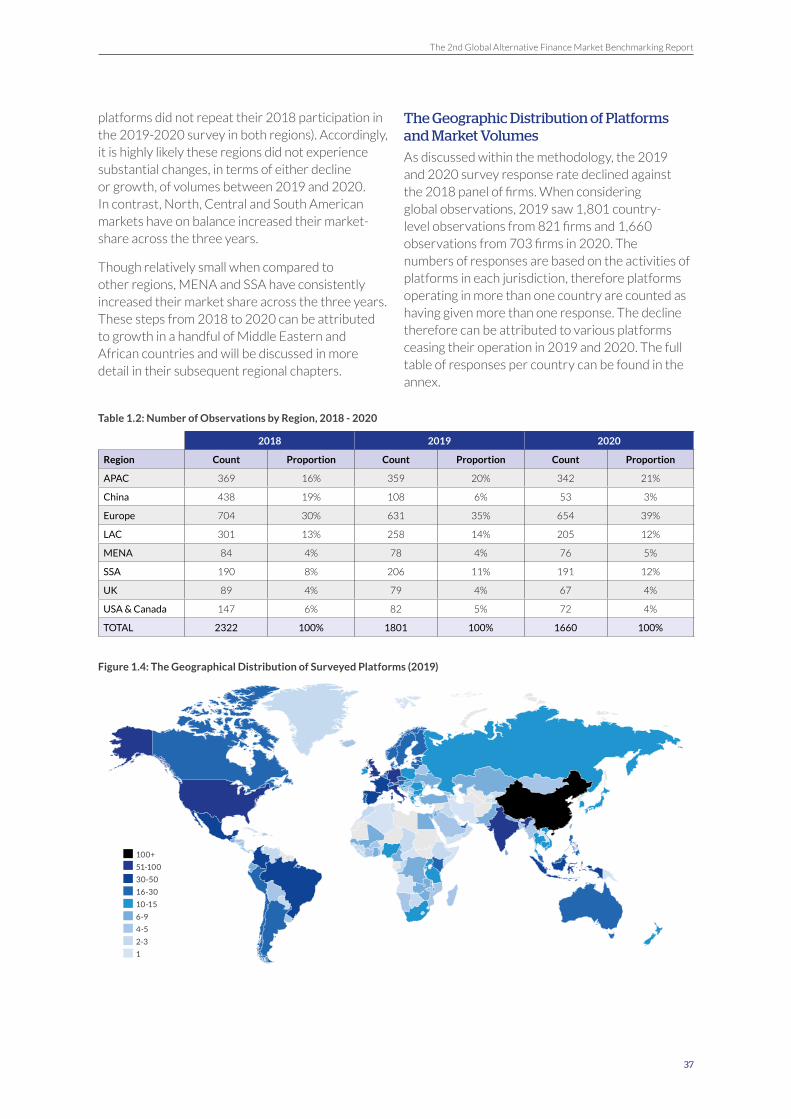
The 2nd Global Alternative Finance Market Benchmarking Report
37
platforms did not repeat their 2018 participation in the 2019-2020 survey in both regions). Accordingly, it is highly likely these regions did not experience substantial changes, in terms of either decline or growth, of volumes between 2019 and 2020. In contrast, North, Central and South American markets have on balance increased their market-share across the three years.
Though relatively small when compared to other regions, MENA and SSA have consistently increased their market share across the three years. These steps from 2018 to 2020 can be attributed to growth in a handful of Middle Eastern and African countries and will be discussed in more detail in their subsequent regional chapters.
The Geographic Distribution of Platforms and Market Volumes
As discussed within the methodology, the 2019 and 2020 survey response rate declined against the 2018 panel of firms. When considering global observations, 2019 saw 1,801 country-level observations from 821 firms and 1,660 observations from 703 firms in 2020. The numbers of responses are based on the activities of platforms in each jurisdiction, therefore platforms operating in more than one country are counted as having given more than one response. The decline therefore can be attributed to various platforms ceasing their operation in 2019 and 2020. The full table of responses per country can be found in the annex.
Table 1.2: Number of Observations by Region, 2018 - 2020
2018 2019 2020
Region Count Proportion Count Proportion Count Proportion
APAC 369 16% 359 20% 342 21%
China 438 19% 108 6% 53 3%
Europe 704 30% 631 35% 654 39%
LAC 301 13% 258 14% 205 12%
MENA 84 4% 78 4% 76 5%
SSA 190 8% 206 11% 191 12%
UK 89 4% 79 4% 67 4%
USA & Canada 147 6% 82 5% 72 4%
TOTAL 2322 100% 1801 100% 1660 100%
Figure 1.4: The Geographical Distribution of Surveyed Platforms (2019)
100+
51-100
30-50
16-30
10-15
6-9
4-5
2-3
1
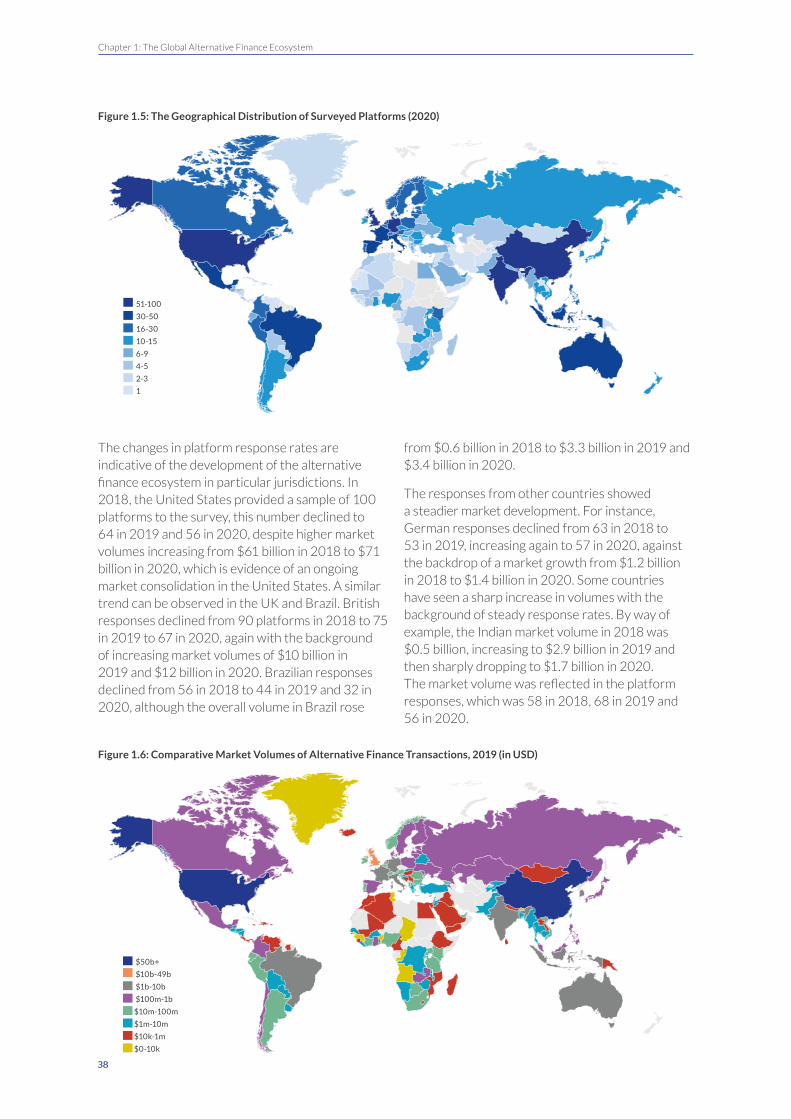
38
Chapter 1: The Global Alternative Finance Ecosystem
Figure 1.5: The Geographical Distribution of Surveyed Platforms (2020)
The changes in platform response rates are indicative of the development of the alternative finance ecosystem in particular jurisdictions. In 2018, the United States provided a sample of 100 platforms to the survey, this number declined to 64 in 2019 and 56 in 2020, despite higher market volumes increasing from $61 billion in 2018 to $71 billion in 2020, which is evidence of an ongoing market consolidation in the United States. A similar trend can be observed in the UK and Brazil. British responses declined from 90 platforms in 2018 to 75 in 2019 to 67 in 2020, again with the background of increasing market volumes of $10 billion in 2019 and $12 billion in 2020. Brazilian responses declined from 56 in 2018 to 44 in 2019 and 32 in 2020, although the overall volume in Brazil rose
from $0.6 billion in 2018 to $3.3 billion in 2019 and $3.4 billion in 2020.
The responses from other countries showed a steadier market development. For instance, German responses declined from 63 in 2018 to 53 in 2019, increasing again to 57 in 2020, against the backdrop of a market growth from $1.2 billion in 2018 to $1.4 billion in 2020. Some countries have seen a sharp increase in volumes with the background of steady response rates. By way of example, the Indian market volume in 2018 was $0.5 billion, increasing to $2.9 billion in 2019 and then sharply dropping to $1.7 billion in 2020. The market volume was reflected in the platform responses, which was 58 in 2018, 68 in 2019 and 56 in 2020.
Figure 1.6: Comparative Market Volumes of Alternative Finance Transactions, 2019 (in USD)
51-100
30-50
16-30
10-15
6-9
4-5
2-3
1
$50b+
$10b-49b
$1b-10b
$100m-1b
$10m-100m
$1m-10m
$10k-1m
$0-10k
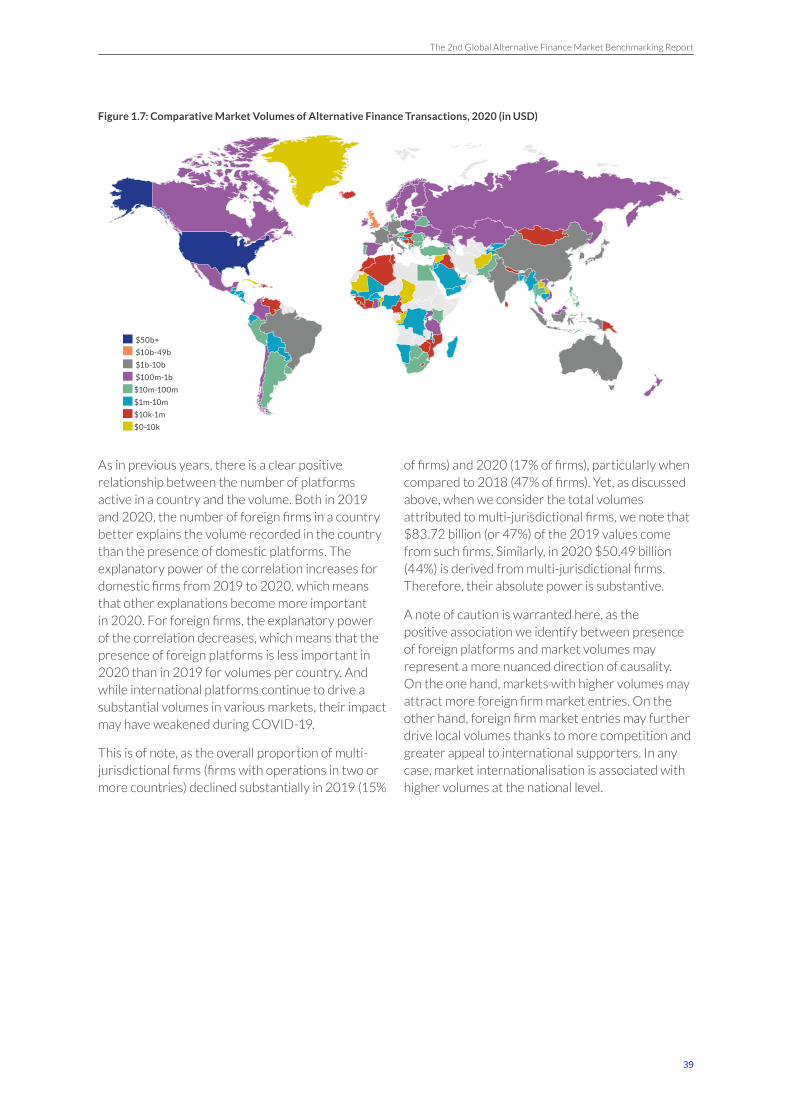
The 2nd Global Alternative Finance Market Benchmarking Report
39
Figure 1.7: Comparative Market Volumes of Alternative Finance Transactions, 2020 (in USD)
As in previous years, there is a clear positive relationship between the number of platforms active in a country and the volume. Both in 2019 and 2020, the number of foreign firms in a country better explains the volume recorded in the country than the presence of domestic platforms. The explanatory power of the correlation increases for domestic firms from 2019 to 2020, which means that other explanations become more important in 2020. For foreign firms, the explanatory power of the correlation decreases, which means that the presence of foreign platforms is less important in 2020 than in 2019 for volumes per country. And while international platforms continue to drive a substantial volumes in various markets, their impact may have weakened during COVID-19.
This is of note, as the overall proportion of multi-jurisdictional firms (firms with operations in two or more countries) declined substantially in 2019 (15%
of firms) and 2020 (17% of firms), particularly when compared to 2018 (47% of firms). Yet, as discussed above, when we consider the total volumes attributed to multi-jurisdictional firms, we note that $83.72 billion (or 47%) of the 2019 values come from such firms. Similarly, in 2020 $50.49 billion (44%) is derived from multi-jurisdictional firms. Therefore, their absolute power is substantive.
A note of caution is warranted here, as the positive association we identify between presence of foreign platforms and market volumes may represent a more nuanced direction of causality. On the one hand, markets with higher volumes may attract more foreign firm market entries. On the other hand, foreign firm market entries may further drive local volumes thanks to more competition and greater appeal to international supporters. In any case, market internationalisation is associated with higher volumes at the national level.
$50b+
$10b-49b
$1b-10b
$100m-1b
$10m-100m
$1m-10m
$10k-1m
$0-10k

40
Chapter 1: The Global Alternative Finance Ecosystem
Figure 1.8: Number of Platforms vs. Volumes in Country (Ln Value) - 2019
Figure 1.9: Number of Platforms vs. Volumes in Country (Ln Value) - 2020
Table 1.3: Domestic vs Foreign Number of Observations from Respondents 2019-2020
2019 2020
Region Domestic Foreign Total Domestic Foreign Total
APAC 172 176 348 157 185 342
China 100 8 108 44 9 53
Europe 257 387 644 252 402 654
LAC 122 136 258 94 111 205
MENA 14 64 78 13 63 76
SSA 28 178 206 26 165 191
UK 60 19 79 53 14 67
USA & Canada 52 28 80 48 24 72
805 996 1801 687 973 1660
Nu
mb
er o
f p
latf
orm
s in
co
un
try
Ln Volumes in Country
• Domestic • Foreign
0
10
20
30
40
50
60
70
80
90
100
0 2 4 6 8 10 12
Domestic Foreign Expon. (Domestic) Expon. (Foreign) Linear (Domestic)
0
10
20
30
40
50
60
70
80
90
100
0 2 4 6 8 10 12
Domestic Foreign Expon. (Domestic) Expon. (Foreign) Linear (Foreign)
R² = 0.3156
R² = 0.487
0
10
20
30
40
50
60
70
80
90
100
0 2 4 6 8 10 12
Domestic Foreign Expon. (Domestic) Linear (Domestic) Expon. (Foreign) Linear (Foreign)
Nu
mb
er o
f p
latf
orm
s in
co
un
try
Ln Volumes in Country
• Domestic • Foreign
0
10
20
30
40
50
60
70
80
90
100
0 2 4 6 8 10 12
Domestic Foreign Expon. (Domestic) Expon. (Foreign) Linear (Domestic)
0
10
20
30
40
50
60
70
80
90
100
0 2 4 6 8 10 12
Domestic Foreign Expon. (Domestic) Expon. (Foreign) Linear (Foreign)
R² = 0.3488
R² = 0.5287
0
10
20
30
40
50
60
0 2 4 6 8 10 12

The 2nd Global Alternative Finance Market Benchmarking Report
41
Global Volume by Alternative Finance Models
Table 1.4: 2019 & 2020 Total Volume by Model Categories (Including China)
2019 Full Dataset (China + ROW) 2020 Full Dataset (China + ROW)
Alternative Finance Model Volume Market Share
2019 Ranking
Change in Ranking
2018 v 2019Volume
Market Share
2020 Ranking
Change in Ranking
2019 v 2020
P2P/Marketplace Consumer Lending $103,107,000,000 59% 1 $34,740,386,058 31% 1
P2P/Marketplace Business Lending $20,813,486,434 12% 2 $15,374,366,221 14% 3 (-1)
Balance Sheet Business Lending $19,815,995,713 11% 3 $28,018,497,789 25% 2 (+1)
Balance Sheet Consumer Lending $10,746,940,564 6% 4 (+1) $13,025,246,839 11% 4
P2P/Marketplace Property Lending $4,593,225,687 3% 5 (+1) $3,073,502,699 3% 7 (-2)
Balance Sheet Property Lending $4,039,738,352 2% 6 (-2) $1,808,250,437 2% 9 (-3)
Invoice Trading $3,715,241,050 2% 7 $3,882,363,843 3% 6 (+1)
Real Estate Crowdfunding $2,874,474,252 2% 8 $2,777,136,757 2% 8
Donation-based Crowdfunding $2,680,580,111 2% 9 (+3) $7,002,990,526 6% 5 (+4)
Equity-based Crowdfunding $1,093,718,625 1% 10 (-1) $1,520,444,679 1% 10
Reward-based Crowdfunding $897,311,407 0.51% 11 (-1) $1,250,683,128 1% 11
Consumer Purchase Finance/BNPL $591,711,865 0.34% 12 $505,372,720 0.44% 12
Debt-based Securities $496,444,345 0.28% 13 (-2) $384,760,119 0.34% 13
Crowd-led Microfinance $182,370,557 0.10% 14 $151,483,347 0.13% 14
Revenue/Profit Sharing $35,585,989 0.02% 15 (-1) $84,514,275 0.07% 15
Community Shares $20,886,410 0.01% 16 $23,693,137 0.02% 17 (-1)
Mini Bonds $6,236,156 0.00% 17 (-2) $43,932,747 0.04% 16 (+1)
Other $878,327 0.00% 18 (-5) $3,044,582 0.00% 18
The decline of the Chinese alternative finance ecosystem plays a substantive role when reviewing the contribution to annual alternative finance derived from two key models, namely P2P/Marketplace Consumer and Business Lending. Of note, the P2P/Marketplace Consumer Lending model has consistently accounted as the largest alternative finance model since 2013, yet it has
faced a significant drop in absolute volume in 2019 ($103 billion) and in 2020 ($35 billion), driven by the decline in Chinese P2P Consumer Lending. Similarly, the P2P/Marketplace Business Lending model saw a significant drop of 59% in 2019 ($21 billion) and a further decline of 26% ($15 billion) in 2020.

42
Chapter 1: The Global Alternative Finance Ecosystem
Table 1.5: 2019 & 2020 Total Volume by Model Categories (Excluding China)
2019 Global Dataset Excluding China 2020 Global Data Excluding China
Alternative Finance Model Volume Market Share
Model Ranking
Change in Ranking
2018 v 2019 Volume
Market Share
Model Ranking
Change in Ranking
2019 v 2020
P2P/Marketplace Consumer Lending $33,606,240,567 37% 1 $34,733,430,066 31% 1
Balance Sheet Business Lending $19,132,408,437 21% 2 $28,018,468,321 25% 2
Balance Sheet Consumer Lending $10,628,711,073 12% 3 (+1) $11,893,247,173 11% 4 (-1)
P2P/Marketplace Business Lending $7,378,843,454 8% 4 (+1) $15,374,032,703 14% 3 (+1)
P2P/Marketplace Property Lending $4,093,908,169 4% 5 (+1) $3,073,501,606 3% 7 (-2)
Balance Sheet Property Lending $4,039,738,352 4% 6 (-3) $1,808,250,436 2% 9 (-3)
Invoice Trading $3,621,223,547 4% 7 (+1) $3,868,914,901 3% 6 (+1)
Real estate Crowdfunding $2,874,474,252 3% 8 (-1) $2,777,136,742 2% 8
Donation-based Crowdfunding $2,680,454,133 3% 9 (+3) $7,002,577,758 6% 5 (+4)
Equity-based Crowdfunding $1,093,646,218 1% 10 (-1) $1,520,408,438 1% 10
Reward-based Crowdfunding $887,443,612 1% 11 (-1) $1,242,796,093 1% 11
Consumer Purchase Finance/BNPL $591,711,865 1% 12 $505,372,721 0% 12
Debt-based Securities $490,227,397 1% 13 (-2) $384,760,118 0% 13
Crowd-led Microfinance $182,370,557 0% 14 $151,483,348 0% 14
Revenue/Profit Sharing $35,585,989 0% 15 (-1) $84,514,275 0% 15
Community Shares $20,886,410 0% 16 (-1) $23,693,137 0% 17 (-1)
Mini Bonds $6,236,156 0% 17 (-1) $43,932,746 0% 16 (+1)
Other $878,327 0% 18 (-5) $3,044,581 0% 18
When excluding China, a clearer picture emerges, allowing for a richer discussion on the evolution of any one model type from year to year. The P2P/Marketplace Consumer Lending model remains the largest single model contributing to market-share across both years, with only a marginal shift in market size from 37% to 31%. It is worth noting that in previous years, this model has always accounted for the largest market share, and when removing Chinese outliers, market share remains consistently in the mid-thirty percent range. However, unlike previous years, this model has not increased at pre-COVID growth-rates. Though in absolute terms this model has grown, some regions saw stagnation or decline, resulting in net-alternative finance drops.
With on-balance sheet activities on the rise, it is not surprising to see that Balance-sheet Business Lending ranked as second largest model for both years, with $19 billion in 2019 and $28 billion in 2020. Closely linked to the P2P/Marketplace Business Lending model (with 16% of respondents operating both models), a growing number of firms are achieving greater scale by relying upon on-balance sheet activities. Increasingly, the research has noted that firms which previously operated only a P2P/Marketplace model have now engaged in on-balance sheet activity, with institutional investors as the primary relationship counterpart. As such, volume driving activity is linked closely
to the balance-sheet model component of a firm. In 2019, Balance Sheet Consumer Lending ranks third (again, closely aligned to P2P/Marketplace Consumer Lending), though dropping to fourth position in 2020. In contrast, the P2P/Marketplace Business Lending model rose to third position in absolute market-share in 2020.
When considering P2P/Marketplace and Balance Sheet Property Lending, these two models have shrunk in absolute volume from 2019 to 2020. Not surprisingly, COVID-19 has played a role in the decline of these two models, with many respondents indicating that loan-origination was suspended or scaled back during the first half of 2020. Qualitative remarks, however, suggest that firms were beginning to recover in the latter half of 2020, and that 2021 has begun to rebound.
When considering market-share, the donation-based Crowdfunding model has experienced exponential growth, going from a ranking of nineth in 2019 to fifth in 2020. This leap relates to its substantial annual growth rate of over 160% between 2019 and 2020. This can be attributed directly to the flurry of charitable, social and health related fundraising activities during the COVID-19 pandemic regionally and globally.
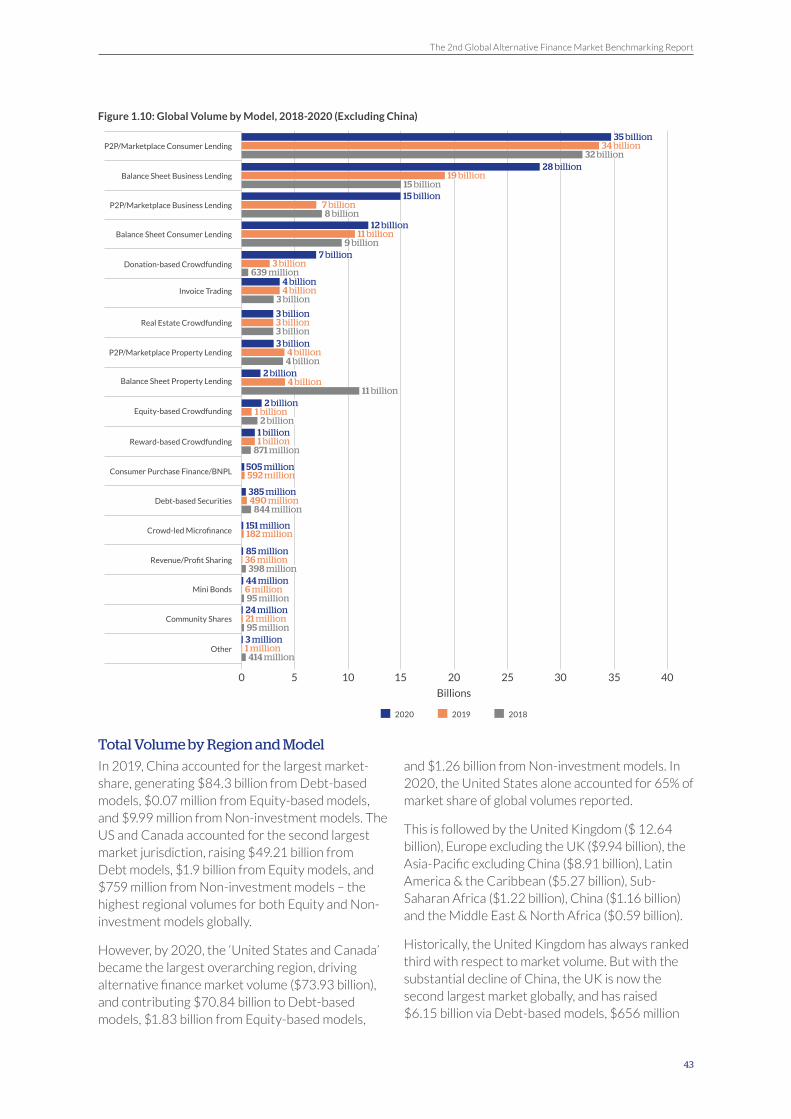
The 2nd Global Alternative Finance Market Benchmarking Report
43
Figure 1.10: Global Volume by Model, 2018-2020 (Excluding China)
Total Volume by Region and Model
In 2019, China accounted for the largest market-share, generating $84.3 billion from Debt-based models, $0.07 million from Equity-based models, and $9.99 million from Non-investment models. The US and Canada accounted for the second largest market jurisdiction, raising $49.21 billion from Debt models, $1.9 billion from Equity models, and $759 million from Non-investment models – the highest regional volumes for both Equity and Non-investment models globally.
However, by 2020, the ‘United States and Canada’ became the largest overarching region, driving alternative finance market volume ($73.93 billion), and contributing $70.84 billion to Debt-based models, $1.83 billion from Equity-based models,
and $1.26 billion from Non-investment models. In 2020, the United States alone accounted for 65% of market share of global volumes reported.
This is followed by the United Kingdom ($ 12.64 billion), Europe excluding the UK ($9.94 billion), the Asia-Pacific excluding China ($8.91 billion), Latin America & the Caribbean ($5.27 billion), Sub-Saharan Africa ($1.22 billion), China ($1.16 billion) and the Middle East & North Africa ($0.59 billion).
Historically, the United Kingdom has always ranked third with respect to market volume. But with the substantial decline of China, the UK is now the second largest market globally, and has raised $6.15 billion via Debt-based models, $656 million
5 10 3015 20 35 400 25
19 billionBalance Sheet Business Lending15 billion
28 billion
Billions
2020 2019 2018
Crowd-led Microfinance 182 million151 million
34 billionP2P/Marketplace Consumer Lending32 billion
35 billion
1 billionReward-based Crowdfunding871 million
1 billion
7 billionP2P/Marketplace Business Lending8 billion
15 billion
4 billionInvoice Trading3 billion
4 billion
3 billionDonation-based Crowdfunding639 million
7 billion
4 billionP2P/Marketplace Property Lending4 billion
3 billion
490 millionDebt-based Securities844 million
385 million
6 millionMini Bonds95 million
44 million
11 billionBalance Sheet Consumer Lending9 billion
12 billion
1 billionEquity-based Crowdfunding2 billion
2 billion
3 billionReal Estate Crowdfunding3 billion
3 billion
1 millionOther414 million
4 billionBalance Sheet Property Lending11 billion
2 billion
3 million
Consumer Purchase Finance/BNPL 505 million592 million
21 millionCommunity Shares24 million
95 million
36 millionRevenue/Profit Sharing85 million
398 million
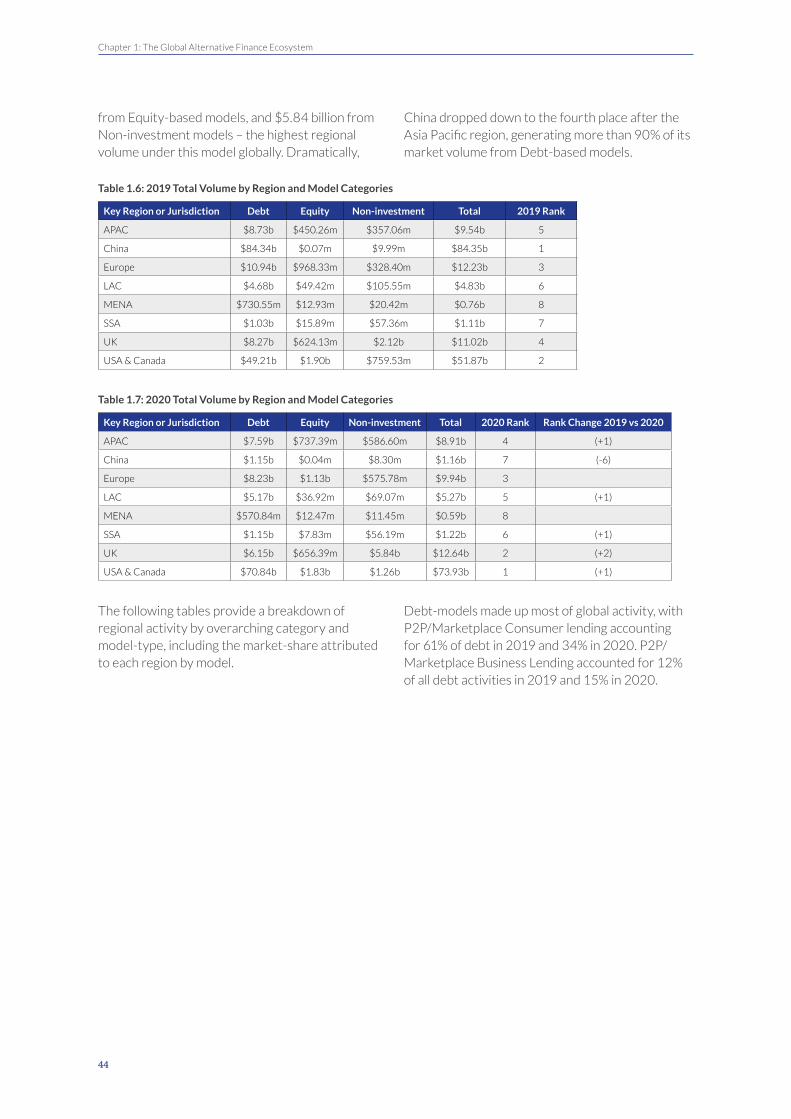
44
Chapter 1: The Global Alternative Finance Ecosystem
from Equity-based models, and $5.84 billion from Non-investment models – the highest regional volume under this model globally. Dramatically,
China dropped down to the fourth place after the Asia Pacific region, generating more than 90% of its market volume from Debt-based models.
Table 1.6: 2019 Total Volume by Region and Model Categories
Key Region or Jurisdiction Debt Equity Non-investment Total 2019 Rank
APAC $8.73b $450.26m $357.06m $9.54b 5
China $84.34b $0.07m $9.99m $84.35b 1
Europe $10.94b $968.33m $328.40m $12.23b 3
LAC $4.68b $49.42m $105.55m $4.83b 6
MENA $730.55m $12.93m $20.42m $0.76b 8
SSA $1.03b $15.89m $57.36m $1.11b 7
UK $8.27b $624.13m $2.12b $11.02b 4
USA & Canada $49.21b $1.90b $759.53m $51.87b 2
Table 1.7: 2020 Total Volume by Region and Model Categories
Key Region or Jurisdiction Debt Equity Non-investment Total 2020 Rank Rank Change 2019 vs 2020
APAC $7.59b $737.39m $586.60m $8.91b 4 (+1)
China $1.15b $0.04m $8.30m $1.16b 7 (-6)
Europe $8.23b $1.13b $575.78m $9.94b 3
LAC $5.17b $36.92m $69.07m $5.27b 5 (+1)
MENA $570.84m $12.47m $11.45m $0.59b 8
SSA $1.15b $7.83m $56.19m $1.22b 6 (+1)
UK $6.15b $656.39m $5.84b $12.64b 2 (+2)
USA & Canada $70.84b $1.83b $1.26b $73.93b 1 (+1)
The following tables provide a breakdown of regional activity by overarching category and model-type, including the market-share attributed to each region by model.
Debt-models made up most of global activity, with P2P/Marketplace Consumer lending accounting for 61% of debt in 2019 and 34% in 2020. P2P/Marketplace Business Lending accounted for 12% of all debt activities in 2019 and 15% in 2020.

The 2nd Global Alternative Finance Market Benchmarking Report
45
Table 1.8: 2019 Regional Volume Breakdown for Debt Models
Geography
APACof which market share
$3134.3m $1623.89m $619.7m $827.5m $1574.1m $574.2m $6.4m $374.3m $8734.5m
36% 19% 7% 9% 18% 0% 7% 0% 0% 4%
Chinaof which market share
$69500.6m $13434.6m $499.3m $118.2m $683.6m $94.0m $6.2m $84336.6m
82% 16% 1% 0% 1% 0% 0% 0% 0% 0%
Europeof which market share
$4182.6m $1481.3m $371.1m $608.0m $33.3m $2249.7m $1808.8m $6.1m $112.0m $79.7m $10932.5m
38% 14% 3% 6% 0% 21% 17% 0% 1% 1%
LACof which market share
$199.0m $58.7m $3.1m $492.8m $3033.4m $10.1m $755.2m $0.0m $55.3m $69.6m $4677.3m
4% 1% 0% 11% 65% 0% 16% 0% 1% 1%
MENAof which market share
$103.3m $152.2m $400.0m $0.0m $0.2m $4.5m $50.0m $20.3m $730.6m
14% 21% 55% 0% 0% 0% 1% 0% 7% 3%
SSAof which market share
$513.0m $15.6m $0.04m $462.7m $23.2m $16.1m $0.4m $1.6m $1032.6m
50% 2% 0% 45% 2% 0% 2% 0% 0% 0%
UKof which market share
$2160.6m $2537.9m $1899.3m $17.8m $1062.3m $462.3m $0.1m $129.2m $8269.6m
26% 31% 23% 0% 13% 0% 6% 0% 2% 0%
USA & Canadaof which market share
$23313.3m $1509.2m $796.7m $8219.9m $13406.0m $1780.0m $0.0m $136.8m $46.2m $49208.2m
47% 3% 2% 17% 27% 4% 0% 0% 0% 0%
TOTAL of which market share
$103106.8m $20813.5m $4589.2m $10746.9m $19816.0m $4039.7m $3715.2m $6.2m $496.4m $591.7m $167921.8m
61% 12% 3% 6% 12% 2% 2% 0% 0% 0%
Table 1.9: 2020 Regional Volume Breakdown for Debt Models
Geography
APACof which market share
$2193.4m $1819.6m $541.8m $999.1m $1259.7m $7.7m $239.3m $2.4m $351.4m $7414.5m30% 25% 7% 13% 17% 0% 3% 0% 0% 5%
Chinaof which market share
$7.0m $0.3m $0.0m $1132.0m $0.0m $13.4m $1152.8m1% 0% 0% 98% 0% 0% 1% 0% 0% 0%
Europeof which market share
$3071.4m $1843.6m $500.2m $657.0m $105.2m $9.7m $2016.5m $13.9m $129.9m $57.0m $8234.2m37% 22% 6% 8% 1% 0% 24% 0% 2% 1%
LACof which market share
$260.8m $29.9m $9.5m $410.9m $3274.6m $10.6m $1146.2m $14.3m $11.7m $5168.5m5% 1% 0% 8% 63% 0% 22% 0% 0% 0%
MENAof which market share
$107.1m $124.3m $300.0m $0.1m $2.3m $2.0m $20.0m $15.0m $570.8m19% 22% 53% 0% 0% 0% 0% 0% 4% 3%
SSAof which market share
$768.8m $13.7m $0.1m $346.3m $15.1m $0.2m $0.2m $3.8m $3.8m $1151.8m67% 1% 0% 30% 1% 0% 0% 0% 0% 0%
UKof which market share
$255.3m $3262.2m $1312.1m $754.9m $462.3m $30.0m $72.1m $6148.9m4% 53% 21% 0% 12% 0% 8% 0% 1% 0%
USA & Canadaof which market share
$28076.7m $8280.7m $409.8m $9479.8m $22606.7m $1780.0m $142.4m $66.5m $70842.5m40% 12% 1% 13% 32% 3% 0% 0% 0% 0%
TOTAL of which market share
$34740.4m $15374.4m $3073.5m $13025.2m $28018.5m $1808.3m $3882.4m $43.9m $384.8m $505.4m $100856.7m34% 15% 3% 13% 28% 2% 4% 0% 0% 1%
Equity-based models accounted for $4 billion in 2019 and $4.4 billion in 2020 of alternative finance volumes globally. Though much smaller than its
debt counterparts, the majority of the models in this category showed a growing trend compared to the previous years.
P2
P/M
arke
tpla
ce
Co
nsu
mer
Len
din
g
P2
P/M
arke
tpla
ce
Bu
sin
ess
Len
din
g
P2
P/M
arke
tpla
ce
Pro
per
ty L
end
ing
Bal
ance
Sh
eet
Co
nsu
mer
Len
din
g
Bal
ance
Sh
eet
Bu
sin
ess
Len
din
g
Bal
ance
Sh
eet
Pro
per
ty L
end
ing
Invo
ice
Trad
ing
Min
i Bo
nd
s
Deb
t-b
ased
Se
curi
ties
Co
nsu
mer
Pu
rch
ase
Fin
ance
/BN
PL
Tota
l Deb
t M
od
els
P2
P/M
arke
tpla
ce
Co
nsu
mer
Len
din
g
P2
P/M
arke
tpla
ce
Bu
sin
ess
Len
din
g
P2
P/M
arke
tpla
ce
Pro
per
ty L
end
ing
Bal
ance
Sh
eet
Co
nsu
mer
Len
din
g
Bal
ance
Sh
eet
Bu
sin
ess
Len
din
g
Bal
ance
Sh
eet
Pro
per
ty L
end
ing
Invo
ice
Trad
ing
Min
i Bo
nd
s
Deb
t-b
ased
Se
curi
ties
Co
nsu
mer
Pu
rch
ase
Fin
ance
/BN
PL
Tota
l Deb
t M
od
els

46
Chapter 1: The Global Alternative Finance Ecosystem
In recent years, Real Estate Crowdfunding (71% or $2.87 billion in 2019; 63% or $2.77 billion in 2020) and Equity-based Crowdfunding (27% or $1.09 billion in 2019; 35% or $1.52 billion in 2020) were the largest model in this category.
The Equity-based Crowdfunding model was the second leading model of this category. In 2020, equity-based crowdfunding accounted for 100% of MENA region ($12.5 million), 84% of UK ($549 million) and 45% of APAC’s ($333 million) equity-based market volume.
Table 1.10: 2019 Regional Volume Breakdown for Equity Models
GeographyEquity-based
CrowdfundingReal Estate
CrowdfundingRevenue/Profit
SharingCommunity
SharesTotal Equity
Models
APACof which market share
$219.4m $222.1m $8.3m $0.4m $450.3m49% 49% 2% 0%
Chinaof which market share
$0.1m $0.1m100% 0% 0%
Europeof which market share
$224.1m $732.8m $11.4m $0.0m $968.3m23% 76% 1% 0%
LACof which market share
$10.3m $28.9m $10.3m $49.4m21% 58% 21% 0%
MENAof which market share
$12.9m $0.0m $0.0m $12.9m100% 0% 0%
SSAof which market share
$10.3m $5.5m $0.0m $15.9m65% 0% 35%
UKof which market share
$474.6m $129.1m $20.4m $624.1m76% 21% 0% 3%
USA & Canadaof which market share
$141.9m $1761.6m $0.1m $0.0m $1903.6m7% 93% 0%
TOTAL of which market share
$1093.7m $2874.5m $35.6m $20.9m $4024.7m27% 71% 1% 1%
Table 1.11: 2020 Regional Volume Breakdown for Equity Models
GeographyEquity-based
CrowdfundingReal Estate
CrowdfundingRevenue/Profit
SharingCommunity
SharesTotal Equity
Models
APACof which market share
$333.5m $351.8m $51.5m $0.6m $737.4m45% 48% 7% 0%
Chinaof which market share
$0.0m $0.0m100% 0% 0% 0%
Europeof which market share
$279.7m $822.1m $26.1m $0.0m $1127.9m25% 73% 2% 0%
LACof which market share
$12.6m $23.8m $0.5m $36.9m34% 64% 1% 0%
MENAof which market share
$12.5m $12.5m100% 0% 0% 0%
SSAof which market share
$1.2m $0.0m $6.6m $7.8m15% 0% 85% 0%
UKof which market share
$549.3m $84.0m $23.1m $656.4m84% 13% 0% 4%
USA & Canadaof which market share
$331.5m $1495.4m $1827.0m18% 82% 0% 0%
TOTAL of which market share
$1520.4m $2777.1m $84.6 $23.7m $4405.9m35% 63% 2% 1%
Donation-based Crowdfunding represented the largest share of Non-Investment models’ volumes, and accounted for $2.68 billion (or 71%) in 2019 and $7 billion (83%) in 2020. The UK
market accounted for 77% of global Donation crowdfunding volumes, following a unique national project that occurred in recent years.

The 2nd Global Alternative Finance Market Benchmarking Report
47
Reward-based Crowdfunding accounted for $897 million in 2019 and $1.25 billion in 2020 globally, maintaining its steady growth from 2018 volumes of $877 million. US and Canada, APAC, and Europe accounted for the main proportion of activities within this volume.
Crowd-led Microfinance contributed a smaller proportion towards Non-Investment models and accounted for $182 million (or 5%) in 2019 and $152 million (or 2%) in 2020 globally. The SSA, LAC and MENA accounted for the main proportion of activities within this model.
Table 1.12: 2019 Regional Volume Breakdown for Non-Investment Models
RegionReward-based Crowdfunding
Donation-based Crowdfunding
Crowd-led Microfinance
Total Non-Investment Models
APACof which market share
$217.5m $96.1m $43.5m $357.1m61% 27% 12%
Chinaof which market share
$9.9m $0.1m $10.0m99% 1% 0%
Europeof which market share
$195.0m $111.9m $21.6m $328.4m59% 34% 7%
LACof which market share
$12.8m $35.4m $57.4m $105.6m12% 33% 54%
MENAof which market share
$2.2m $6.1m $12.1m $20.4m11% 30% 59%
SSAof which market share
$1.2m $12.8m $43.3m $57.4m2% 22% 75%
UKof which market share
$58.9m $2063.1m $0.0m $2121.9m3% 97% 0%
USA & Canadaof which market share
$399.9m $355.2m $4.5m $759.5m53% 47% 1%
TOTAL of which market share
$897.3m $2680.6m $182.4m $3.76b24% 71% 5%
Table 1.13: 2020 Regional Volume Breakdown for Non-Investment Models
RegionReward-based Crowdfunding
Donation-based Crowdfunding
Crowd-led Microfinance
Total Non-Investment Models
APACof which market share
$405.7m $143.3m $37.5m $586.6m69% 25% 6%
Chinaof which market share
$7.9m $0.4m $8.3m95% 5% 0%
Europeof which market share
$261.7m $295.6m $18.5m $575.8m45% 51% 3%
LACof which market share
$10.1m $15.6m $43.3m $69.1m15% 23% 63%
MENAof which market share
$3.3m $3.0m $5.2m $11.4m29% 26% 45%
SSAof which market share
$1.1m $15.8m $39.3m $56.2m2% 28% 70%
UKof which market share
$68.8m $5768.6m $5837.4m1% 99% 0%
USA & Canadaof which market share
$492.0m $760.6m $7.7m $1260.4m39% 60% 1%
TOTAL of which market share
$1250.7m $7003.0m $151.5m $8.41b15% 83% 2%

48
Chapter 1: The Global Alternative Finance Ecosystem
Global Market Concentration by Business Model
Table 1.14: Global Market Concentration by Business Model, 2019-2020
Region Business ModelHHI
2019Market
Concentration 2019HHI
2020Market
Concentration 2020Summary (Direction of
Market Concentration Flow)
Full Panel 0.02 Unconcentrated 0.05 Unconcentrated 0.03
Balance Sheet Business Lending
0.20Moderately
Concentrated0.29 Highly Concentrated 0.09
P2P/Marketplace Business Lending
0.06 Unconcentrated 0.29 Highly Concentrated 0.24
Balance Sheet Consumer Lending
0.17Moderately
Concentrated0.25
Moderately Concentrated
0.07
P2P/Marketplace Consumer Lending
0.04 Unconcentrated 0.22Moderately
Concentrated 0.18
Balance Sheet Property Lending
0.50 Highly Concentrated 0.97 Highly Concentrated 0.47
P2P/Marketplace Property Lending
0.05 Unconcentrated 0.06 Unconcentrated 0.01
Real Estate Crowdfunding
0.23Moderately
Concentrated0.16
Moderately Concentrated
-0.07
Equity-based Crowdfunding
0.12 Unconcentrated 0.11 Unconcentrated -0.01
Donation-based Crowdfunding
0.64 Highly Concentrated 0.80 Highly Concentrated 0.16
Reward-based Crowdfunding
0.46 Highly Concentrated 0.38 Highly Concentrated -0.07
Full Panel 0.04 Unconcentrated 0.05 Unconcentrated 0.01
Balance Sheet Business Lending
0.21Moderately
Concentrated0.29 Highly Concentrated 0.07
P2P/Marketplace Business Lending
0.18Moderately
Concentrated0.29 Highly Concentrated 0.11
Balance Sheet Consumer Lending
0.18Moderately
Concentrated0.28 Highly Concentrated 0.11
P2P/Marketplace Consumer Lending
0.16Moderately
Concentrated0.22
Moderately Concentrated
0.06
Balance Sheet Property Lending
0.50 Highly Concentrated 0.97 Highly Concentrated 0.47
P2P/Marketplace Property Lending
0.06 Unconcentrated 0.06 Unconcentrated 0.00
Real Estate Crowdfunding
0.23Moderately
Concentrated0.16
Moderately Concentrated
-0.07
Equity-based Crowdfunding
0.12 Unconcentrated 0.11 Unconcentrated -0.01
Donation-based Crowdfunding
0.64 Highly Concentrated 0.80 Highly Concentrated 0.16
Reward-based Crowdfunding
0.45 Highly Concentrated 0.38 Highly Concentrated -0.07
When considering market concentration, the research team used the Herfindahl-Hirschman Index (HHI) to assess the concentration of alternative finance activities. While this presents interesting developments at a global level, it must be viewed critically due to two major caveats. First, this analysis is easier to interpret and more robust at the regional rather than global level, given there are very few truly global alternative finance
platforms. Second, high levels of concentration should not be conflated with market maturity, as it is more often the result of few new actors serving in a growing market than a consolidation of players in a mature market. Taking the above carveats into consideration, several interesting insights can also be presented. Overall, the HHI score suggested that at a global market level and taking into account all models, a relatively low level
Glo
bal
Glo
bal
(Exc
lud
ing
Ch
ina)

The 2nd Global Alternative Finance Market Benchmarking Report
49
of market concentration is evident. However, when considering this index with respect to different alternative finance business models, the model specifc HHI scores vary differently and suggest an underlying trend of market concentration from 2019 to 2020 in specific models.
At a global level (both including and excluding China), it was identified that seven out of 10 business models experienced increasing market concentration against the previous year. More specifically, the scores observed show greater market concentration for three specific models: P2P/Marketplace Business Lending; Balance Sheet Consumer Lending; and P2P/Marketplace Consumer Lending. Overall, Business Lending models shifted toward greater market concentration over time. The Balance Sheet Business Lending model denotes a shift from moderate to high market concentration trajectory between 2019 and 2020, when just two firms were responsible for nearly 60% of the market share in both years. Similarly, P2P/Marketplace Business Lending moved markedly towards greater concentration. When considering the underlying dataset in 2019, there were four firms accounting for a 40% (90% excluding China) market share, and by 2020 nearly 70% of volumes were accounted for by two firms. For Consumer Lending models, at the aggregate level, the Balance Sheet Consumer Lending model maintained its position at moderate concentration levels for both years and shifted marginally to higher concentration levels when excluding China in 2020. The rise in the market concentration levels was evident in the market share of four firms, which increased from 70% in 2019 to 80% in 2020. When considering actual geographical distribution of all these three models, the identified concentration trends mostly represented North American dynamics than global ones per se.
In case of P2P/Marketplace Consumer Lending model, the market moved from unconcentrated to moderately concentrated state at the aggregate level in 2020, however, the model noted moderate concentration levels both in 2019 and 2020 when volumes of Chinese firms were excluded. The shift in state from unconcentrated to moderate concentration at the global level resulted, due to five firms increasing the share of market capitalisation from nearly 40% to 80%.
For equity-based models, the Real-estate Crowdfunding model maintained its position at moderate concentration levels both in 2019 and 2020. However, this market registered a significant drop in its HHI score (heading toward unconcentrated levels) from 2019 to 2020. This was due to the drop in the market share activity of one dominant firm in 2019 from 45% to 36% in 2020. Equity Crowdfunding itself, showed relative stability and maintained its status as an unconcentrated market.
In the non-investment model segment, both Donation-based Crowdfunding and Reward-based Crowdfunding maintained higher levels of market concentration in 2019 and 2020, with market concentration risks tilting up for Donation-based Crowdfunding in 2020 and down for Reward-based Crowdfunding.
The Vitality of Alternative Finance Business Funding
Small and Medium-sized businesses actively utilise online alternative finance channels and instruments for their funding needs. Since 2015, alternative finance firms have increasingly serviced SME clients, with discussions around SME-focused FinTech activity serving as a key priority for policymakers globally. The utility of alternative finance for SME clients is undeniable; our data suggested that volumes going to entrepreneurs, start-ups and small and medium-sized businesses (SMEs) globally is on the rise and proving to be a viable and long-lasting funding source, which may be even more critical during COVID-19 and its impact on small business operations and cashflows.13
Overall Business Finance by Year
As mentioned earlier, analyses of global volumes need to distinguish between those including and excluding the Chinese market outlier. Global alternative finance platforms raised $49 billion for businesses in 2019 and $53 billion in 2020. Against the 2018 figure, this is a substantial 39% drop, however an increase was observed in 2020.
When separating Chinese-driven business volumes from the rest of the world, we note that the business-focused online alternative funding increased year-on-year. In 2019, global alternative

50
Chapter 1: The Global Alternative Finance Ecosystem
finance for business accounted for $35 billion, up 13% against 2018’s $31 billion and growing significantly (51%) in 2020 to $53 billion. By way of comparison, in 2019, business funding was 38% of the total volume, while in 2020 business funding was 47% of the total volume.
As with previous years, funding for business overwhelmingly stems from Debt-based models
with $32.8 billion raised in 2019 (or 96% of all business funding) and $49.6 billion raised in 2020 (94%). Equity-based models contributed $1.5 billion in 2019 and $2.2 billion in 2020 (or 3% in 2019 and 4% in 2020 of business funding). Non-Investment models accounted for $533 million (1% of business funding) in 2019 and $744 million (or 1% of business funding) in 2020.
Figure 1.11: Alternative Finance Volumes Attributed to Business Fundraisers, 2015-2020 USD
Figure 1.12: Breakdown of Business Financing by Category When continuing the analysis per region, the highest rates of SME financing via alternative finance volume was recorded in the USA ($15.4 billion in 2019; $32 billion in 2020), the UK ($6.5 billion in 2019; $6.4 billion in 2020) and Europe ($4.3 billion in 2019 and $5.2 billion in 2020).
LAC firms raised $4 billion for businesses in 2019 and $4.5 billion in 2020, with consistent growth over the last four years. Asia-Pacific region (excluding China) raised $4.3 billion for businesses in 2019 and $4.21 billion in 2020, reporting the first-time decrease in volume after five years of continuous growth. SSA and the MENA region accounted for the lowest proportion of SME financing for businesses in both years, however it is worth noting that SME-driven activity is on the rise within specific countries within both regions (as presented in respective regional analysis sections later in this report).
Figure 1.13: Alternative Finance Business Funding, Volumes by Region, USD
4020
8060
120
100
160140
012
60
2015
17
110
2016
31
80
2018
21
153
2017
3549
2019
5353
2020
Global Business Volumes Business Volumes Excluding China
0%
40%
90%
20%
70%
60%
10%
50%
30%
80%
100%
Debt-based Volumes
Equity-based Volumes
Non-Investment Volumes
96%
2019
1%3% 4%
94%
2020
1%
Bill
ion
35
25
30
20
15
10
5
0
2017 2018 2019 2020
SSA
0 0.1
0.1
0
APAC
2.2 3.
5 4.3
4.2
LAC
0.6 1.1 4.
04.
5
MENA
0.2 0.8
0.2
0.2
UK
5.6 6.0 6.5
6.4
Europe
1.9 2.
6 4.3 5.2
USA & Canada
10.7
16.8
15.4
31.9
The 2nd Global Alternative Finance Market Benchmarking Report
51
Market Dynamics
Institutionalisation
Institutional investors play an important role in the Alternative Finance market, increasingly making use of alternative finance to support investment strategies or portfolio diversification for themselves or their clients. To capture this, platforms were asked what percentage of their total 2019 and 2020 funding volume was funded by institutional investors, i.e., banks, trusts, brokerage firms, investment dealers, insurance companies, as well as other non-financial institutions. Based on 58% of the observations, for which relevant information was provided, we found that in 2019, approximately $28.5 billion of the alternative finance volumes was provided by institutional investors, which is 16% of the entire global volume for that year. In 2020, based on 60% of the observations, approximately $43.6 billion of the alternative finance volumes was provisioned by institutional investors, which is 42% of the entire global volume for the year. This represents a 53% growth in institutionally derived funding from one year to the next.
Across both years, the majority of regions had an almost equal split between institutional and non-institutional (i.e. retail or accredited and unaccredited individual) investors. However, some exceptions are noted especially in MENA and SSA with a higher concentration of individual investors, in contrast to the US with the highest concentration of institutional investor activity. While involving substantially lower volumes overall, such indicators suggest that alternative finance has potential to fill financial gaps in markets underserved by traditional financial institutions, especially in developing and emerging economies.
In the year-on-year comparison, regions or markets such as Europe, MENA, SSA, the United Kingdom, and the US and Canada saw an increase in the proportion of institutional investors. Platforms in the US and Canada reported 74% of institutionalised funding in 2019, however, in
2020 firms saw almost an absolute concentration in institutional funders, with over 98% of regional volumes originating from such sources, also representing the highest rate globally. This is mostly a reflection of regulatory conditions favouring accredited investors in debt-financing in North America, as well as conditions of highly developed financial market where retail investors use professional intermediaries more readily.
Following is the United Kingdom market, where companies reported a significant growth of institutional funders between 2019 and 2020, leaping significantly from 43% to 66% of funding proportion as well as reaching a volume of approximately $15 billion and $29 billion respectively.
In Europe, year after year the region increasingly sees more institutional investors, and in 2020, the market surpassed the mark of more than half of the total alternative finance volume coming from professional funders. In terms of volumes, approximately $4 billion was from institutional sources in 2020.
Despite a smaller participation of institutional investors within the MENA and SSA markets, firms reported an increase in the participation of this type of investors. MENA grew from 14% ($96 million) in 2019 to 20% ($104 million) in 2020, and SSA from 21% ($215 million) in 2019 to 31% ($330 million) in 2020.
However, in regions such as APAC and LAC, well-known to be strongly affected by the pandemic, companies reported a decrease in the institutional investment in the year-on-year comparison. APAC firms reported a slight decrease from 61% ($3,47 billion) in 2019 to 55% ($2,93 billion) in 2020. Finally, in LAC, the region with the highest decrease, a volume of approximately $3.16 billion was reported in 2019 and $2.93 billion in 2020.

52
Chapter 1: The Global Alternative Finance Ecosystem
Figure 1.14: Institutionalisation by Region, 2019-2020
Overall, Debt-facing models make up the highest proportion of institutionally led finance, with most debt-based verticals having more than two thirds of their total volume provided by these investors.
P2P/Marketplace Consumer Lending, increased from 56% in 2019 to 62% in 2020, however, in terms of absolute volume, it represented $9.5 billion in 2019 and approximately $5 billion in 2020. Balance Sheet Consumer Lending firms reported a significant increase of institutionalisation between 2019 and 2020, from 31% ($1.3 billion) to 85% ($2.7 billion) respectively.
P2P/Marketplace and Balance Sheet Business Lending firms reported the highest growth in terms of institutional volumes. The first vertical accounted for over $4.4 billion in 2019 and over $13 billion in 2020 from institutional funders. The second vertical accounted for over $10.7 billion and $21.2 billion in 2019 and 2020, respectively.
Invoice Trading companies also reported high proportions of institutional funders. For 2019, over 70% and approximately $2 billion, and in 2020 over 77% and approximately $2,1 billion were provided by this type of investor.
Moreover, firms of Crowdfunding business models reported high concentration of individual investors: only 7% of Equity-based Crowdfunding in both years, only 6% and 2% of Donation-based Crowdfunding in 2019 and 2020 respectively, and only 1% and 6% of Reward-based Crowdfunding in 2019 and 2020 respectively. This reflects the primary profit-seeking interest of traditional financial institutions when considering non-investment models, and their conservative low tolerance of risk when considering equity investments versus lending.
0% 20% 30% 50% 70% 90%10% 60%40% 80% 100%
APAC
SSA
LAC
USA & Canada
Europe
UK
MENA
61% 39%2019
2019
2019
2019
2019
2020
2020
2020
2020
2020
2020 55% 45%
2019 47% 53%
2020 53% 47%
2019 58% 42%
49% 51%
14% 86%
20% 80%
21% 79%
31% 69%
43% 57%
66% 34%
74% 26%
98% 2%
Institutionalisation Non-institutionalisation

The 2nd Global Alternative Finance Market Benchmarking Report
53
Figure 1.15: Institutionalisation by Model, 2019-2020
Internationalisation
Figure 1.16: International Inflow by Model
In order to better understand the inflow of cross-border transactions, participants were asked to indicate the percentage of funding raised through their platforms that came from international funders/investors. Over 36% of all respondents provided significant data, being 661 observations globally.
Analysed by business models, Crowd-led Microfinance firms reported a proportion of 95% (approx. $160 million) of foreign fund raisers, followed by Invoice Trading with 45% and a volume of $553 million.
One third of P2P/Marketplace Consumer Lending funds came from a foreign jurisdiction, accounting
0% 20% 30% 50% 70% 90%10% 60%40% 80% 100%
P2P/Marketplace Consumer Lending
Debt-based Securities
Balance Sheet Business Lending
Donation-based Crowdfunding
Crowd-led Microfinance
P2P/Marketplace Property Lending
Real Estate Crowdfunding
P2P/Marketplace Business Lending
Equity-based Crowdfunding
Invoice Trading
Reward-based Crowdfunding
Balance Sheet Consumer Lending
Revenue/Profit Sharing
56% 44%2019
16% 84%2019
2019
2019
2019
2019
2019
2019
2019
2020
2020
2020
2020
2020
2020
2020
2020
2020
2020 62% 38%
2020 9% 91%
2019 70% 30%
2019 7% 93%
2020 91% 9%
2020 7% 93%
2019 14% 86%
2019 10% 90%
21% 79%
12% 88%
31% 69%
21% 79%
85% 15%
38% 62%
88% 12%
100%
93% 7%
98%
99%
99%
70% 30%
77% 23%
6%
2%1%
1%
6%
94%
94%
Institutionalisation Non-institutionalisation
20% 30% 60%40% 50% 80%70% 90% 100%10%0%
P2P/Marketplace Consumer Lending 33%
P2P/Marketplace Business Lending 21%
Invoice Trading 45%
Balance Sheet Consumer Lending 18%
Real Estate Crowdfunding 22%
Crowd-led Microfinance 95%
P2P/Marketplace Property Lending 5%
Equity-based Crowdfunding 10%
Reward-based Crowdfunding 11%
Balance Sheet Business Lending 3%
Donation-based Crowdfunding 32%

54
Chapter 1: The Global Alternative Finance Ecosystem
for the highest volume of $3.8 billion among the business models. A high proportion of inflow was also reported by Donation-based Crowdfunding
firms, accounting for $760 million of cross-border transactions.
Figure 1.17: International Inflow by Region
When considering the share of cross-border volumes by region it is important to keep in mind that these include cross-border transactions between countries within the region as well as outside it.
Regarding the level of internationalisation among the regions, SSA accounted for the highest proportion of cross-border inflow transactions with 87%. However, in terms of absolute volumes it was approximately $162 million and only higher than MENA, which accounted for an inflow volume of $41 million.
Europe was the second region in terms of proportion of internationalisation in its market, however, it leads when analysed by the $3.3 billion cross-border volume. The United Kingdom market accounted for approximately $1.1 billion of international inflow or a proportion of 24% of its market.
Completing the top three regions by proportion of international inflow, APAC accounted for a proportion of 28% and a volume of approximately $814 million of cross-border transactions. Moreover, the US and Canada and LAC regions had over 5% of international inflow each. In terms of volume, the US and Canada and LAC accounted for $606 million and $187 million, respectively.
Financial InclusionOften lauded as a potential silver bullet, Alternative Finance may be an effective solution when combatting financial exclusion. Financial technology firms in the capital raising arena are well positioned to service households, consumers and MSMEs that
fall outside of traditional banking. Such FinTechs may not only deliver efficiencies to the financial sector but also contribute to financial inclusion, especially in developing and emerging markets. Given the important role that platforms can play in supporting the advancement of key developmental objectives, particularly financial inclusion, it is necessary for us to examine what the impact thus far has been when serving such clients.
Banked Status of Digital Alternative Finance Activities
To measure the level of financial inclusion among customers utilising digital lending or capital raising solutions, respondents were asked to indicate the proportion of their transaction value that went to banked (users that have access to a full suite of financial services), underbanked (with access to some basic financial services, but not a complete suite) or unbanked (not served by or with access to any traditional financial service) fundraisers.
The models analysed within this section are those which fall into Debt or Equity, where the fundraising individual (be it a borrower or issuer) have financial obligations to funders more akin to traditional banking services. As such, we excluded from this analysis the Donation-based and Reward-based Crowdfunding models. China was also excluded from this analysis due to insufficient data. As a result, our analysis was based on 919 (or 51%) platform level observations.
When looking at respondents geographically, it is predominantly banked individuals and businesses that are currently utilising digital lending and capital raising. Not surprisingly, the United Kingdom
0% 20% 30% 50% 70% 90%10% 60%40% 80%
LAC
APAC
MENA
Europe
SSA
UK
5%
28%
6%
64%
87%
24%

The 2nd Global Alternative Finance Market Benchmarking Report
55
primarily caters to banked customers (96%), with only 4% being identified as underbanked. Other regions with a significantly high levels of banked customers were LAC, with 86% of the customer base banked, 11% underbanked and 3% unbanked. MENA was the third most banked market, with 83% of customers banked, 10% underbanked and 7% unbanked.
In contrast, FinTech activities in SSA are showing their potential to improve access to finance for underserved groups, with respondents across the
region indicated that approximately 49% of their customer base could be described as unbanked, and a further 48% as underbanked.
Though still predominantly catering to banked customers, firms across Asia Pacific reported that 51% of their clients were underbanked, with a further 4% unbanked. In Europe, 27% of clients were categorised as underbanked and 11% as unbanked. The latter cases mostly evident in South and Eastern Europe.
Figure 1.18: Banking Status by Region
When considering banking status against specific model types, on balance, alternative finance activities remain heavily skewed towards those individuals and customers which are banked. Crowd-led microfinance, unsurprisingly, is the only exception with 72% of clients defined as the unbanked, and 27% as underbanked.
The P2P/Marketplace and Balance Sheet Consumer Lending models both saw slightly elevated
instances of underbanked clients (25% and 20% respectively). Lending models directed at business clients serviced a slightly higher proportion of underbanked, though again the predominant client category is that of banked customers. 30% of clients in the P2P/Marketplace Business Lending were categorised as underbanked, 27% for Balance Sheet Business Lending and 27% from Invoice Trading.
Figure 1.19: Banking Status by Model
4% 51% 45%
3%49% 48%
11% 27% 62%
3% 11% 86%
7% 10% 83%
4% 96%
28% 72%
0% 10% 20% 30% 40% 50% 60% 70% 80% 90% 100%
APAC
Europe
MENA
SSA
UK
USA & Canada
LAC
Unbanked Underbanked Banked
0% 10% 20% 30% 40% 50% 60% 70% 80% 90% 100%
Unbanked Underbanked Banked
P2P/Marketplace Consumer Lending 3% 25% 72%
P2P/Marketplace Business Lending 4% 30% 66%
P2P/Marketplace Property Lending 2% 8% 89%
Balance Sheet Consumer Lending 7% 20% 74%
Debt-based Securities 2% 29% 69%
95%Equity-based Crowdfunding 3% 2%
Balance Sheet Business Lending 27% 73%1%
Invoice Trading 27% 73%1%
Consumer Purchase Finance/BNPL 20% 79%1%
Revenue/Profit Sharing 44% 56%<1%
72% 27%Crowd-led Microfinance 1%
Real Estate Crowdfunding 2% 98%<1%
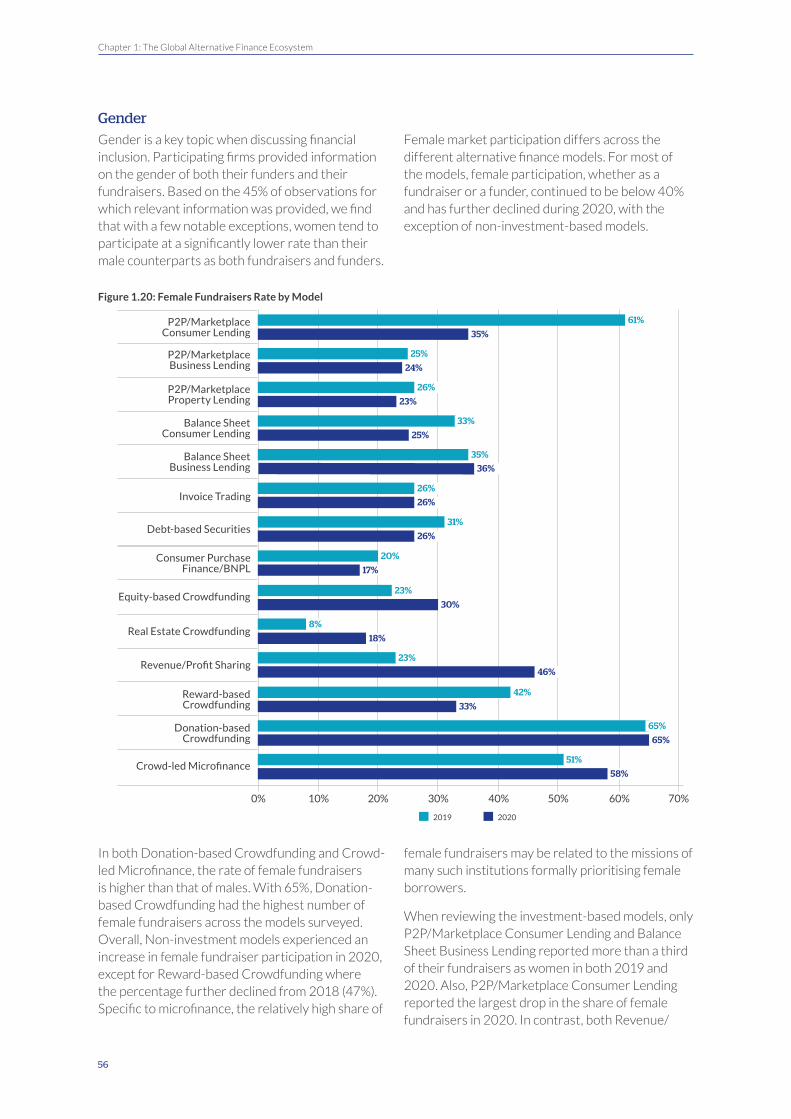
56
Chapter 1: The Global Alternative Finance Ecosystem
Gender
Gender is a key topic when discussing financial inclusion. Participating firms provided information on the gender of both their funders and their fundraisers. Based on the 45% of observations for which relevant information was provided, we find that with a few notable exceptions, women tend to participate at a significantly lower rate than their male counterparts as both fundraisers and funders.
Female market participation differs across the different alternative finance models. For most of the models, female participation, whether as a fundraiser or a funder, continued to be below 40% and has further declined during 2020, with the exception of non-investment-based models.
Figure 1.20: Female Fundraisers Rate by Model
In both Donation-based Crowdfunding and Crowd-led Microfinance, the rate of female fundraisers is higher than that of males. With 65%, Donation-based Crowdfunding had the highest number of female fundraisers across the models surveyed. Overall, Non-investment models experienced an increase in female fundraiser participation in 2020, except for Reward-based Crowdfunding where the percentage further declined from 2018 (47%). Specific to microfinance, the relatively high share of
female fundraisers may be related to the missions of many such institutions formally prioritising female borrowers.
When reviewing the investment-based models, only P2P/Marketplace Consumer Lending and Balance Sheet Business Lending reported more than a third of their fundraisers as women in both 2019 and 2020. Also, P2P/Marketplace Consumer Lending reported the largest drop in the share of female fundraisers in 2020. In contrast, both Revenue/
0% 20% 30% 50% 70%10% 60%40%
Debt-based Securities
Consumer Purchase Finance/BNPL
Invoice Trading
Revenue/Profit Sharing
2019 2020
35%
24%
36%
25%
23%
26%
26%
17%
30%
33%
18%
65%
46%
58%
61%
25%
33%
35%
26%
31%
20%
23%
42%
8%
65%
23%
51%
26%
P2P/Marketplace Consumer Lending
Reward-based Crowdfunding
Equity-based Crowdfunding
P2P/Marketplace Property Lending
P2P/Marketplace Business Lending
Real Estate Crowdfunding
Balance Sheet Consumer Lending
Balance Sheet Business Lending
Donation-based Crowdfunding
Crowd-led Microfinance

The 2nd Global Alternative Finance Market Benchmarking Report
57
Profit Sharing and Real Estate Crowdfunding saw a considerable rise in female participation as fundraisers.
In terms of absolute value, P2P/Marketplace Consumer Lending reported female fundraisers’ volume (including China) at $63 billion in 2019 and $12 billion in 2020, which are the largest among the models. Donation-based Crowdfunding which reported the highest rates, accounted for $1.7 billion and $4.6 billion volumes in 2019 and 2020 respectively.
When looking at geography, the highest rate of female fundraisers was found in the United Kingdom at 47% in 2019 and 59% in 2020, followed by SSA (46% in 2019; 54% in 2020) and North America (55% in 2019; 37% in 2020). While LAC reported the lowest levels at 11% for 2020. Overall, the average female fundraiser rate has slightly increased from 37.8% in 2019 to 38.9% in 2020, accounting for nearly $42 billion in volumes (excluding China) in both years.
Figure 1.21: Female Funders Rate by Model
Overall, the female funder rate is below 50% across the different model types. Under debt and equity-based models, in contrast to the findings from last year where females accounted for roughly 20-30% of funders, the rate has increased especially for P2P/Marketplace Lending models. Over a third of funders for P2P/Marketplace Consumer and P2P/Marketplace Property Lending were women in both years. While Equity-based Crowdfunding and Balance Sheet Consumer Lending saw a decline in female participation from 2018. Non-investment models continued to attract more female funders; however, the rate has almost remained the same over the years.
Across different model types, P2P/Marketplace Consumer Lending reported the highest volumes
(including China) by female funders amounting to $43 billion and $12 billion in 2019 and 2020 respectively. However, in relative terms, Donation-based Crowdfunding reported the highest rates of female funders with 49% accounting for $1.3 billion in 2019 and $3.4 billion in 2020.
The shares of female funders were highest in United Kingdom (32% in 2019; 43% in 2020), MENA (44% in 2019; 43% in 2020), and North America (44% in 2019; 36% in 2020). LAC reported the lowest rate across the regions at 18% for 2020. Overall, the average female funders’ rate increased from 33% in 2019 with a value of $34 billion, to 35.7% in 2020 amounting to $40 billion in total volumes (excluding China).
0% 20% 30% 50% 60%10% 40%
P2P/Marketplace Consumer Lending
Reward-based Crowdfunding
Equity-based Crowdfunding
P2P/Marketplace Property Lending
P2P/Marketplace Business Lending
Real Estate Crowdfunding
Balance Sheet Consumer Lending
Donation-based Crowdfunding
Crowd-led Microfinance
2019 2020
35%
25%
23%
17%
33%
25%
48%
49%
37%
42%
32%
13%
25%
17%
43%
49%
35%
37%

58
Chapter 1: The Global Alternative Finance Ecosystem
Risk & Regulations
Risks by ModelRespondents were asked about their perception of various risks that would potentially impact their platform operations and their ability to serve their clients. These risks were customer fraud; notable increases in defaults; cyber-security breach; changes to current regulation; and the emergence of BigTech activity. In the current section, we review these risks as reported by platforms operating under Debt, Equity, and Non-investment models. Based on 58% of observations for which relevant information was provided, we found that although the perceived risks varied depending on the platform’s model-type, there are several consistent similarities across overarching categories.
First, the main risks highlighted by platforms operating with Debt models included the following; the greatest concern is often associated with risks of changes to regulation. These concerns were especially prominent in platforms offering
services related to P2P/Marketplace Consumer Lending (50%), Balance Sheet Consumer Lending (52%), and Invoice Trading (50%), where over half of the respondents perceived this to be a high potential threat. In addition, customer fraud is ranked as a major concern for platforms offering services related to Invoice Trading (58%), P2P/Marketplace Property Lending (42%), and Balance Sheet Consumer Lending (41%). Similarly, the risk of increasing competition from entry of BigTech firms was also reported to be of high concern among platforms offering services related to Balance Sheet Consumer Lending (43%) and Balance Sheet Business Lending (43%). Further, risk related to a notable increase in defaults was prominently reported by more than one third of platforms offering services related to Invoice Trading (49%), P2P/Marketplace Property Lending (38%), P2P/Marketplace Business Lending (34%), and Balance Sheet Business Lending (32%).
Figure 1.22: Perceived Risks of Platforms by Debt-based Models
P2
P/M
arke
tpla
ce
Co
nsu
mer
Len
din
g
Customer Fraud
Notable increase in defaults
Cyber-security Breach
Emergence of BigTech firms
Changes to current regulation
12%
15%
50%
11%
61%29%
75%
18%
30%
71%
13%
67%
20%
18%
10%
P2
P/M
arke
tpla
ce
Bu
sin
ess
Len
din
g Customer Fraud
Notable increase in defaults
Cyber-security Breach
Emergence of BigTech firms
Changes to current regulation
31%
34%
32%
32%
37%44%
46%
37%
30%
43%
23%
28%
39%
25%
20%
P2
P/M
arke
tpla
ce
Pro
per
ty L
end
ing
Customer Fraud
Notable increase in defaults
Cyber-security Breach
Emergence of BigTech firms
Changes to current regulation
40%
38%
28%
42%
50%30%
26%
35%
28%
44%
33%
27%
44%
14%
20%
Low Medium High
Bal
ance
Sh
eet
C
on
sum
er L
end
ing
Customer Fraud
Notable increase in defaults
Cyber-security Breach
Emergence of BigTech firms
Changes to current regulation
20%
29%
52%
41%
34%23%
52%
29%
19%
37%
28%
42%
30%
22%
43%
Bal
ance
Sh
eet
B
usi
nes
s Le
nd
ing Customer Fraud
Notable increase in defaults
Cyber-security Breach
Emergence of BigTech firms
Changes to current regulation
25%
32%
29%
27%
27%30%
53%
24%
40%
49%
23%
43%
31%
24%
43%
Invo
ice
Trad
ing Customer Fraud
Notable increase in defaults
Cyber-security Breach
Emergence of BigTech firms
Changes to current regulation
44%
49%
50%
58%
42%33%
44%
36%
16%
29%
13%
15%
34%
12%
26%

The 2nd Global Alternative Finance Market Benchmarking Report
59
Similar to Debt models, the greatest concern in Equity models was associated with risks of changes to regulation. These concerns are especially prominent in platforms offering services related to Equity-based Crowdfunding (44%), Real Estate Crowdfunding (36%), and Revenue/Profit Sharing Schemes (33%).
In addition, nearly one third of platforms offering
services related to Real Estate Crowdfunding (34%) and Equity-based Crowdfunding (31%) indicated the risk of cyber-security breach as a major concern. While the risk of increasing competition from entry of new FinTech firms was reported to be of high concern among platforms offering services related to Revenue/Profit Sharing Schemes (50%).
Figure 1.23: Perceived Risks of Platforms by Equity-based Models
For firms operating Non-investment models, each model needs to be considered separately, as it represents models that differ from each other in significant ways.Here, platforms offering Reward Crowdfunding services are mostly concerned with the risks of changes to regulation (69%), and customer fraud (68%). Donation-based Crowdfunding platforms identified fewer risk
factors as medium to high, with only a minority of platforms indicating risks of cyber security and increasing competition from new FinTech entrants (both 19%). Finally, Crowdfunding Microfinance platforms are mostly concerned with cybersecurity breach (71%), and identified customer fraud as a medium risk (75%).
Figure 1.24: Perceived Risks of Platforms by Non-investment Models
Eq
uit
y-b
ased
C
row
dfu
nd
ing
Rea
l Est
ate
Cro
wd
fun
din
gR
even
ue/
Pro
fit
Shar
ing
Customer Fraud
Customer Fraud
Customer Fraud
Cyber-security Breach
Cyber-security Breach
Cyber-security Breach
Emergence of BigTech firms
Emergence of BigTech firms
Emergence of BigTech firms
Changes to current regulation
Changes to current regulation
Changes to current regulation
31%
34%
20%
44%
36%
33%
20%
25%
21%
21%
37%
17%
62%
45%
33%
37%
40%
50%
29%
19%
19%
56%
39%
47%
32%
26%
30%
26%
45%
48%
24%
36%
32%
17%
18%
50%
Low Medium High
Do
nat
ion
-bas
ed
Cro
wd
fun
din
g
Customer Fraud
Cyber-security Breach
Emergence of BigTech firms
Changes to current regulation
19%
16%
14%
27%54%
33%
60%
73%
49%
24%
13%
19%
Rew
ard
-bas
ed
Cro
wd
fun
din
g
Customer Fraud
Cyber-security Breach
Emergence of BigTech firms
Changes to current regulation
8%
69%
68%
10%83%
22%
18%
22%
70%
12%
10%
7%
Low Medium High
Cro
wd
-led
M
icro
fin
ance Customer Fraud
Cyber-security Breach
Emergence of BigTech firms
Changes to current regulation
70%
4%
13%
90%
13%
21%
13%
17%
75%
75%
10%

60
Chapter 1: The Global Alternative Finance Ecosystem
Regulation
Globally, regulation is still a key challenge for the alternative finance sector. This section analyses in greater detail platforms’ perception of regulation in their jurisdiction, breaking down their responses by region and business model (divided between Debt and Equity models).
Based on the 73% of observations for which relevant information was provided, the below analysis compares not only how alternative finance firms perceived the regulatory regimes they operate within, but also how this might have changed from 2019 to 2020.
We found that in the majority of regions analysed, namely the USA and Canada, the UK, Europe, and the Asia-Pacific Region (excluding China), over half of platforms across all business models perceived regulation in their jurisdiction to be both adequate and appropriate. In the UK and the USA this rises to over 70% of platforms considering their regulation to be adequate and appropriate. It remains unclear whether this was a reflection of the efforts regulators have put into developing an appropriate regulatory system for alternative finance, or if it reflected the fact that most platforms reporting this information already met regulatory requirements and were hence operational.
First, with respect to Debt models, regulation is largely deemed adequate in both the UK and North America (USA and Canada), with perception stable
and slightly increasing between 2019 and 2020, reaching 93% and 83% of platforms in each region respectively. On the other hand, the MENA region recorded a stable dissatisfaction with relevant regulation with only 23% and 29% deeming it adequate in 2019 and 2020 respectively. In Europe, 43% and 47% of platforms deemed debt regulation adequate, which may be associated with positive views of the new European Service Provider Regulation overseeing P2P/Marketplace Business and Property Lending, but not P2P/Marketplace Consumer Lending, and hence leaving the latter platforms with often ill-adjusted regulations in the markets where they operate.
Second, with respect to Equity models, perceptions of regulation adequacy seemed to be increasing in both the UK (71%) and MENA (100%). In all other jurisdictions, regulation was deemed less adequate in 2020 than in 2019, with the lowest share of platforms indicating regulation as adequate in 2020 in Sub-Saharan Africa (11%), Europe (48%), and Latin America (57%). Further, around a quarter of platforms in Europe (24%) and LAC (30%) find existing equity regulation to be excessive and too strict.
Overall, consistent dissatisfaction with regulation in 2019 and 2020 was especially evident in Sub-Saharan Africa with respect to regulation overseeing equity models, and in MENA with respect to regulation overseeing debt models.
Figure 1.25: Regulatory Perception towards FinTech Regulation- Debt Models- 2019-2020
2019
2020AP
AC
2019
2020Eu
rop
e
2020LAC
2019
2020ME
NA
2019
2020SSA
UK
2019
2020USA
& C
anad
a
Adequate and appropriate for my platform activities Inadequate and too relaxed for my platform activities
Excessive and too strict for my platform activities No Specific Regulation and not needed
No Specific Regulation and needed Alternative finance (including crowdfunding & P2P lending) is not currently legalized in my country
2019 1%
2019 1%
2020 1%1%
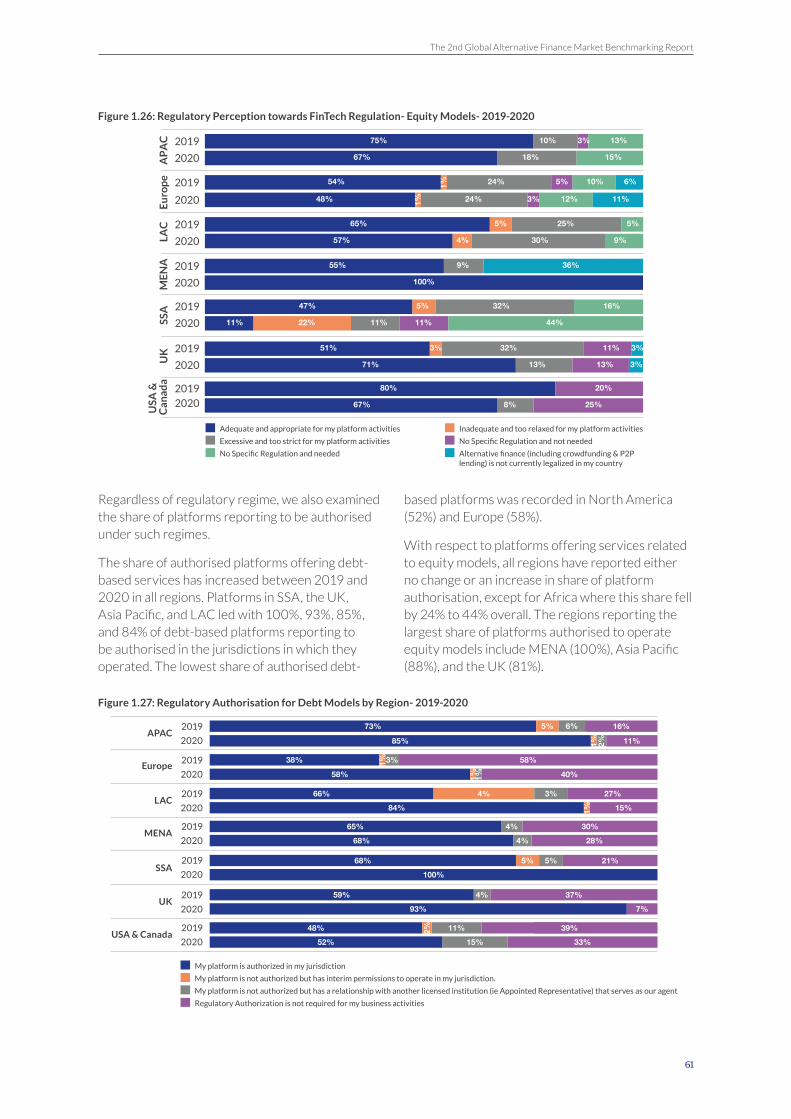
The 2nd Global Alternative Finance Market Benchmarking Report
61
Figure 1.26: Regulatory Perception towards FinTech Regulation- Equity Models- 2019-2020
Regardless of regulatory regime, we also examined the share of platforms reporting to be authorised under such regimes.
The share of authorised platforms offering debt-based services has increased between 2019 and 2020 in all regions. Platforms in SSA, the UK, Asia Pacific, and LAC led with 100%, 93%, 85%, and 84% of debt-based platforms reporting to be authorised in the jurisdictions in which they operated. The lowest share of authorised debt-
based platforms was recorded in North America (52%) and Europe (58%).
With respect to platforms offering services related to equity models, all regions have reported either no change or an increase in share of platform authorisation, except for Africa where this share fell by 24% to 44% overall. The regions reporting the largest share of platforms authorised to operate equity models include MENA (100%), Asia Pacific (88%), and the UK (81%).
Figure 1.27: Regulatory Authorisation for Debt Models by Region- 2019-2020
USA
& C
anad
a
2019
2020
2019
2020
2019
2020
2019
2020
2019
2020
20192020
AP
AC
Eu
rop
eLA
CM
EN
ASS
AU
K
2020 1%
2019 1%
Adequate and appropriate for my platform activities Inadequate and too relaxed for my platform activities
Excessive and too strict for my platform activities No Specific Regulation and not needed
No Specific Regulation and needed Alternative finance (including crowdfunding & P2P lending) is not currently legalized in my country
73% 16%
85% 11%
38%
5%
3%
6%
58%
58% 40%
66% 4% 3% 27%
84% 15%
APAC
LAC
Europe
2019
2020
5% 5%
100%
68% 21%SSA
2019
2020
68% 4% 28%
65% 4% 30%MENA
2019
2020
2020
93% 7%
37%4%59%UK
2019
2020
2019
2020
2019
1%
1%1%
1%
1%
2%
3%11%
15%
39%48%
33%52%USA & Canada
2019
2020
2%
My platform is authorized in my jurisdiction
My platform is not authorized but has interim permissions to operate in my jurisdiction.
My platform is not authorized but has a relationship with another licensed institution (ie Appointed Representative) that serves as our agent
Regulatory Authorization is not required for my business activities
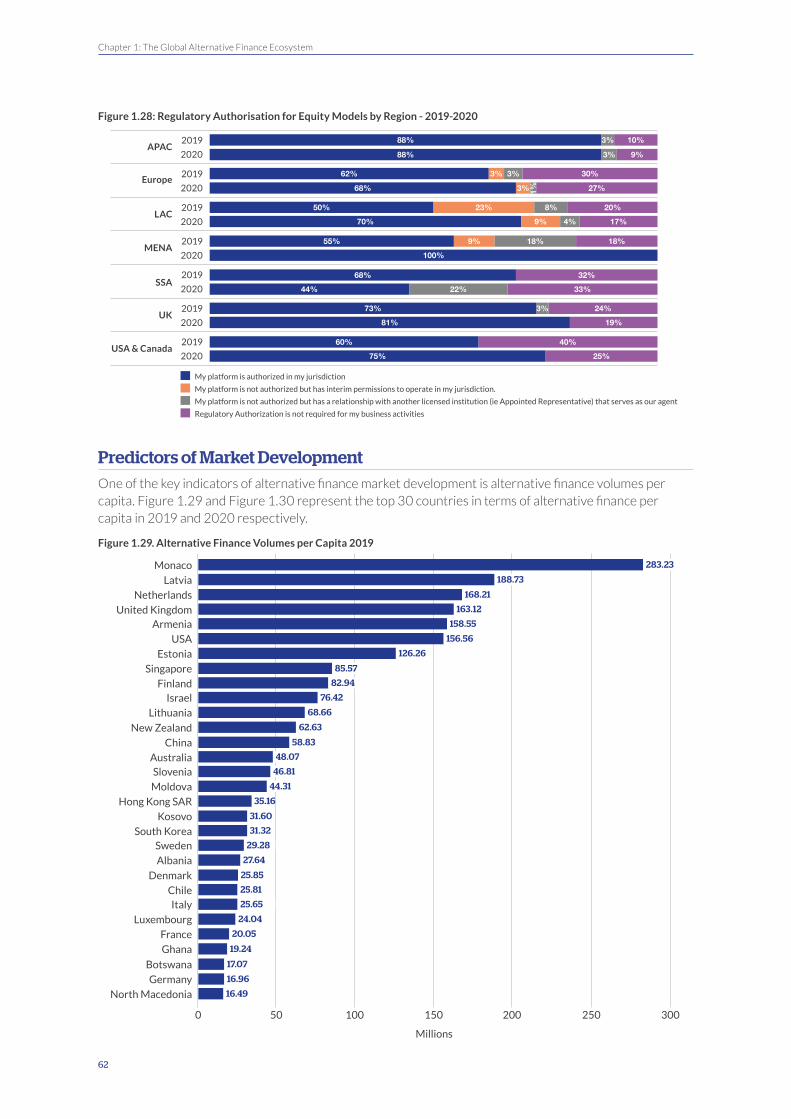
62
Chapter 1: The Global Alternative Finance Ecosystem
Figure 1.28: Regulatory Authorisation for Equity Models by Region - 2019-2020
Predictors of Market DevelopmentOne of the key indicators of alternative finance market development is alternative finance volumes per capita. Figure 1.29 and Figure 1.30 represent the top 30 countries in terms of alternative finance per capita in 2019 and 2020 respectively.
Figure 1.29. Alternative Finance Volumes per Capita 2019
100%
88% 3% 10%
88% 3% 9%
62% 3% 3% 30%
68% 3% 27%
50% 23% 8% 20%
70% 9% 4% 17%
55% 9% 18% 18%
APAC
LAC
Europe
MENA
2019
2019
40%60%
25%75%USA & Canada
2019
2020
2020
44% 22% 33%
68% 32%SSA
2019
2020
2020
2020
81% 19%
24%3%73%UK
2019
2020
2019
2020
2019
1%
My platform is authorized in my jurisdiction
My platform is not authorized but has interim permissions to operate in my jurisdiction.
My platform is not authorized but has a relationship with another licensed institution (ie Appointed Representative) that serves as our agent
Regulatory Authorization is not required for my business activities
0 100 150 25050 200 300
Latvia 188.73
New Zealand 62.63
Estonia 126.26
Hong Kong SAR 35.16
France 20.05
Monaco 283.23
68.66Lithuania
USA 156.56
Moldova 44.31
Luxembourg 24.04
Albania 27.64
Germany 16.96
North Macedonia 16.49
Netherlands 168.21
China 58.83
Denmark 25.85
Singapore 85.57
Kosovo 31.60
Ghana 19.24
Armenia 158.55
Slovenia 46.81
Italy 25.65
Israel 76.42
Sweden 29.28
Botswana 17.07
United Kingdom 163.12
Australia 48.07
Chile 25.81
Finland 82.94
South Korea 31.32
Millions

The 2nd Global Alternative Finance Market Benchmarking Report
63
Figure 1.30. Alternative Finance Volumes per Capita 2020
Overall, markets maintained their dominant position in both years. These included the UK, the USA, Singapore and the Baltic tigers of Latvia, Estonia and Lithuania. However, while the UK, the USA, Singapore and Lithuania reported increases in volumes per capita between 2019 and 2020, Estonia and Latvia reported a decline.
The most extreme growth in terms of volumes per capita was recorded in Uruguay and Ireland, albeit from a relatively modest starting point, with 1611% and 361% respectively. Other impressive growth rates were recorded in the Czech Republic (97%), Singapore (92%), Norway (85%), and Chile (63%).
The most extreme decline in terms of volumes per capita was recorded in Kosovo and Monaco, falling 100%, and China falling 99%. While the former two represent small markets where volumes per capita are sensitive to a small population, the latter case represents truly dramatic decline when
factoring in China’s population. The latter abnormal fall followed a major government crackdown on improperly licensed platform operators. Other dramatic declines were recorded in the Netherlands (-81%), Armenia (-73%), Denmark (-55%) and Moldova (-48%). Some of the decline in these markets and others can be partially explained with lower volumes in alternative models of consumer lending in this period, linked to uncertainties as a result of COVID-19.
Predictors: Economic, Regulation, Trust and Educational Factors
As in previous reports, we explored market conditions most conducive to the alternative finance sector’s development. Specifically, we suggested the ERTE (Economy, Regulation, Trust, and Education) framework for explaining alternative finance market development.
0 100 150 25050 200
Latvia 125.93
New Zealand 46.22
Estonia 114.13
Hong Kong SAR 55.92
France 25.43
90.78Lithuania
USA 222.42
Moldova 23.26
Norway 18.54
Luxembourg 25.90
Germany
Brazil
17.69
15.86
Netherlands 32.68
Singapore 164.66
Ireland 30.67
Armenia 43.52
Slovenia 48.83
Albania 21.12
Italy 30.72
Israel 57.28
Sweden 36.07
United Kingdom 186.23
Australia 45.20
Chile 42.04
Finland 70.42
South Korea 25.43
Denmark 11.61
Spain 14.41
Uruguay 12.51Czech Rep. 12.91
Brazil 25.03
USD Million

64
Chapter 1: The Global Alternative Finance Ecosystem
Economic Development
First, we saw a clear and positive association between economic development, as measured by GDP per capita, and alternative finance volumes
per capita, as shown in figure 1.31. Overall, GDP per capita roughly explained 39% of the variance in alternative finance volumes per capita.
Figure 1.31: Alternative Finance Volumes per Capita 2020 vs. GDP per Capita 2019
Beyond the general trend line, we saw strong performers both from developed and emerging economies. Here, while developed economies generally exhibit higher alternative finance volumes per capita versus other economies, the strongest performers were divided in two groups. The first included markets with advanced traditional finance sector such as USA, UK and Singapore, and the other Baltic countries of Estonia, Latvia, and Lithuania which are becoming leading international hubs of alternative finance sector without a long heritage of a strong traditional financial sector.
Underperformers in developed economy contexts were those associated with a combination of small home markets, strict financial regimes, especially traumatic experiences during previous financial crisis, and/or low levels of social trust (e.g., Croatia, Hungary, Iceland, Malta, Cyprus, and Greece).
With respect to emerging economies some were punching well beyond their weight, while leveraging the opportunities for enhancing improved access
to finance through alternative finance channels. These included a diverse mix of Eastern European (e.g., Armenia, Moldova and Ukraine), Balkan (e.g., Albania and North Macedonia), African (e.g., Ghana and Zambia), and Latin American states (e.g., Brazil and Chile). All are characterised by various forms of relatively reform and liberal-oriented economic policies.
Other emerging economies exhibited a lower uptake across regions including European (e.g., Turkey, Bosnia and Kosovo), Middle Eastern (e.g., Egypt), East Asian (e.g., China and Thailand), Latin American (e.g., Honduras and Costa Rica), and African (e.g., South Africa) countries.
Perceived Regulatory Adequacy
An additional dimension that may influence market development includes the extent to which existing regulation in a country adequately regulates alternative finance platform operations.
Alt
ern
ativ
e F
inan
ce V
olu
mes
per
Cap
ita
20
20
(Lo
g Sc
ale)
GDP per Capita 2019 (Log Scale)
USAUK
SingaporeLatvia Estonia
LithuaniaFinlandHong Kong SARIsrael
SloveniaNZ AustraliaArmenia Chile Sweden
NetherlandsItaly Ireland
S. Korea
Brazil
MoldovaFranceAlbania NorwayGermany
Luxembourg
Spain
Czech Rep.Uruguay
DenmarkPolandN. MacedoniaSwitzerland
BotswanaKazakhstanUkraine Japan Canada
Tonga BulgariaColombia
UAEAustria
SamoaIndonesia
Belgium
GeorgiaNamibia Malaysia
RomaniaPeru
Mexico
Chinese TaipeiIcelandCyprusRussiaBelarus Portugal
Argentina
Kenya India ParaguayVietnam SlovakiaMauritius Malta
Timor-LesteChinaRwanda
NicaraguaFijiPhilippines
Tajikistan Kyrgyzstan Croatia
Zambia
EcuadorRSA TurkeyCambodia
Ghana
EgyptBosnia Puerto Rico
Uganda
Costa RicaLiberiaHonduras ThailandKosovo Hungary
PakistanSierra Leone
R² = 0.3897
-0.500
0.000
0.500
1.000
1.500
2.000
2.500
2.500 3.000 3.500 4.000 4.500 5.000
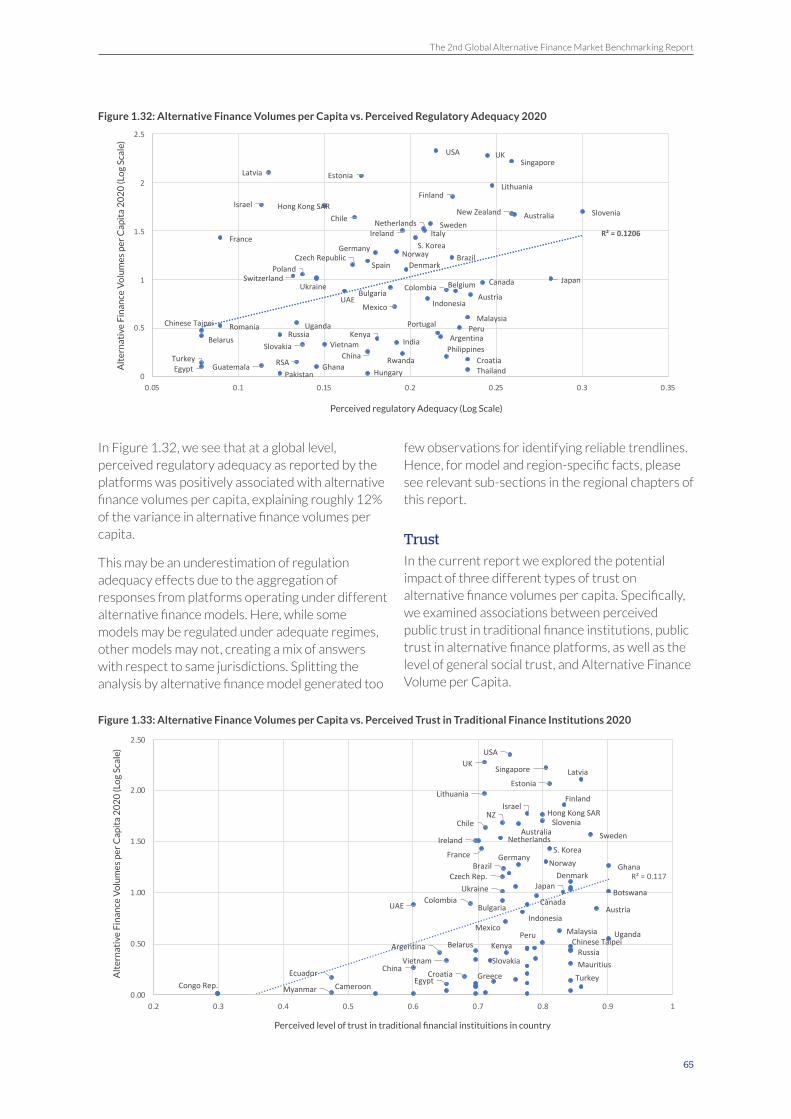
The 2nd Global Alternative Finance Market Benchmarking Report
65
Figure 1.32: Alternative Finance Volumes per Capita vs. Perceived Regulatory Adequacy 2020
In Figure 1.32, we see that at a global level, perceived regulatory adequacy as reported by the platforms was positively associated with alternative finance volumes per capita, explaining roughly 12% of the variance in alternative finance volumes per capita.
This may be an underestimation of regulation adequacy effects due to the aggregation of responses from platforms operating under different alternative finance models. Here, while some models may be regulated under adequate regimes, other models may not, creating a mix of answers with respect to same jurisdictions. Splitting the analysis by alternative finance model generated too
few observations for identifying reliable trendlines. Hence, for model and region-specific facts, please see relevant sub-sections in the regional chapters of this report.
Trust
In the current report we explored the potential impact of three different types of trust on alternative finance volumes per capita. Specifically, we examined associations between perceived public trust in traditional finance institutions, public trust in alternative finance platforms, as well as the level of general social trust, and Alternative Finance Volume per Capita.
Figure 1.33: Alternative Finance Volumes per Capita vs. Perceived Trust in Traditional Finance Institutions 2020
Alt
ern
ativ
e F
inan
ce V
olu
mes
per
Cap
ita
20
20
(Lo
g Sc
ale)
Perceived regulatory Adequacy (Log Scale)
USA UKSingapore
Latvia EstoniaLithuania
FinlandHong Kong SARIsrael
New Zealand AustraliaChileSwedenNetherlands
ItalyS. Korea
France
BrazilNorwayGermany
SpainCzech Republic
DenmarkPolandSwitzerland JapanCanada
BulgariaColombia
UAE
BelgiumAustria
Indonesia
MalaysiaRomania Peru
Mexico
Chinese Taipei PortugalRussia ArgentinaKenya
IndiaVietnamSlovakiaChina
PhilippinesCroatiaRSAGuatemala
Uganda
ThailandPakistan
Belarus
Ukraine
Slovenia
Ireland
EgyptTurkey Rwanda
HungaryGhana
R² = 0.1206
0
0.5
1
1.5
2
2.5
0.05 0.1 0.15 0.2 0.25 0.3 0.35
Alt
ern
ativ
e F
inan
ce V
olu
mes
per
Cap
ita
20
20
(Lo
g Sc
ale)
Perceived level of trust in traditional financial instituitions in country
USAUK
Singapore LatviaEstonia
Lithuania Finland
Hong Kong SARIsrael
SloveniaNZ
AustraliaChile
SwedenNetherlandsIreland
France S. Korea
Brazil NorwayGermany
GhanaCzech Rep. Denmark
BotswanaUkraine Japan
CanadaBulgaria
ColombiaUAE Austria
IndonesiaMexico MalaysiaPeru
Chinese TaipeiRussia
Belarus KenyaArgentina
Vietnam Slovakia MauritiusChinaCroatiaEcuador TurkeyGreeceEgypt
Uganda
Myanmar CameroonCongo Rep.
R² = 0.117
0.00
0.50
1.00
1.50
2.00
2.50
0.2 0.3 0.4 0.5 0.6 0.7 0.8 0.9 1
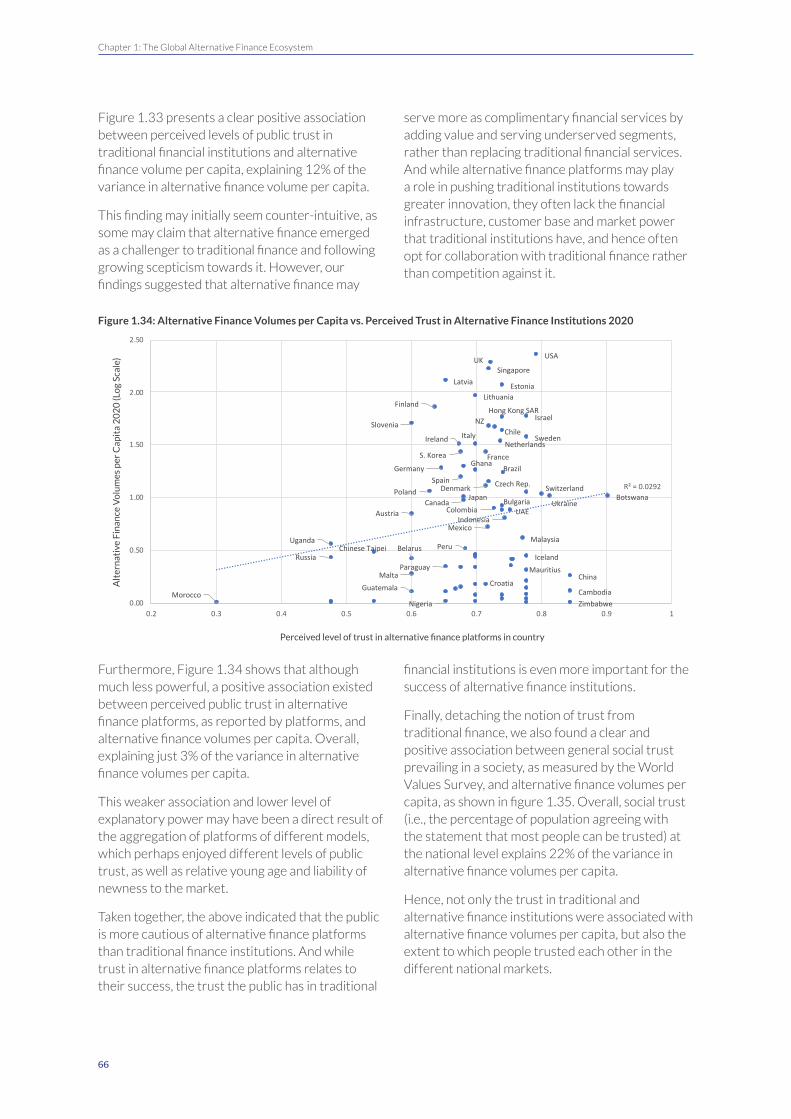
66
Chapter 1: The Global Alternative Finance Ecosystem
Figure 1.33 presents a clear positive association between perceived levels of public trust in traditional financial institutions and alternative finance volume per capita, explaining 12% of the variance in alternative finance volume per capita.
This finding may initially seem counter-intuitive, as some may claim that alternative finance emerged as a challenger to traditional finance and following growing scepticism towards it. However, our findings suggested that alternative finance may
serve more as complimentary financial services by adding value and serving underserved segments, rather than replacing traditional financial services. And while alternative finance platforms may play a role in pushing traditional institutions towards greater innovation, they often lack the financial infrastructure, customer base and market power that traditional institutions have, and hence often opt for collaboration with traditional finance rather than competition against it.
Figure 1.34: Alternative Finance Volumes per Capita vs. Perceived Trust in Alternative Finance Institutions 2020
Furthermore, Figure 1.34 shows that although much less powerful, a positive association existed between perceived public trust in alternative finance platforms, as reported by platforms, and alternative finance volumes per capita. Overall, explaining just 3% of the variance in alternative finance volumes per capita.
This weaker association and lower level of explanatory power may have been a direct result of the aggregation of platforms of different models, which perhaps enjoyed different levels of public trust, as well as relative young age and liability of newness to the market.
Taken together, the above indicated that the public is more cautious of alternative finance platforms than traditional finance institutions. And while trust in alternative finance platforms relates to their success, the trust the public has in traditional
financial institutions is even more important for the success of alternative finance institutions.
Finally, detaching the notion of trust from traditional finance, we also found a clear and positive association between general social trust prevailing in a society, as measured by the World Values Survey, and alternative finance volumes per capita, as shown in figure 1.35. Overall, social trust (i.e., the percentage of population agreeing with the statement that most people can be trusted) at the national level explains 22% of the variance in alternative finance volumes per capita.
Hence, not only the trust in traditional and alternative finance institutions were associated with alternative finance volumes per capita, but also the extent to which people trusted each other in the different national markets.
Alt
ern
ativ
e F
inan
ce V
olu
mes
per
Cap
ita
20
20
(Lo
g Sc
ale)
Perceived level of trust in alternative finance platforms in country
USAUKSingapore
Latvia EstoniaLithuania
FinlandHong Kong SAR
IsraelSlovenia NZ
ChileSweden
NetherlandsIreland Italy
FranceS. Korea
BrazilGermanyGhana
Spain Czech Rep.DenmarkPoland SwitzerlandBotswana
UkraineJapan
Canada BulgariaColombia UAEAustria
IndonesiaMexico
MalaysiaPeruChinese Taipei
IcelandRussiaBelarus
Paraguay MauritiusMalta China
CroatiaCambodiaGuatemala
Uganda
Nigeria ZimbabweMorocco
R² = 0.0292
0.00
0.50
1.00
1.50
2.00
2.50
0.2 0.3 0.4 0.5 0.6 0.7 0.8 0.9 1

The 2nd Global Alternative Finance Market Benchmarking Report
67
Figure 1.35: Alternative Finance Volumes per Capita vs. Perceived Social Trust
Noteworthy are some of the outlier cases. First, despite high levels of social trust, both Iceland and China represented particularly restrictive regimes towards alternative finance. The case of Iceland could be explained by its disproportional exposure to the havoc caused by the last financial crisis, and in the case of China a result of a massive crackdown in recent years on P2P/Marketplace Lending and extensive evidence of fraud in unregulated platforms.
On the other hand, the mix of outliers, such as the UK, USA, Singapore and the Baltics, may suggest
that highly liberal economic policies seemed to push market development beyond that predicted by medium social trust levels alone.
Education
Furthermore, we explored the extent to which the public’s level of skills in using alternative finance is related to alternative finance volumes per capita. Figure 1.36 shows a clear and positive association between perceived levels of public skills in using alternative finance, as reported by platforms, and alternative finance volumes per capita, explaining 6.5% of its variance.
Figure 1.36: Alternative Finance Volumes per Capita vs. Knowledge of Public when using Alternative Finance
Alt
ern
ativ
e F
inan
ce V
olu
mes
per
Cap
ita
20
20
(Lo
g Sc
ale)
Social Trust (Percentage of people indicating that most people can be trusted) - World Value Survey
UKSingapore
USA
Estonia
Lithuania
Finland
Hong Kong SARSlovenia New Zealand
Armenia
Canada
AustraliaChileSwedenNetherlands
S. Korea
Brazil
FranceAlbania
NorwayGermanySpainCzech Rep.
UruguayJapanPoland
N. Macedonia Switzerland
Zimbabwe
Kazakhstan
Ukraine Japan
BulgariaColombia
Italy
AustriaIndonesiaGeorgia
Malaysia
RomaniaPeru
Mexico
Chinese Taipei IcelandCyprus Russia Belarus
Portugal Argentina
India VietnamSlovakiaChinaRwandaNicaragua TajikistanKyrgyzstan
RSAGuatemala
Ghana
EgyptBosnia Thailand
Jordan HungaryPakistan
Zambia
HaitiNigeria
R² = 0.2167
0.00
0.50
1.00
1.50
2.00
2.50
0 0.1 0.2 0.3 0.4 0.5 0.6 0.7 0.8
Alt
ern
ativ
e F
inan
ce V
olu
mes
per
Cap
ita
20
20
(Lo
g Sc
ale)
Perceived level of necessary skills of public to use alternative finance in country
USAUKSingapore
LatviaEstonia
LithuaniaFinland Hong Kong SAR
IsraelSlovenia NZChileSwedenNetherlands
Italy IrelandFranceS. Korea
Norway Germany GhanaSpain
DenmarkPoland N. MacedoniaSwitzerland
CanadaColombia
Belgium
AustriaMexico
MalaysiaPeru Chinese TaipeiPortugalBelarus
IndiaSlovakia
MaltaPhilippinesEcuador RSA Greece
Guatemala
Uganda
Costa Rica
Tanzania
Myanmar ZimbabweCongo Rep.
R² = 0.0646
0.00
0.50
1.00
1.50
2.00
2.50
0.2 0.3 0.4 0.5 0.6 0.7 0.8 0.9 1

68
Chapter 1: The Global Alternative Finance Ecosystem
These findings suggest that alternative finance education and training may also translate into higher volumes per capita. Such input may encourage both platforms and policymakers to invest more in public education on the possibilities and risks associated with using alternative finance, to the benefit of the public and the sectors’ growth.
Finally, while we have explored each of the ERTE framework separately, it is important to stress that all its components are interdependent. It is well
established in research that economic development levels are positively associated with the rule of law, social trust, and education levels of societies. In the current report we specify some of these elements to the alternative finance context, and present interesting findings that can guide both policymakers, industry organisations, and platform operators in their efforts to develop a successful alternative finance sector in their respective jurisdictions.

The 2nd Global Alternative Finance Market Benchmarking Report
69
2. A Regional Discussion on Europe & the United Kingdom

Chapter 2: A Regional Discussion on Europe & the United Kingdom
70
Chapter 2: A Regional Discussion on Europe & the United Kingdom
Total Regional VolumeFrom 2013 to 2019 the European online alternative finance market volumes (including the UK) grew consistently from $1.5 billion in 2013 to $23.2 billion in 2019. However, in 2020 our survey reported a drop in overall market volume to $22.6 billion, representing the first decrease in market volume since 2013. Despite this decrease, however, and in the context of the COVID-19 pandemic and Brexit, the market volume reported for 2020 ($22.6 billion) was higher than the volume recorded in 2018 ($18.1 billion).
It is worth noting, that the reported decline in part may relate to a number of non-responsive platforms which did not respond to the 2019 and 2020 data collection. The analysis of the European (excluding the UK) dataset was based on 631 firm-level observations in 2019 and 654 firm-level observations in 2020, with just over 100 fewer observations than in historic data collections.
Though many new platforms were added between the 2018 and the 2019-2020 data collection rounds, some platforms were unable to repeat their participation in the study this year. This implies that the volumes reported may be underestimated and were more likely to have remained stable rather than declined between 2018 and 2020. A further consideration, however, is the appreciation of the Euro against the USD, meaning European volume growth represented in USD may be higher because of this currency effect.
Overall, after removing all platforms that ceased operations before 2020, there were 117 platforms that did not repeat participation but remained in operation in 2019 and2020. Of these platforms, 17 were global14, while the remaining 100 platforms focused on one or few markets in Europe. While the majority of these were small with little impact on national volumes, some were more substantial.15
Figure 2.1: European Online Alternative Finance Market Volumes 2013-2020, USD (Including UK)
The United Kingdom (UK) remained the main contributor to the European alternative finance volume, though accounting for a smaller market share over time. In isolation, the UK market accounts for the third largest market in 2019 and the second in 2020. The UK online alternative finance market has reported consistent annual
growth in market volume over the past five years, growing from $4.9 billion in 2015 to $12.6 billion in 2020 and, despite disruptions such as the COVID-19 pandemic and Brexit, the UK alternative finance market grew from $11 billion in 2019 to $12.6 billion in 2020.
$0
$20
$10
$5
$25
$15
2015
6.0
2017
11.9
2019
23.2
2016
8.5
2018
18.1
2020
22.6
2013
1.5
2014
3.8
Bill
ion
s
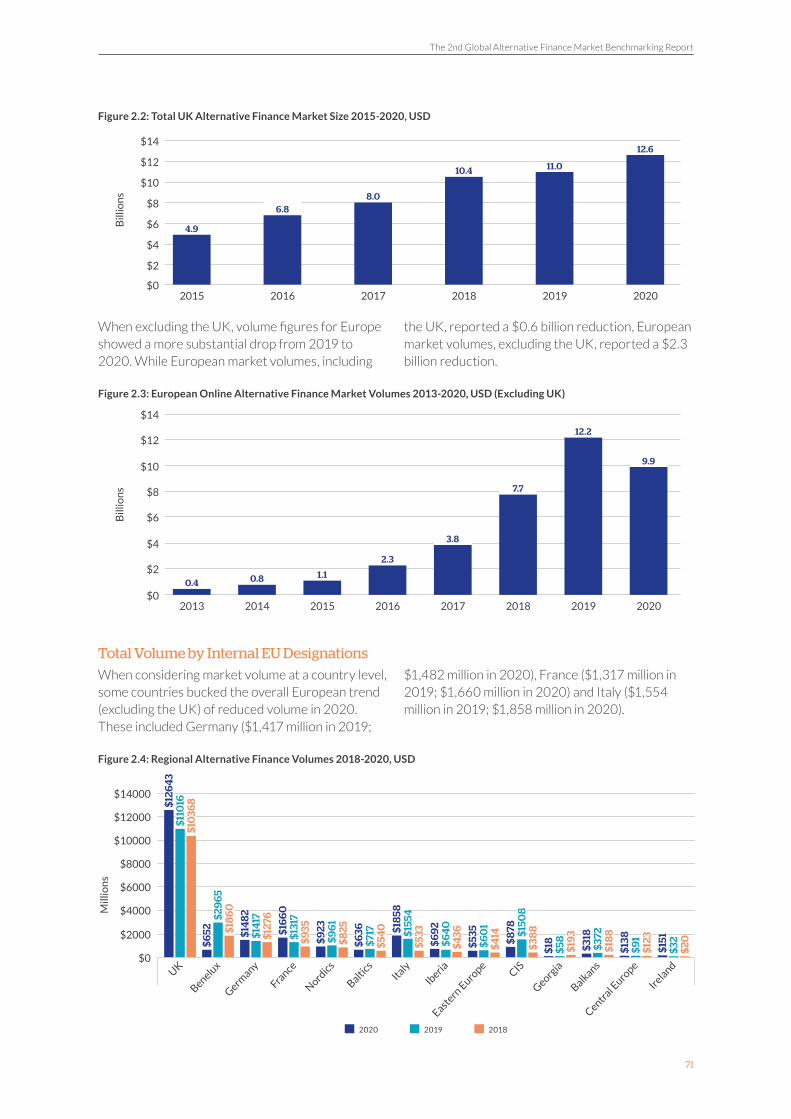
The 2nd Global Alternative Finance Market Benchmarking Report
71
Figure 2.2: Total UK Alternative Finance Market Size 2015-2020, USD
When excluding the UK, volume figures for Europe showed a more substantial drop from 2019 to 2020. While European market volumes, including
the UK, reported a $0.6 billion reduction, European market volumes, excluding the UK, reported a $2.3 billion reduction.
Figure 2.3: European Online Alternative Finance Market Volumes 2013-2020, USD (Excluding UK)
Total Volume by Internal EU Designations
When considering market volume at a country level, some countries bucked the overall European trend (excluding the UK) of reduced volume in 2020. These included Germany ($1,417 million in 2019;
$1,482 million in 2020), France ($1,317 million in 2019; $1,660 million in 2020) and Italy ($1,554 million in 2019; $1,858 million in 2020).
Figure 2.4: Regional Alternative Finance Volumes 2018-2020, USD
$0
$8
$4
$12
$14
$2
$10
$6
2017 2019
8.0
11.0
2018 2020
10.4
12.6
2015
4.9
2016
6.8
Bill
ion
s
$0
$8
$4
$12
$14
$2
$10
$6
2015
1.1
2017
3.8
2019
12.2
2016
2.3
2018
7.7
2020
9.9
2013
0.4
2014
0.8
Bill
ion
s
2020 2019 2018
$14000
$10000
$12000
$8000
$6000
$4000
$2000
$0
$110
16
$961
$60
1
$29
65
$717 $1
508
$141
7
$155
4
$58
$91$1
317
$640
$372
$32
$10
368
$825
$414$1
86
0
$540
$38
8
$127
6
$533
$193
$123$9
35
$436
$18
8
$20
$126
43
$923
$535
$652
$636
$878$1
482
$18
58
$18
$138
$16
60
$692
$318
$151
Mill
ion
s
Benelux
Italy
Balkans
Germany
Iberia
Central E
urope
France
Eastern
Euro
pe
Ireland
Nordics
CISUK
Baltics
Georgia

Chapter 2: A Regional Discussion on Europe & the United Kingdom
72
Debt-based alternative finance activities were shown to dominate the alternative finance markets across Europe in both 2019 and 2020. UK volume was mainly derived from debt-based models ($8.3 billion in 2019; $6.15 billion in 2020), followed by non-investment-based models ($2.1 billion in 2019; $5.8 billion in 2020) and the remainder from equity-based models (2019; $624 million, 2020; $656 million).
The Benelux region (Belgium, Netherlands, Luxembourg) ranked second, with debt-based models in 2019 ($2.9 billion in 2019; $589 million in 2020) significantly outperforming equity-based ($25 million in 2019; $31 million in 2020) and non-investment-based models in the region ($29 million in 2019; $33 million in 2020). The drop of debt-based models in Benelux came primarily from one lending-based platform in the Netherlands which did not participate in 2020.
In Germany, debt-based models ($953 million in 2019; $1 billion in 2020) held the highest market share compared to equity-based ($410 million in 2019; $375 million in 2020) and non-investment-based models ($54 million in 2019; $103 million in 2020). The drop in equity-based activity from 2019 to 2020 came from real estate crowdfunding. However, this was not due to the impact of COVID-19, but instead due to a drop that can be traced to changes in regulation which made it more difficult for real estate project developers to obtain co-financing from traditional banks. Non-investment-based models doubled in 2020 compared to the previous year, largely because of the interaction of the German government with the reward-based crowdfunding platforms for COVID-19 relief measures.
Figure 2.5: European Alternative Finance Market Volume by Sub-region and Model Categorisation 2019, USD
Italy recorded substantial growth in debt-based model volume ($1.5 billion in 2019; $1.8 billion in 2020), making it the third biggest market in Europe. The equity-based sector ($62 million in 2019; $74
million in 2020) comprised a higher volume than non-investment models ($21 million in 2019; $24 million in 2020).
$1000 $2000 $6000$3000 $4000 $7000 $8000 $9000$0 $5000
Millions
Debt Equity Non-investment
$25Benelux$29
$2911
$624UK$2122
$8270
Georgia$1
$7
$57
$410Germany$54
$953
$31Baltics$1
$684
$34Nordics$21
$905
$69Iberia$34
$537
$26Central Europe$22
$43
$302France$70
$945
CIS*$10
$1498
$62Italy$21
$1472
$7Eastern Europe$45
$550
Balkans$363
$2

The 2nd Global Alternative Finance Market Benchmarking Report
73
In the Nordics and Baltics region, the alternative finance volume originated almost entirely from debt-based activities (Nordics: $905 million in 2019; $845 million in 2020. Baltics $684 million in 2019; $607 million in 2020), with 2% and 4% of regional volumes being the result of non-investment models in the Nordics in 2019 and 2020, respectively. In the Baltics, these shares were even smaller capturing just 0.14% and 0.16% in the same periods.
Debt-based models had the highest volume in the CIS region, but market volume continued to decrease over the years, from $3.8 billion in 2018, to $1.5 billion in 2019 and to $867 million in 2020. In contrast, non-investment models showed a substantive growth and accounted for $10 million in 2019 and $11 million in 2020.
Equity-based models accounted for a substantial share of volumes in only a handful of regions. In Central Europe, equity volumes increased from $28 million (28% of the Central European total volume) in 2019 to $61 million (44%) in 2020, which can be attributed to debt models that were prohibited in some of the major countries in Central Europe, but at the same time cross-border activities of equity platforms were more noticeable. In Germany, equity volumes decreased from $410 million (30% of the total German market) in 2019 to $375 million (25%) in 2020. France, in contrast, increased from $302 million (23% of the French market) in 2019 to $432 million (26%) in 2020.
Figure 2.6: European Alternative Finance Market Volume by Sub-region and Model Categorisation 2020, USD
$1000 $2000 $6000 $7000$0
$5000
Millions
Debt Equity Non-investment
$31Benelux$33
$589
$656UK$5837
$6149
Georgia$1
$11
$17
$375Germany$103
$1001
$28Baltics$1
$607
$43Nordics$36
$845
$61Iberia$40
$591
$61Central Europe$31
$46
$432France$69
$1159
CIS*$11
$867
$74Italy$24
$1760
$8Eastern Europe$86
$441
Balkans$294
$13
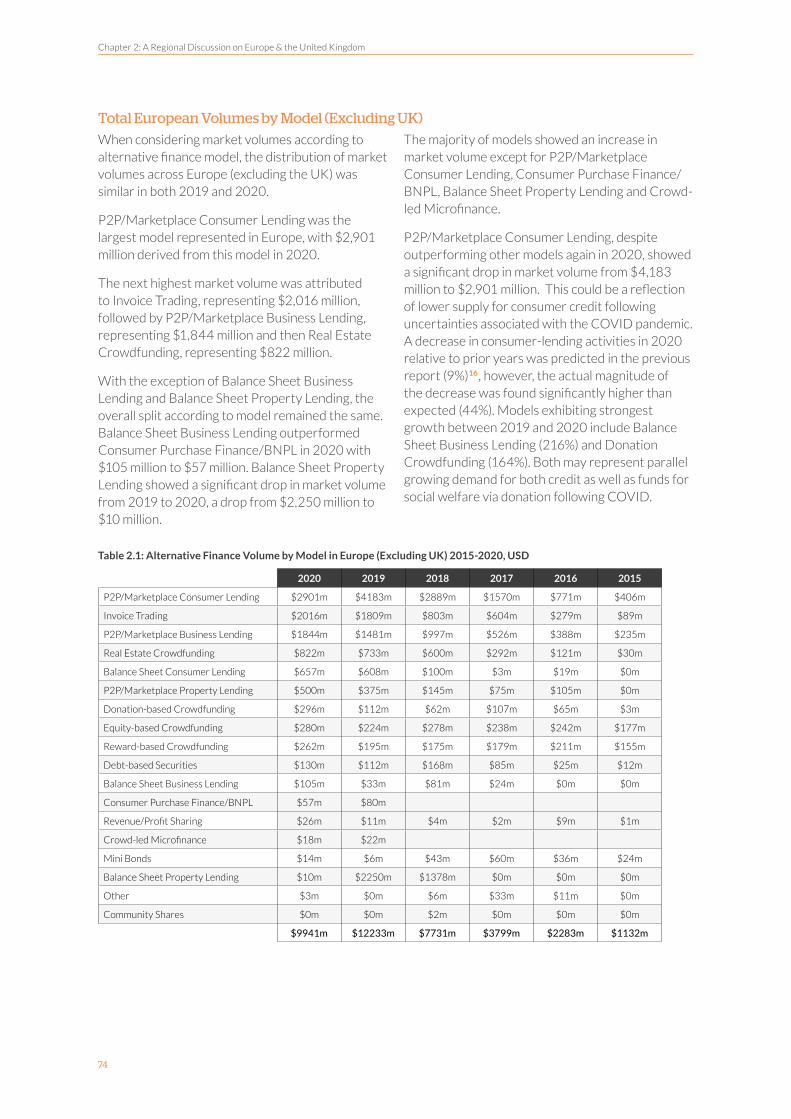
Chapter 2: A Regional Discussion on Europe & the United Kingdom
74
Total European Volumes by Model (Excluding UK)
When considering market volumes according to alternative finance model, the distribution of market volumes across Europe (excluding the UK) was similar in both 2019 and 2020.
P2P/Marketplace Consumer Lending was the largest model represented in Europe, with $2,901 million derived from this model in 2020.
The next highest market volume was attributed to Invoice Trading, representing $2,016 million, followed by P2P/Marketplace Business Lending, representing $1,844 million and then Real Estate Crowdfunding, representing $822 million.
With the exception of Balance Sheet Business Lending and Balance Sheet Property Lending, the overall split according to model remained the same. Balance Sheet Business Lending outperformed Consumer Purchase Finance/BNPL in 2020 with $105 million to $57 million. Balance Sheet Property Lending showed a significant drop in market volume from 2019 to 2020, a drop from $2,250 million to $10 million.
The majority of models showed an increase in market volume except for P2P/Marketplace Consumer Lending, Consumer Purchase Finance/BNPL, Balance Sheet Property Lending and Crowd-led Microfinance.
P2P/Marketplace Consumer Lending, despite outperforming other models again in 2020, showed a significant drop in market volume from $4,183 million to $2,901 million. This could be a reflection of lower supply for consumer credit following uncertainties associated with the COVID pandemic. A decrease in consumer-lending activities in 2020 relative to prior years was predicted in the previous report (9%)16, however, the actual magnitude of the decrease was found significantly higher than expected (44%). Models exhibiting strongest growth between 2019 and 2020 include Balance Sheet Business Lending (216%) and Donation Crowdfunding (164%). Both may represent parallel growing demand for both credit as well as funds for social welfare via donation following COVID.
Table 2.1: Alternative Finance Volume by Model in Europe (Excluding UK) 2015-2020, USD
2020 2019 2018 2017 2016 2015
P2P/Marketplace Consumer Lending $2901m $4183m $2889m $1570m $771m $406m
Invoice Trading $2016m $1809m $803m $604m $279m $89m
P2P/Marketplace Business Lending $1844m $1481m $997m $526m $388m $235m
Real Estate Crowdfunding $822m $733m $600m $292m $121m $30m
Balance Sheet Consumer Lending $657m $608m $100m $3m $19m $0m
P2P/Marketplace Property Lending $500m $375m $145m $75m $105m $0m
Donation-based Crowdfunding $296m $112m $62m $107m $65m $3m
Equity-based Crowdfunding $280m $224m $278m $238m $242m $177m
Reward-based Crowdfunding $262m $195m $175m $179m $211m $155m
Debt-based Securities $130m $112m $168m $85m $25m $12m
Balance Sheet Business Lending $105m $33m $81m $24m $0m $0m
Consumer Purchase Finance/BNPL $57m $80m
Revenue/Profit Sharing $26m $11m $4m $2m $9m $1m
Crowd-led Microfinance $18m $22m
Mini Bonds $14m $6m $43m $60m $36m $24m
Balance Sheet Property Lending $10m $2250m $1378m $0m $0m $0m
Other $3m $0m $6m $33m $11m $0m
Community Shares $0m $0m $2m $0m $0m $0m
$9941m $12233m $7731m $3799m $2283m $1132m
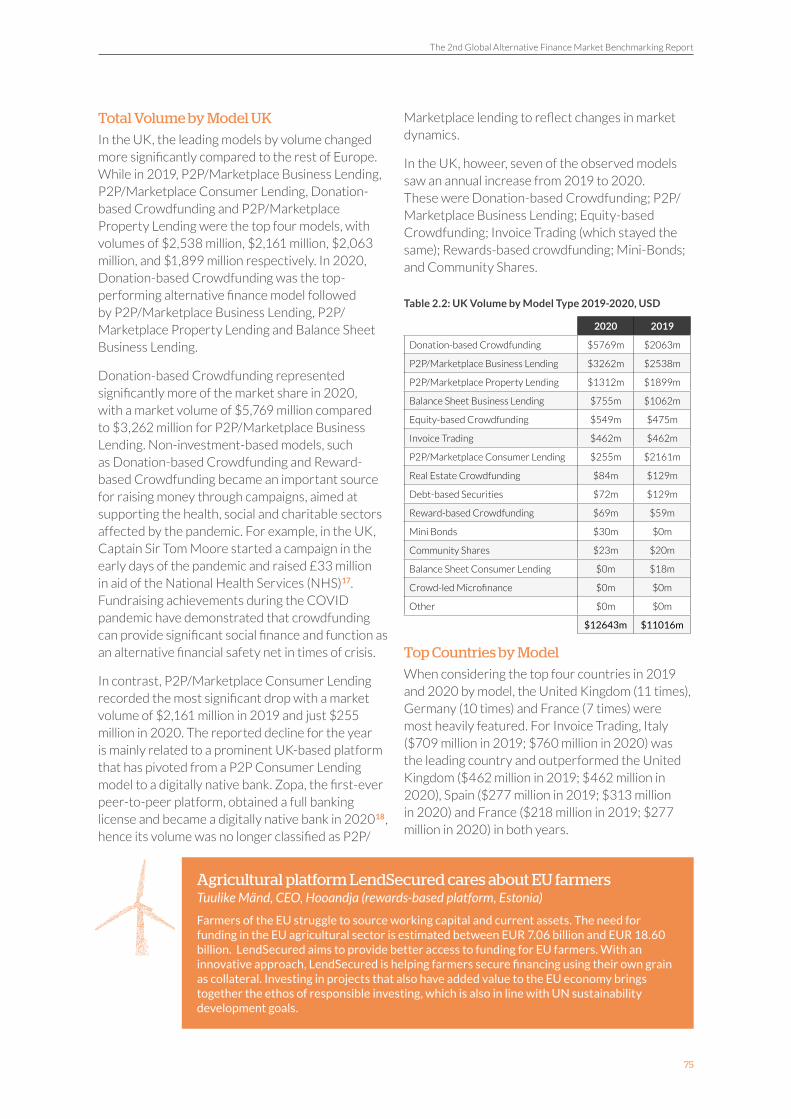
The 2nd Global Alternative Finance Market Benchmarking Report
75
Total Volume by Model UK
In the UK, the leading models by volume changed more significantly compared to the rest of Europe. While in 2019, P2P/Marketplace Business Lending, P2P/Marketplace Consumer Lending, Donation-based Crowdfunding and P2P/Marketplace Property Lending were the top four models, with volumes of $2,538 million, $2,161 million, $2,063 million, and $1,899 million respectively. In 2020, Donation-based Crowdfunding was the top-performing alternative finance model followed by P2P/Marketplace Business Lending, P2P/Marketplace Property Lending and Balance Sheet Business Lending.
Donation-based Crowdfunding represented significantly more of the market share in 2020, with a market volume of $5,769 million compared to $3,262 million for P2P/Marketplace Business Lending. Non-investment-based models, such as Donation-based Crowdfunding and Reward-based Crowdfunding became an important source for raising money through campaigns, aimed at supporting the health, social and charitable sectors affected by the pandemic. For example, in the UK, Captain Sir Tom Moore started a campaign in the early days of the pandemic and raised £33 million in aid of the National Health Services (NHS)17. Fundraising achievements during the COVID pandemic have demonstrated that crowdfunding can provide significant social finance and function as an alternative financial safety net in times of crisis.
In contrast, P2P/Marketplace Consumer Lending recorded the most significant drop with a market volume of $2,161 million in 2019 and just $255 million in 2020. The reported decline for the year is mainly related to a prominent UK-based platform that has pivoted from a P2P Consumer Lending model to a digitally native bank. Zopa, the first-ever peer-to-peer platform, obtained a full banking license and became a digitally native bank in 202018, hence its volume was no longer classified as P2P/
Marketplace lending to reflect changes in market dynamics.
In the UK, howeer, seven of the observed models saw an annual increase from 2019 to 2020. These were Donation-based Crowdfunding; P2P/Marketplace Business Lending; Equity-based Crowdfunding; Invoice Trading (which stayed the same); Rewards-based crowdfunding; Mini-Bonds; and Community Shares.
Table 2.2: UK Volume by Model Type 2019-2020, USD
2020 2019
Donation-based Crowdfunding $5769m $2063m
P2P/Marketplace Business Lending $3262m $2538m
P2P/Marketplace Property Lending $1312m $1899m
Balance Sheet Business Lending $755m $1062m
Equity-based Crowdfunding $549m $475m
Invoice Trading $462m $462m
P2P/Marketplace Consumer Lending $255m $2161m
Real Estate Crowdfunding $84m $129m
Debt-based Securities $72m $129m
Reward-based Crowdfunding $69m $59m
Mini Bonds $30m $0m
Community Shares $23m $20m
Balance Sheet Consumer Lending $0m $18m
Crowd-led Microfinance $0m $0m
Other $0m $0m
$12643m $11016m
Top Countries by Model
When considering the top four countries in 2019 and 2020 by model, the United Kingdom (11 times), Germany (10 times) and France (7 times) were most heavily featured. For Invoice Trading, Italy ($709 million in 2019; $760 million in 2020) was the leading country and outperformed the United Kingdom ($462 million in 2019; $462 million in 2020), Spain ($277 million in 2019; $313 million in 2020) and France ($218 million in 2019; $277 million in 2020) in both years.
Agricultural platform LendSecured cares about EU farmers Tuulike Mänd, CEO, Hooandja (rewards-based platform, Estonia)
Farmers of the EU struggle to source working capital and current assets. The need for funding in the EU agricultural sector is estimated between EUR 7.06 billion and EUR 18.60 billion. LendSecured aims to provide better access to funding for EU farmers. With an innovative approach, LendSecured is helping farmers secure financing using their own grain as collateral. Investing in projects that also have added value to the EU economy brings together the ethos of responsible investing, which is also in line with UN sustainability development goals.

Chapter 2: A Regional Discussion on Europe & the United Kingdom
76
For several debt models, such as P2P/Marketplace Business Lending, P2P/Marketplace Property Lending, and Balance Sheet Business Lending the UK significantly outperformed other countries in both years. For instance, in P2P/Marketplace Business Lending, the UK reported a market volume of $3,262 million with the closest country being Italy ($808 million) in 2020.
In P2P/Marketplace Consumer Lending, the UK reported a market volume of $2,161 million
compared to the closest country, Germany, with an alternative finance volume of £789 million in 2019. However, in 2020 the list of top 4 countries changed, with a significant drop in volume of P2P/Marketplace Consumer Lending in the UK to $255 million. Hence, in 2020, Germany was the leading country for P2P/Marketplace Consumer lending, while the UK represented fourth position among other European countries.
Figure 2.7: Top Four Countries in Volume by Debt Model 2019-2020, USD
For equity and non-investment models, the UK activities dominated model volumes related to the Equity-based, Donation-based and Reward-based Crowdfunding models. Equity-based Crowdfunding in the UK ($475 million in 2019; $549 million in
2020) outperformed Spain ($57 million in 2019; $55 million in 2020), Italy ($50 million in 2019; $67 million in 2020) and Germany ($32 million in 2019; $49 million in 2020) in both years.
$0 $1000 $3000$2000
P2P/Marketplace Consumer Lending
2020
2019
United Kingdom
United Kingdom
United Kingdom
United Kingdom
United Kingdom
United Kingdom
United Kingdom
United Kingdom
United Kingdom
Netherlands
Netherlands
Netherlands
Netherlands
$2161
$803
Germany
Germany
Germany
Germany
Germany
Lithuania
$789
$299
Poland
Poland
France
France
France
France
France
Estonia
Estonia
Sweden
Sweden
Sweden
Sweden
Sweden
France
France
Italy
Italy
Italy
Italy
Italy
Italy
Spain
Spain
$475
$268
Armenia $467
$255
Balance Sheet Business Lending
2020
2019
$1062
$755
$8
$82
$6
$6
$6
$4
P2P/Marketplace Property Lending
2020
2019
$1899
$1312
$91
$128
$65
$82
$56
$63
P2P/Marketplace Business Lending
Invoice Trading
2020
2020
2019
2019
$2538
$709
$3262
$760
$600
$462
$808
$462
$286
$277
$412
$313
$159
$218
$214
$277
Balance Sheet Consumer Lending
2020
2019
$230
$257
$138
$183
$138
$127
$52
$30
Millions
United KingdomSweden
Ukraine
Ukraine
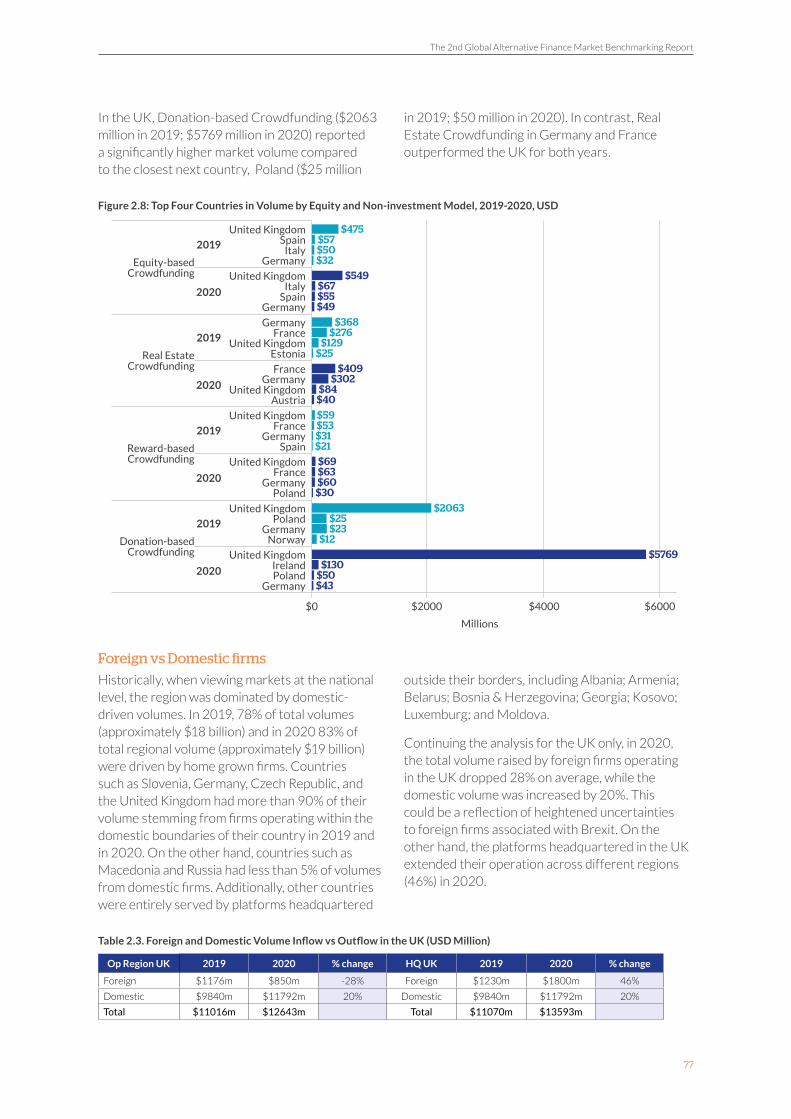
The 2nd Global Alternative Finance Market Benchmarking Report
77
In the UK, Donation-based Crowdfunding ($2063 million in 2019; $5769 million in 2020) reported a significantly higher market volume compared to the closest next country, Poland ($25 million
in 2019; $50 million in 2020). In contrast, Real Estate Crowdfunding in Germany and France outperformed the UK for both years.
Figure 2.8: Top Four Countries in Volume by Equity and Non-investment Model, 2019-2020, USD
Foreign vs Domestic firms
Historically, when viewing markets at the national level, the region was dominated by domestic-driven volumes. In 2019, 78% of total volumes (approximately $18 billion) and in 2020 83% of total regional volume (approximately $19 billion) were driven by home grown firms. Countries such as Slovenia, Germany, Czech Republic, and the United Kingdom had more than 90% of their volume stemming from firms operating within the domestic boundaries of their country in 2019 and in 2020. On the other hand, countries such as Macedonia and Russia had less than 5% of volumes from domestic firms. Additionally, other countries were entirely served by platforms headquartered
outside their borders, including Albania; Armenia; Belarus; Bosnia & Herzegovina; Georgia; Kosovo; Luxemburg; and Moldova.
Continuing the analysis for the UK only, in 2020, the total volume raised by foreign firms operating in the UK dropped 28% on average, while the domestic volume was increased by 20%. This could be a reflection of heightened uncertainties to foreign firms associated with Brexit. On the other hand, the platforms headquartered in the UK extended their operation across different regions (46%) in 2020.
Table 2.3. Foreign and Domestic Volume Inflow vs Outflow in the UK (USD Million)
Op Region UK 2019 2020 % change HQ UK 2019 2020 % change
Foreign $1176m $850m -28% Foreign $1230m $1800m 46%
Domestic $9840m $11792m 20% Domestic $9840m $11792m 20%
Total $11016m $12643m Total $11070m $13593m
$0 $2000 $6000$4000
Equity-based Crowdfunding
2020
2019
United Kingdom
United Kingdom
United Kingdom
United Kingdom
United Kingdom
United Kingdom
United Kingdom
United Kingdom
$475
$549Germany
Germany
Germany
Germany
Germany
Ireland
Germany
Germany
Germany
Estonia
$57
$67
France
France
France
France
Austria
Italy
Italy
Spain
Spain
Poland
Poland
Poland
Norway
Spain
$50
$55
$32
$49
Reward-based Crowdfunding
2020
2019
$59
$69
$53
$63
$31
$60
$21
$30
Real Estate Crowdfunding
2020
2019
$368
$409
$276
$302
$129
$84
$25
$40
Donation-based Crowdfunding
2020
2019
$2063
$5769
$25
$130
$23
$50
$12
$43
Millions
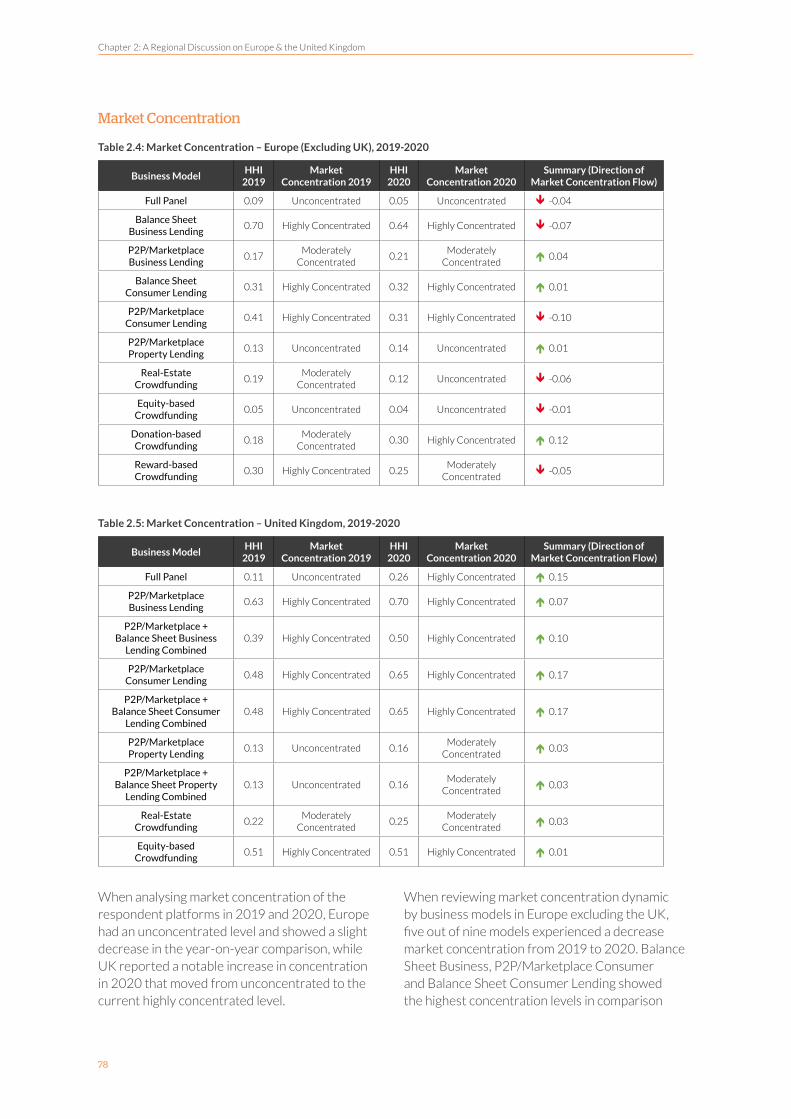
Chapter 2: A Regional Discussion on Europe & the United Kingdom
78
Market Concentration
Table 2.4: Market Concentration – Europe (Excluding UK), 2019-2020
Business ModelHHI
2019Market
Concentration 2019HHI
2020Market
Concentration 2020Summary (Direction of
Market Concentration Flow)
Full Panel 0.09 Unconcentrated 0.05 Unconcentrated -0.04
Balance Sheet Business Lending
0.70 Highly Concentrated 0.64 Highly Concentrated -0.07
P2P/Marketplace Business Lending
0.17Moderately
Concentrated0.21
Moderately Concentrated
0.04
Balance Sheet Consumer Lending
0.31 Highly Concentrated 0.32 Highly Concentrated 0.01
P2P/Marketplace Consumer Lending
0.41 Highly Concentrated 0.31 Highly Concentrated -0.10
P2P/Marketplace Property Lending
0.13 Unconcentrated 0.14 Unconcentrated 0.01
Real-Estate Crowdfunding
0.19Moderately
Concentrated0.12 Unconcentrated -0.06
Equity-based Crowdfunding
0.05 Unconcentrated 0.04 Unconcentrated -0.01
Donation-based Crowdfunding
0.18Moderately
Concentrated0.30 Highly Concentrated 0.12
Reward-based Crowdfunding
0.30 Highly Concentrated 0.25Moderately
Concentrated -0.05
Table 2.5: Market Concentration – United Kingdom, 2019-2020
Business ModelHHI
2019Market
Concentration 2019HHI
2020Market
Concentration 2020Summary (Direction of
Market Concentration Flow)
Full Panel 0.11 Unconcentrated 0.26 Highly Concentrated 0.15
P2P/Marketplace Business Lending
0.63 Highly Concentrated 0.70 Highly Concentrated 0.07
P2P/Marketplace + Balance Sheet Business
Lending Combined0.39 Highly Concentrated 0.50 Highly Concentrated 0.10
P2P/Marketplace Consumer Lending
0.48 Highly Concentrated 0.65 Highly Concentrated 0.17
P2P/Marketplace + Balance Sheet Consumer
Lending Combined0.48 Highly Concentrated 0.65 Highly Concentrated 0.17
P2P/Marketplace Property Lending
0.13 Unconcentrated 0.16Moderately
Concentrated 0.03
P2P/Marketplace + Balance Sheet Property
Lending Combined0.13 Unconcentrated 0.16
Moderately Concentrated
0.03
Real-Estate Crowdfunding
0.22Moderately
Concentrated0.25
Moderately Concentrated
0.03
Equity-based Crowdfunding
0.51 Highly Concentrated 0.51 Highly Concentrated 0.01
When analysing market concentration of the respondent platforms in 2019 and 2020, Europe had an unconcentrated level and showed a slight decrease in the year-on-year comparison, while UK reported a notable increase in concentration in 2020 that moved from unconcentrated to the current highly concentrated level.
When reviewing market concentration dynamic by business models in Europe excluding the UK, five out of nine models experienced a decrease market concentration from 2019 to 2020. Balance Sheet Business, P2P/Marketplace Consumer and Balance Sheet Consumer Lending showed the highest concentration levels in comparison

The 2nd Global Alternative Finance Market Benchmarking Report
79
to other models. In contrast, P2P/Marketplace Property and Equity-based Crowdfunding were the most unconcentrated markets, suggesting these models either had the highest competitive landscape for the platforms or a more localized anchoring of such investments. Changes in the concentration levels were observed in Real Estate Crowdfunding, moving from moderate concentration to unconcentrated level, and Reward-based Crowdfunding, moving from high concentration to moderate concentration level. In contrast, Donation based Crowdfunding moved from moderate (2019) concentration to high concentration level (2020), where internationally oriented platforms are taking an increasingly larger share of volumes.
When reviewing the market concentration by key countries, the Netherlands experienced the highest change in debt models, where concentration declined significantly in 2020 (moderate level) compared to 2019 (high level). France and Portugal also followed a similar pattern within debt models. Among equity-based models, Germany and the Netherlands were the most highly concentrated markets, while Spain was unconcentrated. Non-investment-models in Europe was mainly regarded as highly concentrated market in both years, especially for countries like Norway, Belgium, France and Switzerland.
In the UK, the market concentration level increased across all models from 2019 to 2020. Equity and non-investment models were found to be highly concentrated markets, while the debt models
were the moderately concentrated. The market concentration level for the debt model moved from unconcentrated (in 2019) to highly concentrated (in 2020). Among the debt models, P2P/Marketplace Property and Balance Sheet Property were the unconcentrated markets in 2019, which changed to moderate in 2020. Real-Estate Crowdfunding was regarded as moderate, while Equity-based Crowdfunding was highly concentrated in both years.
An increase in concentration in general sets certain threats to the competitive landscape and sustainability of a sector. Overall, the UK was more concentrated than Europe, as the concentration seemed to increase across all business models. However, this trend can change in future reports, as increase in concentration can be temporary, driven as result of exogenous shocks (e.g., COVID-19) and Brexit that the sector has experienced in 2019 and 2020.
In any case, the above findings should be viewed with certain reservation. First, few platforms operated in all European markets, and the majority only operated in one or few markets, so regional concentration may reflect dominance in specific national markets rather than regional ones. Second, because of the emerging nature of the industry, concentration does not mean maturity, and often represented the existence of few platforms that serve relatively small home markets and innovation leaders. Such conditions presented early-stage development rather than concentration typical of mature markets.
Market Dynamics
The Vitality of Alternative Finance Business Funding
SME Finance activity in Europe
Crowdfunding platforms in Europe, excluding the UK, raised $4.3 billion for businesses in 2019 and $5.2 billion in 2020. Volumes for SME focused finance has been increasing steadily over recent years, with business funding accounting for 35% of the total volume in 2019 and 52% of the total volume in 2020.
Figure 2.9: Total Alternative Finance Funding for Businesses USD (Excluding UK)
$0
$4000
$2000
$6000
$1000
$5000
$3000
2017
1875
2019
4324
2018
2624
2020
5183
2015
595
2016
1246
Mill
ion
s

Chapter 2: A Regional Discussion on Europe & the United Kingdom
80
Funding for businesses overwhelmingly stemmed from debt-based models – with $3.8 billion raised in 2019 and $4.5 billion raised in 2020 in this category. This accounted for 86% in both years. Equity-based models contributed $478 million in
2019 and $593 million in 2020 (or 11% of business funding) and non-Investment models contributed $112 million (or 3% of business funding) in 2019 and $133 million (or 3% of business funding) in 2020.
Figure 2.10: Distribution of Alternative Finance by Category 2019-2020, USD
UK-focused Business Finance
Considering the total UK SME Alternative Finance volume, there was a consistent increase from 2015 to 2019, followed by a slight decrease in 2020. This increase was from $3.4 billion in 2015 to $4.9 billion in 2016, then to $5.6 billion in 2017 and $6.0 billion in 2018. Since 2018, UK SME alternative
finance volumes increased by $0.5 billion, resulting in a reported $6.5 billion total market volume for 2019. However, in 2020, a slight drop in volume was observed due to a decrease in Balance Sheet Business Lending volume, mainly driven by foreign firms.
Figure 2.11: Total UK SME Alternative Finance Volume 2015-2020, USD
100%90%80%70%60%50%40%30%20%10%
0%2019
86.3%
11.1%
2020
86.0%
11.4%
Debt Equity Non-Investment
2.6%2.6%
$0
$4
$2
$6
$7
$1
$5
$3
2017
5.6
2019
6.5
2018
6.0
2020
6.5
2015
3.4
2016
4.9
Bill
ion
s
Swiss Market – Covid-19 ImpactDr. Simon Amrein, Lecturer, Lucerne School of Business and General Secretary, Swiss Marktplace Lending Association
The development of the Swiss online alternative finance market in 2020 was strongly influenced by the Covid-19 crisis. Reward- and donation-based crowdfunding grew strongly due to a high number of Covid-related projects initiated in 2020 that aimed to support local businesses. Many of these projects were funded on newly established and temporary platforms. Lending-based business models, however, were affected strongly by the Swiss government’s loan support programme. The loan support programme allowed businesses to access loans up to CHF 500,000 through banks at 0% interest rate and without a credit assessment. These government-guaranteed loans brought the SME segment on lending platforms in Q2 2020 to a halt.
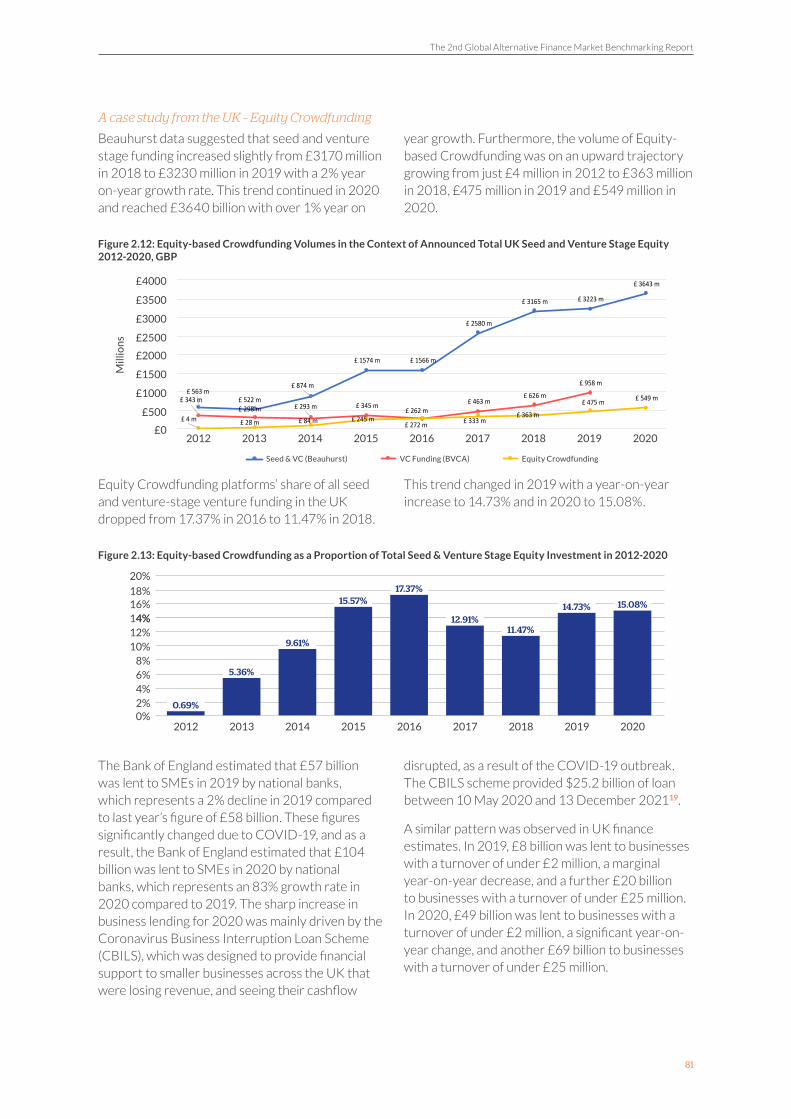
The 2nd Global Alternative Finance Market Benchmarking Report
81
A case study from the UK – Equity Crowdfunding
Beauhurst data suggested that seed and venture stage funding increased slightly from £3170 million in 2018 to £3230 million in 2019 with a 2% year on-year growth rate. This trend continued in 2020 and reached £3640 billion with over 1% year on
year growth. Furthermore, the volume of Equity-based Crowdfunding was on an upward trajectory growing from just £4 million in 2012 to £363 million in 2018, £475 million in 2019 and £549 million in 2020.
Figure 2.12: Equity-based Crowdfunding Volumes in the Context of Announced Total UK Seed and Venture Stage Equity 2012-2020, GBP
Equity Crowdfunding platforms’ share of all seed and venture-stage venture funding in the UK dropped from 17.37% in 2016 to 11.47% in 2018.
This trend changed in 2019 with a year-on-year increase to 14.73% and in 2020 to 15.08%.
Figure 2.13: Equity-based Crowdfunding as a Proportion of Total Seed & Venture Stage Equity Investment in 2012-2020
The Bank of England estimated that £57 billion was lent to SMEs in 2019 by national banks, which represents a 2% decline in 2019 compared to last year’s figure of £58 billion. These figures significantly changed due to COVID-19, and as a result, the Bank of England estimated that £104 billion was lent to SMEs in 2020 by national banks, which represents an 83% growth rate in 2020 compared to 2019. The sharp increase in business lending for 2020 was mainly driven by the Coronavirus Business Interruption Loan Scheme (CBILS), which was designed to provide financial support to smaller businesses across the UK that were losing revenue, and seeing their cashflow
disrupted, as a result of the COVID-19 outbreak. The CBILS scheme provided $25.2 billion of loan between 10 May 2020 and 13 December 202119.
A similar pattern was observed in UK finance estimates. In 2019, £8 billion was lent to businesses with a turnover of under £2 million, a marginal year-on-year decrease, and a further £20 billion to businesses with a turnover of under £25 million. In 2020, £49 billion was lent to businesses with a turnover of under £2 million, a significant year-on-year change, and another £69 billion to businesses with a turnover of under £25 million.
£ 563 m £ 522 m
£ 874 m
£ 1574 m £ 1566 m
£ 2580 m
£ 3165 m £ 3223 m
£ 3643 m
£ 343 m£ 298 m £ 293 m £ 345 m £ 262 m
£ 463 m£ 626 m
£ 958 m
£ 4 m £ 28 m £ 84 m £ 245 m£ 272 m £ 333 m
£ 363 m
£ 475 m £ 549 m
£ 0 m
£ 500 m
£ 1000 m
£ 1500 m
£ 2000 m
£ 2500 m
£ 3000 m
£ 3500 m
£ 4000 m
2012 2013 2014 2015 2016 2017 2018 2019 2020
Seed & VC (Beauhurst) VC Funding (BVCA) Equity Crowdfunding Seed & VC (Beauhurst)
£ 563 m £ 522 m
£ 874 m
£ 1574 m £ 1566 m
£ 2580 m
£ 3165 m £ 3223 m
£ 3643 m
£ 343 m£ 298 m £ 293 m £ 345 m £ 262 m
£ 463 m£ 626 m
£ 958 m
£ 4 m £ 28 m £ 84 m £ 245 m£ 272 m £ 333 m
£ 363 m
£ 475 m £ 549 m
£ 0 m
£ 500 m
£ 1000 m
£ 1500 m
£ 2000 m
£ 2500 m
£ 3000 m
£ 3500 m
£ 4000 m
2012 2013 2014 2015 2016 2017 2018 2019 2020
Seed & VC (Beauhurst) VC Funding (BVCA) Equity Crowdfunding VC Funding (BVCA)
£ 563 m £ 522 m
£ 874 m
£ 1574 m £ 1566 m
£ 2580 m
£ 3165 m £ 3223 m
£ 3643 m
£ 343 m£ 298 m £ 293 m £ 345 m £ 262 m
£ 463 m£ 626 m
£ 958 m
£ 4 m £ 28 m £ 84 m £ 245 m£ 272 m £ 333 m
£ 363 m
£ 475 m £ 549 m
£ 0 m
£ 500 m
£ 1000 m
£ 1500 m
£ 2000 m
£ 2500 m
£ 3000 m
£ 3500 m
£ 4000 m
2012 2013 2014 2015 2016 2017 2018 2019 2020
Seed & VC (Beauhurst) VC Funding (BVCA) Equity Crowdfunding Equity Crowdfunding
£0
£2000
£1000
£3000
£3500
£4000
£500
£2500
£1500Mill
ion
s
2015 2017 20192016 2018 202020132012 2014
£ 563 m£ 522 m
£ 874 m
£ 1574 m £ 1566 m
£ 2580 m
£ 3165 m £ 3223 m
£ 3643 m
£ 343 m£ 298 m £ 293 m £ 345 m
£ 262 m£ 463 m
£ 626 m
£ 958 m
£ 4 m £ 28 m £ 84 m £ 245 m£ 272 m £ 333 m
£ 363 m
£ 475 m £ 549 m
£ 0 m
£ 500 m
£ 1000 m
£ 1500 m
£ 2000 m
£ 2500 m
£ 3000 m
£ 3500 m
£ 4000 m
2012 2013 2014 2015 2016 2017 2018 2019 2020
Seed & VC (Beauhurst) VC Funding (BVCA) Equity Crowdfunding
0%
8%
18%
4%
4%12%14%
2%
10%
20%
6%
16%
2015
15.57%
2017
12.91%
2019
14.73%
2016
17.37%
2018
11.47%
2020
15.08%
20132012
5.36%
0.69%
2014
9.61%

Chapter 2: A Regional Discussion on Europe & the United Kingdom
82
Figure 2.14: P2P Business Lending Compared to Bank Lending in 2012-2020, GBP
By comparing the UK P2P Business Lending volume against that of the BBA/UK Finance annual estimate of new loans to SMEs, it showed online alternative business lending increased its share of total lending from just 0.3% in 2012 to 12% in 2018 to its highest level of 18% in 2019, and then to its lowest level of 6% in 2020, given the considerable increase of traditional financing in light of COVID-19.
Although the share of P2P Business Lending loans
dropped to 6% in 2020, the total absolute volume increased by 12% year-on-year reaching under £4 billion in 2019 and over £4 billion in 2020 compared to £3.6 billion in 2018. One of the biggest P2P/Marketplace Business Lending platforms, Funding Circle, became the first platform accredited to the CBILS in the third quarter of 202020. It became the third-largest provider of finance through the scheme; hence, we expect to see the market grow further in 2021.21
Figure 2.15: P2P Business Lending as a Proportion of Total New Loans to SMEs by Banks in 2012-2020
£0
£80
£40
£120
£20
£100
£60
Bill
ion
s
2015 2017 20192016 2018 202020132012 2014
£ 38.0 b£ 43.0 b
£ 54.0 b£ 58.0 b £ 59.0 b £ 57.0 b £ 57.7 b £ 56.7 b
£ 103.8 b
£ 18.2 b £ 20.5 b £ 22.7 b £ 19.9 b £ 18.3 b £ 21.4 b £ 22.0 b £ 20.2 b
£ 68.8 b
£ 6.6 b £ 6.3 b £ 6.4 b £ 6.7 b £ 6.9 b £ 7.0 b £ 9.2 b £ 8.1 b
£ 48.6 b
£ 60.0 m £ 190.0 m £ 750.0 m £ 880.0 m £ 1.2 b £ 2.0 b £ 2.55 b £ 3.60 b
£ 0.0 b
£ 20.0 b
£ 40.0 b
£ 60.0 b
£ 80.0 b
£ 100.0 b
£ 120.0 b
2012 2013 2014 2015 2016 2017 2018 2019 2020
Bank Bus iness Lending (BoE) New Loans to SMEs (BBA/UK Finance) New Loans to Small Businesses (BBA/UK Finance) P2P Business Lending Bank Business Lending (BoE)
£ 563 m £ 522 m
£ 874 m
£ 1574 m £ 1566 m
£ 2580 m
£ 3165 m £ 3223 m
£ 3643 m
£ 343 m£ 298 m £ 293 m £ 345 m £ 262 m
£ 463 m£ 626 m
£ 958 m
£ 4 m £ 28 m £ 84 m £ 245 m£ 272 m £ 333 m
£ 363 m
£ 475 m £ 549 m
£ 0 m
£ 500 m
£ 1000 m
£ 1500 m
£ 2000 m
£ 2500 m
£ 3000 m
£ 3500 m
£ 4000 m
2012 2013 2014 2015 2016 2017 2018 2019 2020
Seed & VC (Beauhurst) VC Funding (BVCA) Equity Crowdfunding New Loans to SMEs (BBA/UK Finance
£ 563 m £ 522 m
£ 874 m
£ 1574 m £ 1566 m
£ 2580 m
£ 3165 m £ 3223 m
£ 3643 m
£ 343 m£ 298 m £ 293 m £ 345 m £ 262 m
£ 463 m£ 626 m
£ 958 m
£ 4 m £ 28 m £ 84 m £ 245 m£ 272 m £ 333 m
£ 363 m
£ 475 m £ 549 m
£ 0 m
£ 500 m
£ 1000 m
£ 1500 m
£ 2000 m
£ 2500 m
£ 3000 m
£ 3500 m
£ 4000 m
2012 2013 2014 2015 2016 2017 2018 2019 2020
Seed & VC (Beauhurst) VC Funding (BVCA) Equity Crowdfunding New Loans to Small Businesses (BBA/UK Finance)
£ 563 m £ 522 m
£ 874 m
£ 1574 m £ 1566 m
£ 2580 m
£ 3165 m £ 3223 m
£ 3643 m
£ 343 m£ 298 m £ 293 m £ 345 m £ 262 m
£ 463 m£ 626 m
£ 958 m
£ 4 m £ 28 m £ 84 m £ 245 m£ 272 m £ 333 m
£ 363 m
£ 475 m £ 549 m
£ 0 m
£ 500 m
£ 1000 m
£ 1500 m
£ 2000 m
£ 2500 m
£ 3000 m
£ 3500 m
£ 4000 m
2012 2013 2014 2015 2016 2017 2018 2019 2020
Seed & VC (Beauhurst) VC Funding (BVCA) Equity Crowdfunding P2P Business Lending
£ 38.0 b£ 43.0 b
£ 54.0 b£ 58.0 b £ 59.0 b £ 57.0 b £ 57.7 b £ 56.7 b
£ 103.8 b
£ 18.2 b £ 20.5 b £ 22.7 b £ 19.9 b £ 18.3 b£ 21.4 b £ 22.0 b £ 20.2 b
£ 68.8 b
£ 6.6 b £ 6.3 b £ 6.4 b £ 6.7 b £ 6.9 b £ 7.0 b £ 9.2 b £ 8.1 b
£ 48.6 b
£ 60.0 m £ 190.0 m £ 750.0 m £ 880.0 m £ 1.2 b £ 2.0 b £ 2.55 b £ 3.60 b£ 0.0 b
£ 20.0 b
£ 40.0 b
£ 60.0 b
£ 80.0 b
£ 100.0 b
£ 120.0 b
2012 2013 2014 2015 2016 2017 2018 2019 2020
Bank Bus iness Lending (BoE) New Loans to SMEs (BBA/UK Finance) New Loans to Small Businesses (BBA/UK Finance) P2P Business Lending
£4.02b
0%
8%
18%
4%
4%12%14%
2%
10%
20%
6%
16%
2015
4.43%
2017
9.53%
2019
17.79%
2016
6.56%
2018
11.59%
2020
5.83%
20132012
0.94%0.34%
2014
3.30%
New records during in the COVID-19 time Tuulike Mänd, CEO, Hooandja (rewards-based platform, Estonia)
In March-April 2020, we observed a short-term decline in the number of campaigns and backers' activity. People were uncertain about the future. They did not know the duration of the restrictions and their possible impact. However, in May 2020-April 2021, we have been constantly witnessing new records (e.g., the number of backers, sums collected, number of simultaneous campaigns, etc.). The biggest number of campaigns have been started by creative people, who have spotted crowdfunding as an alternative funding source and who are using the pandemic time for realising their projects. Projects which have been previously delayed due to their active offline life.
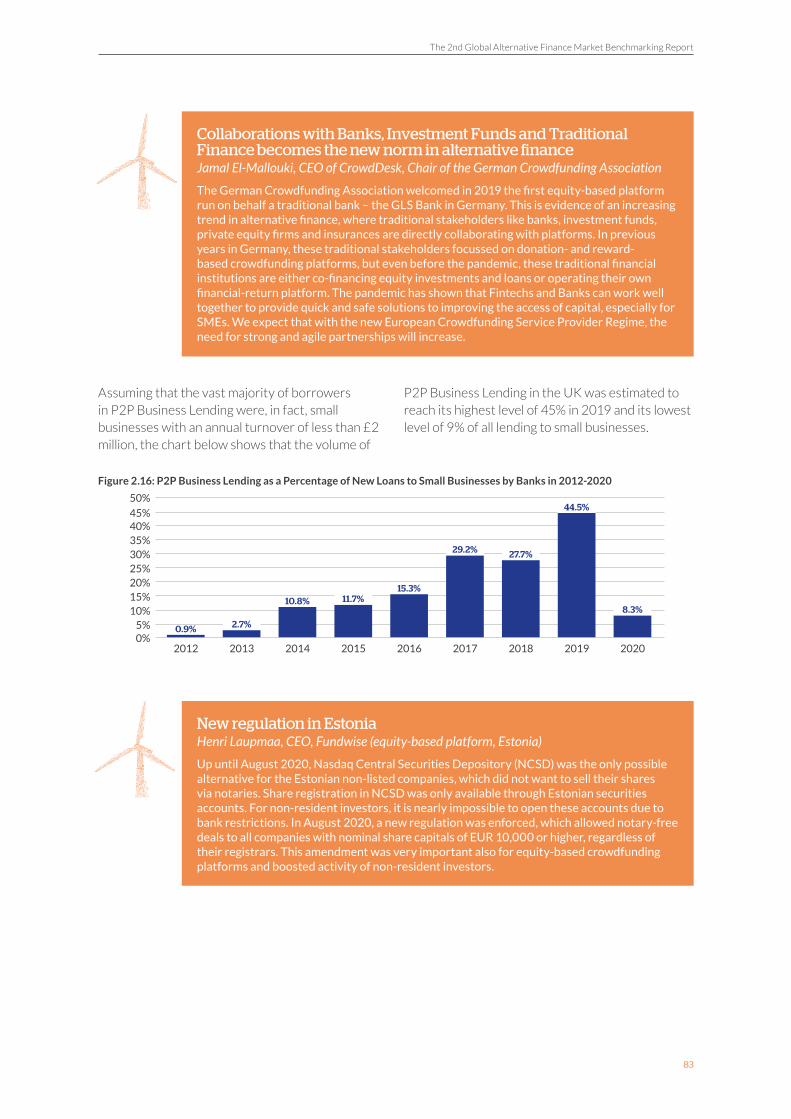
The 2nd Global Alternative Finance Market Benchmarking Report
83
Assuming that the vast majority of borrowers in P2P Business Lending were, in fact, small businesses with an annual turnover of less than £2 million, the chart below shows that the volume of
P2P Business Lending in the UK was estimated to reach its highest level of 45% in 2019 and its lowest level of 9% of all lending to small businesses.
Figure 2.16: P2P Business Lending as a Percentage of New Loans to Small Businesses by Banks in 2012-2020
0%
20%
45%
10%
30%35%
5%
25%
50%
15%
40%
2015
11.7%
2017
29.2%
2019
44.5%
2016
15.3%
2018
27.7%
2020
8.3%
20132012
2.7%0.9%
2014
10.8%
Collaborations with Banks, Investment Funds and Traditional Finance becomes the new norm in alternative finance Jamal El-Mallouki, CEO of CrowdDesk, Chair of the German Crowdfunding Association
The German Crowdfunding Association welcomed in 2019 the first equity-based platform run on behalf a traditional bank – the GLS Bank in Germany. This is evidence of an increasing trend in alternative finance, where traditional stakeholders like banks, investment funds, private equity firms and insurances are directly collaborating with platforms. In previous years in Germany, these traditional stakeholders focussed on donation- and reward-based crowdfunding platforms, but even before the pandemic, these traditional financial institutions are either co-financing equity investments and loans or operating their own financial-return platform. The pandemic has shown that Fintechs and Banks can work well together to provide quick and safe solutions to improving the access of capital, especially for SMEs. We expect that with the new European Crowdfunding Service Provider Regime, the need for strong and agile partnerships will increase.
New regulation in Estonia Henri Laupmaa, CEO, Fundwise (equity-based platform, Estonia)
Up until August 2020, Nasdaq Central Securities Depository (NCSD) was the only possible alternative for the Estonian non-listed companies, which did not want to sell their shares via notaries. Share registration in NCSD was only available through Estonian securities accounts. For non-resident investors, it is nearly impossible to open these accounts due to bank restrictions. In August 2020, a new regulation was enforced, which allowed notary-free deals to all companies with nominal share capitals of EUR 10,000 or higher, regardless of their registrars. This amendment was very important also for equity-based crowdfunding platforms and boosted activity of non-resident investors.

Chapter 2: A Regional Discussion on Europe & the United Kingdom
84
InstitutionalisationThe rate of institutionalisation according to model varied more, compared to rate of institutionalisation according to region, from 2019 to 2020. Lending models particularly showed significant changes in the rate of institutionalisation. Institutionalisation in P2P/Marketplace Business Lending increased from 72% in 2019 to 89% in 2020. For Business Balance Sheet Lending, the rate of institutionalisation increased from 74% in 2019 to 99% in 2020. This can be explained by the involvement of the alternative finance platform in SME support schemes by governments that rely heavily on institutions. For example, P2P/Marketplace Lending platforms were among the accredited partners in government-backed coronavirus business interruption loan schemes and, as a result, were not
able to accept retail funding to support origination of loans linked to a government scheme22 .
Small changes in the rate of institutionalisation were reported in P2P/Marketplace Consumer Lending (33% in 2019; 34% in 2020) and Balance Sheet Consumer Lending (54% in 2019; 53% in 2020). Other significant changes from 2019 to 2020 were shown in Reward-based Crowdfunding which reported 0% institutionalisation in 2019 and a 6% rate of institutionalisation in 2020. Institutional contributions here were more associated with corporate social responsibility initiatives than investment behaviour. The models with the highest rate of institutionalisation in 2020 were Balance Sheet Business Lending (95%), P2P/Marketplace Business Lending (86%) and Invoice Trading (81%)
Figure 2.17: Institutionalisation Rate by Model 2019-2020 (Including UK)
The rate of institutionalisation across countries differed from 2019 to 2020 and varied significantly from country to country. Italy reported the highest rate of institutionalisation among other countries (94% in 2019; 93% in 2020).
Other countries with high and growing rate of institutionalisation were Italy (94%, in 2019; 93% in
2020), Ireland (50% in 2019; 75% in 2020), Iberia (56% in 2019; 67% in 2020), the United Kingdom (43% in 2019; 66% in 2020) and France (59% in 2019; 61% in 2020). The countries with the lowest rate of institutionalisation were Georgia (27% in 2019; 0% in 2020), the Baltics (20% in 2019; 8% in 2020), Eastern Europe (21% in 2019; 16% in 2020) and CIS (22% in 2019; 16% in 2020).
0% 20% 30% 50% 70% 90%10% 60%40% 80% 100%
Institutionalisation Non-institutionalisation
2019
2020P2P/Marketplace
Consumer Lending
33% 67%
34% 66%
2019
2020P2P/Marketplace Business Lending
72% 28%
89% 11%
2019
2020
P2P/Marketplace Property Lending
14% 86%
22% 78%
2019
2020Balance Sheet
Consumer Lending
54% 46%
53% 47%
2019
2020Balance Sheet
Property Lending 25% 75%
25% 75%
2019
2020Invoice Trading
80% 20%
81% 19%
2019
2020Equity-based
Crowdfunding
6% 94%
7% 93%
2019
2020Real Estate
Crowdfunding
11% 89%
11% 89%
2019
2020Balance Sheet
Business Lending
74% 26%
99% 1%
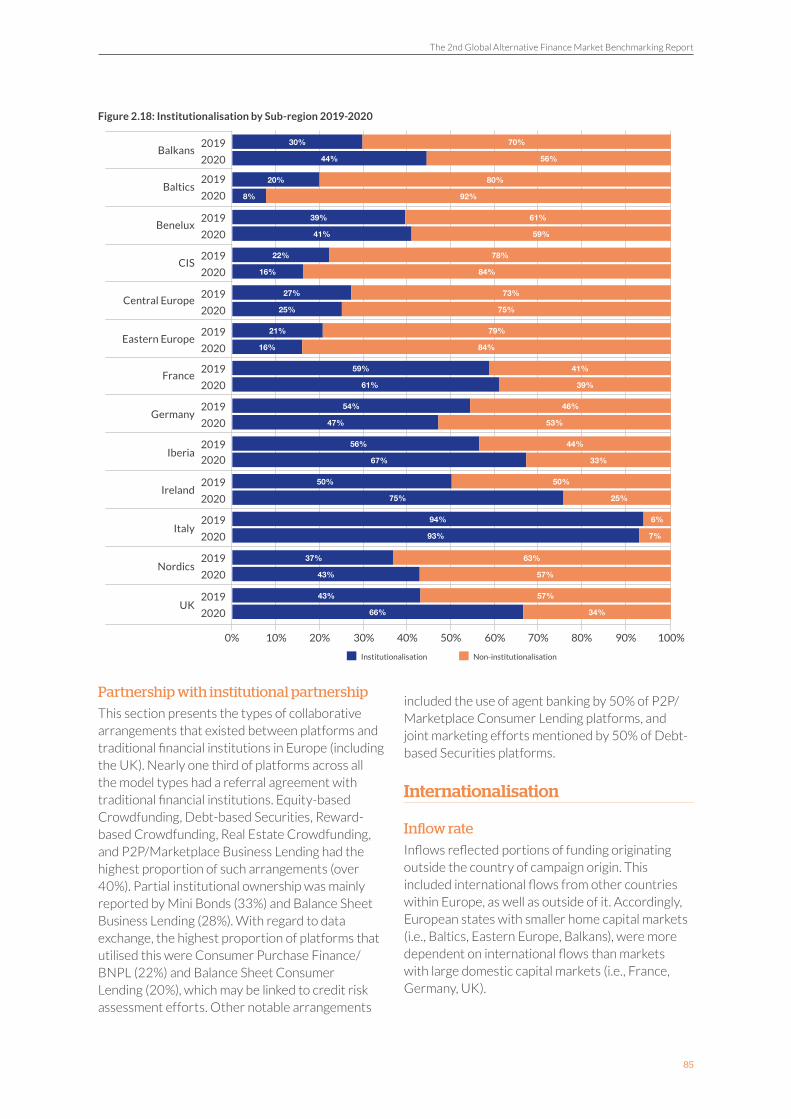
The 2nd Global Alternative Finance Market Benchmarking Report
85
Figure 2.18: Institutionalisation by Sub-region 2019-2020
Partnership with institutional partnership
This section presents the types of collaborative arrangements that existed between platforms and traditional financial institutions in Europe (including the UK). Nearly one third of platforms across all the model types had a referral agreement with traditional financial institutions. Equity-based Crowdfunding, Debt-based Securities, Reward-based Crowdfunding, Real Estate Crowdfunding, and P2P/Marketplace Business Lending had the highest proportion of such arrangements (over 40%). Partial institutional ownership was mainly reported by Mini Bonds (33%) and Balance Sheet Business Lending (28%). With regard to data exchange, the highest proportion of platforms that utilised this were Consumer Purchase Finance/BNPL (22%) and Balance Sheet Consumer Lending (20%), which may be linked to credit risk assessment efforts. Other notable arrangements
included the use of agent banking by 50% of P2P/Marketplace Consumer Lending platforms, and joint marketing efforts mentioned by 50% of Debt-based Securities platforms.
Internationalisation
Inflow rate
Inflows reflected portions of funding originating outside the country of campaign origin. This included international flows from other countries within Europe, as well as outside of it. Accordingly, European states with smaller home capital markets (i.e., Baltics, Eastern Europe, Balkans), were more dependent on international flows than markets with large domestic capital markets (i.e., France, Germany, UK).
0% 20% 30% 50% 70% 90%10% 60%40% 80% 100%
Institutionalisation Non-institutionalisation
2019
2020
2019
2020
2019
2020
2019
2020
2019
2020
2019
2020Germany
2019
2020
2019
2020Ireland
2019
2020Italy
2019
2020Nordics
2019
2020UK
2019
2020Iberia
2019
2020
30% 70%
44% 56%
20% 80%
8% 92%
39% 61%
41% 59%
22% 78%
16% 84%
27% 73%
25% 75%
21% 79%
16% 84%
59% 41%
61% 39%
54% 46%
47% 53%
56% 44%
67% 33%
50% 50%
75% 25%
94% 6%
93% 7%
37% 63%
43% 57%
43% 57%
66% 34%
Eastern Europe
Balkans
France
Baltics
Benelux
CIS
Central Europe

Chapter 2: A Regional Discussion on Europe & the United Kingdom
86
This was prevalent when examining both extremes, with the lowest inflow rate reported by Germany at 5% and the highest reported by Georgia at 95%. The three regions reporting the highest inflow rate
were Georgia (95%), Eastern Europe (91%) and the Baltics (86%). The three regions reporting the lowest inflow rate were Germany (5%), Central Europe (10%) and France (13%).
Figure 2.19: Inflow Rate by Sub-region
Inflow rate varied significantly according to alternative finance model. The highest inflow rate was reported by P2P/Marketplace Consumer Lending (59%) and the lowest inflow rate was reported by Equity-based Crowdfunding (9%) and Reward-based Crowdfunding (9%).
The three models reporting the highest inflow rate were P2P/Marketplace Consumer Lending (59%), Invoice Trading (56%) and P2P/Marketplace Business Lending (26%). P2P/Marketplace Consumer Lending and Invoice Trading therefore reported a significantly higher inflow rate compared
to the next highest model.
The three models reporting the lowest inflow rate were Reward-based Crowdfunding (9%), Equity-based Crowdfunding (9%) and P2P/Marketplace Property Lending (10%). This can be explained by the more locally anchored nature of social action, small-business retail-investor interests.
Overall, P2P/Marketplace Consumer Lending and Invoice Trading were shown to be an outlier with regards to inflow rate, reporting a significantly higher inflow rate than other models.
Figure 2.20: Inflow Rate by Models (Including UK)
0% 20% 30% 50% 70% 90% 100%10% 60%40% 80%
24%
91%
67%
86%
27%
79%
95%
58%
10%
5%
75%
49%
40%
13%
UK
Eastern Europe
Iberia
Baltics
Italy
CIS
Georgia
Nordics
Central Europe
Germany
Balkans
Ireland
Benelux
France
0% 20% 30% 50%10% 60%40%
56%Crowd-led Microfinance
25%Real Estate Crowdfunding
35%Donation-based Crowdfunding
9%Equity-based Crowdfunding
10%P2P/Marketplace Property Lending
59%P2P/Marketplace Consumer Lending
9%Reward-based Crowdfunding
56%Invoice Trading
26%P2P/Marketplace Business Lending

The 2nd Global Alternative Finance Market Benchmarking Report
87
Financial Inclusion
Banking Status of Borrowers
The proportion of platforms supporting the banked, underbanked and unbanked populations varied significantly by regions in Europe (excluding the UK). For example, in the Balkans, 46% of volume was from banked populations, 32% from underbanked populations and 21% was from the unbanked population. Meanwhile, in Central Europe 100% of the market volume was from the banked population.
Some regions and markets, such as CIS (55% unbanked, 45% underbanked), and Eastern Europe (26% unbanked, 26% underbanked), that showed
the highest volumes attributed to the unbanked and underbanked benefited from foreign investors and presented high proportions of international inflow rate, and had significant presence of foreign companies in their national market. Hence, the FinTech market functioned as an alternative way to achieve financial inclusion in underbanked countries with the support of leading markets such as Estonia.
Regions and markets that showed the lowest volumes attributed to the unbanked were Central Europe (100% banked), Germany (100% banked), France (99% banked), the UK (96% banked) and Nordics (88% banked).
Figure 2.21: Banking Status by Sub-region
Gender-based Funding
Female Funder and Fundraiser
Across a majority of sub-regions, female funder rates increased from 2019 to 2020.
For example, the Balkans, the Baltics, Benelux, Central Europe, France, Iberia, Ireland, Italy, the Nordics and the UK all showed an increase in the percentage of female funders, the largest increase
shown by Italy (20% in 2019; 37% in 2020) and the smallest increase shown by Ireland (46% in 2019; 48% in 2020), an increase range of2% to 17%.
Meanwhile, CIS (57% in 2019;14% in 2020), Eastern Europe (31% in 2019; 10% in 2020) and Germany (37% in 2019; 23% in 2020) showed a decrease in the percentage of female funders.
0% 20% 30% 50% 70% 90% 100%10% 60%40% 80%
UK
Nordics
Germany
Benelux
Ireland
Central Europe
France
Balkans
Italy
Georgia
Baltics
Iberia
CIS
Eastern Europe
Unbanked Underbanked Banked
61% 39%
21% 32% 46%
100%
26% 26% 48%
6% 13% 80%
46% 37% 17%
4% 8% 88%
55% 45%
<1
3% 23% 74%
6% 93%1%
99%<1%
1%
12% 88%<1%
4% 96%<1%
100%
<1%<1%
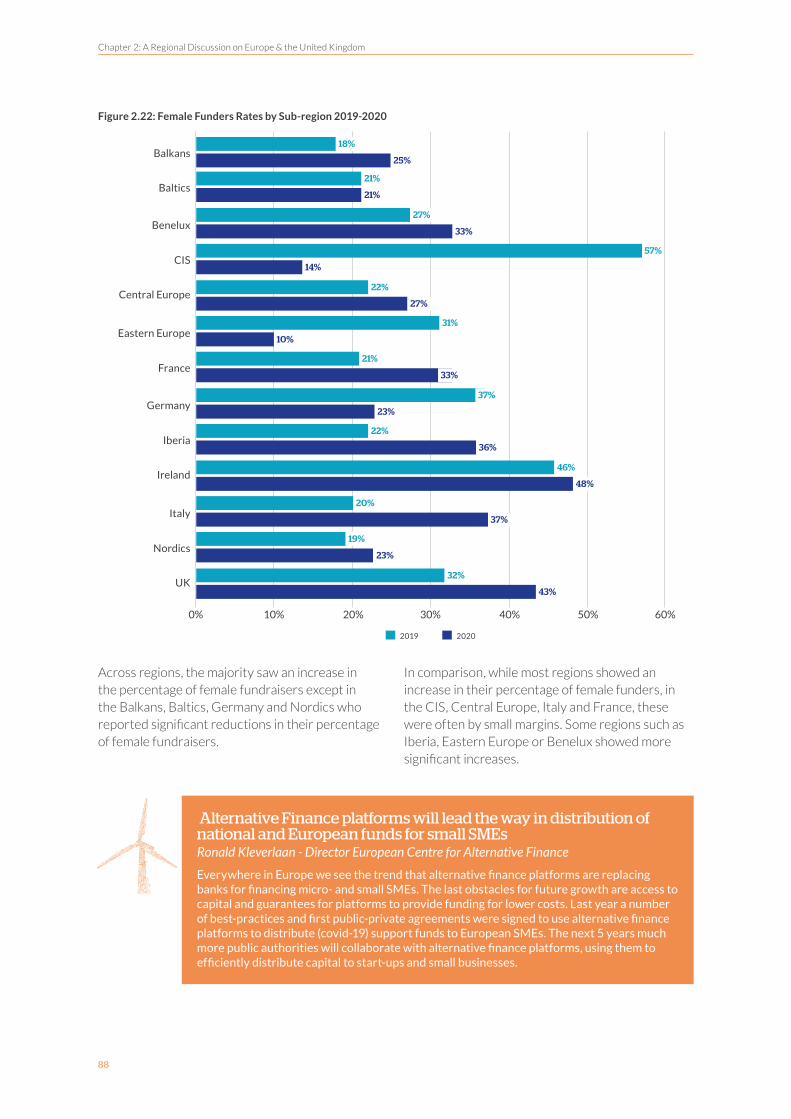
Chapter 2: A Regional Discussion on Europe & the United Kingdom
88
Figure 2.22: Female Funders Rates by Sub-region 2019-2020
Across regions, the majority saw an increase in the percentage of female fundraisers except in the Balkans, Baltics, Germany and Nordics who reported significant reductions in their percentage of female fundraisers.
In comparison, while most regions showed an increase in their percentage of female funders, in the CIS, Central Europe, Italy and France, these were often by small margins. Some regions such as Iberia, Eastern Europe or Benelux showed more significant increases.
0% 20% 30% 50%10% 60%40%
2019 2020
43%
48%
27%
32%
46%
22%
UK
Ireland
Central Europe
23%
36%
14%
33%
21%
25%
19%
22%
57%
21%
21%
18%
Nordics
Iberia
CIS
France
Baltics
Balkans
37%
10%
23%
33%
20%
31%
37%
27%
Italy
Eastern Europe
Germany
Benelux
Alternative Finance platforms will lead the way in distribution of national and European funds for small SMEs Ronald Kleverlaan - Director European Centre for Alternative Finance
Everywhere in Europe we see the trend that alternative finance platforms are replacing banks for financing micro- and small SMEs. The last obstacles for future growth are access to capital and guarantees for platforms to provide funding for lower costs. Last year a number of best-practices and first public-private agreements were signed to use alternative finance platforms to distribute (covid-19) support funds to European SMEs. The next 5 years much more public authorities will collaborate with alternative finance platforms, using them to efficiently distribute capital to start-ups and small businesses.
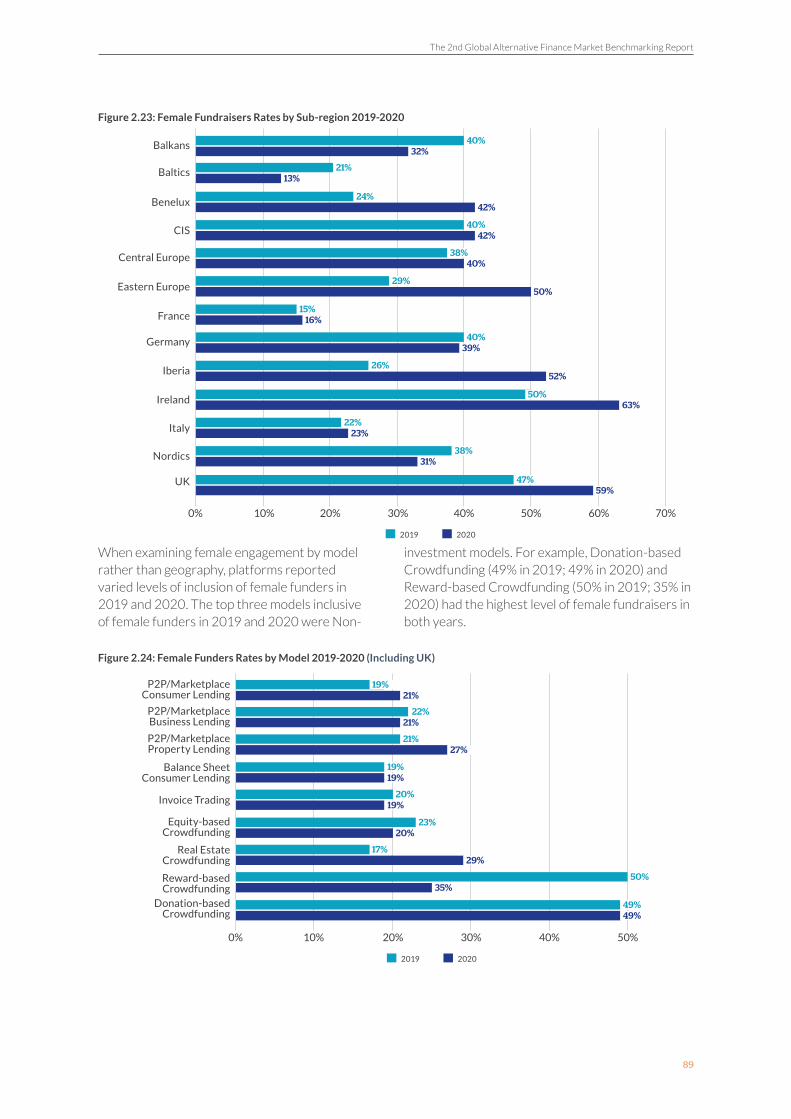
The 2nd Global Alternative Finance Market Benchmarking Report
89
Figure 2.23: Female Fundraisers Rates by Sub-region 2019-2020
When examining female engagement by model rather than geography, platforms reported varied levels of inclusion of female funders in 2019 and 2020. The top three models inclusive of female funders in 2019 and 2020 were Non-
investment models. For example, Donation-based Crowdfunding (49% in 2019; 49% in 2020) and Reward-based Crowdfunding (50% in 2019; 35% in 2020) had the highest level of female fundraisers in both years.
Figure 2.24: Female Funders Rates by Model 2019-2020 (Including UK)
0% 20% 30% 50%10% 60% 70%40%
2019 2020
59%47%UK
63%50%
Ireland
40%38%Central Europe
31%38%
Nordics
52%26%
Iberia
42%40%
CIS
16%15%
France
13%21%Baltics
32%40%Balkans
23%22%
Italy
50%29%
Eastern Europe
39%40%Germany
42%24%
Benelux
0% 20% 30% 50%10% 40%
2019 2020
49%49%Donation-based
Crowdfunding
20%23%Equity-based
Crowdfunding
35%50%Reward-based
Crowdfunding
19%20%
Invoice Trading
27%21%P2P/Marketplace
Property Lending
21%19%P2P/Marketplace
Consumer Lending
29%17%Real Estate
Crowdfunding
19%19%Balance Sheet
Consumer Lending
21%22%P2P/Marketplace
Business Lending
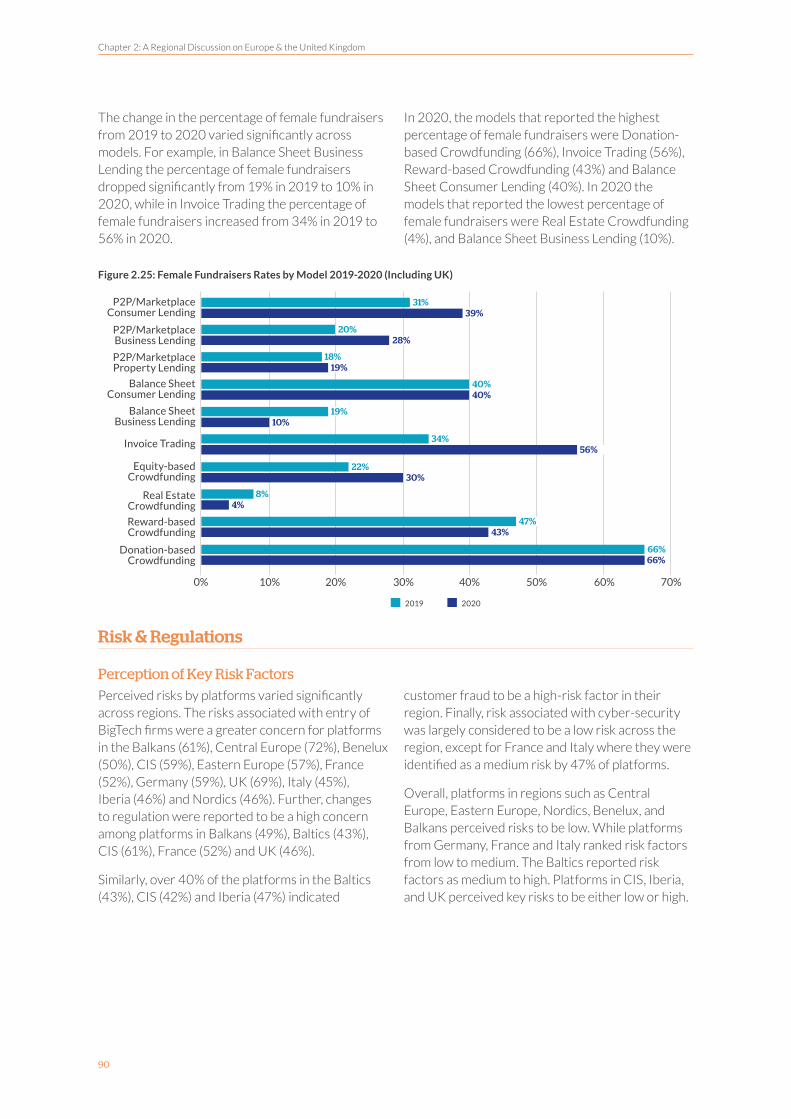
Chapter 2: A Regional Discussion on Europe & the United Kingdom
90
The change in the percentage of female fundraisers from 2019 to 2020 varied significantly across models. For example, in Balance Sheet Business Lending the percentage of female fundraisers dropped significantly from 19% in 2019 to 10% in 2020, while in Invoice Trading the percentage of female fundraisers increased from 34% in 2019 to 56% in 2020.
In 2020, the models that reported the highest percentage of female fundraisers were Donation-based Crowdfunding (66%), Invoice Trading (56%), Reward-based Crowdfunding (43%) and Balance Sheet Consumer Lending (40%). In 2020 the models that reported the lowest percentage of female fundraisers were Real Estate Crowdfunding (4%), and Balance Sheet Business Lending (10%).
Figure 2.25: Female Fundraisers Rates by Model 2019-2020 (Including UK)
Risk & Regulations
Perception of Key Risk Factors
Perceived risks by platforms varied significantly across regions. The risks associated with entry of BigTech firms were a greater concern for platforms in the Balkans (61%), Central Europe (72%), Benelux (50%), CIS (59%), Eastern Europe (57%), France (52%), Germany (59%), UK (69%), Italy (45%), Iberia (46%) and Nordics (46%). Further, changes to regulation were reported to be a high concern among platforms in Balkans (49%), Baltics (43%), CIS (61%), France (52%) and UK (46%).
Similarly, over 40% of the platforms in the Baltics (43%), CIS (42%) and Iberia (47%) indicated
customer fraud to be a high-risk factor in their region. Finally, risk associated with cyber-security was largely considered to be a low risk across the region, except for France and Italy where they were identified as a medium risk by 47% of platforms.
Overall, platforms in regions such as Central Europe, Eastern Europe, Nordics, Benelux, and Balkans perceived risks to be low. While platforms from Germany, France and Italy ranked risk factors from low to medium. The Baltics reported risk factors as medium to high. Platforms in CIS, Iberia, and UK perceived key risks to be either low or high.
0% 20% 30% 50%10% 60% 70%40%
2019 2020
66%66%Donation-based
Crowdfunding
30%22%Equity-based
Crowdfunding
43%47%Reward-based
Crowdfunding
56%34%Invoice Trading
4%8%Real Estate
Crowdfunding
10%19%Balance Sheet
Business Lending
40%40%Balance Sheet
Consumer Lending
19%18%P2P/Marketplace
Property Lending
39%31%P2P/Marketplace
Consumer Lending
28%20%P2P/Marketplace
Business Lending

The 2nd Global Alternative Finance Market Benchmarking Report
91
Figure 2.26: Perceived Risks of Platforms by Sub-region
Low Medium High
Customer Fraud
Customer Fraud
Customer Fraud
Customer Fraud
Customer Fraud
Customer Fraud
Customer Fraud
Customer Fraud
Customer Fraud
Customer Fraud
Customer Fraud
Customer Fraud
Emergence of BigTech firms
Emergence of BigTech firms
Emergence of BigTech firms
Emergence of BigTech firms
Emergence of BigTech firms
Emergence of BigTech firms
Emergence of BigTech firms
Emergence of BigTech firms
Emergence of BigTech firms
Emergence of BigTech firms
Emergence of BigTech firms
Emergence of BigTech firms
Cyber-security Breach
Cyber-security Breach
Cyber-security Breach
Cyber-security Breach
Cyber-security Breach
Cyber-security Breach
Cyber-security Breach
Cyber-security Breach
Cyber-security Breach
Cyber-security Breach
Cyber-security Breach
Cyber-security Breach
Change in Regulation
Change in Regulation
Change in Regulation
Change in Regulation
Change in Regulation
Change in Regulation
Change in Regulation
Change in Regulation
Change in Regulation
Change in Regulation
Change in Regulation
Change in Regulation
Ben
elu
xIb
eria
Eas
tern
E
uro
pe
UK
Bal
tics
Ger
man
yC
ISN
ord
ics
Bal
kan
sFr
ance
Cen
tral
E
uro
pe
Ital
y
45% 35% 19%
24% 47% 29%
21% 27% 52%
63% 13% 25%
43% 30% 26%
64% 18% 18%
23% 56% 21%
36% 5% 59%
47% 7% 47%
49% 29% 22%
28% 39% 33%
43% 11% 46%
34% 47% 19%
19% 60% 21%
45% 10% 45%
57% 17% 25%
54% 33% 13%
26% 50% 24%
51% 4% 46%
57% 30% 13%
42% 36% 22%
34% 20% 46%
26% 5% 69%
29%20%51%
55% 15% 30%
58% 36% 7%
36% 15% 49%
28% 11% 61%
29% 28% 43%
38% 25% 38%
21% 36% 43%
26% 46% 28%
51% 16% 32%
56% 24% 20%
30% 39% 32%
42% 8% 50%
61% 11% 28%
78% 19% 4%
67% 15% 19%
20% 8% 72%
50% 8% 42%
61% 33% 6%
22% 17% 61%
41% 59%
64% 7% 29%
61% 11% 28%
33% 33% 35%
35% 8% 57%

Chapter 2: A Regional Discussion on Europe & the United Kingdom
92
When considering how platforms representing debt-based models considered risk, there was generally a consensus. For example, change in regulation was considered as a high risk by 46% of P2P/Marketplace Consumer Lending Firms, 43% of P2P/Marketplace Business Lending firms and 38% of P2P/Marketplace Property Lending platforms. Similarly, the entry of BigTech firms was a major concern among 48% of Invoice Trading, 42% of P2P/Marketplace Property Lending, and 40% of P2P/Marketplace Business Lending platforms.
Over one third of the platforms across the key debt models identified customer fraud to be a medium risk.
On the other hand, risks associated with cyber-security and notable increases in defaults were mostly indicated as a low risk among key Debt-based models, except for Invoice Trading where 52% of platforms indicated notable increase in defaults to be a medium level risk.
Figure 2.27: Perceived Risks of Platforms by Debt Models (Including UK)
When reviewing risk as perceived by equity models and non-investment models, on average more than half of the respondents operating with an Equity-based Crowdfunding model perceived key risks factors to be low, with only over a quarter of such firms indicating key risks to be medium. Risks related to changes to regulation (36%) and cyber security breaches (34%) were reported as high by platforms offering services related to Real Estate Crowdfunding.
Platforms offering Reward-based Crowdfunding were mostly concerned with changes to regulation (55%) and the entry of BigTech firms (57%). Further, 62% of such firms reported cyber-security breaches to be a medium level risk. Finally, Donation-based Crowdfunding platforms identified fewer risk factors as medium to high, with the majority of such firms perceiving risks to be low. Risk associated with cyber-security breaches and changes to regulations were considered by 48% and 42% of platforms respectively as a medium risk.
Low Medium High
P2
P/M
arke
tpla
ce
Co
nsu
mer
Len
din
gP
2P
/Mar
ketp
lace
B
usi
nes
s Le
nd
ing
P2
P/M
arke
tpla
ce
Pro
per
ty L
end
ing
Customer Fraud
Customer Fraud
Customer Fraud
Customer Fraud
Emergence of BigTech firms
Emergence of BigTech firms
Emergence of BigTech firms
Emergence of BigTech firms
Notable increase in defaults
Notable increase in defaults
Notable increase in defaults
Notable increase in defaults
Cyber-security Breach
Cyber-security Breach
Cyber-security Breach
Cyber-security Breach
Change in Regulation
Change in Regulation
Change in Regulation
Change in Regulation
Invo
ice
Trad
ing
38% 55% 7%
86% 10% 4%
88% 6% 6%
11% 43% 46%
81% 16% 4%
49% 41% 10%
82% 14% 5%
48% 25% 27
27
%
%
25% 32% 43%
28% 56% 16%
55% 33% 12%
25% 38% 38%
37% 37% 27%
42% 15% 42%
46% 35% 19%
21% 52% 28%
57% 20% 23%
46% 50% 4%
45% 48%6%
34% 40%
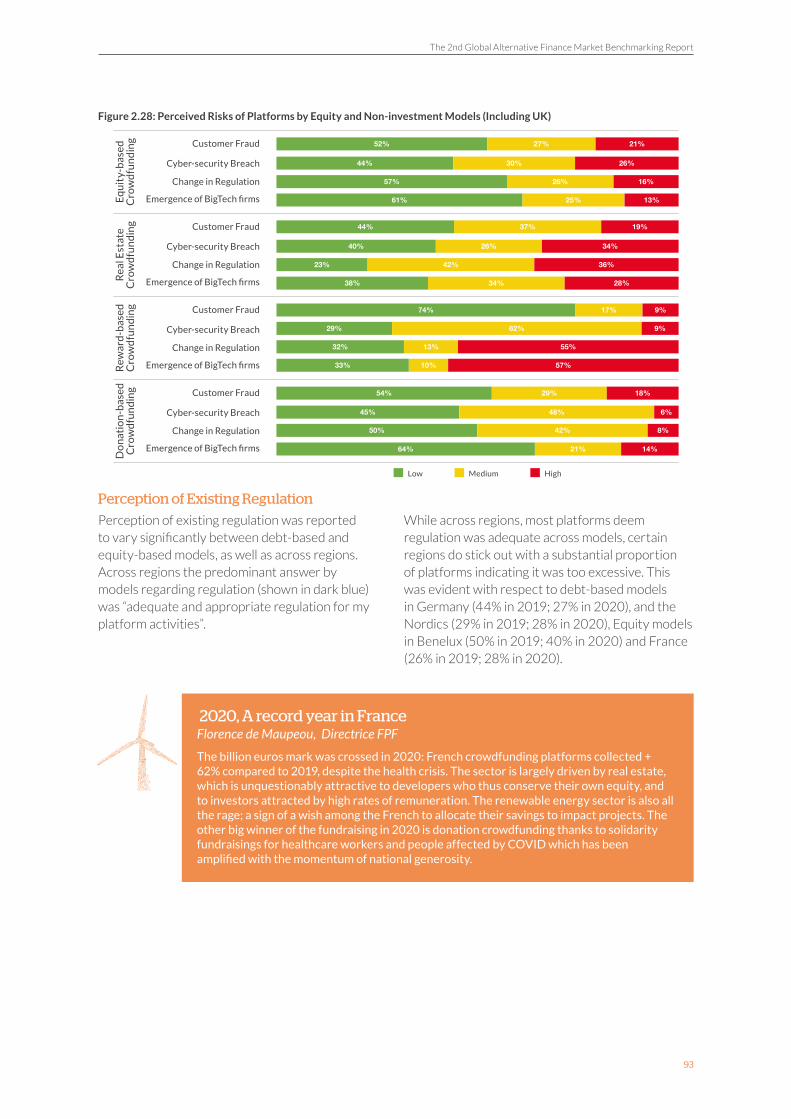
The 2nd Global Alternative Finance Market Benchmarking Report
93
Figure 2.28: Perceived Risks of Platforms by Equity and Non-investment Models (Including UK)
Perception of Existing Regulation
Perception of existing regulation was reported to vary significantly between debt-based and equity-based models, as well as across regions. Across regions the predominant answer by models regarding regulation (shown in dark blue) was “adequate and appropriate regulation for my platform activities”.
While across regions, most platforms deem regulation was adequate across models, certain regions do stick out with a substantial proportion of platforms indicating it was too excessive. This was evident with respect to debt-based models in Germany (44% in 2019; 27% in 2020), and the Nordics (29% in 2019; 28% in 2020), Equity models in Benelux (50% in 2019; 40% in 2020) and France (26% in 2019; 28% in 2020).
Low Medium High
Customer Fraud
Customer Fraud
Customer Fraud
Customer Fraud
Emergence of BigTech firms
Emergence of BigTech firms
Emergence of BigTech firms
Emergence of BigTech firms
Cyber-security Breach
Cyber-security Breach
Cyber-security Breach
Cyber-security Breach
Change in Regulation
Change in Regulation
Change in Regulation
Change in Regulation
Do
nat
ion
-bas
ed
Cro
wd
fun
din
gR
eal E
stat
e C
row
dfu
nd
ing
Rew
ard
-bas
ed
Cro
wd
fun
din
gE
qu
ity-
bas
ed
Cro
wd
fun
din
g 52% 27% 21%
44% 30% 26%
57% 26% 16%
61% 25% 13%
44% 37% 19%
40% 26% 34%
23% 42% 36%
38% 34% 28%
74% 17% 9%
29% 62% 9%
32% 13% 55%
33% 10% 57%
54% 29% 18%
45% 48% 6%
50% 42% 8%
64% 21% 14%
2020, A record year in France Florence de Maupeou, Directrice FPF
The billion euros mark was crossed in 2020: French crowdfunding platforms collected + 62% compared to 2019, despite the health crisis. The sector is largely driven by real estate, which is unquestionably attractive to developers who thus conserve their own equity, and to investors attracted by high rates of remuneration. The renewable energy sector is also all the rage; a sign of a wish among the French to allocate their savings to impact projects. The other big winner of the fundraising in 2020 is donation crowdfunding thanks to solidarity fundraisings for healthcare workers and people affected by COVID which has been amplified with the momentum of national generosity.

Chapter 2: A Regional Discussion on Europe & the United Kingdom
94
Figure 2.29: Regulatory Perception towards FinTech Regulation for Debt Models by Sub-region 2019-2020
32% 18% 11% 39%
Adequate and appropriate for my platform activities Inadequate and too relaxed for my platform activities
Excessive and too strict for my platform activities No Specific Regulation and not needed
No Specific Regulation and needed Alternative finance (including crowdfunding & P2P lending) is not currently legalized in my country
UK
Iberia
Central Europe
Italy
France
Baltics
Nordics
Germany
Benelux
Ireland
CIS
Eastern Europe
Balkans
2019
2019
2019
2019
2019
2019
2019
2019
2019
2019
2019
2019
2019
2020
2020
2020
2020
2020
2020
2020
2020
2020
2020
2020
2020
2020 30% 4% 52% 15%
53% 14% 8% 4% 14% 7%
38% 4% 11% 7% 24% 16%
73% 5% 3%3% 16%
79% 15% 6%
40% 10% 20% 30%
40% 20% 30% 10%
11% 47% 11% 32%
20% 10% 50% 20%
42% 10% 10% 10% 28%
61% 7% 14% 11% 7%
54% 4% 29% 4% 8%
68% 20% 8% 4%
33% 44% 11% 11%
45% 27% 9% 18%
73% 7% 7% 13%
60% 13% 20% 7%
67% 33%
75% 25%
59% 14% 14% 14%
53% 32% 16%
63% 4% 29% 4%
67% 28% 6%
75% 13% 13%
100%
Turning the crisis into opportunityPatrick de Nonneville ,COO/Directeur Général, October.eu
After the shock of the lockdowns, most platforms adapted their business models. A particularly interesting opportunity, in the countries where platforms managed to access State Guaranteed Loans (SGLs), has been the application of technology to the urgent deployment of support money. For example, in the Netherlands, France and Italy, SME platform October applied the data, tech and process learnings gathered over the previous 5 years to provide Instant Decision SGLs up to 250,000 euros. An additional benefit is that this demonstration of its capabilities has created opportunities to monetize its technology by offering it to other finance providers.
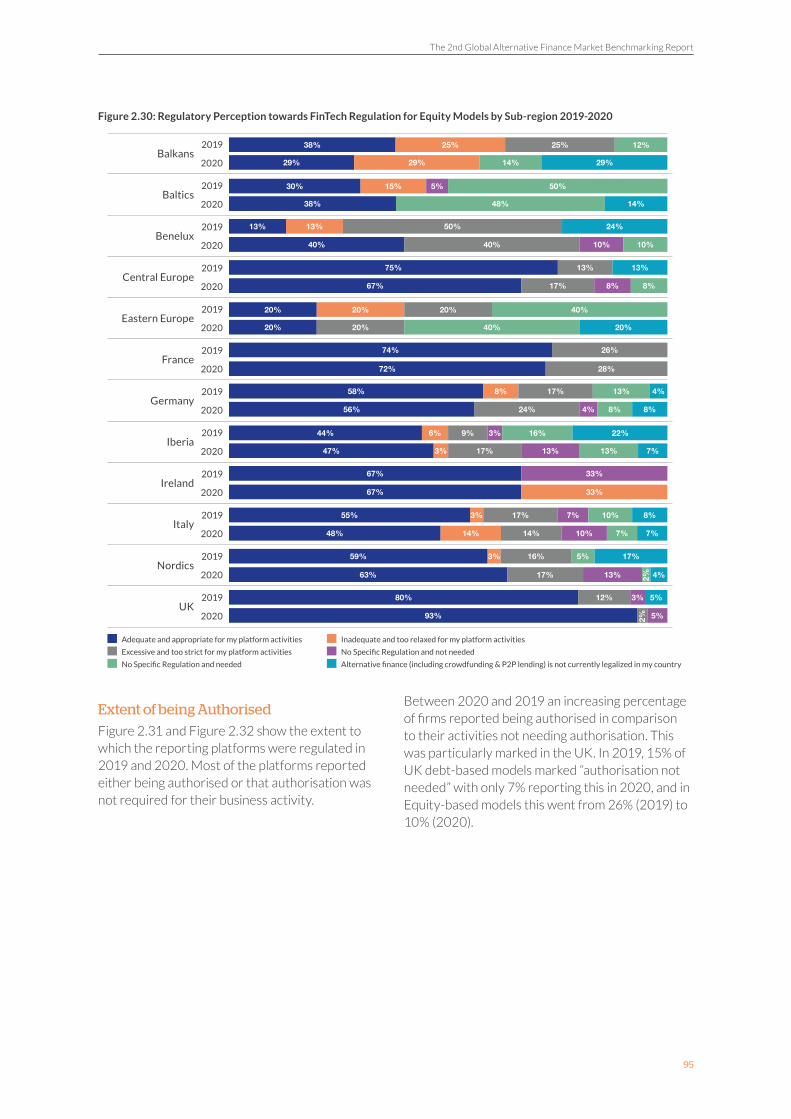
The 2nd Global Alternative Finance Market Benchmarking Report
95
Figure 2.30: Regulatory Perception towards FinTech Regulation for Equity Models by Sub-region 2019-2020
Extent of being Authorised
Figure 2.31 and Figure 2.32 show the extent to which the reporting platforms were regulated in 2019 and 2020. Most of the platforms reported either being authorised or that authorisation was not required for their business activity.
Between 2020 and 2019 an increasing percentage of firms reported being authorised in comparison to their activities not needing authorisation. This was particularly marked in the UK. In 2019, 15% of UK debt-based models marked “authorisation not needed” with only 7% reporting this in 2020, and in Equity-based models this went from 26% (2019) to 10% (2020).
Adequate and appropriate for my platform activities Inadequate and too relaxed for my platform activities
Excessive and too strict for my platform activities No Specific Regulation and not needed
No Specific Regulation and needed Alternative finance (including crowdfunding & P2P lending) is not currently legalized in my country
UK
Iberia
Italy
France
Nordics
Germany
Ireland
Eastern Europe
2019
2019
2019
2019
2019
2019
2019
2019
2020
2020
2020
2020
2020
2020
2020
2020
Central Europe
Baltics
Benelux
Balkans
2019
2019
2019
2019
2020
2020
2020
2020
38% 25% 25% 12%
29% 29% 14% 29%
30% 15% 5% 50%
38% 48% 14%
13% 13% 50% 24%
40% 40% 10% 10%
75% 13% 13%
67% 17% 8% 8%
20% 20% 20% 40%
20% 20% 40% 20%
74% 26%
72% 28%
58% 8% 17% 13% 4%
56% 24% 4% 8% 8%
44% 6% 9% 3% 16% 22%
47% 3% 17% 13% 13% 7%
67% 33%
67% 33%
55% 3% 17% 7% 10% 8%
48% 14% 14% 10% 7% 7%
59% 3% 16% 5% 17%
63% 17% 13% 2% 4%
80% 12% 3% 5%
93% 2% 5%

Chapter 2: A Regional Discussion on Europe & the United Kingdom
96
Figure 2.31: Regulatory Authorisation for Debt Models by Sub-region, 2019- 2020
UK
Iberia
Central Europe
Italy
France
Baltics
Nordics
Germany
Benelux
Ireland
CIS
Eastern Europe
Balkans
2019
2019
2019
2019
2019
2019
2019
2019
2019
2019
2019
2019
2019
2020
2020
2020
2020
2020
2020
2020
2020
2020
2020
2020
2020
2020
My platform is authorized in my jurisdiction
My platform is not authorized but has interim permissions to operate in my jurisdiction.
My platform is not authorized but has a relationship with another licensed institution (ie Appointed Representative) that serves as our agent
Regulatory Authorization is not required for my business activities
54% 17% 4% 25%
73% 4% 4% 19%
24% 3% 74%
44% 56%
44% 56%
44% 56%
63% 2% 34%
79% 3% 18%
30% 10% 60%
60% 40%
5% 5% 89%
30% 70%
32% 68%
64% 36%
68% 4% 28%
88% 12%
33% 6% 61%
58% 42%
33% 67%
67% 33%
48% 7% 7% 38%
55% 10% 7% 28%
57% 10% 2% 31%
77% 7% 16%
80% 5% 15%
93% 7%
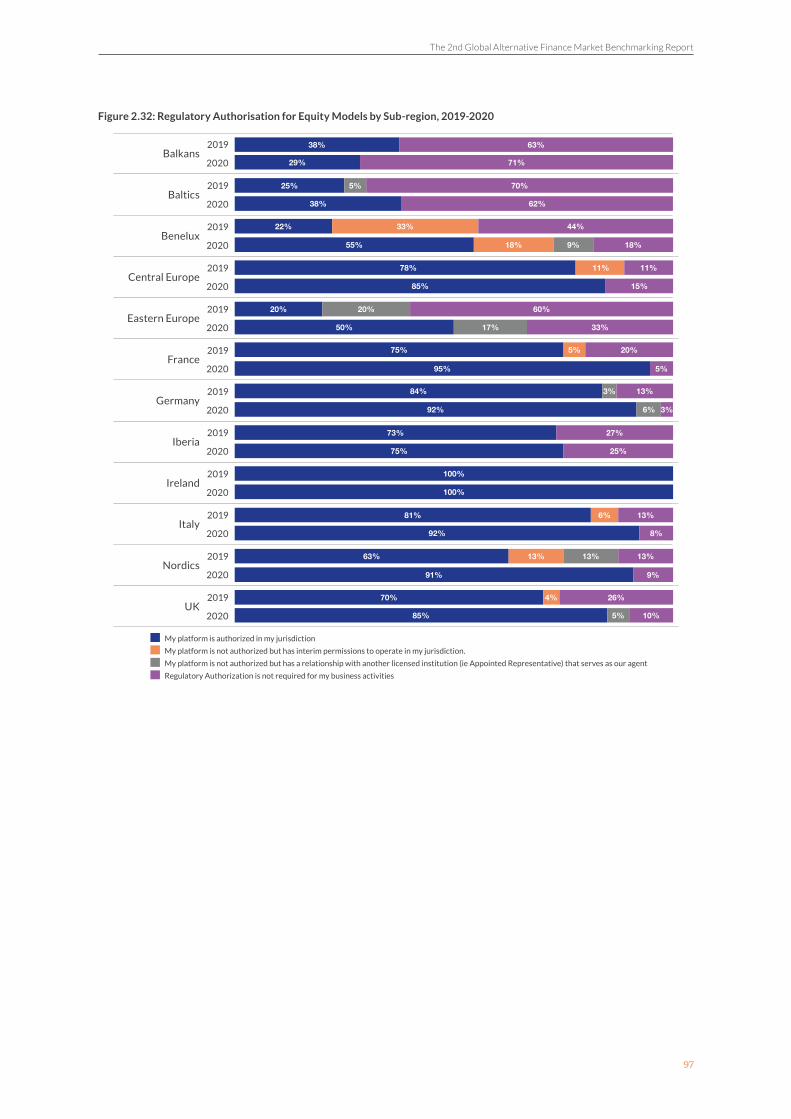
The 2nd Global Alternative Finance Market Benchmarking Report
97
Figure 2.32: Regulatory Authorisation for Equity Models by Sub-region, 2019-2020
UK
Iberia
Italy
France
Nordics
Germany
Ireland
Eastern Europe
2019
2019
2019
2019
2019
2019
2019
2019
2020
2020
2020
2020
2020
2020
2020
2020
Central Europe
Baltics
Benelux
Balkans
2019
2019
2019
2019
2020
2020
2020
2020
My platform is authorized in my jurisdiction
My platform is not authorized but has interim permissions to operate in my jurisdiction.
My platform is not authorized but has a relationship with another licensed institution (ie Appointed Representative) that serves as our agent
Regulatory Authorization is not required for my business activities
100%
100%
38% 63%
29% 71%
25% 5% 70%
38% 62%
22% 33% 44%
55% 18% 9% 18%
78% 11% 11%
85% 15%
20% 20% 60%
50% 17% 33%
75% 5% 20%
95% 5%
84% 3% 13%
92% 6% 3%
73% 27%
75% 25%
81% 6% 13%
92% 8%
63% 13% 13% 13%
91% 9%
70% 4% 26%
85% 5% 10%

The 2nd Global Alternative Finance Market Benchmarking Report
98
3. A Regional Discussion on Asia-Pacific

Chapter 3: A Regional Discussion on Asia Pacific
99
Chapter 3: A Regional Discussion on Asia Pacific
This chapter includes a discussion on the online alternative finance activities in the Asia-Pacific (excluding China) region. The region is characterised by a diverse ecosystem in terms of country income groups (emerging and advanced). Emerging economies led in Consumer and Business Lending models, while developed countries led more in Equity and Real Estate focused activities. As noted globally, P2P/Marketplace Consumer Lending was the leading model in both 2019 and 2020. Domestic players and homegrown platforms dominated the market, accounting for over 80% of regional volumes.
Total Regional VolumeCompared to 2018, the total value of alternative finance activities in the region grew by 55% in 2019 and 44% from 2018 to 2020. Online alternative finance platforms facilitated over $18.5 billion in
funding during 2019 and 2020, nearly 38% more than the total volumes collected from 2013 to 2018. In 2019, the market reached peak volume of $9.5 billion.
Nevertheless, the region saw a decline of 7% of volumes between 2019 and 2020, which may be attributed to lower marketplace consumer lending activities in the region. Furthermore, some of the decline may also be superficial, resulting from non-repeat responses of platforms that participated in 2018 but not in 2020.23
Despite this decline, the Asia-Pacific contribution to global share of alternative finance increased to 8% (from 5% in 2019, and 2% in 2018). Overall, $31.8 billion has been raised by individuals, businesses, and other fundraisers via online alternative finance platforms over the last eight years (2013 to 2020).
Figure 3.1: Asia-Pacific Alternative Finance Market Volume (Excluding China), 2013-2020 (USD Billion)
$0
$8
$4
$12
$2
$10
$6
2015
1.1
2017
3.6
2019
9.5
2016
2.0
2018
6.2
2020
8.9
2013
0.1
2014
0.3
Bill
ion
s

The 2nd Global Alternative Finance Market Benchmarking Report
100
Volume Analysis
Table 3.1: Asia-Pacific Alternative Finance Market Volume by Business Model (Excluding China), 2018-2020 (USD Million)
Asia Pacific Alternative Finance Market Size and Growth Rate according to Model (2018-2020)
Alternative Finance ModelMarket Size (USD) Annual Market Growth (%)
2018 2019 2020 2018-2019 2019-2020
P2P/Marketplace Consumer Lending $982.07m $3134.33m $2363.64m 219% -25%
P2P/Marketplace Business Lending $1772.64m $1623.89m $1819.65m -8% 12%
P2P/Marketplace Property Lending $658.90m $619.67m $541.79m -6% -13%
Balance Sheet Consumer Lending $883.43m $827.53m $999.13m -6% 21%
Balance Sheet Business Lending $917.71m $1574.15m $1259.67m 72% -20%
Balance Sheet Property Lending $18.68m $7.74m
Invoice Trading $94.01m $574.23m $241.79m 511% -58%
Debt-based Securities $2.97m $6.42m $2.43m 117% -62%
Equity-based Crowdfunding $162.07m $219.45m $333.54m 35% 52%
Real Estate Crowdfunding $258.13m $222.11m $351.80m -14% 58%
Revenue/Profit Sharing $9.88m $8.27m $51.46m -16% 522%
Reward-based Crowdfunding $201.50m $217.48m $405.72m 8% 87%
Donation-based Crowdfunding $75.78m $96.09m $143.34m 27% 49%
Community Shares $0.43m $0.59m 38%
Consumer Purchase Finance/BNPL $374.29m $351.36m -6%
Crowd-led Microfinance $43.49m $37.54m -14%
Mini Bonds $10.67m
Others $50.00m
As shown in Table 3.1, the growth of alternative finance varied across business models in the Asia-Pacific region. Debt-based models24,continued to lead the market with over 85% of total volumes in 2019 ($8.7 billion, 92%) and 2020 ($7.6 billion, 85%). However, the debt-based platforms reported a decline of 13% in volumes for 2020 when compared to 2019. This decline could be attributed to a decline in lending activities, especially during the first half of 2020, due to COVID-1925, and also as some key firms from leading lending markets declined to participate or provide volumes for 2020, and some due to low or no activities for the year. P2P/Marketplace Consumer Lending, P2P/Marketplace Business Lending, and Balance Sheet Business Lending continued to be the leading models across the region, contributing over 60% of total volumes.
P2P/Marketplace Consumer Lending was the most popular business model in Asia Pacific (and globally) and alone contributed over one third of regional volumes in 2019, amounting to $3.1 billion and a quarter of volumes in 2020 ($2.4 billion). This model was extremely volatile with especially
significant growth of 219% in 2019 and a decline of 25% in 2020. P2P/Marketplace Business Lending followed, and accounted for 17% ($1.6 billion) and 20% ($1.8 billion) of regional volumes in 2019 and 2020, respectively. Balance Sheet Business Lending amounted to $1.6 billion (16%) and $1.3 billion (14%) of total Asia-Pacific (excluding China) volumes in 2019 and 2020, respectively. Invoice Trading recorded the highest growth rate of 511% across all business models in 2019, and a decline of over 58% for 2020. Consumer Purchase Finance/BNPL was recorded for the first time in the study and accounted for over $350 million volumes in both years. Debt-based models experienced an overall decline of 13% in 2020, except for P2P/Marketplace Business Lending (12%) and Balance Sheet Consumer Lending (21%).
Equity-based26 and Non-investment27 models experienced significant growth (64%) during 2020, accounting for $737 million and $587 million in 2019 and 2020, respectively. Equity-driven business models, like Equity-based Crowdfunding (52%), Real Estate Crowdfunding (58%), Revenue/Profit Sharing (522%, the highest across the

Chapter 3: A Regional Discussion on Asia Pacific
101
models), and Community Shares (38%) all saw a rise in activity. Similarly, Non-investment-based models, such as Donation and Reward-based Crowdfunding increased by 49% and 87%, respectively, in 2020.
During the pandemic, in contrast to debt-based activities in the region, the digital capital raising market reported a considerable growth, mainly driven by an increase in new issuers.28
Table 3.2: Asia-Pacific Region (Excluding China) Volume by Sub-region
South & Central Asia
Change (%) Oceania Change (%) East Asia Change (%) South East
Asia Change (%)
2013 5.1 29.7 97.7 11.0
2014 12.1 137% 126.3 325% 136.2 39% 26.5 141%
2015 40.1 230% 665.4 427% 424.3 211% 46.6 76%
2016 124.5 211% 832.8 25% 830.9 96% 215.9 363%
2017 311.9 151% 1410.2 69% 1590.3 91% 324.8 50%
2018 647.2 108% 1406.4 0% 1929.5 21% 2190.0 574%
2019 3200.3 394% 1515.5 8% 2554.1 32% 2271.9 4%
2020 1915.6 -40% 1378.4 -9% 2911.2 14% 2705.9 19%
In order to assess growth and volume within the region more precisely, Asia Pacific (excluding China) was split into four sub-regions: East Asia29, Oceania30, South and Central Asia31, and South-East Asia.32
In 2019, the online alternative finance market in the Asia-Pacific region saw a rise in activity across all sub-regions, led by South and Central Asia, where the market grew strongly (394% against 2018), totalling $3.2 billion in volume of transactions. This was followed by East Asia (32%) with a market value of $2.6 billion, Oceania (8%) and South-East Asia (4%) with market volumes of $1.5 billion and $2.3 billion, respectively.
The overall market declined in 2020, mainly driven by lending drops in South and Central Asia, which noted a reduction of 40% in activities, amounting to $1.9 billion (volumes decreased by $1.3 billion). Similarly, Oceania saw a decline of 9% in volumes. However, both East Asia and South-East Asia recorded an increase in market activities and continued to grow despite the challenges of the COVID-19 pandemic. This can be attributed to the integration of alternative finance by retailers, telecom companies in their product offerings and increase in smartphone usage in the region. Consequently, East Asia ($2.9 billion) and South-East Asia ($2.7 billion) were the largest regional markets in the Asia-Pacific region (excluding China) for 2020.
South Korea (45%) and Japan (39%) dominated the East Asia market, representing 84% of volumes, while Australia (84%) and New Zealand (16%) accounted for almost all volumes in the Oceania region. Indonesia (54%) and Singapore (36%) dominated the South-East Asia market with 89% of volumes, and India alone contributed to 89% of South and Central Asia’s market. The young population embracing the FinTech sector drove the high level of adoption and popularity of FinTech platforms in these regions. For example, a recent study33 on FinTechs in South-East Asia found that Generation Y and Z were the catalyst for growth of Indonesian e-payments and peer-to-peer lending segments. Alternative lending start-ups in Indonesia attracted the most funding and secured the highest number of deals of any FinTech segments.
In countries like Malaysia, national lockdown due to Covid19 also acted as a catalyst for the FinTech adoption in the country. The Malaysian government’s Movement Control Order (MCO) during the height of the pandemic helped to add 3 million new mobile banking service subscribers in 2020 as well as pushed e-wallet usage and adoption to new highs. Merchants were quick to embrace the trend, with over 400,000 new businesses registering for QR code payment acceptance, a 164% jump from the previous year. Capital raised on Equity-based Crowdfunding platforms jumped more than 457% to RM 127.7 million ($30.4 million) while P2P/Marketplace Lending value rose over 20% to RM 503.3 million ($119.8 million).34
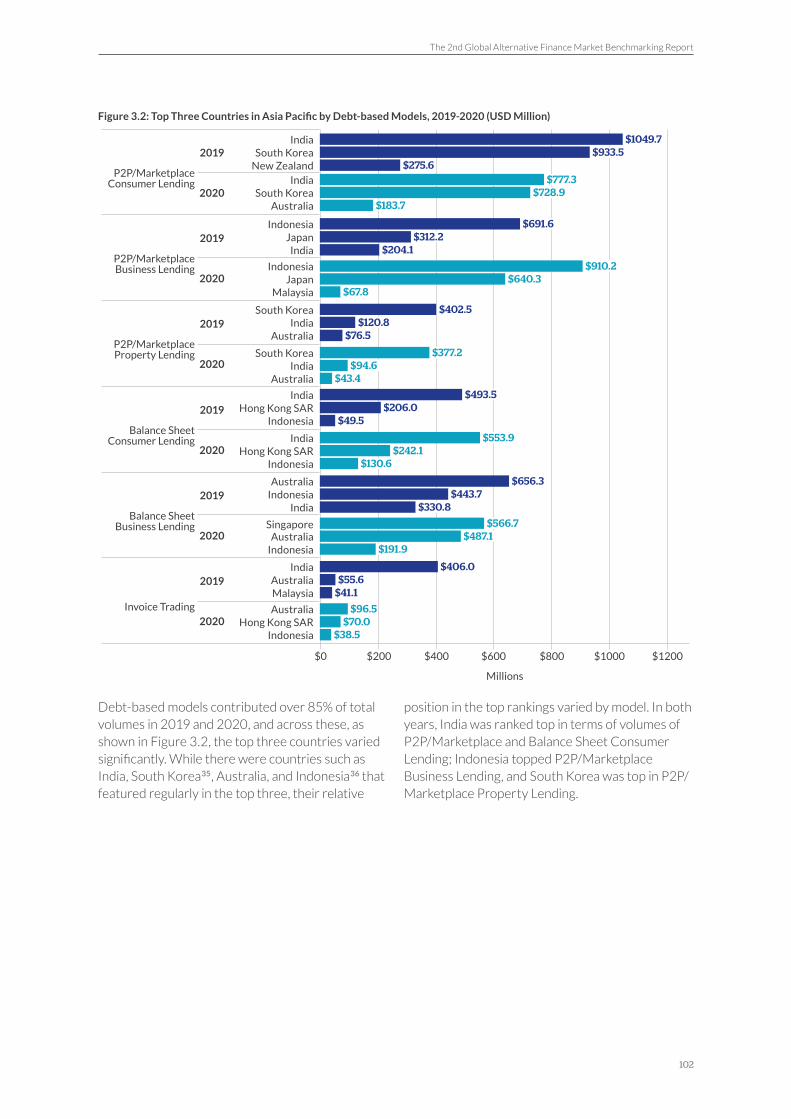
The 2nd Global Alternative Finance Market Benchmarking Report
102
Figure 3.2: Top Three Countries in Asia Pacific by Debt-based Models, 2019-2020 (USD Million)
Debt-based models contributed over 85% of total volumes in 2019 and 2020, and across these, as shown in Figure 3.2, the top three countries varied significantly. While there were countries such as India, South Korea35, Australia, and Indonesia36 that featured regularly in the top three, their relative
position in the top rankings varied by model. In both years, India was ranked top in terms of volumes of P2P/Marketplace and Balance Sheet Consumer Lending; Indonesia topped P2P/Marketplace Business Lending, and South Korea was top in P2P/Marketplace Property Lending.
$0 $400 $800 $1200$200 $1000$600
New Zealand
India
India
India
India
India
India
India
Malaysia
Malaysia
South Korea
South Korea
South Korea
South Korea
Japan
Japan
India
India
Indonesia
Indonesia
Indonesia
Indonesia
Indonesia
Indonesia
Singapore
Indonesia
Australia
Australia
Australia
Australia
Australia
Australia
Australia
Hong Kong SAR
Hong Kong SAR
Hong Kong SAR
$49.5
$275.6
$330.8
$204.1
$41.1
$76.5
$206.0
$933.5
$443.7
$312.2
$55.6
$120.8
$493.5
$1049.7
$656.3
$691.6
$406.0
$402.5
$553.9
$777.3
$566.7
$910.2
$96.5
$377.2
$242.1
$728.9
$487.1
$640.3
$70.0
$94.6
$130.6
$183.7
$191.9
$67.8
$38.5
$43.4
Balance Sheet Consumer Lending
P2P/Marketplace Consumer Lending
Balance Sheet Business Lending
P2P/Marketplace Business Lending
Invoice Trading
P2P/Marketplace Property Lending
2020
2020
2020
2020
2020
2020
2019
2019
2019
2019
2019
2019
Millions
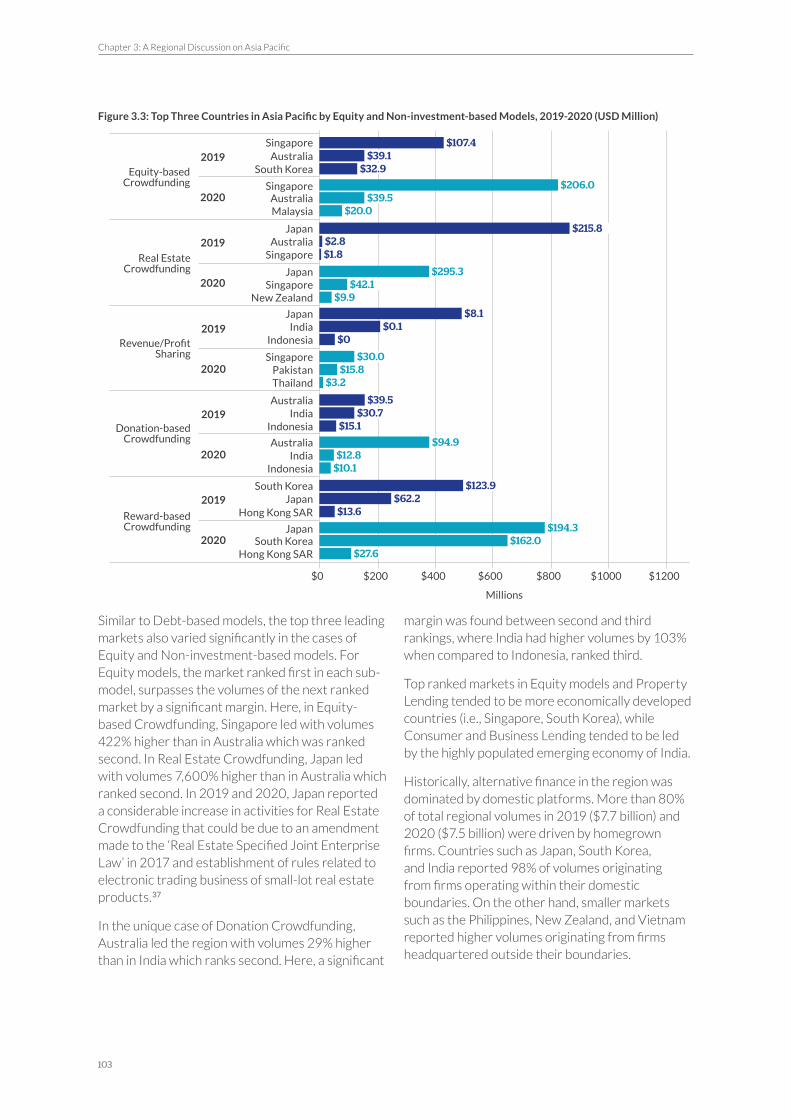
Chapter 3: A Regional Discussion on Asia Pacific
103
Figure 3.3: Top Three Countries in Asia Pacific by Equity and Non-investment-based Models, 2019-2020 (USD Million)
Similar to Debt-based models, the top three leading markets also varied significantly in the cases of Equity and Non-investment-based models. For Equity models, the market ranked first in each sub-model, surpasses the volumes of the next ranked market by a significant margin. Here, in Equity-based Crowdfunding, Singapore led with volumes 422% higher than in Australia which was ranked second. In Real Estate Crowdfunding, Japan led with volumes 7,600% higher than in Australia which ranked second. In 2019 and 2020, Japan reported a considerable increase in activities for Real Estate Crowdfunding that could be due to an amendment made to the ‘Real Estate Specified Joint Enterprise Law’ in 2017 and establishment of rules related to electronic trading business of small-lot real estate products.37
In the unique case of Donation Crowdfunding, Australia led the region with volumes 29% higher than in India which ranks second. Here, a significant
margin was found between second and third rankings, where India had higher volumes by 103% when compared to Indonesia, ranked third.
Top ranked markets in Equity models and Property Lending tended to be more economically developed countries (i.e., Singapore, South Korea), while Consumer and Business Lending tended to be led by the highly populated emerging economy of India.
Historically, alternative finance in the region was dominated by domestic platforms. More than 80% of total regional volumes in 2019 ($7.7 billion) and 2020 ($7.5 billion) were driven by homegrown firms. Countries such as Japan, South Korea, and India reported 98% of volumes originating from firms operating within their domestic boundaries. On the other hand, smaller markets such as the Philippines, New Zealand, and Vietnam reported higher volumes originating from firms headquartered outside their boundaries.
Donation-based Crowdfunding
Equity-based Crowdfunding
Reward-based Crowdfunding
Real Estate Crowdfunding
Revenue/Profit Sharing
$0 $400 $800 $1200$200 $1000$600
India
India
India
Malaysia
South Korea
South Korea
South Korea
Japan
Japan
Japan
Japan
Japan
Indonesia
Indonesia
Indonesia
Singapore
Singapore
Singapore
Singapore
SingaporePakistanThailand
New Zealand
Australia
Australia
Australia
Australia
Australia
Hong Kong SAR
Hong Kong SAR
$0
$15.1
$32.9
$13.6
$1.8
$0.1
$30.7
$39.1
$62.2
$2.8
$8.1
$39.5
$107.4
$123.9
$215.8
$30.0
$94.9
$206.0
$194.3
$295.3
$15.8
$12.8
$39.5
$162.0
$42.1
$3.2
$10.1
$20.0
$27.6
$9.9
2020
2020
2020
2020
2020
2019
2019
2019
2019
2019
Millions

The 2nd Global Alternative Finance Market Benchmarking Report
104
Market Concentration
Table 3.3 Market Concentration – Asia-Pacific (Excluding China) 2019-2020
Business ModelHHI
2019Market
Concentration 2019HHI
2020Market
Concentration 2020Summary (Direction of
Market Concentration Flow)
Full Panel 0.03 Unconcentrated 0.03 Unconcentrated 0.00
Balance Sheet Business Lending
0.17Moderately
Concentrated0.18
Moderately Concentrated
0.01
P2P/Marketplace Business Lending
0.08 Unconcentrated 0.20Moderately
Concentrated 0.12
Balance Sheet Consumer Lending
0.26 Highly Concentrated 0.34 Highly Concentrated 0.07
P2P/Marketplace Consumer Lending
0.15Moderately
Concentrated0.13 Unconcentrated -0.02
P2P/Marketplace Property Lending
0.24 Highly Concentrated 0.29 Highly Concentrated 0.05
Real Estate Crowdfunding
0.66 Highly Concentrated 0.71 Highly Concentrated 0.06
Equity-based Crowdfunding
0.28 Highly Concentrated 0.43 Highly Concentrated 0.15
Donation-based Crowdfunding
0.18Moderately
Concentrated0.18
Moderately Concentrated
No Change
Reward-based Crowdfunding
0.42 Highly Concentrated 0.39 Highly Concentrated -0.03
Based on the responses, when looking at the market concentration by key business models in the Asia-Pacific (excluding China) region, most (six out of nine) of the studied models experienced an increase in the level of market concentration from 2019 to 2020. Such change was a joint outcome of the impact of COVID-19, which has led to both platform churns worldwide (i.e., a decrease in respondents) and sector competition. Market concentration levels have increased mainly for P2P/Marketplace Business Lending, where the concentration level moved from “unconcentrated” in 2019 to “moderately concentrated” in 2020, especially in the top-ranking countries for the model, like Indonesia and Japan. More specifically, the total volume share of the top three platforms increased from 5% to 19%. Similarly, Equity-based Crowdfunding was regarded as a “highly concentrated” market in 2019 and 2020. Looking into the underlying data, the volume share of the largest platform in Asia Pacific (excluding China) has almost doubled from 24% in 2019 to 41% in 2020.
When reviewing market concentration by key countries, India’s Equity and Non-investment models were found to be “highly concentrated”, while the Debt-models were “moderately concentrated”. In Indonesia, Non-investment models were regarded as “highly concentrated”
for 2019 and 2020, whereas the Debt-based models moved from “unconcentrated” in 2019 to “moderately concentrated” in 2020. Similarly, the Debt-based models in Australia regarded it as “moderately concentrated” in both years, while in Singapore, the market concentration level for the same model moved from “moderately concentrated” in 2019 to “highly concentrated” in 2020.
While a general increase in concentration may suggest a certain level of threat to the competitive landscape and sustainability of a sector, the Asia Pacific should be less of a concern given the relatively small scale of increase and the exogenous shocks (e.g., COVID-19) that the sector has experienced in 2019 and 2020. Furthermore, the above findings should be viewed with certain reservation. First, few platforms operate in all Asia-Pacific markets, and the majority only operate in one or few markets, so regional concentration may reflect dominance in specific national markets rather than regional ones. Second, because of the emerging nature of the industry, concentration does not mean maturity, and often represents the existence of few platforms as innovation leaders. Such conditions present early-stage development, rather than concentration typical of mature markets.

Chapter 3: A Regional Discussion on Asia Pacific
105
The Dynamics of Alternative Finance Business Funding
Overall SME Finance Volume
Figure 3.4: Total Alternative Business Funding Volume in Asia-Pacific (Excluding China), 2013-2020 (USD)
In most markets, especially in the South-East Asian region, access to banking services is still a challenge for many SMEs who are in need of accessible and affordable credit. However, digital technologies and readily available data have given rise to new online alternative finance models that are serving SME merchants who are on the cusp of broader digitisation. The governments in the region are working closely with banks to offer SMEs a seamless and interoperable integration with banking systems. For example, in Malaysia, one bank has even put forward a set of API to assist in automating payments and reconciling accounts for SMEs, further extending the availability of digital payment support. A study of SMEs in Indonesia reported to have found 76% of them already accepting digital payments and the next three years.38 The government of Australia introduced Coronavirus Small and Medium Enterprises (SME) Guarantee scheme to enhance lenders’ willingness and ability to provide a credit line of up to 40-billion Australian dollars to SMEs in loans, which included FinTech lenders as well.39
Across the Asia-Pacific region, the online alternative business funding volumes reached an all-time high market value of $4.3 billion in 2019, representing 45% of total regional alternative finance volumes. The market grew 22% between 2018 and 2019. The number of individuals, businesses
and organisations successfully raised finance through online alternative finance platforms were 1,358,090 in 2019 and 1,092,511 in 2020. In 2020, total business volumes declined slightly (2%), despite contributing 2% more (47%) to the total yearly alternative finance volumes, compared to the previous year. This decline of approx. $100 million could be explained by non-repeat platforms in our survey40, and might camouflage and underestimate an actual modest growth between 2019 and 2020.
When assessing contribution to business volume by sub-region, South-East Asia contributed 41% ($1.8 billion) of business volumes in 2019 and 52% ($2.2 billion) in 2020. South and Central Asia, which accounted for 24% ($1.0 billion) of business volumes in 2019, contributed only 6% ($254 million) in 2020. In contrast, East Asia experienced nearly a 10% rise in business volumes during 2020.
Similar to previous years, funding for businesses overwhelmingly stemmed from Debt-based models, with $3,971 million and $3,605 million having been raised during 2019 and 2020, respectively. However, the total share of Debt-based models declined by 7% to 86% in 2020 (compared to 93% in 2019). Equity-based models contributed $386 million or 9% of business funding (compared to 5% in 2019) and Non-investment models $219 million or 5% of business funding in 2020 (compared to 2% in 2019).
$0
$2.0
$4.0
$1.0
$3.0
$0.5
$2.5
$4.5
$1.5
$3.5
2015
0.8
2017
2.2
2019
4.3
2016
1.5
2018
3.5
2020
4.2
2013
0.1
2014
0.2
Bill
ion
s
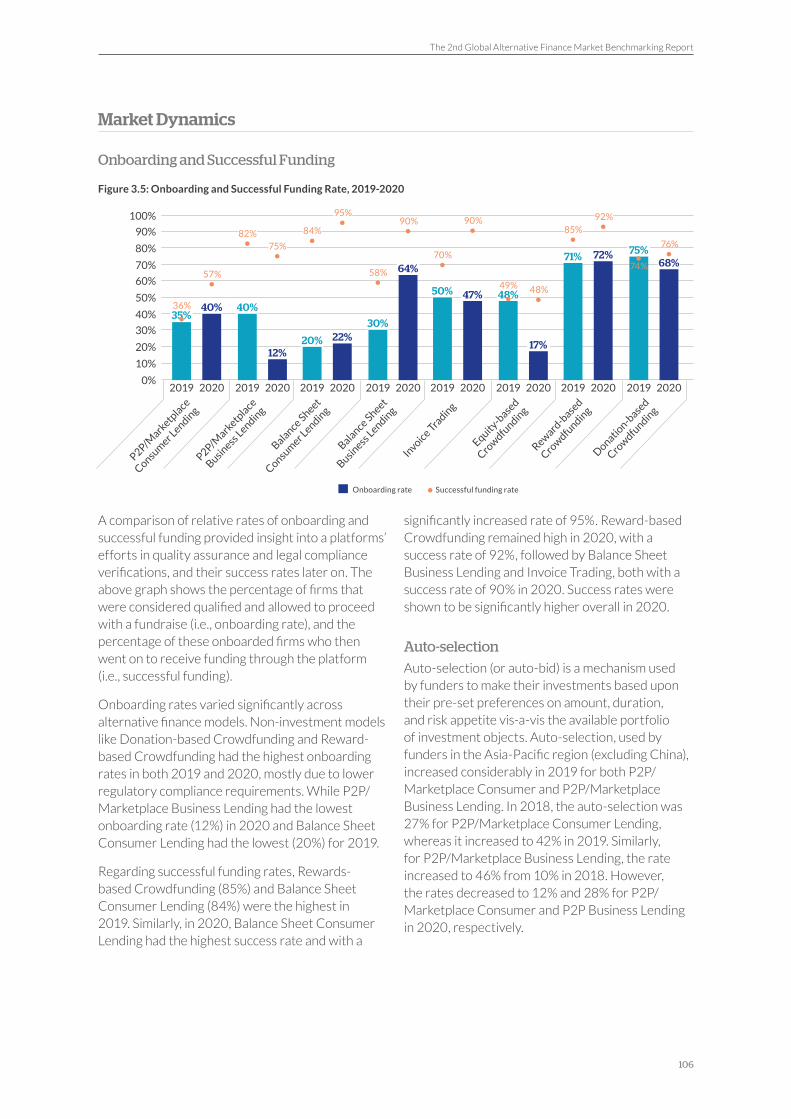
The 2nd Global Alternative Finance Market Benchmarking Report
106
Market Dynamics
Onboarding and Successful Funding Figure 3.5: Onboarding and Successful Funding Rate, 2019-2020
A comparison of relative rates of onboarding and successful funding provided insight into a platforms’ efforts in quality assurance and legal compliance verifications, and their success rates later on. The above graph shows the percentage of firms that were considered qualified and allowed to proceed with a fundraise (i.e., onboarding rate), and the percentage of these onboarded firms who then went on to receive funding through the platform (i.e., successful funding).
Onboarding rates varied significantly across alternative finance models. Non-investment models like Donation-based Crowdfunding and Reward-based Crowdfunding had the highest onboarding rates in both 2019 and 2020, mostly due to lower regulatory compliance requirements. While P2P/Marketplace Business Lending had the lowest onboarding rate (12%) in 2020 and Balance Sheet Consumer Lending had the lowest (20%) for 2019.
Regarding successful funding rates, Rewards-based Crowdfunding (85%) and Balance Sheet Consumer Lending (84%) were the highest in 2019. Similarly, in 2020, Balance Sheet Consumer Lending had the highest success rate and with a
significantly increased rate of 95%. Reward-based Crowdfunding remained high in 2020, with a success rate of 92%, followed by Balance Sheet Business Lending and Invoice Trading, both with a success rate of 90% in 2020. Success rates were shown to be significantly higher overall in 2020.
Auto-selection
Auto-selection (or auto-bid) is a mechanism used by funders to make their investments based upon their pre-set preferences on amount, duration, and risk appetite vis-a-vis the available portfolio of investment objects. Auto-selection, used by funders in the Asia-Pacific region (excluding China), increased considerably in 2019 for both P2P/Marketplace Consumer and P2P/Marketplace Business Lending. In 2018, the auto-selection was 27% for P2P/Marketplace Consumer Lending, whereas it increased to 42% in 2019. Similarly, for P2P/Marketplace Business Lending, the rate increased to 46% from 10% in 2018. However, the rates decreased to 12% and 28% for P2P/Marketplace Consumer and P2P Business Lending in 2020, respectively.
70%
100%
50%
80%
60%
90%
40%
30%
20%
10%
0%
35%
50%
20%
71%
40%48%
30%
75%
40%47%
22%
72%
12%17%
64% 68%
36%
49%
74%70%
84% 85%82%75%
58%57%
90%95% 92%
48%
90%
76%
Onboarding rate Successful funding rate
P2P/Mark
etplace
Consumer L
ending
Invoice Tra
ding
Balance Sheet
Consumer L
ending
Reward
-based
Crow
dfundin
g
P2P/Mark
etplace
Business Lendin
g
Equity-b
ased
Crow
dfundin
g
Balance Sheet
Business Lendin
g
Donation-b
ased
Crow
dfundin
g
2019 20192019 20192019 20192019 20192020 20202020 20202020 20202020 2020

Chapter 3: A Regional Discussion on Asia Pacific
107
Repeat Funder and Fundraiser Activity
Figure 3.6: Repeat Fundraiser Rate by Model, 2019-2020
Figure 3.7: Repeat Funder Rate by Model, 2019-2020
In both years, we observed relatively higher levels of repeat fundraisers and funders across models as compared to 2018. However, there was a decline in repeat fundraisers for most of the models in 2020, while the repeat funders rate increased. Invoice Trading had the highest level of repeat fundraisers (83%) and funders (89%) in 2019. However, the fundraiser rate went down (65%) in 2020, despite an increase in funders (94%). In contrast, Balance
Sheet Business Lending and Donation-based Crowdfunding experienced an increase in repeat fundraisers for 2020, along with rise in repeat funder rate. Reward-based Crowdfunding had the lowest repeat funder rate (34%) in 2020, while Equity-based Crowdfunding had the lowest repeat fundraiser rate at 40%. Both of which representing less frequent fundraising objectives than cashflow management through credit.
0% 20% 30% 50% 70% 90%10% 60%40% 80%
2019 2020
56%
68%Reward-based Crowdfunding
65%
83%Invoice Trading
45%
35%Donation-based Crowdfunding
63%
47%Balance Sheet Business Lending
49%
56%P2P/Marketplace Consumer Lending
40%
55%Equity-based Crowdfunding
41%
57%P2P/Marketplace Business Lending
0% 20% 30% 50% 70% 90% 100%10% 60%40% 80%
2019 2020
34%
24%Reward-based Crowdfunding
94%
89%Invoice Trading
47%
26%Donation-based Crowdfunding
100%
83%Balance Sheet Business Lending
77%
31%P2P/Marketplace Consumer Lending
36%
25%Equity-based Crowdfunding
72%
65%P2P/Marketplace Business Lending

The 2nd Global Alternative Finance Market Benchmarking Report
108
InstitutionalisationInstitutionalisation has been highlighted as one of the most significant trends in the alternative finance sector since 2015, signalling the sector’s evolution from “alternative” to “mainstream”. The involvement of institutional investors strengthens the impact and secures the sustainability of the sector, yet may
also pose a threat to dilute the industry’s nature as a more democratic and diverse channel of financing. We collected responses from 55% and 59% of the surveyed platforms in the Asia-Pacific region (excluding China) in 2019 and 2020, respectively.
Figure 3.8: Institutionalisation by Model, 2019-2020
In the Asia-Pacific region as a whole, most investor activities were driven by individual investors rather than institutional investors. When compared to 2018, the Asia-Pacific region saw an increasing level of institutionalisation in most alternative finance models in 2019 and 2020. However, it did vary significantly between models as presented in Figure 3.8. Most evidently, while institutional investors contributed 84% of the total volume in the Balance Sheet Business Lending model in 2018, this share declined to 72% in 2019, and further declined to 27% in 2020. Balance Sheet Consumer Lending surpassed Balance Sheet Business Lending and became the model with the
highest level of institutionalisation in both 2019 and 2020, at 87% and 91% of volumes in each year respectively. Notably, P2P/Marketplace Consumer Lending reported over half of their volumes from institutional investors in both years.
When we look at the institutionalisation by value, nearly $912 million was contributed by institutional investors through P2P/Marketplace Consumer Lending and $842 million through Balance Sheet Consumer Lending in 2020. While Balance Sheet Consumer Lending also had the highest volumes through institutional investors in 2019, which amounted to $670 million, followed by Balance Sheet Business Lending at $641 million.
50% 50%
0% 10% 20% 30% 40% 50% 60% 70% 80% 90% 100%
69% 31%2019
58% 42%2020
30% 70%2019
51% 49%2020
87% 13%2019
91% 9%2020
72% 28%2019
27% 73%2020
52% 48%2019
69% 31%2020
42% 58%2019
2020
Invoice Trading
Balance Sheet Business Lending
Balance Sheet Consumer Lending
P2P/Marketplace Consumer Lending
Equity-based Crowdfunding
P2P/Marketplace Business Lending
Institutionalisation Non-institutionalisation
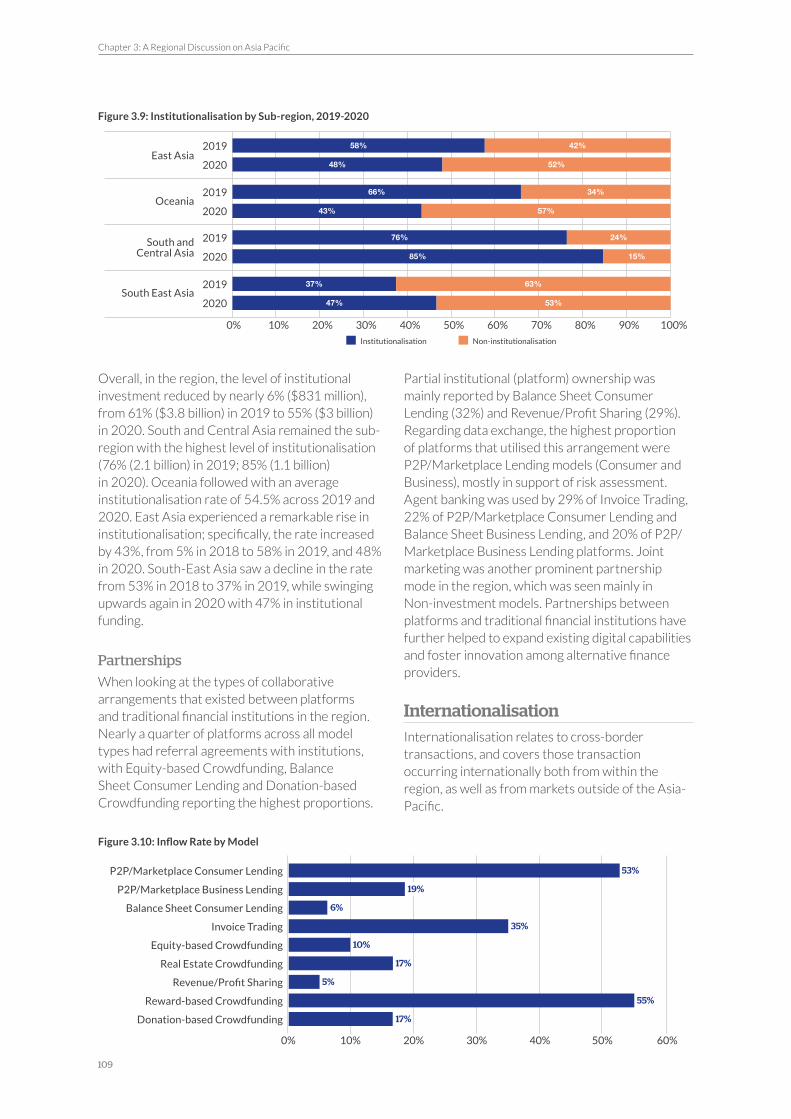
Chapter 3: A Regional Discussion on Asia Pacific
109
Figure 3.9: Institutionalisation by Sub-region, 2019-2020
Overall, in the region, the level of institutional investment reduced by nearly 6% ($831 million), from 61% ($3.8 billion) in 2019 to 55% ($3 billion) in 2020. South and Central Asia remained the sub-region with the highest level of institutionalisation (76% (2.1 billion) in 2019; 85% (1.1 billion) in 2020). Oceania followed with an average institutionalisation rate of 54.5% across 2019 and 2020. East Asia experienced a remarkable rise in institutionalisation; specifically, the rate increased by 43%, from 5% in 2018 to 58% in 2019, and 48% in 2020. South-East Asia saw a decline in the rate from 53% in 2018 to 37% in 2019, while swinging upwards again in 2020 with 47% in institutional funding.
Partnerships
When looking at the types of collaborative arrangements that existed between platforms and traditional financial institutions in the region. Nearly a quarter of platforms across all model types had referral agreements with institutions, with Equity-based Crowdfunding, Balance Sheet Consumer Lending and Donation-based Crowdfunding reporting the highest proportions.
Partial institutional (platform) ownership was mainly reported by Balance Sheet Consumer Lending (32%) and Revenue/Profit Sharing (29%). Regarding data exchange, the highest proportion of platforms that utilised this arrangement were P2P/Marketplace Lending models (Consumer and Business), mostly in support of risk assessment. Agent banking was used by 29% of Invoice Trading, 22% of P2P/Marketplace Consumer Lending and Balance Sheet Business Lending, and 20% of P2P/Marketplace Business Lending platforms. Joint marketing was another prominent partnership mode in the region, which was seen mainly in Non-investment models. Partnerships between platforms and traditional financial institutions have further helped to expand existing digital capabilities and foster innovation among alternative finance providers.
InternationalisationInternationalisation relates to cross-border transactions, and covers those transaction occurring internationally both from within the region, as well as from markets outside of the Asia-Pacific.
Figure 3.10: Inflow Rate by Model
East Asia
Oceania
South and Central Asia
South East Asia
Institutionalisation Non-institutionalisation
0% 10% 20% 30% 40% 50% 60% 70% 80% 90% 100%
58% 42%2019
48% 52%2020
66% 34%2019
43% 57%2020
76% 24%2019
85% 15%2020
37% 63%2019
47% 53%2020
0% 20% 30% 50%10% 60%40%
53%
6%
10%
5%
19%
35%
17%
55%
17%
P2P/Marketplace Business Lending
Invoice Trading
Real Estate Crowdfunding
Reward-based Crowdfunding
Donation-based Crowdfunding
P2P/Marketplace Consumer Lending
Balance Sheet Consumer Lending
Equity-based Crowdfunding
Revenue/Profit Sharing

The 2nd Global Alternative Finance Market Benchmarking Report
110
In 2019 and 2020, most platforms reported relatively low levels of cross-border inflows (i.e., funds from overseas backers and investors), indicating that most of the volumes were still provided by domestic investors. However, there were significant variations between different models. Specifically, cross-border inflows presented a more substantial share of volumes in P2P/Marketplace Consumer Lending and Reward-based Crowdfunding (53% and 55%, respectively). Also, P2P/Marketplace Consumer Lending platforms reported the highest volumes of $523 million in inflows, followed by P2P/Marketplace Business
Lending with $142 million, despite an inflow rate of just 19%.
International inflows in P2P/Marketplace Consumer Lending, compared with a 32% share in 2018, had significantly increased in later years. In contrast, other models showed very low and similar levels of cross-border capital flows, with an average of 15% across P2P/Marketplace Business Lending, Balance Sheet Consumer Lending, Invoice Trading, Equity-based Crowdfunding, Real Estate Crowdfunding, Revenue/Profit Sharing, and Donation-based Crowdfunding.
Figure 3.11: Inflow Rate by Sub-region
Variation was evident with respect to cross-border inflows among the sub-regions of Asia Pacific (excluding China). Markets in South-East and South and Central Asia continued to dominate, with a larger share of inflows from abroad. South-East Asia reported the highest share with 54%, South
and Central Asia followed with 35% (reduced from 53% in 2018). Oceania reported a decline of international inflows from 22% in 2018 to 9%. And, similarly to its position in 2018, East Asia again reported the lowest inflow rate of 5%.
Financial Inclusion
The Banked Status of Borrowers
Figure 3.12: Banking Status by Sub-region
Alternative finance models have been developed to increase financial inclusion, especially the Debt-based models, and are seen as a viable alternative route for individuals’ and businesses’ access to credit. The banking status of fundraisers varied among the sub-regions in the Asia-Pacific region (excluding China). When compared to 2018, the unbanked rate decreased across the sub-regions, particularly in South-East Asia where the rate declined from 26% to 9%. In contrast, the alternative finance platforms serving underbanked
borrowers increased across the region41. Notably, South-East Asia reported to have more than 70% of their consumers as unbanked or underbanked.
Firms in South-East Asia reported more borrowers (59%) under the category of unbanked or underbanked, compared to 20% in 2018.
Overall, around $4.9 billion was raised by borrowers who were underbanked, $382 million by unbanked, and $4.3 billion by banked borrowers through alternative finance platforms (Debt-based models) in the region.
0% 20% 30% 50%10% 60%40%
East Asia 5%Oceania 9%
South and Central Asia 35%South East Asia 54%
9% 50% 41%
0% 10% 20% 30% 40% 50% 60% 70% 80% 90% 100%
3% 59% 38%East Asia
2% 45% 53%South and Central Asia
South East Asia
Unbanked Underbanked Banked
9% 29%Oceania %62

Chapter 3: A Regional Discussion on Asia Pacific
111
Gender-based Funding
Female Funder and Fundraiser
Figure 3.13: Female Fundraisers and Funders Rate by Sub-region, 2019-2020
It has been suggested that alternative finance is playing a role in bridging the investor and fundraiser gender gap. In Asia Pacific, 30% and 39% of the surveyed platforms provided information regarding the proportion of female funders in 2019 and 2020, respectively. In addition, 37% and 45% of the surveyed platforms provided female fundraiser statistics in 2019 and 2020, respectively. Across all sub-regions in Asia Pacific (excluding China), female participation in either category was less than 50% in both 2019 and 2020.
In 2020, East Asia displayed the highest percentage of female funders (46%). Oceania reported a relatively high share of female funders at 34%, as well as the highest percentage of female fundraisers
(33%). In 2019, East Asia also displayed the highest percentage of female funders (38%), while South-East Asia reported the highest percentage of female fundraisers (38%). Overall, female inclusion increased from 2019 to 2020 in most contexts, with the exception of female fundraisers in East Asia and South-East Asia.
Overall, the average female funder rate increased from 26% in 2019 with a value of $2.5 billion, to 35% in 2020, amounting to $3 billion in total volumes. Similarly, the average fundraiser rate for women in the region went up slightly by just under one percent from 23.2% to 24.1%, with drop in volumes from $2.2 billion to $2.1 billion in 2019 and 2020, respectively.
0% 5% 10% 15% 20% 25% 30% 35% 40% 45% 50%
2019 14%23%
202018%
27%
201938%
26%
202027%
34%
202033%
34%
201926%
27%
202031%
46%
201933%
38%East Asia
Oceania
South and Central Asia
South East Asia
Female fundraisers rate Female funders rate
Indian FinTechs enhance efficiencies in MSME credit for benefit of all stakeholders Fin-Tech Association for Consumer Empowerment (FACE), India
FACE members use digital lending models delivering between 30%-40% percent cost advantage over traditional models to MSMEs in India. As a result, it is estimated that 29% of loans for MSMEs are taken through fintechs, eventually giving the MSME market a necessary boost.
The change observed in this business model not only creates business opportunities but also elevates and profits both the Fintechs and the MSMEs, while positively impacting the economy at large. Moreover, it also gives small businesses and venture capitalists feasibility to plug in additional resources.
For minimising risks for stakeholders, FACE members use JAM (Jan Dhan-Aadhaar-Mobile) trinity for credit underwriting since the framework details out and validates customers credentials and their history. JAM is a govt initiative to link Jan Dhan accounts (financial inclusion program), mobile numbers and Aadhaar cards (unique identification card) of Indians to plug the leakages of government subsidies.
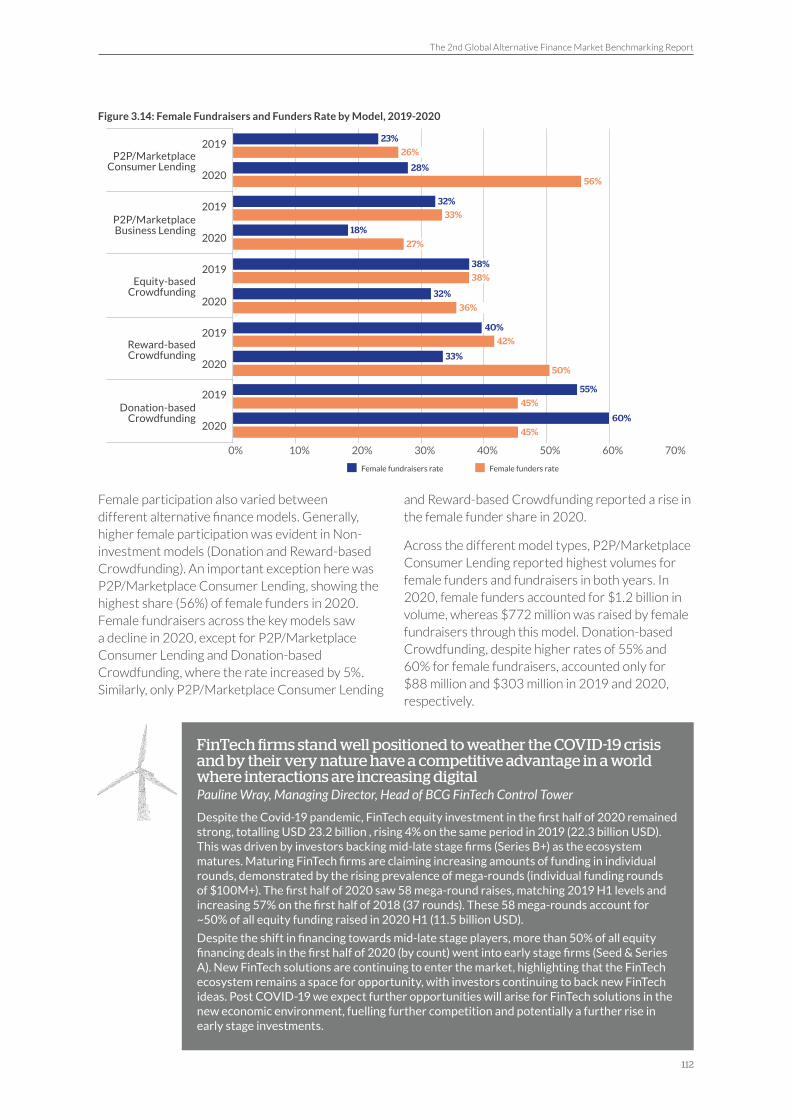
The 2nd Global Alternative Finance Market Benchmarking Report
112
Figure 3.14: Female Fundraisers and Funders Rate by Model, 2019-2020
Female participation also varied between different alternative finance models. Generally, higher female participation was evident in Non-investment models (Donation and Reward-based Crowdfunding). An important exception here was P2P/Marketplace Consumer Lending, showing the highest share (56%) of female funders in 2020. Female fundraisers across the key models saw a decline in 2020, except for P2P/Marketplace Consumer Lending and Donation-based Crowdfunding, where the rate increased by 5%. Similarly, only P2P/Marketplace Consumer Lending
and Reward-based Crowdfunding reported a rise in the female funder share in 2020.
Across the different model types, P2P/Marketplace Consumer Lending reported highest volumes for female funders and fundraisers in both years. In 2020, female funders accounted for $1.2 billion in volume, whereas $772 million was raised by female fundraisers through this model. Donation-based Crowdfunding, despite higher rates of 55% and 60% for female fundraisers, accounted only for $88 million and $303 million in 2019 and 2020, respectively.
0% 10% 20% 30% 40% 50% 60% 70%
Female fundraisers rate Female funders rate
23%
26%2019
32%33%
2019
18%
27%2020
38%
38%2019
32%
36%2020
40%
42%2019
33%
50%2020
55%
45%2019
60%
45%2020
P2P/Marketplace Consumer Lending
Equity-based Crowdfunding
Reward-based Crowdfunding
Donation-based Crowdfunding
P2P/Marketplace Business Lending
56%2020
28%
FinTech firms stand well positioned to weather the COVID-19 crisis and by their very nature have a competitive advantage in a world where interactions are increasing digital Pauline Wray, Managing Director, Head of BCG FinTech Control Tower
Despite the Covid-19 pandemic, FinTech equity investment in the first half of 2020 remained strong, totalling USD 23.2 billion , rising 4% on the same period in 2019 (22.3 billion USD). This was driven by investors backing mid-late stage firms (Series B+) as the ecosystem matures. Maturing FinTech firms are claiming increasing amounts of funding in individual rounds, demonstrated by the rising prevalence of mega-rounds (individual funding rounds of $100M+). The first half of 2020 saw 58 mega-round raises, matching 2019 H1 levels and increasing 57% on the first half of 2018 (37 rounds). These 58 mega-rounds account for ~50% of all equity funding raised in 2020 H1 (11.5 billion USD).
Despite the shift in financing towards mid-late stage players, more than 50% of all equity financing deals in the first half of 2020 (by count) went into early stage firms (Seed & Series A). New FinTech solutions are continuing to enter the market, highlighting that the FinTech ecosystem remains a space for opportunity, with investors continuing to back new FinTech ideas. Post COVID-19 we expect further opportunities will arise for FinTech solutions in the new economic environment, fuelling further competition and potentially a further rise in early stage investments.

Chapter 3: A Regional Discussion on Asia Pacific
113
Risk and Regulations
Perception of Key Risk Factors
Platforms were asked to rate various factors according to the level of risk they represented to their organisation. These factors included customer fraud, a notable increase in defaults, cyber-security breach, change in regulation, and the emergence of BigTech firms.
Analysis by Business Model
Figure 3.15: Perceived Risks of Platforms by Debt Models
Among 61% of the surveyed Asia-Pacific platforms who provided insights into this question, Debt-based models reported several risk factors as being of great concern. Among them, customer fraud was reported as a high concern across the platforms offering marketplace or P2P/Marketplace lending services, i.e., P2P/Marketplace Consumer Lending
(58%); P2P/Marketplace Property Lending (58%); P2P/Marketplace Business Lending (40%); and also Balance Sheet Consumer Lending (50%).
Further, risk related to notable increases in defaults was reported as a medium risk by Balance Sheet Consumer Lending (69%); P2P/Marketplace Consumer Lending (52%); P2P/Marketplace
Low Medium High
83% 17%
17% 83%
19% 22% 58%
23% 52% 25%
51% 25% 25%
11% 34% 55%
10% 61% 29%
25% 35% 40%
38% 22% 41%
46% 21% 33%
60% 20% 20%
32% 32% 35%
19% 22% 58%
23% 52% 25%
23% 25% 52%
51 25%
15% 60% 25%
17% 33% 50%
8% 69% 23%
21% 21% 57%
57% 21% 21%
55% 27% 18%
33% 42% 25%
44% 44% 11%
40% 10% 50%
60% 10% 30%
73% 20% 7%
57% 7% 36%
71% 29%
79% 14% 7%
P2
P/M
arke
tpla
ce
Co
nsu
mer
Len
din
gP
2P
/Mar
ketp
lace
B
usi
nes
s Le
nd
ing
P2
P/M
arke
tpla
ce
Pro
per
ty L
end
ing
Customer Fraud
Customer Fraud
Customer Fraud
Customer Fraud
Customer Fraud
Customer Fraud
Emergence of BigTech firms
Emergence of BigTech firms
Emergence of BigTech firms
Emergence of BigTech firms
Emergence of BigTech firms
Emergence of BigTech firms
Notable increase in defaults
Notable increase in defaults
Notable increase in defaults
Notable increase in defaults
Notable increase in defaults
Notable increase in defaults
Cyber-security Breach
Cyber-security Breach
Cyber-security Breach
Cyber-security Breach
Cyber-security Breach
Cyber-security Breach
Change in Regulation
Change in Regulation
Change in Regulation
Change in Regulation
Change in Regulation
Change in Regulation
Bal
ance
Sh
eet
B
usi
nes
s Le
nd
ing
Bal
ance
Sh
eet
C
on
sum
er L
end
ing
Invo
ice
Trad
ing
% 25%

The 2nd Global Alternative Finance Market Benchmarking Report
114
Property Lending (52%); and Balance Sheet Business Lending (44%). Similarly, Invoice Trading (83%), P2P/Marketplace Consumer Lending (61%) and P2P/Marketplace Property Lending (60%) platforms identified the risk of increasing competition from the entry of BigTech firms as a medium-level risk factor.
Over 89% of the responding P2P/Marketplace Consumer Lending platforms ranked the risks associated with changes in regulation as a medium to high-level risk. A lack of clear P2P regulations has allowed many shady or irresponsible companies to operate for years in the region and recently regulators are taking actions to rectify it. This could be confirmed by the recent action taken by the Indonesian regulatory 42, 43, 44. In Malaysia for the Equity Crowdfunding (ECF) and P2P financing, The Security Commission (SC) has imposed additional requirements on platform operators like the operation of a trust account, obligations and managing conflict of interest and for the issuer to limit the funds raised on the platform and disclosure requirement. Another South Asian economy, India,
has undertaken similar 45 to tighten the regulations on digital lending businesses based on similar 46. It is worth noting that such stricter regulatory measures are the outcome of the increased consumer lending and, subsequently, multiple consumer harassment complaints observed through the digital lending apps in the wake of the pandemic in this region. The outlook of the regional market is optimistic since, according to a recent study, supportive regulation will boost digital lending revenues in the region to $18 billion by 47. For example, in Malaysia, easing of the regulation has helped Equity Crowdfunding and P2P Lending platform to make inroads. Among the steps the Security Commission (SC) took was increasing the upper limit for ECF fundraising to RM10 million ($2.4 million) from RM5 million ($1.2 million) per issuer, and widening the scope of eligible ECF issuers to companies with up to 10 million paid-up capital from the initial RM5 million. In addition, a secondary trading framework for ECF and P2P was launched to provide investors with an exit mechanism.48
Figure 3.16: Perceived Risks of Platforms by Equity and Non-investment Models
When considering risks by Equity and Non-investment models, Equity-based Crowdfunding platforms were mostly concerned with the entry of BigTech firms (72%) and changes to regulation (48%). Similarly, platforms offering Reward-based Crowdfunding indicated the entry of BigTech firms (86%) as a priority risk, along with changes to
regulation as a medium risk (83%). Customer fraud (60%) and change in regulation (48%) were ranked as a major concern for platforms offering services related to Donation Crowdfunding. Further, over half of the responding Non-investment platforms (Reward and Donation) indicated risks relating to cyber-security breaches as a medium risk factor.
21% 50% 29%
Low Medium High
Customer Fraud
Customer Fraud
Customer Fraud
Emergence of BigTech firms
Emergence of BigTech firms
Emergence of BigTech firms
Cyber-security Breach
Cyber-security Breach
Cyber-security Breach
Change in Regulation
Change in Regulation
Change in Regulation
Do
nat
ion
-bas
ed
Cro
wd
fun
din
gR
ewar
d-b
ased
C
row
dfu
nd
ing
Eq
uit
y-b
ased
C
row
dfu
nd
ing 37% 21% 42%
11% 54% 36%
38% 14% 48%
11% 17% 72%
89% 11%
14% 72% 14%
83% 17%
7% 7% 86%
24% 16% 60%
11% 54% 36%
19% 33% 48%
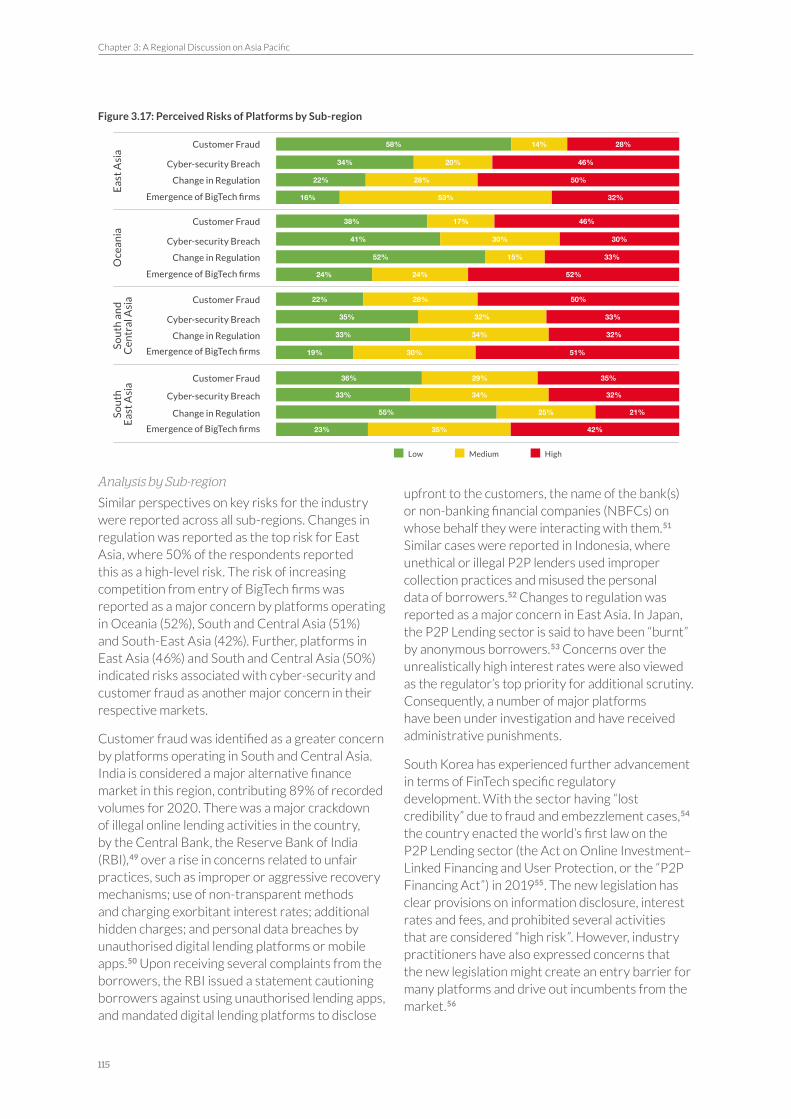
Chapter 3: A Regional Discussion on Asia Pacific
115
Figure 3.17: Perceived Risks of Platforms by Sub-region
Analysis by Sub-region
Similar perspectives on key risks for the industry were reported across all sub-regions. Changes in regulation was reported as the top risk for East Asia, where 50% of the respondents reported this as a high-level risk. The risk of increasing competition from entry of BigTech firms was reported as a major concern by platforms operating in Oceania (52%), South and Central Asia (51%) and South-East Asia (42%). Further, platforms in East Asia (46%) and South and Central Asia (50%) indicated risks associated with cyber-security and customer fraud as another major concern in their respective markets.
Customer fraud was identified as a greater concern by platforms operating in South and Central Asia. India is considered a major alternative finance market in this region, contributing 89% of recorded volumes for 2020. There was a major crackdown of illegal online lending activities in the country, by the Central Bank, the Reserve Bank of India (RBI),49 over a rise in concerns related to unfair practices, such as improper or aggressive recovery mechanisms; use of non-transparent methods and charging exorbitant interest rates; additional hidden charges; and personal data breaches by unauthorised digital lending platforms or mobile apps.50 Upon receiving several complaints from the borrowers, the RBI issued a statement cautioning borrowers against using unauthorised lending apps, and mandated digital lending platforms to disclose
upfront to the customers, the name of the bank(s) or non-banking financial companies (NBFCs) on whose behalf they were interacting with them.51 Similar cases were reported in Indonesia, where unethical or illegal P2P lenders used improper collection practices and misused the personal data of borrowers.52 Changes to regulation was reported as a major concern in East Asia. In Japan, the P2P Lending sector is said to have been “burnt” by anonymous borrowers.53 Concerns over the unrealistically high interest rates were also viewed as the regulator’s top priority for additional scrutiny. Consequently, a number of major platforms have been under investigation and have received administrative punishments.
South Korea has experienced further advancement in terms of FinTech specific regulatory development. With the sector having “lost credibility” due to fraud and embezzlement cases,54 the country enacted the world’s first law on the P2P Lending sector (the Act on Online Investment–Linked Financing and User Protection, or the “P2P Financing Act”) in 201955. The new legislation has clear provisions on information disclosure, interest rates and fees, and prohibited several activities that are considered “high risk”. However, industry practitioners have also expressed concerns that the new legislation might create an entry barrier for many platforms and drive out incumbents from the market.56
Low Medium High
Customer Fraud
Customer Fraud
Customer Fraud
Customer Fraud
Emergence of BigTech firms
Emergence of BigTech firms
Emergence of BigTech firms
Emergence of BigTech firms
Cyber-security Breach
Cyber-security Breach
Cyber-security Breach
Cyber-security Breach
Change in Regulation
Change in Regulation
Change in Regulation
Change in Regulation
So
uth
E
ast
Asi
aS
ou
th a
nd
C
entr
al A
sia
Oce
ania
Eas
t A
sia
58% 14% 28%
34% 20% 46%
22% 28% 50%
16% 53% 32%
38% 17% 46%
41% 30% 30%
52% 15% 33%
24% 24% 52%
22% 28% 50%
35% 32% 33%
33% 34% 32%
19% 30% 51%
36% 29% 35%
33% 34% 32%
55% 25% 21%
23% 35% 42%

The 2nd Global Alternative Finance Market Benchmarking Report
116
Perception of Existing Regulation
Figure 3.18: Perception of FinTech Regulation-Debt Models 2019-2020
Figure 3.19: Perception of FinTech Regulation- Equity Models 2019-2020
Platforms were also asked to comment on the extent to which they view existing regulation in their respective jurisdictions as adequate. Of the surveyed Asia-Pacific platforms, 70% and 67% provided answers to this question for their operations in 2019 and 2020. Most platforms in all sub-regions in both 2019 and 2020 stated that the current regulation was adequate and appropriate for their platform activities.
In the case of Debt-based models, most platforms from Oceania reported regulation to be adequate and appropriate for platform activities. For South and Central Asia, 29% of respondents stated that existing regulation was inadequate and too relaxed for (their) platform activities in 2019, which dropped to 11% in 2020. And the platforms seeking specific regulation, who claimed no specific regulation and regulation needed, doubled from
7% in 2019 to 15% in 2020. A notable share of platforms in East Asia (23% in 2019; 22% in 2020) and South-East Asia (17% in 2019; 15% in 2020) indicated regulation was too strict or non-existent. Overall, the perception of regulation adequacy seemed to be increasing slightly in East Asia and South and Central Asia, but still more than half of the responding platforms indicated a stable dissatisfaction with relevant regulation.
In South and Central Asia, 20% in 2019 and 38% in 2020, and in East Asia 25% in 2019 and 22% in 2020 of platforms using Equity-based models indicated that there was currently no specific regulation, despite being required. And nearly a quarter of firms in East Asia reported regulation to be excessive and too strict for their activities.
Adequate and appropriate for my platform activities Inadequate and too relaxed for my platform activities
Excessive and too strict for my platform activities No Specific Regulation and not needed
No Specific Regulation and needed Alternative finance (including crowdfunding & P2P lending) is not currently legalized in my country
East Asia
Oceania
South and Central Asia
South East Asia
2019
2019
2019
2019
2020
2020
2020
2020
35% 8% 23% 8% 27%
37% 4% 22% 4% 7% 26%
77% 9% 5% 9%
84% 5% 11%
46% 6% 29% 4% 7% 9%
49% 6% 11% 2% 15% 17%
61% 3% 17% 3% 2% 13%
60% 15% 4% 8% 12%1%
Adequate and appropriate for my platform activities Inadequate and too relaxed for my platform activities
Excessive and too strict for my platform activities No Specific Regulation and not needed
No Specific Regulation and needed Alternative finance (including crowdfunding & P2P lending) is not currently legalized in my country
East Asia
Oceania
South and Central Asia
South East Asia
2019
2019
2019
2019
2020
2020
2020
2020
50% 25% 25%
56% 22% 22%
100%
78% 11% 11%
50% 10% 20% 20%
25% 13% 13% 38% 13%
82% 12% 6%
85% 15%
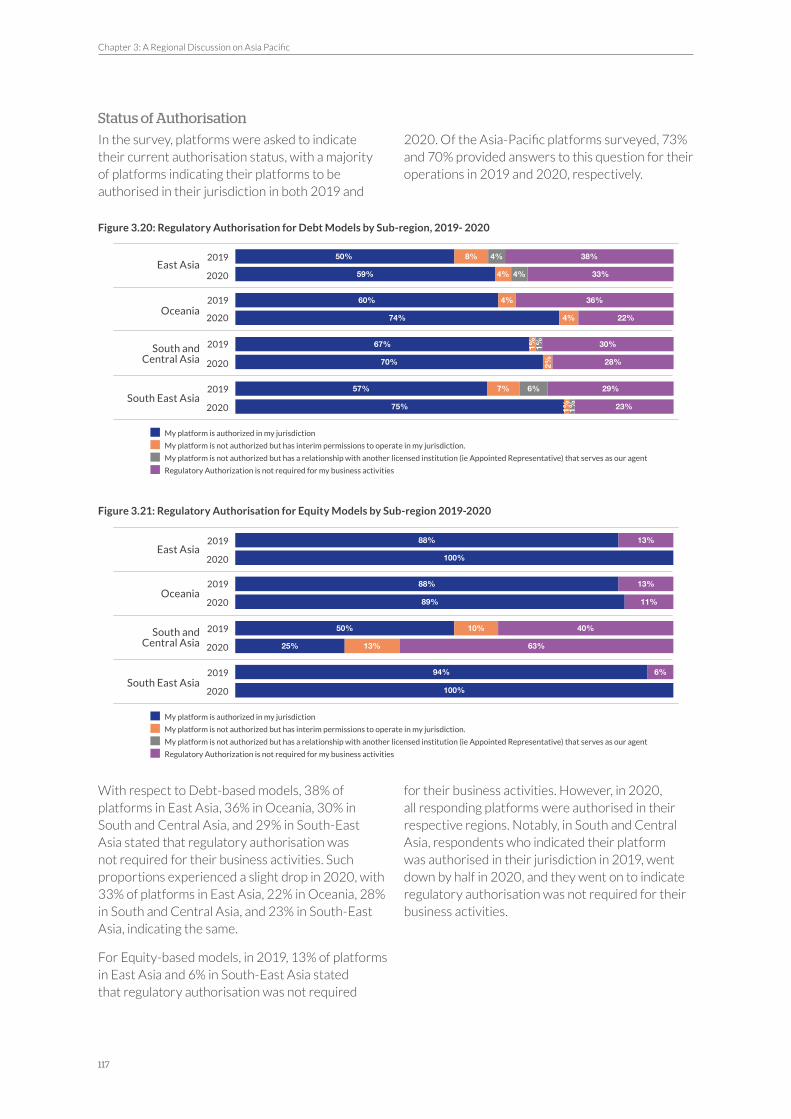
Chapter 3: A Regional Discussion on Asia Pacific
117
Status of Authorisation
In the survey, platforms were asked to indicate their current authorisation status, with a majority of platforms indicating their platforms to be authorised in their jurisdiction in both 2019 and
2020. Of the Asia-Pacific platforms surveyed, 73% and 70% provided answers to this question for their operations in 2019 and 2020, respectively.
Figure 3.20: Regulatory Authorisation for Debt Models by Sub-region, 2019- 2020
Figure 3.21: Regulatory Authorisation for Equity Models by Sub-region 2019-2020
With respect to Debt-based models, 38% of platforms in East Asia, 36% in Oceania, 30% in South and Central Asia, and 29% in South-East Asia stated that regulatory authorisation was not required for their business activities. Such proportions experienced a slight drop in 2020, with 33% of platforms in East Asia, 22% in Oceania, 28% in South and Central Asia, and 23% in South-East Asia, indicating the same.
For Equity-based models, in 2019, 13% of platforms in East Asia and 6% in South-East Asia stated that regulatory authorisation was not required
for their business activities. However, in 2020, all responding platforms were authorised in their respective regions. Notably, in South and Central Asia, respondents who indicated their platform was authorised in their jurisdiction in 2019, went down by half in 2020, and they went on to indicate regulatory authorisation was not required for their business activities.
East Asia
Oceania
South and Central Asia
South East Asia
2019
2019
2019
2019
2020
2020
2020
2020
My platform is authorized in my jurisdiction
My platform is not authorized but has interim permissions to operate in my jurisdiction.
My platform is not authorized but has a relationship with another licensed institution (ie Appointed Representative) that serves as our agent
Regulatory Authorization is not required for my business activities
100%
50% 8% 4% 38%
59% 4% 4% 33%
60% 4% 36%
74% 4% 22%
70% 2% 28%
57% 7% 6% 29%
75% 23%1% 1%
67% 30%1% 1%
East Asia
Oceania
South and Central Asia
South East Asia
2019
2019
2019
2019
2020
2020
2020
2020
My platform is authorized in my jurisdiction
My platform is not authorized but has interim permissions to operate in my jurisdiction.
My platform is not authorized but has a relationship with another licensed institution (ie Appointed Representative) that serves as our agent
Regulatory Authorization is not required for my business activities
100%
88% 13%
100%
88% 13%
89% 11%
50% 10% 40%
25% 13% 63%
94% 6%
100%

The 2nd Global Alternative Finance Market Benchmarking Report
118
4. A Discussion on China

Chapter 4: A Discussion on China
119
Chapter 4: A Discussion on China
The Chinese online alternative finance sector has seen considerable change over the past few years. The volume of the entire sector having first dropped to $84.3 billion in 2019 and then to $1.2 billion in 2020, a drastic decline from $358.3 billion in 2017. Two main reasons underly this drastic decline. The more minor one is associated with COVID-19 and its impact on shrinking credit sectors in several
regions, especially with respect to consumer lending that previously dominated the Chinese alternative finance market. However, a more substantial reason is a concentrated regulatory toughening and crackdown on improperly licensed platforms following growing public complaints about high levels of fraud and defaults57, 58.
Total Regional Volume
Total Volume by Year
Figure 4.1: Chinese Alternative Finance Market Volume 2013-2020, USD
The crackdown on the alternative finance sector in China has led to a further drop in total volume from $215.4 billion in 2018 to $84.3 billion in 2019, and merely $1.2 billion in 2020. Over the past eight years, the sector first witnessed a rise from 2013 to 2017, during which the size of the sector grew by almost 6,400%. In 2018, despite the heightened regulatory environment and the bankruptcy and closures of platforms, the sector still accounted for more than half (58.6%) of the global total. Then, between 2018 and 2020, the sector showed a further and significant decrease in volume to just $1.2 billion. Plagued by fraudulent deals and loan defaults, the sector was reported to be left with only 29 platforms, a drastic shrinkage from over 6,000 platforms at its peak59. As of the end of
2020, China contributed to only 1.03% of global alternative finance volumes.
In 2019 and 2020, the two major alternative finance models in China were namely P2P/Marketplace Consumer Lending and P2P/Marketplace Business Lending. All business models showed a significant decline from 2018. In 2019, the total volume of P2P/Marketplace Consumer Lending in 2018 was $69.5 billion, representing 83.8% of the alternative finance market in China, which later experienced a 57.36% decline in 2019. This decline continued further to $6.96 million in 2020. In 2019, P2P/Marketplace Business Lending generated $13.4 billion, a 68.62% decrease from 2018. In 2020, the total volume of P2P/Marketplace Business Lending has further dropped to a negligible $0.33 million.
0
200
100
300
400
50
250
350
150
2015
102.2
2017
358.3
2019
84.3
2016
243.3
2018
215.4
2020
1.2
2013
5.6
2014
24.3
Bill
ion
s

The 2nd Global Alternative Finance Market Benchmarking Report
120
Total Volume by Business Model (2015-2020)Table 4.1: Total Alternative Finance Market Volume by Model in China 2015-2020 (USD Million)
Alternative Finance ModelsMarket Size (USD)
2020 2019 2018 2017 2016 2015
P2P/Marketplace Consumer Lending 6.96m 69500.60m 163302.74m 224431.77m 136539.03m 52439.70m
P2P/Marketplace Business Lending 0.33m 13434.64m 42741.24m 97430.54m 57780.91m 39634.63m
P2P Real Estate Lending 0.00m 499.32m 1845.67m 5940.11m 6994.89m 5514.77m
Balance Sheet Consumer Lending 1132.00m 118.23m 377.13m 15762.79m 9380.64m 117.90m
Balance Sheet Business Lending 0.03m 683.59m 6124.41m 6868.91m 27291.40m 565.32m
Invoice Trading 13.45m 94.02m 691.31m 5605.17m 2280.10m 1458.38m
Debt-based Securities 6.22m 7.12m
Equity-based Crowdfunding 0.04m 0.07m 5.73m 224.97m 461.00m 1447.78m
Real Estate Crowdfunding 16.45m
Revenue/Profit Sharing 977.89m 91.19m 37.73m
Reward-based Crowdfunding 7.89m 9.87m 5.68m 5.04m 2015.52m 829.52m
Donation-based Crowdfunding 0.41m 0.13m 0.12m
Mini Bonds 278.79m
Market Dynamics
The Dynamics of Alternative Finance Business Funding
The alternative finance sector used to be a strong and important funding option for entrepreneurs, start-ups, and small and medium sized businesses from 2013 to 2018. For example, the total volume of business funding in China once reached an all-time peak of $111.8 billion in 2017. However, as the entire national market declined dramatically, the total volume of business funding in China recorded a volume of $14.2 billion in 2019, and $0.02 billion in 2020. Given that there were only two business models reporting non-zero volumes, 99.99% of the alternative finance supply for business was provided by Debt-based platforms. Notably, in 2020, the share of Non-investment models increased, due to the large decline in Debt-based model activities.
Figure 4.2: Total Alternative Finance Funding for Businesses in China (2016-2020)
0
80
40
120
20
100
60
2016 2017 2018 2019 2020
Bill
ion
s
93.5
111.8
49.6
14.20.02

The 2nd Global Alternative Finance Market Benchmarking Report
121
5. A Regional Discussion on the Americas

Chapter 5: A Regional Discussion on the Americas
122
Chapter 5: A Regional Discussion on the Americas
This chapter includes a discussion of the alternative finance activities in the Americas. Due to unique market development in alternative finance across the region, this chapter is divided into two sections: the United States & Canada and Latin America & the Caribbean (LAC), respectively. North America is characterised by highly concentrated markets
and high volumes, while LAC is characterised by comparatively lower volumes, with more diversified platforms. In 2019, the region reported a total alternative finance volume of $56.7 billion, which rose to $79 billion in 2020, a 40% year-on-year increase.
Figure 5.1: Total Alternative Finance Volume Market Share by Key Country (2019-2020)
A Discussion on the United States & Canada
The United States' (US) online alternative finance market accounts for the largest single volume driver in the Americas, and in 2020 superseded as the global leader accounting for 65% of volume worldwide. In 2020, the US market reached $73.62 billion, growing 43% year-on-year from $51.52 billion in 2019. The US market led nearly 93% of the overall Americas regional activity in 2020. Despite its dominance in the region, its relative marketshare declined by 3% between 2018 and 2020. This was mainly due to the increased share of alternative finance volumes in LAC countries, led by Brazil.
The majority of firms operating in the US market are geographically located within the country. In 2020, 46 firms were headquartered in the US while 11 were based overseas. In 2019, 49 were based in the US and 16 overseas. In terms of volume, domestic firms reached $72.27 billion in 2020, increasing by 43% from 2019 at $50.64 billion. The volume originated by domestic platforms represented nearly 98% of funds disbursed to US-based clients in 2020. Foreign-based firms were responsible for only 2% of that volume. Additionally, foreign-based platforms operating in the US were responsible for delivering $1.35 billion to fundraisers in 2020, an increase of 54% from $876 million in 2019.
2019
9% 9%
91% 91%
2020
US Canada LAC
68% Brazil64% Brazil
10% Chile 15% Chile
11% Mexico 10% Mexico
7% Colombia 6% Colombia2% Peru 1% Peru
1% Argentina 1% Argentina1% Rest of Region 2% Rest of Region
0.6% 0.4%

The 2nd Global Alternative Finance Market Benchmarking Report
123
Table 5.1: Proportion of Foreign vs Domestic Firms - North America 2019-2020
2019 2020
CountryDomestic Volumes
Foreign Volumes
Domestic % Foreign %Domestic Volumes
Foreign Volumes
Domestic % Foreign %
Canada $0.31b $0.05b 86% 14% $0.24b $0.07b 76% 24%
United States
$50.64b $0.88b 98% 2% $72.27b $1.35b 98% 2%
Overall $50.95b $0.92b $72.51b $1.42b
Figure 5.2: United States & Canada Total Volume 2013-2020, USD
As mentioned in Chapter 1, some regions were more affected by the number of unique firm responses captured, and this is certainly the case with responses related to Canadian alternative finance activities. Compared to the 39 respondents in the First Global Alternative Finance Benchmarking Study (24 domestic and 15 overseas platforms), the number of participants dropped significantly in the country. Six domestic and ten foreign-based Canadian firms participated the survey in 2020, while in 2019, five firms engaged in domestic-based activity and 11 had foreign-based operations.
Platforms surveyed in Canada reported declines in volume over the last two years. It shrunk by 61% in 2019 and 12% in 2020. The total alternative finance volume in the country reached $353 million in 2019 and $309 million in 2020. However, this
trend may differ from the what was reported by the Canadian Lenders Association60, as there was also indications that 2020 was a year marked with incredible resilience and innovation, as well as optimism in the market towards expected recovery in 2021.
When considering alternative finance volumes derived from domestic versus foreign firms, a growing proportion of Canadian volume can be attributed to foreign platforms from 2019 to 2020. In 2019, 86% ($305 million) of alternative finance volumes derived from actors headquartered within the country, but dropped to 76% ($236 million) by 2020.
In contrast, volumes derived from foreign firms operating in Canada grew from 14% market share in 2019 ($48 million) to 24% ($74 million) in 2020.
$0 $20 $30 $40 $70$60$10 $80$50
US Canada
$0.33
$34.532016
$0.87
$0.09
$0.35
$0.31
$42.81
$11.56
$51.52
$73.62
2017
2014
2019
2020
$0.21
$0.04
$0.91
$28.40
$4.40
$61.13
2015
2013
2018
Billions
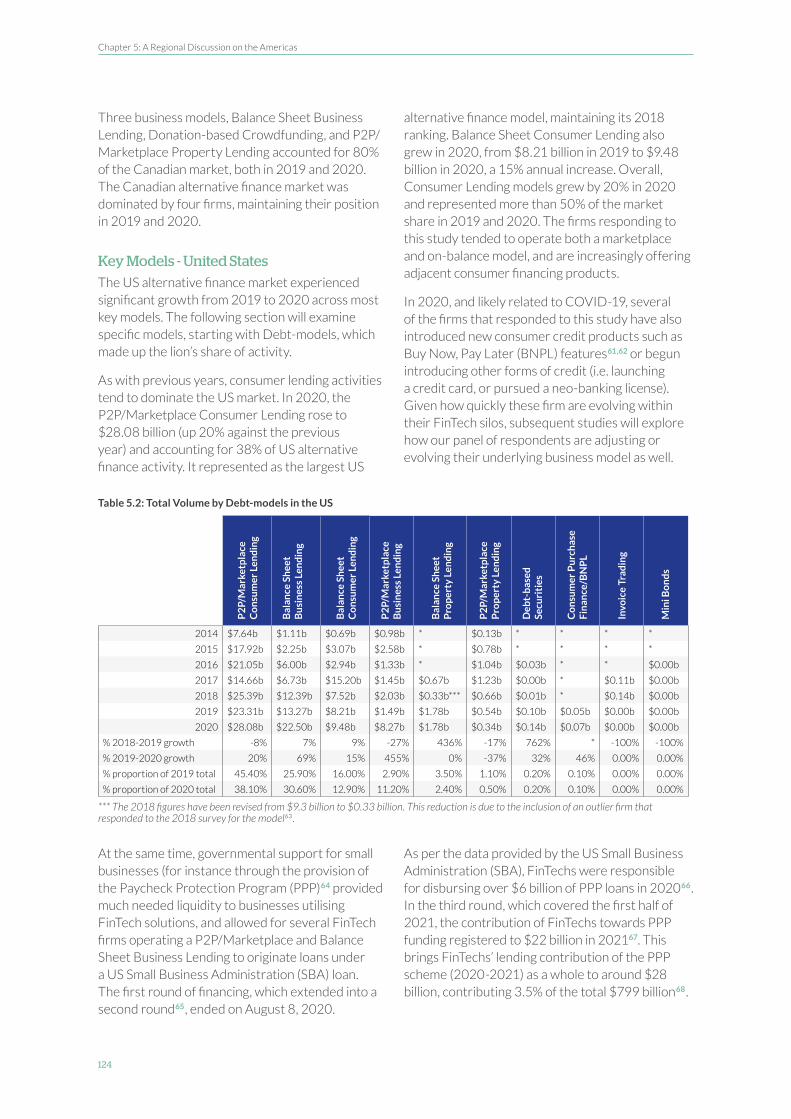
Chapter 5: A Regional Discussion on the Americas
124
Three business models, Balance Sheet Business Lending, Donation-based Crowdfunding, and P2P/Marketplace Property Lending accounted for 80% of the Canadian market, both in 2019 and 2020. The Canadian alternative finance market was dominated by four firms, maintaining their position in 2019 and 2020.
Key Models - United States
The US alternative finance market experienced significant growth from 2019 to 2020 across most key models. The following section will examine specific models, starting with Debt-models, which made up the lion’s share of activity.
As with previous years, consumer lending activities tend to dominate the US market. In 2020, the P2P/Marketplace Consumer Lending rose to $28.08 billion (up 20% against the previous year) and accounting for 38% of US alternative finance activity. It represented as the largest US
alternative finance model, maintaining its 2018 ranking. Balance Sheet Consumer Lending also grew in 2020, from $8.21 billion in 2019 to $9.48 billion in 2020, a 15% annual increase. Overall, Consumer Lending models grew by 20% in 2020 and represented more than 50% of the market share in 2019 and 2020. The firms responding to this study tended to operate both a marketplace and on-balance model, and are increasingly offering adjacent consumer financing products.
In 2020, and likely related to COVID-19, several of the firms that responded to this study have also introduced new consumer credit products such as Buy Now, Pay Later (BNPL) features61,62 or begun introducing other forms of credit (i.e. launching a credit card, or pursued a neo-banking license). Given how quickly these firm are evolving within their FinTech silos, subsequent studies will explore how our panel of respondents are adjusting or evolving their underlying business model as well.
Table 5.2: Total Volume by Debt-models in the US
2014 $7.64b $1.11b $0.69b $0.98b * $0.13b * * * *
2015 $17.92b $2.25b $3.07b $2.58b * $0.78b * * * *
2016 $21.05b $6.00b $2.94b $1.33b * $1.04b $0.03b * * $0.00b
2017 $14.66b $6.73b $15.20b $1.45b $0.67b $1.23b $0.00b * $0.11b $0.00b
2018 $25.39b $12.39b $7.52b $2.03b $0.33b*** $0.66b $0.01b * $0.14b $0.00b
2019 $23.31b $13.27b $8.21b $1.49b $1.78b $0.54b $0.10b $0.05b $0.00b $0.00b
2020 $28.08b $22.50b $9.48b $8.27b $1.78b $0.34b $0.14b $0.07b $0.00b $0.00b
% 2018-2019 growth -8% 7% 9% -27% 436% -17% 762% * -100% -100%
% 2019-2020 growth 20% 69% 15% 455% 0% -37% 32% 46% 0.00% 0.00%
% proportion of 2019 total 45.40% 25.90% 16.00% 2.90% 3.50% 1.10% 0.20% 0.10% 0.00% 0.00%
% proportion of 2020 total 38.10% 30.60% 12.90% 11.20% 2.40% 0.50% 0.20% 0.10% 0.00% 0.00%
*** The 2018 figures have been revised from $9.3 billion to $0.33 billion. This reduction is due to the inclusion of an outlier firm that responded to the 2018 survey for the model63 .
At the same time, governmental support for small businesses (for instance through the provision of the Paycheck Protection Program (PPP)64 provided much needed liquidity to businesses utilising FinTech solutions, and allowed for several FinTech firms operating a P2P/Marketplace and Balance Sheet Business Lending to originate loans under a US Small Business Administration (SBA) loan. The first round of financing, which extended into a second round65, ended on August 8, 2020.
As per the data provided by the US Small Business Administration (SBA), FinTechs were responsible for disbursing over $6 billion of PPP loans in 202066. In the third round, which covered the first half of 2021, the contribution of FinTechs towards PPP funding registered to $22 billion in 202167. This brings FinTechs’ lending contribution of the PPP scheme (2020-2021) as a whole to around $28 billion, contributing 3.5% of the total $799 billion68.
P2
P/M
arke
tpla
ce
Co
nsu
mer
Len
din
g
P2
P/M
arke
tpla
ce
Bu
sin
ess
Len
din
g
P2
P/M
arke
tpla
ce
Pro
per
ty L
end
ing
Bal
ance
Sh
eet
Pro
per
ty L
end
ing
Bal
ance
Sh
eet
Bu
sin
ess
Len
din
g
Bal
ance
Sh
eet
Co
nsu
mer
Len
din
g
Deb
t-b
ased
Se
curi
ties
Co
nsu
mer
Pu
rch
ase
Fin
ance
/BN
PL
Invo
ice
Trad
ing
Min
i Bo
nd
s

The 2nd Global Alternative Finance Market Benchmarking Report
125
The entire business lending segment reported a significant growth of 108% from 2019 to 2020. Balance Sheet Business Lending was the second-largest business model in the US, amounting to a total volume of $13.27 billion in 2019 and reaching $22.5 billion in 2020. This represented a year-on-year market growth of 69% in 2020, after a after relatively modest modest growth of 7% in 2019. This model also reported an increase in market share in the country from 26% in 2019 to nearly 31% in 2020. Similarly, P2P/Marketplace Business Lending also exhibited a remarkable growth of 455% after reporting a decrease of 27% in 2019.
Overall, this lending segment disbursed over $8.27 billion in 2020 from $1.49 billion in 2019, increasing its market share in 2020 to 11.2% from less than 3% in 2019. It is worth noting that the firms which responded to this survey operate both on-balance sheet and marketplace activities. The rise in the performance of both the P2P/Marketplace and Balance sheet Business Lending segments can likely be attributed to the provision of PPP loans through platforms in support of small businesses facing distress due to the pandemic in 2020. As noted, the SBA statistics in 2020 showed that FinTechs channelled over $6 billion of PPP-based loans. It is presumed that a share of the reported values from Business lending platforms operated by P2P/Marketplace should include a certain percentage of the overall $6 billion PPP lending volumes. However, we cannot calculate the total volume lent by the firms participating in our survey exclusively towards PPP lending.
Property Lending (including Balance Sheet and P2P/Marketplace Lending models) experienced an upward growth trajectory in 2019, rising by 135% year-on-year and then experiencing a sudden 9% drop in 2020. The declining year-on-year trend in 2020 could be due to the uncertainty imposed through the pandemic-led macroeconomic factors that placed exogenous stressors upon the real-estate and property market in general. As per a recent Mortgage Bankers Association report, mortgage credit supply has not returned to the pre-pandemic levels69. Overall, the property lending segment shrunk from nearly 4.6% in 2019 to 2.9% in 2020 in terms of market capitalisation. Balance Sheet Property Lending reported similar levels of origination across both years ($1.78 billion), while firms which reported volumes associated with the P2P/Marketplace Property Lending business model
noted volume decline, with total origination from $540 million in 2019 and $343 million in 2020.
Table 5.3: Total Volume by Equity-models in the US
2014 $0.13b $0.27b * *
2015 $0.47b $0.59b * *
2016 $0.81b $0.55b $0.02b *
2017 $1.85b $0.24b $0.01b *
2018 $1.79b $0.51b $0.25b *
2019 $1.76b $0.14b $0.00b $0.00b
2020 $1.50b $0.33b $0.00b $0.00b
% 2018-2019 growth -1% -72% -100% *
% 2019-2020 growth -15% 134% -100% -100%
% proportion of 2019 total 3.40% 0.30% 0.00% 0.00%
% proportion of 2020 total 2.00% 0.50% 0.00% 0.00%
Moving to Equity-based models, Equity-based Crowdfunding reported substantial growth in 2020, by over 134% from 2019 to 2020 after declining 72% in 2019. The increase in 2020 could be attributed to the temporary and conditional relief to small businesses offered by the Securities Exchange Commission (SEC) to pursue expedited crowdfunding offerings in the wake of the COVID-19 pandemic70. The same trend is expected to continue in 2021 since the SEC has extended these temporary exemptions until September 202171. This model raised nearly $332 million in 2020 and $142 million in 2019. Other Equity-based models reported a contrary trend through the period.
In the next fiscal year, we expect to see more significant volumes raised in the Regulated Crowdfunding (Reg-CF) market, with the recent changes issued by the regulator. The SEC increased the limits on the total amount raised by a single fundraiser and relaxed the investment limits in the newly revised Reg-CF rules72 .
Finally, the Real Estate Crowdfunding model accounted for $1.76 billion in 2019, noting a decline of 15% year-on-year to $1.5 billion in 2020. This model was impacted by COVID-19 in a similar fashion to the Property Lending models, as similar exogenous factors came into play related to property demand and pricing.
Rea
l Est
ate
Cro
wd
fun
din
g
Co
mm
un
ity
Shar
es
Eq
uit
y-b
ased
C
row
dfu
nd
ing
Rev
enu
e/P
rofi
t Sh
arin
g

Chapter 5: A Regional Discussion on the Americas
126
Table 5.4: Total Volume by Non-Investment-models in the US
2014 $0.15b $0.46b *
2015 $0.14b $0.60b *
2016 $0.22b $0.55b *
2017 $0.18b $0.41b *
2018 $0.31b $0.38b *
2019 $0.25b $0.38b $0.00b
2020 $0.64b $0.47b $0.01b
% 2018-2019 growth -18% -2% *
% 2019-2020 growth 156% 25% 71%
% proportion of 2019 total 0.50% 0.70% 0.00%
% proportion of 2020 total 0.90% 0.60% 0.00%
Non-investment models captured just over 1% of the US alternative finance market segment. Donation-based Crowdfunding noted increased activity in 2020, after experiencing a drop of 18% in 2019, it reached a 156% growth the following year. These firms raised nearly $643 million in 2020 and $251 million in 2019. Similarly, the Reward-based Crowdfunding model observed a positive trend in 2020, noting a 25% growth from $376 million in 2019 to $471 million in 2020. The underlying data suggested that those models might have profited from the global pandemic environment. According to the COVID-19 Rapid Assessment, Digital Capital Raising companies of in the US & Canada, which includes the Non-investment Crowdfunding models, reported a significant growth in volumes and transactions in the first half of 2020, compared to the same period in 201973.
Key Models - Canada
Table 5.5: Total Volume by Key Models in Canada
2014 $13.53m * $1.60m * $2.50m $0.50m * $0.06m $25.48m $42.14m
2015 $27.02m * $15.55m * $15.50m $28.00m * $5.10m $70.69m $44.36m
2016 $103.30m $5.00m $22.50m $5.00m * $25.00m * $13.11m $105.92m $35.27m
2017 $494.26m $6.00m $9.10m $0.00m $11.57m $94.12m * $13.83m $88.59m $22.94m
2018 $391.36m $58.08m $50.80m $0.00m $117.18m $29.80m * $19.91m $136.09m $22.85m
2019 $131.00m $35.67m $18.44m $35.18m $5.20m $0.00m $0.50m $0.15m $104.00m $23.15m
2020 $80.32m $66.23m $14.17m $7.45m $1.50m $0.00m $0.00m $0.00m $118.00m $22.02m
% 2018-2019 growth -67% -39% -64% 35% -96% -100% * -99% -24% 1%
% 2019-2020 growth -39% 86% -23% -79% -71% 0.00% -100% -100% 13% -5%
% proportion of 2019 total 37.10% 10.10% 5.20% 10.00% 1.50% 0.00% 0.10% 0.00% 29.40% 6.60%
% proportion of 2020 total 25.90% 21.40% 4.60% 2.40% 0.50% 0.00% 0.00% 0.00% 38.10% 7.10%
With respect to the Canadian alternative finance market74, Balance Sheet Business Lending became the second-largest business model in 2020 in terms of market share (26%) after being superseded by the Donation-based Crowdfunding model (38%). In 2020, the Donation-based model accounted for $118 million while the Balance Sheet Business model contributed to $80.32 million.
Overall, the Balance Sheet Business Lending model showed a drop across both years by 67% in 2019 and a further 39% in 2020. At the same time,
Donation-based Crowdfunding experienced a drop of 24% in 2019, but reported an increase of 13% in 2020.
One possible reason for the decline of alternate finance driven business lending may relate to these FinTech digital lenders being excluded from government-backed business support schemes. As noted by the Canadian Lender Association75, FinTechs had not yet been included in the government business aid scheme in the country as the market was still being affected by COVID-19.
Do
nat
ion
-bas
ed
Cro
wd
fun
din
g
Eq
uit
y-b
ased
C
row
dfu
nd
ing
Cro
wd
-led
M
icro
fin
ance
Bal
ance
Sh
eet
Bu
sin
ess
Len
din
g
Deb
t-b
ased
Se
curi
ties
P2
P/M
arke
tpla
ce
Co
nsu
mer
Len
din
g
Bal
ance
Sh
eet
Co
nsu
mer
Len
din
g
P2
P/M
arke
tpla
ce
Pro
per
ty L
end
ing
P2
P/M
arke
tpla
ce
Bu
sin
ess
Len
din
g
Co
nsu
mer
Pu
rch
ase
Fin
ance
/BN
PL
Eq
uit
y-b
ased
C
row
dfu
nd
ing
Do
nat
ion
-bas
ed
Cro
wd
fun
din
g
Rew
ard
-bas
ed
Cro
wd
fun
din
g
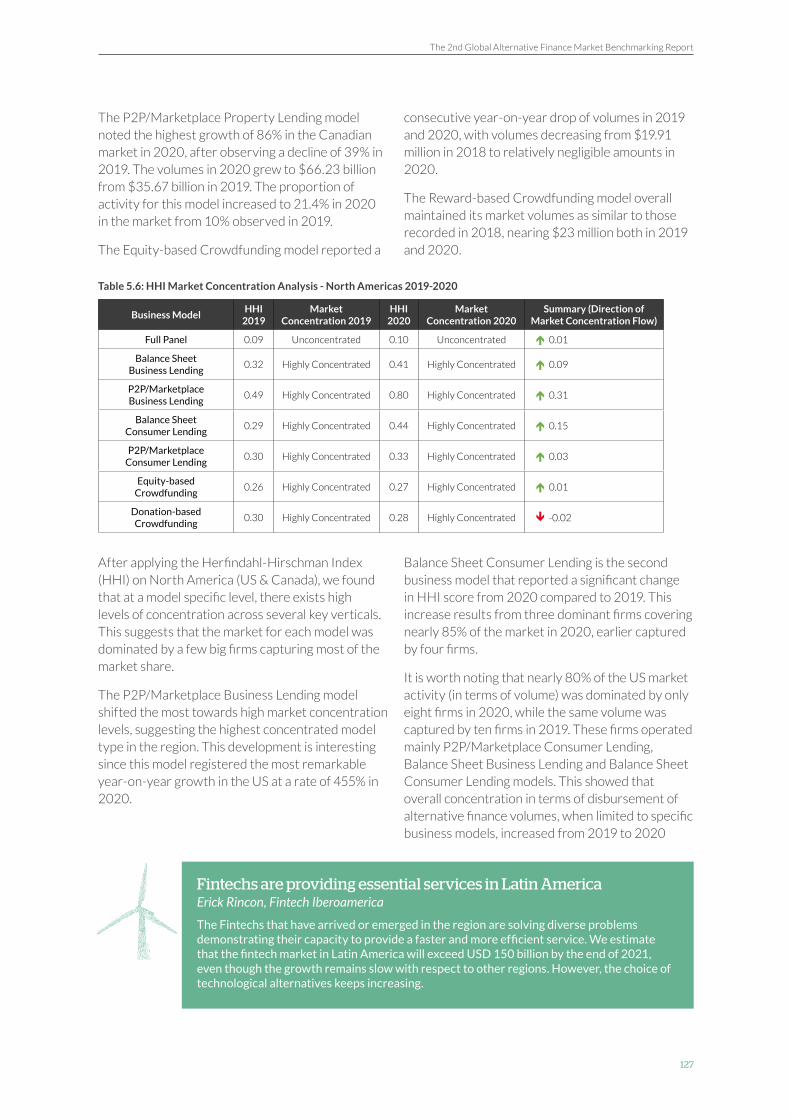
The 2nd Global Alternative Finance Market Benchmarking Report
127
The P2P/Marketplace Property Lending model noted the highest growth of 86% in the Canadian market in 2020, after observing a decline of 39% in 2019. The volumes in 2020 grew to $66.23 billion from $35.67 billion in 2019. The proportion of activity for this model increased to 21.4% in 2020 in the market from 10% observed in 2019.
The Equity-based Crowdfunding model reported a
consecutive year-on-year drop of volumes in 2019 and 2020, with volumes decreasing from $19.91 million in 2018 to relatively negligible amounts in 2020.
The Reward-based Crowdfunding model overall maintained its market volumes as similar to those recorded in 2018, nearing $23 million both in 2019 and 2020.
Table 5.6: HHI Market Concentration Analysis - North Americas 2019-2020
Business ModelHHI
2019Market
Concentration 2019HHI
2020Market
Concentration 2020Summary (Direction of
Market Concentration Flow)
Full Panel 0.09 Unconcentrated 0.10 Unconcentrated 0.01
Balance Sheet Business Lending
0.32 Highly Concentrated 0.41 Highly Concentrated 0.09
P2P/Marketplace Business Lending
0.49 Highly Concentrated 0.80 Highly Concentrated 0.31
Balance Sheet Consumer Lending
0.29 Highly Concentrated 0.44 Highly Concentrated 0.15
P2P/Marketplace Consumer Lending
0.30 Highly Concentrated 0.33 Highly Concentrated 0.03
Equity-based Crowdfunding
0.26 Highly Concentrated 0.27 Highly Concentrated 0.01
Donation-based Crowdfunding
0.30 Highly Concentrated 0.28 Highly Concentrated -0.02
After applying the Herfindahl-Hirschman Index (HHI) on North America (US & Canada), we found that at a model specific level, there exists high levels of concentration across several key verticals. This suggests that the market for each model was dominated by a few big firms capturing most of the market share.
The P2P/Marketplace Business Lending model shifted the most towards high market concentration levels, suggesting the highest concentrated model type in the region. This development is interesting since this model registered the most remarkable year-on-year growth in the US at a rate of 455% in 2020.
Balance Sheet Consumer Lending is the second business model that reported a significant change in HHI score from 2020 compared to 2019. This increase results from three dominant firms covering nearly 85% of the market in 2020, earlier captured by four firms.
It is worth noting that nearly 80% of the US market activity (in terms of volume) was dominated by only eight firms in 2020, while the same volume was captured by ten firms in 2019. These firms operated mainly P2P/Marketplace Consumer Lending, Balance Sheet Business Lending and Balance Sheet Consumer Lending models. This showed that overall concentration in terms of disbursement of alternative finance volumes, when limited to specific business models, increased from 2019 to 2020
Fintechs are providing essential services in Latin America Erick Rincon, Fintech Iberoamerica
The Fintechs that have arrived or emerged in the region are solving diverse problems demonstrating their capacity to provide a faster and more efficient service. We estimate that the fintech market in Latin America will exceed USD 150 billion by the end of 2021, even though the growth remains slow with respect to other regions. However, the choice of technological alternatives keeps increasing.

Chapter 5: A Regional Discussion on the Americas
128
Business Finance in the USA and Canada
Figure 5.3: Total Alternative Business Finance – US & Canada 2016-2020, USD
In the US, alternative finance activities directed at Business fundraisers, issuers and borrowers dominated much of the conversation around the alternative finance landscape for 2020.
However, when we observe how the market changed from 2018 to 2019, we note a slight year-on-year decline, from $16.30 billion to $15.07 billion. In 2019, this relates to approximately 269,500 transactions to SMEs utilising an alternative finance solution (or around 29% of all 2019 volumes).
In 2020, however, alternative finance volumes directed to businesses rose considerably, with a 124% year-on-year increase from 2019 to 2020. This accounts for 43% of all US alternative finance in the year, and relates to approximately 604,940 transactions.
This substantive growth can be attributed to the important role that the US PPP scheme has played when orignating new loans to SMEs through a number of FinTech digital lending platforms. In all, business volumes in 2020 amounted to an all-time high of $31.73 billion.
In Canada, the business lending segment reported a decline in its total volume against the height of 2018. Hence, the 2019 and 2020 alternative finance volumes attributed to businesses saw a drop of nearly 72% compared to 2018 volumes. This decline could also be because certain Canadian alternative business finance firms declined to participate in the survey.76
Figure 5.4: Composition of Business Finance by Facing-models – US & Canada 2019-2020
In the US, Debt-based models maintained their market share at the same levels in 2019 and 2020, representing nearly 98% of volumes. This share represents a further increase from 2018, when Debt-based models accounted for 93% of volumes in 2018. Debt-based models in the US contributed nearly $14.83 billion in 2019 and observed a
significant jump with total volume disbursement of $30.86 billion.
Similarly, Canada also reported Debt models dominating nearly 95% of the market share with the disbursement of over $150 million in 2019 and 2020.
$10
$5
$20
$15
$30
$25
$35
$0
8.80
2016
0.56
16.30
2018
0.53
10.00
2017
0.20
15.07
2019
0.15
31.73
2020
Bill
ion
s
US Canada
0% 20% 30% 50% 70% 90%10% 60%40% 80% 100%
2020
2019
95% 5%Canada
US 97%
Canada 96% 4%
US 98%
Debt-based Models Equity-based Models Non Investment-based Models
2%1% 1%
1%

The 2nd Global Alternative Finance Market Benchmarking Report
129
Alternative Finance in Latin America & the Caribbean (LAC)Figure 5.5: Alternative Finance Total Volume by Latin America & the Caribbean 2013-2020, USD
The following data and findings are based upon survey responses from 143 unique firms which provided 258 country-level responses from across 28 LAC countries77for 2019. As related to data relevant to 2020, this study captured responses from 116 providing 205 country-level responses from 26 LAC78 countries. The three countries which accounted for the highest number of respondents came from Mexico (with 49 entries in 2019 and 40 in 2020), followed by Brazil (44 for 2019 and 32 for 2020) and Colombia (31 for 2019, 25 for 2020).
In 2020, online alternative finance volumes in LAC reached a value of $5.27 billion. Historically, substantial growth can be observed from one year to another, and this is certainly the case between 2018 to 2019, with a 167% increase. Yet, the annual growth rate for 2020 rose by 9%, a far more modest increase when considering past trends. This likely relates to the COVID-19 pandemic, and to a certain extent, the impact of currency devaluation against USD in some of the markets within the LAC region.
As with previous years, six key markets account for most alternative finance activity in the region: Argentina, Brazil, Chile, Colombia, Mexico and Peru.
In both 2019 and 2020, Brazil accounted for the highest market share, accounting for more than 60% of the region’s volume. In 2019, the Brazilian alternative finance market grew by a resounding 386%, to $3.27 billion. In 2020, the market grew by 3% to $3.37 billion.
The Mexican market captured the second largest regional market share (11%) in 2019. This accounting for $547.9 million and represented a 135% year on year growth. In 2020, the Mexican
market saw a slight decline in volume, a 2% drop to $536.9 million. In terms of market share, Mexico ranked third and accounted for 10% of the region's volume.
Chile, on the other hand, has seen substantive market change, and follows new regulation proposal by CMF this past February 2021. In the coming months, it will be crucial to understand if a new FinTech law will be issued and enacted, and its possible effects on the market.
In 2020, Chilean activity accounted for 15% of LAC alternative finance and rose to the the second largest market in the region having grown 64% from $489.1 million in 2019 to $803.6 million in 2020.
Furthermore, in 2020 Chile registered some of the highest volumes of Alternative Finance per capita ($42.04), suggesting that alternative finance activities play a greater role in the broader Chilean ecosystem. Specifically, digital lending activities are growing in importance in the country.
Colombia represented the fourth largest market in LAC, with 7% in 2019 and 6% in 2020. Firms operating in Colombia reported a volume of $ 337.43 million in 2019 and $341.7 million in 2020.
Finally, Peru, Argentina and the remaining 22 countries represented in the region accounted for 3% of market share in 2020. Due to some key previous participants that did not participate in this survey and/or changed their business model, there is a noted decrease in terms of volume in the Argentinean and Peruvian markets by 55% and 48% in 2019, respectively. The market in Argentina recovered by 19% in the next year, in contrast, Peru saw a further decrease in volumes by 13%.
$0
$4
$2
$1
$5
$6
$3
2015
0.11
2017
0.66
2019
4.83
2016
0.34
2018
1.81
2020
5.27
2013
0.02
2014
0.06
Bill
ion
s

Chapter 5: A Regional Discussion on the Americas
130
Figure 5.6: Total Alternative Finance Volume of Leading LAC Countries 2014-2020, USD
$0 $4000$3000
$500 $3500$1000
$69.2
$83.0
$337.4
$547.9
$489.1
$12.6
$0.3
$0.3
$13.2
$47.6
$24.2
$72.5
$341.7
$536.8
$803.6
$29.9
$9.9
$5.6
$114.2
$97.8
$64.4
$58.4
$9.6
$0.1
$0.2
$4.5
$37.4
$7.5
$129.2
$158.5
$192.5
$233.4
$289.3
$673.2
$22.6
$50.6
$151.1
$126.7
$216.4
$2.8
Argentina
Peru
Colombia
Mexico
Chile
Brazil
Millions
$3370.6$3472.6
2020 2019 2018 2017 2016 2015 2014
Doopla, first Mexican platform to receive authorisation to operate as crowdfunding platform Juan Carlos Flores, CEO, Doopla.mx
Doopla.mx became, last February 2, 2021, the first platform to receive the authorization to organize and operate as a Crowdfunding institution. The process began in October 2018 and involved significant investment of material and human resources. This historic achievement was made possible thanks to a thoughtful planning and implementation process, having focused on making a polished application dossier, and always responding in a timely manner to each and every one of the observations of the regulatory authority. Among the main activities carried out, the following stand out: preparation of manuals and policies related to internal control, cybersecurity, money laundering prevention, corporate governance, etc. In addition, having a money laundering prevention system, testing of vulnerabilities of the technological platform, business continuity plan, equity audit of the company's main shareholders. In sum, more than 35 documents have been prepared and approximately 150 activities have been carried out in the process.

The 2nd Global Alternative Finance Market Benchmarking Report
131
Key Models - Latin America & the Caribbean
Table 5.7: Alternative Finance Volumes by Model 2019 - Key LAC Countries
Geography
Brazil of which market share
$85.02m $41.21m $1.27m $175.83m $2838.67m $0.00m $7.61m $11.67m3% 1% 0% 5% 87% 0% 0% 0%
Chileof which market share
$0.00m $14.28m $17.09m $455.25m0% 3% 0% 0% 4% 0% 0% 93%
Mexicoof which market share
$39.62m $0.21m $0.00m $303.00m $146.30m $9.87m $20.20m7% 0% 0% 55% 27% 2% 0% 4%
Colombiaof which market share
$33.38m $0.00m $3.82m $26.88m $62.00m $204.82m10% 0% 0% 1% 8% 0% 18% 61%
Peruof which market share
$0.51m $8.74m $0.00m $63.25m0.0% 0.6% 0.0% 10.6% 0.0% 0.0% 0.0% 76.7%
Argentinaof which market share
$38.48m $1.50m $1.42m $4.26m $0.00m74.8% 0.0% 2.9% 2.8% 8.3% 0.0% 0.0% 0.0%
Total region $196.49m $56.20m $2.77m $492.80m $3033.20m $9.87m $69.61m $755.19m
Table 5.7: continued...
Geography
Brazil of which market share
$8.09m $5.66m $30.51m $9.66m0% 0% 1% 0%
Chileof which market share
$1.29m $0.37m $0.00m $0.07m0% 0% 0% 0%
Mexicoof which market share
$0.81m $17.07m $3.82m $1.30m0% 3% 1% 0%
Colombiaof which market share
$0.09m $0.10m $0.61m $1.04m0% 0% 0% 0%
Peruof which market share
$0.00m $0.05m $0.02m $0.19m0.0% 0.1% 0.0% 0.2%
Argentinaof which market share
$0.00m $5.64m $0.07m $0.05m0.0% 11.0% 0.1% 0.1%
Total region $10.27m $28.88m $35.02m $12.31m
P2
P/M
arke
tpla
ce
Co
nsu
mer
Len
din
g
P2
P/M
arke
tpla
ce
Bu
sin
ess
Len
din
g
P2
P/M
arke
tpla
ce
Pro
per
ty L
end
ing
Bal
ance
Sh
eet
Co
nsu
mer
Len
din
g
Bal
ance
Sh
eet
Bu
sin
ess
Len
din
g
Bal
ance
Sh
eet
Pro
per
ty L
end
ing
Co
nsu
mer
Pu
rch
ase
Fin
ance
/BN
PL
Invo
ice
Trad
ing
Eq
uit
y-b
ased
C
row
dfu
nd
ing
Rea
l Est
ate
Cro
wd
fun
din
g
Do
nat
ion
-bas
ed
Cro
wd
fun
din
g
Rew
ard
-bas
ed
Cro
wd
fun
din
g
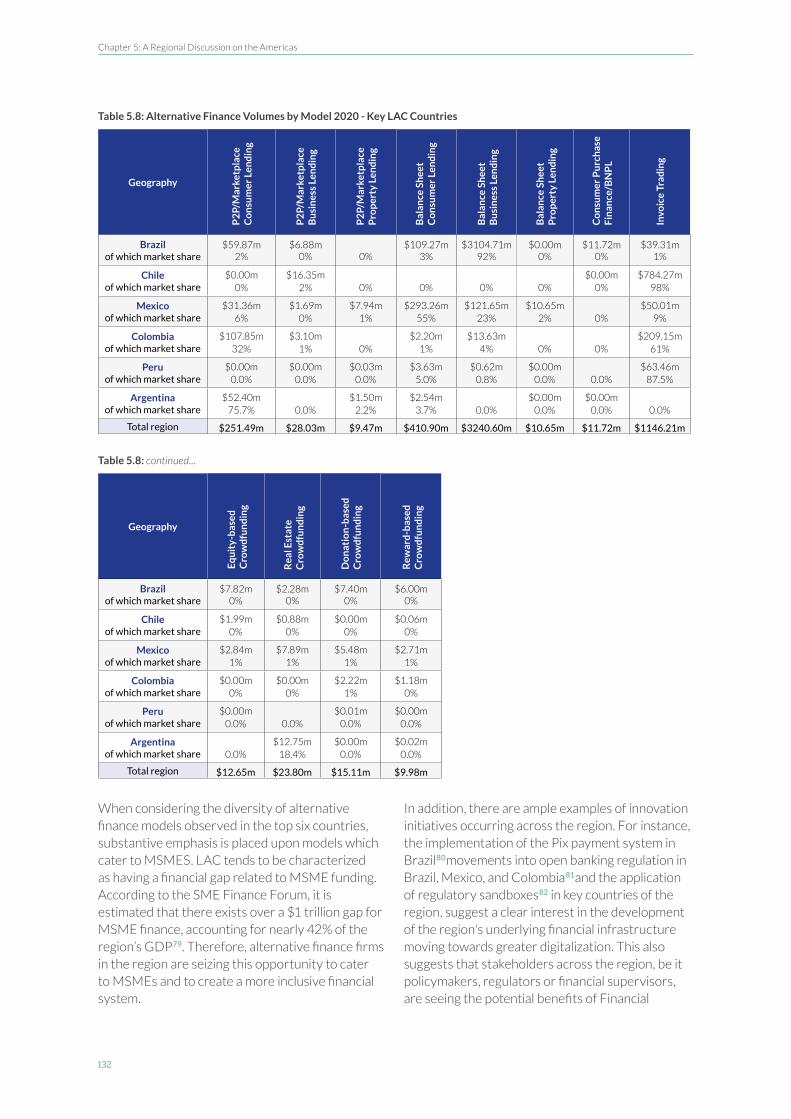
Chapter 5: A Regional Discussion on the Americas
132
Table 5.8: Alternative Finance Volumes by Model 2020 - Key LAC Countries
Geography
Brazil of which market share
$59.87m $6.88m $109.27m $3104.71m $0.00m $11.72m $39.31m2% 0% 0% 3% 92% 0% 0% 1%
Chileof which market share
$0.00m $16.35m $0.00m $784.27m0% 2% 0% 0% 0% 0% 0% 98%
Mexicoof which market share
$31.36m $1.69m $7.94m $293.26m $121.65m $10.65m $50.01m6% 0% 1% 55% 23% 2% 0% 9%
Colombiaof which market share
$107.85m $3.10m $2.20m $13.63m $209.15m32% 1% 0% 1% 4% 0% 0% 61%
Peruof which market share
$0.00m $0.00m $0.03m $3.63m $0.62m $0.00m $63.46m0.0% 0.0% 0.0% 5.0% 0.8% 0.0% 0.0% 87.5%
Argentinaof which market share
$52.40m $1.50m $2.54m $0.00m $0.00m75.7% 0.0% 2.2% 3.7% 0.0% 0.0% 0.0% 0.0%
Total region $251.49m $28.03m $9.47m $410.90m $3240.60m $10.65m $11.72m $1146.21m
Table 5.8: continued...
Geography
Brazil of which market share
$7.82m $2.28m $7.40m $6.00m0% 0% 0% 0%
Chileof which market share
$1.99m $0.88m $0.00m $0.06m0% 0% 0% 0%
Mexicoof which market share
$2.84m $7.89m $5.48m $2.71m1% 1% 1% 1%
Colombiaof which market share
$0.00m $0.00m $2.22m $1.18m0% 0% 1% 0%
Peruof which market share
$0.00m $0.01m $0.00m0.0% 0.0% 0.0% 0.0%
Argentinaof which market share
$12.75m $0.00m $0.02m0.0% 18.4% 0.0% 0.0%
Total region $12.65m $23.80m $15.11m $9.98m
When considering the diversity of alternative finance models observed in the top six countries, substantive emphasis is placed upon models which cater to MSMES. LAC tends to be characterized as having a financial gap related to MSME funding. According to the SME Finance Forum, it is estimated that there exists over a $1 trillion gap for MSME finance, accounting for nearly 42% of the region’s GDP79. Therefore, alternative finance firms in the region are seizing this opportunity to cater to MSMEs and to create a more inclusive financial system.
In addition, there are ample examples of innovation initiatives occurring across the region. For instance, the implementation of the Pix payment system in Brazil80movements into open banking regulation in Brazil, Mexico, and Colombia81and the application of regulatory sandboxes82 in key countries of the region, suggest a clear interest in the development of the region's underlying financial infrastructure moving towards greater digitalization. This also suggests that stakeholders across the region, be it policymakers, regulators or financial supervisors, are seeing the potential benefits of Financial
P2
P/M
arke
tpla
ce
Co
nsu
mer
Len
din
g
P2
P/M
arke
tpla
ce
Bu
sin
ess
Len
din
g
P2
P/M
arke
tpla
ce
Pro
per
ty L
end
ing
Bal
ance
Sh
eet
Co
nsu
mer
Len
din
g
Bal
ance
Sh
eet
Bu
sin
ess
Len
din
g
Bal
ance
Sh
eet
Pro
per
ty L
end
ing
Co
nsu
mer
Pu
rch
ase
Fin
ance
/BN
PL
Invo
ice
Trad
ing
Eq
uit
y-b
ased
C
row
dfu
nd
ing
Rea
l Est
ate
Cro
wd
fun
din
g
Do
nat
ion
-bas
ed
Cro
wd
fun
din
g
Rew
ard
-bas
ed
Cro
wd
fun
din
g
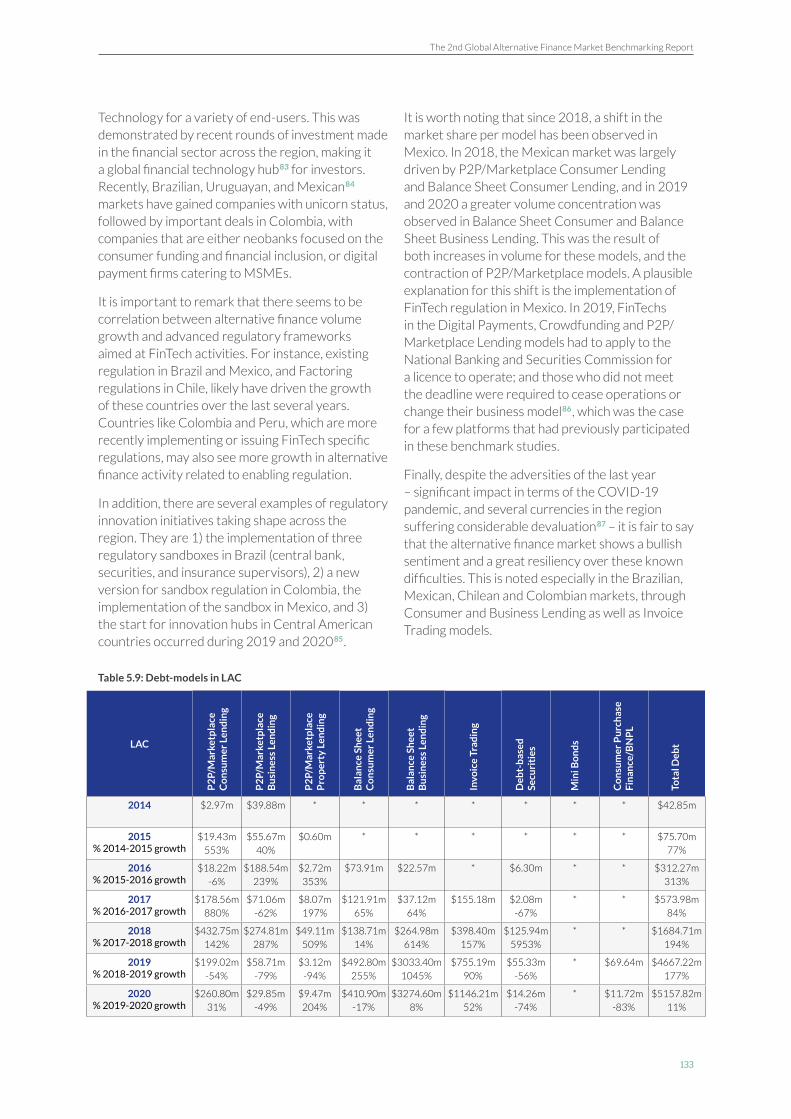
The 2nd Global Alternative Finance Market Benchmarking Report
133
Technology for a variety of end-users. This was demonstrated by recent rounds of investment made in the financial sector across the region, making it a global financial technology hub83 for investors. Recently, Brazilian, Uruguayan, and Mexican84 markets have gained companies with unicorn status, followed by important deals in Colombia, with companies that are either neobanks focused on the consumer funding and financial inclusion, or digital payment firms catering to MSMEs.
It is important to remark that there seems to be correlation between alternative finance volume growth and advanced regulatory frameworks aimed at FinTech activities. For instance, existing regulation in Brazil and Mexico, and Factoring regulations in Chile, likely have driven the growth of these countries over the last several years. Countries like Colombia and Peru, which are more recently implementing or issuing FinTech specific regulations, may also see more growth in alternative finance activity related to enabling regulation.
In addition, there are several examples of regulatory innovation initiatives taking shape across the region. They are 1) the implementation of three regulatory sandboxes in Brazil (central bank, securities, and insurance supervisors), 2) a new version for sandbox regulation in Colombia, the implementation of the sandbox in Mexico, and 3) the start for innovation hubs in Central American countries occurred during 2019 and 202085.
It is worth noting that since 2018, a shift in the market share per model has been observed in Mexico. In 2018, the Mexican market was largely driven by P2P/Marketplace Consumer Lending and Balance Sheet Consumer Lending, and in 2019 and 2020 a greater volume concentration was observed in Balance Sheet Consumer and Balance Sheet Business Lending. This was the result of both increases in volume for these models, and the contraction of P2P/Marketplace models. A plausible explanation for this shift is the implementation of FinTech regulation in Mexico. In 2019, FinTechs in the Digital Payments, Crowdfunding and P2P/Marketplace Lending models had to apply to the National Banking and Securities Commission for a licence to operate; and those who did not meet the deadline were required to cease operations or change their business model86, which was the case for a few platforms that had previously participated in these benchmark studies.
Finally, despite the adversities of the last year – significant impact in terms of the COVID-19 pandemic, and several currencies in the region suffering considerable devaluation87 – it is fair to say that the alternative finance market shows a bullish sentiment and a great resiliency over these known difficulties. This is noted especially in the Brazilian, Mexican, Chilean and Colombian markets, through Consumer and Business Lending as well as Invoice Trading models.
Table 5.9: Debt-models in LAC
LAC
2014 $2.97m $39.88m * * * * * * * $42.85m
2015 $19.43m $55.67m $0.60m * * * * * * $75.70m% 2014-2015 growth 553% 40% 77%
2016 $18.22m $188.54m $2.72m $73.91m $22.57m * $6.30m * * $312.27m% 2015-2016 growth -6% 239% 353% 313%
2017 $178.56m $71.06m $8.07m $121.91m $37.12m $155.18m $2.08m * * $573.98m% 2016-2017 growth 880% -62% 197% 65% 64% -67% 84%
2018 $432.75m $274.81m $49.11m $138.71m $264.98m $398.40m $125.94m * * $1684.71m% 2017-2018 growth 142% 287% 509% 14% 614% 157% 5953% 194%
2019 $199.02m $58.71m $3.12m $492.80m $3033.40m $755.19m $55.33m * $69.64m $4667.22m% 2018-2019 growth -54% -79% -94% 255% 1045% 90% -56% 177%
2020 $260.80m $29.85m $9.47m $410.90m $3274.60m $1146.21m $14.26m * $11.72m $5157.82m% 2019-2020 growth 31% -49% 204% -17% 8% 52% -74% -83% 11%
P2
P/M
arke
tpla
ce
Co
nsu
mer
Len
din
g
Bal
ance
Sh
eet
Co
nsu
mer
Len
din
g
Invo
ice
Trad
ing
Bal
ance
Sh
eet
Bu
sin
ess
Len
din
g
P2
P/M
arke
tpla
ce
Bu
sin
ess
Len
din
g
P2
P/M
arke
tpla
ce
Pro
per
ty L
end
ing
Deb
t-b
ased
Se
curi
ties
Min
i Bo
nd
s
Co
nsu
mer
Pu
rch
ase
Fin
ance
/BN
PL
Tota
l Deb
t

Chapter 5: A Regional Discussion on the Americas
134
In LAC, once again Debt-based models led the alternative finance market volume. From 2018 and 2019, Debt-based models increased their volumes by 177% and accounted for $4.7 billion. In 2020, despite surpassing a volume of $5.1 billion, Debt-based models registered a slower growth rate when compared to previous years.
Balance Sheet Business Lending saw an exponential growth from 2018 to 2019, when this model grew by 1,045% mainly backed by the Brazilian market. Since 2018, it leads half of the market share in the region. In 2019 and 2020, platforms in this vertical accounted for a volume of more than $3 billion. Invoice Trading has the second largest market share among Debt-based models, this vertical surpassed the $1 billion threshold in 2020, and had the third highest volume by model in the region. P2P/Marketplace Business Lending had experienced a decrease during the last two years. In contrast to 2018 volume, in 2020 this model accounted for only $29.85 million volume.
The relative share of Consumer Lending models, which represented the main debt-based segment
until 2018, saw a shift where the alternative finance market in LAC became more business focused in recent years. P2P/Marketplace Consumer Lending decreased year-on-year by 54% with a volume of $199 million in 2019 and returned to increase by 31% in 2020 with a volume of $260.80 million.
The decrease in P2P/Marketplace Consumer Lending volumes in 2019 and 2020 was due to some key platforms in Mexico and Brazil who either did not want to respond to this benchmarking study or changed their business model. However, companies in Colombia led the provision of funding to consumers and over 260,000 clients received credit through an online platform in both 2019 and 2020.
On the other hand, Balance Sheet Consumer Lending had a significant increase of 255% between 2018 and 2019, headed by Mexico, Brazil and Peru, respectively, outgrowing the P2P model with a volume of $492.80 million in 2019. In the following year, which was affected by the pandemic, the vertical decreased by 17% in terms of volume, yet still accounted for more than $400 million.
Capital commitments from all over the US during Covid-19 Sherwoord Neiss, CEO, Crowdfunding Capital Advisors
COVID was a tipping point for online investing in the United States. With investors sequestered at home but stepping up to support local businesses and pre-IPO startups we saw a 64% increase in the number of offerings in the 12 months after the onset of COVID, a 95% increase in the number of investors and a 194% increase in capital commitments. What is most interesting is the continued distribution of offerings across the United States (and away from Silicon Valley) with almost 1,200 cities represented among the more than $1.1B that has been committed in the past 5 years. With the new SEC caps that allow issuers to raise up to $5M we expect the next 12 months to be good for the industry.

The 2nd Global Alternative Finance Market Benchmarking Report
135
Figure 5.7: Top Three Countries by Debt Models - LAC 2019-2020, USD
$0 $3500$2500
$500 $1000
Guatemala
Argentina
Guatemala
Brazil
Brazil
Brazil
Chile
Brazil
Peru
Peru
Chile
Mexico
Brazil
Brazil
Mexico
Mexico
Brazil
Argentina
Brazil
Brazil
Chile
Colombia
Argentina
Colombia
Uruguay
Guatemala
Mexico
Peru
Mexico
Colombia
Argentina
Peru
Peru
Mexico
Chile
Colombia
Mexico
Mexico
Colombia
$26.88
$2.48
$38.48
$0.35
$63.25
$8.74
$146.30
$14.28
$39.62
$0.20
$1.27
$204.82
$175.83
$41.21
$85.02
$9.87
$1.50
$455.25
$303.00
$3104.71
$16.35
$107.85
$7.94
$784.27
$293.26
$121.65
$6.88
$59.87
$1.50
$209.15
$109.27
$34.00
$3.10
$52.40
$10.65
$0.03
$63.46
$3.63
Balance Sheet Business Lending
P2P/Marketplace Business Lending
P2P/Marketplace Consumer Lending
Balance Sheet Property Lending
P2P/Marketplace Property Lending
Invoice Trading
Balance Sheet Consumer Lending
2020
2020
2020
2020
2020
2020
2020
2019
2019
2019
2019
2019
2019
2019
$2838.67
Millions

Chapter 5: A Regional Discussion on the Americas
136
Table 5.10: Equity-models in LAC
LACEquity-based
CrowdfundingReal Estate
CrowdfundingCommunity
SharesRevenue/Profit
SharingTotal Equity
2014 $0.15m $3.20m * * $3.35m
2015 $2.05m $14.86m * * $16.91m% 2014-2015 growth 1258% 364% 404%
2016 $7.30m $3.40m * * $10.70m% 2015-2016 growth 256% -77% -37%
2017 $11.08m $12.50m $0.05m $22.97m $46.59m% 2016-2017 growth 52% 268% 335%
2018 $19.16m $25.35m * $1.00m $45.51m% 2017-2018 growth 73% 103% -96% -2%
2019 $49.42m $28.88m * $10.27m $88.57m% 2018-2019 growth 158% 14% 929% 95%
2020 $36.92m $23.80m * $0.47m $61.19m% 2019-2020 growth -25% -18% -95% -31%
Equity-models reached a volume of $88.57 million in 2019, representing a growth of 95% in comparison to 2018. Equity-based Crowdfunding led with a volume of $49.42 million, followed by Real Estate Crowdfunding with a volume of $28.88 million, and Revenue/Profit Sharing accounting for the highest growth of 929% (albeit from a smaller starting point) with a volume of $10.27 million.
It changed in 2020, when Equity models accounted for a volume of $61.19 million, a decrease in volumes of all three business models, mostly felt by Brazilian Equity-based Crowdfunding activities, Mexican Real Estate Crowdfunding and Argentinean Revenue/Profit Sharing platforms. The most significant decrease, by 95%, was noted in Revenue/Profit Sharing. It is worth noting that the onboarding rate for Equity-based Crowdfunding decreased by 16% between 2019 and 2020 (fig 5.16), but saw a significant growth of repeat fundraiser volumes (fig 5.20).
Figure 5.8: Top Three Countries by Equity Models - LAC 2019-2020, USD
$0 $8$2 $10$6 $14 $18$4 $12 $16
Argentina
Argentina
Argentina
Colombia
Mexico
Mexico
Mexico
Mexico
Mexico
Mexico
Chile
Chile
Chile
Real Estate Crowdfunding
2020
2019$17.07
$12.75
$5.66
$7.89
$5.64
$2.28
Revenue/Profit Sharing
2020
2019
$7.00$1.02
$0.75
$0.23
$0.75
$0.23
Equity-based Crowdfunding
2020
2019$8.09
$7.82
$1.29
$2.84
$0.81
$1.99
Millions
Brazil
Brazil
Brazil
Brazil
Brazil
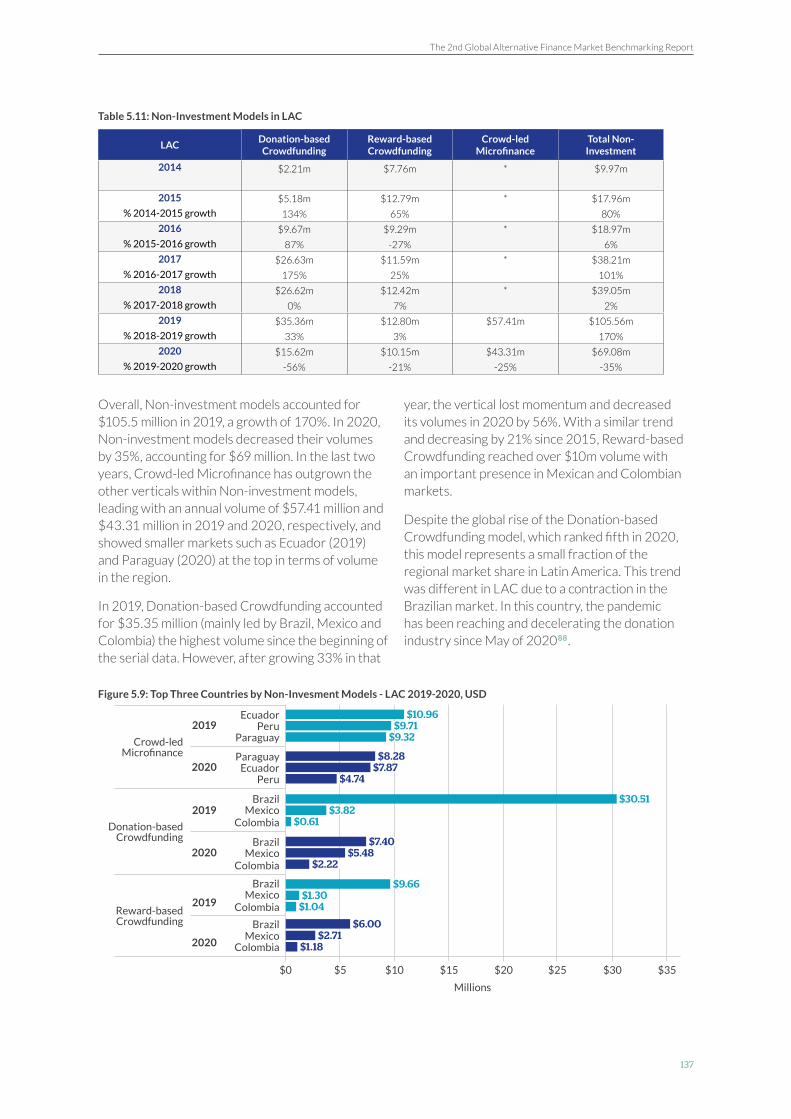
The 2nd Global Alternative Finance Market Benchmarking Report
137
Table 5.11: Non-Investment Models in LAC
LACDonation-based
CrowdfundingReward-based Crowdfunding
Crowd-led Microfinance
Total Non-Investment
2014 $2.21m $7.76m * $9.97m
2015 $5.18m $12.79m * $17.96m
% 2014-2015 growth 134% 65% 80%
2016 $9.67m $9.29m * $18.97m
% 2015-2016 growth 87% -27% 6%
2017 $26.63m $11.59m * $38.21m
% 2016-2017 growth 175% 25% 101%
2018 $26.62m $12.42m * $39.05m
% 2017-2018 growth 0% 7% 2%
2019 $35.36m $12.80m $57.41m $105.56m
% 2018-2019 growth 33% 3% 170%
2020 $15.62m $10.15m $43.31m $69.08m
% 2019-2020 growth -56% -21% -25% -35%
Overall, Non-investment models accounted for $105.5 million in 2019, a growth of 170%. In 2020, Non-investment models decreased their volumes by 35%, accounting for $69 million. In the last two years, Crowd-led Microfinance has outgrown the other verticals within Non-investment models, leading with an annual volume of $57.41 million and $43.31 million in 2019 and 2020, respectively, and showed smaller markets such as Ecuador (2019) and Paraguay (2020) at the top in terms of volume in the region.
In 2019, Donation-based Crowdfunding accounted for $35.35 million (mainly led by Brazil, Mexico and Colombia) the highest volume since the beginning of the serial data. However, after growing 33% in that
year, the vertical lost momentum and decreased its volumes in 2020 by 56%. With a similar trend and decreasing by 21% since 2015, Reward-based Crowdfunding reached over $10m volume with an important presence in Mexican and Colombian markets.
Despite the global rise of the Donation-based Crowdfunding model, which ranked fifth in 2020, this model represents a small fraction of the regional market share in Latin America. This trend was different in LAC due to a contraction in the Brazilian market. In this country, the pandemic has been reaching and decelerating the donation industry since May of 202088.
Figure 5.9: Top Three Countries by Non-Invesment Models - LAC 2019-2020, USD
$0 $20$5 $25$15 $35$10 $30
Colombia
Colombia
Ecuador
Ecuador
Mexico
Peru
Peru
Donation-based Crowdfunding
2020
2019$30.51
$7.40
$3.82
$5.48
$0.61
$2.22
Reward-based Crowdfunding
2020
2019
$9.66$1.30
$1.04
$2.71$6.00
$1.18
Crowd-led Microfinance
2020
2019$10.96
$8.28
$9.71
$7.87
$9.32
$4.74
Millions
Brazil
MexicoBrazil
Paraguay
Paraguay
Colombia
Colombia
Mexico
Mexico
Brazil
Brazil
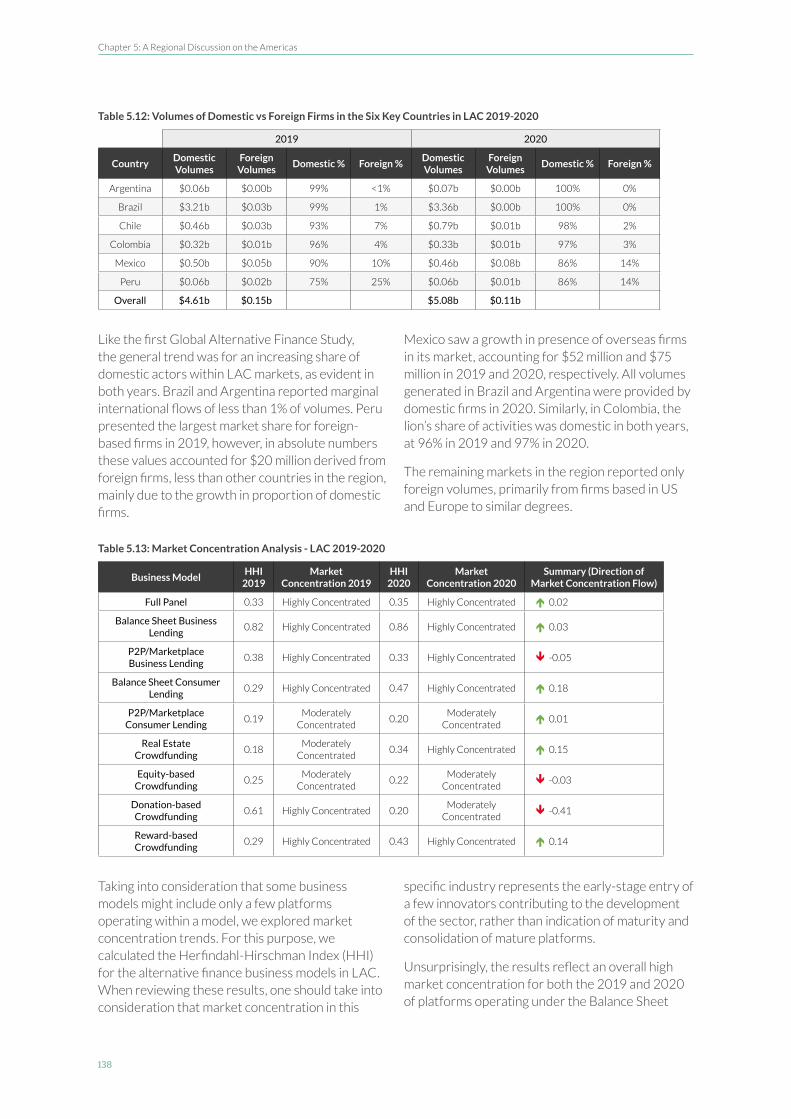
Chapter 5: A Regional Discussion on the Americas
138
Table 5.12: Volumes of Domestic vs Foreign Firms in the Six Key Countries in LAC 2019-2020
2019 2020
CountryDomestic Volumes
Foreign Volumes
Domestic % Foreign %Domestic Volumes
Foreign Volumes
Domestic % Foreign %
Argentina $0.06b $0.00b 99% <1% $0.07b $0.00b 100% 0%
Brazil $3.21b $0.03b 99% 1% $3.36b $0.00b 100% 0%
Chile $0.46b $0.03b 93% 7% $0.79b $0.01b 98% 2%
Colombia $0.32b $0.01b 96% 4% $0.33b $0.01b 97% 3%
Mexico $0.50b $0.05b 90% 10% $0.46b $0.08b 86% 14%
Peru $0.06b $0.02b 75% 25% $0.06b $0.01b 86% 14%
Overall $4.61b $0.15b $5.08b $0.11b
Like the first Global Alternative Finance Study, the general trend was for an increasing share of domestic actors within LAC markets, as evident in both years. Brazil and Argentina reported marginal international flows of less than 1% of volumes. Peru presented the largest market share for foreign-based firms in 2019, however, in absolute numbers these values accounted for $20 million derived from foreign firms, less than other countries in the region, mainly due to the growth in proportion of domestic firms.
Mexico saw a growth in presence of overseas firms in its market, accounting for $52 million and $75 million in 2019 and 2020, respectively. All volumes generated in Brazil and Argentina were provided by domestic firms in 2020. Similarly, in Colombia, the lion’s share of activities was domestic in both years, at 96% in 2019 and 97% in 2020.
The remaining markets in the region reported only foreign volumes, primarily from firms based in US and Europe to similar degrees.
Table 5.13: Market Concentration Analysis - LAC 2019-2020
Business ModelHHI
2019Market
Concentration 2019HHI
2020Market
Concentration 2020Summary (Direction of
Market Concentration Flow)
Full Panel 0.33 Highly Concentrated 0.35 Highly Concentrated 0.02
Balance Sheet Business Lending
0.82 Highly Concentrated 0.86 Highly Concentrated 0.03
P2P/Marketplace Business Lending
0.38 Highly Concentrated 0.33 Highly Concentrated -0.05
Balance Sheet Consumer Lending
0.29 Highly Concentrated 0.47 Highly Concentrated 0.18
P2P/Marketplace Consumer Lending
0.19Moderately
Concentrated0.20
Moderately Concentrated
0.01
Real Estate Crowdfunding
0.18Moderately
Concentrated0.34 Highly Concentrated 0.15
Equity-based Crowdfunding
0.25Moderately
Concentrated0.22
Moderately Concentrated
-0.03
Donation-based Crowdfunding
0.61 Highly Concentrated 0.20Moderately
Concentrated -0.41
Reward-based Crowdfunding
0.29 Highly Concentrated 0.43 Highly Concentrated 0.14
Taking into consideration that some business models might include only a few platforms operating within a model, we explored market concentration trends. For this purpose, we calculated the Herfindahl-Hirschman Index (HHI) for the alternative finance business models in LAC. When reviewing these results, one should take into consideration that market concentration in this
specific industry represents the early-stage entry of a few innovators contributing to the development of the sector, rather than indication of maturity and consolidation of mature platforms.
Unsurprisingly, the results reflect an overall high market concentration for both the 2019 and 2020 of platforms operating under the Balance Sheet

The 2nd Global Alternative Finance Market Benchmarking Report
139
Business Lending, which showed particularly high levels of market concentration.
There was a rise in concentration among platforms offering Balance Sheet Consumer Lending and Real Estate Crowdfunding. The latter, in 2019, was a moderately concentrated model, and in the next year became highly concentrated.
Finally, the market concentration of Non-investment models showed interesting changes in annual comparisons. On the one hand, between 2019 and 2020, Donation-based Crowdfunding market deconcentrated and had a more distributed share of volume among firms. On the other hand, the Reward-based Crowdfunding market became more concentrated.
Business Finance in Latin America & the Caribbean
Figure 5.10: Total Alternative Business Funding Volume in LAC - 2016-2020, USD
In the last five years, online alternative finance volumes directed at business clients, borrowers and issuers in LAC increased considerably. Between 2018 and 2019, the region showed an impressive
growth of more than 260%, jumping from $1.08 billion to $3.97 billion. Between 2019 and 2020 this volume grew by 15%, reaching $4.54 billion. This accounted for just over 85% of all alternative finance volumes raised in the region.
When considering the number of transactions occurring in 2019 (20,000) and 2020 (20,685) compared to 2018, there appears to be a drop in the overall number. However, a high rate of repeat fundraising was observed for key models that contributed to business-focused activities. These included high levels of repeat fundraisers attributed to the Balance Sheet Business Lending model (fig 5.19), which will be discussed in greater detail later in this chapter.
Figure 5.11: Composition of Business Finance - Proportion of Category in LAC 2018-2020
The business finance volume in LAC has been historically driven by Debt-based alternative finance models. In 2020 Debt models represented almost all alternative finance volumes in the region.
$0
$3.5
$1.5
$5.0
$1.0
$2.0
$0.5
$4.0$4.5
$2.5$3.0
2016 2017 2018 2019 2020
Bill
ion
s
0.230.57
1.08
3.974.54
0% 20% 30% 50% 70% 90%10% 60%40% 80% 100%
2020 99%
2019 98%
2018 96% 4%
Debt-based Models Equity-based Models Non Investment-based Models
1%
<1%<1%

Chapter 5: A Regional Discussion on the Americas
140
Table 5.14: Business Finance by Country - LAC 2018-2020, USD
Country Year Debt models Equity models Non-Investment models
Argentina2018 $83.75m $0.21m $0.45m
2019 $4.41m $14.00m $0.31m2020 $0.01m $0.00m $0.01m
Brazil
2018 $122.60m $18.04m $2.76m
2019 $2926.67m $14.00m $2.37m2020 $3198.00m $10.34m $4.01m
Chile
2018 $286.18m $2.63m $0.18m
2019 $486.62m $2.11m $0.03m2020 $800.63m $2.09m $0.02m
Colombia
2018 $149.27m $0.24m $0.09m
2019 $233.68m $1.59m $0.27m2020 $226.92m $0.00m $0.89m
Mexico
2018 $133.89m $16.61m $1.09m
2019 $185.49m $16.30m $6.16m2020 $181.28m $8.91m $1.83m
Peru
2018 $154.47m $0.15m $0.02m
2019 $63.76m $1.00m $1.40m2020 $64.29m $0.00m $1.33m
When analysing the six main markets in LAC, the predominance of Debt-based models within the respective markets can be noted.
Brazil led Debt volumes in the region, accounting for approximately $3 billion in 2019 and $3.2 billion in 2020, which represented over 99% of its
alternative finance market in both years. The same trend was noted in all countries, except Argentina.
The only country where Equity-based models prevailed over Debt-based models was Argentina in 2019. In that year, Equity models accounted for a volume of $21 million.
Market Dynamics
Institutionalisation Across the Region
Figure 5.12: Institutionalisation by Model in Americas
0% 20% 30% 50% 70% 90%10% 60%40% 80% 100%
Institutionalisation Non-institutionalisation
2019
2020
P2P/Marketplace Consumer Lending
2019
2020
P2P/Marketplace Business Lending
2019
2020
Balance Sheet Consumer Lending
2019
2020
Balance Sheet Business Lending
2019
2020
Equity-based Crowdfunding
2019
2020Invoice Trading
70% 30%
93% 7%
95% 5%
99%<1%
8% 92%
75% 25%
89% 11%
96% 4%
68% 32%
67% 33%<1%
100%<1%
100%

The 2nd Global Alternative Finance Market Benchmarking Report
141
Based on 58% and 57% of observations in for 2019 and 2020 respectively, we can document the relative share of institutional funding and investment across key models for the entire Americas dataset. The levels of institutional funding across the region increased in both years for P2P/Marketplace Lending models. The share of institutional funding in P2P/Marketplace Consumer Lending went from 70% in 2019 to 93% in 2020, Similarly, the proportion of institutionally driven volumes for the P2P/Marketplace Business Lending model also increased, from 95% to nearly 100% by 2020.
As for Balance Sheet models, the share of institutional investment for Balance Sheet
Consumer Lending increased from 8% in 2019 to 75% in 2020.
This substantial increase in institutionalisation suggests that institutional investors may be hastening how quickly this model can scale. As more institutional investors participate and supply greater liquidity to borrowers using this model, we will likely continue to see substantive growth of the Balance Sheet Consumer Lending model in coming years.
Institutional investment related to the Balance Sheet Business Lending model also increased, from 89% in 2019 to 96% in 2020.
Internationalisation
Figure 5.13: International Inflow by Model in Americas
Figure 5.14: International Inflow by Region
Based on 52% of responses from platforms in the Americas, Reward-based Crowdfunding reported the highest levels of internationalisation among the models, with 30% of the volume coming from backers and investors outside the platforms’ home market. This rate is largely driven by three Reward-based Crowdfunding platforms, in both North America and LAC.
The rates for the different models are mostly consistent with those reported in 2018, with the highest inbound cross-border activity registered
through specific Debt models, such as Invoice Trading, and Non-investment models, such as Reward-based Crowdfunding and Donation-based Crowdfunding.
As for the region, Canada shows higher levels of cross-border activity, with a 12% inflow rate, followed by LAC with 5% and finally the US with 4%. When analysing the inflow rate in LAC by model, most models reported low rates of funding from cross-border transactions, except for Crowd-led Microfinance and Reward-based Crowdfunding.
0% 10% 15% 25% 35%5% 30%20%
7%
30%
15%
3%
14%
6%
2%
Donation-based Crowdfunding
Invoice Trading
Reward-based Crowdfunding
Balance Sheet Business Lending
P2P/Marketplace Business Lending
Balance Sheet Consumer Lending
P2P/Marketplace Consumer Lending
0% 4% 6% 10% 14%2% 12%8%
4%
5%
12%
US
LAC
Canada
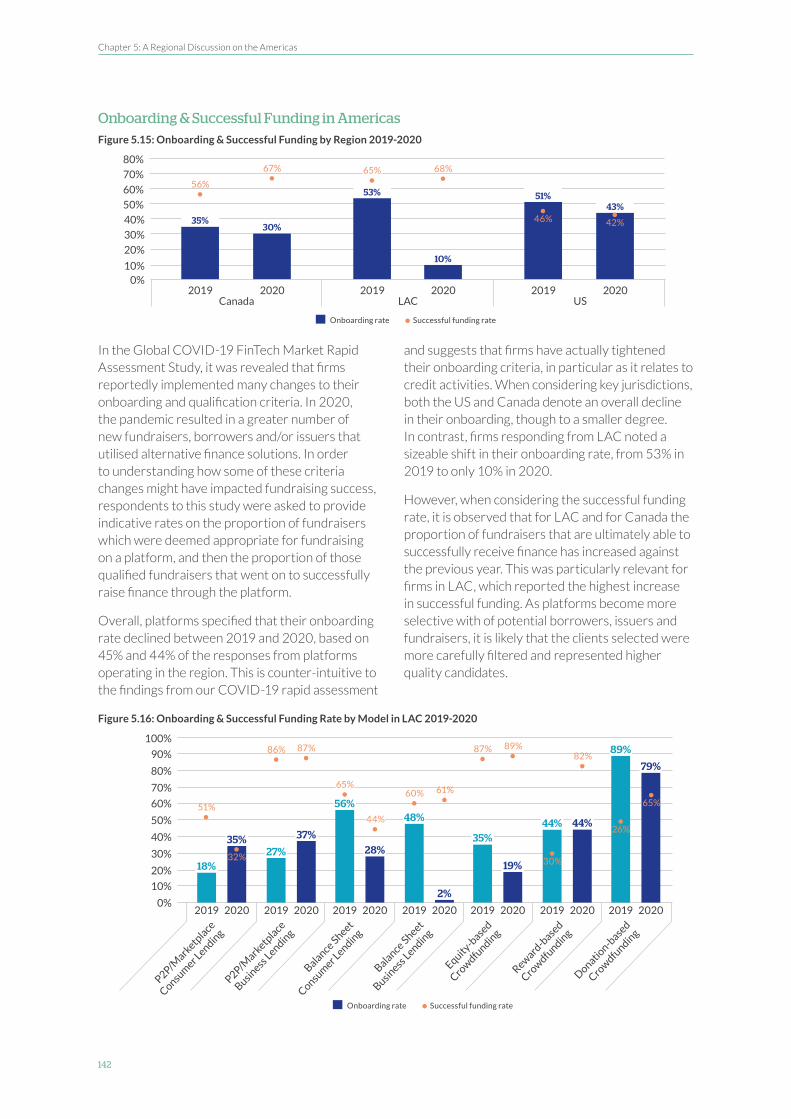
Chapter 5: A Regional Discussion on the Americas
142
Onboarding & Successful Funding in AmericasFigure 5.15: Onboarding & Successful Funding by Region 2019-2020
In the Global COVID-19 FinTech Market Rapid Assessment Study, it was revealed that firms reportedly implemented many changes to their onboarding and qualification criteria. In 2020, the pandemic resulted in a greater number of new fundraisers, borrowers and/or issuers that utilised alternative finance solutions. In order to understanding how some of these criteria changes might have impacted fundraising success, respondents to this study were asked to provide indicative rates on the proportion of fundraisers which were deemed appropriate for fundraising on a platform, and then the proportion of those qualified fundraisers that went on to successfully raise finance through the platform.
Overall, platforms specified that their onboarding rate declined between 2019 and 2020, based on 45% and 44% of the responses from platforms operating in the region. This is counter-intuitive to the findings from our COVID-19 rapid assessment
and suggests that firms have actually tightened their onboarding criteria, in particular as it relates to credit activities. When considering key jurisdictions, both the US and Canada denote an overall decline in their onboarding, though to a smaller degree. In contrast, firms responding from LAC noted a sizeable shift in their onboarding rate, from 53% in 2019 to only 10% in 2020.
However, when considering the successful funding rate, it is observed that for LAC and for Canada the proportion of fundraisers that are ultimately able to successfully receive finance has increased against the previous year. This was particularly relevant for firms in LAC, which reported the highest increase in successful funding. As platforms become more selective with of potential borrowers, issuers and fundraisers, it is likely that the clients selected were more carefully filtered and represented higher quality candidates.
Figure 5.16: Onboarding & Successful Funding Rate by Model in LAC 2019-2020
0%
40%
20%
60%
80%
10%
50%
70%
30%
2019 2019
53% 51%
2020 2020
10%
43%
2019
35%
2020
30%46% 42%
67%
56%
65% 68%
Onboarding rate Successful funding rate
Canada LAC US
70%
100%
50%
80%
60%
90%
40%
30%
20%
10%
0%
18%
35%
56%
89%
27%
44%48%
35%
19%
28%
79%
37%44%
2%
32% 30%
26%
65%
87%
65%
86% 87%
60%
51%
89%
44%
82%
61%
Onboarding rate Successful funding rate
P2P/Mark
etplace
Consumer L
ending
Equity-b
ased
Crow
dfundin
g
Balance Sheet
Consumer L
ending
Donation-b
ased
Crow
dfundin
g
P2P/Mark
etplace
Business Lendin
g
Reward
-based
Crow
dfundin
g
Balance Sheet
Business Lendin
g
2019 20192019 20192019 201920192020 20202020 20202020 20202020

The 2nd Global Alternative Finance Market Benchmarking Report
143
When looking specifically at the LAC region, onboarding and successful funding rates of specific models vary considerably and allow for us to assess how specific models are evolving from one year to another, and particularly during a pandemic context. In general, most models reported tighter onboarding rates in 2020, with the only exception from P2P/Marketplace Consumer and Business Lending.
For P2P/ Marketplace Consumer Lending, onboarding rates went from 18% in 2019 to 35% in 2020, and for P2P/Marketplace Business Lending onboarding rates went from 27% to 37%.
Of the remaining models, two models show no changes in the onboarding rates and three reported a lower rate.
Repeat Funder and Fundraiser Activity in AmericasFigure 5.17: Repeat Funders by Region 2019-2020
The repeat funder rate remained mostly unchanged across the different sub-regions, with Canada and LAC showing relatively small decreases and the US reporting a 9% increase, the largest increase from the region. Here, while the decrease in LAC was more likely to be the result of sectoral
expansion and entry of new funders into the cycle, the decrease in Canada was more likely due to a combination of growing apprehension about riskiness of investments in times of COVID-19, as well as lower region-specific response rates compared to earlier surveys.
Figure 5.18: Repeat Funders by Model in LAC 2019-2020
As previously mentioned, on a sub-regional level, a decrease was observed in the repeat funder rate in LAC. This trend was observed across the different models. P2P/Marketplace Consumer Lending and Equity-based Crowdfunding were the exceptions to
this trend, as they experienced an increase in repeat funders, growing from 30% to 86% and 39% to 58% between 2019 and 2020, respectively.
0% 20% 30% 70%50% 90%10% 60% 100%40% 80%
2019 2020
91%
82%US
51%
54%LAC
38%
41%Canada
0% 20% 50% 70% 90% 100%10% 60% 80%40%30%
39%
76%
46%
30%
87%
23%
58%
63%
28%
86%
25%
20%
Equity-based Crowdfunding
P2P/Marketplace Business Lending
Reward-based Crowdfunding
P2P/Marketplace Consumer Lending
Balance Sheet Consumer Lending
Donation-based Crowdfunding
2019
2019
2019
2019
2019
2019
2020
2020
2020
2020
2020
2020

Chapter 5: A Regional Discussion on the Americas
144
Figure 5.19: Repeat Fundraisers by Region 2019-2020
Regarding the repeat fundraiser activity across the Americas, we observed drops in Canada and the US, falling from 53% to 39% and from 48% to 12%, respectively. This indicates platforms have seen
increases in new fundraising customers. No change was observed in LAC, where the rate kept level at 76% in both years.
Figure 5.20: Repeat Fundraisers by Model in LAC 2019-2020
On a sub-regional level, a slight increase in the repeat fundraiser rate was observed, which was primarily driven by three different models. P2P/Marketplace Business Lending increased from 30% to 48%, Equity-based Crowdfunding from 6% to 39%, and Donation-based Crowdfunding from 19% to 23% between 2019 and 2020.
The remaining models saw decreases in repeat fundraiser rate, with the exception of Balance Sheet Business Lending, which remained unchanged between these two years.
0% 20% 30% 70%50%10% 60%40% 80%
2019 2020
12%
48%US
76%
76%LAC
39%
53%Canada
0% 20% 50% 70% 90%10% 60% 80%40%30%
6%
31%
61%
45%
30%
79%
19%
39%
27%
48%
28%
48%
79%
23%
Equity-based Crowdfunding
P2P/Marketplace Consumer Lending
Balance Sheet Consumer Lending
Reward-based Crowdfunding
P2P/Marketplace Business Lending
Balance Sheet Business Lending
Donation-based Crowdfunding
2019
2019
2019
2019
2019
2019
2019
2020
2020
2020
2020
2020
2020
2020

The 2nd Global Alternative Finance Market Benchmarking Report
145
Financial Inclusion
Figure 5.21: Banking Status by Region
When considering the ‘banked’ status of borrowers and fundraiser using alternative finance models in the Americas region, the vast majority of users have been identified as banked or underbanked.
In Canada, firms indicated that 37% of users would most accurately be categorised as underbanked, with the remaining 63% as banked. Unlike the findings from 2018, where 84% underbanked, current findings suggest that alternative finance models are predominantly catering to users that are fully banked.
In LAC, the proportion of users that would be categorised as Banked rose to 86%, a substantial increase when considering the 2018 findings (63%). The region also saw a decline in the proportions of users that could be categorised as unbanked or
underbanked, with this study reporting that only 3% could be categorised as unbanked and 11% as underbanked. This suggests that, alternative finance models are perhaps not addressing concerns of financial exclusion to the extent of previous years.
Finally, the proportion of US-based banked users remained unchanged from 2018, however, the percentage of under banked users increased by 2%, from 26% to 28% in this year’s report. Also, as noted earlier, the business lending market observed an overall 108% rise in 2020. These findings jointly suggest that both in absolute and relative terms, alternative finance platforms have catered to more underbanked customers in these years than ever before. This trend is supported by the recent NBER report89, which corroborated that FinTechs mostly expanded the overall supply of financial services.
Gender
Figure 5.22: Female Funder Rate by Region, 2019-2020
Decreases in the female funder rate between 2019 and 2020 were observed across the sub-regions. In Canada, where the highest sub-regional female funder rate was observed, there was a slight decrease from 48% in 2019 to 47% in 2020.
In LAC, this rate decreased from 27% to 23% between the same period. Finally, in the US, 44% of funders were female in 2019 and this decreased to 36% in 2020.
0% 10% 20% 30% 40% 50% 60% 70% 80% 90% 100
28%
37%
11%3%
72%
86%
63%
US
LAC
Canada
Unbanked Underbanked Banked
<1%
<1%
0% 20% 30% 50%10% 40%
2019 2020
36%
44%US
23%
27%LAC
47%
48%Canada
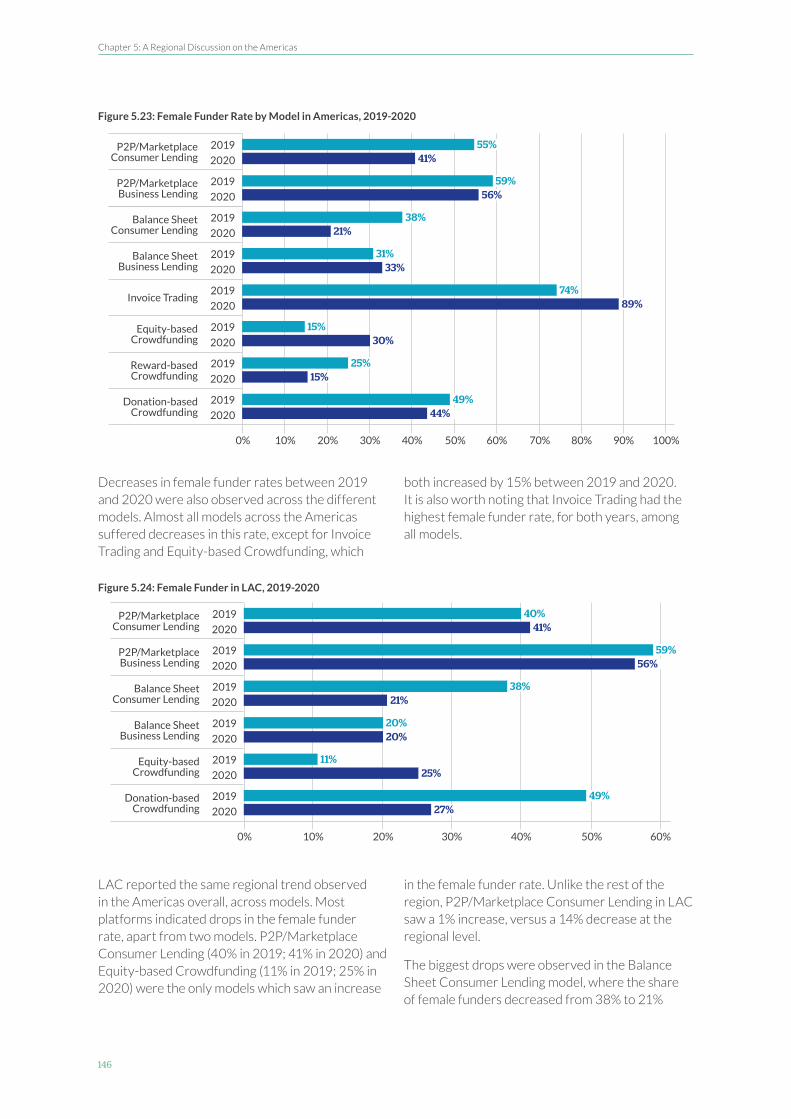
Chapter 5: A Regional Discussion on the Americas
146
Figure 5.23: Female Funder Rate by Model in Americas, 2019-2020
Decreases in female funder rates between 2019 and 2020 were also observed across the different models. Almost all models across the Americas suffered decreases in this rate, except for Invoice Trading and Equity-based Crowdfunding, which
both increased by 15% between 2019 and 2020. It is also worth noting that Invoice Trading had the highest female funder rate, for both years, among all models.
Figure 5.24: Female Funder in LAC, 2019-2020
LAC reported the same regional trend observed in the Americas overall, across models. Most platforms indicated drops in the female funder rate, apart from two models. P2P/Marketplace Consumer Lending (40% in 2019; 41% in 2020) and Equity-based Crowdfunding (11% in 2019; 25% in 2020) were the only models which saw an increase
in the female funder rate. Unlike the rest of the region, P2P/Marketplace Consumer Lending in LAC saw a 1% increase, versus a 14% decrease at the regional level.
The biggest drops were observed in the Balance Sheet Consumer Lending model, where the share of female funders decreased from 38% to 21%
0% 20% 50% 70% 90% 100%10% 60% 80%40%30%
15%
31%
59%
25%
38%
55%
74%
49%
30%
33%
56%
15%
21%
41%
89%
44%
Equity-based Crowdfunding
Balance Sheet Business Lending
P2P/Marketplace Business Lending
Reward-based Crowdfunding
Balance Sheet Consumer Lending
P2P/Marketplace Consumer Lending
Invoice Trading
Donation-based Crowdfunding
2019
2019
2019
2019
2019
2019
2019
2019
2020
2020
2020
2020
2020
2020
2020
2020
0% 20% 50%10% 60%40%30%
20%
59%
11%
40%
38%
49%
20%
56%
25%
41%
21%
27%
Balance Sheet Business Lending
P2P/Marketplace Business Lending
Equity-based Crowdfunding
P2P/Marketplace Consumer Lending
Balance Sheet Consumer Lending
Donation-based Crowdfunding
2019
2019
2019
2019
2019
2019
2020
2020
2020
2020
2020
2020
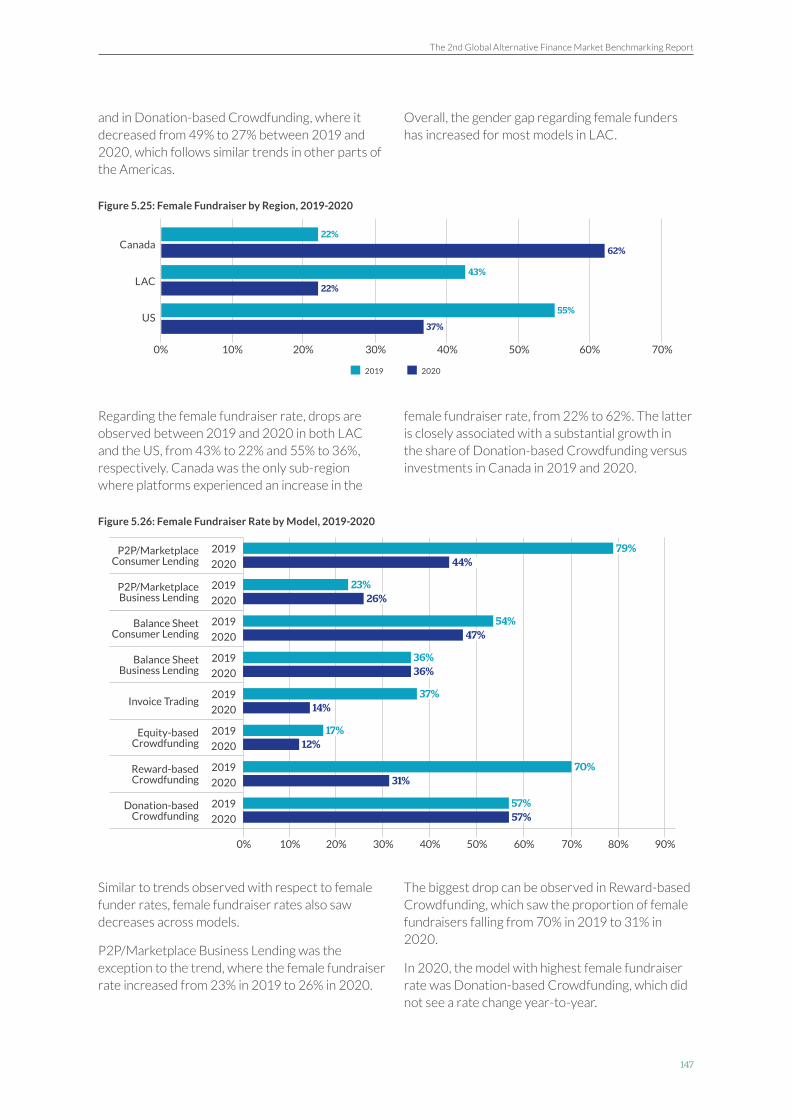
The 2nd Global Alternative Finance Market Benchmarking Report
147
and in Donation-based Crowdfunding, where it decreased from 49% to 27% between 2019 and 2020, which follows similar trends in other parts of the Americas.
Overall, the gender gap regarding female funders has increased for most models in LAC.
Figure 5.25: Female Fundraiser by Region, 2019-2020
Regarding the female fundraiser rate, drops are observed between 2019 and 2020 in both LAC and the US, from 43% to 22% and 55% to 36%, respectively. Canada was the only sub-region where platforms experienced an increase in the
female fundraiser rate, from 22% to 62%. The latter is closely associated with a substantial growth in the share of Donation-based Crowdfunding versus investments in Canada in 2019 and 2020.
Figure 5.26: Female Fundraiser Rate by Model, 2019-2020
Similar to trends observed with respect to female funder rates, female fundraiser rates also saw decreases across models.
P2P/Marketplace Business Lending was the exception to the trend, where the female fundraiser rate increased from 23% in 2019 to 26% in 2020.
The biggest drop can be observed in Reward-based Crowdfunding, which saw the proportion of female fundraisers falling from 70% in 2019 to 31% in 2020.
In 2020, the model with highest female fundraiser rate was Donation-based Crowdfunding, which did not see a rate change year-to-year.
0% 20% 30% 70%50%10% 60%40%
2019 2020
37%
55%US
22%
43%LAC
62%
22%Canada
0% 20% 50% 70% 90%10% 60% 80%40%30%
17%
36%
23%
70%
54%
79%
37%
57%
12%
36%
26%
31%
47%
44%
14%
57%
Equity-based Crowdfunding
Balance Sheet Business Lending
P2P/Marketplace Business Lending
Reward-based Crowdfunding
Balance Sheet Consumer Lending
P2P/Marketplace Consumer Lending
Invoice Trading
Donation-based Crowdfunding
2019
2019
2019
2019
2019
2019
2019
2019
2020
2020
2020
2020
2020
2020
2020
2020
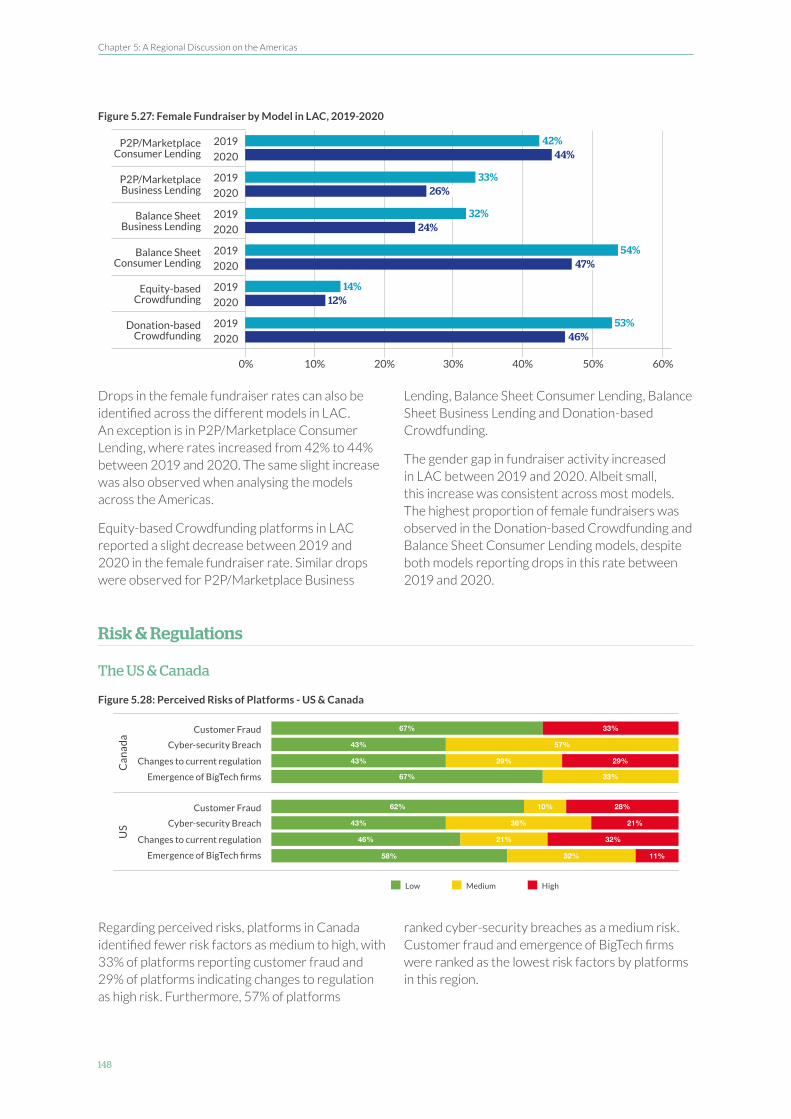
Chapter 5: A Regional Discussion on the Americas
148
Figure 5.27: Female Fundraiser by Model in LAC, 2019-2020
Drops in the female fundraiser rates can also be identified across the different models in LAC. An exception is in P2P/Marketplace Consumer Lending, where rates increased from 42% to 44% between 2019 and 2020. The same slight increase was also observed when analysing the models across the Americas.
Equity-based Crowdfunding platforms in LAC reported a slight decrease between 2019 and 2020 in the female fundraiser rate. Similar drops were observed for P2P/Marketplace Business
Lending, Balance Sheet Consumer Lending, Balance Sheet Business Lending and Donation-based Crowdfunding.
The gender gap in fundraiser activity increased in LAC between 2019 and 2020. Albeit small, this increase was consistent across most models. The highest proportion of female fundraisers was observed in the Donation-based Crowdfunding and Balance Sheet Consumer Lending models, despite both models reporting drops in this rate between 2019 and 2020.
Risk & Regulations
The US & Canada
Figure 5.28: Perceived Risks of Platforms - US & Canada
Regarding perceived risks, platforms in Canada identified fewer risk factors as medium to high, with 33% of platforms reporting customer fraud and 29% of platforms indicating changes to regulation as high risk. Furthermore, 57% of platforms
ranked cyber-security breaches as a medium risk. Customer fraud and emergence of BigTech firms were ranked as the lowest risk factors by platforms in this region.
0% 20% 50%10% 60%40%30%
54%
33%
14%
42%
32%
53%
47%
26%
12%
44%
24%
46%
Balance Sheet Consumer Lending
P2P/Marketplace Business Lending
Equity-based Crowdfunding
P2P/Marketplace Consumer Lending
Balance Sheet Business Lending
Donation-based Crowdfunding
2019
2019
2019
2019
2019
2019
2020
2020
2020
2020
2020
2020
Customer Fraud
Customer Fraud
Cyber-security Breach
Cyber-security Breach
Emergence of BigTech firms
Emergence of BigTech firms
Changes to current regulation
Changes to current regulation
Low Medium High
US
Can
ada
67% 33%
43% 57%
43% 29% 29%
67% 33%
62% 10% 28%
43% 36% 21%
46% 21% 32%
58% 32% 11%

The 2nd Global Alternative Finance Market Benchmarking Report
149
Like Canada, platforms in the US reported fewer risk factors as medium to high. Nearly one third of platforms indicated changes to regulation as a high risk. Risks associated with cyber-security
breaches and entry of BigTech firms were reported as a medium risk by 36% and 32% of US platforms, respectively. Furthermore, US firms reported customer fraud as the lowest risk factor.
Figure 5.29: Perception towards FinTech Regulation Debt & Equity Models – US & Canada 2019-2020
The majority of platforms in the US and Canada indicated that regulation was adequate and appropriate for their platform activities in 2019. For Debt models, this was reported by 69% of respondents and for Equity models it was reported by 86% of respondents.
In 2020, all Equity model platforms surveyed considered regulation adequate for their platforms.
However, 25% of Debt-model platforms reported that regulation was excessive and too strict for their platform activities, a significant growth in this perception.
Figure 5.30: Regulatory Authorisation for Debt & Equity Models - US & Canada 2019-2020
More than half of Debt-model respondents indicated that their platforms was authorised in their jurisdiction in both years. For Equity model platforms, reporting was unanimous in viewing regulation as adequate in 2020, growing from 86% in 2019.
In both years, more than 40% of Debt-model platforms responded that regulatory authorisation is not required for their business activities.
Latin America & the Caribbean
Figure 5.31: Perceived Risks of Platforms - LAC
69% 9%9% 13%
50% 25%25%
86%
100%
14%
Debt Models
Equity Models
2019
2020
2019
2020
Adequate and appropriate for my platform activities Inadequate and too relaxed for my platform activities
Excessive and too strict for my platform activities No Specific Regulation and not needed
No Specific Regulation and needed Alternative finance (including crowdfunding & P2P lending) is not currently legalized in my country
53% 45%3%
58% 42%
86%
100%
14%
Debt Models
Equity Models
2019
2020
2019
2020
My platform is authorized in my jurisdiction
My platform is not authorized but has interim permissions to operate in my jurisdiction.
My platform is not authorized but has a relationship with another licensed institution (ie Appointed Representative) that serves as our agent
Regulatory Authorization is not required for my business activities
Customer Fraud
Cyber-security Breach
Emergence of BigTech firms
Changes to current regulation
Low Medium High
LA
C
53% 18% 29%
45% 30% 25%
30% 26% 44%
51% 40% 9%
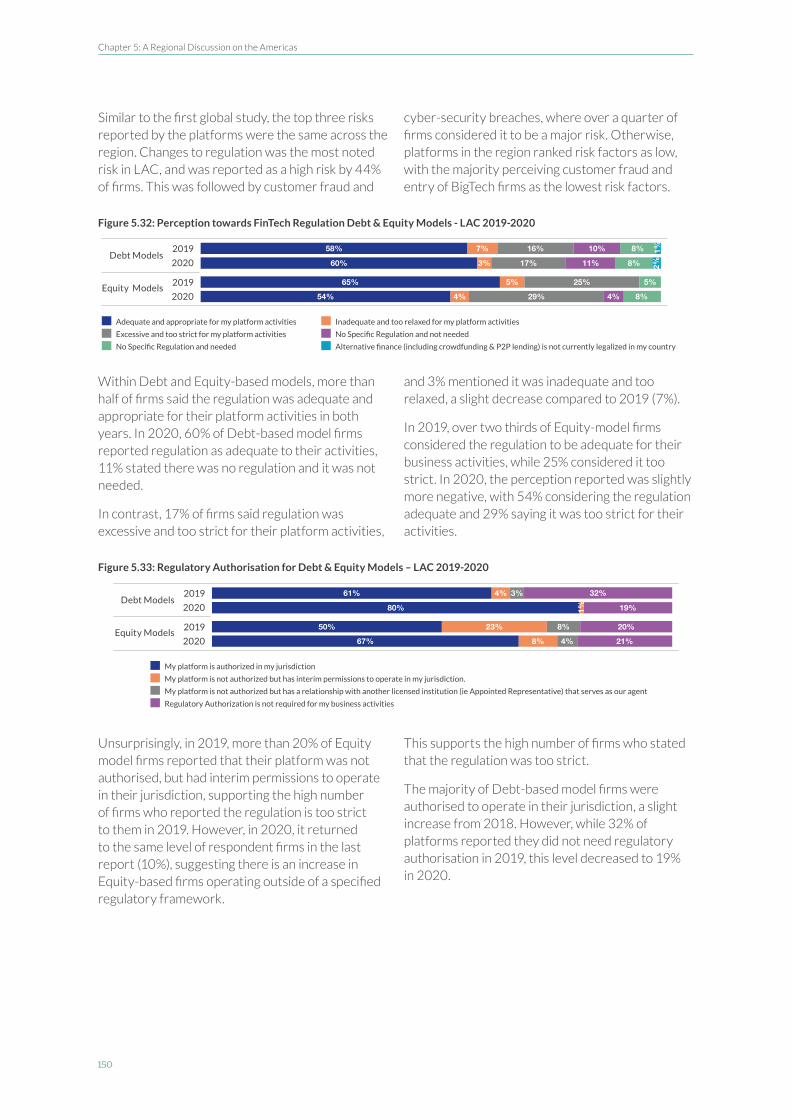
Chapter 5: A Regional Discussion on the Americas
150
Similar to the first global study, the top three risks reported by the platforms were the same across the region. Changes to regulation was the most noted risk in LAC, and was reported as a high risk by 44% of firms. This was followed by customer fraud and
cyber-security breaches, where over a quarter of firms considered it to be a major risk. Otherwise, platforms in the region ranked risk factors as low, with the majority perceiving customer fraud and entry of BigTech firms as the lowest risk factors.
Figure 5.32: Perception towards FinTech Regulation Debt & Equity Models - LAC 2019-2020
Within Debt and Equity-based models, more than half of firms said the regulation was adequate and appropriate for their platform activities in both years. In 2020, 60% of Debt-based model firms reported regulation as adequate to their activities, 11% stated there was no regulation and it was not needed.
In contrast, 17% of firms said regulation was excessive and too strict for their platform activities,
and 3% mentioned it was inadequate and too relaxed, a slight decrease compared to 2019 (7%).
In 2019, over two thirds of Equity-model firms considered the regulation to be adequate for their business activities, while 25% considered it too strict. In 2020, the perception reported was slightly more negative, with 54% considering the regulation adequate and 29% saying it was too strict for their activities.
Figure 5.33: Regulatory Authorisation for Debt & Equity Models – LAC 2019-2020
Unsurprisingly, in 2019, more than 20% of Equity model firms reported that their platform was not authorised, but had interim permissions to operate in their jurisdiction, supporting the high number of firms who reported the regulation is too strict to them in 2019. However, in 2020, it returned to the same level of respondent firms in the last report (10%), suggesting there is an increase in Equity-based firms operating outside of a specified regulatory framework.
This supports the high number of firms who stated that the regulation was too strict.
The majority of Debt-based model firms were authorised to operate in their jurisdiction, a slight increase from 2018. However, while 32% of platforms reported they did not need regulatory authorisation in 2019, this level decreased to 19% in 2020.
58% 7% 16% 8%10%
60% 3% 11%17% 8%
65% 5% 25% 5%
54% 4% 8%4%29%
Debt Models
Equity Models
2019
2020
2019
2020
2%1%
Adequate and appropriate for my platform activities Inadequate and too relaxed for my platform activities
Excessive and too strict for my platform activities No Specific Regulation and not needed
No Specific Regulation and needed Alternative finance (including crowdfunding & P2P lending) is not currently legalized in my country
61% 4% 3%
80%
50% 23% 8% 20%
32%
19%
67% 8% 21%4%
Debt Models
Equity Models
2019
2020
2019
2020
1%
My platform is authorized in my jurisdiction
My platform is not authorized but has interim permissions to operate in my jurisdiction.
My platform is not authorized but has a relationship with another licensed institution (ie Appointed Representative) that serves as our agent
Regulatory Authorization is not required for my business activities

The 2nd Global Alternative Finance Market Benchmarking Report
151

The 2nd Global Alternative Finance Market Benchmarking Report
152
6. A Regional Discussion on The Middle East and North Africa

Chapter 6: A Regional Discussion on the Middle East and North Africa
153
Chapter 6: A Regional Discussion on the Middle East and North Africa
IntroductionThis chapter discusses the online alternative finance industry in the Middle East and North Africa (MENA) region. A total of 19 countries were included in the analysis. In the Middle East, 15 countries participated in the study including Afghanistan, Bahrain, Iran, Iraq, Israel, Jordan, Kuwait, Lebanon, Oman, Palestine, Qatar, Saudi Arabia, Syria, the United Arab Emirates (UAE), and Yemen. In North Africa, four countries participated including Algeria, Egypt, Morocco, and Tunisia. No volumes were reported for Libya and Sudan.
The previous benchmarking report combined North
African countries in an African chapter, but for this report these countries were analysed as part of a MENA regional chapter. This decision was made due to closer institutional, cultural, and economic anchoring of Northern African economies in the Middle East and the Mediterranean Basin rather than in Sub-Saharan Africa. These difference also translate into varying characteristics and development of the alternative finance sector. One of these main differences is the prevalence of overseas-based platform activity in SSA, as opposed to the mostly domestic-based platform activity in MENA.
Total Regional VolumeThe MENA region has experienced an impressive growth in alternative finance activities between 2013 and 2018. In this period, the region’s total alternative finance volumes grew from $36 million to $802 million, which translates into an average annual growth rate of 93%. However, over the past two years, the region has seen a decline in alternative finance volumes. Between 2018 and 2019, the total funds raised in the region declined by 6% from $802 million in 2018 to $764 million 2019 with a further 22% decline in 2020 to $595 million.
A major part of the decline is likely to be superficial and resulting from the non-participation of platforms in the 2019 and 2020 survey, while participating in the 2018 survey. Overall, in MENA, a total of 84 platforms responded in 2018, 78 platforms did so in 2019, and 76 platforms responded in 2020. The joint volumes of the platforms which did not participate amounted to $38 million in 2018, likely to explain the majority of the funding gaps in later years.90
As one of the key hubs for Islamic Finance, a number of platforms intermediating access to finance according to Islamic principles exist in MENA region. However, some of these financial intermediaries do not consider themselves as alternative finance, as they are subsidiaries of traditional capital market stakeholders. Therefore, these platforms were not captured in this survey.
Due to the circumstances brought forth by COVID-19 in 2020, the response rate from MENA was lower than expected. Lastly, P2P/Marketplace Property Lending volumes, which accounted for more than 50% of the total volume in 2018, 2019 and 2020 declined substantially. The model volumes declined by $157 million between 2018 and 2019, and declined by an additional $100 million between 2019 and 2020, which could further explain the decline in total volumes presented in this report.
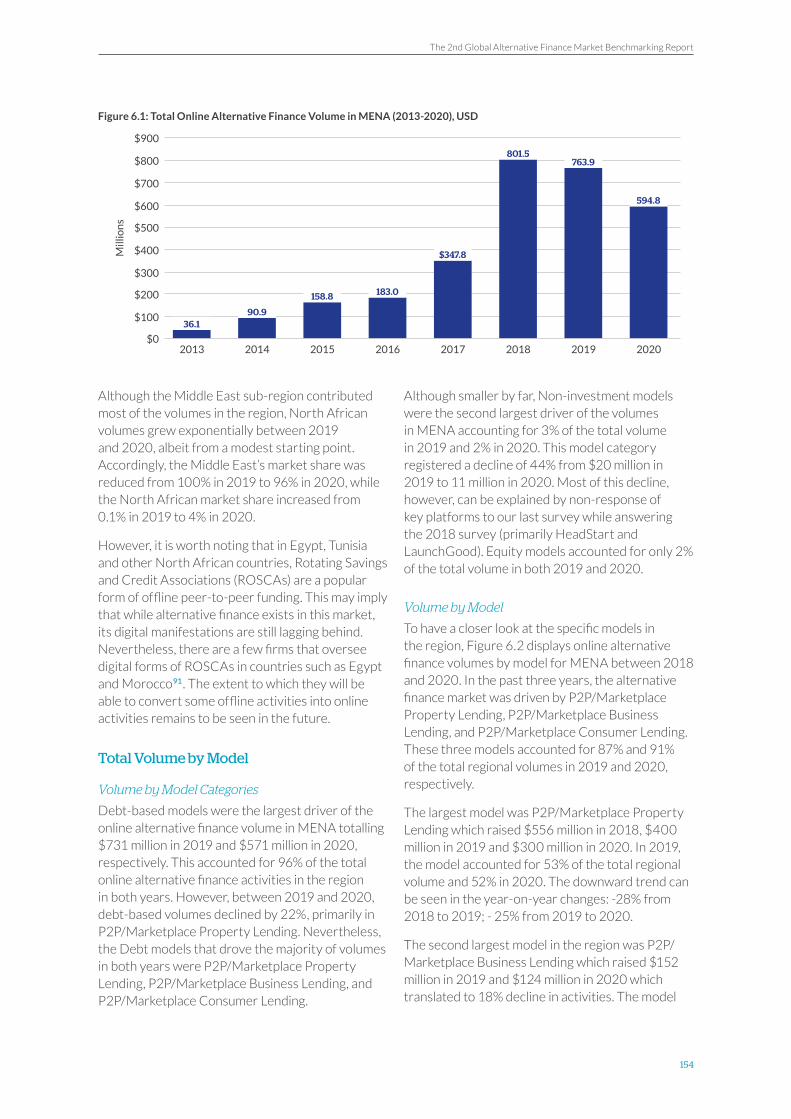
The 2nd Global Alternative Finance Market Benchmarking Report
154
Figure 6.1: Total Online Alternative Finance Volume in MENA (2013-2020), USD
Although the Middle East sub-region contributed most of the volumes in the region, North African volumes grew exponentially between 2019 and 2020, albeit from a modest starting point. Accordingly, the Middle East’s market share was reduced from 100% in 2019 to 96% in 2020, while the North African market share increased from 0.1% in 2019 to 4% in 2020.
However, it is worth noting that in Egypt, Tunisia and other North African countries, Rotating Savings and Credit Associations (ROSCAs) are a popular form of offline peer-to-peer funding. This may imply that while alternative finance exists in this market, its digital manifestations are still lagging behind. Nevertheless, there are a few firms that oversee digital forms of ROSCAs in countries such as Egypt and Morocco91. The extent to which they will be able to convert some offline activities into online activities remains to be seen in the future.
Total Volume by Model
Volume by Model Categories
Debt-based models were the largest driver of the online alternative finance volume in MENA totalling $731 million in 2019 and $571 million in 2020, respectively. This accounted for 96% of the total online alternative finance activities in the region in both years. However, between 2019 and 2020, debt-based volumes declined by 22%, primarily in P2P/Marketplace Property Lending. Nevertheless, the Debt models that drove the majority of volumes in both years were P2P/Marketplace Property Lending, P2P/Marketplace Business Lending, and P2P/Marketplace Consumer Lending.
Although smaller by far, Non-investment models were the second largest driver of the volumes in MENA accounting for 3% of the total volume in 2019 and 2% in 2020. This model category registered a decline of 44% from $20 million in 2019 to 11 million in 2020. Most of this decline, however, can be explained by non-response of key platforms to our last survey while answering the 2018 survey (primarily HeadStart and LaunchGood). Equity models accounted for only 2% of the total volume in both 2019 and 2020.
Volume by Model
To have a closer look at the specific models in the region, Figure 6.2 displays online alternative finance volumes by model for MENA between 2018 and 2020. In the past three years, the alternative finance market was driven by P2P/Marketplace Property Lending, P2P/Marketplace Business Lending, and P2P/Marketplace Consumer Lending. These three models accounted for 87% and 91% of the total regional volumes in 2019 and 2020, respectively.
The largest model was P2P/Marketplace Property Lending which raised $556 million in 2018, $400 million in 2019 and $300 million in 2020. In 2019, the model accounted for 53% of the total regional volume and 52% in 2020. The downward trend can be seen in the year-on-year changes: -28% from 2018 to 2019; - 25% from 2019 to 2020.
The second largest model in the region was P2P/Marketplace Business Lending which raised $152 million in 2019 and $124 million in 2020 which translated to 18% decline in activities. The model
$0
$400
$200
$600
$800
$900
$100
$500
$700
$300
2015
158.8
2017
$347.8
2019
763.9
2016
183.0
2018
801.5
2020
594.8
2013
36.1
2014
90.9
Mill
ion
s
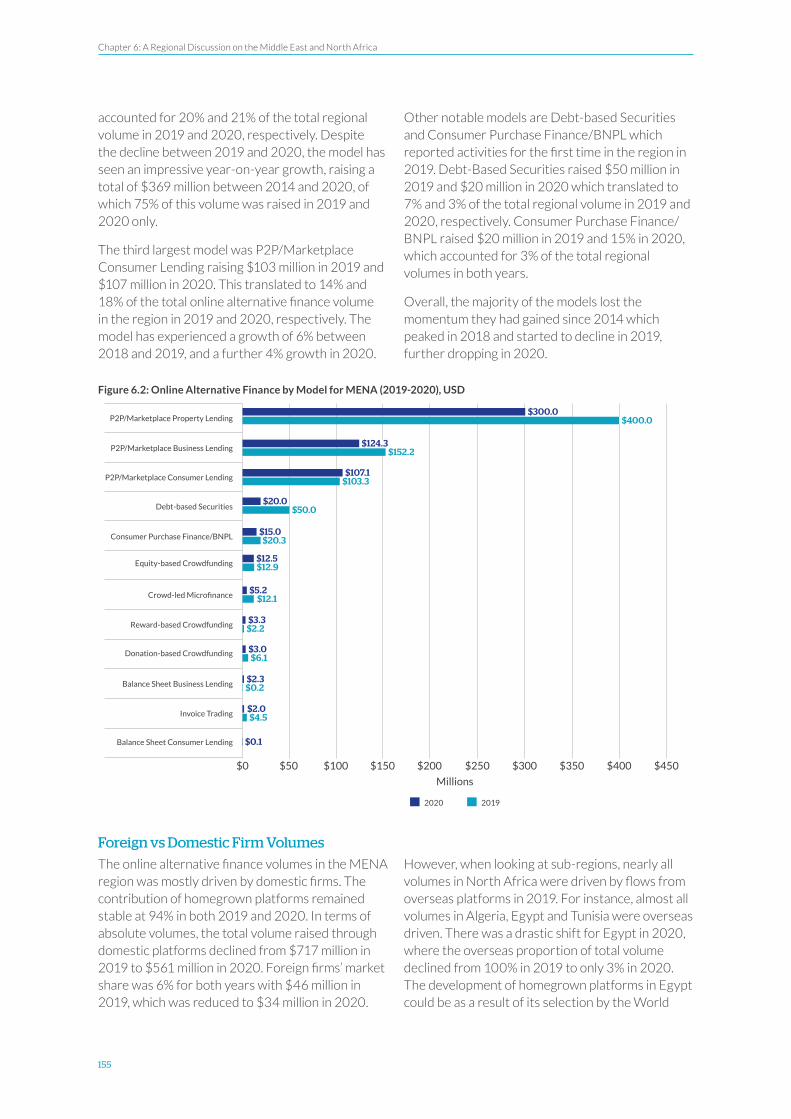
Chapter 6: A Regional Discussion on the Middle East and North Africa
155
accounted for 20% and 21% of the total regional volume in 2019 and 2020, respectively. Despite the decline between 2019 and 2020, the model has seen an impressive year-on-year growth, raising a total of $369 million between 2014 and 2020, of which 75% of this volume was raised in 2019 and 2020 only.
The third largest model was P2P/Marketplace Consumer Lending raising $103 million in 2019 and $107 million in 2020. This translated to 14% and 18% of the total online alternative finance volume in the region in 2019 and 2020, respectively. The model has experienced a growth of 6% between 2018 and 2019, and a further 4% growth in 2020.
Other notable models are Debt-based Securities and Consumer Purchase Finance/BNPL which reported activities for the first time in the region in 2019. Debt-Based Securities raised $50 million in 2019 and $20 million in 2020 which translated to 7% and 3% of the total regional volume in 2019 and 2020, respectively. Consumer Purchase Finance/BNPL raised $20 million in 2019 and 15% in 2020, which accounted for 3% of the total regional volumes in both years.
Overall, the majority of the models lost the momentum they had gained since 2014 which peaked in 2018 and started to decline in 2019, further dropping in 2020.
Figure 6.2: Online Alternative Finance by Model for MENA (2019-2020), USD
Foreign vs Domestic Firm Volumes
The online alternative finance volumes in the MENA region was mostly driven by domestic firms. The contribution of homegrown platforms remained stable at 94% in both 2019 and 2020. In terms of absolute volumes, the total volume raised through domestic platforms declined from $717 million in 2019 to $561 million in 2020. Foreign firms’ market share was 6% for both years with $46 million in 2019, which was reduced to $34 million in 2020.
However, when looking at sub-regions, nearly all volumes in North Africa were driven by flows from overseas platforms in 2019. For instance, almost all volumes in Algeria, Egypt and Tunisia were overseas driven. There was a drastic shift for Egypt in 2020, where the overseas proportion of total volume declined from 100% in 2019 to only 3% in 2020. The development of homegrown platforms in Egypt could be as a result of its selection by the World
$50 $100 $300$150 $200 $350 $400 $450$0 $250
$152.2P2P/Marketplace Business Lending$124.3
Millions
2020 2019
$400.0P2P/Marketplace Property Lending$300.0
$103.3P2P/Marketplace Consumer Lending$107.1
$12.9Equity-based Crowdfunding$12.5
$20.3Consumer Purchase Finance/BNPL$15.0
$2.2
$4.5
Reward-based Crowdfunding
Invoice Trading
$3.3
$2.0
$50.0Debt-based Securities$20.0
$12.1
$0.2
Crowd-led Microfinance
Balance Sheet Business Lending
$5.2
$2.3
$6.1Donation-based Crowdfunding
Balance Sheet Consumer Lending
$3.0
$0.1
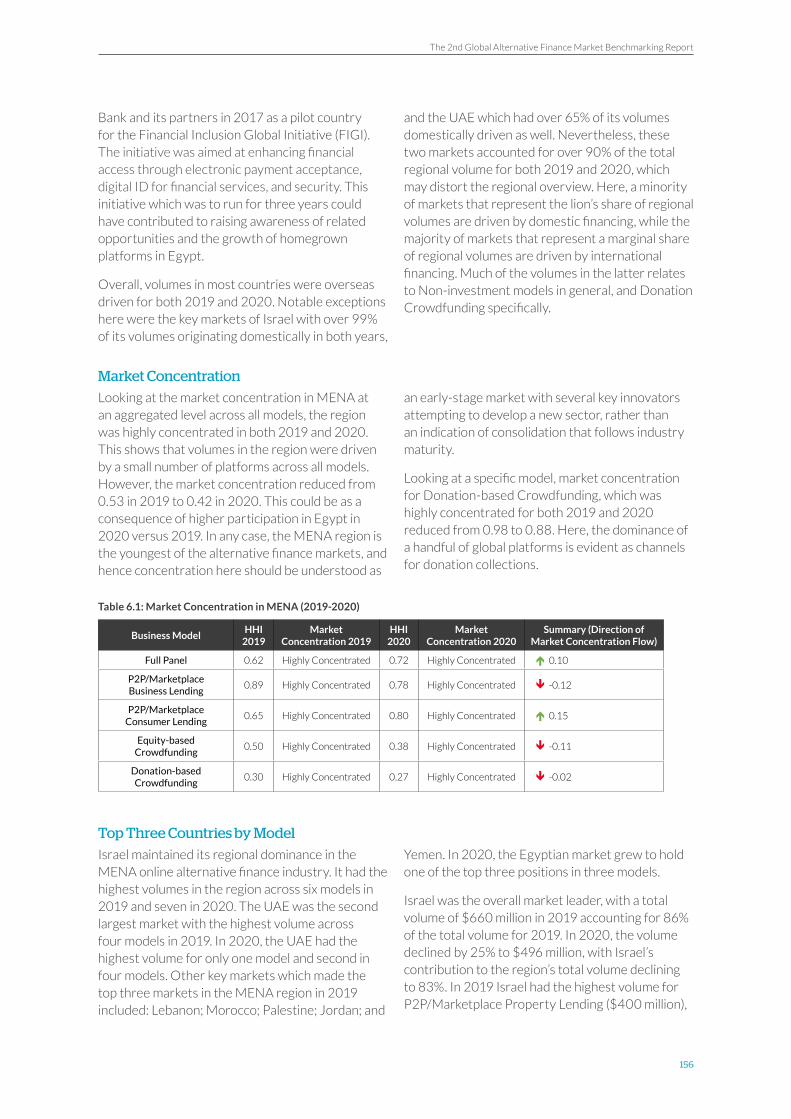
The 2nd Global Alternative Finance Market Benchmarking Report
156
Bank and its partners in 2017 as a pilot country for the Financial Inclusion Global Initiative (FIGI). The initiative was aimed at enhancing financial access through electronic payment acceptance, digital ID for financial services, and security. This initiative which was to run for three years could have contributed to raising awareness of related opportunities and the growth of homegrown platforms in Egypt.
Overall, volumes in most countries were overseas driven for both 2019 and 2020. Notable exceptions here were the key markets of Israel with over 99% of its volumes originating domestically in both years,
and the UAE which had over 65% of its volumes domestically driven as well. Nevertheless, these two markets accounted for over 90% of the total regional volume for both 2019 and 2020, which may distort the regional overview. Here, a minority of markets that represent the lion’s share of regional volumes are driven by domestic financing, while the majority of markets that represent a marginal share of regional volumes are driven by international financing. Much of the volumes in the latter relates to Non-investment models in general, and Donation Crowdfunding specifically.
Market Concentration
Looking at the market concentration in MENA at an aggregated level across all models, the region was highly concentrated in both 2019 and 2020. This shows that volumes in the region were driven by a small number of platforms across all models. However, the market concentration reduced from 0.53 in 2019 to 0.42 in 2020. This could be as a consequence of higher participation in Egypt in 2020 versus 2019. In any case, the MENA region is the youngest of the alternative finance markets, and hence concentration here should be understood as
an early-stage market with several key innovators attempting to develop a new sector, rather than an indication of consolidation that follows industry maturity.
Looking at a specific model, market concentration for Donation-based Crowdfunding, which was highly concentrated for both 2019 and 2020 reduced from 0.98 to 0.88. Here, the dominance of a handful of global platforms is evident as channels for donation collections.
Table 6.1: Market Concentration in MENA (2019-2020)
Business ModelHHI
2019Market
Concentration 2019HHI
2020Market
Concentration 2020Summary (Direction of
Market Concentration Flow)
Full Panel 0.62 Highly Concentrated 0.72 Highly Concentrated 0.10
P2P/Marketplace Business Lending
0.89 Highly Concentrated 0.78 Highly Concentrated -0.12
P2P/Marketplace Consumer Lending
0.65 Highly Concentrated 0.80 Highly Concentrated 0.15
Equity-based Crowdfunding
0.50 Highly Concentrated 0.38 Highly Concentrated -0.11
Donation-based Crowdfunding
0.30 Highly Concentrated 0.27 Highly Concentrated -0.02
Top Three Countries by Model
Israel maintained its regional dominance in the MENA online alternative finance industry. It had the highest volumes in the region across six models in 2019 and seven in 2020. The UAE was the second largest market with the highest volume across four models in 2019. In 2020, the UAE had the highest volume for only one model and second in four models. Other key markets which made the top three markets in the MENA region in 2019 included: Lebanon; Morocco; Palestine; Jordan; and
Yemen. In 2020, the Egyptian market grew to hold one of the top three positions in three models.
Israel was the overall market leader, with a total volume of $660 million in 2019 accounting for 86% of the total volume for 2019. In 2020, the volume declined by 25% to $496 million, with Israel’s contribution to the region’s total volume declining to 83%. In 2019 Israel had the highest volume for P2P/Marketplace Property Lending ($400 million),
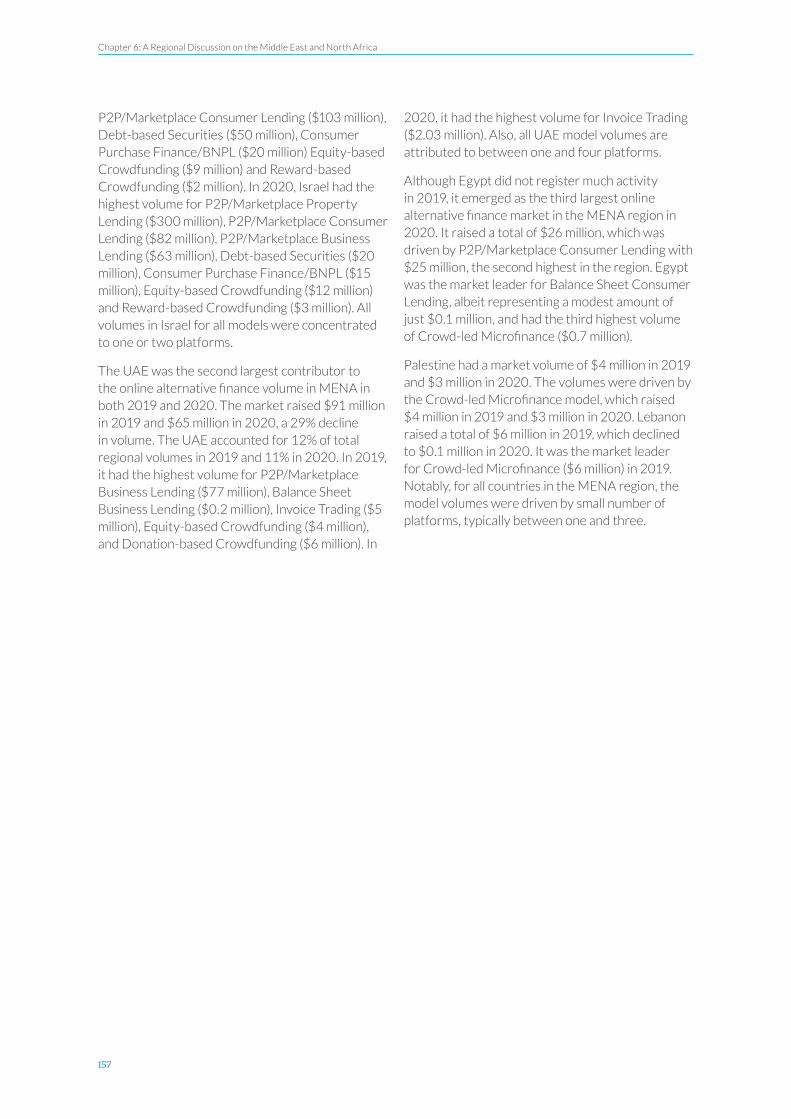
Chapter 6: A Regional Discussion on the Middle East and North Africa
157
P2P/Marketplace Consumer Lending ($103 million), Debt-based Securities ($50 million), Consumer Purchase Finance/BNPL ($20 million) Equity-based Crowdfunding ($9 million) and Reward-based Crowdfunding ($2 million). In 2020, Israel had the highest volume for P2P/Marketplace Property Lending ($300 million), P2P/Marketplace Consumer Lending ($82 million), P2P/Marketplace Business Lending ($63 million), Debt-based Securities ($20 million), Consumer Purchase Finance/BNPL ($15 million), Equity-based Crowdfunding ($12 million) and Reward-based Crowdfunding ($3 million). All volumes in Israel for all models were concentrated to one or two platforms.
The UAE was the second largest contributor to the online alternative finance volume in MENA in both 2019 and 2020. The market raised $91 million in 2019 and $65 million in 2020, a 29% decline in volume. The UAE accounted for 12% of total regional volumes in 2019 and 11% in 2020. In 2019, it had the highest volume for P2P/Marketplace Business Lending ($77 million), Balance Sheet Business Lending ($0.2 million), Invoice Trading ($5 million), Equity-based Crowdfunding ($4 million), and Donation-based Crowdfunding ($6 million). In
2020, it had the highest volume for Invoice Trading ($2.03 million). Also, all UAE model volumes are attributed to between one and four platforms.
Although Egypt did not register much activity in 2019, it emerged as the third largest online alternative finance market in the MENA region in 2020. It raised a total of $26 million, which was driven by P2P/Marketplace Consumer Lending with $25 million, the second highest in the region. Egypt was the market leader for Balance Sheet Consumer Lending, albeit representing a modest amount of just $0.1 million, and had the third highest volume of Crowd-led Microfinance ($0.7 million).
Palestine had a market volume of $4 million in 2019 and $3 million in 2020. The volumes were driven by the Crowd-led Microfinance model, which raised $4 million in 2019 and $3 million in 2020. Lebanon raised a total of $6 million in 2019, which declined to $0.1 million in 2020. It was the market leader for Crowd-led Microfinance ($6 million) in 2019. Notably, for all countries in the MENA region, the model volumes were driven by small number of platforms, typically between one and three.

The 2nd Global Alternative Finance Market Benchmarking Report
158
Figure 6.3: Top Countries by Model – 2019-2020, USD
$0 $100m $350m$250m
$450m$50m $400m$300m$150m
Egypt
TunisiaIsrael
$0.11m$12.36m
$0.08m
JordanIsrael
$0.26m$20.00m
IsraelUAE
Morocco
$8.97m$3.78m
$0.17m
P2P/Marketplace Consumer Lending
P2P/Marketplace Business Lending
Equity-based Crowdfunding
Donation-based Crowdfunding
Reward-based Crowdfunding
Crowd-led Microfinance
Balance Sheet Business Lending
Consumer Purchase Finance/BNPL
P2P/Marketplace Property Lending
Invoice Trading
Debt-based Securities
Balance Sheet Consumer Lending
Israel $81.74m2019
UAEIsrael
$76.70m$75.53m2019
2019
UAEYemen
Palestine
$5.61m$0.40m$0.02m
2019
IsraelMoroccoLebanon
$2.02m$0.06m$0.05m
2019
LebanonPalestine
Jordan
$5.57m$3.95m
$1.59m2019
UAE $0.21m2019
2019
EgyptIsrael
$25.36m$81.74m
2020
IsraelUAE
$62.76m$61.55m
2020
2020
IsraelUAE
Yemen
$0.59m$0.82m$1.01m
2020
UAELebanon
Israel
$0.03m$0.06m$3.10m
2020
EgyptJordan
Palestine
$0.67m$1.41m$2.78m
2020
UAESaudi Arabia
$0.18m$2.13m
2020
Israel $15.00m2020
UAE $2.03m2020
Israel $20.00m2020
2020
UAE $4.54m2019
Israel $50.00m2019
UAE = United Arab Emirates
Israel $300.00m2020
Israel $400.00m2019

Chapter 6: A Regional Discussion on the Middle East and North Africa
159
Market Dynamics
The Vitality of Alternative Finance Business Funding
While there was rapid growth in the volumes of alternative finance for business funding by 243% between 2017 and 2018, it was followed by a 70% decline in volumes between 2018 and 2019, or from $760 million to $230 million in monetary terms. This drop could be attributed to non-participation of key platforms (such as OurCrowd, Eureka, and others). The volume declined further by 11% in 2020 to $204 million. As opposed to 2018, when much of the business-oriented alternative finance volumes in MENA were attributed to P2P/Marketplace Property Lending; P2P/Marketplace Business Lending was the key driver of such volumes in recent years, accounting for 66% of all business volumes in 2019 and 61% in 2020.
In 2020, businesses raised $124 million through P2P/Marketplace Business Lending, a decline of 18% from 152 million in 2019. Other key models included Debt-based Securities and P2P/Marketplace Consumer Lending, which together raised 22% of the total business volumes in 2019 and 25% in 2020.
Figure 6.4: Overall SME Finance Volume- 2017-2020, USD
Debt-based models generated 94% ($217 million) of the total regional volumes raised by businesses in 2019. The lending models also dominated in 2020, generating 93% ($188 million) of total business funding. However, between 2019 and 2020, Debt-based model funding for businesses declined by 13%. Equity-based and Non-investment models generated low volumes to business in both 2019 and 2020. Only 6% of the total volume raised by businesses were generated by these two model categories in 2019, with their contribution slightly increasing to 7% in 2020.
Figure 6.5: Debt vs Equity vs Non-investment Models Online Alternative Business Finance – 2019-2020, USD
InstitutionalisationOverall, the investor activities in MENA were driven by individuals rather than institutions. The average share of institutional investors in 2019 regional volumes stood at 14%, which increased further to 20% in 2020.
Based on the 31% of the surveyed platforms operating in MENA, who responded to this specific question, institutional funding provided 17% ($17 million) of the total P2P/Marketplace Consumer
Lending model volumes in the region in 2019. In 2020, based on the responses of 25% of the platforms in MENA, the proportion of institutional funding for the model increased to 19% ($15 million), while still representing a decline in absolute monetary terms. In P2P/Marketplace Business Lending, the share of institutional funding was 10% ($13 million) in 2019. This proportion increased to 33% ($41 million) in 2020.
$0
$400
$200
$600
$800
$100
$500
$700
$300
Mill
ion
s
2017 2018 2019 2020
$221.6m
$759.8m
$230.0m $203.6m
$0
$200
$100
$50
$250
$150
Mill
ion
s
Debt Models Equity Models Non-investment Models
$216
.7m
$18
8.3
m
$12.
5m
$2.4
m
$12.
9m
$0.7
m
2019 2020

The 2nd Global Alternative Finance Market Benchmarking Report
160
Figure 6.6: Percentage of Institutional Funding by Key Models- 2019-2020
Other Collaborations with Institutional Partners
With regards to partnerships, 29% of the P2P/Marketplace Business Lending platforms, 18% of the Equity-based Crowdfunding platforms, and 24% of the Consumer Purchase Finance/BNPL models reported having institutional partnerships.
Regarding platform ownership, 29% of Equity-based Crowdfunding platforms and 24% of the Consumer Purchase Finance/BNPL models reported partial institutional ownership. For agent banking, 14% of the P2P/Marketplace Business Lending platforms, 6% of the Equity-based
Crowdfunding platforms, and 5% of the Consumer Purchase Finance/BNPL platforms reported partnerships.
Equity-based Crowdfunding had the highest use of referral agreements in the MENA region with 47% of platforms reporting such arrangements. Of the P2P/Marketplace Business Lending platforms, 43% of had referral agreements, followed by 24% of Consumer Purchase Finance/BNPL services reporting the same. Finally, 14% of P2P/Marketplace Business Lending platforms and 24% of Consumer Purchase Finance/BNPL platforms utilised data exchange.
InternationalisationCrowd-led Microfinance had the highest cross-border activity with all its transaction volume attributed to cross-border inflows. The key markets for this model were Palestine, Jordan, Egypt, and Lebanon. This is followed by Donation-
based Crowdfunding with 35% of its total volume attributed to inflows. Lastly, P2P/Marketplace Business Lending had 13% of their total volumes associated with cross-border inflows.
Figure 6.7: Funding Inflow Rate by Models
Financial Inclusion
The Banked Status of Borrowers
In the MENA region, 83% of borrowers were defined as banked individuals. This is a drop from the 95% indicated in 2018. This means that the proportion of underbanked and unbanked borrowers increased from 5% in 2019 to 17% in 2020. More specifically, the share of unbanked
borrowers increased from 2% to 7%, and the share of underbanked borrowers increased from 3% to 10%. This could be as a result of COVID-19 with banks and other financial service providers closing branches to encourage cashless transactions as a measure to curb the spread of the pandemic92 ..
Figure 6.8: Banking Status of Borrowers
0% 20% 30% 50% 70% 90%10% 60%40% 80% 100%
P2P/Marketplace Consumer Lending
P2P/Marketplace Business Lending
17% 83%2019
2020 19% 81%
2019 10% 90%
2020 33% 67%
Institutionalisation Non-institutionalisation
20% 60%40% 80% 100%0%
Crowd-led Microfinance 100%
Donation-based Crowdfunding 35%
P2P/Marketplace Business Lending 13%
0% 10% 20% 30% 40% 50% 60% 70% 80% 90%
7% 10% 83%MENA
Unbanked Underbanked Banked
100%

Chapter 6: A Regional Discussion on the Middle East and North Africa
161
Gender Dynamics
Female Funder Participation
Based on responses from 35% and 42% of the surveyed MENA platforms in 2019 and 2020, respectively, female funder participation in online alternative finance activities slightly decreased from 44% ($337 million) in 2019 to 42% ($255 million) in 2020.
Figure 6.9: Female Funders Rate in MENA -2019-2020
Female funder participation for the Consumer Purchase Finance/BNPL model remained unchanged at 45%, but the overall volumes attributed to female funders declined by 67% from $20 million in 2019 to $7 million in 2020.
Donation-based Crowdfunding reported that 35% of its funders identified as female in both 2019 and 2020. However, actual volumes provided declined by 50% from more than $3 million in 2019 to less than $2 million to 2020.
Figure 6.10: Female Funders Rate by Key Models -2019-2020
Female Fundraiser Participation
Of the surveyed platforms operating in MENA, 25% and 43% responded to this question in 2019 and 2020, respectively.
The share of female fundraisers in online alternative finance activities in the MENA region decreased slightly from 34% in 2019 to 30% in 2020. The volumes raised by female fundraisers declined by 31% from $261 million in 2019 to $180 million in 2020.
Figure 6.11: Female Fundraisers Rate in MENA - 2019-2020
Female fundraiser participation in P2P/Marketplace Consumer Lending remained unchanged at 33% in 2019 and 2020. However, the volumes raised by female fundraisers in this model increased by 3% from $34 million in 2019 to $35 million in 2020.
With regards to P2P/Marketplace Business Lending, the volume raised by the female fundraisers accounted for 21% in 2019 and 22% in 2020. The absolute volume raised by female fundraisers decreased by 16% from $32 million in 2019 to $27 million in 2019.
Finally, Donation-based Crowdfunding had 66% female participation in both 2019 and 2020. However, the volumes raised by female fundraisers through this model declined by 50% from $4 million in 2019 to $2 million to 2020.
0% 35%25% 40%20%15%10%5% 30% 45%
2019
2020
44%
43%
0% 20% 50%10% 60%40%30%
45%
49%
45%
49%
Consumer Purchase Finance/BNPL
Donation-based Crowdfunding
2020
2020
2019
2019
0% 35%25% 40%20%15%10%5% 30%
2020
2019 34%
30%
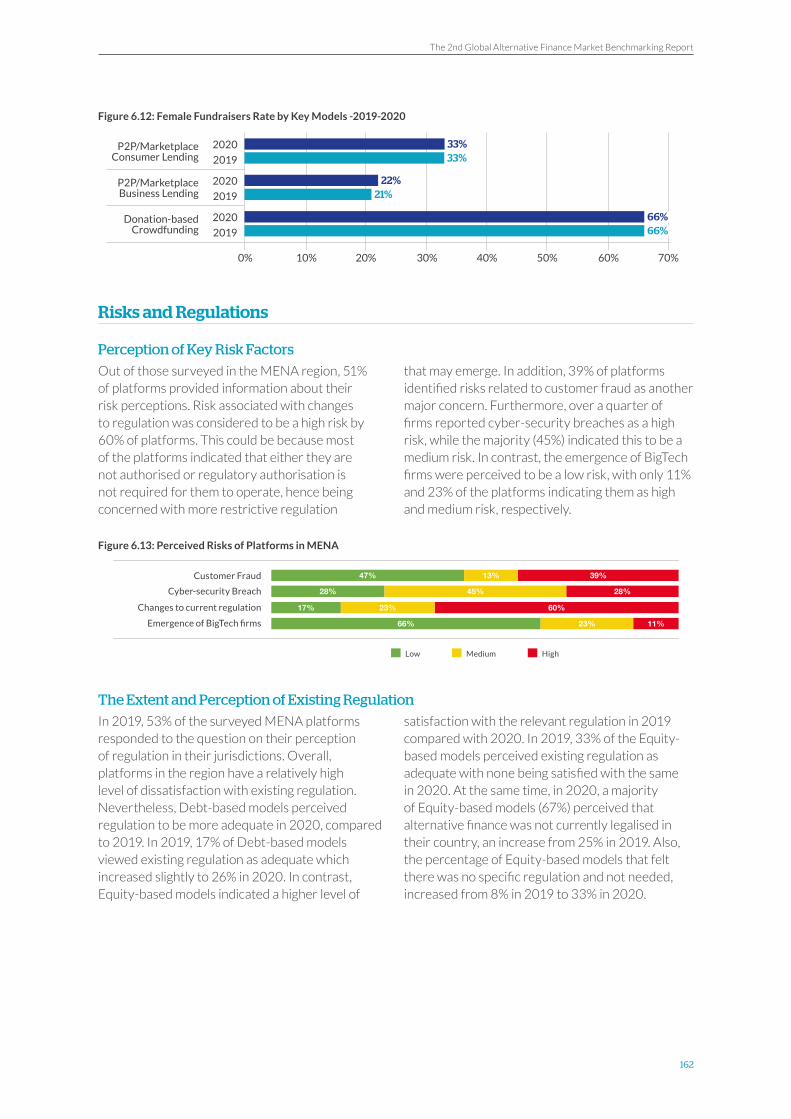
The 2nd Global Alternative Finance Market Benchmarking Report
162
Figure 6.12: Female Fundraisers Rate by Key Models -2019-2020
Risks and Regulations
Perception of Key Risk Factors
Out of those surveyed in the MENA region, 51% of platforms provided information about their risk perceptions. Risk associated with changes to regulation was considered to be a high risk by 60% of platforms. This could be because most of the platforms indicated that either they are not authorised or regulatory authorisation is not required for them to operate, hence being concerned with more restrictive regulation
that may emerge. In addition, 39% of platforms identified risks related to customer fraud as another major concern. Furthermore, over a quarter of firms reported cyber-security breaches as a high risk, while the majority (45%) indicated this to be a medium risk. In contrast, the emergence of BigTech firms were perceived to be a low risk, with only 11% and 23% of the platforms indicating them as high and medium risk, respectively.
Figure 6.13: Perceived Risks of Platforms in MENA
The Extent and Perception of Existing Regulation
In 2019, 53% of the surveyed MENA platforms responded to the question on their perception of regulation in their jurisdictions. Overall, platforms in the region have a relatively high level of dissatisfaction with existing regulation. Nevertheless, Debt-based models perceived regulation to be more adequate in 2020, compared to 2019. In 2019, 17% of Debt-based models viewed existing regulation as adequate which increased slightly to 26% in 2020. In contrast, Equity-based models indicated a higher level of
satisfaction with the relevant regulation in 2019 compared with 2020. In 2019, 33% of the Equity-based models perceived existing regulation as adequate with none being satisfied with the same in 2020. At the same time, in 2020, a majority of Equity-based models (67%) perceived that alternative finance was not currently legalised in their country, an increase from 25% in 2019. Also, the percentage of Equity-based models that felt there was no specific regulation and not needed, increased from 8% in 2019 to 33% in 2020.
0% 20% 50% 70%10% 60%40%30%
33%
22%
66%
33%
21%
66%
P2P/Marketplace Consumer Lending
P2P/Marketplace Business Lending
Donation-based Crowdfunding
2020
2020
2020
2019
2019
2019
Customer Fraud
Cyber-security Breach
Emergence of BigTech firms
Changes to current regulation
28%
60%
39%
66% 23%
28%
17%
47%
45%
23%
13%
11%
Low Medium High

Chapter 6: A Regional Discussion on the Middle East and North Africa
163
Figure 6.14: Perception of Regulation by Debt & Equity Models - 2019-2020
In terms of the extent of the existing regulation, 58% of the surveyed platforms in MENA provided insights for 2019. Overall, the platforms with authorisation to operate in their countries declined between 2019 and 2020. Only 3% of Debt-based models indicated that they were authorised in their jurisdictions in 2020 compared to 56% in 2019.
Likewise, in 2019, 58% of Equity-based models indicated that they were authorised to operate in their countries, compared with none in 2020. Also, the percentage of Equity-based models that indicated regulatory authorisation was not required to operate in their countries increased from 25% in 2019 to 100% in 2020.
Figure 6.15: Extent of Existing Regulation by Debt & Equity Models -2019-2020
17% 13% 21% 38%8%4%
26% 4% 4%22% 33%11%
33% 25% 25% 8%8%
67% 33%
Debt Models
Equity Models
2019
2020
2019
2020
Adequate and appropriate for my platform activities Inadequate and too relaxed for my platform activities
Excessive and too strict for my platform activities No Specific Regulation and not needed
No Specific Regulation and needed Alternative finance (including crowdfunding & P2P lending) is not currently legalized in my country
56% 4% 40%
3% 59% 3% 34%
58% 8%8% 25%
100%
Debt Models
Equity Models
2019
2020
2019
2020
My platform is authorized in my jurisdiction
My platform is not authorized but has interim permissions to operate in my jurisdiction.
My platform is not authorized but has a relationship with another licensed institution (ie Appointed Representative) that serves as our agent
Regulatory Authorization is not required for my business activities

164
The Global Alternative Finance Market Benchmarking Report
164
7. A Regional Discussion on Sub-Saharan Africa

Chapter 7: A Regional Discussion on Sub-Saharan Africa
165
Chapter 7: A Regional Discussion on Sub-Saharan Africa
IntroductionThis section gives an overview of the Sub-Saharan Africa (SSA) region with an initial overview of the total online alternative finance volumes, followed by an analysis of the activity of platforms in the four key sub-regions93: West Africa; East Africa; Southern Africa; and Central Africa.
In the previous benchmarking report, platforms from SSA and the MENA region were included in the Middle East and Africa (MEA) chapter. However, for this report, these countries were analysed separately, so that SSA and MENA could be discussed in the context of their different market conditions. One of the main differences between these regions was the relative dominance of foreign-based platforms in SSA, as opposed to mostly domestic-based platform activities in MENA.
Total Volume by YearThe alternative finance volume in 2018 and the years beforehand was based on an analysis of SSA and the Northern Africa region together, with the latter involving only marginal volumes. In the current report, North Africa is accounted for in the MENA region chapter.
In 2019, the total online alternative finance volume in SSA raised $1.1 billion, a significant increase of 429% from 2018. A general growth trajectory was maintained in 2020, though more modestly, with a 10% growth from 2019 reaching a total of $1.2 billion. Overall, since 2017, there was a continuous year-on-year growth in online alternative finance volumes in SSA as seen in Figure 7.1, driven mainly by growth in P2P/Marketplace Consumer Lending.
The stagnation in growth from 2019 and 2020 could have occurred as a result of three separate effects;
Firstly, the number of respondents from the region in 2018 were 190, increasing to 206 in 2019 and decreasing to 191 in the 2020 survey. While some platforms went out of business in 2019, others continued operations but were unable to respond in later surveys. Overall, it can be assumed that growth is likely to be underestimated following non-participation of several platforms that reported figures for SSA in 2018 but did not do so in 2019 and 2020. The joint 2018 volumes of these platforms who did not respond in 2019 and 2020 was estimated at about $57 million 94
Secondly, the impact of COVID-19, especially on Lending models, as seen in the CCAF COVID-19 report, may also explain some of the stagnation. In the report, while market indicators reported by FinTech firms suggested a positive direction, limited government support for FinTechs in SSA caused some platforms to be more severely affected by the pandemic.
Finally, the depreciation of SSA currencies against the USD and EUR has meant that while domestic volumes in local currencies may have increased, their US dollar equivalents have not to the same extent. For instance, the South African Rand sank to a new record low95 against the US dollar in April 2020, while Angola’s Kwanza and Zambia’s Kwacha also fell to a record low in March 202096. In addition, the Kenyan Shilling depreciated by about 8%97 against the US dollar overall in 2020.

The 2nd Global Alternative Finance Market Benchmarking Report
166
Figure 7.1: Total Online Alternative Finance Volume in SSA (2013 - 2020), USD
Foreign and Domestic Alternative Finance Platforms in SSAThe proportion of volumes derived from platforms based outside SSA has continued to increase over the past four years, with only a slight temporary decline between 2017 and 2018 as seen in Table 7.1. In 2018, foreign firms accounted for 76% of total volumes in the region. This proportion increased to 96% in 2019 and 97% in 2020. The latter being the highest ever foreign-driven volume ($1.2 billion) recorded.
Accordingly, the continuous growth in volumes for the region can be credited largely to the volumes derived from overseas firms. Domestic firms’ share of the market declined over the past two surveyed periods from the gradual increase that was registered in 2016 (12%) to 2018 (24%). Their market share decreased further from 4% ($48 million) in 2019 to 3% ($40 million) in 2020.
Table 7.1: Proportion of Volume Derived from Domestic vs. Foreign Firms, SSA, 2016-2020
Foreign-driven Domestic-driven Foreign Firms Domestic Firms
Volumes (USD Millions) Percentages
2016 $130 $18 88% 12%
2017 $82 $21 79% 21%
2018 $159 $50 76% 24%
2019 $1,058 $48 96% 4%
2020 $1,175 $40 97% 3%
Market Concentration
Looking at the market concentration by key business model, among the surveyed platforms in SSA for both 2019 and 2020, the region was found to be ‘highly concentrated’. This concentration, however, should not be interpreted as indication of maturity, but rather as an indication of early-stage development where several innovators attempt entry and lead sectoral development.
The direction of market concentration from 2019 to 2020, however, decreased for P2P/Marketplace Business Lending, Equity-based Crowdfunding and Donation-based Crowdfunding models in the region.
P2P/Marketplace Consumer Lending was the only model that experienced an increase in the level of market concentration from 2019 to 2020 as seen in Table 7.2. P2P/Marketplace Consumer Lending platforms mostly based in Uganda and Zambia increased their market share, therefore this market showed an increase in market concentration.
Globally, Kenya was the only country from SSA among the top 30 ranked markets in both years under study. For assessing concentration levels, a minimum threshold of seven platforms was set. Both debt-based and non-investment models were found to be highly concentrated, with debt models in this market showing an increase in the direction of market concentration from 2019 to 2020.
$0
$800
$400
$1200
$200
$1000
$1400
$600
2015
83.2
2017
103.8
2019
1105.8
2016
181.6
2018
209.1
2020
1215.8
2013
44.4
2014
61.4
Mill
ion
s

Chapter 7: A Regional Discussion on Sub-Saharan Africa
167
Table 7.2: Market Concentration Analysis, SSA 2019-2020
Business ModelHHI
2019Market
Concentration 2019HHI
2020Market
Concentration 2020Summary (Direction of
Market Concentration Flow)
Full Panel 0.62 Highly Concentrated 0.72 Highly Concentrated 0.10
P2P/Marketplace Business Lending
0.89 Highly Concentrated 0.78 Highly Concentrated -0.12
P2P/Marketplace Consumer Lending
0.65 Highly Concentrated 0.80 Highly Concentrated 0.15
Equity-based Crowdfunding
0.50 Highly Concentrated 0.38 Highly Concentrated -0.11
Donation-based Crowdfunding
0.30 Highly Concentrated 0.27 Highly Concentrated -0.02
Total Volume by ModelOverall, P2P/Marketplace Consumer Lending and Balance Sheet Consumer Lending models dominated the online alternative finance landscape in the SSA region.
The model that had the highest volumes in SSA in both 2019 and 2020 was P2P/Marketplace Consumer Lending. In 2019, the model had a market share of 46% of the total regional volumes and this share increased to 63% in 2020. Consumer Lending platforms are active in SSA since they are already highly digitalised and there are several platforms which combine mobile payments and consumer loans or payroll-loans.
The second largest model by regional volumes in both 2019 and 2020 was Balance Sheet Consumer Lending which registered volumes of $463 million (representing 42% market share) in 2019 and $346 million (representing 28% market share) in 2020. The Balance Sheet Business Lending model showed a decline in volumes over the past three years, from $46 million in 2018, to $23 million in 2019 and down further to $15 million in 2020. Balance Sheet Consumer Lending and Balance Sheet Business Lending are prevalent in SSA because P2P/Marketplace Business Lending in most SSA countries is still highly regulated and sometimes even prohibited for FinTechs without a banking licence. Furthermore, it is important to note that a large portion of consumer loans actually represent loans for micro-entrepreneurs and venturing, as business loans are not available for such small-scale ventures.
Among non-investment models, Donation-based Crowdfunding exhibited increasing volumes over the past two years, growing from $13 million in 2019 to $16 million in 2020. However, Crowd-led Microfinance had a 9% decline in volumes from $43 million in 2019 to $39 million in 2020. Reward-based Crowdfunding also had a decline over the past three years, falling 19% between 2018 and 2020 as seen in Figure 7.2.
Equity models had relatively low volumes over the past two years. Nevertheless, Equity-based Crowdfunding did exhibit a growth from $3 million in 2018 up to $10 million in 2019, which was followed by a dramatic fall to just $1 million in 2020. Equity-based Crowdfunding is nascent across the region due to prohibitive regulation. In most countries, platforms need to have a stockbroker licence for equity crowdfunding, which is a high burden for small platforms.
Models whose volume share has consistently remained low in SSA include Community Shares, Real Estate Crowdfunding, and Balance Sheet Property Lending. Community Share Crowdfunding is low since community-led finance is done offline and FinTech firms are gradually emerging to cater to rotating savings and credit associations (ROSCAs), which are a dominant form of community finance in the region.
Lastly, Real Estate Crowdfunding did not show high volumes in SSA because Real Estate platforms were focusing on areas where real estate project developers do not have adequate access to finance, but in SSA, traditional banks still provide a large amount of real estate finance.
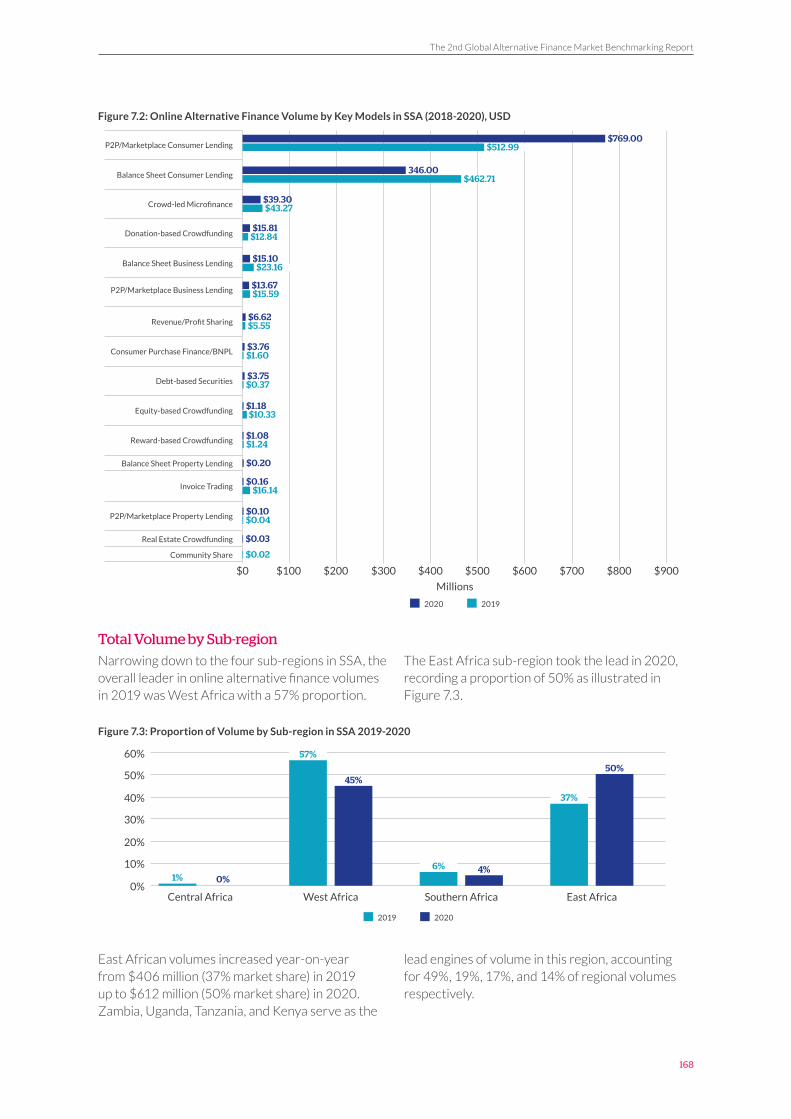
The 2nd Global Alternative Finance Market Benchmarking Report
168
Figure 7.2: Online Alternative Finance Volume by Key Models in SSA (2018-2020), USD
Total Volume by Sub-region
Narrowing down to the four sub-regions in SSA, the overall leader in online alternative finance volumes in 2019 was West Africa with a 57% proportion.
The East Africa sub-region took the lead in 2020, recording a proportion of 50% as illustrated in Figure 7.3.
Figure 7.3: Proportion of Volume by Sub-region in SSA 2019-2020
East African volumes increased year-on-year from $406 million (37% market share) in 2019 up to $612 million (50% market share) in 2020. Zambia, Uganda, Tanzania, and Kenya serve as the
lead engines of volume in this region, accounting for 49%, 19%, 17%, and 14% of regional volumes respectively.
$100 $200 $600$300 $400 $700 $800 $900$0 $500
$462.71Balance Sheet Consumer Lending346.00
$512.99P2P/Marketplace Consumer Lending$769.00
$43.27Crowd-led Microfinance$39.30
$15.59P2P/Marketplace Business Lending$13.67
$23.16Balance Sheet Business Lending$15.10
$1.60
$1.24
Consumer Purchase Finance/BNPL
Reward-based Crowdfunding
$3.76
$1.08
$0.04
$16.14
P2P/Marketplace Property Lending
Invoice Trading
$0.10
$0.16
$12.84Donation-based Crowdfunding$15.81
$5.55
$10.33
Revenue/Profit Sharing
Equity-based Crowdfunding
$6.62
$1.18
$0.37Debt-based Securities$3.75
Millions
2020 2019
Community Share $0.02
Real Estate Crowdfunding $0.03
Balance Sheet Property Lending $0.20
0%
40%
20%
60%
10%
50%
30%
West Africa
57%
Southern Africa
6%
East Africa
37%
45%
4%
50%
Central Africa
1% 0%
2019 2020

Chapter 7: A Regional Discussion on Sub-Saharan Africa
169
West Africa conversely declined over the same period, registering $625 million (57% market share) in 2019 to a lower volume of $545 million (45% market share) in 2020. This region was dominated by the Ghanaian market accounting for 97% of regional volume.
Despite showing an increase in volume from $43 million in 2018 up to $66 million in 2019, the Southern Africa region declined to $54 million in 2020, representing only 4% of the volume for the entire SSA region. This region is dominated by South Africa and Botswana, accounting for 44% and 42% of sub-regional volumes, respectively.
The Central African region showed the lowest volume over the past two years, recording $10 million and $5 million in 2019 and 2020, respectively. This region was dominated by the Democratic Republic of Congo, accounting for 95% of regional volume.
All activities in Central Africa originate internationally with no domestic activity recorded in either Congo Republic, Angola, Central African Republic, Chad, or the Democratic Republic of Congo in both 2019 and 2020.
The East African region’s volumes increased five-fold over the three-year period from $121 million in 2018 up to $612 million in 2020 as seen in Figure 7.4.
Figure 7.4: Total Online Alternative Finance Market Volume by Sub-region in SSA 2018-2020, USD
Key Countries
Looking at overall volumes for the region in 2019, the largest alternative finance markets included Ghana ($582 million), Zambia ($172 million) and Tanzania ($83 million). In the second tier, we had Kenya ($77 million) and Uganda ($60 million).
In 2020, the regions’ largest markets included Ghana ($528 million), Zambia ($297 million) and Uganda ($115 million). Tanzania ($103 million) and Kenya ($82 million) were in the second tier while South Africa ($23 million) and Botswana ($21 million) appeared in the third tier over the same period.
In both years, Ghana and Zambia were well represented, appearing as the top two countries in P2P/Marketplace Consumer Lending and Balance Sheet Consumer Lending models. Tanzania was among the top countries in Balance Sheet Consumer Lending and Consumer Purchase Finance/BNPL in 2019.
In 2019 and 2020, Kenya was among the top three markets in six out of the nine models available in SSA, making it the country with the most diversified and developed alternative finance market in SSA as illustrated in Figure 7.5.
Millions
2020 2019 2018
$0 $200 $500 $700$100 $600$400$300
$612.00m$405.63m
$65.55m
$624.88m
$9.78m$14.76m
$29.36m
$43.12m
$120.92m
$54.15m
$4.62m
$545.00m
Southern Africa
East Africa
West Africa
Central Africa

The 2nd Global Alternative Finance Market Benchmarking Report
170
Figure 7.5: Top Three Countries in Volume by Model 2019-2020, USD
$0 $100m $250m$300m
$400m$50m $350m$200m$150m
Uganda
Tanzania
Kenya
Uganda
Botswana
Cameroon
Uganda
Cameroon
Tanzania
Rwanda
Zambia
DRC
Nigeria
Zambia
Kenya
Nigeria
Kenya
Uganda
Kenya
Ghana
South Africa
Kenya
Ghana
South Africa
Kenya
South Africa
Kenya
Ghana
South Africa
Nigeria
Ghana
Ghana
Kenya
South Africa
Uganda
Rwanda
Zambia
Kenya
Kenya
Zambia
South Africa
Uganda
Kenya
Burkino Faso
Senegal
Uganda
Uganda
Mauritius
Uganda
Senegal
Nigeria
Kenya
$5.35
$80.70
$0.92
$1.12
$39.32
$0.56
$0.62
$0.15
$0.59
$6.60
$83.79
$5.58
$5.25
$87.61
$2.00
$7.83
$0.16
$1.01
$11.00
$237.00
$5.97
$5.64
$6.92
$14.71
$0.70
$9.97
$192.46
$12.29
$4.50
$332.76
$0.34
$14.10
$0.71
$1.94
$5.61
$148.79
$2.81
$4.49
$147.97
$0.24
$1.00
$0.26
$1.04
$4.45
$2.53
$0.32
$1.27
$104.55
$0.23
$0.03
$0.34
Crowd-led Microfinance
Balance Sheet Consumer Lending
Donation-based Crowdfunding
P2P/Marketplace Business Lending
P2P/Marketplace Consumer Lending
Equity-based Crowdfunding
Balance Sheet Business Lending
Reward-based Crowdfunding
Consumer Purchase Finance/BNPL
2020
2020
2020
2020
2020
2020
2020
2020
2020
2019
2019
2019
2019
2019
2019
2019
2019
2019
DRC = Democratic Republic of Congo
$346.00

Chapter 7: A Regional Discussion on Sub-Saharan Africa
171
Alternative Business Funding in SSA
Despite most alternative finance volumes in SSA being associated with consumer lending, it is important to highlight that the SME sector is critical in the region, as these businesses create the bulk of employment (seven out of ten jobs) in the continent98.
Accordingly, platforms were asked if they facilitate funding to these businesses and the total online alternative funding attributed to business was calculated through aggregating the volumes across different models for both 2019 and 2020. Again, figures presented are likely to underestimate funding allocated to micro and small businesses, as they are taken as consumer loans rather than
business loans by respective micro-entrepreneurs. Accordingly, the figures reported here do not account for such funding.
In 2019, the total business funding in SSA was $76 million, this decreased to $44 million in 2020.
West Africa recorded the highest total alternative funding attributed to business with a volume of $32 million while Central Africa had the lowest business funding at $1 million in 2019.
In 2020, East Africa had the highest total funding to business with $29 million, while Central Africa registered the lowest business funding with a volume of $0.04 million, as seen in Figure 7.6.
Figure 7.6: Business Funding - SSA by Sub-region 2019-2020, USD
Overall, the main source of business funding in SSA in both 2019 and 2020 were Debt-based models, which cumulatively accounted for 74% ($56 million) and 76% ($33 million) of alternative finance business funding, respectively.
Looking at the sub-regions, in 2019, the main source of funding was Debt-based models from West Africa (represented by 18 platforms). These platforms accounted for 54% ($31 million) of the debt-based business funding in SSA. This was followed by East African Debt-Based models who accounted for 46% ($26 million) of business debt-based funding in SSA.
In 2020, East African Debt-based models (represented by 40 platforms) recorded the highest alternative business funding of $27 million, which accounted for 82% of the debt-based funding in SSA.
Notably, for the Southern African sub-region, Equity models had a higher share of business funding for both years surveyed ($12 million in 2019; $7 million in 2020) when compared to the Debt and Non-investment models which registered lower volumes as seen in Table 7.3.
$0
$20
$10
$30
$35
$5
$25
$15
West Africa
$30.59
Southern Africa
$12.98
East Africa
$31.60$29.13
$7.50 $6.99
Central Africa
$0.96 $0.04
Mill
ion
s
2019 2020

The 2nd Global Alternative Finance Market Benchmarking Report
172
Table 7.3: Business Funding - SSA by Model 2019-2020, USD
Debt Equity Non-Investment
2019 2020 2019 2020 2019 2020
Southern Africa $0.00m $0.10m $12.46m $6.87m $0.51m $0.52m
Central Africa $0.00m $0.00m $0.56m $0.00m $0.40m $0.04m
West Africa $30.57m $5.87m $0.84m $0.93m $0.19m $0.19m
East Africa $25.82m $26.99m $2.00m $0.01m $2.77m $2.13m
InstitutionalisationThis section looks at how traditional financial institutions have interacted with alternative finance platforms across the continent. From 2019 to 2020, the rate of institutional funding increased, with institutional investors providing $216 million in 2019 (21% of the SSA volume), according to 66 platform respondents. In 2020, institutional investors provided $330 million (31%), according to 59 platform respondents. Despite growing institutional funding, most funders came from a retail background.
Analysis by Region
In general, for both 2019 and 2020, SSA had a low proportion of institutional investors, as seen in Figure 7.7. In 2019, the Central African region had the lowest level (2%) of institutional finance in SSA, which further declined to no institutional funding in the same sub-region in 2020.
Both the East African and Southern Africa regions had the same proportion (29%) of their finance volumes originating from institutional investors in 2019. However, in 2020, the Southern Africa region was leading with 92% of funding originating from traditional financial institutions.
Figure 7.7: Institutionalisation by Sub-region 2019-2020
Analysis by Model
Looking at institutional investors by business models in the region, on the one hand, we saw a decrease in the share of institutional investors between 2019 and 2020 among P2P/Marketplace Consumer Lending and P2P/Marketplace Business Lending platforms. On the other hand, Balance
Sheet Consumer Lending recorded an increase in institutional investors from 2019 (33%) to 2020 (87%). Similarly platforms offering P2P/Marketplace Property Lending services saw the share of institutional investors increased from 8% to 30% over the same period, as seen in Figure 7.8.
0% 20% 30% 50% 70% 90%10% 60%40% 80% 100%
29% 71%2019
29% 71%2019
92% 8%2020
35% 65%2020West Africa
Southern Africa
East Africa
Central Africa 2% 98%2019
100%2020
15% 85%2019
26% 74%2020
Institutionalisation Non-institutionalisation

Chapter 7: A Regional Discussion on Sub-Saharan Africa
173
Figure 7.8: Institutionalisation by Model 2019-2020
Partnership with Institutions
When looking at the types of collaborative arrangements that existed between platforms and traditional financial institutions in SSA, one half of Reward-based Crowdfunding and 40% of Equity-based Crowdfunding platforms had referral agreements with traditional institutions. P2P/Marketplace Consumer Lending platforms on the other hand reported the highest proportion in utilising agent banking in the region (38%) while
P2P/Marketplace Business Lending platforms had the highest proportion of data exchange partnership (15%).
Donation-based Crowdfunding platforms had a good mix of collaborative arrangements, utilising all partnership channels except data exchange during the survey period.
InternationalisationThe provision of alternative finance in SSA is to a large extent an international activity, with many firms having operations in multiple countries. It should be noted that international flows do not necessarily mean from outside the SSA region, but rather from outside the country the platform is headquartered (whether they are other African countries or not).
To understand the impact of cross-border transactions, we analysed inflows of funds (i.e. the percentage of funding raised that came from
funders or investors outside of the indicated country of operation). As indicated by 104 platform observations in SSA, on average, the inflow to a country in the region accounted for 87% of volumes.
The West African region had the highest inflow rate (99%) followed by Central Africa (97%). While still substantial, Southern Africa registered the lowest inflow rate (79%), in relative terms, as seen in Figure 7.9.
Figure 7.9: Inflow Rate by Sub-region
0% 20% 30% 50% 70% 90%10% 60%40% 80% 100%
100%2019
100%2020
100%2020
7% 93%2019
87% 13%2020
33% 67%2019
3% 97%2020
33% 67%2019
7% 93%2019P2P/Marketplace Consumer Lending
P2P/Marketplace Business Lending
Equity-based Crowdfunding
Donation-based Crowdfunding
Crowd-led Microfinance
Balance Sheet Consumer Lending
Institutionalisation Non-institutionalisation
99%2020 1%
100%2019
0% 20% 30% 50% 70% 90%10% 60%40% 80% 100%
West Africa
Southern Africa
East Africa
Central Africa
99%
79%
90%
97%
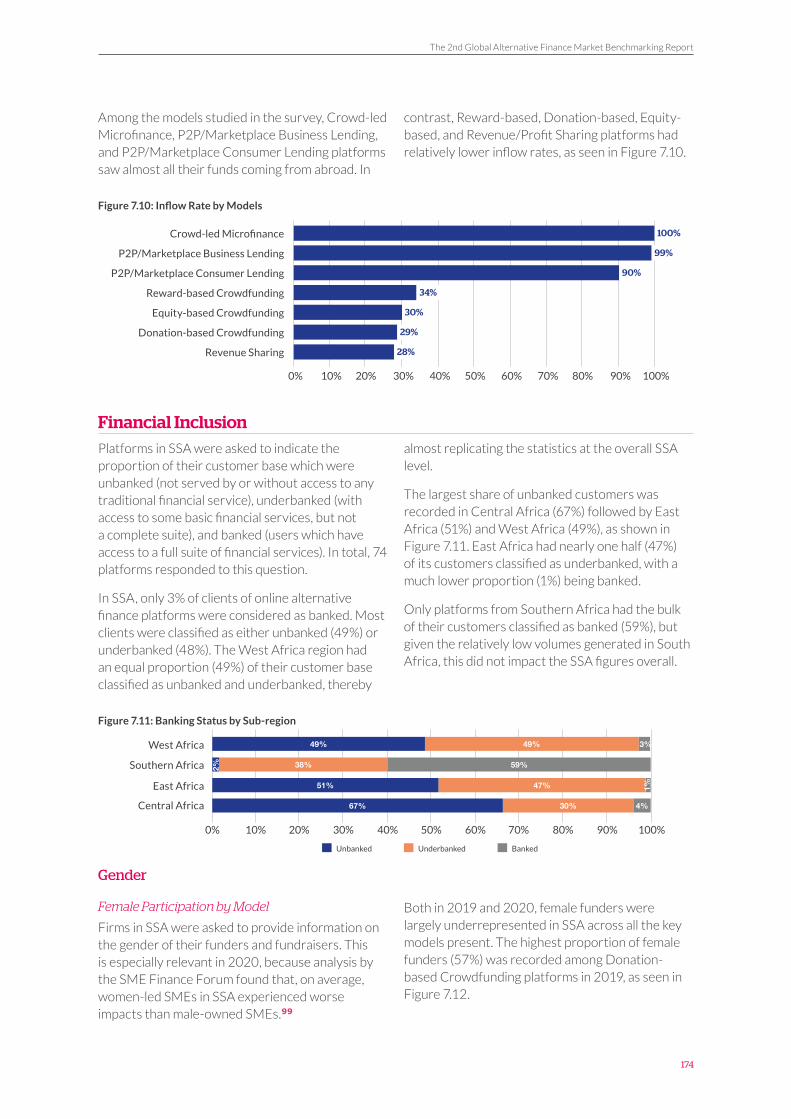
The 2nd Global Alternative Finance Market Benchmarking Report
174
Among the models studied in the survey, Crowd-led Microfinance, P2P/Marketplace Business Lending, and P2P/Marketplace Consumer Lending platforms saw almost all their funds coming from abroad. In
contrast, Reward-based, Donation-based, Equity-based, and Revenue/Profit Sharing platforms had relatively lower inflow rates, as seen in Figure 7.10.
Figure 7.10: Inflow Rate by Models
Financial InclusionPlatforms in SSA were asked to indicate the proportion of their customer base which were unbanked (not served by or without access to any traditional financial service), underbanked (with access to some basic financial services, but not a complete suite), and banked (users which have access to a full suite of financial services). In total, 74 platforms responded to this question.
In SSA, only 3% of clients of online alternative finance platforms were considered as banked. Most clients were classified as either unbanked (49%) or underbanked (48%). The West Africa region had an equal proportion (49%) of their customer base classified as unbanked and underbanked, thereby
almost replicating the statistics at the overall SSA level.
The largest share of unbanked customers was recorded in Central Africa (67%) followed by East Africa (51%) and West Africa (49%), as shown in Figure 7.11. East Africa had nearly one half (47%) of its customers classified as underbanked, with a much lower proportion (1%) being banked.
Only platforms from Southern Africa had the bulk of their customers classified as banked (59%), but given the relatively low volumes generated in South Africa, this did not impact the SSA figures overall.
Figure 7.11: Banking Status by Sub-region
Gender
Female Participation by Model
Firms in SSA were asked to provide information on the gender of their funders and fundraisers. This is especially relevant in 2020, because analysis by the SME Finance Forum found that, on average, women-led SMEs in SSA experienced worse impacts than male-owned SMEs.99
Both in 2019 and 2020, female funders were largely underrepresented in SSA across all the key models present. The highest proportion of female funders (57%) was recorded among Donation-based Crowdfunding platforms in 2019, as seen in Figure 7.12.
20%10% 60%50%40%30% 80%70% 100%90%0%
P2P/Marketplace Consumer Lending
Equity-based Crowdfunding
Revenue Sharing
90%
30%
34%
28%
P2P/Marketplace Business Lending
Reward-based Crowdfunding
Donation-based Crowdfunding
99%
29%
Crowd-led Microfinance 100%
0% 20% 30% 50% 70% 90%10% 60%40% 80% 100%
Southern Africa 38% 59%2%
Central Africa 30% 4%67%
West Africa 49% 3%49%
Unbanked Underbanked Banked
East Africa 47%51% 1%

Chapter 7: A Regional Discussion on Sub-Saharan Africa
175
Figure 7.12: Female Funders by Model: 2019-2020
A different picture emerges when looking at the fundraisers. In 2019, female fundraisers were well represented across various alternative finance business models in SSA. The highest proportion of female fundraisers was among Crowd-led Microfinance platforms (89%) and Donation-based Crowdfunding platforms (63%), as seen in Figure 7.13. Specifically with respect to Crowd-led Microfinance, female participation may be a direct result of policy prioritisation of female clients by such institutions by their very mission.
Because of COVID-19, female fundraisers disappeared in various models which could also be attributed to platform reporting errors. However, in some models, the participation of female fundraisers in 2020 was higher compared to 2019, for instance in Donation-based Crowdfunding, P2P/Marketplace Consumer Lending and P2P/Marketplace Business Lending models, across the region.
Figure 7.13: Female Fundraisers by Model 2019-2020
Female Participation by Region
Narrowing down to the sub-regions, in 2019, female funder participation was reasonably high across the continent, with Central Africa showing the highest proportion (57%), followed by East Africa (42%). West Africa had 32% female funders in 2019, while Southern Africa had the lowest proportion of 29% female funders, as seen in Figure 7.14.
In 2020, female funder participation was reasonably high, similar to the levels that were observed in 2019. Central Africa was still showing the highest proportion of female funders at 52%, followed by Southern Africa with 44% female funders. East Africa had the lowest proportion at 18%.
0% 20% 30% 50%10% 60%40%
35%
38%
2019 2020
50%Equity-based Crowdfunding
44%P2P/Marketplace Business Lending
57%
36%Donation-based
Crowdfunding
Crowd-led Microfinance
0% 20% 30% 50% 70% 90%10% 60%40% 80%
2019 2020
39%Real Estate Crowdfunding
12%Equity-based Crowdfunding
44%Revenue/Profit Sharing
53%Reward-based Crowdfunding
89%Crowd-led Microfinance
31%
37%
P2P/Marketplace Business Lending
44%
47%P2P/Marketplace
Consumer Lending
63%
65%Donation-based
Crowdfunding
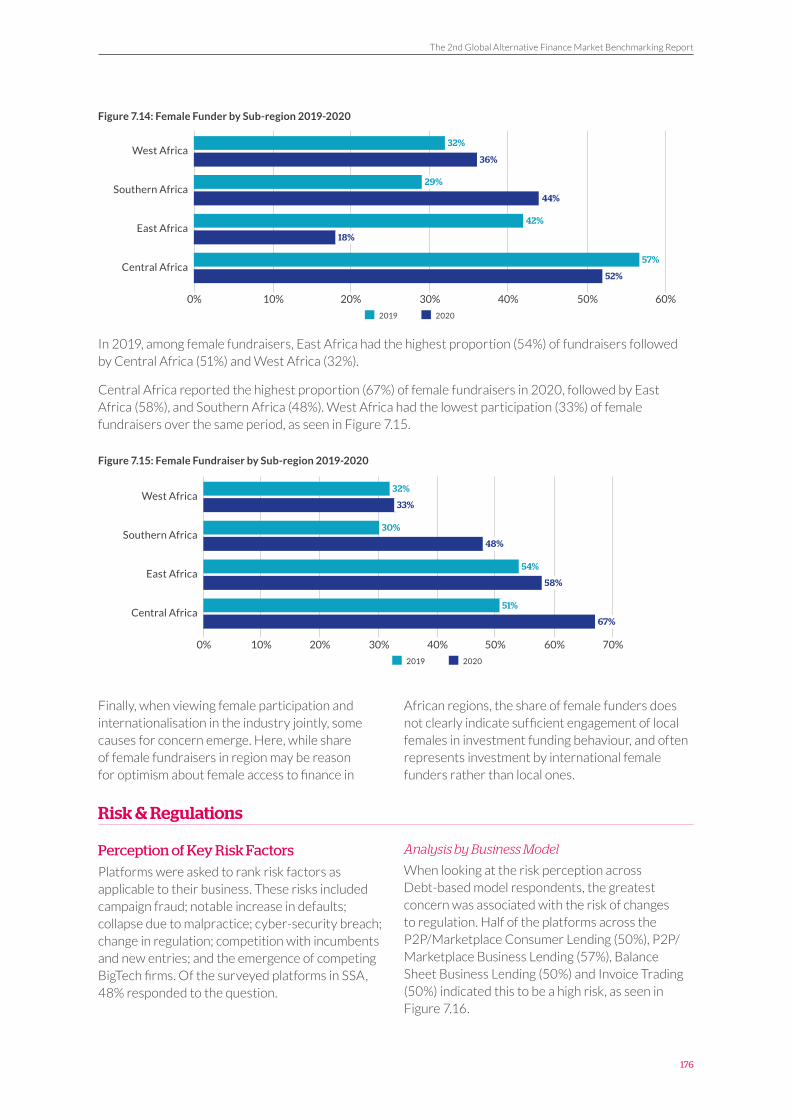
The 2nd Global Alternative Finance Market Benchmarking Report
176
Figure 7.14: Female Funder by Sub-region 2019-2020
In 2019, among female fundraisers, East Africa had the highest proportion (54%) of fundraisers followed by Central Africa (51%) and West Africa (32%).
Central Africa reported the highest proportion (67%) of female fundraisers in 2020, followed by East Africa (58%), and Southern Africa (48%). West Africa had the lowest participation (33%) of female fundraisers over the same period, as seen in Figure 7.15.
Figure 7.15: Female Fundraiser by Sub-region 2019-2020
Finally, when viewing female participation and internationalisation in the industry jointly, some causes for concern emerge. Here, while share of female fundraisers in region may be reason for optimism about female access to finance in
African regions, the share of female funders does not clearly indicate sufficient engagement of local females in investment funding behaviour, and often represents investment by international female funders rather than local ones.
Risk & Regulations
Perception of Key Risk Factors
Platforms were asked to rank risk factors as applicable to their business. These risks included campaign fraud; notable increase in defaults; collapse due to malpractice; cyber-security breach; change in regulation; competition with incumbents and new entries; and the emergence of competing BigTech firms. Of the surveyed platforms in SSA, 48% responded to the question.
Analysis by Business Model
When looking at the risk perception across Debt-based model respondents, the greatest concern was associated with the risk of changes to regulation. Half of the platforms across the P2P/Marketplace Consumer Lending (50%), P2P/Marketplace Business Lending (57%), Balance Sheet Business Lending (50%) and Invoice Trading (50%) indicated this to be a high risk, as seen in Figure 7.16.
0% 20% 30% 50%10% 60%40%
18%
36%
52%
44%
2019 2020
East Africa
West Africa
Central Africa
Southern Africa
42%
32%
57%
29%
0% 20% 30% 50% 70%10% 60%40%
2019 2020
67%Central Africa
48%Southern Africa
58%East Africa
33%West Africa
51%
30%
54%
32%

Chapter 7: A Regional Discussion on Sub-Saharan Africa
177
Risks related to notable increases in defaults was indicated as a top concern by platforms offering services related to Balance Sheet Business Lending, Invoice Trading, and P2P/Marketplace Business Lending. Similarly, the risk of increasing competition
from entry of BigTech firms was also reported to be a high concern among Balance Sheet Business Lending and Invoice Trading. Finally, risks associated with cyber-security was identified as either low or medium risk across the key Debt models.
Figure 7.16: Perceived Risks of Platforms by Debt Models
Looking at the risks by Equity and Non-investment models, similarly to Debt models, changes to regulation was considered a high risk among Equity-based Crowdfunding (81%), Real Estate Crowdfunding (100%) and Reward based Crowdfunding (94%). Cyber-security breach was largely considered as a medium risk by Donation-based Crowdfunding (64%), Reward-based Crowdfunding (83%) and Equity-based
Crowdfunding (53%) firms, while 67% of Real Estate platforms found it to be a high risk. In addition, customer fraud was ranked as a major concern by platforms offering Reward-based Crowdfunding services. On the other hand, risks related to entry of BigTech firms was perceived to be a low across key Equity and Non-investment platforms in SSA, as seen in Figure 7.17.
67%
50%25%
100%
50% 50%
25%
14% 43%
43%
50% 50%
100%
100%
29%
P2
P/M
arke
tpla
ce
Co
nsu
mer
Len
din
gP
2P
/Mar
ketp
lace
B
usi
nes
s Le
nd
ing
Bal
ance
Sh
eet
B
usi
nes
s Le
nd
ing
Invo
ice
Trad
ing
Low Medium High
Customer Fraud
Customer Fraud
Customer Fraud
Customer Fraud
Emergence of BigTech firms
40% 20% 40%Emergence of BigTech firms
100%Emergence of BigTech firms
50% 50%Emergence of BigTech firms
Notable increase in defaults
Notable increase in defaults
Notable increase in defaults
Notable increase in defaults
43% 29%
14% 57%
Cyber-security Breach
Change in Regulation
100%
50% 50%
Cyber-security Breach
Change in Regulation
100%
50% 50%
Cyber-security Breach
Change in Regulation
33%
100%
25%25% 50%
Cyber-security Breach
Change in Regulation
29%
43%
43%
29%
29%

The 2nd Global Alternative Finance Market Benchmarking Report
178
Figure 7.17: Perceived Risks of Platforms by Equity and Non-investment Models
Analysis by Sub-region
Across the sub-regions, changes to regulation was largely perceived as being high risk by 69% of platforms in West Africa, 55% of platforms in Central and East Africa, and 50% of firms from Southern Africa. In addition, customer fraud was reported as a major concern for platforms in Southern Africa (60%), East Africa (48%), and West
Africa (42%). The risk of increasing competition from entry of BigTech firms was found to be a high by 50% of platforms in Southern Africa, while other sub-regions consider it to be a low. Cyber-security breach was mostly perceived to be a medium risk across the platforms in Central Africa (78%) and West Africa (57%), as seen in Figure 7.18.
Figure 7.18: Perceived Risks of Platforms by Sub-regions
100%
100%
100%
17% 83%
13% 53% 33%
6% 13% 81%
82% 12%
33% 67%
100%
28% 72%
6% 94%
67% 13% 20%
29% 64% 7%
73% 13% 13%
64% 18% 18%
Eq
uit
y-b
ased
C
row
dfu
nin
gR
eal E
stat
e
Cro
wd
fun
ing
Rew
ard
-bas
ed
Cro
wd
fun
din
gD
on
atio
n-b
ased
C
row
dfu
nin
g
22% 33% 44%Customer Fraud
Emergence of BigTech firms
Cyber-security Breach
Change in Regulation
Customer Fraud
Customer Fraud
Customer Fraud
Emergence of BigTech firms
Emergence of BigTech firms
Emergence of BigTech firms
Cyber-security Breach
Cyber-security Breach
Cyber-security Breach
Change in Regulation
Change in Regulation
Change in Regulation
Low Medium High
Low Medium High
22% 78%
67% 33%
44% 33% 22%
18% 27% 55%
88%
24% 28% 48%
34% 38% 28%
28% 17% 55%
50% 27% 23%
40% 60%
33% 17% 50%
25% 25% 50%
23% 35% 42%
10% 57% 33%
17% 14% 69%
85% 5% 10%
Cen
tral
Afr
ica
Eas
t A
fric
aS
ou
ther
n
Afr
ica
Wes
t A
fric
a
Customer Fraud
Customer Fraud
Customer Fraud
Customer Fraud
Emergence of BigTech firms
Emergence of BigTech firms
Emergence of BigTech firms
Emergence of BigTech firms
Cyber-security Breach
Cyber-security Breach
Cyber-security Breach
Cyber-security Breach
Change in Regulation
Change in Regulation
Change in Regulation
Change in Regulation
12%
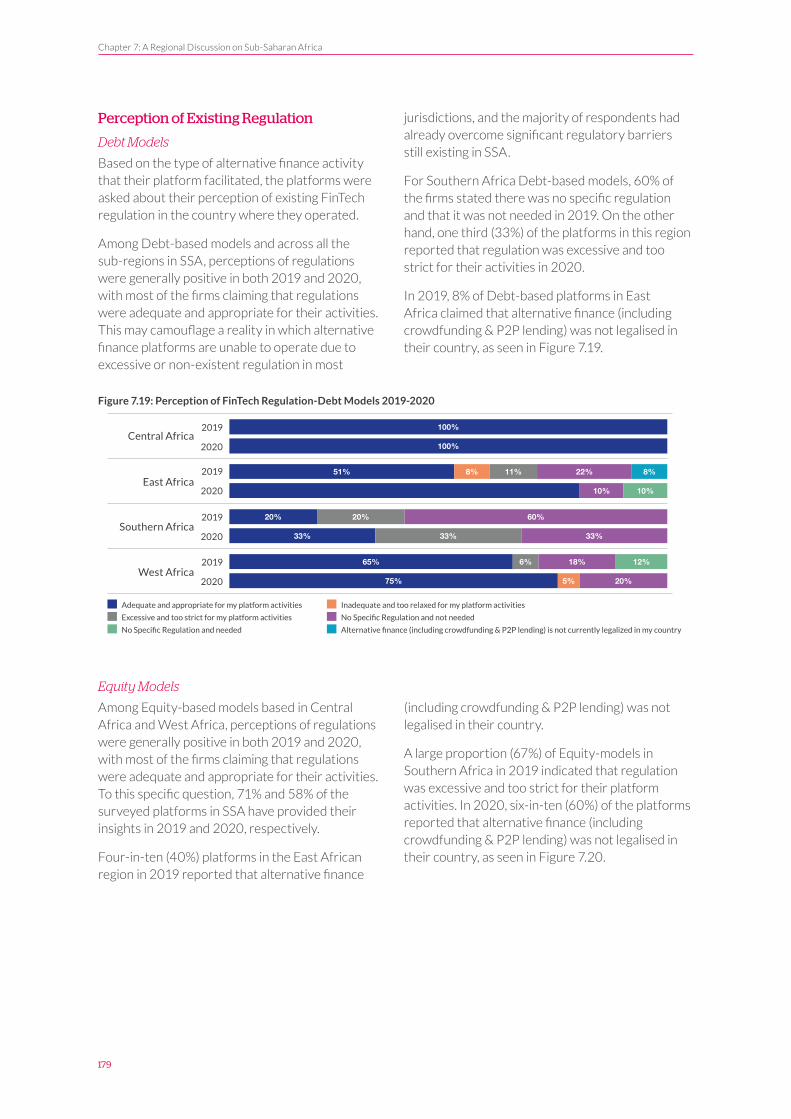
Chapter 7: A Regional Discussion on Sub-Saharan Africa
179
Perception of Existing Regulation
Debt Models
Based on the type of alternative finance activity that their platform facilitated, the platforms were asked about their perception of existing FinTech regulation in the country where they operated.
Among Debt-based models and across all the sub-regions in SSA, perceptions of regulations were generally positive in both 2019 and 2020, with most of the firms claiming that regulations were adequate and appropriate for their activities. This may camouflage a reality in which alternative finance platforms are unable to operate due to excessive or non-existent regulation in most
jurisdictions, and the majority of respondents had already overcome significant regulatory barriers still existing in SSA.
For Southern Africa Debt-based models, 60% of the firms stated there was no specific regulation and that it was not needed in 2019. On the other hand, one third (33%) of the platforms in this region reported that regulation was excessive and too strict for their activities in 2020.
In 2019, 8% of Debt-based platforms in East Africa claimed that alternative finance (including crowdfunding & P2P lending) was not legalised in their country, as seen in Figure 7.19.
Figure 7.19: Perception of FinTech Regulation-Debt Models 2019-2020
Equity Models
Among Equity-based models based in Central Africa and West Africa, perceptions of regulations were generally positive in both 2019 and 2020, with most of the firms claiming that regulations were adequate and appropriate for their activities. To this specific question, 71% and 58% of the surveyed platforms in SSA have provided their insights in 2019 and 2020, respectively.
Four-in-ten (40%) platforms in the East African region in 2019 reported that alternative finance
(including crowdfunding & P2P lending) was not legalised in their country.
A large proportion (67%) of Equity-models in Southern Africa in 2019 indicated that regulation was excessive and too strict for their platform activities. In 2020, six-in-ten (60%) of the platforms reported that alternative finance (including crowdfunding & P2P lending) was not legalised in their country, as seen in Figure 7.20.
Adequate and appropriate for my platform activities Inadequate and too relaxed for my platform activities
Excessive and too strict for my platform activities No Specific Regulation and not needed
No Specific Regulation and needed Alternative finance (including crowdfunding & P2P lending) is not currently legalized in my country
Central Africa
East Africa
Southern Africa
West Africa
2019
2019
2019
2019
2020
2020
2020
2020
100%
100%
80%
20% 20% 60%
33% 33% 33%
75% 5% 20%
10% 10%
65% 6% 18% 12%
51% 8% 11% 22% 8%

The 2nd Global Alternative Finance Market Benchmarking Report
180
Figure 7.20: Perception of FinTech Regulation- Equity Models 2019-2020
Extent of Regulation
Debt Models
In 2019, all the surveyed Debt-based platforms in Central Africa and Southern Africa, as well as the majority of these firms in West Africa (71%) and East Africa (57%), mentioned that regulatory authorisation was not required for their business activities.
In 2020, generally, a larger proportion of the Debt-based models across all the regions indicated that their platforms were authorised in their jurisdiction, as seen in Figure 7.21.
Figure 7.21: Extent of Existing Regulation for Debt-based Models 2019-2020
Equity Models
For Equity-based models, in 2019, most of the surveyed platforms indicated that their platform was authorised in their jurisdiction. In contrast to the 2019 response, in 2020, all Investment-based models surveyed in Southern Africa claimed
that they were not required to obtain regulatory authorisation for their business activities, while 20% of platforms in West Africa mentioned that their platform was not authorised but had interim permissions to operate in their jurisdiction, as seen in Figure 7.22.
Adequate and appropriate for my platform activities Inadequate and too relaxed for my platform activities
Excessive and too strict for my platform activities No Specific Regulation and not needed
No Specific Regulation and needed Alternative finance (including crowdfunding & P2P lending) is not currently legalized in my country
Central Africa
East Africa
Southern Africa
West Africa
2019
2019
2019
2019
2020
2020
2020
2020
40% 20% 20% 20%
81% 6% 3% 3% 6%
33% 67%
62% 31% 8%
67% 17% 17%
20% 20% 20% 40%
100%
10% 30% 60%
Central Africa
East Africa
Southern Africa
West Africa
2019
2019
2019
2019
2020
2020
2020
2020
My platform is authorized in my jurisdiction
My platform is not authorized but has interim permissions to operate in my jurisdiction.
My platform is not authorized but has a relationship with another licensed institution (ie Appointed Representative) that serves as our agent
Regulatory Authorization is not required for my business activities
100%
100%
41% 3% 57%
90% 10%
100%
75% 25%
24% 6% 71%
90% 10%
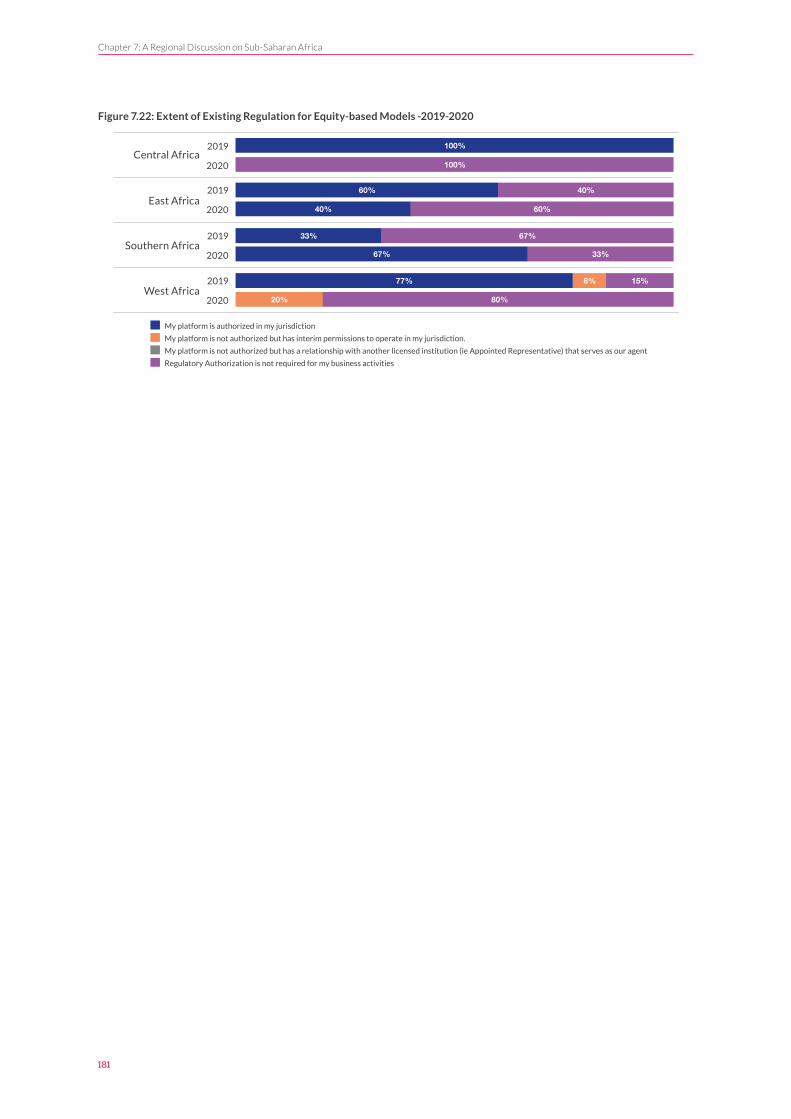
Chapter 7: A Regional Discussion on Sub-Saharan Africa
181
Figure 7.22: Extent of Existing Regulation for Equity-based Models -2019-2020
Central Africa
East Africa
Southern Africa
West Africa
2019
2019
2019
2019
2020
2020
2020
2020
My platform is authorized in my jurisdiction
My platform is not authorized but has interim permissions to operate in my jurisdiction.
My platform is not authorized but has a relationship with another licensed institution (ie Appointed Representative) that serves as our agent
Regulatory Authorization is not required for my business activities
100%
100%
60% 40%
40% 60%
33% 67%
67% 33%
77% 8% 15%
20% 80%

Endnotes
Endnotes

Endnotes
183
1. Peer-to-peer (P2P) Lending: A group of individual or institutional investors provide a loan (secured or unsecured) to a consumer or business borrower. In its most orthodox form, the P2P lending platform acts as a marketplace that connects the borrower and investor(s) such that the risk of financial loss if the loan is not repaid is with the investor and not with the platform. Depending upon the jurisdiction, this model may be referred to as Loan-based Crowdfunding, Marketplace Lending, Collaborative Financing or Crowdlending.
2. Balance Sheet Lending: A digital lending platform directly retains consumer or business loans (either whole loans or partial loans), using funds from the platform operator’s balance sheet. These platforms therefore function as more than just intermediaries, originating and actively funding loans, so the risk of financial loss if the loan is not repaid is with the platform operator. In this respect, the platform operator looks more like a non-bank credit intermediary.
3. Increasingly, Invoice Trading models are expanding into Supply-Chain finance activities. At present, this subset activity is too small to categorise as its own model. It is possible that further refining of this model will be necessary in subsequent years.
4. Mini Bonds are not always transferable, either because the issue size is too small to provide secondary market liquidity or because prospectus exemptions require investors to hold the bond until maturity. Other terms can be very similar to traditional corporate bonds, such as being subject to early call provisions allowing the issuer to repay prior to maturity if its prospects improve.
5. Though a lending model, Crowd-led Microfinance shares many characteristics with a Non-investment model. This is due to the fact that ‘lenders’ are participating in the supply of finance for non-financial motivations. Typically, these lenders are not receiving a return on their capital, or minimal return.
6. Results of campaigns run independently and outside of alternative finance platform activities were not included in the results of this study.
7. In addition, as national initiatives towards regulating the industry are taken in a non-harmonious way (with exception of the ECSP in Europe), platforms may find it more difficult to accommodate multiple and costly compliance requirements during their early years, and may postpone international expansion accordingly.
8. For many firms, the pandemic has created internal resource constraints that made it difficult for them to dedicate the time necessary in providing data. Wherever possible, the research team endeavored to capture relevant and verifiable data through desktop research and then provide the firm an opportunity to ‘validate’ an offline entry. In some cases, firms simply were unable to do so. Therefore, the figures presented in this study are only those which the research team could verify and may present a conservative volume or growth rate for certain regions or jurisdictions. It is our hope that in subsequent data collection activities, firms which could not join this year’s collection will be able to back-fill their data.
9. Section A: This section collected key data points and information about fundraisers (borrowers, issuers and campaigners) that had actively utilised the platform to raise finance in 2017. Section B: Funders: This section collected key data points and information about active funders (investors, lenders, backers, etc.) that had provided finance through a platform in 2017. Section C: Platform Structure & Strategy: This section collected information relating to a platform’s strategic decision making and strategies as related to their platform operations and future business goals. Section D: Risks & Regulations. This section collected information related to a platform’s own perception towards potential risks and changes to regulation, and its impact on their operations.
10. The CCAF utilizes ‘The OANDA Historical Currency Converter’, using the annual average conversion bid-rate to convert local currency into USD.
The 2nd Global Alternative Finance Market Benchmarking Report
184
11. We use the HHI score metric recognised by U.S. Department of Justice to categorise the alternative finance industry volumes at different levels of market concentration activities, namely unconcentrated, moderately concentrated, and highly concentrated. Accordingly, the market competition level is adjudged based on the below mentioned HHI score bands: HHI Competition level < 0.15 Unconcentrated Markets 0.15 to 0.25 Moderately Concentrated Markets > 0.25 Highly Concentrated Markets Our research methodology adopted a funnel approach when applying HHI analysis. That is, first we try to compute overall alternative finance volumes at global and regional levels and then we drill deep into the HHI scores of respective business models. Finally in the appendix of the report, we have represented the HHI scores at model category level (Debt, Equity, and Non-investment) for top 30 countries by number of platform-level participation in our survey. This we have done to overcome the primary disadvantage of the HHI measure i.e., it fails to consider the various market complexities that may arise due to inherent differences in the characteristics of a particular region (or country), and models. The HHI scores at each of the levels in this study have been computed at the operational volumes level i.e., it considers both domestic as well as foreign firms operational at a particular level (geographical and business model). It has been ensured that the HHI scores calculated for each of the models have considered at least seven unique firms’ responses that participated in the year 2019. The same cut off was not applied to 2020 dataset to note market consolidation activity from 2019 to 2020.
12. https://www.jbs.cam.ac.uk/faculty-research/centress/alternative-finance/publications/2020-global-covid-19-fintech-market-rapid-assessment-study/
13. To calculate the total online alternative funding attributed to business, the CCAF research team captured the 2019 and 2020 volumes from the following models: P2P/Marketplace Business Lending, Balance Sheet Business Lending, Invoice Trading, Equity-based Crowdfunding, Debt-based Securities, Revenue/Profit Sharing and Mini Bonds alongside relevant volumes specifically attributed to businesses by platform’s operating P2P/Marketplace Consumer and Property Lending, Consumer and Property Balance Sheet Lending, Real Estate Crowdfunding, Donation-based Crowdfunding and the Reward-based Crowdfunding models. Additionally, 36% of web scraped Reward-based Crowdfunding volume was attributed to business funding. Fundraising from individuals or for creative or communal projects unrelated to a business were excluded from this figure. It is worth adding a word of caution when interpreting the figures presented. While these figures present trends reliably, the actual volumes are assumed to be substantially underestimated as not all platforms that reported total volumes, also reported its divisions between business and non-business volumes. Hence, the above figures are taken only from the sub-sample of platforms reporting these figures.
14. The most prominent global platforms unable to participate in the study this year included 1%Club, LaunchGood, OurCrowd, and Fundrazr.
15. Some of the platforms with more substantial volumes that did not participate in the 2019-2020 data rounds include: Belgium (Bolero Crowdfunding), Estonia (Bondora), France ( WiSeed, Lumo, L’Arrondi), Germany (Zinsbaustein), Ireland (InvoiceFair), Italy (Borsa del Credito, Walliance), Netherlands (Voldaan Factoring, NPEX, Debiteurenbeurs, Duurzaamivesteren, SamenInGeld), Poland (PolakPotrafi), Spain (Housers, Fundacion Goteo), Sweden (Peppins, Toborrow), and Switzerland (Swisspeers, Lend.ch, Lokalhelden).
16. The Global COVID-19 FinTech Market Rapid Assessment Study 2020
17. Hazel Shearing (3 February 2021). “Capt Tom donations: What was the £33m spent on?”. BBC
18. Megaw, Nicholas (23 June 2020). “P2P lender Zopa wins UK banking licence”. Financial Times
Endnotes
185
19. HM Treasury coronavirus (COVID-19) business loan scheme statistics derived from https://www.gov.uk/government/collections/hm-treasury-coronavirus-COVID-19-business-loan-scheme-statistics
20. Funding Circle (4 September 2020). Important update on lending through Funding Circle. Derived from https://www.fundingcircle.com/uk/resources/investors/coronavirus/important-update-on-lending-through-funding-circle/
21. Daniel Lanyon (28 May 2021). The alternative lender is the first platform to become accredited under the new scheme. Altfi
22. Kathryn Gaw (26 March 2021). When will Funding Circle reopen to retail investors?. P2PFinancenews
23. While many new platforms were added in 2019 and 2020 surveys, some that participated in 2018 did not repeat their participation. In total 15 global platforms operating in APAC, and 99 platforms with headquarters in APAC did not repeat their response to the 2020 survey. The main global platforms not providing input for 2020 include: 1%Club, LaunchGood, OurCrowd, SpotCap, etc. The main platforms headquartered in APAC that did not provide input in 2020 include: Australia (BrickX, Propsa, Kikka), India (AntworksMoney, IndiaLends, Klathrate, KNAB Finance, KredX), Indonesia (Dana Cita, DANAdidik, Danamas, KoinWorks, UangTeman), Japan (LC Lending, Maneo, OwnerBook, SBI Social Lending), Malaysia (B2B Finpal), New Zealand (Givealittle, Squirrel Money), Philippines (LoanChamp), Singapore (CoAssets, Capital match, Capital Springboard, fundedhere), South Korea (8percent, Tera Funding and Tumblbug), and Thailand (ICORA).
24. Debt-based models are P2P/Marketplace Consumer Lending, P2P/Marketplace Business Lending, P2P/Marketplace Property Lending, Balance Sheet Consumer Lending, Balance Sheet Business Lending, Balance Sheet Property Lending, Invoice Trading, Debt-based Securities, and Consumer Purchase Finance/BNPL.
25. Global COVID-19 FinTech Market Rapid Assessment Study (2020). CCAF, World Bank and World Economic Forum. This study reported a decline of 16% in transaction volumes for Digital Lending in the Asia-Pacific region (H1 2020 vs. H1 2019). The decline was heavily impacted by respondents from countries like India, Indonesia, Singapore and Chinese Taipei. In contrast, we saw some countries with a handful of platforms like Australia, Malaysia, South Korea and Vietnam which saw a growth in transaction volumes during the same period.
26. Equity-based models are Equity-based Crowdfunding, Real Estate Crowdfunding, Community Shares, and Revenue/Profit Sharing.
27. Non-investment models are Donation-based Crowdfunding, Reward-based Crowdfunding and Crowd-led Microfinance.
28. The Global COVID-19 FinTech Market Rapid Assessment Study. CCAF (2020).
29. East Asia includes South Korea, Japan, Taipei, Hong Kong SAR, North Korea and Mongolia.
30. Oceania incudes Australia, New Zealand, Vanuatu, Fiji, Guam, New Caledonia, Papua New Guinea, Tonga, Samoa, Solomon Islands and Northern Mariana Islands.
31. South and Central Asia includes India, Kazakhstan, Pakistan, Tajikistan, Kyrgyzstan, Azerbaijan, Nepal, Sri Lanka, Bangladesh and Bhutan.
32. South-East Asia includes Singapore, Indonesia, Philippines, Malaysia, Cambodia, Vietnam, Thailand, Myanmar, Timor-Leste, Laos and Macao.
33. The Future of Fintech in Southeast Asia. Dealroom.co (2020). https://dealroom.co/uploaded/2020/09/Fintech-in-Southeast-Asia-Dealroom-x-Finch-Capital-x-MDI-Ventures.pdf
34. Fintech Malaysia Report (2021). https://fintechnews.my/wp-content/uploads/2021/05/Fintech-Report-Malaysia-2021-Fintech-News-Malaysia-x-BigPay.pdf
The 2nd Global Alternative Finance Market Benchmarking Report
186
35. South Korea is one of the leading consumer lending markets in the region. They experienced a significant growth in consumer lending activities during 2019 and the first half of 2020. The decline in volumes for 2020 (especially during the last quarter) could be attributed to a regulatory decision taken against P2P lending, based on funds borrowed from commercial banks. www.spglobal.com/marketintelligence/en/news-insights/latest-news-headlines/south-korean-regulator-bans-p2p-lending-based-on-bank-loans-60410865
36. Indonesia reported substantial increases in P2P lending activities during 2019 and 2020, as per the statistics published by the regulator, OJK. www.microsave.net/2021/01/28/can-the-oft-criticized-p2p-fintech-platforms-in-indonesia-solve-the-lack-of-diversity-in-msme-loan-programs
37. About the market size of crowdfunding: impact survey results. CrowdFunding Channel (2020). www.crowdfundingchannel.jp/article-40003
38. Fulfilling its Promise: The Future of Southeast Asia’s Digital Financial Services. Bain & Company (2019). www.bain.com/globalassets/noindex/2019/bain-report-fulfilling-its-promise.pdf
39. The Treasury, Australian Government. Coronavirus SME Guarantee Scheme - supporting the flow of credit. https://treasury.gov.au/coronavirus/coronavirus-sme-guarantee-scheme
40. See footnote above.
41. Ibid.
42. Request for Response to RPOJK Information Technology-Based Co-Financing Services (2020). OJK. www.ojk.go.id/id/regulasi/otoritas-jasa-keuangan/rancangan-regulasi/Pages/Permintaan-Tanggapan-Atas-RPOJK-Layanan-Pendanaan-Bersama-Berbasis-Teknologi-Informasi.aspx
43. Broader adoption, tighter regulations: what to expect from the Indonesian fintech sector in 2021 (2020). KrASIA. https://kr-asia.com/broader-adoption-tighter-regulations-what-to-expect-from-the-indonesian-fintech-sector-in-2021
44. Illegal lending continues to hamper fintech sector in Indonesia (2020). KrASIA. https://kr-asia.com/illegal-lending-continues-to-hamper-fintech-sector-in-indonesia
45. Reserve Bank constitutes a Working Group on digital lending including lending through online platforms and mobile apps (2021). The Reserve Bank of India. www.rbi.org.in/Scripts/BS_PressReleaseDisplay.aspx?prid=50961
46. Asian authorities clamp down on digital lenders (2021). The Financial Times. www.ft.com/content/b72c33a4-b6af-4a8d-8475-256fb7075546
47. Ibid.
48. SC Annual Report 2020: SC’s liberalisation of ECF, P2P financing platforms bolsters funding, up 43% y-oy. (2021) The Edge Markets. https://www.theedgemarkets.com/article/sc-annual-report-2020-scs-liberalisation-ecf-p2p-financing-platforms-bolsters-funding-43-yoy
49. Malpractices force RBI to crack down on loan apps. The Times in India (June, 2020). https://timesofindia.indiatimes.com/business/india-business/malpractices-force-rbi-to crack-down-on-loan-apps/articleshow/76615086.cms
50. This happened during the peak of the pandemic where there was a financial crunch in the country, and these apps made best use of the situation by offering credit in quick time with minimal borrowing requirements. The major recipients of these loans were the ones who were either neglected by banks and other financial institutions due to low credit score, or who did not have a previous credit score, and who mostly depended on daily income for their living. They were short-term loans, such as weekly loans, with a small ticket size and high interest rates, and one-time non-repayable registration fees and extension fees in the case of defaults. When borrowers defaulted, the recovery agents, mostly third parties, would approach the borrowers’ contact list (since most apps ask for access to

Endnotes
187
phone contacts during installation) through a phone call or by creating WhatsApp groups with the borrower to shame them and persuade payments. Some of the key contacts were sent multiple messages or called several times. In many of the cases, the contacts (family and friends) were not even aware of the loan taken by the borrower. There were instances where recovery agents used foul language and threatened the contacts in order to persuade the borrower to make repayment. This also led to few instances of suicide in the country.
51. RBI Cautions Against Unauthorised Digital Lending Platforms/Mobile Apps (2020). The Reserve Bank of India. www.rbi.org.in/Scripts/BS_PressReleaseDisplay.aspx?prid=50846
52. Can the often-criticized P2P FinTech platforms in Indonesia solve the lack of diversity in MSME loan programs? MicroSave Consulting (2021). www.microsave.net/2021/01/28/can-the-oft-criticized-p2p-fintech-platforms-in-indonesia-solve-the-lack-of-diversity-in-msme-loan-programs
53. https://asia.nikkei.com/Business/Business-trends/Japan-s-peer-to-peer-lenders-get-burned-by-anonymous-borrowers
54. https://fintechnews.hk/8145/fintechkorea/p2p-lending-korea
55. www.legal500.com/developments/thought-leadership/south-korea-enacts-worlds-first-law-on-p2p-financing
56. www.koreaherald.com/view.php?ud=20210223001033
57. www.wsj.com/articles/china-hails-victory-in-crackdown-on-peer-to-peer-lending-11607515547
58. https://www.wsj.com/articles/ant-wins-chinas-approval-to-set-up-consumer-finance-company-11622710885
59. https://www.wsj.com/articles/china-hails-victory-in-crackdown-on-peer-to-peer-lending-11607515547
60. 2020 Wrap Up in Canadian Lending – Canadian Lenders Association
61. www.wsj.com/articles/covid-19-economy-boosts-buy-now-pay-later-installment-services-11609340400
62. www.cnbc.com/2020/12/14/buy-now-pay-later-plans-are-booming-in-the-covid-economy.html
63. A non-Fintech firm had reported $9.2 billion in 2018 toward the Balance Sheet Property Lending model
64. www.sba.gov/funding-programs/loans/covid-19-relief-options/paycheck-protection-program
65.
Round Legislation Funding Covered Period
1 H.R. 748 - CARES Acti $349 billion Feb 15, 2020 – June 30, 2020
2 H.R. 266 - PPP and Health Care Enhancement Actii $310 billion Feb 15, 2020 – Aug 8, 2020iii
3 H.R. 133 - Consolidated Appropriations Act, 2021iv $284 billion Dec 27, 2020 – June 30, 2021*v
i www.congress.gov/bill/116th-congress/house-bill/748 ii www.congress.gov/bill/116th-congress/house-bill/266 iii www.congress.gov/bill/116th-congress/senate-bill/4116 iv www.congress.gov/bill/116th-congress/house-bill/133 v www.congress.gov/bill/117th-congress/house-bill/1799 *Or until funds are exhausted
66. Paycheck Protection Program (PPP): Approvals through 08/08/2020 (sba.gov)
67. Paycheck Protection Program (PPP) Report: Approvals through 05/31/2021 (sba.gov)

The 2nd Global Alternative Finance Market Benchmarking Report
188
68. Applications to PPP ended on May 31, 2021. www.sba.gov/funding-programs/loans/covid-19-relief-options/paycheck-protection-program/ppp-data#section-header-11
69. Mortgage Credit Availability Index (MCAI) fell from 181 at the end of 2019 to nearly 125 level in 2020 www.mba.org/news-research-and-resources/research-and-economics/single-family-research/mortgage-credit-availability-index
70. www.sec.gov/news/press-release/2020-101
71. www.sec.gov/rules/interim/2020/33-10829.pdf
72. www.sec.gov/news/press-release/2020-273
73. https://www.jbs.cam.ac.uk/wp-content/uploads/2021/03/2020-ccaf-global-covid-fintech-market-rapid-assessment-study-v2.pdf (cam.ac.uk), page 63.
74. Canadian firms that declined to participate in the survey included: Vested Technology Corp; SeedUps Canada; Evolocity Financial Group Inc.; FundThrough Inc.; Merchant Growth; NexusCrowd; OurCrowd; Borrowell Inc.; Lending Loop; FrontFundr; Progressa; FundRazr; Community Funded; Crowdmatrix Inc; GlobalGiving; Thinking Capital Financial Corporation; BAMFi; and Borrowell Inc.
75. Excluding Fintech Lending in the Time of COVID – Canadian Lenders Association
76. Vested Technology Corp; Evolocity Financial Group Inc.; FundThrough Inc.; Merchant Growth; NexusCrowd; OurCrowd; Lending Loop; and FrontFundr.
77. Participants’ operational countries and territories in 2019: Argentina; Bahamas; Belize; Bermuda; Bolivia; Brazil; Chile; Colombia; Costa Rica; Cuba; Dominican Republic; Ecuador; El Salvador; Falkland Islands; Guatemala; Haiti; Honduras; Jamaica; Mexico; Nicaragua; Panama; Paraguay; Peru; Puerto Rico; Suriname; Trinidad and Tobago; Uruguay; and Venezuela.
78. Participants’ operational countries and territories in 2020: Argentina; Belize; Bermuda; Bolivia; Brazil; Chile; Colombia; Costa Rica; Cuba; Dominican Republic; Ecuador; El Salvador; Falkland Islands; Guatemala; Haiti; Honduras; Jamaica; Mexico; Nicaragua; Panama; Paraguay; Peru; Puerto Rico; Trinidad and Tobago; Uruguay; and Venezuela.
79. https://www.smefinanceforum.org/data-sites/msme-finance-gap
80. Brazil launches ‘Pix’ instant payments system, Whatsapp to enter ‘soon’ | Reuters
81. Open banking in LatAm: The State of Play | IUPANA | LatAm Banking & Fintech News
82. Sandbox regulatorio en LatAm: Los entornos de pruebas fintech toman forma (colombiafintech.co)
83. Four countries lead Latin America’s fintech funding ranking in 2020 (labsnews.com)
84. Mexico’s Clip hits unicorn status after SoftBank investment | Reuters and Uruguay’s DLocal valued at nearly $9 bln in Nasdaq debut | Reuters and Con inversión de Warren Buffett, Nubank logra recaudo más alto de región en 2021 (colombiafintech.co)
85. https://publications.iadb.org/publications/english/document/Regulatory-Sandboxes-and-Innovation-Testbeds-A-Look-at-International-Experience-in-Latin-America-and-the-Caribbean.pdf
86. www.eleconomista.com.mx/sectorfinanciero/Termina-el-plazo-para-que-Fintech-ingresen-su-solicitud-ante-la-CNBV-20190924-0104.html
87. Coronavirus How can the collapse of currencies in Latin America affect? - Archyde
88. www.nexojornal.com.br/expresso/2021/03/23/A-queda-das-doações-na-pandemia.-E-os-caminhos-para-ajudar
89. Isil Erel and Jack Liebersohn. 2020. “Does FinTech Substitute for Banks? Evidence from the Paycheck Protection Program”. www.nber.org/system/files/working_papers/w27659/w27659.pdf
Endnotes
189
90. Platforms that provided data in 2018 but did not provide data for 2019 and 2020 include: 1% Club, 2nate, Bassita/Clickfunding, Cinecrowd, Creditplace, Eureeca, Mehrabane, OurCrowd, Propnology, and Zoomaal.
91. https://www.cgap.org/research/slide-deck/fintechs-across-arab-world
92. https://openknowledge.worldbank.org/bitstream/handle/10986/34637/COVID-19-and-Digital-Financial-Inclusion-in-Africa-How-to-Leverage-Digital-Technologies-During-the-Pandemic.pdf?sequence=1&isAllowed=y
93. This categorisation was: West Africa: Benin; Burkina Faso; Cote d'Ivoire; Gambia; Ghana; Guinea; Guinea-Bissau; Liberia; Mali; Mauritania; Nigeria; Senegal; Sierra Leone; and Togo. East Africa: Burundi; Kenya; Madagascar; Malawi; Mauritius; Mozambique; Rwanda; Seychelles; Somalia; Tanzania; Uganda; Zambia; and Zimbabwe. Southern Africa: Botswana; Lesotho; Namibia; and South Africa. Central Africa: Cameroon; Congo Republic; and the Democratic Republic of Congo. Other African countries were not included, as there were no alternative finance volumes reported for them.
94. Platforms that responded in 2018 but did not respond in the 2019 and 2020 surveys include: 1%Club; CrowdRacing; Different.org; Eureeca (only provided 2019 data); Jumpstarter Crowdfunding; KiaKia; Launchgood; Lendwithcare; QuickRaiz; RainFin; Root Capital; and WealthCre8.
95. www.focus-economics.com/countries/south-africa/news/exchange-rate/rand-slumps-to-new-all-time-low-on-rising-fiscal-concerns
96. www.bloomberg.com/news/articles/2021-02-03/zambian-currency-s-42-day-losing-streak-not-about-to-end
97. www.imf.org/-/media/Files/Publications/CR/2021/English/1KENEA2021002.ashx
98. www.worldbank.org/en/topic/smefinance
99. www.smefinanceforum.org/sites/default/files/publication/202103-COVID-19-%2Band-Women-Led%2BMSMEs-Sub-Saharan-Africa.pdf
Appendix
Appendix

Appendix
191
Appendix 1
Country/Jurisdiction Volume 2019 (USD) Volume 2020 (USD)
United States $51,517,809,478.93 $73,620,196,501.32
United Kingdom $11,015,704,172.97 $12,642,678,927.45
Brazil $4,032,593,999.38 $5,320,256,780.17
Italy $1,553,067,817.32 $1,857,579,606.86
India $2,918,927,515.44 $1,711,415,456.87
France $1,305,833,196.14 $1,659,732,510.49
Germany $1,416,759,250.45 $1,482,413,458.30
Indonesia $1,446,645,877.69 $1,448,268,490.20
South Korea $1,604,485,917.75 $1,303,541,750.74
China $84,346,675,112.17 $1,161,105,256.95
Australia $1,211,581,537.18 $1,152,469,941.94
Japan $598,652,505.98 $1,141,081,739.33
Singapore $496,686,398.31 $963,297,183.08
Chile $489,093,338.55 $803,556,924.13
Spain $610,473,330.15 $673,607,601.44
Netherlands $2,875,853,128.92 $559,956,012.63
Mexico $547,898,666.99 $536,819,485.23
Ghana $585,239,532.58 $528,074,210.31
Israel $660,064,326.59 $495,784,598.96
Hong Kong SAR $307,177,478.83 $419,265,308.80
Ukraine $542,580,427.90 $400,685,110.42
Finland $458,818,327.89 $390,162,222.86
Poland $523,851,123.46 $389,928,181.56
Sweden $293,874,101.62 $364,295,886.01
Colombia $337,431,726.35 $341,719,382.57
Canada $353,545,961.58 $309,672,582.85
Zambia $172,383,365.84 $297,647,205.02
Lithuania $189,489,200.02 $247,142,425.41
Russia $313,281,190.91 $239,062,451.99
Latvia $359,866,980.64 $237,537,126.98
New Zealand $299,579,393.64 $222,878,493.56
Kazakhstan $260,409,198.83 $172,733,120.34
Ireland $32,462,127.84 $151,459,158.83
Estonia $167,375,733.45 $151,399,673.79
Czech Republic $70,145,554.22 $138,293,397.27
Armenia $468,938,169.96 $128,946,978.54
Uganda $60,411,448.59 $115,566,447.65
Vietnam $46,158,438.02 $110,419,316.17
Tanzania $83,109,062.53 $102,995,896.23
Slovenia $97,306,057.95 $101,520,535.14
Malaysia $128,019,896.47 $100,523,410.10
Norway $53,865,547.41 $100,522,038.41
Moldova $179,143,141.92 $93,821,151.90
Switzerland $68,826,494.80 $83,916,833.46
Kenya $77,064,656.52 $82,363,886.46
Belgium $74,453,231.98 $75,548,596.34
Peru $82,972,100.58 $72,493,299.77
Argentina $58,410,547.75 $69,218,961.56
Denmark $149,182,200.31 $67,231,030.79
Philippines $139,759,337.49 $64,774,908.00
United Arab Emirates $90,844,231.30 $64,626,506.45
Albania $79,631,971.80 $60,784,545.87
Austria $22,138,053.00 $53,837,340.57
Bulgaria $67,661,815.26 $50,402,244.51
Chinese Taipei $43,631,984.58 $46,803,717.73
Romania $29,850,948.26 $44,492,253.71
Uruguay $2,531,111.87 $43,453,796.95
Turkey $2,833,315.45 $30,606,167.61
Egypt $804,576.12 $26,139,021.28
South Africa $23,529,730.41 $23,791,096.65
Botswana $39,322,748.31 $21,812,415.27
Macedonia $34,361,363.62 $21,026,742.38
Portugal $29,542,365.22 $18,475,527.93
Georgia $57,712,130.83 $17,913,447.11
Pakistan $5,437,235.06 $17,279,724.86
Luxembourg $14,801,721.79 $16,214,646.37
Belarus $4,017,637.25 $15,332,056.65
Thailand $6,453,835.70 $11,478,006.32
Rwanda $6,732,687.69 $9,197,368.80
Namibia $2,430,212.90 $8,376,821.46
Paraguay $9,354,049.17 $8,279,725.00
Country/Jurisdiction Volume 2019 (USD) Volume 2020 (USD)
Ecuador $11,110,382.91 $8,147,925.23
Slovakia $6,864,483.37 $6,168,681.51
Bangladesh $8,131,151.47 $5,722,303.41
Nigeria $14,236,123.72 $5,164,047.15
Tajikistan $4,018,901.96 $5,119,070.00
Guatemala $7,068,886.46 $4,837,370.57
Senegal $4,230,945.36 $4,718,422.23
Cambodia $4,650,076.63 $4,598,448.84
Democratic Republic of Congo $8,779,930.12 $4,435,936.39
Nicaragua $2,047,884.91 $4,120,542.07
Greece $1,517,646.98 $3,436,840.87
Bolivia $2,333,059.42 $3,386,757.14
El Salvador $5,186,156.00 $3,370,675.00
Kyrgyzstan $3,119,017.11 $3,179,450.00
Burkina Faso $1,284,233.80 $2,829,183.41
Palestine $3,991,840.01 $2,781,788.63
Saudi Arabia $15,000.00 $2,233,448.06
Cyprus $184,983.24 $2,116,782.30
Croatia $2,398,714.48 $1,986,308.18
Honduras $2,009,670.90 $1,664,164.40
Myanmar $1,478,140.14 $1,414,070.15
Jordan $1,862,021.45 $1,411,025.00
Togo $1,324,038.81 $1,326,018.11
Mauritius $539,969.53 $1,277,424.02
Maldives $815.06 $1,262,350.43
Samoa $1,894,412.00 $1,156,375.00
Malawi $2,134,086.92 $1,143,715.10
Madagascar $965,213.32 $1,132,334.88
Timor-Leste $1,374,575.00 $1,100,250.00
Yemen $403,020.81 $1,008,844.83
Costa Rica $845,013.66 $1,006,910.71
Liberia $1,139,693.75 $985,075.00
Bosnia & Herzegovina $31,756.17 $837,319.33
Tonga $849,900.00 $816,150.00
Hungary $457,875.32 $789,103.00
Haiti $895,997.13 $678,055.80
Puerto Rico $338,720.00 $618,772.46
Iceland $728,697.04 $603,387.60
Sierra Leone $574,190.29 $570,622.68
Mongolia $193,281.35 $545,449.25
Fiji $804,950.00 $537,625.00
Mozambique $654,858.72 $514,403.37
Solomon Islands $659,025.00 $409,850.00
Mali $746,836.81 $381,811.87
Lebanon $5,628,151.55 $287,208.72
Kosovo $56,527,520.93 $258,075.00
Faroe Islands $4,501,795.37 $232,025.24
Dominican Republic $669,275.60 $226,100.00
Panama $147,823.00 $197,795.91
Iraq $31,685.31 $195,795.22
Cameroon $980,209.24 $185,836.45
Cote d'Ivoire $16,095,704.09 $173,442.76
Lesotho $270,791.53 $167,131.28
Serbia $68,898.47 $155,845.27
Tunisia $4,060.75 $136,927.43
Papua New Guinea $114,800.00 $107,150.00
Nepal $181,545.63 $87,779.51
Sri Lanka $79,114.44 $85,840.06
Algeria $14,559.12 $74,818.35
Vanuatu $1,820.78 $54,700.00
Zimbabwe $1,600,277.79 $37,142.78
Guinea $5,170.00 $32,483.75
Morocco $227,876.20 $23,756.45
Kuwait $5,000.00 $22,623.15
Qatar $20,785.43
Belize $34,594.27 $15,241.32
Macao $12,768.41
Venezuela $17,489.66 $12,146.60
Greenland $8,849.00 $8,077.00
Gambia $2,132.32 $6,374.59
Benin $752.06 $5,740.68

The 2nd Global Alternative Finance Market Benchmarking Report
192
Country/Jurisdiction Volume 2019 (USD) Volume 2020 (USD)
Syria $5,325.10
Cuba $4,932.39
Trinidad and Tobago $3,207.42 $4,662.80
Afghanistan $3,522.70
Malta $851,456.50 $3,055.76
Chad $4,415.86 $2,924.54
Laos $24,387.66 $2,826.41
New Caledonia $0.00 $2,798.97
Bermuda $23,614.14 $1,378.37
Jamaica $94,817.18 $693.00
Falkland Islands $202.54
Congo Rep. $9,550.00 $80.04
Angola $3,977.90
Bahamas $21,126.00
Bhutan $638.42
Brunei $639,020.61
Central African Republic $10,995.47
Ethiopia $30,296.14
Liechtenstein $42,681.71
Monaco $11,036,588.67
Suriname $18,407.15
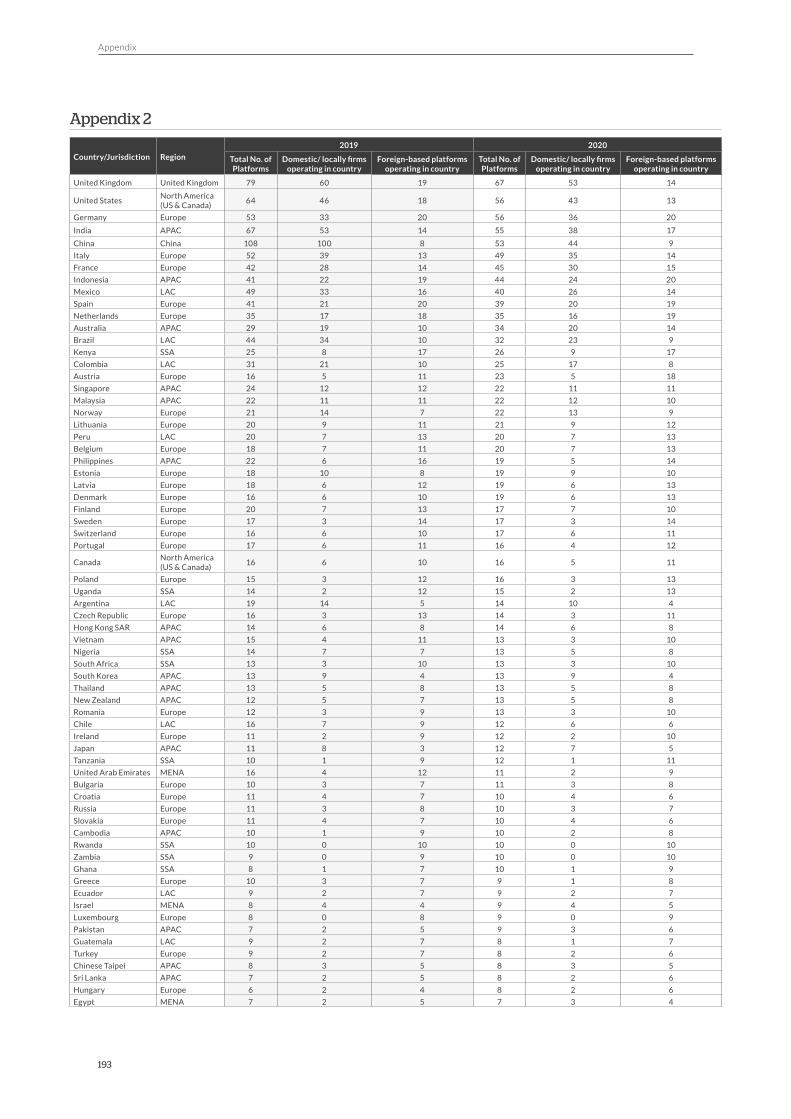
Appendix
193
Appendix 2
Country/Jurisdiction Region
2019 2020
Total No. of Platforms
Domestic/ locally firms operating in country
Foreign-based platforms operating in country
Total No. of Platforms
Domestic/ locally firms operating in country
Foreign-based platforms operating in country
United Kingdom United Kingdom 79 60 19 67 53 14
United StatesNorth America (US & Canada)
64 46 18 56 43 13
Germany Europe 53 33 20 56 36 20
India APAC 67 53 14 55 38 17
China China 108 100 8 53 44 9
Italy Europe 52 39 13 49 35 14
France Europe 42 28 14 45 30 15
Indonesia APAC 41 22 19 44 24 20
Mexico LAC 49 33 16 40 26 14
Spain Europe 41 21 20 39 20 19
Netherlands Europe 35 17 18 35 16 19
Australia APAC 29 19 10 34 20 14
Brazil LAC 44 34 10 32 23 9
Kenya SSA 25 8 17 26 9 17
Colombia LAC 31 21 10 25 17 8
Austria Europe 16 5 11 23 5 18
Singapore APAC 24 12 12 22 11 11
Malaysia APAC 22 11 11 22 12 10
Norway Europe 21 14 7 22 13 9
Lithuania Europe 20 9 11 21 9 12
Peru LAC 20 7 13 20 7 13
Belgium Europe 18 7 11 20 7 13
Philippines APAC 22 6 16 19 5 14
Estonia Europe 18 10 8 19 9 10
Latvia Europe 18 6 12 19 6 13
Denmark Europe 16 6 10 19 6 13
Finland Europe 20 7 13 17 7 10
Sweden Europe 17 3 14 17 3 14
Switzerland Europe 16 6 10 17 6 11
Portugal Europe 17 6 11 16 4 12
CanadaNorth America (US & Canada)
16 6 10 16 5 11
Poland Europe 15 3 12 16 3 13
Uganda SSA 14 2 12 15 2 13
Argentina LAC 19 14 5 14 10 4
Czech Republic Europe 16 3 13 14 3 11
Hong Kong SAR APAC 14 6 8 14 6 8
Vietnam APAC 15 4 11 13 3 10
Nigeria SSA 14 7 7 13 5 8
South Africa SSA 13 3 10 13 3 10
South Korea APAC 13 9 4 13 9 4
Thailand APAC 13 5 8 13 5 8
New Zealand APAC 12 5 7 13 5 8
Romania Europe 12 3 9 13 3 10
Chile LAC 16 7 9 12 6 6
Ireland Europe 11 2 9 12 2 10
Japan APAC 11 8 3 12 7 5
Tanzania SSA 10 1 9 12 1 11
United Arab Emirates MENA 16 4 12 11 2 9
Bulgaria Europe 10 3 7 11 3 8
Croatia Europe 11 4 7 10 4 6
Russia Europe 11 3 8 10 3 7
Slovakia Europe 11 4 7 10 4 6
Cambodia APAC 10 1 9 10 2 8
Rwanda SSA 10 0 10 10 0 10
Zambia SSA 9 0 9 10 0 10
Ghana SSA 8 1 7 10 1 9
Greece Europe 10 3 7 9 1 8
Ecuador LAC 9 2 7 9 2 7
Israel MENA 8 4 4 9 4 5
Luxembourg Europe 8 0 8 9 0 9
Pakistan APAC 7 2 5 9 3 6
Guatemala LAC 9 2 7 8 1 7
Turkey Europe 9 2 7 8 2 6
Chinese Taipei APAC 8 3 5 8 3 5
Sri Lanka APAC 7 2 5 8 2 6
Hungary Europe 6 2 4 8 2 6
Egypt MENA 7 2 5 7 3 4

The 2nd Global Alternative Finance Market Benchmarking Report
194
Country/Jurisdiction Region
2019 2020
Total No. of Platforms
Domestic/ locally firms operating in country
Foreign-based platforms operating in country
Total No. of Platforms
Domestic/ locally firms operating in country
Foreign-based platforms operating in country
Slovenia Europe 6 2 4 7 2 5
Serbia Europe 5 1 4 7 1 6
Myanmar APAC 4 1 3 7 0 7
Cameroon SSA 8 3 5 6 1 5
Malawi SSA 7 0 7 6 0 6
Palestine MENA 7 0 7 6 0 6
Senegal SSA 7 0 7 6 0 6
Cyprus Europe 6 0 6 6 1 5
Nepal APAC 6 0 6 6 0 6
Ukraine Europe 6 2 4 6 2 4
Lebanon MENA 5 1 4 6 1 5
Macedonia Europe 4 1 3 6 1 5
Saudi Arabia MENA 4 0 4 6 0 6
Democratic Republic of Congo
SSA 7 0 7 5 0 5
Mali SSA 6 0 6 5 0 5
Zimbabwe SSA 6 1 5 5 1 4
Bangladesh APAC 5 0 5 5 0 5
Bosnia & Herzegovina Europe 5 0 5 5 0 5
Georgia Europe 5 0 5 5 0 5
Iceland Europe 4 1 3 5 1 4
Qatar MENA 4 0 4 5 0 5
Uruguay LAC 4 0 4 5 1 4
Morocco MENA 3 1 2 5 1 4
Kazakhstan APAC 6 0 6 4 0 4
Malta Europe 6 1 5 4 1 3
Togo SSA 6 0 6 4 0 4
Armenia Europe 5 0 5 4 0 4
Belarus Europe 5 1 4 4 1 3
Costa Rica LAC 5 0 5 4 0 4
Honduras LAC 5 0 5 4 0 4
Madagascar SSA 5 0 5 4 0 4
Mozambique SSA 5 0 5 4 0 4
Albania Europe 4 0 4 4 0 4
Burkina Faso SSA 4 0 4 4 0 4
Moldova Europe 4 0 4 4 0 4
Botswana SSA 3 0 3 4 1 3
Iraq MENA 3 0 3 4 0 4
Mauritius SSA 3 1 2 4 1 3
Jordan MENA 7 1 6 3 1 2
Bolivia LAC 5 0 5 3 0 3
Cote d'Ivoire SSA 5 0 5 3 0 3
Panama LAC 5 0 5 3 0 3
Dominican Republic LAC 4 0 4 3 0 3
Mongolia APAC 4 3 1 3 2 1
Namibia SSA 4 0 4 3 0 3
Nicaragua LAC 4 0 4 3 0 3
Belize LAC 3 0 3 3 0 3
Liechtenstein Europe 3 0 3 3 0 3
Sierra Leone SSA 3 0 3 3 0 3
Cuba LAC 2 0 2 3 0 3
Greenland Europe 2 0 2 3 0 3
Puerto Rico LAC 2 0 2 3 0 3
Algeria MENA 1 0 1 3 0 3
Bahrain MENA 4 0 4 2 0 2
Kosovo Europe 4 0 4 2 0 2
Congo Rep. SSA 3 1 2 2 1 1
Kuwait MENA 3 0 3 2 0 2
Kyrgyzstan Europe 3 0 3 2 0 2
Paraguay LAC 3 2 1 2 1 1
El Salvador LAC 2 0 2 2 0 2
Faroe Islands Europe 2 0 2 2 0 2
Gambia SSA 2 0 2 2 0 2
Guinea SSA 2 0 2 2 0 2
Haiti LAC 2 0 2 2 0 2
Isle of Man Europe 2 0 2 2 0 2
Lesotho SSA 2 0 2 2 0 2
Tajikistan APAC 2 0 2 2 0 2
Tunisia MENA 2 0 2 2 0 2
Macao APAC 1 0 1 2 0 2
Venezuela LAC 4 0 4 1 0 1
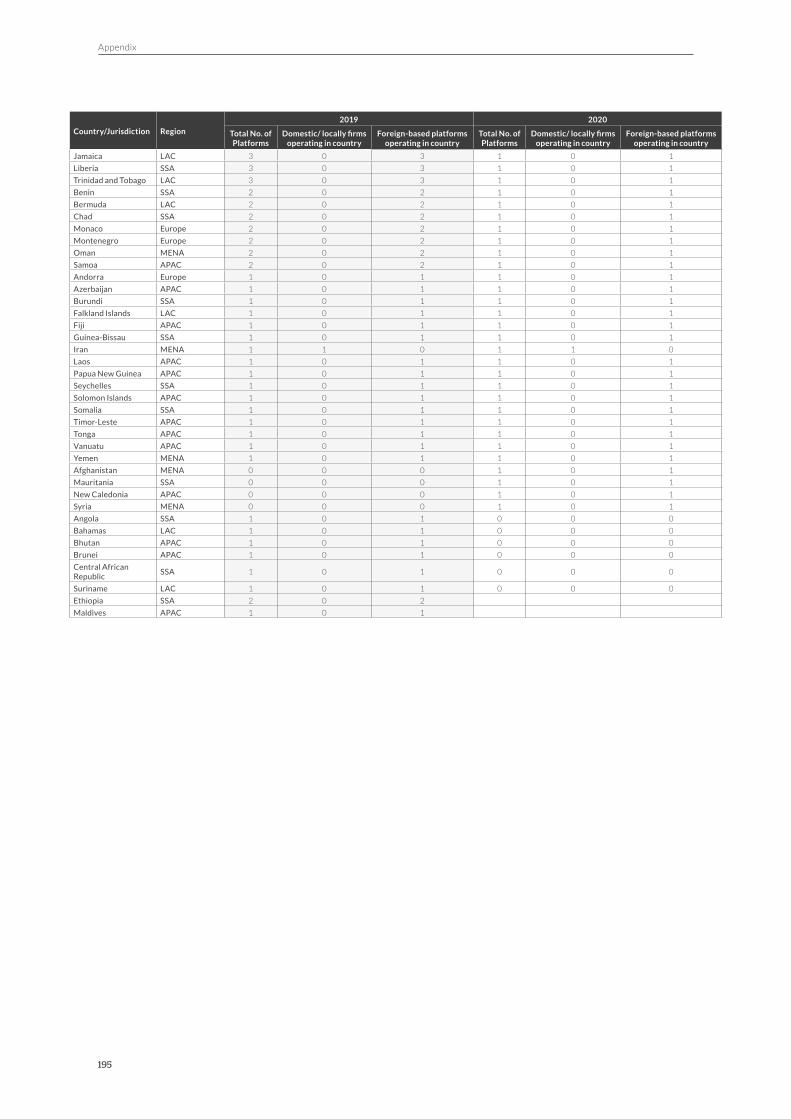
Appendix
195
Country/Jurisdiction Region
2019 2020
Total No. of Platforms
Domestic/ locally firms operating in country
Foreign-based platforms operating in country
Total No. of Platforms
Domestic/ locally firms operating in country
Foreign-based platforms operating in country
Jamaica LAC 3 0 3 1 0 1
Liberia SSA 3 0 3 1 0 1
Trinidad and Tobago LAC 3 0 3 1 0 1
Benin SSA 2 0 2 1 0 1
Bermuda LAC 2 0 2 1 0 1
Chad SSA 2 0 2 1 0 1
Monaco Europe 2 0 2 1 0 1
Montenegro Europe 2 0 2 1 0 1
Oman MENA 2 0 2 1 0 1
Samoa APAC 2 0 2 1 0 1
Andorra Europe 1 0 1 1 0 1
Azerbaijan APAC 1 0 1 1 0 1
Burundi SSA 1 0 1 1 0 1
Falkland Islands LAC 1 0 1 1 0 1
Fiji APAC 1 0 1 1 0 1
Guinea-Bissau SSA 1 0 1 1 0 1
Iran MENA 1 1 0 1 1 0
Laos APAC 1 0 1 1 0 1
Papua New Guinea APAC 1 0 1 1 0 1
Seychelles SSA 1 0 1 1 0 1
Solomon Islands APAC 1 0 1 1 0 1
Somalia SSA 1 0 1 1 0 1
Timor-Leste APAC 1 0 1 1 0 1
Tonga APAC 1 0 1 1 0 1
Vanuatu APAC 1 0 1 1 0 1
Yemen MENA 1 0 1 1 0 1
Afghanistan MENA 0 0 0 1 0 1
Mauritania SSA 0 0 0 1 0 1
New Caledonia APAC 0 0 0 1 0 1
Syria MENA 0 0 0 1 0 1
Angola SSA 1 0 1 0 0 0
Bahamas LAC 1 0 1 0 0 0
Bhutan APAC 1 0 1 0 0 0
Brunei APAC 1 0 1 0 0 0
Central African Republic
SSA 1 0 1 0 0 0
Suriname LAC 1 0 1 0 0 0
Ethiopia SSA 2 0 2
Maldives APAC 1 0 1

The 2nd Global Alternative Finance Market Benchmarking Report
196
Appendix 3
Country Model CategoryHHI
2019Market Concentration 2019
HHI 2020
Market Concentration 2020Summary (Direction of
Market Concentration Flow)
Argentina Debt Models 0.65 Highly Concentrated Markets 0.86 Highly Concentrated Markets 0.21
AustraliaDebt Models 0.16 Moderately Concentrated Markets 0.16 Moderately Concentrated Markets 0.00
Non-InvestMent Models 0.33 Highly Concentrated Markets 0.22 Moderately Concentrated Markets -0.11
Austria Non-InvestMent Models 0.30 Highly Concentrated Markets 0.24 Moderately Concentrated Markets -0.06
BelgiumDebt Models 0.21 Moderately Concentrated Markets 0.23 Moderately Concentrated Markets 0.02
Non-InvestMent Models 0.32 Highly Concentrated Markets 0.30 Highly Concentrated Markets -0.02
BrazilDebt Models 0.73 Highly Concentrated Markets 0.82 Highly Concentrated Markets 0.09
Non-InvestMent Models 0.48 Highly Concentrated Markets 0.51 Highly Concentrated Markets 0.03
Canada Debt Models 0.31 Highly Concentrated Markets 0.27 Highly Concentrated Markets -0.04
Chile Debt Models 0.38 Highly Concentrated Markets 0.40 Highly Concentrated Markets 0.02
ColombiaDebt Models 0.41 Highly Concentrated Markets 0.56 Highly Concentrated Markets 0.15
Non-InvestMent Models 0.54 Highly Concentrated Markets 0.30 Highly Concentrated Markets -0.24
Estonia Debt Models 0.40 Highly Concentrated Markets 0.39 Highly Concentrated Markets -0.01
Finland Debt Models 0.33 Highly Concentrated Markets 0.30 Highly Concentrated Markets -0.03
France
Debt Models 0.24 Moderately Concentrated Markets 0.33 Highly Concentrated Markets 0.09
Equity Models 0.21 Moderately Concentrated Markets 0.18 Moderately Concentrated Markets -0.03
Non-InvestMent Models 0.42 Highly Concentrated Markets 0.40 Highly Concentrated Markets -0.01
Germany
Debt Models 0.69 Highly Concentrated Markets 0.65 Highly Concentrated Markets -0.04
Equity Models 0.49 Highly Concentrated Markets 0.31 Highly Concentrated Markets -0.18
Non-InvestMent Models 0.29 Highly Concentrated Markets 0.28 Highly Concentrated Markets -0.01
India
Debt Models 0.16 Moderately Concentrated Markets 0.22 Moderately Concentrated Markets 0.06
Equity Models 0.89 Highly Concentrated Markets 0.93 Highly Concentrated Markets 0.04
Non-InvestMent Models 0.51 Highly Concentrated Markets 0.40 Highly Concentrated Markets -0.11
IndonesiaDebt Models 0.14 Unconcentrated Markets 0.19 Moderately Concentrated Markets 0.05
Non-InvestMent Models 0.89 Highly Concentrated Markets 0.82 Highly Concentrated Markets -0.07
Italy
Debt Models 0.25 Moderately Concentrated Markets 0.29 Highly Concentrated Markets 0.04
Equity Models 0.16 Moderately Concentrated Markets 0.17 Moderately Concentrated Markets 0.01
Non-InvestMent Models 0.30 Highly Concentrated Markets 0.30 Highly Concentrated Markets 0.00
KenyaDebt Models 0.27 Highly Concentrated Markets 0.35 Highly Concentrated Markets 0.08
Non-InvestMent Models 0.81 Highly Concentrated Markets 0.60 Highly Concentrated Markets -0.21
Latvia Debt Models 0.62 Highly Concentrated Markets 0.53 Highly Concentrated Markets -0.09
Lithuania Debt Models 0.20 Moderately Concentrated Markets 0.22 Moderately Concentrated Markets 0.02
MalaysiaDebt Models 0.43 Highly Concentrated Markets 0.29 Highly Concentrated Markets -0.13
Non-InvestMent Models 0.33 Highly Concentrated Markets 0.25 Moderately Concentrated Markets -0.09
Mexico
Debt Models 0.27 Highly Concentrated Markets 0.33 Highly Concentrated Markets 0.06
Equity Models 0.28 Highly Concentrated Markets 0.27 Highly Concentrated Markets -0.02
Non-InvestMent Models 0.24 Moderately Concentrated Markets 0.27 Highly Concentrated Markets 0.04
Netherlands
Debt Models 0.63 Highly Concentrated Markets 0.19 Moderately Concentrated Markets -0.44
Equity Models 0.45 Highly Concentrated Markets 0.30 Highly Concentrated Markets -0.15
Non-InvestMent Models 0.32 Highly Concentrated Markets 0.32 Highly Concentrated Markets 0.01
NorwayDebt Models 0.33 Highly Concentrated Markets 0.33 Highly Concentrated Markets 0.00
Non-InvestMent Models 0.59 Highly Concentrated Markets 0.71 Highly Concentrated Markets 0.12
PeruDebt Models 0.23 Moderately Concentrated Markets 0.39 Highly Concentrated Markets 0.16
Non-InvestMent Models 0.73 Highly Concentrated Markets 0.56 Highly Concentrated Markets -0.16
PhilippinesDebt Models 0.26 Highly Concentrated Markets 0.34 Highly Concentrated Markets 0.07
Non-InvestMent Models 0.93 Highly Concentrated Markets 0.91 Highly Concentrated Markets -0.02
Poland Debt Models 0.62 Highly Concentrated Markets 0.54 Highly Concentrated Markets -0.08
Portugal Debt Models 0.28 Highly Concentrated Markets 0.41 Highly Concentrated Markets 0.13
Singapore Debt Models 0.19 Moderately Concentrated Markets 0.36 Highly Concentrated Markets 0.17
Spain
Debt Models 0.25 Moderately Concentrated Markets 0.20 Moderately Concentrated Markets -0.04
Equity Models 0.16 Moderately Concentrated Markets 0.14 Unconcentrated Markets -0.03
Non-InvestMent Models 0.25 Highly Concentrated Markets 0.20 Moderately Concentrated Markets -0.05
Sweden Debt Models 0.47 Highly Concentrated Markets 0.45 Highly Concentrated Markets -0.02
Switzerland Non-InvestMent Models 0.38 Highly Concentrated Markets 0.30 Highly Concentrated Markets -0.08
United Kingdom
Debt Models 0.13 Unconcentrated Markets 0.23 Moderately Concentrated Markets 0.10
Equity Models 0.30 Highly Concentrated Markets 0.37 Highly Concentrated Markets 0.06
Non-InvestMent Models 0.93 Highly Concentrated Markets 0.96 Highly Concentrated Markets 0.03
United States
Debt Models 0.10 Unconcentrated Markets 0.11 Unconcentrated Markets 0.01
Equity Models 0.49 Highly Concentrated Markets 0.33 Highly Concentrated Markets -0.16
Non-InvestMent Models 0.40 Highly Concentrated Markets 0.28 Highly Concentrated Markets -0.12

Cambridge Centre for Alternative Finance10 Trumpington StreetCambridge CB2 1QAUnited KingdomEmail: [email protected]: +44 (0)1223 339111