Embed Size (px)
Citation preview


Roskill | Approachable. Independent. Expert
54, Russell Road, London SW19 1QL, UK Tel: +44 20 8417 0087 Fax: +44 20 8417 1308
Online: www.roskill.com Email: [email protected]
Lithium: Market Outlook to 2017
Twelfth Edition, 2013
Copyright © Roskill Information Services Ltd. ISBN 978 0 86214 589 7

This report is copyright It is illegal to copy it without obtaining a licence
The customer number of the organisation receiving this report has been encrypted
throughout the report so that any copies made can be tracked back to the original source
Copyright © April 2013 Roskill Information Services Ltd
The contents of this report may not be reproduced, stored or transmitted in any form
or by any means, without prior permission in writing.
We want you to get the best value from your investment in this report. If you wish to
photocopy a few pages of the report for use within your own organisation, you can
obtain the necessary licence and make copies at a cost of £4/$8 per page from the
Copyright Licensing Agency, 90 Tottenham Court Road, London, W1P 9HE, from the
Copyright Clearance Center in the USA, and from similar organisations in other
countries.
Please do not allow this report to be photocopied without a licence. Illegal
photocopying harms us because cannot afford to update reports as often as we would
like, and it may harm you too when you next want an up-to-date report from us. Your
co-operation is much appreciated.

Table of Contents
Page
1. Summary 1
2. Lithium Mineralogy, Occurrences and Reserves 10
2.1 Occurrence of lithium 10
2.1.1 Lithium minerals 10
2.1.2 Lithium clays 12
2.1.3 Lithium brines 12
2.2 Lithium reserves 14
3. Lithium mining and processing 16
3.1 Extraction and processing of lithium brines 17
3.1.1 Other methods of brine extraction 20
3.2 Mining and processing of lithium minerals 21
3.3 Processing lithium mineral concentrates to lithium compounds 23
3.4 Processing lithium bearing clays into lithium compounds 26
3.5 Lithium compounds and chemicals 27
3.6 Production costs 30
4. Production of lithium 34
4.1 Lithium production by source 35
4.1.1 Production of Lithium Minerals 37
4.1.2 Production from Lithium Brines 39
4.1.3 Production of lithium compounds from mineral conversion 41
4.1.4 Production of downstream lithium chemicals 43
4.2 Outlook for production capacity of lithium to 2017 44
4.2.1 Outlook for production capacity of lithium minerals 45
4.2.2 Outlook for lithium production capacity from brines 48
4.2.3 Outlook on lithium compound production from mineral conversion 51
4.3 Forecast production of lithium to 2017 52
5. Review of lithium producing countries 55
5.1 Afghanistan 55
5.2 Argentina 56
5.2.1 FMC Litihum (Minera del Altiplano S.A.) 58
5.2.2 ADY Resources 59
5.2.3 Lithium Americas 61
5.2.4 Galaxy Resources (Lithium 1) 66
5.2.4.1 Sal de Vida Project 66
5.2.4.2 James Bay Hard-rock Lithium Project 68
5.2.5 Orocobre Ltd. 69
5.2.5.1 Salar de Olaroz 71
5.2.5.2 Salinas Grandes (Cangrejillo) 74
5.2.5.3 Guayatoyoc Project 74
5.2.5.4 Cauchari Project 75
5.2.6 Rodinia Lithium Inc. 76
5.2.6.1 Rodinia Lithium USA 78
5.2.7 Marifil Mines Ltd. 78
5.2.8 International Lithium Corporation 79
5.2.9 Other prospects for Lithium Production 79
5.3 Australia 80
5.3.1 Talison Lithium 82
5.3.1.1 Resources and Reserves 82
5.3.1.2 Production 85
5.3.1.3 Products 86
5.3.2 Galaxy Resources Ltd. 87
5.3.2.1 Reserves and Resources 88
5.3.2.2 Production 90
5.3.3 Reed Resources Ltd. 91
5.3.4 Altura Mining Ltd. 92
5.3.5 Artemis Resources 93
5.3.6 Amerilithium 93
5.3.7 Reward Minerals 93
5.4 Austria 93
5.5 Belgium 94
5.6 Bolivia 96
5.6.1 Salar de Uyuni 97
5.6.2 Salar de Coipasa 99
5.6.3 New World Resource Corp. 99
5.7 Brazil 100
5.7.1 Companhia Brasileira de Litio 102
5.7.2 Arqueana de Minérios e Metais Ltda. 103
5.7.3 Advance Metallurgical Group (AMG) 104
5.8 Canada 104
5.8.1 Lithium resources in Canada 105
5.8.2 Canadian trade in lithium 107
5.8.3 Past producers of lithium in Canada 108
5.8.3.1 Tantalum Mining Corp. of Canada Ltd. (TANCO) 108
5.8.4 Potential new producers of lithium in Canada 109
5.8.4.1 Canada Lithium Corp. 109
5.8.4.2 Nemaska Lithium 112
5.8.4.3 Avalon Rare Metals Inc. 115
5.8.4.4 Perilya Limited 116
5.8.4.5 Rock Tech Lithium Inc. 117
5.8.4.6 Critical Elements Corporation 120
5.8.4.7 Glen Eagle Resources Inc. 120
5.8.4.8 Aben Resources Ltd. 121
5.8.4.9 Toxco Inc. Canada 122
5.8.4.10 Other Canadian Lithium Projects 122
5.9 Chile 126
5.9.1 Chilean lithium reserves 127
5.9.2 Chilean lithium production 127
5.9.3 Special Lithium Operations Contracts (CEOLs) 128
5.9.4 Sociedad Química y Minera 129
5.9.4.1 Reserves and Resources 130
5.9.4.2 Production 131
5.9.4.3 Products 132
5.9.4.4 Markets 134
5.9.4.5 Exports 135
5.9.5 Rockwood Litihum (Salar de Atacama and La Negra Plant) 136
5.9.6 Simbalik Group 138
5.9.7 Li3 Energy Inc. 139
5.9.7.1 Maricunga Property 139
5.9.7.2 Li3 Energy Peruvian Projects 141
5.9.8 First Potash Corp. 141
5.9.9 CODELCO 142
5.9.10 Mammoth Energy Group Inc. 142
5.9.11 Lomiko Metals Inc. 143
5.9.12 Errázuriz Lithium 143
5.9.13 Exports of litihum from Chile 143
5.10 China 146
5.10.1 Chinese reserves of lithium 147
5.10.1.1 Lithium Mineral Reserves 147
5.10.1.2 Lithium Brine Reserves 148
5.10.2 Production of lithium 149
5.10.2.1 Mineral Production 150
5.10.2.2 Brine Production 151
5.10.2.3 Lithium Chemicals and Metal Production 152
5.10.3 Chinese trade in lithium 155
5.10.4 Chinese lithium brine producers 157
5.10.4.1 Tibet Lithium New Technology Development Co. Ltd. 157
5.10.4.2 Qinghai CITIC Guoan Technology Development Co. Ltd. 159
5.10.4.3 Qinghai Salt Lake Industry Co. Ltd. 160
5.10.4.4 Qinghai Lanke Lithium Industry Co. Ltd. 161
5.10.4.5 Tibet Sunrise Mining Development Ltd. 162
5.10.4.6 China MinMetals Non-Ferrous Metals Co. Ltd 163
5.10.5 Chinese lithium mineral producers 163
5.10.5.1 Fujian Huamin Import & Export Co. Ltd. 163
5.10.5.2 Yichun Huili Industrial Co. Ltd. 164
5.10.5.3 GanZi Rongda Lithium Co., Ltd. 164
5.10.5.4 Sichuan Hidili Dexin Mineral Industry 165
5.10.5.5 Xinjiang Non-Ferrous Metals (Group) Ltd. 166
5.10.6 Chinese lithium mineral producers with mineral conversion capacity 166
5.10.6.1 Jiangxi Western Resources Lithium Industry 166
5.10.6.2 Sichuan Aba Guangsheng Lithium Co. Ltd. 167
5.10.6.3 Minfeng Lithium Co. Ltd. 167
5.10.6.4 Sichuan Ni&Co Guorun New Materials Co. Ltd. 168
5.10.7 Chinese mineral conversion plants 169
5.10.7.1 Sichuan Tianqi Lithium Shareholding Co. Ltd. 169
5.10.7.2 Galaxy Resources (Jiangsu Lithium Carbonate Plant) 171
5.10.7.3 General Lithium (Haimen) Corp. 172
5.10.7.4 China Non-Ferrous Metal Import & Export Xinjiang Corp. 173
5.10.7.5 Sichuan State Lithium Materials Co. Ltd. 174
5.10.7.6 Jiangxi Ganfeng Lithium Co. Ltd. 174
5.10.7.7 Sichuan Chenghehua Lithium Technology Co. Ltd. 176
5.10.8 Chinese lithium chemical producers 176
5.10.9 Specialist lithium bromide producers 177
5.10.10 Specialist lithium metal producers 178
5.11 Czech Republic 179
5.12 Democratic Republic of Congo (DRC) 179
5.13 Finland 180
5.13.1 Keliber Oy 180
5.13.2 Nortec Minerals Corp. 181
5.13.3 Leviäkangas Deposit 182
5.13.4 Syväjärvi Deposit 182
5.14 France 182
5.15 Germany 184
5.15.1 Rockwood Lithium (Langelsheim Plant) 185
5.15.2 Helm AG 185
5.15.3 Lithium exploration in Germany 185
5.16 Greece 186
5.17 India 186
5.17.1 FMC India Private Ltd. 188
5.17.2 Rockwood Lithium 188
5.18 Ireland 189
5.19 Israel 189
5.20 Japan 190
5.21 Kazakhstan 192
5.22 Mali 193
5.23 Mexico 193
5.23.1 Litio Mex S.A. de C.V. (Piero Sutti S.A. de C.V.) 193
5.23.2 First Potash Corp. (Mexico) 195
5.23.3 Bacanora Minerals Ltd. 195
5.24 Mongolia 196
5.25 Mozambique 196
5.26 Namibia 197
5.27 Netherlands 198
5.28 Portugal 199
5.28.1 Sociedad Mineira de Pegmatites 200
5.29 Russia 200
5.29.1 Russian Lithium Reserves and Resources 201
5.29.2 Russian Lithium Production 202
5.29.2.1 JSC Chemical and Metallurgical Plant 202
5.29.2.2 JSC Novosibirsk Chemical Concentration Plant 203
5.29.3 Russian Imports and Exports of Lithium 204
5.30 Serbia 205
5.31 South Africa 206
5.32 South Korea 206
5.33 Spain 207
5.33.1 Minera Del Duero 208
5.33.2 Solid Resources Ltd. 209
5.34 Taiwan 209
5.35 Tajikistan 210
5.36 Turkey 210
5.37 UK 211
5.38 Ukraine 212
5.39 USA 212
5.39.1 Trade in lithium to/from the USA 213
5.39.2 Rockwood Lithium (Chemetall Group) 214
5.39.2.1 Silver Peak, Kings Mountain and New Johnsonville operations
(USA) 215
5.39.3 FMC Corporation 216
5.39.3.1 FMC Lithium 217
5.39.3.2 Other FMC Corporation facilities 218
5.39.4 Western Lithium Corporation 219
5.39.5 Simbol Materials Corp. 222
5.39.6 Albemarle Corporation 223
5.39.7 Toxco Inc. 223
5.39.8 AusAmerican Mining Corp. Ltd. 223
5.39.9 Other USA Companies 224
5.40 Uzbekistan 226
5.41 Zimbabwe 226
5.41.1 Bikita Minerals Ltd 227
5.41.2 Zimbabwe Mining Development Corporation 228
5.41.3 Premier African Minerals 228
5.41.4 Cape Range Ltd. 229
6. International trade in lithium 230
6.1 Trade in lithium carbonate 230
6.2 Trade in lithium hydroxide and oxides 233
6.3 Trade in lithium chloride 236
6.4 Trade in mineral concentrates 237
6.5 Trade in lithium brines 238
7. Consumption of lithium 239
7.1 Consumption of lithium by end-use 239
7.2 Consumption of lithium by country/region 243
7.3 Consumption of lithium by product 245
7.4 Outlook for consumption of lithium by end-use 247
7.5 Outlook for lithium consumption by product 251
8. Use of lithium in rechargeable batteries 253
8.1 Types of rechargeable batteries 253
8.1.1 Lithium-ion batteries 254
8.1.2 Lithium metal polymer batteries 256
8.1.3 Lithium-sulphur batteries 256
8.1.4 Lithium-air batteries 258
8.1.5 NiMH and NiCd batteries 258
8.2 Production of rechargeable batteries 258
8.2.1 Producers of rechargeable lithium batteries 261
8.2.2 Producers of nickel metal hydride batteries 262
8.3 Production of rechargeable lithium battery materials 262
8.3.1 Producers of rechargeable lithium battery materials 264
8.3.1.1 Cathode materials 264
8.3.1.2 Electrolyte salts 267
8.3.1.3 Anode materials 268
8.4 Consumption of rechargeable lithium batteries 268
8.4.1 Computing, communication and consumer (3C) market 269
8.4.2 Power devices and motive power 270
8.4.3 Heavy duty applications 272
8.4.4 Transportation 272
8.5 Consumption of NiMH and NiCd batteries 274
8.6 Consumption of lithium in rechargeable batteries 274
8.7 Outlook for demand for rechargeable batteries 278
8.8 Outlook for consumption of lithium in rechargeable batteries 281
9. Use of lithium in ceramics 284
9.1 Use of lithium in ceramics 284
9.2 Production and consumption of ceramics 286
9.2.1 Ceramic tiles 287
9.2.1.1 Producers of ceramic tiles 289
9.2.2 Sanitaryware 291
9.2.2.1 Producers of sanitaryware 291
9.2.3 Tableware 293
9.2.3.1 Producers of tableware 294
9.2.4 Cookware and bakeware 295
9.3 Production and consumption of glazes and enamels 295
9.3.1 Producers of glazes and enamels 297
9.4 Outlook for ceramics production and consumption 298
9.5 Consumption of lithium in ceramics 299
9.5.1 Outlook for lithium demand in ceramics 300
10. Use of lithium in glass-ceramics 302
10.1 Use of lithium in glass-ceramics 302
10.2 Production and consumption of glass-ceramics 304
10.2.1 Producers of glass-ceramics 305
10.3 Consumption of lithium in glass-ceramics 306
11. Use of lithium in lubricating grease 309
11.1 Types of lubricating grease 309
11.2 Production of grease 311
11.2.1 Producers of lithium grease 314
11.3 Consumption of lithium greases 317
11.4 Consumption of lithium in greases 320
11.4.1 Outlook for demand for lithium in greases 321
12. Use of lithium in glass 323
12.1 Use of lithium in glass 323
12.2 Production and consumption of glass 325
12.2.1 Container glass 326
12.2.2 Fibreglass 329
12.2.3 Speciality glass 330
12.3 Consumption of lithium in glass 330
12.3.1 Outlook for demand for lithium in glass 331
13. Use of lithium in metallurgical powders 333
13.1 Continuous casting 333
13.1.1 Producers of continuous casting mould powders 334
13.1.2 Continually cast steel production 334
13.1.3 Consumption of continuous casting mould powders 335
13.1.4 Consumption of lithium in continuous casting mould powders 335
13.2 Traditional metal casting 337
13.3 Outlook for demand for lithium in casting powders 337
14. Use of lithium in polymers 338
14.1 Types of polymers 338
14.2 Production of polymers 340
14.2.1 Producers of polymers 342
14.3 Consumption of polymers 344
14.4 Consumption of lithium in polymers 348
14.4.1 Outlook for lithium demand in polymers 348
15. Use of lithium in air treatment 350
15.1 Absorption chillers 350
15.1.1 Production of absorption chillers 351
15.1.2 Producers of adsorption chillers 352
15.1.3 Producers of lithium bromide for absorption chillers 354
15.1.4 Consumption of lithium in absorption chillers 356
15.2 Dehumidification 357
15.2.1 Production of desiccant dehumidification systems 358
15.2.2 Producers of desiccant dehumidification systems 358
15.2.3 Consumption of lithium in desiccant dehumidifiers 359
15.3 Air purification 359
15.5 Outlook for demand for lithium in air treatment 360
16. Use of lithium in primary batteries 362
16.1 Types of primary batteries 362
16.2 Production of lithium primary batteries 365
16.2.1 Producers of lithium primary batteries 367
16.3 Trade in primary batteries 369
16.4 Production of primary lithium battery materials 370
16.4.1 Producers of lithium primary battery anodes 371
16.5 Consumption of lithium primary batteries 373
16.5.1 Outlook for primary lithium battery consumption 374
16.6 Consumption of lithium in primary batteries 374
16.6.1 Outlook for demand for lithium in primary batteries 377
17. Use of lithium in aluminium smelting 378
17.1 Process of aluminium smelting 378
17.2 Consumers of lithium in aluminium smelting 380
17.3 Consumption of lithium in aluminium smelting 382
17.3.1 Outlook for lithium demand in aluminium smelting 383
18. Minor end-uses for lithium 385
18.1 Sanitization 385
18.2 Organic synthesis 386
18.3 Construction 388
18.4 Alkyd resins 388
18.5 Alloys 391
18.5.1 Aluminium-lithium alloy 391
18.5.1.1 Producers of aluminium-lithium alloys 394
18.5.1.2 Applications for aluminium-lithium alloys 395
18.5.1.3 Consumption of lithium in aluminium-lithium alloys 398
18.5.1.4 Outlook for demand for lithium in aluminium-lithium alloys 398
18.5.2 Magnesium-lithium alloy 400
18.6 Electronics 400
18.7 Analytical agents 402
18.8 Dyestuffs 402
18.9 Metallurgy 402
18.10 Photographic industry 402
18.11 Welding fluxes 402
18.12 Electrochromic glass 403
18.13 Pharmaceuticals 403
18.13.1 Producers of lithium-based pharmaceuticals 404
18.13.2 Production and consumption of lithium-based pharmaceuticals 404
18.13.3 Consumption of lithium in pharmaceuticals 405
18.14 Speciality lithium inorganics 405
19. Prices of lithium 408
19.1 Technical-grade lithium mineral prices 409
19.2 Chemical-grade spodumene prices 412
19.3 Technical-grade lithium carbonate prices 413
19.4 Battery-grade lithium carbonate 415
19.5 Technical-grade lithium hydroxide prices 416
19.6 Battery-grade lithium hydroxide prices 418
19.7 Lithium chloride prices 419
19.8 Lithium metal prices 420
19.9 Outlook for lithium prices 421
19.9.1 Technical-grade lithium carbonate prices 421
19.9.2 Battery-grade lithium carbonate prices 424
19.9.3 Technical-grade lithium mineral prices 425
19.9.4 Chemical-grade spodumene prices 425
19.9.5 Lithium hydroxide prices 426
List of Tables
Page
Table 1: World: Forecast nominal and real prices for technical-grade lithium
carbonate, 2012 to 2017 8
Table 2: Properties of lithium 10
Table 3: Significant lithium minerals 11
Table 4: Major lithium bearing smectite group members 12
Table 5: Brine concentrations at selected deposits 13
Table 6: Lithium reserves by country 15
Table 7: Composition of standard lithium concentrates 22
Table 8: Specifications for lithium carbonate produced by SQM and Rockwood
Lithium 28
Table 9: Specifications for lithium carbonate produced by other suppliers 28
Table 10: Battery grade lithium hydroxide product specifications of major producers 29
Table 11: Production of lithium by country and company, 2005 to 2012 35
Table 12: Capacity and production of lithium minerals by company, 2011 to 2012 39
Table 13: Capacity and production of lithium compounds from brine-based
producers, 2011 to 2012 40
Table 14: Capacity and production of lithium mineral converters, 2011 to 2012 42
Table 15: Production of lithium compounds from minerals, 2005 to 2012 43
Table 16: Planned expansions as reported by existing lithium mineral producers
to 2017 46
Table 17: Potential lithium mineral producers to 2017 47
Table 18: Planned expansions by existing lithium brine producers to 2017 49
Table 19: Potential new lithium brine projects to 2017 50
Table 20: Planned expansions to production capacity for existing and potential
mineral conversion plants 51
Table 21: Afghanistan: Spodumene bearing pegmatites identified in Nuristan,
Badakhshan, Nangarhar, Lagman and Uruzgan provinces 55
Table 22: Argentina: Exports of lithium carbonate, 2004 to 2012 57
Table 23: Argentina: Exports of lithium chloride, 2004 to 2012 58
Table 24:FMC: Brine reserves at the Salar del Hombre Muerto 58
Table 25: FMC: Production and value of lithium carbonate and chloride at the Salta
plant, Argentina 2005 to 2012 59
Table 26: ADY Resources: Salar del Rincón reserve estimation, 2007 60
Table 27: Lithium Americas: Lithium and potash resource estimation for the
Cauchari-Olaroz property, July 2012 61
Table 28: Lithium Americas: Lithium and potash reserve estimation for the Cauchari-
Olaroz property, July 2012 61
Table 29: Lithium Americas: Estimated capital costs for Lithium carbonate
production at the Cauchari-Olaroz project, July 2012 63
Table 30: Lithium Americas: Estimated operating costs for Cauchari-Olaroz project,
July 2012 65
Table 31: Galaxy Resources: Resource estimation for the Sal de Vida project,
January 2012 66
Table 32: Galaxy Resources: Reserve estimate for the Sal de Vida project,
April 2013 67
Table 33: Galaxy Resources: Estimated capital costs for Sal de Vida project ,
October 2011 68
Table 34: Orocobre: Agreements between Borax Argentina and other lithium
companies 70
Table 35: Orocobre: Resource estimation for the Salar de Olaroz project, May 2011 71
Table 36: Orocobre: Assay results of first battery grade lithium carbonate product
from the Orocobre pilot plant 72
Table 37: Orocobre: Capital costs for 16,400tpy LCE operation at the Salar de
Olaroz, May 2011 73
Table 38: Orocobre: Operating costs for battery grade lithium carbonate
for the Salar de Olaroz, May 2011 73
Table 39: Orocobre: Resource estimation for the Salinas Grande project, April 2012 74
Table 40: Orocobre: Averaged assay results from pit sampling of brine at the
Guayatoyoc project 75
Table 41: Orocobre: Maiden resource estimation for the Salar de Cauchari project,
October 2012 75
Table 42: Rodinia Lithium: Salar de Diablillos resource estimation, March 2011 76
Table 43: Rodinia Lithium: Estimated capital costs for the Salar de Diablillos project 77
Table 44: Rodinia Lithium: Estimated operating costs for the Salar de Diablillos
project 77
Table 45: Rodinia Lithium: Other Argentine lithium projects 78
Table 46: Australia: Exports of mineral substances NES (excl. natural micaceous
iron oxides) 2005 to 2012 81
Table 47: Australia: Unit value of mineral substances NES (excl. natural micaeous
iron oxides) 2005 to 2011 81
Table 48: Talison Lithium: Resource estimation for the Greenbushes deposit,
December 2012 83
Table 49: Talison Lithium: Lithium mineral reserve estimation for the Greenbushes
deposit, December 2012 83
Table 50: Talison Lithium: Li, K and Na content of brines, Salares 7 project saline
lakes 1998, (ppm) 84
Table 51: Talison Lithium: Li, K and Na content of brines, Salares 7 project saline
lakes 2009, (ppm) 84
Table 52: Talison Lithium: Production and sales of lithium mineral concentrates and
ores, 2005 to 2011 85
Table 53: Talison Lithium: Standard lithium mineral concentrate product
specifications 87
Table 54: Galaxy Resources: Mount Cattlin mineral resource estimate, February
2011 89
Table 55: Galaxy Resources: Mount Cattlin mineral reserve estimate, December
2011 89
Table 56: Galaxy Resources: James Bay mineral resource estimate, November
2010 89
Table 57: Galaxy Resources: Mt. Cattlin mine and plant production, Q3 2010 –
Q4 2011 90
Table 58: Reed Resources : Mt Marion resource estimation, July 2011 91
Table 59: Altura: Mineral resource estimation for the Pilgangoora lithium project,
October 2012 92
Table 60: Belgium: Trade is lithium carbonate, 2005 to 2012 95
Table 61: Belgium: Trade in lithium hydroxide and oxide, 2005 to 2012 96
Table 62: Salars and Lagunas in Bolivia identified by Gerencia Nacional de
Recursos Evaporíticos 97
Table 63: Results of sampling campaign by Université de Liegé and Universidad
Tecnica de Oruro at the Salar de Coipasa, 2002 99
Table 64: Assay data for brines intercepted during drilling at the Pastos Grandes
Salar, August 2011 100
Table 65: Brazil: Lithium resource estimation by mineral type, 2009 101
Table 66: Brazil: Trade in lithium chemicals and concentrates, 2004 to 2011 102
Table 67: CBL: Production of lithium concentrates and lithium salts, 2005 to 2011 102
Table 68: Arqueana: Production of lithium concentrates, 2008 to 2011 103
Table 69: Canada: Resources estimations for Canadian lithium projects 106
Table 70: Canada: Imports and exports of lithium compounds 2005 to 2012 108
Table 71: TANCO: Spodumene concentrate production 2005 to 2011 109
Table 72: Canada Lithium: Resource estimation for the Quebec Lithium project,
December 2011 109
Table 73: Canada Lithium: Reserve estimation for the Quebec Lithium project,
December 2011 110
Table 74: Canada Lithium: Estimated capital expenditure for Quebec Lithium
project (inc. LiOH and Na2SO4 plant costs), October 2012 111
Table 75 :Canada Lithium: Estimated operating expenditure for Quebec Lithium
project, October 2012 111
Table 76: Nemaska Lithium: Resource estimation for the Whabouchi project,
June 2011 113
Table 77: Nemaska Lithium: Reserve estimation for the Whabouchi project,
October 2012 113
Table 78: Avalon Rare Metals: Separation Rapids NI 43-101 resource and reserve
estimation, 1999 116
Table 79: Perilya Ltd: Mineral resource estimation for Moblan deposit, May 2011 117
Table 80: Rock Tech Lithium: Structure of the Georgia Lake project, November
2011 118
Table 81: Rock Tech Lithium: Updated mineral resource estimation for Georgia
Lake project, July 2012 119
Table 82: Glen Eagle: Resource estimation for Authier lithium property, January
2012 121
Table 83: Canada: Lithium exploration projects in Canada with uncompleted
scoping studies or PFS in October 2012 122
Table 84: Chile: Lithium carbonate, chloride and hydroxide production, 2004 to 2011 128
Table 85: Chile: Special operating licence bidders for the September 2012 auction 129
Table 86: SQM: Majority shareholders of SQM as of December 31st 2011 130
Table 87: SQM: Reserves within brines at the Salar de Atacama project 131
Table 88: SQM: Production, revenue and value per tonne of lithium compounds,
2003 to 2012 132
Table 89: SQM: Specifications for lithium carbonate 133
Table 90: SQM: Specifications for lithium hydroxide 134
Table 91: RWL: Gross tonnage, value and unit value of lithium carbonate exports,
2006 to 2012 137
Table 92: RWL: Gross tonnage, value and unit value of lithium chloride exports,
2006 to 2012 138
Table 93: Li3 Energy: Resource estimation for the Maricunga property, April 2012 140
Table 94: Chile: Exports of lithium carbonate by destiatnion, 2004 to 2011 144
Table 95: Chile: Litihum carbonate export volume, value and unit price by company,
2005 to 2011 144
Table 96: Chile: Lithium chloride exports by destination, 2004 to 2012 145
Table 97: Chile: Lithium hydroxide exports by destination, 2004 to 2012 146
Table 98: China : Estimated resources and reserves of both lithium mineral and
brine operations and projects 148
Table 99: China: Production of lithium, 2003 to 2012 149
Table 100: China: Producers of lithium minerals, 2011 to 2012 151
Table 101: China: Production and capacity of Chinese lithium brine operations,
2011 152
Table 102: China: Mineral conversion plant production and production capacity,
2012 154
Table 103: China: Producers of battery grade lithium metal, 2012 154
Table 104: China: Imports and exports of lithium carbonate, 2005 to 2012 155
Table 105: China: Imports and exports of lithium chloride, 2005 to 2012 156
Table 106: China: Imports and exports of lithium hydroxide, 2005 to 2012 157
Table 107: China: Imports and exports of lithium oxide, 2005 to 2012 157
Table 108: Tibet Lithium New Technology Development: Lithium production,
2010 to 2012 158
Table 109: Qinghai CITIC: Lithium carbonate production, 2008 to 2012 160
Table 110: Dangxiongcuo reserve estimation from 2006 qualifying report 163
Table 111: Jiangxi Western Resources: Lithium Production, 2010 167
Table 112: Sichuan Tianqi: Production and sales of lithium products, 2010 to 2011 169
Table 113: Galaxy Resources: Battery grade lithium carbonate chemical
specifications 172
Table 114: Keliber Oy: Claims, reservation and mining concessions for lithium
projects held by Keliber in Finland, 2012 181
Table 115: France: Imports and exports of lithium carbonate, 2005 to 2012 183
Table 116: France: Imports and exports of lithium hydroxide and oxide, 2005
to 2012 184
Table 117: Germany: Imports and exports of lithium carbonate, 2005 to 2012 184
Table 118: India: Trade in lithium hydroxide and oxides, 2005 to 2012 187
Table 119: India: Trade in lithium carbonate, 2005 to 2012 187
Table 120: India: Producers of lithium chemicals 188
Table 121: Japan: Trade in lithium carbonate, 2005 to 2012 190
Table 122: Japan: Trade in lithium hydroxide and oxide, 2005 to 2012 191
Table 123: Mexico: Litio Mex S.A. concessions and resource estimations 194
Table 124: Namibia: Production of lithium minerals, 1990 to 1998 197
Table 125: Netherlands: Trade in lithium carbonate, 2005 to 2012 198
Table 126: Netherlands: Trade in lithium hydroxide and oxide, 2005 to 2012 199
Table 127: Sociedad Mineira de Pegmatites: Production of Lithium, 2004 to 2012 200
Table 128: Russia: Deposits of lithium 201
Table 129: Russia: Imports of lithium carbonate, 2002 to 2012 204
Table 130: Russia: Exports of lithium hydroxide, 2002 to 2012 204
Table 131: Russia: Imports of lithium hydroxide, 2002 to 2012 205
Table 132: South Korea: Trade in lithium carbonate, 2005 to 2012 207
Table 133: South Korea: Trade in lithium hydroxide, 2005 to 2012 207
Table 134: Spain: Imports of lithium compounds, 2005 to 2012 208
Table 135: Minera Del Duero: Production of lepidolite in Spain, 2003 to 2011 208
Table 136: Inferred mineral resource estimation for the Doade-Presquerias project,
October 2011 209
Table 137: Taiwan: Imports of lithium carbonate, 2005 to 2012 210
Table 138: UK: Imports of lithium carbonate and lithium hydroxides and oxides
2005 to 2012 211
Table 139: USA: Imports and exports of lithium carbonate 2005 to 2012 213
Table 140: USA: Imports and exports of lithium oxide and hydroxide 2005 to 2012 214
Table 141: FMC: Product range 218
Table 142: WLC: Resource estimation for the Kings Valley project, January 2012 219
Table 143: WLC: Reserve estimation for the Kings Valley project, December 2011 220
Table 144: WLC: Estimated operating and capital costs for ‘Case 1’ and ‘Case 2’
scenarios at the Kings Valley project. 221
Table 145: USA: Lithium exploration projects yet to reach scoping study or PFS
stage in development 224
Table 146: Zimbabwe: South African imports of mineral substances from
Zimbabwe, 2005 to 2012 227
Table 147: Bikita Minerals: Mine production and lithium content 2003 to 2011 228
Table 148: World: Total exports of lithium carbonate, 2005 to 2012 230
Table 149: World: Total imports of lithium carbonate, 2005 to 2012 232
Table 150: World: Total exports of lithium hydroxide and oxide, 2005 to 2012 234
Table 151: World: Total imports of lithium hydroxide and oxide, 2005 to 2012 236
Table 152: World: Major importers and exporters of lithium chloride, 2005 to 2012 237
Table 153: World: Exports of lithium minerals by major lithium mineral producing
nations (excl. China), 2005 to 2012 238
Table 154: Chile: Exports of lithium chloride brine1 by SQM to China, 2005 to 2012 238
Table 155: World: Consumption of lithium by end-use, 2002, 2007 and 2012 240
Table 156: World: Estimated consumption of lithium by country/region, 2002, 2007
and 2012 244
Table 157: World: Consumption of lithium by end-use, by product, 2012 246
Table 158: World: Forecast consumption of lithium by end-use, 2012 to 2017 248
Table 159: Japan: Producers of lithium-ion battery cathode materials, 2012 265
Table 160: South Korea: Producers of lithium-ion battery cathode materials, 2012 265
Table 161: China: Producers of lithium-ion battery cathode materials, 2012 266
Table 162: World: Producers of lithium salts for electrolytes, 2012 267
Table 163: World: Lithium battery consumption in 3C products, 2012 269
Table 164: World: Lithium battery consumption in power devices and motive
power, 2012 271
Table 165: World: Lithium battery consumption in heavy duty applications, 2012 272
Table 166: World: Lithium battery consumption in transport applications, 2012 274
Table 167: World: Lithium consumption in rechargeable lithium batteries
end-use, 2012 275
Table 168: World: Lithium consumption in NiMH and NiCd batteries, 2012 275
Table 169: World: Consumption of lithium in rechargeable batteries by type, 2007
to 2012 277
Table 170: Japan: Consumption of lithium in rechargeable batteries, 2007 to 2012 277
Table 171: World: Consumption of lithium in rechargeable batteries by country,
2007 to 2012 278
Table 172: World: Rechargeable lithium battery demand by market, 2012 and 2017 278
Table 173: World: Comparison of EV production estimates in 2017 by industry
consultant 280
Table 174: World: Forecast rechargeable battery consumption in EVs, 2017 281
Table 175: World: Lithium consumption in rechargeable lithium batteries by
end-use, 2017 281
Table 176: World: Forecast demand for lithium in rechargeable lithium batteries,
2012 to 2017 282
Table 177: World: Forecast demand for lithium in rechargeable batteries by battery
type, 2012 to 2017 282
Table 178: World: Forecast demand for lithium in rechargeable batteries by
product type, 2007 to 2012 283
Table 179: Typical whiteware body compositions 285
Table 180: World: Production of ceramic tiles by leading country, 2007 to 2012 287
Table 181: World: Consumption of ceramic tiles by leading countries, 2007 to 2011 289
Table 182: World: Leading ceramic tile manufacturing companies, 2010 290
Table 183: World: Leading sanitaryware manufacturing companies, 2010 292
Table 184: World: Consumption of lithium in ceramics, 2012 300
Table 185: World: Consumption of lithium in ceramics, 2007 to 2012 300
Table 186: World: Forecast demand for lithium in ceramics, 2012 to 2017 301
Table 187: Glass-ceramic matrices 302
Table 188: Compositions of commercial glass-ceramics 303
Table 189: Japan: Consumption of lithium carbonate in glass-ceramics, 2007
to 2012 306
Table 190: World: Consumption of lithium in glass-ceramics by end-use and
product type, 2012 307
Table 191: World: Consumption of lithium in glass-ceramics, 2007 to 2012 307
Table 192: World: Forecast demand for lithium in glass-ceramics, 2012 to 2017 308
Table 193: Properties of commercial greases 311
Table 194: World: Producers of lubricating grease 315
Table 195: World: Forecast demand for lithium in greases, 2012 to 2017 322
Table 196: Typical batch compositions for glass by type 323
Table 197: Main sources of lithium used in glass 324
Table 198: EU: Production of glass by type, 1998 to 2012 328
Table 199: USA: Production of container glass, 1999 to 2008 328
Table 200: Typical chemical composition of types of textile-grade fibreglass 329
Table 201: World: Estimated consumption of lithium in glass, 2012 331
Table 202: World: Consumption of lithium in glass, 2007 to 2012 331
Table 203: World: Forecast demand for lithium in glass, 2012 to 2017 332
Table 204: World: Consumption of lithium in continuous casting mould powders,
2007 to 2012 336
Table 205: Japan: Consumption of lithium in fluxes, 2007 to 2012 336
Table 206: World: Forecast demand for lithium in casting powders, 2012 to 2017 337
Table 207: Microstructure of different types of polybutadienes 339
Table 208: World: Producers of SSBR, BR and SBC, 2012 343
Table 209: World: Planned new/expanded SBR, BR and SBC plants 344
Table 210: World: Forecast demand for lithium in synthetic rubber and
thermoplastics, 2011 to 2017 349
Table 211: World: Capacity for lithium bromide production, end-2012 355
Table 212: Japan: Consumption of lithium bromide, 2007 to 2012 356
Table 213: World: Forecast demand for lithium in air treatment, 2012 to 2017 361
Table 214: Characteristics of primary lithium batteries 363
Table 215: Japan: Production of primary batteries by type, 1998 to 2012 367
Table 216: World: Trade in lithium primary batteries, 2007 to 2011 369
Table 217: Primary lithium batteries and their material compositions 371
Table 218: Specifications for battery-grade lithium metal 371
Table 219: World: Producers of battery-grade lithium metal, end-2012 372
Table 220: Japan: Consumption of lithium in primary lithium batteries, 2007 to 2012 375
Table 221: Japan: Unit consumption of lithium in primary batteries, 2007 to 2012 375
Table 222: World: Imports of battery-grade lithium metal, 2007 to 2012 376
Table 223: World: Forecast demand for lithium in primary batteries, 2012 to 2017 377
Table 224: Effects of additives and temperatures on properties of molten cryolite 379
Table 225: World: Aluminium smelters using Söderberg technology, end-2012 381
Table 226: World: Forecast demand for lithium in aluminium smelting, 2012 to 2017 384
Table 227: World: Consumption of lithium in other end-uses, 2007, 2012 and 2017 385
Table 228: Examples of uses for lithium in organic synthesis 387
Table 229: Physical properties of Al-Li alloys 392
Table 230: Chemical composition of Al-Li alloys 393
Table 231: Use of Al-Li alloys in selected aircraft 397
Table 232: World: Forecast demand for lithium in aluminium-lithium alloys, 2012
to 2017 399
Table 233: Properties of lithium niobate and lithium tantalite 401
Table 234: Applications for SAW components 401
Table 235: Applications for speciality inorganic lithium compounds 406
Table 236: Prices of lithium minerals, 2000-2013 410
Table 237: Comparison of prices for lithium minerals and carbonate, 2004 to 2012 411
Table 238: Comparison of prices for chemical-grade spodumene concentrate and
lithium carbonate, 2004 to 2012 412
Table 239: Comparison of technical- and battery- grade lithium carbonate prices,
2004 to 2012 416
Table 240: Average values of exports/imports of lithium oxides and hydroxides by
leading exporting/importing country, 2004 to 2012 417
Table 241: Average values of exports of lithium chloride by leading producing
country, 2004 to 2012 420
Table 242: Average values of exports of lithium metal by leading producing
country, 2004 to 2012 421
Table 243: World: Forecast nominal and real prices for technical-grade lithium
carbonate, 2012 to 2017 423
Table 244: World: Forecast nominal prices for technical-grade lithium carbonate
and chemical-grade lithium minerals, 2012 to 2017 425
Table 245: World: Forecast nominal prices for technical-grade lithium carbonate
and technical-grade lithium hydroxide, 2012 to 2017 426

List of Figures
Figure 1: Lithium product flow chart and main end-uses, 2012 1
Figure 2: Consumption of lithium by end-use, 2000 to 2012 2
Figure 3: Production of lithium by country, 2000 to 2012 4
Figure 4: Price history of lithium carbonate, 1990 to 2012 6
Figure 5: World: Forecast real prices for technical-grade lithium carbonate, 2012
to 2017 9
Figure 6: Overview of lithium production 16
Figure 7: Extraction and processing of brines from the Salar de Atacama, Chile and
Silver Peak, Nevada by Rockwood Lithium 18
Figure 8: Flow sheet showing the processing of brines at Salar de Carmen by SQM 19
Figure 9: Simplified flow sheet of the Li SX™ method patented by Bateman Lithium
Projects 21
Figure 10: Simplified mineral concentrate production flow sheet for a typical hard
rock lithium operation 22
Figure 11: Simplified flow sheet for lithium carbonate production from spodumene
mineral concentrate using the acid-roast method 24
Figure 12: Simplified flow sheet for lithium hydroxide and lithium hydroxide
monohydrate production from spodumene mineral concentrate using the
lime-roast method 25
Figure 13: Simplified flow sheet for lithium carbonate production from hectorite clay
developed by Western Lithium 27
Figure 14: Mining and milling costs for hard rock lithium mineral operations/projects 31
Figure 15: Lithium carbonate cash operating costs, 2012 32
Figure 16: Potential new producers production costs 33
Figure 17: World: Production of lithium by country, 2000 to 2012 34
Figure 18: Production of lithium from mineral and brine sources, 2005 to 2012 37
Figure 19: Production of lithium minerals by company, 2012 38
Figure 20: Production of lithium from brines by country, 2005 to 2012 40
Figure 21: Planned production capacity and consumption for lithium, 2012 to 2017 45
Figure 22: Forecast production and consumption of lithium, 2012 to 2017 54
Figure 23: Pilot plant flow sheet developed for Lithium Americas at SGS Mineral
Services 62
Figure 24: Brazil: Production of Lithium products 2005 to 2010 101
Figure 25: SQM: Lithium sales by destination 2011, 2009, 2007 and 2005 135
Figure 26: SQM: Destination of lithium carbonate exports, 2006 to 2011 136
Figure 27: China: Location of mineral conversion and lithium chemical/metal plants
in China, 2012 153
Figure 28: Japan: Imports of lithium carbonate, hydroxide & oxide and combined
LCE, 2005 to 2012 191
Figure 29: World: Leading exporters of lithium carbonate, 2006, 2008, 2010
and 2012 231
Figure 30: World: Leading importers of lithium carbonate, 2006, 2008, 2010
and 2012 233
Figure 31: World: Leading exporters of lithium hydroxide and oxides, 2006, 2008,
2010 and 2012 235
Figure 32: World: Growth in consumption of lithium, 2000 to 2012 239
Figure 33: World: Consumption of lithium by end-use, 2012 240
Figure 34: World: Consumption of lithium by end-use, 2000 to 2012 241
Figure 35: World: Consumption of lithium by end-use, 2000 to 2012 241
Figure 36: World: Estimated consumption of lithium by country/region, 2002, 2007
and 2012 244
Figure 37: World: Consumption of lithium by product, 2012 245
Figure 38: World: Consumption of lithium by type, 2000 to 2012 247
Figure 39: World: Historical and forecast consumption of lithium by end-use, 2007
to 2017 248
Figure 40: World: Forecast consumption of lithium by form, 2007, 2012 and 2017 252
Figure 41: Specific energy and energy density of rechargeable batteries 253
Figure 42: Lithium-ion battery schematic 254
Figure 43: Lithium metal polymer battery schematic 256
Figure 44: Lithium-sulphur cell schematic 257
Figure 45: Lithium-air cell schematic 258
Figure 46: World: Production of rechargeable batteries1, 1995 to 2012 259
Figure 47: World: Production of rechargeable batteries1, 1995 to 2012 260
Figure 48: World: Rechargeable lithium battery production by country, 2000 to 2012 260
Figure 49: Lithium-ion battery materials value chain 263
Figure 50: World: Production of lithium cathode materials by type, 2000 to 2012 264
Figure 51: World: Market for rechargeable lithium batteries by end-use, 2002, 2007
and 2012 268
Figure 52: World: Market for rechargeable lithium batteries by end-use, 2012 269
Figure 53: World: Production of rechargeable batteries and consumption of lithium,
2000 to 2012 276
Figure 54: World: Market for rechargeable lithium batteries by end-use, 2002
to 2017 279
Figure 55: World: Ceramic tile production by region, 2007 and 2012 288
Figure 56: World: Sanitaryware production by region/country, 2010 291
Figure 57: World: Production of tableware by country/region, 2008 293
Figure 58: USA: Shipments of cookware, bakeware and kitchenware, 2001 to 2010 295
Figure 59: World: Shipments of white goods by region, 2000 to 2020 296
Figure 60: World: Year-on-year growth in construction spending and GDP, 2000
to 2017 298
Figure 61: World: Production of lubricating grease by additive type, 2011 312
Figure 62: World: Production of lubricating grease by type, 2000 to 2012 313
Figure 63: World: Production of lithium grease by region/country and by type, 2000
and 2011 314
Figure 64: World: Output of automobiles by region, 2000 to 2012 318
Figure 65: World: Deliveries of commercial aircraft, 2000 to 2012 318
Figure 66: World: Shipbuilding deliveries, 2000 to 2012 319
Figure 67: World: Relative industrial and transport output and lithium grease
production, 2002 to 2011 320
Figure 68: World: Production of grease and consumption of lithium, 2000 to 2012 321
Figure 69: World: Estimated production of glass by type, 2012 326
Figure 70: World: Production of container glass by region/country, 2012 326
Figure 71: World: Consumption of glass packaging by region, 2011 327
Figure 72: World: Production of continuously cast steel by region, 1998 to 2012 335
Figure 73: World: Capacity for synthetic rubber production by country/region, 2012 340
Figure 74: World: Capacity for BR, ESBR and SSBR rubber by country/region,
end-2011 341
Figure 75: World: SBC capacity by region/country, end-2010 341
Figure 76: World: Production of synthetic rubber by region, 1996 to 2011 342
Figure 77: World: Consumption of synthetic rubber by type, 2012 345
Figure 78: World: consumption of BR by end-use, 2010 346
Figure 79: World: Consumption of SBC by region/country, 2010 347
Figure 80: Consumption of SBC by end-use, 2007 347
Figure 81: World: Production of absorption chillers, 2003 to 2012 352
Figure 82: World: Consumption of lithium bromide in air treatment, 2001 to 2012 356
Figure 83: Specific energy and energy density of primary batteries 362
Figure 84: Primary and secondary battery gravimetric energy density 365
Figure 85: World: Production of primary lithium batteries by country, 1998 to 2012 366
Figure 86: Primary lithium battery schematics 370
Figure 87: World: Demand for lithium metal in primary batteries, 2000 to 2012 376
Figure 88: World: Aluminium output by type and lithium consumption, 2000 to 2012 383
Figure 89: World: Consumption of alkyd-based paints and coatings, 2010 390
Figure 90: Development of Al-Li alloys 392
Figure 91: World: Deliveries of commercial aircraft and lithium consumption, 2007
to 2019 399
Figure 92: Price history of lithium carbonate, 1990 to 2012 408
Figure 93: Compound annual prices of lithium minerals, 2000 to 2013 411
Figure 94: Prices for technical-grade lithium carbonate, 1999 to 2012 414
Figure 95: Prices for battery-grade lithium carbonate, 1999 to 2012 415
Figure 96: Comparison of lithium hydroxide and lithium carbonate prices, 2000
to 2012 418
Figure 97: Japan: Quarterly average import value of lithium hydroxide from the
USA, 2008 to 2012 419
Figure 98: World: Forecast nominal prices for technical-grade lithium carbonate,
2012 to 2017 423
Figure 99: World: Forecast real prices for technical-grade lithium carbonate,
2012 to 2017 424
List of Appendices (See attached CD)
Appendix A: International trade statistics

List of Symbols and Abbreviations
Symbols
p Preliminary ø Under half of one unit
e Estimated … Not available
r Revised - Nil
Abbreviations
M Million
Bn Billion
t Tonne
Mt Million tonnes
tpd Metric tonne per day
tpm Metric tonne per month
tpy Metric tonne per year
g Gramme
kg Kilogramme
mg Milligramme
lb Pound
l Litre
μm Micrometre
m Metre
m3 Cubic metre
km Kilometre
km2
Square kilometre
wt % Weight percent
ppm Parts per million
V Volt
Ah Ampere-hour
kWh KiloWatt hour
Wh/kg Watt hours/kg oC Degrees Celsius
K Kelvins
Pa Pascal
dwt Deadweight tonnage
3C Computing, communication & consumers
HLF High lithium feldspar
BR Polybutadiene rubber
SBR Styrene butadiene rubber
SBC Styrenic block polymers
SBS Styrene-butadiene-styrene
SSBR Solution based styrene butadiene rubber
BQM Bank Cubic Metre
LCE Lithium Carbonate Equivalent
LCO Lithium cobalt oxide
LMO Lithium manganese oxide
LNO Lithium nickel (+/- cobalt) oxide
LFP Fluorinated lithium iron phosphate
LMPF Fluorinated lithium metal phosphate
NCM Lithium nickel-cobalt-manganese oxide
NCA Lithium nickel-cobalt-aluminium oxide
PEA Preliminary Economic Assessment
PFS Preliminary Feasibility Study
DFS Definative Feasibility Study
BFS Bankable Feasibility Study
USGS US Geological Survey
BGS British Geological Survey
DNPM Departamento Nacional de Produção Mineral
IGME Instituto Geológico y Minero de España
CIS Commonwealth of Independent States
Equivalent values kg lb kg 1 2.204662 t 1,000 2,204.62
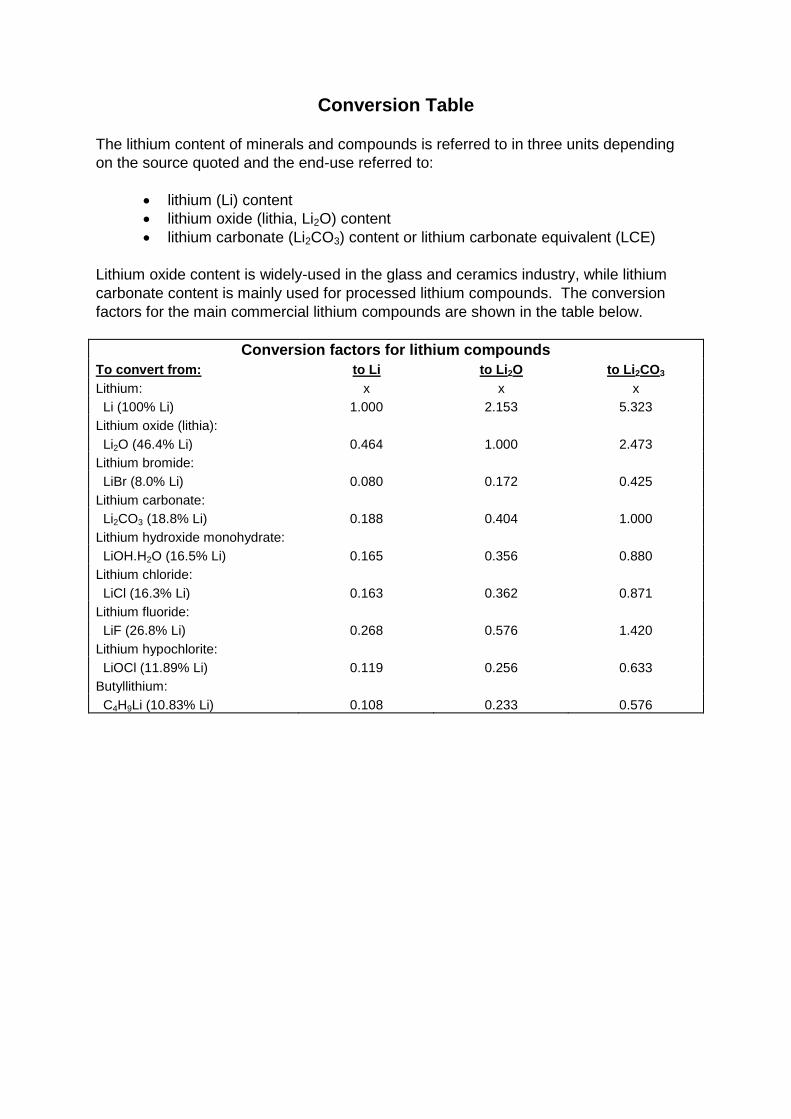
Conversion Table
The lithium content of minerals and compounds is referred to in three units depending
on the source quoted and the end-use referred to:
lithium (Li) content
lithium oxide (lithia, Li2O) content
lithium carbonate (Li2CO3) content or lithium carbonate equivalent (LCE)
Lithium oxide content is widely-used in the glass and ceramics industry, while lithium
carbonate content is mainly used for processed lithium compounds. The conversion
factors for the main commercial lithium compounds are shown in the table below.
Conversion factors for lithium compounds
To convert from: to Li to Li2O to Li2CO3
Lithium: x x x
Li (100% Li) 1.000 2.153 5.323
Lithium oxide (lithia):
Li2O (46.4% Li) 0.464 1.000 2.473
Lithium bromide:
LiBr (8.0% Li) 0.080 0.172 0.425
Lithium carbonate:
Li2CO3 (18.8% Li) 0.188 0.404 1.000
Lithium hydroxide monohydrate:
LiOH.H2O (16.5% Li) 0.165 0.356 0.880
Lithium chloride:
LiCl (16.3% Li) 0.163 0.362 0.871
Lithium fluoride:
LiF (26.8% Li) 0.268 0.576 1.420
Lithium hypochlorite:
LiOCl (11.89% Li) 0.119 0.256 0.633
Butyllithium:
C4H9Li (10.83% Li) 0.108 0.233 0.576

Lithium: Market Outlook to 2017, 12th edition 2013 Page | 1
Roskill
Copyright © 2013 by Roskill Information Services Ltd. Unauthorised copying prohibited. www.roskill.com
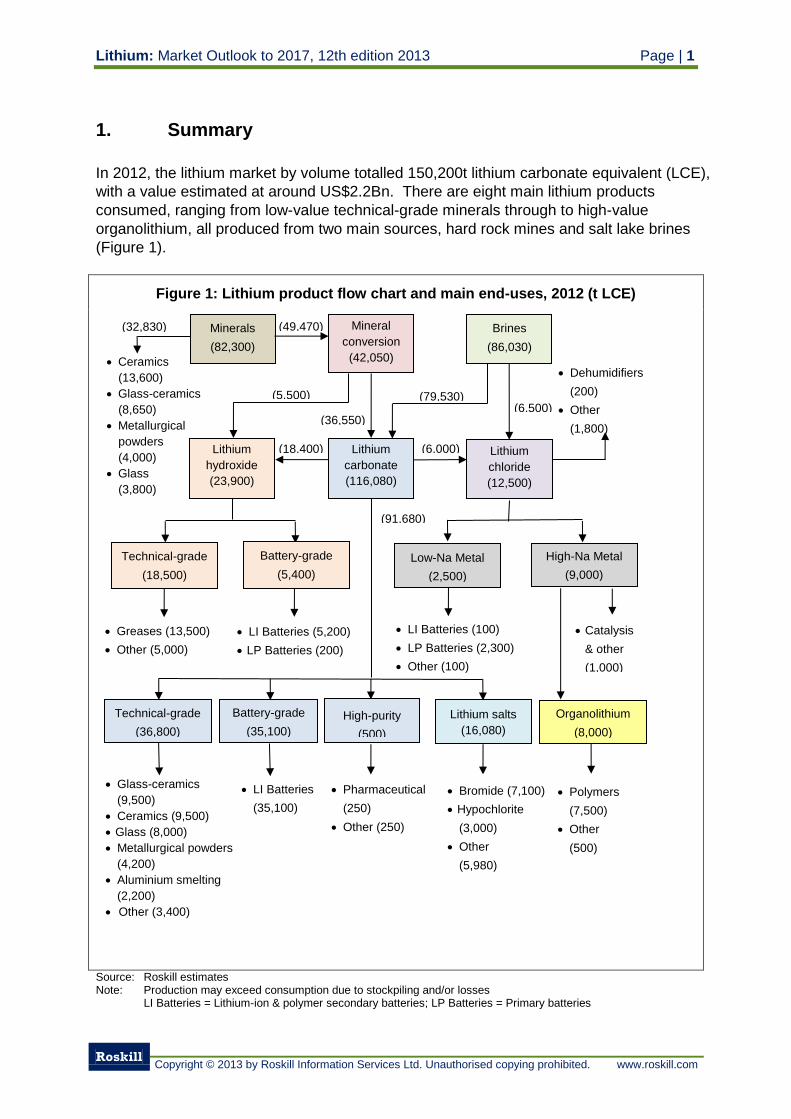
1. Summary
In 2012, the lithium market by volume totalled 150,200t lithium carbonate equivalent (LCE),
with a value estimated at around US$2.2Bn. There are eight main lithium products
consumed, ranging from low-value technical-grade minerals through to high-value
organolithium, all produced from two main sources, hard rock mines and salt lake brines
(Figure 1).
Figure 1: Lithium product flow chart and main end-uses, 2012 (t LCE)
Source: Roskill estimates Note: Production may exceed consumption due to stockpiling and/or losses LI Batteries = Lithium-ion & polymer secondary batteries; LP Batteries = Primary batteries
Minerals
(82,300)
Brines
(86,030)
Lithium
carbonate
(116,080)
Lithium
hydroxide
(23,900)
Lithium
chloride
(12,500)
Glass-ceramics
(9,500)
Ceramics (9,500)
Glass (8,000)
Metallurgical powders
(4,200)
Aluminium smelting
(2,200)
Other (3,400)
Low-Na Metal
(2,500)
Pharmaceutical
(250)
Other (250)
LI Batteries
(35,100)
Technical-grade
(36,800)
Mineral
conversion
(42,050)
Battery-grade
(35,100)
Technical-grade
(18,500)
Battery-grade
(5,400)
Greases (13,500)
Other (5,000)
LI Batteries (5,200)
LP Batteries (200)
Lithium salts
(16,080)
High-purity
(500)
Bromide (7,100)
Hypochlorite
(3,000)
Other
(5,980)
LI Batteries (100)
LP Batteries (2,300)
Other (100)
(49,470)
(6,500)
(6,000)
(79,530)
(36,550)
(5,500)
(18,400)
Organolithium
(8,000)
(91,680)
Polymers
(7,500)
Other
(500)
(32,830)
High-Na Metal
(9,000)
Catalysis
& other
(1,000)
Ceramics
(13,600)
Glass-ceramics
(8,650)
Metallurgical
powders
(4,000)
Glass
(3,800)
Dehumidifiers
(200)
Other
(1,800)
Page | 2 Lithium: Market Outlook to 2017, 12th edition 2013
Roskill
Copyright © 2013 by Roskill Information Services Ltd. Unauthorised copying prohibited. www.roskill.com
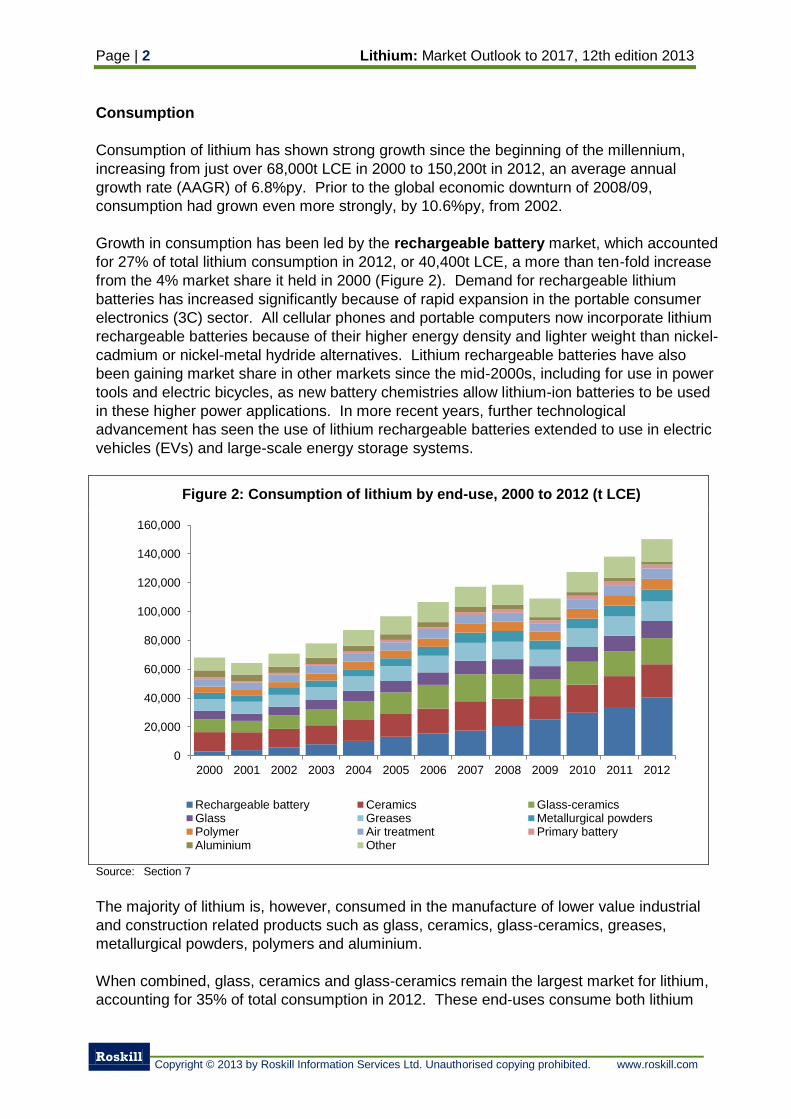
Consumption
Consumption of lithium has shown strong growth since the beginning of the millennium,
increasing from just over 68,000t LCE in 2000 to 150,200t in 2012, an average annual
growth rate (AAGR) of 6.8%py. Prior to the global economic downturn of 2008/09,
consumption had grown even more strongly, by 10.6%py, from 2002.
Growth in consumption has been led by the rechargeable battery market, which accounted
for 27% of total lithium consumption in 2012, or 40,400t LCE, a more than ten-fold increase
from the 4% market share it held in 2000 (Figure 2). Demand for rechargeable lithium
batteries has increased significantly because of rapid expansion in the portable consumer
electronics (3C) sector. All cellular phones and portable computers now incorporate lithium
rechargeable batteries because of their higher energy density and lighter weight than nickel-
cadmium or nickel-metal hydride alternatives. Lithium rechargeable batteries have also
been gaining market share in other markets since the mid-2000s, including for use in power
tools and electric bicycles, as new battery chemistries allow lithium-ion batteries to be used
in these higher power applications. In more recent years, further technological
advancement has seen the use of lithium rechargeable batteries extended to use in electric
vehicles (EVs) and large-scale energy storage systems.
Figure 2: Consumption of lithium by end-use, 2000 to 2012 (t LCE)
Source: Section 7
The majority of lithium is, however, consumed in the manufacture of lower value industrial
and construction related products such as glass, ceramics, glass-ceramics, greases,
metallurgical powders, polymers and aluminium.
When combined, glass, ceramics and glass-ceramics remain the largest market for lithium,
accounting for 35% of total consumption in 2012. These end-uses consume both lithium
0
20,000
40,000
60,000
80,000
100,000
120,000
140,000
160,000
2000 2001 2002 2003 2004 2005 2006 2007 2008 2009 2010 2011 2012
Rechargeable battery Ceramics Glass-ceramicsGlass Greases Metallurgical powdersPolymer Air treatment Primary batteryAluminium Other
Lithium: Market Outlook to 2017, 12th edition 2013 Page | 3
Roskill
Copyright © 2013 by Roskill Information Services Ltd. Unauthorised copying prohibited. www.roskill.com
compounds and lithium minerals, with an almost 50:50 share of demand between the two
products. Growth in consumption of lithium in ceramics and glass-ceramics has averaged
6.0 and 6.5%py, to 23,100t and 18,100t LCE, respectively since 2002, driven by a boom in
construction in emerging and developed economies, especially before 2008/09, and hence
increased use of construction materials and kitchen equipment. In glass, lithium lowers the
viscosity of the melt and can partially replace fluorine and other refining agents, and is
especially valued in the manufacture of flaconnage and container glass. The glass market
for lithium grew by 7.0%py between 2002 and 2012, to 11,800t LCE.
Rapid growth in construction and manufacturing output in emerging economies, particularly
China, has also led to increased lithium consumption in metallurgical powders used in the
continuous casting of steel, and in the production of lithium-based greases. Lithium
consumption in greases increased by 5.0%py between 2002 and 2012, to 13,500t LCE,
while the metallurgical powders market expanded by 6.0%py over the same period to 8,200t
LCE. The use of organolithium products for catalysing certain synthetic rubbers and
thermoplastics has also provided strong growth, of around 6.0%py, in consumption of lithium
in polymers since 2002 as demand for tyres, tubes and consumer goods increased in
emerging economies.
Lithium is added during aluminium smelting using Söderberg pot lines to reduce fluorine
emissions, as well as occasional use to decrease the melting point of alumina and raise
electrical conductivity of the bath in newer smelters using pre-baked anode pot lines. In
absorption chillers, lithium bromide is used as the absorption medium to produce chilled air
from waste heat in large commercial and industrial complexes. The air treatment market
for lithium also includes desiccant dehumidifiers and air purification systems. While
consumption of lithium in aluminium has declined by 7.0%py to 2,200t LCE since 2002, as outdated Söderberg smelters are decommissioned or replaced, the air treatment market has
grown by 4.0%py to 7,400t LCE, again largely due to emerging economy industrialisation.
The primary battery industry has witnessed growth, albeit on a much smaller scale than for
rechargeable batteries (7.0%py compared to 21.5%py) since 2002 to total 2,500t LCE.
Primary batteries are used for memory back-up in 3C electronics and remote monitoring
systems through to industrial equipment.
China is the world’s largest consumer of lithium, accounting for 35% of consumption in 2012,
with domestic demand having grown three-fold since 2002, to 53,000t LCE. Europe
represented a further 24% of consumption followed by Japan and South Korea. South
Korea and China are the dominant rechargeable battery and battery material producers,
hence their consumption has increased rapidly during the mid-2000s on increased
rechargeable battery output. Japan is also a major battery material producer, but has faced
growing competition from its Asian neighbours. China, Europe and North America consume
lithium in the manufacture of industrial and construction –related products, such as
ceramics, glass-ceramics, greases, polymers and aluminium.
The surge in consumption of lithium in rechargeable batteries in the 2000s has led to a
sharp rise in battery-grade lithium carbonate, and battery-grade lithium hydroxide,
consumption, the latter growing particularly strongly since 2008. Together, these two
products account for a similar volume (40,300t LCE) of consumption to technical-grade
lithium carbonate (40,000t LCE). Lithium mineral use is also significant, at over 30,000t
Page | 4 Lithium: Market Outlook to 2017, 12th edition 2013
Roskill
Copyright © 2013 by Roskill Information Services Ltd. Unauthorised copying prohibited. www.roskill.com
LCE, followed by technical-grade lithium hydroxide at 18,500t LCE. Other lithium products
such as butylithium, lithium bromide and lithium metal together account for the remaining
20% of lithium consumption by product.
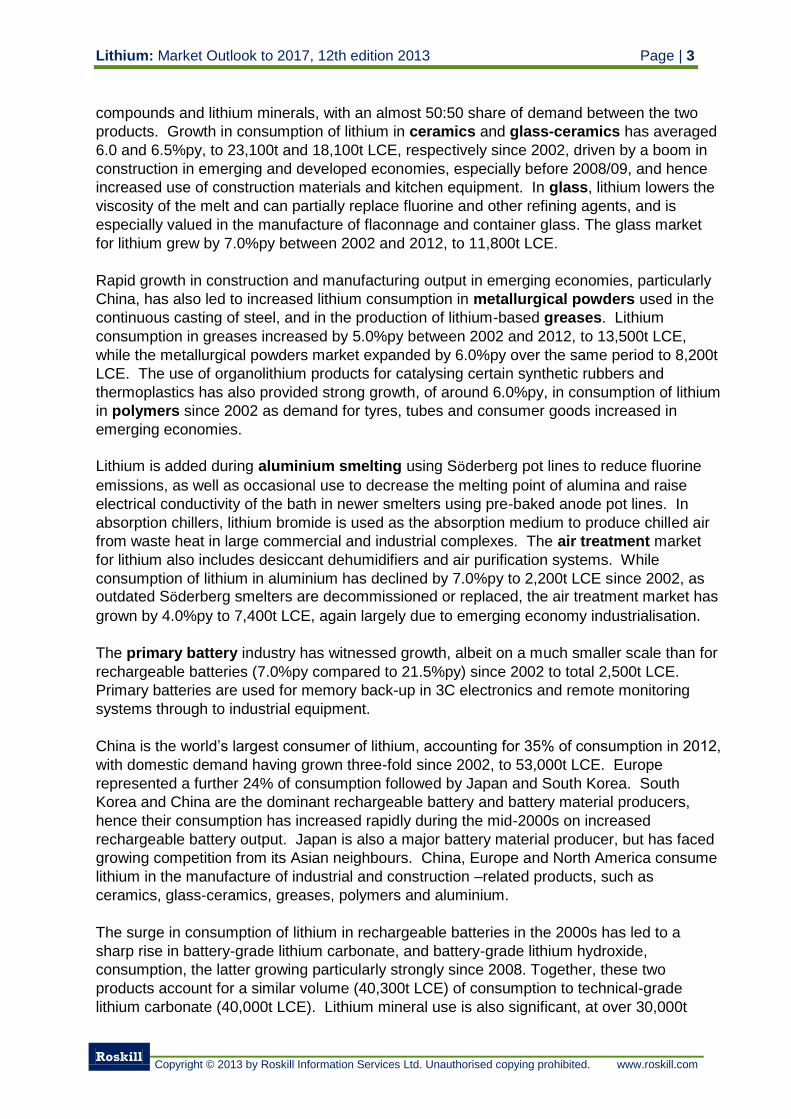
Production
Since 2000, global lithium production has increased by 7.0%py, from just over 68,000t LCE
to 152,400t LCE in 2012. Lithium is produced from two different sources: lithium brines and
lithium minerals. Production from lithium brine sources is confined to Chile, Argentina, the
USA and China, which collectively accounted for 51% of global lithium output in 2012.
Lithium mineral production is dominated by output from Australia, accounting for 40.5% of
global lithium output in 2012, with lesser amounts produced in China (3.7%) and Zimbabwe
(3.2%).
Figure 3: Production of lithium by country, 2000 to 2012 (t LCE)
Source: Roskill estimates
The majority of lithium production is undertaken by the ‘big four’ companies: Talison Lithium
in Australia, SQM in Chile, Rockwood Lithium in Chile and the USA, and FMC Lithium in
Argentina. Together, these four companies produced 82.3% of global lithium output in 2012.
The largest producer of lithium mineral concentrates is Talison Lithium, which produced
398,874t (59,185t LCE) of spodumene concentrate in 2012. SQM is the largest producer of
lithium compounds, such as lithium carbonate and lithium hydroxide, and produced 45,700t
LCE in 2012.
Lithium compounds are also produced through the conversion of lithium minerals at facilities
predominantly located in China, sourcing raw materials from Australian and domestic
sources. World lithium mineral conversion capacity in 2012 was 68,500t LCE, with 99% of
this located in China; however global production totalled 42,054t LCE.
0
20,000
40,000
60,000
80,000
100,000
120,000
140,000
160,000
180,000
2000 2001 2002 2003 2004 2005 2006 2007 2008 2009 2010 2011 2012
Argentina Australia Chile China Others
Lithium: Market Outlook to 2017, 12th edition 2013 Page | 5
Roskill
Copyright © 2013 by Roskill Information Services Ltd. Unauthorised copying prohibited. www.roskill.com
The production of downstream lithium chemicals and lithium metal is undertaken by a
number of companies in China. Outside of China, Rockwood Lithium and FMC Lithium are
the largest producers of lithium chemicals and metal, from facilities in Germany, the USA,
Taiwan, India, the UK and Japan.
Trade
As the main centres of lithium production are in countries that have little domestic
consumption (with the exception of China), trade in lithium is significant, with world exports
reaching 79,064t (gross weight) of lithium carbonate, 21,109t (gross weight) of lithium
hydroxide and 8,860t (gross weight) lithium chloride in 2012. The largest exporter of lithium
compounds in 2012 was Chile, which exported 55,899t (gross weight) of lithium carbonate,
6,711t (gross weight) of lithium hydroxide and 4,123t (gross weight) of lithium chloride in
2012, mainly to Asia, the USA and Europe. Lithium minerals are predominantly exported by
Australia and Zimbabwe, to markets in China, Japan, Europe and the USA.
Prices
The concentration of lithium production among a small number of producers means pricing
is very competitive. Producers negotiate prices with individual consumers and price
information is rarely reported, particularly for downstream lithium chemicals.
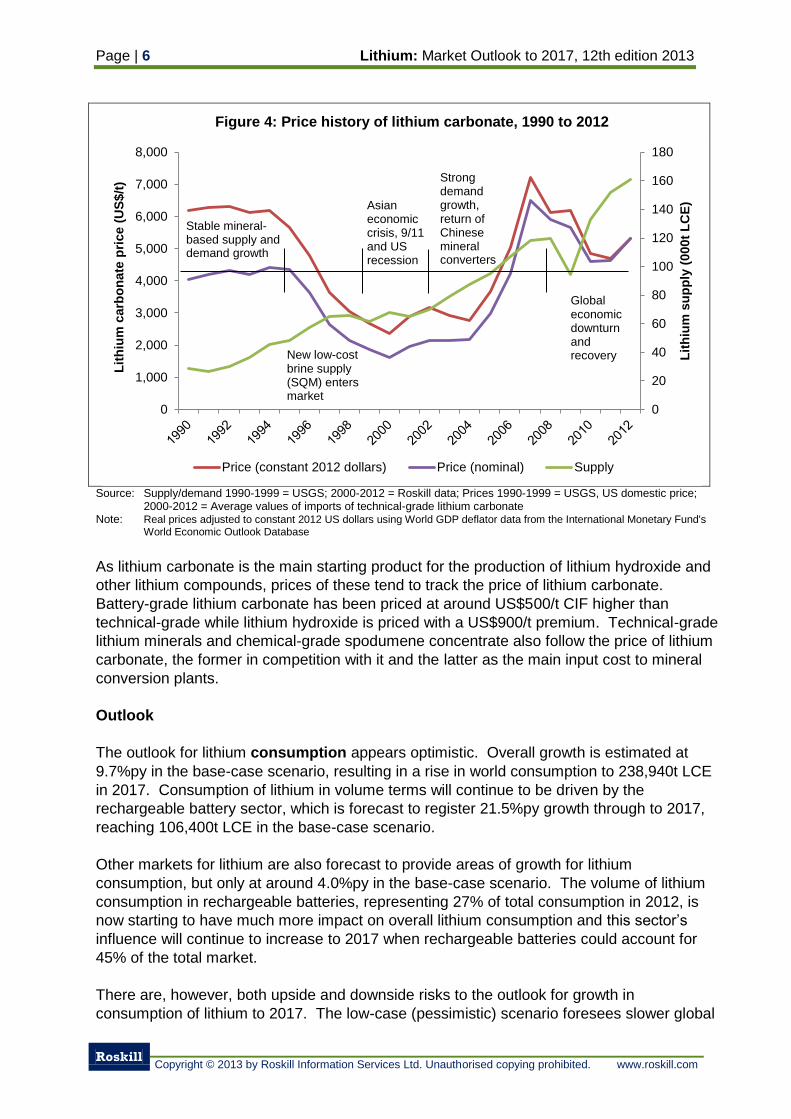
The entry of SQM into the lithium market in 1996 resulted in a fundamental restructuring of
the industry. Between 1995 and 1999, average technical-grade lithium carbonate prices
plunged from US$4,400/t CIF (US$6,175/t in constant 2012 dollars) to US$1,625/t CIF
(US$2,350 in constant 2012 dollars), causing the closure of mineral-based operations in
China, Russia and the USA.
In the mid-2000s, the combination of accelerating consumption and a lag in the response
time of brine producers to increase output (due to the time taken to concentrate brine by
natural evaporation) led to rising prices as higher-cost (>US$4,000/t LCE compared to
<US$3,000/t for brine operations) lithium mineral conversion plants re-started to fulfil market
requirements.
Prices peaked in 2007 at just over US$6,500/t CIF (US$7,230/t in constant 2012 dollars) but
then gradually fell as the global economic downturn of 2008/09 reversed the tightness in
supply leading up to the peak.
Page | 6 Lithium: Market Outlook to 2017, 12th edition 2013
Roskill
Copyright © 2013 by Roskill Information Services Ltd. Unauthorised copying prohibited. www.roskill.com
Figure 4: Price history of lithium carbonate, 1990 to 2012
Source: Supply/demand 1990-1999 = USGS; 2000-2012 = Roskill data; Prices 1990-1999 = USGS, US domestic price;
2000-2012 = Average values of imports of technical-grade lithium carbonate Note: Real prices adjusted to constant 2012 US dollars using World GDP deflator data from the International Monetary Fund's
World Economic Outlook Database
As lithium carbonate is the main starting product for the production of lithium hydroxide and
other lithium compounds, prices of these tend to track the price of lithium carbonate.
Battery-grade lithium carbonate has been priced at around US$500/t CIF higher than
technical-grade while lithium hydroxide is priced with a US$900/t premium. Technical-grade
lithium minerals and chemical-grade spodumene concentrate also follow the price of lithium
carbonate, the former in competition with it and the latter as the main input cost to mineral
conversion plants.
Outlook
The outlook for lithium consumption appears optimistic. Overall growth is estimated at
9.7%py in the base-case scenario, resulting in a rise in world consumption to 238,940t LCE
in 2017. Consumption of lithium in volume terms will continue to be driven by the
rechargeable battery sector, which is forecast to register 21.5%py growth through to 2017,
reaching 106,400t LCE in the base-case scenario.
Other markets for lithium are also forecast to provide areas of growth for lithium
consumption, but only at around 4.0%py in the base-case scenario. The volume of lithium
consumption in rechargeable batteries, representing 27% of total consumption in 2012, is
now starting to have much more impact on overall lithium consumption and this sector’s
influence will continue to increase to 2017 when rechargeable batteries could account for
45% of the total market.
There are, however, both upside and downside risks to the outlook for growth in
consumption of lithium to 2017. The low-case (pessimistic) scenario foresees slower global
0
20
40
60
80
100
120
140
160
180
0
1,000
2,000
3,000
4,000
5,000
6,000
7,000
8,000
Lit
hiu
m s
up
ply
(000t
LC
E)
Lit
hiu
m c
arb
on
ate
pri
ce (
US
$/t
)
Price (constant 2012 dollars) Price (nominal) Supply
Stable mineral-based supply and demand growth
New low-cost brine supply (SQM) enters market
Asian economic crisis, 9/11 and US recession
Strong demand growth, return of Chinese mineral converters
Global economic downturn and recovery
Lithium: Market Outlook to 2017, 12th edition 2013 Page | 7
Roskill
Copyright © 2013 by Roskill Information Services Ltd. Unauthorised copying prohibited. www.roskill.com
economic growth affecting demand for basic products like ceramics, glass, aluminium, steel
and rubber, as well as lower demand for portable consumer electronics and delays in the
introduction of lithium battery powered EVs. In this scenario, growth in consumption of
lithium is forecast at 4.5%py to reach just under 187,000t LCE by 2017. Meanwhile, in the
high-case (optimistic) scenario, growth in consumption of lithium is forecast to increase by
15.7%py to reach just under 313,000t LCE by 2017. The optimistic scenario is based on
stronger global economic growth, and surging demand for lithium secondary batteries in
EVs.
Installed capacity for lithium production at end-2012 (279,000t LCE) is sufficient to meet
forecast demand to 2017 in the base-case demand scenario (238,940t LCE). Installed
capacity for lithium compound production, however, is only 190,650t LCE (comprising
122,150t LCE of brine and 68,500t LCE of mineral conversion capacity), versus projected
consumption of compounds at around 200,000t LCE. New or expanded capacity is
therefore required to satisfy future demand for lithium compounds (around 200,000t LCE) in
the base-case demand scenario.
Two new projects (Canada Lithium, 19,000tpy LCE and Orocobre, 17,000tpy LCE) are
expected to be commissioned in 2013 and 2014 meaning that capacity should be more than
sufficient to meet market requirements to 2017. In addition to these new projects, however,
FMC Lithium in Argentina is ramping up its 7,000tpy LCE expansion in mid-2013 and
Rockwood Lithium is expanding its operations in Chile by 20,000tpy LCE by late-2013.
SQM has also stated its intention to increase capacity to 60,000tpy LCE. Chinese mineral
converters have also recently expanded their plants (Sichuan Tianqi by 5,000tpy LCE and
Ganfeng Lithium by 10,000tpy LCE), utilising increased availability of spodumene from
Talison Lithium’s newly (2012) expanded chemical-grade spodumene capacity in Australia.
From a situation of relative market balance in 2011/12, following re-stocking in 2010 after
the global economic downturn, 2013 and 2014 are likely to witness supply-side pressure on
pricing. Nevertheless, there is insufficient low-cost capacity entering the market to displace
all of the high-cost mineral conversion capacity. The lithium market will therefore continue to
be reliant on supplies of lithium compounds from higher-cost producers in China through to
2017, and this effectively puts a floor under pricing. Retaining some higher-cost production
in the supply chain is also advantageous for lower-cost producers, because despite
potentially losing some market share its means low-cost producers can operate at very
healthy margins on commodity lithium products (carbonate and hydroxide in particular).
Lithium carbonate prices appear to have reached a floor of US$4,600/t CIF for technical-
grade and US$4,830/t CIF for battery-grade in 2011. Cost inflation for both brine-based and
mineral-based producers is forecast at 4.5%py and will be the main underlying driver for
increased prices in the long-term. Assuming a 4.5%py rise in operating costs, the floor price
in 2017 would be US$6,000/t CIF (US$5,702/t in constant 2012 dollars) (Table 241). This
forms the basis for the low-case scenario for pricing.
A US$250-500/t CIF (~10%) increase is considered likely in the base-case scenario for
2013, given the 20% increase already pushed through for 2012 contracts and increased
supply entering the market during 2013. Under the base-case scenario, average prices for
technical-grade lithium carbonate are expected to rise by 4.5%py to around US$6,900/t CIF
(US$6,558/t in constant 2012 dollars) in 2017.
Page | 8 Lithium: Market Outlook to 2017, 12th edition 2013
Roskill
Copyright © 2013 by Roskill Information Services Ltd. Unauthorised copying prohibited. www.roskill.com
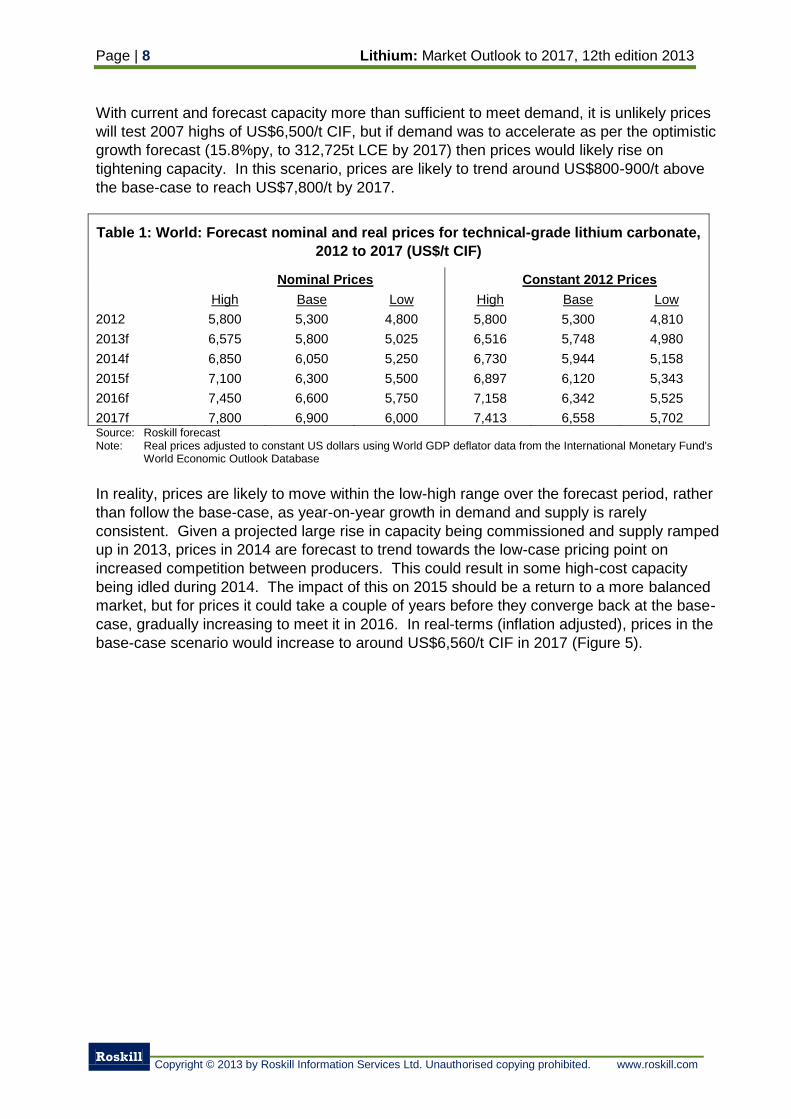
With current and forecast capacity more than sufficient to meet demand, it is unlikely prices
will test 2007 highs of US$6,500/t CIF, but if demand was to accelerate as per the optimistic
growth forecast (15.8%py, to 312,725t LCE by 2017) then prices would likely rise on
tightening capacity. In this scenario, prices are likely to trend around US$800-900/t above
the base-case to reach US$7,800/t by 2017.
Table 1: World: Forecast nominal and real prices for technical-grade lithium carbonate,
2012 to 2017 (US$/t CIF)
Nominal Prices Constant 2012 Prices
High Base Low High Base Low
2012 5,800 5,300 4,800 5,800 5,300 4,810
2013f 6,575 5,800 5,025 6,516 5,748 4,980
2014f 6,850 6,050 5,250 6,730 5,944 5,158
2015f 7,100 6,300 5,500 6,897 6,120 5,343
2016f 7,450 6,600 5,750 7,158 6,342 5,525
2017f 7,800 6,900 6,000 7,413 6,558 5,702 Source: Roskill forecast Note: Real prices adjusted to constant US dollars using World GDP deflator data from the International Monetary Fund's
World Economic Outlook Database
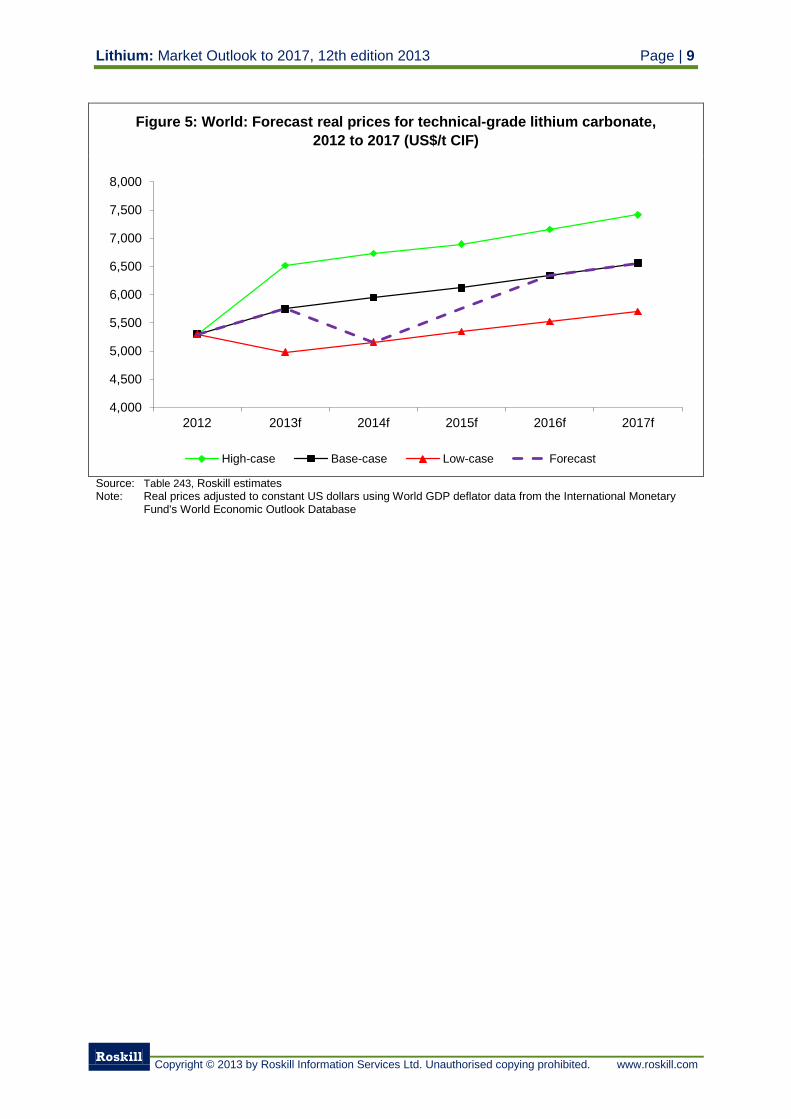
In reality, prices are likely to move within the low-high range over the forecast period, rather
than follow the base-case, as year-on-year growth in demand and supply is rarely
consistent. Given a projected large rise in capacity being commissioned and supply ramped
up in 2013, prices in 2014 are forecast to trend towards the low-case pricing point on
increased competition between producers. This could result in some high-cost capacity
being idled during 2014. The impact of this on 2015 should be a return to a more balanced
market, but for prices it could take a couple of years before they converge back at the base-
case, gradually increasing to meet it in 2016. In real-terms (inflation adjusted), prices in the
base-case scenario would increase to around US$6,560/t CIF in 2017 (Figure 5).
Lithium: Market Outlook to 2017, 12th edition 2013 Page | 9
Roskill
Copyright © 2013 by Roskill Information Services Ltd. Unauthorised copying prohibited. www.roskill.com
Figure 5: World: Forecast real prices for technical-grade lithium carbonate,
2012 to 2017 (US$/t CIF)
Source: Table 243, Roskill estimates Note: Real prices adjusted to constant US dollars using World GDP deflator data from the International Monetary
Fund's World Economic Outlook Database
4,000
4,500
5,000
5,500
6,000
6,500
7,000
7,500
8,000
2012 2013f 2014f 2015f 2016f 2017f
High-case Base-case Low-case Forecast
Page | 10 Lithium: Market Outlook to 2017, 12th edition 2013
Roskill
Copyright © 2013 by Roskill Information Services Ltd. Unauthorised copying prohibited. www.roskill.com
2. Lithium Mineralogy, Occurrences and Reserves
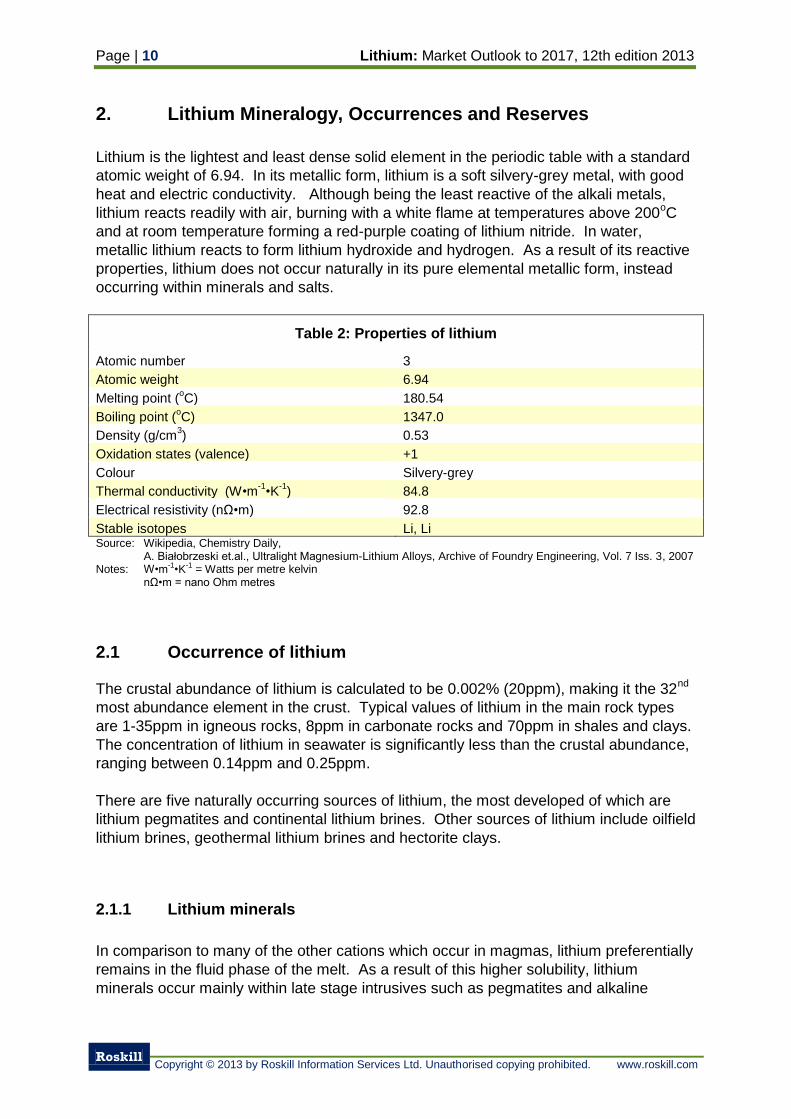
Lithium is the lightest and least dense solid element in the periodic table with a standard
atomic weight of 6.94. In its metallic form, lithium is a soft silvery-grey metal, with good
heat and electric conductivity. Although being the least reactive of the alkali metals,
lithium reacts readily with air, burning with a white flame at temperatures above 200oC
and at room temperature forming a red-purple coating of lithium nitride. In water,
metallic lithium reacts to form lithium hydroxide and hydrogen. As a result of its reactive
properties, lithium does not occur naturally in its pure elemental metallic form, instead
occurring within minerals and salts.
Table 2: Properties of lithium
Atomic number 3
Atomic weight 6.94
Melting point (oC) 180.54
Boiling point (oC) 1347.0
Density (g/cm3) 0.53
Oxidation states (valence) +1
Colour Silvery-grey
Thermal conductivity (W•m-1
•K-1
) 84.8
Electrical resistivity (nΩ•m) 92.8
Stable isotopes Li, Li Source: Wikipedia, Chemistry Daily,
A. Białobrzeski et.al., Ultralight Magnesium-Lithium Alloys, Archive of Foundry Engineering, Vol. 7 Iss. 3, 2007 Notes: W•m-1•K-1 = Watts per metre kelvin nΩ•m = nano Ohm metres
2.1 Occurrence of lithium
The crustal abundance of lithium is calculated to be 0.002% (20ppm), making it the 32nd
most abundance element in the crust. Typical values of lithium in the main rock types
are 1-35ppm in igneous rocks, 8ppm in carbonate rocks and 70ppm in shales and clays.
The concentration of lithium in seawater is significantly less than the crustal abundance,
ranging between 0.14ppm and 0.25ppm.
There are five naturally occurring sources of lithium, the most developed of which are
lithium pegmatites and continental lithium brines. Other sources of lithium include oilfield
lithium brines, geothermal lithium brines and hectorite clays.
2.1.1 Lithium minerals
In comparison to many of the other cations which occur in magmas, lithium preferentially
remains in the fluid phase of the melt. As a result of this higher solubility, lithium
minerals occur mainly within late stage intrusives such as pegmatites and alkaline
Lithium: Market Outlook to 2017, 12th edition 2013 Page | 11
Roskill
Copyright © 2013 by Roskill Information Services Ltd. Unauthorised copying prohibited. www.roskill.com
intrusives. Lithium minerals also occur within hydrothermal deposits which have been
derived from magmatic fluids.
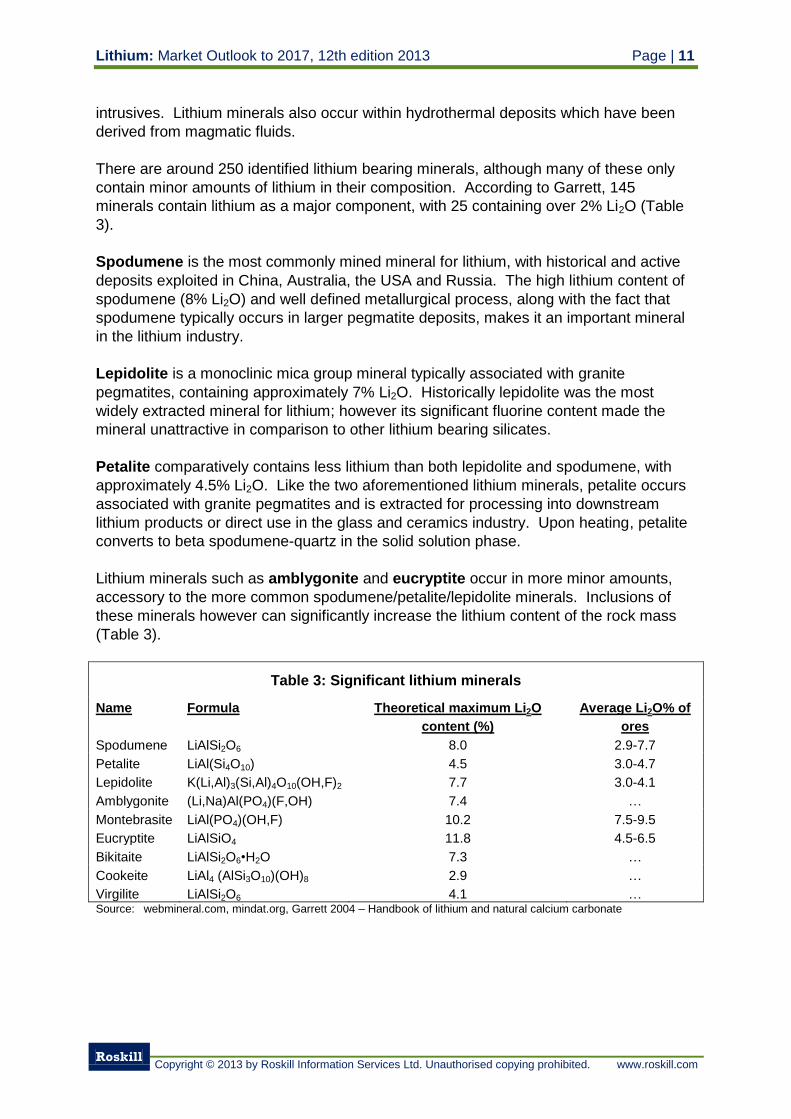
There are around 250 identified lithium bearing minerals, although many of these only
contain minor amounts of lithium in their composition. According to Garrett, 145
minerals contain lithium as a major component, with 25 containing over 2% Li2O (Table
3).
Spodumene is the most commonly mined mineral for lithium, with historical and active
deposits exploited in China, Australia, the USA and Russia. The high lithium content of
spodumene (8% Li2O) and well defined metallurgical process, along with the fact that
spodumene typically occurs in larger pegmatite deposits, makes it an important mineral
in the lithium industry.
Lepidolite is a monoclinic mica group mineral typically associated with granite
pegmatites, containing approximately 7% Li2O. Historically lepidolite was the most
widely extracted mineral for lithium; however its significant fluorine content made the
mineral unattractive in comparison to other lithium bearing silicates.
Petalite comparatively contains less lithium than both lepidolite and spodumene, with
approximately 4.5% Li2O. Like the two aforementioned lithium minerals, petalite occurs
associated with granite pegmatites and is extracted for processing into downstream
lithium products or direct use in the glass and ceramics industry. Upon heating, petalite
converts to beta spodumene-quartz in the solid solution phase.
Lithium minerals such as amblygonite and eucryptite occur in more minor amounts,
accessory to the more common spodumene/petalite/lepidolite minerals. Inclusions of
these minerals however can significantly increase the lithium content of the rock mass
(Table 3).
Table 3: Significant lithium minerals
Name Formula Theoretical maximum Li2O
content (%)
Average Li2O% of
ores
Spodumene LiAlSi2O6 8.0 2.9-7.7
Petalite LiAl(Si4O10) 4.5 3.0-4.7
Lepidolite K(Li,Al)3(Si,Al)4O10(OH,F)2 7.7 3.0-4.1
Amblygonite (Li,Na)Al(PO4)(F,OH) 7.4 …
Montebrasite LiAl(PO4)(OH,F) 10.2 7.5-9.5
Eucryptite LiAlSiO4 11.8 4.5-6.5
Bikitaite LiAlSi2O6•H2O 7.3 …
Cookeite LiAl4 (AlSi3O10)(OH)8 2.9 …
Virgilite LiAlSi2O6 4.1 … Source: webmineral.com, mindat.org, Garrett 2004 – Handbook of lithium and natural calcium carbonate
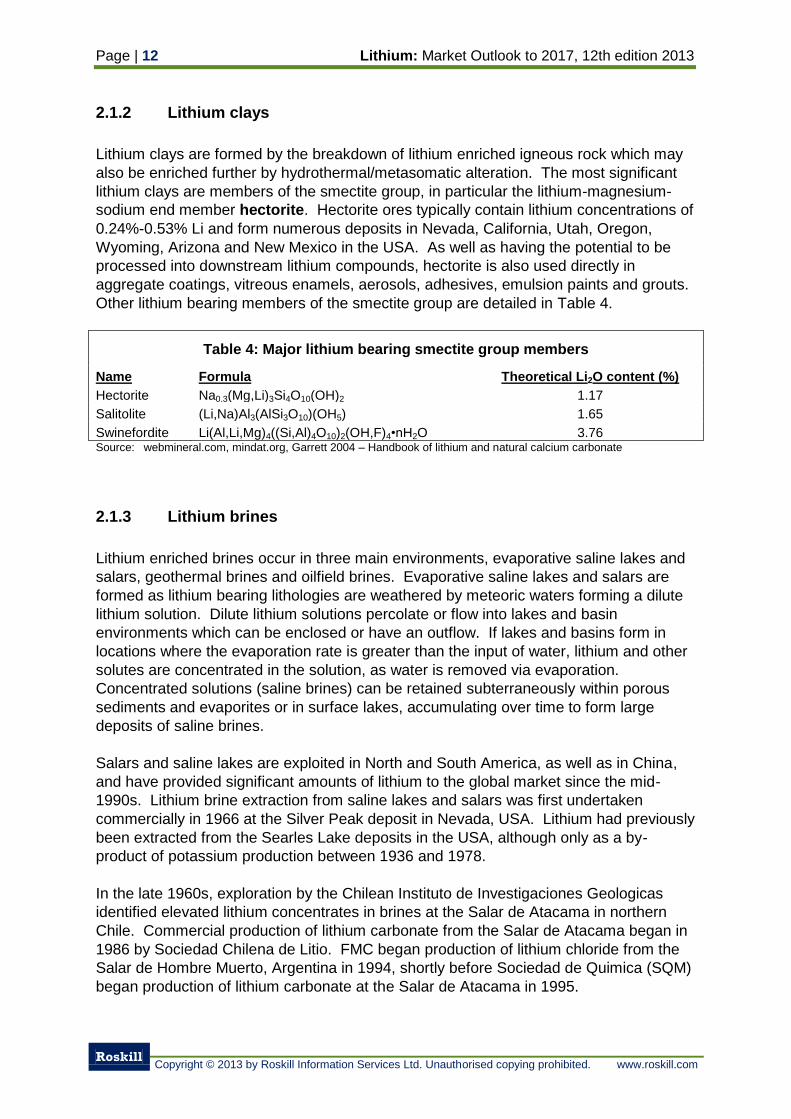
Page | 12 Lithium: Market Outlook to 2017, 12th edition 2013
Roskill
Copyright © 2013 by Roskill Information Services Ltd. Unauthorised copying prohibited. www.roskill.com
2.1.2 Lithium clays
Lithium clays are formed by the breakdown of lithium enriched igneous rock which may
also be enriched further by hydrothermal/metasomatic alteration. The most significant
lithium clays are members of the smectite group, in particular the lithium-magnesium-
sodium end member hectorite. Hectorite ores typically contain lithium concentrations of
0.24%-0.53% Li and form numerous deposits in Nevada, California, Utah, Oregon,
Wyoming, Arizona and New Mexico in the USA. As well as having the potential to be
processed into downstream lithium compounds, hectorite is also used directly in
aggregate coatings, vitreous enamels, aerosols, adhesives, emulsion paints and grouts.
Other lithium bearing members of the smectite group are detailed in Table 4.
Table 4: Major lithium bearing smectite group members
Name Formula Theoretical Li2O content (%)
Hectorite Na0.3(Mg,Li)3Si4O10(OH)2 1.17
Salitolite (Li,Na)Al3(AlSi3O10)(OH5) 1.65
Swinefordite Li(Al,Li,Mg)4((Si,Al)4O10)2(OH,F)4•nH2O 3.76 Source: webmineral.com, mindat.org, Garrett 2004 – Handbook of lithium and natural calcium carbonate
2.1.3 Lithium brines
Lithium enriched brines occur in three main environments, evaporative saline lakes and
salars, geothermal brines and oilfield brines. Evaporative saline lakes and salars are
formed as lithium bearing lithologies are weathered by meteoric waters forming a dilute
lithium solution. Dilute lithium solutions percolate or flow into lakes and basin
environments which can be enclosed or have an outflow. If lakes and basins form in
locations where the evaporation rate is greater than the input of water, lithium and other
solutes are concentrated in the solution, as water is removed via evaporation.
Concentrated solutions (saline brines) can be retained subterraneously within porous
sediments and evaporites or in surface lakes, accumulating over time to form large
deposits of saline brines.
Salars and saline lakes are exploited in North and South America, as well as in China,
and have provided significant amounts of lithium to the global market since the mid-
1990s. Lithium brine extraction from saline lakes and salars was first undertaken
commercially in 1966 at the Silver Peak deposit in Nevada, USA. Lithium had previously
been extracted from the Searles Lake deposits in the USA, although only as a by-
product of potassium production between 1936 and 1978.
In the late 1960s, exploration by the Chilean Instituto de Investigaciones Geologicas
identified elevated lithium concentrates in brines at the Salar de Atacama in northern
Chile. Commercial production of lithium carbonate from the Salar de Atacama began in
1986 by Sociedad Chilena de Litio. FMC began production of lithium chloride from the
Salar de Hombre Muerto, Argentina in 1994, shortly before Sociedad de Quimica (SQM)
began production of lithium carbonate at the Salar de Atacama in 1995.
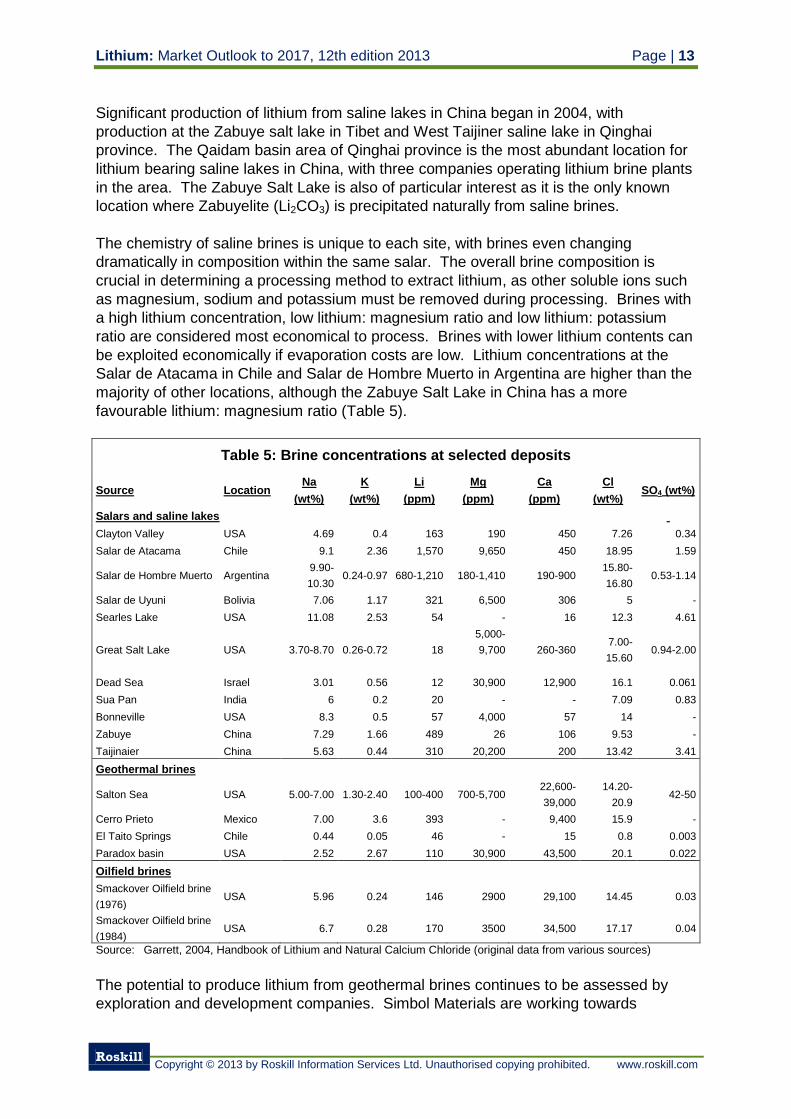
Lithium: Market Outlook to 2017, 12th edition 2013 Page | 13
Roskill
Copyright © 2013 by Roskill Information Services Ltd. Unauthorised copying prohibited. www.roskill.com
Significant production of lithium from saline lakes in China began in 2004, with
production at the Zabuye salt lake in Tibet and West Taijiner saline lake in Qinghai
province. The Qaidam basin area of Qinghai province is the most abundant location for
lithium bearing saline lakes in China, with three companies operating lithium brine plants
in the area. The Zabuye Salt Lake is also of particular interest as it is the only known
location where Zabuyelite (Li2CO3) is precipitated naturally from saline brines.
The chemistry of saline brines is unique to each site, with brines even changing
dramatically in composition within the same salar. The overall brine composition is
crucial in determining a processing method to extract lithium, as other soluble ions such
as magnesium, sodium and potassium must be removed during processing. Brines with
a high lithium concentration, low lithium: magnesium ratio and low lithium: potassium
ratio are considered most economical to process. Brines with lower lithium contents can
be exploited economically if evaporation costs are low. Lithium concentrations at the
Salar de Atacama in Chile and Salar de Hombre Muerto in Argentina are higher than the
majority of other locations, although the Zabuye Salt Lake in China has a more
favourable lithium: magnesium ratio (Table 5).
Table 5: Brine concentrations at selected deposits
Source Location Na K Li Mg Ca Cl
SO4 (wt%) (wt%) (wt%) (ppm) (ppm) (ppm) (wt%)
Salars and saline lakes
Clayton Valley USA 4.69 0.4 163 190 450 7.26 0.34
Salar de Atacama Chile 9.1 2.36 1,570 9,650 450 18.95 1.59
Salar de Hombre Muerto Argentina 9.90-
10.30 0.24-0.97 680-1,210 180-1,410 190-900
15.80-
16.80 0.53-1.14
Salar de Uyuni Bolivia 7.06 1.17 321 6,500 306 5 -
Searles Lake USA 11.08 2.53 54 - 16 12.3 4.61
Great Salt Lake USA 3.70-8.70 0.26-0.72 18
5,000-
9,700
260-360 7.00-
15.60 0.94-2.00
Dead Sea Israel 3.01 0.56 12 30,900 12,900 16.1 0.061
Sua Pan India 6 0.2 20 - - 7.09 0.83
Bonneville USA 8.3 0.5 57 4,000 57 14 -
Zabuye China 7.29 1.66 489 26 106 9.53 -
Taijinaier China 5.63 0.44 310 20,200 200 13.42 3.41
Geothermal brines
Salton Sea USA 5.00-7.00 1.30-2.40 100-400 700-5,700 22,600-
39,000
14.20-
20.9 42-50
Cerro Prieto Mexico 7.00 3.6 393 - 9,400 15.9 -
El Taito Springs Chile 0.44 0.05 46 - 15 0.8 0.003
Paradox basin USA 2.52 2.67 110 30,900 43,500 20.1 0.022
Oilfield brines Smackover Oilfield brine
(1976) USA 5.96 0.24 146 2900 29,100 14.45 0.03
Smackover Oilfield brine
(1984) USA 6.7 0.28 170 3500 34,500 17.17 0.04
Source: Garrett, 2004, Handbook of Lithium and Natural Calcium Chloride (original data from various sources)
The potential to produce lithium from geothermal brines continues to be assessed by
exploration and development companies. Simbol Materials are working towards
Page | 14 Lithium: Market Outlook to 2017, 12th edition 2013
Roskill
Copyright © 2013 by Roskill Information Services Ltd. Unauthorised copying prohibited. www.roskill.com
commercial production of lithium, zinc and manganese from waste streams of a
geothermal power plant near to the Salton Sea in southern California, USA.
A number of oilfield brines are enriched in lithium, with localized areas of the Smackover
oilfield brines in Arkansas, USA, considered to possess the highest lithium
concentrations. Brines of the Smackover oilfields are described as being derived from
concentrated seawater enriched in calcium by dolomitisation of oolitic limestone in which
brines are hosted, and in lithium by interaction with geothermal fluids. Albemarle extract
bromine from the Smackover oilfield brines in Arkansas and are developing a method to
recover lithium from extracted brines.
2.2 Lithium reserves
Lithium reserves predominantly occur within lithium brine deposits located in the Andean
Altiplano regions of Chile, Argentina and Bolivia, along with the Qaidam Basin of Qinghai
province China and lithium brines in Tibet. Although the brines contain only low
concentrations of lithium, their large size allows for substantial reserves of lithium, with
brines estimated to account for 90% of global lithium reserves. Lithium contained within
sea water, although significant, is not considered to be a reserve, as concentrations are
too low. Lithium mineral reserves, typically associated with pegmatite and alkaline
intrusives, have been identified on every populated continent and form approximately
10% of global lithium reserves.
In 2013, the USGS reported global lithium reserves of 13.0Mt Li, with Chile and China
accounting for almost 85% of global reserves. The USGS estimate excluded reserves
identified in Bolivia at the Salar de Uyuni, considered by some to be the largest single
lithium reserve at 5.5Mt Li. Roskill estimates global lithium reserves to be 20.8Mt in
2013, as the continued exploration and development of lithium projects has significantly
increased global reserves since Garrett’s estimate of 17.8Mt Li in 2004 (Table 6). In
1985, the National Research Council (NRC) reported estimated combined lithium
reserves and resources to total 28.5Mt Li, which Roskill estimate have increased to
>30Mt Li in 2013.
Evans, in “An Abundance of Lithium, Part Two”, released in July 2008, reported global
lithium reserves and resources at 29.8Mt Li, with lithium brine depostis accounting for
19.3Mt Li and lithium mineral deposits accounting for the remaining 10.5Mt Li.
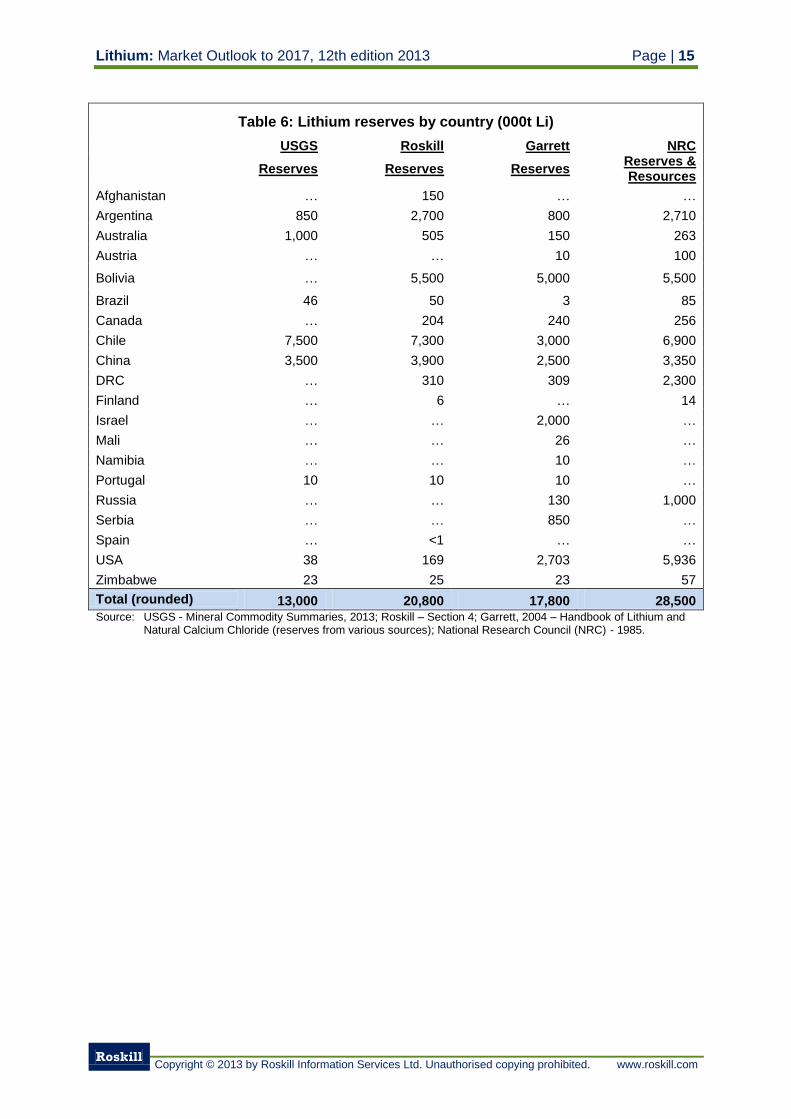
Lithium: Market Outlook to 2017, 12th edition 2013 Page | 15
Roskill
Copyright © 2013 by Roskill Information Services Ltd. Unauthorised copying prohibited. www.roskill.com
Table 6: Lithium reserves by country (000t Li)
USGS Roskill Garrett NRC
Reserves Reserves Reserves
Reserves & Resources
Afghanistan … 150 … …
Argentina 850 2,700 800 2,710
Australia 1,000 505 150 263
Austria … … 10 100
Bolivia … 5,500 5,000 5,500
Brazil 46 50 3 85
Canada … 204 240 256
Chile 7,500 7,300 3,000 6,900
China 3,500 3,900 2,500 3,350
DRC … 310 309 2,300
Finland … 6 … 14
Israel … … 2,000 …
Mali … … 26 …
Namibia … … 10 …
Portugal 10 10 10 …
Russia … … 130 1,000
Serbia … … 850 …
Spain … <1 … …
USA 38 169 2,703 5,936
Zimbabwe 23 25 23 57
Total (rounded) 13,000 20,800 17,800 28,500 Source: USGS - Mineral Commodity Summaries, 2013; Roskill – Section 4; Garrett, 2004 – Handbook of Lithium and
Natural Calcium Chloride (reserves from various sources); National Research Council (NRC) - 1985.
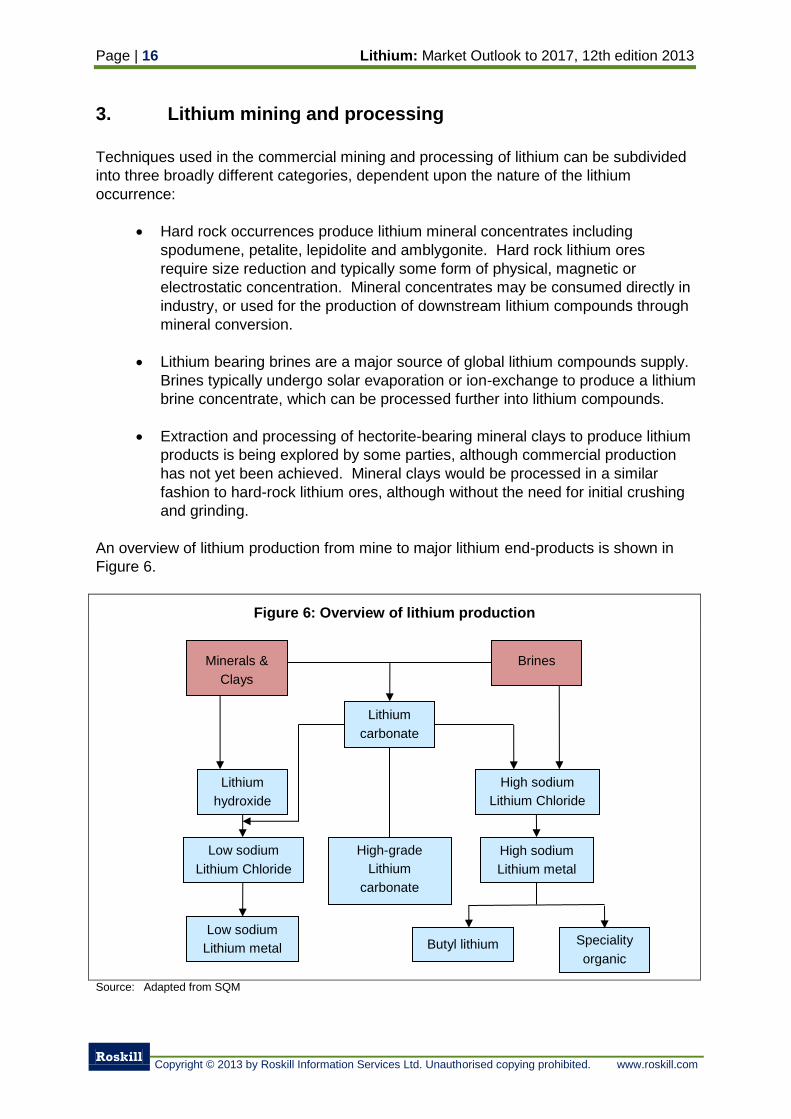
Page | 16 Lithium: Market Outlook to 2017, 12th edition 2013
Roskill
Copyright © 2013 by Roskill Information Services Ltd. Unauthorised copying prohibited. www.roskill.com
3. Lithium mining and processing
Techniques used in the commercial mining and processing of lithium can be subdivided
into three broadly different categories, dependent upon the nature of the lithium
occurrence:
Hard rock occurrences produce lithium mineral concentrates including
spodumene, petalite, lepidolite and amblygonite. Hard rock lithium ores
require size reduction and typically some form of physical, magnetic or
electrostatic concentration. Mineral concentrates may be consumed directly in
industry, or used for the production of downstream lithium compounds through
mineral conversion.
Lithium bearing brines are a major source of global lithium compounds supply.
Brines typically undergo solar evaporation or ion-exchange to produce a lithium
brine concentrate, which can be processed further into lithium compounds.
Extraction and processing of hectorite-bearing mineral clays to produce lithium
products is being explored by some parties, although commercial production
has not yet been achieved. Mineral clays would be processed in a similar
fashion to hard-rock lithium ores, although without the need for initial crushing
and grinding.
An overview of lithium production from mine to major lithium end-products is shown in
Figure 6.
Figure 6: Overview of lithium production
Source: Adapted from SQM
Minerals &
Clays
Brines
Lithium
carbonate
Lithium
hydroxide
Low sodium
Lithium Chloride
High sodium
Lithium Chloride
Low sodium
Lithium metal
High sodium
Lithium metal
Butyl lithium Speciality
organic
High-grade
Lithium
carbonate
Lithium: Market Outlook to 2017, 12th edition 2013 Page | 17
Roskill
Copyright © 2013 by Roskill Information Services Ltd. Unauthorised copying prohibited. www.roskill.com
3.1 Extraction and processing of lithium brines
Lithium is extracted from brine deposits in Argentina, Chile, China and the USA. At
operations in Chile, China and the USA, brines are first pumped to the surface to be
concentrated by solar evaporation in a series of evaporation ponds. Concentrated
brines are then transferred to a processing facility where reagents are added to remove
impurities and produce a lithium compounds by precipitation. In Argentina, at FMC
Lithium’s Salar del Hombre Muerto property, lithium brines are first concentrated by ion-
absorption onto polycrystalline alumina, before solar evaporation and extraction. At the
Zabuye salt lake in Tibet, China, Tibet Lithium New Technology are believed to have
developed a process utilising the freezing temperatures experienced at the property
when the evaporation rate is very slow, along with conventional solar evaporation when
evaporation rates are higher. The process involves alternate freezing and evaporation
stages to concentrate the brines and extract lithium carbonate, although few specific
details have emerged on the exact nature of the process.
Other methods to extract lithium from brines have been studied and developed with
varying success, for example the use other absorbent materials such as spinel,
magnesium dioxide or sodium phosphate during ion-absorption, or the use of ultrasonic
generators to promote precipitation of lithium from brines in Canada. The extraction and
processing of lithium at commercial operations in Chile, Argentina, China and the USA
are described in more detail below.
Rockwood Lithium (Salar de Atacama, Chile and Clayton Valley, USA) and SQM
(Salar de Atacama, Chile)
The method used by Rockwood Lithium at Clayton Valley and SQM at the Salar de
Atacama is based upon solar evaporation of extracted brines within a series of
evaporation ponds, concentrating brines to a level where lithium can be precipitated via
the addition of a reagent. This method is also often referred to as the ‘Silver Peak’
method. Brines in the evaporation ponds are maintained within a certain depth range to
allow maximum evaporation. At Rockwood Lithium, evaporation of brines in evaporation
ponds 1, 2 and 3 allows crystallisation of minor amounts of calcite and gypsum, followed
by crystallisation of halite. Brine is transferred to evaporation pond 4, where lime is
added to precipitate magnesium hydroxide and gypsum in pond 5. In ponds 6 and 7,
halite, sylvenite and glaserite are precipitated before the concentrated brine is
transferred to evaporation ponds 8 and 9 where final precipitation of halite, potash and
glaserite occurs. The resultant brine concentrate contains around 6% Li, which is
pumped to the lithium carbonate plant at Silver Peak. At the Silver Peak plant, the brine
concentrate is mixed with lime to precipitate any residual magnesium and/or minor
amounts of sulphate and boron. Soda ash is then added to the solution to precipitate
calcium, before being filter pressed and finally heated with soda ash to 93oC to
precipitate lithium carbonate. Waste water from the lithium carbonate production
process are put back into the evaporation ponds as they still contain at least half of the
feed brine’s lithium content.
Rockwood Lithium also uses a similar process to the Silver Peak method at the Salar de Atacama and La Negra plant in Chile. One notable difference is the boron content of brines at the Salar de Atacama is higher than at Clayton Valley in the USA, which
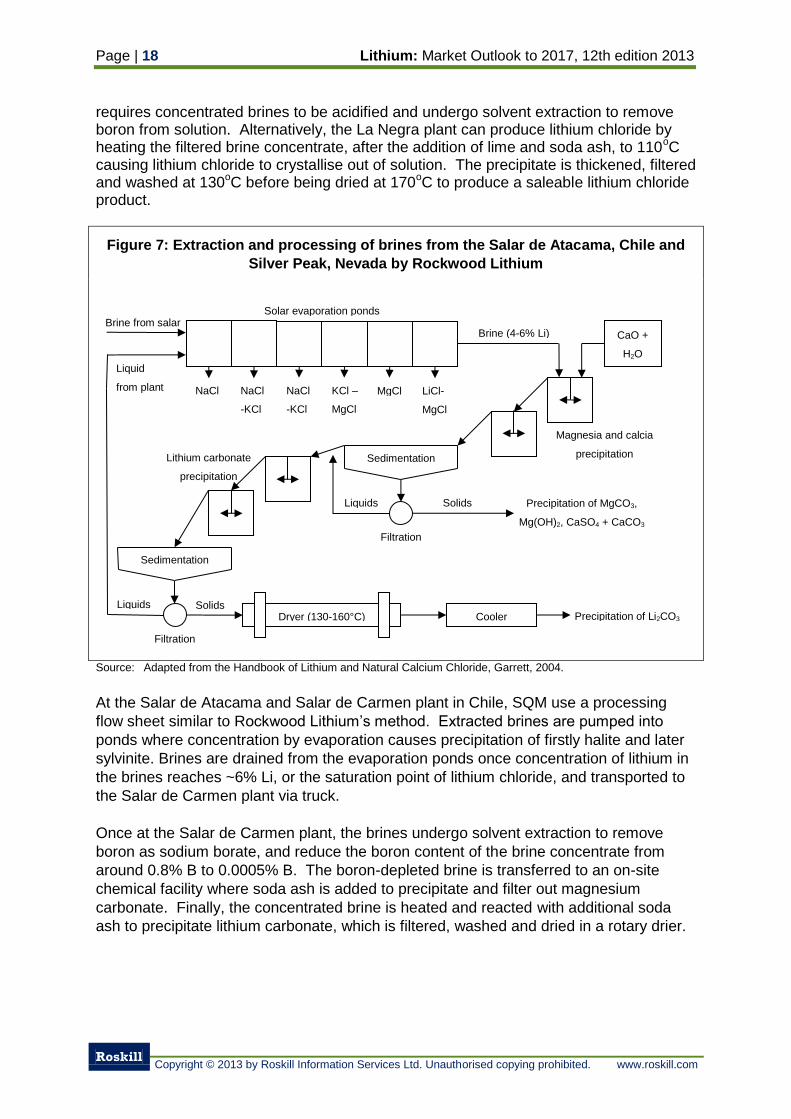
Page | 18 Lithium: Market Outlook to 2017, 12th edition 2013
Roskill
Copyright © 2013 by Roskill Information Services Ltd. Unauthorised copying prohibited. www.roskill.com
requires concentrated brines to be acidified and undergo solvent extraction to remove boron from solution. Alternatively, the La Negra plant can produce lithium chloride by heating the filtered brine concentrate, after the addition of lime and soda ash, to 110
oC
causing lithium chloride to crystallise out of solution. The precipitate is thickened, filtered and washed at 130
oC before being dried at 170
oC to produce a saleable lithium chloride
product.
Figure 7: Extraction and processing of brines from the Salar de Atacama, Chile and
Silver Peak, Nevada by Rockwood Lithium
Source: Adapted from the Handbook of Lithium and Natural Calcium Chloride, Garrett, 2004.
At the Salar de Atacama and Salar de Carmen plant in Chile, SQM use a processing
flow sheet similar to Rockwood Lithium’s method. Extracted brines are pumped into
ponds where concentration by evaporation causes precipitation of firstly halite and later
sylvinite. Brines are drained from the evaporation ponds once concentration of lithium in
the brines reaches ~6% Li, or the saturation point of lithium chloride, and transported to
the Salar de Carmen plant via truck.
Once at the Salar de Carmen plant, the brines undergo solvent extraction to remove
boron as sodium borate, and reduce the boron content of the brine concentrate from
around 0.8% B to 0.0005% B. The boron-depleted brine is transferred to an on-site
chemical facility where soda ash is added to precipitate and filter out magnesium
carbonate. Finally, the concentrated brine is heated and reacted with additional soda
ash to precipitate lithium carbonate, which is filtered, washed and dried in a rotary drier.
Solar evaporation ponds
LiCl-
MgCl
NaCl NaCl
-KCl
NaCl
-KCl
KCl –
MgCl
MgCl
Brine from salar CaO +
H2O
Brine (4-6% Li)
Magnesia and calcia
precipitation Sedimentation
Filtration
Solids Precipitation of MgCO3,
Mg(OH)2, CaSO4 + CaCO3
Liquids
Lithium carbonate
precipitation
Sedimentation
Dryer (130-160°C) Cooler Precipitation of Li2CO3
Solids
Filtration
Liquid
from plant
Liquids
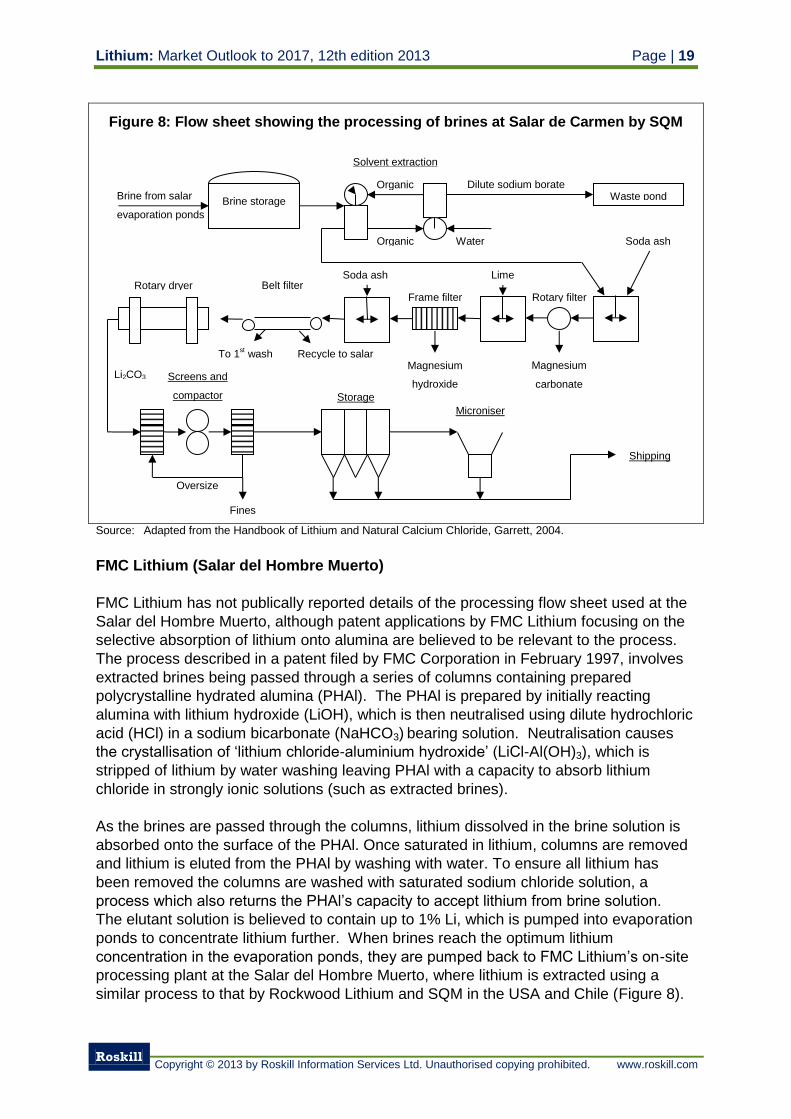
Lithium: Market Outlook to 2017, 12th edition 2013 Page | 19
Roskill
Copyright © 2013 by Roskill Information Services Ltd. Unauthorised copying prohibited. www.roskill.com
Figure 8: Flow sheet showing the processing of brines at Salar de Carmen by SQM
Source: Adapted from the Handbook of Lithium and Natural Calcium Chloride, Garrett, 2004.
FMC Lithium (Salar del Hombre Muerto)
FMC Lithium has not publically reported details of the processing flow sheet used at the
Salar del Hombre Muerto, although patent applications by FMC Lithium focusing on the
selective absorption of lithium onto alumina are believed to be relevant to the process.
The process described in a patent filed by FMC Corporation in February 1997, involves
extracted brines being passed through a series of columns containing prepared
polycrystalline hydrated alumina (PHAl). The PHAl is prepared by initially reacting
alumina with lithium hydroxide (LiOH), which is then neutralised using dilute hydrochloric
acid (HCl) in a sodium bicarbonate (NaHCO3) bearing solution. Neutralisation causes
the crystallisation of ‘lithium chloride-aluminium hydroxide’ (LiCl-Al(OH)3), which is
stripped of lithium by water washing leaving PHAl with a capacity to absorb lithium
chloride in strongly ionic solutions (such as extracted brines).
As the brines are passed through the columns, lithium dissolved in the brine solution is
absorbed onto the surface of the PHAl. Once saturated in lithium, columns are removed
and lithium is eluted from the PHAl by washing with water. To ensure all lithium has
been removed the columns are washed with saturated sodium chloride solution, a
process which also returns the PHAl’s capacity to accept lithium from brine solution.
The elutant solution is believed to contain up to 1% Li, which is pumped into evaporation
ponds to concentrate lithium further. When brines reach the optimum lithium
concentration in the evaporation ponds, they are pumped back to FMC Lithium’s on-site
processing plant at the Salar del Hombre Muerto, where lithium is extracted using a
similar process to that by Rockwood Lithium and SQM in the USA and Chile (Figure 8).
Brine storage Brine from salar
evaporation ponds
Organic
Organic
Waste pond Dilute sodium borate
Water Soda ash
Lime Soda ash Rotary dryer Belt filter
Recycle to salar To 1st wash
Magnesium
hydroxide
Magnesium
carbonate
Frame filter Rotary filter
Screens and
compactor Storage
Microniser
Shipping
Fines
Oversize
Solvent extraction
Li2CO3
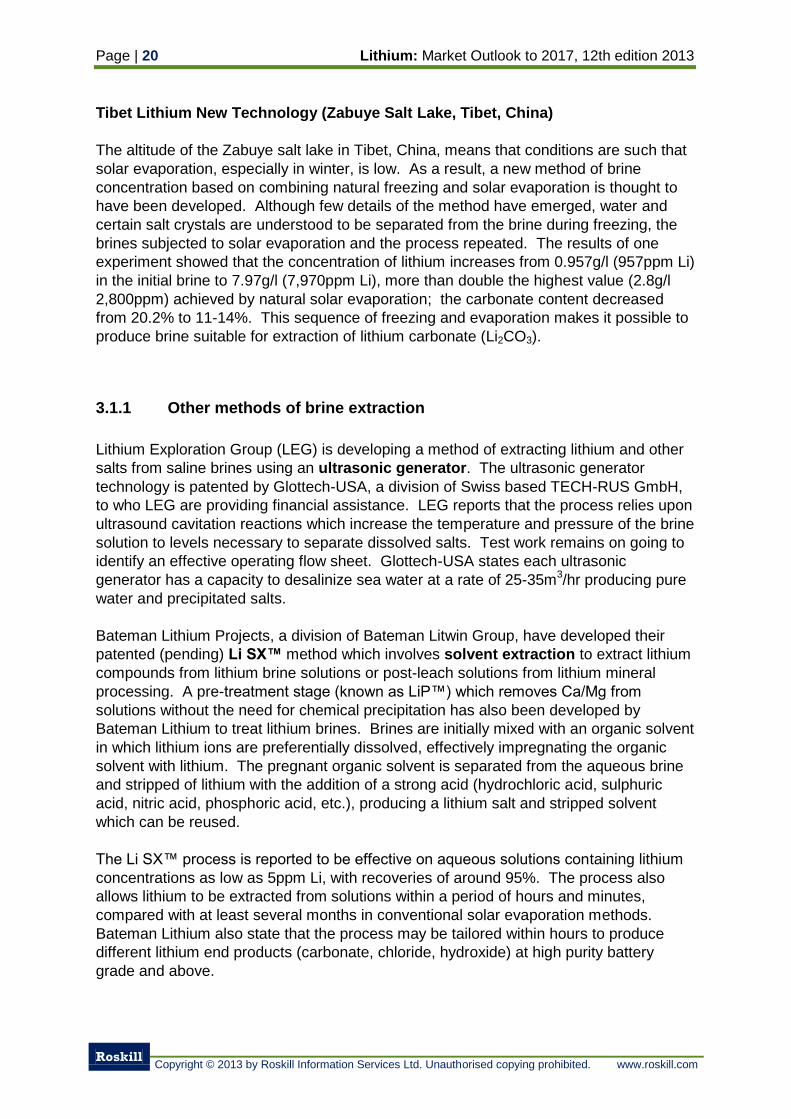
Page | 20 Lithium: Market Outlook to 2017, 12th edition 2013
Roskill
Copyright © 2013 by Roskill Information Services Ltd. Unauthorised copying prohibited. www.roskill.com
Tibet Lithium New Technology (Zabuye Salt Lake, Tibet, China)
The altitude of the Zabuye salt lake in Tibet, China, means that conditions are such that
solar evaporation, especially in winter, is low. As a result, a new method of brine
concentration based on combining natural freezing and solar evaporation is thought to
have been developed. Although few details of the method have emerged, water and
certain salt crystals are understood to be separated from the brine during freezing, the
brines subjected to solar evaporation and the process repeated. The results of one
experiment showed that the concentration of lithium increases from 0.957g/l (957ppm Li)
in the initial brine to 7.97g/l (7,970ppm Li), more than double the highest value (2.8g/l
2,800ppm) achieved by natural solar evaporation; the carbonate content decreased
from 20.2% to 11-14%. This sequence of freezing and evaporation makes it possible to
produce brine suitable for extraction of lithium carbonate (Li2CO3).
3.1.1 Other methods of brine extraction
Lithium Exploration Group (LEG) is developing a method of extracting lithium and other
salts from saline brines using an ultrasonic generator. The ultrasonic generator
technology is patented by Glottech-USA, a division of Swiss based TECH-RUS GmbH,
to who LEG are providing financial assistance. LEG reports that the process relies upon
ultrasound cavitation reactions which increase the temperature and pressure of the brine
solution to levels necessary to separate dissolved salts. Test work remains on going to
identify an effective operating flow sheet. Glottech-USA states each ultrasonic
generator has a capacity to desalinize sea water at a rate of 25-35m3/hr producing pure
water and precipitated salts.
Bateman Lithium Projects, a division of Bateman Litwin Group, have developed their
patented (pending) Li SX™ method which involves solvent extraction to extract lithium
compounds from lithium brine solutions or post-leach solutions from lithium mineral
processing. A pre-treatment stage (known as LiP™) which removes Ca/Mg from
solutions without the need for chemical precipitation has also been developed by
Bateman Lithium to treat lithium brines. Brines are initially mixed with an organic solvent
in which lithium ions are preferentially dissolved, effectively impregnating the organic
solvent with lithium. The pregnant organic solvent is separated from the aqueous brine
and stripped of lithium with the addition of a strong acid (hydrochloric acid, sulphuric
acid, nitric acid, phosphoric acid, etc.), producing a lithium salt and stripped solvent
which can be reused.
The Li SX™ process is reported to be effective on aqueous solutions containing lithium
concentrations as low as 5ppm Li, with recoveries of around 95%. The process also
allows lithium to be extracted from solutions within a period of hours and minutes,
compared with at least several months in conventional solar evaporation methods.
Bateman Lithium also state that the process may be tailored within hours to produce
different lithium end products (carbonate, chloride, hydroxide) at high purity battery
grade and above.
Lithium: Market Outlook to 2017, 12th edition 2013 Page | 21
Roskill
Copyright © 2013 by Roskill Information Services Ltd. Unauthorised copying prohibited. www.roskill.com
Figure 9: Simplified flow sheet of the Li SX™ method patented by Bateman Lithium
Projects
Source: Bateman Lithium Projects presentation
3.2 Mining and processing of lithium minerals
The majority of lithium bearing pegmatites mined at present are near surface lending
themselves to open-pit mining methods. Hard rock lithium mines in Australia, Zimbabwe,
Brazil, China and Spain all use open pit drill and blast methods, whilst a small number of
mines in China and the Bernic Lake mine (currently on care and maintenance) in
Canada, use underground room and pillar methods to extract lithium ores.
In a typical process to produce lithium mineral concentrate, mined ore initially undergoes
size reduction by a combination of primary and secondary jaw crushers and tertiary cone
crushers (Figure 10). Crushed ore is concentrated by heavy media separation, milling
and classification, floatation and/or magnetic separation, and final filtering, washing and
drying. The exact process varies between operations dependant on the ore
composition, for example heavy media separation is not undertaken at Talison Lithium’s
Greenbushes mine and only a simplified heavy media separation stage is undertaken by
Bikita Minerals in Zimbabwe.
Brine
Feedstock
Solvent extraction
Organic
(loaded)
Organic
(stripped)
Strong Acid
(e.g. HCl)
Lithium salt
(e.g. LiCl)
Waste
brine
Storage Lithium
chloride
product
Lithium
hydroxide
product
Lithium
carbonate
product
Electrolysis Precipitation and
washing
Soda ash
(Na2CO3)
Spent
solution
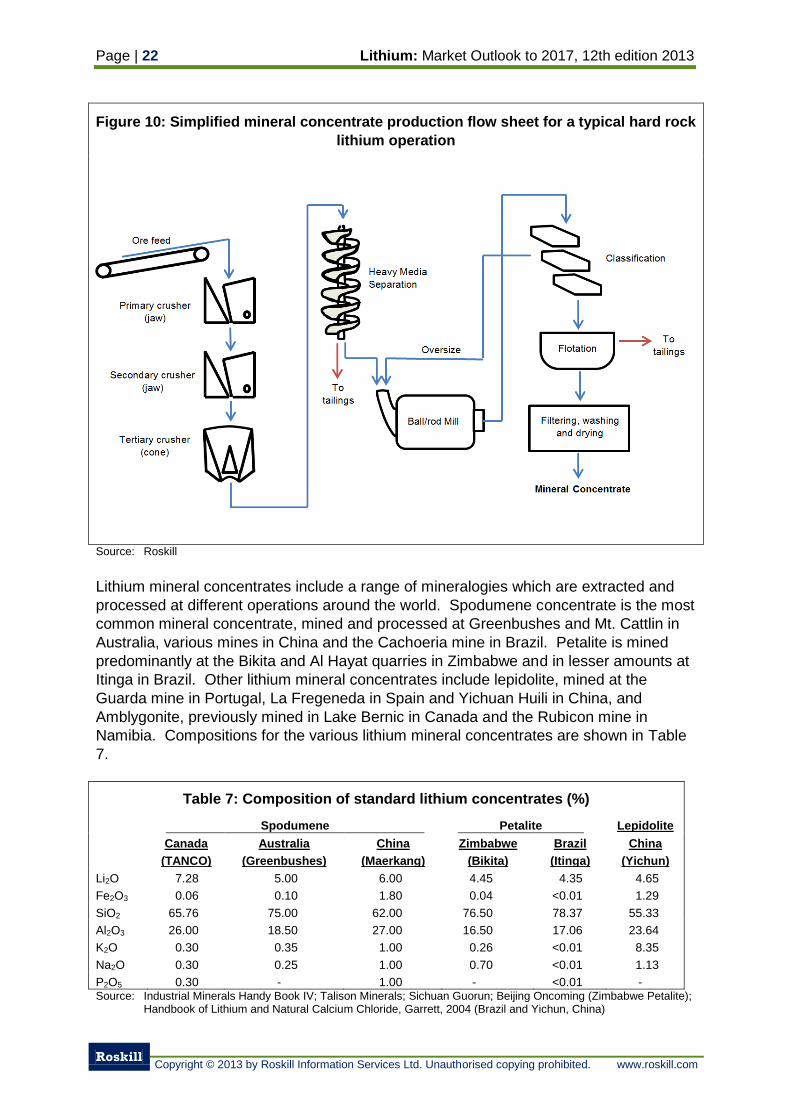
Page | 22 Lithium: Market Outlook to 2017, 12th edition 2013
Roskill
Copyright © 2013 by Roskill Information Services Ltd. Unauthorised copying prohibited. www.roskill.com
Figure 10: Simplified mineral concentrate production flow sheet for a typical hard rock
lithium operation
Source: Roskill
Lithium mineral concentrates include a range of mineralogies which are extracted and
processed at different operations around the world. Spodumene concentrate is the most
common mineral concentrate, mined and processed at Greenbushes and Mt. Cattlin in
Australia, various mines in China and the Cachoeria mine in Brazil. Petalite is mined
predominantly at the Bikita and Al Hayat quarries in Zimbabwe and in lesser amounts at
Itinga in Brazil. Other lithium mineral concentrates include lepidolite, mined at the
Guarda mine in Portugal, La Fregeneda in Spain and Yichuan Huili in China, and
Amblygonite, previously mined in Lake Bernic in Canada and the Rubicon mine in
Namibia. Compositions for the various lithium mineral concentrates are shown in Table
7.
Table 7: Composition of standard lithium concentrates (%)
Spodumene Petalite Lepidolite
Canada
(TANCO)
Australia
(Greenbushes)
China
(Maerkang)
Zimbabwe
(Bikita)
Brazil
(Itinga)
China
(Yichun)
Li2O 7.28 5.00 6.00 4.45 4.35 4.65
Fe2O3 0.06 0.10 1.80 0.04 <0.01 1.29
SiO2 65.76 75.00 62.00 76.50 78.37 55.33
Al2O3 26.00 18.50 27.00 16.50 17.06 23.64
K2O 0.30 0.35 1.00 0.26 <0.01 8.35
Na2O 0.30 0.25 1.00 0.70 <0.01 1.13
P2O5 0.30 - 1.00 - <0.01 - Source: Industrial Minerals Handy Book IV; Talison Minerals; Sichuan Guorun; Beijing Oncoming (Zimbabwe Petalite);
Handbook of Lithium and Natural Calcium Chloride, Garrett, 2004 (Brazil and Yichun, China)
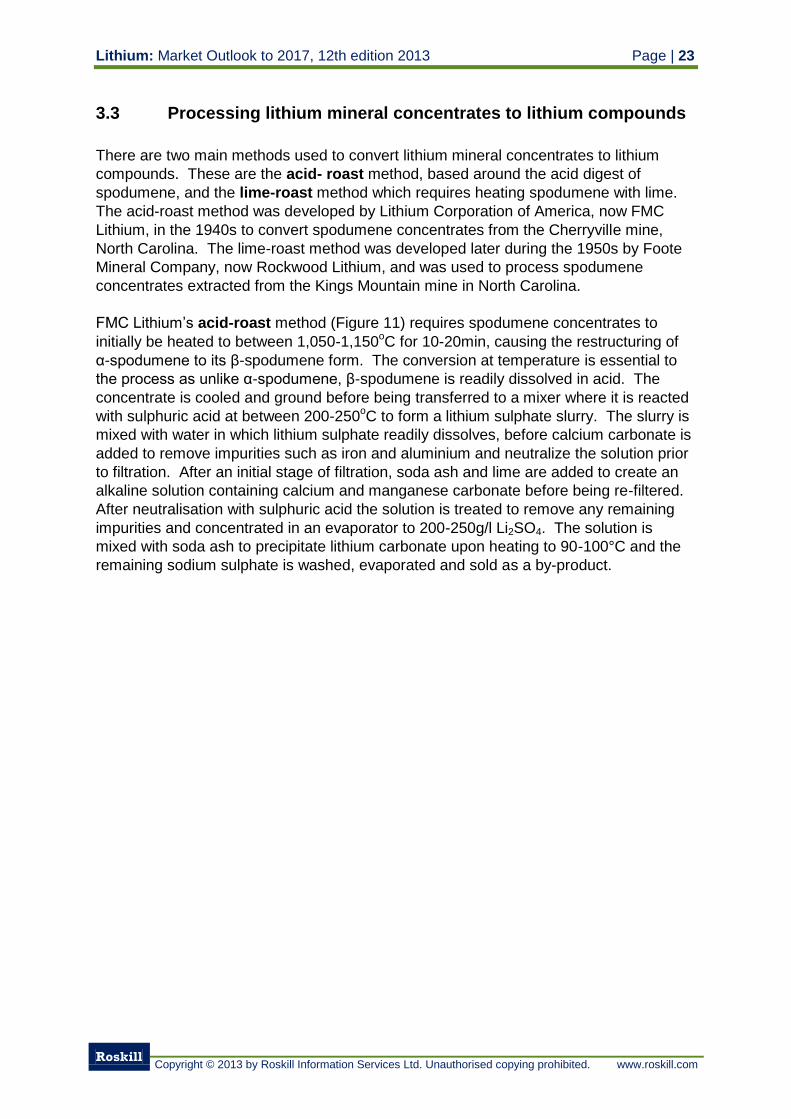
Lithium: Market Outlook to 2017, 12th edition 2013 Page | 23
Roskill
Copyright © 2013 by Roskill Information Services Ltd. Unauthorised copying prohibited. www.roskill.com
3.3 Processing lithium mineral concentrates to lithium compounds
There are two main methods used to convert lithium mineral concentrates to lithium
compounds. These are the acid- roast method, based around the acid digest of
spodumene, and the lime-roast method which requires heating spodumene with lime.
The acid-roast method was developed by Lithium Corporation of America, now FMC
Lithium, in the 1940s to convert spodumene concentrates from the Cherryville mine,
North Carolina. The lime-roast method was developed later during the 1950s by Foote
Mineral Company, now Rockwood Lithium, and was used to process spodumene
concentrates extracted from the Kings Mountain mine in North Carolina.
FMC Lithium’s acid-roast method (Figure 11) requires spodumene concentrates to
initially be heated to between 1,050-1,150oC for 10-20min, causing the restructuring of
α-spodumene to its β-spodumene form. The conversion at temperature is essential to
the process as unlike α-spodumene, β-spodumene is readily dissolved in acid. The
concentrate is cooled and ground before being transferred to a mixer where it is reacted
with sulphuric acid at between 200-250oC to form a lithium sulphate slurry. The slurry is
mixed with water in which lithium sulphate readily dissolves, before calcium carbonate is
added to remove impurities such as iron and aluminium and neutralize the solution prior
to filtration. After an initial stage of filtration, soda ash and lime are added to create an
alkaline solution containing calcium and manganese carbonate before being re-filtered.
After neutralisation with sulphuric acid the solution is treated to remove any remaining
impurities and concentrated in an evaporator to 200-250g/l Li2SO4. The solution is
mixed with soda ash to precipitate lithium carbonate upon heating to 90-100°C and the
remaining sodium sulphate is washed, evaporated and sold as a by-product.
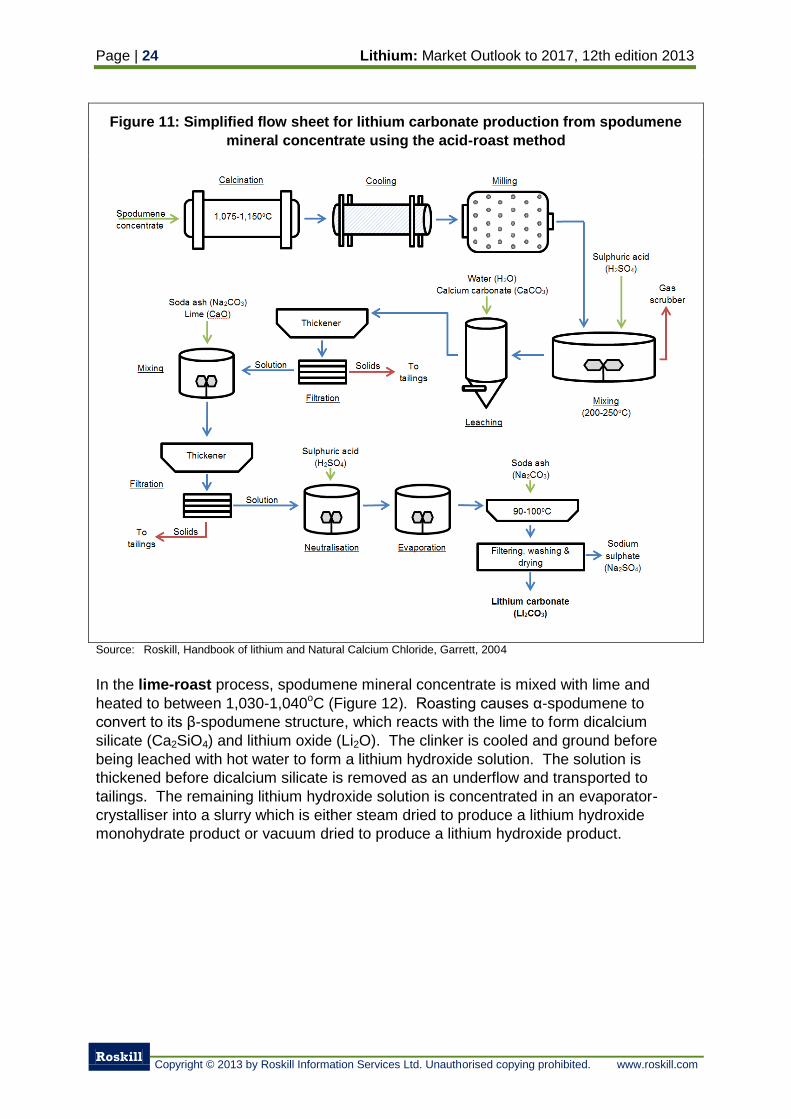
Page | 24 Lithium: Market Outlook to 2017, 12th edition 2013
Roskill
Copyright © 2013 by Roskill Information Services Ltd. Unauthorised copying prohibited. www.roskill.com
Figure 11: Simplified flow sheet for lithium carbonate production from spodumene
mineral concentrate using the acid-roast method
Source: Roskill, Handbook of lithium and Natural Calcium Chloride, Garrett, 2004
In the lime-roast process, spodumene mineral concentrate is mixed with lime and
heated to between 1,030-1,040oC (Figure 12). Roasting causes α-spodumene to
convert to its β-spodumene structure, which reacts with the lime to form dicalcium
silicate (Ca2SiO4) and lithium oxide (Li2O). The clinker is cooled and ground before
being leached with hot water to form a lithium hydroxide solution. The solution is
thickened before dicalcium silicate is removed as an underflow and transported to
tailings. The remaining lithium hydroxide solution is concentrated in an evaporator-
crystalliser into a slurry which is either steam dried to produce a lithium hydroxide
monohydrate product or vacuum dried to produce a lithium hydroxide product.
Lithium: Market Outlook to 2017, 12th edition 2013 Page | 25
Roskill
Copyright © 2013 by Roskill Information Services Ltd. Unauthorised copying prohibited. www.roskill.com
Figure 12: Simplified flow sheet for lithium hydroxide and lithium hydroxide
monohydrate production from spodumene mineral concentrate using the lime-roast
method
Source: Roskill, Handbook of lithium and Natural Calcium Chloride, Garrett, 2004
American Lithium Chemicals constructed a plant in San Antonio, Texas in the 1950s to
process imported lepidolite from Zimbabwe into lithium hydroxide monohydrate under a
government contract; however this plant closed following the termination of the contract
in the 1960s. The process was similar to the lime-roast operation at Kings Mountain
described above. In China, Xinyu Ganfeng, was thought to use a similar method of
production to that used by American Lithium Chemicals to extract lithium carbonate from
lepidolite produced as a by-product of tantalum and niobium mining. Other plants in
China are thought to use variations of the lime-roast and acid-roast processes; although
there is indication that some have switched to the acid-roast process to enable them to
produce lithium carbonate more cost effectively. The Cia Brasileira do Litio (CBL) plant
in Brazil uses an acid-roast process to produce lithium carbonate and chloride from
spodumene and, prior to its closure, the JSC Krasnoyarsk Chemical Metallurgical Plant
in Russia used the lime-roast process to produce lithium hydroxide.
Keliber Oy and Outotec Oy in Finland have developed a tailored version of the lime-
roast method to incorporate its supply of biogas (a mixture of chiefly carbon dioxide and
methane) as both a reagent and an energy source. Spodumene concentrate is roasted
(using bio-methane fuel) converting it to its β-spodumene form, before being mixed with
Page | 26 Lithium: Market Outlook to 2017, 12th edition 2013
Roskill
Copyright © 2013 by Roskill Information Services Ltd. Unauthorised copying prohibited. www.roskill.com
sodium carbonate (Na2CO3) solution to produce lithium bicarbonate. The lithium
bicarbonate bearing solution is crystallised, filtered, washed and dried to produce a
lithium carbonate product, before further micronization is undertaken if required. Lithium
carbonate is refined by mixing with carbon dioxide from the adjacent biogas plant to
produce a final product.
3.4 Processing lithium bearing clays into lithium compounds
A standard, cost effective method for the extraction of lithium from clays is under
development by a number of companies holding projects in the USA, Mexico and
Turkey. Western Lithium has developed a flow sheet to process hectorite bearing clay
from the King’s Valley lithium project with assistance from Hazen Research Inc. in the
USA, K-UTEC Salt Technologies and Outo Tech in Germany, and the Centro de
Investigación Cientίfico Tecnológico para la Minerίa (CICITEM) in Chile. The process
initially requires clays to be mixed with anhydrite (CaSO4) and limestone (CaCO3),
before being granulated (3-5mm). The mixed granules are calcined in a rotary kiln at
1,050oC to form alkali -metal sulphates ((Li, K, Na)2 SO4) and silica (SiO2), which reacts
with limestone to form wollastonite (CaSiO3). Calcined material is cooled and leached
with 75-90oC water to dissolve the alkali-metal sulphates and form brine. Brines are
sent to an evaporator-crystalliser to crystallise glaserite (K2SO4) and glauber salt
(Na2SO4), before the remaining brine is mixed with soda ash (Na2CO3) to precipitate
lithium carbonate (Li2CO3). Lithium carbonate precipitate is filtered, washed and dried to
produce a final product, which can be purified by ion-exchange with carbon dioxide
(CO2) if required.
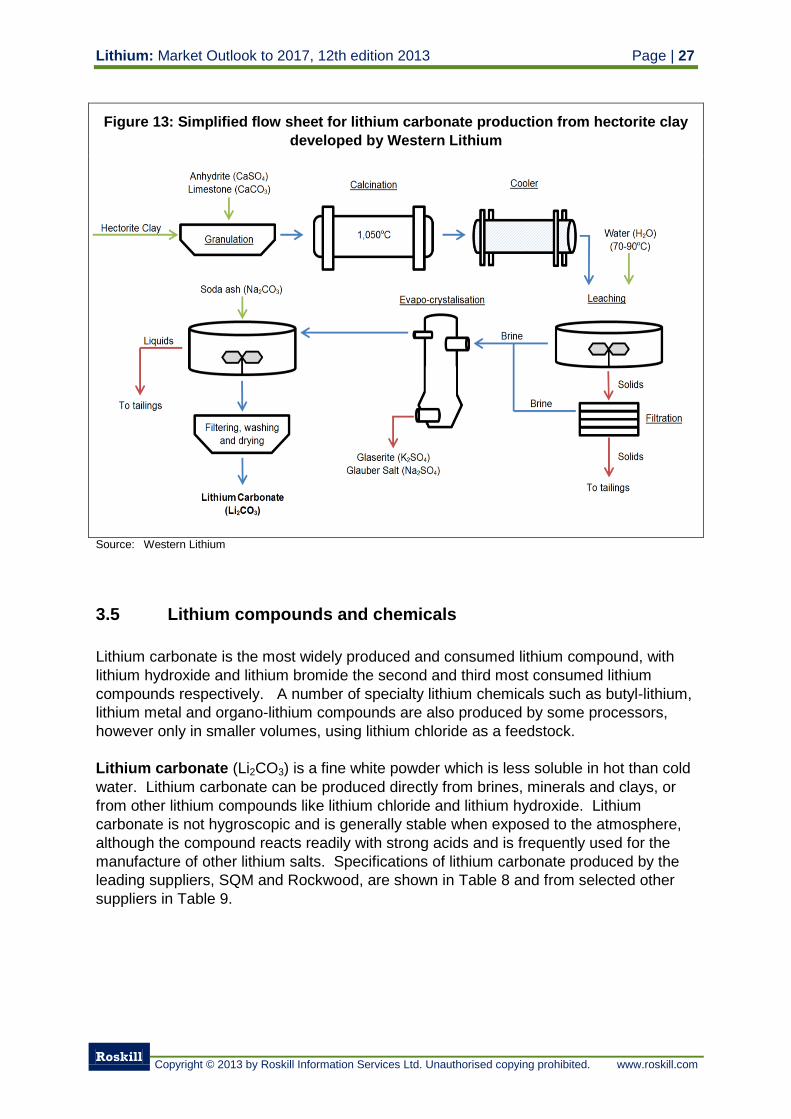
Lithium: Market Outlook to 2017, 12th edition 2013 Page | 27
Roskill
Copyright © 2013 by Roskill Information Services Ltd. Unauthorised copying prohibited. www.roskill.com
Figure 13: Simplified flow sheet for lithium carbonate production from hectorite clay
developed by Western Lithium
Source: Western Lithium
3.5 Lithium compounds and chemicals
Lithium carbonate is the most widely produced and consumed lithium compound, with
lithium hydroxide and lithium bromide the second and third most consumed lithium
compounds respectively. A number of specialty lithium chemicals such as butyl-lithium,
lithium metal and organo-lithium compounds are also produced by some processors,
however only in smaller volumes, using lithium chloride as a feedstock.
Lithium carbonate (Li2CO3) is a fine white powder which is less soluble in hot than cold
water. Lithium carbonate can be produced directly from brines, minerals and clays, or
from other lithium compounds like lithium chloride and lithium hydroxide. Lithium
carbonate is not hygroscopic and is generally stable when exposed to the atmosphere,
although the compound reacts readily with strong acids and is frequently used for the
manufacture of other lithium salts. Specifications of lithium carbonate produced by the
leading suppliers, SQM and Rockwood, are shown in Table 8 and from selected other
suppliers in Table 9.
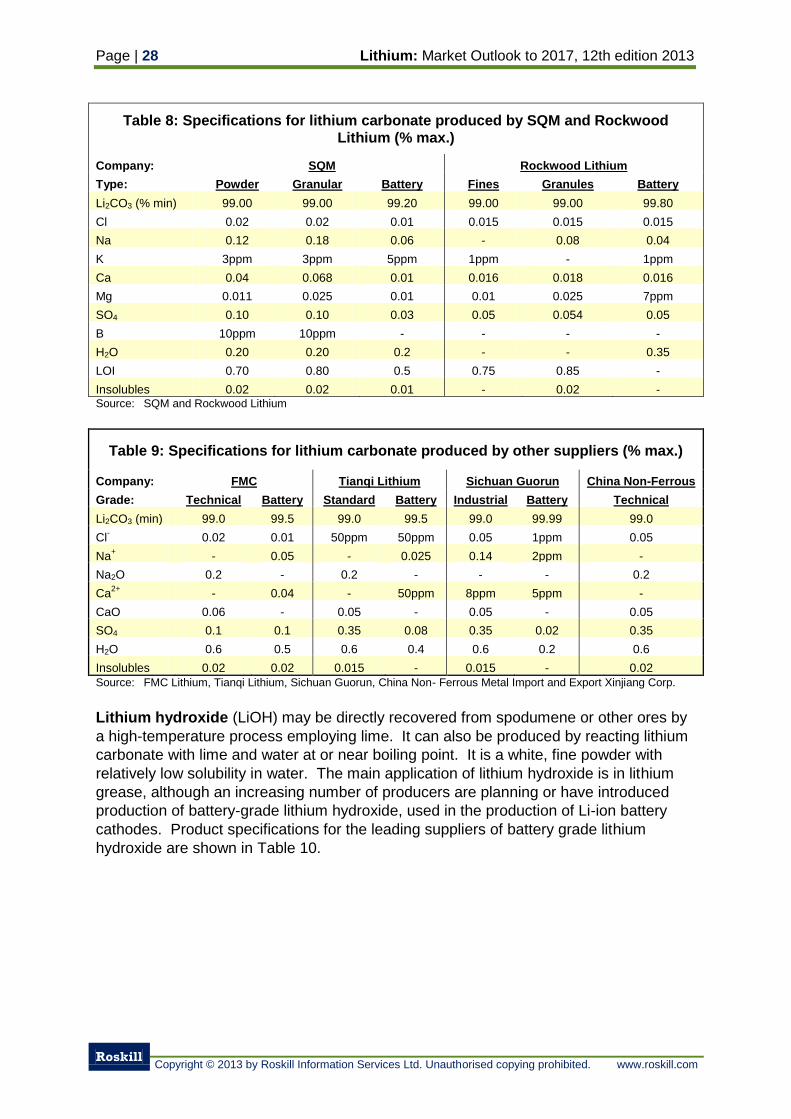
Page | 28 Lithium: Market Outlook to 2017, 12th edition 2013
Roskill
Copyright © 2013 by Roskill Information Services Ltd. Unauthorised copying prohibited. www.roskill.com
Table 8: Specifications for lithium carbonate produced by SQM and Rockwood
Lithium (% max.)
Company: SQM Rockwood Lithium
Type: Powder Granular Battery Fines Granules Battery
Li2CO3 (% min) 99.00 99.00 99.20 99.00 99.00 99.80
Cl 0.02 0.02 0.01 0.015 0.015 0.015
Na 0.12 0.18 0.06 - 0.08 0.04
K 3ppm 3ppm 5ppm 1ppm - 1ppm
Ca 0.04 0.068 0.01 0.016 0.018 0.016
Mg 0.011 0.025 0.01 0.01 0.025 7ppm
SO4 0.10 0.10 0.03 0.05 0.054 0.05
B 10ppm 10ppm - - - -
H2O 0.20 0.20 0.2 - - 0.35
LOI 0.70 0.80 0.5 0.75 0.85 -
Insolubles 0.02 0.02 0.01 - 0.02 - Source: SQM and Rockwood Lithium
Table 9: Specifications for lithium carbonate produced by other suppliers (% max.)
Company: FMC Tianqi Lithium Sichuan Guorun China Non-Ferrous
Grade: Technical Battery Standard Battery Industrial Battery Technical
Li2CO3 (min) 99.0 99.5 99.0 99.5 99.0 99.99 99.0
Cl- 0.02 0.01 50ppm 50ppm 0.05 1ppm 0.05
Na+ - 0.05 - 0.025 0.14 2ppm -
Na2O 0.2 - 0.2 - - - 0.2
Ca2+
- 0.04 - 50ppm 8ppm 5ppm -
CaO 0.06 - 0.05 - 0.05 - 0.05
SO4 0.1 0.1 0.35 0.08 0.35 0.02 0.35
H2O 0.6 0.5 0.6 0.4 0.6 0.2 0.6
Insolubles 0.02 0.02 0.015 - 0.015 - 0.02
Source: FMC Lithium, Tianqi Lithium, Sichuan Guorun, China Non- Ferrous Metal Import and Export Xinjiang Corp.
Lithium hydroxide (LiOH) may be directly recovered from spodumene or other ores by
a high-temperature process employing lime. It can also be produced by reacting lithium
carbonate with lime and water at or near boiling point. It is a white, fine powder with
relatively low solubility in water. The main application of lithium hydroxide is in lithium
grease, although an increasing number of producers are planning or have introduced
production of battery-grade lithium hydroxide, used in the production of Li-ion battery
cathodes. Product specifications for the leading suppliers of battery grade lithium
hydroxide are shown in Table 10.
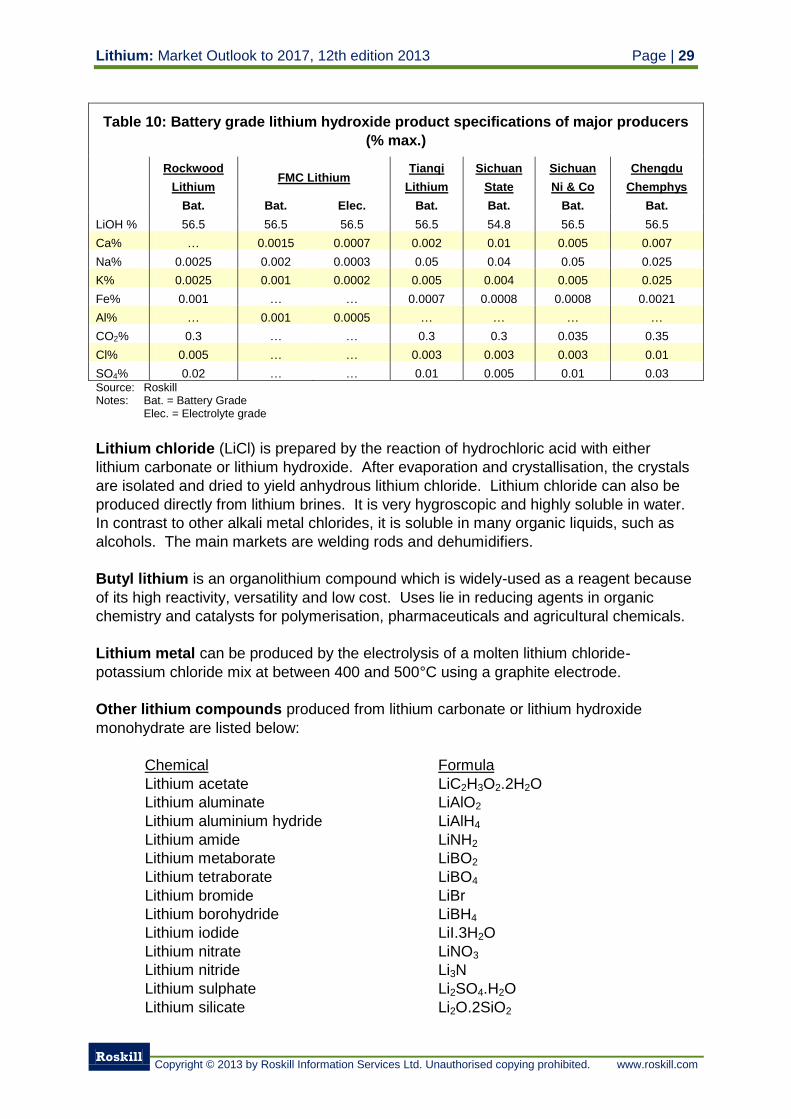
Lithium: Market Outlook to 2017, 12th edition 2013 Page | 29
Roskill
Copyright © 2013 by Roskill Information Services Ltd. Unauthorised copying prohibited. www.roskill.com
Table 10: Battery grade lithium hydroxide product specifications of major producers
(% max.)
Rockwood
Lithium FMC Lithium
Tianqi
Lithium
Sichuan
State
Sichuan
Ni & Co
Chengdu
Chemphys
Bat. Bat. Elec. Bat. Bat. Bat. Bat.
LiOH % 56.5 56.5 56.5 56.5 54.8 56.5 56.5
Ca% … 0.0015 0.0007 0.002 0.01 0.005 0.007
Na% 0.0025 0.002 0.0003 0.05 0.04 0.05 0.025
K% 0.0025 0.001 0.0002 0.005 0.004 0.005 0.025
Fe% 0.001 … … 0.0007 0.0008 0.0008 0.0021
Al% … 0.001 0.0005 … … … …
CO2% 0.3 … … 0.3 0.3 0.035 0.35
Cl% 0.005 … … 0.003 0.003 0.003 0.01
SO4% 0.02 … … 0.01 0.005 0.01 0.03 Source: Roskill Notes: Bat. = Battery Grade Elec. = Electrolyte grade
Lithium chloride (LiCl) is prepared by the reaction of hydrochloric acid with either
lithium carbonate or lithium hydroxide. After evaporation and crystallisation, the crystals
are isolated and dried to yield anhydrous lithium chloride. Lithium chloride can also be
produced directly from lithium brines. It is very hygroscopic and highly soluble in water.
In contrast to other alkali metal chlorides, it is soluble in many organic liquids, such as
alcohols. The main markets are welding rods and dehumidifiers.
Butyl lithium is an organolithium compound which is widely-used as a reagent because
of its high reactivity, versatility and low cost. Uses lie in reducing agents in organic
chemistry and catalysts for polymerisation, pharmaceuticals and agricultural chemicals.
Lithium metal can be produced by the electrolysis of a molten lithium chloride-
potassium chloride mix at between 400 and 500°C using a graphite electrode.
Other lithium compounds produced from lithium carbonate or lithium hydroxide
monohydrate are listed below:
Chemical Formula
Lithium acetate LiC2H3O2.2H2O
Lithium aluminate LiAlO2
Lithium aluminium hydride LiAlH4
Lithium amide LiNH2
Lithium metaborate LiBO2
Lithium tetraborate LiBO4
Lithium bromide LiBr
Lithium borohydride LiBH4
Lithium iodide LiI.3H2O
Lithium nitrate LiNO3
Lithium nitride Li3N
Lithium sulphate Li2SO4.H2O
Lithium silicate Li2O.2SiO2
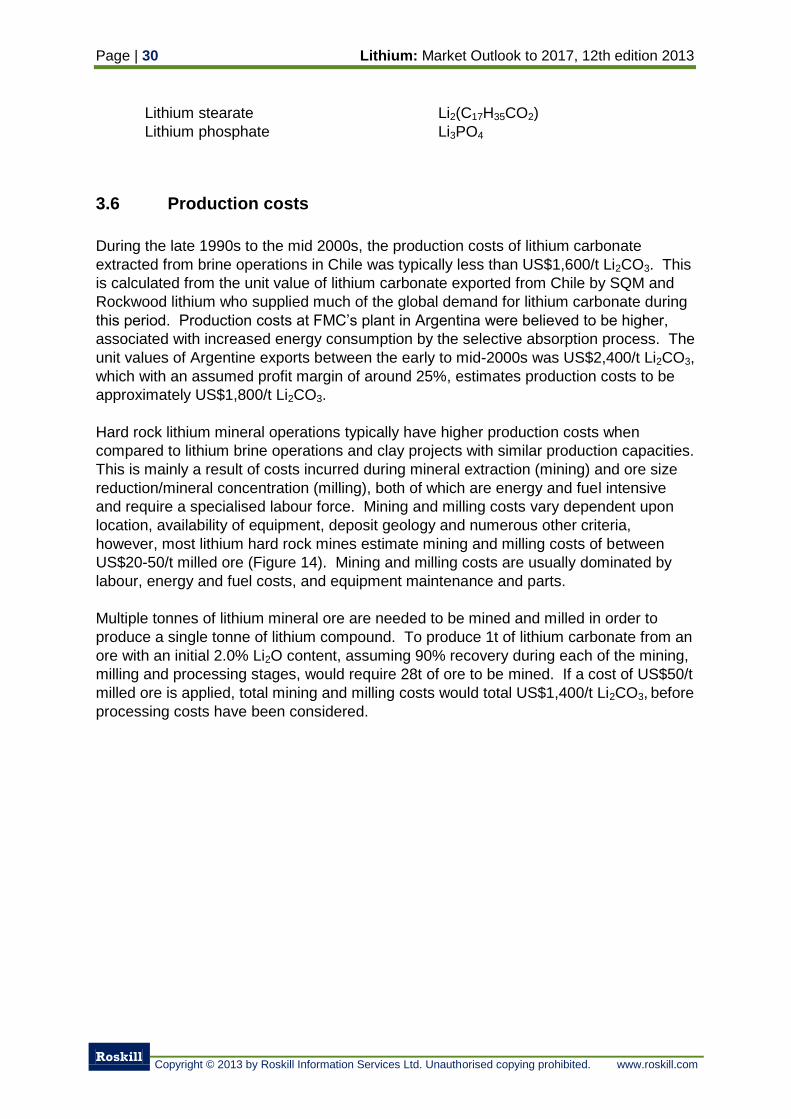
Page | 30 Lithium: Market Outlook to 2017, 12th edition 2013
Roskill
Copyright © 2013 by Roskill Information Services Ltd. Unauthorised copying prohibited. www.roskill.com
Lithium stearate Li2(C17H35CO2)
Lithium phosphate Li3PO4
3.6 Production costs
During the late 1990s to the mid 2000s, the production costs of lithium carbonate
extracted from brine operations in Chile was typically less than US$1,600/t Li2CO3. This
is calculated from the unit value of lithium carbonate exported from Chile by SQM and
Rockwood lithium who supplied much of the global demand for lithium carbonate during
this period. Production costs at FMC’s plant in Argentina were believed to be higher,
associated with increased energy consumption by the selective absorption process. The
unit values of Argentine exports between the early to mid-2000s was US$2,400/t Li2CO3,
which with an assumed profit margin of around 25%, estimates production costs to be
approximately US$1,800/t Li2CO3.
Hard rock lithium mineral operations typically have higher production costs when
compared to lithium brine operations and clay projects with similar production capacities.
This is mainly a result of costs incurred during mineral extraction (mining) and ore size
reduction/mineral concentration (milling), both of which are energy and fuel intensive
and require a specialised labour force. Mining and milling costs vary dependent upon
location, availability of equipment, deposit geology and numerous other criteria,
however, most lithium hard rock mines estimate mining and milling costs of between
US$20-50/t milled ore (Figure 14). Mining and milling costs are usually dominated by
labour, energy and fuel costs, and equipment maintenance and parts.
Multiple tonnes of lithium mineral ore are needed to be mined and milled in order to
produce a single tonne of lithium compound. To produce 1t of lithium carbonate from an
ore with an initial 2.0% Li2O content, assuming 90% recovery during each of the mining,
milling and processing stages, would require 28t of ore to be mined. If a cost of US$50/t
milled ore is applied, total mining and milling costs would total US$1,400/t Li2CO3, before
processing costs have been considered.
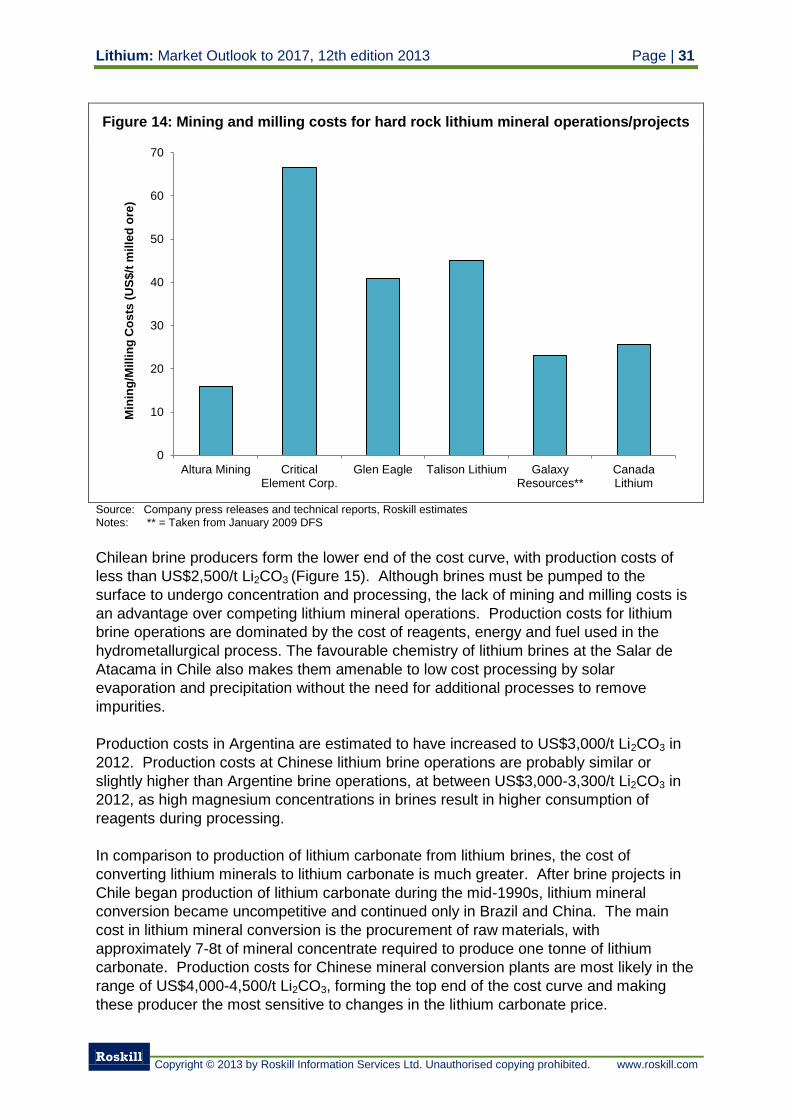
Lithium: Market Outlook to 2017, 12th edition 2013 Page | 31
Roskill
Copyright © 2013 by Roskill Information Services Ltd. Unauthorised copying prohibited. www.roskill.com
Figure 14: Mining and milling costs for hard rock lithium mineral operations/projects
Source: Company press releases and technical reports, Roskill estimates Notes: ** = Taken from January 2009 DFS
Chilean brine producers form the lower end of the cost curve, with production costs of
less than US$2,500/t Li2CO3 (Figure 15). Although brines must be pumped to the
surface to undergo concentration and processing, the lack of mining and milling costs is
an advantage over competing lithium mineral operations. Production costs for lithium
brine operations are dominated by the cost of reagents, energy and fuel used in the
hydrometallurgical process. The favourable chemistry of lithium brines at the Salar de
Atacama in Chile also makes them amenable to low cost processing by solar
evaporation and precipitation without the need for additional processes to remove
impurities.
Production costs in Argentina are estimated to have increased to US$3,000/t Li2CO3 in
2012. Production costs at Chinese lithium brine operations are probably similar or
slightly higher than Argentine brine operations, at between US$3,000-3,300/t Li2CO3 in
2012, as high magnesium concentrations in brines result in higher consumption of
reagents during processing.
In comparison to production of lithium carbonate from lithium brines, the cost of
converting lithium minerals to lithium carbonate is much greater. After brine projects in
Chile began production of lithium carbonate during the mid-1990s, lithium mineral
conversion became uncompetitive and continued only in Brazil and China. The main
cost in lithium mineral conversion is the procurement of raw materials, with
approximately 7-8t of mineral concentrate required to produce one tonne of lithium
carbonate. Production costs for Chinese mineral conversion plants are most likely in the
range of US$4,000-4,500/t Li2CO3, forming the top end of the cost curve and making
these producer the most sensitive to changes in the lithium carbonate price.
0
10
20
30
40
50
60
70
Altura Mining CriticalElement Corp.
Glen Eagle Talison Lithium GalaxyResources**
CanadaLithium
Min
ing
/Mil
lin
g C
os
ts (
US
$/t
mil
led
ore
)
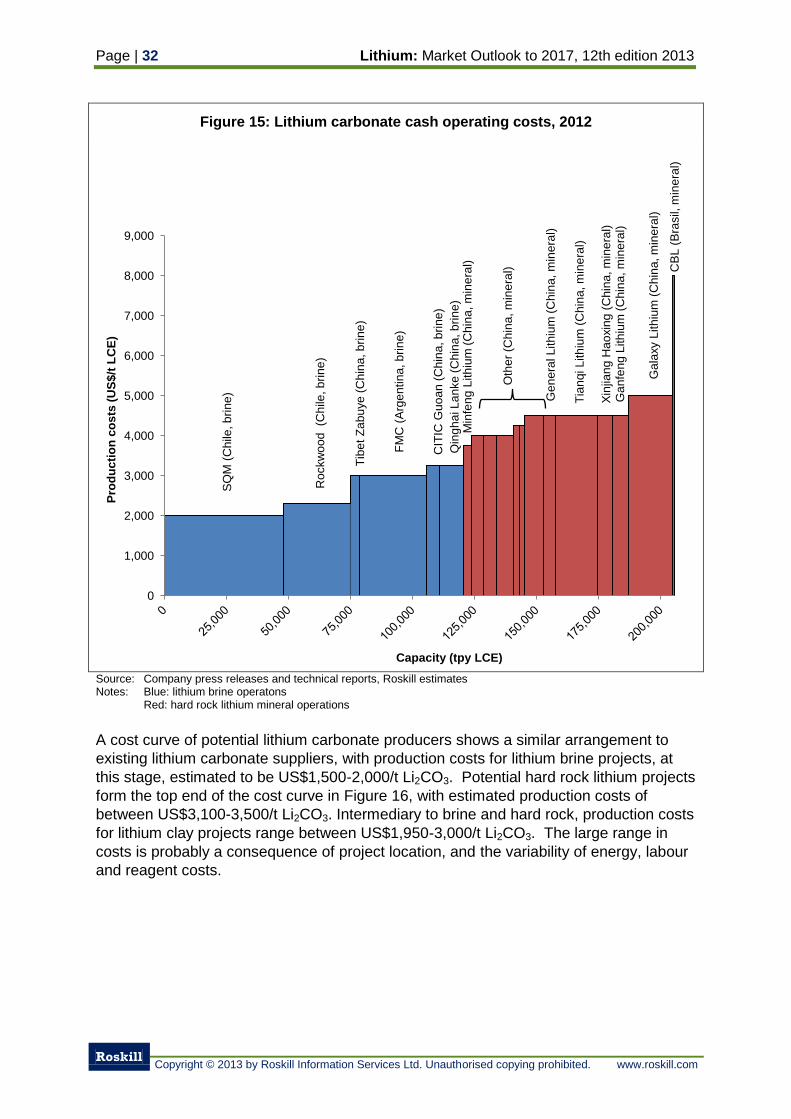
Page | 32 Lithium: Market Outlook to 2017, 12th edition 2013
Roskill
Copyright © 2013 by Roskill Information Services Ltd. Unauthorised copying prohibited. www.roskill.com
Figure 15: Lithium carbonate cash operating costs, 2012
Source: Company press releases and technical reports, Roskill estimates Notes: Blue: lithium brine operatons Red: hard rock lithium mineral operations
A cost curve of potential lithium carbonate producers shows a similar arrangement to
existing lithium carbonate suppliers, with production costs for lithium brine projects, at
this stage, estimated to be US$1,500-2,000/t Li2CO3. Potential hard rock lithium projects
form the top end of the cost curve in Figure 16, with estimated production costs of
between US$3,100-3,500/t Li2CO3. Intermediary to brine and hard rock, production costs
for lithium clay projects range between US$1,950-3,000/t Li2CO3. The large range in
costs is probably a consequence of project location, and the variability of energy, labour
and reagent costs.
SQ
M (
Chile
, b
rin
e)
Rockw
oo
d (C
hile
, b
rin
e)
Tib
et
Za
bu
ye
(C
hin
a, b
rin
e)
FM
C (
Arg
en
tin
a, b
rin
e)
CIT
IC G
uo
an
(C
hin
a, b
rin
e)
Qin
gh
ai L
an
ke
(C
hin
a, b
rin
e)
Min
fen
g L
ith
ium
(C
hin
a, m
ine
ral)
Oth
er
(Ch
ina
, m
ine
ral)
Ge
ne
ral L
ith
ium
(C
hin
a, m
ine
ral)
Tia
nq
i L
ith
ium
(C
hin
a, m
ine
ral)
Xin
jian
g H
ao
xin
g (
Ch
ina
, m
ine
ral)
G
an
fen
g L
ith
ium
(C
hin
a, m
ine
ral)
Ga
laxy L
ith
ium
(C
hin
a, m
ine
ral)
CB
L (
Bra
sil,
min
era
l)
0
1,000
2,000
3,000
4,000
5,000
6,000
7,000
8,000
9,000
Pro
du
cti
on
co
sts
(U
S$
/t L
CE
)
Capacity (tpy LCE)
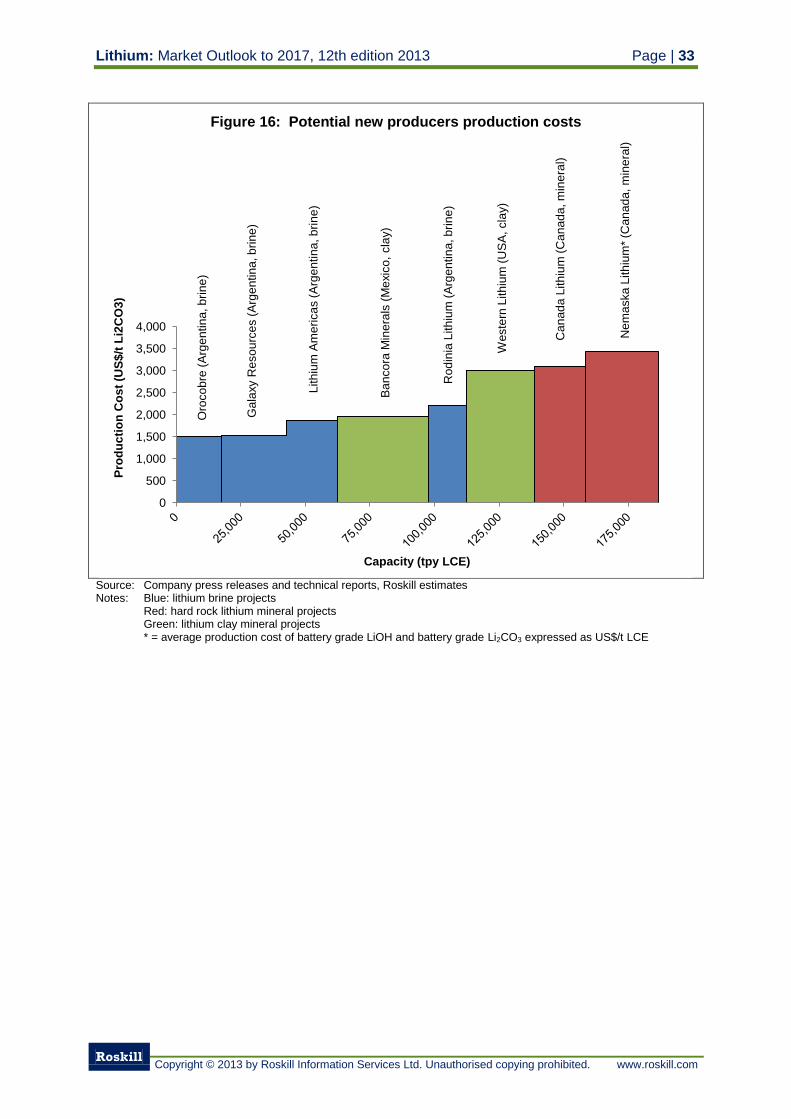
Lithium: Market Outlook to 2017, 12th edition 2013 Page | 33
Roskill
Copyright © 2013 by Roskill Information Services Ltd. Unauthorised copying prohibited. www.roskill.com
Figure 16: Potential new producers production costs
Source: Company press releases and technical reports, Roskill estimates Notes: Blue: lithium brine projects Red: hard rock lithium mineral projects Green: lithium clay mineral projects * = average production cost of battery grade LiOH and battery grade Li2CO3 expressed as US$/t LCE
Lith
ium
Am
eri
ca
s (
Arg
en
tin
a, b
rin
e)
Weste
rn L
ith
ium
(U
SA
, cla
y)
Ca
na
da
Lith
ium
(C
an
ad
a, m
ine
ral)
Ne
ma
ska
Lith
ium
* (C
an
ad
a, m
ine
ral)
Oro
co
bre
(A
rge
ntin
a, b
rin
e)
Ga
laxy R
eso
urc
es (
Arg
en
tin
a, b
rin
e)
Ba
nco
ra M
ine
rals
(M
exic
o,
cla
y)
Ro
din
ia L
ith
ium
(A
rge
ntin
a, b
rin
e)
0
500
1,000
1,500
2,000
2,500
3,000
3,500
4,000
Pro
du
cti
on
Co
st
(US
$/t
Li2
CO
3)
Capacity (tpy LCE)
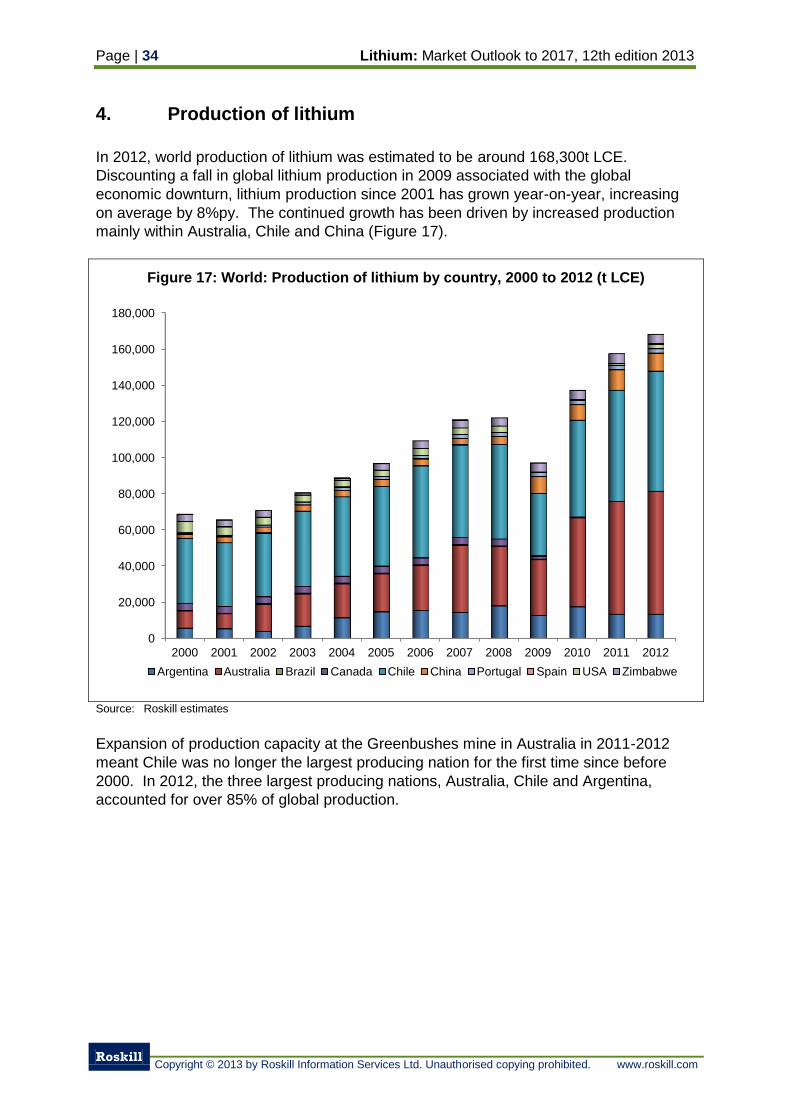
Page | 34 Lithium: Market Outlook to 2017, 12th edition 2013
Roskill
Copyright © 2013 by Roskill Information Services Ltd. Unauthorised copying prohibited. www.roskill.com
4. Production of lithium
In 2012, world production of lithium was estimated to be around 168,300t LCE.
Discounting a fall in global lithium production in 2009 associated with the global
economic downturn, lithium production since 2001 has grown year-on-year, increasing
on average by 8%py. The continued growth has been driven by increased production
mainly within Australia, Chile and China (Figure 17).
Figure 17: World: Production of lithium by country, 2000 to 2012 (t LCE)
Source: Roskill estimates
Expansion of production capacity at the Greenbushes mine in Australia in 2011-2012
meant Chile was no longer the largest producing nation for the first time since before
2000. In 2012, the three largest producing nations, Australia, Chile and Argentina,
accounted for over 85% of global production.
0
20,000
40,000
60,000
80,000
100,000
120,000
140,000
160,000
180,000
2000 2001 2002 2003 2004 2005 2006 2007 2008 2009 2010 2011 2012
Argentina Australia Brazil Canada Chile China Portugal Spain USA Zimbabwe
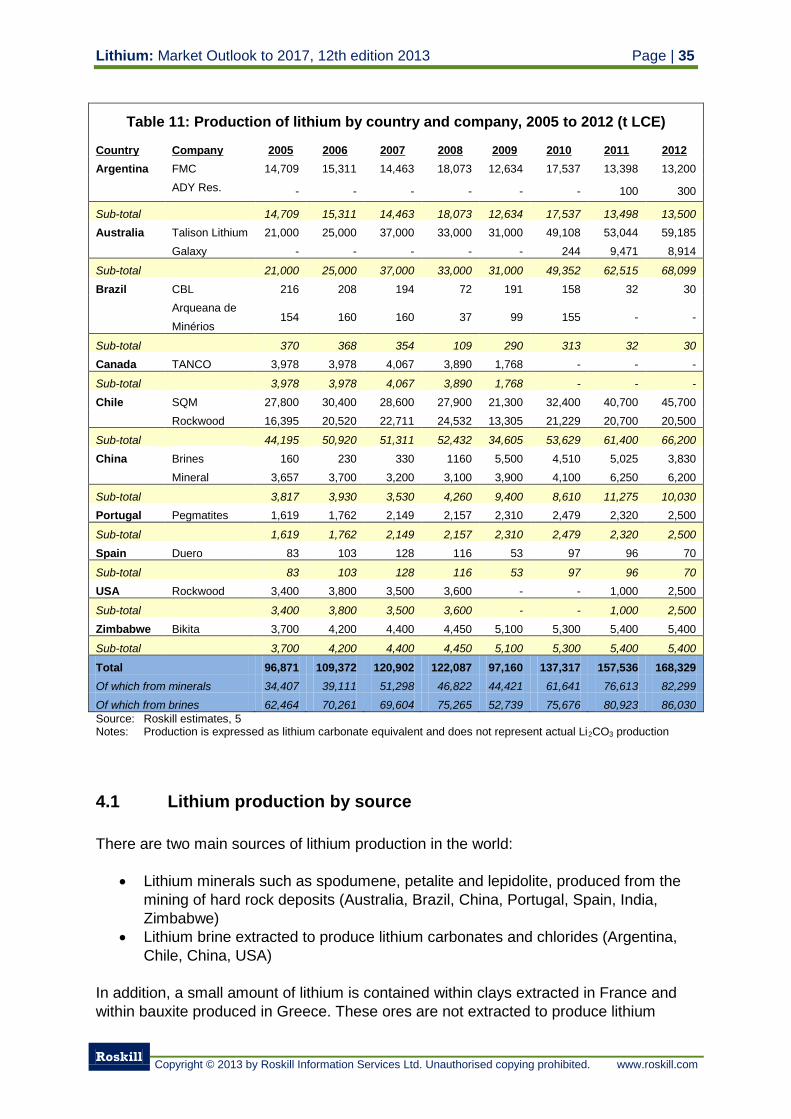
Lithium: Market Outlook to 2017, 12th edition 2013 Page | 35
Roskill
Copyright © 2013 by Roskill Information Services Ltd. Unauthorised copying prohibited. www.roskill.com
Table 11: Production of lithium by country and company, 2005 to 2012 (t LCE)
Country Company 2005 2006 2007 2008 2009 2010 2011 2012
Argentina FMC 14,709 15,311 14,463 18,073 12,634 17,537 13,398 13,200
ADY Res. - - - - - - 100 300
Sub-total 14,709 15,311 14,463 18,073 12,634 17,537 13,498 13,500
Australia Talison Lithium 21,000 25,000 37,000 33,000 31,000 49,108 53,044 59,185
Galaxy - - - - - 244 9,471 8,914
Sub-total 21,000 25,000 37,000 33,000 31,000 49,352 62,515 68,099
Brazil CBL 216 208 194 72 191 158 32 30
Arqueana de
Minérios 154 160 160 37 99 155 - -
Sub-total 370 368 354 109 290 313 32 30
Canada TANCO 3,978 3,978 4,067 3,890 1,768 - - -
Sub-total 3,978 3,978 4,067 3,890 1,768 - - -
Chile SQM 27,800 30,400 28,600 27,900 21,300 32,400 40,700 45,700
Rockwood 16,395 20,520 22,711 24,532 13,305 21,229 20,700 20,500
Sub-total 44,195 50,920 51,311 52,432 34,605 53,629 61,400 66,200
China Brines 160 230 330 1160 5,500 4,510 5,025 3,830
Mineral 3,657 3,700 3,200 3,100 3,900 4,100 6,250 6,200
Sub-total 3,817 3,930 3,530 4,260 9,400 8,610 11,275 10,030
Portugal Pegmatites 1,619 1,762 2,149 2,157 2,310 2,479 2,320 2,500
Sub-total 1,619 1,762 2,149 2,157 2,310 2,479 2,320 2,500
Spain Duero 83 103 128 116 53 97 96 70
Sub-total 83 103 128 116 53 97 96 70
USA Rockwood 3,400 3,800 3,500 3,600 - - 1,000 2,500
Sub-total 3,400 3,800 3,500 3,600 - - 1,000 2,500
Zimbabwe Bikita 3,700 4,200 4,400 4,450 5,100 5,300 5,400 5,400
Sub-total 3,700 4,200 4,400 4,450 5,100 5,300 5,400 5,400
Total 96,871 109,372 120,902 122,087 97,160 137,317 157,536 168,329
Of which from minerals 34,407 39,111 51,298 46,822 44,421 61,641 76,613 82,299
Of which from brines 62,464 70,261 69,604 75,265 52,739 75,676 80,923 86,030
Source: Roskill estimates, 5 Notes: Production is expressed as lithium carbonate equivalent and does not represent actual Li2CO3 production
4.1 Lithium production by source
There are two main sources of lithium production in the world:
Lithium minerals such as spodumene, petalite and lepidolite, produced from the
mining of hard rock deposits (Australia, Brazil, China, Portugal, Spain, India,
Zimbabwe)
Lithium brine extracted to produce lithium carbonates and chlorides (Argentina,
Chile, China, USA)
In addition, a small amount of lithium is contained within clays extracted in France and
within bauxite produced in Greece. These ores are not extracted to produce lithium
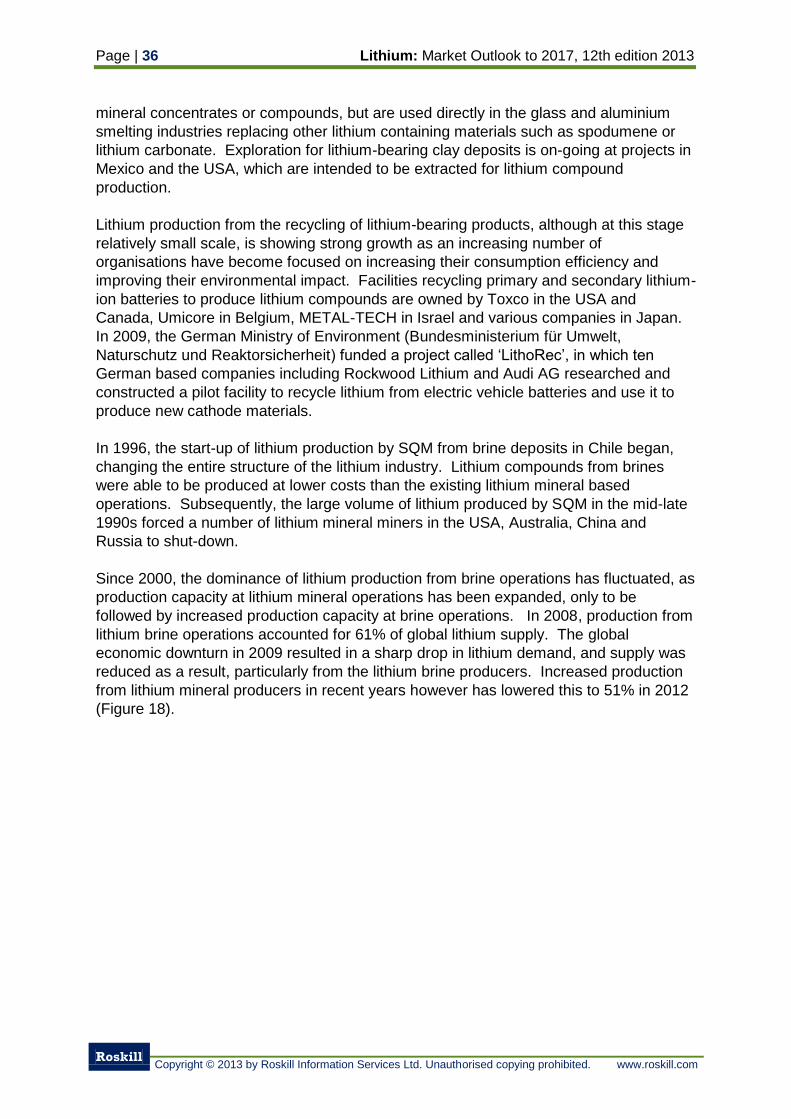
Page | 36 Lithium: Market Outlook to 2017, 12th edition 2013
Roskill
Copyright © 2013 by Roskill Information Services Ltd. Unauthorised copying prohibited. www.roskill.com
mineral concentrates or compounds, but are used directly in the glass and aluminium
smelting industries replacing other lithium containing materials such as spodumene or
lithium carbonate. Exploration for lithium-bearing clay deposits is on-going at projects in
Mexico and the USA, which are intended to be extracted for lithium compound
production.
Lithium production from the recycling of lithium-bearing products, although at this stage
relatively small scale, is showing strong growth as an increasing number of
organisations have become focused on increasing their consumption efficiency and
improving their environmental impact. Facilities recycling primary and secondary lithium-
ion batteries to produce lithium compounds are owned by Toxco in the USA and
Canada, Umicore in Belgium, METAL-TECH in Israel and various companies in Japan.
In 2009, the German Ministry of Environment (Bundesministerium für Umwelt,
Naturschutz und Reaktorsicherheit) funded a project called ‘LithoRec’, in which ten
German based companies including Rockwood Lithium and Audi AG researched and
constructed a pilot facility to recycle lithium from electric vehicle batteries and use it to
produce new cathode materials.
In 1996, the start-up of lithium production by SQM from brine deposits in Chile began,
changing the entire structure of the lithium industry. Lithium compounds from brines
were able to be produced at lower costs than the existing lithium mineral based
operations. Subsequently, the large volume of lithium produced by SQM in the mid-late
1990s forced a number of lithium mineral miners in the USA, Australia, China and
Russia to shut-down.
Since 2000, the dominance of lithium production from brine operations has fluctuated, as
production capacity at lithium mineral operations has been expanded, only to be
followed by increased production capacity at brine operations. In 2008, production from
lithium brine operations accounted for 61% of global lithium supply. The global
economic downturn in 2009 resulted in a sharp drop in lithium demand, and supply was
reduced as a result, particularly from the lithium brine producers. Increased production
from lithium mineral producers in recent years however has lowered this to 51% in 2012
(Figure 18).
Lithium: Market Outlook to 2017, 12th edition 2013 Page | 37
Roskill
Copyright © 2013 by Roskill Information Services Ltd. Unauthorised copying prohibited. www.roskill.com
Figure 18: Production of lithium from mineral and brine sources, 2005 to 2012 (t LCE)
Source: Roskill estimates
4.1.1 Production of Lithium Minerals
Since 2005, the supply of lithium minerals has grown by 13%py, totalling around 83,000t
LCE in 2012. The majority of this production originates from the Greenbushes mine
operated by Talison Lithium in Western Australia, which accounted for just over 70% of
global lithium mineral production in 2012 (Figure 19). High grade spodumene (>5.0%
Li2O) produced by Talison Lithium is mainly used in the glass, ceramics and metals
casting industries. Lower grade spodumene is not used directly in the glass and
ceramics industries as its iron content is too high, and is instead widely used to produce
lithium compounds at mineral conversion plants in China. Galaxy Resources in Australia
accounted for 11% of global lithium production in 2012, a similar volume to the collective
production of lithium mineral mines in China.
In 2009, production of spodumene concentrate from Talison Lithium fell to 31,000t LCE
in a second consecutive year of decreasing production. The fall in production between
2008 and 2009 was attributed to reduced demand for lithium as a result of the global
economic downturn. Production from Talison Lithium recovered strongly in 2010 as
demand for lithium minerals returned and the company subsequently increased
production capacity at the Greenbushes mine and processing facilities.
0
20,000
40,000
60,000
80,000
100,000
120,000
140,000
160,000
180,000
2005 2006 2007 2008 2009 2010 2011 2012
Lithium Minerals Lithium Brine Total Production
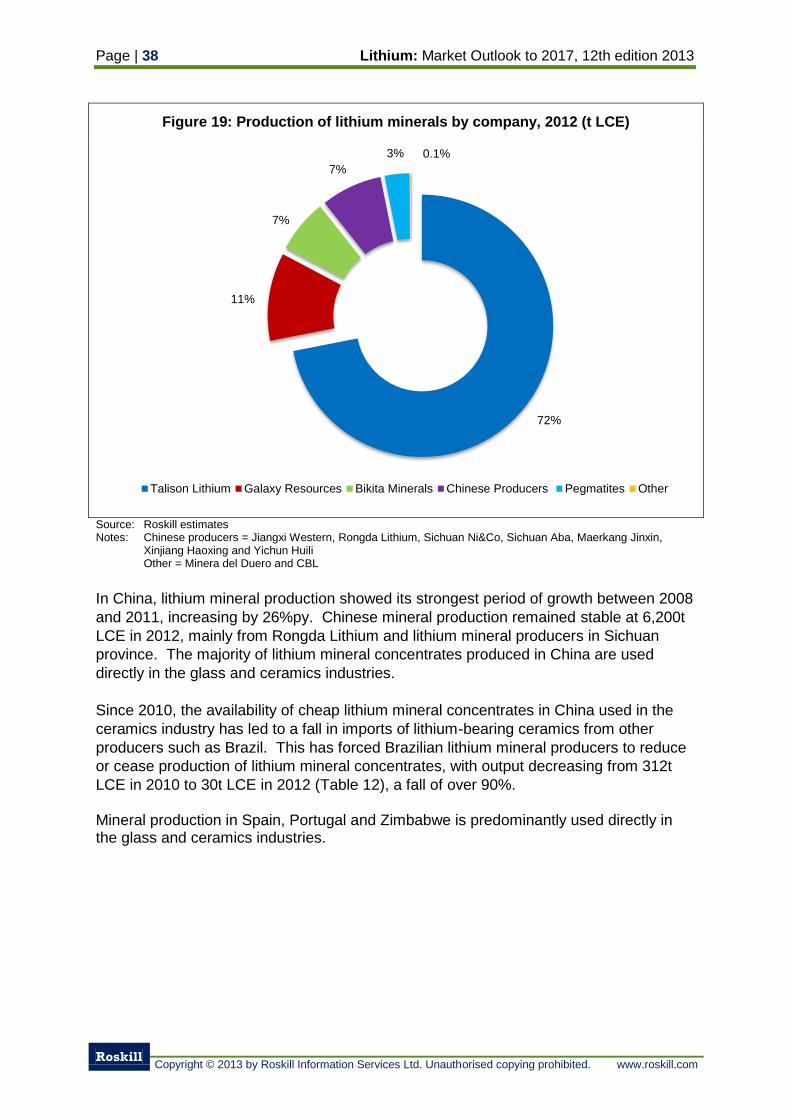
Page | 38 Lithium: Market Outlook to 2017, 12th edition 2013
Roskill
Copyright © 2013 by Roskill Information Services Ltd. Unauthorised copying prohibited. www.roskill.com
Figure 19: Production of lithium minerals by company, 2012 (t LCE)
Source: Roskill estimates Notes: Chinese producers = Jiangxi Western, Rongda Lithium, Sichuan Ni&Co, Sichuan Aba, Maerkang Jinxin,
Xinjiang Haoxing and Yichun Huili Other = Minera del Duero and CBL
In China, lithium mineral production showed its strongest period of growth between 2008
and 2011, increasing by 26%py. Chinese mineral production remained stable at 6,200t
LCE in 2012, mainly from Rongda Lithium and lithium mineral producers in Sichuan
province. The majority of lithium mineral concentrates produced in China are used
directly in the glass and ceramics industries.
Since 2010, the availability of cheap lithium mineral concentrates in China used in the
ceramics industry has led to a fall in imports of lithium-bearing ceramics from other
producers such as Brazil. This has forced Brazilian lithium mineral producers to reduce
or cease production of lithium mineral concentrates, with output decreasing from 312t
LCE in 2010 to 30t LCE in 2012 (Table 12), a fall of over 90%. Mineral production in Spain, Portugal and Zimbabwe is predominantly used directly in the glass and ceramics industries.
72%
11%
7%
7%
3% 0.1%
Talison Lithium Galaxy Resources Bikita Minerals Chinese Producers Pegmatites Other
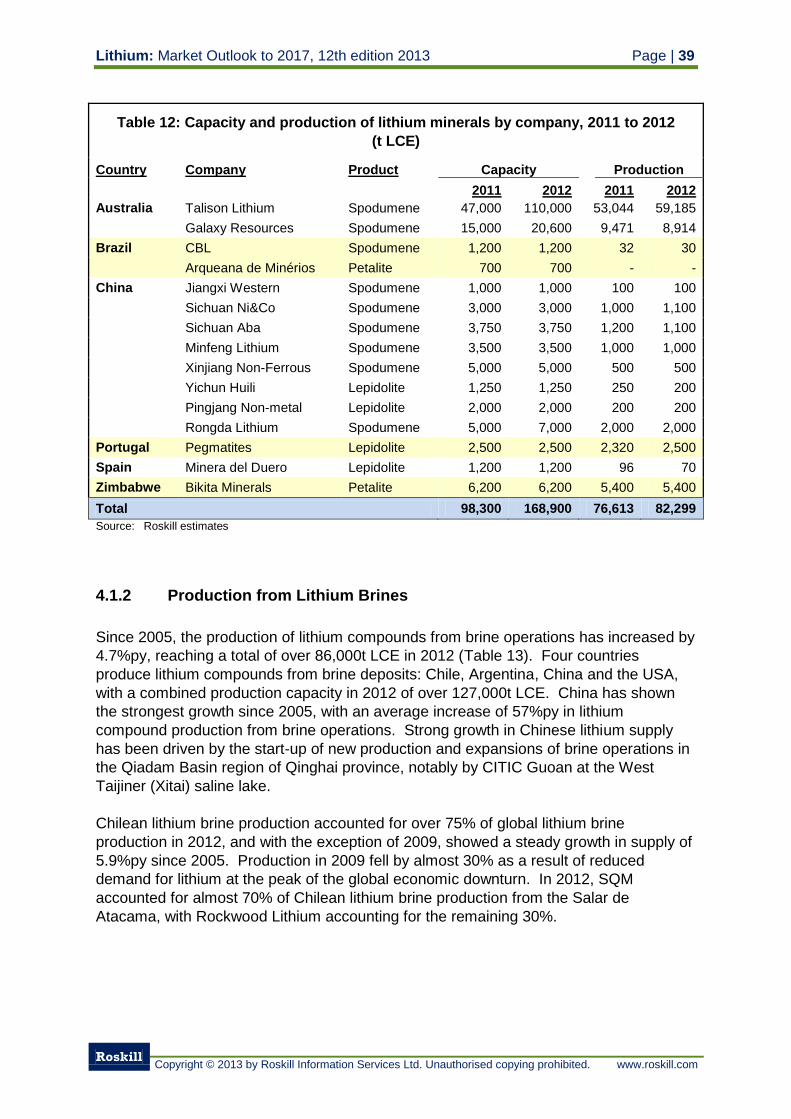
Lithium: Market Outlook to 2017, 12th edition 2013 Page | 39
Roskill
Copyright © 2013 by Roskill Information Services Ltd. Unauthorised copying prohibited. www.roskill.com
Table 12: Capacity and production of lithium minerals by company, 2011 to 2012
(t LCE)
Country Company Product Capacity
Production
2011 2012 2011 2012
Australia Talison Lithium Spodumene 47,000 110,000 53,044 59,185
Galaxy Resources Spodumene 15,000 20,600 9,471 8,914
Brazil CBL Spodumene 1,200 1,200 32 30
Arqueana de Minérios Petalite 700 700 - -
China Jiangxi Western Spodumene 1,000 1,000 100 100
Sichuan Ni&Co Spodumene 3,000 3,000 1,000 1,100
Sichuan Aba Spodumene 3,750 3,750 1,200 1,100
Minfeng Lithium Spodumene 3,500 3,500 1,000 1,000
Xinjiang Non-Ferrous Spodumene 5,000 5,000 500 500
Yichun Huili Lepidolite 1,250 1,250 250 200
Pingjang Non-metal Lepidolite 2,000 2,000 200 200
Rongda Lithium Spodumene 5,000 7,000 2,000 2,000
Portugal Pegmatites Lepidolite 2,500 2,500 2,320 2,500
Spain Minera del Duero Lepidolite 1,200 1,200 96 70
Zimbabwe Bikita Minerals Petalite 6,200 6,200 5,400 5,400
Total 98,300 168,900 76,613 82,299
Source: Roskill estimates
4.1.2 Production from Lithium Brines
Since 2005, the production of lithium compounds from brine operations has increased by
4.7%py, reaching a total of over 86,000t LCE in 2012 (Table 13). Four countries
produce lithium compounds from brine deposits: Chile, Argentina, China and the USA,
with a combined production capacity in 2012 of over 127,000t LCE. China has shown
the strongest growth since 2005, with an average increase of 57%py in lithium
compound production from brine operations. Strong growth in Chinese lithium supply
has been driven by the start-up of new production and expansions of brine operations in
the Qiadam Basin region of Qinghai province, notably by CITIC Guoan at the West
Taijiner (Xitai) saline lake.
Chilean lithium brine production accounted for over 75% of global lithium brine
production in 2012, and with the exception of 2009, showed a steady growth in supply of
5.9%py since 2005. Production in 2009 fell by almost 30% as a result of reduced
demand for lithium at the peak of the global economic downturn. In 2012, SQM
accounted for almost 70% of Chilean lithium brine production from the Salar de
Atacama, with Rockwood Lithium accounting for the remaining 30%.
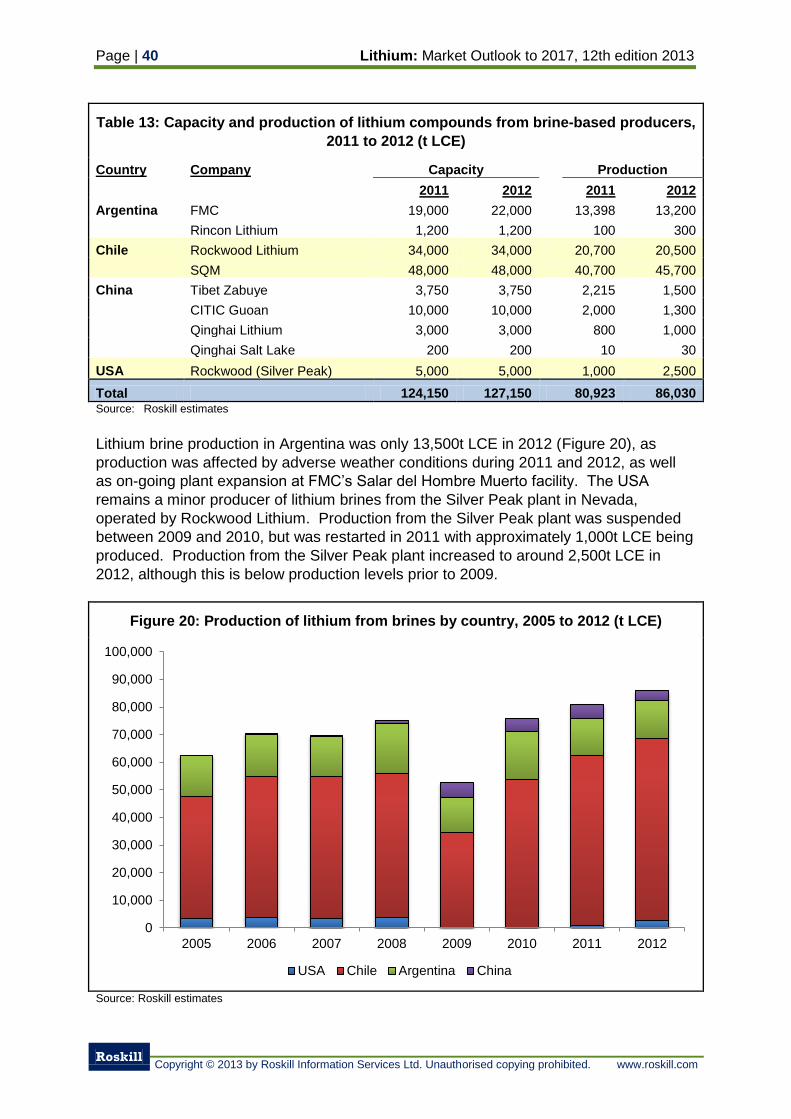
Page | 40 Lithium: Market Outlook to 2017, 12th edition 2013
Roskill
Copyright © 2013 by Roskill Information Services Ltd. Unauthorised copying prohibited. www.roskill.com
Table 13: Capacity and production of lithium compounds from brine-based producers,
2011 to 2012 (t LCE)
Country Company Capacity
Production
2011 2012 2011 2012
Argentina FMC 19,000 22,000 13,398 13,200
Rincon Lithium 1,200 1,200 100 300
Chile Rockwood Lithium 34,000 34,000 20,700 20,500
SQM 48,000 48,000 40,700 45,700
China Tibet Zabuye 3,750 3,750 2,215 1,500
CITIC Guoan 10,000 10,000 2,000 1,300
Qinghai Lithium 3,000 3,000 800 1,000
Qinghai Salt Lake 200 200 10 30
USA Rockwood (Silver Peak) 5,000 5,000 1,000 2,500
Total 124,150 127,150 80,923 86,030 Source: Roskill estimates
Lithium brine production in Argentina was only 13,500t LCE in 2012 (Figure 20), as
production was affected by adverse weather conditions during 2011 and 2012, as well
as on-going plant expansion at FMC’s Salar del Hombre Muerto facility. The USA
remains a minor producer of lithium brines from the Silver Peak plant in Nevada,
operated by Rockwood Lithium. Production from the Silver Peak plant was suspended
between 2009 and 2010, but was restarted in 2011 with approximately 1,000t LCE being
produced. Production from the Silver Peak plant increased to around 2,500t LCE in
2012, although this is below production levels prior to 2009.
Figure 20: Production of lithium from brines by country, 2005 to 2012 (t LCE)
Source: Roskill estimates
0
10,000
20,000
30,000
40,000
50,000
60,000
70,000
80,000
90,000
100,000
2005 2006 2007 2008 2009 2010 2011 2012
USA Chile Argentina China
Lithium: Market Outlook to 2017, 12th edition 2013 Page | 41
Roskill
Copyright © 2013 by Roskill Information Services Ltd. Unauthorised copying prohibited. www.roskill.com
4.1.3 Production of lithium compounds from mineral conversion
The conversion of lithium minerals to lithium compounds is only undertaken
commercially in China and Brazil, with much of the material converted in China sourced
from Australia. Mineral conversion in Brazil is undertaken on domestically sourced
lithium mineral concentrates only.
Prior to the commercialisation of lithium production from brines in the 1980s, production
of lithium compounds, and therefore downstream lithium chemicals, came almost
entirely from the conversion of lithium minerals. Lower cost production of lithium
compounds from brine operations (US$1.1/kg in 1992) compared to minerals
(US$2.43/kg), and the subsequent drop in prices as a result of SQM in Chile entering
the market in 1998, rendered production of lithium compounds from lithium minerals
uneconomic. This caused a number of plants in Australia, Russia, Canada, China and
the USA converting lithium minerals to close down in the late 1990s, or instead switch to
producing downstream lithium chemicals from lithium carbonate imported from South
America. The only plant known to have sustained production of lithium compounds from
minerals during this period was CBL in Brazil, probably because of restrictions on
imports of lithium carbonate into Brazil.
During the late 1990s, production from lithium brine operations was forecast to meet
demand for downstream lithium industries for the foreseeable future. What was
unknown at that point was the rapid increase in lithium demand which would take place
during the early 2000s as lithium-ion batteries were incorporated into more electronic
devices and the rise of China as a key market for lithium market. Brine production was
unable to respond quickly enough to the sudden increase in demand for lithium
carbonate, as brine production relies heavily upon natural evaporation rates, and lithium
carbonate prices increased threefold between 2004 and 2007, peaking at US$6,500/t
CIF in 2007. As prices for lithium carbonate increased, Chinese mineral converters
began converting spodumene mineral concentrates imported from Australia into lithium
compounds, mainly as lithium carbonate. Production from mineral conversion plants has
supplied the rapid growth in China’s domestic demand for lithium observed since the
mid-2000s.
Chinese mineral conversion plants have continued to increase production, sourcing
mineral concentrates from Australian imports and domestic producers. Lithium
carbonate prices have stabilised at around US$4,600/t CIF since 2010, which in
conjunction with increased production capacity at Talison Lithium’s Greenbushes mine
and plant in Australia to 110,000tpy LCE in 2012, has ensured Chinese lithium mineral
converters are able to operate economically and can maintain a stable supply of lithium
compounds.
In 2012, global supply of lithium compounds from mineral conversion was 42,054t LCE,
an increase of 29% from the previous year (Table 14 and Table 15). Chinese mineral
conversion has increased from 17,500t in 2005 to 41,454t in 2012, a compound annual
growth rate of 13%py, accounting for over 98% of global lithium mineral conversion in
2012. Sichuan Tianqi was the largest mineral converting company in 2012, representing
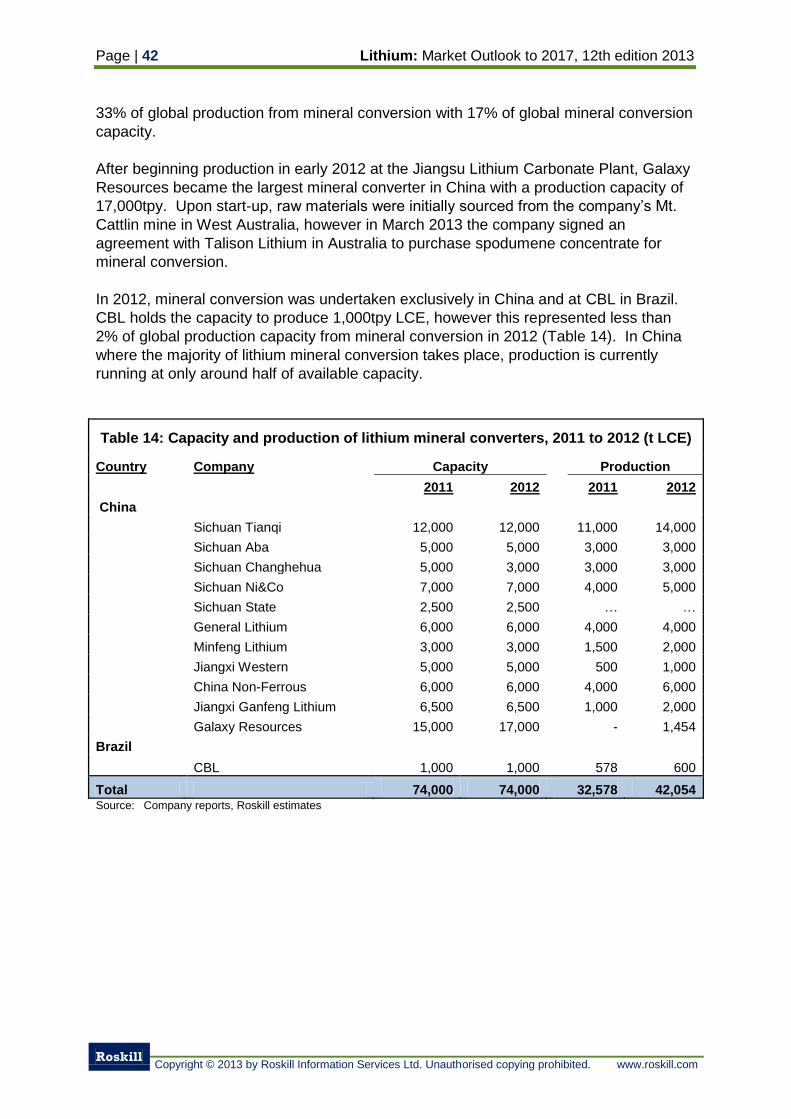
Page | 42 Lithium: Market Outlook to 2017, 12th edition 2013
Roskill
Copyright © 2013 by Roskill Information Services Ltd. Unauthorised copying prohibited. www.roskill.com
33% of global production from mineral conversion with 17% of global mineral conversion
capacity.
After beginning production in early 2012 at the Jiangsu Lithium Carbonate Plant, Galaxy
Resources became the largest mineral converter in China with a production capacity of
17,000tpy. Upon start-up, raw materials were initially sourced from the company’s Mt.
Cattlin mine in West Australia, however in March 2013 the company signed an
agreement with Talison Lithium in Australia to purchase spodumene concentrate for
mineral conversion.
In 2012, mineral conversion was undertaken exclusively in China and at CBL in Brazil.
CBL holds the capacity to produce 1,000tpy LCE, however this represented less than
2% of global production capacity from mineral conversion in 2012 (Table 14). In China
where the majority of lithium mineral conversion takes place, production is currently
running at only around half of available capacity.
Table 14: Capacity and production of lithium mineral converters, 2011 to 2012 (t LCE)
Country Company Capacity Production
2011 2012 2011 2012
China
Sichuan Tianqi 12,000 12,000 11,000 14,000
Sichuan Aba 5,000 5,000 3,000 3,000
Sichuan Changhehua 5,000 3,000 3,000 3,000
Sichuan Ni&Co 7,000 7,000 4,000 5,000
Sichuan State 2,500 2,500 … …
General Lithium 6,000 6,000 4,000 4,000
Minfeng Lithium 3,000 3,000 1,500 2,000
Jiangxi Western 5,000 5,000 500 1,000
China Non-Ferrous 6,000 6,000 4,000 6,000
Jiangxi Ganfeng Lithium 6,500 6,500 1,000 2,000
Galaxy Resources 15,000 17,000 - 1,454
Brazil
CBL 1,000 1,000 578 600
Total 74,000 74,000 32,578 42,054 Source: Company reports, Roskill estimates
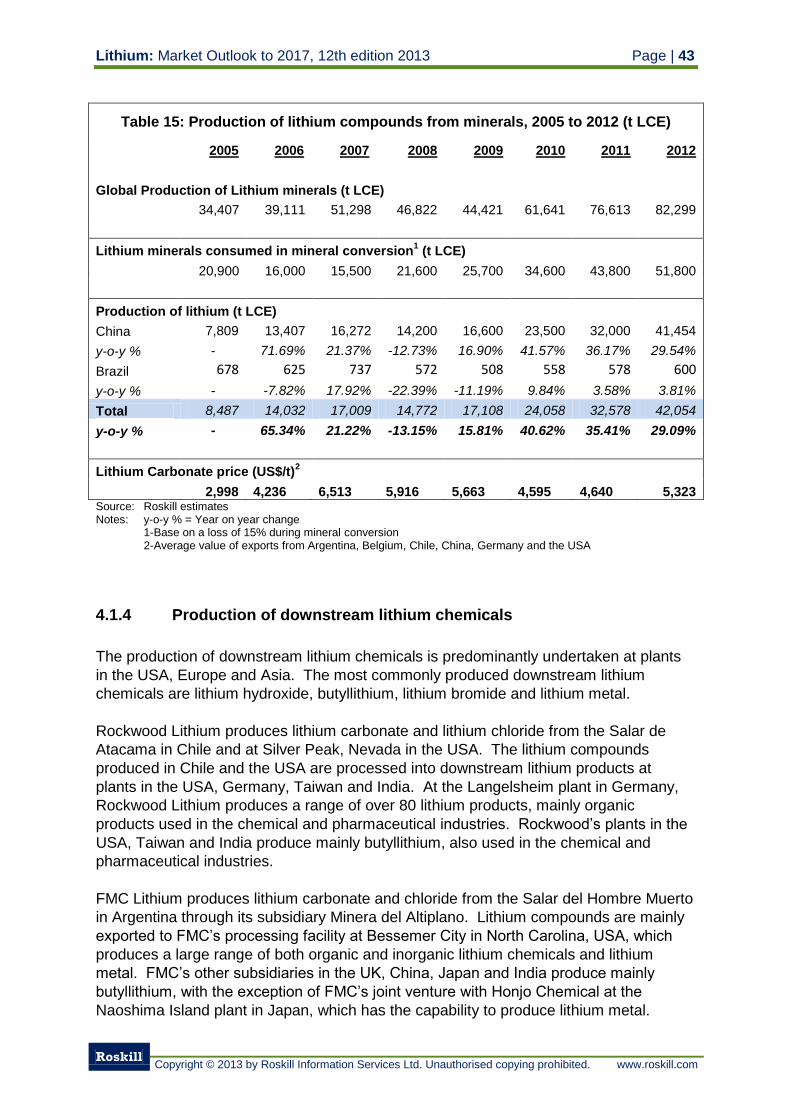
Lithium: Market Outlook to 2017, 12th edition 2013 Page | 43
Roskill
Copyright © 2013 by Roskill Information Services Ltd. Unauthorised copying prohibited. www.roskill.com
Table 15: Production of lithium compounds from minerals, 2005 to 2012 (t LCE)
2005 2006 2007 2008 2009 2010 2011 2012
Global Production of Lithium minerals (t LCE)
34,407 39,111 51,298 46,822 44,421 61,641 76,613 82,299
Lithium minerals consumed in mineral conversion1 (t LCE)
20,900 16,000 15,500 21,600 25,700 34,600 43,800 51,800
Production of lithium (t LCE)
China 7,809 13,407 16,272 14,200 16,600 23,500 32,000 41,454
y-o-y % - 71.69% 21.37% -12.73% 16.90% 41.57% 36.17% 29.54%
Brazil 678 625 737 572 508 558 578 600
y-o-y % - -7.82% 17.92% -22.39% -11.19% 9.84% 3.58% 3.81%
Total 8,487 14,032 17,009 14,772 17,108 24,058 32,578 42,054
y-o-y % - 65.34% 21.22% -13.15% 15.81% 40.62% 35.41% 29.09%
Lithium Carbonate price (US$/t)2
2,998 4,236 6,513 5,916 5,663 4,595 4,640 5,323 Source: Roskill estimates Notes: y-o-y % = Year on year change
1-Base on a loss of 15% during mineral conversion 2-Average value of exports from Argentina, Belgium, Chile, China, Germany and the USA
4.1.4 Production of downstream lithium chemicals
The production of downstream lithium chemicals is predominantly undertaken at plants
in the USA, Europe and Asia. The most commonly produced downstream lithium
chemicals are lithium hydroxide, butyllithium, lithium bromide and lithium metal.
Rockwood Lithium produces lithium carbonate and lithium chloride from the Salar de
Atacama in Chile and at Silver Peak, Nevada in the USA. The lithium compounds
produced in Chile and the USA are processed into downstream lithium products at
plants in the USA, Germany, Taiwan and India. At the Langelsheim plant in Germany,
Rockwood Lithium produces a range of over 80 lithium products, mainly organic
products used in the chemical and pharmaceutical industries. Rockwood’s plants in the
USA, Taiwan and India produce mainly butyllithium, also used in the chemical and
pharmaceutical industries.
FMC Lithium produces lithium carbonate and chloride from the Salar del Hombre Muerto
in Argentina through its subsidiary Minera del Altiplano. Lithium compounds are mainly
exported to FMC’s processing facility at Bessemer City in North Carolina, USA, which
produces a large range of both organic and inorganic lithium chemicals and lithium
metal. FMC’s other subsidiaries in the UK, China, Japan and India produce mainly
butyllithium, with the exception of FMC’s joint venture with Honjo Chemical at the
Naoshima Island plant in Japan, which has the capability to produce lithium metal.
Page | 44 Lithium: Market Outlook to 2017, 12th edition 2013
Roskill
Copyright © 2013 by Roskill Information Services Ltd. Unauthorised copying prohibited. www.roskill.com
In 2005, SQM opened a lithium hydroxide plant at the Salar de Carmen with a
production capacity of 6,000tpy LiOH. Prior to completion of the Salar de Carmen
lithium hydroxide plant, SQM exported lithium carbonate to the JSC Chemical and
Metallurgical Plant in Russia for toll processing into lithium hydroxide. Exports of lithium
carbonate to Russia fell sharply in 2006 when the Salar de Carmen plant was
completed. In 2011, SQM restarted toll processing of lithium carbonate in Russia as
demand for lithium hydroxide exceeded production capacity in Chile.
The downstream production of lithium chemicals in China is mainly undertaken by
specialist chemical companies. Historically, Chinese lithium mineral converters have
been considered to produce only the basic lithium chemicals such as lithium carbonate,
hydroxide and chloride, however a number of companies such as Sichuan State Lithium
Materials, China Non-Ferrous Metal Import & Export Xinjiang Corp. and Jiangxi Ganfeng
Lithium have widened their product range to include specialist lithium chemicals
including n-butyllithium, lithium phosphate and lithium sulphate. Chinese chemical
companies continue to produce specialty lithium chemicals and lithium metal, such as
Dalian Honjo Chemical, Liaoning province and Jinan Sigma Chemical Co. Ltd.,
Shandong province, which both produce lithium bromide for the manufacture of
absorption chillers.
Downstream lithium chemicals and lithium metal are also produced from imported lithium
compounds in India, Japan, Israel and the Ukraine, along with other small volume
specialist chemical companies located worldwide.
4.2 Outlook for production capacity of lithium to 2017
In 2012, available production capacity for lithium totalled approximately 291,050t LCE,
however, actual production only reached 58% of this. Capacity utilisation was low
compared with available capacity as Talison Lithium in Australia, the largest producer of
lithium minerals, more than doubled its production capacity between 2011 and 2012 and
was yet to ramp-up production. Since 2007, capacity utilisation has typically been
between 70-75%, with the exception of 2009 where production fell at a number of major
producers.
Lithium brine operations in 2012 utilised around 70% of available capacity, producing
86,030t LCE. The majority of unused brine capacity came from Chinese brine
operations in the Qaidam Basin area of Qinghai Province, but also from FMC in
Argentina, which cut production in order to undertake plant debottlenecking and
expansion at the Salar del Hombre Muerto.
Production capacity of lithium mineral producers increased by over 72% in 2012,
compared with the previous year. As mentioned above the rise in production capacity
by Talison Lithium is mainly accountable for the increase, along with the commissioning
of new production capacity in China. As a result, utilisation of production capacity by
lithium mineral producers fell to 49%, the lowest since 2001, as actual production is yet
to be ramped-up.
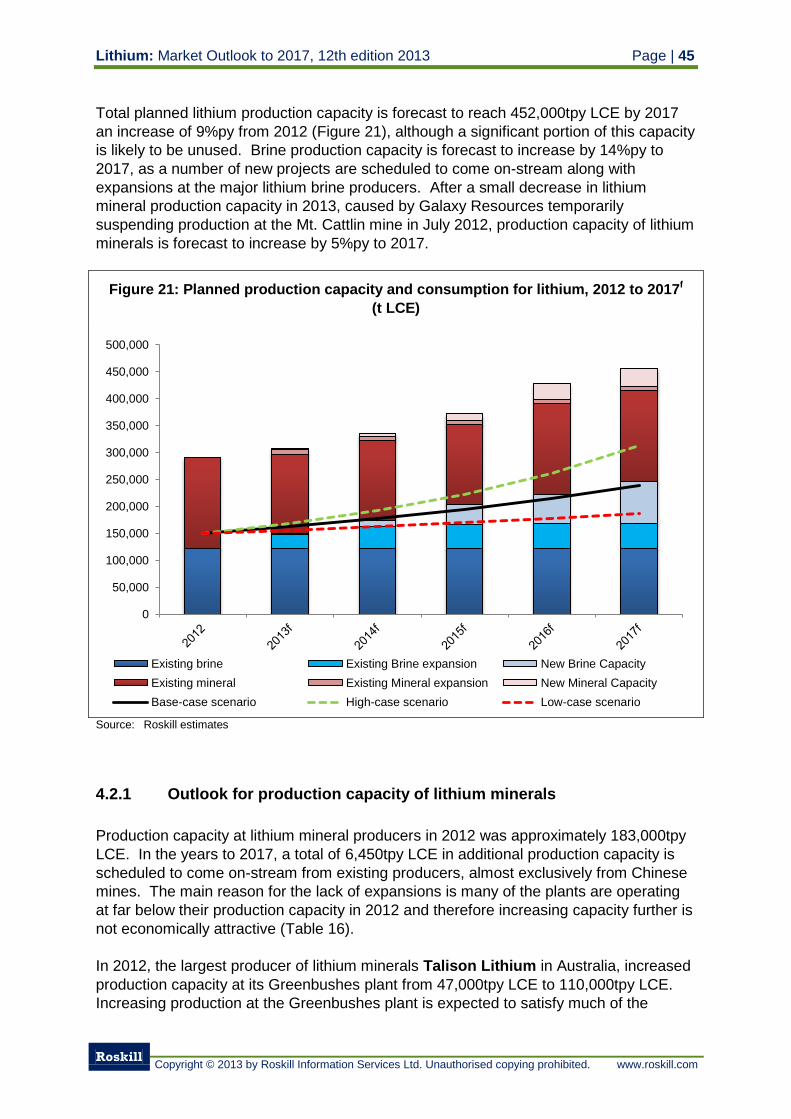
Lithium: Market Outlook to 2017, 12th edition 2013 Page | 45
Roskill
Copyright © 2013 by Roskill Information Services Ltd. Unauthorised copying prohibited. www.roskill.com
Total planned lithium production capacity is forecast to reach 452,000tpy LCE by 2017
an increase of 9%py from 2012 (Figure 21), although a significant portion of this capacity
is likely to be unused. Brine production capacity is forecast to increase by 14%py to
2017, as a number of new projects are scheduled to come on-stream along with
expansions at the major lithium brine producers. After a small decrease in lithium
mineral production capacity in 2013, caused by Galaxy Resources temporarily
suspending production at the Mt. Cattlin mine in July 2012, production capacity of lithium
minerals is forecast to increase by 5%py to 2017.
Figure 21: Planned production capacity and consumption for lithium, 2012 to 2017f
(t LCE)
Source: Roskill estimates
4.2.1 Outlook for production capacity of lithium minerals
Production capacity at lithium mineral producers in 2012 was approximately 183,000tpy
LCE. In the years to 2017, a total of 6,450tpy LCE in additional production capacity is
scheduled to come on-stream from existing producers, almost exclusively from Chinese
mines. The main reason for the lack of expansions is many of the plants are operating
at far below their production capacity in 2012 and therefore increasing capacity further is
not economically attractive (Table 16).
In 2012, the largest producer of lithium minerals Talison Lithium in Australia, increased
production capacity at its Greenbushes plant from 47,000tpy LCE to 110,000tpy LCE.
Increasing production at the Greenbushes plant is expected to satisfy much of the
0
50,000
100,000
150,000
200,000
250,000
300,000
350,000
400,000
450,000
500,000
Existing brine Existing Brine expansion New Brine Capacity
Existing mineral Existing Mineral expansion New Mineral Capacity
Base-case scenario High-case scenario Low-case scenario
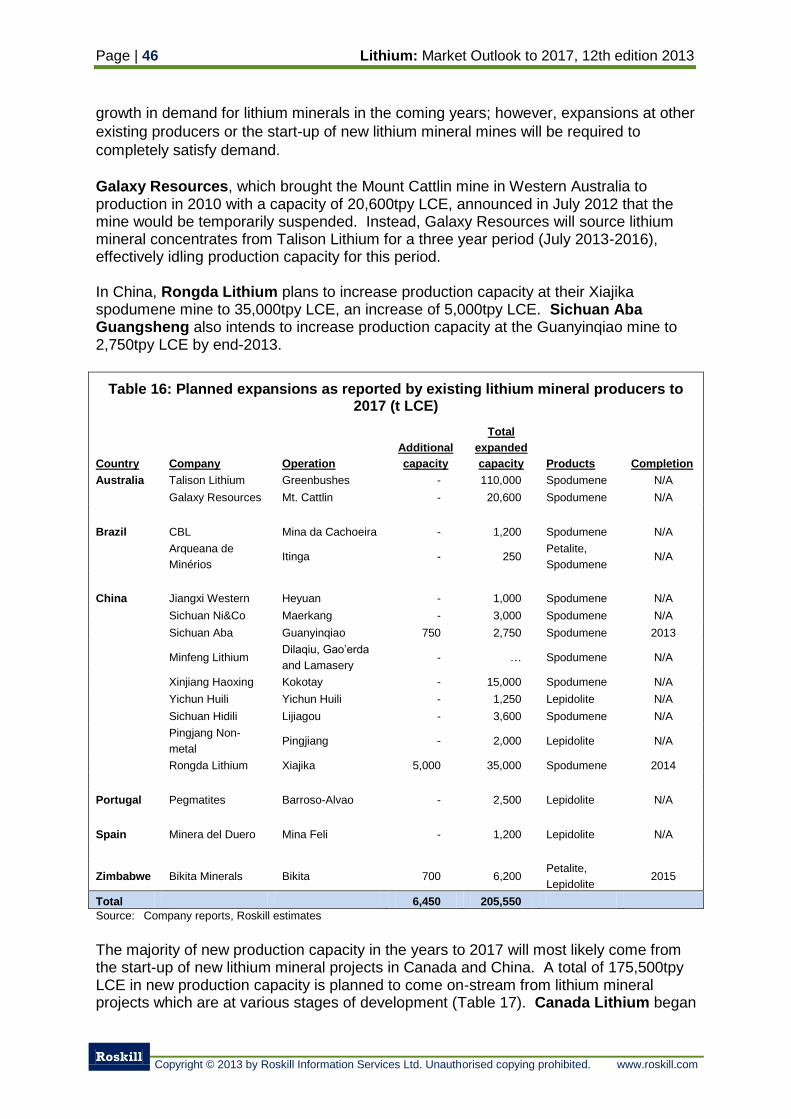
Page | 46 Lithium: Market Outlook to 2017, 12th edition 2013
Roskill
Copyright © 2013 by Roskill Information Services Ltd. Unauthorised copying prohibited. www.roskill.com
growth in demand for lithium minerals in the coming years; however, expansions at other
existing producers or the start-up of new lithium mineral mines will be required to
completely satisfy demand.
Galaxy Resources, which brought the Mount Cattlin mine in Western Australia to production in 2010 with a capacity of 20,600tpy LCE, announced in July 2012 that the mine would be temporarily suspended. Instead, Galaxy Resources will source lithium mineral concentrates from Talison Lithium for a three year period (July 2013-2016), effectively idling production capacity for this period. In China, Rongda Lithium plans to increase production capacity at their Xiajika spodumene mine to 35,000tpy LCE, an increase of 5,000tpy LCE. Sichuan Aba Guangsheng also intends to increase production capacity at the Guanyinqiao mine to 2,750tpy LCE by end-2013.
Table 16: Planned expansions as reported by existing lithium mineral producers to 2017 (t LCE)
Country Company Operation
Additional
capacity
Total
expanded
capacity Products Completion
Australia Talison Lithium Greenbushes - 110,000 Spodumene N/A
Galaxy Resources Mt. Cattlin - 20,600 Spodumene N/A
Brazil CBL Mina da Cachoeira - 1,200 Spodumene N/A
Arqueana de
Minérios Itinga - 250
Petalite,
Spodumene N/A
China Jiangxi Western Heyuan - 1,000 Spodumene N/A
Sichuan Ni&Co Maerkang - 3,000 Spodumene N/A
Sichuan Aba Guanyinqiao 750 2,750 Spodumene 2013
Minfeng Lithium
Dilaqiu, Gao’erda
and Lamasery - … Spodumene N/A
Xinjiang Haoxing Kokotay - 15,000 Spodumene N/A
Yichun Huili Yichun Huili - 1,250 Lepidolite N/A
Sichuan Hidili Lijiagou - 3,600 Spodumene N/A
Pingjang Non-
metal Pingjiang - 2,000 Lepidolite N/A
Rongda Lithium Xiajika 5,000 35,000 Spodumene 2014
Portugal Pegmatites Barroso-Alvao - 2,500 Lepidolite N/A
Spain Minera del Duero Mina Feli - 1,200 Lepidolite N/A
Zimbabwe Bikita Minerals Bikita 700 6,200 Petalite,
Lepidolite 2015
Total 6,450 205,550
Source: Company reports, Roskill estimates
The majority of new production capacity in the years to 2017 will most likely come from the start-up of new lithium mineral projects in Canada and China. A total of 175,500tpy LCE in new production capacity is planned to come on-stream from lithium mineral projects which are at various stages of development (Table 17). Canada Lithium began
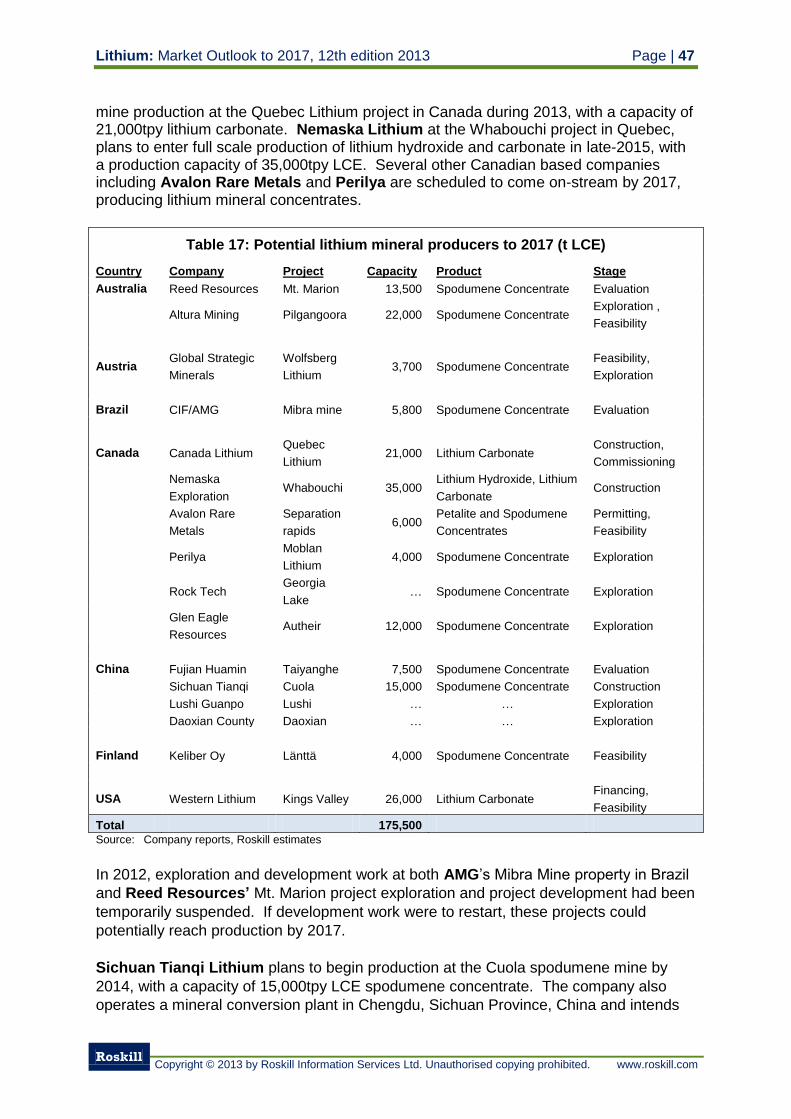
Lithium: Market Outlook to 2017, 12th edition 2013 Page | 47
Roskill
Copyright © 2013 by Roskill Information Services Ltd. Unauthorised copying prohibited. www.roskill.com
mine production at the Quebec Lithium project in Canada during 2013, with a capacity of 21,000tpy lithium carbonate. Nemaska Lithium at the Whabouchi project in Quebec, plans to enter full scale production of lithium hydroxide and carbonate in late-2015, with a production capacity of 35,000tpy LCE. Several other Canadian based companies including Avalon Rare Metals and Perilya are scheduled to come on-stream by 2017, producing lithium mineral concentrates.
Table 17: Potential lithium mineral producers to 2017 (t LCE)
Country Company Project Capacity Product Stage
Australia Reed Resources Mt. Marion 13,500 Spodumene Concentrate Evaluation
Altura Mining Pilgangoora 22,000 Spodumene Concentrate Exploration ,
Feasibility
Austria Global Strategic
Minerals
Wolfsberg
Lithium 3,700 Spodumene Concentrate
Feasibility,
Exploration
Brazil CIF/AMG Mibra mine 5,800 Spodumene Concentrate Evaluation
Canada Canada Lithium Quebec
Lithium 21,000 Lithium Carbonate
Construction,
Commissioning
Nemaska
Exploration Whabouchi 35,000
Lithium Hydroxide, Lithium
Carbonate Construction
Avalon Rare
Metals
Separation
rapids 6,000
Petalite and Spodumene
Concentrates
Permitting,
Feasibility
Perilya Moblan
Lithium 4,000 Spodumene Concentrate Exploration
Rock Tech Georgia
Lake … Spodumene Concentrate Exploration
Glen Eagle
Resources Autheir 12,000 Spodumene Concentrate Exploration
China Fujian Huamin Taiyanghe 7,500 Spodumene Concentrate Evaluation
Sichuan Tianqi Cuola 15,000 Spodumene Concentrate Construction
Lushi Guanpo Lushi … … Exploration
Daoxian County Daoxian … … Exploration
Finland Keliber Oy Länttä 4,000 Spodumene Concentrate Feasibility
USA Western Lithium Kings Valley 26,000 Lithium Carbonate Financing,
Feasibility
Total 175,500 Source: Company reports, Roskill estimates
In 2012, exploration and development work at both AMG’s Mibra Mine property in Brazil
and Reed Resources’ Mt. Marion project exploration and project development had been
temporarily suspended. If development work were to restart, these projects could
potentially reach production by 2017.
Sichuan Tianqi Lithium plans to begin production at the Cuola spodumene mine by
2014, with a capacity of 15,000tpy LCE spodumene concentrate. The company also
operates a mineral conversion plant in Chengdu, Sichuan Province, China and intends
Page | 48 Lithium: Market Outlook to 2017, 12th edition 2013
Roskill
Copyright © 2013 by Roskill Information Services Ltd. Unauthorised copying prohibited. www.roskill.com
to supply raw materials to this plant from the Cuola mine; however, it is not clear with
Tianqi’s recent (2013) purchase of Talison Lithium whether development of the Cuola
mine will continue. Another Chinese company Fujian Huamin has invested in
assessing the feasibility of a 7,500tpy LCE spodumene mine at Taiyanghe Village,
Sichuan Province, although the project remains under evaluation.
In the USA, a lithium-bearing clay deposit is being developed by Western Lithium at the
Kings Valley project, Nevada. Western Lithium intends to process the clays extracted to
produce lithium carbonate, but has more recently concentrated on producing by-product
gel and organo-clay products used in certain drilling applications.
4.2.2 Outlook for lithium production capacity from brines
Much of the increasing demand for lithium products in the years to 2017 will be satisfied
by increased production from existing brine producers and new brine production
capacity coming on-stream, particularly in Argentina and Chile. Existing brine producers
plan to bring online a further 88,050tpy LCE production capacity by 2017, mainly from
projects in Chile, Argentina and China.
In the years to 2017, Chile is expected to witness a large increase in production capacity
by existing lithium brine producers to 110,000tpy LCE, an increase of 33,000tpy LCE on
2012. Rockwood Lithium and SQM both plan capacity increases at their respective
Salar de Atacama operations. Rockwood Lithium intend to construct and bring to
production a new 20,000tpy lithium carbonate plant by end-2013, whilst SQM are
understood to be planning a rise in processing capacity to 60,000tpy LCE (Table 18).
Rockwood Lithium also plans to increase production capacity of its brine ponds and
lithium carbonate processing facilities at Silver Peak in Nevada, USA to 10,000tpy LCE.
Debottlenecking and expansion at FMC’s Salar del Hombre Muerto operation, Argentina
is set to increase production capacity at the site to 30,000tpy LCE by the end of 2013.
Production capacity in Argentina is also planned to be increased by ADY Resources,
who intend to ramp up production capacity at the Salar del Rincón, which began small-
scale commercial production of lithium carbonate in 2010, to 10,000tpy LCE. Within the
next 20 years, ADY Resource intends to increase production capacity at the Salar de
Rincón to over 100,000tpy LCE.
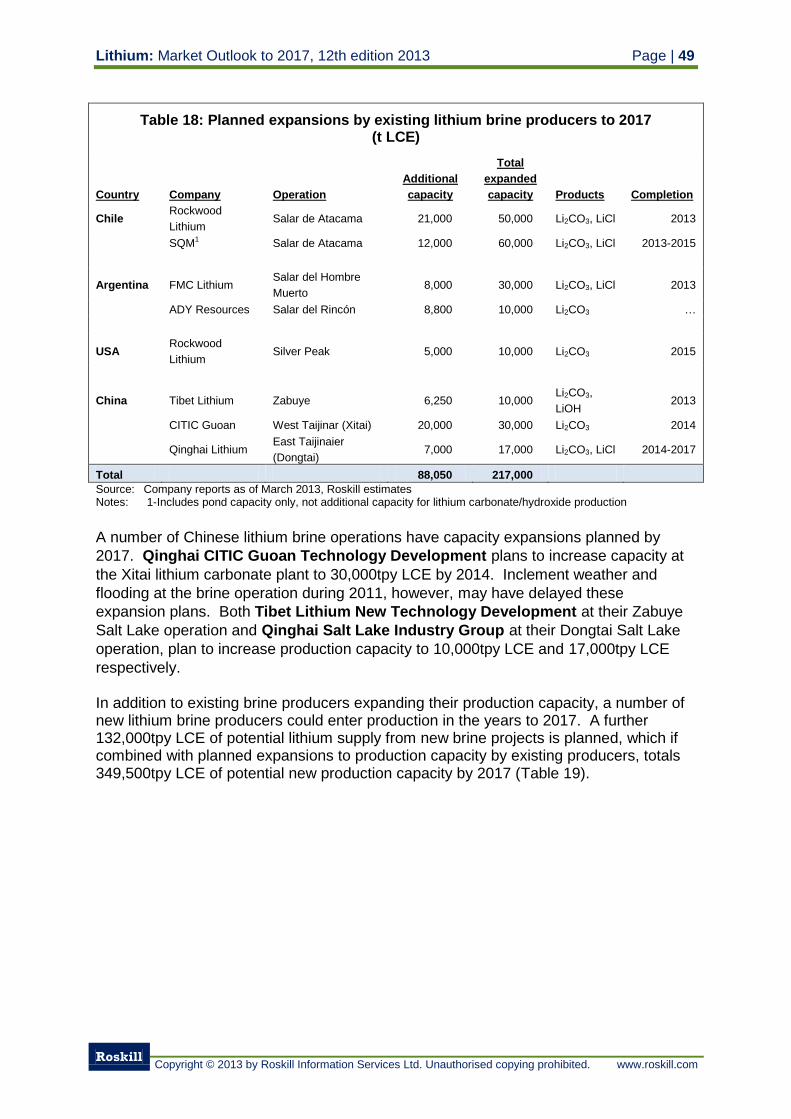
Lithium: Market Outlook to 2017, 12th edition 2013 Page | 49
Roskill
Copyright © 2013 by Roskill Information Services Ltd. Unauthorised copying prohibited. www.roskill.com
Table 18: Planned expansions by existing lithium brine producers to 2017 (t LCE)
Country Company Operation
Additional
capacity
Total
expanded
capacity Products Completion
Chile Rockwood
Lithium Salar de Atacama 21,000 50,000 Li2CO3, LiCl 2013
SQM1 Salar de Atacama 12,000 60,000 Li2CO3, LiCl 2013-2015
Argentina FMC Lithium Salar del Hombre
Muerto 8,000 30,000 Li2CO3, LiCl 2013
ADY Resources Salar del Rincón 8,800 10,000 Li2CO3 …
USA Rockwood
Lithium Silver Peak 5,000 10,000 Li2CO3 2015
China Tibet Lithium Zabuye 6,250 10,000 Li2CO3,
LiOH 2013
CITIC Guoan West Taijinar (Xitai) 20,000 30,000 Li2CO3 2014
Qinghai Lithium
East Taijinaier
(Dongtai) 7,000 17,000 Li2CO3, LiCl 2014-2017
Total 88,050 217,000
Source: Company reports as of March 2013, Roskill estimates Notes: 1-Includes pond capacity only, not additional capacity for lithium carbonate/hydroxide production
A number of Chinese lithium brine operations have capacity expansions planned by
2017. Qinghai CITIC Guoan Technology Development plans to increase capacity at
the Xitai lithium carbonate plant to 30,000tpy LCE by 2014. Inclement weather and
flooding at the brine operation during 2011, however, may have delayed these
expansion plans. Both Tibet Lithium New Technology Development at their Zabuye
Salt Lake operation and Qinghai Salt Lake Industry Group at their Dongtai Salt Lake
operation, plan to increase production capacity to 10,000tpy LCE and 17,000tpy LCE
respectively. In addition to existing brine producers expanding their production capacity, a number of new lithium brine producers could enter production in the years to 2017. A further 132,000tpy LCE of potential lithium supply from new brine projects is planned, which if combined with planned expansions to production capacity by existing producers, totals 349,500tpy LCE of potential new production capacity by 2017 (Table 19).
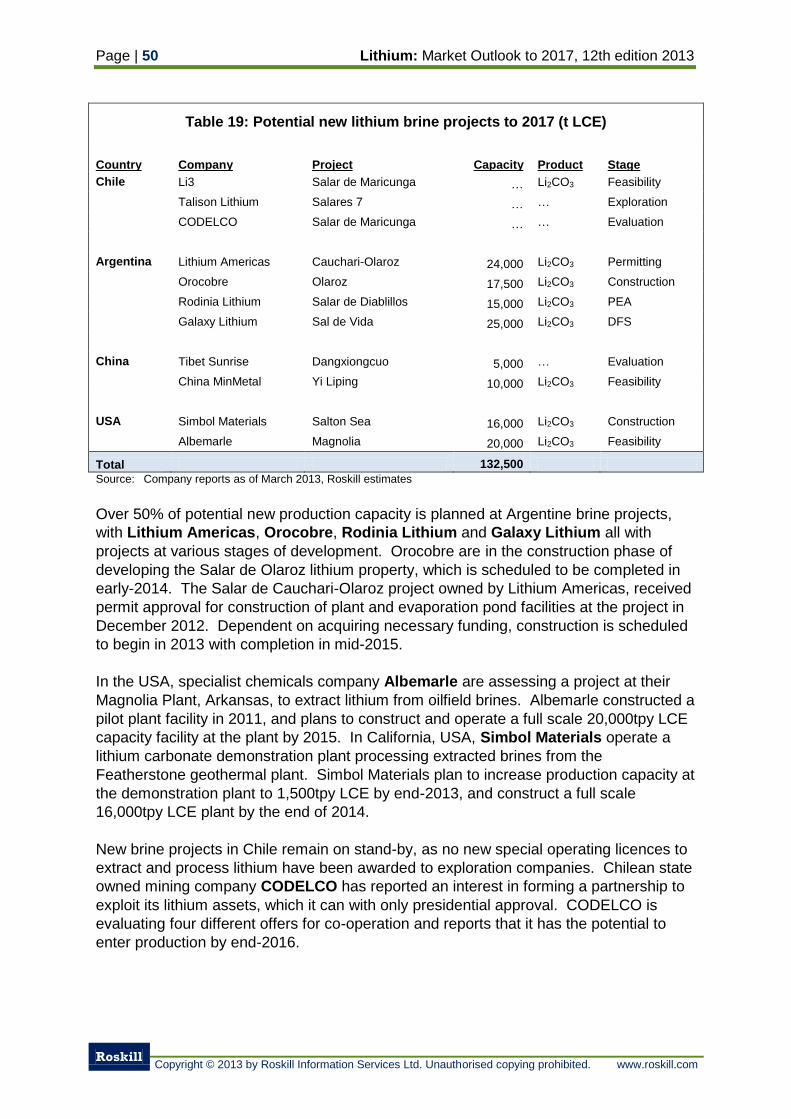
Page | 50 Lithium: Market Outlook to 2017, 12th edition 2013
Roskill
Copyright © 2013 by Roskill Information Services Ltd. Unauthorised copying prohibited. www.roskill.com
Table 19: Potential new lithium brine projects to 2017 (t LCE)
Country Company Project Capacity Product Stage
Chile Li3 Salar de Maricunga … Li2CO3 Feasibility
Talison Lithium Salares 7 … … Exploration
CODELCO Salar de Maricunga … … Evaluation
Argentina Lithium Americas Cauchari-Olaroz 24,000 Li2CO3 Permitting
Orocobre Olaroz 17,500 Li2CO3 Construction
Rodinia Lithium Salar de Diablillos 15,000 Li2CO3 PEA
Galaxy Lithium Sal de Vida 25,000 Li2CO3 DFS
China Tibet Sunrise Dangxiongcuo 5,000 … Evaluation
China MinMetal Yi Liping 10,000 Li2CO3 Feasibility
USA Simbol Materials Salton Sea 16,000 Li2CO3 Construction
Albemarle Magnolia 20,000 Li2CO3 Feasibility
Total 132,500
Source: Company reports as of March 2013, Roskill estimates
Over 50% of potential new production capacity is planned at Argentine brine projects,
with Lithium Americas, Orocobre, Rodinia Lithium and Galaxy Lithium all with
projects at various stages of development. Orocobre are in the construction phase of
developing the Salar de Olaroz lithium property, which is scheduled to be completed in
early-2014. The Salar de Cauchari-Olaroz project owned by Lithium Americas, received
permit approval for construction of plant and evaporation pond facilities at the project in
December 2012. Dependent on acquiring necessary funding, construction is scheduled
to begin in 2013 with completion in mid-2015.
In the USA, specialist chemicals company Albemarle are assessing a project at their
Magnolia Plant, Arkansas, to extract lithium from oilfield brines. Albemarle constructed a
pilot plant facility in 2011, and plans to construct and operate a full scale 20,000tpy LCE
capacity facility at the plant by 2015. In California, USA, Simbol Materials operate a
lithium carbonate demonstration plant processing extracted brines from the
Featherstone geothermal plant. Simbol Materials plan to increase production capacity at
the demonstration plant to 1,500tpy LCE by end-2013, and construct a full scale
16,000tpy LCE plant by the end of 2014.
New brine projects in Chile remain on stand-by, as no new special operating licences to
extract and process lithium have been awarded to exploration companies. Chilean state
owned mining company CODELCO has reported an interest in forming a partnership to
exploit its lithium assets, which it can with only presidential approval. CODELCO is
evaluating four different offers for co-operation and reports that it has the potential to
enter production by end-2016.
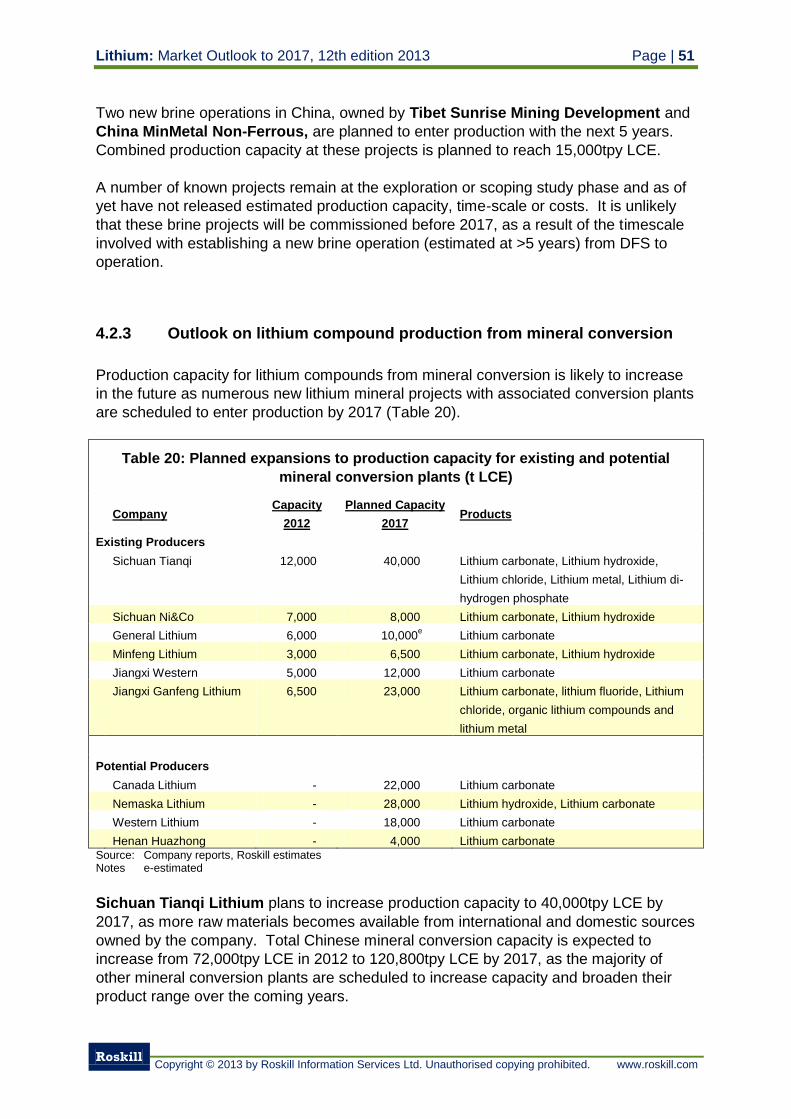
Lithium: Market Outlook to 2017, 12th edition 2013 Page | 51
Roskill
Copyright © 2013 by Roskill Information Services Ltd. Unauthorised copying prohibited. www.roskill.com
Two new brine operations in China, owned by Tibet Sunrise Mining Development and
China MinMetal Non-Ferrous, are planned to enter production with the next 5 years.
Combined production capacity at these projects is planned to reach 15,000tpy LCE.
A number of known projects remain at the exploration or scoping study phase and as of
yet have not released estimated production capacity, time-scale or costs. It is unlikely
that these brine projects will be commissioned before 2017, as a result of the timescale
involved with establishing a new brine operation (estimated at >5 years) from DFS to
operation.
4.2.3 Outlook on lithium compound production from mineral conversion
Production capacity for lithium compounds from mineral conversion is likely to increase
in the future as numerous new lithium mineral projects with associated conversion plants
are scheduled to enter production by 2017 (Table 20).
Table 20: Planned expansions to production capacity for existing and potential
mineral conversion plants (t LCE)
Company
Capacity
2012
Planned Capacity
2017 Products
Existing Producers
Sichuan Tianqi 12,000 40,000 Lithium carbonate, Lithium hydroxide,
Lithium chloride, Lithium metal, Lithium di-
hydrogen phosphate
Sichuan Ni&Co 7,000 8,000 Lithium carbonate, Lithium hydroxide
General Lithium 6,000 10,000e
Lithium carbonate
Minfeng Lithium 3,000 6,500 Lithium carbonate, Lithium hydroxide
Jiangxi Western 5,000 12,000 Lithium carbonate
Jiangxi Ganfeng Lithium 6,500 23,000 Lithium carbonate, lithium fluoride, Lithium
chloride, organic lithium compounds and
lithium metal
Potential Producers
Canada Lithium - 22,000 Lithium carbonate
Nemaska Lithium - 28,000 Lithium hydroxide, Lithium carbonate
Western Lithium - 18,000 Lithium carbonate
Henan Huazhong - 4,000 Lithium carbonate Source: Company reports, Roskill estimates Notes e-estimated
Sichuan Tianqi Lithium plans to increase production capacity to 40,000tpy LCE by
2017, as more raw materials becomes available from international and domestic sources
owned by the company. Total Chinese mineral conversion capacity is expected to
increase from 72,000tpy LCE in 2012 to 120,800tpy LCE by 2017, as the majority of
other mineral conversion plants are scheduled to increase capacity and broaden their
product range over the coming years.
Page | 52 Lithium: Market Outlook to 2017, 12th edition 2013
Roskill
Copyright © 2013 by Roskill Information Services Ltd. Unauthorised copying prohibited. www.roskill.com
Canada Lithium are commissioning a lithium carbonate plant to convert spodumene
concentrate extracted at the Quebec Lithium project, scheduled for completion in April
2013. The facility is planned to have capacity to produce 22,000tpy LCE, the majority of
which is likely to be shipped to China. Nemaska Lithium is also developing its
Whabouchi project in Quebec, including a lithium hydroxide/carbonate production facility
to process mineral concentrate from the mine. Construction and commissioning of the
full scale 28,000tpy LCE plant is scheduled to be completed in 2015. In the meantime,
Nemaksa Lithium intends to operate a 426tpy capacity demonstration scale plant,
producing lithium hydroxide and carbonate.
Future production of lithium compounds is ultimately dependent upon maintaining high
prices of lithium carbonate (>US$5,000/t) to ensure the process is economically
attractive using current methods. Mineral conversion companies are becoming
increasingly integrated upstream, to ensure a secure supply of raw materials and protect
themselves against increasing lithium mineral concentrate prices.
4.3 Forecast production of lithium to 2017
Global production capacity in 2012 is capable of supporting forecast base-case scenario
growth in demand for lithium to beyond 2017. A significant amount of lithium production
capacity, however, is not utilised by current producers. Lithium mineral producers need
to ramp up their production and Chinese brine projects must overcome difficulties with
logistics, the local climate and unfavourable brine chemistry.
Therefore new lithium compound producers or expansions by existing producers will be
required to meet base-case consumption through to 2017.
The consumption of technical grade minerals in applications including glass, ceramics
and metallurgical uses is forecast to increase by 3.6%py to 2017 in the base-case
scenario. This is equivalent to additional consumption of 8,700t-10,100tpy of mineral
concentrate grading 5% Li2O. In a high-case scenario, consumption is forecast to
increase by 5.2%py equivalent to an additional 12,500t-15,000tpy mineral concentrate
grading 5% Li2O. Production capacity at existing lithium mineral producers including
Talison Lithium in Australia and various lithium mineral producers in Sichuan province,
China, is expected to support high-scenario growth in consumption of lithium minerals.
New lithium mineral producers not integrated with downstream lithium converters or end-
users will be dependent upon securing a market for their product or being able to
compete on price and specifications with existing producers.
In 2012, production capacity for lithium compounds from both mineral conversion and
brine sources was 190,650t LCE, although only 67% of this capacity was utilised. Much
of the unused capacity is accounted for by Chinese brine producers. Consumption of
lithium compounds in 2012 was 120,175t LCE, supported by production from brine
operations (64%) and the remainder supplied by mineral conversion plants (36%) in
China and Brazil. Compound annual growth in consumption of lithium compounds is
forecast to be 10.6%py in the base-case demand scenario, on average equivalent to
16,500tpy LCE of additional consumption to 2017. In the high-case demand scenario,
Lithium: Market Outlook to 2017, 12th edition 2013 Page | 53
Roskill
Copyright © 2013 by Roskill Information Services Ltd. Unauthorised copying prohibited. www.roskill.com
growth of 17.2%py is forecast, on average equivalent to additional consumption of
30,900tpy LCE between 2013 and 2017, although this growth is strongly weighted
toward the later years in this period.
Lithium production from lithium brine producers in Chile and Argentina is forecast to
support much of the growth in lithium compound demand, with production in 2017
forecast at over 130,000t LCE from brine operations alone. SQM and Rockwood Lithium
both plan to increase production capacity to a combined total of 110,000tpy LCE by
2015. Existing production could be boosted further by ADY Resources plans to ramp-up
production at their Salar del Rincon in Argentina after starting commercial production in
2012. New lithium brine projects in Argentina are set to enter production in the coming
years with Orocobre in Argentina expected to begin production at the Salar de Olaroz in
2013 with a capacity to produce 17,500tpy LCE, and Lithium Americas at the Salar de
Cauchari-Olaroz also in Argentina planning to begin production during late-2015 with a
20,000tpy LCE capacity. Brine projects outside South America such as those in the
USA could support supply although likely not on the same scale.
Chinese lithium brine producers have the capability to increase production significantly,
although it is believed to be unlikely at existing brine operatons as difficulties in
processing are on-going and logistics continue to restrict production.
In the base-case demand scenario, mineral conversion is forecast to account for around
a third of lithium compound supply to 2017. Production from new mineral conversion
projects in Canada including Canada Lithium (planned 2013) and Nemaska Lithium
(planned 2015) along with existing Chinese mineral conversion plants, which are
forecast to maintain steady production. If consumption of lithium compounds is higher,
as in the high-case demand scenario, brine projects are likely to meet the increased
demand in the long term, however mineral conversion plants are likely to provide any
necessary increase in short term production.
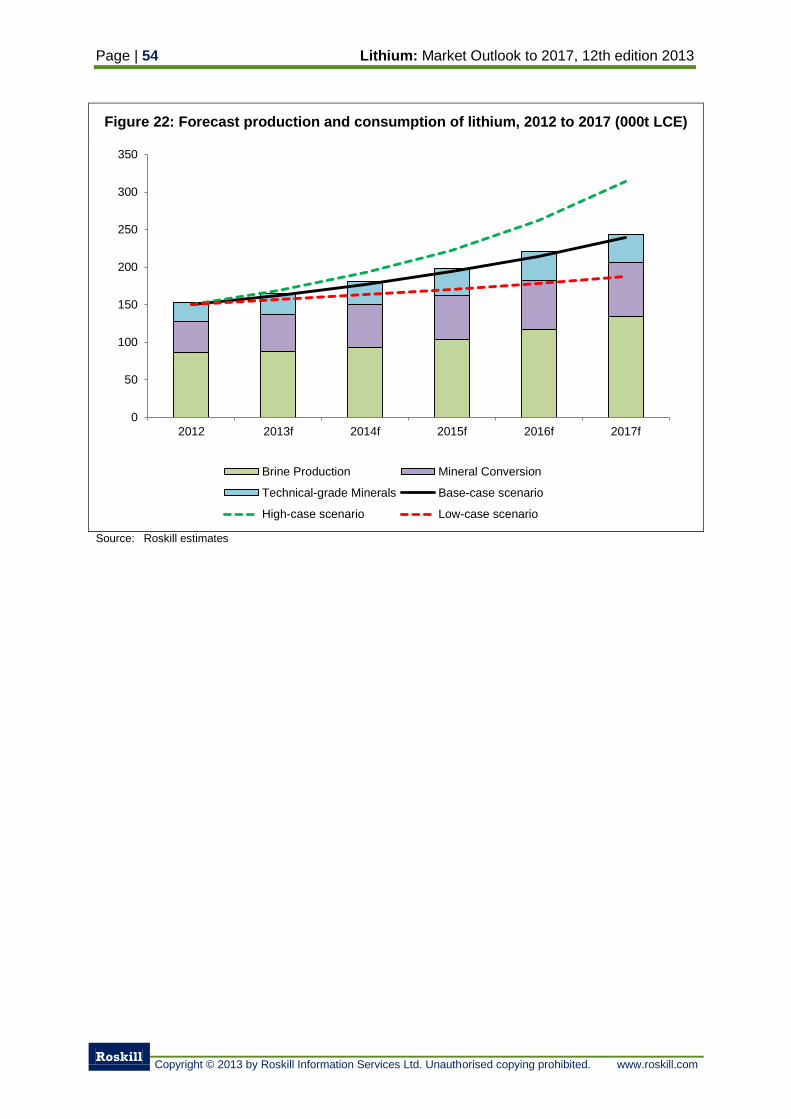
Page | 54 Lithium: Market Outlook to 2017, 12th edition 2013
Roskill
Copyright © 2013 by Roskill Information Services Ltd. Unauthorised copying prohibited. www.roskill.com
Figure 22: Forecast production and consumption of lithium, 2012 to 2017 (000t LCE)
Source: Roskill estimates
0
50
100
150
200
250
300
350
2012 2013f 2014f 2015f 2016f 2017f
Brine Production Mineral Conversion
Technical-grade Minerals Base-case scenario
High-case scenario Low-case scenario
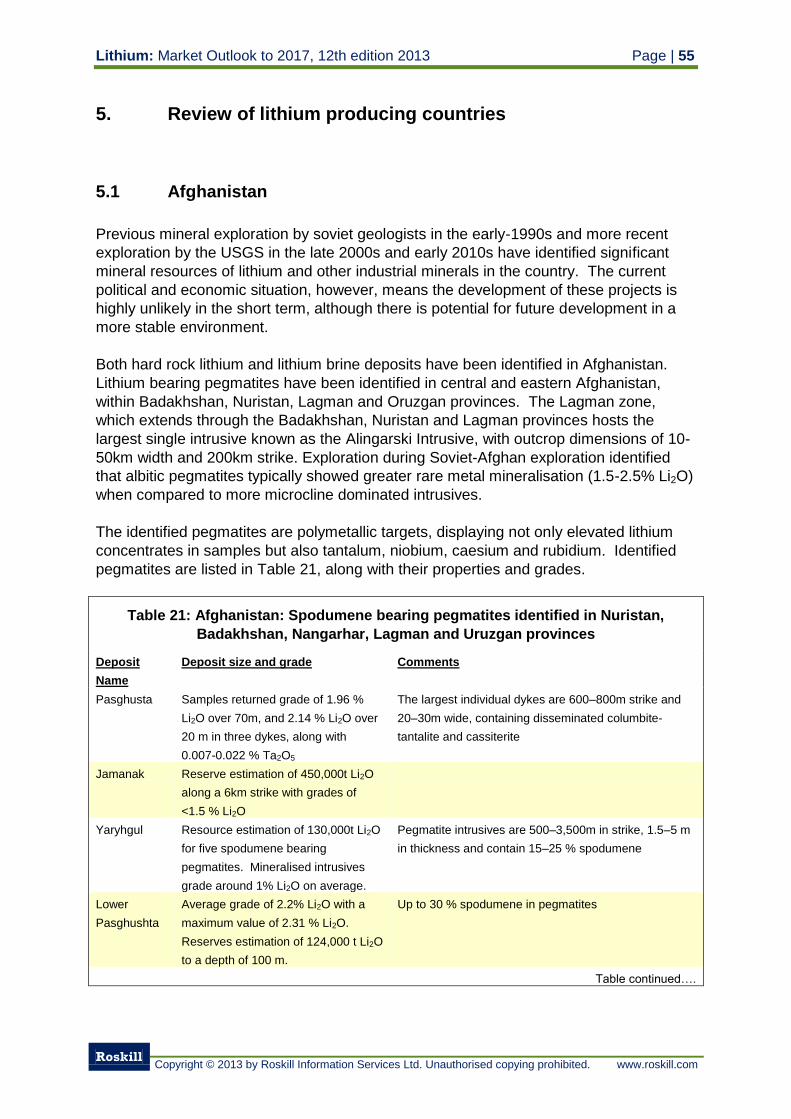
Lithium: Market Outlook to 2017, 12th edition 2013 Page | 55
Roskill
Copyright © 2013 by Roskill Information Services Ltd. Unauthorised copying prohibited. www.roskill.com
5. Review of lithium producing countries
5.1 Afghanistan
Previous mineral exploration by soviet geologists in the early-1990s and more recent
exploration by the USGS in the late 2000s and early 2010s have identified significant
mineral resources of lithium and other industrial minerals in the country. The current
political and economic situation, however, means the development of these projects is
highly unlikely in the short term, although there is potential for future development in a
more stable environment.
Both hard rock lithium and lithium brine deposits have been identified in Afghanistan.
Lithium bearing pegmatites have been identified in central and eastern Afghanistan,
within Badakhshan, Nuristan, Lagman and Oruzgan provinces. The Lagman zone,
which extends through the Badakhshan, Nuristan and Lagman provinces hosts the
largest single intrusive known as the Alingarski Intrusive, with outcrop dimensions of 10-
50km width and 200km strike. Exploration during Soviet-Afghan exploration identified
that albitic pegmatites typically showed greater rare metal mineralisation (1.5-2.5% Li2O)
when compared to more microcline dominated intrusives.
The identified pegmatites are polymetallic targets, displaying not only elevated lithium
concentrates in samples but also tantalum, niobium, caesium and rubidium. Identified
pegmatites are listed in Table 21, along with their properties and grades.
Table 21: Afghanistan: Spodumene bearing pegmatites identified in Nuristan,
Badakhshan, Nangarhar, Lagman and Uruzgan provinces
Deposit
Name
Deposit size and grade Comments
Pasghusta Samples returned grade of 1.96 %
Li2O over 70m, and 2.14 % Li2O over
20 m in three dykes, along with
0.007-0.022 % Ta2O5
The largest individual dykes are 600–800m strike and
20–30m wide, containing disseminated columbite-
tantalite and cassiterite
Jamanak Reserve estimation of 450,000t Li2O
along a 6km strike with grades of
<1.5 % Li2O
Yaryhgul Resource estimation of 130,000t Li2O
for five spodumene bearing
pegmatites. Mineralised intrusives
grade around 1% Li2O on average.
Pegmatite intrusives are 500–3,500m in strike, 1.5–5 m
in thickness and contain 15–25 % spodumene
Lower
Pasghushta
Average grade of 2.2% Li2O with a
maximum value of 2.31 % Li2O.
Reserves estimation of 124,000 t Li2O
to a depth of 100 m.
Up to 30 % spodumene in pegmatites
Table continued….
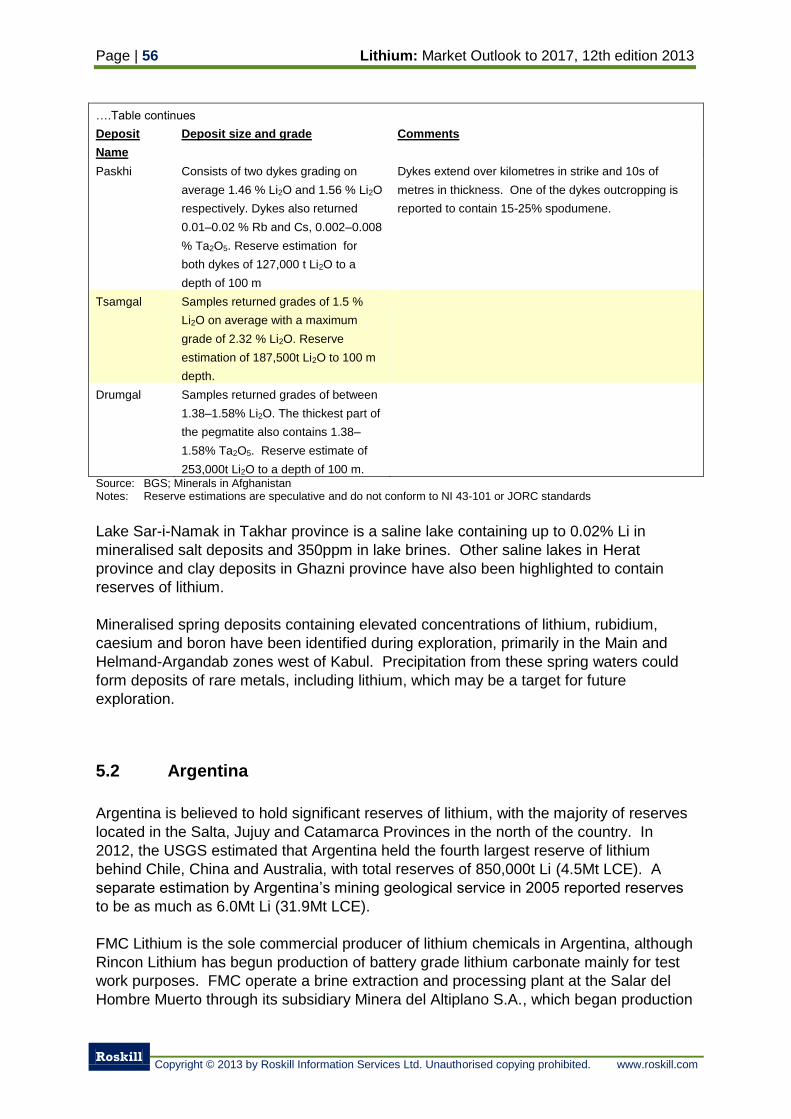
Page | 56 Lithium: Market Outlook to 2017, 12th edition 2013
Roskill
Copyright © 2013 by Roskill Information Services Ltd. Unauthorised copying prohibited. www.roskill.com
….Table continues
Deposit
Name
Deposit size and grade Comments
Paskhi Consists of two dykes grading on
average 1.46 % Li2O and 1.56 % Li2O
respectively. Dykes also returned
0.01–0.02 % Rb and Cs, 0.002–0.008
% Ta2O5. Reserve estimation for
both dykes of 127,000 t Li2O to a
depth of 100 m
Dykes extend over kilometres in strike and 10s of
metres in thickness. One of the dykes outcropping is
reported to contain 15-25% spodumene.
Tsamgal Samples returned grades of 1.5 %
Li2O on average with a maximum
grade of 2.32 % Li2O. Reserve
estimation of 187,500t Li2O to 100 m
depth.
Drumgal Samples returned grades of between
1.38–1.58% Li2O. The thickest part of
the pegmatite also contains 1.38–
1.58% Ta2O5. Reserve estimate of
253,000t Li2O to a depth of 100 m.
Source: BGS; Minerals in Afghanistan Notes: Reserve estimations are speculative and do not conform to NI 43-101 or JORC standards
Lake Sar-i-Namak in Takhar province is a saline lake containing up to 0.02% Li in
mineralised salt deposits and 350ppm in lake brines. Other saline lakes in Herat
province and clay deposits in Ghazni province have also been highlighted to contain
reserves of lithium.
Mineralised spring deposits containing elevated concentrations of lithium, rubidium,
caesium and boron have been identified during exploration, primarily in the Main and
Helmand-Argandab zones west of Kabul. Precipitation from these spring waters could
form deposits of rare metals, including lithium, which may be a target for future
exploration.
5.2 Argentina
Argentina is believed to hold significant reserves of lithium, with the majority of reserves
located in the Salta, Jujuy and Catamarca Provinces in the north of the country. In
2012, the USGS estimated that Argentina held the fourth largest reserve of lithium
behind Chile, China and Australia, with total reserves of 850,000t Li (4.5Mt LCE). A
separate estimation by Argentina’s mining geological service in 2005 reported reserves
to be as much as 6.0Mt Li (31.9Mt LCE).
FMC Lithium is the sole commercial producer of lithium chemicals in Argentina, although
Rincon Lithium has begun production of battery grade lithium carbonate mainly for test
work purposes. FMC operate a brine extraction and processing plant at the Salar del
Hombre Muerto through its subsidiary Minera del Altiplano S.A., which began production
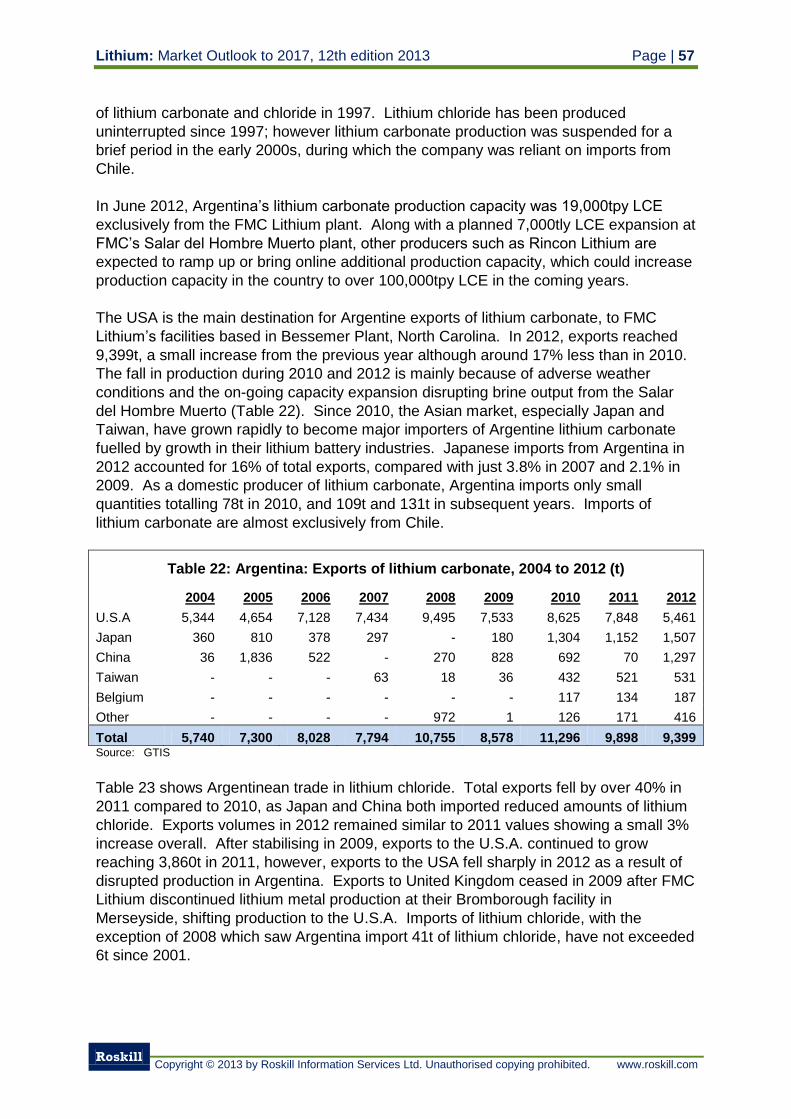
Lithium: Market Outlook to 2017, 12th edition 2013 Page | 57
Roskill
Copyright © 2013 by Roskill Information Services Ltd. Unauthorised copying prohibited. www.roskill.com
of lithium carbonate and chloride in 1997. Lithium chloride has been produced
uninterrupted since 1997; however lithium carbonate production was suspended for a
brief period in the early 2000s, during which the company was reliant on imports from
Chile.
In June 2012, Argentina’s lithium carbonate production capacity was 19,000tpy LCE
exclusively from the FMC Lithium plant. Along with a planned 7,000tly LCE expansion at
FMC’s Salar del Hombre Muerto plant, other producers such as Rincon Lithium are
expected to ramp up or bring online additional production capacity, which could increase
production capacity in the country to over 100,000tpy LCE in the coming years.
The USA is the main destination for Argentine exports of lithium carbonate, to FMC
Lithium’s facilities based in Bessemer Plant, North Carolina. In 2012, exports reached
9,399t, a small increase from the previous year although around 17% less than in 2010.
The fall in production during 2010 and 2012 is mainly because of adverse weather
conditions and the on-going capacity expansion disrupting brine output from the Salar
del Hombre Muerto (Table 22). Since 2010, the Asian market, especially Japan and
Taiwan, have grown rapidly to become major importers of Argentine lithium carbonate
fuelled by growth in their lithium battery industries. Japanese imports from Argentina in
2012 accounted for 16% of total exports, compared with just 3.8% in 2007 and 2.1% in
2009. As a domestic producer of lithium carbonate, Argentina imports only small
quantities totalling 78t in 2010, and 109t and 131t in subsequent years. Imports of
lithium carbonate are almost exclusively from Chile.
Table 22: Argentina: Exports of lithium carbonate, 2004 to 2012 (t)
2004 2005 2006 2007 2008 2009 2010 2011 2012
U.S.A 5,344 4,654 7,128 7,434 9,495 7,533 8,625 7,848 5,461
Japan 360 810 378 297 - 180 1,304 1,152 1,507
China 36 1,836 522 - 270 828 692 70 1,297
Taiwan - - - 63 18 36 432 521 531
Belgium - - - - - - 117 134 187
Other - - - - 972 1 126 171 416
Total 5,740 7,300 8,028 7,794 10,755 8,578 11,296 9,898 9,399 Source: GTIS
Table 23 shows Argentinean trade in lithium chloride. Total exports fell by over 40% in
2011 compared to 2010, as Japan and China both imported reduced amounts of lithium
chloride. Exports volumes in 2012 remained similar to 2011 values showing a small 3%
increase overall. After stabilising in 2009, exports to the U.S.A. continued to grow
reaching 3,860t in 2011, however, exports to the USA fell sharply in 2012 as a result of
disrupted production in Argentina. Exports to United Kingdom ceased in 2009 after FMC
Lithium discontinued lithium metal production at their Bromborough facility in
Merseyside, shifting production to the U.S.A. Imports of lithium chloride, with the
exception of 2008 which saw Argentina import 41t of lithium chloride, have not exceeded
6t since 2001.
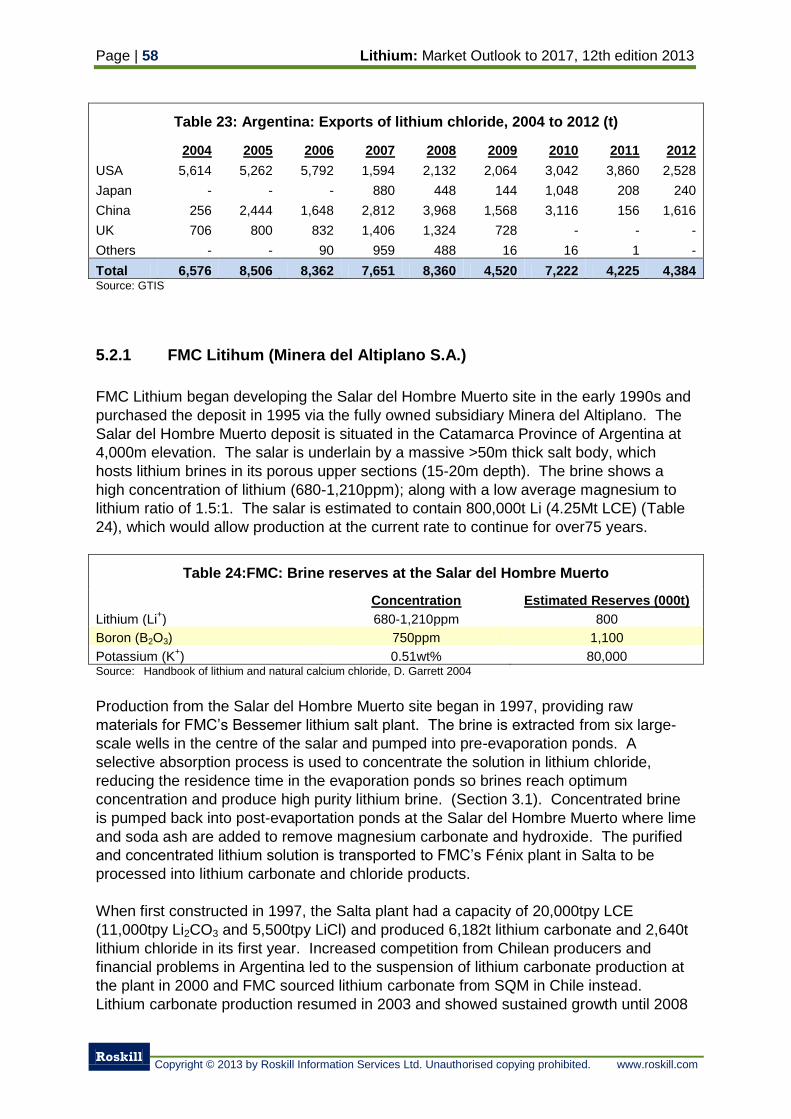
Page | 58 Lithium: Market Outlook to 2017, 12th edition 2013
Roskill
Copyright © 2013 by Roskill Information Services Ltd. Unauthorised copying prohibited. www.roskill.com
Table 23: Argentina: Exports of lithium chloride, 2004 to 2012 (t)
2004 2005 2006 2007 2008 2009 2010 2011 2012
USA 5,614 5,262 5,792 1,594 2,132 2,064 3,042 3,860 2,528
Japan - - - 880 448 144 1,048 208 240
China 256 2,444 1,648 2,812 3,968 1,568 3,116 156 1,616
UK 706 800 832 1,406 1,324 728 - - -
Others - - 90 959 488 16 16 1 -
Total 6,576 8,506 8,362 7,651 8,360 4,520 7,222 4,225 4,384 Source: GTIS
5.2.1 FMC Litihum (Minera del Altiplano S.A.)
FMC Lithium began developing the Salar del Hombre Muerto site in the early 1990s and
purchased the deposit in 1995 via the fully owned subsidiary Minera del Altiplano. The
Salar del Hombre Muerto deposit is situated in the Catamarca Province of Argentina at
4,000m elevation. The salar is underlain by a massive >50m thick salt body, which
hosts lithium brines in its porous upper sections (15-20m depth). The brine shows a
high concentration of lithium (680-1,210ppm); along with a low average magnesium to
lithium ratio of 1.5:1. The salar is estimated to contain 800,000t Li (4.25Mt LCE) (Table
24), which would allow production at the current rate to continue for over75 years.
Table 24:FMC: Brine reserves at the Salar del Hombre Muerto
Concentration Estimated Reserves (000t)
Lithium (Li+) 680-1,210ppm 800
Boron (B2O3) 750ppm 1,100
Potassium (K+) 0.51wt% 80,000
Source: Handbook of lithium and natural calcium chloride, D. Garrett 2004
Production from the Salar del Hombre Muerto site began in 1997, providing raw
materials for FMC’s Bessemer lithium salt plant. The brine is extracted from six large-
scale wells in the centre of the salar and pumped into pre-evaporation ponds. A
selective absorption process is used to concentrate the solution in lithium chloride,
reducing the residence time in the evaporation ponds so brines reach optimum
concentration and produce high purity lithium brine. (Section 3.1). Concentrated brine
is pumped back into post-evaportation ponds at the Salar del Hombre Muerto where lime
and soda ash are added to remove magnesium carbonate and hydroxide. The purified
and concentrated lithium solution is transported to FMC’s Fénix plant in Salta to be
processed into lithium carbonate and chloride products.
When first constructed in 1997, the Salta plant had a capacity of 20,000tpy LCE
(11,000tpy Li2CO3 and 5,500tpy LiCl) and produced 6,182t lithium carbonate and 2,640t
lithium chloride in its first year. Increased competition from Chilean producers and
financial problems in Argentina led to the suspension of lithium carbonate production at
the plant in 2000 and FMC sourced lithium carbonate from SQM in Chile instead.
Lithium carbonate production resumed in 2003 and showed sustained growth until 2008
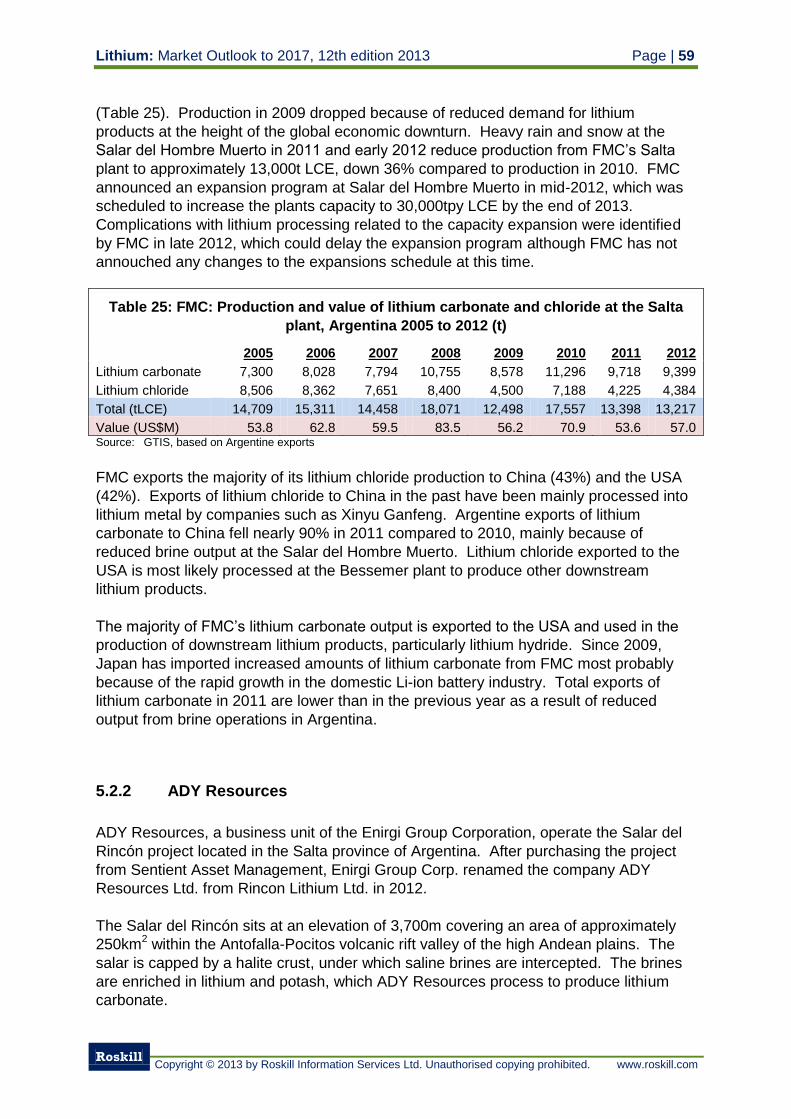
Lithium: Market Outlook to 2017, 12th edition 2013 Page | 59
Roskill
Copyright © 2013 by Roskill Information Services Ltd. Unauthorised copying prohibited. www.roskill.com
(Table 25). Production in 2009 dropped because of reduced demand for lithium
products at the height of the global economic downturn. Heavy rain and snow at the
Salar del Hombre Muerto in 2011 and early 2012 reduce production from FMC’s Salta
plant to approximately 13,000t LCE, down 36% compared to production in 2010. FMC
announced an expansion program at Salar del Hombre Muerto in mid-2012, which was
scheduled to increase the plants capacity to 30,000tpy LCE by the end of 2013.
Complications with lithium processing related to the capacity expansion were identified
by FMC in late 2012, which could delay the expansion program although FMC has not
annouched any changes to the expansions schedule at this time.
Table 25: FMC: Production and value of lithium carbonate and chloride at the Salta
plant, Argentina 2005 to 2012 (t)
2005 2006 2007 2008 2009 2010 2011 2012
Lithium carbonate 7,300 8,028 7,794 10,755 8,578 11,296 9,718 9,399
Lithium chloride 8,506 8,362 7,651 8,400 4,500 7,188 4,225 4,384
Total (tLCE) 14,709 15,311 14,458 18,071 12,498 17,557 13,398 13,217
Value (US$M) 53.8 62.8 59.5 83.5 56.2 70.9 53.6 57.0 Source: GTIS, based on Argentine exports
FMC exports the majority of its lithium chloride production to China (43%) and the USA
(42%). Exports of lithium chloride to China in the past have been mainly processed into
lithium metal by companies such as Xinyu Ganfeng. Argentine exports of lithium
carbonate to China fell nearly 90% in 2011 compared to 2010, mainly because of
reduced brine output at the Salar del Hombre Muerto. Lithium chloride exported to the
USA is most likely processed at the Bessemer plant to produce other downstream
lithium products.
The majority of FMC’s lithium carbonate output is exported to the USA and used in the
production of downstream lithium products, particularly lithium hydride. Since 2009,
Japan has imported increased amounts of lithium carbonate from FMC most probably
because of the rapid growth in the domestic Li-ion battery industry. Total exports of
lithium carbonate in 2011 are lower than in the previous year as a result of reduced
output from brine operations in Argentina.
5.2.2 ADY Resources
ADY Resources, a business unit of the Enirgi Group Corporation, operate the Salar del
Rincón project located in the Salta province of Argentina. After purchasing the project
from Sentient Asset Management, Enirgi Group Corp. renamed the company ADY
Resources Ltd. from Rincon Lithium Ltd. in 2012.
The Salar del Rincón sits at an elevation of 3,700m covering an area of approximately
250km2 within the Antofalla-Pocitos volcanic rift valley of the high Andean plains. The
salar is capped by a halite crust, under which saline brines are intercepted. The brines
are enriched in lithium and potash, which ADY Resources process to produce lithium
carbonate.
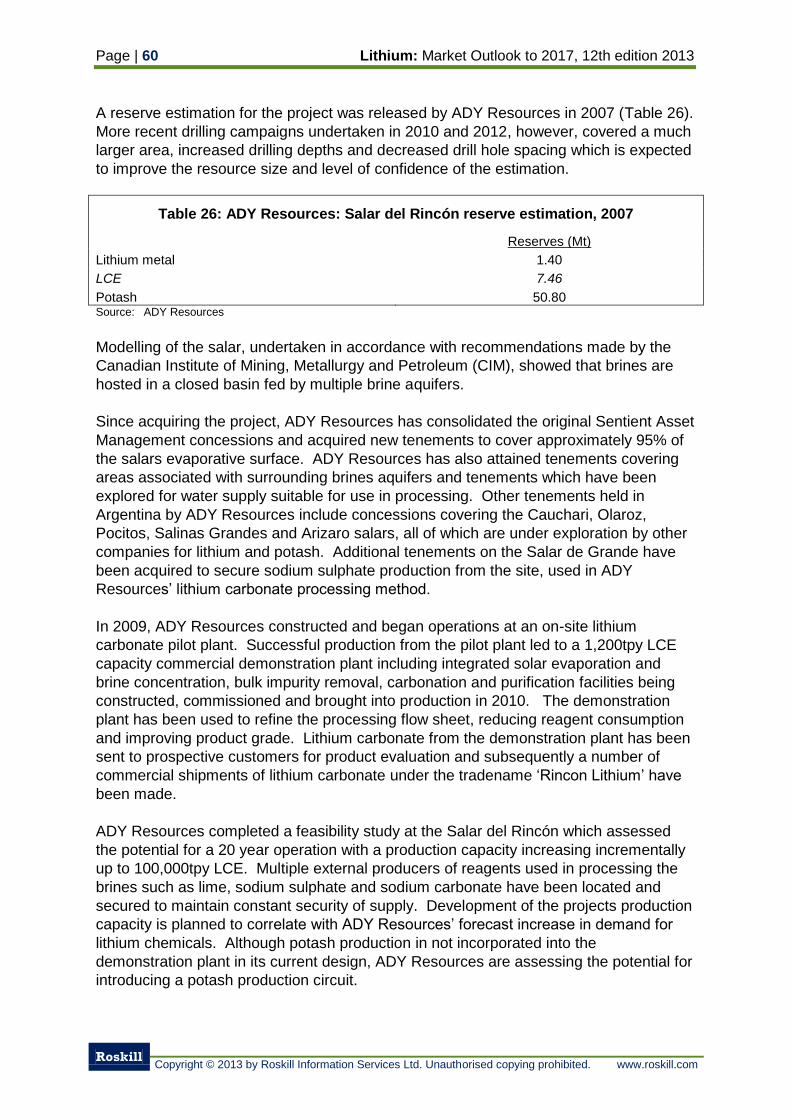
Page | 60 Lithium: Market Outlook to 2017, 12th edition 2013
Roskill
Copyright © 2013 by Roskill Information Services Ltd. Unauthorised copying prohibited. www.roskill.com
A reserve estimation for the project was released by ADY Resources in 2007 (Table 26).
More recent drilling campaigns undertaken in 2010 and 2012, however, covered a much
larger area, increased drilling depths and decreased drill hole spacing which is expected
to improve the resource size and level of confidence of the estimation.
Table 26: ADY Resources: Salar del Rincón reserve estimation, 2007
Reserves (Mt)
Lithium metal 1.40
LCE 7.46
Potash 50.80 Source: ADY Resources
Modelling of the salar, undertaken in accordance with recommendations made by the
Canadian Institute of Mining, Metallurgy and Petroleum (CIM), showed that brines are
hosted in a closed basin fed by multiple brine aquifers.
Since acquiring the project, ADY Resources has consolidated the original Sentient Asset
Management concessions and acquired new tenements to cover approximately 95% of
the salars evaporative surface. ADY Resources has also attained tenements covering
areas associated with surrounding brines aquifers and tenements which have been
explored for water supply suitable for use in processing. Other tenements held in
Argentina by ADY Resources include concessions covering the Cauchari, Olaroz,
Pocitos, Salinas Grandes and Arizaro salars, all of which are under exploration by other
companies for lithium and potash. Additional tenements on the Salar de Grande have
been acquired to secure sodium sulphate production from the site, used in ADY
Resources’ lithium carbonate processing method.
In 2009, ADY Resources constructed and began operations at an on-site lithium
carbonate pilot plant. Successful production from the pilot plant led to a 1,200tpy LCE
capacity commercial demonstration plant including integrated solar evaporation and
brine concentration, bulk impurity removal, carbonation and purification facilities being
constructed, commissioned and brought into production in 2010. The demonstration
plant has been used to refine the processing flow sheet, reducing reagent consumption
and improving product grade. Lithium carbonate from the demonstration plant has been
sent to prospective customers for product evaluation and subsequently a number of
commercial shipments of lithium carbonate under the tradename ‘Rincon Lithium’ have
been made.
ADY Resources completed a feasibility study at the Salar del Rincón which assessed
the potential for a 20 year operation with a production capacity increasing incrementally
up to 100,000tpy LCE. Multiple external producers of reagents used in processing the
brines such as lime, sodium sulphate and sodium carbonate have been located and
secured to maintain constant security of supply. Development of the projects production
capacity is planned to correlate with ADY Resources’ forecast increase in demand for
lithium chemicals. Although potash production in not incorporated into the
demonstration plant in its current design, ADY Resources are assessing the potential for
introducing a potash production circuit.
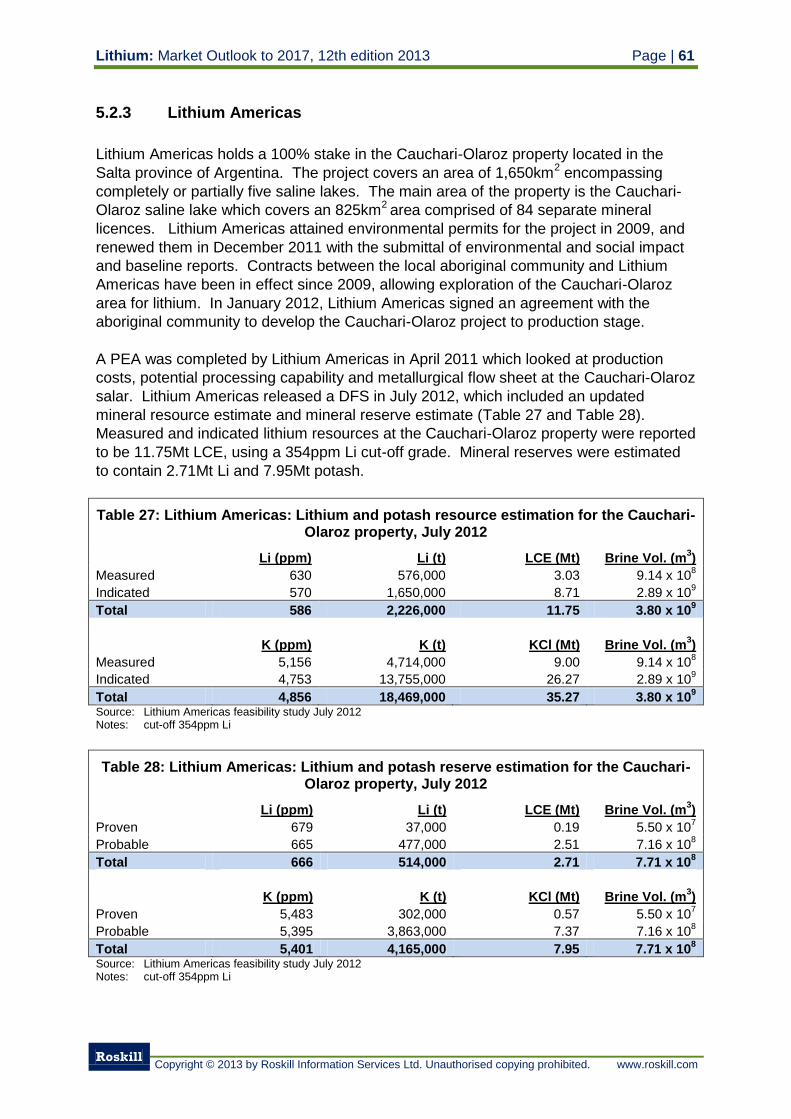
Lithium: Market Outlook to 2017, 12th edition 2013 Page | 61
Roskill
Copyright © 2013 by Roskill Information Services Ltd. Unauthorised copying prohibited. www.roskill.com
5.2.3 Lithium Americas
Lithium Americas holds a 100% stake in the Cauchari-Olaroz property located in the
Salta province of Argentina. The project covers an area of 1,650km2 encompassing
completely or partially five saline lakes. The main area of the property is the Cauchari-
Olaroz saline lake which covers an 825km2 area comprised of 84 separate mineral
licences. Lithium Americas attained environmental permits for the project in 2009, and
renewed them in December 2011 with the submittal of environmental and social impact
and baseline reports. Contracts between the local aboriginal community and Lithium
Americas have been in effect since 2009, allowing exploration of the Cauchari-Olaroz
area for lithium. In January 2012, Lithium Americas signed an agreement with the
aboriginal community to develop the Cauchari-Olaroz project to production stage.
A PEA was completed by Lithium Americas in April 2011 which looked at production
costs, potential processing capability and metallurgical flow sheet at the Cauchari-Olaroz
salar. Lithium Americas released a DFS in July 2012, which included an updated
mineral resource estimate and mineral reserve estimate (Table 27 and Table 28).
Measured and indicated lithium resources at the Cauchari-Olaroz property were reported
to be 11.75Mt LCE, using a 354ppm Li cut-off grade. Mineral reserves were estimated
to contain 2.71Mt Li and 7.95Mt potash.
Table 27: Lithium Americas: Lithium and potash resource estimation for the Cauchari-Olaroz property, July 2012
Li (ppm) Li (t) LCE (Mt) Brine Vol. (m3)
Measured 630 576,000 3.03 9.14 x 10⁸
Indicated 570 1,650,000 8.71 2.89 x 10⁹
Total 586 2,226,000 11.75 3.80 x 10⁹
K (ppm) K (t) KCl (Mt) Brine Vol. (m3)
Measured 5,156 4,714,000 9.00 9.14 x 10⁸
Indicated 4,753 13,755,000 26.27 2.89 x 10⁹
Total 4,856 18,469,000 35.27 3.80 x 10⁹
Source: Lithium Americas feasibility study July 2012 Notes: cut-off 354ppm Li
Table 28: Lithium Americas: Lithium and potash reserve estimation for the Cauchari-Olaroz property, July 2012
Li (ppm) Li (t) LCE (Mt) Brine Vol. (m3)
Proven 679 37,000 0.19 5.50 x 10⁷
Probable 665 477,000 2.51 7.16 x 10⁸
Total 666 514,000 2.71 7.71 x 10⁸
K (ppm) K (t) KCl (Mt) Brine Vol. (m3)
Proven 5,483 302,000 0.57 5.50 x 10⁷
Probable 5,395 3,863,000 7.37 7.16 x 10⁸
Total 5,401 4,165,000 7.95 7.71 x 10⁸
Source: Lithium Americas feasibility study July 2012 Notes: cut-off 354ppm Li
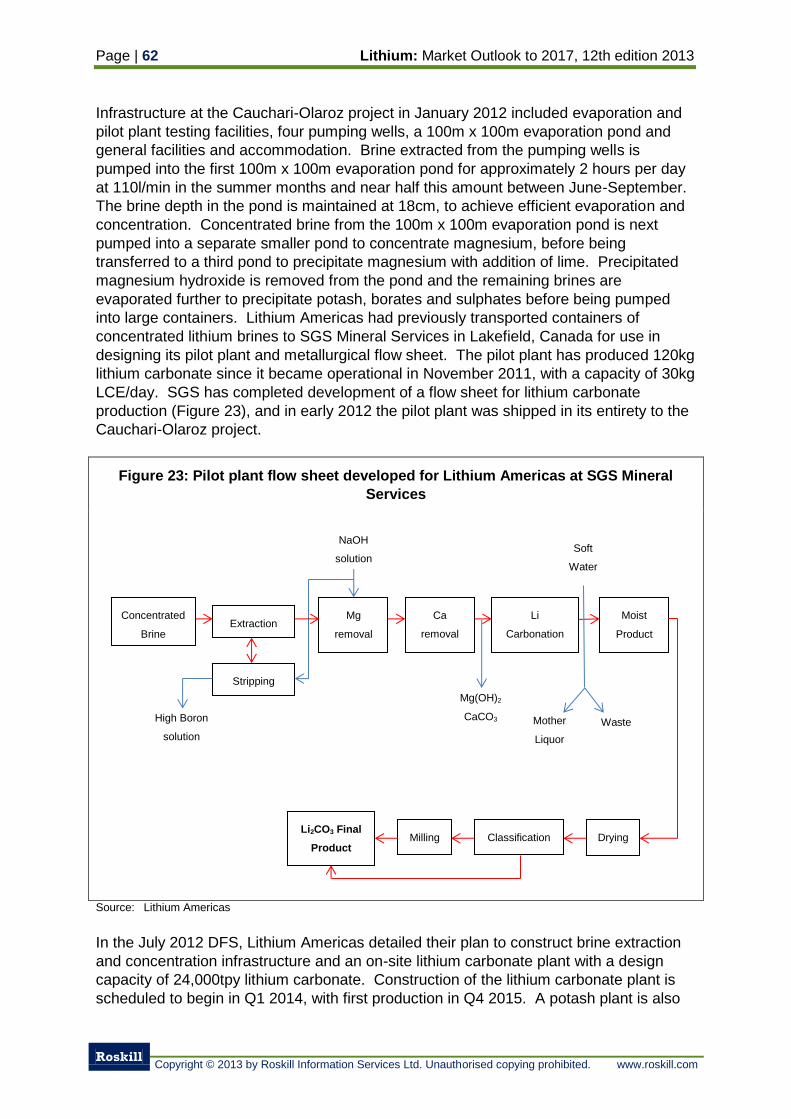
Page | 62 Lithium: Market Outlook to 2017, 12th edition 2013
Roskill
Copyright © 2013 by Roskill Information Services Ltd. Unauthorised copying prohibited. www.roskill.com
Infrastructure at the Cauchari-Olaroz project in January 2012 included evaporation and
pilot plant testing facilities, four pumping wells, a 100m x 100m evaporation pond and
general facilities and accommodation. Brine extracted from the pumping wells is
pumped into the first 100m x 100m evaporation pond for approximately 2 hours per day
at 110l/min in the summer months and near half this amount between June-September.
The brine depth in the pond is maintained at 18cm, to achieve efficient evaporation and
concentration. Concentrated brine from the 100m x 100m evaporation pond is next
pumped into a separate smaller pond to concentrate magnesium, before being
transferred to a third pond to precipitate magnesium with addition of lime. Precipitated
magnesium hydroxide is removed from the pond and the remaining brines are
evaporated further to precipitate potash, borates and sulphates before being pumped
into large containers. Lithium Americas had previously transported containers of
concentrated lithium brines to SGS Mineral Services in Lakefield, Canada for use in
designing its pilot plant and metallurgical flow sheet. The pilot plant has produced 120kg
lithium carbonate since it became operational in November 2011, with a capacity of 30kg
LCE/day. SGS has completed development of a flow sheet for lithium carbonate
production (Figure 23), and in early 2012 the pilot plant was shipped in its entirety to the
Cauchari-Olaroz project.
Figure 23: Pilot plant flow sheet developed for Lithium Americas at SGS Mineral
Services
Source: Lithium Americas
In the July 2012 DFS, Lithium Americas detailed their plan to construct brine extraction
and concentration infrastructure and an on-site lithium carbonate plant with a design
capacity of 24,000tpy lithium carbonate. Construction of the lithium carbonate plant is
scheduled to begin in Q1 2014, with first production in Q4 2015. A potash plant is also
NaOH
solution
High Boron
solution
Concentrated
Brine Extraction
Stripping
Mg
removal
Soft
Water
Mg(OH)2
CaCO3 Waste Mother
Liquor
Ca
removal
Li
Carbonation
Moist
Product
Drying
Classification
Milling
Li2CO3 Final
Product
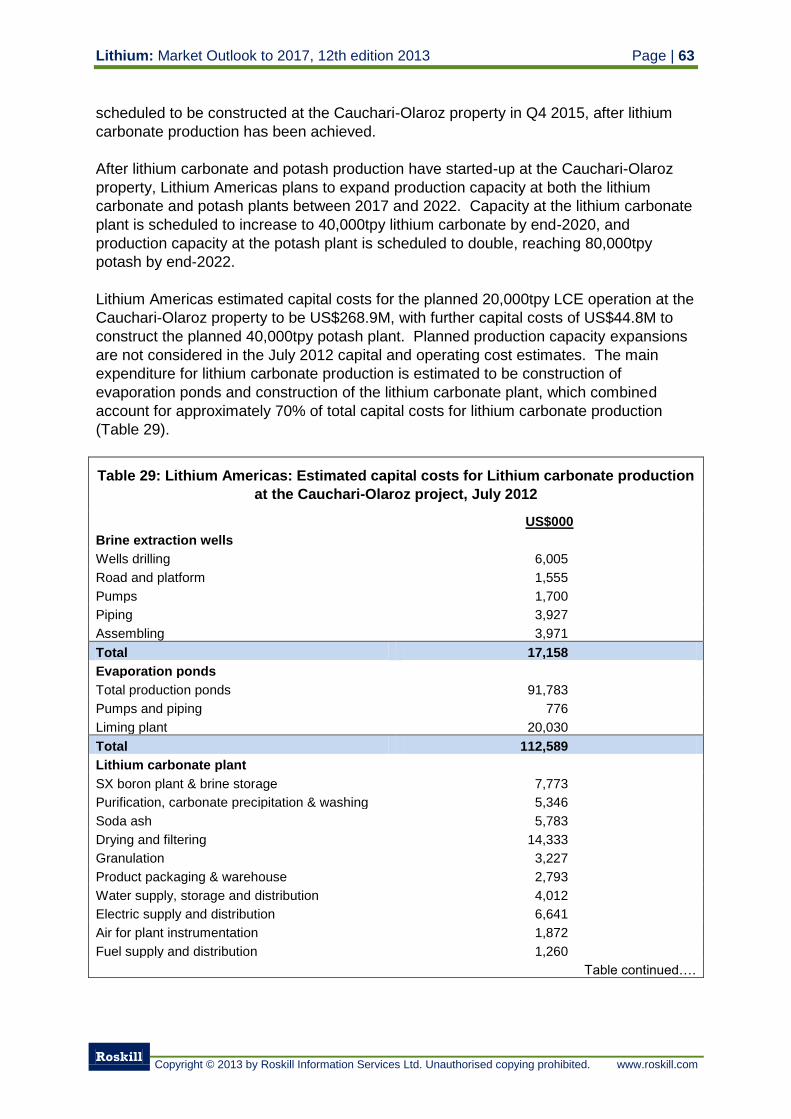
Lithium: Market Outlook to 2017, 12th edition 2013 Page | 63
Roskill
Copyright © 2013 by Roskill Information Services Ltd. Unauthorised copying prohibited. www.roskill.com
scheduled to be constructed at the Cauchari-Olaroz property in Q4 2015, after lithium
carbonate production has been achieved.
After lithium carbonate and potash production have started-up at the Cauchari-Olaroz
property, Lithium Americas plans to expand production capacity at both the lithium
carbonate and potash plants between 2017 and 2022. Capacity at the lithium carbonate
plant is scheduled to increase to 40,000tpy lithium carbonate by end-2020, and
production capacity at the potash plant is scheduled to double, reaching 80,000tpy
potash by end-2022.
Lithium Americas estimated capital costs for the planned 20,000tpy LCE operation at the
Cauchari-Olaroz property to be US$268.9M, with further capital costs of US$44.8M to
construct the planned 40,000tpy potash plant. Planned production capacity expansions
are not considered in the July 2012 capital and operating cost estimates. The main
expenditure for lithium carbonate production is estimated to be construction of
evaporation ponds and construction of the lithium carbonate plant, which combined
account for approximately 70% of total capital costs for lithium carbonate production
(Table 29).
Table 29: Lithium Americas: Estimated capital costs for Lithium carbonate production
at the Cauchari-Olaroz project, July 2012
US$000
Brine extraction wells
Wells drilling 6,005
Road and platform 1,555
Pumps 1,700
Piping 3,927
Assembling 3,971
Total 17,158
Evaporation ponds
Total production ponds 91,783
Pumps and piping 776
Liming plant 20,030
Total 112,589
Lithium carbonate plant
SX boron plant & brine storage 7,773
Purification, carbonate precipitation & washing 5,346
Soda ash 5,783
Drying and filtering 14,333
Granulation 3,227
Product packaging & warehouse 2,793
Water supply, storage and distribution 4,012
Electric supply and distribution 6,641
Air for plant instrumentation 1,872
Fuel supply and distribution 1,260
Table continued….
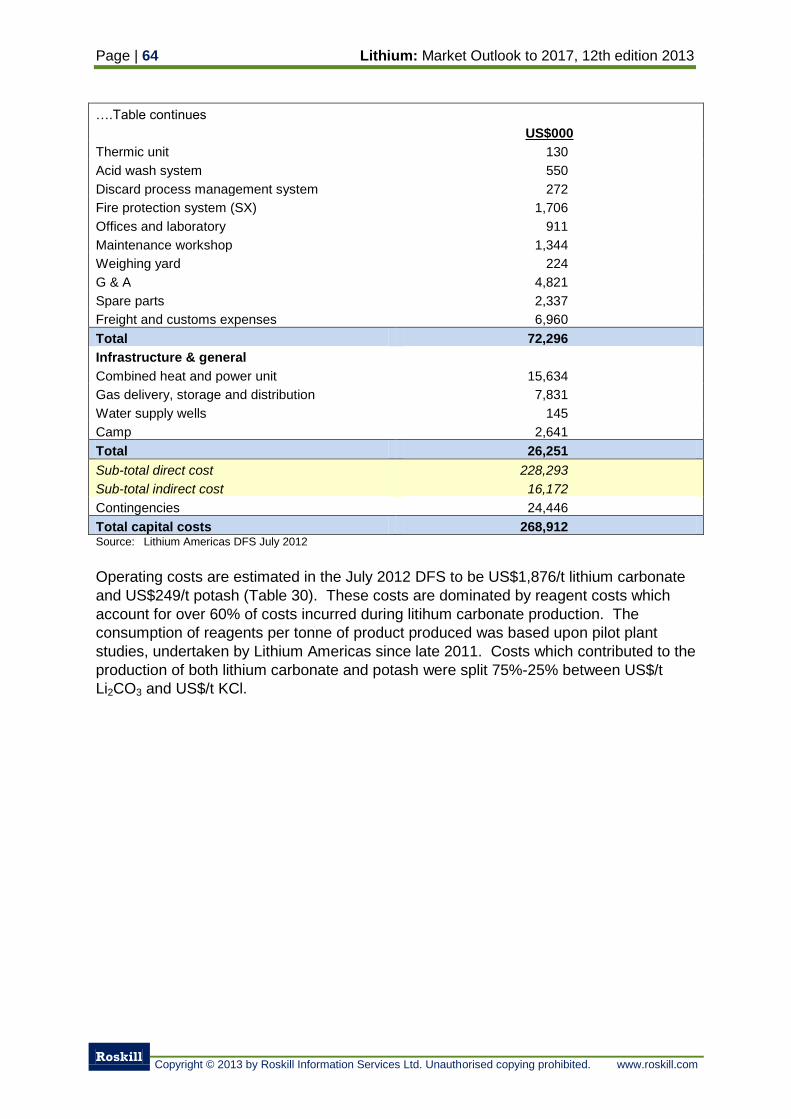
Page | 64 Lithium: Market Outlook to 2017, 12th edition 2013
Roskill
Copyright © 2013 by Roskill Information Services Ltd. Unauthorised copying prohibited. www.roskill.com
….Table continues
US$000
Thermic unit 130
Acid wash system 550
Discard process management system 272
Fire protection system (SX) 1,706
Offices and laboratory 911
Maintenance workshop 1,344
Weighing yard 224
G & A 4,821
Spare parts 2,337
Freight and customs expenses 6,960
Total 72,296
Infrastructure & general
Combined heat and power unit 15,634
Gas delivery, storage and distribution 7,831
Water supply wells 145
Camp 2,641
Total 26,251
Sub-total direct cost 228,293
Sub-total indirect cost 16,172
Contingencies 24,446
Total capital costs 268,912 Source: Lithium Americas DFS July 2012
Operating costs are estimated in the July 2012 DFS to be US$1,876/t lithium carbonate
and US$249/t potash (Table 30). These costs are dominated by reagent costs which
account for over 60% of costs incurred during litihum carbonate production. The
consumption of reagents per tonne of product produced was based upon pilot plant
studies, undertaken by Lithium Americas since late 2011. Costs which contributed to the
production of both lithium carbonate and potash were split 75%-25% between US$/t
Li2CO3 and US$/t KCl.
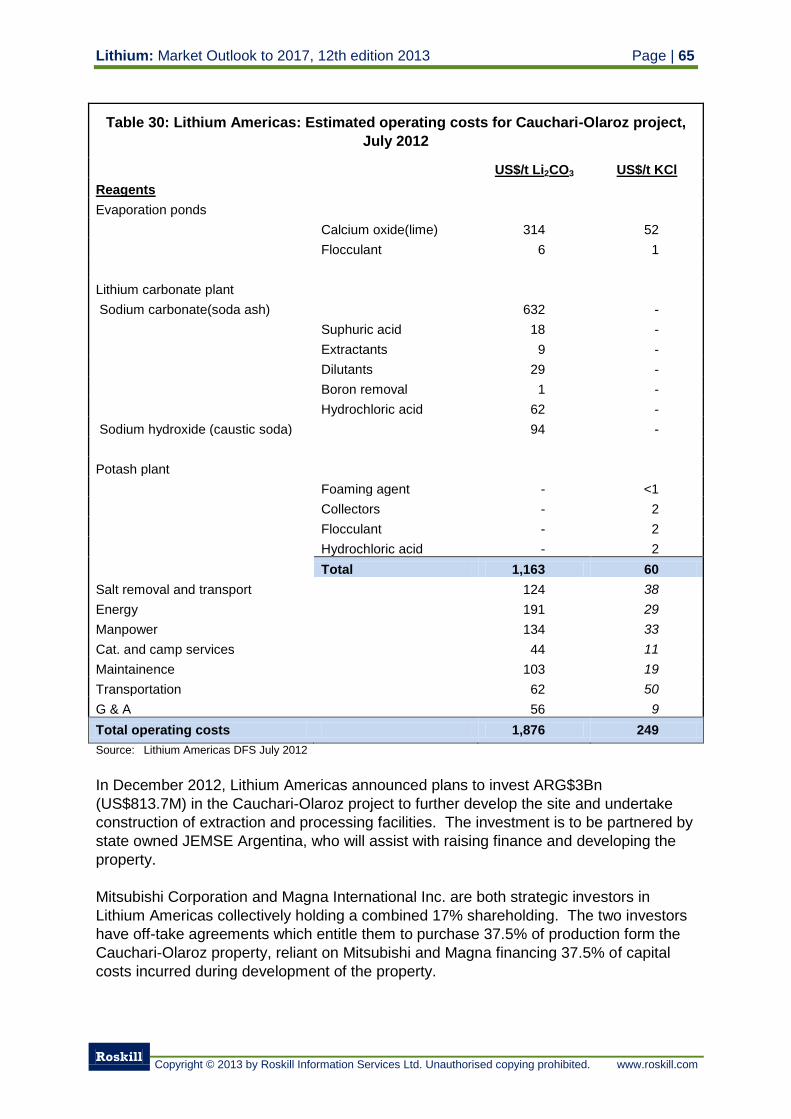
Lithium: Market Outlook to 2017, 12th edition 2013 Page | 65
Roskill
Copyright © 2013 by Roskill Information Services Ltd. Unauthorised copying prohibited. www.roskill.com
Table 30: Lithium Americas: Estimated operating costs for Cauchari-Olaroz project,
July 2012
US$/t Li2CO3 US$/t KCl
Reagents Evaporation ponds Calcium oxide(lime) 314 52
Flocculant 6 1
Lithium carbonate plant Sodium carbonate(soda ash) 632 -
Suphuric acid 18 -
Extractants 9 -
Dilutants 29 -
Boron removal 1 -
Hydrochloric acid 62 -
Sodium hydroxide (caustic soda) 94 -
Potash plant Foaming agent - <1
Collectors - 2
Flocculant - 2
Hydrochloric acid - 2
Total 1,163 60
Salt removal and transport
124 38
Energy
191 29
Manpower
134 33
Cat. and camp services
44 11
Maintainence
103 19
Transportation
62 50
G & A
56 9
Total operating costs 1,876 249
Source: Lithium Americas DFS July 2012
In December 2012, Lithium Americas announced plans to invest ARG$3Bn
(US$813.7M) in the Cauchari-Olaroz project to further develop the site and undertake
construction of extraction and processing facilities. The investment is to be partnered by
state owned JEMSE Argentina, who will assist with raising finance and developing the
property.
Mitsubishi Corporation and Magna International Inc. are both strategic investors in
Lithium Americas collectively holding a combined 17% shareholding. The two investors
have off-take agreements which entitle them to purchase 37.5% of production form the
Cauchari-Olaroz property, reliant on Mitsubishi and Magna financing 37.5% of capital
costs incurred during development of the property.
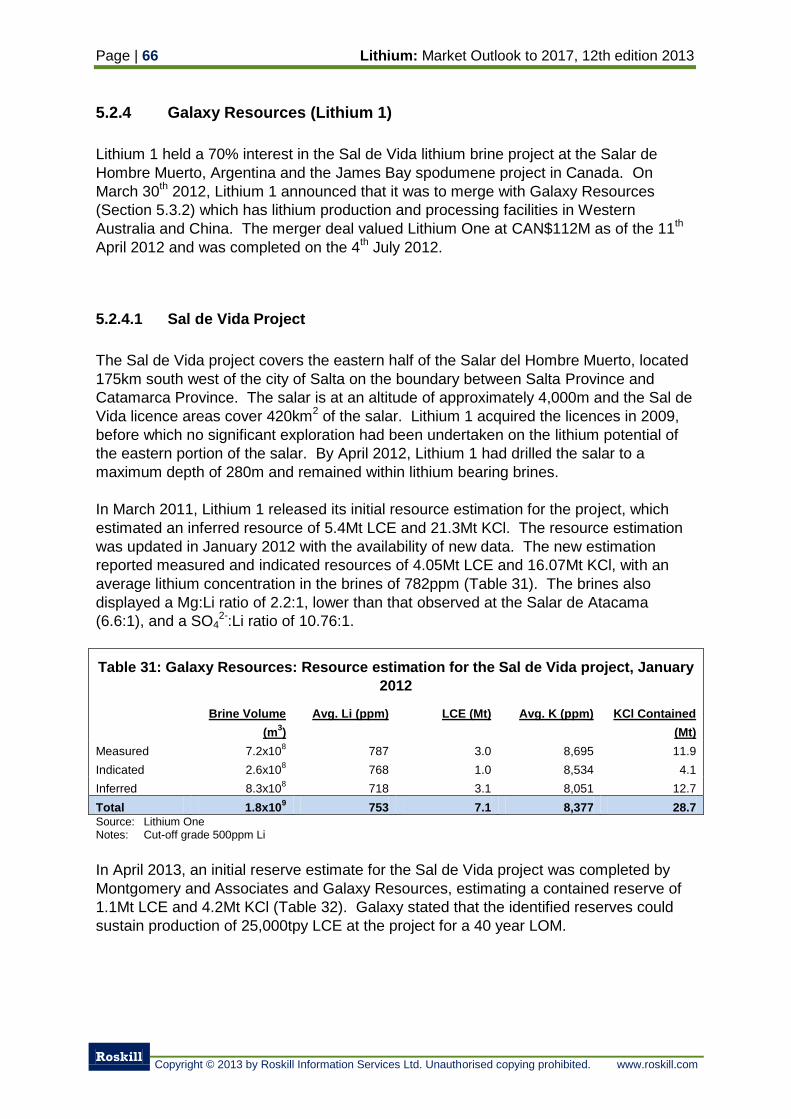
Page | 66 Lithium: Market Outlook to 2017, 12th edition 2013
Roskill
Copyright © 2013 by Roskill Information Services Ltd. Unauthorised copying prohibited. www.roskill.com
5.2.4 Galaxy Resources (Lithium 1)
Lithium 1 held a 70% interest in the Sal de Vida lithium brine project at the Salar de
Hombre Muerto, Argentina and the James Bay spodumene project in Canada. On
March 30th 2012, Lithium 1 announced that it was to merge with Galaxy Resources
(Section 5.3.2) which has lithium production and processing facilities in Western
Australia and China. The merger deal valued Lithium One at CAN$112M as of the 11th
April 2012 and was completed on the 4th July 2012.
5.2.4.1 Sal de Vida Project
The Sal de Vida project covers the eastern half of the Salar del Hombre Muerto, located
175km south west of the city of Salta on the boundary between Salta Province and
Catamarca Province. The salar is at an altitude of approximately 4,000m and the Sal de
Vida licence areas cover 420km2 of the salar. Lithium 1 acquired the licences in 2009,
before which no significant exploration had been undertaken on the lithium potential of
the eastern portion of the salar. By April 2012, Lithium 1 had drilled the salar to a
maximum depth of 280m and remained within lithium bearing brines.
In March 2011, Lithium 1 released its initial resource estimation for the project, which
estimated an inferred resource of 5.4Mt LCE and 21.3Mt KCl. The resource estimation
was updated in January 2012 with the availability of new data. The new estimation
reported measured and indicated resources of 4.05Mt LCE and 16.07Mt KCl, with an
average lithium concentration in the brines of 782ppm (Table 31). The brines also
displayed a Mg:Li ratio of 2.2:1, lower than that observed at the Salar de Atacama
(6.6:1), and a SO42-
:Li ratio of 10.76:1.
Table 31: Galaxy Resources: Resource estimation for the Sal de Vida project, January
2012
Brine Volume
(m3)
Avg. Li (ppm) LCE (Mt) Avg. K (ppm) KCl Contained
(Mt)
Measured 7.2x10⁸
787 3.0 8,695 11.9
Indicated 2.6x10⁸
768 1.0 8,534 4.1
Inferred 8.3x10⁸
718 3.1 8,051 12.7
Total 1.8x10⁹
753 7.1 8,377 28.7 Source: Lithium One Notes: Cut-off grade 500ppm Li
In April 2013, an initial reserve estimate for the Sal de Vida project was completed by
Montgomery and Associates and Galaxy Resources, estimating a contained reserve of
1.1Mt LCE and 4.2Mt KCl (Table 32). Galaxy stated that the identified reserves could
sustain production of 25,000tpy LCE at the project for a 40 year LOM.
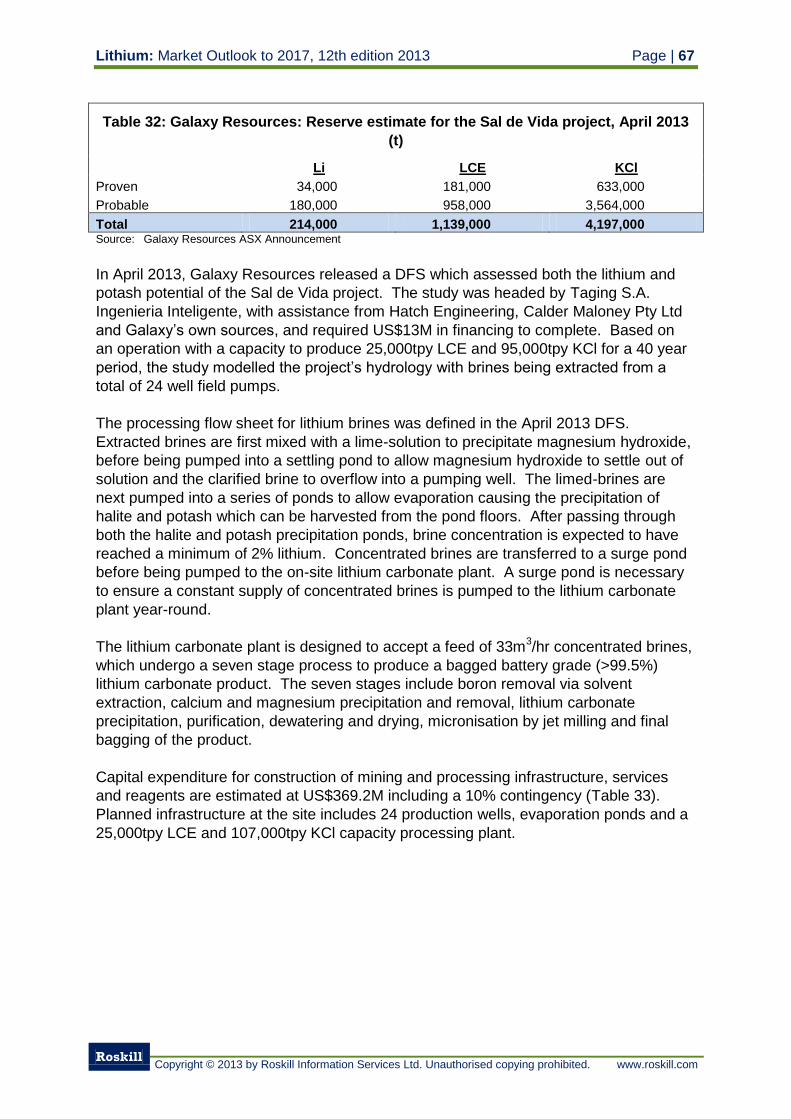
Lithium: Market Outlook to 2017, 12th edition 2013 Page | 67
Roskill
Copyright © 2013 by Roskill Information Services Ltd. Unauthorised copying prohibited. www.roskill.com
Table 32: Galaxy Resources: Reserve estimate for the Sal de Vida project, April 2013
(t)
Li LCE KCl
Proven 34,000 181,000 633,000
Probable 180,000 958,000 3,564,000
Total 214,000 1,139,000 4,197,000 Source: Galaxy Resources ASX Announcement
In April 2013, Galaxy Resources released a DFS which assessed both the lithium and
potash potential of the Sal de Vida project. The study was headed by Taging S.A.
Ingenieria Inteligente, with assistance from Hatch Engineering, Calder Maloney Pty Ltd
and Galaxy’s own sources, and required US$13M in financing to complete. Based on
an operation with a capacity to produce 25,000tpy LCE and 95,000tpy KCl for a 40 year
period, the study modelled the project’s hydrology with brines being extracted from a
total of 24 well field pumps.
The processing flow sheet for lithium brines was defined in the April 2013 DFS.
Extracted brines are first mixed with a lime-solution to precipitate magnesium hydroxide,
before being pumped into a settling pond to allow magnesium hydroxide to settle out of
solution and the clarified brine to overflow into a pumping well. The limed-brines are
next pumped into a series of ponds to allow evaporation causing the precipitation of
halite and potash which can be harvested from the pond floors. After passing through
both the halite and potash precipitation ponds, brine concentration is expected to have
reached a minimum of 2% lithium. Concentrated brines are transferred to a surge pond
before being pumped to the on-site lithium carbonate plant. A surge pond is necessary
to ensure a constant supply of concentrated brines is pumped to the lithium carbonate
plant year-round.
The lithium carbonate plant is designed to accept a feed of 33m3/hr concentrated brines,
which undergo a seven stage process to produce a bagged battery grade (>99.5%)
lithium carbonate product. The seven stages include boron removal via solvent
extraction, calcium and magnesium precipitation and removal, lithium carbonate
precipitation, purification, dewatering and drying, micronisation by jet milling and final
bagging of the product.
Capital expenditure for construction of mining and processing infrastructure, services
and reagents are estimated at US$369.2M including a 10% contingency (Table 33).
Planned infrastructure at the site includes 24 production wells, evaporation ponds and a
25,000tpy LCE and 107,000tpy KCl capacity processing plant.
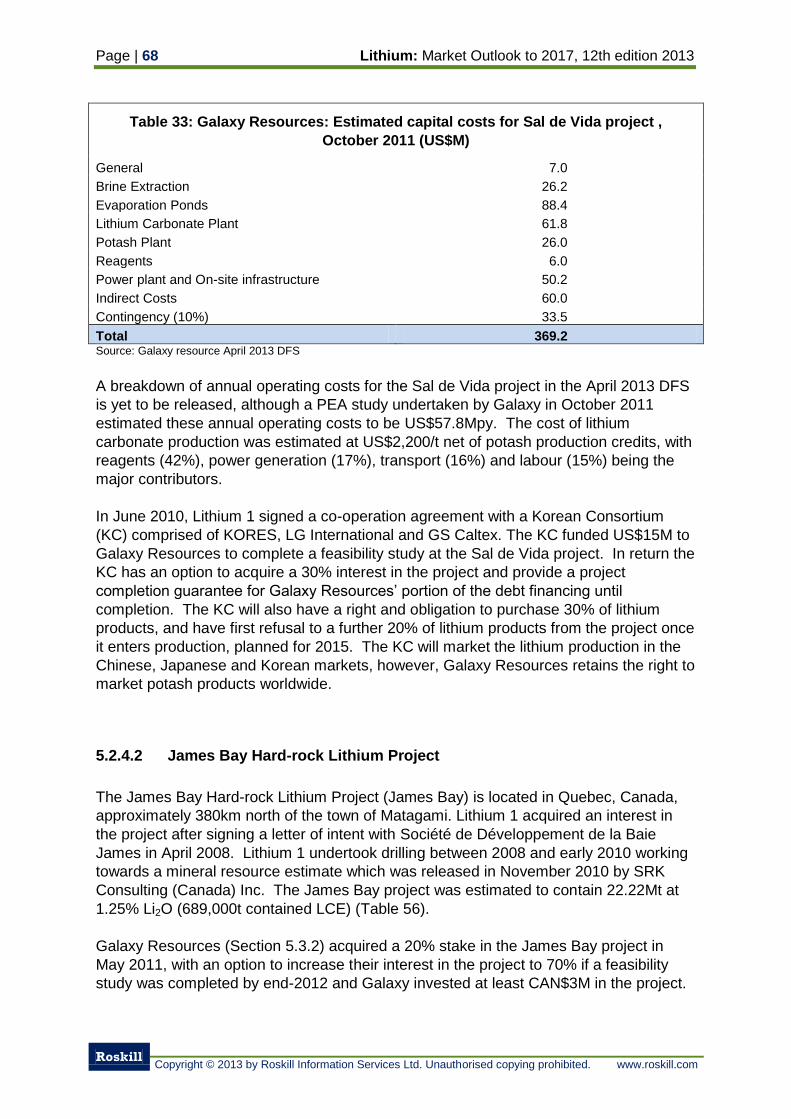
Page | 68 Lithium: Market Outlook to 2017, 12th edition 2013
Roskill
Copyright © 2013 by Roskill Information Services Ltd. Unauthorised copying prohibited. www.roskill.com
Table 33: Galaxy Resources: Estimated capital costs for Sal de Vida project ,
October 2011 (US$M)
General 7.0
Brine Extraction 26.2
Evaporation Ponds 88.4
Lithium Carbonate Plant 61.8
Potash Plant 26.0
Reagents 6.0
Power plant and On-site infrastructure 50.2
Indirect Costs 60.0
Contingency (10%) 33.5
Total 369.2 Source: Galaxy resource April 2013 DFS
A breakdown of annual operating costs for the Sal de Vida project in the April 2013 DFS
is yet to be released, although a PEA study undertaken by Galaxy in October 2011
estimated these annual operating costs to be US$57.8Mpy. The cost of lithium
carbonate production was estimated at US$2,200/t net of potash production credits, with
reagents (42%), power generation (17%), transport (16%) and labour (15%) being the
major contributors.
In June 2010, Lithium 1 signed a co-operation agreement with a Korean Consortium
(KC) comprised of KORES, LG International and GS Caltex. The KC funded US$15M to
Galaxy Resources to complete a feasibility study at the Sal de Vida project. In return the
KC has an option to acquire a 30% interest in the project and provide a project
completion guarantee for Galaxy Resources’ portion of the debt financing until
completion. The KC will also have a right and obligation to purchase 30% of lithium
products, and have first refusal to a further 20% of lithium products from the project once
it enters production, planned for 2015. The KC will market the lithium production in the
Chinese, Japanese and Korean markets, however, Galaxy Resources retains the right to
market potash products worldwide.
5.2.4.2 James Bay Hard-rock Lithium Project
The James Bay Hard-rock Lithium Project (James Bay) is located in Quebec, Canada,
approximately 380km north of the town of Matagami. Lithium 1 acquired an interest in
the project after signing a letter of intent with Société de Développement de la Baie
James in April 2008. Lithium 1 undertook drilling between 2008 and early 2010 working
towards a mineral resource estimate which was released in November 2010 by SRK
Consulting (Canada) Inc. The James Bay project was estimated to contain 22.22Mt at
1.25% Li2O (689,000t contained LCE) (Table 56).
Galaxy Resources (Section 5.3.2) acquired a 20% stake in the James Bay project in
May 2011, with an option to increase their interest in the project to 70% if a feasibility
study was completed by end-2012 and Galaxy invested at least CAN$3M in the project.
Lithium: Market Outlook to 2017, 12th edition 2013 Page | 69
Roskill
Copyright © 2013 by Roskill Information Services Ltd. Unauthorised copying prohibited. www.roskill.com
Galaxy fully acquired the James Bay project in its merger agreement with Lithium 1,
completed on 4th July 2012.
5.2.5 Orocobre Ltd.
Australian mining and exploration company Orocobre are exploring four saline brine
projects in North West Argentina for lithium, potash and boron. The four projects are:
Salar de Olaroz, Jujuy Province
Salinas Grandes (Cangrejillo), Jujuy-Salta Province boarder
Guayatoyoc Project, Jujuy Province
Cauchari Project, Jujuy-Salta Province boarder
Orocobre owns a 72.68% stake in its subsidiary Sales de Jujuy Pte. Ltd. (Singapore)
(SJS), which in turn holds a 91.5% share of the Olaroz, Salinas Grandes, Guayatoyoc
and Cauchari projects through its Argentinian base subsiduary Sales de Jujuy S.A.
(SDJ). The remaining 8.5% share in SDJ is held by Jujuy Energia y Mineria Sociedad
del Estado (JEMSE), a company set up by the provincial Jujuy government in 2012.
JEMSE is required to fufill its responsibilities with funding the projects construction and
will also take a leading role liaising with municipal, provincial and national government
departments and customs authorities.
In June 2012, Orocobre received approval from Jujuy Province for its Salar de Olaroz
project, after a meeting with representatives from Argentine national and regional
government. Approval by an expert committee responsible for assessing lithium
projects in the country was also granted to Orocobre.
In August 2012, Orocobre announced the acquisition of Borax Argentina S.A. from Rio
Tinto PLC. Borax Argentina operates three borate projects at Tinacalayu, Sijes and
Porvenir in Salta and Jujuy provinces along with refinery facilities at Campo Quijano,
producing approximately 35,000tpy of boron based products and concentrates. In the
agreement, Orocobre are required to pay Rio Tinto US$8.5M in total with an upfront
payment of US$5.5M and a further US$1.0M payable annually for the following three
years.
Parallels between borate and lithium extraction and the proximity to Orocobre’s Salar de
Olaroz project are believed to be the main reasons behind the acquision; however Borax
Argentina also held a number of pre-existing agreements with lithium companies in the
local area. Orocobre will take over these pre-exisitng agreements which refer to the
tenure of local projects, requiring some local lithium companies to make annual
payments or pay royalties on future production (Table 34).
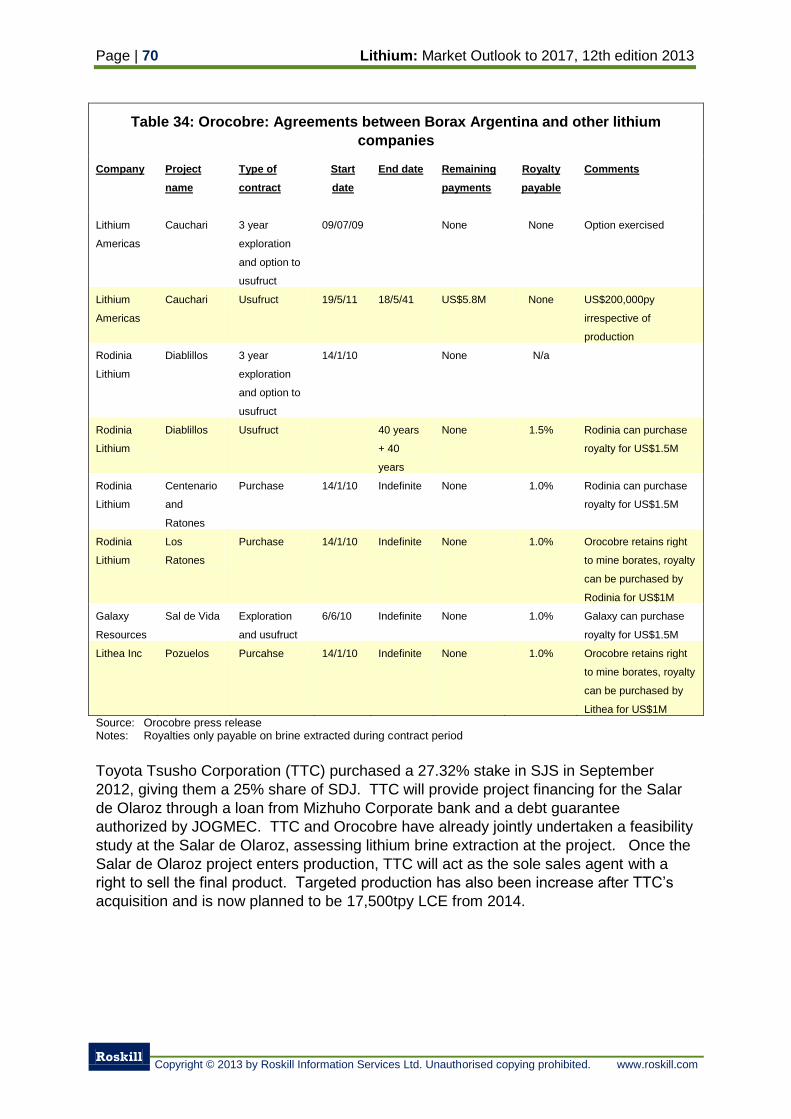
Page | 70 Lithium: Market Outlook to 2017, 12th edition 2013
Roskill
Copyright © 2013 by Roskill Information Services Ltd. Unauthorised copying prohibited. www.roskill.com
Table 34: Orocobre: Agreements between Borax Argentina and other lithium
companies
Company Project
name
Type of
contract
Start
date
End date Remaining
payments
Royalty
payable
Comments
Lithium
Americas
Cauchari 3 year
exploration
and option to
usufruct
09/07/09 None None Option exercised
Lithium
Americas
Cauchari Usufruct 19/5/11 18/5/41 US$5.8M None US$200,000py
irrespective of
production
Rodinia
Lithium
Diablillos 3 year
exploration
and option to
usufruct
14/1/10 None N/a
Rodinia
Lithium
Diablillos Usufruct 40 years
+ 40
years
None 1.5% Rodinia can purchase
royalty for US$1.5M
Rodinia
Lithium
Centenario
and
Ratones
Purchase 14/1/10 Indefinite None 1.0% Rodinia can purchase
royalty for US$1.5M
Rodinia
Lithium
Los
Ratones
Purchase 14/1/10 Indefinite None 1.0% Orocobre retains right
to mine borates, royalty
can be purchased by
Rodinia for US$1M
Galaxy
Resources
Sal de Vida Exploration
and usufruct
6/6/10 Indefinite None 1.0% Galaxy can purchase
royalty for US$1.5M
Lithea Inc Pozuelos Purcahse 14/1/10 Indefinite None 1.0% Orocobre retains right
to mine borates, royalty
can be purchased by
Lithea for US$1M
Source: Orocobre press release Notes: Royalties only payable on brine extracted during contract period
Toyota Tsusho Corporation (TTC) purchased a 27.32% stake in SJS in September
2012, giving them a 25% share of SDJ. TTC will provide project financing for the Salar
de Olaroz through a loan from Mizhuho Corporate bank and a debt guarantee
authorized by JOGMEC. TTC and Orocobre have already jointly undertaken a feasibility
study at the Salar de Olaroz, assessing lithium brine extraction at the project. Once the
Salar de Olaroz project enters production, TTC will act as the sole sales agent with a
right to sell the final product. Targeted production has also been increase after TTC’s
acquisition and is now planned to be 17,500tpy LCE from 2014.
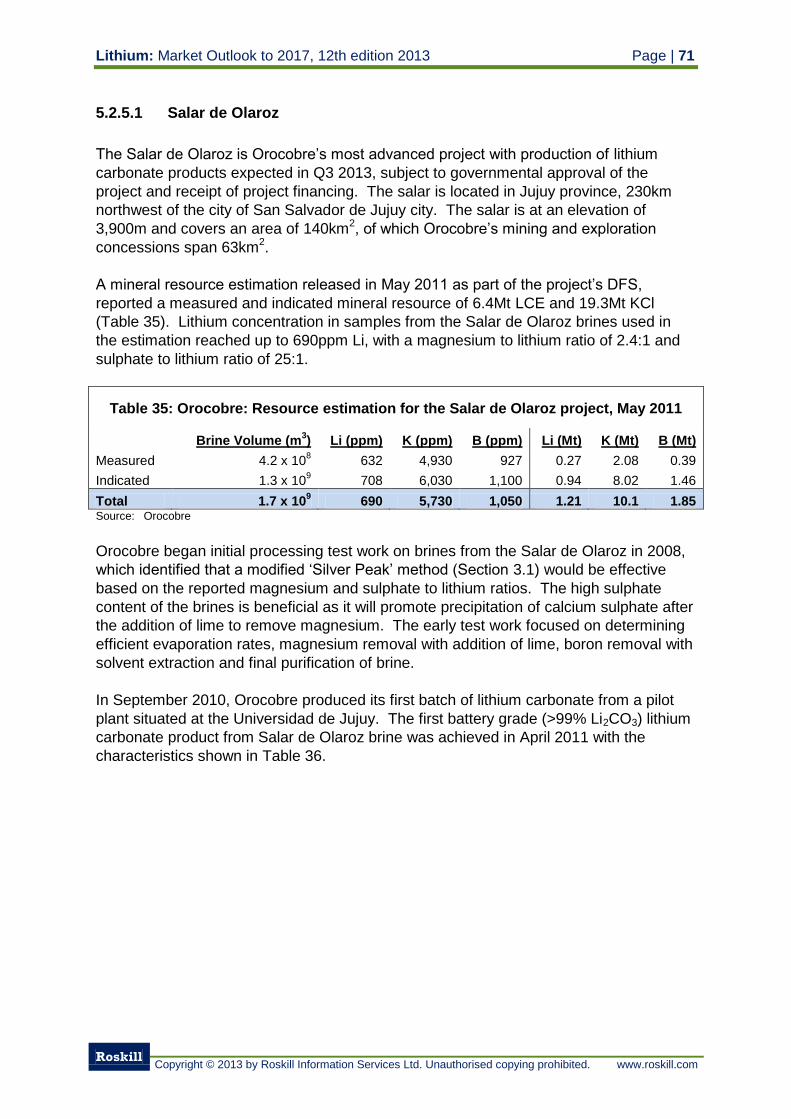
Lithium: Market Outlook to 2017, 12th edition 2013 Page | 71
Roskill
Copyright © 2013 by Roskill Information Services Ltd. Unauthorised copying prohibited. www.roskill.com
5.2.5.1 Salar de Olaroz
The Salar de Olaroz is Orocobre’s most advanced project with production of lithium
carbonate products expected in Q3 2013, subject to governmental approval of the
project and receipt of project financing. The salar is located in Jujuy province, 230km
northwest of the city of San Salvador de Jujuy city. The salar is at an elevation of
3,900m and covers an area of 140km2, of which Orocobre’s mining and exploration
concessions span 63km2.
A mineral resource estimation released in May 2011 as part of the project’s DFS,
reported a measured and indicated mineral resource of 6.4Mt LCE and 19.3Mt KCl
(Table 35). Lithium concentration in samples from the Salar de Olaroz brines used in
the estimation reached up to 690ppm Li, with a magnesium to lithium ratio of 2.4:1 and
sulphate to lithium ratio of 25:1.
Table 35: Orocobre: Resource estimation for the Salar de Olaroz project, May 2011
Brine Volume (m
3) Li (ppm) K (ppm) B (ppm) Li (Mt) K (Mt) B (Mt)
Measured 4.2 x 10⁸ 632 4,930 927 0.27 2.08 0.39
Indicated 1.3 x 10⁹ 708 6,030 1,100 0.94 8.02 1.46
Total 1.7 x 10⁹ 690 5,730 1,050 1.21 10.1 1.85
Source: Orocobre
Orocobre began initial processing test work on brines from the Salar de Olaroz in 2008,
which identified that a modified ‘Silver Peak’ method (Section 3.1) would be effective
based on the reported magnesium and sulphate to lithium ratios. The high sulphate
content of the brines is beneficial as it will promote precipitation of calcium sulphate after
the addition of lime to remove magnesium. The early test work focused on determining
efficient evaporation rates, magnesium removal with addition of lime, boron removal with
solvent extraction and final purification of brine.
In September 2010, Orocobre produced its first batch of lithium carbonate from a pilot
plant situated at the Universidad de Jujuy. The first battery grade (>99% Li2CO3) lithium
carbonate product from Salar de Olaroz brine was achieved in April 2011 with the
characteristics shown in Table 36.
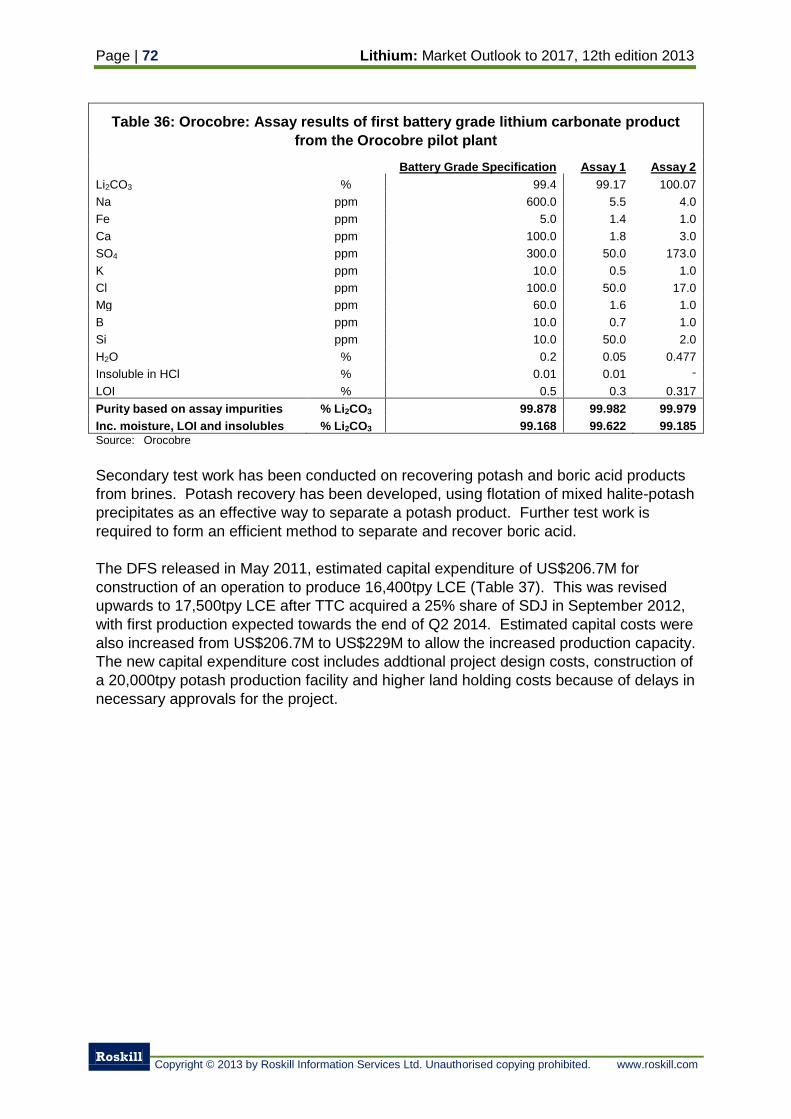
Page | 72 Lithium: Market Outlook to 2017, 12th edition 2013
Roskill
Copyright © 2013 by Roskill Information Services Ltd. Unauthorised copying prohibited. www.roskill.com
Table 36: Orocobre: Assay results of first battery grade lithium carbonate product
from the Orocobre pilot plant
Battery Grade Specification Assay 1 Assay 2
Li2CO3 % 99.4 99.17 100.07
Na ppm 600.0 5.5 4.0
Fe ppm 5.0 1.4 1.0
Ca ppm 100.0 1.8 3.0
SO4 ppm 300.0 50.0 173.0
K ppm 10.0 0.5 1.0
Cl ppm 100.0 50.0 17.0
Mg ppm 60.0 1.6 1.0
B ppm 10.0 0.7 1.0
Si ppm 10.0 50.0 2.0
H2O % 0.2 0.05 0.477
Insoluble in HCl % 0.01 0.01 -
LOI % 0.5 0.3 0.317
Purity based on assay impurities % Li2CO3 99.878 99.982 99.979
Inc. moisture, LOI and insolubles % Li2CO3 99.168 99.622 99.185 Source: Orocobre
Secondary test work has been conducted on recovering potash and boric acid products
from brines. Potash recovery has been developed, using flotation of mixed halite-potash
precipitates as an effective way to separate a potash product. Further test work is
required to form an efficient method to separate and recover boric acid.
The DFS released in May 2011, estimated capital expenditure of US$206.7M for
construction of an operation to produce 16,400tpy LCE (Table 37). This was revised
upwards to 17,500tpy LCE after TTC acquired a 25% share of SDJ in September 2012,
with first production expected towards the end of Q2 2014. Estimated capital costs were
also increased from US$206.7M to US$229M to allow the increased production capacity.
The new capital expenditure cost includes addtional project design costs, construction of
a 20,000tpy potash production facility and higher land holding costs because of delays in
necessary approvals for the project.
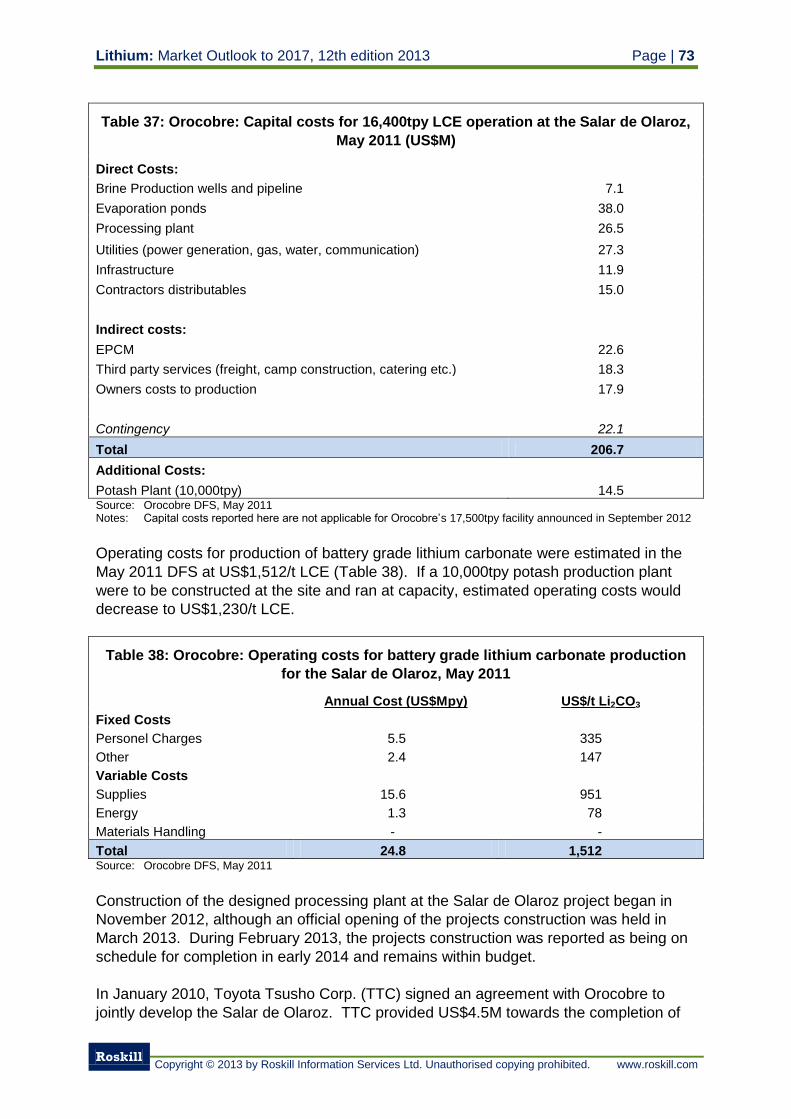
Lithium: Market Outlook to 2017, 12th edition 2013 Page | 73
Roskill
Copyright © 2013 by Roskill Information Services Ltd. Unauthorised copying prohibited. www.roskill.com
Table 37: Orocobre: Capital costs for 16,400tpy LCE operation at the Salar de Olaroz,
May 2011 (US$M)
Direct Costs: Brine Production wells and pipeline 7.1
Evaporation ponds 38.0
Processing plant 26.5
Utilities (power generation, gas, water, communication) 27.3
Infrastructure 11.9
Contractors distributables 15.0
Indirect costs: EPCM 22.6
Third party services (freight, camp construction, catering etc.) 18.3
Owners costs to production 17.9
Contingency 22.1
Total 206.7
Additional Costs:
Potash Plant (10,000tpy) 14.5 Source: Orocobre DFS, May 2011 Notes: Capital costs reported here are not applicable for Orocobre’s 17,500tpy facility announced in September 2012
Operating costs for production of battery grade lithium carbonate were estimated in the
May 2011 DFS at US$1,512/t LCE (Table 38). If a 10,000tpy potash production plant
were to be constructed at the site and ran at capacity, estimated operating costs would
decrease to US$1,230/t LCE.
Table 38: Orocobre: Operating costs for battery grade lithium carbonate production
for the Salar de Olaroz, May 2011
Annual Cost (US$Mpy) US$/t Li2CO3
Fixed Costs
Personel Charges 5.5 335
Other 2.4 147
Variable Costs
Supplies 15.6 951
Energy 1.3 78
Materials Handling - -
Total 24.8 1,512 Source: Orocobre DFS, May 2011
Construction of the designed processing plant at the Salar de Olaroz project began in
November 2012, although an official opening of the projects construction was held in
March 2013. During February 2013, the projects construction was reported as being on
schedule for completion in early 2014 and remains within budget.
In January 2010, Toyota Tsusho Corp. (TTC) signed an agreement with Orocobre to
jointly develop the Salar de Olaroz. TTC provided US$4.5M towards the completion of
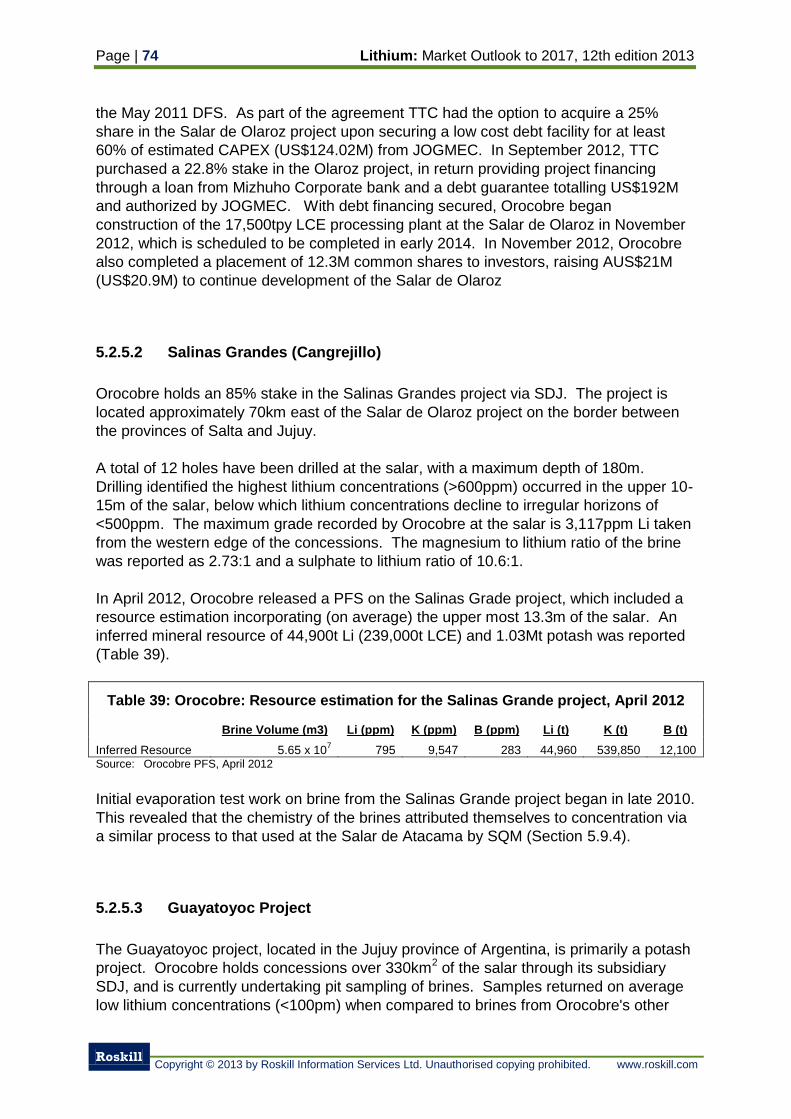
Page | 74 Lithium: Market Outlook to 2017, 12th edition 2013
Roskill
Copyright © 2013 by Roskill Information Services Ltd. Unauthorised copying prohibited. www.roskill.com
the May 2011 DFS. As part of the agreement TTC had the option to acquire a 25%
share in the Salar de Olaroz project upon securing a low cost debt facility for at least
60% of estimated CAPEX (US$124.02M) from JOGMEC. In September 2012, TTC
purchased a 22.8% stake in the Olaroz project, in return providing project financing
through a loan from Mizhuho Corporate bank and a debt guarantee totalling US$192M
and authorized by JOGMEC. With debt financing secured, Orocobre began
construction of the 17,500tpy LCE processing plant at the Salar de Olaroz in November
2012, which is scheduled to be completed in early 2014. In November 2012, Orocobre
also completed a placement of 12.3M common shares to investors, raising AUS$21M
(US$20.9M) to continue development of the Salar de Olaroz
5.2.5.2 Salinas Grandes (Cangrejillo)
Orocobre holds an 85% stake in the Salinas Grandes project via SDJ. The project is
located approximately 70km east of the Salar de Olaroz project on the border between
the provinces of Salta and Jujuy.
A total of 12 holes have been drilled at the salar, with a maximum depth of 180m.
Drilling identified the highest lithium concentrations (>600ppm) occurred in the upper 10-
15m of the salar, below which lithium concentrations decline to irregular horizons of
<500ppm. The maximum grade recorded by Orocobre at the salar is 3,117ppm Li taken
from the western edge of the concessions. The magnesium to lithium ratio of the brine
was reported as 2.73:1 and a sulphate to lithium ratio of 10.6:1.
In April 2012, Orocobre released a PFS on the Salinas Grade project, which included a
resource estimation incorporating (on average) the upper most 13.3m of the salar. An
inferred mineral resource of 44,900t Li (239,000t LCE) and 1.03Mt potash was reported
(Table 39).
Table 39: Orocobre: Resource estimation for the Salinas Grande project, April 2012
Brine Volume (m3) Li (ppm) K (ppm) B (ppm) Li (t) K (t) B (t)
Inferred Resource 5.65 x 10⁷ 795 9,547 283 44,960 539,850 12,100
Source: Orocobre PFS, April 2012
Initial evaporation test work on brine from the Salinas Grande project began in late 2010.
This revealed that the chemistry of the brines attributed themselves to concentration via
a similar process to that used at the Salar de Atacama by SQM (Section 5.9.4).
5.2.5.3 Guayatoyoc Project
The Guayatoyoc project, located in the Jujuy province of Argentina, is primarily a potash
project. Orocobre holds concessions over 330km2 of the salar through its subsidiary
SDJ, and is currently undertaking pit sampling of brines. Samples returned on average
low lithium concentrations (<100pm) when compared to brines from Orocobre's other
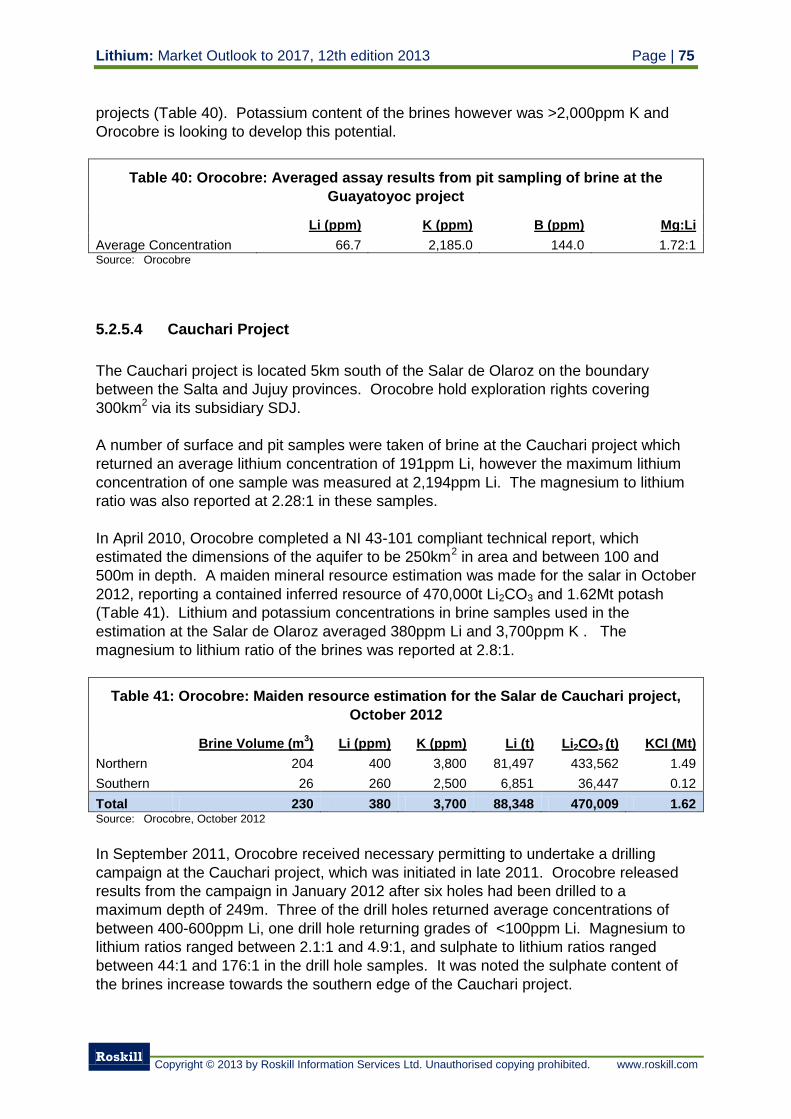
Lithium: Market Outlook to 2017, 12th edition 2013 Page | 75
Roskill
Copyright © 2013 by Roskill Information Services Ltd. Unauthorised copying prohibited. www.roskill.com
projects (Table 40). Potassium content of the brines however was >2,000ppm K and
Orocobre is looking to develop this potential.
Table 40: Orocobre: Averaged assay results from pit sampling of brine at the
Guayatoyoc project
Li (ppm) K (ppm) B (ppm) Mg:Li
Average Concentration 66.7 2,185.0 144.0 1.72:1 Source: Orocobre
5.2.5.4 Cauchari Project
The Cauchari project is located 5km south of the Salar de Olaroz on the boundary
between the Salta and Jujuy provinces. Orocobre hold exploration rights covering
300km2 via its subsidiary SDJ.
A number of surface and pit samples were taken of brine at the Cauchari project which
returned an average lithium concentration of 191ppm Li, however the maximum lithium
concentration of one sample was measured at 2,194ppm Li. The magnesium to lithium
ratio was also reported at 2.28:1 in these samples.
In April 2010, Orocobre completed a NI 43-101 compliant technical report, which
estimated the dimensions of the aquifer to be 250km2 in area and between 100 and
500m in depth. A maiden mineral resource estimation was made for the salar in October
2012, reporting a contained inferred resource of 470,000t Li2CO3 and 1.62Mt potash
(Table 41). Lithium and potassium concentrations in brine samples used in the
estimation at the Salar de Olaroz averaged 380ppm Li and 3,700ppm K . The
magnesium to lithium ratio of the brines was reported at 2.8:1.
Table 41: Orocobre: Maiden resource estimation for the Salar de Cauchari project,
October 2012
Brine Volume (m
3) Li (ppm) K (ppm) Li (t) Li2CO3 (t) KCl (Mt)
Northern 204 400 3,800 81,497 433,562 1.49
Southern 26 260 2,500 6,851 36,447 0.12
Total 230 380 3,700 88,348 470,009 1.62 Source: Orocobre, October 2012
In September 2011, Orocobre received necessary permitting to undertake a drilling
campaign at the Cauchari project, which was initiated in late 2011. Orocobre released
results from the campaign in January 2012 after six holes had been drilled to a
maximum depth of 249m. Three of the drill holes returned average concentrations of
between 400-600ppm Li, one drill hole returning grades of <100ppm Li. Magnesium to
lithium ratios ranged between 2.1:1 and 4.9:1, and sulphate to lithium ratios ranged
between 44:1 and 176:1 in the drill hole samples. It was noted the sulphate content of
the brines increase towards the southern edge of the Cauchari project.
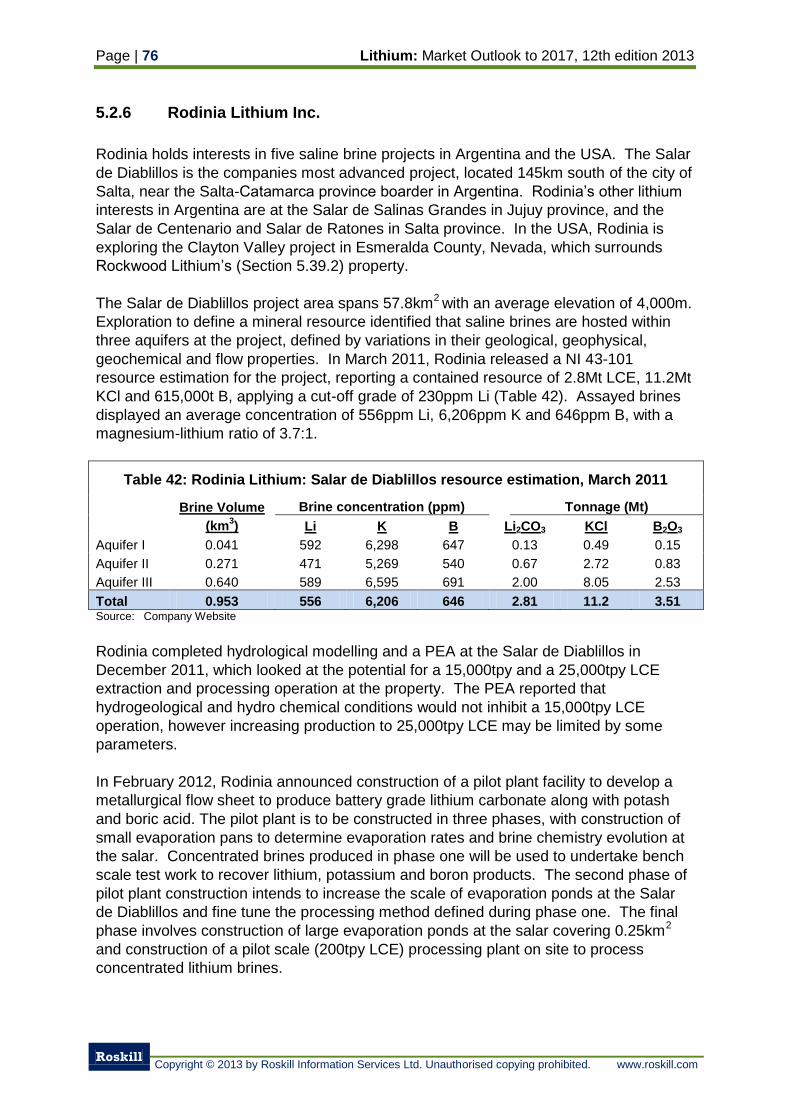
Page | 76 Lithium: Market Outlook to 2017, 12th edition 2013
Roskill
Copyright © 2013 by Roskill Information Services Ltd. Unauthorised copying prohibited. www.roskill.com
5.2.6 Rodinia Lithium Inc.
Rodinia holds interests in five saline brine projects in Argentina and the USA. The Salar
de Diablillos is the companies most advanced project, located 145km south of the city of
Salta, near the Salta-Catamarca province boarder in Argentina. Rodinia’s other lithium
interests in Argentina are at the Salar de Salinas Grandes in Jujuy province, and the
Salar de Centenario and Salar de Ratones in Salta province. In the USA, Rodinia is
exploring the Clayton Valley project in Esmeralda County, Nevada, which surrounds
Rockwood Lithium’s (Section 5.39.2) property.
The Salar de Diablillos project area spans 57.8km2 with an average elevation of 4,000m.
Exploration to define a mineral resource identified that saline brines are hosted within
three aquifers at the project, defined by variations in their geological, geophysical,
geochemical and flow properties. In March 2011, Rodinia released a NI 43-101
resource estimation for the project, reporting a contained resource of 2.8Mt LCE, 11.2Mt
KCl and 615,000t B, applying a cut-off grade of 230ppm Li (Table 42). Assayed brines
displayed an average concentration of 556ppm Li, 6,206ppm K and 646ppm B, with a
magnesium-lithium ratio of 3.7:1.
Table 42: Rodinia Lithium: Salar de Diablillos resource estimation, March 2011
Brine Volume
(km3)
Brine concentration (ppm)
Tonnage (Mt)
Li K B Li2CO3 KCl B2O3
Aquifer I 0.041 592 6,298 647 0.13 0.49 0.15
Aquifer II 0.271 471 5,269 540 0.67 2.72 0.83
Aquifer III 0.640 589 6,595 691 2.00 8.05 2.53
Total 0.953 556 6,206 646 2.81 11.2 3.51 Source: Company Website
Rodinia completed hydrological modelling and a PEA at the Salar de Diablillos in
December 2011, which looked at the potential for a 15,000tpy and a 25,000tpy LCE
extraction and processing operation at the property. The PEA reported that
hydrogeological and hydro chemical conditions would not inhibit a 15,000tpy LCE
operation, however increasing production to 25,000tpy LCE may be limited by some
parameters.
In February 2012, Rodinia announced construction of a pilot plant facility to develop a
metallurgical flow sheet to produce battery grade lithium carbonate along with potash
and boric acid. The pilot plant is to be constructed in three phases, with construction of
small evaporation pans to determine evaporation rates and brine chemistry evolution at
the salar. Concentrated brines produced in phase one will be used to undertake bench
scale test work to recover lithium, potassium and boron products. The second phase of
pilot plant construction intends to increase the scale of evaporation ponds at the Salar
de Diablillos and fine tune the processing method defined during phase one. The final
phase involves construction of large evaporation ponds at the salar covering 0.25km2
and construction of a pilot scale (200tpy LCE) processing plant on site to process
concentrated lithium brines.
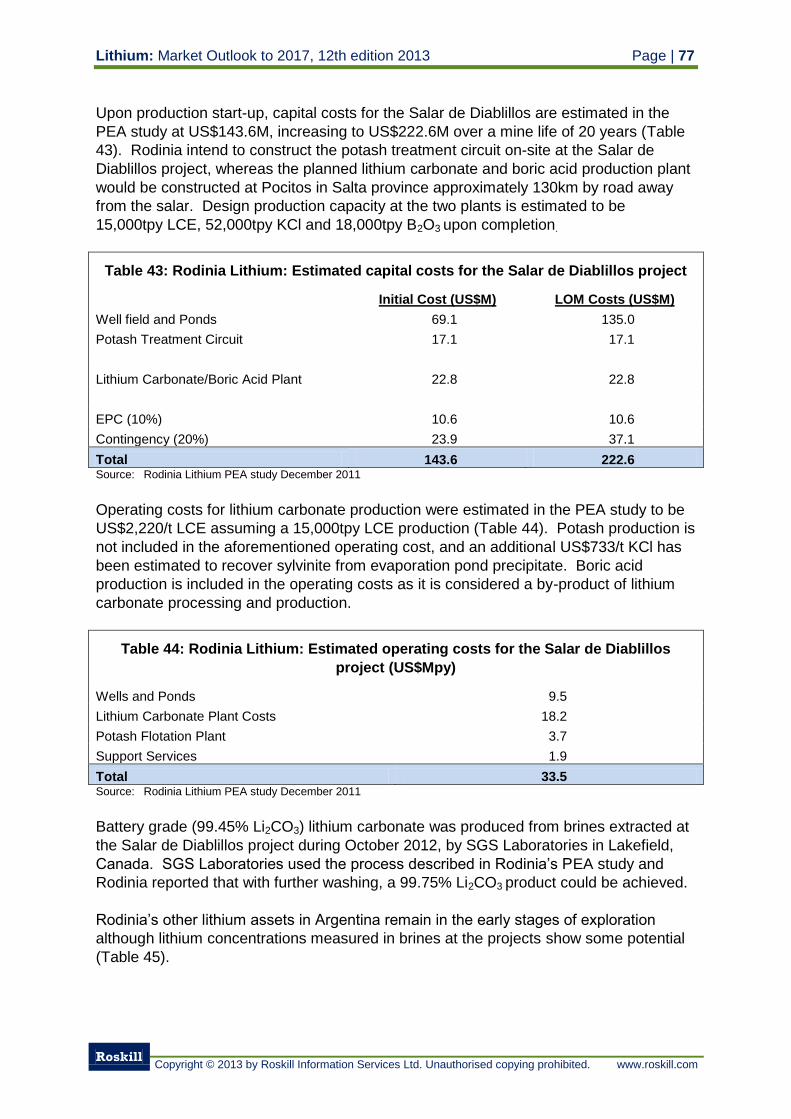
Lithium: Market Outlook to 2017, 12th edition 2013 Page | 77
Roskill
Copyright © 2013 by Roskill Information Services Ltd. Unauthorised copying prohibited. www.roskill.com
Upon production start-up, capital costs for the Salar de Diablillos are estimated in the
PEA study at US$143.6M, increasing to US$222.6M over a mine life of 20 years (Table
43). Rodinia intend to construct the potash treatment circuit on-site at the Salar de
Diablillos project, whereas the planned lithium carbonate and boric acid production plant
would be constructed at Pocitos in Salta province approximately 130km by road away
from the salar. Design production capacity at the two plants is estimated to be
15,000tpy LCE, 52,000tpy KCl and 18,000tpy B2O3 upon completion.
Table 43: Rodinia Lithium: Estimated capital costs for the Salar de Diablillos project
Initial Cost (US$M) LOM Costs (US$M)
Well field and Ponds 69.1 135.0
Potash Treatment Circuit 17.1 17.1
Lithium Carbonate/Boric Acid Plant 22.8 22.8
EPC (10%) 10.6 10.6
Contingency (20%) 23.9 37.1
Total 143.6 222.6 Source: Rodinia Lithium PEA study December 2011
Operating costs for lithium carbonate production were estimated in the PEA study to be
US$2,220/t LCE assuming a 15,000tpy LCE production (Table 44). Potash production is
not included in the aforementioned operating cost, and an additional US$733/t KCl has
been estimated to recover sylvinite from evaporation pond precipitate. Boric acid
production is included in the operating costs as it is considered a by-product of lithium
carbonate processing and production.
Table 44: Rodinia Lithium: Estimated operating costs for the Salar de Diablillos
project (US$Mpy)
Wells and Ponds 9.5
Lithium Carbonate Plant Costs 18.2
Potash Flotation Plant 3.7
Support Services 1.9
Total 33.5 Source: Rodinia Lithium PEA study December 2011
Battery grade (99.45% Li2CO3) lithium carbonate was produced from brines extracted at
the Salar de Diablillos project during October 2012, by SGS Laboratories in Lakefield,
Canada. SGS Laboratories used the process described in Rodinia’s PEA study and
Rodinia reported that with further washing, a 99.75% Li2CO3 product could be achieved.
Rodinia’s other lithium assets in Argentina remain in the early stages of exploration
although lithium concentrations measured in brines at the projects show some potential
(Table 45).
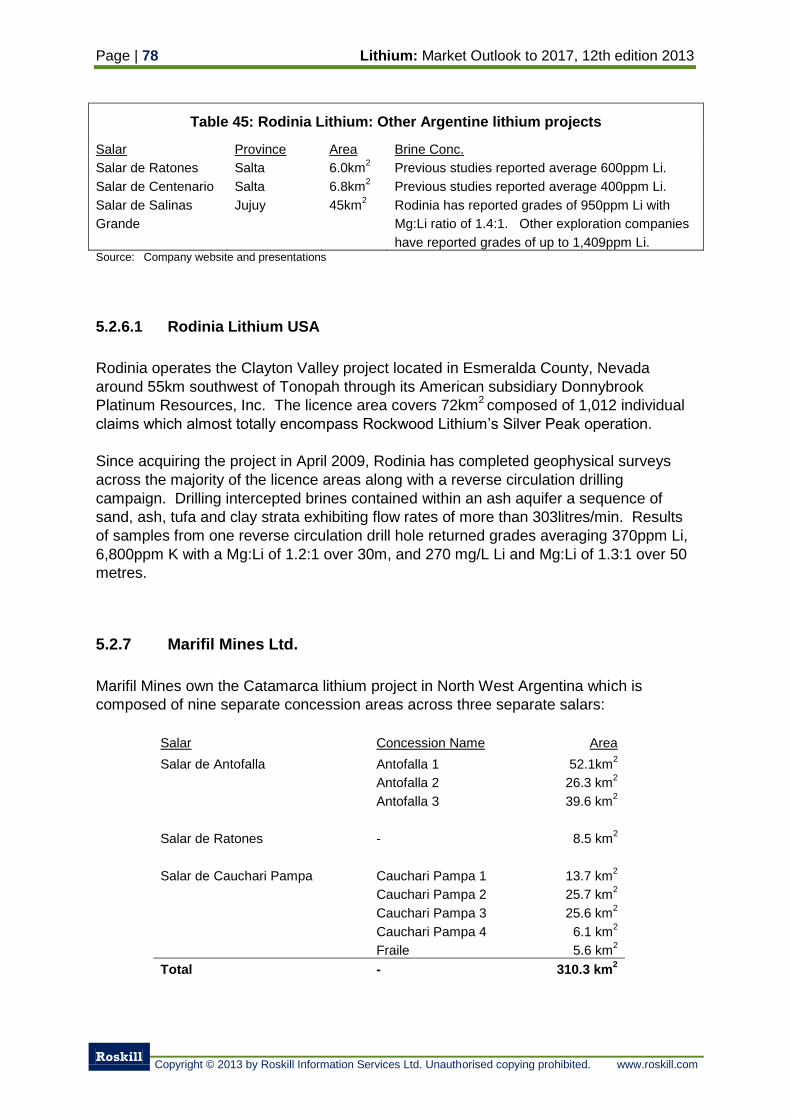
Page | 78 Lithium: Market Outlook to 2017, 12th edition 2013
Roskill
Copyright © 2013 by Roskill Information Services Ltd. Unauthorised copying prohibited. www.roskill.com
Table 45: Rodinia Lithium: Other Argentine lithium projects
Salar Province Area Brine Conc.
Salar de Ratones Salta 6.0km2
Previous studies reported average 600ppm Li.
Salar de Centenario Salta 6.8km2
Previous studies reported average 400ppm Li.
Salar de Salinas
Grande
Jujuy 45km2
Rodinia has reported grades of 950ppm Li with
Mg:Li ratio of 1.4:1. Other exploration companies
have reported grades of up to 1,409ppm Li. Source: Company website and presentations
5.2.6.1 Rodinia Lithium USA
Rodinia operates the Clayton Valley project located in Esmeralda County, Nevada
around 55km southwest of Tonopah through its American subsidiary Donnybrook
Platinum Resources, Inc. The licence area covers 72km2 composed of 1,012 individual
claims which almost totally encompass Rockwood Lithium’s Silver Peak operation.
Since acquiring the project in April 2009, Rodinia has completed geophysical surveys
across the majority of the licence areas along with a reverse circulation drilling
campaign. Drilling intercepted brines contained within an ash aquifer a sequence of
sand, ash, tufa and clay strata exhibiting flow rates of more than 303litres/min. Results
of samples from one reverse circulation drill hole returned grades averaging 370ppm Li,
6,800ppm K with a Mg:Li of 1.2:1 over 30m, and 270 mg/L Li and Mg:Li of 1.3:1 over 50
metres.
5.2.7 Marifil Mines Ltd.
Marifil Mines own the Catamarca lithium project in North West Argentina which is
composed of nine separate concession areas across three separate salars:
Salar Concession Name Area
Salar de Antofalla Antofalla 1 52.1km2
Antofalla 2 26.3 km2
Antofalla 3 39.6 km2
Salar de Ratones - 8.5 km2
Salar de Cauchari Pampa Cauchari Pampa 1 13.7 km2
Cauchari Pampa 2 25.7 km2
Cauchari Pampa 3 25.6 km2
Cauchari Pampa 4 6.1 km2
Fraile 5.6 km2
Total - 310.3 km2
Lithium: Market Outlook to 2017, 12th edition 2013 Page | 79
Roskill
Copyright © 2013 by Roskill Information Services Ltd. Unauthorised copying prohibited. www.roskill.com
After signing an agreement with Renholn Holdings Inc. to sell the Catamarca Property in
October 2010, Marafil terminated the agreement in September 2011 after Renholn
Holdings and its majority owner Oblata Resources in their view undertook minimal
follow-up exploration work at the property. Subsequently Marafil purchased the
Cauchari Pampa 4 and Fralie concessions increasing their concenssion area by
11.7km2.
Marifil have budgeted US$1.5M to undertake a two phase exploration program including
drilling on the concession areas to identify anomalous lithium concentrations in brines
and work towards producing a resource estimation for the project.
5.2.8 International Lithium Corporation
International Lithium Corp. (ILC) is a mineral exploration company with lithium projects in
Canada (Section 5.8), Ireland (Section 5.18), the USA (Section 5.39) and Argentina.
The company is owned 25.5% by TNR Gold Corporation and 14.7% by Jiangxi Ganfeng
Lithium Co. Ltd. (Section 5.10.7.6)
ILC’s exploration efforts are mainly focused on the wholly owned Mariana project in
Salta Province of Argentina. The lithium-potash project licence areas cover 160km2,
encompassing the entire salar. ILC began a US$750,000 reverse circulation drilling
program in January 2012, working towards delineating an inferred resource estimation in
late 2012. Results from samples taken from brines during the January 2012 drilling
returned average lithium concentrations of between 255ppm and 345ppm Li, with Mg:Li
ratios ranging between 14.6:1 and 17.4:1. A second US$1.5M drilling campaign is
planned at the Mariana Project in mid-2012 composed of between 10-20 drill holes
which will be used in any future resource estimations.
5.2.9 Other prospects for Lithium Production
Dajin Resource Corp. owns concession covering the Salar de Salinas Grandes and
Salar de Guayatayoc in Salta and Jujuy provinces of Argentina. The concessions held
cover approximately 1,030km2 of which 830km
2 overlies salar and tertiary palaeo-salar.
Chemical analysis of brines at the Salar de Salinas Grandes have returned lithium
concentrations of 700 ppm Li and 10,000ppm K, with a Mg:Li ratio of 3.5:1.
Renholn Holdings Inc. owned 80% by Oblata Resources and 20% by Red Sea
Resources hold concessions covering the Salar de Arizaro in Salta Province and
Catamarca lithium project in Catamarca Province. At the Salar de Arizaro, samples of
the brines have returned concentrations of 700ppm Li, with potassium grades exceeding
8,000ppm K and boron concentrations averaging 750ppm B.
A joint venture between Bolloré and Eramet (Bollore S.A. - Eramet S.A. JV) signed an
agreement with Minera Santa Rita in February 2012, giving the joint venture access to
explore a number of concession in the north of Argentina.
Page | 80 Lithium: Market Outlook to 2017, 12th edition 2013
Roskill
Copyright © 2013 by Roskill Information Services Ltd. Unauthorised copying prohibited. www.roskill.com
Leopard Resources is scheduled to purchase a 70% interest in an Argentine company
with an 85% interest in two mining licences overlying salars. The company has planned
to produce 10,000tpy LCE from the projects within three years of an agreement being
signed with the original owners, after which it shall receive a further 15% stake in the
company.
Lacus Minerals is an Argentina-based resource company focused on the exploration
and development of brine projects for their lithium and potash potential. The company
owns claims covering 726km2 in northern Argentina at two separate salars, the Salar de
Centenario and Salar de Pocitos. Geochemical and gravity surveys have been
completed by Lacus on both the Centenario and Pocitos salars, along with an initial drill
campaign to prove the existence of lithium and potash bearing brines at the projects.
Lacus also previously held claims over the Salar de Rincon, however the company sold
these claims to ADY Resources (Section 5.2.2), in July 2011.
5.3 Australia
Since September 2010, Talison Lithium and Galaxy Resources have been responsible
for all of Australia’s lithium mineral extraction and production. In 2011, Australia became
the largest supplier of lithium products producing approximately 66,000t LCE, exceeding
Chilean output for the first time since the early 1990s. A number of other mineral
exploration companies including Reed Resources, Altura Mining and Artemis Resources
are also developing lithium projects based around pegmatite intrusives and saline lakes
in Western Australia and Queensland.
The USGS estimates that Australia contains lithium reserves of 970,000t Li, the third
largest national reserves behind Chile and China. Talison Lithium’s Greenbushes
project and Galaxy Resources’ Mt. Cattlin spodumene mines in Western Australia form
the majority of Australia’s reserves.
Australia’s imports and exports of lithium chemicals are minor; however the country’s
trade in mineral concentrates in notable on a global scale. Exports of mineral
substances are shown in Table 46, excluding natural micaeous iron oxides. The values
in Table 46 include exports of natural magnesium sulphate and vermiculite, however
spodumene mineral concentrates contribute the majority of total exports. This is also
shown by the close correlation with reported sales of spodumene concentrate by Galaxy
Resources and Talison Lithium. Since 2007, China has consistently been the largest
market for Australian spodumene concentrates with exports to the country growing on
average at over 18%py. In 2012, China was the destination for 87% of Australian
mineral substance exports, reaching nearly 450,000t. Other importers of Australian
spodumene material include Germany, the USA and Belgium, importing 14,340t, 13,999t
and 23,330t in 2011 respectively.
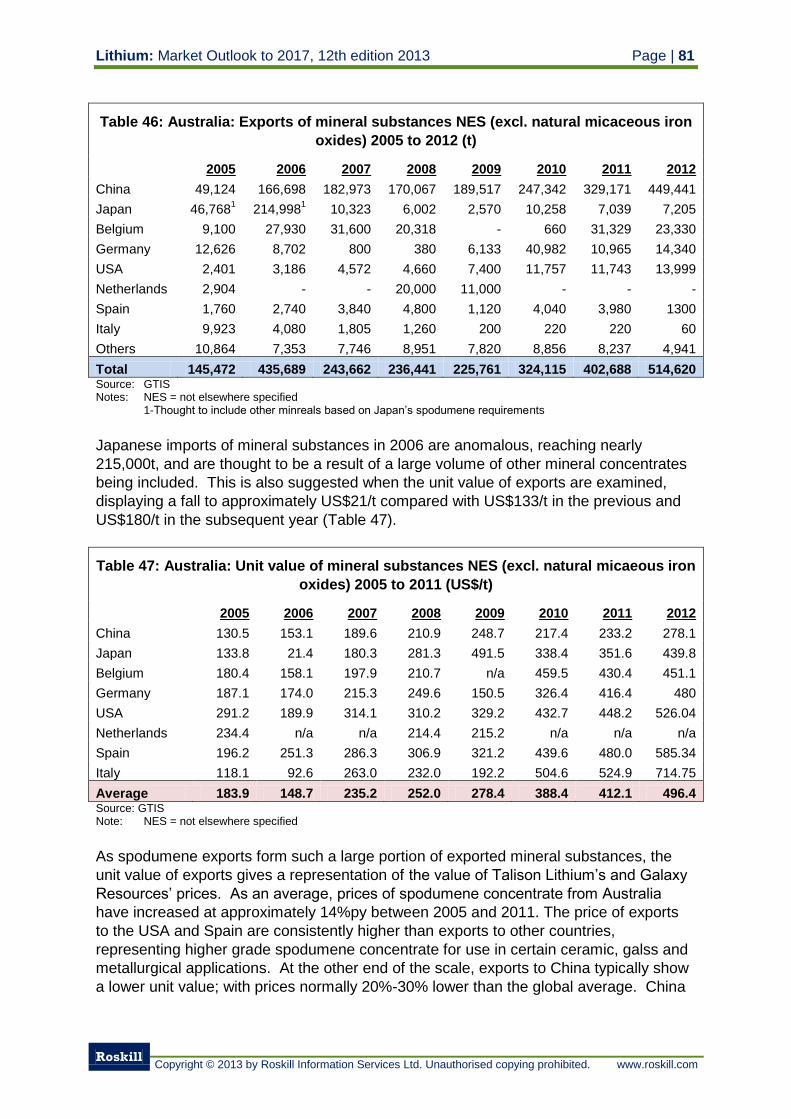
Lithium: Market Outlook to 2017, 12th edition 2013 Page | 81
Roskill
Copyright © 2013 by Roskill Information Services Ltd. Unauthorised copying prohibited. www.roskill.com
Table 46: Australia: Exports of mineral substances NES (excl. natural micaceous iron
oxides) 2005 to 2012 (t)
2005 2006 2007 2008 2009 2010 2011 2012
China 49,124 166,698 182,973 170,067 189,517 247,342 329,171 449,441
Japan 46,7681
214,9981
10,323 6,002 2,570 10,258 7,039 7,205
Belgium 9,100 27,930 31,600 20,318 - 660 31,329 23,330
Germany 12,626 8,702 800 380 6,133 40,982 10,965 14,340
USA 2,401 3,186 4,572 4,660 7,400 11,757 11,743 13,999
Netherlands 2,904 - - 20,000 11,000 - - -
Spain 1,760 2,740 3,840 4,800 1,120 4,040 3,980 1300
Italy 9,923 4,080 1,805 1,260 200 220 220 60
Others 10,864 7,353 7,746 8,951 7,820 8,856 8,237 4,941
Total 145,472 435,689 243,662 236,441 225,761 324,115 402,688 514,620 Source: GTIS Notes: NES = not elsewhere specified
1-Thought to include other minreals based on Japan’s spodumene requirements
Japanese imports of mineral substances in 2006 are anomalous, reaching nearly
215,000t, and are thought to be a result of a large volume of other mineral concentrates
being included. This is also suggested when the unit value of exports are examined,
displaying a fall to approximately US$21/t compared with US$133/t in the previous and
US$180/t in the subsequent year (Table 47).
Table 47: Australia: Unit value of mineral substances NES (excl. natural micaeous iron
oxides) 2005 to 2011 (US$/t)
2005 2006 2007 2008 2009 2010 2011 2012
China 130.5 153.1 189.6 210.9 248.7 217.4 233.2 278.1
Japan 133.8 21.4 180.3 281.3 491.5 338.4 351.6 439.8
Belgium 180.4 158.1 197.9 210.7 n/a 459.5 430.4 451.1
Germany 187.1 174.0 215.3 249.6 150.5 326.4 416.4 480
USA 291.2 189.9 314.1 310.2 329.2 432.7 448.2 526.04
Netherlands 234.4 n/a n/a 214.4 215.2 n/a n/a n/a
Spain 196.2 251.3 286.3 306.9 321.2 439.6 480.0 585.34
Italy 118.1 92.6 263.0 232.0 192.2 504.6 524.9 714.75
Average 183.9 148.7 235.2 252.0 278.4 388.4 412.1 496.4 Source: GTIS Note: NES = not elsewhere specified
As spodumene exports form such a large portion of exported mineral substances, the
unit value of exports gives a representation of the value of Talison Lithium’s and Galaxy
Resources’ prices. As an average, prices of spodumene concentrate from Australia
have increased at approximately 14%py between 2005 and 2011. The price of exports
to the USA and Spain are consistently higher than exports to other countries,
representing higher grade spodumene concentrate for use in certain ceramic, galss and
metallurgical applications. At the other end of the scale, exports to China typically show
a lower unit value; with prices normally 20%-30% lower than the global average. China
Page | 82 Lithium: Market Outlook to 2017, 12th edition 2013
Roskill
Copyright © 2013 by Roskill Information Services Ltd. Unauthorised copying prohibited. www.roskill.com
imports a large volume of spodumene concentrate with higher iron content used in
mineral conversion to lithium chemicals, which might explain the lower average price.
5.3.1 Talison Lithium
In August 2007, Talison Minerals was formed after the acquisition of Sons of Gwalia’s
Advanced Minerals Division by a group of five private equity firms. In the takeover,
Talison Minerals gained control of the Greenbushes lithium, tantalum and tin mine in
Western Australia, the Wodgina tantalum mine in the Pilbara region of Western Australia
and exploration leases around the Wodgina project. In 2009, Talison Minerals split into
two companies; Talison Lithium Ltd. which focuses on lithium operations and exploration
projects and Global Advanced Metals, which took control of the tantalum operations and
exploration prospects.
In September 2010, Talison Lithium merged with Salares Lithium Inc. (Salares). Salares
owns the option to purchase a 70% share of Salar de Atacama Sociedad Contractual
Minera who themselves wholly own five brine lakes and partly own a further 2 brine
lakes in Chile. The seven brine lakes are collectively known as the ‘Salares 7’ project.
As part of the merger with Salares, Talison Lithium listed on the Toronto Stock
Exchange.
In August 2012, Rockwood Lithium (Section 5.39.2) announced that they had signed an
agreement to purchase 100% of shares and options in Talison Lithium at a cost of
CAN$6.50 per share, totalling CAN$724M (US$733.7M). In December 2012 however,
Sichuan Tianqi offered to purchase 100% of Talison Lithium’s shares for an improved
price of CAN$7.50/share, valuing Talison Litihum at CAN$847M (US$851.6M). The
Sichuan Tianqi offer was accepted by Talison Lithium shareholders in February and is
awaiting approval by the Federal Court of Australia on 12th March 2013. Further details
of the acquisition and Sichuan Tianqi are detailed in section 5.10.7.1.
5.3.1.1 Resources and Reserves
Greenbushes Mine
Located 250km south of Perth in Western Australia, the Greenbushes operation is the
largest and highest grade resource of lithium minerals in the world. The operation works
a mineralised pegmatite body which extends roughly north west-south east for more
than 3,000m with a width of up to 300m. The morphology of the pegmatite is a main
steeply dipping pegmatite intrusive with multiple smaller pegmatite offshoots and footwall
pods confined within the Donny Brook – Bridgetown shear zone.
The pegmatite contains two distinct economic zones of mineralisation, the sodium zone
and the lithium zone. The sodium zone is characterised by an albite-muscovite-
tourmaline assemblage with associated tantalite and cassiterite. The lithium zone is
enriched in the mineral spodumene, forming around 50% of the total rock mass. A third
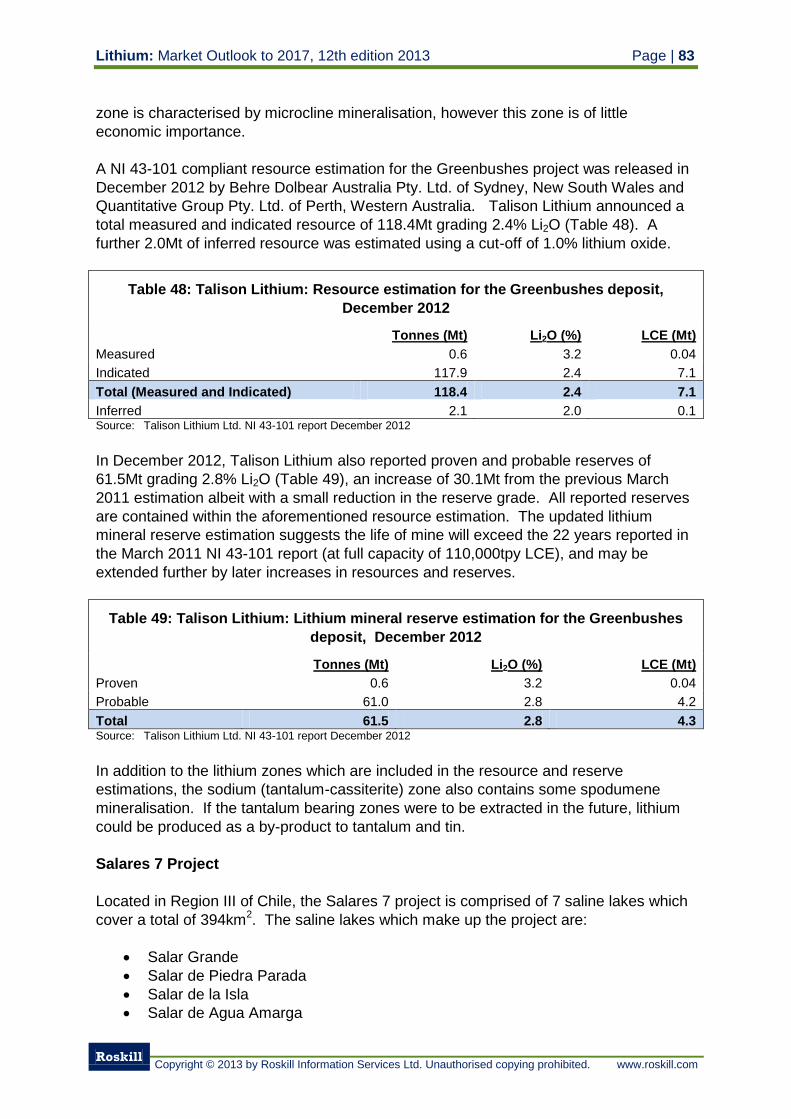
Lithium: Market Outlook to 2017, 12th edition 2013 Page | 83
Roskill
Copyright © 2013 by Roskill Information Services Ltd. Unauthorised copying prohibited. www.roskill.com
zone is characterised by microcline mineralisation, however this zone is of little
economic importance.
A NI 43-101 compliant resource estimation for the Greenbushes project was released in
December 2012 by Behre Dolbear Australia Pty. Ltd. of Sydney, New South Wales and
Quantitative Group Pty. Ltd. of Perth, Western Australia. Talison Lithium announced a
total measured and indicated resource of 118.4Mt grading 2.4% Li2O (Table 48). A
further 2.0Mt of inferred resource was estimated using a cut-off of 1.0% lithium oxide.
Table 48: Talison Lithium: Resource estimation for the Greenbushes deposit,
December 2012
Tonnes (Mt) Li2O (%) LCE (Mt)
Measured 0.6 3.2 0.04
Indicated 117.9 2.4 7.1
Total (Measured and Indicated) 118.4 2.4 7.1
Inferred 2.1 2.0 0.1 Source: Talison Lithium Ltd. NI 43-101 report December 2012
In December 2012, Talison Lithium also reported proven and probable reserves of
61.5Mt grading 2.8% Li2O (Table 49), an increase of 30.1Mt from the previous March
2011 estimation albeit with a small reduction in the reserve grade. All reported reserves
are contained within the aforementioned resource estimation. The updated lithium
mineral reserve estimation suggests the life of mine will exceed the 22 years reported in
the March 2011 NI 43-101 report (at full capacity of 110,000tpy LCE), and may be
extended further by later increases in resources and reserves.
Table 49: Talison Lithium: Lithium mineral reserve estimation for the Greenbushes
deposit, December 2012
Tonnes (Mt) Li2O (%) LCE (Mt)
Proven 0.6 3.2 0.04
Probable 61.0 2.8 4.2
Total 61.5 2.8 4.3 Source: Talison Lithium Ltd. NI 43-101 report December 2012
In addition to the lithium zones which are included in the resource and reserve
estimations, the sodium (tantalum-cassiterite) zone also contains some spodumene
mineralisation. If the tantalum bearing zones were to be extracted in the future, lithium
could be produced as a by-product to tantalum and tin.
Salares 7 Project
Located in Region III of Chile, the Salares 7 project is comprised of 7 saline lakes which
cover a total of 394km2. The saline lakes which make up the project are:
Salar Grande
Salar de Piedra Parada
Salar de la Isla
Salar de Agua Amarga
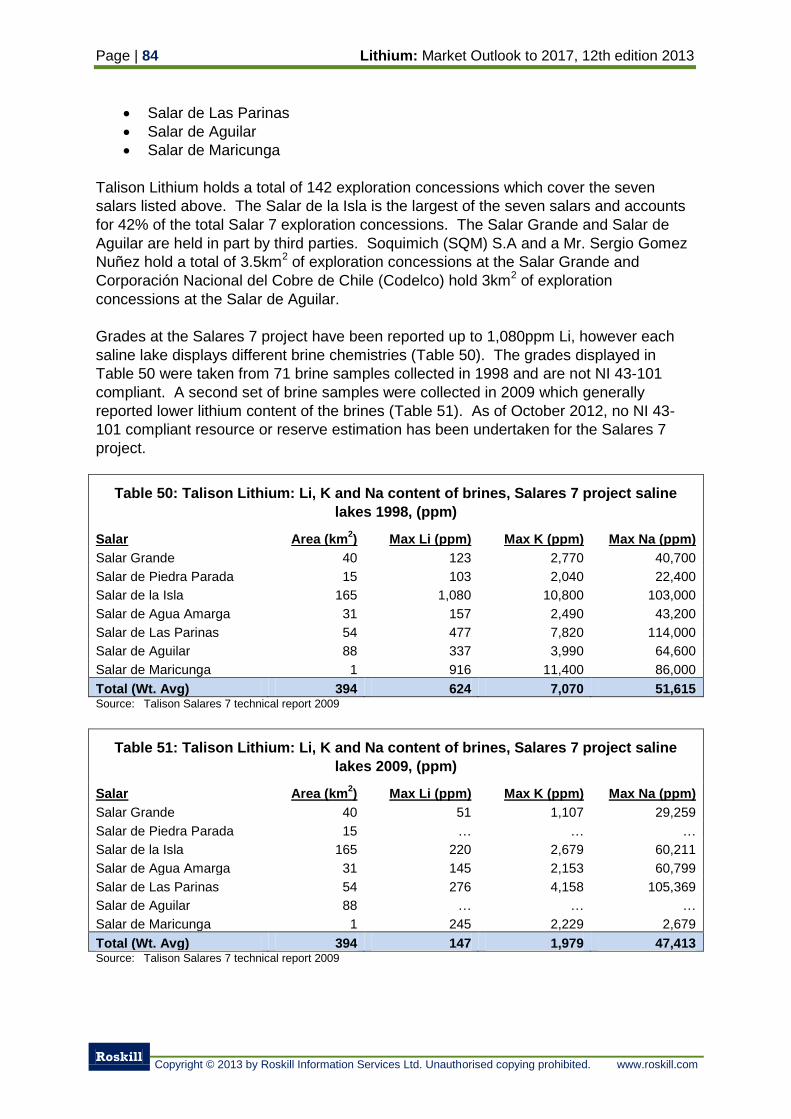
Page | 84 Lithium: Market Outlook to 2017, 12th edition 2013
Roskill
Copyright © 2013 by Roskill Information Services Ltd. Unauthorised copying prohibited. www.roskill.com
Salar de Las Parinas
Salar de Aguilar
Salar de Maricunga
Talison Lithium holds a total of 142 exploration concessions which cover the seven
salars listed above. The Salar de la Isla is the largest of the seven salars and accounts
for 42% of the total Salar 7 exploration concessions. The Salar Grande and Salar de
Aguilar are held in part by third parties. Soquimich (SQM) S.A and a Mr. Sergio Gomez
Nuñez hold a total of 3.5km2 of exploration concessions at the Salar Grande and
Corporación Nacional del Cobre de Chile (Codelco) hold 3km2 of exploration
concessions at the Salar de Aguilar.
Grades at the Salares 7 project have been reported up to 1,080ppm Li, however each
saline lake displays different brine chemistries (Table 50). The grades displayed in
Table 50 were taken from 71 brine samples collected in 1998 and are not NI 43-101
compliant. A second set of brine samples were collected in 2009 which generally
reported lower lithium content of the brines (Table 51). As of October 2012, no NI 43-
101 compliant resource or reserve estimation has been undertaken for the Salares 7
project.
Table 50: Talison Lithium: Li, K and Na content of brines, Salares 7 project saline
lakes 1998, (ppm)
Salar Area (km2) Max Li (ppm) Max K (ppm) Max Na (ppm)
Salar Grande 40 123 2,770 40,700
Salar de Piedra Parada 15 103 2,040 22,400
Salar de la Isla 165 1,080 10,800 103,000
Salar de Agua Amarga 31 157 2,490 43,200
Salar de Las Parinas 54 477 7,820 114,000
Salar de Aguilar 88 337 3,990 64,600
Salar de Maricunga 1 916 11,400 86,000
Total (Wt. Avg) 394 624 7,070 51,615 Source: Talison Salares 7 technical report 2009
Table 51: Talison Lithium: Li, K and Na content of brines, Salares 7 project saline
lakes 2009, (ppm)
Salar Area (km2) Max Li (ppm) Max K (ppm) Max Na (ppm)
Salar Grande 40 51 1,107 29,259
Salar de Piedra Parada 15 … … …
Salar de la Isla 165 220 2,679 60,211
Salar de Agua Amarga 31 145 2,153 60,799
Salar de Las Parinas 54 276 4,158 105,369
Salar de Aguilar 88 … … …
Salar de Maricunga 1 245 2,229 2,679
Total (Wt. Avg) 394 147 1,979 47,413 Source: Talison Salares 7 technical report 2009
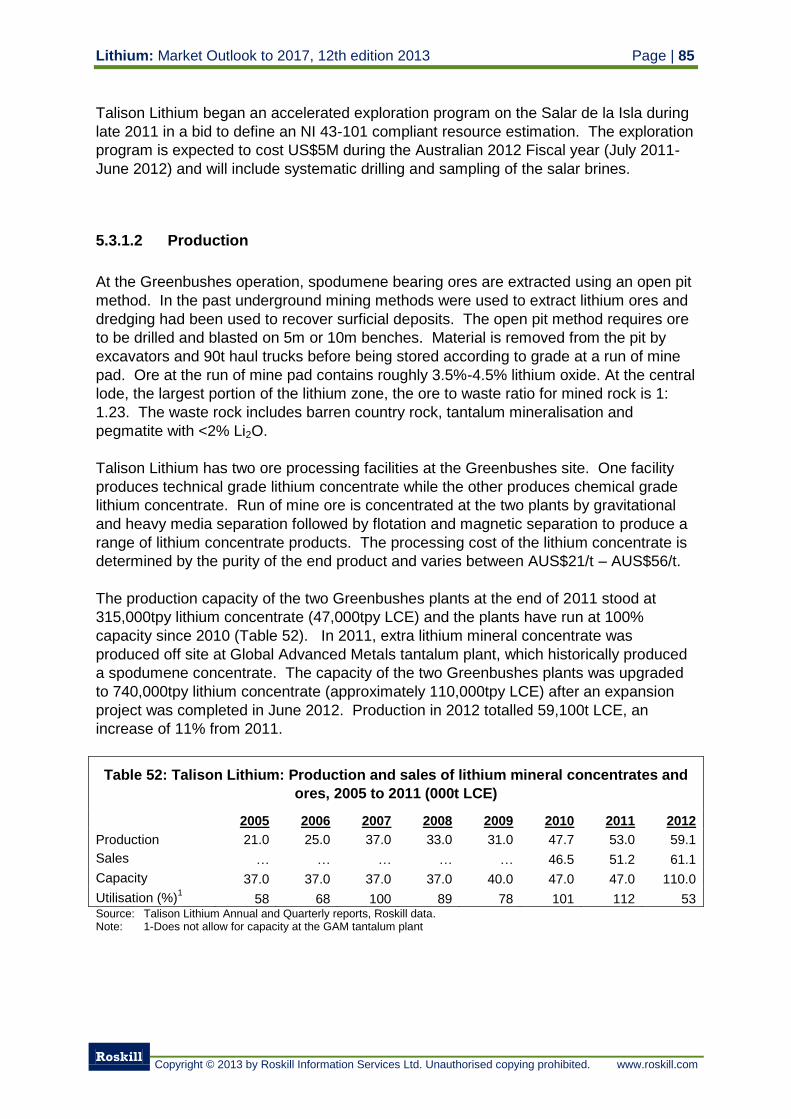
Lithium: Market Outlook to 2017, 12th edition 2013 Page | 85
Roskill
Copyright © 2013 by Roskill Information Services Ltd. Unauthorised copying prohibited. www.roskill.com
Talison Lithium began an accelerated exploration program on the Salar de la Isla during
late 2011 in a bid to define an NI 43-101 compliant resource estimation. The exploration
program is expected to cost US$5M during the Australian 2012 Fiscal year (July 2011-
June 2012) and will include systematic drilling and sampling of the salar brines.
5.3.1.2 Production
At the Greenbushes operation, spodumene bearing ores are extracted using an open pit
method. In the past underground mining methods were used to extract lithium ores and
dredging had been used to recover surficial deposits. The open pit method requires ore
to be drilled and blasted on 5m or 10m benches. Material is removed from the pit by
excavators and 90t haul trucks before being stored according to grade at a run of mine
pad. Ore at the run of mine pad contains roughly 3.5%-4.5% lithium oxide. At the central
lode, the largest portion of the lithium zone, the ore to waste ratio for mined rock is 1:
1.23. The waste rock includes barren country rock, tantalum mineralisation and
pegmatite with <2% Li2O.
Talison Lithium has two ore processing facilities at the Greenbushes site. One facility
produces technical grade lithium concentrate while the other produces chemical grade
lithium concentrate. Run of mine ore is concentrated at the two plants by gravitational
and heavy media separation followed by flotation and magnetic separation to produce a
range of lithium concentrate products. The processing cost of the lithium concentrate is
determined by the purity of the end product and varies between AUS$21/t – AUS$56/t.
The production capacity of the two Greenbushes plants at the end of 2011 stood at
315,000tpy lithium concentrate (47,000tpy LCE) and the plants have run at 100%
capacity since 2010 (Table 52). In 2011, extra lithium mineral concentrate was
produced off site at Global Advanced Metals tantalum plant, which historically produced
a spodumene concentrate. The capacity of the two Greenbushes plants was upgraded
to 740,000tpy lithium concentrate (approximately 110,000tpy LCE) after an expansion
project was completed in June 2012. Production in 2012 totalled 59,100t LCE, an
increase of 11% from 2011.
Table 52: Talison Lithium: Production and sales of lithium mineral concentrates and
ores, 2005 to 2011 (000t LCE)
2005 2006 2007 2008 2009 2010 2011 2012
Production 21.0 25.0 37.0 33.0 31.0 47.7 53.0 59.1
Sales … … … … … 46.5 51.2 61.1
Capacity 37.0 37.0 37.0 37.0 40.0 47.0 47.0 110.0
Utilisation (%)1
58 68 100 89 78 101 112 53 Source: Talison Lithium Annual and Quarterly reports, Roskill data. Note: 1-Does not allow for capacity at the GAM tantalum plant
Page | 86 Lithium: Market Outlook to 2017, 12th edition 2013
Roskill
Copyright © 2013 by Roskill Information Services Ltd. Unauthorised copying prohibited. www.roskill.com
After preliminary engineering and location studies at two sites in Western Australia,
Talison Lithium announced in February 2012 that it intends to construct a lithium
minerals conversion plant producing 20,000tpy lithium carbonate at Kwinana. The
Kwinana site is located approximately 40km south of Perth and was chosen because of
its proximity to water, reagents and energy supply, access to skilled labour and close
location to Fremantle Port. In December 2011, Talison Lithium invested AUS$3.7M in
the mineral conversion plant project to finance a detailed engineering study commencing
in early 2012 on the recommended construction site. The detailed study will work on a
proposed 20,000tpy LCE plant capacity, which would be doubled during a second phase
of construction. Commissioning is anticipated to be completed in 2015 and Talison
Lithium intend to make an investment decision on the project by the end of 2012.
In December 2011, Talison Lithium announced they were in talks with Japanese trading
firm Sojitz Corporation to discuss collaborative marketing and distribution for any lithium
carbonate production from the planned facility.
In February 2012, Talison Lithium signed a non-binding memorandum of understanding
(MoU) with Mitsui & Co., Ltd to discuss marketing future production from the planned
mineral conversion plant in Western Australia. Mitsui will aim to distribute lithium
carbonate in Japan, a major market for lithium-ion batteries and lithium chemicals.
5.3.1.3 Products
Talison Lithium supplies a number of lithium mineral products (Table 53). Product
SC6.0 is produced at the Greenbushes Chemical Grade Plant whilst all other lithium
mineral concentrate products (SC4.8, SC6.4, SC 7.0 and SC 7.5) are produced at the
Greenbushes Technical Grade Plant. SC4.8 grade is mostly exported to Europe and
China for use in glass-ceramics because of its low iron content. Talison Lithium’s
SC6.4, SC7.0 & SC7.5 products are typically used in the glass, ceramics, and foundry
and casting industries because of their high lithium and low iron content.
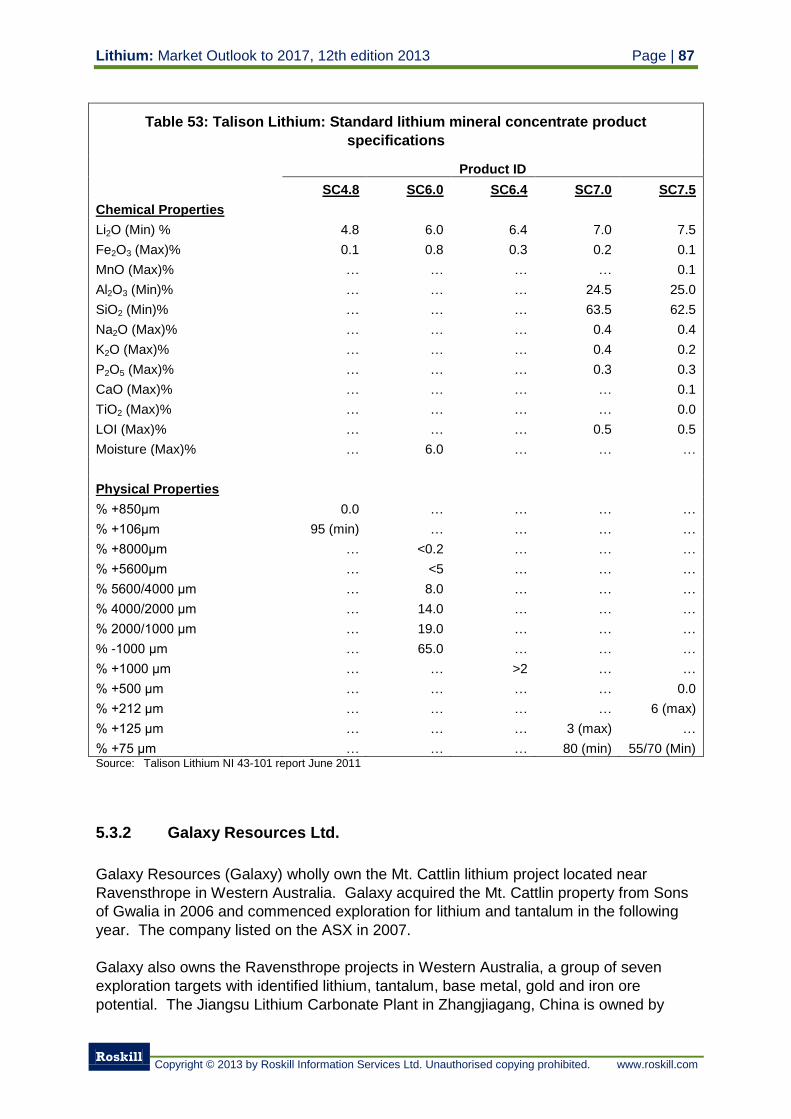
Lithium: Market Outlook to 2017, 12th edition 2013 Page | 87
Roskill
Copyright © 2013 by Roskill Information Services Ltd. Unauthorised copying prohibited. www.roskill.com
Table 53: Talison Lithium: Standard lithium mineral concentrate product
specifications
Product ID
SC4.8 SC6.0 SC6.4 SC7.0 SC7.5
Chemical Properties
Li2O (Min) % 4.8 6.0 6.4 7.0 7.5
Fe2O3 (Max)% 0.1 0.8 0.3 0.2 0.1
MnO (Max)% … … … … 0.1
Al2O3 (Min)% … … … 24.5 25.0
SiO2 (Min)% … … … 63.5 62.5
Na2O (Max)% … … … 0.4 0.4
K2O (Max)% … … … 0.4 0.2
P2O5 (Max)% … … … 0.3 0.3
CaO (Max)% … … … … 0.1
TiO2 (Max)% … … … … 0.0
LOI (Max)% … … … 0.5 0.5
Moisture (Max)% … 6.0 … … …
Physical Properties
% +850μm 0.0 … … … …
% +106μm 95 (min) … … … …
% +8000μm … <0.2 … … …
% +5600μm … <5 … … …
% 5600/4000 μm … 8.0 … … …
% 4000/2000 μm … 14.0 … … …
% 2000/1000 μm … 19.0 … … …
% -1000 μm … 65.0 … … …
% +1000 μm … … >2 … …
% +500 μm … … … … 0.0
% +212 μm … … … … 6 (max)
% +125 μm … … … 3 (max) …
% +75 μm … … … 80 (min) 55/70 (Min) Source: Talison Lithium NI 43-101 report June 2011
5.3.2 Galaxy Resources Ltd.
Galaxy Resources (Galaxy) wholly own the Mt. Cattlin lithium project located near
Ravensthrope in Western Australia. Galaxy acquired the Mt. Cattlin property from Sons
of Gwalia in 2006 and commenced exploration for lithium and tantalum in the following
year. The company listed on the ASX in 2007.
Galaxy also owns the Ravensthrope projects in Western Australia, a group of seven
exploration targets with identified lithium, tantalum, base metal, gold and iron ore
potential. The Jiangsu Lithium Carbonate Plant in Zhangjiagang, China is owned by
Page | 88 Lithium: Market Outlook to 2017, 12th edition 2013
Roskill
Copyright © 2013 by Roskill Information Services Ltd. Unauthorised copying prohibited. www.roskill.com
Galaxy and was officially opened in March 2012. The plant has a capacity to produce
17,000tpy battery grade lithium carbonate, all of which will be distributed to long term off-
take partners in Japan and China.
On 30th March 2012, Galaxy announced that it had signed a definitive agreement with
Lithium One to merge the two companies into a single enterprise. The merger will not
only boost the resource base, but also allows Galaxy to develop both brine and
spodumene based lithium projects. The James Bay exploration project, held by both
Lithium One and Galaxy will also become wholly owned by Galaxy. The offer valued
Lithium One at CAN$112M which at the time of the merger agreement held an 80%
stake in the James Bay Project, Canada and 100% owned the Sal de Vida project in
Argentina. On 30th March 2012, Galaxy raised AUS$30M (US$31.2M) in capital via a
share placement, to support its merger with Lithium One. The merger deal was accepted
by both companies’ shareholders in June 2012, and finalised after a final court hearing
to approve the merger on the 3rd July 2012.
In November 2012, Galaxy Resources raised AUS$81M (US$84.5M) through a two
‘tranche’ placement of 162.3M common shares to current shareholder M&G Investments
(30M common shares at AUS$0.50/share) in the first tranche, and East China Mineral
Exploration and Development Bureau (ECME) (132.4M common shares at
AUS$0.50/share) in a second tranche. The first tranche of the share purchase
increased M&G Investments’ interest in Galaxy Resources to 19.3%. M&G Investment’s
shareholding was expected to be diluted to 16.4% by the second tranche of the
placement which would have seen state owned ECME’s gain a 19.8% interest in Galaxy
Resources. ECME however withdrew their intention to invest in Galaxy in January 2013,
indicating that it would consider the investment again when stable production at the
Jiangsu Litihum Carboante Plant was achieved.
5.3.2.1 Reserves and Resources
Mount Cattlin Mine
Located approximately 430km south east of Perth, the Mt. Cattlin operation mines
lithium bearing pegmatites. The morphology of the pegmatite body is flat lying which
allows for a low stripping ratio of 2.4:1. The main lithium bearing minerals are
spodumene and lepidolite, which occur along with tantalum and niobium mineralisation
as tantalite/columbite and sporadic tin mineralisation as cassiterite.
In February 2011, Galaxy released an updated mineral resource estimation completed
by both Galaxy and Hellman and Schofield Pty Ltd. A cut-off grade of 0.4% Li2O was
used for the updated resource and the results are shown in Table 54. As a result of the
increased resource, the life of mine was extended to 18 years, assuming a 1Mt ore/y
mining rate. The February 2011 resource estimate was updated to incorporate depletion
by mining up until December 2011, lowering the estimated remaining mineral resource to
17.15Mt grading 1.09% Li2O and 155ppm Ta2O5.
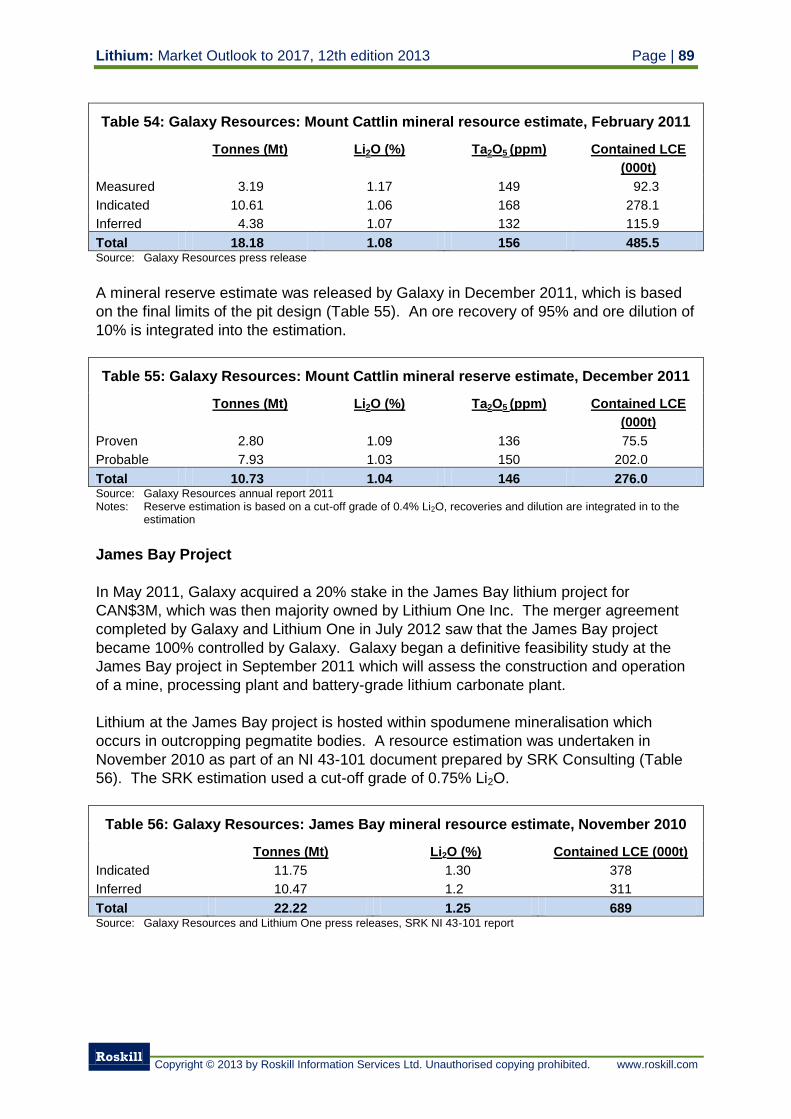
Lithium: Market Outlook to 2017, 12th edition 2013 Page | 89
Roskill
Copyright © 2013 by Roskill Information Services Ltd. Unauthorised copying prohibited. www.roskill.com
Table 54: Galaxy Resources: Mount Cattlin mineral resource estimate, February 2011
Tonnes (Mt) Li2O (%) Ta2O5 (ppm) Contained LCE
(000t)
Measured 3.19 1.17 149 92.3
Indicated 10.61 1.06 168 278.1
Inferred 4.38 1.07 132 115.9
Total 18.18 1.08 156 485.5 Source: Galaxy Resources press release
A mineral reserve estimate was released by Galaxy in December 2011, which is based
on the final limits of the pit design (Table 55). An ore recovery of 95% and ore dilution of
10% is integrated into the estimation.
Table 55: Galaxy Resources: Mount Cattlin mineral reserve estimate, December 2011
Tonnes (Mt) Li2O (%) Ta2O5 (ppm) Contained LCE
(000t)
Proven 2.80 1.09 136 75.5
Probable 7.93 1.03 150 202.0
Total 10.73 1.04 146 276.0 Source: Galaxy Resources annual report 2011 Notes: Reserve estimation is based on a cut-off grade of 0.4% Li2O, recoveries and dilution are integrated in to the
estimation
James Bay Project
In May 2011, Galaxy acquired a 20% stake in the James Bay lithium project for
CAN$3M, which was then majority owned by Lithium One Inc. The merger agreement
completed by Galaxy and Lithium One in July 2012 saw that the James Bay project
became 100% controlled by Galaxy. Galaxy began a definitive feasibility study at the
James Bay project in September 2011 which will assess the construction and operation
of a mine, processing plant and battery-grade lithium carbonate plant.
Lithium at the James Bay project is hosted within spodumene mineralisation which
occurs in outcropping pegmatite bodies. A resource estimation was undertaken in
November 2010 as part of an NI 43-101 document prepared by SRK Consulting (Table
56). The SRK estimation used a cut-off grade of 0.75% Li2O.
Table 56: Galaxy Resources: James Bay mineral resource estimate, November 2010
Tonnes (Mt) Li2O (%) Contained LCE (000t)
Indicated 11.75 1.30 378
Inferred 10.47 1.2 311
Total 22.22 1.25 689 Source: Galaxy Resources and Lithium One press releases, SRK NI 43-101 report
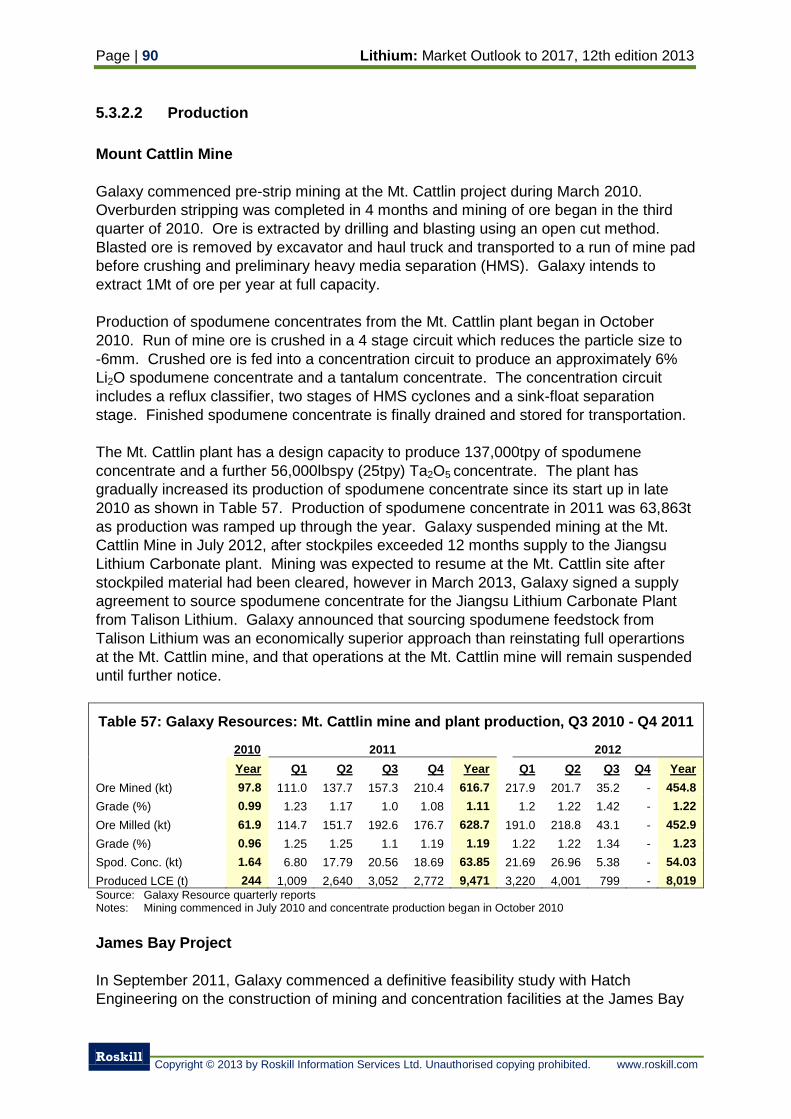
Page | 90 Lithium: Market Outlook to 2017, 12th edition 2013
Roskill
Copyright © 2013 by Roskill Information Services Ltd. Unauthorised copying prohibited. www.roskill.com
5.3.2.2 Production
Mount Cattlin Mine
Galaxy commenced pre-strip mining at the Mt. Cattlin project during March 2010.
Overburden stripping was completed in 4 months and mining of ore began in the third
quarter of 2010. Ore is extracted by drilling and blasting using an open cut method.
Blasted ore is removed by excavator and haul truck and transported to a run of mine pad
before crushing and preliminary heavy media separation (HMS). Galaxy intends to
extract 1Mt of ore per year at full capacity.
Production of spodumene concentrates from the Mt. Cattlin plant began in October
2010. Run of mine ore is crushed in a 4 stage circuit which reduces the particle size to
-6mm. Crushed ore is fed into a concentration circuit to produce an approximately 6%
Li2O spodumene concentrate and a tantalum concentrate. The concentration circuit
includes a reflux classifier, two stages of HMS cyclones and a sink-float separation
stage. Finished spodumene concentrate is finally drained and stored for transportation.
The Mt. Cattlin plant has a design capacity to produce 137,000tpy of spodumene
concentrate and a further 56,000lbspy (25tpy) Ta2O5 concentrate. The plant has
gradually increased its production of spodumene concentrate since its start up in late
2010 as shown in Table 57. Production of spodumene concentrate in 2011 was 63,863t
as production was ramped up through the year. Galaxy suspended mining at the Mt.
Cattlin Mine in July 2012, after stockpiles exceeded 12 months supply to the Jiangsu
Lithium Carbonate plant. Mining was expected to resume at the Mt. Cattlin site after
stockpiled material had been cleared, however in March 2013, Galaxy signed a supply
agreement to source spodumene concentrate for the Jiangsu Lithium Carbonate Plant
from Talison Lithium. Galaxy announced that sourcing spodumene feedstock from
Talison Lithium was an economically superior approach than reinstating full operartions
at the Mt. Cattlin mine, and that operations at the Mt. Cattlin mine will remain suspended
until further notice.
Table 57: Galaxy Resources: Mt. Cattlin mine and plant production, Q3 2010 - Q4 2011
2010 2011 2012
Year Q1 Q2 Q3 Q4 Year Q1 Q2 Q3 Q4 Year
Ore Mined (kt) 97.8 111.0 137.7 157.3 210.4 616.7 217.9 201.7 35.2 - 454.8
Grade (%) 0.99 1.23 1.17 1.0 1.08 1.11 1.2 1.22 1.42 - 1.22
Ore Milled (kt) 61.9 114.7 151.7 192.6 176.7 628.7 191.0 218.8 43.1 - 452.9
Grade (%) 0.96 1.25 1.25 1.1 1.19 1.19 1.22 1.22 1.34 - 1.23
Spod. Conc. (kt) 1.64 6.80 17.79 20.56 18.69 63.85 21.69 26.96 5.38 - 54.03
Produced LCE (t) 244 1,009 2,640 3,052 2,772 9,471 3,220 4,001 799 - 8,019
Source: Galaxy Resource quarterly reports Notes: Mining commenced in July 2010 and concentrate production began in October 2010
James Bay Project
In September 2011, Galaxy commenced a definitive feasibility study with Hatch
Engineering on the construction of mining and concentration facilities at the James Bay
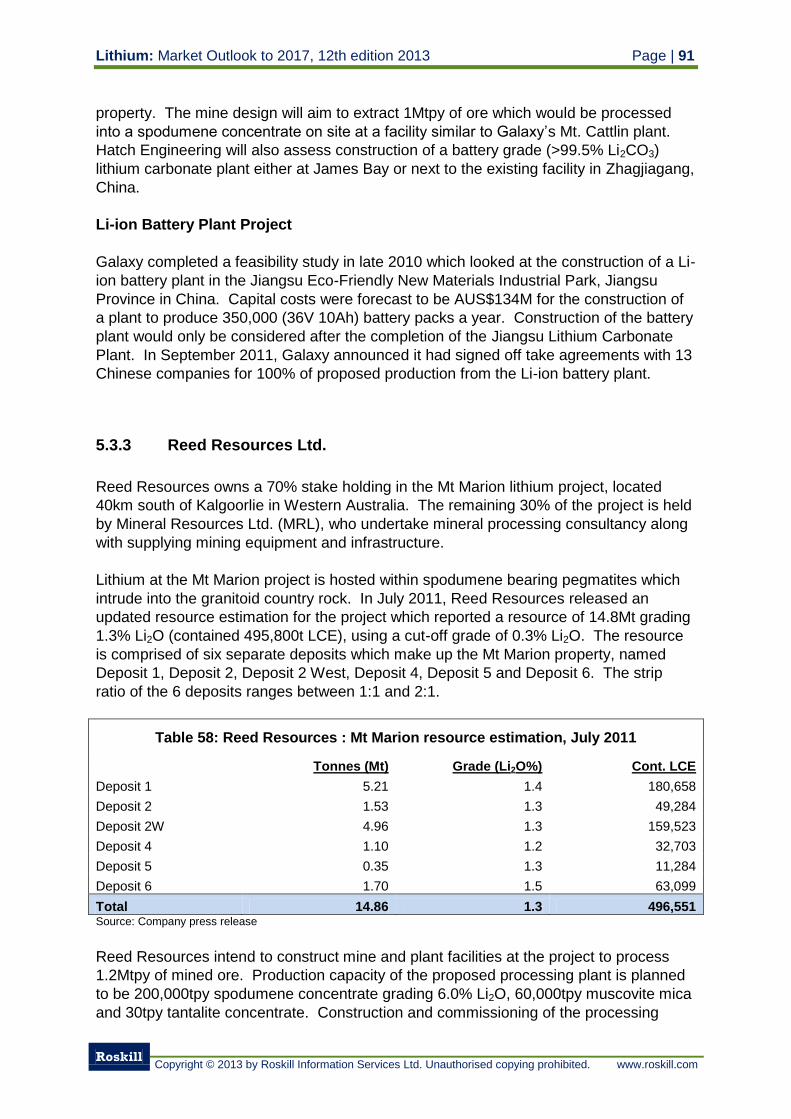
Lithium: Market Outlook to 2017, 12th edition 2013 Page | 91
Roskill
Copyright © 2013 by Roskill Information Services Ltd. Unauthorised copying prohibited. www.roskill.com
property. The mine design will aim to extract 1Mtpy of ore which would be processed
into a spodumene concentrate on site at a facility similar to Galaxy’s Mt. Cattlin plant.
Hatch Engineering will also assess construction of a battery grade (>99.5% Li2CO3)
lithium carbonate plant either at James Bay or next to the existing facility in Zhagjiagang,
China.
Li-ion Battery Plant Project
Galaxy completed a feasibility study in late 2010 which looked at the construction of a Li-
ion battery plant in the Jiangsu Eco-Friendly New Materials Industrial Park, Jiangsu
Province in China. Capital costs were forecast to be AUS$134M for the construction of
a plant to produce 350,000 (36V 10Ah) battery packs a year. Construction of the battery
plant would only be considered after the completion of the Jiangsu Lithium Carbonate
Plant. In September 2011, Galaxy announced it had signed off take agreements with 13
Chinese companies for 100% of proposed production from the Li-ion battery plant.
5.3.3 Reed Resources Ltd.
Reed Resources owns a 70% stake holding in the Mt Marion lithium project, located
40km south of Kalgoorlie in Western Australia. The remaining 30% of the project is held
by Mineral Resources Ltd. (MRL), who undertake mineral processing consultancy along
with supplying mining equipment and infrastructure.
Lithium at the Mt Marion project is hosted within spodumene bearing pegmatites which
intrude into the granitoid country rock. In July 2011, Reed Resources released an
updated resource estimation for the project which reported a resource of 14.8Mt grading
1.3% Li2O (contained 495,800t LCE), using a cut-off grade of 0.3% Li2O. The resource
is comprised of six separate deposits which make up the Mt Marion property, named
Deposit 1, Deposit 2, Deposit 2 West, Deposit 4, Deposit 5 and Deposit 6. The strip
ratio of the 6 deposits ranges between 1:1 and 2:1.
Table 58: Reed Resources : Mt Marion resource estimation, July 2011
Tonnes (Mt) Grade (Li2O%) Cont. LCE
Deposit 1 5.21 1.4 180,658
Deposit 2 1.53 1.3 49,284
Deposit 2W 4.96 1.3 159,523
Deposit 4 1.10 1.2 32,703
Deposit 5 0.35 1.3 11,284
Deposit 6 1.70 1.5 63,099
Total 14.86 1.3 496,551 Source: Company press release
Reed Resources intend to construct mine and plant facilities at the project to process
1.2Mtpy of mined ore. Production capacity of the proposed processing plant is planned
to be 200,000tpy spodumene concentrate grading 6.0% Li2O, 60,000tpy muscovite mica
and 30tpy tantalite concentrate. Construction and commissioning of the processing
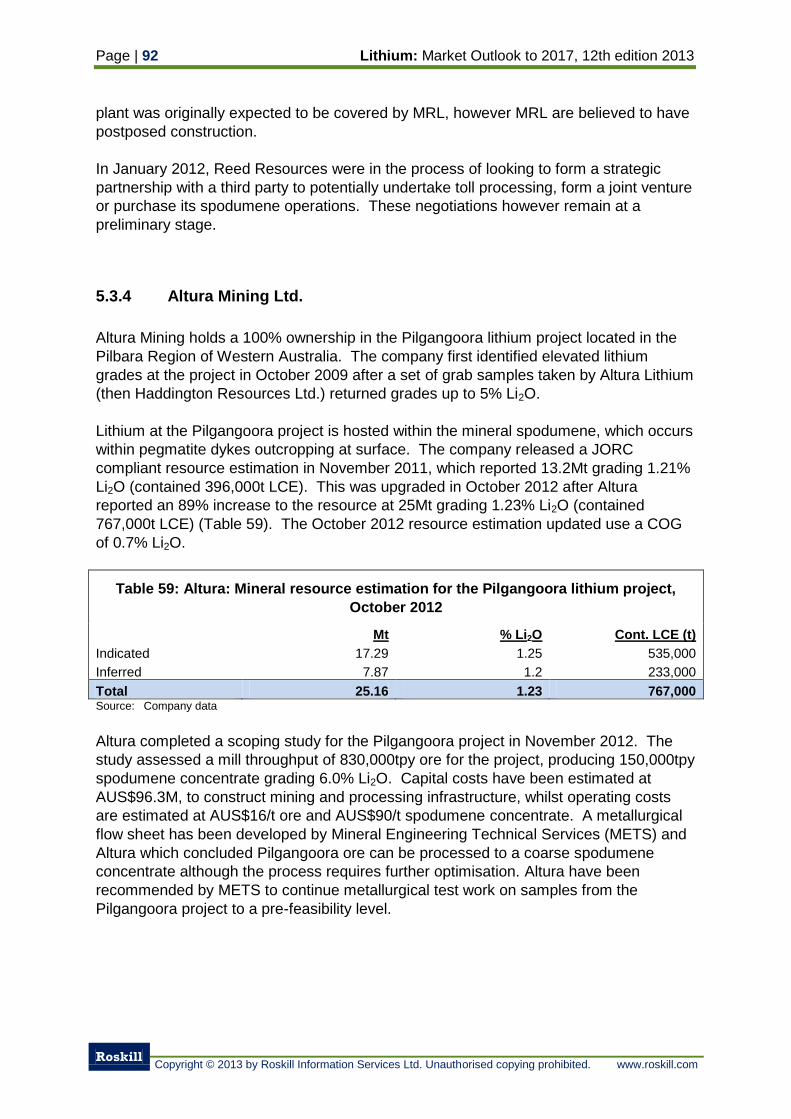
Page | 92 Lithium: Market Outlook to 2017, 12th edition 2013
Roskill
Copyright © 2013 by Roskill Information Services Ltd. Unauthorised copying prohibited. www.roskill.com
plant was originally expected to be covered by MRL, however MRL are believed to have
postposed construction.
In January 2012, Reed Resources were in the process of looking to form a strategic
partnership with a third party to potentially undertake toll processing, form a joint venture
or purchase its spodumene operations. These negotiations however remain at a
preliminary stage.
5.3.4 Altura Mining Ltd.
Altura Mining holds a 100% ownership in the Pilgangoora lithium project located in the
Pilbara Region of Western Australia. The company first identified elevated lithium
grades at the project in October 2009 after a set of grab samples taken by Altura Lithium
(then Haddington Resources Ltd.) returned grades up to 5% Li2O.
Lithium at the Pilgangoora project is hosted within the mineral spodumene, which occurs
within pegmatite dykes outcropping at surface. The company released a JORC
compliant resource estimation in November 2011, which reported 13.2Mt grading 1.21%
Li2O (contained 396,000t LCE). This was upgraded in October 2012 after Altura
reported an 89% increase to the resource at 25Mt grading 1.23% Li2O (contained
767,000t LCE) (Table 59). The October 2012 resource estimation updated use a COG
of 0.7% Li2O.
Table 59: Altura: Mineral resource estimation for the Pilgangoora lithium project,
October 2012
Mt % Li2O Cont. LCE (t)
Indicated 17.29 1.25 535,000
Inferred 7.87 1.2 233,000
Total 25.16 1.23 767,000 Source: Company data
Altura completed a scoping study for the Pilgangoora project in November 2012. The
study assessed a mill throughput of 830,000tpy ore for the project, producing 150,000tpy
spodumene concentrate grading 6.0% Li2O. Capital costs have been estimated at
AUS$96.3M, to construct mining and processing infrastructure, whilst operating costs
are estimated at AUS$16/t ore and AUS$90/t spodumene concentrate. A metallurgical
flow sheet has been developed by Mineral Engineering Technical Services (METS) and
Altura which concluded Pilgangoora ore can be processed to a coarse spodumene
concentrate although the process requires further optimisation. Altura have been
recommended by METS to continue metallurgical test work on samples from the
Pilgangoora project to a pre-feasibility level.
Lithium: Market Outlook to 2017, 12th edition 2013 Page | 93
Roskill
Copyright © 2013 by Roskill Information Services Ltd. Unauthorised copying prohibited. www.roskill.com
5.3.5 Artemis Resources
Artemis Resources own the Buchanans Creek rare metal project located in Queensland.
The company purchased the project in January 2010 for a fee of US$450,000 after
conducting initial sampling of the property. Artemis has since increased the size of its
tenements to cover more than 100km2 believed to contain pegmatite dykes and stocks.
Drilling at the project during 2008 returned assays of between 0.71% Li2O and 1.40%
Li2O. Artemis has since begun geological mapping of the tenements and rock chip
sampling to identify and map out the pegmatite dykes.
5.3.6 Amerilithium
Amerilithium holds three projects within Western Australia situated around Lake
Dumbleyung. These are the Bare Rocks Project to the east, Normans Lake Project to
the South and the Hoffmans Hill Project to the North. At all three of the projects lithium
is hosted within saline brines with concentrations at the Bare Rocks Project measured at
530ppm Li.
Amerilitihum’s main exploration focus has been on its projects located in Nevada, USA,
however it plans to start initial exploration at its three Australian projects in 2012 to make
use of government grants to help fund exploratory drilling.
5.3.7 Reward Minerals
Reward Minerals is exploring the Lake Disappointment project located in Western
Australia. The project is being explored primarily for potassium sulphate for which it has
a contained resource estimation of between 24.43Mt and 27.37Mt K2SO4. The Lake
disappointment brines are reported to contain elevated lithium concentrations with a
magnesium: lithium ratio of 23:1. The project may be explored for its lithium content in
the future.
5.4 Austria
Since 2005, Austria has imported and exported minor amount of lithium carbonate,
trading mainly with Germany and Belgium. Imported lithium carbonate is used
domestically in the chemicals and pharmaceutical industries although a large portion of
imports is stockpiled or directly exported back to Germany.
Global Strategic Metals NL control an 80% holding in the Wolfsberg Lithium Project
located in Carinthia state, Austria. The remaining 20% ownership of the project is held
by Exchange Minerals Group, from whom Global Strategic Metals acquired their 80%
Page | 94 Lithium: Market Outlook to 2017, 12th edition 2013
Roskill
Copyright © 2013 by Roskill Information Services Ltd. Unauthorised copying prohibited. www.roskill.com
stake in December 2011, in exchange for 116.7 million Global Strategic Metals common
shares.
The Wolfsburg project has an inferred JORC resource estimation of 18Mt grading 1.6%
Li2O (contained 710,000t LCE), which East Coast’s exploration program plans to
increase to 30Mt grading between 1.5% -2.0% Li2O. The project will require
underground mining methods, with a mine and mill output estimated at 150,000tpy ore.
Metallurgical test work on Wolfsburg ore began in 1982, which has produced individual
mica, feldspar, quartz and spodumene (6% Li2O) products through floatation. East
Coast estimate production capacity at the project to be 25,000tpy spodumene
concentrate (6% Li20), 49,500tpy feldspar, 24,500tpy quartz (silica sand) and 3,375tpy
mica. Bench scale test work assessing production of lithium carbonate from Wolfsburg
spodumene concentrate has also been completed by Austroplan Austrian Engineering
GmbH in 1988, achieving 93% recovery.
5.5 Belgium
Although Belgium has no domestic production of lithium compounds and metals, there is
a significant amount of trade between Belgium and the main producing nations such as
Chile, USA and Argentina. This is because SQM’s warehouse is located near Antwerp
in Belgium, storing lithium carbonate and hydroxide produced at the company’s facility in
Chile. Lithium compounds exported from Belgium are predominantly destined for
Germany, France, the Netherlands and other European destinations.
Imports of lithium carbonate fell sharply in both 2008 and 2009, because of reduced
demand for lithium compounds in the European market and financial insecurities during
the onset and peak of the global economic downturn. Lithium carbonate sourced from
Chile has remained the dominant source of imports since 2005, forming 94% of total
imports in 2011 (Table 60). Imports from Chile are expected to contribute to over 90% of
total imports in 2012, with imports from Argentina estimated to be the second largest
source.
Germany was the major destination for Belgian exports of lithium carbonate between
2005 and 2010 although imports fell sharply in 2011, even after a strong recovery in
2010. In 2011, Russian imports increased more than fifteen-fold, making the previously
trivial or absent importer Belgium’s largest export market for lithium carbonate. Lithium
carbonate exported to Russia in 2010-2012 is believed to supply the same consumers
as material previously exported to Germany, as German imports have fallen by a similar
amount.
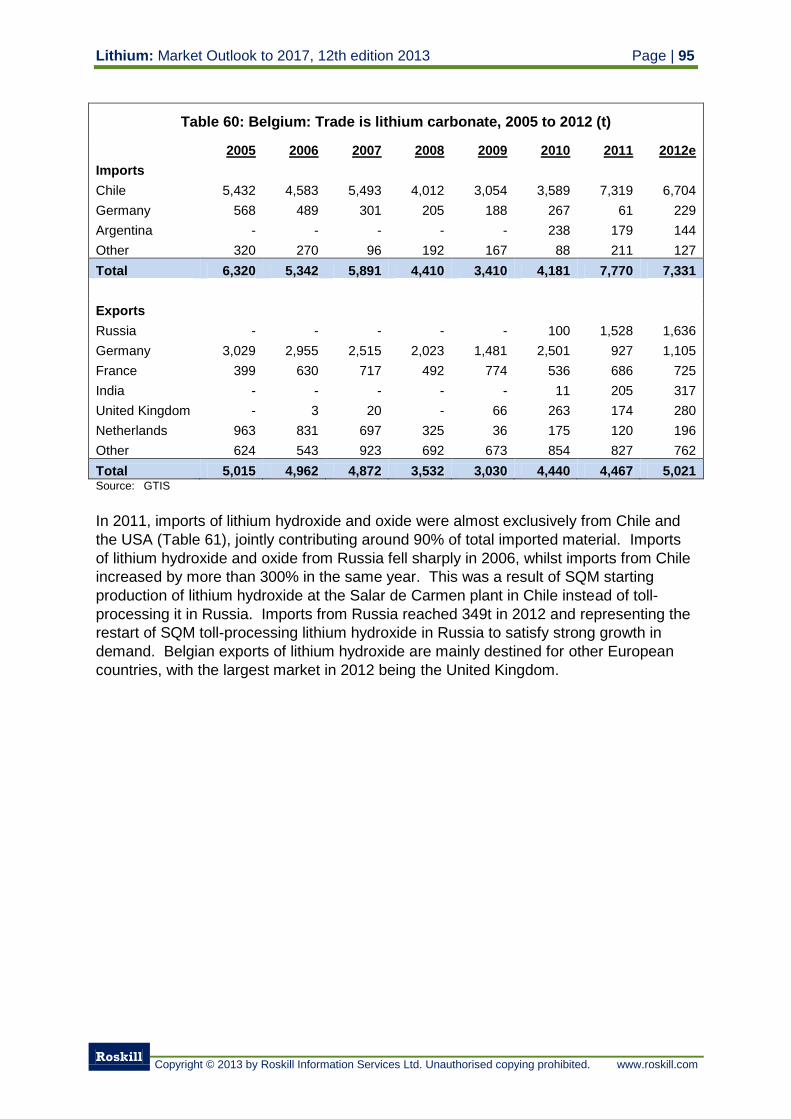
Lithium: Market Outlook to 2017, 12th edition 2013 Page | 95
Roskill
Copyright © 2013 by Roskill Information Services Ltd. Unauthorised copying prohibited. www.roskill.com
Table 60: Belgium: Trade is lithium carbonate, 2005 to 2012 (t)
2005 2006 2007 2008 2009 2010 2011 2012e
Imports Chile 5,432 4,583 5,493 4,012 3,054 3,589 7,319 6,704
Germany 568 489 301 205 188 267 61 229
Argentina - - - - - 238 179 144
Other 320 270 96 192 167 88 211 127
Total 6,320 5,342 5,891 4,410 3,410 4,181 7,770 7,331
Exports
Russia - - - - - 100 1,528 1,636
Germany 3,029 2,955 2,515 2,023 1,481 2,501 927 1,105
France 399 630 717 492 774 536 686 725
India - - - - - 11 205 317
United Kingdom - 3 20 - 66 263 174 280
Netherlands 963 831 697 325 36 175 120 196
Other 624 543 923 692 673 854 827 762
Total 5,015 4,962 4,872 3,532 3,030 4,440 4,467 5,021 Source: GTIS
In 2011, imports of lithium hydroxide and oxide were almost exclusively from Chile and
the USA (Table 61), jointly contributing around 90% of total imported material. Imports
of lithium hydroxide and oxide from Russia fell sharply in 2006, whilst imports from Chile
increased by more than 300% in the same year. This was a result of SQM starting
production of lithium hydroxide at the Salar de Carmen plant in Chile instead of toll-
processing it in Russia. Imports from Russia reached 349t in 2012 and representing the
restart of SQM toll-processing lithium hydroxide in Russia to satisfy strong growth in
demand. Belgian exports of lithium hydroxide are mainly destined for other European
countries, with the largest market in 2012 being the United Kingdom.
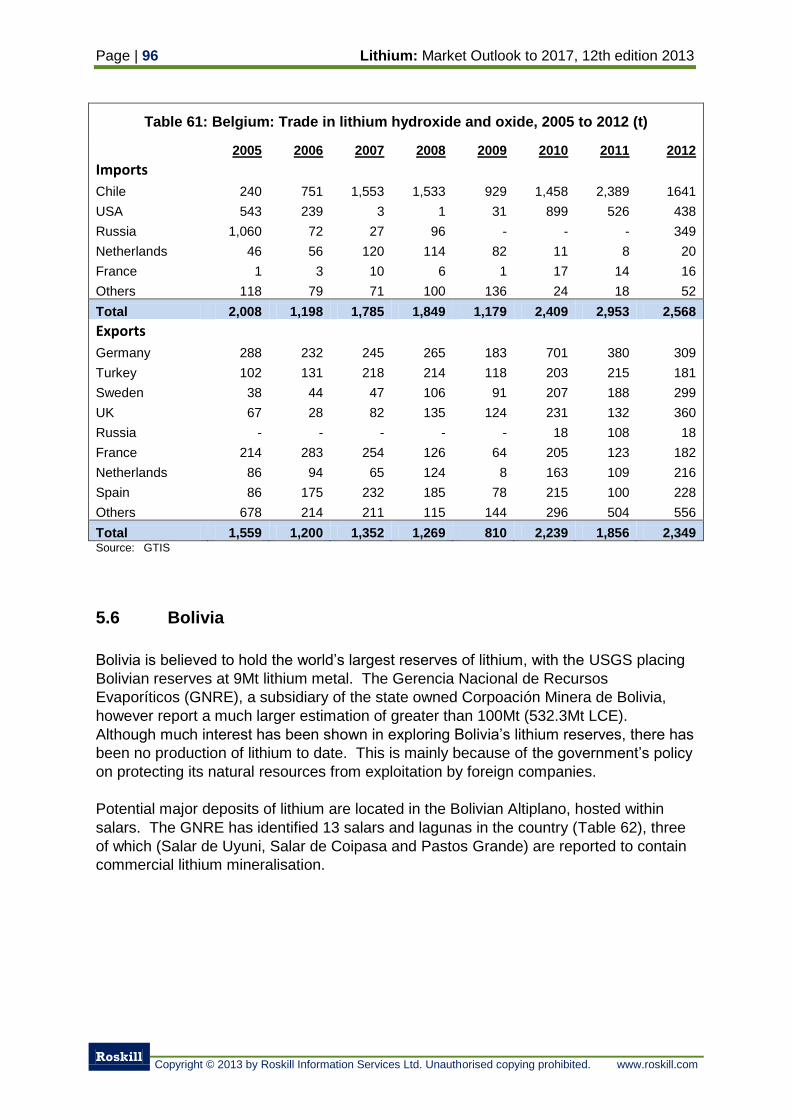
Page | 96 Lithium: Market Outlook to 2017, 12th edition 2013
Roskill
Copyright © 2013 by Roskill Information Services Ltd. Unauthorised copying prohibited. www.roskill.com
Table 61: Belgium: Trade in lithium hydroxide and oxide, 2005 to 2012 (t)
2005 2006 2007 2008 2009 2010 2011 2012
Imports
Chile 240 751 1,553 1,533 929 1,458 2,389 1641
USA 543 239 3 1 31 899 526 438
Russia 1,060 72 27 96 - - - 349
Netherlands 46 56 120 114 82 11 8 20
France 1 3 10 6 1 17 14 16
Others 118 79 71 100 136 24 18 52
Total 2,008 1,198 1,785 1,849 1,179 2,409 2,953 2,568
Exports
Germany 288 232 245 265 183 701 380 309
Turkey 102 131 218 214 118 203 215 181
Sweden 38 44 47 106 91 207 188 299
UK 67 28 82 135 124 231 132 360
Russia - - - - - 18 108 18
France 214 283 254 126 64 205 123 182
Netherlands 86 94 65 124 8 163 109 216
Spain 86 175 232 185 78 215 100 228
Others 678 214 211 115 144 296 504 556
Total 1,559 1,200 1,352 1,269 810 2,239 1,856 2,349 Source: GTIS
5.6 Bolivia
Bolivia is believed to hold the world’s largest reserves of lithium, with the USGS placing
Bolivian reserves at 9Mt lithium metal. The Gerencia Nacional de Recursos
Evaporíticos (GNRE), a subsidiary of the state owned Corpoación Minera de Bolivia,
however report a much larger estimation of greater than 100Mt (532.3Mt LCE).
Although much interest has been shown in exploring Bolivia’s lithium reserves, there has
been no production of lithium to date. This is mainly because of the government’s policy
on protecting its natural resources from exploitation by foreign companies.
Potential major deposits of lithium are located in the Bolivian Altiplano, hosted within
salars. The GNRE has identified 13 salars and lagunas in the country (Table 62), three
of which (Salar de Uyuni, Salar de Coipasa and Pastos Grande) are reported to contain
commercial lithium mineralisation.
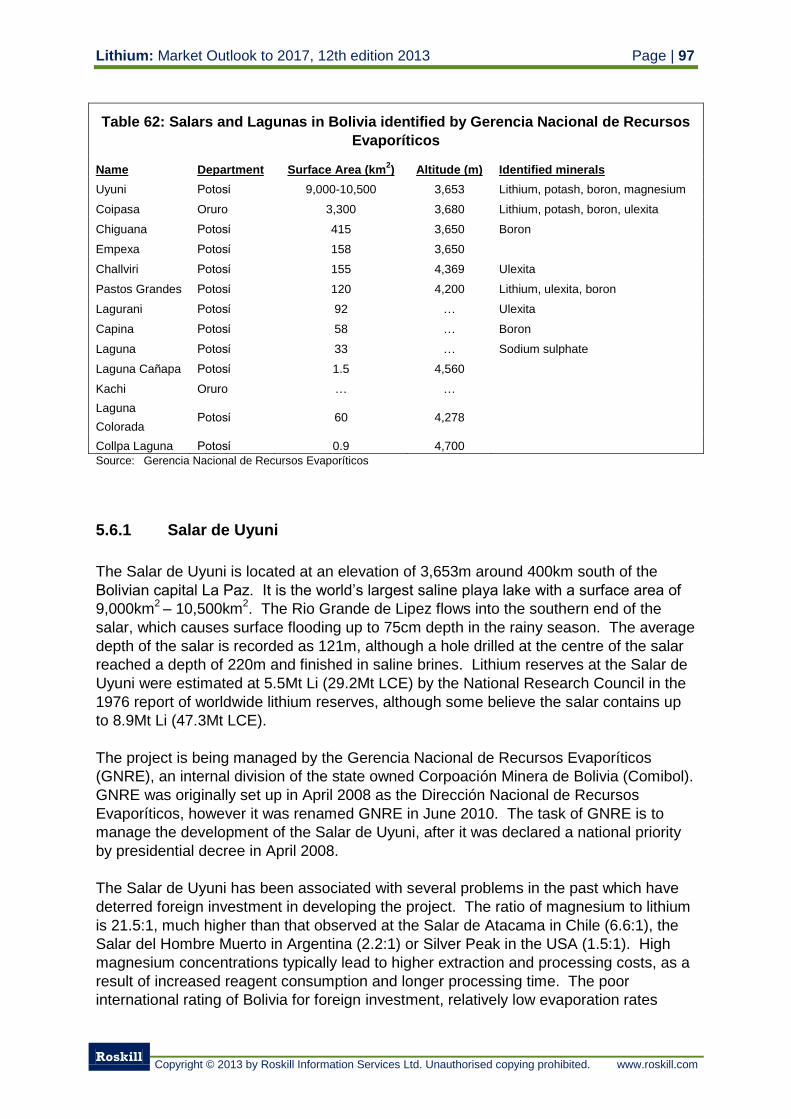
Lithium: Market Outlook to 2017, 12th edition 2013 Page | 97
Roskill
Copyright © 2013 by Roskill Information Services Ltd. Unauthorised copying prohibited. www.roskill.com
Table 62: Salars and Lagunas in Bolivia identified by Gerencia Nacional de Recursos
Evaporíticos
Name Department Surface Area (km2) Altitude (m) Identified minerals
Uyuni Potosί 9,000-10,500 3,653 Lithium, potash, boron, magnesium
Coipasa Oruro 3,300 3,680 Lithium, potash, boron, ulexita
Chiguana Potosί 415 3,650 Boron
Empexa Potosί 158 3,650
Challviri Potosί 155 4,369 Ulexita
Pastos Grandes Potosί 120 4,200 Lithium, ulexita, boron
Lagurani Potosί 92 … Ulexita
Capina Potosί 58 … Boron
Laguna Potosί 33 … Sodium sulphate
Laguna Cañapa Potosί 1.5 4,560
Kachi Oruro … …
Laguna
Colorada Potosί 60 4,278
Collpa Laguna Potosί 0.9 4,700 Source: Gerencia Nacional de Recursos Evaporíticos
5.6.1 Salar de Uyuni
The Salar de Uyuni is located at an elevation of 3,653m around 400km south of the
Bolivian capital La Paz. It is the world’s largest saline playa lake with a surface area of
9,000km2 – 10,500km
2. The Rio Grande de Lipez flows into the southern end of the
salar, which causes surface flooding up to 75cm depth in the rainy season. The average
depth of the salar is recorded as 121m, although a hole drilled at the centre of the salar
reached a depth of 220m and finished in saline brines. Lithium reserves at the Salar de
Uyuni were estimated at 5.5Mt Li (29.2Mt LCE) by the National Research Council in the
1976 report of worldwide lithium reserves, although some believe the salar contains up
to 8.9Mt Li (47.3Mt LCE).
The project is being managed by the Gerencia Nacional de Recursos Evaporíticos
(GNRE), an internal division of the state owned Corpoación Minera de Bolivia (Comibol).
GNRE was originally set up in April 2008 as the Dirección Nacional de Recursos
Evaporíticos, however it was renamed GNRE in June 2010. The task of GNRE is to
manage the development of the Salar de Uyuni, after it was declared a national priority
by presidential decree in April 2008.
The Salar de Uyuni has been associated with several problems in the past which have
deterred foreign investment in developing the project. The ratio of magnesium to lithium
is 21.5:1, much higher than that observed at the Salar de Atacama in Chile (6.6:1), the
Salar del Hombre Muerto in Argentina (2.2:1) or Silver Peak in the USA (1.5:1). High
magnesium concentrations typically lead to higher extraction and processing costs, as a
result of increased reagent consumption and longer processing time. The poor
international rating of Bolivia for foreign investment, relatively low evaporation rates
Page | 98 Lithium: Market Outlook to 2017, 12th edition 2013
Roskill
Copyright © 2013 by Roskill Information Services Ltd. Unauthorised copying prohibited. www.roskill.com
compared with other salars, seasonal flooding and the availability of lithium investment
targets in Chile and Argentina were also unfavourable for the deposit.
In 2008, construction of a pilot plant for lithium carbonate production was authorised by
President Evo Morales, to be operated by Comibol. The plant was originally planned to
be completed in December 2009 with an expected capacity of 12,500tpy potassium
chloride and 500tpy lithium carbonate, however completion of the plant was not realised.
Since May 2011, construction of the lithium carbonate pilot plant has been assisted by a
Japanese consortium. The pilot plant was designed to use an evaporation pond
method to concentrate and produce lithium carbonate products from extracted brine.
Construction of the pilot plant was completed in late 2012 and production at the facility
began in January 2013. The pilot plant facility has a capacity to produce 40tpm lithium
carbonate, although actual production is estimated to be approximately 7tpm lithium
carbonate. Comibol have reported an investment of US$120M in infrastructure at Salar
de Uyuni during 2012, including construction of the pilot plant, dykes, and designs and
engineering works for full scale production facility. Investment in the project by Comibol
is expected to continue as the company aims to produce 30,000tpy LCE by 2016.
After declining offers from French company Bolloré, South Korean company LG and
Japanese companies Mitsubishi and Sumitomo, which the Bolivian government felt did
not attempt to develop the lithium industry in Bolivia sufficiently, Comibol signed a
memorandum of understanding with a South Korean consortium in August 2011, to
manufacture Li-ion battery components in Bolivia. The memorandum of understanding
also stated that the South Korean consortium would look to develop the Salar de Uyuni
via potential partnerships with other Asian companies and undertake research on brines
from the Salar de Uyuni. Bolivia however was unable to negotiate partial ownership of
any patents developed in research undertaken by the South Korean consortium to
produce lithium based cathodes from the Salar de Uyuni brine.
KORES and Posco signed a preliminary agreement in early 2012 to build a lithium
based cathode pilot plant in Bolivia in which both companies would each invest
US$1.5M. The partnership with Posco is an interesting development as Posco
announced in February 2012 that it had developed a process to directly extract lithium
from sea water achieving high yields. This technology may be used to extract lithium
directly from brines at the Salar de Uyuni, by-passing the solar evaporation process and
cutting processing times from one year to one month. It is not known whether this would
replace the current plant under construction.
On the 30th March 2012, Comibol signed a contract with Chinese battery manufacturer
Linyi Gelon New Battery Materials to construct a pilot lithium battery production facility in
the South American country. The plant will be funded by Comibol, which is expected to
cost US$2.7M, and Linyi Gelon New Battery Materials will provide the technical
knowledge for lithium battery production. Along with the pilot plant, Comibol will
construct six laboratories to train and instruct employees, which in total will bring costs to
over US$5M. Initially the plant will produce lithium based cathodes at a pilot scale before
increasing production to an industrial scale and finally begin producing electrolytes at the
facility. Comibol expect to import membranes, anodes and housings for lithium
batteries.
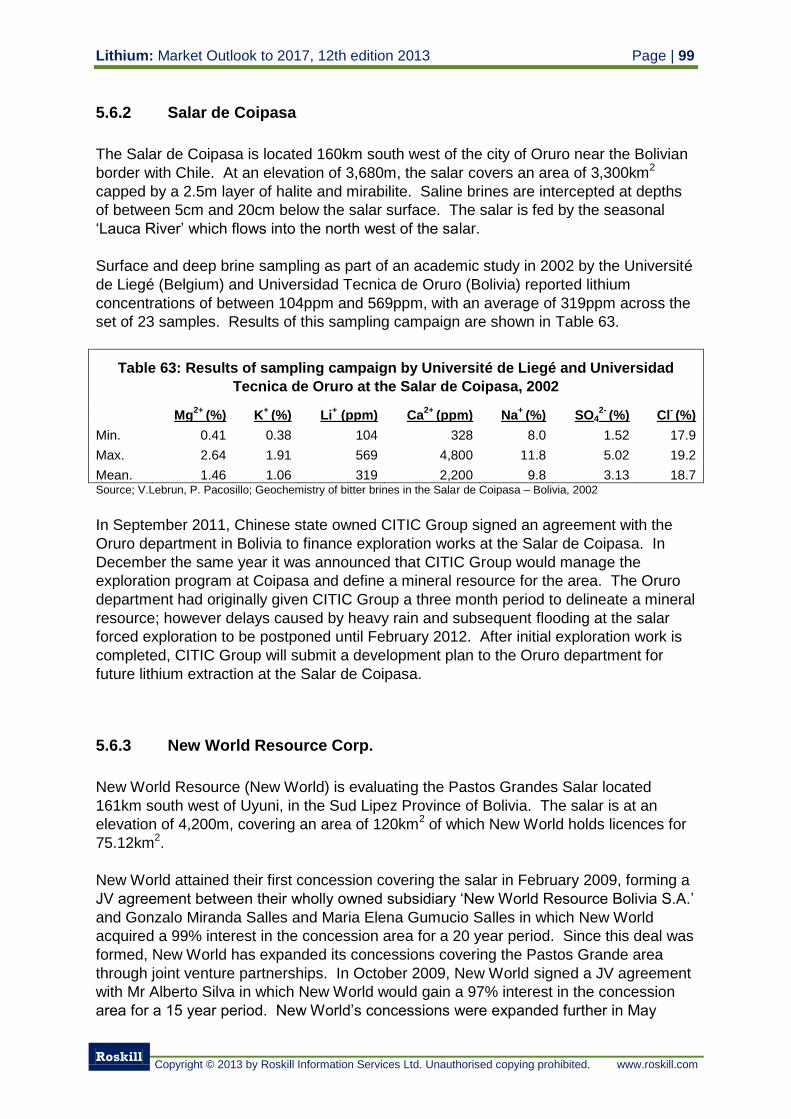
Lithium: Market Outlook to 2017, 12th edition 2013 Page | 99
Roskill
Copyright © 2013 by Roskill Information Services Ltd. Unauthorised copying prohibited. www.roskill.com
5.6.2 Salar de Coipasa
The Salar de Coipasa is located 160km south west of the city of Oruro near the Bolivian
border with Chile. At an elevation of 3,680m, the salar covers an area of 3,300km2
capped by a 2.5m layer of halite and mirabilite. Saline brines are intercepted at depths
of between 5cm and 20cm below the salar surface. The salar is fed by the seasonal
‘Lauca River’ which flows into the north west of the salar.
Surface and deep brine sampling as part of an academic study in 2002 by the Université
de Liegé (Belgium) and Universidad Tecnica de Oruro (Bolivia) reported lithium
concentrations of between 104ppm and 569ppm, with an average of 319ppm across the
set of 23 samples. Results of this sampling campaign are shown in Table 63.
Table 63: Results of sampling campaign by Université de Liegé and Universidad
Tecnica de Oruro at the Salar de Coipasa, 2002
Mg
2+ (%)
K
+ (%) Li
+ (ppm)
Ca
2+ (ppm) Na
+ (%) SO4
2- (%) Cl
- (%)
Min. 0.41 0.38 104 328 8.0 1.52 17.9
Max. 2.64 1.91 569 4,800 11.8 5.02 19.2
Mean. 1.46 1.06 319 2,200 9.8 3.13 18.7 Source; V.Lebrun, P. Pacosillo; Geochemistry of bitter brines in the Salar de Coipasa – Bolivia, 2002
In September 2011, Chinese state owned CITIC Group signed an agreement with the
Oruro department in Bolivia to finance exploration works at the Salar de Coipasa. In
December the same year it was announced that CITIC Group would manage the
exploration program at Coipasa and define a mineral resource for the area. The Oruro
department had originally given CITIC Group a three month period to delineate a mineral
resource; however delays caused by heavy rain and subsequent flooding at the salar
forced exploration to be postponed until February 2012. After initial exploration work is
completed, CITIC Group will submit a development plan to the Oruro department for
future lithium extraction at the Salar de Coipasa.
5.6.3 New World Resource Corp.
New World Resource (New World) is evaluating the Pastos Grandes Salar located
161km south west of Uyuni, in the Sud Lipez Province of Bolivia. The salar is at an
elevation of 4,200m, covering an area of 120km2 of which New World holds licences for
75.12km2.
New World attained their first concession covering the salar in February 2009, forming a
JV agreement between their wholly owned subsidiary ‘New World Resource Bolivia S.A.’
and Gonzalo Miranda Salles and Maria Elena Gumucio Salles in which New World
acquired a 99% interest in the concession area for a 20 year period. Since this deal was
formed, New World has expanded its concessions covering the Pastos Grande area
through joint venture partnerships. In October 2009, New World signed a JV agreement
with Mr Alberto Silva in which New World would gain a 97% interest in the concession
area for a 15 year period. New World’s concessions were expanded further in May
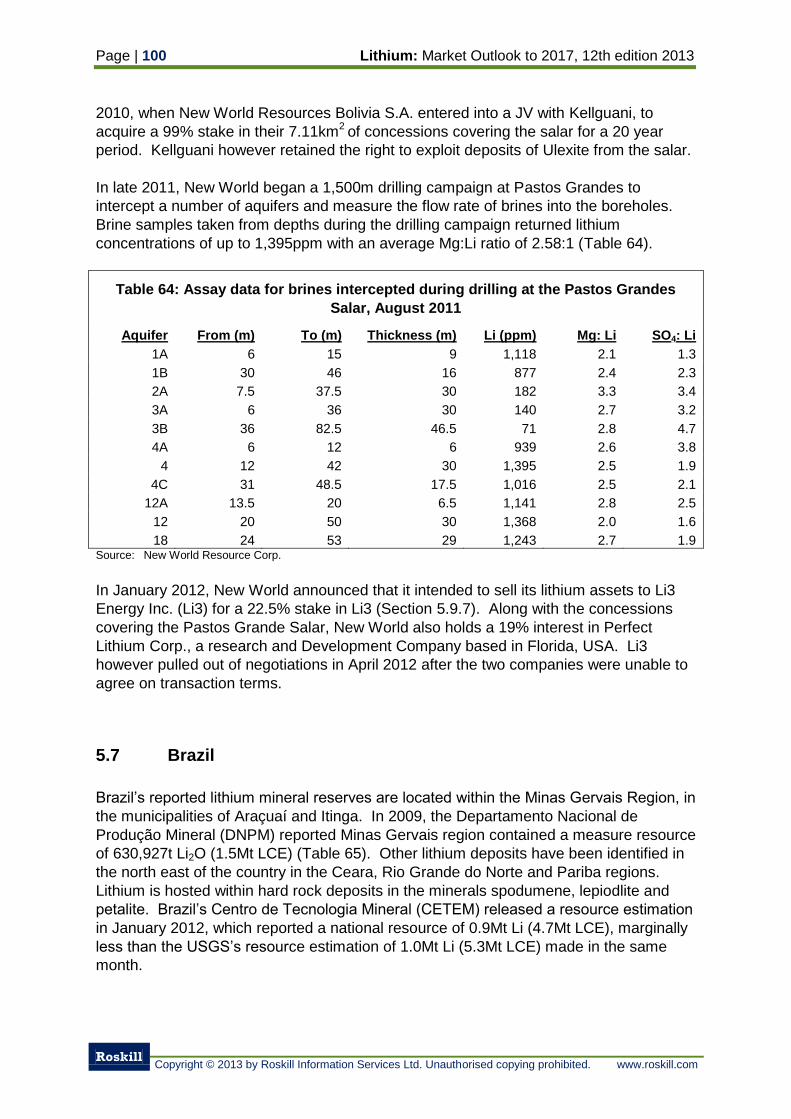
Page | 100 Lithium: Market Outlook to 2017, 12th edition 2013
Roskill
Copyright © 2013 by Roskill Information Services Ltd. Unauthorised copying prohibited. www.roskill.com
2010, when New World Resources Bolivia S.A. entered into a JV with Kellguani, to
acquire a 99% stake in their 7.11km2 of concessions covering the salar for a 20 year
period. Kellguani however retained the right to exploit deposits of Ulexite from the salar.
In late 2011, New World began a 1,500m drilling campaign at Pastos Grandes to
intercept a number of aquifers and measure the flow rate of brines into the boreholes.
Brine samples taken from depths during the drilling campaign returned lithium
concentrations of up to 1,395ppm with an average Mg:Li ratio of 2.58:1 (Table 64).
Table 64: Assay data for brines intercepted during drilling at the Pastos Grandes
Salar, August 2011
Aquifer From (m) To (m) Thickness (m) Li (ppm) Mg: Li SO4: Li
1A 6 15 9 1,118 2.1 1.3
1B 30 46 16 877 2.4 2.3
2A 7.5 37.5 30 182 3.3 3.4
3A 6 36 30 140 2.7 3.2
3B 36 82.5 46.5 71 2.8 4.7
4A 6 12 6 939 2.6 3.8
4 12 42 30 1,395 2.5 1.9
4C 31 48.5 17.5 1,016 2.5 2.1
12A 13.5 20 6.5 1,141 2.8 2.5
12 20 50 30 1,368 2.0 1.6
18 24 53 29 1,243 2.7 1.9 Source: New World Resource Corp.
In January 2012, New World announced that it intended to sell its lithium assets to Li3
Energy Inc. (Li3) for a 22.5% stake in Li3 (Section 5.9.7). Along with the concessions
covering the Pastos Grande Salar, New World also holds a 19% interest in Perfect
Lithium Corp., a research and Development Company based in Florida, USA. Li3
however pulled out of negotiations in April 2012 after the two companies were unable to
agree on transaction terms.
5.7 Brazil
Brazil’s reported lithium mineral reserves are located within the Minas Gervais Region, in
the municipalities of Araçuaí and Itinga. In 2009, the Departamento Nacional de
Produção Mineral (DNPM) reported Minas Gervais region contained a measure resource
of 630,927t Li2O (1.5Mt LCE) (Table 65). Other lithium deposits have been identified in
the north east of the country in the Ceara, Rio Grande do Norte and Pariba regions.
Lithium is hosted within hard rock deposits in the minerals spodumene, lepiodlite and
petalite. Brazil’s Centro de Tecnologia Mineral (CETEM) released a resource estimation
in January 2012, which reported a national resource of 0.9Mt Li (4.7Mt LCE), marginally
less than the USGS’s resource estimation of 1.0Mt Li (5.3Mt LCE) made in the same
month.
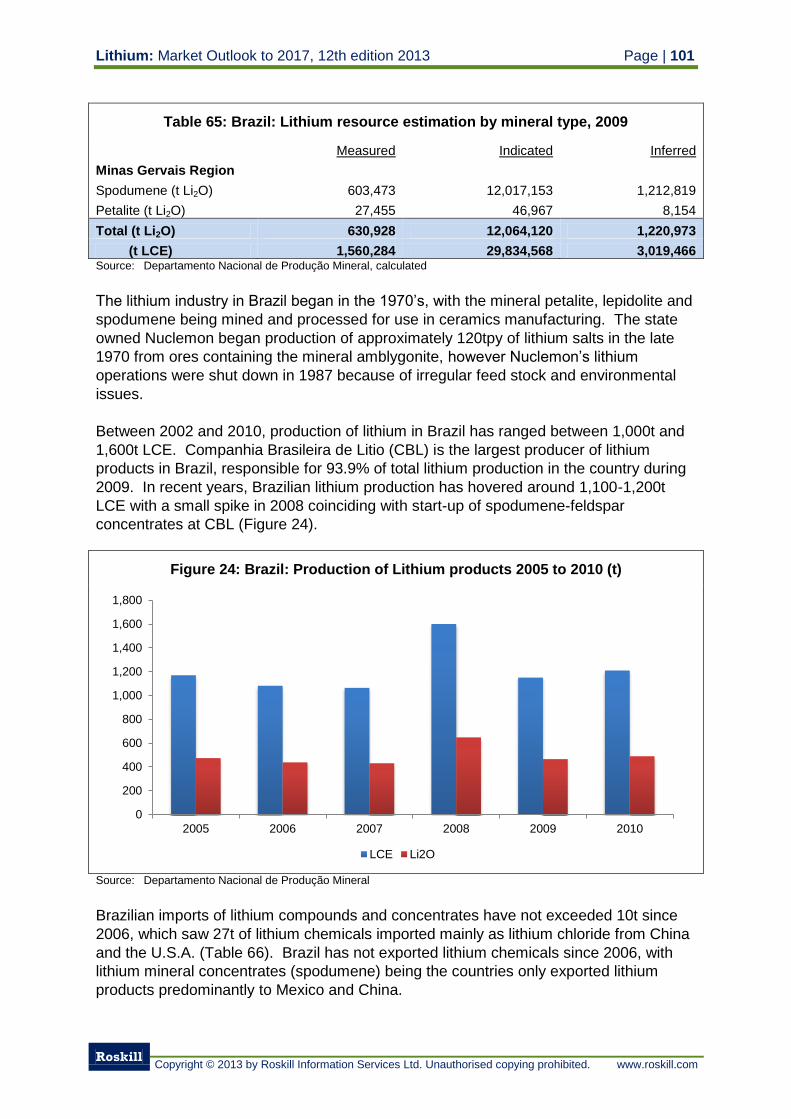
Lithium: Market Outlook to 2017, 12th edition 2013 Page | 101
Roskill
Copyright © 2013 by Roskill Information Services Ltd. Unauthorised copying prohibited. www.roskill.com
Table 65: Brazil: Lithium resource estimation by mineral type, 2009
Measured Indicated Inferred
Minas Gervais Region
Spodumene (t Li2O) 603,473 12,017,153 1,212,819
Petalite (t Li2O) 27,455 46,967 8,154
Total (t Li2O) 630,928 12,064,120 1,220,973
(t LCE) 1,560,284 29,834,568 3,019,466 Source: Departamento Nacional de Produção Mineral, calculated
The lithium industry in Brazil began in the 1970’s, with the mineral petalite, lepidolite and
spodumene being mined and processed for use in ceramics manufacturing. The state
owned Nuclemon began production of approximately 120tpy of lithium salts in the late
1970 from ores containing the mineral amblygonite, however Nuclemon’s lithium
operations were shut down in 1987 because of irregular feed stock and environmental
issues.
Between 2002 and 2010, production of lithium in Brazil has ranged between 1,000t and
1,600t LCE. Companhia Brasileira de Litio (CBL) is the largest producer of lithium
products in Brazil, responsible for 93.9% of total lithium production in the country during
2009. In recent years, Brazilian lithium production has hovered around 1,100-1,200t
LCE with a small spike in 2008 coinciding with start-up of spodumene-feldspar
concentrates at CBL (Figure 24).
Figure 24: Brazil: Production of Lithium products 2005 to 2010 (t)
Source: Departamento Nacional de Produção Mineral
Brazilian imports of lithium compounds and concentrates have not exceeded 10t since
2006, which saw 27t of lithium chemicals imported mainly as lithium chloride from China
and the U.S.A. (Table 66). Brazil has not exported lithium chemicals since 2006, with
lithium mineral concentrates (spodumene) being the countries only exported lithium
products predominantly to Mexico and China.
0
200
400
600
800
1,000
1,200
1,400
1,600
1,800
2005 2006 2007 2008 2009 2010
LCE Li2O
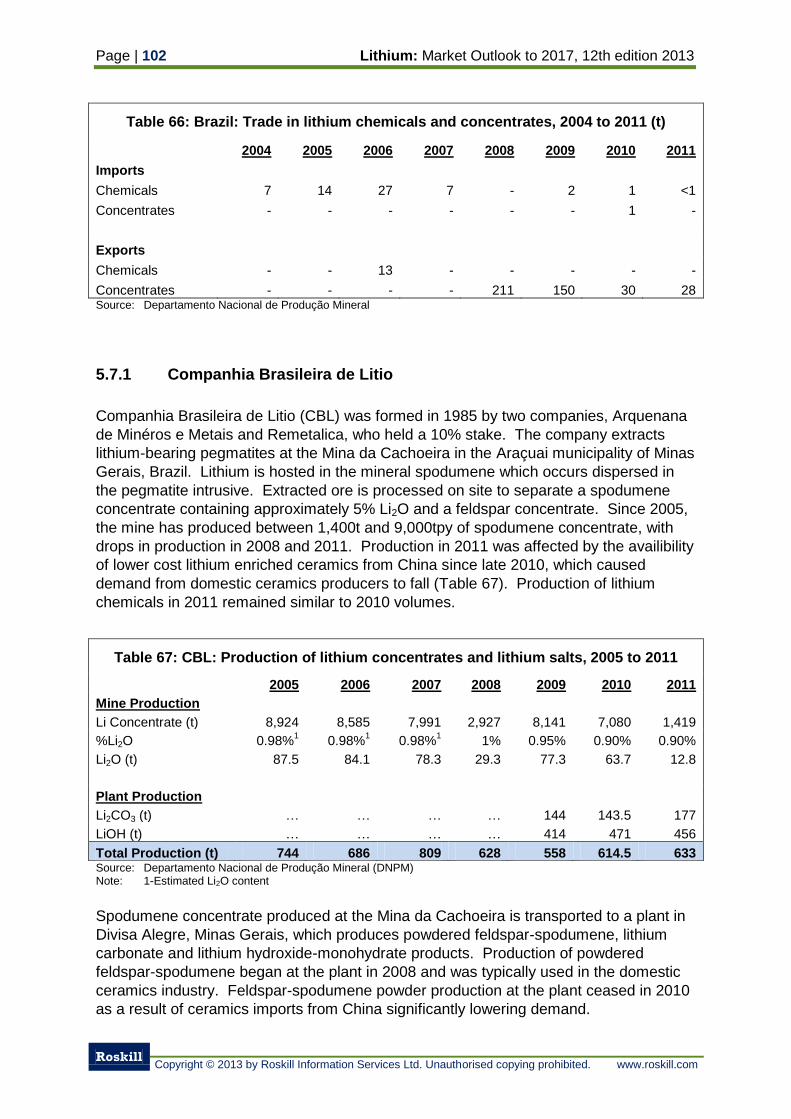
Page | 102 Lithium: Market Outlook to 2017, 12th edition 2013
Roskill
Copyright © 2013 by Roskill Information Services Ltd. Unauthorised copying prohibited. www.roskill.com
Table 66: Brazil: Trade in lithium chemicals and concentrates, 2004 to 2011 (t)
2004 2005 2006 2007 2008 2009 2010 2011
Imports
Chemicals 7 14 27 7 - 2 1 <1
Concentrates - - - - - - 1 -
Exports
Chemicals - - 13 - - - - -
Concentrates - - - - 211 150 30 28 Source: Departamento Nacional de Produção Mineral
5.7.1 Companhia Brasileira de Litio
Companhia Brasileira de Litio (CBL) was formed in 1985 by two companies, Arquenana
de Minéros e Metais and Remetalica, who held a 10% stake. The company extracts
lithium-bearing pegmatites at the Mina da Cachoeira in the Araçuai municipality of Minas
Gerais, Brazil. Lithium is hosted in the mineral spodumene which occurs dispersed in
the pegmatite intrusive. Extracted ore is processed on site to separate a spodumene
concentrate containing approximately 5% Li2O and a feldspar concentrate. Since 2005,
the mine has produced between 1,400t and 9,000tpy of spodumene concentrate, with
drops in production in 2008 and 2011. Production in 2011 was affected by the availibility
of lower cost lithium enriched ceramics from China since late 2010, which caused
demand from domestic ceramics producers to fall (Table 67). Production of lithium
chemicals in 2011 remained similar to 2010 volumes.
Source: Departamento Nacional de Produção Mineral (DNPM) Note: 1-Estimated Li2O content
Spodumene concentrate produced at the Mina da Cachoeira is transported to a plant in
Divisa Alegre, Minas Gerais, which produces powdered feldspar-spodumene, lithium
carbonate and lithium hydroxide-monohydrate products. Production of powdered
feldspar-spodumene began at the plant in 2008 and was typically used in the domestic
ceramics industry. Feldspar-spodumene powder production at the plant ceased in 2010
as a result of ceramics imports from China significantly lowering demand.
Table 67: CBL: Production of lithium concentrates and lithium salts, 2005 to 2011
2005 2006 2007 2008 2009 2010 2011
Mine Production
Li Concentrate (t) 8,924 8,585 7,991 2,927 8,141 7,080 1,419
%Li2O 0.98%1
0.98%1 0.98%
1 1% 0.95% 0.90% 0.90%
Li2O (t) 87.5 84.1 78.3 29.3 77.3 63.7 12.8
Plant Production
Li2CO3 (t) … … … … 144 143.5 177
LiOH (t) … … … … 414 471 456
Total Production (t) 744 686 809 628 558 614.5 633
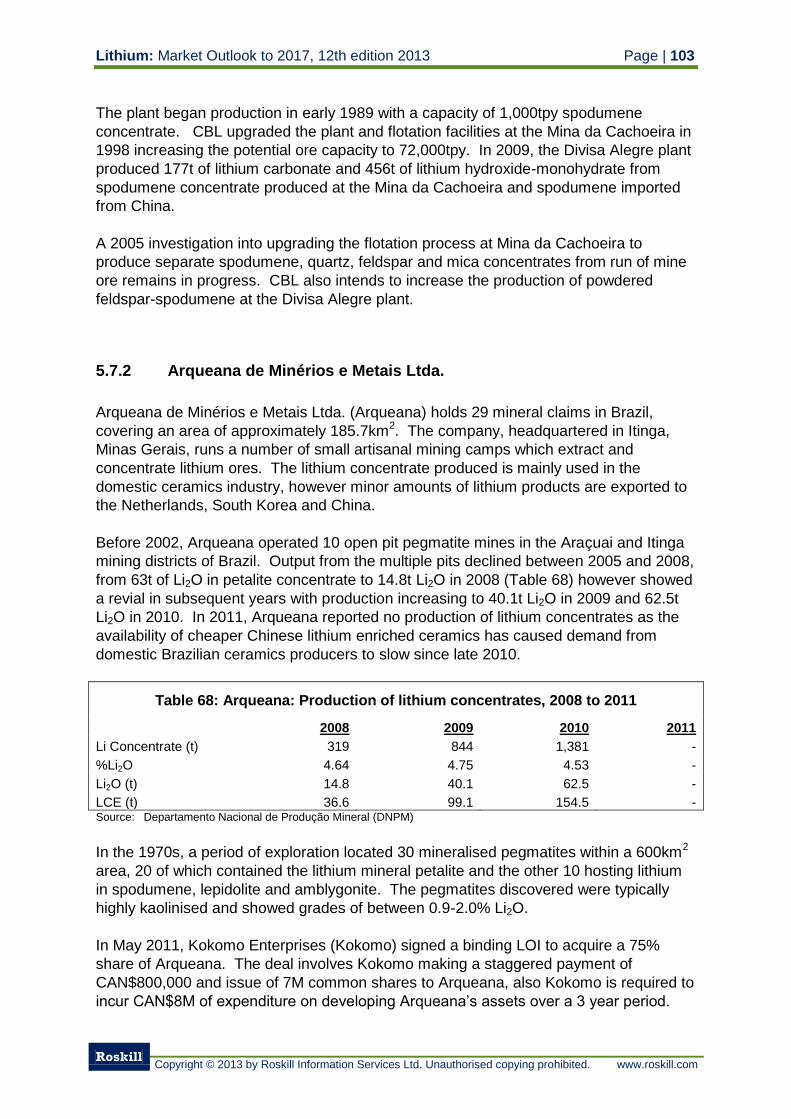
Lithium: Market Outlook to 2017, 12th edition 2013 Page | 103
Roskill
Copyright © 2013 by Roskill Information Services Ltd. Unauthorised copying prohibited. www.roskill.com
The plant began production in early 1989 with a capacity of 1,000tpy spodumene
concentrate. CBL upgraded the plant and flotation facilities at the Mina da Cachoeira in
1998 increasing the potential ore capacity to 72,000tpy. In 2009, the Divisa Alegre plant
produced 177t of lithium carbonate and 456t of lithium hydroxide-monohydrate from
spodumene concentrate produced at the Mina da Cachoeira and spodumene imported
from China.
A 2005 investigation into upgrading the flotation process at Mina da Cachoeira to
produce separate spodumene, quartz, feldspar and mica concentrates from run of mine
ore remains in progress. CBL also intends to increase the production of powdered
feldspar-spodumene at the Divisa Alegre plant.
5.7.2 Arqueana de Minérios e Metais Ltda.
Arqueana de Minérios e Metais Ltda. (Arqueana) holds 29 mineral claims in Brazil,
covering an area of approximately 185.7km2. The company, headquartered in Itinga,
Minas Gerais, runs a number of small artisanal mining camps which extract and
concentrate lithium ores. The lithium concentrate produced is mainly used in the
domestic ceramics industry, however minor amounts of lithium products are exported to
the Netherlands, South Korea and China.
Before 2002, Arqueana operated 10 open pit pegmatite mines in the Araçuai and Itinga
mining districts of Brazil. Output from the multiple pits declined between 2005 and 2008,
from 63t of Li2O in petalite concentrate to 14.8t Li2O in 2008 (Table 68) however showed
a revial in subsequent years with production increasing to 40.1t Li2O in 2009 and 62.5t
Li2O in 2010. In 2011, Arqueana reported no production of lithium concentrates as the
availability of cheaper Chinese lithium enriched ceramics has caused demand from
domestic Brazilian ceramics producers to slow since late 2010.
Table 68: Arqueana: Production of lithium concentrates, 2008 to 2011
2008 2009 2010 2011
Li Concentrate (t) 319 844 1,381 -
%Li2O 4.64 4.75 4.53 -
Li2O (t) 14.8 40.1 62.5 -
LCE (t) 36.6 99.1 154.5 - Source: Departamento Nacional de Produção Mineral (DNPM)
In the 1970s, a period of exploration located 30 mineralised pegmatites within a 600km2
area, 20 of which contained the lithium mineral petalite and the other 10 hosting lithium
in spodumene, lepidolite and amblygonite. The pegmatites discovered were typically
highly kaolinised and showed grades of between 0.9-2.0% Li2O.
In May 2011, Kokomo Enterprises (Kokomo) signed a binding LOI to acquire a 75%
share of Arqueana. The deal involves Kokomo making a staggered payment of
CAN$800,000 and issue of 7M common shares to Arqueana, also Kokomo is required to
incur CAN$8M of expenditure on developing Arqueana’s assets over a 3 year period.
Page | 104 Lithium: Market Outlook to 2017, 12th edition 2013
Roskill
Copyright © 2013 by Roskill Information Services Ltd. Unauthorised copying prohibited. www.roskill.com
Wardrop Engineering will undertake a NI 43-101 report on Arqueana’s properties, which
if found to meet certain criteria with regards to reserves, potential development and
profitability, will trigger a further payment of CAN$1M and issue of 3M common shares
by Kokomo.
5.7.3 Advance Metallurgical Group (AMG)
AMG produce spodumene concentrate from a pilot plant at the Mibra mine in Minas
Gerais state, constructed and commissioned in early 2010. The Mibra mine extracts
pegmatite material which is mined primarily as a tantalum, niobium and feldspar deposit.
Formed of multiple intrusive pegmatite ore bodies, the Mibra mine has an estimated
resource of 25.5Mt grading 290ppm Ta2O5. Ore body A is the most developed of the
identified ore bodies at Mibra, returning grades of 375ppm Ta2O5, 92ppm Nb2O5 and
283ppm Sn. Spodumene was identified to form between 10-15% of the mined
pegmatites rock mass in Ore body A, prompting AMG to develop a process to extract
and produce a spodumene concentrate from mine tailings via flotation.
In 2011, AMG estimated that the Mibra mine had an annual output of at least 600,000t mined ore from Orebody A, giving it the potential to produce 36,000tpy spodumene concentrate (at 100% recovery). Spodumene concentrate produced at the Mibra mine could be marketed for use in the ceramic industry or used to produce lithium compounds through chemical conversion. AMG has since undertaken metallurgical test work to produce a processing flow sheet to convert spodumene concentrate into a battery-grade lithium carbonate product, with an estimated production capacity of 2,400tpy. In October 2011, AMG reported a strategic plan for the Mibra mine, which included the design, construction and commissioning of both a full scale spodumene concentrate production facility and lithium carbonate plant. No further developments have been reported since.
5.8 Canada
Until 2010, lithium minerals were mined in Canada at the Bernic Lake project, owned by
Tantalum Mining Corp of Canada Ltd. (TANCO). Production however ceased in
September 2009 when the mine was placed on care and maintenance and Canada
currently has no domestic mining or extraction of lithium minerals or brines.
Throughout the first decade of the 2000s, a number of exploration companies staked
lithium exploration claims in Canada, particularly in Ontario, Quebec and Alberta
provinces. Although the majority of these companies remain at an early stage of
exploration, companies such as Canada Lithium (Section 5.8.4.1) and Nemaska Lithium
(Section 5.8.4.2) in Quebec are expected to begin production of lithium mineral
concentrates and compounds by the end-2013.
Lithium: Market Outlook to 2017, 12th edition 2013 Page | 105
Roskill
Copyright © 2013 by Roskill Information Services Ltd. Unauthorised copying prohibited. www.roskill.com
5.8.1 Lithium resources in Canada
Canada contains lithium resources hosted within deposits of both lithium minerals,
typically located within Ontario and Quebec provinces, and lithium bearing brines
located mainly within Alberta province. In Ontario alone, lithium bearing pegmatites
have been identified at Pakeagama, Separation Lake, Seymour Lake, Root Lake, Zig
Zag property, Desrosiers and many other locations.
Quebec province has achieved no production of lithium concentrates since Quebec
Lithium Corp. ceased production from the Val d’Or pegmatite ore body in 1965. Activity
by exploration companies in the province has increased since the early 2000s with
multiple projects at James Bay, Sirmac Lake, Val d’Or and Whabouchi focussing on
lithium bearing pegmatites. Other lithium pegmatite projects are being developed
around Snow Lake in Manitoba, Cantung in North Western Territories, Torp Lake in
Nunavut and Brazil Lake in Nova Scotia.
In Alberta, oilfield brines associated with deposits of oil and gas are the focus of lithium
exploration. Projects at Fox Creek, South Leduc, Silver Creek, Berland River and
Valleyview are being assessed by exploration companies.
In 2012, the USGS identified Canada’s domestic lithium resource to be 360,000t Li
(1.9Mt LCE). Work undertaken by Anstett et al in 1990 identified reserves of 241,000t Li
(1.2Mt LCE), which included 73,000t Li from the Bernic Lake property and 139,000t Li
from deposits in Ontario and Quebec. However, in 2008 Evans stated that reserves at
the Bernic Lake property were only 18,600t Li. The National Research Council reported
total resources to be 155,000t Li in 1976. Table 69 details any resource estimations for
projects being developed in Canada and indicates that total lithium resources are 1.2Mt
Li (6.58Mt LCE), excluding non NI 43-101 estimations, as of 2012.
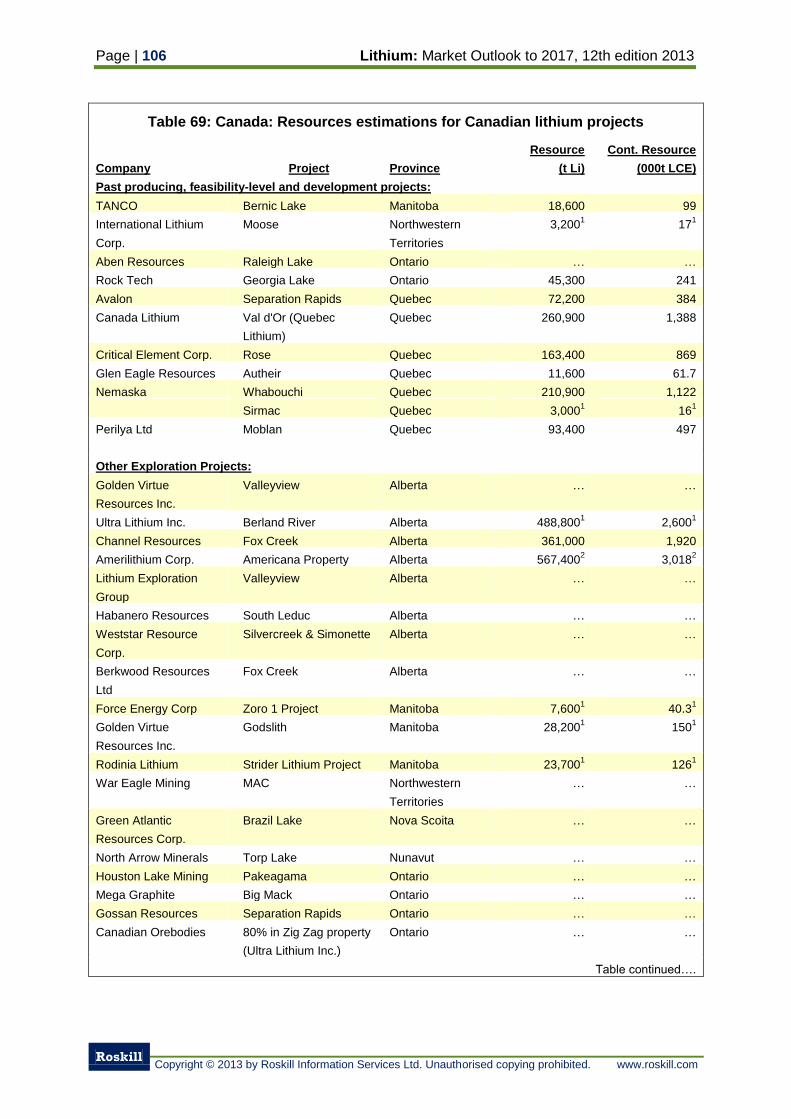
Page | 106 Lithium: Market Outlook to 2017, 12th edition 2013
Roskill
Copyright © 2013 by Roskill Information Services Ltd. Unauthorised copying prohibited. www.roskill.com
Table 69: Canada: Resources estimations for Canadian lithium projects
Company Project Province
Resource
(t Li)
Cont. Resource
(000t LCE)
Past producing, feasibility-level and development projects:
TANCO Bernic Lake Manitoba 18,600 99
International Lithium
Corp.
Moose Northwestern
Territories
3,2001 17
1
Aben Resources Raleigh Lake Ontario … …
Rock Tech Georgia Lake Ontario 45,300 241
Avalon Separation Rapids Quebec 72,200 384
Canada Lithium Val d'Or (Quebec
Lithium)
Quebec 260,900 1,388
Critical Element Corp. Rose Quebec 163,400 869
Glen Eagle Resources Autheir Quebec 11,600 61.7
Nemaska Whabouchi Quebec 210,900 1,122
Sirmac Quebec 3,0001 16
1
Perilya Ltd Moblan Quebec 93,400 497
Other Exploration Projects:
Golden Virtue
Resources Inc.
Valleyview Alberta … …
Ultra Lithium Inc. Berland River Alberta 488,8001 2,600
1
Channel Resources Fox Creek Alberta 361,000 1,920
Amerilithium Corp. Americana Property Alberta 567,4002 3,018
2
Lithium Exploration
Group
Valleyview Alberta … …
Habanero Resources South Leduc Alberta … …
Weststar Resource
Corp.
Silvercreek & Simonette Alberta … …
Berkwood Resources
Ltd
Fox Creek Alberta … …
Force Energy Corp Zoro 1 Project Manitoba 7,6001 40.3
1
Golden Virtue
Resources Inc.
Godslith Manitoba 28,2001 150
1
Rodinia Lithium Strider Lithium Project Manitoba 23,7001 126
1
War Eagle Mining MAC Northwestern
Territories
… …
Green Atlantic
Resources Corp.
Brazil Lake Nova Scoita … …
North Arrow Minerals Torp Lake Nunavut … …
Houston Lake Mining Pakeagama Ontario … …
Mega Graphite Big Mack Ontario … …
Gossan Resources Separation Rapids Ontario … …
Canadian Orebodies 80% in Zig Zag property
(Ultra Lithium Inc.)
Ontario … …
Table continued….
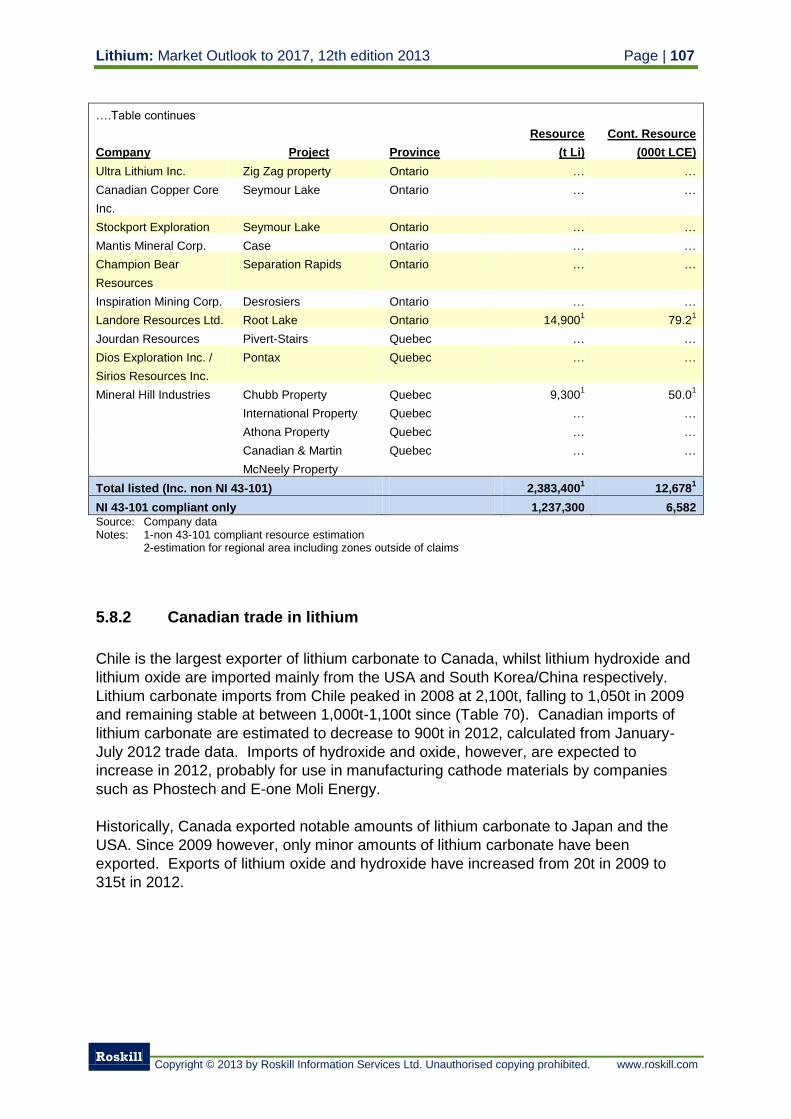
Lithium: Market Outlook to 2017, 12th edition 2013 Page | 107
Roskill
Copyright © 2013 by Roskill Information Services Ltd. Unauthorised copying prohibited. www.roskill.com
….Table continues
Company Project Province
Resource
(t Li)
Cont. Resource
(000t LCE)
Ultra Lithium Inc. Zig Zag property Ontario … …
Canadian Copper Core
Inc.
Seymour Lake Ontario … …
Stockport Exploration Seymour Lake Ontario … …
Mantis Mineral Corp. Case Ontario … …
Champion Bear
Resources
Separation Rapids Ontario … …
Inspiration Mining Corp. Desrosiers Ontario … …
Landore Resources Ltd. Root Lake Ontario 14,9001 79.2
1
Jourdan Resources Pivert-Stairs Quebec … …
Dios Exploration Inc. /
Sirios Resources Inc.
Pontax Quebec … …
Mineral Hill Industries Chubb Property Quebec 9,3001 50.0
1
International Property Quebec … …
Athona Property Quebec … …
Canadian & Martin
McNeely Property
Quebec … …
Total listed (Inc. non NI 43-101) 2,383,4001 12,678
1
NI 43-101 compliant only 1,237,300 6,582
Source: Company data Notes: 1-non 43-101 compliant resource estimation
2-estimation for regional area including zones outside of claims
5.8.2 Canadian trade in lithium
Chile is the largest exporter of lithium carbonate to Canada, whilst lithium hydroxide and
lithium oxide are imported mainly from the USA and South Korea/China respectively.
Lithium carbonate imports from Chile peaked in 2008 at 2,100t, falling to 1,050t in 2009
and remaining stable at between 1,000t-1,100t since (Table 70). Canadian imports of
lithium carbonate are estimated to decrease to 900t in 2012, calculated from January-
July 2012 trade data. Imports of hydroxide and oxide, however, are expected to
increase in 2012, probably for use in manufacturing cathode materials by companies
such as Phostech and E-one Moli Energy.
Historically, Canada exported notable amounts of lithium carbonate to Japan and the
USA. Since 2009 however, only minor amounts of lithium carbonate have been
exported. Exports of lithium oxide and hydroxide have increased from 20t in 2009 to
315t in 2012.
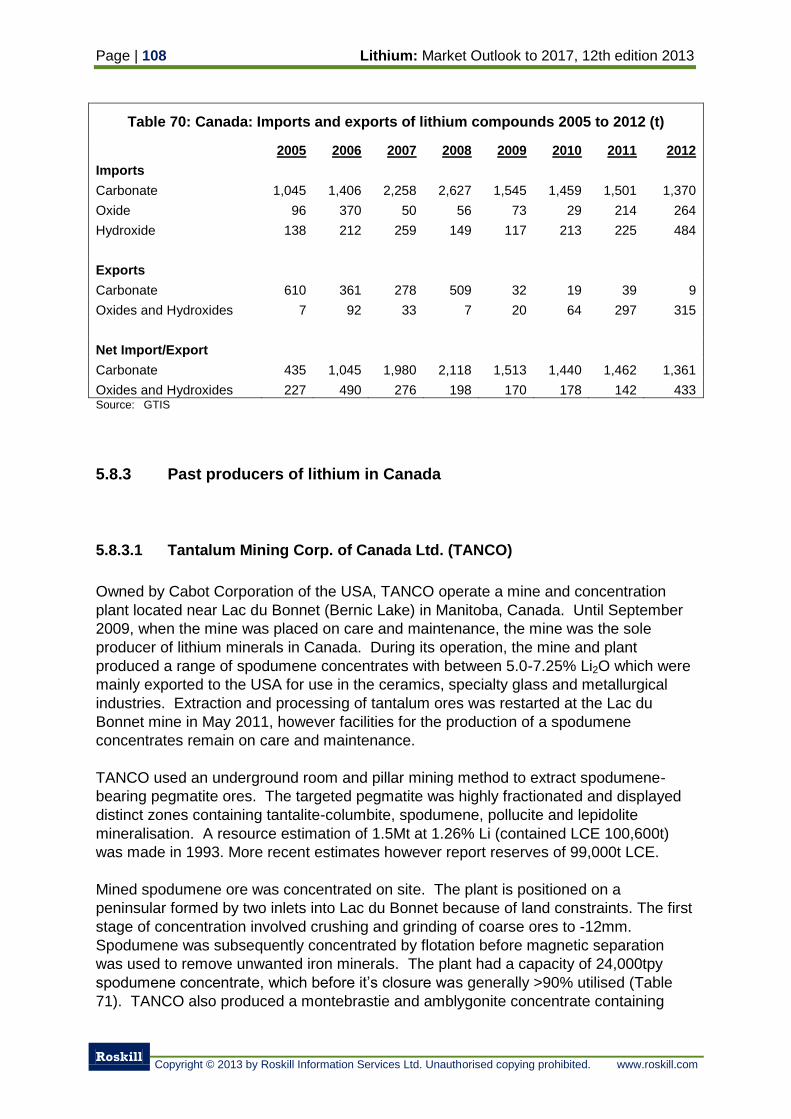
Page | 108 Lithium: Market Outlook to 2017, 12th edition 2013
Roskill
Copyright © 2013 by Roskill Information Services Ltd. Unauthorised copying prohibited. www.roskill.com
Table 70: Canada: Imports and exports of lithium compounds 2005 to 2012 (t)
2005 2006 2007 2008 2009 2010 2011 2012
Imports Carbonate 1,045 1,406 2,258 2,627 1,545 1,459 1,501 1,370
Oxide 96 370 50 56 73 29 214 264
Hydroxide 138 212 259 149 117 213 225 484
Exports Carbonate 610 361 278 509 32 19 39 9
Oxides and Hydroxides 7 92 33 7 20 64 297 315
Net Import/Export Carbonate 435 1,045 1,980 2,118 1,513 1,440 1,462 1,361
Oxides and Hydroxides 227 490 276 198 170 178 142 433 Source: GTIS
5.8.3 Past producers of lithium in Canada
5.8.3.1 Tantalum Mining Corp. of Canada Ltd. (TANCO)
Owned by Cabot Corporation of the USA, TANCO operate a mine and concentration
plant located near Lac du Bonnet (Bernic Lake) in Manitoba, Canada. Until September
2009, when the mine was placed on care and maintenance, the mine was the sole
producer of lithium minerals in Canada. During its operation, the mine and plant
produced a range of spodumene concentrates with between 5.0-7.25% Li2O which were
mainly exported to the USA for use in the ceramics, specialty glass and metallurgical
industries. Extraction and processing of tantalum ores was restarted at the Lac du
Bonnet mine in May 2011, however facilities for the production of a spodumene
concentrates remain on care and maintenance.
TANCO used an underground room and pillar mining method to extract spodumene-
bearing pegmatite ores. The targeted pegmatite was highly fractionated and displayed
distinct zones containing tantalite-columbite, spodumene, pollucite and lepidolite
mineralisation. A resource estimation of 1.5Mt at 1.26% Li (contained LCE 100,600t)
was made in 1993. More recent estimates however report reserves of 99,000t LCE.
Mined spodumene ore was concentrated on site. The plant is positioned on a
peninsular formed by two inlets into Lac du Bonnet because of land constraints. The first
stage of concentration involved crushing and grinding of coarse ores to -12mm.
Spodumene was subsequently concentrated by flotation before magnetic separation
was used to remove unwanted iron minerals. The plant had a capacity of 24,000tpy
spodumene concentrate, which before it’s closure was generally >90% utilised (Table
71). TANCO also produced a montebrastie and amblygonite concentrate containing
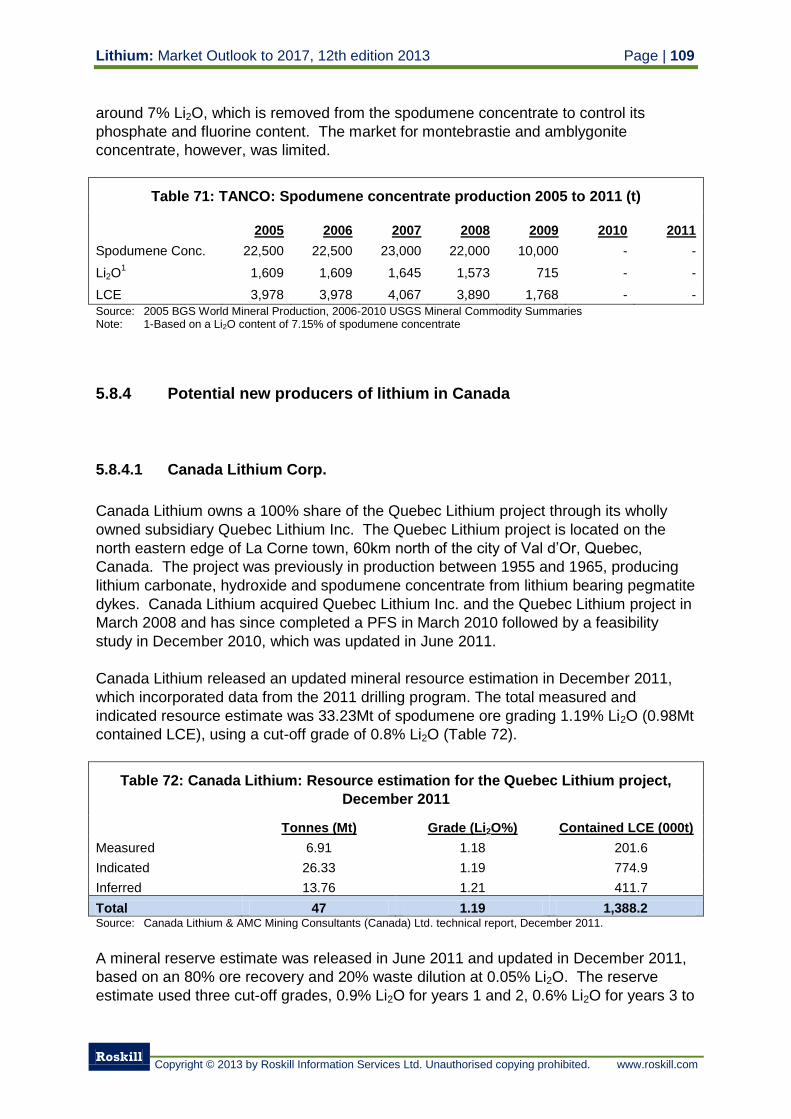
Lithium: Market Outlook to 2017, 12th edition 2013 Page | 109
Roskill
Copyright © 2013 by Roskill Information Services Ltd. Unauthorised copying prohibited. www.roskill.com
around 7% Li2O, which is removed from the spodumene concentrate to control its
phosphate and fluorine content. The market for montebrastie and amblygonite
concentrate, however, was limited.
Table 71: TANCO: Spodumene concentrate production 2005 to 2011 (t)
2005 2006 2007 2008 2009 2010 2011
Spodumene Conc. 22,500 22,500 23,000 22,000 10,000 - -
Li2O1 1,609 1,609 1,645 1,573 715 - -
LCE 3,978 3,978 4,067 3,890 1,768 - -
Source: 2005 BGS World Mineral Production, 2006-2010 USGS Mineral Commodity Summaries Note: 1-Based on a Li2O content of 7.15% of spodumene concentrate
5.8.4 Potential new producers of lithium in Canada
5.8.4.1 Canada Lithium Corp.
Canada Lithium owns a 100% share of the Quebec Lithium project through its wholly
owned subsidiary Quebec Lithium Inc. The Quebec Lithium project is located on the
north eastern edge of La Corne town, 60km north of the city of Val d’Or, Quebec,
Canada. The project was previously in production between 1955 and 1965, producing
lithium carbonate, hydroxide and spodumene concentrate from lithium bearing pegmatite
dykes. Canada Lithium acquired Quebec Lithium Inc. and the Quebec Lithium project in
March 2008 and has since completed a PFS in March 2010 followed by a feasibility
study in December 2010, which was updated in June 2011.
Canada Lithium released an updated mineral resource estimation in December 2011,
which incorporated data from the 2011 drilling program. The total measured and
indicated resource estimate was 33.23Mt of spodumene ore grading 1.19% Li2O (0.98Mt
contained LCE), using a cut-off grade of 0.8% Li2O (Table 72).
Table 72: Canada Lithium: Resource estimation for the Quebec Lithium project,
December 2011
Tonnes (Mt) Grade (Li2O%) Contained LCE (000t)
Measured 6.91 1.18 201.6
Indicated 26.33 1.19 774.9
Inferred 13.76 1.21 411.7
Total 47 1.19 1,388.2 Source: Canada Lithium & AMC Mining Consultants (Canada) Ltd. technical report, December 2011.
A mineral reserve estimate was released in June 2011 and updated in December 2011,
based on an 80% ore recovery and 20% waste dilution at 0.05% Li2O. The reserve
estimate used three cut-off grades, 0.9% Li2O for years 1 and 2, 0.6% Li2O for years 3 to
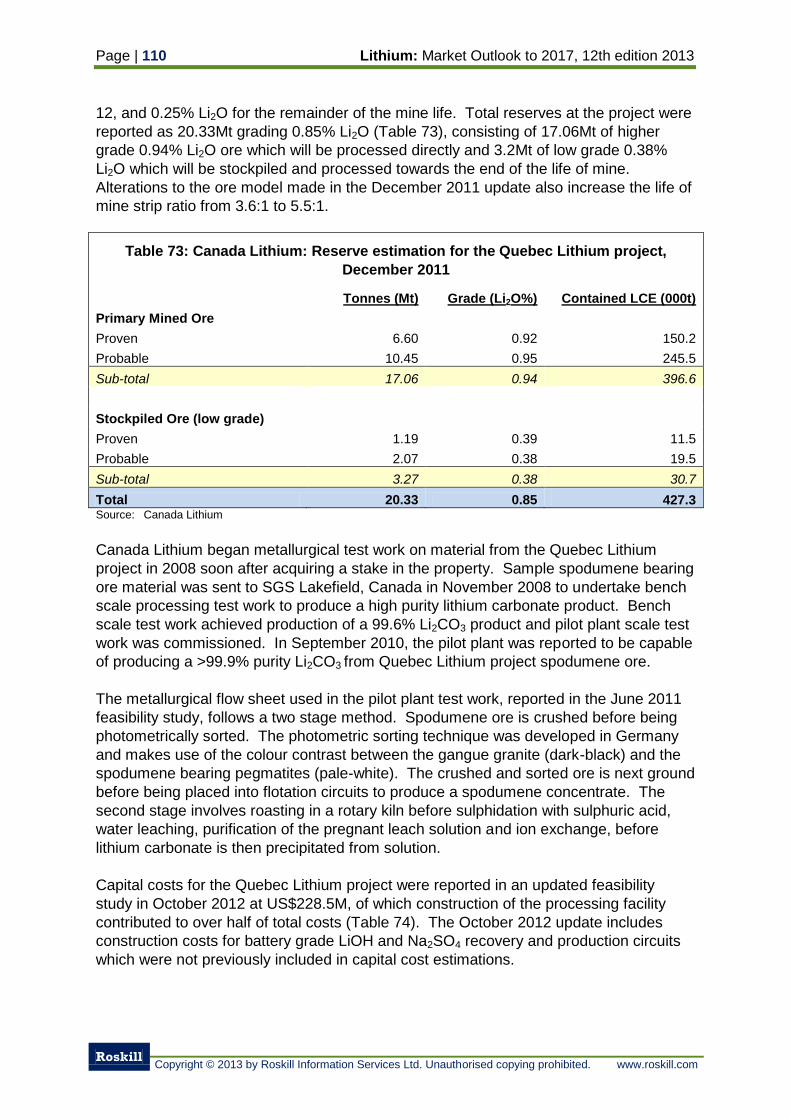
Page | 110 Lithium: Market Outlook to 2017, 12th edition 2013
Roskill
Copyright © 2013 by Roskill Information Services Ltd. Unauthorised copying prohibited. www.roskill.com
12, and 0.25% Li2O for the remainder of the mine life. Total reserves at the project were
reported as 20.33Mt grading 0.85% Li2O (Table 73), consisting of 17.06Mt of higher
grade 0.94% Li2O ore which will be processed directly and 3.2Mt of low grade 0.38%
Li2O which will be stockpiled and processed towards the end of the life of mine.
Alterations to the ore model made in the December 2011 update also increase the life of
mine strip ratio from 3.6:1 to 5.5:1.
Table 73: Canada Lithium: Reserve estimation for the Quebec Lithium project,
December 2011
Tonnes (Mt) Grade (Li2O%) Contained LCE (000t)
Primary Mined Ore
Proven 6.60 0.92 150.2
Probable 10.45 0.95 245.5
Sub-total 17.06 0.94 396.6
Stockpiled Ore (low grade)
Proven 1.19 0.39 11.5
Probable 2.07 0.38 19.5
Sub-total 3.27 0.38 30.7
Total 20.33 0.85 427.3 Source: Canada Lithium
Canada Lithium began metallurgical test work on material from the Quebec Lithium
project in 2008 soon after acquiring a stake in the property. Sample spodumene bearing
ore material was sent to SGS Lakefield, Canada in November 2008 to undertake bench
scale processing test work to produce a high purity lithium carbonate product. Bench
scale test work achieved production of a 99.6% Li2CO3 product and pilot plant scale test
work was commissioned. In September 2010, the pilot plant was reported to be capable
of producing a >99.9% purity Li2CO3 from Quebec Lithium project spodumene ore.
The metallurgical flow sheet used in the pilot plant test work, reported in the June 2011
feasibility study, follows a two stage method. Spodumene ore is crushed before being
photometrically sorted. The photometric sorting technique was developed in Germany
and makes use of the colour contrast between the gangue granite (dark-black) and the
spodumene bearing pegmatites (pale-white). The crushed and sorted ore is next ground
before being placed into flotation circuits to produce a spodumene concentrate. The
second stage involves roasting in a rotary kiln before sulphidation with sulphuric acid,
water leaching, purification of the pregnant leach solution and ion exchange, before
lithium carbonate is then precipitated from solution.
Capital costs for the Quebec Lithium project were reported in an updated feasibility
study in October 2012 at US$228.5M, of which construction of the processing facility
contributed to over half of total costs (Table 74). The October 2012 update includes
construction costs for battery grade LiOH and Na2SO4 recovery and production circuits
which were not previously included in capital cost estimations.
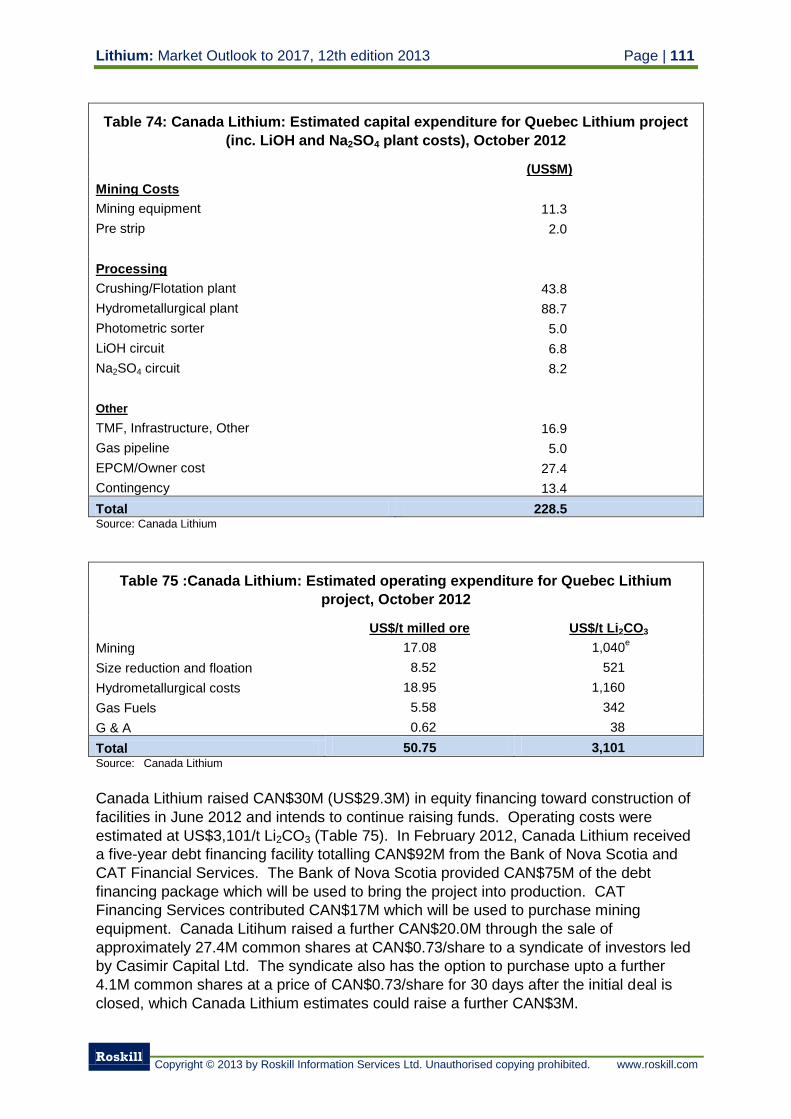
Lithium: Market Outlook to 2017, 12th edition 2013 Page | 111
Roskill
Copyright © 2013 by Roskill Information Services Ltd. Unauthorised copying prohibited. www.roskill.com
Table 74: Canada Lithium: Estimated capital expenditure for Quebec Lithium project
(inc. LiOH and Na2SO4 plant costs), October 2012
(US$M)
Mining Costs
Mining equipment 11.3
Pre strip 2.0
Processing
Crushing/Flotation plant 43.8
Hydrometallurgical plant 88.7
Photometric sorter 5.0
LiOH circuit 6.8
Na2SO4 circuit 8.2
Other
TMF, Infrastructure, Other 16.9
Gas pipeline 5.0
EPCM/Owner cost 27.4
Contingency 13.4
Total 228.5 Source: Canada Lithium
Table 75 :Canada Lithium: Estimated operating expenditure for Quebec Lithium
project, October 2012
US$/t milled ore US$/t Li2CO3
Mining 17.08 1,040e
Size reduction and floation 8.52 521
Hydrometallurgical costs 18.95 1,160
Gas Fuels 5.58 342
G & A 0.62 38
Total 50.75 3,101 Source: Canada Lithium
Canada Lithium raised CAN$30M (US$29.3M) in equity financing toward construction of
facilities in June 2012 and intends to continue raising funds. Operating costs were
estimated at US$3,101/t Li2CO3 (Table 75). In February 2012, Canada Lithium received
a five-year debt financing facility totalling CAN$92M from the Bank of Nova Scotia and
CAT Financial Services. The Bank of Nova Scotia provided CAN$75M of the debt
financing package which will be used to bring the project into production. CAT
Financing Services contributed CAN$17M which will be used to purchase mining
equipment. Canada Litihum raised a further CAN$20.0M through the sale of
approximately 27.4M common shares at CAN$0.73/share to a syndicate of investors led
by Casimir Capital Ltd. The syndicate also has the option to purchase upto a further
4.1M common shares at a price of CAN$0.73/share for 30 days after the initial deal is
closed, which Canada Lithium estimates could raise a further CAN$3M.
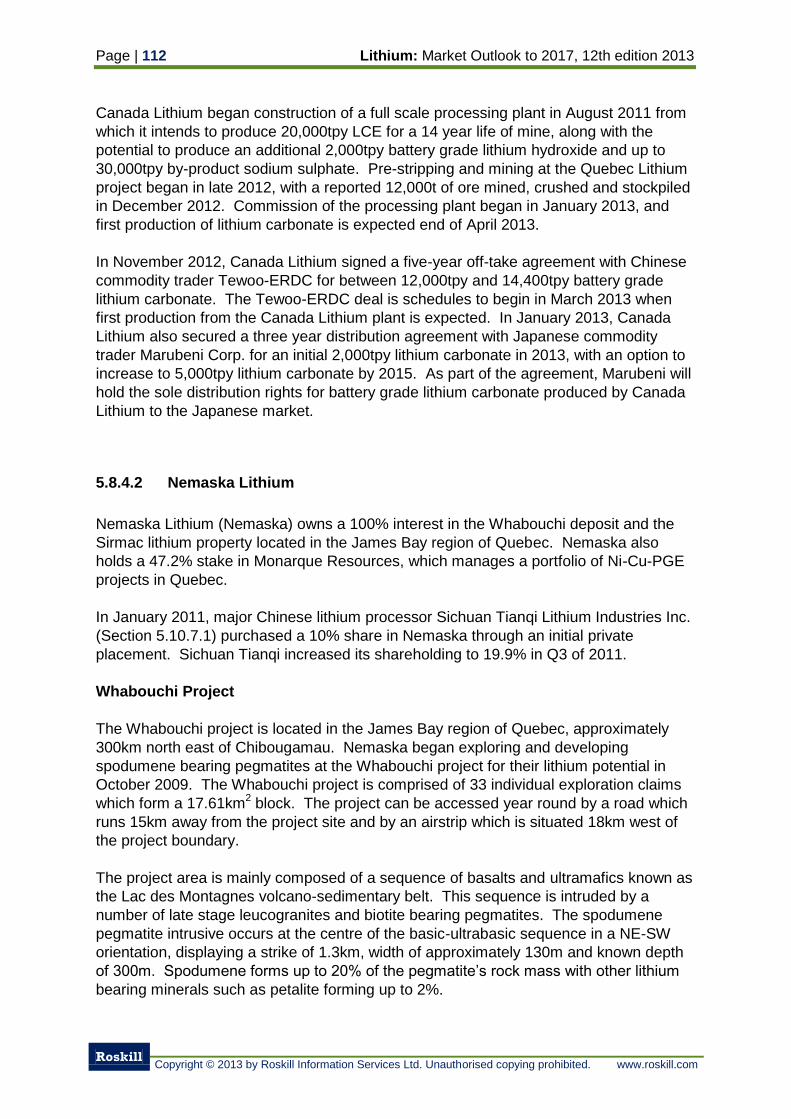
Page | 112 Lithium: Market Outlook to 2017, 12th edition 2013
Roskill
Copyright © 2013 by Roskill Information Services Ltd. Unauthorised copying prohibited. www.roskill.com
Canada Lithium began construction of a full scale processing plant in August 2011 from
which it intends to produce 20,000tpy LCE for a 14 year life of mine, along with the
potential to produce an additional 2,000tpy battery grade lithium hydroxide and up to
30,000tpy by-product sodium sulphate. Pre-stripping and mining at the Quebec Lithium
project began in late 2012, with a reported 12,000t of ore mined, crushed and stockpiled
in December 2012. Commission of the processing plant began in January 2013, and
first production of lithium carbonate is expected end of April 2013.
In November 2012, Canada Lithium signed a five-year off-take agreement with Chinese
commodity trader Tewoo-ERDC for between 12,000tpy and 14,400tpy battery grade
lithium carbonate. The Tewoo-ERDC deal is schedules to begin in March 2013 when
first production from the Canada Lithium plant is expected. In January 2013, Canada
Lithium also secured a three year distribution agreement with Japanese commodity
trader Marubeni Corp. for an initial 2,000tpy lithium carbonate in 2013, with an option to
increase to 5,000tpy lithium carbonate by 2015. As part of the agreement, Marubeni will
hold the sole distribution rights for battery grade lithium carbonate produced by Canada
Lithium to the Japanese market.
5.8.4.2 Nemaska Lithium
Nemaska Lithium (Nemaska) owns a 100% interest in the Whabouchi deposit and the
Sirmac lithium property located in the James Bay region of Quebec. Nemaska also
holds a 47.2% stake in Monarque Resources, which manages a portfolio of Ni-Cu-PGE
projects in Quebec.
In January 2011, major Chinese lithium processor Sichuan Tianqi Lithium Industries Inc.
(Section 5.10.7.1) purchased a 10% share in Nemaska through an initial private
placement. Sichuan Tianqi increased its shareholding to 19.9% in Q3 of 2011.
Whabouchi Project
The Whabouchi project is located in the James Bay region of Quebec, approximately
300km north east of Chibougamau. Nemaska began exploring and developing
spodumene bearing pegmatites at the Whabouchi project for their lithium potential in
October 2009. The Whabouchi project is comprised of 33 individual exploration claims
which form a 17.61km2 block. The project can be accessed year round by a road which
runs 15km away from the project site and by an airstrip which is situated 18km west of
the project boundary.
The project area is mainly composed of a sequence of basalts and ultramafics known as
the Lac des Montagnes volcano-sedimentary belt. This sequence is intruded by a
number of late stage leucogranites and biotite bearing pegmatites. The spodumene
pegmatite intrusive occurs at the centre of the basic-ultrabasic sequence in a NE-SW
orientation, displaying a strike of 1.3km, width of approximately 130m and known depth
of 300m. Spodumene forms up to 20% of the pegmatite’s rock mass with other lithium
bearing minerals such as petalite forming up to 2%.
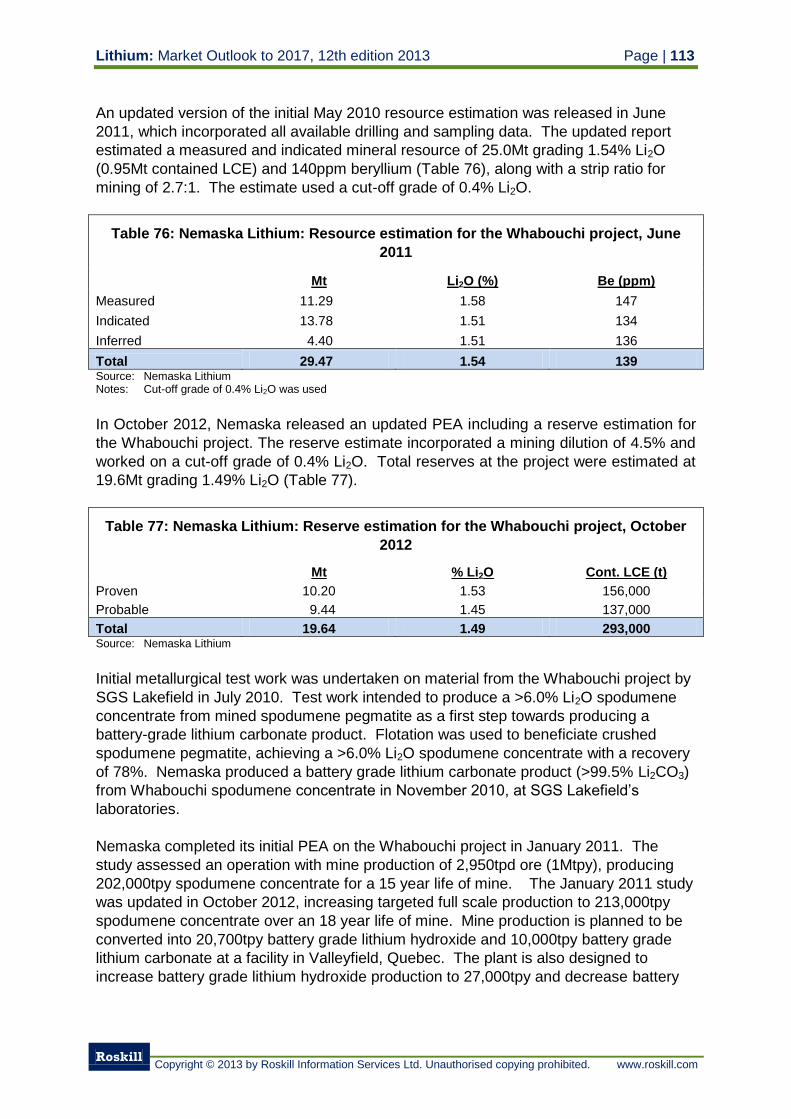
Lithium: Market Outlook to 2017, 12th edition 2013 Page | 113
Roskill
Copyright © 2013 by Roskill Information Services Ltd. Unauthorised copying prohibited. www.roskill.com
An updated version of the initial May 2010 resource estimation was released in June
2011, which incorporated all available drilling and sampling data. The updated report
estimated a measured and indicated mineral resource of 25.0Mt grading 1.54% Li2O
(0.95Mt contained LCE) and 140ppm beryllium (Table 76), along with a strip ratio for
mining of 2.7:1. The estimate used a cut-off grade of 0.4% Li2O.
Table 76: Nemaska Lithium: Resource estimation for the Whabouchi project, June
2011
Mt Li2O (%) Be (ppm)
Measured 11.29 1.58 147
Indicated 13.78 1.51 134
Inferred 4.40 1.51 136
Total 29.47 1.54 139 Source: Nemaska Lithium Notes: Cut-off grade of 0.4% Li2O was used
In October 2012, Nemaska released an updated PEA including a reserve estimation for
the Whabouchi project. The reserve estimate incorporated a mining dilution of 4.5% and
worked on a cut-off grade of 0.4% Li2O. Total reserves at the project were estimated at
19.6Mt grading 1.49% Li2O (Table 77).
Table 77: Nemaska Lithium: Reserve estimation for the Whabouchi project, October
2012
Mt % Li2O Cont. LCE (t)
Proven 10.20 1.53 156,000
Probable 9.44 1.45 137,000
Total 19.64 1.49 293,000 Source: Nemaska Lithium
Initial metallurgical test work was undertaken on material from the Whabouchi project by
SGS Lakefield in July 2010. Test work intended to produce a >6.0% Li2O spodumene
concentrate from mined spodumene pegmatite as a first step towards producing a
battery-grade lithium carbonate product. Flotation was used to beneficiate crushed
spodumene pegmatite, achieving a >6.0% Li2O spodumene concentrate with a recovery
of 78%. Nemaska produced a battery grade lithium carbonate product (>99.5% Li2CO3)
from Whabouchi spodumene concentrate in November 2010, at SGS Lakefield’s
laboratories.
Nemaska completed its initial PEA on the Whabouchi project in January 2011. The
study assessed an operation with mine production of 2,950tpd ore (1Mtpy), producing
202,000tpy spodumene concentrate for a 15 year life of mine. The January 2011 study
was updated in October 2012, increasing targeted full scale production to 213,000tpy
spodumene concentrate over an 18 year life of mine. Mine production is planned to be
converted into 20,700tpy battery grade lithium hydroxide and 10,000tpy battery grade
lithium carbonate at a facility in Valleyfield, Quebec. The plant is also designed to
increase battery grade lithium hydroxide production to 27,000tpy and decrease battery
Page | 114 Lithium: Market Outlook to 2017, 12th edition 2013
Roskill
Copyright © 2013 by Roskill Information Services Ltd. Unauthorised copying prohibited. www.roskill.com
grade lithium carbonate production to 4,000tpy should demand for battery grade lithium
hydroxide outpace that for battery grade lithium carbonate.
Initial capital costs were estimated in the updated October 2012 PEA to be CAN$454M,
including a CAN$50M contingency and CAN$15M working capital. Operating costs for
the producion of both battery grade lithium hydroxide and battery grade lithium
carbonate were reported to be CAN$3,400/t and CAN$3,500/t respectively.
Plans to construct a 500tpy lithium hydroxide and carbonate plant at Salaberry-de-
Valleyfield, Quebec were confirmed by Nemaska in February 2013, with construction
completed by end November 2013 and commissioning undertaken during December
2013. In March 2013, Nemaska announced that the pilot plant would have an average
production capacity of 426tpy lithium hydroxide during the first phase of operation. First
production from the pilot facility is scheduled for January 2014, and lithium chemicals
produced at the plant are to be used to supply Phostech Lithium and provide product
samples for potential customers. Nemaska intend to produce and purchase feedstock in
the form of lithium sulphate and spodumene concentrate, to sustain two years
production at the pilot plant. Raw materials will be purchased from the open market or
produced from the Whabouchi deposit during bulk sampling programs. The pilot plant
has been assigned a budget of CAN$25M including EPCM and contingency, by Met-
Chem Canada Inc. who completed a PEA on the facility in October 2012.
In March 2012, Nemaska reported successful results in producing a battery grade lithium
hydroxide product, before filing for the process to be patented in June 2012. The lithium
hydroxide product can be used to produce battery grade lithium carbonate. The
process, unlike the standard LiOH production method, does not use caustic soda,
instead producing LiOH directly from Li2SO4 by electrolysis. Also in March 2012,
Nemaska reported advancements in producing spodumene concentrate through flotation
and dense media separation. A locked cycle flotation test returned recoveries of 85-
98% when producing a 6.5% Li2O spodumene concentrate. Patent applications for both
battery grade lithium hydroxide and battery grade lithium carbonate production by the
electrolysis method were applied for by Nemaska in June 2012.
Nemaska continue to work towards producing a feasibility study for the Whabouchi
project, expected to be completed in Q2-2013. Engineering and construction of
processing and mine infrastructure is expected to begin soon after and continue
throughout 2013-2014. Comissioning of the Whabouchi mine and concentration
facilities is forecast to begin by in Q2-2015, with first commercial spodumene
concentrate production in Q4-2015.
In October 2012, Nemaska signed an off-take agreement with Phostech Lithium, a
subsidiary of Clariant AG Group producing cathode materials in Canada. The
agreement will see Phostech evaluate and purchase lithium hydroxide produced at the
Nemaska pilot plant, and the two companies will also jointly investigate the feasibility of
tailoring Nemaska’s lithium hydroxide output to Phostech’s demand specifications.
Nemaska has also highlighted the potential of regenerating Phostech’s by-product
production of lithium sulphate into lithium hydroxide via electrolysis, a process which
could be applied to other cathode material plants.
Lithium: Market Outlook to 2017, 12th edition 2013 Page | 115
Roskill
Copyright © 2013 by Roskill Information Services Ltd. Unauthorised copying prohibited. www.roskill.com
Sirmac Project
The Sirmac project is located 130km south of Nemaska’s Whabouchi project,
approximately 100km north of the town of Chibougamau. Nemaska acquired the project
from Everton Resources Inc. in November 2010 after commissioning an initial review of
the project in the previous month. The project is comprised of 15 mining claims which
cover 6.45km2 south of Lake Sirmac.
Lithium is hosted within spodumene bearing pegmatites which intrude into mainly
metavolcanic and metasedimentary sequences. Spodumene is the main lithium bearing
mineral in the pegmatites, however tryphylite and beryl also occur in lesser amounts. A
historical (non-NI 43-101 compliant) resource was reported in 1994, which estimated
318,324t grading 2.04% Li2O (approximately 16,000t contained LCE).
Nemaska are in the process of constructing transport routes to the Sirmac site, so that
machinery and equipment can be brought in for sampling and construction of general
infrastructure. Details of recent exploration activities were released in November 2012,
reporting assays of between 1.08% Li2O over 18.5m and 1.87% Li2O over 4.5m, taken
as part of a channel sampling program across the main target dyke (Dyke #5). The
2012 exploration program also identified a new spodumene bearing dyke (Dyke #1)
500m west of Dyke#5, returning grades of 0.51% Li2O over 9m. The channel sampling
program is planned to be followed up by a primary drilling campaign, to determine the
dimensions and grade of the spodumene-pegmatite intrusives and ultimately estimate a
NI 43-101 compliant resource.
5.8.4.3 Avalon Rare Metals Inc.
Avalon Rare Metals fully owns the Separation Rapids project located 70km North of
Kenora, Ontario. The project area consists of ten adjacent mineral claims covering
14.5km2. The project area is centred on the ‘Big Whopper’ pegmatite which is host to
lithium, tantalum and other rare metal mineralisation. Avalon has also secured a lease
for an area adjacent to the Separation Rapids project, covering 4.0km2 for a 21 year
period.
Prior to purchasing the Separation Rapids project in October 1996, Avalon concentrated
on gold exploration in Canada, deciding to switch their focus to rare metal and rare earth
exploration. Avalon completed a PFS for the project in 1999, after undertaking
geological mapping, sampling programs, geophysical surveys and a 10,000m diamond
drilling campaign. The PFS included a NI 43-101 mineral resource estimation of 11.6Mt
grading 1.34% Li2O, 0.007% Ta2O5 and 0.30% Rb2O (Table 78). A NI 43-101 compliant
reserve estimation by Micon International Inc. was also included in the PFS, suggesting
a probable reserve of 7.72Mt grading 1.4% Li2O.
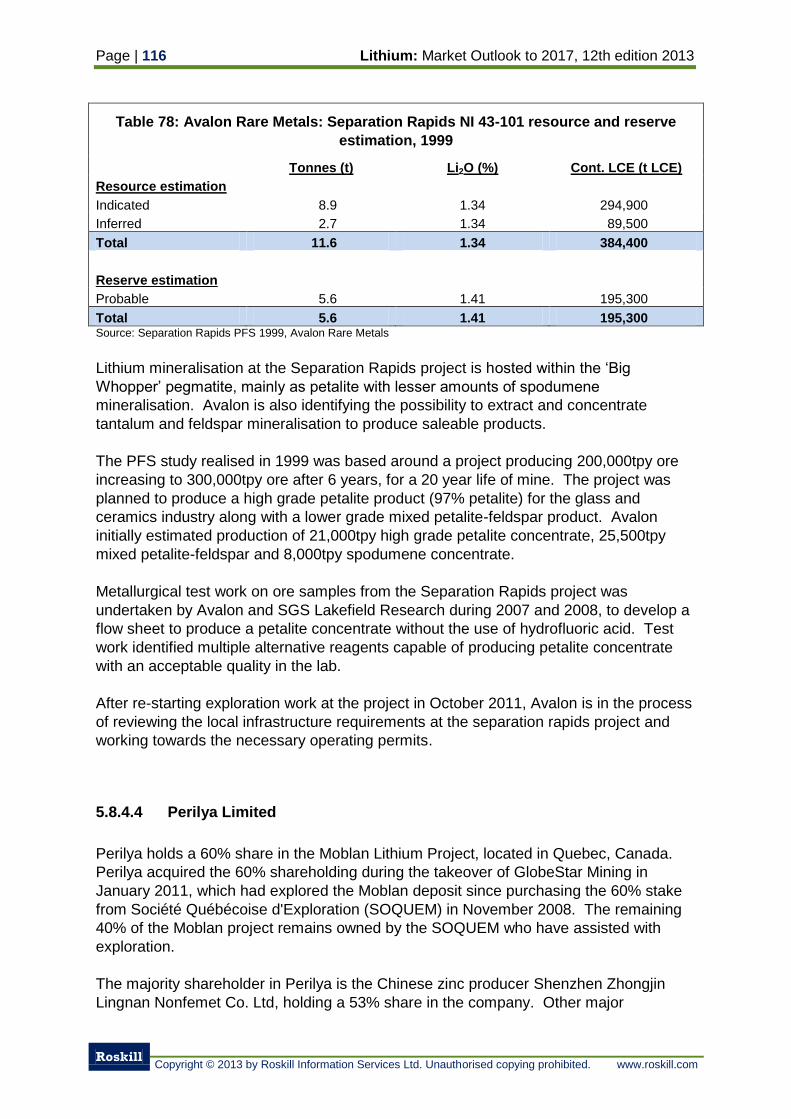
Page | 116 Lithium: Market Outlook to 2017, 12th edition 2013
Roskill
Copyright © 2013 by Roskill Information Services Ltd. Unauthorised copying prohibited. www.roskill.com
Table 78: Avalon Rare Metals: Separation Rapids NI 43-101 resource and reserve
estimation, 1999
Tonnes (t) Li2O (%) Cont. LCE (t LCE)
Resource estimation
Indicated 8.9 1.34 294,900
Inferred 2.7 1.34 89,500
Total 11.6 1.34 384,400
Reserve estimation
Probable 5.6 1.41 195,300
Total 5.6 1.41 195,300 Source: Separation Rapids PFS 1999, Avalon Rare Metals
Lithium mineralisation at the Separation Rapids project is hosted within the ‘Big
Whopper’ pegmatite, mainly as petalite with lesser amounts of spodumene
mineralisation. Avalon is also identifying the possibility to extract and concentrate
tantalum and feldspar mineralisation to produce saleable products.
The PFS study realised in 1999 was based around a project producing 200,000tpy ore
increasing to 300,000tpy ore after 6 years, for a 20 year life of mine. The project was
planned to produce a high grade petalite product (97% petalite) for the glass and
ceramics industry along with a lower grade mixed petalite-feldspar product. Avalon
initially estimated production of 21,000tpy high grade petalite concentrate, 25,500tpy
mixed petalite-feldspar and 8,000tpy spodumene concentrate.
Metallurgical test work on ore samples from the Separation Rapids project was
undertaken by Avalon and SGS Lakefield Research during 2007 and 2008, to develop a
flow sheet to produce a petalite concentrate without the use of hydrofluoric acid. Test
work identified multiple alternative reagents capable of producing petalite concentrate
with an acceptable quality in the lab.
After re-starting exploration work at the project in October 2011, Avalon is in the process
of reviewing the local infrastructure requirements at the separation rapids project and
working towards the necessary operating permits.
5.8.4.4 Perilya Limited
Perilya holds a 60% share in the Moblan Lithium Project, located in Quebec, Canada.
Perilya acquired the 60% shareholding during the takeover of GlobeStar Mining in
January 2011, which had explored the Moblan deposit since purchasing the 60% stake
from Société Québécoise d'Exploration (SOQUEM) in November 2008. The remaining
40% of the Moblan project remains owned by the SOQUEM who have assisted with
exploration.
The majority shareholder in Perilya is the Chinese zinc producer Shenzhen Zhongjin
Lingnan Nonfemet Co. Ltd, holding a 53% share in the company. Other major
Lithium: Market Outlook to 2017, 12th edition 2013 Page | 117
Roskill
Copyright © 2013 by Roskill Information Services Ltd. Unauthorised copying prohibited. www.roskill.com
shareholders include L1 Capital Pty Ltd. and Acorn Capital Ltd. who own a 10% and a
5% shareholding respectively.
The project is split into two separate areas known as East and West Moblan. To date
the majority of exploration has been undertaken on Moblan West, which is composed of
14 claim areas covering 2.35km2. Unlike the West Moblan area, the East Moblan area is
100% owned by Perilya Ltd., however it covers a smaller area of 1.63km2 composed of
11 claims and is less advanced.
Perilya released an updated mineral resource estimation in May 2011, after results of a
2010 drilling campaign were assessed. The results reported a contained resource of
14.2Mt grading 1.41% Li2O (contained 497,000t LCE) using a cut-off grade of 0.6% Li2O
(Table 79).
Table 79: Perilya Ltd: Mineral resource estimation for Moblan deposit, May 2011
Tonnes (Mt) Grade (% Li2O) Contained LCE (t)
Measured 4.71 1.63 190,000
Indicated 6.75 1.33 222,000
Inferred 2.78 1.22 84,000
Total 14.25 1.41 497,000 Source: Company data
Mineralisation at the Moblan property occurs within a pegmatite body known as the
‘Main Sill’, which intrudes into greenschisst-lower amphibolite facies metamorphic rocks
forming the greenstone belt. Lithium is hosted within sporadic spodumene
mineralisation within the pegmatites, occurring along with tantalum and niobium
mineralisation.
Perilya has completed a scoping study at the Moblan project, focussing on developing
an initial metallurgical flow sheet, environmental impacts and a preliminary mine design.
The scoping study is based on an operation with a mining rate of 135,000tpy for a 10
year life of mine. The scoping study also estimated capital costs at CAN$22M for both
mining and milling equipment and facilities to produce a spodumene concentrate along
with sodium and potassium feldspar by-products.
Perilya plan to undertake an infill drilling program at the Moblan project to expand and
increase confidence in the resource estimation. Metallurgical samples will be taken
during the drilling to undertake further metallurgical test work on spodumene concentrate
production from the deposit. Geological mapping and initial grab sampling is also
planned for the Moblan east area to assess its resource potential.
5.8.4.5 Rock Tech Lithium Inc.
Rock Tech Lithium holds interests in three lithium projects within Quebec and Ontario
provinces of Canada. The Georgia Lake project is the company’s most developed
lithium project, with a NI 43-101 compliant resource estimation, completed metallurgical
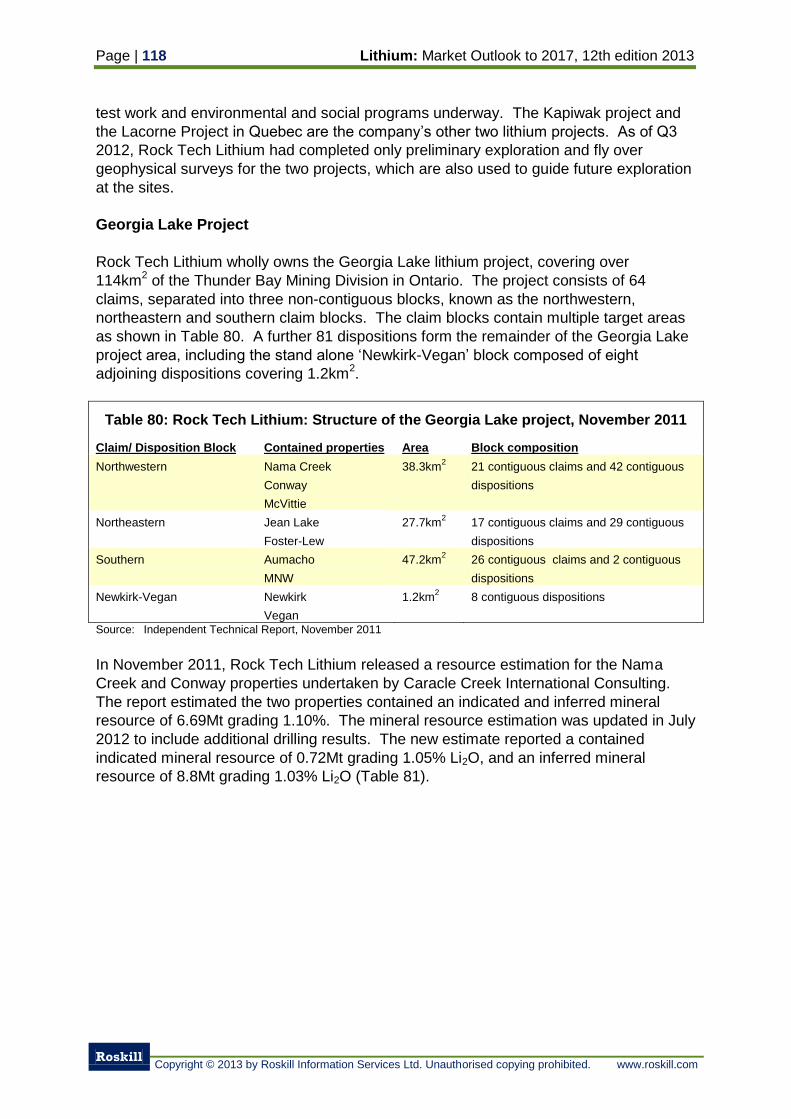
Page | 118 Lithium: Market Outlook to 2017, 12th edition 2013
Roskill
Copyright © 2013 by Roskill Information Services Ltd. Unauthorised copying prohibited. www.roskill.com
test work and environmental and social programs underway. The Kapiwak project and
the Lacorne Project in Quebec are the company’s other two lithium projects. As of Q3
2012, Rock Tech Lithium had completed only preliminary exploration and fly over
geophysical surveys for the two projects, which are also used to guide future exploration
at the sites.
Georgia Lake Project
Rock Tech Lithium wholly owns the Georgia Lake lithium project, covering over
114km2 of the Thunder Bay Mining Division in Ontario. The project consists of 64
claims, separated into three non-contiguous blocks, known as the northwestern,
northeastern and southern claim blocks. The claim blocks contain multiple target areas
as shown in Table 80. A further 81 dispositions form the remainder of the Georgia Lake
project area, including the stand alone ‘Newkirk-Vegan’ block composed of eight
adjoining dispositions covering 1.2km2.
Table 80: Rock Tech Lithium: Structure of the Georgia Lake project, November 2011
Claim/ Disposition Block Contained properties Area Block composition
Northwestern Nama Creek
Conway
McVittie
38.3km2 21 contiguous claims and 42 contiguous
dispositions
Northeastern Jean Lake
Foster-Lew
27.7km2
17 contiguous claims and 29 contiguous
dispositions
Southern Aumacho
MNW
47.2km2 26 contiguous claims and 2 contiguous
dispositions
Newkirk-Vegan Newkirk
Vegan
1.2km2 8 contiguous dispositions
Source: Independent Technical Report, November 2011
In November 2011, Rock Tech Lithium released a resource estimation for the Nama
Creek and Conway properties undertaken by Caracle Creek International Consulting.
The report estimated the two properties contained an indicated and inferred mineral
resource of 6.69Mt grading 1.10%. The mineral resource estimation was updated in July
2012 to include additional drilling results. The new estimate reported a contained
indicated mineral resource of 0.72Mt grading 1.05% Li2O, and an inferred mineral
resource of 8.8Mt grading 1.03% Li2O (Table 81).
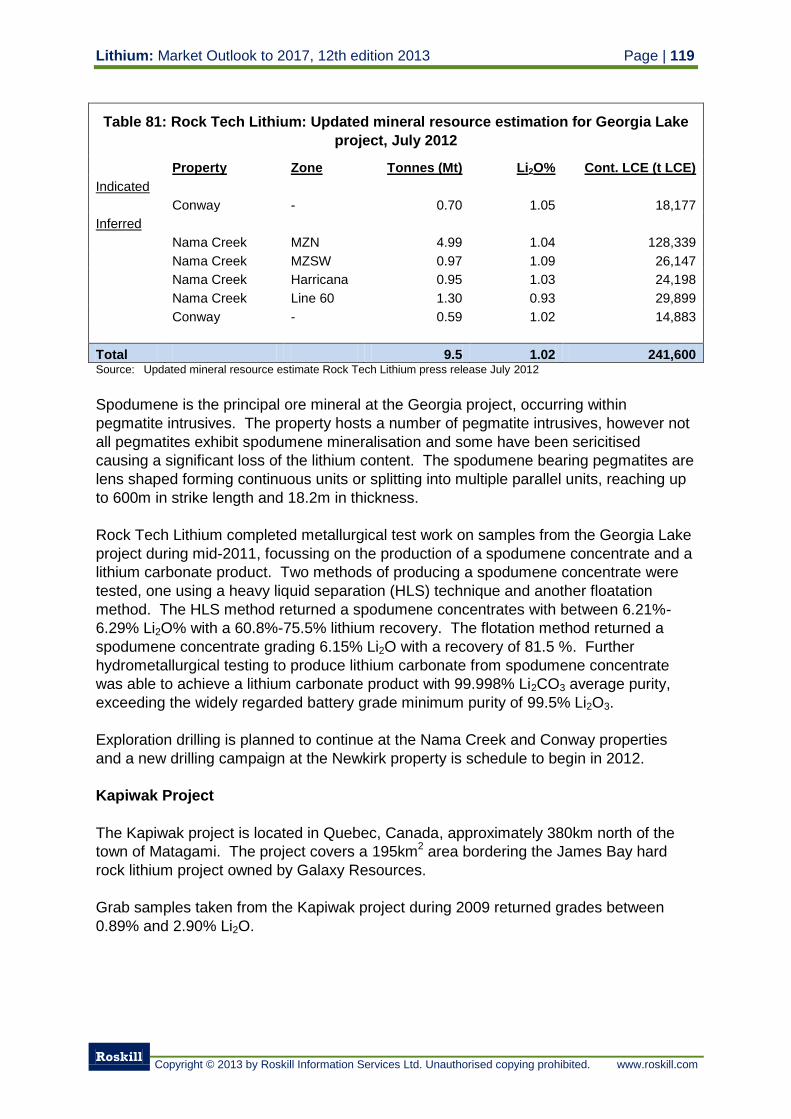
Lithium: Market Outlook to 2017, 12th edition 2013 Page | 119
Roskill
Copyright © 2013 by Roskill Information Services Ltd. Unauthorised copying prohibited. www.roskill.com
Table 81: Rock Tech Lithium: Updated mineral resource estimation for Georgia Lake
project, July 2012
Property Zone Tonnes (Mt) Li2O% Cont. LCE (t LCE)
Indicated
Conway - 0.70 1.05 18,177
Inferred
Nama Creek MZN 4.99 1.04 128,339
Nama Creek MZSW 0.97 1.09 26,147
Nama Creek Harricana 0.95 1.03 24,198
Nama Creek Line 60 1.30 0.93 29,899
Conway - 0.59 1.02 14,883
Total 9.5 1.02 241,600 Source: Updated mineral resource estimate Rock Tech Lithium press release July 2012
Spodumene is the principal ore mineral at the Georgia project, occurring within
pegmatite intrusives. The property hosts a number of pegmatite intrusives, however not
all pegmatites exhibit spodumene mineralisation and some have been sericitised
causing a significant loss of the lithium content. The spodumene bearing pegmatites are
lens shaped forming continuous units or splitting into multiple parallel units, reaching up
to 600m in strike length and 18.2m in thickness.
Rock Tech Lithium completed metallurgical test work on samples from the Georgia Lake
project during mid-2011, focussing on the production of a spodumene concentrate and a
lithium carbonate product. Two methods of producing a spodumene concentrate were
tested, one using a heavy liquid separation (HLS) technique and another floatation
method. The HLS method returned a spodumene concentrates with between 6.21%-
6.29% Li2O% with a 60.8%-75.5% lithium recovery. The flotation method returned a
spodumene concentrate grading 6.15% Li2O with a recovery of 81.5 %. Further
hydrometallurgical testing to produce lithium carbonate from spodumene concentrate
was able to achieve a lithium carbonate product with 99.998% Li2CO3 average purity,
exceeding the widely regarded battery grade minimum purity of 99.5% Li2O3.
Exploration drilling is planned to continue at the Nama Creek and Conway properties
and a new drilling campaign at the Newkirk property is schedule to begin in 2012.
Kapiwak Project
The Kapiwak project is located in Quebec, Canada, approximately 380km north of the
town of Matagami. The project covers a 195km2 area bordering the James Bay hard
rock lithium project owned by Galaxy Resources.
Grab samples taken from the Kapiwak project during 2009 returned grades between
0.89% and 2.90% Li2O.
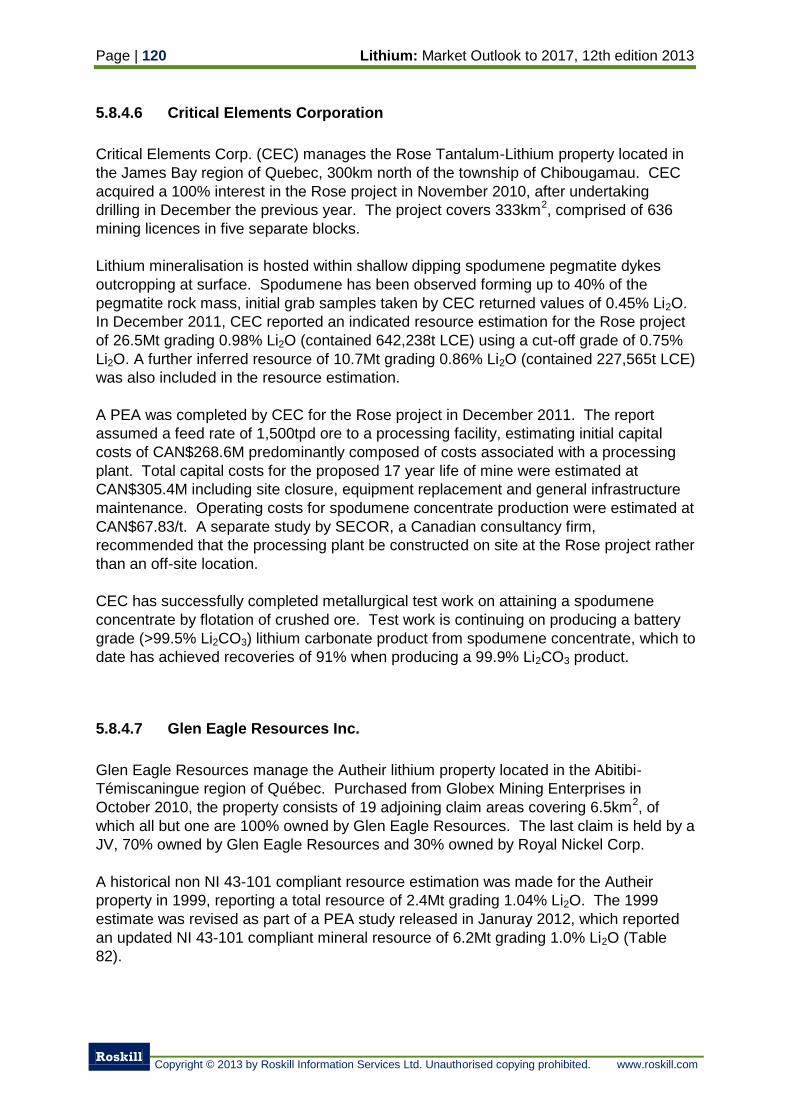
Page | 120 Lithium: Market Outlook to 2017, 12th edition 2013
Roskill
Copyright © 2013 by Roskill Information Services Ltd. Unauthorised copying prohibited. www.roskill.com
5.8.4.6 Critical Elements Corporation
Critical Elements Corp. (CEC) manages the Rose Tantalum-Lithium property located in
the James Bay region of Quebec, 300km north of the township of Chibougamau. CEC
acquired a 100% interest in the Rose project in November 2010, after undertaking
drilling in December the previous year. The project covers 333km2, comprised of 636
mining licences in five separate blocks.
Lithium mineralisation is hosted within shallow dipping spodumene pegmatite dykes
outcropping at surface. Spodumene has been observed forming up to 40% of the
pegmatite rock mass, initial grab samples taken by CEC returned values of 0.45% Li2O.
In December 2011, CEC reported an indicated resource estimation for the Rose project
of 26.5Mt grading 0.98% Li2O (contained 642,238t LCE) using a cut-off grade of 0.75%
Li2O. A further inferred resource of 10.7Mt grading 0.86% Li2O (contained 227,565t LCE)
was also included in the resource estimation.
A PEA was completed by CEC for the Rose project in December 2011. The report
assumed a feed rate of 1,500tpd ore to a processing facility, estimating initial capital
costs of CAN$268.6M predominantly composed of costs associated with a processing
plant. Total capital costs for the proposed 17 year life of mine were estimated at
CAN$305.4M including site closure, equipment replacement and general infrastructure
maintenance. Operating costs for spodumene concentrate production were estimated at
CAN$67.83/t. A separate study by SECOR, a Canadian consultancy firm,
recommended that the processing plant be constructed on site at the Rose project rather
than an off-site location.
CEC has successfully completed metallurgical test work on attaining a spodumene
concentrate by flotation of crushed ore. Test work is continuing on producing a battery
grade (>99.5% Li2CO3) lithium carbonate product from spodumene concentrate, which to
date has achieved recoveries of 91% when producing a 99.9% Li2CO3 product.
5.8.4.7 Glen Eagle Resources Inc.
Glen Eagle Resources manage the Autheir lithium property located in the Abitibi-
Témiscaningue region of Québec. Purchased from Globex Mining Enterprises in
October 2010, the property consists of 19 adjoining claim areas covering 6.5km2, of
which all but one are 100% owned by Glen Eagle Resources. The last claim is held by a
JV, 70% owned by Glen Eagle Resources and 30% owned by Royal Nickel Corp.
A historical non NI 43-101 compliant resource estimation was made for the Autheir
property in 1999, reporting a total resource of 2.4Mt grading 1.04% Li2O. The 1999
estimate was revised as part of a PEA study released in Januray 2012, which reported
an updated NI 43-101 compliant mineral resource of 6.2Mt grading 1.0% Li2O (Table
82).
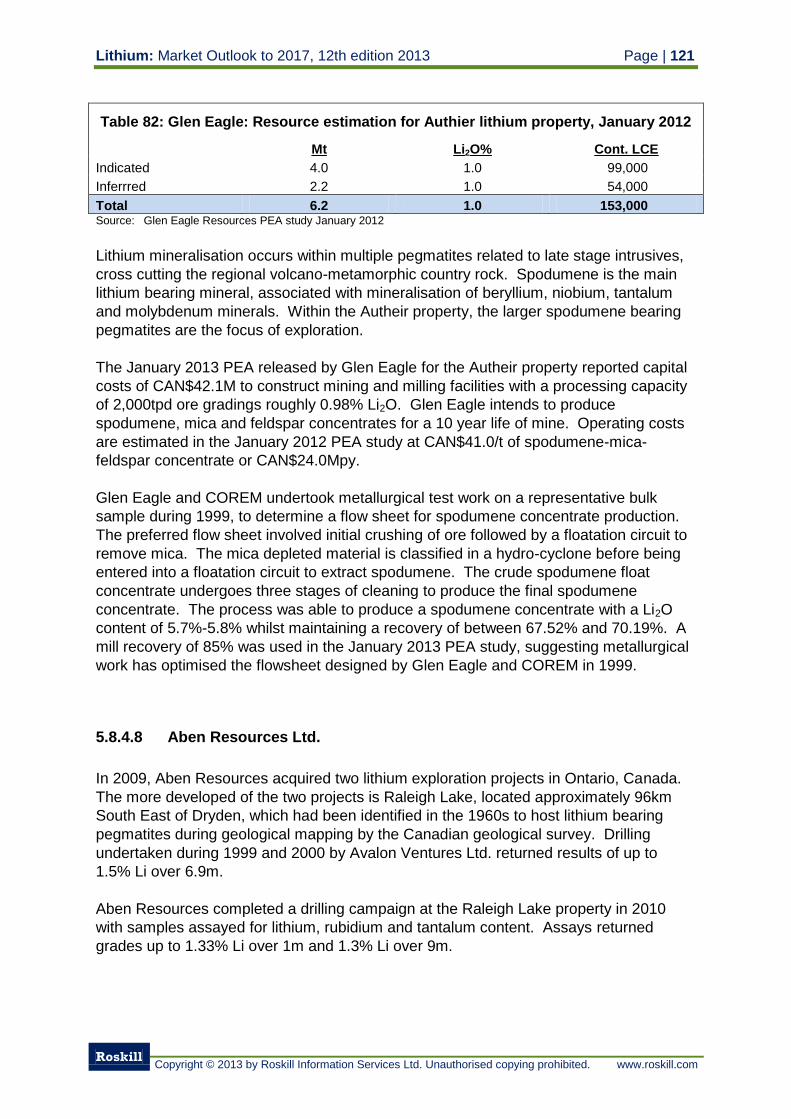
Lithium: Market Outlook to 2017, 12th edition 2013 Page | 121
Roskill
Copyright © 2013 by Roskill Information Services Ltd. Unauthorised copying prohibited. www.roskill.com
Table 82: Glen Eagle: Resource estimation for Authier lithium property, January 2012
Mt Li2O% Cont. LCE
Indicated 4.0 1.0 99,000
Inferrred 2.2 1.0 54,000
Total 6.2 1.0 153,000 Source: Glen Eagle Resources PEA study January 2012
Lithium mineralisation occurs within multiple pegmatites related to late stage intrusives,
cross cutting the regional volcano-metamorphic country rock. Spodumene is the main
lithium bearing mineral, associated with mineralisation of beryllium, niobium, tantalum
and molybdenum minerals. Within the Autheir property, the larger spodumene bearing
pegmatites are the focus of exploration.
The January 2013 PEA released by Glen Eagle for the Autheir property reported capital
costs of CAN$42.1M to construct mining and milling facilities with a processing capacity
of 2,000tpd ore gradings roughly 0.98% Li2O. Glen Eagle intends to produce
spodumene, mica and feldspar concentrates for a 10 year life of mine. Operating costs
are estimated in the January 2012 PEA study at CAN$41.0/t of spodumene-mica-
feldspar concentrate or CAN$24.0Mpy.
Glen Eagle and COREM undertook metallurgical test work on a representative bulk
sample during 1999, to determine a flow sheet for spodumene concentrate production.
The preferred flow sheet involved initial crushing of ore followed by a floatation circuit to
remove mica. The mica depleted material is classified in a hydro-cyclone before being
entered into a floatation circuit to extract spodumene. The crude spodumene float
concentrate undergoes three stages of cleaning to produce the final spodumene
concentrate. The process was able to produce a spodumene concentrate with a Li2O
content of 5.7%-5.8% whilst maintaining a recovery of between 67.52% and 70.19%. A
mill recovery of 85% was used in the January 2013 PEA study, suggesting metallurgical
work has optimised the flowsheet designed by Glen Eagle and COREM in 1999.
5.8.4.8 Aben Resources Ltd.
In 2009, Aben Resources acquired two lithium exploration projects in Ontario, Canada.
The more developed of the two projects is Raleigh Lake, located approximately 96km
South East of Dryden, which had been identified in the 1960s to host lithium bearing
pegmatites during geological mapping by the Canadian geological survey. Drilling
undertaken during 1999 and 2000 by Avalon Ventures Ltd. returned results of up to
1.5% Li over 6.9m.
Aben Resources completed a drilling campaign at the Raleigh Lake property in 2010
with samples assayed for lithium, rubidium and tantalum content. Assays returned
grades up to 1.33% Li over 1m and 1.3% Li over 9m.
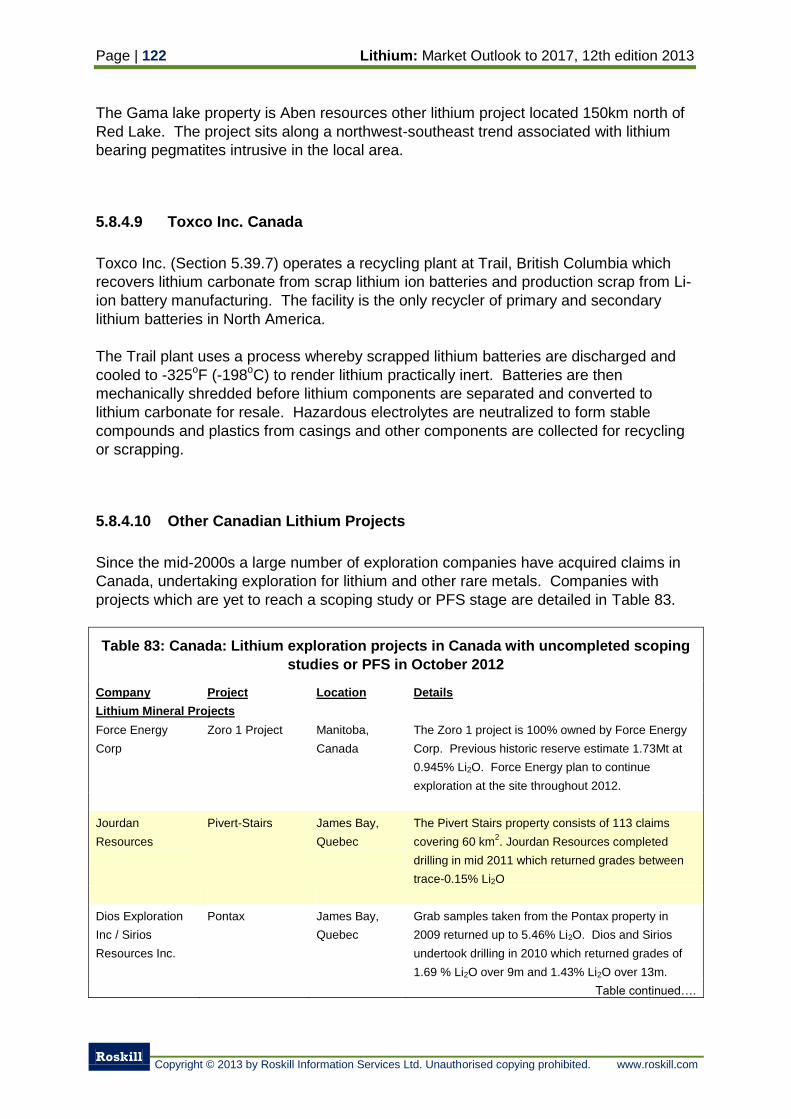
Page | 122 Lithium: Market Outlook to 2017, 12th edition 2013
Roskill
Copyright © 2013 by Roskill Information Services Ltd. Unauthorised copying prohibited. www.roskill.com
The Gama lake property is Aben resources other lithium project located 150km north of
Red Lake. The project sits along a northwest-southeast trend associated with lithium
bearing pegmatites intrusive in the local area.
5.8.4.9 Toxco Inc. Canada
Toxco Inc. (Section 5.39.7) operates a recycling plant at Trail, British Columbia which
recovers lithium carbonate from scrap lithium ion batteries and production scrap from Li-
ion battery manufacturing. The facility is the only recycler of primary and secondary
lithium batteries in North America.
The Trail plant uses a process whereby scrapped lithium batteries are discharged and
cooled to -325oF (-198
oC) to render lithium practically inert. Batteries are then
mechanically shredded before lithium components are separated and converted to
lithium carbonate for resale. Hazardous electrolytes are neutralized to form stable
compounds and plastics from casings and other components are collected for recycling
or scrapping.
5.8.4.10 Other Canadian Lithium Projects
Since the mid-2000s a large number of exploration companies have acquired claims in
Canada, undertaking exploration for lithium and other rare metals. Companies with
projects which are yet to reach a scoping study or PFS stage are detailed in Table 83.
Table 83: Canada: Lithium exploration projects in Canada with uncompleted scoping
studies or PFS in October 2012
Company Project Location Details
Lithium Mineral Projects
Force Energy
Corp
Zoro 1 Project Manitoba,
Canada
The Zoro 1 project is 100% owned by Force Energy
Corp. Previous historic reserve estimate 1.73Mt at
0.945% Li2O. Force Energy plan to continue
exploration at the site throughout 2012.
Jourdan
Resources
Pivert-Stairs James Bay,
Quebec
The Pivert Stairs property consists of 113 claims
covering 60 km2. Jourdan Resources completed
drilling in mid 2011 which returned grades between
trace-0.15% Li2O
Dios Exploration
Inc / Sirios
Resources Inc.
Pontax James Bay,
Quebec
Grab samples taken from the Pontax property in
2009 returned up to 5.46% Li2O. Dios and Sirios
undertook drilling in 2010 which returned grades of
1.69 % Li2O over 9m and 1.43% Li2O over 13m.
Table continued….
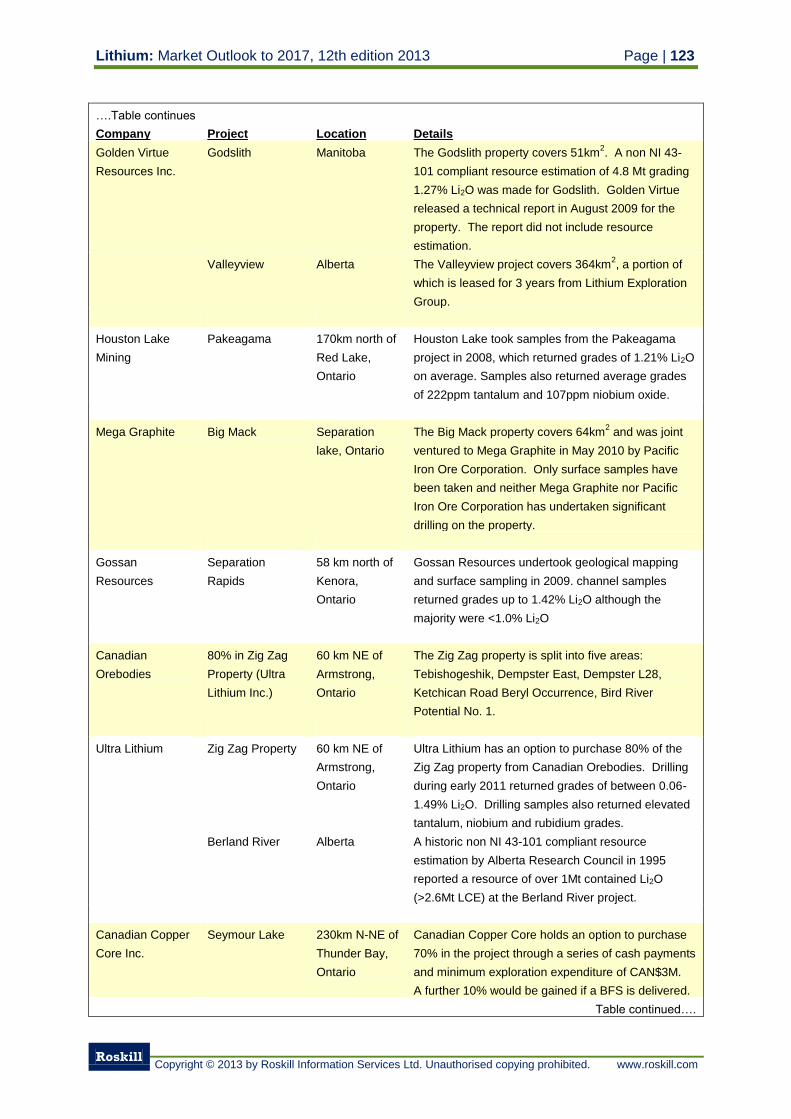
Lithium: Market Outlook to 2017, 12th edition 2013 Page | 123
Roskill
Copyright © 2013 by Roskill Information Services Ltd. Unauthorised copying prohibited. www.roskill.com
….Table continues
Company Project Location Details
Golden Virtue
Resources Inc.
Godslith Manitoba The Godslith property covers 51km2. A non NI 43-
101 compliant resource estimation of 4.8 Mt grading
1.27% Li2O was made for Godslith. Golden Virtue
released a technical report in August 2009 for the
property. The report did not include resource
estimation.
Valleyview Alberta The Valleyview project covers 364km2, a portion of
which is leased for 3 years from Lithium Exploration
Group.
Houston Lake
Mining
Pakeagama 170km north of
Red Lake,
Ontario
Houston Lake took samples from the Pakeagama
project in 2008, which returned grades of 1.21% Li2O
on average. Samples also returned average grades
of 222ppm tantalum and 107ppm niobium oxide.
Mega Graphite Big Mack Separation
lake, Ontario
The Big Mack property covers 64km2 and was joint
ventured to Mega Graphite in May 2010 by Pacific
Iron Ore Corporation. Only surface samples have
been taken and neither Mega Graphite nor Pacific
Iron Ore Corporation has undertaken significant
drilling on the property.
Gossan
Resources
Separation
Rapids
58 km north of
Kenora,
Ontario
Gossan Resources undertook geological mapping
and surface sampling in 2009. channel samples
returned grades up to 1.42% Li2O although the
majority were <1.0% Li2O
Canadian
Orebodies
80% in Zig Zag
Property (Ultra
Lithium Inc.)
60 km NE of
Armstrong,
Ontario
The Zig Zag property is split into five areas:
Tebishogeshik, Dempster East, Dempster L28,
Ketchican Road Beryl Occurrence, Bird River
Potential No. 1.
Ultra Lithium Zig Zag Property 60 km NE of
Armstrong,
Ontario
Ultra Lithium has an option to purchase 80% of the
Zig Zag property from Canadian Orebodies. Drilling
during early 2011 returned grades of between 0.06-
1.49% Li2O. Drilling samples also returned elevated
tantalum, niobium and rubidium grades.
Berland River Alberta A historic non NI 43-101 compliant resource
estimation by Alberta Research Council in 1995
reported a resource of over 1Mt contained Li2O
(>2.6Mt LCE) at the Berland River project.
Canadian Copper
Core Inc.
Seymour Lake 230km N-NE of
Thunder Bay,
Ontario
Canadian Copper Core holds an option to purchase
70% in the project through a series of cash payments
and minimum exploration expenditure of CAN$3M.
A further 10% would be gained if a BFS is delivered.
Table continued….
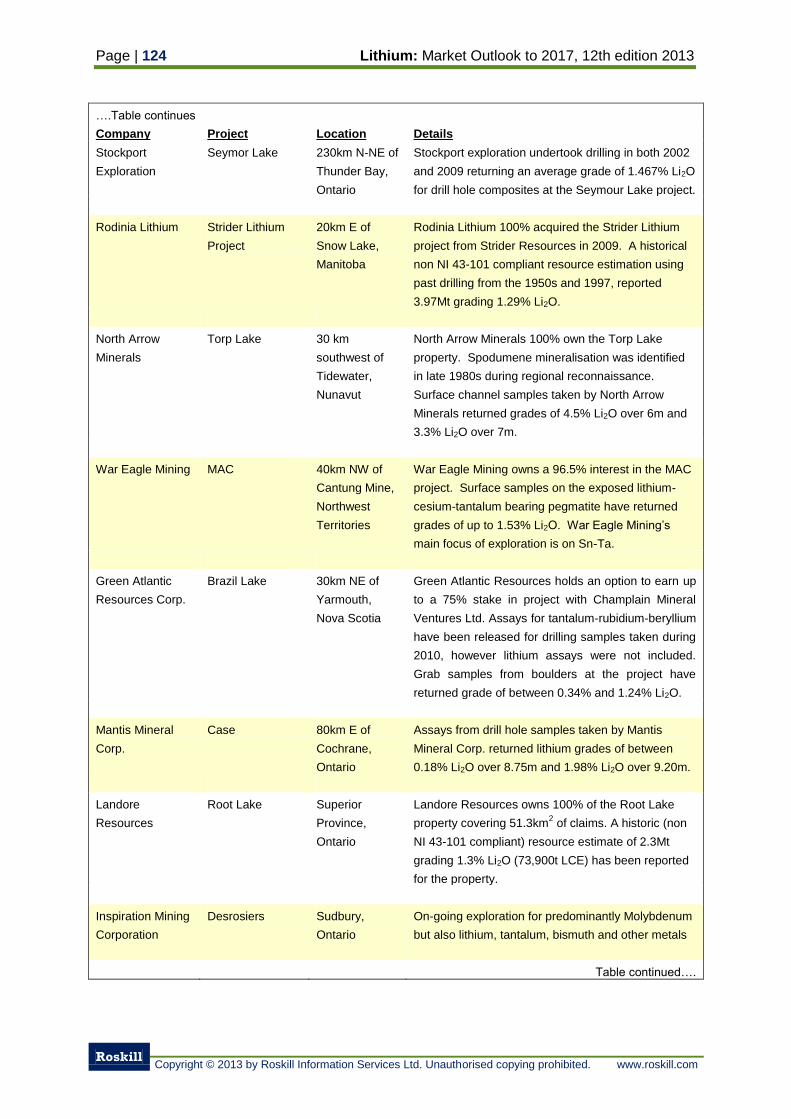
Page | 124 Lithium: Market Outlook to 2017, 12th edition 2013
Roskill
Copyright © 2013 by Roskill Information Services Ltd. Unauthorised copying prohibited. www.roskill.com
….Table continues
Company Project Location Details
Stockport
Exploration
Seymor Lake 230km N-NE of
Thunder Bay,
Ontario
Stockport exploration undertook drilling in both 2002
and 2009 returning an average grade of 1.467% Li2O
for drill hole composites at the Seymour Lake project.
Rodinia Lithium Strider Lithium
Project
20km E of
Snow Lake,
Manitoba
Rodinia Lithium 100% acquired the Strider Lithium
project from Strider Resources in 2009. A historical
non NI 43-101 compliant resource estimation using
past drilling from the 1950s and 1997, reported
3.97Mt grading 1.29% Li2O.
North Arrow
Minerals
Torp Lake 30 km
southwest of
Tidewater,
Nunavut
North Arrow Minerals 100% own the Torp Lake
property. Spodumene mineralisation was identified
in late 1980s during regional reconnaissance.
Surface channel samples taken by North Arrow
Minerals returned grades of 4.5% Li2O over 6m and
3.3% Li2O over 7m.
War Eagle Mining MAC 40km NW of
Cantung Mine,
Northwest
Territories
War Eagle Mining owns a 96.5% interest in the MAC
project. Surface samples on the exposed lithium-
cesium-tantalum bearing pegmatite have returned
grades of up to 1.53% Li2O. War Eagle Mining’s
main focus of exploration is on Sn-Ta.
Green Atlantic
Resources Corp.
Brazil Lake 30km NE of
Yarmouth,
Nova Scotia
Green Atlantic Resources holds an option to earn up
to a 75% stake in project with Champlain Mineral
Ventures Ltd. Assays for tantalum-rubidium-beryllium
have been released for drilling samples taken during
2010, however lithium assays were not included.
Grab samples from boulders at the project have
returned grade of between 0.34% and 1.24% Li2O.
Mantis Mineral
Corp.
Case 80km E of
Cochrane,
Ontario
Assays from drill hole samples taken by Mantis
Mineral Corp. returned lithium grades of between
0.18% Li2O over 8.75m and 1.98% Li2O over 9.20m.
Landore
Resources
Root Lake Superior
Province,
Ontario
Landore Resources owns 100% of the Root Lake
property covering 51.3km2 of claims. A historic (non
NI 43-101 compliant) resource estimate of 2.3Mt
grading 1.3% Li2O (73,900t LCE) has been reported
for the property.
Inspiration Mining
Corporation
Desrosiers Sudbury,
Ontario
On-going exploration for predominantly Molybdenum
but also lithium, tantalum, bismuth and other metals
Table continued….
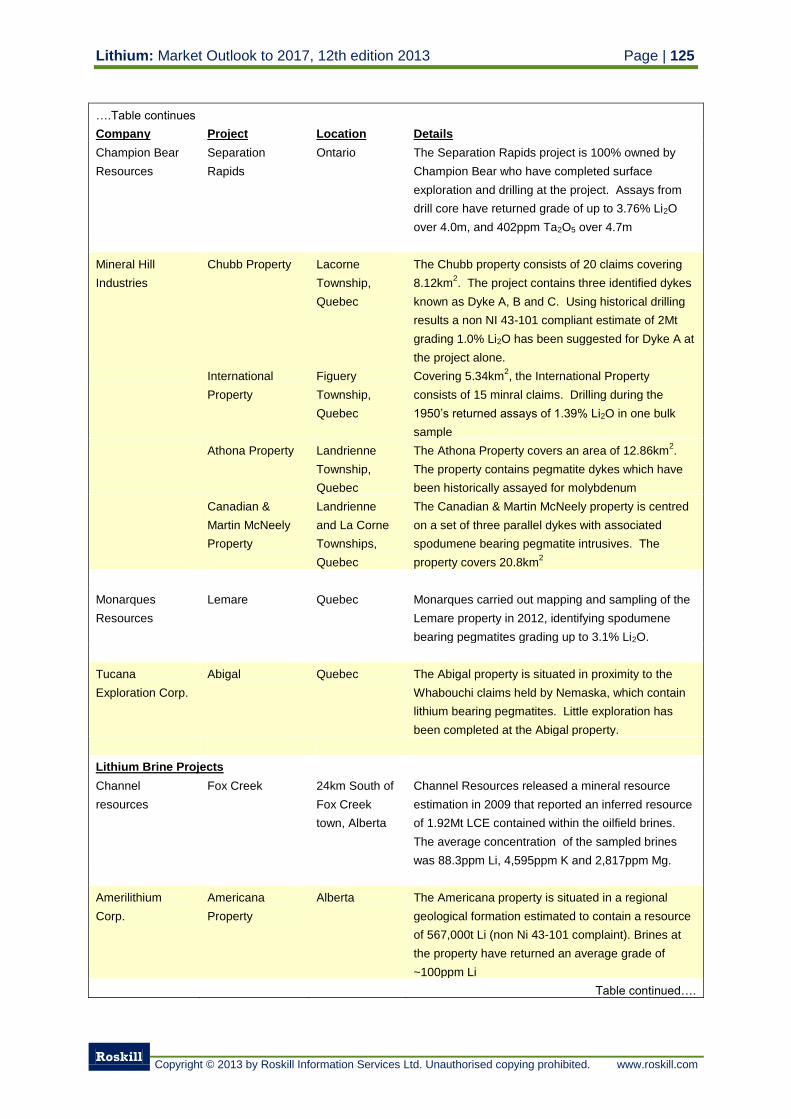
Lithium: Market Outlook to 2017, 12th edition 2013 Page | 125
Roskill
Copyright © 2013 by Roskill Information Services Ltd. Unauthorised copying prohibited. www.roskill.com
….Table continues
Company Project Location Details
Champion Bear
Resources
Separation
Rapids
Ontario The Separation Rapids project is 100% owned by
Champion Bear who have completed surface
exploration and drilling at the project. Assays from
drill core have returned grade of up to 3.76% Li2O
over 4.0m, and 402ppm Ta2O5 over 4.7m
Mineral Hill
Industries
Chubb Property Lacorne
Township,
Quebec
The Chubb property consists of 20 claims covering
8.12km2. The project contains three identified dykes
known as Dyke A, B and C. Using historical drilling
results a non NI 43-101 compliant estimate of 2Mt
grading 1.0% Li2O has been suggested for Dyke A at
the project alone.
International
Property
Figuery
Township,
Quebec
Covering 5.34km2, the International Property
consists of 15 minral claims. Drilling during the
1950’s returned assays of 1.39% Li2O in one bulk
sample
Athona Property Landrienne
Township,
Quebec
The Athona Property covers an area of 12.86km2.
The property contains pegmatite dykes which have
been historically assayed for molybdenum
Canadian &
Martin McNeely
Property
Landrienne
and La Corne
Townships,
Quebec
The Canadian & Martin McNeely property is centred
on a set of three parallel dykes with associated
spodumene bearing pegmatite intrusives. The
property covers 20.8km2
Monarques
Resources
Lemare Quebec Monarques carried out mapping and sampling of the
Lemare property in 2012, identifying spodumene
bearing pegmatites grading up to 3.1% Li2O.
Tucana
Exploration Corp.
Abigal Quebec The Abigal property is situated in proximity to the
Whabouchi claims held by Nemaska, which contain
lithium bearing pegmatites. Little exploration has
been completed at the Abigal property.
Lithium Brine Projects
Channel
resources
Fox Creek 24km South of
Fox Creek
town, Alberta
Channel Resources released a mineral resource
estimation in 2009 that reported an inferred resource
of 1.92Mt LCE contained within the oilfield brines.
The average concentration of the sampled brines
was 88.3ppm Li, 4,595ppm K and 2,817ppm Mg.
Amerilithium
Corp.
Americana
Property
Alberta The Americana property is situated in a regional
geological formation estimated to contain a resource
of 567,000t Li (non Ni 43-101 complaint). Brines at
the property have returned an average grade of
~100ppm Li
Table continued….
Page | 126 Lithium: Market Outlook to 2017, 12th edition 2013
Roskill
Copyright © 2013 by Roskill Information Services Ltd. Unauthorised copying prohibited. www.roskill.com
….Table continues
Company Project Location Details
Lithium
Exploration Group
Valleyview Alberta Lithium Exploration Group holds a 100% share in the
Valleyview project. Previous sampling undertaken
by Lithium exploration Group has reported brine
concentrations of between 70-85ppm.
Habanero
resources
South Leduc Alberta Habanero Resources acquired the South Leduc
property in 2009, covering 1,618km2. Since
acquiring the property, Habanero Resources has not
released any information on exploration updates.
Weststar
Resource Corp.
Silvercreek &
Simonette
30km and
60km West of
Fox Creek
town, Alberta
Weststar purchased the Silvercreek and Simonette
projects in August 2009. Since then it has not
released any information on the progress of the
exploration project
Berkwood
Resources Ltd
Fox Creek 35km west of
Fox Creek
town, Alberta
Berkwood Resources have continued preliminary
exploration at the Fox Creek site throughout 2012.
Source: Company data
5.9 Chile
In 2011, Chile was the second largest producer of lithium after Australia, although it
remains the largest producer of lithium products from brine deposits. Chilean production
began to accelerate after SQM entered production in 1996 at the Salar de Atacama.
Since 1996, the countries lithium carbonate production has grown at a rate of 9.7%py,
from 15,069t LCE in 1996 to 66,200t in 2012. The majority of Chilean lithium production
is exported, with South Korea, Japan and China being the destination for over 60% of
lithium carbonate exports. Domestic production of lithium hydroxide resumed in 2004,
when Sociedad Chilena del Litio (SCL) restarted operations at its production facility
which had been suspended since the late 1990s.
In 2011 there were only two commercial producers of lithium carbonate in Chile, both
extracting brines from the Salar de Atacama which lies between the main Andean range
to the east and Cordillera de Domeyko to the west. Rockwood Lithium (Section 5.39.2)
began production of lithium in 1984 at La Negra, followed by SQM in 1996 in
Antofagasta. SQM’s large production low pricing strategy, as lithium was considered a
by-product to fertilizer production, transformed the lithium industry which had previously
been dependent on production from mineral concentrates. The surge in supply from
Chilean brine deposits and diminished lithium carbonate prices resulted in a number of
mineral-based conversion operation in China, Russia and the USA to cease operation.
Lithium: Market Outlook to 2017, 12th edition 2013 Page | 127
Roskill
Copyright © 2013 by Roskill Information Services Ltd. Unauthorised copying prohibited. www.roskill.com
Bids for special operating contracts began on the 12th June through the Chilean Ministry
of Mining. The successful bidder was announced on the 24th September and the
licences became valid soon after.
5.9.1 Chilean lithium reserves
Chile was estimated by the USGS in January 2012 to contain reserves of 7.5Mt Li, the
largest reserves for a single nation in the world and accounting for approximately 57% of
global reserves. The Salar de Atacama is the countries largest single lithium reserve
contained in brines with elevated concentrations of lithium, potassium, boron and
sulphates. Combined resource estiamtions from Rockwood Litihum and SQM at the
Salar de Atacama total approximately 5.9Mt Li (31.4Mt LCE) and a further 400,000t Li is
believed to be contained elsewhere in the salar.
Other salars in Chile such as the Salar de Maricunga, the Salar de Pedernales and the
Salar Piedra Parada have been estimated to contain significant resources of lithium
which may be converted into reserves with further exploration.
5.9.2 Chilean lithium production
In 2009 demand for lithium compounds in the battery, pottery and glass, lubricant and
pharmecuticals industries fell sharply as a result of the global economic downturn.
Recovery since 2009 has been strong, returning lithium carbonate production in 2010 to
marginally above the 2008 total (Table 84).
In 2011, Chilean production of lithium compounds was reported by the Servicio Nacional
de Geología y Minería as 68,403t LCE, an increase of approximately 16,500t LCE from
2010, although this is thought to include some double counting of lithium carbonate and
lithium hydroxide production. Production may have been greater if bad weather had not
affected lithium brine production in the country during early 2011.
Production capacity in Chile totalled 82,000tpy LCE in 2012 and planned expansions by
both Rockwood Lithium and SQM in 2013-2015 are expected to increase production
capacity in the country to 111,000tpy LCE.
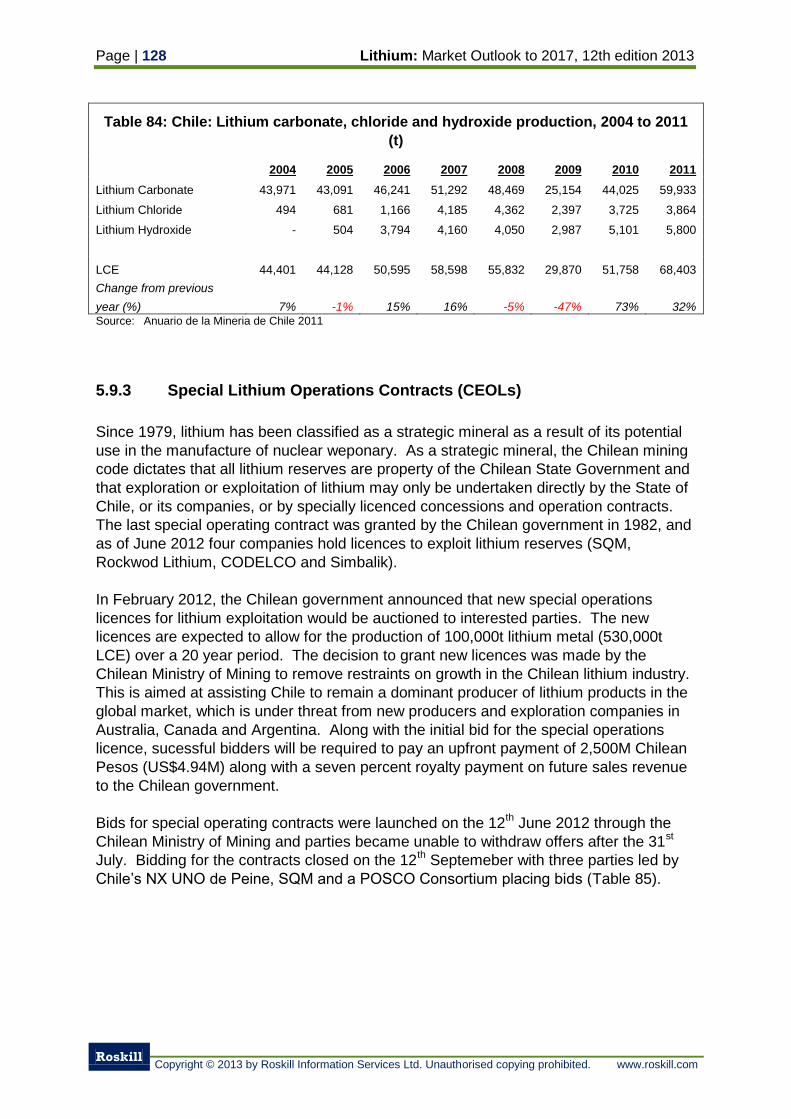
Page | 128 Lithium: Market Outlook to 2017, 12th edition 2013
Roskill
Copyright © 2013 by Roskill Information Services Ltd. Unauthorised copying prohibited. www.roskill.com
Table 84: Chile: Lithium carbonate, chloride and hydroxide production, 2004 to 2011
(t)
2004 2005 2006 2007 2008 2009 2010 2011
Lithium Carbonate 43,971 43,091 46,241 51,292 48,469 25,154 44,025 59,933
Lithium Chloride 494 681 1,166 4,185 4,362 2,397 3,725 3,864
Lithium Hydroxide - 504 3,794 4,160 4,050 2,987 5,101 5,800
LCE 44,401 44,128 50,595 58,598 55,832 29,870 51,758 68,403
Change from previous
year (%) 7% -1% 15% 16% -5% -47% 73% 32% Source: Anuario de la Mineria de Chile 2011
5.9.3 Special Lithium Operations Contracts (CEOLs)
Since 1979, lithium has been classified as a strategic mineral as a result of its potential
use in the manufacture of nuclear weponary. As a strategic mineral, the Chilean mining
code dictates that all lithium reserves are property of the Chilean State Government and
that exploration or exploitation of lithium may only be undertaken directly by the State of
Chile, or its companies, or by specially licenced concessions and operation contracts.
The last special operating contract was granted by the Chilean government in 1982, and
as of June 2012 four companies hold licences to exploit lithium reserves (SQM,
Rockwod Lithium, CODELCO and Simbalik).
In February 2012, the Chilean government announced that new special operations
licences for lithium exploitation would be auctioned to interested parties. The new
licences are expected to allow for the production of 100,000t lithium metal (530,000t
LCE) over a 20 year period. The decision to grant new licences was made by the
Chilean Ministry of Mining to remove restraints on growth in the Chilean lithium industry.
This is aimed at assisting Chile to remain a dominant producer of lithium products in the
global market, which is under threat from new producers and exploration companies in
Australia, Canada and Argentina. Along with the initial bid for the special operations
licence, sucessful bidders will be required to pay an upfront payment of 2,500M Chilean
Pesos (US$4.94M) along with a seven percent royalty payment on future sales revenue
to the Chilean government.
Bids for special operating contracts were launched on the 12th June 2012 through the
Chilean Ministry of Mining and parties became unable to withdraw offers after the 31st
July. Bidding for the contracts closed on the 12th Septemeber with three parties led by
Chile’s NX UNO de Peine, SQM and a POSCO Consortium placing bids (Table 85).
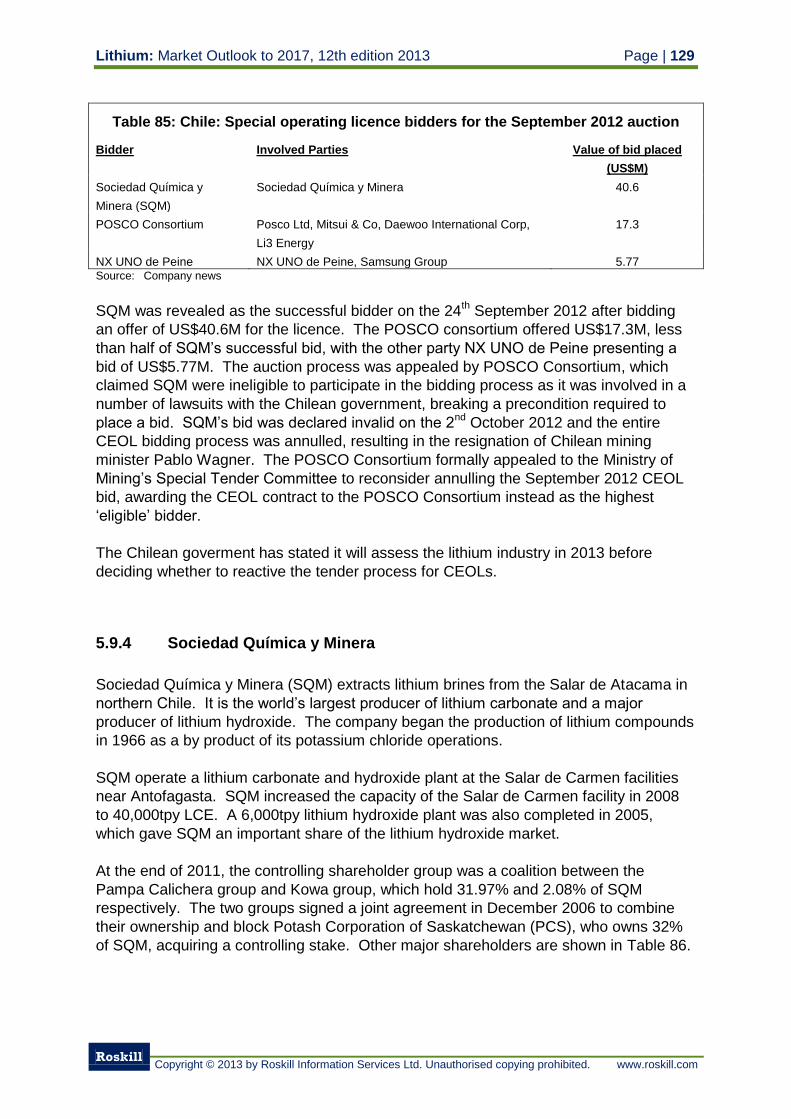
Lithium: Market Outlook to 2017, 12th edition 2013 Page | 129
Roskill
Copyright © 2013 by Roskill Information Services Ltd. Unauthorised copying prohibited. www.roskill.com
Table 85: Chile: Special operating licence bidders for the September 2012 auction
Bidder Involved Parties Value of bid placed
(US$M)
Sociedad Química y
Minera (SQM)
Sociedad Química y Minera 40.6
POSCO Consortium Posco Ltd, Mitsui & Co, Daewoo International Corp,
Li3 Energy
17.3
NX UNO de Peine NX UNO de Peine, Samsung Group 5.77 Source: Company news
SQM was revealed as the successful bidder on the 24th September 2012 after bidding
an offer of US$40.6M for the licence. The POSCO consortium offered US$17.3M, less
than half of SQM’s successful bid, with the other party NX UNO de Peine presenting a
bid of US$5.77M. The auction process was appealed by POSCO Consortium, which
claimed SQM were ineligible to participate in the bidding process as it was involved in a
number of lawsuits with the Chilean government, breaking a precondition required to
place a bid. SQM’s bid was declared invalid on the 2nd
October 2012 and the entire
CEOL bidding process was annulled, resulting in the resignation of Chilean mining
minister Pablo Wagner. The POSCO Consortium formally appealed to the Ministry of
Mining’s Special Tender Committee to reconsider annulling the September 2012 CEOL
bid, awarding the CEOL contract to the POSCO Consortium instead as the highest
‘eligible’ bidder.
The Chilean goverment has stated it will assess the lithium industry in 2013 before
deciding whether to reactive the tender process for CEOLs.
5.9.4 Sociedad Química y Minera
Sociedad Química y Minera (SQM) extracts lithium brines from the Salar de Atacama in
northern Chile. It is the world’s largest producer of lithium carbonate and a major
producer of lithium hydroxide. The company began the production of lithium compounds
in 1966 as a by product of its potassium chloride operations.
SQM operate a lithium carbonate and hydroxide plant at the Salar de Carmen facilities
near Antofagasta. SQM increased the capacity of the Salar de Carmen facility in 2008
to 40,000tpy LCE. A 6,000tpy lithium hydroxide plant was also completed in 2005,
which gave SQM an important share of the lithium hydroxide market.
At the end of 2011, the controlling shareholder group was a coalition between the
Pampa Calichera group and Kowa group, which hold 31.97% and 2.08% of SQM
respectively. The two groups signed a joint agreement in December 2006 to combine
their ownership and block Potash Corporation of Saskatchewan (PCS), who owns 32%
of SQM, acquiring a controlling stake. Other major shareholders are shown in Table 86.
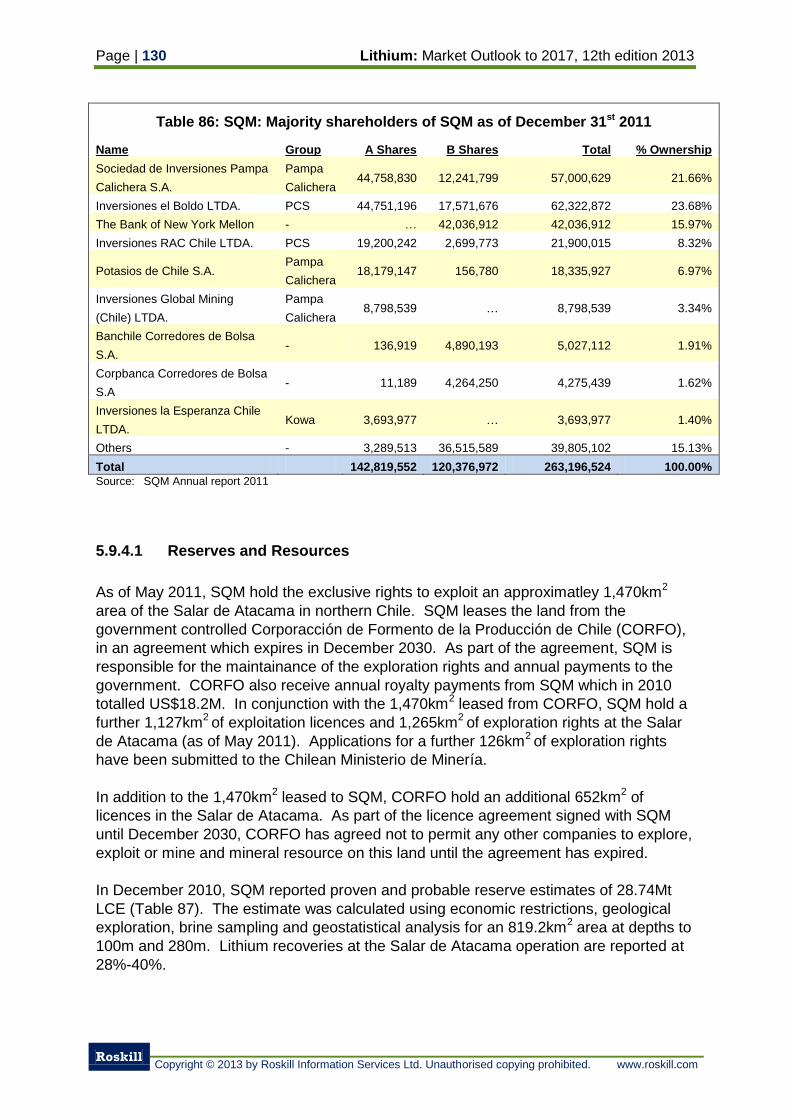
Page | 130 Lithium: Market Outlook to 2017, 12th edition 2013
Roskill
Copyright © 2013 by Roskill Information Services Ltd. Unauthorised copying prohibited. www.roskill.com
Table 86: SQM: Majority shareholders of SQM as of December 31st 2011
Name Group A Shares B Shares Total % Ownership
Sociedad de Inversiones Pampa
Calichera S.A.
Pampa
Calichera 44,758,830 12,241,799 57,000,629 21.66%
Inversiones el Boldo LTDA. PCS 44,751,196 17,571,676 62,322,872 23.68%
The Bank of New York Mellon - … 42,036,912 42,036,912 15.97%
Inversiones RAC Chile LTDA. PCS 19,200,242 2,699,773 21,900,015 8.32%
Potasios de Chile S.A. Pampa
Calichera 18,179,147 156,780 18,335,927 6.97%
Inversiones Global Mining
(Chile) LTDA.
Pampa
Calichera 8,798,539 … 8,798,539 3.34%
Banchile Corredores de Bolsa
S.A. - 136,919 4,890,193 5,027,112 1.91%
Corpbanca Corredores de Bolsa
S.A - 11,189 4,264,250 4,275,439 1.62%
Inversiones la Esperanza Chile
LTDA. Kowa 3,693,977 … 3,693,977 1.40%
Others - 3,289,513 36,515,589 39,805,102 15.13%
Total 142,819,552 120,376,972 263,196,524 100.00%
Source: SQM Annual report 2011
5.9.4.1 Reserves and Resources
As of May 2011, SQM hold the exclusive rights to exploit an approximatley 1,470km2
area of the Salar de Atacama in northern Chile. SQM leases the land from the
government controlled Corporacción de Formento de la Producción de Chile (CORFO),
in an agreement which expires in December 2030. As part of the agreement, SQM is
responsible for the maintainance of the exploration rights and annual payments to the
government. CORFO also receive annual royalty payments from SQM which in 2010
totalled US$18.2M. In conjunction with the 1,470km2 leased from CORFO, SQM hold a
further 1,127km2 of exploitation licences and 1,265km
2 of exploration rights at the Salar
de Atacama (as of May 2011). Applications for a further 126km2 of exploration rights
have been submitted to the Chilean Ministerio de Minería.
In addition to the 1,470km2 leased to SQM, CORFO hold an additional 652km
2 of
licences in the Salar de Atacama. As part of the licence agreement signed with SQM
until December 2030, CORFO has agreed not to permit any other companies to explore,
exploit or mine and mineral resource on this land until the agreement has expired.
In December 2010, SQM reported proven and probable reserve estimates of 28.74Mt
LCE (Table 87). The estimate was calculated using economic restrictions, geological
exploration, brine sampling and geostatistical analysis for an 819.2km2 area at depths to
100m and 280m. Lithium recoveries at the Salar de Atacama operation are reported at
28%-40%.
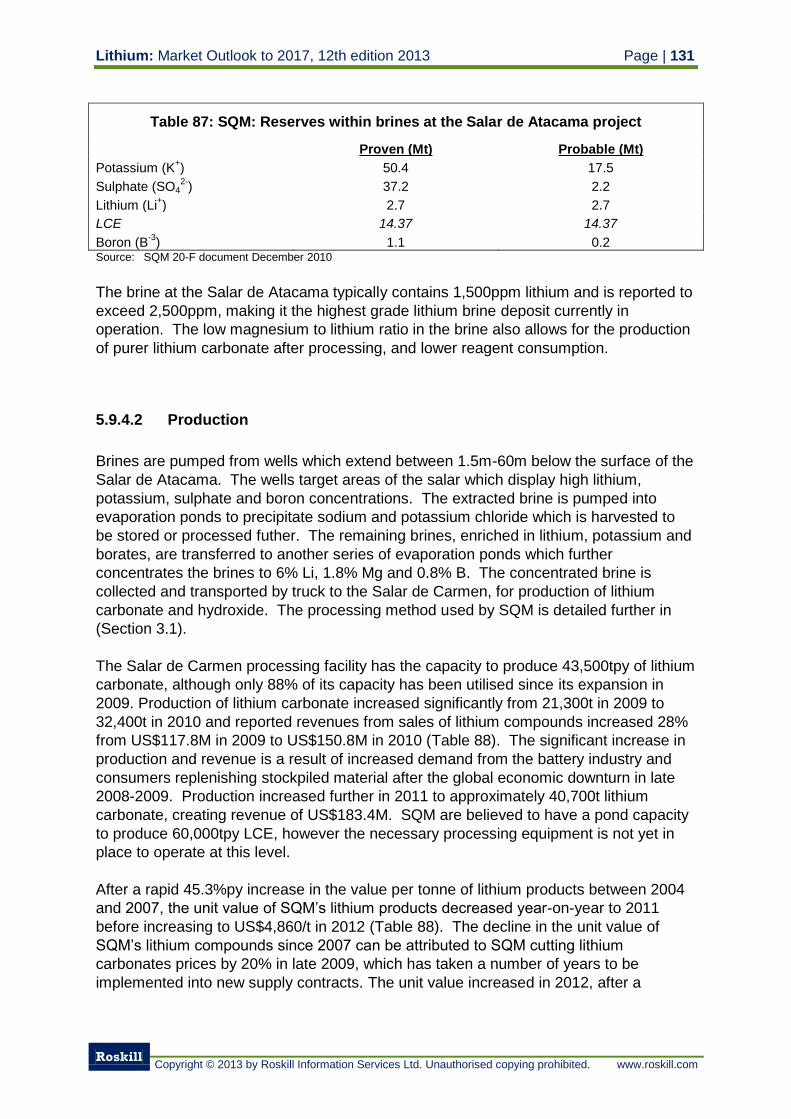
Lithium: Market Outlook to 2017, 12th edition 2013 Page | 131
Roskill
Copyright © 2013 by Roskill Information Services Ltd. Unauthorised copying prohibited. www.roskill.com
Table 87: SQM: Reserves within brines at the Salar de Atacama project
Proven (Mt) Probable (Mt)
Potassium (K+) 50.4 17.5
Sulphate (SO42-
) 37.2 2.2
Lithium (Li+) 2.7 2.7
LCE 14.37 14.37
Boron (B-3
) 1.1 0.2 Source: SQM 20-F document December 2010
The brine at the Salar de Atacama typically contains 1,500ppm lithium and is reported to
exceed 2,500ppm, making it the highest grade lithium brine deposit currently in
operation. The low magnesium to lithium ratio in the brine also allows for the production
of purer lithium carbonate after processing, and lower reagent consumption.
5.9.4.2 Production
Brines are pumped from wells which extend between 1.5m-60m below the surface of the
Salar de Atacama. The wells target areas of the salar which display high lithium,
potassium, sulphate and boron concentrations. The extracted brine is pumped into
evaporation ponds to precipitate sodium and potassium chloride which is harvested to
be stored or processed futher. The remaining brines, enriched in lithium, potassium and
borates, are transferred to another series of evaporation ponds which further
concentrates the brines to 6% Li, 1.8% Mg and 0.8% B. The concentrated brine is
collected and transported by truck to the Salar de Carmen, for production of lithium
carbonate and hydroxide. The processing method used by SQM is detailed further in
(Section 3.1).
The Salar de Carmen processing facility has the capacity to produce 43,500tpy of lithium
carbonate, although only 88% of its capacity has been utilised since its expansion in
2009. Production of lithium carbonate increased significantly from 21,300t in 2009 to
32,400t in 2010 and reported revenues from sales of lithium compounds increased 28%
from US$117.8M in 2009 to US$150.8M in 2010 (Table 88). The significant increase in
production and revenue is a result of increased demand from the battery industry and
consumers replenishing stockpiled material after the global economic downturn in late
2008-2009. Production increased further in 2011 to approximately 40,700t lithium
carbonate, creating revenue of US$183.4M. SQM are believed to have a pond capacity
to produce 60,000tpy LCE, however the necessary processing equipment is not yet in
place to operate at this level.
After a rapid 45.3%py increase in the value per tonne of lithium products between 2004
and 2007, the unit value of SQM’s lithium products decreased year-on-year to 2011
before increasing to US$4,860/t in 2012 (Table 88). The decline in the unit value of
SQM’s lithium compounds since 2007 can be attributed to SQM cutting lithium
carbonates prices by 20% in late 2009, which has taken a number of years to be
implemented into new supply contracts. The unit value increased in 2012, after a
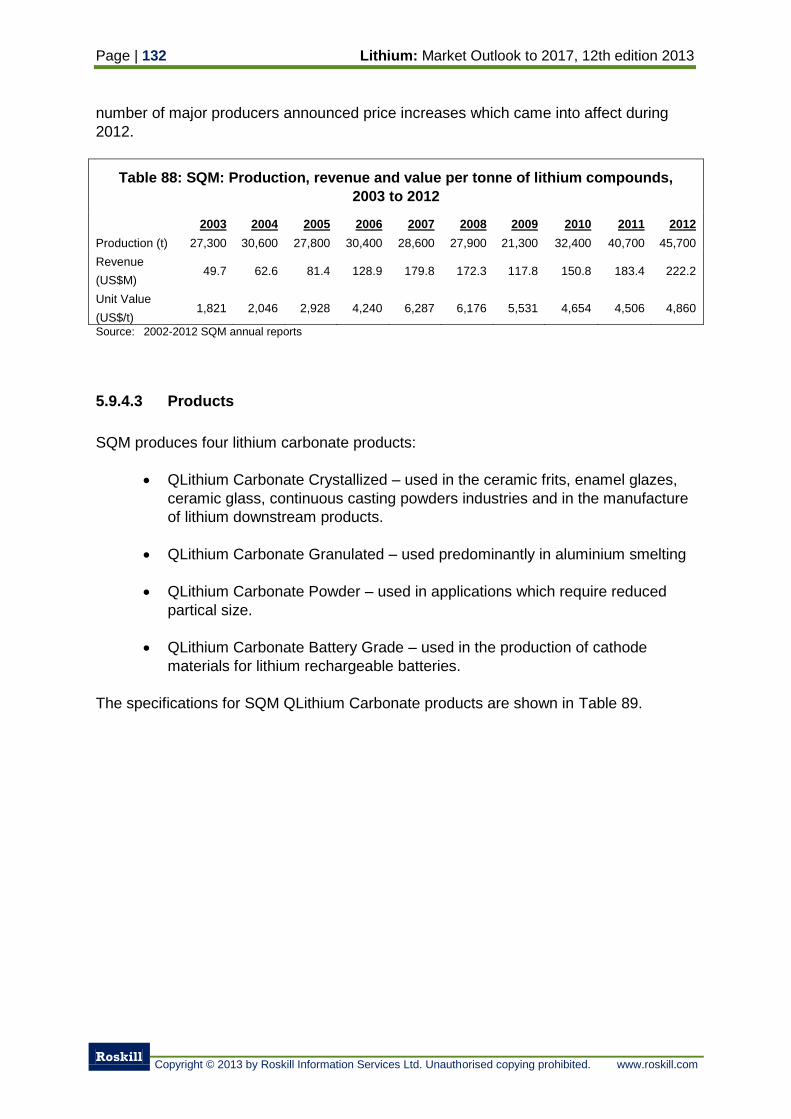
Page | 132 Lithium: Market Outlook to 2017, 12th edition 2013
Roskill
Copyright © 2013 by Roskill Information Services Ltd. Unauthorised copying prohibited. www.roskill.com
number of major producers announced price increases which came into affect during
2012.
Table 88: SQM: Production, revenue and value per tonne of lithium compounds,
2003 to 2012
2003 2004 2005 2006 2007 2008 2009 2010 2011 2012
Production (t) 27,300 30,600 27,800 30,400 28,600 27,900 21,300 32,400 40,700 45,700
Revenue
(US$M) 49.7 62.6 81.4 128.9 179.8 172.3 117.8 150.8 183.4 222.2
Unit Value
(US$/t) 1,821 2,046 2,928 4,240 6,287 6,176 5,531 4,654 4,506 4,860
Source: 2002-2012 SQM annual reports
5.9.4.3 Products
SQM produces four lithium carbonate products:
QLithium Carbonate Crystallized – used in the ceramic frits, enamel glazes,
ceramic glass, continuous casting powders industries and in the manufacture
of lithium downstream products.
QLithium Carbonate Granulated – used predominantly in aluminium smelting
QLithium Carbonate Powder – used in applications which require reduced
partical size.
QLithium Carbonate Battery Grade – used in the production of cathode
materials for lithium rechargeable batteries.
The specifications for SQM QLithium Carbonate products are shown in Table 89.
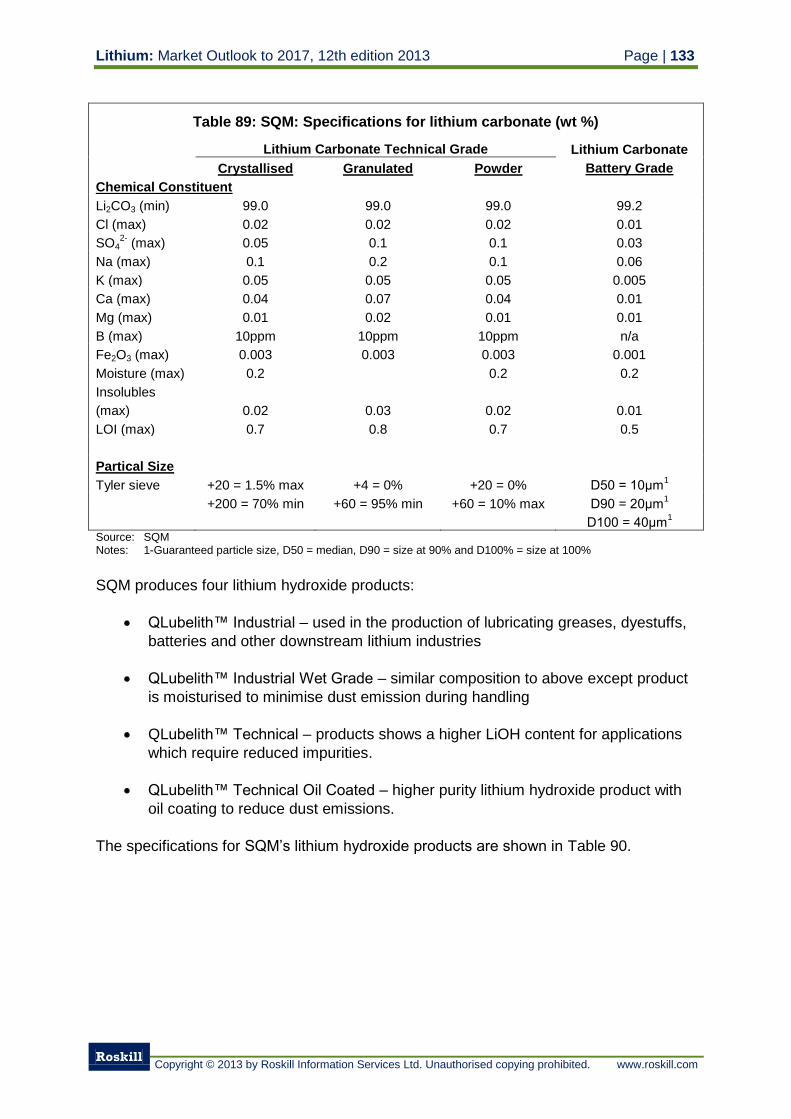
Lithium: Market Outlook to 2017, 12th edition 2013 Page | 133
Roskill
Copyright © 2013 by Roskill Information Services Ltd. Unauthorised copying prohibited. www.roskill.com
Table 89: SQM: Specifications for lithium carbonate (wt %)
Lithium Carbonate Technical Grade Lithium Carbonate
Battery Grade Crystallised Granulated Powder
Chemical Constituent
Li2CO3 (min) 99.0 99.0 99.0 99.2
Cl (max) 0.02 0.02 0.02 0.01
SO42-
(max) 0.05 0.1 0.1 0.03
Na (max) 0.1 0.2 0.1 0.06
K (max) 0.05 0.05 0.05 0.005
Ca (max) 0.04 0.07 0.04 0.01
Mg (max) 0.01 0.02 0.01 0.01
B (max) 10ppm 10ppm 10ppm n/a
Fe2O3 (max) 0.003 0.003 0.003 0.001
Moisture (max) 0.2 0.2 0.2
Insolubles
(max) 0.02 0.03 0.02 0.01
LOI (max) 0.7 0.8 0.7 0.5
Partical Size
Tyler sieve +20 = 1.5% max +4 = 0% +20 = 0% D50 = 10μm1
+200 = 70% min +60 = 95% min +60 = 10% max D90 = 20μm1
D100 = 40μm1
Source: SQM Notes: 1-Guaranteed particle size, D50 = median, D90 = size at 90% and D100% = size at 100%
SQM produces four lithium hydroxide products:
QLubelith™ Industrial – used in the production of lubricating greases, dyestuffs,
batteries and other downstream lithium industries
QLubelith™ Industrial Wet Grade – similar composition to above except product
is moisturised to minimise dust emission during handling
QLubelith™ Technical – products shows a higher LiOH content for applications
which require reduced impurities.
QLubelith™ Technical Oil Coated – higher purity lithium hydroxide product with
oil coating to reduce dust emissions.
The specifications for SQM’s lithium hydroxide products are shown in Table 90.
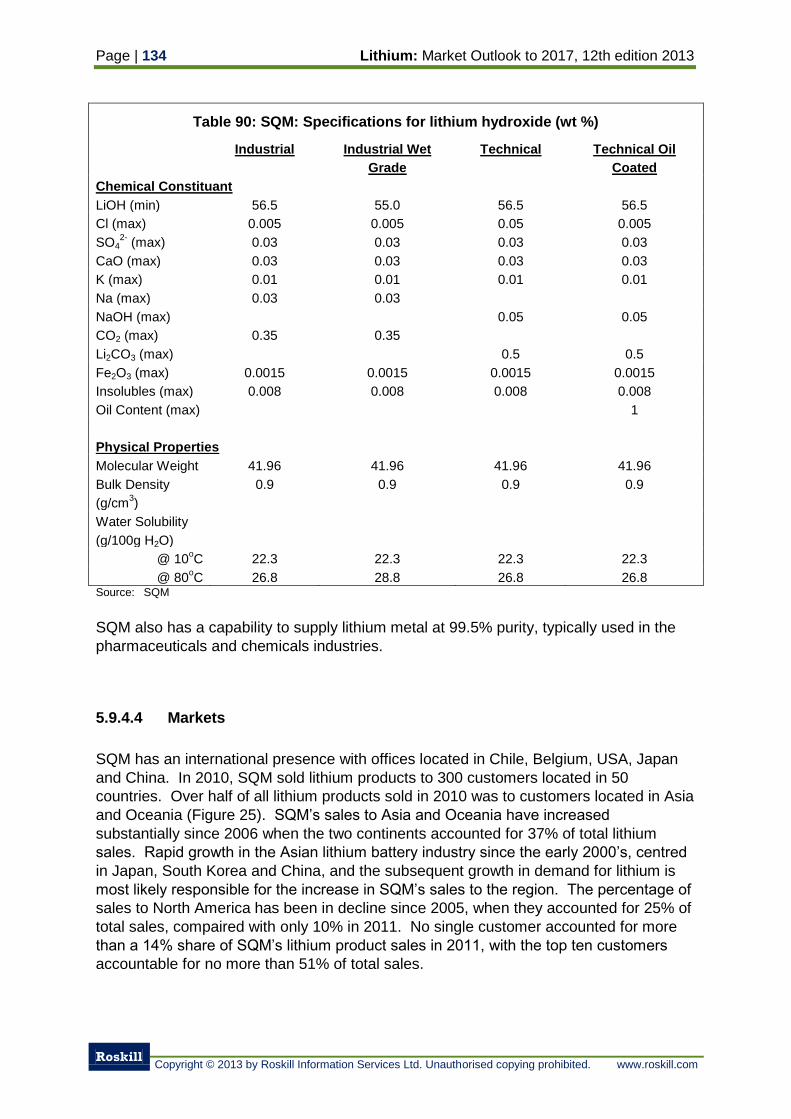
Page | 134 Lithium: Market Outlook to 2017, 12th edition 2013
Roskill
Copyright © 2013 by Roskill Information Services Ltd. Unauthorised copying prohibited. www.roskill.com
Table 90: SQM: Specifications for lithium hydroxide (wt %)
Industrial Industrial Wet
Grade
Technical Technical Oil
Coated
Chemical Constituant
LiOH (min) 56.5 55.0 56.5 56.5
Cl (max) 0.005 0.005 0.05 0.005
SO42-
(max) 0.03 0.03 0.03 0.03
CaO (max) 0.03 0.03 0.03 0.03
K (max) 0.01 0.01 0.01 0.01
Na (max) 0.03 0.03
NaOH (max) 0.05 0.05
CO2 (max) 0.35 0.35
Li2CO3 (max) 0.5 0.5
Fe2O3 (max) 0.0015 0.0015 0.0015 0.0015
Insolubles (max) 0.008 0.008 0.008 0.008
Oil Content (max) 1
Physical Properties
Molecular Weight 41.96 41.96 41.96 41.96
Bulk Density
(g/cm3)
0.9 0.9 0.9 0.9
Water Solubility
(g/100g H2O)
@ 10oC 22.3 22.3 22.3 22.3
@ 80oC 26.8 28.8 26.8 26.8
Source: SQM
SQM also has a capability to supply lithium metal at 99.5% purity, typically used in the
pharmaceuticals and chemicals industries.
5.9.4.4 Markets
SQM has an international presence with offices located in Chile, Belgium, USA, Japan
and China. In 2010, SQM sold lithium products to 300 customers located in 50
countries. Over half of all lithium products sold in 2010 was to customers located in Asia
and Oceania (Figure 25). SQM’s sales to Asia and Oceania have increased
substantially since 2006 when the two continents accounted for 37% of total lithium
sales. Rapid growth in the Asian lithium battery industry since the early 2000’s, centred
in Japan, South Korea and China, and the subsequent growth in demand for lithium is
most likely responsible for the increase in SQM’s sales to the region. The percentage of
sales to North America has been in decline since 2005, when they accounted for 25% of
total sales, compaired with only 10% in 2011. No single customer accounted for more
than a 14% share of SQM’s lithium product sales in 2011, with the top ten customers
accountable for no more than 51% of total sales.
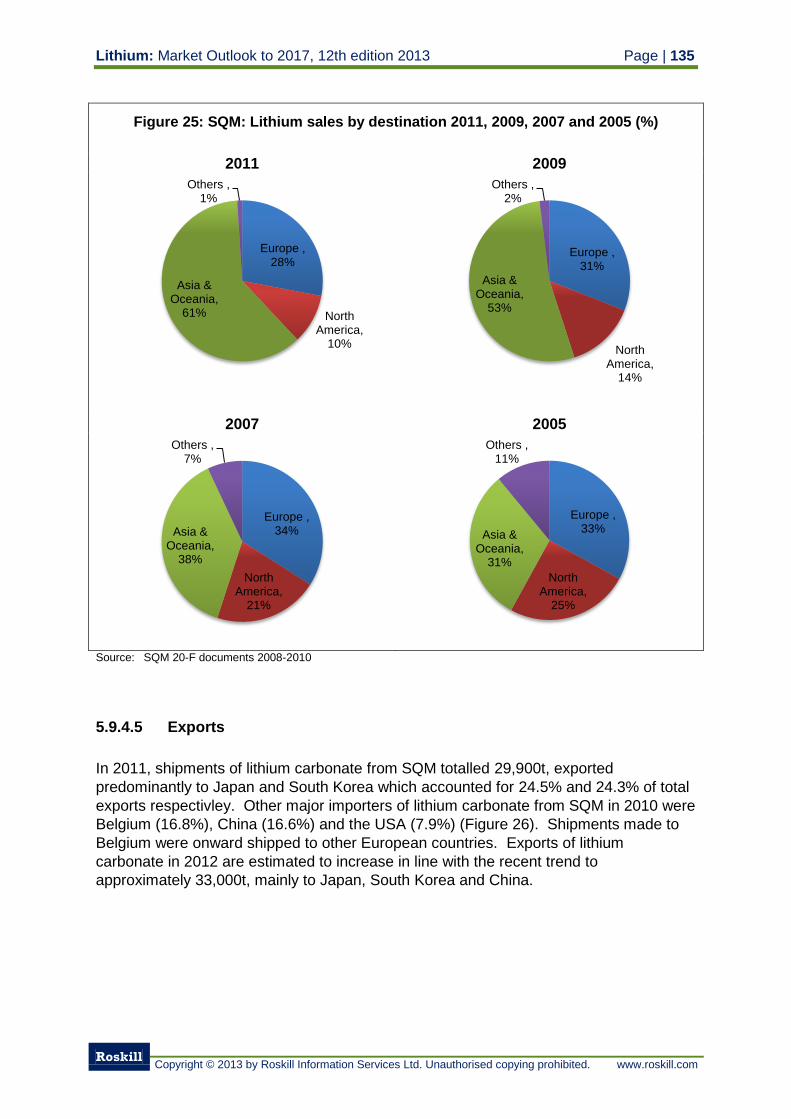
Lithium: Market Outlook to 2017, 12th edition 2013 Page | 135
Roskill
Copyright © 2013 by Roskill Information Services Ltd. Unauthorised copying prohibited. www.roskill.com
Figure 25: SQM: Lithium sales by destination 2011, 2009, 2007 and 2005 (%)
2011 2009
2007 2005
Source: SQM 20-F documents 2008-2010
5.9.4.5 Exports
In 2011, shipments of lithium carbonate from SQM totalled 29,900t, exported
predominantly to Japan and South Korea which accounted for 24.5% and 24.3% of total
exports respectivley. Other major importers of lithium carbonate from SQM in 2010 were
Belgium (16.8%), China (16.6%) and the USA (7.9%) (Figure 26). Shipments made to
Belgium were onward shipped to other European countries. Exports of lithium
carbonate in 2012 are estimated to increase in line with the recent trend to
approximately 33,000t, mainly to Japan, South Korea and China.
Europe , 28%
North America,
10%
Asia & Oceania,
61%
Others , 1%
Europe , 31%
North America,
14%
Asia & Oceania,
53%
Others , 2%
Europe , 34%
North America,
21%
Asia & Oceania,
38%
Others , 7%
Europe , 33%
North America,
25%
Asia & Oceania,
31%
Others , 11%
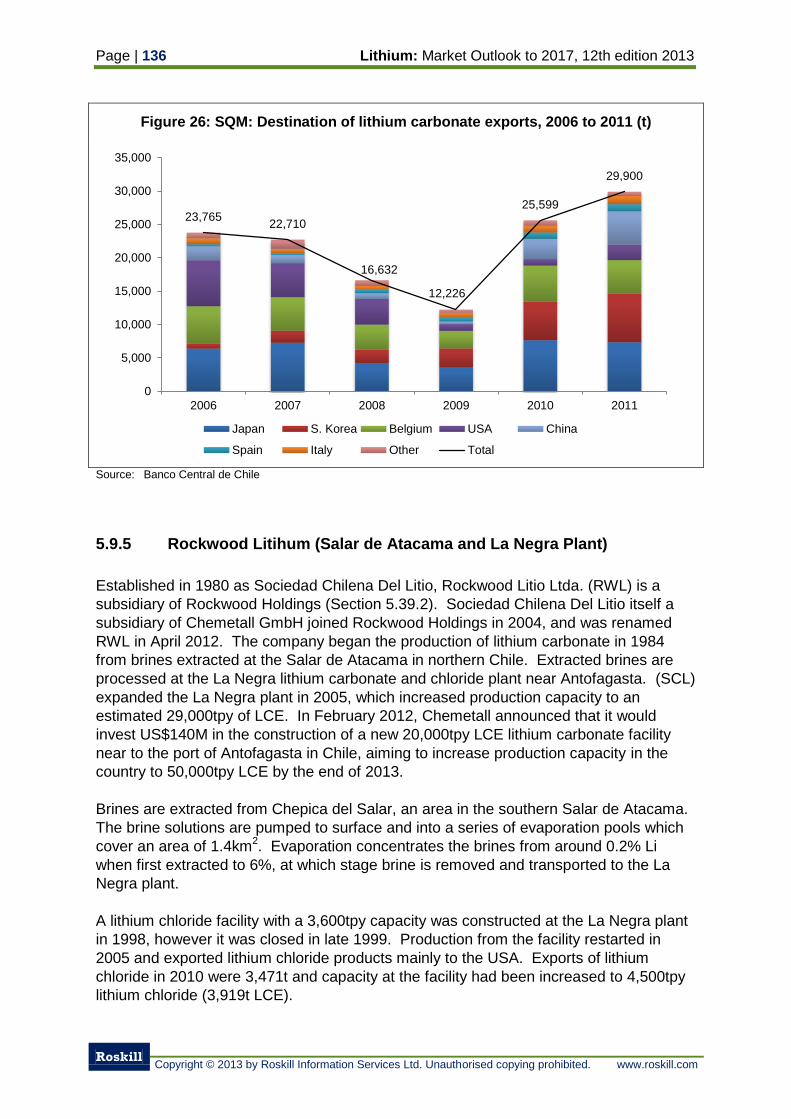
Page | 136 Lithium: Market Outlook to 2017, 12th edition 2013
Roskill
Copyright © 2013 by Roskill Information Services Ltd. Unauthorised copying prohibited. www.roskill.com
Figure 26: SQM: Destination of lithium carbonate exports, 2006 to 2011 (t)
Source: Banco Central de Chile
5.9.5 Rockwood Litihum (Salar de Atacama and La Negra Plant)
Established in 1980 as Sociedad Chilena Del Litio, Rockwood Litio Ltda. (RWL) is a
subsidiary of Rockwood Holdings (Section 5.39.2). Sociedad Chilena Del Litio itself a
subsidiary of Chemetall GmbH joined Rockwood Holdings in 2004, and was renamed
RWL in April 2012. The company began the production of lithium carbonate in 1984
from brines extracted at the Salar de Atacama in northern Chile. Extracted brines are
processed at the La Negra lithium carbonate and chloride plant near Antofagasta. (SCL)
expanded the La Negra plant in 2005, which increased production capacity to an
estimated 29,000tpy of LCE. In February 2012, Chemetall announced that it would
invest US$140M in the construction of a new 20,000tpy LCE lithium carbonate facility
near to the port of Antofagasta in Chile, aiming to increase production capacity in the
country to 50,000tpy LCE by the end of 2013.
Brines are extracted from Chepica del Salar, an area in the southern Salar de Atacama.
The brine solutions are pumped to surface and into a series of evaporation pools which
cover an area of 1.4km2. Evaporation concentrates the brines from around 0.2% Li
when first extracted to 6%, at which stage brine is removed and transported to the La
Negra plant.
A lithium chloride facility with a 3,600tpy capacity was constructed at the La Negra plant
in 1998, however it was closed in late 1999. Production from the facility restarted in
2005 and exported lithium chloride products mainly to the USA. Exports of lithium
chloride in 2010 were 3,471t and capacity at the facility had been increased to 4,500tpy
lithium chloride (3,919t LCE).
23,765 22,710
16,632
12,226
25,599
29,900
0
5,000
10,000
15,000
20,000
25,000
30,000
35,000
2006 2007 2008 2009 2010 2011
Japan S. Korea Belgium USA China
Spain Italy Other Total
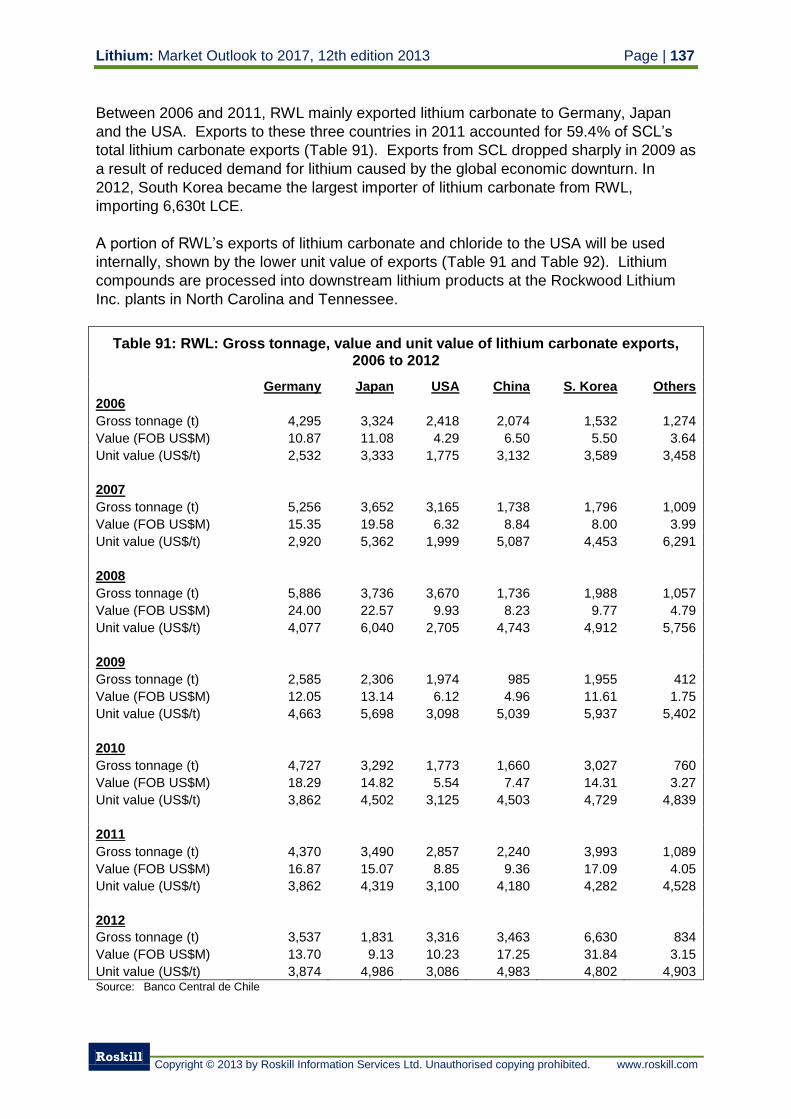
Lithium: Market Outlook to 2017, 12th edition 2013 Page | 137
Roskill
Copyright © 2013 by Roskill Information Services Ltd. Unauthorised copying prohibited. www.roskill.com
Between 2006 and 2011, RWL mainly exported lithium carbonate to Germany, Japan
and the USA. Exports to these three countries in 2011 accounted for 59.4% of SCL’s
total lithium carbonate exports (Table 91). Exports from SCL dropped sharply in 2009 as
a result of reduced demand for lithium caused by the global economic downturn. In
2012, South Korea became the largest importer of lithium carbonate from RWL,
importing 6,630t LCE.
A portion of RWL’s exports of lithium carbonate and chloride to the USA will be used
internally, shown by the lower unit value of exports (Table 91 and Table 92). Lithium
compounds are processed into downstream lithium products at the Rockwood Lithium
Inc. plants in North Carolina and Tennessee.
Table 91: RWL: Gross tonnage, value and unit value of lithium carbonate exports, 2006 to 2012
Germany Japan USA China S. Korea Others
2006
Gross tonnage (t) 4,295 3,324 2,418 2,074 1,532 1,274
Value (FOB US$M) 10.87 11.08 4.29 6.50 5.50 3.64
Unit value (US$/t) 2,532 3,333 1,775 3,132 3,589 3,458
2007
Gross tonnage (t) 5,256 3,652 3,165 1,738 1,796 1,009
Value (FOB US$M) 15.35 19.58 6.32 8.84 8.00 3.99
Unit value (US$/t) 2,920 5,362 1,999 5,087 4,453 6,291
2008
Gross tonnage (t) 5,886 3,736 3,670 1,736 1,988 1,057
Value (FOB US$M) 24.00 22.57 9.93 8.23 9.77 4.79
Unit value (US$/t) 4,077 6,040 2,705 4,743 4,912 5,756
2009
Gross tonnage (t) 2,585 2,306 1,974 985 1,955 412
Value (FOB US$M) 12.05 13.14 6.12 4.96 11.61 1.75
Unit value (US$/t) 4,663 5,698 3,098 5,039 5,937 5,402
2010
Gross tonnage (t) 4,727 3,292 1,773 1,660 3,027 760
Value (FOB US$M) 18.29 14.82 5.54 7.47 14.31 3.27
Unit value (US$/t) 3,862 4,502 3,125 4,503 4,729 4,839
2011
Gross tonnage (t) 4,370 3,490 2,857 2,240 3,993 1,089
Value (FOB US$M) 16.87 15.07 8.85 9.36 17.09 4.05
Unit value (US$/t) 3,862 4,319 3,100 4,180 4,282 4,528
2012
Gross tonnage (t) 3,537 1,831 3,316 3,463 6,630 834
Value (FOB US$M) 13.70 9.13 10.23 17.25 31.84 3.15
Unit value (US$/t) 3,874 4,986 3,086 4,983 4,802 4,903 Source: Banco Central de Chile
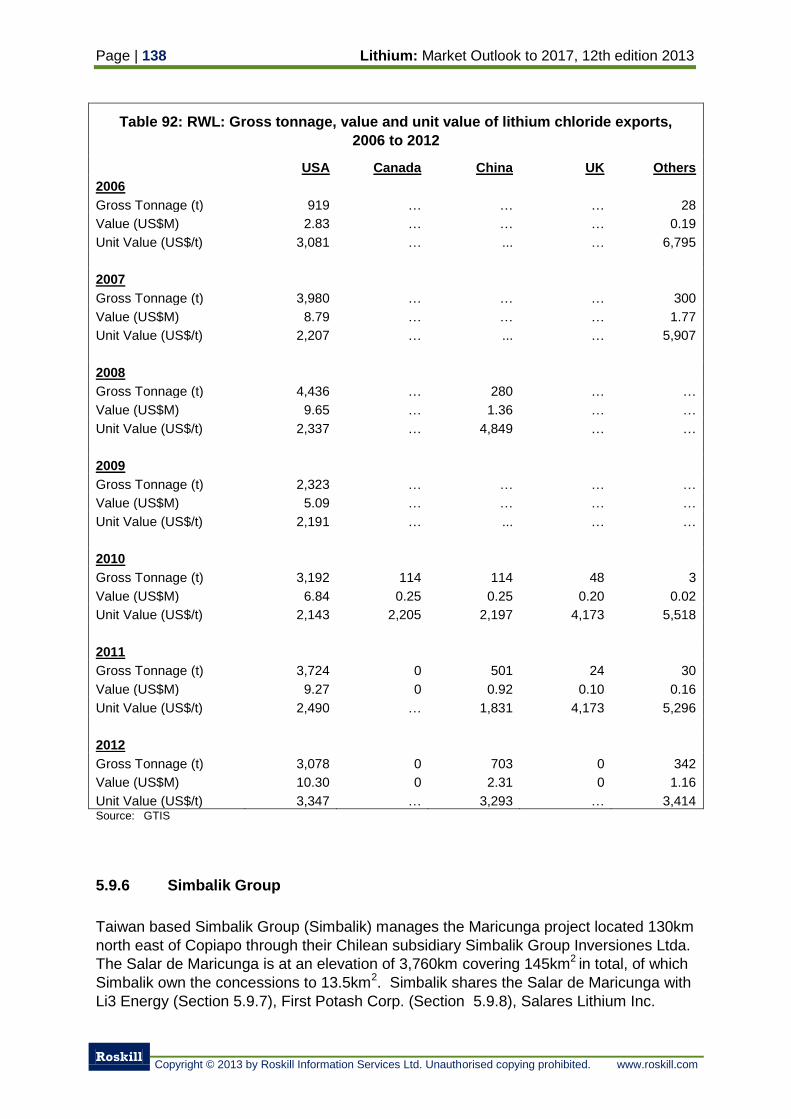
Page | 138 Lithium: Market Outlook to 2017, 12th edition 2013
Roskill
Copyright © 2013 by Roskill Information Services Ltd. Unauthorised copying prohibited. www.roskill.com
Table 92: RWL: Gross tonnage, value and unit value of lithium chloride exports,
2006 to 2012
USA Canada China UK Others
2006
Gross Tonnage (t) 919 … … … 28
Value (US$M) 2.83 … … … 0.19
Unit Value (US$/t) 3,081 … ... … 6,795
2007
Gross Tonnage (t) 3,980 … … … 300
Value (US$M) 8.79 … … … 1.77
Unit Value (US$/t) 2,207 … ... … 5,907
2008
Gross Tonnage (t) 4,436 … 280 … …
Value (US$M) 9.65 … 1.36 … …
Unit Value (US$/t) 2,337 … 4,849 … …
2009
Gross Tonnage (t) 2,323 … … … …
Value (US$M) 5.09 … … … …
Unit Value (US$/t) 2,191 … ... … …
2010
Gross Tonnage (t) 3,192 114 114 48 3
Value (US$M) 6.84 0.25 0.25 0.20 0.02
Unit Value (US$/t) 2,143 2,205 2,197 4,173 5,518
2011
Gross Tonnage (t) 3,724 0 501 24 30
Value (US$M) 9.27 0 0.92 0.10 0.16
Unit Value (US$/t) 2,490 … 1,831 4,173 5,296
2012
Gross Tonnage (t) 3,078 0 703 0 342
Value (US$M) 10.30 0 2.31 0 1.16
Unit Value (US$/t) 3,347 … 3,293 … 3,414 Source: GTIS
5.9.6 Simbalik Group
Taiwan based Simbalik Group (Simbalik) manages the Maricunga project located 130km
north east of Copiapo through their Chilean subsidiary Simbalik Group Inversiones Ltda.
The Salar de Maricunga is at an elevation of 3,760km covering 145km2 in total, of which
Simbalik own the concessions to 13.5km2. Simbalik shares the Salar de Maricunga with
Li3 Energy (Section 5.9.7), First Potash Corp. (Section 5.9.8), Salares Lithium Inc.
Lithium: Market Outlook to 2017, 12th edition 2013 Page | 139
Roskill
Copyright © 2013 by Roskill Information Services Ltd. Unauthorised copying prohibited. www.roskill.com
(Section 5.3.1) and Mammoth Energy Group Inc. (Section 5.9.10), all of whom own
concessions covering the salar. Unlike the other concession holders at the Salar de
Maricunga, Simbalik’s concession has been granted a mining licence in 1932 by
Comisión Chilena de Energίa Nuclear, which Simbalik inherited when they purchased
the concession in July 2011. The mining licence allows Simbalik to extract 50,000t Li for
a period of 15 years.
Based on an estimation of the Salar de Maricunga by CORFO in 1982, Simbalik have
projected a total contained resource at the salar to be 1.79Mt Li and 19.29Mt K. Brines
at the project are reported to reach 1,400ppm Li and 13,120ppm K, however a sample
program by Qinghai Institute Salt Lake in 2010 returned maximum concentrations of
1,486ppm Li, 9,686ppm K and 2,069ppm B.
Simbalik intend to construct a processing facility either on site or in proximity to the
Maricunga project with a capacity to produce 35,000tpy LCE and 80,000tpy potash.
5.9.7 Li3 Energy Inc.
Li3 Energy Inc. (Li3) own a 60% stake in the Maricunga property in northern Chile, along
with 100% stakes in the Loriscota, Suches and Viscachas lithium brine projects in Peru.
The Maricunga property is the most advanced of Li3’s lithium interests. In late January
2012, Li3 declared an interest in purchasing the lithium assets of New World Resources
Corp. (Section 5.6.3), however Li3 pulled out a deal between the two companies in April
2012 over disagreements on transaction terms.
In 2012, Li3 participated in the Special Lithium Operations Contract (CEOL) bidding
process as part of a consortium with POSCO, Daewoo International Corp and Mitsui &
Co. After the Chilean government had declared SQM’s highest bid to be invalid, Li3
appealed to the Ministry of Mining’s Special Tender Committee, asking for the CEOL to
be awarded to the second highest bidder. The appeal however was rejected and the
Chilean government annulled the entire bidding process in October 2012. Li3 continue
to make calls for new CEOL contracts to be awarded, or for a change in the law to allow
Chilean lithium deposits to be exploited.
5.9.7.1 Maricunga Property
In May 2011, Li3 finalised an agreement with Sociedades Legales Mineras Litio 1 a 6 de
la Sierra Hoyada de Maricunga, a group of 6 companies, to acquire a 60% stake in the
Maricunga property. The project is located on the Salar de Maricunga, 130km east of
the city of Copiapó in Region III of Chile. At an elevation of 3,760m, the Salar de
Maricunga covers an area of 145km2 of which Li3’s concessions cover 14.38km
2. The
Salar de Maricunga is also occupied by Simbalik Group Inversiones Ltda (5.9.6), First
Potash Corp. (Section 5.9.8) who acquired concessions in February 2011, Mammoth
Energy Group (Section 5.9.10) who acquired concessions in March 2011 and Salares
Lithium (Section 5.3.1), acquiring concessions after their merger in August 2010.
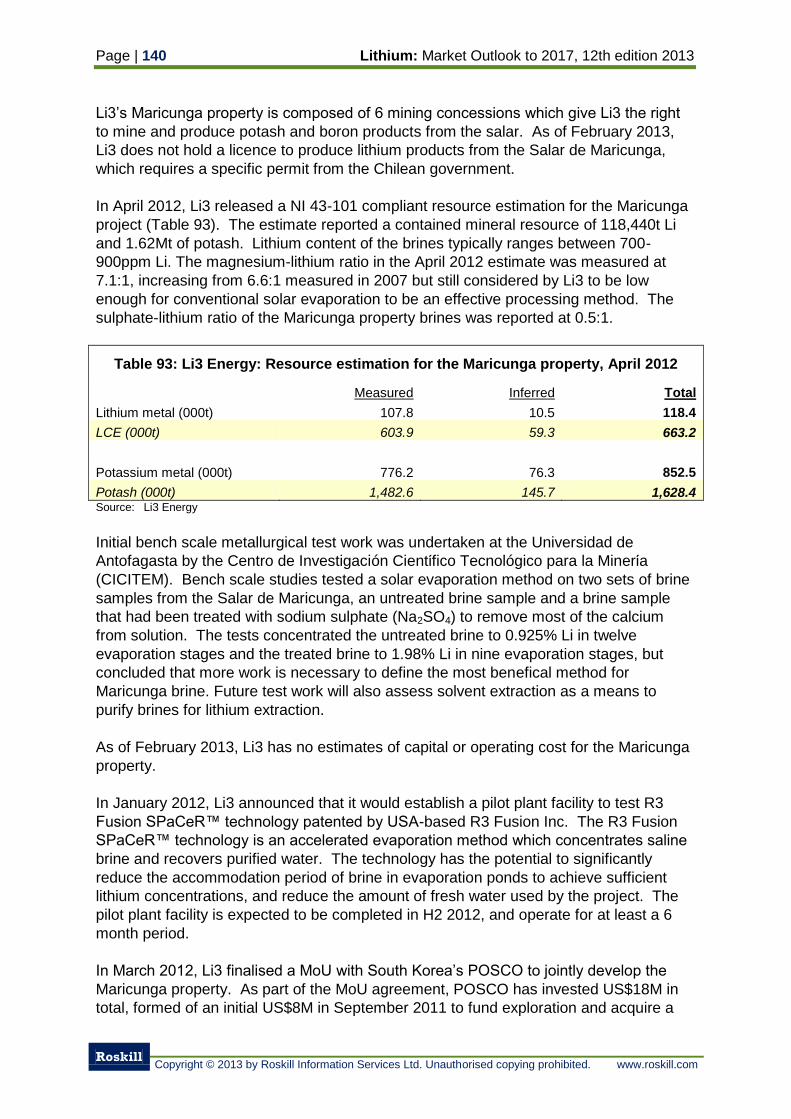
Page | 140 Lithium: Market Outlook to 2017, 12th edition 2013
Roskill
Copyright © 2013 by Roskill Information Services Ltd. Unauthorised copying prohibited. www.roskill.com
Li3’s Maricunga property is composed of 6 mining concessions which give Li3 the right
to mine and produce potash and boron products from the salar. As of February 2013,
Li3 does not hold a licence to produce lithium products from the Salar de Maricunga,
which requires a specific permit from the Chilean government.
In April 2012, Li3 released a NI 43-101 compliant resource estimation for the Maricunga
project (Table 93). The estimate reported a contained mineral resource of 118,440t Li
and 1.62Mt of potash. Lithium content of the brines typically ranges between 700-
900ppm Li. The magnesium-lithium ratio in the April 2012 estimate was measured at
7.1:1, increasing from 6.6:1 measured in 2007 but still considered by Li3 to be low
enough for conventional solar evaporation to be an effective processing method. The
sulphate-lithium ratio of the Maricunga property brines was reported at 0.5:1.
Table 93: Li3 Energy: Resource estimation for the Maricunga property, April 2012
Measured Inferred Total
Lithium metal (000t) 107.8 10.5 118.4
LCE (000t) 603.9 59.3 663.2
Potassium metal (000t) 776.2 76.3 852.5
Potash (000t) 1,482.6 145.7 1,628.4 Source: Li3 Energy
Initial bench scale metallurgical test work was undertaken at the Universidad de
Antofagasta by the Centro de Investigación Cientίfico Tecnológico para la Minerίa
(CICITEM). Bench scale studies tested a solar evaporation method on two sets of brine
samples from the Salar de Maricunga, an untreated brine sample and a brine sample
that had been treated with sodium sulphate (Na2SO4) to remove most of the calcium
from solution. The tests concentrated the untreated brine to 0.925% Li in twelve
evaporation stages and the treated brine to 1.98% Li in nine evaporation stages, but
concluded that more work is necessary to define the most benefical method for
Maricunga brine. Future test work will also assess solvent extraction as a means to
purify brines for lithium extraction.
As of February 2013, Li3 has no estimates of capital or operating cost for the Maricunga
property.
In January 2012, Li3 announced that it would establish a pilot plant facility to test R3
Fusion SPaCeR™ technology patented by USA-based R3 Fusion Inc. The R3 Fusion
SPaCeR™ technology is an accelerated evaporation method which concentrates saline
brine and recovers purified water. The technology has the potential to significantly
reduce the accommodation period of brine in evaporation ponds to achieve sufficient
lithium concentrations, and reduce the amount of fresh water used by the project. The
pilot plant facility is expected to be completed in H2 2012, and operate for at least a 6
month period.
In March 2012, Li3 finalised a MoU with South Korea’s POSCO to jointly develop the
Maricunga property. As part of the MoU agreement, POSCO has invested US$18M in
total, formed of an initial US$8M in September 2011 to fund exploration and acquire a
Lithium: Market Outlook to 2017, 12th edition 2013 Page | 141
Roskill
Copyright © 2013 by Roskill Information Services Ltd. Unauthorised copying prohibited. www.roskill.com
9% interest in the company, and a second US$10M investment in August 2012.
POSCO will also design, build, operate and finance a pilot processing facility, either in
Chile or South Korea, to which Li3 will provide technical assistance. Any technology
developed during the pilot plant test work may be used by POSCO on Li3’s other lithium
projects. In the pilot plant test work, POSCO will attempt to incorporate technology
developed in South Korea to extract lithium directly from low concentration brines, which
has previously been successful on treating brine from the Salar de Maricunga.
5.9.7.2 Li3 Energy Peruvian Projects
Li3’s Peruvian projects include Loriscota in Puno department, Suches in Tacna
department and Vizcachas in the Moquegua department. The three projects cover a
combined area of 79km3 and are located at an elevation of >4,000m. The projects were
identified in a 1981 study by the Peruvian Ministry of Energy and Mines (MoEM) to
contain elevated concentrations of lithium and potassium in brines and Li3 has since
confirmed this in an initial sampling program. Unlike the Maricunga project in Chile, the
exploitation of lithium deposits in Peru is not restricted by the government, and the three
projects are situated in areas allocated for mineral exploration and mining.
5.9.8 First Potash Corp.
On 16th November 2012, Pan American Lithium changed its name to First Potash Corp.
(FPC) to reflect the company’s focus on developing potash resources. FPC acquired a
99% stake in South American Lithium Co. S.A. Cerrada (Salico) in December 2009. The
remaining 1% in the company is held by a Chilean nominee. Prior to its purchase by
FPC, Salico controlled licences covering nine salars in Region III of Chile. FPC acquired
licences covering two more salars, the Salar de Maricunga and Salar de Pedernales in
May 2012, after signing an agreement with Sociedad Gareste Ltd. The May 2012,
agreement saw FPC receive 100% control of the Salar de Pedernales and an option to
gain an 80% in the Salar de Maricunga project through a series of development and
financing stages. Salars which are covered by FPCs licences include:
Lagunas Jilgueros 11km2
Laguna Brava 11km2
Salar Igorado 6km2
Salar de Wheelwright 12km2
Laguna Escondida 9km2
Rio de la Sal / Llanta 30km2
Laguna Verde 34km2
La Laguna 4km2
Salar Piedra Parada 36km2
Salar de Maricunga 12km2
Salar de Pedernales 51km2
Total 216km2
Page | 142 Lithium: Market Outlook to 2017, 12th edition 2013
Roskill
Copyright © 2013 by Roskill Information Services Ltd. Unauthorised copying prohibited. www.roskill.com
The Laguna Verde licence area is FPCs most advanced project with an inferred
resource estimation supported by technical reports. Laguna Verde is located 190km
from Copiapo at an elevation of 4,320m. The resource estimation using an average
brine concentration of 212.4ppm lithium and 4,881ppm potassium was 519,900t LCE
and a further 4.2Mt KCl. FPC plan to improve the resource estimation at Laguna Verde
to a measured and indicated category during 2012, along with the initiation of a PFS
expected to be completed in 2013. If the PFS returns favourable results, FPC will look
to design and attain necessary permits for a 10,000tpy LCE plant to process surface
brines and extend their exploration to deep brines.
In September 2011, FPC signed an agreement with POSCAN, the Canadian subsidiary
of South Korean steel producer POSCO. In the agreement POSCAN purchased a 10%
share in FPC for CAN$1.43M. POSCAN will also finance and construct a pilot plant or
R&D facility at one of FPCs Chilean salar projects for the production of lithium
carbonate.
5.9.9 CODELCO
State owned Chilean copper miner CODELCO holds lithium claims at the Maricunga and
Pedernales salars in Region III of Chile. The claims were awarded prior to 1979 and can
be exploited with only presidential approval, by-passing the need for a CEOL.
CODELCO have declared an interest in exploiting their lithium assets and are looking to
form a partnership agreement with companies already involved in the lithium industry. In
March 2013, four offers of co-opearation from interested parties had been been put
forward, which CODELCO will assess during Q2 2013. CODELCO has stated that it has
the potential to begin lithium production at one of its lithium assets by end-2016,
although this is remains speculative.
5.9.10 Mammoth Energy Group Inc.
Mammoth Energy Group is an exploration and development company focused on
strategic and energy resources. Since its formation, Mammoth has acquired additional
concession areas through its 100% subsidiary Compania Lithium Investments Limitada
of Chile (CLIL). In 2011, CLIL purchased concessions at four new projects in addition
to the concessions held at the Salar de Marciunga. The company now holds
concessions covering five projects in northern Chile.
Salar District Area (km2) Brine Concentration
Salar de
Maricunga
Copiapó Province,
Region III
35 -
Salar de Luco El Loa Province,
Region II
10 500-750ppm Li
Salar de Pujsa El Loa Province, 19 500-750ppm Li
Lithium: Market Outlook to 2017, 12th edition 2013 Page | 143
Roskill
Copyright © 2013 by Roskill Information Services Ltd. Unauthorised copying prohibited. www.roskill.com
Region II 9,000-10,000ppm K
Laguna Paguisa Parinacote Province,
Region I
25 -
Laguna Lagunilla Tamarugal Province,
Region I
10 -
5.9.11 Lomiko Metals Inc.
Lomiko Metals wholly own eight concessions covering the Salar de Aguas Caliente brine
project located in Region III of Chile. In total, nine concession areas span the total
surface area of the Salar de Aguas Caliente. The ninth concession is owned by SQM
(Section 5.9.4) covering 4km2. The Lomiko Metals concessions were purchased in June
2009 and span 19km2 of the salar.
5.9.12 Errázuriz Lithium
Errázuriz Lithium formed part of the NX UNO de Peine group along with Samsung SDI
and Minera Copiapó who participated in the failed CEOL bidding process in September
2012. The company is a private enterprise owned by the Errázuriz family and holds
concessions covering roughly 700km2 of land in Chile.
5.9.13 Exports of litihum from Chile
In 2012, Chile exported just under 56,000t of lithium carbonate with the main
destinations for exports being South Korea, Japan and China. Since 2006, exports of
lithium carbonate to South Korea have increased 36.3%py and China 19.3%py as strong
demand has been driven by growth in these countries lithium ion battery industries
(Table 94). Exports to Japan fell in 2012 most likely a result of of on-going disruption to
battery production along the Fukushima prefecture coast and an unfavourable currency
exchange rate. As Asian imports of lithium carbonate from Chile have increased
dramatically, exports to the USA have been in decline since the mid-2000s, and
recovery after the global economic crisis has been relatively slow.
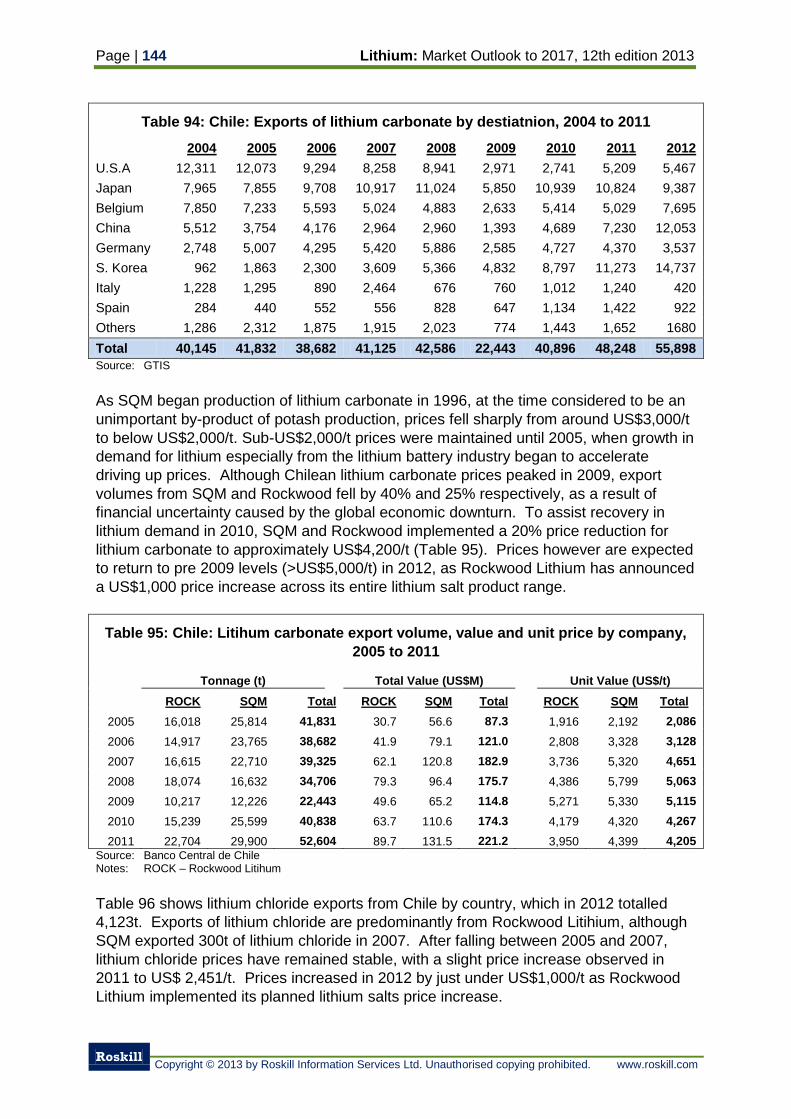
Page | 144 Lithium: Market Outlook to 2017, 12th edition 2013
Roskill
Copyright © 2013 by Roskill Information Services Ltd. Unauthorised copying prohibited. www.roskill.com
Table 94: Chile: Exports of lithium carbonate by destiatnion, 2004 to 2011
2004 2005 2006 2007 2008 2009 2010 2011 2012
U.S.A 12,311 12,073 9,294 8,258 8,941 2,971 2,741 5,209 5,467
Japan 7,965 7,855 9,708 10,917 11,024 5,850 10,939 10,824 9,387
Belgium 7,850 7,233 5,593 5,024 4,883 2,633 5,414 5,029 7,695
China 5,512 3,754 4,176 2,964 2,960 1,393 4,689 7,230 12,053
Germany 2,748 5,007 4,295 5,420 5,886 2,585 4,727 4,370 3,537
S. Korea 962 1,863 2,300 3,609 5,366 4,832 8,797 11,273 14,737
Italy 1,228 1,295 890 2,464 676 760 1,012 1,240 420
Spain 284 440 552 556 828 647 1,134 1,422 922
Others 1,286 2,312 1,875 1,915 2,023 774 1,443 1,652 1680
Total 40,145 41,832 38,682 41,125 42,586 22,443 40,896 48,248 55,898
Source: GTIS
As SQM began production of lithium carbonate in 1996, at the time considered to be an
unimportant by-product of potash production, prices fell sharply from around US$3,000/t
to below US$2,000/t. Sub-US$2,000/t prices were maintained until 2005, when growth in
demand for lithium especially from the lithium battery industry began to accelerate
driving up prices. Although Chilean lithium carbonate prices peaked in 2009, export
volumes from SQM and Rockwood fell by 40% and 25% respectively, as a result of
financial uncertainty caused by the global economic downturn. To assist recovery in
lithium demand in 2010, SQM and Rockwood implemented a 20% price reduction for
lithium carbonate to approximately US$4,200/t (Table 95). Prices however are expected
to return to pre 2009 levels (>US$5,000/t) in 2012, as Rockwood Lithium has announced
a US$1,000 price increase across its entire lithium salt product range.
Table 95: Chile: Litihum carbonate export volume, value and unit price by company,
2005 to 2011
Tonnage (t) Total Value (US$M)
Unit Value (US$/t)
ROCK SQM Total ROCK SQM Total ROCK SQM Total
2005 16,018 25,814 41,831 30.7 56.6 87.3 1,916 2,192 2,086
2006 14,917 23,765 38,682 41.9 79.1 121.0 2,808 3,328 3,128
2007 16,615 22,710 39,325 62.1 120.8 182.9 3,736 5,320 4,651
2008 18,074 16,632 34,706 79.3 96.4 175.7 4,386 5,799 5,063
2009 10,217 12,226 22,443 49.6 65.2 114.8 5,271 5,330 5,115
2010 15,239 25,599 40,838 63.7 110.6 174.3 4,179 4,320 4,267
2011 22,704 29,900 52,604 89.7 131.5 221.2 3,950 4,399 4,205
Source: Banco Central de Chile Notes: ROCK – Rockwood Litihum
Table 96 shows lithium chloride exports from Chile by country, which in 2012 totalled
4,123t. Exports of lithium chloride are predominantly from Rockwood Litihium, although
SQM exported 300t of lithium chloride in 2007. After falling between 2005 and 2007,
lithium chloride prices have remained stable, with a slight price increase observed in
2011 to US$ 2,451/t. Prices increased in 2012 by just under US$1,000/t as Rockwood
Lithium implemented its planned lithium salts price increase.
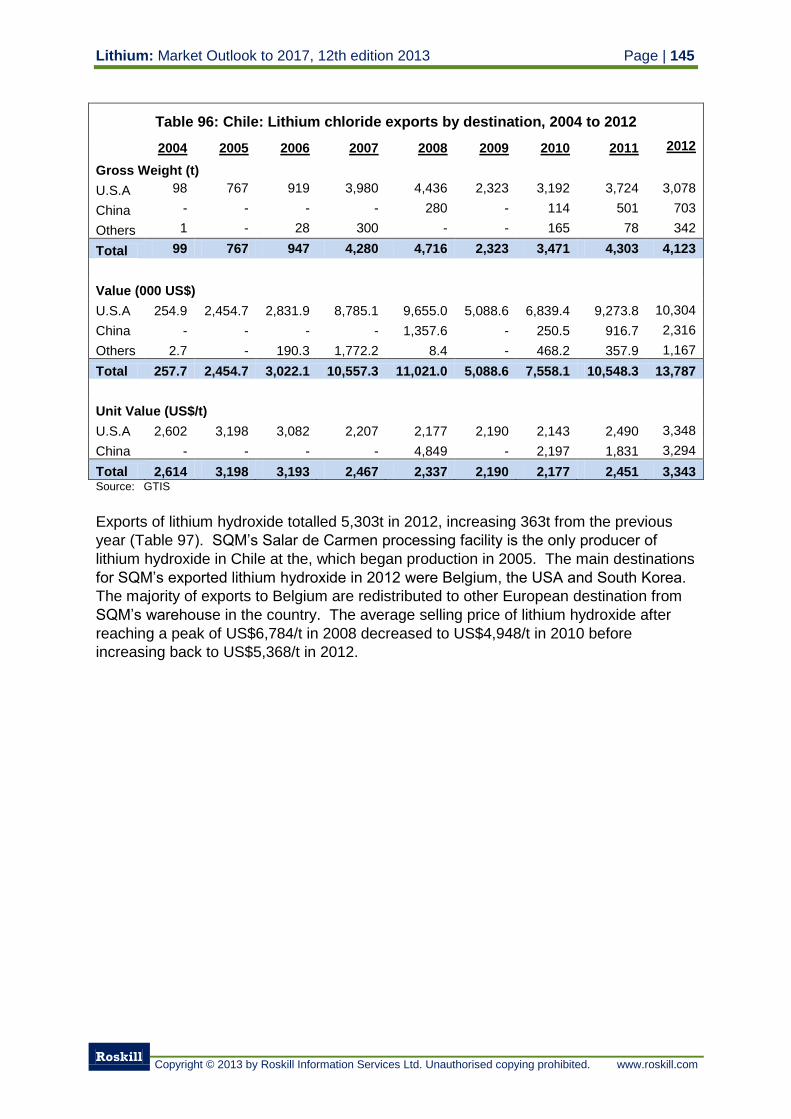
Lithium: Market Outlook to 2017, 12th edition 2013 Page | 145
Roskill
Copyright © 2013 by Roskill Information Services Ltd. Unauthorised copying prohibited. www.roskill.com
Table 96: Chile: Lithium chloride exports by destination, 2004 to 2012
2004 2005 2006 2007 2008 2009 2010 2011 2012
Gross Weight (t)
U.S.A 98 767 919 3,980 4,436 2,323 3,192 3,724 3,078
China - - - - 280 - 114 501 703
Others 1 - 28 300 - - 165 78 342
Total 99 767 947 4,280 4,716 2,323 3,471 4,303 4,123
Value (000 US$)
U.S.A 254.9 2,454.7 2,831.9 8,785.1 9,655.0 5,088.6 6,839.4 9,273.8 10,304
China - - - - 1,357.6 - 250.5 916.7 2,316
Others 2.7 - 190.3 1,772.2 8.4 - 468.2 357.9 1,167
Total 257.7 2,454.7 3,022.1 10,557.3 11,021.0 5,088.6 7,558.1 10,548.3 13,787
Unit Value (US$/t)
U.S.A 2,602 3,198 3,082 2,207 2,177 2,190 2,143 2,490 3,348
China - - - - 4,849 - 2,197 1,831 3,294
Total 2,614 3,198 3,193 2,467 2,337 2,190 2,177 2,451 3,343 Source: GTIS
Exports of lithium hydroxide totalled 5,303t in 2012, increasing 363t from the previous
year (Table 97). SQM’s Salar de Carmen processing facility is the only producer of
lithium hydroxide in Chile at the, which began production in 2005. The main destinations
for SQM’s exported lithium hydroxide in 2012 were Belgium, the USA and South Korea.
The majority of exports to Belgium are redistributed to other European destination from
SQM’s warehouse in the country. The average selling price of lithium hydroxide after
reaching a peak of US$6,784/t in 2008 decreased to US$4,948/t in 2010 before
increasing back to US$5,368/t in 2012.
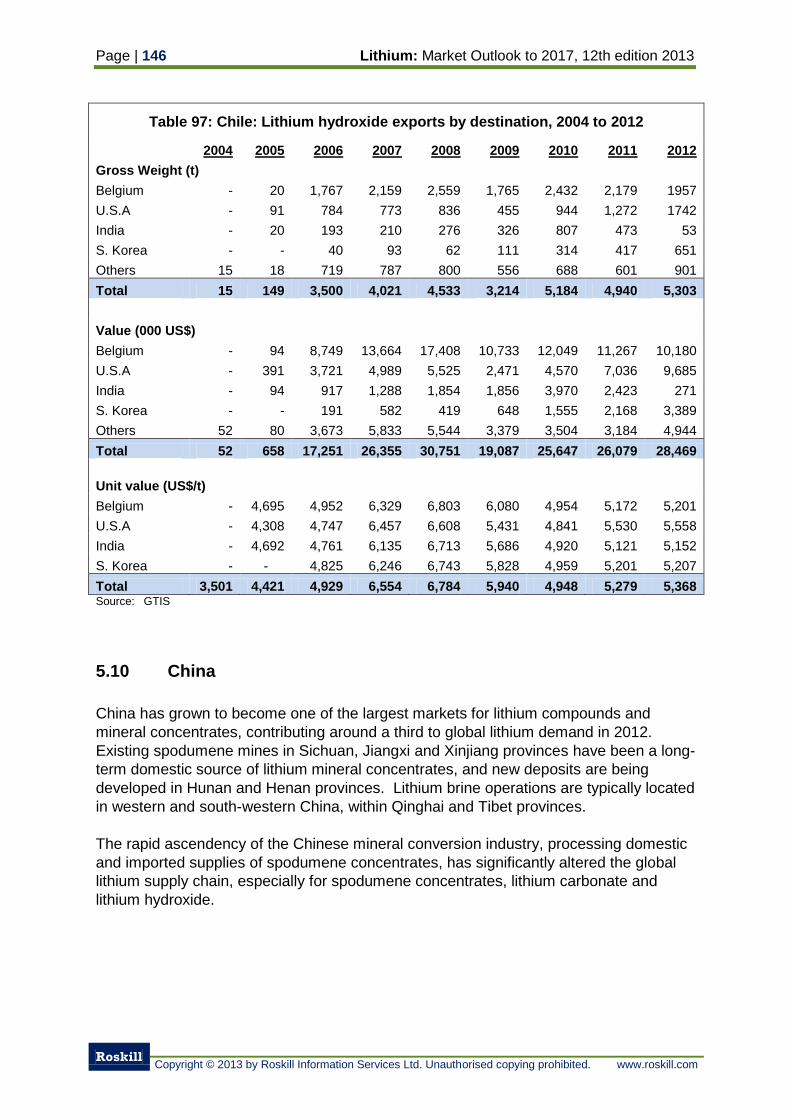
Page | 146 Lithium: Market Outlook to 2017, 12th edition 2013
Roskill
Copyright © 2013 by Roskill Information Services Ltd. Unauthorised copying prohibited. www.roskill.com
Table 97: Chile: Lithium hydroxide exports by destination, 2004 to 2012
2004 2005 2006 2007 2008 2009 2010 2011 2012
Gross Weight (t)
Belgium - 20 1,767 2,159 2,559 1,765 2,432 2,179 1957
U.S.A - 91 784 773 836 455 944 1,272 1742
India - 20 193 210 276 326 807 473 53
S. Korea - - 40 93 62 111 314 417 651
Others 15 18 719 787 800 556 688 601 901
Total 15 149 3,500 4,021 4,533 3,214 5,184 4,940 5,303
Value (000 US$)
Belgium - 94 8,749 13,664 17,408 10,733 12,049 11,267 10,180
U.S.A - 391 3,721 4,989 5,525 2,471 4,570 7,036 9,685
India - 94 917 1,288 1,854 1,856 3,970 2,423 271
S. Korea - - 191 582 419 648 1,555 2,168 3,389
Others 52 80 3,673 5,833 5,544 3,379 3,504 3,184 4,944
Total 52 658 17,251 26,355 30,751 19,087 25,647 26,079 28,469
Unit value (US$/t)
Belgium - 4,695 4,952 6,329 6,803 6,080 4,954 5,172 5,201
U.S.A - 4,308 4,747 6,457 6,608 5,431 4,841 5,530 5,558
India - 4,692 4,761 6,135 6,713 5,686 4,920 5,121 5,152
S. Korea - - 4,825 6,246 6,743 5,828 4,959 5,201 5,207
Total 3,501 4,421 4,929 6,554 6,784 5,940 4,948 5,279 5,368 Source: GTIS
5.10 China
China has grown to become one of the largest markets for lithium compounds and
mineral concentrates, contributing around a third to global lithium demand in 2012.
Existing spodumene mines in Sichuan, Jiangxi and Xinjiang provinces have been a long-
term domestic source of lithium mineral concentrates, and new deposits are being
developed in Hunan and Henan provinces. Lithium brine operations are typically located
in western and south-western China, within Qinghai and Tibet provinces.
The rapid ascendency of the Chinese mineral conversion industry, processing domestic
and imported supplies of spodumene concentrates, has significantly altered the global
lithium supply chain, especially for spodumene concentrates, lithium carbonate and
lithium hydroxide.
Lithium: Market Outlook to 2017, 12th edition 2013 Page | 147
Roskill
Copyright © 2013 by Roskill Information Services Ltd. Unauthorised copying prohibited. www.roskill.com
5.10.1 Chinese reserves of lithium
There are conflicting views on China’s contained lithium reserves. Roskill estimates
Chinese reserves and resources to be 27.14Mt LCE, with 21.29Mt LCE contained within
lithium brine deposits and the remaining 5.85Mt LCE contained within hard-rock lithium
deposits.
Chinese lithium reserves are estimated by the USGS to be 18.63Mt LCE, the second
largest national reserve behind Chile. An estimation of lithium resources, also
undertaken by the USGS in 2012, reported 28.7Mt LCE.
Between 2008 and 2010, a number of reserve estimations were produced by SinoLatin
Capital, ResearchInChina and Mr. R. Keith Evans, which reported reserves of between
14.3Mt-17.8Mt LCE.
5.10.1.1 Lithium Mineral Reserves
Chinese deposits of lithium minerals are almost exclusively located within four provinces,
Sichuan, Jiangxi, Hunan and Xinjiang. The majority of lithium mineral operations are
located in the Aba and Jinchuan prefectures of Sichuan province, representing 43% of
the total mineral reserves being mined in 2012. Spodumene-bearing pegmatites in the
province are generally associated with two large granitic intrusives located at Kangding
and Jinchuan in the western Sichuan Plateau.
In 2012, those Chinese lithium hard rock projects in operation are estimated to contain
reserves of 4.2Mt LCE (Table 98). A further 1.7Mt LCE are estimated to be contained
within deposits being explored and developed.
Xiajika is widely considered one of largest spodumene deposits in the world with
estimated mineral reserves of 2.9Mt LCE. In 2012, GanZi Rongda (Section 5.10.5.3)
which owns the Xiajika property held concessions covering only a small area of the
spodumene-pegmatite deposit. GanZi Rogda’s concessions are estimated to contain
reserves of 73,700t Li, although the company has a first refusal for mining rights in
surrounding claims.
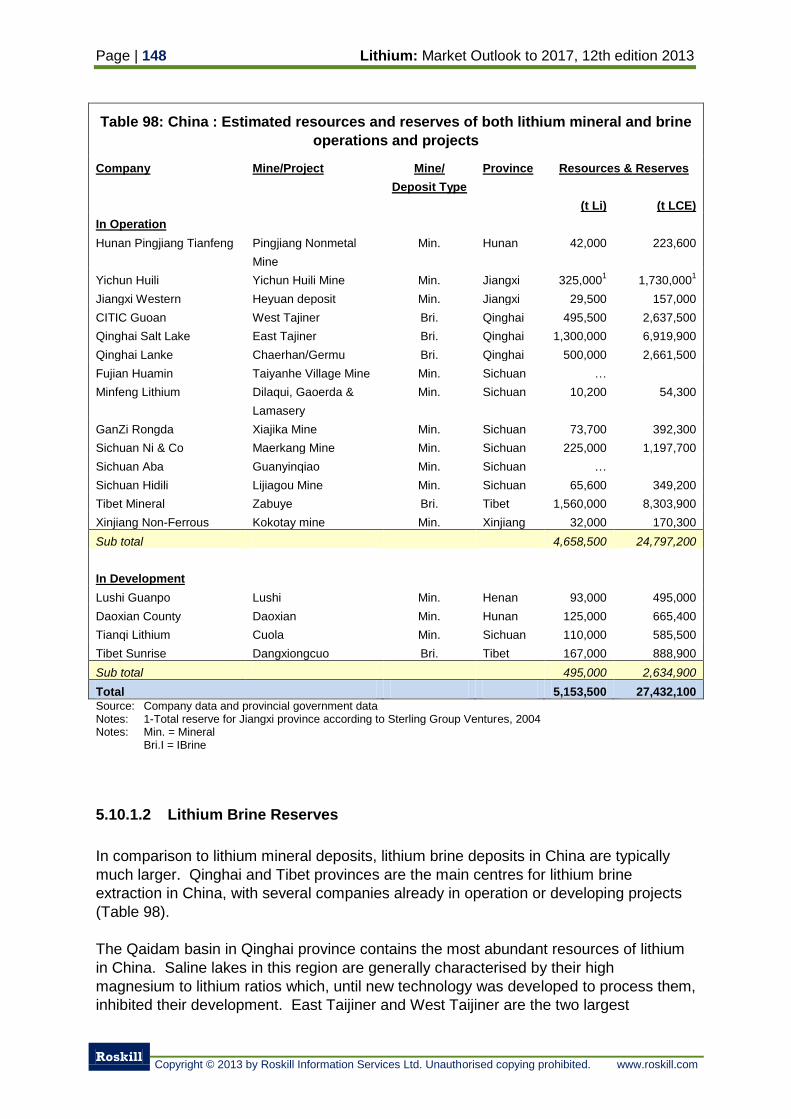
Page | 148 Lithium: Market Outlook to 2017, 12th edition 2013
Roskill
Copyright © 2013 by Roskill Information Services Ltd. Unauthorised copying prohibited. www.roskill.com
Table 98: China : Estimated resources and reserves of both lithium mineral and brine
operations and projects
Company Mine/Project Mine/
Deposit Type
Province Resources & Reserves
(t Li) (t LCE)
In Operation
Hunan Pingjiang Tianfeng Pingjiang Nonmetal
Mine
Min. Hunan 42,000 223,600
Yichun Huili Yichun Huili Mine Min. Jiangxi 325,0001 1,730,000
1
Jiangxi Western Heyuan deposit Min. Jiangxi 29,500 157,000
CITIC Guoan West Tajiner Bri. Qinghai 495,500 2,637,500
Qinghai Salt Lake East Tajiner Bri. Qinghai 1,300,000 6,919,900
Qinghai Lanke Chaerhan/Germu Bri. Qinghai 500,000 2,661,500
Fujian Huamin Taiyanhe Village Mine Min. Sichuan …
Minfeng Lithium Dilaqui, Gaoerda &
Lamasery
Min. Sichuan 10,200 54,300
GanZi Rongda Xiajika Mine Min. Sichuan 73,700 392,300
Sichuan Ni & Co Maerkang Mine Min. Sichuan 225,000 1,197,700
Sichuan Aba Guanyinqiao Min. Sichuan …
Sichuan Hidili Lijiagou Mine Min. Sichuan 65,600 349,200
Tibet Mineral Zabuye Bri. Tibet 1,560,000 8,303,900
Xinjiang Non-Ferrous Kokotay mine Min. Xinjiang 32,000 170,300
Sub total 4,658,500 24,797,200
In Development
Lushi Guanpo Lushi Min. Henan 93,000 495,000
Daoxian County Daoxian Min. Hunan 125,000 665,400
Tianqi Lithium Cuola Min. Sichuan 110,000 585,500
Tibet Sunrise Dangxiongcuo Bri. Tibet 167,000 888,900
Sub total 495,000 2,634,900
Total 5,153,500 27,432,100 Source: Company data and provincial government data Notes: 1-Total reserve for Jiangxi province according to Sterling Group Ventures, 2004 Notes: Min. = Mineral
Bri.I = IBrine
5.10.1.2 Lithium Brine Reserves
In comparison to lithium mineral deposits, lithium brine deposits in China are typically
much larger. Qinghai and Tibet provinces are the main centres for lithium brine
extraction in China, with several companies already in operation or developing projects
(Table 98).
The Qaidam basin in Qinghai province contains the most abundant resources of lithium
in China. Saline lakes in this region are generally characterised by their high
magnesium to lithium ratios which, until new technology was developed to process them,
inhibited their development. East Taijiner and West Taijiner are the two largest
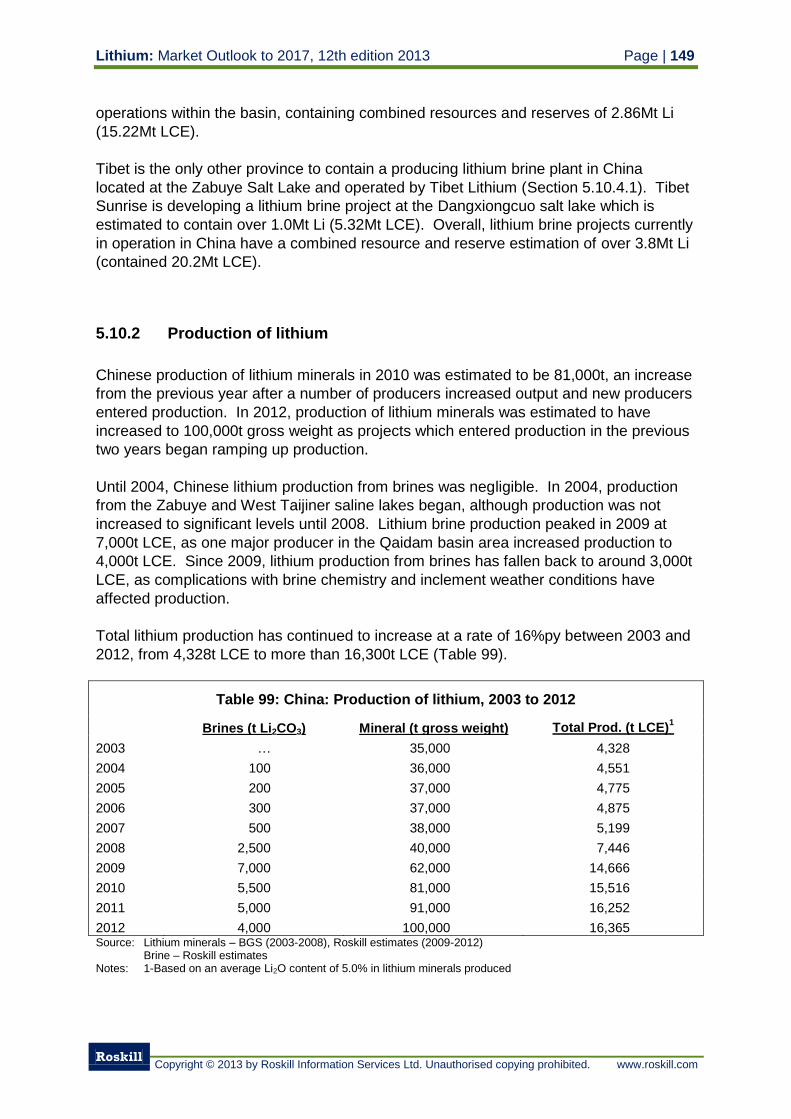
Lithium: Market Outlook to 2017, 12th edition 2013 Page | 149
Roskill
Copyright © 2013 by Roskill Information Services Ltd. Unauthorised copying prohibited. www.roskill.com
operations within the basin, containing combined resources and reserves of 2.86Mt Li
(15.22Mt LCE).
Tibet is the only other province to contain a producing lithium brine plant in China
located at the Zabuye Salt Lake and operated by Tibet Lithium (Section 5.10.4.1). Tibet
Sunrise is developing a lithium brine project at the Dangxiongcuo salt lake which is
estimated to contain over 1.0Mt Li (5.32Mt LCE). Overall, lithium brine projects currently
in operation in China have a combined resource and reserve estimation of over 3.8Mt Li
(contained 20.2Mt LCE).
5.10.2 Production of lithium
Chinese production of lithium minerals in 2010 was estimated to be 81,000t, an increase
from the previous year after a number of producers increased output and new producers
entered production. In 2012, production of lithium minerals was estimated to have
increased to 100,000t gross weight as projects which entered production in the previous
two years began ramping up production.
Until 2004, Chinese lithium production from brines was negligible. In 2004, production
from the Zabuye and West Taijiner saline lakes began, although production was not
increased to significant levels until 2008. Lithium brine production peaked in 2009 at
7,000t LCE, as one major producer in the Qaidam basin area increased production to
4,000t LCE. Since 2009, lithium production from brines has fallen back to around 3,000t
LCE, as complications with brine chemistry and inclement weather conditions have
affected production.
Total lithium production has continued to increase at a rate of 16%py between 2003 and
2012, from 4,328t LCE to more than 16,300t LCE (Table 99).
Table 99: China: Production of lithium, 2003 to 2012
Brines (t Li2CO3) Mineral (t gross weight) Total Prod. (t LCE)
1
2003 … 35,000 4,328
2004 100 36,000 4,551
2005 200 37,000 4,775
2006 300 37,000 4,875
2007 500 38,000 5,199
2008 2,500 40,000 7,446
2009 7,000 62,000 14,666
2010 5,500 81,000 15,516
2011 5,000 91,000 16,252
2012 4,000 100,000 16,365 Source: Lithium minerals – BGS (2003-2008), Roskill estimates (2009-2012) Brine – Roskill estimates Notes: 1-Based on an average Li2O content of 5.0% in lithium minerals produced
Page | 150 Lithium: Market Outlook to 2017, 12th edition 2013
Roskill
Copyright © 2013 by Roskill Information Services Ltd. Unauthorised copying prohibited. www.roskill.com
5.10.2.1 Mineral Production
The mining of lithium minerals in China began as early as the mid-1950s with the first
deposit to be exploited being the Li-Be-Nb-Ta pegmatite deposit at Koktokay in Xinjiang.
Lithium concentrates mined at Kokotay during this early period were mainly supplied to
the former Soviet Union. Since then, several other lithium mines have been opened,
and dressing, smelting and processing plants built, mainly in Sichuan, Jiangxi and
Hunan.
Sichuan became the second largest producer of lithium minerals during the late 1980s,
as Sichuan Ni&Co Guorun (Section 5.10.6.4) and Sichuan Aba Guangsheng (Section
5.10.6.2) brought both the Maerkang and Guanyinqiao spodumene mines into
production. Sichuan has since become the largest spodumene producing province in
China after the mineral potential of the Aba and Jinchuan prefectures was further
explored and developed by other mining companies such as Minfeng Lithium (Section
5.10.6.3) and GanZi Rongda (Section 5.10.5.3). As a domestic supply of lithium mineral
concentrates became more available, a number of lithium processing plants became
established in Sichuan, producing lithium compounds initially from both local, and later
imported from sources of spodumene.
Growth in demand for lepidolite concentrates by the glass and ceramic industries in
China resulted in the Yichun Ta-Nb-Li mine in Jiangxi, a lepidolite deposit, upgrading its
flotation plant twice between 1987 and 1989. Jiangxi is currently the largest producer of
lepidolite concentrates in China. The Yichun deposit is currently worked by Yichun Huili
Industrial (Section 5.10.5.2).
In 2011, Capacity for the production of lithium minerals in China was estimated at over
30,500t LCE, equivalent to approximately 205,000t 6% Li2O spodumene concentrate.
Actual production in 2011 however was much less, estimated at just over 8,000t LCE
(Table 100).
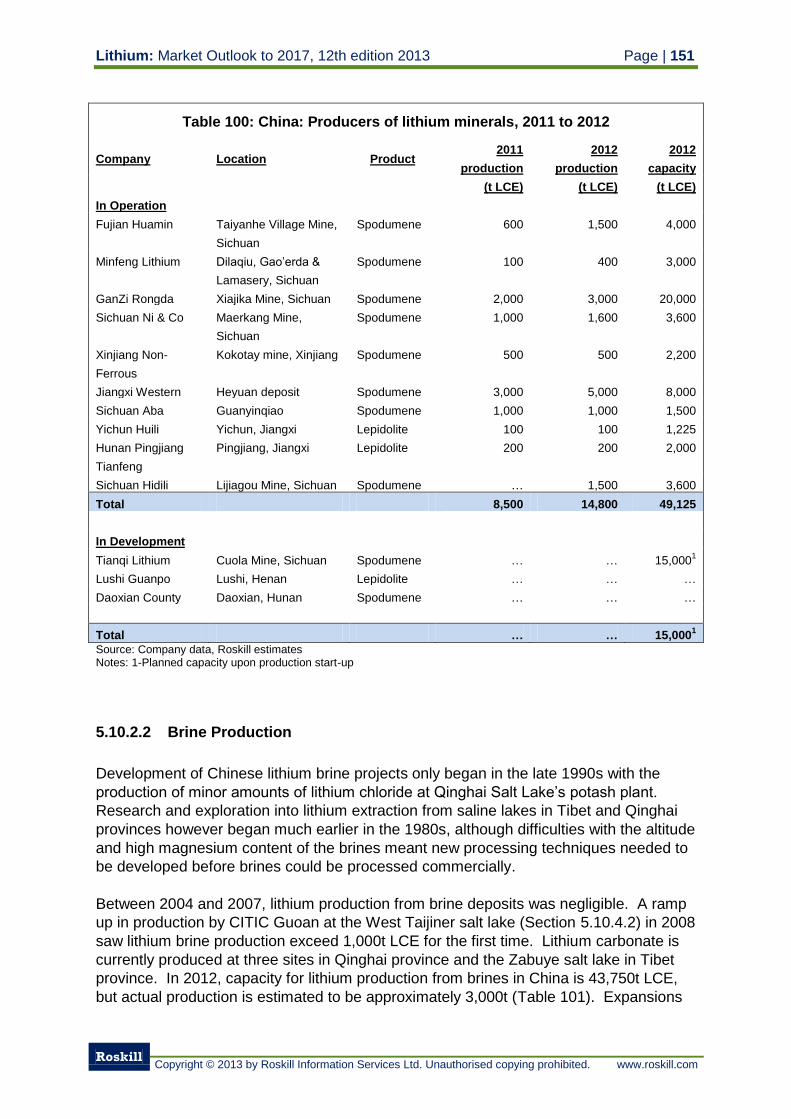
Lithium: Market Outlook to 2017, 12th edition 2013 Page | 151
Roskill
Copyright © 2013 by Roskill Information Services Ltd. Unauthorised copying prohibited. www.roskill.com
Table 100: China: Producers of lithium minerals, 2011 to 2012
Company Location Product 2011
production
2012
production
2012
capacity
(t LCE) (t LCE) (t LCE)
In Operation
Fujian Huamin Taiyanhe Village Mine,
Sichuan
Spodumene 600 1,500 4,000
Minfeng Lithium Dilaqiu, Gao’erda &
Lamasery, Sichuan
Spodumene 100 400 3,000
GanZi Rongda Xiajika Mine, Sichuan Spodumene 2,000 3,000 20,000
Sichuan Ni & Co Maerkang Mine,
Sichuan
Spodumene 1,000 1,600 3,600
Xinjiang Non-
Ferrous
Kokotay mine, Xinjiang Spodumene 500 500 2,200
Jiangxi Western Heyuan deposit Spodumene 3,000 5,000 8,000
Sichuan Aba Guanyinqiao Spodumene 1,000 1,000 1,500
Yichun Huili Yichun, Jiangxi Lepidolite 100 100 1,225
Hunan Pingjiang
Tianfeng
Pingjiang, Jiangxi Lepidolite 200 200 2,000
Sichuan Hidili Lijiagou Mine, Sichuan Spodumene … 1,500 3,600
Total 8,500 14,800 49,125
In Development
Tianqi Lithium Cuola Mine, Sichuan Spodumene … … 15,0001
Lushi Guanpo Lushi, Henan Lepidolite … … …
Daoxian County Daoxian, Hunan Spodumene … … …
Total … … 15,0001
Source: Company data, Roskill estimates Notes: 1-Planned capacity upon production start-up
5.10.2.2 Brine Production
Development of Chinese lithium brine projects only began in the late 1990s with the
production of minor amounts of lithium chloride at Qinghai Salt Lake’s potash plant.
Research and exploration into lithium extraction from saline lakes in Tibet and Qinghai
provinces however began much earlier in the 1980s, although difficulties with the altitude
and high magnesium content of the brines meant new processing techniques needed to
be developed before brines could be processed commercially.
Between 2004 and 2007, lithium production from brine deposits was negligible. A ramp
up in production by CITIC Guoan at the West Taijiner salt lake (Section 5.10.4.2) in 2008
saw lithium brine production exceed 1,000t LCE for the first time. Lithium carbonate is
currently produced at three sites in Qinghai province and the Zabuye salt lake in Tibet
province. In 2012, capacity for lithium production from brines in China is 43,750t LCE,
but actual production is estimated to be approximately 3,000t (Table 101). Expansions
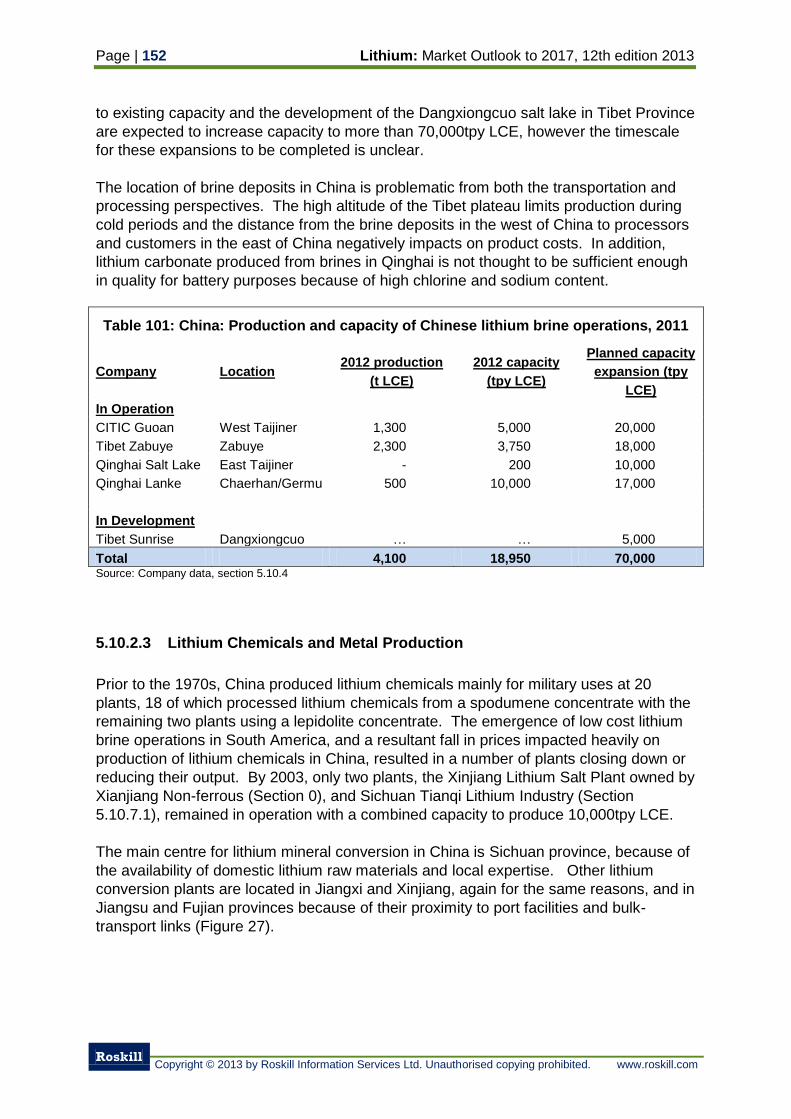
Page | 152 Lithium: Market Outlook to 2017, 12th edition 2013
Roskill
Copyright © 2013 by Roskill Information Services Ltd. Unauthorised copying prohibited. www.roskill.com
to existing capacity and the development of the Dangxiongcuo salt lake in Tibet Province
are expected to increase capacity to more than 70,000tpy LCE, however the timescale
for these expansions to be completed is unclear.
The location of brine deposits in China is problematic from both the transportation and
processing perspectives. The high altitude of the Tibet plateau limits production during
cold periods and the distance from the brine deposits in the west of China to processors
and customers in the east of China negatively impacts on product costs. In addition,
lithium carbonate produced from brines in Qinghai is not thought to be sufficient enough
in quality for battery purposes because of high chlorine and sodium content.
Table 101: China: Production and capacity of Chinese lithium brine operations, 2011
Company Location 2012 production
(t LCE)
2012 capacity
(tpy LCE)
Planned capacity
expansion (tpy
LCE)
In Operation
CITIC Guoan West Taijiner 1,300 5,000 20,000
Tibet Zabuye Zabuye 2,300 3,750 18,000
Qinghai Salt Lake East Taijiner - 200 10,000
Qinghai Lanke Chaerhan/Germu 500 10,000 17,000
In Development
Tibet Sunrise Dangxiongcuo … … 5,000
Total 4,100 18,950 70,000 Source: Company data, section 5.10.4
5.10.2.3 Lithium Chemicals and Metal Production
Prior to the 1970s, China produced lithium chemicals mainly for military uses at 20
plants, 18 of which processed lithium chemicals from a spodumene concentrate with the
remaining two plants using a lepidolite concentrate. The emergence of low cost lithium
brine operations in South America, and a resultant fall in prices impacted heavily on
production of lithium chemicals in China, resulted in a number of plants closing down or
reducing their output. By 2003, only two plants, the Xinjiang Lithium Salt Plant owned by
Xianjiang Non-ferrous (Section 0), and Sichuan Tianqi Lithium Industry (Section
5.10.7.1), remained in operation with a combined capacity to produce 10,000tpy LCE.
The main centre for lithium mineral conversion in China is Sichuan province, because of
the availability of domestic lithium raw materials and local expertise. Other lithium
conversion plants are located in Jiangxi and Xinjiang, again for the same reasons, and in
Jiangsu and Fujian provinces because of their proximity to port facilities and bulk-
transport links (Figure 27).
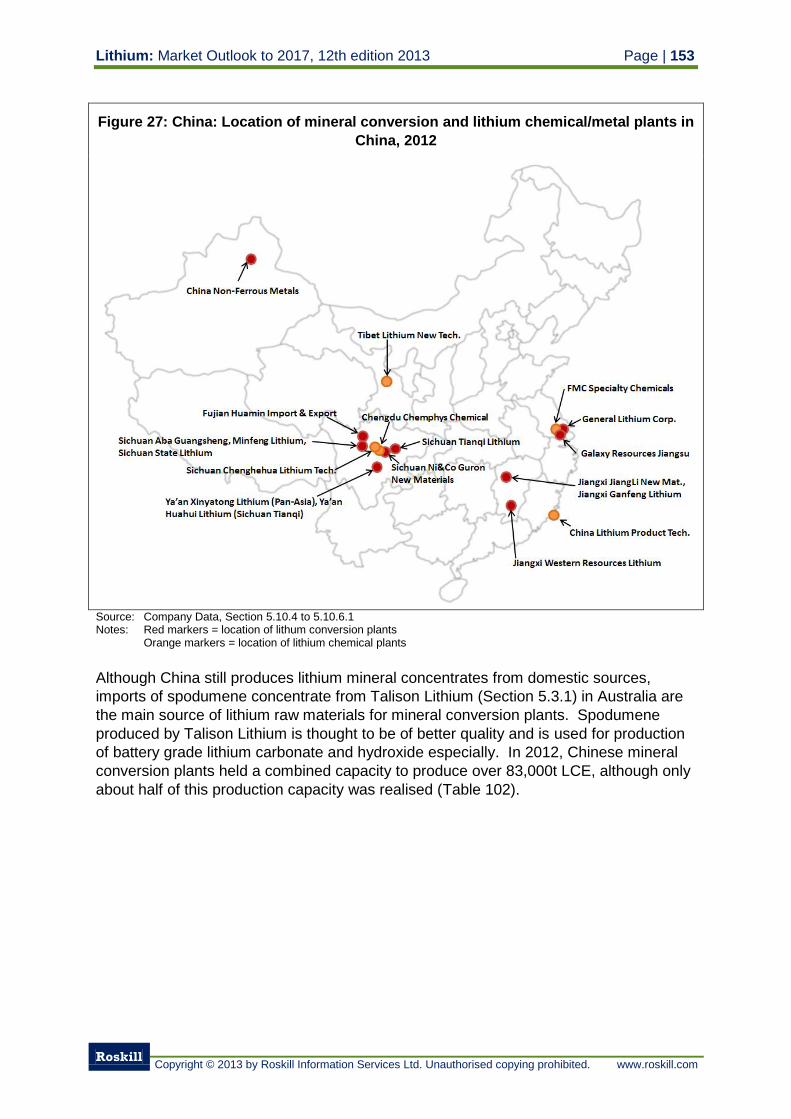
Lithium: Market Outlook to 2017, 12th edition 2013 Page | 153
Roskill
Copyright © 2013 by Roskill Information Services Ltd. Unauthorised copying prohibited. www.roskill.com
Figure 27: China: Location of mineral conversion and lithium chemical/metal plants in
China, 2012
Source: Company Data, Section 5.10.4 to 5.10.6.1 Notes: Red markers = location of lithum conversion plants Orange markers = location of lithium chemical plants
Although China still produces lithium mineral concentrates from domestic sources,
imports of spodumene concentrate from Talison Lithium (Section 5.3.1) in Australia are
the main source of lithium raw materials for mineral conversion plants. Spodumene
produced by Talison Lithium is thought to be of better quality and is used for production
of battery grade lithium carbonate and hydroxide especially. In 2012, Chinese mineral
conversion plants held a combined capacity to produce over 83,000t LCE, although only
about half of this production capacity was realised (Table 102).
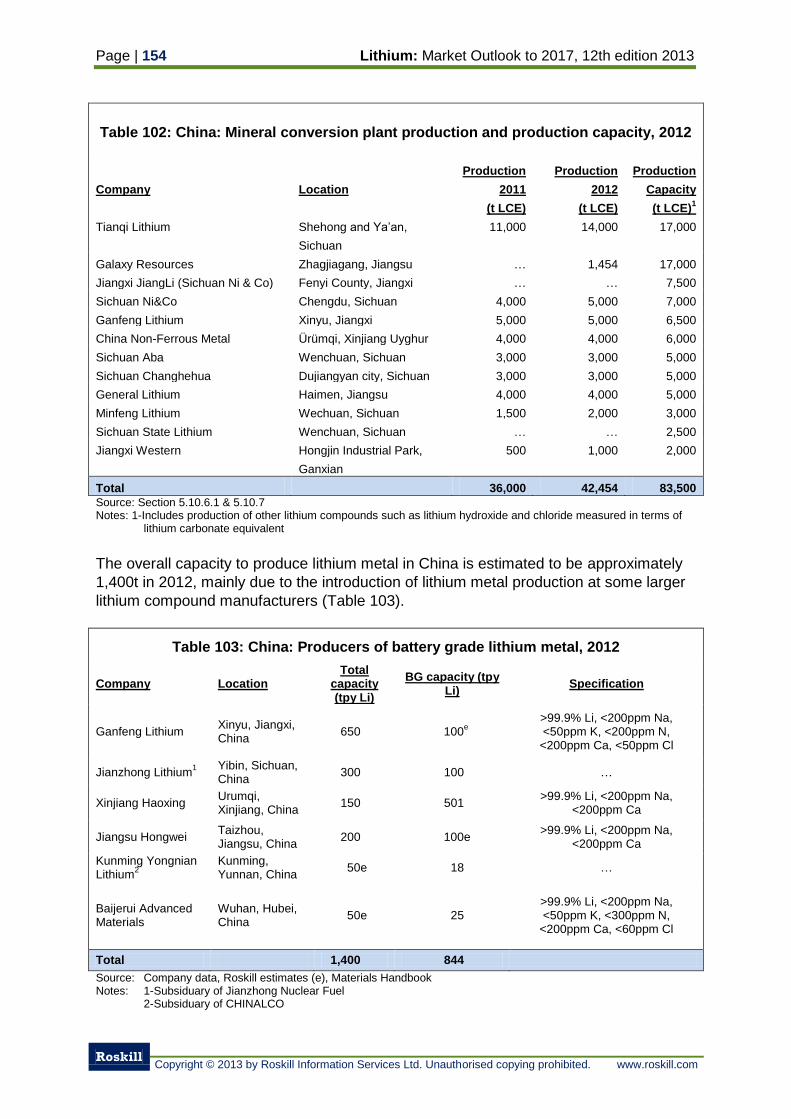
Page | 154 Lithium: Market Outlook to 2017, 12th edition 2013
Roskill
Copyright © 2013 by Roskill Information Services Ltd. Unauthorised copying prohibited. www.roskill.com
Table 102: China: Mineral conversion plant production and production capacity, 2012
Company Location
Production
2011
(t LCE)
Production
2012
(t LCE)
Production
Capacity
(t LCE)1
Tianqi Lithium Shehong and Ya’an,
Sichuan
11,000 14,000 17,000
Galaxy Resources Zhagjiagang, Jiangsu … 1,454 17,000
Jiangxi JiangLi (Sichuan Ni & Co) Fenyi County, Jiangxi … … 7,500
Sichuan Ni&Co Chengdu, Sichuan 4,000 5,000 7,000
Ganfeng Lithium Xinyu, Jiangxi 5,000 5,000 6,500
China Non-Ferrous Metal Ürümqi, Xinjiang Uyghur 4,000 4,000 6,000
Sichuan Aba Wenchuan, Sichuan 3,000 3,000 5,000
Sichuan Changhehua Dujiangyan city, Sichuan 3,000 3,000 5,000
General Lithium Haimen, Jiangsu 4,000 4,000 5,000
Minfeng Lithium Wechuan, Sichuan 1,500 2,000 3,000
Sichuan State Lithium Wenchuan, Sichuan … … 2,500
Jiangxi Western Hongjin Industrial Park,
Ganxian
500 1,000 2,000
Total 36,000 42,454 83,500
Source: Section 5.10.6.1 & 5.10.7 Notes: 1-Includes production of other lithium compounds such as lithium hydroxide and chloride measured in terms of
lithium carbonate equivalent
The overall capacity to produce lithium metal in China is estimated to be approximately
1,400t in 2012, mainly due to the introduction of lithium metal production at some larger
lithium compound manufacturers (Table 103).
Table 103: China: Producers of battery grade lithium metal, 2012
Company Location Total
capacity (tpy Li)
BG capacity (tpy Li)
Specification
Ganfeng Lithium Xinyu, Jiangxi, China
650 100e
>99.9% Li, <200ppm Na, <50ppm K, <200ppm N, <200ppm Ca, <50ppm Cl
Jianzhong Lithium1
Yibin, Sichuan, China
300 100 …
Xinjiang Haoxing Urumqi, Xinjiang, China
150 501 >99.9% Li, <200ppm Na,
<200ppm Ca
Jiangsu Hongwei Taizhou, Jiangsu, China
200 100e >99.9% Li, <200ppm Na,
<200ppm Ca
Kunming Yongnian Lithium
2
Kunming, Yunnan, China
50e 18 …
Baijerui Advanced Materials
Wuhan, Hubei, China
50e 25 >99.9% Li, <200ppm Na, <50ppm K, <300ppm N,
<200ppm Ca, <60ppm Cl
Total 1,400 844
Source: Company data, Roskill estimates (e), Materials Handbook Notes: 1-Subsiduary of Jianzhong Nuclear Fuel 2-Subsiduary of CHINALCO
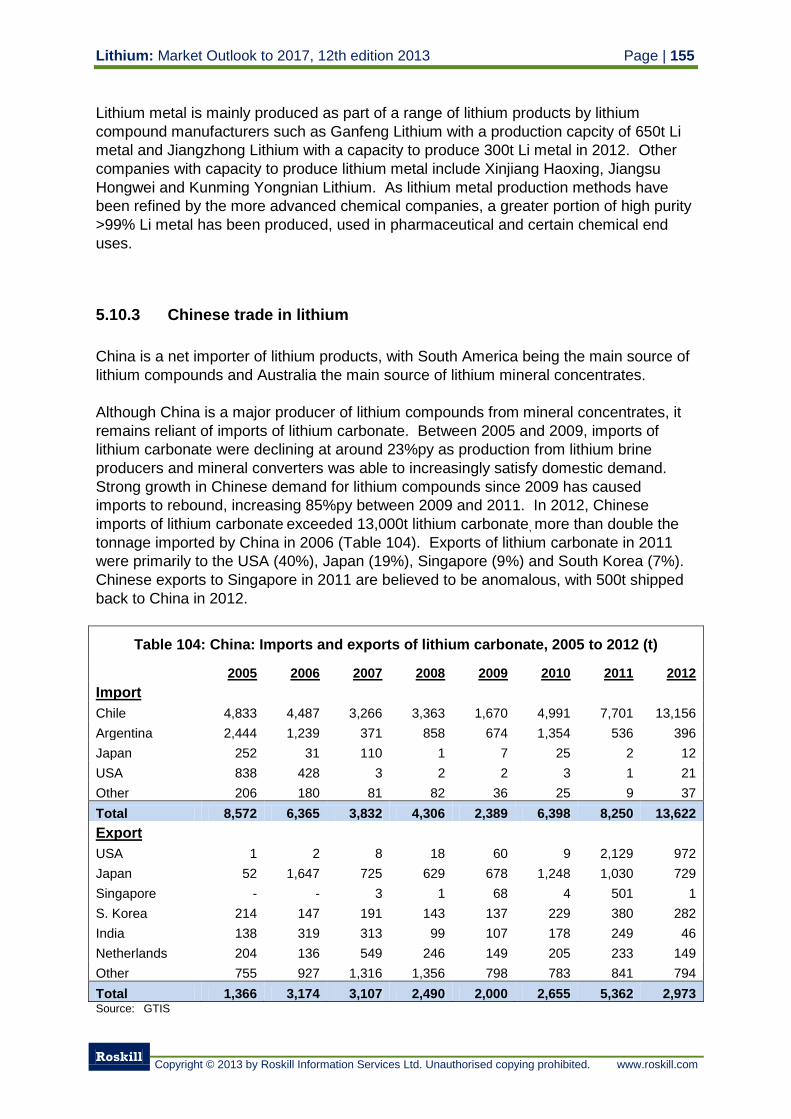
Lithium: Market Outlook to 2017, 12th edition 2013 Page | 155
Roskill
Copyright © 2013 by Roskill Information Services Ltd. Unauthorised copying prohibited. www.roskill.com
Lithium metal is mainly produced as part of a range of lithium products by lithium
compound manufacturers such as Ganfeng Lithium with a production capcity of 650t Li
metal and Jiangzhong Lithium with a capacity to produce 300t Li metal in 2012. Other
companies with capacity to produce lithium metal include Xinjiang Haoxing, Jiangsu
Hongwei and Kunming Yongnian Lithium. As lithium metal production methods have
been refined by the more advanced chemical companies, a greater portion of high purity
>99% Li metal has been produced, used in pharmaceutical and certain chemical end
uses.
5.10.3 Chinese trade in lithium
China is a net importer of lithium products, with South America being the main source of
lithium compounds and Australia the main source of lithium mineral concentrates.
Although China is a major producer of lithium compounds from mineral concentrates, it
remains reliant of imports of lithium carbonate. Between 2005 and 2009, imports of
lithium carbonate were declining at around 23%py as production from lithium brine
producers and mineral converters was able to increasingly satisfy domestic demand.
Strong growth in Chinese demand for lithium compounds since 2009 has caused
imports to rebound, increasing 85%py between 2009 and 2011. In 2012, Chinese
imports of lithium carbonate exceeded 13,000t lithium carbonate, more than double the
tonnage imported by China in 2006 (Table 104). Exports of lithium carbonate in 2011
were primarily to the USA (40%), Japan (19%), Singapore (9%) and South Korea (7%).
Chinese exports to Singapore in 2011 are believed to be anomalous, with 500t shipped
back to China in 2012.
Table 104: China: Imports and exports of lithium carbonate, 2005 to 2012 (t)
2005 2006 2007 2008 2009 2010 2011 2012
Import
Chile 4,833 4,487 3,266 3,363 1,670 4,991 7,701 13,156
Argentina 2,444 1,239 371 858 674 1,354 536 396
Japan 252 31 110 1 7 25 2 12
USA 838 428 3 2 2 3 1 21
Other 206 180 81 82 36 25 9 37
Total 8,572 6,365 3,832 4,306 2,389 6,398 8,250 13,622
Export
USA 1 2 8 18 60 9 2,129 972
Japan 52 1,647 725 629 678 1,248 1,030 729
Singapore - - 3 1 68 4 501 1
S. Korea 214 147 191 143 137 229 380 282
India 138 319 313 99 107 178 249 46
Netherlands 204 136 549 246 149 205 233 149
Other 755 927 1,316 1,356 798 783 841 794
Total 1,366 3,174 3,107 2,490 2,000 2,655 5,362 2,973 Source: GTIS
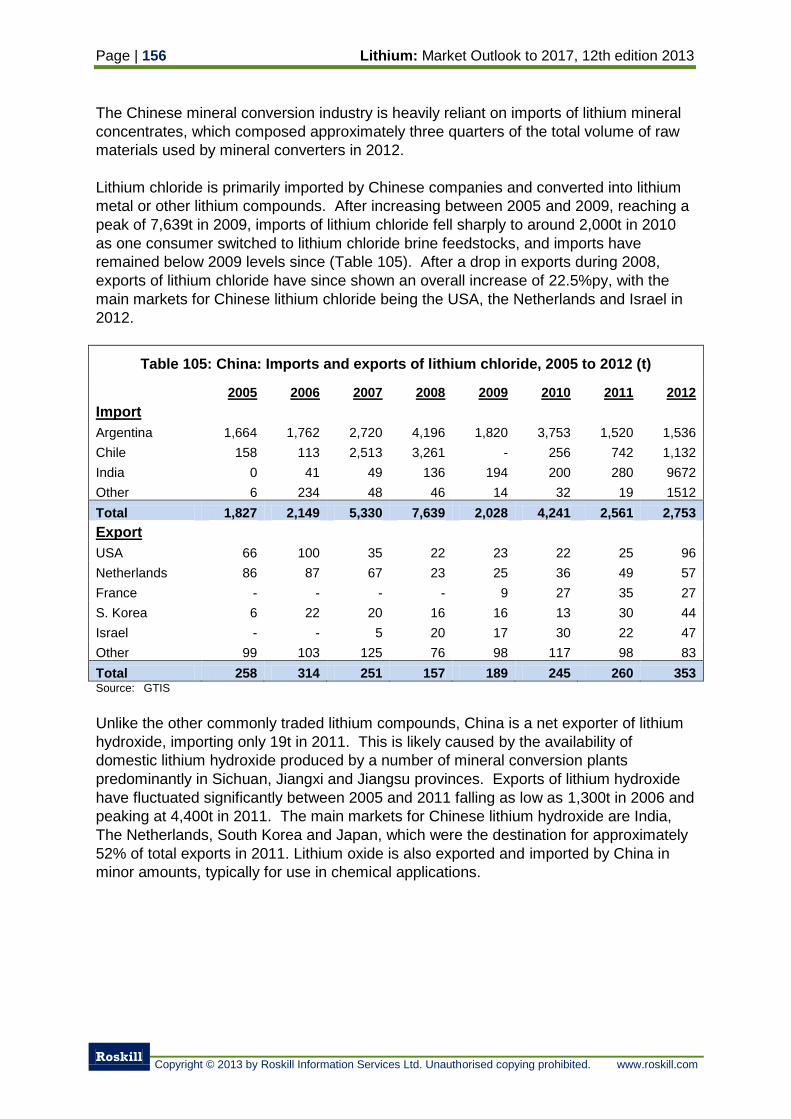
Page | 156 Lithium: Market Outlook to 2017, 12th edition 2013
Roskill
Copyright © 2013 by Roskill Information Services Ltd. Unauthorised copying prohibited. www.roskill.com
The Chinese mineral conversion industry is heavily reliant on imports of lithium mineral
concentrates, which composed approximately three quarters of the total volume of raw
materials used by mineral converters in 2012.
Lithium chloride is primarily imported by Chinese companies and converted into lithium
metal or other lithium compounds. After increasing between 2005 and 2009, reaching a
peak of 7,639t in 2009, imports of lithium chloride fell sharply to around 2,000t in 2010
as one consumer switched to lithium chloride brine feedstocks, and imports have
remained below 2009 levels since (Table 105). After a drop in exports during 2008,
exports of lithium chloride have since shown an overall increase of 22.5%py, with the
main markets for Chinese lithium chloride being the USA, the Netherlands and Israel in
2012.
Table 105: China: Imports and exports of lithium chloride, 2005 to 2012 (t)
2005 2006 2007 2008 2009 2010 2011 2012
Import
Argentina 1,664 1,762 2,720 4,196 1,820 3,753 1,520 1,536
Chile 158 113 2,513 3,261 - 256 742 1,132
India 0 41 49 136 194 200 280 9672
Other 6 234 48 46 14 32 19 1512
Total 1,827 2,149 5,330 7,639 2,028 4,241 2,561 2,753
Export
USA 66 100 35 22 23 22 25 96
Netherlands 86 87 67 23 25 36 49 57
France - - - - 9 27 35 27
S. Korea 6 22 20 16 16 13 30 44
Israel - - 5 20 17 30 22 47
Other 99 103 125 76 98 117 98 83
Total 258 314 251 157 189 245 260 353 Source: GTIS
Unlike the other commonly traded lithium compounds, China is a net exporter of lithium
hydroxide, importing only 19t in 2011. This is likely caused by the availability of
domestic lithium hydroxide produced by a number of mineral conversion plants
predominantly in Sichuan, Jiangxi and Jiangsu provinces. Exports of lithium hydroxide
have fluctuated significantly between 2005 and 2011 falling as low as 1,300t in 2006 and
peaking at 4,400t in 2011. The main markets for Chinese lithium hydroxide are India,
The Netherlands, South Korea and Japan, which were the destination for approximately
52% of total exports in 2011. Lithium oxide is also exported and imported by China in
minor amounts, typically for use in chemical applications.
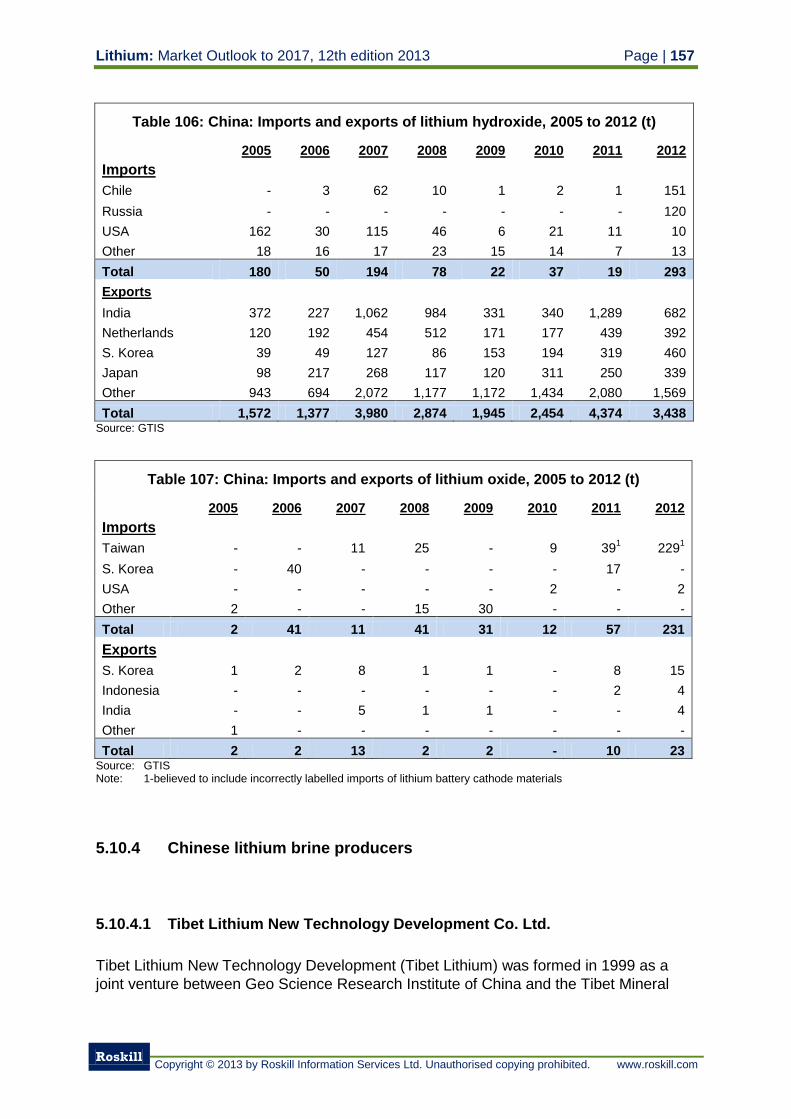
Lithium: Market Outlook to 2017, 12th edition 2013 Page | 157
Roskill
Copyright © 2013 by Roskill Information Services Ltd. Unauthorised copying prohibited. www.roskill.com
Table 106: China: Imports and exports of lithium hydroxide, 2005 to 2012 (t)
2005 2006 2007 2008 2009 2010 2011 2012
Imports Chile - 3 62 10 1 2 1 151
Russia - - - - - - - 120
USA 162 30 115 46 6 21 11 10
Other 18 16 17 23 15 14 7 13
Total 180 50 194 78 22 37 19 293
Exports India 372 227 1,062 984 331 340 1,289 682
Netherlands 120 192 454 512 171 177 439 392
S. Korea 39 49 127 86 153 194 319 460
Japan 98 217 268 117 120 311 250 339
Other 943 694 2,072 1,177 1,172 1,434 2,080 1,569
Total 1,572 1,377 3,980 2,874 1,945 2,454 4,374 3,438 Source: GTIS
Table 107: China: Imports and exports of lithium oxide, 2005 to 2012 (t)
2005 2006 2007 2008 2009 2010 2011 2012
Imports Taiwan - - 11 25 - 9 39
1 229
1
S. Korea - 40 - - - - 17 -
USA - - - - - 2 - 2
Other 2 - - 15 30 - - -
Total 2 41 11 41 31 12 57 231
Exports S. Korea 1 2 8 1 1 - 8 15
Indonesia - - - - - - 2 4
India - - 5 1 1 - - 4
Other 1 - - - - - - -
Total 2 2 13 2 2 - 10 23 Source: GTIS Note: 1-believed to include incorrectly labelled imports of lithium battery cathode materials
5.10.4 Chinese lithium brine producers
5.10.4.1 Tibet Lithium New Technology Development Co. Ltd.
Tibet Lithium New Technology Development (Tibet Lithium) was formed in 1999 as a
joint venture between Geo Science Research Institute of China and the Tibet Mineral
Page | 158 Lithium: Market Outlook to 2017, 12th edition 2013
Roskill
Copyright © 2013 by Roskill Information Services Ltd. Unauthorised copying prohibited. www.roskill.com
Development Co. Ltd. Tibet Minerals own a 50.72% share of the joint venture with other
major shareholders including BYD Co. Ltd. who control an 18% share in the company.
The company exploits the Zabuye Salt Lake located in the north of Zhongba County in
Tibet province, China. The company also undertakes the production and refining of
lithium compounds via a number of subsidiaries.
The Zabuye salt lake sits at an altitude of 4,421m and covers an area of 247km2 which is
split into the northern area (98km2) composed of a surface brine lake and a southern
area (149km2) composed of a semi-dry salar. The saline lake has an estimated
resource of more than 8.3Mt LCE. Brine at the lake shows a lithium concentration of up
to 1,525ppm Li, with a low magnesium to lithium ratio of <0.1:1. High concentrations of
boron and potassium in the brines however have affected the processing of the brine.
The Zabuye salt lake is classed as a carbonate-type brine as opposed to the sulphate-
type brines found in other Chinese salars in the Qaidam basin.
Tibet Lithium began lithium carbonate production at the Zabuye plant in 2004 after a
total investment of RMB2Bn (US$300M) in the project. The plant has a reported
capacity to produce 5,000tpy of crude lithium carbonate (75% purity). Poor
infrastructure and supply of utilities at the Zabuye plant limit lithium carbonate production
and significant investment would be needed to allow for increased production and
ultimately increased capacity. The crude lithium carbonate produced at Zabuye is
transported 3,300km via Qinghai province to a separation plant in Baiyin, Gansu
Province. Fuzhou Zabuye Lithium Industry located in Fujian province and Baiyin
Zabuye Lithium Industry located in the north of the Gansu Province, are both
subsidiaries of Tibet Lithium New Technology Development. Baiyin Zabuye processes
crude lithium carbonate concentrates from Tibet Lithium into finished products including
lithium carbonate and hydroxide. The Baiyin Zabuye plant has a capacity to process
7,500tpy industrial grade (>75% Li2CO3) lithium carbonate.
In 2010, Tibet Minerals announced production of 2,249t of lithium carbonate and 717t of
lithium hydroxide. A fall in the company’s 2010 gross profit margin from the previous
year was put down to production of lower grade lithium concentrate, lower plant
throughput and increased processing costs. Production is estimated to decrease by
approximately 10% in 2012 based on production figures in the first half of 2012 (Table
108).
Table 108: Tibet Lithium New Technology Development: Lithium production,
2010 to 2012e
Production 2010 2011 2012e
Lithium Carbonate (t) 1,479 2,063 2,400
1
Lithium Hydroxide (t) 452 648 Source: Tibet Minerals Annual Reports Notes: e-estimated from January to June 2012 data
1-Hydroxide and carbonate production not differentiated
In April 2011, Tibet Minerals raised RMB1.21Bn (US$187M) through a non-public
offering to eight investors. Tibet Lithium was assigned US$15.5M of the raised capital to
increase production capacity at the Zabuye operation to 18,000tpy LCE and improve
Lithium: Market Outlook to 2017, 12th edition 2013 Page | 159
Roskill
Copyright © 2013 by Roskill Information Services Ltd. Unauthorised copying prohibited. www.roskill.com
infrastructure at the operation. The remainder of the raised capital will be used by Tibet
Mineral’s other subsidiaries including the separation plant at Bayin which intends to
increase its capacity to 10,000tpy of lithium products, including 5,000tpy battery grade
lithium carbonate, 2,000tpy technical grade lithium carbonate and 3,000tpy lithium
hydroxide.
5.10.4.2 Qinghai CITIC Guoan Technology Development Co. Ltd.
Qinghai CITIC Guoan Technology Development (Qinghai CITIC) is a wholly owned
subsidiary of the CITIC Group and operates at the West Taijinar (Xitai) saline lake in the
Qaidam Basin, China. In 2003, Qinghai CITIC signed an agreement with the Qinghai
provincial government to develop salt lake resources in the Qaidam Basin and invested
RMB2.3Bn (US$335M) in establishing production facilities.
The Xitai salt lake, which covers an area of 82.4km2, is estimated to contain reserves of
3.04Mt of lithium chloride (2.68Mt LCE), along with 26.56Mt of potassium chloride,
1.63Mt of boron trioxide and significant amounts of magnesium and sodium chloride.
Brines in the Qaidam basin contain approximately 310ppm Li and a lithium to
magnesium ratio of 1: 65, which initially hindered the extraction and processing of lithium
compounds. In 2004, the Bluestar Changsha Design & Research Institution developed
a technique to pre-treat brine from the Qaidam basin to remove magnesium and enable
the production of high purity lithium carbonate products.
Qinghai CITIC owns a processing plant at the Xitai property which produces lithium
carbonate along with specialist magnesium-potassium fertiliser and potassium chloride
products. The original pilot plant was constructed at the Dongtai saline lake,
approximately 30km east of Xitai. The plant was gradually relocated to the Xitai saline
lake between 2007 and 2010, as Qinghai Salt Lake Industry (Section 5.10.4.3) hold the
mining rights to the Dongtai saline lake. Upgrading of the 500tpy lithium carbonate pilot
plant was completed in August 2006; however production at the plant did not begin until
January 2007. Upon completion, the plant had a reported capacity of 5,000tpy lithium
carbonate which Qinghai CITIC had intended to increase to 20,000tpy lithium carbonate
by 2011, budgeting RMB2.2Bn (US$297.5M) for the necessary development in the
fourth quarter of 2007.
In September 2009, Qinghai CITIC signed an agreement with Chengdu CHEMPHYS
Chemical Co. Ltd to assist in the financing, production and marketing of battery grade
lithium carbonate and construct a new production facility at the Xitai property. The new
plant aimed to produce a minimum of 500tpy of battery grade lithium carbonate in 2010;
however there have been no further developments reported since the initial report in
2009.
As of December 2011, the Xitai plant has a reported capacity of 5,000tpy lithium
carbonate, which Qinghai CITIC plan to increase to 30,000tpy by 2014. Since 2008
however, actual production has not exceeded 4,000t LCE (Table 109). In 2010,
production of lithium carbonate was 3,000t, a substantial drop from the previous year.
Production in 2011 is estimated to have fallen by a third to approximately 2,000t LCE
Page | 160 Lithium: Market Outlook to 2017, 12th edition 2013
Roskill
Copyright © 2013 by Roskill Information Services Ltd. Unauthorised copying prohibited. www.roskill.com
because of flooding in the Qaidam Basin during early 2011 which greatly affected
operations at Xitai. Qinghai CITIC has subsequently invested heavily in flood defence
equipment to prevent future disruptions to lithium carbonate production at the site, but
oputput fell again in 2012 to an estimated 1,300t LCE.
Table 109: Qinghai CITIC: Lithium carbonate production, 2008 to 2012 (tLCE)
2008 2009 2010 2011 2012
Production 600 4,000 3,000 2,000 1,300
Reported Capacity 5,000 5,000 5,000 5,000 5,000 Source: Roskill data
In August 2011, Qinghai CITIC signed an agreement with the Bolivian government to
explore the 2,218km2 Coipasa salt flats located roughly 300km south of La Paz. As part
of the agreement, Qinghai CITIC is to quantify the lithium and potassium reserves
present. If an initial assessment of the salt flats meets expectations, Qinghai CITIC will
work in conjunction with a state owned Bolivian company specifically formed to develop
the countries mineral resources.
5.10.4.3 Qinghai Salt Lake Industry Co. Ltd.
In March 2011, Qinghai Salt Lake Industry Group Co. Ltd. merged with Qinghai Salt
Lake Potash Co. Ltd. in order to prevent the company being disintegrated. The name of
the newly formed company was changed to Qinghai Salt Lake Industry Co. Ltd. in May
2011. Qinghai Salt Lake Industry (QSLI), 74% owned by Western Mining Group,
operates at the East Taijinaier (Dongtai) saline lake in the Qaidam Basin, China. The
company produces industrial and edible salt products from a production facility at the
Dongtai property.
The Dongtai saline lake covers an area of 116km2 and sits at an elevation of 2681m.
The typical water depth of the lake is between 0.60m and 1.0m however a substantial
portion of the brine is held within an aquifer below the surface lake. Lithium content of
the surface brines is typically around 120ppm Li, increasing to 638ppm Li in inter-
crystalline brines in the aquifer. As is characteristic of saline brines in the Qaidam basin,
the magnesium to lithium ratio is relatively high (40:1 to 60:1) when compared to brine
operations in Chile, Argentina and the USA. The Dongtai saline lake property is
operated by QSLI’s subsidiary Qinghai Lanke Lithium Industry (Section 5.10.4.4)
estimated to contain reserves of 1.3Mt Li (7.0Mt LCE).
Production dropped as a result of heavy rainfall and flooding across Qinghai province in
early 2011, which badly affected lithium brine operations in the area. Production in 2012
was <100t as difficulties with brine evaporation and processing continued.
In May 2009, QSLI signed an agreement with Pulead Technology Industry to develop a
10,000tpy lithium battery functional material plant. It also plans to invest RMB5.5Bn
(US$800M) in developing lithium battery materials and Li-ion battery production lines.
Lithium: Market Outlook to 2017, 12th edition 2013 Page | 161
Roskill
Copyright © 2013 by Roskill Information Services Ltd. Unauthorised copying prohibited. www.roskill.com
5.10.4.4 Qinghai Lanke Lithium Industry Co. Ltd.
Qinghai Lanke Lithium (Lanke) is owned by Qinghai Salt Lake Industry (Section
5.10.4.3) and the Beijing Research Institute of Chemical Engineering and Metallurgy.
The company was established in 2007 to extract and process lithium brines from the
Chaerhan saline lake in the Qaidam Basin, China.
The Chaerhan saline lake covers an area of 5,856km2 and sits at an elevation of
2,670m. The area contains 9 surface brine lakes.
Dabu Xunhu
Nanhuo Luxunhu
Beihuo Luxunhu
Senie Hu
Dabiele
Xiaobiele
Xiadabuxum
Tuanjie
Xiezuo
Dabu Xunhu is the largest of the nine lakes with a surface area of 184km2 and depth of
0.6m-1.0m. It sits at the lowest point in the Chaerhan saline lake zone along with
Nanhuo Luxunhu, Beihuo Luxunhu and Senie Hu, into which the other five lakes
eventually inflow. Overall the saline lake zone is fed by six permanent streams and
seven intermittent streams.
Shortly after its formation, Lanke began construction of a 10,000tpy lithium carbonate
plant at Germu. The plant was completed in 2009 producing 400t of lithium carbonate in
that year. The plant uses resin absorption technology to extract lithium and potassium
chloride from the brines. The processing method includes resin absorption, elution,
concentration, membrane separation and carbonation. The production costs of the
lithium carbonate production however are relatively high, estimated at RMB15,000/t
(US$2,250/t in 2010), when compared to other Chinese lithium carbonate producers.
This is because the process has a high consumption of resin, water and power in
separating lithium from brine.
In 2010, the plant produced 1,000t of lithium carbonate. The output of the plant fell in
2011 as a result of heavy rain and flooding which adversely affected lithium brine
evaporation and processing in the Qaidam Basin in early 2011 and throughout the year.
In 2012, production recovered back to levels observed in 2010 at approximately 1,000t
LCE.
Through its parent company Qinghai Salt Lake Industry, Lanke operate the Dongtai
property which began production of lithium carbonate at a pilot plant in October 2007.
The pilot plant passed its Verification and Acceptance tests by the Chinese Academy of
Sciences (CAS) in October 2009, which allows the plant to increase its capacity to
3,000tpy lithium carbonate, 2,500tpy boric acid and 25,000tpy potassium sulphate.
QSLI planned to invest RMB1.67Bn (US$250M) in a new facility which would increase
QSLI’s lithium carbonate production capacity to 17,000tpy in the coming years.
Page | 162 Lithium: Market Outlook to 2017, 12th edition 2013
Roskill
Copyright © 2013 by Roskill Information Services Ltd. Unauthorised copying prohibited. www.roskill.com
In 2009, Lanke signed an agreement with Qinghai Fozhao Lithium Energy Development
Co. Ltd. (Fozhao) to construct a 10,000tpy battery grade lithium carbonate plant. Fozhao
and Lanke merged in July 2010 and continue to work on and develop the planned
battery grade lithium carbonate plant. Fozhao are believed to possess some of the most
advanced technology for the extraction of lithium from brines, called Adsorption Brine
Lithium Extraction (ABLE).
5.10.4.5 Tibet Sunrise Mining Development Ltd.
In October 2011, Tibet Sunrise Mining Development Ltd. (Sunrise) and Beijing Mianping
Salt Lake Research Institute (BMRI) signed an agreement with Micro Express Holdings
Inc. (MEH), a subsidiary of the Sterling Group Ventures Inc. The agreement regarded
the termination of a previous contract between MEH and BMRI signed in September
2005, to co-operatively develop the Dangxiongcuo (DXC) Salt Lake Project in Nima
County, Tibet. Once this agreement has been fulfilled and Sunrise has increased its
registered capital to RMB100M (US$15.7M), Sunrise has confirmed it will pay a single
fee of RMB10M (US$1.57M) to MEH to take control of the DXC deposit and for MEH to
relinquish any claim to interest in the deposit. The RMB10M payment will cover the
RMB6.22M (US$0.98M) costs incurred by MEH during its development of the DXC
project.
Sterling Group Ventures had originally acquired an interest in the DXC deposit during
2005 in an agreement between their subsidiary MEH and BMRI. The agreement
detailed the formation of a JV owned 65% by MEH and 35% by BMRI named Tibet
Saline Lake Mining High-Science & Technology (TSLM), which would continue the
development of the DXC saline lake. Construction costs of US$30M were estimated in
2005 to develop the deposit which at the time aimed to produce 5,000tpy LCE in its first
year of operation.
In July 2007, BMRI attempted to terminate the deal made in 2005 because of a lack of
progress in the approval of TSLM. In July the following year Sterling Group Ventures
signed an agreement with Zhong Chuan International Mining Holding Co. Ltd. of China
to hasten development of the DXC project. In this agreement Zhong Chuan
International Mining Holding would inherit the rights and obligations taken on by MEH in
the 2005 agreement with BMRI.
The DXC brine lake is a carbonate type saline lake covering 55.53km2 with an average
depth of 7.5m. In the 1980s, regional geological exploration undertaken by the Tibet
Regional Geology Brigade identified the saline lake which was followed up by
preliminary exploration in the late 1990s and early 2000s by independent Chinese
geologists and the Mianping Salt Lake Research Institute. A 20,000m2 evaporation
pond was constructed at the site in 2003 of which half was revamped in the following
year due to issues with permeability.
In December 2005, Sterling Group Ventures and MEH commissioned the Tibet
Geothermal Brigade to conduct measurements and in March 2006, Sterling and BMRI
commissioned Zhengzhou Comprehensive Utilisation Institute of China Academy of
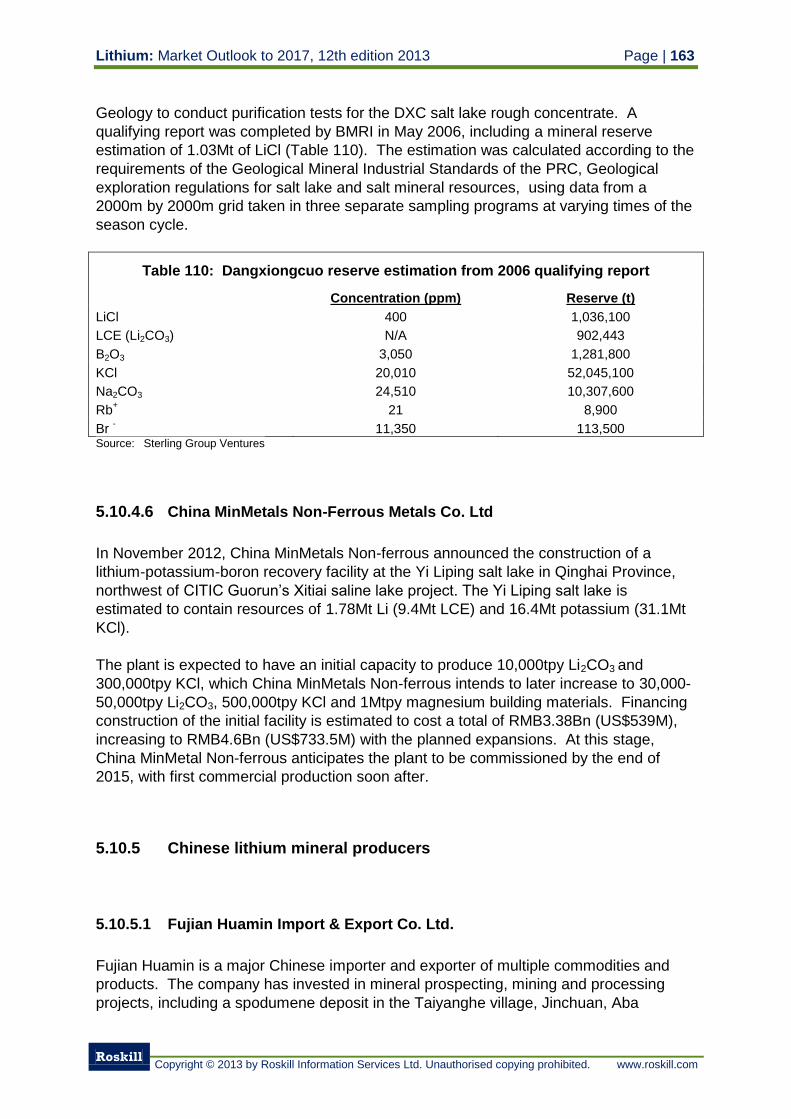
Lithium: Market Outlook to 2017, 12th edition 2013 Page | 163
Roskill
Copyright © 2013 by Roskill Information Services Ltd. Unauthorised copying prohibited. www.roskill.com
Geology to conduct purification tests for the DXC salt lake rough concentrate. A
qualifying report was completed by BMRI in May 2006, including a mineral reserve
estimation of 1.03Mt of LiCl (Table 110). The estimation was calculated according to the
requirements of the Geological Mineral Industrial Standards of the PRC, Geological
exploration regulations for salt lake and salt mineral resources, using data from a
2000m by 2000m grid taken in three separate sampling programs at varying times of the
season cycle.
Table 110: Dangxiongcuo reserve estimation from 2006 qualifying report
Concentration (ppm) Reserve (t)
LiCl 400 1,036,100
LCE (Li2CO3) N/A 902,443
B2O3 3,050 1,281,800
KCl 20,010 52,045,100
Na2CO3 24,510 10,307,600
Rb+
21 8,900
Br -
11,350 113,500 Source: Sterling Group Ventures
5.10.4.6 China MinMetals Non-Ferrous Metals Co. Ltd
In November 2012, China MinMetals Non-ferrous announced the construction of a
lithium-potassium-boron recovery facility at the Yi Liping salt lake in Qinghai Province,
northwest of CITIC Guorun’s Xitiai saline lake project. The Yi Liping salt lake is
estimated to contain resources of 1.78Mt Li (9.4Mt LCE) and 16.4Mt potassium (31.1Mt
KCl).
The plant is expected to have an initial capacity to produce 10,000tpy Li2CO3 and
300,000tpy KCl, which China MinMetals Non-ferrous intends to later increase to 30,000-
50,000tpy Li2CO3, 500,000tpy KCl and 1Mtpy magnesium building materials. Financing
construction of the initial facility is estimated to cost a total of RMB3.38Bn (US$539M),
increasing to RMB4.6Bn (US$733.5M) with the planned expansions. At this stage,
China MinMetal Non-ferrous anticipates the plant to be commissioned by the end of
2015, with first commercial production soon after.
5.10.5 Chinese lithium mineral producers
5.10.5.1 Fujian Huamin Import & Export Co. Ltd.
Fujian Huamin is a major Chinese importer and exporter of multiple commodities and
products. The company has invested in mineral prospecting, mining and processing
projects, including a spodumene deposit in the Taiyanghe village, Jinchuan, Aba
Page | 164 Lithium: Market Outlook to 2017, 12th edition 2013
Roskill
Copyright © 2013 by Roskill Information Services Ltd. Unauthorised copying prohibited. www.roskill.com
prefecture Sichuan province. An investment of RMB30M (US$4.8M) was made to
develop and construct mining and milling infrastructure at the spodumene deposit, which
has a mining capacity of 150,000-200,000tpy of spodumene ores (5,500-7,500tpy LCE
assuming a 1.5% Li2O content). Fujian Huamin plans to invest RMB50M (US$8M) to
develop processing, production and marketing techniques for lithium carbonate, lithium
hydroxide, lithium alloys and lithium metal.
5.10.5.2 Yichun Huili Industrial Co. Ltd.
Yichun Huili Industrial Co. Ltd. is a subsidiary of Jiangxi Tungsten, which itself is a
subsidiary of China MinMetals. The company operates the Yichun Huili mine in Jiangxi
Province which produces lepidolite concentrate. The company also produces other
industrial mineral products from plants in Jiangxi and Guangzhou provinces.
In the late 1990’s, the Yichun Huili mine had the capacity to produce 45,000tpy lepidolite
concentrate which contained 0.8%-1.4% Li2O (1,225tpy LCE). Production is now
estimated at approximately 2,000tpy lepidolite concentrate (54.5tpy LCE).
5.10.5.3 GanZi Rongda Lithium Co., Ltd.
GanZi Rongda Lithium Co. Ltd. (Rongda Lithium) was formed in July 2005, after Youngy
Group Co. Ltd. (70%) and Sichuan Provincial Mineral Industry (30%) purchased the
Ganzi Xiajika spodumene mine project located in Xiajika Village, Kangding County,
Sichuan Province. In August 2009, Luxiang Co., Ltd. acquired a controlling 51% stake in
the company with Youngy Group’s holding falling to 43% and a private investor holding
the remaining 6% ownership. Luxiang increased its shareholding to 100% in July 2012
after purchasing both Youngy Group’s and the private investor’s shares.
Rondga Lithium has been granted mining rights for a 0.88km2 area of the Xiajika deposit
for a 30 year period (from 2004). The Xiajika deposit in total is believed to contain 32Mt
of spodumene (82Mt grading 1.44% Li2O), making it one of the largest spodumene
deposits in the world. The area which Rongda Lithium holds the mining rights to is
estimated to contain 5.1Mt spodumene reserves, equivalent to approximately 392,000t
LCE. First refusal has also been given to Rongda Lithium to acquire mining rights to the
remaining 29.7Mt of spodumene reserves surrounding the original claim.
Youngy Group Co. Ltd are the second largest shareholder in Rongda Lithium holding a
49% shareholding in the company. The company is also a major shareholder in BYD (a
leading battery producer and developer of electric vehicles) and its CEO, Li Xiangyang,
is the cousin of Wang Chuanfu, the owner of BYD. In September 2009, Luxiang Co. Ltd.
a manufacturer of asphalt in Guangzhou province, became the majority shareholder of
Rongda Lithium after purchasing a 51% stake in the company for RMB73.10M
(US$10.69M). The 51% purchase was comprised of a 21% stake from Youngy Group
Co. Ltd. (RMB23.10M (US$3.37M)) and a 30% stake from Sichuan Provincial Mineral
Industry (RMB50M (US$7.32M)).
Lithium: Market Outlook to 2017, 12th edition 2013 Page | 165
Roskill
Copyright © 2013 by Roskill Information Services Ltd. Unauthorised copying prohibited. www.roskill.com
As of December 2011, the mining and milling capacity of spodumene ore at the Xiajika
deposit is more than 3,000tpd (145,000tpy). A feasibility study regarding a potential
expansion to 3,500tpd has been completed by the Ganzi Tibetan Autonomous
Prefecture of Industry and Information Committee which displayed a positive outcome.
Rongda Lithium has invested RMB650M (US$98M) in developing the Xiajika mine to this
stage.
Rongda Lithium constructed a hydrometallurgical plant throughout 2012 for the
production of lithium salts such as lithium carbonate and lithium hydroxide from
spodumene concentrate. A total of RMB10M was intially invested in the project which
included the formation of ‘Ganzi Tibetan Autonomous Prefecture Sip Kika Co. Ltd.’ which
will operate the planned facility, commissioning by the Sichuan Province Engineering
Consulting Institute of Luding County, and site surveys which have identified a
recommended location for the plant in Kanroji dam, Luding county. Geological hazard,
environmental, safety and hydrological surveys have all been commissioned for the
Kanroji dam site. The planned facility will have a capacity to produce 1,500tpy battery
grade lithium carbonate.
5.10.5.4 Sichuan Hidili Dexin Mineral Industry
The Lijiagou spodumene deposit in Jimu village, Jinchuan, Aba prefecture has been
prospected since 2006, and is currently operated by Sichuan Hidili. Reserves at the
Lijiagou spodumene deposit have been estimated by Sichuan Hidili to be 10.1Mt of
spodumene ore grading 1.4% Li2O; however, estimates from other parties for the deposit
place its reserves at nearly 30Mt spodumene ore. Since its purchase of the deposit in
2006, Sichuan Hidili has invested over RMB100M (US$15.8M) in the project.
After completing an assessment study of the Lijiagou deposit in 2009, Hidili Industry
International Development (HIID) placed a down payment of RMB79M (US$12.5M) in
early 2010 with the intention to acquire an 80% stake in the property. HIID acquired a
100% stake in Sichuan Dexin taking ownership of the Lijiagou deposit in late 2010 for
RMB140.3M (US$21.0M).
Sichuan Dexin had worked closely with Sichuan Hengding Industrial since 2009 on
developing the Lijiagou lithium deposit further. The two companies aimed to construct a
mine and plant with an initial design capacity of 500tpd mined ore, increasing to
3,000tpd mined ore in the following years. Designed production capacity of spodumene
concentrate from the processing plant was estimated at 24,000tpy grading 5.6%-7%
Li2O. Sichuan Hengding had intended to invest RMB500M (US$75M) in developing the
project into a mine and becoming a majority shareholder in Sichuan Dexin, however the
purchase of Sichuan Dexin by HIID in 2010 is likely to have made Sichuan Hengding
reconsider any investment.
Page | 166 Lithium: Market Outlook to 2017, 12th edition 2013
Roskill
Copyright © 2013 by Roskill Information Services Ltd. Unauthorised copying prohibited. www.roskill.com
5.10.5.5 Xinjiang Non-Ferrous Metals (Group) Ltd.
Xinjiang Non-Ferrous produces spodumene concentrate from the Kokotay (Keketouhai)
mine located near to the Mongolian border, Xinjiang Uyghur Autonomous Region.
Production from the mine is estimated at between 5,000-7,000tpy spodumene
concentrate, although the mine is predicted to have a capacity of 15,000tpy.
Spodumene concentrate produced at the Kokotay mine is either sold on the Chinese
market or sent to be processed into downstream lithium products at the China Non-
Ferrous Metal Import & Exports (Section 5.10.7.4) plant in Ürümqi also in Xinjiang
Uyghur Autonomous Region.
Mining at Kokotay focuses on the No. 3 pegmatite which was previously mined between
the mid-1950s and 1999. The mine was closed and flooded in 1999 as reserves at the
deposit were believed to have been exhausted or become uneconomical. In August
2006, Xianjiang Non-Ferrous began to reopen and drain the Kokotay mine, because of
rising lithium prices making mining of spodumene ores at the site economic once more.
Xinjiang are also believed to have identified reserves of beryllium, tantalum, niobium and
mica at Kokotay which may be extracted and concentrated as by-products.
5.10.6 Chinese lithium mineral producers with mineral conversion capacity
5.10.6.1 Jiangxi Western Resources Lithium Industry
In July 2010, Sichuan Western Resources acquired Jiangxi Ningdu Lithium Industry Co.
Ltd. (Ningdu Taiyu) and Ganzhou Jintai Lithium Industry (Ganzhou Jintai), merging them
to form a 100% owned subsidiary, Jiangxi Western Resources Lithium Industry Co. Ltd.
(Jiangxi Western). Jiangxi Western has also been exploring a deeper ore body to
extend mine life, and has increased ore reserves to 5.8Mt.
Ningdu Taiyu held the mining rights to the Heyuan spodumene deposit located in
Ningdu, Ganzhou city, which Jiangxi Western now operates. Spodumene ore is
extracted by an open pit operation which has a design capacity of 90,000tpy of ore.
Extracted ore is concentrated on site to produce a spodumene concentrate containing
approximately 5% Li2O.
Ganzhou Jintai, established in September 2007, operated a lithium carbonate plant in
Hongjin Industrial Park, Ganxian. The plant remains in operation under Jiangxi
Western’s control, sourcing lithium raw materials from Ningdu. The plant has a capacity
to produce 5,000tpy lithium carbonate.
In 2010, Jiangxi Western produced 1,489t lithium powder from the Heyuan operation
and 35.8t lithium carbonate from Ganxian pilot plant (Table 111). Production of lithium
carbonate from the Ganxian plant increased to 49.68t Li2CO3 in 2012, however no data
for the volume of sales or production from the Heyuan mine is not available. Sales in
2011 increased to 49.8t lithium carbonate, with a revenue of US$257,744.
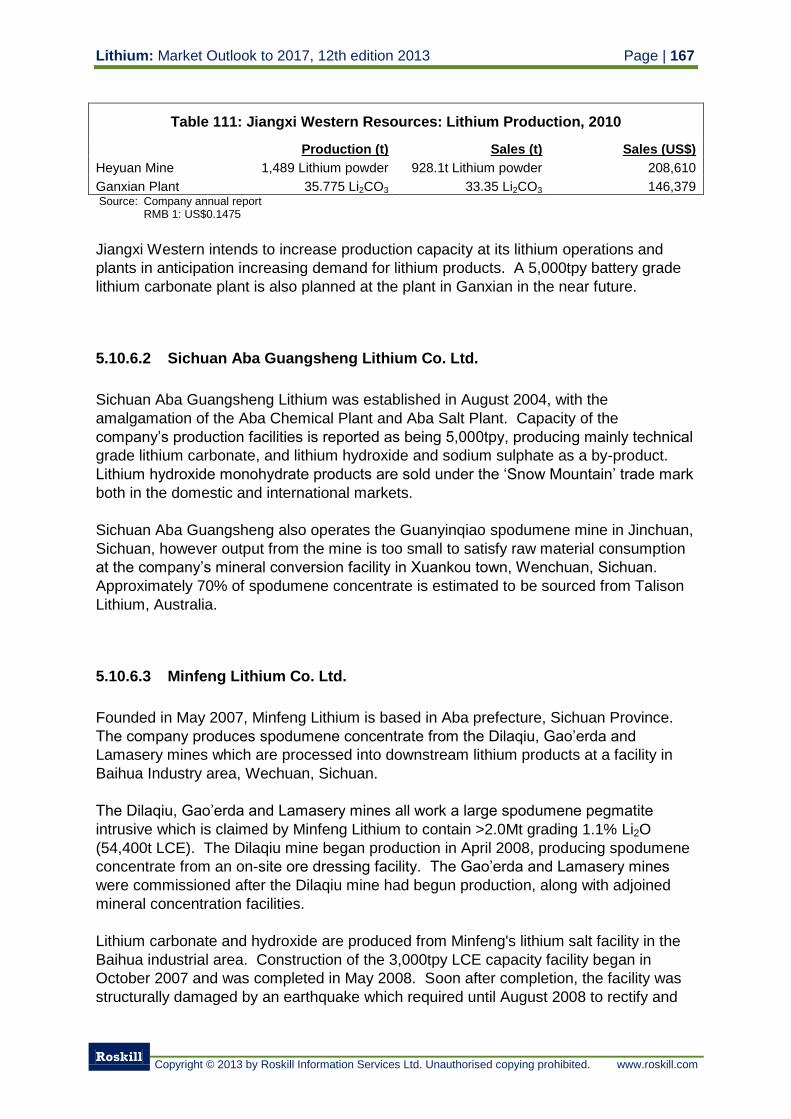
Lithium: Market Outlook to 2017, 12th edition 2013 Page | 167
Roskill
Copyright © 2013 by Roskill Information Services Ltd. Unauthorised copying prohibited. www.roskill.com
Table 111: Jiangxi Western Resources: Lithium Production, 2010
Production (t) Sales (t) Sales (US$)
Heyuan Mine 1,489 Lithium powder 928.1t Lithium powder 208,610
Ganxian Plant 35.775 Li2CO3 33.35 Li2CO3 146,379 Source: Company annual report RMB 1: US$0.1475
Jiangxi Western intends to increase production capacity at its lithium operations and
plants in anticipation increasing demand for lithium products. A 5,000tpy battery grade
lithium carbonate plant is also planned at the plant in Ganxian in the near future.
5.10.6.2 Sichuan Aba Guangsheng Lithium Co. Ltd.
Sichuan Aba Guangsheng Lithium was established in August 2004, with the
amalgamation of the Aba Chemical Plant and Aba Salt Plant. Capacity of the
company’s production facilities is reported as being 5,000tpy, producing mainly technical
grade lithium carbonate, and lithium hydroxide and sodium sulphate as a by-product.
Lithium hydroxide monohydrate products are sold under the ‘Snow Mountain’ trade mark
both in the domestic and international markets.
Sichuan Aba Guangsheng also operates the Guanyinqiao spodumene mine in Jinchuan,
Sichuan, however output from the mine is too small to satisfy raw material consumption
at the company’s mineral conversion facility in Xuankou town, Wenchuan, Sichuan.
Approximately 70% of spodumene concentrate is estimated to be sourced from Talison
Lithium, Australia.
5.10.6.3 Minfeng Lithium Co. Ltd.
Founded in May 2007, Minfeng Lithium is based in Aba prefecture, Sichuan Province.
The company produces spodumene concentrate from the Dilaqiu, Gao’erda and
Lamasery mines which are processed into downstream lithium products at a facility in
Baihua Industry area, Wechuan, Sichuan.
The Dilaqiu, Gao’erda and Lamasery mines all work a large spodumene pegmatite
intrusive which is claimed by Minfeng Lithium to contain >2.0Mt grading 1.1% Li2O
(54,400t LCE). The Dilaqiu mine began production in April 2008, producing spodumene
concentrate from an on-site ore dressing facility. The Gao’erda and Lamasery mines
were commissioned after the Dilaqiu mine had begun production, along with adjoined
mineral concentration facilities.
Lithium carbonate and hydroxide are produced from Minfeng's lithium salt facility in the
Baihua industrial area. Construction of the 3,000tpy LCE capacity facility began in
October 2007 and was completed in May 2008. Soon after completion, the facility was
structurally damaged by an earthquake which required until August 2008 to rectify and
Page | 168 Lithium: Market Outlook to 2017, 12th edition 2013
Roskill
Copyright © 2013 by Roskill Information Services Ltd. Unauthorised copying prohibited. www.roskill.com
restart production. Minfeng intend to increase production capacity at the facility to
6,500tpy LCE including 3,000tpy lithium carbonate and 4,000tpy lithium hydroxide.
5.10.6.4 Sichuan Ni&Co Guorun New Materials Co. Ltd.
Sichuan Ni&Co Guorun New Materials Co. Ltd. (SGNM) are an integrated lithium
producer operating out of Sichuan province, China. SGNM extracts lithium minerals
from the Maerkang spodumene mine. The Maerkang mine is estimated to contain
reserves of 225,000t Li (1.19Mt LCE) with a production capacity of 24,000tpy
spodumene concentrate.
The spodumene mineral concentrate is processed into lithium carbonate and lithium
hydroxide products at SGNM’s plant in Chengdu, Sichuan province which holds a
capacity to produce approximately 7,000tpy LCE. SGNM has recently upgraded the
Chengdu plant improving recoveries, end product grade and increasing lithium
hydroxide production capacity to 3,600tpy.
SGNM markets four lithium carbonate and four lithium hydroxide monohydrate products
ranging from an industrial grade product to a high purity product:
LiOH Li2CO3 Fe Ca Na K
min% min% max% max% max% max%
Lithium Hydroxide Monohydrate
Industrial Grade 56.5 n/a 0.1 0.1 0.002 0.035
Battery Grade 56.5 n/a 0.005 0.005 0.0008 0.005
Non-Dust (with 1% oil) 56.5 n/a 0.1 0.1 0.002 0.035
High Purity 56.5 n/a 0.0005 0.0005 0.0008 0.002
Lithium Carbonate
Battery Grade 1 n/a 99.5 0.025 0.001 0.002 0.005
Battery Grade 2 n/a 99.9 0.002 0.001 0.001 0.002
High Purity n/a 99.99 0.0002 0.0002 0.0002 0.0005
Industrial Grade n/a 99 0.14 n/a n/a 0.008
Jiangxi JiangLi New Material Sci-Tech was established by Sichuan Ni&Co Guorun
New Materials in December 2005. The new facility was based on the original Jiangxi
Lithium factory managed by Jiangxi Metallurgy Group, which produced lithium products
at the site between 1966 and 2001. At the new plant, Jiangxi JiangLi produces lithium
compounds, sulphuric acid, electrolytic zinc and electrolytic nickel. The company also
undertakes research into non-ferrous metals including lithium, nickel and cobalt.
After a RMB78M upgrade program of plant equipment in 2007, production capacity at
the plant is now reported at 3,000tpy technical grade lithium carbonate, 2,000tpy lithium
hydroxide and 3,000tpy battery grade lithium carbonate.
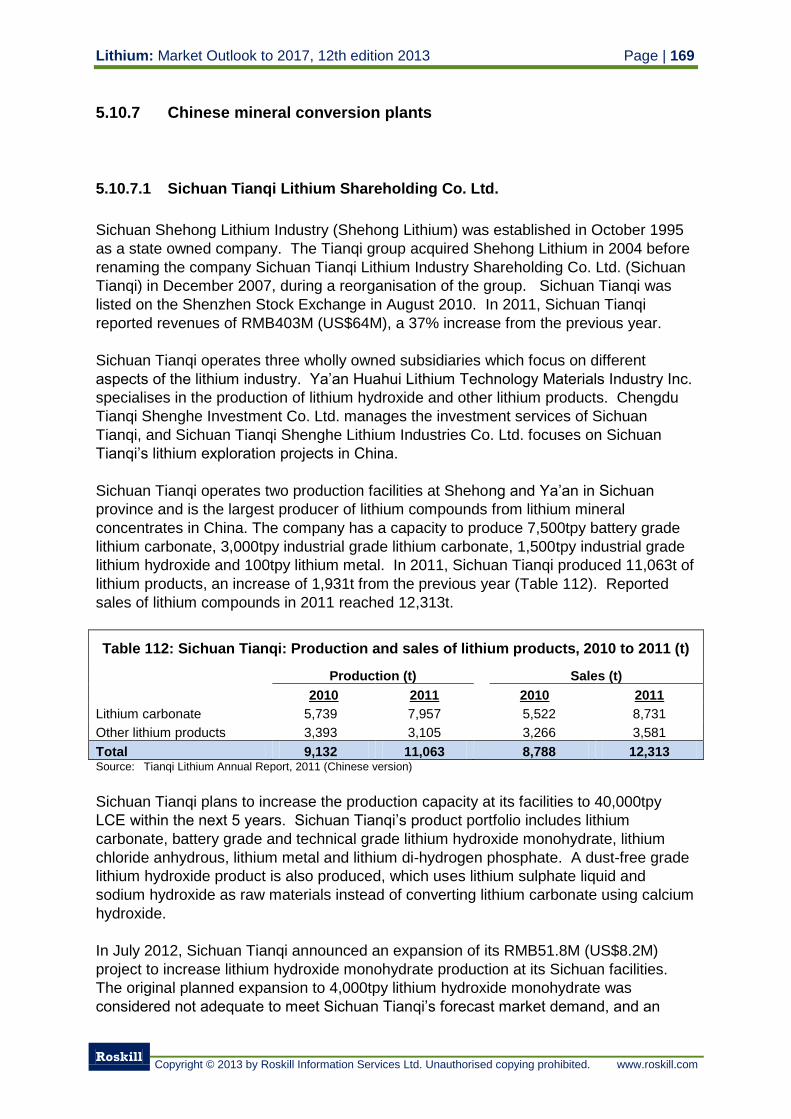
Lithium: Market Outlook to 2017, 12th edition 2013 Page | 169
Roskill
Copyright © 2013 by Roskill Information Services Ltd. Unauthorised copying prohibited. www.roskill.com
5.10.7 Chinese mineral conversion plants
5.10.7.1 Sichuan Tianqi Lithium Shareholding Co. Ltd.
Sichuan Shehong Lithium Industry (Shehong Lithium) was established in October 1995
as a state owned company. The Tianqi group acquired Shehong Lithium in 2004 before
renaming the company Sichuan Tianqi Lithium Industry Shareholding Co. Ltd. (Sichuan
Tianqi) in December 2007, during a reorganisation of the group. Sichuan Tianqi was
listed on the Shenzhen Stock Exchange in August 2010. In 2011, Sichuan Tianqi
reported revenues of RMB403M (US$64M), a 37% increase from the previous year.
Sichuan Tianqi operates three wholly owned subsidiaries which focus on different
aspects of the lithium industry. Ya’an Huahui Lithium Technology Materials Industry Inc.
specialises in the production of lithium hydroxide and other lithium products. Chengdu
Tianqi Shenghe Investment Co. Ltd. manages the investment services of Sichuan
Tianqi, and Sichuan Tianqi Shenghe Lithium Industries Co. Ltd. focuses on Sichuan
Tianqi’s lithium exploration projects in China.
Sichuan Tianqi operates two production facilities at Shehong and Ya’an in Sichuan
province and is the largest producer of lithium compounds from lithium mineral
concentrates in China. The company has a capacity to produce 7,500tpy battery grade
lithium carbonate, 3,000tpy industrial grade lithium carbonate, 1,500tpy industrial grade
lithium hydroxide and 100tpy lithium metal. In 2011, Sichuan Tianqi produced 11,063t of
lithium products, an increase of 1,931t from the previous year (Table 112). Reported
sales of lithium compounds in 2011 reached 12,313t.
Table 112: Sichuan Tianqi: Production and sales of lithium products, 2010 to 2011 (t)
Production (t)
Sales (t)
2010 2011 2010 2011
Lithium carbonate 5,739 7,957 5,522 8,731
Other lithium products 3,393 3,105 3,266 3,581
Total 9,132 11,063 8,788 12,313 Source: Tianqi Lithium Annual Report, 2011 (Chinese version)
Sichuan Tianqi plans to increase the production capacity at its facilities to 40,000tpy
LCE within the next 5 years. Sichuan Tianqi’s product portfolio includes lithium
carbonate, battery grade and technical grade lithium hydroxide monohydrate, lithium
chloride anhydrous, lithium metal and lithium di-hydrogen phosphate. A dust-free grade
lithium hydroxide product is also produced, which uses lithium sulphate liquid and
sodium hydroxide as raw materials instead of converting lithium carbonate using calcium
hydroxide.
In July 2012, Sichuan Tianqi announced an expansion of its RMB51.8M (US$8.2M)
project to increase lithium hydroxide monohydrate production at its Sichuan facilities.
The original planned expansion to 4,000tpy lithium hydroxide monohydrate was
considered not adequate to meet Sichuan Tianqi’s forecast market demand, and an
Page | 170 Lithium: Market Outlook to 2017, 12th edition 2013
Roskill
Copyright © 2013 by Roskill Information Services Ltd. Unauthorised copying prohibited. www.roskill.com
expansion to 5,000tpy (including 3,000tpy battery grade lithium hydroxide monohydrate
and 2,000tpy technical grade lithium hydroxide monohydrate) was proposed instead.
The new 5,000tpy lithium hydroxide capacity plant will be based at the Ya’an plant,
giving both facilities the capability to produce battery grade lithium hydroxide
monohydrate. Estimated capital costs have increased to RMB53.9M (US$8.5M),
however the added capacity is expected to reduce the overall production costs for
lithium hydroxide.
The company imports 100% of its spodumene concentrate raw materials from Talison
Lithium in Australia (Section 5.3.1). In 2009, Talison Lithium and Sichuan Tianqi signed
a three year agreement for the supply of spodumene concentrates. Sichuan Tianqi also
assists Talison Lithium with the distribution of spodumene concentrate to other mineral
conversion plants in China. Imported spodumene accounts for 55% of Sichuan Tianqi’s
production cost which for lithium carbonate is estimated at between (US$4,000-4,250/t).
In October 2008, Sichuan Tianqi acquired an exploration licence for the Cuola
spodumene deposit located in Yanjiang County, Sichuan. The deposit is located close
to the Xiajika spodumene mine in Ganzi, owned by GanZi Rongda Lithium Co. Ltd.
(Section 5.10.5.3). The Cuola deposit was assessed in 2009 by the Sichuan Provincial
Geological Team and was reported to hold reserves of 19.05Mt grading 1.24% Li2O
(583,400t LCE). Sichuan Tianqi are planning to invest RMB1.5Bn (US$225M) in the
Cuola deposit through its subsidiary Sichuan Tianqi Shenghe Lithium Industries Co. Ltd.,
to construct mining facilities and a processing facility to produce 100,000tpy spodumene
concentrate at 5.5-6.2% Li2O. Production from the Cuola deposit was projected to begin
in 2012, with mining and processing costs estimated at RMB1,200/t (US$180/t);
significantly cheaper than importing spodumene concentrate from Talison Lithium. A
mining licence was granted to Sichuan Tianqi in April 2012 by the Department of Land
and Resources of Sichuan Province, giving Sichuan Tianqi permission to mine the
project for lithium until 2032.
In February 2012, Sichuan Tianqi signed a partnership agreement with Targray
Technology International (Targray), a supplier of materials to battery manufactures in the
USA, Europe and Asia. The agreement dictates that Targray will distribute lithium
carbonate and lithium hydroxide monohydrate products produced by Sichuan Tianqi in
North America and parts of Europe. Targray will mainly distribute lithium products to
manufacturers of cathode and cathode pre-cursor materials.
Talison Lithium acquisition
On 12th November 2012, Sichuan Tianqi purchased a 14.99% share holding
(17,143,422 common shares at CAN$6.50/share) in Talison Lithium through their
Australian subsidiary Windfield Holdings Pty. Ltd (Windfield). A condition of the share
purchase agreement also stated that Windfield, or a related party, announced their
intention to purchase further shares Talison Lithium at >CAN$6.50/share. On 19th
November 2012, Sichuan Tianqi announced its intention to purchase all remaining
shares in Talison Lithium for CAN$7.15/share totalling approximately CAN$806M,
exceeding Rockwood Litihum’s (Section 5.39.2) previous offer of CAN$6.50/share
(valuing Talison Lithium at CAN$724M) made in August 2012. Talison Lithium assessed
Lithium: Market Outlook to 2017, 12th edition 2013 Page | 171
Roskill
Copyright © 2013 by Roskill Information Services Ltd. Unauthorised copying prohibited. www.roskill.com
Sichuan Tianqi’s 19th November offer of CAN$7.15/share during late Novemeber 2012
and met with Windfiled (Sichuan Tianqi) to determine whether their bid was superior. On
6th December, Windfield announced it was to increase its bid to CAN$7.50/share valuing
the Talison Lithium takeover deal at CAN$848M (US$855.4M). Rockwood lithium was
given five business days to submit an offer equal to Windfield’s, although Rockwood
stated it would not proceed into a bidding war and the Windfield bid was accepted.
Talison Lithium and Windfield entered into a Scheme Implementation Agreement (SIA),
which includes a CAN$25M reserve break fee which would be paid to Talison Lithium if
Windfield were unable to raise sufficient finance or fails payment to security holders.
Talison Lithium held a scheme meeting for share and option holders on 27th February
2013, in which 99.98% of shareholders voted in favour of the Windfield bid. Talison
Lithium and Windfield now await approval of the scheme by the Federal Court of
Australia on the 12th March 2013. If the scheme is approved Talison Lithium would
cease trading on the TSX market on March 13th 2013. Payment to entiled shareholders
is scheduled to take place on the 26th March 2013.
On 24
th December, Sichuan Tianqi announced plans to issue approximately 170M
shares at RMB24.60/share (US$3.89/share) to raise RMB3.8Bn (US$602.0M). Finances will be used to purchase shares in Talison Lithium acquisition and in other on-going acquisitions. In February 2013, Sichuan Tianqi provided documentation to show it had access to the necessary funds to complete the Talison Lithium transaction. Sichuan Tianqi has entered into an agreement for China Investment Corp. to purchase a 35% stake holding in Windfield for a fee of US$292M, along with completing loan agreements for a total of US$200M from Credit Suisse AG, US$120M from Industrial and Commercial Bank of China Ltd and US$50M from Twenty Two Dragons Ltd.
5.10.7.2 Galaxy Resources (Jiangsu Lithium Carbonate Plant)
The Jiangsu Lithium Carbonate Plant (JLCP) is located at the Yangtze River
International Chemical Industrial Park in Zhagjiagang, China. In October 2009, Galaxy
completed a definitive feasibility study for the construction of a battery grade lithium
carbonate plant in Zhangjiagang. The capital cost was estimated at AUS$55M and site
preparation began in November 2009. In the following month Galaxy signed an
Engineering, Procurement, and Construction Management contract with Hatch
Consulting Shanghai although a construction permit was only attained in June 2010.
Construction of the plant began shortly after the permit was granted.
The production process at the plant requires spodumene concentrate to be roasted and
leached with sulphuric acid. Subsequent precipitation of magnesium, calcium and other
impurities results in a lithium sulphate enriched solution from which lithium carbonate
can be crystallised. Galaxy has also begun a feasibility study to assess a possible
expansion of the JLCP onto adjacent land which would include a 5,000tpy battery grade
lithium hydroxide production circuit. The study was conducted by Hatch Engineering
and Galaxy, although results have not yet been reported.
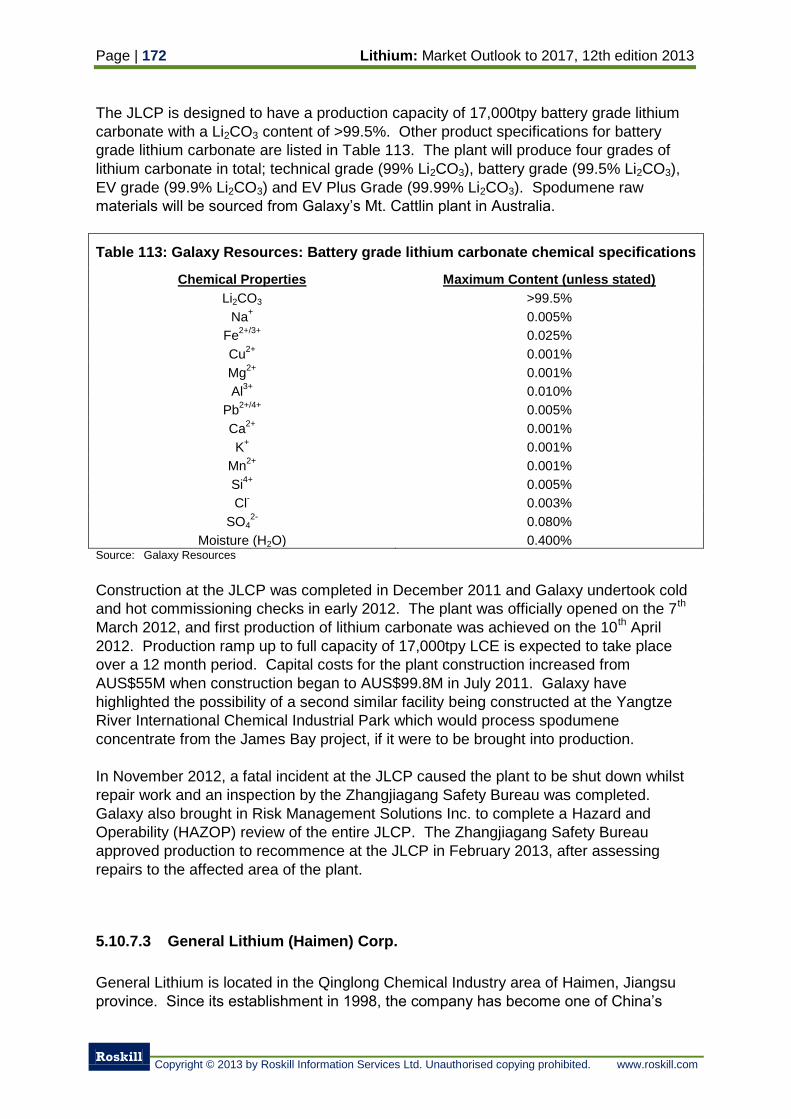
Page | 172 Lithium: Market Outlook to 2017, 12th edition 2013
Roskill
Copyright © 2013 by Roskill Information Services Ltd. Unauthorised copying prohibited. www.roskill.com
The JLCP is designed to have a production capacity of 17,000tpy battery grade lithium
carbonate with a Li2CO3 content of >99.5%. Other product specifications for battery
grade lithium carbonate are listed in Table 113. The plant will produce four grades of
lithium carbonate in total; technical grade (99% Li2CO3), battery grade (99.5% Li2CO3),
EV grade (99.9% Li2CO3) and EV Plus Grade (99.99% Li2CO3). Spodumene raw
materials will be sourced from Galaxy’s Mt. Cattlin plant in Australia.
Table 113: Galaxy Resources: Battery grade lithium carbonate chemical specifications
Chemical Properties Maximum Content (unless stated)
Li2CO3 >99.5%
Na+
0.005%
Fe2+/3+
0.025%
Cu2+
0.001%
Mg2+
0.001%
Al3+
0.010%
Pb2+/4+
0.005%
Ca2+
0.001%
K+ 0.001%
Mn2+
0.001%
Si4+
0.005%
Cl- 0.003%
SO42-
0.080%
Moisture (H2O) 0.400% Source: Galaxy Resources
Construction at the JLCP was completed in December 2011 and Galaxy undertook cold
and hot commissioning checks in early 2012. The plant was officially opened on the 7th
March 2012, and first production of lithium carbonate was achieved on the 10th April
2012. Production ramp up to full capacity of 17,000tpy LCE is expected to take place
over a 12 month period. Capital costs for the plant construction increased from
AUS$55M when construction began to AUS$99.8M in July 2011. Galaxy have
highlighted the possibility of a second similar facility being constructed at the Yangtze
River International Chemical Industrial Park which would process spodumene
concentrate from the James Bay project, if it were to be brought into production.
In November 2012, a fatal incident at the JLCP caused the plant to be shut down whilst
repair work and an inspection by the Zhangjiagang Safety Bureau was completed.
Galaxy also brought in Risk Management Solutions Inc. to complete a Hazard and
Operability (HAZOP) review of the entire JLCP. The Zhangjiagang Safety Bureau
approved production to recommence at the JLCP in February 2013, after assessing
repairs to the affected area of the plant.
5.10.7.3 General Lithium (Haimen) Corp.
General Lithium is located in the Qinglong Chemical Industry area of Haimen, Jiangsu
province. Since its establishment in 1998, the company has become one of China’s
Lithium: Market Outlook to 2017, 12th edition 2013 Page | 173
Roskill
Copyright © 2013 by Roskill Information Services Ltd. Unauthorised copying prohibited. www.roskill.com
largest lithium processors with a production capacity of 5,000tpy battery grade lithium
carbonate and 1,000tpy technical grade lithium carbonate. The company imports
spodumene concentrate from Talison Lithium in Australia as it controls no domestic
sources of raw material. General Lithium intends to expand lithium carbonate production
capacity at its plant by end-2013.
5.10.7.4 China Non-Ferrous Metal Import & Export Xinjiang Corp.
State owned China Non-Ferrous Metal Import & Export Xinjiang Corp. (CNIEC) operates
the Xinjiang Lithium Salt Plant, located in northern Ürümqi, Xinjiang Uyghur Autonomous
Region. The original Xinjiang plant founded in 1958 was located in southern Ürümqi,
however a new facility at the present site was constructed in 2006 and commissioned in
2007.
The company is considered to be one of China’s largest producers of lithium products,
marketing its products under the ‘Bo Feng’ trademark. The product range available from
CNIEC includes:
Li2CO3 Technical Grade >99% Li2CO3, >98.5% Li2CO3
Li2CO3 Pharmaceutical Grade >98.5% Li2CO3
Li2CO3 High Purity >99.999% Li2CO3, >99.995% Li2CO3, >99.99%
Li2CO3
Li Hypochloride >71% LiClO
Li Fluoride >98.5% LiF, >98% LiF
Lithium Metal >99% Li, >99.8% Li, >99.98% Li
Li-Al Alloy 27% Li – 73% Al
Li Phosphate >95% Li3PO4, >98% Li3PO4
Li Sulphate >99% Li2SO4, >98% Li2SO4
Li Chloride (Anhydrous) >99.3% LiCl, >99% LiCl, >98% LiCl
Li Molydbate >99% Li2MoO4
Li Hydrite >97% LiH
Li Hydroxide Monohydrate >56.6% LiOH, >56.5% LiOH, >55% LiOH
Li-Al Tetra Chloride >98% purity
Li Perchlorate Anhydrous >99% purity
The new plant commissioned in 2007 has a capacity to produce 6,000tpy lithium
compounds and 200tpy lithium metal. CNIEC imports 100% of its spodumene
concentrate raw materials from Talison Lithium in Australia. Historically CNIEC sourced
spodumene concentrate raw materials locally, however mining of spodumene in the
surrounding area has been suspended because of high mining costs and resource
depletion.
Page | 174 Lithium: Market Outlook to 2017, 12th edition 2013
Roskill
Copyright © 2013 by Roskill Information Services Ltd. Unauthorised copying prohibited. www.roskill.com
5.10.7.5 Sichuan State Lithium Materials Co. Ltd.
Sichuan State Lithium Materials is based in Xuankou town, Wenchuan, Sichuan
Province, undertaking research and development, manufacturing and marketing of
lithium products. The majority of the company’s lithium raw materials are sourced from
Aba Guangsheng Lithium Industry Co. Ltd. (Section 5.10.6.2) in the form of spodumene
concentrate. Sichuan State Lithium Materials was founded in 2007, producing a
portfolio of downstream caesium, rubidium and lithium products. Since 2007 the
company has increased its capacity from 1,500tpy lithium products to 2,500tpy, as a
result of upgrading the battery grade lithium carbonate production line.
The range of lithium products produced by Sichuan State Lithium Materials is marketed
both for the domestic market and for export and includes:
Li Carbonate (Technical, Battery, High Purity and Fluorescent grade)
Li Hydroxide Monohydrate
Li Perchlorate Anhydrous
Li Acetate Dihydrate
Li Phosphate (Fluorescent grade)
Li Nitrate
Li Iodide
Li Fluoride
Li Sulphate
Sichuan State Lithium Materials works closely with Sichuan University and the University
of Science and Technology of China to develop new lithium products and plans to
construct a new R&D facility by 2015. The proposed facility will focus its research on
development of lithium iron phosphate technologies and work towards industrial
production of new lithium products.
5.10.7.6 Jiangxi Ganfeng Lithium Co. Ltd.
Jiangxi Ganfeng Lithium was established in 2000 in Xinyu town, Jiangxi province. In
August 2010, the company was listed on the Shenzhen stock exchange, the first solely
lithium producing company to do so in China. Ganfeng Lithium produces a range of
lithium inorganic and organic compounds, along with lithium metal and alloys from four
subsidiaries:
Name Location Activities
Xinyu Ganfeng Organic
Lithium Co. Ltd.
Hexia Town Fairy
Lake, Xinyu, Jiangxi
Production of butyllithium and
butylchloride
Fengxin Ganfeng Lithium
Co. Ltd.
Fentian Development
Zone, Fengxin County
Jiangxi
Production of lithium metal,
lithium-magnesium alloy and
lithium carbonate.
Xinyu Ganfeng Lithium
Sales Co. Ltd.
Xinyu Economic
Development Zone,
Lithium product sales
Lithium: Market Outlook to 2017, 12th edition 2013 Page | 175
Roskill
Copyright © 2013 by Roskill Information Services Ltd. Unauthorised copying prohibited. www.roskill.com
Jiangxi
Xinyu Ganfeng
Transportation Co. Ltd.
Hexia Town Fairy
Lake, Xinyu, Jiangxi
Transportation
The company imports lithium raw materials from a number of sources in the domestic
and international markets. SQM, FMC, TOXCO and Qinghai CITIC Guoan have all
supplied raw materials to Jiangxi Ganfeng in the past, in the form of lithium brines and
lithium chloride, along with Talison Lithium in the form of spodumene concentrate.
The production capacity of the four subsidiaries is 650tpy lithium metal, 1,500tpy lithium
chloride, 300tpy lithium fluoride and 3,000tpy lithium carbonate. In 2011, Jiangxi
Ganfeng Lithium reported sales of lithium products totalling US$75M, an increase of
34% from the previous year.
In 2011, Jiangxi Ganfeng announced plans to construct a new lithium compound
production facility in Xinyu, Jiangxi province, in close proximity to the existing lithium
plant. The plant will process imported spodumene concentrates, producing lithium
compounds including lithium chloride, battery grade lithium hydroxide, battery grade
lithium carbonate and other lithium compounds for Jiangxi Ganfeng’s internal use. The
planned capacity of the new plant is 23,000tpy LCE, including 6,000tpy battery grade
lithium hydroxide, 9,000tpy battery grade litihum carbonate and 10,000tpy lithium
chloride, organic compounds and metal. Construction of the facility is expected to take
place in two phases, with construction beginning on the first phase in October 2011.
Capital costs for the plant were revised upwards in H1 2012 from RMB120M
(US$18.9M) to RMB163.3M (US$25.8M). Commissioning of the phase one plant was
scheduled for October 2012, although this has been delayed to mid-2013.
In 2012, Jiangxi Ganfeng assessed the feasibility of constructing a lithium-iron-
phosphate production facility, as a step towards producing Li ion batteries. In January
2013, Jiangxi Ganfeng announced it was to invest RMB294M (US$46.7M) in a project to
increase production capacity of lithium salts and extend downstream its production of
lithium products, producting ultra-thin lithium metal strips, plates, foil, grain, alloys and
precursor materials. The RMB294M (US$46.7M) will be raised in a combination of
privae placements and revenue raised from an IPO. The expansion project will increase
production capacity of lithium metal foil by 500tpy, production of lithium salts by
10,000tpy and production of ternary precursor materials (with a focus on lithium-iron-
phosphate precursor materials) by 4,500tpy.
Jiangxi Ganfeng initially purchased a 9.99% stake in Canadian lithium explorer
International Lithium Corporation in July 2011, who is exploring lithium projects in
Argentina and Canada. Jiangxi Ganfeng increased its stake in the company to 14.7% in
March 2012 through a private placement.
Page | 176 Lithium: Market Outlook to 2017, 12th edition 2013
Roskill
Copyright © 2013 by Roskill Information Services Ltd. Unauthorised copying prohibited. www.roskill.com
5.10.7.7 Sichuan Chenghehua Lithium Technology Co. Ltd.
Sichuan Chenghehua operates a lithium processing facility at the Chuan Su-Tech
Industrial Zone in Dujiangyan city, Sichuan province. The facility produces industrial,
battery (99.9% Li2CO3) and high purity (99.99% Li2CO3) grade lithium carbonate products
along with industrial and battery grade lithium hydroxide monohydrate. The Chuan Su-
tech Industrial Zone facility is reported to have a 3,000tpy lithium carbonate and
hydroxide production capacity, and a processing circuit to produce 300tpy lithium iron
phosphate is under construction.
5.10.8 Chinese lithium chemical producers
China Lithium Product Technology Co. Ltd. is located in Xiamen, Fujian province,
manufacturing lithium compounds mainly for the grease and lubricant industry. The
Xiamen production facility has a capacity to produce 2,800tpy lithium hydroxide (57%
LiOH purity), 1,500tpy battery grade lithium carbonate and 5,000tpy 12-hydroxy stearic
acid flakes. China Lithium Product produces a range of lithium hydroxide and carbonate
products which include:
Lithium hydroxide monohydrate (fines grade)
Lithium hydroxide monohydrate (reduced dusting grade)
Lithium hydroxide monohydrate purified (greases and lubricants grade)
Lithium hydroxide monohydrate (technical grade)
Lithium hydroxide (electrochemical grade)
Lithium carbonate (industry and electrochemical grade)
Chengdu Chemphys Chemical, established in 1998, is a producer of high purity lithium
carbonate and lithium hydroxide used in the production of pharmaceutical, battery and
fusion flux products. Lithium carbonate produced at the Chengdu Chemphys facility
located in Wenjiang, near Chengdu, Sichuan province has purities between 99% and
99.99% Li2CO3. The Wenjiang plant is reported to have a capacity to produce 1,500tpy
high purity lithium carbonate. Other lithium compounds including lithium phosphates,
borates and di-hydrogen phosphates are also produced by Chengdu Chemphys.
FMC (Zhangjiagang) Specialty Chemicals, a subsidiary of FMC Corporation (Section
5.39.3), began production of butyllithium products at the Yangzijiang International
Chemical industry park in 2008. The butyllithium products manufactured at the
Yangzijiang plant are mainly used in the polymers industry.
Jiangxi Dongpeng New Materials Co. Ltd. produces lithium, caesium and rubidium
series chemicals at Xin Yu High & New Technology Development Zone, Jiangxi
Province. The range of lithium products produced includes lithium carbonate, hydroxide
monohydrate, fluoride, sulphate, nitrate, phosphate, chloride and perchlorate tri-hydride.
Kinmet Lithium Chemicals produces a range of lithium products including lithium
carbonate, hydroxide, fluoride, bromide, chloride, chromate and metal from a plant in
Liuzhou city, Guangxi province.
Lithium: Market Outlook to 2017, 12th edition 2013 Page | 177
Roskill
Copyright © 2013 by Roskill Information Services Ltd. Unauthorised copying prohibited. www.roskill.com
Shanghai China-Lithium Industrial was established in the Shanghai Chemical
Industrial Zone, Shanghai province during October 2002. The company has a capacity
to produce a range of both inorganic and organic lithium products, which include:
Lithium carbonate 1,000tpy
Lithium di-hydrogen phosphate 1,000tpy
Lithium fluoride 500tpy
Lithium acetate 500tpy
Lithium iodide 200tpy
Lithium chloride 300tpy
Lithium nitrate anhydrous 50tpy
Lithium perchlorate anhydrous 50tpy
Products are marketed under the China-Lithium™ trade name both domestically and
internationally. Shanghai China-Lithium Industrial are also investing in research and
development facilities and increasing production capacity at the Shanghai province
plant.
Wuhan Baijierui Advanced Materials Co. Ltd. located in Wuhan Economy and
Technology Exploitation District, Hubei Province is a division of Eastern Lithium
Enterprises, producing and marketing lithium, caesium and rubidium products for
applications in the lithium ion battery, pharmaceuticals and catalysts industries.
Production capacity at the Wuhan Baijierui Advanced Materials plant is reported as
1,200tpy lithium hydroxide, 900tpy lithium chloride, 120tpy lithium metal and 500tpy
lithium celite.
Ruiyuan Group Ltd. is a broad range chemical producer based in Pudong district,
Shanghai, providing products for the pharmaceutical, catalyst and metallurgical
industries. The company manufactures a range of lithium compounds including
carbonates, hydroxides and chlorides along with lithium metal.
5.10.9 Specialist lithium bromide producers
Dalian Honjo Chemical is a joint venture between Honjo Chemical Co., Ltd. of Japan,
Dalian Bingshan Group, Sanyo Electric Co., Ltd. of Japan, Honjo Chemical Corporation
of Japan and Dalian Sanyo Refrigeration Co., Ltd. Production of lithium bromide began
in October 1993, soon after the company’s formation, mainly for use in manufacturing air
conditioning units in Dalian, China. The company has a capacity to produce 6,000tpy
lithium bromide, 40% of which is reserved for Dalian Sanyo Refrigeration Co. Ltd., 30%
exported to Japan and the remaining 30% used to supply domestic demand.
Jinan Sigma Chemical Co. Ltd. produces lithium bromide in Jinan city, Shandong
Province under the brand name ‘Sigma’. The company also lists lithium molybdenate
and lithium chromate in its product list.
Page | 178 Lithium: Market Outlook to 2017, 12th edition 2013
Roskill
Copyright © 2013 by Roskill Information Services Ltd. Unauthorised copying prohibited. www.roskill.com
Dongying Pacific Ocean Chemical Engineering Co. Ltd. produces lithium bromide
and other bromine compounds at a facility in Dongguan, Shandong Province. The
company exports bromine compounds including lithium bromide to South East Asia,
Europe, the USA and South Africa.
Shandong Tianyi Chemicals is a subsidiary of Shandong Ocean Chemical Industry
Institute of Science and Technology, producing lithium bromide at the Weifang Binhai
Economic Development Zone, Shandong Province. The company has a reported
capacity to produce 2,000tpy lithium bromide.
Sanxing Chemical Industry Corporation is a producer of 50-55% lithium bromine
solution along with various other bromine compounds in Dangjia town, Shandong
Province.
Weifang Qiangyuan Chemical Industry Co. Ltd. located in the Weifang Binhai
Economic Development Zone, Shandong Province, produces a range of bromide
solutions including lithium bromide.
In addition, producers of air conditioning units and absorption chillers in China, Broad
Air Conditioning, Yantai Ebara Air Conditioning Equipment Co., Ltd. and Jiangsu
Shuang Liang Group are believed to possess an in-house capability to produce lithium
bromide.
5.10.10 Specialist lithium metal producers
Located in Yibin City, Sichuan Province, China Jianzhong Nuclear Fuel Co. Ltd. is a
subsidiary of the China National Nuclear Corporation (CNNC). The company has a
production capacity of 300tpy lithium metal which is marketed as either a 99.9% or
99.95% Li purity product. China Jianzhong also produces lithium-calcium and lithium
batteries which are supplied to both the domestic and export markets.
China Jianzhong has a capability to produce lithium rods, wires and granules, together
with lithium compounds such as lithium hydroxide monohydrate, lithium anhydrous
chloride, lithium carbonate, lithium bromide and lithium hydride.
Kunming Yongnian Liye Co. Ltd. is a producer of lithium metal ingots in South West
Yunnan Province, with a production capacity of 50tpy lithium metal. The company was
formed as a subsidiary of Kunming University of Science and Technology (34%) and
Yunnan Copper (Chinalco Yunnan Copper Resources Ltd.), which developed and
patented a vacuum smelting process to produce lithium metal.
Jiangsu Hongwei Lithium Industry Co. Ltd. produces four lithium metal products at a
plant located in Taizhou, Jiangsu province. The company began production in 1996
under the name Xinghua Hongda Electroheat Chemical Co., Ltd and has a capacity to
produce 180tpy industrial grade lithium and sodium metal and 20tpy lithium metal
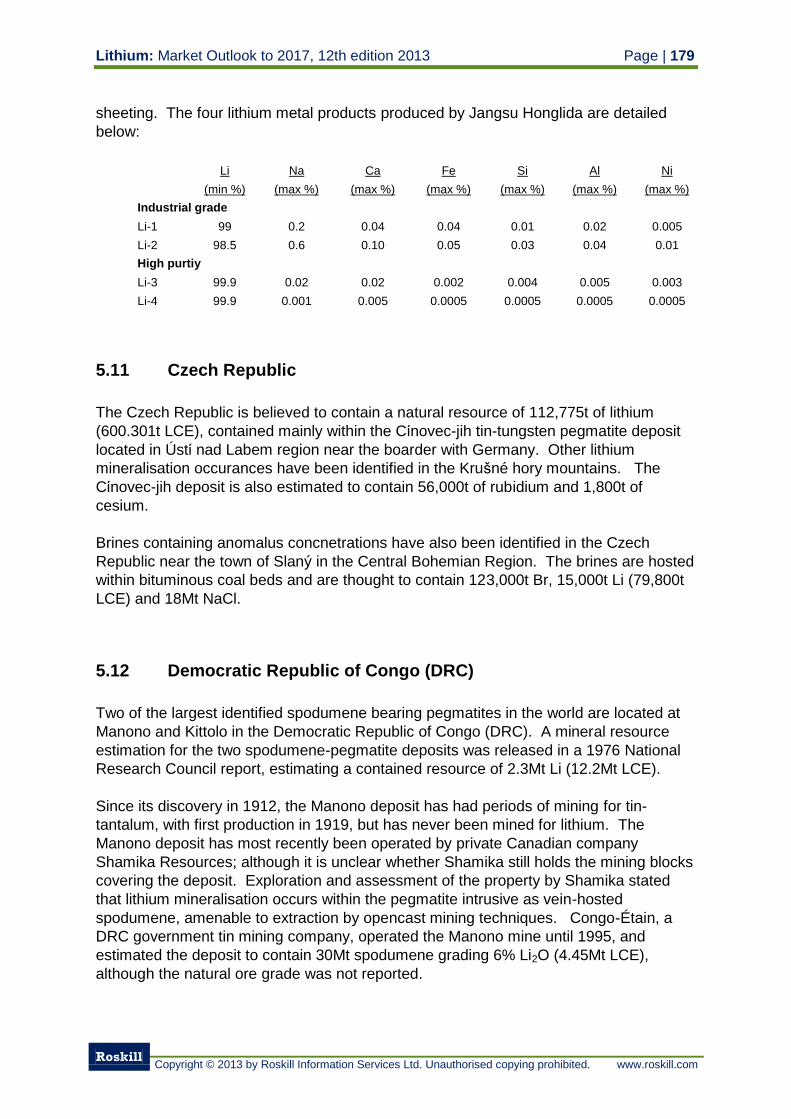
Lithium: Market Outlook to 2017, 12th edition 2013 Page | 179
Roskill
Copyright © 2013 by Roskill Information Services Ltd. Unauthorised copying prohibited. www.roskill.com
sheeting. The four lithium metal products produced by Jangsu Honglida are detailed
below:
Li
(min %)
Na
(max %)
Ca
(max %)
Fe
(max %)
Si
(max %)
Al
(max %)
Ni
(max %)
Industrial grade
Li-1 99 0.2 0.04 0.04 0.01 0.02 0.005
Li-2 98.5 0.6 0.10 0.05 0.03 0.04 0.01
High purtiy
Li-3 99.9 0.02 0.02 0.002 0.004 0.005 0.003
Li-4 99.9 0.001 0.005 0.0005 0.0005 0.0005 0.0005
5.11 Czech Republic
The Czech Republic is believed to contain a natural resource of 112,775t of lithium
(600.301t LCE), contained mainly within the Cίnovec-jih tin-tungsten pegmatite deposit
located in Ústί nad Labem region near the boarder with Germany. Other lithium
mineralisation occurances have been identified in the Krušné hory mountains. The
Cίnovec-jih deposit is also estimated to contain 56,000t of rubidium and 1,800t of
cesium.
Brines containing anomalus concnetrations have also been identified in the Czech
Republic near the town of Slaný in the Central Bohemian Region. The brines are hosted
within bituminous coal beds and are thought to contain 123,000t Br, 15,000t Li (79,800t
LCE) and 18Mt NaCl.
5.12 Democratic Republic of Congo (DRC)
Two of the largest identified spodumene bearing pegmatites in the world are located at
Manono and Kittolo in the Democratic Republic of Congo (DRC). A mineral resource
estimation for the two spodumene-pegmatite deposits was released in a 1976 National
Research Council report, estimating a contained resource of 2.3Mt Li (12.2Mt LCE).
Since its discovery in 1912, the Manono deposit has had periods of mining for tin-
tantalum, with first production in 1919, but has never been mined for lithium. The
Manono deposit has most recently been operated by private Canadian company
Shamika Resources; although it is unclear whether Shamika still holds the mining blocks
covering the deposit. Exploration and assessment of the property by Shamika stated
that lithium mineralisation occurs within the pegmatite intrusive as vein-hosted
spodumene, amenable to extraction by opencast mining techniques. Congo-Étain, a
DRC government tin mining company, operated the Manono mine until 1995, and
estimated the deposit to contain 30Mt spodumene grading 6% Li2O (4.45Mt LCE),
although the natural ore grade was not reported.
Page | 180 Lithium: Market Outlook to 2017, 12th edition 2013
Roskill
Copyright © 2013 by Roskill Information Services Ltd. Unauthorised copying prohibited. www.roskill.com
In July 2012, Alphamin Resources Corp. announced it had purchased permits for two
the areas surrounding the Manono deposit for a fee of US$2M and 6.1M common
shares. The Manono deposit was identified in the press release as the largest
pegmatite hosted deposit of cassiterite, columbo-tantalite and lithium mined to date.
Alphamin also reported that some samples of material from the deposit exceeded
grades of 2% Li2O.
The Kittolo deposit, unlike Manono, has not been explored and developed to the
production stage. The deposit is located 2.4km southwest of Manono and has been
explored by various companies in the past, with a reserve estimation of at least 310,000t
Li (1.65Mt LCE), in addition to tin, tantalum and niobium mineralisation.
5.13 Finland
Lithium mineralisation is hosted within two main deposit types within Finland, firstly in
albite-spodumene type pegmatites, typically located in the Emmes Li-area of Central
Ostrobothnia region, Western Finland, and secondly in more complex polymetallic-rare
element type pegmatites, identified in the Somero Li-area, south-western Finland.
Exploration and identification of lithium resources in Finland first started in the 1950s,
with assessment of lithium mineralisation in spodumene-bearing pegmatites of the
Ostrobothnia region. In the 1960s, Suomen Mineraali continued lithium exploration in
the Ostrobothnia region, identifying 11 pegmatites containing lithium bearing minerals.
The most prospective of these deposits were located at Emmes, Jänislampi and Länttä.
5.13.1 Keliber Oy
Keliber has held the Länttä spodumene-pegmatite deposit located in Ullava district,
60km southeast of Kokkola city, since 1999. Nordic Mining hold a 68% share in Keliber
with the remaining 32% share in the company held by private Finnish investors. The
company was founded in 2001, after the ‘Keliber Project Working Group’ released a
positive assessment of the Länttä deposit, with assistance from the Geological Survey of
Finland (GTK). The Keliber Project Working Group subsequently started a mining
research and development company Keliber Resources Ltd. Oy., purchasing the permits
for the Länttä property. The company became a mining company in 2006 and was
renamed Keliber.
The Länttä pegmatite intrudes into meta-siltstone and schist country rock dipping steeply
toward the south-east. The pegmatite mineralogy is predominantly a quartz-albite-
spodumene mineral assemblage, with less common potassium feldspar and accessory
minerals. A mineral resource estimate for the Länttä deposit was released in 2001 by
GTK to a depth of 200m, which reported 2.95Mt grading 0.92% Li2O (contained 67,000t
LCE), with tantalum, quartz-feldspar and analcime by products.
In addition to the Länttä deposit, Keliber holds claims, reservations and mining
concessions covering six other lithium deposits in Finland (Table 114). The most
Lithium: Market Outlook to 2017, 12th edition 2013 Page | 181
Roskill
Copyright © 2013 by Roskill Information Services Ltd. Unauthorised copying prohibited. www.roskill.com
advanced of these are the Emmes and Jänislampi deposits both located in the Central
Ostrobothnia region. The Emmes deposit is centred on a steeply dipping spodumene-
pegmatite vein with a strike of around 350m estimated to contain a mineral resource of
1.1Mt grading 1.3% Li2O down to a depth of 155m. Identified in drilling between 1960-
1982 by Partek Oy and Suomen Mineraali Oy, the Jänislampi spodumene-pegmatite
vein has a thickness of between 3-12m over a strike length of 200m. Samples taken
from the Jänislampi deposit returned grade of up to 1.5-1.7% Li2O and a mineral
resource estimation of at least 60,000t grading 0.5% Li2O (7,400t LCE contained) to a
depth of 15m was reported.
Table 114: Keliber Oy: Claims, reservation and mining concessions for lithium
projects held by Keliber in Finland, 2012
Deposit Location Licence Type
Länttä Ullava district, Central Ostrobothnia Mining Concession
Emmes Kronoby Municipality, Central Ostrobothnia Claim
Jänislampi Kronoby-Kaustinen Municipality, Central Ostrobothnia Claim
Matoneva - Reservation
Peuraneva - Reservation
Nikula Central Ostrobothnia Reservation
Känsälä near Vaasa, Central Ostrobothnia Reservation Source: Keliber Oy
Nordic Mining in co-operation with mineral processing specialists OutoTec Oy, have
developed an eco-friendly method of producing Li2CO3 from spodumene concentrate
using self-generated biogas. Biogas is used both for creating energy and as a raw
material in a continuous processing method. Spodumene concentrate is reduced in size
and run through a magnetic separator to remove gangue minerals. Flotation is used to
produce a spodumene concentrate and converted to beta-spodumene. Energy for the
flotation and conversion stage will be generated using combustion of biogas. The
produced beta-spodumene concentrate is leached before being re-crystallised, filtered
washed, dried and packed. Carbon dioxide from biogas can also be used to purify the
final lithium carbonate product.
5.13.2 Nortec Minerals Corp.
Nortec Minerals is a Canadian based multi-commodity exploration company with
projects located in Canada, Finland and Ecuador. The company was founded in 1999,
as Nortec Ventures Corp. listing on the Toronto stock exchange in 2004. In January
2010, the company changed its name to Nortec Minerals Corp. Nortec holds claim
reservations for two properties with identified lithium mineralisation at Tammela and
Kaatiala. The Kaatiala property is classed as a rare earth element pegmatite deposit,
although studies have reported notable columbite, cassiterite and lepidolite
mineralisation.
The Tammela property is 100% owned by Nortec and covers an area of 23km2. Located
in southern Finland, approximately 60km south west of Hämeenlinna, Nortec are
Page | 182 Lithium: Market Outlook to 2017, 12th edition 2013
Roskill
Copyright © 2013 by Roskill Information Services Ltd. Unauthorised copying prohibited. www.roskill.com
exploring the property for lithium-tin-tantalum-gold mineralisation. Lithium is contained
within spodumene mineralisation at the deposit, which is hosted with the Kietyönmäki
Main Dyke. The Kietyönmäki Main Dyke extends over a strike length of 400m with an
average width of 12m.
Samples of drill core taken by Nortec and the Geological Survey of Finland (GTK) have
returned grades of up to 1.67% over 3.0m and 0.51% Li2O over 3m. A non NI 43-103
compliant resource estimation of the deposit was also made by the GTK, estimating a
resource of 400,000t grading 1.0% Li2O (9,900t LCE contained).
5.13.3 Leviäkangas Deposit
The GTK completed a mineral deposit report on the Leviäkangas deposit in 2010, as a
follow up to exploration conducted on the site by Suomen Mineraali Oy during the
1960s. The report concluded that the Leviäkangas deposit, located in Kaustinen
municipality of Central Ostrobothnia region, hosts lithium mineralisation within
spodumene-pegmatite veins intruding into the schist and meta-sandstone country rock.
GTK collected and analysed a number of samples from the deposit as part of the mineral
deposit report. Samples returned grades of up to 0.74% Li2O, representing an average
spodumene concentration of 21% in the pegmatite vein material. GTK were able to trace
the pegmatite vein along 500m of strike with a range in thickness between 1-20m. A
mineral resource for the deposit was reported as 2.1Mt grading 0.6% Li2O (31,000t LCE
contained).
5.13.4 Syväjärvi Deposit
Located in Kaustinen municipality of Central Ostrobothnia region, The Syväjärvi deposit
was also assessed by GTK between 2006 and 2010. Around 20 samples were taken
from the property by GTK which were assessed using ICP-MS methods. The samples
of pegmatite material contained an average of 13% spodumene, and returned grades of
approximately 1.0% Li2O. A mineral resource estimation of 2.6Mt grading 0.98%
(62,900t LCE contained) was made for the Syväjärvi lithium deposit which remains open
to the north, south and at depth.
5.14 France
France is reported to have no domestic production of lithium, although some mineral
concentrates produced from pegmatites near Clermont-Ferrand contain notable amounts
of lithium.
Kaolins de Beauvoir, a subsidiary of International industrial minerals producer IMERYS,
operate the Echassiéres site, located near Clermont-Ferrand. The site produces kaolin
and other mineral concentrates including a lepidolite rich sand marketed as ‘Felithe’.
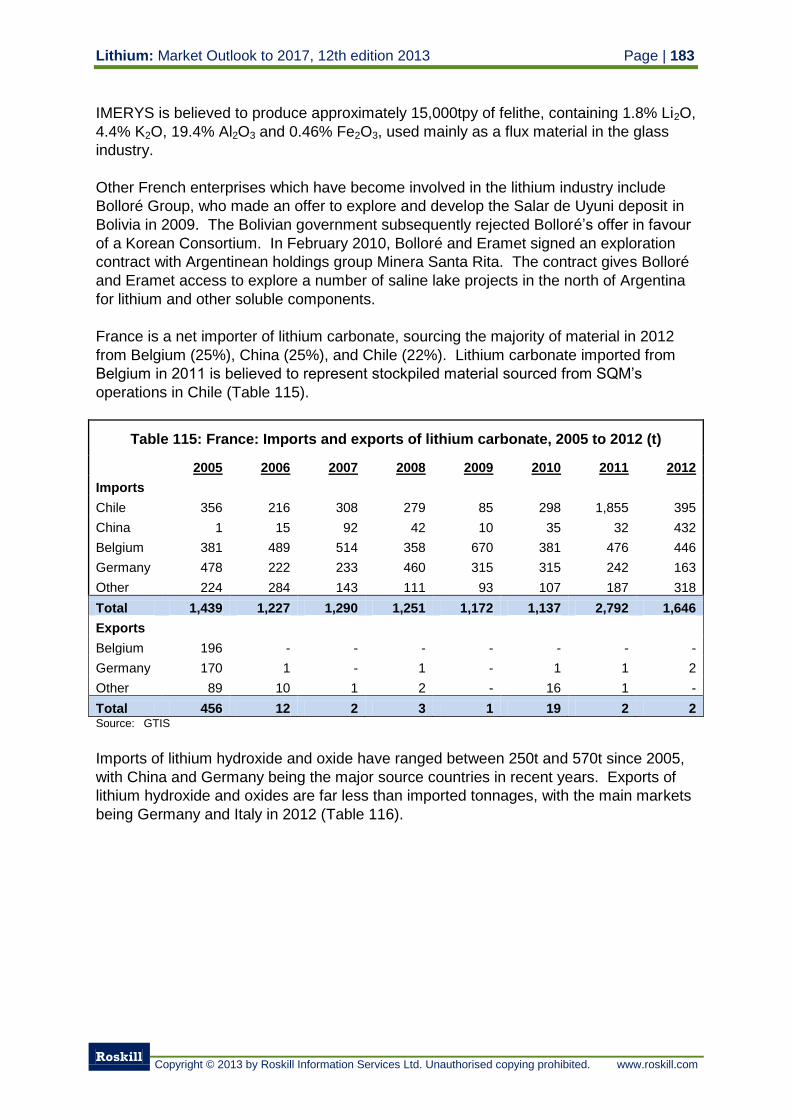
Lithium: Market Outlook to 2017, 12th edition 2013 Page | 183
Roskill
Copyright © 2013 by Roskill Information Services Ltd. Unauthorised copying prohibited. www.roskill.com
IMERYS is believed to produce approximately 15,000tpy of felithe, containing 1.8% Li2O,
4.4% K2O, 19.4% Al2O3 and 0.46% Fe2O3, used mainly as a flux material in the glass
industry.
Other French enterprises which have become involved in the lithium industry include
Bolloré Group, who made an offer to explore and develop the Salar de Uyuni deposit in
Bolivia in 2009. The Bolivian government subsequently rejected Bolloré’s offer in favour
of a Korean Consortium. In February 2010, Bolloré and Eramet signed an exploration
contract with Argentinean holdings group Minera Santa Rita. The contract gives Bolloré
and Eramet access to explore a number of saline lake projects in the north of Argentina
for lithium and other soluble components.
France is a net importer of lithium carbonate, sourcing the majority of material in 2012
from Belgium (25%), China (25%), and Chile (22%). Lithium carbonate imported from
Belgium in 2011 is believed to represent stockpiled material sourced from SQM’s
operations in Chile (Table 115).
Table 115: France: Imports and exports of lithium carbonate, 2005 to 2012 (t)
2005 2006 2007 2008 2009 2010 2011 2012
Imports
Chile 356 216 308 279 85 298 1,855 395
China 1 15 92 42 10 35 32 432
Belgium 381 489 514 358 670 381 476 446
Germany 478 222 233 460 315 315 242 163
Other 224 284 143 111 93 107 187 318
Total 1,439 1,227 1,290 1,251 1,172 1,137 2,792 1,646
Exports
Belgium 196 - - - - - - -
Germany 170 1 - 1 - 1 1 2
Other 89 10 1 2 - 16 1 -
Total 456 12 2 3 1 19 2 2 Source: GTIS
Imports of lithium hydroxide and oxide have ranged between 250t and 570t since 2005,
with China and Germany being the major source countries in recent years. Exports of
lithium hydroxide and oxides are far less than imported tonnages, with the main markets
being Germany and Italy in 2012 (Table 116).
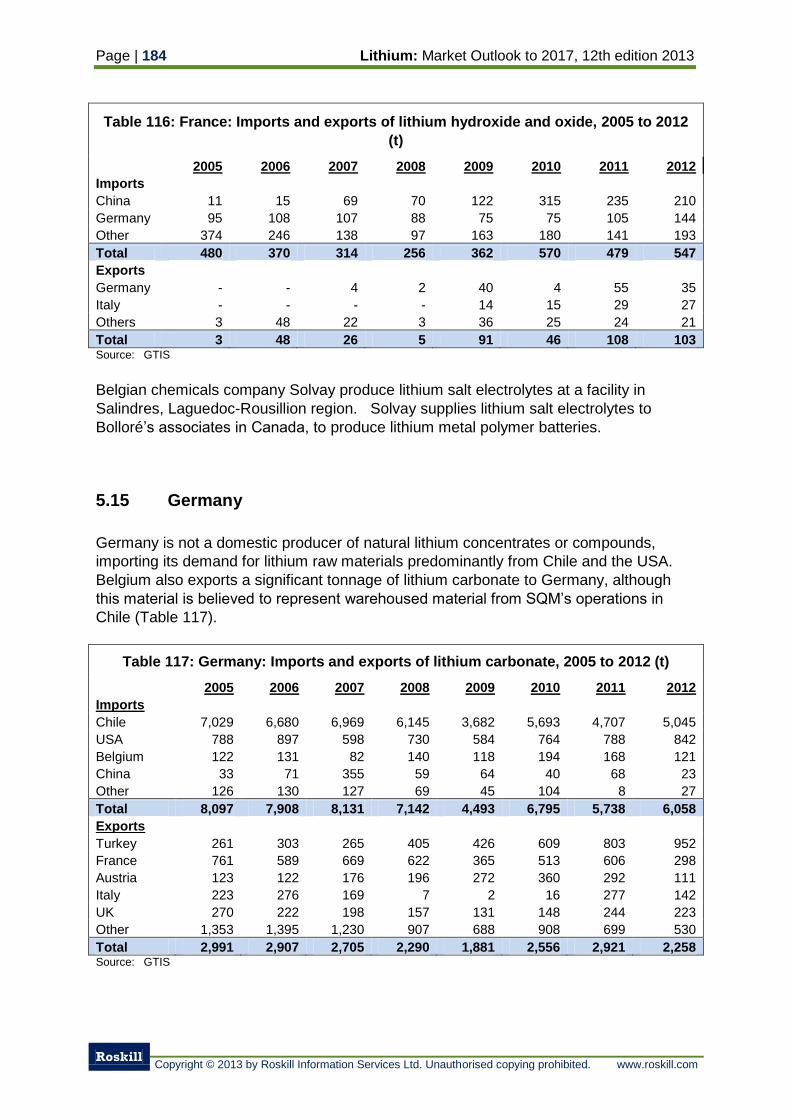
Page | 184 Lithium: Market Outlook to 2017, 12th edition 2013
Roskill
Copyright © 2013 by Roskill Information Services Ltd. Unauthorised copying prohibited. www.roskill.com
Table 116: France: Imports and exports of lithium hydroxide and oxide, 2005 to 2012
(t)
2005 2006 2007 2008 2009 2010 2011 2012
Imports
China 11 15 69 70 122 315 235 210
Germany 95 108 107 88 75 75 105 144
Other 374 246 138 97 163 180 141 193
Total 480 370 314 256 362 570 479 547
Exports
Germany - - 4 2 40 4 55 35
Italy - - - - 14 15 29 27
Others 3 48 22 3 36 25 24 21
Total 3 48 26 5 91 46 108 103 Source: GTIS
Belgian chemicals company Solvay produce lithium salt electrolytes at a facility in
Salindres, Laguedoc-Rousillion region. Solvay supplies lithium salt electrolytes to
Bolloré’s associates in Canada, to produce lithium metal polymer batteries.
5.15 Germany
Germany is not a domestic producer of natural lithium concentrates or compounds,
importing its demand for lithium raw materials predominantly from Chile and the USA.
Belgium also exports a significant tonnage of lithium carbonate to Germany, although
this material is believed to represent warehoused material from SQM’s operations in
Chile (Table 117).
Table 117: Germany: Imports and exports of lithium carbonate, 2005 to 2012 (t)
2005 2006 2007 2008 2009 2010 2011 2012
Imports
Chile 7,029 6,680 6,969 6,145 3,682 5,693 4,707 5,045
USA 788 897 598 730 584 764 788 842
Belgium 122 131 82 140 118 194 168 121
China 33 71 355 59 64 40 68 23
Other 126 130 127 69 45 104 8 27
Total 8,097 7,908 8,131 7,142 4,493 6,795 5,738 6,058
Exports
Turkey 261 303 265 405 426 609 803 952
France 761 589 669 622 365 513 606 298
Austria 123 122 176 196 272 360 292 111
Italy 223 276 169 7 2 16 277 142
UK 270 222 198 157 131 148 244 223
Other 1,353 1,395 1,230 907 688 908 699 530
Total 2,991 2,907 2,705 2,290 1,881 2,556 2,921 2,258 Source: GTIS
Lithium: Market Outlook to 2017, 12th edition 2013 Page | 185
Roskill
Copyright © 2013 by Roskill Information Services Ltd. Unauthorised copying prohibited. www.roskill.com
5.15.1 Rockwood Lithium (Langelsheim Plant)
Rockwood Lithium has operated in Germany since 1923, producing lithium metal,
chloride, hydride and bromide. The product range produced by Rockwood Lithium has
increased to over 80 different lithium products, mainly organic based compounds used in
chemical and pharmaceutical industries.
Lithium products are produced at the Langelsheim plant located in Goslar district. In
2000, the plant capacity was increased by 50% with the commissioning of a new lithium
aluminium hydride unit. The plant capacity was increased again in 2008 with the
construction of a new production facility, manufacturing mainly organo-lithium
compounds used in agricultural and pharmaceutical applications.
Rockwood Lithium is a member of LithoRec, a research and development group which
focuses on energy efficient and environmentally friendly technologies. In 2009,
Rockwood Lithium was granted €5.7M by the German Federal Ministry for the
Environment, Nature Conservation and Nuclear Safety, for construction of a pilot plant to
undertake research into recycling large lithium-ion batteries used in electric vehicles.
The funded project concluded in September 2011; however Rockwood Lithium
continues to address the possibility of recycling auto-batteries to produce high grade
lithium carbonate.
5.15.2 Helm AG
Based in Hamburg, Helm AG produces a largest range of chemicals for the
pharmaceutical, fertilizer, nutrition and specialty chemicals industries. Helm operates
several production facilities, three in Germany located in Hanover, Hamburg and
Bovenau, along with other facilities situated in Oman, Argentina, Saudi Arabia and
Trinidad and Tobago.
As part of their Chemical Solids business unit product list, Helm produces lithium
hydroxide (>55% LiOH purity) and lithium polysilicate. Lithium chemicals are believed to
be produced at Helms facilities in either Germany or Argentina, because of the
availability of raw materials. Helm has an international network of distribution centres,
although the majority of its sales are to European countries, with North and Central
America being their second largest market.
5.15.3 Lithium exploration in Germany
SolarWorld, a photovoltaic manufacturer headquartered in Bonn, Germany, is exploring
a previously mined deposit in Saxon-Zinnwald, Germany for lithium mineralisation.
Previous exploration of the site was undertaken as early as 1930, as lithium became
more widely used in lubricants. SolarWorld has undertaken drilling at the project during
2011-2012 and expected to produce a resource estimation for the project by the end of
2012. At this stage, first production is forecast by SolarWorld in Q1 2016 although
Page | 186 Lithium: Market Outlook to 2017, 12th edition 2013
Roskill
Copyright © 2013 by Roskill Information Services Ltd. Unauthorised copying prohibited. www.roskill.com
feasibility studies, relevant licencing and mine/plant designs are yet to be attained or
completed.
5.16 Greece
In Greece, some of the bauxite mined is thought to contain lithium which is transferred to
the Alumina when processed. The lithium content of the alumina is utilised by smelters,
most likely in the major destinations for Greek alumina (Europe, Russia, and the USA)
which more commonly add lithium carbonate to reduce energy consumption in the
smelting pot. No information regarding how lithium is processed during alumina
production has been found and the producer of lithium coated bauxite has not been
identified. The major producers of alumina in Greece are Aluminium de Gréce, S&B
Indusrial Minerals, and Elmin.
5.17 India
Lithium mineralisation in India occurs within pegmatite intrusives located in the states of
Andhra Pradesh and Karnataka in the south, Jharkhand and Bihar in the east and
Rajasthan in the west. Pegmatites located in Bihar state and near Nellore in Andhra
Pradesh state are some of the largest deposits of mica in the world, including significant
volumes of the less common lithium-bearing mica mineral lepidolite. In 2005-2006 a
programme by the Entrepreneurship Development Institute of Ahmedabad, Gujarat was
looking to develop carbonate production from Indian lepidolite-bearing pegmatites;
however no further details have emerged since then.
In India, products or devices containing enriched lithium such as elemental lithium,
alloys, compounds and mixtures containing lithium, are classified as strategic minerals
under the Atomic Energy Act of 1962. The development of lithium deposits or
production of lithium products is overseen by the Atomic Minerals Division (AMD), part of
the Department of Atomic Energy, and information regarding individual producers of
lithium is not released. However, the AMD has reported recovery and production of
approximately 3-5tpy columbite-tantalite concentrate along with by-product spodumene
at Marlagalla, Mundur and Arehalli in Karnatka. AMD has also in the past formed
stockpiles of lepiodlite mineral concentrate containing up to 2.9% Li2O in Chattabar in
Giya district of Bihar.
Indian imports of lithium hydroxide and oxide have remained relatively steady since
2005, with only two notable dips in imports during 2006 and 2009 (Table 118). Prior to
2006, the USA was the major supplier of lithium hydroxides and oxides; however imports
from the USA fell to only 10t in 2007. In recent years, China and Chile have been the
largest suppliers of lithium hydroxides and oxides to India contributing 74% of total
imports in 2011. In 2012, imports from Russia increase significantly to 749t, whilst
imports from Chile, China and the USA are all declined further. Indian exports of lithium
hydroxide and oxide are minor in comparison to its imports.
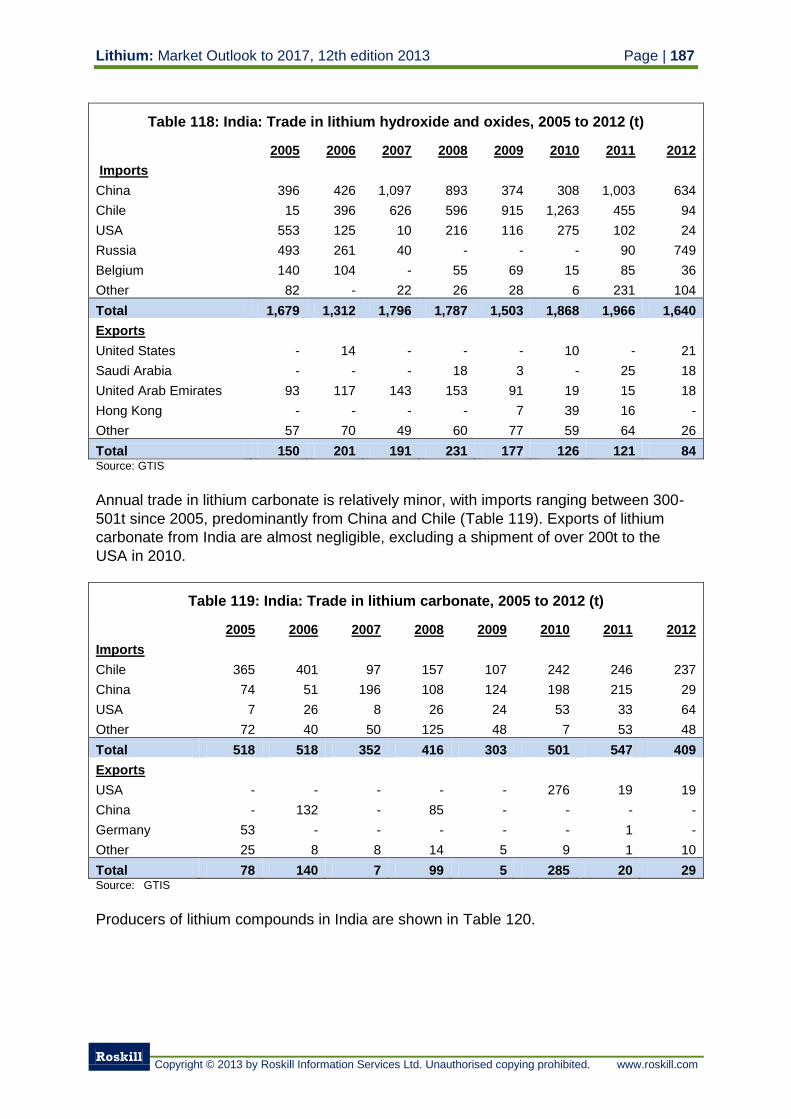
Lithium: Market Outlook to 2017, 12th edition 2013 Page | 187
Roskill
Copyright © 2013 by Roskill Information Services Ltd. Unauthorised copying prohibited. www.roskill.com
Table 118: India: Trade in lithium hydroxide and oxides, 2005 to 2012 (t)
2005 2006 2007 2008 2009 2010 2011 2012
Imports
China 396 426 1,097 893 374 308 1,003 634
Chile 15 396 626 596 915 1,263 455 94
USA 553 125 10 216 116 275 102 24
Russia 493 261 40 - - - 90 749
Belgium 140 104 - 55 69 15 85 36
Other 82 - 22 26 28 6 231 104
Total 1,679 1,312 1,796 1,787 1,503 1,868 1,966 1,640
Exports
United States - 14 - - - 10 - 21
Saudi Arabia - - - 18 3 - 25 18
United Arab Emirates 93 117 143 153 91 19 15 18
Hong Kong - - - - 7 39 16 -
Other 57 70 49 60 77 59 64 26
Total 150 201 191 231 177 126 121 84 Source: GTIS
Annual trade in lithium carbonate is relatively minor, with imports ranging between 300-
501t since 2005, predominantly from China and Chile (Table 119). Exports of lithium
carbonate from India are almost negligible, excluding a shipment of over 200t to the
USA in 2010.
Table 119: India: Trade in lithium carbonate, 2005 to 2012 (t)
2005 2006 2007 2008 2009 2010 2011 2012
Imports
Chile 365 401 97 157 107 242 246 237
China 74 51 196 108 124 198 215 29
USA 7 26 8 26 24 53 33 64
Other 72 40 50 125 48 7 53 48
Total 518 518 352 416 303 501 547 409
Exports
USA - - - - - 276 19 19
China - 132 - 85 - - - -
Germany 53 - - - - - 1 -
Other 25 8 8 14 5 9 1 10
Total 78 140 7 99 5 285 20 29 Source: GTIS
Producers of lithium compounds in India are shown in Table 120.
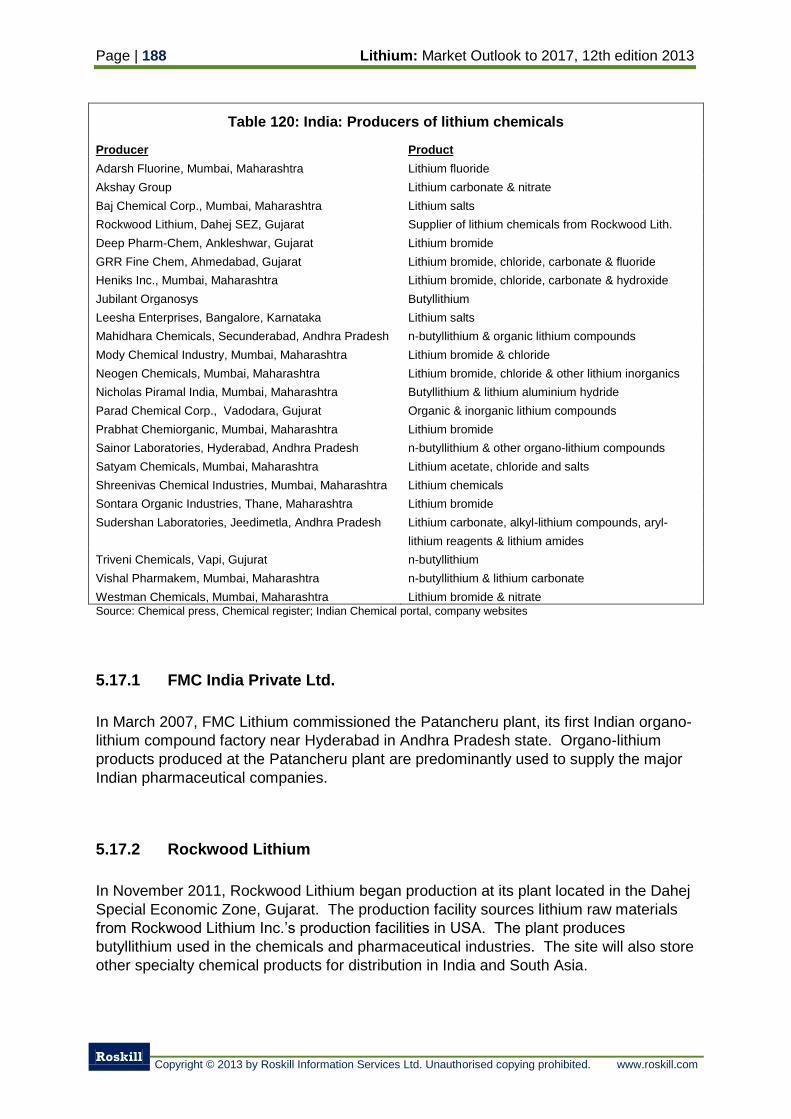
Page | 188 Lithium: Market Outlook to 2017, 12th edition 2013
Roskill
Copyright © 2013 by Roskill Information Services Ltd. Unauthorised copying prohibited. www.roskill.com
Table 120: India: Producers of lithium chemicals
Producer Product
Adarsh Fluorine, Mumbai, Maharashtra Lithium fluoride
Akshay Group Lithium carbonate & nitrate
Baj Chemical Corp., Mumbai, Maharashtra Lithium salts
Rockwood Lithium, Dahej SEZ, Gujarat Supplier of lithium chemicals from Rockwood Lith.
Deep Pharm-Chem, Ankleshwar, Gujarat Lithium bromide
GRR Fine Chem, Ahmedabad, Gujarat Lithium bromide, chloride, carbonate & fluoride
Heniks Inc., Mumbai, Maharashtra Lithium bromide, chloride, carbonate & hydroxide
Jubilant Organosys Butyllithium
Leesha Enterprises, Bangalore, Karnataka Lithium salts
Mahidhara Chemicals, Secunderabad, Andhra Pradesh n-butyllithium & organic lithium compounds
Mody Chemical Industry, Mumbai, Maharashtra Lithium bromide & chloride
Neogen Chemicals, Mumbai, Maharashtra Lithium bromide, chloride & other lithium inorganics
Nicholas Piramal India, Mumbai, Maharashtra Butyllithium & lithium aluminium hydride
Parad Chemical Corp., Vadodara, Gujurat Organic & inorganic lithium compounds
Prabhat Chemiorganic, Mumbai, Maharashtra Lithium bromide
Sainor Laboratories, Hyderabad, Andhra Pradesh n-butyllithium & other organo-lithium compounds
Satyam Chemicals, Mumbai, Maharashtra Lithium acetate, chloride and salts
Shreenivas Chemical Industries, Mumbai, Maharashtra Lithium chemicals
Sontara Organic Industries, Thane, Maharashtra Lithium bromide
Sudershan Laboratories, Jeedimetla, Andhra Pradesh Lithium carbonate, alkyl-lithium compounds, aryl-
lithium reagents & lithium amides
Triveni Chemicals, Vapi, Gujurat n-butyllithium
Vishal Pharmakem, Mumbai, Maharashtra n-butyllithium & lithium carbonate
Westman Chemicals, Mumbai, Maharashtra Lithium bromide & nitrate Source: Chemical press, Chemical register; Indian Chemical portal, company websites
5.17.1 FMC India Private Ltd.
In March 2007, FMC Lithium commissioned the Patancheru plant, its first Indian organo-
lithium compound factory near Hyderabad in Andhra Pradesh state. Organo-lithium
products produced at the Patancheru plant are predominantly used to supply the major
Indian pharmaceutical companies.
5.17.2 Rockwood Lithium
In November 2011, Rockwood Lithium began production at its plant located in the Dahej
Special Economic Zone, Gujarat. The production facility sources lithium raw materials
from Rockwood Lithium Inc.’s production facilities in USA. The plant produces
butyllithium used in the chemicals and pharmaceutical industries. The site will also store
other specialty chemical products for distribution in India and South Asia.
Lithium: Market Outlook to 2017, 12th edition 2013 Page | 189
Roskill
Copyright © 2013 by Roskill Information Services Ltd. Unauthorised copying prohibited. www.roskill.com
5.18 Ireland
Ireland has to date not been a producer of lithium products. Spodumene bearing
pegmatite intrusives were identified and drilled in Ireland between 1970 and 1980, which
reported a resource of 2Mt grading 0.63% Li2O (contained 31,000t LCE). Occurrences
are localised to southern Leinster province, in the Carlow and Wexford counties.
International Lithium Corporation (ILC), a multinational mineral exploration company
owned 25.5% by TNR Gold Corporation and 14.7% by Jiangxi Ganfeng Lithium Co. Ltd.
(Section 5.10.7.6), is exploring for lithium in the Leinster province of Ireland at the
Blackfriars project. The Blackfriars licence area covers 292km2 which contains 19
occurrences of lithium-bearing pegmatites. A non NI 43-101 compliant resource
estimation for the Blackfriars project suggests a resource of 570,000t grading 1.5% Li2O
(contained 21,000t LCE), which ILC intend to increase both in size and confidence with
further exploration.
Grab sampling of pegmatite boulders has returned grades exceeding 4.0% Li2O, with a
maximum grade of 4.74% Li2O from the Moylisha area of the property. Drilling at four of
the 19 pegmatite occurrences has returned lithium oxide grades of up to 1.85% Li2O.
5.19 Israel
The Dead Sea in Israel is one of the world’s largest and lowest inland lakes, containing
brines with typical concentrations of between 10-20ppm Li. The Dead Sea in both Israel
and Jordan is estimated to contain reserves of 2.0Mt Li, although no commercial of
lithium has taken place at the inland lake. The Mg: Li is also highly unfavourable for
traditional lithium brine extraction method, frequently exceeding 2,000: 1 compared to
1.5:1 at the Salar del Hombre Muerto in Argentina and 7.1:1 at the Salar de Maricunga
in Chile.
Dead Sea brines are extracted and evaporated in solar ponds to produce potash and
investigations on raffinates from this process to extract lithium have so far proved
unsuccessful.
The Dead Sea Bromine Group, a division of Israel Chemical produces lithium bromide
from a facility located in Ramat Hovav. The facility was constructed as a joint venture
with SQM of Chile, who presumably supplies lithium raw materials to the plant.
Established in 1989, METAL–TECH is the exclusive recycler of lithium batteries for the
Israeli government at a facility in Ramat Hovav near Beersheba.
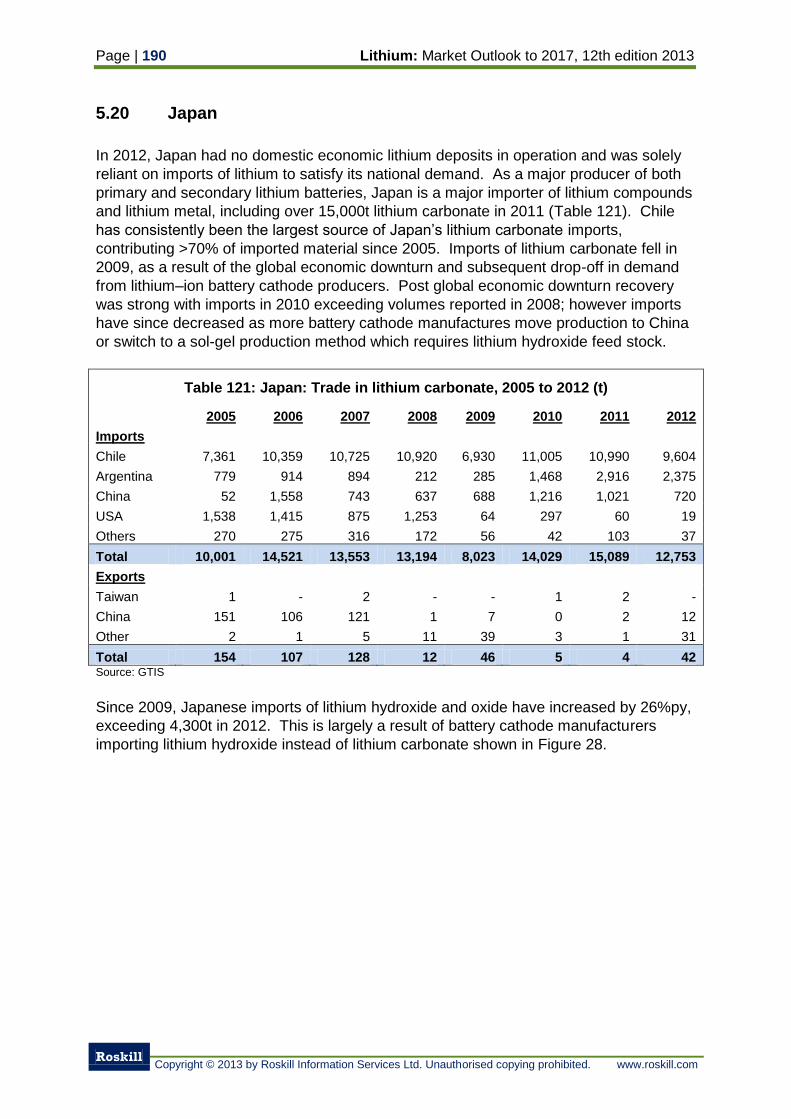
Page | 190 Lithium: Market Outlook to 2017, 12th edition 2013
Roskill
Copyright © 2013 by Roskill Information Services Ltd. Unauthorised copying prohibited. www.roskill.com
5.20 Japan
In 2012, Japan had no domestic economic lithium deposits in operation and was solely
reliant on imports of lithium to satisfy its national demand. As a major producer of both
primary and secondary lithium batteries, Japan is a major importer of lithium compounds
and lithium metal, including over 15,000t lithium carbonate in 2011 (Table 121). Chile
has consistently been the largest source of Japan’s lithium carbonate imports,
contributing >70% of imported material since 2005. Imports of lithium carbonate fell in
2009, as a result of the global economic downturn and subsequent drop-off in demand
from lithium–ion battery cathode producers. Post global economic downturn recovery
was strong with imports in 2010 exceeding volumes reported in 2008; however imports
have since decreased as more battery cathode manufactures move production to China
or switch to a sol-gel production method which requires lithium hydroxide feed stock.
Table 121: Japan: Trade in lithium carbonate, 2005 to 2012 (t)
2005 2006 2007 2008 2009 2010 2011 2012
Imports
Chile 7,361 10,359 10,725 10,920 6,930 11,005 10,990 9,604
Argentina 779 914 894 212 285 1,468 2,916 2,375
China 52 1,558 743 637 688 1,216 1,021 720
USA 1,538 1,415 875 1,253 64 297 60 19
Others 270 275 316 172 56 42 103 37
Total 10,001 14,521 13,553 13,194 8,023 14,029 15,089 12,753
Exports
Taiwan 1 - 2 - - 1 2 -
China 151 106 121 1 7 0 2 12
Other 2 1 5 11 39 3 1 31
Total 154 107 128 12 46 5 4 42 Source: GTIS
Since 2009, Japanese imports of lithium hydroxide and oxide have increased by 26%py,
exceeding 4,300t in 2012. This is largely a result of battery cathode manufacturers
importing lithium hydroxide instead of lithium carbonate shown in Figure 28.
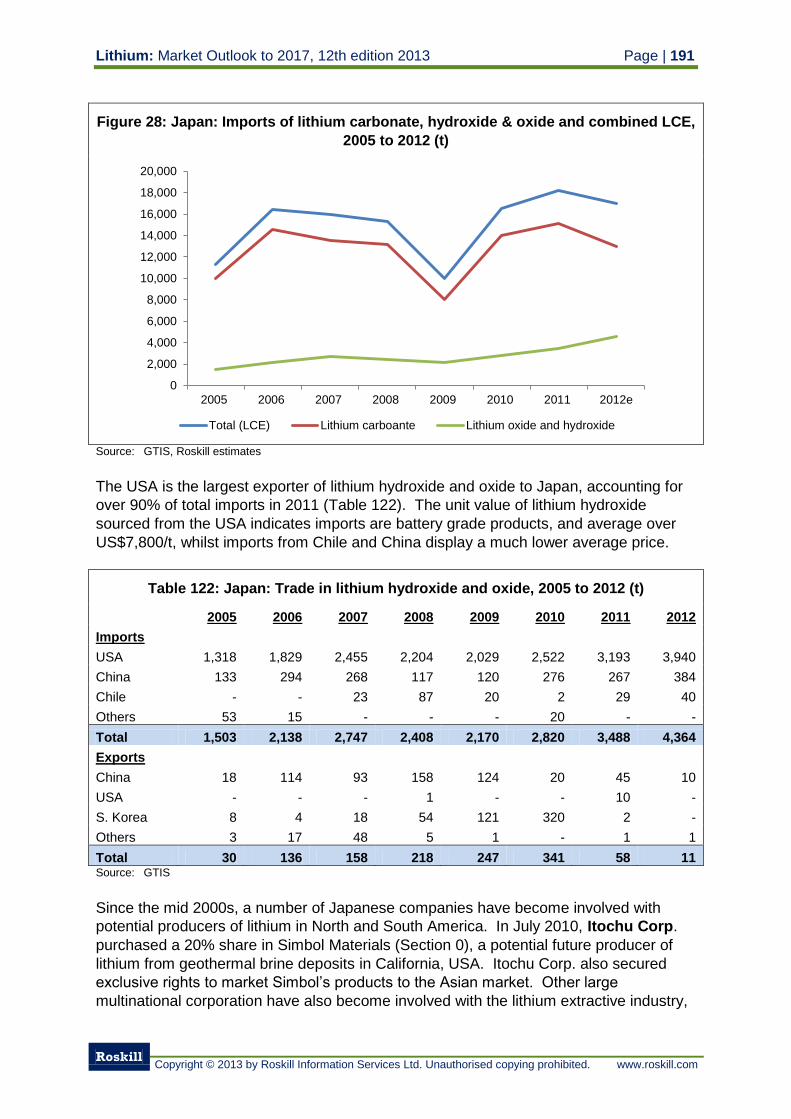
Lithium: Market Outlook to 2017, 12th edition 2013 Page | 191
Roskill
Copyright © 2013 by Roskill Information Services Ltd. Unauthorised copying prohibited. www.roskill.com
Figure 28: Japan: Imports of lithium carbonate, hydroxide & oxide and combined LCE,
2005 to 2012 (t)
Source: GTIS, Roskill estimates
The USA is the largest exporter of lithium hydroxide and oxide to Japan, accounting for
over 90% of total imports in 2011 (Table 122). The unit value of lithium hydroxide
sourced from the USA indicates imports are battery grade products, and average over
US$7,800/t, whilst imports from Chile and China display a much lower average price.
Table 122: Japan: Trade in lithium hydroxide and oxide, 2005 to 2012 (t)
2005 2006 2007 2008 2009 2010 2011 2012
Imports
USA 1,318 1,829 2,455 2,204 2,029 2,522 3,193 3,940
China 133 294 268 117 120 276 267 384
Chile - - 23 87 20 2 29 40
Others 53 15 - - - 20 - -
Total 1,503 2,138 2,747 2,408 2,170 2,820 3,488 4,364
Exports
China 18 114 93 158 124 20 45 10
USA - - - 1 - - 10 -
S. Korea 8 4 18 54 121 320 2 -
Others 3 17 48 5 1 - 1 1
Total 30 136 158 218 247 341 58 11 Source: GTIS
Since the mid 2000s, a number of Japanese companies have become involved with
potential producers of lithium in North and South America. In July 2010, Itochu Corp.
purchased a 20% share in Simbol Materials (Section 0), a potential future producer of
lithium from geothermal brine deposits in California, USA. Itochu Corp. also secured
exclusive rights to market Simbol’s products to the Asian market. Other large
multinational corporation have also become involved with the lithium extractive industry,
0
2,000
4,000
6,000
8,000
10,000
12,000
14,000
16,000
18,000
20,000
2005 2006 2007 2008 2009 2010 2011 2012e
Total (LCE) Lithium carboante Lithium oxide and hydroxide
Page | 192 Lithium: Market Outlook to 2017, 12th edition 2013
Roskill
Copyright © 2013 by Roskill Information Services Ltd. Unauthorised copying prohibited. www.roskill.com
with Toyota Tsusho investing US$150M in Orocobre’s Salar de Olaroz property in
Argentina, and Mitsubishi Corp. investing in Lithium Americas’ Salar de Caurachi
property, also located in Argentina.
Marubeni Corp. holds a 30% voting right in Pacific Lithium, a producer of high purity
lithium carbonate at its facility in Osaka prefecture. Marubeni also agreed in November
2010 to set up a Centre of Lithium Innovation in Chile with support from SQM,
Rockwood Lithium and Universidad de Chile. The Innovation centre will focus on
developing lithium-ion battery technologies and raw materials for future demand.
Honjo Chemical Corp. began the production of lithium metal and compounds in 1955
and has grown to become the largest producer of lithium chemicals and compounds in
Japan. Honjo has formed a number of joint ventures to produce specialty lithium
compounds. A joint venture between Honjo and Lithium Corp. of America (FMC Lithium)
began producing butyl lithium in 1986 and lithium metal in 1989. In 1993, Honjo formed
another joint venture ‘Dalian Honjo Chemicals’ with Dalian Chemicals, producing and
marketing lithium bromide. Honjo Energy Systems, a subsidiary of Honjo Chemicals
formed during restructuring of the company in 2002, produces cathode materials for
secondary lithium-ion batteries.
Honjo Chemicals operates two plants, on Naoshima Island in Kanagawa prefecture and
Neyagawa in Osaka prefecture. The product range includes:
Neyagawa Naoshima
Lithium cobalate Lithium bromide
Lithium manganate Lithium hydroxide
Lithium nickelate High-purity lithium carbonate
Lithium foil Lithium chloride
Lithium alloy Lithium carbonate micro powder
5.21 Kazakhstan
Until 1995, the Belogorsky combine exploited the Belogorsky, Yubileiny and Bakenny
deposits, which form part of the Ak Kezen pegmatite complex. Historically, Belogorsky
produced a tantalum concentrate grading around 28% Ta2O5, however, after 1995
production of tantalum concentrate ceased and a feldspar concentrate was produced up
until 1998. In late 1999, the Belogorsky combine was declared bankrupt and was sold to
Zolotoi Drakon of Kazakhstan.
In the mid 2000s, Belogorsky undertook pilot plant technological test work on samples of
spodumene concentrate to identify a method for lithium extraction. Ores were leached
with sulphuric acid at 1,105oC for 30 minutes to extract lithium from the spodumene.
The Belogorsky pilot plant is not believed to be in production and no further test work
into lithium extraction has been undertaken at the plant.
In October 2009, Galaxy Resources signed a Strategic Lithium Alliance Agreement with
General Mining Corp. Ltd. to explore multiple locations in Mongolia and Kazakhstan for
Lithium: Market Outlook to 2017, 12th edition 2013 Page | 193
Roskill
Copyright © 2013 by Roskill Information Services Ltd. Unauthorised copying prohibited. www.roskill.com
lithium. The Uvs Basin project was the main focus for exploration, where previous
exploration by General Mining Corp. had identified deposits of solid potash and saline
brines. As part of the agreement, Galaxy Resources and General Mining Corp. plan to
co-operate on the identification, exploration, acquisition and development of both the
evaporite and brines deposits for their lithium and potassium potential.
Nova Mining Corporation has also shown interest in acquiring a mineral exploration
licences for multiple projects in Kazakhstan, although negotiations for the licences are
on-going.
5.22 Mali
Lithium deposits from spodumene-bearing pegmatites occur in the southwest of the
country within the Southern Mining district. The most notable lithium occurrence is the
Bougouni Lithium deposit, which produced a small amount of lithium products between
1956 and 1970.
In 1974, a deposit of 300,000t of spodumene with associated quartz, microcline, albite
and muscovite was discovered in the Sikasso-Bougouni area of Mali. The deposit was
later identified by Protec of Canada as economically exploitable, although no further
development plans have been announced.
5.23 Mexico
Although not a historic producer of lithium products, Mexico hosts a number of known
hectorite and geothermal brine deposits being investigated for their lithium potential. In
2011, Mexico was only a minor importer of lithium compounds, importing approximately
175t lithium oxides and hydroxides, and a further 220t lithium carbonate.
5.23.1 Litio Mex S.A. de C.V. (Piero Sutti S.A. de C.V.)
In 2009, Piero Sutti S.A.de C.V. (Piero Sutti) announced the discovery of lithium deposits
at a number of concessions in Zacatecas and San Luis Potosi states, Mexico. In total
Piero Sutti controlled six separate concessions overlying multiple lagoons, covering
468.35km2 (Table 123).
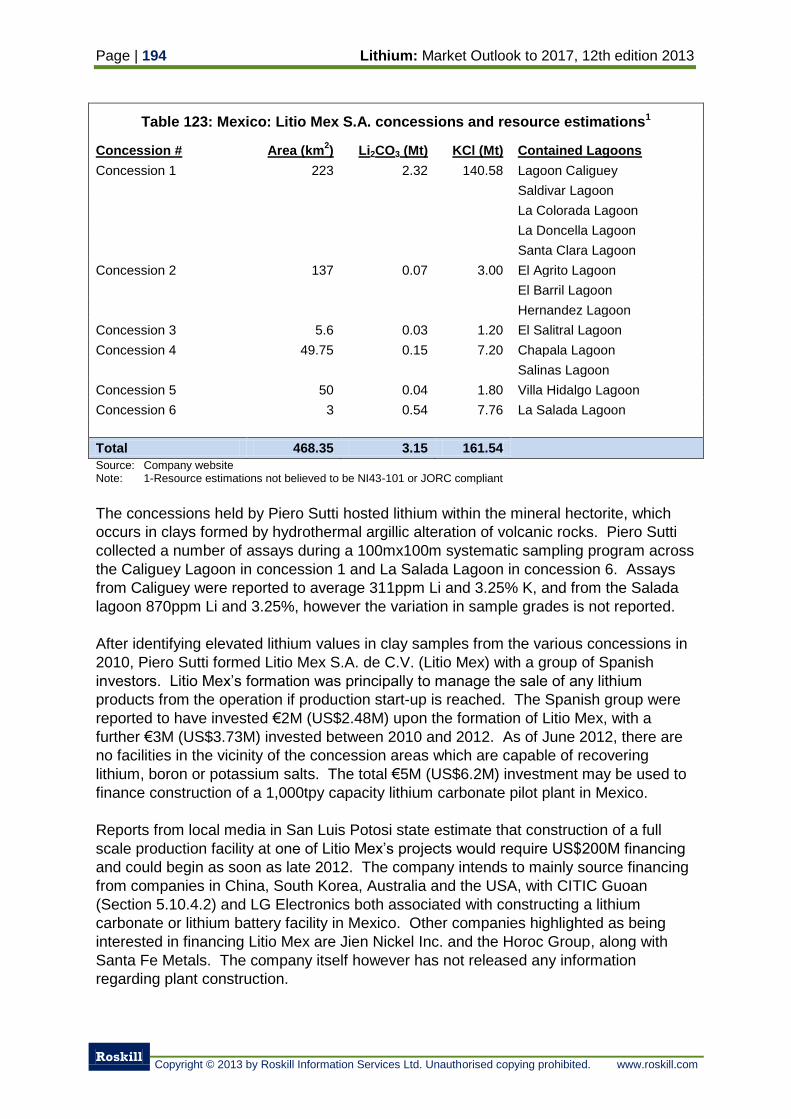
Page | 194 Lithium: Market Outlook to 2017, 12th edition 2013
Roskill
Copyright © 2013 by Roskill Information Services Ltd. Unauthorised copying prohibited. www.roskill.com
Table 123: Mexico: Litio Mex S.A. concessions and resource estimations1
Concession # Area (km2) Li2CO3 (Mt) KCl (Mt) Contained Lagoons
Concession 1 223 2.32 140.58 Lagoon Caliguey
Saldivar Lagoon
La Colorada Lagoon
La Doncella Lagoon
Santa Clara Lagoon
Concession 2 137 0.07 3.00 El Agrito Lagoon
El Barril Lagoon
Hernandez Lagoon
Concession 3 5.6 0.03 1.20 El Salitral Lagoon
Concession 4 49.75 0.15 7.20 Chapala Lagoon
Salinas Lagoon
Concession 5 50 0.04 1.80 Villa Hidalgo Lagoon
Concession 6 3 0.54 7.76 La Salada Lagoon
Total 468.35 3.15 161.54
Source: Company website Note: 1-Resource estimations not believed to be NI43-101 or JORC compliant
The concessions held by Piero Sutti hosted lithium within the mineral hectorite, which
occurs in clays formed by hydrothermal argillic alteration of volcanic rocks. Piero Sutti
collected a number of assays during a 100mx100m systematic sampling program across
the Caliguey Lagoon in concession 1 and La Salada Lagoon in concession 6. Assays
from Caliguey were reported to average 311ppm Li and 3.25% K, and from the Salada
lagoon 870ppm Li and 3.25%, however the variation in sample grades is not reported.
After identifying elevated lithium values in clay samples from the various concessions in
2010, Piero Sutti formed Litio Mex S.A. de C.V. (Litio Mex) with a group of Spanish
investors. Litio Mex’s formation was principally to manage the sale of any lithium
products from the operation if production start-up is reached. The Spanish group were
reported to have invested €2M (US$2.48M) upon the formation of Litio Mex, with a
further €3M (US$3.73M) invested between 2010 and 2012. As of June 2012, there are
no facilities in the vicinity of the concession areas which are capable of recovering
lithium, boron or potassium salts. The total €5M (US$6.2M) investment may be used to
finance construction of a 1,000tpy capacity lithium carbonate pilot plant in Mexico.
Reports from local media in San Luis Potosi state estimate that construction of a full
scale production facility at one of Litio Mex’s projects would require US$200M financing
and could begin as soon as late 2012. The company intends to mainly source financing
from companies in China, South Korea, Australia and the USA, with CITIC Guoan
(Section 5.10.4.2) and LG Electronics both associated with constructing a lithium
carbonate or lithium battery facility in Mexico. Other companies highlighted as being
interested in financing Litio Mex are Jien Nickel Inc. and the Horoc Group, along with
Santa Fe Metals. The company itself however has not released any information
regarding plant construction.
Lithium: Market Outlook to 2017, 12th edition 2013 Page | 195
Roskill
Copyright © 2013 by Roskill Information Services Ltd. Unauthorised copying prohibited. www.roskill.com
5.23.2 First Potash Corp. (Mexico)
In December 2009, First Potash Corp. (FPC) (Section 5.9.8) acquired an option to
purchase a 76% stake in the Cerro Prieto geothermal brine deposit located in Baja
California State, 30km south of Mexicali. Cerro Prieto is operated by a JV between
Escondida Internacional S.A. de C.V. (76%) and CPI Internacional S.A. de C.V. (24%).
FPC agreed the option to acquire Cerro Prieto with Escondida Internacional, for an initial
fee of US$125,000, 5M common shares and 5M warrants (US$0.50/share for two years)
upon signing. Furthermore, FPC have agreed to pay US$200,000 on signing the
agreement along with US$8,000 per month and US$50,000 upon closure of the
agreement to Escondida Internacional, to repay outstanding debts and cover costs for
due diligence, legal fees and G&A fees. An agreement between the two parties, has not
yet been signed and confirmed.
If the Cerro Prieto project reaches commercial production of lithium products, FPC are
also obliged to pay US$1.75M to shareholders in three phases over an 18 month period
from first production.
The Cerro Prieto project draws geothermal brine from 170 geothermal wells, pumping to
surface 5.7M gallons of hot brine per day. Approximately 60% of brine is pumped into
evaporation ponds and the other 40% used to produce steam for power generation.
Potential lithium carbonate production from the project is projected at 10,000t LCE.
5.23.3 Bacanora Minerals Ltd.
Bacanora Minerals is focused on the development of borate and lithium projects in
Sonora State, Mexico. The company holds two projects in Sorona State, the Magdalena
Borate project 17km east of Magdalena de Kino, and the Sonora Lithium project 180km
north east of Hermosillo. At the Sonora Lithium project, Lithium is hosted within the
minerals hectorite and polylithionite occurring in clay outcrops in volcano-sedimentary
sequences.
Surface sampling of the hectorite-polylithionite clays has returned grades of between
1,700ppm Li and 5,500ppm Li. Primary phase drilling completed in January 2011 at the
La Ventana target returned 955-5,080ppm Li along with anomalous caesium, boron,
potassium and magnesium concentrations. This was backed up by a second phase of
drilling on the target in December 2011, which returned similar grades.
Bacanora Minerals released a PEA for the La Ventana target at the Sonora project in
Januray 2013. The study assumed the production of 35,000tpy LCE over a 20 year
LOM, with average operating costs of US$1,958/t lithium carbonate and an initial capital
cost of US$114M. An additional inferred resource estimation of 16.83Mt grading 1.3%
Li2CO3 was reported by Bacanora, bringing the total inferred resource at the Sonara
property to 60Mt grading 1.6% LCE (contained 960,000t LCE).
Page | 196 Lithium: Market Outlook to 2017, 12th edition 2013
Roskill
Copyright © 2013 by Roskill Information Services Ltd. Unauthorised copying prohibited. www.roskill.com
In February 2013, Bacanora signed a farm-in-agreement (binding MoU) with Rare Earth
Minerals (REM) to co-operate in exploration of the newly identified El Sauz and Fleur
concessions adjacent to and along strike from Bacanora's La Ventana deposit. In the
agreement, REM will purchase a 10% shareholding in Bacanora Minerals for an initial
fee of US$250,000 and a further US$500,000 in exploration expenditure over a six
month period. After the initial six month period, REM has an option to increase its
shareholding to 30% for a fee of US$500,000 and a further US$1M in exploration
expenditure over a six month period. REM will also have first refusal to increase its
interest up to 49.9%.
5.24 Mongolia
Although Mongolia is not a producer of lithium at present, the country is known to
contain deposits of evaporate minerals and saline brines are being explored for their
lithium and potash potential. In 2010, JOGMEC and the National Institute of Advanced
Industry, Science and Technology of Japan signed an agreement with the Mongolian
government to develop lithium resources in the country. Exploration is likely to focus on
areas in the north west of the country near the border with Russia which contains known
occurrences of potash minerals and saline brines.
Golden Cross LLC, a wholly owned subsidiary of General Mining Corporation, holds
over 2,000km2 of exploration licences named the Uvs Basin project in Uvs Aimag
province, North West Mongolia. The exploration licences target mainly coal and solid
potash deposits although the area is thought to be prospective for lithium brines and
soda ash.
In October 2009, Galaxy Resources (Section 5.3.2) signed an agreement with Golden
Cross LLC through their parent company General Mining Corporation for a right to
finance any lithium project in Kazakhstan and Mongolia through to BFS stage. In return
Galaxy would take ownership of 80% of the funded project with General Mining
Corporation having the option to retain a 20% stake.
Nova Mining Corporation acquired the right to purchase production from three lithium
projects in Mongolia. The letter of intent signed in June 2012 with Mongolian National
Mining Consultants Limited (MNMC) exclusively allows Nova Mining to purchase at a
discounted rate production from three lithium mining licences located in Bayankhongor,
Dornogobi and Dundgobi. Nova is to undertake a due diligence studies before signing a
Definitive Mineral Production Agreement.
5.25 Mozambique
The Alto Ligonha Pegmatite Field is located close to the town of Alto Ligonha, eastern
Nampula area, and is host to the greatest concentration of lithium depostis in the
country. The pegmatites of the Alto Ligonha field display a range of mineral
assemblages and chemistries, although lithium predominatnely occurs as spodumene
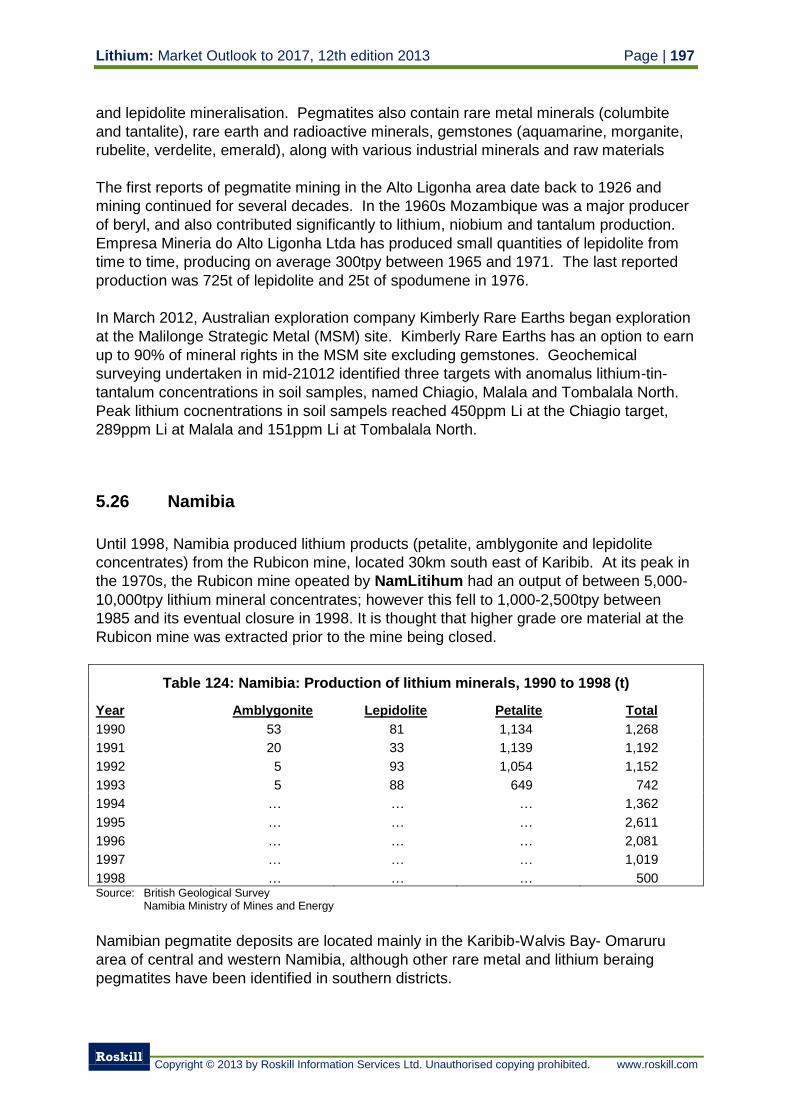
Lithium: Market Outlook to 2017, 12th edition 2013 Page | 197
Roskill
Copyright © 2013 by Roskill Information Services Ltd. Unauthorised copying prohibited. www.roskill.com
and lepidolite mineralisation. Pegmatites also contain rare metal minerals (columbite
and tantalite), rare earth and radioactive minerals, gemstones (aquamarine, morganite,
rubelite, verdelite, emerald), along with various industrial minerals and raw materials
The first reports of pegmatite mining in the Alto Ligonha area date back to 1926 and
mining continued for several decades. In the 1960s Mozambique was a major producer
of beryl, and also contributed significantly to lithium, niobium and tantalum production.
Empresa Mineria do Alto Ligonha Ltda has produced small quantities of lepidolite from
time to time, producing on average 300tpy between 1965 and 1971. The last reported
production was 725t of lepidolite and 25t of spodumene in 1976.
In March 2012, Australian exploration company Kimberly Rare Earths began exploration
at the Malilonge Strategic Metal (MSM) site. Kimberly Rare Earths has an option to earn
up to 90% of mineral rights in the MSM site excluding gemstones. Geochemical
surveying undertaken in mid-21012 identified three targets with anomalus lithium-tin-
tantalum concentrations in soil samples, named Chiagio, Malala and Tombalala North.
Peak lithium cocnentrations in soil sampels reached 450ppm Li at the Chiagio target,
289ppm Li at Malala and 151ppm Li at Tombalala North.
5.26 Namibia
Until 1998, Namibia produced lithium products (petalite, amblygonite and lepidolite
concentrates) from the Rubicon mine, located 30km south east of Karibib. At its peak in
the 1970s, the Rubicon mine opeated by NamLitihum had an output of between 5,000-
10,000tpy lithium mineral concentrates; however this fell to 1,000-2,500tpy between
1985 and its eventual closure in 1998. It is thought that higher grade ore material at the
Rubicon mine was extracted prior to the mine being closed.
Table 124: Namibia: Production of lithium minerals, 1990 to 1998 (t)
Year Amblygonite Lepidolite Petalite Total
1990 53 81 1,134 1,268
1991 20 33 1,139 1,192
1992 5 93 1,054 1,152
1993 5 88 649 742
1994 … … … 1,362
1995 … … … 2,611
1996 … … … 2,081
1997 … … … 1,019
1998 … … … 500 Source: British Geological Survey Namibia Ministry of Mines and Energy
Namibian pegmatite deposits are located mainly in the Karibib-Walvis Bay- Omaruru
area of central and western Namibia, although other rare metal and lithium beraing
pegmatites have been identified in southern districts.
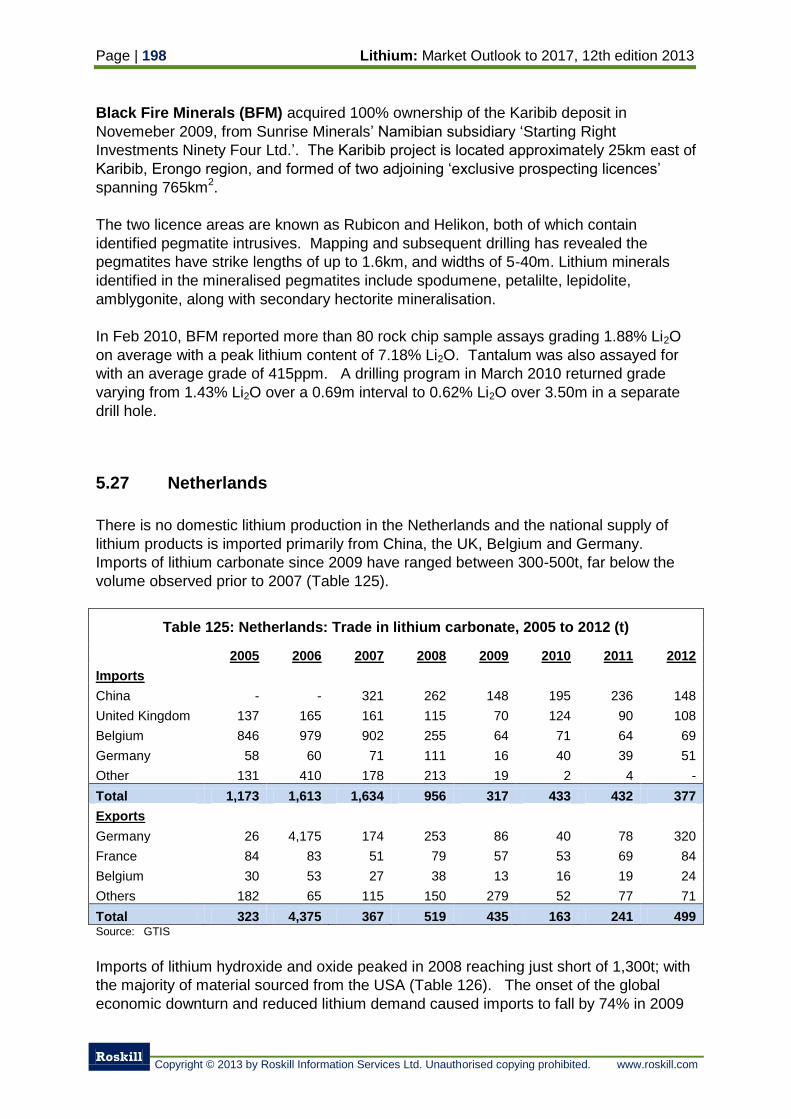
Page | 198 Lithium: Market Outlook to 2017, 12th edition 2013
Roskill
Copyright © 2013 by Roskill Information Services Ltd. Unauthorised copying prohibited. www.roskill.com
Black Fire Minerals (BFM) acquired 100% ownership of the Karibib deposit in
Novemeber 2009, from Sunrise Minerals’ Namibian subsidiary ‘Starting Right
Investments Ninety Four Ltd.’. The Karibib project is located approximately 25km east of
Karibib, Erongo region, and formed of two adjoining ‘exclusive prospecting licences’
spanning 765km2.
The two licence areas are known as Rubicon and Helikon, both of which contain
identified pegmatite intrusives. Mapping and subsequent drilling has revealed the
pegmatites have strike lengths of up to 1.6km, and widths of 5-40m. Lithium minerals
identified in the mineralised pegmatites include spodumene, petalilte, lepidolite,
amblygonite, along with secondary hectorite mineralisation.
In Feb 2010, BFM reported more than 80 rock chip sample assays grading 1.88% Li2O
on average with a peak lithium content of 7.18% Li2O. Tantalum was also assayed for
with an average grade of 415ppm. A drilling program in March 2010 returned grade
varying from 1.43% Li2O over a 0.69m interval to 0.62% Li2O over 3.50m in a separate
drill hole.
5.27 Netherlands
There is no domestic lithium production in the Netherlands and the national supply of
lithium products is imported primarily from China, the UK, Belgium and Germany.
Imports of lithium carbonate since 2009 have ranged between 300-500t, far below the
volume observed prior to 2007 (Table 125).
Table 125: Netherlands: Trade in lithium carbonate, 2005 to 2012 (t)
2005 2006 2007 2008 2009 2010 2011 2012
Imports
China - - 321 262 148 195 236 148
United Kingdom 137 165 161 115 70 124 90 108
Belgium 846 979 902 255 64 71 64 69
Germany 58 60 71 111 16 40 39 51
Other 131 410 178 213 19 2 4 -
Total 1,173 1,613 1,634 956 317 433 432 377
Exports
Germany 26 4,175 174 253 86 40 78 320
France 84 83 51 79 57 53 69 84
Belgium 30 53 27 38 13 16 19 24
Others 182 65 115 150 279 52 77 71
Total 323 4,375 367 519 435 163 241 499 Source: GTIS
Imports of lithium hydroxide and oxide peaked in 2008 reaching just short of 1,300t; with
the majority of material sourced from the USA (Table 126). The onset of the global
economic downturn and reduced lithium demand caused imports to fall by 74% in 2009
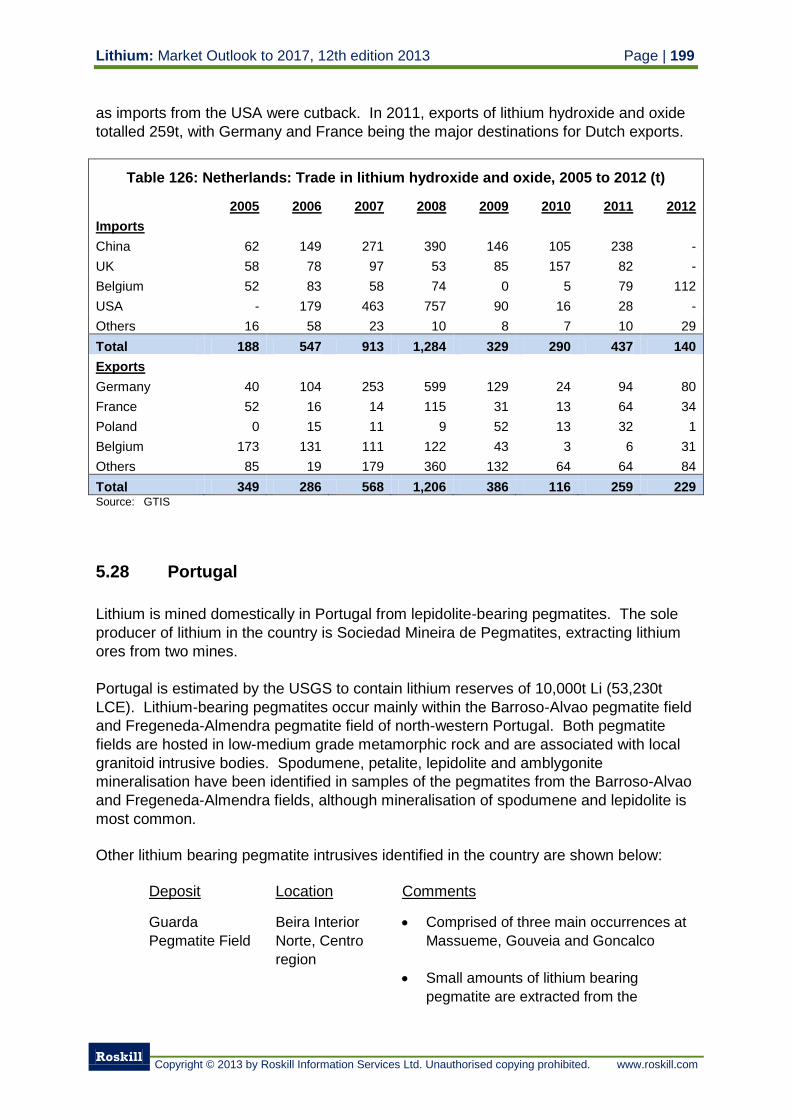
Lithium: Market Outlook to 2017, 12th edition 2013 Page | 199
Roskill
Copyright © 2013 by Roskill Information Services Ltd. Unauthorised copying prohibited. www.roskill.com
as imports from the USA were cutback. In 2011, exports of lithium hydroxide and oxide
totalled 259t, with Germany and France being the major destinations for Dutch exports.
Table 126: Netherlands: Trade in lithium hydroxide and oxide, 2005 to 2012 (t)
2005 2006 2007 2008 2009 2010 2011 2012
Imports
China 62 149 271 390 146 105 238 -
UK 58 78 97 53 85 157 82 -
Belgium 52 83 58 74 0 5 79 112
USA - 179 463 757 90 16 28 -
Others 16 58 23 10 8 7 10 29
Total 188 547 913 1,284 329 290 437 140
Exports
Germany 40 104 253 599 129 24 94 80
France 52 16 14 115 31 13 64 34
Poland 0 15 11 9 52 13 32 1
Belgium 173 131 111 122 43 3 6 31
Others 85 19 179 360 132 64 64 84
Total 349 286 568 1,206 386 116 259 229 Source: GTIS
5.28 Portugal
Lithium is mined domestically in Portugal from lepidolite-bearing pegmatites. The sole
producer of lithium in the country is Sociedad Mineira de Pegmatites, extracting lithium
ores from two mines.
Portugal is estimated by the USGS to contain lithium reserves of 10,000t Li (53,230t
LCE). Lithium-bearing pegmatites occur mainly within the Barroso-Alvao pegmatite field
and Fregeneda-Almendra pegmatite field of north-western Portugal. Both pegmatite
fields are hosted in low-medium grade metamorphic rock and are associated with local
granitoid intrusive bodies. Spodumene, petalite, lepidolite and amblygonite
mineralisation have been identified in samples of the pegmatites from the Barroso-Alvao
and Fregeneda-Almendra fields, although mineralisation of spodumene and lepidolite is
most common.
Other lithium bearing pegmatite intrusives identified in the country are shown below:
Deposit Location Comments
Guarda
Pegmatite Field
Beira Interior
Norte, Centro
region
Comprised of three main occurrences at
Massueme, Gouveia and Goncalco
Small amounts of lithium bearing
pegmatite are extracted from the
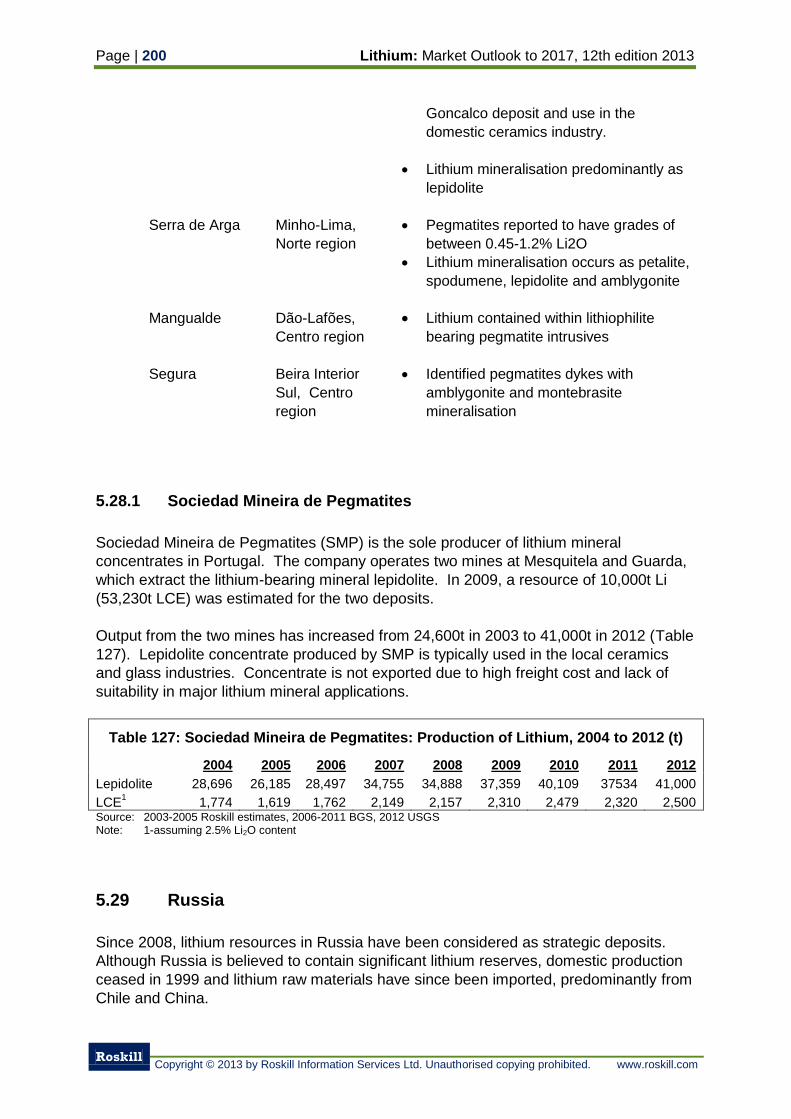
Page | 200 Lithium: Market Outlook to 2017, 12th edition 2013
Roskill
Copyright © 2013 by Roskill Information Services Ltd. Unauthorised copying prohibited. www.roskill.com
Goncalco deposit and use in the
domestic ceramics industry.
Lithium mineralisation predominantly as
lepidolite
Serra de Arga Minho-Lima,
Norte region
Pegmatites reported to have grades of
between 0.45-1.2% Li2O
Lithium mineralisation occurs as petalite,
spodumene, lepidolite and amblygonite
Mangualde Dão-Lafões,
Centro region
Lithium contained within lithiophilite
bearing pegmatite intrusives
Segura Beira Interior
Sul, Centro
region
Identified pegmatites dykes with
amblygonite and montebrasite
mineralisation
5.28.1 Sociedad Mineira de Pegmatites
Sociedad Mineira de Pegmatites (SMP) is the sole producer of lithium mineral
concentrates in Portugal. The company operates two mines at Mesquitela and Guarda,
which extract the lithium-bearing mineral lepidolite. In 2009, a resource of 10,000t Li
(53,230t LCE) was estimated for the two deposits.
Output from the two mines has increased from 24,600t in 2003 to 41,000t in 2012 (Table
127). Lepidolite concentrate produced by SMP is typically used in the local ceramics
and glass industries. Concentrate is not exported due to high freight cost and lack of
suitability in major lithium mineral applications.
Table 127: Sociedad Mineira de Pegmatites: Production of Lithium, 2004 to 2012 (t)
2004 2005 2006 2007 2008 2009 2010 2011 2012
Lepidolite 28,696 26,185 28,497 34,755 34,888 37,359 40,109 37534 41,000
LCE1 1,774 1,619 1,762 2,149 2,157 2,310 2,479 2,320 2,500
Source: 2003-2005 Roskill estimates, 2006-2011 BGS, 2012 USGS Note: 1-assuming 2.5% Li2O content
5.29 Russia
Since 2008, lithium resources in Russia have been considered as strategic deposits.
Although Russia is believed to contain significant lithium reserves, domestic production
ceased in 1999 and lithium raw materials have since been imported, predominantly from
Chile and China.
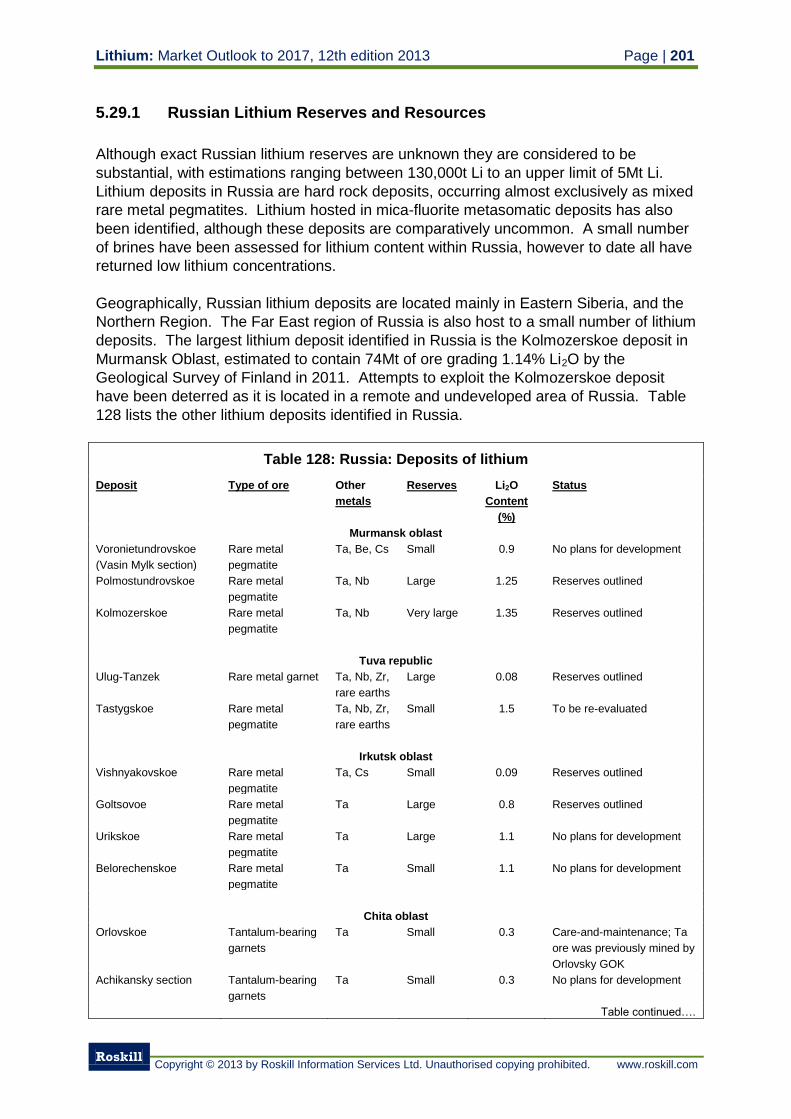
Lithium: Market Outlook to 2017, 12th edition 2013 Page | 201
Roskill
Copyright © 2013 by Roskill Information Services Ltd. Unauthorised copying prohibited. www.roskill.com
5.29.1 Russian Lithium Reserves and Resources
Although exact Russian lithium reserves are unknown they are considered to be
substantial, with estimations ranging between 130,000t Li to an upper limit of 5Mt Li.
Lithium deposits in Russia are hard rock deposits, occurring almost exclusively as mixed
rare metal pegmatites. Lithium hosted in mica-fluorite metasomatic deposits has also
been identified, although these deposits are comparatively uncommon. A small number
of brines have been assessed for lithium content within Russia, however to date all have
returned low lithium concentrations.
Geographically, Russian lithium deposits are located mainly in Eastern Siberia, and the
Northern Region. The Far East region of Russia is also host to a small number of lithium
deposits. The largest lithium deposit identified in Russia is the Kolmozerskoe deposit in
Murmansk Oblast, estimated to contain 74Mt of ore grading 1.14% Li2O by the
Geological Survey of Finland in 2011. Attempts to exploit the Kolmozerskoe deposit
have been deterred as it is located in a remote and undeveloped area of Russia. Table
128 lists the other lithium deposits identified in Russia.
Table 128: Russia: Deposits of lithium
Deposit Type of ore Other
metals
Reserves Li2O
Content
(%)
Status
Murmansk oblast
Voronietundrovskoe
(Vasin Mylk section)
Rare metal
pegmatite
Ta, Be, Cs Small 0.9 No plans for development
Polmostundrovskoe Rare metal
pegmatite
Ta, Nb Large 1.25 Reserves outlined
Kolmozerskoe Rare metal
pegmatite
Ta, Nb Very large 1.35 Reserves outlined
Tuva republic
Ulug-Tanzek Rare metal garnet Ta, Nb, Zr,
rare earths
Large 0.08 Reserves outlined
Tastygskoe Rare metal
pegmatite
Ta, Nb, Zr,
rare earths
Small 1.5 To be re-evaluated
Irkutsk oblast
Vishnyakovskoe Rare metal
pegmatite
Ta, Cs Small 0.09 Reserves outlined
Goltsovoe Rare metal
pegmatite
Ta Large 0.8 Reserves outlined
Urikskoe Rare metal
pegmatite
Ta Large 1.1 No plans for development
Belorechenskoe Rare metal
pegmatite
Ta Small 1.1 No plans for development
Chita oblast
Orlovskoe Tantalum-bearing
garnets
Ta Small 0.3 Care-and-maintenance; Ta
ore was previously mined by
Orlovsky GOK
Achikansky section Tantalum-bearing
garnets
Ta Small 0.3 No plans for development
Table continued….
Page | 202 Lithium: Market Outlook to 2017, 12th edition 2013
Roskill
Copyright © 2013 by Roskill Information Services Ltd. Unauthorised copying prohibited. www.roskill.com
….Table continues
Deposit Type of ore Other
metals
Reserves Li2O
Content
(%)
Status
Etykinskoe Tantalum-bearing
garnets
Ta Medium 0.1 Under preparation for
mining
Zavitinskoe Rare metal
pegmatite
Ta, Be Medium 0.7 Care-and-maintenance; ore
was previously mined by
Zabaikalsky GOK
Primorsky krai
Voznesenskoe Mica-fluorite ores Be, CaF2 Medium 0.5 Fluorite is mined by
Yaroslavsky GOK
Pogranichnoe Mica-fluorite ores Be, CaF2 Small 0.2 Fluorite is mined by
Yaroslavsky GOK
Source: Light Metals in the CIS, Roskill Information Services Ltd; InfoMine Note: Small: <100,000t Li2O; medium: 100,000-300,000t Li2O; large: 300,000-600,000t Li2O; very large: >600,000t
Li2O
5.29.2 Russian Lithium Production
Russian production of lithium raw materials declined in the 1990’s as falling lithium
prices and increased supply from brine deposits in Chile ultimately made the Russian
hard rock projects uneconomic and uncompetitive. The Zavitinskoe deposit in Chita
Oblast was the last miner of lithium raw materials in Russia, stopping production of
spodumene concentrate in 1997. The Zavitinskoe mine remains on care and
maintenance, managed by the TVEL Corporation, supporting the possibility that
production from the project may be restarted in favourable market conditions.
TVEL was established in 1996 to improve the production efficiency of nuclear fuel
enterprises in Russia. The corporation is comprised of 15 enterprises involved in the
mining and processing of natural uranium and rare metals including lithium. Two of
TVEL’s subsidiaries, process lithium products, which are JSC Chemical and
Metallurgical Plant in Krasnoyarsk Krai, and JSC Novosibirsk Chemical Concentration
Plant in Novosibirsk Oblast.
5.29.2.1 JSC Chemical and Metallurgical Plant
JSC Chemical and Metallurgical Plant (JSC C&MP) was founded in 1956 to process
spodumene concentrate from the Zavitinskoe (Zabaykalskogo) rare metal pegmatite in
Chita Oblast. Spodumene concentrates were originally processed to produce lithium
hydroxide, however production circuits to produce lithium carbonate, lithium metal and
other rare metals such as rubidium caesium and gallium were added later during the
plants operation. Production capacity at the JSC C&MP is reported to be 8,000tpy
lithium hydroxide and 50tpy lithium metal. The product list in May 2012 includes:
Lithium metal: catalyst grade (98% Li), technical grade (99% Li), battery grade
(99.9% Li)
Lithium: Market Outlook to 2017, 12th edition 2013 Page | 203
Roskill
Copyright © 2013 by Roskill Information Services Ltd. Unauthorised copying prohibited. www.roskill.com
Lithium hydroxide anhydrous (99% LiOH)
Lithium carbonate (99.95% Li2CO3)
Lithium hydride (98% LiH)
Lithium hydroxide monohydrate (55% LiOH)
Production from the Zavitinskoe rare metal pegmatite mine declined after the dissolution
of the Soviet Union in 1991, and mining finally ceased in 1997 as a result of falling
lithium prices. The Zavitinskoe mine was originally designed to extract >1Mtpy ore
grading 0.6-0.7% Li2O and produce a spodumene concentrate containing 5% Li2O.
When the mine was closed in 1997 the Zavitinskoe deposit was reported to contain
reserves of >7Mt ore grading 0.6-0.7% Li2O, and if ore adjacent to the known deposit
was considered, mining of 1Mtpy ore could be sustained for a further 20 years.
After the closure of the Zavitinskoe mine in 1997, JSC C&MP began importing lithium
carbonate, mainly from SQM in Chile and various Chinese producers to produce lithium
hydroxide. The processing of lithium chloride at the JSC C&MP is likely to be phased
out when lithium carbonate becomes more readily available.
5.29.2.2 JSC Novosibirsk Chemical Concentration Plant
JSC Novosibirsk Chemical Concentration Plant (JSC NCCP) operates a lithium
processing facility in Novosibirsk oblast. The plant sources its raw materials, typically in
the form of lithium hydroxide from JSC C&MP (Section 5.29.2.1) when available, lithium
carbonate or chloride, and lithium bearing wastes from other Russian enterprises,
producing a range of lithium products including:
Lithium metal (98%, 99% and 99.9% Li purity)
Li-7 hydroxide monohydrate (55.5% or 54.0-59.0% Li7OH)
Hi-aluminium lithium metal (99.9% Li-Al inc. 0.1-5.0% Al)
Lithium chloride (98% or 99.5% LiCl)
LIDOS sanitizer/disinfectant solution
In mid-2011 JSC NCCP’s parent company TVEL agreed to progress with a US$56.5M
project to produce cathode materials for lithium-ion batteries with Rusnano. The new
facility will be constructed at the JSC NCCP site in Novosibirsk oblast and will be
financed US$28M by Rusnano, US$23.5M by TVEL Corp. and US$5M by JSC NCCP.
The plant will be constructed in three phases, the first of which will be a test production
phase with a capacity of 20tpy cathode materials, mainly to determine preferable
cathode material characteristics and quality. The second phase is planned to increase
production capacity to 1,750tpy lithium iron phosphate in Q3 2013 with the third and final
phase of construction anticipated for Q4 2014 which would see production capacity of
lithium iron phosphate increased to 3,500tpy.
Page | 204 Lithium: Market Outlook to 2017, 12th edition 2013
Roskill
Copyright © 2013 by Roskill Information Services Ltd. Unauthorised copying prohibited. www.roskill.com
5.29.3 Russian Imports and Exports of Lithium
Between 2002 and 2005 Russian imports of lithium carbonate increased 17%py
reaching 2,903t in 2005 (Table 129). This was caused by an increase in toll processing
of lithium carbonate from SQM in Chile at JSC C&MP and JSC NCCP to produce lithium
hydroxide. A sharp drop in lithium carbonate imports in 2006 coincides with the
completion of SQM’s lithium hydroxide production facility in Antofagasta, Chile resulting
in a reduced amount of lithium carbonate being exported for toll processing in the
subsequent years. Lithium carbonate imports in 2011 increased by over 300% on the
previous year, with material sourced mainly from Chile and lesser amounts from China.
The sudden increase is likely caused by the restart of toll processing lithium carbonate
for SQM in Chile as demand exceeds its lithium hydroxide plant capacity. The lithium
hydroxide produced in Russia is exported to SQM’s European warehouses in Belgium or
to Helm AG (Section 5.15.2) in Germany (Table 130).
Table 129: Russia: Imports of lithium carbonate, 2002 to 2012 (t)
2002 2003 2004 2005 2006 2007 2008 2009 2010 2011 2012
Chile 1,800 1,449 2,331 2,903 891 660 820 526 617 1,884 2,130
China - - 1 - - 66 36 14 74 219 53
Uzbekistan 35 72 58 39 47 26 32 1 - - -
Others - 6 9 13 - 121 3 4 6 7 69
Total 1,835 1,526 2,399 2,955 938 873 891 545 696 2,110 2,200 Source: GTIS
Russian exports of lithium hydroxide show a similar pattern to lithium carbonate imports,
increasing between 2002 and 2005 as toll processing of lithium carbonate to hydroxide
increased. Exports fall sharply by nearly 90% in 2006 as SQM began producing lithium
hydroxide in Chile and selling lithium hydroxide direct to customers. The recovery in
exports of lithium hydroxide in 2011 moved Russia back to being a net exporter of
lithium hydroxide, something which it had not achieved since 2005 (Table 130 and Table
131).
Table 130: Russia: Exports of lithium hydroxide, 2002 to 2012 (t)
2002 2003 2004 2005 2006 2007 2008 2009 2010 2011 2012
Belgium 900 860 1,606 2,300 120 - - - - 690 2,000
Germany 260 520 200 300 200 220 80 180 200 520 310
Japan 21 21 29 - - - - - - - -
Others 3 1 - 9 - 10 - 2 - 1 -
Total 1,184 1,402 1,836 2,610 320 230 80 182 200 1,211 2,310 Source: GTIS
Lithium: Market Outlook to 2017, 12th edition 2013 Page | 205
Roskill
Copyright © 2013 by Roskill Information Services Ltd. Unauthorised copying prohibited. www.roskill.com
Table 131: Russia: Imports of lithium hydroxide, 2002 to 2012 (t)
2002 2003 2004 2005 2006 2007 2008 2009 2010 2011 2012
USA 1,612 191 748 678 481 380 260 60 141 79 -
China 47 193 80 20 53 213 111 90 69 206 185
Chile - - 7 - 232 - - 72 88 161 18
Belgium - - 120 21 20 - - - - 58 200
Others - 18 - - - - 5 - - - 20
Total 1,660 402 955 719 786 593 376 222 297 503 423 Source: GTIS
5.30 Serbia
Rio Tinto holds the Jadar lithium project through its subsidiary Rio Sava Exploration
based in Belgrade, Serbia. The Jadar project is situated 100km west of the city of
Belgrade and was identified in 2004, after exploration for sodium borates covered the
area. The deposit is based upon Jadarite (LiNaB3SiO7(OH)) mineralisation which
contains both the elements lithium and boron. The mineral Jadarite is a relatively recent
discovery, having only been formally identified and named in 2006. Underground mining
methods will be required to extract mineralisation, which occurs between 250m and
600m in depth.
A PFS was released for the Jadar project in January 2009 after Rio Tinto had invested
US$27M in exploration. The initial PFS inferred resource estimation totalled 114.6Mt
grading 1.8% Li2O and 13.1% B2O3. The resource estimation was upgraded in 2010
to125.3Mt grading 1.8% Li2O (contained 5.58Mt LCE) and containing 16.2Mt B2O3. The
later 2010 estimation only assessed the lower jadarite zone of the deposit, on which Rio
Tinto intend to focus future exploration work on until production.
Jadarite ore at the project is described as being amenable to a simple beneficiation and
upgrading process to produce a mineral concentrate. From the mineral concentrate Rio
Tinto plan to produce both lithium carbonate (Li2CO3) and boric acid (H3BO3).
Production is not expected to come online at the Jadar project until 2016.
Pan Global Resource Inc. (Pan Global) is developing the Balkans JV project in co-
operation with Lithium Li Holdings. The Balkans project is comprised of 14 different
license areas in Serbia and Bosnia Herzegovina targeting Jadarite mineralisation, similar
to that observed at Rio Tinto’s Jadar Lithium project. Pan Global has an option to gain
an 80% stake in three of the 14 Balkan JV Licence areas through financing the
development of the project. The licence areas located within Serbia are the Jadar West,
Badanja and Bela Crkva projects which lie adjacent or near to Rio Tinto’s Jadar project,
Raduŝa, Valjevo and Ljig to the east, and the Kosjerić and Gorobilje licences which lie
further south.
The option for Pan Global to gain an 80% stake in the Balkans JV licences is split into a
three phase development program. The company must invest US$4M in exploration
during the first three years to gain a 51% stake in the licence area and satisfy the first
Page | 206 Lithium: Market Outlook to 2017, 12th edition 2013
Roskill
Copyright © 2013 by Roskill Information Services Ltd. Unauthorised copying prohibited. www.roskill.com
phase. After the completion of phase 1, Pan Global are required to invest a further
US$12M in the project over a period of four years to gain a 65% stake. To acquire an
80% stake in three of the licences, Pan Global must finance the project through to the
completion of a feasibility study, or have invested US$20M in the project’s development.
Ultra Lithium is exploring six licence areas in Serbia through its wholly-owned local
subsidiary Ultra Balkans. The licences are for the Koceljeva, Trnava, Valjevo East,
Preljina, Ladevci and Kragujevac mineral prospects, which cover over 540km2.
Exploration hopes to identify jadarite mineralisation and define a lithium and boron
resource for the projects. Ultra Lithium intends to initiate exploration drilling in 2013
dependant on favourable results from geochemical and geophysical analysis.
In May 2012, Ultra Lithium signed an agreement with Beijing Explo-Tech Engineering
Co. Ltd. (BETEC) to help develop its projects in the Balkans. BETEC will provide an
initial payment of CAN$1M to fast track exploration. For a period of three years, BETEC
will also provide funding of up to CAN$3.5M to cover exploration costs. For every
CAN$500,000 in funding which BETEC provides, they will acquire a 5% stake in Ultra
lithium’s subsidiary Ultra Balkans, up to a maximum stakeholding of 35%.
5.31 South Africa
South Africa is believed to host a great number of lithium and rare metal containing
pegmatites, although in the majority of cases the pegmatite are not economically viable.
Lithium bearing pegamtites in the Noumas and Norrabees areas of the Cape Province
were estimated by Garrett in 2004 to contain 30,000t Li (160,000t LCE). In Port
Shepstone District, south of Durban, significant quantities of spodumene have been
identified in a number of leucocratic pegmatoidal vein bodies. Although further drilling is
required to estimate the ore reserves, these pegmatites could satisfy the lithium
requirements of South Africa for a number of years. The pegmatite also has potential to
produce dimension stone and feldspar as useful by-products. Other lithium bearing
pegamatites have been identified in the lower Orange River region, forming the
westernmost extension of the Northern Cape pegmatite belt. South Africa is known to import thousands of tonnes of lithium mineral concentrate from Bikita Minerals (Section 5.41.1) in Zimbabwe. In 2011, South Africa imported 35,453t of mineral concentrate from Zimbabwe, most of which is presumed to be petalite concentrate from Bikita minerals. South African imports and exports of lithium compounds are mostly negligible; with the import of approximately 500t of lithium hydroxide and oxide mainly from Chile and India being the only notable trade in 2011.
5.32 South Korea
South Korea possesses no domestic sources of lithium raw materials and needs to
import lithium compounds to supply the strong demand from the country’s battery
materials and lithium grease industries. Since 2005, imports of lithium carbonate have
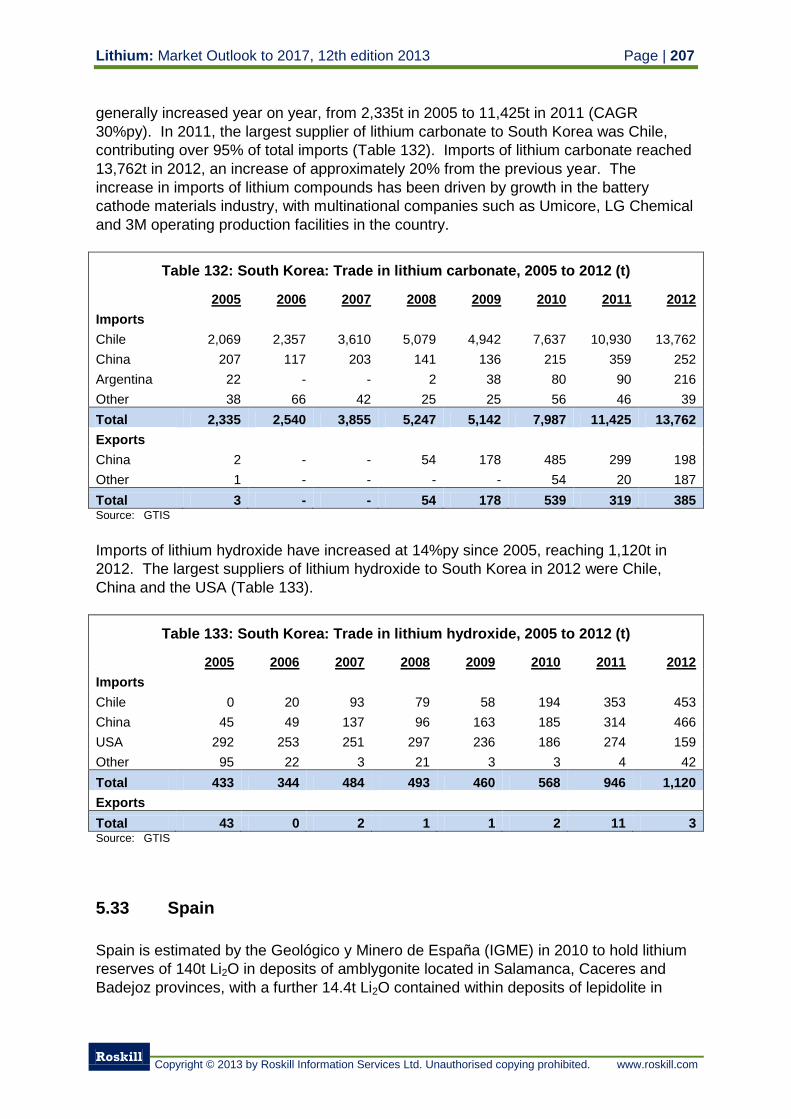
Lithium: Market Outlook to 2017, 12th edition 2013 Page | 207
Roskill
Copyright © 2013 by Roskill Information Services Ltd. Unauthorised copying prohibited. www.roskill.com
generally increased year on year, from 2,335t in 2005 to 11,425t in 2011 (CAGR
30%py). In 2011, the largest supplier of lithium carbonate to South Korea was Chile,
contributing over 95% of total imports (Table 132). Imports of lithium carbonate reached
13,762t in 2012, an increase of approximately 20% from the previous year. The
increase in imports of lithium compounds has been driven by growth in the battery
cathode materials industry, with multinational companies such as Umicore, LG Chemical
and 3M operating production facilities in the country.
Table 132: South Korea: Trade in lithium carbonate, 2005 to 2012 (t)
2005 2006 2007 2008 2009 2010 2011 2012
Imports Chile 2,069 2,357 3,610 5,079 4,942 7,637 10,930 13,762
China 207 117 203 141 136 215 359 252
Argentina 22 - - 2 38 80 90 216
Other 38 66 42 25 25 56 46 39
Total 2,335 2,540 3,855 5,247 5,142 7,987 11,425 13,762
Exports
China 2 - - 54 178 485 299 198
Other 1 - - - - 54 20 187
Total 3 - - 54 178 539 319 385 Source: GTIS
Imports of lithium hydroxide have increased at 14%py since 2005, reaching 1,120t in
2012. The largest suppliers of lithium hydroxide to South Korea in 2012 were Chile,
China and the USA (Table 133).
Table 133: South Korea: Trade in lithium hydroxide, 2005 to 2012 (t)
2005 2006 2007 2008 2009 2010 2011 2012
Imports
Chile 0 20 93 79 58 194 353 453
China 45 49 137 96 163 185 314 466
USA 292 253 251 297 236 186 274 159
Other 95 22 3 21 3 3 4 42
Total 433 344 484 493 460 568 946 1,120
Exports
Total 43 0 2 1 1 2 11 3 Source: GTIS
5.33 Spain
Spain is estimated by the Geológico y Minero de España (IGME) in 2010 to hold lithium
reserves of 140t Li2O in deposits of amblygonite located in Salamanca, Caceres and
Badejoz provinces, with a further 14.4t Li2O contained within deposits of lepidolite in
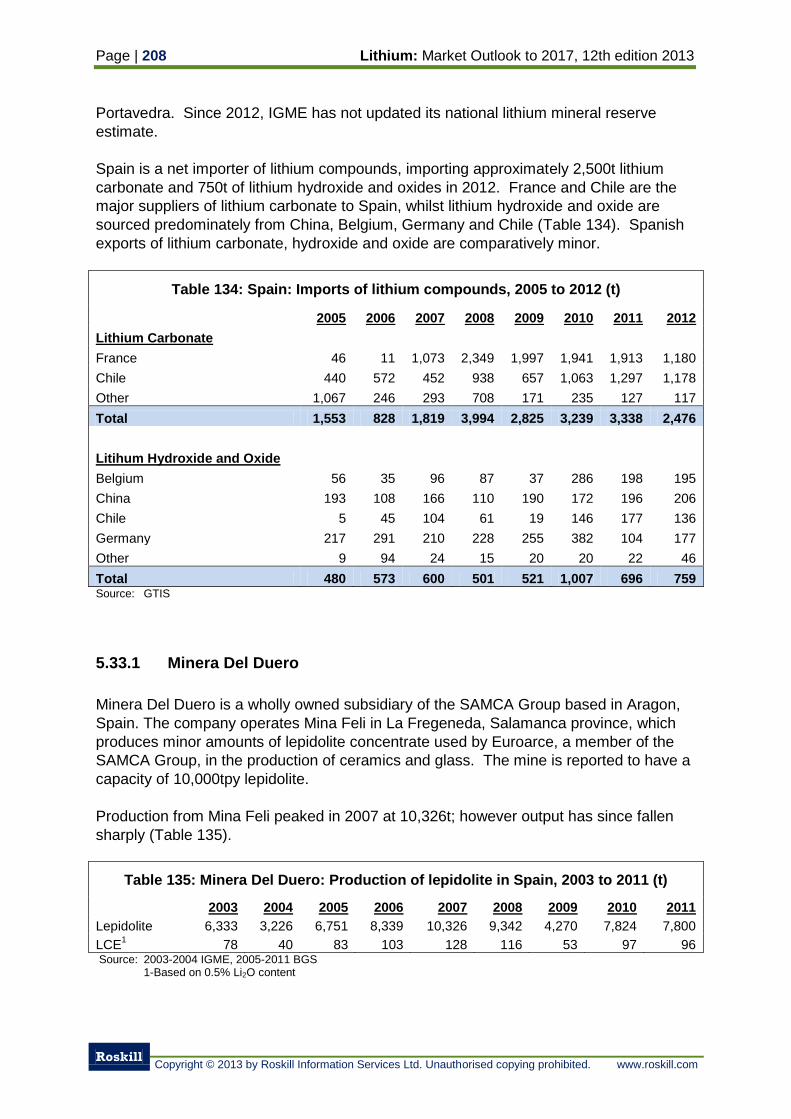
Page | 208 Lithium: Market Outlook to 2017, 12th edition 2013
Roskill
Copyright © 2013 by Roskill Information Services Ltd. Unauthorised copying prohibited. www.roskill.com
Portavedra. Since 2012, IGME has not updated its national lithium mineral reserve
estimate.
Spain is a net importer of lithium compounds, importing approximately 2,500t lithium
carbonate and 750t of lithium hydroxide and oxides in 2012. France and Chile are the
major suppliers of lithium carbonate to Spain, whilst lithium hydroxide and oxide are
sourced predominately from China, Belgium, Germany and Chile (Table 134). Spanish
exports of lithium carbonate, hydroxide and oxide are comparatively minor.
Table 134: Spain: Imports of lithium compounds, 2005 to 2012 (t)
2005 2006 2007 2008 2009 2010 2011 2012
Lithium Carbonate
France 46 11 1,073 2,349 1,997 1,941 1,913 1,180
Chile 440 572 452 938 657 1,063 1,297 1,178
Other 1,067 246 293 708 171 235 127 117
Total 1,553 828 1,819 3,994 2,825 3,239 3,338 2,476
Litihum Hydroxide and Oxide
Belgium 56 35 96 87 37 286 198 195
China 193 108 166 110 190 172 196 206
Chile 5 45 104 61 19 146 177 136
Germany 217 291 210 228 255 382 104 177
Other 9 94 24 15 20 20 22 46
Total 480 573 600 501 521 1,007 696 759 Source: GTIS
5.33.1 Minera Del Duero
Minera Del Duero is a wholly owned subsidiary of the SAMCA Group based in Aragon,
Spain. The company operates Mina Feli in La Fregeneda, Salamanca province, which
produces minor amounts of lepidolite concentrate used by Euroarce, a member of the
SAMCA Group, in the production of ceramics and glass. The mine is reported to have a
capacity of 10,000tpy lepidolite.
Production from Mina Feli peaked in 2007 at 10,326t; however output has since fallen
sharply (Table 135).
Table 135: Minera Del Duero: Production of lepidolite in Spain, 2003 to 2011 (t)
2003 2004 2005 2006 2007 2008 2009 2010 2011
Lepidolite 6,333 3,226 6,751 8,339 10,326 9,342 4,270 7,824 7,800
LCE1 78 40 83 103 128 116 53 97 96
Source: 2003-2004 IGME, 2005-2011 BGS 1-Based on 0.5% Li2O content
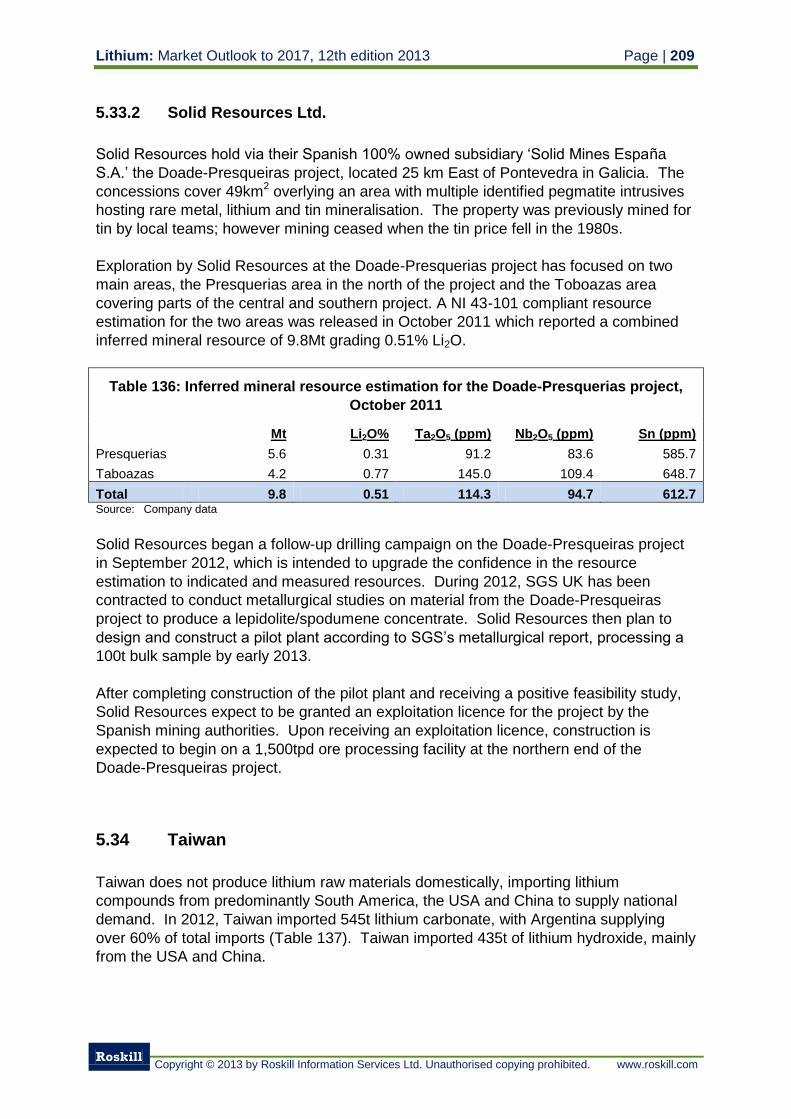
Lithium: Market Outlook to 2017, 12th edition 2013 Page | 209
Roskill
Copyright © 2013 by Roskill Information Services Ltd. Unauthorised copying prohibited. www.roskill.com
5.33.2 Solid Resources Ltd.
Solid Resources hold via their Spanish 100% owned subsidiary ‘Solid Mines España
S.A.’ the Doade-Presqueiras project, located 25 km East of Pontevedra in Galicia. The
concessions cover 49km2 overlying an area with multiple identified pegmatite intrusives
hosting rare metal, lithium and tin mineralisation. The property was previously mined for
tin by local teams; however mining ceased when the tin price fell in the 1980s.
Exploration by Solid Resources at the Doade-Presquerias project has focused on two
main areas, the Presquerias area in the north of the project and the Toboazas area
covering parts of the central and southern project. A NI 43-101 compliant resource
estimation for the two areas was released in October 2011 which reported a combined
inferred mineral resource of 9.8Mt grading 0.51% Li2O.
Table 136: Inferred mineral resource estimation for the Doade-Presquerias project,
October 2011
Mt Li2O% Ta2O5 (ppm) Nb2O5 (ppm) Sn (ppm)
Presquerias 5.6 0.31 91.2 83.6 585.7
Taboazas 4.2 0.77 145.0 109.4 648.7
Total 9.8 0.51 114.3 94.7 612.7 Source: Company data
Solid Resources began a follow-up drilling campaign on the Doade-Presqueiras project
in September 2012, which is intended to upgrade the confidence in the resource
estimation to indicated and measured resources. During 2012, SGS UK has been
contracted to conduct metallurgical studies on material from the Doade-Presqueiras
project to produce a lepidolite/spodumene concentrate. Solid Resources then plan to
design and construct a pilot plant according to SGS’s metallurgical report, processing a
100t bulk sample by early 2013.
After completing construction of the pilot plant and receiving a positive feasibility study,
Solid Resources expect to be granted an exploitation licence for the project by the
Spanish mining authorities. Upon receiving an exploitation licence, construction is
expected to begin on a 1,500tpd ore processing facility at the northern end of the
Doade-Presqueiras project.
5.34 Taiwan
Taiwan does not produce lithium raw materials domestically, importing lithium
compounds from predominantly South America, the USA and China to supply national
demand. In 2012, Taiwan imported 545t lithium carbonate, with Argentina supplying
over 60% of total imports (Table 137). Taiwan imported 435t of lithium hydroxide, mainly
from the USA and China.
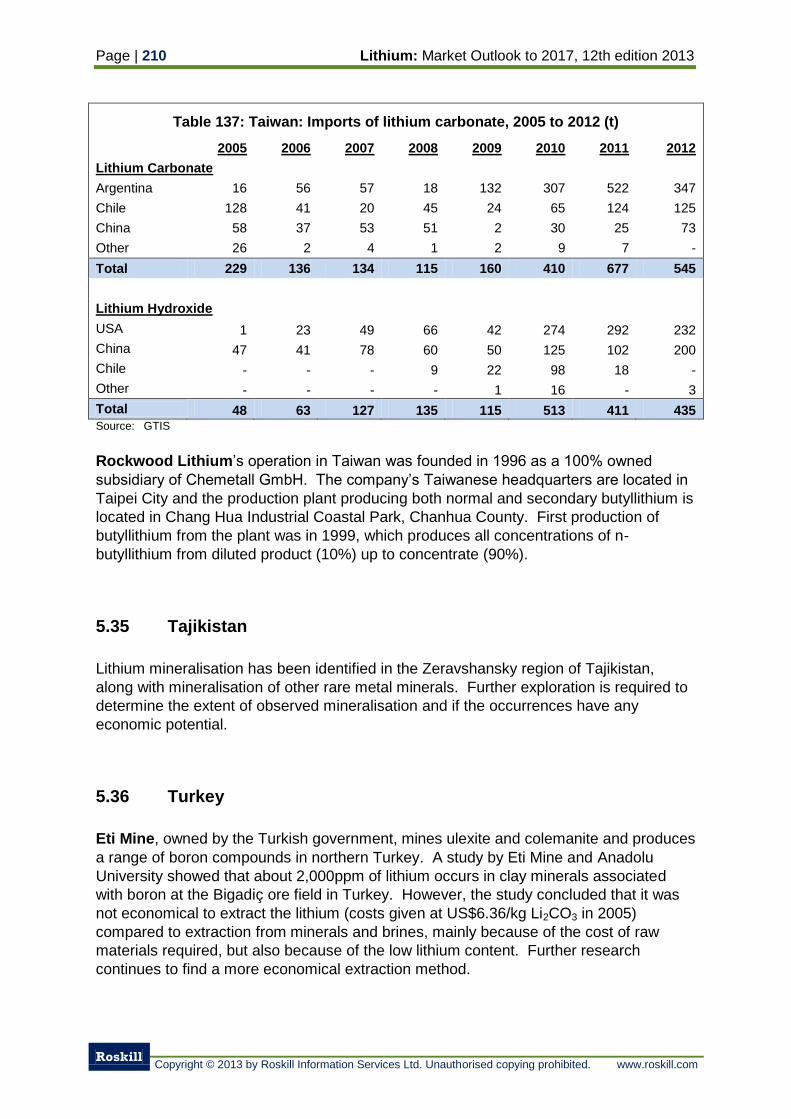
Page | 210 Lithium: Market Outlook to 2017, 12th edition 2013
Roskill
Copyright © 2013 by Roskill Information Services Ltd. Unauthorised copying prohibited. www.roskill.com
Table 137: Taiwan: Imports of lithium carbonate, 2005 to 2012 (t)
2005 2006 2007 2008 2009 2010 2011 2012
Lithium Carbonate
Argentina 16 56 57 18 132 307 522 347
Chile 128 41 20 45 24 65 124 125
China 58 37 53 51 2 30 25 73
Other 26 2 4 1 2 9 7 -
Total 229 136 134 115 160 410 677 545
Lithium Hydroxide
USA 1 23 49 66 42 274 292 232
China 47 41 78 60 50 125 102 200
Chile - - - 9 22 98 18 -
Other - - - - 1 16 - 3
Total 48 63 127 135 115 513 411 435 Source: GTIS
Rockwood Lithium’s operation in Taiwan was founded in 1996 as a 100% owned
subsidiary of Chemetall GmbH. The company’s Taiwanese headquarters are located in
Taipei City and the production plant producing both normal and secondary butyllithium is
located in Chang Hua Industrial Coastal Park, Chanhua County. First production of
butyllithium from the plant was in 1999, which produces all concentrations of n-
butyllithium from diluted product (10%) up to concentrate (90%).
5.35 Tajikistan
Lithium mineralisation has been identified in the Zeravshansky region of Tajikistan,
along with mineralisation of other rare metal minerals. Further exploration is required to
determine the extent of observed mineralisation and if the occurrences have any
economic potential.
5.36 Turkey
Eti Mine, owned by the Turkish government, mines ulexite and colemanite and produces
a range of boron compounds in northern Turkey. A study by Eti Mine and Anadolu
University showed that about 2,000ppm of lithium occurs in clay minerals associated
with boron at the Bigadiç ore field in Turkey. However, the study concluded that it was
not economical to extract the lithium (costs given at US$6.36/kg Li2CO3 in 2005)
compared to extraction from minerals and brines, mainly because of the cost of raw
materials required, but also because of the low lithium content. Further research
continues to find a more economical extraction method.
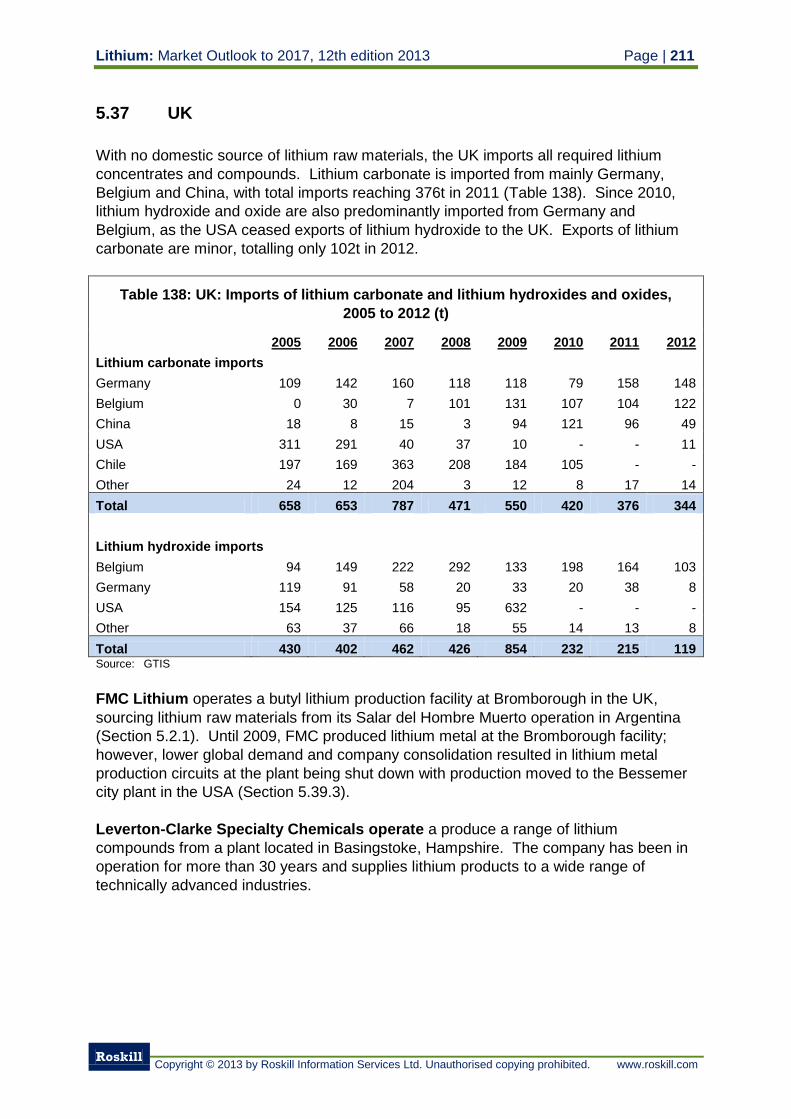
Lithium: Market Outlook to 2017, 12th edition 2013 Page | 211
Roskill
Copyright © 2013 by Roskill Information Services Ltd. Unauthorised copying prohibited. www.roskill.com
5.37 UK
With no domestic source of lithium raw materials, the UK imports all required lithium
concentrates and compounds. Lithium carbonate is imported from mainly Germany,
Belgium and China, with total imports reaching 376t in 2011 (Table 138). Since 2010,
lithium hydroxide and oxide are also predominantly imported from Germany and
Belgium, as the USA ceased exports of lithium hydroxide to the UK. Exports of lithium
carbonate are minor, totalling only 102t in 2012.
Table 138: UK: Imports of lithium carbonate and lithium hydroxides and oxides,
2005 to 2012 (t)
2005 2006 2007 2008 2009 2010 2011 2012
Lithium carbonate imports
Germany 109 142 160 118 118 79 158 148
Belgium 0 30 7 101 131 107 104 122
China 18 8 15 3 94 121 96 49
USA 311 291 40 37 10 - - 11
Chile 197 169 363 208 184 105 - -
Other 24 12 204 3 12 8 17 14
Total 658 653 787 471 550 420 376 344
Lithium hydroxide imports
Belgium 94 149 222 292 133 198 164 103
Germany 119 91 58 20 33 20 38 8
USA 154 125 116 95 632 - - -
Other 63 37 66 18 55 14 13 8
Total 430 402 462 426 854 232 215 119 Source: GTIS
FMC Lithium operates a butyl lithium production facility at Bromborough in the UK,
sourcing lithium raw materials from its Salar del Hombre Muerto operation in Argentina
(Section 5.2.1). Until 2009, FMC produced lithium metal at the Bromborough facility;
however, lower global demand and company consolidation resulted in lithium metal
production circuits at the plant being shut down with production moved to the Bessemer
city plant in the USA (Section 5.39.3).
Leverton-Clarke Specialty Chemicals operate a produce a range of lithium
compounds from a plant located in Basingstoke, Hampshire. The company has been in
operation for more than 30 years and supplies lithium products to a wide range of
technically advanced industries.
Page | 212 Lithium: Market Outlook to 2017, 12th edition 2013
Roskill
Copyright © 2013 by Roskill Information Services Ltd. Unauthorised copying prohibited. www.roskill.com
5.38 Ukraine
Ukraine is not a current producer of lithium raw materials; however, the country is
reported to contain significant lithium reserves. The Shevchenkivske lithium deposit in
Zaporizka region has been assessed by the State Geological Research Institute and
developed for commercial mining. A prefeasibility study has also been completed for the
Polokhivske lithium deposit in Kirovogradska region. Both deposits are considered to be
economic but the latter seems to be more attractive for mining.
The Ovruchskiy complex formed of sequences of volcano- sedimentary deposits in the
Bilokorovychska, Ovrutska and Vilchanska structural basins, Zhytomyr Oblast, have
been identified to contain lithium mineralisation. The basins are also identified to contain
copper, beryllium and zirconium mineralization within the volcano-sedimentary deposits.
Perekop Bromine is the only producer of bromine chemicals in the Ukraine, producing
lithium bromine dyhydrate and lithium bromine solution at the Sivash plant in
Krasnoperekopsk, Crimea region.
Trade in lithium products in Ukraine is relatively minor, with imports of lithium hydroxide
and oxides contributing almost the entire flow of lithium products into the country. In
2011, Ukraine imported 143t of lithium hydroxide and oxide, with China (77%) and Chile
(19%) being the two largest suppliers.
5.39 USA
Two of the largest lithium companies, Rockwood Lithium and FMC Litihum are based in
the USA, although the majority of their lithium production occurs overseas. FMC Lithium
has no domestic production of lithium minerals or brines and imports lithium carbonate
and chloride from its subsidiary in Argentina. Rockwood Lithium remains the only
domestic producer of lithium compounds from brines in the USA, at the Silver Peak
operation in Nevada.
The USA however has a history of lithium mineral production, most recently from Cyprus
Foote’s (now Rockwood Lithium) Kings Mountain spodumene mine in North Carolina
which ceased production in 1986. During its operation, the Kings Mountain mine and
adjacent plant had a capacity to produce 8,000tpy lithium carbonate and was one of the
world’s largest lithium mines.
As Rockwood lithium was the sole domestic producer of lithium in the USA during 2011,
production information is withheld to stop company specific data being distributed.
Production by Rockwood Lithium in 2011 was estimated to be around 25,000t LCE,
however the majority of this was from the Salar de Atacama property in Chile and Silver
Peak is estimated to have contributed less than 20% of this total.
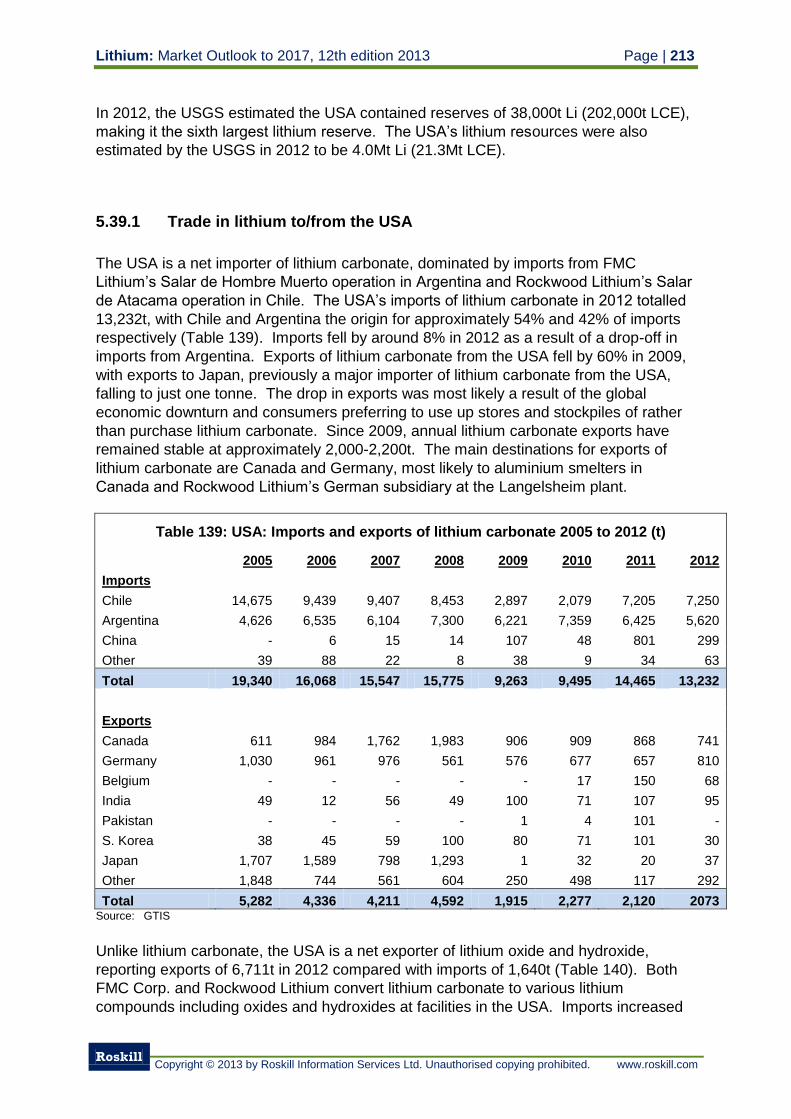
Lithium: Market Outlook to 2017, 12th edition 2013 Page | 213
Roskill
Copyright © 2013 by Roskill Information Services Ltd. Unauthorised copying prohibited. www.roskill.com
In 2012, the USGS estimated the USA contained reserves of 38,000t Li (202,000t LCE),
making it the sixth largest lithium reserve. The USA’s lithium resources were also
estimated by the USGS in 2012 to be 4.0Mt Li (21.3Mt LCE).
5.39.1 Trade in lithium to/from the USA
The USA is a net importer of lithium carbonate, dominated by imports from FMC
Lithium’s Salar de Hombre Muerto operation in Argentina and Rockwood Lithium’s Salar
de Atacama operation in Chile. The USA’s imports of lithium carbonate in 2012 totalled
13,232t, with Chile and Argentina the origin for approximately 54% and 42% of imports
respectively (Table 139). Imports fell by around 8% in 2012 as a result of a drop-off in
imports from Argentina. Exports of lithium carbonate from the USA fell by 60% in 2009,
with exports to Japan, previously a major importer of lithium carbonate from the USA,
falling to just one tonne. The drop in exports was most likely a result of the global
economic downturn and consumers preferring to use up stores and stockpiles of rather
than purchase lithium carbonate. Since 2009, annual lithium carbonate exports have
remained stable at approximately 2,000-2,200t. The main destinations for exports of
lithium carbonate are Canada and Germany, most likely to aluminium smelters in
Canada and Rockwood Lithium’s German subsidiary at the Langelsheim plant.
Table 139: USA: Imports and exports of lithium carbonate 2005 to 2012 (t)
2005 2006 2007 2008 2009 2010 2011 2012
Imports Chile 14,675 9,439 9,407 8,453 2,897 2,079 7,205 7,250
Argentina 4,626 6,535 6,104 7,300 6,221 7,359 6,425 5,620
China - 6 15 14 107 48 801 299
Other 39 88 22 8 38 9 34 63
Total 19,340 16,068 15,547 15,775 9,263 9,495 14,465 13,232
Exports
Canada 611 984 1,762 1,983 906 909 868 741
Germany 1,030 961 976 561 576 677 657 810
Belgium - - - - - 17 150 68
India 49 12 56 49 100 71 107 95
Pakistan - - - - 1 4 101 -
S. Korea 38 45 59 100 80 71 101 30
Japan 1,707 1,589 798 1,293 1 32 20 37
Other 1,848 744 561 604 250 498 117 292
Total 5,282 4,336 4,211 4,592 1,915 2,277 2,120 2073 Source: GTIS
Unlike lithium carbonate, the USA is a net exporter of lithium oxide and hydroxide,
reporting exports of 6,711t in 2012 compared with imports of 1,640t (Table 140). Both
FMC Corp. and Rockwood Lithium convert lithium carbonate to various lithium
compounds including oxides and hydroxides at facilities in the USA. Imports increased
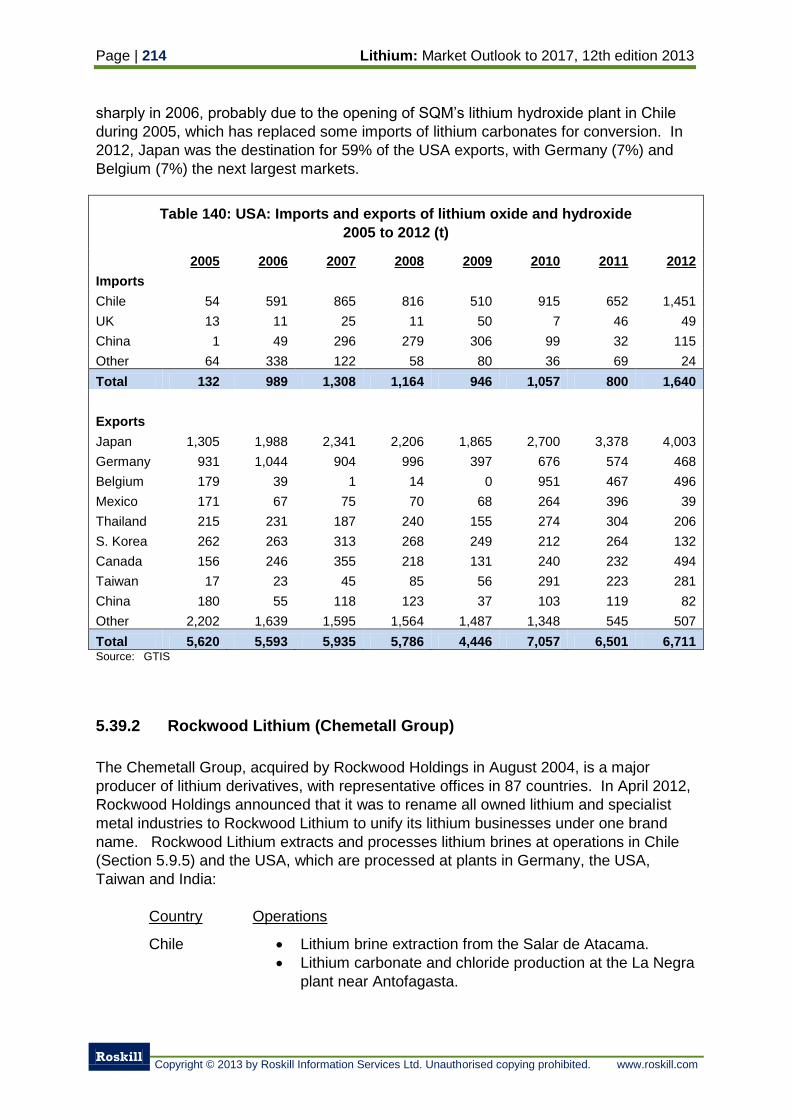
Page | 214 Lithium: Market Outlook to 2017, 12th edition 2013
Roskill
Copyright © 2013 by Roskill Information Services Ltd. Unauthorised copying prohibited. www.roskill.com
sharply in 2006, probably due to the opening of SQM’s lithium hydroxide plant in Chile
during 2005, which has replaced some imports of lithium carbonates for conversion. In
2012, Japan was the destination for 59% of the USA exports, with Germany (7%) and
Belgium (7%) the next largest markets.
Table 140: USA: Imports and exports of lithium oxide and hydroxide
2005 to 2012 (t)
2005 2006 2007 2008 2009 2010 2011 2012
Imports Chile 54 591 865 816 510 915 652 1,451
UK 13 11 25 11 50 7 46 49
China 1 49 296 279 306 99 32 115
Other 64 338 122 58 80 36 69 24
Total 132 989 1,308 1,164 946 1,057 800 1,640
Exports
Japan 1,305 1,988 2,341 2,206 1,865 2,700 3,378 4,003
Germany 931 1,044 904 996 397 676 574 468
Belgium 179 39 1 14 0 951 467 496
Mexico 171 67 75 70 68 264 396 39
Thailand 215 231 187 240 155 274 304 206
S. Korea 262 263 313 268 249 212 264 132
Canada 156 246 355 218 131 240 232 494
Taiwan 17 23 45 85 56 291 223 281
China 180 55 118 123 37 103 119 82
Other 2,202 1,639 1,595 1,564 1,487 1,348 545 507
Total 5,620 5,593 5,935 5,786 4,446 7,057 6,501 6,711 Source: GTIS
5.39.2 Rockwood Lithium (Chemetall Group)
The Chemetall Group, acquired by Rockwood Holdings in August 2004, is a major
producer of lithium derivatives, with representative offices in 87 countries. In April 2012,
Rockwood Holdings announced that it was to rename all owned lithium and specialist
metal industries to Rockwood Lithium to unify its lithium businesses under one brand
name. Rockwood Lithium extracts and processes lithium brines at operations in Chile
(Section 5.9.5) and the USA, which are processed at plants in Germany, the USA,
Taiwan and India:
Country Operations
Chile Lithium brine extraction from the Salar de Atacama.
Lithium carbonate and chloride production at the La Negra
plant near Antofagasta.
Lithium: Market Outlook to 2017, 12th edition 2013 Page | 215
Roskill
Copyright © 2013 by Roskill Information Services Ltd. Unauthorised copying prohibited. www.roskill.com
Germany Produces over 80 different lithium products at the
Langelsheim plant, Goslar district (Section 5.15.1).
USA Lithium brine extraction from the Silver Peak deposit,
Nevada
Lithium carbonate and hydroxide production at the Silver
Peak, Nevada and King’s Mountain, North Carolina plants.
Normal and secondary butyllithium production at two
plants in New Johnsonville, Tennessee
Taiwan Production of normal and secondary butyllithium at a plant
in Chanhua County
India Production of butyllithium at the Gujarat plant.
5.39.2.1 Silver Peak, Kings Mountain and New Johnsonville operations (USA)
In 1988, the Foote Mineral Company, which operated the Kings Mountain Spodumene
Mine in North Carolina, was purchased by the Cyprus Mineral Company and became
Cyprus Foote Mineral Company. Chemetall GmbH acquired the Cyprus Foote Mineral
Company in 1998 renaming the company Chemetall Foote Corporation, before joining
Rockwood Holdings in 2004. Rockwood Holdings changed the company name to
Rockwood Lithium in April 2012 to unify all its lithium operations under one trading
name.
The company began the production of lithium chemicals in the 1950’s after being
granted mining rights for the King’s Mountain spodumene deposit. The King’s Mountain
deposit sits on a 60km long belt which hosts multiple pegmatite intrusives containing tin
and lithium mineralisation. Pegmatites along the belt are estimated to contain 185,000t
Li (984,000t LCE). A resource estimate of the northern part of the deposit reported
proven reserves of 29Mt grading 0.7% lithium and a further 14Mt of probable reserves.
The associated King’s Mountain lithium carbonate plant had a capacity to produce
8,000tpy lithium carbonate. Both the King’s Mountain mine and lithium carbonate plant
were closed in 1986 and in 1994 the lithium carbonate plant was dismantled.
A pilot lithium chemical facility remained in operation at the King’s Mountain site after the
mine closure, producing lithium salts and metal for primary batteries from lithium brine
concentrates. In 2010, construction of a new battery grade lithium hydroxide plant at the
King’s Mountain site began. The new facility was completed in June 2012, with a design
capacity of 5,000tpy battery grade lithium hydroxide. Originally the existing lithium
hydroxide facility at Silver Peak was set to be closed upon completion of the new facility,
although the site may now continue producing lithium products to some degree.
In the 1960s, Foote Minerals began the extraction of lithium brines at Silver Peak in
Nevada. The extracted brines were used in the production of lithium carbonate at the
Silver Peak plant and other lithium compounds at the King’s Mountain plant. The brines
are extracted from the Silver Peak dry lake (playa) which covers a 16km long and 6.4km
Page | 216 Lithium: Market Outlook to 2017, 12th edition 2013
Roskill
Copyright © 2013 by Roskill Information Services Ltd. Unauthorised copying prohibited. www.roskill.com
wide area, estimated to contain 40,000t Li (212,900t LCE). The brines are enriched in
lithium chloride, which in 1966 assayed 400ppm Li. The natural lithium content of the
brines has decreased since 1966, with expected grades of 150-170ppm in 2011. The
brine is pumped to surface from a number of 100-300m deep gravel packed wells and
stored in evaporation ponds. The solution is concentrated to 6% Li via natural
evaporation which can take between 12-18 months to achieve. Lime is added after 10
months to remove magnesium from the solution. The concentrated solution is pumped to
the Silver Peak lithium carbonate plant where soda ash is added to precipitate lithium
carbonate. The precipitate is filtered and dried to produce a saleable lithium carbonate
product. A portion if the produced lithium carbonate is used internally at the Silver Peak
facility for the production of lithium hydroxide.
As the sole producer of lithium carbonate in the USA, Rockwood Lithium has withheld
the publication of production data by the USGS. The Silver Peak plant capacity was
estimated in 2003 to be 9,000tpy LCE; however actual capacity is considered to be
5,000tpy LCE.
In 2010, the then Chemetall Foote was granted US$28.4M by the U.S. Department of
Energy to increase production capacity of lithium materials and construct new lithium
production facilities. The planned expansion includes the construction of the new lithium
hydroxide plant and global technical centre at the Kings Mountain site and expansion of
the Silver Peaks brine ponds and lithium carbonate facility to 10,000tpy LCE capacity.
These projects are part of a US$75M program by Rockwood Holdings to increase its
lithium capabilities in the USA.
Rockwood Lithium operates two production facilities at the New Johnsonville site located
in Tennessee. Both facilities produce normal and secondary butyl lithium, used in the
chemicals and pharmaceuticals industries, along with other specialty products.
5.39.3 FMC Corporation
FMC Lithium forms part of the specialty chemicals division of the diversified chemical
company FMC Corporation, headquartered in Charlotte, North Carolina. The division
operates the company’s lithium production and processing facilities in the USA and
overseas. In 2011, FMC reported revenues of US$224.8M from its lithium operations
worldwide compared with US$213M in the previous year, an increase of approximately
5%. FMC expect revenue from its specialty chemicals division to increase by a futher
10% in 2012 driven by higher lithium and biopolymer prices.
Country Subsiduary Operations
Argentina Minera del Altiplano
S.A.
Lithum brine extraction from the
Salar del Hombre Muerto
Lithium carbonate production at the
Fénix Plant
Lithium chloride production at the
Fuemes Plant, Salta
Lithium: Market Outlook to 2017, 12th edition 2013 Page | 217
Roskill
Copyright © 2013 by Roskill Information Services Ltd. Unauthorised copying prohibited. www.roskill.com
USA FMC Lithium Production of various lithium salts
and organo-lithium products at the
Bessemer Plant in North Carolina
Center for Lithium Energy and
Advanced Research in North
Carolina undertakes research on
lithium battery materials.
UK FMC Chemicals Ltd. Butyllithium production at the
Bromborough facility on Merseyside
India FMC India Private
Ltd.
Butyllithium production at a facility
in Hyderabad
China FMC Specialty
Chemicals
(Zhangjiagang)
Butyllithium production at a plant in
the Yangtse River Chemical Park in
Zhangjiagang.
Japan Asia Lithium
Corportation (joint
venture)
Production of butyllithium and
lithium metal at a facility located on
Naoshima Island.
In 2011, FMC extracted lithium brines from the Salar del Hombre Muerto in Argentina
(Section 5.2.1). Historically the company operated a spodumene mine near Cherryville
in North Carolina, which extracted lithium ore from the Hallman-Bean spodumene
pegmatite deposit grading around 0.7% Li. Extracted ore was sent to the Bessemer
plant, North Carolina to be processed into lithium compounds. As a result of new brine
extraction and processing facilities constructed in Argentina during 1997, the Cherryville
mine was closed in 1998 because of the higher extraction cost of spodumene ores.
5.39.3.1 FMC Lithium
The Bessemer plant in North Carolina produces a range of lithium compounds shown in
Table 141. The plant sources lithium raw materials from the Salar del Hombre Muerto
and Salta plant. In late 2011, FMC began a US$50M 2-3 year program of expansion at
the Bessemer plant. The expansion program aims to double the lithium hydroxide
production capacity at the facility and construct a new battery grade lithium metal
production line.
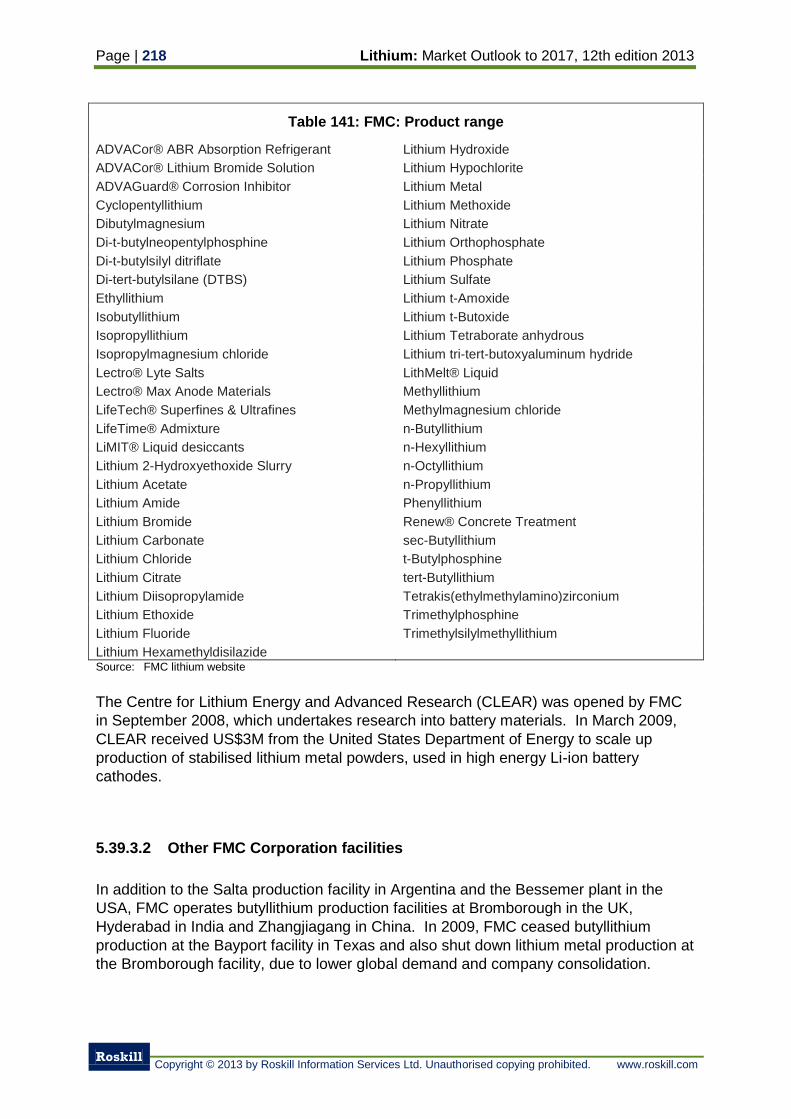
Page | 218 Lithium: Market Outlook to 2017, 12th edition 2013
Roskill
Copyright © 2013 by Roskill Information Services Ltd. Unauthorised copying prohibited. www.roskill.com
Table 141: FMC: Product range
ADVACor® ABR Absorption Refrigerant Lithium Hydroxide
ADVACor® Lithium Bromide Solution Lithium Hypochlorite
ADVAGuard® Corrosion Inhibitor Lithium Metal
Cyclopentyllithium Lithium Methoxide
Dibutylmagnesium Lithium Nitrate
Di-t-butylneopentylphosphine Lithium Orthophosphate
Di-t-butylsilyl ditriflate Lithium Phosphate
Di-tert-butylsilane (DTBS) Lithium Sulfate
Ethyllithium Lithium t-Amoxide
Isobutyllithium Lithium t-Butoxide
Isopropyllithium Lithium Tetraborate anhydrous
Isopropylmagnesium chloride Lithium tri-tert-butoxyaluminum hydride
Lectro® Lyte Salts LithMelt® Liquid
Lectro® Max Anode Materials Methyllithium
LifeTech® Superfines & Ultrafines Methylmagnesium chloride
LifeTime® Admixture n-Butyllithium
LiMIT® Liquid desiccants n-Hexyllithium
Lithium 2-Hydroxyethoxide Slurry n-Octyllithium
Lithium Acetate n-Propyllithium
Lithium Amide Phenyllithium
Lithium Bromide Renew® Concrete Treatment
Lithium Carbonate sec-Butyllithium
Lithium Chloride t-Butylphosphine
Lithium Citrate tert-Butyllithium
Lithium Diisopropylamide Tetrakis(ethylmethylamino)zirconium
Lithium Ethoxide Trimethylphosphine
Lithium Fluoride Trimethylsilylmethyllithium
Lithium Hexamethyldisilazide Source: FMC lithium website
The Centre for Lithium Energy and Advanced Research (CLEAR) was opened by FMC
in September 2008, which undertakes research into battery materials. In March 2009,
CLEAR received US$3M from the United States Department of Energy to scale up
production of stabilised lithium metal powders, used in high energy Li-ion battery
cathodes.
5.39.3.2 Other FMC Corporation facilities
In addition to the Salta production facility in Argentina and the Bessemer plant in the
USA, FMC operates butyllithium production facilities at Bromborough in the UK,
Hyderabad in India and Zhangjiagang in China. In 2009, FMC ceased butyllithium
production at the Bayport facility in Texas and also shut down lithium metal production at
the Bromborough facility, due to lower global demand and company consolidation.
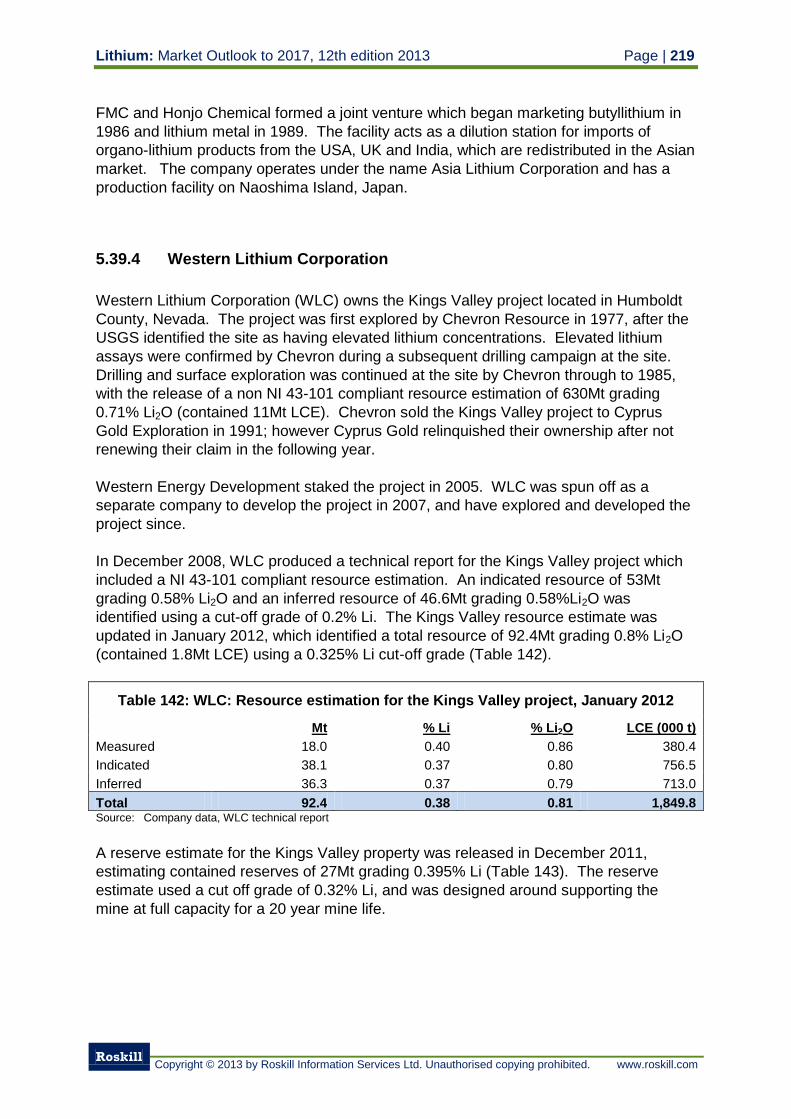
Lithium: Market Outlook to 2017, 12th edition 2013 Page | 219
Roskill
Copyright © 2013 by Roskill Information Services Ltd. Unauthorised copying prohibited. www.roskill.com
FMC and Honjo Chemical formed a joint venture which began marketing butyllithium in
1986 and lithium metal in 1989. The facility acts as a dilution station for imports of
organo-lithium products from the USA, UK and India, which are redistributed in the Asian
market. The company operates under the name Asia Lithium Corporation and has a
production facility on Naoshima Island, Japan.
5.39.4 Western Lithium Corporation
Western Lithium Corporation (WLC) owns the Kings Valley project located in Humboldt
County, Nevada. The project was first explored by Chevron Resource in 1977, after the
USGS identified the site as having elevated lithium concentrations. Elevated lithium
assays were confirmed by Chevron during a subsequent drilling campaign at the site.
Drilling and surface exploration was continued at the site by Chevron through to 1985,
with the release of a non NI 43-101 compliant resource estimation of 630Mt grading
0.71% Li2O (contained 11Mt LCE). Chevron sold the Kings Valley project to Cyprus
Gold Exploration in 1991; however Cyprus Gold relinquished their ownership after not
renewing their claim in the following year.
Western Energy Development staked the project in 2005. WLC was spun off as a
separate company to develop the project in 2007, and have explored and developed the
project since.
In December 2008, WLC produced a technical report for the Kings Valley project which
included a NI 43-101 compliant resource estimation. An indicated resource of 53Mt
grading 0.58% Li2O and an inferred resource of 46.6Mt grading 0.58%Li2O was
identified using a cut-off grade of 0.2% Li. The Kings Valley resource estimate was
updated in January 2012, which identified a total resource of 92.4Mt grading 0.8% Li2O
(contained 1.8Mt LCE) using a 0.325% Li cut-off grade (Table 142).
Table 142: WLC: Resource estimation for the Kings Valley project, January 2012
Mt % Li % Li2O LCE (000 t)
Measured 18.0 0.40 0.86 380.4
Indicated 38.1 0.37 0.80 756.5
Inferred 36.3 0.37 0.79 713.0
Total 92.4 0.38 0.81 1,849.8 Source: Company data, WLC technical report
A reserve estimate for the Kings Valley property was released in December 2011,
estimating contained reserves of 27Mt grading 0.395% Li (Table 143). The reserve
estimate used a cut off grade of 0.32% Li, and was designed around supporting the
mine at full capacity for a 20 year mine life.
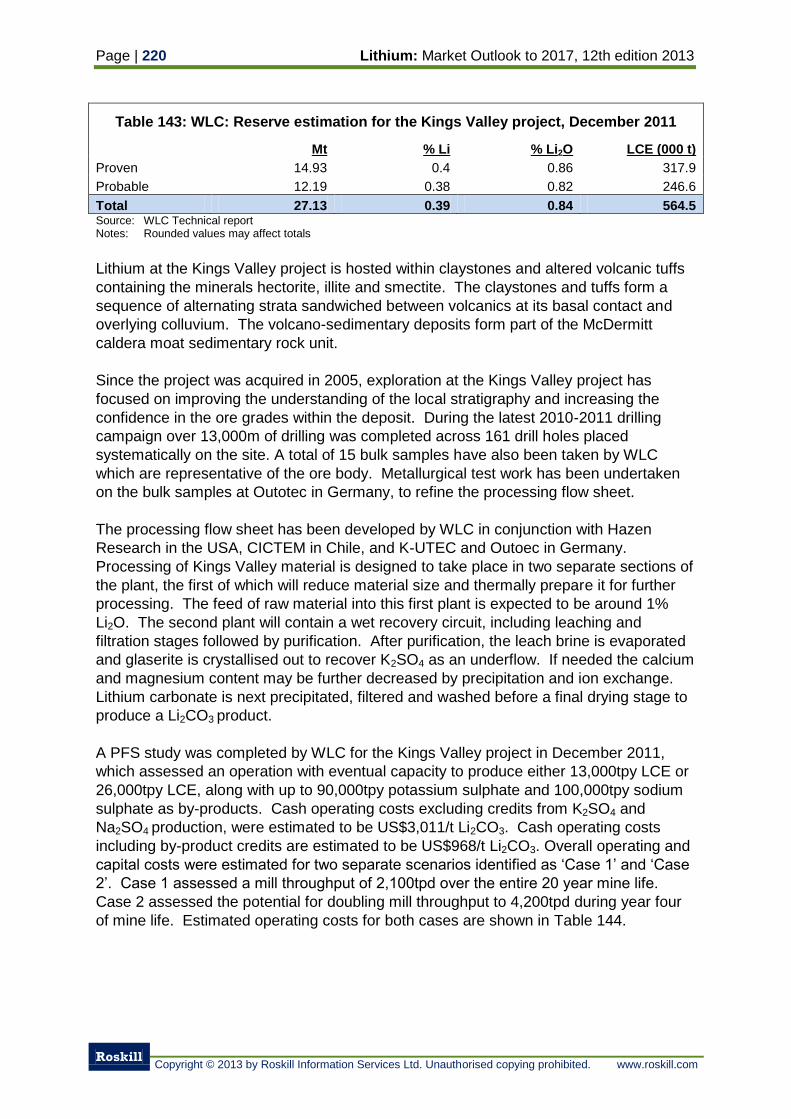
Page | 220 Lithium: Market Outlook to 2017, 12th edition 2013
Roskill
Copyright © 2013 by Roskill Information Services Ltd. Unauthorised copying prohibited. www.roskill.com
Table 143: WLC: Reserve estimation for the Kings Valley project, December 2011
Mt % Li % Li2O LCE (000 t)
Proven 14.93 0.4 0.86 317.9
Probable 12.19 0.38 0.82 246.6
Total 27.13 0.39 0.84 564.5 Source: WLC Technical report Notes: Rounded values may affect totals
Lithium at the Kings Valley project is hosted within claystones and altered volcanic tuffs
containing the minerals hectorite, illite and smectite. The claystones and tuffs form a
sequence of alternating strata sandwiched between volcanics at its basal contact and
overlying colluvium. The volcano-sedimentary deposits form part of the McDermitt
caldera moat sedimentary rock unit.
Since the project was acquired in 2005, exploration at the Kings Valley project has
focused on improving the understanding of the local stratigraphy and increasing the
confidence in the ore grades within the deposit. During the latest 2010-2011 drilling
campaign over 13,000m of drilling was completed across 161 drill holes placed
systematically on the site. A total of 15 bulk samples have also been taken by WLC
which are representative of the ore body. Metallurgical test work has been undertaken
on the bulk samples at Outotec in Germany, to refine the processing flow sheet.
The processing flow sheet has been developed by WLC in conjunction with Hazen
Research in the USA, CICTEM in Chile, and K-UTEC and Outoec in Germany.
Processing of Kings Valley material is designed to take place in two separate sections of
the plant, the first of which will reduce material size and thermally prepare it for further
processing. The feed of raw material into this first plant is expected to be around 1%
Li2O. The second plant will contain a wet recovery circuit, including leaching and
filtration stages followed by purification. After purification, the leach brine is evaporated
and glaserite is crystallised out to recover K2SO4 as an underflow. If needed the calcium
and magnesium content may be further decreased by precipitation and ion exchange.
Lithium carbonate is next precipitated, filtered and washed before a final drying stage to
produce a Li2CO3 product.
A PFS study was completed by WLC for the Kings Valley project in December 2011,
which assessed an operation with eventual capacity to produce either 13,000tpy LCE or
26,000tpy LCE, along with up to 90,000tpy potassium sulphate and 100,000tpy sodium
sulphate as by-products. Cash operating costs excluding credits from K2SO4 and
Na2SO4 production, were estimated to be US$3,011/t Li2CO3. Cash operating costs
including by-product credits are estimated to be US$968/t Li2CO3. Overall operating and
capital costs were estimated for two separate scenarios identified as ‘Case 1’ and ‘Case
2’. Case 1 assessed a mill throughput of 2,100tpd over the entire 20 year mine life.
Case 2 assessed the potential for doubling mill throughput to 4,200tpd during year four
of mine life. Estimated operating costs for both cases are shown in Table 144.
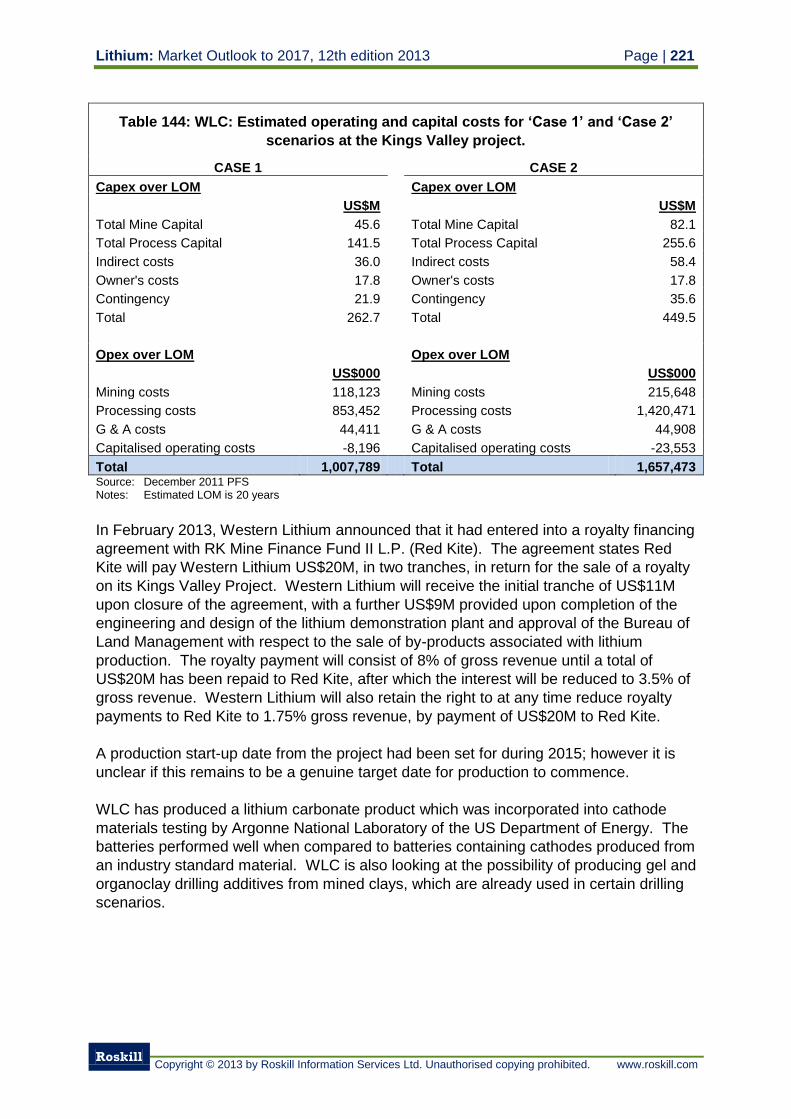
Lithium: Market Outlook to 2017, 12th edition 2013 Page | 221
Roskill
Copyright © 2013 by Roskill Information Services Ltd. Unauthorised copying prohibited. www.roskill.com
Table 144: WLC: Estimated operating and capital costs for ‘Case 1’ and ‘Case 2’
scenarios at the Kings Valley project.
CASE 1 CASE 2
Capex over LOM Capex over LOM
US$M US$M
Total Mine Capital 45.6 Total Mine Capital 82.1
Total Process Capital 141.5 Total Process Capital 255.6
Indirect costs 36.0 Indirect costs 58.4
Owner's costs 17.8 Owner's costs 17.8
Contingency 21.9 Contingency 35.6
Total 262.7 Total 449.5
Opex over LOM Opex over LOM
US$000 US$000
Mining costs 118,123 Mining costs 215,648
Processing costs 853,452 Processing costs 1,420,471
G & A costs 44,411 G & A costs 44,908
Capitalised operating costs -8,196 Capitalised operating costs -23,553
Total 1,007,789 Total 1,657,473 Source: December 2011 PFS Notes: Estimated LOM is 20 years
In February 2013, Western Lithium announced that it had entered into a royalty financing
agreement with RK Mine Finance Fund II L.P. (Red Kite). The agreement states Red
Kite will pay Western Lithium US$20M, in two tranches, in return for the sale of a royalty
on its Kings Valley Project. Western Lithium will receive the initial tranche of US$11M
upon closure of the agreement, with a further US$9M provided upon completion of the
engineering and design of the lithium demonstration plant and approval of the Bureau of
Land Management with respect to the sale of by-products associated with lithium
production. The royalty payment will consist of 8% of gross revenue until a total of
US$20M has been repaid to Red Kite, after which the interest will be reduced to 3.5% of
gross revenue. Western Lithium will also retain the right to at any time reduce royalty
payments to Red Kite to 1.75% gross revenue, by payment of US$20M to Red Kite.
A production start-up date from the project had been set for during 2015; however it is
unclear if this remains to be a genuine target date for production to commence.
WLC has produced a lithium carbonate product which was incorporated into cathode
materials testing by Argonne National Laboratory of the US Department of Energy. The
batteries performed well when compared to batteries containing cathodes produced from
an industry standard material. WLC is also looking at the possibility of producing gel and
organoclay drilling additives from mined clays, which are already used in certain drilling
scenarios.
Page | 222 Lithium: Market Outlook to 2017, 12th edition 2013
Roskill
Copyright © 2013 by Roskill Information Services Ltd. Unauthorised copying prohibited. www.roskill.com
5.39.5 Simbol Materials Corp.
Simbol Materials is a private company formed in 2008. Since its formation, the company
has investigated the potential to extract lithium and other metals from brines and waste
streams at geothermal plants in California. Simbol are focussed on developing the
Salton Sea project, located in the Salton Sea Geothermal Resource Area (SSGR) near
the USA’s border with Mexico.
In July 2008, Simbol signed a financing agreement with a group led by Mohr Davidow
Ventures and Firelake Capital for US$6.7M. These funds were assigned to continue
development of the Salton Sea project. In July 2010, Itochu Corp. of Japan purchased a
20% equity stake in Simbol Materials, providing funding for the company in return
acquiring exclusive sales rights for Simbols future production in Asia.
A lithium carbonate demonstration plant is based at the John. L. Featherstone
geothermal plant, Hudson Ranch, operated by California based renewable energy
company EnergySource. The Featherstone geothermal plant was opened in March
2012 and is designed to produce electricity (50MW) from water extracted from depth.
Simbol’s on-site demonstration pilot plant has a capacity to produce 500tpy battery
grade lithium carbonate, from brines extracted by EnergySource. The capacity of the
demonstration plant is scheduled to be upgraded to 1,500tpy lithium carbonate by end-
2013, although the plant is not for commercial purposes.
Simbol intend to construct a full scale production facility in Brawley, close to the
Featherstone geothermal plant by the end of 2014, with a capacity to produce 16,000tpy
battery grade lithium carbonate over a 20 year period. In 2012, Simbol operates a
smaller capacity purification facility at the Brawley site producing high grade lithium
carbonate from imported materials. Construction of the production facility has received
approval from an environmental impact study released in late 2012 and has the
necessary permitting to proceed. The planned production facility will use a patented
processing method developed by Simbol at the demonstration plant and in previous
metallurgical test work. The patented method is reported to require mostly raw materials
available from the geothermal power plant, such as carbon dioxide, steam and
electricity, to produce a battery grade lithium carbonate product, with only minor raw
materials required to be purchased.
Simbol is also assessing the feasibility of producing lithium hydroxide and other refined
lithium chemicals from geothermal brines and conversion from lithium carbonate. A pilot
facility has been built in Pleasanton, California which has produced lithium hydroxide
solution from imported raw materials with a recovery of up to 90%.
Other geothermal plants in the southern California area have also been highlighted by
Simbol to show potential for lithium, manganese and zinc production in the future. The
Hudson Ranch II being constructed by EnergySource has been identified as a potential
site for Simbol to construct a lithium extraction facility in the future with a similar capacity
to that at the original Hudson Ranch site.
Lithium: Market Outlook to 2017, 12th edition 2013 Page | 223
Roskill
Copyright © 2013 by Roskill Information Services Ltd. Unauthorised copying prohibited. www.roskill.com
5.39.6 Albemarle Corporation
Major chemicals and materials producer Albemarle are investigating a possible entry into
the lithium market by producing lithium compounds at its Magnolia plant, Arkansas. The
company processes Smackover oilfield brines to extract bromine at the Magnolia plant,
which has a capacity to produce approximately 148,000tpy bromine compounds. The
residual waste fluid after bromine extraction contains between 100ppm and 300ppm
lithium, and the remaining Smackover brines are estimated to contain 750,000t Li
(contained 3.99Mt LCE).
In April 2011, Albemarle announced that it had developed a process to extract lithium
from the Smackover brines. A pilot plant facility was set-up in mid-2011 to research the
production of lithium carbonate and developing the process to a commercial scale.
Albemarle plan to construct and operate a 20,000tpy LCE capacity facility at the
Magnolia plant site by 2015. Upon start-up only lithium carbonate products are
expected to be produced, however the company intends to explore its option in
producing a range of lithium products in the future.
5.39.7 Toxco Inc.
Toxco recycles battery materials, lithium chemicals and electronics, along with other
metals and precious metals. The company is headquartered in Anaheim, California and
has production/recycling facilities situated at Oak Ridge in Tennessee, Lancaster and
Baltimore in Ohio, and a facility at Trail, British Columbia in Canada.
The Trail facility in British Columbia (Section 5.8.4.9) specialises in the recycling of both
primary and secondary lithium batteries of all sizes. The plant also recycles production
scrap from the manufacturing of lithium-ion batteries.
LitihChem Energy is a wholly owned subsidiary division of Toxco based in Delaware
County, Pennsylvania. The LithChem facility produces primary and secondary cells for
lithium batteries, cathode materials, electrolytes and electrolytic salts.
5.39.8 AusAmerican Mining Corp. Ltd.
AusAmerican Mining holds 100% ownership of the White Picacho specialty metals
project located in Maricopa County, Arizona. The project was first staked by
AusAmerican Mining in October 2010, after analysis of samples taken from the
pegmatites revealed elevated grades of lithium and other rare metals. Since acquiring
its first claims covering the deposit, the company has increased its land holding to
7.12km2 and has initiated metallurgical test work on pegmatite samples from the deposit.
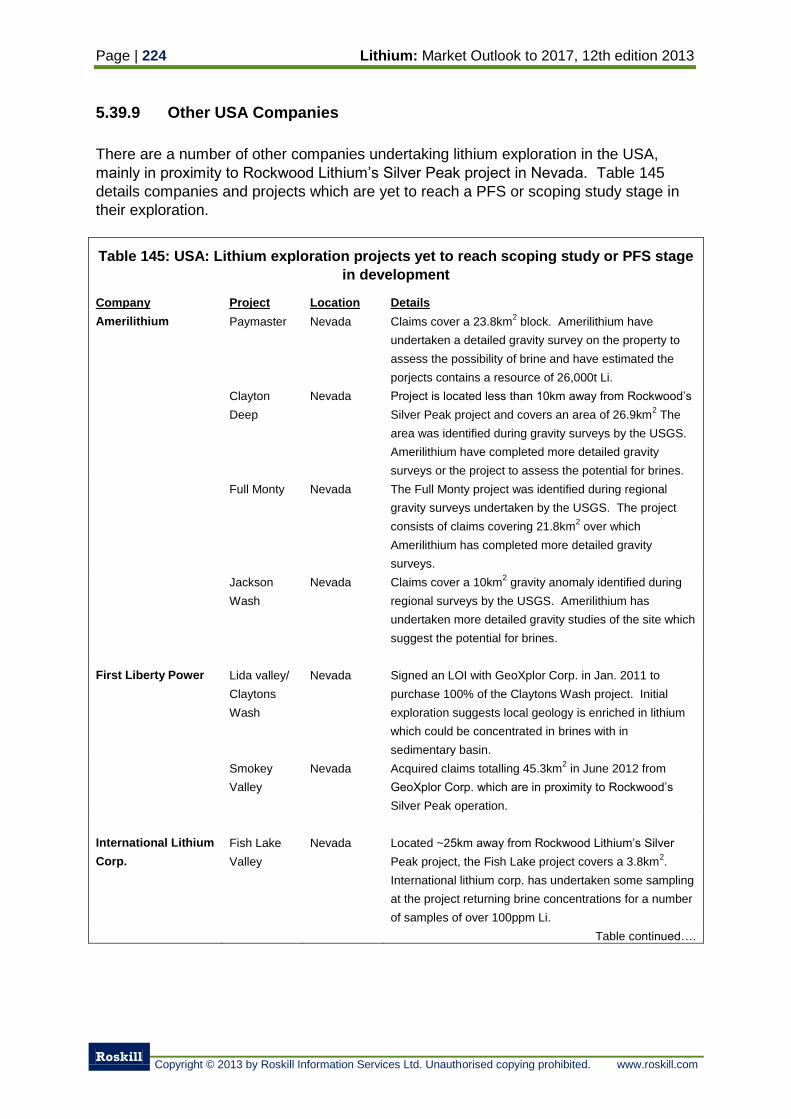
Page | 224 Lithium: Market Outlook to 2017, 12th edition 2013
Roskill
Copyright © 2013 by Roskill Information Services Ltd. Unauthorised copying prohibited. www.roskill.com
5.39.9 Other USA Companies
There are a number of other companies undertaking lithium exploration in the USA,
mainly in proximity to Rockwood Lithium’s Silver Peak project in Nevada. Table 145
details companies and projects which are yet to reach a PFS or scoping study stage in
their exploration.
Table 145: USA: Lithium exploration projects yet to reach scoping study or PFS stage
in development
Company Project Location Details
Amerilithium Paymaster Nevada Claims cover a 23.8km2 block. Amerilithium have
undertaken a detailed gravity survey on the property to
assess the possibility of brine and have estimated the
porjects contains a resource of 26,000t Li.
Clayton
Deep
Nevada Project is located less than 10km away from Rockwood’s
Silver Peak project and covers an area of 26.9km2 The
area was identified during gravity surveys by the USGS.
Amerilithium have completed more detailed gravity
surveys or the project to assess the potential for brines.
Full Monty Nevada The Full Monty project was identified during regional
gravity surveys undertaken by the USGS. The project
consists of claims covering 21.8km2 over which
Amerilithium has completed more detailed gravity
surveys.
Jackson
Wash
Nevada Claims cover a 10km2 gravity anomaly identified during
regional surveys by the USGS. Amerilithium has
undertaken more detailed gravity studies of the site which
suggest the potential for brines.
First Liberty Power Lida valley/
Claytons
Wash
Nevada Signed an LOI with GeoXplor Corp. in Jan. 2011 to
purchase 100% of the Claytons Wash project. Initial
exploration suggests local geology is enriched in lithium
which could be concentrated in brines with in
sedimentary basin.
Smokey
Valley
Nevada Acquired claims totalling 45.3km2 in June 2012 from
GeoXplor Corp. which are in proximity to Rockwood’s
Silver Peak operation.
International Lithium
Corp.
Fish Lake
Valley
Nevada Located ~25km away from Rockwood Lithium’s Silver
Peak project, the Fish Lake project covers a 3.8km2.
International lithium corp. has undertaken some sampling
at the project returning brine concentrations for a number
of samples of over 100ppm Li.
Table continued….
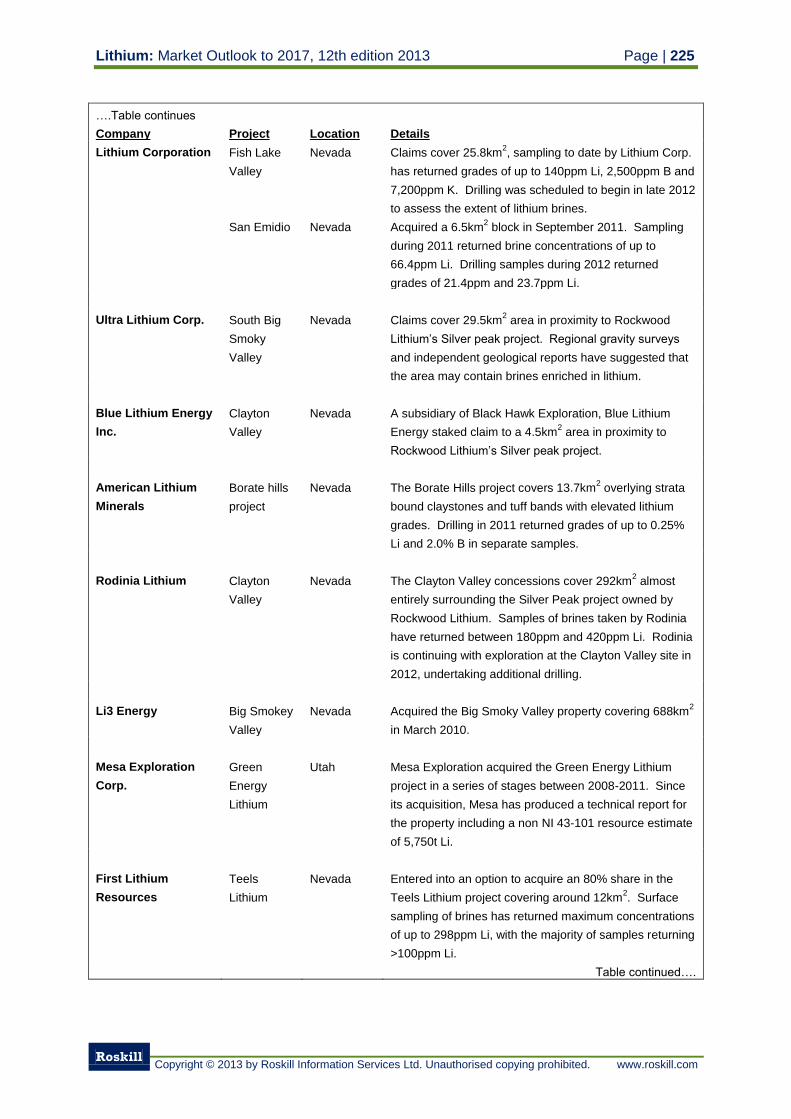
Lithium: Market Outlook to 2017, 12th edition 2013 Page | 225
Roskill
Copyright © 2013 by Roskill Information Services Ltd. Unauthorised copying prohibited. www.roskill.com
….Table continues
Company Project Location Details
Lithium Corporation Fish Lake
Valley
Nevada Claims cover 25.8km2, sampling to date by Lithium Corp.
has returned grades of up to 140ppm Li, 2,500ppm B and
7,200ppm K. Drilling was scheduled to begin in late 2012
to assess the extent of lithium brines.
San Emidio Nevada Acquired a 6.5km2 block in September 2011. Sampling
during 2011 returned brine concentrations of up to
66.4ppm Li. Drilling samples during 2012 returned
grades of 21.4ppm and 23.7ppm Li.
Ultra Lithium Corp. South Big
Smoky
Valley
Nevada Claims cover 29.5km2 area in proximity to Rockwood
Lithium’s Silver peak project. Regional gravity surveys
and independent geological reports have suggested that
the area may contain brines enriched in lithium.
Blue Lithium Energy
Inc.
Clayton
Valley
Nevada A subsidiary of Black Hawk Exploration, Blue Lithium
Energy staked claim to a 4.5km2 area in proximity to
Rockwood Lithium’s Silver peak project.
American Lithium
Minerals
Borate hills
project
Nevada The Borate Hills project covers 13.7km2 overlying strata
bound claystones and tuff bands with elevated lithium
grades. Drilling in 2011 returned grades of up to 0.25%
Li and 2.0% B in separate samples.
Rodinia Lithium Clayton
Valley
Nevada The Clayton Valley concessions cover 292km2 almost
entirely surrounding the Silver Peak project owned by
Rockwood Lithium. Samples of brines taken by Rodinia
have returned between 180ppm and 420ppm Li. Rodinia
is continuing with exploration at the Clayton Valley site in
2012, undertaking additional drilling.
Li3 Energy Big Smokey
Valley
Nevada Acquired the Big Smoky Valley property covering 688km2
in March 2010.
Mesa Exploration
Corp.
Green
Energy
Lithium
Utah Mesa Exploration acquired the Green Energy Lithium
project in a series of stages between 2008-2011. Since
its acquisition, Mesa has produced a technical report for
the property including a non NI 43-101 resource estimate
of 5,750t Li.
First Lithium
Resources
Teels
Lithium
Nevada Entered into an option to acquire an 80% share in the
Teels Lithium project covering around 12km2. Surface
sampling of brines has returned maximum concentrations
of up to 298ppm Li, with the majority of samples returning
>100ppm Li.
Table continued….
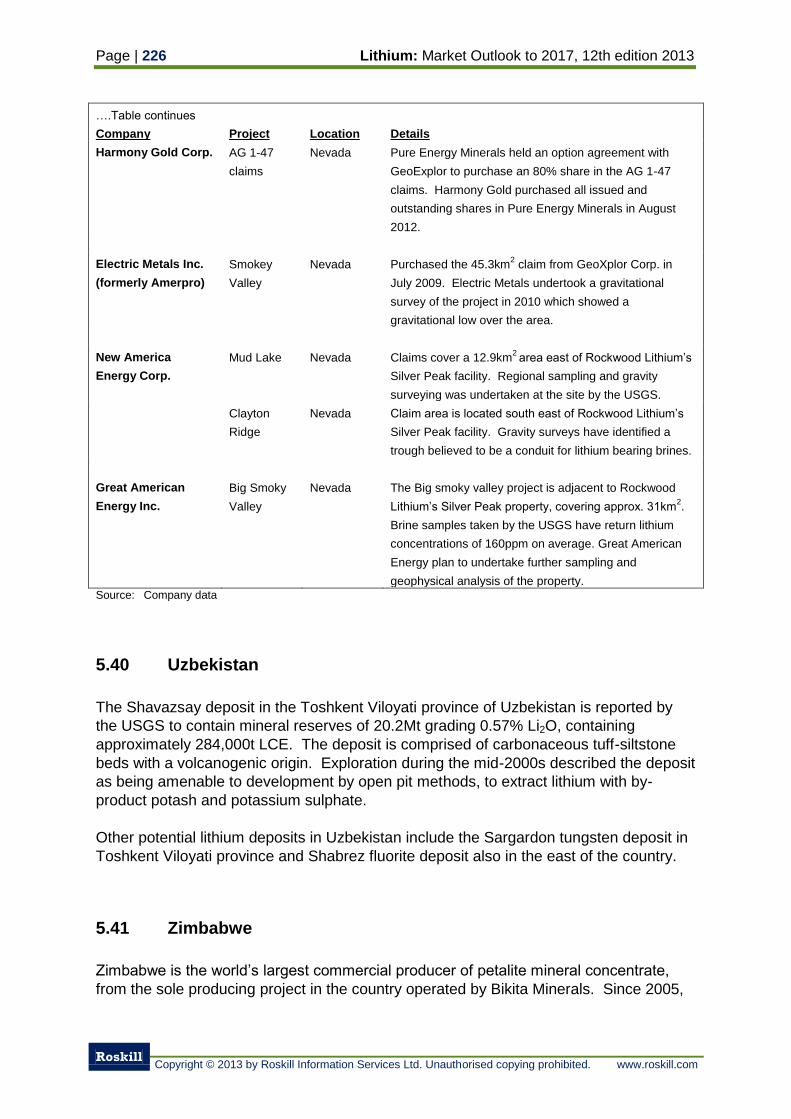
Page | 226 Lithium: Market Outlook to 2017, 12th edition 2013
Roskill
Copyright © 2013 by Roskill Information Services Ltd. Unauthorised copying prohibited. www.roskill.com
….Table continues
Company Project Location Details
Harmony Gold Corp. AG 1-47
claims
Nevada Pure Energy Minerals held an option agreement with
GeoExplor to purchase an 80% share in the AG 1-47
claims. Harmony Gold purchased all issued and
outstanding shares in Pure Energy Minerals in August
2012.
Electric Metals Inc.
(formerly Amerpro)
Smokey
Valley
Nevada Purchased the 45.3km2 claim from GeoXplor Corp. in
July 2009. Electric Metals undertook a gravitational
survey of the project in 2010 which showed a
gravitational low over the area.
New America
Energy Corp.
Mud Lake Nevada Claims cover a 12.9km2 area east of Rockwood Lithium’s
Silver Peak facility. Regional sampling and gravity
surveying was undertaken at the site by the USGS.
Clayton
Ridge
Nevada Claim area is located south east of Rockwood Lithium’s
Silver Peak facility. Gravity surveys have identified a
trough believed to be a conduit for lithium bearing brines.
Great American
Energy Inc.
Big Smoky
Valley
Nevada The Big smoky valley project is adjacent to Rockwood
Lithium’s Silver Peak property, covering approx. 31km2.
Brine samples taken by the USGS have return lithium
concentrations of 160ppm on average. Great American
Energy plan to undertake further sampling and
geophysical analysis of the property. Source: Company data
5.40 Uzbekistan
The Shavazsay deposit in the Toshkent Viloyati province of Uzbekistan is reported by
the USGS to contain mineral reserves of 20.2Mt grading 0.57% Li2O, containing
approximately 284,000t LCE. The deposit is comprised of carbonaceous tuff-siltstone
beds with a volcanogenic origin. Exploration during the mid-2000s described the deposit
as being amenable to development by open pit methods, to extract lithium with by-
product potash and potassium sulphate.
Other potential lithium deposits in Uzbekistan include the Sargardon tungsten deposit in
Toshkent Viloyati province and Shabrez fluorite deposit also in the east of the country.
5.41 Zimbabwe
Zimbabwe is the world’s largest commercial producer of petalite mineral concentrate,
from the sole producing project in the country operated by Bikita Minerals. Since 2005,
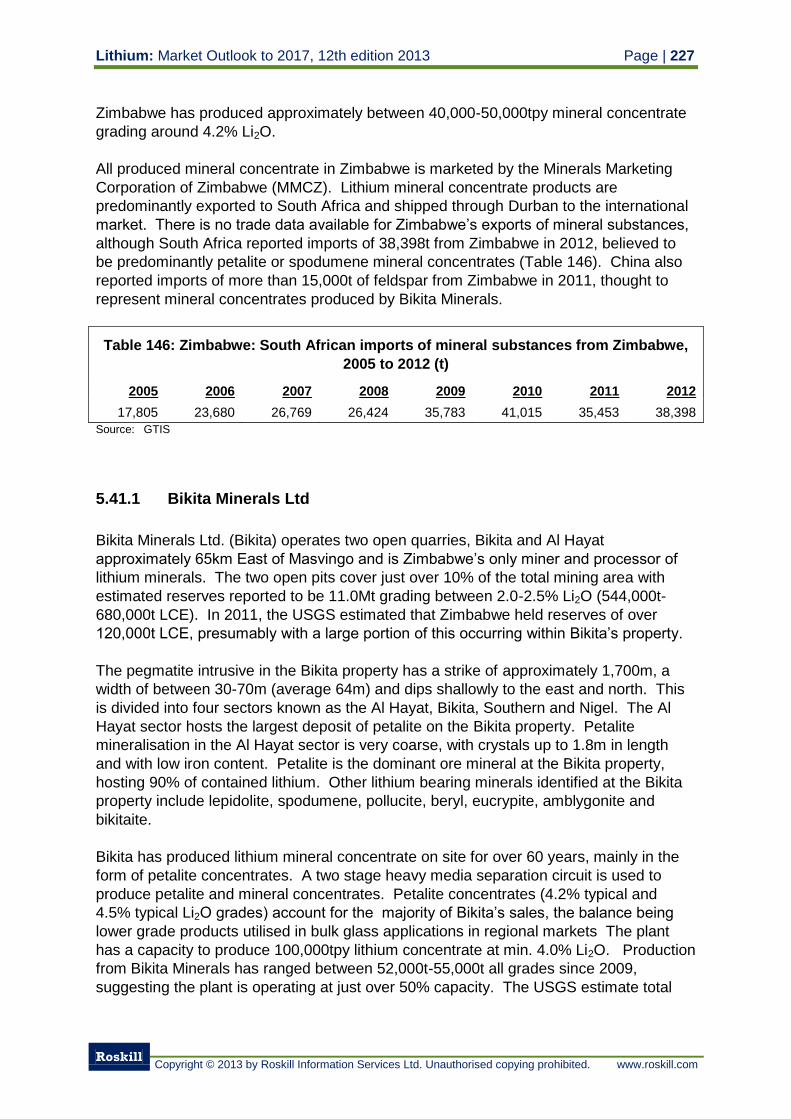
Lithium: Market Outlook to 2017, 12th edition 2013 Page | 227
Roskill
Copyright © 2013 by Roskill Information Services Ltd. Unauthorised copying prohibited. www.roskill.com
Zimbabwe has produced approximately between 40,000-50,000tpy mineral concentrate
grading around 4.2% Li2O.
All produced mineral concentrate in Zimbabwe is marketed by the Minerals Marketing
Corporation of Zimbabwe (MMCZ). Lithium mineral concentrate products are
predominantly exported to South Africa and shipped through Durban to the international
market. There is no trade data available for Zimbabwe’s exports of mineral substances,
although South Africa reported imports of 38,398t from Zimbabwe in 2012, believed to
be predominantly petalite or spodumene mineral concentrates (Table 146). China also
reported imports of more than 15,000t of feldspar from Zimbabwe in 2011, thought to
represent mineral concentrates produced by Bikita Minerals.
Table 146: Zimbabwe: South African imports of mineral substances from Zimbabwe,
2005 to 2012 (t)
2005 2006 2007 2008 2009 2010 2011 2012
17,805 23,680 26,769 26,424 35,783 41,015 35,453 38,398
Source: GTIS
5.41.1 Bikita Minerals Ltd
Bikita Minerals Ltd. (Bikita) operates two open quarries, Bikita and Al Hayat
approximately 65km East of Masvingo and is Zimbabwe’s only miner and processor of
lithium minerals. The two open pits cover just over 10% of the total mining area with
estimated reserves reported to be 11.0Mt grading between 2.0-2.5% Li2O (544,000t-
680,000t LCE). In 2011, the USGS estimated that Zimbabwe held reserves of over
120,000t LCE, presumably with a large portion of this occurring within Bikita’s property.
The pegmatite intrusive in the Bikita property has a strike of approximately 1,700m, a
width of between 30-70m (average 64m) and dips shallowly to the east and north. This
is divided into four sectors known as the Al Hayat, Bikita, Southern and Nigel. The Al
Hayat sector hosts the largest deposit of petalite on the Bikita property. Petalite
mineralisation in the Al Hayat sector is very coarse, with crystals up to 1.8m in length
and with low iron content. Petalite is the dominant ore mineral at the Bikita property,
hosting 90% of contained lithium. Other lithium bearing minerals identified at the Bikita
property include lepidolite, spodumene, pollucite, beryl, eucrypite, amblygonite and
bikitaite.
Bikita has produced lithium mineral concentrate on site for over 60 years, mainly in the
form of petalite concentrates. A two stage heavy media separation circuit is used to
produce petalite and mineral concentrates. Petalite concentrates (4.2% typical and
4.5% typical Li2O grades) account for the majority of Bikita’s sales, the balance being
lower grade products utilised in bulk glass applications in regional markets The plant
has a capacity to produce 100,000tpy lithium concentrate at min. 4.0% Li2O. Production
from Bikita Minerals has ranged between 52,000t-55,000t all grades since 2009,
suggesting the plant is operating at just over 50% capacity. The USGS estimate total
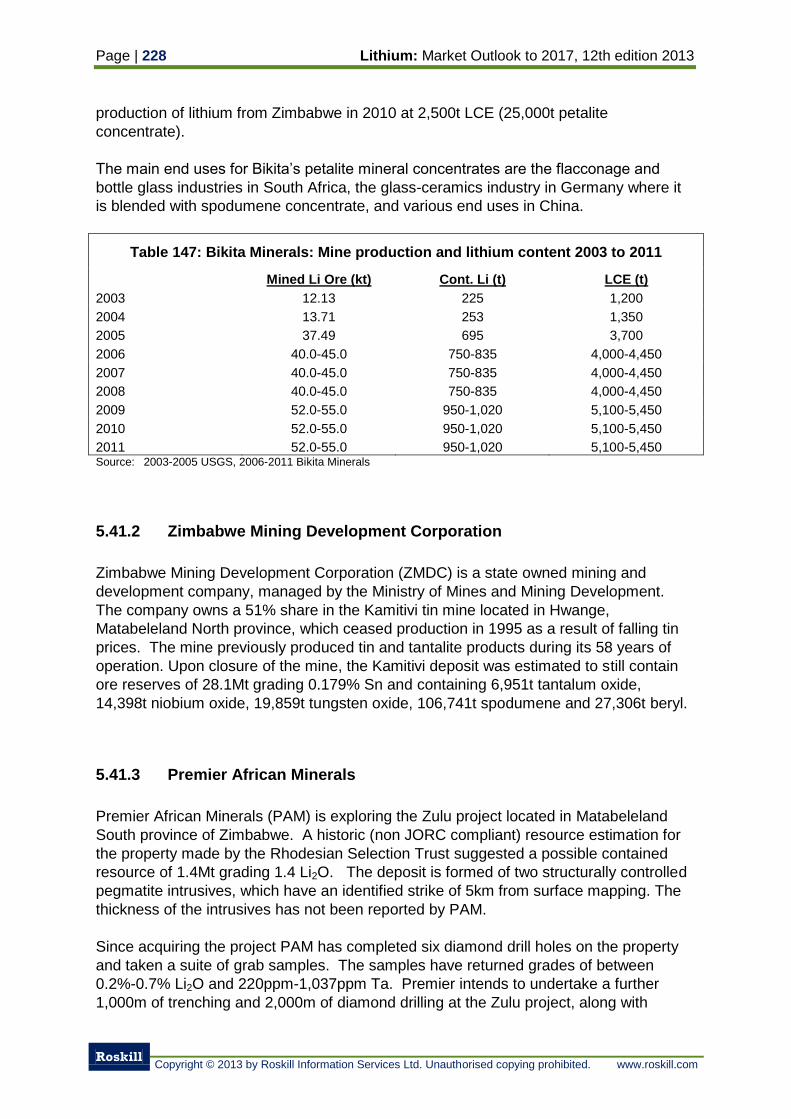
Page | 228 Lithium: Market Outlook to 2017, 12th edition 2013
Roskill
Copyright © 2013 by Roskill Information Services Ltd. Unauthorised copying prohibited. www.roskill.com
production of lithium from Zimbabwe in 2010 at 2,500t LCE (25,000t petalite
concentrate).
The main end uses for Bikita’s petalite mineral concentrates are the flacconage and
bottle glass industries in South Africa, the glass-ceramics industry in Germany where it
is blended with spodumene concentrate, and various end uses in China.
Table 147: Bikita Minerals: Mine production and lithium content 2003 to 2011
Mined Li Ore (kt) Cont. Li (t) LCE (t)
2003 12.13 225 1,200
2004 13.71 253 1,350
2005 37.49 695 3,700
2006 40.0-45.0 750-835 4,000-4,450
2007 40.0-45.0 750-835 4,000-4,450
2008 40.0-45.0 750-835 4,000-4,450
2009 52.0-55.0 950-1,020 5,100-5,450
2010 52.0-55.0 950-1,020 5,100-5,450
2011 52.0-55.0 950-1,020 5,100-5,450 Source: 2003-2005 USGS, 2006-2011 Bikita Minerals
5.41.2 Zimbabwe Mining Development Corporation
Zimbabwe Mining Development Corporation (ZMDC) is a state owned mining and
development company, managed by the Ministry of Mines and Mining Development.
The company owns a 51% share in the Kamitivi tin mine located in Hwange,
Matabeleland North province, which ceased production in 1995 as a result of falling tin
prices. The mine previously produced tin and tantalite products during its 58 years of
operation. Upon closure of the mine, the Kamitivi deposit was estimated to still contain
ore reserves of 28.1Mt grading 0.179% Sn and containing 6,951t tantalum oxide,
14,398t niobium oxide, 19,859t tungsten oxide, 106,741t spodumene and 27,306t beryl.
5.41.3 Premier African Minerals
Premier African Minerals (PAM) is exploring the Zulu project located in Matabeleland
South province of Zimbabwe. A historic (non JORC compliant) resource estimation for
the property made by the Rhodesian Selection Trust suggested a possible contained
resource of 1.4Mt grading 1.4 Li2O. The deposit is formed of two structurally controlled
pegmatite intrusives, which have an identified strike of 5km from surface mapping. The
thickness of the intrusives has not been reported by PAM.
Since acquiring the project PAM has completed six diamond drill holes on the property
and taken a suite of grab samples. The samples have returned grades of between
0.2%-0.7% Li2O and 220ppm-1,037ppm Ta. Premier intends to undertake a further
1,000m of trenching and 2,000m of diamond drilling at the Zulu project, along with
Lithium: Market Outlook to 2017, 12th edition 2013 Page | 229
Roskill
Copyright © 2013 by Roskill Information Services Ltd. Unauthorised copying prohibited. www.roskill.com
metallurgical studies with the overall goal of producing a JORC compliant Mineral
Resource.
5.41.4 Cape Range Ltd.
In October 2010, the Australian information technology company ‘Cape Range’ entered
into a MoU with privately owned Willaway Enterprises Limited (Willaway), to purchase up
to 75% equity in the Domboshawa Hill Lithium Project, Mashonaland Central Province.
The project is identified by Cape Range to have potential for pegmatite related
mineralisation including lithium and rare earth bearing minerals. Historically, the
surrounding area has been worked for pegmatite minerals, for example the Casa
Ventura mine in Goromonzi was mined for lepidolite between 1957 and 1981 producing
606t, and the Mistress Mine produced 1,677t lepidolite and 80t spodumene. Since the
initial announcement in October 2010, there have been no new developments reported
by Cape Range on the progress of the Domboshawa Hill Lithium Project.
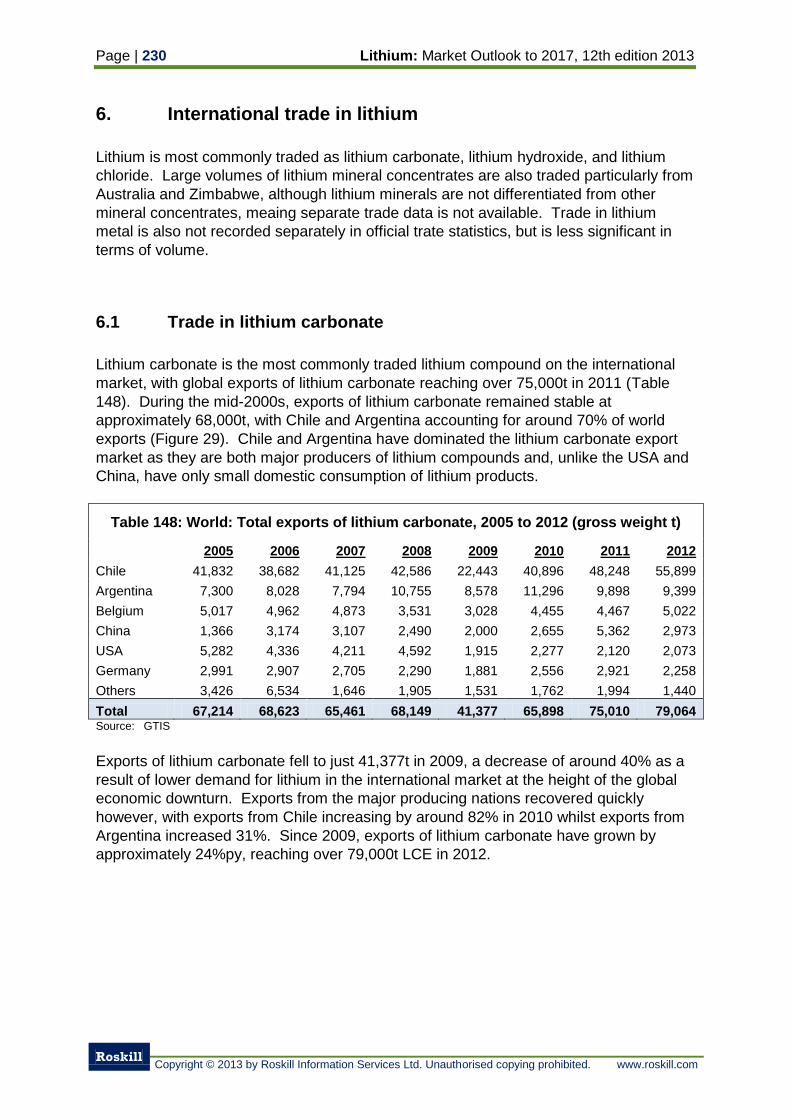
Page | 230 Lithium: Market Outlook to 2017, 12th edition 2013
Roskill
Copyright © 2013 by Roskill Information Services Ltd. Unauthorised copying prohibited. www.roskill.com
6. International trade in lithium
Lithium is most commonly traded as lithium carbonate, lithium hydroxide, and lithium
chloride. Large volumes of lithium mineral concentrates are also traded particularly from
Australia and Zimbabwe, although lithium minerals are not differentiated from other
mineral concentrates, meaing separate trade data is not available. Trade in lithium
metal is also not recorded separately in official trate statistics, but is less significant in
terms of volume.
6.1 Trade in lithium carbonate
Lithium carbonate is the most commonly traded lithium compound on the international
market, with global exports of lithium carbonate reaching over 75,000t in 2011 (Table
148). During the mid-2000s, exports of lithium carbonate remained stable at
approximately 68,000t, with Chile and Argentina accounting for around 70% of world
exports (Figure 29). Chile and Argentina have dominated the lithium carbonate export
market as they are both major producers of lithium compounds and, unlike the USA and
China, have only small domestic consumption of lithium products.
Table 148: World: Total exports of lithium carbonate, 2005 to 2012 (gross weight t)
2005 2006 2007 2008 2009 2010 2011 2012
Chile 41,832 38,682 41,125 42,586 22,443 40,896 48,248 55,899
Argentina 7,300 8,028 7,794 10,755 8,578 11,296 9,898 9,399
Belgium 5,017 4,962 4,873 3,531 3,028 4,455 4,467 5,022
China 1,366 3,174 3,107 2,490 2,000 2,655 5,362 2,973
USA 5,282 4,336 4,211 4,592 1,915 2,277 2,120 2,073
Germany 2,991 2,907 2,705 2,290 1,881 2,556 2,921 2,258
Others 3,426 6,534 1,646 1,905 1,531 1,762 1,994 1,440
Total 67,214 68,623 65,461 68,149 41,377 65,898 75,010 79,064 Source: GTIS
Exports of lithium carbonate fell to just 41,377t in 2009, a decrease of around 40% as a
result of lower demand for lithium in the international market at the height of the global
economic downturn. Exports from the major producing nations recovered quickly
however, with exports from Chile increasing by around 82% in 2010 whilst exports from
Argentina increased 31%. Since 2009, exports of lithium carbonate have grown by
approximately 24%py, reaching over 79,000t LCE in 2012.
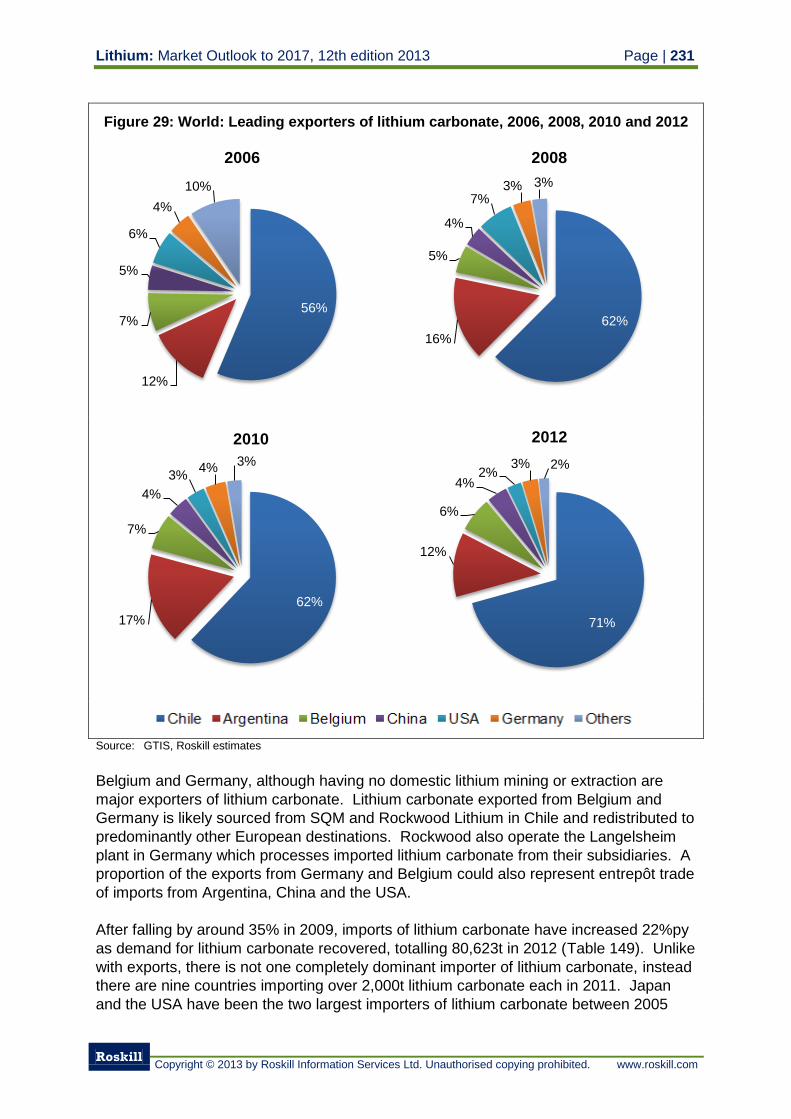
Lithium: Market Outlook to 2017, 12th edition 2013 Page | 231
Roskill
Copyright © 2013 by Roskill Information Services Ltd. Unauthorised copying prohibited. www.roskill.com
Figure 29: World: Leading exporters of lithium carbonate, 2006, 2008, 2010 and 2012
Source: GTIS, Roskill estimates
Belgium and Germany, although having no domestic lithium mining or extraction are
major exporters of lithium carbonate. Lithium carbonate exported from Belgium and
Germany is likely sourced from SQM and Rockwood Lithium in Chile and redistributed to
predominantly other European destinations. Rockwood also operate the Langelsheim
plant in Germany which processes imported lithium carbonate from their subsidiaries. A
proportion of the exports from Germany and Belgium could also represent entrepôt trade
of imports from Argentina, China and the USA.
After falling by around 35% in 2009, imports of lithium carbonate have increased 22%py
as demand for lithium carbonate recovered, totalling 80,623t in 2012 (Table 149). Unlike
with exports, there is not one completely dominant importer of lithium carbonate, instead
there are nine countries importing over 2,000t lithium carbonate each in 2011. Japan
and the USA have been the two largest importers of lithium carbonate between 2005
56%
12%
7%
5%
6%
4%
10%
2006
62%
16%
5%
4%
7% 3% 3%
2008
62%
17%
7%
4%
3% 4%
3%
2010
71%
12%
6%
4% 2%
3% 2%
2012
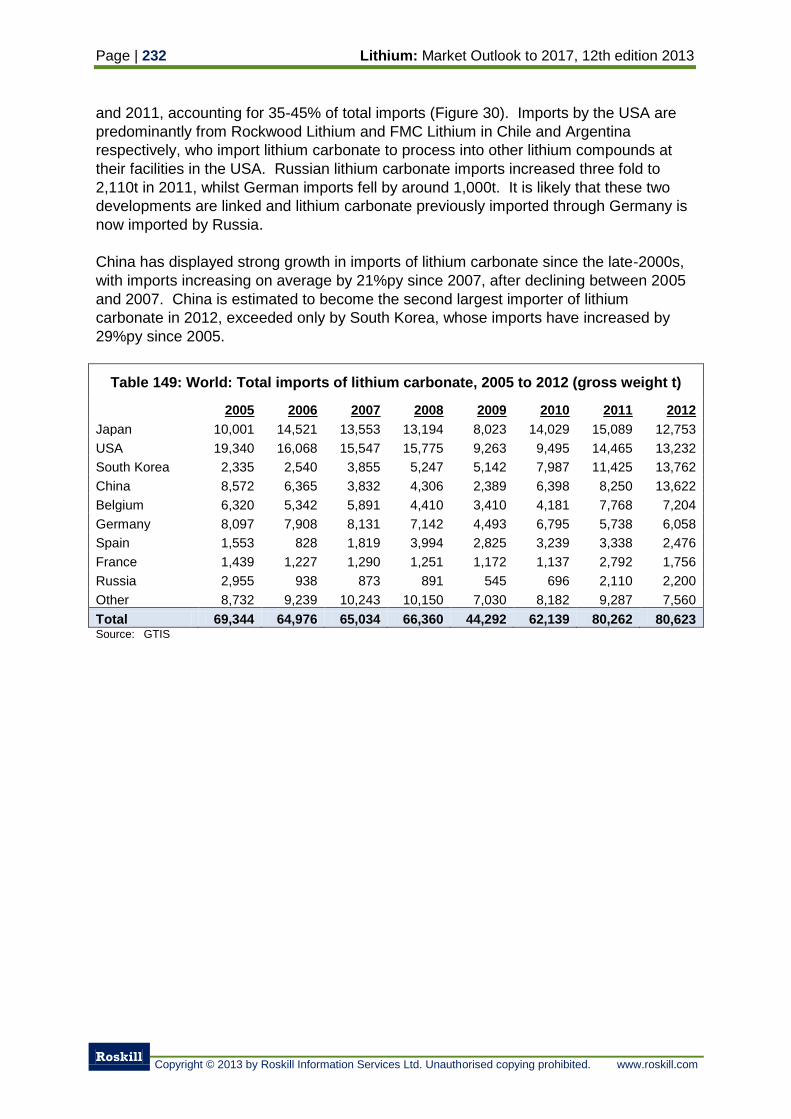
Page | 232 Lithium: Market Outlook to 2017, 12th edition 2013
Roskill
Copyright © 2013 by Roskill Information Services Ltd. Unauthorised copying prohibited. www.roskill.com
and 2011, accounting for 35-45% of total imports (Figure 30). Imports by the USA are
predominantly from Rockwood Lithium and FMC Lithium in Chile and Argentina
respectively, who import lithium carbonate to process into other lithium compounds at
their facilities in the USA. Russian lithium carbonate imports increased three fold to
2,110t in 2011, whilst German imports fell by around 1,000t. It is likely that these two
developments are linked and lithium carbonate previously imported through Germany is
now imported by Russia.
China has displayed strong growth in imports of lithium carbonate since the late-2000s,
with imports increasing on average by 21%py since 2007, after declining between 2005
and 2007. China is estimated to become the second largest importer of lithium
carbonate in 2012, exceeded only by South Korea, whose imports have increased by
29%py since 2005.
Table 149: World: Total imports of lithium carbonate, 2005 to 2012 (gross weight t)
2005 2006 2007 2008 2009 2010 2011 2012
Japan 10,001 14,521 13,553 13,194 8,023 14,029 15,089 12,753
USA 19,340 16,068 15,547 15,775 9,263 9,495 14,465 13,232
South Korea 2,335 2,540 3,855 5,247 5,142 7,987 11,425 13,762
China 8,572 6,365 3,832 4,306 2,389 6,398 8,250 13,622
Belgium 6,320 5,342 5,891 4,410 3,410 4,181 7,768 7,204
Germany 8,097 7,908 8,131 7,142 4,493 6,795 5,738 6,058
Spain 1,553 828 1,819 3,994 2,825 3,239 3,338 2,476
France 1,439 1,227 1,290 1,251 1,172 1,137 2,792 1,756
Russia 2,955 938 873 891 545 696 2,110 2,200
Other 8,732 9,239 10,243 10,150 7,030 8,182 9,287 7,560
Total 69,344 64,976 65,034 66,360 44,292 62,139 80,262 80,623 Source: GTIS
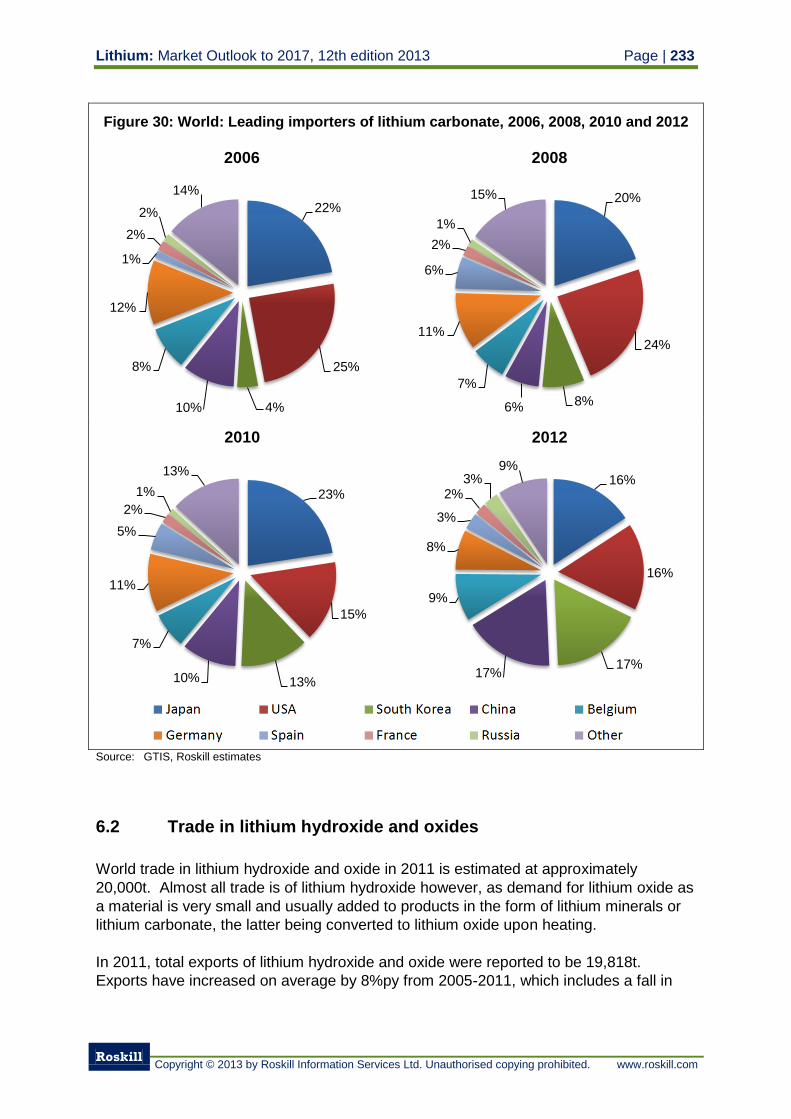
Lithium: Market Outlook to 2017, 12th edition 2013 Page | 233
Roskill
Copyright © 2013 by Roskill Information Services Ltd. Unauthorised copying prohibited. www.roskill.com
Figure 30: World: Leading importers of lithium carbonate, 2006, 2008, 2010 and 2012
Source: GTIS, Roskill estimates
6.2 Trade in lithium hydroxide and oxides
World trade in lithium hydroxide and oxide in 2011 is estimated at approximately
20,000t. Almost all trade is of lithium hydroxide however, as demand for lithium oxide as
a material is very small and usually added to products in the form of lithium minerals or
lithium carbonate, the latter being converted to lithium oxide upon heating.
In 2011, total exports of lithium hydroxide and oxide were reported to be 19,818t.
Exports have increased on average by 8%py from 2005-2011, which includes a fall in
22%
25%
4% 10%
8%
12%
1%
2%
2%
14%
2006
20%
24%
8% 6%
7%
11%
6%
2%
1%
15%
2008
23%
15%
13% 10%
7%
11%
5%
2%
1%
13%
2010
16%
16%
17% 17%
9%
8%
3%
2% 3%
9%
2012
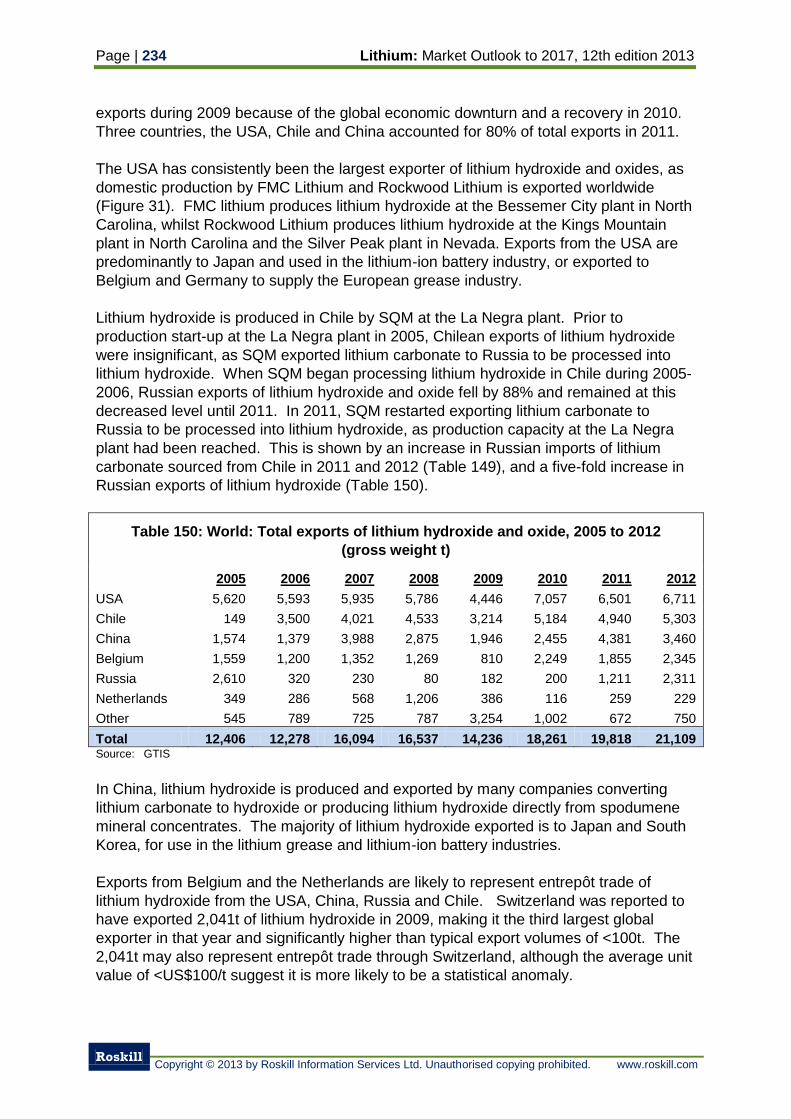
Page | 234 Lithium: Market Outlook to 2017, 12th edition 2013
Roskill
Copyright © 2013 by Roskill Information Services Ltd. Unauthorised copying prohibited. www.roskill.com
exports during 2009 because of the global economic downturn and a recovery in 2010.
Three countries, the USA, Chile and China accounted for 80% of total exports in 2011.
The USA has consistently been the largest exporter of lithium hydroxide and oxides, as
domestic production by FMC Lithium and Rockwood Lithium is exported worldwide
(Figure 31). FMC lithium produces lithium hydroxide at the Bessemer City plant in North
Carolina, whilst Rockwood Lithium produces lithium hydroxide at the Kings Mountain
plant in North Carolina and the Silver Peak plant in Nevada. Exports from the USA are
predominantly to Japan and used in the lithium-ion battery industry, or exported to
Belgium and Germany to supply the European grease industry.
Lithium hydroxide is produced in Chile by SQM at the La Negra plant. Prior to
production start-up at the La Negra plant in 2005, Chilean exports of lithium hydroxide
were insignificant, as SQM exported lithium carbonate to Russia to be processed into
lithium hydroxide. When SQM began processing lithium hydroxide in Chile during 2005-
2006, Russian exports of lithium hydroxide and oxide fell by 88% and remained at this
decreased level until 2011. In 2011, SQM restarted exporting lithium carbonate to
Russia to be processed into lithium hydroxide, as production capacity at the La Negra
plant had been reached. This is shown by an increase in Russian imports of lithium
carbonate sourced from Chile in 2011 and 2012 (Table 149), and a five-fold increase in
Russian exports of lithium hydroxide (Table 150).
Table 150: World: Total exports of lithium hydroxide and oxide, 2005 to 2012
(gross weight t)
2005 2006 2007 2008 2009 2010 2011 2012
USA 5,620 5,593 5,935 5,786 4,446 7,057 6,501 6,711
Chile 149 3,500 4,021 4,533 3,214 5,184 4,940 5,303
China 1,574 1,379 3,988 2,875 1,946 2,455 4,381 3,460
Belgium 1,559 1,200 1,352 1,269 810 2,249 1,855 2,345
Russia 2,610 320 230 80 182 200 1,211 2,311
Netherlands 349 286 568 1,206 386 116 259 229
Other 545 789 725 787 3,254 1,002 672 750
Total 12,406 12,278 16,094 16,537 14,236 18,261 19,818 21,109 Source: GTIS
In China, lithium hydroxide is produced and exported by many companies converting
lithium carbonate to hydroxide or producing lithium hydroxide directly from spodumene
mineral concentrates. The majority of lithium hydroxide exported is to Japan and South
Korea, for use in the lithium grease and lithium-ion battery industries.
Exports from Belgium and the Netherlands are likely to represent entrepôt trade of
lithium hydroxide from the USA, China, Russia and Chile. Switzerland was reported to
have exported 2,041t of lithium hydroxide in 2009, making it the third largest global
exporter in that year and significantly higher than typical export volumes of <100t. The
2,041t may also represent entrepôt trade through Switzerland, although the average unit
value of <US$100/t suggest it is more likely to be a statistical anomaly.
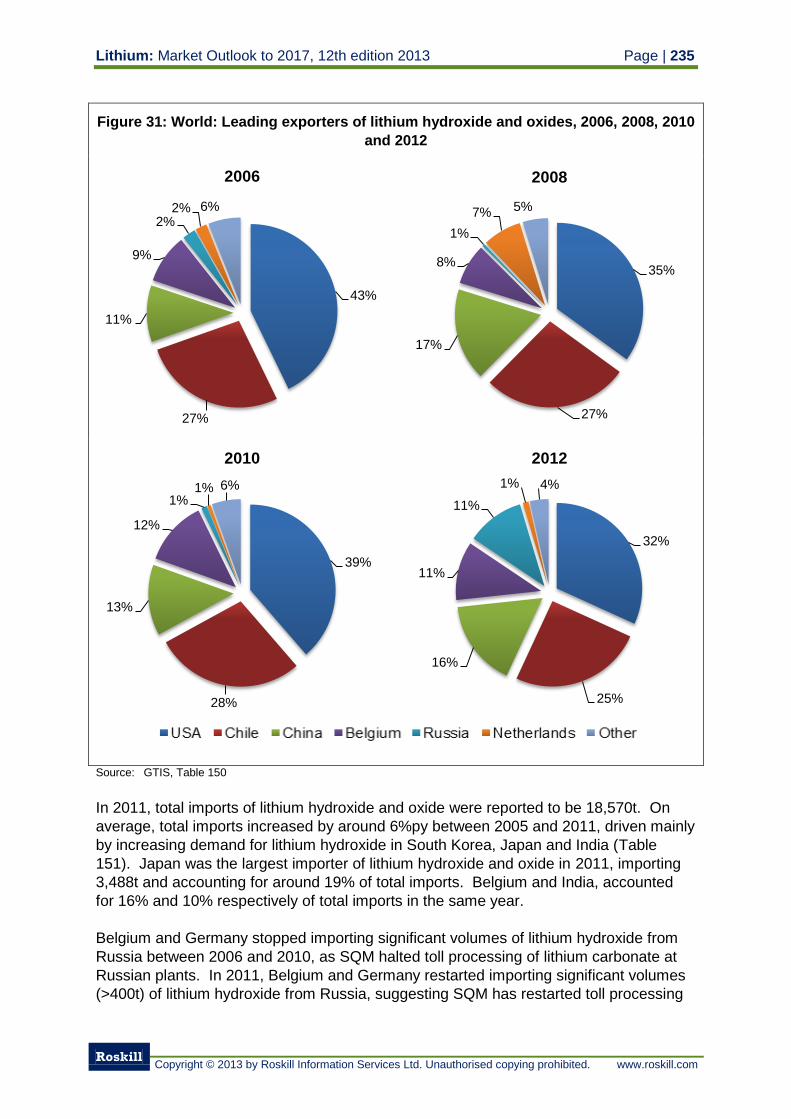
Lithium: Market Outlook to 2017, 12th edition 2013 Page | 235
Roskill
Copyright © 2013 by Roskill Information Services Ltd. Unauthorised copying prohibited. www.roskill.com
Figure 31: World: Leading exporters of lithium hydroxide and oxides, 2006, 2008, 2010
and 2012
Source: GTIS, Table 150
In 2011, total imports of lithium hydroxide and oxide were reported to be 18,570t. On
average, total imports increased by around 6%py between 2005 and 2011, driven mainly
by increasing demand for lithium hydroxide in South Korea, Japan and India (Table
151). Japan was the largest importer of lithium hydroxide and oxide in 2011, importing
3,488t and accounting for around 19% of total imports. Belgium and India, accounted
for 16% and 10% respectively of total imports in the same year.
Belgium and Germany stopped importing significant volumes of lithium hydroxide from
Russia between 2006 and 2010, as SQM halted toll processing of lithium carbonate at
Russian plants. In 2011, Belgium and Germany restarted importing significant volumes
(>400t) of lithium hydroxide from Russia, suggesting SQM has restarted toll processing
43%
27%
11%
9%
2% 2% 6%
2006
35%
27%
17%
8%
1%
7% 5%
2008
39%
28%
13%
12%
1% 1% 6%
2010
32%
25%
16%
11%
11%
1% 4%
2012
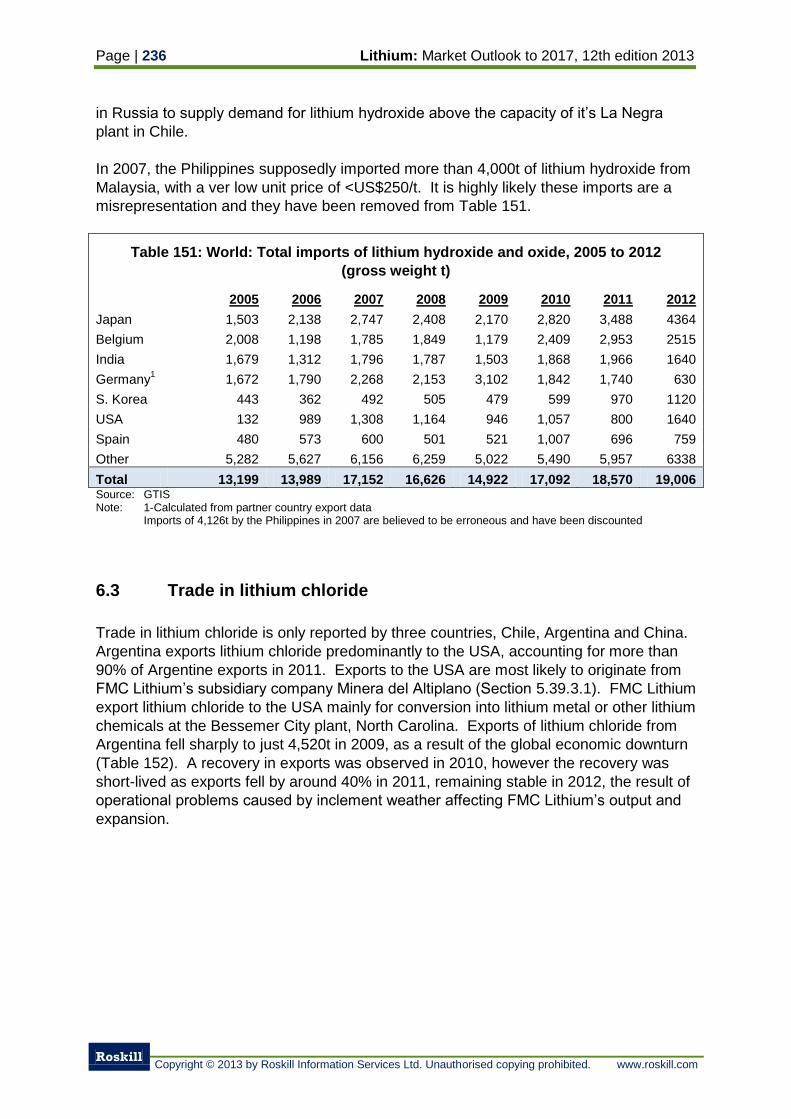
Page | 236 Lithium: Market Outlook to 2017, 12th edition 2013
Roskill
Copyright © 2013 by Roskill Information Services Ltd. Unauthorised copying prohibited. www.roskill.com
in Russia to supply demand for lithium hydroxide above the capacity of it’s La Negra
plant in Chile.
In 2007, the Philippines supposedly imported more than 4,000t of lithium hydroxide from
Malaysia, with a ver low unit price of <US$250/t. It is highly likely these imports are a
misrepresentation and they have been removed from Table 151.
Table 151: World: Total imports of lithium hydroxide and oxide, 2005 to 2012
(gross weight t)
2005 2006 2007 2008 2009 2010 2011 2012
Japan 1,503 2,138 2,747 2,408 2,170 2,820 3,488 4364
Belgium 2,008 1,198 1,785 1,849 1,179 2,409 2,953 2515
India 1,679 1,312 1,796 1,787 1,503 1,868 1,966 1640
Germany1 1,672 1,790 2,268 2,153 3,102 1,842 1,740 630
S. Korea 443 362 492 505 479 599 970 1120
USA 132 989 1,308 1,164 946 1,057 800 1640
Spain 480 573 600 501 521 1,007 696 759
Other 5,282 5,627 6,156 6,259 5,022 5,490 5,957 6338
Total 13,199 13,989 17,152 16,626 14,922 17,092 18,570 19,006 Source: GTIS Note: 1-Calculated from partner country export data
Imports of 4,126t by the Philippines in 2007 are believed to be erroneous and have been discounted
6.3 Trade in lithium chloride
Trade in lithium chloride is only reported by three countries, Chile, Argentina and China.
Argentina exports lithium chloride predominantly to the USA, accounting for more than
90% of Argentine exports in 2011. Exports to the USA are most likely to originate from
FMC Lithium’s subsidiary company Minera del Altiplano (Section 5.39.3.1). FMC Lithium
export lithium chloride to the USA mainly for conversion into lithium metal or other lithium
chemicals at the Bessemer City plant, North Carolina. Exports of lithium chloride from
Argentina fell sharply to just 4,520t in 2009, as a result of the global economic downturn
(Table 152). A recovery in exports was observed in 2010, however the recovery was
short-lived as exports fell by around 40% in 2011, remaining stable in 2012, the result of
operational problems caused by inclement weather affecting FMC Lithium’s output and
expansion.
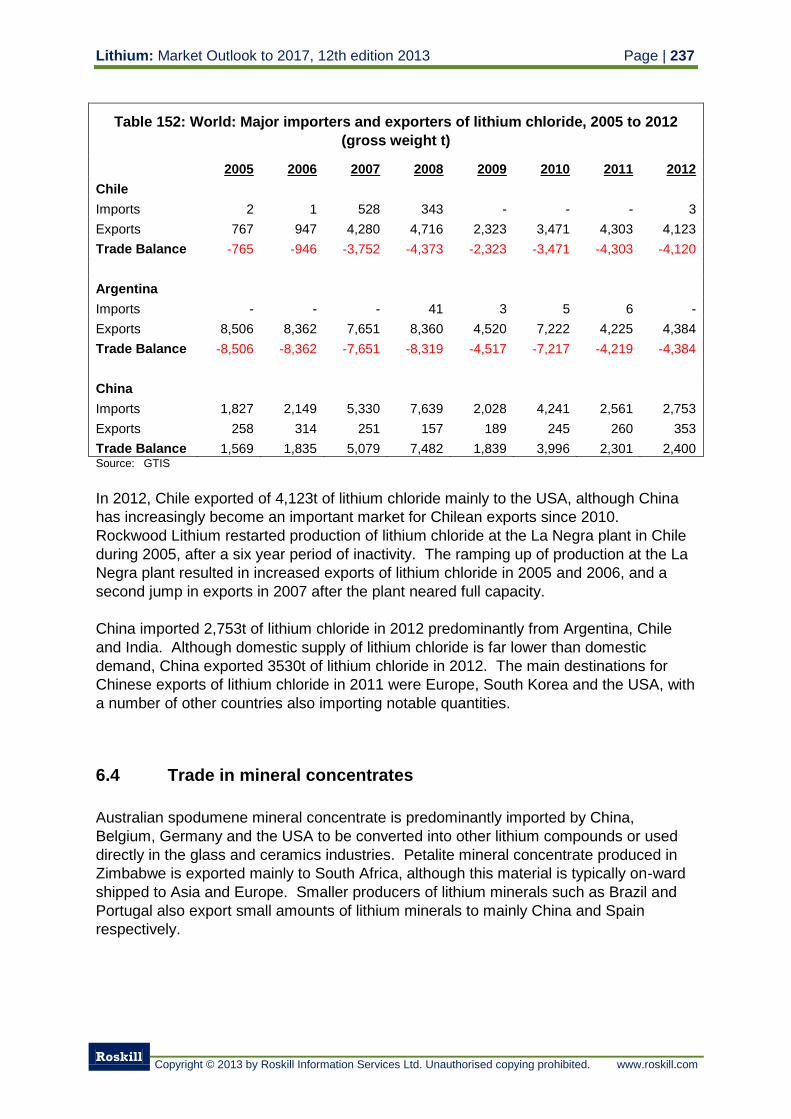
Lithium: Market Outlook to 2017, 12th edition 2013 Page | 237
Roskill
Copyright © 2013 by Roskill Information Services Ltd. Unauthorised copying prohibited. www.roskill.com
Table 152: World: Major importers and exporters of lithium chloride, 2005 to 2012
(gross weight t)
2005 2006 2007 2008 2009 2010 2011 2012
Chile Imports 2 1 528 343 - - - 3
Exports 767 947 4,280 4,716 2,323 3,471 4,303 4,123
Trade Balance -765 -946 -3,752 -4,373 -2,323 -3,471 -4,303 -4,120
Argentina Imports - - - 41 3 5 6 -
Exports 8,506 8,362 7,651 8,360 4,520 7,222 4,225 4,384
Trade Balance -8,506 -8,362 -7,651 -8,319 -4,517 -7,217 -4,219 -4,384
China Imports 1,827 2,149 5,330 7,639 2,028 4,241 2,561 2,753
Exports 258 314 251 157 189 245 260 353
Trade Balance 1,569 1,835 5,079 7,482 1,839 3,996 2,301 2,400 Source: GTIS
In 2012, Chile exported of 4,123t of lithium chloride mainly to the USA, although China
has increasingly become an important market for Chilean exports since 2010.
Rockwood Lithium restarted production of lithium chloride at the La Negra plant in Chile
during 2005, after a six year period of inactivity. The ramping up of production at the La
Negra plant resulted in increased exports of lithium chloride in 2005 and 2006, and a
second jump in exports in 2007 after the plant neared full capacity.
China imported 2,753t of lithium chloride in 2012 predominantly from Argentina, Chile
and India. Although domestic supply of lithium chloride is far lower than domestic
demand, China exported 3530t of lithium chloride in 2012. The main destinations for
Chinese exports of lithium chloride in 2011 were Europe, South Korea and the USA, with
a number of other countries also importing notable quantities.
6.4 Trade in mineral concentrates
Australian spodumene mineral concentrate is predominantly imported by China,
Belgium, Germany and the USA to be converted into other lithium compounds or used
directly in the glass and ceramics industries. Petalite mineral concentrate produced in
Zimbabwe is exported mainly to South Africa, although this material is typically on-ward
shipped to Asia and Europe. Smaller producers of lithium minerals such as Brazil and
Portugal also export small amounts of lithium minerals to mainly China and Spain
respectively.
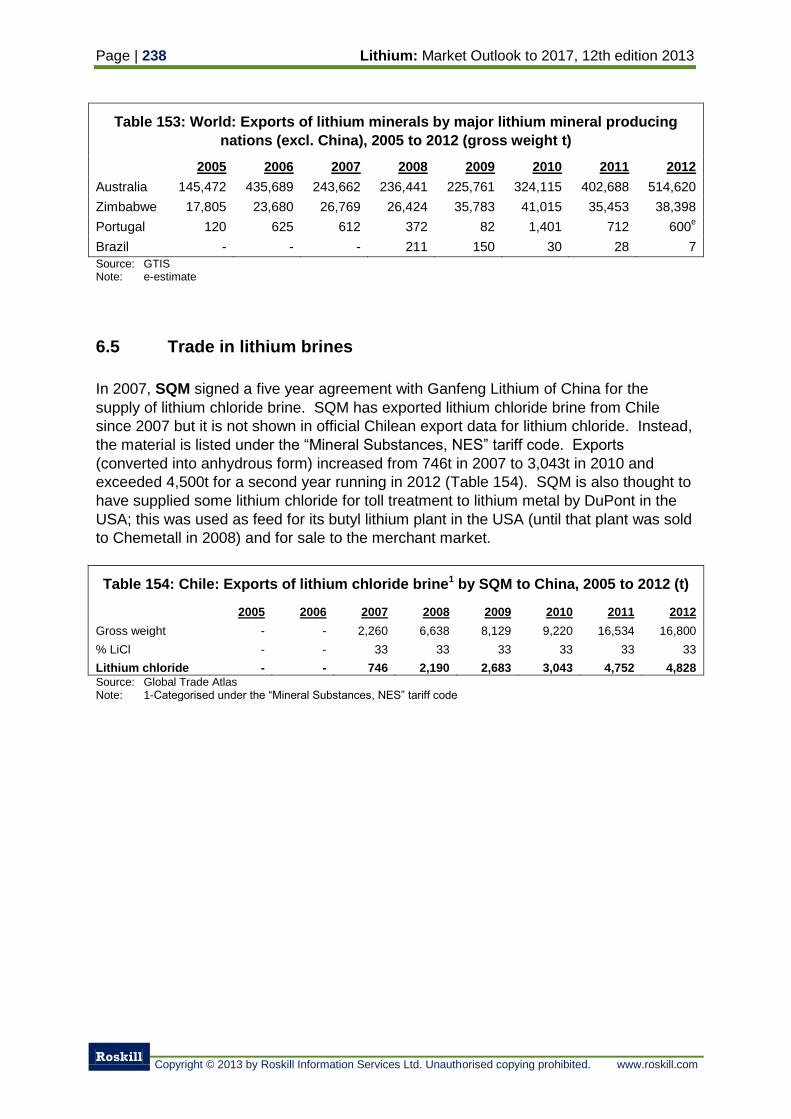
Page | 238 Lithium: Market Outlook to 2017, 12th edition 2013
Roskill
Copyright © 2013 by Roskill Information Services Ltd. Unauthorised copying prohibited. www.roskill.com
Table 153: World: Exports of lithium minerals by major lithium mineral producing
nations (excl. China), 2005 to 2012 (gross weight t)
2005 2006 2007 2008 2009 2010 2011 2012
Australia 145,472 435,689 243,662 236,441 225,761 324,115 402,688 514,620
Zimbabwe 17,805 23,680 26,769 26,424 35,783 41,015 35,453 38,398
Portugal 120 625 612 372 82 1,401 712 600e
Brazil - - - 211 150 30 28 7
Source: GTIS Note: e-estimate
6.5 Trade in lithium brines
In 2007, SQM signed a five year agreement with Ganfeng Lithium of China for the
supply of lithium chloride brine. SQM has exported lithium chloride brine from Chile
since 2007 but it is not shown in official Chilean export data for lithium chloride. Instead,
the material is listed under the “Mineral Substances, NES” tariff code. Exports
(converted into anhydrous form) increased from 746t in 2007 to 3,043t in 2010 and
exceeded 4,500t for a second year running in 2012 (Table 154). SQM is also thought to
have supplied some lithium chloride for toll treatment to lithium metal by DuPont in the
USA; this was used as feed for its butyl lithium plant in the USA (until that plant was sold
to Chemetall in 2008) and for sale to the merchant market.
Table 154: Chile: Exports of lithium chloride brine1 by SQM to China, 2005 to 2012 (t)
2005 2006 2007 2008 2009 2010 2011 2012
Gross weight - - 2,260 6,638 8,129 9,220 16,534 16,800
% LiCl - - 33 33 33 33 33 33
Lithium chloride - - 746 2,190 2,683 3,043 4,752 4,828 Source: Global Trade Atlas Note: 1-Categorised under the “Mineral Substances, NES” tariff code
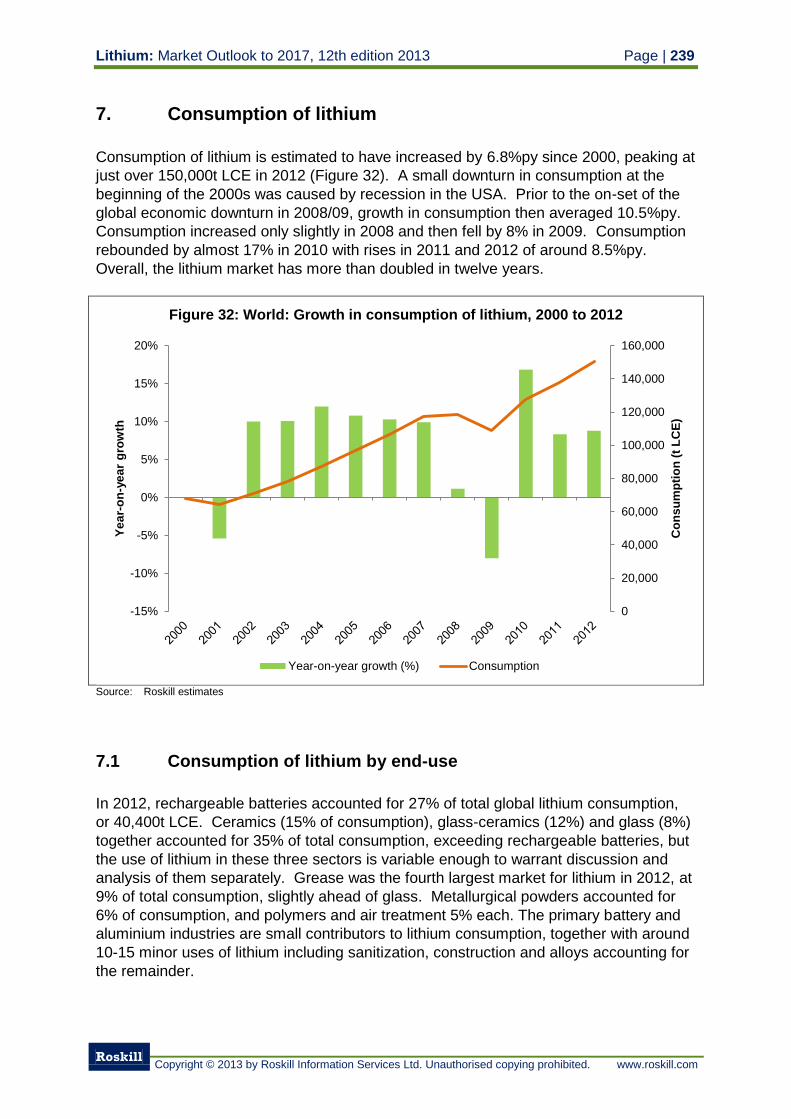
Lithium: Market Outlook to 2017, 12th edition 2013 Page | 239
Roskill
Copyright © 2013 by Roskill Information Services Ltd. Unauthorised copying prohibited. www.roskill.com
7. Consumption of lithium
Consumption of lithium is estimated to have increased by 6.8%py since 2000, peaking at
just over 150,000t LCE in 2012 (Figure 32). A small downturn in consumption at the
beginning of the 2000s was caused by recession in the USA. Prior to the on-set of the
global economic downturn in 2008/09, growth in consumption then averaged 10.5%py.
Consumption increased only slightly in 2008 and then fell by 8% in 2009. Consumption
rebounded by almost 17% in 2010 with rises in 2011 and 2012 of around 8.5%py.
Overall, the lithium market has more than doubled in twelve years.
Figure 32: World: Growth in consumption of lithium, 2000 to 2012
Source: Roskill estimates
7.1 Consumption of lithium by end-use
In 2012, rechargeable batteries accounted for 27% of total global lithium consumption,
or 40,400t LCE. Ceramics (15% of consumption), glass-ceramics (12%) and glass (8%)
together accounted for 35% of total consumption, exceeding rechargeable batteries, but
the use of lithium in these three sectors is variable enough to warrant discussion and
analysis of them separately. Grease was the fourth largest market for lithium in 2012, at
9% of total consumption, slightly ahead of glass. Metallurgical powders accounted for
6% of consumption, and polymers and air treatment 5% each. The primary battery and
aluminium industries are small contributors to lithium consumption, together with around
10-15 minor uses of lithium including sanitization, construction and alloys accounting for
the remainder.
0
20,000
40,000
60,000
80,000
100,000
120,000
140,000
160,000
-15%
-10%
-5%
0%
5%
10%
15%
20%
Co
ns
um
pti
on
(t
LC
E)
Ye
ar-
on
-ye
ar
gro
wth
Year-on-year growth (%) Consumption
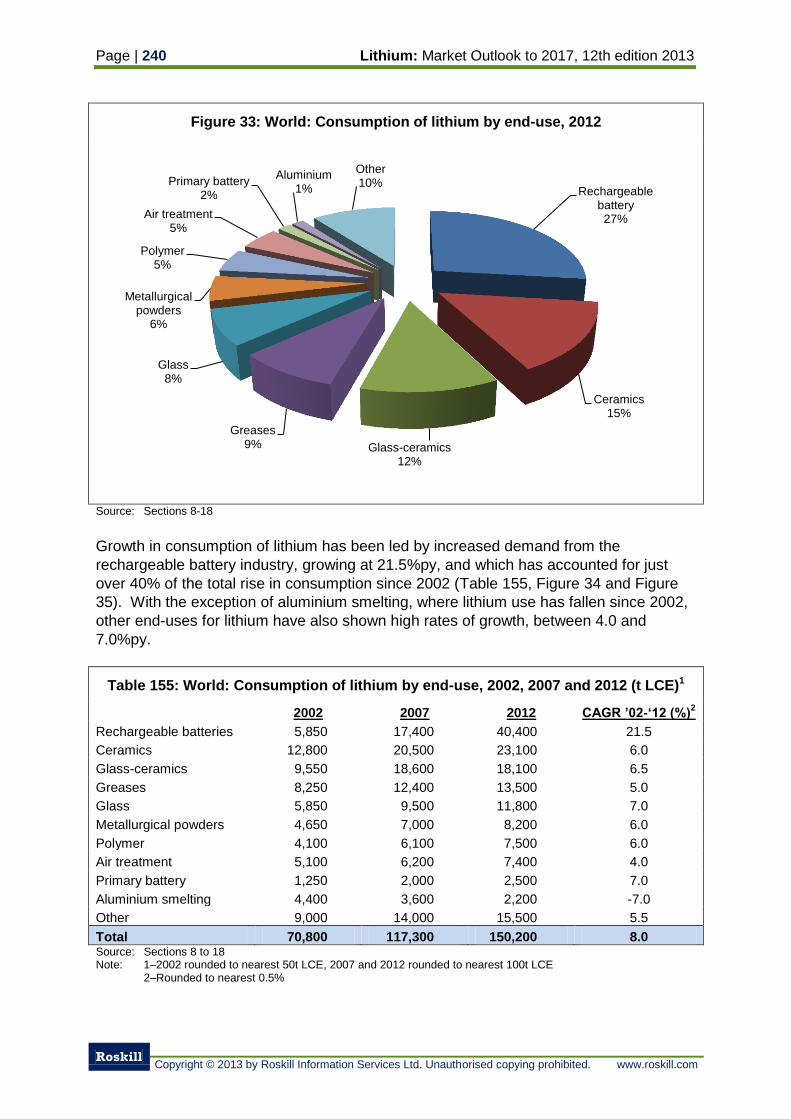
Page | 240 Lithium: Market Outlook to 2017, 12th edition 2013
Roskill
Copyright © 2013 by Roskill Information Services Ltd. Unauthorised copying prohibited. www.roskill.com
Figure 33: World: Consumption of lithium by end-use, 2012
Source: Sections 8-18
Growth in consumption of lithium has been led by increased demand from the
rechargeable battery industry, growing at 21.5%py, and which has accounted for just
over 40% of the total rise in consumption since 2002 (Table 155, Figure 34 and Figure
35). With the exception of aluminium smelting, where lithium use has fallen since 2002,
other end-uses for lithium have also shown high rates of growth, between 4.0 and
7.0%py.
Table 155: World: Consumption of lithium by end-use, 2002, 2007 and 2012 (t LCE)1
2002 2007 2012 CAGR ’02-‘12 (%)2
Rechargeable batteries 5,850 17,400 40,400 21.5
Ceramics 12,800 20,500 23,100 6.0
Glass-ceramics 9,550 18,600 18,100 6.5
Greases 8,250 12,400 13,500 5.0
Glass 5,850 9,500 11,800 7.0
Metallurgical powders 4,650 7,000 8,200 6.0
Polymer 4,100 6,100 7,500 6.0
Air treatment 5,100 6,200 7,400 4.0
Primary battery 1,250 2,000 2,500 7.0
Aluminium smelting 4,400 3,600 2,200 -7.0
Other 9,000 14,000 15,500 5.5
Total 70,800 117,300 150,200 8.0 Source: Sections 8 to 18 Note: 1–2002 rounded to nearest 50t LCE, 2007 and 2012 rounded to nearest 100t LCE
2–Rounded to nearest 0.5%
Rechargeable battery 27%
Ceramics 15%
Glass-ceramics 12%
Greases 9%
Glass 8%
Metallurgical powders
6%
Polymer 5%
Air treatment 5%
Primary battery 2%
Aluminium 1%
Other 10%
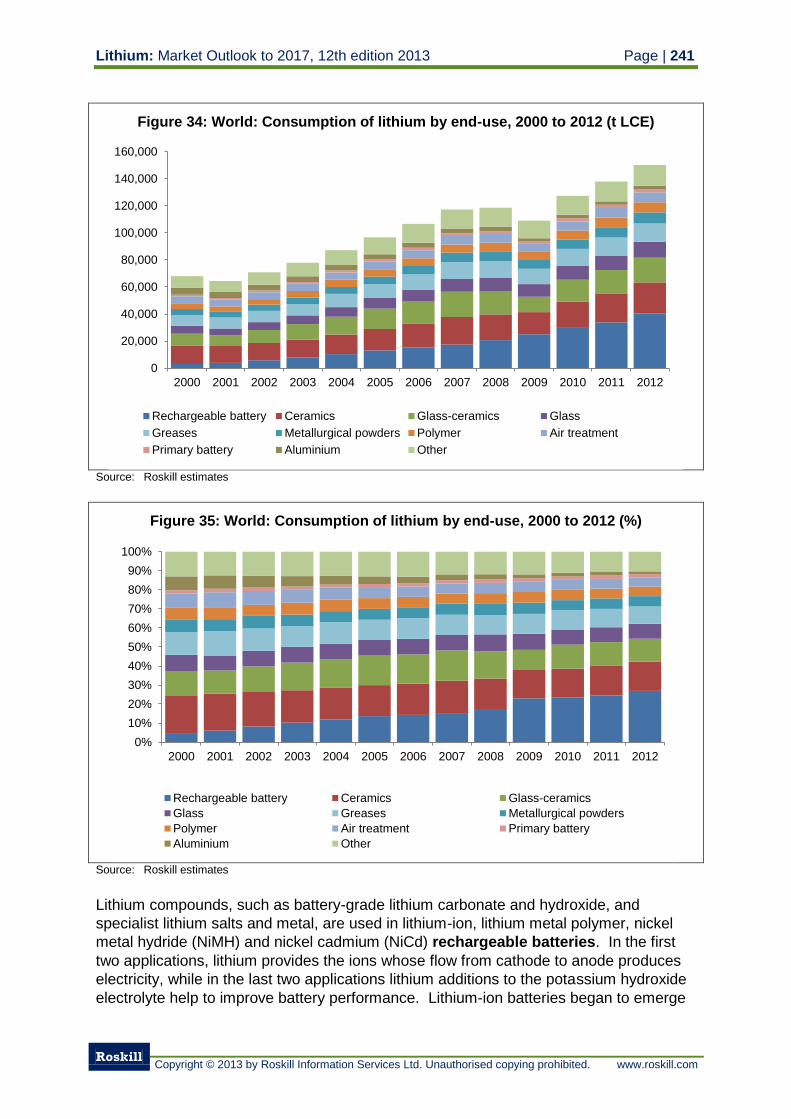
Lithium: Market Outlook to 2017, 12th edition 2013 Page | 241
Roskill
Copyright © 2013 by Roskill Information Services Ltd. Unauthorised copying prohibited. www.roskill.com
Figure 34: World: Consumption of lithium by end-use, 2000 to 2012 (t LCE)
Source: Roskill estimates
Figure 35: World: Consumption of lithium by end-use, 2000 to 2012 (%)
Source: Roskill estimates
Lithium compounds, such as battery-grade lithium carbonate and hydroxide, and
specialist lithium salts and metal, are used in lithium-ion, lithium metal polymer, nickel
metal hydride (NiMH) and nickel cadmium (NiCd) rechargeable batteries. In the first
two applications, lithium provides the ions whose flow from cathode to anode produces
electricity, while in the last two applications lithium additions to the potassium hydroxide
electrolyte help to improve battery performance. Lithium-ion batteries began to emerge
0
20,000
40,000
60,000
80,000
100,000
120,000
140,000
160,000
2000 2001 2002 2003 2004 2005 2006 2007 2008 2009 2010 2011 2012
Rechargeable battery Ceramics Glass-ceramics Glass
Greases Metallurgical powders Polymer Air treatment
Primary battery Aluminium Other
0%
10%
20%
30%
40%
50%
60%
70%
80%
90%
100%
2000 2001 2002 2003 2004 2005 2006 2007 2008 2009 2010 2011 2012
Rechargeable battery Ceramics Glass-ceramics
Glass Greases Metallurgical powders
Polymer Air treatment Primary battery
Aluminium Other
Page | 242 Lithium: Market Outlook to 2017, 12th edition 2013
Roskill
Copyright © 2013 by Roskill Information Services Ltd. Unauthorised copying prohibited. www.roskill.com
as competitors to NiCd and NiMH batteries in the late 1990s/early 2000s, as
manufacturers of portable consumer devices, particularly mobile phones, started to
utilise them to produce increasingly smaller and lightweight devices. Rising use meant
costs for lithium-ion batteries subsequently fell and their appeal started to grow further,
with replacement of NiCd and NiMH batteries in other portable devices progressing
rapidly, albeit at variable rates depending on lithium-ion’s suitability. During the mid-
2000s, demand for portable consumer goods accelerated, with notebook PC sales
overtaking desktop PCs, the emergence of digital music players, and later netbook PCs
and tablet PCs, helping to boost lithium-ion battery use, and hence lithium consumption.
The rechargeable battery market became the leading end-use for lithium in 2007,
overtaking ceramics, and has almost doubled in size since then.
Lithium compounds and minerals are used only in certain ceramic products, mainly as a
flux in ceramic bodies and enamel and ceramic glazes, but also for the production of
heat-resistant ovenware/cookware. This market has benefitted from higher levels of
construction and output of white goods since the early 2000s.
Glass-ceramics based on the lithia-alumino-silicate (LAS) system have a high
resistance to thermal shock, making them useful for applications where severe
temperature variations are common, such as cooktops, stove and furnace windows and
fireproof architectural panels. This market has benefited from growth in construction,
especially in Asia where the use of electricity for cooking is far more prevalent than
Europe and North America, which use more natural gas. Both lithium carbonate and
lithium minerals (spodumene & petalite) are used, the former in transparent or impurity-
intolerant applications while the latter can be cost effective because of the other
elements contained (alumina & silica) in the mineral.
Lithium-based greases are the most widely produced grease types, accounting for
around 75% of total grease production in 2012. Lithium-based greases are used in a
wide range of applications, from general purpose household uses to marine equipment.
The use of lithium-based greases is strongly tied to manufacturing output, which has
recorded strong growth in the 2000s. Lithium-based greases are the major market for
lithium hydroxide monohydrate.
Lithium has several uses in glass manufacturing, ranging from altering the viscosity of
the melt in container glass production to replacing lead in lighting glass and tableware.
Lithium minerals (petalite and spodumene) and compounds are used, and lithium
consumption in this end-use has risen because of the performance improvement and
environmental benefits lithium brings to the melting process.
In metallurgical powders, lithium’s ability to act as a strong flux makes it useful for
reducing viscosity and increasing flow during the continual casting process, as well as in
the production of ferrous and non-ferrous castings where it helps prevent veining and
deformation. Growth in crude steel output accelerated in the mid-2000s, largely on
surging Chinese output and demand, and together with increased use of casting
powders led to lithium consumption rising by 8.5%py from 2000 to 2012. Both lithium
minerals and lithium carbonate are used in metallurgical powders.
Butyllithium is used as an initiator for anionic polymerisation reactions in the production
of certain synthetic rubber and thermoplastic products, such as styrene-butadiene
Lithium: Market Outlook to 2017, 12th edition 2013 Page | 243
Roskill
Copyright © 2013 by Roskill Information Services Ltd. Unauthorised copying prohibited. www.roskill.com
rubber (SBR) and styrene block copolymers (SBCs). Growth in lithium consumption in
polymers has exceeded that of synthetic rubber as a whole because of strong demand
for the specific products lithium is used to polymerise, especially solution polymerised
SBR (SSBR).
The air treatment market for lithium has witnessed slower growth than some other end-
uses, as absorption chillers, which use large quantities of lithium bromide, remain a
niche product and face competition from electric compressors.
Battery-grade lithium metal and lithium salts are used in primary batteries, which utilise
the electrochemical potential of lithium to provide high energy density in a small cell.
The market for lithium primary batteries has benefitted from consumers switching from
cheaper alkaline batteries in power-hungry portable devices as well as increased use in
applications such as remote utility monitoring. As a result lithium consumption has risen
by 7%py over the last ten years.
Aluminium smelting is the only significant market where consumption of lithium has been falling long-term, as older Söderberg smelters using an open-bath system, in which
lithium carbonate is used to reduce fluorine emissions, are replaced with modern
facilities using pre-baked pot lines. Consumption of lithium in this end-use has halved
since 2002.
Consumption growth in other end-uses has been mixed, with alloys showing the highest
levels as aluminium-lithium enjoys resurgence in use in modern aircraft, together with
increased consumption in organic synthesis and construction.
7.2 Consumption of lithium by country/region
China and Europe are the largest consumers of lithium, accounting for around 35% and
24% of total consumption respectively in 2012 (Table 156 and Figure 36). Chinese
consumption has increased by 11.4%py since 2002, largely through rapid expansion of
its domestic industrial, construction and battery sectors. European consumption has
risen by 7%py, led by its construction and export –led industries. However, while
Chinese consumption has maintained its strong growth trend post the 2009 global
economic downturn, Europe has struggled and has witnessed growth of only 2.5%py
since 2007.
Japan and South Korea represent 12% and 10% of the global market for lithium
respectively. South Korean consumption has grown at >30%py since 2002 because of a
rapid expansion in its domestic rechargeable battery industry, and associated material
requirements. Japan, meanwhile, saw consumption grow by 7%py between 2002 and
2007, again due to the demands of the rechargeable battery industry, but as of 2012
consumption stands 15% below the pre- global economic downturn peak. Japanese
industry has come under pressure from Chinese and South Korean competition, where
lower costs and more favourable exchange rates for exports are benefiting producers of
manufactured goods using lithium.
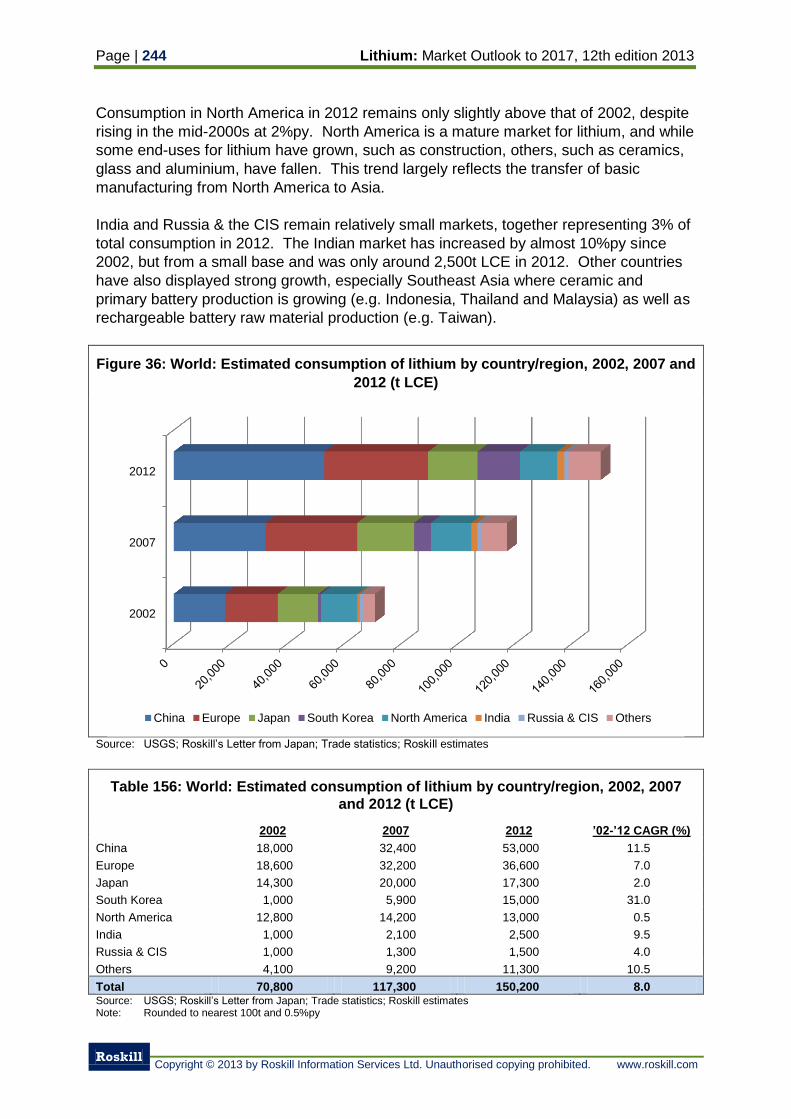
Page | 244 Lithium: Market Outlook to 2017, 12th edition 2013
Roskill
Copyright © 2013 by Roskill Information Services Ltd. Unauthorised copying prohibited. www.roskill.com
Consumption in North America in 2012 remains only slightly above that of 2002, despite
rising in the mid-2000s at 2%py. North America is a mature market for lithium, and while
some end-uses for lithium have grown, such as construction, others, such as ceramics,
glass and aluminium, have fallen. This trend largely reflects the transfer of basic
manufacturing from North America to Asia.
India and Russia & the CIS remain relatively small markets, together representing 3% of
total consumption in 2012. The Indian market has increased by almost 10%py since
2002, but from a small base and was only around 2,500t LCE in 2012. Other countries
have also displayed strong growth, especially Southeast Asia where ceramic and
primary battery production is growing (e.g. Indonesia, Thailand and Malaysia) as well as
rechargeable battery raw material production (e.g. Taiwan).
Figure 36: World: Estimated consumption of lithium by country/region, 2002, 2007 and
2012 (t LCE)
Source: USGS; Roskill’s Letter from Japan; Trade statistics; Roskill estimates
Table 156: World: Estimated consumption of lithium by country/region, 2002, 2007
and 2012 (t LCE)
2002 2007 2012 ’02-’12 CAGR (%)
China 18,000 32,400 53,000 11.5
Europe 18,600 32,200 36,600 7.0
Japan 14,300 20,000 17,300 2.0
South Korea 1,000 5,900 15,000 31.0
North America 12,800 14,200 13,000 0.5
India 1,000 2,100 2,500 9.5
Russia & CIS 1,000 1,300 1,500 4.0
Others 4,100 9,200 11,300 10.5
Total 70,800 117,300 150,200 8.0 Source: USGS; Roskill’s Letter from Japan; Trade statistics; Roskill estimates Note: Rounded to nearest 100t and 0.5%py
2002
2007
2012
China Europe Japan South Korea North America India Russia & CIS Others
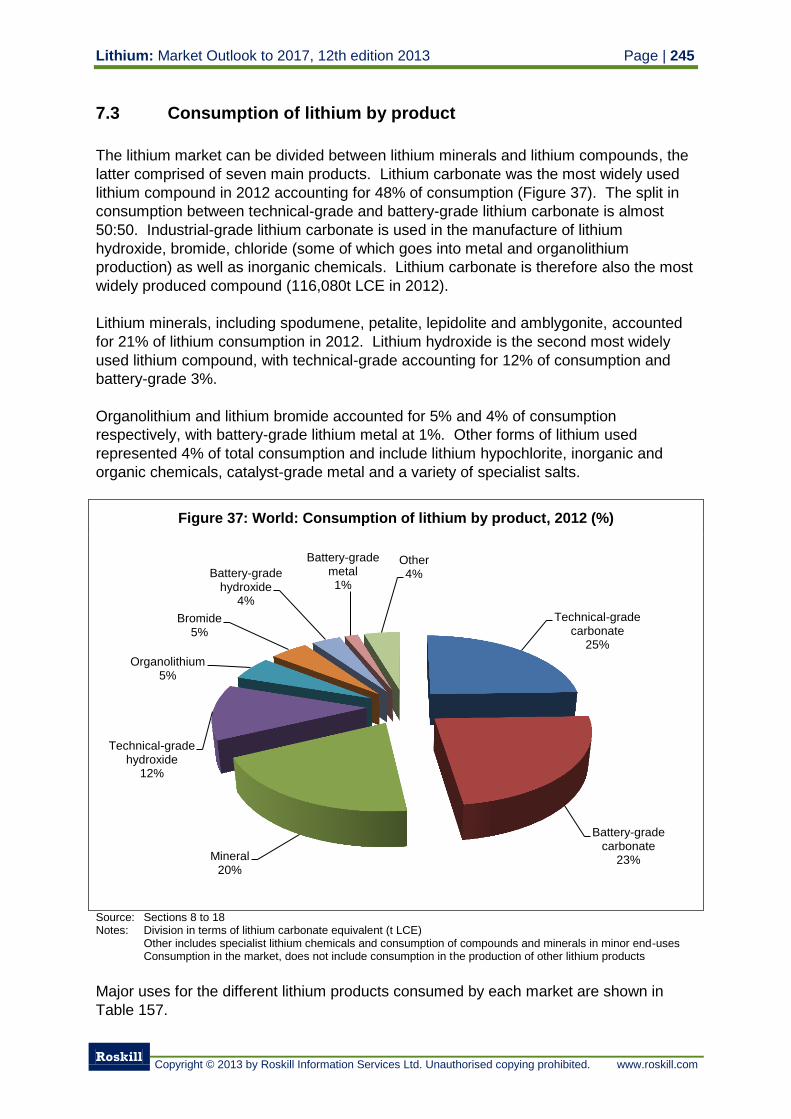
Lithium: Market Outlook to 2017, 12th edition 2013 Page | 245
Roskill
Copyright © 2013 by Roskill Information Services Ltd. Unauthorised copying prohibited. www.roskill.com
7.3 Consumption of lithium by product
The lithium market can be divided between lithium minerals and lithium compounds, the
latter comprised of seven main products. Lithium carbonate was the most widely used
lithium compound in 2012 accounting for 48% of consumption (Figure 37). The split in
consumption between technical-grade and battery-grade lithium carbonate is almost
50:50. Industrial-grade lithium carbonate is used in the manufacture of lithium
hydroxide, bromide, chloride (some of which goes into metal and organolithium
production) as well as inorganic chemicals. Lithium carbonate is therefore also the most
widely produced compound (116,080t LCE in 2012).
Lithium minerals, including spodumene, petalite, lepidolite and amblygonite, accounted
for 21% of lithium consumption in 2012. Lithium hydroxide is the second most widely
used lithium compound, with technical-grade accounting for 12% of consumption and
battery-grade 3%.
Organolithium and lithium bromide accounted for 5% and 4% of consumption
respectively, with battery-grade lithium metal at 1%. Other forms of lithium used
represented 4% of total consumption and include lithium hypochlorite, inorganic and
organic chemicals, catalyst-grade metal and a variety of specialist salts.
Figure 37: World: Consumption of lithium by product, 2012 (%)
Source: Sections 8 to 18 Notes: Division in terms of lithium carbonate equivalent (t LCE)
Other includes specialist lithium chemicals and consumption of compounds and minerals in minor end-uses Consumption in the market, does not include consumption in the production of other lithium products
Major uses for the different lithium products consumed by each market are shown in
Table 157.
Technical-grade carbonate
25%
Battery-grade carbonate
23% Mineral 20%
Technical-grade hydroxide
12%
Organolithium 5%
Bromide 5%
Battery-grade hydroxide
4%
Battery-grade metal 1%
Other 4%
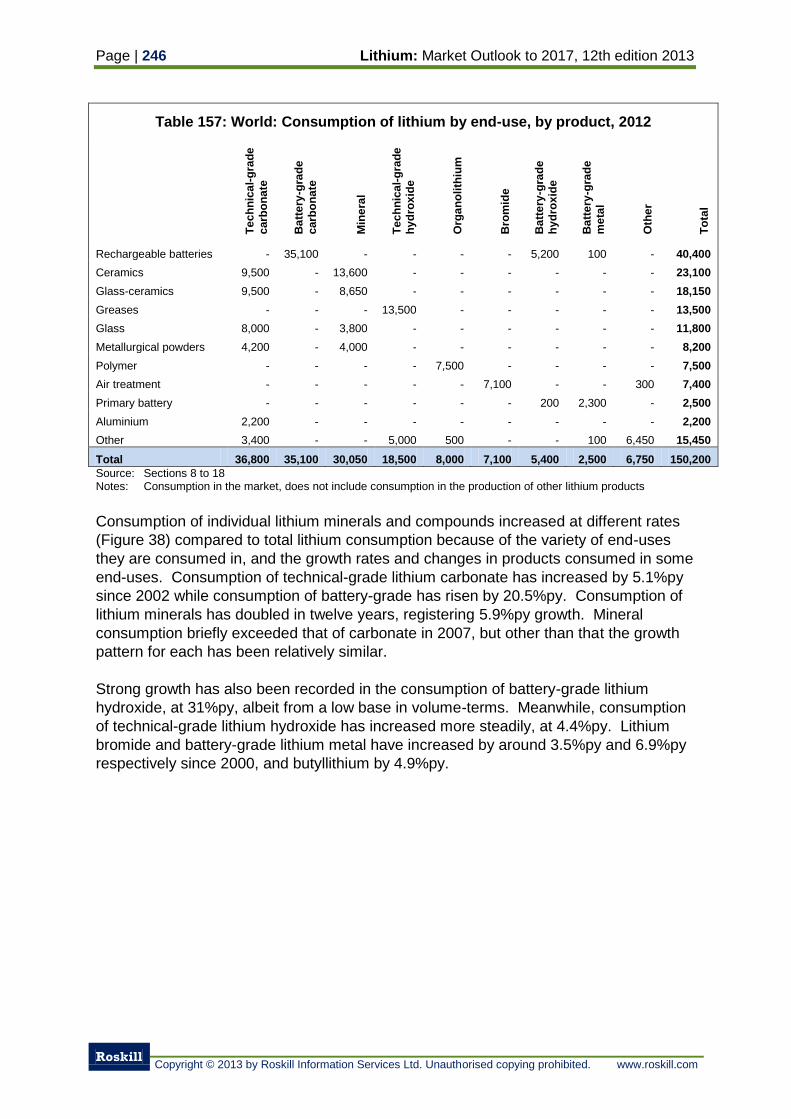
Page | 246 Lithium: Market Outlook to 2017, 12th edition 2013
Roskill
Copyright © 2013 by Roskill Information Services Ltd. Unauthorised copying prohibited. www.roskill.com
Table 157: World: Consumption of lithium by end-use, by product, 2012
Te
ch
nic
al-
gra
de
carb
on
ate
Ba
tte
ry-g
rad
e
carb
on
ate
Min
era
l
Te
ch
nic
al-
gra
de
hy
dro
xid
e
Org
an
oli
thiu
m
Bro
mid
e
Ba
tte
ry-g
rad
e
hy
dro
xid
e
Ba
tte
ry-g
rad
e
me
tal
Oth
er
To
tal
Rechargeable batteries - 35,100 - - - - 5,200 100 - 40,400
Ceramics 9,500 - 13,600 - - - - - - 23,100
Glass-ceramics 9,500 - 8,650 - - - - - - 18,150
Greases - - - 13,500 - - - - - 13,500
Glass 8,000 - 3,800 - - - - - - 11,800
Metallurgical powders 4,200 - 4,000 - - - - - - 8,200
Polymer - - - - 7,500 - - - - 7,500
Air treatment - - - - - 7,100 - - 300 7,400
Primary battery - - - - - - 200 2,300 - 2,500
Aluminium 2,200 - - - - - - - - 2,200
Other 3,400 - - 5,000 500 - - 100 6,450 15,450
Total 36,800 35,100 30,050 18,500 8,000 7,100 5,400 2,500 6,750 150,200
Source: Sections 8 to 18 Notes: Consumption in the market, does not include consumption in the production of other lithium products
Consumption of individual lithium minerals and compounds increased at different rates
(Figure 38) compared to total lithium consumption because of the variety of end-uses
they are consumed in, and the growth rates and changes in products consumed in some
end-uses. Consumption of technical-grade lithium carbonate has increased by 5.1%py
since 2002 while consumption of battery-grade has risen by 20.5%py. Consumption of
lithium minerals has doubled in twelve years, registering 5.9%py growth. Mineral
consumption briefly exceeded that of carbonate in 2007, but other than that the growth
pattern for each has been relatively similar.
Strong growth has also been recorded in the consumption of battery-grade lithium
hydroxide, at 31%py, albeit from a low base in volume-terms. Meanwhile, consumption
of technical-grade lithium hydroxide has increased more steadily, at 4.4%py. Lithium
bromide and battery-grade lithium metal have increased by around 3.5%py and 6.9%py
respectively since 2000, and butyllithium by 4.9%py.
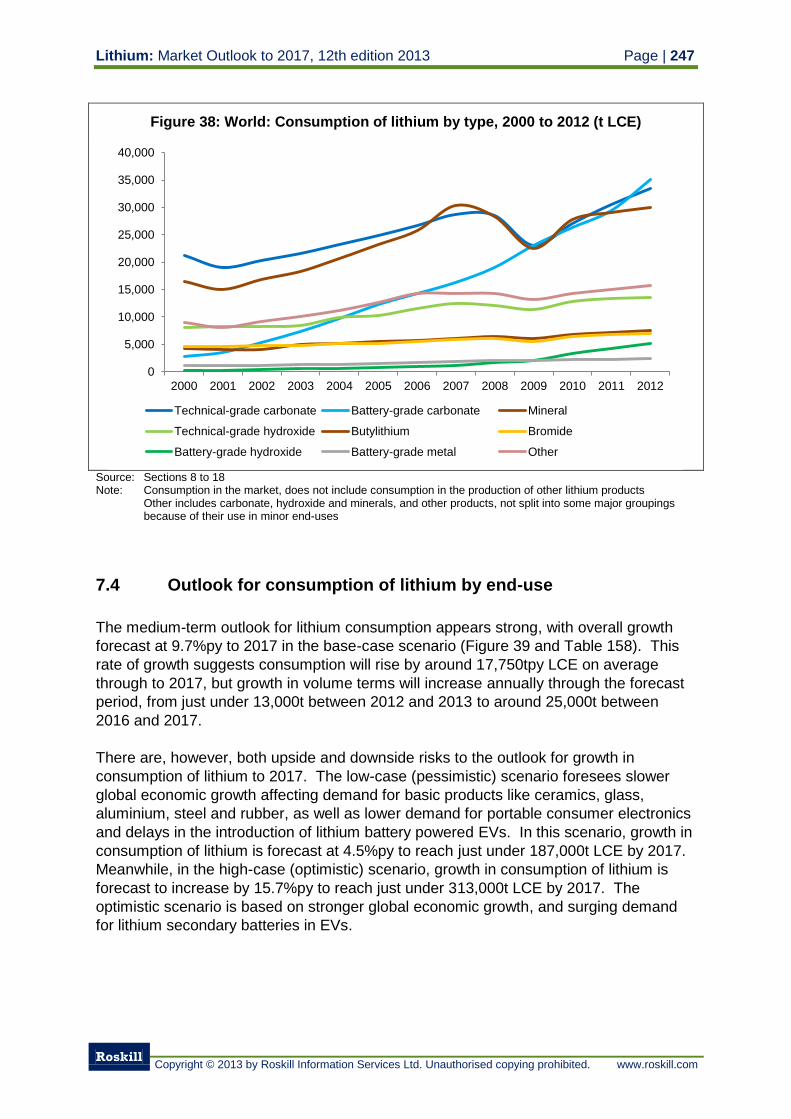
Lithium: Market Outlook to 2017, 12th edition 2013 Page | 247
Roskill
Copyright © 2013 by Roskill Information Services Ltd. Unauthorised copying prohibited. www.roskill.com
Figure 38: World: Consumption of lithium by type, 2000 to 2012 (t LCE)
Source: Sections 8 to 18 Note: Consumption in the market, does not include consumption in the production of other lithium products
Other includes carbonate, hydroxide and minerals, and other products, not split into some major groupings because of their use in minor end-uses
7.4 Outlook for consumption of lithium by end-use
The medium-term outlook for lithium consumption appears strong, with overall growth
forecast at 9.7%py to 2017 in the base-case scenario (Figure 39 and Table 158). This
rate of growth suggests consumption will rise by around 17,750tpy LCE on average
through to 2017, but growth in volume terms will increase annually through the forecast
period, from just under 13,000t between 2012 and 2013 to around 25,000t between
2016 and 2017.
There are, however, both upside and downside risks to the outlook for growth in
consumption of lithium to 2017. The low-case (pessimistic) scenario foresees slower
global economic growth affecting demand for basic products like ceramics, glass,
aluminium, steel and rubber, as well as lower demand for portable consumer electronics
and delays in the introduction of lithium battery powered EVs. In this scenario, growth in
consumption of lithium is forecast at 4.5%py to reach just under 187,000t LCE by 2017.
Meanwhile, in the high-case (optimistic) scenario, growth in consumption of lithium is
forecast to increase by 15.7%py to reach just under 313,000t LCE by 2017. The
optimistic scenario is based on stronger global economic growth, and surging demand
for lithium secondary batteries in EVs.
0
5,000
10,000
15,000
20,000
25,000
30,000
35,000
40,000
2000 2001 2002 2003 2004 2005 2006 2007 2008 2009 2010 2011 2012
Technical-grade carbonate Battery-grade carbonate Mineral
Technical-grade hydroxide Butylithium Bromide
Battery-grade hydroxide Battery-grade metal Other
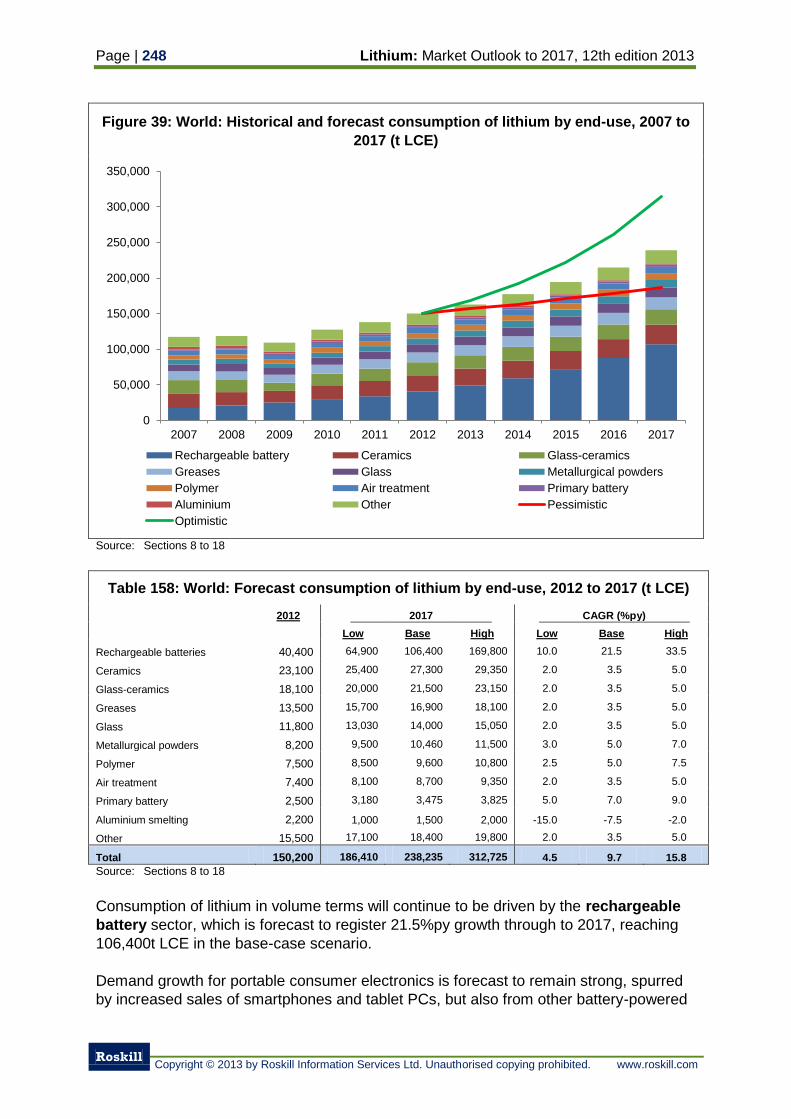
Page | 248 Lithium: Market Outlook to 2017, 12th edition 2013
Roskill
Copyright © 2013 by Roskill Information Services Ltd. Unauthorised copying prohibited. www.roskill.com
Figure 39: World: Historical and forecast consumption of lithium by end-use, 2007 to
2017 (t LCE)
Source: Sections 8 to 18
Table 158: World: Forecast consumption of lithium by end-use, 2012 to 2017 (t LCE)
2012 2017 CAGR (%py)
Low Base High Low Base High
Rechargeable batteries 40,400 64,900 106,400 169,800 10.0 21.5 33.5
Ceramics 23,100 25,400 27,300 29,350 2.0 3.5 5.0
Glass-ceramics 18,100 20,000 21,500 23,150 2.0 3.5 5.0
Greases 13,500 15,700 16,900 18,100 2.0 3.5 5.0
Glass 11,800 13,030 14,000 15,050 2.0 3.5 5.0
Metallurgical powders 8,200 9,500 10,460 11,500 3.0 5.0 7.0
Polymer 7,500 8,500 9,600 10,800 2.5 5.0 7.5
Air treatment 7,400 8,100 8,700 9,350 2.0 3.5 5.0
Primary battery 2,500 3,180 3,475 3,825 5.0 7.0 9.0
Aluminium smelting 2,200 1,000 1,500 2,000 -15.0 -7.5 -2.0
Other 15,500 17,100 18,400 19,800 2.0 3.5 5.0
Total 150,200 186,410 238,235 312,725 4.5 9.7 15.8
Source: Sections 8 to 18
Consumption of lithium in volume terms will continue to be driven by the rechargeable
battery sector, which is forecast to register 21.5%py growth through to 2017, reaching
106,400t LCE in the base-case scenario.
Demand growth for portable consumer electronics is forecast to remain strong, spurred
by increased sales of smartphones and tablet PCs, but also from other battery-powered
0
50,000
100,000
150,000
200,000
250,000
300,000
350,000
2007 2008 2009 2010 2011 2012 2013 2014 2015 2016 2017
Rechargeable battery Ceramics Glass-ceramics
Greases Glass Metallurgical powders
Polymer Air treatment Primary battery
Aluminium Other Pessimistic
Optimistic
Lithium: Market Outlook to 2017, 12th edition 2013 Page | 249
Roskill
Copyright © 2013 by Roskill Information Services Ltd. Unauthorised copying prohibited. www.roskill.com
devices. The penetration of lithium-ion batteries in some applications, such as power
tools and household/garden goods, is still low, but is expected to grow and displace
NiCd and NiMH. In power devices and motive power applications, the use of lithium-ion
batteries is expected to continue displacing NiCd, NiMH and lead-acid batteries, and
although growth is forecast at only 13%py in unit shipments, rising capacity per unit will
mean a much greater growth in demand for lithium.
Grid and off-grid storage use of lithium-ion batteries is expected to witness significant
growth in installed capacity to 2017, at >120%py, but from a low base. In this
application, lithium-ion faces much more competition from other battery and storage
types as space constraints are typically less limited than for portable consumer goods,
heavy duty/power and transport applications. Significant potential exists from the EV
market for increased consumption of lithium in rechargeable batteries to 2017. PHEV
and BEV sales have not yet had a dramatic impact on the rechargeable battery industry,
largely because cost and range are prohibitive and hence their appeal to the mass
market is limited.
If production of EVs is higher than forecast, demand for lithium-ion batteries from
consumer electronic producers increases or lithium-ion increases market share in grid
and off-grid storage systems, then consumption of lithium could increase to 169,800t
LCE, a growth rate of 33.5%py. Concerns over the success of EVs in the market, and
the suitability of lithium-ion to meet vehicle electrification goals warrants a more
conservative approach to the baseline forecast however, with a pessimistic scenario
forecasting growth of 10%py, to 64,900t LCE.
Other markets for lithium are also forecast to provide areas of growth for lithium
consumption, but only at around 4%py in the base-case scenario. The volume of lithium
consumption in rechargeable batteries, representing 27% of total consumption in 2012,
is now starting to have much more impact on overall lithium consumption and this
sector’s influence will continue to increase to 2017 when rechargeable batteries could
account for 45% of the total market.
Consumption of lithium in ceramics and glass-ceramics is forecast to increase by
3.5%py to reach 27,300t LCE and 21,500t LCE respectively by 2017. Urbanisation in
developing economies such as China and India will continue to provide rising demand
for products using lithium but growth will be constrained by lower, or even negative,
rates of construction output in developed economies, especially Europe. A rise in US
housing completions since H2 2012 is positive for both these end-uses, and if the
European construction industry returns to growth it could create additional upside
resulting in 5.0%py growth. However, the outlook for both these developed regions
appears uncertain and further recessionary and debt pressures could weigh on demand
and further constrain growth, in which case demand might only grow by 2.0%py.
Growth in consumption of lithium in greases is forecast to increase by 4.5%py to reach
16,900t LCE in 2013, thanks to higher demand in industrialising countries, and
increased production of complex lithium greases which contain 10-15% more lithium
hydroxide than simple lithium greases. If manufacturing output returns to the high levels
seen in the mid-2000s, demand for lithium from the grease industry could show potential
Page | 250 Lithium: Market Outlook to 2017, 12th edition 2013
Roskill
Copyright © 2013 by Roskill Information Services Ltd. Unauthorised copying prohibited. www.roskill.com
upside, but if economic growth continues to remain subdued, or producers start using
alternative soaps (e.g. urea), consumption might rise by as little as 3.0%py.
The use of lithium in glass manufacturing is not widespread and is restricted mainly to
specialist uses. Lithium can provide environmental benefits by substituting for heavy
metals, such as lead; performance benefits by improving output; and, save energy and
therefore reduce costs and CO2 emissions. This trend is expected to see the glass
industry match ceramics and glass-ceramics at 3.5%py, and reach 14,000t LCE by
2017. More widespread use of lithium in glass manufacturing could boost growth to
5.0%py, but equally lower global economic growth might restrict growth in current uses
to 2.0%py.
Steel and foundry production, the major markets for metallurgical powders, has shown
strong growth in the mid-2000s, but is forecast to slow through the mid-2010s on lower
global economic growth. Nevertheless, consumption of lithium carbonate and lithium
minerals in metallurgical powders provides benefits which improve yield and reduce
costs, therefore their use will likely continue to grow faster than steel and foundry output,
at 5%py, with the market reaching 10,460t LCE by 2017.
Growth in consumption of lithium in polymers will be dependent upon demand for
synthetic rubber and thermoplastic products such as tyres, tubes, footwear and
household goods. A weak recovery in automotive sales since the global economic
downturn of 2008/09 has impacted previously strong demand for tyres and rubber tubes,
but in developing countries, particularly China and India, there remains considerable
potential and this is forecast to spur synthetic rubber production through 2017. Lithium
consumption is forecast to increase by 5.0%py to reach 9,600t LCE in this market.
The use of absorption chillers and heaters for the cooling and heating of large buildings
has grown in popularity during the mid-2000s, particularly where waste heat is available
as steam or hot water, or where gas prices are low, as this often makes them more
efficient that electric chillers. On the other hand, the use of lithium chloride as a
desiccant in dehumidifiers has declined in favour of other materials. These trends are
forecast to continue to 2017, with growth in demand for lithium in air treatment
applications increasing by 3.5%py to reach 8,700t LCE.
Consumption of lithium in the primary battery industry is forecast to grow at 7.0%py to
reach 3,475t LCE by 2017. The industry is benefiting from increased output of portable
electronic devices which require primary battery back-up, remote utility monitoring
systems, and replacement of alkaline batteries for longevity improvements in non-
rechargeable devices.
The use of lithium carbonate in aluminium smelting is not widespread, with less than
10% of aluminium smelters utilising lithium carbonate bath additions in 2012. Some of
the major users of lithium in aluminium smelting are upgrading or closing their older
smelters and this trend is expected to continue, resulting in further declines in lithium
consumption, to 1,500t LCE by 2017. If further closures occur the market could decline
quicker, unless newer smelters start adopting lithium for energy saving purposes, which
currently looks unlikely.
Lithium: Market Outlook to 2017, 12th edition 2013 Page | 251
Roskill
Copyright © 2013 by Roskill Information Services Ltd. Unauthorised copying prohibited. www.roskill.com
The outlook for other end-uses for lithium is mixed, but this sector overall is expected to
witness growth of 3.5%py. The use of aluminium-lithium alloy in aerospace applications
is increasing as new aircraft reach the production line and will provide considerable
potential in the mid- to late- 2010s, albeit from a low base in volume terms. The use of
lithium for construction and organic synthesis is also expected to rise, but other end-
uses, such as sanitization, could limit growth.
7.5 Outlook for lithium consumption by product
Commensurate with predicted strong growth in demand for lithium in rechargeable
batteries, battery-grade lithium carbonate consumption is forecast to increase from
35,100t LCE in 2012 to around 82,000t LCE in 2017, an CAGR of 18.5%py (Figure 40).
The increasing use of battery-grade lithium hydroxide in the manufacture of lithium-
mixed metal oxide cathode materials means lithium hydroxide consumption is forecast to
increase at rates above that for lithium carbonate, to reach just over 28,000t LCE in
2017, an CAGR of 36.5%. Consumption of technical-grade lithium carbonate and
hydroxide are expected to rise by 3.2%py and 4.5%py respectively.
Consumption of lithium minerals is forecast to increase by around 3.6%py to just under
36,000t LCE in 2017. Butyllithium and lithium bromide consumption will track that of the
main end-uses sectors they are used in – polymers and air treatment, and grow at
5.0%py and 3.0%py respectively. Consumption of battery-grade lithium metal is forecast
to increase by 8.1%py to 3,500t LCE, as increasing volumes are used in primary and
rechargeable batteries. Lithium metal for use in aluminium-lithium alloys is also
expected to show high rates of growth, but with other lithium products growing by
3.5%py overall to 18,800t LCE in 2017.
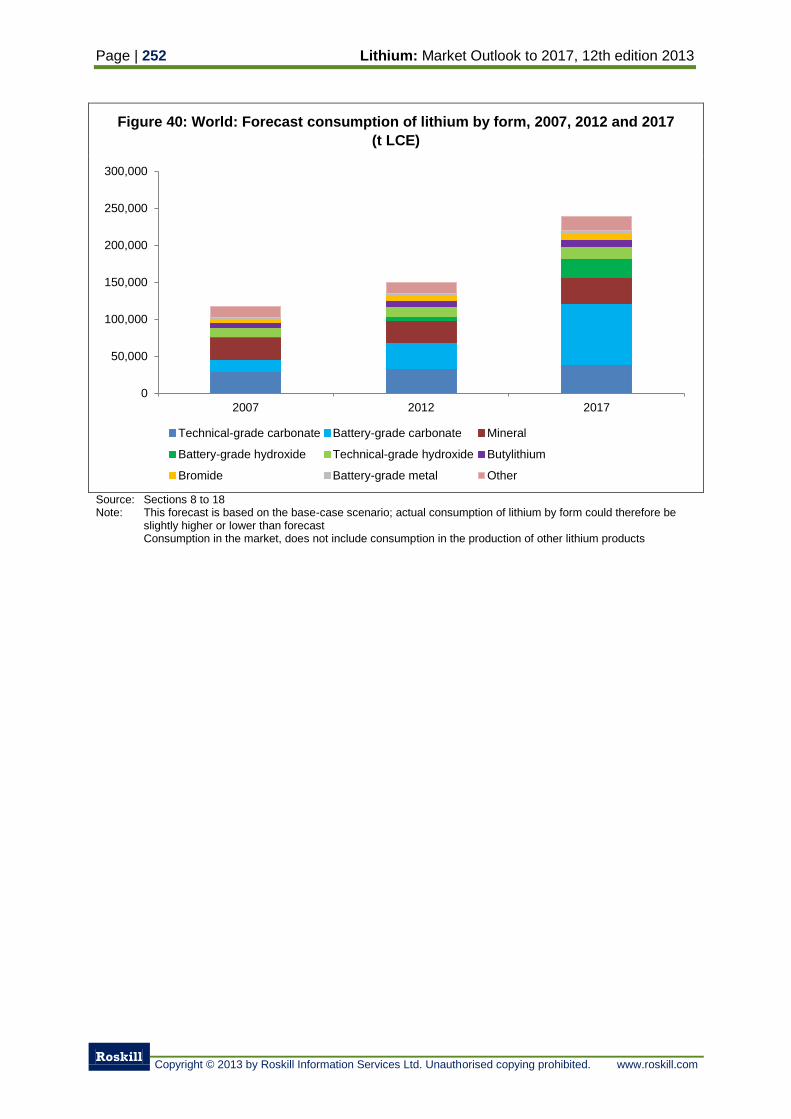
Page | 252 Lithium: Market Outlook to 2017, 12th edition 2013
Roskill
Copyright © 2013 by Roskill Information Services Ltd. Unauthorised copying prohibited. www.roskill.com
Figure 40: World: Forecast consumption of lithium by form, 2007, 2012 and 2017
(t LCE)
Source: Sections 8 to 18 Note: This forecast is based on the base-case scenario; actual consumption of lithium by form could therefore be
slightly higher or lower than forecast Consumption in the market, does not include consumption in the production of other lithium products
0
50,000
100,000
150,000
200,000
250,000
300,000
2007 2012 2017
Technical-grade carbonate Battery-grade carbonate Mineral
Battery-grade hydroxide Technical-grade hydroxide Butylithium
Bromide Battery-grade metal Other
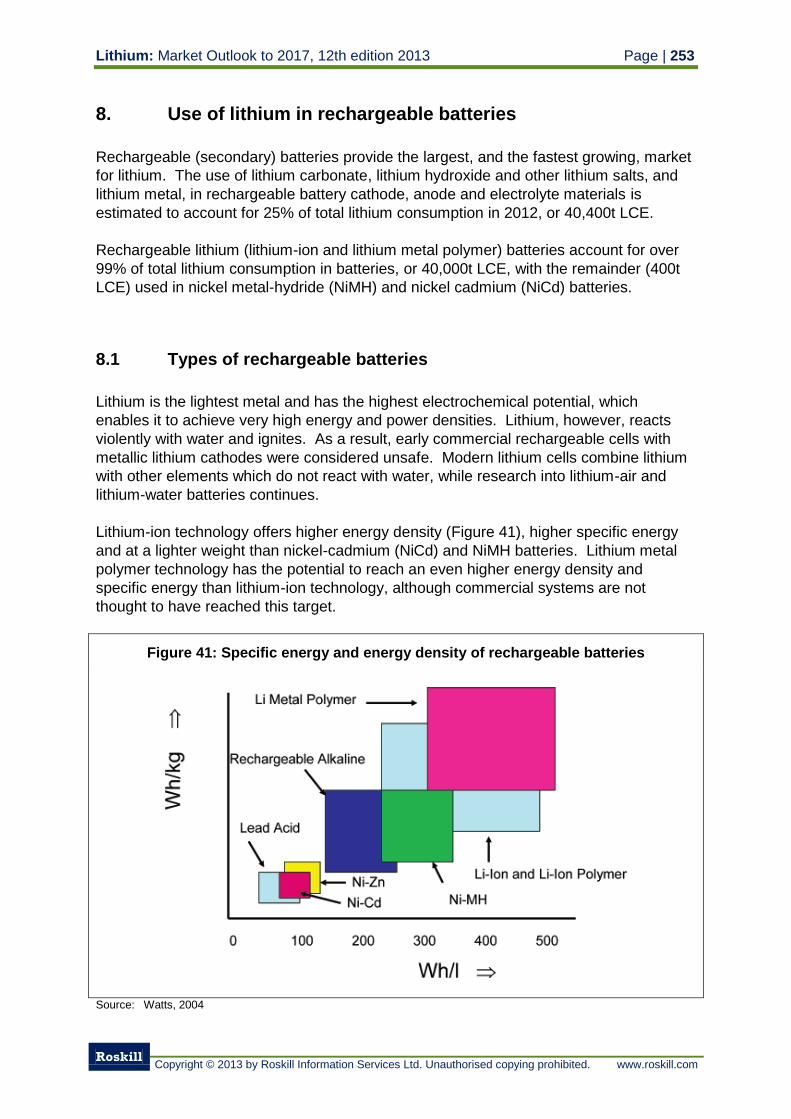
Lithium: Market Outlook to 2017, 12th edition 2013 Page | 253
Roskill
Copyright © 2013 by Roskill Information Services Ltd. Unauthorised copying prohibited. www.roskill.com
8. Use of lithium in rechargeable batteries
Rechargeable (secondary) batteries provide the largest, and the fastest growing, market
for lithium. The use of lithium carbonate, lithium hydroxide and other lithium salts, and
lithium metal, in rechargeable battery cathode, anode and electrolyte materials is
estimated to account for 25% of total lithium consumption in 2012, or 40,400t LCE.
Rechargeable lithium (lithium-ion and lithium metal polymer) batteries account for over
99% of total lithium consumption in batteries, or 40,000t LCE, with the remainder (400t
LCE) used in nickel metal-hydride (NiMH) and nickel cadmium (NiCd) batteries.
8.1 Types of rechargeable batteries
Lithium is the lightest metal and has the highest electrochemical potential, which
enables it to achieve very high energy and power densities. Lithium, however, reacts
violently with water and ignites. As a result, early commercial rechargeable cells with
metallic lithium cathodes were considered unsafe. Modern lithium cells combine lithium
with other elements which do not react with water, while research into lithium-air and
lithium-water batteries continues.
Lithium-ion technology offers higher energy density (Figure 41), higher specific energy
and at a lighter weight than nickel-cadmium (NiCd) and NiMH batteries. Lithium metal
polymer technology has the potential to reach an even higher energy density and
specific energy than lithium-ion technology, although commercial systems are not
thought to have reached this target.
Figure 41: Specific energy and energy density of rechargeable batteries
Source: Watts, 2004
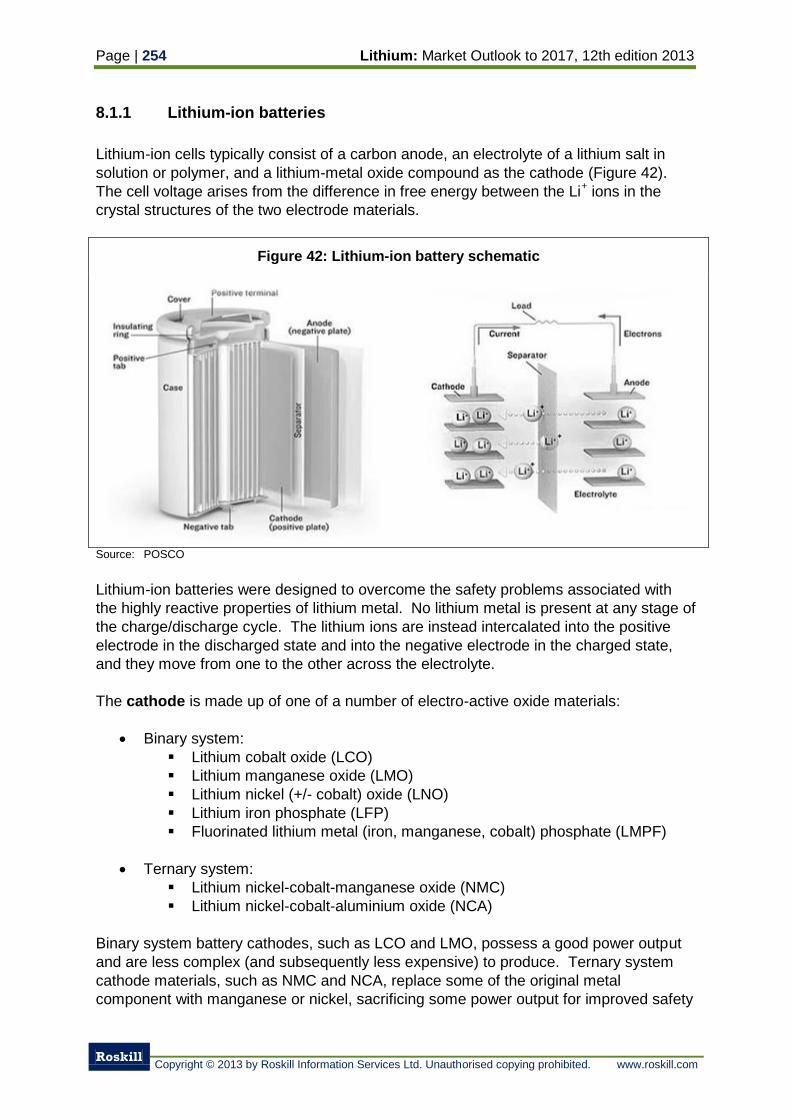
Page | 254 Lithium: Market Outlook to 2017, 12th edition 2013
Roskill
Copyright © 2013 by Roskill Information Services Ltd. Unauthorised copying prohibited. www.roskill.com
8.1.1 Lithium-ion batteries
Lithium-ion cells typically consist of a carbon anode, an electrolyte of a lithium salt in
solution or polymer, and a lithium-metal oxide compound as the cathode (Figure 42).
The cell voltage arises from the difference in free energy between the Li+ ions in the
crystal structures of the two electrode materials.
Figure 42: Lithium-ion battery schematic
Source: POSCO
Lithium-ion batteries were designed to overcome the safety problems associated with
the highly reactive properties of lithium metal. No lithium metal is present at any stage of
the charge/discharge cycle. The lithium ions are instead intercalated into the positive
electrode in the discharged state and into the negative electrode in the charged state,
and they move from one to the other across the electrolyte.
The cathode is made up of one of a number of electro-active oxide materials:
Binary system:
Lithium cobalt oxide (LCO)
Lithium manganese oxide (LMO)
Lithium nickel (+/- cobalt) oxide (LNO)
Lithium iron phosphate (LFP)
Fluorinated lithium metal (iron, manganese, cobalt) phosphate (LMPF)
Ternary system:
Lithium nickel-cobalt-manganese oxide (NMC)
Lithium nickel-cobalt-aluminium oxide (NCA)
Binary system battery cathodes, such as LCO and LMO, possess a good power output
and are less complex (and subsequently less expensive) to produce. Ternary system
cathode materials, such as NMC and NCA, replace some of the original metal
component with manganese or nickel, sacrificing some power output for improved safety
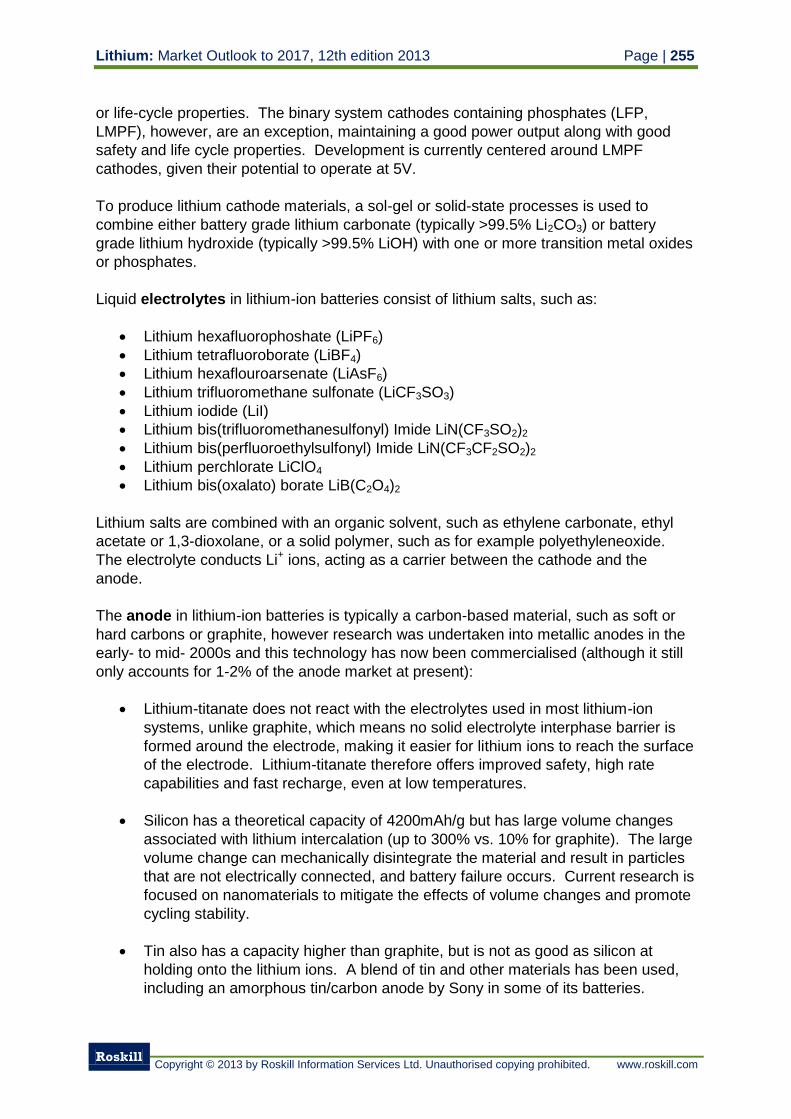
Lithium: Market Outlook to 2017, 12th edition 2013 Page | 255
Roskill
Copyright © 2013 by Roskill Information Services Ltd. Unauthorised copying prohibited. www.roskill.com
or life-cycle properties. The binary system cathodes containing phosphates (LFP,
LMPF), however, are an exception, maintaining a good power output along with good
safety and life cycle properties. Development is currently centered around LMPF
cathodes, given their potential to operate at 5V.
To produce lithium cathode materials, a sol-gel or solid-state processes is used to
combine either battery grade lithium carbonate (typically >99.5% Li2CO3) or battery
grade lithium hydroxide (typically >99.5% LiOH) with one or more transition metal oxides
or phosphates.
Liquid electrolytes in lithium-ion batteries consist of lithium salts, such as:
Lithium hexafluorophoshate (LiPF6)
Lithium tetrafluoroborate (LiBF4)
Lithium hexaflouroarsenate (LiAsF6)
Lithium trifluoromethane sulfonate (LiCF3SO3)
Lithium iodide (LiI)
Lithium bis(trifluoromethanesulfonyl) Imide LiN(CF3SO2)2
Lithium bis(perfluoroethylsulfonyl) Imide LiN(CF3CF2SO2)2
Lithium perchlorate LiClO4
Lithium bis(oxalato) borate LiB(C2O4)2
Lithium salts are combined with an organic solvent, such as ethylene carbonate, ethyl
acetate or 1,3-dioxolane, or a solid polymer, such as for example polyethyleneoxide.
The electrolyte conducts Li+ ions, acting as a carrier between the cathode and the
anode.
The anode in lithium-ion batteries is typically a carbon-based material, such as soft or
hard carbons or graphite, however research was undertaken into metallic anodes in the
early- to mid- 2000s and this technology has now been commercialised (although it still
only accounts for 1-2% of the anode market at present):
Lithium-titanate does not react with the electrolytes used in most lithium-ion
systems, unlike graphite, which means no solid electrolyte interphase barrier is
formed around the electrode, making it easier for lithium ions to reach the surface
of the electrode. Lithium-titanate therefore offers improved safety, high rate
capabilities and fast recharge, even at low temperatures.
Silicon has a theoretical capacity of 4200mAh/g but has large volume changes
associated with lithium intercalation (up to 300% vs. 10% for graphite). The large
volume change can mechanically disintegrate the material and result in particles
that are not electrically connected, and battery failure occurs. Current research is
focused on nanomaterials to mitigate the effects of volume changes and promote
cycling stability.
Tin also has a capacity higher than graphite, but is not as good as silicon at
holding onto the lithium ions. A blend of tin and other materials has been used,
including an amorphous tin/carbon anode by Sony in some of its batteries.
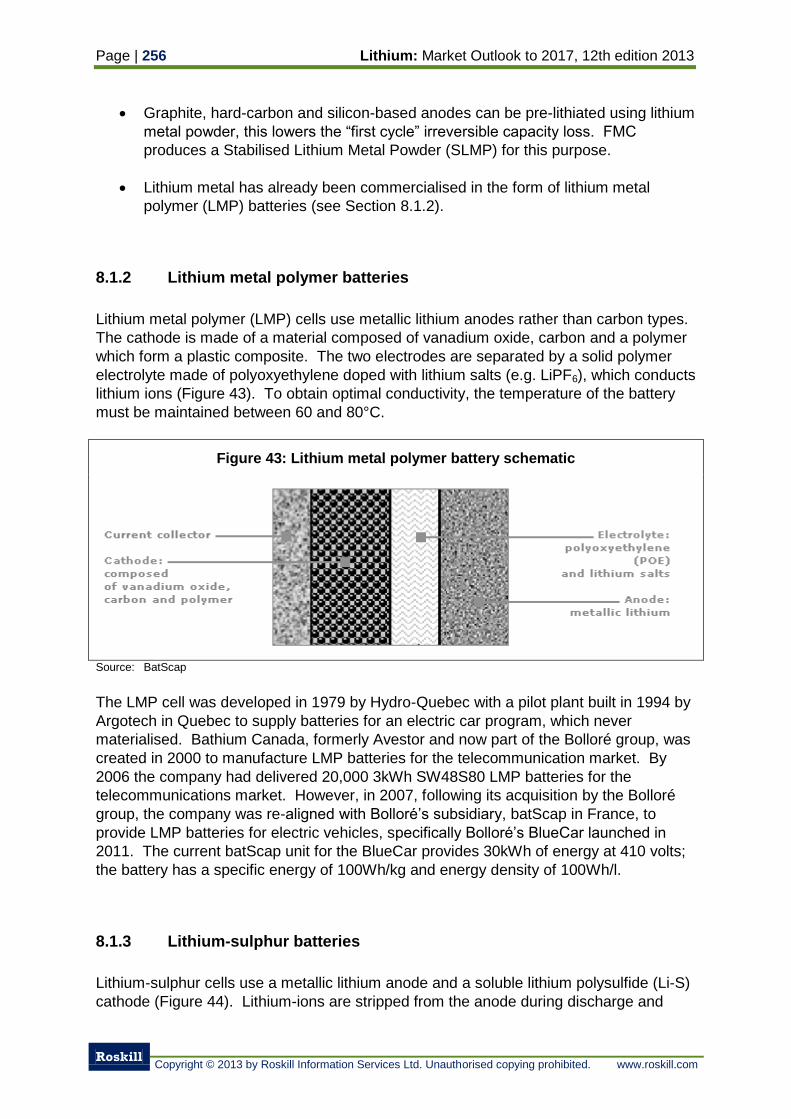
Page | 256 Lithium: Market Outlook to 2017, 12th edition 2013
Roskill
Copyright © 2013 by Roskill Information Services Ltd. Unauthorised copying prohibited. www.roskill.com
Graphite, hard-carbon and silicon-based anodes can be pre-lithiated using lithium
metal powder, this lowers the “first cycle” irreversible capacity loss. FMC
produces a Stabilised Lithium Metal Powder (SLMP) for this purpose.
Lithium metal has already been commercialised in the form of lithium metal
polymer (LMP) batteries (see Section 8.1.2).
8.1.2 Lithium metal polymer batteries
Lithium metal polymer (LMP) cells use metallic lithium anodes rather than carbon types.
The cathode is made of a material composed of vanadium oxide, carbon and a polymer
which form a plastic composite. The two electrodes are separated by a solid polymer
electrolyte made of polyoxyethylene doped with lithium salts (e.g. LiPF6), which conducts
lithium ions (Figure 43). To obtain optimal conductivity, the temperature of the battery
must be maintained between 60 and 80°C.
Figure 43: Lithium metal polymer battery schematic
Source: BatScap
The LMP cell was developed in 1979 by Hydro-Quebec with a pilot plant built in 1994 by
Argotech in Quebec to supply batteries for an electric car program, which never
materialised. Bathium Canada, formerly Avestor and now part of the Bolloré group, was
created in 2000 to manufacture LMP batteries for the telecommunication market. By
2006 the company had delivered 20,000 3kWh SW48S80 LMP batteries for the
telecommunications market. However, in 2007, following its acquisition by the Bolloré
group, the company was re-aligned with Bolloré’s subsidiary, batScap in France, to
provide LMP batteries for electric vehicles, specifically Bolloré’s BlueCar launched in
2011. The current batScap unit for the BlueCar provides 30kWh of energy at 410 volts;
the battery has a specific energy of 100Wh/kg and energy density of 100Wh/l.
8.1.3 Lithium-sulphur batteries
Lithium-sulphur cells use a metallic lithium anode and a soluble lithium polysulfide (Li-S)
cathode (Figure 44). Lithium-ions are stripped from the anode during discharge and
Lithium: Market Outlook to 2017, 12th edition 2013 Page | 257
Roskill
Copyright © 2013 by Roskill Information Services Ltd. Unauthorised copying prohibited. www.roskill.com
form lithium polysulfides in the cathode. On recharge, the lithium-ions are plated back
onto the anode. High order lithium polysulfides are soluble in the electrolyte and migrate
to the anode, scrubbing off any dendrite growth.
Figure 44: Lithium-sulphur cell schematic
Source: Sion Power
Lithium-sulphur is both cost effective and cost competitive when compared to other
battery systems. Sulphur is much less expensive than the typical components of lithium-
ion battery cathodes. Lithium-sulphur cells have been designed with a specific energy of
over 350Wh/kg and an energy density of over 400Wh/l, but the theoretical upper limit of
lithium-sulphur chemistry is up to 2,500Wh/kg and 2600Wh/l, five times that of lithium-
ion. However, one of the primary shortfalls of lithium-sulphur cells is intermediary
reactions with the electrolytes. While S and Li2S are relatively insoluble in most
electrolytes, many of the intermediary polysulfides are not. The majority of research on
lithium-sulphur batteries is to improve the choice of electrolytes to minimize this side
reaction.
Lithium-sulphur cells are under development by Sion Power of Arizona, USA and Oxis
Energy of Abingdon, UK, but have yet to be fully commercialised. Sion Power signed an
agreement with BASF in 2009 to further develop Sion Power’s lithium-sulphur
technology using BASF’s electrolyte technology and BASF later (2012) invested
US$50M in Sion Power and took an equity stake. Meanwhile Oxis Energy has received
a US$15M investment from Sasol of South Africa to further develop its own technology.
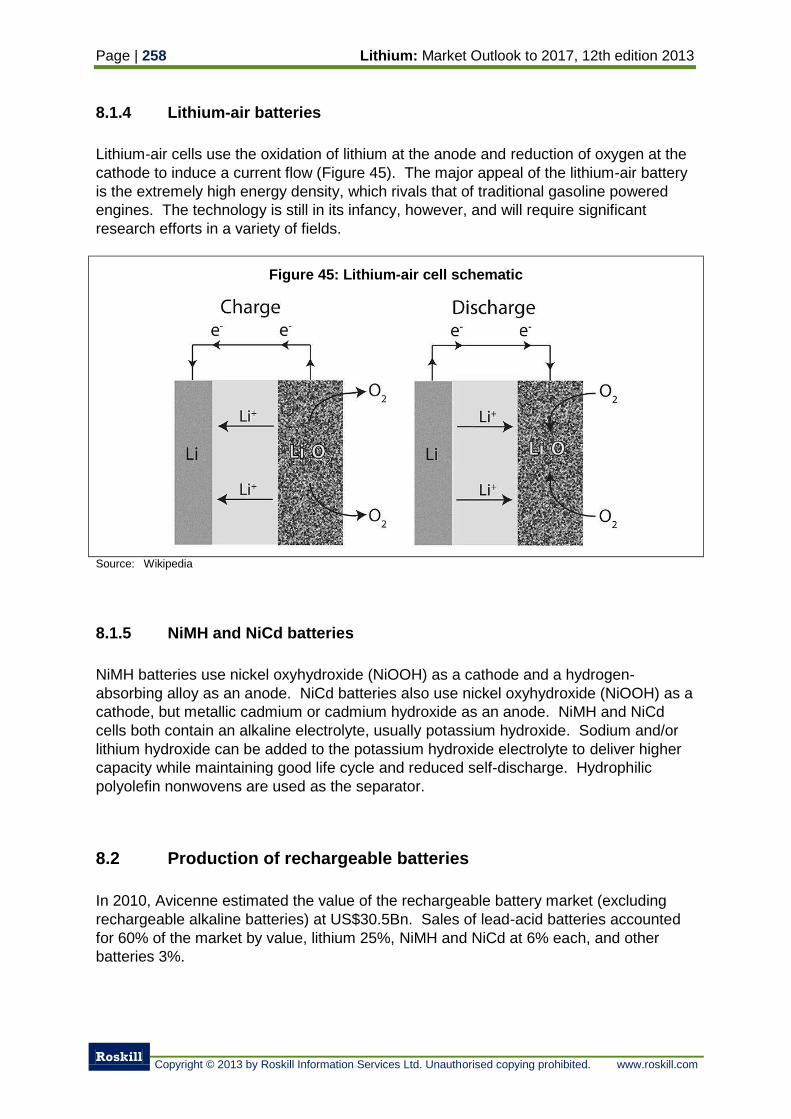
Page | 258 Lithium: Market Outlook to 2017, 12th edition 2013
Roskill
Copyright © 2013 by Roskill Information Services Ltd. Unauthorised copying prohibited. www.roskill.com
8.1.4 Lithium-air batteries
Lithium-air cells use the oxidation of lithium at the anode and reduction of oxygen at the
cathode to induce a current flow (Figure 45). The major appeal of the lithium-air battery
is the extremely high energy density, which rivals that of traditional gasoline powered
engines. The technology is still in its infancy, however, and will require significant
research efforts in a variety of fields.
Figure 45: Lithium-air cell schematic
Source: Wikipedia
8.1.5 NiMH and NiCd batteries
NiMH batteries use nickel oxyhydroxide (NiOOH) as a cathode and a hydrogen-
absorbing alloy as an anode. NiCd batteries also use nickel oxyhydroxide (NiOOH) as a
cathode, but metallic cadmium or cadmium hydroxide as an anode. NiMH and NiCd
cells both contain an alkaline electrolyte, usually potassium hydroxide. Sodium and/or
lithium hydroxide can be added to the potassium hydroxide electrolyte to deliver higher
capacity while maintaining good life cycle and reduced self-discharge. Hydrophilic
polyolefin nonwovens are used as the separator.
8.2 Production of rechargeable batteries
In 2010, Avicenne estimated the value of the rechargeable battery market (excluding
rechargeable alkaline batteries) at US$30.5Bn. Sales of lead-acid batteries accounted
for 60% of the market by value, lithium 25%, NiMH and NiCd at 6% each, and other
batteries 3%.
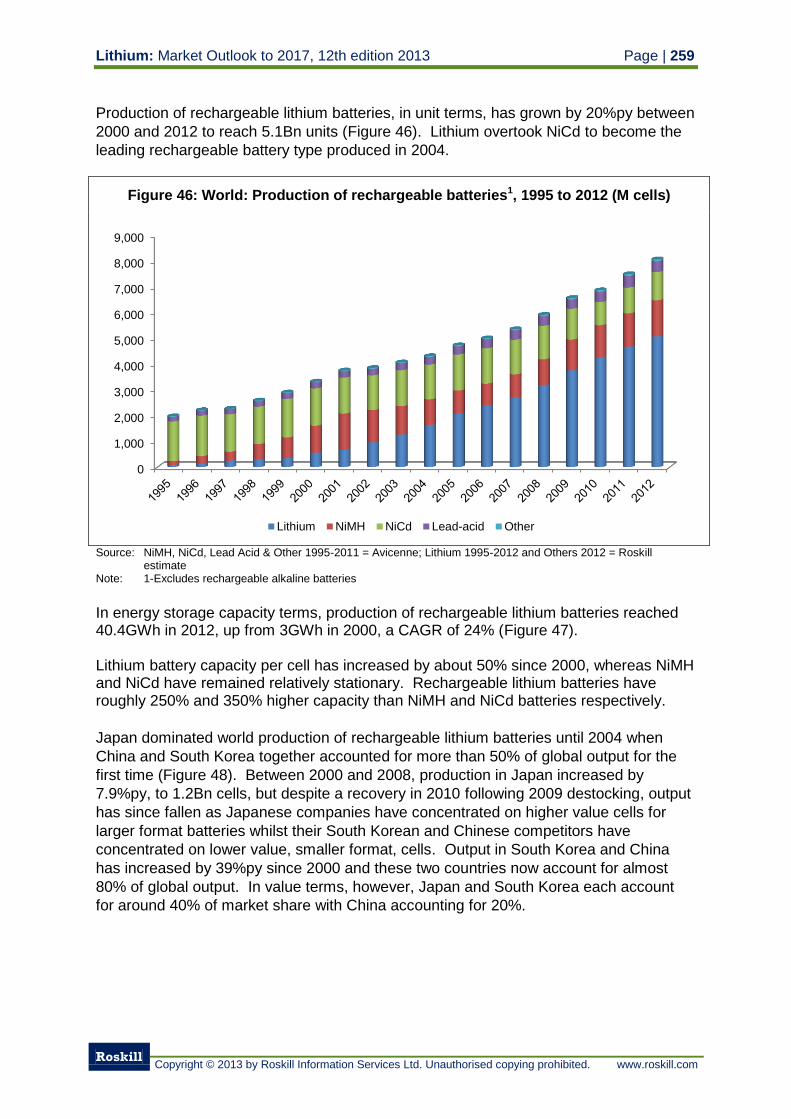
Lithium: Market Outlook to 2017, 12th edition 2013 Page | 259
Roskill
Copyright © 2013 by Roskill Information Services Ltd. Unauthorised copying prohibited. www.roskill.com
Production of rechargeable lithium batteries, in unit terms, has grown by 20%py between
2000 and 2012 to reach 5.1Bn units (Figure 46). Lithium overtook NiCd to become the
leading rechargeable battery type produced in 2004.
Figure 46: World: Production of rechargeable batteries1, 1995 to 2012 (M cells)
Source: NiMH, NiCd, Lead Acid & Other 1995-2011 = Avicenne; Lithium 1995-2012 and Others 2012 = Roskill
estimate Note: 1-Excludes rechargeable alkaline batteries
In energy storage capacity terms, production of rechargeable lithium batteries reached 40.4GWh in 2012, up from 3GWh in 2000, a CAGR of 24% (Figure 47). Lithium battery capacity per cell has increased by about 50% since 2000, whereas NiMH and NiCd have remained relatively stationary. Rechargeable lithium batteries have roughly 250% and 350% higher capacity than NiMH and NiCd batteries respectively.
Japan dominated world production of rechargeable lithium batteries until 2004 when
China and South Korea together accounted for more than 50% of global output for the
first time (Figure 48). Between 2000 and 2008, production in Japan increased by
7.9%py, to 1.2Bn cells, but despite a recovery in 2010 following 2009 destocking, output
has since fallen as Japanese companies have concentrated on higher value cells for
larger format batteries whilst their South Korean and Chinese competitors have
concentrated on lower value, smaller format, cells. Output in South Korea and China
has increased by 39%py since 2000 and these two countries now account for almost
80% of global output. In value terms, however, Japan and South Korea each account
for around 40% of market share with China accounting for 20%.
0
1,000
2,000
3,000
4,000
5,000
6,000
7,000
8,000
9,000
Lithium NiMH NiCd Lead-acid Other
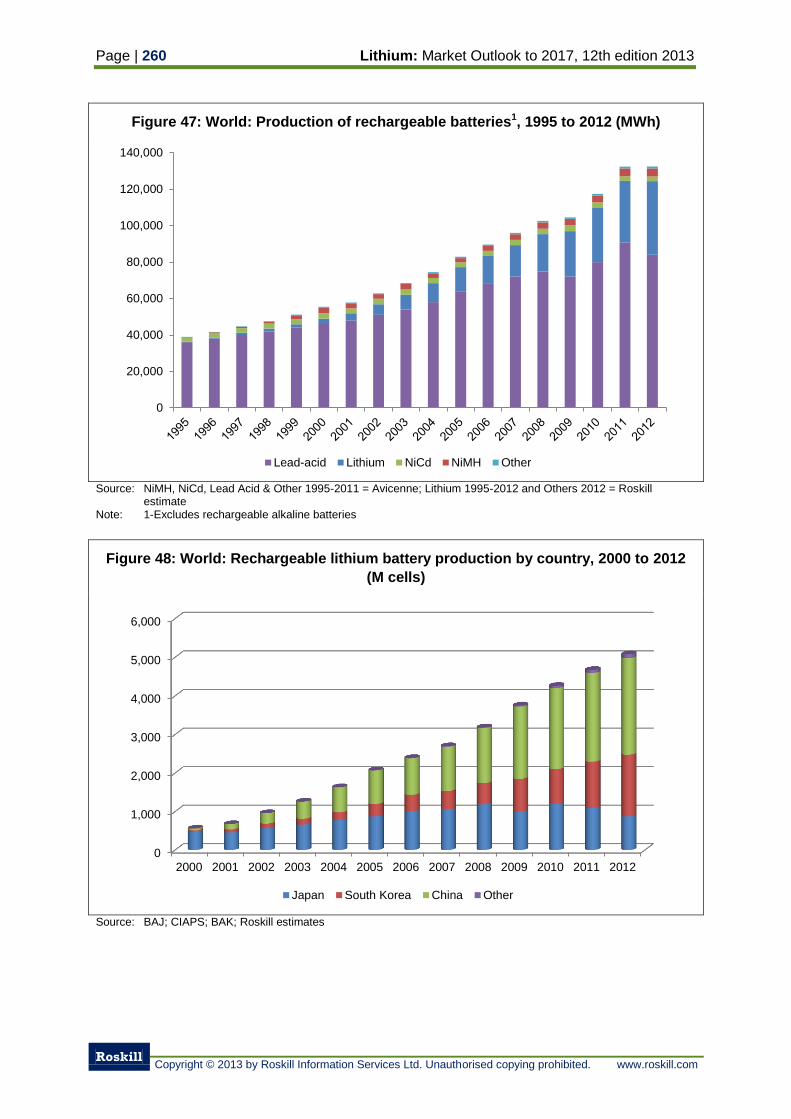
Page | 260 Lithium: Market Outlook to 2017, 12th edition 2013
Roskill
Copyright © 2013 by Roskill Information Services Ltd. Unauthorised copying prohibited. www.roskill.com
Figure 47: World: Production of rechargeable batteries1, 1995 to 2012 (MWh)
Source: NiMH, NiCd, Lead Acid & Other 1995-2011 = Avicenne; Lithium 1995-2012 and Others 2012 = Roskill
estimate Note: 1-Excludes rechargeable alkaline batteries
Figure 48: World: Rechargeable lithium battery production by country, 2000 to 2012
(M cells)
Source: BAJ; CIAPS; BAK; Roskill estimates
0
20,000
40,000
60,000
80,000
100,000
120,000
140,000
Lead-acid Lithium NiCd NiMH Other
0
1,000
2,000
3,000
4,000
5,000
6,000
2000 2001 2002 2003 2004 2005 2006 2007 2008 2009 2010 2011 2012
Japan South Korea China Other
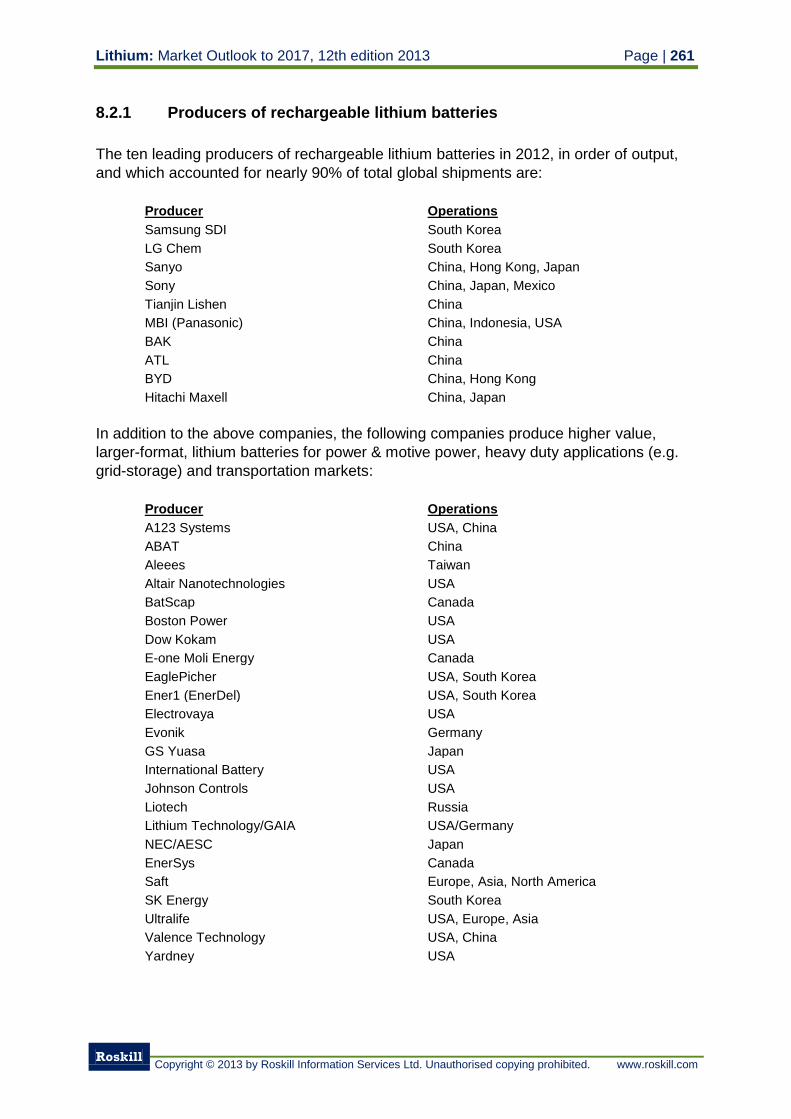
Lithium: Market Outlook to 2017, 12th edition 2013 Page | 261
Roskill
Copyright © 2013 by Roskill Information Services Ltd. Unauthorised copying prohibited. www.roskill.com
8.2.1 Producers of rechargeable lithium batteries
The ten leading producers of rechargeable lithium batteries in 2012, in order of output,
and which accounted for nearly 90% of total global shipments are:
Producer Operations
Samsung SDI South Korea
LG Chem South Korea
Sanyo China, Hong Kong, Japan
Sony China, Japan, Mexico
Tianjin Lishen China
MBI (Panasonic) China, Indonesia, USA
BAK China
ATL China
BYD China, Hong Kong
Hitachi Maxell China, Japan
In addition to the above companies, the following companies produce higher value,
larger-format, lithium batteries for power & motive power, heavy duty applications (e.g.
grid-storage) and transportation markets:
Producer Operations
A123 Systems USA, China
ABAT China
Aleees Taiwan
Altair Nanotechnologies USA
BatScap Canada
Boston Power USA
Dow Kokam USA
E-one Moli Energy Canada
EaglePicher USA, South Korea
Ener1 (EnerDel) USA, South Korea
Electrovaya USA
Evonik Germany
GS Yuasa Japan
International Battery USA
Johnson Controls USA
Liotech Russia
Lithium Technology/GAIA USA/Germany
NEC/AESC Japan
EnerSys Canada
Saft Europe, Asia, North America
SK Energy South Korea
Ultralife USA, Europe, Asia
Valence Technology USA, China
Yardney USA
Page | 262 Lithium: Market Outlook to 2017, 12th edition 2013
Roskill
Copyright © 2013 by Roskill Information Services Ltd. Unauthorised copying prohibited. www.roskill.com
8.2.2 Producers of nickel metal hydride batteries
The leading producers of NiMH batteries in 2012 are as follows:
Producer Operations
BYD China
Canon Japan
Cobasys (Bosch) USA
Energizer Various worldwide
FDK Japan
Furukawa Japan
Gold Peak (GP) Batteries Singapore, Hong Kong, China, Taiwan, and
Malaysia
GS Yuasa Japan
Guangzhou Great Power Battery China
Guangdong Shida Battery China
Harding Energy USA
Henan Huanyu Group China
Hitachi Maxell Japan
Hyundai South Korea
KAN Battery China
Lexel Battery China
Panasonic (PEVE) Japan, China
Saft Europe, Asia, North America
Samsung South Korea, USA
SANIK Battery China
Sanoh Japan
Sanyo Electric Japan
Shenzhen EPT Battery China
Shenzhen GREPOW Battery China
Shenzhen High Power Tech Co. China
TMK Power Industries China
Toshiba Japan
TWD Battery China
Union Suppo Battery Company China
Unitech Battery China
Varta Microbattery China, Indonesia
Walsin China
YiYang Corun Battery China
8.3 Production of rechargeable lithium battery materials
The lithium-ion battery producers listed above, assemble cells from a variety of
intermediate materials. The lithium-containing parts, namely the cathode, electrolyte
and, in some cases, the anode, are all manufactured separately and assembled by the
battery producers. The cells may then be packaged, or combined and packaged, to
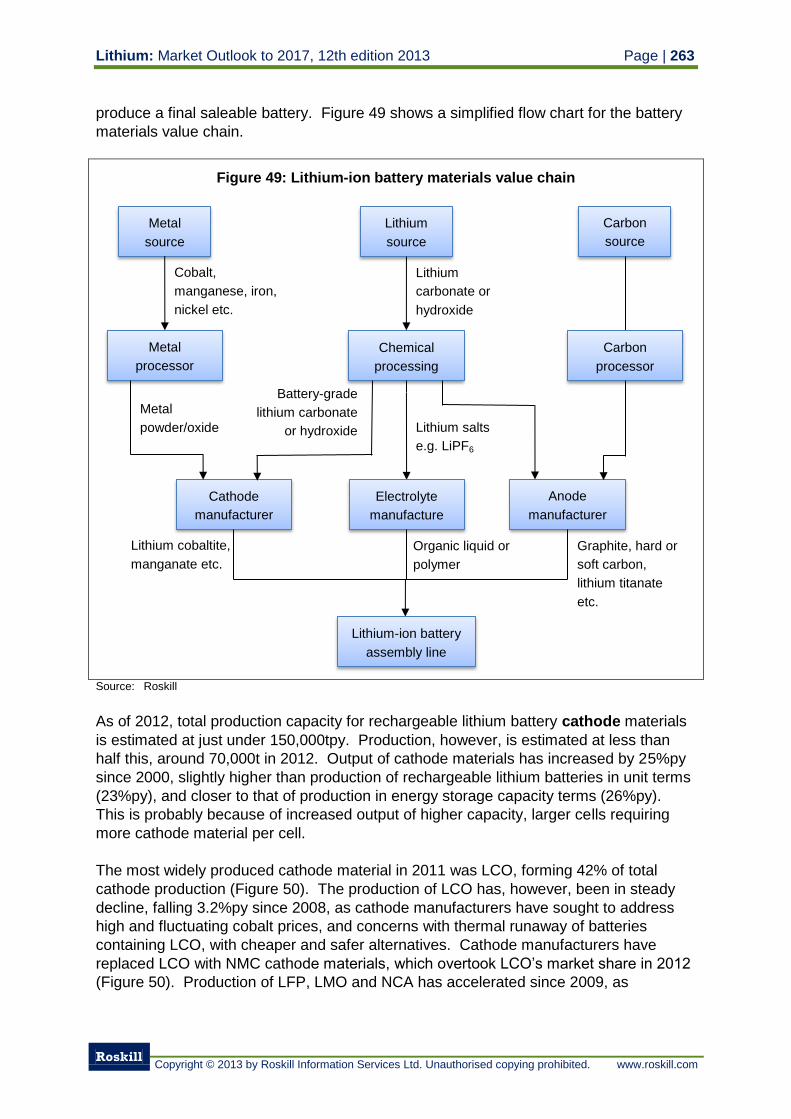
Lithium: Market Outlook to 2017, 12th edition 2013 Page | 263
Roskill
Copyright © 2013 by Roskill Information Services Ltd. Unauthorised copying prohibited. www.roskill.com
produce a final saleable battery. Figure 49 shows a simplified flow chart for the battery
materials value chain.
Figure 49: Lithium-ion battery materials value chain
Source: Roskill
As of 2012, total production capacity for rechargeable lithium battery cathode materials
is estimated at just under 150,000tpy. Production, however, is estimated at less than
half this, around 70,000t in 2012. Output of cathode materials has increased by 25%py
since 2000, slightly higher than production of rechargeable lithium batteries in unit terms
(23%py), and closer to that of production in energy storage capacity terms (26%py).
This is probably because of increased output of higher capacity, larger cells requiring
more cathode material per cell.
The most widely produced cathode material in 2011 was LCO, forming 42% of total
cathode production (Figure 50). The production of LCO has, however, been in steady
decline, falling 3.2%py since 2008, as cathode manufacturers have sought to address
high and fluctuating cobalt prices, and concerns with thermal runaway of batteries
containing LCO, with cheaper and safer alternatives. Cathode manufacturers have
replaced LCO with NMC cathode materials, which overtook LCO’s market share in 2012
(Figure 50). Production of LFP, LMO and NCA has accelerated since 2009, as
Lithium
source
Cathode
manufacturer
Metal
source
Lithium-ion battery
assembly line
Chemical
processing
Metal
processor
Carbon
source
Lithium
carbonate or
hydroxide
Cobalt,
manganese, iron,
nickel etc.
Metal
powder/oxide
Battery-grade
lithium carbonate
or hydroxide Lithium salts
e.g. LiPF6
Lithium cobaltite,
manganate etc.
Electrolyte
manufacture
Anode
manufacturer
Organic liquid or
polymer
Graphite, hard or
soft carbon,
lithium titanate
etc.
Carbon
processor
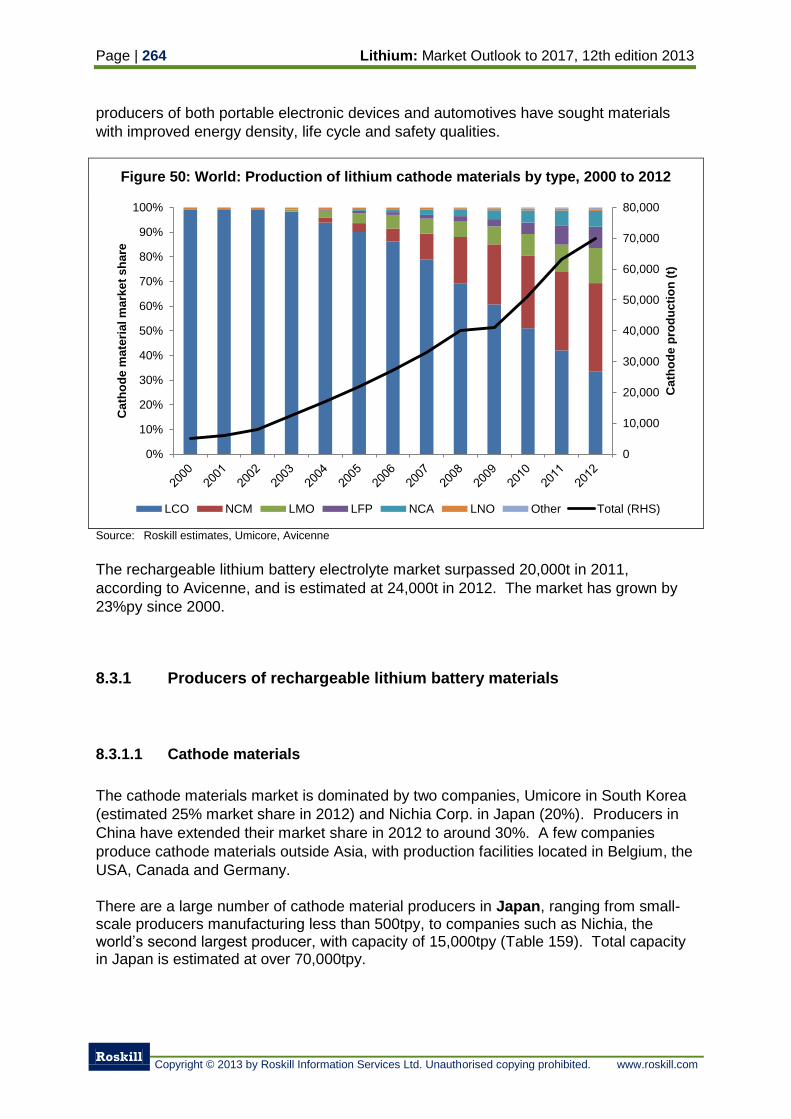
Page | 264 Lithium: Market Outlook to 2017, 12th edition 2013
Roskill
Copyright © 2013 by Roskill Information Services Ltd. Unauthorised copying prohibited. www.roskill.com
producers of both portable electronic devices and automotives have sought materials
with improved energy density, life cycle and safety qualities.
Figure 50: World: Production of lithium cathode materials by type, 2000 to 2012
Source: Roskill estimates, Umicore, Avicenne
The rechargeable lithium battery electrolyte market surpassed 20,000t in 2011,
according to Avicenne, and is estimated at 24,000t in 2012. The market has grown by
23%py since 2000.
8.3.1 Producers of rechargeable lithium battery materials
8.3.1.1 Cathode materials
The cathode materials market is dominated by two companies, Umicore in South Korea
(estimated 25% market share in 2012) and Nichia Corp. in Japan (20%). Producers in
China have extended their market share in 2012 to around 30%. A few companies
produce cathode materials outside Asia, with production facilities located in Belgium, the
USA, Canada and Germany.
There are a large number of cathode material producers in Japan, ranging from small-scale producers manufacturing less than 500tpy, to companies such as Nichia, the world’s second largest producer, with capacity of 15,000tpy (Table 159). Total capacity in Japan is estimated at over 70,000tpy.
0
10,000
20,000
30,000
40,000
50,000
60,000
70,000
80,000
0%
10%
20%
30%
40%
50%
60%
70%
80%
90%
100%
Ca
tho
de
pro
du
cti
on
(t)
Ca
tho
de
ma
teri
al m
ark
et
sh
are
LCO NCM LMO LFP NCA LNO Other Total (RHS)
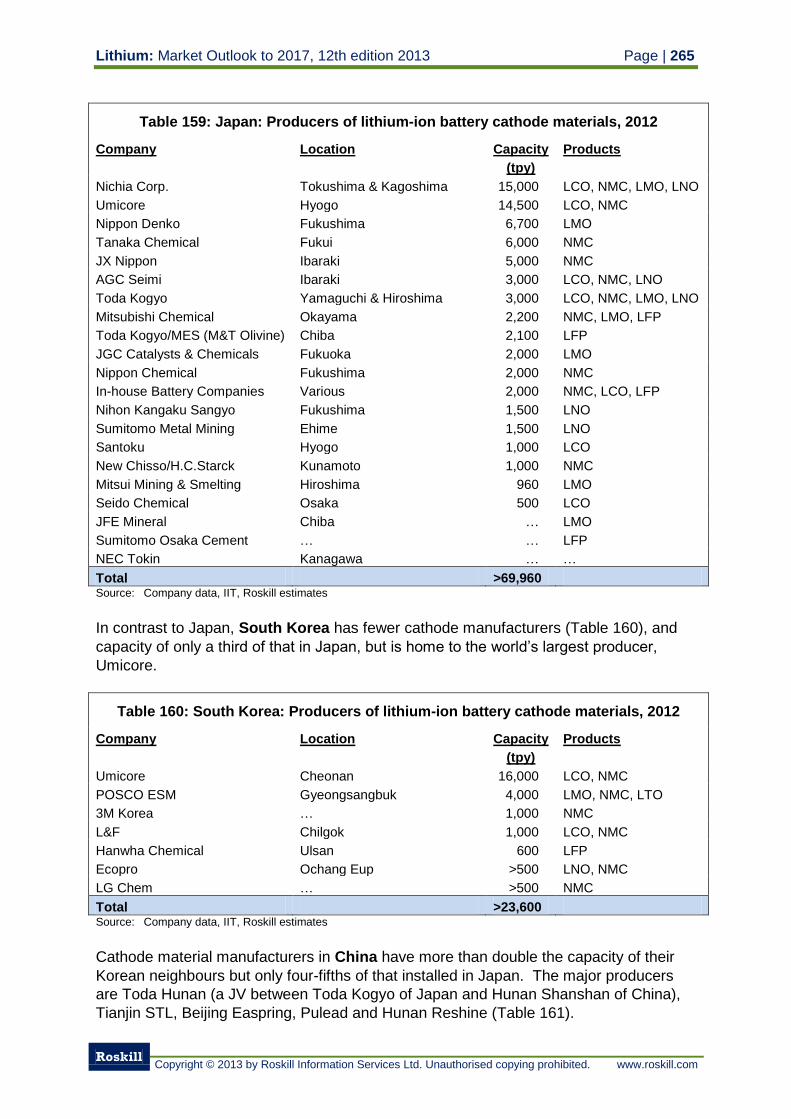
Lithium: Market Outlook to 2017, 12th edition 2013 Page | 265
Roskill
Copyright © 2013 by Roskill Information Services Ltd. Unauthorised copying prohibited. www.roskill.com
Table 159: Japan: Producers of lithium-ion battery cathode materials, 2012
Company Location Capacity
(tpy)
Products
Nichia Corp. Tokushima & Kagoshima 15,000 LCO, NMC, LMO, LNO
Umicore Hyogo 14,500 LCO, NMC
Nippon Denko Fukushima 6,700 LMO
Tanaka Chemical Fukui 6,000 NMC
JX Nippon Ibaraki 5,000 NMC
AGC Seimi Ibaraki 3,000 LCO, NMC, LNO
Toda Kogyo Yamaguchi & Hiroshima 3,000 LCO, NMC, LMO, LNO
Mitsubishi Chemical Okayama 2,200 NMC, LMO, LFP
Toda Kogyo/MES (M&T Olivine) Chiba 2,100 LFP
JGC Catalysts & Chemicals Fukuoka 2,000 LMO
Nippon Chemical Fukushima 2,000 NMC
In-house Battery Companies Various 2,000 NMC, LCO, LFP
Nihon Kangaku Sangyo Fukushima 1,500 LNO
Sumitomo Metal Mining Ehime 1,500 LNO
Santoku Hyogo 1,000 LCO
New Chisso/H.C.Starck Kunamoto 1,000 NMC
Mitsui Mining & Smelting Hiroshima 960 LMO
Seido Chemical Osaka 500 LCO
JFE Mineral Chiba … LMO
Sumitomo Osaka Cement … … LFP
NEC Tokin Kanagawa … …
Total >69,960 Source: Company data, IIT, Roskill estimates
In contrast to Japan, South Korea has fewer cathode manufacturers (Table 160), and
capacity of only a third of that in Japan, but is home to the world’s largest producer,
Umicore.
Table 160: South Korea: Producers of lithium-ion battery cathode materials, 2012
Company Location Capacity
(tpy)
Products
Umicore Cheonan 16,000 LCO, NMC
POSCO ESM Gyeongsangbuk 4,000 LMO, NMC, LTO
3M Korea … 1,000 NMC
L&F Chilgok 1,000 LCO, NMC
Hanwha Chemical Ulsan 600 LFP
Ecopro Ochang Eup >500 LNO, NMC
LG Chem … >500 NMC
Total >23,600 Source: Company data, IIT, Roskill estimates
Cathode material manufacturers in China have more than double the capacity of their
Korean neighbours but only four-fifths of that installed in Japan. The major producers
are Toda Hunan (a JV between Toda Kogyo of Japan and Hunan Shanshan of China),
Tianjin STL, Beijing Easpring, Pulead and Hunan Reshine (Table 161).
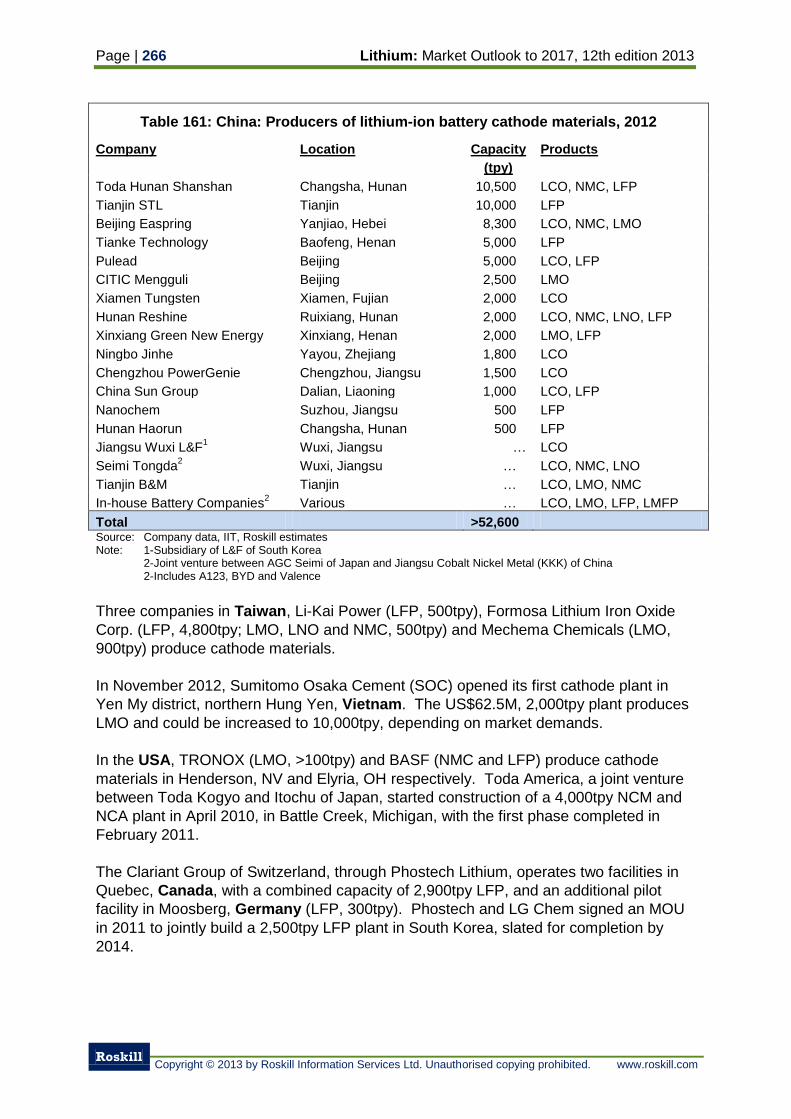
Page | 266 Lithium: Market Outlook to 2017, 12th edition 2013
Roskill
Copyright © 2013 by Roskill Information Services Ltd. Unauthorised copying prohibited. www.roskill.com
Table 161: China: Producers of lithium-ion battery cathode materials, 2012
Company Location Capacity
(tpy)
Products
Toda Hunan Shanshan Changsha, Hunan 10,500 LCO, NMC, LFP
Tianjin STL Tianjin 10,000 LFP
Beijing Easpring Yanjiao, Hebei 8,300 LCO, NMC, LMO
Tianke Technology Baofeng, Henan 5,000 LFP
Pulead Beijing 5,000 LCO, LFP
CITIC Mengguli Beijing 2,500 LMO
Xiamen Tungsten Xiamen, Fujian 2,000 LCO
Hunan Reshine Ruixiang, Hunan 2,000 LCO, NMC, LNO, LFP
Xinxiang Green New Energy Xinxiang, Henan 2,000 LMO, LFP
Ningbo Jinhe Yayou, Zhejiang 1,800 LCO
Chengzhou PowerGenie Chengzhou, Jiangsu 1,500 LCO
China Sun Group Dalian, Liaoning 1,000 LCO, LFP
Nanochem Suzhou, Jiangsu 500 LFP
Hunan Haorun Changsha, Hunan 500 LFP
Jiangsu Wuxi L&F1
Wuxi, Jiangsu … LCO
Seimi Tongda2
Wuxi, Jiangsu … LCO, NMC, LNO
Tianjin B&M Tianjin … LCO, LMO, NMC
In-house Battery Companies2
Various … LCO, LMO, LFP, LMFP
Total >52,600 Source: Company data, IIT, Roskill estimates Note: 1-Subsidiary of L&F of South Korea
2-Joint venture between AGC Seimi of Japan and Jiangsu Cobalt Nickel Metal (KKK) of China 2-Includes A123, BYD and Valence
Three companies in Taiwan, Li-Kai Power (LFP, 500tpy), Formosa Lithium Iron Oxide
Corp. (LFP, 4,800tpy; LMO, LNO and NMC, 500tpy) and Mechema Chemicals (LMO,
900tpy) produce cathode materials.
In November 2012, Sumitomo Osaka Cement (SOC) opened its first cathode plant in
Yen My district, northern Hung Yen, Vietnam. The US$62.5M, 2,000tpy plant produces
LMO and could be increased to 10,000tpy, depending on market demands.
In the USA, TRONOX (LMO, >100tpy) and BASF (NMC and LFP) produce cathode
materials in Henderson, NV and Elyria, OH respectively. Toda America, a joint venture
between Toda Kogyo and Itochu of Japan, started construction of a 4,000tpy NCM and
NCA plant in April 2010, in Battle Creek, Michigan, with the first phase completed in
February 2011.
The Clariant Group of Switzerland, through Phostech Lithium, operates two facilities in
Quebec, Canada, with a combined capacity of 2,900tpy LFP, and an additional pilot
facility in Moosberg, Germany (LFP, 300tpy). Phostech and LG Chem signed an MOU
in 2011 to jointly build a 2,500tpy LFP plant in South Korea, slated for completion by
2014.
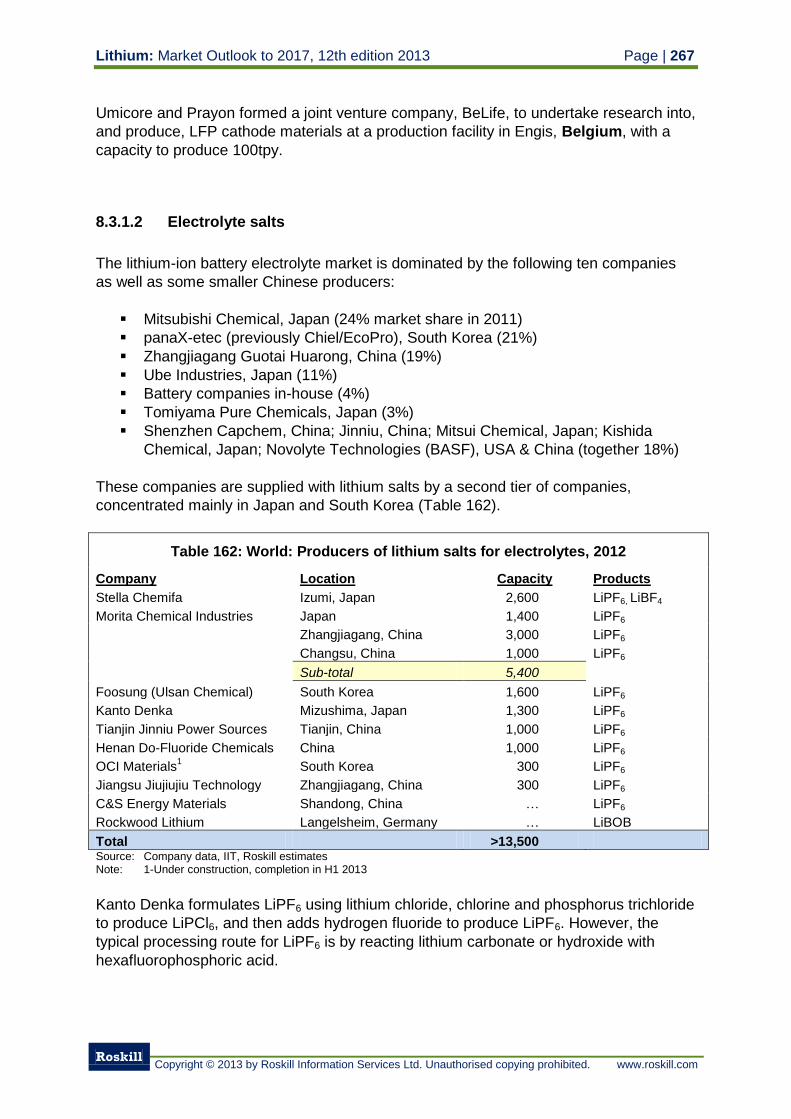
Lithium: Market Outlook to 2017, 12th edition 2013 Page | 267
Roskill
Copyright © 2013 by Roskill Information Services Ltd. Unauthorised copying prohibited. www.roskill.com
Umicore and Prayon formed a joint venture company, BeLife, to undertake research into,
and produce, LFP cathode materials at a production facility in Engis, Belgium, with a
capacity to produce 100tpy.
8.3.1.2 Electrolyte salts
The lithium-ion battery electrolyte market is dominated by the following ten companies
as well as some smaller Chinese producers:
Mitsubishi Chemical, Japan (24% market share in 2011)
panaX-etec (previously Chiel/EcoPro), South Korea (21%)
Zhangjiagang Guotai Huarong, China (19%)
Ube Industries, Japan (11%)
Battery companies in-house (4%)
Tomiyama Pure Chemicals, Japan (3%)
Shenzhen Capchem, China; Jinniu, China; Mitsui Chemical, Japan; Kishida
Chemical, Japan; Novolyte Technologies (BASF), USA & China (together 18%)
These companies are supplied with lithium salts by a second tier of companies,
concentrated mainly in Japan and South Korea (Table 162).
Table 162: World: Producers of lithium salts for electrolytes, 2012
Company Location Capacity Products
Stella Chemifa Izumi, Japan 2,600 LiPF6, LiBF4
Morita Chemical Industries Japan 1,400 LiPF6
Zhangjiagang, China 3,000 LiPF6
Changsu, China 1,000 LiPF6
Sub-total 5,400
Foosung (Ulsan Chemical) South Korea 1,600 LiPF6
Kanto Denka Mizushima, Japan 1,300 LiPF6
Tianjin Jinniu Power Sources Tianjin, China 1,000 LiPF6
Henan Do-Fluoride Chemicals China 1,000 LiPF6
OCI Materials1
South Korea 300 LiPF6
Jiangsu Jiujiujiu Technology Zhangjiagang, China 300 LiPF6
C&S Energy Materials Shandong, China … LiPF6
Rockwood Lithium Langelsheim, Germany … LiBOB
Total >13,500 Source: Company data, IIT, Roskill estimates Note: 1-Under construction, completion in H1 2013
Kanto Denka formulates LiPF6 using lithium chloride, chlorine and phosphorus trichloride
to produce LiPCl6, and then adds hydrogen fluoride to produce LiPF6. However, the
typical processing route for LiPF6 is by reacting lithium carbonate or hydroxide with
hexafluorophosphoric acid.
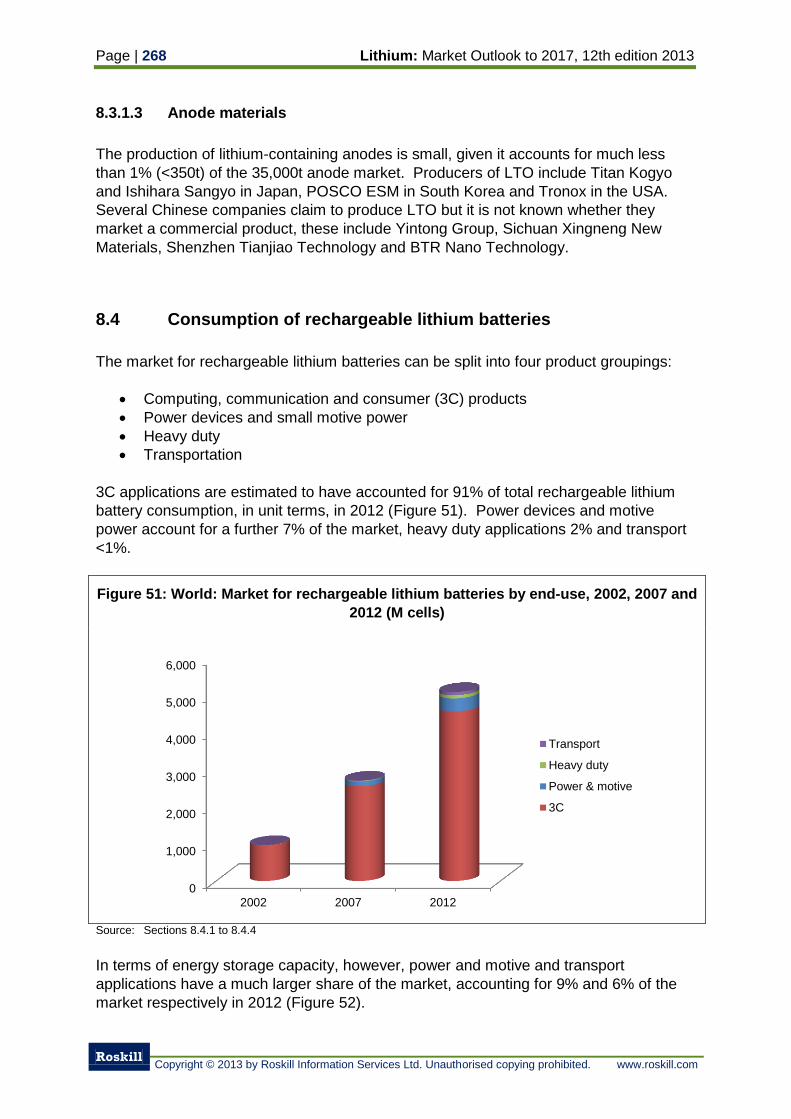
Page | 268 Lithium: Market Outlook to 2017, 12th edition 2013
Roskill
Copyright © 2013 by Roskill Information Services Ltd. Unauthorised copying prohibited. www.roskill.com
8.3.1.3 Anode materials
The production of lithium-containing anodes is small, given it accounts for much less
than 1% (<350t) of the 35,000t anode market. Producers of LTO include Titan Kogyo
and Ishihara Sangyo in Japan, POSCO ESM in South Korea and Tronox in the USA.
Several Chinese companies claim to produce LTO but it is not known whether they
market a commercial product, these include Yintong Group, Sichuan Xingneng New
Materials, Shenzhen Tianjiao Technology and BTR Nano Technology.
8.4 Consumption of rechargeable lithium batteries
The market for rechargeable lithium batteries can be split into four product groupings:
Computing, communication and consumer (3C) products
Power devices and small motive power
Heavy duty
Transportation
3C applications are estimated to have accounted for 91% of total rechargeable lithium
battery consumption, in unit terms, in 2012 (Figure 51). Power devices and motive
power account for a further 7% of the market, heavy duty applications 2% and transport
<1%.
Figure 51: World: Market for rechargeable lithium batteries by end-use, 2002, 2007 and
2012 (M cells)
Source: Sections 8.4.1 to 8.4.4
In terms of energy storage capacity, however, power and motive and transport
applications have a much larger share of the market, accounting for 9% and 6% of the
market respectively in 2012 (Figure 52).
0
1,000
2,000
3,000
4,000
5,000
6,000
2002 2007 2012
Transport
Heavy duty
Power & motive
3C
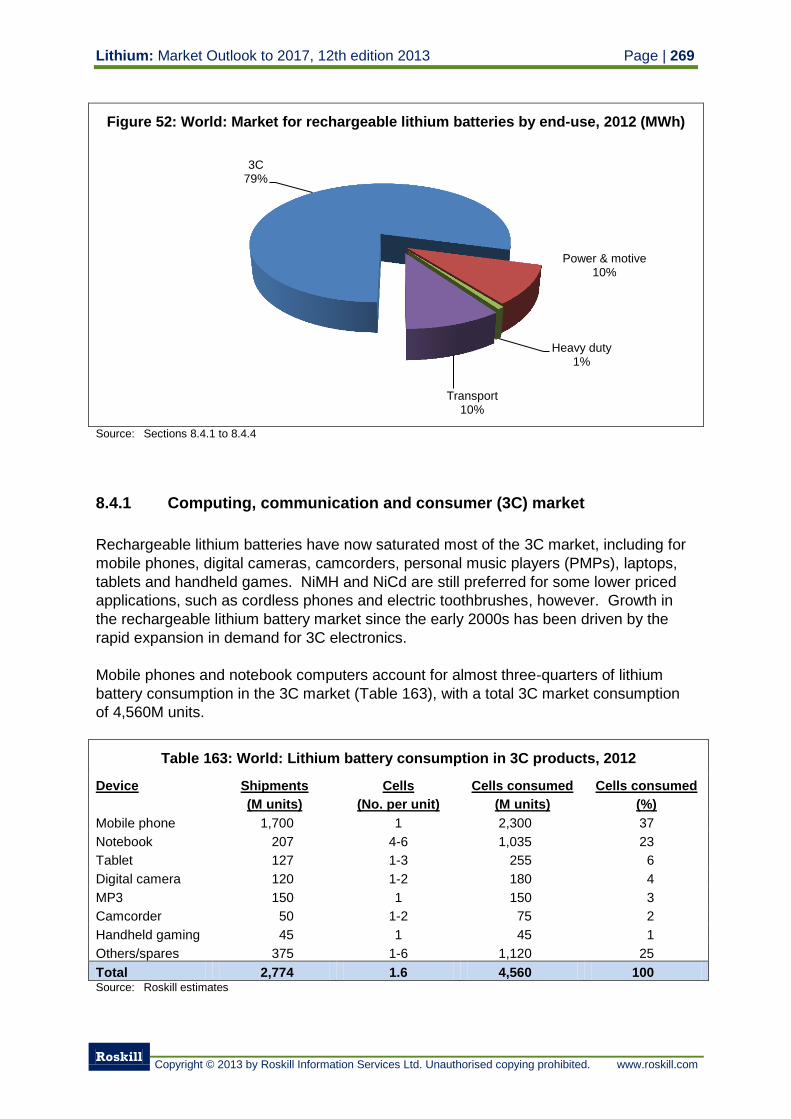
Lithium: Market Outlook to 2017, 12th edition 2013 Page | 269
Roskill
Copyright © 2013 by Roskill Information Services Ltd. Unauthorised copying prohibited. www.roskill.com
Figure 52: World: Market for rechargeable lithium batteries by end-use, 2012 (MWh)
Source: Sections 8.4.1 to 8.4.4
8.4.1 Computing, communication and consumer (3C) market
Rechargeable lithium batteries have now saturated most of the 3C market, including for
mobile phones, digital cameras, camcorders, personal music players (PMPs), laptops,
tablets and handheld games. NiMH and NiCd are still preferred for some lower priced
applications, such as cordless phones and electric toothbrushes, however. Growth in
the rechargeable lithium battery market since the early 2000s has been driven by the
rapid expansion in demand for 3C electronics.
Mobile phones and notebook computers account for almost three-quarters of lithium
battery consumption in the 3C market (Table 163), with a total 3C market consumption
of 4,560M units.
Table 163: World: Lithium battery consumption in 3C products, 2012
Device Shipments
(M units)
Cells
(No. per unit)
Cells consumed
(M units)
Cells consumed
(%)
Mobile phone 1,700 1 2,300 37
Notebook 207 4-6 1,035 23
Tablet 127 1-3 255 6
Digital camera 120 1-2 180 4
MP3 150 1 150 3
Camcorder 50 1-2 75 2
Handheld gaming 45 1 45 1
Others/spares 375 1-6 1,120 25
Total 2,774 1.6 4,560 100 Source: Roskill estimates
3C 79%
Power & motive 10%
Heavy duty 1%
Transport 10%
Page | 270 Lithium: Market Outlook to 2017, 12th edition 2013
Roskill
Copyright © 2013 by Roskill Information Services Ltd. Unauthorised copying prohibited. www.roskill.com
Shipments of mobile (cell) phones, the largest market for rechargeable lithium batteries
by volume, are estimated to have reached 1.7Bn units in 2012, a CAGR of 12.5% from
the 420M units produced in 2000. Smartphone shipments in 2012 are estimated to
account for 46% of the total market, up from 35% in 2011, according to IHS iSuppli, and
will rise to half of all cell phone shipments in 2013.
World production of notebooks (laptops), the second largest market for rechargeable
lithium batteries, is estimated by Digitimes to have reached 207M units in 2012, up from
28M units in 2000, a CAGR of 18%. Improving specifications, falling prices and the
introduction of netbooks boosted the popularity of notebooks and sales exceeded those
of desktop PCs for the first time in 2008. However, despite the launch of ultrabooks in
around 2010, growth in notebook sales has slowed in recent years in face of competition
from tablet PCs. Shipments of ultrabooks are estimated to have reached 10.3M units in
2012 and will rise to 44M units in 2013 according to IHS iSuppli.
Tablet PC shipments in 2012 are estimated at 126.6M units according to HIS iSuppli, up
from 82.1M in 2011. New low-cost devices have provided a boost to the market which
was previously dominated by e-books, such as Amazon’s Kindle, at the lower end and
Apple’s iPad at the higher end.
Shipments of low-middle end digital cameras climbed by 18%py from 15M in 2001 to
around 120M units in 2011. Digitimes predicted 106M low- and middle- end digital
cameras would be shipped worldwide in 2012, down 12.5% from 2011 because of the
rise in popularity of smartphones with in-built cameras. High-end shipments account for
a smaller proportion of sales, taking total digital camera shipments closer to an
estimated 120M units in 2012.
The PMP market was one of the fastest-growing segments in the consumer electronics
industry in the mid-2000s, with Apple as the runaway leader with its successful
iPod line-up, and shipments reached 225M units 2009. However, the market has
witnessed a serious slowdown as Apple shifts its focus to its iPhone and iPad, and as
competitors pop up with similar smartphone and tablet products. Shipments in 2012 are
estimated to have fallen to around 150M units.
Sales of Sony and Nintendo handheld gaming devices are forecast to fall to 38M units
in 2013, down from 47M in 2008. Total shipments of handheld gaming devices
containing lithium batteries is estimate at 45M units.
8.4.2 Power devices and motive power
Unlike the 3C market, rechargeable lithium batteries have not saturated the market for
power devices, with lead-acid and NiCd still holding a large share. Power tools are the
largest market for lithium batteries in this segment, with electric bikes and electric
scooters/motorcycles the other major market (Table 164).
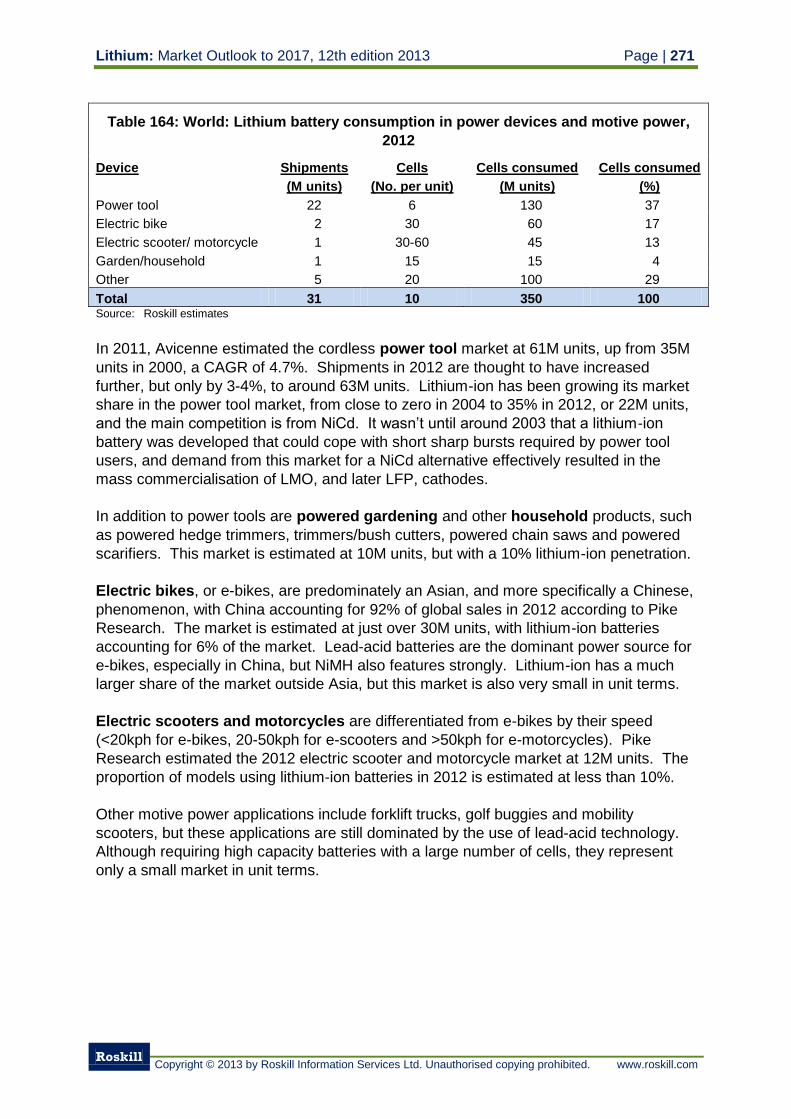
Lithium: Market Outlook to 2017, 12th edition 2013 Page | 271
Roskill
Copyright © 2013 by Roskill Information Services Ltd. Unauthorised copying prohibited. www.roskill.com
Table 164: World: Lithium battery consumption in power devices and motive power,
2012
Device Shipments
(M units)
Cells
(No. per unit)
Cells consumed
(M units)
Cells consumed
(%)
Power tool 22 6 130 37
Electric bike 2 30 60 17
Electric scooter/ motorcycle 1 30-60 45 13
Garden/household 1 15 15 4
Other 5 20 100 29
Total 31 10 350 100 Source: Roskill estimates
In 2011, Avicenne estimated the cordless power tool market at 61M units, up from 35M
units in 2000, a CAGR of 4.7%. Shipments in 2012 are thought to have increased
further, but only by 3-4%, to around 63M units. Lithium-ion has been growing its market
share in the power tool market, from close to zero in 2004 to 35% in 2012, or 22M units,
and the main competition is from NiCd. It wasn’t until around 2003 that a lithium-ion
battery was developed that could cope with short sharp bursts required by power tool
users, and demand from this market for a NiCd alternative effectively resulted in the
mass commercialisation of LMO, and later LFP, cathodes.
In addition to power tools are powered gardening and other household products, such
as powered hedge trimmers, trimmers/bush cutters, powered chain saws and powered
scarifiers. This market is estimated at 10M units, but with a 10% lithium-ion penetration.
Electric bikes, or e-bikes, are predominately an Asian, and more specifically a Chinese,
phenomenon, with China accounting for 92% of global sales in 2012 according to Pike
Research. The market is estimated at just over 30M units, with lithium-ion batteries
accounting for 6% of the market. Lead-acid batteries are the dominant power source for
e-bikes, especially in China, but NiMH also features strongly. Lithium-ion has a much
larger share of the market outside Asia, but this market is also very small in unit terms.
Electric scooters and motorcycles are differentiated from e-bikes by their speed
(<20kph for e-bikes, 20-50kph for e-scooters and >50kph for e-motorcycles). Pike
Research estimated the 2012 electric scooter and motorcycle market at 12M units. The
proportion of models using lithium-ion batteries in 2012 is estimated at less than 10%.
Other motive power applications include forklift trucks, golf buggies and mobility
scooters, but these applications are still dominated by the use of lead-acid technology.
Although requiring high capacity batteries with a large number of cells, they represent
only a small market in unit terms.
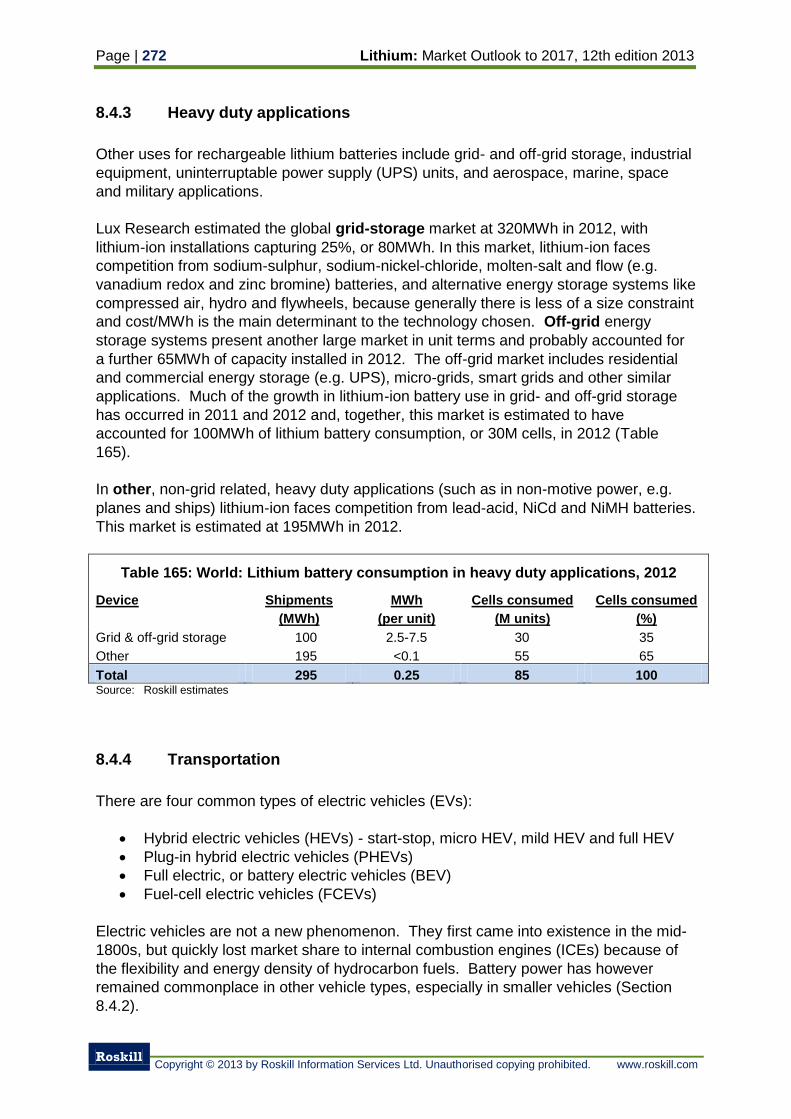
Page | 272 Lithium: Market Outlook to 2017, 12th edition 2013
Roskill
Copyright © 2013 by Roskill Information Services Ltd. Unauthorised copying prohibited. www.roskill.com
8.4.3 Heavy duty applications
Other uses for rechargeable lithium batteries include grid- and off-grid storage, industrial
equipment, uninterruptable power supply (UPS) units, and aerospace, marine, space
and military applications.
Lux Research estimated the global grid-storage market at 320MWh in 2012, with
lithium-ion installations capturing 25%, or 80MWh. In this market, lithium-ion faces
competition from sodium-sulphur, sodium-nickel-chloride, molten-salt and flow (e.g.
vanadium redox and zinc bromine) batteries, and alternative energy storage systems like
compressed air, hydro and flywheels, because generally there is less of a size constraint
and cost/MWh is the main determinant to the technology chosen. Off-grid energy
storage systems present another large market in unit terms and probably accounted for
a further 65MWh of capacity installed in 2012. The off-grid market includes residential
and commercial energy storage (e.g. UPS), micro-grids, smart grids and other similar
applications. Much of the growth in lithium-ion battery use in grid- and off-grid storage
has occurred in 2011 and 2012 and, together, this market is estimated to have
accounted for 100MWh of lithium battery consumption, or 30M cells, in 2012 (Table
165).
In other, non-grid related, heavy duty applications (such as in non-motive power, e.g.
planes and ships) lithium-ion faces competition from lead-acid, NiCd and NiMH batteries.
This market is estimated at 195MWh in 2012.
Table 165: World: Lithium battery consumption in heavy duty applications, 2012
Device Shipments
(MWh)
MWh
(per unit)
Cells consumed
(M units)
Cells consumed
(%)
Grid & off-grid storage 100 2.5-7.5 30 35
Other 195 <0.1 55 65
Total 295 0.25 85 100 Source: Roskill estimates
8.4.4 Transportation
There are four common types of electric vehicles (EVs):
Hybrid electric vehicles (HEVs) - start-stop, micro HEV, mild HEV and full HEV
Plug-in hybrid electric vehicles (PHEVs)
Full electric, or battery electric vehicles (BEV)
Fuel-cell electric vehicles (FCEVs)
Electric vehicles are not a new phenomenon. They first came into existence in the mid-
1800s, but quickly lost market share to internal combustion engines (ICEs) because of
the flexibility and energy density of hydrocarbon fuels. Battery power has however
remained commonplace in other vehicle types, especially in smaller vehicles (Section
8.4.2).
Lithium: Market Outlook to 2017, 12th edition 2013 Page | 273
Roskill
Copyright © 2013 by Roskill Information Services Ltd. Unauthorised copying prohibited. www.roskill.com
The energy crises of the 1970s and 80s brought a short-lived interest in EVs, though
those cars did not reach mass marketing. In the early 1990s, the California Air
Resources Board (CARB) began a push for more fuel-efficient, lower-emission vehicles,
with the ultimate goal being a move to zero-emissions vehicles such as EVs. In
response, automakers, such as GM, Chrysler, Toyota, Ford and Honda, developed and
sold several EVs, but these cars were eventually withdrawn.
The modern incarnation of EVs began with the launch of Toyota’s Prius HEV in 1997,
equipped with a 1.4kWh NiMH battery, which has gone on to achieve cumulative global
sales of 2.8M units, as of October 2012. Despite being capable of only a few kilometres
at low speed in electric-only mode, the Prius’ efficiency (60mpg) and commercial
success prompted other manufacturers to invest in hybrid technology using NiMH
batteries with numerous models from Japanese and US automotive companies
developed and sold from the late-1990s to the mid-2000s. Despite strong intentions to
switch to lithium-ion batteries for its 2009 model, Toyota stuck with NiMH leaving
Mercedes to launch the first lithium-ion powered HEV, the S400 Blue, a mild HEV in
2009. Hyundai released a full HEV, the Sonata, in 2010.
The low energy density of NiMH batteries compared to lithium batteries meant
development of PHEVs lagged HEVs until suitable battery technology was developed,
and they did not enter the mass market until 2008 when BYD of China launched its
F3DM to Chinese fleet buyers (although conversion of HEVs to PHEVs by installing
lithium-ion batteries was commonplace from the mid-2000s). General Motors began
deliveries of the Chevrolet Volt to the US market in December 2010 and Toyota’s Prius
Plug-in was released in Japan in January 2012. As of end-2012, almost 60,000 PHEVs
have been sold worldwide.
The first series production of BEVs using rechargeable lithium batteries started in 2008
with deliveries of the Tesla Roadster and TH!NK City, although production of both of
these vehicles has since been halted. Following these in 2009 was the start of mass
production of Mitsubishi’s iMiEV in Japan (re-badged and marketed briefly in Europe as
the Citroen C-zero and Peugeot iON from 2010) and from 2011 Nissan’s Leaf, now the
world's top-selling highway-capable all-electric car with more than 40,000 sold through to
end-2012. Bolloré released its Pininfarina-designed lithium metal polymer battery
powered BlueCar in 2012.
For the 2008 Beijing Olympics, 50 lithium-ion battery powered EV buses were used to
transport athletes from the Olympic village to the stadiums.
In 2006, East Japan Railway and Hitachi Maxell successfully developed the world’s first
HEV train using a lithium-ion battery and an improved diesel engine. The hybrid train
has run from Obuchizawa, Yamanashi prefecture to Komoro, Nagano prefecture since
summer 2007.
Production of BEVs is estimated at 65,000 units in 2012, PHEVs 57,000 units and HEVs
1.57M units, according to Advanced Automotive Batteries, an industry consultant.
Within the HEV segment, sales of HEVs powered by NiMH batteries are estimated at
1.2M units while those powered by lithium-ion are estimated at 370,000 units.
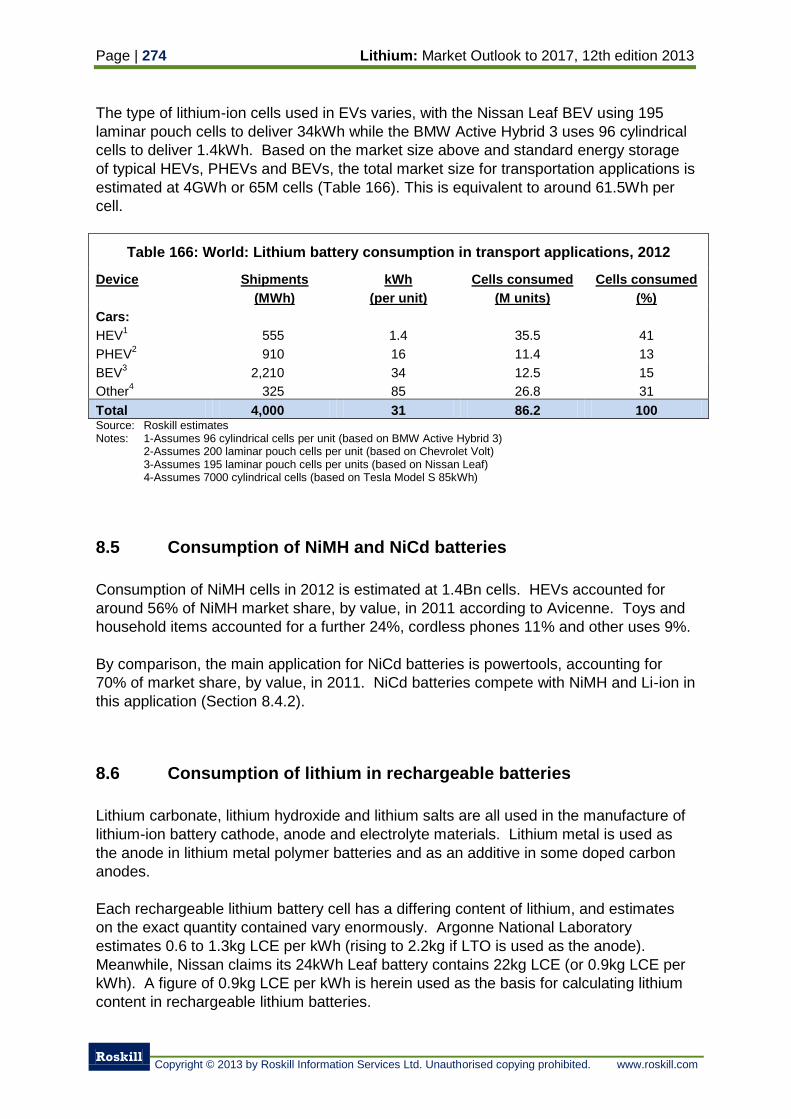
Page | 274 Lithium: Market Outlook to 2017, 12th edition 2013
Roskill
Copyright © 2013 by Roskill Information Services Ltd. Unauthorised copying prohibited. www.roskill.com
The type of lithium-ion cells used in EVs varies, with the Nissan Leaf BEV using 195
laminar pouch cells to deliver 34kWh while the BMW Active Hybrid 3 uses 96 cylindrical
cells to deliver 1.4kWh. Based on the market size above and standard energy storage
of typical HEVs, PHEVs and BEVs, the total market size for transportation applications is
estimated at 4GWh or 65M cells (Table 166). This is equivalent to around 61.5Wh per
cell.
Table 166: World: Lithium battery consumption in transport applications, 2012
Device Shipments
(MWh)
kWh
(per unit)
Cells consumed
(M units)
Cells consumed
(%)
Cars:
HEV1
555 1.4 35.5 41
PHEV2
910 16 11.4 13
BEV3
2,210 34 12.5 15
Other4
325 85 26.8 31
Total 4,000 31 86.2 100 Source: Roskill estimates Notes: 1-Assumes 96 cylindrical cells per unit (based on BMW Active Hybrid 3)
2-Assumes 200 laminar pouch cells per unit (based on Chevrolet Volt) 3-Assumes 195 laminar pouch cells per units (based on Nissan Leaf) 4-Assumes 7000 cylindrical cells (based on Tesla Model S 85kWh)
8.5 Consumption of NiMH and NiCd batteries
Consumption of NiMH cells in 2012 is estimated at 1.4Bn cells. HEVs accounted for
around 56% of NiMH market share, by value, in 2011 according to Avicenne. Toys and
household items accounted for a further 24%, cordless phones 11% and other uses 9%.
By comparison, the main application for NiCd batteries is powertools, accounting for
70% of market share, by value, in 2011. NiCd batteries compete with NiMH and Li-ion in
this application (Section 8.4.2).
8.6 Consumption of lithium in rechargeable batteries
Lithium carbonate, lithium hydroxide and lithium salts are all used in the manufacture of
lithium-ion battery cathode, anode and electrolyte materials. Lithium metal is used as
the anode in lithium metal polymer batteries and as an additive in some doped carbon
anodes.
Each rechargeable lithium battery cell has a differing content of lithium, and estimates
on the exact quantity contained vary enormously. Argonne National Laboratory
estimates 0.6 to 1.3kg LCE per kWh (rising to 2.2kg if LTO is used as the anode).
Meanwhile, Nissan claims its 24kWh Leaf battery contains 22kg LCE (or 0.9kg LCE per
kWh). A figure of 0.9kg LCE per kWh is herein used as the basis for calculating lithium
content in rechargeable lithium batteries.
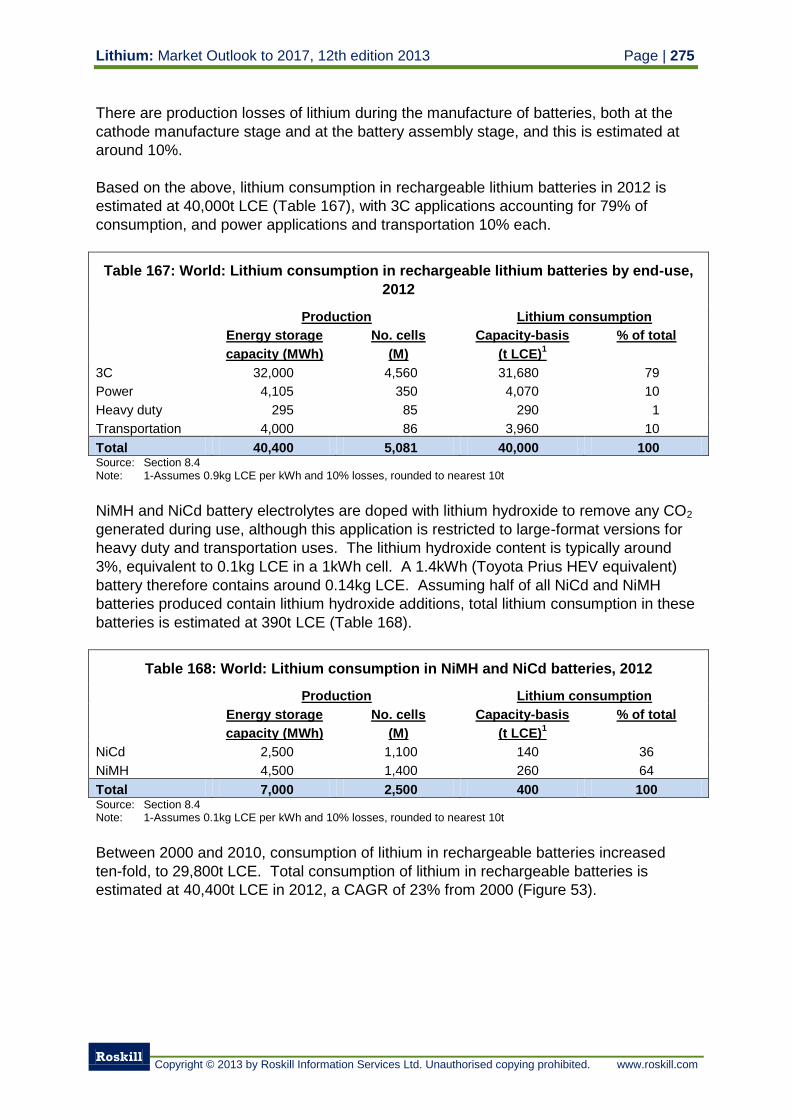
Lithium: Market Outlook to 2017, 12th edition 2013 Page | 275
Roskill
Copyright © 2013 by Roskill Information Services Ltd. Unauthorised copying prohibited. www.roskill.com
There are production losses of lithium during the manufacture of batteries, both at the
cathode manufacture stage and at the battery assembly stage, and this is estimated at
around 10%.
Based on the above, lithium consumption in rechargeable lithium batteries in 2012 is
estimated at 40,000t LCE (Table 167), with 3C applications accounting for 79% of
consumption, and power applications and transportation 10% each.
Table 167: World: Lithium consumption in rechargeable lithium batteries by end-use,
2012
Production Lithium consumption
Energy storage
capacity (MWh)
No. cells
(M)
Capacity-basis
(t LCE)1
% of total
3C 32,000 4,560 31,680 79
Power 4,105 350 4,070 10
Heavy duty 295 85 290 1
Transportation 4,000 86 3,960 10
Total 40,400 5,081 40,000 100 Source: Section 8.4 Note: 1-Assumes 0.9kg LCE per kWh and 10% losses, rounded to nearest 10t
NiMH and NiCd battery electrolytes are doped with lithium hydroxide to remove any CO2
generated during use, although this application is restricted to large-format versions for
heavy duty and transportation uses. The lithium hydroxide content is typically around
3%, equivalent to 0.1kg LCE in a 1kWh cell. A 1.4kWh (Toyota Prius HEV equivalent)
battery therefore contains around 0.14kg LCE. Assuming half of all NiCd and NiMH
batteries produced contain lithium hydroxide additions, total lithium consumption in these
batteries is estimated at 390t LCE (Table 168).
Table 168: World: Lithium consumption in NiMH and NiCd batteries, 2012
Production Lithium consumption
Energy storage
capacity (MWh)
No. cells
(M)
Capacity-basis
(t LCE)1
% of total
NiCd 2,500 1,100 140 36
NiMH 4,500 1,400 260 64
Total 7,000 2,500 400 100 Source: Section 8.4 Note: 1-Assumes 0.1kg LCE per kWh and 10% losses, rounded to nearest 10t
Between 2000 and 2010, consumption of lithium in rechargeable batteries increased
ten-fold, to 29,800t LCE. Total consumption of lithium in rechargeable batteries is
estimated at 40,400t LCE in 2012, a CAGR of 23% from 2000 (Figure 53).
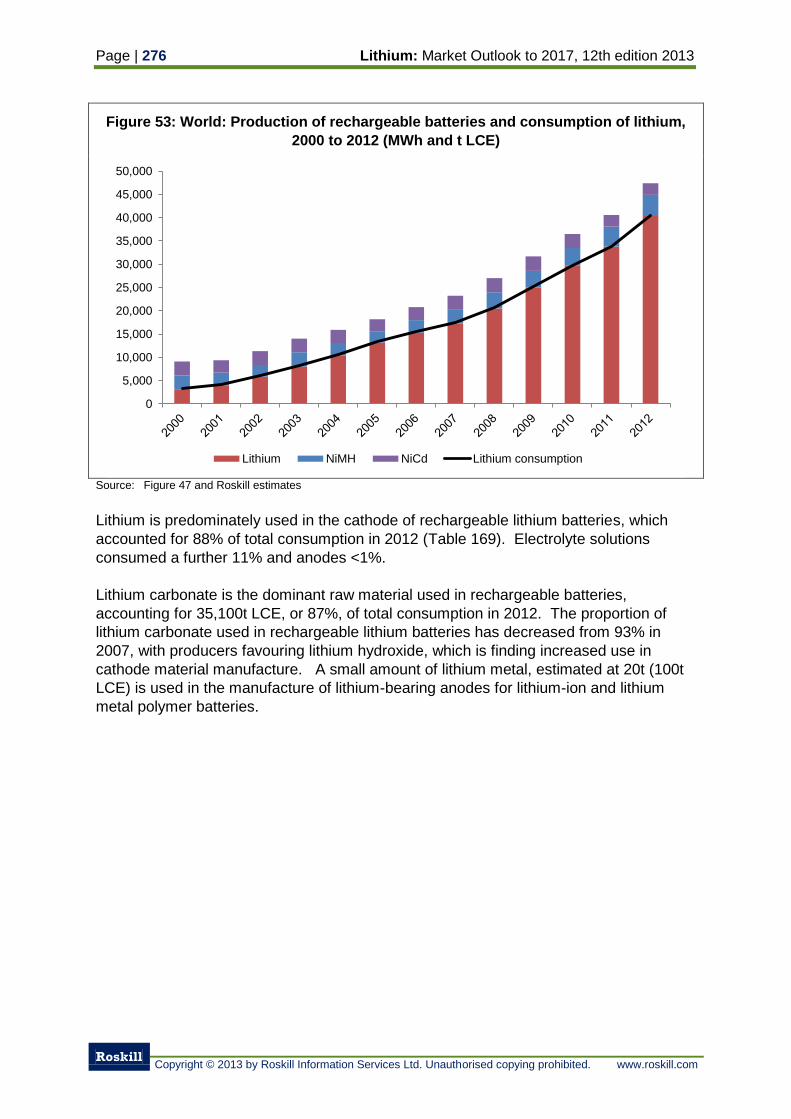
Page | 276 Lithium: Market Outlook to 2017, 12th edition 2013
Roskill
Copyright © 2013 by Roskill Information Services Ltd. Unauthorised copying prohibited. www.roskill.com
Figure 53: World: Production of rechargeable batteries and consumption of lithium,
2000 to 2012 (MWh and t LCE)
Source: Figure 47 and Roskill estimates
Lithium is predominately used in the cathode of rechargeable lithium batteries, which
accounted for 88% of total consumption in 2012 (Table 169). Electrolyte solutions
consumed a further 11% and anodes <1%.
Lithium carbonate is the dominant raw material used in rechargeable batteries,
accounting for 35,100t LCE, or 87%, of total consumption in 2012. The proportion of
lithium carbonate used in rechargeable lithium batteries has decreased from 93% in
2007, with producers favouring lithium hydroxide, which is finding increased use in
cathode material manufacture. A small amount of lithium metal, estimated at 20t (100t
LCE) is used in the manufacture of lithium-bearing anodes for lithium-ion and lithium
metal polymer batteries.
0
5,000
10,000
15,000
20,000
25,000
30,000
35,000
40,000
45,000
50,000
Lithium NiMH NiCd Lithium consumption
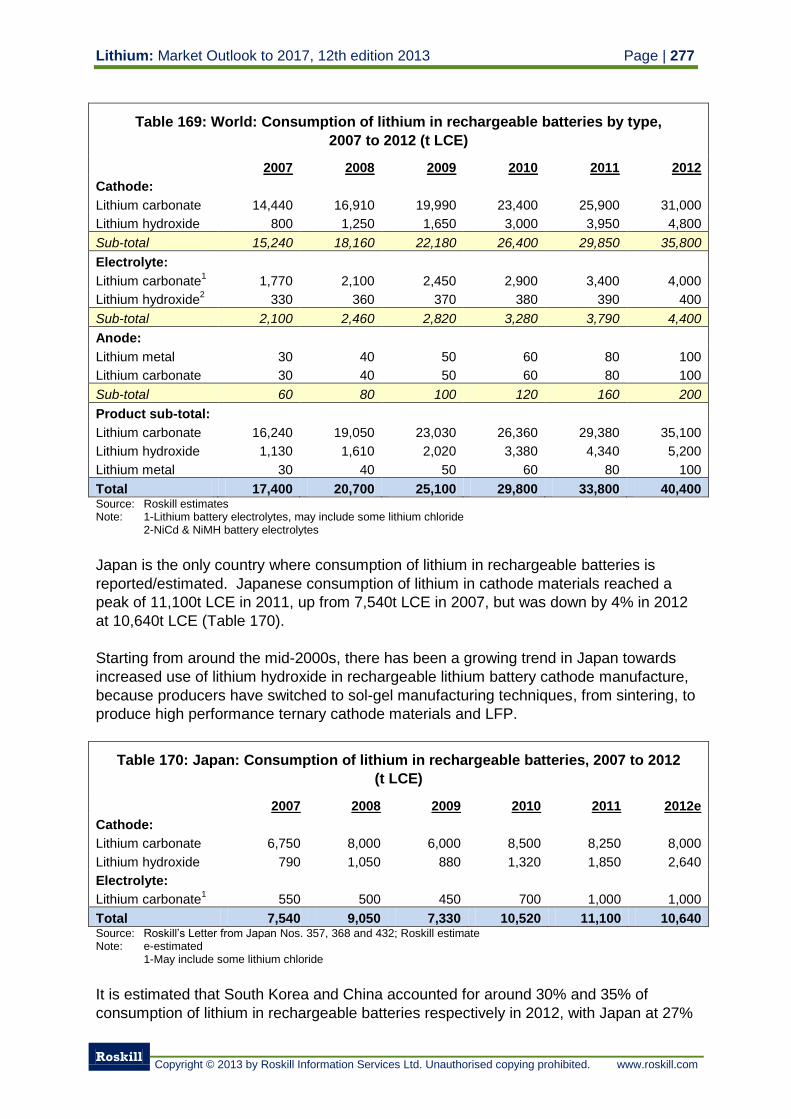
Lithium: Market Outlook to 2017, 12th edition 2013 Page | 277
Roskill
Copyright © 2013 by Roskill Information Services Ltd. Unauthorised copying prohibited. www.roskill.com
Table 169: World: Consumption of lithium in rechargeable batteries by type,
2007 to 2012 (t LCE)
2007 2008 2009 2010 2011 2012
Cathode:
Lithium carbonate 14,440 16,910 19,990 23,400 25,900 31,000
Lithium hydroxide 800 1,250 1,650 3,000 3,950 4,800
Sub-total 15,240 18,160 22,180 26,400 29,850 35,800
Electrolyte:
Lithium carbonate1
1,770 2,100 2,450 2,900 3,400 4,000
Lithium hydroxide2
330 360 370 380 390 400
Sub-total 2,100 2,460 2,820 3,280 3,790 4,400
Anode:
Lithium metal 30 40 50 60 80 100
Lithium carbonate 30 40 50 60 80 100
Sub-total 60 80 100 120 160 200
Product sub-total:
Lithium carbonate 16,240 19,050 23,030 26,360 29,380 35,100
Lithium hydroxide 1,130 1,610 2,020 3,380 4,340 5,200
Lithium metal 30 40 50 60 80 100
Total 17,400 20,700 25,100 29,800 33,800 40,400 Source: Roskill estimates Note: 1-Lithium battery electrolytes, may include some lithium chloride
2-NiCd & NiMH battery electrolytes
Japan is the only country where consumption of lithium in rechargeable batteries is
reported/estimated. Japanese consumption of lithium in cathode materials reached a
peak of 11,100t LCE in 2011, up from 7,540t LCE in 2007, but was down by 4% in 2012
at 10,640t LCE (Table 170).
Starting from around the mid-2000s, there has been a growing trend in Japan towards
increased use of lithium hydroxide in rechargeable lithium battery cathode manufacture,
because producers have switched to sol-gel manufacturing techniques, from sintering, to
produce high performance ternary cathode materials and LFP.
Table 170: Japan: Consumption of lithium in rechargeable batteries, 2007 to 2012
(t LCE)
2007 2008 2009 2010 2011 2012e
Cathode:
Lithium carbonate 6,750 8,000 6,000 8,500 8,250 8,000
Lithium hydroxide 790 1,050 880 1,320 1,850 2,640
Electrolyte:
Lithium carbonate1
550 500 450 700 1,000 1,000
Total 7,540 9,050 7,330 10,520 11,100 10,640 Source: Roskill’s Letter from Japan Nos. 357, 368 and 432; Roskill estimate Note: e-estimated
1-May include some lithium chloride
It is estimated that South Korea and China accounted for around 30% and 35% of
consumption of lithium in rechargeable batteries respectively in 2012, with Japan at 27%
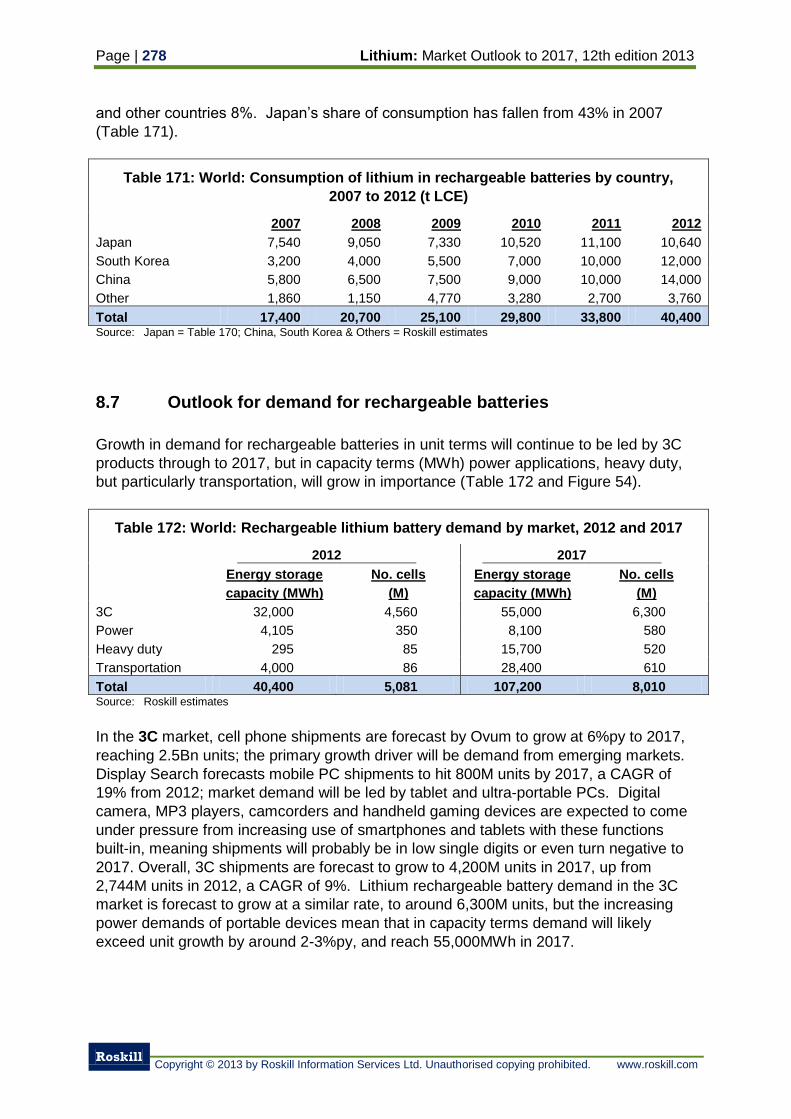
Page | 278 Lithium: Market Outlook to 2017, 12th edition 2013
Roskill
Copyright © 2013 by Roskill Information Services Ltd. Unauthorised copying prohibited. www.roskill.com
and other countries 8%. Japan’s share of consumption has fallen from 43% in 2007
(Table 171).
Table 171: World: Consumption of lithium in rechargeable batteries by country,
2007 to 2012 (t LCE)
2007 2008 2009 2010 2011 2012
Japan 7,540 9,050 7,330 10,520 11,100 10,640
South Korea 3,200 4,000 5,500 7,000 10,000 12,000
China 5,800 6,500 7,500 9,000 10,000 14,000
Other 1,860 1,150 4,770 3,280 2,700 3,760
Total 17,400 20,700 25,100 29,800 33,800 40,400 Source: Japan = Table 170; China, South Korea & Others = Roskill estimates
8.7 Outlook for demand for rechargeable batteries
Growth in demand for rechargeable batteries in unit terms will continue to be led by 3C
products through to 2017, but in capacity terms (MWh) power applications, heavy duty,
but particularly transportation, will grow in importance (Table 172 and Figure 54).
Table 172: World: Rechargeable lithium battery demand by market, 2012 and 2017
2012 2017
Energy storage
capacity (MWh)
No. cells
(M)
Energy storage
capacity (MWh)
No. cells
(M)
3C 32,000 4,560 55,000 6,300
Power 4,105 350 8,100 580
Heavy duty 295 85 15,700 520
Transportation 4,000 86 28,400 610
Total 40,400 5,081 107,200 8,010 Source: Roskill estimates
In the 3C market, cell phone shipments are forecast by Ovum to grow at 6%py to 2017,
reaching 2.5Bn units; the primary growth driver will be demand from emerging markets.
Display Search forecasts mobile PC shipments to hit 800M units by 2017, a CAGR of
19% from 2012; market demand will be led by tablet and ultra-portable PCs. Digital
camera, MP3 players, camcorders and handheld gaming devices are expected to come
under pressure from increasing use of smartphones and tablets with these functions
built-in, meaning shipments will probably be in low single digits or even turn negative to
2017. Overall, 3C shipments are forecast to grow to 4,200M units in 2017, up from
2,744M units in 2012, a CAGR of 9%. Lithium rechargeable battery demand in the 3C
market is forecast to grow at a similar rate, to around 6,300M units, but the increasing
power demands of portable devices mean that in capacity terms demand will likely
exceed unit growth by around 2-3%py, and reach 55,000MWh in 2017.
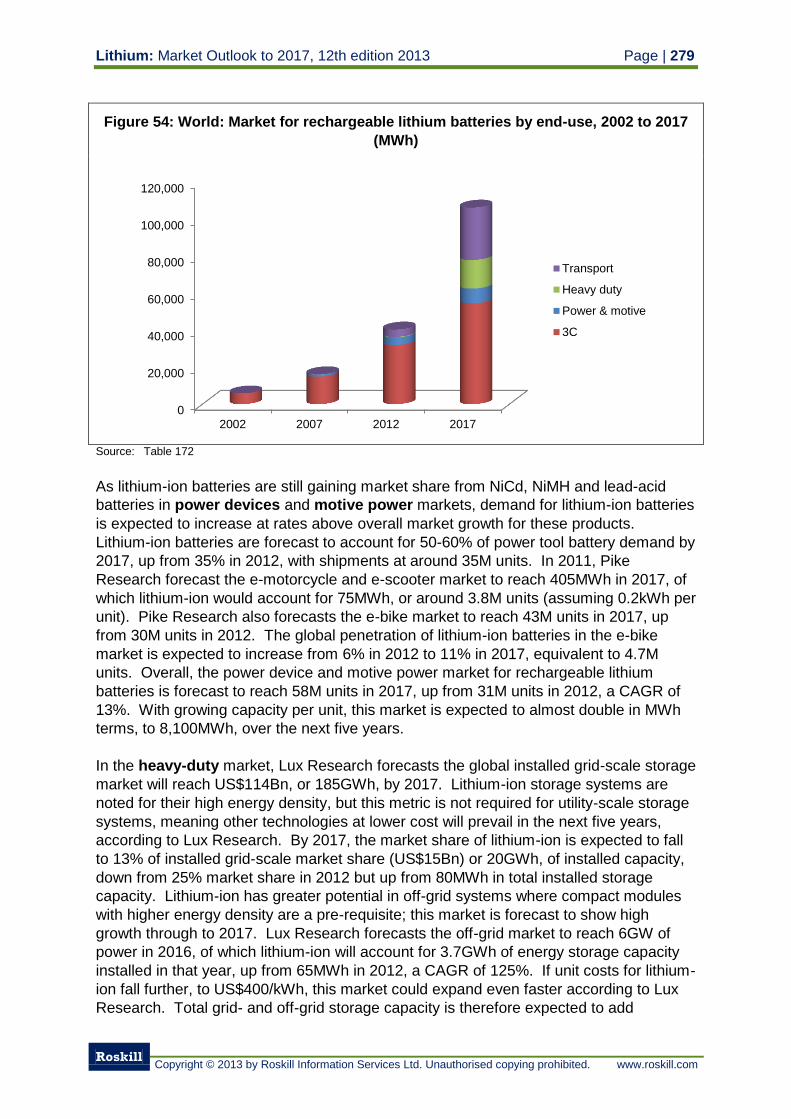
Lithium: Market Outlook to 2017, 12th edition 2013 Page | 279
Roskill
Copyright © 2013 by Roskill Information Services Ltd. Unauthorised copying prohibited. www.roskill.com
Figure 54: World: Market for rechargeable lithium batteries by end-use, 2002 to 2017
(MWh)
Source: Table 172
As lithium-ion batteries are still gaining market share from NiCd, NiMH and lead-acid
batteries in power devices and motive power markets, demand for lithium-ion batteries
is expected to increase at rates above overall market growth for these products.
Lithium-ion batteries are forecast to account for 50-60% of power tool battery demand by
2017, up from 35% in 2012, with shipments at around 35M units. In 2011, Pike
Research forecast the e-motorcycle and e-scooter market to reach 405MWh in 2017, of
which lithium-ion would account for 75MWh, or around 3.8M units (assuming 0.2kWh per
unit). Pike Research also forecasts the e-bike market to reach 43M units in 2017, up
from 30M units in 2012. The global penetration of lithium-ion batteries in the e-bike
market is expected to increase from 6% in 2012 to 11% in 2017, equivalent to 4.7M
units. Overall, the power device and motive power market for rechargeable lithium
batteries is forecast to reach 58M units in 2017, up from 31M units in 2012, a CAGR of
13%. With growing capacity per unit, this market is expected to almost double in MWh
terms, to 8,100MWh, over the next five years.
In the heavy-duty market, Lux Research forecasts the global installed grid-scale storage
market will reach US$114Bn, or 185GWh, by 2017. Lithium-ion storage systems are
noted for their high energy density, but this metric is not required for utility-scale storage
systems, meaning other technologies at lower cost will prevail in the next five years,
according to Lux Research. By 2017, the market share of lithium-ion is expected to fall
to 13% of installed grid-scale market share (US$15Bn) or 20GWh, of installed capacity,
down from 25% market share in 2012 but up from 80MWh in total installed storage
capacity. Lithium-ion has greater potential in off-grid systems where compact modules
with higher energy density are a pre-requisite; this market is forecast to show high
growth through to 2017. Lux Research forecasts the off-grid market to reach 6GW of
power in 2016, of which lithium-ion will account for 3.7GWh of energy storage capacity
installed in that year, up from 65MWh in 2012, a CAGR of 125%. If unit costs for lithium-
ion fall further, to US$400/kWh, this market could expand even faster according to Lux
Research. Total grid- and off-grid storage capacity is therefore expected to add
0
20,000
40,000
60,000
80,000
100,000
120,000
2002 2007 2012 2017
Transport
Heavy duty
Power & motive
3C
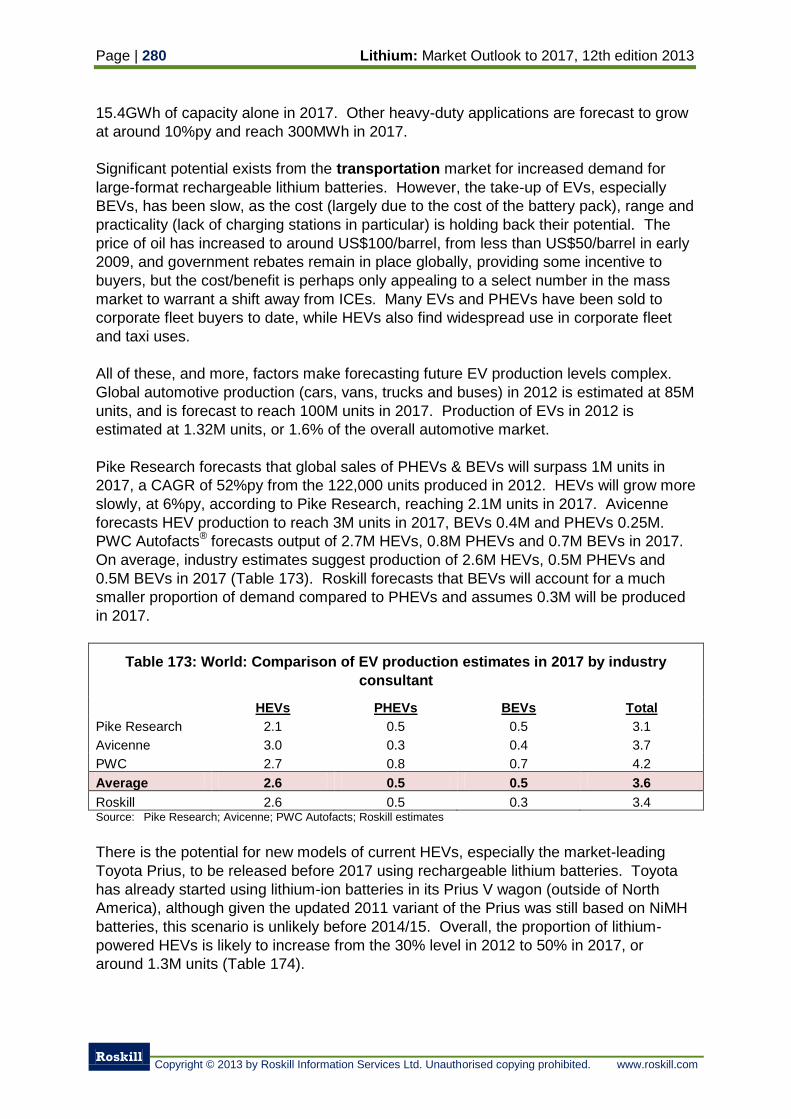
Page | 280 Lithium: Market Outlook to 2017, 12th edition 2013
Roskill
Copyright © 2013 by Roskill Information Services Ltd. Unauthorised copying prohibited. www.roskill.com
15.4GWh of capacity alone in 2017. Other heavy-duty applications are forecast to grow
at around 10%py and reach 300MWh in 2017.
Significant potential exists from the transportation market for increased demand for
large-format rechargeable lithium batteries. However, the take-up of EVs, especially
BEVs, has been slow, as the cost (largely due to the cost of the battery pack), range and
practicality (lack of charging stations in particular) is holding back their potential. The
price of oil has increased to around US$100/barrel, from less than US$50/barrel in early
2009, and government rebates remain in place globally, providing some incentive to
buyers, but the cost/benefit is perhaps only appealing to a select number in the mass
market to warrant a shift away from ICEs. Many EVs and PHEVs have been sold to
corporate fleet buyers to date, while HEVs also find widespread use in corporate fleet
and taxi uses.
All of these, and more, factors make forecasting future EV production levels complex.
Global automotive production (cars, vans, trucks and buses) in 2012 is estimated at 85M
units, and is forecast to reach 100M units in 2017. Production of EVs in 2012 is
estimated at 1.32M units, or 1.6% of the overall automotive market.
Pike Research forecasts that global sales of PHEVs & BEVs will surpass 1M units in
2017, a CAGR of 52%py from the 122,000 units produced in 2012. HEVs will grow more
slowly, at 6%py, according to Pike Research, reaching 2.1M units in 2017. Avicenne
forecasts HEV production to reach 3M units in 2017, BEVs 0.4M and PHEVs 0.25M.
PWC Autofacts® forecasts output of 2.7M HEVs, 0.8M PHEVs and 0.7M BEVs in 2017.
On average, industry estimates suggest production of 2.6M HEVs, 0.5M PHEVs and
0.5M BEVs in 2017 (Table 173). Roskill forecasts that BEVs will account for a much
smaller proportion of demand compared to PHEVs and assumes 0.3M will be produced
in 2017.
Table 173: World: Comparison of EV production estimates in 2017 by industry
consultant
HEVs PHEVs BEVs Total
Pike Research 2.1 0.5 0.5 3.1
Avicenne 3.0 0.3 0.4 3.7
PWC
2.7 0.8 0.7 4.2
Average 2.6 0.5 0.5 3.6
Roskill 2.6 0.5 0.3 3.4 Source: Pike Research; Avicenne; PWC Autofacts; Roskill estimates
There is the potential for new models of current HEVs, especially the market-leading
Toyota Prius, to be released before 2017 using rechargeable lithium batteries. Toyota
has already started using lithium-ion batteries in its Prius V wagon (outside of North
America), although given the updated 2011 variant of the Prius was still based on NiMH
batteries, this scenario is unlikely before 2014/15. Overall, the proportion of lithium-
powered HEVs is likely to increase from the 30% level in 2012 to 50% in 2017, or
around 1.3M units (Table 174).
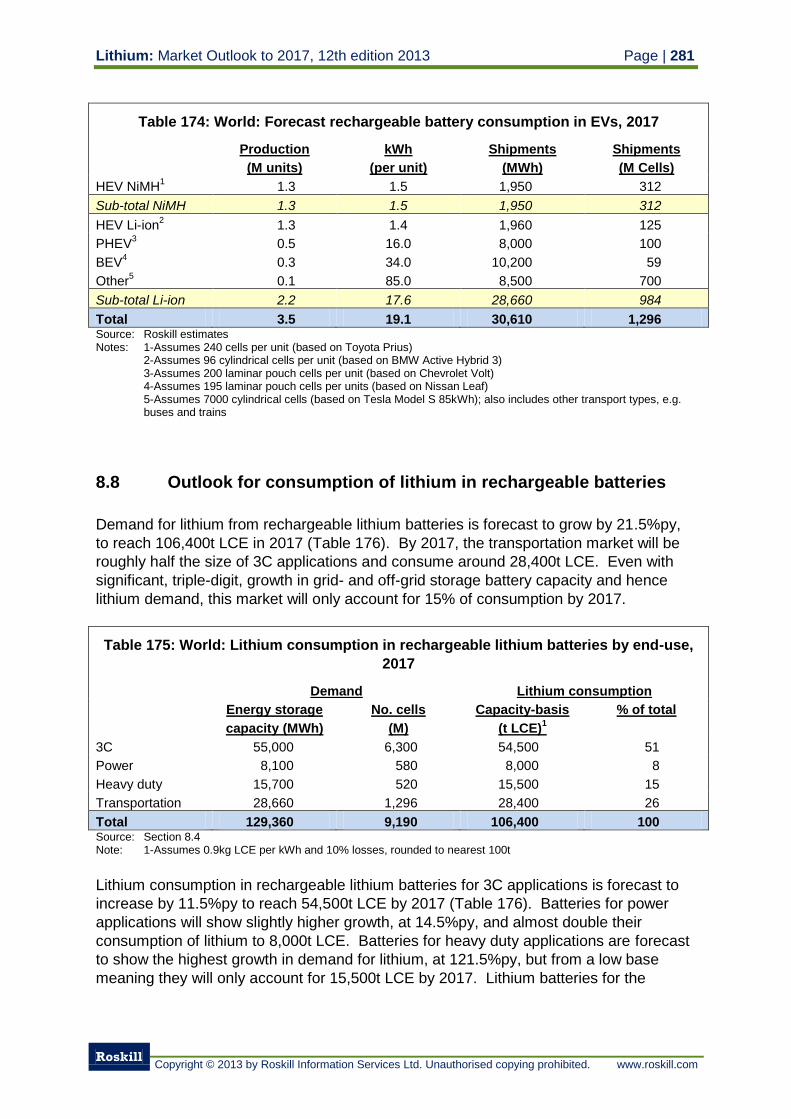
Lithium: Market Outlook to 2017, 12th edition 2013 Page | 281
Roskill
Copyright © 2013 by Roskill Information Services Ltd. Unauthorised copying prohibited. www.roskill.com
Table 174: World: Forecast rechargeable battery consumption in EVs, 2017
Production
(M units)
kWh
(per unit)
Shipments
(MWh)
Shipments
(M Cells)
HEV NiMH1
1.3 1.5 1,950 312
Sub-total NiMH 1.3 1.5 1,950 312
HEV Li-ion2 1.3 1.4 1,960 125
PHEV3
0.5 16.0 8,000 100
BEV4
0.3 34.0 10,200 59
Other5
0.1 85.0 8,500 700
Sub-total Li-ion 2.2 17.6 28,660 984
Total 3.5 19.1 30,610 1,296 Source: Roskill estimates Notes: 1-Assumes 240 cells per unit (based on Toyota Prius)
2-Assumes 96 cylindrical cells per unit (based on BMW Active Hybrid 3) 3-Assumes 200 laminar pouch cells per unit (based on Chevrolet Volt) 4-Assumes 195 laminar pouch cells per units (based on Nissan Leaf) 5-Assumes 7000 cylindrical cells (based on Tesla Model S 85kWh); also includes other transport types, e.g. buses and trains
8.8 Outlook for consumption of lithium in rechargeable batteries
Demand for lithium from rechargeable lithium batteries is forecast to grow by 21.5%py,
to reach 106,400t LCE in 2017 (Table 176). By 2017, the transportation market will be
roughly half the size of 3C applications and consume around 28,400t LCE. Even with
significant, triple-digit, growth in grid- and off-grid storage battery capacity and hence
lithium demand, this market will only account for 15% of consumption by 2017.
Table 175: World: Lithium consumption in rechargeable lithium batteries by end-use,
2017
Demand Lithium consumption
Energy storage
capacity (MWh)
No. cells
(M)
Capacity-basis
(t LCE)1
% of total
3C 55,000 6,300 54,500 51
Power 8,100 580 8,000 8
Heavy duty 15,700 520 15,500 15
Transportation 28,660 1,296 28,400 26
Total 129,360 9,190 106,400 100 Source: Section 8.4 Note: 1-Assumes 0.9kg LCE per kWh and 10% losses, rounded to nearest 100t
Lithium consumption in rechargeable lithium batteries for 3C applications is forecast to
increase by 11.5%py to reach 54,500t LCE by 2017 (Table 176). Batteries for power
applications will show slightly higher growth, at 14.5%py, and almost double their
consumption of lithium to 8,000t LCE. Batteries for heavy duty applications are forecast
to show the highest growth in demand for lithium, at 121.5%py, but from a low base
meaning they will only account for 15,500t LCE by 2017. Lithium batteries for the
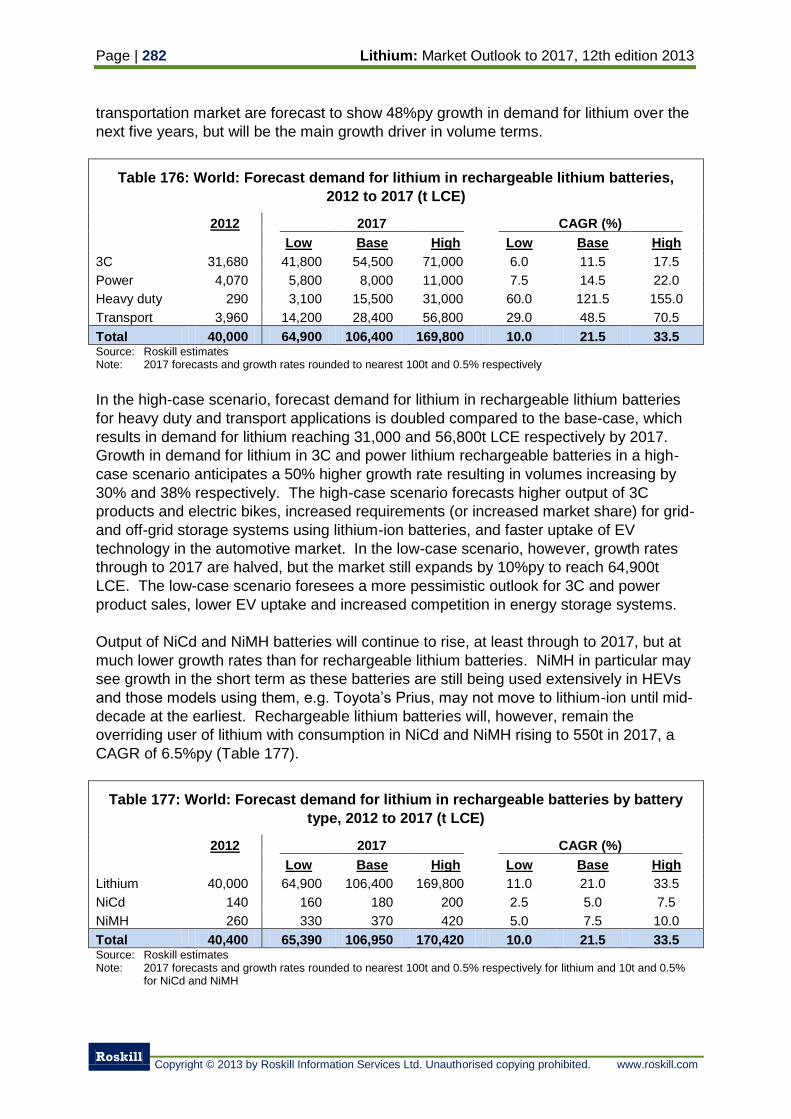
Page | 282 Lithium: Market Outlook to 2017, 12th edition 2013
Roskill
Copyright © 2013 by Roskill Information Services Ltd. Unauthorised copying prohibited. www.roskill.com
transportation market are forecast to show 48%py growth in demand for lithium over the
next five years, but will be the main growth driver in volume terms.
Table 176: World: Forecast demand for lithium in rechargeable lithium batteries,
2012 to 2017 (t LCE)
2012 2017 CAGR (%)
Low Base High Low Base High
3C 31,680 41,800 54,500 71,000 6.0 11.5 17.5
Power 4,070 5,800 8,000 11,000 7.5 14.5 22.0
Heavy duty 290 3,100 15,500 31,000 60.0 121.5 155.0
Transport 3,960 14,200 28,400 56,800 29.0 48.5 70.5
Total 40,000 64,900 106,400 169,800 10.0 21.5 33.5 Source: Roskill estimates Note: 2017 forecasts and growth rates rounded to nearest 100t and 0.5% respectively
In the high-case scenario, forecast demand for lithium in rechargeable lithium batteries
for heavy duty and transport applications is doubled compared to the base-case, which
results in demand for lithium reaching 31,000 and 56,800t LCE respectively by 2017.
Growth in demand for lithium in 3C and power lithium rechargeable batteries in a high-
case scenario anticipates a 50% higher growth rate resulting in volumes increasing by
30% and 38% respectively. The high-case scenario forecasts higher output of 3C
products and electric bikes, increased requirements (or increased market share) for grid-
and off-grid storage systems using lithium-ion batteries, and faster uptake of EV
technology in the automotive market. In the low-case scenario, however, growth rates
through to 2017 are halved, but the market still expands by 10%py to reach 64,900t
LCE. The low-case scenario foresees a more pessimistic outlook for 3C and power
product sales, lower EV uptake and increased competition in energy storage systems.
Output of NiCd and NiMH batteries will continue to rise, at least through to 2017, but at
much lower growth rates than for rechargeable lithium batteries. NiMH in particular may
see growth in the short term as these batteries are still being used extensively in HEVs
and those models using them, e.g. Toyota’s Prius, may not move to lithium-ion until mid-
decade at the earliest. Rechargeable lithium batteries will, however, remain the
overriding user of lithium with consumption in NiCd and NiMH rising to 550t in 2017, a
CAGR of 6.5%py (Table 177).
Table 177: World: Forecast demand for lithium in rechargeable batteries by battery
type, 2012 to 2017 (t LCE)
2012 2017 CAGR (%)
Low Base High Low Base High
Lithium 40,000 64,900 106,400 169,800 11.0 21.0 33.5
NiCd 140 160 180 200 2.5 5.0 7.5
NiMH 260 330 370 420 5.0 7.5 10.0
Total 40,400 65,390 106,950 170,420 10.0 21.5 33.5 Source: Roskill estimates Note: 2017 forecasts and growth rates rounded to nearest 100t and 0.5% respectively for lithium and 10t and 0.5%
for NiCd and NiMH
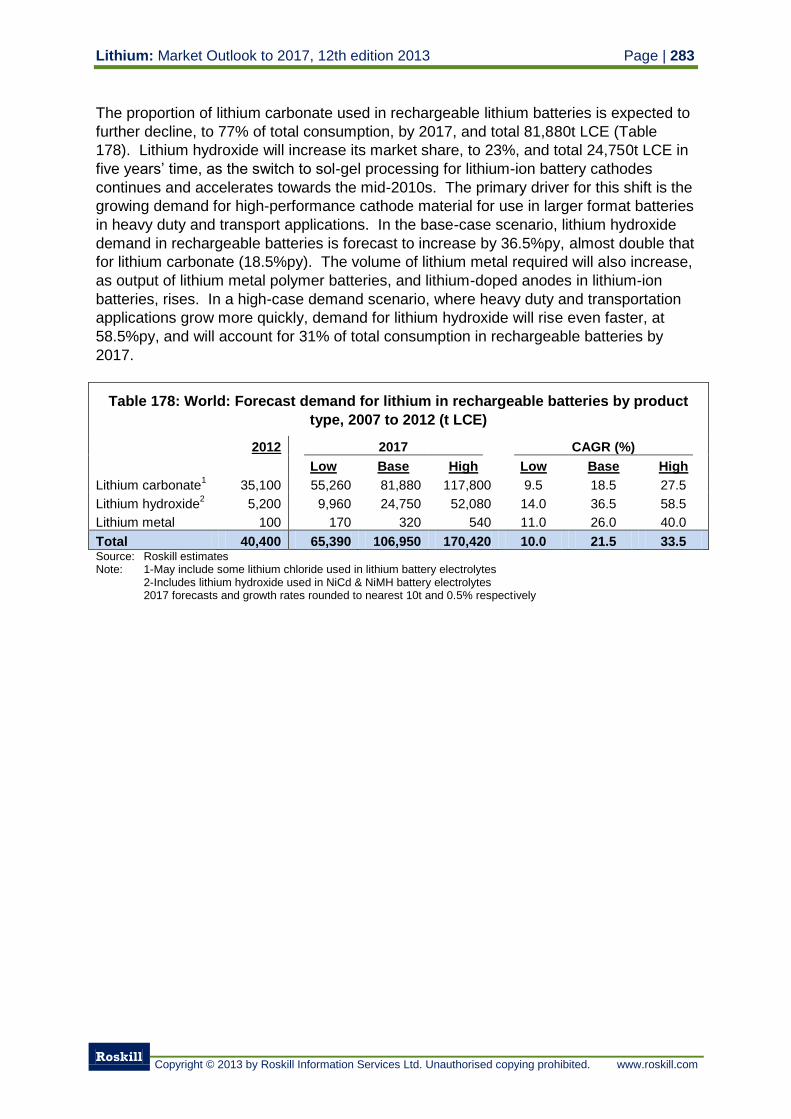
Lithium: Market Outlook to 2017, 12th edition 2013 Page | 283
Roskill
Copyright © 2013 by Roskill Information Services Ltd. Unauthorised copying prohibited. www.roskill.com
The proportion of lithium carbonate used in rechargeable lithium batteries is expected to
further decline, to 77% of total consumption, by 2017, and total 81,880t LCE (Table
178). Lithium hydroxide will increase its market share, to 23%, and total 24,750t LCE in
five years’ time, as the switch to sol-gel processing for lithium-ion battery cathodes
continues and accelerates towards the mid-2010s. The primary driver for this shift is the
growing demand for high-performance cathode material for use in larger format batteries
in heavy duty and transport applications. In the base-case scenario, lithium hydroxide
demand in rechargeable batteries is forecast to increase by 36.5%py, almost double that
for lithium carbonate (18.5%py). The volume of lithium metal required will also increase,
as output of lithium metal polymer batteries, and lithium-doped anodes in lithium-ion
batteries, rises. In a high-case demand scenario, where heavy duty and transportation
applications grow more quickly, demand for lithium hydroxide will rise even faster, at
58.5%py, and will account for 31% of total consumption in rechargeable batteries by
2017.
Table 178: World: Forecast demand for lithium in rechargeable batteries by product
type, 2007 to 2012 (t LCE)
2012 2017 CAGR (%)
Low Base High Low Base High
Lithium carbonate1
35,100 55,260 81,880 117,800 9.5 18.5 27.5
Lithium hydroxide2
5,200 9,960 24,750 52,080 14.0 36.5 58.5
Lithium metal 100 170 320 540 11.0 26.0 40.0
Total 40,400 65,390 106,950 170,420 10.0 21.5 33.5 Source: Roskill estimates Note: 1-May include some lithium chloride used in lithium battery electrolytes
2-Includes lithium hydroxide used in NiCd & NiMH battery electrolytes 2017 forecasts and growth rates rounded to nearest 10t and 0.5% respectively
Page | 284 Lithium: Market Outlook to 2017, 12th edition 2013
Roskill
Copyright © 2013 by Roskill Information Services Ltd. Unauthorised copying prohibited. www.roskill.com
9. Use of lithium in ceramics
Ceramics provide the second largest market for lithium, when consumption of both
lithium carbonate and lithium minerals is combined. This market is estimated to have
consumed around 23,100t LCE in 2012, 15% of total consumption.
Lithium carbonate is mostly used as a flux in the manufacture of ceramic glazes, used to
coat ceramic bodies, and porcelain enamels, used to coat white goods. Spodumene
can also be used in glazes but its main use, along with other lithium minerals, notably
lepidolite, amblygonite and petalite, is as a flux in the production of ceramic tile,
sanitaryware, tableware and ovenware/cookware bodies.
9.1 Use of lithium in ceramics
Lithium provides advantages in the production of ceramic bodies and glazes, and
porcelain enamels.
In ceramic bodies, lithium offers the following advantages:
lowers firing temperatures (reducing energy demand & extending refractory life)
shortens firing cycle times (leading to higher output)
lowers thermal expansion (imparting thermal shock resistance)
lowers shrinkage in whitewares (reducing reject rates)
promotes formation of glassy phase (vitrification)
increases (with nepheline syenite) or decreases (with feldspar) density
increases mechanical strength
In ceramic glazes and porcelain enamels, lithium offers the following advantages:
improves colour, lustre and resistivity
reduces viscosity (enhancing flowability and surface smoothness)
can replace lead oxide, zinc oxide and barium carbonate additions
lithia-strontia glazes increase hardness and chemical resistance
Table 179 shows typical compositions of various types of whiteware bodies. The
quantity of flux used may vary from 15% to as much as 45% in the case of porcelain tiles
(grès porcellanato).
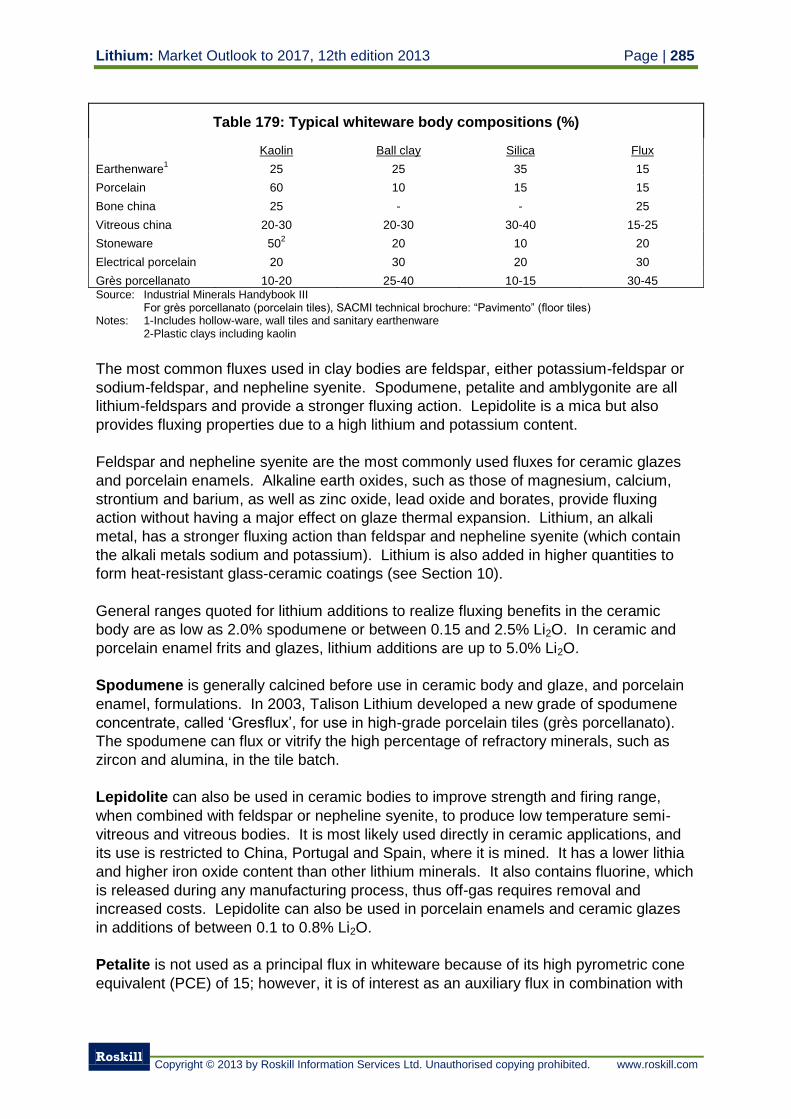
Lithium: Market Outlook to 2017, 12th edition 2013 Page | 285
Roskill
Copyright © 2013 by Roskill Information Services Ltd. Unauthorised copying prohibited. www.roskill.com
Table 179: Typical whiteware body compositions (%)
Kaolin Ball clay Silica Flux
Earthenware1
25 25 35 15
Porcelain 60 10 15 15
Bone china 25 - - 25
Vitreous china 20-30 20-30 30-40 15-25
Stoneware 502
20 10 20
Electrical porcelain 20 30 20 30
Grès porcellanato 10-20 25-40 10-15 30-45 Source: Industrial Minerals Handybook III
For grès porcellanato (porcelain tiles), SACMI technical brochure: “Pavimento” (floor tiles) Notes: 1-Includes hollow-ware, wall tiles and sanitary earthenware
2-Plastic clays including kaolin
The most common fluxes used in clay bodies are feldspar, either potassium-feldspar or
sodium-feldspar, and nepheline syenite. Spodumene, petalite and amblygonite are all
lithium-feldspars and provide a stronger fluxing action. Lepidolite is a mica but also
provides fluxing properties due to a high lithium and potassium content.
Feldspar and nepheline syenite are the most commonly used fluxes for ceramic glazes
and porcelain enamels. Alkaline earth oxides, such as those of magnesium, calcium,
strontium and barium, as well as zinc oxide, lead oxide and borates, provide fluxing
action without having a major effect on glaze thermal expansion. Lithium, an alkali
metal, has a stronger fluxing action than feldspar and nepheline syenite (which contain
the alkali metals sodium and potassium). Lithium is also added in higher quantities to
form heat-resistant glass-ceramic coatings (see Section 10).
General ranges quoted for lithium additions to realize fluxing benefits in the ceramic
body are as low as 2.0% spodumene or between 0.15 and 2.5% Li2O. In ceramic and
porcelain enamel frits and glazes, lithium additions are up to 5.0% Li2O.
Spodumene is generally calcined before use in ceramic body and glaze, and porcelain
enamel, formulations. In 2003, Talison Lithium developed a new grade of spodumene
concentrate, called ‘Gresflux’, for use in high-grade porcelain tiles (grès porcellanato).
The spodumene can flux or vitrify the high percentage of refractory minerals, such as
zircon and alumina, in the tile batch.
Lepidolite can also be used in ceramic bodies to improve strength and firing range,
when combined with feldspar or nepheline syenite, to produce low temperature semi-
vitreous and vitreous bodies. It is most likely used directly in ceramic applications, and
its use is restricted to China, Portugal and Spain, where it is mined. It has a lower lithia
and higher iron oxide content than other lithium minerals. It also contains fluorine, which
is released during any manufacturing process, thus off-gas requires removal and
increased costs. Lepidolite can also be used in porcelain enamels and ceramic glazes
in additions of between 0.1 to 0.8% Li2O.
Petalite is not used as a principal flux in whiteware because of its high pyrometric cone
equivalent (PCE) of 15; however, it is of interest as an auxiliary flux in combination with
Page | 286 Lithium: Market Outlook to 2017, 12th edition 2013
Roskill
Copyright © 2013 by Roskill Information Services Ltd. Unauthorised copying prohibited. www.roskill.com
feldspar and nepheline syenite. It can be added to porcelain enamels as a source of
alumina and lithium, or in up to 45% concentrations to semi-fritted tableware glazes.
Amblygonite is the least expensive source of alumia-phosphate and it has high lithia
content. As an active flux, it has been used in low-temperature bodies and porcelain
enamels. However, like lepidolite, is not a preferred form of lithia as it contains fluorine.
Production of amblygonite for industrial use is rare, having been produced only in small
quantities in Argentina, Namibia and Zimbabwe in the past.
Lithium carbonate is added to porcelain enamel batches to lower the melting point and
produce a more even, smoother surface with increased gloss. In tableware, lithium
carbonate is used in leadless glazes and frits. It is often used in higher quantities in
vitroceramic glazes to impart heat resistance. Lithium carbonate is rarely used as a flux
in ceramic bodies due to cost.
Lithium borates are used to introduce both boron and lithium to fluxes and glazes.
Lithium borosilicate glass is used in high-temperature, corrosion-resistant coatings and
in combination with lithium fluoride in coating compositions. Lithium fluoride on its
own can be added to porcelain enamels and glazes as a flux and minor opacifier.
Lithium citrate is used as a curing agent in speciality ceramics and lithium sulphate is
used occasionally in fluxes and glazes. Lithium manganate is often added to porcelain
enamel ground coats because of its strong fluxing power. The addition of 0.5 to 1.0%
lithium manganate results in a 30 to 70°C decrease in firing temperature.
Avalon Rare Metals (see Section 5.8.4.3) has developed petalite and high-lithium
feldspar (HLF) products for potential production from its Big Whopper Pegmatite in
Ontario, Canada. The HLF product is a blend of petalite, sodium feldspar, potassium
feldspar, mica and quartz.
9.2 Production and consumption of ceramics
The ceramics industry is divided into a number of sectors, notably “traditional ceramics”
(or “whiteware”) which tend to be high-volume, low value products, and “advanced
ceramics”, which are low-volume, high value products.
Whiteware production is divided between floor and wall tiles (output estimated at 90Mt in
2011), sanitaryware (6Mt), tableware (1.4Mt) and others (including cookware and
bakeware, <1Mt). In terms of value however, the proportion is more evenly split with
floor and wall tiles accounting for ~US$25Bn of sales, sanitaryware US$20Bn, tableware
US$10Bn and other applications US$5Bn.
“White goods” refers to household and commercial kitchen and laundry goods such as
refrigerators, ovens and dishwashers. White goods derive their name from the original
white enamel paint finish of products, despite availability now in other colours. Statistics
on the production and consumption of glazes and porcelain enamels are not reported.
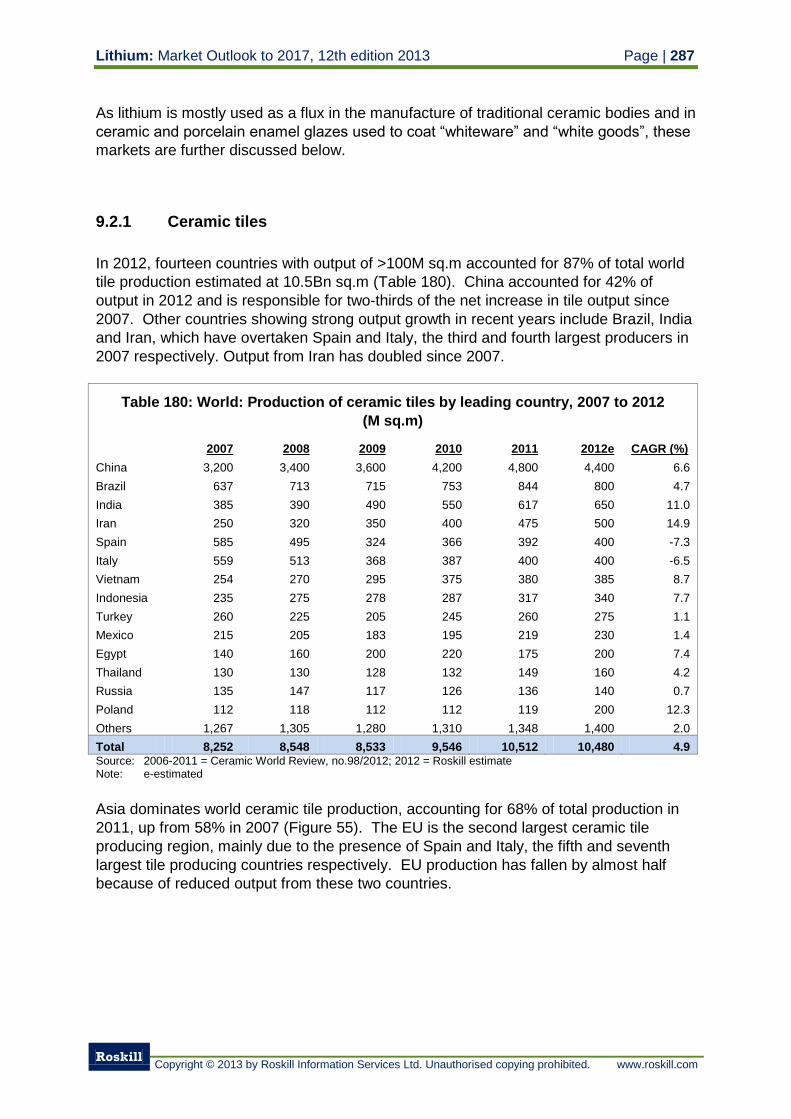
Lithium: Market Outlook to 2017, 12th edition 2013 Page | 287
Roskill
Copyright © 2013 by Roskill Information Services Ltd. Unauthorised copying prohibited. www.roskill.com
As lithium is mostly used as a flux in the manufacture of traditional ceramic bodies and in
ceramic and porcelain enamel glazes used to coat “whiteware” and “white goods”, these
markets are further discussed below.
9.2.1 Ceramic tiles
In 2012, fourteen countries with output of >100M sq.m accounted for 87% of total world
tile production estimated at 10.5Bn sq.m (Table 180). China accounted for 42% of
output in 2012 and is responsible for two-thirds of the net increase in tile output since
2007. Other countries showing strong output growth in recent years include Brazil, India
and Iran, which have overtaken Spain and Italy, the third and fourth largest producers in
2007 respectively. Output from Iran has doubled since 2007.
Table 180: World: Production of ceramic tiles by leading country, 2007 to 2012
(M sq.m)
2007 2008 2009 2010 2011
2012e
CAGR (%)
China 3,200 3,400 3,600 4,200 4,800 4,400 6.6
Brazil 637 713 715 753 844 800 4.7
India 385 390 490 550 617 650 11.0
Iran 250 320 350 400 475 500 14.9
Spain 585 495 324 366 392 400 -7.3
Italy 559 513 368 387 400 400 -6.5
Vietnam 254 270 295 375 380 385 8.7
Indonesia 235 275 278 287 317 340 7.7
Turkey 260 225 205 245 260 275 1.1
Mexico 215 205 183 195 219 230 1.4
Egypt 140 160 200 220 175 200 7.4
Thailand 130 130 128 132 149 160 4.2
Russia 135 147 117 126 136 140 0.7
Poland 112 118 112 112 119 200 12.3
Others 1,267 1,305 1,280 1,310 1,348 1,400 2.0
Total 8,252 8,548 8,533 9,546 10,512 10,480 4.9 Source: 2006-2011 = Ceramic World Review, no.98/2012; 2012 = Roskill estimate Note: e-estimated
Asia dominates world ceramic tile production, accounting for 68% of total production in
2011, up from 58% in 2007 (Figure 55). The EU is the second largest ceramic tile
producing region, mainly due to the presence of Spain and Italy, the fifth and seventh
largest tile producing countries respectively. EU production has fallen by almost half
because of reduced output from these two countries.
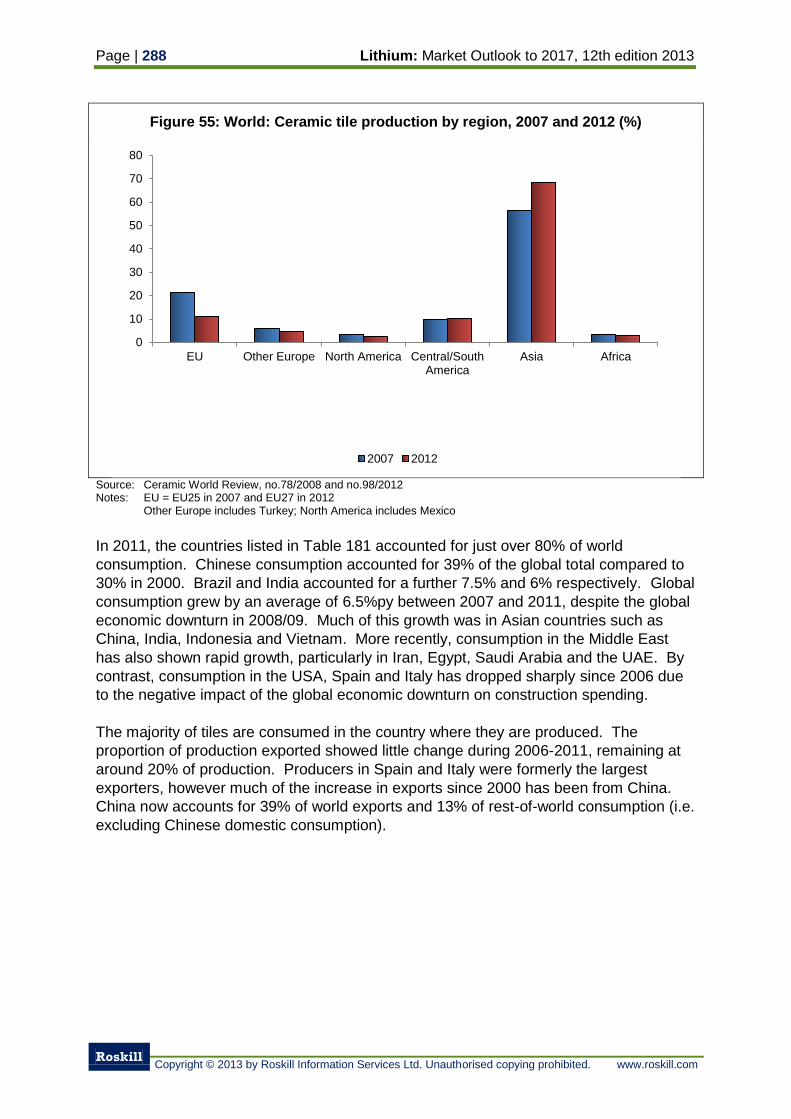
Page | 288 Lithium: Market Outlook to 2017, 12th edition 2013
Roskill
Copyright © 2013 by Roskill Information Services Ltd. Unauthorised copying prohibited. www.roskill.com
Figure 55: World: Ceramic tile production by region, 2007 and 2012 (%)
Source: Ceramic World Review, no.78/2008 and no.98/2012 Notes: EU = EU25 in 2007 and EU27 in 2012 Other Europe includes Turkey; North America includes Mexico
In 2011, the countries listed in Table 181 accounted for just over 80% of world
consumption. Chinese consumption accounted for 39% of the global total compared to
30% in 2000. Brazil and India accounted for a further 7.5% and 6% respectively. Global
consumption grew by an average of 6.5%py between 2007 and 2011, despite the global
economic downturn in 2008/09. Much of this growth was in Asian countries such as
China, India, Indonesia and Vietnam. More recently, consumption in the Middle East
has also shown rapid growth, particularly in Iran, Egypt, Saudi Arabia and the UAE. By
contrast, consumption in the USA, Spain and Italy has dropped sharply since 2006 due
to the negative impact of the global economic downturn on construction spending.
The majority of tiles are consumed in the country where they are produced. The
proportion of production exported showed little change during 2006-2011, remaining at
around 20% of production. Producers in Spain and Italy were formerly the largest
exporters, however much of the increase in exports since 2000 has been from China.
China now accounts for 39% of world exports and 13% of rest-of-world consumption (i.e.
excluding Chinese domestic consumption).
0
10
20
30
40
50
60
70
80
EU Other Europe North America Central/SouthAmerica
Asia Africa
2007 2012
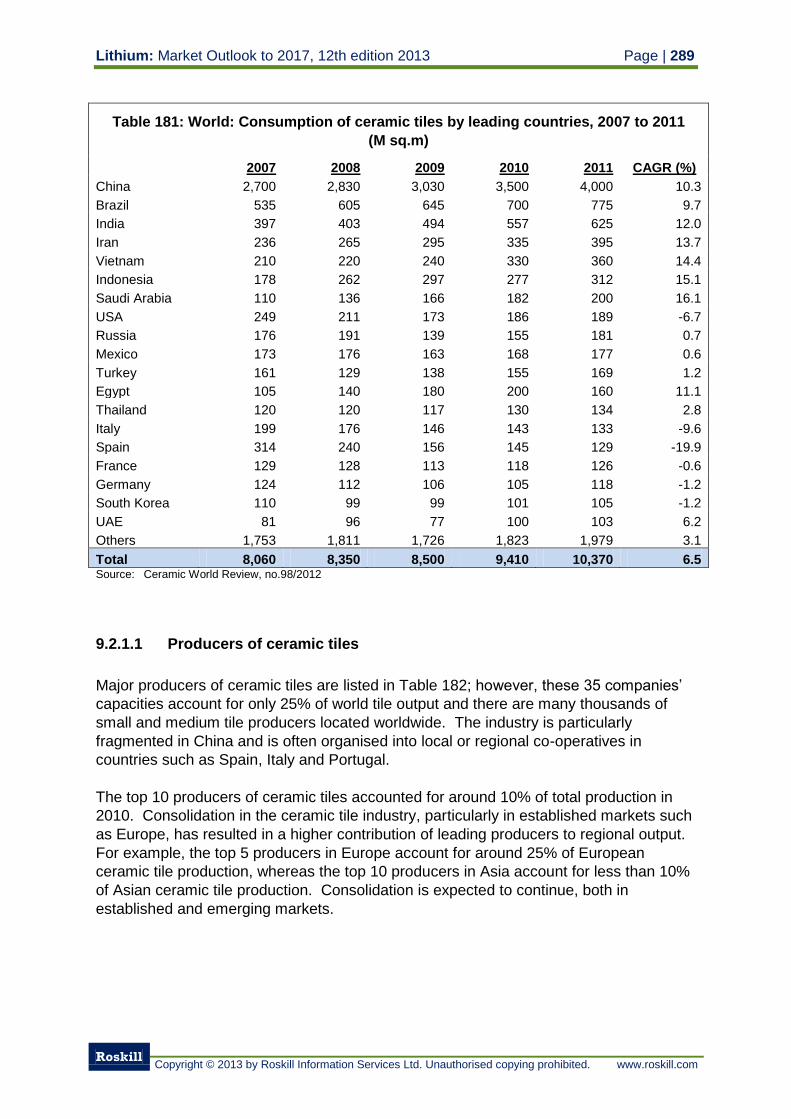
Lithium: Market Outlook to 2017, 12th edition 2013 Page | 289
Roskill
Copyright © 2013 by Roskill Information Services Ltd. Unauthorised copying prohibited. www.roskill.com
Table 181: World: Consumption of ceramic tiles by leading countries, 2007 to 2011
(M sq.m)
2007 2008 2009 2010 2011 CAGR (%)
China 2,700 2,830 3,030 3,500 4,000 10.3
Brazil 535 605 645 700 775 9.7
India 397 403 494 557 625 12.0
Iran 236 265 295 335 395 13.7
Vietnam 210 220 240 330 360 14.4
Indonesia 178 262 297 277 312 15.1
Saudi Arabia 110 136 166 182 200 16.1
USA 249 211 173 186 189 -6.7
Russia 176 191 139 155 181 0.7
Mexico 173 176 163 168 177 0.6
Turkey 161 129 138 155 169 1.2
Egypt 105 140 180 200 160 11.1
Thailand 120 120 117 130 134 2.8
Italy 199 176 146 143 133 -9.6
Spain 314 240 156 145 129 -19.9
France 129 128 113 118 126 -0.6
Germany 124 112 106 105 118 -1.2
South Korea 110 99 99 101 105 -1.2
UAE 81 96 77 100 103 6.2
Others 1,753 1,811 1,726 1,823 1,979 3.1
Total 8,060 8,350 8,500 9,410 10,370 6.5 Source: Ceramic World Review, no.98/2012
9.2.1.1 Producers of ceramic tiles
Major producers of ceramic tiles are listed in Table 182; however, these 35 companies’
capacities account for only 25% of world tile output and there are many thousands of
small and medium tile producers located worldwide. The industry is particularly
fragmented in China and is often organised into local or regional co-operatives in
countries such as Spain, Italy and Portugal.
The top 10 producers of ceramic tiles accounted for around 10% of total production in
2010. Consolidation in the ceramic tile industry, particularly in established markets such
as Europe, has resulted in a higher contribution of leading producers to regional output.
For example, the top 5 producers in Europe account for around 25% of European
ceramic tile production, whereas the top 10 producers in Asia account for less than 10%
of Asian ceramic tile production. Consolidation is expected to continue, both in
established and emerging markets.
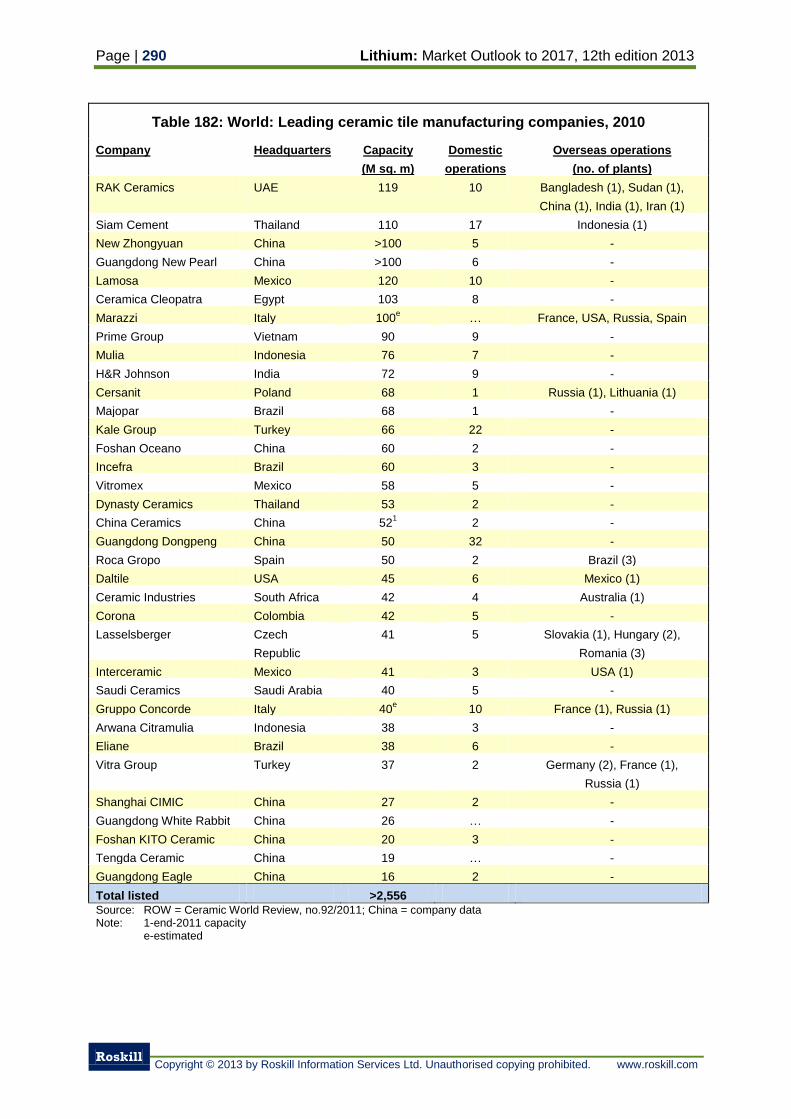
Page | 290 Lithium: Market Outlook to 2017, 12th edition 2013
Roskill
Copyright © 2013 by Roskill Information Services Ltd. Unauthorised copying prohibited. www.roskill.com
Table 182: World: Leading ceramic tile manufacturing companies, 2010
Company Headquarters Capacity
(M sq. m)
Domestic
operations
Overseas operations
(no. of plants)
RAK Ceramics UAE 119 10 Bangladesh (1), Sudan (1),
China (1), India (1), Iran (1)
Siam Cement Thailand 110 17 Indonesia (1)
New Zhongyuan China >100 5 -
Guangdong New Pearl China >100 6 -
Lamosa Mexico 120 10 -
Ceramica Cleopatra Egypt 103 8 -
Marazzi Italy 100e … France, USA, Russia, Spain
Prime Group Vietnam 90 9 -
Mulia Indonesia 76 7 -
H&R Johnson India 72 9 -
Cersanit Poland 68 1 Russia (1), Lithuania (1)
Majopar Brazil 68 1 -
Kale Group Turkey 66 22 -
Foshan Oceano China 60 2 -
Incefra Brazil 60 3 -
Vitromex Mexico 58 5 -
Dynasty Ceramics Thailand 53 2 -
China Ceramics China 521
2 -
Guangdong Dongpeng China 50 32 -
Roca Gropo Spain 50 2 Brazil (3)
Daltile USA 45 6 Mexico (1)
Ceramic Industries South Africa 42 4 Australia (1)
Corona Colombia 42 5 -
Lasselsberger Czech
Republic
41 5 Slovakia (1), Hungary (2),
Romania (3)
Interceramic Mexico 41 3 USA (1)
Saudi Ceramics Saudi Arabia 40 5 -
Gruppo Concorde Italy 40e 10 France (1), Russia (1)
Arwana Citramulia Indonesia 38 3 -
Eliane Brazil 38 6 -
Vitra Group Turkey 37 2 Germany (2), France (1),
Russia (1)
Shanghai CIMIC China 27 2 -
Guangdong White Rabbit China 26 … -
Foshan KITO Ceramic China 20 3 -
Tengda Ceramic China 19 … -
Guangdong Eagle China 16 2 -
Total listed >2,556
Source: ROW = Ceramic World Review, no.92/2011; China = company data Note: 1-end-2011 capacity e-estimated
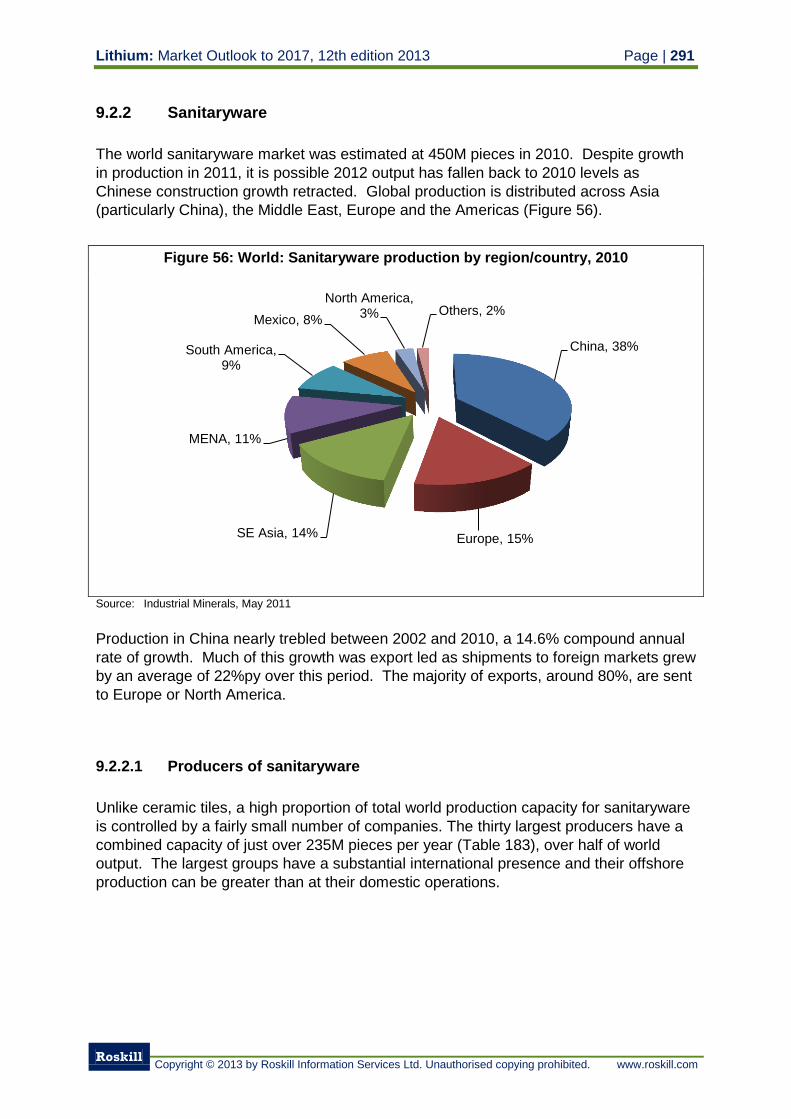
Lithium: Market Outlook to 2017, 12th edition 2013 Page | 291
Roskill
Copyright © 2013 by Roskill Information Services Ltd. Unauthorised copying prohibited. www.roskill.com
9.2.2 Sanitaryware
The world sanitaryware market was estimated at 450M pieces in 2010. Despite growth
in production in 2011, it is possible 2012 output has fallen back to 2010 levels as
Chinese construction growth retracted. Global production is distributed across Asia
(particularly China), the Middle East, Europe and the Americas (Figure 56).
Figure 56: World: Sanitaryware production by region/country, 2010
Source: Industrial Minerals, May 2011
Production in China nearly trebled between 2002 and 2010, a 14.6% compound annual
rate of growth. Much of this growth was export led as shipments to foreign markets grew
by an average of 22%py over this period. The majority of exports, around 80%, are sent
to Europe or North America.
9.2.2.1 Producers of sanitaryware
Unlike ceramic tiles, a high proportion of total world production capacity for sanitaryware
is controlled by a fairly small number of companies. The thirty largest producers have a
combined capacity of just over 235M pieces per year (Table 183), over half of world
output. The largest groups have a substantial international presence and their offshore
production can be greater than at their domestic operations.
China, 38%
Europe, 15% SE Asia, 14%
MENA, 11%
South America, 9%
Mexico, 8%
North America, 3% Others, 2%
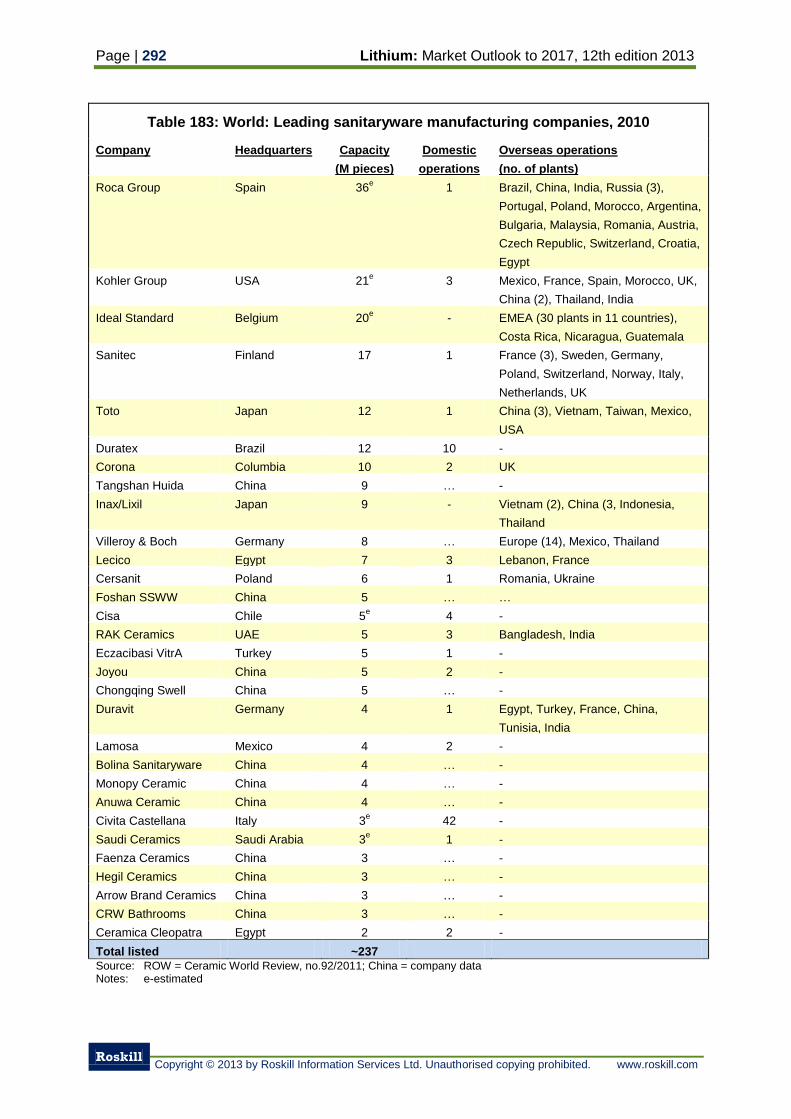
Page | 292 Lithium: Market Outlook to 2017, 12th edition 2013
Roskill
Copyright © 2013 by Roskill Information Services Ltd. Unauthorised copying prohibited. www.roskill.com
Table 183: World: Leading sanitaryware manufacturing companies, 2010
Company Headquarters Capacity
(M pieces)
Domestic
operations
Overseas operations
(no. of plants)
Roca Group Spain 36e 1 Brazil, China, India, Russia (3),
Portugal, Poland, Morocco, Argentina,
Bulgaria, Malaysia, Romania, Austria,
Czech Republic, Switzerland, Croatia,
Egypt
Kohler Group USA 21e 3 Mexico, France, Spain, Morocco, UK,
China (2), Thailand, India
Ideal Standard Belgium 20e
- EMEA (30 plants in 11 countries),
Costa Rica, Nicaragua, Guatemala
Sanitec Finland 17 1 France (3), Sweden, Germany,
Poland, Switzerland, Norway, Italy,
Netherlands, UK
Toto Japan 12 1 China (3), Vietnam, Taiwan, Mexico,
USA
Duratex Brazil 12 10 -
Corona Columbia 10 2 UK
Tangshan Huida China 9 … -
Inax/Lixil Japan 9 - Vietnam (2), China (3, Indonesia,
Thailand
Villeroy & Boch Germany 8 … Europe (14), Mexico, Thailand
Lecico Egypt 7 3 Lebanon, France
Cersanit Poland 6 1 Romania, Ukraine
Foshan SSWW China 5 … …
Cisa Chile 5e 4 -
RAK Ceramics UAE 5 3 Bangladesh, India
Eczacibasi VitrA Turkey 5 1 -
Joyou China 5 2 -
Chongqing Swell China 5 … -
Duravit Germany 4 1 Egypt, Turkey, France, China,
Tunisia, India
Lamosa Mexico 4 2 -
Bolina Sanitaryware China 4 … -
Monopy Ceramic China 4 … -
Anuwa Ceramic China 4 … -
Civita Castellana Italy 3e 42 -
Saudi Ceramics Saudi Arabia 3e 1 -
Faenza Ceramics China 3 … -
Hegil Ceramics China 3 … -
Arrow Brand Ceramics China 3 … -
CRW Bathrooms China 3 … -
Ceramica Cleopatra Egypt 2 2 -
Total listed ~237
Source: ROW = Ceramic World Review, no.92/2011; China = company data Notes: e-estimated
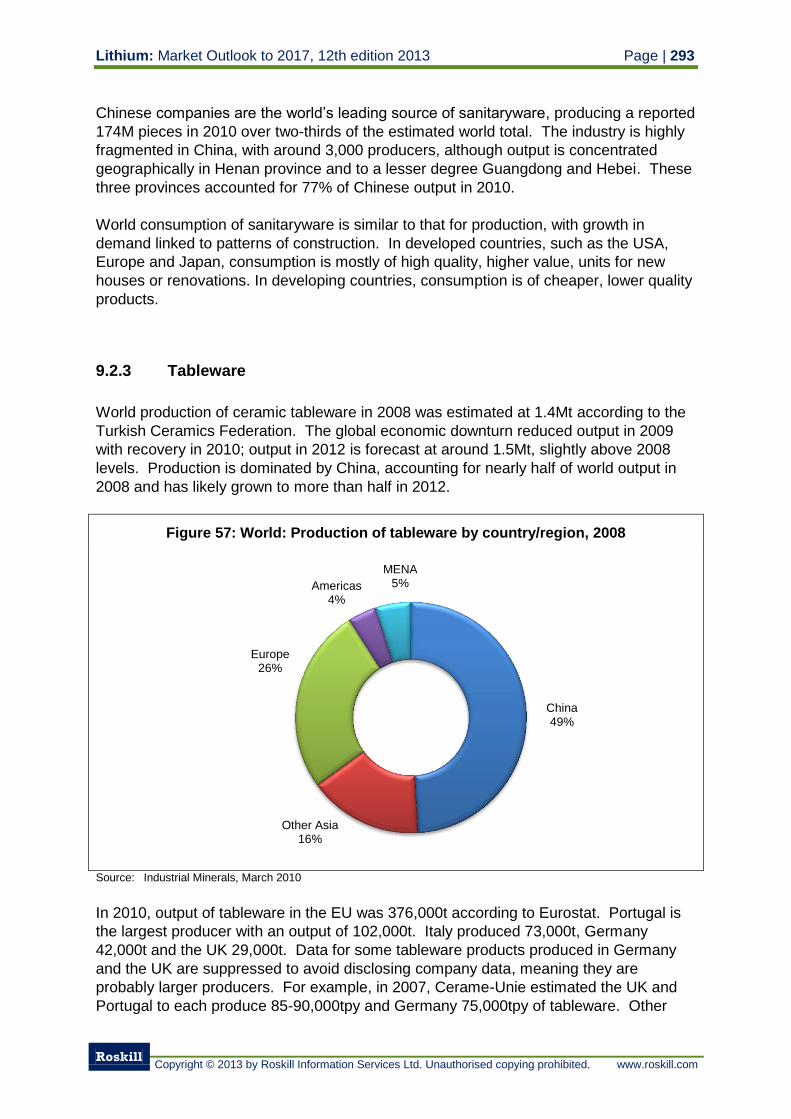
Lithium: Market Outlook to 2017, 12th edition 2013 Page | 293
Roskill
Copyright © 2013 by Roskill Information Services Ltd. Unauthorised copying prohibited. www.roskill.com
Chinese companies are the world’s leading source of sanitaryware, producing a reported
174M pieces in 2010 over two-thirds of the estimated world total. The industry is highly
fragmented in China, with around 3,000 producers, although output is concentrated
geographically in Henan province and to a lesser degree Guangdong and Hebei. These
three provinces accounted for 77% of Chinese output in 2010.
World consumption of sanitaryware is similar to that for production, with growth in
demand linked to patterns of construction. In developed countries, such as the USA,
Europe and Japan, consumption is mostly of high quality, higher value, units for new
houses or renovations. In developing countries, consumption is of cheaper, lower quality
products.
9.2.3 Tableware
World production of ceramic tableware in 2008 was estimated at 1.4Mt according to the
Turkish Ceramics Federation. The global economic downturn reduced output in 2009
with recovery in 2010; output in 2012 is forecast at around 1.5Mt, slightly above 2008
levels. Production is dominated by China, accounting for nearly half of world output in
2008 and has likely grown to more than half in 2012.
Figure 57: World: Production of tableware by country/region, 2008
Source: Industrial Minerals, March 2010
In 2010, output of tableware in the EU was 376,000t according to Eurostat. Portugal is
the largest producer with an output of 102,000t. Italy produced 73,000t, Germany
42,000t and the UK 29,000t. Data for some tableware products produced in Germany
and the UK are suppressed to avoid disclosing company data, meaning they are
probably larger producers. For example, in 2007, Cerame-Unie estimated the UK and
Portugal to each produce 85-90,000tpy and Germany 75,000tpy of tableware. Other
China 49%
Other Asia 16%
Europe 26%
Americas 4%
MENA 5%
Page | 294 Lithium: Market Outlook to 2017, 12th edition 2013
Roskill
Copyright © 2013 by Roskill Information Services Ltd. Unauthorised copying prohibited. www.roskill.com
large producers in the EU are Romania (31,000t in 2010), Poland (26,000t), France
(14,000t), Spain (13,000t) and the Czech Republic (9,000t). The value of EU tableware
output in 2010 was estimated at around €2Bn, up from €1.8Bn in 2006.
Output of tableware in Japan, once a leading producer together with the EU, fell from
304,000t in 1995 to 67,000t in 2010.
Other countries with large tableware industries are Bangladesh, Malaysia, Indonesia,
Iran and Turkey. Iran is a major tableware producer in the Middle East area, with an
output of 135,000t in 2006. Output in 2011 is estimated to be almost double that of
2006.
China’s tableware production growth and exports has impacted tableware production
worldwide. In 2010, Chinese output of household ceramics reached 27.1Bn pieces, up
31% from 20.6Bn in 2009. The major producing provinces are Hunan, Jiangxi, Guangxi,
Shandong and Henan.
9.2.3.1 Producers of tableware
Major multinational producers of tableware with famous brands include Vista Alegre
Atlantis of Portugal, Lladro of Spain, Mikasa of the USA, Noritake and Nurumi of Japan,
Royal Doulton Waterford Wedgwood of the UK and Villeroy & Boch of Germany. The
main producers in each major producing country are identified below:
Bangladesh – RAK Porcelain, Shinepukur Ceramics, Monno Ceramic Industries,
Farr Ceramics, Artisan Ceramics, Peoples Ceramic
Czech Republic - BVD Pece
France - Sabre
Germany - Villeroy & Boch, Rosenthal
Malaysia - Goh Ban Huat, Claytan Group (Oriental Ceramics and Claytan Fine
China), Kuala Kangsar Ceramics, T&T Ceramics
Indonesia – Indo Keramik, Haeng Nam Sejahtera
India – Tata Ceramics
Iran – Espidar Porcelain, Hamgam Porcelain, Hamid Porcelain, Kashan China,
Maghsoud Porcelain, Toos Porcelain, Zarin Iran Porcelain and at least 25 other
companies
Italy – Alessi, Richard Ginori
Poland – Polish Table
Portugal – Matceramica, SECLA, CAVN, Bemorporce, Porcel
Romania - Ves
South Korea - Hankook Chinaware
Turkey – Kutahya Porselen, Heris Seramik, Altin Cini, Marmara Cini, Dogus Cini,
Evliya Calebi Cini
UAE - RAK Porcelain
UK – Churchill, Royal Worcester, Wedgewood, Steelite, Royal Doulton Waterford
Wedgwood
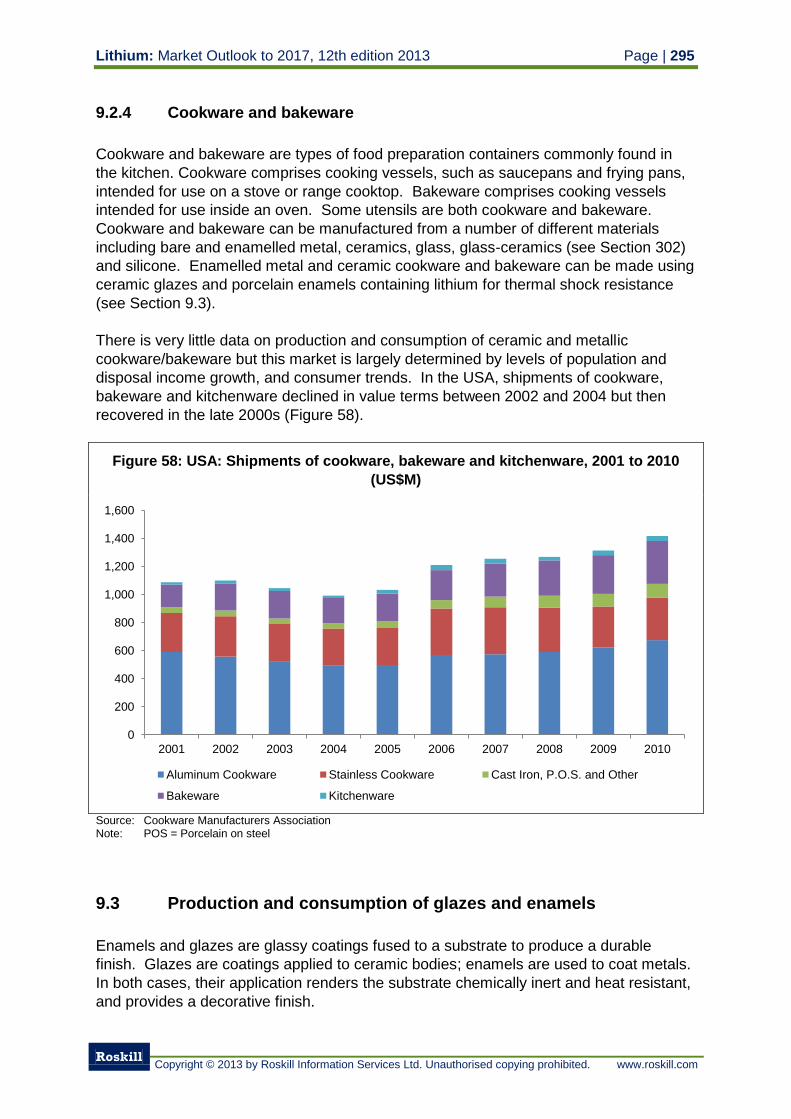
Lithium: Market Outlook to 2017, 12th edition 2013 Page | 295
Roskill
Copyright © 2013 by Roskill Information Services Ltd. Unauthorised copying prohibited. www.roskill.com
9.2.4 Cookware and bakeware
Cookware and bakeware are types of food preparation containers commonly found in
the kitchen. Cookware comprises cooking vessels, such as saucepans and frying pans,
intended for use on a stove or range cooktop. Bakeware comprises cooking vessels
intended for use inside an oven. Some utensils are both cookware and bakeware.
Cookware and bakeware can be manufactured from a number of different materials
including bare and enamelled metal, ceramics, glass, glass-ceramics (see Section 302)
and silicone. Enamelled metal and ceramic cookware and bakeware can be made using
ceramic glazes and porcelain enamels containing lithium for thermal shock resistance
(see Section 9.3).
There is very little data on production and consumption of ceramic and metallic
cookware/bakeware but this market is largely determined by levels of population and
disposal income growth, and consumer trends. In the USA, shipments of cookware,
bakeware and kitchenware declined in value terms between 2002 and 2004 but then
recovered in the late 2000s (Figure 58).
Figure 58: USA: Shipments of cookware, bakeware and kitchenware, 2001 to 2010
(US$M)
Source: Cookware Manufacturers Association Note: POS = Porcelain on steel
9.3 Production and consumption of glazes and enamels
Enamels and glazes are glassy coatings fused to a substrate to produce a durable
finish. Glazes are coatings applied to ceramic bodies; enamels are used to coat metals.
In both cases, their application renders the substrate chemically inert and heat resistant,
and provides a decorative finish.
0
200
400
600
800
1,000
1,200
1,400
1,600
2001 2002 2003 2004 2005 2006 2007 2008 2009 2010
Aluminum Cookware Stainless Cookware Cast Iron, P.O.S. and Other
Bakeware Kitchenware
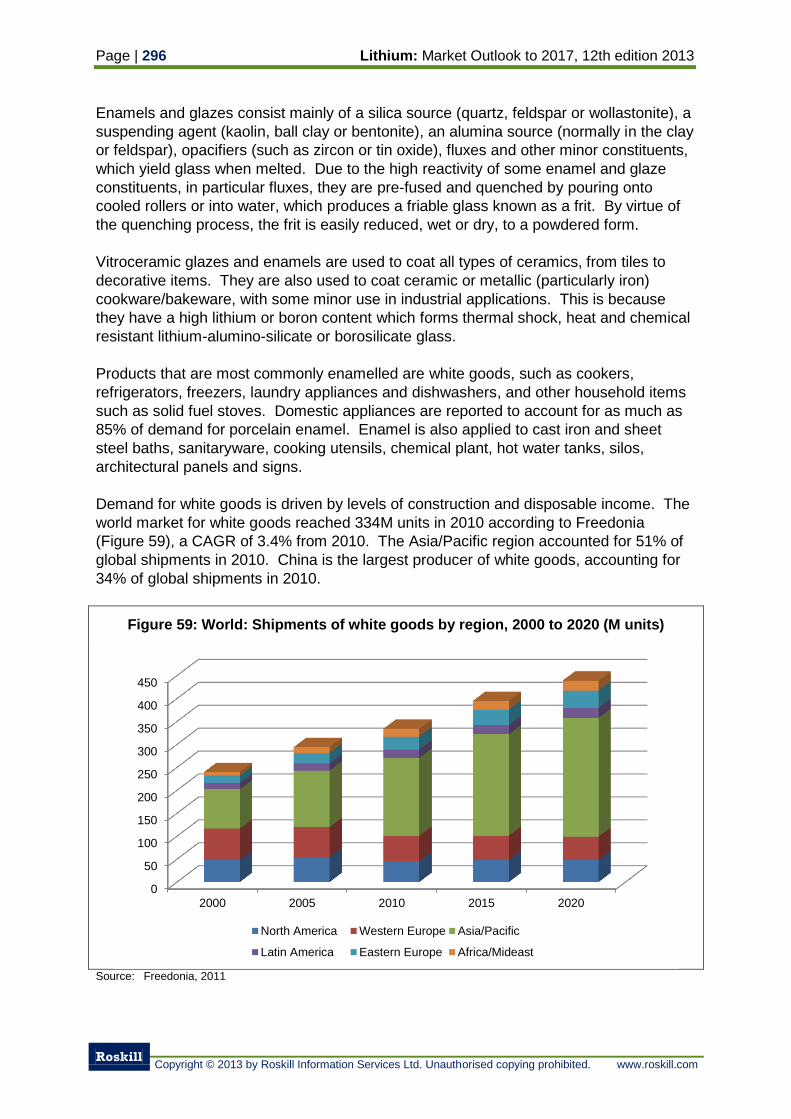
Page | 296 Lithium: Market Outlook to 2017, 12th edition 2013
Roskill
Copyright © 2013 by Roskill Information Services Ltd. Unauthorised copying prohibited. www.roskill.com
Enamels and glazes consist mainly of a silica source (quartz, feldspar or wollastonite), a
suspending agent (kaolin, ball clay or bentonite), an alumina source (normally in the clay
or feldspar), opacifiers (such as zircon or tin oxide), fluxes and other minor constituents,
which yield glass when melted. Due to the high reactivity of some enamel and glaze
constituents, in particular fluxes, they are pre-fused and quenched by pouring onto
cooled rollers or into water, which produces a friable glass known as a frit. By virtue of
the quenching process, the frit is easily reduced, wet or dry, to a powdered form.
Vitroceramic glazes and enamels are used to coat all types of ceramics, from tiles to
decorative items. They are also used to coat ceramic or metallic (particularly iron)
cookware/bakeware, with some minor use in industrial applications. This is because
they have a high lithium or boron content which forms thermal shock, heat and chemical
resistant lithium-alumino-silicate or borosilicate glass.
Products that are most commonly enamelled are white goods, such as cookers,
refrigerators, freezers, laundry appliances and dishwashers, and other household items
such as solid fuel stoves. Domestic appliances are reported to account for as much as
85% of demand for porcelain enamel. Enamel is also applied to cast iron and sheet
steel baths, sanitaryware, cooking utensils, chemical plant, hot water tanks, silos,
architectural panels and signs.
Demand for white goods is driven by levels of construction and disposable income. The
world market for white goods reached 334M units in 2010 according to Freedonia
(Figure 59), a CAGR of 3.4% from 2010. The Asia/Pacific region accounted for 51% of
global shipments in 2010. China is the largest producer of white goods, accounting for
34% of global shipments in 2010.
Figure 59: World: Shipments of white goods by region, 2000 to 2020 (M units)
Source: Freedonia, 2011
0
50
100
150
200
250
300
350
400
450
2000 2005 2010 2015 2020
North America Western Europe Asia/Pacific
Latin America Eastern Europe Africa/Mideast
Lithium: Market Outlook to 2017, 12th edition 2013 Page | 297
Roskill
Copyright © 2013 by Roskill Information Services Ltd. Unauthorised copying prohibited. www.roskill.com
9.3.1 Producers of glazes and enamels
Production of glazes and enamels is concentrated in the hands of relatively few
companies with significant international presence:
Ferro is one of the largest producers of ceramic and porcelain enamel frits and glazes
worldwide. Products manufactured by Ferro containing lithium include:
Frit for the production of conventional grinding wheels
Special glasses for the bonding of superabrasives
Frit, glaze and fluxes for the production of ceramic tiles
Porcelain enamel for cookware, bakeware and white goods
It operates plants for the production of these products in China, France, Mexico, Spain
and the USA.
PEMCO operates plants producing porcelain enamel coatings containing lithium in
Argentina, Belgium, Italy, Spain and the USA.
Torrecid use lithium in the manufacture of frits for vitroceramics. The company has
plants in Brazil, China, Czech Republic, Indonesia, Mexico, Spain, Thailand and the UK.
GizemFrit is the largest producer of porcelain enamel frit in Turkey, from a plant at
Adapazari, and one of the largest frit producers worldwide.
Tokan Material Technology (Tomatec) is a Japanese company with porcelain enamel
frit manufacturing facilities in Japan and China. Ferro sold a small stake in Tomatec in
2008. Tomatec is thought to be one of the largest enamel frit manufacturers in East
Asia.
Takara Standard purchased the frit business of NGK Frit in 2002 and spun it out into a
new company, Nippon Frit, which produces enamel frit in Japan.
Colorobbia manufactures ceramic and porcelain enamel frits containing lithium at plants
in Brazil, Indonesia, Italy, Mexico, Portugal and Spain.
In addition to the large multi-national producers identified above, other companies
producing ceramic and porcelain enamel frit include:
China – China Glaze, Hunan Lifa Chemicals, Zibo Fuxing Glaze, Zhongguan
Ceramic Glaze, Guangdong Sanshui T&H Glaze, Zibo Guisheng Glaze
Czech Republic - Mefrit
Thailand – Poplar
Poland – QuimiCer Polska
Indonesia – EsmalGlass, Smalticeram
Slovenia – EMO Frite
Companies in Brazil, Croatia, Hungary, India, Iran, Portugal, Romania, Russia
and Ukraine
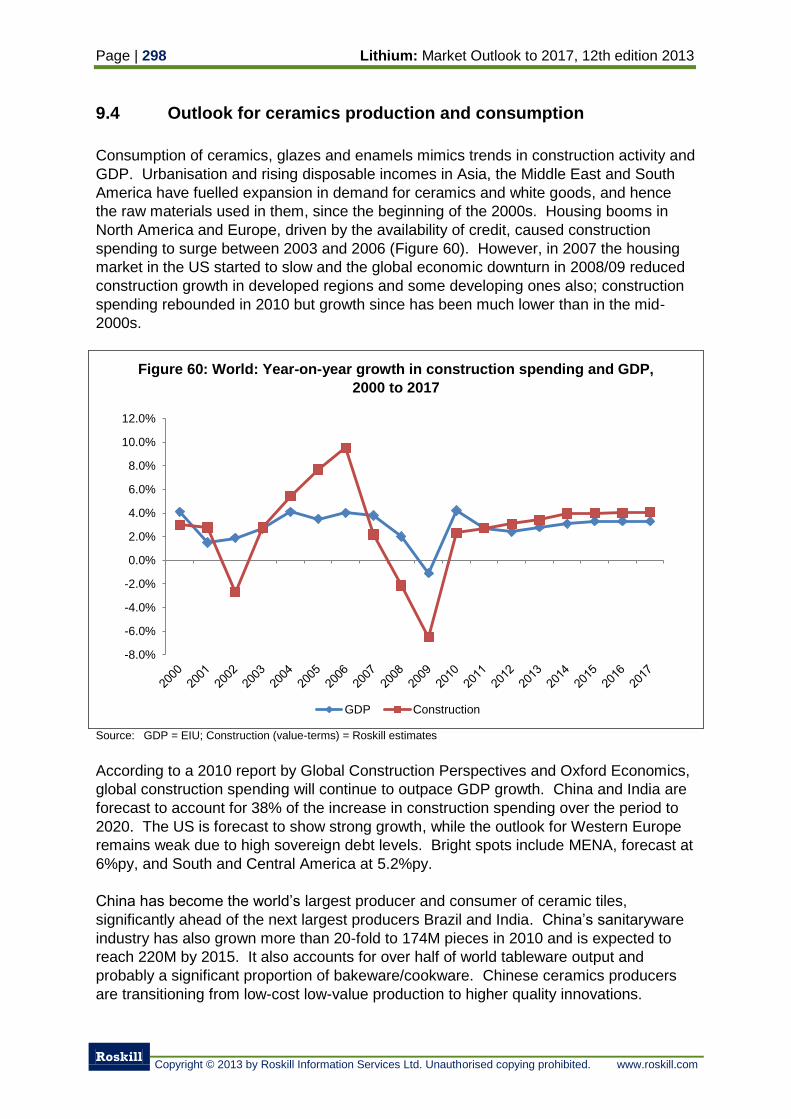
Page | 298 Lithium: Market Outlook to 2017, 12th edition 2013
Roskill
Copyright © 2013 by Roskill Information Services Ltd. Unauthorised copying prohibited. www.roskill.com
9.4 Outlook for ceramics production and consumption
Consumption of ceramics, glazes and enamels mimics trends in construction activity and
GDP. Urbanisation and rising disposable incomes in Asia, the Middle East and South
America have fuelled expansion in demand for ceramics and white goods, and hence
the raw materials used in them, since the beginning of the 2000s. Housing booms in
North America and Europe, driven by the availability of credit, caused construction
spending to surge between 2003 and 2006 (Figure 60). However, in 2007 the housing
market in the US started to slow and the global economic downturn in 2008/09 reduced
construction growth in developed regions and some developing ones also; construction
spending rebounded in 2010 but growth since has been much lower than in the mid-
2000s.
Figure 60: World: Year-on-year growth in construction spending and GDP,
2000 to 2017
Source: GDP = EIU; Construction (value-terms) = Roskill estimates
According to a 2010 report by Global Construction Perspectives and Oxford Economics,
global construction spending will continue to outpace GDP growth. China and India are
forecast to account for 38% of the increase in construction spending over the period to
2020. The US is forecast to show strong growth, while the outlook for Western Europe
remains weak due to high sovereign debt levels. Bright spots include MENA, forecast at
6%py, and South and Central America at 5.2%py.
China has become the world’s largest producer and consumer of ceramic tiles,
significantly ahead of the next largest producers Brazil and India. China’s sanitaryware
industry has also grown more than 20-fold to 174M pieces in 2010 and is expected to
reach 220M by 2015. It also accounts for over half of world tableware output and
probably a significant proportion of bakeware/cookware. Chinese ceramics producers
are transitioning from low-cost low-value production to higher quality innovations.
-8.0%
-6.0%
-4.0%
-2.0%
0.0%
2.0%
4.0%
6.0%
8.0%
10.0%
12.0%
GDP Construction
Lithium: Market Outlook to 2017, 12th edition 2013 Page | 299
Roskill
Copyright © 2013 by Roskill Information Services Ltd. Unauthorised copying prohibited. www.roskill.com
Shipments of white goods are forecast to increase by 3.4%py to 2015 and by 2.8%py to
2020, to reach 439M units (Figure 59). Western Europe will see declining shipments but
in most other regions growth will be positive. Growth is forecast to be highest in
Asia/Pacific in volume terms, but South America, Eastern Europe and Africa/Middle East
could show high rates of demand growth, albeit from a lower base in volume terms.
Smart appliances - which offer advanced features at higher prices - will gain market
share in developed markets.
Growth in demand for ceramics and white goods is likely to be lower through to 2017
compared to the last decade, although overall demand will continue to grow, especially
in volume terms, as urbanisation and infrastructure requirements in emerging markets
off-set declines in residential housing starts in developed countries. There is also likely
to be increased investment in infrastructure in developed and developing countries,
governments of developed countries have increased spending on public projects to
offset job losses in the private sector, resulting from the global economic downturn.
9.5 Consumption of lithium in ceramics
Lithium, in the form of minerals or compounds, is not added by every ceramics producer,
and typical additions of lithium to different types of ceramic bodies, glazes and enamels
vary widely. In the vast majority of ceramic tiles, sanitaryware, tableware and
cookware/bakeware, no lithium is added at all.
Growth in consumption of lithium minerals in ceramics was strong through the mid-
1990s, with consumption more than doubling between 1988 and 1996 as new
applications were developed. However, this trend was reversed at the end of the
decade as the availability of lower-cost lithium carbonate from SQM in Chile resulted in
producers of ceramic glazes and porcelain enamels shifting away from lithium minerals.
Consumption of spodumene in ceramic glazes and porcelain enamels was estimated
by Industrial Minerals at 5,000t (620t LCE assuming a 5% Li2O product) in 2003. Most
glaze and enamel producers use lithium carbonate, but some companies in China prefer
to use spodumene for glaze production due to its lower cost. As most of the growth in
ceramics output has occurred in China since 2003, consumption of spodumene in
ceramic glazes and porcelain enamel glazes is estimated at 1,100t LCE (9,000t gross
weight) in 2012, a CAGR of 6.7%. Consumption of lithium compounds, largely lithium
carbonate, in ceramic glazes and porcelain enamels, is estimated at 9,500t LCE for
2012, having grown from around 5,000t LCE in 2000, a CAGR of 5.5%. Consumption of
lithium in ceramic glazes and porcelain enamels is mainly concentrated in Europe and
China, coincident with where the major producers’ plants are sited.
Production of lepidolite in Portugal was estimated at 41,000t (2,500t LCE) in 2012 and in
Spain at 5,000t (60t LCE). Chinese output of lepidolite was estimated at 65,000t (4,000t
LCE) in 2012. All of this material, totalling 6,570t LCE, was likely consumed in the
manufacture of ceramic bodies. Consumption of spodumene in ceramic bodies is
estimated at a further 5,930t LCE bringing total consumption of lithium minerals in
ceramic bodies to 12,500t LCE (or around 100,000t gross weight) in 2012.
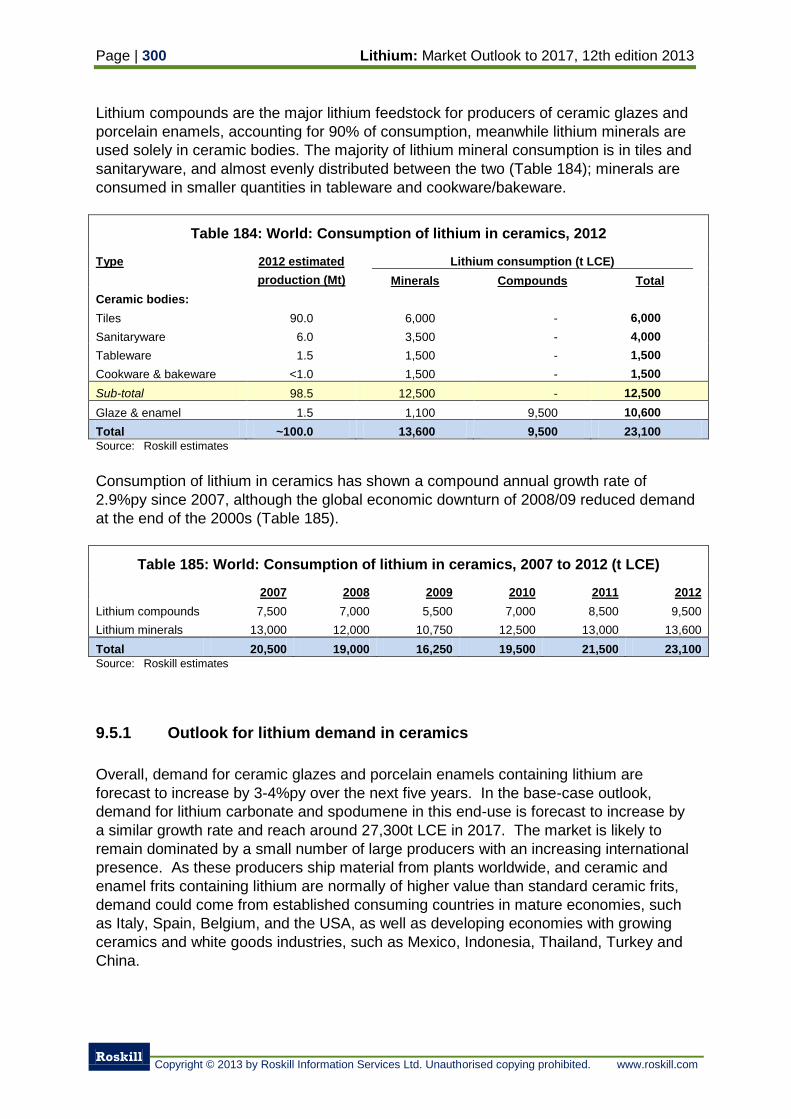
Page | 300 Lithium: Market Outlook to 2017, 12th edition 2013
Roskill
Copyright © 2013 by Roskill Information Services Ltd. Unauthorised copying prohibited. www.roskill.com
Lithium compounds are the major lithium feedstock for producers of ceramic glazes and
porcelain enamels, accounting for 90% of consumption, meanwhile lithium minerals are
used solely in ceramic bodies. The majority of lithium mineral consumption is in tiles and
sanitaryware, and almost evenly distributed between the two (Table 184); minerals are
consumed in smaller quantities in tableware and cookware/bakeware.
Table 184: World: Consumption of lithium in ceramics, 2012
Type 2012 estimated
production (Mt)
Lithium consumption (t LCE)
Minerals Compounds Total
Ceramic bodies:
Tiles 90.0 6,000 - 6,000
Sanitaryware 6.0 3,500 - 4,000
Tableware
1.5 1,500 - 1,500
Cookware & bakeware <1.0 1,500 - 1,500
Sub-total 98.5 12,500 - 12,500
Glaze & enamel 1.5 1,100 9,500 10,600
Total ~100.0 13,600 9,500 23,100
Source: Roskill estimates
Consumption of lithium in ceramics has shown a compound annual growth rate of
2.9%py since 2007, although the global economic downturn of 2008/09 reduced demand
at the end of the 2000s (Table 185).
Table 185: World: Consumption of lithium in ceramics, 2007 to 2012 (t LCE)
2007 2008 2009 2010 2011 2012
Lithium compounds 7,500 7,000 5,500 7,000 8,500 9,500
Lithium minerals 13,000 12,000 10,750 12,500 13,000 13,600
Total 20,500 19,000 16,250 19,500 21,500 23,100
Source: Roskill estimates
9.5.1 Outlook for lithium demand in ceramics
Overall, demand for ceramic glazes and porcelain enamels containing lithium are
forecast to increase by 3-4%py over the next five years. In the base-case outlook,
demand for lithium carbonate and spodumene in this end-use is forecast to increase by
a similar growth rate and reach around 27,300t LCE in 2017. The market is likely to
remain dominated by a small number of large producers with an increasing international
presence. As these producers ship material from plants worldwide, and ceramic and
enamel frits containing lithium are normally of higher value than standard ceramic frits,
demand could come from established consuming countries in mature economies, such
as Italy, Spain, Belgium, and the USA, as well as developing economies with growing
ceramics and white goods industries, such as Mexico, Indonesia, Thailand, Turkey and
China.
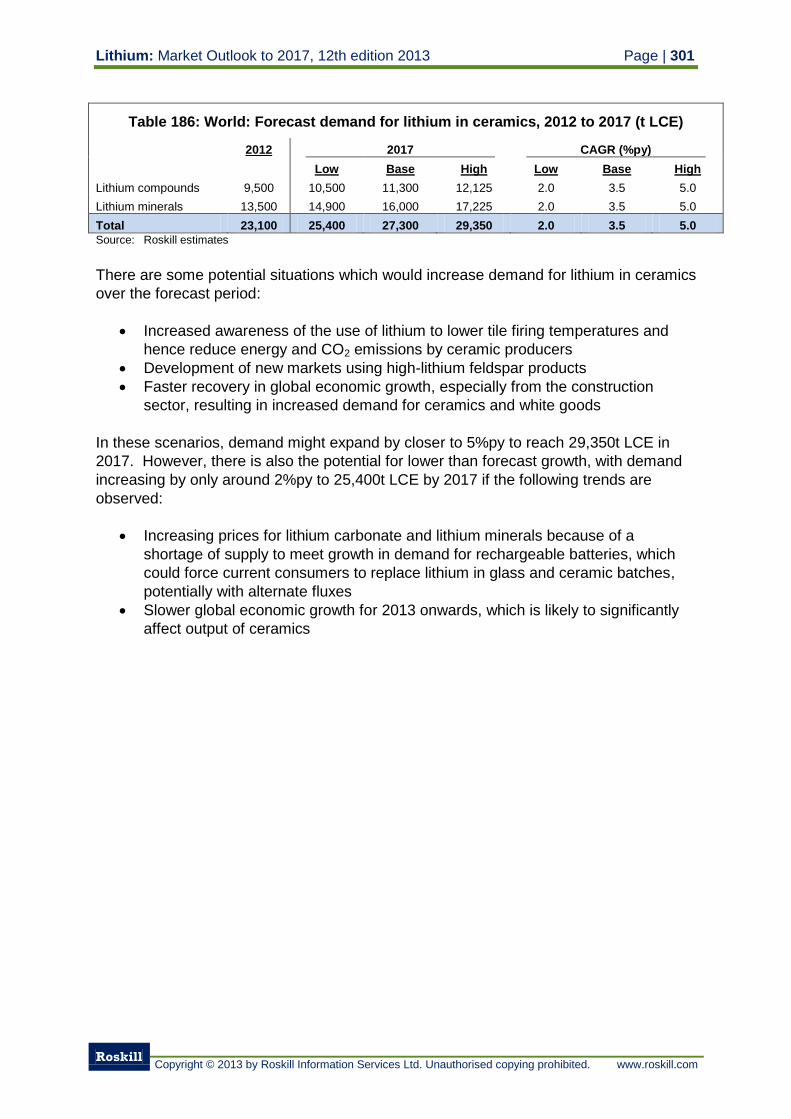
Lithium: Market Outlook to 2017, 12th edition 2013 Page | 301
Roskill
Copyright © 2013 by Roskill Information Services Ltd. Unauthorised copying prohibited. www.roskill.com
Table 186: World: Forecast demand for lithium in ceramics, 2012 to 2017 (t LCE)
2012 2017 CAGR (%py)
Low Base High Low Base High
Lithium compounds 9,500 10,500 11,300 12,125 2.0 3.5 5.0
Lithium minerals 13,500 14,900 16,000 17,225 2.0 3.5 5.0
Total 23,100 25,400 27,300 29,350 2.0 3.5 5.0
Source: Roskill estimates
There are some potential situations which would increase demand for lithium in ceramics
over the forecast period:
Increased awareness of the use of lithium to lower tile firing temperatures and
hence reduce energy and CO2 emissions by ceramic producers
Development of new markets using high-lithium feldspar products
Faster recovery in global economic growth, especially from the construction
sector, resulting in increased demand for ceramics and white goods
In these scenarios, demand might expand by closer to 5%py to reach 29,350t LCE in
2017. However, there is also the potential for lower than forecast growth, with demand
increasing by only around 2%py to 25,400t LCE by 2017 if the following trends are
observed:
Increasing prices for lithium carbonate and lithium minerals because of a
shortage of supply to meet growth in demand for rechargeable batteries, which
could force current consumers to replace lithium in glass and ceramic batches,
potentially with alternate fluxes
Slower global economic growth for 2013 onwards, which is likely to significantly
affect output of ceramics
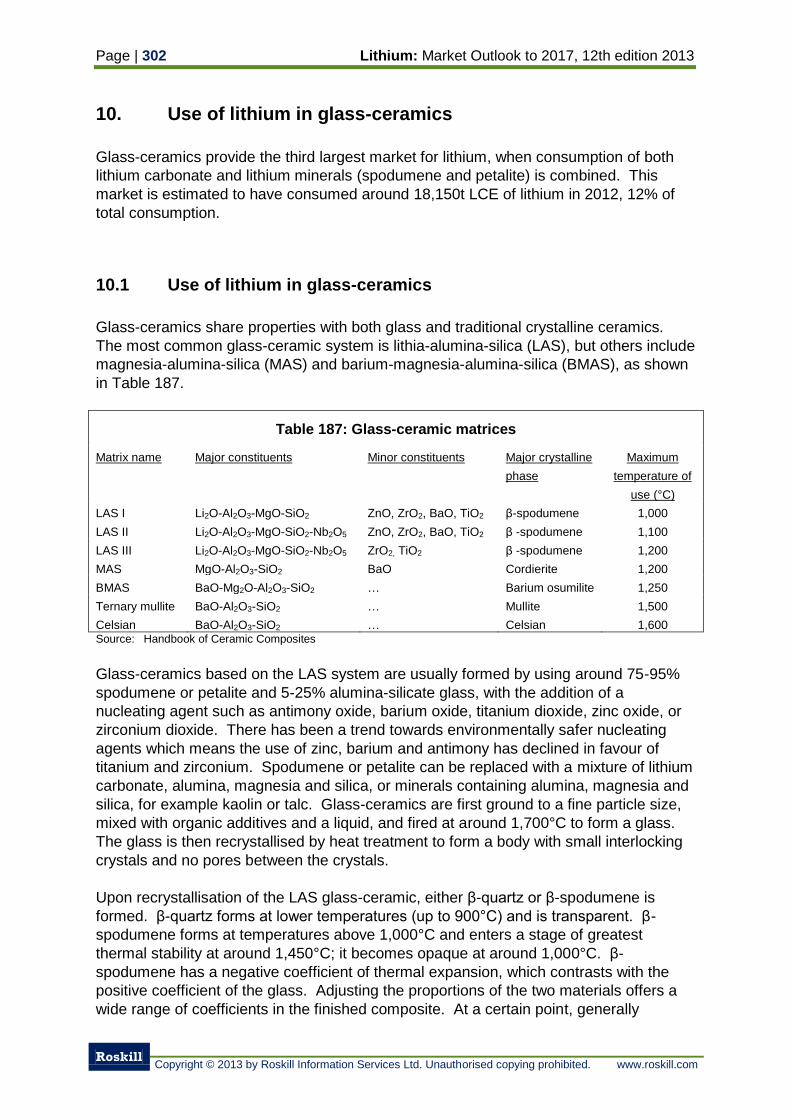
Page | 302 Lithium: Market Outlook to 2017, 12th edition 2013
Roskill
Copyright © 2013 by Roskill Information Services Ltd. Unauthorised copying prohibited. www.roskill.com
10. Use of lithium in glass-ceramics
Glass-ceramics provide the third largest market for lithium, when consumption of both
lithium carbonate and lithium minerals (spodumene and petalite) is combined. This
market is estimated to have consumed around 18,150t LCE of lithium in 2012, 12% of
total consumption.
10.1 Use of lithium in glass-ceramics
Glass-ceramics share properties with both glass and traditional crystalline ceramics.
The most common glass-ceramic system is lithia-alumina-silica (LAS), but others include
magnesia-alumina-silica (MAS) and barium-magnesia-alumina-silica (BMAS), as shown
in Table 187.
Table 187: Glass-ceramic matrices
Matrix name Major constituents Minor constituents Major crystalline
phase
Maximum
temperature of
use (°C)
LAS I Li2O-Al2O3-MgO-SiO2 ZnO, ZrO2, BaO, TiO2 β-spodumene 1,000
LAS II Li2O-Al2O3-MgO-SiO2-Nb2O5 ZnO, ZrO2, BaO, TiO2 β -spodumene 1,100
LAS III Li2O-Al2O3-MgO-SiO2-Nb2O5 ZrO2, TiO2 β -spodumene 1,200
MAS MgO-Al2O3-SiO2 BaO Cordierite 1,200
BMAS BaO-Mg2O-Al2O3-SiO2 … Barium osumilite 1,250
Ternary mullite BaO-Al2O3-SiO2 … Mullite 1,500
Celsian BaO-Al2O3-SiO2 … Celsian 1,600 Source: Handbook of Ceramic Composites
Glass-ceramics based on the LAS system are usually formed by using around 75-95%
spodumene or petalite and 5-25% alumina-silicate glass, with the addition of a
nucleating agent such as antimony oxide, barium oxide, titanium dioxide, zinc oxide, or
zirconium dioxide. There has been a trend towards environmentally safer nucleating
agents which means the use of zinc, barium and antimony has declined in favour of
titanium and zirconium. Spodumene or petalite can be replaced with a mixture of lithium
carbonate, alumina, magnesia and silica, or minerals containing alumina, magnesia and
silica, for example kaolin or talc. Glass-ceramics are first ground to a fine particle size,
mixed with organic additives and a liquid, and fired at around 1,700°C to form a glass.
The glass is then recrystallised by heat treatment to form a body with small interlocking
crystals and no pores between the crystals.
Upon recrystallisation of the LAS glass-ceramic, either β-quartz or β-spodumene is
formed. β-quartz forms at lower temperatures (up to 900°C) and is transparent. β-
spodumene forms at temperatures above 1,000°C and enters a stage of greatest
thermal stability at around 1,450°C; it becomes opaque at around 1,000°C. β-
spodumene has a negative coefficient of thermal expansion, which contrasts with the
positive coefficient of the glass. Adjusting the proportions of the two materials offers a
wide range of coefficients in the finished composite. At a certain point, generally
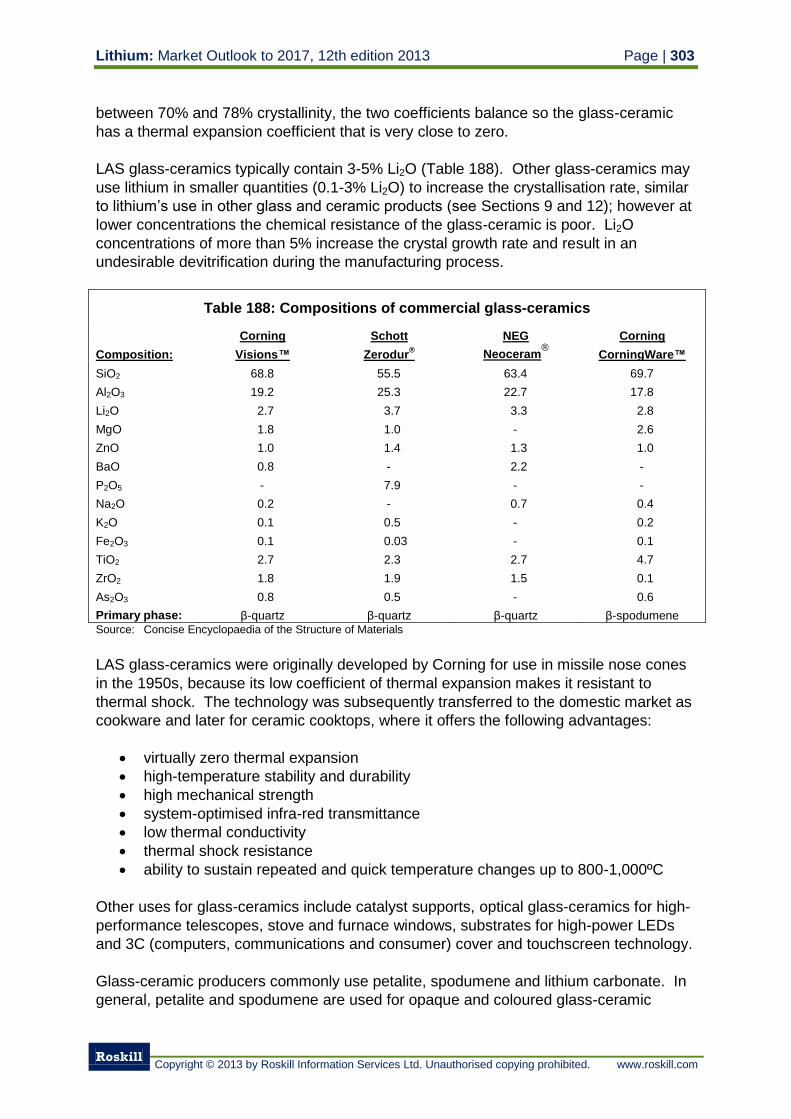
Lithium: Market Outlook to 2017, 12th edition 2013 Page | 303
Roskill
Copyright © 2013 by Roskill Information Services Ltd. Unauthorised copying prohibited. www.roskill.com
between 70% and 78% crystallinity, the two coefficients balance so the glass-ceramic
has a thermal expansion coefficient that is very close to zero.
LAS glass-ceramics typically contain 3-5% Li2O (Table 188). Other glass-ceramics may
use lithium in smaller quantities (0.1-3% Li2O) to increase the crystallisation rate, similar
to lithium’s use in other glass and ceramic products (see Sections 9 and 12); however at
lower concentrations the chemical resistance of the glass-ceramic is poor. Li2O
concentrations of more than 5% increase the crystal growth rate and result in an
undesirable devitrification during the manufacturing process.
Table 188: Compositions of commercial glass-ceramics
Corning Schott NEG Corning
Composition: Visions™ Zerodur® Neoceram
® CorningWare™
SiO2 68.8 55.5 63.4 69.7
Al2O3 19.2 25.3 22.7 17.8
Li2O 2.7 3.7 3.3 2.8
MgO 1.8 1.0 - 2.6
ZnO 1.0 1.4 1.3 1.0
BaO 0.8 - 2.2 -
P2O5 - 7.9 - -
Na2O 0.2 - 0.7 0.4
K2O 0.1 0.5 - 0.2
Fe2O3 0.1 0.03 - 0.1
TiO2 2.7 2.3 2.7 4.7
ZrO2 1.8 1.9 1.5 0.1
As2O3 0.8 0.5 - 0.6
Primary phase: β-quartz β-quartz β-quartz β-spodumene Source: Concise Encyclopaedia of the Structure of Materials
LAS glass-ceramics were originally developed by Corning for use in missile nose cones
in the 1950s, because its low coefficient of thermal expansion makes it resistant to
thermal shock. The technology was subsequently transferred to the domestic market as
cookware and later for ceramic cooktops, where it offers the following advantages:
virtually zero thermal expansion
high-temperature stability and durability
high mechanical strength
system-optimised infra-red transmittance
low thermal conductivity
thermal shock resistance
ability to sustain repeated and quick temperature changes up to 800-1,000ºC
Other uses for glass-ceramics include catalyst supports, optical glass-ceramics for high-
performance telescopes, stove and furnace windows, substrates for high-power LEDs
and 3C (computers, communications and consumer) cover and touchscreen technology.
Glass-ceramic producers commonly use petalite, spodumene and lithium carbonate. In
general, petalite and spodumene are used for opaque and coloured glass-ceramic
Page | 304 Lithium: Market Outlook to 2017, 12th edition 2013
Roskill
Copyright © 2013 by Roskill Information Services Ltd. Unauthorised copying prohibited. www.roskill.com
panels while lithium carbonate is used for translucent panels, particularly stove and
furnace windows, and architectural and special glass-ceramic objects such as fire doors
and mirror substrates. The reason for this is that the impurities in spodumene, notably
iron oxide, can lead to discolouration of the glass-ceramic after firing.
For example, Schott uses lithium carbonate in the production of translucent ROBAX®
glass-ceramic and spodumene and petalite in opaque glass-ceramic CERAN® products.
Corning used a combination of spodumene from TANCO in Canada and petalite from
Bikita in Zimbabwe in the production of opaque CorningWare™, until its glass-ceramic
plant was closed in 2003.
Talison Lithium in Australia is the largest supplier of spodumene to glass-ceramic
producers. TANCO in Canada, prior to its closure, also supplied some spodumene.
Producers of glass-ceramics in China are likely using domestic spodumene and
imported material from Talison Lithium. Bikita are producing and exporting 50-55,000tpy
of petalite, and some of the glass-ceramic producers in Section 10.2.1 are known to be
using petalite.
10.2 Production and consumption of glass-ceramics
As glass-ceramics comprise only a small proportion of total glass and ceramic
production, detailed production data is not available. The largest market for glass-
ceramics is cooktops, with fireplace and stove windows second. These markets are
driven by consumer trends and levels of construction, particularly residential
construction.
Between 2002 and 2009, Schott produced 50 million CERAN® cooktop panels, or just
over 7 million per year, a CAGR of 10.4%. Sales of Schott cooktop panels decreased in
2007 because of a slowdown in the housing market in the USA and in 2008 because of
a slowdown in the housing market in Europe. The cooktop panel market recovered
more strongly in 2010 than expected, due primarily to the improving economy in Europe,
but 2011 saw a decline in the USA and a moderate rise in Europe. Sales of ROBAX®
glass-ceramic viewing panels for fireplaces and wood stoves in particular were excellent
in 2010, mirroring their performance in 2009; the expected delayed effects from the
global financial crisis on ROBAX®
sales never materialised.
In 2008, Fagor, a manufacturer of induction cooktops estimated the European market at
at 1.2M units, up from 0.3M in 2002, a CAGR of 24%py.
Another market which has grown in the 2000s is the use of glass-ceramics in
architectural glass. Shatterproof partitions, windows or fire doors that can withstand
building fires, without the use of strengthening wire mesh, can be manufactured from
glass-ceramic, however it faces strong competition from tempered flat glass and
borosilicate glass, for example Schott’s PYRAN®, which in many cases can satisfty
current fire regulations at lower cost.
Lithium: Market Outlook to 2017, 12th edition 2013 Page | 305
Roskill
Copyright © 2013 by Roskill Information Services Ltd. Unauthorised copying prohibited. www.roskill.com
10.2.1 Producers of glass-ceramics
There are only a small number of companies producing large volumes of lithium-
containing glass-ceramic; NEG, EuroKera and Schott are the market leaders. A few
Chinese companies also produce large volumes but mainly concentrate on the domestic
market.
Nippon Electric Glass (NEG) produces Neoceram®, a zero expansion β-spodumene
glass-ceramic for tableware and industrial, electrical and kitchen appliances.
Neoceram® is produced at Otsu, Shiga prefecture, Japan. The company also has plants
in Malaysia and the USA; however, these are thought to fabricate products from the
glass-ceramic melted in Japan.
EuroKera, a 50:50 joint venture between Saint-Gobain and Corning, produces
KeraGlass, a β-spodumene glass-ceramic material for ceramic hobs, and fireplace and
stove windows. Production takes place at Bagneaux-sur-Loing, near Nemours, France
with fabrication at plants in Chateau-Thierry, France; Fountain Inn, SC, USA; and,
Guangzhou, China.
Schott introduced CERAN® glass-ceramic panel cooktops in 1971. CERAN
® (coloured)
and ROBAX® (transparent) stove tops are produced at Mainz in Germany, the company
also produces small quantities of glass-ceramic at Duryea, PA, USA. Schott established
a new factory at Suzhou in China in 2002 with a CERAN® production line. ROBAX
® is
also used for fireplace and stove windows. Schott developed the ZERODUR® zero
expansion β-spodumene glass-ceramic in 1968 for use as a telescope mirror substrate
for astronomy. A recent addition to Schott’s glass-ceramic line-up is Xensation™ Cover
3D for capacitive touch technologies.
Wenzhou Kanger is reportedly the largest glass-ceramic producer in China. The
company operate at least one plant in China, at Wenzhou, Zhejiang province.
Kedi Glass-Ceramic, based in Puning, Guangdong province, China, produces glass-
ceramic cooktops, and stove and fireplace glass panels.
Huzhou Daxiang produced 12M pieces of glass-ceramic in 2009 from a plant in
Huzhou, Zhejiang province.
It is possible that there are other producers in China manufacturing glass-ceramic
articles, but at a smaller-scale then the companies identified above.
There are several other companies producing glass-ceramics, but as these are for
purposes other than cooktops, they generally produce much smaller volumes:
Colorobbia is mainly engaged in the production of porcelain enamel frit (see Section
9.3.1). The company also operates a plant in Vinci, Italy, producing transparent glass-
ceramic panels for architectural purposes.
In 1953, Corning Glass Works developed a β-spodumene glass-ceramic material with
a high thermal shock resistance called Pyroceram for the US ballistic program. In 1958
Page | 306 Lithium: Market Outlook to 2017, 12th edition 2013
Roskill
Copyright © 2013 by Roskill Information Services Ltd. Unauthorised copying prohibited. www.roskill.com
Corning introduced Corning Ware®, based on Pyroceram, for domestic use. The
Corning Ware® factory was located in Martinsburg, West Virginia. The Corning Ware
®
brand name was licensed to World Kitchens in 2001 and relaunched as CorningWare®;
however, World Kitchens closed the Martinsberg plant in 2003 and current
CorningWare® products instead use imported ceramic stoneware produced in Asia.
Corning continues to produce small volumes of glass-ceramics in the USA and Mexico,
but these are now largely for laboratory hot plates. KeraGlass is sometimes marketed
as Pyroceram in North America by Corning’s subsidiary, EuroKera.
Sitall, a Russian company, produced Astrositall®, a competitor to ZERODUR
®, at a
factory near Moscow; however it is not known if the company is still operational.
CLEARCERAM®-Z, a zero expansion glass-ceramic, is produced by Ohara Glass in
Japan. It is used for semiconductor steppers, laser refraction mirrors, astronomical
telescope mirrors and other high-tech applications.
Shanghai Xinhu Glass produces glass-ceramics for telescopes and aviation directors in
China.
In 2010, Asahi Glass (AGC) of Japan started commercial production of a new glass-
ceramics substrate targeted at manufacturers of stronger, brighter LEDs for residential,
automotive and electronics. The glass–ceramic substrate will be made in a new factory
in Taiwan. AGC claimed the market for high-durability LED substrate material will be
worth US$1.1Bn by 2020 and is aiming for a 20% market share. In this market, LAS
glass competes with alumina substrates.
Ohara, based in Japan, specialises in the manufacture of ultra-low expansion glass-
ceramics and glass-ceramic substrates for hard disc drives (HDD) and filters.
10.3 Consumption of lithium in glass-ceramics
Japanese demand for lithium carbonate in glass-ceramics peaked at 3,500t in 2007 but
fell to 1,700t in 2009. Consumption recovered by a third in 2010 and was flat in 2011,
but 2012 is forecast to show a decline to 1,900t (Table 189). The majority of Japanese
consumption is by NEG for the production of Neoceram® and by Ohara for the
production of glass-ceramic HDD substrates.
Table 189: Japan: Consumption of lithium carbonate in glass-ceramics, 2007 to 2012
(t)
2007 2008 2009 2010 2011 2012e
3,500 2,250 1,700 2,250 2,250 1,900 Source: Roskill’s Letter from Japan Nos. 357, 368, 417 & 432
A typical 4-ring 30”x20” (78x52cm) glass-ceramic cooktop panel has a thickness of
around 4mm, which gives a total volume of around 1,620cm3. Using the typical
composition of CERAN® (Table 188) the density of the glass ceramic is calculated at
Lithium: Market Outlook to 2017, 12th edition 2013 Page | 307
Roskill
Copyright © 2013 by Roskill Information Services Ltd. Unauthorised copying prohibited. www.roskill.com
around 2.7g/cm3, which means a typical glass-ceramic cooktop panel weighs around
4.5kg. Each glass-ceramic cooktop contains 0.15kg of Li2O, assuming an average of
3.3wt% Li2O in the glass-ceramic batch as per a typical CERAN™ composition. If seven
million cooktops were produced by Schott annually, the company’s total annual lithium
requirement would be around 2,570t LCE of lithium carbonate, or around 21,000t of
glass-grade spodumene containing 5% Li2O. However, Schott also produces other
glass-ceramic and its total consumption could be closer to 3,000t LCE.
Assuming EuroKera produce a similar volume of glass-ceramic to Schott and NGC, its
consumption is also estimated at around 3,000t LCE. Chinese consumption in glass-
ceramics is estimated at 4,500t LCE.
Consumption of lithium in other glass-ceramics such as tableware, mirror substrates and
for electronics is unknown, but the volume is likely to be much lower than that consumed
in cooktops, stove and fireplace windows and architectural glass. Total consumption of
lithium in glass-ceramic applications other than cooktops is estimated at around 600t
LCE.
Total consumption of lithium carbonate in glass-ceramics in 2011 is estimated at 9,500t
(Table 190) and minerals 8,650t LCE (or 70,000t gross weight based on 5% Li2O
content).
Table 190: World: Consumption of lithium in glass-ceramics by end-use and product
type, 2012 (t LCE)
Minerals1
Compounds2
Total
Cooktops 8,000 8,000 16,000
Stoves/fireplaces - 1,000 1,000
Other3
650 500 1,150
Total 8,650 9,500 18,150
Source: Roskill estimates Note: 1-Spodumene and petalite
2-Lithium carbonate 3-Includes fire-resistance architectural glass
Consumption of lithium in glass-ceramics has shown a rising growth trend since 2007,
but the global economic downturn of 2008/09 reduced demand, especially for minerals,
and has taken until 2011 to recover fully (Table 191).
Table 191: World: Consumption of lithium in glass-ceramics, 2007 to 2012 (t LCE)
2007 2008 2009 2010 2011 2012
Lithium compounds1 7,500 7,000 6,500 8,000 9,000 9,500
Lithium minerals2
11,100 9,900 5,000 8,000 8,500 8,650
Total 18,600 16,900 11,500 16,000 17,500 18,150
Source: Roskill estimates Note: 1-Lithium carbonate
2-Spodumene and petalite
Recycling rates for glass-ceramics are not known but recycling may be decreasing the
total requirement for virgin lithium carbonate or spodumene, by as much as 10%, if not
Page | 308 Lithium: Market Outlook to 2017, 12th edition 2013
Roskill
Copyright © 2013 by Roskill Information Services Ltd. Unauthorised copying prohibited. www.roskill.com
more. EuroKera, for example, are known to recycle production scrap and used cooktops
in the production of new cooktops in France. There are problems with recycling used
cooktops however, as previous glass-ceramic formulations were different to those used
today and often contained heavy metals such as arsenic and antimony, which producers
have strived to remove.
10.3.1 Outlook for lithium demand in glass-ceramics
The largest market for glass-ceramics is cooktops and stove windows. This market is
driven by consumer trends and levels of construction, particularly residential
construction. Growth in demand for these products is likely to be similar to demand for
household appliances (see Section 9.3), which is forecast to increase by 3-4%py to
2017.
Demand for lithium in glass-ceramics is forecast to increase by a similar growth rate and
reach around 21,500t LCE in 2017. Particular areas of potential high growth for lithium
in glass-ceramics are LED substrates and 3C touchscreens, although these will be from
a low starting point in volume terms given their recent entry into these respective
markets.
Table 192: World: Forecast demand for lithium in glass-ceramics, 2012 to 2017 (t LCE)
2012 2017 CAGR (%py)
Low Base High Low Base High
Lithium compounds1
9,500 10,600 11,400 12,250 2.2 3.7 5.2
Lithium minerals2
8,650 9,400 10,100 10,900 1.7 3.2 4.7
Total 18,150 20,000 21,500 23,150 2.0 3.5 5.0
Source: Roskill estimates Note: 1-Lithium carbonate
2-Spodumene and petalite
If there is a faster recovery in global economic growth from 2013, especially from the
construction sector, there may be increased demand for glass-ceramics. In this
scenario, demand might expand by closer to 5%py to reach 23,150t LCE in 2017.
However, there is also the potential for lower than forecast growth, with demand
increasing by only around 2.0%py to 20,000t LCE by 2017 if global economic growth is
slower, which is likely to significantly affect the construction market and hence demand
for glass-ceramic products.
Lithium: Market Outlook to 2017, 12th edition 2013 Page | 309
Roskill
Copyright © 2013 by Roskill Information Services Ltd. Unauthorised copying prohibited. www.roskill.com
11. Use of lithium in lubricating grease
Lubricating greases are the fourth largest market for lithium, accounting for an estimated
15,400t (13,500t LCE) of lithium hydroxide in 2012, or 9% of total lithium consumption.
11.1 Types of lubricating grease
Lubricating greases are made up of three basic components: base oil (75-95%); a
thickener to provide body and structure (5-20%); and additives to add properties such as
resistance to oxidation and water (0-10%). Greases function by bleeding oil from the
thickener, which then lubricates the mechanical component. Motion within the
component mixes some of the released oil into the thickener, so the grease does not run
dry of oil. Greases are normally categorised according to the thickener used:
Lithium greases are multi-purpose, relatively inexpensive greases, divided into two
types: conventional (or simple) and complex. Lithium greases are produced by adding a
lithium soap to lubricating oils and reacting them, usually with the application of heat,
pressure and/or agitation. The difference between simple and complex greases is that
simple greases are produced by reacting a metal salt with an acid, and complex greases
react a metal salt with two or more acids. Lithium grease thickeners are manufactured
by reacting lithium hydroxide monohydrate (a lithium salt) with fatty acids; common
lithium thickeners include:
di-lithium azelate
lithium stearate
lithium docosanoate
lithium 12-hydroxystearate
hydrogenated castor oil + lithium salt
C16-22 fatty acids + lithium salt
The advantages of lithium simple greases include:
retention of lubricating properties over a wide temperature range
good resistance to water, oxidation and handling
high temperature resistance providing good viscosity properties up to 140ºC
formation of a stable grease on cooling after melting
good dispersibility and pumpability
exceptional shear stability; suitable for use in high-speed plain and rolling-
element bearings
Lithium complex greases have similar properties to lithium simple greases but can
tolerate higher temperatures and offer longer service life than their simple-soap
counterparts. Typically, dropping points of lithium complex greases are above 260°C
and the maximum service temperature for lithium complex greases is about 175°C.
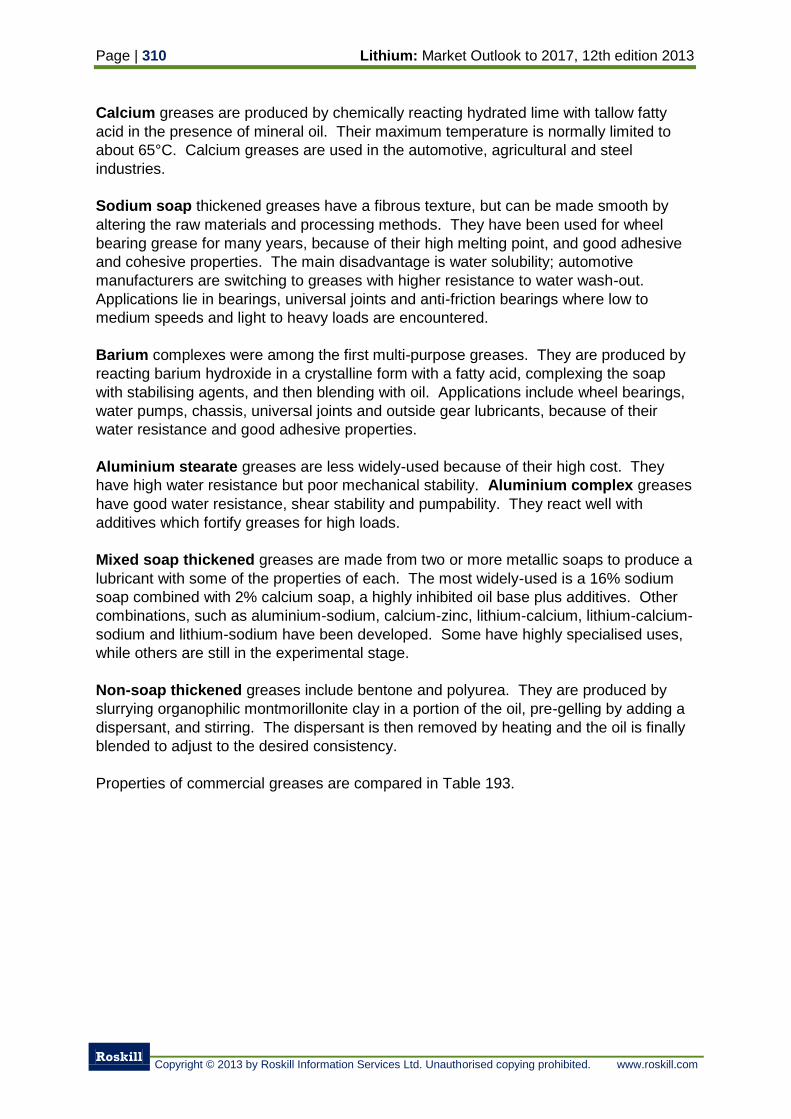
Page | 310 Lithium: Market Outlook to 2017, 12th edition 2013
Roskill
Copyright © 2013 by Roskill Information Services Ltd. Unauthorised copying prohibited. www.roskill.com
Calcium greases are produced by chemically reacting hydrated lime with tallow fatty
acid in the presence of mineral oil. Their maximum temperature is normally limited to
about 65°C. Calcium greases are used in the automotive, agricultural and steel
industries.
Sodium soap thickened greases have a fibrous texture, but can be made smooth by
altering the raw materials and processing methods. They have been used for wheel
bearing grease for many years, because of their high melting point, and good adhesive
and cohesive properties. The main disadvantage is water solubility; automotive
manufacturers are switching to greases with higher resistance to water wash-out.
Applications lie in bearings, universal joints and anti-friction bearings where low to
medium speeds and light to heavy loads are encountered.
Barium complexes were among the first multi-purpose greases. They are produced by
reacting barium hydroxide in a crystalline form with a fatty acid, complexing the soap
with stabilising agents, and then blending with oil. Applications include wheel bearings,
water pumps, chassis, universal joints and outside gear lubricants, because of their
water resistance and good adhesive properties.
Aluminium stearate greases are less widely-used because of their high cost. They
have high water resistance but poor mechanical stability. Aluminium complex greases
have good water resistance, shear stability and pumpability. They react well with
additives which fortify greases for high loads.
Mixed soap thickened greases are made from two or more metallic soaps to produce a
lubricant with some of the properties of each. The most widely-used is a 16% sodium
soap combined with 2% calcium soap, a highly inhibited oil base plus additives. Other
combinations, such as aluminium-sodium, calcium-zinc, lithium-calcium, lithium-calcium-
sodium and lithium-sodium have been developed. Some have highly specialised uses,
while others are still in the experimental stage.
Non-soap thickened greases include bentone and polyurea. They are produced by
slurrying organophilic montmorillonite clay in a portion of the oil, pre-gelling by adding a
dispersant, and stirring. The dispersant is then removed by heating and the oil is finally
blended to adjust to the desired consistency.
Properties of commercial greases are compared in Table 193.
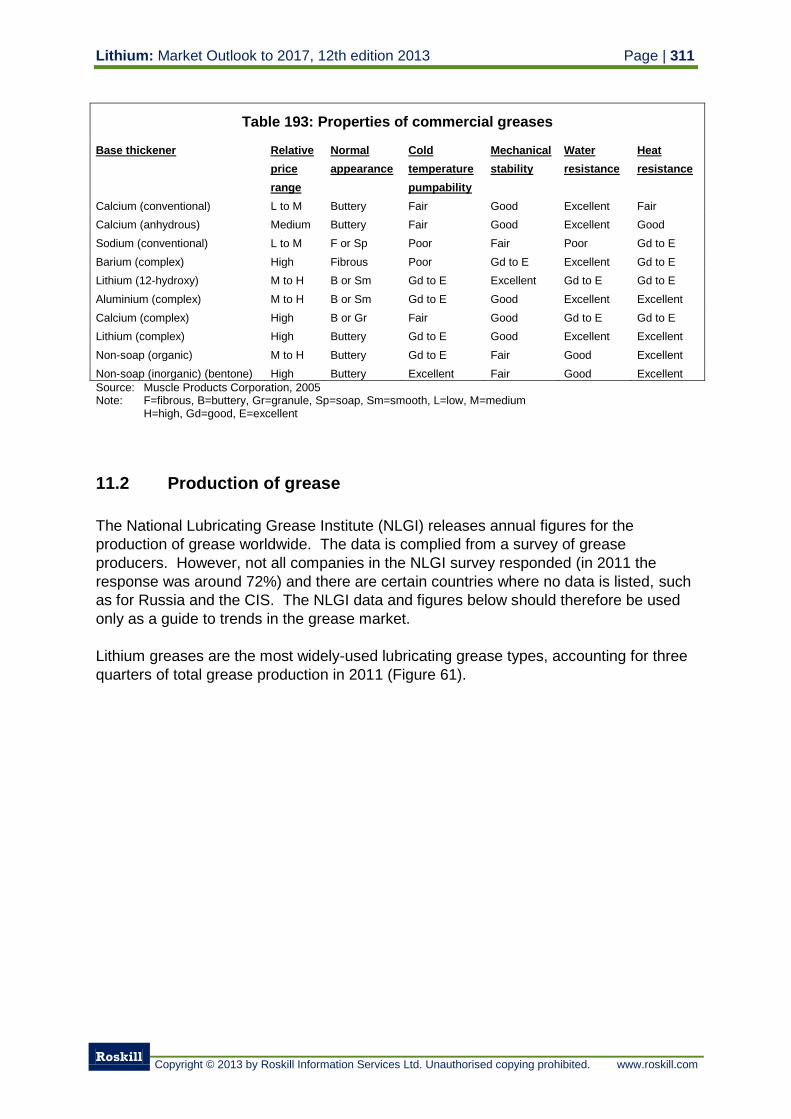
Lithium: Market Outlook to 2017, 12th edition 2013 Page | 311
Roskill
Copyright © 2013 by Roskill Information Services Ltd. Unauthorised copying prohibited. www.roskill.com
Table 193: Properties of commercial greases
Base thickener Relative
price
range
Normal
appearance
Cold
temperature
pumpability
Mechanical
stability
Water
resistance
Heat
resistance
Calcium (conventional) L to M Buttery Fair Good Excellent Fair
Calcium (anhydrous) Medium Buttery Fair Good Excellent Good
Sodium (conventional) L to M F or Sp Poor Fair Poor Gd to E
Barium (complex) High Fibrous Poor Gd to E Excellent Gd to E
Lithium (12-hydroxy) M to H B or Sm Gd to E Excellent Gd to E Gd to E
Aluminium (complex) M to H B or Sm Gd to E Good Excellent Excellent
Calcium (complex) High B or Gr Fair Good Gd to E Gd to E
Lithium (complex) High Buttery Gd to E Good Excellent Excellent
Non-soap (organic) M to H Buttery Gd to E Fair Good Excellent
Non-soap (inorganic) (bentone) High Buttery Excellent Fair Good Excellent
Source: Muscle Products Corporation, 2005 Note: F=fibrous, B=buttery, Gr=granule, Sp=soap, Sm=smooth, L=low, M=medium H=high, Gd=good, E=excellent
11.2 Production of grease
The National Lubricating Grease Institute (NLGI) releases annual figures for the
production of grease worldwide. The data is complied from a survey of grease
producers. However, not all companies in the NLGI survey responded (in 2011 the
response was around 72%) and there are certain countries where no data is listed, such
as for Russia and the CIS. The NLGI data and figures below should therefore be used
only as a guide to trends in the grease market.
Lithium greases are the most widely-used lubricating grease types, accounting for three
quarters of total grease production in 2011 (Figure 61).
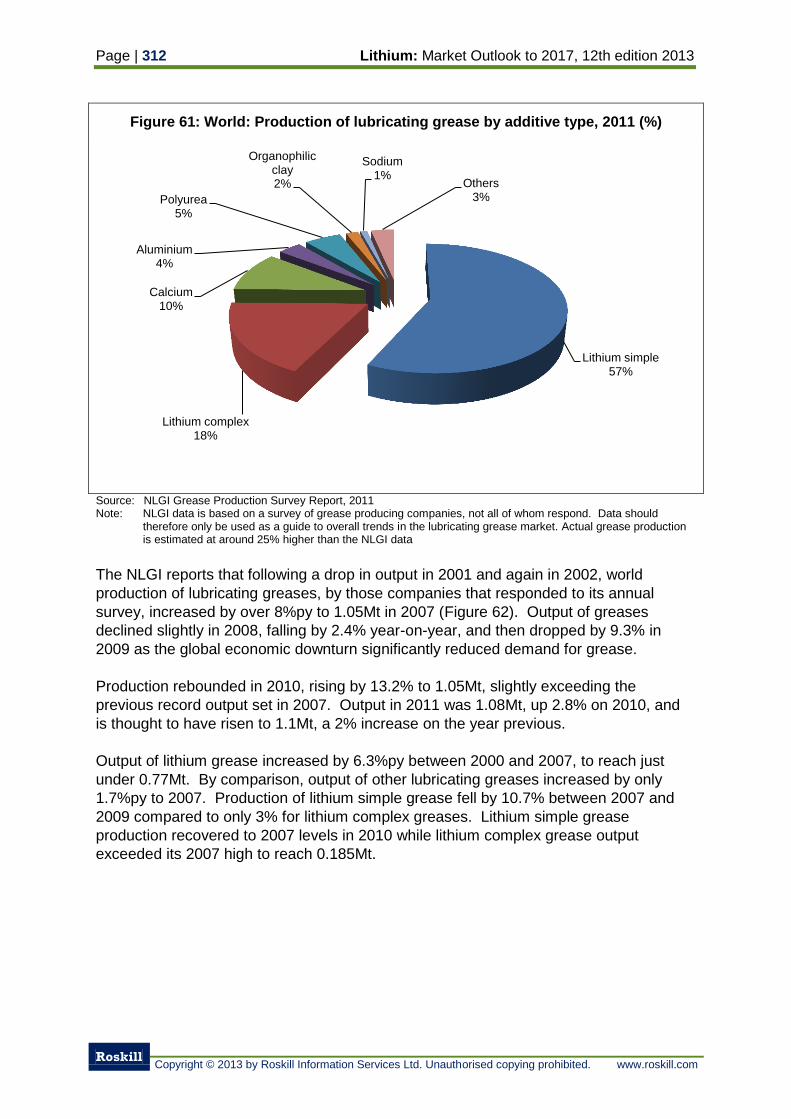
Page | 312 Lithium: Market Outlook to 2017, 12th edition 2013
Roskill
Copyright © 2013 by Roskill Information Services Ltd. Unauthorised copying prohibited. www.roskill.com
Figure 61: World: Production of lubricating grease by additive type, 2011 (%)
Source: NLGI Grease Production Survey Report, 2011 Note: NLGI data is based on a survey of grease producing companies, not all of whom respond. Data should
therefore only be used as a guide to overall trends in the lubricating grease market. Actual grease production is estimated at around 25% higher than the NLGI data
The NLGI reports that following a drop in output in 2001 and again in 2002, world
production of lubricating greases, by those companies that responded to its annual
survey, increased by over 8%py to 1.05Mt in 2007 (Figure 62). Output of greases
declined slightly in 2008, falling by 2.4% year-on-year, and then dropped by 9.3% in
2009 as the global economic downturn significantly reduced demand for grease.
Production rebounded in 2010, rising by 13.2% to 1.05Mt, slightly exceeding the
previous record output set in 2007. Output in 2011 was 1.08Mt, up 2.8% on 2010, and
is thought to have risen to 1.1Mt, a 2% increase on the year previous.
Output of lithium grease increased by 6.3%py between 2000 and 2007, to reach just
under 0.77Mt. By comparison, output of other lubricating greases increased by only
1.7%py to 2007. Production of lithium simple grease fell by 10.7% between 2007 and
2009 compared to only 3% for lithium complex greases. Lithium simple grease
production recovered to 2007 levels in 2010 while lithium complex grease output
exceeded its 2007 high to reach 0.185Mt.
Lithium simple 57%
Lithium complex 18%
Calcium 10%
Aluminium 4%
Polyurea 5%
Organophilic clay 2%
Sodium 1%
Others 3%
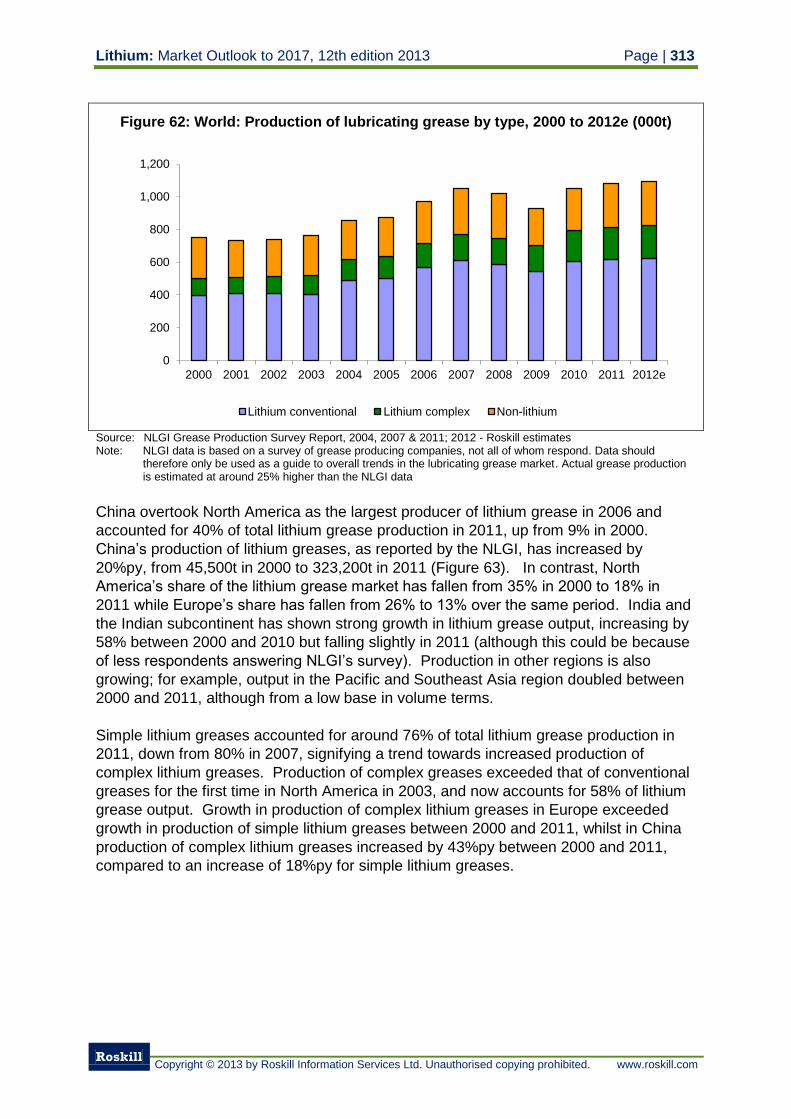
Lithium: Market Outlook to 2017, 12th edition 2013 Page | 313
Roskill
Copyright © 2013 by Roskill Information Services Ltd. Unauthorised copying prohibited. www.roskill.com
Figure 62: World: Production of lubricating grease by type, 2000 to 2012e (000t)
Source: NLGI Grease Production Survey Report, 2004, 2007 & 2011; 2012 - Roskill estimates Note: NLGI data is based on a survey of grease producing companies, not all of whom respond. Data should
therefore only be used as a guide to overall trends in the lubricating grease market. Actual grease production is estimated at around 25% higher than the NLGI data
China overtook North America as the largest producer of lithium grease in 2006 and
accounted for 40% of total lithium grease production in 2011, up from 9% in 2000.
China’s production of lithium greases, as reported by the NLGI, has increased by
20%py, from 45,500t in 2000 to 323,200t in 2011 (Figure 63). In contrast, North
America’s share of the lithium grease market has fallen from 35% in 2000 to 18% in
2011 while Europe’s share has fallen from 26% to 13% over the same period. India and
the Indian subcontinent has shown strong growth in lithium grease output, increasing by
58% between 2000 and 2010 but falling slightly in 2011 (although this could be because
of less respondents answering NLGI’s survey). Production in other regions is also
growing; for example, output in the Pacific and Southeast Asia region doubled between
2000 and 2011, although from a low base in volume terms.
Simple lithium greases accounted for around 76% of total lithium grease production in
2011, down from 80% in 2007, signifying a trend towards increased production of
complex lithium greases. Production of complex greases exceeded that of conventional
greases for the first time in North America in 2003, and now accounts for 58% of lithium
grease output. Growth in production of complex lithium greases in Europe exceeded
growth in production of simple lithium greases between 2000 and 2011, whilst in China
production of complex lithium greases increased by 43%py between 2000 and 2011,
compared to an increase of 18%py for simple lithium greases.
0
200
400
600
800
1,000
1,200
2000 2001 2002 2003 2004 2005 2006 2007 2008 2009 2010 2011 2012e
Lithium conventional Lithium complex Non-lithium
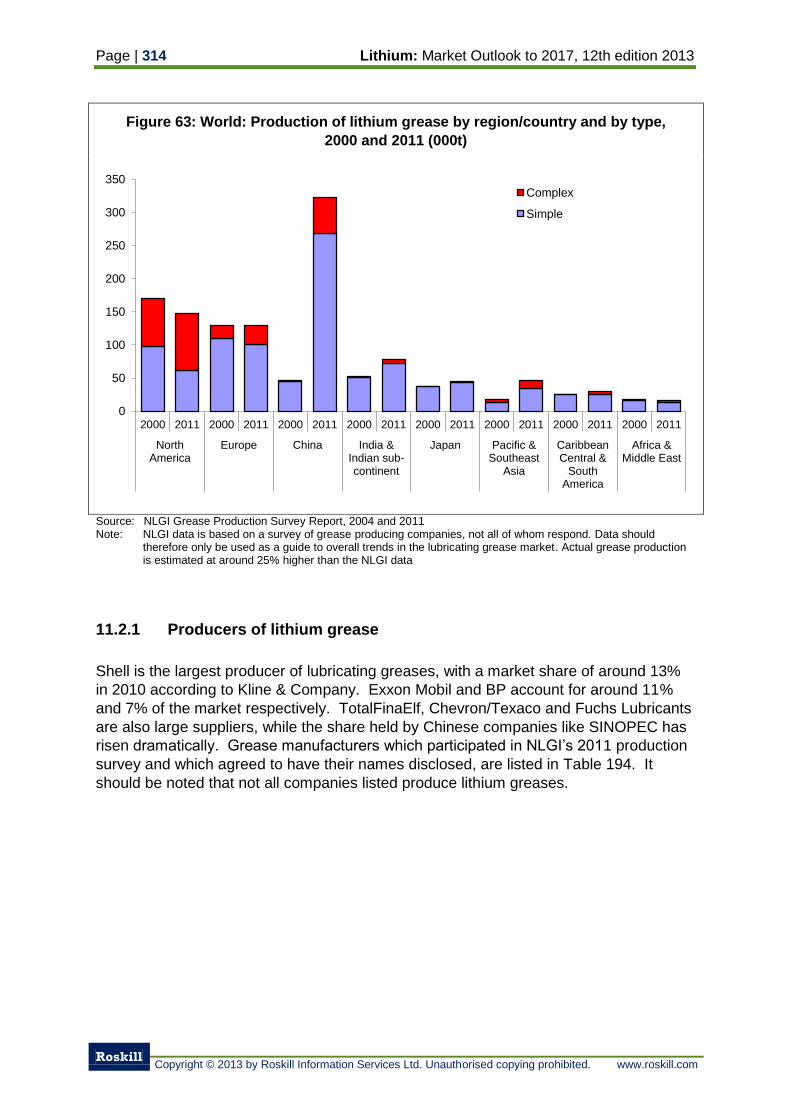
Page | 314 Lithium: Market Outlook to 2017, 12th edition 2013
Roskill
Copyright © 2013 by Roskill Information Services Ltd. Unauthorised copying prohibited. www.roskill.com
Figure 63: World: Production of lithium grease by region/country and by type,
2000 and 2011 (000t)
Source: NLGI Grease Production Survey Report, 2004 and 2011 Note: NLGI data is based on a survey of grease producing companies, not all of whom respond. Data should
therefore only be used as a guide to overall trends in the lubricating grease market. Actual grease production is estimated at around 25% higher than the NLGI data
11.2.1 Producers of lithium grease
Shell is the largest producer of lubricating greases, with a market share of around 13%
in 2010 according to Kline & Company. Exxon Mobil and BP account for around 11%
and 7% of the market respectively. TotalFinaElf, Chevron/Texaco and Fuchs Lubricants
are also large suppliers, while the share held by Chinese companies like SINOPEC has
risen dramatically. Grease manufacturers which participated in NLGI’s 2011 production
survey and which agreed to have their names disclosed, are listed in Table 194. It
should be noted that not all companies listed produce lithium greases.
0
50
100
150
200
250
300
350
2000 2011 2000 2011 2000 2011 2000 2011 2000 2011 2000 2011 2000 2011 2000 2011
NorthAmerica
Europe China India &Indian sub-continent
Japan Pacific &Southeast
Asia
CaribbeanCentral &
SouthAmerica
Africa &Middle East
Complex
Simple
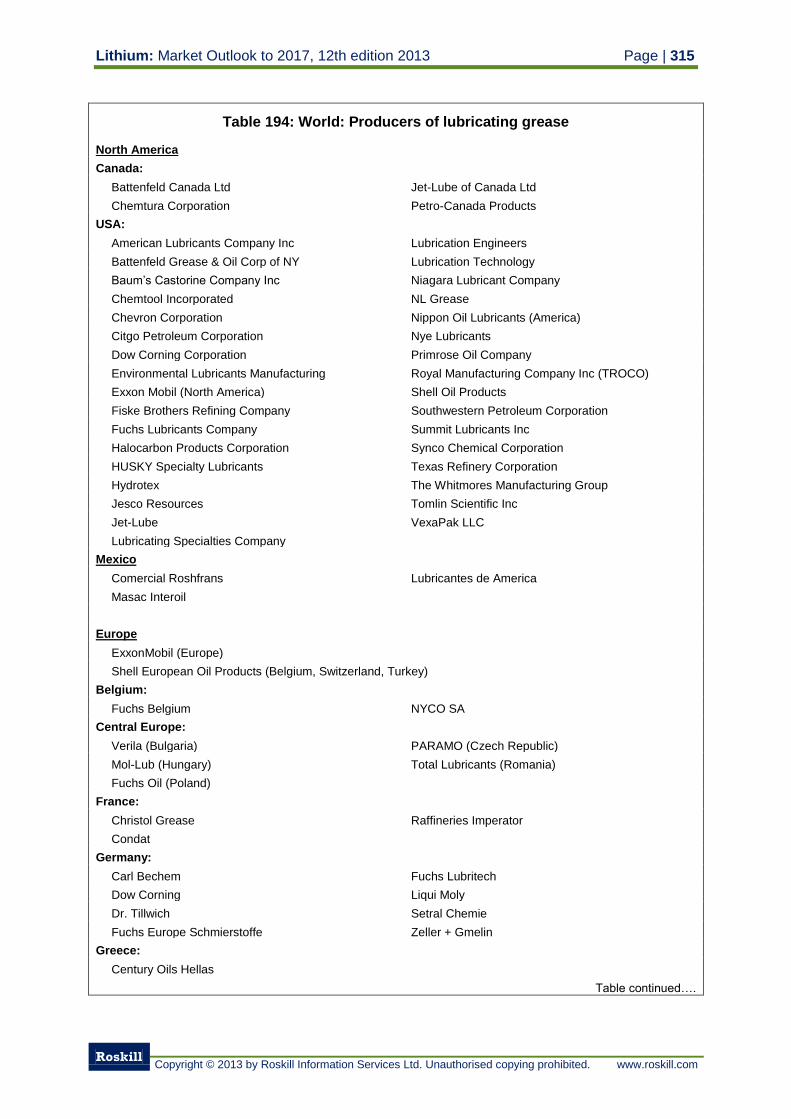
Lithium: Market Outlook to 2017, 12th edition 2013 Page | 315
Roskill
Copyright © 2013 by Roskill Information Services Ltd. Unauthorised copying prohibited. www.roskill.com
Table 194: World: Producers of lubricating grease
North America
Canada:
Battenfeld Canada Ltd Jet-Lube of Canada Ltd
Chemtura Corporation Petro-Canada Products
USA:
American Lubricants Company Inc Lubrication Engineers
Battenfeld Grease & Oil Corp of NY Lubrication Technology
Baum’s Castorine Company Inc Niagara Lubricant Company
Chemtool Incorporated NL Grease
Chevron Corporation Nippon Oil Lubricants (America)
Citgo Petroleum Corporation Nye Lubricants
Dow Corning Corporation Primrose Oil Company
Environmental Lubricants Manufacturing Royal Manufacturing Company Inc (TROCO)
Exxon Mobil (North America) Shell Oil Products
Fiske Brothers Refining Company Southwestern Petroleum Corporation
Fuchs Lubricants Company Summit Lubricants Inc
Halocarbon Products Corporation Synco Chemical Corporation
HUSKY Specialty Lubricants Texas Refinery Corporation
Hydrotex The Whitmores Manufacturing Group
Jesco Resources Tomlin Scientific Inc
Jet-Lube VexaPak LLC
Lubricating Specialties Company
Mexico
Comercial Roshfrans Lubricantes de America
Masac Interoil
Europe
ExxonMobil (Europe)
Shell European Oil Products (Belgium, Switzerland, Turkey)
Belgium:
Fuchs Belgium NYCO SA
Central Europe:
Verila (Bulgaria) PARAMO (Czech Republic)
Mol-Lub (Hungary) Total Lubricants (Romania)
Fuchs Oil (Poland)
France:
Christol Grease Raffineries Imperator
Condat
Germany:
Carl Bechem Fuchs Lubritech
Dow Corning Liqui Moly
Dr. Tillwich Setral Chemie
Fuchs Europe Schmierstoffe Zeller + Gmelin
Greece:
Century Oils Hellas
Table continued….
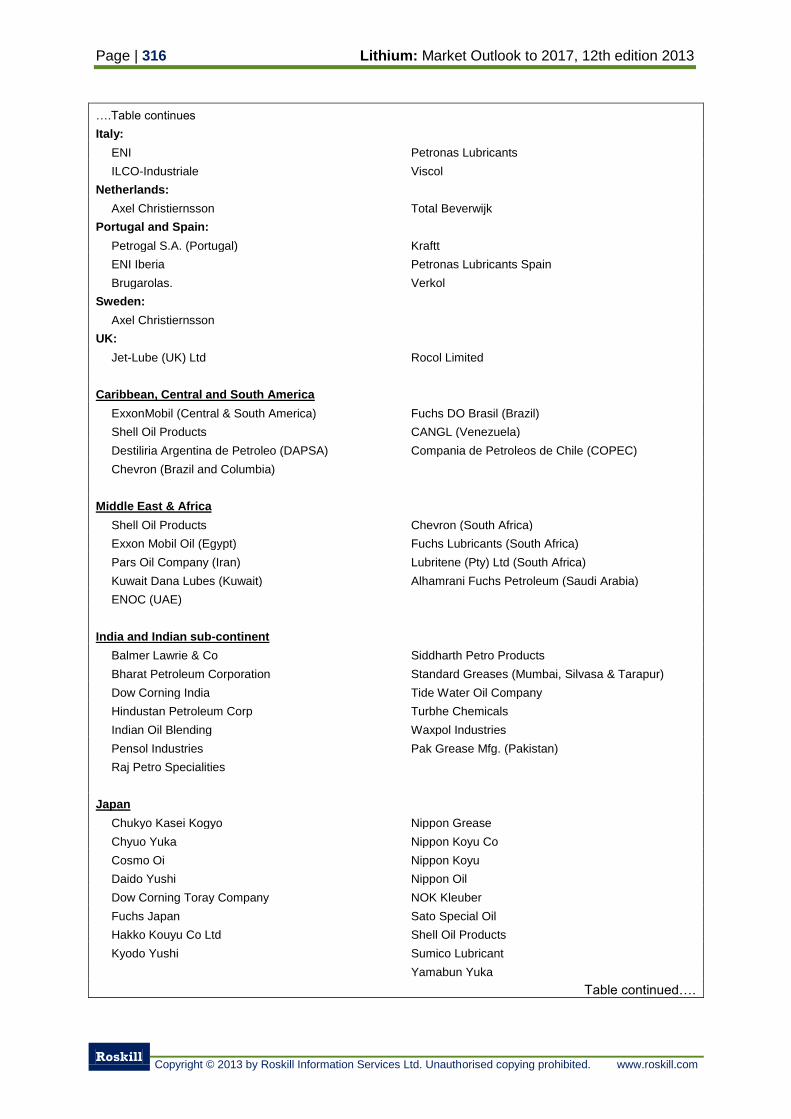
Page | 316 Lithium: Market Outlook to 2017, 12th edition 2013
Roskill
Copyright © 2013 by Roskill Information Services Ltd. Unauthorised copying prohibited. www.roskill.com
….Table continues
Italy:
ENI Petronas Lubricants
ILCO-Industriale Viscol
Netherlands:
Axel Christiernsson Total Beverwijk
Portugal and Spain:
Petrogal S.A. (Portugal) Kraftt
ENI Iberia Petronas Lubricants Spain
Brugarolas. Verkol
Sweden:
Axel Christiernsson
UK:
Jet-Lube (UK) Ltd Rocol Limited
Caribbean, Central and South America
ExxonMobil (Central & South America) Fuchs DO Brasil (Brazil)
Shell Oil Products CANGL (Venezuela)
Destiliria Argentina de Petroleo (DAPSA) Compania de Petroleos de Chile (COPEC)
Chevron (Brazil and Columbia)
Middle East & Africa
Shell Oil Products Chevron (South Africa)
Exxon Mobil Oil (Egypt) Fuchs Lubricants (South Africa)
Pars Oil Company (Iran) Lubritene (Pty) Ltd (South Africa)
Kuwait Dana Lubes (Kuwait) Alhamrani Fuchs Petroleum (Saudi Arabia)
ENOC (UAE)
India and Indian sub-continent
Balmer Lawrie & Co Siddharth Petro Products
Bharat Petroleum Corporation Standard Greases (Mumbai, Silvasa & Tarapur)
Dow Corning India Tide Water Oil Company
Hindustan Petroleum Corp Turbhe Chemicals
Indian Oil Blending Waxpol Industries
Pensol Industries Pak Grease Mfg. (Pakistan)
Raj Petro Specialities
Japan
Chukyo Kasei Kogyo Nippon Grease
Chyuo Yuka Nippon Koyu Co
Cosmo Oi Nippon Koyu
Daido Yushi Nippon Oil
Dow Corning Toray Company NOK Kleuber
Fuchs Japan Sato Special Oil
Hakko Kouyu Co Ltd Shell Oil Products
Kyodo Yushi Sumico Lubricant
Yamabun Yuka
Table continued….
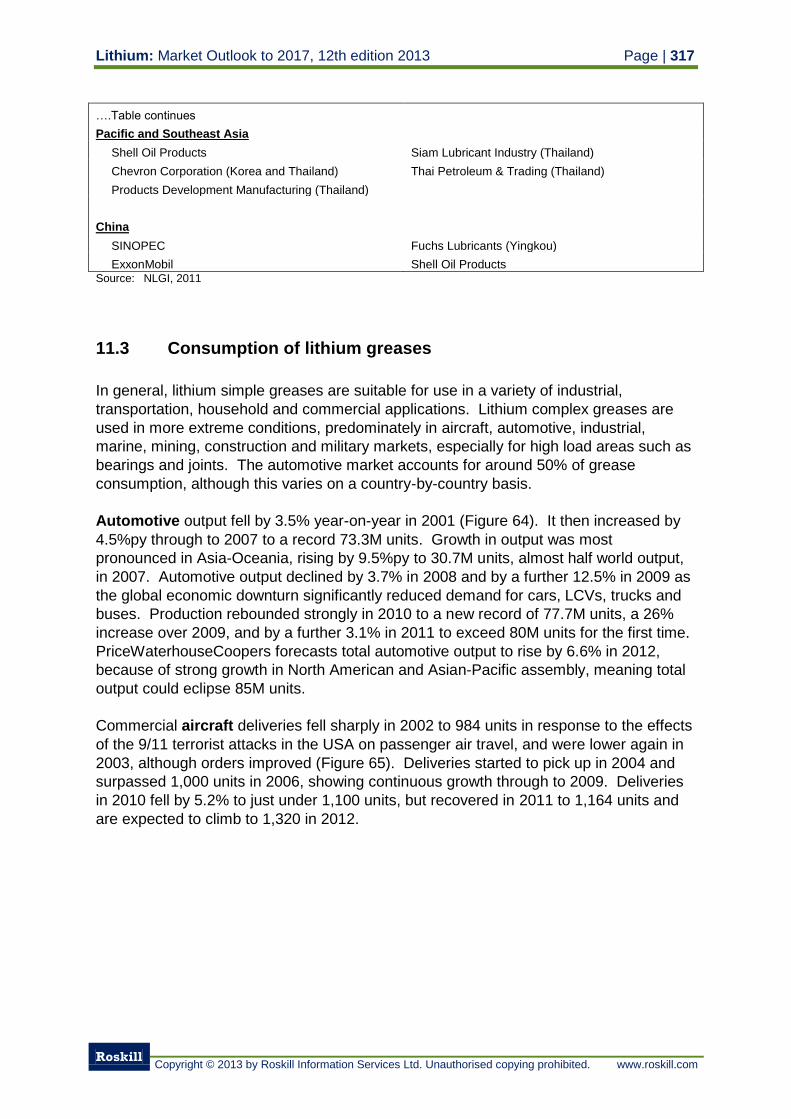
Lithium: Market Outlook to 2017, 12th edition 2013 Page | 317
Roskill
Copyright © 2013 by Roskill Information Services Ltd. Unauthorised copying prohibited. www.roskill.com
….Table continues
Pacific and Southeast Asia
Shell Oil Products Siam Lubricant Industry (Thailand)
Chevron Corporation (Korea and Thailand) Thai Petroleum & Trading (Thailand)
Products Development Manufacturing (Thailand)
China
SINOPEC Fuchs Lubricants (Yingkou)
ExxonMobil Shell Oil Products Source: NLGI, 2011
11.3 Consumption of lithium greases
In general, lithium simple greases are suitable for use in a variety of industrial,
transportation, household and commercial applications. Lithium complex greases are
used in more extreme conditions, predominately in aircraft, automotive, industrial,
marine, mining, construction and military markets, especially for high load areas such as
bearings and joints. The automotive market accounts for around 50% of grease
consumption, although this varies on a country-by-country basis.
Automotive output fell by 3.5% year-on-year in 2001 (Figure 64). It then increased by
4.5%py through to 2007 to a record 73.3M units. Growth in output was most
pronounced in Asia-Oceania, rising by 9.5%py to 30.7M units, almost half world output,
in 2007. Automotive output declined by 3.7% in 2008 and by a further 12.5% in 2009 as
the global economic downturn significantly reduced demand for cars, LCVs, trucks and
buses. Production rebounded strongly in 2010 to a new record of 77.7M units, a 26%
increase over 2009, and by a further 3.1% in 2011 to exceed 80M units for the first time.
PriceWaterhouseCoopers forecasts total automotive output to rise by 6.6% in 2012,
because of strong growth in North American and Asian-Pacific assembly, meaning total
output could eclipse 85M units.
Commercial aircraft deliveries fell sharply in 2002 to 984 units in response to the effects
of the 9/11 terrorist attacks in the USA on passenger air travel, and were lower again in
2003, although orders improved (Figure 65). Deliveries started to pick up in 2004 and
surpassed 1,000 units in 2006, showing continuous growth through to 2009. Deliveries
in 2010 fell by 5.2% to just under 1,100 units, but recovered in 2011 to 1,164 units and
are expected to climb to 1,320 in 2012.
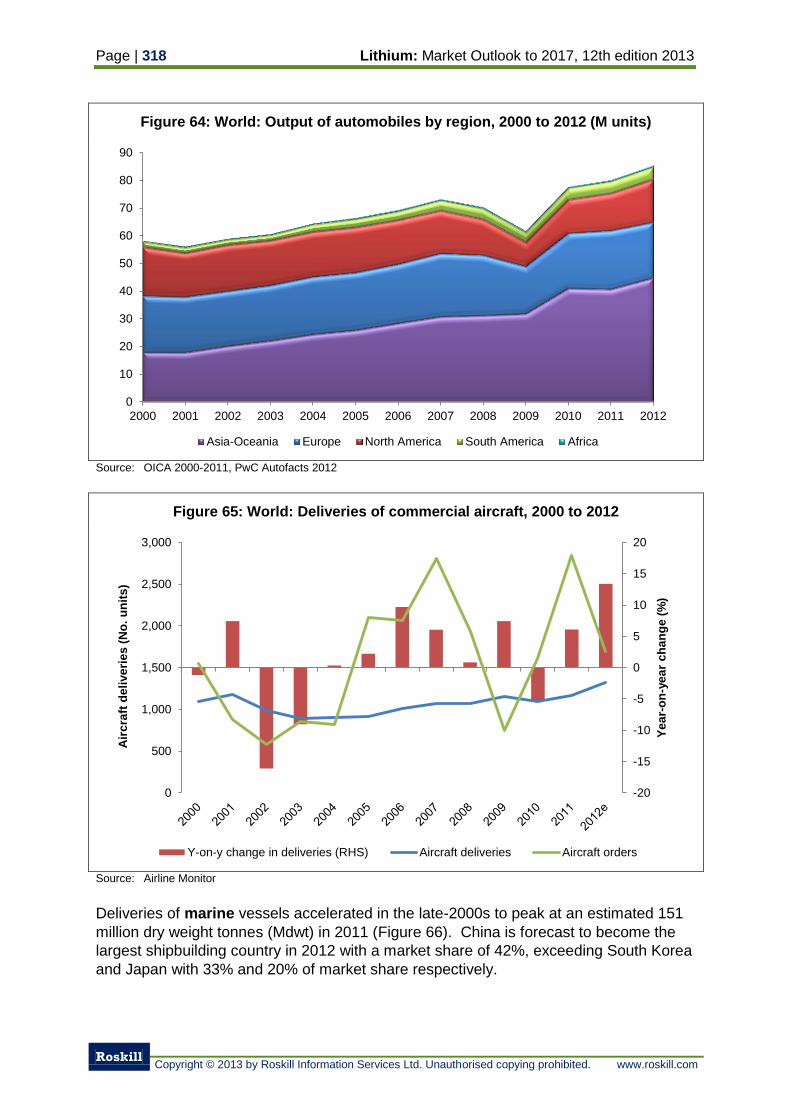
Page | 318 Lithium: Market Outlook to 2017, 12th edition 2013
Roskill
Copyright © 2013 by Roskill Information Services Ltd. Unauthorised copying prohibited. www.roskill.com
Figure 64: World: Output of automobiles by region, 2000 to 2012 (M units)
Source: OICA 2000-2011, PwC Autofacts 2012
Figure 65: World: Deliveries of commercial aircraft, 2000 to 2012
Source: Airline Monitor
Deliveries of marine vessels accelerated in the late-2000s to peak at an estimated 151
million dry weight tonnes (Mdwt) in 2011 (Figure 66). China is forecast to become the
largest shipbuilding country in 2012 with a market share of 42%, exceeding South Korea
and Japan with 33% and 20% of market share respectively.
0
10
20
30
40
50
60
70
80
90
2000 2001 2002 2003 2004 2005 2006 2007 2008 2009 2010 2011 2012
Asia-Oceania Europe North America South America Africa
-20
-15
-10
-5
0
5
10
15
20
0
500
1,000
1,500
2,000
2,500
3,000
Ye
ar-
on
-ye
ar
ch
an
ge
(%
)
Air
cra
ft d
eli
ve
rie
s (
No
. u
nit
s)
Y-on-y change in deliveries (RHS) Aircraft deliveries Aircraft orders
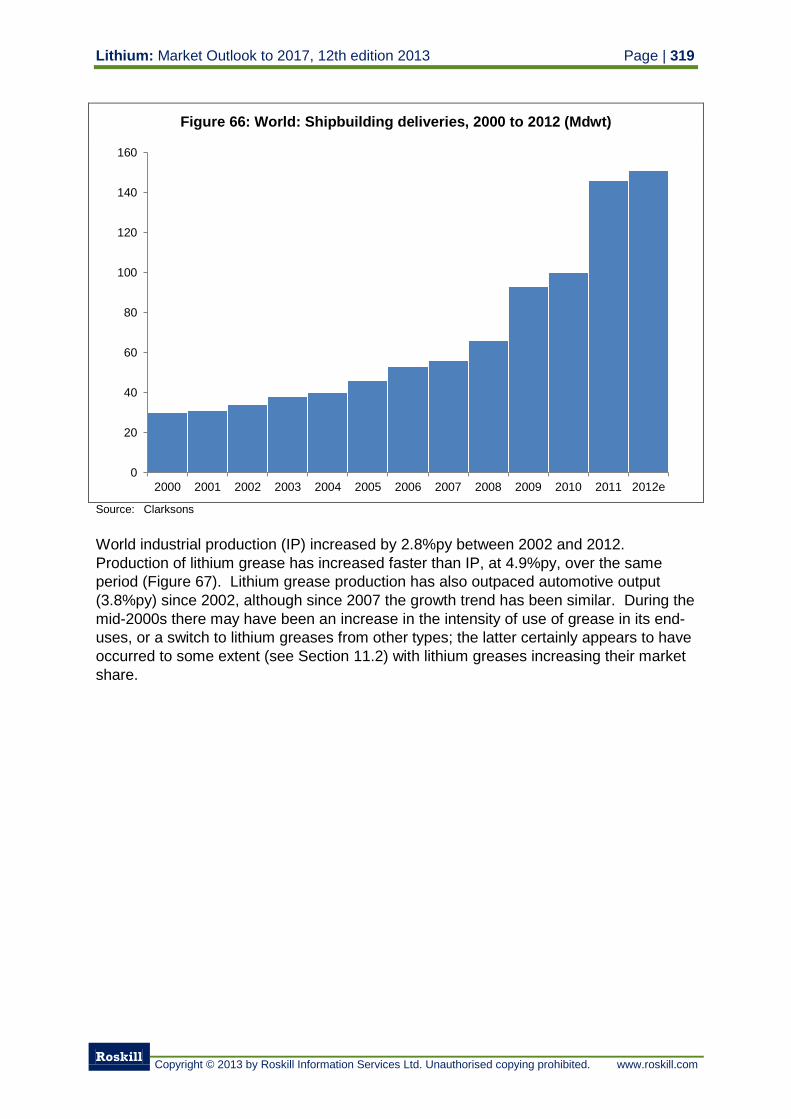
Lithium: Market Outlook to 2017, 12th edition 2013 Page | 319
Roskill
Copyright © 2013 by Roskill Information Services Ltd. Unauthorised copying prohibited. www.roskill.com
Figure 66: World: Shipbuilding deliveries, 2000 to 2012 (Mdwt)
Source: Clarksons
World industrial production (IP) increased by 2.8%py between 2002 and 2012.
Production of lithium grease has increased faster than IP, at 4.9%py, over the same
period (Figure 67). Lithium grease production has also outpaced automotive output
(3.8%py) since 2002, although since 2007 the growth trend has been similar. During the
mid-2000s there may have been an increase in the intensity of use of grease in its end-
uses, or a switch to lithium greases from other types; the latter certainly appears to have
occurred to some extent (see Section 11.2) with lithium greases increasing their market
share.
0
20
40
60
80
100
120
140
160
2000 2001 2002 2003 2004 2005 2006 2007 2008 2009 2010 2011 2012e
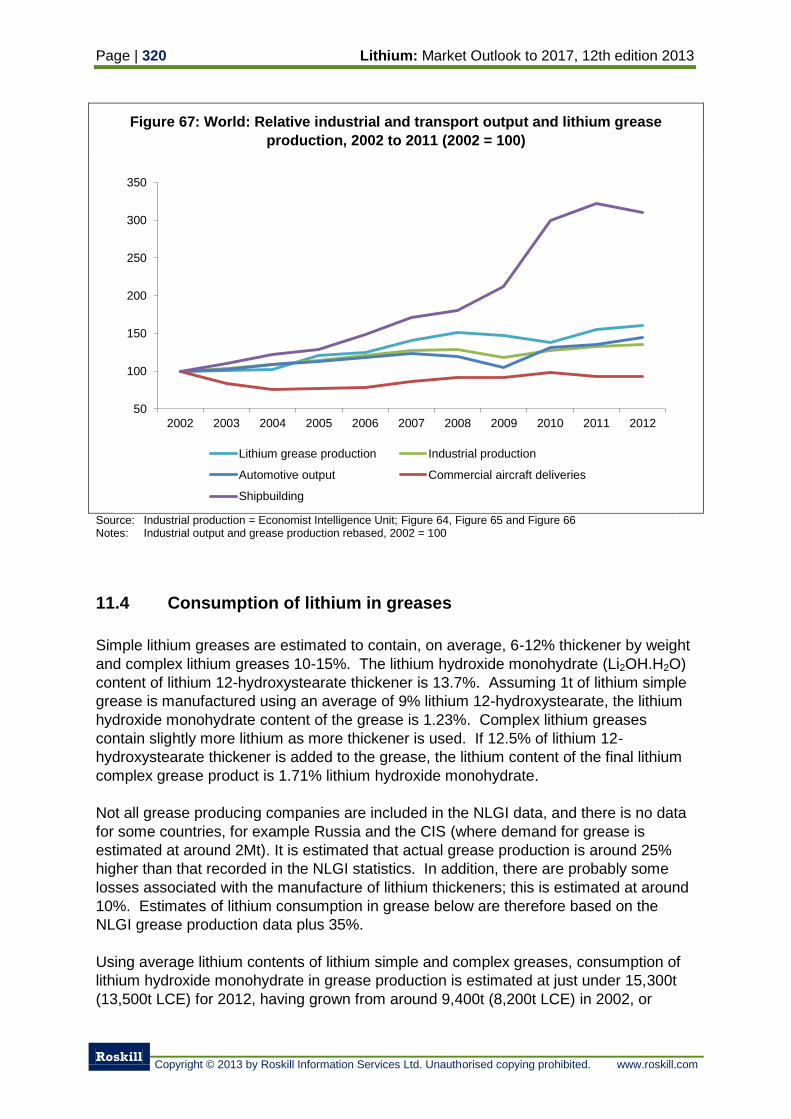
Page | 320 Lithium: Market Outlook to 2017, 12th edition 2013
Roskill
Copyright © 2013 by Roskill Information Services Ltd. Unauthorised copying prohibited. www.roskill.com
Figure 67: World: Relative industrial and transport output and lithium grease
production, 2002 to 2011 (2002 = 100)
Source: Industrial production = Economist Intelligence Unit; Figure 64, Figure 65 and Figure 66 Notes: Industrial output and grease production rebased, 2002 = 100
11.4 Consumption of lithium in greases
Simple lithium greases are estimated to contain, on average, 6-12% thickener by weight
and complex lithium greases 10-15%. The lithium hydroxide monohydrate (Li2OH.H2O)
content of lithium 12-hydroxystearate thickener is 13.7%. Assuming 1t of lithium simple
grease is manufactured using an average of 9% lithium 12-hydroxystearate, the lithium
hydroxide monohydrate content of the grease is 1.23%. Complex lithium greases
contain slightly more lithium as more thickener is used. If 12.5% of lithium 12-
hydroxystearate thickener is added to the grease, the lithium content of the final lithium
complex grease product is 1.71% lithium hydroxide monohydrate.
Not all grease producing companies are included in the NLGI data, and there is no data
for some countries, for example Russia and the CIS (where demand for grease is
estimated at around 2Mt). It is estimated that actual grease production is around 25%
higher than that recorded in the NLGI statistics. In addition, there are probably some
losses associated with the manufacture of lithium thickeners; this is estimated at around
10%. Estimates of lithium consumption in grease below are therefore based on the
NLGI grease production data plus 35%.
Using average lithium contents of lithium simple and complex greases, consumption of
lithium hydroxide monohydrate in grease production is estimated at just under 15,300t
(13,500t LCE) for 2012, having grown from around 9,400t (8,200t LCE) in 2002, or
50
100
150
200
250
300
350
2002 2003 2004 2005 2006 2007 2008 2009 2010 2011 2012
Lithium grease production Industrial production
Automotive output Commercial aircraft deliveries
Shipbuilding
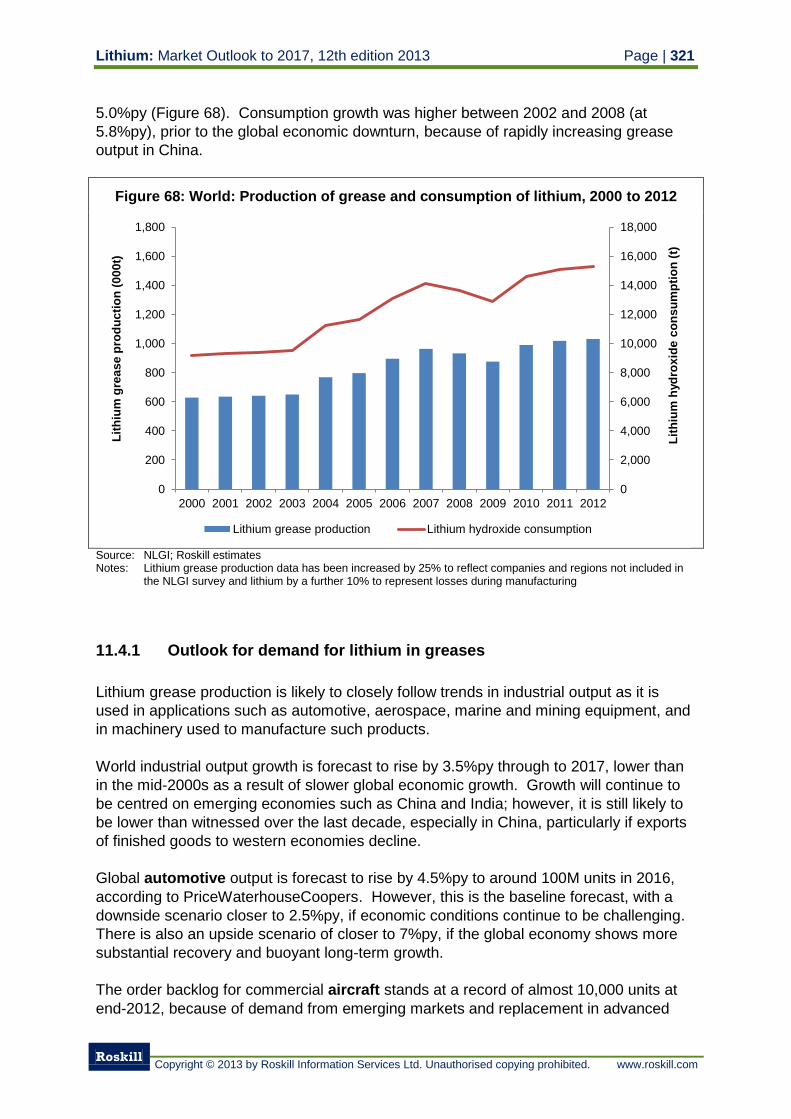
Lithium: Market Outlook to 2017, 12th edition 2013 Page | 321
Roskill
Copyright © 2013 by Roskill Information Services Ltd. Unauthorised copying prohibited. www.roskill.com
5.0%py (Figure 68). Consumption growth was higher between 2002 and 2008 (at
5.8%py), prior to the global economic downturn, because of rapidly increasing grease
output in China.
Figure 68: World: Production of grease and consumption of lithium, 2000 to 2012
Source: NLGI; Roskill estimates Notes: Lithium grease production data has been increased by 25% to reflect companies and regions not included in
the NLGI survey and lithium by a further 10% to represent losses during manufacturing
11.4.1 Outlook for demand for lithium in greases
Lithium grease production is likely to closely follow trends in industrial output as it is
used in applications such as automotive, aerospace, marine and mining equipment, and
in machinery used to manufacture such products.
World industrial output growth is forecast to rise by 3.5%py through to 2017, lower than
in the mid-2000s as a result of slower global economic growth. Growth will continue to
be centred on emerging economies such as China and India; however, it is still likely to
be lower than witnessed over the last decade, especially in China, particularly if exports
of finished goods to western economies decline.
Global automotive output is forecast to rise by 4.5%py to around 100M units in 2016,
according to PriceWaterhouseCoopers. However, this is the baseline forecast, with a
downside scenario closer to 2.5%py, if economic conditions continue to be challenging.
There is also an upside scenario of closer to 7%py, if the global economy shows more
substantial recovery and buoyant long-term growth.
The order backlog for commercial aircraft stands at a record of almost 10,000 units at
end-2012, because of demand from emerging markets and replacement in advanced
0
2,000
4,000
6,000
8,000
10,000
12,000
14,000
16,000
18,000
0
200
400
600
800
1,000
1,200
1,400
1,600
1,800
2000 2001 2002 2003 2004 2005 2006 2007 2008 2009 2010 2011 2012
Lit
hiu
m h
yd
rox
ide
co
ns
um
pti
on
(t)
Lit
hiu
m g
rea
se
pro
du
cti
on
(0
00
t)
Lithium grease production Lithium hydroxide consumption
Page | 322 Lithium: Market Outlook to 2017, 12th edition 2013
Roskill
Copyright © 2013 by Roskill Information Services Ltd. Unauthorised copying prohibited. www.roskill.com
economies, meaning growth in deliveries is expected to continue for at least the next five
years. Nevertheless, Airline Monitor forecast growth in deliveries of only 2.9%py, as
Airbus and Boeing struggle to deliver new aircraft such as the A380 and Dreamliner.
The global marine orderbook as of the end-August 2012 stood at almost 282 million dry
weight tonnes (4,795 units) according to Clarkson’s, but 2012 is likely to be the peak
year for deliveries as overcapacity weighs on the shipping industry. Deliveries will
decline in the short-term.
Lithium grease production is forecast to rise by around 4.5%py through to 2017, similar
to global automotive output, the main market driver. However, should manufacturing
output show lower rates of growth because of continued global economic challenges,
such as Europe’s lingering sovereign debt problems and the recent slowing in Chinese
economic growth, lithium grease production growth could be closer to 2.5%py.
In the base case scenario, lithium hydroxide consumption will closely follow lithium
grease production with demand forecast to increase from an estimated 15,400t (13,500t
LCE) in 2012 to around 19,200t (16,900t LCE) in 2016 (Table 195). Growth in lithium
hydroxide consumption in grease will slightly exceed actual grease production because
the rate of growth of lithium complex greases, which contain 15-50% more lithium than
simple lithium greases, is slightly higher than that of simple lithium greases.
Table 195: World: Forecast demand for lithium in greases, 2012 to 2017
2012 2017 CAGR (%py)
Low Base High Low Base High
Lithium hydroxide (t LiOH) 15,400 17,850 19,200 20,600 3.0 4.5 6.0
Total (t LCE) 13,500 15,700 16,900 18,100 3.0 4.5 6.0
Source: Roskill estimates
It is unlikely that lithium simple grease will loose its dominant position as the ‘multi-
purpose’ grease of choice for everyday mechanical use in the short (to 2017) and mid
(to 2022) term. The penetration of lithium greases in the market is high and substitution
is unlikely, unless prices for lithium hydroxide increase substantially. In Japan, there is
growing use of polyurea grease in place of lithium grease, but this is probably only a
local trend (the doubling in price of lithium hydroxide between 2004 and 2007 may have
contributed, however). Even if lithium greases were substituted more quickly in the
short-term, it is unlikely growth would be below the low-case scenario above.
Most of the potential growth in lithium greases comes from higher performance
applications, such as in the automotive market, where longevity, higher operating
temperatures and reduced noise are driving demand for more specialist greases based
on lithium complex types. Although these trends could reduce demand for simple lithium
greases, as complex lithium grease contains more lithium hydroxide than simple lithium
grease, so the overall effect will be positive. If lithium complex greases replace lithium
simple grease at a faster rate than forecast, there is potential for increased lithium
hydroxide demand, although this is unlikely to result in growth above the high-case
scenario above.
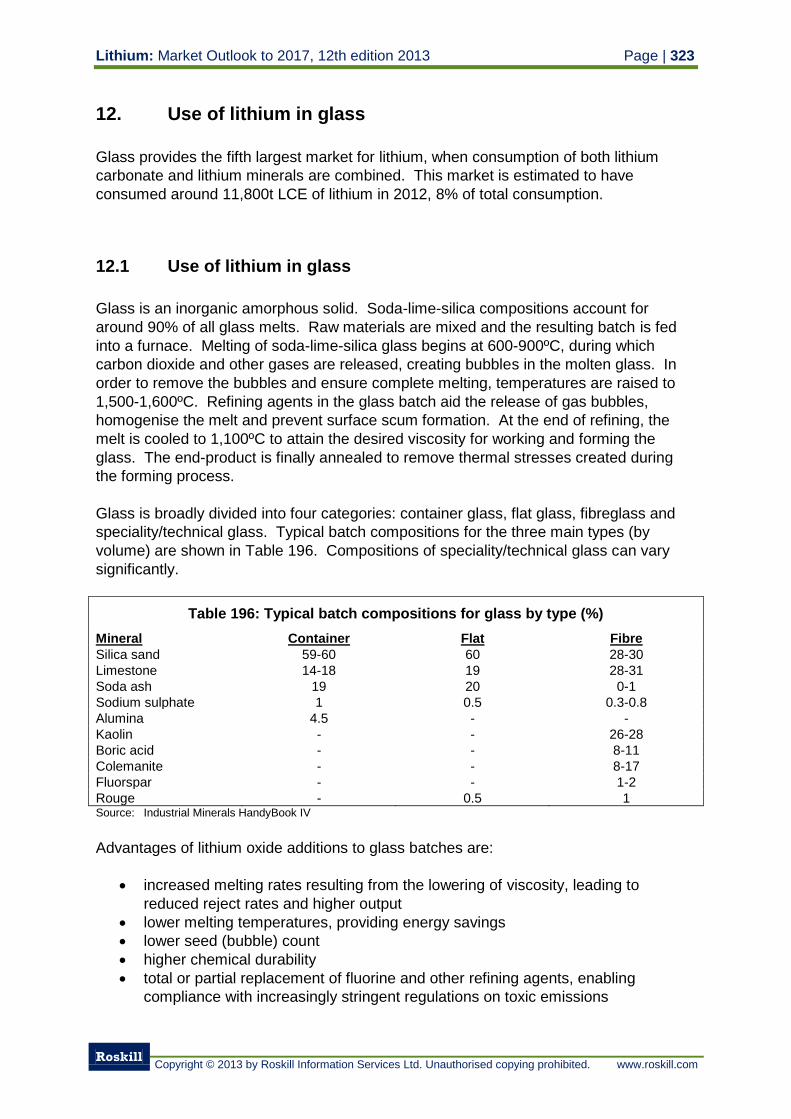
Lithium: Market Outlook to 2017, 12th edition 2013 Page | 323
Roskill
Copyright © 2013 by Roskill Information Services Ltd. Unauthorised copying prohibited. www.roskill.com
12. Use of lithium in glass
Glass provides the fifth largest market for lithium, when consumption of both lithium
carbonate and lithium minerals are combined. This market is estimated to have
consumed around 11,800t LCE of lithium in 2012, 8% of total consumption.
12.1 Use of lithium in glass
Glass is an inorganic amorphous solid. Soda-lime-silica compositions account for
around 90% of all glass melts. Raw materials are mixed and the resulting batch is fed
into a furnace. Melting of soda-lime-silica glass begins at 600-900ºC, during which
carbon dioxide and other gases are released, creating bubbles in the molten glass. In
order to remove the bubbles and ensure complete melting, temperatures are raised to
1,500-1,600ºC. Refining agents in the glass batch aid the release of gas bubbles,
homogenise the melt and prevent surface scum formation. At the end of refining, the
melt is cooled to 1,100ºC to attain the desired viscosity for working and forming the
glass. The end-product is finally annealed to remove thermal stresses created during
the forming process.
Glass is broadly divided into four categories: container glass, flat glass, fibreglass and
speciality/technical glass. Typical batch compositions for the three main types (by
volume) are shown in Table 196. Compositions of speciality/technical glass can vary
significantly.
Table 196: Typical batch compositions for glass by type (%)
Mineral Container Flat Fibre
Silica sand 59-60 60 28-30
Limestone 14-18 19 28-31
Soda ash 19 20 0-1
Sodium sulphate 1 0.5 0.3-0.8
Alumina 4.5 - -
Kaolin - - 26-28
Boric acid - - 8-11
Colemanite - - 8-17
Fluorspar - - 1-2
Rouge - 0.5 1 Source: Industrial Minerals HandyBook IV
Advantages of lithium oxide additions to glass batches are:
increased melting rates resulting from the lowering of viscosity, leading to
reduced reject rates and higher output
lower melting temperatures, providing energy savings
lower seed (bubble) count
higher chemical durability
total or partial replacement of fluorine and other refining agents, enabling
compliance with increasingly stringent regulations on toxic emissions
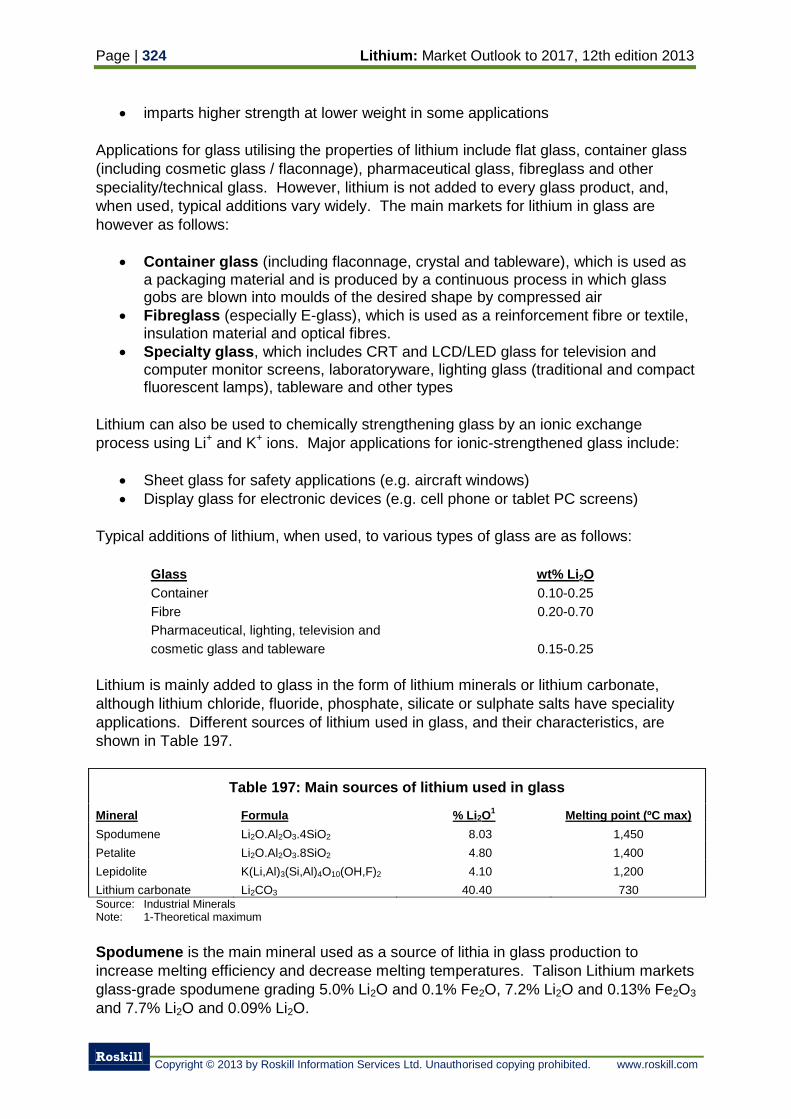
Page | 324 Lithium: Market Outlook to 2017, 12th edition 2013
Roskill
Copyright © 2013 by Roskill Information Services Ltd. Unauthorised copying prohibited. www.roskill.com
imparts higher strength at lower weight in some applications
Applications for glass utilising the properties of lithium include flat glass, container glass
(including cosmetic glass / flaconnage), pharmaceutical glass, fibreglass and other
speciality/technical glass. However, lithium is not added to every glass product, and,
when used, typical additions vary widely. The main markets for lithium in glass are
however as follows:
Container glass (including flaconnage, crystal and tableware), which is used as a packaging material and is produced by a continuous process in which glass gobs are blown into moulds of the desired shape by compressed air
Fibreglass (especially E-glass), which is used as a reinforcement fibre or textile, insulation material and optical fibres.
Specialty glass, which includes CRT and LCD/LED glass for television and computer monitor screens, laboratoryware, lighting glass (traditional and compact fluorescent lamps), tableware and other types
Lithium can also be used to chemically strengthening glass by an ionic exchange
process using Li+ and K
+ ions. Major applications for ionic-strengthened glass include:
Sheet glass for safety applications (e.g. aircraft windows)
Display glass for electronic devices (e.g. cell phone or tablet PC screens)
Typical additions of lithium, when used, to various types of glass are as follows:
Glass wt% Li2O
Container 0.10-0.25
Fibre 0.20-0.70
Pharmaceutical, lighting, television and
cosmetic glass and tableware
0.15-0.25
Lithium is mainly added to glass in the form of lithium minerals or lithium carbonate,
although lithium chloride, fluoride, phosphate, silicate or sulphate salts have speciality
applications. Different sources of lithium used in glass, and their characteristics, are
shown in Table 197.
Table 197: Main sources of lithium used in glass
Mineral Formula % Li2O1
Melting point (ºC max)
Spodumene Li2O.Al2O3.4SiO2 8.03 1,450
Petalite Li2O.Al2O3.8SiO2 4.80 1,400
Lepidolite K(Li,Al)3(Si,Al)4O10(OH,F)2 4.10 1,200
Lithium carbonate Li2CO3 40.40 730 Source: Industrial Minerals Note: 1-Theoretical maximum
Spodumene is the main mineral used as a source of lithia in glass production to
increase melting efficiency and decrease melting temperatures. Talison Lithium markets
glass-grade spodumene grading 5.0% Li2O and 0.1% Fe2O, 7.2% Li2O and 0.13% Fe2O3
and 7.7% Li2O and 0.09% Li2O.
Lithium: Market Outlook to 2017, 12th edition 2013 Page | 325
Roskill
Copyright © 2013 by Roskill Information Services Ltd. Unauthorised copying prohibited. www.roskill.com
Petalite is used in large quantities in the production of container glass to lower the
viscosity of the melt. Bikita Minerals markets container-grade petalite containing 4.1%
Li2O.
Lepidolite is used in opal, borosilicate and flint glass. In opal glass, up to 40% lepidolite
is added, giving a final lithium content of around 1.5% Li2O. Lepidolite may also be used
as a convenient source of alumina for CRT television tubes, and is easily melted
because of the presence of lithium and fluorine. This market has all but vanished with
the advent of LCD, LED and plasma display panels however.
For high-grade optical special glasses, where lithia is added in such small quantities that
use of minerals would not be cost-effective, and applications where decolouration from
Fe2O3 is an issue, lithium carbonate (technical grade) and other lithium compounds are
generally preferred to minerals. Some lithium carbonate is consumed in flat glass to
reduce the seed count, however this practice is not considered widespread.
Avalon Rare Metals in Canada (see Section5.8.4.3) developed a high-lithium feldspar
(HLF) product for use in the glass industry. The HLF product is a blend of petalite,
sodium feldspar, potassium feldspar, mica and quartz. This provides lithium pre-mixed
into quartz-feldspar glass sand at minimal additional cost. Avalon has been in
discussions with industrial minerals marketers with a view toward commercialising the
HLF product, but is not currently used commercially.
12.2 Production and consumption of glass
Total production of glass is estimated at around 145Mt in 2012. Container glass accounts
for the largest proportion of glass production by volume, at 50% of the total, followed by flat
glass at 38% (Figure 69). Fibreglass and speciality glass each account for 6% of glass
production.
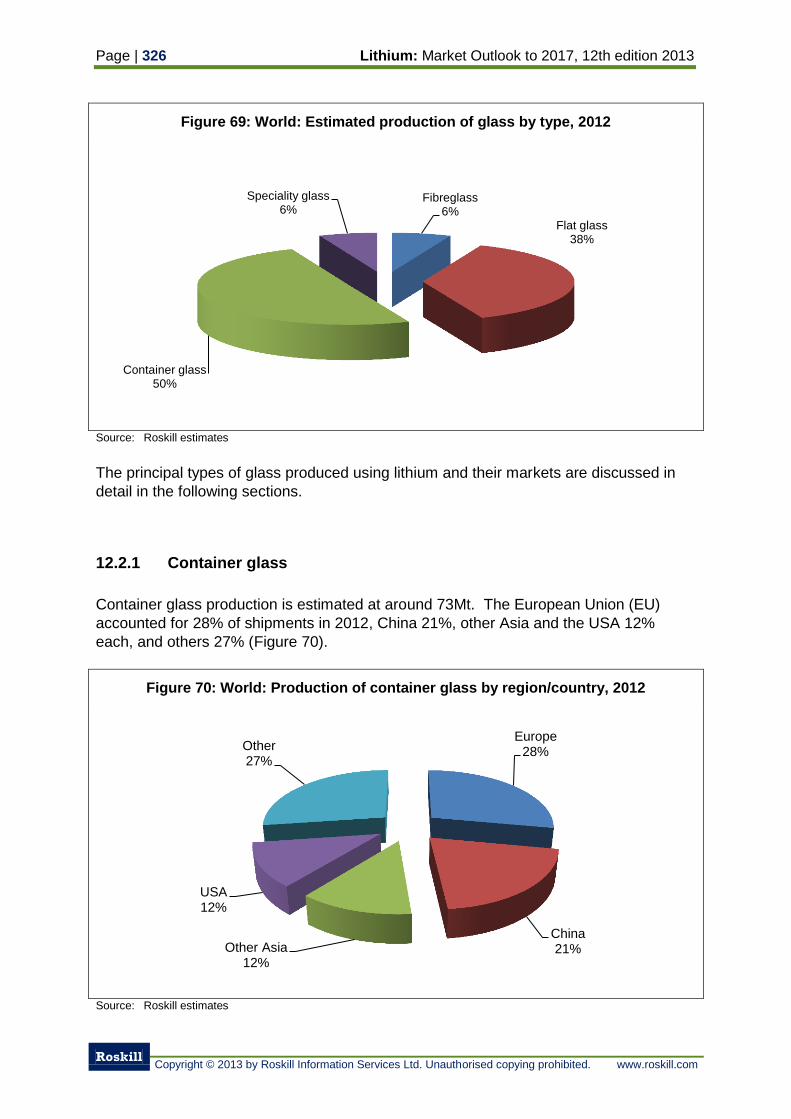
Page | 326 Lithium: Market Outlook to 2017, 12th edition 2013
Roskill
Copyright © 2013 by Roskill Information Services Ltd. Unauthorised copying prohibited. www.roskill.com
Figure 69: World: Estimated production of glass by type, 2012
Source: Roskill estimates
The principal types of glass produced using lithium and their markets are discussed in
detail in the following sections.
12.2.1 Container glass
Container glass production is estimated at around 73Mt. The European Union (EU)
accounted for 28% of shipments in 2012, China 21%, other Asia and the USA 12%
each, and others 27% (Figure 70).
Figure 70: World: Production of container glass by region/country, 2012
Source: Roskill estimates
Fibreglass 6%
Flat glass 38%
Container glass 50%
Speciality glass 6%
Europe 28%
China 21% Other Asia
12%
USA 12%
Other 27%
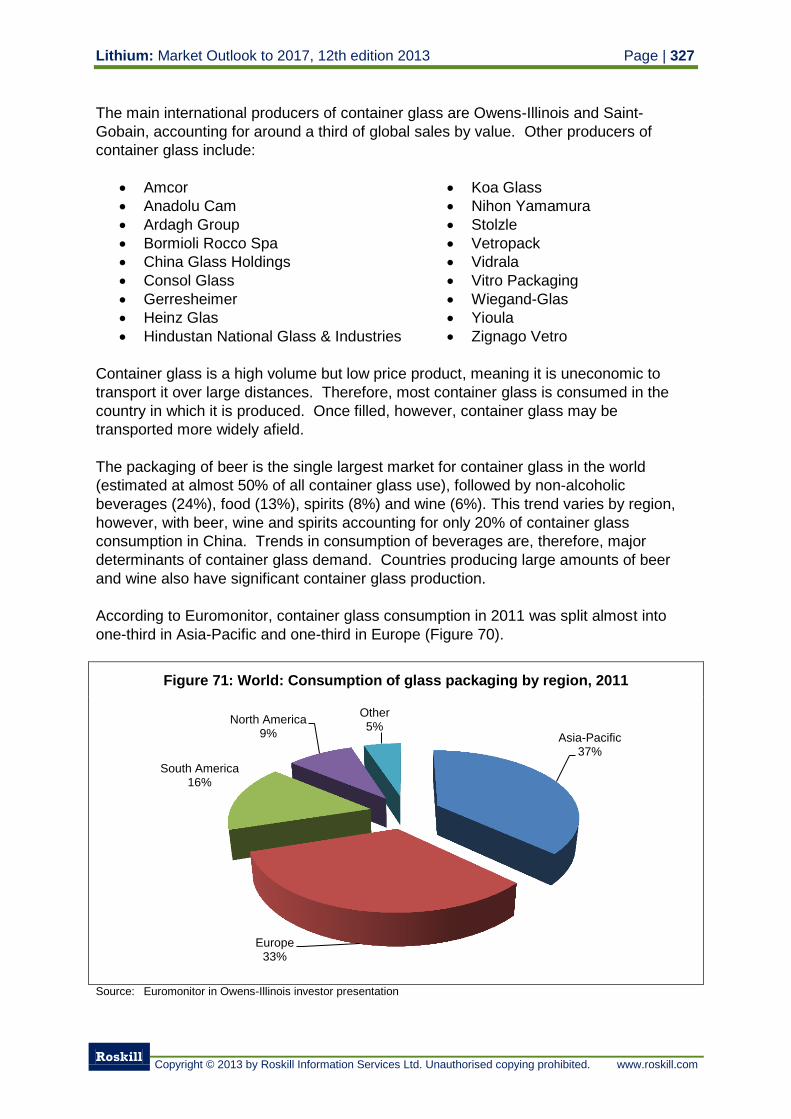
Lithium: Market Outlook to 2017, 12th edition 2013 Page | 327
Roskill
Copyright © 2013 by Roskill Information Services Ltd. Unauthorised copying prohibited. www.roskill.com
The main international producers of container glass are Owens-Illinois and Saint-
Gobain, accounting for around a third of global sales by value. Other producers of
container glass include:
Amcor
Anadolu Cam
Ardagh Group
Bormioli Rocco Spa
China Glass Holdings
Consol Glass
Gerresheimer
Heinz Glas
Hindustan National Glass & Industries
Koa Glass
Nihon Yamamura
Stolzle
Vetropack
Vidrala
Vitro Packaging
Wiegand-Glas
Yioula
Zignago Vetro
Container glass is a high volume but low price product, meaning it is uneconomic to
transport it over large distances. Therefore, most container glass is consumed in the
country in which it is produced. Once filled, however, container glass may be
transported more widely afield.
The packaging of beer is the single largest market for container glass in the world
(estimated at almost 50% of all container glass use), followed by non-alcoholic
beverages (24%), food (13%), spirits (8%) and wine (6%). This trend varies by region,
however, with beer, wine and spirits accounting for only 20% of container glass
consumption in China. Trends in consumption of beverages are, therefore, major
determinants of container glass demand. Countries producing large amounts of beer
and wine also have significant container glass production.
According to Euromonitor, container glass consumption in 2011 was split almost into
one-third in Asia-Pacific and one-third in Europe (Figure 70).
Figure 71: World: Consumption of glass packaging by region, 2011
Source: Euromonitor in Owens-Illinois investor presentation
Asia-Pacific 37%
Europe 33%
South America 16%
North America 9%
Other 5%
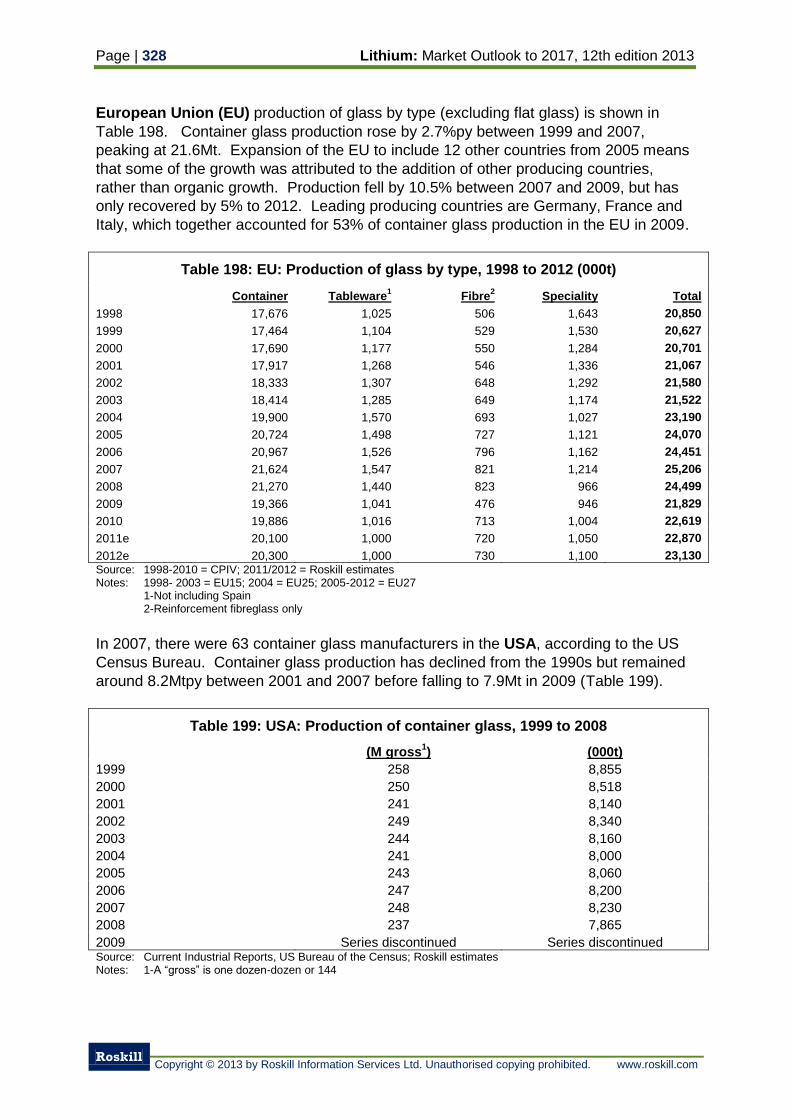
Page | 328 Lithium: Market Outlook to 2017, 12th edition 2013
Roskill
Copyright © 2013 by Roskill Information Services Ltd. Unauthorised copying prohibited. www.roskill.com
European Union (EU) production of glass by type (excluding flat glass) is shown in
Table 198. Container glass production rose by 2.7%py between 1999 and 2007,
peaking at 21.6Mt. Expansion of the EU to include 12 other countries from 2005 means
that some of the growth was attributed to the addition of other producing countries,
rather than organic growth. Production fell by 10.5% between 2007 and 2009, but has
only recovered by 5% to 2012. Leading producing countries are Germany, France and
Italy, which together accounted for 53% of container glass production in the EU in 2009.
Table 198: EU: Production of glass by type, 1998 to 2012 (000t)
Container Tableware1 Fibre
2 Speciality Total
1998 17,676 1,025 506 1,643 20,850
1999 17,464 1,104 529 1,530 20,627
2000 17,690 1,177 550 1,284 20,701
2001 17,917 1,268 546 1,336 21,067
2002 18,333 1,307 648 1,292 21,580
2003 18,414 1,285 649 1,174 21,522
2004 19,900 1,570 693 1,027 23,190
2005 20,724 1,498 727 1,121 24,070
2006 20,967 1,526 796 1,162 24,451
2007 21,624 1,547 821 1,214 25,206
2008 21,270 1,440 823 966 24,499
2009 19,366 1,041 476 946 21,829
2010 19,886 1,016 713 1,004 22,619
2011e 20,100 1,000 720 1,050 22,870
2012e 20,300 1,000 730 1,100 23,130 Source: 1998-2010 = CPIV; 2011/2012 = Roskill estimates Notes: 1998- 2003 = EU15; 2004 = EU25; 2005-2012 = EU27 1-Not including Spain 2-Reinforcement fibreglass only
In 2007, there were 63 container glass manufacturers in the USA, according to the US
Census Bureau. Container glass production has declined from the 1990s but remained
around 8.2Mtpy between 2001 and 2007 before falling to 7.9Mt in 2009 (Table 199).
Table 199: USA: Production of container glass, 1999 to 2008
(M gross1) (000t)
1999 258 8,855
2000 250 8,518
2001 241 8,140
2002 249 8,340
2003 244 8,160
2004 241 8,000
2005 243 8,060
2006 247 8,200
2007 248 8,230
2008 237 7,865
2009 Series discontinued Series discontinued Source: Current Industrial Reports, US Bureau of the Census; Roskill estimates Notes: 1-A “gross” is one dozen-dozen or 144
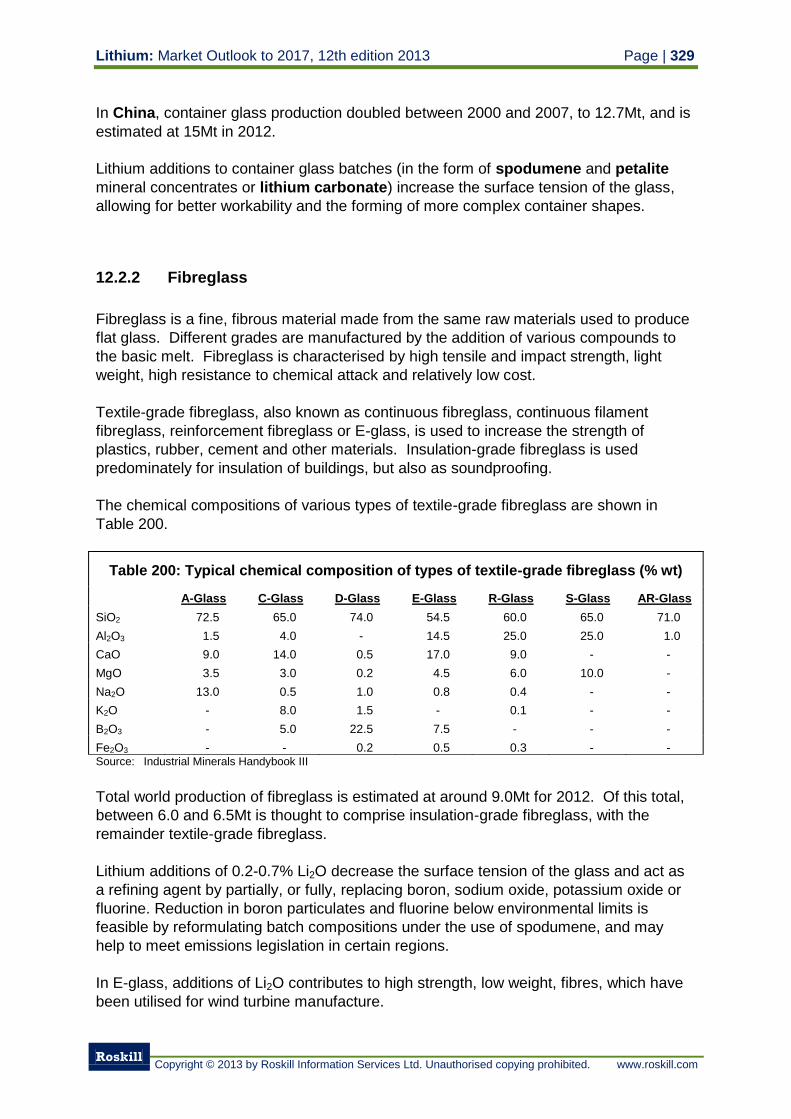
Lithium: Market Outlook to 2017, 12th edition 2013 Page | 329
Roskill
Copyright © 2013 by Roskill Information Services Ltd. Unauthorised copying prohibited. www.roskill.com
In China, container glass production doubled between 2000 and 2007, to 12.7Mt, and is
estimated at 15Mt in 2012.
Lithium additions to container glass batches (in the form of spodumene and petalite
mineral concentrates or lithium carbonate) increase the surface tension of the glass,
allowing for better workability and the forming of more complex container shapes.
12.2.2 Fibreglass
Fibreglass is a fine, fibrous material made from the same raw materials used to produce
flat glass. Different grades are manufactured by the addition of various compounds to
the basic melt. Fibreglass is characterised by high tensile and impact strength, light
weight, high resistance to chemical attack and relatively low cost.
Textile-grade fibreglass, also known as continuous fibreglass, continuous filament
fibreglass, reinforcement fibreglass or E-glass, is used to increase the strength of
plastics, rubber, cement and other materials. Insulation-grade fibreglass is used
predominately for insulation of buildings, but also as soundproofing.
The chemical compositions of various types of textile-grade fibreglass are shown in
Table 200.
Table 200: Typical chemical composition of types of textile-grade fibreglass (% wt)
A-Glass C-Glass D-Glass E-Glass R-Glass S-Glass AR-Glass
SiO2 72.5 65.0 74.0 54.5 60.0 65.0 71.0
Al2O3 1.5 4.0 - 14.5 25.0 25.0 1.0
CaO 9.0 14.0 0.5 17.0 9.0 - -
MgO 3.5 3.0 0.2 4.5 6.0 10.0 -
Na2O 13.0 0.5 1.0 0.8 0.4 - -
K2O - 8.0 1.5 - 0.1 - -
B2O3 - 5.0 22.5 7.5 - - -
Fe2O3 - - 0.2 0.5 0.3 - - Source: Industrial Minerals Handybook III
Total world production of fibreglass is estimated at around 9.0Mt for 2012. Of this total,
between 6.0 and 6.5Mt is thought to comprise insulation-grade fibreglass, with the
remainder textile-grade fibreglass.
Lithium additions of 0.2-0.7% Li2O decrease the surface tension of the glass and act as
a refining agent by partially, or fully, replacing boron, sodium oxide, potassium oxide or
fluorine. Reduction in boron particulates and fluorine below environmental limits is
feasible by reformulating batch compositions under the use of spodumene, and may
help to meet emissions legislation in certain regions.
In E-glass, additions of Li2O contributes to high strength, low weight, fibres, which have
been utilised for wind turbine manufacture.
Page | 330 Lithium: Market Outlook to 2017, 12th edition 2013
Roskill
Copyright © 2013 by Roskill Information Services Ltd. Unauthorised copying prohibited. www.roskill.com
12.2.3 Speciality glass
Speciality glass accounts for around 6% of world glass production in terms of volume but
around 20% in terms of value. Speciality glass includes:
Cathode ray tube (CRT) glass Thin-film transistor (TFT) glass
Lead-free glass Light bulbs and fluorescent tubes
Glass tubing Tableware
Pharmaceutical glass Scientific and laboratory glassware
Fibreoptics Lasers
Optical glass
Lithium was an essential constituent of monochrome CRT glass where, in combination
with strontium carbonate, it reduced radiation from faceplate glass and improved surface
finish. Lithium is not essential in colour CRT glass, though it can be added to match the
thermal expansion coefficients of the faceplate and funnel, which have different chemical
compositions. Lithium can also replace fluorspar as a flux. The production of CRT glass
has declined rapidly, and is now only produced in small quantities in China and India.
Lithium can be used as replacement to lead in lead-free glass. Additions of up to 3%
Li2O result in glassware with similar properties to leaded glass. Lithium is also used as
a flux in leaded and lead-free crystal glass, together with barium, zinc and boron in
quantities of up to 10%.
Lithia is added as high-purity carbonate to photochromic glass, to give improved
stability. On exposure to ultra-violet light, lithium ions in the glass combines with silver
halide to form a compound which discolours or darkens the glass. This reaction is
reversed when the glass is no longer exposed to ultra-violet light.
Lithium glass detectors are scintillation-type detectors that emit light in response to
energy excitation received from ionizing radiation. The detectors are silicate-based
glasses into which a few weight percent of lithium has been incorporated. They also
contain a small percentage of an activator species (necessary to produce the
fluorescence effect); this is usually cerium in oxide form.
12.3 Consumption of lithium in glass
The market for lithium minerals in glass began to develop in the mid-1980s when Lithium
Australia (now Talison Lithium) introduced its glass-grade spodumene. Almost all
manufacturers of black and white television tubes adopted lithium minerals between
1983 and 1988 because of the availability of competitively-priced spodumene. Lithium
was essential in black and white television tube glass production to act with strontium in
absorbing high-energy radiation. The end of large-scale production of black and white
television tube glass in the early 1990s resulted in lower demand for lithium minerals and
a change in the pattern of consumption. This market, which accounted for 16% of
lithium mineral consumption in 1990, was negligible by 2000.
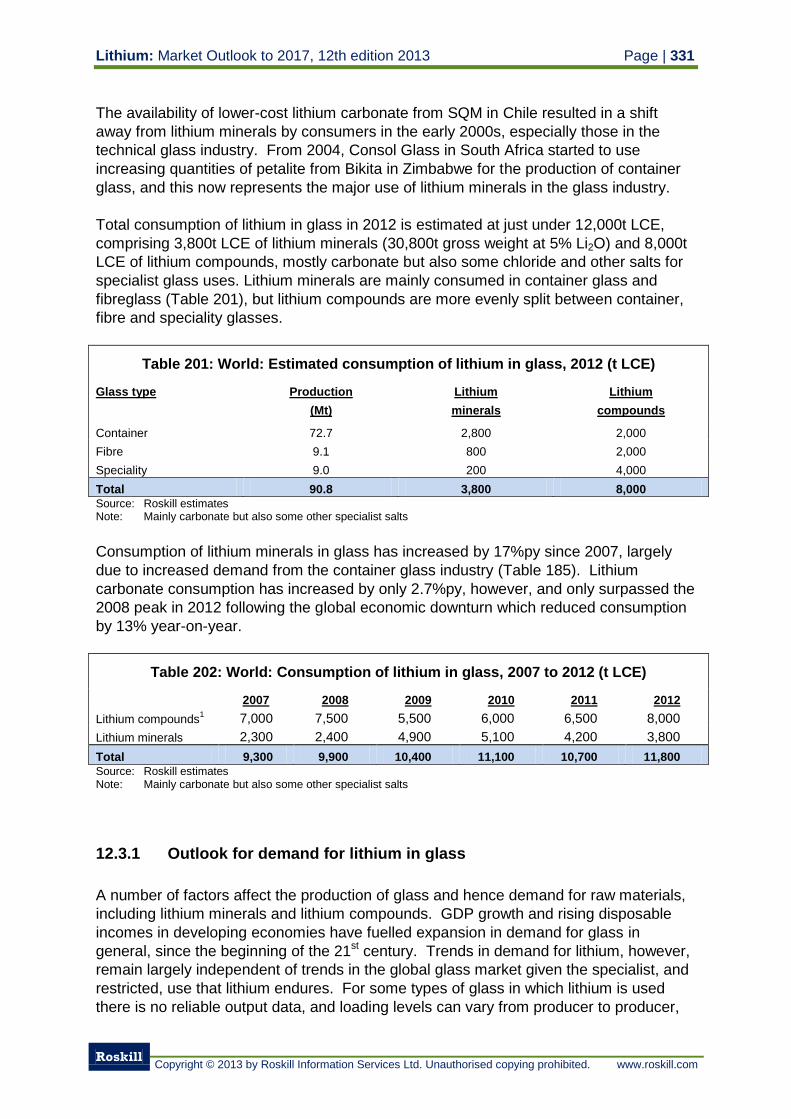
Lithium: Market Outlook to 2017, 12th edition 2013 Page | 331
Roskill
Copyright © 2013 by Roskill Information Services Ltd. Unauthorised copying prohibited. www.roskill.com
The availability of lower-cost lithium carbonate from SQM in Chile resulted in a shift
away from lithium minerals by consumers in the early 2000s, especially those in the
technical glass industry. From 2004, Consol Glass in South Africa started to use
increasing quantities of petalite from Bikita in Zimbabwe for the production of container
glass, and this now represents the major use of lithium minerals in the glass industry.
Total consumption of lithium in glass in 2012 is estimated at just under 12,000t LCE,
comprising 3,800t LCE of lithium minerals (30,800t gross weight at 5% Li2O) and 8,000t
LCE of lithium compounds, mostly carbonate but also some chloride and other salts for
specialist glass uses. Lithium minerals are mainly consumed in container glass and
fibreglass (Table 201), but lithium compounds are more evenly split between container,
fibre and speciality glasses.
Table 201: World: Estimated consumption of lithium in glass, 2012 (t LCE)
Glass type Production
(Mt)
Lithium
minerals
Lithium
compounds
Container 72.7 2,800 2,000
Fibre 9.1 800 2,000
Speciality 9.0 200 4,000
Total 90.8 3,800 8,000
Source: Roskill estimates Note: Mainly carbonate but also some other specialist salts
Consumption of lithium minerals in glass has increased by 17%py since 2007, largely
due to increased demand from the container glass industry (Table 185). Lithium
carbonate consumption has increased by only 2.7%py, however, and only surpassed the
2008 peak in 2012 following the global economic downturn which reduced consumption
by 13% year-on-year.
Table 202: World: Consumption of lithium in glass, 2007 to 2012 (t LCE)
2007 2008 2009 2010 2011 2012
Lithium compounds1 7,000 7,500 5,500 6,000 6,500 8,000
Lithium minerals 2,300 2,400 4,900 5,100 4,200 3,800
Total 9,300 9,900 10,400 11,100 10,700 11,800
Source: Roskill estimates Note: Mainly carbonate but also some other specialist salts
12.3.1 Outlook for demand for lithium in glass
A number of factors affect the production of glass and hence demand for raw materials,
including lithium minerals and lithium compounds. GDP growth and rising disposable
incomes in developing economies have fuelled expansion in demand for glass in
general, since the beginning of the 21st century. Trends in demand for lithium, however,
remain largely independent of trends in the global glass market given the specialist, and
restricted, use that lithium endures. For some types of glass in which lithium is used
there is no reliable output data, and loading levels can vary from producer to producer,
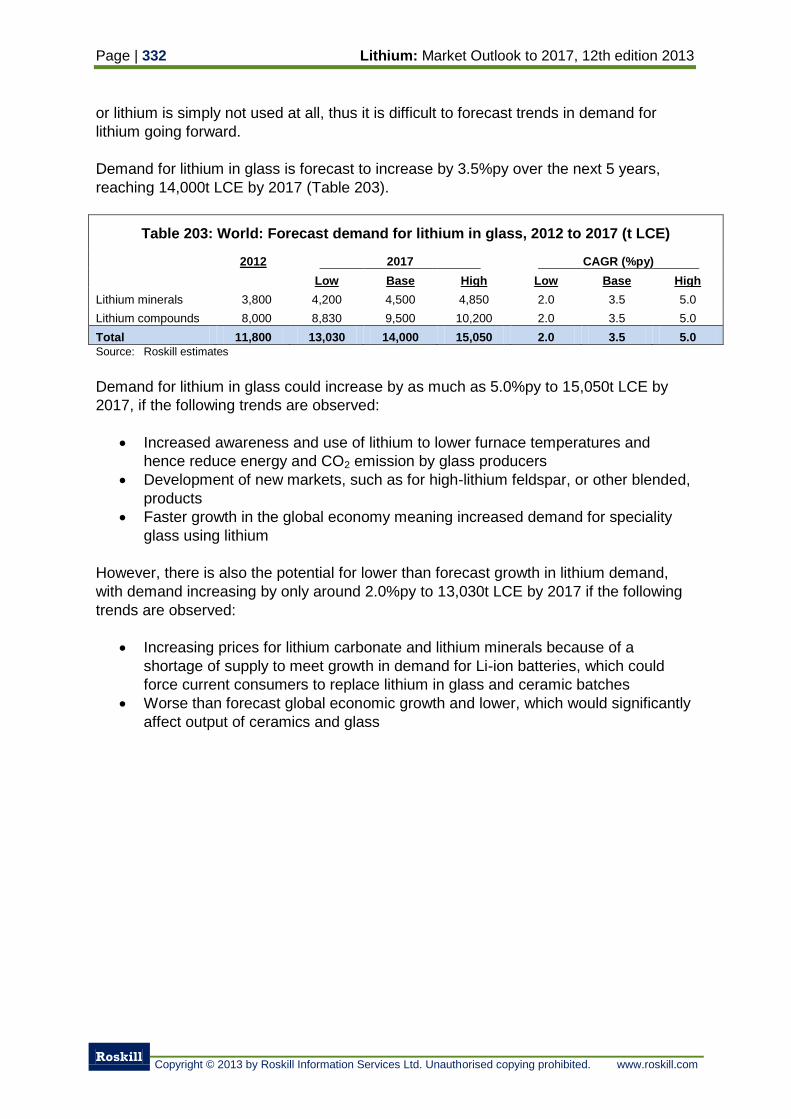
Page | 332 Lithium: Market Outlook to 2017, 12th edition 2013
Roskill
Copyright © 2013 by Roskill Information Services Ltd. Unauthorised copying prohibited. www.roskill.com
or lithium is simply not used at all, thus it is difficult to forecast trends in demand for
lithium going forward.
Demand for lithium in glass is forecast to increase by 3.5%py over the next 5 years,
reaching 14,000t LCE by 2017 (Table 203).
Table 203: World: Forecast demand for lithium in glass, 2012 to 2017 (t LCE)
2012 2017 CAGR (%py)
Low Base High Low Base High
Lithium minerals 3,800 4,200 4,500 4,850 2.0 3.5 5.0
Lithium compounds 8,000 8,830 9,500 10,200 2.0 3.5 5.0
Total 11,800 13,030 14,000 15,050 2.0 3.5 5.0
Source: Roskill estimates
Demand for lithium in glass could increase by as much as 5.0%py to 15,050t LCE by
2017, if the following trends are observed:
Increased awareness and use of lithium to lower furnace temperatures and
hence reduce energy and CO2 emission by glass producers
Development of new markets, such as for high-lithium feldspar, or other blended,
products
Faster growth in the global economy meaning increased demand for speciality
glass using lithium
However, there is also the potential for lower than forecast growth in lithium demand,
with demand increasing by only around 2.0%py to 13,030t LCE by 2017 if the following
trends are observed:
Increasing prices for lithium carbonate and lithium minerals because of a
shortage of supply to meet growth in demand for Li-ion batteries, which could
force current consumers to replace lithium in glass and ceramic batches
Worse than forecast global economic growth and lower, which would significantly
affect output of ceramics and glass
Lithium: Market Outlook to 2017, 12th edition 2013 Page | 333
Roskill
Copyright © 2013 by Roskill Information Services Ltd. Unauthorised copying prohibited. www.roskill.com
13. Use of lithium in metallurgical powders
Consumption of lithium in metallurgical casting powders is estimated at 8,200t LCE in
2012 or 6% of total lithium consumption.
Lithia, a strong flux, is introduced into metallurgical casting powders either in the form of
lithium minerals (spodumene and petalite) or lithium carbonate. Lithia reduces the
viscosity of the casting powder, which in continuous casting increases flow, allowing the
continuous casting process to operate at greater speeds. In traditional metal casting,
lithia additions to mould sands reduce the co-efficient of thermal expansion, helping to
prevent veining and deformation of the cast.
13.1 Continuous casting
In the continuous casting of steel, a mould flux is generally added to the surface of the
molten steel in the mould, as the steel is poured. The mould flux provides lubrication
between the mould wall and the steel, reduces the loss of heat from the surface of the
steel, protects the surface from oxidation, and it may even remove impurities such as
alumina from the steel.
Continuous casting mould fluxes comprise one or more refractory metal oxides (45-90%
of the mould flux), one or more fluxing agents (10-50%), a binder (0.05-10%), an
expanding agent (0-10%) and carbonaceous material (1-6%).
Typical components in the mould flux are:
Glass formers (SiO2, Al2O3, B2O3, Fe2O3)
Basic oxides (CaO, MgO, BaO)
Alkali oxides (Na2O, Li2O, K2O)
Fluidisers (F2, MnO)
Melt control (C)
Lithium oxide/lithia (Li2O), when utilised, is usually present in concentrations up to 5% to
control the melting behaviour and fluidity of the mould flux. In most cases, lithium oxide
is added in the form of lithium carbonate, which decomposes at the elevated
temperatures in the casting mould. However, lithium oxide can also be introduced into
the mould flux by the addition of spodumene or petalite, which also introduces the glass
forming minerals SiO2 and Al2O3 into the flux. Lithium’s main benefit in the mould flux is
to reduce the viscosity and thereby increase flow, allowing the continuous casting
process to operate at greater speeds.
Mould fluxes come in three forms: powdery, granular, or spherical granular. Powdery
and granular types are chiefly employed in continuous casting. Powdery-type mould
fluxes are used mainly for low carbon aluminum-killed steel which is easily affected by
contamination defects such as pin-holes and blow holes, as well as for high speed
continuous casting where the casting speeds are at least 1.6m/min requiring even
speedier fluxing and slagging. Granular types are superior from an environmental
Page | 334 Lithium: Market Outlook to 2017, 12th edition 2013
Roskill
Copyright © 2013 by Roskill Information Services Ltd. Unauthorised copying prohibited. www.roskill.com
aspect because they generate less dust and produce uniform fusing of the granular
layer. For these reasons, granular additives are mainly used for medium carbon steels
which require uniform fusion and uniform influx of the additive or for use in low speed
casting which gives priority to environmental problems.
13.1.1 Producers of continuous casting mould powders
Producers of continuous casting mould fluxes include:
Lipterm (Macedonia)
Foseco (worldwide)
Xixia Longcheng (China)
Stollberg (worldwide)
Shinagawa Refractories (Japan)
SAM Americas (USA)
Henan Xibao Metallurgy (China)
Thermochem (South Africa)
Kempro (Italy)
Metallurgica (Germany)
RT Vanderbilt (USA)
Grindchem (India)
Hirono Chemical Industries (Japan)
Sakai Chemical Industry (Japan)
Prosimet (Italy)
Nippon Steel & Sumikin Metal
Products (Japan and China)
Xixia Longcheng has a capacity for 100,000tpy of mould flux powders and supplies
major steel mills in China, such as Baosteel, Wuhan Iron and Steel, Shougang, Anshan
Iron and Steel, Maanshan Iron and Steel, Panzhihua Iron and Steel, Taiyuan Iron and
Steel, Jinan Iron and Steel and Sha Steel. The company claims to supply 30% of the
Chinese market, suggesting the Chinese market is around 400,000tpy.
Stollberg (part of S&B Industrial Minerals) had a capacity of 190,000tpy and produced
160,000t of mould fluxes in 2005. The company claimed to hold a 30% share of the
world mould flux market in 2005, suggesting that the total world market in 2005 was
around 535,000t. Stollberg has operations in Germany, USA, South Korea, China
(35,000tpy), France, Brazil (10,000tpy) and India (10,000tpy).
Lipterm supplies mainly the southeast European market. Its SANTALIT product is
recommended for all steel grades cast and various profiles of semi-finished casts at
speeds 0.4-1.8m/min. Consumption of SANTALIT is typically 0.8-1.1kg/t steel.
13.1.2 Continually cast steel production
In 2011, continually cast steel accounted for 94% of total global steel output according to
the German Steel Federation, up from 86% in 2000. World production of continuously
cast steel has increased by 5.8%py since 1998, reaching 1.43Bnt in 2012 (Figure 72).
The mid-2000s witnessed an exceptional period of growth, with output rising by 9.5%py
between 2001 and 2007, but since the 2008/09 global economic downturn, output has
slowed, despite initially rebounding strongly in 2010.
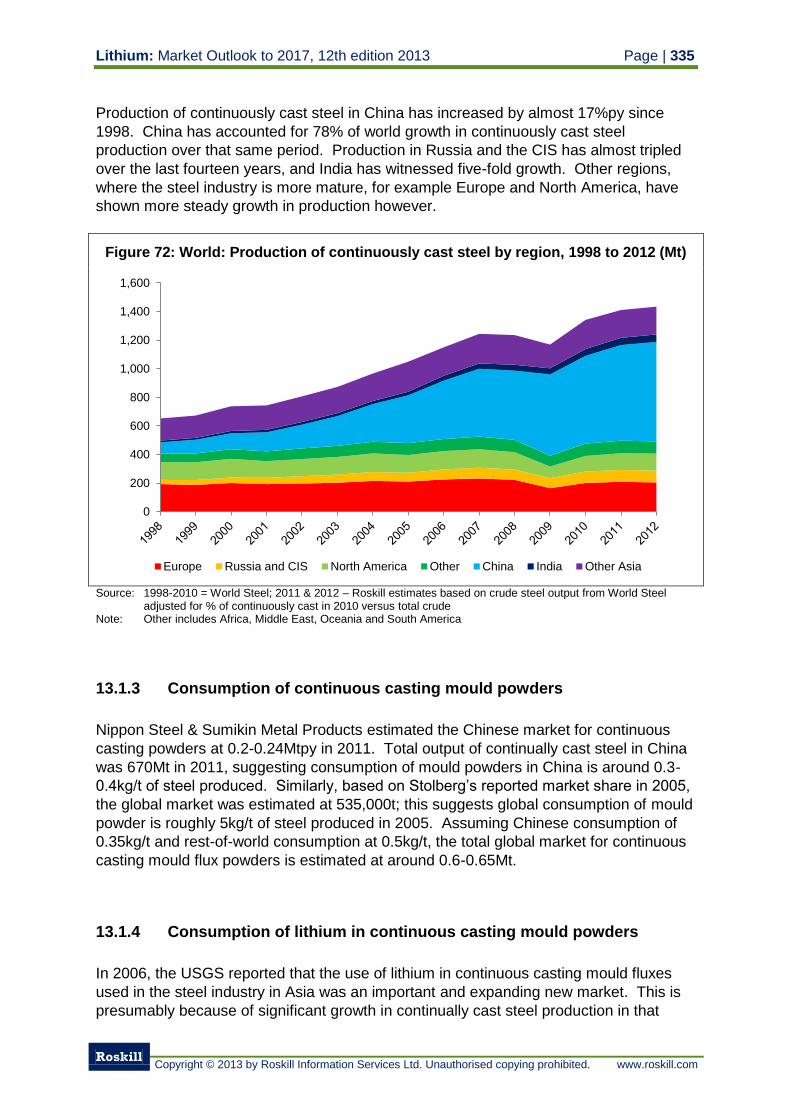
Lithium: Market Outlook to 2017, 12th edition 2013 Page | 335
Roskill
Copyright © 2013 by Roskill Information Services Ltd. Unauthorised copying prohibited. www.roskill.com
Production of continuously cast steel in China has increased by almost 17%py since
1998. China has accounted for 78% of world growth in continuously cast steel
production over that same period. Production in Russia and the CIS has almost tripled
over the last fourteen years, and India has witnessed five-fold growth. Other regions,
where the steel industry is more mature, for example Europe and North America, have
shown more steady growth in production however.
Figure 72: World: Production of continuously cast steel by region, 1998 to 2012 (Mt)
Source: 1998-2010 = World Steel; 2011 & 2012 – Roskill estimates based on crude steel output from World Steel
adjusted for % of continuously cast in 2010 versus total crude Note: Other includes Africa, Middle East, Oceania and South America
13.1.3 Consumption of continuous casting mould powders
Nippon Steel & Sumikin Metal Products estimated the Chinese market for continuous
casting powders at 0.2-0.24Mtpy in 2011. Total output of continually cast steel in China
was 670Mt in 2011, suggesting consumption of mould powders in China is around 0.3-
0.4kg/t of steel produced. Similarly, based on Stolberg’s reported market share in 2005,
the global market was estimated at 535,000t; this suggests global consumption of mould
powder is roughly 5kg/t of steel produced in 2005. Assuming Chinese consumption of
0.35kg/t and rest-of-world consumption at 0.5kg/t, the total global market for continuous
casting mould flux powders is estimated at around 0.6-0.65Mt.
13.1.4 Consumption of lithium in continuous casting mould powders
In 2006, the USGS reported that the use of lithium in continuous casting mould fluxes
used in the steel industry in Asia was an important and expanding new market. This is
presumably because of significant growth in continually cast steel production in that
0
200
400
600
800
1,000
1,200
1,400
1,600
Europe Russia and CIS North America Other China India Other Asia
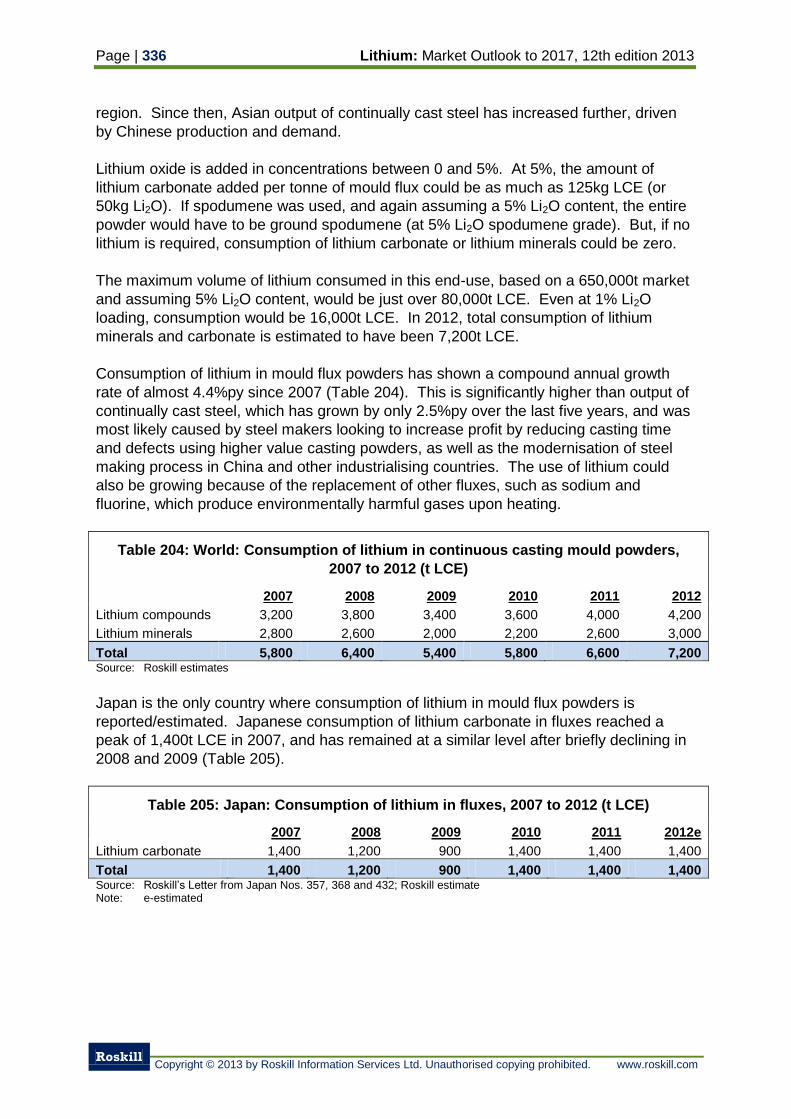
Page | 336 Lithium: Market Outlook to 2017, 12th edition 2013
Roskill
Copyright © 2013 by Roskill Information Services Ltd. Unauthorised copying prohibited. www.roskill.com
region. Since then, Asian output of continually cast steel has increased further, driven
by Chinese production and demand.
Lithium oxide is added in concentrations between 0 and 5%. At 5%, the amount of
lithium carbonate added per tonne of mould flux could be as much as 125kg LCE (or
50kg Li2O). If spodumene was used, and again assuming a 5% Li2O content, the entire
powder would have to be ground spodumene (at 5% Li2O spodumene grade). But, if no
lithium is required, consumption of lithium carbonate or lithium minerals could be zero.
The maximum volume of lithium consumed in this end-use, based on a 650,000t market
and assuming 5% Li2O content, would be just over 80,000t LCE. Even at 1% Li2O
loading, consumption would be 16,000t LCE. In 2012, total consumption of lithium
minerals and carbonate is estimated to have been 7,200t LCE.
Consumption of lithium in mould flux powders has shown a compound annual growth
rate of almost 4.4%py since 2007 (Table 204). This is significantly higher than output of
continually cast steel, which has grown by only 2.5%py over the last five years, and was
most likely caused by steel makers looking to increase profit by reducing casting time
and defects using higher value casting powders, as well as the modernisation of steel
making process in China and other industrialising countries. The use of lithium could
also be growing because of the replacement of other fluxes, such as sodium and
fluorine, which produce environmentally harmful gases upon heating.
Table 204: World: Consumption of lithium in continuous casting mould powders,
2007 to 2012 (t LCE)
2007 2008 2009 2010 2011 2012
Lithium compounds 3,200 3,800 3,400 3,600 4,000 4,200
Lithium minerals 2,800 2,600 2,000 2,200 2,600 3,000
Total 5,800 6,400 5,400 5,800 6,600 7,200 Source: Roskill estimates
Japan is the only country where consumption of lithium in mould flux powders is
reported/estimated. Japanese consumption of lithium carbonate in fluxes reached a
peak of 1,400t LCE in 2007, and has remained at a similar level after briefly declining in
2008 and 2009 (Table 205).
Table 205: Japan: Consumption of lithium in fluxes, 2007 to 2012 (t LCE)
2007 2008 2009 2010 2011 2012e
Lithium carbonate 1,400 1,200 900 1,400 1,400 1,400
Total 1,400 1,200 900 1,400 1,400 1,400 Source: Roskill’s Letter from Japan Nos. 357, 368 and 432; Roskill estimate Note: e-estimated
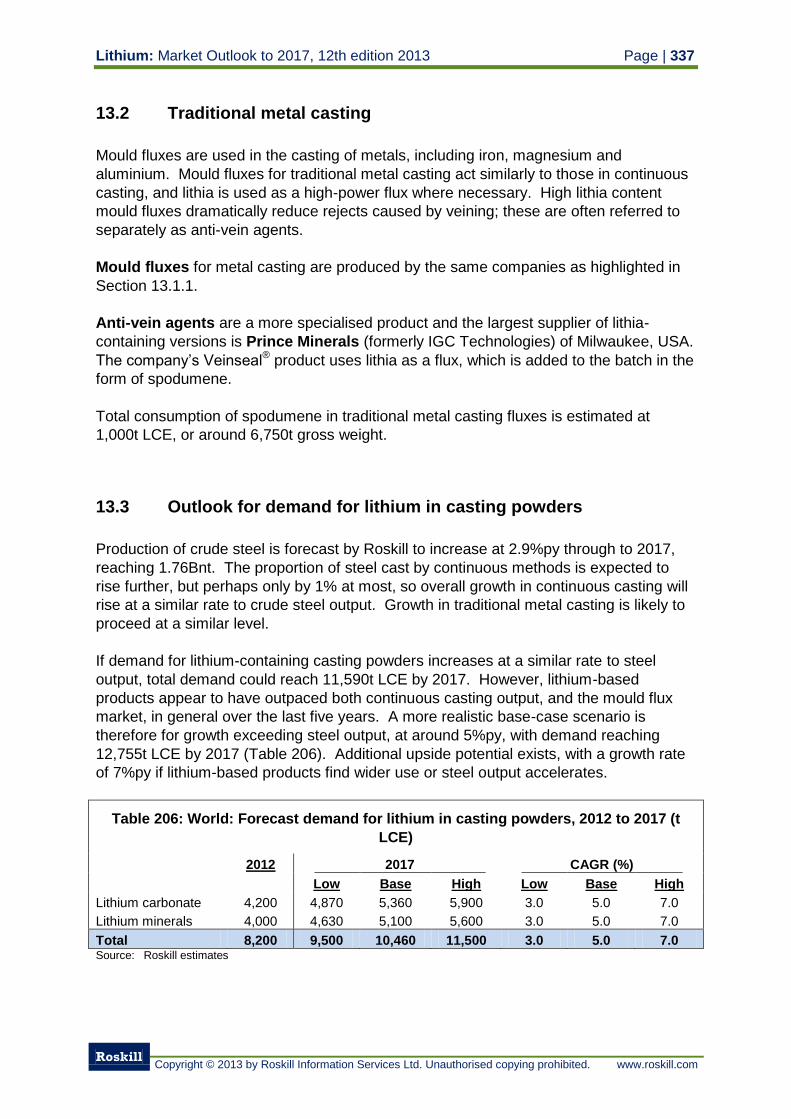
Lithium: Market Outlook to 2017, 12th edition 2013 Page | 337
Roskill
Copyright © 2013 by Roskill Information Services Ltd. Unauthorised copying prohibited. www.roskill.com
13.2 Traditional metal casting
Mould fluxes are used in the casting of metals, including iron, magnesium and
aluminium. Mould fluxes for traditional metal casting act similarly to those in continuous
casting, and lithia is used as a high-power flux where necessary. High lithia content
mould fluxes dramatically reduce rejects caused by veining; these are often referred to
separately as anti-vein agents.
Mould fluxes for metal casting are produced by the same companies as highlighted in
Section 13.1.1.
Anti-vein agents are a more specialised product and the largest supplier of lithia-
containing versions is Prince Minerals (formerly IGC Technologies) of Milwaukee, USA.
The company’s Veinseal® product uses lithia as a flux, which is added to the batch in the
form of spodumene.
Total consumption of spodumene in traditional metal casting fluxes is estimated at
1,000t LCE, or around 6,750t gross weight.
13.3 Outlook for demand for lithium in casting powders
Production of crude steel is forecast by Roskill to increase at 2.9%py through to 2017,
reaching 1.76Bnt. The proportion of steel cast by continuous methods is expected to
rise further, but perhaps only by 1% at most, so overall growth in continuous casting will
rise at a similar rate to crude steel output. Growth in traditional metal casting is likely to
proceed at a similar level.
If demand for lithium-containing casting powders increases at a similar rate to steel
output, total demand could reach 11,590t LCE by 2017. However, lithium-based
products appear to have outpaced both continuous casting output, and the mould flux
market, in general over the last five years. A more realistic base-case scenario is
therefore for growth exceeding steel output, at around 5%py, with demand reaching
12,755t LCE by 2017 (Table 206). Additional upside potential exists, with a growth rate
of 7%py if lithium-based products find wider use or steel output accelerates.
Table 206: World: Forecast demand for lithium in casting powders, 2012 to 2017 (t
LCE)
2012 2017 CAGR (%)
Low Base High Low Base High
Lithium carbonate 4,200 4,870 5,360 5,900 3.0 5.0 7.0
Lithium minerals 4,000 4,630 5,100 5,600 3.0 5.0 7.0
Total 8,200 9,500 10,460 11,500 3.0 5.0 7.0 Source: Roskill estimates
Page | 338 Lithium: Market Outlook to 2017, 12th edition 2013
Roskill
Copyright © 2013 by Roskill Information Services Ltd. Unauthorised copying prohibited. www.roskill.com
14. Use of lithium in polymers
Rubbers and thermoplastics are estimated to have accounted for 7,500t LCE, or 5%, of
lithium consumption in 2012.
14.1 Types of polymers
Butyllithium is used as an initiator for anionic polymerisation reactions in the production
of styrene-butadiene rubber (SBR) and polybutadiene rubber (BR). n-butyllithium and
smaller quantities of sec-butyllithium catalyse reactions to yield polymers with
thermoplastic properties that require no vulcanisation, such as styrene block copolymers
(SBC).
Synthetic rubbers are a group of man-made elastomers that show one or more
properties of natural rubber. They are classified into SBR, BR, nitriles (NR),
polyisoprenes (IR), butyl rubbers (IIR), ethylene-propylene copolymers (EPR) and
terpolymers (EPT).
Thermoplastic elastomers are a mix of polymers (usually a plastic and a rubber) which
consist of materials with both thermoplastic and elastomeric properties. There are six
generic classes of thermoplastic elastomers: styrenic block copolymers (SBC), polyolefin
blends, elastomeric alloys, thermoplastic polyurethanes, thermoplastic copolyester and
thermoplastic polyamides.
SBR is the most widely-produced synthetic rubber and is used mainly for vehicle tyres.
It accounts for over a third of world SR production capacity. SBR can be further divided
into “latex” and “solid” types and is produced by two methods: emulsion polymerisation
(ESBR) and solution polymerisation (SSBR).
Emulsion polymerisation remains the most common method of producing SBR but does
not use a lithium-based catalyst. Use of solution polymerisation, which requires a
butyllithium catalyst to initiate polymerisation, is increasing. Unlike most catalysts, small
quantities of butyllithium are carried over into the final product (believed to be under
0.1% of monomer weight). Compared to other polymerisation methods, this process
allows the micro level of the rubber to be changed easily, enabling a more economical
burn rate in vehicle tyres and expansion of the design range into products such as all-
season tyres.
BR is the second most widely-produced synthetic rubber, accounting for around a
quarter of world SR production capacity.
Most BR is made by a solution process using either a transition metal (Nd, Ni, or Co)
complex or an alkyl metal, like butyllithium, as a catalyst. Since the reaction is very
exothermic and can be explosive, particularly with alkyllithium catalysts, the reaction is
normally carried out in solvents such as hexane, cyclohexane, benzene or toluene. The
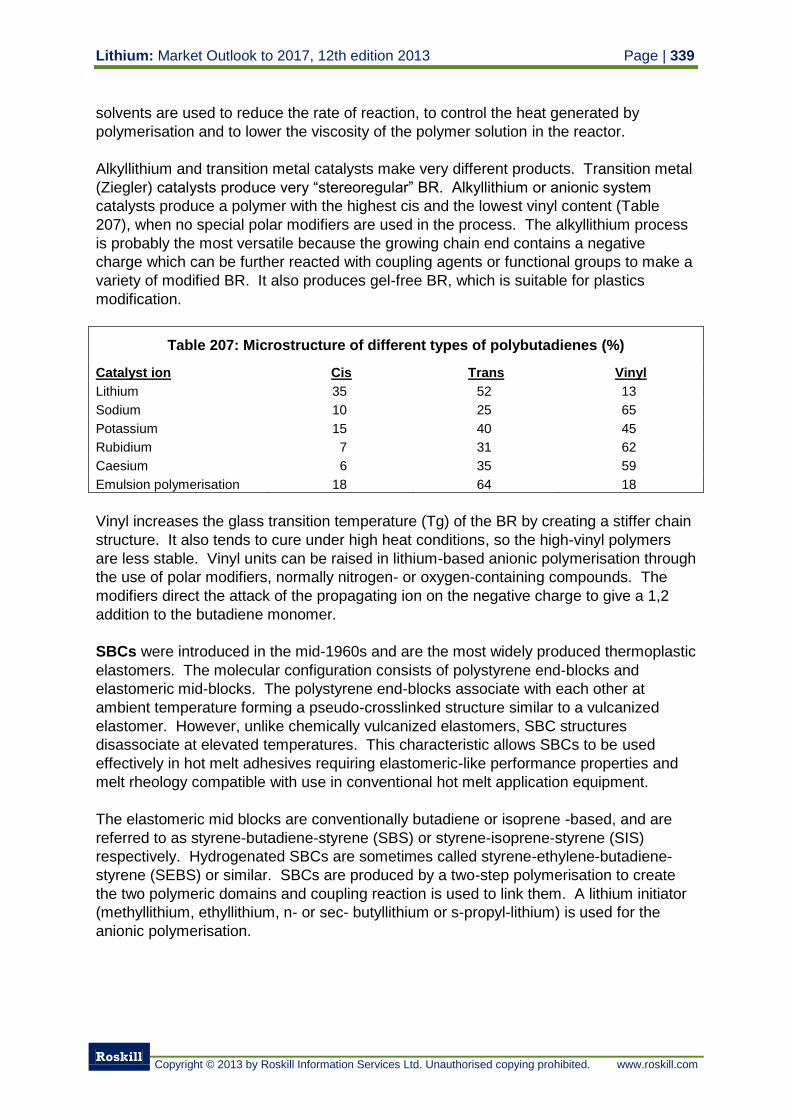
Lithium: Market Outlook to 2017, 12th edition 2013 Page | 339
Roskill
Copyright © 2013 by Roskill Information Services Ltd. Unauthorised copying prohibited. www.roskill.com
solvents are used to reduce the rate of reaction, to control the heat generated by
polymerisation and to lower the viscosity of the polymer solution in the reactor.
Alkyllithium and transition metal catalysts make very different products. Transition metal
(Ziegler) catalysts produce very “stereoregular” BR. Alkyllithium or anionic system
catalysts produce a polymer with the highest cis and the lowest vinyl content (Table
207), when no special polar modifiers are used in the process. The alkyllithium process
is probably the most versatile because the growing chain end contains a negative
charge which can be further reacted with coupling agents or functional groups to make a
variety of modified BR. It also produces gel-free BR, which is suitable for plastics
modification.
Table 207: Microstructure of different types of polybutadienes (%)
Catalyst ion Cis Trans Vinyl
Lithium 35 52 13
Sodium 10 25 65
Potassium 15 40 45
Rubidium 7 31 62
Caesium 6 35 59
Emulsion polymerisation 18 64 18
Vinyl increases the glass transition temperature (Tg) of the BR by creating a stiffer chain
structure. It also tends to cure under high heat conditions, so the high-vinyl polymers
are less stable. Vinyl units can be raised in lithium-based anionic polymerisation through
the use of polar modifiers, normally nitrogen- or oxygen-containing compounds. The
modifiers direct the attack of the propagating ion on the negative charge to give a 1,2
addition to the butadiene monomer.
SBCs were introduced in the mid-1960s and are the most widely produced thermoplastic
elastomers. The molecular configuration consists of polystyrene end-blocks and
elastomeric mid-blocks. The polystyrene end-blocks associate with each other at
ambient temperature forming a pseudo-crosslinked structure similar to a vulcanized
elastomer. However, unlike chemically vulcanized elastomers, SBC structures
disassociate at elevated temperatures. This characteristic allows SBCs to be used
effectively in hot melt adhesives requiring elastomeric-like performance properties and
melt rheology compatible with use in conventional hot melt application equipment.
The elastomeric mid blocks are conventionally butadiene or isoprene -based, and are
referred to as styrene-butadiene-styrene (SBS) or styrene-isoprene-styrene (SIS)
respectively. Hydrogenated SBCs are sometimes called styrene-ethylene-butadiene-
styrene (SEBS) or similar. SBCs are produced by a two-step polymerisation to create
the two polymeric domains and coupling reaction is used to link them. A lithium initiator
(methyllithium, ethyllithium, n- or sec- butyllithium or s-propyl-lithium) is used for the
anionic polymerisation.
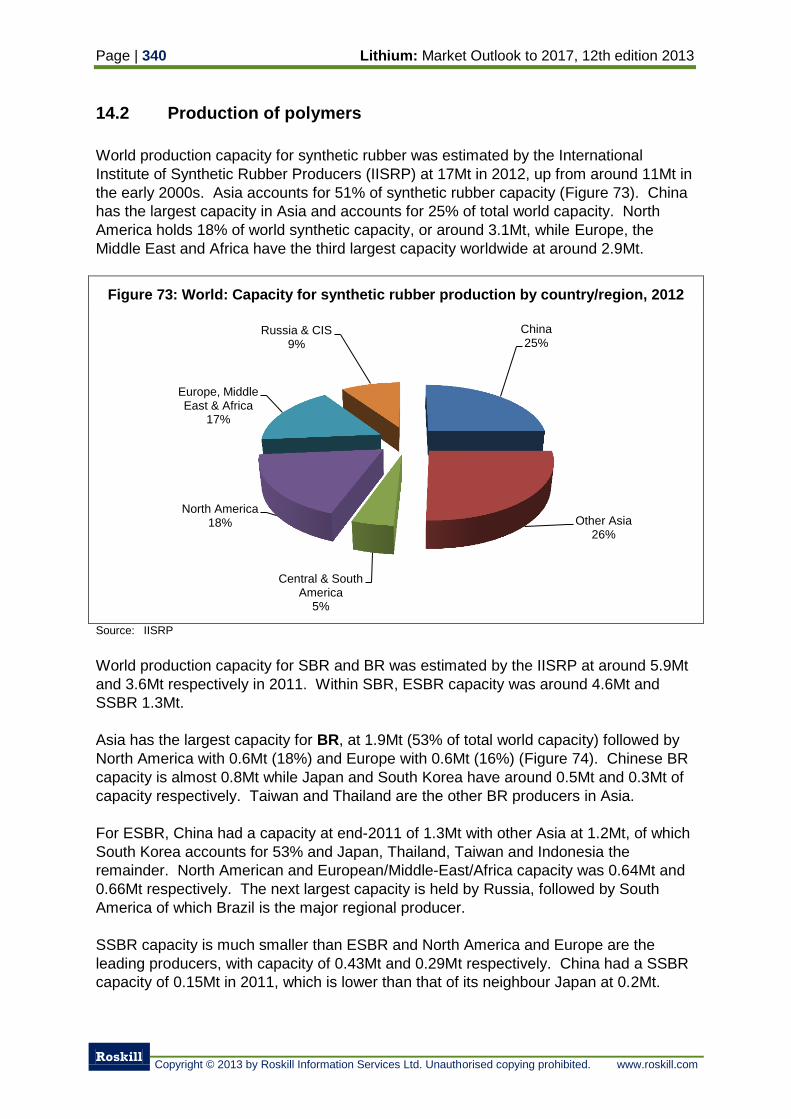
Page | 340 Lithium: Market Outlook to 2017, 12th edition 2013
Roskill
Copyright © 2013 by Roskill Information Services Ltd. Unauthorised copying prohibited. www.roskill.com
14.2 Production of polymers
World production capacity for synthetic rubber was estimated by the International
Institute of Synthetic Rubber Producers (IISRP) at 17Mt in 2012, up from around 11Mt in
the early 2000s. Asia accounts for 51% of synthetic rubber capacity (Figure 73). China
has the largest capacity in Asia and accounts for 25% of total world capacity. North
America holds 18% of world synthetic capacity, or around 3.1Mt, while Europe, the
Middle East and Africa have the third largest capacity worldwide at around 2.9Mt.
Figure 73: World: Capacity for synthetic rubber production by country/region, 2012
Source: IISRP
World production capacity for SBR and BR was estimated by the IISRP at around 5.9Mt
and 3.6Mt respectively in 2011. Within SBR, ESBR capacity was around 4.6Mt and
SSBR 1.3Mt.
Asia has the largest capacity for BR, at 1.9Mt (53% of total world capacity) followed by
North America with 0.6Mt (18%) and Europe with 0.6Mt (16%) (Figure 74). Chinese BR
capacity is almost 0.8Mt while Japan and South Korea have around 0.5Mt and 0.3Mt of
capacity respectively. Taiwan and Thailand are the other BR producers in Asia.
For ESBR, China had a capacity at end-2011 of 1.3Mt with other Asia at 1.2Mt, of which
South Korea accounts for 53% and Japan, Thailand, Taiwan and Indonesia the
remainder. North American and European/Middle-East/Africa capacity was 0.64Mt and
0.66Mt respectively. The next largest capacity is held by Russia, followed by South
America of which Brazil is the major regional producer.
SSBR capacity is much smaller than ESBR and North America and Europe are the
leading producers, with capacity of 0.43Mt and 0.29Mt respectively. China had a SSBR
capacity of 0.15Mt in 2011, which is lower than that of its neighbour Japan at 0.2Mt.
China 25%
Other Asia 26%
Central & South America
5%
North America 18%
Europe, Middle East & Africa
17%
Russia & CIS 9%
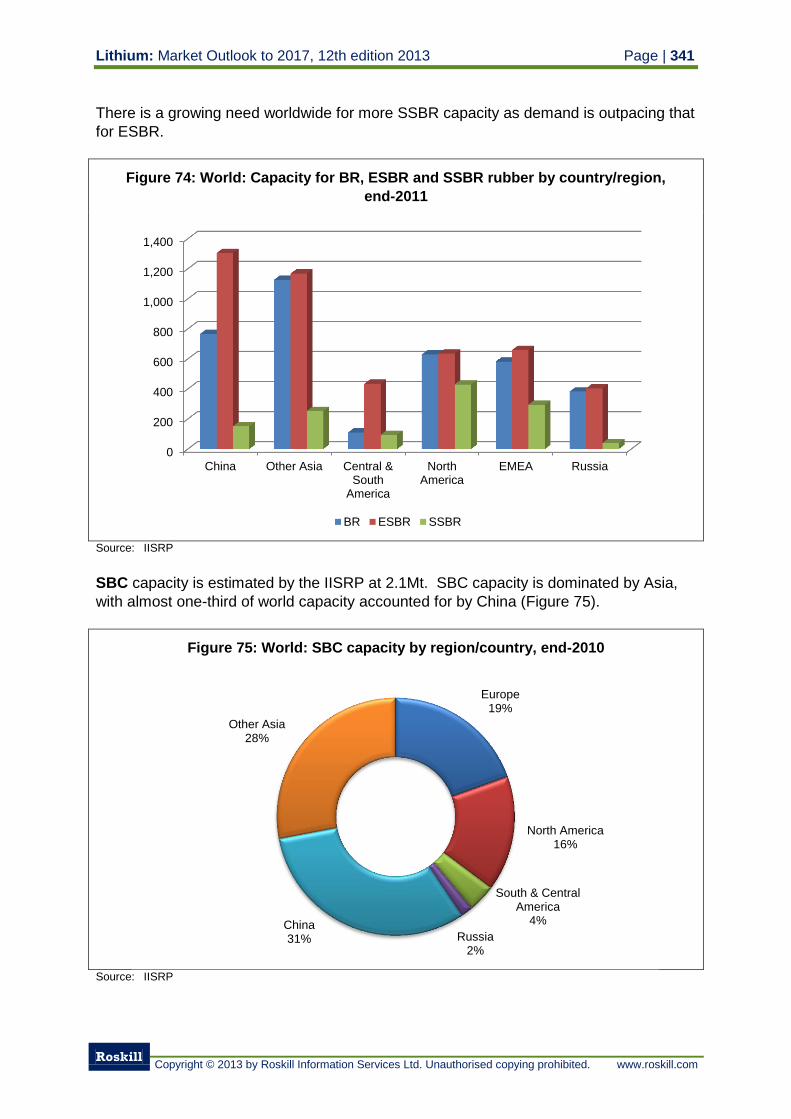
Lithium: Market Outlook to 2017, 12th edition 2013 Page | 341
Roskill
Copyright © 2013 by Roskill Information Services Ltd. Unauthorised copying prohibited. www.roskill.com
There is a growing need worldwide for more SSBR capacity as demand is outpacing that
for ESBR.
Figure 74: World: Capacity for BR, ESBR and SSBR rubber by country/region,
end-2011
Source: IISRP
SBC capacity is estimated by the IISRP at 2.1Mt. SBC capacity is dominated by Asia,
with almost one-third of world capacity accounted for by China (Figure 75).
Figure 75: World: SBC capacity by region/country, end-2010
Source: IISRP
0
200
400
600
800
1,000
1,200
1,400
China Other Asia Central &South
America
NorthAmerica
EMEA Russia
BR ESBR SSBR
Europe 19%
North America 16%
South & Central America
4%
Russia 2%
China 31%
Other Asia 28%
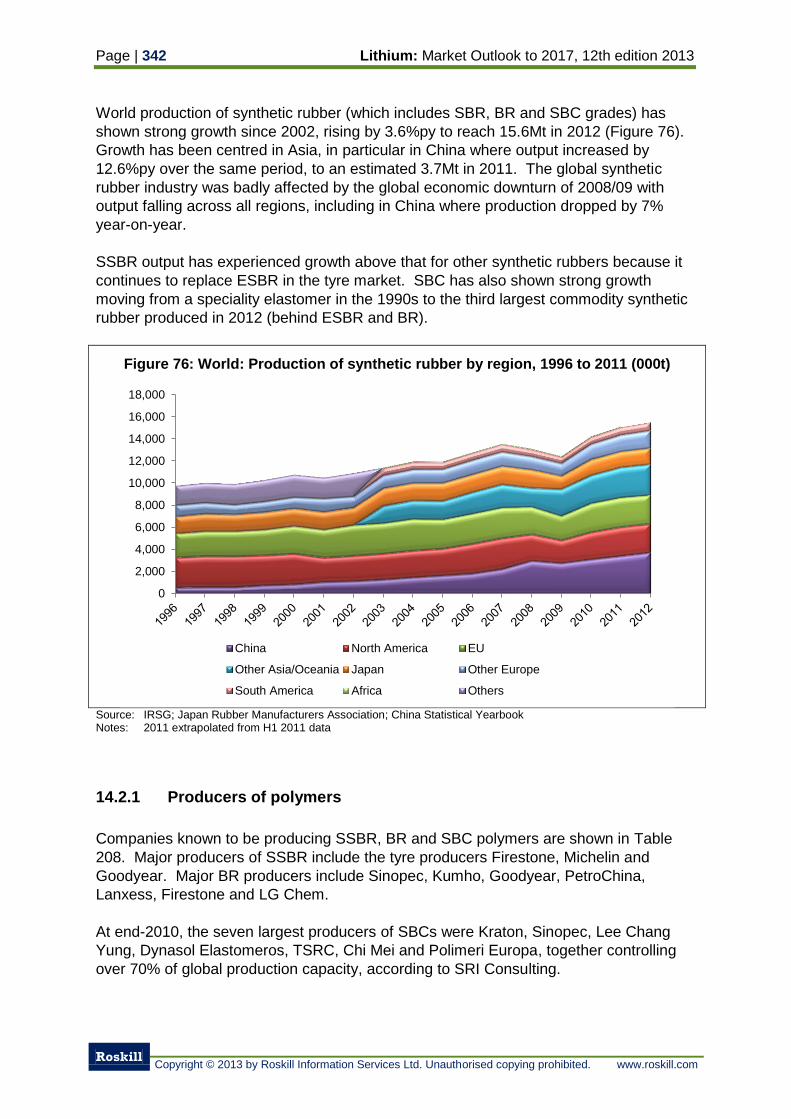
Page | 342 Lithium: Market Outlook to 2017, 12th edition 2013
Roskill
Copyright © 2013 by Roskill Information Services Ltd. Unauthorised copying prohibited. www.roskill.com
World production of synthetic rubber (which includes SBR, BR and SBC grades) has
shown strong growth since 2002, rising by 3.6%py to reach 15.6Mt in 2012 (Figure 76).
Growth has been centred in Asia, in particular in China where output increased by
12.6%py over the same period, to an estimated 3.7Mt in 2011. The global synthetic
rubber industry was badly affected by the global economic downturn of 2008/09 with
output falling across all regions, including in China where production dropped by 7%
year-on-year.
SSBR output has experienced growth above that for other synthetic rubbers because it
continues to replace ESBR in the tyre market. SBC has also shown strong growth
moving from a speciality elastomer in the 1990s to the third largest commodity synthetic
rubber produced in 2012 (behind ESBR and BR).
Figure 76: World: Production of synthetic rubber by region, 1996 to 2011 (000t)
Source: IRSG; Japan Rubber Manufacturers Association; China Statistical Yearbook Notes: 2011 extrapolated from H1 2011 data
14.2.1 Producers of polymers
Companies known to be producing SSBR, BR and SBC polymers are shown in Table
208. Major producers of SSBR include the tyre producers Firestone, Michelin and
Goodyear. Major BR producers include Sinopec, Kumho, Goodyear, PetroChina,
Lanxess, Firestone and LG Chem.
At end-2010, the seven largest producers of SBCs were Kraton, Sinopec, Lee Chang
Yung, Dynasol Elastomeros, TSRC, Chi Mei and Polimeri Europa, together controlling
over 70% of global production capacity, according to SRI Consulting.
0
2,000
4,000
6,000
8,000
10,000
12,000
14,000
16,000
18,000
China North America EU
Other Asia/Oceania Japan Other Europe
South America Africa Others
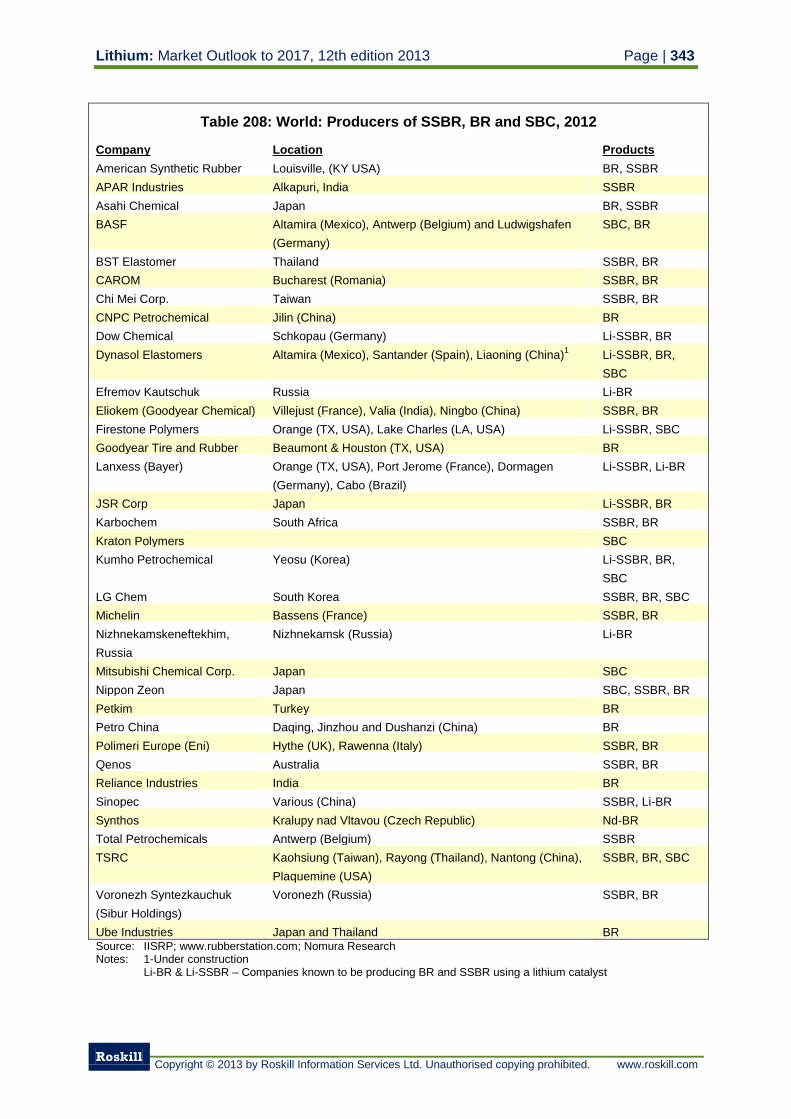
Lithium: Market Outlook to 2017, 12th edition 2013 Page | 343
Roskill
Copyright © 2013 by Roskill Information Services Ltd. Unauthorised copying prohibited. www.roskill.com
Table 208: World: Producers of SSBR, BR and SBC, 2012
Company Location Products
American Synthetic Rubber Louisville, (KY USA) BR, SSBR
APAR Industries Alkapuri, India SSBR
Asahi Chemical Japan BR, SSBR
BASF Altamira (Mexico), Antwerp (Belgium) and Ludwigshafen
(Germany)
SBC, BR
BST Elastomer Thailand SSBR, BR
CAROM Bucharest (Romania) SSBR, BR
Chi Mei Corp. Taiwan SSBR, BR
CNPC Petrochemical Jilin (China) BR
Dow Chemical Schkopau (Germany) Li-SSBR, BR
Dynasol Elastomers Altamira (Mexico), Santander (Spain), Liaoning (China)1
Li-SSBR, BR,
SBC
Efremov Kautschuk Russia Li-BR
Eliokem (Goodyear Chemical) Villejust (France), Valia (India), Ningbo (China) SSBR, BR
Firestone Polymers Orange (TX, USA), Lake Charles (LA, USA) Li-SSBR, SBC
Goodyear Tire and Rubber Beaumont & Houston (TX, USA) BR
Lanxess (Bayer) Orange (TX, USA), Port Jerome (France), Dormagen
(Germany), Cabo (Brazil)
Li-SSBR, Li-BR
JSR Corp Japan Li-SSBR, BR
Karbochem South Africa SSBR, BR
Kraton Polymers SBC
Kumho Petrochemical Yeosu (Korea) Li-SSBR, BR,
SBC
LG Chem South Korea SSBR, BR, SBC
Michelin Bassens (France) SSBR, BR
Nizhnekamskeneftekhim,
Russia
Nizhnekamsk (Russia) Li-BR
Mitsubishi Chemical Corp. Japan SBC
Nippon Zeon Japan SBC, SSBR, BR
Petkim Turkey BR
Petro China Daqing, Jinzhou and Dushanzi (China) BR
Polimeri Europe (Eni) Hythe (UK), Rawenna (Italy) SSBR, BR
Qenos Australia SSBR, BR
Reliance Industries India BR
Sinopec Various (China) SSBR, Li-BR
Synthos Kralupy nad Vltavou (Czech Republic) Nd-BR
Total Petrochemicals Antwerp (Belgium) SSBR
TSRC Kaohsiung (Taiwan), Rayong (Thailand), Nantong (China),
Plaquemine (USA)
SSBR, BR, SBC
Voronezh Syntezkauchuk
(Sibur Holdings)
Voronezh (Russia) SSBR, BR
Ube Industries Japan and Thailand BR Source: IISRP; www.rubberstation.com; Nomura Research Notes: 1-Under construction Li-BR & Li-SSBR – Companies known to be producing BR and SSBR using a lithium catalyst
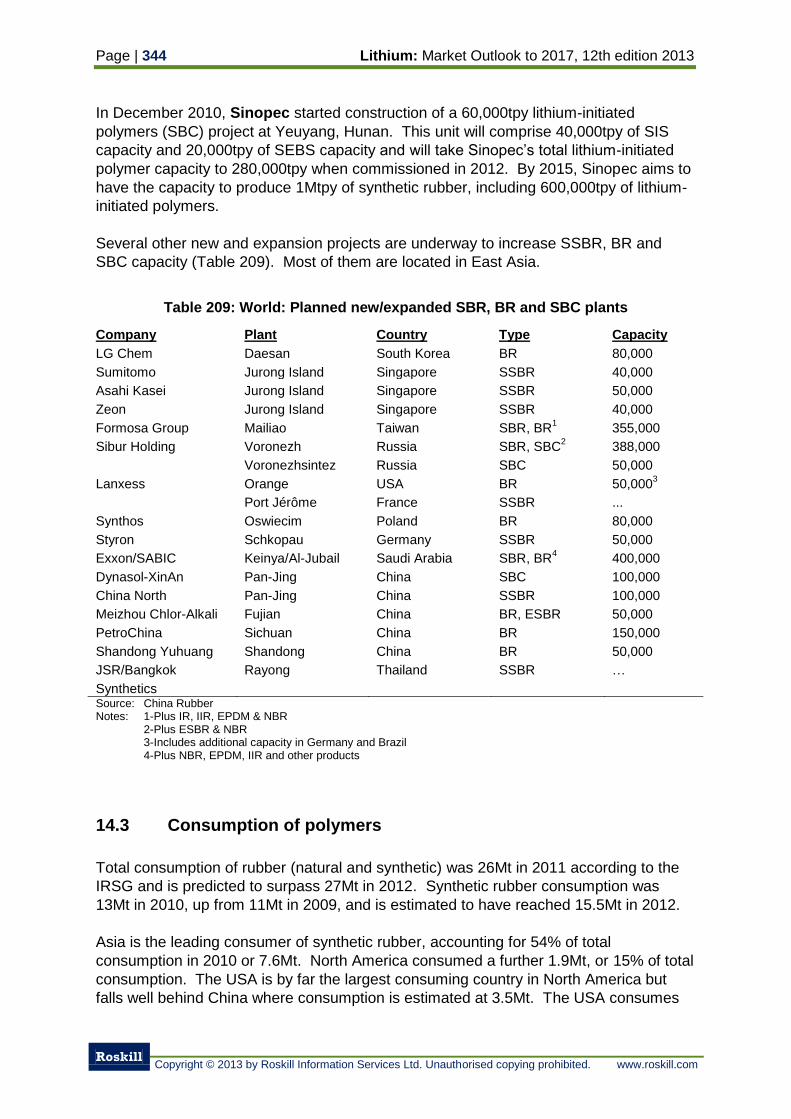
Page | 344 Lithium: Market Outlook to 2017, 12th edition 2013
Roskill
Copyright © 2013 by Roskill Information Services Ltd. Unauthorised copying prohibited. www.roskill.com
In December 2010, Sinopec started construction of a 60,000tpy lithium-initiated
polymers (SBC) project at Yeuyang, Hunan. This unit will comprise 40,000tpy of SIS
capacity and 20,000tpy of SEBS capacity and will take Sinopec’s total lithium-initiated
polymer capacity to 280,000tpy when commissioned in 2012. By 2015, Sinopec aims to
have the capacity to produce 1Mtpy of synthetic rubber, including 600,000tpy of lithium-
initiated polymers.
Several other new and expansion projects are underway to increase SSBR, BR and
SBC capacity (Table 209). Most of them are located in East Asia.
Table 209: World: Planned new/expanded SBR, BR and SBC plants
Company Plant Country Type Capacity
LG Chem Daesan South Korea BR 80,000
Sumitomo Jurong Island Singapore SSBR 40,000
Asahi Kasei Jurong Island Singapore SSBR 50,000
Zeon Jurong Island Singapore SSBR 40,000
Formosa Group Mailiao Taiwan SBR, BR1
355,000
Sibur Holding Voronezh Russia SBR, SBC2
388,000
Voronezhsintez Russia SBC 50,000
Lanxess Orange USA BR 50,0003
Port Jérôme France SSBR ...
Synthos Oswiecim Poland BR 80,000
Styron Schkopau Germany SSBR 50,000
Exxon/SABIC Keinya/Al-Jubail Saudi Arabia SBR, BR4
400,000
Dynasol-XinAn Pan-Jing China SBC 100,000
China North Pan-Jing China SSBR 100,000
Meizhou Chlor-Alkali Fujian China BR, ESBR 50,000
PetroChina Sichuan China BR 150,000
Shandong Yuhuang Shandong China BR 50,000
JSR/Bangkok
Synthetics
Rayong Thailand SSBR …
Source: China Rubber Notes: 1-Plus IR, IIR, EPDM & NBR 2-Plus ESBR & NBR 3-Includes additional capacity in Germany and Brazil
4-Plus NBR, EPDM, IIR and other products
14.3 Consumption of polymers
Total consumption of rubber (natural and synthetic) was 26Mt in 2011 according to the
IRSG and is predicted to surpass 27Mt in 2012. Synthetic rubber consumption was
13Mt in 2010, up from 11Mt in 2009, and is estimated to have reached 15.5Mt in 2012.
Asia is the leading consumer of synthetic rubber, accounting for 54% of total
consumption in 2010 or 7.6Mt. North America consumed a further 1.9Mt, or 15% of total
consumption. The USA is by far the largest consuming country in North America but
falls well behind China where consumption is estimated at 3.5Mt. The USA consumes
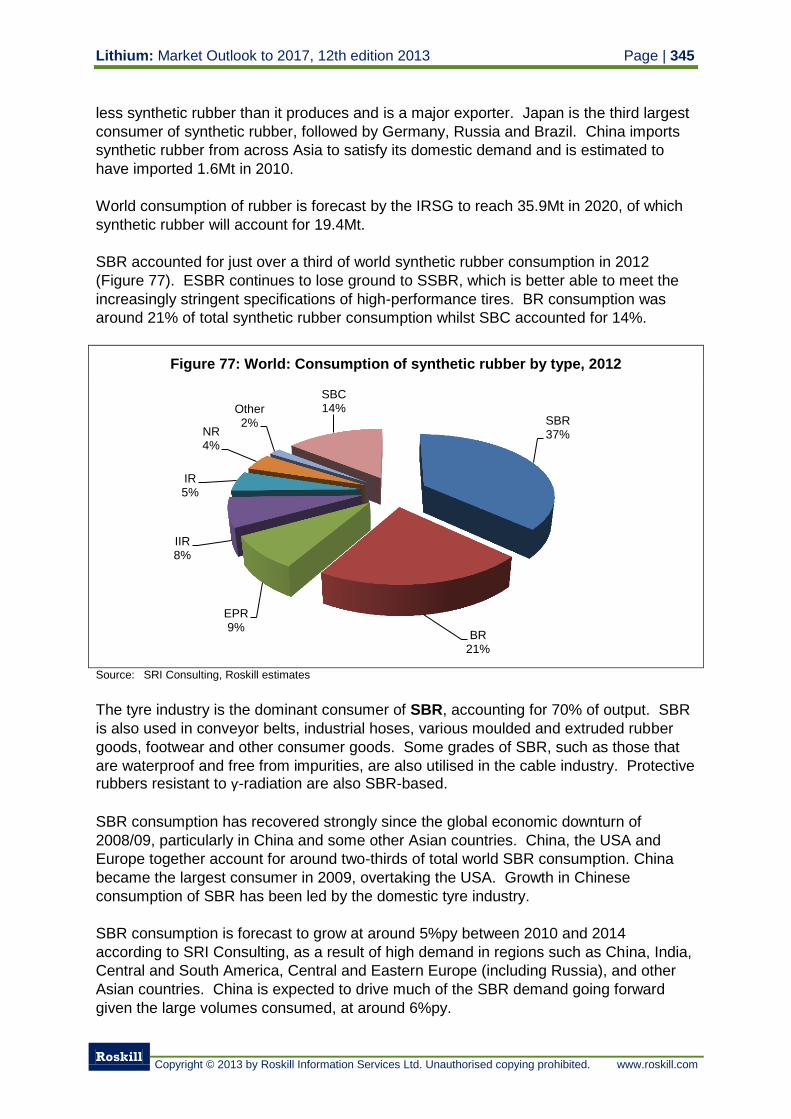
Lithium: Market Outlook to 2017, 12th edition 2013 Page | 345
Roskill
Copyright © 2013 by Roskill Information Services Ltd. Unauthorised copying prohibited. www.roskill.com
less synthetic rubber than it produces and is a major exporter. Japan is the third largest
consumer of synthetic rubber, followed by Germany, Russia and Brazil. China imports
synthetic rubber from across Asia to satisfy its domestic demand and is estimated to
have imported 1.6Mt in 2010.
World consumption of rubber is forecast by the IRSG to reach 35.9Mt in 2020, of which
synthetic rubber will account for 19.4Mt.
SBR accounted for just over a third of world synthetic rubber consumption in 2012
(Figure 77). ESBR continues to lose ground to SSBR, which is better able to meet the
increasingly stringent specifications of high-performance tires. BR consumption was
around 21% of total synthetic rubber consumption whilst SBC accounted for 14%.
Figure 77: World: Consumption of synthetic rubber by type, 2012
Source: SRI Consulting, Roskill estimates
The tyre industry is the dominant consumer of SBR, accounting for 70% of output. SBR
is also used in conveyor belts, industrial hoses, various moulded and extruded rubber
goods, footwear and other consumer goods. Some grades of SBR, such as those that
are waterproof and free from impurities, are also utilised in the cable industry. Protective rubbers resistant to ƴ-radiation are also SBR-based.
SBR consumption has recovered strongly since the global economic downturn of
2008/09, particularly in China and some other Asian countries. China, the USA and
Europe together account for around two-thirds of total world SBR consumption. China
became the largest consumer in 2009, overtaking the USA. Growth in Chinese
consumption of SBR has been led by the domestic tyre industry.
SBR consumption is forecast to grow at around 5%py between 2010 and 2014
according to SRI Consulting, as a result of high demand in regions such as China, India,
Central and South America, Central and Eastern Europe (including Russia), and other
Asian countries. China is expected to drive much of the SBR demand going forward
given the large volumes consumed, at around 6%py.
SBR 37%
BR 21%
EPR 9%
IIR 8%
IR 5%
NR 4%
Other 2%
SBC 14%
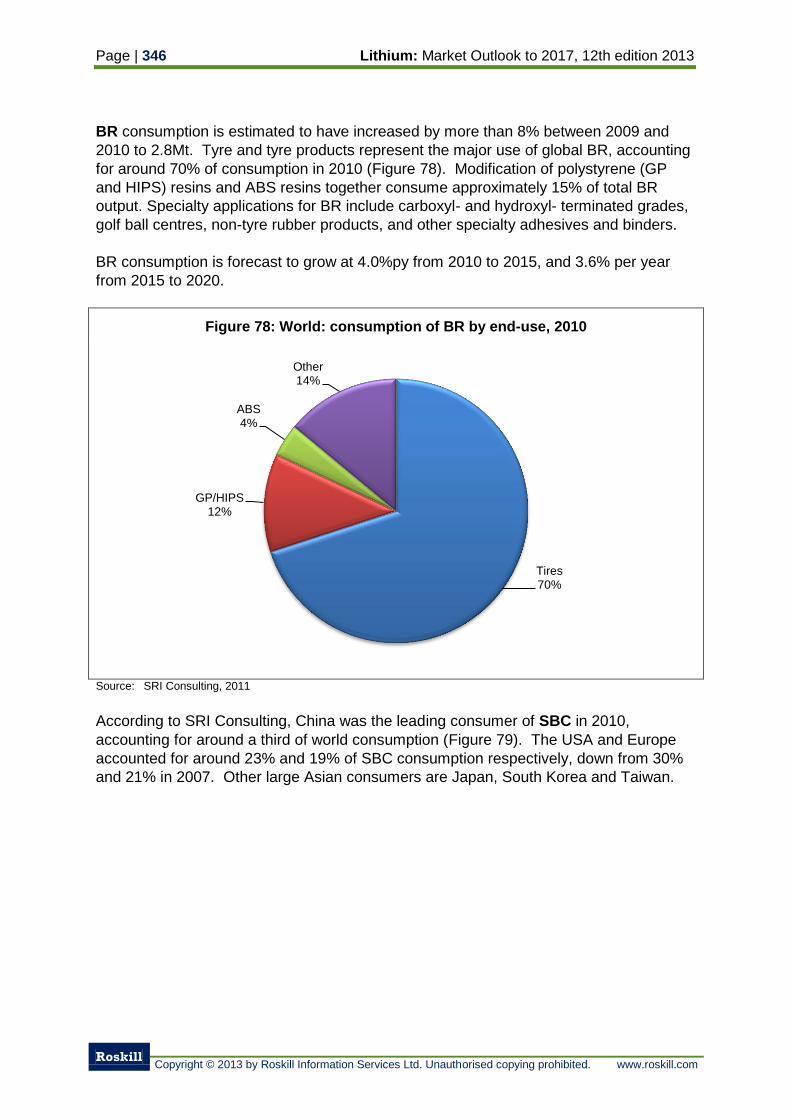
Page | 346 Lithium: Market Outlook to 2017, 12th edition 2013
Roskill
Copyright © 2013 by Roskill Information Services Ltd. Unauthorised copying prohibited. www.roskill.com
BR consumption is estimated to have increased by more than 8% between 2009 and
2010 to 2.8Mt. Tyre and tyre products represent the major use of global BR, accounting
for around 70% of consumption in 2010 (Figure 78). Modification of polystyrene (GP
and HIPS) resins and ABS resins together consume approximately 15% of total BR
output. Specialty applications for BR include carboxyl- and hydroxyl- terminated grades,
golf ball centres, non-tyre rubber products, and other specialty adhesives and binders.
BR consumption is forecast to grow at 4.0%py from 2010 to 2015, and 3.6% per year
from 2015 to 2020.
Figure 78: World: consumption of BR by end-use, 2010
Source: SRI Consulting, 2011
According to SRI Consulting, China was the leading consumer of SBC in 2010,
accounting for around a third of world consumption (Figure 79). The USA and Europe
accounted for around 23% and 19% of SBC consumption respectively, down from 30%
and 21% in 2007. Other large Asian consumers are Japan, South Korea and Taiwan.
Tires 70%
GP/HIPS 12%
ABS 4%
Other 14%
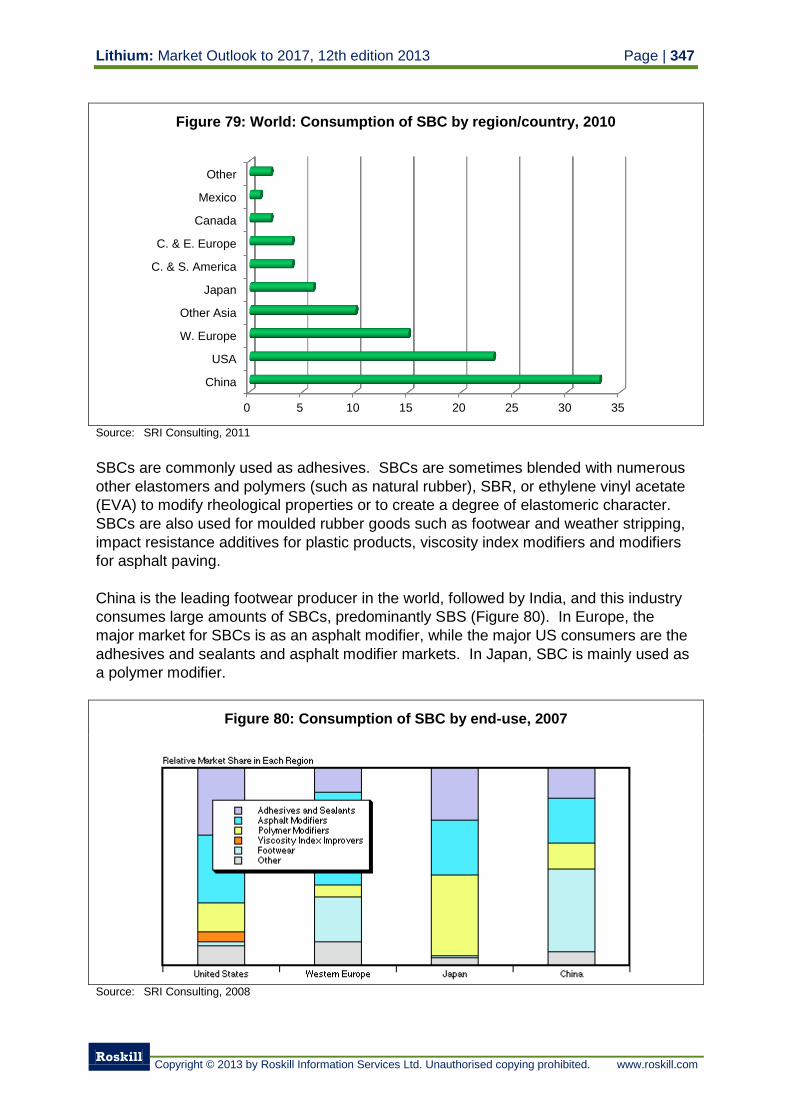
Lithium: Market Outlook to 2017, 12th edition 2013 Page | 347
Roskill
Copyright © 2013 by Roskill Information Services Ltd. Unauthorised copying prohibited. www.roskill.com
Figure 79: World: Consumption of SBC by region/country, 2010
Source: SRI Consulting, 2011
SBCs are commonly used as adhesives. SBCs are sometimes blended with numerous
other elastomers and polymers (such as natural rubber), SBR, or ethylene vinyl acetate
(EVA) to modify rheological properties or to create a degree of elastomeric character.
SBCs are also used for moulded rubber goods such as footwear and weather stripping,
impact resistance additives for plastic products, viscosity index modifiers and modifiers
for asphalt paving.
China is the leading footwear producer in the world, followed by India, and this industry
consumes large amounts of SBCs, predominantly SBS (Figure 80). In Europe, the
major market for SBCs is as an asphalt modifier, while the major US consumers are the
adhesives and sealants and asphalt modifier markets. In Japan, SBC is mainly used as
a polymer modifier.
Figure 80: Consumption of SBC by end-use, 2007
Source: SRI Consulting, 2008
0 5 10 15 20 25 30 35
China
USA
W. Europe
Other Asia
Japan
C. & S. America
C. & E. Europe
Canada
Mexico
Other
Page | 348 Lithium: Market Outlook to 2017, 12th edition 2013
Roskill
Copyright © 2013 by Roskill Information Services Ltd. Unauthorised copying prohibited. www.roskill.com
According to Transparency Market Research, global consumption of SBC is expected to
reach 1.9Mt in 2017, a CAGR of approximately 4% from 2012.
14.4 Consumption of lithium in polymers
The amount of butyllithium required to polymerise SSBR is typically 3kg per tonne. Total
production capacity for SSBR in 2010 was estimated at 1.2Mt with production closer to
1.1Mt. If 1.1Mt of SSBR was polymerised by butyllithium, total consumption of
butyllithium would have been around 3,300t (1,900t LCE). However, not all SSBR is
catalysed by butyllithium, with nickel, cobalt, neodymium, titanium and other rare metal
catalysts used as well.
The amount of butyllithium required to polymerise BR is on average 14kg per tonne.
Total production of BR in 2010 is estimated at 3Mt. If all BR was polymerised by
butyllithium, total consumption of butyllithium would be around 4,200t (2,420t LCE). BR
can also be catalysed by other metals, but to a lesser degree than for SSBR, and the
proportion of lithium to other metals depends on the finished product being produced.
Consumption of butyllithium in the production of BR is therefore likely to be less than
420t.
Finally, the amount of butyllithium initiator required to produce 1t of SBC is, on average,
8kg per tonne. Total production of SBC is estimated at 1.8Mt; therefore, if all SBC was
polymerised by butyllithium, total consumption of butyllithium would have been 14,400t
(8,300t LCE). Again, butyllithium is not the only catalyst used in SBC production, so
14,400t is likely to be the maximum.
Total consumption of lithium organics in polymer catalysis, largely butyllithium and other
organolithium compounds, is estimated at 13,000t (7,500t LCE) for 2012. Consumption
is estimated to have increased by 5%py since 2000, above the CAGR for synthetic
rubber of 3.1%py because of strong growth in SSBR and SBC production.
14.4.1 Outlook for lithium demand in polymers
SSBR and BR synthetic rubber production will largely be driven by trends in their major
end use market, tyres. BR consumption is forecast to increase by 4%py through 2015.
SSBR consumption is likely to increase at a much higher rate, and probably higher than
the 6%py estimated by SRI Consulting, perhaps at 8-10%py, given the on-going switch
by consumers from ESBR to meet the demands for higher performance tyres.
SBC production will largely be driven by trends in manufacturing and construction,
infrastructure and sales of footwear. SBC rubber production is forecast by SRI
consulting to increase by 4-5%py between 2010 and 2015. Demand for lithium in
polymers is forecast to continue increasing by 5%py, consistent with historical growth
patterns, and reach 9,600t LCE by 2017.
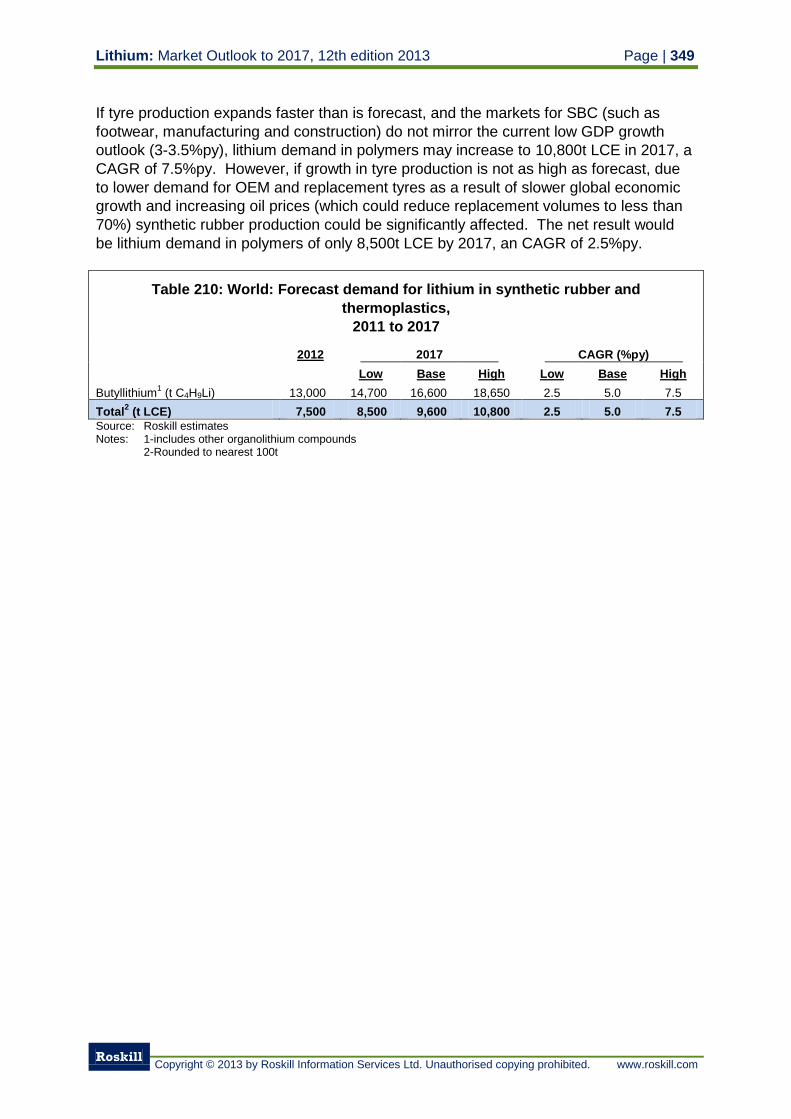
Lithium: Market Outlook to 2017, 12th edition 2013 Page | 349
Roskill
Copyright © 2013 by Roskill Information Services Ltd. Unauthorised copying prohibited. www.roskill.com
If tyre production expands faster than is forecast, and the markets for SBC (such as
footwear, manufacturing and construction) do not mirror the current low GDP growth
outlook (3-3.5%py), lithium demand in polymers may increase to 10,800t LCE in 2017, a
CAGR of 7.5%py. However, if growth in tyre production is not as high as forecast, due
to lower demand for OEM and replacement tyres as a result of slower global economic
growth and increasing oil prices (which could reduce replacement volumes to less than
70%) synthetic rubber production could be significantly affected. The net result would
be lithium demand in polymers of only 8,500t LCE by 2017, an CAGR of 2.5%py.
Table 210: World: Forecast demand for lithium in synthetic rubber and
thermoplastics,
2011 to 2017
2012 2017 CAGR (%py)
Low Base High Low Base High
Butyllithium1 (t C4H9Li) 13,000 14,700 16,600 18,650 2.5 5.0 7.5
Total2 (t LCE) 7,500 8,500 9,600 10,800 2.5 5.0 7.5
Source: Roskill estimates Notes: 1-includes other organolithium compounds 2-Rounded to nearest 100t
Page | 350 Lithium: Market Outlook to 2017, 12th edition 2013
Roskill
Copyright © 2013 by Roskill Information Services Ltd. Unauthorised copying prohibited. www.roskill.com
15. Use of lithium in air treatment
Absorption chilling, dehumidification and carbon dioxide removal are estimated to
account for 5% of the lithium market, equivalent to 7,350t LCE of lithium, in 2012.
Lithium bromide is used as an absorption medium in CFC-free industrial absorption
refrigeration systems. Lithium chloride is used in industrial humidity control and drying
systems. Anhydrous lithium hydride and peroxide remove carbon dioxide from the air in
closed systems such as submarines and space shuttles. Emergency air packs issued to
underground miners use lithium hydroxide to absorb carbon dioxide.
15.1 Absorption chillers
Concentrated (54%) lithium bromide brine is widely-used as the absorption medium in
industrial absorption refrigeration systems. The principle is based on the latent heat
involved in the transfer of water between the vapour and the liquid phase. The solution
can be recycled almost indefinitely as lithium bromide is a stable compound.
The basic cooling system is the same for lithium absorption and traditional electric
compression technology. Both systems use a low-temperature liquid refrigerant that
absorbs heat from the water to be cooled and converts to a vapour. The refrigerant
vapour is then compressed to a higher pressure by a compressor or generator, and is
converted back to a liquid by rejecting heat to the external surroundings in the
condenser section. It is then expanded to a low-pressure mixture of liquid and vapour,
which boils in the evaporator section, absorbing heat and producing the cooling effect.
The cycle is repeated.
The primary difference between electric and absorption chillers is: electric chillers use an
electric motor to operate the compressor raising the pressure of refrigerant vapours,
whereas absorption chillers use heat to compress refrigerant vapours to a high pressure.
Heat is provided either in the form of waste heat from industrial apparatus, for example
steam or hot water from turbines and boilers, which are often referred to as “indirect
fired” systems, or by using an external source of energy such as natural gas, often
referred to as “direct fired” systems.
Absorption systems have higher primary energy requirements and higher initial costs
than electric chillers. They are therefore most cost-effective in applications where waste
heat is available in the form of steam or hot water, where electricity is not readily
available for summer cooling loads, or where high electricity cost structures (including
demand charges) make gas-fired absorption a lower-cost alternative.
As such, absorption chilling is mainly used where supplies of by-product waste heat are
available, such as in industrial facilities, hotels, universities, apartment blocks and
hospitals. Typically, units of 300 refrigerated-tonne capacity are used in large office
blocks or industrial units, and units two to three times as large are used in high-rise
residential buildings.
Lithium: Market Outlook to 2017, 12th edition 2013 Page | 351
Roskill
Copyright © 2013 by Roskill Information Services Ltd. Unauthorised copying prohibited. www.roskill.com
Absorption chillers are increasingly being used for cooling where combined heat and
power (CHP) systems are utilised. A single plant can now produce cold air, hot air and
power simultaneously and cost effectively.
15.1.1 Production of absorption chillers
At the end of the 1940s, a single-effect residential absorption chiller using lithium
bromide was first marketed in the USA. The first commercial/industrial units started to
appear in the 1950s. By the mid-1960's, US manufacturers had 100% of the world
market for absorption chillers using the standard single-effect method. In the late 1960s,
Kawasaki successfully developed the double-effect absorption chiller and Japanese
production subsequently grew. The technology for double-effect chillers was licensed by
Japanese companies to producers in the USA.
In the USA, from the late 1980s to the mid-1990s, the use of absorption chillers
increased as a result of relatively low gas prices, CFC phase-outs, and gas utility
rebates. However, as gas prices increased, deregulation became a factor, and the
commercial replacement market slowed down along with the economy. As a result
absorption chiller markets in the USA dropped sharply.
In 2001, the Japan Air Conditioning, Heating & Refrigeration News (JARN) estimated the
world market for absorption chillers of >100 refrigeration-tonne capacity at US$549M,
divided between China (52% of demand), Japan (21%), USA (7.8%), Korea (6.5%) and
others (12.7%). Total production was 6,539 units, with Asia the largest producer
followed by Europe. Chillers with <100 refrigeration-tonne capacity generally use
ammonia in place of lithium bromide.
In 2005, JARN reported worldwide demand for absorption chillers at 7,500 units, with
BSRIA reporting a market value (for units >100 refrigeration tonne) at US$710M in 2007.
In 2005, a JARN report also indicated the trend for >350kW (>100 refrigeration-tonne)
absorption chillers is mainly confined to the East Asia with China (4,000 units), Japan
(1,600) and Korea (900) leading demand.
BSRIA estimate the total air conditioning market at US$85Bn and 118.2M units as of
end-2011, meaning absorption chillers account for only a very small part of the market,
perhaps 1% in value terms and much less than 1% in volume.
Japanese production of absorption-type refrigerators increased by 14% between 2005
and 2006 but dropped by a similar amount to 3,309 units in 2007, due to attempts to
reduce carbon dioxide emissions by using electric powered compression or screw
chillers instead of gas. Output has continued to fall, and was 2,563 units in 2011, down
2% on 2010. Production is expected to remain similar in 2012.
The total market for chillers in Europe in 2010 was around 55,000 units, according to
JARN, with a value of US$1.7Bn. These were mostly electrically driven compression
units, and absorption chillers accounted for only around US$63M or 3.7% of sales.
Since nearly all these were in the medium to large size range (above 100 kW), in volume
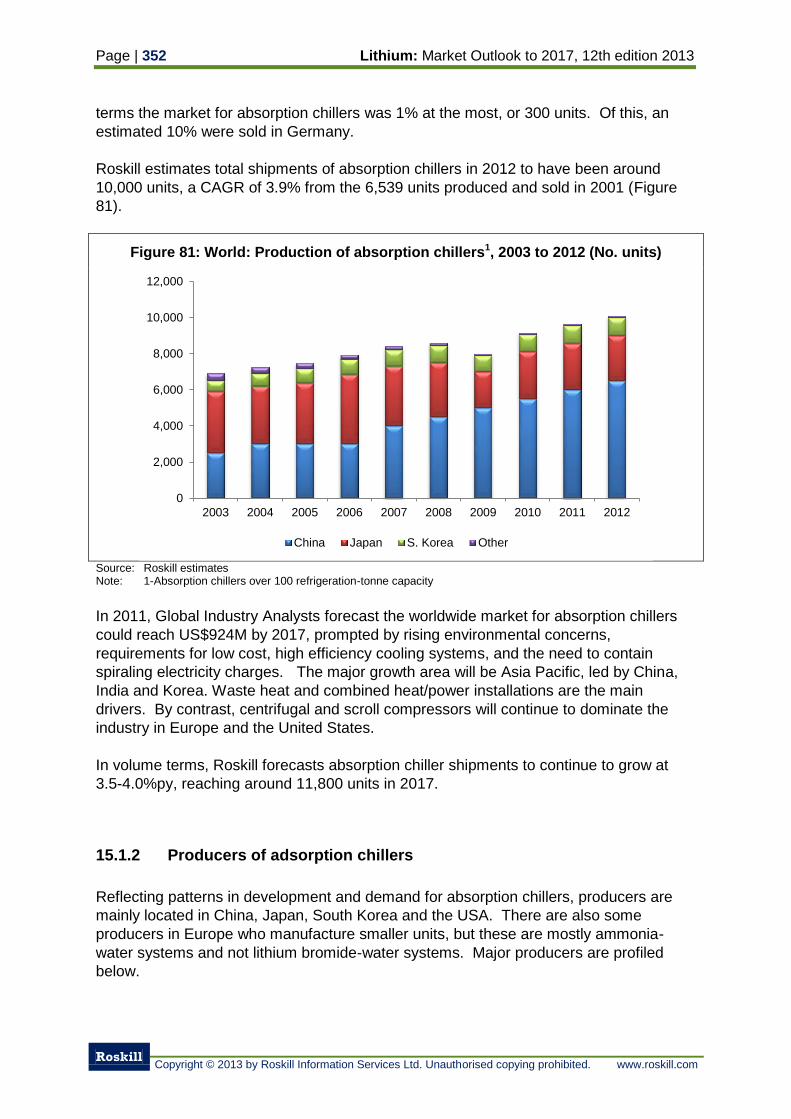
Page | 352 Lithium: Market Outlook to 2017, 12th edition 2013
Roskill
Copyright © 2013 by Roskill Information Services Ltd. Unauthorised copying prohibited. www.roskill.com
terms the market for absorption chillers was 1% at the most, or 300 units. Of this, an
estimated 10% were sold in Germany.
Roskill estimates total shipments of absorption chillers in 2012 to have been around
10,000 units, a CAGR of 3.9% from the 6,539 units produced and sold in 2001 (Figure
81).
Figure 81: World: Production of absorption chillers1, 2003 to 2012 (No. units)
Source: Roskill estimates Note: 1-Absorption chillers over 100 refrigeration-tonne capacity
In 2011, Global Industry Analysts forecast the worldwide market for absorption chillers
could reach US$924M by 2017, prompted by rising environmental concerns,
requirements for low cost, high efficiency cooling systems, and the need to contain
spiraling electricity charges. The major growth area will be Asia Pacific, led by China,
India and Korea. Waste heat and combined heat/power installations are the main
drivers. By contrast, centrifugal and scroll compressors will continue to dominate the
industry in Europe and the United States.
In volume terms, Roskill forecasts absorption chiller shipments to continue to grow at
3.5-4.0%py, reaching around 11,800 units in 2017.
15.1.2 Producers of adsorption chillers
Reflecting patterns in development and demand for absorption chillers, producers are
mainly located in China, Japan, South Korea and the USA. There are also some
producers in Europe who manufacture smaller units, but these are mostly ammonia-
water systems and not lithium bromide-water systems. Major producers are profiled
below.
0
2,000
4,000
6,000
8,000
10,000
12,000
2003 2004 2005 2006 2007 2008 2009 2010 2011 2012
China Japan S. Korea Other
Lithium: Market Outlook to 2017, 12th edition 2013 Page | 353
Roskill
Copyright © 2013 by Roskill Information Services Ltd. Unauthorised copying prohibited. www.roskill.com
China
Shuangliang Eco-Energy Systems produced its first lithium bromide absorption chiller
in 1985 and is the only publically-listed producer of such products in China. The
company markets direct and indirect (e.g. hot water, steam and flue gas) -fired lithium
bromide absorption chillers to the Chinese and export market. The company is a joint
venture between Jiangsu ShuangLiang Group and Teling Company of the USA, and its
products are marketed by Trane.
Zhejiang Lianfeng Refrigeration Machine produces a mechanical and electrical
integration direct-burning style lithium bromide air chiller in Zhejiang.
Broad Air Conditioning is a privately-owned Chinese company established in 1988 and
headquartered in Changsha, Hunan province. The company is thought to be the world's
largest manufacturer of double-effect absorption systems with a 3,000 unit production
line producing absorption chillers between 100 and 2,600 refrigeration-tonne capacity.
Broad's primary product is a direct fired lithium bromide absorption chiller/heater called
“Spectrum”. Double-effect indirect steam and hot water or waste heat driven units are
also produced.
USA
York International, a Johnson Controls company, manufactures absorption chillers in
Houston, Texas. York has the only large tonnage absorption chiller manufacturing plant
in the USA.
Trane, an Ingersoll Rand company, has been manufacturing absorption chillers since
the 1950s. The newest line, the Trane Horizon® two-stage steam-fired absorption water
chiller is the only line of two-stage absorption products designed, built and supported in
the USA.
Yazaki Energy Systems produces gas fired and water fired (i.e. using hot process
water from industrial plant or solar plant) lithium bromide adsorption chillers in Texas.
The company has over 10,000 units in operation worldwide.
India
The absorption cooling division of Thermax, part of the Thermax Group, pioneered
vapour absorption technology in India and offers global solutions for industrial cooling
and air conditioning. Thermax produces hot water, fuel and steam driven absorption
chillers. The company has a technical collaboration with Kawasaki in Japan.
South Korea
CHP Solution (previously Cention Corporation) is a manufacturer of absorption chillers
in South Korea. The company’s main product is a 30-525 refrigeration-tonne (105-1845
kW) hot water driven absorption chiller.
Page | 354 Lithium: Market Outlook to 2017, 12th edition 2013
Roskill
Copyright © 2013 by Roskill Information Services Ltd. Unauthorised copying prohibited. www.roskill.com
LG Machinery produces both single- and double- effect absorption chillers (direct fired
and hot water/steam driven indirect fired) with 100-200 refrigeration-tonne capacities.
Kyung Won Century manufactures double-effect steam absorption chillers in the range
of 80-1,500 refrigeration-tonne capacity. They also produce direct fired double-effect
absorption chillers from 20-1,500 refrigeration-tonne capacity.
Japan
Sanyo entered the absorption chiller market in 1971 and after 3 years became one of
the leading producers in Japan. The company produce a double-effect direct fired
absorption chiller/heater in the cooling capacity range of 100-1,500 refrigeration-tonne, a
double-effect hot water absorption chiller in the cooling capacity range of 30-526
refrigeration-tonne and a double-effect steam absorption chiller in the cooling capacity
range of 100-1,500 refrigeration-tonne. Carrier of Syracuse, New York, is a division of
United Technologies and markets water and steam fired single effect absorption chillers
and direct and steam fired double effect absorption chillers produced by Sanyo in Japan.
Ebara Refrigeration Equipment & Systems of Tokyo started manufacturing lithium
bromide absorption chillers in 1963, the company produces single- and double- effect
absorption chillers.
Other producers in Japan include Mitsubishi Heavy Industries, Daikin, Takuma,
Toshiba, Hitachi Appliances and Kawasaki Heavy Industries, which has ties with
Matsushita Electric. McQuay International, a division of Daikin Industries of Japan, sells
absorption chillers produced by Daikin in Japan to the US market.
Europe
Entropie of France/Germany manufactures absorption chillers in the capacity range
from 300kW (100 refrigeration-tonne) to more than 6,000kW (2,000 refrigeration-tonne).
Robur provides small direct fired chiller and chiller-heaters (natural or propane gas fired)
with 3, 4 and 5 tonne capacities.
A number of companies in Europe are developing small (<100kW) chillers for the home
market and chillers which use solar heated water; these include Schuco, Rotartica,
Abakus, Sonnenkilma, EAW, Climatewell and Pink. However, most of these
companies use ammonia instead of lithium bromide as the absorbent.
15.1.3 Producers of lithium bromide for absorption chillers
Lithium bromide is produced by reacting lithium carbonate with hydrobromic acid.
Lithium bromide is used almost exclusively in absorption chillers.
Lithium bromide is produced by only a few upstream integrated lithium companies,
notably FMC Lithium and Rockwood Lithium (Table 211). The remainder of output is
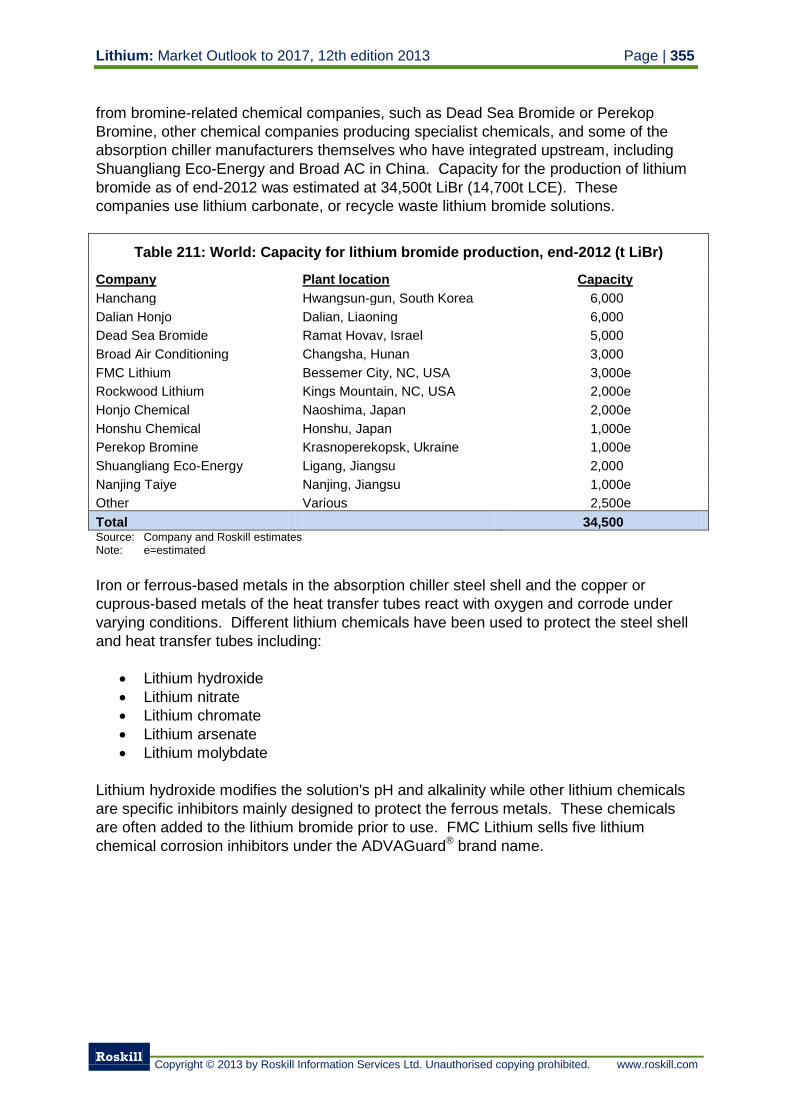
Lithium: Market Outlook to 2017, 12th edition 2013 Page | 355
Roskill
Copyright © 2013 by Roskill Information Services Ltd. Unauthorised copying prohibited. www.roskill.com
from bromine-related chemical companies, such as Dead Sea Bromide or Perekop
Bromine, other chemical companies producing specialist chemicals, and some of the
absorption chiller manufacturers themselves who have integrated upstream, including
Shuangliang Eco-Energy and Broad AC in China. Capacity for the production of lithium
bromide as of end-2012 was estimated at 34,500t LiBr (14,700t LCE). These
companies use lithium carbonate, or recycle waste lithium bromide solutions.
Table 211: World: Capacity for lithium bromide production, end-2012 (t LiBr)
Company Plant location Capacity
Hanchang Hwangsun-gun, South Korea 6,000
Dalian Honjo Dalian, Liaoning 6,000
Dead Sea Bromide Ramat Hovav, Israel 5,000
Broad Air Conditioning Changsha, Hunan 3,000
FMC Lithium Bessemer City, NC, USA 3,000e
Rockwood Lithium Kings Mountain, NC, USA 2,000e
Honjo Chemical Naoshima, Japan 2,000e
Honshu Chemical Honshu, Japan 1,000e
Perekop Bromine Krasnoperekopsk, Ukraine 1,000e
Shuangliang Eco-Energy Ligang, Jiangsu 2,000
Nanjing Taiye Nanjing, Jiangsu 1,000e
Other Various 2,500e
Total 34,500 Source: Company and Roskill estimates Note: e=estimated
Iron or ferrous-based metals in the absorption chiller steel shell and the copper or
cuprous-based metals of the heat transfer tubes react with oxygen and corrode under
varying conditions. Different lithium chemicals have been used to protect the steel shell
and heat transfer tubes including:
Lithium hydroxide
Lithium nitrate
Lithium chromate
Lithium arsenate
Lithium molybdate
Lithium hydroxide modifies the solution's pH and alkalinity while other lithium chemicals
are specific inhibitors mainly designed to protect the ferrous metals. These chemicals
are often added to the lithium bromide prior to use. FMC Lithium sells five lithium
chemical corrosion inhibitors under the ADVAGuard® brand name.
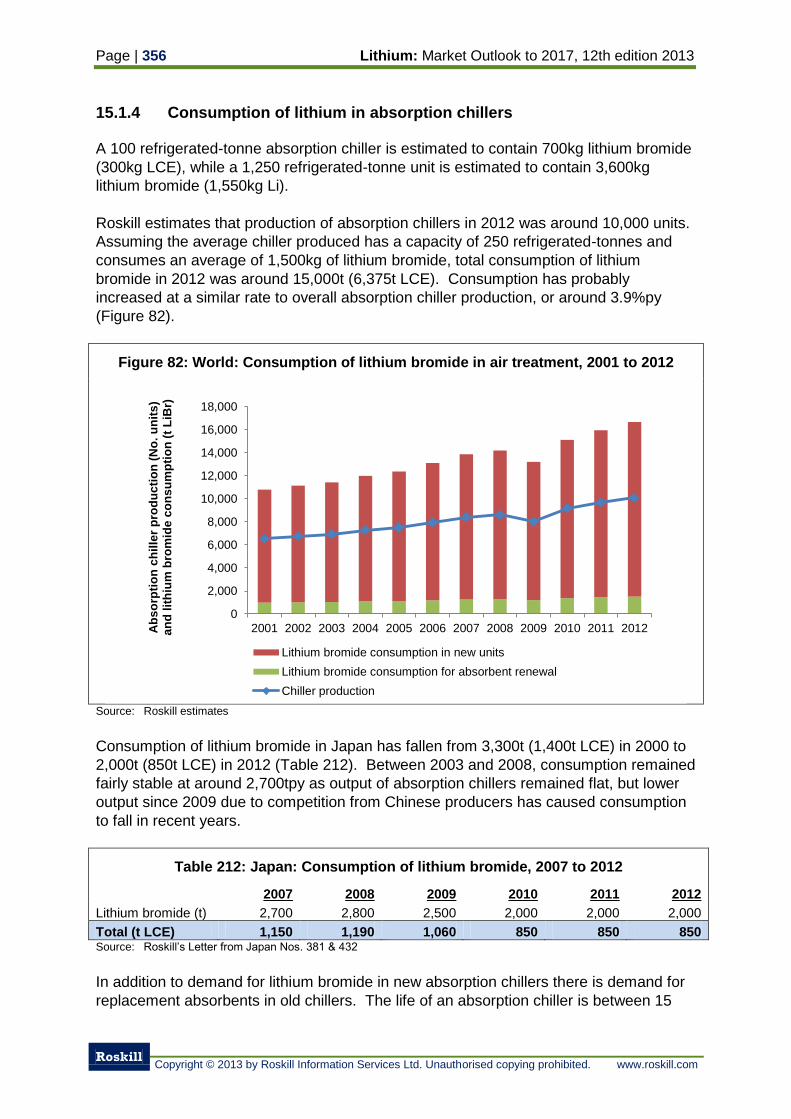
Page | 356 Lithium: Market Outlook to 2017, 12th edition 2013
Roskill
Copyright © 2013 by Roskill Information Services Ltd. Unauthorised copying prohibited. www.roskill.com
15.1.4 Consumption of lithium in absorption chillers
A 100 refrigerated-tonne absorption chiller is estimated to contain 700kg lithium bromide
(300kg LCE), while a 1,250 refrigerated-tonne unit is estimated to contain 3,600kg
lithium bromide (1,550kg Li).
Roskill estimates that production of absorption chillers in 2012 was around 10,000 units.
Assuming the average chiller produced has a capacity of 250 refrigerated-tonnes and
consumes an average of 1,500kg of lithium bromide, total consumption of lithium
bromide in 2012 was around 15,000t (6,375t LCE). Consumption has probably
increased at a similar rate to overall absorption chiller production, or around 3.9%py
(Figure 82).
Figure 82: World: Consumption of lithium bromide in air treatment, 2001 to 2012
Source: Roskill estimates
Consumption of lithium bromide in Japan has fallen from 3,300t (1,400t LCE) in 2000 to
2,000t (850t LCE) in 2012 (Table 212). Between 2003 and 2008, consumption remained
fairly stable at around 2,700tpy as output of absorption chillers remained flat, but lower
output since 2009 due to competition from Chinese producers has caused consumption
to fall in recent years.
Table 212: Japan: Consumption of lithium bromide, 2007 to 2012
2007 2008 2009 2010 2011 2012
Lithium bromide (t) 2,700 2,800 2,500 2,000 2,000 2,000
Total (t LCE) 1,150 1,190 1,060 850 850 850 Source: Roskill’s Letter from Japan Nos. 381 & 432
In addition to demand for lithium bromide in new absorption chillers there is demand for
replacement absorbents in old chillers. The life of an absorption chiller is between 15
0
2,000
4,000
6,000
8,000
10,000
12,000
14,000
16,000
18,000
2001 2002 2003 2004 2005 2006 2007 2008 2009 2010 2011 2012Ab
so
rpti
on
ch
ille
r p
rod
uc
tio
n (
No
. u
nit
s)
an
d lit
hiu
m b
rom
ide
co
ns
um
pti
on
(t
LiB
r)
Lithium bromide consumption in new units
Lithium bromide consumption for absorbent renewal
Chiller production
Lithium: Market Outlook to 2017, 12th edition 2013 Page | 357
Roskill
Copyright © 2013 by Roskill Information Services Ltd. Unauthorised copying prohibited. www.roskill.com
and 20 years and the frequency of replacement of the absorbent is around every 5
years. The number of absorption chiller units in use worldwide is unknown but is
probably around 120,000 units. However, recycling of old lithium bromide absorbent is
common and therefore the additional requirement for lithium bromide in servicing older
units is estimated at 10% of total consumption. Consumption of lithium chemicals to
prevent corrosion in absorption chillers is estimated at less than 5t LCE per year.
15.2 Dehumidification
Desiccant dehumidification systems are widely-used in industrial, commercial and
institutional environments where humidity control is a concern and low humidity has an
economic benefit. Examples include photographic processing, laboratories, food
processing and pharmaceuticals manufacturing.
A desiccant dehumidifier uses a drying agent, or sorbent, to release water from air.
Desiccants can work in conjunction with chillers or commercial air conditioning systems
to significantly increase overall system energy efficiency, by avoiding over-cooling and
reheating air. Desiccants can run off the waste heat from distribution generation
technology, with system energy efficiency reaching 80% in combined heat and power
(CHP) plants.
The desiccant process involves exposing the desiccant material (silica gel, activated
alumina, lithium chloride salt or molecular sieve) to a moisture-laden air stream.
Allowing the sorbent to extract and retain heated regeneration air streams drives off the
retained moisture from the desiccant.
A solid desiccant dehumidifier is usually placed on the surface of a corrugated matrix in
a wheel that rotates between the process and regenerated air streams. The desiccant
removes moisture from the air while releasing heat (resulting from the sorption process)
into the process airstream. As the wheel rotates onto the regeneration side, natural gas,
waste heat or solar energy can be used to regenerate the desiccant material.
Liquid desiccant dehumidifiers spray the process air with a regenerated desiccant
(lithium chloride and glycol solutions) to remove the moisture in a conditioner. The
diluted desiccant solution is pumped to a separate refrigerator and heat is applied to the
solution to release the absorbed water into an exhaust air system.
Lithium chloride is an extremely powerful absorbent and is one of the most economical
systems on an operating cost basis. Advantages include:
Moisture removal capacity: Lithium chloride can attract and hold over ten times its
weight in water and is one of the most hygroscopic compounds in existence. It
has the best moisture removal capacity over a very broad range of inlet air
conditions.
Bacteriostatic: The bacteriostatic properties of lithium chloride can significantly
reduce the number of organisms which may be carried in the air stream.
Page | 358 Lithium: Market Outlook to 2017, 12th edition 2013
Roskill
Copyright © 2013 by Roskill Information Services Ltd. Unauthorised copying prohibited. www.roskill.com
Stability: As a salt having very stable chemical qualities, lithium chloride is not
dependent on a pore system for its water absorption capability. Lithium chloride is
unaffected by most air stream pollutants and resistant to many contaminants like
petroleum vapour, solvents and phenols.
Efficiency: The ability of the lithium chloride to both absorb and release large
amounts of water from a small amount of desiccant creates a tremendous drying
capacity. Thus for each unit of energy input, a greater percentage goes to the
useful work of removing water rather than heating and cooling the structure.
However, if exposed to high relative humidity air without sufficient regeneration, lithium
chloride rotors will deliquesce, a phenomenon whereby the desiccant over-adsorbs
moisture to the point where damage occurs. If it is not regenerated, the lithium chloride
will continue to absorb moisture until it becomes such a weak solution that it can drain
out of the matrix. The combination of water weight and the soaking effect can also
destroy the structural integrity of the matrix.
In addition, lithium chloride is not flame proof and can cause desiccation contamination
carryover, a process where lithium is released into the air and settles on ferrous
surfaces, subsequently causing corrosion.
15.2.1 Production of desiccant dehumidification systems
Lithium chloride was first used as a liquid desiccant dehumidifier in the 1940s. The
lithium chloride desiccant impregnated honeycomb wheel was introduced by Cargocaire
Engineering and Munters in the 1960s and provided engineers with a new type of
dehumidifier with a tremendous capacity for moisture absorption. In the 1980s and
1990s however, new desiccants were developed using silica gel, activated alumina,
titanium dioxide or the molecular sieve and have largely replaced lithium chloride as the
desiccant of choice. Munters, of the USA, indicate that lithium chloride as a desiccant in
dehumidifiers is now restricted mainly to specialist industrial applications where
resistance to contamination is needed. They also indicate there is some demand for
replacement lithium chloride disks for older machines, but that this is now very small.
15.2.2 Producers of desiccant dehumidification systems
Munters, of the USA, is thought to be only company producing rotary desiccant
dehumidifiers based on lithium chloride. Other companies that used to produce lithium
chloride-containing dehumidifiers have converted to using other desiccants, mainly silica
gel. Munters indicated that lithium chloride desiccant dehumidifiers comprise less than
10% of its sales.
Kathabar, of the USA, produces industrial dehumidification systems using Kathene®, a
lithium chloride brine solution that dehumidifies or humidifies the air as necessary.
Lithium: Market Outlook to 2017, 12th edition 2013 Page | 359
Roskill
Copyright © 2013 by Roskill Information Services Ltd. Unauthorised copying prohibited. www.roskill.com
FMC Lithium produces the LIMIT® range of lithium chloride solutions for
dehumidification.
15.2.3 Consumption of lithium in desiccant dehumidifiers
Total desiccant demand for rotor materials was estimated by HB Engineering at 2,500m3
in 2008. Of this total, 85% is silica gel. Assuming lithium chloride comprised 10% of
desiccant demand, total demand for lithium chloride would have been 105m3 or around
220t (190t LCE). Lithium chloride demand for other dehumidifiers was estimated at
around 50t (43t LCE) in 2008. Consumption in 2012 is estimated to have fallen to
around 200t LCE, as lithium chloride’s market share falls, especially as old units are
replaced.
15.3 Air purification
There are many methods of removing carbon dioxide from a closed or semi-closed
breathing atmosphere including chemical (chemisorption), physical (absorption and
adsorption) and mixed methods. In chemical methods, carbon dioxide is removed with
the use of alkali hydroxide substances.
Lithium hydroxide is used in breathing gas purification systems for spacecraft,
submarines, and rebreathers, such as those used in underground mines for
emergencies. These systems remove carbon dioxide from exhaled gas by producing
lithium carbonate and water:
2LiOH·H2O + CO2 → Li2CO3 + 3H2O
Anhydrous lithium hydroxide is preferred for its lower mass and lesser water production
for respirator systems in spacecraft. 1 gram of anhydrous lithium hydroxide can remove
450cm3 of carbon dioxide gas:
2LiOH + CO2 → Li2CO3 + H2O
Even better materials are lithium peroxide (Li2O2) and lithium superoxide (LiO2) that, in
presence of moisture, besides absorbing carbon dioxide to form lithium carbonate, they
also release oxygen back into the atmosphere:
2Li2O2 + 2CO2 → 2Li2CO3 + O2
The process is irreversible, so in applications where several days of carbon dioxide
removal are required, such as on the space shuttle, regenerative carbon dioxide removal
systems are used instead because the weight of lithium hydroxide required would be
prohibitive.
Page | 360 Lithium: Market Outlook to 2017, 12th edition 2013
Roskill
Copyright © 2013 by Roskill Information Services Ltd. Unauthorised copying prohibited. www.roskill.com
Consumption of lithium in air treatment is estimated at around 100t LCE. Companies
producing carbon dioxide absorption equipment include ExtendAir of the USA.
Hamilstrand Sundstrand, also of the USA, used to use lithium hydroxide but now uses
a metal oxide canister regeneration system. Rockwood Lithium produces lithium
hydroxide and peroxide for air treatment purposes, and EPSI Metals sells high purity
lithium hydride.
15.5 Outlook for demand for lithium in air treatment
Demand for absorption chillers comes mainly from large industrial and commercial
buildings, such as manufacturing and power plants, schools, hospitals and offices, as
well as large residential buildings. Industrial, commercial and residential development
expanded strongly in the mid-2000s, particularly in emerging economies and especially
in China. There has also been an increased focus on indirect-fired absorption chillers as
a means to reduce energy demand and CO2 emissions by using them instead of electric
chillers where waste heat is available. Sales of direct-fired absorption chillers, which use
natural gas or other fossil fuels, are slowing as users seek to reduce their CO2
emissions.
Potential new markets for absorption chillers include their use in combination with solar
powered hot water production and the residential market, where electricity supply
security is becoming a concern but where natural gas may be available. Growing shale
gas supplies could also boost direct-fired absorption chillers, especially if natural gas is
available at low cost.
The use of lithium in desiccant dehumidifiers is now restricted to niche industrial markets
as silica gel and other desiccants have replaced lithium chloride. In addition, older
equipment has been upgraded to use newer desiccants so replacement demand is also
declining. There is potential for increased use of lithium chloride desiccants in solar
powered refrigeration units which utilise dehumidifiers, although these are more likely to
use silica gel or similar.
The use of lithium hydroxide for carbon dioxide removal is also restricted to niche
markets such as space travel, submarines and for emergency ventilation. Lithium has
been largely replaced by regenerative systems in this market.
Demand for lithium in air treatment is forecast to increase by 3.5%py to 8,700t LCE in
2017 in the base case scenario (Table 209). The base case envisages continuing
growth in demand for absorption chillers using lithium bromide, a stable for market
lithium chloride desiccants, a slight growth in demand for lithium hydroxide for carbon
dioxide removal and a small increase in lithium chemicals demand for corrosion
prevention in lithium bromide systems.
Solar powered refrigeration technology using absorption chillers and desiccant
dehumidification systems, where both systems use lithium, could increase demand by
5.0%py to 9,350t LCE by 2017. However, if direct-fired absorption chillers are replaced
by electric compressors, and lithium chloride desiccants are further replaced by
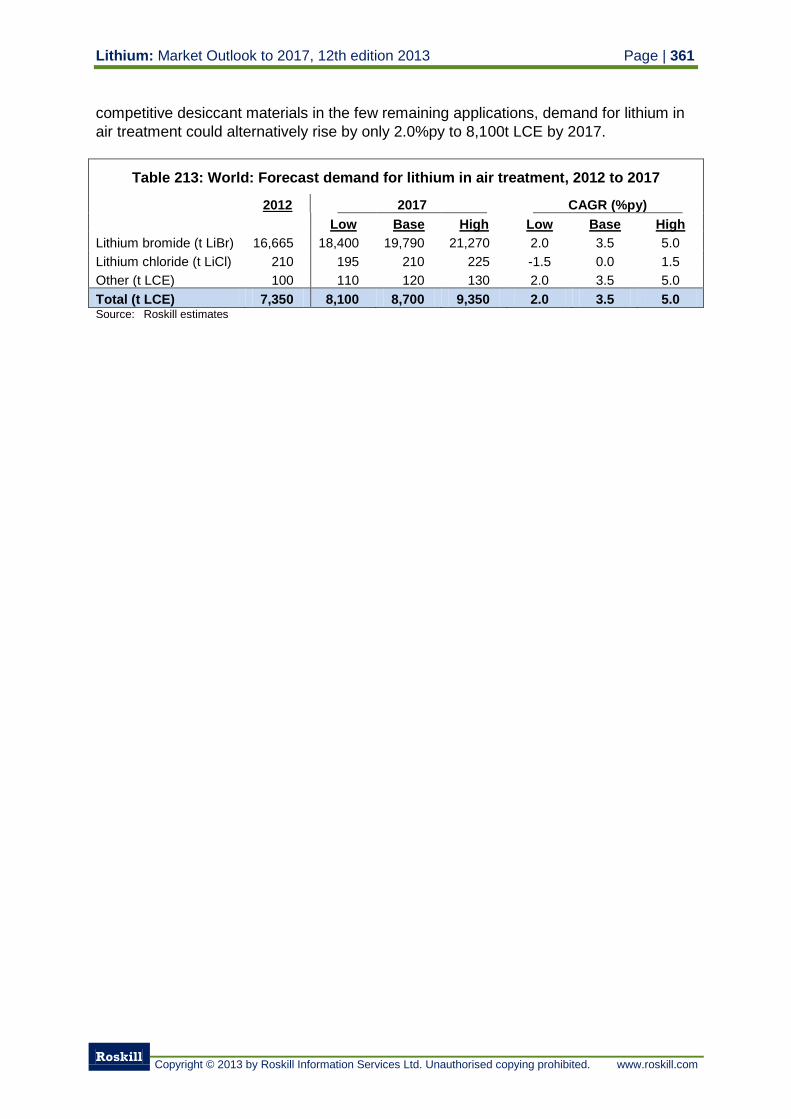
Lithium: Market Outlook to 2017, 12th edition 2013 Page | 361
Roskill
Copyright © 2013 by Roskill Information Services Ltd. Unauthorised copying prohibited. www.roskill.com
competitive desiccant materials in the few remaining applications, demand for lithium in
air treatment could alternatively rise by only 2.0%py to 8,100t LCE by 2017.
Table 213: World: Forecast demand for lithium in air treatment, 2012 to 2017
2012 2017 CAGR (%py)
Low Base High Low Base High
Lithium bromide (t LiBr) 16,665 18,400 19,790 21,270 2.0 3.5 5.0
Lithium chloride (t LiCl) 210 195 210 225 -1.5 0.0 1.5
Other (t LCE) 100 110 120 130 2.0 3.5 5.0
Total (t LCE) 7,350 8,100 8,700 9,350 2.0 3.5 5.0 Source: Roskill estimates
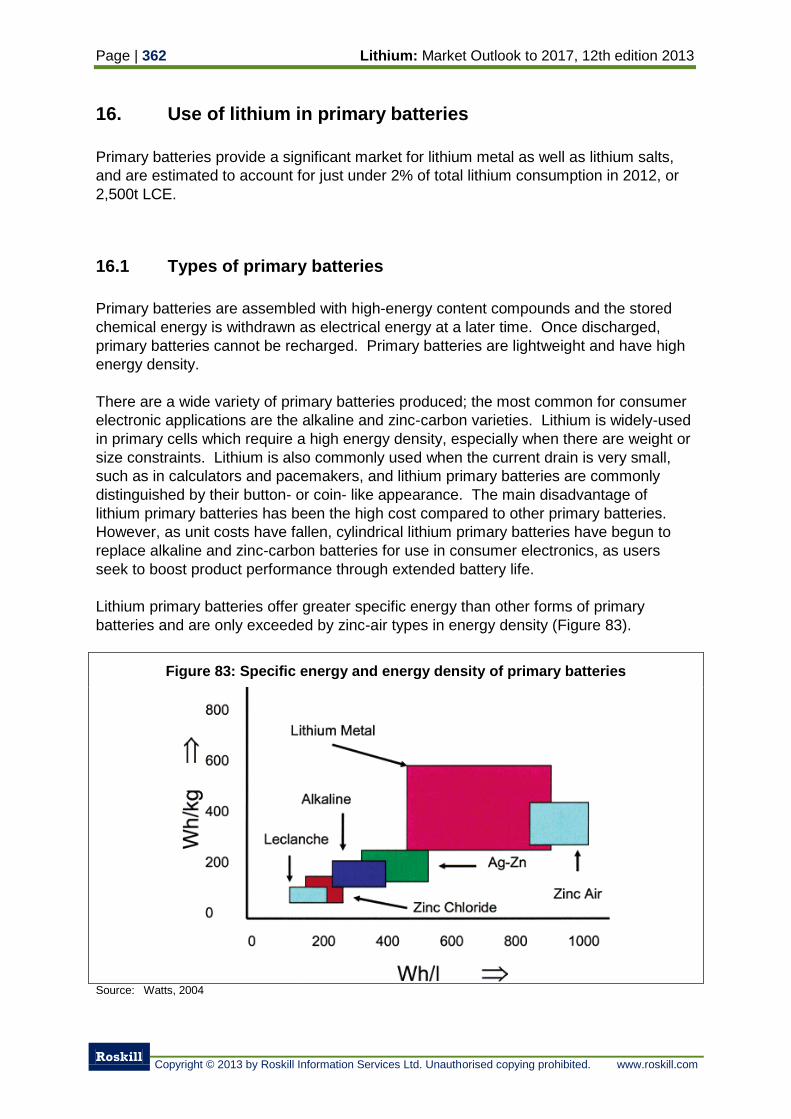
Page | 362 Lithium: Market Outlook to 2017, 12th edition 2013
Roskill
Copyright © 2013 by Roskill Information Services Ltd. Unauthorised copying prohibited. www.roskill.com
16. Use of lithium in primary batteries
Primary batteries provide a significant market for lithium metal as well as lithium salts,
and are estimated to account for just under 2% of total lithium consumption in 2012, or
2,500t LCE.
16.1 Types of primary batteries
Primary batteries are assembled with high-energy content compounds and the stored
chemical energy is withdrawn as electrical energy at a later time. Once discharged,
primary batteries cannot be recharged. Primary batteries are lightweight and have high
energy density.
There are a wide variety of primary batteries produced; the most common for consumer
electronic applications are the alkaline and zinc-carbon varieties. Lithium is widely-used
in primary cells which require a high energy density, especially when there are weight or
size constraints. Lithium is also commonly used when the current drain is very small,
such as in calculators and pacemakers, and lithium primary batteries are commonly
distinguished by their button- or coin- like appearance. The main disadvantage of
lithium primary batteries has been the high cost compared to other primary batteries.
However, as unit costs have fallen, cylindrical lithium primary batteries have begun to
replace alkaline and zinc-carbon batteries for use in consumer electronics, as users
seek to boost product performance through extended battery life.
Lithium primary batteries offer greater specific energy than other forms of primary
batteries and are only exceeded by zinc-air types in energy density (Figure 83).
Figure 83: Specific energy and energy density of primary batteries
Source: Watts, 2004
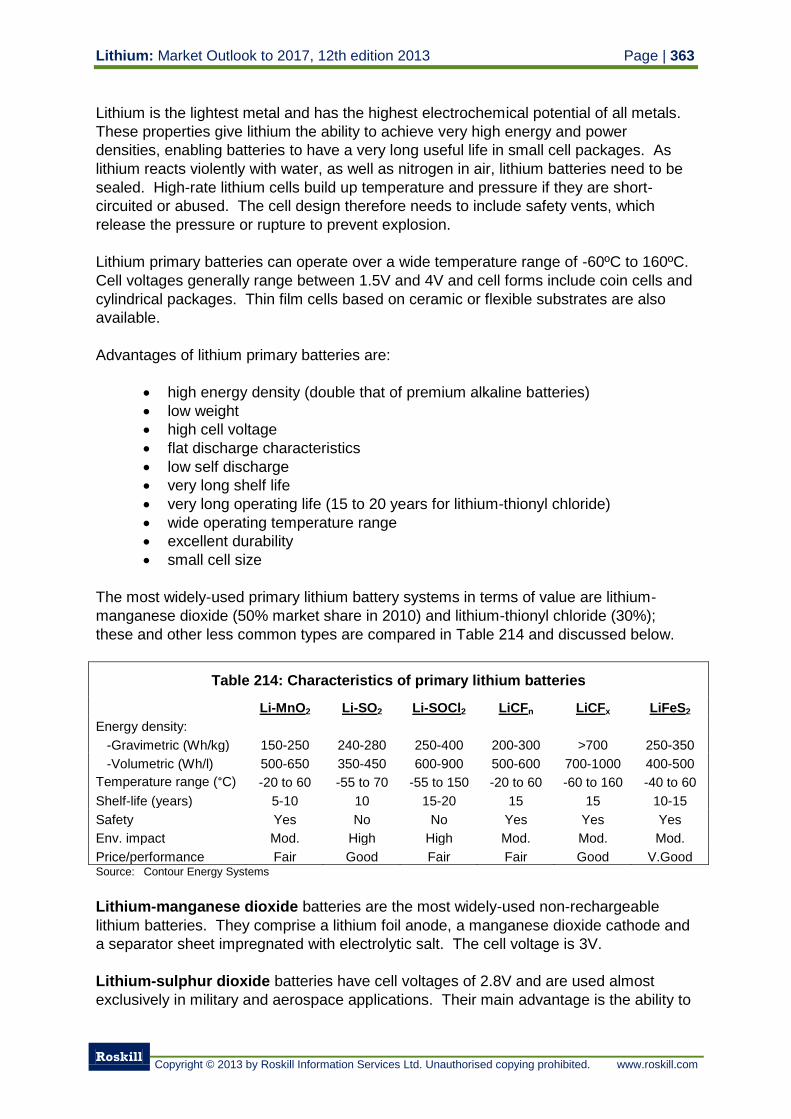
Lithium: Market Outlook to 2017, 12th edition 2013 Page | 363
Roskill
Copyright © 2013 by Roskill Information Services Ltd. Unauthorised copying prohibited. www.roskill.com
Lithium is the lightest metal and has the highest electrochemical potential of all metals.
These properties give lithium the ability to achieve very high energy and power
densities, enabling batteries to have a very long useful life in small cell packages. As
lithium reacts violently with water, as well as nitrogen in air, lithium batteries need to be
sealed. High-rate lithium cells build up temperature and pressure if they are short-
circuited or abused. The cell design therefore needs to include safety vents, which
release the pressure or rupture to prevent explosion.
Lithium primary batteries can operate over a wide temperature range of -60ºC to 160ºC.
Cell voltages generally range between 1.5V and 4V and cell forms include coin cells and
cylindrical packages. Thin film cells based on ceramic or flexible substrates are also
available.
Advantages of lithium primary batteries are:
high energy density (double that of premium alkaline batteries)
low weight
high cell voltage
flat discharge characteristics
low self discharge
very long shelf life
very long operating life (15 to 20 years for lithium-thionyl chloride)
wide operating temperature range
excellent durability
small cell size
The most widely-used primary lithium battery systems in terms of value are lithium-
manganese dioxide (50% market share in 2010) and lithium-thionyl chloride (30%);
these and other less common types are compared in Table 214 and discussed below.
Table 214: Characteristics of primary lithium batteries
Li-MnO2 Li-SO2 Li-SOCl2 LiCFn LiCFx LiFeS2
Energy density:
-Gravimetric (Wh/kg) 150-250 240-280 250-400 200-300 >700 250-350
-Volumetric (Wh/l) 500-650 350-450 600-900 500-600 700-1000 400-500
Temperature range (°C) -20 to 60 -55 to 70 -55 to 150 -20 to 60 -60 to 160 -40 to 60
Shelf-life (years) 5-10 10 15-20 15 15 10-15
Safety Yes No No Yes Yes Yes
Env. impact Mod. High High Mod. Mod. Mod.
Price/performance Fair Good Fair Fair Good V.Good Source: Contour Energy Systems
Lithium-manganese dioxide batteries are the most widely-used non-rechargeable
lithium batteries. They comprise a lithium foil anode, a manganese dioxide cathode and
a separator sheet impregnated with electrolytic salt. The cell voltage is 3V.
Lithium-sulphur dioxide batteries have cell voltages of 2.8V and are used almost
exclusively in military and aerospace applications. Their main advantage is the ability to
Page | 364 Lithium: Market Outlook to 2017, 12th edition 2013
Roskill
Copyright © 2013 by Roskill Information Services Ltd. Unauthorised copying prohibited. www.roskill.com
deliver high current, especially in low temperatures. The electrolyte is kept in a liquid
state by maintaining two atmospheres of pressure within the cell, and cells are vented to
prevent over-pressurisation. As a result, service life and energy density are typically
less than half those shown by lithium-thionyl chloride cells.
Lithium-thionyl chloride batteries have the highest density of all commercial lithium
primary cells, at 3.6V, and a service life of up to 15 to 20 years. They are suitable for
applications requiring very low continuous current and/or moderate pulse currents.
Markets lie in life-saving equipment such as automatic external defibrillators which must
be ready for use at all times without risk of battery failure. The batteries are available as
bobbins or spirally wound.
Lithium-polycarbon monofluoride batteries have a cell voltage of 2.8V and moderate
energy density. Cylindrical types are manufactured with a spiral cathode for higher rate
capability. Though generally safe, under extreme temperature and humidity conditions
the seal can break, allowing the cell to fail due to loss of the low-vapour point electrolyte.
Lithium-iodine batteries have excellent stability and long life. They use only solid
components and the separator is self-sealing if cracks occur. High internal impedance
limits their use to low-drain applications, however. The largest market lies in implanted
cardiac pacemakers.
Lithium-iron disulphide batteries were designed as a drop-in replacement for zinc-
carbon or alkaline types. They are often called ‘voltage compatible’ lithium cells (at
1.5V) but have a higher energy density than zinc-carbon and alkaline types. The cells
comprise a lithium foil anode, an iron disulphide with aluminium cathode and a separator
sheet impregnated with electrolyte salts.
Lithium primary batteries currently offer greater energy density than both lithium-ion
rechargeable batteries and alkaline primary batteries (Figure 84). In addition, under load
conditions, such as when used in digital cameras, lithium primary batteries are superior
to alkaline primary batteries. The use of iron disulphide cathode material, which is
cheaper than manganese dioxide, has enabled them to compete with alkaline and zinc-
carbon alternatives.
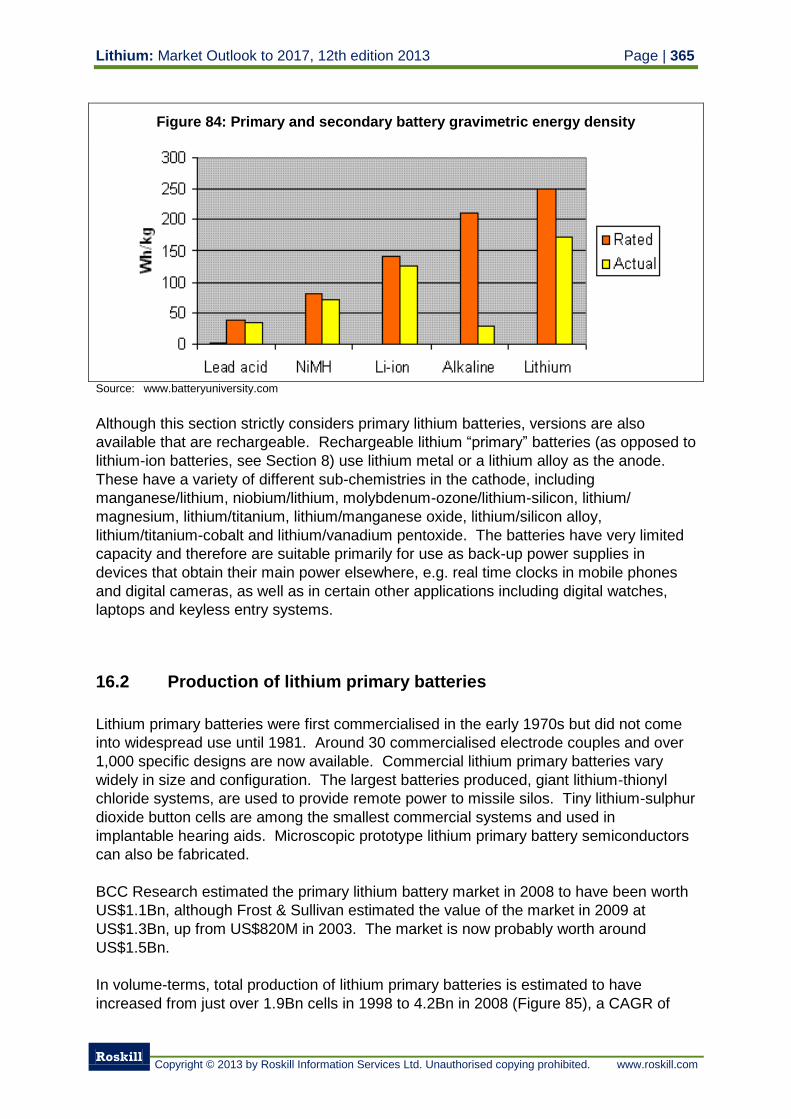
Lithium: Market Outlook to 2017, 12th edition 2013 Page | 365
Roskill
Copyright © 2013 by Roskill Information Services Ltd. Unauthorised copying prohibited. www.roskill.com
Figure 84: Primary and secondary battery gravimetric energy density
Source: www.batteryuniversity.com
Although this section strictly considers primary lithium batteries, versions are also
available that are rechargeable. Rechargeable lithium “primary” batteries (as opposed to
lithium-ion batteries, see Section 8) use lithium metal or a lithium alloy as the anode.
These have a variety of different sub-chemistries in the cathode, including
manganese/lithium, niobium/lithium, molybdenum-ozone/lithium-silicon, lithium/
magnesium, lithium/titanium, lithium/manganese oxide, lithium/silicon alloy,
lithium/titanium-cobalt and lithium/vanadium pentoxide. The batteries have very limited
capacity and therefore are suitable primarily for use as back-up power supplies in
devices that obtain their main power elsewhere, e.g. real time clocks in mobile phones
and digital cameras, as well as in certain other applications including digital watches,
laptops and keyless entry systems.
16.2 Production of lithium primary batteries
Lithium primary batteries were first commercialised in the early 1970s but did not come
into widespread use until 1981. Around 30 commercialised electrode couples and over
1,000 specific designs are now available. Commercial lithium primary batteries vary
widely in size and configuration. The largest batteries produced, giant lithium-thionyl
chloride systems, are used to provide remote power to missile silos. Tiny lithium-sulphur
dioxide button cells are among the smallest commercial systems and used in
implantable hearing aids. Microscopic prototype lithium primary battery semiconductors
can also be fabricated.
BCC Research estimated the primary lithium battery market in 2008 to have been worth
US$1.1Bn, although Frost & Sullivan estimated the value of the market in 2009 at
US$1.3Bn, up from US$820M in 2003. The market is now probably worth around
US$1.5Bn.
In volume-terms, total production of lithium primary batteries is estimated to have
increased from just over 1.9Bn cells in 1998 to 4.2Bn in 2008 (Figure 85), a CAGR of
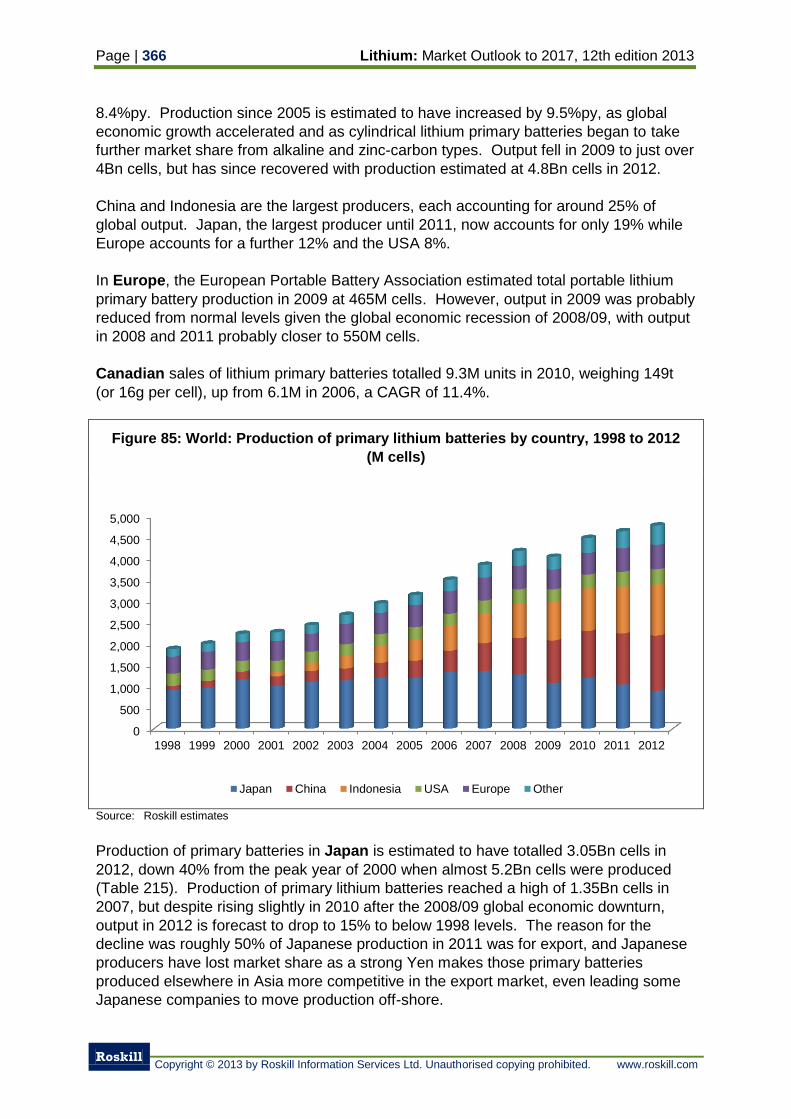
Page | 366 Lithium: Market Outlook to 2017, 12th edition 2013
Roskill
Copyright © 2013 by Roskill Information Services Ltd. Unauthorised copying prohibited. www.roskill.com
8.4%py. Production since 2005 is estimated to have increased by 9.5%py, as global
economic growth accelerated and as cylindrical lithium primary batteries began to take
further market share from alkaline and zinc-carbon types. Output fell in 2009 to just over
4Bn cells, but has since recovered with production estimated at 4.8Bn cells in 2012.
China and Indonesia are the largest producers, each accounting for around 25% of
global output. Japan, the largest producer until 2011, now accounts for only 19% while
Europe accounts for a further 12% and the USA 8%.
In Europe, the European Portable Battery Association estimated total portable lithium
primary battery production in 2009 at 465M cells. However, output in 2009 was probably
reduced from normal levels given the global economic recession of 2008/09, with output
in 2008 and 2011 probably closer to 550M cells.
Canadian sales of lithium primary batteries totalled 9.3M units in 2010, weighing 149t
(or 16g per cell), up from 6.1M in 2006, a CAGR of 11.4%.
Figure 85: World: Production of primary lithium batteries by country, 1998 to 2012
(M cells)
Source: Roskill estimates
Production of primary batteries in Japan is estimated to have totalled 3.05Bn cells in
2012, down 40% from the peak year of 2000 when almost 5.2Bn cells were produced
(Table 215). Production of primary lithium batteries reached a high of 1.35Bn cells in
2007, but despite rising slightly in 2010 after the 2008/09 global economic downturn,
output in 2012 is forecast to drop to 15% to below 1998 levels. The reason for the
decline was roughly 50% of Japanese production in 2011 was for export, and Japanese
producers have lost market share as a strong Yen makes those primary batteries
produced elsewhere in Asia more competitive in the export market, even leading some
Japanese companies to move production off-shore.
0
500
1,000
1,500
2,000
2,500
3,000
3,500
4,000
4,500
5,000
1998 1999 2000 2001 2002 2003 2004 2005 2006 2007 2008 2009 2010 2011 2012
Japan China Indonesia USA Europe Other
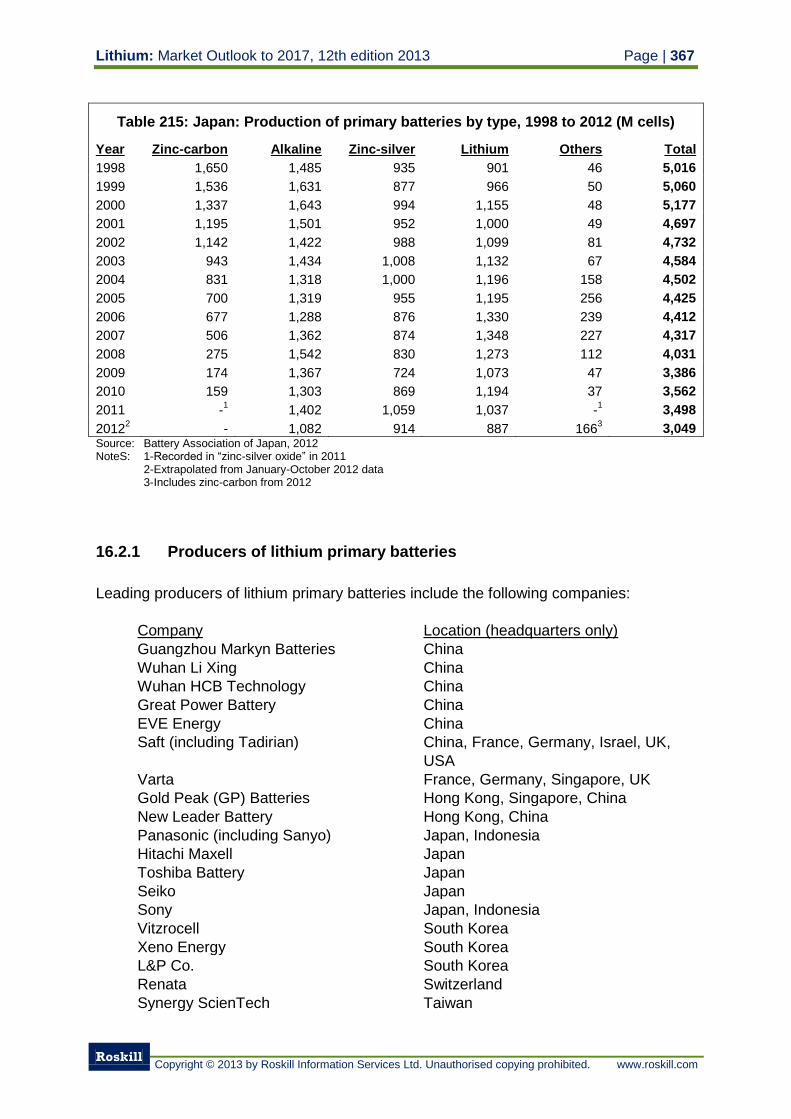
Lithium: Market Outlook to 2017, 12th edition 2013 Page | 367
Roskill
Copyright © 2013 by Roskill Information Services Ltd. Unauthorised copying prohibited. www.roskill.com
Table 215: Japan: Production of primary batteries by type, 1998 to 2012 (M cells)
Year Zinc-carbon Alkaline Zinc-silver Lithium Others Total
1998 1,650 1,485 935 901 46 5,016
1999 1,536 1,631 877 966 50 5,060
2000 1,337 1,643 994 1,155 48 5,177
2001 1,195 1,501 952 1,000 49 4,697
2002 1,142 1,422 988 1,099 81 4,732
2003 943 1,434 1,008 1,132 67 4,584
2004 831 1,318 1,000 1,196 158 4,502
2005 700 1,319 955 1,195 256 4,425
2006 677 1,288 876 1,330 239 4,412
2007 506 1,362 874 1,348 227 4,317
2008 275 1,542 830 1,273 112 4,031
2009 174 1,367 724 1,073 47 3,386
2010 159 1,303 869 1,194 37 3,562
2011 -1
1,402 1,059 1,037 -1
3,498
20122
-
1,082 914 887 1663
3,049 Source: Battery Association of Japan, 2012 NoteS: 1-Recorded in “zinc-silver oxide” in 2011
2-Extrapolated from January-October 2012 data 3-Includes zinc-carbon from 2012
16.2.1 Producers of lithium primary batteries
Leading producers of lithium primary batteries include the following companies:
Company Location (headquarters only)
Guangzhou Markyn Batteries China
Wuhan Li Xing China
Wuhan HCB Technology China
Great Power Battery China
EVE Energy China
Saft (including Tadirian) China, France, Germany, Israel, UK,
USA
Varta France, Germany, Singapore, UK
Gold Peak (GP) Batteries Hong Kong, Singapore, China
New Leader Battery Hong Kong, China
Panasonic (including Sanyo) Japan, Indonesia
Hitachi Maxell Japan
Toshiba Battery Japan
Seiko Japan
Sony Japan, Indonesia
Vitzrocell South Korea
Xeno Energy South Korea
L&P Co. South Korea
Renata Switzerland
Synergy ScienTech Taiwan
Page | 368 Lithium: Market Outlook to 2017, 12th edition 2013
Roskill
Copyright © 2013 by Roskill Information Services Ltd. Unauthorised copying prohibited. www.roskill.com
Ultralife Batteries/ABLE USA/China
Sprectrum Brands (Rayovac, Baowang) USA
Greatbatch USA & Mexico
Duracell (a Proctor & Gamble company) USA
Energizer (Eveready) USA, Indonesia
In 2013, Panasonic (which took over Sanyo in 2011) will move production of primary
lithium batteries from Osaka, Japan to a new factory in Indonesia in order to increase
production and reduce costs. The new factory, which will start operation in 2013, will
have an annual production capacity of 350M units. Panasonic’s primary lithium-
manganese dioxide battery (often referred to as CR series) production capacity will grow
by 70% to approximately 850M units after the completion of the Indonesian plant and the
company is targeting 40% global market share for these batteries. Although Panasonic
will maintain production sites in Japan and the USA, the Indonesian site will now be its
major plant. Panasonic is also the world’s largest producer of higher-value lithium-
carbon monofluoride cells, with a 50% market share.
Since its merger with Sanyo, Panasonic has become the leading supplier of
rechargeable lithium-manganese dioxide coin-type batteries with a 60-70% market
share; the other major producers of these batteries are Seiko and Hitachi Maxell. The
latter doubled its production capacity for coin-type lithium-manganese dioxide batteries
in Ono, Hyogo prefecture in 2005 to 4.5M cells a year. Hitachi Maxell also has capacity
to produce 30M other lithium primary batteries a year at two plants at Ibaraki, Osaka and
Ono, Hyogo in Japan.
Vitzrocell is the largest producer of lithium-thionyl chloride batteries in South Korea, with
a capacity of 40M cells per year, and claims to be the second largest supplier of lithium-
thionyl chloride batteries behind Saft/Tadiran. Other producers in South Korea include
Xeno Energy and L&P.
Saft is one of the leading producers of lithium primary batteries with operations
worldwide, and a reported 20% market share of the primary lithium battery market (by
value). A subsidiary company, Tadiran Batteries, has plants in Germany and Israel.
Saft produces lithium-thionyl chloride (LS, LST, LSX), lithium-sulphur dioxide (LSH, LO,
G) and lithium-manganese dioxide (LM) series. Other major European manufacturers
include Varta and Renata, the latter producing over 365M cells a year from its plant in
Switzerland. Varta also has a plant in Singapore which supplies the Asian market.
In 2008, China had 50 domestic producers of primary lithium batteries with five more due
to be added that year. Great Power Battery and EVE Energy between them had 170M
units per year of capacity in 2008, but have probably grown appreciably since.
Guangzhou Markyn Battery has production facilities in Guangzhou City and Wuhan
with a combined capacity of 1.5MAh (roughly 50M units per year). Wuhan Li Xing
(Lisun) has the capacity for 200M lithium-manganese primary batteries, which it claims
makes it the third largest producer worldwide.
In the USA, Energizer and Duracell are the volume leaders, with Energizer having a
monopoly on lithium-iron disulphide cells thanks to its development and patenting of
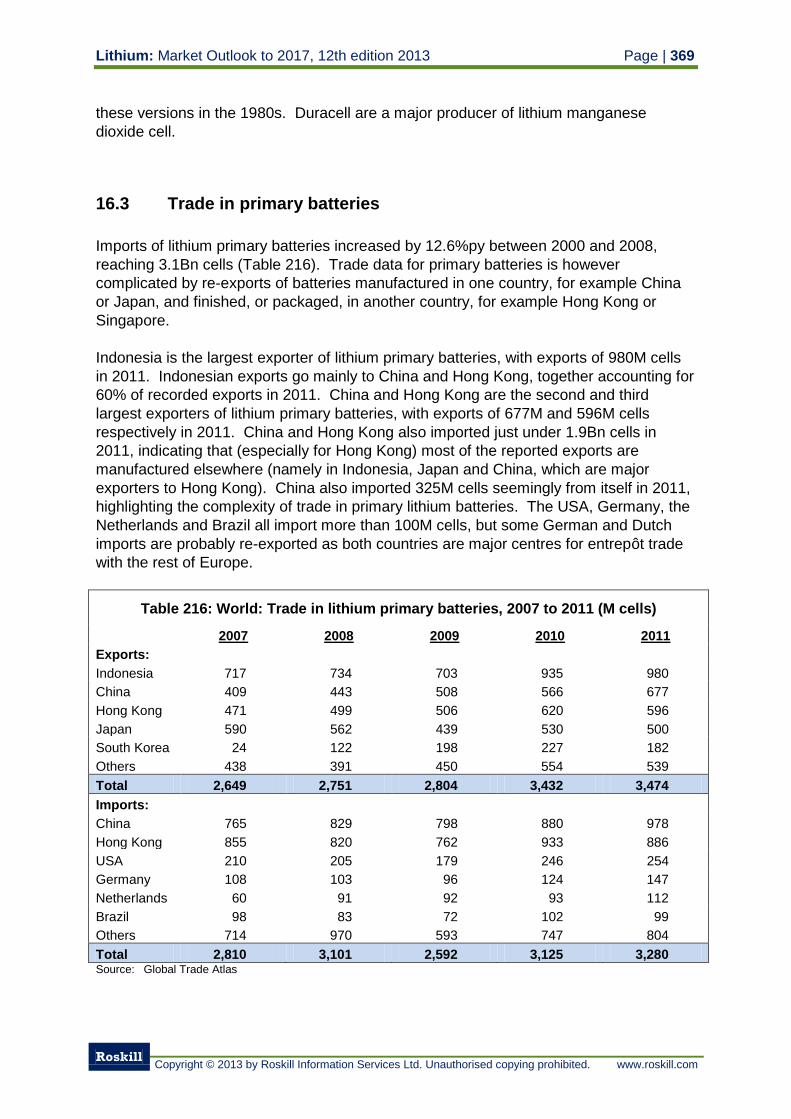
Lithium: Market Outlook to 2017, 12th edition 2013 Page | 369
Roskill
Copyright © 2013 by Roskill Information Services Ltd. Unauthorised copying prohibited. www.roskill.com
these versions in the 1980s. Duracell are a major producer of lithium manganese
dioxide cell.
16.3 Trade in primary batteries
Imports of lithium primary batteries increased by 12.6%py between 2000 and 2008,
reaching 3.1Bn cells (Table 216). Trade data for primary batteries is however
complicated by re-exports of batteries manufactured in one country, for example China
or Japan, and finished, or packaged, in another country, for example Hong Kong or
Singapore.
Indonesia is the largest exporter of lithium primary batteries, with exports of 980M cells
in 2011. Indonesian exports go mainly to China and Hong Kong, together accounting for
60% of recorded exports in 2011. China and Hong Kong are the second and third
largest exporters of lithium primary batteries, with exports of 677M and 596M cells
respectively in 2011. China and Hong Kong also imported just under 1.9Bn cells in
2011, indicating that (especially for Hong Kong) most of the reported exports are
manufactured elsewhere (namely in Indonesia, Japan and China, which are major
exporters to Hong Kong). China also imported 325M cells seemingly from itself in 2011,
highlighting the complexity of trade in primary lithium batteries. The USA, Germany, the
Netherlands and Brazil all import more than 100M cells, but some German and Dutch
imports are probably re-exported as both countries are major centres for entrepôt trade
with the rest of Europe.
Table 216: World: Trade in lithium primary batteries, 2007 to 2011 (M cells)
2007 2008 2009 2010 2011
Exports:
Indonesia 717 734 703 935 980
China 409 443 508 566 677
Hong Kong 471 499 506 620 596
Japan 590 562 439 530 500
South Korea 24 122 198 227 182
Others 438 391 450 554 539
Total 2,649 2,751 2,804 3,432 3,474
Imports:
China 765 829 798 880 978
Hong Kong 855 820 762 933 886
USA 210 205 179 246 254
Germany 108 103 96 124 147
Netherlands 60 91 92 93 112
Brazil 98 83 72 102 99
Others 714 970 593 747 804
Total 2,810 3,101 2,592 3,125 3,280 Source: Global Trade Atlas
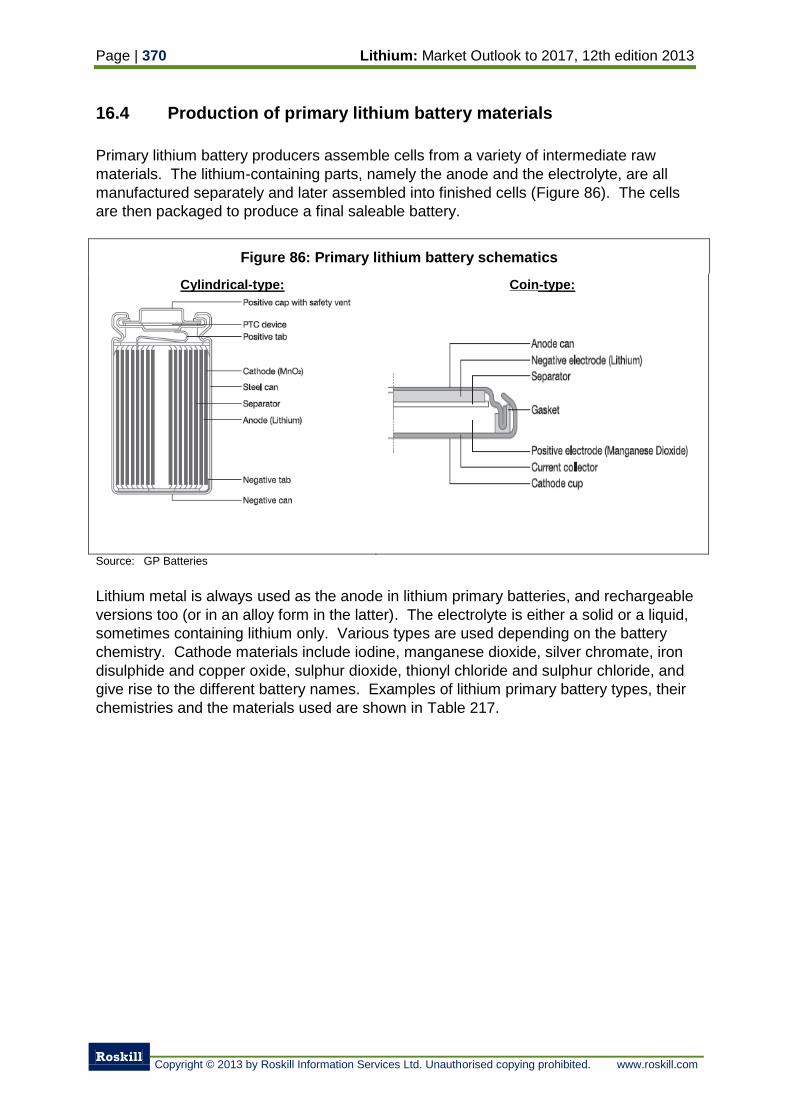
Page | 370 Lithium: Market Outlook to 2017, 12th edition 2013
Roskill
Copyright © 2013 by Roskill Information Services Ltd. Unauthorised copying prohibited. www.roskill.com
16.4 Production of primary lithium battery materials
Primary lithium battery producers assemble cells from a variety of intermediate raw
materials. The lithium-containing parts, namely the anode and the electrolyte, are all
manufactured separately and later assembled into finished cells (Figure 86). The cells
are then packaged to produce a final saleable battery.
Figure 86: Primary lithium battery schematics
Cylindrical-type:
Coin-type:
Source: GP Batteries
Lithium metal is always used as the anode in lithium primary batteries, and rechargeable
versions too (or in an alloy form in the latter). The electrolyte is either a solid or a liquid,
sometimes containing lithium only. Various types are used depending on the battery
chemistry. Cathode materials include iodine, manganese dioxide, silver chromate, iron
disulphide and copper oxide, sulphur dioxide, thionyl chloride and sulphur chloride, and
give rise to the different battery names. Examples of lithium primary battery types, their
chemistries and the materials used are shown in Table 217.
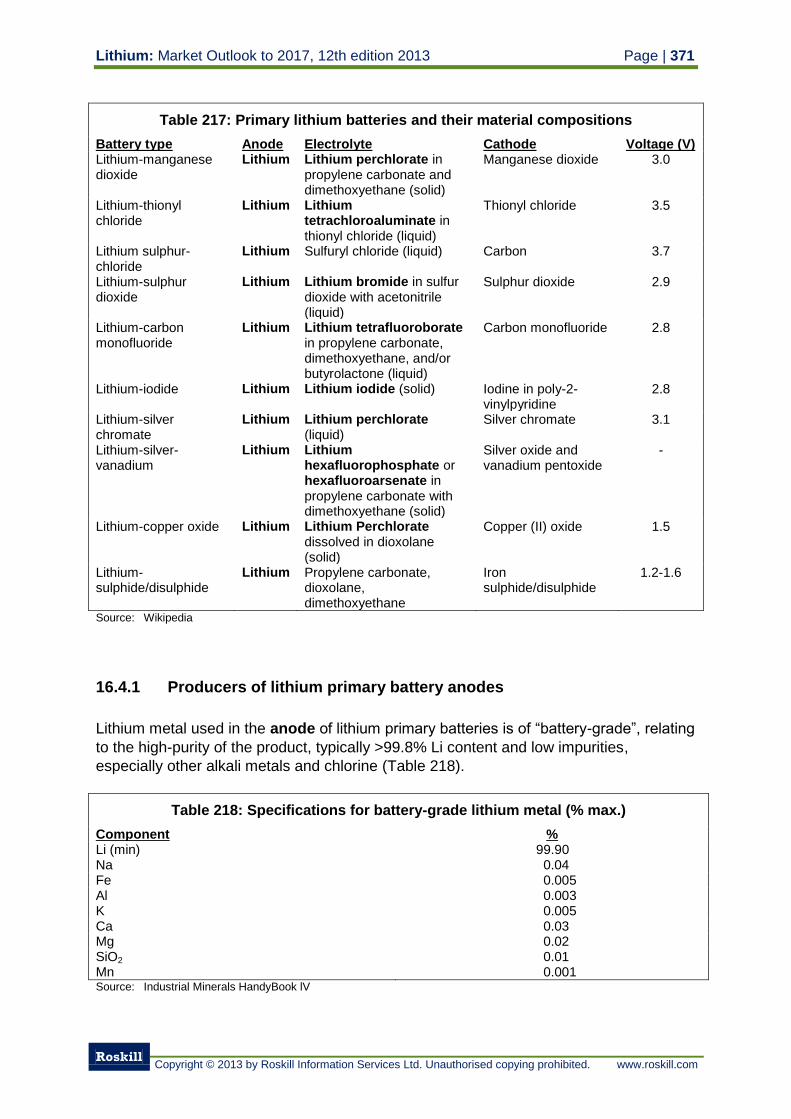
Lithium: Market Outlook to 2017, 12th edition 2013 Page | 371
Roskill
Copyright © 2013 by Roskill Information Services Ltd. Unauthorised copying prohibited. www.roskill.com
Table 217: Primary lithium batteries and their material compositions
Battery type Anode Electrolyte Cathode Voltage (V) Lithium-manganese dioxide
Lithium Lithium perchlorate in propylene carbonate and dimethoxyethane (solid)
Manganese dioxide 3.0
Lithium-thionyl chloride
Lithium Lithium tetrachloroaluminate in thionyl chloride (liquid)
Thionyl chloride 3.5
Lithium sulphur-chloride
Lithium Sulfuryl chloride (liquid) Carbon 3.7
Lithium-sulphur dioxide
Lithium Lithium bromide in sulfur dioxide with acetonitrile (liquid)
Sulphur dioxide 2.9
Lithium-carbon monofluoride
Lithium Lithium tetrafluoroborate in propylene carbonate, dimethoxyethane, and/or butyrolactone (liquid)
Carbon monofluoride 2.8
Lithium-iodide Lithium Lithium iodide (solid) Iodine in poly-2-vinylpyridine
2.8
Lithium-silver chromate
Lithium Lithium perchlorate (liquid)
Silver chromate 3.1
Lithium-silver-vanadium
Lithium Lithium hexafluorophosphate or hexafluoroarsenate in propylene carbonate with dimethoxyethane (solid)
Silver oxide and vanadium pentoxide
-
Lithium-copper oxide Lithium Lithium Perchlorate dissolved in dioxolane (solid)
Copper (II) oxide 1.5
Lithium-sulphide/disulphide
Lithium Propylene carbonate, dioxolane, dimethoxyethane
Iron sulphide/disulphide
1.2-1.6
Source: Wikipedia
16.4.1 Producers of lithium primary battery anodes
Lithium metal used in the anode of lithium primary batteries is of “battery-grade”, relating
to the high-purity of the product, typically >99.8% Li content and low impurities,
especially other alkali metals and chlorine (Table 218).
Table 218: Specifications for battery-grade lithium metal (% max.)
Component % Li (min) 99.90 Na 0.04 Fe 0.005 Al 0.003 K 0.005 Ca 0.03 Mg 0.02 SiO2 0.01 Mn 0.001 Source: Industrial Minerals HandyBook lV
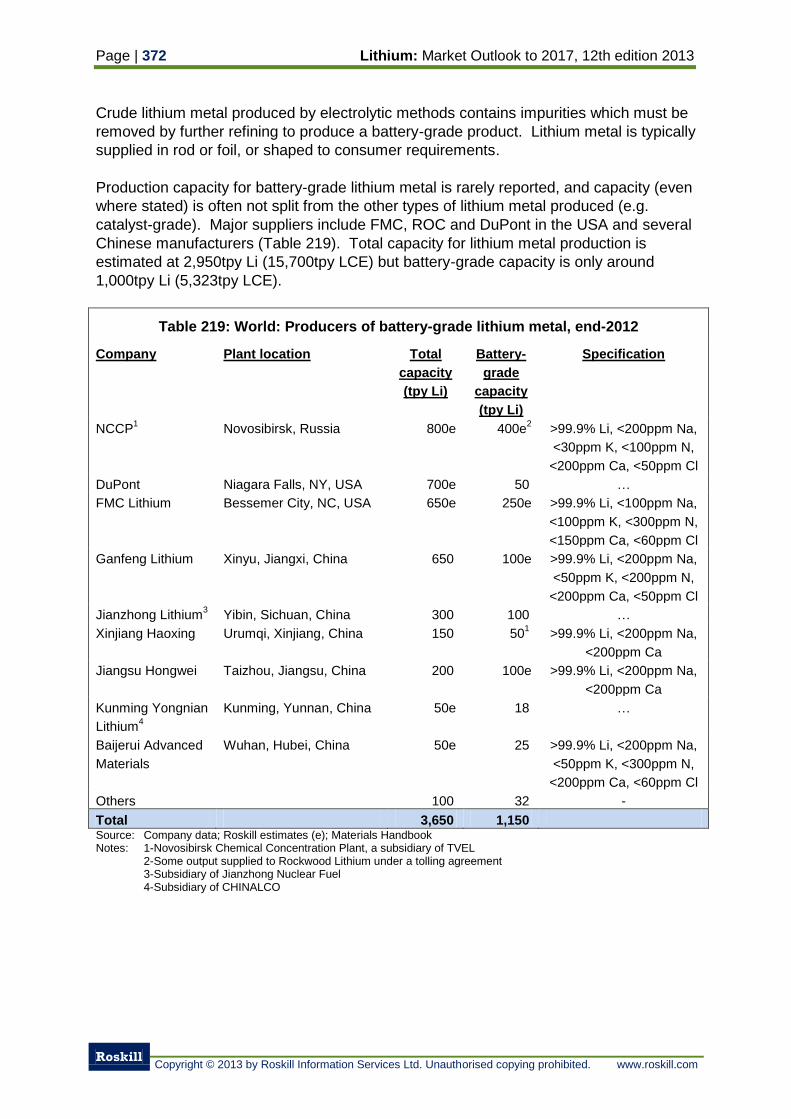
Page | 372 Lithium: Market Outlook to 2017, 12th edition 2013
Roskill
Copyright © 2013 by Roskill Information Services Ltd. Unauthorised copying prohibited. www.roskill.com
Crude lithium metal produced by electrolytic methods contains impurities which must be
removed by further refining to produce a battery-grade product. Lithium metal is typically
supplied in rod or foil, or shaped to consumer requirements.
Production capacity for battery-grade lithium metal is rarely reported, and capacity (even
where stated) is often not split from the other types of lithium metal produced (e.g.
catalyst-grade). Major suppliers include FMC, ROC and DuPont in the USA and several
Chinese manufacturers (Table 219). Total capacity for lithium metal production is
estimated at 2,950tpy Li (15,700tpy LCE) but battery-grade capacity is only around
1,000tpy Li (5,323tpy LCE).
Table 219: World: Producers of battery-grade lithium metal, end-2012
Company Plant location Total
capacity
(tpy Li)
Battery-
grade
capacity
(tpy Li)
Specification
NCCP1
Novosibirsk, Russia 800e 400e2
>99.9% Li, <200ppm Na,
<30ppm K, <100ppm N,
<200ppm Ca, <50ppm Cl
DuPont Niagara Falls, NY, USA 700e 50 …
FMC Lithium Bessemer City, NC, USA 650e 250e >99.9% Li, <100ppm Na,
<100ppm K, <300ppm N,
<150ppm Ca, <60ppm Cl
Ganfeng Lithium Xinyu, Jiangxi, China 650 100e >99.9% Li, <200ppm Na,
<50ppm K, <200ppm N,
<200ppm Ca, <50ppm Cl
Jianzhong Lithium3
Yibin, Sichuan, China 300 100 …
Xinjiang Haoxing Urumqi, Xinjiang, China 150 501
>99.9% Li, <200ppm Na,
<200ppm Ca
Jiangsu Hongwei Taizhou, Jiangsu, China 200
100e >99.9% Li, <200ppm Na,
<200ppm Ca
Kunming Yongnian
Lithium4
Kunming, Yunnan, China 50e 18 …
Baijerui Advanced
Materials
Wuhan, Hubei, China 50e 25 >99.9% Li, <200ppm Na,
<50ppm K, <300ppm N,
<200ppm Ca, <60ppm Cl
Others 100 32 -
Total 3,650 1,150 Source: Company data; Roskill estimates (e); Materials Handbook Notes: 1-Novosibirsk Chemical Concentration Plant, a subsidiary of TVEL
2-Some output supplied to Rockwood Lithium under a tolling agreement 3-Subsidiary of Jianzhong Nuclear Fuel 4-Subsidiary of CHINALCO
Lithium: Market Outlook to 2017, 12th edition 2013 Page | 373
Roskill
Copyright © 2013 by Roskill Information Services Ltd. Unauthorised copying prohibited. www.roskill.com
16.5 Consumption of lithium primary batteries
The superior performance of lithium primary batteries means they are found in a wide
range of applications. In consumer markets, lithium-polycarbon monofluoride and
lithium-manganese dioxide batteries are used in cameras, calculators and watches.
Consumer applications are estimated to account for 70% of primary battery
consumption. In the military sector, lithium-sulphur dioxide batteries are used in high-
power radios, while lithium-thionyl chloride and lithium-iodine products are used in
industrial and medical applications.
Saft splits the commercial primary lithium battery market into the following sectors:
Utility monitoring – smart meters; remote meter systems utility meter reading
systems
Tracking - automated identification systems (toll tags and RFID tags); GPS
tracking devices
Oil & gas – Geophysical surveys, down-hole drilling, well completion, monitoring
Medical – automatic external defibrillators; automated non-invasive blood
pressure monitors; infra-red ear thermometers; pulse oximeters; implantable
cardioverter defibrillators and pacemakers; hearing aids; implantable infusion
pumps
Security - security protection equipment
Automation & instrumentation – industrial electronics/instruments that require
memory back-up capabilities
Search, rescue & environmental - EPIRBs; GPS; life jacket lamps
Other examples of applications for lithium primary batteries are given below:
Automotive – tyre pressure monitoring systems; keyless entry systems;
telematic systems
Commercial - business and retail equipment such as cellular phones, facsimile
machines and communications devices
Consumer – cameras; watches; calculators; CD players; televisions; remote
controls; other audio and video equipment; security precaution devices; television
boxes
Military/aerospace/space – memory back-up for military communications
devices; stand-alone communications equipment such as soldier, aircraft and
shipboard radios; defence message systems and base communications.
Page | 374 Lithium: Market Outlook to 2017, 12th edition 2013
Roskill
Copyright © 2013 by Roskill Information Services Ltd. Unauthorised copying prohibited. www.roskill.com
Demand for lithium primary batteries has been driven by higher demand for portable and
smaller electronic products such as digital cameras, and by the replacement of less
efficient battery systems, such as alkaline and zinc-carbon, by higher-density, low weight
lithium batteries. Smart metering has provided significant growth for primary lithium
batteries over the last few years, with Saft estimating the market at €125M (US$163M) in
2011 with that market accounting for almost half of Saft’s civil (i.e. non-military) sales in
2011.
16.5.1 Outlook for primary lithium battery consumption
According to Frost & Sullivan, military applications are likely to remain the primary driver
for primary lithium batteries, in value terms, because of their advantages of simple
logistics, long shelf life as well as rugged and robust construction. Even though primary
lithium batteries have many desirable features, some inherent features dampen the
demand for these batteries and the threat from other primary chemistries, including
rechargeable lithium-ion batteries. This could hinder the growth of primary lithium
batteries for certain applications. The market is nevertheless expected to continue
growing for the next four to five years before these batteries with alternate chemistries
are produced for the mass market.
Medical, industrial and military markets are expected to remain growth drivers in value
terms, but smart metering, replacement of alkaline and zinc-carbon cells, and consumer
electronics will provide the greatest boost to demand in volume-terms in the period to
2017. The smart metering market is expected to double in value-terms by 2015
according to Saft. In industrialising countries, especially China and India, large
populations and rising disposable incomes mean that consumer electronic products will
provide the main area of growth for lithium primary batteries.
Irrespective of the ascension of the smart meter market, continued industrialisation in
emerging economies with large populations, and demand from the high-value
commercial/military market, slower world global economic expansion compared to the
mid-2000s is likely to dampen growth in production of lithium primary batteries to 2017,
although the market is still forecast to record growth of 7%py (compared to 8.4%py
between 1998 and 2012) reaching 6.7Bn cells. If smart meter installation does not
proceed as fast as is forecast and emerging economy growth slows, consumption could
rise by only 5%py to 6.2Bn cells in a conservative scenario. Alternatively, if the opposite
is true, the market may grow by 9%py to 7.4Bn cells in an optimistic forecast.
16.6 Consumption of lithium in primary batteries
Lithium metal and lithium salts are used in the manufacture of primary lithium battery
anodes and electrolyte solutions respectively.
Primary lithium batteries come in a wide variety of shapes and sizes, from coin and
needle types weighing <1g with a capacity <50mAh, to the 10,000Ah lithium-
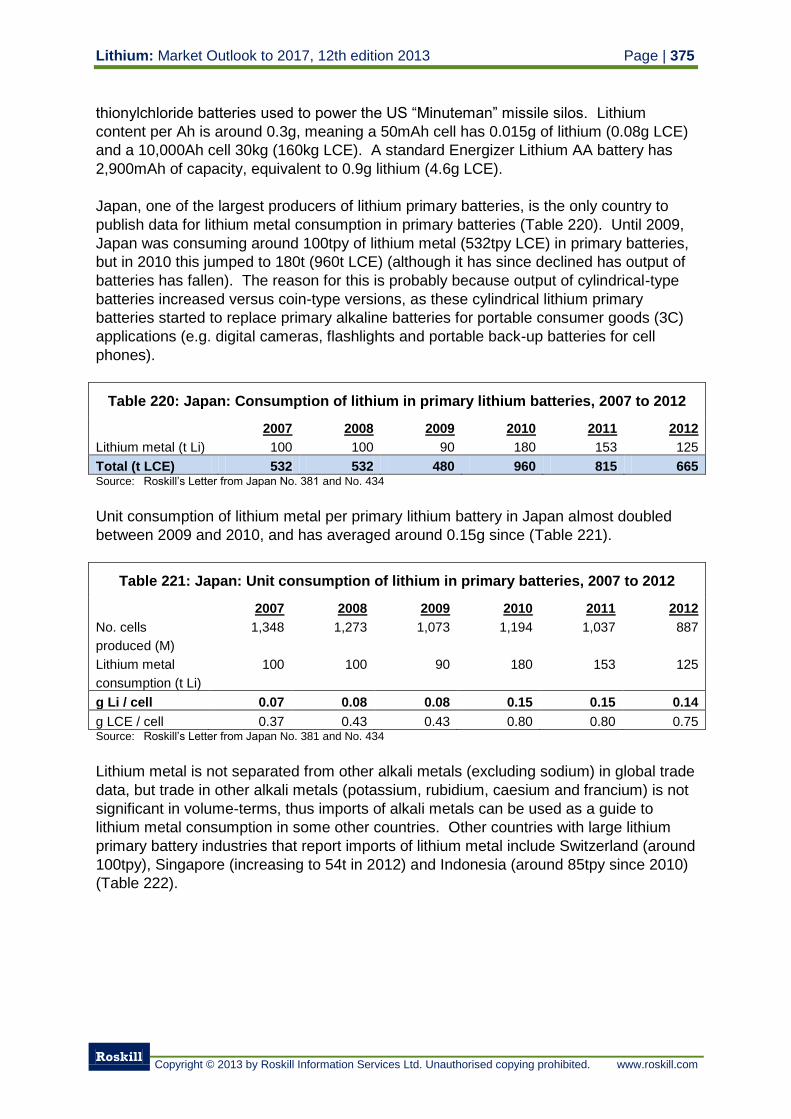
Lithium: Market Outlook to 2017, 12th edition 2013 Page | 375
Roskill
Copyright © 2013 by Roskill Information Services Ltd. Unauthorised copying prohibited. www.roskill.com
thionylchloride batteries used to power the US “Minuteman” missile silos. Lithium
content per Ah is around 0.3g, meaning a 50mAh cell has 0.015g of lithium (0.08g LCE)
and a 10,000Ah cell 30kg (160kg LCE). A standard Energizer Lithium AA battery has
2,900mAh of capacity, equivalent to 0.9g lithium (4.6g LCE).
Japan, one of the largest producers of lithium primary batteries, is the only country to
publish data for lithium metal consumption in primary batteries (Table 220). Until 2009,
Japan was consuming around 100tpy of lithium metal (532tpy LCE) in primary batteries,
but in 2010 this jumped to 180t (960t LCE) (although it has since declined has output of
batteries has fallen). The reason for this is probably because output of cylindrical-type
batteries increased versus coin-type versions, as these cylindrical lithium primary
batteries started to replace primary alkaline batteries for portable consumer goods (3C)
applications (e.g. digital cameras, flashlights and portable back-up batteries for cell
phones).
Table 220: Japan: Consumption of lithium in primary lithium batteries, 2007 to 2012
2007 2008 2009 2010 2011 2012
Lithium metal (t Li) 100 100 90 180 153 125
Total (t LCE) 532 532 480 960 815 665 Source: Roskill’s Letter from Japan No. 381 and No. 434
Unit consumption of lithium metal per primary lithium battery in Japan almost doubled
between 2009 and 2010, and has averaged around 0.15g since (Table 221).
Table 221: Japan: Unit consumption of lithium in primary batteries, 2007 to 2012
2007 2008 2009 2010 2011 2012
No. cells
produced (M)
1,348 1,273 1,073 1,194 1,037 887
Lithium metal
consumption (t Li)
100 100 90 180 153 125
g Li / cell 0.07 0.08 0.08 0.15 0.15 0.14
g LCE / cell 0.37 0.43 0.43 0.80 0.80 0.75 Source: Roskill’s Letter from Japan No. 381 and No. 434
Lithium metal is not separated from other alkali metals (excluding sodium) in global trade
data, but trade in other alkali metals (potassium, rubidium, caesium and francium) is not
significant in volume-terms, thus imports of alkali metals can be used as a guide to
lithium metal consumption in some other countries. Other countries with large lithium
primary battery industries that report imports of lithium metal include Switzerland (around
100tpy), Singapore (increasing to 54t in 2012) and Indonesia (around 85tpy since 2010)
(Table 222).
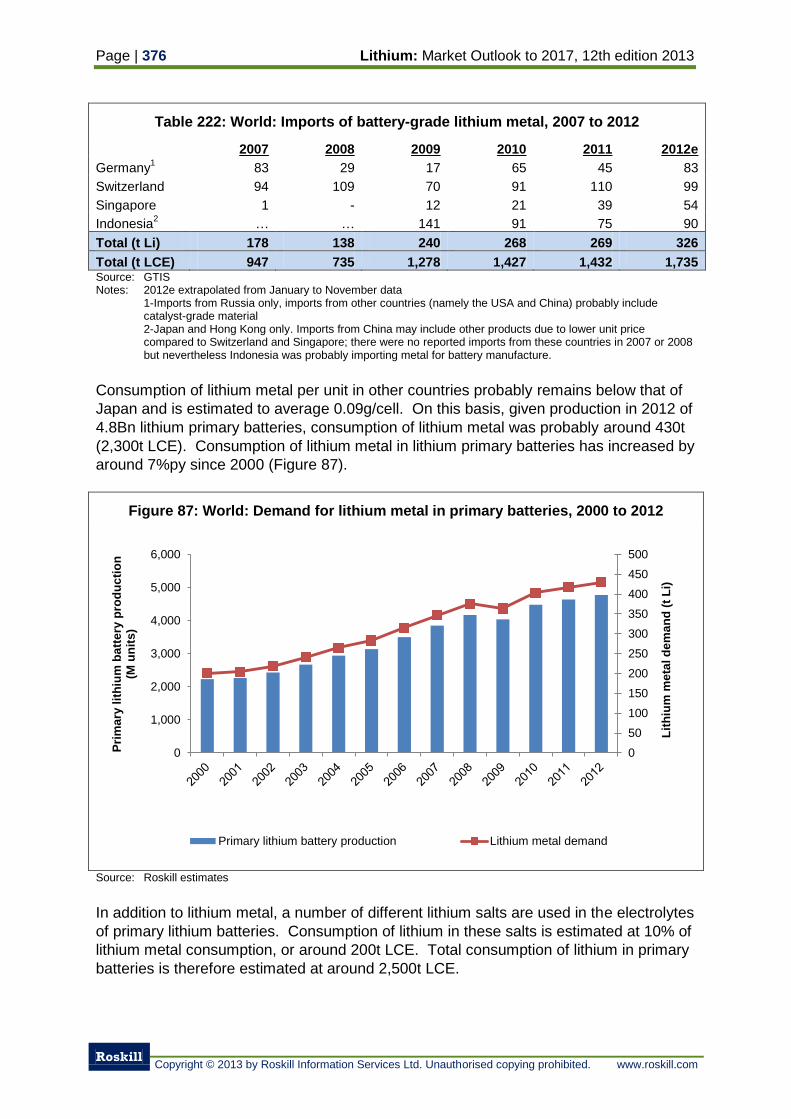
Page | 376 Lithium: Market Outlook to 2017, 12th edition 2013
Roskill
Copyright © 2013 by Roskill Information Services Ltd. Unauthorised copying prohibited. www.roskill.com
Table 222: World: Imports of battery-grade lithium metal, 2007 to 2012
2007 2008 2009 2010 2011 2012e
Germany1
83 29 17 65 45 83
Switzerland 94 109 70 91 110 99
Singapore 1 - 12 21 39 54
Indonesia2
… … 141 91 75 90
Total (t Li) 178 138 240 268 269 326
Total (t LCE) 947 735 1,278 1,427 1,432 1,735 Source: GTIS Notes: 2012e extrapolated from January to November data
1-Imports from Russia only, imports from other countries (namely the USA and China) probably include catalyst-grade material 2-Japan and Hong Kong only. Imports from China may include other products due to lower unit price compared to Switzerland and Singapore; there were no reported imports from these countries in 2007 or 2008 but nevertheless Indonesia was probably importing metal for battery manufacture.
Consumption of lithium metal per unit in other countries probably remains below that of
Japan and is estimated to average 0.09g/cell. On this basis, given production in 2012 of
4.8Bn lithium primary batteries, consumption of lithium metal was probably around 430t
(2,300t LCE). Consumption of lithium metal in lithium primary batteries has increased by
around 7%py since 2000 (Figure 87).
Figure 87: World: Demand for lithium metal in primary batteries, 2000 to 2012
Source: Roskill estimates
In addition to lithium metal, a number of different lithium salts are used in the electrolytes
of primary lithium batteries. Consumption of lithium in these salts is estimated at 10% of
lithium metal consumption, or around 200t LCE. Total consumption of lithium in primary
batteries is therefore estimated at around 2,500t LCE.
0
50
100
150
200
250
300
350
400
450
500
0
1,000
2,000
3,000
4,000
5,000
6,000
Lit
hiu
m m
eta
l d
em
an
d (
t L
i)
Pri
ma
ry l
ith
ium
ba
tte
ry p
rod
uc
tio
n
(M u
nit
s)
Primary lithium battery production Lithium metal demand
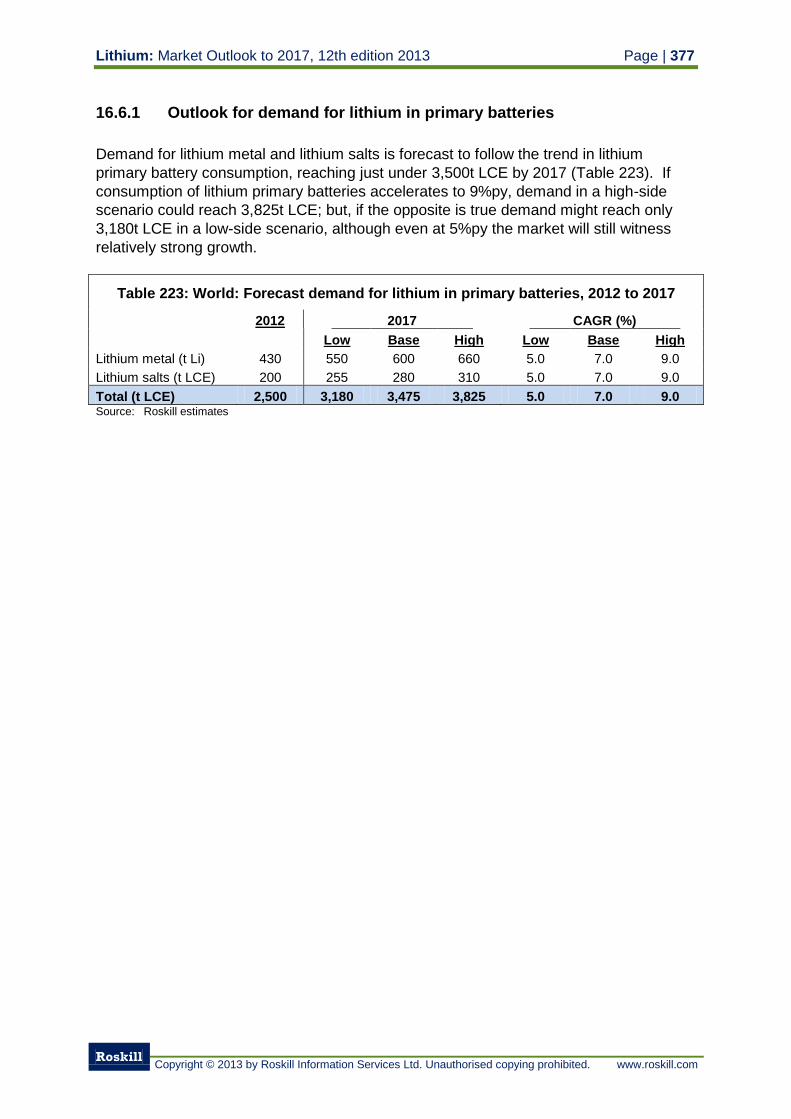
Lithium: Market Outlook to 2017, 12th edition 2013 Page | 377
Roskill
Copyright © 2013 by Roskill Information Services Ltd. Unauthorised copying prohibited. www.roskill.com
16.6.1 Outlook for demand for lithium in primary batteries
Demand for lithium metal and lithium salts is forecast to follow the trend in lithium
primary battery consumption, reaching just under 3,500t LCE by 2017 (Table 223). If
consumption of lithium primary batteries accelerates to 9%py, demand in a high-side
scenario could reach 3,825t LCE; but, if the opposite is true demand might reach only
3,180t LCE in a low-side scenario, although even at 5%py the market will still witness
relatively strong growth.
Table 223: World: Forecast demand for lithium in primary batteries, 2012 to 2017
2012 2017 CAGR (%)
Low Base High Low Base High
Lithium metal (t Li) 430 550 600 660 5.0 7.0 9.0
Lithium salts (t LCE) 200 255 280 310 5.0 7.0 9.0
Total (t LCE) 2,500 3,180 3,475 3,825 5.0 7.0 9.0 Source: Roskill estimates
Page | 378 Lithium: Market Outlook to 2017, 12th edition 2013
Roskill
Copyright © 2013 by Roskill Information Services Ltd. Unauthorised copying prohibited. www.roskill.com
17. Use of lithium in aluminium smelting
Lithium carbonate additions to the electrolyte during aluminium smelting increase the
electrical conductivity of the bath, reduce bath temperature, increase metal throughput
and reduce fluorine emissions. Aluminium smelting is estimated to account for 1% of
the lithium market, equivalent to 2,200t LCE in 2012.
17.1 Process of aluminium smelting
The basis for all modern aluminium smelting plants is the Hall-Héroult process. Alumina
is dissolved in an electrolytic bath of molten cryolite (sodium aluminium fluoride -
Na3AlF6) within a large carbon or graphite lined steel container known as a pot. An
electric current is passed through the electrolyte at low voltage but very high current,
typically 150,000A. The electric current flows between a carbon anode (positive) made
of petroleum coke and pitch, and a cathode (negative) formed by the thick carbon or
graphite pot lining.
Molten aluminium is deposited at the bottom of the pot and is siphoned off periodically,
taken to a holding furnace, often but not always blended to an alloy specification,
cleaned and then cast. A typical aluminium smelter ‘shop’ consists of around 300 pots,
producing approximately 125,000tpy of aluminium. However, some of the latest
generation smelters have several shops producing >500,000tpy.
Aluminium is formed at around 900ºC. Aluminium smelting is therefore energy intensive
(on average 15.7kWh of electricity is consumed in the production of 1kg aluminium) and
smelters are predominately located in areas which have access to abundant cheap
power resources (hydro-electric, natural gas, coal or nuclear). Many locations are
remote and electricity is often generated specifically for the aluminium plant.
The electrolyte used in aluminium smelting is cryolite, which is the best solvent for
alumina. Various other compounds can be added to improve the performance of the
cell. Aluminium fluoride and calcium fluoride are the most widely-used additives, to
reduce the freezing point of the electrolyte (Table 224).
As a result of the high temperature in the pot, some fluoride is released to the
atmosphere from the cryolite during smelting. In older “open-bath” (Söderberg)
smelters, fluoride emissions can be reduced by up to 60% with concentrations of up to
5% lithium fluoride in the bath. In modern “pre-baked” smelters, however, pot exhaust is
captured by advanced exhaust systems and treated with alumina which absorbs the
fluoride. The fluoride-enriched alumina is recovered and distributed to the electrolyte
pots. These systems remove over 99% of exhaust gases and do not require lithium
additions.
As a result, the use of lithium for reducing fluoride emissions is mainly restricted to older
Söderberg-type aluminium plants.
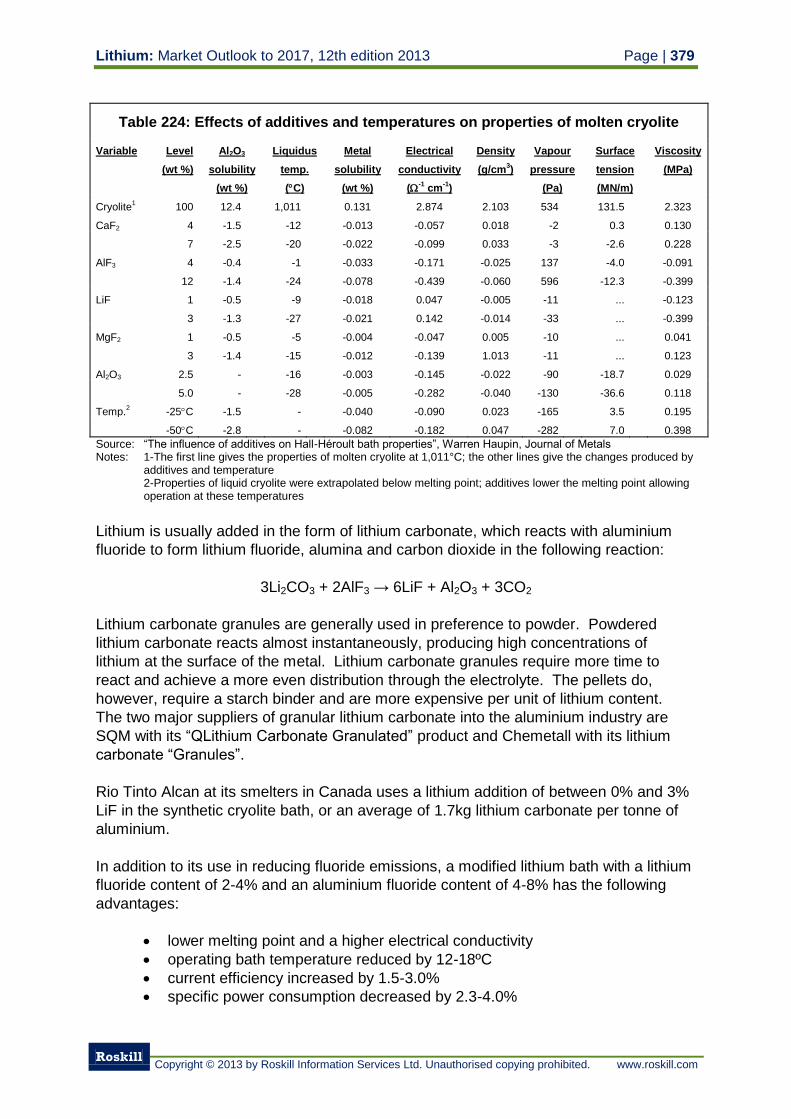
Lithium: Market Outlook to 2017, 12th edition 2013 Page | 379
Roskill
Copyright © 2013 by Roskill Information Services Ltd. Unauthorised copying prohibited. www.roskill.com
Table 224: Effects of additives and temperatures on properties of molten cryolite
Variable Level
(wt %)
Al2O3
solubility
(wt %)
Liquidus
temp.
(C)
Metal
solubility
(wt %)
Electrical
conductivity
(-1 cm
-1)
Density
(g/cm3)
Vapour
pressure
(Pa)
Surface
tension
(MN/m)
Viscosity
(MPa)
Cryolite1 100 12.4 1,011 0.131 2.874 2.103 534 131.5 2.323
CaF2 4 -1.5 -12 -0.013 -0.057 0.018 -2 0.3 0.130
7 -2.5 -20 -0.022 -0.099 0.033 -3 -2.6 0.228
AlF3 4 -0.4 -1 -0.033 -0.171 -0.025 137 -4.0 -0.091
12 -1.4 -24 -0.078 -0.439 -0.060 596 -12.3 -0.399
LiF 1 -0.5 -9 -0.018 0.047 -0.005 -11 ... -0.123
3 -1.3 -27 -0.021 0.142 -0.014 -33 ... -0.399
MgF2 1 -0.5 -5 -0.004 -0.047 0.005 -10 ... 0.041
3 -1.4 -15 -0.012 -0.139 1.013 -11 ... 0.123
Al2O3 2.5 - -16 -0.003 -0.145 -0.022 -90 -18.7 0.029
5.0 - -28 -0.005 -0.282 -0.040 -130 -36.6 0.118
Temp.2 -25C -1.5 - -0.040 -0.090 0.023 -165 3.5 0.195
-50C -2.8 - -0.082 -0.182 0.047 -282 7.0 0.398
Source: “The influence of additives on Hall-Héroult bath properties”, Warren Haupin, Journal of Metals Notes: 1-The first line gives the properties of molten cryolite at 1,011°C; the other lines give the changes produced by
additives and temperature 2-Properties of liquid cryolite were extrapolated below melting point; additives lower the melting point allowing operation at these temperatures
Lithium is usually added in the form of lithium carbonate, which reacts with aluminium
fluoride to form lithium fluoride, alumina and carbon dioxide in the following reaction:
3Li2CO3 + 2AlF3 → 6LiF + Al2O3 + 3CO2
Lithium carbonate granules are generally used in preference to powder. Powdered
lithium carbonate reacts almost instantaneously, producing high concentrations of
lithium at the surface of the metal. Lithium carbonate granules require more time to
react and achieve a more even distribution through the electrolyte. The pellets do,
however, require a starch binder and are more expensive per unit of lithium content.
The two major suppliers of granular lithium carbonate into the aluminium industry are
SQM with its “QLithium Carbonate Granulated” product and Chemetall with its lithium
carbonate “Granules”.
Rio Tinto Alcan at its smelters in Canada uses a lithium addition of between 0% and 3%
LiF in the synthetic cryolite bath, or an average of 1.7kg lithium carbonate per tonne of
aluminium.
In addition to its use in reducing fluoride emissions, a modified lithium bath with a lithium
fluoride content of 2-4% and an aluminium fluoride content of 4-8% has the following
advantages:
lower melting point and a higher electrical conductivity
operating bath temperature reduced by 12-18ºC
current efficiency increased by 1.5-3.0%
specific power consumption decreased by 2.3-4.0%
Page | 380 Lithium: Market Outlook to 2017, 12th edition 2013
Roskill
Copyright © 2013 by Roskill Information Services Ltd. Unauthorised copying prohibited. www.roskill.com
net carbon consumption decreased by 1-2%
reduced aluminium fluoride consumption
improved pot stability and less amplitude in the momentary variations in pot
resistance
increased production through a combination of improved current efficiency
and increased line current
The main disadvantage of adding lithium carbonate to the bath is traces of lithium report
to the pot metal. In a bath containing 3% lithium fluoride, the pot metal could contain
24ppm Li. During and after tapping, the lithium and sodium in the molten aluminium will
burn off, and by the time the crucible has reached the cast house, the lithium
concentration will be reduced to 8-10ppm.
17.2 Consumers of lithium in aluminium smelting
In the 1950’s, smelters in the former Soviet Union were probably the first to use a
modified lithium bath on a wide scale. Reynolds Metals (now Alcoa) was the first
aluminium company in the west to have all their smelters converted to a lithium modified
bath by 1972.
In the 1980s, all of the former Soviet Union smelters were using a lithium modified bath;
however these smelters were taken off lithium as a cost saving in the early 1990s at the
time of the break-up of the Soviet Union. Russian aluminium often contained trace
quantities of lithium and this, combined with the poor quality and appearance of their
primary products, meant the smelters had to sell the aluminium at a discount to the LME
market price. These smelters have not re-instated the use of lithium but have instead
invested in other technologies to reduce fluorine emissions and improve product quality.
Total primary aluminium production capacity at end-2011 is estimated at around 50Mt.
Of this, just over 6Mt, or 12%, of capacity was at plants operating Söderberg technology
(Table 225). With the exception of Russia and Brazil, most Söderberg smelters are
currently idled or are being converted to “pre-baked” or other smelting technology. This
is mainly from the requirement to meet ever increasingly stringent emissions legislation.
Even in China, the vast majority of Söderberg smelters were closed or converted to “pre-
baked” technology in the early- to mid- 2000s.
Rusal accounts for 53% of Söderberg smelter capacity, but as mentioned above none of
the aluminium smelters in Russia (or indeed Rusal’s plants in the wider CIS region)
currently use lithium bath additions. Alcoa has the second largest installed Söderberg
capacity, just over 0.8Mt. Alcoa is estimated to consume up to around 1,000tpy LCE of
lithium carbonate at full capacity, although 0.3Mt of capacity is currently idled and plants
in Spain and Italy may be closed completely. In addition, its largest Söderberg smelter,
Baie-Comeau, is currently being converted to “pre-baked” technology and there are
plans for similar modernisation at Messena.
CBA in Brazil is estimated to consume up to 500tpy LCE of lithium carbonate. Vedanta
could also consume a similar volume in India but, like Rusal, is not thought to use lithium
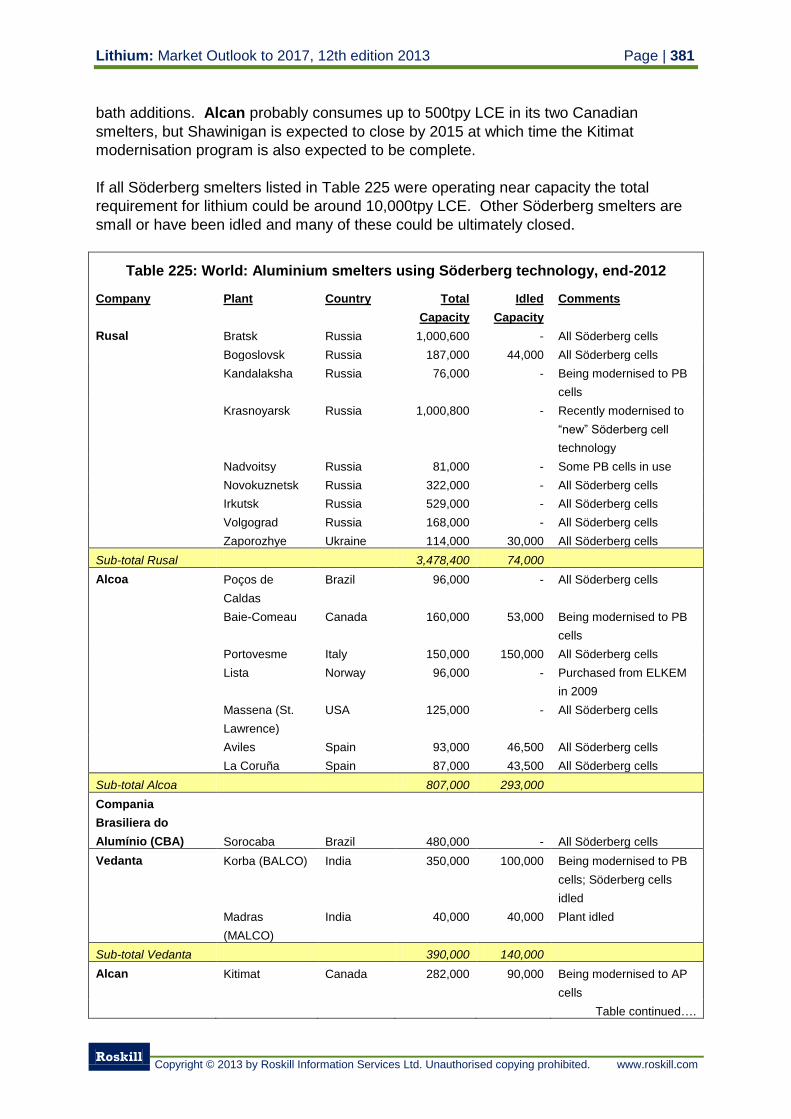
Lithium: Market Outlook to 2017, 12th edition 2013 Page | 381
Roskill
Copyright © 2013 by Roskill Information Services Ltd. Unauthorised copying prohibited. www.roskill.com
bath additions. Alcan probably consumes up to 500tpy LCE in its two Canadian
smelters, but Shawinigan is expected to close by 2015 at which time the Kitimat
modernisation program is also expected to be complete.
If all Söderberg smelters listed in Table 225 were operating near capacity the total
requirement for lithium could be around 10,000tpy LCE. Other Söderberg smelters are
small or have been idled and many of these could be ultimately closed.
Table 225: World: Aluminium smelters using Söderberg technology, end-2012
Company Plant Country Total
Capacity
Idled
Capacity
Comments
Rusal Bratsk Russia 1,000,600 - All Söderberg cells
Bogoslovsk Russia 187,000 44,000 All Söderberg cells
Kandalaksha Russia 76,000 - Being modernised to PB
cells
Krasnoyarsk Russia 1,000,800 - Recently modernised to
“new” Söderberg cell
technology
Nadvoitsy Russia 81,000 - Some PB cells in use
Novokuznetsk Russia 322,000 - All Söderberg cells
Irkutsk Russia 529,000 - All Söderberg cells
Volgograd Russia 168,000 - All Söderberg cells
Zaporozhye Ukraine 114,000 30,000 All Söderberg cells
Sub-total Rusal 3,478,400 74,000
Alcoa Poços de
Caldas
Brazil 96,000 - All Söderberg cells
Baie-Comeau Canada 160,000 53,000 Being modernised to PB
cells
Portovesme Italy 150,000 150,000 All Söderberg cells
Lista Norway 96,000 - Purchased from ELKEM
in 2009
Massena (St.
Lawrence)
USA 125,000 - All Söderberg cells
Aviles Spain 93,000 46,500 All Söderberg cells
La Coruña Spain 87,000 43,500 All Söderberg cells
Sub-total Alcoa 807,000 293,000
Compania
Brasiliera do
Alumínio (CBA) Sorocaba Brazil 480,000 - All Söderberg cells
Vedanta Korba (BALCO) India 350,000 100,000 Being modernised to PB
cells; Söderberg cells
idled
Madras
(MALCO)
India 40,000 40,000 Plant idled
Sub-total Vedanta 390,000 140,000
Alcan Kitimat Canada 282,000 90,000 Being modernised to AP
cells
Table continued….
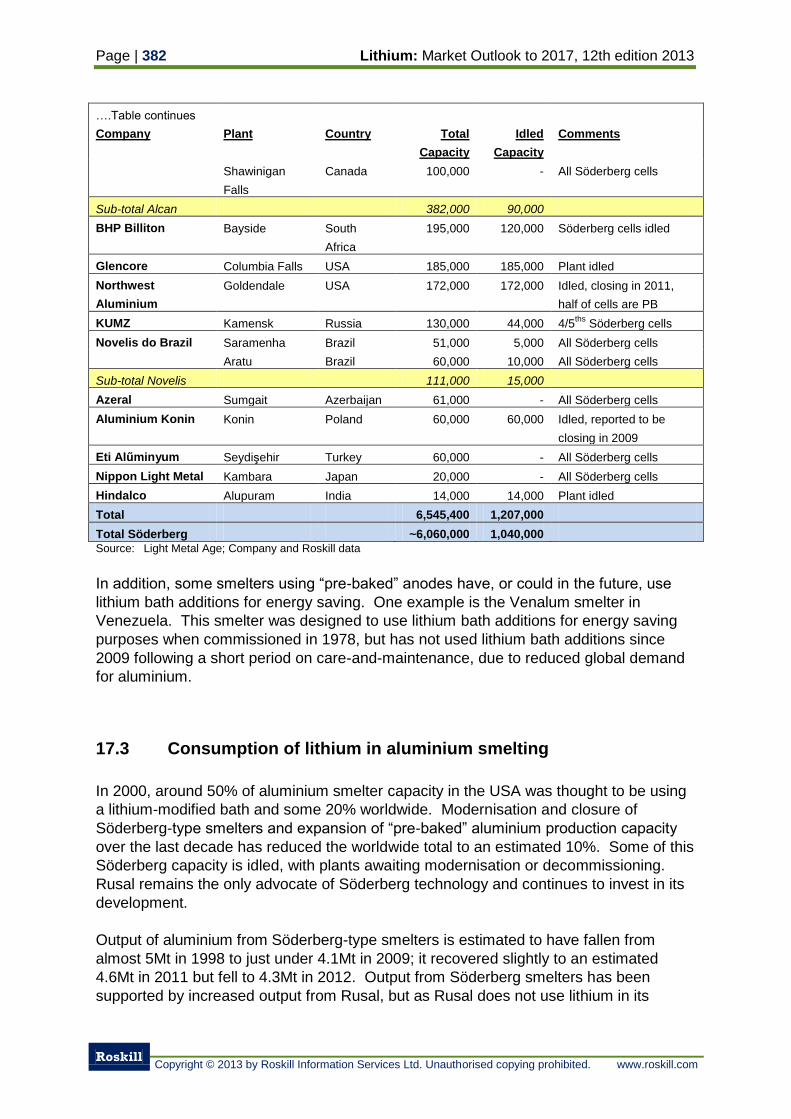
Page | 382 Lithium: Market Outlook to 2017, 12th edition 2013
Roskill
Copyright © 2013 by Roskill Information Services Ltd. Unauthorised copying prohibited. www.roskill.com
….Table continues
Company Plant Country Total
Capacity
Idled
Capacity
Comments
Shawinigan
Falls
Canada 100,000 - All Söderberg cells
Sub-total Alcan 382,000 90,000
BHP Billiton Bayside South
Africa
195,000 120,000 Söderberg cells idled
Glencore Columbia Falls USA 185,000 185,000 Plant idled
Northwest
Aluminium
Goldendale USA 172,000 172,000 Idled, closing in 2011,
half of cells are PB
KUMZ Kamensk Russia 130,000 44,000 4/5ths
Söderberg cells
Novelis do Brazil Saramenha Brazil 51,000 5,000 All Söderberg cells
Aratu Brazil 60,000 10,000 All Söderberg cells
Sub-total Novelis 111,000 15,000
Azeral Sumgait Azerbaijan 61,000 - All Söderberg cells
Aluminium Konin Konin Poland 60,000 60,000 Idled, reported to be
closing in 2009
Eti Alűminyum Seydişehir Turkey 60,000 - All Söderberg cells
Nippon Light Metal Kambara Japan 20,000 - All Söderberg cells
Hindalco Alupuram India 14,000 14,000 Plant idled
Total 6,545,400 1,207,000
Total Söderberg ~6,060,000 1,040,000
Source: Light Metal Age; Company and Roskill data
In addition, some smelters using “pre-baked” anodes have, or could in the future, use
lithium bath additions for energy saving. One example is the Venalum smelter in
Venezuela. This smelter was designed to use lithium bath additions for energy saving
purposes when commissioned in 1978, but has not used lithium bath additions since
2009 following a short period on care-and-maintenance, due to reduced global demand
for aluminium.
17.3 Consumption of lithium in aluminium smelting
In 2000, around 50% of aluminium smelter capacity in the USA was thought to be using
a lithium-modified bath and some 20% worldwide. Modernisation and closure of
Söderberg-type smelters and expansion of “pre-baked” aluminium production capacity
over the last decade has reduced the worldwide total to an estimated 10%. Some of this
Söderberg capacity is idled, with plants awaiting modernisation or decommissioning.
Rusal remains the only advocate of Söderberg technology and continues to invest in its
development.
Output of aluminium from Söderberg-type smelters is estimated to have fallen from
almost 5Mt in 1998 to just under 4.1Mt in 2009; it recovered slightly to an estimated
4.6Mt in 2011 but fell to 4.3Mt in 2012. Output from Söderberg smelters has been
supported by increased output from Rusal, but as Rusal does not use lithium in its
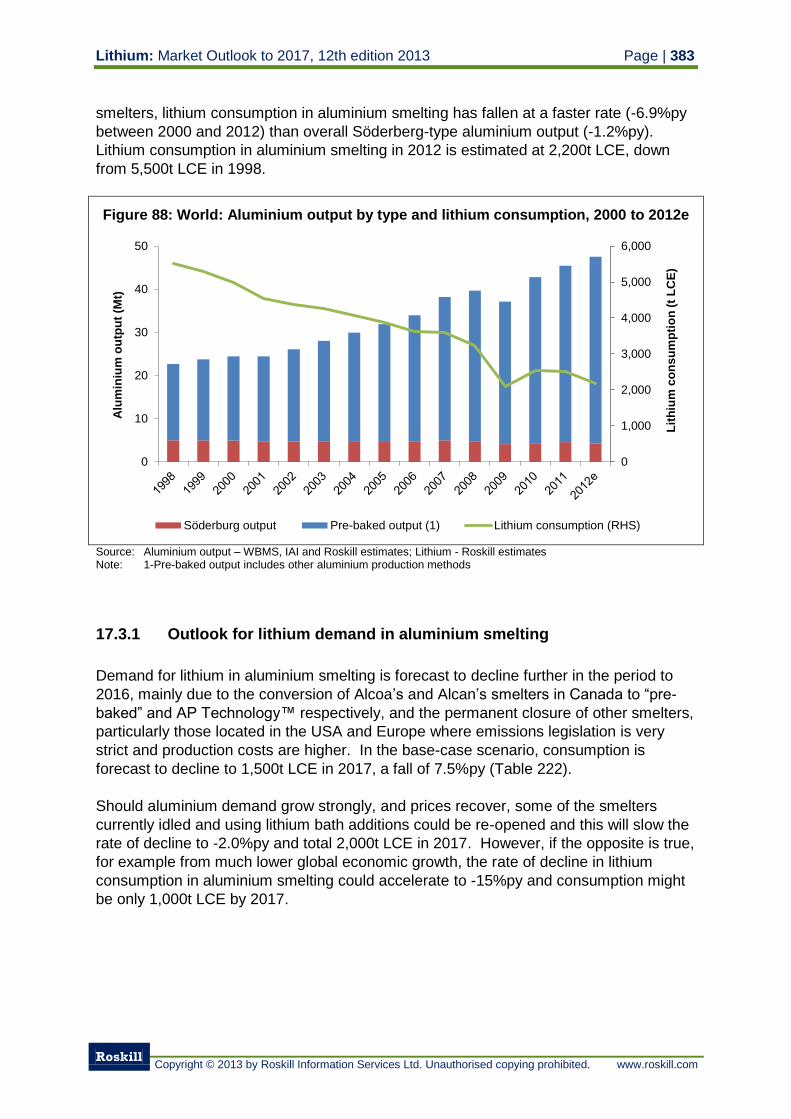
Lithium: Market Outlook to 2017, 12th edition 2013 Page | 383
Roskill
Copyright © 2013 by Roskill Information Services Ltd. Unauthorised copying prohibited. www.roskill.com
smelters, lithium consumption in aluminium smelting has fallen at a faster rate (-6.9%py
between 2000 and 2012) than overall Söderberg-type aluminium output (-1.2%py).
Lithium consumption in aluminium smelting in 2012 is estimated at 2,200t LCE, down
from 5,500t LCE in 1998.
Figure 88: World: Aluminium output by type and lithium consumption, 2000 to 2012e
Source: Aluminium output – WBMS, IAI and Roskill estimates; Lithium - Roskill estimates Note: 1-Pre-baked output includes other aluminium production methods
17.3.1 Outlook for lithium demand in aluminium smelting
Demand for lithium in aluminium smelting is forecast to decline further in the period to
2016, mainly due to the conversion of Alcoa’s and Alcan’s smelters in Canada to “pre-
baked” and AP Technology™ respectively, and the permanent closure of other smelters,
particularly those located in the USA and Europe where emissions legislation is very
strict and production costs are higher. In the base-case scenario, consumption is
forecast to decline to 1,500t LCE in 2017, a fall of 7.5%py (Table 222).
Should aluminium demand grow strongly, and prices recover, some of the smelters
currently idled and using lithium bath additions could be re-opened and this will slow the
rate of decline to -2.0%py and total 2,000t LCE in 2017. However, if the opposite is true,
for example from much lower global economic growth, the rate of decline in lithium
consumption in aluminium smelting could accelerate to -15%py and consumption might
be only 1,000t LCE by 2017.
0
1,000
2,000
3,000
4,000
5,000
6,000
0
10
20
30
40
50
Lit
hiu
m c
on
su
mp
tio
n (
t L
CE
)
Alu
min
ium
ou
tpu
t (M
t)
Söderburg output Pre-baked output (1) Lithium consumption (RHS)
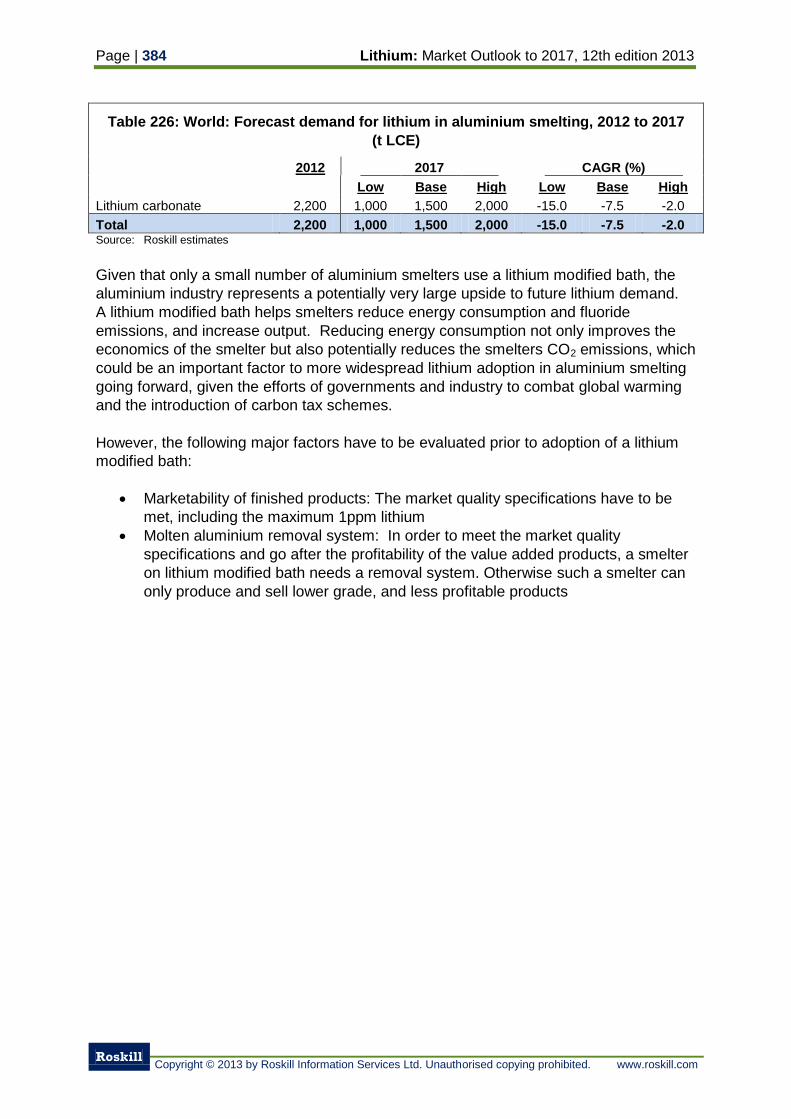
Page | 384 Lithium: Market Outlook to 2017, 12th edition 2013
Roskill
Copyright © 2013 by Roskill Information Services Ltd. Unauthorised copying prohibited. www.roskill.com
Table 226: World: Forecast demand for lithium in aluminium smelting, 2012 to 2017
(t LCE)
2012 2017 CAGR (%)
Low Base High Low Base High
Lithium carbonate
2,200 1,000 1,500 2,000 -15.0 -7.5 -2.0
Total 2,200 1,000 1,500 2,000 -15.0 -7.5 -2.0 Source: Roskill estimates
Given that only a small number of aluminium smelters use a lithium modified bath, the
aluminium industry represents a potentially very large upside to future lithium demand.
A lithium modified bath helps smelters reduce energy consumption and fluoride
emissions, and increase output. Reducing energy consumption not only improves the
economics of the smelter but also potentially reduces the smelters CO2 emissions, which
could be an important factor to more widespread lithium adoption in aluminium smelting
going forward, given the efforts of governments and industry to combat global warming
and the introduction of carbon tax schemes.
However, the following major factors have to be evaluated prior to adoption of a lithium
modified bath:
Marketability of finished products: The market quality specifications have to be
met, including the maximum 1ppm lithium
Molten aluminium removal system: In order to meet the market quality
specifications and go after the profitability of the value added products, a smelter
on lithium modified bath needs a removal system. Otherwise such a smelter can
only produce and sell lower grade, and less profitable products
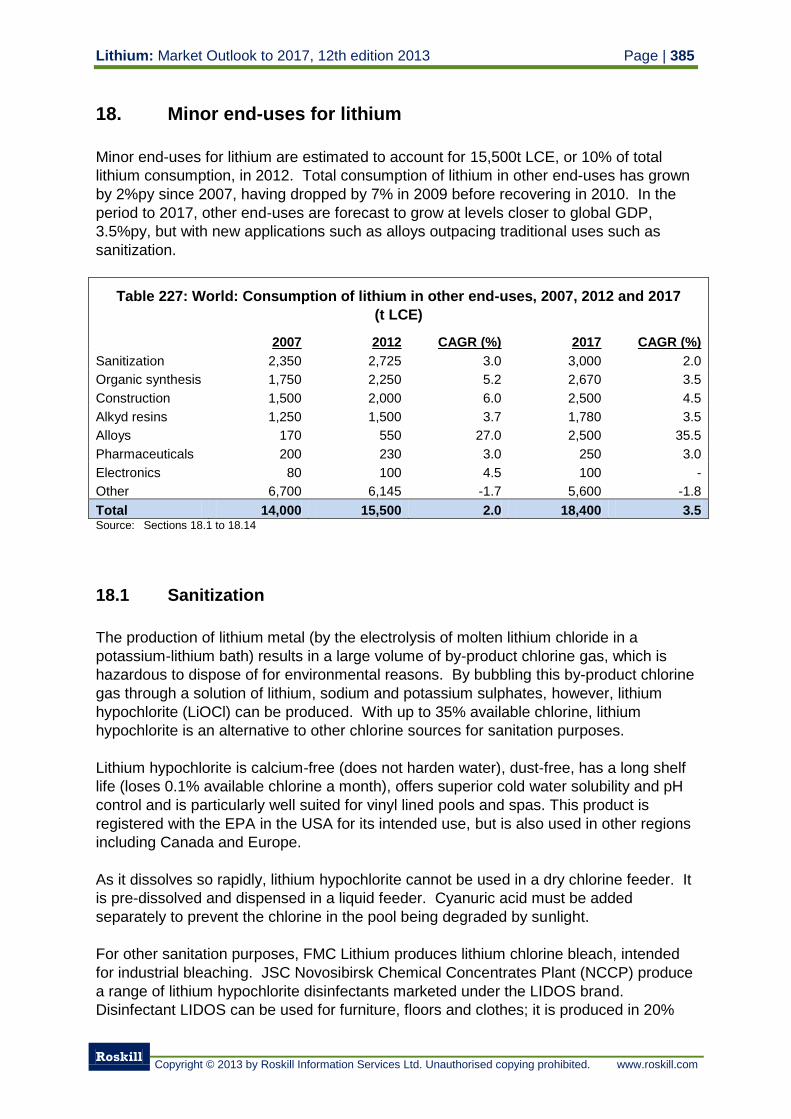
Lithium: Market Outlook to 2017, 12th edition 2013 Page | 385
Roskill
Copyright © 2013 by Roskill Information Services Ltd. Unauthorised copying prohibited. www.roskill.com
18. Minor end-uses for lithium
Minor end-uses for lithium are estimated to account for 15,500t LCE, or 10% of total
lithium consumption, in 2012. Total consumption of lithium in other end-uses has grown
by 2%py since 2007, having dropped by 7% in 2009 before recovering in 2010. In the
period to 2017, other end-uses are forecast to grow at levels closer to global GDP,
3.5%py, but with new applications such as alloys outpacing traditional uses such as
sanitization.
Table 227: World: Consumption of lithium in other end-uses, 2007, 2012 and 2017
(t LCE)
2007 2012 CAGR (%) 2017 CAGR (%)
Sanitization 2,350 2,725 3.0 3,000 2.0
Organic synthesis 1,750 2,250 5.2 2,670 3.5
Construction 1,500 2,000 6.0 2,500 4.5
Alkyd resins 1,250 1,500 3.7 1,780 3.5
Alloys 170 550 27.0 2,500 35.5
Pharmaceuticals 200 230 3.0 250 3.0
Electronics 80 100 4.5 100 -
Other 6,700 6,145 -1.7 5,600 -1.8
Total 14,000 15,500 2.0 18,400 3.5 Source: Sections 18.1 to 18.14
18.1 Sanitization
The production of lithium metal (by the electrolysis of molten lithium chloride in a
potassium-lithium bath) results in a large volume of by-product chlorine gas, which is
hazardous to dispose of for environmental reasons. By bubbling this by-product chlorine
gas through a solution of lithium, sodium and potassium sulphates, however, lithium
hypochlorite (LiOCl) can be produced. With up to 35% available chlorine, lithium
hypochlorite is an alternative to other chlorine sources for sanitation purposes.
Lithium hypochlorite is calcium-free (does not harden water), dust-free, has a long shelf
life (loses 0.1% available chlorine a month), offers superior cold water solubility and pH
control and is particularly well suited for vinyl lined pools and spas. This product is
registered with the EPA in the USA for its intended use, but is also used in other regions
including Canada and Europe.
As it dissolves so rapidly, lithium hypochlorite cannot be used in a dry chlorine feeder. It
is pre-dissolved and dispensed in a liquid feeder. Cyanuric acid must be added
separately to prevent the chlorine in the pool being degraded by sunlight.
For other sanitation purposes, FMC Lithium produces lithium chlorine bleach, intended
for industrial bleaching. JSC Novosibirsk Chemical Concentrates Plant (NCCP) produce
a range of lithium hypochlorite disinfectants marketed under the LIDOS brand.
Disinfectant LIDOS can be used for furniture, floors and clothes; it is produced in 20%
Page | 386 Lithium: Market Outlook to 2017, 12th edition 2013
Roskill
Copyright © 2013 by Roskill Information Services Ltd. Unauthorised copying prohibited. www.roskill.com
and 25% grades containing 15-20% and 20-25% active chlorine fractions. Domestic
LIDOS-20 and LIDOS-25 are bleaches with disinfectant effects available with 15-20% or
20-25% active chlorine fractions respectively. LIDOS-B is a disinfectant for swimming
pools and swimming pool facilities; LIDOS-B contains 15-25% active chlorine fractions.
Production of lithium hypochlorite in 2012 is estimated at 3,000t LCE. Output is
estimated to have grown by 5%py since 2007 commensurate with a similar rise in lithium
metal output.
The outlook for lithium hypochlorite use is uncertain, however, as despite a forecast rise
in lithium metal production providing the necessary by-product chlorine feedstock, it is
more expensive than competing chorine-producing products and hence under pressure
for market share. Growth in available output will therefore be tempered by demand,
resulting in growth of 2%py to 2017.
18.2 Organic synthesis
Alkyllithiums, aryllithiums, lithium amides, lithium alkoxides and lithium metal hydrides
are functionally used as strong hindered bases, nucleophiles and reducing agents in
organic synthesis in the following industries:
Pharmaceuticals
Flavors and fragrances
Agrochemicals
Electronics
Other organic intermediates
Organolithium compounds including butylltihium and hexyllithium serve as strong,
nucleophilic bases to generate carbanions by proton abstraction and lithium-halide
exchange, while other organolithium compounds are used in Grignard-type reactions
such as for the preparation of products such as vitamin A and steroids. Lithium
aluminium hydride (LAH) is a powerful reducing agent used to convert esters, carboxylic
acids, and ketones into the corresponding alcohols; and amide, nitro, nitrile, imine,
oxime, and azide compounds into the amines. Other examples of uses for lithium in
organic synthesis are shown in Table 228.
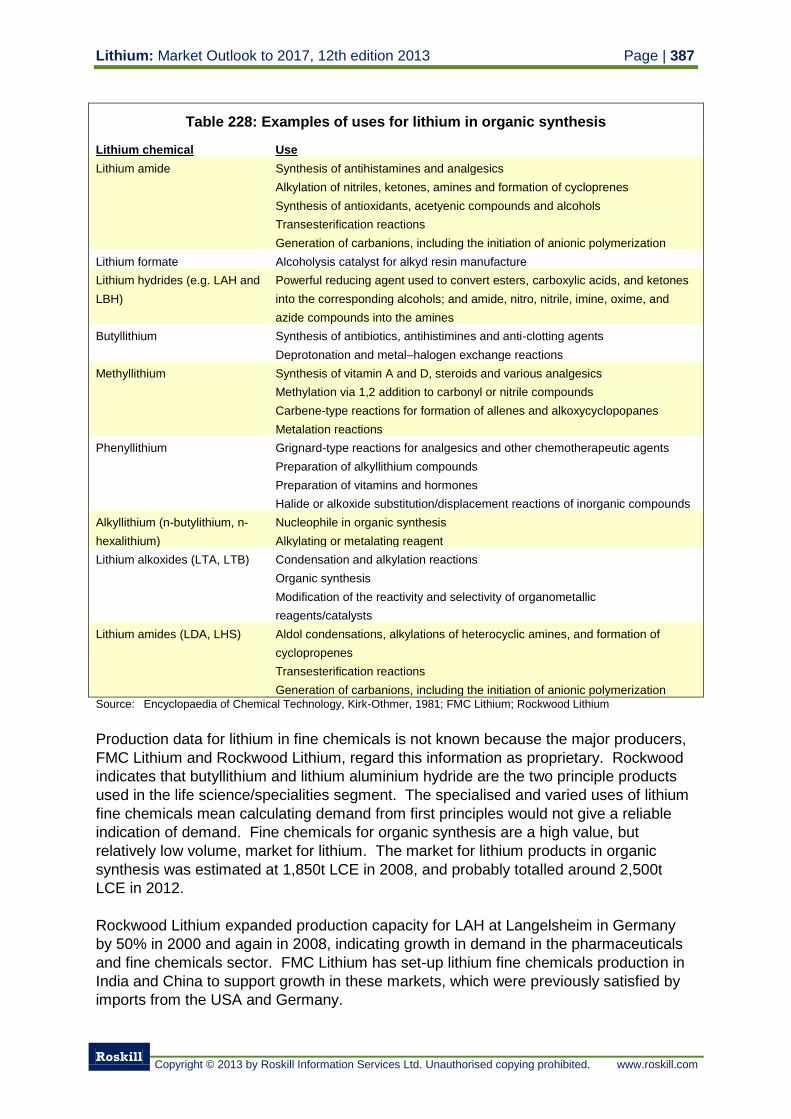
Lithium: Market Outlook to 2017, 12th edition 2013 Page | 387
Roskill
Copyright © 2013 by Roskill Information Services Ltd. Unauthorised copying prohibited. www.roskill.com
Table 228: Examples of uses for lithium in organic synthesis
Lithium chemical Use
Lithium amide Synthesis of antihistamines and analgesics
Alkylation of nitriles, ketones, amines and formation of cycloprenes
Synthesis of antioxidants, acetyenic compounds and alcohols
Transesterification reactions
Generation of carbanions, including the initiation of anionic polymerization
Lithium formate Alcoholysis catalyst for alkyd resin manufacture
Lithium hydrides (e.g. LAH and
LBH)
Powerful reducing agent used to convert esters, carboxylic acids, and ketones
into the corresponding alcohols; and amide, nitro, nitrile, imine, oxime, and
azide compounds into the amines
Butyllithium Synthesis of antibiotics, antihistimines and anti-clotting agents
Deprotonation and metal–halogen exchange reactions
Methyllithium Synthesis of vitamin A and D, steroids and various analgesics
Methylation via 1,2 addition to carbonyl or nitrile compounds
Carbene-type reactions for formation of allenes and alkoxycyclopopanes
Metalation reactions
Phenyllithium Grignard-type reactions for analgesics and other chemotherapeutic agents
Preparation of alkyllithium compounds
Preparation of vitamins and hormones
Halide or alkoxide substitution/displacement reactions of inorganic compounds
Alkyllithium (n-butylithium, n-
hexalithium)
Nucleophile in organic synthesis
Alkylating or metalating reagent
Lithium alkoxides (LTA, LTB) Condensation and alkylation reactions
Organic synthesis
Modification of the reactivity and selectivity of organometallic
reagents/catalysts
Lithium amides (LDA, LHS) Aldol condensations, alkylations of heterocyclic amines, and formation of
cyclopropenes
Transesterification reactions
Generation of carbanions, including the initiation of anionic polymerization Source: Encyclopaedia of Chemical Technology, Kirk-Othmer, 1981; FMC Lithium; Rockwood Lithium
Production data for lithium in fine chemicals is not known because the major producers,
FMC Lithium and Rockwood Lithium, regard this information as proprietary. Rockwood
indicates that butyllithium and lithium aluminium hydride are the two principle products
used in the life science/specialities segment. The specialised and varied uses of lithium
fine chemicals mean calculating demand from first principles would not give a reliable
indication of demand. Fine chemicals for organic synthesis are a high value, but
relatively low volume, market for lithium. The market for lithium products in organic
synthesis was estimated at 1,850t LCE in 2008, and probably totalled around 2,500t
LCE in 2012.
Rockwood Lithium expanded production capacity for LAH at Langelsheim in Germany
by 50% in 2000 and again in 2008, indicating growth in demand in the pharmaceuticals
and fine chemicals sector. FMC Lithium has set-up lithium fine chemicals production in
India and China to support growth in these markets, which were previously satisfied by
imports from the USA and Germany.
Page | 388 Lithium: Market Outlook to 2017, 12th edition 2013
Roskill
Copyright © 2013 by Roskill Information Services Ltd. Unauthorised copying prohibited. www.roskill.com
Production of life science products, which require synthesis using lithium fine chemicals,
is forecast to grow to 2017 as new products are released into the market. The specialist
applications for these products, such as new and evolving medicines, are difficult to
forecast so quantifying the exact growth rates is difficult; nevertheless, growth of 3.5%py
is envisaged, taking demand to 2,670t LCE by 2017. Growth could be higher if demand
for medicines, flavours and agrochemical products increases, particularly in emerging
markets.
18.3 Construction
Lithium carbonate can be used to adjust and accelerate the setting time of cementitious
systems such as high-alumina cements (HAC) and alumina-portland cement blends.
Common applications for HAC and HAC/PC blends include: refractory cements,
shotcrete / gunite, self-levelling floor systems, quickset adhesives, quickset mortars and
rapid-repair materials. Lithium carbonate is added when other additions to the cement
formulation have the disadvantage of retarding the hardening process below the
required properties. Depending upon the effect intended, 0.1–2.5% of lithium carbonate
is added. Lithium hydroxide and sulphate are also used in particular cement
applications.
Lithium nitrate and lithium hydroxide can be used to mitigate and treat alkali-silica
reactivity (ASR) in concrete. ASR occurs when silica in the aggregate reacts with alkali
in cement to produce a silica gel. The gel then absorbs water, causing expansion and
hydraulic pressure sufficient to crack the concrete. If left untreated, the reaction will
continue through the structure, resulting in cracking and leaving the concrete vulnerable
to deterioration through corrosion of rebar, freeze-thaw damage and sulphate attack.
Several national and local specifications in the USA now include lithium technology to
control and treat ASR. Lithium technology has also been tested and shown to be
applicable in Canada, the UK and Argentina.
Consumption of lithium salts in construction applications is estimated at less than 2,000t
LCE in 2012. FMC Lithium and Rockwood Lithium are the two major suppliers of lithium
salts to the construction industry. Growth in consumption is forecast at 4.5%py through
2017.
18.4 Alkyd resins
Oil-based paint uses a binder that is derived from a vegetable oil (such as that obtained
from linseed or soya). In alkyd paint, the binder is a synthetic resin, which is called an
alkyd resin. The term alkyd was coined in the early days and originates from the “al” in
polyhydric alcohols and the “cid” (modified to “kyd”) in polybasic acids. In a chemical
sense the terms alkyd and polyester are synonymous. Commonly, the term “alkyd” is
limited to polyesters modified with oils or fatty acids.
Lithium: Market Outlook to 2017, 12th edition 2013 Page | 389
Roskill
Copyright © 2013 by Roskill Information Services Ltd. Unauthorised copying prohibited. www.roskill.com
Two processes can be used for the production of alkyd resins: direct esterification
(fusion cooking) or solvent esterification (azeotropic cooking). Both processes remove
water during esterification. When alkyds are produced using fatty acids as the modifier
(a one-step process) all the ingredients are charged and esterification is undertaken via
the direct or solvent method. However, when oil (such as soybean, castor and linseed)
is used as a modifier, it is first reacted with polyol in the presence of a catalyst consisting of lithium hydroxide, lithium napthanate or lithium ricinoleate, at 220-230°C in a process
called alcoholysis. The alcoholysis product is then reacted with the remaining
ingredients during esterification.
Alkyd resins are useful as film forming agents in paint, varnish and enamels, and as
thermosetting plastics that can be moulded into solid objects. As such, alkyd resins are
one of the important ingredients in the synthetic paint industry.
Alkyd resins were the primary resin used in the paint and coatings industries until water-
based DIY products were introduced in the 1950s for architectural use. The consumer
friendly nature of water-based paints expanded their use considerably. In 1970, the
Clean Air Act added encouragement to the development of other resin systems that
could replace traditional alkyd resin solvent systems. The driving force behind the Clean
Air act was the need to reduce volatile organic content (VOC) emissions from the
workplace and the environment in general. Although alkyd resin paints were well proven
and acceptable, they were replaced with lower VOC higher performing new resin
systems including epoxies, polyesters, urethanes, acrylics and others. As a result, in
North America, Western Europe and Japan, consumption of alkyds has diminished over
the last thirty years.
Nevertheless, alkyd paints and coatings are still popular today, and used in a variety of
applications. It can still be difficult to duplicate the high gloss, adhesion to metal and
plastic and stain blocking abilities of alkyd paints. More recently, some companies have
developed solvent-free alkyd resins to combine the advantage of a low VOC system with
the performance of the typical solvent borne coatings. Alkyds still remain a sizable
factor in the coatings industry. In the USA, for example, alkyd resins are used in 20% of
architectural paint systems and slightly under 20% of the industrial coatings market.
China and other Asian countries represent the largest market for alkyd paints and
coatings (Figure 89). Eastern Europe is also a large market, suggesting that alkyd
paints and coatings are more prevalent in emerging economies because of less
stringent environmental regulations on high VOC products.
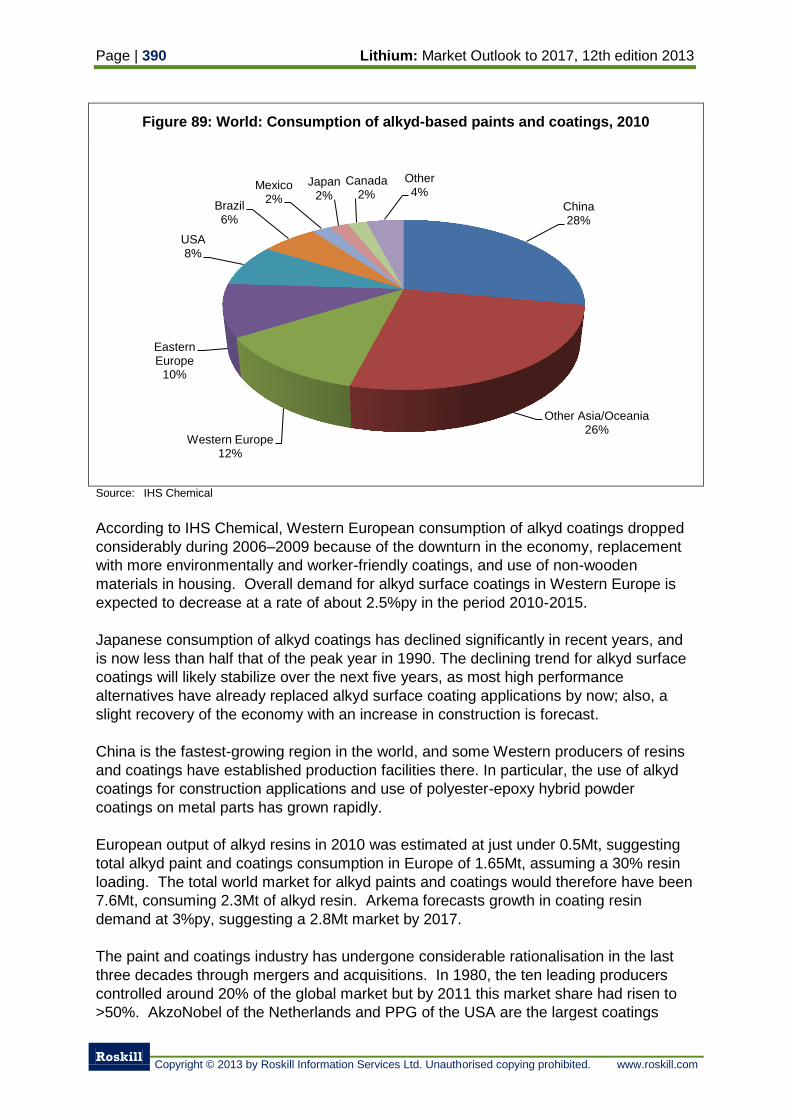
Page | 390 Lithium: Market Outlook to 2017, 12th edition 2013
Roskill
Copyright © 2013 by Roskill Information Services Ltd. Unauthorised copying prohibited. www.roskill.com
Figure 89: World: Consumption of alkyd-based paints and coatings, 2010
Source: IHS Chemical
According to IHS Chemical, Western European consumption of alkyd coatings dropped
considerably during 2006–2009 because of the downturn in the economy, replacement
with more environmentally and worker-friendly coatings, and use of non-wooden
materials in housing. Overall demand for alkyd surface coatings in Western Europe is
expected to decrease at a rate of about 2.5%py in the period 2010-2015.
Japanese consumption of alkyd coatings has declined significantly in recent years, and
is now less than half that of the peak year in 1990. The declining trend for alkyd surface
coatings will likely stabilize over the next five years, as most high performance
alternatives have already replaced alkyd surface coating applications by now; also, a
slight recovery of the economy with an increase in construction is forecast.
China is the fastest-growing region in the world, and some Western producers of resins
and coatings have established production facilities there. In particular, the use of alkyd
coatings for construction applications and use of polyester-epoxy hybrid powder
coatings on metal parts has grown rapidly.
European output of alkyd resins in 2010 was estimated at just under 0.5Mt, suggesting
total alkyd paint and coatings consumption in Europe of 1.65Mt, assuming a 30% resin
loading. The total world market for alkyd paints and coatings would therefore have been
7.6Mt, consuming 2.3Mt of alkyd resin. Arkema forecasts growth in coating resin
demand at 3%py, suggesting a 2.8Mt market by 2017.
The paint and coatings industry has undergone considerable rationalisation in the last
three decades through mergers and acquisitions. In 1980, the ten leading producers
controlled around 20% of the global market but by 2011 this market share had risen to
>50%. AkzoNobel of the Netherlands and PPG of the USA are the largest coatings
China 28%
Other Asia/Oceania 26%
Western Europe 12%
Eastern Europe
10%
USA 8%
Brazil 6%
Mexico 2%
Japan 2%
Canada 2%
Other 4%
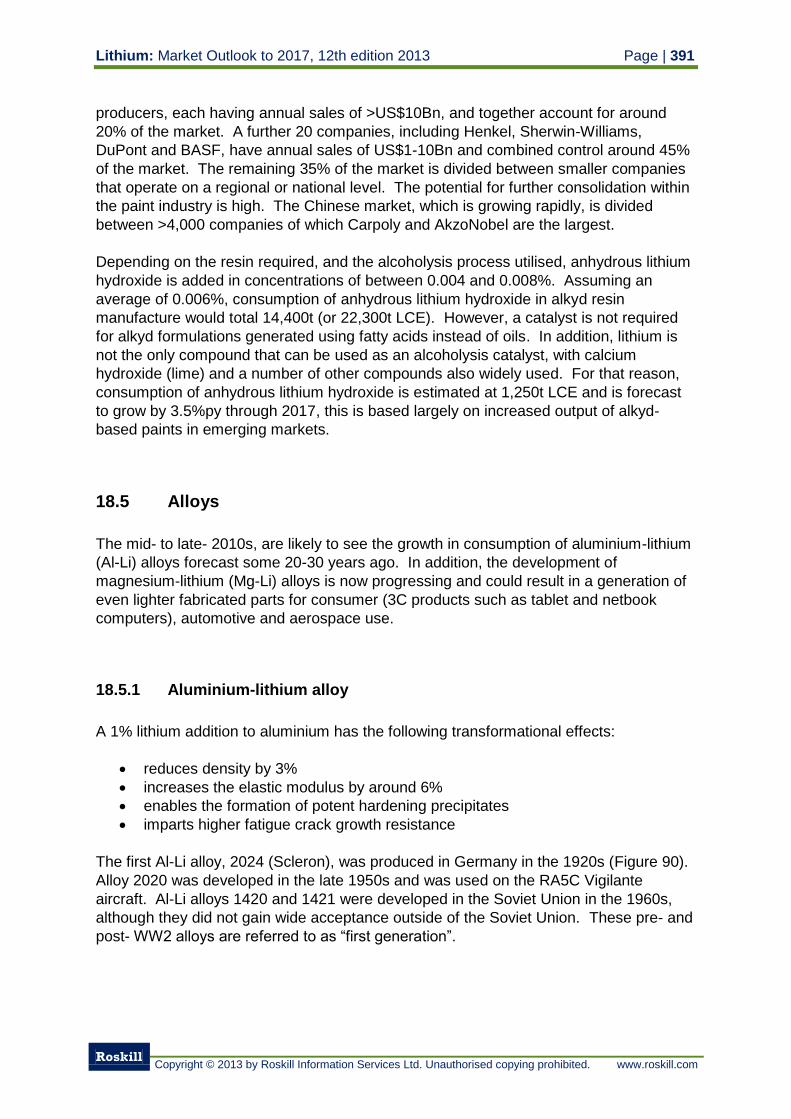
Lithium: Market Outlook to 2017, 12th edition 2013 Page | 391
Roskill
Copyright © 2013 by Roskill Information Services Ltd. Unauthorised copying prohibited. www.roskill.com
producers, each having annual sales of >US$10Bn, and together account for around
20% of the market. A further 20 companies, including Henkel, Sherwin-Williams,
DuPont and BASF, have annual sales of US$1-10Bn and combined control around 45%
of the market. The remaining 35% of the market is divided between smaller companies
that operate on a regional or national level. The potential for further consolidation within
the paint industry is high. The Chinese market, which is growing rapidly, is divided
between >4,000 companies of which Carpoly and AkzoNobel are the largest.
Depending on the resin required, and the alcoholysis process utilised, anhydrous lithium
hydroxide is added in concentrations of between 0.004 and 0.008%. Assuming an
average of 0.006%, consumption of anhydrous lithium hydroxide in alkyd resin
manufacture would total 14,400t (or 22,300t LCE). However, a catalyst is not required
for alkyd formulations generated using fatty acids instead of oils. In addition, lithium is
not the only compound that can be used as an alcoholysis catalyst, with calcium
hydroxide (lime) and a number of other compounds also widely used. For that reason,
consumption of anhydrous lithium hydroxide is estimated at 1,250t LCE and is forecast
to grow by 3.5%py through 2017, this is based largely on increased output of alkyd-
based paints in emerging markets.
18.5 Alloys
The mid- to late- 2010s, are likely to see the growth in consumption of aluminium-lithium
(Al-Li) alloys forecast some 20-30 years ago. In addition, the development of
magnesium-lithium (Mg-Li) alloys is now progressing and could result in a generation of
even lighter fabricated parts for consumer (3C products such as tablet and netbook
computers), automotive and aerospace use.
18.5.1 Aluminium-lithium alloy
A 1% lithium addition to aluminium has the following transformational effects:
reduces density by 3%
increases the elastic modulus by around 6%
enables the formation of potent hardening precipitates
imparts higher fatigue crack growth resistance
The first Al-Li alloy, 2024 (Scleron), was produced in Germany in the 1920s (Figure 90).
Alloy 2020 was developed in the late 1950s and was used on the RA5C Vigilante
aircraft. Al-Li alloys 1420 and 1421 were developed in the Soviet Union in the 1960s,
although they did not gain wide acceptance outside of the Soviet Union. These pre- and
post- WW2 alloys are referred to as “first generation”.
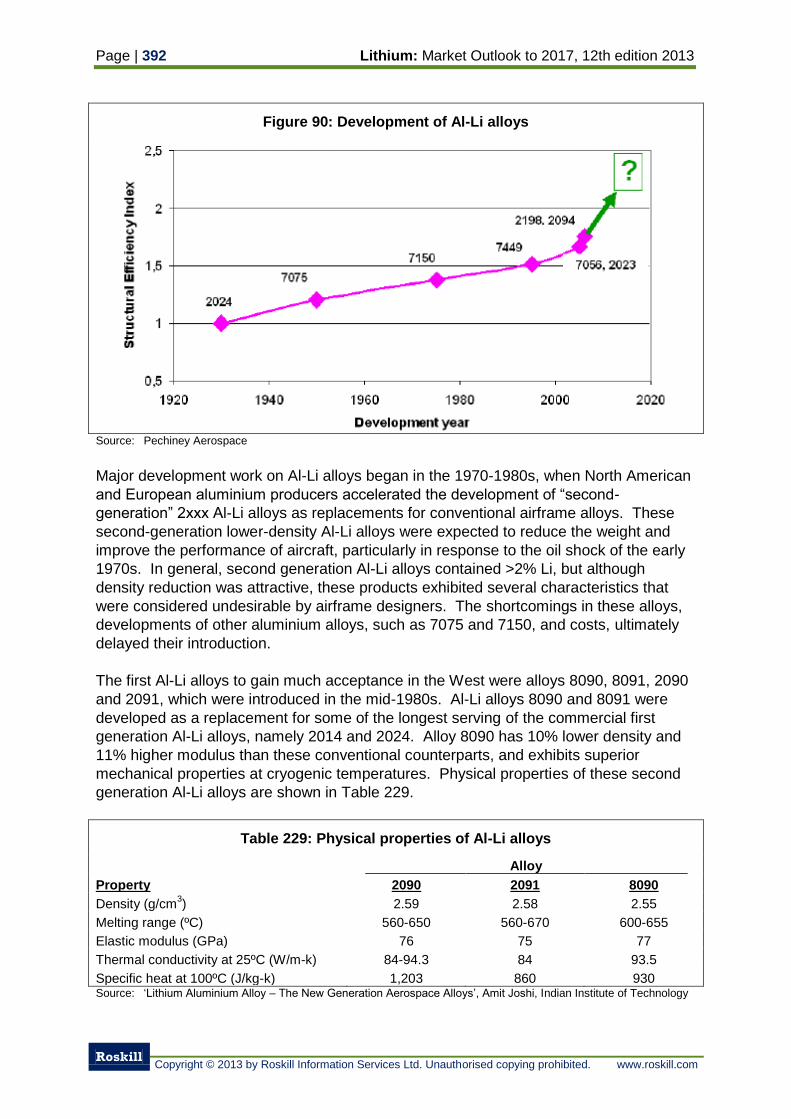
Page | 392 Lithium: Market Outlook to 2017, 12th edition 2013
Roskill
Copyright © 2013 by Roskill Information Services Ltd. Unauthorised copying prohibited. www.roskill.com
Figure 90: Development of Al-Li alloys
Source: Pechiney Aerospace
Major development work on Al-Li alloys began in the 1970-1980s, when North American
and European aluminium producers accelerated the development of “second-
generation” 2xxx Al-Li alloys as replacements for conventional airframe alloys. These
second-generation lower-density Al-Li alloys were expected to reduce the weight and
improve the performance of aircraft, particularly in response to the oil shock of the early
1970s. In general, second generation Al-Li alloys contained >2% Li, but although
density reduction was attractive, these products exhibited several characteristics that
were considered undesirable by airframe designers. The shortcomings in these alloys,
developments of other aluminium alloys, such as 7075 and 7150, and costs, ultimately
delayed their introduction.
The first Al-Li alloys to gain much acceptance in the West were alloys 8090, 8091, 2090
and 2091, which were introduced in the mid-1980s. Al-Li alloys 8090 and 8091 were
developed as a replacement for some of the longest serving of the commercial first
generation Al-Li alloys, namely 2014 and 2024. Alloy 8090 has 10% lower density and
11% higher modulus than these conventional counterparts, and exhibits superior
mechanical properties at cryogenic temperatures. Physical properties of these second
generation Al-Li alloys are shown in Table 229.
Table 229: Physical properties of Al-Li alloys
Alloy
Property 2090 2091 8090
Density (g/cm3) 2.59 2.58 2.55
Melting range (ºC) 560-650 560-670 600-655
Elastic modulus (GPa) 76 75 77
Thermal conductivity at 25ºC (W/m-k) 84-94.3 84 93.5
Specific heat at 100ºC (J/kg-k) 1,203 860 930 Source: ‘Lithium Aluminium Alloy – The New Generation Aerospace Alloys’, Amit Joshi, Indian Institute of Technology
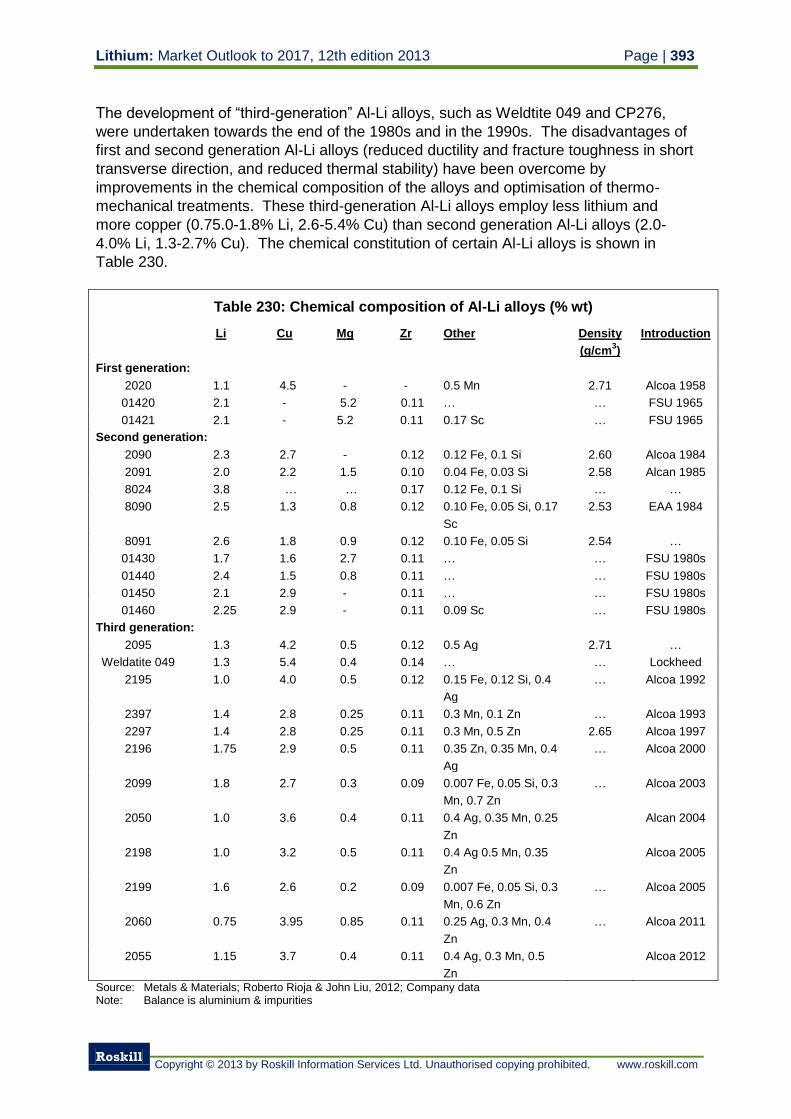
Lithium: Market Outlook to 2017, 12th edition 2013 Page | 393
Roskill
Copyright © 2013 by Roskill Information Services Ltd. Unauthorised copying prohibited. www.roskill.com
The development of “third-generation” Al-Li alloys, such as Weldtite 049 and CP276,
were undertaken towards the end of the 1980s and in the 1990s. The disadvantages of
first and second generation Al-Li alloys (reduced ductility and fracture toughness in short
transverse direction, and reduced thermal stability) have been overcome by
improvements in the chemical composition of the alloys and optimisation of thermo-
mechanical treatments. These third-generation Al-Li alloys employ less lithium and
more copper (0.75.0-1.8% Li, 2.6-5.4% Cu) than second generation Al-Li alloys (2.0-
4.0% Li, 1.3-2.7% Cu). The chemical constitution of certain Al-Li alloys is shown in
Table 230.
Table 230: Chemical composition of Al-Li alloys (% wt)
Li Cu Mg Zr Other Density
(g/cm3)
Introduction
First generation:
2020 1.1 4.5 - - 0.5 Mn 2.71 Alcoa 1958
01420 2.1 - 5.2 0.11 … … FSU 1965
01421 2.1 - 5.2 0.11 0.17 Sc … FSU 1965
Second generation:
2090 2.3 2.7 - 0.12 0.12 Fe, 0.1 Si 2.60 Alcoa 1984
2091 2.0 2.2 1.5 0.10 0.04 Fe, 0.03 Si 2.58 Alcan 1985
8024 3.8 … … 0.17 0.12 Fe, 0.1 Si … …
8090 2.5 1.3 0.8 0.12 0.10 Fe, 0.05 Si, 0.17
Sc
2.53 EAA 1984
8091 2.6 1.8 0.9 0.12 0.10 Fe, 0.05 Si 2.54 …
01430 1.7 1.6 2.7 0.11 … … FSU 1980s
01440 2.4 1.5 0.8 0.11 … … FSU 1980s
01450 2.1 2.9 - 0.11 … … FSU 1980s
01460 2.25 2.9 - 0.11 0.09 Sc … FSU 1980s
Third generation:
2095 1.3 4.2 0.5 0.12 0.5 Ag 2.71 …
Weldatite 049 1.3 5.4 0.4 0.14 … … Lockheed
2195 1.0 4.0 0.5 0.12 0.15 Fe, 0.12 Si, 0.4
Ag
… Alcoa 1992
2397 1.4 2.8 0.25 0.11 0.3 Mn, 0.1 Zn … Alcoa 1993
2297 1.4 2.8 0.25 0.11 0.3 Mn, 0.5 Zn 2.65 Alcoa 1997
2196 1.75 2.9 0.5 0.11 0.35 Zn, 0.35 Mn, 0.4
Ag
… Alcoa 2000
2099 1.8 2.7 0.3 0.09 0.007 Fe, 0.05 Si, 0.3
Mn, 0.7 Zn
… Alcoa 2003
2050 1.0 3.6 0.4 0.11 0.4 Ag, 0.35 Mn, 0.25
Zn
Alcan 2004
2198 1.0 3.2 0.5 0.11 0.4 Ag 0.5 Mn, 0.35
Zn
Alcoa 2005
2199 1.6 2.6 0.2 0.09 0.007 Fe, 0.05 Si, 0.3
Mn, 0.6 Zn
… Alcoa 2005
2060 0.75 3.95 0.85 0.11 0.25 Ag, 0.3 Mn, 0.4
Zn
… Alcoa 2011
2055 1.15 3.7 0.4 0.11 0.4 Ag, 0.3 Mn, 0.5
Zn
Alcoa 2012
Source: Metals & Materials; Roberto Rioja & John Liu, 2012; Company data Note: Balance is aluminium & impurities
Page | 394 Lithium: Market Outlook to 2017, 12th edition 2013
Roskill
Copyright © 2013 by Roskill Information Services Ltd. Unauthorised copying prohibited. www.roskill.com
18.5.1.1 Producers of aluminium-lithium alloys
There are believed to be only three commercial producers of Al-Li alloy, Alcoa in the
USA, Alcan in Canada and Europe and SUAL in Russia. These three companies have
strong ties to the North American, European and Russian space, and commercial and
military aerospace, markets. From 2013, these companies will be joined by Aleris, which
is scheduled to open a new plant in Germany. China is also developing Al-Li alloys, with
Chinalco reported in 2012 to have developed and produced an alloy variant of its own.
Alloy 2195 and 2197 were produced by McCook Metals of the USA until 2002 when
McCook Metals filed for bankruptcy. The Al-Li plant in Chicago was subsequently
purchased by Pechiney Rolled Products and, when Pechiney Rolled Products was
bought by Alcan in 2003, the Al-Li plant was transferred to the Dubuc Works in
Saguenay, Canada. In 2011, Alcan invested US$3M in expanding the capacity of the
Dubuc Works’ Al-Li line by 50%.
Alcan also produces Al-Li alloys at Ravenswood, West Virginia. Pechiney in France and
British Aluminium in the UK both produced alloy 8090 until their purchase by Alcan in the
early 2000s. Al-Li alloys are still produced at Issoire, France, but no Al-Li alloy
production is thought to take place in the UK. The plant at Issoire supplies aluminium
products to the European aerospace industry. It is not clear whether Alcan still produces
alloy 8090 as it is not listed amongst its products, however it may be cast by Alcan and
extruded by other companies, such as Mitsubishi.
Alcan developed innovative welding technologies such as laser welding and friction stir
welding which has enabled greater use of Al-Li alloy in commercial aerospace
applications. Alcan is the exclusive supplier of AIRWARE, Alcan’s Al-Li alloy
technology, for the Bombardier C-Series aircraft. The C-Series contains 20% Al-Li alloy
by weight. The company also supply AIRWARE for the Airbus XWB.
Alcoa manufactures Al-Li alloy at the Alcoa Technical Center in Pittsburgh, USA, before
it is shipped to the Davenport Works to be rolled into plate. The company is also
constructing a new plant to produce Al-Li alloy at its existing Lafayette aluminium plant,
which will have the capacity to produce 20,000tpy of round and rectangular Al-Li ingots
when it opens in 2014. The Kitts Green plant in the UK was also upgraded during 2012
to create additional casting capacity for Al-Li alloys.
Facing increasing competition from composite materials, Alcoa launched its Aerospace
20-20 Initiative in 2002, aiming to cut the cost and weight of aerospace metallics by 20%
in two decades, through the development of new alloys and manufacturing technologies.
In practice, the aim was achieved in just three years, partly due to the commercialisation
of Al-Li alloys by Airbus in the A350. Alcoa produces a 2198 Al-Li alloy developed for
the Airbus A350 fuselage.
In the early 2000s, a major effort was made by Alcoa towards establishing a production
capability for C458 plate under Air Force Research Laboratory and NASA's Space
Launch Initiative (SLI) sponsorship. C458 and L277 alloys with less than 2.0% Li are
being developed for future space use. In 2007, NASA awarded Alcoa a US$18.5M
contract to develop the manufacturing capability and to supply the initial requirements of
Lithium: Market Outlook to 2017, 12th edition 2013 Page | 395
Roskill
Copyright © 2013 by Roskill Information Services Ltd. Unauthorised copying prohibited. www.roskill.com
high performance Al-Li plate and ingot to which will be used for the Ares 1 crew launch
vehicle upper stage. In November 2008, Alcoa announced that NASA had certified its
Davenport, Iowa, facility as the only supplier in the USA to produce Al-Li alloy 2195 thin
plate for the Ares 1 crew launch vehicle, the rocket that will enable astronauts to explore
space beyond low earth orbit with the goal of reaching the moon by 2020. Alcoa will
initially produce around 450t of Al-Li alloy for the Ares programme.
In late 2011, Aleris announced it was to start construction on a specialised casting
facility for Al-Li plate and sheet at Koblenz, Germany. The company expected
production to start in early 2013.
In Russia, Al-Li alloy is produced by SUAL (now part of Rusal), possibly at the
Kamensk-Uralsky Metallurgical Plant. In February 2006, Corus Aluminium Rolled
Products of Germany, SUAL Holdings of Russia and Alu Menziken Aerospace/UAC of
the USA, formed an alliance to research, develop and produce extruded and rolled Al-Li
alloys for aerospace markets.
Aluminium Corporation of China (Chinalco) announced in 2012 that the company
had successfully developed the capacity to produce new third generation 540mm Al-Li
alloy round ingots, used in large airplanes. The material will likely be used in China’s
growing commercial and military aerospace sector.
New alloys containing lithium and zirconium additions beyond those achievable in
directionally cast materials, have been developed using spray forming by Cospray of the
UK in collaboration with Lockheed and GKN-Westland Helicopters. High lithium levels
impart high strength and elastic modulus and low density, while high zirconium levels
result in a high volume fraction of dispersoid particles which control the grain and sub-
grain structures. Potential applications have been identified in spacecraft and
helicopters, where weight savings are of paramount importance. Two new alloys have
been developed, UL30 (3.0% Li, 1.0% Cu and 0.7% Mg) and UL40 (4.0% Li and 0.2%
Zr), the latter having the lowest density of any commercial aluminium alloy. Cospray has
also used sprayforming to produce alloys 8090 and 8091 with superior properties to cast
versions.
18.5.1.2 Applications for aluminium-lithium alloys
Applications for Al-Li alloys lie mainly in space, military aerospace and commercial
aerospace uses.
Space
The greatest use of Al-Li alloy to date has been the inclusion of alloy 2195 in the Space
Shuttle external fuel tank, where weldability, high strength, cryogenic fracture toughness
and lower density were beneficial. The Space Shuttle was retired in 2010, however. In
2005, Boeing began preparing a range of Delta IV Heavy Launcher options for NASA’s
Crew Exploration Vehicle (CEV) developed for the Mars programme. One of the options
considered by Boeing is the use of Al-Li alloys to save weight and enhance the
Page | 396 Lithium: Market Outlook to 2017, 12th edition 2013
Roskill
Copyright © 2013 by Roskill Information Services Ltd. Unauthorised copying prohibited. www.roskill.com
performance of the Delta IV’s RS-68 engines. Alcoa will also supply alloy 2090 for the
Ares 1 spacecraft, which is due to fly in 2020. The Ares 1 rocket is NASA’s replacement
for the scrapped Space Shuttle program.
Military aircraft
The second largest use of Al-Li alloy to date has been in the Augusta-Westland EH101
helicopter produced in Europe, where 90% of the aluminium used is alloy 8090, resulting
in a weight saving of 180kg. Alloys 2097 and 2197 have been retrospectively fitted in
the bulkheads of the US Air-Force F16 fighter jet to reduce weight and increase that
aircraft’s range. Examples of other military applications for Al-Li alloys include the Atlas
Centaur payload adapter (Alcoa 2090), the Titan IV payload adapter (Alcan 8090) and
the McDonnell Douglas C17 aft and fuselage, cargo door and deck (Alcoa 2090),
although Al-Li alloy was later removed from the C17 because of material deficiencies.
The Eurofighter, developed by the EADS consortium, contains 5% by weight of Al-Li
alloys in the leading edges and tips of the wings.
Russia has been using Al-Li alloys in operational fighter aircraft, cargo aircraft,
helicopters and missiles since the early 1980s. Al-Li alloy 1420 was used in MIG-29
welded fuselage-tank structures and was able to achieve 24% weight savings with this
approach. In 1985, Al-Li alloy 1420 was applied to passenger aircraft, although it is not
known to which models. However, the strength and fatigue durability of alloy 1420 did
not meet the increasing demands of modern aircraft and a new generation of Russian
Al-Li alloys were developed, including 1430, 1441, 1450, 1451, and 1470.
Commercial aircraft
Attempts to introduce Al-Li alloys into commercial aircraft in the 1980s were delayed
because of material deficiencies in the available second generation alloys. The poor
short-transverse properties of alloy 2090 caused cracking when integrally stiffened
panels are formed in the fabrication of propellant tanks for example. Al-Li alloy was
going to be used extensively in Boeing’s 777 series aircraft, but material deficiency
problems caused Boeing to go back to cheaper, but slightly heavier, aluminium alloys.
However, initial problems with Al-Li alloys have been overcome in the third-generation
alloys and they have now begun to be more widely introduced in the commercial
aerospace industry as a means of reducing structural weight and increasing fuel
efficiency. In current aircraft, Mitsubishi extrudes alloy 8090 sheet for the Boeing 777
aircraft while the Airbus A330 and A340 leading edges use Alcoa 2090 and Alcan 8090
Al-Li alloys.
The recently launched Airbus A380 uses Al-Li alloy C460/2196 for the floor beams, seat
rails and as part of the wing box. The Airbus A380-F freighter, which was due to fly in
2012 but has been suspended, will feature a higher content of advanced materials,
mainly due to the replacement of aluminium by Al-Li alloy, especially in the wing box.
The A380-F will comprise 22% composites, 10% titanium and steel alloys, 9% Al-Li alloy
and 3% laminated composites. The incorporation of Al-Li alloys has resulted in a weight
saving of 350kg in the A380-F freighter and 200kg in the A380 passenger version.
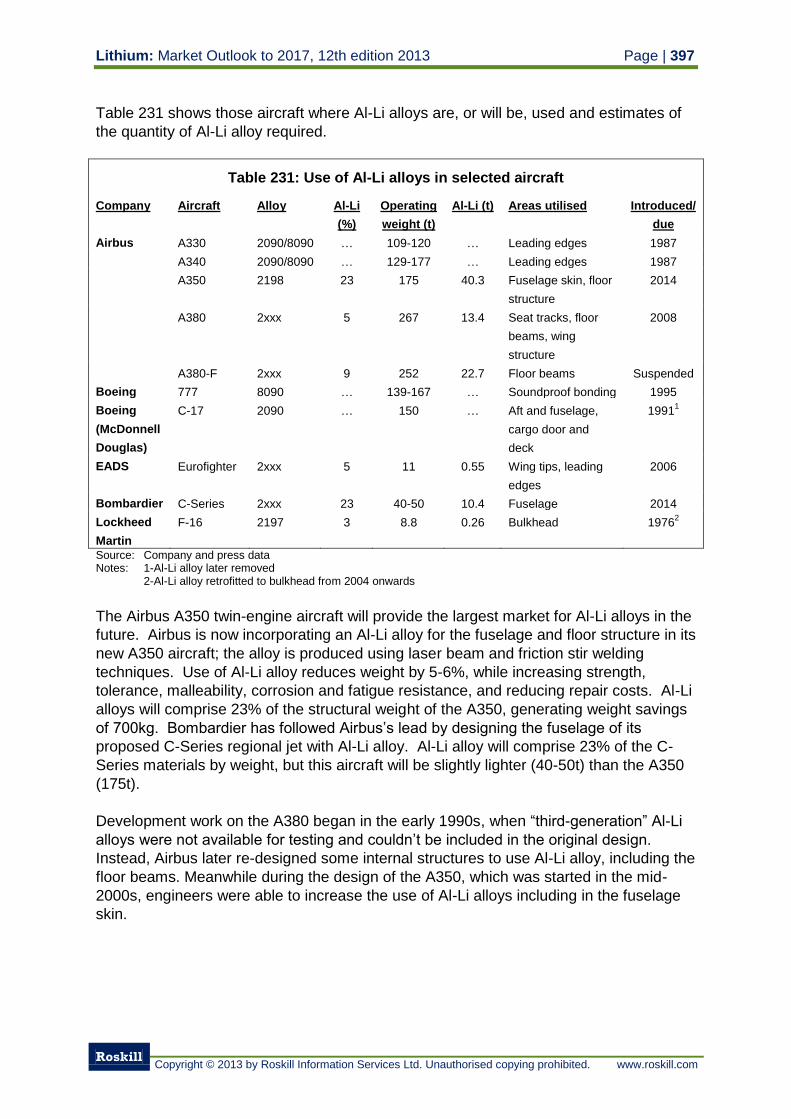
Lithium: Market Outlook to 2017, 12th edition 2013 Page | 397
Roskill
Copyright © 2013 by Roskill Information Services Ltd. Unauthorised copying prohibited. www.roskill.com
Table 231 shows those aircraft where Al-Li alloys are, or will be, used and estimates of
the quantity of Al-Li alloy required.
Table 231: Use of Al-Li alloys in selected aircraft
Company Aircraft Alloy Al-Li
(%)
Operating
weight (t)
Al-Li (t) Areas utilised Introduced/
due
Airbus A330 2090/8090 … 109-120 … Leading edges 1987
A340 2090/8090 … 129-177 … Leading edges 1987
A350 2198 23 175 40.3 Fuselage skin, floor
structure
2014
A380 2xxx 5 267 13.4 Seat tracks, floor
beams, wing
structure
2008
A380-F 2xxx 9 252 22.7 Floor beams Suspended
Boeing 777 8090 … 139-167 … Soundproof bonding 1995
Boeing
(McDonnell
Douglas)
C-17 2090 … 150 … Aft and fuselage,
cargo door and
deck
19911
EADS Eurofighter 2xxx 5 11 0.55 Wing tips, leading
edges
2006
Bombardier C-Series 2xxx 23 40-50 10.4 Fuselage 2014
Lockheed
Martin
F-16 2197 3 8.8 0.26 Bulkhead 19762
Source: Company and press data Notes: 1-Al-Li alloy later removed 2-Al-Li alloy retrofitted to bulkhead from 2004 onwards
The Airbus A350 twin-engine aircraft will provide the largest market for Al-Li alloys in the
future. Airbus is now incorporating an Al-Li alloy for the fuselage and floor structure in its
new A350 aircraft; the alloy is produced using laser beam and friction stir welding
techniques. Use of Al-Li alloy reduces weight by 5-6%, while increasing strength,
tolerance, malleability, corrosion and fatigue resistance, and reducing repair costs. Al-Li
alloys will comprise 23% of the structural weight of the A350, generating weight savings
of 700kg. Bombardier has followed Airbus’s lead by designing the fuselage of its
proposed C-Series regional jet with Al-Li alloy. Al-Li alloy will comprise 23% of the C-
Series materials by weight, but this aircraft will be slightly lighter (40-50t) than the A350
(175t).
Development work on the A380 began in the early 1990s, when “third-generation” Al-Li
alloys were not available for testing and couldn’t be included in the original design.
Instead, Airbus later re-designed some internal structures to use Al-Li alloy, including the
floor beams. Meanwhile during the design of the A350, which was started in the mid-
2000s, engineers were able to increase the use of Al-Li alloys including in the fuselage
skin.
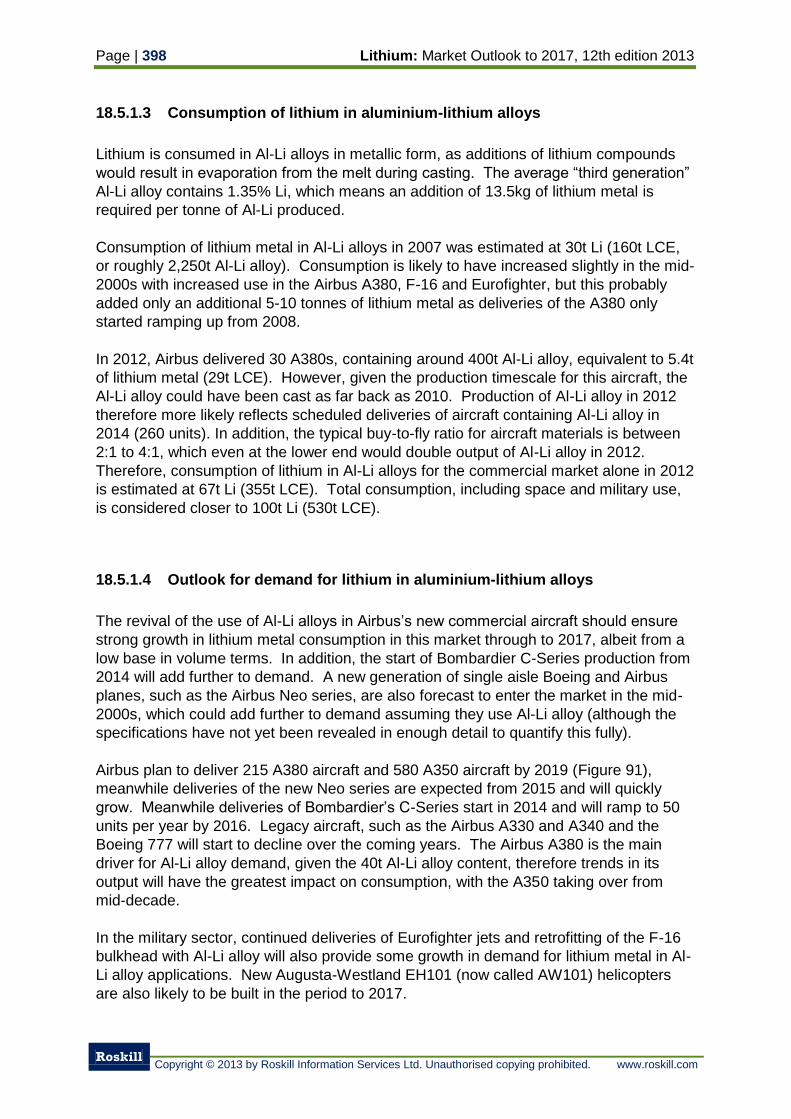
Page | 398 Lithium: Market Outlook to 2017, 12th edition 2013
Roskill
Copyright © 2013 by Roskill Information Services Ltd. Unauthorised copying prohibited. www.roskill.com
18.5.1.3 Consumption of lithium in aluminium-lithium alloys
Lithium is consumed in Al-Li alloys in metallic form, as additions of lithium compounds
would result in evaporation from the melt during casting. The average “third generation”
Al-Li alloy contains 1.35% Li, which means an addition of 13.5kg of lithium metal is
required per tonne of Al-Li produced.
Consumption of lithium metal in Al-Li alloys in 2007 was estimated at 30t Li (160t LCE,
or roughly 2,250t Al-Li alloy). Consumption is likely to have increased slightly in the mid-
2000s with increased use in the Airbus A380, F-16 and Eurofighter, but this probably
added only an additional 5-10 tonnes of lithium metal as deliveries of the A380 only
started ramping up from 2008.
In 2012, Airbus delivered 30 A380s, containing around 400t Al-Li alloy, equivalent to 5.4t
of lithium metal (29t LCE). However, given the production timescale for this aircraft, the
Al-Li alloy could have been cast as far back as 2010. Production of Al-Li alloy in 2012
therefore more likely reflects scheduled deliveries of aircraft containing Al-Li alloy in
2014 (260 units). In addition, the typical buy-to-fly ratio for aircraft materials is between
2:1 to 4:1, which even at the lower end would double output of Al-Li alloy in 2012.
Therefore, consumption of lithium in Al-Li alloys for the commercial market alone in 2012
is estimated at 67t Li (355t LCE). Total consumption, including space and military use,
is considered closer to 100t Li (530t LCE).
18.5.1.4 Outlook for demand for lithium in aluminium-lithium alloys
The revival of the use of Al-Li alloys in Airbus’s new commercial aircraft should ensure
strong growth in lithium metal consumption in this market through to 2017, albeit from a
low base in volume terms. In addition, the start of Bombardier C-Series production from
2014 will add further to demand. A new generation of single aisle Boeing and Airbus
planes, such as the Airbus Neo series, are also forecast to enter the market in the mid-
2000s, which could add further to demand assuming they use Al-Li alloy (although the
specifications have not yet been revealed in enough detail to quantify this fully).
Airbus plan to deliver 215 A380 aircraft and 580 A350 aircraft by 2019 (Figure 91),
meanwhile deliveries of the new Neo series are expected from 2015 and will quickly
grow. Meanwhile deliveries of Bombardier’s C-Series start in 2014 and will ramp to 50
units per year by 2016. Legacy aircraft, such as the Airbus A330 and A340 and the
Boeing 777 will start to decline over the coming years. The Airbus A380 is the main
driver for Al-Li alloy demand, given the 40t Al-Li alloy content, therefore trends in its
output will have the greatest impact on consumption, with the A350 taking over from
mid-decade.
In the military sector, continued deliveries of Eurofighter jets and retrofitting of the F-16
bulkhead with Al-Li alloy will also provide some growth in demand for lithium metal in Al-
Li alloy applications. New Augusta-Westland EH101 (now called AW101) helicopters
are also likely to be built in the period to 2017.
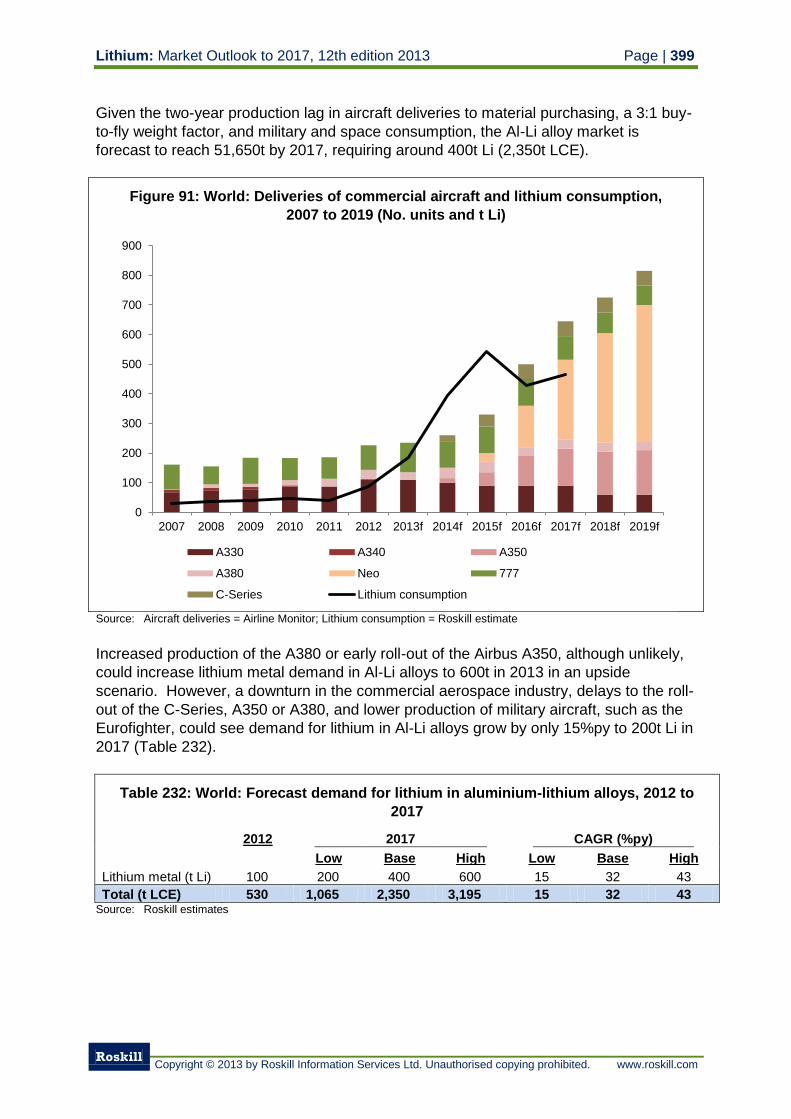
Lithium: Market Outlook to 2017, 12th edition 2013 Page | 399
Roskill
Copyright © 2013 by Roskill Information Services Ltd. Unauthorised copying prohibited. www.roskill.com
Given the two-year production lag in aircraft deliveries to material purchasing, a 3:1 buy-
to-fly weight factor, and military and space consumption, the Al-Li alloy market is
forecast to reach 51,650t by 2017, requiring around 400t Li (2,350t LCE).
Figure 91: World: Deliveries of commercial aircraft and lithium consumption,
2007 to 2019 (No. units and t Li)
Source: Aircraft deliveries = Airline Monitor; Lithium consumption = Roskill estimate
Increased production of the A380 or early roll-out of the Airbus A350, although unlikely,
could increase lithium metal demand in Al-Li alloys to 600t in 2013 in an upside
scenario. However, a downturn in the commercial aerospace industry, delays to the roll-
out of the C-Series, A350 or A380, and lower production of military aircraft, such as the
Eurofighter, could see demand for lithium in Al-Li alloys grow by only 15%py to 200t Li in
2017 (Table 232).
Table 232: World: Forecast demand for lithium in aluminium-lithium alloys, 2012 to
2017
2012 2017 CAGR (%py)
Low Base High Low Base High
Lithium metal (t Li) 100 200 400 600 15 32 43
Total (t LCE) 530 1,065 2,350 3,195 15 32 43 Source: Roskill estimates
0
100
200
300
400
500
600
700
800
900
2007 2008 2009 2010 2011 2012 2013f 2014f 2015f 2016f 2017f 2018f 2019f
A330 A340 A350
A380 Neo 777
C-Series Lithium consumption
Page | 400 Lithium: Market Outlook to 2017, 12th edition 2013
Roskill
Copyright © 2013 by Roskill Information Services Ltd. Unauthorised copying prohibited. www.roskill.com
18.5.2 Magnesium-lithium alloy
Magnesium-lithium (Mg-Li) alloy is the lightest workable metal material available
commercially. It was originally developed by NASA in the 1960s for research and
military purposes.
Nippon Kinzoku of Japan has the capacity to produce 60tpy of magnesium alloy,
including LZ91, which contains 9% lithium.
Santoku of Japan developed a Mg-Li alloy with 20% lighter weight than magnesium and
commercialised it in 2011. The company can produce 50tpm from its Miki factory in
Hyogo prefecture, but volumes will have to increase substantially before costs fall;
currently the material is being evaluated for use in 3C and automotive applications.
In 2012, Sifang Ultra-lightweight Material of China opened a 100tpy Mg-Li alloy plant
at Xi’an Yanliang National Aerospace High-Tech Industrial Base.
Consumption of lithium metal in Mg-Li alloys is likely to be minor at present, perhaps
only a few tens of tonnes per year, but could grow should the benefits of Mg-Li alloy get
increased focus and hence use.
18.6 Electronics
Lithium niobate (LiNbO3 / LNB) and lithium tantalate (LiTaO3 / LTA) provide a very small
but very high-value market for lithium, estimated at 100t LCE in 2012.
LNB is produced by melting high-purity (4N) lithium carbonate and niobium oxide.
Single crystals of LNB are produced by the Czochralski (CZ) vertical-pulling process, in
which a monocrystalline seed is placed in the bath of molten LNB. A single-crystal boule
slowly grows around the seed crystal as it is rotated and slowly pulled upwards while the
temperature is lowered. The electronic properties of single-crystals may be controlled by
the addition of selected doping agents to the melt before crystal growth begins. The
completed crystal is sliced into wafers. LTA crystals are grown along the x-axis, fully
poled, with diameters and lengths up to 60mm. Properties of LNB and LTA are shown in
Table 233.
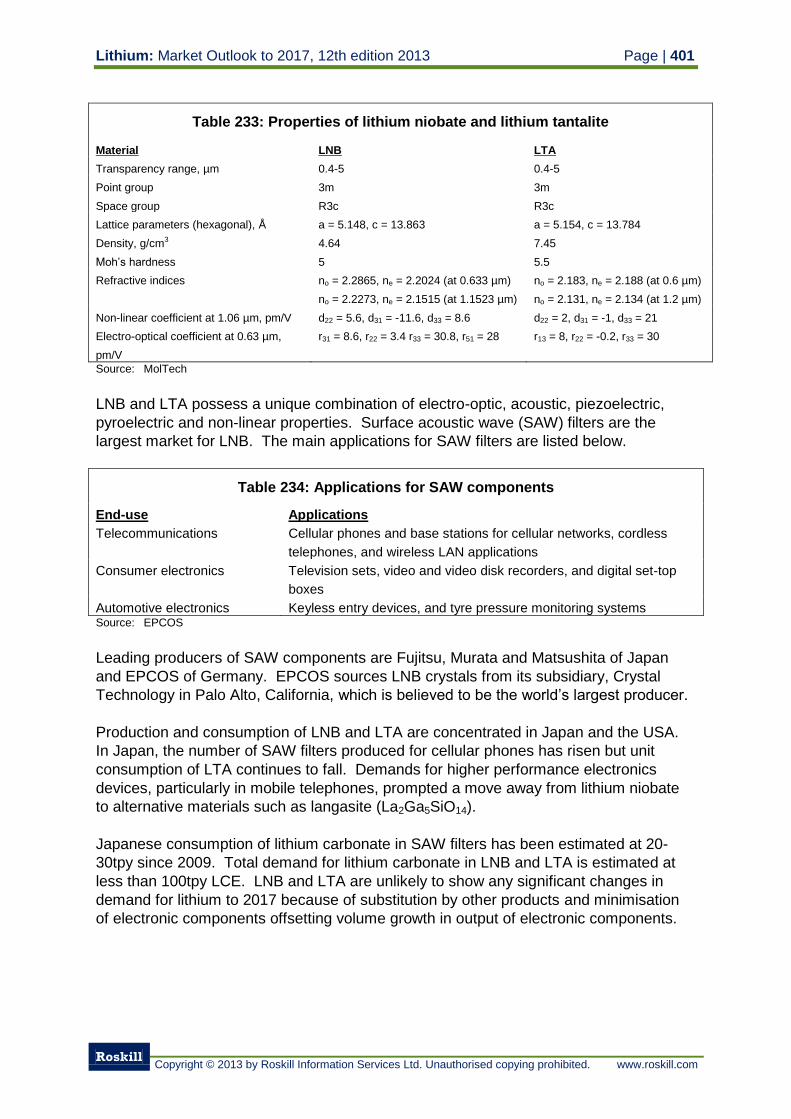
Lithium: Market Outlook to 2017, 12th edition 2013 Page | 401
Roskill
Copyright © 2013 by Roskill Information Services Ltd. Unauthorised copying prohibited. www.roskill.com
Table 233: Properties of lithium niobate and lithium tantalite
Material LNB LTA
Transparency range, µm 0.4-5 0.4-5
Point group 3m 3m
Space group R3c R3c
Lattice parameters (hexagonal), Å a = 5.148, c = 13.863 a = 5.154, c = 13.784
Density, g/cm3 4.64 7.45
Moh’s hardness 5 5.5
Refractive indices no = 2.2865, ne = 2.2024 (at 0.633 µm) no = 2.183, ne = 2.188 (at 0.6 µm)
no = 2.2273, ne = 2.1515 (at 1.1523 µm) no = 2.131, ne = 2.134 (at 1.2 µm)
Non-linear coefficient at 1.06 µm, pm/V d22 = 5.6, d31 = -11.6, d33 = 8.6 d22 = 2, d31 = -1, d33 = 21
Electro-optical coefficient at 0.63 µm,
pm/V
r31 = 8.6, r22 = 3.4 r33 = 30.8, r51 = 28 r13 = 8, r22 = -0.2, r33 = 30
Source: MolTech
LNB and LTA possess a unique combination of electro-optic, acoustic, piezoelectric,
pyroelectric and non-linear properties. Surface acoustic wave (SAW) filters are the
largest market for LNB. The main applications for SAW filters are listed below.
Table 234: Applications for SAW components
End-use Applications
Telecommunications Cellular phones and base stations for cellular networks, cordless
telephones, and wireless LAN applications
Consumer electronics Television sets, video and video disk recorders, and digital set-top
boxes
Automotive electronics Keyless entry devices, and tyre pressure monitoring systems Source: EPCOS
Leading producers of SAW components are Fujitsu, Murata and Matsushita of Japan
and EPCOS of Germany. EPCOS sources LNB crystals from its subsidiary, Crystal
Technology in Palo Alto, California, which is believed to be the world’s largest producer.
Production and consumption of LNB and LTA are concentrated in Japan and the USA.
In Japan, the number of SAW filters produced for cellular phones has risen but unit
consumption of LTA continues to fall. Demands for higher performance electronics
devices, particularly in mobile telephones, prompted a move away from lithium niobate
to alternative materials such as langasite (La2Ga5SiO14).
Japanese consumption of lithium carbonate in SAW filters has been estimated at 20-
30tpy since 2009. Total demand for lithium carbonate in LNB and LTA is estimated at
less than 100tpy LCE. LNB and LTA are unlikely to show any significant changes in
demand for lithium to 2017 because of substitution by other products and minimisation
of electronic components offsetting volume growth in output of electronic components.
Page | 402 Lithium: Market Outlook to 2017, 12th edition 2013
Roskill
Copyright © 2013 by Roskill Information Services Ltd. Unauthorised copying prohibited. www.roskill.com
18.7 Analytical agents
Both pure and doped (with beryllium or strontium) lithium tetraborate and metaborate are
used as fluxing agents for the quality control of cements and ores functioning as internal
standards in X-ray spectroscopy or optical emission analysis.
18.8 Dyestuffs
Lithium acetate and lithium acetate dihydrate are used as an additive in dyestuffs for
polymers, textiles and speciality applications to improve viscosity, smoothness and
dyeability, while decreasing lustre and breaks. Lithium hydroxide finds application as an
additive for dyestuffs as well as increasing the brilliance for specific pigments.
18.9 Metallurgy
Lithium is used in copper smelting to reduce the porosity of copper and copper alloys,
because of lithium metal’s affinity for oxygen. The addition of lithium metal, sealed in
copper cartridges, to the melt reduces the free oxygen content to very low levels and
prevents the formation of steam during cooling, thereby reducing porosity. This
increases the density of the cast metal, reduces inclusions, refines the grain and gives
greater fluidity to the alloy.
Lithium chloride and lithium fluoride can be used as additives to salt baths for dip
brazing and open furnace soldering.
18.10 Photographic industry
Several lithium salts, including lithium chloride, lithium sulphate and lithium sulphite, are
used as photographic developers.
18.11 Welding fluxes
When heated, welding fluxes dissolve surface oxides and protect cleaned surfaces from
re-oxidation, they transfer heat from the heat source to joints and remove oxidation
products, allowing filler metal to contact and wet the base materials.
Brazing fluxes – pastes or powders – fuse at temperatures below those needed to melt
filler metals. Because fluxes must be in close contact with the joint surfaces, they are
liquid or gaseous at brazing temperatures. They remove only surface oxides and
Lithium: Market Outlook to 2017, 12th edition 2013 Page | 403
Roskill
Copyright © 2013 by Roskill Information Services Ltd. Unauthorised copying prohibited. www.roskill.com
tarnish; other contaminants – oil, grease, lubricants, lacquer and paint – must be
removed either mechanically or chemically before brazing.
Fluxes for aluminium and magnesium contain alkaline chlorides or fluorides. Lithium
salts give these fluxes low melting points of 1,000-1,140ºF and high chemical activity,
enabling the fluxes to dissolve stubborn metal oxides.
18.12 Electrochromic glass
Antimony, base metal or lithium alloys can be used to create eletrochromic glass, a
glass that transitions from clear to tinted upon exposure to an electrical charge.
Electrochromic glass can be used in buildings and vehicles to control glare and heat
transmission. The main electrochromic glass producers are View (previously Soladigm)
in the USA, SAGE Electrochromics in the USA (50% owned by Saint Gobain) and
EControl-Glas in Europe. Saint-Gobain already produces switchable electrochromic
sunroofs. As lithium alloys are only one choice for electrochromic glass it is unclear if
lithium consumption will grow with any future expansion of glass output. The use of
lithium in this end-use is considered very small at present, but could grow over time.
18.13 Pharmaceuticals
Lithium carbonate has been a mainstay of treatment for bipolar disorder and an
augmentation treatment for unipolar depression since the 1970s. In the USA, the
National Institutes of Health estimates that bipolar disorder affects about 2.3 million
people domestically and about 1.2% of the population worldwide. Meta-analyses have
shown an 8 to 13-fold difference in the annual risk of suicide between patients with
affective disorder (primarily bipolar disorder) who were and were not treated with lithium.
Scotia Pharmaceuticals of the UK markets a seborrheic dermatitis ointment, which
contains lithium succinate and zinc sulphate as active ingredients, under the trade-name
Efalith.
Lithium gamma-linolenic acid is in chemical studies for the treatment of certain cancers.
There are also suggestions that lithium might be a useful supplement in the treatment of
alcoholism or immune disorders. The Central Drug Research Institute in Lucknow, India
has found a bis-glycosylated diamino alcohol produced by reduction with lithium
aluminium hydride, is active against multi-drug resistant Mycobacterium tuberculosis.
Lithium metal and organic compounds are used in the production of protease inhibitors
used in the treatment of HIV-AIDS.
Page | 404 Lithium: Market Outlook to 2017, 12th edition 2013
Roskill
Copyright © 2013 by Roskill Information Services Ltd. Unauthorised copying prohibited. www.roskill.com
18.13.1 Producers of lithium-based pharmaceuticals
In the USA, the brand names of lithium carbonate drugs commonly associated with
treatment of bipolar disorder are Lithobid and Eskalith. Licab, Lithane, Lithonate,
Lithotabs, Lithosun, Carbolith, Duralith, Lithizine, Camcolit, Liskonum Li-liquid and
Priadel are also lithium carbonate drug trade names used in various countries.
Generic versions of Lithobid are now available, because Solvay’s original patent has
expired, and producers include: Noven Therapeutics, Glenmark Generics, Barr
Laboratories, Roxane Laboratories, Sun Pharmaceuticals and UDL Laboratories.
Lithobid and its generic versions contain 300 or 400mg of Li2CO3 per tablet.
Eskalith and Eskalith CR were produced by GlaxoSmithKline, however the company
has ceased manufacture of these products. Eskalith and Eskalith CR are however
available as generic versions and producers include the following companies: Apotex,
Major Pharmaceuticals, Roxane Laboratories, UDL Laboratories and West Ward
Pharmaceuticals. Eskalith and its generic versions contain 300 or 400mg of Li2CO3 per
tablet, similar to Lithobid. Eskalith CR contains 450mg of Li2CO3 per tablet.
Cibalith-S is a lithium citrate (C6H5Li3O7) drug marketed in the USA while Litarex,
produced by Alphapharm in Denmark and marketed in some European countries, and
Demalit are other common lithium citrate-based drugs.
Lithium orotate (LiC5H3N2O4H2O) has been marketed as a dietary supplement used in
small doses to treat conditions including stress, manic depression, alcoholism, ADHD
and ADD, aggression, PTSD, Alzheimer's and to improve memory. However, it has not
been approved by the FDA for general prescription in the USA and is only available from
alternative health practitioners.
18.13.2 Production and consumption of lithium-based pharmaceuticals
The market for psychotherapeutic drugs, i.e. those used to treat bipolar disorder and
unipolar depression, is confined mostly to the USA, Canada, Europe, Japan and
Australia. In other countries the use of psychotherapeutic drugs is not as extensively
practiced. Decision Resources estimates that the bipolar disorder drug market is
dominated by sales of therapies in the USA. In 2011, the USA accounted for nearly 90
percent of major-market sales for bipolar disorder. The total market value of
psychotherapeutic drugs was estimated at US$6.3Bn.
In 2002, lithium accounted for 16% of prescriptions for treatment of bipolar disorder in
the USA, and its market share was roughly similar in 2005 according to
GlaxoSmithKline. Assuming lithium retains a similar market share in 2012, lithium is
probably prescribed to around 350,000 people in the USA alone.
Noven Therapeutics, producer of Lithobid lithium carbonate, estimated the annual
market for lithium therapies to exceed US$400M (calculated at branded prices) in the
Lithium: Market Outlook to 2017, 12th edition 2013 Page | 405
Roskill
Copyright © 2013 by Roskill Information Services Ltd. Unauthorised copying prohibited. www.roskill.com
USA in 2007. Net sales of Lithobid reported by JDS in 2006 (prior to the takeover by
Noven) were approximately US$9M.
The expiry of patents for lithium-based psychotherapeutic drugs held by companies such
as Solvay Pharmaceuticals and GlaxoSmithKline, and the introduction of cheaper
generic versions, has prompted the major pharmaceutical companies to invest in
research and development of alternative non-lithium based psychotherapeutic drugs.
Examples include Lamictal and Depakote, which GlaxoSmithKline estimate account for a
quarter of the market, as well as Carbamazepine, Lamotrigine and Valproate, which are
well established as alternatives to lithium and are licensed for this use. However,
because the use of lithium is well documented and has been practised for over 40 years
it remains one of the major long-term treatments of bi-polar disorder, and will continue to
be prescribed.
18.13.3 Consumption of lithium in pharmaceuticals
For acute episodes of mania the dosage of lithium prescribed is 1,800mg per day of
LCE, while for long-term bipolar disorder control, 900-1,200mg per day is prescribed.
Assuming an average of 900mg LCE per day, total consumption of lithium in the USA
would have been around 115t LCE based on 350,000 prescriptions. Assuming similar
levels of lithium prescriptions in other major centres of use, i.e. Europe, Australia and
Japan, total world demand for lithium carbonate worldwide would be around 230t LCE.
The continual search for effective treatment of bipolar disorder and the expiration of
patents means pharmaceutical companies often bring alternatives to the market.
Lithium has shown some resolve, however, and therefore consumption in this end-use is
likely to remain relatively stagnant to 2017.
FMC Lithium and Rockwood Lithium are the major suppliers of United States
pharmaceutical-grade (USP) lithium carbonate and other FDA-approved lithium
chemicals. Several producers in China report production of China pharmacopoeia-
grade lithium carbonate including Xinjiang Lithium Salts Plant, Wuhan Baijierui
Advanced Material and Sichuan Guorun (300tpy capacity).
18.14 Speciality lithium inorganics
Speciality inorganic lithium compounds, together with their end-uses, are listed in Table
235.
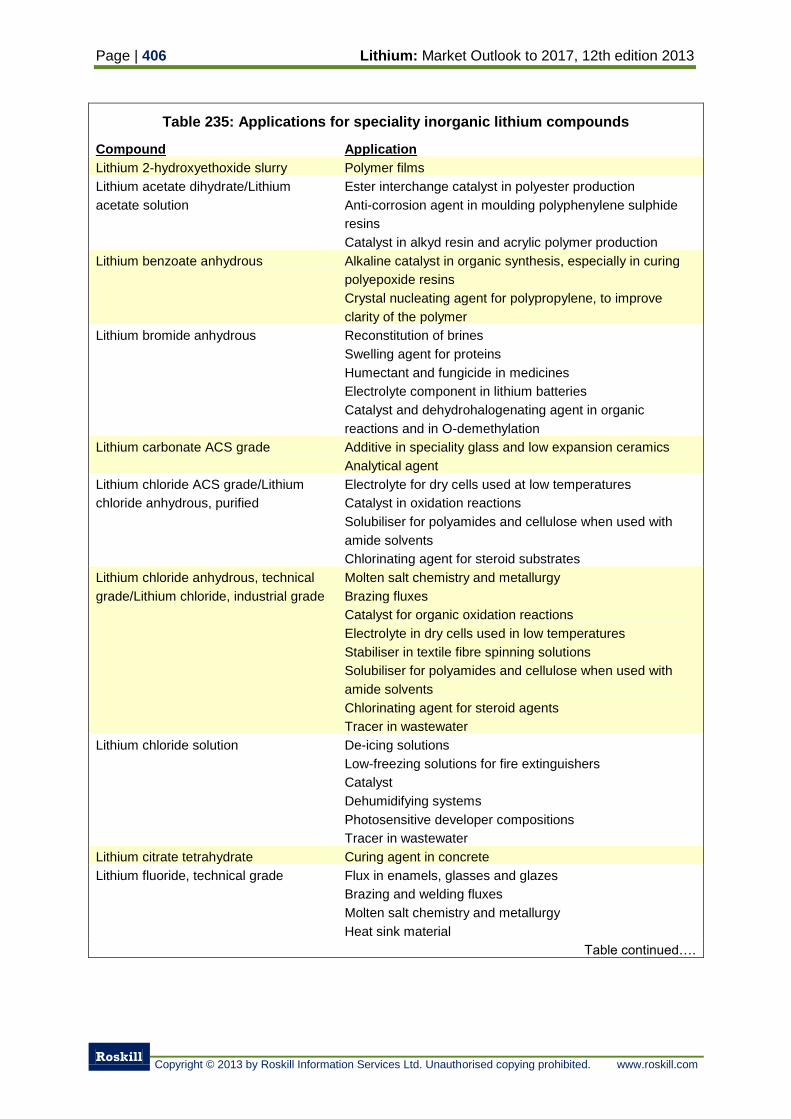
Page | 406 Lithium: Market Outlook to 2017, 12th edition 2013
Roskill
Copyright © 2013 by Roskill Information Services Ltd. Unauthorised copying prohibited. www.roskill.com
Table 235: Applications for speciality inorganic lithium compounds
Compound Application
Lithium 2-hydroxyethoxide slurry Polymer films
Lithium acetate dihydrate/Lithium
acetate solution
Ester interchange catalyst in polyester production
Anti-corrosion agent in moulding polyphenylene sulphide
resins
Catalyst in alkyd resin and acrylic polymer production
Lithium benzoate anhydrous Alkaline catalyst in organic synthesis, especially in curing
polyepoxide resins
Crystal nucleating agent for polypropylene, to improve
clarity of the polymer
Lithium bromide anhydrous Reconstitution of brines
Swelling agent for proteins
Humectant and fungicide in medicines
Electrolyte component in lithium batteries
Catalyst and dehydrohalogenating agent in organic
reactions and in O-demethylation
Lithium carbonate ACS grade Additive in speciality glass and low expansion ceramics
Analytical agent
Lithium chloride ACS grade/Lithium
chloride anhydrous, purified
Electrolyte for dry cells used at low temperatures
Catalyst in oxidation reactions
Solubiliser for polyamides and cellulose when used with
amide solvents
Chlorinating agent for steroid substrates
Lithium chloride anhydrous, technical
grade/Lithium chloride, industrial grade
Molten salt chemistry and metallurgy
Brazing fluxes
Catalyst for organic oxidation reactions
Electrolyte in dry cells used in low temperatures
Stabiliser in textile fibre spinning solutions
Solubiliser for polyamides and cellulose when used with
amide solvents
Chlorinating agent for steroid agents
Tracer in wastewater
Lithium chloride solution De-icing solutions
Low-freezing solutions for fire extinguishers
Catalyst
Dehumidifying systems
Photosensitive developer compositions
Tracer in wastewater
Lithium citrate tetrahydrate Curing agent in concrete
Lithium fluoride, technical grade Flux in enamels, glasses and glazes
Brazing and welding fluxes
Molten salt chemistry and metallurgy
Heat sink material
Table continued….
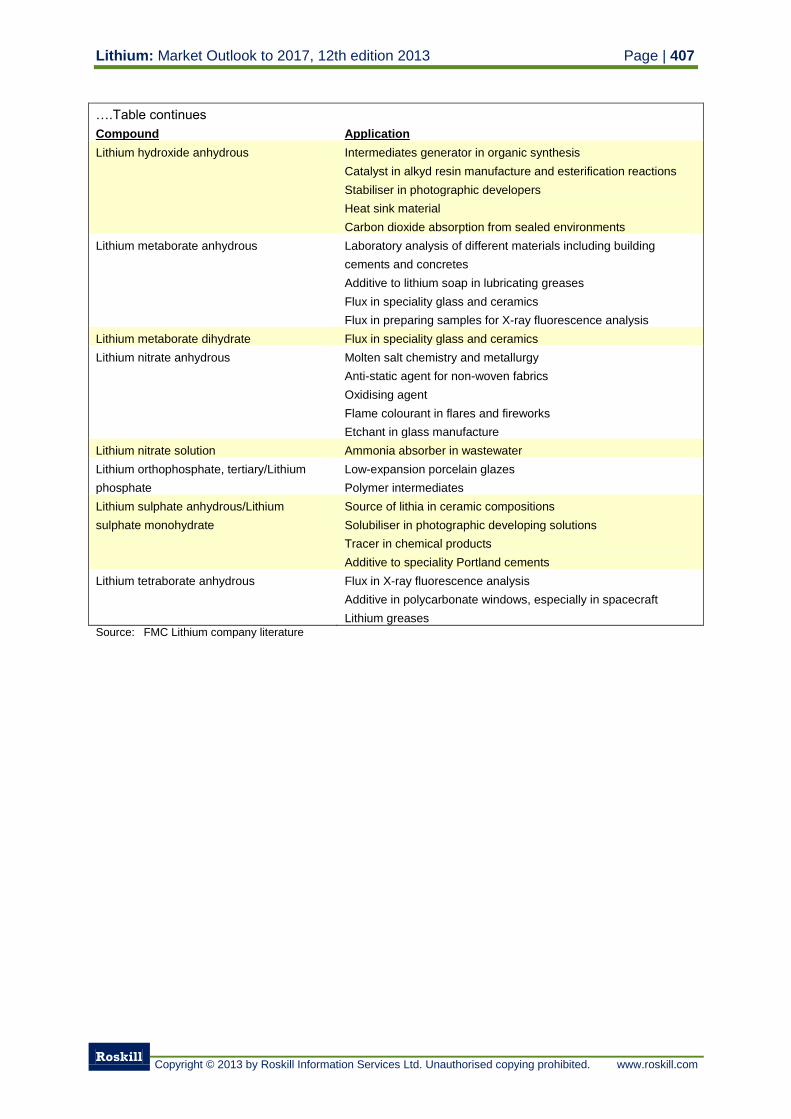
Lithium: Market Outlook to 2017, 12th edition 2013 Page | 407
Roskill
Copyright © 2013 by Roskill Information Services Ltd. Unauthorised copying prohibited. www.roskill.com
….Table continues
Compound Application
Lithium hydroxide anhydrous Intermediates generator in organic synthesis
Catalyst in alkyd resin manufacture and esterification reactions
Stabiliser in photographic developers
Heat sink material
Carbon dioxide absorption from sealed environments
Lithium metaborate anhydrous Laboratory analysis of different materials including building
cements and concretes
Additive to lithium soap in lubricating greases
Flux in speciality glass and ceramics
Flux in preparing samples for X-ray fluorescence analysis
Lithium metaborate dihydrate Flux in speciality glass and ceramics
Lithium nitrate anhydrous Molten salt chemistry and metallurgy
Anti-static agent for non-woven fabrics
Oxidising agent
Flame colourant in flares and fireworks
Etchant in glass manufacture
Lithium nitrate solution Ammonia absorber in wastewater
Lithium orthophosphate, tertiary/Lithium
phosphate
Low-expansion porcelain glazes
Polymer intermediates
Lithium sulphate anhydrous/Lithium
sulphate monohydrate
Source of lithia in ceramic compositions
Solubiliser in photographic developing solutions
Tracer in chemical products
Additive to speciality Portland cements
Lithium tetraborate anhydrous Flux in X-ray fluorescence analysis
Additive in polycarbonate windows, especially in spacecraft
Lithium greases Source: FMC Lithium company literature
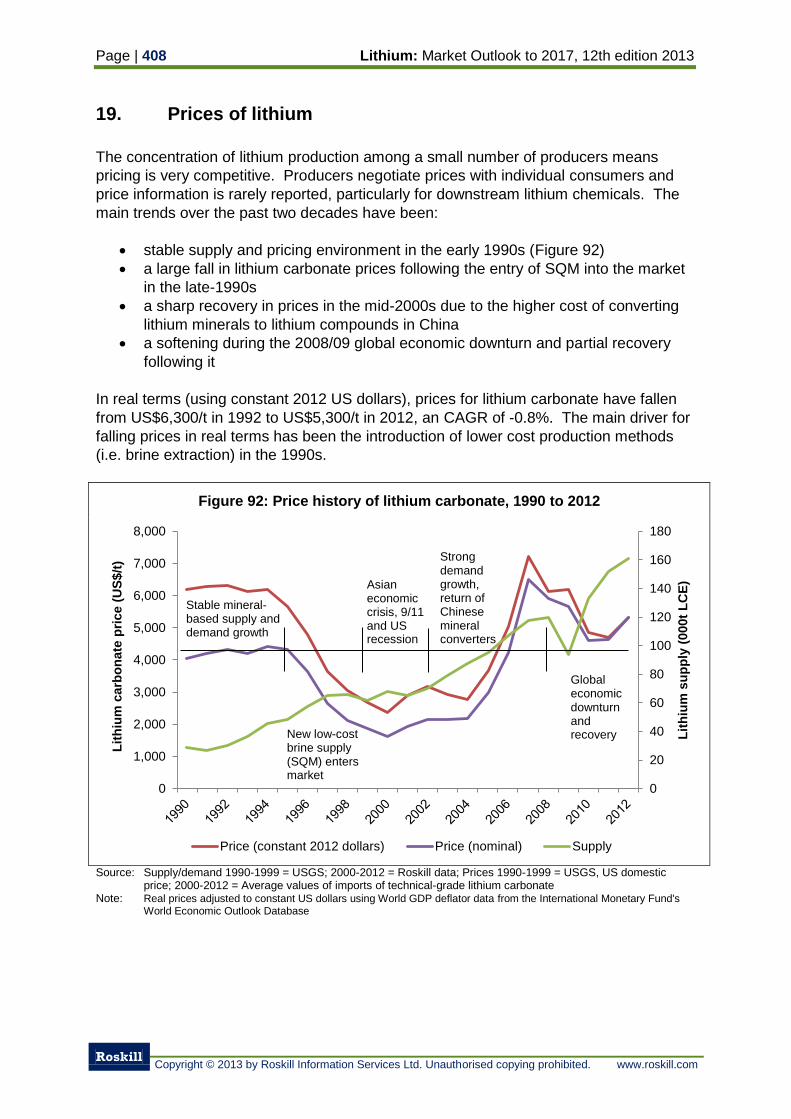
Page | 408 Lithium: Market Outlook to 2017, 12th edition 2013
Roskill
Copyright © 2013 by Roskill Information Services Ltd. Unauthorised copying prohibited. www.roskill.com
19. Prices of lithium
The concentration of lithium production among a small number of producers means
pricing is very competitive. Producers negotiate prices with individual consumers and
price information is rarely reported, particularly for downstream lithium chemicals. The
main trends over the past two decades have been:
stable supply and pricing environment in the early 1990s (Figure 92)
a large fall in lithium carbonate prices following the entry of SQM into the market
in the late-1990s
a sharp recovery in prices in the mid-2000s due to the higher cost of converting
lithium minerals to lithium compounds in China
a softening during the 2008/09 global economic downturn and partial recovery
following it
In real terms (using constant 2012 US dollars), prices for lithium carbonate have fallen
from US$6,300/t in 1992 to US$5,300/t in 2012, an CAGR of -0.8%. The main driver for
falling prices in real terms has been the introduction of lower cost production methods
(i.e. brine extraction) in the 1990s.
Figure 92: Price history of lithium carbonate, 1990 to 2012
Source: Supply/demand 1990-1999 = USGS; 2000-2012 = Roskill data; Prices 1990-1999 = USGS, US domestic
price; 2000-2012 = Average values of imports of technical-grade lithium carbonate Note: Real prices adjusted to constant US dollars using World GDP deflator data from the International Monetary Fund's
World Economic Outlook Database
0
20
40
60
80
100
120
140
160
180
0
1,000
2,000
3,000
4,000
5,000
6,000
7,000
8,000
Lit
hiu
m s
up
ply
(000t
LC
E)
Lit
hiu
m c
arb
on
ate
pri
ce (
US
$/t
)
Price (constant 2012 dollars) Price (nominal) Supply
Stable mineral-based supply and demand growth
New low-cost brine supply (SQM) enters market
Asian economic crisis, 9/11 and US recession
Strong demand growth, return of Chinese mineral converters
Global economic downturn and recovery
Lithium: Market Outlook to 2017, 12th edition 2013 Page | 409
Roskill
Copyright © 2013 by Roskill Information Services Ltd. Unauthorised copying prohibited. www.roskill.com
19.1 Technical-grade lithium mineral prices
Prices of lithium minerals have historically changed very infrequently. Table 236 and
Figure 93 show prices quoted by Industrial Minerals for petalite free-on-board (FOB)
Durban and spodumene concentrate cost-insurance-freight (CIF) Europe, CIF USA and
CIF Asia. The petalite price is understood to be sourced from Bikita Minerals in
Zimbabwe and spodumene prices from Talison Lithium in Australia. The higher price of
high-grade spodumene concentrate (>7.5% Li2O), over glass-grade spodumene (5.0%
Li2O), reflects the processing costs required to upgrade the product to a higher lithia,
and lower impurity, content.
Petalite prices fell between 2000 and 2005 and have since remained at US$165-260/t
FOB Durban.
Spodumene prices remained steady between 2000 and 2006, then >7.25% Li2O grade
concentrate rose by 45% CIF Europe. This was followed by rises in the CIF USA price
of both 5.0% Li2O and 7.25% Li2O grade spodumene concentrate in April 2006, but
5.0% Li2O grade prices did not move upwards until January 2007. These moves were
likely triggered by the sharp rise in technical-grade lithium carbonate prices that occurred
between 2005 and 2007 (Section 19.3).
Prices for all grades of spodumene increased by between 14% and 37% in early 2009,
despite the weakness in the global economy at the time (and when prices for most other
commodities were falling). Prices for spodumene CIF USA increased by a further
US$100/t for 5.0% Li2O grade and US$33/t for 7.25% Li2O grade in July 2009, despite
no similar rise in prices CIF Europe. CIF USA prices then rose by a further 5-7% in
January 2011; they have since remained static. Increases in CIF Europe prices
occurred a few months later in April 2011, rising by 23-25% for 5.0% Li2O grade and 7-
10% for 7.5% Li2O grade; they have also since remained steady.
Quoted prices for glass-grade 5.0% Li2O and >7.5% Li2O spodumene CIF Asia have
remained at US$430-480/t and US$720-770/t respectively since they were first
published in April 2011.
In January 2013, Talison Lithium announced it had secured price rises of 10% for
technical-grade minerals. This does not appear to have been factored into the quoted
prices from Industrial Minerals.
The premium in quoted CIF USA versus CIF Europe prices probably reflects increased
shipping costs from Australia to the USA, likewise in the small premium between CIF
Asia and CIF Europe prices.
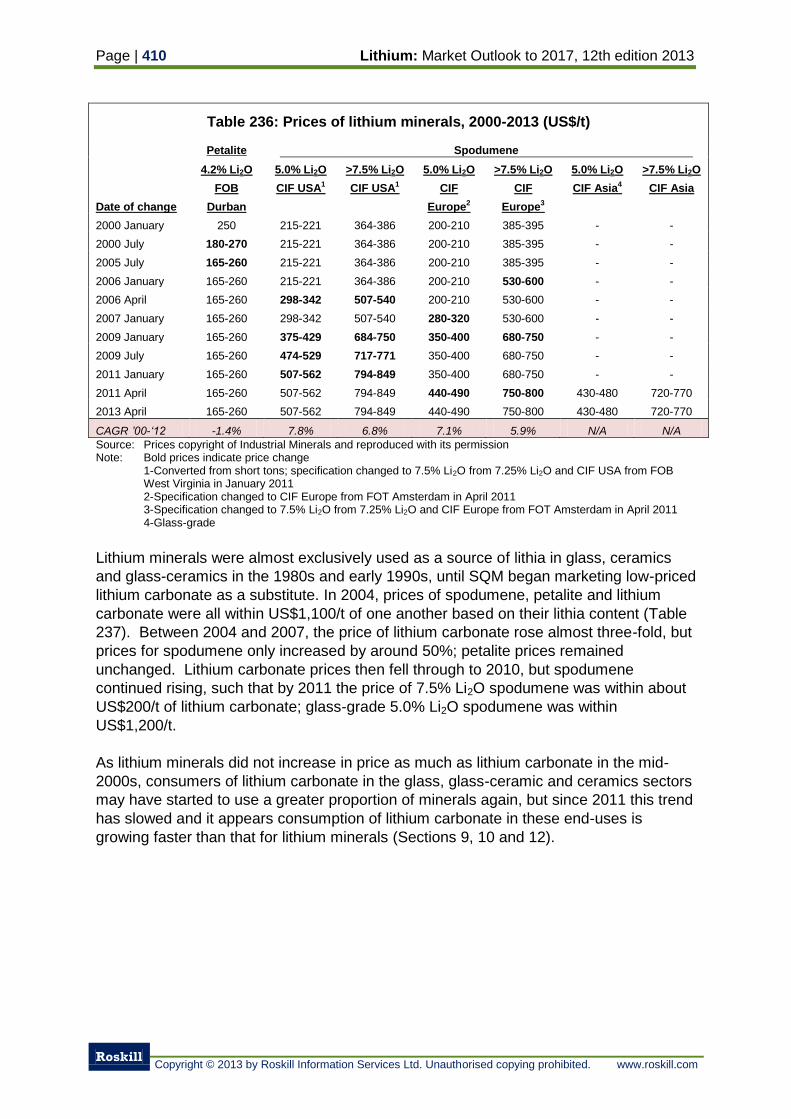
Page | 410 Lithium: Market Outlook to 2017, 12th edition 2013
Roskill
Copyright © 2013 by Roskill Information Services Ltd. Unauthorised copying prohibited. www.roskill.com
Table 236: Prices of lithium minerals, 2000-2013 (US$/t)
Petalite Spodumene
Date of change
4.2% Li2O
FOB
Durban
5.0% Li2O
CIF USA1
>7.5% Li2O
CIF USA1
5.0% Li2O
CIF
Europe2
>7.5% Li2O
CIF
Europe3
5.0% Li2O
CIF Asia4
>7.5% Li2O
CIF Asia
2000 January 250 215-221 364-386 200-210 385-395 - -
2000 July 180-270 215-221 364-386 200-210 385-395 - -
2005 July 165-260 215-221 364-386 200-210 385-395 - -
2006 January 165-260 215-221 364-386 200-210 530-600 - -
2006 April 165-260 298-342 507-540 200-210 530-600 - -
2007 January 165-260 298-342 507-540 280-320 530-600 - -
2009 January 165-260 375-429 684-750 350-400 680-750 - -
2009 July 165-260 474-529 717-771 350-400 680-750 - -
2011 January 165-260 507-562 794-849 350-400 680-750 - -
2011 April 165-260 507-562 794-849 440-490 750-800 430-480 720-770
2013 April 165-260 507-562 794-849 440-490 750-800 430-480 720-770
CAGR ’00-‘12 -1.4% 7.8% 6.8% 7.1% 5.9% N/A N/A
Source: Prices copyright of Industrial Minerals and reproduced with its permission Note: Bold prices indicate price change
1-Converted from short tons; specification changed to 7.5% Li2O from 7.25% Li2O and CIF USA from FOB West Virginia in January 2011 2-Specification changed to CIF Europe from FOT Amsterdam in April 2011 3-Specification changed to 7.5% Li2O from 7.25% Li2O and CIF Europe from FOT Amsterdam in April 2011 4-Glass-grade
Lithium minerals were almost exclusively used as a source of lithia in glass, ceramics
and glass-ceramics in the 1980s and early 1990s, until SQM began marketing low-priced
lithium carbonate as a substitute. In 2004, prices of spodumene, petalite and lithium
carbonate were all within US$1,100/t of one another based on their lithia content (Table
237). Between 2004 and 2007, the price of lithium carbonate rose almost three-fold, but
prices for spodumene only increased by around 50%; petalite prices remained
unchanged. Lithium carbonate prices then fell through to 2010, but spodumene
continued rising, such that by 2011 the price of 7.5% Li2O spodumene was within about
US$200/t of lithium carbonate; glass-grade 5.0% Li2O spodumene was within
US$1,200/t.
As lithium minerals did not increase in price as much as lithium carbonate in the mid-
2000s, consumers of lithium carbonate in the glass, glass-ceramic and ceramics sectors
may have started to use a greater proportion of minerals again, but since 2011 this trend
has slowed and it appears consumption of lithium carbonate in these end-uses is
growing faster than that for lithium minerals (Sections 9, 10 and 12).
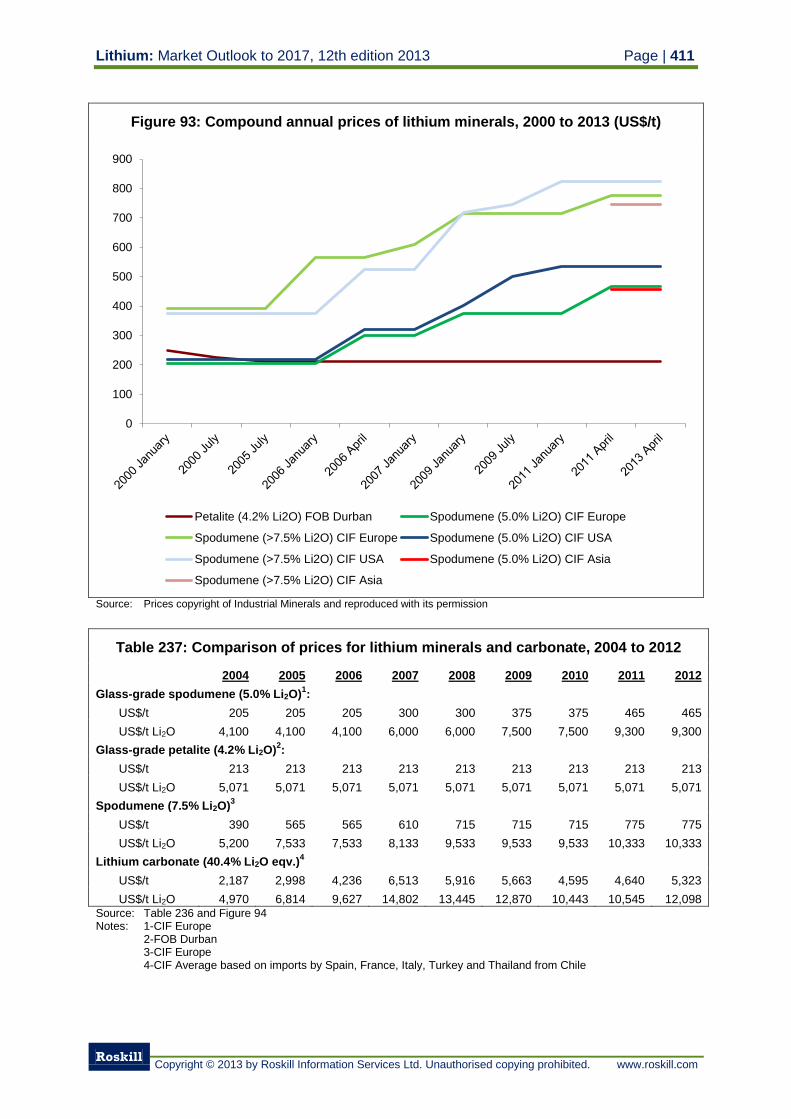
Lithium: Market Outlook to 2017, 12th edition 2013 Page | 411
Roskill
Copyright © 2013 by Roskill Information Services Ltd. Unauthorised copying prohibited. www.roskill.com
Figure 93: Compound annual prices of lithium minerals, 2000 to 2013 (US$/t)
Source: Prices copyright of Industrial Minerals and reproduced with its permission
Table 237: Comparison of prices for lithium minerals and carbonate, 2004 to 2012
2004 2005 2006 2007 2008 2009 2010 2011 2012
Glass-grade spodumene (5.0% Li2O)1:
US$/t 205 205 205 300 300 375 375 465 465
US$/t Li2O 4,100 4,100 4,100 6,000 6,000 7,500 7,500 9,300 9,300
Glass-grade petalite (4.2% Li2O)2:
US$/t 213 213 213 213 213 213 213 213 213
US$/t Li2O 5,071 5,071 5,071 5,071 5,071 5,071 5,071 5,071 5,071
Spodumene (7.5% Li2O)3
US$/t 390 565 565 610 715 715 715 775 775
US$/t Li2O 5,200 7,533 7,533 8,133 9,533 9,533 9,533 10,333 10,333
Lithium carbonate (40.4% Li2O eqv.)4
US$/t 2,187 2,998 4,236 6,513 5,916 5,663 4,595 4,640 5,323
US$/t Li2O 4,970 6,814 9,627 14,802 13,445 12,870 10,443 10,545 12,098 Source: Table 236 and Figure 94 Notes: 1-CIF Europe 2-FOB Durban 3-CIF Europe 4-CIF Average based on imports by Spain, France, Italy, Turkey and Thailand from Chile
0
100
200
300
400
500
600
700
800
900
Petalite (4.2% Li2O) FOB Durban Spodumene (5.0% Li2O) CIF Europe
Spodumene (>7.5% Li2O) CIF Europe Spodumene (5.0% Li2O) CIF USA
Spodumene (>7.5% Li2O) CIF USA Spodumene (5.0% Li2O) CIF Asia
Spodumene (>7.5% Li2O) CIF Asia
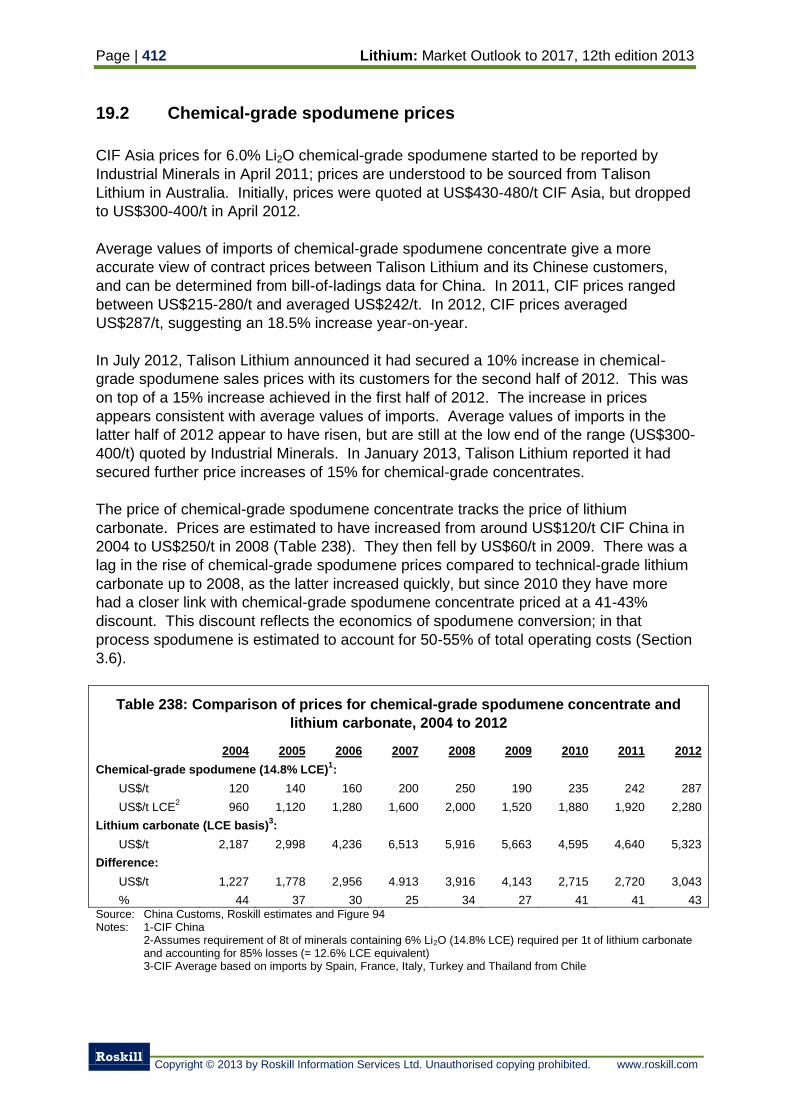
Page | 412 Lithium: Market Outlook to 2017, 12th edition 2013
Roskill
Copyright © 2013 by Roskill Information Services Ltd. Unauthorised copying prohibited. www.roskill.com
19.2 Chemical-grade spodumene prices
CIF Asia prices for 6.0% Li2O chemical-grade spodumene started to be reported by
Industrial Minerals in April 2011; prices are understood to be sourced from Talison
Lithium in Australia. Initially, prices were quoted at US$430-480/t CIF Asia, but dropped
to US$300-400/t in April 2012.
Average values of imports of chemical-grade spodumene concentrate give a more
accurate view of contract prices between Talison Lithium and its Chinese customers,
and can be determined from bill-of-ladings data for China. In 2011, CIF prices ranged
between US$215-280/t and averaged US$242/t. In 2012, CIF prices averaged
US$287/t, suggesting an 18.5% increase year-on-year.
In July 2012, Talison Lithium announced it had secured a 10% increase in chemical-
grade spodumene sales prices with its customers for the second half of 2012. This was
on top of a 15% increase achieved in the first half of 2012. The increase in prices
appears consistent with average values of imports. Average values of imports in the
latter half of 2012 appear to have risen, but are still at the low end of the range (US$300-
400/t) quoted by Industrial Minerals. In January 2013, Talison Lithium reported it had
secured further price increases of 15% for chemical-grade concentrates.
The price of chemical-grade spodumene concentrate tracks the price of lithium
carbonate. Prices are estimated to have increased from around US$120/t CIF China in
2004 to US$250/t in 2008 (Table 238). They then fell by US$60/t in 2009. There was a
lag in the rise of chemical-grade spodumene prices compared to technical-grade lithium
carbonate up to 2008, as the latter increased quickly, but since 2010 they have more
had a closer link with chemical-grade spodumene concentrate priced at a 41-43%
discount. This discount reflects the economics of spodumene conversion; in that
process spodumene is estimated to account for 50-55% of total operating costs (Section
3.6).
Table 238: Comparison of prices for chemical-grade spodumene concentrate and
lithium carbonate, 2004 to 2012
2004 2005 2006 2007 2008 2009 2010 2011 2012
Chemical-grade spodumene (14.8% LCE)1:
US$/t 120 140 160 200 250 190 235 242 287
US$/t LCE2
960 1,120 1,280 1,600 2,000 1,520 1,880 1,920 2,280
Lithium carbonate (LCE basis)3:
US$/t 2,187 2,998 4,236 6,513 5,916 5,663 4,595 4,640 5,323
Difference:
US$/t 1,227 1,778 2,956 4.913 3,916 4,143 2,715 2,720 3,043
% 44 37 30 25 34 27 41 41 43 Source: China Customs, Roskill estimates and Figure 94 Notes: 1-CIF China
2-Assumes requirement of 8t of minerals containing 6% Li2O (14.8% LCE) required per 1t of lithium carbonate and accounting for 85% losses (= 12.6% LCE equivalent)
3-CIF Average based on imports by Spain, France, Italy, Turkey and Thailand from Chile
Lithium: Market Outlook to 2017, 12th edition 2013 Page | 413
Roskill
Copyright © 2013 by Roskill Information Services Ltd. Unauthorised copying prohibited. www.roskill.com
19.3 Technical-grade lithium carbonate prices
The average value of imports (CIF) of lithium carbonate into key industrial (i.e. non-
battery-grade) markets from Chile can be used as a guide to changes in yearly average
contract prices for technical-grade lithium carbonate from SQM and Rockwood Lithium.
Key industrial markets include Spain, France, Italy, Turkey and Thailand, where lithium
carbonate is used in glass, ceramics, glass-ceramic and metallurgical end-uses.
In addition, Industrial Minerals lists average monthly prices for lithium carbonate
(technical-grade, large contracts) delivered duty paid (DDP) USA. Industrial Minerals’
prices are understood to be sourced from SQM. Asian Metal, a China-based trade
publication, also lists average weekly prices for technical-grade lithium carbonate DDP
China, although these are considered to represent spot transactions.
With world production concentrated in the hands of just two producers – FMC Lithium
and Foote Mineral (now Rockwood Lithium) of the USA – lithium carbonate prices in the
USA increased steadily from US$3,800/t DDP in 1990 to US$4,300/t DDP in 1995,
according to the USGS. The entry of SQM of Chile into the market in late 1996
subsequently resulted in a restructuring of the lithium carbonate industry. Shipment of
an additional 11,739t of lithium carbonate in 1997 and SQM’s aggressive pricing policy
to secure market share resulted in a sharp drop in prices. Average prices fell to
US$1,700/t DDP in 1999, the lowest historical level.
Average values of imports of technical-grade lithium carbonate from Chile were below
US$2,200/t CIF in the early 2000s. During this time FMC Lithium suspended lithium
carbonate production in Argentina because of competition from Rockwood Lithium and
SQM in Chile, who both had a cost advantage over FMC (Section 3.6).
SQM raised lithium carbonate prices by 10% in January 2004, citing high demand and
freight costs and the strengthening of the Chilean peso against the US dollar. The
increase in demand and prices prompted FMC Lithium to re-enter the market and
production of lithium carbonate in Argentina was restarted. FMC Lithium raised prices
by 9% from October 2004, reporting that between 2002 and 2004 natural gas costs had
increased by nearly 300% and freight costs by 15%.
In 2005, strong growth in demand resulted in a tightening in supply as the South
America brine producers could not increase production quickly enough. The conversion
of lithium minerals to lithium compounds in China, which had become uneconomic
following the entry of SQM to the market in 1997, started to reappear to meet surging
domestic, but also export, demand. The higher costs involved in converting lithium
minerals to lithium carbonate compared to brine production meant prices had to move
back to pre-1997 levels (>US$4,000/t), to make the process economic for producers,
and did so relatively quickly.
By 2007 prices had peaked at around US$6,500/t CIF. In 2008, however, average
values of imports fell by almost 10% to US$5,900/t CIF, as the global economic
downturn started to reduce demand meaning supply no longer was under pressure.
Average values of imports continued to fall in 2009 and bottomed out at US$4,600/t CIF
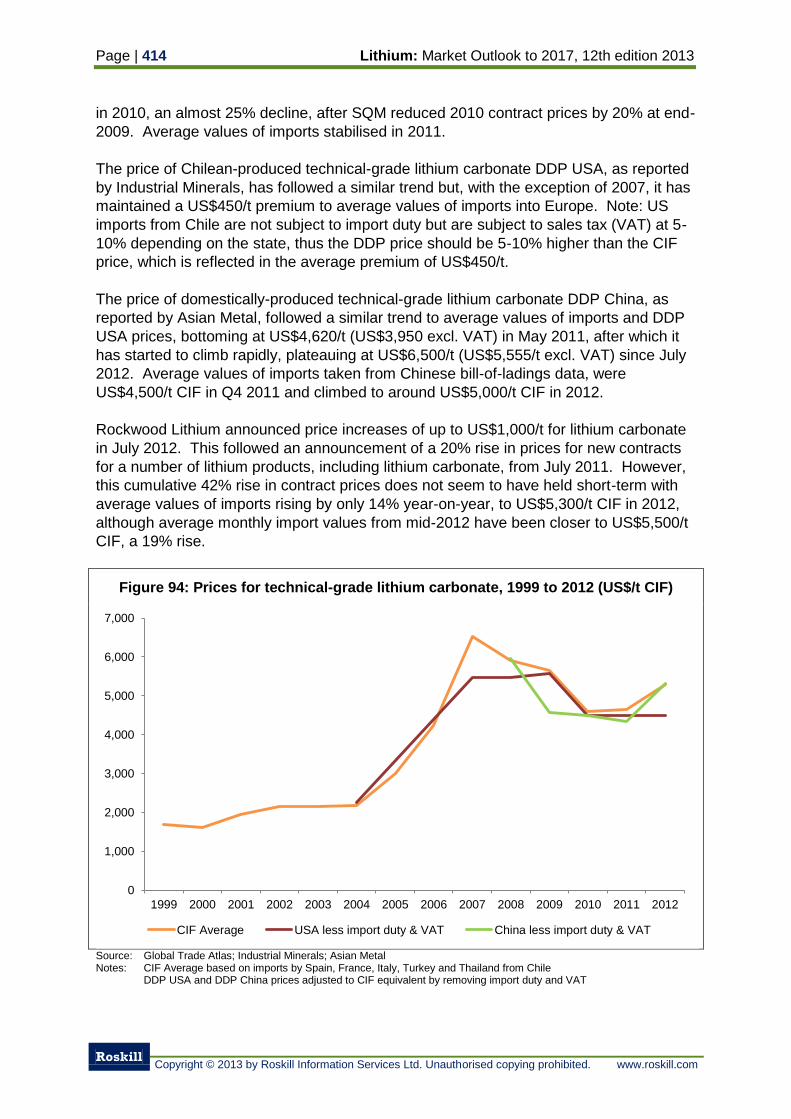
Page | 414 Lithium: Market Outlook to 2017, 12th edition 2013
Roskill
Copyright © 2013 by Roskill Information Services Ltd. Unauthorised copying prohibited. www.roskill.com
in 2010, an almost 25% decline, after SQM reduced 2010 contract prices by 20% at end-
2009. Average values of imports stabilised in 2011.
The price of Chilean-produced technical-grade lithium carbonate DDP USA, as reported
by Industrial Minerals, has followed a similar trend but, with the exception of 2007, it has
maintained a US$450/t premium to average values of imports into Europe. Note: US
imports from Chile are not subject to import duty but are subject to sales tax (VAT) at 5-
10% depending on the state, thus the DDP price should be 5-10% higher than the CIF
price, which is reflected in the average premium of US$450/t.
The price of domestically-produced technical-grade lithium carbonate DDP China, as
reported by Asian Metal, followed a similar trend to average values of imports and DDP
USA prices, bottoming at US$4,620/t (US$3,950 excl. VAT) in May 2011, after which it
has started to climb rapidly, plateauing at US$6,500/t (US$5,555/t excl. VAT) since July
2012. Average values of imports taken from Chinese bill-of-ladings data, were
US$4,500/t CIF in Q4 2011 and climbed to around US$5,000/t CIF in 2012.
Rockwood Lithium announced price increases of up to US$1,000/t for lithium carbonate
in July 2012. This followed an announcement of a 20% rise in prices for new contracts
for a number of lithium products, including lithium carbonate, from July 2011. However,
this cumulative 42% rise in contract prices does not seem to have held short-term with
average values of imports rising by only 14% year-on-year, to US$5,300/t CIF in 2012,
although average monthly import values from mid-2012 have been closer to US$5,500/t
CIF, a 19% rise.
Figure 94: Prices for technical-grade lithium carbonate, 1999 to 2012 (US$/t CIF)
Source: Global Trade Atlas; Industrial Minerals; Asian Metal Notes: CIF Average based on imports by Spain, France, Italy, Turkey and Thailand from Chile DDP USA and DDP China prices adjusted to CIF equivalent by removing import duty and VAT
0
1,000
2,000
3,000
4,000
5,000
6,000
7,000
1999 2000 2001 2002 2003 2004 2005 2006 2007 2008 2009 2010 2011 2012
CIF Average USA less import duty & VAT China less import duty & VAT
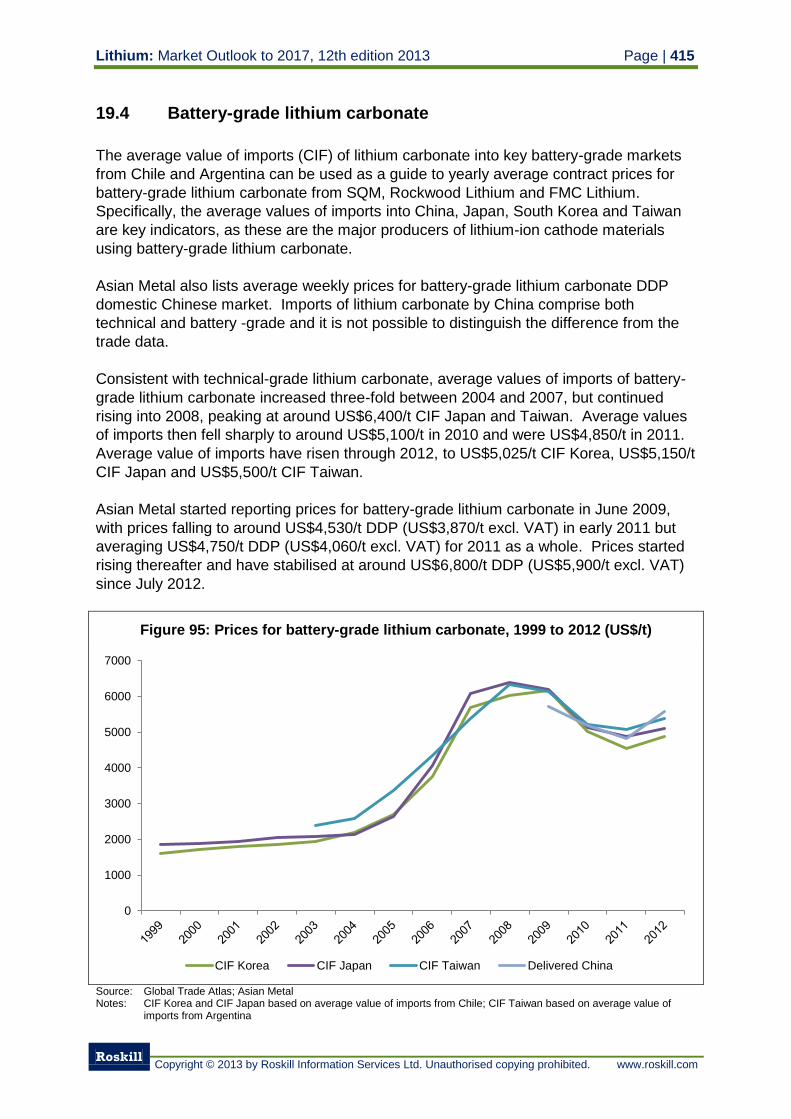
Lithium: Market Outlook to 2017, 12th edition 2013 Page | 415
Roskill
Copyright © 2013 by Roskill Information Services Ltd. Unauthorised copying prohibited. www.roskill.com
19.4 Battery-grade lithium carbonate
The average value of imports (CIF) of lithium carbonate into key battery-grade markets
from Chile and Argentina can be used as a guide to yearly average contract prices for
battery-grade lithium carbonate from SQM, Rockwood Lithium and FMC Lithium.
Specifically, the average values of imports into China, Japan, South Korea and Taiwan
are key indicators, as these are the major producers of lithium-ion cathode materials
using battery-grade lithium carbonate.
Asian Metal also lists average weekly prices for battery-grade lithium carbonate DDP
domestic Chinese market. Imports of lithium carbonate by China comprise both
technical and battery -grade and it is not possible to distinguish the difference from the
trade data.
Consistent with technical-grade lithium carbonate, average values of imports of battery-
grade lithium carbonate increased three-fold between 2004 and 2007, but continued
rising into 2008, peaking at around US$6,400/t CIF Japan and Taiwan. Average values
of imports then fell sharply to around US$5,100/t in 2010 and were US$4,850/t in 2011.
Average value of imports have risen through 2012, to US$5,025/t CIF Korea, US$5,150/t
CIF Japan and US$5,500/t CIF Taiwan.
Asian Metal started reporting prices for battery-grade lithium carbonate in June 2009,
with prices falling to around US$4,530/t DDP (US$3,870/t excl. VAT) in early 2011 but
averaging US$4,750/t DDP (US$4,060/t excl. VAT) for 2011 as a whole. Prices started
rising thereafter and have stabilised at around US$6,800/t DDP (US$5,900/t excl. VAT)
since July 2012.
Figure 95: Prices for battery-grade lithium carbonate, 1999 to 2012 (US$/t)
Source: Global Trade Atlas; Asian Metal Notes: CIF Korea and CIF Japan based on average value of imports from Chile; CIF Taiwan based on average value of
imports from Argentina
0
1000
2000
3000
4000
5000
6000
7000
CIF Korea CIF Japan CIF Taiwan Delivered China
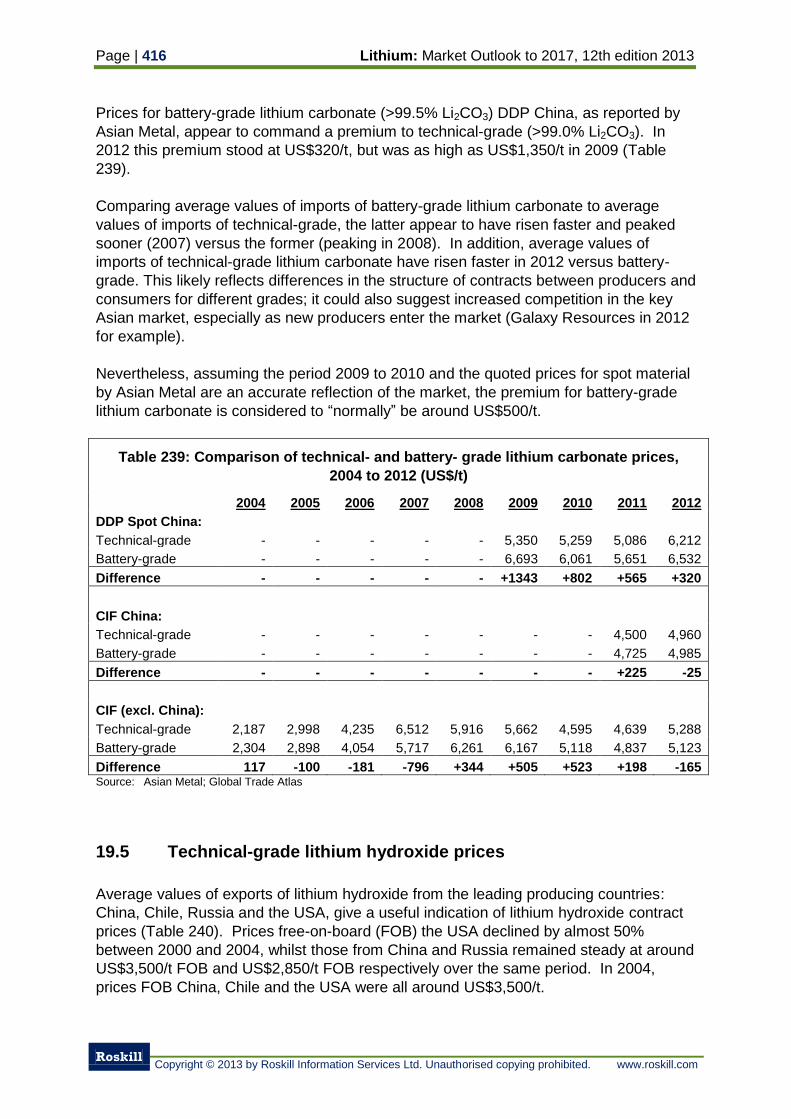
Page | 416 Lithium: Market Outlook to 2017, 12th edition 2013
Roskill
Copyright © 2013 by Roskill Information Services Ltd. Unauthorised copying prohibited. www.roskill.com
Prices for battery-grade lithium carbonate (>99.5% Li2CO3) DDP China, as reported by
Asian Metal, appear to command a premium to technical-grade (>99.0% Li2CO3). In
2012 this premium stood at US$320/t, but was as high as US$1,350/t in 2009 (Table
239).
Comparing average values of imports of battery-grade lithium carbonate to average
values of imports of technical-grade, the latter appear to have risen faster and peaked
sooner (2007) versus the former (peaking in 2008). In addition, average values of
imports of technical-grade lithium carbonate have risen faster in 2012 versus battery-
grade. This likely reflects differences in the structure of contracts between producers and
consumers for different grades; it could also suggest increased competition in the key
Asian market, especially as new producers enter the market (Galaxy Resources in 2012
for example).
Nevertheless, assuming the period 2009 to 2010 and the quoted prices for spot material
by Asian Metal are an accurate reflection of the market, the premium for battery-grade
lithium carbonate is considered to “normally” be around US$500/t.
Table 239: Comparison of technical- and battery- grade lithium carbonate prices,
2004 to 2012 (US$/t)
2004 2005 2006 2007 2008 2009 2010 2011 2012
DDP Spot China:
Technical-grade - - - - - 5,350 5,259 5,086 6,212
Battery-grade - - - - - 6,693 6,061 5,651 6,532
Difference - - - - - +1343 +802 +565 +320
CIF China:
Technical-grade - - - - - - - 4,500 4,960
Battery-grade - - - - - - - 4,725 4,985
Difference - - - - - - - +225 -25
CIF (excl. China):
Technical-grade 2,187 2,998 4,235 6,512 5,916 5,662 4,595 4,639 5,288
Battery-grade 2,304 2,898 4,054 5,717 6,261 6,167 5,118 4,837 5,123
Difference 117 -100 -181 -796 +344 +505 +523 +198 -165 Source: Asian Metal; Global Trade Atlas
19.5 Technical-grade lithium hydroxide prices
Average values of exports of lithium hydroxide from the leading producing countries:
China, Chile, Russia and the USA, give a useful indication of lithium hydroxide contract
prices (Table 240). Prices free-on-board (FOB) the USA declined by almost 50%
between 2000 and 2004, whilst those from China and Russia remained steady at around
US$3,500/t FOB and US$2,850/t FOB respectively over the same period. In 2004,
prices FOB China, Chile and the USA were all around US$3,500/t.
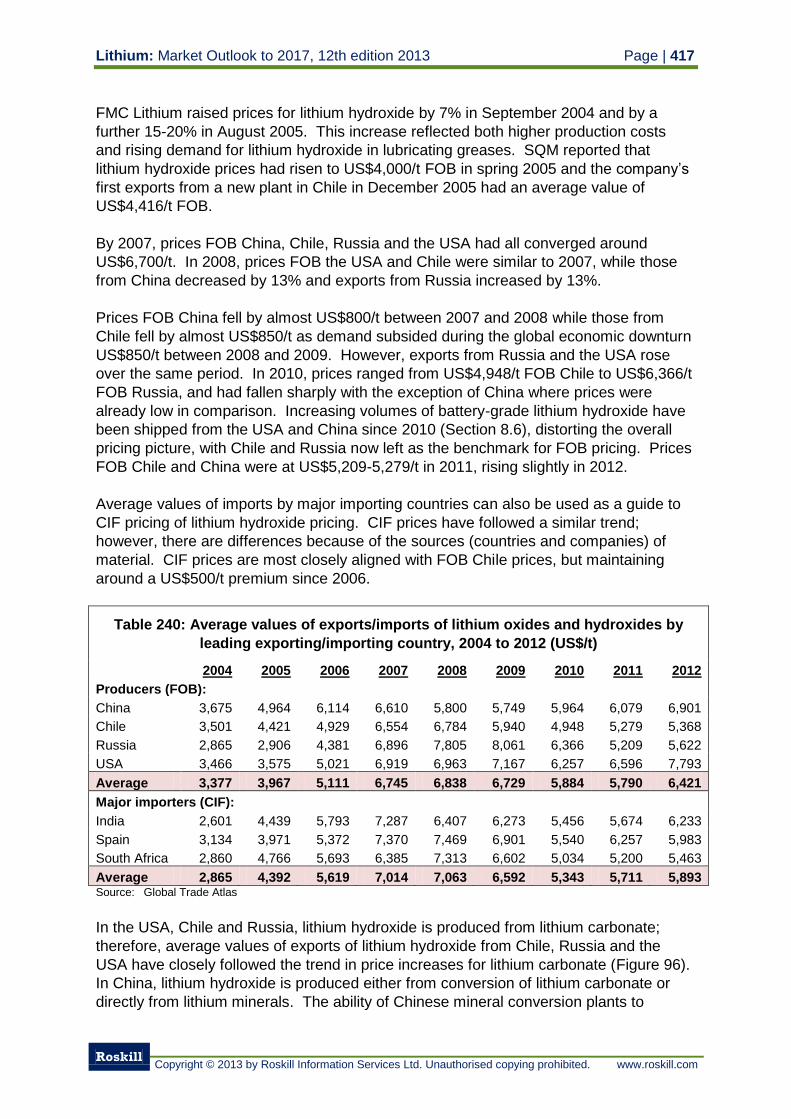
Lithium: Market Outlook to 2017, 12th edition 2013 Page | 417
Roskill
Copyright © 2013 by Roskill Information Services Ltd. Unauthorised copying prohibited. www.roskill.com
FMC Lithium raised prices for lithium hydroxide by 7% in September 2004 and by a
further 15-20% in August 2005. This increase reflected both higher production costs
and rising demand for lithium hydroxide in lubricating greases. SQM reported that
lithium hydroxide prices had risen to US$4,000/t FOB in spring 2005 and the company’s
first exports from a new plant in Chile in December 2005 had an average value of
US$4,416/t FOB.
By 2007, prices FOB China, Chile, Russia and the USA had all converged around
US$6,700/t. In 2008, prices FOB the USA and Chile were similar to 2007, while those
from China decreased by 13% and exports from Russia increased by 13%.
Prices FOB China fell by almost US$800/t between 2007 and 2008 while those from
Chile fell by almost US$850/t as demand subsided during the global economic downturn
US$850/t between 2008 and 2009. However, exports from Russia and the USA rose
over the same period. In 2010, prices ranged from US$4,948/t FOB Chile to US$6,366/t
FOB Russia, and had fallen sharply with the exception of China where prices were
already low in comparison. Increasing volumes of battery-grade lithium hydroxide have
been shipped from the USA and China since 2010 (Section 8.6), distorting the overall
pricing picture, with Chile and Russia now left as the benchmark for FOB pricing. Prices
FOB Chile and China were at US$5,209-5,279/t in 2011, rising slightly in 2012.
Average values of imports by major importing countries can also be used as a guide to
CIF pricing of lithium hydroxide pricing. CIF prices have followed a similar trend;
however, there are differences because of the sources (countries and companies) of
material. CIF prices are most closely aligned with FOB Chile prices, but maintaining
around a US$500/t premium since 2006.
Table 240: Average values of exports/imports of lithium oxides and hydroxides by
leading exporting/importing country, 2004 to 2012 (US$/t)
2004 2005 2006 2007 2008 2009 2010 2011 2012
Producers (FOB):
China 3,675 4,964 6,114 6,610 5,800 5,749 5,964 6,079 6,901
Chile 3,501 4,421 4,929 6,554 6,784 5,940 4,948 5,279 5,368
Russia 2,865 2,906 4,381 6,896 7,805 8,061 6,366 5,209 5,622
USA 3,466 3,575 5,021 6,919 6,963 7,167 6,257 6,596 7,793
Average 3,377 3,967 5,111 6,745 6,838 6,729 5,884 5,790 6,421
Major importers (CIF):
India 2,601 4,439 5,793 7,287 6,407 6,273 5,456 5,674 6,233
Spain 3,134 3,971 5,372 7,370 7,469 6,901 5,540 6,257 5,983
South Africa 2,860 4,766 5,693 6,385 7,313 6,602 5,034 5,200 5,463
Average 2,865 4,392 5,619 7,014 7,063 6,592 5,343 5,711 5,893 Source: Global Trade Atlas
In the USA, Chile and Russia, lithium hydroxide is produced from lithium carbonate;
therefore, average values of exports of lithium hydroxide from Chile, Russia and the
USA have closely followed the trend in price increases for lithium carbonate (Figure 96).
In China, lithium hydroxide is produced either from conversion of lithium carbonate or
directly from lithium minerals. The ability of Chinese mineral conversion plants to
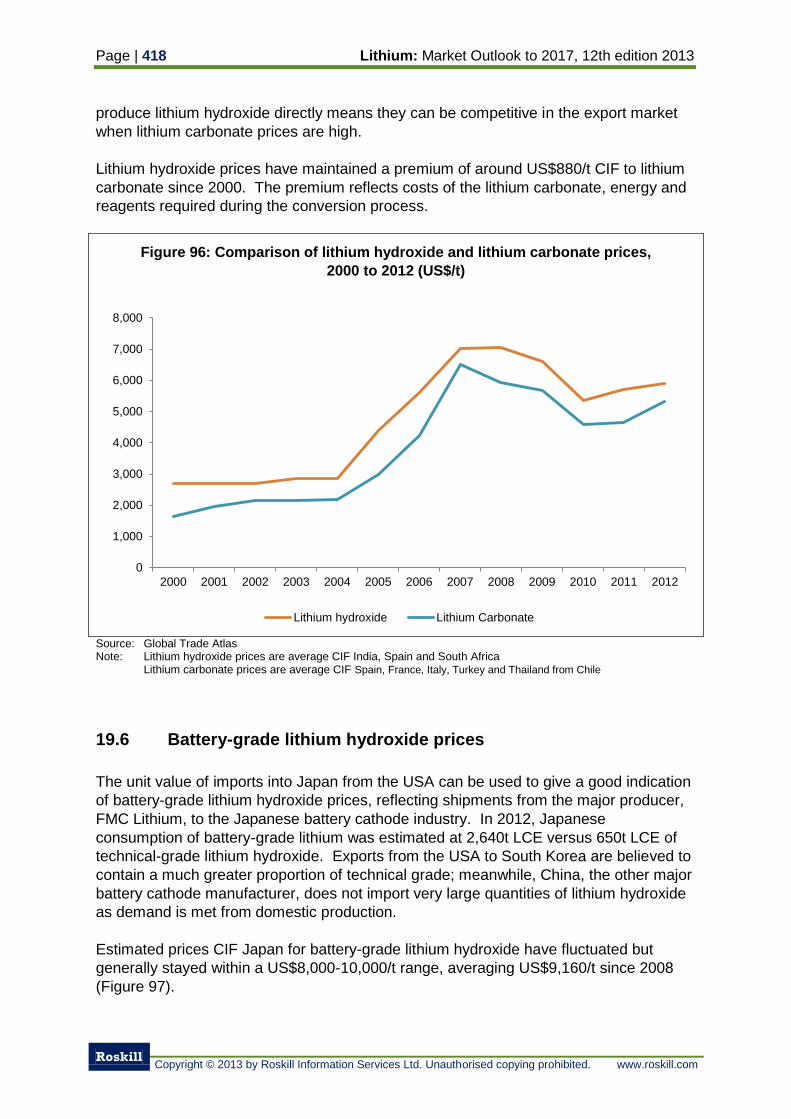
Page | 418 Lithium: Market Outlook to 2017, 12th edition 2013
Roskill
Copyright © 2013 by Roskill Information Services Ltd. Unauthorised copying prohibited. www.roskill.com
produce lithium hydroxide directly means they can be competitive in the export market
when lithium carbonate prices are high.
Lithium hydroxide prices have maintained a premium of around US$880/t CIF to lithium
carbonate since 2000. The premium reflects costs of the lithium carbonate, energy and
reagents required during the conversion process.
Figure 96: Comparison of lithium hydroxide and lithium carbonate prices,
2000 to 2012 (US$/t)
Source: Global Trade Atlas Note: Lithium hydroxide prices are average CIF India, Spain and South Africa Lithium carbonate prices are average CIF Spain, France, Italy, Turkey and Thailand from Chile
19.6 Battery-grade lithium hydroxide prices
The unit value of imports into Japan from the USA can be used to give a good indication
of battery-grade lithium hydroxide prices, reflecting shipments from the major producer,
FMC Lithium, to the Japanese battery cathode industry. In 2012, Japanese
consumption of battery-grade lithium was estimated at 2,640t LCE versus 650t LCE of
technical-grade lithium hydroxide. Exports from the USA to South Korea are believed to
contain a much greater proportion of technical grade; meanwhile, China, the other major
battery cathode manufacturer, does not import very large quantities of lithium hydroxide
as demand is met from domestic production.
Estimated prices CIF Japan for battery-grade lithium hydroxide have fluctuated but
generally stayed within a US$8,000-10,000/t range, averaging US$9,160/t since 2008
(Figure 97).
0
1,000
2,000
3,000
4,000
5,000
6,000
7,000
8,000
2000 2001 2002 2003 2004 2005 2006 2007 2008 2009 2010 2011 2012
Lithium hydroxide Lithium Carbonate
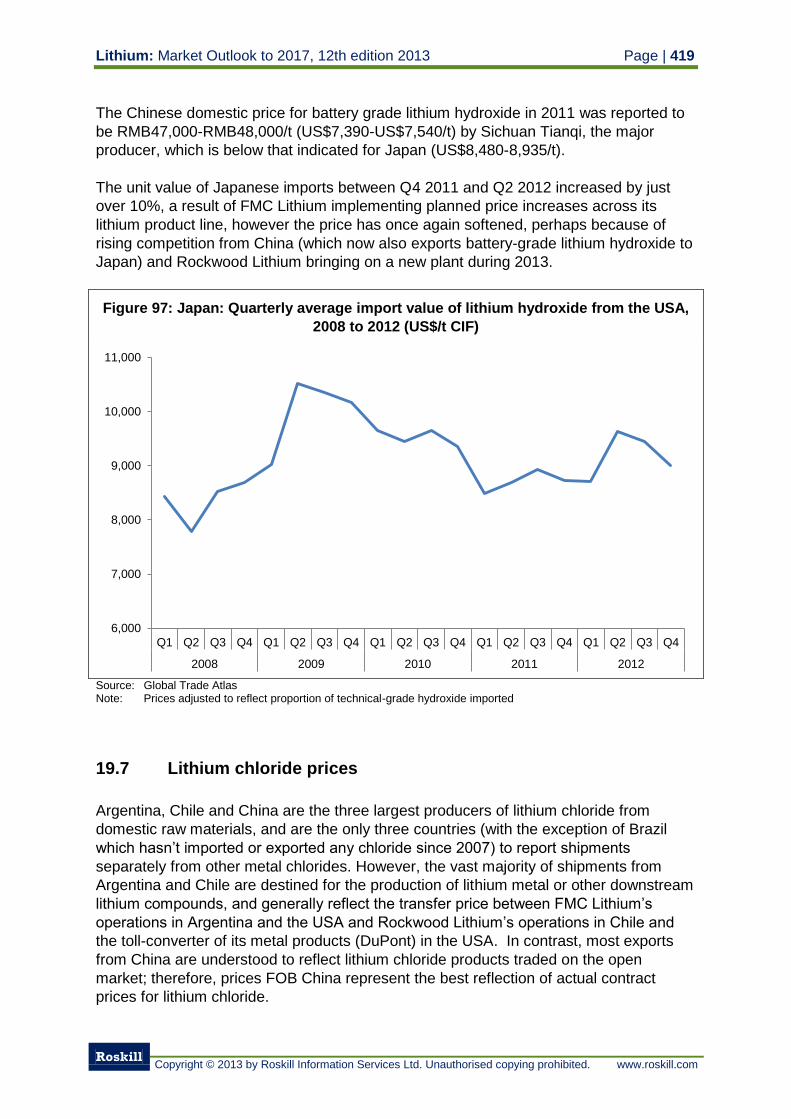
Lithium: Market Outlook to 2017, 12th edition 2013 Page | 419
Roskill
Copyright © 2013 by Roskill Information Services Ltd. Unauthorised copying prohibited. www.roskill.com
The Chinese domestic price for battery grade lithium hydroxide in 2011 was reported to
be RMB47,000-RMB48,000/t (US$7,390-US$7,540/t) by Sichuan Tianqi, the major
producer, which is below that indicated for Japan (US$8,480-8,935/t).
The unit value of Japanese imports between Q4 2011 and Q2 2012 increased by just
over 10%, a result of FMC Lithium implementing planned price increases across its
lithium product line, however the price has once again softened, perhaps because of
rising competition from China (which now also exports battery-grade lithium hydroxide to
Japan) and Rockwood Lithium bringing on a new plant during 2013.
Figure 97: Japan: Quarterly average import value of lithium hydroxide from the USA,
2008 to 2012 (US$/t CIF)
Source: Global Trade Atlas Note: Prices adjusted to reflect proportion of technical-grade hydroxide imported
19.7 Lithium chloride prices
Argentina, Chile and China are the three largest producers of lithium chloride from
domestic raw materials, and are the only three countries (with the exception of Brazil
which hasn’t imported or exported any chloride since 2007) to report shipments
separately from other metal chlorides. However, the vast majority of shipments from
Argentina and Chile are destined for the production of lithium metal or other downstream
lithium compounds, and generally reflect the transfer price between FMC Lithium’s
operations in Argentina and the USA and Rockwood Lithium’s operations in Chile and
the toll-converter of its metal products (DuPont) in the USA. In contrast, most exports
from China are understood to reflect lithium chloride products traded on the open
market; therefore, prices FOB China represent the best reflection of actual contract
prices for lithium chloride.
6,000
7,000
8,000
9,000
10,000
11,000
Q1 Q2 Q3 Q4 Q1 Q2 Q3 Q4 Q1 Q2 Q3 Q4 Q1 Q2 Q3 Q4 Q1 Q2 Q3 Q4
2008 2009 2010 2011 2012
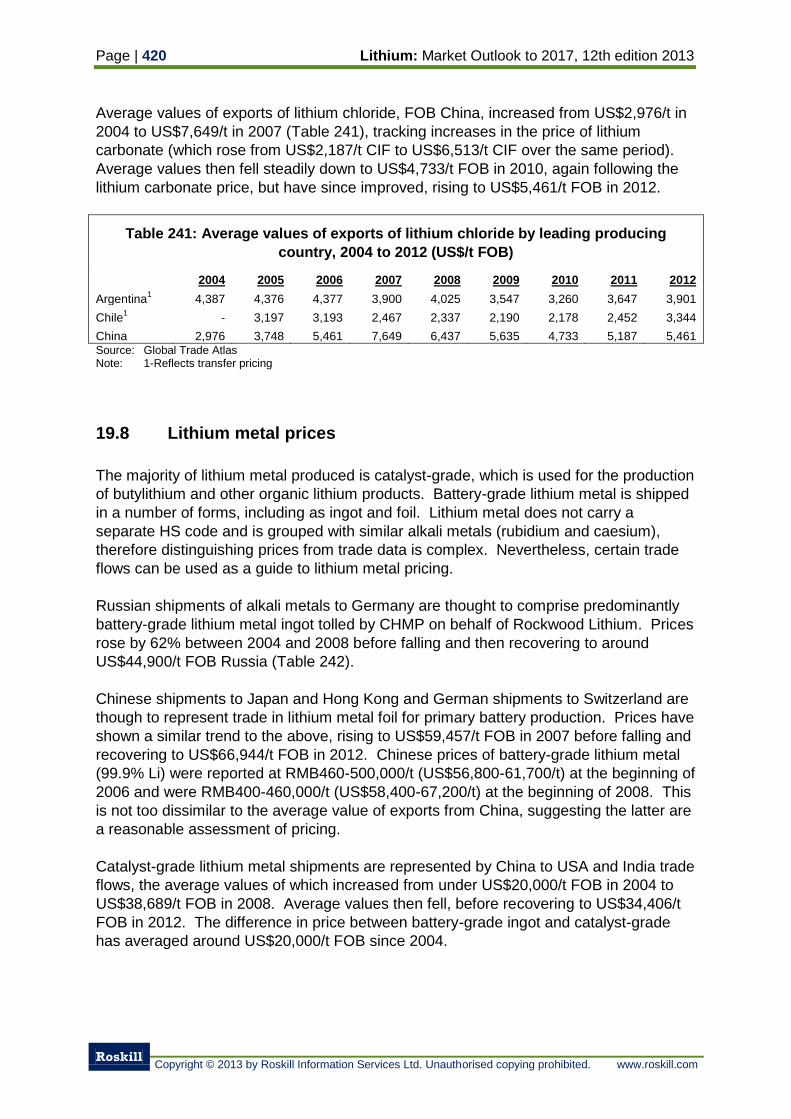
Page | 420 Lithium: Market Outlook to 2017, 12th edition 2013
Roskill
Copyright © 2013 by Roskill Information Services Ltd. Unauthorised copying prohibited. www.roskill.com
Average values of exports of lithium chloride, FOB China, increased from US$2,976/t in
2004 to US$7,649/t in 2007 (Table 241), tracking increases in the price of lithium
carbonate (which rose from US$2,187/t CIF to US$6,513/t CIF over the same period).
Average values then fell steadily down to US$4,733/t FOB in 2010, again following the
lithium carbonate price, but have since improved, rising to US$5,461/t FOB in 2012.
Table 241: Average values of exports of lithium chloride by leading producing
country, 2004 to 2012 (US$/t FOB)
2004 2005 2006 2007 2008 2009 2010 2011 2012
Argentina1
4,387 4,376 4,377 3,900 4,025 3,547 3,260 3,647 3,901
Chile1
- 3,197 3,193 2,467 2,337 2,190 2,178 2,452 3,344
China 2,976 3,748 5,461 7,649 6,437 5,635 4,733 5,187 5,461 Source: Global Trade Atlas Note: 1-Reflects transfer pricing
19.8 Lithium metal prices
The majority of lithium metal produced is catalyst-grade, which is used for the production
of butylithium and other organic lithium products. Battery-grade lithium metal is shipped
in a number of forms, including as ingot and foil. Lithium metal does not carry a
separate HS code and is grouped with similar alkali metals (rubidium and caesium),
therefore distinguishing prices from trade data is complex. Nevertheless, certain trade
flows can be used as a guide to lithium metal pricing.
Russian shipments of alkali metals to Germany are thought to comprise predominantly
battery-grade lithium metal ingot tolled by CHMP on behalf of Rockwood Lithium. Prices
rose by 62% between 2004 and 2008 before falling and then recovering to around
US$44,900/t FOB Russia (Table 242).
Chinese shipments to Japan and Hong Kong and German shipments to Switzerland are
though to represent trade in lithium metal foil for primary battery production. Prices have
shown a similar trend to the above, rising to US$59,457/t FOB in 2007 before falling and
recovering to US$66,944/t FOB in 2012. Chinese prices of battery-grade lithium metal
(99.9% Li) were reported at RMB460-500,000/t (US$56,800-61,700/t) at the beginning of
2006 and were RMB400-460,000/t (US$58,400-67,200/t) at the beginning of 2008. This
is not too dissimilar to the average value of exports from China, suggesting the latter are
a reasonable assessment of pricing.
Catalyst-grade lithium metal shipments are represented by China to USA and India trade
flows, the average values of which increased from under US$20,000/t FOB in 2004 to
US$38,689/t FOB in 2008. Average values then fell, before recovering to US$34,406/t
FOB in 2012. The difference in price between battery-grade ingot and catalyst-grade
has averaged around US$20,000/t FOB since 2004.
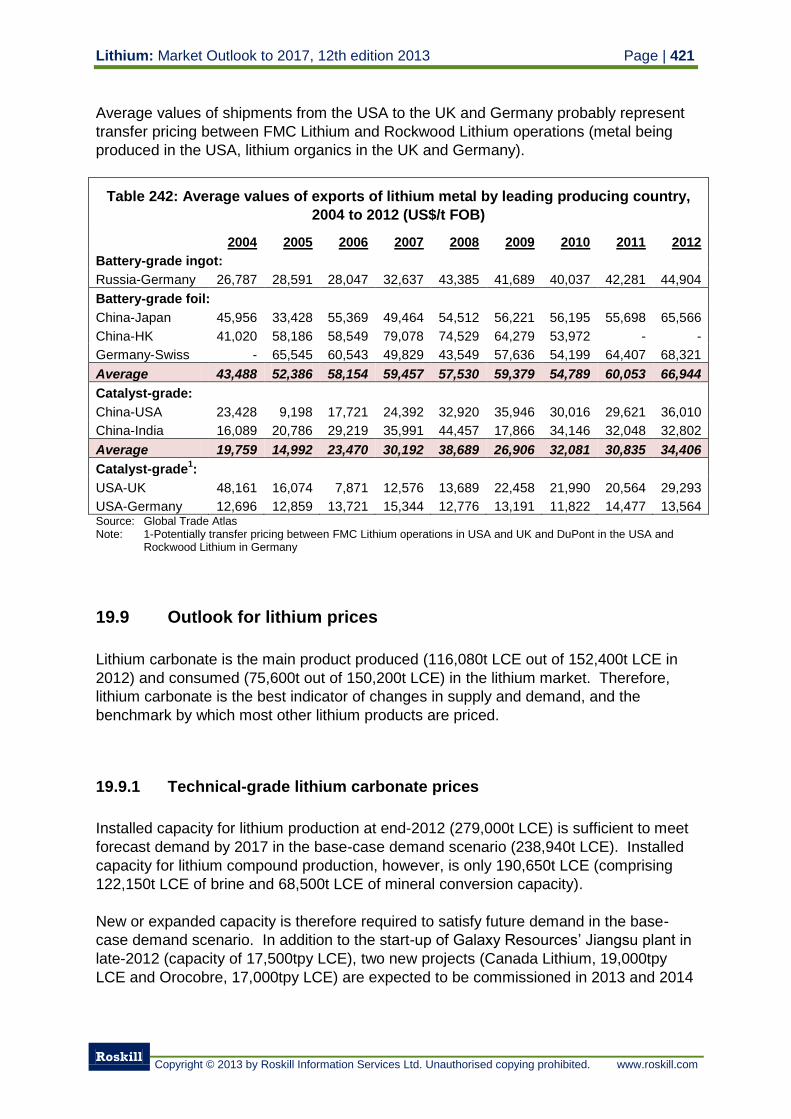
Lithium: Market Outlook to 2017, 12th edition 2013 Page | 421
Roskill
Copyright © 2013 by Roskill Information Services Ltd. Unauthorised copying prohibited. www.roskill.com
Average values of shipments from the USA to the UK and Germany probably represent
transfer pricing between FMC Lithium and Rockwood Lithium operations (metal being
produced in the USA, lithium organics in the UK and Germany).
Table 242: Average values of exports of lithium metal by leading producing country,
2004 to 2012 (US$/t FOB)
2004 2005 2006 2007 2008 2009 2010 2011 2012
Battery-grade ingot:
Russia-Germany 26,787 28,591 28,047 32,637 43,385 41,689 40,037 42,281 44,904
Battery-grade foil:
China-Japan
45,956 33,428 55,369 49,464 54,512 56,221 56,195 55,698 65,566
China-HK
41,020 58,186 58,549 79,078 74,529 64,279 53,972 - -
Germany-Swiss - 65,545 60,543 49,829 43,549 57,636 54,199 64,407 68,321
Average 43,488 52,386 58,154 59,457 57,530 59,379 54,789 60,053 66,944
Catalyst-grade:
China-USA 23,428 9,198 17,721 24,392 32,920 35,946 30,016 29,621 36,010
China-India 16,089 20,786 29,219 35,991 44,457 17,866 34,146 32,048 32,802
Average 19,759 14,992 23,470 30,192 38,689 26,906 32,081 30,835 34,406
Catalyst-grade1:
USA-UK 48,161 16,074 7,871 12,576 13,689 22,458 21,990 20,564 29,293
USA-Germany
12,696 12,859 13,721 15,344 12,776 13,191 11,822 14,477 13,564 Source: Global Trade Atlas Note: 1-Potentially transfer pricing between FMC Lithium operations in USA and UK and DuPont in the USA and
Rockwood Lithium in Germany
19.9 Outlook for lithium prices
Lithium carbonate is the main product produced (116,080t LCE out of 152,400t LCE in
2012) and consumed (75,600t out of 150,200t LCE) in the lithium market. Therefore,
lithium carbonate is the best indicator of changes in supply and demand, and the
benchmark by which most other lithium products are priced.
19.9.1 Technical-grade lithium carbonate prices
Installed capacity for lithium production at end-2012 (279,000t LCE) is sufficient to meet
forecast demand by 2017 in the base-case demand scenario (238,940t LCE). Installed
capacity for lithium compound production, however, is only 190,650t LCE (comprising
122,150t LCE of brine and 68,500t LCE of mineral conversion capacity).
New or expanded capacity is therefore required to satisfy future demand in the base-
case demand scenario. In addition to the start-up of Galaxy Resources’ Jiangsu plant in
late-2012 (capacity of 17,500tpy LCE), two new projects (Canada Lithium, 19,000tpy
LCE and Orocobre, 17,000tpy LCE) are expected to be commissioned in 2013 and 2014
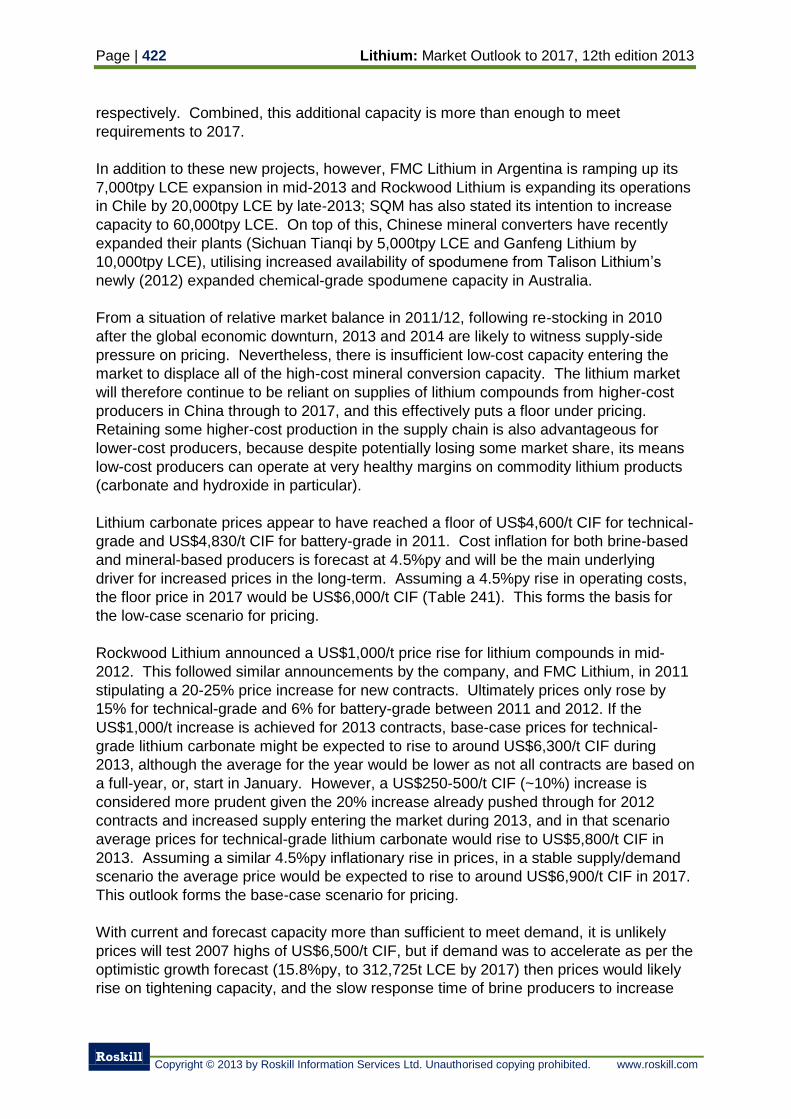
Page | 422 Lithium: Market Outlook to 2017, 12th edition 2013
Roskill
Copyright © 2013 by Roskill Information Services Ltd. Unauthorised copying prohibited. www.roskill.com
respectively. Combined, this additional capacity is more than enough to meet
requirements to 2017.
In addition to these new projects, however, FMC Lithium in Argentina is ramping up its
7,000tpy LCE expansion in mid-2013 and Rockwood Lithium is expanding its operations
in Chile by 20,000tpy LCE by late-2013; SQM has also stated its intention to increase
capacity to 60,000tpy LCE. On top of this, Chinese mineral converters have recently
expanded their plants (Sichuan Tianqi by 5,000tpy LCE and Ganfeng Lithium by
10,000tpy LCE), utilising increased availability of spodumene from Talison Lithium’s
newly (2012) expanded chemical-grade spodumene capacity in Australia.
From a situation of relative market balance in 2011/12, following re-stocking in 2010
after the global economic downturn, 2013 and 2014 are likely to witness supply-side
pressure on pricing. Nevertheless, there is insufficient low-cost capacity entering the
market to displace all of the high-cost mineral conversion capacity. The lithium market
will therefore continue to be reliant on supplies of lithium compounds from higher-cost
producers in China through to 2017, and this effectively puts a floor under pricing.
Retaining some higher-cost production in the supply chain is also advantageous for
lower-cost producers, because despite potentially losing some market share, its means
low-cost producers can operate at very healthy margins on commodity lithium products
(carbonate and hydroxide in particular).
Lithium carbonate prices appear to have reached a floor of US$4,600/t CIF for technical-
grade and US$4,830/t CIF for battery-grade in 2011. Cost inflation for both brine-based
and mineral-based producers is forecast at 4.5%py and will be the main underlying
driver for increased prices in the long-term. Assuming a 4.5%py rise in operating costs,
the floor price in 2017 would be US$6,000/t CIF (Table 241). This forms the basis for
the low-case scenario for pricing.
Rockwood Lithium announced a US$1,000/t price rise for lithium compounds in mid-
2012. This followed similar announcements by the company, and FMC Lithium, in 2011
stipulating a 20-25% price increase for new contracts. Ultimately prices only rose by
15% for technical-grade and 6% for battery-grade between 2011 and 2012. If the
US$1,000/t increase is achieved for 2013 contracts, base-case prices for technical-
grade lithium carbonate might be expected to rise to around US$6,300/t CIF during
2013, although the average for the year would be lower as not all contracts are based on
a full-year, or, start in January. However, a US$250-500/t CIF (~10%) increase is
considered more prudent given the 20% increase already pushed through for 2012
contracts and increased supply entering the market during 2013, and in that scenario
average prices for technical-grade lithium carbonate would rise to US$5,800/t CIF in
2013. Assuming a similar 4.5%py inflationary rise in prices, in a stable supply/demand
scenario the average price would be expected to rise to around US$6,900/t CIF in 2017.
This outlook forms the base-case scenario for pricing.
With current and forecast capacity more than sufficient to meet demand, it is unlikely
prices will test 2007 highs of US$6,500/t CIF, but if demand was to accelerate as per the
optimistic growth forecast (15.8%py, to 312,725t LCE by 2017) then prices would likely
rise on tightening capacity, and the slow response time of brine producers to increase
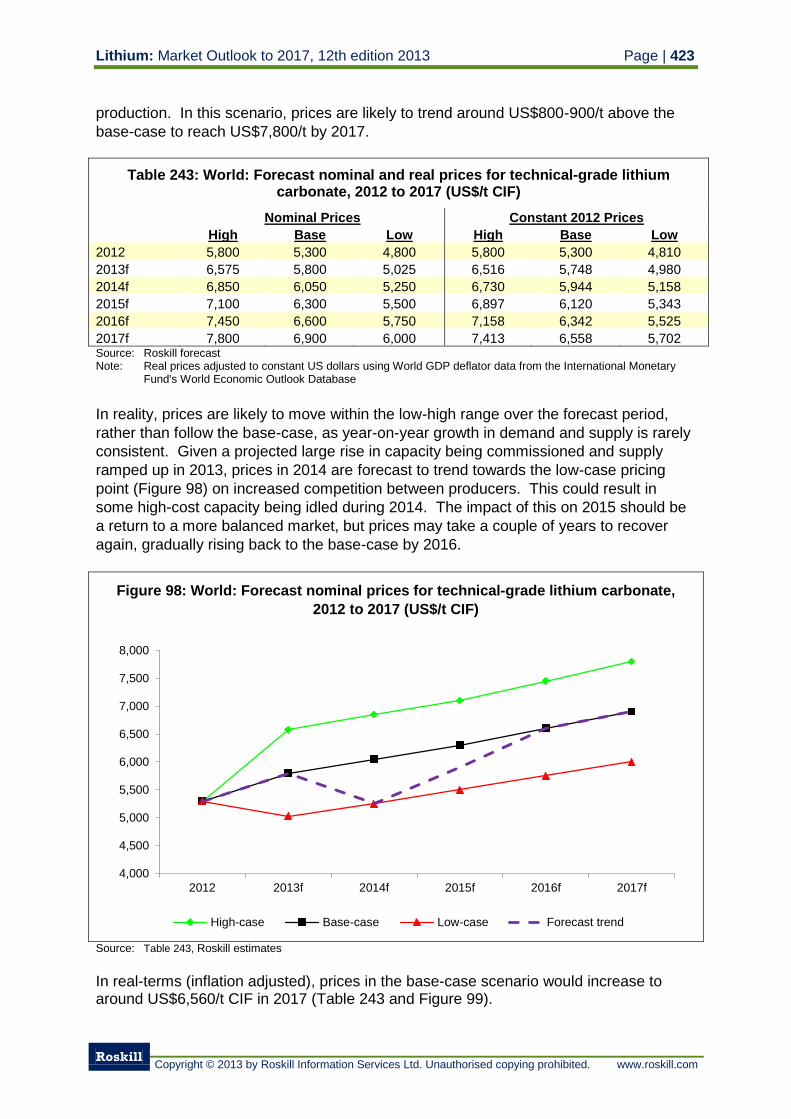
Lithium: Market Outlook to 2017, 12th edition 2013 Page | 423
Roskill
Copyright © 2013 by Roskill Information Services Ltd. Unauthorised copying prohibited. www.roskill.com
production. In this scenario, prices are likely to trend around US$800-900/t above the
base-case to reach US$7,800/t by 2017.
Table 243: World: Forecast nominal and real prices for technical-grade lithium carbonate, 2012 to 2017 (US$/t CIF)
Nominal Prices Constant 2012 Prices
High Base Low High Base Low
2012 5,800 5,300 4,800 5,800 5,300 4,810
2013f 6,575 5,800 5,025 6,516 5,748 4,980
2014f 6,850 6,050 5,250 6,730 5,944 5,158
2015f 7,100 6,300 5,500 6,897 6,120 5,343
2016f 7,450 6,600 5,750 7,158 6,342 5,525
2017f 7,800 6,900 6,000 7,413 6,558 5,702 Source: Roskill forecast Note: Real prices adjusted to constant US dollars using World GDP deflator data from the International Monetary
Fund's World Economic Outlook Database
In reality, prices are likely to move within the low-high range over the forecast period,
rather than follow the base-case, as year-on-year growth in demand and supply is rarely
consistent. Given a projected large rise in capacity being commissioned and supply
ramped up in 2013, prices in 2014 are forecast to trend towards the low-case pricing
point (Figure 98) on increased competition between producers. This could result in
some high-cost capacity being idled during 2014. The impact of this on 2015 should be
a return to a more balanced market, but prices may take a couple of years to recover
again, gradually rising back to the base-case by 2016.
Figure 98: World: Forecast nominal prices for technical-grade lithium carbonate,
2012 to 2017 (US$/t CIF)
Source: Table 243, Roskill estimates
In real-terms (inflation adjusted), prices in the base-case scenario would increase to around US$6,560/t CIF in 2017 (Table 243 and Figure 99).
4,000
4,500
5,000
5,500
6,000
6,500
7,000
7,500
8,000
2012 2013f 2014f 2015f 2016f 2017f
High-case Base-case Low-case Forecast trend
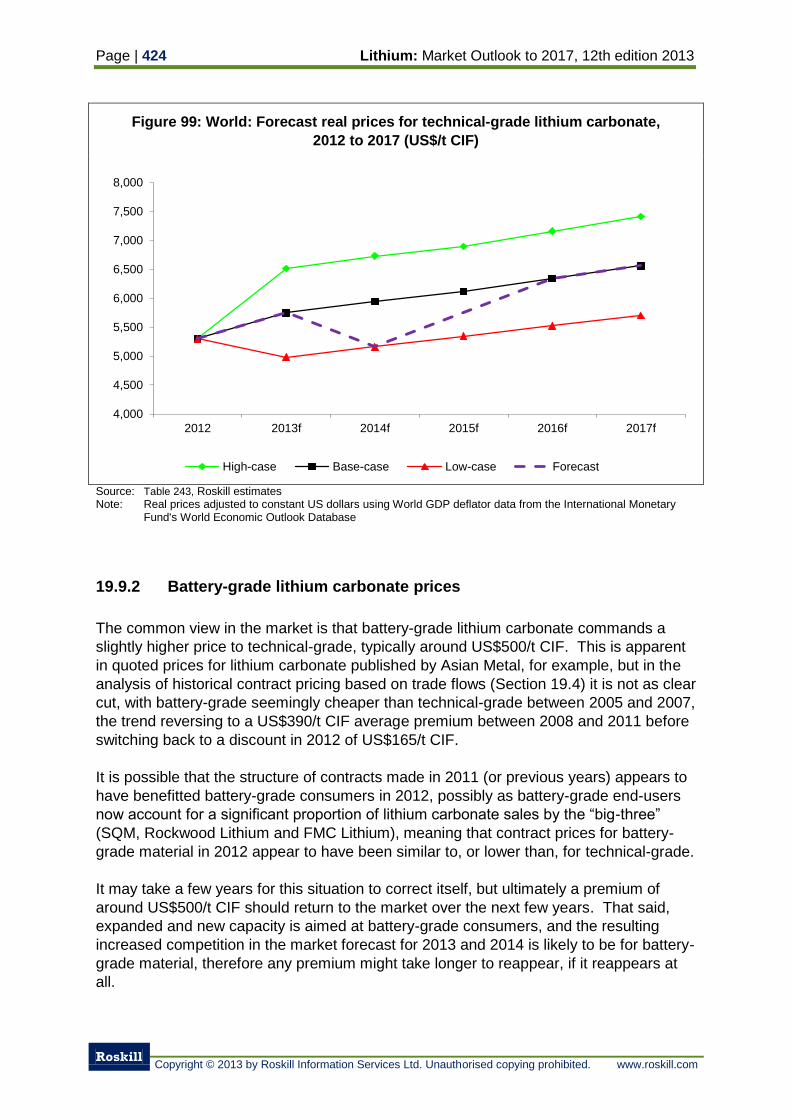
Page | 424 Lithium: Market Outlook to 2017, 12th edition 2013
Roskill
Copyright © 2013 by Roskill Information Services Ltd. Unauthorised copying prohibited. www.roskill.com
Figure 99: World: Forecast real prices for technical-grade lithium carbonate,
2012 to 2017 (US$/t CIF)
Source: Table 243, Roskill estimates Note: Real prices adjusted to constant US dollars using World GDP deflator data from the International Monetary
Fund's World Economic Outlook Database
19.9.2 Battery-grade lithium carbonate prices
The common view in the market is that battery-grade lithium carbonate commands a
slightly higher price to technical-grade, typically around US$500/t CIF. This is apparent
in quoted prices for lithium carbonate published by Asian Metal, for example, but in the
analysis of historical contract pricing based on trade flows (Section 19.4) it is not as clear
cut, with battery-grade seemingly cheaper than technical-grade between 2005 and 2007,
the trend reversing to a US$390/t CIF average premium between 2008 and 2011 before
switching back to a discount in 2012 of US$165/t CIF.
It is possible that the structure of contracts made in 2011 (or previous years) appears to
have benefitted battery-grade consumers in 2012, possibly as battery-grade end-users
now account for a significant proportion of lithium carbonate sales by the “big-three”
(SQM, Rockwood Lithium and FMC Lithium), meaning that contract prices for battery-
grade material in 2012 appear to have been similar to, or lower than, for technical-grade.
It may take a few years for this situation to correct itself, but ultimately a premium of
around US$500/t CIF should return to the market over the next few years. That said,
expanded and new capacity is aimed at battery-grade consumers, and the resulting
increased competition in the market forecast for 2013 and 2014 is likely to be for battery-
grade material, therefore any premium might take longer to reappear, if it reappears at
all.
4,000
4,500
5,000
5,500
6,000
6,500
7,000
7,500
8,000
2012 2013f 2014f 2015f 2016f 2017f
High-case Base-case Low-case Forecast
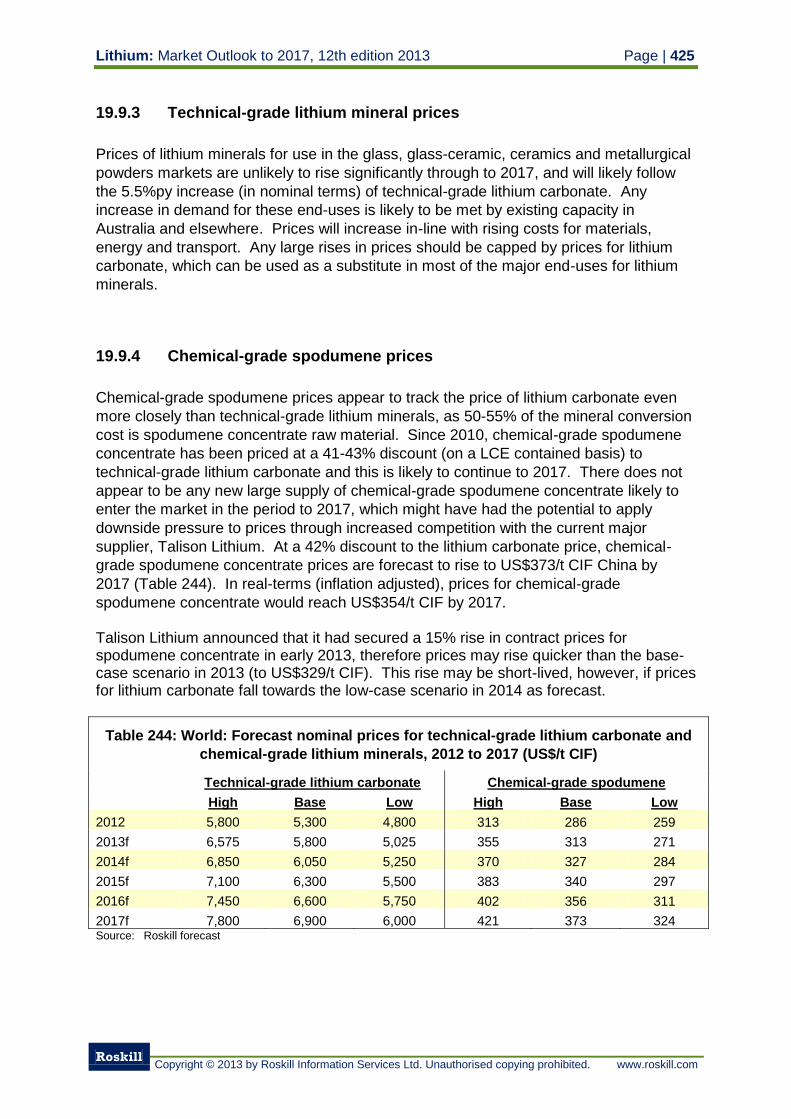
Lithium: Market Outlook to 2017, 12th edition 2013 Page | 425
Roskill
Copyright © 2013 by Roskill Information Services Ltd. Unauthorised copying prohibited. www.roskill.com
19.9.3 Technical-grade lithium mineral prices
Prices of lithium minerals for use in the glass, glass-ceramic, ceramics and metallurgical
powders markets are unlikely to rise significantly through to 2017, and will likely follow
the 5.5%py increase (in nominal terms) of technical-grade lithium carbonate. Any
increase in demand for these end-uses is likely to be met by existing capacity in
Australia and elsewhere. Prices will increase in-line with rising costs for materials,
energy and transport. Any large rises in prices should be capped by prices for lithium
carbonate, which can be used as a substitute in most of the major end-uses for lithium
minerals.
19.9.4 Chemical-grade spodumene prices
Chemical-grade spodumene prices appear to track the price of lithium carbonate even
more closely than technical-grade lithium minerals, as 50-55% of the mineral conversion
cost is spodumene concentrate raw material. Since 2010, chemical-grade spodumene
concentrate has been priced at a 41-43% discount (on a LCE contained basis) to
technical-grade lithium carbonate and this is likely to continue to 2017. There does not
appear to be any new large supply of chemical-grade spodumene concentrate likely to
enter the market in the period to 2017, which might have had the potential to apply
downside pressure to prices through increased competition with the current major
supplier, Talison Lithium. At a 42% discount to the lithium carbonate price, chemical-
grade spodumene concentrate prices are forecast to rise to US$373/t CIF China by
2017 (Table 244). In real-terms (inflation adjusted), prices for chemical-grade
spodumene concentrate would reach US$354/t CIF by 2017. Talison Lithium announced that it had secured a 15% rise in contract prices for spodumene concentrate in early 2013, therefore prices may rise quicker than the base-case scenario in 2013 (to US$329/t CIF). This rise may be short-lived, however, if prices for lithium carbonate fall towards the low-case scenario in 2014 as forecast.
Table 244: World: Forecast nominal prices for technical-grade lithium carbonate and
chemical-grade lithium minerals, 2012 to 2017 (US$/t CIF)
Technical-grade lithium carbonate Chemical-grade spodumene
High Base Low High Base Low
2012 5,800 5,300 4,800 313 286 259
2013f 6,575 5,800 5,025 355 313 271
2014f 6,850 6,050 5,250 370 327 284
2015f 7,100 6,300 5,500 383 340 297
2016f 7,450 6,600 5,750 402 356 311
2017f 7,800 6,900 6,000 421 373 324 Source: Roskill forecast
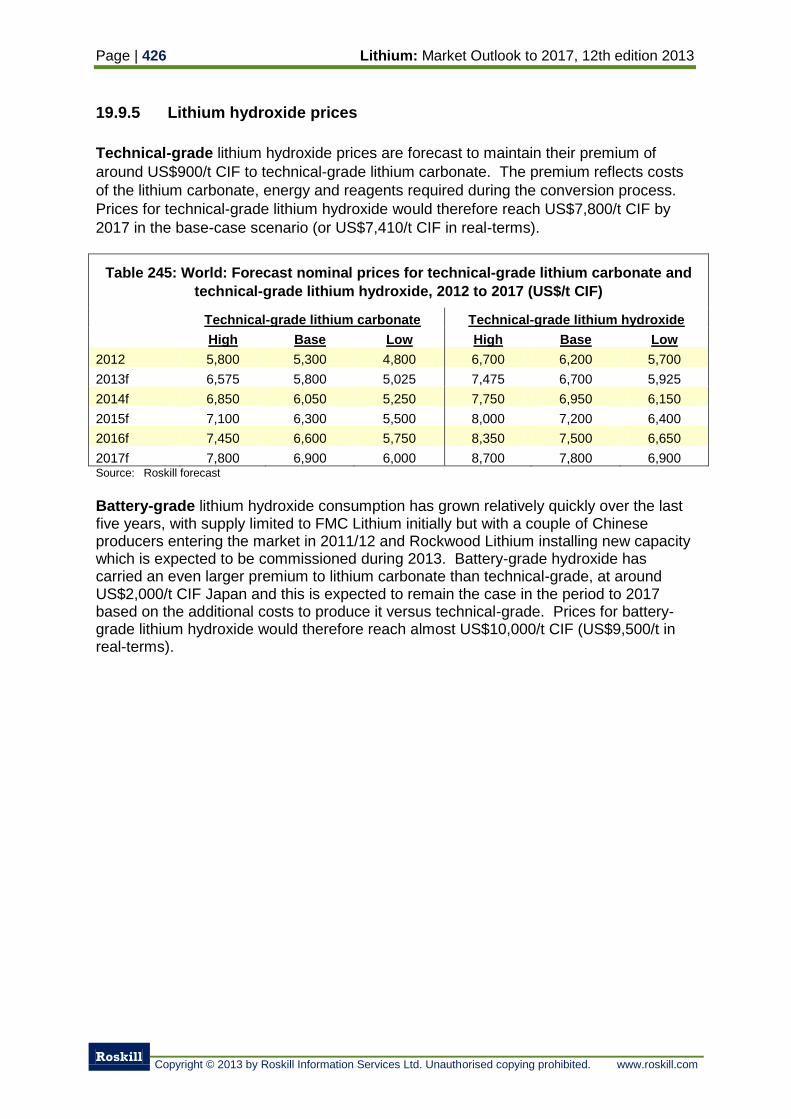
Page | 426 Lithium: Market Outlook to 2017, 12th edition 2013
Roskill
Copyright © 2013 by Roskill Information Services Ltd. Unauthorised copying prohibited. www.roskill.com
19.9.5 Lithium hydroxide prices
Technical-grade lithium hydroxide prices are forecast to maintain their premium of
around US$900/t CIF to technical-grade lithium carbonate. The premium reflects costs
of the lithium carbonate, energy and reagents required during the conversion process.
Prices for technical-grade lithium hydroxide would therefore reach US$7,800/t CIF by
2017 in the base-case scenario (or US$7,410/t CIF in real-terms).
Table 245: World: Forecast nominal prices for technical-grade lithium carbonate and
technical-grade lithium hydroxide, 2012 to 2017 (US$/t CIF)
Technical-grade lithium carbonate Technical-grade lithium hydroxide
High Base Low High Base Low
2012 5,800 5,300 4,800 6,700 6,200 5,700
2013f 6,575 5,800 5,025 7,475 6,700 5,925
2014f 6,850 6,050 5,250 7,750 6,950 6,150
2015f 7,100 6,300 5,500 8,000 7,200 6,400
2016f 7,450 6,600 5,750 8,350 7,500 6,650
2017f 7,800 6,900 6,000 8,700 7,800 6,900 Source: Roskill forecast
Battery-grade lithium hydroxide consumption has grown relatively quickly over the last five years, with supply limited to FMC Lithium initially but with a couple of Chinese producers entering the market in 2011/12 and Rockwood Lithium installing new capacity which is expected to be commissioned during 2013. Battery-grade hydroxide has carried an even larger premium to lithium carbonate than technical-grade, at around US$2,000/t CIF Japan and this is expected to remain the case in the period to 2017 based on the additional costs to produce it versus technical-grade. Prices for battery-grade lithium hydroxide would therefore reach almost US$10,000/t CIF (US$9,500/t in real-terms).


