Embed Size (px)
Citation preview
y
GEOLOGICAL SURVEY
RESEARCH 1968
Chapter C
GEOLOGICAL SURVEY PROFESSIONAL PAPER 600-C
Scientific notes and summaries of investigations in geology, hydrology, and related fields
UNITED STATES GOVERNMENT PRINTING OFFICE, WASHINGTON: 1968
UNITED STATES DEPARTMENT OF THE INTERIOR
STEW ART l. UDALL, Secretary
GEOLOGICAL SURVEY
William T. Pecora, Director
For sale by the Superintendent of Documents, U.S. Government Printing Office Washington, D.C. 20402- Price $2.25 (paper cover)
CONTENTS
GEOLOGIC STUDIES Economic geol·ogy Page
Occurrence of refractory clay in Randolph County, W.Va., by K. J. Englund and H. J. Goett______________________ C1
Mineralogy and petrology Texture and composition of outcropping phosphorite in the Turayf region, northern Saudi Arabia, by J. B. Cathcart__ 4 Albite-pyroxene-glaucophane schist from Valley Ford, Calif., by T. E. C. Keith and R. G. Coleman__________________ 13 Chemistry of primary minerals and rocks from the Red Mountain-Del Puerto ultramafic mass, California, by G. R.
Himmelberg and R. G. Coleman ______________________________ -- ____ - ____ -_________________________________ 18
Refractive index of glass beads distinguishes Tertiary basalts in the Grays River area, southwestern Washington, by E. H. ~cKee---------------------------------------------------------------------------------------------- 27
Problems of small-particle analysis with the electron microprobe, by N. J Page, L. C. Calk, and M. H. Carr__________ 31 Mineralogy of a rutile- and apatite-bearing ultramafic chlorite rock, Harford County, Md., by D. L. Southwick_______ 38 Quartz diorite-quartz monzonite and granite plutons of the Pasayten River area, Washington-Petrology, age, and
emplacement, by R. W. Tabor, J. C. Engels, and~. H. Staatz----------------------------------------------- 45
Stratigraphy Permian and Pennsylvanian stratigraphy and nomenclature, Elk Mountains, Colo., by B. L. Bartleson, Bruce Bryant,
and F. E. ~utschler __________________________________________________ - _ _ _ _ _ _ _ _ _ _ _ _ _ _ _ _ _ _ _ _ _ _ _ _ _ _ _ _ _ _ _ _ _ _ 53
Zonal relations and paleomagnetism of the Spearhead and Rocket Wash Members of the Thirsty Canyon Tuff, southern Nevada, by D. C. Noble, G. D. Bath, R. L. Christiansen, and P. P. Orkild_____________________________________ 61
Coincidence of fossil and lithologic zones in the lower part of Upper Cretaceous Mancos Shale, Slick Rock district,Col-orado, by D. R. Shawe ____________________________________________ - ___________________ :- _ _ _ _ _ _ _ _ _ _ _ _ _ _ _ _ _ _ 66
Paleontology Foraminifera from the Clayton Formation (Paleocene) in southeastern Hardeman County, Tenn., by S. M. Herrick and
D. R. Rima---------------------------------------------~----------------------------------------------- 69 Stratigraphic paleontology of the Barstow Formation in the Alvord ~ountain area, San Bernardino County, Calif., by
G. E. Lewis--------------------------------------------------------------------------------------------- 75
Geochronology Basement-rock geochronology of the Black Canyon of the Gunnison, Colo., by W. R. Hansen and Z. E. Peterman________ 80 Precambrian geochronology of the northwestern Uncompahgre Plateau, Utah and Colorado, by C. E. Hedge, z. E.
Peterman, J. E. Case, and J.D. Obradovich ____________________ -----_________________________________________ 91
Geochemistry Organic geochemistry of Recent sediments in the Choctawatchee Bay area, Florida-A preliminary report, by J. G.
Palacas, V. E. Swanson, and A. H. Love--------------------------------------------------------------------- 97
Isotope geology A comparison of field and laboratory measurements of radium-equivalent uranium, thorium, and potassium by gamma-ray
spectrometry, Ludlow, Calif., by C.~. Bunker, C. A. Bush, and J. T. O'Connor__________________________________ 107 ,.. Geophysics
Spectral analysis of seismic measurements from explosions in southern ~ississippi, by Roger Borcherdt_ _ _ _ _ _ _ _ _ _ _ _ _ _ _ _ _ 113 Earthquakes from common sources beneath Kilauea and Mauna Loa volcanoes in Hawaii from 1962 to 1965, by R. Y.
Koyanagi----------------------------------------------------------------------------------------------- 120
V·olcanology Recent volcanic activity on Augustine Island, Alaska, by R. L. Detterman______ _ __ ____ _ _ _ _ _ _ _ _ _ _ __ _ _ _ _ ____ ________ _ 126
Geomorphology A postglacial mudflow of large volume in the La Paz Valley, Bolivia, by Ernest Dobrovolny _____ _ _ _ _ _ _ _ _ _ _ _ _ _ _ _ _ _ _ _ _ _ _ _ 130 The Troy Valley of southeastern Wisconsin, by J. H. Green_______________________________________________________ 135 High-level Quaternary beach deposits in northwestern Puerto Rico, by W. H. ~onroe_ _ _ _ _ _ _ _ _ _ _ _ _ _ _ _ _ _ _ _ _ _ _ _ _ _ _ _ _ _ _ _ 140
Marine geology Geology of the Klamath River delta, California, by G. W. Moore and E. A. Silver ______________ ._____________________ 144
m
IV CONTENTS
Structural geology Page
A transcurrent structure in Fayette and Greene Counties, Pa., by J. B. Roen_ _ _ _ _ _ _ _ _ _ _ _ _ _ _ _ _ _ _ _ _ _ _ _ _ _ _ _ _ _ _ _ _ _ _ _ _ _ C149 Structural controls on streamflow in the North Fork River and Bryant Creek basins, Missouri, by John Skelton and
E. J. IIarveY--------------------------------------------------------------------------------------------- 153 Tertiary trough between the Arkansas and San Luis Valleys, Colo., by R. E. Van Alstine__________________________ 158
Analytical methods Determination of gold, platinum, and palladium by a combined fire-assay, ion-exchange, and spectrochemical technique,
by P. R. Barnett, D. L. Skinner, and Claude Huffman, Jr _ __ __ __ _ _ __ __ __ __ __ __ ___ _ _ _ _ _ _ _ _ _ __ __ __ _ _ __ ___ _ _____ _ 161 A rapid method for measuring the Rb/Sr ratio in silicate rocks, by W. P. Doering__________________________________ 164
Remote sensing A photomosaic of western Peru from Gemini photography, by J. A. MacKallor _ _ _ _ _ _ _ _ _ _ _ _ _ _ _ _ _ _ _ _ _ _ _ _ _ _ _ _ _ _ _ _ _ _ _ 169
Cartographic techniques Determination of rectangular coordinates for map projections-Modification of basic formulas and application to com-
puter plotting, by Donald Plouff____________________________________________________________________________ 17 4 "Cut-and-try" method for locating distant geologic features on topographic maps, by R. L. Sutton__________________ 177
HYDROLOGIC STUDIES Ground water
Regional draft-storage relations in west-central Alabama, by P. 0. Jefferson______________________________________ 182 Notes on the geohydrology of the Dakota Sandstone, eastern North Dakota, by T. E. Kelly________________________ 185 Relation between aquifer constants and estimated stress on an artesian aquifer in eastern Montana, by 0. J. Taylor__ 192
Surface water Preliminary estimates of low-flow frequency interrelations for upstate New York streams, by R. M. Beall____________ 196 Method of volume-diversion analysis of a stream, by M. R. Collings_____________________________________________ 199 The boundary conditions in the implicit solution of river transients, by Chintu LaL _ _ _ _ _ _ _ _ _ _ _ _ _ _ _ _ _ _ _ _ _ _ _ _ _ _ _ _ _ _ _ 204
Hydrologic techniques Freeze-drying of organic matter, clays, and other earth materials, by R. L. Malcolm______________________________ 211
Waste-disposal problems Ilydrologic study of a waste-disposal problem in a.karst area at Springfield, Mo., by E. J. IIarvey and John Skelton___ 217
INDEXES
Subjed----------------------------------------------------------------------------------- 221
Author-----------------------------------------··----------------------------------------- 225
GEOLOGICAL SURVEY RESEARCH 1968
This collection of 40 short papers is the second published chapter of "Geological Survey Research 1968." The papers report on scientific and economic results of current work by members of the Geologic and Water Resources Divisions of the U.S. Geological Survey.
Chapter A, to be published later in the year, will present a summary of significant results of work done during fiscal year 1968, together with lists of investigations in progress, reports published, cooperating agencies, and Geological Survey offices.
"Geological Survey Research 1968" is the ninth volume of the annual series Geological Survey Research. The eight volumes already published are listed below, with their series designations.
Geological Survey Research 19,60-Prof. Paper 400 Geological Survey Research 1961-Prof. Paper 424 Geological Survey Research 1962-Prof. Paper 450 Geological Survey Research 1963-Prof. Paper 475 Geological Survey Research 1964-Prof. Paper 501 Geological Survey Research 1965-Prof. Paper 525 Geological Survey Research 1966-Prof. Paper 550 Geological Survey Research 1967-Prof. Paper 575
v
GEOLOGICAL SURVEY RESEARCH 1968
OCCURRENCE OF REFRACTORY CLAY IN RANDOLPH COUNTY, WEST VIRGINIA
By KENNETH j. ENGLUND and HARRY j. GOETT, Washington, D.C.
A.bstract.-Refraotory flint cl'ay -and semiflint cl•ay layers, totaling as much as 7% feet in thickness, occur in the lower part of the Allegheny Formation of Pennsylvanian uge in northcentral Randolph County, W.Va. The deposit seems to be a lens in a widespread bed of plastic clay and may underlie an area of 1-2 square miles. Refractory tests of three samples indicute a pyrometric cone equivalent of cone 30-31 which is compara·ble with tests of the most highly refractory clay previously reported from West Virgini·a.
Recent geologic 1napping in north-central Randol~h County, W. Va., has disclosed a bed of refractory fhnt clay and semiflint clay of potential economic interest. Flint clay has been reported at several localities in the northern and northeastern counties of the State, and it has been mined in Mineral County, about 65 miles northeast of the Randolph County occurrence (Waage, 1950, p. 67). The principal use of flint clay, which con~ists largely of kaolinite, is in the manufacture ?f hig~temperature refractory products such as fire bnck. This report describes the location and geologic setting of the flint clay deposit in Randolph County, together with the results of refvactory tests.
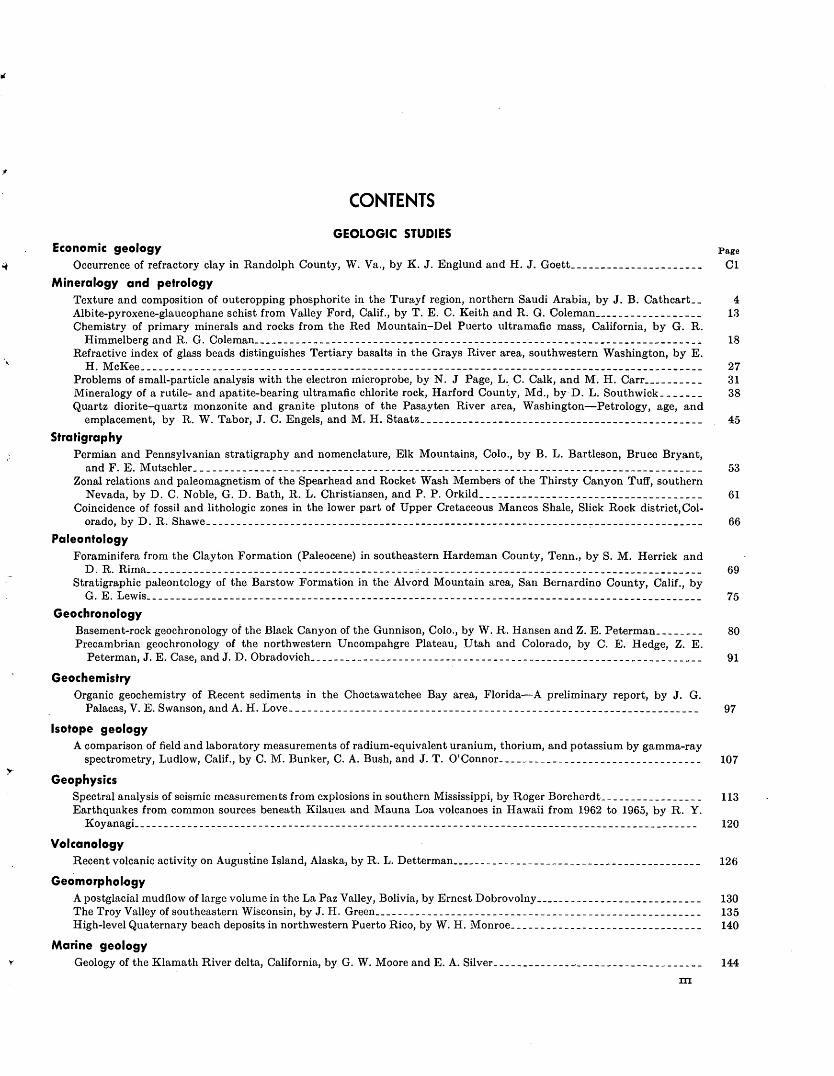
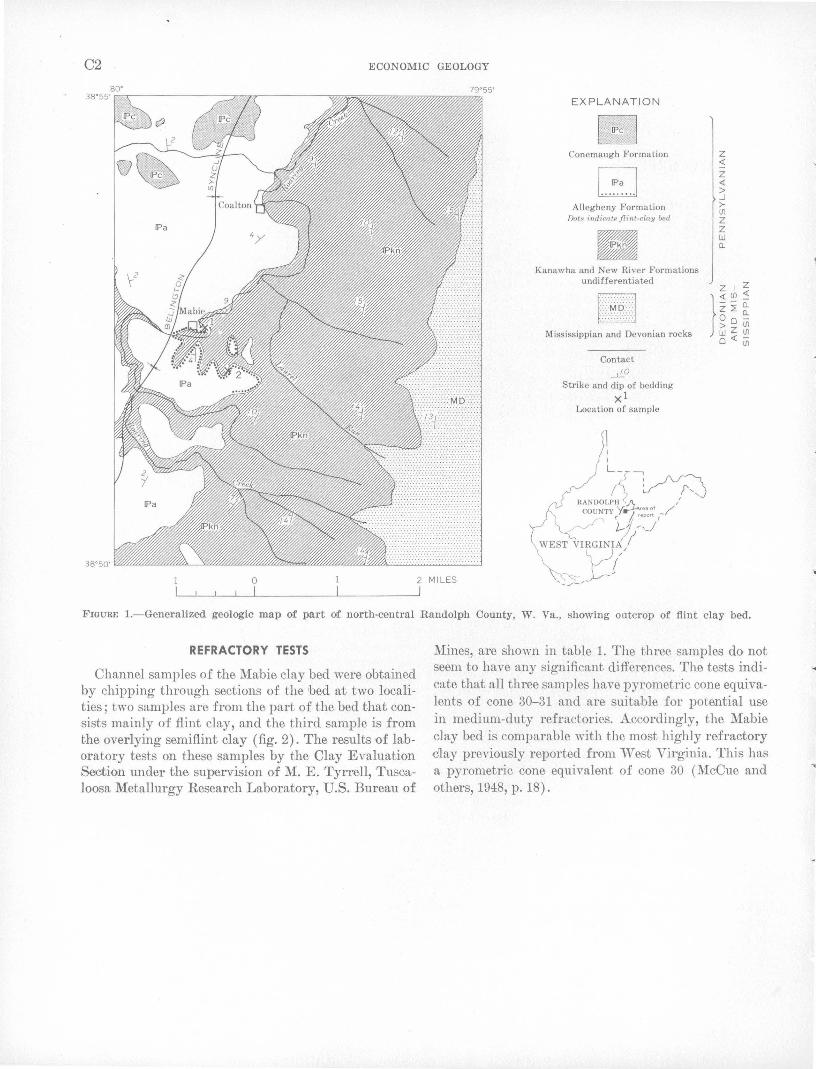
The flint clay deposit in Randolph County crops out along the upper part of Roaring Creek a~d along se:eral tributary streams, from the community of Mabie southeastward for about one mile (fig. 1). Flint clay occurs with semiflint and plastic clay in a bed which is referred to informally in this report as the Mabie clay bed. Because of the lack of subsurface information, the exact distribution of the flint clay is unknown; however, discontinuous exposures in roadcuts and shallow drainage ditches indicate that the flint clay may underlie an area of 1-2 square miles. Most exposures are along West Virginia State Highway 33, which passes northward through Ma:bie, and along a gravel road that extends southwestward from Highway 33, rubout half a. mile southeast of Mabie.
GEOLOGIC SETTING
The Mabie clay bed occurs near the base of the Allegheny Formation of Pennsylvanian age in a sequence of coal-bearing sedimentary rocks. This formation and
its correlatives contain flint clay deposits elsewhere in the Appalachian Plateaus from northeaste:n:- I<:e1_1tuc~y to western Maryland and include clay deposits mined 111 northeastern West Virginia. In addition to clay, coal, and a few thin beds of argillaceous limestone, the Allegheny Formation is composed mainly of shale, sil~stone, and sandstone. As shown in figure 2, the ~iab1e clay bed occurs above the Roaring Creek Sandst~ne Member of the underlying l{anawha FormatiOn (White, 1903). This sandstone, the uppermost of a predominantly sandstone sequence, is ·fine to medium grained, locally conglomeratic, and forms a broad bench below the less resistant clay and shale beds. The Roaring Creek Sandstone Member and the flint clay are separated by 2-4 foot of plastic clay and lenses of silty shale or silty sandstone as much as 1112 feet thick. The flint clay is hard, nonplastic, medium light gray to brownish gray, and breaks with a smooth conchoidal fracture. A maximum thickness of 31h feet was measured in a roadcut exposure. As much as 4 feet of semiflint clay overlies the flint clay. The two clay layers are similar in color, but the semiflint clay is softer and has a rough or irregular conchoidal fracture. About 20 feet of medium-gray shale, which loca.Ily includes a few inches of coal at its base, overlies the semiflint clay. The remainder of the Allegheny Formation consists of sandstone which is locally conglomeratic, medium-gray to black carbonaceous shale, siltstone, plastic clay, argillaceous limestone, and several beds of coal, including the intensively mined I<:ittanning coal bed. In addition to the flint clay in the Mabie clay bed, the Allegheny Formation includes as much as 1 foot of flint clay locally in other beds of plastic clay. The total thickness of the Allegheny Formation in north-central Randolph County is about 300 feet. Isolated hilltops in the ·area of this report are capped by grayish-red and grooni.shgray shale, siltstone, and sandstone of the overlying Conemaugh Formation. .
The Mabie clay bed lies in the trough of the Belington syncline, a broad gentle fold at the east edge of the Appalachian Plateaus. In the immediate area of the flint clay deposit, beds dip 4°-10° NW.
01 U.S. GEOL. SURVEY PROF. PAPER 600-C, PAGES Cl-C3
C2 ECONOMIC GEOLOGY
0 2 MILES
EXPLANATION
Conemaugh Formation
Allegheny Formation Dots indicate }lint-clay bed
Kanawha and New River Formations undifferentiated
F37l LZZ:J
Mississippian and Devonian rocks
Contact
~0
Strike and dip of bedding xi
Location of sample
z <!
z <! > _J
>(f)
z z w ()._
FIGURE !.-Generalized geologic map of part of north-central Randolph County, W. Va., showing outcrop of flint clay bed.
REFRACTORY TESTS
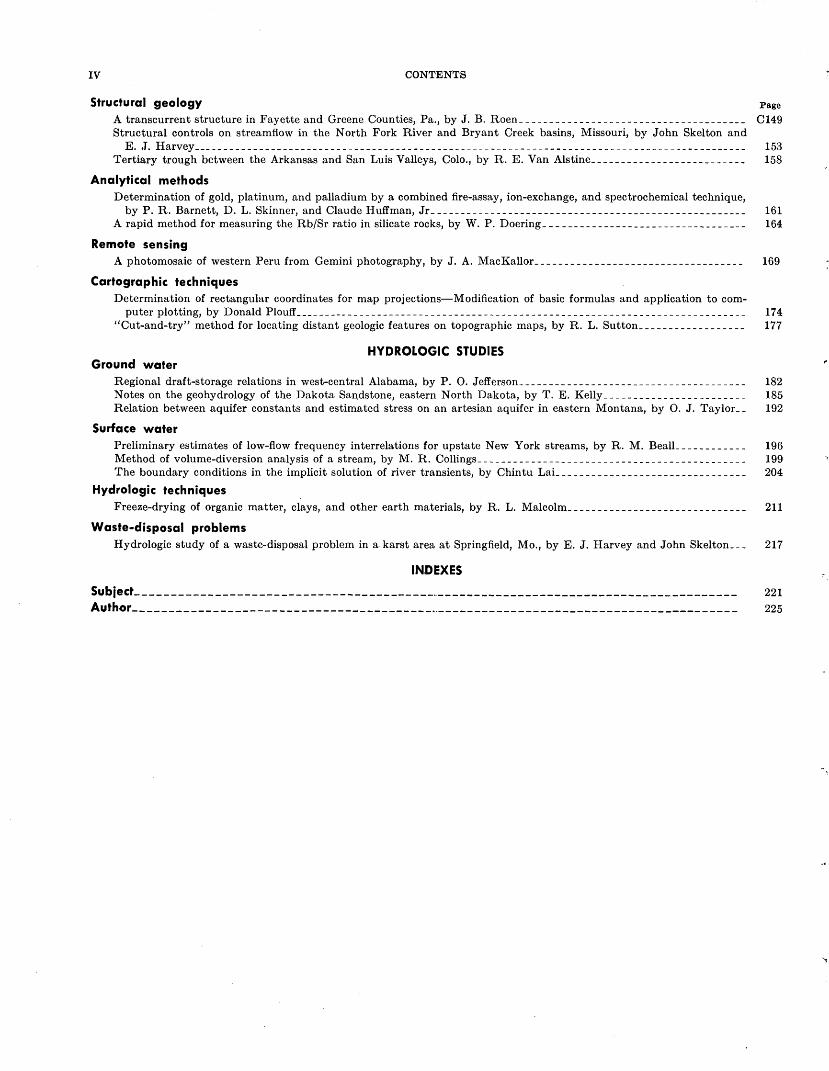
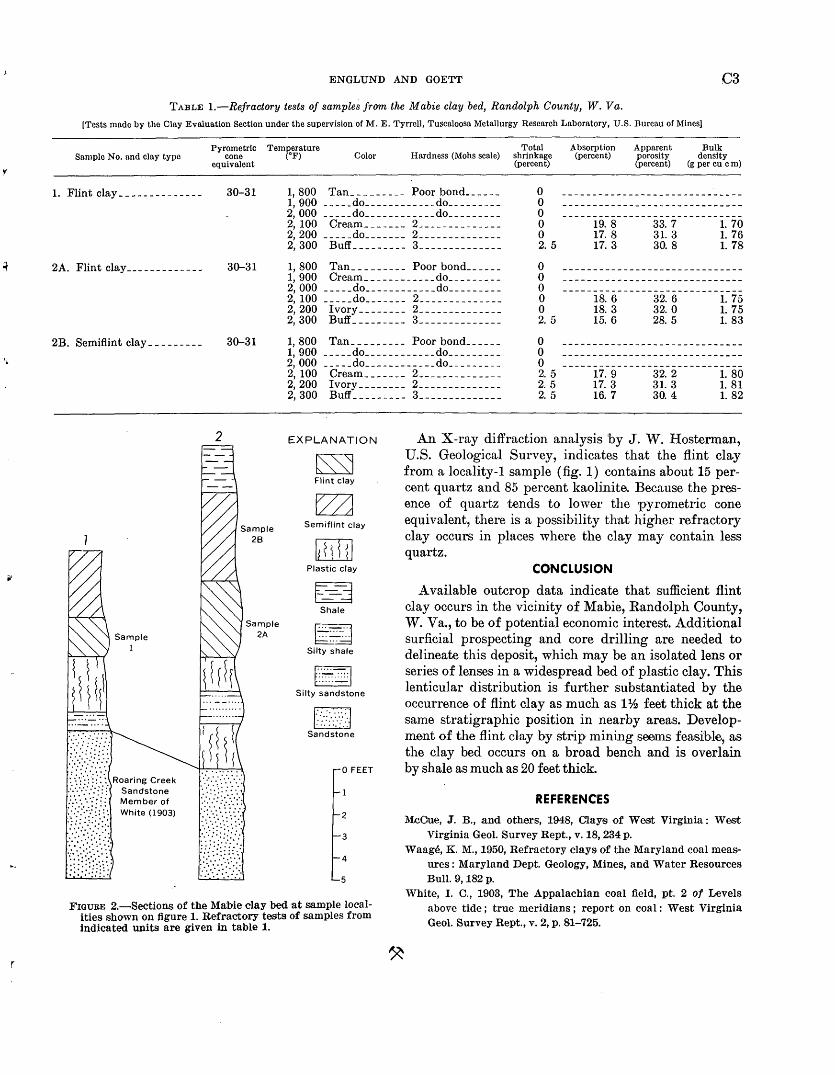
Channel samples of the Mabie clay bed were obtained by chipping through sections of the bed at two localities; two samples are from the part of the bed that consists mainly of flint clay, and the third sample is from the overlying semiflint clay (fig. 2). The results of laboratory tests on these samples by the Clay Evaluation Section under the supervision of M. E. Tyrrell, Tuscaloosa Metallurgy Research Laboratory, U.S. Bureau of
Mines, are shown in table 1. The three samples do not seem to have any significant differences. The tests indicate that all three samples have pyrometric cone equivalents of cone 30-31 and are suitable for potential use in medium-duty refractories. Accordingly, the Mabie clay bed is comparable with the most highly refractory day previously reported from \Vest Virginia. This has a pyrometric cone equivalent of cone 30 (McCue and others, 1948, p. 18).
·.
ENGLUND AND GOETT C3
TABLE !.-Refractory tests of samples from the Mabie clay bed, Randolph County, W. Va.
[Tests made by tho Clay Evaluation Section under the supervision of M. E. Tyrrell, Tuscaloosa Metallurgy Research Laboratory, U.S. Bureau of Mines]
Sample No. and clay typo
1. Flint clay _____________ _
2A. Flint clay ____________ _
2B. Semiflint clay ________ _
Pyrornetrlc Temperature cone (°F) Color
Total Hardness (Mohs scale) shrinkage
Absorption (percent)
Apparent porosity (percent)
Bulk density
equivalent
2
30-31
30-31
30-31
Sample 2A
(percent) (g per cu em)
1, 800 Tan _________ Poor bond _____ _ 0 1, 900 _____ do ____________ do ________ _ 0 2,000 _____ do ____________ do ________ _ 0 2, 100 Cream_ _ _ _ _ _ _ 2 _____________ _ 0 19. 8
17. 8 17. 3
33. 7 31. 3 30.8
1. 70 1. 76 1. 78
2, 200 _____ do _______ 2 _____________ _ 0 2. 5 2,300 Buff _________ 3 _____________ _
1, 800 Tan _________ Poor bond _____ _ 1, 900 Cream ____________ do ________ _
0 0 2,000 _____ do ____________ do ________ _ 0
2, 100 _____ do _______ 2 _____________ _ 0 18. 6 18. 3 15. 6
32. 6 32. 0 28.5
1. 75 1. 75 1. 83
2, 200 Ivory ________ 2 _____________ _ 0 2, 300 Buff _________ 3-------------- 2. 5
1,800 Tan _________ Poor bond _____ _ 0 1,900 _____ do ____________ do ________ _ 0 2, 000 _____ do ____________ do ________ _ 0 2, 100 Cream_ _ _ _ _ _ _ 2 _____________ _ 2. 5
2. 5 2. 5
17. 9 17. 3 16. 7
32.2 31. 3 30.4
1. 80 1. 81 1. 82
2, 200 Ivory ________ 2 _____________ _ 2,300 Buff _________ 3 _____________ _
EXPLANATION
~ Flint clay
~ Semiflint clay
Plastic clay
Shale
~ b~
Silty shale
. -
Silty sandstone
~ L=~J
Sandstone
-O FEET
2
3
4
5
An X-ray diffraction analysis by J. W. Hosterman, U.S. Geological Survey, indicates that the flint clay from a locality-1 sample (fig. 1) contains about 15 percent quartz and 85 percent kaolinite. Because the presence of quartz tends to lower the pyrometric cone equivalent, there is a possibility that higher refractory clay occurs in places where the clay may contain less quartz.
CONCLUSION
Available outcrop data indicate that sufficient flint clay occurs in the vicinity of Mabie, Randolph County, W. V a., to be of potential economic interest. Additional surficial prospecting and core drilling are needed to delineate this deposit, which may be an isolated lens or series of lenses in a widespread bed of plastic clay. This lenticular distribution is further substantiated by the occurrence of flint clay as much as 1% feet thick at the same stratigraphic position in nearby areas. Development of the flint clay by strip mining sooms feasib1e, as the clay bed occurs on a broad bench and is overlain by shale as much as 20 feet thick.
REFERENCES
M.cOu.e, J. B., .and others, 1948, Clay;s of West Virginia: West Virginia Geol. Survey Rept., v. 18,234 p.
Waage, K. M., 1950, Refractory clays of the Maryland coal meas"' ures: Maryland Dept. Geology, Mines, and Water Resources Bull. 9, 182 p.
FIGURE 2.-Sections of the Mabie clay bed ·at sample localities shown on figure 1. Refractory teSits of samples from indicated units are given in table 1.
White, I. C., 1903, The Appalachian coal field, pt. 2 of Levels above tide; true meridians; report on coal: West Virginia Geol. Survey Rept., v. 2, p. 81-725.
GEOLOGICAL SURVEY RESEARCH 1968
TEXTURE AND COMPOSITION OF OUTCROPPING PHOSPHORITE
IN THE TURAYF REGION, NORTHERN SAUDI ARABIA
By JAMES B. CATHCART, Denver, Colo.
Work done in cooperation with the Ministry of Petroleum and Mineral Resources, Kingdom of Saudi Arabia
Abstract.-Phosphorite deposits of Eocene and Late Creta- · ceous age in northern Saudi Arabia are of three types: calcareous, siliceous, and unconsolidated. Calcareous and siliceous types contain 1-22 percent P20s, and over large areas they contain more than 15 percent P205. Because of processing difficulties these phosphorites are probably not economic. Unconsolidated phosphorites contain 8-32 percent P205 and are potentially economic. The phosphorites are.composed of well-sorted, fine-sandsize pellets of carbonate fluorapatite cemented by calcite or quartz and minor clay. Chemically, the phosphate pellets are very similar rto phosphorites from Florida and North Carolina, U.S.A.
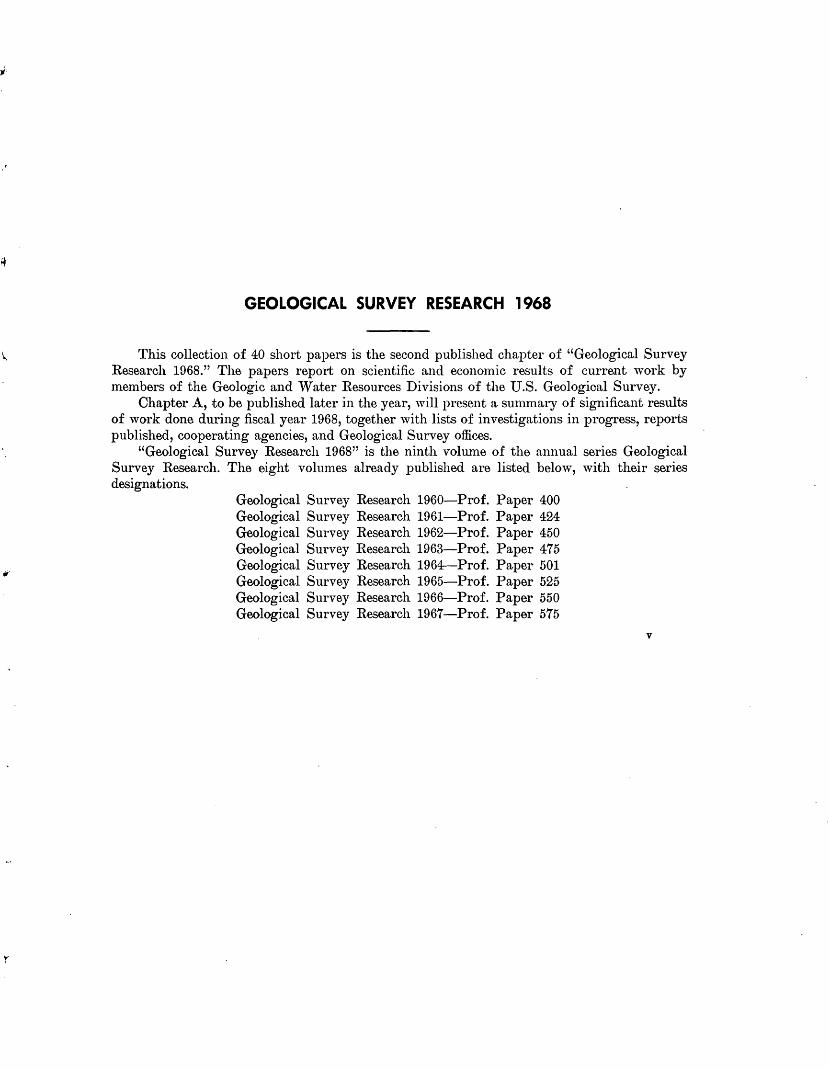
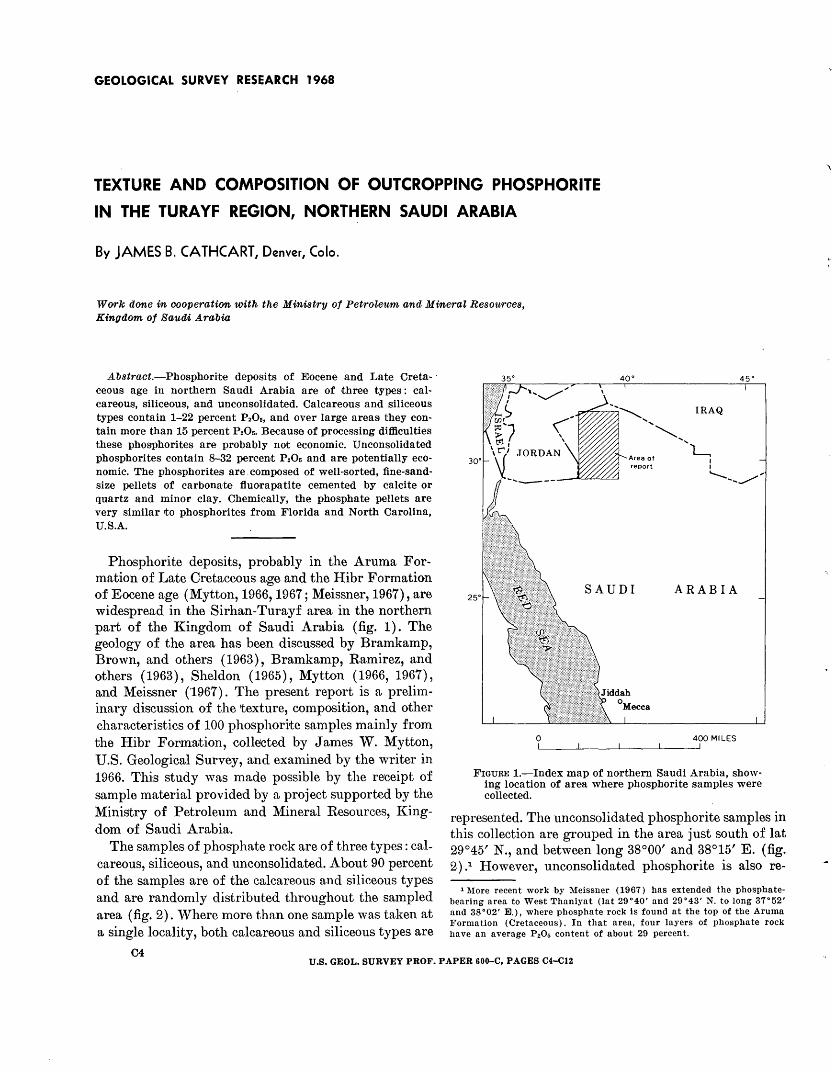
Phosphorite deposits, probably in the Aruma Formation of Late Cretaceous age and the Hibr Formation of Eocene age (Mytton, 1966,1967; Meissner, 1967), are widespread in the Sirhan-Turayf area in the northern part of the Kingdom of Saudi Arabia (fig. 1). The geology of the area has been discussed by Bramkamp, Brown, and others (1963), Bramkamp, Ramirez, and others ( 1963), Sheldon ( 1965), Mytton ( 1966, 1967), and Meissner (1967). The present report is a preliminary discussion of the texture, composition, and other characteristics of 100 phosphorite samples mainly from the Hibr Formation, coll~ted by James W. Mytton, U.S. Geological Survey, and examined by the writer in 1966. Thi~s study was made possible by the receipt of sample material provided by a project supported by the Ministry of Petroleum and Mineral Resources, Kingdom of Saudi Arabia.
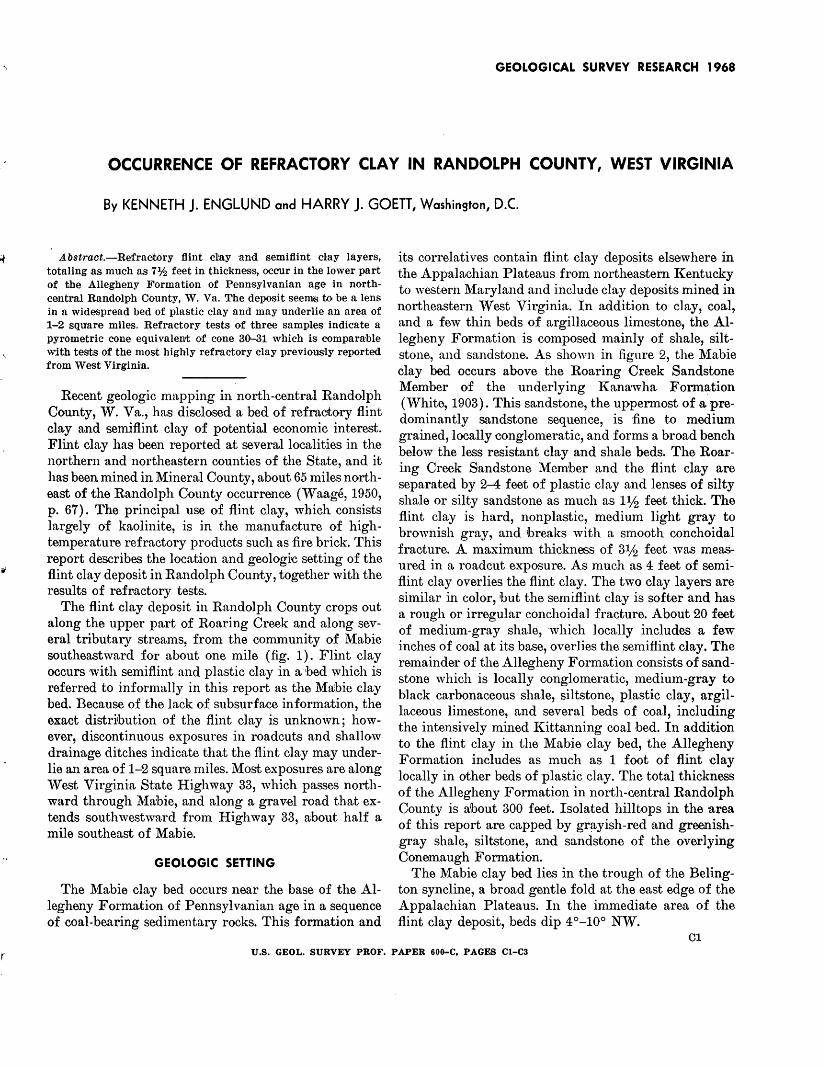
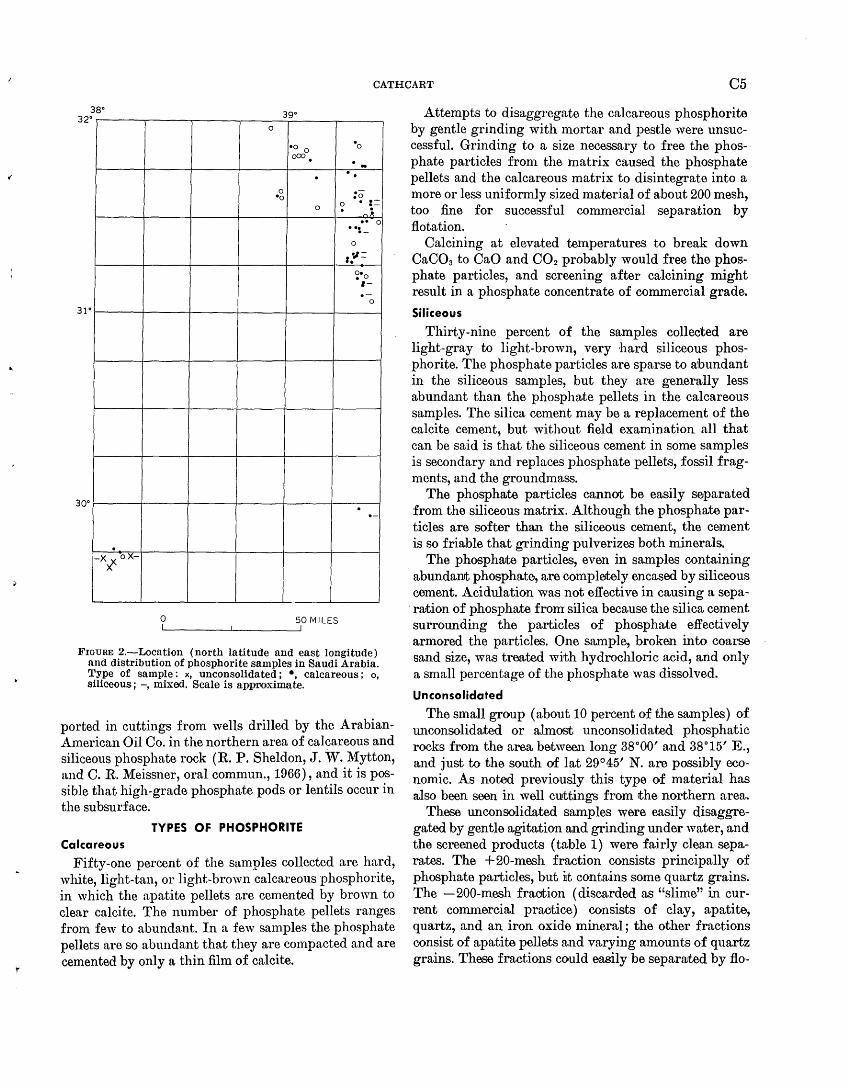
The samples of phosphate rock are of three types: calcareous, siliceous, and unconsolidated. About 90 percent of the samples are of the calcareous and siliceous types and are randomly distributed throughout the sampled area (fig. 2). Where more than one sample was taken at a single locality, both calcareous and siliceous types are
C4
0
Area of report
SAUDI
IRAQ
ARABIA
400 MILES
FIGURE 1.-Index map of northern Saudi Arabia, showing location of area where phosphorite samples were collected.
represented. The unconsolidated phosphorite samples in this collection are grouped in the area just south of lat 29°45' N., and between long 38°00' and 38°15' E. (fig. 2) .1 However, unconsolidated phosphorite is also re-
1 More recent work by Meissner (1967) has extended the phosphatebearing a·rea to West Thaniyat (lat 29.40' and 29°43' N. t() long 37•52' and 38.02' E.), where phosphate rock is found at the top of the Aruma Formation (Cretaceous). In that area, four layers of phosphate rock have an average P 20s content of about 29 percent.
U.S. GEOL. SURVEY PROF. PAPER 600-C, PAGES C4-Cl2
CATHCART C5
38• 39• 32·r-----,-----,-----.------r----~-----.
0
•o o ()(X) •
0
•• 0 . •:_
. -0
31·r-----+-----+-----4-----~-----+----~
3o·r-----+-----+-----~----~-----r----~
0 50 MILES
FIGURE 2.-Location (north latitude and east longitude) nnd distribution of phosphorite samples in Saudi Arabia. Type of sample: x, unconsolidated; •, calcareous; o, siliceous; -, mixed. Scale is appmximate.
ported in cuttings from wells drilled by the ArabianAmerican Oil Co. in the northern area of calcareous and siliceous phosphate rock (R. P. Sheldon, J. W. Mytton, and C. R. Meissner, oral commun., 1966), and it is possible that high-grade phosphate pods or lentils occur in the subsurface.
TYPES OF PHOSPHORITE Calcareous
Fifty-one percent of the samples collected are hard, white, light-tan, or light-brown calcareous phosphorite, in which the apatite pellets are cemented by brown to clear calcite. The number of phosphate pellets ranges from few to abundant. In a few samples the phosphate pellets are so abundant that they are compacted and are cemented by only a thin film of calcite.
Attempts to disaggregate the calcareous phosphorite by gentle grinding with mortar and pestle were unsuccessful. Grinding to a size necessary to free the phosphate particles from the matrix caused the phosphate pellets and the calcareous matrix to disintegrate into a more or less uniformly sized material of about 200 mesh, too fine for successful commercial separation by flotation .
Calcining at elevated temperatures to break down CaC03 to CaO and C02 probably would free the phosphate particles, and screening after calcining might result in a phosphate concentrate of commercial grade .
Siliceous
Thirty-nine percent of the samples collected are light-gray to light-brown, very hard siliceous phosphorite. The phosphate particles are sparse to a:bundant in the siliceous samples, but they are generally less abundant than the phosphate pellets in the calcareous samples. The silica cement may be a replacement of the calcite cement, but without field examination all that can be said is that the siliceous cement in some samples is secondary and replaces phosphate pellets, fossil fragments, and the groundmass.
The phosphate particles cannot be easily separated from the siliceous matrix. Although the phosphate particles are softer than the siliceous cement, the cement is so friable that grinding pulverizes both minerals.
The phosphwte particles, even in samples containing abundant phosphate, are completely encased by siliceous cement. Acidulation was not effective in causing a sepa-
. ra:tion of phosphate from silica because the silica cement surrounding the particles of phosphate effectively armored the particles. One sample, broken into coarse sand size, was treated with hydrochloric acid, and only a small percentage of the phosphate was dissolved.
Unconsolidated
The small group (about 10 percent of the samples) of unconsolidated or almost unconsolidated phosphatic rocks from the area between long 38°00' and 38°15' E., and just to the south of lat 29°45' N. are possibly economic. As noted previously this type of material has also boon soon in well cuttings from rthe northern area.
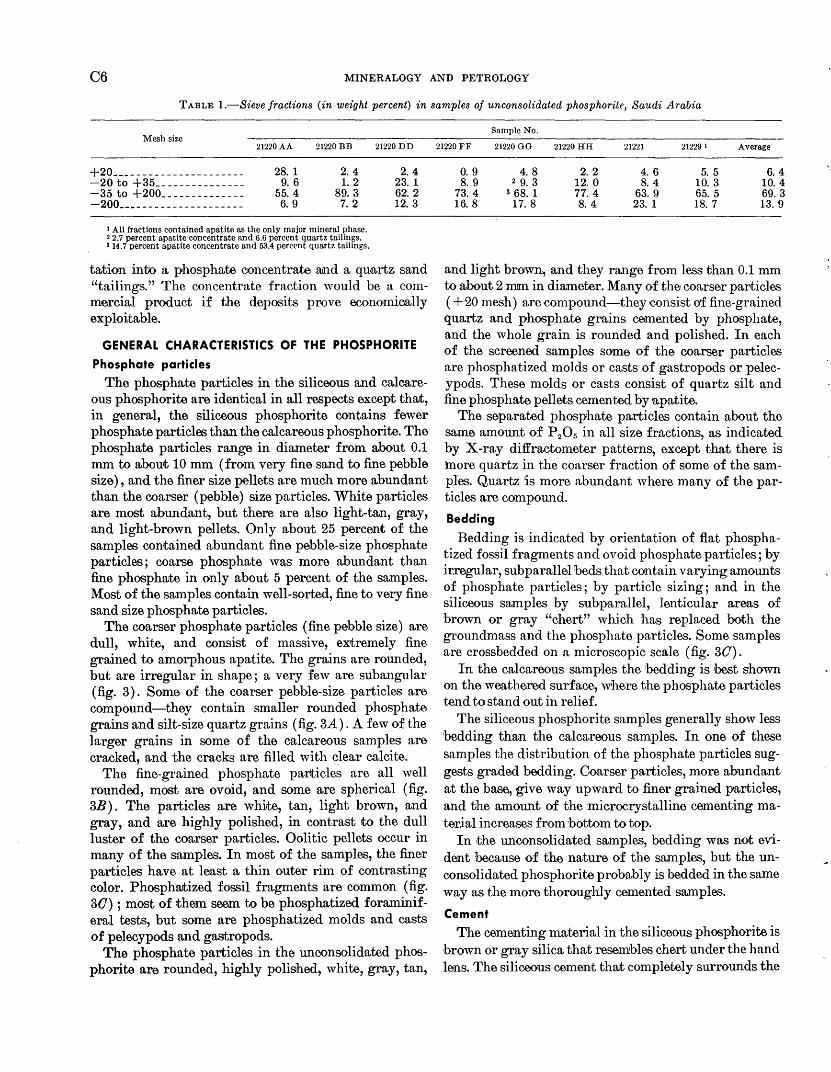
These unconsolidated samples were easily disaggregated by gentle agitation and grinding under water, and the screened products (table 1) were fairly clean separates. The +20-mesh fraction consists principally of phosphate particles, but ~t contains some quartz grains. The -200-mesh fraction (discarded as "slime" in current commercial pracrtice) consists of clay, apatite, quartz, and an iron oxide mineral; the other fractions consist of apatite pellets and varying amounts of quartz grains. These fractions could easily be separated by flo-
C6 MINERALOGY AND PETROLOGY
TABLE 1.-Sieve fractions (in weight percent) in samples of unconsolidated phosphorite, Saudi Arabia
Mesh size
~20 _____________________ _ -20 to ~35 ______________ _ -35 to ~200 _____________ _ -200 ____________________ _
21220 AA
28. 1 9. 6
55.4 6. 9
21220 BB
2. 4 1.2
89.3 7. 2
I All fractions contained apatite as the only major mineral phase. 2 2.7 percent apatite concentrate and 6.6 percent quartz tailings. a 14.7 percent apatite concentrate and 53.4 percent quartz tailings.
21220 DD
2. 4 23. 1 62. 2 12. 3
tation intJo a phosphate concentrate and ·a quartz sand "tailings." The concentrate fraction would be a commercial product if the deposits p11ove economically exploitable.
GENERAL CHARACTERISTICS OF THE PHOSPHORITE
Phosphate particles
The phosphate particles in the siliceous and calcareous phosphorite are identical in all respects except thrut, in general, the siliceous phosphorite contains fewer phosphate particles than the calcareous phosphorite. The phosphate particles range in diameter from about 0.1 mm to about 10 mm (from very fine sand to fine pebble size), and the finer size pellets are much more abundant than the coarser (pebble) size particles. White particles are most abundant, but there are also light-tan, gray, and light-brown pellets. Only about 25 percent of the samples contained abundant fine pebble-size phosphate particles; coarse phosphate was more abundant than fine phosphate in only about 5 percent of the samples. Most of the samples contain well-sorted, fine to very fine sand size phosphate pa.rticles.
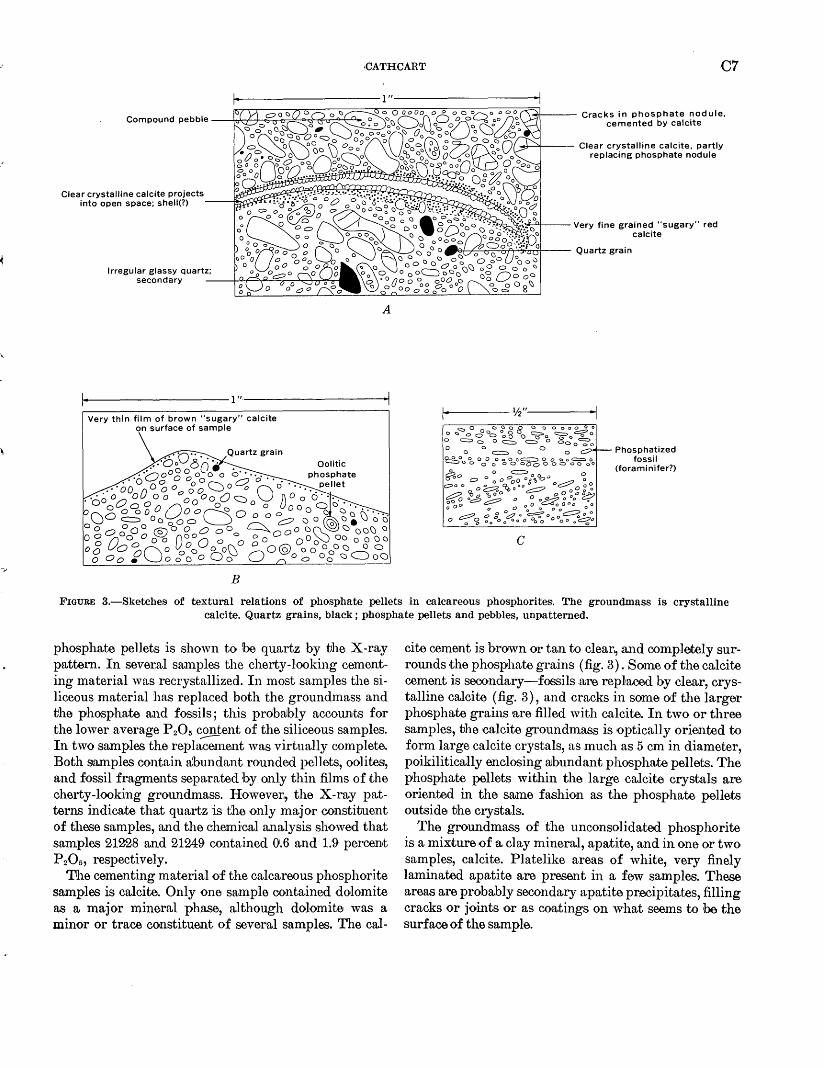
The coarser phosphate particles (fine pebble size) are dull, white, and consist of massive, extremely fine grained to amorphous apatite. The grains are rounded, but are irregular in shape; a very few are subangular (fig. 3). Some of the coarser pebble-size particles are compound-they contain smaller rounded phosphate grains and silt-size quartz grains (fig. 3A) . A few of the larger grains in some of the calcareous samples are cracked, and the cracks are filled with clear calcite.
The fine-grained phosphate pa:riticles are all well rounded, most are ovoid, and some are spherical (fig. 3B). The particles are white, tan, light brown, and gray, and are highly polished, in contrast rto the dull luster of the coarser particles. Oolitic pellets occur in many of the samples. In most of the samples, the finer particles have at least a thin outer rim of contrasting color. Phosphrutized fossil fragments are common (fig. 30) ; most of them seem to be phosphatized foraminiferal tests, but some are phosphatized molds and casts of pelecypods and gastropods.
The phosphate particles in the unconsolidated phosphorite are rounded, highly polished, white, gray, tan,
21220 FF
0. 9 8. 9
73. 4 16. 8
Sample No.
21220 GG 21220 HH
4. 8 2 9. 3
3 68. 1 17. 8
2. 2 12. 0 77. 4 8. 4
21221
4. 6 8. 4
63. 9 23. 1
21229 I Average
5. 5 6.4 10. 3 10. 4 65. 5 69.3 18. 7 13. 9
and light brown, and they range from less than 0.1 mm to about 2 mm in diamete~. Many of the coarser pa~ticles ( + 20 mesh) are compound-they consist o'f fine-grained quartz and phosphate grains cemented by phosphate, and the whole grain is rounded and polished. In each of the screened samples some of the coarser particles are phosphatized molds or casts of gastropods or pelecypods. These molds or casts consist of quartz silt and fine phosphate pellets cemented by 'apatite.
The separated phosphate particles conta.in about the same amount of P 20s in all size fractions, as indicated by X-ray diffractometer patterns, except that there is more quartz in the coarser fraction of some of the samples. Quartz is more abundant where many of the particles are oompound.
Bedding
Bedding is indicated by orientation of flat phosphatized fossil fragments and ovoid phosphate particles; by ir.regular, subparallel beds tha.t contain varying amounts of phosphate particles; by particle sizing; and in the siliceous samples by subparallel, lenticular areas of brown or gray "chert" which has replaced both the groundmass and the phosphate particles. Some samples are cross bedded on a microscopic scale (fig. 30).
In the calcareous samples the bedding is rbest shown on the weathered surface, where the phosphate particles tend to stand out in relief.
The siliceous phosphorite samples generally show less 'bedding than the calcareous samples. In one of these samples the distribution of the phosphate particles suggests graded bedding. Coarser particles, more rubundant at the base, ~give way upward to finer grained particles, and the amount of the microcrystalline cementing material increases from bottom to top.
In ~the unconsolidated samples, bedding was not evidoot because of the nature of the samples, but the unconsolidated phosphorite probably is bedded in the same way as the more thoroughly cemented samples.
Cement
The cemooting material in the siliceous phosphorite is brown or gray silica that resembles chert under the hand lens. The siliceous cement that completely surrounds the
'CATHCART C7
Clear crystalline calcite projects into open space; shell(?) --~n'i)8"r
Irregular glassy quartz; secondary --+"'-~'1-"'--=>.---:::-'"="1'"?"!"':~
A
14------------1"·----------+1
Very thin film of brown "sugary" calcite on surface of sample
B
\4}1--- Cracks in phosphate nodule, cemented by calcite
~_,__ ___ Clear crystalline calcite, partly replacing phosphate nodule
.~'+---Very fine grained "sugary" red calcite
c
FIGURE 3.-Sketches of textural relations of phosphate pellets in calcareous phosphorites. The ground.mass is crystalline calcite. Quartz grains, black; phosphate pellets and pebbles, unpatterned.
phosphate pellets is shown to 'be quartz by the X-ray pattern. In several samples the cherty-looking cementing material was recrystallized. In most samples the siliceous material has replaced both the groundmass and the phosphate and fossils; this prdbaibly accow11ts for the lower average P205 ~ent of the siliceous samples. In two samples the replacetnent wa,s virtually complete. Both samples contain abundant rounded pellets, oolites, and fossil fragments separated by only thin films of ~the cherty-looking groundmass. However,, the X-ray patterns indicate that quartz is the only major constituent of these samples, and the chemical analysis showed that samples 21228 'and '21249 contained 0.6 and 1.9 percent P20s, respectively. ~he cementing material of the calcareous phosphorite
samples is calcite. Only one sample contained dolomite as a major mineral phase, although dolomite was a minor or trace constituent of several samples. The cal-
cite cement is brown or tan to clear,, .and completely surrounds the phosphate grains (fig. 3). Some of the calcite cement is secondary-fossils .rure replraced by clear, crystalline calcite (fig. 3), and cracks in some of the larger phosphate grains 'are filled with calcite. In two or three samples, the calcite groundmass is optically oriented to form large calcite crystals, as much as 5 em in diameter, poikilitically enclosing aJbundant phosphate pellets. The phosphate pellets within the large calcite crystals are oriented in the same fashion as the phosphate pellets outside the crystals.
The groundmass of the unconsolidated phosphorite is a mixture of a clay mineral, apatite, a.nd in one or two samples, calcite. Platelike areas of white, very finely laminated apatite are present in a few samples. These areas are probably secondary apatite precipitates, filling cracks or joints or as coatings on what seetns to be the surface of the sample.
C8 MINERALOGY AND PETROLOGY
Fossils
Microfossils (Foraminifera) and frag·ments of megafossils (pelecypods and gastropods) are found in many samples; and fl~t o:r slightly curved, rounded fragments in many samples may be fossil fragmoots that have been phosphatized. Megafossils in the siliceous samples tend to be replaced by silica, and in the calcareous samples, by calcite; but most fossil fragments are phosphatized. For example, in the unconsolidated samples, many of the coarse fragments are phosphatized molds and casts of gastropods or pelecypods, a.nd similar frrugmoots in the calcareous and siliceous phosphorites are believed to be phosphatized, although the grains could not be separated for analysis. Microfossils are ahundant in only one sample (21228), and here the phosphate grains and the microfossils are almost completely replaced by silica.
MINER,ALOGY
The mineralogy, as determined by X-ray diffractometer, is basically simple. The phosphate mineral is a carbonate fluorapatite, and is present as a major mineral phase in most samples, or as amino~ or tl"ace constituent in a few samples.
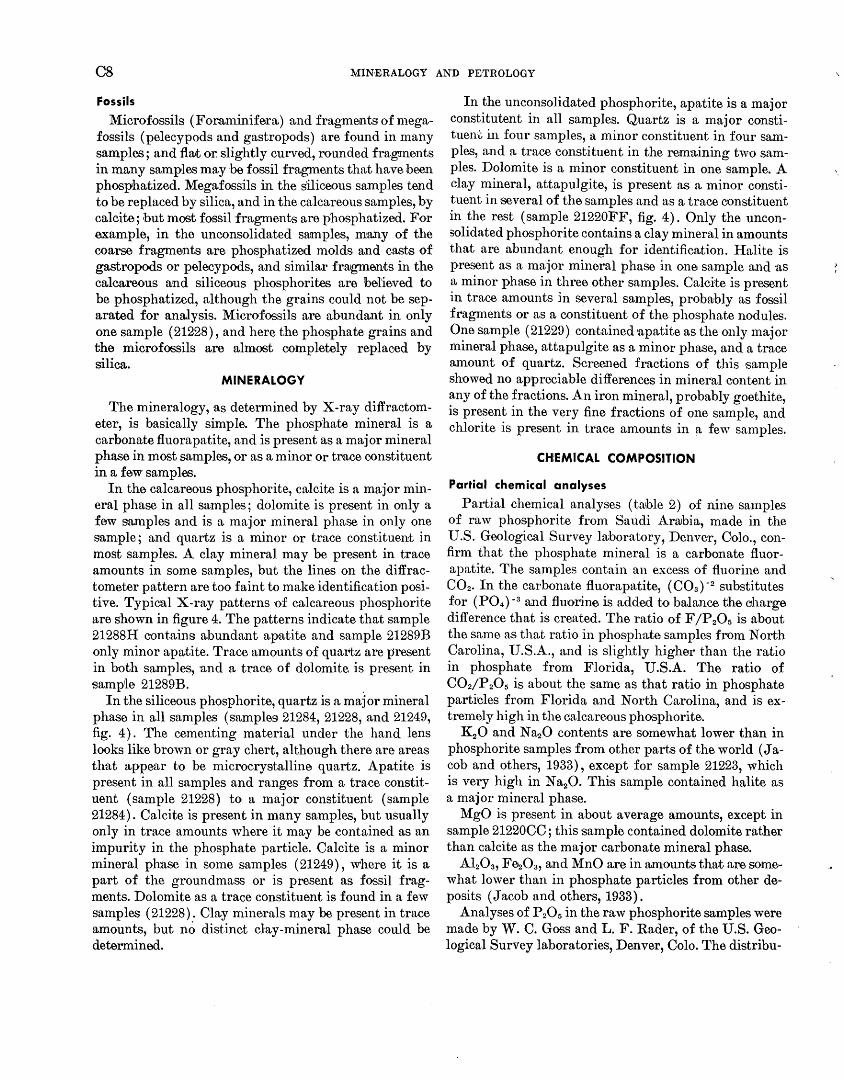
In the calcareous phosphorite, calcite is a major mineral phase in aU samples; dolomite is present in only a few samples and is a major mineral phase in only one sample; and quartz is a minor or trace constituent in most samples. A clay mineral may be present in trace amounts in some samples, but the lines on the diffractometer pattern are too faint to make identification positive. Typical X-ray patterns of calcareous phosphorite are shown in figure 4. The patterns indicate that sample 21288H contains abundant apatite and sample 21289B only minor apatite. Trace amounts of quartz are present in both samples, and a trace of dolomite. is present in s'amp'le 21289B. .
In the siliceous phosphorite, quartz is a major mineral phase in all samples (samples 21284, 21228, and 21249, fig. 4) . The cementing material under the hand lens looks like brown or gray chert, although there are areas that appear to be microcrystalline quartz. Apatite is present in all samples and ranges from a trace constituent (sample 21228) to a major constituent (sample 21284). Calcite is present in many samples, but usually only in trace amounts where it may be ·contained as an impurity in the phosphate particle. Calcite is a minor mineral phase in some samples (21249), where it is a part of the groundmass or is present as fossil fragments. Dolomite as a trace constituent is found in a few samples (21228). Clay minerals may be present in trace amounts, but no distinct clay-mineral phase could be determined.
In the unconsolidated phosphorite, apatite is a major constitutent in all samples. Quartz is a major constituent in four samples, a minor constituent in four samples, and a trace constituent in the rem·aining two samples. Dolomite is a minor constituent in one sample. A clay mineral, attapulgite, is present as a minor constituent in several of the samples and as a trace constituent in the rest (sample 21220FF, fig. 4). Only the unconsolidated phosphorite contains a clay mineral in amounts that are abundant enough for identification. Halite is present as a major mineral phase in one sample and as a minor phase in three other samples. Calcite is present in trace amounts jn several samples, probably as fossil fragments or as a constituent of the phosphate nodules. One sample (21229) contained apatite as the only major mineral phase, attapulgite as a minor phase, and a trace amount of qU'artz. Screened fractions of this sample showed no appreciable differences in mineral content in any of the fractions. An iron mineral, probably goethite, is present in the very fine fractions of one sample, and chlorite is present in trace amounts in ~ few samples.
CHEMICAL COMPOSITION
Partial chemical analyses
Partial chemical analyses (truble 2) of nine samples of raw phosphorite from Saudi Arrubia, made in the U.S. Geologica,! Survey laboratory, Denver, Oolo., confirm that the phosphate mineral is a carbonate fluorapatite. The samples contain an excess of fluorine and C02. In the carbonate fluorapatite, ( C03 ) - 2 substitutes for (P04) -a and fluorine is added to balance the CJhavge difference that is created. The ratio of F jP 20 5 is about the same as that ratio in phosphate samples from North Carolina, U.S.A., and is slightly higher than the nl-tio in phosphate from Florida, U.S.A. The ratio of C02/P 205 is about the same as that ratio in phosphate partides from Florida and North Carolina, and is extremely high in the calcareous phosphorite.
K20 and Na20 contents are somewhat lower than in phosphorite samples from other parts of the world ( J acob and others, 1933), except for sample 21223, which is very high in N a20. This sample contained halite as a major mineral phase.
MgO is present in about average amounts, except in sample 21220CC; this sample contained dolomite rather than calcite as the major carbonate mineral phase.
Al20a, Fe20a, and MnO are in amounts that are somewhat lower than in phosphate particles from other deposits (Jacob and others, 1933).
Analyses of P z05 in the raw phosphorite samples were made by W. C. Goss and L. F. Rader, of the U.S. Geological Survey laboratories, Denver, Colo. The distribu-
t en z I.JJ fz I.JJ > i= <( ...J I.JJ a:::
100
Sample 21288H
22.0 percent P2 Os
50 Sample
0
100
50
0
100
50
0
21220FF 24.5 percent
P2 0 5
Sample 212898
3.3 percent P2 Os
Sample 21249
1.9 percent P2 Os
Sample 21228
0.6 percent Il! Os
Sample 21284
10.7 percent p2 05
0 C\1
0 Ln
50 40
CATHCART
u
30
DEGREES 28
20 10 2
100
50
0
100
>f-u; z I.JJ f-
50 z I.JJ > i= <( ...J I.JJ a:::
0
100
50
0
FIGURE 4.-Selected X-ray diffractometer patterns of Saudi Arabian phosphorites. Samples 21288H and 21289B, calcareous phosphorite; sample 21220FF, unconsolidated phosphorite; and samples 21249, 21228, and 21284, siliceous phosphorite. A, apatite; 0, calcite; Q, quartz; D, dolomite; Att, attapulgite.
CIO MINERALOGY AND PETROLOGY
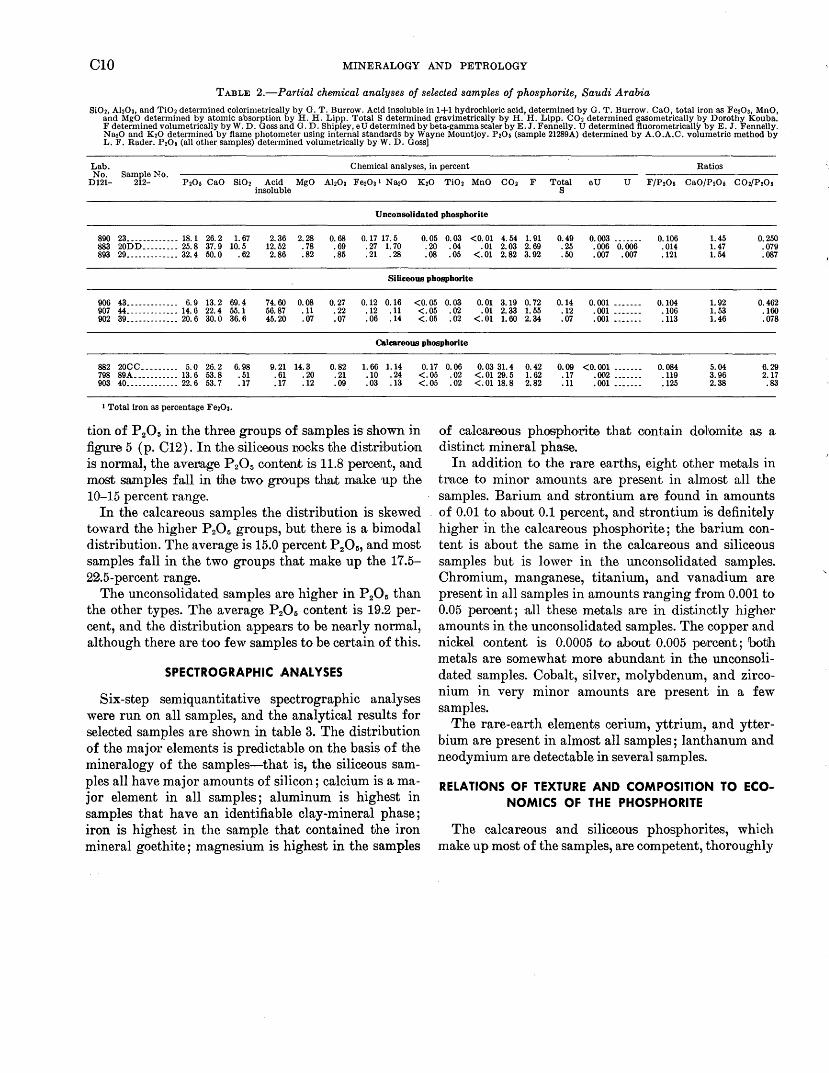
TABLE 2.-Partial chemical analyses of selected samples of phosphorite, Saudi Arabia
Si02, Ah03, and Ti02 determined colorimetrically by G. T. Burrow. Acid insoluble in 1+1 hydrochloric acid, determined by G. T. Burrow. CaO, total iron as Fe203, MnO, and MgO determined by atomic absorption by H. H. Lipp. Total S determined gravimetrically by H. H. Lipp. C02 determined gasometrically by Dorothy Kouba. F determined volumetrically byW. D. Gossand G. D. Shipley, eU determined bybeta-gammascalerby E. J. Fennelly. U determined fluorometrically by E. J. Fennelly. Na20 and K20 determined by flame photometer using internal standards by Wayne Mountjoy. P20~ (sample 21289A) determined by A.O.A.C. volumetric method by L. F. Rader. P20~ (all other samples) determined volumetrically by W. D. Goss]
Lab. Chemical analyses, in percent Ratios No. Sample No.
D121- 212- P20~ CaO Si02 Acid MgO Ah03 Fe203' Na20 K20 Ti02 MnO C02 F Total eU u F/P20~ CaO/P20~ C02/P20s insoluble s
Unconsolidated phosphorite
890 23_--- --------- 18. 1 26.2 1. 67 2.36 2.28 0.68 0. 17 17.5 0.05 0.03 <0.01 4.54 1. 91 0.49 0.003 ------- 0.106 1. 45 0.250 883 20DD _________ 25.8 37.9 10.5 12.52 . 78 .69 .27 1. 70 .20 .04 .01 2.03 2.69 .25 .006 0.006 .014 1. 47 .079 893 29 _____________ 32.4 50.0 . 62 2.86 .82 .85 . 21 .28 .08 .05 <.01 2.82 3.92 .50 .007 .007 .121 1.54 .087
Siliceous phosphorite
906 43 __ ----------- 6. 9 13.2 69.4 74.60 0.08 0. 27 0.12 0.16 <0.05 907 44 _____________ 14.6 22.4 55.1 56.87 .11 .22 .12 .11 <.05 902 39 _____________ 20.6 30.0 36.6 45.20 .07 .07 .06 .14 <.05
0.03 0.01 3.19 0. 72 .02 .01 2.33 1. 55 .02 <.01 1.60 2.34
0.14 0. 001 -------.12 .001 -------.07 .001 -------
0.104 .106 .113
1. 92 1. 53 1. 46
0.462 .160 .078
Calcareous phosphorite
882 20CC _________ 5.0 26.2 6.98 9. 21 14.3 0.82 1. 66 1.14 0.17 798 89A ___________ 13.6 53.8 .51 . 61 .20 . 21 .10 .24 <.05 903 40_------------ 22. 6 53. 7 . 17 .17 .12 .09 .03 .13 <.05
1 Total iron as percentage Fe201.
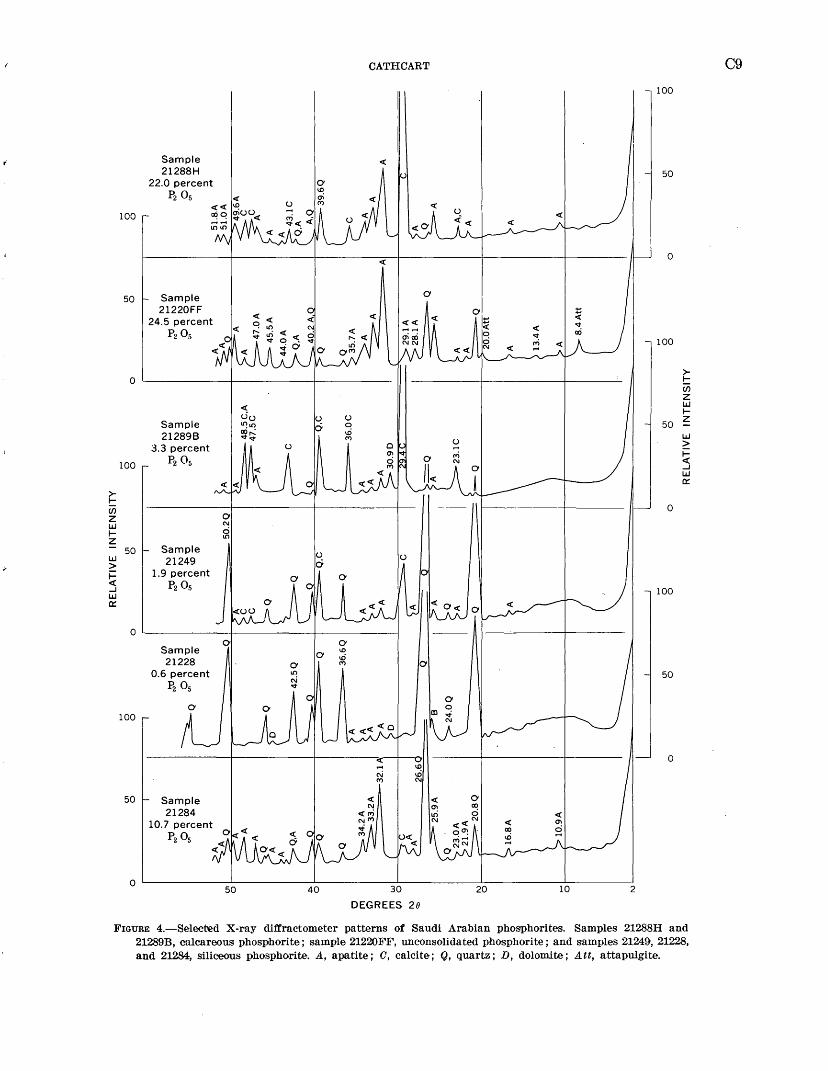
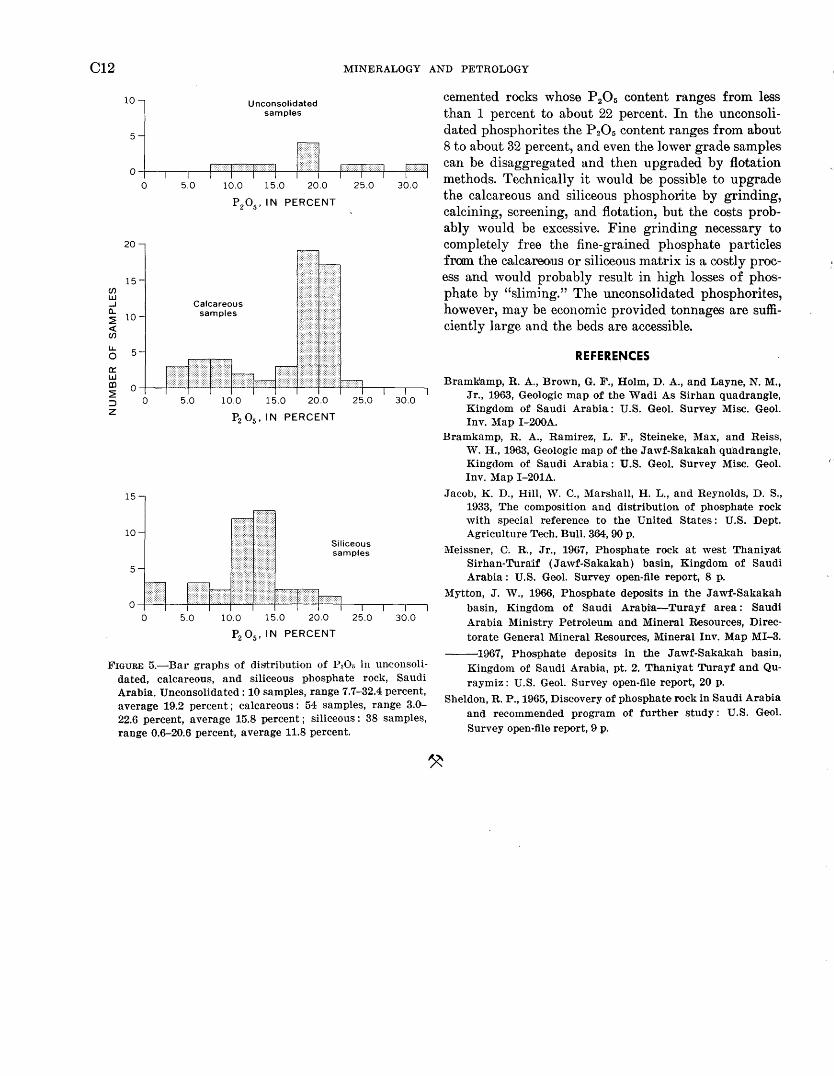
tion of P 20 11 in the three groups of samples is shown in figure 5 ( p. 012). In the siliceous I10Cks the distribution is normal, the average P205 content is 11.8 percent, and most samples fall in the two groups tha.t make up the 10-15 percent range.
In the calcareous samples the distribution is skewed toward the higher P 20 5 groups, but there is a bimodal distribution. The average is 15.0 percent P 20 5, and most samples fall in the two groups that make up the 17.5-22.5-percent range.
The unconsolidated samples are higher in P 205 than the other types. The average P 20 5 content is 19.2 percent, and the distribution appears to be nearly normal, although there are too few samples to be certain of this.
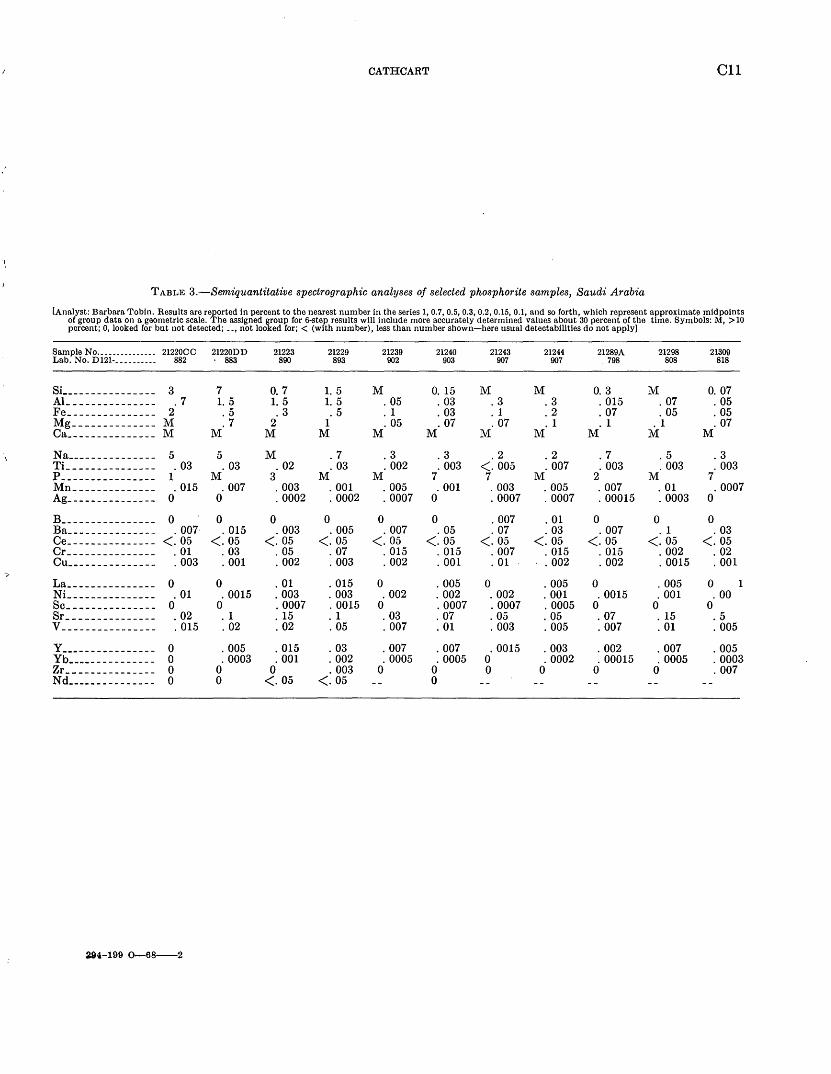
SPECTROGRAPHIC ANALYSES
Six-step semiquantitative spectrographic analyses were run on all samples, and the analytical results for selected samples are shown in table 3. The distribution of the major elements is predictable on the basis of the mineralogy of the samples-that is, the siliceous samples all have major amounts of silicon; calcium is a major element in all samples; aluminum is highest in samples that have an identifiable clay-mineral phase; iron is highest in the sample that contained the iron mineral goethite; magnesium is highest in the samples
0.06 0. 03 31.4 0.42 0.09 .02 <.01 29.5 1.62 .17 .02 <.01 18.8 2.82 .11
<0.001 ------- 0.084 .002 ------- .119 .001 ------- .125
5.04 3.96 2.38
6.29 2.17 .83
of calcareous phosphorite that contain do~omite as a distinct mineral phase.
In addition to the rare earths, eight other metals in tvace to minor amounts are present in almost all the samples. Barium and strontium are found in amounts of 0.01 to about 0.1 percent, and strontium i·s definitely higher in the calcareous phosphorite; the barium content is about the same in the calcareous and siliceous samples but is lower in the unconsolidated samples. Chromium, manganese, titanium, and vanadium are present in all samples in amounts ranging from 0.001 to 0.05 percent; all these metals are in distinctly higher amounts in the unconsolidated samples. The copper and nickel content is 0.0005 to about 0.005 percent; both metals are somewhat more abundant in the unconsolidated samples. Cobalt, silver, molybdenum, and zirconium in very minor amounts are present in a few samples.
The rare-earth elements cerium, yttrium, and ytterbium are present in almost all samples; lanthanum and neodymium are detectable in several samples.
RELATIONS OF TEXTURE AND COMPOSITION TO ECONOMICS OF THE PHOSPHORITE
The calcareous and siliceous phosphorites, which make up most of the samples, are competent, thoroughly
CATHCART Cll
TABLE 3.-Semiquantitative spectrographic analyses of selected phosphorite samples, Saudi Arabia
!Analyst: Barbara Tobin. Results are re~ortcd in percent to the nearest number in the series 1, 0.7, 0.5, 0.3, 0.2, 0.15, 0.1, and so forth, which represent approximate midpoints of group data on a geometric scale. he assigned roup for 6-step results will include more accurately determined values about 30 percent of the time. Symbols: M, >10 percent; 0, looked for but not detected; __ , not loo ed for;< (with number), less than number shown-here usual detectabilities do not apply]
Sample No. ______________ 2122000 21220DD 21223 21229 21239 21240 21243 21244 21289A 21298 21309 Lab. No. Dl21·---------- 882 883 890 893 002 903 907 007 798 808 818
Si ________________ 3 7 0. 7 1.5 M 0. 15 M M 0. 3 M 0. 07 Al _______________ .7 1.5 1.5 1.5 . 05 . 03 .3 .3 . 015 . 07 . 05 Fe _______________
2 .5 .3 .5 . 1 . 03 . 1 .2 . 07 . 05 . 05
~a~~~============ M .7 2 1 . 05 . 07 . 07 . 1 . 1 . 1 . 07 M M M M M M M M M M M
~a _______________ 5 5 M .7 .3 .3 .2 .2 .7 .5 .3 Ti _______________ . 03 . 03 . 02 . 03 . 002 . 003 <. 005 . 007 . 003 . 003 . 003 p ________________
1 M 3 M M 7 7 M 2 M 7 Mn ______________ . 015 . 007 . 003 . 001 . 005 . 001 . 003 . 005 . 007 . 01 . 0007 Ag _______________
0 0 . 0002 . 0002 . 0007 0 . 0007 . 0007 . 00015 . 0003 0 B ________________
0 0 0 0 0 0 . 007 . 01 0 0 0 Ba _______________ . 007· . 015 . 003 . 005 . 007 . 05 . 07 . 03 . 007 . 1 . 03 Ce _______________ <. 05 <. 05 <. 05 <. 05 <. 05 <. 05 <. 05 <. 05 <. 05 <. 05 <. 05 Cr _______________ . 01 . 03 . 05 . 07 . 015 . 015 . 007 . 015 . 015 . 002 . 02 Cu _______________ . 003 . 001 . 002 . 003 . 002 . 001 . 01 . 002 . 002 . 0015 . 001
-;;-- La _______________ 0 0 . 01 . 015 0 . 005 0 . 005 0 . 005 0 1
~i _______________ . 01 . 0015 . 003 . 003 . 002 . 002 . 002 . 001 . 0015 . 001 . 00 Sc _______________
0 0 . 0007 . 0015 0 . 0007 . 0007 . 0005 0 0 0 Sr _______________ . 02 . 1 . 15 . 1 . 03 . 07 . 05 . 05 . 07 . 15 .5 v ________________ . 015 . 02 . 02 . 05 . 007 . 01 . 003 . 005 . 007 . 01 . 005
y ________________ 0 . 005 . 015 . 03 . 007 . 007 . 0015 . 003 . 002 . 007 . 005 Yb _______________ 0 . 0003 . 001 . 002 . 0005 . 0005 0 . 0002 . 00015 . 0005 . 0003 Zr _______________ 0 0 0 . 003 0 0 0 0 0 0 . 007
~d _______________ 0 0 <. 05 <. 05 0
294-199 0-68--2
C12 MINERALOGY AND PETROLOGY
(/) w ...J a.. ~ <! (/)
I.J... 0 0:: w en ~ ::J z
10
5
Unconsolidated samples
o~~~~422P34ZZ+--P£+1 --¥24ZS+~EZq 0
20
15
10
5
0 0
15
10
5
0
0
5.0 10.0 15.0 20.0 25.0
P 2 0 5 , IN PERCENT
Calcareous samples
5.0
5.0
10.0 15.0 20.0 25.0
P2 0 5 , IN PERCENT
Siliceous samples
10.0 15.0 20.0 25.0
P2 0 5 , IN PERCENT
30.0
30.0
30.0
FIGURE 5.-Bar graphs of distribution of P20o in unconsolidated, calcareous, and siliceous phosphate rock, Saudi Arabia. Unconsolidated: 10 samples, range 7.7-32.4 percent, average 19.2 percent; calcareous: 54 samples, range 3.0--22.6 percent, average 15.8 percent; siliceous: 38 samples, range 0.6-20.6 percent, average 11.8 percent.
cemented rocks whose P 20 5 content ranges from less than 1 percent to about 22 percent. In the unconsolidated phosphorites the P 205 content ranges from about 8 to about 32 percent, and even the lower grade samples can be disaggregated and then upgraded by flotation methods. Technically it would be possible to upgrade the calcareous and siliceous phosphorite by grinding, calcining, screening, and flotation, but the costs probably would be excessive. Fine grinding necessary to completely free the fine-grained phosphate particles from the calcareous or siliceous matrix is a costly process and would probably result in high losses of phosphate by "sliming." The unconsolidated phosphorites, however, may be economic provided tonnages are sufficiently large and the beds are accessible.
REFERENCES
Bramk!amp, R. A., Brown, G. F., Holm, D. A., and Layne, N. M., Jr., 1963, Geologic map of the Wadi As Sirhan quadrangle, Kingdom of Saudi Arabia: U.S. Geol. Survey Misc. Geol. Inv. Map I-200A.
Bramkamp, R. A., Ramirez, L. F., Steineke, Max, and Reiss, ,V. H., 1963, Geologic map of the Jawf-Sakakah qu!adrangle, Kingdom of Saudi Arabia: U . .S. Geol. Survey Misc. Geol. Inv. Map I-201A.
Jacob, K. D., Hill, W. C., Marshall, H. L., and Reynolds, D. S., 1933, The composition and distribution of phospha1te rock with special reference to the United States: U.S. Dept. Agriculture Tech. Bull. 364, 90 p.
Meissner, C. R., Jr., 1967, Phosphate rock at west Thaniyat Sirhan-Tura:if (Jawf-Sakakah) basin, Kingdom of Saudi Arabia: U.S. Geol. Survey open-file report, 8 p.
Mytton, J. W., 1966, Phosphate deposits in the Jawf-Sakakah basin, Kingdom of Saudi Arabi:a-Turayf area: Saudi Arabia Ministry Petroleum and Mineral Resources, Directorate General Mineral Resources, Mineral Inv. Map MI-3.
--1967, Phosphate deposits in the Jawf-Sakakah basin, Kingdom of Saudi Arabi:a, pt. 2. Thaniyat Turayf and Quraymiz: U.S. Geol. Survey open-file report, 20 p.
Sheldon, R. P., 1005, Discovery of phosphate rock in Saudi Arabia and recommended program of further study: U.S. Geol. Survey open-file report, 9 p.
GEOLOGICAL SURVEY RESEARCH 1968
ALBITE-PYROXENE-GLAUCOPHANE SCHIST FROM VALLEY FORD, CALIFORNIA
By TERRY E. C. KEITH and ROBERT G. COLEMAN, Menlo Park, Calif.
Abstract.-A single tectonic block of blueschist from Valley Ford, Calif., consists of an unusual assemblage of glaucophane and jadeitic pyroxene with later albite and a minor amount of analcime. Chemical analysis of the whole rock suggests a composition similar to an altered metagraywacke or keratophyre. Each mineral was carefully purified, and i'ts chemical composition, optical properties, and unit-cell parameters were determined. Concordant potassium-argon ages of 75 to 80 m.y. on glaucophane and albite indicate that the albite-jadeitic pyrox·ene-glaucophane assemblage originated a·s a result of a Late Cretaceous metamorphic event. The assemblage apparently re:flects several periods of tectonism and metamorphism under high-pressure-low .. temperature conditions of the blueschist facies. The blueschist tectonic block is rela,ted in time and style of metamorphism to other blueschists of the Franciscan Formation.
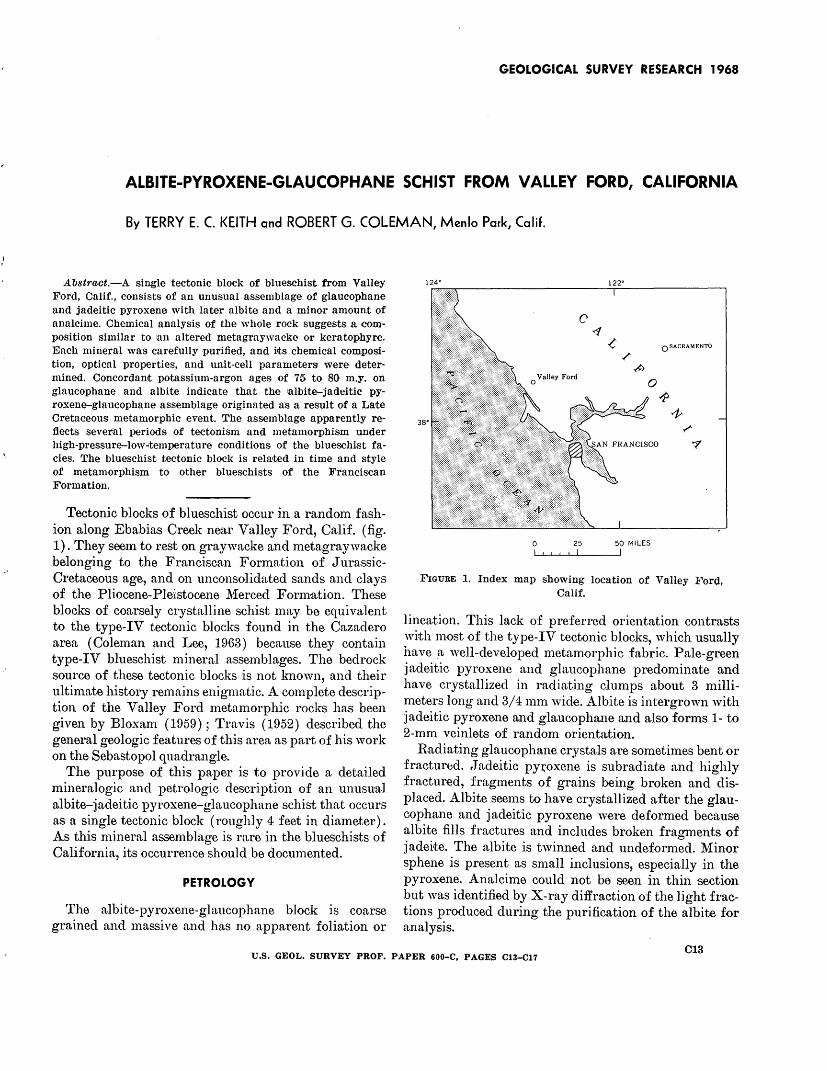
Tectonic blocks of blueschist occur in a random fashion along Ebabias Creek near Valley Ford, Calif. (fig. 1) . They seem to rest on graywacke and metagraywacke belonging to the Franciscan Formation of JurassicCretaceous age, and on unconsolidated sands and clays of the Pliocene-Pleistocene l\ierced Form·ation. These blocks of coarsely crystalline schist may be equivalent to the type-IV tectonic blocks found in the Cazadero area (Coleman and Lee, 1963) because they contain type-IV blueschist mineral assemblages. The bedrock source of these tectonic blocks is not known, and their ulti1nate history remains enigmatic. A complete description of the Valley Ford metamorphic rocks has been given by Bloxam (1959); Travis (1952) described the general geologic features of this area as part of his work on the Sebastopol quadrangle.
The purpose of this paper is to provide a detailed mineralogic and petrologic description of an unusual albite-jadeitic pyroxene-glaucophane schist that occurs as a single tectonic block (roughly 4 feet in diameter). As this n1ineral assemblage is rare in the blueschists of California, its occurrence should be documented.
PETROLOGY
The albite-pyroxene-glaucophane block is coarse grained and massive and has no apparent foliation or
124° 122°
QSACRAMENTO
0 Valley Ford
38°
0 25 50 MILES
FIGURE 1. Index map showing location of Valley Ford, Calif.
lineation. This lack of preferred orientation contrasts with most of the type-IV tectonic blocks which usually , ' ~1ave .. ~ well-developed metamorphic fabric. Pale-green Jadeitic pyroxene and glaucophane predominate and have crystallized in radiating clumps about 3 millinleters long and 3/4 mm wide. Albite is intergrown with jadeitic pyroxene and glaucophane and also forms 1- to 2-mm veinlets of random orientation.
Radiating glaucophane crystals are sometimes bent or fracturbd. Jadeitic pyl.'oxene is subradiate and highly fractured, fragments of grains being broken and displaced. Albite seems to have crystallized after the glaucophane and jadeitic pyroxene were deformed because albite fills fractures and includes broken fraQTilents of jadei,te. The albite is twinned and undeform:d. Minor sphene is present as small inclusions, especially in the pyroxene. Analcime could not be seen in thin section but was identified by X-ray diffraction of the li()'ht frac-
. b
twns produced during the purification of the albite for analysis.
U.S. GEOL. SURVEY PROF. PAPER 600-C, PAGES Cl3-Cl7 C13
C14 MINERALOGY AND PETROLOGY
The textural evidence suggests that the minerals present may not be in equilibrium because albite seems to be late and related to deformation. Cataclastic deformation of type-IV tectonic blocks is commonly associated with retrograde metamorphic assemblages, and the albite in this block may be retrograde. The presence of analcime suggests continued adjustment of the minerals to lower pressure-temperature conditions. Coleman (1961) has described analcime replacing jadeite and al-bite in the New Idria jadeite deposits.
Modal composition of the block is as follows:
Glaucophane ______ 35+5 volume percent Jadeitic pyroxene __ 44+5 Albite ------------21+5
This was established by point counting two thin sections and averaging the results; the accuracy was estimated using the curves of Van Der Plas and Tobi ( 1965) .
The mineral assemblage and the chemical composi-
X X
X
0 •
•+ + +
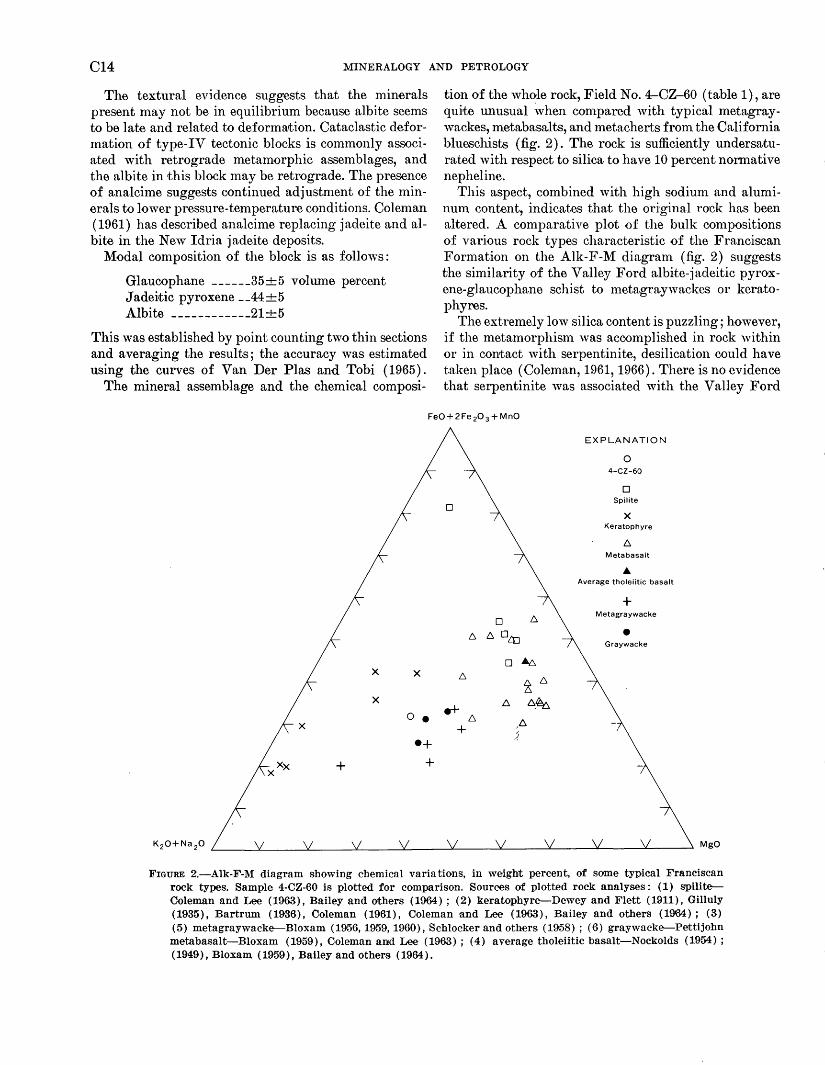
tion of the whole rock, Field No. 4-CZ-60 (table 1), are quite unusual \vhen compared with typical metagraywackes, metabasalts, and metacherts from the California blueschists (fig. 2). The rock is sufficiently undersaJturated with respect to silica to have 10 percent normative nepheline.
This aspect, combined with high sodium and aluminum content, indicates that the original rack has been altered. A comparative plot of the bulk compositions of various rock types characteristic of the Franciscan Formation on the Alk-F-M diagram (fig. 2) suggests the similarity of the Valley Ford albite-jadeitic pyroxene-glaucophane schist to metagraywackes or kera.tophyres.
The extremely low silica content is puzzling; however, if the metamorphism was accomplished in rock within or in contact with serpentinite, desilication could have taken place (Coleman, 1961, 1966). There is no evidence that serpentinite was associated with the Valley Ford
0
0 6.
6. 6. 04:1
0 110:. 6
~ 6.
6. 6_~ .-+-6.
6 + J
EXPLANATION
0 4-CZ-60
0 Spilite
X Keratophyre
6. Metabasalt
... Average tholeiitic basalt
+ Metagraywacke
• Graywacke
FIGURE 2.-Alk-F-M diagram showing chemical variations, in weight percent, of some typical Franciscan rock types. Sample 4-CZ-60 is plotted for comparison. Sources of plotted rock analyses: (1) spilite-Coleman and Lee (1963), Bailey and others (1964) ; (2) keratophyre-Dewey and Flett (1911), Gilluly ( 1935), Bartrum ( 1936), Coleman ( 1961), Coleman ·and Lee ( 1963) , Bailey and others ( 1964) ; ( 3) (5) metagraywacke-Bloxam (1956, 1959, 1960), Schlocker and others (1958) ; (6) graywacke-Pettijohn metabasalt-Bloxam (1959), Coleman and Lee (1963) ; ( 4) average tholeiitic basalt-Nockolds (1954) ; ( 1949), Bloxam ( 1959), Bailey and others ( 1964).
KEITH AND COLEMAN C15
. TABLE 1. Chemical and spectrographic analysis and CIPW norm of albite-jadeitic pyroxene-glaucophane schist, Valley Ford, Calif.
[U.S. Oeol. Survey Lab. No. 164063, Field No. 4-CZ-60]
1 Chemical analysis (weight percent)
Si 02-------------AhOa--- ---------Fe20a----- _ -------FeO _____________ _
~~:~~========== ~a20 ____________ _
Ka0-------------Ti0a------------P205-------------MnO ____________ _ H20+ --- _--- ___ ---H2o-____________ _ C02--------------
56.1 16.1 5.7 3.4 4.0 2.0 9.3 1.4
.95
.14
.26 1.2
.04
.09
TotaL ________ 100. 7 Density______ 3.16
2 3 Spectrographic analysis CIPW norm
(parts per million) (molecular percent)
Cu _______ 280 Pb________ 40 Co________ 20 ~i_ _______ 160 Cr________ 90 v _________ 18o Ga _______ 14 Sc________ 30 y - - - - - - - - 40 Yb_______ 3 La ________ <60 Zr ________ 190 ~b-------<20 Sr________ 38 Ba ________ 420
Or _______ _ Ab ______ _ ~e ______ _ Ac _______ _ Wo ______ _ En ______ _ Fs _______ _ Fo _______ _ Fa _______ _ Mt_ _____ _ IL _______ _ Ap ______ _ Cc _______ _
8.3 56.4 10.1 3.2 3.5 2.8
.4 5.1
.8 6.6 1.8
.3
.2
99.5
1, Whole-rock chemical analysis. Analyst, Paul Elmore, U.S. Geol. Survey. Analyzed by X-ray fluorescence supplemented by methods described by Shapiro and Brannock (1962).
2, Whole-rock quantitative spectrographic analysis; analyst, R. E. Mays, U.S. Geol. Survey.
3, CIPW norm calculated from whole-rock anaylsis.
blueschists, but close spatial relationships between serpentinite and type-IV tectonic blocks are common in other central California blueschist areas. The obvious tectonic displacement of these blocks will, of course, always leave open the question of origin because the original relationships have been destroyed.
MINERALOGY
Clean fractions of albite, jadeitic pyroxene, and glaucophane (0.147-0.074-mm grain size) were obtained by centrifuging in heavy organic liquids adjusted to appropriate densities and by repeated runs through a Frantz isodynamic separator. No impurities were detected on X-ray powder diffraction patterns of the final mineral separ.ates, but optical inspection revealed inclusions, which may be sphene, in the jadeitic pyroxene. The clean mineral fractions were used to obtain chemical and mineralogical data (tables 2 and 3).
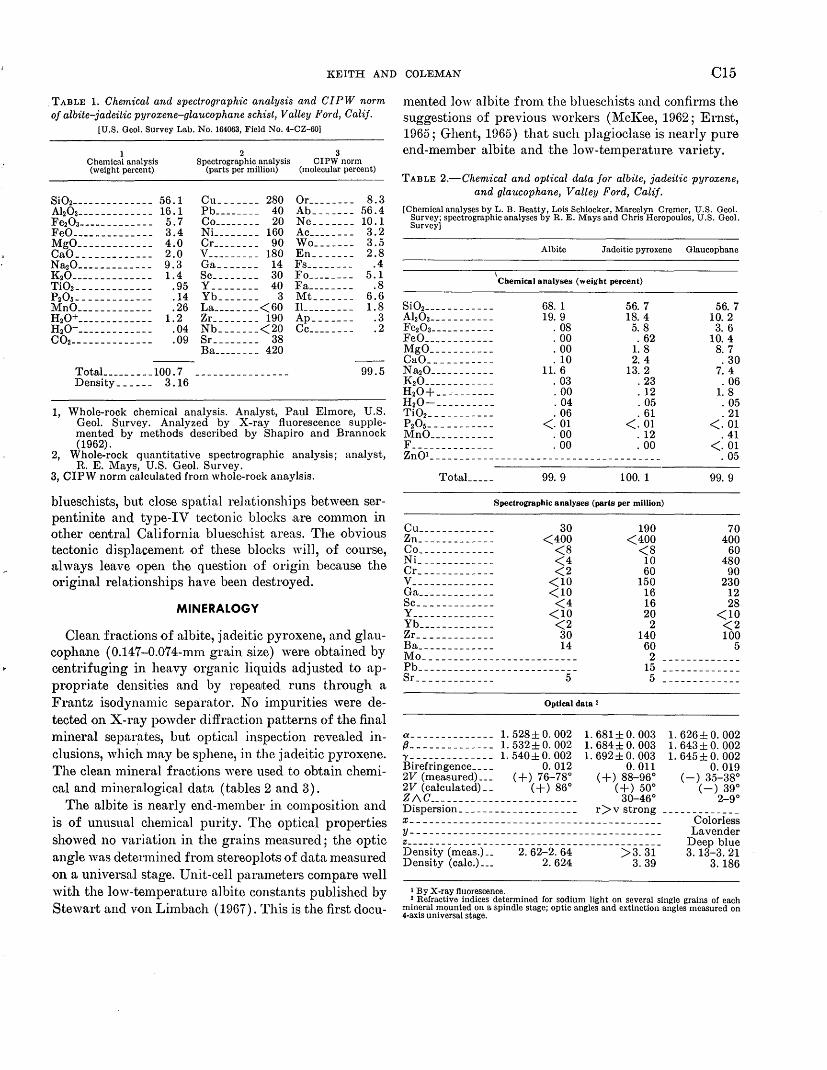
The albite is nearly end-member in composition and is of unusual chemical purity. The optical properties showed no variation in the grains measured; the optic angle was determined from stereo plots of data measured on a universal stage. Unit-cell parameters compare well with the low-temperature albite constants published by Stewart .and von Limbach (1967). This is the first docu-
mentedlow albite from the blueschists and confirms the suggestions of previous workers C~1cl(ee, 1962; Ernst, 1965; Ghent, 1965) that such plagioclase is nearly pure end-member albite and the low-temperature variety.
TABLE 2.-Chemical and optical data for albite, jadeitic pyroxene, and glaucophane, Valley Ford, Calif.
[Chemical analyses by L. B. Beatty, Lois Schlocker, Marcelyn Cremer, U.S. Ocol. Survey; spectrographic analyses by R. E. Mays and Chris Hcropoulos, U.S. Oeol. Survey]
Albite Jadeitic pyroxene Glaucophane
I Chemical analyses (weight percent)
Si02------------ 68.1 56.7 Al20a----------- 19. 9 18.4 Fe20a----------- . 08 5. 8 FeO____________ . 00 . 62 MgO___________ . 00 1. 8 CaO _ _ _ _ _ _ _ _ _ _ _ . 10 2. 4 ~a20___________ 11. 6 13.2 K20____________ . 03 . 23 H20+---'------- . 00 . 12 H20-__________ . 04 . 05 Ti02----------- . 06 . 61 P205----------- <· 01 <. 01 MnO___________ . 00 . 12 F _ _ _ _ _ _ _ _ _ _ _ _ _ _ . 00 . 00 Zn01 ______________________________________ _
TotaL ___ _ 99. 9 100. 1
Spectrographic analyses (parts per million)
Cu_____________ 30 Zn_____________ <400 Co_____________ <8 ~i_____________ <4 Cr_____________ <2 v______________ <10 Ga_____________ <10 Sc_____________ <4 y______________ <10 Yb _ _ _ _ _ _ _ _ _ _ _ _ _ < 2 Zr_____________ 30 Ba_____________ 14 Mo _________________________ _ Pb __________________________ _ Sr_____________ 5
Optical data 2
190 <400
<8 10 60
150 16 16 20
2 140
60 2
15 5
a ______________ 1. 528±0. 002 1. 681±0. 003 (3 ______________ 1. 532±0. 002 1. 684±0. 003 /'-------------- 1. 540±0. 002 1. 692±0. 003 Birefringence____ 0. 012 0. 011 2V (measured)___ ( +) 76-78° ( +) 88-96° 2V (calculated)__ ( +) 86° ( +) 50° z 1\ c ------------------------- 30-46° Dispersion____________________ r > v strong
X-----------------------------------------Y-----------------------------------------Z-------------------------------------------Density (meas.) __ 2. 62-2. 64 > 3. 31 Density (calc.)___ 2. 624 3. 39
1 By X-ray fluorescence.
56. 7 10. 2
3. 6 10. 4
8. 7 . 30
7. 4 . 06
1.8 . 05 . 21
<. 01 . 41
<. 01 . 05
99. 9
70 400
60 480
90 230
12 28
<10 <2 100
5
1. 626 ± 0. 002 1. 643± 0. 002 1. 645± 0. 002
0.019 (-) 35-38°
(-) 39° 2-9°
Colorless Lavender
Deep blue 3.13-3.21
3. 186
2 Refractive indices determined for sodium light on several single grains of each mineral mounted on a spindle stage; optic angles and extinction angles measured on 4-axis universal stage.
C16 MINERALOGY AND PETROLOGY
TABLE 3.-Chemical formulas and unit-cell parameters for albite, jadeitic pyroxene, and glaucophane, Valley Ford, Calif. [Albite measurements by T. L. Wright, jadeitic pyroxene by T. E. C. Keith, and glaucophane by J. J. Papike, U.S. Geol. Survey]
Albite Jadeitic pyroxene Glaucophane
Chemical Comulas
Cations on basis of_ ___________ 8(0) 6(0) 24(0,0H)
~C~======================== 2: 6~} 3. 00 ~~~~=================--===-- 1. 97} 2 00 SL _________________ _ . 03 · AL _________________ _ 7. 94 } . 06 8. 00
if!~j~~ ~--~-~-- ~~ ~~ ~ ~~ -~ ~: ~ ~ ~ i~ ~;l :: :: ~;;j~l-l-;~~ii i iii ii -~--__ : __ :_~ :~- :_~ -;_- :.~ :0
!;1
J} :: :: f;:_ :_:-!-! j j 11~ 1 i 1 i il ]{ __________________ _
1. 63 I . 02
1: ~~ 5. 13 1. 23 . 05
2. 01 } . 05 2. 07 . 01 OH _________________ _ 1. 68 1. 68
·Unit-cell parameters
a ___________________________ & 14A b ___________________________ 1a 78A
~--------------------------- ~ 16A a--------------------------- 94°16' ~---------------------------116°37' ~--------------------------- 87°41' Volume_____________________ 664A3
Single grains of glaucophane appear optically homogeneous, but a slight variation of refractive indices on various grains might indicate a small range in composition. The optic angle was measured directly on the universal stage and showed little variation. The composition of this glaucophane is similar to glaucophane from other Franciscan blueschists, and the unit-cell parameters are consistent with glaucophane II (highpressure, low-temperature glaucophane polymorph) of this compositional range (Coleman and Pa pjke, in press).
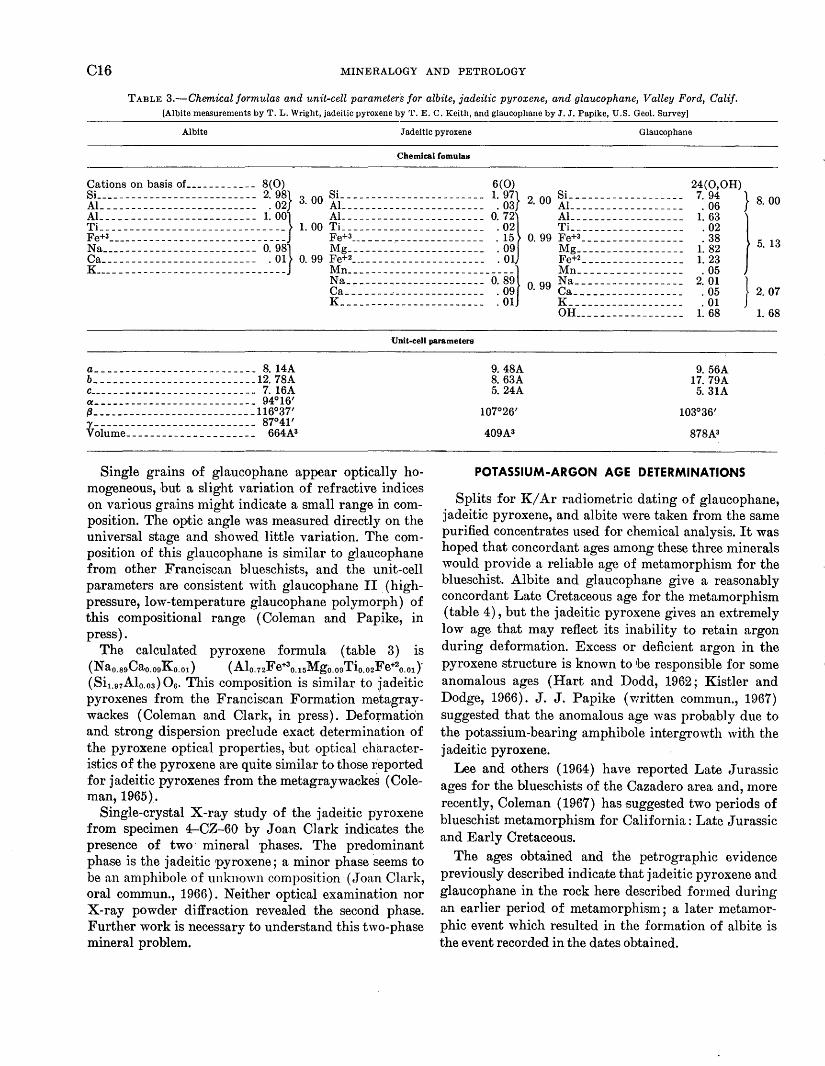
The calculated pyroxene formula (table 3) is (Nao.s9Cao.o9Ko.ot) (Alo.7zFe+3o.t5Mgo.o9Tio.ozFe+2o.ot} (Sit.97Alo.oa) Oa. This composition is similar to jadeitic pyroxenes from the Franciscan Formation metagraywackes (Coleman and Clark, in press). Deformation and strong dispersion preclude exact determination of the pyroxene optical properties, but optical characteristics of the pyroxene are quite similar to those reported for jadeitic pyroxenes from the metagraywackes (Coleman, 1965).
Single-crystal X-ray study of the jadeitic pyroxene from specimen 4-CZ-60 hy Joan Clark indicates the presence of two· mineral ·phases. The predominant phase is the jadeitic pyroxene ; a minor phase seems to be an amphibole of unknown composition (Joan Clark, oral commun., 1966). Neither optical examination nor X-ray powder diffraction revealed the second phase. Further work is necessary to understand this two-phase mineral problem.
9. 48A 8. 63A 5. 24A
409A3
9. 56A 17. 79A
5. 31A
878A3
POTASSIUM-ARGON AGE DETERMINATIONS
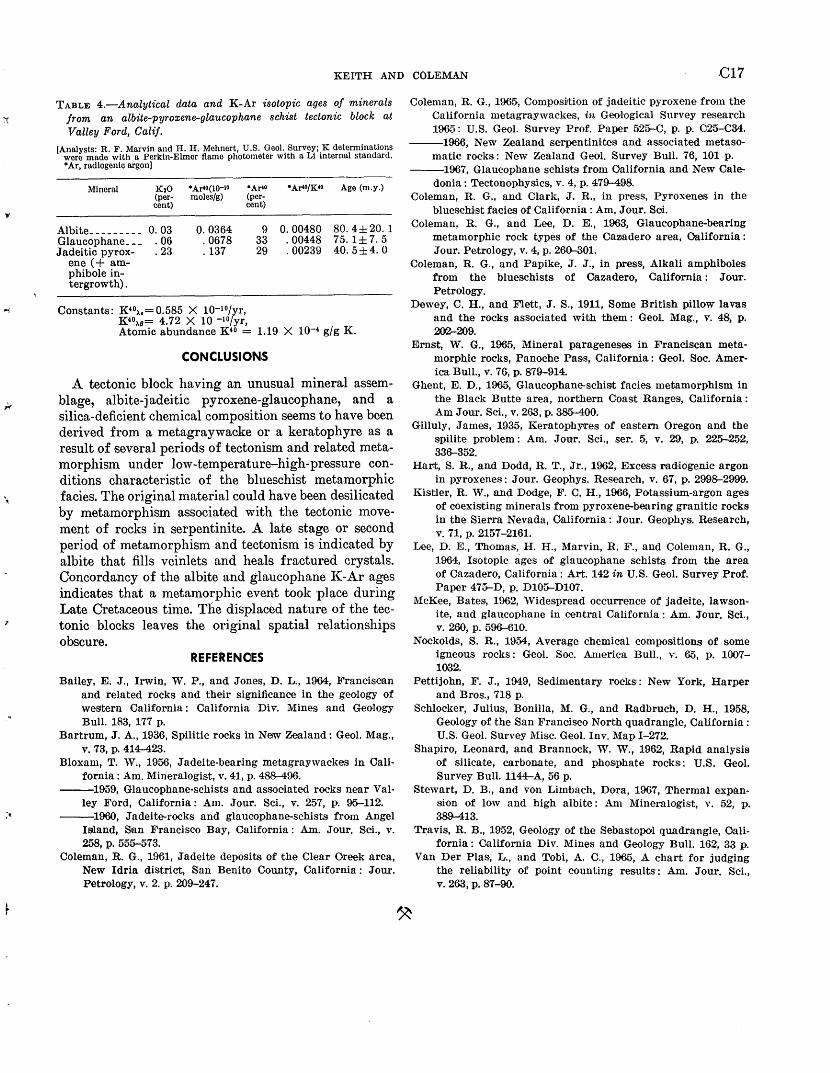
Splits for K/ Ar radiometric dating of glaucophane, jadeitic pyroxene, and albite were taken from the same purified concentrates used for chemical analysis. It was hoped that concordant ages among these three minerals would provide a reliable age of metamorphism for the blueschist. Albite and glaucophane give a reasonably concordant Late Cretaceous age for the metamorphism (table 4), but the jadeitic pyroxene gives a.n extremely low age that may reflect its inability to retain argon during deformation. Excess or deficient argon in the pyroxene structure is known to be responsible for some anomalous ages (Hart and Dodd, 1962; Kistler and Dodge, 1966). J. J. Papike (written commun., 1967) suggested that the anomalous age was probably due to the potassium-bearing amphibole intergrowth with the jadeitic pyroxene.
Lee and others (1964) have reported Late Jurassic ages for the blueschists of the Cazadero area and, more recently, Coleman (1967) has suggested two periods of blueschist metamorphism for California : Late Jurassic and Early Cretaceous.
The ages obtained and the petrographic evidence previously described indicate that jadeitic pyroxene and glaucophane in the rock here described formed during an earlier period of metamorphism; a later metamorphic event which resulted in the formation of albite is the event recorded in the dates obtained.
,..
' .
_ ..
KEITH AND COLEMAN C17
TABLE 4.-A nalytical data and K-Ar isotopic ages of minerals from an albite-pyroxene-glaucophane schist tectonic block at Valley Ford, Calif.
(Analysts: R. F. Marvin and H. H. Mehnert, U.S. Geol. Survey; K determinations were made with a Perkin-Elmer flame photometer with a Li internal standard. • Ar, radiogenic argon]
Mineral
Albite _____ ----Glaucophane __ _ Jadeitic pyrox-
ene(+ amphibole intergrowth) .
K20 • ArfO(lQ-10 (per- moles/g) cent)
0.03 . 06 . 23
0.0364 . 0678 . 137
•Ar•o (percent)
Age (m.y.)
9 0. 00480 80. 4± 20. 1 33 . 00448 75. 1±7. 5 29 . 00239 40. 5± 4. 0
Constants: K•o>..= 0.585 X 10⁻¹°/yr, K•o>.IJ= 4.72 X 10 - 10/yr, Atomic abundance K•o = 1.19 X 10-• g/g K.
CONCLUSIONS
A tectonic block having an unusual mineral assemblage, albite-jadeitic pyroxene-glaucophane, and a silica-deficient chemical composition seems to have been derived from a metagraywacke or a keratophyre as a result of several periods of tectonism and related metamorphism under low-temperature-high-pressure conditions characteristic of the blueschist metamorphic facies. The original material could have been desilicated by metamorphism associated with the tectonic movement of rocks in serpentinite. A late stage or second period of metamorphism and tectonism is indicated by albite that fills veinlets and heals fractured crystals. Concordancy of the albite and glaucophane l(-Ar ages indicates that a metamorphic event took place during Late Cretaceous time. Tl1e displaced nature of the tectonic blocks leaves the original spatial relationships obscure.
REFERENCES
Bailey, E. J., Irwin, W. P., and Jones, D. L., 1964, Francis~an and related rocks and their significance in the geology of western California: California Div. Mines and Geology Bull. 183, 177 p.
Burtrum, J. A., 1936, Spilitic rocks in New Zealand: Geol. Mag., v. 73, p. 414-423.
Bloxam, T. ·w., 1956, Jadeite-bear.ing metagraywackes in Cali· fornia: Am. Mineralogist, v. 41, p. 488-496.
---1959, Glaucophane-schists and associated rocks near Valley Ford, California: Am. Jour. Sci., v. 257, p. 95-112.
---1960, Jadeite-rocks and glaucophane-schists from Angel Island, San Francisco Bay, California: Am. Jour. Sci., v. 258, p. 555-573.
Coleman, R. G., 1961, Jadeite deposits of the Clear Oreek area, New Idria district, San Benito County, California: Jour. Petrology, v. 2. p. 209-247.
Coleman, R. G., 1965, Gomposi1tion ·of jadeitic pyroxene from the California metagraywackes, in Geological Survey research 1965: U.S. Geol. Survey Prof. Paper 525-C, p. p. C25-C34.
---1966, New Zealand serpentinites and associated metasomatic rocks: New Zealand Geol. Survey Bull. 76, 101 p.
---1967, Glaucophane schists from Oalifornia and New Caledonia: Tectonophysics, v. 4, p. 479-498.
Coleman, R. G., and Cllark, J. R., in press, Pyroxenes: in the blueschi•st facies of California: Am. Jour. Sci.
Coleman, R. G., and Lee, D. E., 1963, Glaucophane..1bearing metamorphic rock types of the Caoo.dero area, Oalifornia : Jour. Petrology, v. 4, p. 260-301 .
Coleman, R. G., and Papike, J. J., in press, Alkali amphiboles from the blueschists of Cazadero, California: Jour. Petrology.
Dewey, C. H., and Flett, J. S., 1911, Some B-ritish pillow lavas and the rocks associated with them: Geol. Mag., v. 48, p. 202r-209.
Ernst, W. G., 1965, Mineral parageneses in Franciscan metamorphic rocks, Panoche Pass, California : Geol. Soc. America Bull., v. 76, p. 879-914.
Ghent, E. D., 1965, Glaucophane-schist facies mebamorphism in the Black Butte area, northern Coast Ranges·, California : Am Jour. Sci., v. 263, p. 385-400.
Gilluly, James, 1935, KeratophYTes of eastern Oregon and the spilite problem : Am. Jour. Sci., ser. 5, v. 29, p, 225-252, 336-352.
Hart, S. R., and Dodd, R. T., Jr., 1962, Exces-s rod·iogenic argon in pyroxenes: Jour. Geophys. Research, v. 67, p. 2998-2999.
Kistler, R. ,V., and Dodge, F. C. H., 1966, Potassium-argon ages of coexisting minerals from pyroxene-bearing granitic rocks in the Sierra Nevada, California: Jour. Geophys. Research, v. 71, p. 2157-2161.
Lee, D. E., Thomas, H. H., Marvin, R. F., and Coleman, R. G., 1964, Isotopic ages of glaucophane schists from the area of Cazadero, California: Art. 142 in U.S. Geol. Survey Prof. Paper 475-D, p, D105-D107.
McKee, Bates, 1962, ·widespread occurrence of jadeite, lawsonite, and glaucophane in central California: Am. Jour. Sci., v. 260, p. 596-610.
Nockolds, S. R., 1954, Average chemical compositions of some igneous rocks: Geol. Soc. America Bull., v. 65, p. 100'7-1032.
Pettijohn, F. J., 1949, Sedimentary rocks: New York, Harper and Bros., 718 p.
Schlocker, Julius, Bonilla, M. G., and Radbruch, D. H., 1958, Geology of the San Francisco North quadrangle, California: U.S. Geol. Survey Misc. Geol. Inv. Map I-272.
Shapiro, Leonard, and Brannock, '\V. W., 1962, Rapid analysis of silicate, carbonate, -and phosphate rocks: U.S. Geol. Survey Bull. 1144-A, 56 p.
Stewart, D. B., and von Limb-ach, Dora, 1967, Thermal expansion of low and high albite: .A:m Mineralogist, v. 52, p. 389-413.
Travis, R. B., 1952, Geology of the Sebastopol quadrangle, California: California Div. Mines and Geology Bull. 162, 33 p.
Van Der Plas, L., and Tobi, A. C., 1965, A chart for judging the reliability of point counting results·: Am. Jour. Sci., v. 263, p. 87-90.
GEOLOGICAL SURVEY RESEARCH 1968
CHEMISTRY OF PRIMARY MINERALS AND ROCKS FROM THE
RED MOUNTAIN-DEL PUERTO ULTRAMAFIC MASS, CALIFORNIA
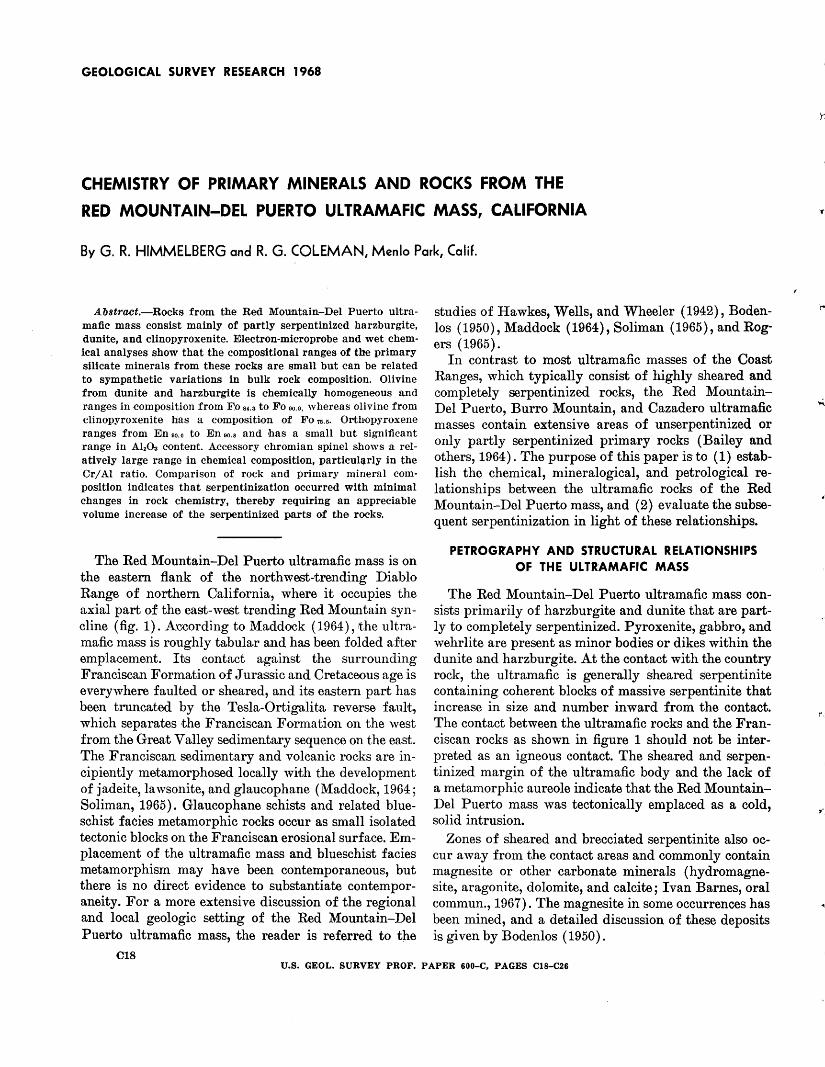
By G. R. HIMMELBERG and R. G. COLEMAN, Menlo Park, Calif.
Abstract.-Rocks from the Red Mountain-Del Puerto ultramafic mass consist mainly of partly serpentinized harzburgite, dunite, and clinopyroxenite. Electron-microprobe and wet chemical analyses show that the compositional ranges of the primary silicate minerals from these rocks are small but can be related to sympathetic variations in bulk rock composition. Olivine from dunite and harzburgite is chemically homogeneous and ranges in composition from F.o su to Fo oo.o, whereas olivine from clinopyroxenite bias a composition of Fo 75.5· Orthopyroxene ranges from En oo.o to En oo.s and has a small but significant range in Ab03 contell't. Accessory chromian spinel shows a relatively large range in chemical composition, particularly in the Or/ Al ratio. Comparison of rock and primary mineral composition indicates that serpentinization occurred with minimal changes in rock chemistry, thereby requiring an appreciable volume increase of the serpentinized parts of the rocks·.
The Red Mountain-Del Puerto ultramafic mass is on the eastern flank of the northwest-trending Diablo Range of northern California, where it occupies the axial part of the east-west trending Red Mountain syncline (fig. 1) . kocording to Maddock ( 1964), tthe ultramafic mass is roughly tabular and has been folded after emp'lacement. Its contact against the surrounding Franciscan Formation of Jurassic and Cretaceous age is everywhere faulted or sheared, and its eastern part has been truncated by the Tesla-Ortigalita reverse fault, which separates the Franciscan Formation on the west from the Great Valley sedimentary sequence on the east. The Franciscan sedimentary and volcanic rocks are incipiently metamorphosed locally with the development of jadeite, lawsonite, and glaucophane (Maddock, 1964; Soliman, 1965). Glaucophane schists and related blueschist facies metamorphic rocks occur as small isolated tectonic blocks on the Franciscan erosional surface. Emplacement of the ultramafic mass and blueschist facies metamorphism may have been contemporaneous, but there is no direct evidence to substantiate contemporaneity. For a more extensive discussion of the regional and local geologic setting of the Red Mountain-Del Puerto ultramafic mass, the reader is referred to the
C18
studies of Hawkes, Wells, and Wheeler (1942), Bodenlos ( 1950) , Maddock ( 1964) , Soliman ( 1965) , and Rogers (1965).
In contrast to most ultramafic masses of the Coast Ranges, which typically consist of highly sheared and completely serpentinized rocks, the Red MountainDel Puerto, Burro Mountain, and Cazadero ultramafic masses contain extensive areas of unserpentinized or only partly serpentinized primary rocks (Bailey and others, 1964). The purpose of this paper is to (1) establish the chemical, mineralogical, and petrological relationships between the ultramafic rocks of the Red Mountain-Del Puerto mass, and (2) evaluate the subsequent serpentinization in light of these relationships.
PETROGRAPHY AND STRUCTURAL RELATIONSHIPS OF THE ULTR·AMAFIC MASS
The Red Mountain-Del Puerto ultramafic mass consists primarily of harzburgite and dunite that are partly to completely serpentinized. Pyroxenite, gabbro, and wehrlite are present as minor bodies or dikes within the dunite and harzburgite. At the contact with the country rock, the ultramafic is generally sheared serpentinite containing coherent blocks of massive serpentinite that increase in size and number inward from the contact. The contact between the ultramafic rocks and the Franciscan rocks as shown in figure 1 should not be interpreted as an igneous contact. The sheared and serpentinized margin of the ultramafic body and the lack of a metamorphic aureole indicate that the Red MountainDel Puerto mass was tectonically em placed as a cold, solid intrusion.
Zones of sheared and brecciated serpentinite also occur away from the contact areas and commonly contain magnesite or other carbonate minerals (hydromagnesite, aragonite, dolomite, and calcite; I van Barnes, oral commun., 1967). The magnesite in some occurrences has been mined, and a detailed discussion of these deposits is given by Bodenlos (1950).
U.S. GEOL. SURVEY PROF. PAPER 600-C, PAGES Cl8-C26
,.
..
121"30'
• KJf
a Sacramento
CALIFORNIA
& Red Mtn· Del Puerto Canyon
9:->~ •Bu"o Mtn .. _,_
INDEX MAP
HIMMELBERG AND COLEMAN C19
KJf •
- ~~
• • '
I .. •
0
Great Valley sedimentary sequence
Franciscan Formation Sedimentary and volcanic rocks
., -·. "
'
121"25'
••
KJf
3 MILES
•
I
Geology compiled and modified from Hawkes and others (1942); Bodentos (1950); Maddock (1964); and Soliman (1965)
EXPLANATION
Serpentinite
Harzburgite
Dunite Includes small bodies of cli-rw
pyroxenite and gabbro
Crystalline rocks, undivided
Glaucophane schist Occurs as tectonic blocks
Fault Dashed where approximate
A
Axis of anticline Dashed where approximate
-t---Axis of syncline
X 66-R-20
Sample location
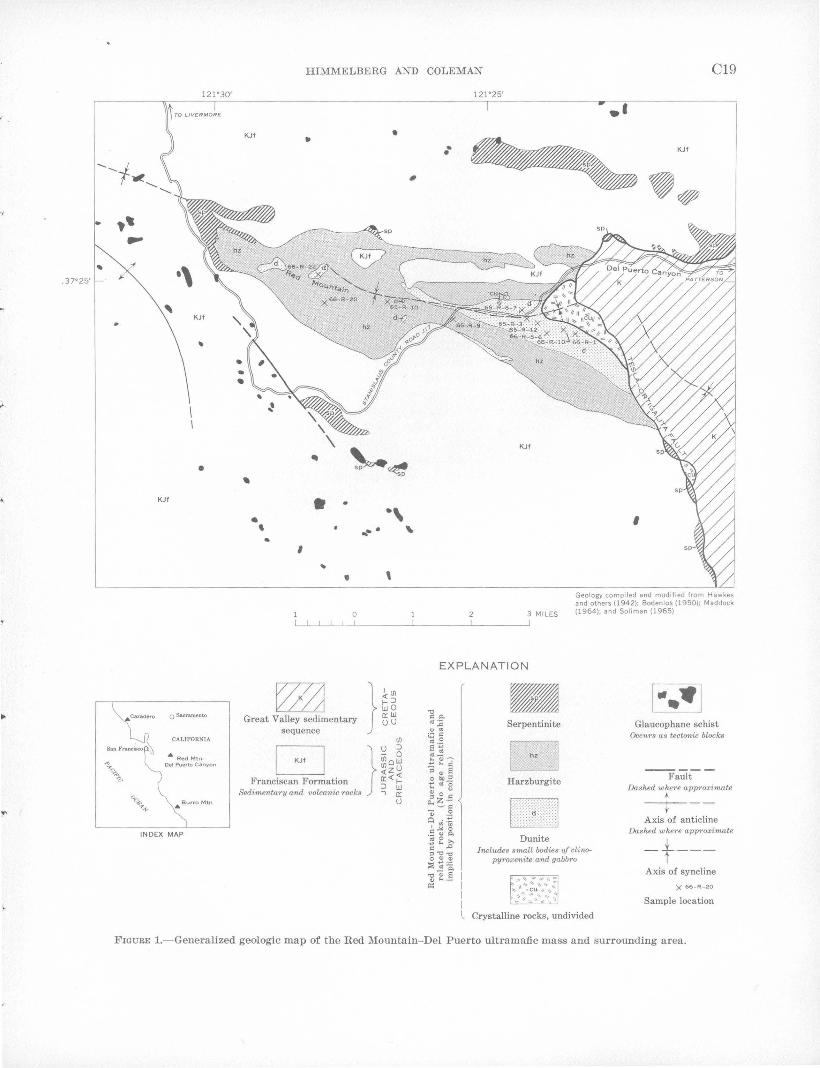
FIGURE 1.-Generalized geologic map of the Red Mountain-Del Puerto ultramafic mass and surrounding area.
C20 MINERALOGY AND PETROLOGY
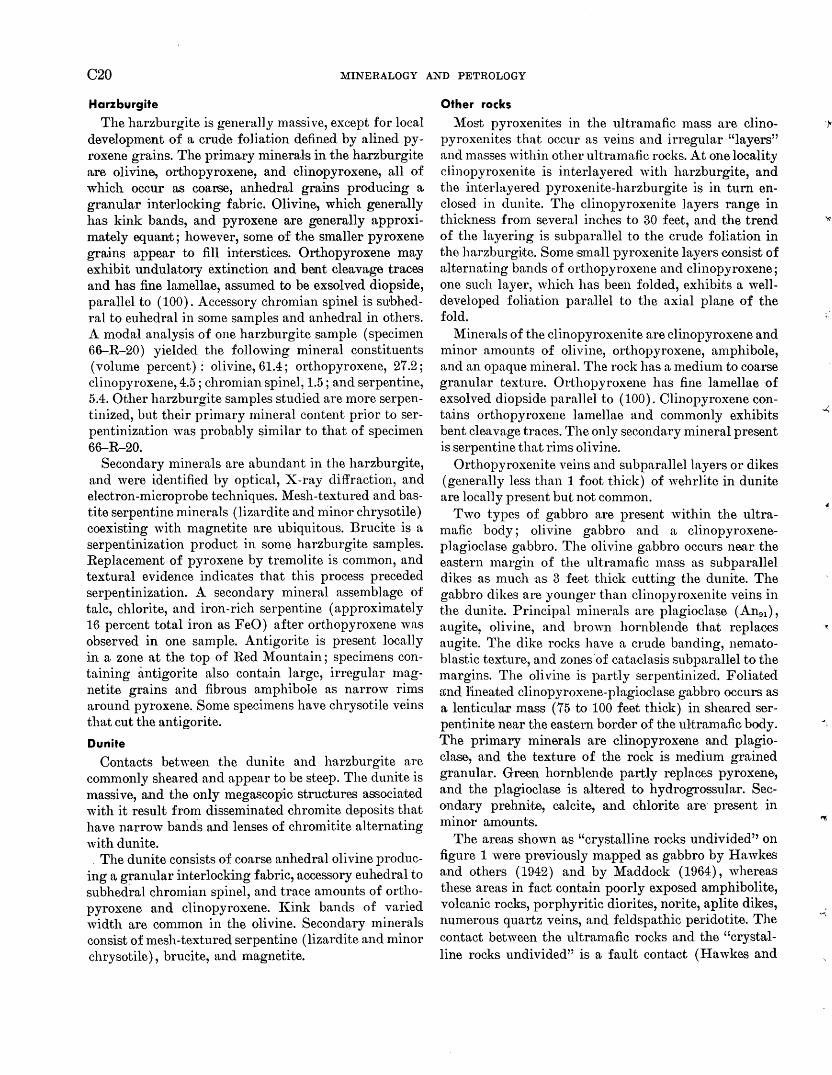
Harzburgite
The harzburgite is generally massive, except :for local development of a crude :foliation defined by alined pyroxene grains. The primary minerals in the harzburgite are olivine, orthopyroxene, and clinopyroxene, all of which occur as coavse, anhedral grains producing a granular interlocking fabric. Olivine, which generally has kink bands, and pyroxene are generally approximately equant; however, some of the smaller pyroxene grains appear to fill interstices. Orthopyroxene may exhibit undulatory extinction and bent cleavage traces and has fine lamellae, assumed to be exsolved diopside, parallel to (100). Accessory chromian spinel is suhhedral to euhedral in some samples and anhedral in others. A modal analysis of one harzburgite sample (specimen 66-R-20) yielded the following mineral constituents (volume percent) : olivine, 61.4; orthopyroxene, 27.2; clinopyroxene, 4.5 ; chromian spinel, 1.5 ; and serpentine, 5.4. Other harzburgite samples studied are more serpentinized, but their primary mineral content prior to serpentinization was probably $imilar to that of specimen 66-R-20.
Secondary minerals are abundant in the harzburgite, and were identified by optical, X-ray diffraction, and electron-microprobe techniques. Mesh-textured and bastite serpentine minerals (lizardite and minor chrysotile) coexisting with magnetite are ubiquitous. Brucite is a serpentinization product in some harzburgite samples. Replacement of pyroxene by tremolite is common, and textural evidence indicates that this process preceded serpentinization. A secondary mineral ·assemblage of talc, chlorite, and iron-rich serpentine (approximately 16 percent total iron as FeO) after orthopyroxene was observed in one sample. Antigorite is present locally in a zone at the top of Red Mountain ; specimens containing antigorite also contain large, irregular magnetite grains and fibrous amphibole as narrow rims around pyroxene. Some specimens have chrysotile veins that cut the antigorite.
Dunite
Contacts between the dunite and harzburgite are commonly sheared and appear to be steep. The dunite is massive, and the only megascopic structures associated with it result :from disseminated chromite deposits that have narrow bands and lenses of chromitite alternating with dunite. . The dunite consists of coarse anhedral olivine produc
ing a granular interlocking fabric, a.ccessory euhedral to subhedral chromian spinel, and trace amounts of orthopyroxene and clinopyroxene. IGnk bands of varied width are common in the olivine. Secondary minerals consist of mesh-textured serpentine (lizardite and minor chrysotile), brucite, and magnetite.
Other rocks
l\{ost pyroxenites in the ultramafic mass are clinopyroxenites that occur as veins and irregular "layers" and masses within other ultramafic rocks. At one locality clinopyroxenite is interlayered with harzburgite, and the interlayered pyroxenite-harzburgite is in turn enclosed in dunite. The clinopyroxenite layers range in thickness :from several inches to 30 :feet, and the trend of the layering is subparallel to the crude :foliation in the harzburgiite. Some ·small pyroxenite layers consist of alternating bands of orthopyroxene and clinopyroxene; one such layer, which has been folded, exhibits a welldeveloped foliation parallel to the axial plane of the fold.
Minet~als of the clinopyroxenite are clinopyroxene and minor amounts of olivine, orthopyroxene, amphibole, and an opaque mineral. The rock has a medium to coarse granular texture. Orthopyroxene has fine lamellae of exsolved diopside parallel to ( 100). Clinopyroxene contains orthopyroxene lamellae and commonly exhibits bent cleavage traces. The only secondary n1ineral present is serpentine that rims olivine.
Orthopyroxenite veins and subparallel layers or dikes (generally less than 1 foot thick) of wehrlite in dunite are locally present but not common.
Two types of gabbro are present within the ultramafic body; olivine gabbro and a clinopyroxeneplagioclase gabbro. The olivine gabbro occurs near the eastern margin of the ultramafic mass as subparallel dikes as much as 3 :feet thick cutting the dunite. The gabbro dikes are younger than clinopyroxenite veins in the dunite. Principal minerals are plagioclase (An9t), augite, olivine, and brown hornblende that replaces augite. The dike rocks have a crude banding, nematoblastic texture, and zones ·of cataclasis subparallel to the margins. The olivine is partly serpentinized. Foliated and llneated clinopyroxene-plagioelase gabbro occurs as a lenticular mass (75 to 100 feet thick) in sheared serpentinite near the eastern border of the ul·trama,fic body. The primary minerals are clinopyroxene and plagioclase, and the texture of the rock is medium grained granular. Green hornblende partly replaCEiS pyroxene, and the plagioclase is altered to hydrogrossular. Secondary prehnite, calcite, and chlorite are· present in minor amounts.
The areas shown as "crystalline rocks undivided'' on figure 1 were previously mapped as gabbro by Hawkes and others (1942) and by Maddock (1964), whereas these areas in fact contain poorly exposed amphibolite, volcanic rocks, porphyritic diorites, norite, aplite dikes, numerous quartz veins, and :feldspathic peridotite. The contact between the ultramafic rocks and the "crystalline rocks undivided" is a fault contact (Hawkes and
')'
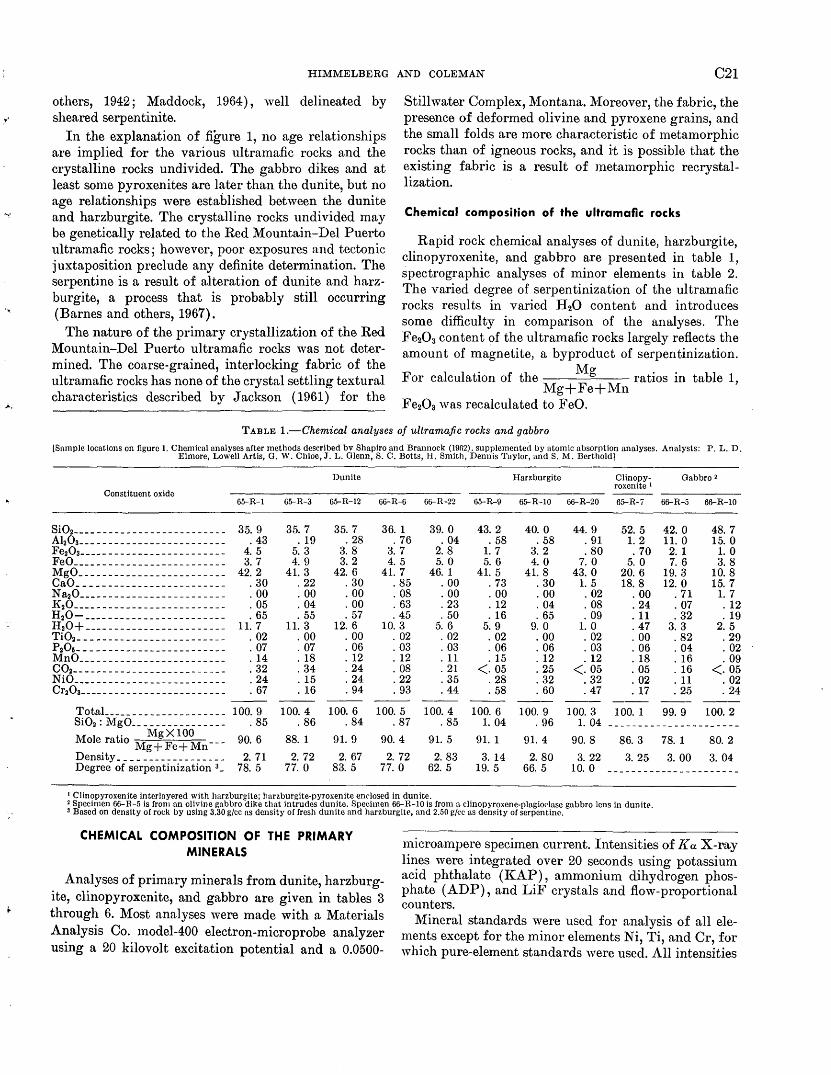
•'
·~
HIMMELBERG AND COLEMAN C21
others, 1942; Maddock, 1964) , well delineated by sheared serpentinite.
In the explanation of figure 1, no age relationships are implied for the various ultramafic rocks and the crystalline rocks undivided. The gabbro dikes and at least some pyroxenites are later than the dunite, but no age relationships were established between the dunite and harzburgite. The crystalline rocks undivided may be genetically related to the Red Mountain-Del Puerto ultramafic rocks; however, poor exposures and tectonic juxtaposition preclude any definite determination. The serpentine is a result of alteration of dunite and harzburgite, a process that is probably still occurring (Barnes and others, 1967).
The nature of the primary crystallization of the Red Mountain-Del Puerto ultramafic rocks was not determined. The coarse-grained, interlocking fabric of the ultramafic rocks has none of the crystal settling textural characteristics described by Jackson ( 1961) for the
Stillwater Complex, Montana. ~Ioreov~r, the fabric, the presence of deformed olivine and pyroxene grains, and the small folds are more characteristic of metamorphic rocks than of igneous rocks, and it is possible that the existing fabric is a result of metamorphic recrystallization.
Che·mical composition of the ultramafic rocks
Rapid rock chemical analyses of dunite, harzburgite, clinopyroxenite, and gabbro are presented in table 1, spectrographic analyses of minor elements in table 2. The varied degree of serpentinization of the ultramafic rocks results in varied H20 content and introduces some difficulty in comparison of the analyses. The Fe203 content of the ultramafic rocks largely reflects the amount of magnetite, a byproduct of serpentinization.
For calculation of the ~{g ratios in table 1, ~1g+Fe+Mn
Fe203 was recalculated to FeO.
TABLE 1.-Chemical analyses of ultramafic rocks and gabbro
[Sample locations on figure I. Chemical analyses after methods described bv Shapiro and Brannoek (19fi2). supplemented by atomic absorption analyses. Analysts: P.L.D. Elmore, Lowell Artis, G. W. Chloe, J. L. Glenn, S.C. Botts, H. Smith, Dennis Taylor, and S.M. Berthold!
Dunite Harzburgite Clinopy- Gabbro 2 roxenite I
Constituent oxide 65--R-1 65--R-3 65--R-12 66-H-6 66-R-22 65--R-9 65--R-10 66-R-20 65--R-i 66-R-5 66-R-10
Si02-------------------------- 35. 9 35. 7 35. 7 36. 1 39. 0 43. 2 40. 0 44. 9 52. 5 42. 0 48. 7 AlaOa--------- ---------------- . 43 . 19 . 28 . 76 . 04 . 58 . 58 . 91 1.2 11. 0 15. 0 Fe20a------------------------- 4. 5 5. 3 3. 8 3. 7 2. 8 1.7 3. 2 . 80 . 70 2. 1 1.0 FeO __________________________ 3. 7 4. 9 3.2 4. 5 5. 0 5. 6 4. 0 7. 0 5. 0 7. 6 3. 8
~:~-~:~===================== 42. 2 41. 3 42. 6 41. 7 46. 1 41. 5 41. 8 43. 0 20. 6 19. 3 10. 8
. 30 . 22 . 30 . 85 . 00 . 73 . 30 1.5 18. 8 12. 0 15. 7 ~a20------------------------- . 00 . 00 . 00 . 08 . 00 . 00 . 00 . 02 . 00 . 71 1.7 K
20 __________________________ . 05 . 04 . 00 . 63 . 23 . 12 . 04 . 08 . 24 . 07 . 12
H 20- ----- ___ --------- ------- . 65 . 55 . 57 . 45 . 50 . 16 . 65 . 09 .11 . 32 . 19 H 20+ ---- _______ ------------- 11. 7 11. 3 12. 6 10. 3 5. 6 5. 9 9. 0 1.0 . 47 3. 3 2. 5 Ti0
2 _________________________
. 02 . 00 . 00 . 02 . 02 . 02 . 00 . 02 . 00 . 82 . 29 P206------------------------- . 07 . 07 . 06 . 03 . 03 . 06 . 06 . 03 . 06 . 04 . 02 ~no _________________________
. 14 . 18 . 12 . 12 .11 . 15 . 12 . 12 . 18 . 16 . 09 C02--- ----------- ___ - ___ ----- . 32 . 34 . 24 . 08 . 21 <. 05 . 25 <. 05 . 05 . 16 <· 05 ~iO __________________________ . 24 . 15 . 24 . 22 . 35 . 28 . 32 . 32 . 02 .11 . 02 Cr203----- ___ - _____________ --- . 67 . 16 . 94 . 93 . 44 . 58 . 60 . 47 . 17 . 25 . 24
TotaL ___________ --------- 100. 9 100.4 100. 6 100. 5 100.4 100. 6 100. 9 100. 3 100. 1 99. 9 100. 2 Si02: ~gO ________________ . 85 . 86 . 84 . 87 . 85 1. 04 . 96 1. 04 ----------------------~ole ratio
~gX100 90. 6 88. 1 91. 9 90.4 91. 5 91. 1 91. 4 90. 8 86. 3 78. 1 80.2
~g+Fe+~n---Density __________________ 2. 71 2. 72 2. 67 2. 72 2. 83 3. 14 2. 80 3. 22 3. 25 3. 00 3. 04 Degree of serpentinization a_ 78. 5 77. 0 83. 5 77. 0 62. 5 19. 5 66. 5 10. 0 ----------------------
1 Clinopyroxenite intcrlayered with harzburgite; harzburgite-pyroxenite enclosed in dunite. 2 Specimen 66-R-5 is from an olivine gabbro dike that intrudes dunite. Specimen 66-R-10 is from a clinopyroxene-plagioclase gabbro lens in dunite. 3 Based on density of rock by using 3.30 g/cc ns density of fresh dunite and harzburgite, and 2.50 gjcc as demity of serpentino.
CHEMICAL COMPOSITION OF THE PRIMARY MINERALS
Analyses of primary minerals from dunite, harzburgite, clinopyroxenite, and gabbro are given in tables 3 through 6. Most analyses were made with a Materials Analysis Co. model-400 electron-microprobe analyzer using a 20 kilovolt excitation potential and a 0.0500-
1nicroampere specimen current. Intensities of K a X-ray lines were integrated over 20 seconds using potassi urn acid phthalate (I\:AP), ammonium dihydrogen phosphate (ADP), and LiF crystals and flow-proportional counters.
Mineral standards were used for analysis of all elements except for the minor elements Ni, Ti, and Cr, for which pure-element standards were used. All intensities
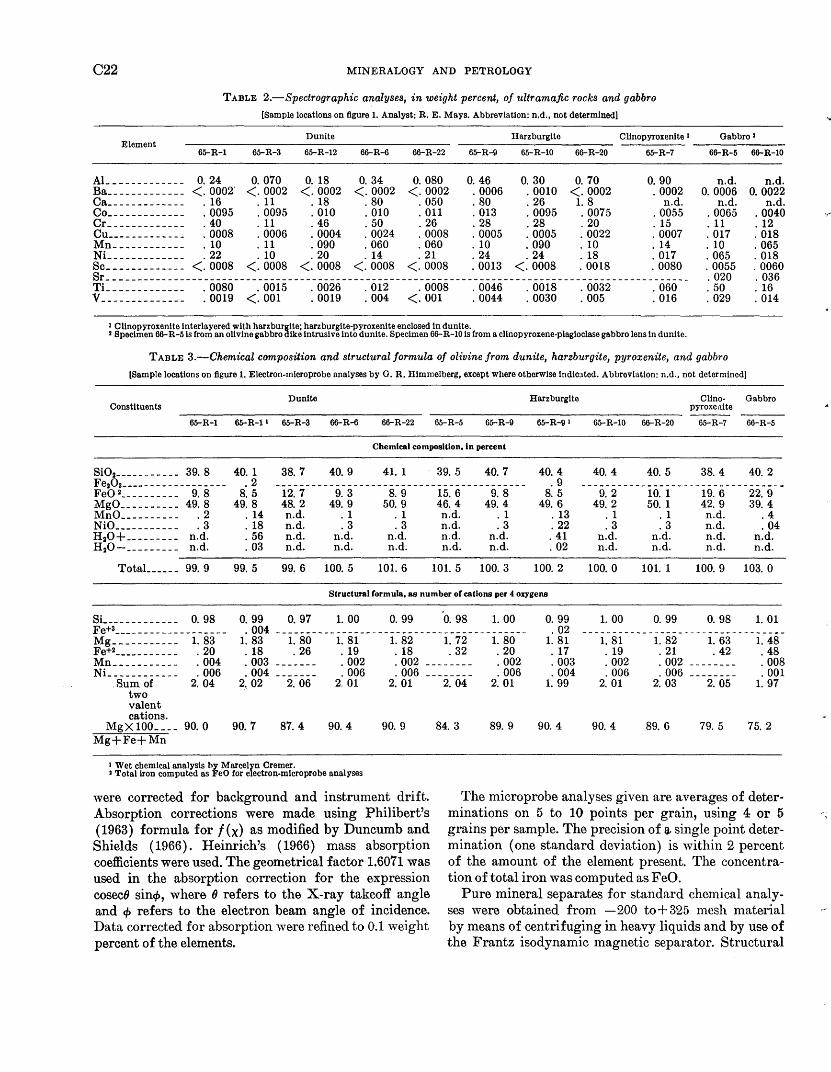
C22
Element
Al ______ ---- _--Ba _____________ Ca _____________ Co _____________ Cr _____________ Cu __ - ____ --- ___ Mn ____________ Ni _____________ Sc _____________
MINERALOGY AND PETROLOGY
TABLE 2.-Spectrographic analyses, in weight percent, of ultramafic rocks and gabbro
[Sample locations on figure 1. Analyst: R. E. Mays. Abbreviation: n.d., not determined)
Dunite Harzburgite Clinopyroxenite 1
65-R-1 65-R-3 65-R-12 66-R-6 66-R-22 65-R-9 65-R-10 66-R-20 65-R-7
0. 24 0. 070 0. 18 0. 34 0. 080 0. 46 0. 30 0. 70 0. 90 <. 0002' <. 0002 <. 0002 <. 0002 <. 0002 . 0006 . 0010 <. 0002 . 0002 . 16 .11 . 18 . 80 . 050 . 80 . 26 1.8 n.d . . 0095 . 0095 . 010 . 010 . 011 . 013 . 0095 . 0075 . 0055 . 40 .11 . 46 . 50 . 26 . 28 . 28 . 20 . 15 . 0008 . 0006 . 0004 . 0024 . 0008 . 0005 . 0005 . 0022 . 0007 .10 .11 . 090 . 060 . 060 . 10 . 090 . 10 . 14 . 22 . 10 . 20 . 14 . 21 . 24 . 24 . 18 . 017
<. 0008 <. 0008 <. 0008 <. 0008 <. 0008 . 0013 <. 0008 . 0018 . 0080 Sr-------------------------------------------------------------------------------------------------Ti _____________ . 0080 . 0015 . 0026 . 012 . 0008 . 0046 . 0018 . 0032 . 060 v ______________
. 0019 <. 001 . 0019 . 004 <. 001 . 0044 . 0030 . 005 . 016
I Clinopyroxenite interlayered with harzburgite; harzburgite-pyroxenite enclosed In dunite. 2 Specimen 66-R-51s from an olivine gabbro dike intrusive into dunite. Specimen 66-R-10 is from a clinopyroxene-plagioclase gabbro lens In dunite.
Gabbro 2
66-R-5 66-R-10
n.d. n.d. 0. 0006 0. 0022
n.d . n.d. . 0065 . 0040 .11 . 12 . 017 . 018 . 10 . 065 . 065 . 018 . 0055 . 0060 . 020 . 036 . 50 . 16 . 029 . 014
TABLE 3.-Chemical composition and structural formula of olivine from dunite, harzburgite, pyroxenite, and gabbro
(Sample locations on figure 1. Electron-microprobe analyses by G. R. Himrnelberg, except where otherwise indicated. Abbreviation: n.d., not determined]
Dunlte Harz burglte Clino- Gabbro Constituents pyroxeoite
65-R-1 65-R-11 65-R-3 66-R-6 66-R-22 65-R-5 65-R-9 65-R-91 65-R-10 66-R-20 65-R-7 66-R-5
Chemical composition, in percent
Si 02---- - - - - - - - 39.8 40. 1 38. 7 40. 9 41. 1 39. 5 40. 7 40. 4 40. 4 40. 5 38. 4 40. 2 Fe20a- ----------------- .2 ------------------------------------------ .9 ----------------------------------FeO 2 _____ - - ___ 9. 8 8. 5 12. 7 9. 3 8. 9 15. 6 9. 8 8. 5 9. 2 10. 1 19. 6 22.9 MgO __ - - - - - - _ - 49. 8 49. 8 48. 2 49. 9 50. 9 46. 4 49. 4 49. 6 49. 2 50. 1 42. 9 39. 4 Mn 0 ________ - - .2 . 14 n.d. . 1 . 1 n.d. . 1 . 13 . 1 . 1 n.d. .4 NiO ______ -- ___ .3 . 18 n.d. .3 .3 n.d. .3 . 22 .3 .3 n.d. . 04 H20 +-- - - - - - - - n.d. . 56 n.d. n.d. n.d. n.d. n.d. . 41 n.d. n.d. n.d . n.d . H20- __ ------- n.d. . 03 n.d. n.d. n.d. n.d. n.d. . 02 n.d. n.d . n.d. n.d.
TotaL _____ 99. 9 99. 5 99. 6 100. 5 101. 6 101. 5 100. 3 100. 2 100. 0 101. 1 100. 9 103. 0
Structural formula, as number of cations per 4 oxygens
Si ________ - - ___ 0. 98 0. 99 0. 97 1. 00 0. 99 0. 98 1. 00 0. 99 1. 00 0. 99 0. 98 1. 01 Fe+3 ___________________
. 004 ------------------------------------------ . 02 ----------------------------------Mg ___________ 1. 83 1. 83 1. 80 1. 81 1. 82 1. 72 1. 80 1. 81 1. 81 1. 82 1. 63 1. 48 Fe+2 ___________ . 20 . 18 . 26 . 19 . 18 . 32 . 20 . 17 . 19 . 21 . 42 . 48 Mn ___________ . 004 . 003 . 002 . 002 -------- . 002 . 003 . 002 . 002 -------- . 008
Ni ____________ . 006 . 004 . 006 . 006 -------- . 006 . 004 . 006 . 006 -------- . 001 .Sum of 2. 04 2_. 02 2. 06 2. 01 2. 01
two valent cations.
MgX 100 ____ 90.0 90. 7 87. 4 90. 4 90. 9 Mg+Fe+Mn
1 Wet chemical analysis hy Marcel~n Cremer. 2 Total iron computed as FeO for e ectron-mlcroprobe analyses
were corrected for background and instrument drift. Absorption corrections were made using Philibert's ( 1963) formula for f (x) as modified by Duncumb and Shields ( 1966). Heinrich's ( 1966) mass absorption coefficients were used. The geometrical factor 1.6071 was used in the absorption correction for the expression cosec(} sinq,, where () refers to the X-ray takeoff angle and q, refers to the electron beam angle of incidence. Data corrected for absorption were refined to 0.1 weight percent of the elements.
2. 04 2. 01 1. 99 2. 01 2. 03 2. 05 1. 97
84. 3 89. 9 90. 4 90. 4 89.6 79. 5 75. 2
The microprobe analyses given are averages of determinations on 5 to 10 points per grain, using 4 or 5 grains per sample. The precision of a, single point determination (one standard deviation) is within 2 percent of the amount of the element present. The concentration of total iron was computed as FeO.
Pure mineral separates for standard chemical analyses were obtained from -200 to+ 325 mesh material by means of centrifuging in heavy liquids and by use of the Frantz isodynamic magnetic separator. Structural
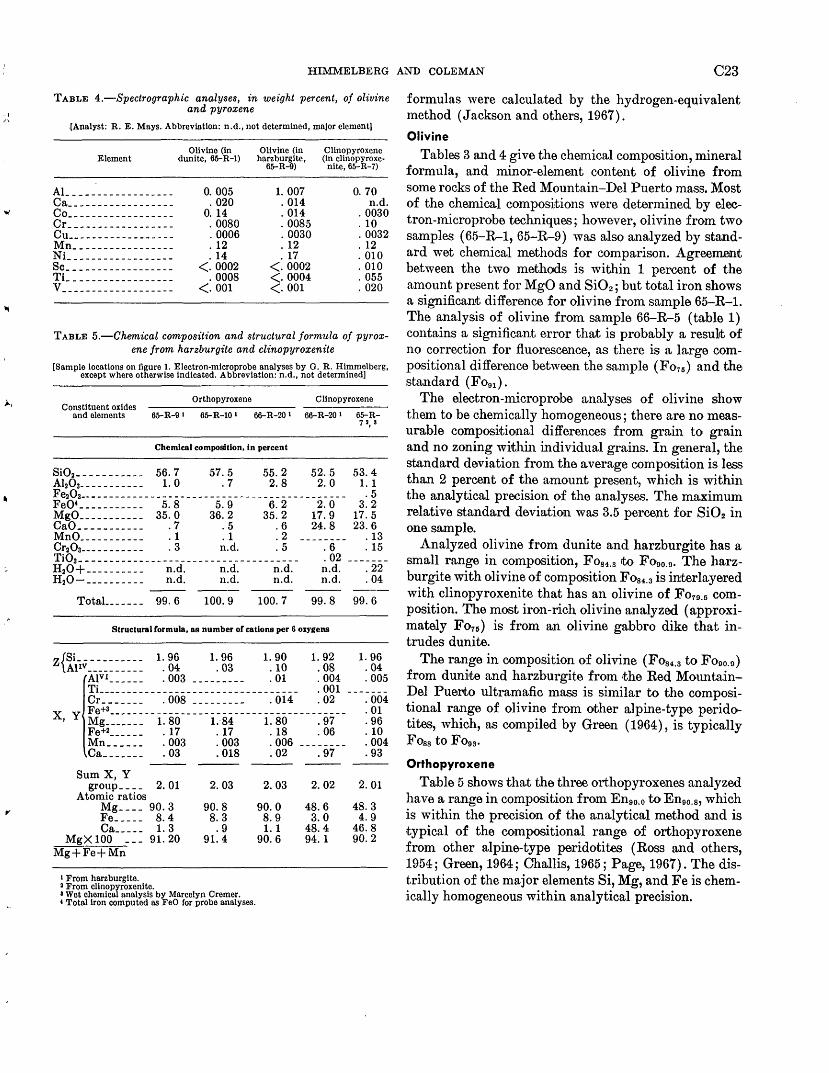
I
"
HIMMELBERG AND COLEMAN C23
TABLE 4.-Spectrographic analyses, in weight percent, of olivine and pyroxene
.[Analyst: R. E. Mays. Abbreviation: n.d., not determined, major element]
Element Olivine (in
dunite, 65-R-1) Olivine (In
harz burg! tc, 65-R-9)
Clinopyroxene (in cllnopyroxe
nite, 65-R-7)
AI _________________ _ Ca _________________ _ Co _________________ _ Cr _________________ _ Cu _________________ _ ~n ________________ _ Ni _________________ _ Sc _________________ _ Ti _________________ _ v __________________ _
0. 005 . 020
0. 14 . 0080 . 0006 . 12 . 14
<. 0002 . 0008 <. 001
1. 007 . 014 . 014 . 0085 . 0030 . 12 . 17 <. 0002
<· 0004 <· 001
0. 70 n.d .
. 0030
. 10
. 0032
. 12
. 010
. 010
. 055
. 020
TABLE 5.-Chemical composition and structural formula of pyroxene from harzburgite and clinopyroxenite
[Sample locations on figure 1. Electron-microprobe analyses by G. R. Himmel berg, except where otherwise Indicated. Abbreviation: n.d., not determined]
Orthopyroxene Clinopyroxene Constituent oxides
and elements 65-R-9 1 65-R-10 1 66-R-20 1 66-R-20 1 65-R-
Chemical composition, in percent
Si02----------- 56.7 57.5 55.2 52.5 Ah03.------ _ _ _ _ 1. 0 . 7 2. 8 2. 0 Fe20a---------------------------------------------Fe0'----------- 5.8 5.9 6.2 2.0 ~gO ___________ 35.0 36.2 35.2 17.9 CaO _ _ _ _ _ _ _ _ _ _ _ . 7 . 5 . 6 24. 8 ~no___________ . 1 . 1 . 2 _______ _ Cr20 3___________ • 3 n.d. . 5 . 6 Ti0
2_____________________________________ .02
H20+---------- n.d. n.d. n.d. n.d. H20----------- n.d. n.d. n.d. n.d.
7 2, a
53.4 1.1 .5
3.2 17.5 23.6
. 13
. 15
. 22
. 04
TotaL______ 99.6 100.9 100. 7 99.8 99.6
Structural rormula, as number or cations per G oxygens
z{Si ___________ 1.96 1.96 1.90 1.92 A}IV__________ . 04 . 03 . 10 . 08
AI vI_-- --- . 003 --------- . 01 . 004 Ti__________________________________ .001 Cr_______ .008 --------- .014 .02
X y Fe+a----------------------------------------I ~g_____ _ _ 1. 80 1.84 1. 80 • 97
Fe+2______ . 17 . 17 . 18 . 06 ~n______ .003 .003 .006 --------Ca_______ .03 .018 .02 .97
Sum X, Y group____ 2. 01
Atomic ratios ~g ____ 90.3 Fe _____ 8.4 Ca____ _ 1. 3
~g X 100 _ _ _ 91. 20 ~g+Fe+Mn
1 From harzburgite. 2 From cllnopyroxenito.
2.03
90.8 8.3 .9
91.4
a Wet chemical analysis by Marcelyn Cremer. • Total iron computed as FeO for probe analyses.
2.03 2.02
90.0 48.6 8.9 3.0 1.1 48.4
90.6 94. 1
1. 96 . 04 . 005
. 004
. 01
. 96
. 10
. 004
. 93
2.01
48.3 4.9
46.8 90.2
formulas were calculated by the hydrogen-equivalent method (Jackson and others, 1967).
Olivine
Tables 3 and 4 give the chemical composition, mineral formula, and minor-element content of olivine from some rocks of the Red Mountain-Del Puerto mass. Most of the chemical compos~tions were determined by electron-Inicroprobe teclmiques; however, olivine from two samples (65-R-1, 65-R-9) was also analyzed by standard wet chemical methods for comparison. Agree:m.enlt between the two methods is within 1 percent of the amount present for MgO and Si02; but total iron shows a significant difference for olivine from sample 65-R-1. The analysis of olivine from sample 66-R-5 (table 1) contains a significant error that is probably a result of no correction for fluorescence, as there is a large compositional difference between the sample (Fo75 ) and the standard (Fo9I).
The electron-microprobe analyses of olivine show them to be chemically homogeneous; there are no measurable compositional differences from grain to grain and no zoning within individual grains. In general, the standard deviation from the average composition is less than 2 percent of the a.mount present, which is within the analytical precision of the analyses. The maximum relative standard deviation was 3.5 percent for Si02 in one sample.
Analyzed olivine from dunite and harzburgite has a small range in composition, Fos4.3 rto Fo90.9. The harzburgite with olivine of composition Fos4.3 is inter layered with clinopyroxenite that has an olivine of Fo79.5 composition. The most iron-rich olivine analyzed (approximately Fo76 ) is from an olivine gabbro dike that intrudes dunite.
The range in composition of olivine (Fo8 4.3 to Fo9o.9) from dunite and harzburgite from ~the Red MountainDel Pue~to ultramafic mass is similar to the compositional range of olivine from other alpine-type peridotites, which, as compiled by Green (1964), is typically Foss to Fo9s·
Orthopyroxene
Table 5 shows that the three orthopyroxenes analyzed have a range in composition from En9o.o to En9o.8, which is within the precision of the analytical method and is typical of the compositional range of orthopyroxene from other alpine-type peridotites (Ross and others, 1954; Green, 1964; Challis, 1965; Page, 1967). The distribution of the major elements Si, Mg, and Fe is chemically homogeneous within analytical precision.
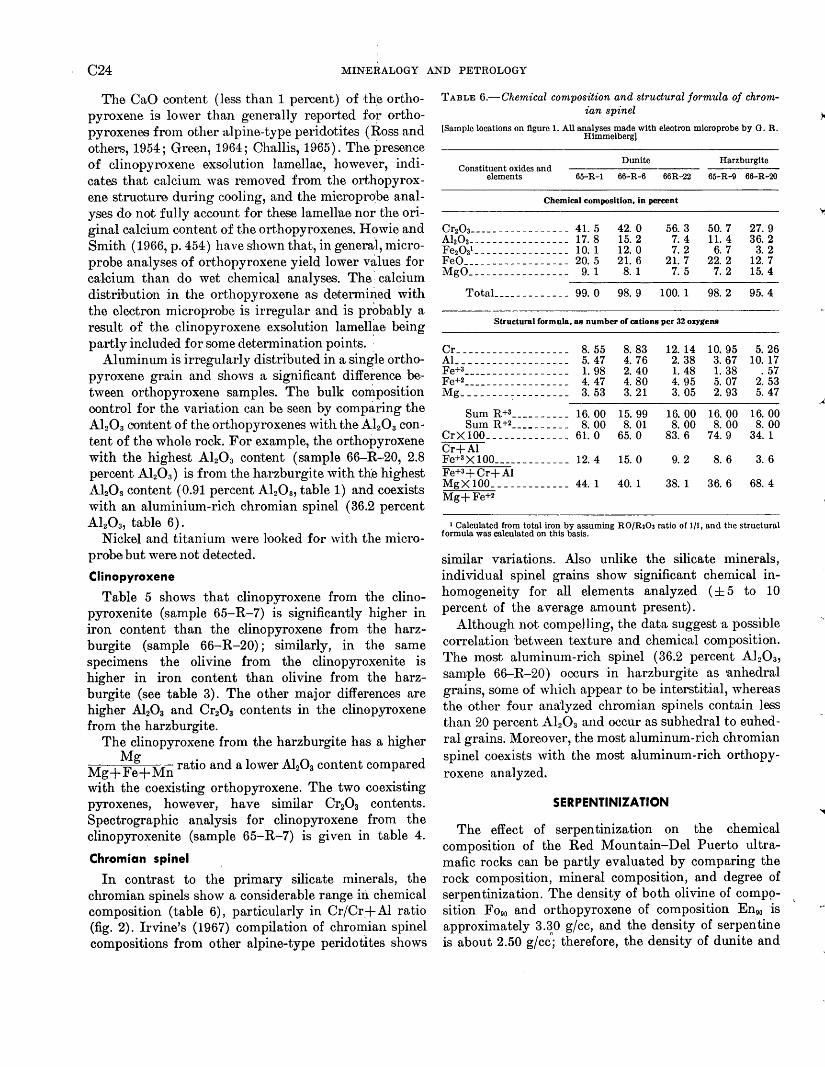
C24 MINERALOGY AND PETROLOGY
The CaO content (less than 1 percent) of the orthopyroxene is lower than generally reported for orthopyroxenes from other alpine-type peridotites (Ross and others, 1954; Green, 1964; Challis, 1965). The presence of clinopyroxene exSdlution lamellae, however, indicates that calcium was removed from the orthopyroxene struoture during cooling, and the microprobe analyses do not fully account for these lameHae nor the original calcium content of the orthopyroxenes. Howie and Smith (1966, p. 454) have shown that, in general, microprobe analyses of orthopyroxene yield lower values for calcium than do wet chemical analyses. The: calcium distribution in the orthopyroxene as determined with the ~lootron microprobe is irregular and is probably a result of the clinopyroxene exsolution lamellae being partly included for some determination points. :
Aluminum is irregularly distributed in a single orthopyroxene grain and shows a significant difference betwe.en orthopyroxene samples. The bulk composition control for the variation can be seen by comparing the Al20s con:tent of the orthopyroxenes with the Al20 3 content of the whole rock. For example, the orthopyroxene with the highest Al20 3 content (sample 66-R-20, 2.8 percent Al20 3 ) is from the harzburgite with the highest Al20s content ( 0.91 percent Al20s, table 1) and coexists with an aluminium-rich chromian spinel (36.2 percent Al20s, table 6).
Nickel and titanium were looked for with the microprobe but were not detected.
Clinopyroxene
Table 5 shows that clinopyroxene from the clinopyroxenite (sample 65-R-7) is significantly higher in iron content than the clinopyroxene from the harzburgite (sample 66-R-20); similarly, in the same specimens the olivine from the clinopyroxenite is higher in iron content than olivine from the harzburgite (see table 3). The other major differences are higher Al203 and Cr20 3 contents in the clinopyroxene from the harzburgite.
The clinopyroxene from the harzburgite ha~ a higher
Mg+ ~:+ Mn ratio and a lower Al20 3 content compared
with the coexisting orthopyroxene. The two coexisting pyroxenes, however, have similar Cr20 3 contents. Spectrographic analysis for clinopyroxene from the clinopyroxenite (sample 65-R-7) is given in table 4.
Chromian spinel
In contrast to the primary silicate minerals, the chromian spinels show a considerable range iu chemical composition (table 6), particularly in Cr/Cr+Al ratio (fig. 2). Irvine's (1967) compilation of chromian spinel compositions from other alpine-type peridotites shows
TABLE 6.-Chemical composition and structural formula of chromian spinel
[Sample locations on figure 1. All analyses made with electron microprobe by G. R. Himmel berg]
Constituent oxides and elements
____ n_un_ite Harzburgite
65-R-1 66-R-6 66R-22 65-R-9 66-R-20
Chemical composition, in percent
Cr20a- ________________ 41. 5 42. 0 56.3 50. 7 27. 9 AhOa- ________________ 17.8 15. 2 7. 4 11. 4 36. 2 Fe20a1 ________________ 10. 1 12. 0 7. 2 6. 7 3. 2 FeO __________________ 20. 5 21. 6 21. 7 22. 2 12. 7 ~gO _________________ 9. 1 8. 1 7. 5 7. 2 15. 4
TotaL ____________ 99.0 98. 9 100. 1 98. 2 95.4
Structural formula, as number of cations per 32 oxygens
Cr ___________________ 8. 55 8.83 12. 14 10.95 5. 26 Al ___________________ 5. 47 4. 76 2. 38 3. 67 10. 17 Fe+3 __________________ 1. 98 2. 40 1. 48 1. 38 . 57 Fe+2 __________________ 4. 47 4. 80 4. 95 5. 07 2. 53 ~g ________ 7 _________ 3. 53 3. 21 3. 05 2.93 5. 47
Sum R+a __________ 16. 00 15. 99 16. 00 16. 00 16. 00 S urn R +2 __________ 8. 00 8. 01 8. 00 8. 00 8. 00
CrX 100 ______________ 61. 0 65. 0 83. 6 74. 9 34. 1 Cr+Al Fe+3 X 1 00 _____________ 12. 4 15. 0 9. 2 8. 6 3. 6 Fe+3+Cr+Al ~g X 100 _____________ 44. 1 40. 1 38. 1 36. 6 68. 4 ~g+Fe+2
1 Calculated from total iron by assuming RO/R203 ratio of 1/1, and the structural formula was calculated on this basis.
similar variations. Also unlike the silicate minerals, individual spinel grains show significant chemical inhomogeneity for all elements analyzed (± 5 to 10 percent of the average amount present).
Although not compelling, the data suggest ·a possible correlation between texture and chemical composition. The most aluminum-rich spinel (36.2 percent Al20a, sample 66-R-20) oocurs in harzburgite as anhedral grains, some of which ·appea.r to be interstitial, whereas the other four analyzed chromian spinels contain less than 20 percent Al203 and occur as subhedral to euhedral grains. Moreover, the most aluminum-rich chromian spinel coexists with the most aluminum-rich orthopyroxene analyzed.
SERPENTINIZATION
The effect of serpentinization on the chemical composition of the Red Mountain-Del Puerto ultramafic rocks can be partly evaluated by comparing the rock composition, mineral composition, and degree of serpentinization. The density of both olivine of comppsition Fo90 and orthopyroxene of composition En90 is approximately 3.30 g/cc, and the density of serpentine is about 2.50 g/cco; therefore, the density of dunite and
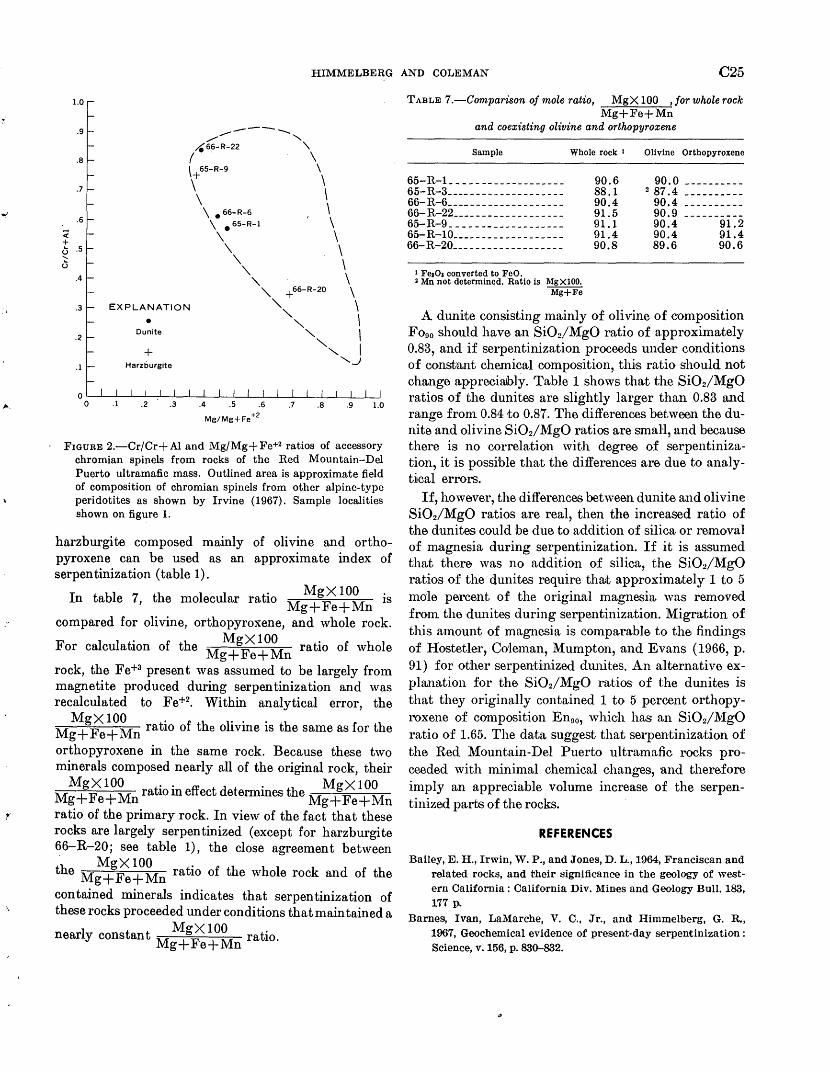
)>.,
HIMMELBERG AND COLEMAN C25
.....------/ ....... /e66-R-22 '\
( . \
.7
I 65-R-9 \ I+ \ \\ \
\ 66-R-6 \ \• 65-R-1 \
\. \ ;( + u .5 \ \
\ \ ......
"'\, \ " +66-R-20 \
" \ "-, \
u . 4
.3 EXPLANATION
• "- I -......., I
'-..J
.2 Dunite
.1
+ Harzburgite
Mg/Mg+Fe +2
FIGURE 2.-Cr/Cr+ Al and Mg/Mg+ Fe+2 ratios of accessory chromian spinels from rocks of the Red Mountain-Del Puerto ultramafic mass. Outlined area is approximate field of composition of chromian spinels from other alpine-type peridotites as shown by Irvine (1967). Sample localities shown on figure 1.
harzburgite composed mainly of olivine and orthopyroxene can be used as an approximate index of serpentinization (table 1).
. MgXlOO In table 7, the molecular ratw Mg+Fe+Mn IS
compared for olivine, orthopyroxene, and whole rock. . MgXlOO
For calculatwn of the Mg+ Fe+ Mn ratio of whole
rock, the Fe+3 present was assumed to be largely from magnetite produced during serpentinization and was recalculated to Fe+2
• Within analytical error, the
MgX 100 t' f h l' . . h f h Mg+Fe+Mn ra 10 o t eo Ivme Is t e same as or t e
orthopyroxene in the same rock. Because these two minerals composed nearly all of the original rock, their
MgX100 . . . MgXIOO Mg+ Fe+ Mn ratiO m effect determmes the Mg+ Fe+ Mn
ratio of the primary rock. In view of the fact that these rocks are largely serpentinized (except for harzburgite 66-R-20; see table 1), the close agreement between . MgXlOO .
the Mg+Fe+Mn ratw of the whole rock and of the
contained minerals indicates that serpentinization of these rocks proceeded under conditions that maintained a
nearly constant M Mgi 10~ ratio. g+ e+ n
TABLE 7.-Comparison of mole ratio, MgX 100 , for whole rock Mg+Fe+Mn
and coexisting olivine and orthopyroxene
Sample Whole rock 1
65-R-1 __________________ _
65-R-3--------------------66-R-6 ___________________ _ 66-R-22 __________________ _ 65- R-9 __________________ _ 65-R-10 ________________ - _-66-R-20 __________________ _
1 FesOa converted to FeO . 2 Mn not determined. Ratio is MgXIOO.
Mg+Fe
90.6 88.1 90.4 91.5 91.1 91.4 90.8
Olivine Orthopyroxene
90.0 ----------2 87.4 ----------
90.4 ----------90.9 ----------90.4 91.2 90.4 91.4 89.6 90.6
A dunite consisting mainly of olivine of composition Fo90 should have an Si02/MgO ratio of approximately 0.83, and if serpentinization proceeds under conditions of constant chemical composition, this ratio should not change apprecirubly. 'Table 1 shows that the Si02/Mg0 ratios of the dunites are slightly larger than 0.83 and range from 0.84 to 0.87. The differences between the dunite and olivine SiOdMgO ratios are smaH, and because there is no correlation with degree of serpentinization, it is possible that the differences are due to analyt]cal errors.
If, however, the differences between dunite and olivine Si02/Mg0 ratios are real, then the increased ratio of the dunites could be due to addition of silica or removal of magnesia during serpentinization. If it is assumed that there was no addition of silica, the Si02/M:g0 ratios of the dunites require tha:t approximately 1 to 5 mole percent of the original magnesia was removed from the dunites during serpentinization. Migration of this amount of magnesia is comparable to the findings of Hostetler, Co'leman, Mumpton, and Evans (1966, p. 91) for other serpentinized dunites. An alternative explanation for the Si02/Mg0 ratios of the dunites is that they originally contained 1 to 5 percent orthopyroxene of composition En90 , which has an Si02/~lg0 ratio of 1.65. The data suggest that serpentinization of the Red Mountain-Del Puerto ultramafic rocks proceeded with minimal chemical changes, ·and therefore imply an appreciable volume increase of the serpentinized parts of the rocks.
REFERENCES
Bailey, E. H., Irwin, W. P., and Jones, D. L., 1964, Franciscan and related rocks, and t:heir significance in the geology of western California: California Div. Mines and Geology Bull. 183, 177 p.
Barnes, Ivan, LaMarche, V. C., Jr., and Himmelberg, G. R., 1967, Geochemical evidence of present-day serpentinization: Science,v.156,p.830-832.
C26 MINERALOGY AND PETROLOGY
Bodenlos, A. J., 1950, Geology of the Red Mountain magnesite district, Santa Clara and Stanislaus Counties, California: California Jour. Mines and Geology, v. 46, p. 223-278.
Challis, G. A., 1965, The origin of New Zealand ultramafic intrusions: Joor. Petrology, v. 6, p. 322-364.
Duncumb, Peter, and Shields, P. K., 1966, Effect of critical excitation potential on the absorption corr~on, in McKinley, T. D., Henrich, K. F. J., and Witttry, D. B.,, eds., The electron microprobe. Proceedings of the symposium sponsored by the Electrothermic and Metallurgy Division, the Electrochemical Society, Washington, D.C., 1964: New York, John Wiley and Sons, p. 284--295.
Green, D. H., 1964, The petrogenesis of the high-temperature peridotite instrusion in the Lizard area, C'ornwell: Jour. Petrology, v. 5, p. 134-188.
Hawkes, H. E., Jr., 'Vells, F. G., and Wheeler, D. P., Jr., 1942, Ohromite and quicksilver deposits of the Del Puerto •area, Stanislaus County, Oalifornia: U.S. Geol. Survey Bull. 936-D, p. 79-110.
Heinrich, K. F. J., 1966, X-ray absorption uncertainty, in McKinley, T. D., Heinrich, K. F. J., and Wittry, D. B., eds., The electron microprobe, Proceedings of the S'Ymposium sponsored by The Electrothermic and Metallurgy Divisrion, The Electrochemical Society, Washington, D.C., 1964: New York, John Wiley and Sons, p. 396-377.
Hostetler, P. B., Coleman, R. G., Mum.pton, F. A., and Evans, B. W., 1966, Brucite in alpine serpentinites: Am. Mineralogist, v. 51, p. 75--98.
Howie, R. A., and Smith J. V., 1966, X-ray emission microanalysis of .rock-forming minerals; V, Orthopyroxenes: Jow;. Geology, v. 74, p. 443-462.
I·rvine, T. N., 1967, Chromian spinel as a petrogenetic indicator; Pt. 2, Petrologic a.pplications: Canadian Jour. Earth Sci., v. 4, p. 71-103.
Jackson, E. D., 1961, Primary textures and mineral associa.tions in the ultramafic zone of the Stillwater Complex, Montana: U.S. Geol Survey Prof. Paper 358, 106 P:
Jackson, E. D., StevelliS, R. E., and Bowen, R. W., 1967, A computer-based procedure for deriving mineral formulas from mineral analyses, in Geological Survey Research 1967: U.S. Geol. SUJrvey Prof. Paper 575--C, p. C23-C31.
Maddock, M. E., 1964, Geologic map and sections of the Mount Boardman quadrangle, Santa Olara and Stanislaus Counties, California: California Div. Mines and Geology Map Sheet 3, scale about 1 inch to 1 mile.
Page, N. J., 1967, Serpentinization at Burro Mountain, Califorp.ia: Contr. Mineralogy and Petrology, v. 14, p. 321-342.
Philibert, J., 1963, A method for calculartJi.ng the ·absorption correction in electron probe microanalysis, in Pattee, H. H., Cosslett, V. E., oand Engstrom, A., eds., X-ray optics and X-ray microanalysis, Proceedings of ·the Third International Symposium on X-ray optics and X-ray microanalysis, Stanford, 1962: New York, Academic Press, p. 379-392.
Rogers, T. H., 1966, Geologic map of California, Olaf P. Jenkins edition-San Jose sheet [San Francisco, Calif.] : California Div. Mines and Geology, scale 1 : 250,000.
Ross, C. S., Foster, M. D., and Myers A. T., 1954, Origin of dunites and of olivine-rich inclusions in basaltic rocks: Am. Mineralogist, v. 39, p. 693-737.
Shapiro, Leonard, and Brannock, W. W., 1962, Rapid analysis of silicate, carbonate, and phosph'ate rocks: U.S. Geol. Survey Bull. 1144-A, 56 p.
Soliman, S. M., 1965, Geology of the east half of the Mount Hamilton quadrangle, Oalifornia: California Div. Mines and Geology Bull. 185, 32 p.
GEOLOGICAL SURVEY RESEARCH 1968
REFRACTIVE INDEX OF GLASS BEADS DISTINGUISHES TERTIARY BASALTS
IN THE GRAYS RIVER AREA, SOUTHWESTERN WASHINGTON
By EDWIN H. McKEE, Menlo Park, Calif.
Abstract.~Measurement of refractive indices of fused glass beads furnishes a means for distinguishing the lowest of three upper Tertiary basalt units in the Grays River area of southwestern 'Vashington from the upper :two. Fused glass beads can be rapidly and inexpensively produced, and for identification purposes are an effective substitute for chemical analyses.
Regional geologic, chemical, and petrographic studies by P. D. Snavely, tTr., H. C. Wagner, and N. S. MacLeod have led to a· thre-efold stratigraphic and petrologic subdivision of basaltic rocks of middle Miocene to early Pliocene age in western Oregon and Washington (P. D. Snavely, oral commun., 1964). During this work, they also established a general temporal and petrochemical equivalence between these basalts and the Yakima Basalt of the Columbia River Group ('Vaters, 1961) and specific equivalence with the normal Yakima and late Yakima types of Waters (1961, p. 593-594) and the Pomona flow of Schmincke (1967). Field and laborrutory work by E. W. )Volfe and E. H. Mcl{ee indicate that this threefold petrochemical subdivision is also applicable in the Grays River area.
Although definite petrographic differences exist, it is sometimes difficult to distinguish these three units except on the basis of petrochemistry. The refractive index of fused glass beads frmn these upper Tertiary basalts in the Grays River area offers a rapid and inexpensive means of distinguishing the oldest of the units from the other two.
Acknowledgments.-Special thanks are due Edward )V. '\Volfe for discussions of the geology of the region and for suggestions made during the study. Parke D. Snavely, Jr., and Holly C. '\Vagner made available their data on basalts from nearby regions.
FIELD RELATIONSHIPS
Basalt flows and intrusive rocks of late Teritary age crop out along the north side of the lower Columbia River in the Grays River area (fig. 1). The flow rocks, which are usually several hundred feet thick, consist of
pillow basalt, basalt breccia, and massive flows. The intrusive rocks are chiefly dikes and sills a hundred feet or less in thickness; they occur throughout the region and most com1nonly intrude Oligocene and Miocene sedimentary rocks.
The basalts of the m.ap area can be separated into the three petvochemical types known to occur in western Oregon and )Vashington, but the temporal relationship of the different upper Teritary basalt types in the Grays River area is uncertain because in no place does one overlie or intrude the other. However, the age relations determined for these petrochemical types elsewhere (Waters, 1961; Snavely and others, 1965) probably holds in the Grays River area as well. The term "basalt of Three Tree Point" and "basalt of Altoona" (Wolfe and Mcl(ee, 1968) are used in this paper for equivalents of the Yakima and late Yakima types, respectively. The third type is referred to as the "Pomona" type in this paper.
PETROGRAPHY AND CHEMICAL COMPOSITION
The basalts are gray to· black aphanitic rocks that are usually difficult to tell apart in the field. The presence of large (up to three-fourths of ·an inch long) phenocrysts of plagioclase can be used to distinguish the basalt of Altoona, but they occur sparsely and may not be found in small outcrops.
Definite distinction between the basalts is difficult to make from thin section. All are hypocrystalline, typi· cally with intersertal texture; and the basalt of Altoona is porphyritic in some places. Plagioclase ( An47- An67 ),
augi1te (2V=50° and nY=1.70), and less abundant pigeonite (2V less than 30°) make up about 50 percent of most rocks; they are in a matr!x of dark glass ( refvactive index greater than balsam) that is generally only slightly devitrified. The ·hasa1t of Altoona also contains some smaJl anhedral crystals of olivine which do not occur in the basalt of Three Tree Point, but these are difficult to recognize. Accessory. minerals include magnetite and apatite.
294-199 0--68----3 U.S. GEOL. SURVEY PROF. PAPER 600-C, PAGES C27-C30 027
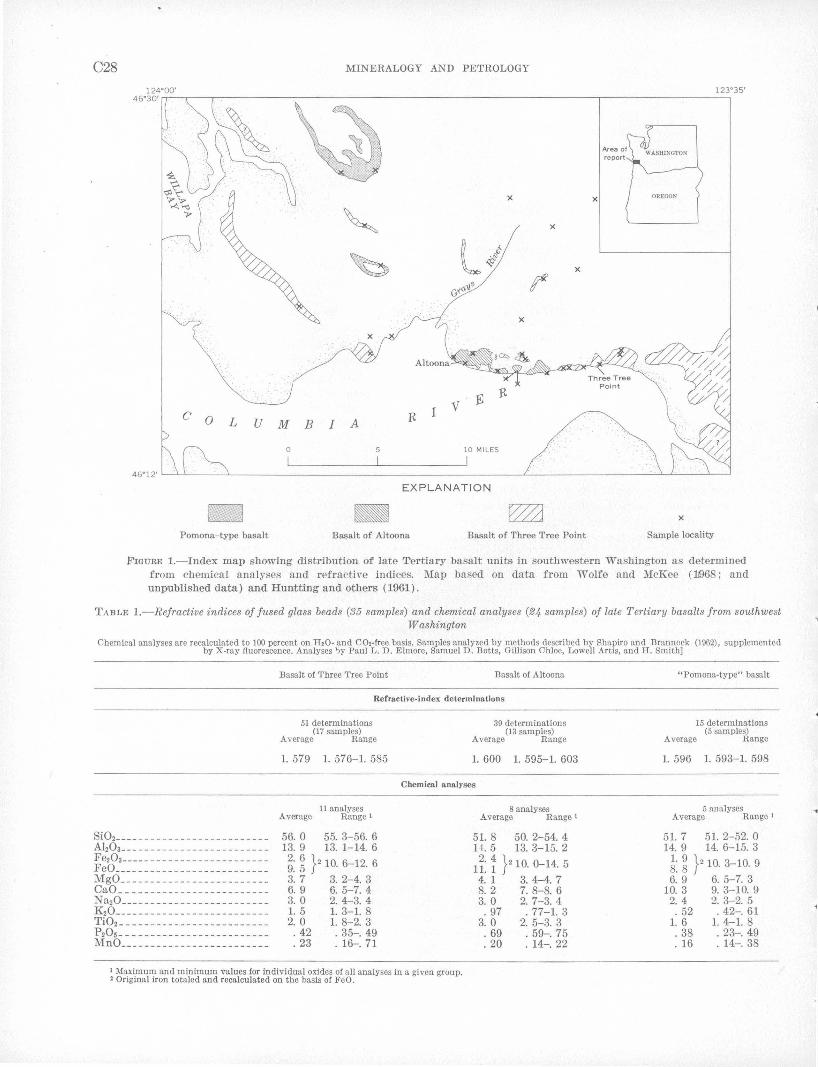
C28
124°00' 46°30'
Pomona-type basalt
M~ERALOGY AND PETROLOGY
X
X
X
EXPLANATION
Ba~alt of Altoona Basalt of Three Tree Point
123.35'
X
Sample locality
FIGURE 1.- Index map showing distribution af late Tertiary basalt units in southwestern Washington as determined from chemical analyses and refractive indices. l\1ap based on data from Wolfe and McKee (W68; and unpublished data) and Huntting and others (1961).
TABLE I.-Refractive indices of fused glass beads (35 samples) and chemical analyses (24 samples) of late Tertiary basalts from southwest Washington
Chemical ana lyses are recalculated to 100 percent on H,O- and CO,-free basis. Samples analyzed by methods described by Shapiro and Brannock (1962), supplemented by X-ray fluorescence. Analyses ')y PaulL. D. Elmore, Samuel D. Botts, Gillison Chloe, Lowell Artis, and H. Smith]
Basalt of Three Tree Point Basalt of Altoona
Refractive-index determinations
51 determinations (17 samples)
Average Range
1. 579 1. 576- 1. 585
39 determinations (13 samples)
Average Range
1. 600 1. 595-1. 603
Chemical analyses
Si02-------------------------Ah0a--- - - - - - - ---- ------------Fe20a----- --- - ---- --- -- _ --- __ _ FeO ____ _____________________ _ ~gO ________________________ _ Cao __________ ______ ___ ____ _ _
Na20----------- -- -------- ----K20 __________ ___ ______ ______ _
Ti02------------------------P205-------------------------~no ________________________ _
11 analyses Average Range 1
56. 0 55. 3-56. 6 13. 9 13. 1-14. 6
~: ~ } 2 10. 6- 12. 6 3. 7 3. 2- 4. 3 6. 9 6. 5-7. 4 3. 0 2. 4-3. 4 1. 5 1. 3-1. 8 2. 0 1. 8-2. 3
. 42 . 35-. 49
. 23 . 16-. 71
1 Maximum and minimum values for individual oxides of all analyses in a given group. 'Original iron totaled and recalculated on the basis of FeO.
8 analyses Average Range 1
51. 8 50. 2-54. 4 14. 5 13. 3-15. 2
1i: i }210. 0-14. 5 4. 1 3. 4-4. 7 8. 2 7. 8-8. 6 3. 0 2. 7-3. 4 . 97 . 77-1. 3
3. 0 2. 5-3. 3 .69 .59-.75 . 20 . 14-. 22
"Pomona-type" basalt
15 determinations (5 samples)
Average Range
1. 596 1. 593-1. 598
5 analyses Average Range 1
51. 7 51. 2-52. 0 14. 9 14. 6-15. 3
§: ~ }2 10. 3-10. 9 6. 9 6. 5-7. 3
10. 3 9. 3-10. 9 2. 4 2. 3-2. 5
. 52 . 42-. 61 1. 6 1. 4-1. 8 . 38 . 23-. 49 . 16 . 14-. 38
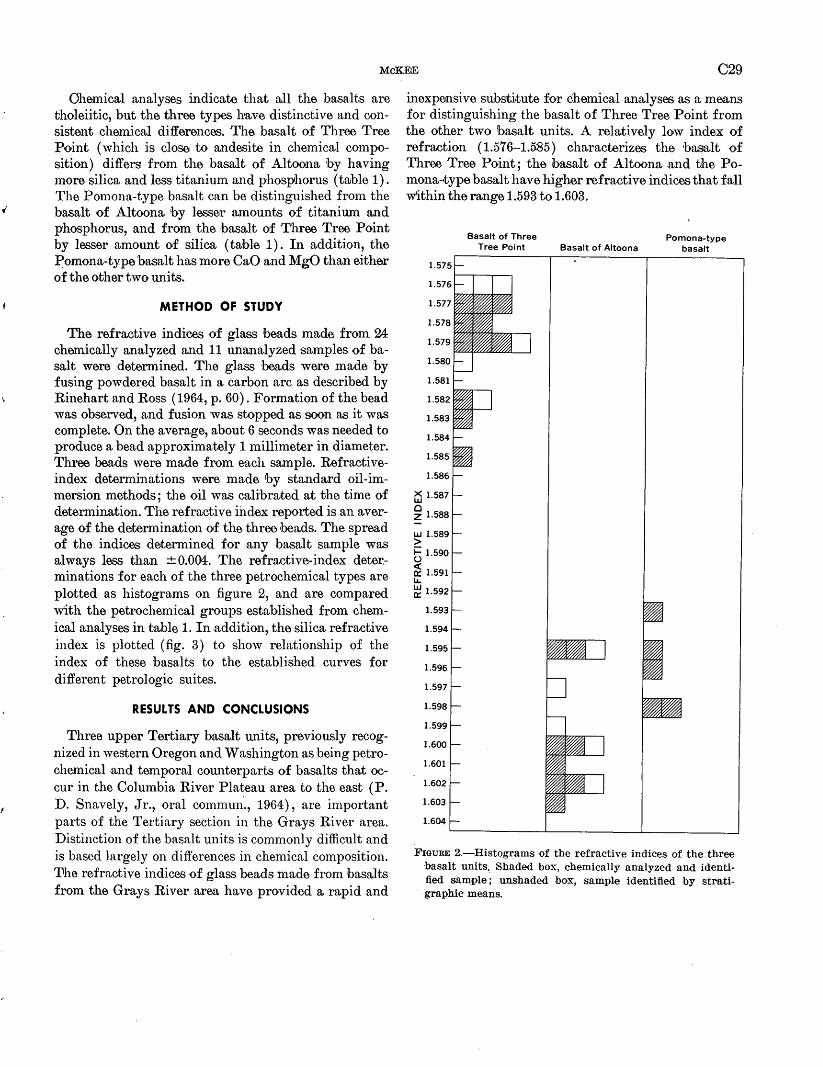
McKEE C29
Ohemical analyses indicate that all the basalts are tholeiitic, but the three types have distinctive and oonsistent chemical differences. The basalt of Three Tree Point (which is close to andesite in chemical composition) differs from the basalt of Altoona by having more silica and less titanium and phosphorus ( truble 1). The Pomona-type basalt can be distinguished from the basalt of Altoona by lesser amounts of titanium and phosphorus, and from the hasalt of Three Tree Point by lesser amount of silica ( truble 1). In addition, the ~omona-type 'basalt has more CaO and MgO than either of the other two units.
METHOD OF STUDY
The refractive indices of glass beads made from 24 chemically analyzed and 11 unanalyzed samples of basalt were determined. The glass beads were made by fusing powdered basalt in a carbon arc as described by Rinehart and Ross (1964, p. 60). Formation of the bead was observed, and fusion was stopped as soon as it was complete. On the average, about 6 seconds was needed to produce a bead approximately 1 millimeter in diameter. Three beads were made from each sample. Refractiveindex determinations were made by standard oil-immersion methods; the oil was calihraJted at the time of determination. The refractive index reported is an average of the determination of the three beads. The spread of the indices determined for any basalt sample was always less than ±0.004. The refractive-index determinations for each of the three petrochemical types are plotted as histograms on figure 2, and are compared with the petrochemical groups established from chemical analyses in table 1. In ,addition, the silica refractive index is plotted (fig. 3) to show relationship of the index of these basalts to the established curves for different petrologic suites.
RESULTS AND CONCLUSIONS
Three upper Tertiary basalt units, previously recognized in western Oregon and Washington as being petrochemical and temporal cow1terparts of basalts that occur in the Columbia River Plateau area to the east (P. D. Snavely, Jr., oral commun·., 1964), are important parts of the Tertiary section in the Grays River area. Distinction of the basalt units is commonly difficult and is based largely on difl'erences in chemical composition. '.Dhe refractive indices of glass beads made from basalts from the Grays River area have provided a rapid and
inexpensive substitute fur chemical an.alyses as a means for distinguishing the basalt of Three Tree Point from the other two basalt units. A relatively low index of refraction (1.576-1.585) characterizes the 'basalt of Three Tree Point; the ibasalt of Altoona .and tJhe Pomona-•type basalt have higher refractive indices that fall within the range 1.593 to 1.603.
1.596
1.597
1.598
1.599
1.600
1.601
1.602
1.603
1.604
Basalt of Three Tree Point Basalt of Altoona
Pomona-type basalt
FIGURE 2.-Histogra.ms of the refractive indices of the three hasalt units. Shaded box, chemically analyzed and identified sample ; unshaded box, sample identified by strati
. graphic means.
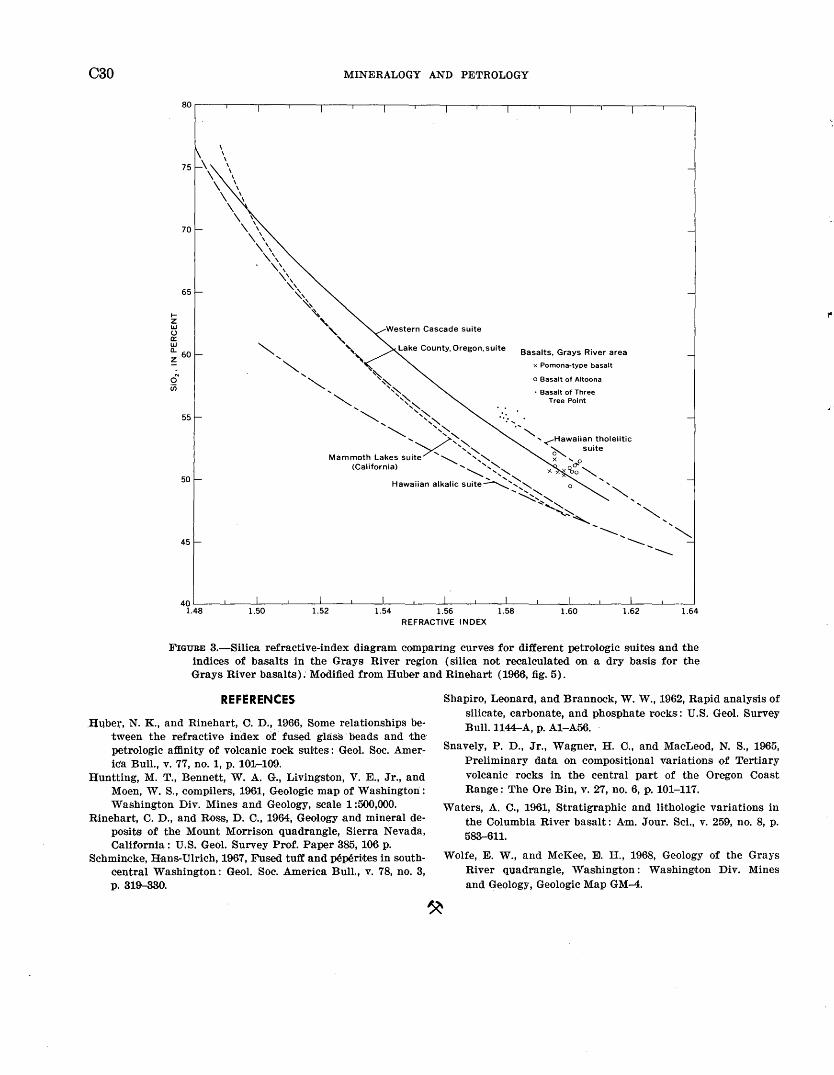
C30 MINERALOGY AND PETROLOGY
..... z UJ (.) a:: UJ
~ 60
55
50
45
\ \ \ \ \ \
\ \ \ \
\ \ X
\\ \\ \\ '\\ '\\
'\'
"' ~' ~ ' " " '-, Basalts, Grays River area
x Pomona-type basalt
o Basalt of Altoona
• Basalt of Three Tree Point
1.50 1.52 1.54 1.56 REFRACTIVE INDEX
1.58 1.60 1.62 1.64
FIGURE 3.-Silica refractive-index diagram comparing curves for different petrologic suites and the indices of basalts in the Grays River region (silica not recalculated on a dry basis for the Grays River basalts); Modified from Huber and Rinehart (1966, :fig. 5).
REFERENCES
.llubet;, N. K., and Rinehart, C. D., 1966, Some relationships be· tween the refractive index of" fused glass. beads and the· petrologic affinity of volcanic rock sui,tes: Geol. Soc. Americ'a Bull., v. 77, no. 1, p. 10lr-109.
Huntting, M. T., Bennett, W. A. G., Livingston, V. E., Jr., and Moen, ·w. S., compilers, 1961, Geologic map of Washington: Washington Div. Mines and Geology, scale 1:500,000.
Rinehart, C. D., and Ross, D. C., 1964, Geology and mineral deposits of the Mount Morrison quadrangle, Sierra Nevada, California: U.S. Geol. Survey Prof. Paper 385, 100 p.
Schmin.cke, Hans-Ulrich, 1967, Fused tuff and peperittes in southcentral Washington: Geol. Soc. America Bull., v. 78, no. 3, p. 319-330.
Shapiro, Leonard, and Brannock, W. W., 1962, Rapid analysis of silicate, carbonate, and phosphate rocks: U.S. Geol. Survey Bull.1144-A, p. A1-.A:56.
Snavely, P. D., Jr., Wagner, H. C., and MacLeod, N. S., 1965, Preliminary data on compositional variations of Tertiary volcanic rocks in the central part of the Oregon Coast Range: The Ore Bin, v. 27, no. 6, p. 101-117.
Waters, A. C., 1961, Stratigraphic and lithologic variations in the Columbia River basalt: Am. Jour. Sci., v. 259, no. 8, p. 583-611.
Wolfe, E. W., and McKee, E. H., 1968, Geology of the Grays River quadrangle, Washington : Washington Div. Mines and Geology, Geologic Map GM-4.
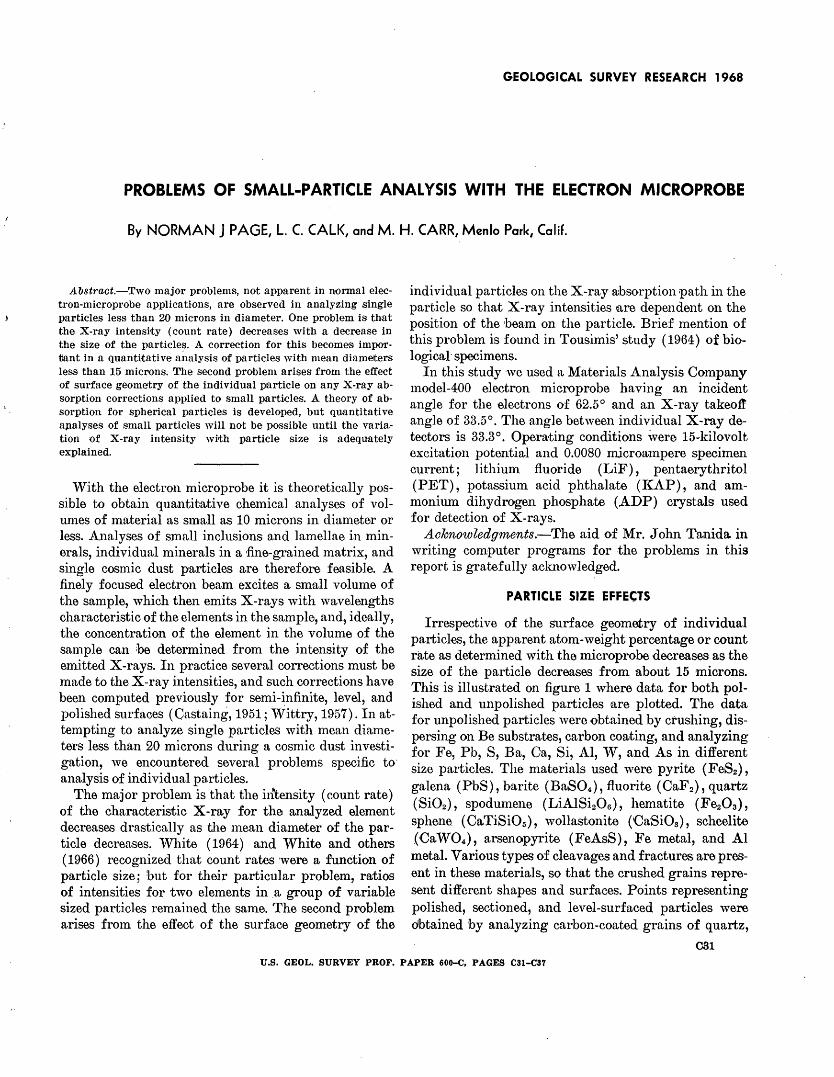
GEOLOGICAL SURVEY RESEARCH 1968
PROBLEMS OF SMALL-PARTICLE ANALYSIS WITH THE ELECTRON MICROPROBE
By NORMAN J PAGE, L. C. CALK, and M. H. CARR, Menlo Park, Calif.
A.bstract.-Two major problems, not apparent in normal electron-microprobe applications, are observed in analyzing single pavticles less than 20 microns in diameter. One problem is that the X-ray intensi·ty (count rate) decreases with a decrease in the size of the particle~. A correction for this becomes importJant in a quantitative analysis of particles with mean diameters less than 15 microns. The second problem arises from the effect of surface geometry of the individual particle on any X-ray absorption corrections applied to small particles. A theory of absorption for spherical particles is developed, but quantitative a;palyses of small particles will not be possible until the variation of X-ray intensity with particle size is adequately explained.
With the electron microprobe it is theoretically possible to obtain quantitative chemical analyses of volmnes of n1aterial as sm-all as 10 microns in diameter or less. Analyses of small inclusions and lamellae in minerals, individual minerals in a ·fine-grained matrix, and single cosmic dust particles are therefore feasible. A finely :focused electron beam excites a small volume of the sample, which then emits X-rays with wavelengths characteristic of the elements in the sample, and, ideally, the concentration o:f the element in the volume of the sample can be determined from the intensity of the emitted X-rays. In practice several corrections must be made to the X-ray intensities, and such corrections have been computed previously for semi-infinite, level, and polished surfaces ( Castaing, 1951; Wittry, 1957). In attempting to analyze single particles with mean diameters less than 20 microns during a cosmic dust investigation, we encountered several problems specific to· analysis of individual pa.rticles.
The major proble1n is that the ii~tensity (count rate) of the characteristic X-ray :for the analyzed element decreases drastically as the 1nean diameter of the particle decreases. 'iVhite ( 1964) and White and others ( 1966) recognized that count rates were a function of particle size; but for their particular problem, ratios of intensities for two elements in a group of variable sized particles remained the same. The second problem arises from the effect of the surface geometry of the
individual particles on the X-ray a;bsorption path in the particle so that X-ray intensities ~are de.pendent on the position of the beam on the particle. Brief 1nention of this problem is found in Tousimis' study (1964) of biological· specimens.
In this study we used a Materials Analysis Company lnodel-400 electron microprobe having an incident angle for the electrons of 62.5° and an X-ray takeo1t angle of 33.5°. The angle between individual X-ray detectors is 33.3°. Opera·ting conditions \vere 15-kilovolt excitation potential and 0.0080 microampere specimen current; lithium fluoride (LiF), pentaerythritol (PET), potassium acid phthalate (l{AP), and ammonium dihydrogen phosphate (ADP) crystals used for detection of X-rays.
Aoknowledgments.-The aid of Mr. John Tanida in writing computer programs for .the problems in this report is gratefully aclrnowledged.
PARTICLE SIZE EFFECTS
Irrespective of the surface geometry of individual particles, the apparent atom-weight percentage or count rate as determined with the microprobe decreases as the size of the particle decreases from about 15 microns. This is illustrated on figure 1 where data for both polished and unpolished particles ·are plotted. The data for unpolished particles were obtained by crushing, dispersing on Be substrates, carbon coating, and analyzing for Fe, Pb, S, Ba, Ca, Si, AI, W, and As in different size particles. The materials used were pyrite (FeS2), galena (PbS), barite (BaS04), fluorite (CaF2), quartz (Si02), spodumene (Li.AlSi20s), hematite (Fe20 3),
sphene ( CaTiSi05 ), wollastonite (CaSi03 ), scheelite (Ca W04), arsenopyrite (FeAsS), Fe metal, and AI metal. Various types o:f cleavages and fractures are pres-ent in these materials, so that the crushed grains represent different shapes and surfaces. Points representing polished, sectioned, and level-surfaced particles were dhtained by analyzing carbon-coated grains of quartz,
081 U.S. GEOL. SURVEY PROF. PAPER 60D-C, PAGES C31-C37
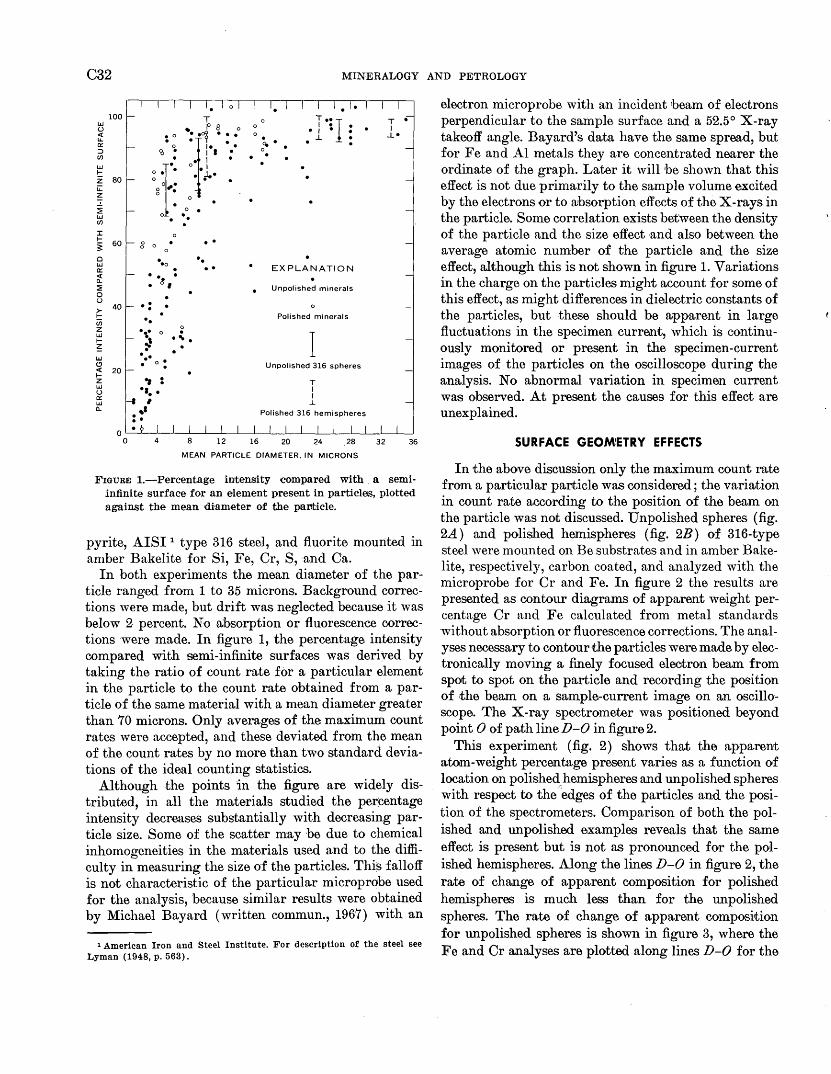
C32 MINERALOGY AND PETROLOGY
LIJ (.) <{ ~ a:: ::::l Cll
LIJ
t: z u: z
~ LIJ Cll
J: 1-
~ Q LIJ a:: <{ a.. ::?! 0 (.)
~ 40
Ui z LIJ 1-z LIJ (!)
~ 20 z LIJ (.) a:: LIJ a..
T • p 8 0 °
:.1: .~ ~.Jl" ::: 0 • •
g "· . 0 . .
0 . . . . 8 0 • .
•o . : ·~I •
. : . ..
., : •• ••
I
••• ..
~ .... .
.. .. ..
. . I • •
• I • • . ..L • ~ .
0 •
T •• I . . .
EXPLANATION
Unpolished minerals
Polished minerals
I Unpolished 316 spheres
T I I
..L
Polished 316 hemispheres
MEAN PARTICLE DIAMETER, IN MICRONS
FIGURE !.-Percentage intensity compared with . a semiinfinite surface for an element present in particles, plotted •against the mean diameter of the particle.
pyrite, AISI 1 type 316 steel, and fluorite mounted in amber Bakelite for Si, Fe, Cr, S, ·and Ca.
In both experiments the mean diameter of the particle ranged from 1 to 35 microns. Background corrections were made, but drift was neglected because it was below 2 percent. No absorption or fluorescence corrections were made. In figure 1, the percentage intensity compared with semi-infinite surfaces was derived by taking the ratio of count rate for a particular element in the particle to the count rate obtained from a particle of the same material with a mean diameter greater than 70 microns. Only averages of the maximum count rates were accepted, and these deviated from the mean of the count rates by no more than two standard deviations of the ideal counting statistics.
Although the points in the figure are widely distributed, in all the materials studied the percentage intensity decreases substantially with decreasing particle size. Some of the scatter may he due to chemical inhomogeneities in the materials used and to the difficulty in measuring the size of the particles. This falloff is not characteristic of the particular microprobe used for the analysis, because similar results were obtained by Michael Bayard (written commun., 1967) with an
1 American Iron and Steel Institute. For description of the steel see Lyman (1948, p. 563).
electron microprobe with an incident 1beam of electrons perpendicular to the sample surface and a 52.5° X-ray takeoff angle. Bayard's data have the same spread, but for Fe and AI metals they are concentrated nearer the ordinate of the graph. Later it will he shown that this effect is not due primarily to the sample volume excited by the electrons or to absorption effects of the X-rays in the particle. Some correlation exists between the density of the particle and the size effect ·and also between the average atomic number of the particle and the size effect, although this is not shown in figure 1. Variations in the charge on the particles might account for some of this effect, as might differences in dielectric constants of the particles, but these should he apparent in large fluctuations in the specimen current, which is continuously monitored or present in the specimen-current images of the particles on the oscilloscope during the analysis. No abnormal variation in specimen current wa;s observed. At present the causes for this effect are unexplained.
SURFACE GEOM1ETRY EFFECTS
In the above discussion only the maximum count rate from a particular paflticle was considered; the variation in count rate according to the position of the beam on the particle was not discussed. Unpolished spheres (fig. 2A) and polished hemispheres (fig. 2B) of 316-type steel were mounted on Be substrates and in amber Bakelite, respectively, carbon coated, and analyzed with the microprobe for Cr and Fe. In figure 2 the results are presented as contour diagrams of apparent weight percentage Cr and Fe calculated from metal standards without absorption or fluorescence corrections. The analyses necessary to contour the particles were made by electronically moving a finely focused electron beam from spot to spot on the particle and recording the position of the beam on a sample-current image on an oscilloscope. The X-ray spectrometer was positioned beyond point 0 of path line D-0 in figure 2.
This experiment (fig. 2) shows that the apparent atom-weight percentage present varies as a function of l~tion on polishe~hemispheres and unpolished spheres w1th respect to the edges of the particles and the position of the spectrometers. Comparison of both the polished and unpolished examples reveals that the same effect is present but is not as pronounced for the polished hemispheres. Along the lines D-0 in figure 2, the rate of change of apparent composition for polished hemispheres is much less than for the unpolished spheres. The rate of change of apparent composition for unpolished spheres is shown in figure 3, where the Fe and Cr analyses are plotted along lines D-0 for the
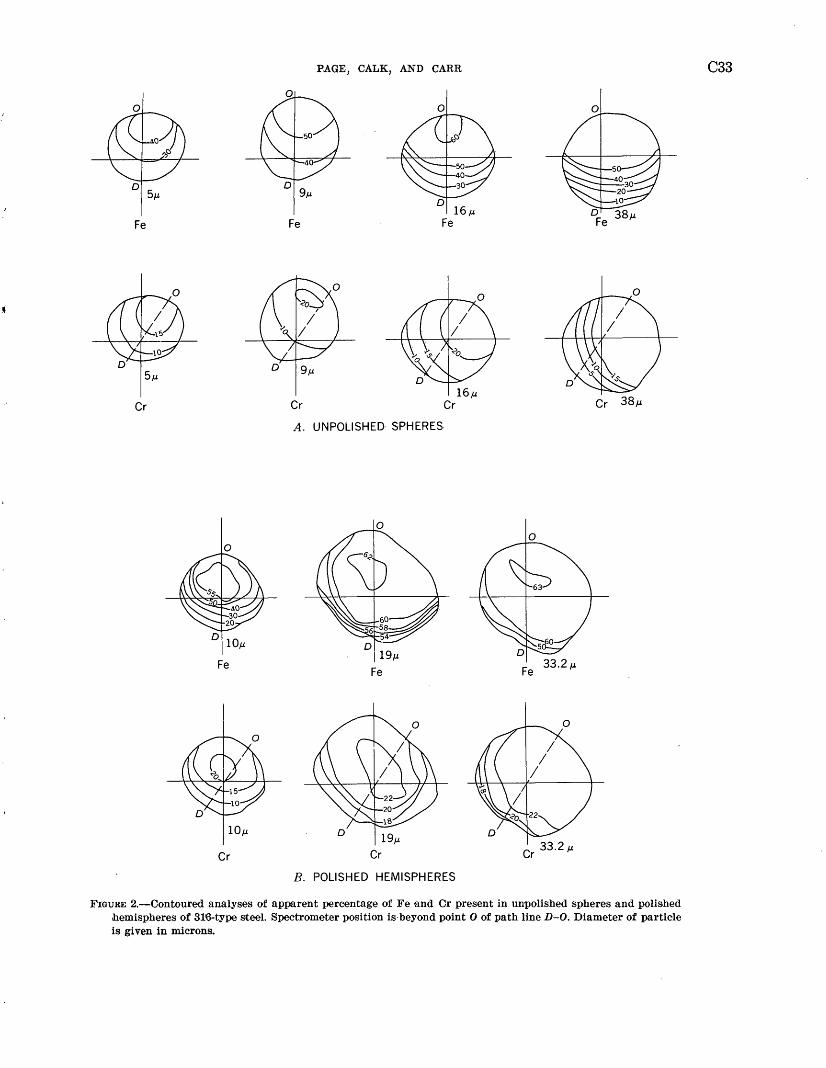
D 5~-t
Fe
Cr
0
Cr
Fe
Cr
PAGE, CALK, AND CARR
0
16,u Cr
A. UNPOLISHED· SPHERES.
Cr
B. POLISHED HEMISPHERES
0
Cr 33.2 ,u
FIGURE 2.-Contoured analyses of apparent percentage of Fe and Cr present in unpolished spheres and polished hemispheres of 316-type steel. Spectrometer position is· beyond point 0 of path line D-0. Diameter of particle is given in microns.
C33
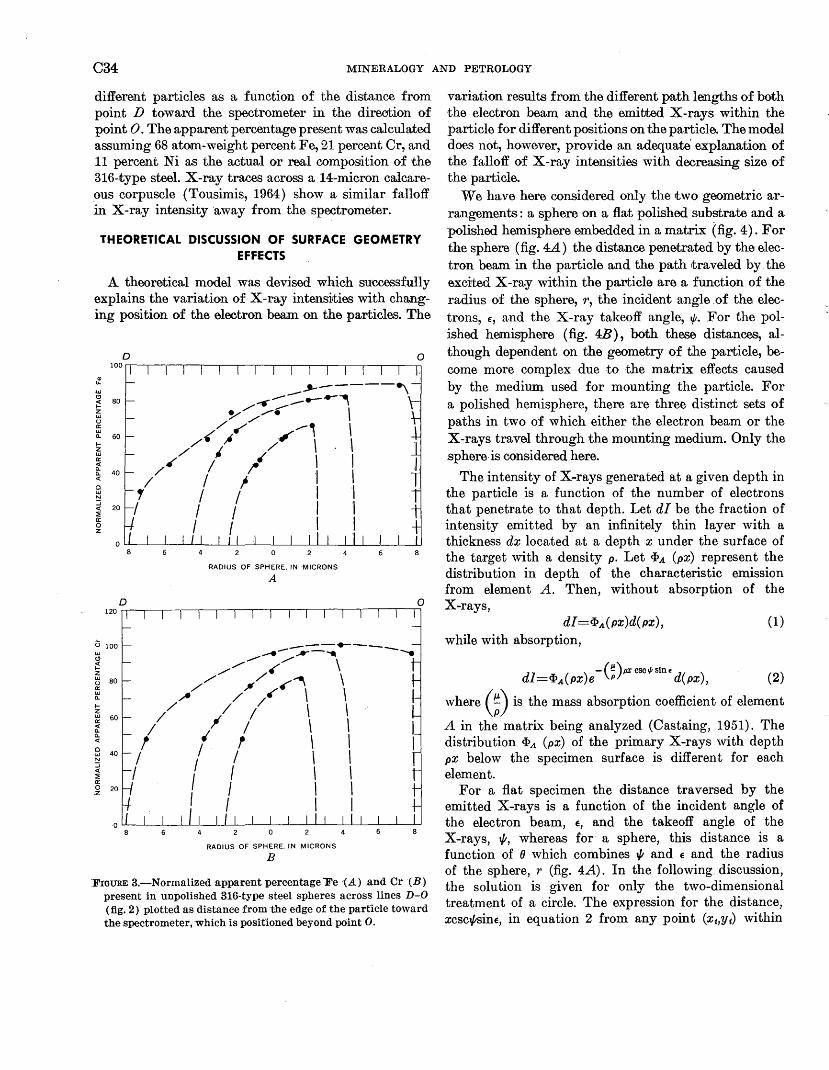
C34 M~ERALOGY AND PETROLOGY
different particles as a function of the distance from point D toward the spectrometer in the direction of point 0. The apparent percentage present was calculated assuming 68 atom-weight percent Fe, 21 percent Cr, and 11 percent Ni as the actual or real composition of the 316-type steel. X-ray traces across a 14-micron calcareous corpuscle (Tousimis, 1964) show a similar falloff in X-ray intensity away from the spectrometer.
THEORETICAL DISCUSSION OF SUR'FACE GEOMETRY EFFECTS
A theoretical model was devised which successfully explains the variation of X-ray intensities with changing position of the electron beam on the particles. The
Q) Ll-
UJ
~ 80 tz UJ u a: UJ 0.. 60 t-z UJ a: ~ 0.. 40 <(
0 UJ N
~ 20 ::E a: 0 z
0
0
u 100 UJ ~ <( t-z ~ 80 a: UJ 0..
tz ~ 60
~ 0.. <(
8 40 N ::; <(
::E a: .~ 20
0
_ ...... -----~ ~::-------~
~~,... \ / ~ __ , \ /"' ,. /, \ \
/ ' ~ /~ 1 ~ I I / I ! ·1 I
1 I 1 I ·1 I I 1 I I
I I I I
RADIUS OF SPHERE. IN ·MICRONS
A
0
_.-·-:::;..::-=- ..... .-----.... _,.., / \
/// / .. ~ \ ~/ /~ f(". \ \
// ~/ 1/ \ \ I ,r I \ \
! I f \ I I I I \ I I I I I I
I I I I I I I
8
RADIUS OF SPHERE, IN MICRONS
B
·FIGURE 3.-Normalized apparent percentage 'Fe '(.A) and Cr (B) present in unpolished 316-type steel spheres across lines D-0 (fig. 2) plotted as distance from the edge of the particle toward the spectrometer, which is positioned beyond po:int 0.
variation results from the different path lengths of both the electron beam and the emitted X-rays within the particle for different positions on the particle. The model does not, however, provide an adequate' explanation of the falloff of X-ray intensities with decreasing size of the particle.
We ha.ve here considered only the two geometric arrangements: a sphere on a flat polished substrate and a polished hemisphere embedded in a matrix (fig. 4). For the sphere (fig. 4A) the distance penetrated by the electron beam in the particle and the path 1tra veled by. the excited X-ray within the particle are a function of the radius of the sphere, r, the incident angle .of the electrons, E, and the X-ray takeoff angle, t/J. For the polished hemisphere (fig. 4B), both these distances, although dependent on the geometry of the particle, become more complex due to the matrix effects caused by the medium used for mounting the particle. For a polished hemisphere, there ·are three distinct sets of paths in two of which either the electron beam or the X-rays travel through the mounting medium. Only the sphere· is considered here.
The intensity of X-rays generated at a given depth in the particle is a function of the number of electrons that penetrate to that depth. Let dl be the fraction of intensity emitted by an infinitely thin layer with a thickness dx located at a depth x under the surface of the target with a density p. Let <I>A (px) represent the distribution in depth of the characteristic emission from element A. Then, without absorption of the X-rays,
dl =<I>A(px)d(px), while with absorption,
(1)
dl =<I>A(px)e- (~)pX cscl/l sine d(px), (2)
where(~) is the mass absorption coefficient of element
A in the matrix being analyzed (Castaing, 1951). The distribution <I>A (px) of the primary X-rays with depth px below the specimen surface is different for each element.
For a flat specimen the distance traversed by the emitted X-rays is a function of the incident angle of the electron beam, E, and the takeoff angle of the X-rays, 1/1, whereas for a sphere, this distance is a function of (} which combines 1/1 and E and the radius of the sphere, r (fig. 4A). In the following. discussion, the solution is given for only the two-dimensional treatment of a circle. The expression for the distance, xcsc,PsinE, in equation 2 from any point (xt,Yt) within
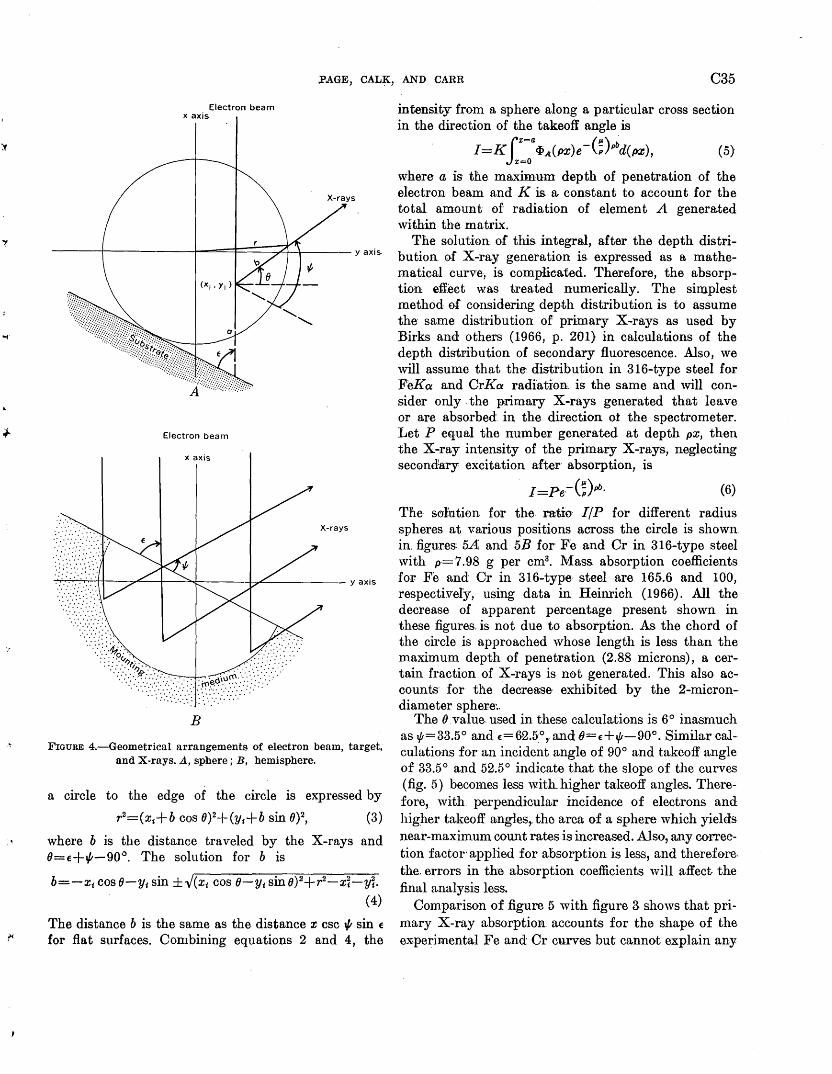
-.
.PAGE, CALK, AND CARR C35
Electron beam x axis
Electron beam
x axis
B
FIGURE 4.-Geometrical arrangements of electron beam, target, and X-rays. A, sphere; B, hemisphere.
a circle to the edge of the circle is expressed by
r2=(x1+b cos 0)2+(y1+b sin 0)2, (3)
where b is the distance traveled by the X-rays and 0=E+1/t-90°. The solution for b is
b=-xt cos 0-Yt sin ±.J(xt cos O-y1 sin 0) 2+r2-x~-y1. (4)
The distance b is the same as the distance x esc 1jt sin E for fiat surfaces. Combining equations 2 and 4, the
intensity from a sphere along a particular cross section in the direction of the takeoff angle is
I =Ki::a cJ> A(i>X)e -(~)pbd(px), (5)
where a is the maximum depth of penetration of the electron beam and K is a. constant to account for the total amount of radiation of element A generated within the matrix.
The solution of' this. integral, after the depth distribution. of' X-ray generation is expressed as a mathematical curve, is compli:ca.ted. Therefore, the absorption eff.ect was treated numerically. The simplest method of' considering depth distribution is to assume the· same distribution of primary X-rays as used by Birks and others (1966, p. 201} in calculations of the depth distribution of secondary fluorescence. Also, we will assume that the distribution in 316-type steel for FeKa and OrKa radiation. is the same and will consider only . the primary X-rays generated that leave or are absorbed in the direction ot the spectrometer. Let P equal the· number generated at depth px, then the X-ray intensity of the primary X-rays, neglecting secondary excitation after· absorption, is
l=Pe·- (;)pb. (6)
The so-Jution for the- rntia I/P for different radius spheres at various positions across the circle is shown in. figures·. 5A and 5B for Fe and Or in 316-type steel with p=7.9.8 g per cm3• Mass absorption coefficients for Fe and Or in 316-type' steel are 165.6 and 100, respectively, using data in Heinrich (1966). All the decrease of apparent percentage present shown in these figures. is not due to absorption. As the chord of the circle is approached whose length is less than the maximum depth of penetration (2.88 microns), a certain fraction of X-rays is not generated. This also accounts· for the decrease- exhibited by the 2-microndiameter sphere~.
The 0 value used in these calculations is 6° inasmuch as 1f=33.5° and t:=62.5_0
, and O=t:+Y,-90°. Similar calculations for an incident angle of 90° a,nd takeoff angle of 33.5 o and 52.5 o indicate that the slope of the curves (fig. 5) becomes less with. higher takeoff angles. Therefore, with perpendicular incidence of electrons and higher takeoff angles,. the area o:f a sphere which yields near-maximum count rates is increased. Also, any coiTeetion factor· applied for absorption is less, and therefore. the. errors in the absorption coefficients will affect the final analysis less.
Comparison of figure 5 with figure 3 shows that primary X-ray absorption accounts for the shape o:f the experimental Fe and Or curves but cannot explain any
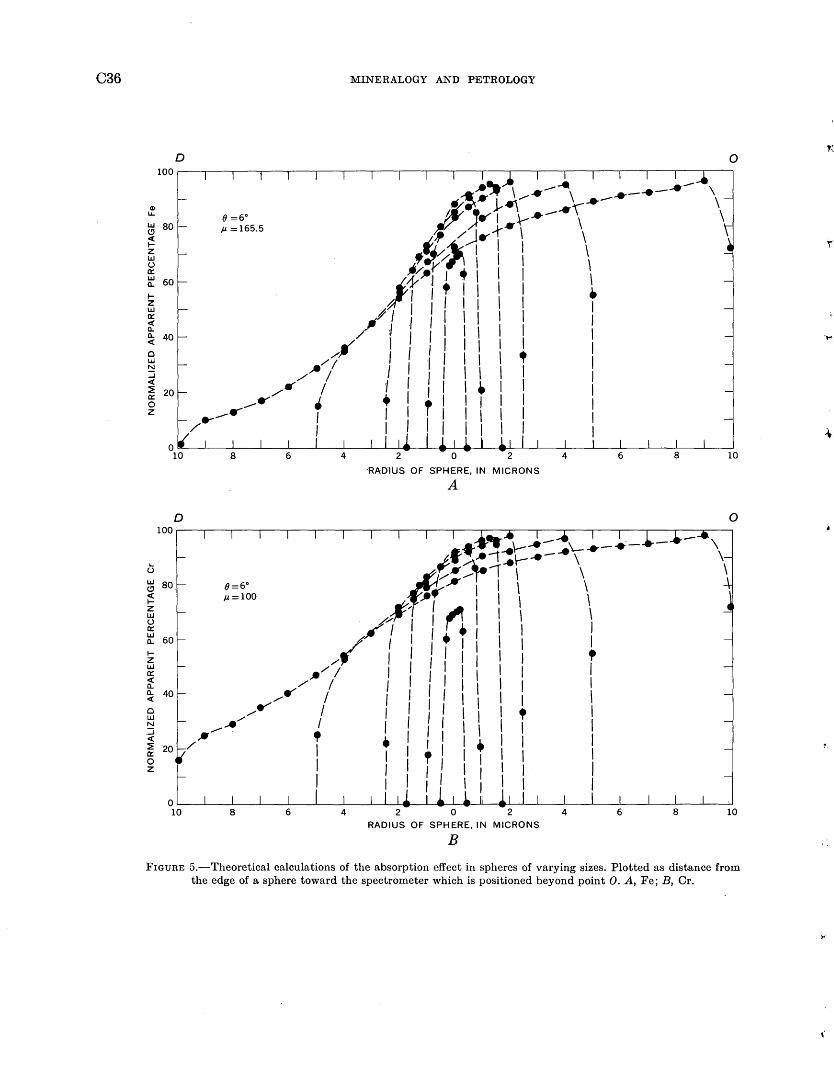
C36
Q) LL.
~ 80 <( 1-z w () 0::
~ 60
1-z w a::: <( a.. ~ 40
0 w N :::i <(
~ 20 0 z
D
D
MINERALOGY AND PETROLOGY
0
....... .... ... -......... .)IIJJ ,.,..., .. - \ .... ---- \
;
".r! _!,.~ -r ... - \ o =6° ;..-- I ..-.\-_..-~ \ \ fJ. = 165.5 ~ /_)...---r \ \
,!t/~1 I\ I
lt.-r 1 ! I I I \ 1 '1 • I I I I • 1 1 I I I I I 1
•'' 1 1 I I I I I 1 / :I ·
1 1 I I I I I 1
/~~ l1r11::+ 1 /,-1 I 1 I I I I I 1
/.- I ·J
11 1 I I • I I 1 _.....- • + • I I I I I 1
.......... ...- 1 I I 'I I I I I I 1 / 1 I I I I I I I 1
8 6 4 2 0 2 4 6 10
HAD'IUS OF SPHERE, IN MICRONS
A
0 1oo~· --~~--~~--~~--~--~~--~~--~~--~~~~--~~--~~
u ~ 80, <( 1-z w () a::: ~ 60 1-z w a::: <( a.. ~ 40
0 w N :::i <(
~ '20 0 z
..a: ~ }-- .... - ~----··-.t'~ .--r!\--___ ... ' ,.-•~1 I \
o=60 tf"__.. I \ \ fJ.=lOO ¥ ~ I I \
//llr• 1 \ 1 /~I I f. I I I I
/J' I I I I I I I f .11/ I I I 1 I I 1 I I
/ I I I I I I I I I ,.-..-- I I I 1 I I 1 I I
,.-r I I I I I I I t I .,..., __....- I I I I I I I I I
/_. • • I 1 I I • I I I I I ' I I I I I I 1 I 1 I I 1 I I I I I 1 I I 1 I I
8 6 4 2 0 2 4 6 8 10 RADIUS OF SPHERE, IN MICRONS
B
FIGURE 5.-Theoretical calculations of the absorption effect in spheres of varying sizes. Plotted as distance from the edge of a sphere toward the spectrometer which is positioned beyond point 0. A, Fe; B, Cr.
~·
1P.AGE, CALK, AND CARR C37
falloff in count rates except for very small particles (smaller than the excited X-ray vohune). A discussion of secondary X-rays and primary X-rays by Green and Cosslett (1961) indicates that for FeKa about 4 percent of the total X-ray intensity is derived from secondary X-rays and about 3 percent of the total intensity for Crl{a radiation is derived frmn secondary X-rays. The effect of secondary emission is negligible and has therefore been ignored in the previous discussion; it would have its greatest effect on very small spheres and at the edges of the particles. For f{a radiation of elements with atomic numbers greater than 30, secondary excitation becomes irnportant, but in such a microprobe analysis, L or 11/ lines can be used to avoid it.
In the quantitative microprobe n,nalysis of particles less than about 20 microns in diameter, problems arise which are not normally encountered in the analysis of polished, flat, semi-infinite surfaces. X-ray intensities are dependent on particle size and position of the beam on the particle. The variation in X-ray intensity that results frmn position of the electron beam on the particle can be explained by electron and X-ray absorption. No adequate explanation of the variation of X-ray intensity with particle size is known. ·until the latter effect is understood, qua.ntitative a.nalysis of neither polished nor unpolished particles will be possible. These various problems, although discussed here with reference to unpolished particles, suggest tha.t similar problems will arise in the interpretation of small polished flat-surfaced grains.
REFER.ENCES
Birks, L. S., Ellis, D. J., and Grant, B. K., 1966, Distribution of secondary fluorescence with depth using Monte Carlo calculations, in McKinley, T. D., Heinrich, K. F. J., and 'Vittry, D. B., eds., The electron microprobe; Proceedings of Symposium, Electrochem. Soc., Washington, D.O., 1964: New York, John 'Viley and Sons, p. 99-216.
Oastaing, Raymond, 1951, Application des sondes electroniques a une methode d'analyse ponctuelle chimique et christallographique: Paris Univ., Paris, thesis; also in Office Natl. Etudes Recherches Aeronaut. ( ONERA), no. 55 [1952], 92 p.
Green, Martin, and Orosslett, V. E., 1961, The efficiency of production of characteristic X-radiation in thick targets of a pure element: Phys. Soc. [London] Proc., v. 78, p. 1206-1214.
Heinrich, K. F. J., 1966, X-ray absorption uncertainty, in McKinley, T. D., Heinrich, K. F. J., and 'Vittry, D. B., eds., The electron microprobe; Proceedings of Symposium, Electrochem Soc., Washington, D.C., 1964: New York, John Wiley and Sons, p. 296-377.
Lyman, Taylor, 1948, Metals handbook: Cleveland, Am. Soc. for Metals, 1332 p.
Tousimis, A. J., 1964, Electron probe X-ray microanalysis of medical and biological specimens, in Symposium on X-ray and electron probe analyses: Am. Soc. Testing Materials Spec. Tech. Pub. 349, p. 193-206.
White, E. ,V., 1964, Microprobe technique for analysis of multiphase microcrystalline powders : Am. Mineralogist, v. 49, p. 196.
White, E. ,V., Denny, P. J., and Irving, S. M., 1966, Quantitative microprobe analysis of microcrystalline powders, in McKinley, T. D., Heinrich, K. F. J., and \Vittry, D. B., eds., The electron microprobe; Proceedings of Symposium, Electrochem. Soc., 'Vashington, D.O., 1964: New York, John Wiley and Sons, p. 791-804.
'Vittry, D. B., 1957, An electron probe for local analysis by means of X-rays: California Inst. Tech. thesis 188, AD-13400, 189 p.
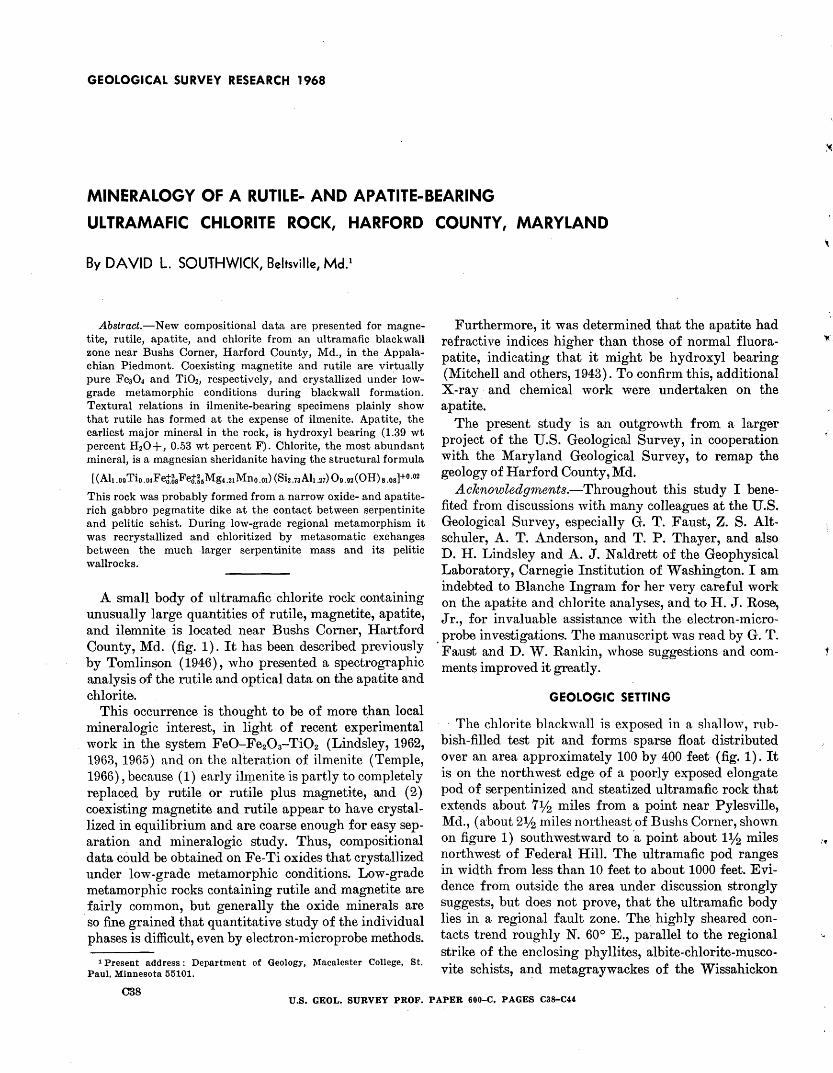
GEOLOGICAL SURVEY RESEARCH 1968
MINERALOGY OF A RUTILE- AND APATITE-BEARING
ULTRAMAFIC CHLORITE ROCK, HARFORD COUNTY, MARYLAND
By DAVID L. SOUTHWICK, Beltsville, Md.1
Abstract.-New compositional data are presented for magnetite, rutile, apatite, and chlorite from an ultramafic blackwall zone near Bushs Corner, Harford Coun-ty, Md., in the Appalachian Piedmont. Coexisting magnetite and rutile are virtually pure Fe304 and Ti02, respectively, and crystallized unde~ lowgrade metamorphic conditions during blackwall formation. Textural relations in ilmenite-bearing specimens plainly show that rutile has formed at the expense of ilmenite. Apatite, the earliest major mineral in the rock, is hydroxyl bearing (1.39 wt percent H20+, 0.53 wt percent F). Chlorite, the most abundant mineral, is a magnesian sheridanite having the structural formula
[ (Alt .09 Tio.o4Fet.~sFet.~5Mg4.2tMno.ot) (Sia.7aAlt.27) Oo.o2(0H) s.os]+0·02
This rock was probably formed from a narrow oxide- and apatiterich gabbro pegmatite dike at the contact between serpentinite and pelitic schist. During low-grade regional metamorphism it was recrystallized and chloritized by metasomatic exchanges between the much larger serpentinite mass and its pelitic wallrocks.
A small body of ultramafic chlorite rock containing unusually large quantities of rutile, magnetite, apatite, and ilemnite is located near Bushs Corner, Hartford County, Md. (fig. 1). It has been described previously by Tomlinson (1946), who presented a spectrographic analysis of the rutile and optical data on the apa.tite and chlorite.
This occurrence is thought to be of more than local mineralogic interest, in light of recent experimental work in the system FeO-Fe203-Ti02 (Lindsley, 1962, 1963, 1965) and on the alteration of ilmenite (Temple, 1966), because ( 1) early il:rp.enite is partly to completely repla.ced by rutile or rutile plus magnetite, and (2) coexisting magnetite and rutile appear to have crystallized in equilibrium and are coarse enough for easy separation and mineralogic study. Thus, compositional data could be obtained on Fe-Ti oxides that crystallized under low-grade metamorphic conditions. Low-grade metamorphic rocks containing rutile and magnetite are fairly common, but generally the oxide minerals are so fine grained that quantitative study of the individual phases is difficult, even by electron-microprobe methods.
1 Present address: Department of Geology, Macalester College, St. Paul, Minnesota 55101.
C'38
Furthermore, it was determined that the apatite had refractive indices higher than those of normal fluorapatite, indicating that it might be hydroxyl bearing (Mitchell and others, 1943). To confirm this, additional X-ray and chemical work were undertaken on the apatite.
The present study is an outgrowth from a larger project of the U.S. Geological Survey, in cooperation with the Maryland Geological Survey, to remap the geology of Harford County, Md.
Acknm.vledgments.-Throughout this study I benefited from discussions with many colleagues at the U.S. Geological Survey, especially G. T. Faust, Z. S. Altschuler, A. T. Anderson, and T. P. Thayer, and also D. H. Lindsley and A. J. Naldrett of the Geophysical Laboratory, Carnegie Institution of Washington. I am indebted to Blanche Ingram for her very careful work on the apatite and chlorite analyses, and to H. J. Rose, Jr., for invaluable assistance with the electron-micro-
. probe investigations. The manuscript was read by G. T. Faust and D. W. Rankin, whose suggestions and comments improved it greatly.
GEOLOGIC SETTING
· The chlorite black wall is exposed in a shallow, rubbish-filled test pit and forms sparse float distributed over an area approximately 100 by 400 feet (fig. 1). It is on the northwest edge of a poorly exposed elongate pod of serpentinized and steatized ultramafic rock that extends about 71h miles from a point near Pylesville, Md., (about 2112 miles northeast of Bushs Corner, shown on figure 1) southwestward to ·a point about Vf2 miles northwest of Federal Hill. The ultramafic pod ranges in width from less than 10 feet to about 1000 feet. Evidence from outside the area under discussion strongly suggests, but does not prove, that the ultramafic body lies in a regional fault zone. The highly sheared contacts trend roughly N. 60° E., parallel to the regional strike of the enclosing phyllites, albite-chlorite-muscovite schists, and metagraywackes of the Wissahickon
U.S. GEOL. SURVEY PROF. PAPER 600-C, PAGES C38-C44
'
.·~
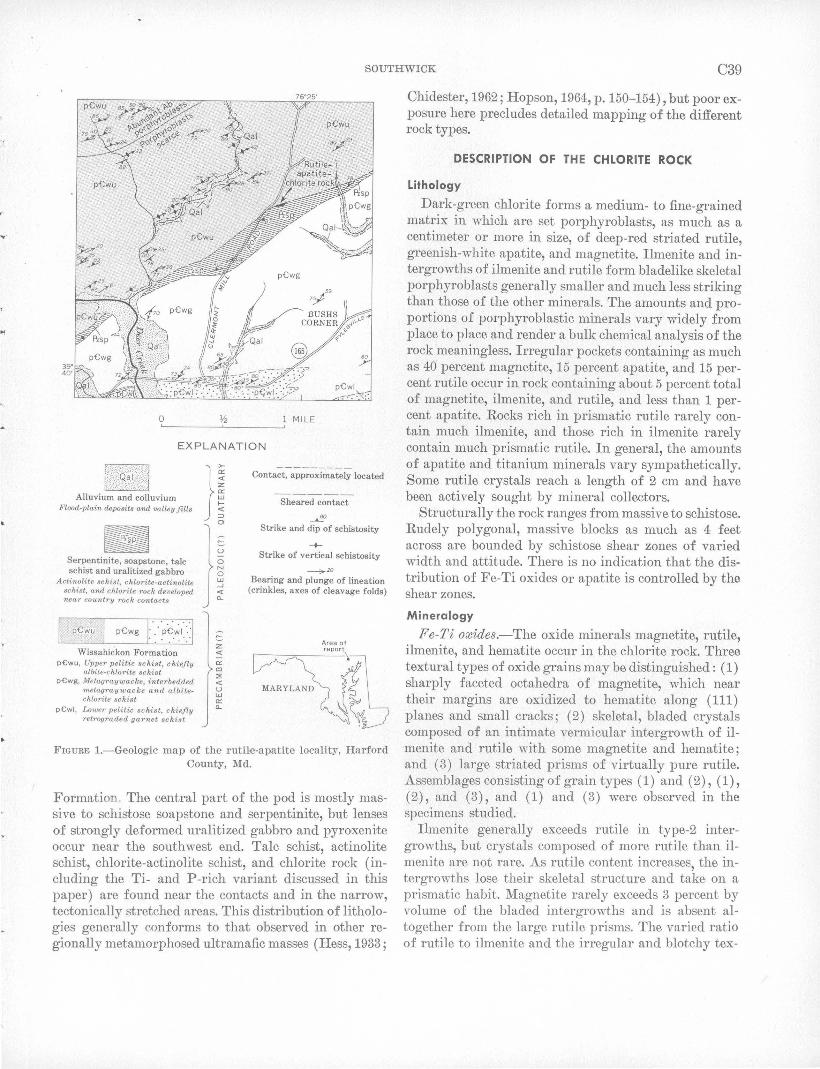
SOUTHWICK C39
0 1 MILE
EXPLANATION
Alluvium and colluvium Flood-plain deposits and valley fills
Ill Serpentinite, soapstone, talc schist and uralitized gabbro
Actinolite schist, chlorite-actinolite schist, and chlorite rock developed near country rock contacts
Wissahickon Formation p£wu, Upper pelitic schist, chiefly
albite-chlorite schist p£wg, Metagraywacke, interbedded
metagraywacke and albitechlorite schis t
p£wl, Lower pelitic sc hist, chiefly retrograded garnet schist
}I 0
u 0 N 0 w ...J <(
"-
z <(
"' "' "' <(
u w
"' "-
Contact, approximately located
Sheared contact
_20
Strike and dip of schistosity
-+-Strike of vertical schistosity
~"' Bearing and plunge of lineation
(crinkles, axes of cleavage folds)
FIGURE 1.-Geologic map of the rutile-apatite locality, Harford County, Md.
Formation. The central part of the pod is mostly massive to schistose soapstone and serpentinite, but lenses of strongly deformed uralitized gabbro and pyroxenite occur near the southwest end. Talc schist, actinolite schist, chlorite-actinolite schist, and chlorite rock (including the Ti- and P-rich variant discussed in this paper) are found near the contacts and in the narrow, tectonically stretched areas. This distribution of lithologies generally conforms to that observed in other regionally metamorphosed ultramafic masses (Hess, 1933;
Chidester, 1962; Hopson, 1964, p. 150-154), but poor exposure here precludes detailed mapping of the different rock types.
DESCRIPTION OF THE CHLORITE ROCK
Lithology
Dark-green chlorite forms a medium- to fine-grained matrix in which are set porphyroblasts, as much as a centimeter or more in size, of deep-red striated rutile, greenish-white apatite, and magnetite. Ilmenite and intergrowths of ilmenite and rutile form bladelike skeletal porphyroblasts generally smaller and much less striking than those of the other minerals. The amounts and proportions of porphyroblastic minerals vary widely from place to place and render a bulk chemical analysis of the rock meaningless. Irregular pockets containing as much as 40 percent magnetite, 15 percent apatite, and 15 percent rutile occur in rock containing about 5 percent total of magnetite, ilmenite, and rutile, and less than 1 percent apatite. Rocks rich in prismatic rutile rarely contain much ilmenite, and those rich in ilmenite rarely contain much prismatic rutile. In general, the amounts of apatite and titanium minerals vary sympathetically. Some rutile crystals reach a length of 2 em and have been actively sought by mineral collectors.
Structurally the rock ranges from massive to schistose. Rudely polygonal, massive blocks as much as 4 feet across are bounded by schistose shear zones of varied width and attitude. There is no indication that the distribution of Fe-Ti oxides or apatite is controlled by the shear zones.
Mineralogy
Fe-Ti owides.-The oxide minerals magnetite, rutile, ilmenite, and hematite occur in the chlorite rock. Three textural types of oxide grains may be distinguished: (1) sharply faceted octahedra of magnetite, which near their margins are oxidized to hematite along (111) planes and small cracks; ( 2) skeletal, bladed crystals composed of an intimate vermicular intergrowth of il·menite and rutile with some magnetite and hematite; and (3) large striated prisms of virtually pure rutile. Assemblages consisting of grain types ( 1) and ( 2), ( 1), (2), and (3), and (1) and (3) were observed in the specimens studied.
Ilmenite generally exceeds rutile in type-2 intergrowths, but crystals composed of more rutile than ilmenite are not rare. As rutile content increases, the intergrowths lose their skeletal structure and take on a prismatic habit. Magnetite rarely exceeds 3 percent by volume of the bladed intergrowths and is absent altogether from the large rutile prisms. The varied ratio of rutile to ilmenite and the irregular and blotchy tex-
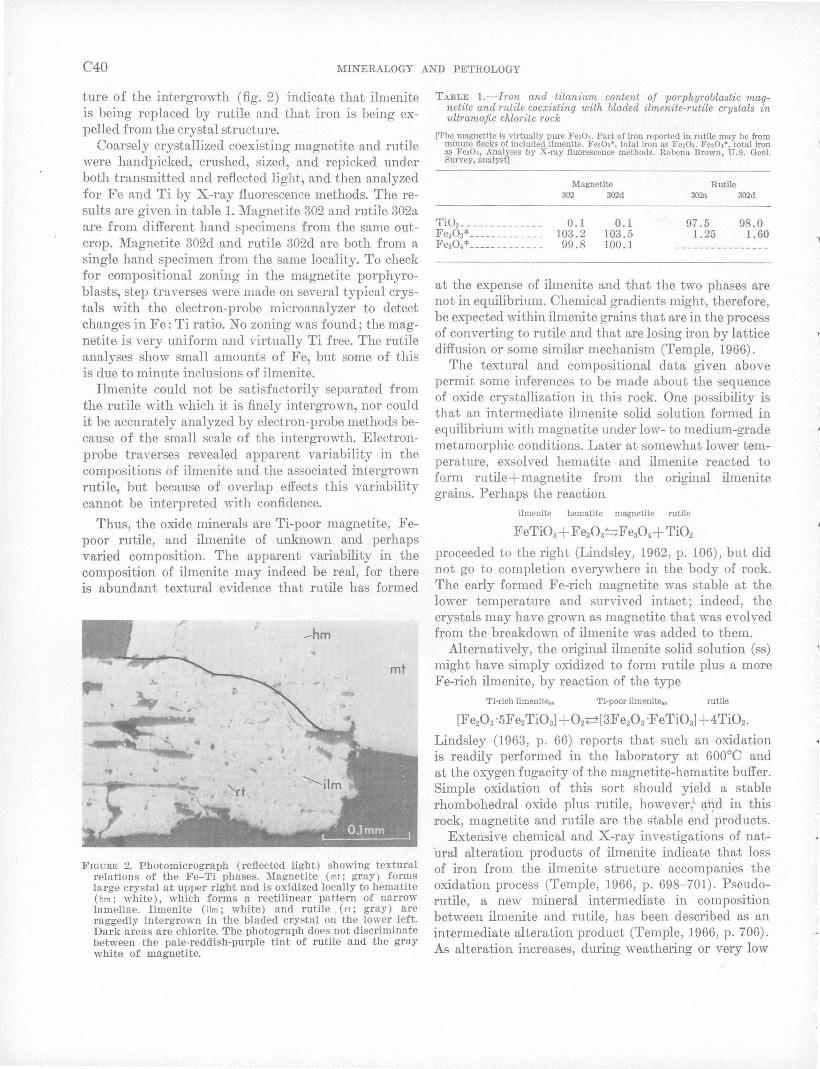
C40 MINERALOGY AND PETROLOGY
ture of the intergrowth (fig. 2') indicate that ilmenite is being replaced by rutile and that iron is being expelled from the crystal structure.
Coarsely crystallized coexisting magnetite and rutile were handpicked, crushed, sized, and repicked under both transmitted and reflected light, and then analyzed for Fe and Ti by X-ray fluorescence methods. Theresults are given in table 1. Magnetite 302 and rutile 302a are from different hand specimens from the same outcrop. Magnetite 302d and rutile 302d are both from a single hand specimen from the same locality. To check for compositional zoning in the magnetite porphyroblasts, step traverses were made on several typical crystals with the electron-probe microanalyzer to detect changes in Fe: Ti ratio. No zoning was found; the magnetite is very uniform and virtually Ti free. The rutile analyses show small amounts of Fe, but some of this is due to minute inclusions of ilmenite.
Ilmenite could not be satisfactorily separated from the rutile with which it is finely intergrown, nor could it be accurately analyzed by electron-probe methods because of the small scale of the intergrowth. Electronprobe traverses revealed apparent variability in the compositions of ilmenite and the associated intergrown rutile, but because of overlap effects this variability cannot be interpreted with confidence.
Thus, the oxide minerals are Ti-poor magnetite, Fepoor rutile, and ilmenite of unknown and perhaps varied composition. The apparent variability in the composition of ilmenite may indeed be real, for there IS abundant textural evidence that rutile has formed
FIGURE 2. Photomicrograph (reflected light) showing textural relations of the Fe-Ti phases. Magnetite (mt; gray) fonns large crystal at upper right and is oxidized locally to hematite ( hm ; white), which forms a rectilinear pattern of narrow lamellae. Ilmenite (ilm; white) and rutile (rt; gray) are raggedly intergrown in the bladed crystal on the lower left. Dark areas are chlorite. The photograph does not discriminate between the pale-reddish-purple tint of rutile and the gray white of magnetite.
TABLE 1.-lron and. ti!aniu~ content .of porphyroblastic magnettle and ruttle coextsttng wtth bladed t lmemte-rutile crystals in ultramafic chlorite rock
[The. magnetite is virtually pure Fea0<. Part or Iron reported in rutile may be from mmute flecks of included ilmenite. Fe,oa•, total iron as Fe,03• Fe3o,•, total iron as FeaO,, Analyses by X-ray fluorescence methods. Robena Brown, U.S. Oeol. Survey, analyst]
Magnetite Rutile 302 302d 302a 302d
Ti02-- ------------Fe20a* --- - - _______ _ FeaO,* ____________ _
0.1 103.2 99.8
0.1 103.5 100.1
97.5 1.25
98.0 1.60
at the expense of ilmenite and that the two phases are not in equilibrium. Chemical gradients might, therefore, be expected within ilmenite grains that are in the process of converting to rutile and that are losing iron by lattice diffusion or some similar mechanism (Temple, 1966).
The textural and compositional data given above permit some inferences to be made about the sequence of oxide crystallization in this rock. One possibility is that an intermediate ilmenite solid solution formed in equilibrium with magnetite under low- to medium-grade metamorphic conditions. Later at somewhat lower temperature, exsolved hematite and ilmenite reacted to form rutile+magnetite from the original ilmenite grains. Perhaps the reaction
ilmenite hematite magnetite rutile
FeTi03 + F~03=::;Fe304 + Ti02
proceeded to the right (Lindsley, 1962, p. 106), but did not go to completion everywhere in the body of rock. The early formed Fe-rich magnetite was stable at the lower temperature and survived intact; indeed, the crystals may have grown as magnetite that was evolved from the breakdown of ilmenite was added to them.
Alternatively, the original ilmenite solid solution (ss) might have simply oxidized to form rutile plus a more Fe-rich ilmenite, by reaction of the type
Ti-ricb ilmenite,. Ti-poor Ilmenite,. rutile
[Fe20a ·SFe2 Ti03] +02p[3Fe203 ·FeTi03] +4 Ti02.
Lindsley (1963, p. 66) reports that such an oxidation is readily performed in the laboratory at 600°C and at the oxygen fugacity of the magnetite-hematite buffer. Simple oxidation of this sort should yield a stable rhombohedral oxide plus rutile, however,1. a-ltd in this rock, magnetite and rutile are the stable end 'products.
Extensive chemical and X-ray investigations of nat·ural alteration products of ilmenite indicate that loss of iron from the ilmenite structure accompanies the oxidation process (Temple, 1966, p. 698- 701) . Pseudorutile, a new mineral intermediate in composition between ilmenite and rutile, has been described as an intermediate alteration product (Temple, 1966, p. 706). As alteration increases, during weathering or very low
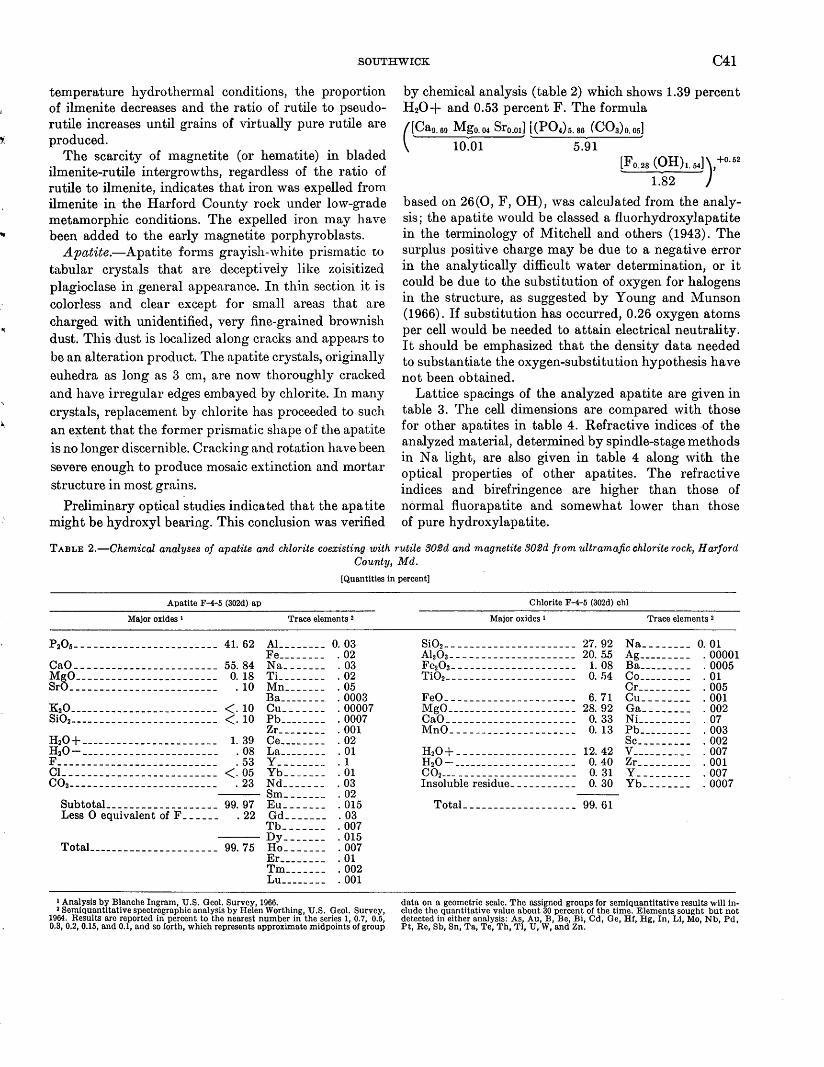
.SOUTHWICK C41
temperature hydrothermal conditions, the proportion of ilmenite decreases and the ratio of rutile to pseudorutile increases until grains of virtually pure rutile are produced.
The scarcity of magnetite (or hematite) in bladed ilmenite-rutile intergrowths, regardless of the ratio of rutile to ilmenite, indicates that iron was expelled from ilmenite in the Harford County rock under low-grade metamorphic conditions. The expelled iron may have been added to the early magnetite porphyroblasts.
Apatite.-Apatite forms grayish-white prismatic to
tabular crystals that are deceptively like zoisitized plagioclase in .general appearance. In thin section it is colorless and clear except for small areas that are charged with unidentified, very fine-grained brownish dust. This dust is localized along cracks and appears to be an alteration product. The apatite crystals, originally euhedra as long as 3 em, are now thoroughly cracked and have irregular edges embayed by chlorite. In many crystals, replacement by chlorite has proceeded to such an e~tent that the former prismatic shape of the apatite is no longer discernible. Cracking and rotation have been severe enough to produce mosaic extinction and mortar structure in most grains.
Preliminary optical studies indicated that the apatite might be hydroxyl bearing. This conclusion was verified
by chemical analysis (table 2) which shows 1.39 percent H20+ and 0.53 percent F. The formula
( [ Oa9. 69 Mgo. o4 Sro.01J i (PO 4) 5. s6 (CO a) o. o5]
10.01 5.91 [Fo.2s (OH)I. 54]), +o.s2
1.82
based on 26(0, F, OH), was calcu)ated from the analysis; the apatite would be classed a fiuorhydroxylapatite in the terminology of Mitchell and others (1943). The surplus positive charge may be due to a negative error in the analytically difficult water determination, or it could be due to the substitution of oxygen for halogens in the structure, as suggested by Young and Munson (1966). If substitution has occurred, 0.26 oxygen atoms per cell would be needed to attain electrical neutrality. It should be emphasized that the density data needed to substantiate the oxygen-substitution hypothesis have not been obtained.
Lattice spacings of the analyzed apatite are given in table 3. The cell dimensions are compared with those for other apatites in table 4. Refractive indices of the analyzed material, deter;mined by spindle-stage methods in N a light, are also given in table 4 along with the optical properties of other apatites. The refractive indices and birefringence are higher than those of normal fluorapatite and somewhat lower than those of pure hydroxylapatite.
TABLE 2.-Chemical analyses of apatite and chlorite coexisting with rutile 302d and magnetite 302d from ultramafic chlorite rock, Harford County, Md.
[Quantities in percent]
Apatite F-4-5 (302d) ap
Major oxides 1
P20a------------------------ 41.62 Cao ________________________ 55. 84 MgO________________________ 0. 18 SrO _ _ _ _ _ _ _ _ _ _ _ _ _ _ _ _ _ _ _ _ _ _ _ _ _ . 1 0
K20------------------------- <. 10 Si02------------------------- <. 10 H20 + _ _ _ _ _ _ _ _ _ _ _ _ _ _ _ _ _ _ _ _ _ _ _ 1. 39 H
20- --- _ _ _ _ _ _ _ _ _ _ _ _ _ _ _ _ _ _ _ _ . 08
F _ _ _ _ _ _ _ _ _ _ _ _ _ _ _ _ _ _ _ _ _ _ _ _ _ _ _ . 53 Cl_ _ _ _ _ _ _ _ _ _ _ _ _ _ _ _ _ _ _ _ _ _ _ _ _ _ <. 05
002------------------------- . 23
SubtotaL __________________ 99. 97 Less 0 equivalent of F _ _ _ _ _ _ . 22
Trace elements 2
Al ________ 0. 03 Fe________ . 02 Na _______ . 03 Ti________ . 02 Mn_______ . 05 Ba________ . 0003 Cu _ _ _ _ _ _ _ . 00007 Pb________ . 0007 Zr________ . 001 Ce________ . 02 La________ . 01 y ________ .1 Yb _ _ _ _ _ _ _ . 01 Nd _______ . 03 Sm_ _ _ _ _ _ _ . 02 Eu _______ . 015 Gd_______ . 03 Tb _ _ _ _ _ _ _ . 007
--- Dy_______ . 015 TotaL _____________________ 99.75 Ho_______ . 007
Er _ _ _ _ _ _ _ _ . 0 1 Tm__ _ _ _ _ _ . 002 Lu________ . 001
I Analysis by Blanche Ingram, U.S. Geol. Survey, 1966. 2 Semiquantitative spectrographic analysis by Helen Worthing, U.S. Geol. Survey,
1964. Results arc reported in percent to the nearest number in the series 1, 0. 7, 0.5, 0.3, 0.2, 0.15, and 0.1, and so forth, which represents approximate midpoints of group
Chlorite F-4-5 (302d) chi
Major oxides 1
Si02---------------------- 27.92 AbOa---- _- _______________ 20. 55 Fe20a-- _ _ _ _ _ _ _ _ _ _ _ _ _ _ _ _ _ _ _ 1. 08 Ti02---------------------- Q 54
FeO______________________ a 71 MgO ______________________ 28. 92 CaO______________________ Q 33 MnO _ _ _ _ _ _ _ _ _ _ _ _ _ _ _ _ _ _ _ _ _ 0. 13
H20+-------------------- 12.42 H20- ------ _ _ _ _ _ _ _ _ _ _ _ _ _ _ _ 0. 40 002----------------------- 0. 31 Insoluble residue___________ 0. 30
TotaL __________________ 99.61
Trace elements 2
Na ________ 0. 01 Ag_____ _ _ _ _ . 00001 Ba_________ . 0005 Co_________ . 01 Cr_________ . 005 Cu ________ . 001 Ga________ . 002 Ni_________ . 07 Pb_________ . 003 Sc_________ . 002 v ---------- . 007 Zr _ _ _ _ _ _ _ _ _ . 001 y- - - - - - - - - . 007 Yb________ . 0007
data on a geometric scale. The assigned groups for semiquantitative results will include the quantitative value about 30 percent of the time. Elements sought but not detected in either analysis: As, Au, B, Be, Bi, Cd, Ge, Hf, Hg, In, Li, Mo, Nb, Pd, Pt, Re, Sb, Sn, Ta, Te, Th, Tl, U, W, and Zn.
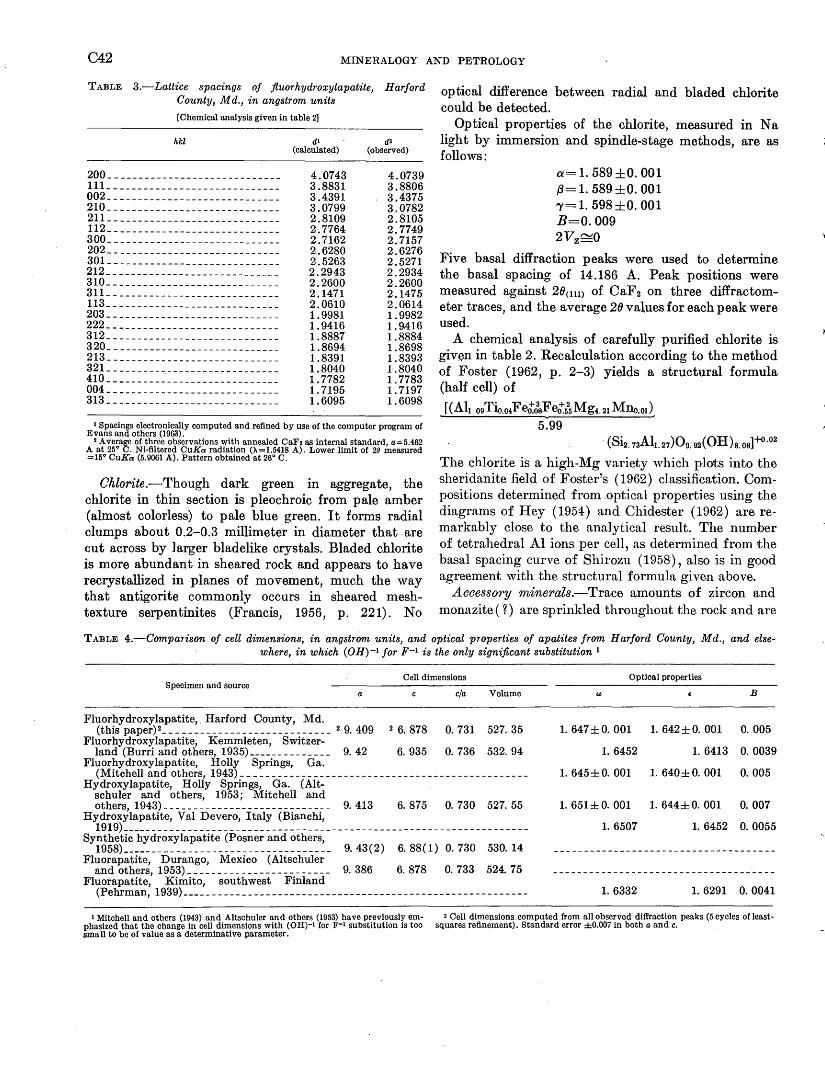
C42 MINERALOGY AND PETROLOGY
TABLE 3.-Lattice spacings of fluorhydroxylapatite, Harford County, Md., in angstrom units
[Chemical analysis given in table 2]
hkl
200 ____________________________ _ 111 ____________________________ _ 002 ____________________________ _ 210 ____________________________ _ 211 ____________________________ _ 112 ____________________________ _ 300 ____________________________ _ 202 ____________________________ _ 301 ____________________________ _ 212 ____________________________ _ 310 ____________________________ _ 311 ____________________________ _ 113 ____________________________ _ 203 ____________________________ _ 222 ____________________________ _ 312 ____________________________ _ 320 ____________________________ _ 213 ____________________________ _
. 321---------~-------------------410 ____________________________ _ 004 ____________________________ _ 313 ____________________________ _
dl (calculated)
4.0743 3.8831 3.4391 3.0799 2.8109 2.7764 2.7162 2.6280 2.5263 2.2943 2.2600 2.1471 2.0610 1.9981 1. 9416 1.8887 1.8694 1.8391 1.8040 1.7782 1.7195 1.6095
d2 (observed)
4.0739 3.8806 3.4375 3.0782 2.8105 2.7749 2.7157 2.6276 2.5271 2.2934 2.2600 2.1475 2.0614 1.9982 1. 9416 1.8884 1.8698 1.8393 1.8040 1.7783 1.7197 1.6098
1 Spacings electronically computed and refined by use of the computer program of Evans and others (1963).
2 Average of three observations with annealed CaF2 a8 internal standard· a=5.462 A at 25° C. Ni-filtered CuKa radiation (X=l.5418 A). Lower limit of 2/J .:neasured =15° CuKa (5.9061 A). Pattern obtained at 26° C.
Chlorite.-Though dark green in aggregate, the chlorite in thin section is pleochroic from pale amber (almost colorless) to pale blue green. It forms radial clumps about 0.2-0.3 millimeter in diameter that are cut across by 1arger bladelike crystals. Bladed chlorite is more abundant in sheared rock and appears to have recrystallized in planes of movement, much the way that antigorite commonly occurs in sheared meshtexture serpentinites (Francis, 1956, p. 221). No
optical difference between radial and bladed chlorite could be detected.
Optical properties of the chlorite, measured in N a light by immersion and spindle-stage methods, are as follows:
a= 1. 589 ±0. 001 {j= 1. 589 ±0. 001 "(= 1. 598 ±0. 001 B=O. 009 2Vz"'0
Five basal diffraction peaks were used to determine the basal spacing of 14.186 A. Peak positions were measured against 200 11) of CaF2 on three diffractometer traces, and the average 20 values for each peak were used.
A chemical analysis of carefully purified chlorite is given in table 2. Recalculation according to the method of Foster (1962, p. 2-3) yields a structural formula (half cell) of
[(Alt. o9Tio.o4Fet.~sFetfsMg4.2I Mno.ox) 5.99
· (Si2. 73Ali.27)09. 92(0H)8.08]+o·02
The chlorite is a high-Mg variety which plots into the sheridanite field of Foster's (1962) classification. Compositions determined from .optical properties using the diagrams of Hey ( 1954) and Chidester ( 1962) are remarkably close to the analytical result. The number of tetrahedral Al ions per cell, as determined from the basal spacing curve of Shirozu (1958), also is in· good agreement with the structural formula given above.
Accessory minerals.-Trace amounts of zircon and monazite ( ~) are sprinkled throughout the rock and are
TABLE 4.-Comparison of cell dimensions, in angstr~m units, and optical properties of apatites from Harford County, M d., and elsewhere, in which (OH)-1 for F-1 is the only significant substitution 1
Cell dimensions Specimen and source
a cfa Volume
Fluorhydroxylapatite,. Harford County, Md. (this paper)2 ____________________________ 2 9. 409 2 6. 878 0. 731 527. 35
Fluorhydroxylapatite, Kemmleten, Switzer-land (Burri and others, 1935) _ _ _ _ _ _ _ _ _ _ _ _ _ _ 9. 42 6. 935 0. 736 532. 94
Fluorhydroxylapatite, Holly Springs, Ga. (Mitchell and others, 1943) _______________________________________________ _
Hydroxylapatite, Holly Springs, Ga. (Alt-schuler and others, 1953; Mitchell and others, 1943)---------------------------- 9. 413 6. 875 0. 730 527. 55
Hydroxylapatite, Val Devero, Italy (Bianchi, 1919)--------------------------------------------------------------------
Synthetic hydroxylapatite (Posner and others, 1958)___________________________________ 9. 43(2) 6. 88(1) 0. 730 530. 14
Fluorapatite, Durango, Mexico (Altschuler and others, 1953)------------------------ 9. 386 6. 878 0. 733 524. 75
Fluorapatite, Kimito, southwest Finland (Pehrman, 1939)----------------------------------------------------------
Optical properties
B
1. 647 ± 0. 001 1. 642± 0. 001 0. 005
1. 6452 1. 6413 0. 0039
1. 645± 0. 001 1. 640± 0. 001 0. 005
1. 651 ± 0. 001 1. 644± 0. 001 0. 007
1. 6507 1. 6452 0. 0055
1. 6332 1. 6291 0. 0041
I Mitchell and others (1943) and Altschuler and others (1953) have previously em- 2 Cell dimensions computed from all observed diffraction peaks (5 cycles of least-pbasized that the change in cell dimensions with (OH)-1 for F-1 substitution is too squares refinement). Standard error ±0.007 in both a and c. small to be of value as a determinative parameter.
SOUTHWICK C43
unaffected by the othenvise pervasive chloritization. Narrow veinlets and small patches of talc are present but sporadically developed. Irregular s1nall granules of pyrite, usually in close association with magnetite and rutile, are scattered throughout the rock but are not abundant. Biotite, reported by Tomlinson ( 1946, p. 324-325), was not found in the author's specimens.
POSSIBLE ORIGIN
Inasmuch as apatite is strained, granulated, and partly replaced by chlorite, it is plainly an early-formed mineral in this rock. Zircon and monazite ( ~) show no evidence of chloritization, but as there is no reason to suppose they are late, they are assumed to be nonreactive relics and early in the paragenetic sequence. The time relations of Fe-Ti ·oxides to chlorite are not completely clear. Magnetite and rutile-ilmenite contain inclusions of both chlorite and apatite and present some sharp crystal faces against chlorite, thereby indicating that they may be younger; on the other hand, chlorite fills irregular cracks in the oxide grains and locally· seems to be replacing them. Possibly magnetite and ilmenite predated chloritization, whereas the breakdown of ilmenite to rutile-bearing assemblages coincided with it. In summary, the following mineral sequence is inferred:
( 1) Apatite, zircon, and monazite ( ~) (2) Chlorite, octahedral magnetite,
and ilmenite
~ ( 3) rutile pi us some additional 1na~netite.
Except for its unusually high content of Fe-Ti oxides and apatite, this rock is similar in composition to blackwall ~hlorite rock that occurs at the margins of steatized serpentinite bodies in Vermont (Chidester, 1962, p. 65-71) and throughout the Appalachian Piedmont. In Vermont, the chlorite rock has developed along the contacts between serpentinite masses and porphyroblastic albite· schist; the Mary land rock occurs in a similar geologic setting. Chidester attributes blackwall formation to profound alteration of albite schist by a magnesium-rich "wave of chloritization" ,that emanated from adjacent serpentinite during steatization and regional metamorphism. His chemical analyses and constant-volume calculations substantiate the contention that "steatite and blackwall formed simultaneously by metamorphic differentiation, with the alteration of serpentinite to steatite supplying Mg and H20 (the latter in excess) to the developing blackwall zone, and the alteration of schist to blackwall supplying Si to the developing steatite zone." (Chidester, 1962, p. 122.)
The regional geologic setting and highly magnesian chlorite of the Mary land rock are compatible with the blackwall theory; the problem, however, is to explain
294-199 0--68~
the high content of apatite and Fe-Ti oxides. At least three possibilities may account for this : ( 1) the schist from which the blackwall was derived was anomalously rich in P and Ti at this particular locality; ( 2) P, Ti, and Fe migrated into the blackwall zone during metamorphism and were contributed by the serpentinite; and (3) the P- and Ti-rich blackwall represents a third ancestral rock unit, such as a thin gabbro-pegmatite or nelsonite dike, that lay between serpentinite and schist and was chloritized by chemical gradients between the larger rock bodies.
Chemical analyses of Wissahickon schists from nearby localities and of unsteatized serpentinite from Maryland Green Marble Co. quarry at Cardiff, Md. (in a separate ultramafic mass that almost joins the mass under discussion), show no anomalous concentrations of either P or Ti. Petrographic study of many Harford County serpentinites and the schists that they intrude failed to detect an unusual abundance of apatite or Ti minerals in either rock. Moreover, the chlorite blackwall found at other Harford County localities (such as on the southeast side of the Cherry Hill ultramafic mass; Johannsen, 1928; Southwick and Owens, unpub. map.) is not rich in these minerals. This, of course, does not eliminate the possibility of higher concentrations in schist and serpentinite at the site of the rutile-apatite blackwall, where there are no outcrops of unweathered, unchJ.oritized rocks to analyze. It indicates, however, that in general the schist and serpentinite are not unusually rich in P and Ti.
Chemical data on the Vermont blackwalls indicate that both P and Ti were relatively immobile during steatization (Chidester, 1962, p. 127). Textural evidence shows that apatite in the Maryland rock is a prechlorite relic and did not crystallize during blackwall formation. The Fe-Ti oxides did recrystallize during blackwall formation, but no evidence requires net ingress of Ti during the process.
The possibility that the rutile-apatite blackwall formed by chloritization of a thin gabbro-pegmatite dike merits further consideration. Bodies of coarsegrained, almost pegmatitic gabbro, now composed of uralitic hornblende and partly saussuritized calcic labradorite, occur from place to place in the ultramafic pod to which the blackwall is related. They contain some apatite, ilmenite, and as much as 2 percent granular sphene, which appears to be derived in part from the breakdown of titaniferous pyroxene.
That gabbro pegmatites crystallize from late-stage residual magmas enriched in iron, titanium, phosphorous, and volatiles has been demonstrated in many unaltered mafic complexes (for example, Baragar, 1960). In some places the concentration of these elements is ex-
C44 MINERALOGY AND PETROLOGY
treme. For example, 1- to 3-foot oxide-rich pegmatites associated with gabbroic anorthosite at Eagle Lake, Fronten~c County, Ontario " * * * consist mainly of coarse augite and apatite crystals up to 6 inches long and large clumps of magnetite-ilmenite. The proportions of augite, apatite, and magnetite-ilmenite differ greatly at different locations in the same dike." (Lister, 1966, p. 290.)
The emplacement of a finer grained dike of this type along the schist-serpentinite contact in Maryland is a reasonable hypothesis. Probably the dike was sheared as the serpentinite mass moved upward along a fault zone (thus producing strained and granulated apatites) and then was chloritized during regionalinetamorphism. This hypothesis would explain not only the presence of apatite and Ti minerals in the blackwall, but also their highly irregular, pockety distribution.
The apatite now in the rock is hydroxy 1 bearing, but probably it was originally normal fluorapatite. The only other well-documented occurrence of hydroxyl-bearing apatite in the United States is near Holly Springs, Ga., where the apatite occurs in talc schist and chlorite schist situated geologically much like the rocks here described in Maryland (Mitchell and others, 1943). Mitchell and others (1943, p. 368) concluded that in the Georgia occurrence OH-1 for F-1 exchange took place in the apatite during metamorphism in the presence of abundant water. A similar process of OH-1 for F-1 exchange during metamorphism and blackwall formation probably produced the fluorhydroxylapatite of the Maryland locality.
REFERENCES
Altshuler, Z. S., Cisney, E. A., and Barlow, I. H., 1953, X-ray evidence of the nature of carbonate-apatite [ahs.] : Geol. Soc-. America Bull., v. 63, no. 12, pt. 2, p. 1230-1231; Am. Mineralogist, v. 38, nos. 3-4, p. 328.
Baragar, W. R. A., 1960, Petrology of basa1tic rocks in part of the Labrador trough: Geol. Soc. America Bull., v. 71, no. 11, p. 1589-1644.
Bianchi, Angelo, 1919, Apatite di Val Devero (Ossola) : Soc. Italiana Sci. Nat. e Mus. Civico S:toria Nat., Milano, Atti, v. 58, p. 306-331.
BurDi, Conrad, Jakob, Johann, Parker, R. L., and Strunz, Hugo, 1935, Uber Hydroxylapatit von der Kemmleten bei Hospenthal (Kt. Uri) : Schweizer. Mineralog. Petrog. Mitt., v. 15,no.2, p. 327-339.
Chidester, A. H., 1962, Petrology and geochemistry of selected talc-bearing ultramafic rocks and adjacent country rocks in north-central Vermont: U.S. Geol. Survey Prof. Paper 345,207 p,
Deer, W. A., Howie, R. A., and Zussman, Jack, 1962, Rock-fonuing minerals; 5, Non-silicates: New York, John Wiley & Sons, 371 p.
Evans, H. T., Jr., Appleman, D. E., and Handwerker, P. S., 1963, The least squares refinement of cry;stal unit cells with powder diffraction data by an automatic computer indexing method [abs.]: Am. Cryst. Assoc., Ann. Mtg., Cambridge, Mass., Mar. 1963, Program and Abs. E-10, p. 42-43.
Foster, M. D., 1002, Interpretation of the composition and a classification of the chlorites: U.S. Geol. Survey Prof. Paper 414-A, 33 p.
Francis, G. H., 1956, The serpen'tinite mass in Glen Urquhart, Invernessshire, Scotland: Am. Jour. Sci., v. 254, no. 4, p. 201-226.
Hess, H. H., 1933, The problem of serpentinization and the origin of certain chrysotile asbestos, talc, and soapstone deposits: Econ. Geology, v. 28, no. 7, p. 634-657.
Hey, M. H., 1954, A new review of the chlorites: Mineralog. Mag., v. 30, p. 277-292.
Hopson, C. A., 1964, The crystalline rocks of Howard and Montgomery Counties, in The geology of Howard and Montgomery Counties: Maryland Geol. Survey, p. 27-215 .
. Johannsen, Albert, 1928, The serpen:tines of Harford County, Maryland: Maryland Geol. Survey, v. 12, pt. 3, p. 19·~287.
Lindsley, D. H., 1962, Investigations in the system FeO-Fe20aTi02: Carnegie Inst. Washington Yearbook 61, 1961-62, p. 100-106.
---1963, Fe-Ti oxides. in rocks as thermometel'ls and oxygen barometers: Equilibrium relations of coexisting pairs of Fe-Ti oxides: Carnegie Inst. 'Vashington Yearbook 62, 1962-63, p. 60-66.
---1965, Iron titanium oxides: Carnegie Inst. ·washington Yearbook 64, 1964-65, p. 144-148.
Lister, G. F., 1006, The composition and origin of selected irontitanium deposits: Econ. Geology, v. 61, no. 2, p. 275-310.
Mitchell, Lane, Faust, G. T., Hendricks, S. B., and Reynolds, D. S., 1943, The mineralogy and genesis of hydroxylapati.Jte : Am. Mineralogist, v. 28, no. 6, p. 356-371.
Pehrman, Gunnar, 1939, Uber Phosphate aus dem Pegmatit von Lemnas (Kimito, S. W. Finland) : Acta Acad. Aboensis, Math. et Physica, v. 12, no. 6 (M.A. 7-417) [as cited in Deer, Howie, and Zussman, 1962, v. 5, p. 337].
Posner, A. S., Perloff, Alvin, and Diorio, A. F., 1958, Refinement of the hydroxylapatite structure: Acta Crystallographica, v. 11, pt. 4, p. 308-309.
Shirozu, Haruo, 1958, X-ray powder patterns and cell dimensions of some chlorites in Japan, with a note on their interference colors: Mineralog. Jour. Japan, v. 2, p. 209.
Temple, A. K., 1966, Alteration of ilmenite: Econ. Geology, v. 61, no. 4, p. 69~ 714.
Tomlinson, W. H., 1946, Rutile in Harford County, Maryland : Am. Mineralogist, v. 31, nos. 5-6, p. 322-325.
Young, E. J., and Munson, E. L., 1966, Fluor-chlor-oxy-apatite and sphene from Crystal Lode pegmatite near Eagle, Colo·rado: Am. Mineralogist, v. 51, nos. 9-10, p. 1476-1493.
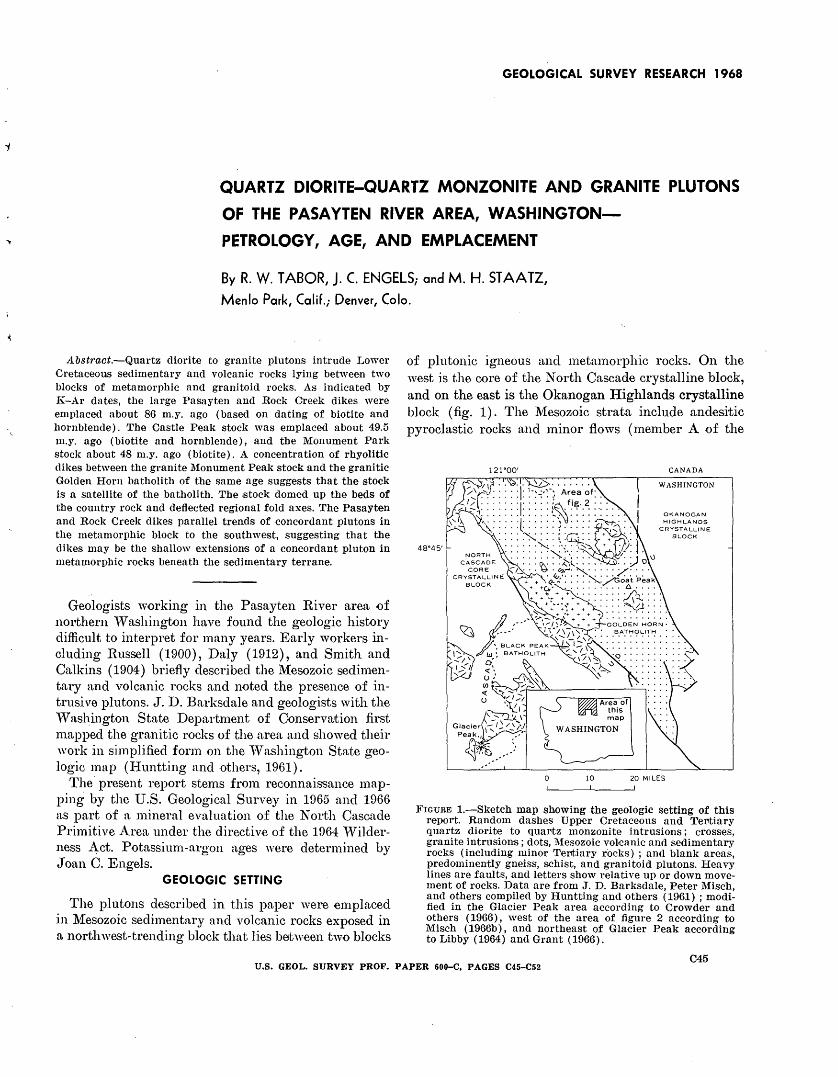
GEOLOGICAL SURVEY RESEARCH 1968
QUARTZ DIORITE-QUARTZ MONZONITE AND GRANITE PLUTONS
OF THE PASAYTEN RIVER AREA, WASHINGTON-
PETROLOGY, AGE, AND EMPLACEMENT
By R. W. TABOR, J. C. ENGELS; and M. H. ST AA TZ, Menlo Park, Calif.; Denver, Colo.
Abstract.-Quartz diorite to granite plutons intrude Lower Cretaceous sedimentary and volcanic rocks lying between two blocks of metamorphic and granitoicl rocks. As indicated by K-Ar dates, the large Pasa_yten and Rock Creek dikes were emplaced about 86 m.y. ago (based on dating of biotite and hornblende). The Castle Pealr stock was emplaced about 49.5 m.y. ago (biotite and hornblende), and the Monument Park stock about 48 m.y. ago (biotite). A concentration of rhyolitic dikes between the granite Monument Peak stock and the granitic Golden Horn batholith of the same age suggests that the stock is a satellite of the batholith. The stock domed up the beds of the country rock and deflected regional fold axes. The Pasayten and Rock Creek dikes parallel trends of concordant plutons in the metamorphic block to the southwest, suggesting that the dikes may be the shallow extensions of a concordant pluton in metamorphic rocl\:s beneath the sedimentary terrane.
Geologists working in the Pasayten River area of nOI~thern ""\Vashington have found the geologic history difficult to interpret for many years. Early workers including Russell (1900), Daly (1912), and Smith and Calkins (1904) briefly described the Mesozoic sedimentary and volcanic rocks and noted the presence of intrusive plutons. J.D. Barksdale and geologists with the ""\Vashington State Department of Conservation first 1napped the granitic rocks of the .area and showed their work in simplified form on the ""\Vashington State geologic map (fluntting and others, 1961).
The present report stems from reconnaissance mapping by the U.S. Geological Survey in 1965 and 1966 as part of a mineral evaluation of the North Cascade Primitive Are.a under the directive of the 1964 ""\Vilderness Act. Potassium-argon ages were determined by Joan C. Engels.
GEOLOGIC SETTING
The plutons described in this paper were emplaced in M:esozoic sedimentary and volcanic rocks exposed in a northwest-trending block that lies beJtween two blocks
of plutonic igneous and metamorphic rocks. On the west is the core of the North Cascade crystalline block, and on the east is the Okanogan Highlands crystalline block (fig. 1). The l\1esozoic strata include anclesitic pyroclastic rocks and minor flows (member A of the
121"00'
48"45'
0 10
CANADA
WASHINGTON
OKANOGAN HIGHLANDS
CRYSTALLINE BLOCK
20 MILES
FIGURE 1.-Sketch map showing the geologic setting of this report. Random dashes Upper Cretaceous and Tefltiary quartz diorite to quartz monzonite intrusions; crosses, granite intrusions; dots, Mesozoic voloeanic and sedimentary roclrs (including minor Tefltiary rocks) ; and blank areas, predominently gneiss, schist, and granitoid plutons. Heavy lines are faults, and letters show relative up or down movement of roclrs. Data are from J. D. Barksdale, Peter Misch, and others compiled by Huntting and others ( 1961) ; modified in the Glacier Peak area according to Crowder and others ( 1966) , west of the area of figure 2 according to Misch ( 1966b), and northeast of Glacier Peal{ according to Libby (1964) and Grant (1966).
C45 U.S. GEOL. SURVEY PROF. PAPER 600-C, PAGES C45-C52
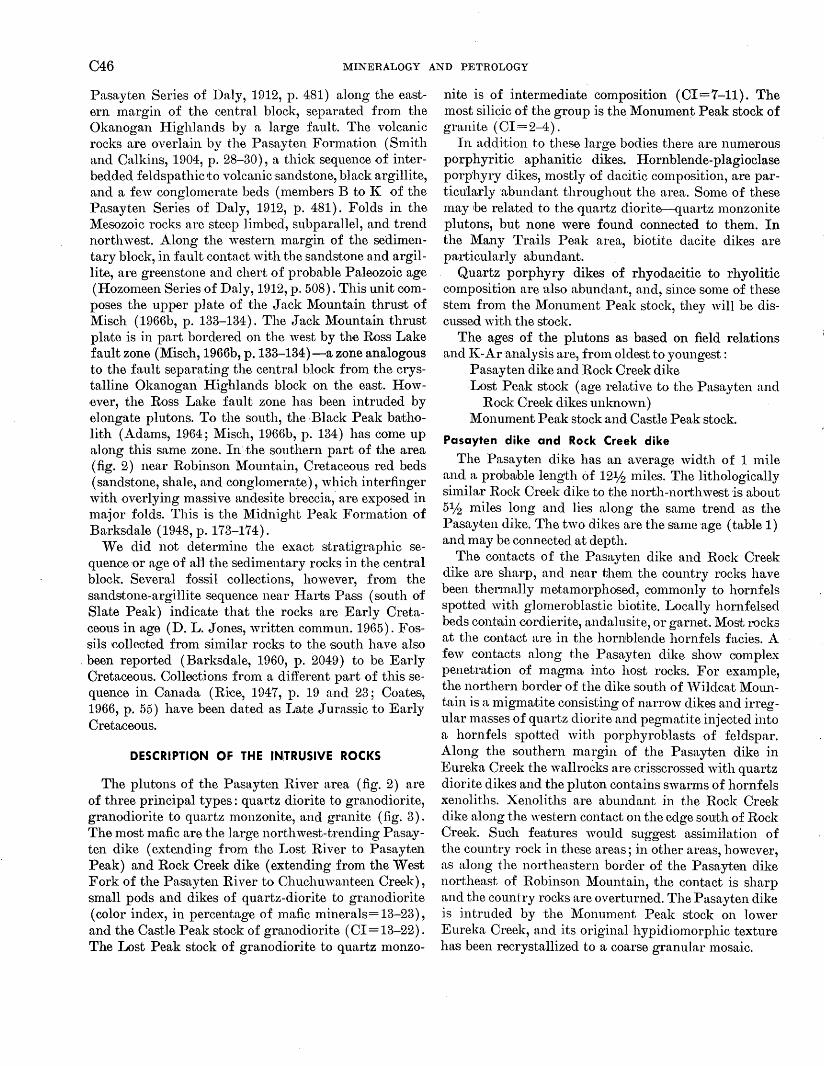
C46 MINERALOGY AND PETROLOGY
Pasayten Series of Daly, 1912, p. 481) along the eastern margin of the central block, separated from the Okanogan I-Iighlands by a large fault. The volcanic rocks are overlain by the Pasayten Fonnation (Smith and Calkins, 1904, p. 28-30), a thick sequence of interbedded feldspathic to volcanic sandstone, black argillite, and a few conglomerate beds (members B to l{ of the Pasayten Series of Daly, 1912, p. 481). Folds in the l\1:esozoic rocks are steep limbed, subparallel, and trend nortlnvest. Along the western margin of the sedimentary block, in fault contact with the sandstone and argillite, are greenstone and chert of probable Paleozoic age (Hozomeen Series of Daly, 1912, p. 508). This unit com-poses the upper plate of the Jack Mountain thrust of Misch (1966b, p. 133-134). The Jack Mountain thrust plrute is in part bordered on the west by the Ross Lake fault zone (Misch, 1966b, p.133-134)-a zone analogous to the fault separating the central block fron1 the crystalline Okanogan Highlands block on the east. However, the Ross Lake fault zone has been intruded by elongate plutons. To the south, the ·-Black Peak batholith (Adams, 1964; Misch, 1966b, p. 134) has come up along this same zone. In the southern part of the ;area (fig. 2) near Robinson Mountain, Cretaceous red beds (sandstone, shale, and conglomerate) , which interfinger with overlying massive andesite breccia, are exposed in major folds. This is the Midnight Peak Formation of Barksdale ( 1948, p. 173-17 4) .
We did not determine the exact stratigraphic sequence ·or age of aU the sedimentary rocks in the central block. Several fossil collections, however, from the sandstone-argillite sequence near Harts Pass (south of Slate Peak) indicate that the rocks are Early Cretaceous in age (D. L. Jones, written commun. 1965). Fossils collected from simi'lar rocks to the south have also been reported (Barksdale, 1960, p. 2049) to be Early Cretaceous. Collections from a different part of this sequence in Canada (Rice, 1947, p. 19 and 23; Coates, 1966, p. 55) have been dated as l,;ate Jurassic to Early CretaJCeous.
DESCRIPTION OF THE INTRUSIVE ROCKS
The plutons of the Pasayten River area (fig. 2) are of three principal types: quartz diorite to granodiorite, granodiorite to quartz monzonite, and granite (fig. 3). The most mafic are the large northwest-trending Pasayten dike (extending from the Lost River to Pasayten Peak) and Rock Creek dike (extending from the West Fork of the Pasayten River to Chuchuwanteen Creek), small pods and dikes of quartz-diorite to granodiorite (color index, in percentage of 1nafic minerals= 13-23), and the Castle Peak stock of granodiorite ( CI = 13-22) . The Lost Peak stock of granodiorite to quartz monzo-
nite is of intermediate composition (CI=7-11). The most silicic of the group is the Monument Peak stock of granite (CI=2-4).
In addition to these large bodies there are numerous porphyritic aphanitic dikes. Hornblende-plagioclase porphyry dikes, mostly of dacitic composition, are particularly ·abundant throughout the area. Some of these may be related to the quartz diorite--quartz monzonite plutons, but none were found connected to them. In the Many Trails Peak area, biotite dacite dikes are particularly abundant.
Quartz porphyry dikes of rhyodacitic to rhyolitic composition are also abundant, and, since some of these stem from the l\1:onument Peak stock, they will be discussed with the stock.
The ages of the plutons as based on field relations and l{-Ar analysis are, from oldest to youngest :
Pasayten dike and Rock Creek dike Lost Peak stock (age relative to the Pasayten and
Rock Creek dikes unknown) Monument Peak stock and Castle Peak stock.
Pasayten dike and Rock Creek dike
The Pasayten dike has an average width of 1 1nile and a probruble length of 12112 miles. The lithologically si1nilar Rock Creek dike to the north-northwest is about 51f2 miles long and lies along the same trend as the Pasayten dike. The two dikes are the same age (table 1) and may be connected at depth.
The contacts of the Pasayten dike and Rock Creek dike are sharp, and near them the country rocks have been thennally metamorphosed, commonly to hornfels spotted with glomerobla.stic biotite. Locally hon1felsed beds cont1ain cordierite, andalusite, or garnet. Mos't rocks at the contact are in the hornblende hornfels facies. A few contacts along the Pasayten dike show complex penetration of magma into host rocks. For example, the northern border of the dike south of "\Vildcat Mountain is a migmatite consisting of narrow dikes and irregular masses of quartz diorite and pegmatite injected into a hornfels spotted with porphyroblasts of feldspar. Along the southern margin of the Pasayten dike in Eureka Creek the wallrocks are crisscrossed with quartz diorite dikes and the pluton contains swanns of hornfels xenoliths. Xenoliths are abundant in the Rock Creek dike along the western contact on the edge south of Rock Creek. Such features would suggest assimilation of the country rock in these areas; in other areas, however, as along the northeastern border of the Pasayten dike northeast of Robinson l\1:ountain, the contact is sharp and the country rocks are overturned. The Pasayten dike is intruded by the Monument Peak stock on lower Eureka Creek, and its original hypidiomorphic texture has been recrystallized to a coarse granular mosaic.
.,
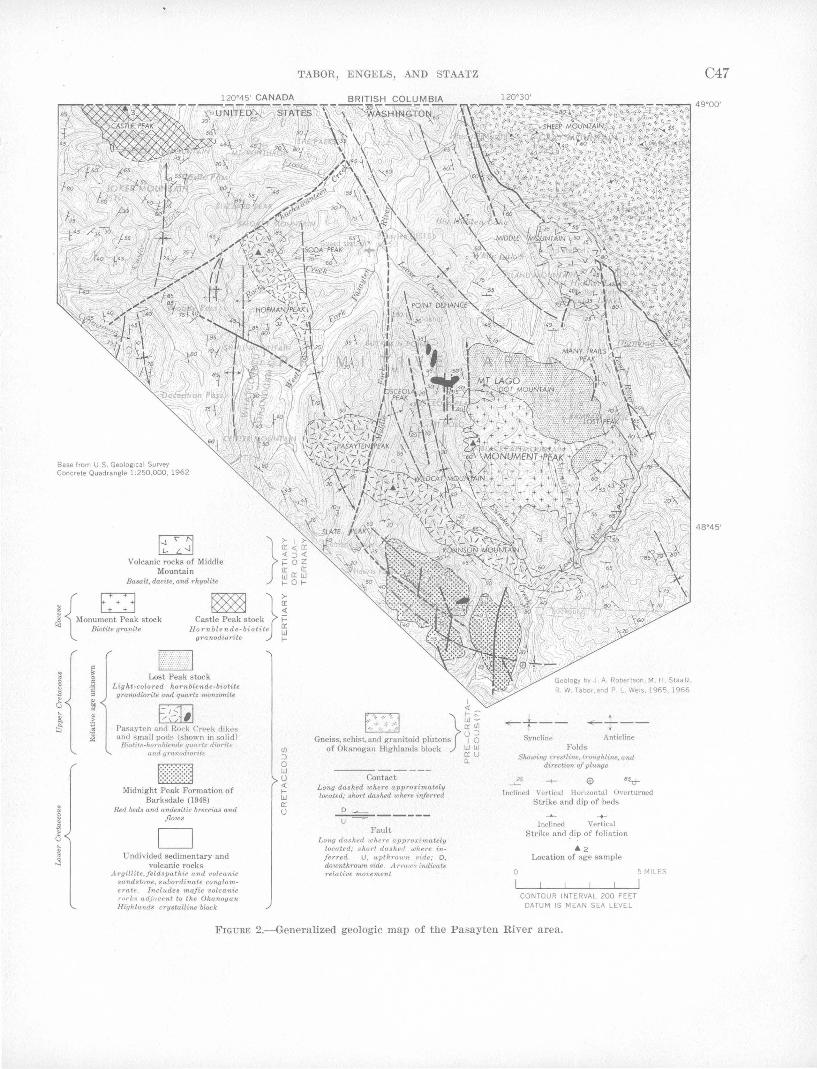
120"45' CANADA
Base from U.S. Geological Survey Concrete Quadrangle 1:250,000, 1962
Volcanic rocks of Middle Mountain
Basalt, dacite, and rhyolite
~{ ~ ~ Monument Peak stock Biotite granite
m }~ Castle Peak stock i= Hornble'_!td.e-bioti te ~
granodtortte r
Lost Peak stock Li ght-colored hornblende-bi oti te granodiorite and quartz monzonite
~ :-J,I Pasayten and Rock Cre-ek dikt>s and s tnall pods (shown in solid)
Biotite-hon1blende quartz diorite und grnnodiorite
Midnight Peak Formation of Barksdale (1948)
Red beds and andesitic breccias and flows
D Undivided sedimentary and
volcanic rocks Argillite,feldspathic and volcanic
sandstone, subordinate conglomerate. Includes ·mafic volcanic rorks adjacent to the Okanogan Highlands crystalline block
<Jl ::J 0 w (j <{ fw a: (j
TABOR, ENGELS, AND STAATZ
I
~ }~~ Gneiss, schi st.,:·n~·· ;r:nitoid plUtons ~ 6
of Okanogan Highlands block ~ ~ a_
------ --Contact
Long dashed where appro:timately located; short dashed where i1'1/erred
o ~
~-----
Fault Long clashed where approxim,ately
located; short dashed whe re inf erred. U, upthrown ~idej D, dov.mthrown side. A rrowH indicate relative movement
120"30'
Geology by J A. Robertson, M. H. Staatz,
R. W. Tabor. and P. L. Weos, 1965. 1966
~+-- +-+--Syncline Anticline
Folds Showing crestline, troughline, and
direction of plunge
Inclined Vertical Horizontal Overturned Strike and dip of beds
0
-+-[nclined Vertical
Strike and _d ip of foliation
.11. 2 Location of age sample
CONTOUR INTERVAL 200 FEET DATUM IS MEAN SEA LEVEL
5 MILES
FIGURE 2.-Generalized geologic map of the Pasayten River area.
C47
49"00'
48"45'
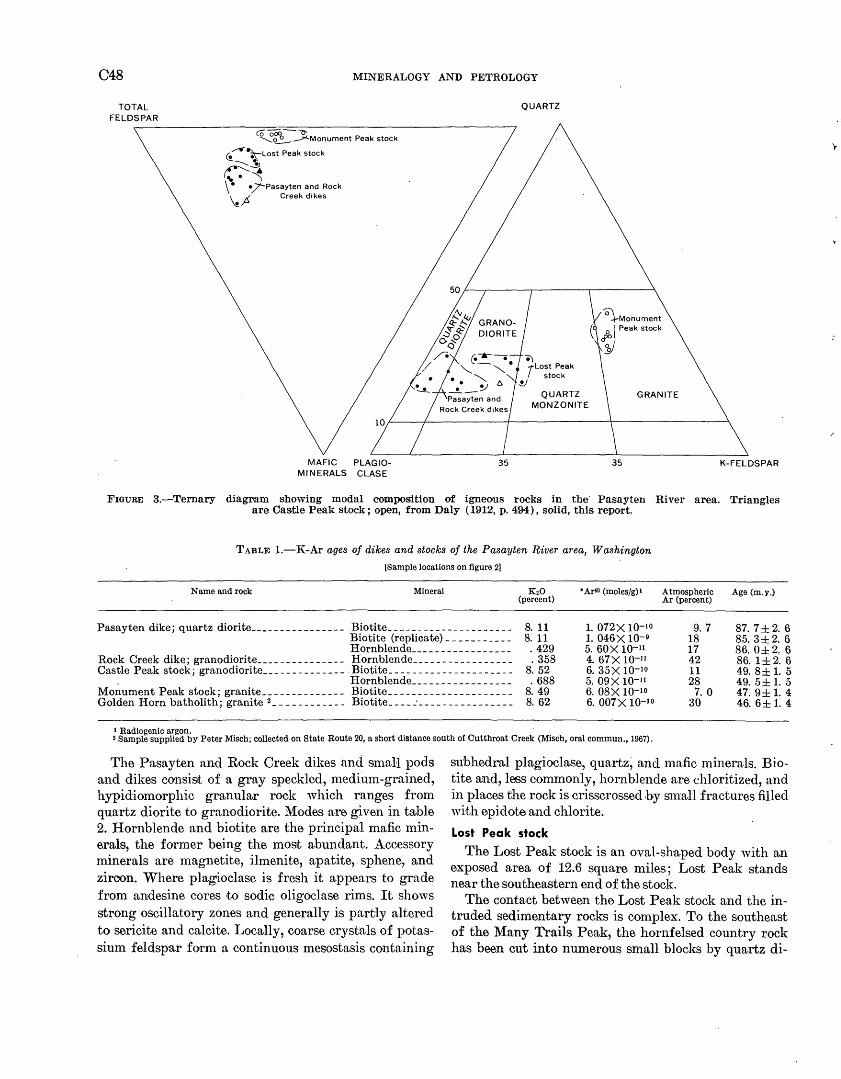
C48
TOTAL FELDSPAR
MINERALOGY AND PETROLOGY
~g:'o ~Monument Peak stock
~~Lost Peak stock --.......~ ,............._ ..
( .. . -...:::; \ • •/Pasayten and Rock ~p Creek dikes
QUARTZ
QUARTZ MONZONITE
GRANITE
MAFIC PLAGIO- 35 35 K-FELDSPAR MINERALS CLASE
FIGURE 3.-T'ernary diagram showing modal composition of igneous rocks in the· Pasayten River area. Triangles are Castle Peak stock ; open, from Daly ( 1912, p. 494) , solid, this report.
TABLE 1.-K-Ar ages of dikes and stocks of the Pasayten River area, Washington
[Sample locations on figure 2]
N arne and rock Mineral • Ar40 (moles/g) 1
Pasayten dike; quartz diorite ________________ Biotite_----- ______________ _ Biotite (replicate) __________ _
8. 11 1. 072X 10-10
8. 11 1. 046X 10-o Hornblende ______ ...; _________ _ . 429 5. 60X 10-11
Rock Creek dike; granodiorite _______________ Hornblende ________________ _ Castle Peak stock; granodiorite ______________ .Biotite ____________________ _
, Hornblende ________________ _
. 358 4. 67X 10-11
8. 52 6. 35X 10-10
. 688 5. 09X 10-u Monument Peak stock; granite ______________ Biotite ____________________ _ Golden Horn batholith; granite 2 ____________ Biotite _____ . _______________ _
8. 49 6. 08X 10-10
8. 62 6. 007X 10-10
1 Radiogenic argon. · 2 Sample supplied by Peter Misch; collected on State Route 20, a short distance south of Cutthroat Creek (Misch, oral commun., 1967).
Atmospheric Age (m.y.) Ar (percent)
9. 7 87. 7±2. 6 18 85. 3±2. 6 17 86. 0±2. 6 42 86. 1±2. 6 11 49. 8± 1. 5 28 49. 5± 1. 5
7. 0 47. 9± 1. 4 30 46. 6± 1. 4
The Pasayten and Rock Creek dikes and smal·l pods and dikes consist of a gray speckled, medium-grained, hypidiomorphic granular rock which ranges from quartz diorite to granodiorite. Modes are given in table 2. Hornblende and biotite are the principal mafic minerals, the former being the most abundant. Accessory minerals are magnetite, ilmenite, apatite, sphene, and zircon. Where plagioclase is fresh it appears to grade from andesine cores to sodic oligoclase rims. It shows strong oscillatory zones and generally is partly altered to sericite and calcite. Locally, coarse crystals of potassium feldspar form a continuous mesostasis containing
suhhedral plagiodase, quartz, and mafic minerals. Biotite a;nd, less commonly, hornblende are chloritized, and in plaoos the rock is crisscrossed hy snTall fractures filled with epidote and chlorite.
Lost Peak stock
The Lost Peak stock is an oval-shaped body with an exposed area of 12.6 square miles; Lost Peak stands near the southeastern end of the stock.
The contact between the Lost Peak stock and the intruded sedimentary rocks is complex. To the southeast of the Many Trails Peak, the hornfelsed country rock has been cut into numerous small blocks by quartz di-
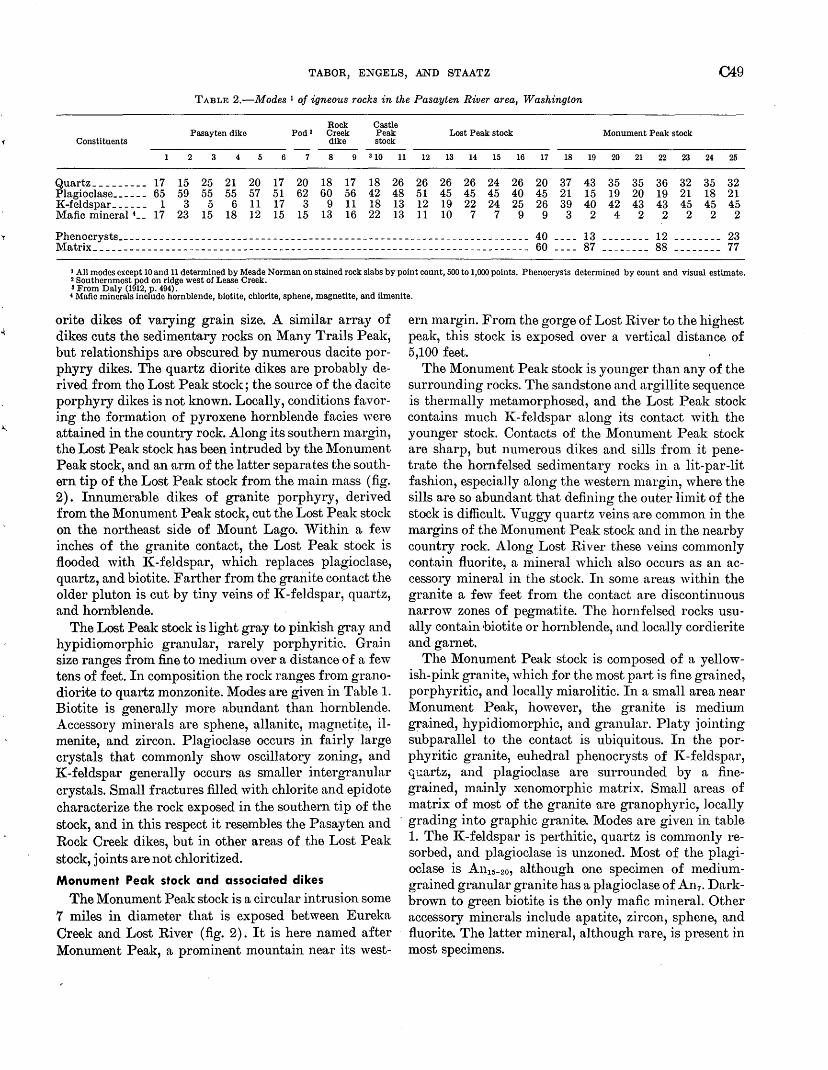
.,.
...
TABOR, ENGELS, AND STAATZ C49
TABLE 2.-Modes 1 of igneous rocks in the Pasayten River area, Washington
Rock Castle Pasayten dike Pod 2 Creek Peak Lost Peak stock Monument Peak stock
Constituents dike stock
3 4 5 8 9 310 11 12 13 14 15 16 17 18 19 20 21 22 23 24 25
Quartz _________ 17 15 25 21 20 17 20 18 17 18 26 26 26 26 24 26 20 37 43 35 35 36 32 35 32 Plagioclase ______ 65 59 55 55 57 51 62 60 56 42 48 51 45 45 45 40 45 21 15 19 20 19 21 18 21 K-feldspar ______ 1 3 5 6 11 17 3 9 11 18 13 12 19 22 24 25 26 39 40 42 43 43 45 45 45 Mafic mineral • __ 17 23 15 18 12 15 15 13 16 22 13 11 10 7 7 9 9 3 2 4 2 2 2 2 2
Phenocrysts--------------------------------------------------------------------- 40 ---- 13 -------- 12 -------- 23 Matrix------------------------------------------------------------------------- 60 ---- 87 -------- 88 -------- 77
I All modes except 10 and 11 determined by Meade Norman on stained rock slabs by point count, 500 to 1,000 points. Phenocrysts determined by count and visual estimate. 2 Southernmost pod on ridge west of Lease Creek. s From Daly (1912, p. 494). · 4 Mafic minerals include hornblende, biotite, chlorite, sphene, magnetite, and ilmenite.
orite dikes of varying grain size. A similar array of dikes cuts the sedimentary rocks on Many Trails Peak, but relationships are obscured by numerous dacite porphyry dikes. The quartz diorite dikes are probably derived from the Lost Peak stock; the source of the dacite porphyry dikes is not known. Locally, conditions favoring the formation of pyroxene hornblende facies were attained in the country rock. Along its southern margin, the Lost Peak stock has boon intruded by the Monument Peak stock, and an ~arm of the latter separates the southern tip of the Lost Peak stock from the main mass (fig. 2). I1mumerable dikes of granite porphyry, derived from the Monument Peak stock, cut the Lost Peak stock on the northeast side of Mount Lago. Within a few inches of the granite contact, the Lost Peak stock is flooded with !(-feldspar, which replaces plagioclase, quartz, and biotite. Farther from the grai1ite contact the older pluton is cut by tiny veins of !(-feldspar, quartz, and hornblende.
The Lost Peak stock is light gray to pinkish gray and hypidiomorphic granular, rarely porphyritic. Grain size ranges from fine to medium over a distance of a few tens of feet. In composition the rock ranges from granodiorite to quartz monzonite. Modes are given in Table 1. Biotite is generally more abundant than hornblende. Accessory minerals are sphene, allanite, mn,gn.etite, ilmenite, and zircon. Plagioclase occurs in fairly large crystals that commonly show oscillatory zoning, and !(-feldspar generally occurs as smaller intergranular crystals. Small fractures filled with chlorite and epidote characterize the rock exposed in the southern tip of the stock, and in this respect it resembles the Pasayten and Rock Creek dikes, but in other areas of the Lost Peak stock, joints are not chloritized.
Monument Peak stock and associated dikes
The Monument Peak stock is a circular intrusion some 7 miles in diameter that is exposed between Eureka Creek and Lost River (fig. 2). It is here named after Monument Peak, ,a prominent mountain near its west-
ern margin. Fron1 the gorge of Lost River to the highest peak, this stock is exposed over a vertical distance of 5,100 feet.
The Monument Peak stock is younger than any of the surrounding rocks. The sandstone and argillite sequence is thermally metamorphosed, and the Lost Peak stock contains much !(-feldspar along its contact with the younger stock. Contacts of the Monument Peak stock are sharp, but numerous dikes and sills fron1 it penetrate the hornfelsed sedimentary rocks in a lit-par-lit fashion, especially along the western margin, where the sills are so abundant that defining the outer limit of the stock is difficult. V uggy quartz veins ·are common in the margins of the Monument Pea.k stock and in the nearby country rock. Along Lost River these veins commonly contain fluorite, a mineral which also occurs as an accessory mineral in the stock. In some areas within the granite a few feet from the contact are discontinuous narrow zones of pegm~a.tite. The hornfelsed rocks usually contain biotite or hornblende, and locally cordierite and garnet.
The Monument Peak stock is composed of a yellowish-pink granite, which for the most part is fine grained, porphyritic, and locally miarolitic. In a small area near J\1onument Peak, however, the granite is medimn grained, hypidiomorphic, and granular. Platy jointing subparallel to the contact is ubiquitous. In the porphyritic granite, euhedral phenocrysts of J(-feldspar, quartz, and plagioclase are surrounded by a finegrained, mainly xenomorphic matrix. Small areas of matrix of most of the granite ~are granophyric, locally
- grading into graphic granite. Modes are given in table 1. The !(-feldspar is perthitic, quartz is commonly resorbed, and plagioclase is unzoned. Most of the plagioclase is An15-2o, although one specimen of mediumgrained granular granite has a plagioclase of An7 • Darkbrown to green biotite is the only mafic mineral. Other accessory minerals include apatite, zircon, sphene, and fluorite. The latter mineral, although rare, is present in most specimens.
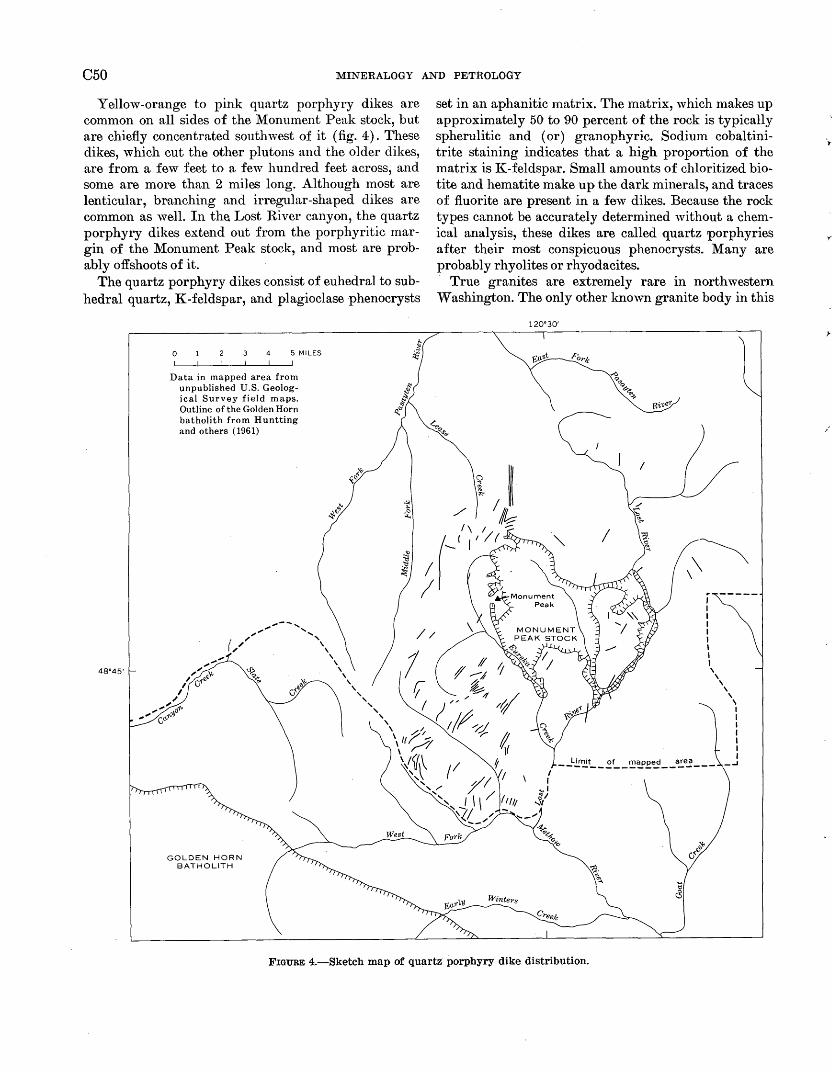
C50 MINERALOGY AND PETROLOGY
Yellow-orange to pink quartz porphyry dikes are common on all sides of the Monument Peak stock, but are chiefly concentrated southwest of it (fig. 4). These dikes, which cut the other plutons and the older dikes, are from a few feet to a few hundred feet across, and some are more than 2 miles long. Although most are lenticular, b~anching and irregular-shaped dikes are common as well. In th~ Lost River canyon, the quartz porphyry dikes extend out from the porphyritic margin of the Monument Peak stock, and most are probably offshoots of it.
The quartz porphyry dikes consist of euhedral to subhedral quartz, K-feldspar, and plagioclase phenocrysts
48"45'
0 4 5 MILES
Data in mapped area from unpublished U.S. Geological Survey field maps. Outline of the Golden Horn batholith from Huntting and others (1961)
GOLDEN HORN BATHOLITH
set in an aphanitic matrix. The matrix, which makes up approximately 50 to 90 percent of the rock is typically spherulitic and (or) granophyric. Sodium cobaltinitrite staining indicates that a high proportion of the matrix is K-feldspar. Small amounts of chloritized biotite and hematite make up the dark minerals, and traces of fluorite are present in a few dikes. Because the rock types cannot be accurately determined without a chemical analysis, these dikes are called quartz porphyries after their most conspicuous phenocrysts. Many are probably rhyolites or rhyodacites.
True granites are extremely rare in northwestern Washington. The only other known granite body in this
120"30'
\~ \
I I I I I I I I I
' ' ' ' ' I I I I I
. . I }
~
Lrmrt of mapped area ...1 ------------------ -
FIGURE 4.-Sketch map of quartz porphyry dike distribution.
y
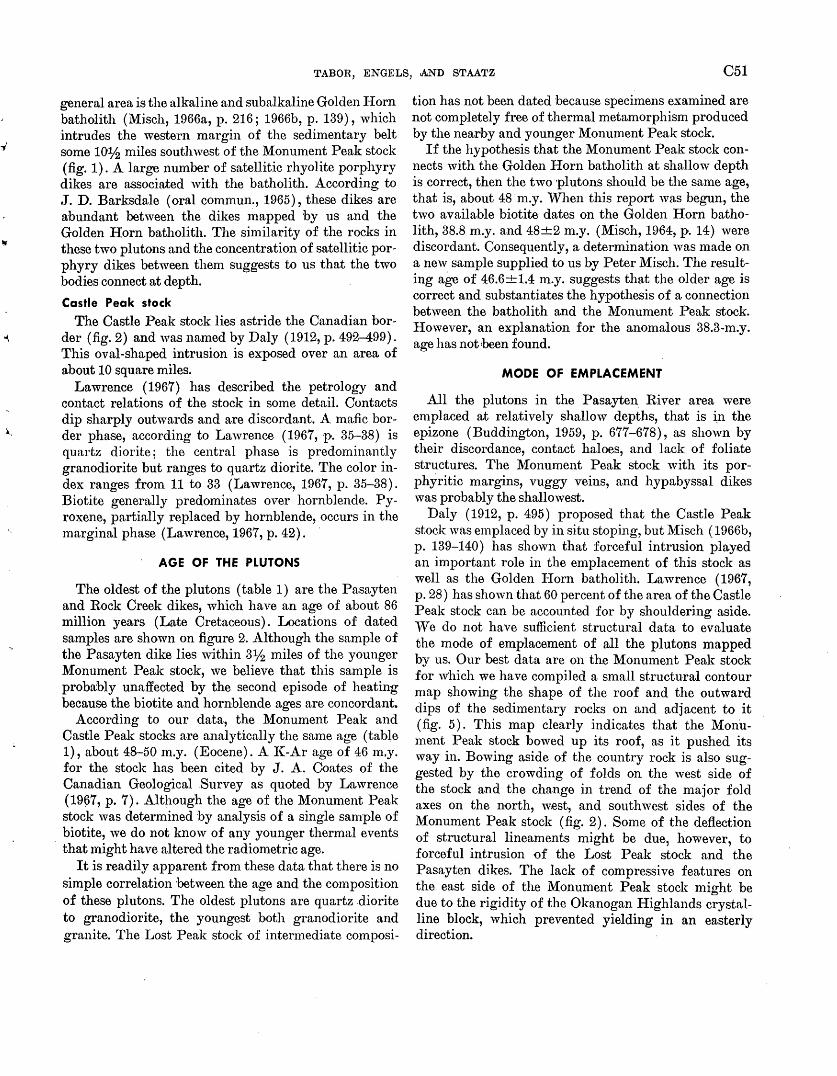
TABOR, ENGELS, .AND STAATZ C51
general area is the alkaline and sub alkaline Golden Horn batholith (Misch, 1966a, p. 216; 1966h, p. 139), which intrudes the western margin of the sedimentary belt some 10% miles southwest of the Monument Peak stock (fig. 1). A large number of satellitic rhyolite porphyry dikes are associated with the batholith. According to J. D. Barksdale (oral commun., 1965), these dikes are abundant between the dikes mapped by us and the Golden Horn batholith. The similarity of the rocks in these two plutons and the concentration of satellitic porphyry dikes between them suggests to us that the two bodies connect at depth.
Castle Peak stock
The Castle Peak stock lies astride the Canadian border (fig. 2) and was named by Daly (1912, p. 492-499). This oval-shaped intrusion is exposed over an area of about 10 square miles.
Lawrence (1967) has described the petrology and contact relations of the stock in some detail. Contacts dip sharply outwards and are discordant. A mafic border phase, according to Lawrence (1967, p. 35-38) is quartz diorite; the central phase is predominantly granodiorite but ranges to quartz diorite. The color index ranges from 11 to 33 (Lawrence, 1967, p. 35-38). Biotite generally predominates over hornblende. Pyroxene, partially replaced by hornblende, occurs in the marginal phase (Lawrence, 1967, p. 42).
AGE OF THE PLUTONS
The oldest of the plutons (table 1) are the Pasayten and Rock Creek dikes, which have an age of about 86 million years (Late Cretaceous). Locations of dated samples are shown on figure 2. Although the sample of the Pasayten dike lies within 31h miles of the younger Monument Peak stock, we believe that this sample is proba:bly unaffected by the second episode of heating because the biotite and hornblende ages are concordant.
According to our data, the Monument Peak and Castle Peak stocks are analytically the same age (table 1), about 48-50 m.y. (Eocene). A J(-Ar age of 46 m,y. for the stock has been cited by J. A. Coates of the Canadian Geological Survey as quoted by Lawrence (1967, p. 7). Although the age of the Monument Peak stock was determined by analysis of a single sample of biotite, we do not know of any younger thermal events
· that 1night have altered the radiometric age. It is readily apparent from these data that there is no
simple correlation between the age and the composition of these plutons. The oldest plutons are quartz diorite to granodiorite, the youngest both granodiorite and granite. The Lost Peak stock of intermediate composi-
tion has not been dated because specimens examined are not completely free of thermal metamorphism produced by the nearby and younger Monument Peak stock.
If the hypothesis that the Monument Peak stock connects with the Golden Horn batholith at shallow depth is correct, then the two ·plutons should be the same age, that is, about 48 ·m.y. "'When this report was begun, the two available biotite dates on the Golden Horn batholith, 38.8 m.y. and 48+2 m.y. (Misch, 1964, p. 14) were discordant. Consequently, a determination was made on a new sample supplied to us by Peter Misch. The resulting age of 46.6+1.4 m.y. suggests that the older age is correct and substantiates the hypothesis of a connection between the batholith and the Monument Peak stock. However, an explanation for the anomalous 38.3-m.y. age has not ~been found.
MODE OF EMPLACEMENT
All the plutons in the Pasayten River area were emplaced at relatively shallow depths, that is ~n the epizone (Buddington, 1959, p. 677-678), as shown by their discordance, contact haloes, and lack of foliate structures. The Monument Peak stock with its porphyritic margins, vuggy veins, and hypabyssal dikes was probably the shallowest.
Daly (1912, p. 495) proposed that the Castle Peak stock was emplaced by in situ stoping, but Misch ( 1966b, p. 139-140) has shown that forceful intrusion played an important role in the emplacement of this stock as well as the Golden Horn batholith. Lawrence (1967, p. 28) has shown that 60 percent of the area of the Castle Peak stock can be accounted for by shouldering aside. vVe do not have sufficient structural data to evaluate the mode of emplacement of all the plutons mapped by us. Our best data are on the Monument Peak stock for which we have compiled a small structural contour map showing the shape of the roof and the outward dips of the sedimentary rocks on and adjacent to it (fig. 5). This map clearly indicates that the Monument Peak stock bowed up its roof, as it pushed its way in. Bowing aside of the country rock is also suggested by the crowding of folds on the west side of the stock and the change in trend of the major fold axes on the north, west, and southwest sides of the Monument Peak stock (fig. 2). Some of the deflection of structural lineaments might be due, however, to forceful intrusion of the Lost Peak stock and the Pasayten dikes. The lack of compressive features on the east side of the Monument Peak stock might be due to the rigidity of the Okanogan Highlands crystalline block, which prevented yielding in an easterly direction.
C52 MINERALOGY AND PETROLOGY
120°30'
48°45'
60
0 3MILES
CONTOUR INTERVAL 1000 FEET DATUM IS MEAN SEA LEVEL
-r-65
FIGURE 5.-Contours drawn on the top of the Monument Peak stock (patterned). Selected bedding attitudes (strike and dip symbols) show the bowing up of the country rocks (unpatterned). Dashed contours are less reliable than solid contours.
Overturned beds adjacent to the ~contacts of the Pasayten and Rock Creek dikes suggest that forceful intrusion has played-a part in their emplacement. On the other hand, numerous xenoliths and migmatites along the contacts indicate that some stoping and assimilation may also have taken place.
The northwest trend of the Pasayten dike and its probable extension, the Rock Creek dike, roughly parallels folds and some faults in the sedimentary belt of the Pasayten area. The emplacement may have been controlled by these structural elements, although we found no specific structure which could do so, such as a fault along the trend of the dikes. However, the dikes also parallel concordant and elongate quartz dioritegranodiorite plutons in the North Cascades farther west, such as the probably Cretaceous Black Peak batholith (Adams, 1964; Misch, 1966b, p. 139). Perhaps the dike is the extension of a concordant pluton lying deeper in the metamorphic floor of the sedimentary belt.
REFERENCES
Adams, J. B., 1964, Origin of the Black Peak Quartz Diorite, Northern Cascades, Washington: Am. Jour. Sci .. v. 262, no. 3, p. 290-306.
Barksdale, J.D., 1948, Stratigraphy in the Methow quadrangle, Washington: Northwest Sci., v. 22, no. 4, p. 164-176.
---1960, Late Mesozoic sequences in the northeastern Cascade Mountains of Washington [abs.] : Geol. Soc. America Bull., v. 71, no. 12, pt. 2, p. 2049.
Buddington, A. F., 1959, Granite emplacement with special reference to Nor-th America: Geol. Soc. America Bull., v. 70, no. 6, p, 671-747.
Coates, J. A., 1966, Manning Park area, Cascade Mountains: Canada Geol. Survey Paper 66--1, p. 55-56.
Crowder, D. F., Tabor, R. W., and Ford, A. B., 1966, Geologic map of the Glacier Peak quadrangle, Snohomish and Chelan Counties, Washington: U.S. Geol. Survey Geol. Quad. Map GQ-473, scale 1: 62,500.
Daly, R. A., 1912, Geology of the North American Cordillera at the forty-ninth parallel: Canada Geol. Survey Mem. 38, pts. 1-3, 857 p.
Grant, A. R., 1966, Bedrock geology of the Dome Peak area, Chelan, Skagit, and Snohomish Counties, Northern Cascades, Washington: Washington Univ., Seattle, Ph. D. thesis, 306 p.
Huntting, M. T., Bennett, W. A. G., Livingston, V. E., Jr., and Moen, "\V. S., compliers, 1961, Geologic map of 'Vashington: Washington Div. Mines and Geology, scale 1: 500,000.
Lawrence, D. P., 1967, Structure and petrology of the Castle Peak stock, Northeasten1 Cascade Mountains, Washington: "\Vashington Univ., Seattle, M.S. thesis, 67 p.
J.;ibby, W. G., 1964, Petrography and structure of the crystaline rocks between Agnes Creek and the Methow Valley, Washington: Washington Univ., Seattle, Ph. D. thesis, 171 p.
Misch, Peter, 1964, Age determinations on crystalline rocks of Northern Cascade Mountains, Washington, in Kulp, J. L., senior investigator, and others, Investigations in isotopic geochemistry: Palisades, N.Y., Columbia Univ., Lamont Geol. Observatory (U.S. Atomic Energy Comm. [Pub.] NY0-7243), App. D, p. 1-15.
---1966a, Alkaline granite amidst the calc-alkaline instrusive suite of the Northern Cascades, Washington [abs.] : Geol. Soc. America Spec. Paper 87, p, 216.
---1966b, Tectonic evolution of the northern Cascades of Washington State-A west-Cordilleran case history, in Gunning; H. C., ed., A symposium on tectonic history and mineral deposits of the Western Cordillera in British Columbia and neighbouring parts of the United States: Canadian lnst. Mining and Metalurgy Spec. Paper, v. 8, p. 101-148.
Rice, H. M. A., 1947, Geology and mineral deposits of the Princeton map-area, British Columbia : Canada Geol. Survey Mem. 243, Pub. 2477, 136 p.
Russell, I. C., 1900, A preliminary paper on the geology of the Cascade Mountains : U.S. Geol. Survey 20th Ann. Rept., pt. 2, p, 83-210.
Smith, G. 0., and Calkins, F. C., 1904, A geological reconnaissance across the Cascade Range near the forty-ninth parallel: U.S., Geol. Survey Bull. 235, 103 p.
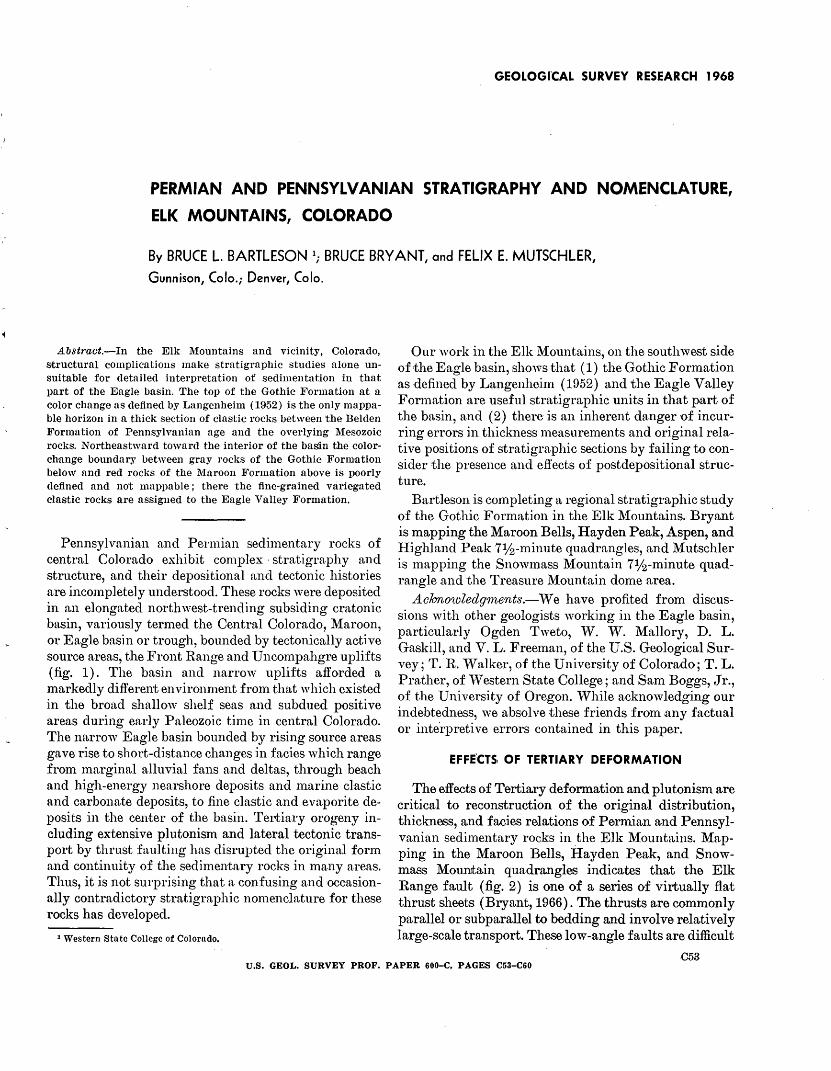
GEOLOGrCAL SURVEY RESEARCH 1968
PERMIAN AND PENNSYLVANIAN STRATIGRAPHY AND NOMENCLATURE,
ELK MOUNTAINS, COLORADO
By BRUCE L. BARTLESON 1; BRUCE BRYANT, and FELIX E. MUTSCHLER,
Gunnison, Colo.; Denver, Colo.
A.bstract.-In the Elk Mountains and vicinity, Colorado, structural complications make stratigraphic studies alone unsuitable for detailed interpretation of sedimentation in that part of the Eagle basin. The top of the Gothic Formation at a color change as defined by Langenheim (1952) is the only mappable horizon in a thick section of claSitic rocks between the Belden Formation of Pennsylvanian age and the overlying Mesozoic rocks. Northeastward toward the interior of the basin the colorchange boundary between gray rocks of the Gothic Formation below and red rocl.:s of the Maroon Formation above is poorly defined and not mappable; there the fine-grained variegated clastic rocks are assigned to the Eagle Valley Formation.
Pennsylvanian and Permian sedimentary rocks of central Colorado exhibit complex ·stratigra-phy and structure, and their depositional and tectonic histories are incompletely understood. These rocks 'vere deposited in an elongated northwest-trending subsiding cratonic basin, variously termed the Central Colorado, Maroon, or Eagle basin or trough, bounded by tectonically active source areas, the Front Range and Uncompahgre uplifts (fig. 1). The basin and narrow uplifts afforded a markedly different environment from that which existed in the broad shallow shelf seas and subdued positive areas during early Paleozoic time in central Colorado. The narrow Eagle basin bounded by rising source areas gave rise to short-distance changes in facies which range from marginal alluvial fans and deltas, through beach and high-energy nearshore deposits and marine clastic and carbonate deposits, to fine clastic and evaporite deposits in the center of the basin. Tertiary orogeny including extensive plutonism and lateral tectonic transport by thrust faulting has disrupted the original form and continuity of the sedimentary rocks in many areas. Thus, it is not surprising that a confusing and occasionally contradictory stratigraphic nomenclature for these rocks has developed.
1 Western State College of Colorado.
Our work in the Elk Mountains, on the southwest side of the Eagle basin, shows that ( 1) the Gothic Formation as defined by Langenheim (1952) and the Eagle Valley Formation are useful stratigraphic units in that part of the basin, and (2) there is an inherent danger of incurring errors in thickness measurements and original relative positions of stratigraphic sections by failing to consider the presence and effects of postdepositional structure.
Bartleson is completing a regional stratigraphic study of the Gothic Formation in the Elk l\iountains. Bryant is mapping the Maroon Bells, Hayden Peak, Aspen, and Highland Peak 7lf2-minute quadrangles, and l\iutschler is mapping the Snowmass Mountain 7lj2-minute quadrangle and the Treasure l\1ountain dome area.
Achnmo.ledgrnents.-We have profited from discussions with other geologists working in the Eagle basin, particularly Ogden Tweto, W. vV. Mallory, D. L. Gaskill, and V. L. Freeman, of the U.S. Geological Survey; T. R. vValker, of the University of Colorado; T. L. Prather, of '\Vestern State College; and Sam Boggs, Jr., of the University of Oregon. '\Vhile acknowledging our indebtedness, we absolve these friends from any factual or inte-rpretive errors contained in this paper.
EFFE:CTSr OF TERTIARY DEFORMATION
The effects of Tertiary deformation and plutonism are critical to reconstruction of the original distribution, thickness, and facies relations of Permian and Pennsy 1-vanian sedimentary rocks in the Elk Mountains. Mapping in the Maroon Bells, Hayden Peak, and Snowmass MoU11ltain quadrangles indicates that the Elk Range fault (fig. 2) is one of a series of virtually flat thrust sheets (Bryant, 1966). The thrusts are commonly parallel or subparallel to bedding and involve relatively large-scale transport. These low-angle faults are difficult
,Q53 U.S. GEOL. SURVEY PROF. PAPER 600-C, PAGES C53-C60
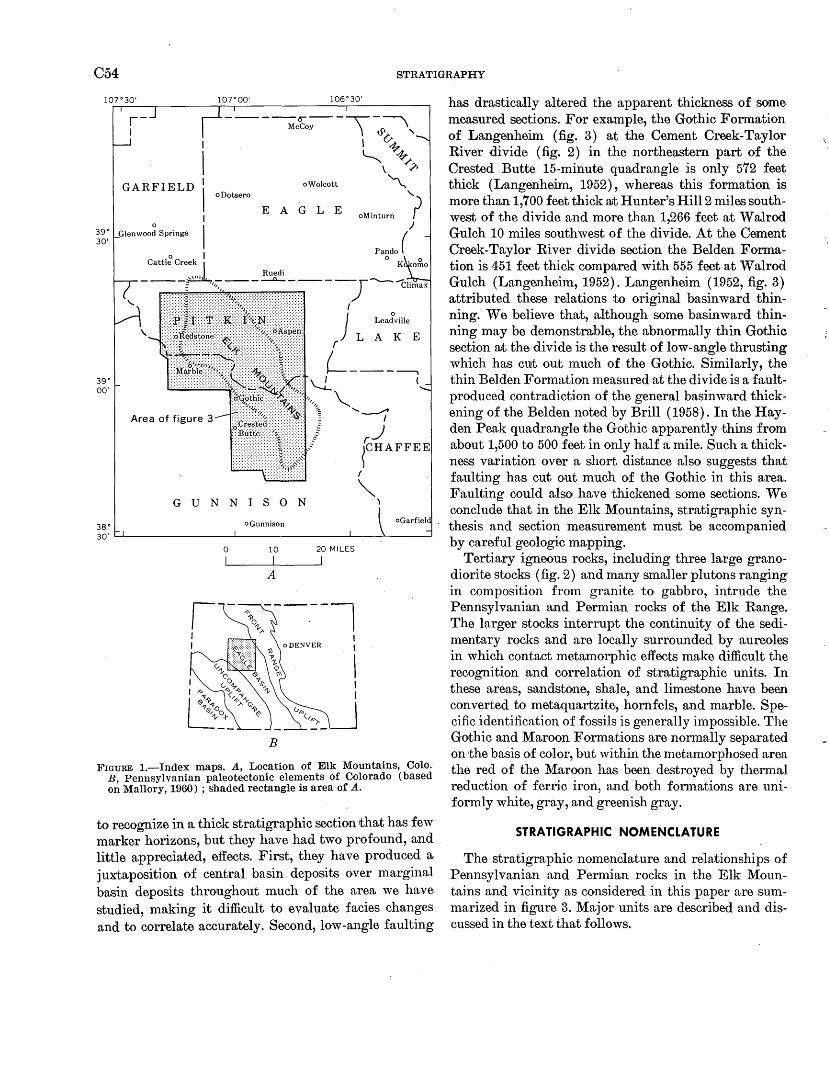
C54 STRATIGRAPHY
GARFIELD
Area of figure 3
GUNNISON
38° oGunnison
30' ~--------------~------------~----~--~
0 10 20 MILES
A
B
FIGURE 1.-Index maps. A, Location of Elk Mountains, Colo. B, Pennsylvanian paleotectonic ele~ents of Colorado (based on Mallory, 1960) ; shaded rectangle 1s area of A.
to recognize in a thick stratigraphic section rthat has few marker horizons, but they have had two profound, and little appreciated, effects. First, they have produced a juxtaposition of central basin deposits over marginal basin deposits throughout much of the area we have studied, making it difficult to evaluate facies changes and to correlate accurately. Second, low-angle faulting
has drastically altered the apparent thickness of some measured sections. For example, the Gothic Formation of Langenheim (fig. 3) at the Cement Creek-Taylor River divide (fig. 2) in the northeastern part of the Crested Butte 15-minute quadrangle is only 572 feet thick (Langenheim, 1952), whereas this formation is more than 1,700 feet thick rut Hunter's Hill2 miles southwest of the divide and more than 1,266 feet at Walrod Gulch 10 miles southwest of the divide. At the Cement Creek-Taylor River divide section the Belden Formation is 451 feet thick compared with 555 foot at Walrod Gulch (Langenheim, 1952). Langenheim (1952, fig. 3) attributed these relations to original basinward thinning. We believe that, although some basinward thinning may be demonstrable, the abnormally thin Gothic section a;t the divide is the result of low-angle thrusting which has curt out much of the Gothic. Similarly, the thin Belden Formation measured at the divide is a faultproduced contradiction of the general basinward thickening of the Belden noted by Brill (1958). In the Hayden Peak quadrangle the Gothic apparently thins from about 1,500 to 500 feet in only half a mile. Such a thickness variation over a short distance also suggests that faulting ha.s cut out much of the Gothic in this area. Faulting could also have thickened some sections. We conclude that in the Elk Mountains, stratigraphic synthesis and section measurement must be accompanied by careful geologic mapping.
Tertiary igneous rocks, including three large granodiorite stocks (fig. 2) and many smaller plutons ranging in composition from granite to gabbro, intrude the Pennsylvanian and Permian rocks of the Elk Range. The larger stocks interrupt the continuity of the sedimentary rocks and are locally surrounded by aureoles in which contact metamorphic effects make difficult the recognition and correlation of stratigraphic units. In these areas, sandstone, shale, and limestone have been converted to metaquartzite, hornfels, and marble. Specific identification of fossils is generally impossible. The Gothic and Maroon Formations are normaily separated on the basis of color, but within the meta.Inorphosed area the red of the Maroon has been destroyed by thermal reduction of ferric iron, and ·both formations are uniformly white, gray, and greenish gray.
STRATIGRAPHIC NOMENCLATURE
The stratigraphic nomenclature and rela.tionshi ps of Pennsylvanian and Permian rocks in the Elk Mountains and vicinity as considered in this paper are summarized in figure 3. Major units are described and discussed in the text that follows.
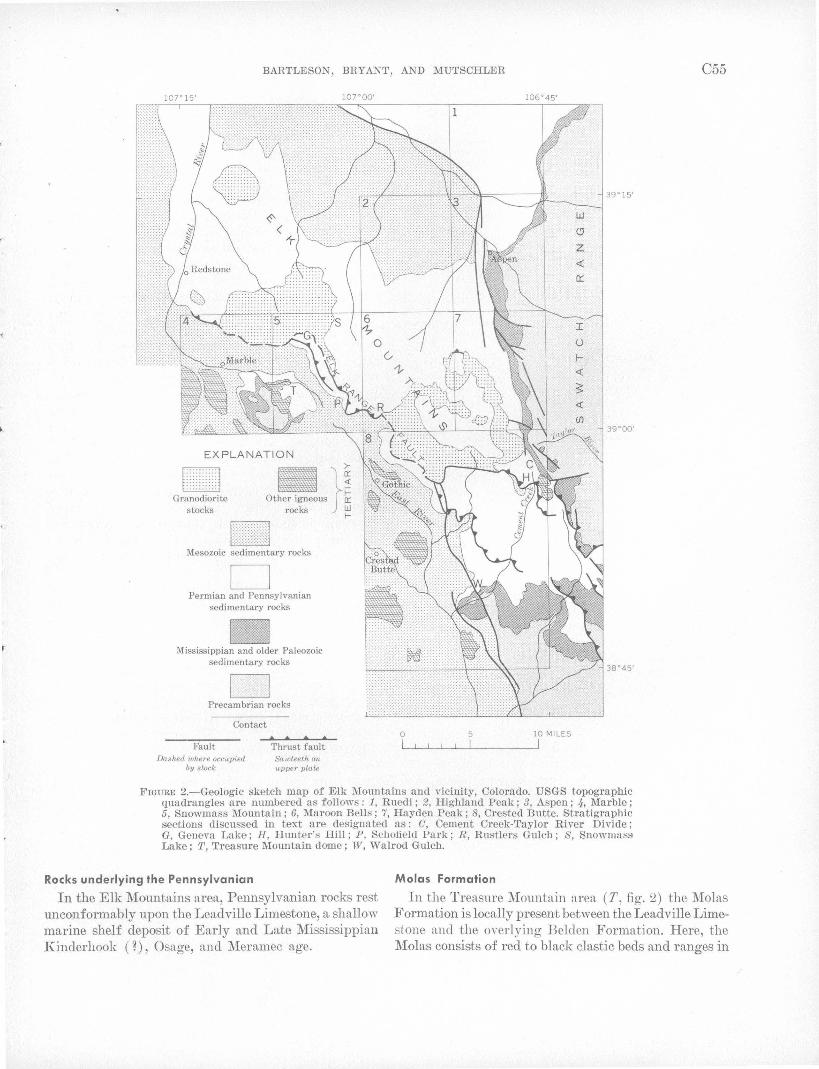
r
BARTLESON, BRYANT, AND MUTSCHLER
107"15' 107'00'
EXPLANATION
FSSl L2lJ
Granodiorite stocks
>-
Other igneous }~ rocks ~
D Permian and Pennsylvanian
sedimentary rocks
Miss issippian and older Paleozoic sedimentary rocks
D Precambrian rocks
Contact
Fault Dashed where occupied
by sU>ck
Thrust fault Sawueth em upper plate
0 5
106'45'
39'15'
39'00'
38'45'
10 MILES
FIGURE 2.-Geologic sketch map of Elk Mountains and vicinity, Colorado. USGS topographic quadrangles are numbered as follows: 1, Ruedi; 2, Highland Peak; S, Aspen; 4, Marble; 5, Snowmass Mountain; 6, Maroon Bells; 7, Hayden Peak; 8, Crested Butte. Stratigraphic sections discussed in text are designated as: 0, Cement Creek-Taylor River Divide; G, Geneva Lake; I-I, Hunter ':; Hill; P, Schofield Park; R, Rustlers Gulch; S, Snowmass Lake; T, Treasure Mountain dome; W, Walrod Gulch.
Rocks underlying the Pennsylvanian Molas Formation
C55
In the Elk Mountains area, Pennsylvanian rocks rest unconformably upon the Leadville Limestone, a shallow marine shelf deposit o:f Early and Late Mississippian Kinderhook ( n, Osage, and Meramec age.
In the Treasure Mountain area (T, fig. 2) the Molas Formation is locally present between the Leadville Limestone and the overlying Belden Formation. Here, the Molas consists o:f red to black clastic beds and ranges in
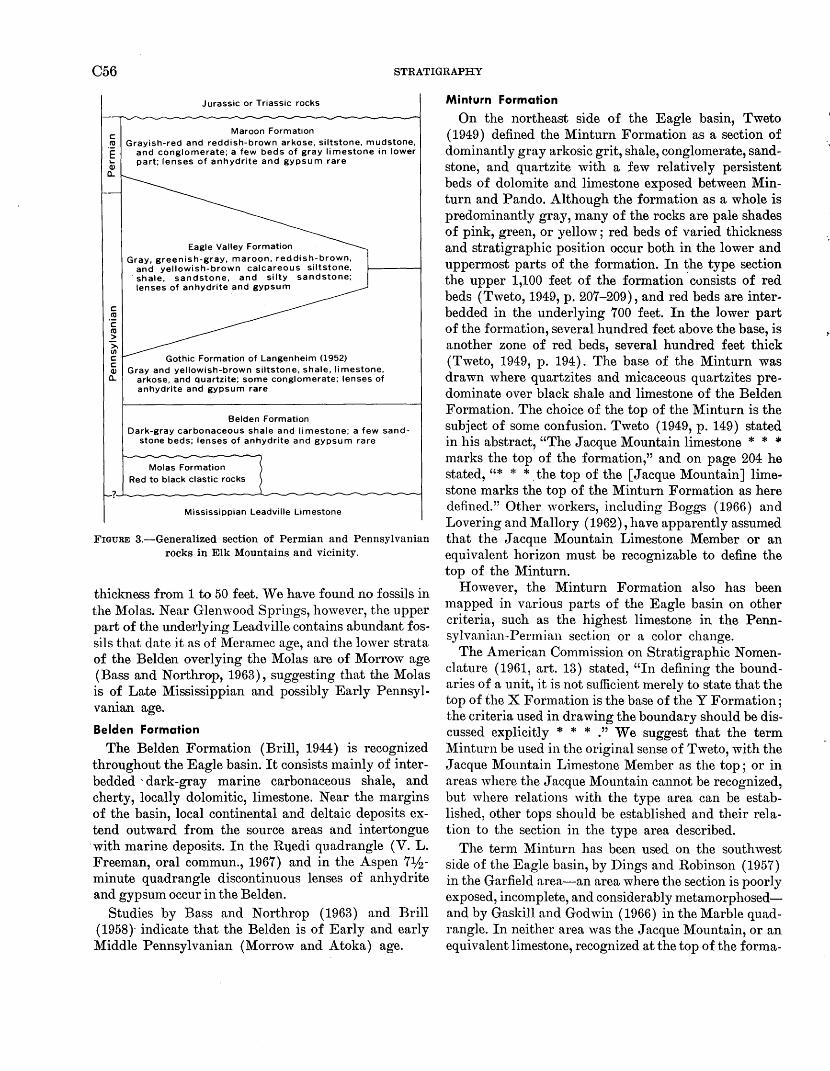
C56 STRATIGRAPHY
Jurassic or Triassic rocks
Maroon Formation Grayish-red and reddish-brown arkose, siltstone, mudstone,
and conglomerate; a few beds of gray limestone in lower part; lenses of anhydrite and gypsum rare
Gothic Formation of Langenheim (1952) Gray and yellowish-brown siltstone, shale, limestone,
arkose, and quartzite; some conglomerate; lenses of anhydrite and gypsum rare
Belden Formation Dark-gray carbonaceous shale and limestone; a few sand
stone beds; lenses of anhydrite and gypsum rare
Molas Formation Red to black clastic rocks
Mississippian Leadville Limestone
FIGURE 3.-Generalized section of Permian and Pennsylvanian rocks in Elk Mountains and vicinity.
thickness from 1 to 50 feet. We have found no fossils in the Molas. Near Glenwood Springs, however, the upper part of the underlying Leadville contains abundant fossils that date it as of Meramec age, and the lower strata of the Belden overlying the Molas are of Morrow age (Bass and Northrop, 1963), suggesting that the Molas is of Late Mississippian and possibly Early Pennsylvanian age.
Belden Formation
The Belden Formation (Brill, 1944) is recognized throughout the Eagle basin. It consists mainly of interbedded' dark-gray marine carbonaceous shale, and cherty, locally dolomitic, limestone. Near the margins of the basin, local continental and deltaic deposits extend outward from the source areas and intertongue ·with marine deposits. In the Rqedi quadrangle (V. L. Freeman, oral commun., 1967) and in the Aspen 71hminute quadrangle discontinuous lenses of anhydrite and gypsum occur in the Belden.
Studies by Bass and Northrop (1963) and Brill (1958)· indicate that the Belden is of Early and early Middle Pennsylvanian (Morrow and Atoka) age.
Minturn Formation
On the northeast side of the Eagle basin, Tweto ( 1949) defined the Minturn Formation as a section of dominantly gray arkosic grit, shale, conglomerate, sandstone, and quartzite with a few relatively persistent beds of dolomite and limestone exposed between Minturn and Pando. Although the formation as a whole is predominantly gray, many of the rocks are pale shades of pink, green, or yellow; red beds of varied thickness and stratigraphic position occur both in the lower and uppermost parts of the formation. In the type section the upper 1,100 feet of the formation ·consists of red beds (Tweto, 1949, p. 207-209), and red beds are interbedded in the underlying 700 feet. In the lower part of the formation, several hundred feet above the base, is another zone of red beds, several hundred feet thick (Tweto, 1949, p. 194). The base of the Minturn was drawn where quartzites and micaceous quartzites predominate over black shale and limestone of the Belden Formation. The choice of the top of the Minturn is the subject of some confusion. Tweto (1949, p. 149) stated in his abstract, "The Jacque Mountain limestone * * * marks the top of the formation," and on page 204 he stated,"* * *the top of the [Jacque Mountain] limestone marks the top of the Minturn Formation as here defined." Other workers, including Boggs (1966) and Lovering and Mallory (1962), have apparently assumed that the Jacque Mountain Limestone Member or an equivalent horizon must be recognizable to define the top of the Minturn.
However, the Minturn Formation also has been mapped in various parts of the Eagle basin on other criteria, such as the highest limestone in the Pennsylvanian-Permian section or a color change.
The American Commission on Stratigraphic Nomenclature (1961, art. 13) stated, "In defining the boundaries of a unit, it is not sufficient merely to state that the top of the X Formation is the base of the Y Formation; the criteria used in drawing the boundary should be discussed explicitly * * * ." We suggest that the term Minturn be used in the original sense of Tweto, with the Jacque Mountain Limestone Member as the top ; or in areas where the Jacque ~fountain cannot be recognized, but where relations with the type area can be established, other tops should be established and their relation to the section in the type area described.
The term Minturn has been used on the south west side of the Eagle basin, by Dings and Robinson (1957) in the Garfield area-an area where the section is poorly exposed, incomplete, and considerably metamorphosedand by Gaskill and God·win (1966) in the Marble quadrangle. In neither area was the Jacque ~fountain, or an equivalent limestone, recognized at the top of the forma-
.BARTLESON, BRYANT, AND MUTSCHLER C57
tion, nor has any physical connection of these rocks with the Minturn on the northeast side of the basin been demonstrated.
Fauna from the type area of the Minturn indicates a Middle Pennsylvanian age, for at least the lower fivesixths of the formation ( Tweto, 1949, p. 205) .
Gothic Formation of Langenheim (1952)
In the Elk Mountains and the Treasure Mountain dome area we utilize Langenheim's Gothic Formation rather than the term Minturn. Langenheim ( 1952) named the Gothic Formation for exposures of "buff" [various shades of brown and gray] siltstone, and lesser amounts of arkosic sandstone, conglomerate, and limestone which crop out near the town of Gothic. Subsequently, Langenheim (1954) extended the term northward into the Crystal River valley. The base of the Gothic was defined as the base of the lowest sandstone in the section, and the top as the change from dominantly gray and brown beds to dominantly red beds of the overlying Maroon Formation. The use of a color change for the top has apparently led to rejection of the Gothic as a formation by Eagle basin stratigraphers on the basis that similar color changes elsewhere in the basin fluctuate both vertically and horizontally in the section.
In the Elk Mountain region the color change between the lower predominantly gray to brown beds and the uppe~· pred~minantly r~d beds is the only m-appable stratigraphic boundary Ill the strata that lie between the Belden Formation of Pennsylvanian ao-e and the Triassic or Jurassic rocks which unconformably overlie the Per1nian and Pennsylvanian deposits. Although·this color ~hange m·ay be a secondary alteration ('Valker, 1967) It appears to occur at about the same relative stratigraphic position in this very thick section of similar r?~ks and it probably reflects the environment of depoSition. In most ·areas the change is relatively aibrupt, but a northward widening of the transition zone between gray to brown and red strata is apparent subparallel to the depositional strike between Crested Butte and the lower Crystal River valley. A similar broadening of the stratigraphic interval in which the color change occurs is noticeable also in traversing from the basin margin toward the basin center.
The color change does fluctuate both parallel to and normal to the depositional strike. Several hundred feet of vertical shift in the position of this change occurs in the area between Crested Butte and Redstone.
Attempts to trace individual limestone beds in the ~othic Formation . have not been successful over any distance. The lenticular nature and structural interruptions of the limestones on the southwest side of the basin make the1n less useful as formation boundaries than the color change.
Detailed stratigraphic descriptions and measured sections of the Gothic Formation will be presented in a forthcomi~g ~aper by Bartleson; consequently only •a summary IS given here. In the Crested Butte area the Gothic Formation consists of 1,600 to 2,400 feet of brown to gray arkose, conglomerate, and siltstone. Seven fossiliferous marine limestones are present in this section. One of these limestones, ·aibout two-thirds of the way up the section, contains a fusulinid fauna similar to that in the Robinson Limestone Member of the Minturn Formation (George Verville, written commun., 1964). Fauna from a limestone at the top of the Gothic, collected at the head of Rustlers Gulch in the upper plate of the Elk Range thrust fault, resembles the fauna of the White Quail Lin1estone Member of the Minturn Formation (Mackenzie Gordon, Jr., and E. L. Yochels?n, written commun., .1966 ; U.S. Geol. Survey collection 22251-PC). The Robinson and White Quail Limes~one Members are about 1,300 and 900 feet, respectively, below the Jacque Mountain Limestone Member in the type area of the 1\{inturn Formation. Thus Langenheim's ( 1954) suggestion is reasonable· that is if ' . ' rocks equivalent to the Jacque Mountain were deposited on the southwest side of the basin, they would lbe in the lower part of the Maroon Fonnation overlying the Gothic. These limestones can be traced for only a few mil~s owing .to structural complications and apparent fames changes. Fauna of Middle Pennsylvanian (probably middle Atoka) age in limestone samples (U.S. Geol. Survey colin. f-13241 and f-13242) in upper plate thrust slices west of Geneva Lake has been identified by Lloyd G. Henbest (written cmnmun., 1967). It seems probable that the limestone members of the Minturn and the discontinuous limestone beds of the Gothic are pal~ of. separate basin margin facies deposited on opposite sides of the Eagle basin and are replaced by fine clastic rocks and evaporites in the central part of the basin.
The lower contact assigned to the Gothic Formation varies in character depending on its location within the basin. Along the western front of the Elk Mountains it is convenient to use Langenheim's ( 1952) suggested contact between the base of the lowest conspicuous sandstone bed and the beds of dark-gray thin-bedded shale, carbonaceous shale, and limestone of the Belden Formation. This basal sandstone, which is locally a well-sorted quartz sandstone, reaches a thickness of 60-100 feet in the Treasure Mountain area. Toward the center of the basin, no thick basal sandstone is present. In the Hayden Peak and Aspen quadrangles the base of the Gothic is placed where light-gray micaceous siltstone beds predominate over dark-gray shale and limestone beds of the Belden.
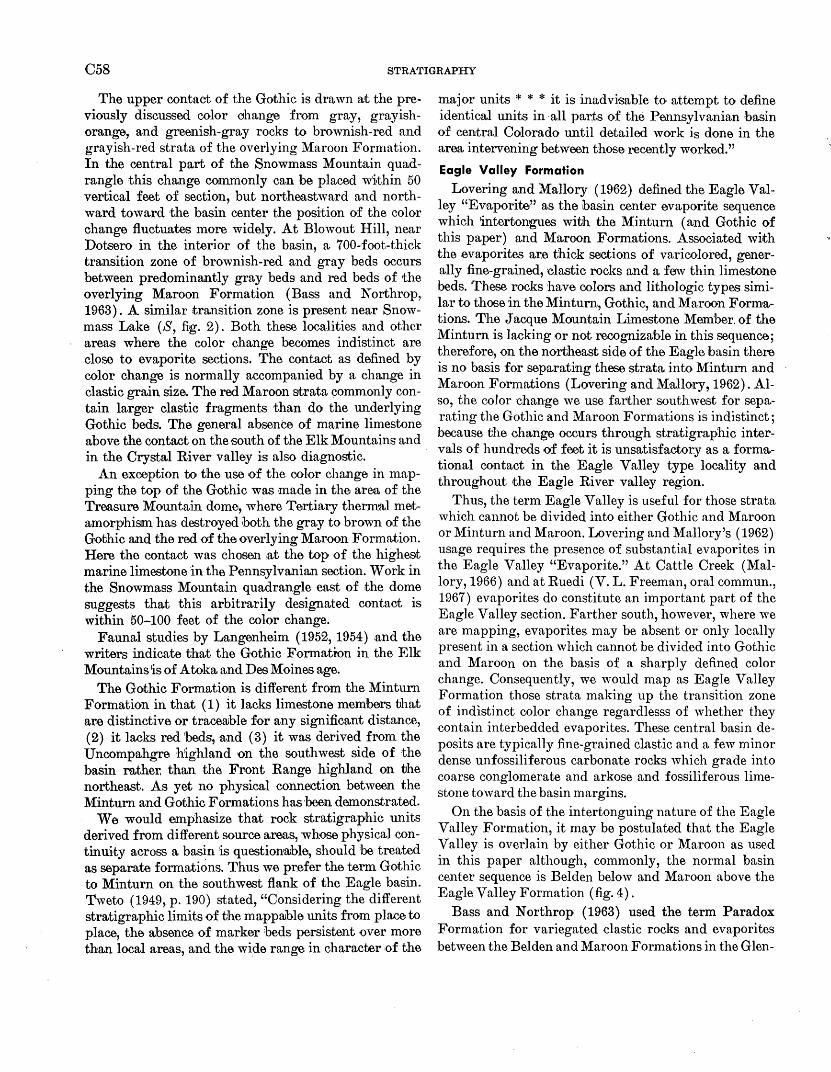
C58 STRATIGRAPHY
The upper contact of the Gothic is drawn at the previously discussed color CJhan~ from gray, grayishorange, and greenish-gray rocks to brownish-red and grayish-red strata of the overlying Maroon Formation. In the central part of the Snowmass Mountain quadrangle this change commonly can be placed wi,thin 50 vertical feet of section, but northeastwa.rd and northward toward the basin center the position of the color change fluctuates more widely. At Blowout Hill, near Dotsero in the interior of the basin, a 700-·foot-thick transition zone of brownish-red and gray beds occurs between predominantly gray beds and red beds of the overlying Maroon Formation (Bass and Northrop, 1963). A similar transition zone is present near Snowmass Lake (S, fig. 2). Both these localities and other areas where the color change becomes indistinct are close to evaporite sections; The contact as defined· by color change is normally accompanied by a change in clastic grain size. The red Maroon strata commonly contain larger clastic fragments than do the underlying Gothic beds. The general absence of marine limestone above the contact on the south of the Elk Mountains and in the Crystal River valley is also diagnostic.
An exception to the use of the color change in mapping the top of the Gothic was made in the area of the Treasure Mountain dome, where Tertiary thermal metamorphism has destroyed both the gray to brown of the Gothic and the red of the overlying Maroon Formation. Here the contact was chosen at the top of the highest marine limestone in the Pennsylvanian section. Work in the Snowmass Mountain quadrangle east of the dome suggests that this arbitrarily designated contaCJt is within 50-100 feet of the color change.
Faunal studies by Langenheim (1952, 1954) .and the writers indicate that the Gothic Formatron in the Elk Mountains 'is of Atoka ~and Des Moines age.
The Gothic Formation is different from the Minturn Formation in that (1) it.lacks limestone members that are distinctive or traceruble for any significant distance, (2) it lacks red 'beds, and (3) it was derived from the Uncompahgre highland on the southwest side of the basin rather: than the Fvont Range highland on the northeast. As yet no physical connection between the Minturn and Gothic Formations has been demonstrated.
We would emphasize that rock stratigraphic units derived from different source areas, whose physical continuity across a basin 1is questionable, should be treated as separate formations. Thus we prefer the term Gothic to Minturn on the southwest flank of the Eagle basin. Tweto (1949, p. 190) stated, "Considering the different stratigraphic limits of the mappruble units from place to place, the absence of marker beds persistent over more than local areas, and the wide range in character of the
major units * * * it is inadvisable to attempt to define identical units in ·all par:ts of the Pennsylvanian !basin of cellJtral Colorado until detailed work is done in the area intervening between those recently worked."
Eagle Valley Formation
Lovering and Mallory (1962) defined the Eagle Valley. "E~aporite" as the basin center evaporite sequence wl~Ich mtertongues with the Minturn (and Gothic of tlus paper) and Maroon Form.ations. Associated with the evaporites are thick sections of varicolored generally fine-grained, clastic rocks and a few thin li~estone beds. These rocks have oolors and lithologic types similar to those in the Minturn., Gothic and Maroon Form•a-. ' tlons. The Jacque MOliDtain Limestone Member. of the
Minturn is lacking or not recognizable in this sequence; therefore, on the northeast side of the Eagle ibasin there is no basis for separating these strata into Minturn and Maroon Formations (Lovering and Mallory, 1962). Also, the color change we use farther southwest for separating the Gothic and Maroon Formations is indistinct· because the change occurs through stratigraphic inter~ v:als of hundre~s of feet it is unsatisfactory as a formational contact In the Eagle Valley type locality and throughout ~the Eagle River valley region.
Thus, the term Eagle Valley is useful for those strata which cannot be divided into either Gothic and Maroon or Minturn. and Maroon. Lovering and Mallory's ( 1962) usage requires the presence of substantial evaporites in the Eagle Valley "Evaporite." At Cattle Creek (Mallory, 1966) and at Ruedi (V. L. Freeman, oral commun., 1967) evaporites do constitute an important part of the Eagle Valley section. Farther south, however, where we are mapping, evaporites may be absent or only locally present in a section which cannot be divided into Gothic and Maroon on the basis of a sharply defined color change. Consequently, we would map as Eagle Valley Formation those strata making up the transition zone of indistinct color change regardlesss of whether they contain interbedded evaporites. These central basin deposits are typically fine-grained clastic and a few minor dense unfossiliferous carbonate rocks which grade into coarse conglomerate and arkose and fossiliferous limestone toward the basin margins.
On the basis of the intertonguing nature of the Eagle Valley Formation, it may be postulated that the Eagle Valley is overlain by either Gothic or Maroon as used in this paper although, commonly, the normal basin center sequence is Belden below and Maroon above the Eagle Valley Formation (fig. 4).
Bass and Northrop ( 1963) used the term Paradox Formation for variegated clastic rocks and evaporites between the Belden and Maroon Formations in the Glen-
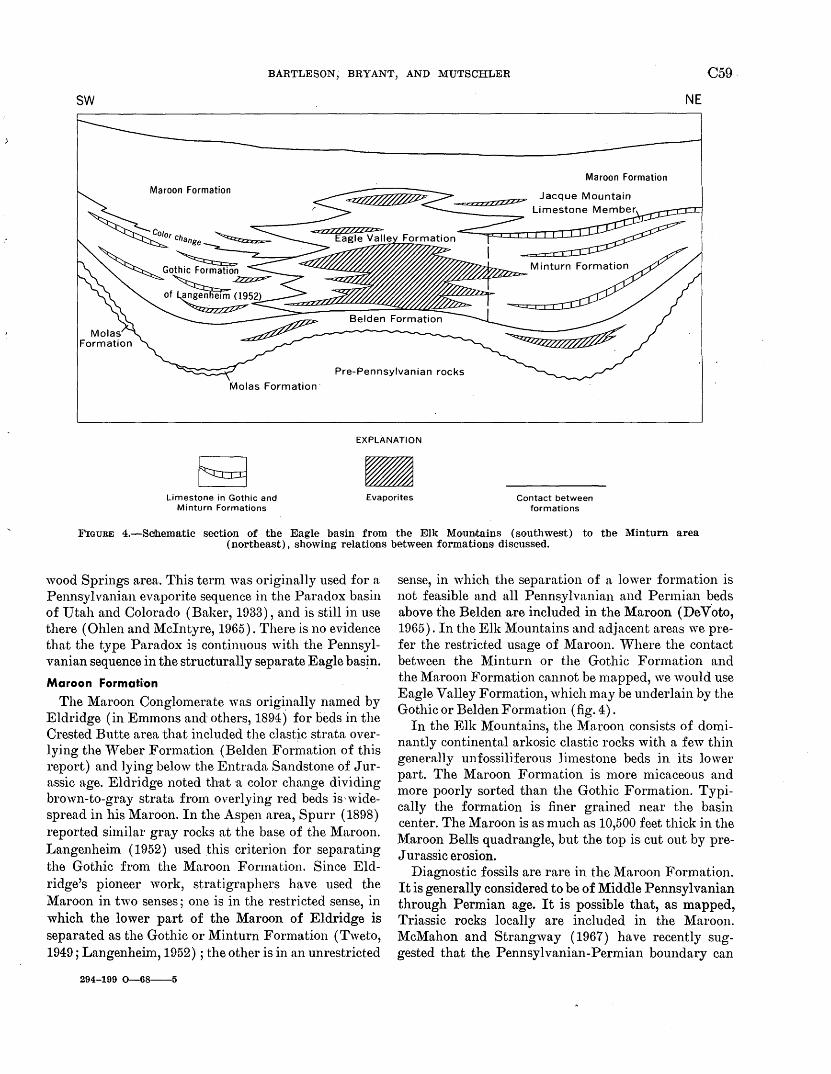
BARTLESON; BRYANT, AND MUTSCHLER C59.
sw NE
Maroon Formation Maroon Formation
Jacque Mountain
Pre-Pennsylvanian rocks
Molas Formation·
EXPLANATION
Limestone in Gothic and Minturn Formations
Evaporites Contact between formations
FIGURE 4.-SC!hematic section of the Eagle basin from the Elk Mountains (southwest) to the Minturn area (northeast), showing relations between formations discussed.
wood Springs area. This term was originally used for a Pennsylvanian evaporite sequence in the Paradox basin of Utah and Colorado (Baker, 1933), and is still in use there ( Ohlen and M:cintyre, 1965). There is no evidence that the type Paradox is continuous with the Pennsylvanian sequence in the structurally separate Eagle bas~n.
Maroon Formation
The Maroon Conglomerate was originally named by Eldridge (in Emmons and· others, 1894 j for beds in the Crested Butte area that included the clastic strata overlying the 'Veber Formation (Belden Formation of this report) and lying below the Entrada Sandstone of J urassic age. Eldridge noted that a color change dividing brown-to-gray strata from overlying red beds is··widespread in his Maroon. In the Aspen area, Spurr ( 1898) reported similar gray rocks at the base of the Maroon. Langenheim ( 1952) used this criterion for separating the Gothic from the Maroon Formation. Since Eldridge's pioneer work, stratigraphers have used the Maroon in two senses; one is in the restricted sense, in which the lower part of the Maroon of Eldridge is separated as the Gothic or Minturn Formation (Tweto, 1949; Langenheim, 1952) ; the other is in an unrestricted
294-199 0-68--5
sense, in which the separation of a lower formation is not feasible and all Pennsylvanian and Permian beds above the Belden are included in the Maroon (DeVoto, 1965). In the Elk Mountains and adjacent areas we prefer the restricted usage of Maroon. 'Vhere the contact between the Minturn or the Gothic Formation and the Maroon Formation cannot be mapped, we would use Eagle Valley Formation, which may be underlain by the Gothic or Belden Formation (fig. 4).
In the Elk Mountains, the Maroon consists of dominantly continental arkosic clastic rocks with a few thin generally unfossiliferous limestone beds in its lower part. The Maroon Formation is n1ore micaceous and more poorly sorted than the Gothic Formation. Typically the formation is finer grained near the basin center. The Maroon is as much as 10,500 feet thick in the Maroon BelliS quadrangle, but the top is cut out by preJurassic erosion.
Diagnostic fossils are rare in the Maroon Formation. It is generally considered to be of Middle Pennsylvanian through Permian age. It is possible that, as mapped, Triassic rocks locally are included in the Maroon. McMahon and Strangway (1967) have recently suggested that the Pennsy I van ian-Permian boundary can
C60 STRATIGRAPHY
be delineated by rock magnetism studies. This technique is being evaluated in the Elk Mountains.
DEPOSITIONAL ENVIR'ONMENTS
Pennsylvanian and Permian rocks in the Elk Mountains were deposited in a basin bounded by highlands on the northeast and southwest sides. The Gothic Formation on the southwest side of the basin represents the analog of the environmental regimes postulated by Boggs (1966) for the Minturn Formation on the northeast side of the basin. In both places a zone of fluvial to high-energy nearshore marine sedimentation occurred along the edge of the basin. Over much of the southwest edge, deposits of this zone have been removed by erosion or they are buried beneath Mesozoic and Cenozoic deposits. The limestone members of the Minturn and the Gothic containing normal marine shallow-water faunas mark offshore zones of open marine sedimentation. Farther toward the center of the basin, the deposits were in shallow and perhaps partly restricted environments. Under these conditions the limestones thinned and were replaced by low-energy clastic sediments, which intertongued with evaporites in the basin center. Here the normal marine fauna also disappeared. The basin may have consisted of marginal linear furrows in which the normal marine sequence collected and a central shallow pan in which the evaporite sequence formed (Boggs, 1966,p. 1419-1420).
The Eagle Valley Formation is recognized as the midbasin equivalent of the Gothic, Minturn, and Maroon Formations. The lateral contacts between these units complexly intertongue and are difficult to define. Evaporite facies occur in the Gothic, Minturn, Maroon, and Eagle Valley Formations and represent restricted conditions of sedimentation produced by tectonic, sedi- · mentary, and hydrodynamic barriers.
The coarse red clastic rocks of the l\{aroon Formation represent intertonguing of subaerial fanglomerates with deltaic, tidal flat; and evaporite pan deposits. The flood of continental clastics eventually choked the Eagle basin, and marine waters were forced northwestward toward the Cordilleran geosyncline.
R"EFERENCES
American Commission on Stratigraphic Nomenclature, 1961, Code of stratigraphic nomenclature: Am. Assoc. Petroleum Geologists Bull., v. 45, p. 645-665.
Baker, A. A., 1933, Geology and oil possibilities of the Moab district, Grand and San Juan Counties, Utah: U.S. Geol. Survey Bull. 841, 95 p.
Bass, N. W., and Northrop, S. A., 1963, Geology of the Glenwood Springs quadrangle and vicinity, northwestern Colorado : U.S. Geol. Survey Bull.l142-J, 74 p.
Boggs, Sam, Jr., 1966, Petrology of Minturn Formation, eastcentral Eagle County, Colorado: Am. Assoc. Petroleum Geologists Bull., v. 50, p. 1399-1422.
Brill, K. G,. Jr., 1944, Late Paleozoic stratigraphy of west-central and northwestern Colorado: Geol. Soc. America Bull., v. 55, p. 621-656.
-- 1958, The Belden formation, in Symposium on Pennsyl-· vanian rocks of Colorado and adjacent areas: Rocky Mtn. Assoc. Geologists, p. 103..:..100.
Bryant, Bruce, 1966, Possible window in the Elk Range thrust sheet near Aspen, Colorado, in Geological Survey Research 1966: U.S. Geol. Survey Prof. Paper 550-D, p. D1-D8.
De Voto, R. H., 1965, Pennsylvanian and Permian stratigraphy of central Colorado: The Mountain Geologist, v. 2, p. 209-228.
Dings, M. G., and Robinson, C. S., 1957, Geology and ore deposits of the Garfield quadrangle, Colorado: U.S. Geol. Survey Prof. Paper 289, 110 p.
Emmons, S. F., Cross, Whitman, and Eldridge, G. H., 1894, Anthracite-Crested Butte folio, Colorado: U.S. Geol. Survey Geol. Atlas, Folio 9, 11 p.
Gaskill, D. L., and Godwin, L. H., 1966, Geologic niap of the Marble quadrangle, Gunnison and Pitkin Counties, Colorado: U.S. Geol. Survey Geol. Quad. Map GQ-512.
Langenheim, R. L., 1952, Pennsylvanian and Permian stratigraphy in the Crested Butte quadrangle, Gunnison County, Colorado : Am. Assoc. Petroleum Geologists Bull., v. 36, p. 543-574.
-- 1954, Correlation of Maroon formation in Crystal River Valley, Gunnison, Pitkin, and Garfield Counties, Colorado: Am. Assoc. Petroleum Geologists Bull., v. 38, p. 1748-1779.
Lovering, T. S., and Mallory, W. W., 1962, The Eagle Valley Evaporite and its relation to the Minturn and Maroon Formations, northwest Colorado: Art. 132 in U.S. Geol. Survey Prof. Paper 450-D, p. D45-D48.
MacMahon, B. E., and Strangway, D. W., 1967, Kiaman magnetic interval in the western United States: Science, v. 155, p. 1012-1013.
Mallory, W. W., 1960, Outline of Pennsylvanian stratigraphy of Colorado, in Rocky Mtn. Assoc. Geologists, Guide to the geology of Colorado: Denver, p. 23-33.
-- 1966, Cattle Creek anticline, a salt diapir near Glenwood Springs, Colorado, in Geoiogical Survey Research 1966: U.S. Geol. Survey Prof. Paper 550-B, p. B12-B15.
Ohlen, H. R., and Mcintyre, L. B., 1965, Stratigraphy and tectonic features of Paradox Basin, Four Corners area : Am. Assoc. Petroleum Geologists Bull., v. 49, p. 2020-2040.
Spurr, J. E., 1898, Geology of the Aspen mining district, Colorado: U.S. Geol. Survey Mon. 31,260 p.
Tweto, Ogden, 1949, Stratigraphy of the Pando area, Eagle County, Colorado: Colorado Sci. Soc. Proc., v. 15, p. 145-235.
·walker, T. R., 1967, Formation of red beds in modern and ancient deserts: Geol. Soc. America Bull., v. 78, p. 353-368.
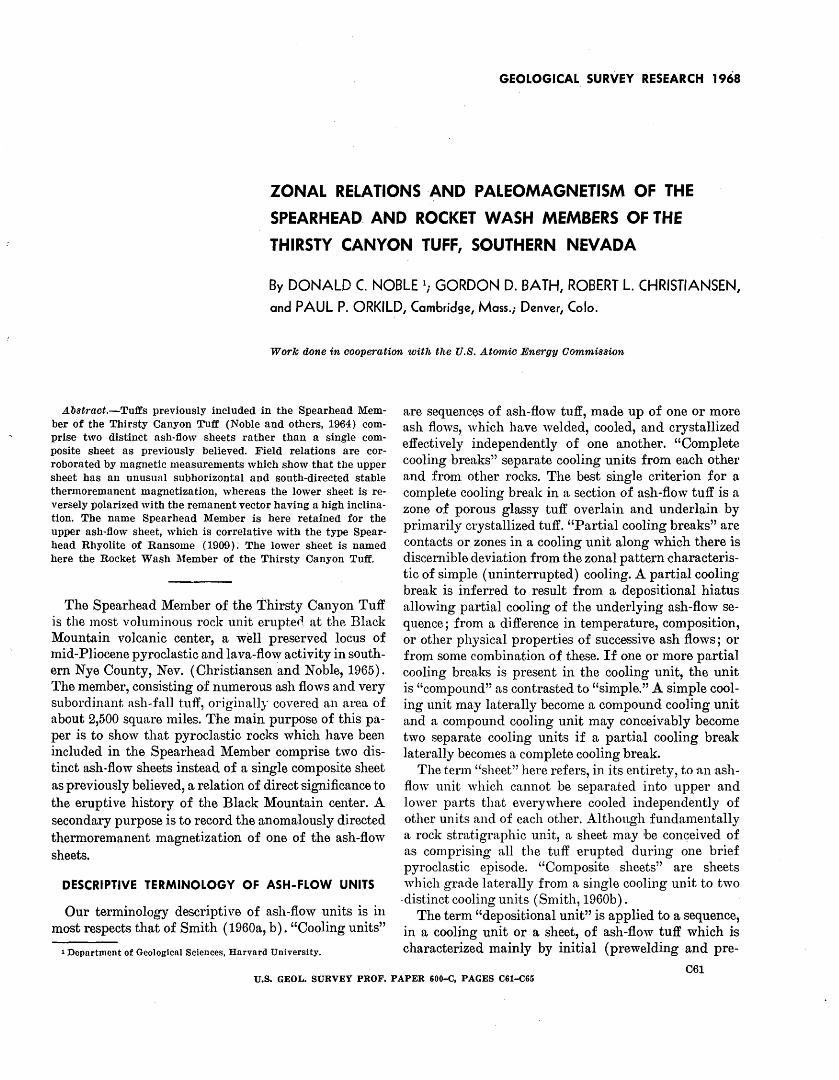
GEOLOGICAL SURVEY RESEARCH 1968
ZONAL RELATIONS AND PALEOMAGNE.TISM OF THE
SPEARHEAD AND ROCKET WASH MEMBERS OF THE
THIRSTY CANYON TUFF, SOUTHERN NEVADA
By DONALD C. NOBLE 1; GORDON D. BATH, ROBERT L. CHRISTIANSEN,
and PAUL P. ORKILD, Cambridge, Mass.; Denver, Colo.
Work done in cooperation with the U.S. Atomic Energy Commission
A.bstraot.-Tuffs previously included in the Spearhead Member of the Thirsty Canyon Tuff (Noble and others, 1964) comprise two distinct ash-flow sheets rather than a single composite sheet as previously believed. Field relations are corroborated by magnetic measurements which show that the upper sheet has an unusual subhorizontal and south-directed stable thermoremanent magnetization, whereas the lower sheet is reversely polarized with the remanent vector having a high inclination. The name Spearhead Member is here retained for the upper ash-flow sheet, which is correlative with the type Spearhead Rhyolite of Ransome ( 1909); The lower sheet is named here the Rocket Wash Member of the Thirsty Canyon Tuff.
The Spearhead Member of the Thirsty Canyon Tuff is the most voluminous rock unit erupte~. at the Black Mountain volcanic center, a well preserved locus of mid-Pliocene pyroclastic and lava-flow activity in southern Nye County, Nev. (Christiansen and Noble, 1965). The member, consisting of numerous ash flows and very subordinant ash-fall tuff, originally covered an area of about 2,500 square miles. The main purpose of this paper is to show that pyroclastic rocks which have been included in the Spearhead Member comprise two distinct ash-flow sheets instead of a single composite sheet as previously believed, a relation of direct significance to the eruptive history of the Black Mountain center. A secondary purpose is to record the anomalously directed thermoremanent magnetization of one of the ash-flow sheets.
DESCRIPTIVE TERMINOLOGY OF ASH-FLOW UNITS
Our terminology descriptive of ash-flow units is in most respects that of Smith ( 1960a, b). "Cooling units"
1 Department of Geological Sciences, Harvard University.
are sequences of ash-flow tuff, made up of one or more ash flows, which have welded, cooled, and crystallized effectively independently of one another. "Complete cooling breaks" separate cooling units from each other and from other rocks. The best single criterion for a complete cooling break in a section of ash-flow tuff is a zone of porous glassy tuff overlain and underlain by primarily crystallized tuff. "Partial cooling breaks" are contacts or zones in a cooling unit along which there is discernible deviation from the zonal pattern characteristic of simple (uninterrupted) cooling. A partial cooling break is inferred to result from a depositional hiatus allowing partial cooling of the underlying ash-flow sequence; :from a difference in temperature, composition, or other physical properties of successive ash flows; or from some combination o:£ these. I:£ one or more partial cooling breaks is present in the cooling unit, the unit is "compound" as contrasted to "simple." A simple cooling unit may laterally become a compound cooling unit and a compound cooling unit may conceivably become two separate cooling units if a partial cooling break laterally becomes a complete cooling break.
The term "sheet" here refers, in its entirety, to an ashflow unit which cannot be separated into upper and lower parts that everywhere cooled independently of other units and of each other. Although :fundamentally a rock stratigraphic unit, a sheet may he conceived of as comprising all the tuff -erupted during one brief pyroclastic episode. "Composite sheets" are sheets which grade laterally :from a single cooling unit to two -distinct cooling units (Smith, 1960b).
The term "depositional unit" is applied to a sequence, in a cooling unit or a sheet, of ash-flow tuff which is characterized mainly by initial (prewelding and pre-
061 U.S. GEOL. SURVEY PROF. PAPER 600-C, PAGES C61-C65
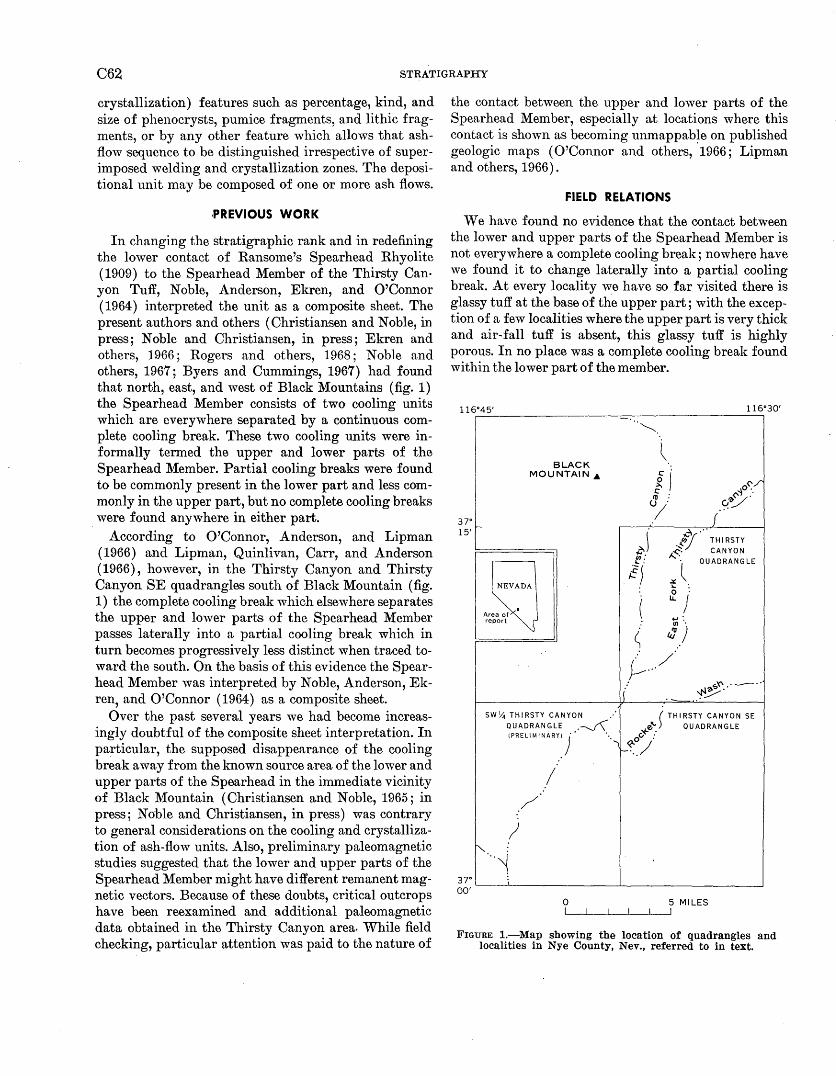
C62 STRATIGRAPHY
crystallization) features such as percentage, kind, and size of phenocrysts, pumice fragments, and lithic fragments, or by any other feature which allows that ashflow sequence to be distinguished irrespective of superimposed welding and crystallization zones. The depositional unit may be composed of one or more ash flows.
·PREVIOUS WORK
In changing the stratigraphic rank and in redefining the lower contact of Ransome's Spearhead Rhyolite (1909) to the Spearhead Member of the Thirsty Can· yon Tuff, Noble, Anderson, Ekren, and O'Connor (1964) interpreted the unit as a composite sheet. The present authors and others (Christiansen and Noble, in press; Noble and Christiansen, in press ; Ekren and others, 1966; Rogers and others, 1968; Noble and others, 1967; Byers and Cummings, 1967) had found that north, east, and west of Black Mountains (fig. 1) the Spearhead Member consists of two cooling units which are everywhere separated by a continuous complete cooling break. These two cooling units were informally termed the upper and lower parts of the Spearhead l\1ember. Partial cooling breaks were found to be commonly present in the lower part and less commonly in the upper part, but no complete cooling breaks
. were found anywhere in either part. According to O'Connor, Anderson, and Lipman
(1966) and Lipman, Quinlivan, Carr, and Anderson (1966), however, in the Thirsty Canyon and Thirsty Canyon SE quadrangles south of Black Mountain (fig. 1) the complete cooling break which elsewhere separates the upper and lower parts of the Spearhead Member passes laterally into a partial cooling break which in turn becomes progressively less distinct when traced toward the south. On the basis of this evidence the Spearhead Member was interpreted by Noble, Anderson, Ekren, and O'Connor (1964) as a composite sheet.
Over the past several years we had become increasingly doubtful of the composite sheet interpretation. In particular, the supposed disappearance of the cooling break away from the known source area of the lower and upper parts of the Spearhead in the immediate vicinity of Black Mountain (Christiansen and Noble, 1965; in press; Noble and Christiansen, in press) was contrary to general considerations on the cooling and crystallization of ash-flow units. Also, preliminary paleomagnetic studies suggested that the lower and upper parts of the Spearhead Member might have different remanent magnetic vectors. Because of these doubts, critical outcrops have been reexamined and additional paleomagnetic data obtained in the Thirsty Canyon area. While field checking, particular attention was paid to the nature .of
the contact between the upper and lower parts of the Spearhead Member, especially at locations where this contact is shown as becoming unmappable on published geologic maps (O'Connor and others, , 1966; Lipman and others, 1966).
FIELD RELATIONS
We have found no evidence that the contact between the lower and upper parts of the Spearhead Member is not everywhere a complete cooling break; nowhere have we found it to change laterally into a partial cooling break. At every locality we have so far visited there is glassy tuff at the base of the upper part; with the exception of a few localities where the upper part is very thick and air-fall tuff is absent, this glassy tuff is highly porous. In no place was a complete cooling break found within the lower part of the member.
116°45' 116°30'
37" e-. 15'
BLACK MOUNTAIN_.
MlNEVADA \
.~~~~
.. ~
c I. ~ ~:
(J .
I ~ .··
.~tif THIRSTY ~· CANYON
: .( QUADRANGLE
... : 0 .
IJ_ )
.... :
~ U)•
~)
. / )--···
... ,~'<>'(\ .. ·--·· ~~ ·-
SWY.t THIRSTY CANYON .: (THIRSTY CANYON SE QUADRANGLE .-.......(\ ew...) QUADRANGLE (PRELIMINARY!).. •• • .._, O~ .:
/
)
I ~'f../
""""· : ··~
37" 00'~--~------------~----------------~
0 5 MILES
FIGURE 1.-Map showing the location of quadrangles and localities in Nye County, Nev., referred to in text.
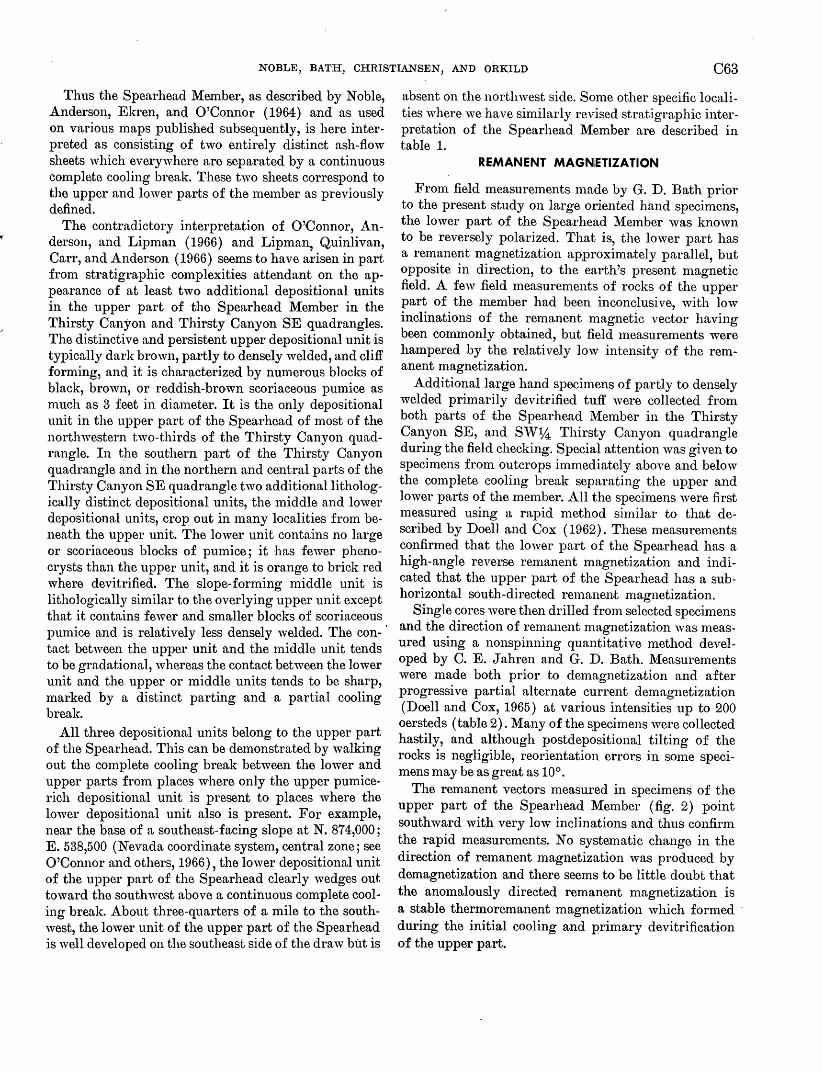
NOBLE, BATH, CHRISTIANSEN, AND ORKILD C63
Thus the Spearhead Member, as described by Noble, Anderson, Ekren, and O'Connor (1964) and as used on various maps published subsequently, is here interpreted as consisting of two entirely distinct ash-flow sheets which everywhere are separated by a continuous complete cooling break. These two sheets correspond to the upper and lower parts of the me1nber as previously defined.
The contradictory interpretation of O'Connor, Anderson, and Lip1nan (1966) and Lipman, Quinlivan, Carr, and Anderson (1966) seems to have arisen in part from stratigraphic complexities attendant on the appearance of at least two additional depositional units in the upper part of the Spearhead Member in the Thirsty Canyon and Thirsty Canyon SE quadrangles. The distinctive and persistent upper depositional unit ·is typically dark brown, partly to densely welded, and cliff forming, and it is characterized by numerous blocks of black, brown, or reddish-brown scoriaceous pumice as much as 3 feet in diameter. It is the only depositional unit in the upper part of the Spearhead of most of the northwestern two-thirds of the Thirsty Canyon quadrangle. In t.he southern part of the Thirsty Canyon quadrangle and in the northern and central parts of the Thirsty Canyon SE quadrangle two additional lithologically distinct depositional units, the middle and lower depositional units, crop out in many localities from beneath the upper unit. The lower unit contains no large or scoriaceous blocks of pumice; it has fewer phenocrysts than the upper unit, and it is orange to brick red where devitrified. The slope-forming middle unit is lithologically similar to the overlying upper unit except that it contains fewer and smaller blocks of scoriaceous pumice and is relatively less densely welded. The con-· tact between the upper unit and the middle unit tends to be gradational, whereas the contact between the lower unit and the upper or middle units tends to be sharp, marked by a distinct parting and a partial cooling break.
All three depositional units belong to the upper part of the Spearhead. This can be demonstrated by walking out the complete cooling break between the lower and upper parts frmn places where only the upper pumicerich depositional unit is present to places where the lower depositional unit also is present. For example, near the base of a southeast-facing slope at N. 874,000; E. 538,500 (Nevada coordinate system, central zone; see O'Connor and others, 1966), the lower depositional unit of the upper part of the Spearhead clearly wedges out toward the southwest above a continuous com·plete cool~ ing break. About three-quarters of a mile to the southwest, the lower unit of the upper part of the Spearhead is well developed on the southeast side of the draw but is
absent on the nortlnvest side. Some other specific localities \vhere we have similarly revised stratio-raphic inter-
• b
pretatwn of the Spearhead Member are described in table 1.
REMANENT MAGNETIZATION
From field measurements n1ade by G. D. Bath prior to the present study on large oriented hand specimens, the lower part of the Spearhead ~{ember was known to be reversely polarized. That is, the lower part has a remanent magnetization approximately parallel but opposite in direction, to the earth's present mag~etic field. A few field measurements of rocks of the upper part of the member had been inconclusive with low inclinations of the remanent magnetic vec~or having been commonly obtained, but field measurements were hampered by the relatively low intensity of the remanent magnetization.
Additional large hand specimens of partly to densely welded primarily devitrified tuff were collected from both parts of the Spearhead Member in the Thirsty Canyon SE, and SW%, Thirsty Canyon quadrangle duri~1g the field checking. Special attention was given to speCimens from outcrops immediately above and below the complete cooling break separating the up,per and lower parts of the me1nber. All the specimens were first measured using a rapid method si1nilar to that described by Doell and Cox ( 1962). These measurements c~nfirmed that the lower part of the Spearhead has a h1gh-angle reverse remanent magnetization and indicated that the upper part of the Spearhead has a subhorizontal south-directed remanent magnetization.
Single cores were then drilled from selected specimens and the direction of remanent magnetization was measured using a nonspinning quantitative method developed by C. E. J ahren and G. D. Bath. Measurements were made both prior to demagnetization and after progressive partial alternate current demagnetization (Doell and Cox, 1965) at various intensities up to 200 oersteds (table 2) . Many of the specimens were collected hastily, and although postdepositional tiltino- of the rocks is negligible, reorientation errors in sm~e specimens may be as great as 10°.
The remanent vectors measured in specimens of the upper part of the Spearhead Member (fig. 2) point southward with very low inclinations and thus confirm the rapid measurements. No systematic chano-e in the direction of remanent magnetization was produced by demagnetization and there seems to be little doubt that the anomalously directed remanent magnetization is a stable thermoremanent magnetization which formed · during the initial cooling and primary devitrification of the upper part.
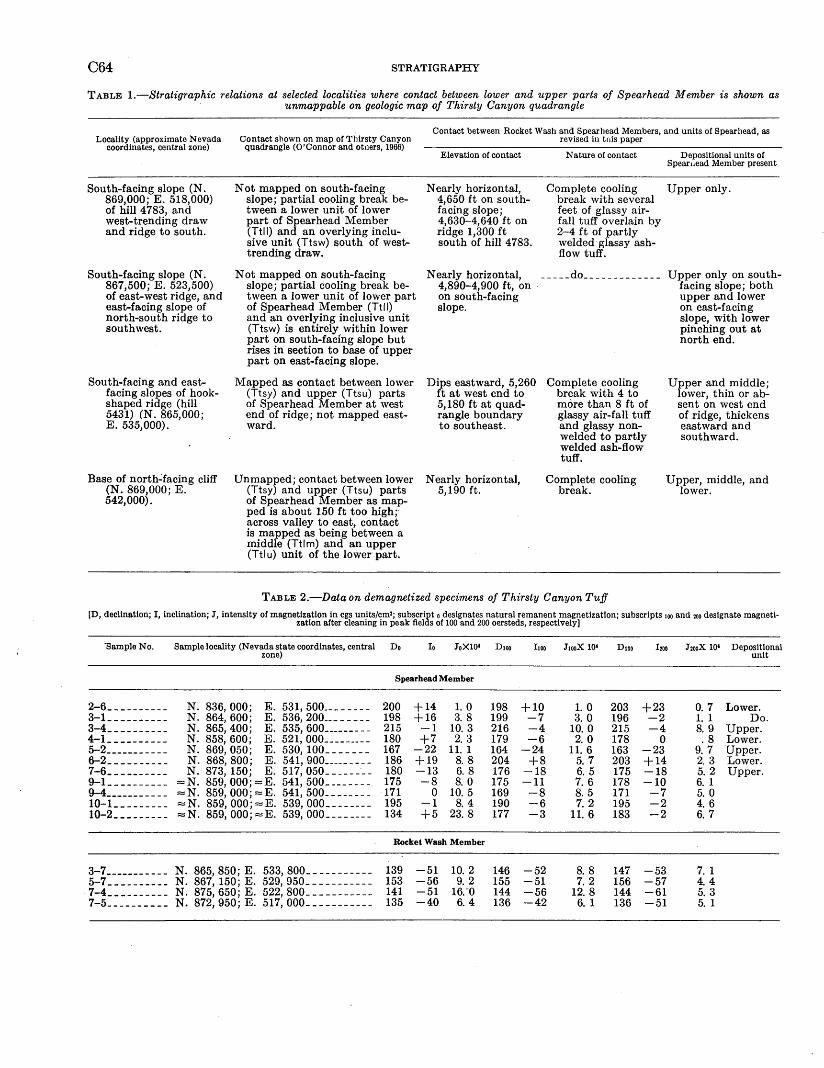
C64 STRATIGRAPHY
TABLE !.-Stratigraphic relations at selected localities where contact between lower and upper parts of Spearhead Member is shown as unmappable on geologic map of Thirsty Canyon quadrangle
Locality (approximate Nevada Contact shown on map of Thirsty Canyon coordinates, central zone) quadrangle (O'Connor and ot11ers, 1966)
Contact between Rocket Wash and Spearhead Members, and units of Spearhead, as revised in tnis paper
South-facing slope (N. 869,000; E. 518,000) of hill 4783, and west-trending draw and ridge to south.
South-facing slope (N. 867,500; E. 523,500) of east-west ridge, and east-facing slope of north-south ridge to southwest.
South-facing and eastfacing slopes of hookshaped ridge (hill 5431) (N. 865,000; E. 535,000).
Not mapped on south-facing slope; partial cooling break between a lower unit of lower part of Spearhead Member (Ttl I) and an overlying inclusive unit (Ttsw) south of westtrending draw.
Not mapped on south-facing slope; partial cooling break between a lower unit of lower part of Spearhead Member (Ttll) and an overlying inclusive unit (Ttsw) is entirely within lower part on south-facing slope but rises in section to base of upper part on east-facing slope.
Mapped as contact between lower (Ttsy) and upper (Ttsu) parts of Spearhead Member at west end of ridge; not mapped eastward.
Elevation of contact
Nearly horizontal, 4,650 ft on southfacing slope; 4,630-4,640 ft on ridge 1,300 ft south of hill 4 783.
Nearly horizontal, 4,89Q-4,900 ft, on on south-facing slope.
Dips eastward, 5,260 ft at west end to 5,180 ft at quadrangle boundary to southeast.
Nature of contact
Complete cooling break with several feet of glassy airfall tuff overlain by 2-4 ft of partly welded· glassy ashflow tuff.
_____ do ____________ _
Complete cooling break with 4 to more than 8 ft of glassy air-fall tuff and glassy nonwelded to partly welded ash-flow tuff.
Depositional units of Speart.ead Member present
Upper only.
Upper only on southfacing slope; both upper and lower on east-facing slope, with lower pinching out at north end.
Upper and middle; lower, thin or absent on west end of ridge, thickens eastward and southward.
Base of north..:facing cliff (N. 869~000; E. 542,000).
Unmapped; contact between lower (Ttsy) and upper (Ttsu) parts of Spearhead Member as mapped is about 150ft too high; across valley to east, contact
Nearly horizontal, 5,190 ft.
Complete cooling break.
Upper, middle, and lower.
is mapped as being between a middle (Ttlm) and an upper (Ttlu) unit of the lower part.
TABLE 2.-Data on demagnetized specimens of Thirsty Canyon Tuff
[D, declination; I, inclination; J, intensity of magnetization in cgs units/cma; subscript o designates natural remanent magnetization; subscripts 1oo and 200 designate magnetization after cleaning in peak fields or 100 and 200 oersteds, respectively]
"Sample No. Sample locality (Nevada state coordinates, central Do Io JoX104 D1oo zone)
Spearhead Member
2-6 __________ N. 836,000; E. 531, 500 ________ 200 +14 1.0 198 3-1 __________ N. 864,600; E. 536, 200 ___ ----- 198 +16 3. 8 199 3-4 __________ N. 865,400; E. 535, 600 _________ 215 -1 10. 3 216 4-1 __________ N. 858, 600; E. 521, ooo _________ 180 +7 2. 3 179 5-2 ___________ N. 869,050; E. 530, 100 _______ 167 -22 11. 1 164 6-2 __________ N. 868,800; E. 541, 900 _________ 186 +19 8. 8 204 7-6 __________ N. 873, 150; E. 517, 050- ------- 180 -13 6. 8 176 9-1 __________ =N. 859, 000; =E. 541,500-------- 175 -8 8. 0 175 9-4 ___________
=N. 859, 000; =E. 541, 500 ________ 171 0 10. 5 169 10-L _------- =N. 859, 000; =E. 539,000 ________ 195 -1 8. 4 190 10-2 _________ =N. 859, 000; =E. 539, ooo ________ 134 +5 23. 8 177
Rocket Wash Member
3-7 ___________ N. 865,850 E. 533,800 ___________ 139 -51 10. 2 146 5-7 __________ N. 867, 150 E. 529, 950 ___________ 153 -56 9. 2 155 . 7-4 __________ N. 875,650 E. 522, 800 ___________ 141 -51 16.-o 144 7-5 __________ N. 872,950 E. 517, ooo ___________ 135 -40 6. 4 136
l1oo J1ooX 104 D2oo l2oo J2ooX 104 Depositional
+10 -7 -4 -6
-24 +8
-18 -11 -8 -6 -3
-52 -51 -56 -42
1.0 3. 0
10. 0 2. 0
11. 6 5. 7 6. 5 7. 6 8. 5 7. 2
11. 6
8. 8 7. 2
12. 8 6. 1
203 +23 196 -2 215 -4 178 0 163 -23 203 +14 175 -18 178 -10 171 -7 195 -2 183 -2
147 -53 156 -57 144 -61 136 -51
0. 7 1. 1 8. 9 .8
9. 7 2. 3 5. 2 6. 1 5. 0 4. 6 6. 7
7. 1 4. 4 5. 3 5. 1
unit
Lower. Do.
Upper. Lower. Upper. Lower. Upper.
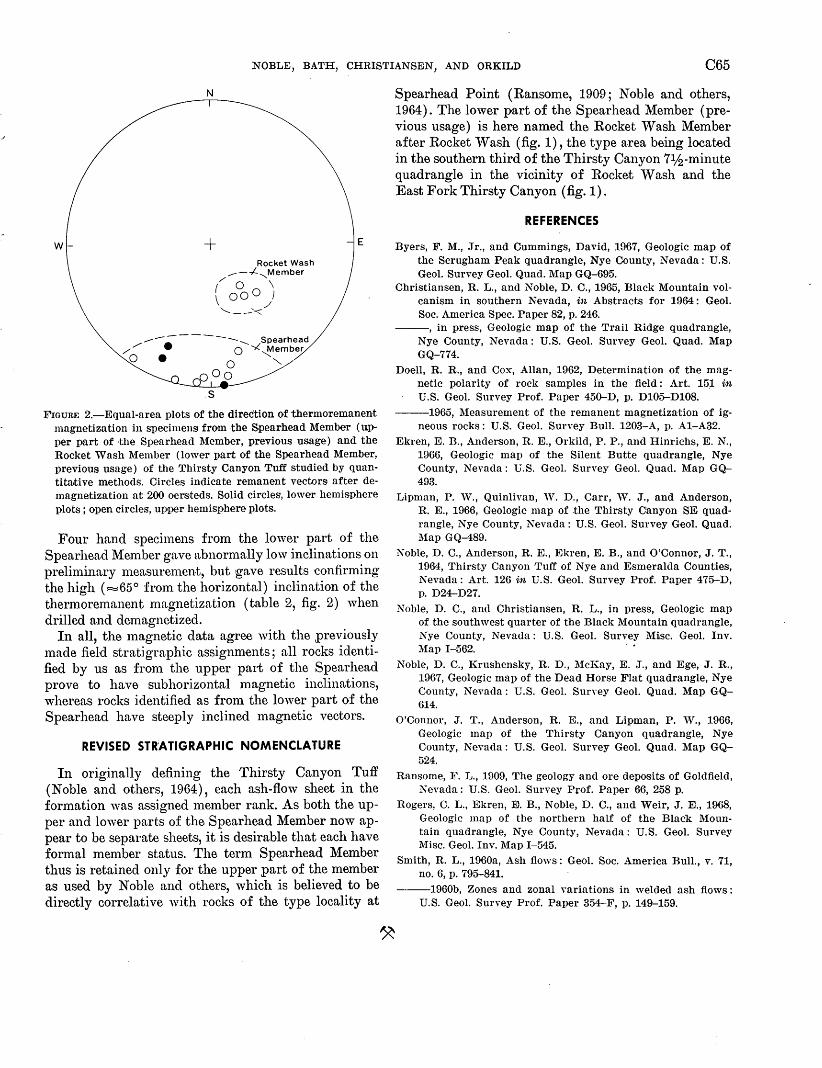
NOBLE, BATH, CHRISTIANSEN, AND ORKILD C65
w
N
+ Rocket Wash
.....--+-......_Member / 0 \ ( ooo)
........_- --'<
.....--------...__ Spearhead / • 0 -.,<,Member
/0 • " 0 "-... 0 oo .S
E
FIGURE 2.-Equal-area plots of the direction o·f thermoremanent magnetization in specimens from the S.pearhead Member (upper part of othe Spearhead Member, previous usage) and the Rocket ·wash Member (lower part o·f the Spearhead Member, previous usage) of the Thirsty Canyon Tuff studied by quantitative methods. Circles indicate remanent vectors after demagnetization at 200 oer.steds. Solid circles, lower hemisphere plots ; open circles, upper hemisphere plots.
Four hand specimens from the lower part of the Spearhead ~1ember gave abnormally low inclinations on preliminary 1neasuren1ent, but gave results ·confirming the high ( =65° from the horizontal) inclination of the thermoremanent magnetization (table 2, fig. 2) when drilled and demagnetized.
In all, the magnetic data agree with the ,previously made field stratigraphic assignments; all rocks identified by us as from the upper part of the Spearhead prove to have subhorizontal magnetic inclinations, whereas rocks identified as fron1 the lower part of the Spearhead have steeply inclined magnetic vectors.
REVISED STR'ATIGRAPHIC NOMENCLATURE
In originally defining the Thirsty Canyon Tuff (Noble and others, 1964), each ash-flow sheet in the formation was assigned member rank. As both the upper and lower parts of the Spearhead Member now appear to be separate sheets, it is desirable that each have formal member status. The term Spearhead Member thus is retained only for the upper part of the member as used by Noble and others, which is believed to be directly correlative with rocks of the type locality at
Spearhead Point (Ransome, 1909; Noble and others, 1964). The lower part of the Spearhead Member (previous usage) is here named the Rocket Wash Member after Rocket Wash (fig. 1) , the type area being located in the southern third of the Thirsty Canyon 71h-minute quadrangle in the vicinity of Rocket Wash and the East Fork Thirsty Canyon (fig. 1).
REFERENCES
Byers, F. M., Jr., and Cummings, David, 1967, Geologic map of the Scrugham Peak quadrangle, Nye County, Nevada: U.S. Geol. Survey Geol. Quad. Map GQ-695.
Christiansen, R. L., and Noble, D. C., 1965, Black Mountain volcanism in southern Nevada, in Abstracts for 1964: Geol. Soc. America Spec. Paper 82, p. 246.
--, in press, Geologic map of the Trail Ridge quadrangle, Nye County, Nevada: U.S. Geol. Survey Geol. Quad. Map GQ-774.
Doell, R. R., and Cox, Allan, 1962, Determination of the magnetic polarity of rock samples in the field: Art. 15.1 in U.S. Geol. Survey Prof. Paper 450-D, p. D105-D108.
--1965, Measurement of the remanent magnetization of igneous rocks: U.S. Geol. Survey Bull. 1203-A, p. A1-A32.
Ekren, E. B., Anderson, R. E., Orkild, P. P., and Hinrichs, E. N., 1966, Geologic map of the Silent Butte quadrangle, Nye County, Nevada: u.S. Geol. Survey Geol. Quad. Map GQ-493.
I.Jipman, P. ,V., Quinlivan, "'· D., Carr, ,V. J., and Anderson, R. E., 1966, Geologic map of the Thirsty Canyon SE quadrangle, Nye County, Nevada: U.S. Geol. Survey Geol. Quad. Map GQ-489.
Noble, D. C., Anderson, R. E., }1Jkren, E. B., and O'Connor, J. T., 1964, Thirsty Canyon Tuff of Nye and Esmeralda Counties, Nevada: Art. 126 in U.S. Geol. Survey Prof. Paper 475-D, p. D24-D27.
Noble, D. C., and Christiansen, R. L., in press, Geologic map of the southwest quarter of the Black Mountain quadrangle, Nye County, Nevada: U.S. Geol. Survey MLsc. Geol. Inv. Map I-562.
Noble, D. C., Krushensky, R. D., McKay, E. J., and Ege, J. R., 1967, Geologic map of the Dead Horse Flat quadrangle, Nye County, Nevada: U.S. Geol. Suney Geol. Quad. Map GQ-614.
O'Connor, J. T., Anderson, R. E., and Lipman, P. ,V., 1966, Geologic map of the Thirsty Canyon quadrangle, Nye County, Nevada: U.S. Geol. Survey Geol. Quad. Map GQ-524.
Ransome, 1!'. L., 1909, 'l'he geology and ore deposits of Goldfield, Nevada: U.S. Geol. Survey Pl'of. Paper 66, 258 p.
Rogers, C. L., Ekren, E. B., Noble, D. C., and Weir, J. E., 1968, Geologic map of the northern half of the Black Mountain quadrangle, Nye County, Nevada: U.S. Geol. Survey Misc. Geol. Inv. Map I-545.
Smith, R. L., 1960a, Ash flows : Geol. Soc. America Bull., v. 71, no. 6, p. 795-841.
--1960b, Zones and zonal variations in welded ash flows: U.S. Geol. Survey Prof. Paper 354-F, p. 149-159.
GEOLOGICAL SURVEY RESEARCH 1968
COI·NCIDENCE OF FOSSIL AND LITHOLOGIC ZONES IN THE LOWER PART
OF UPPER CRETACEOUS MANCOS SHALE, SLICK ROCK DISTRICT, COLORADO
By DANIEL R. SHA WE, Denver, Colo.
Work done in cooperation with the U.S. A.tomic Energy Commission
Abstract.-Fossil zones comprising widespread faunas in the lower part of the Upper Cretaceous Mancos Shale coincide with lithologic zones distinguished by variations in amounts of bentonitic shale layers, calcite, and pyrite, and by variations in amounts of trace elements in the pyrite. The lithologic differ-
. ences reflect local environmental differences that most paleontologists consider should not have influenced distribution of the contained faunas.
Study of a drill core of Mancos Shale of Late Cretaceous age from Disappointment Valley, Slick Rock district, San Miguel County, Colo., shows that fossil zones coincide with !ithologic zones that are distinguished by variations in amounts of bentonitic shale layers, calcite, and pyrite, and by variations in amounts of trace elements in pyrite. This article is not intended to explain this coincidence, but rather to call attention to the fact that here several widespread faunas appear only in particular lithologic units that reflect unique local environmental conditions.
A core was collected from diamond drill hole DVR-1, which penetrated the lower 855 feet of the Mancos Shale during exploration for uranium-vanadium deposits by the U.S. Geological Survey in 1956. The drill core is a fossiliferous, complete section of this stratigraphic interval in the Mancos and provides an unusual opportunity to study in detail and at one place the relations of fossils and lithology through a period of sedimentation that included several changes in depositional environment.
The Mancos Shale is a dark-gray carbonaceous marine shale that was deposited in a somewhat restricted seaway. The lower part of the Mancos in the Slick Rock district abounds in macrofossils, notably several species of cephalopods and pelecypods, and fish debris, particularly scales and bones. Carbonaceous shale contains many interbedded thin layers of lightgreenish-gray bentonitic shale that originated as vol-
066
canic ash. Calcite and pyrite vary in abundance in different stratigraphic parts of the Mancos.
The core was logged by the author; mineral and rock samples were analyzed chemically and spectrographically in Geological Survey laboratories. lVIacrofossils were collected by splitting beds at %- to %-inch intervals; all recognizable fossils thus found throughout the core were colle~ted. The late J. B. Reeside, Jr., of the Geological Survey, identified more than 420 fossils encon1passing about 26 species that were recovered from the core. Calcium carbonate content of nine rock samples was determined by N. L. Archbold, of the Survey, usjng his method to estimate calcite content of drill cores (Archbold, 1959). Pyrite was separ.ated from 12 rock samples by R. G. Coleman, of the Survey (method described by Coleman and Delevaux, 1957, p. 501), and submitted for semiquantitative spectrographic analyses by Joseph Haffty, of the Survey, and for colorimetric determination of selenium by Maryse Delevaux, of the .Survey. The results of all this work .are summarized in figure 1.
Reeside's fossil identifications establish four fossil zones which from the base of the J\{ancos upward indicate the respective equivalents of the upper 1niddle part of the Greenhorn Limestone, lower and upper parts of the Carlile Shale, and upper part of the Niobrara Formation of the Great Plains (Reeside, 1963). Reeside used 13 guide fossils (ranges shown in fig. 1) : 9 cephalopods (free-floating forms), and 4 pelecypods (bottomdwelling types) , to establish the zones. The index fossils for the four zones (keyed by number to fig. 1) are: upper middle part of the Greenhorn, Gryphaea 1W'Lvberryi Stanton (1); lower part of Carlile, Oollignoniceras 1.ooollgari (Mantell) (2), Oollignoniceras hyatti (Stanton) ( 3) ; upper part of Carlile, I nocera1nus fragilis Hall and Meek ( 4), I noceram'lt8 dimidius White ( 5) , Prionocyclus nwcombi Meek ( 6), Prionocyclus wyo-
U.S. GEOL. SURVEY PROF. PAPER 600-C, PAGES C66-C68
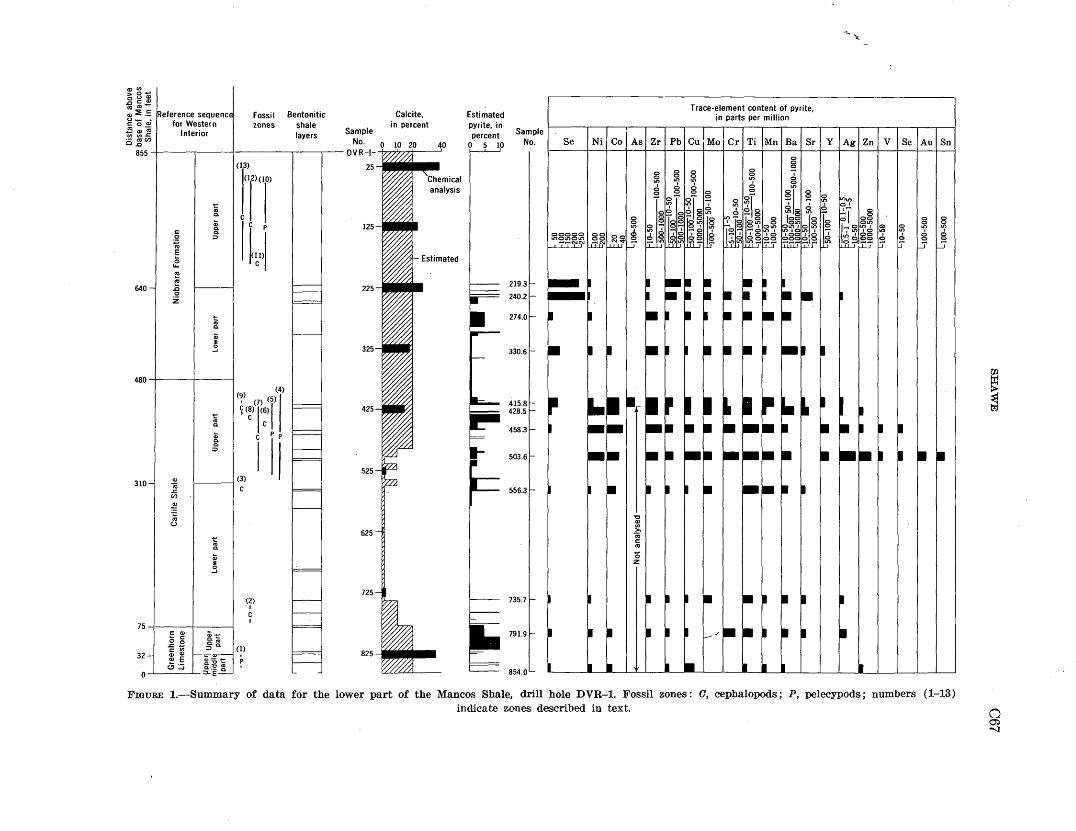
~sQ; ~~2 ~ :: -~ reference sequenc, Fossil ~ o ~ for Western zones -:;; :Jl ~ Interior ·- "'en O.c
855 I I
o13>
! ),rr
"'
IL~ c
Q. Q.
0 ::J :;:;
"' E 0
LL..
"' 640-l
~ .c 0 z
I "' Q.
"' ~
480 I I (4)
,~, (7) "'I ~ ~(~) r:)l ., I , .. Q. Q.
I (3) I II ::J
310--l Q) I
~ en
~ u
I ~ "' ~
I (2)
I
c I
75 c Q) gt:: .... c 0 0
g~(l) ~-c "' 32- Q) Q) =- I
~ .§ ~~ '5 p c.!1....J ~:e c. 0
Bentonitic shale layers Sample
No.
Calcite, in percent
DVR~l; t~r ..,, t
125 ___ _
225 ltttt%1
325
425
525
625"-tl
i 725
825 [((('('. )))))
Estimated pyrite, in percent . 5
I
Sample No.
I I
I I
Se
Trace-element content of pyrite, in parts per million
""
Ni I Co I A~ I Zr I Pb I CuI Mo i Cr I Ti IMn I Ba I SrI Y I Ag I Zn I V I Sc I Au I Sn
0
~ ~
5? 2
0 10 0 0
'? '1 0 0
~ ~
"C Q)
I I I~ c
"' 0 z
I I II
FIGURE 1.-Summary of data for the lower part of the Mancos Shale, drill hole DVR-1. Fossil zones: 0, cephalopods; P, pelecypods; numbers (1-13) indicate zones described in text.
rJ1
~ t:=.l
() ~ -...:r
C68 STRATIGRAPHY
1ningensis Meek (7), Scaphites ferronensis Cobban (8), Scaphites 1-ohitjieldi Cobban (9); upper part of the Niobrara, Inocermnus stantoni Sokolow (10), Phlycticrioceras oregonense R.eeside ( 11), B aculites asper Morton ( 12) , B aculites codyensis Reeside ( 13). Reeside noted that no distinctive fossils were present in the stratigraphic intervals in which fossils of the age of the upper part of the Greenhorn and the lower part of the Niobrara would be expected. He suggested the probable equivalence of these intervals with those zones of the Greenhorn and Niobrara, however (R.eeside, 1963).
Several of the forms listed above have ·world wide distribution in Upper Cretaceous strata.
Changes in the lithologic and mineralogic character of the lower part of the Mancos occur at or near the boundaries between fossil zones (zone boundaries shown were established by Reeside, 1963). Light-greenish-gray bentonitic shale layers that originated as volcanic ash are common in the lower part of the section but are absent from the topmost zone, or upper part of the Niobrara. Calcite is abundant in all the fossil zones except the lower part of the Oarlile, from which it is nearly absent except near the top and bottom of that zone. Pyrite is common in the Greenhorn, the upper part of the Carlile, and the lower part of the Niobrara; it is especially abundant in the upper part of the Greenhorn. Pyrite is absent from the lower part of the Carlile, except near the top ~and bottom, and from the upper part of the Niobrara.
Trace elements in pyrite vary, in both number and amount, in different fossil zones. Between 9 and 12 trace elements were detected in relatively small amounts in pyrite fro~n the upper middle and the upper parts of the Greenhorn, and the lower part of the Carlile. From 14 to 17 elements were found in pyrite samples from the upper part of the Carlile, and in generally larger amounts than in pyrite from the the three lowest fos8il zones. Between 9 and 13 elements, generally the same ones as in pyrite from the three lowest fossil zones, were detected in pyrite from the lower part of the Niobrara, but in generally greater amounts than in that from the three lowest fossil zones. Some of the elements detected, such as zirconium, chromium, titanium, barium, and strontium, are probably present in other heavy minerals that were not separated from pyrite, and do not reflect the chemical character of the pyrite.
Lithologic characteristics of the six zones defined on the basis of fossils in the lower part of the Mancos Shale can be summarized as follows: The highly fossiliferous (only one species abundant) upper-middle part of the
Greenhorn contains bentonitic shale layers, abundant calcite throughout, and pyrite in a few layers. This pyrite contains minor amounts of a few trace metals. The sparsely fossiliferous upper part of the Greenhorn contains bentonitic shale layers, abundant calcite throughout, and abundant pyrite throughout; this pyrite, too, contains minor amounts of a few trace metals. The lower part of the Carlile, which is moderately fossiliferous, contains bentonitic shale layers, only sparse calcite, and pyrite only near top and bottom of the zone. This pyrite also contains only small amounts of a few trace metals. The upper part of the Carlile, which is highly fossiliferous (several species), contains bentonitic shale layers, abundant calcite, and pyrite throughout. The pyrite contains, in general, several times as much nickel, cobalt, lead, copper, and silver as does pyrite lower in the section, and in addition contains a few metals not detected in the lower pyrite. The lower part of the Niobrara, sparsely fossiliferous, contains bentonitic shale beds, abundant calcite, and pyrite throughout. This pyrite has generally more selenium, less nickel and cobalt, and fewer trace metals than that in the underlying upper part of the Carlile. The uppe,r part of the Niobrara, which is highly fossiliferous (several species), contains no bentonitic shale layers, abundant calcite throughout, and no pyrite.
Pyrite and calcite in the Mancos Shale are believed to have been deposited in large part during or shortly after deposition of the shale. Pyrite cubes commonly have bedding deformed around them as a result of compaction, indicating early growth of the pyrite cubes. Calcite consists in large part of tests of microfossils ~and is considered an abundant original component of the Man-. cos. Inasmuch as the pyrite and calcite are largely original components, their distribution and composition reflect differences in environment of deposition.
Why worldwide faunal assemblages are here coextensive with lithologic types, each representing a changed, local environment of deposition, remains an unanswered question.
REFERENCES
Archbold, N. L., 1959, Relationship of carbonate cement to lithology and vanadium-uranium deposits in the Morrison Formation in southwestern Colorado: Econ. Geology, v. 54, no. 4, p. 666--682.
Coleman, R. G., and Delevaux, Maryse, 1957, Occurrence of selenium in sulfides from some sedimentary ro,cks of the western United States: Econ. Geology, v. 52, no. 5, p. 499-527.
Reeside, J. B., Jr., 1963, Fossils from lower part of the Mancos Shale, Disappointment Valley, San Miguel County, Colorado: U.S. Geol. Survey open-file report, 1 sheet [1964].
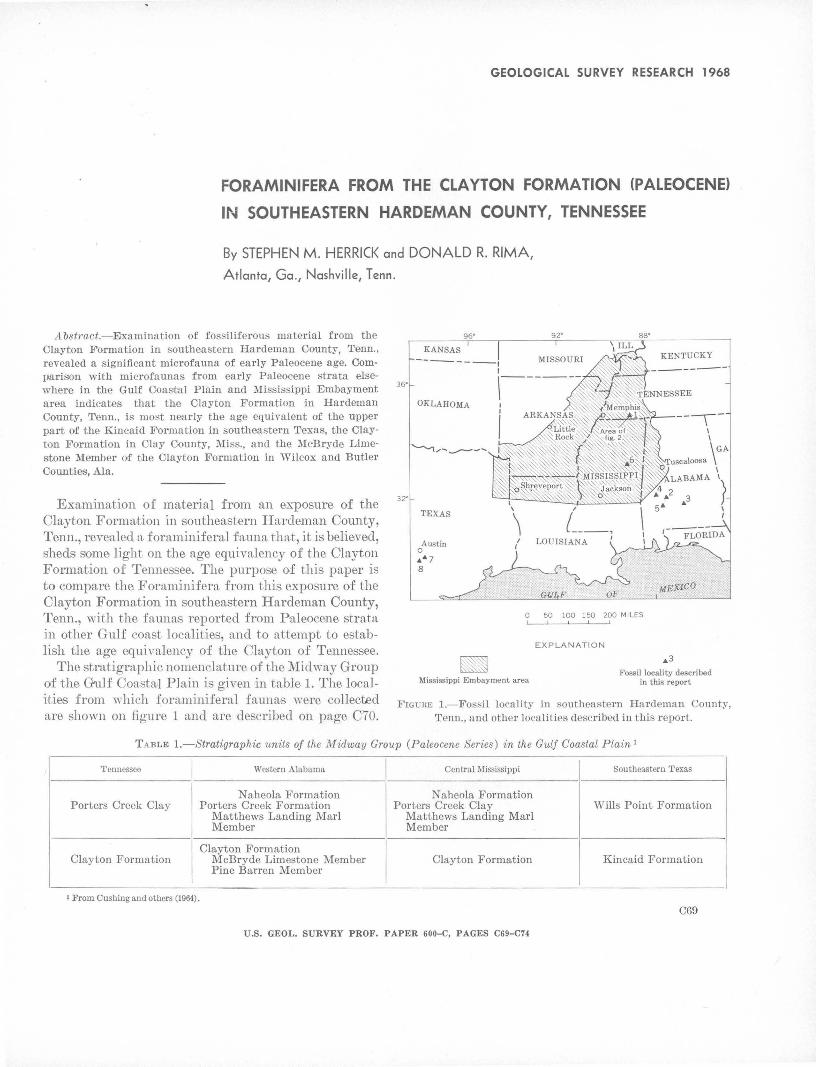
GEOLOGICAL SURVEY RESEARCH 1968
FORAMINIFERA FROM THE CLAYTON FORMATION (PALEOCENE)
IN SOUTHEASTERN HARDEMAN COUNTY, TENNESSEE
By STEPHEN M. HERRICK and DONALD R. RIMA/ A tlanta 1 Ga.1 Nashville/ Tenn.
A.bst1·act.-Examination of fossiliferous material from the Clayton Formation in southeastern Hardeman County, Tenn., revealed a significant microfauna of early Paleocene age. Comparison with microfaunas from early Paleocene strata elsewhere in the Gulf Coastal Plain and Mississippi Embayment area indicates that the Clayton Formation in Hardeman County, Tenn., is most nearly the age equivalent af the upper part af the Kincaid Formation in southeastern Texas, the Clayton Formation in Clay County, Miss., and the McBryde Limestone Member of the Clayton Formation in Wilcox and Butler Counties, Ala.
Examination of material from an ro..--posure of the Clayton Formation in southeastern Hardeman County, Tenn., revealed a foraminiferal fauna that, it is believed, sheds some light on the age equivalency of the Clayton Formation of Tennessee. The purpose of this paper is to compare the Foraminifera from this exposure of the Clayton Formation in southeastern Hardeman County, Team., with the faunas reported from Paleocene strata in other Gulf coast localities, and to attempt to establish the age equivalency of the Clayton of Tennessee.
The stratigraphic nomenclature of the Midway Group of the Gulf Coas tal Plain is given in table 1. The localities from which foraminiferal faunas were collected are shown on figure 1 and are described on page C70.
32'
96'
KANSAS
OKLAHOMA
TEXAS
Austin 0 ...... 7 8
lt:~\t?~j
KENTUCKY
0 50 100 150 200 MILES
EXPLANATION
,.3
Mississippi Embayment area Fossil locality described
in this report
FrouRE 1.-Fossil locality in southeastern Hardeman County, Tenn., all'd other localities described in this report.
TABLE !.-Stratigraphic units of the Midway Group (Paleocene Series) in the Gulf Coastal Plain 1
Tennessee Western Alabama Central Mississippi Southeastern Texas
Naheola Formation N aheola Formation Porters Creek Clay Porters Creek Formation Porters Creek Clay Wills Point Formation
Matthews Landing Marl Matthews Landing Marl Member Member
Clayton Formation Clayton Formation
McBryde Limestone Member Clayton Formation Kincaid Formation Pine Barren Member
' From Cushing and others (1964). C69
U.S. GEOL. SURVEY PROF. PAPER 600-C, PAGES C69-C74
C70 PALEONTOLOGY
Description of fossil localities mentioned in this report: Locality 1
Hardeman County, Tenn. Ravine west of Muddy Creek Ridge road 4.2 miles south of intersection with State Highway 57. Sample taken from Clayton ]formation about 36 feet above contact with underlying Owl Creek Formation of Late Cretaceous age. Collector: S. M. Herrick, U.S. Geological Survey.
Locality 2 Wilcox County, Ala. Roadcut on Alabama Highway 10,
about 1 mile south of intersection with Alabama Highway 28, in S"\VlA, SEtA, sec. 12, T. 13 N., R. 6 E. Sample taken from McBryde I .. imestone Member of the Clayton Formation, about 10 feet above the "Nautilus Rock." Collector: J. G. Newton, U.S. Geological Survey.
Locality 3 Butler County, Ala. Bank of Cedar Creek in NEtA, sec. 21,
T. 11 N., R. 13 E. Sample taken from McBryde Limestone Member of the Clayton Formation, 4 feet below "Nautilus Rock." Collector: C. ,V, Copeland, Alabama Geological Survey.
Locality 4 Marengo County, Ala. Roadcut on west side of Alabama
Highway 25 and about 2 miles south of Thomaston in · SE:JA, sec. 25, T. 15 N., R. 4 E. Sample taken from Porters Creek Formation (bed 88, Newton and others, 1961, p. 64). Collector: C. W. Copeland, Alabama Geological Survey.
Locality 5 Wilcox County, Ala. Roadcut on Alabama Highway 10 about
3.5 miles southwest of intersection with Alabama Highway 28 (stop 12, Southeastern Geological Society 1st
. Field Trip, Toulmin, 1944, p. 20). Sample taken from Matthews Landing Marl Member of the Porters Creek Formation. Collector: S. M. Herrick, U.S. Geological Survey.
Locality 6 Clay County, Miss. (Kline, 1943).
Locality 7 Bastrop County, Tex. Roadcut on north side of Austin
Bastrop Highway, 0.55 mile east of Travis-Bastrop County line and 0.05 mile west of the gate to a framehouse (Hill residence) on the south side of road. Sample :taken from bas'al bed of the Kincaid Formation, just above contact with underlying Navarro Group of Late Cretaceous age, Collector: P. S. Morey, Balcones Research Center, Austin, Tex.
Locality 8 Caldwell County, Tex. Steep bank on south side of small
stream branch that intersects Austin-Lockhart Highway 0.2 mile south of Mendoza Church. Sample taken from basal part of the Kincaid Formation, 21/z-3 feet above contact with underlying Navarro Group of Late Cretace·
. ous age. Collector : P. S. Morey, Balcones Research Center, Austin, Tex.
CLAYTON EXPOSURE IN HARDEMAN COUNTY
The Clayton Formation is well exposed in southeastern Hardeman County (fig. 2) where it consists of a basal limestone overlain successively by micaceous
clayey silts, fine to medimn quartzose sands, and a topmost bed of loose glauconitic sand. The Foraminifera listed in table 2 are from an exposure of the lower part of the Clayton Formation in the ridge east of Muddy Creek, a northward-flowing tributary of the Hatchie River (locality 1 on figs. 1 and 2). This exposure is 4.3 miles southwest of Pocahontas and 0.3 mile north of the Tennessee-Mississippi line. Following is the measured section of the Clayton Formation at this locality:
Geologic section 4.3 miles smtthwest ot Pocahontas, Hardeman County, Tennessee
[Pocahontas 7%-minute quadrangle]
Unit and description
Paleocene Series Midway Group
Clayton Formation
Thickness (feet)
1. Sand, medium to fine, red, micaceous; mixed with soil at tap ____________ ...,_______________ 15
2. 1Silt, sandy, micaceous, yellow, fossiliferous,
thin-bedded ------------------------------- 12 3. SHt, sandy, micaceous, medium- to dark-gray,
fossiliferous, thin..:bedded___________________ 8 4. Silt, •sandy, calcareous, micaceous, dark-gray;
contains well-preserved megafossils_________ 4 5. Concealed intervaL _____ _,____________________ 20
6. Limestone, glauconitic, sandy, fossiliferous_____ 16 Upper Cretaceous Series
Owl Creek Formation 7. Silt, clayey, very fossiliferous, lignitic_________ 12
Beds 2 through 4 of the measured section are believed to represent three stages of weathering of the micaceous clayey silts that overlie the basal limestone of the Clayton Formation. Bed 4 yielded the Foraminifera discussed in this paper.
Numerous other exposures of bed 4 may be found in roadcuts on both sides of Muddy Creek. One such exposure (locality 13, fig. 2), a cut along the Southern Railroad about 1¥2 miles east of Middleton and 200 feet east of milepost 481, has been mentioned several times in the literature. Gabb ( 1860) identified fossils collected there as Cretaceous in age, whereas Harris (1896) showed them to be Midway (Tertiary) in age. Although Cushman (1951, p. 2) identified the Foraminifera from this same locality as Paleocene in age, he described the material £rom which the fauna was recovered as the Porters Creek Clay. Later geologic mapping has shown that the Clayton Formation (not the Porters Creek Clay) is the stratigraphic unit that is exposed at this locality.
COMPARISON OF FORAM.INIFERAL FAUNAS
At locality 1, a total of 62 species were recovered. A complete listing of this fauna is presented in table 2, and
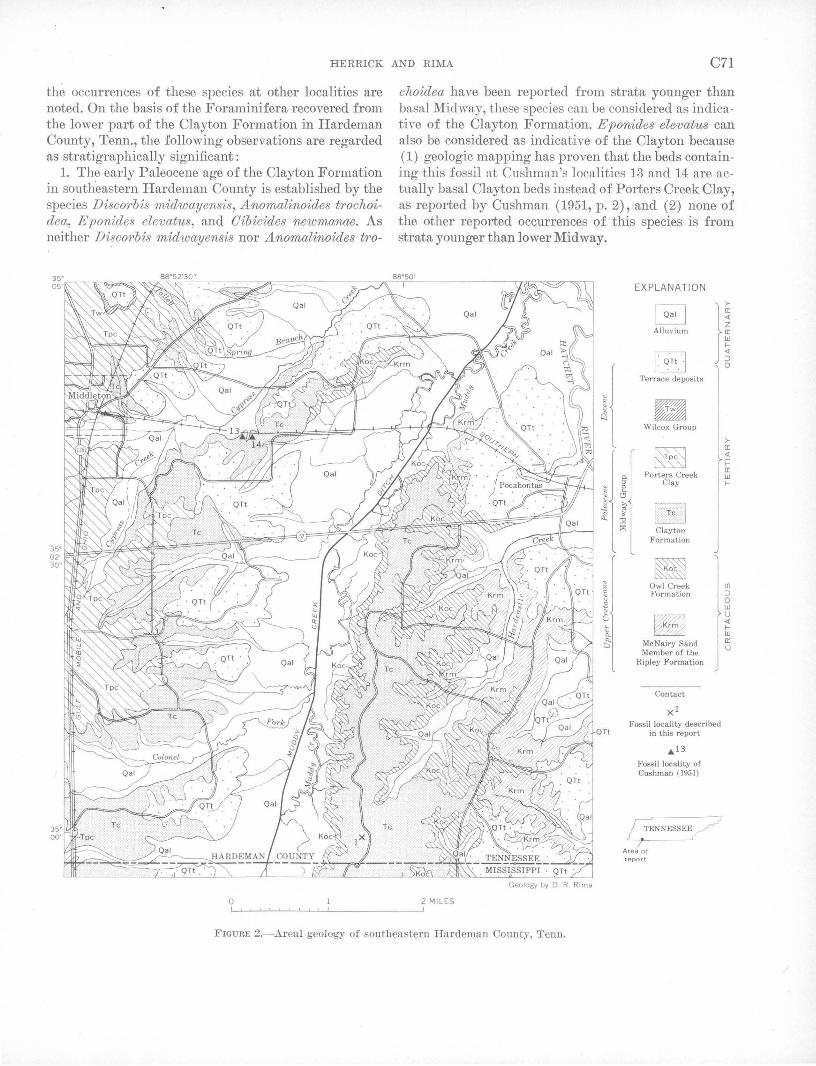
HERRICK AND RIMA C71
the occurrences of these species at other localities are noted. On the basis of the Foraminifera recovered from the lower part of the Clayton Formation in Hardeman County, Tenn., the following observations are regarded as stratigraphically significant:
1. The early Paleocene age of the Clayton Formation in southeastern Hardeman County is established by the species Discorbis midwayensis, Anomalinoides trochoidea:, Eponides elevatus, and Oibicides newmanae. As neither Discorbis mid~oayensis nor Anomalinoides tro-
0
choidea have been reported from strata younger than basal Midway, these species can be considered as indicative of the Clayton Formation. Eponides elevatus can also be considered as indicative of the Clayton because (1) geologic mapping has proven that the beds containing this fossil at Cushman's localities 13 and 14 are actually basal Clayton beds instead of Porters Creek Clay, as reported by Cushman (1951, p. 2), and (2) none of the other reported occurrences of this species is from strata younger than lower Midway.
~ ~ til
l! j &:
~ 0
" ~ 6 t; c. ~
Geology by D. R. Roma
2 MILES
EXPLANATION
B }!
Alluvium
1· QTt·l 0
Terrace deposits
B Wilcox Group
>-
~ a: <(
f= Porters Creek
a: c. w " Clay 1-0
c:; >.
G "' ~ "' ~ Clayton
Formation
[~ Owl Creek (/)
Formation :J 0 w
[:BY£;] u <( 1-w
McNairy Sand a: Member of the
u Ripley Formation
Contact
xl
Fossil locality described in this report
.13
Fossil locality of Cushman (1951)
Area of report
FIGURE 2.-Areal geology of southeastern Hardeman County, Tenn.
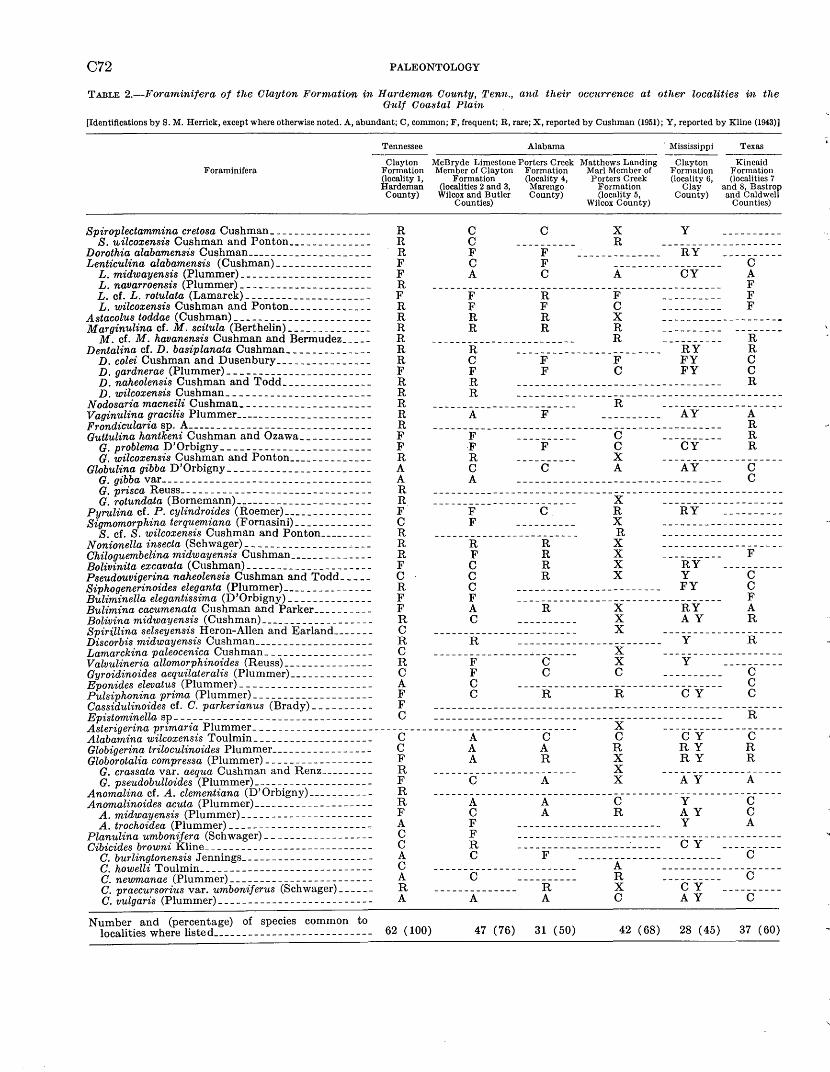
C72 PALEONTOLOGY
TABLE 2.-Forami-nifera of the Clayton Formation in Hardeman County, Tenn., a1ul their occurrence at other localities in the Gulf Coastal Plain
[Identifications by S.M. Herrick, except where otherwise noted. A, abundant; C, common; F, frequent; R, rare; X, reported by Cushman (1951); Y, reported by Kline (1943)]
Tennessee Alabama · Mississippi Texas
Clayton McBryde Limestone Porters Creek Matthews Landing Clayton Kincaid Foraminifera Formation Member of Clayton Formation Marl Member of Formation Formation
(locality 1, Formation (locality 4, Porters Creek (locality 6, (localities 7 Hardeman (localities 2 and 3, Marengo Formation Clay and 8, Bastrop
County) Wilcox and Butler County) (locality 5, County) and Caldwell Counties) Wilcox County) Counties)
Spiroplectammina cretosa Cushman_________________ R C C X Y _________ _ S. UJilcoxensis Cushman and Ponton______________ R C __________ R --------------------
Dorothia alabamensis Cushman_____________________ R F F -------------- RY _________ _ Lenticulina alabamensis (Cushman)________________ F C F ------------------ C
L. midwayensis (Plummer)______________________ F A C A CY A L. navarroensis (Plummer)______________________ R _ _ _ _ _ _ _ _ _ _ _ _ _ _ _ _ _ _ _ _ _ _ _ _ _ _ _ _ _ _ _ _ _ _ _ _ _ _ _ _ _ _ _ _ _ _ _ _ F L. cf. L. rotulata (Lamarck)_____________________ F F R F __________ F L. wilcoxensis Cushman and Ponton______________ R F F C _ _ __ _ _ _ _ __ F
Astacolus toddae (Cushman)_______________________ R R R X --------------------Marginulina cf. M. scitula (Berthelin)______________ R R R R __________ --------
M. cf. M. havanensis Cushman and Bermudez_____ R ------------------------ R ---------- R Dentalina cf. D. basiplanata Cushman______________ R R _ _ _ _ _ _ _ _ _ _ _ _ _ _ _ _ _ _ _ _ _ _ _ _ R Y R
D. colei Cushman and Dusenbury________________ R C F F FY C D. gardnerae (Plummer)________________________ F F F C FY C D. naheolensis Cushman and Todd_______________ R R _ _ _ __ __ _ _ _ __ _ ___ __ __ _ __ __ _ _ _ __ __ _ _ R D. wilcoxensis Cushman________________________ R R ____________________________________ -- _- ___ _
Nodosaria macneili Cushman_ _ _ _ _ _ _ _ _ _ _ _ _ _ _ _ _ _ _ _ _ _ R _ _ _ _ _ _ _ _ _ _ _ _ _ _ _ _ _ _ _ _ _ _ _ _ R __ - _________ -- -- -- _-Vaginulina gracilis Plummer_______________________ R A F ---------- AY A Frondicularia sp. A------------------------------- R _ _ _ _ _ _ ___ __ R Guttulina hantkeni Cushman and Ozawa____________ F ---- _F _______ -===-===-= -----0------- -=---===-- R
G. problema D'Orbigny_________________________ F ·F F C CY R G. wilcoxensis Cushman and Ponton______________ R R __________ X --------------------
Globulina gibba D'Orbigny________________________ A C C A AY C
g: ~~~~avff;~s~~~~~~=========================== 1t ------~------==================================----? ____ _ G. rotundata (Bornemann)_______________________ R ------------------------ X --------------------
Pyrulina cf. P. cylindroides (Roemer)_______________ F F C. R RY _________ _ Sigmomorphina terquemiana (Fornasini) _ _ _ _ _ _ _ _ _ _ _ _ _ C F _ _ _ _ _ _ _ _ _ _ X ___________________ _
S. cf. S. wilcoxensis Cushman and Ponton_________ R ------------------------ R --------------------Nonionella insecta (Schwager)-----------------~--- R R R X --------------------Chiloguembelina midwayensis Cushman______________ R F R X ---------- F Bolivinita excavata (Cushman)_____________________ F C R X RY ----------Pseudouvigerina naheolensis Cushman and Todd_____ C C R X Y C Siphogenerinoides eleganta (Plummer)_______________ R C ------------------------ FY C Buliminella elegantissima (D'Orbigny) _ _ _ _ _ _ _ _ _ _ _ _ _ _ F F _ _ _ _ _ _ _ _ _ _ _ _ _ _ _ _ _ _ _ _ _ _ _ _ _ _ _ _ _ _ _ _ _ _ F Bulimina cacumenata Cushman and Parker__________ F A R X R Y A Bolivina midwayensis (Cushman)___________________ R C ---------- X A Y R Spiri.llina selseyensis Heron-Allen and Earland___ _ _ _ _ C _ _ _ _ _ _ _ _ _ _ _ _ _ _ _ _ _ _ _ _ _ _ _ _ X ___________________ _ Discorbis midwayensis Cushman____________________ R R ------------------------ Y R Lamarckina paleocenica Cushman__________________ C ------------------------ X --------------------Valvulineria allomorphinoides (Reuss)_______________ R F C X Y ----------Gyroidinoides aequilateralis (Plummer)______________ C F C C _ _ _ _ _ _ _ _ _ _ C Eponides elevatus (Plummer)-_____________________ A C _ _ _ _ _ _ _ _ _ _ _ _ _ _ _ _ _ _ _ _ _ _ _ _ _ _ _ _ _ _ _ _ _ _ C Pulsiphonina prima (Plummer)____________________ F C R R C Y C Cassidulinoides cf. C. parkerianus (Brady)__________ F _________________________________________________________ _
~~~~Zg~:f:~~:r~;ri~-p~~~~~;~===================----?-----========================------5(------==========----==----Alabamina wilcoxensis Toulmin____________________ C A C C C Y C Globigerina triloculinoides Plummer ____________ -_--- C A A R R Y R Globorotalia compressa (Plummer)__________________ F A R X R Y R
G. crassata var. aequa Cushman and Renz_________ R ------------------------ X --------------------G. pseudobulloides (Plummer)____________________ F C A X A Y A
Anomalina cf. A. clementiana (D'Orbigny) ________ - _- R ___ ------ ________________________________________________ _ Anomalinoides acuta (Plummer)____________________ R A A C Y C
A. midwayensis (Plummer)______________________ F C A R A Y C A. trochoidea (Plummer) _____________ ----------.,. A F ------------------------ Y A
Planulina umbonifera (Schwager)_------ ______ ----- C F ------ _ ---- ___ --- ______ ---- _________ - ______ _ Cibicides browni Kline ____________ ---------------- C R ------------------------ C Y ----------
C. burlingtonensis Jennings ___________ ----------- A C F ------------------------ C C. howelli Toulmin _______________ --- __ --------- C -------------------- _ _ _ _ A -- _________________ _ C. newmanae (Plummer)________________________ A C ---------- R ---------- C C. praecursorius var. umboniferus (Schwager)______ R -------------- R X C Y ----------C. vulgaris (Plummer)__________________________ A A A C A Y C
Number and (percentage) of species common to localities where listed ______________________ ----- 62 ( 100) 47 (76) 31 (50) 42 (68) 28 (45) 37 (60)
...
•
,/
HERRICK AND RIMA C73
Oibicides newmanae also belongs in the group of microfossils that are indicative of the Clayton Formation, because in Texas, as far as the authors are aware, this fossil has been reported only from the sandy facies of the basa;l zone of the Paleocene. In ·fact, Plummer ( 1926, p. 139) states, "No other formation in the Texas geologic column has yielded, this form." Hence, O; new'fnanae is regarded as a guide fossil for the lower part of the Midway Group in Texas. It occurs abundantly in the Clayton of Hardeman County, Tenn. It should also be noted, however, that this species has been reported by Cushman and Todd ( 1942, P• 46) from the Naheola Formation, and by Cushman (1951, p. 66) from the Matthews Landing Marl Member of the Porters Creek Formation in Alabama (locality 5, table 2).
2. Discorbis mid~oayensis, Anomalinoides trochoidea, and Eponides elevatus occur also in the McBryde Limestone Member of the Clayton Formation in Butler and Wilcox Counties, Ala. (localities 2 and 3) and in the basal part of the IGncaid Formation in Bastrop and Caldwell Counties, Tex. (localities 7 and 8). Moreover, the species Discorbis midwayensis and A nomalinoides trochoidea are reported from the Clayton Formation in Clay County, Miss. (locality 6). From the occurrences of these particular species, it is concluded that the strata exposed at localities 1, 2, 3, 6, 7, and 8 are equivalent or nearly equivalent in age.
The occurrence of Oibicides newmanae at localities 1, 2 and 3, and 7 and 8, and the occurrence of Oibicides browni at localities 1, 2 and 3, and 6 should be noted. Although 0. browni was described by Kline (1943, p. 9-11) from the Porters Creek Formation, it was reported (I{]ine, 1943, p. 62) as commonly occurring in the "lower Midway" of Clay County, Miss. This species also occurs commonly at the Hardeman locality. On the basis of relative abundance, both of these species are considered to be indicative of sediments that are equivalent in age to the Clayton Formation of Hardeman County, Tenn.
3. On a purely statistical basis, of the 62 species found in Hardeman County (locality 1), 47 also occur in the McBryde Limestone Member of the Clayton Formation in Alabama (localities 2 and 3). This fact indicates that the foraminiferal fauna in southeastern Hardeman County, Tenn., is very closely related to that of localities 2 and 3 in Alabama.
4. Also worthy of note is the occurrence of Epistominella sp. at the Hardeman County locality. As far as the authors are aware this occurrence represents the first time that a species belonging under this genus has been reported from the Paleocene of North America. Haynes (1956, p. 88) reports Epistominella vitrea Parker from the upper Paleocene (Thanet) beds of
l(ent, in the United Kingdom. Although our specimens may represent an occurrence similar to that reported by Haynes, or may even represent a new species, it seems best to list this form as Epistominella sp. until such time as direct comparisons with all previously described species belonging to this genus may be made.
5. A peculiar feature of the Clayton fauna from Hardeman County is the occurrence of three species, Lenticulina na·varroensis, Globulina prisca, and Anomalina cf. clementiana. Each of these forms was originally reported from Cretaceous sedilnents. In addition, Lenticulina navan·oensis was reported frmn the IGncaid of Texas. There are a·t least two possible explanations for the occurrence of these species in Paleocene sediments. Perhaps these forms represent species that have bridged the gap between the Cretaceous and the Tertiary and hence represent species that might be considered indigenous to the basal Paleocene. The generally accepted theory is that these species represent fossils that have been reworked from the underlying C1~etaceous by a transgressive sea during early Paleocene time. The same phenomenon has been observed in many localities by various workers such as Stephenson (1915, p. 162-163) and LaMoreaux and Touhnin (1959, fig.11, p. 37).
CONCLUSION
On the basis of the foraminiferal evidence, it seems reasonable to conclude that the Clayton Formation in southeastern H.ardeman County, Tenn., is the age equivalent of the McBryde Limestone Member of the Clayton Formation of Butler and Wilcox Counties, Ala., the Clayton Formation of ~1ississippi, and the IGncaid Formation of Bastrop and Caldwell Counties, Tex.
REFERENCES Cushing, E. M., Bo.swell, E. H., and Hosman, R. L., 1964, General
geology of the Mississippi Embayment: U.S. Geol. Survey Prof. Paper 448-B, p. B1-B28 ..
Cushman, J. A., 1951, Paleocene Foraminfera of the Gulf Ooastal Region of the United States and adjacent areas: U.S. Geol. Survey Prof. Paper 232, 75 p., 24 pls.
Cushman, J. A., and Todd, Ruth, 1942, The Foraminifera of the type locality of the Naheola Formation: Cushman Lab. Foraminiferal Research Contr., v. 18, pt. 2, p. 23-46, pls. 5-8.
Gabb, ,V. M., 1860, Descriptions of new species of American Tertiary and Cretaceous fossils: Philadelphia Acad. Nat . Sci. Jour., 2d ser., v. 4, p. 375-406.
Harris, G. D., 1896, The Midway stage: Bull. Am. Paleontology, V'. 1, no. 4, 157 p.
Haynes, John, 1956, Certain smaller British Paleocene Foraminifera: Cushman Lab. Foraminiferal Research Contr., v. 7,pt.3,p. 79-101, pls.16-18. ·
Kline, V. H., 1943, Clay County fossils-Midway Foraminifera and Ostracoda: Mississippi Geol. Survey Bull. 53, p. 5-98, 8 pls.
LaMoreaux, P. E., and Toulmin, L. D., Jr., 1959, Geology and ground-water resources of 'Yilcox County, Ala. : Alabama Geol. Survey County Rept. 4.
C74 PALEONTOLOGY
Newton, J. G., Sutcliff, Horace, Jr., and LaMoreaux, P. E., 1961, Geology and ground-water resources of Marengo County, Alabama: Alabama Geol. Survey County Rept. 5, 433 p.
Plummer, H. J., 1926, Foraminifera of the l\fichvay Formation of Texas: Texas Univ. Bull. 2644, 206 p., 15 pls.
Stephenson, L. ,V., 1915, The Cretaceous-Eocene contact in the Atlantic and Gulf Coastal Plain: U.S. Geol. Survey Prof. Paper 90, p. 155-180.
Toulmin, L. D., 1944, Southwestern Alabama field trip, in Southeastern Geol. Soc. Guide Book, 1st Field Trip: 15 p.
~.·
•
''(
GEOLOGICAL SURVEY RESEARCH 1968
STRATIGRAPHIC PALEONTOLOGY OF THE BARSTOW FORMATION
IN THE ALVORD MOUNTAIN AREA, SAN BERNARDINO COUNTY, CALIFORNIA
By G. EDWARD LEWIS, Denver, Colo.
AJbstract.-Two diagnostic fossil vertebrate faunas, one orf which includes a new species of Protolabis, establish the stratigra·phic position of the lower and middle members of the Ba-rstow FormatiOI~ in .the Alvord Mountain ·area, California. The faunas are correlated with the oldest a.Ilid intermediate faunas of the Barstow in the Mud Hills. The youngest of the three faunas of the Barstow in the Mud Hills has not been reported from the Alvord Mountain quadrangle, but may occur several miles to the east. If a twofold division of Miocene time be made, then these three successive faunas together represent all of . late Miocene time.
I have published ( Lewis, 1964) a review of the usage of the terms "Barstow Formation" and "Barstow fauna," and more recently a report on the stratigraphic paleontology of this 'forma1tion in the Mud Hills (Barstow syncline) area (Lewis, 1968). The purpose of this report is to :give, in greater detail, my interpretations of the stratigraphic paleontology of the Barstow Formation· in ·the Alvord Motmtain area, outlined briefly 8 years ago (in Byers, 1960, p. 32-33).
The U.S. Geological Survey has mapped outcrops identified as the Barstow Formation in the Mojave Desert from lat 34°40' N. to 35°15' N., and from long 116°30' W. to 117°20' W. In 1964 I published a summary of the history of the formational and faunal names, reporting that at least two and probably three faunal assemblages of three distinct ages occur in the Barstow Formation. This was contrary to •the generally held opinion that the Barstow Forn1a.tion yields a single, approximately contemporaneous ma.mmalian fossil assemblage for which Wood and others (1941, p. 12, 14) had proposed the "provincial age" name "Barstovian." I also noted (Lewis, 1964, p. D21) that in the Mud Hills, Schultz and Falkenbach (1940, p. 223-228) earlier had distinguished a fauna characterized by the presence of the oreodont Brachycrus buwaldi, older and stratigraphically lower than the supposedly typical youngest Barstow fauna. I also recorded (in Byers, 1960, p. 32-33, pl. 2) the occurrence of the B1·achycrus fauna in the
Alvord Mountain area, and of the oldest, pre-Brachycrus faunal element found to date in the Barstow, also from the Alvord Mountain area: this oldest zone is characterized by the presence of M erychippus tehachapiensis ("with a ·stratigraphic position well below that of the
typical Barstow fauna" according to Buwalda and Lewis ( 1955, p. 150), of "middle Miocene" age if a threefold division were used) 500 feet stratigraphically below Brachycrus buwaldi in that area.
Although the U.S. Geological Survey collections from the Mud Hills do not include any faunal elements from the Brachycrus buwaldi and M erychippus tehachapiensis zones, inasmuch as R. H. Tedford and R. L. Shultz, Jr., collected only from 12 localities all confined to the uppermost, youngest of the three zones recognized in the Barstow, Ted Galusha and his colleagues of the Frick Laboratory, American Museum, New York, N.Y. (written commun., 1966) have reported the presence of M erychippus tehachapiensis about 650 feet stratigraphically below the lowest occurrence of Brachycrus buwaldi in the Mud Hills.
Acknowledgments.-! am indebted to my Survey colleagues D. F. Hewett, W. C. Smith, and I\:. E. Lohman for helpful advice and interest; and T. W. Dibblee, Jr., and F. M. Byers, Jr., who mapped the Barstow in the Mud Hills and Alvord Moun:tain areas, respectively, for their helpful cooperation. Messrs. R. H. Tedford and R. L. Shultz, Jr., collected most of the fossils for the U.S. Geological Survey, and thanks are due to Mr. Ray Alf of the Webb School, Claremont, Calif., for the opportunity to study a collection made for the School. D. P. Willoughby made the wash drawings of the new species of Protolabis, which is the property of the Los Angeles County Muse urn, kindly loaned to me by Theodore Downs of that institution.
SUBDIVISION OF THE MIOCENE
Most writers (for example, "\Vood and others, 1941) subdivide series and epochs, including the Miocene, into
U.S. GEOL. SURVEY PROF. PAPER 600-C, PAGES C75-C79 294-199 0--68----6
075
C76 PALEONTOLOGY
three parts. The continental Miocene faunas of the United States seem to fall most naturally into a twofold rather than a threefold division ; the occurrence of highcrowned horse teeth (in M erychippus s. l.) for the first time iri geologic history, with comparable morphogenetic changes in other taxa, together with the first siliceous, highly abrasive grasses (see Elias, 1942, p. 32, 44, pl. 17) in Sheep Creek time, seems to mark a prac-
. tical datum for the beginning of late (as opposed to early) Miocene time.
Recently, SaJto and Denson (1967) and Denson and Izett (written commun., 1968) have demonstrated a comparable stratigraphic division; they use a twofold division of the Miocene Series in the High Plains and middle Rocky Mountains, with the boundary between lower Miocene (Arikaree) and upper Miocene (Ogallala) marked by a change in the regimen of sedimentation that begins with the Sheep Creek Formation.
According to Lewis~ zonation of the Barstow ( 1964 and this report), the M erychippus tehachapiensis zone, the Braohycrus buwaldi zone, and the M erychippus sumani/ M erychippus intermontanus/ U statochoerus medius zone, in ascending order, reflect the transition from the approxima;te beginning of late Miocene time and base of upper Miocene rocks to the approximate end of late Miocene time and top of upper Miocene rocks in the Barstow Formation.
BARSTOW FAUNAS, ALVORD MOUNTAIN AREA
According to Byers ( 1960, p. 26-35, pl. 2), the lower member of the Barstow Formation, about 700 to 900 feet thick, is sparsely fossiliferous (USGS fossil vertebrate localities D320 and D321), but has yielded good fossil mammalian age indicators. The thin, tuffaceous middle member has yielded the best-preserved mammalian fossils in the area (USGS fossil ver.tebrate localities 0301 and D319). The upper member of the Barstow Formation in the Alvord Mountain area is at least 500 feet in maximum thickness; this member yielded only rare bone fragments to U.S. Geological Survey collecting parties in the .Alvord Mountain quadrangle, but a locality several miles to the east yielded a specimen tha;t probably should be referred to the upper member. New information about these localities follows:
Locality D3~0 (lower member) .-NW% sec. 34, T. 12 N., R. 4 E. The only change from the original list (in Byers, 1960, p. 33) is that "M erychippus sp. indet.," represented by a medial and an ungual phalanx, is now referred toM erychippus cf. M. tehachapiensis Buwalda and Lewis.
Locality D321 (lower member) .-SEl!.t, sec. 34, T. 12 N., R. 4 E. Merychippus tehachapiensis material collected from this locality consists of an M3
, three incom-
plete upper cheek teeth, an M3 , an incomplete lower cheek tooth, and a medial phalanx. The only change from the original list (in Byers, 1960, p. 33) is that "tlJI e1·ychyus sp." is now referred to JI;J erychyus cf. AI. (M.) relictus Matthew and Cook; it is represented by badly weathered skeletal parts with right P, C/, P 1-4 ,
M1 (incomplete), P 1, P 3 _4 , M1 (incomplete), left P, C/, P 1-4 (incomplete), /C, P1_4 (incomplete), and incomplete humerus, radii, ulnae, carpi, mani, tibiae, tarsus, and pes.
Locality D301 (tuffaceous middle- member) .-SW¥J, sec. 19, T. 12 N., R. 4 E. In Byers (1960), "Brachypsalis cf. B. pachycephalus, Merychippus sp. indet., Hespe·rocameltt8 primitive sp., and M erycodus sp." were listed for this locality. The single specimen of Brachypsalis cf. B. pachycephal!us Cope is a badly worn right M1. Except that it is somewhat larger and more massive, this specimen is very similar to the left M1 described by Henshaw (1942, p. 116-119) from the Tonopah fauna; Henshaw made good comparisons to other species of this genus. In crown diameters, the Barsto'v specimen from Alvord Mountain measures 7.4 mm across the paracone and metacone, and 8.5 mm anteroposteriorly across the protocone; the greatest diameter along an oblique line extending backward and tongueward, as measured by Henshaw, is 13.3 mm. The comparable measurements of the Tonopah specimen are, respectively, 6.9 mm, 8.2 mm, and 12.5 mm. Henshaw notes that the Barstow collections of the University of California at Berkeley contain an undescribed maxillary dentition that closely resembles the Tonopah specimen but is slightly more massive. Perhaps the Berkeley specimen and the one described here from the Alvord Mountain area more nearly resemble each other. The horse, now referred to M erychipptt8 cf. AI. stylodontus Merriam, is represented by fragments of two juvenile rami, fragments of several cheek teeth and foot bones. The specimen originally listed as "H esperocameltts" is now referred to Protolabis.
Protolabis barstowensis, n. sp.
Figure 1
The type (Los Angeles County Museum No. CIT 450/ 4033) is a skull (with R. P, C/, P 1-2
, roots of P 3-\
M2-
3; L. P-a, C/, P1, roots of P 2
-4M\ ~~P-3 ), an incom
plete left ramus (with a root of P 2 , P 3 _ 4 , roots of M1, M2_3) ; incomplete cervical vertebrae, 4, 5, and 6; pelvis; a rib fragment; humerus; fragments of scapula, radiulna, metapodials, and phalanges. It represents a very old individual whose cheek teeth are badly worn, perhaps because of the abrasive action of the abundant volcanic ash that was falling periodically during deposition of
t-
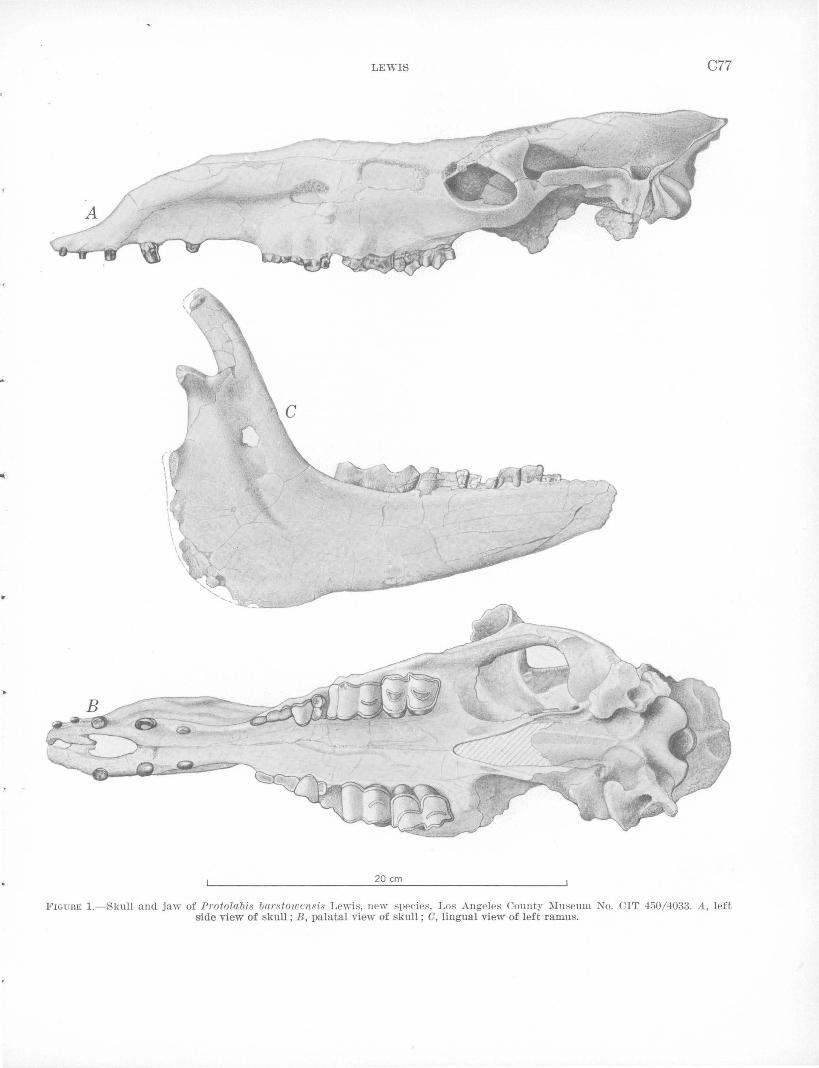
..
,--1 I
\ I I I
LEWIS C77
20 em
FIGU RE 1.- Skull and jaw of Protolab·is barstowcns'is Lewis, new species, Los Angeles County i\Iuseum No. CIT 450/4033. A., left side view of skull; B, palatal view of skull; 0, lingual view of left ramus.
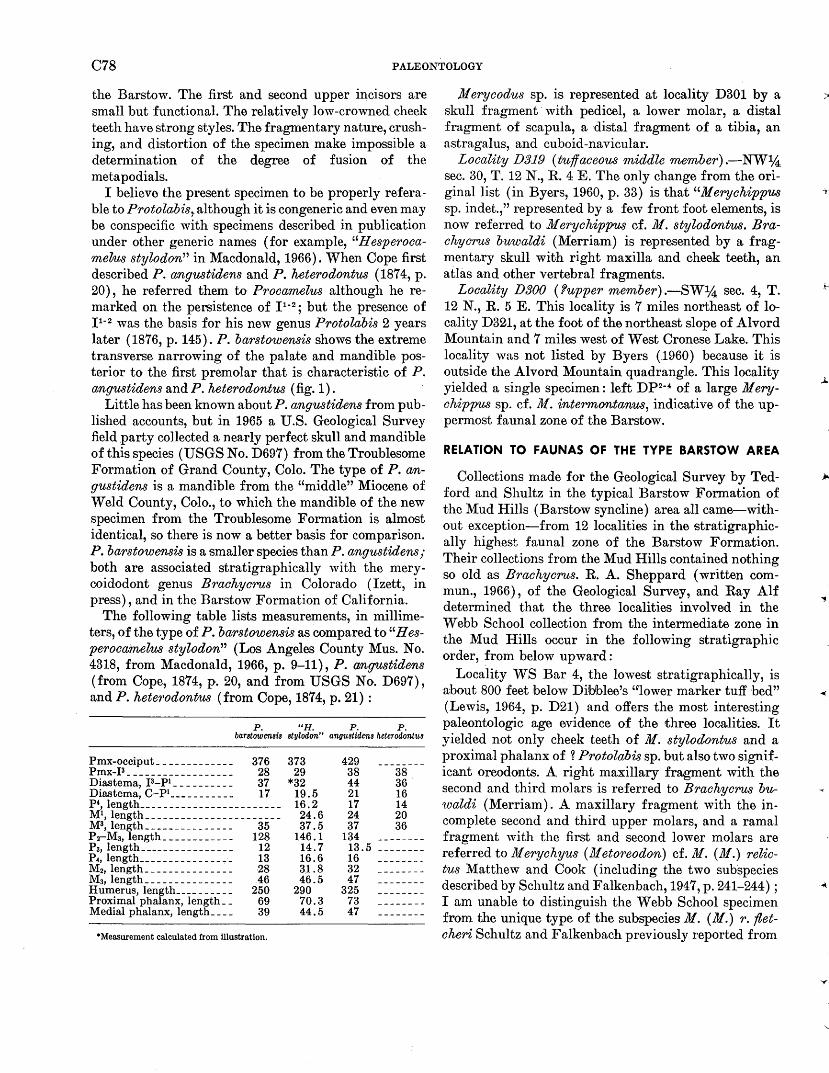
C78 PALEONTOLOGY
the Barstow. The first and second upper incisors are small but functional. The relatively low-crowned cheek teeth have strong styles. The fragmentary nature, crushing, and distortion of the specimen make impossible a determination of the degree of fusion of the meta podials.
I believe the present specimen to be properly referable to Protolabis,. although it i·s congeneric and even may be conspecific with specimens described in publication under other generic names (for example, "H esperocamelJus stylodon" in Macdonald, 1966). When Cope first described P. angustidens and P. heterodontus ( 187 4, p. 20), he referred them to Procamelus although he remarked on the persistence of P- 2
; but the presence of P- 2 was the basis for his new genus Protolabis 2 years later ( 1876, p. 145) . P. barstowensis shows the extreme transverse narrowing of the palate and mandible posterior to the first premolar that is characteristic of P. angustidens and P. heterodontus (fig. 1).
Little has been known about P. angustidens from published accounts, but in 1965 a U.S. Geological Survey field .party collected a nearly perfect skull and mandible of this species (USGS No. D697) from the Troublesome Formation of Grand County, Colo. The type of P. angustidens is a mandible from the "middle" Miocene of Weld County, Colo., to which the mandible of the new specimen from the Troublesome Formation is almost identical, so there is now a better basis for comparison. P. barstowensis is a smaller species than P. angustidens; both are associated stratigraphically with the meryooidodont genus Brachycrus in Colorado (Izett, in press), and in the Barstow Formation of California.
The following table lists measurements, in millimeters, of the type of P. barstowensis as compared to "Hesperocamelus stylodon" (Los Angeles County Mus. No. 4318, from Macdonald, 1966, p. 9-11), P. angustidens (from Cope, 1874, p. 20, and from USGS No. D697), and P. hete1•odontus (from Cope, 1874, p. 21):
P. "H. P. P. barstowensis stylodon" angustidens heterodontus
Pmx-occiput_ _ _ _ _ _ _ _ _ _ _ _ _ 376 Pmx-P__________________ 28 Diastema, P-P1 _ _ _ _ _ _ _ _ _ _ 37 Diastema, C-P1___________ 17 P4, length _______________________ _ M1, length ______________________ _ M3, length_______________ 35 P2-Ma, length____________ 128 Pa, length________________ 12 P4, length ______________ .,._ 13 M2, length_ _ _ _ _ _ _ _ _ _ _ _ _ _ _ 28 Ma, length__ _ _ _ _ _ _ _ _ _ _ _ _ _ 46 Humerus, length__________ 250 Proximal phalanx, length_ _ 69 Medial phalanx, length____ 39
*Measurement calculated from illustration.
373 29
*32 19.5 16.2 24.6 37.5
146.1 14.7 16.6 3.1.8 46.5
290 70.3 44.5
429 --------38 38 44 36 21 16 17 14 24 20 37 36
134 --------13.5 --------16 --------32 --------47 --------
325 --------73 --------47 --------
M erycodus sp. is represented at locality D301 by a skull fragment· with pedicel, a lower molar, a distal fragment of sea pula, a distal fragment of a tibia, an astragalus, and cuboid-navicular.
Locality D319 (tuffaceous middle men~ber).-NW1,4 sec. 30, T. 12 N., R. 4 E. The only change from the original list (in Byers, 1960, p. 33) is that "Merychippus sp. indet.," represented by a few front foot elements, is now referred to J1! erychippus cf. M. stylodontus. Brachycrus buu,aldi (J\IIerriam) is represented by a fragmentary skull with right maxilla and cheek teeth, an atlas and other vertebral fragments.
Locality D300 (?upper member) .-SW1,4 sec. 4, T. 12 N., R. 5 E. This locality is 7 miles northeast of locality D321, at the foot of the northeast slope of Alvord Mountain and 7 miles west of West Cronese Lake. This locality was not listed by Byers (1960) because it is outside the Alvord Mountain quadrangle. This locality yielded a single specimen: left DP2
- 4 of a large M erychippus sp. cf. M. intermontanus, indicative of the uppermost faunal zone of the Barstow.
RELATION TO FAUNAS OF THE TYPE BARSTOW AREA
Collections made for the Geological Survey by Tedford and Shultz in the typical Barstow Formation of the Mud Hills (Barstow syncline) area all came-without exception-from 12 localities in the stratigraphically highest faunal zone of the Barstow Formation. Their collections from the Mud Hills contained nothing so old as Brachycrus. R. A. Sheppard (written commun., 1966) , of the Geological Survey, and Ray Alf determined that the three localities involved in the Webb School collection from the intermediate zone in the Mud Hills occur in the following stratigraphic order, from below upward:
Locality WS Bar 4, the lowest stratigraphically, is about 800 feet below Diilmlee's 'glower marker tuff bed" (Lewis, 1964, p. D21) and offers the most interesting paleontologic age evidence of the three localities. It yielded not only cheek teeth of M. stylodon&us and a proximal phalanx of~ Protolabis sp. but also two significant oreodonts. A right maxillary fragment with the second and third molars is referred to Brachycrus bu-1oaldi (Merriam). A maxillary fragment with the incomplete second and third upper molars, and a ramal fragment with the first and second lower molars are referred to Merychyus (Metoreodon) cf.llf. (11/.) relictus Matthew and Cook (including the two subspecies described by Schultz and Falkenbach, 1947, p. 241-244) ; I am unable to distinguish the Webb School specimen from the unique type of the subspecies M. ( M.) r. fletcheri Schultz and Falkenbach previously reported from
.~·
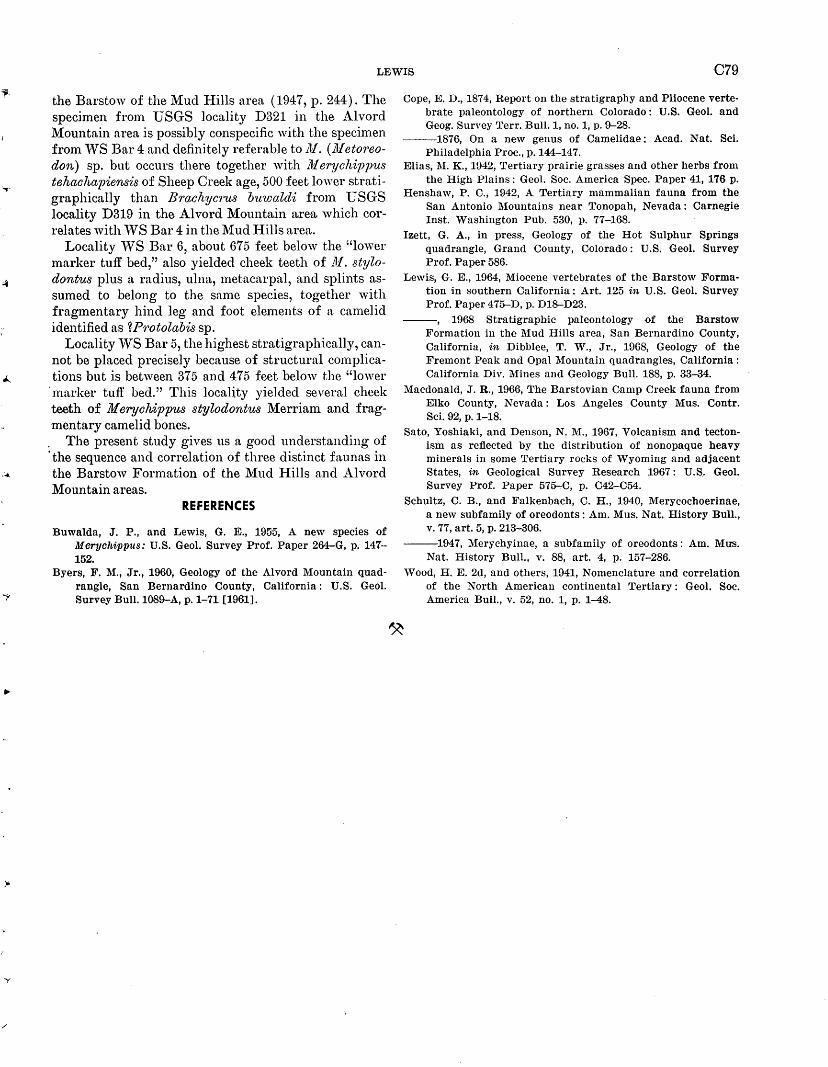
. :..
LEWIS C79
the Barstow o:f the Mud Hills area (1947, p. 244). The specimen :from USGS locality D321 in the Alvord Mountain area is possibly conspecific with the specimen :from 'VS Bar 4 and definitely referable to 111. (111 etoreodon) sp. but occurs there together with 11! erychippus tehaclUt]Jiensis of Sheep Creek age, 500 :feet lower stratigraphically than B1·achycrus buwaldi :from USGS locality D319 in the Alvord Mountain area which correlates with vVS Bar 4 in the l\iud Hills area.
Locality vVS Bar 6, about 675 :feet below the "lower marker tuff bed," also yielded cheek teeth o:f 11!. stylodontus plus a radius, ulna, metacarpal, and splints assumed to belong to the same species, together with :fragmentary hind leg and :foot elements o:f a camelid identified as ~P1·otolabis sp.
Locality 'VS Bar 5, the highest stratigraphically, cannot be placed precisely because o:f structural co1nplications but is between 375 and 475 :feet below the "lower
·1narker tuff bed." This locality yielded several cheek teeth o:f M erychippus stylodontus Merriam and :fragmentary camelid bones.
, The present study gives us a good understanding o:f ·the sequence and correlation o:f three distinct :faunas in the Barstow Formation o:f the Mud Hills and Alvord Mountain areas.
REFERENC:ES
Buwalda, J. P., and Lewis, G. E., 195'5, A new species of Merychippus: U.S. Geol. Survey Prof. Paper 264-G, p. 147-152.
Byers, F. M., Jr., 1960, Geology of the Alvord Mountain quadrangle, San Bernardino County, California: U.S. Geol. Survey Bull.1089-A, p. 1-71 [1961].
Cope, E. D., 1874, Report on the stratigraphy and Pliocene vertebrate paleontology of northern Colorado: U.S. Geol. and Geog. Survey Terr. Bull. 1, no. 1, p. 9-28.
--1876, On a new genus of Camelidae: Acad. Nat. Sci. Philadelphia Proc., p.144-147.
Elias, M. K., 1942, Tertiary prairie grasses and other herbs from the High Plains : Geol. Soc. America Spec. Paper 41, 176 p.
Henshaw, P. C., 1942, A Tertiary mammalian fauna from the San Antonio Mountains near Tonopah, Nevada: Carnegie Inst. Washington Pub. 530, p. 77-168.
lzett, G. A., in press, Geology of the Hot Sulphur Springs quadrangle, Grand County, Colorado: U.S. Geol. Survey Prof. Paper 586.
Lewis, G. E., 1964, Miocene vertebrates of the Barstow Formation 'in southern California: Art. 125 in U.S. Geol. Survey Prof. Paper 475-D, p. D18-D23.
--, 1968 Stratigraphic paleontology of the Barstow Formation in the Mud Hills area, San Bernardino County, California, in Dibblee, T. W., Jr., 1968, Geology of the Fremont Penk and Opal Mountain quadrangles, California : California Div. Mines and Geology Bull. 188, p. 33-34.
Macdonald, J. R., 1966, The Barstovian Camp Creek fauna from Elko County, Nevada: Los Angeles County Mus. Contr. Sci. 92, p. 1-18.
Sato, Yoshiaki, and Denson, N. M., 1967, Volcanism and tectonism as reflected by the distribution of nonopaque heavy minerals in some Tertiary rocks of Wyoming and adjacent States, in Geological Survey Research 1967: U.S. Geol . Survey Prof. Paper 575-C, p. C42-C54.
Schultz, C. B., and Falkenbach, C. H., 1940, Merycochoerinae, a new subfamily of oreodonts: Am. Mus. Nat. History Bull., v.77,art.5,p.213-306.
--1947, Merychyinae, a subfamily of oreodonts: Am. Mus. Nat. History Bull., v. 88, art. 4, p. 157-286.
'Vood, H. E. 2d, and others, 1941, Nomenclature and correlation of the North American continental Tertiary: Geol. Soc. America Bull., v. 52, no. 1, p. 1-48.
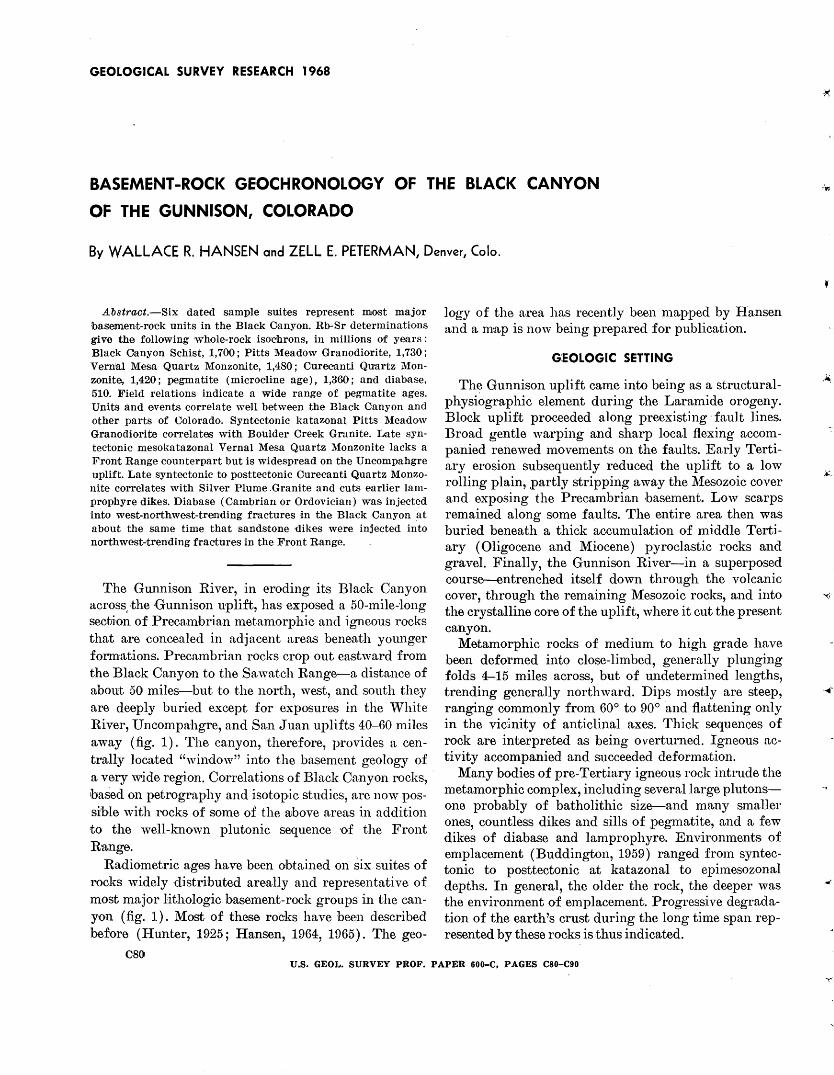
GEOLOGICAL SURVEY RESEARCH 1968
BASEMENT-ROCK GEOCHRONOLOGY OF THE BLACK CANYON
OF THE GUNNISON, COLORADO
By WALLACE R. HANSEN and ZELL E. PETERMAN, Denver, Colo.
Abstract.-Six dated sample suites represent most major hasement-rO'ck units in the Black Canyon. Rb-Sr determinations give the following whole-rock iso·cbrons, in millions <Yf years: Black Canyon Schist, 1,700; Pitts Meadow Granodiorite, 1,730; Vern1al Mesa Quartz Monzonite, 1,480; Curecanti Quartz Monzonite, 1,420; pegmatite ( microcline age), 1,360; and diabase, 510. Field relations indicate a wide range of pergmatite ages. Units and events correlate well between the Black Oanyon and other parts of Colorado. Syntectonic katazonal Pitts Meadow Granodiorite correlates with Boulder Creek Granite. Late syntectonic mesokatazonal Vernal Mesa Quartz Monzonite lacks a Front Range counterpart but is widespread on the Uncompahgre uplift. Late syntectonic to posttectonic Curecanti Quartz Monzonite correlates with Silver Plume .Granite and cuts earlier lamprophyre dikes. Diabase (Cambrian or Ordovician) was injected into west-northwest-trending fractures in the Black Canyon at about the same time that sandstone dikes were injected into northwest-trending fractures in the Front Range.
The Gunnison River, in eroding its Black Canyon across,·the ·Gunnison uplift, has exposed a 50-mile-long sectJion of Precambrian metamorphic and igneous rocks that are concealed in adjacent areas beneath yom1ger form·ations. Precambrian rocks crop out eastward from the Black Canyon to the Sawatch Range-a distance of about 50 miles--but to the north, west, and south they are deeply buried except for exposures in the White River, Uncompahgre, and San Juan uplifts 40-60 miles away (fig. 1). The canyon, therefore, provides a centrally located "window" into the basement geology of a very wide region. Correlations of Black Canyon rocks, based on petrography and isotopic studies, are now possible with rocks of some of the rubove areas in addition to the well-known plutonic sequence of the Front R·ange.
Radiometric ages have been obtained on six suites of rocks widely distributed areally and representative of most major lithologic basement-rock groups in the canyon (fig. 1) . Most of these rocks have been described before (Hunter, 1925; Hansen, 1964, 1965). The geo-
C80
logy of the area has recently been mapped by Hansen and a m·ap is now being prepared for publication.
G:EOLOGIC SETTING
The Gunnison uplift came into being as a structuralphysi~graphic element during the Laramide orogeny. Block uplift proceeded along preexisting· fault lines. Broad gentle warping and sharp local flexing accompanied renewed movements on the faults. Early Tertiary erosion subsequently reduced the uplift to a low rolling plain, partly stripping away the l\1esozoic cover and exposing the Precambrian basement. Low scarps remained along some faults. The entire area then was buried beneath a thick accumulation of middle Tertiary (Oligocene and Miocene) pyroclastic rocks and gravel. Finally, the Gunnison River-in a superposed course-entrenched itself down through the volcanic cover, through the remaining Mesozoic rocks, and into the crystalline core of the uplift, where it cut the present canyon.
Metamorphic rocks of medium to high grade have been deformed into close-limbed, generally plunging folds 4-15 miles across, but of m1determined lengths, trending generally northward. Dips mostly are steep, ranging commonly from 60° to 90° and flattening only in the vicinity of anticlinal axes. Thick sequences of rock are interpreted as being overturned. Igneous activity accompanied and succeeded deformation.
Many bodies of pre-Tertiary igneous rock intrude the metamorphic complex, including several large plutonsone probably of batholithic size-and many smaller ones, countless dikes and sills of ,pegmatite, and a few dikes of diabase and lamprophyre. Environments of emplacement (Buddington, 1959) ranged from syntectonic to posttectonic at kata.zonal to epimesozonal depths. In general, the older the rock, the deeper was the environment of emplacement. Progressive degradation of the earth's crust during the long time span represented by these rocks is thus indicated.
U.S. GEOL. SURVEY PROF. PAPER 600-C, PAGES C80-C90
-~.
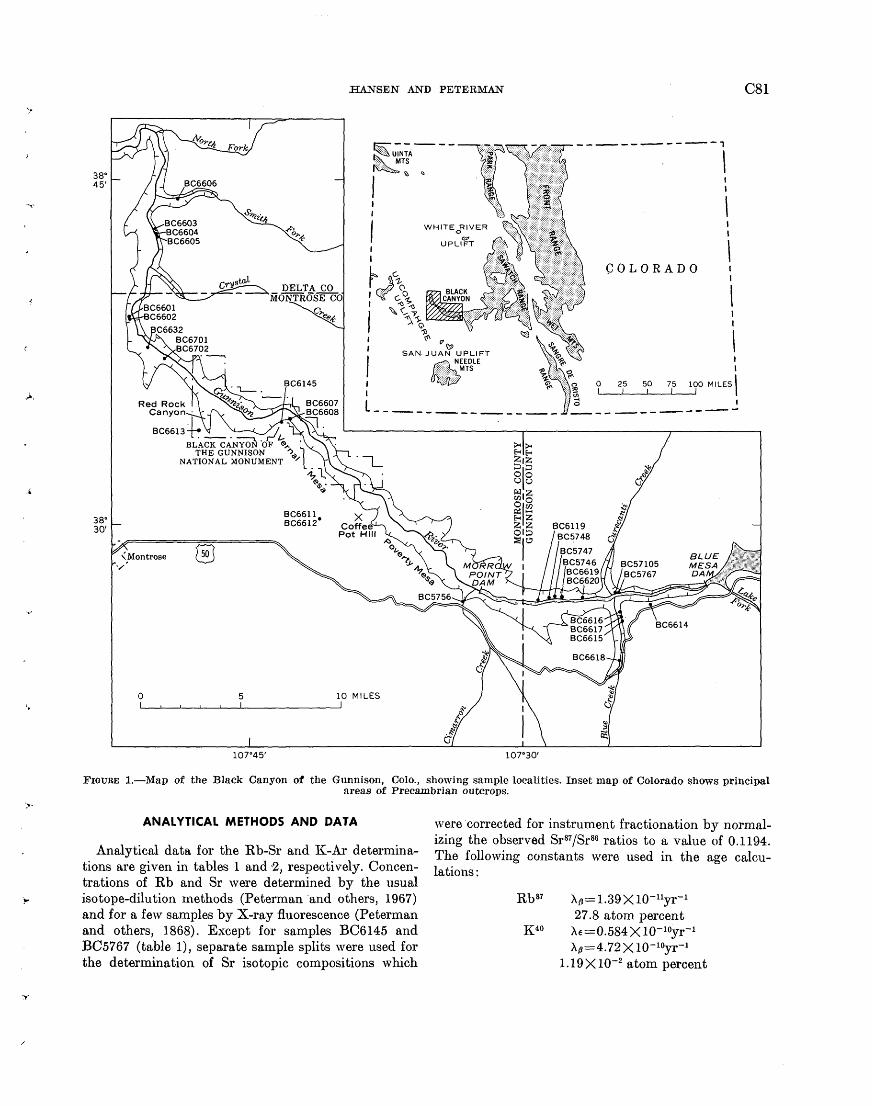
,.A.,
38" 45'
38" 30'
0 5
107"45'
HANSEN AND PETERMAN
I I
~~~·-.. --
'
11~ SAN JUAN UPLIFT
1{~~\~LE
L ____________ _
10 MILES
107"30'
-------------, \
COLORADO
I I
\
I I
·:::::: ~ 0 25 50 75 100 MILES\
i~ ____________ ..!
C81
FIGURE 1.-:Map of the Black Canyon CYt the Gunnison, Colo., showing sample localities. Inset map of Colorado shows principal areas of Precambrian outcrops.
ANALYTICAL METHODS AND DATA
Analytical data for the Rb-Sr and IC-Ar determinations are given in tables 1 and ·2, respectively. Concentrations of Rb and Sr were determined by the usual isotope-dilution methods (Peterman ·and others, 1967) and for a few samples by X-ray fluorescence (Peterman and others, 1868). Except for samples BC6145 and BC5767 (table 1), separate sample splits were used for the determination of Sr isotopic compositions which
were corrected for instrument fractionation by normalizing the observed Sr87/Sr86 ratios to a value of 0.1194. The following constants were used in the age calculations:
Rb87 AtJ= 1.39 X Io-uyr-1
27.8 atom percent K 40 A.e=0.584 X 10⁻¹⁰yr-1
Ap=4.72X10⁻¹⁰yr-1
1.19Xl0-2 atom percent
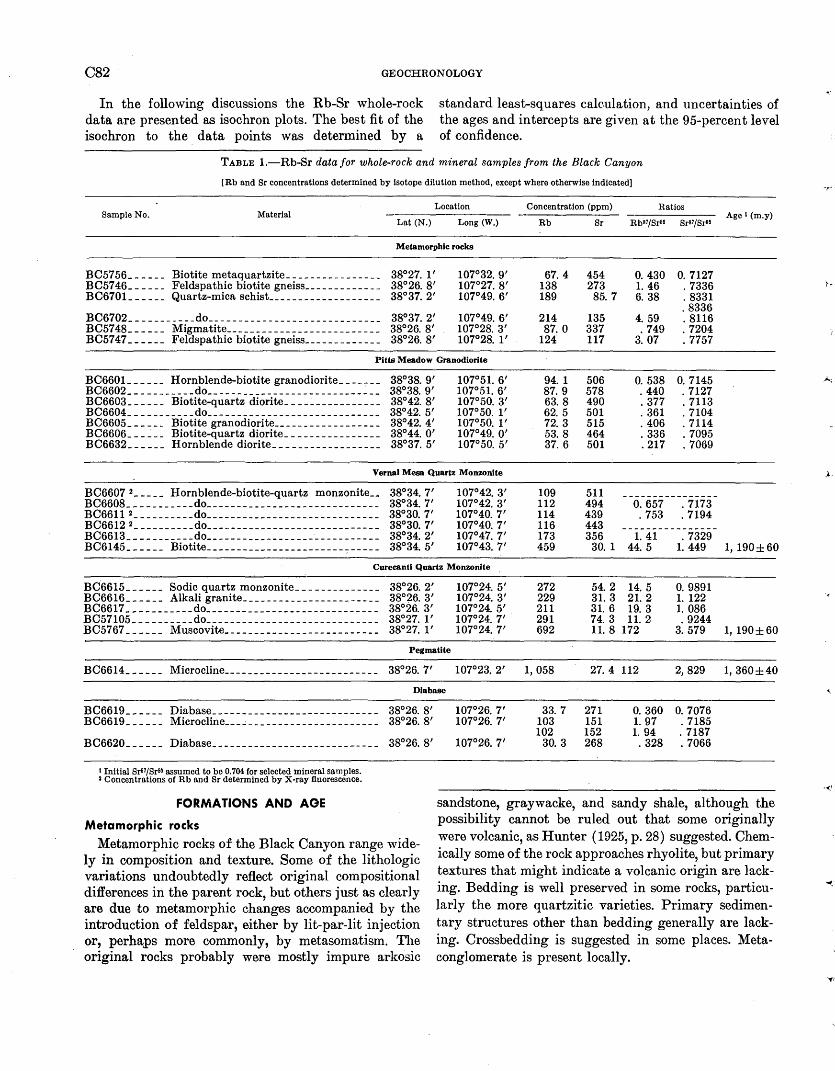
C82 GEOCHRONOLOGY
In the following discussions the Rb-Sr whole-rock data a.re presented as isochron plots. The best fit of the isochron to the data points was determined by a
standard least-squares caleulation, and uncertainties of the ages and intercepts are given at the 95-percent level of confidence.
TABLE 1.-Rb-Sr data for whole-rock and mineral samples from the Black Canyon
[Rb and Sr concentrations determined by isotope dilution method, except where otherwise indicated]
Location Concentration (ppm) Ratios Material Sample No.
Lat (N.) Long (W.) Rb Sr RbB7fSrBe SrB7/Srse Age 1 (m.y)
Metamorphic rocks
BC5756_ _ _ _ _ _ Biotite metaquartzite_ _ _ _ _ _ _ _ _ _ _ _ _ _ _ _ 38°27. 1' BC5746 ______ Feldspathic biotite gneiss_____________ 38°26. 8' BC670L _____ Quartz-mica schist ___________________ 38°37. 2'
BC6702 ___________ do __ -__________________________ 38°37. 2' BC5748 ______ Migmatite ___________________ ------- 38°26. 8' BC5747 ______ Feldspathic biotite gneiss _____________ 38°26. 8'
107°32. 9' 107°27. 8' 107°49. 6'
107°49. 6' 107°28. 3' 107°28. 1'
67. 4 138 189
214 87.0
124
454 0. 430 0. 7127 273 1. 46 . 7336
85. 7 6. 38 . 8331 . 8336
135 4. 59 . 8116 337 . 749 . 7204 117 3. 07 . 7757
Pitts Meadow Granodiorite
BC6601_ _ _ _ _ _ Hornblende-biotite granodiorite ____ .,.__ 38°38. 9' BC6602 ___________ do _________________________ ---- 38°38. 9' BC6603 ______ Biotite-quartz diorite _______________ , 38°42. 8' BC6604 ___________ do_____________________________ 38°42. 5' BC6605 ______ Biotite granodiorite __________________ 38°42. 4' BC6606 ___ ~ _ _ Biotite-quartz diorite________________ 38°44. 0' BC6632 ______ Hornblende diorite__________________ 38°37. 5'
107°51. 6' 107°51. 6' 107°50. 3' 107°50. 1' 107°50. 1' 107°49. 0' 107°50. 5'
94. 1 87. 9 63. 8 62. 5 72. 3 53. 8 37. 6
506 0. 538 0. 7145 578 . 440 . 7127 490 . 377 . 7113 501 . 361 . 7104 515 . 406 . 7114 464 . 336 . 7095 501 . 217 . 7069
Vernal Mesa Quartz Monzonite
BC6607 2 _____ Hornblende-biotite-quartz monzonite__ 38°34. 7' BC6608 ___________ do __________________ ----------_ 38°34. 7' BC6611 2 __________ do _____________________________ 38°30. 7' BC6612 2 __________ do _____________________________ 38°30. 7' BC6613 ___________ do ______ ----___________________ 38°34. 2' BC6145 ______ Biotite _____________________________ 38°34. 5'
107°42. 3' 107°42. 3' 107°40. 7' 107°40. 7' 107°47. 7' 107°43. 7'
109 112 114 116 173 459
511 494 439 443 356
30. 1
----------------0. 657 . 7173
. 753 . 7194 ----------------1. 41 . 7329 44. 5 1. 449 1,190±60
Curecanti Quartz Monzonite
BC6615 ______ Sodic quartz monzonite______________ 38°26. 2' BC6616 ______ Alkali granite_______________________ 38°26. 3' BC6617 ___________ do_____________________________ 38°26. 3' BC57105 __________ do _________________ ----- __ ----_ 38°27. 1' BC5767 ______ Muscovite __________________________ 38°27. 1'
107°24. 5' 107°24. 3' 107°24. 5' 107°24. 7' 107°24. 7'
272 229 211 291 692
54. 2 14. 5 0. 9891 31. 3 21. 2 1. 122 31. 6 19. 3 1. 086 74. 3 11. 2 . 9244 11. 8 172 3. 579 1, 190±60
Pegmatite
BC6614 ______ Microcline __________________________ 38°26. 7' 1,058 27. 4 112 2,829 1, 360±40
Diabase
BC6619 ______ Diabase ____________________________ 38°26. 8' BC6619 ______ Microcline ___ ..: ______________________ 38°26. 8'
BC6620 ______ Diabase ____________________________ 38°26. 8'
1 Initial SrB7/Srs6 assumed to be 0.704 for selected mineral samples. 2 Concentrations of Rb and Sr determined by X-ray fluorescence.
FORMATIONS AND AGE
Metamorphic rocks
Metamorphic rocks of the Black Canyon range widely in composition and texture. Some of the lithologic variations undoubtedly reflect original compositional differences in the parent rock, but others just as clearly are due to metamorphic changes accompanied by the introduction of feldspar, either by lit-par-lit injection or, perhaps more commonly, by metasomatism. The original rocks probably were mostly impure arkosic
107°26. 7' 107°26. 7'
107°26. 7'
33. 7 103 102
30.3
271 151 152 268
0. 360 0. 7076 1. 97 . 7185 1. 94 . 7187
. 328 . 7066
sandstone, graywacke, and sandy shale, although the possibility cannot be ruled out that some originally were volcanic, as Hunter (1925, p. 28) suggested. Chemically some of the rock approaches rhyolite, but primary textures that might indicate a volcanic origin are lacking. Bedding is well preserved in some rocks, particularly the more quartzitic varieties. Primary sedimentary structures other than bedding generally are lacking. Crossbedding is suggested in some places. Metaconglomerate is present locally.
-.,-
.J._
"(
~
-o(,l
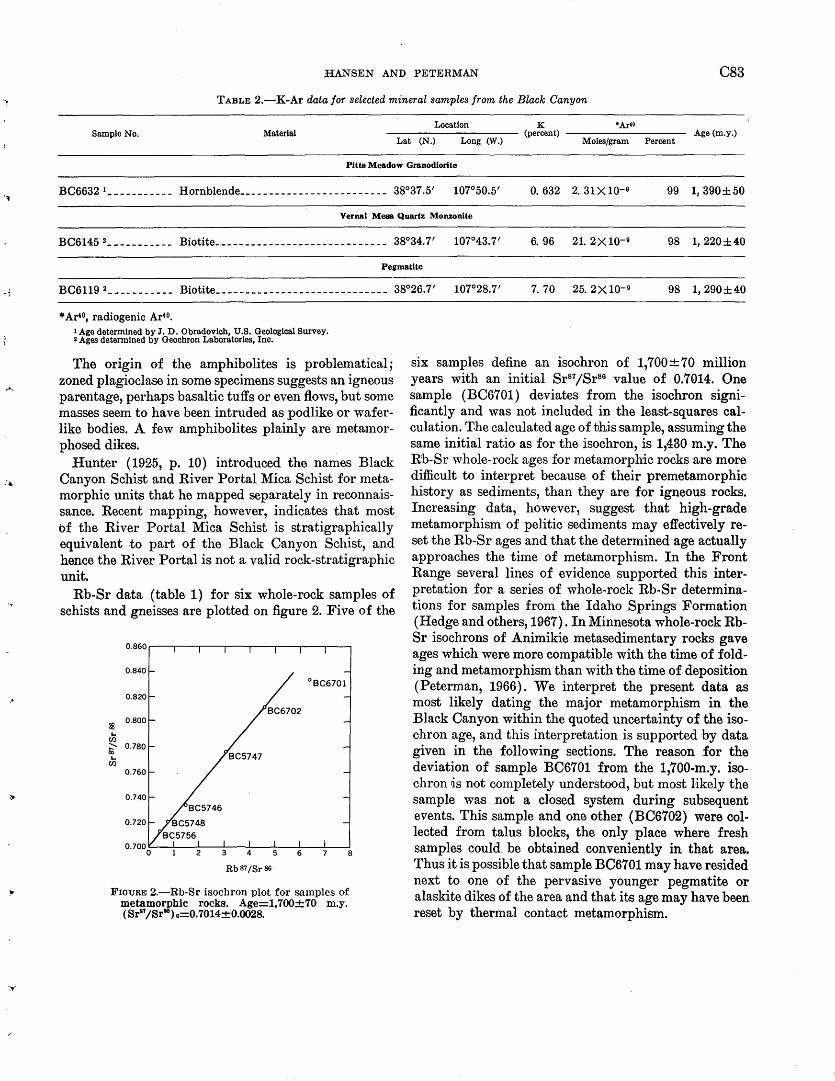
.....
.;
HANSEN AND PETERMAN C83
TABLE 2.-K-Ar data for selected mineral samples from the Black Canyon
Sample No. Material Location K
---------(percent)-------- Age(m.y.) Lat (N .) Long (W .) Moles/gram Percent
•Arto
Pitts Meadow Granodiorite
BC6632 1----'------- Hornblende _________________________ 38°37.5' 107°50.5' 0. 632 2. 31 X lQ-9 99 1, 390±50
Vernal Mesa Quartz Monzonite
BC6145 2----------- Biotite----------------------------- 38°34.7' 107°43.7' 6. 96 21. 2X lQ-9 98 1, 220±40
Pegmatite
BC6119 2 _-- ________ Biotite ____ - ________________________ 38°26.7' 107°28.7' 7. 70 25. 2 X lQ-9 98 1, 290±40
* Ar4°, radiogenic Ar•o. 1 Age determined by J.D. Obradovich, U.S. Geological Survey. 2 Ages determined by Geochron Laboratories, Inc.
The origin of the amphibolites is problematical; zoned plagioclase in some specimens suggests an igneous parentage, perhaps basaltic tuffs or even flows, but some masses seem to have been intruded as pod like or waferlike bodies. A few amphibolites plainly are metamorphosed dikes.
Hunter (1925, p. 10) introduced the names Black Canyon Schist and River Portal Mica Schist for metamorphic units that he mapped separately in reconnaissance. Recent mapping, however, indicates that most of the River Portal Mica Schist is stratigraphically equivalent to part of the Black Canyon Schist, and hence the River Portal is not a valid rock-stratigraphic unit.
Rb-Sr data (table 1} for six whole-rock samples of schists and gneisses are plotted on figure 2. Five of the
Rb87fSr 86
FIGURE 2.-Rb-Sr isochron plot for samples of metamorphic rocks. Age=1,700±70 m.y. ( Sr8'/Sr16
) o=O. 7014±0.0028.
six samples define an isochron of 1,700±70 million years with an initial Sr87/Sr86 value of 0.7014. One sample (BC6701) deviates from the isochron significantly and was not included in the least-squares calculation. The calculated age of this sample, assuming the same initial ratio as for the isochron, is 1,430 m.y. The Rb-Sr whole-rock ages for metamorphic rocks are more difficult to interpret because of their premetamorphic history as sediments, than they are for igneous rocks. Increasing data, however, suggest that high-grade metamorphism of pelitic sediments may effectively reset the Rb-Sr ages and that the determined age actually approaches the time of metamorphism. In the Front Range several lines of evidence supported this interpretation for a series of whole-rock Rb-Sr determinations for samples from the Idaho Springs Formation (Hedge and others, 1967). In Minnesota whole-rock RbSr isochrons of Animikie metasedimentary rocks gave ages which were more compatible with the time of folding and metamorphism than with the time of. deposition (Peterman, 1966). We interpret the present data as most likely dating the major metamorphism in the Black Canyon within the quoted uncertainty of the isochron age, and this interpretation is supported hy data given in the following sections. The reason for the deviation of sample BC6701 from the 1,700-m.y. isochron ~s not completely understood, but most likely the sample was not a closed system during subsequent events. This sample and one other (BC6702) were collected from talus blocks, the only place where fresh samples could be obtained conveniently in that area. Thus it is possible that sample BC6701 may have resided next to one of the pervasive younger pegmatite or alaskite dikes of the area and that its age may have been reset by thermal contact metamorphism.
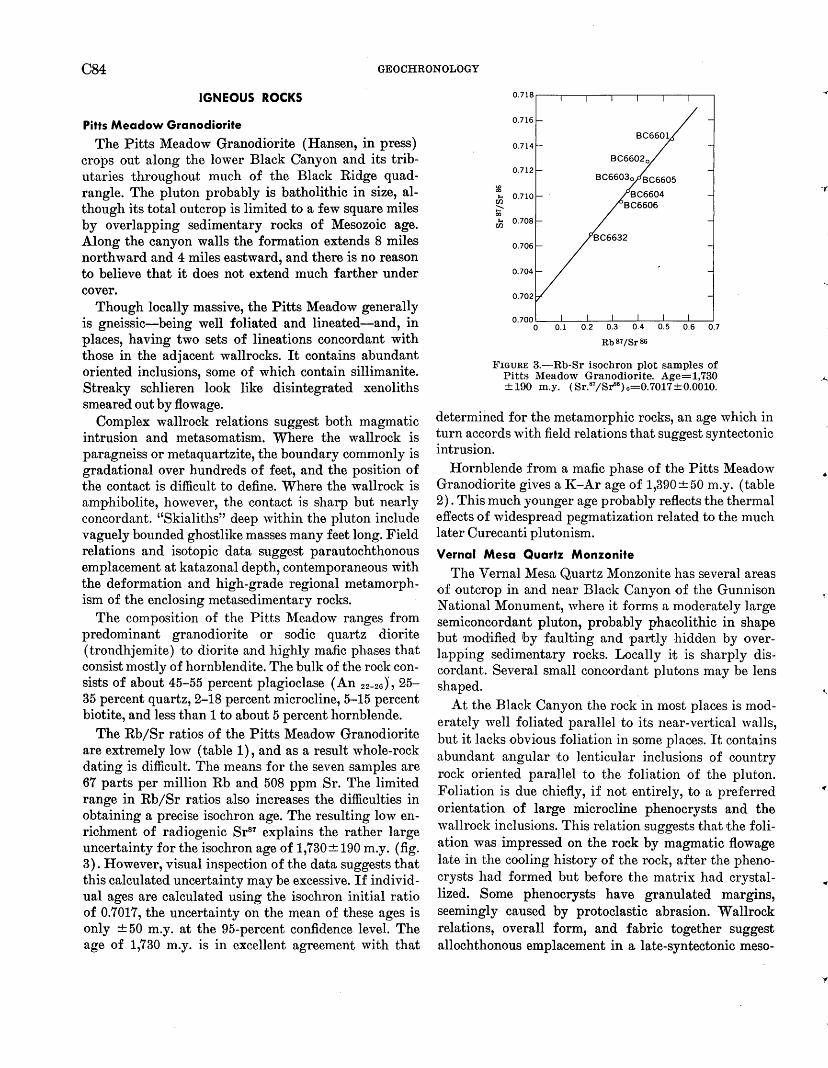
C84 GEOCHRONOLOGY
IGNEOUS ROCKS
Pitts Meadow Granodiorite
The Pitts Meadow Granodiorite (Hansen, in press) crops out along the lower Black Canyon and its tributaries throughout much of the Black Ridge quadrangle. The pluton probably is batholithic in size, although its total outcrop is limited to a few square miles by overlapping sedimentary rocks of Mesozoic age. Along the canyon walls the formation extends 8 miles northward and 4 miles eastward, and there is no reason to believe that it does not extend much farther under cover.
Though locally massive, the Pitts Meadow generally is gneissic-being well foliated and lineated-and, in places, having two sets of lineations concordant with those in the adjacent wallrocks. It contains abundant oriented inclusions, some of which contain sillimanite. Streaky schlieren look like disintegrated xenoliths smeared out by flowage.
Complex wallrock relations suggest both magmatic intrusion and metasomatism. Where the wallrock is paragneiss or metaquartzite, the boundary commonly is gradational over hundreds of feet, and the position of the contact is difficult to define. Where the wallrock is amphibolite, however, the ·contact is sharp but nearly concordant. "Skialiths" deep within the pluton include vaguely bounded ghostlike masses many feet long. Field relations and isotopic data suggest parautochthonous emplacement at katazonal depth, contemporaneous with the deformation and high-grade regional metamorphism of the enclosing metasedimentary rocks.
The composition of the Pitts Meadow ranges from predominant granodiorite or sodic quartz diorite (trondhjemite) to diorite and highly mafic phases that consist mostly of hornblendite. The bulk of the rock consists of about 45-55 percent plagioclase (An 22_26 ), 25-35 percent quartz, 2-18 percent microcline, 5-15 percent biotite, and less than 1 to about 5 percent hornblende.
The Rb/Sr ratios of the Pitts Meadow Granodiorite are extremely low (table 1), and as a result whole-rock dating is difficult. The means for the seven samples are 67 parts per million Rb and 508 ppm Sr. The limited range in Rb/Sr ratios also increases the difficulties in obtaining a precise isochron age. The resulting low enrichment of radiogenic Sr87 explains the rather large uncertainty for the isochron age of 1,730±190 m.y. (fig. 3). However, visual inspection of the data suggests that this calculated uncertainty may be excessive. If individual ages are calculated using the isochron initial ratio of 0.7017, the uncertainty on the mean of these ages is only ±50 m.y. at the 95-percent confidence level. The age of 1,730 m.y. is in excellent agreement with that
Rb87/Sr86
FIGURE 3.-Rb-Sr isochron plot samples of Pitts Meadow Granodiorite. Age=1,730 ± 190 m.y. (Sr. 87 /Sr86
) o=O. 7017 ± 0.0010.
determined for the metamorphic rocks, an age which in turn accords with field relations that suggest syntectonic intrusion.
Hornblende from a mafic phase of the Pitts Meadow Granodiorite gives a l(-Ar age of 1,390±50 m.y. (table 2). This much younger age probably reflects the thermal effects of widespread pegmatization related to the much later Curecanti plutonism.
Vernal Mesa Quartz Monzonite
The Vernal Mesa Quartz Monzonite has several areas of outcrop in and near Black Canyon of the Gunnison National Monument, where it forms a moderately large semiconcordant pluton, probably phacolithic in shape but modified iby faulting and ·partly hidden by overlapping sedimentary rocks. Locally it is sharply discordant. Several small concordant plutons may be lens shaped.
At the Black Canyon the rock in most places is moderately well foliated parallel to its near-vertical walls, but it lacks obvious foliation in some places. It contains abundant angular •to lenticular inclusions of country rock oriented parallel to the foliation of the pluton. Foliation is due chiefly, if not entirely, to a preferred orientation of large microcline phenocrysts and the wallrock inclusions. This relation suggests that the foliation was impressed on the rock by magmatic flowage late in the cooling history of the rock, after the phenocrysts had formed but before the matrix had crystallized. Some phenocrysts have granulated margins, seemingly caused by protoclastic abrasion. Wallrock relations, overall form, and fabric together suggest allochthonous emplacement in a late-syntectonic meso-
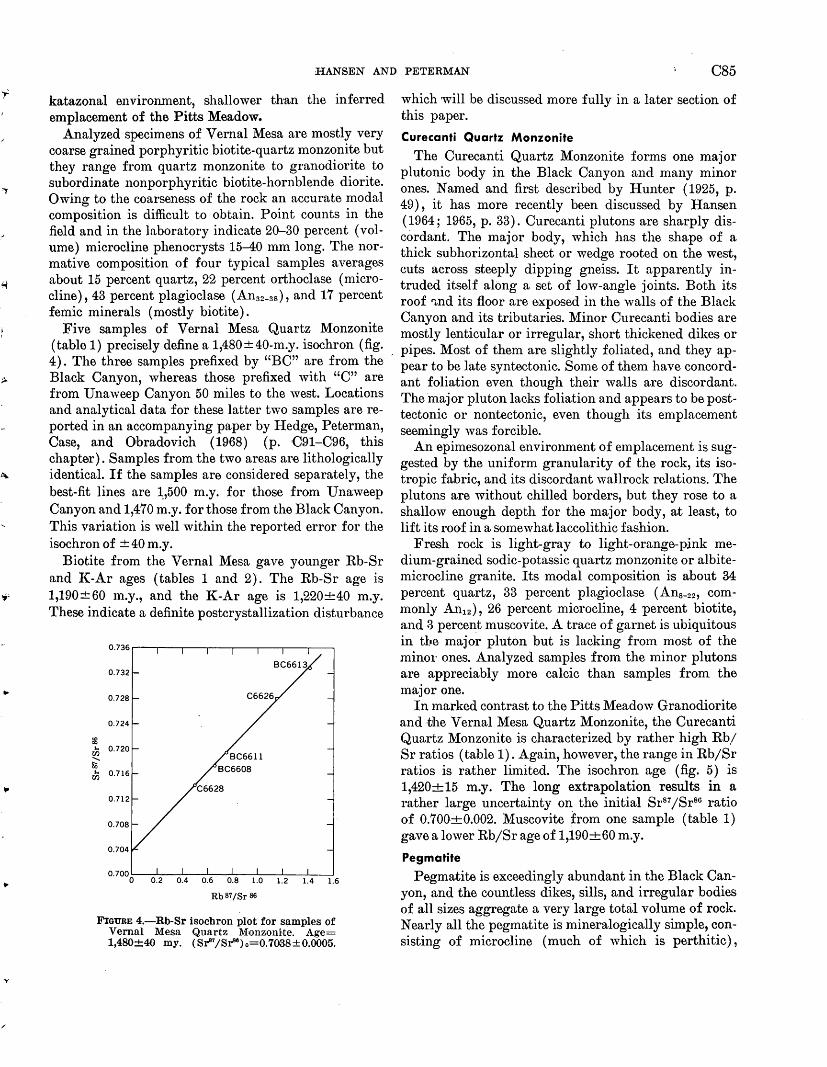
y
HANSEN AND PETERMAN C85
katazonal envirorunent, shallower than the inferred emplacement of the Pitts Meadow.
Analyzed specimens of Vernal Mesa are mostly very coarse grained porphyritic biotite-quartz monzonite but they range from quartz monzonite to granodiorite to subordinate non porphyritic biotite-hornblende diorite. Owino- to the coarseness of the rock an accurate modal comp~sition is difficult to obtain. Point counts in the field and in the laboratory indicate 20-30 percent ( volume) microcline phenocrysts 15-40 mm long. The normative composition of four typical samples averages about 15 percent quartz, 22 percent orthoclase (microcline), 43 percent plagioclase ( An32-as), and 17 percent fernie minerals (mostly biotite).
Five samples of Vernal Mesa Quartz Monzonite (table 1) precisely define a 1,480±40-m.y. isochron (fig. 4). The three samples prefixed by "BC" are from the Black Canyon, whereas those prefixed with "C" are from Una weep Canyon 50 miles to the west. Locations and analytical data for these latter two samples are reported in an accompanying paper by Hedge, Peterman, Case, and Obradovich (1968) (p. C91-C96, this chapter). Samples from the two areas are lithologically identical. If the samples are considered separately, the best-fit lines are ~,500 m.y. for those from Unaweep Canyon and 1,470 m.y. for those from the Black Canyon. This variation is well within the reported error for the isochron of ±40 m.y.
Biotite from the Vernal Mesa gave younger Rb-Sr and 1\:-Ar ages (tables 1 and 2). The Rb-Sr age is 1,190±60 m.y., and the K-Ar age is 1,220+40 m.y. These indicate a definite postcrystallization disturbance
Rb87/Sr 86
FIGURE 4.-Rb-Sr isochron plot for samples of Vernal Mesa Quartz MonzonHe. Age= 1,480±40 my. (Sr'"/SJ:"'lG)o=0.7038±0.0005.
which will be discussed more fully in a later section of this paper.
Curecanti Quartz Monzonite
The Curecanti Quartz Monzonite forms one major plutonic body in the Black Canyon and many minor ones. Named and first described by Hunter (1925, p. 49) , it has more recently been discussed by Hansen ( 1964; 1965, p. 33). Curecanti plutons are sharply discordant. The major body, which has the shape of a thick subhorizontal sheet or wedge rooted on the west, cuts across steeply dipping gneiss. It apparently intruded itself along a set of low-angle joints. Both its roof '"'"nd its floor are exposed in the walls of the Black Canyon and its tributaries. Minor Curecanti bodies are mostly lenticular or irregular, short thickened dikes or
, pipes. Most of them are slightly foliated, and they appear to be late syntectonic. Some of them have concordant foliation even though their walls are discordant. The major pluton lacks foliation and appears to be posttectonic or nontectonic, even though its emplacement seemingly was forcible.
An epimesozonal envirorunent of emplacement is suggested by the uniform granularity of the rock, its isotropic fabric, and its discordant wallrock relations. The plutons are without chilled borders, but they rose to a shallow enough depth for the major body, at least, to lift its roof in a somewhat laccolithic fashion.
Fresh rock is light-gray to light-orange-pink medium-grained sodic-potassic quartz monzonite or albitemicrocline granite. Its modal composition is about 34 percent quartz, 33 percent plagioclase ( Ans-22, commonly An12) , 26 percent microcline, 4 percent biotite, and 3 percent muscovite. A trace of garnet is ubiquitous in the major pluton but is lacking from most of the minot· ones. Analyzed samples from the minor plutons are appreciably more calcic than samples from the major one.
In marked contrast to the Pitts Meadow Granodiorite and ,tJhe Vernal Mesa Quartz Monzonite, the Curecanti Quartz Monzonite is characterized by rather high Rb/ Sr ratios (table 1). Again, however, the range in Rb /Sr ratios is rather limited. The isochron age (fig. 5) is 1,420+15 m.y. The long extrapolation results in a rather large uncertainty on the initial Sr87 /Sr86 ratio of 0.700+0.002. Muscovite from one sample (table 1) gave a lower Rb/Sr age of 1,190+60 m.y.
Pegmatite
Pegmatite is exceedingly abundant in the Black Canyon, and the countless dikes, sills, and irregular bodies of all sizes aggregate a very large total volume of rock. Nearly all the pegmatite is mineralogically simple, consisting of microcline (much of which is perthitic),
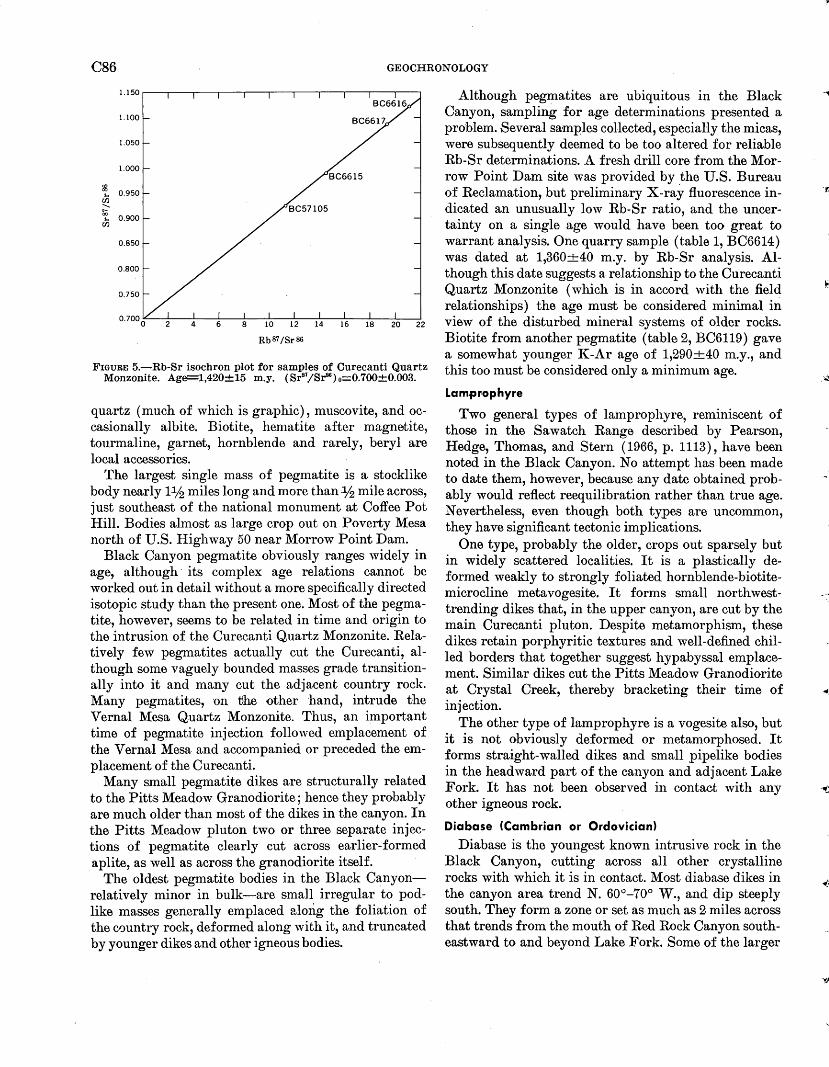
C86 GEOCHRONOLOGY
1.150
1.100
1.050
1.000
~ 0.950 ,...
r:n ...... fiO
0.900 ,... r:n
0.850
0.800
0.750
Rb87fSr86
FIGURE 5.-Rb-Sr isochron plot for samples of Curecanti Quartz Monzonite. Age=l,420±15 m.y. (Sr87/SJ:"'l6)o=0.700±0.003.
quartz (much of which is graphic), muscovite, and occasionally albite. Biotite, hematite after magnetite, tourmaline, garnet, hornblende and rarely, beryl are local accessories.
The largest single mass of pegmatite is a stocklike body nearly 1.112 miles long and more than·¥2 mile across, just southeast of the national monument at Coffee Pot Hill. Bodies almost as large crop out on Poverty Mesa north of U.S. Highway 50 near ~{orrow Point Dam.
Black Canyon pegmatite obviously ranges widely in age, although· its complex age relations cannot be worked out in detail without a more specifically directed isotopic study than the present one. Most of the pegmatite, however, seems to be related in time and ?rigin to the intrusion of the Curecanti Quartz Monzorute. Relatively few pegmatites actually cut the Curecanti, although some vaguely bounded masses grade transitionally into it and many cut the adjacent country rock. Many pegmatites, on tlhe other hand, intrude the Vernal Mesa Quartz Monzonite. Thus, an important time of pegmatite injection followed emplacement of the Vernal Mesa and accompanied or preceded the emplacement of the Curecanti.
Many small pegmatite dikes are structurally related to the Pitts Meadow Granodiorite; hence they probably are much older than most of the dikes in the canyon. In the Pitts Meadow pluton two or three separate injections of pegmatite clearly cut across earlier-formed aplite, as well as across the granodiorite itself. ·
The oldest pegmatite bodies in the Black Canyonrelatively minor in bulk-are small irregular to podlike masses generally emplaced a1orig the foliation of the c0untry rock, deformed along with it, and truncated by younger dikes and other igneous bodies.
Although pegmatites are ubiquitous in the Black Canyon, sampling for age determinations presented a problem. Several sa·mples collected, especially the micas, were subsequently deemed to be too altered for reliable Rb-Sr determinations. A fresh drill core from the Morrow Point Dam site was provided by .the U.S. Bureau of Reclamation, but preliminary X-ray fluorescence indicated an unusually low Rb-Sr ratio, and the uncertainty on a single age would have been too great to warrant analysis. One quarry sample (table 1, BC6614) was dated at 1,360+40 m.y. by Rb-Sr analysis. Although this date suggests a relationship to the Curecanti Quartz Monzonite (which is in accord with the field relationships) the age must be considered minimal in view of the disturbed mineral systems of older rocks. Biotite from another pegmatite (table 2, BC6119) gave a somewhat younger K-Ar age of 1,290+40 m.y., and this too must be considered only a minimum age.
Lam.pr·ophyre
Two general types of lamprophyre, reminiscent of those in the Sawatch Range described by Pearson, Hedge, Thomas, and Stern (1966, p. 1113), have been noted in the Black Canyon. No attempt has been made to date them, however, because any date obtained probably would reflect reequilibration rather than true age. Nevertheless, even though both types are uncommon, they have significant tectonic implications.
One type, probably the older, crops out sparsely but in widely scattered localities. It is a plastically deformed weakly to strongly foliated hornblende-biotitemicrocline metavogesite. It forms small northwesttrending dikes that, in the upper canyon, are cut by the main Curecanti pluton. Despite metamorphism, these dikes retain porphyritic textures and well-defined chilled borders that together suggest hypabyssal emplacement. Similar dikes cut the Pitts Meadow Granodiorite at Crystal Creek, thereby bracketing their time of injection.
The other type of lamprophyre is a vogesite also, but it is not obviously deformed or metamorphosed. It forms straight-walled dikes and small pipelike bodies in the headward part of the canyon and adjacent Lake Fork. It has not been observed in contact with any other igneous rock.
Diabase (Cambrian or Ordovician)
Diabase is the youngest known intrusive rock in the Black Canyon, cutting across all other crystalline rocks with which it is in contact. Most diabase dikes in the canyon area trend N. 60°-70° W., and dip steeply south. They form a zone or set as much as 2 miles across that trends from the mouth of Red Rock Canyon southeastward to and beyond Lake Fork. Some of the larger
....
·-c
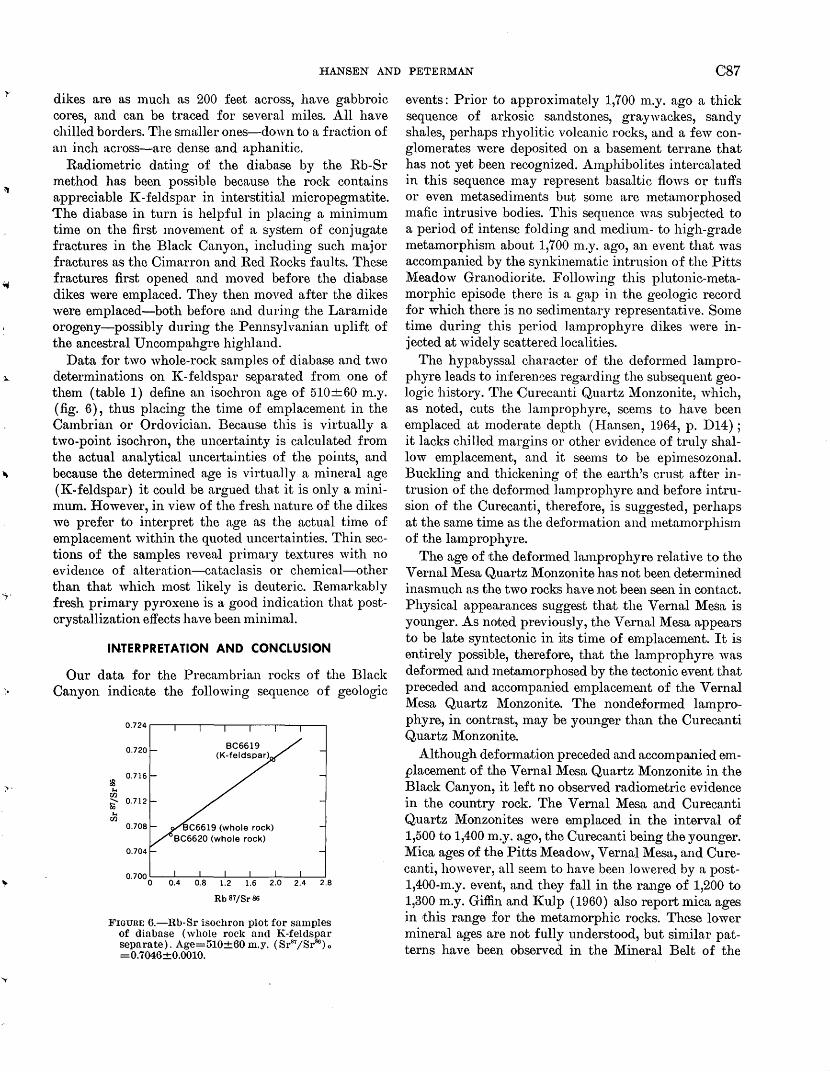
HANSEN AND PETERMAN C87
dikes are as much as 200 feet across, have gabbroic cores, and can be traced for several miles. All have chilled borders. The smaUer ones-down to a fraction of nn inch across-are dense and aphanitic.
Radiometric dating of the diabase by the Rb-Sr method has been possible because the rock contains appreciable !(-feldspar in interstitial micropegmatite. The diabase in turn is helpful in placing a minimum time on the first movmnent of a system of conjugate fractures in the Black Canyon, including such major fractures as the Cimarron and Red Rocks faults. These fractures first opened and moved before the diabase dikes were emplaced. They then moved after the dikes were emplaced-both before and during the Laramide orogeny-possibly during the Pennsylvanian uplift of the ancestral Uncompahgre highland.
Data for two whole-rock samples of diabase and two detenninations on !(-feldspar separated from one of them (table 1) define an isochron age of 510±60 m.y. (fig. 6), thus placing the time of emplacement in the Cambrian or Ordovician. Because this is virtually a two-point isochron, the uncertainty is calculated from the actual analytical uncertainties of the points, and because the determined age is virtually a mineral age (!(-feldspar) it could be argued that it is only a mini-mum. However, in view of the fresh nature of the dikes we prefer to interpret the age as the actual time of emplacement within the quoted uncertainties. Thin sections of the sa1nples reveal primary textures with no evidence of alteration-cataclasis or chemical-other than that which most likely is deuteric. Remarkably fresh primary pyroxene is a good indication that postcrystallization effects have been 1ninimal.
INTERPRETATION AND CONCLUSION
Our data for the Precambrian rocks of the Black Canyon indicate the following sequence of geologic
1:8 0.716
.... r:n ........ 0.712 &i ....
r:n 0.708
0.704
Rb87/Sr86
FwuuE 6.-Rb-Sr isochron plot for samples of diabase (whole rock and K-feldspar separate). Age=510±60 m.y. ( Sr87/Sr86
) o
=0.7046±0.0010.
events: Prior to approximately 1,700 m.y. ago a thick sequence of arkosic sandstones, graywackes, sandy shales, perhaps rhyolitic volcanic rocks, and a few conglomerates were deposited on a basement terrane that has not yet been recognized. Am,ph.ibolites intercalated in this sequence may represent basaltic flows or tuffs or even metasediments but smne are 1netamorphosed mafic intrusive bodies. This sequence was subjected to a period of intense folding and 1nedium- to high-grade metamorphis1n about 1,700 m.y. ago, an event that was accompanied by the synkinematic intrusion of the Pitts Meadow Granodiorite. Following this plutonic-metamorphic episode there is a gap in the geologic record for which there is no sedimentary representative. Some time during this period lamprophyre dikes ·were injected at widely scattered localities.
The hypabyssal character of the deformed lmnprophyre leads to inferen!;eS regarding the subsequent geologic 'history. The Curecanti Quartz Monzonite, which, as noted, cuts the lamprophyre, seems to have been emplaced at moderate depth (Hansen, 1964, p. D14); it lacks chilled margins or other evidence of truly shallow emplacement, and it seems to be epimesozonal. Buckling and thickening of the earth's crust after intrusion of the deformed lamprophyre and before intrusion of the Curecanti, therefore, is suggested, perhaps at the same time as the deformation and metamorphism of the lamprophyre.
The age of the deformed lmnprophyre relative to the Vernal Mesa Quartz Monzonite has not been determined inasmuch as the two rocks have not been seen in contact. Physical appearances suggest that the Vernal Mesa is younger. As noted previously, the Vernal Mesa appears to be late syntectonic in i.ts time of emplacement. It is entirely possible, therefore, that the lamprophyre was deformed and metamorphosed by the tectonic event that preceded and accompanied emplacemm1t of the Vernal Mesa Quartz ~fonzonite. The nonde:f-ormed lalllprophyre, in contrast, may be yow1ger than the Curecanti Quartz Monzonite.
Although deformation preceded and a.ccompanied emplacement of the Vernal Mesa Quartz Monzonite in the Black Canyon, it left no observed radiometric evidence in the country rock. The Vernal Mesa and Curecanti Quartz Monzonites were empla.ced in the interval of 1,500 to 1,400 m.y. ago, the Curecanti being the younger. Mica ages of the Pitts Meadow, Vernal Mesa, and Curecanti, however, all seem to have been lowered by a post-1,400-m.y. event, and they fall in the range of 1,200 to 1,300 m.y. Giffin and Kulp (1960) also report mica ages in this range for the metamorphic rocks. These lower mineral ages are not fully understood, but similar patterns have been observed in the Mineral Belt of the
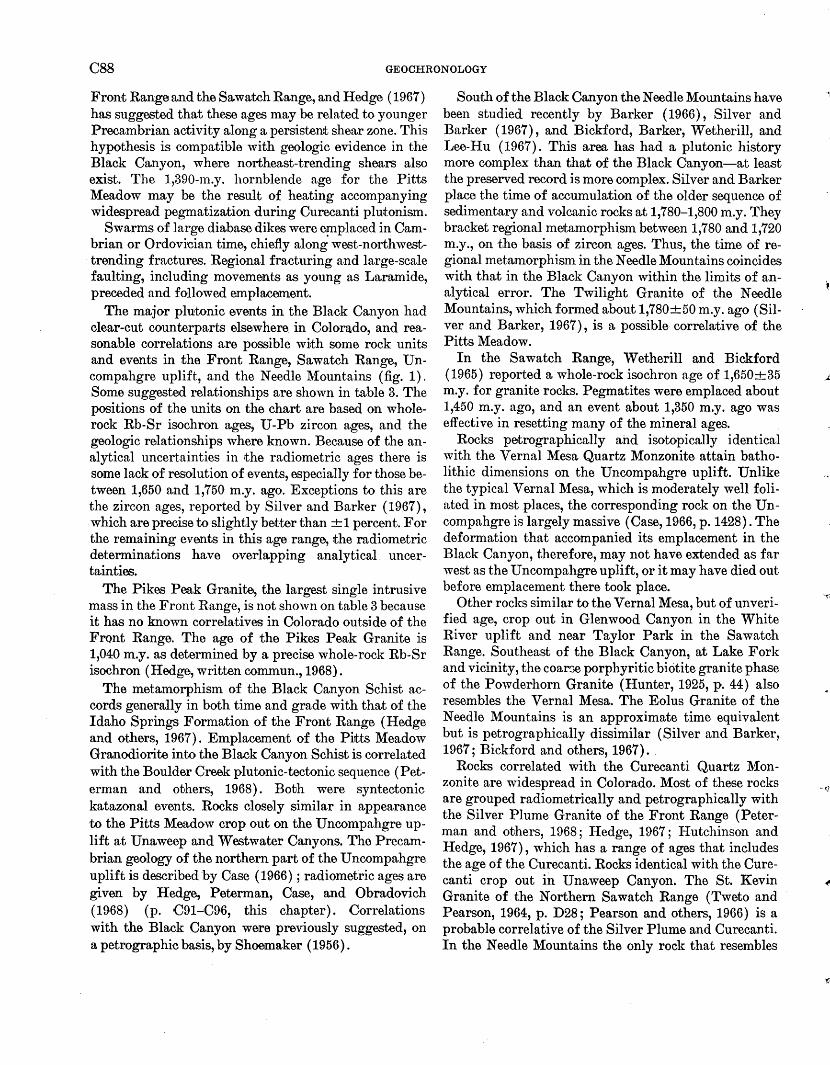
C88 GEOCHRONOLOGY
Front Range and the Sa watch Range, and Hedge (1967) has suggested that these ages may be related to younger Precambrian activity along a persistent shear zone. This hypothesis is compatible with geologic evidence in the Black Canyon, where northeast-trending shears also exist. The 1,390-m.y. hornblende age for the Pitts Meadow may be the result of heating accompanying widespread pegmatization during Curecanti plutonism.
Swarms of large diabase dikes were emplaced in Cambrian or Ordovician time, chiefly along west-northwesttrending fractures. Regional fracturing and large-scale faulting, including movements as young as La,ramide, preceded and followed emplacement.
The major plutonic events in the Black Canyon had clear-cut counterparts elsewhere in Colorado, and reasonable correlations are possible wi:th some rock units and events in the Front Range, Sawatch Range, Uncompahgre uplift, and the Needle Mountains (fig. 1). Some suggested relationships are shown in table 3. The positions of the units on the chart are based on wholerock Rb-Sr isochron ages, U-Pb zircon ages, and the geologic relationships where known. Because of the analytical uncertainties in the radiometric ages there is some lack of resolution of events, especially for those between 1,650 and 1,750 m.y. ago. Exceptions to this are the zircon ages, reported by Silver and Barker (1967), which are precise to slightly better than +1 percent. For the remaining events in this age range, the radiometric determinations have overlapping analytical uncertainties.
The Pikes Peak Granite, the largest single intrusive mass in the Front Range, is not shown on table 3 because it has no known correlatives in Colorado outside of the Front Range. The age of the Pikes Peak Granite is 1,040 m.y. as determined by a precise whole-rock Rb-Sr isochron (Hedge, written commun., 1968).
The metamorphism of the Black Canyon Schist accords generally in both time and grade with that of the Idaho Springs Formation of the Front Range (Hedge and others, 1967). Emplacement of the Pitts Meadow Granodiorite into the Black Canyon Schist is correlated with the Boulder Creek plutonic-tectonic sequence (Peterman and others, 1968). Both were syntectonic katazonal events. Rocks closely similar in appearance to the Pitts Meadow crop out on the Uncompahgre uplift at Unaweep and Westwater Canyons. The Precambrian geology of the northern part of the Uncompahgre uplift is described 'by Case ( 1966) ; radiometric ages are given by Hedge, Peterman, Case, and Obradovich (19,68) (p. C91-'C9·6, this chapter). Correlations with the Black Canyon were previously suggested, on a petrographic basis, by Shoemaker ( 1956).
South of the Black Canyon rthe Needle Mountains have been studied recently by Barker (1966), Silver and Barker (1967), and Bickford, Barker, Wetherill, and Lee-Hu (1967). This area has had a plutonic history more complex than that of the Black Canyon-at least the preserved record is more complex. Silver and Barker place the time of accumulation of the older sequence of sedimentary and volcanic rocks at 1,780-1,800 m.y. They bracket regional metamorphism between 1,780 and 1,720 m.y., on the basis of zircon ages. Thus, the time of regional metamorphism in the Needle Mountains coincides with that in the Black Canyon within the limits of analytical error. The Twilight Granite of the Needle Mountains, which formed about 1,780+50 m.y. ago (Silver and Barker, 1967), is a possible correlative of the Pitts Meadow.
In the Sawatch Range, Wetherill and Bickford (1965) reported a whole-rock isochron age of 1,650+35 m.y. for granite rocks. Pegmatites were emplaced about 1,450 m.y. ago, and an event about 1,350 m.y. ago was effective in resetting many of the mineral ages.
Rooks petrographically and isotopically identical with the Vernal Mesa Quartz Monzonite attain batholithic dimensions on the Uncompahgre uplift. Unlike the typical Vernal Mesa, which is moderately well foliated in most places, the corresponding rock on the Uncompahgre is largely massive (Case, 1966, p. 1428). The deformation that accompanied its emplacement in the Black Canyon, therefore, may not have extended as far west as the Uncompahgre uplift, or it may have died out before emplacement there took place.
Other rocks similar to the Vernal Mesa, but of unverified age, crop out in Glenwood Canyon in the White River uplift and near Taylor Park in the Sawatch Range. Southeast of the Black Canyon, at Lake Fork and vicinity, the coar3e porphyritic biotite granite phase of the Powderhorn Granite (Hunter, 1925, p. 44) also resembles the Vernal Mesa. The Eolus Granite of the Needle Mountains is an approximate time equivalent but is petrographically dissimilar (Silver and Barker, 1967; Bickford and others, 1967) ..
Rocks correlated with the Curecanti Quartz Monzonite are widespread in Colorado. Most of these rocks are grouped radiometrically and petrographically with the Silver Plume Granite of the Front Range (Peterman and others, 1968; Hedge, 1967; Hutchinson and Hedge, 1967), which has a range of ages that includes the age of the Curecanti. Rocks identical with the Curecanti crop out in Unaweep Canyon. The St. Kevin Granite of the Northern Sawatch Range (Tweto and Pearson, 1964, p. D28 ; Pearson and others, 1966) is a probable correlative of the Silver Plume and Curecanti. In the Needle Mountains the only rock that resembles
HANSEN AND PETERMAN C89
TABLE 3.-Provisional con·elation chart tor some major Precambrian units of Colorado
[The position of the geologic name on the chart approximates the radiometric age except where modified by known geologic relationships. A question mark above or below the name indicates that the precise position on the chart is not known. Numbers in parentheses refer to sources of dn.ta as follows: (1)· Peterman and others (1968), (2) Hutchinson andl Hedge (1967), (3) Hedge (1967), (4) r.r. W. Stern (in U.S. Geological Survey, 1964, p, A95), (5) Hedge and others (1967), (6) Pearson and others (1966), (7) B. R. Doe (oral commun., 1968), (8) Wetherill and Bickford (1965), (9) Hedge and others (1968), (10) Bickford and others (1967), and (11) 'Silver and Barker (1967))
AGE (m.y.) FRONT RANGE SAWATCH RANGE BLACK CANYON UNCOMPAHGRE UPLIFT NEEDLE MOUNTAINS
1,400 ---------------- --------------- -------------- --------------- --------------
1.450
Silver Plume and Sherman Granites (1,2,3)
1 St. Kevin Granite (6, 7) Pegmatites (8)
Curecanti Quartz Monzonite
Vernal Mesa Quartz Monzonite
1,500 - --------------- --------------- --------------
1,550
? Biotite-muscovite granite (9)
Vernal Mesa Quartz Monzonite (9)
Eolus Granite, gabbro of Electra Lake, granitic dikes (10,11) -----------------------------
? Uncompahgre' Formation (11)
? 1,600 ---------------------------------------------------------------------------
1,650 Granite to granodiorite (8)
1,700 ---Boulder Creek Granite-- -Augen gneiss of Trout Creek- ----Metamorphism---. (1,2,3.4) (Mosquito Range) (2) Pitts Meadow Granodiorite
Black Canyon Schist
1.750 Metamorphism (5) ?
Gneissic granodiorite (9) Porphyroblastic gneiss (9) Feldspathic gneiss (9)
-----------------------------Posttectonic granites (10,11)
Metamorphism (11) Twilight Granite (11)
Idaho Springs Formation (5) Irving Greenstone (11) ? Vallecito Conglomerate (11)
1,800 ------------------------------- ----;----------- ------------------------------
1 B. R. Doe reports a U-Pb zircon age of 1,420 m,y, for the St. Kevin Granite, compared with a whole-rock isochron age of 1,470 m.y. reported by Pearson and others ( 1966).
the Curecanti in appearance and age is the Trimble Granite (Fred Barker, oral commun., 1967).
The relatively youthful age of diabase dikes in the Black Canyon, formerly regarded as probably Precambrian, is not too surprising in view of the freshness of the rock and the lack of deformational or metamorphic features associated with the other crystalline rocks. Cambrian or Ordovician diabase has not yet been identified elsewhere 1in Colorado, although alkalic rocks of Early Cambrian age have been dated from the Wet Mountains and from the Iron Hill area in the Powderhorn district. The diabase dike set of the Black Canyon extends southeast into the Powderhorn district and, according to D. C. Hedlund and J. C. Olson (oral commun~, 1967), cuts the alkalic rocks at Iron Hill. Largescale fracturing, or renewed movement on older fractures, seems to have been widespread in Colorado in Late Cambrian time. In the Front Range, sandstone dikes filling northwest-trending ·fractures hav~ been known for many years (Cross, 1894; Crosby, 1895 ; Vitanage, 1954; Scott, 1963, p. 8,5). These dikes, which are muoh more prevalent in the Front Range than previously known, correlate with the Sa watch Quartzite (Late Cambrian) and must have been injected as unconsolidated sand into open fractures in Late Cambrian time (G. R. Scott, oral commun., 1967). As in the Black
Canyon and elsewhere on the Colorado Plateau, many of these northwest-trending fractures had Laramide as well as earlier movements.
RE.FERENCES
Barker, Fred, 1966, Precambrian geologic history in the Needle Mountans, Colorado [abs.] Geol. Soc. America Rocky Moun·tain Sec. 19th Ann. Mtg., Prograllll, p. 17.
Bickford, M. E., Barker, Fred, Wetherill, G. W., and Lee-Hu, Chin-Nan, 1967, Precambrian chronology in the Needle Mountains, southwestern Colorado [abs.] : Geol. Soc. .America 1967 Ann. Mtgs., New Orleans, Program, p. 14.
Buddington, A. F., 1959, Granite emplacement with special reference to North America: Geol. Soc. America Bull., v. 70, p, 671-747.
Case, J. E., 1966, Geophysical anomalies over' Precambrian rocks, northwestern Uncompahgre Plateau, Utah and Colorado: Am. Assoc. Petroleum Geologists Bull., v. 50, No. 7, p. 1423-1443.
Crosby, W. 0., 1895, Sandstone dikes accompanying the great fault of Ute Pass, Colorado: Essex Inst. Bull., v. 27, p. 113-147.
Cross, C. W., 1894, Intrusive sandstone dikes in granite: Geol. Soc. America Bull., v. 5, p. 225-230.
Giffin, C. E., and Kulp, J. L., 1960, Potassium-argon ages in the Precambrian basement of Co.lorado : Geol. Soc. America Bull., v. 71, no. 2, p. 219-222.
Hansen, W. R., 1964, Curecanti pluton, an unusual intrusive body in the Black Canyon of the Gunnison, Colorado: U.S. Geol. Survey Bull. 1181-D, p. Dl-D15.
C90 GEOCHRONOLOGY
Hansen, W. R., 1965, The Black Canyon of the Gunnison, today and yesterday: U.S. Geol. Survey Bull. 1191, 76 p.
---in press, Geologic map of the Black Ridge quadrangle, Colorado: U.S. Geol. Survey Geol. Quad. Map GQ-747.
Hedge, C. E., 1967, Precambrian geochronology of the central Front Range, Colorado [abs.] : Geol. Soc. America Rocky Mountain Sec. 20th Ann. Mtg., Program, p. 39.
Hedge, C. E., Peterman, Z. E., Case, J. E., and Obradovich, J. D. 1968, Precambrian geochronology of the northwestern Uncompahgre Plateau, in Geological Survey research 1968: U.S. Geol. Survey Prof. Paper 600-C, p. C91~C96.
Hedge, C. E., Peterman, Z. E., and Braddock, "\V. A., 1967, Age of the major Precambrian regional metamorphism in the northern Front Range; Colorado: Geol. Soc. America Bull., v.78,no.4,p.551-558.
Hunter, J. F., 1925, Precambrian rocks of Gunnison River, Colorado: U.S. Geol. Survey Bull. 777, 94 p.
Hutchinson, R. M., and Hedge, C. E., 1967, Depth-zone emplacement and geochronology of Precambrian plutons, c~ntral Colorado Front Range [abs.] : Geol. Soc. America Rocky Mountain Sec. 20th Ann. Mtg. Program, p. 40-41.
Pearson, R. C., Hedge, C. E., Thomas, H. H., and Stern, T. "\V., 1966, Geochronology of the St. Kevin Granite and neighboring Precambrian rocks, northern Sawatch Range, Colorad(l Geol. Soc. America Bull., v. 77, no. 10, p. 1109-1120.
Peterman, Z. E., 1966, Rb-Sr dating of metasedimentary rocks of the Animikie Group of Minnesota, in Abstracts for 1965 : Geol. Soc. America Spec. Paper 87, p. 126-127.
Peterman, Z. E., Doe, B. R., and Bartel, Ardith, 1967, Data on the rock GSP-1 (granodiorite) and the isotope-dilution method of analysis for Rb and Sr, in Geological Survey Research 1967: U.S. Geol. Survey Prof. Paper 575-B, p. B181-B186.
Peterman, Z. E., Hedge, C. E., and Braddock, W. A., 1968, Age of Precambrian events in the northeastern Front Range, Colorado: Jour. Geophys. Resea·rch, v. 73, no. 6, p. 2277-2296.
Scott, G. R., 1963, Bedrock geology of the Kassler quadrangle, Colorado: U.S. Geol. Survey Prof. Paper 421-B, 125 p.
Shoemaker, E. M., 1956, Precambrian rocks of the north-central Colorado Plateau, in Intermtn. Assoc. Petroleum Geologists Guidebok, 7th Ann. Field Conf., east-central Utah, 1956 : p. 54-57.
Silver, L. T., and Barker, Fred, 1967, Geochronology of Precambrian rocks of the Needle Mountains, Southwestern Colorado-Pt. I, U-Pb zircon results [abs.] : Geol. Soc. America 1967 Ann. Mtgs., New Orleans, Program, p. 204.
Twieto, Ogden, and Pearson, R. C., 1964, St. Kevin Granite, Sawatch Range, Colorado: Art. 127 in U.S. Geol. Survey Prof. Paper 475-D, p. D28-D32.
U.S. Geological Survey, 1964, Geological Survey Research 1964, Chapter A: U.S. Geol. Survey Prof. Paper 501-A, p. A1-A367.
Vitanage, P. W., 1954, Sandstone dikes in the South Platte area, Colorado: Jour. Geology, v. 62, no. 5, p. 493-500.
Wetherill, G. "\V., and Bickford, M. E., 1965, Primary and metamorphic Rb-Sr chronology in central Colorado: Jour. Geophys. Research, v. 70, no. 18, p. 4669-4686.
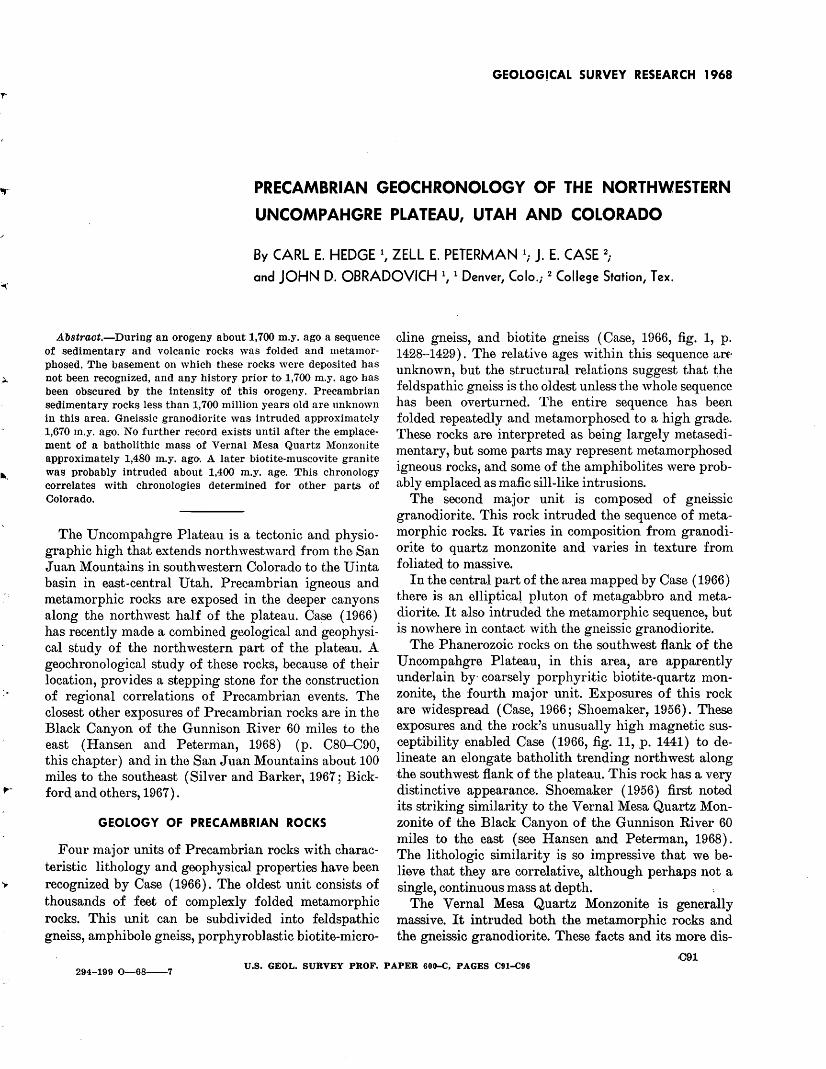
,...
·.
GEOLOGICAL SURVEY RESEARCH 1968
PRECAMBRIAN GEOCHRONOLOGY OF THE NORTHWESTERN
UNCOMPAHGRE PLATEAU, UTAH AND COLORADO
By CARL E. HEDGE 1, ZELL E. PETERMAN 1
; J, E. CASE 2;
and JOHN D. OBRADOVICH 1,
1 Denver, Colo.; 2 College Station, Tex.
Abstract.-During an orogeny about 1,700 m.y. ago a sequence of sedimentary and volcanic rocks was folded and metamorphosed. The basement on which these rocks were deposited has not been recognized, and any history prior to 1,700 m.y. ago has been obscured by the intensity of this orogeny. Precambrian sedimentary rocks less than 1,700 million years old are unknown in this area. Gneissic granodiorite was intruded approximately 1,670 m.y. a~. No further record exists until after the emplacement of a batholithic mass of Vernal Mesa Quartz Monzonite approximately 1,480 m.y. ago. A later biotite-muscovite granite was probably intruded about 1,400 m.y. age. This chronology correlates with chronologies determined for other parts of Colorado.
The Uncompahgre Plateau is a tectonic and physiographic high that extends northwestward from the San Juan Mountains in southwestern Colorado to the Uinta basin in east-central Utah. Precambrian igneous and metamorphic rocks are exposed in the deeper canyons along the northwest half of the plateau. Ca.se ( 1966) has recently made a combined geological and geophysical study of the northwestern part of the plateau. A geochronological study of these rocks, because of their location, provides a stepping stone for the construction of regional correlations of Precambrian events. The closest other exposures of Precambrian rocks ate in the Black Canyon of the Gunnison River 60 miles to the east (Hansen and Peterman, 1968) (p. C80-C90, this chapter) and in the San Juan Mountains about 100 miles to the southeast (Silver and Barker, 1967; Bickford and others, 1967).
GE.OLOGY OF PRECAMBRIAN ROCKS
Four major units of Precambrian rocks with characteristic lithology and geophysical properties have been recognized by Case (1966). The oldest unit consists of thousands of feet of complexly folded metamorphic rocks. This unit can be subdivided into feldspathic gneiss, amphibole gneiss, porphyroblastic biotite-micro-
cline gneiss, and biotite gneiss (Case, 1966, fig. 1, p. 1428-1429). The relative ages within this sequence an~ unknown, but the structural relations suggest that the feldspathic gneiss is the oldest unless the whole sequence has been overturned. The entire sequence has been folded repeatedly and metamorphosed to a high grade. These rocks are interpreted as being largely metasedimentary, but some parts may represent metamorphosed igneous rocks, and some of the amphibolites were probably emplaced as mafic sill-like intrusions.
The second major unit is composed of gneissic granodiorite. This rock intruded the sequence of metamorphic rocks. It varies in composition from granodiorite to quartz monzonite and varies in texture from foliated to massive.
In the central part of the area mapped by Case (1966) there is an elliptical pluton of metagabbro and metadiorite. It also intruded the metamorphic sequence, but is now here in contact with the gneissic granodiorite.
The Phanerozoic rocks on the southwest flank of the Uncompahgre Plateau, in this area, are apparently underlain by- coarsely porphyritic biotite-quartz monzonite, the fourth major unit. Exposures of this rock are widespread (Case, 1966; Shoemaker, 1956). These exposures and the rock's unusually high magnetic susceptibility enabled Case (1966, fig. 11, p. 1441) to delineate an elongate batholith trending northwest along .the southwest flank of the plateau. This rock has a very distinctive appearance. Shoemaker ( 1956) first noted its striking similarity to the Vernal Mesa Quartz Monzonite of the Black Canyon of the Gunnison River 60 miles to the east (see Hansen and Peterman, 1968). The lithologic similarity is so impressive that we believe that they are correlative, although perhaps not a single, continuous mass at depth.
The Vernal Mesa Quartz Monzonite is generally massive. It intruded both the metamorphic rocks and the gneissic granodiorite. These facts and its more dis-
'C91 294-199 Q--68----7
U.S. GEOL. SURVEY PROF. PAPER 6011-C. PAGES C91-C96
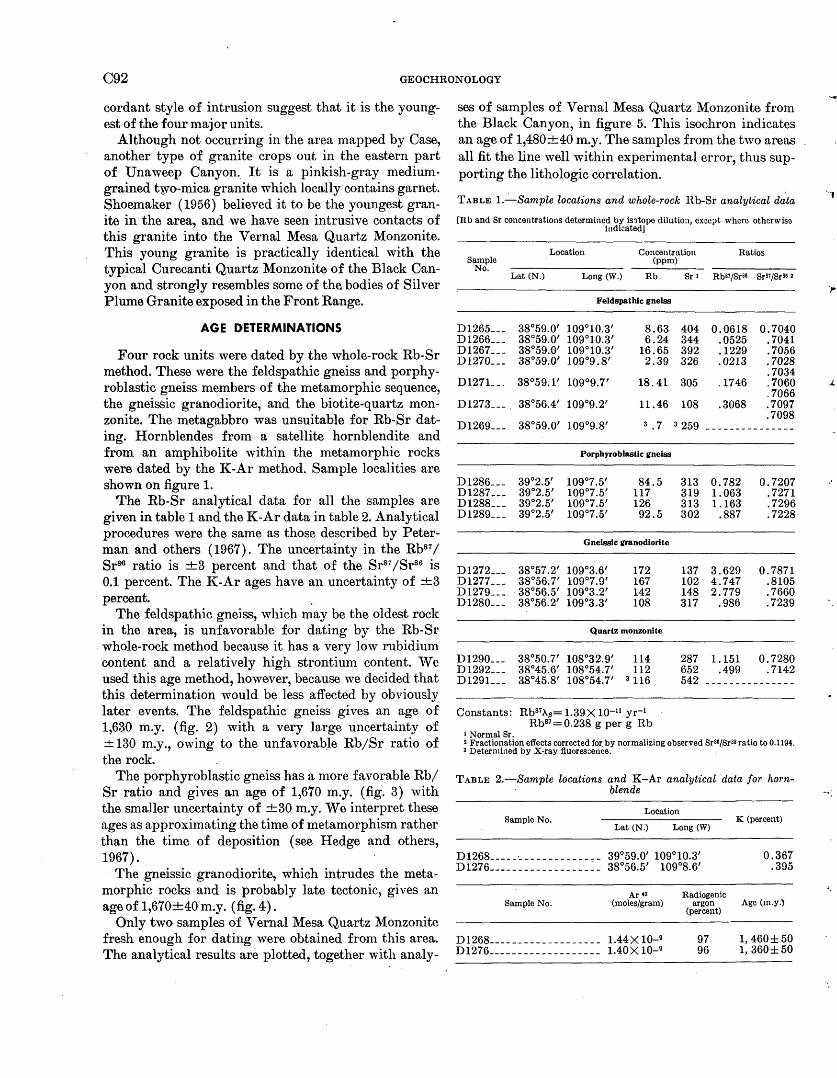
C92 GEOCHRONOLOGY
cordant style of intrusion suggest that it is the youngest of the four major units.
Although not occurring in the area mapped by Case, another type of granite crops out in the eastern part of Unaweep Canyon. It is a pinkish-gray mediumgrained two-mica granite which locally contains garnet. Shoemaker (1956) believed it to be the youngest granite in the area, and we have seen intrusive contacts of this granite into the Vernal Mesa Quartz Monzonite. This young granite is practically identical with the typical Curecanti Quartz Monzonite of the Black Canyon and strongly resembles some of the bodies of Silver Plume Granite exposed in the Front Range.
AGE D1ETERMINATIONS
Four rock units were dated by the whole-rock Rb-Sr method. These were the feldspathic gneiss and porphyroblastic gneiss members of the metamorphic sequence, the gneissic granodiorite, and the biotite-quartz monzonite. The metagabbro was unsuitable for Rb-Sr dating. Hornblendes from a satellite hornblendite and from an amphibolite within the metamorphic rocks were dated by the K-Ar method. Sample localities are shown on figure 1.
The Rb-Sr analytical data for all the samples are given in table 1 and the K-Ar data in table 2. Analytical procedures were the same as those described by Peterman and others ( 1967). The uncertainty in the Rb87 I Sr86 ratio is +3 percent and that of the Sr87 /Sr86 is 0.1 percent. The K-Ar ages have an uncertainty of +3 percent. .
The feldspathic gneiss, which may be the oldest rock in the area, is unfavorable for dating by the Rb-Sr
. whole-rock method because it has a very low rubidium content and a relatively high strontium content. We used this age method, however, because we decided that this determination would be less affected by obviously later events. The feldspathic gneiss gives an age of 1,630 m.y. (fig. 2) with a very large uncertainty of ± 130 m.y., owing to the unfavorable Rb/Sr ratio of the rock.
The porphyroblastic gneiss has a more favorable Rb/ Sr ratio and gives an age of 1,670 m.y. (fig. 3) with the smaller uncertainty of +30 m.y. We interpret these ages as approximating the time of metamorphism rather than the time of deposition (see Hedge and others, 1967).
The gneissic granodiorite, which intrudes the metamorphic rocks and is probably late tectonic, gives an age of 1,670+40 m.y. (fig. 4).
Only two samples of Vernal Mesa Quartz Monzonite fresh enough for dating were obtained from this area. The analytical results are plotted, together with analy-
ses of samples of Vernal Mesa Quartz Monzonite from the Black Canyon, in figure 5. This isochron indicates an age of 1,480+40 m.y. The samples from the two areas all fit the line well within experimental error, thus supporting the lithologic correlation.
TABLE !._:_Sample locations and whole-rock Rb-Sr analytical data
[Rb and Sr concentrations determined by is'ltope dilution, except where otherwise indicatedj
Location Concentration Ratios Sample (ppm)
No. Lat (N.) Long (W.) Rb Sr 1 RbB7fSrB6 SrB7fSrB6 2
Feldspatbic gneiss
D1265 ___ 38°59.0' 109°10.3' 8.63 404 0.0618 0.7040 D1266 ___ 38°59.0' 109°10.3' 6.24 344 .0525 .7041 D1267 --- 38°59.0' 109°10.3' 16.65 392 .1229 .7056 D1270 ___ 38°59.0' 109°9.8' 2.39 326 .0213 .7028
.7034 D127L __ 38°59.1' 109°9.7' 18.41 305 .1746 .7060
.7066 D1273 ___ 38°56.4' 109°9.2' 11.46 108 .3068 .7097
.7098 D1269 ___ 38°59.0' 109°9.8' 3 • 7 3 259 ---------------
Porphyroblastic gneiss
D1286 ___ 39°2.5' 109°7.5' 84.5 313 0.782 0.7207 D1287 --- 39°2.5' 109°7.5' 117 319 1.063 .7271 D1288 ___ 39°2.5' 109°7.5' 126 313 1.163 .7296 D1289 ___ 39°2.5' 109°7.5' 92.5 302 .887 .7228
Gneissic granodiorite
D1272 ___ 38°57.2' 109°3.6' 172 137 3.629 0.7871 D1277 --- 38°56.7' 109°7.9' 167 102 4.747 .8105 D1279 ___ 38°56.5' 109°3.2' 142 148 2.779 .7660 D1280 ___ 38°56.2' 109°3.3' 108 317 .986 .7239
Quartz monzonite
D1290 ___ 38°50.7' 108°32.9' 114 287 1.151 0.7280 D1292 ___ 38°45.6' 108°54.7' 112 652 .499 .7142 D129L __ 38°45.8' 108°54.7' 3 116 542 ---------------
Constants: Rb87Xfl= 1.39X 10⁻¹¹ yr-1
RbB7 = 0.238 g per g Rb 1 Normal Sr. 2 Fractionation effects corrected for. by normalizing observed SrB6/Srss ratio to 0.1194. a Determiaed by X-ray fluorescence.
TABLE 2.-Sample locations and K-Ar analytical data for hornblende
Location Sample No. K (percent)
Lat (N.) Long (W)
D1268-----~------------- 39°59.0' 109°10.3' 0.367 D1276-----------------~- 38°56.5' 109°8.6' .395
Ar•o Radiogenic Sample No. (moles/gram) argon Age (m.y.)
(percent)
D1268------------------- 1.44X 10⁻⁹ 97 1, 460± 50 D1276 ___________________ 1.40X 10⁻⁹ 96 1, 360± 50
.
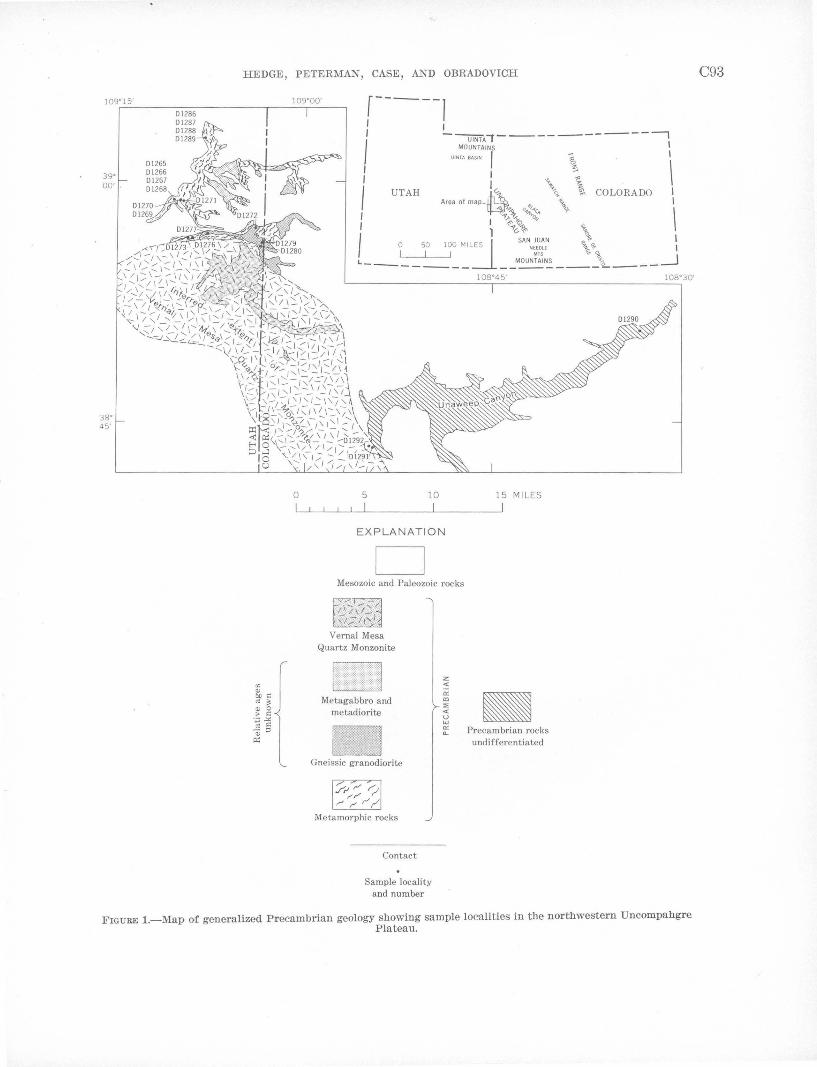
109"15'
39" 00'
38" 45'
HEDGE, P ETERMAN, CASE, AND OBRADOVICH
0
r-----1 I I I ----uiNTA"l---------------, I MOUNTAINS ~ I
I
I UINTABASIN ~ / \ \ \
UTAH U.'b ~ % COLORADO Area of map ~ 8/. ~""
I ~ "">~-"""".,. ~ \ I ""-1- 'S-Gl 'o.,. I 1 U \
I 0 50 100 MIL:JS SAN JUAN ~ ~ I N~TDSLE \~~ '
L-------- --M~~--- _y.tL. ____ _l
5 10
EXPLANATION
Mesozoic and Paleozoic rocks
Vernal Mesa Quartz Monzonite
Metagabbro and metadiorite
Gneissic granodiorite
Metamorphic rocks
Contact
Sample locality and number
z <(
"' "' "' <(
u
"' "' "-
108"45'
15 MILES
• Precambrian rocks undifferentiated
108"30'
FIGURE I.-Map of generalized Precambrian geology showing sample localities in the northwestern Uncompahgre Plateau.
C93
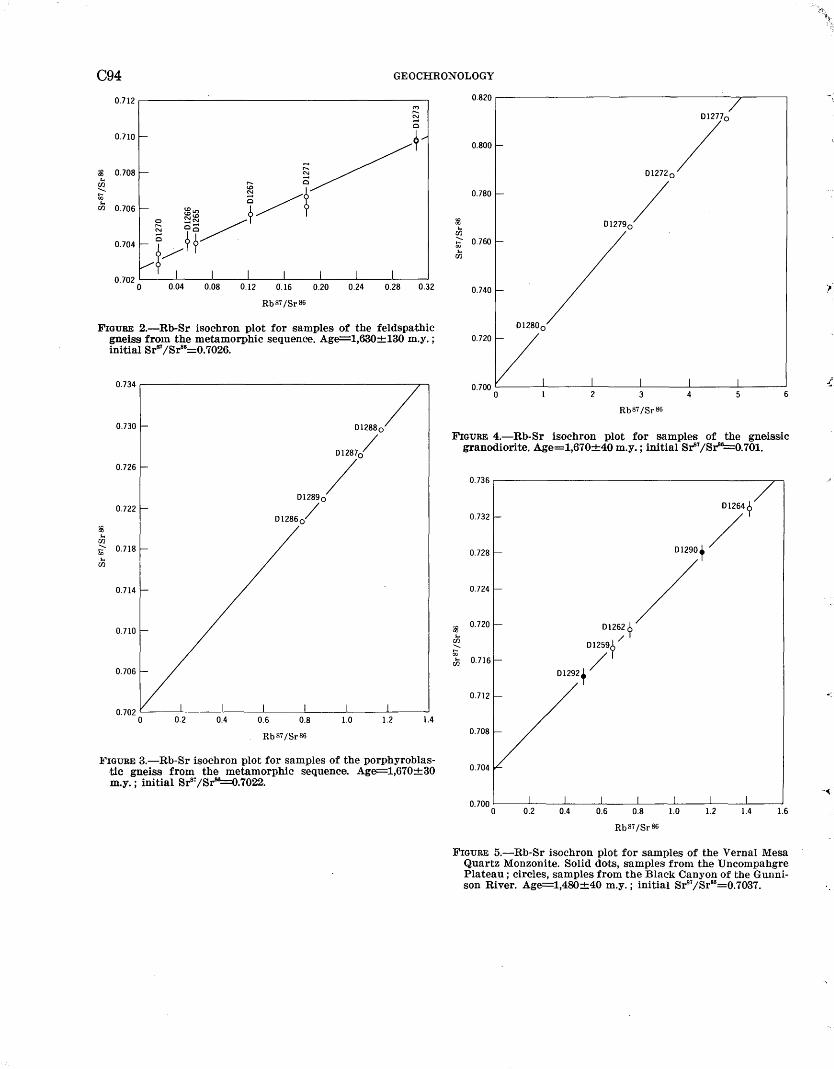
C94 GEOCHRONOLOGY
0.712 .-------------------------,
0.710-
~ 0.708 r-
"" ~ "" rn 0.706 r-
I 0.08 0.12
I I I I 0.16 0.20 0.24 0.28 0.32
Rb87fSr86
FIGURE 2.-Rb-Sr isochron plot for samples of the feldspathic gneiss from the metamorphic sequence. Age=1,630±130 m.y. ; initial Sr87 /Sr86=0. 7026.
0.734
0.730 01288 0
01287/
0.726
01289 0 /
0.722 01286 0 /
~
"" ~ 0.718 &;
"" rn
0.714
0.710
0.706
1.4
Rb87 /Sr86
FIGURE 3.-Rb-Sr isochron plot for samples of the porphyroblastic gneiss from the metamorphic sequence. Age=1,670±30 m.y.; initial Sr87/Sr84-=0.7022.
0.820 ,...---------------------,-------,
0.800
0.780
~
"" ~ 0.760
"" rn
0.740
01280 0
0.720
0.700 L__ __ ___. ___ ____L ___ __L ___ _L ___ ~----'
0 4 6
Rb87fSr86
FIGURE 4.-Rb-Sr isochron plot for samples of the gneissic granodiorite. Age=1,670±40 m.y.; initial Stn;srP 0.701.
0.736
0.732
0.728
0.724
~ 0.720
"" ~ &;
"" rn
0.712
0.708
0.2
01264?
01290+/
01262?/ 01259? /
012!12+ /
0.4 0.6 0.8
Rb87fSr86
1.0 1.2 1.4 1.6
FIGURE 5.-Rb-Sr isochron plot for samples of the Vernal Mesa Quartz Monzonite. Solid dots, samples from the Uncompahgre Plateau; circles, samples from the Black Canyon of the Gwmison River. Age=1,480±40 m.y.; initial Sr87/Sr86=0.7037.
.
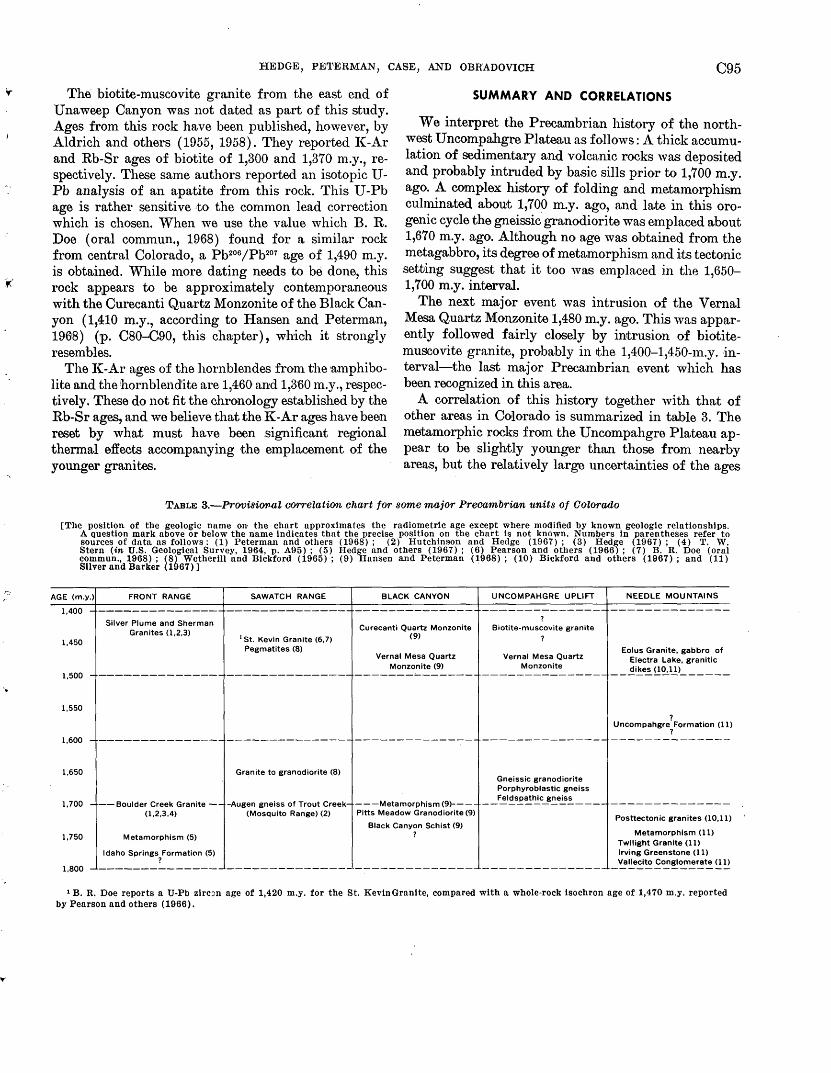
HEDGE, PETERMAN, CASE, AND OBRADOVICH C95
The biotite-muscovite granite from the east end of Unaweep Canyon was not dated as part of this study. Ages from this rock have been published, however, by Aldrich and others (1955, 1958). They reported J{-Ar and Rb-Sr ages of biotite of 1,300 and 1,370 m.y., respectively. These same authors reported an isotopic UPb analysis of an apatite from this rock. This U-Ph age is rather sensitive to the common lead correction which is chosen. When we use the value which B. R. Doe (oral commun., 1968) found for a similar rock from central Colorado, a Pb206 /Pb207 age of 1,490 m.y. is obtained. While more dating needs to be done, this rock appears to be approximately contemporaneous with the Curecanti Quartz Monzonite of the Black Canyon (1,410 m.y., according to Hansen and Peterman, 196'8) (p. C80-C90, this chrupter), which it strongly resembles.
The J(-Ar ages of the hornblendes from the amphibolite and the hornblendite are 1,460 and 1,3'60 m.y., respectively. These do not fit the chronology established by the Rb-Sr ages, and we believe that the J{-Ar ages have been reset by what must have been significant regional thermal effects accompanying the emplacement of the younger granites.
SUMMARY AND CORRELATIONS
We interpret the Precambrian history of the northwest Uncompahgre Plateau as follows: A thick accumulation of sedimentary and volcanic rocks was deposited and probably intruded by basic sills prior to 1,700 m.y. ago. A complex history of folding and metamorphism culminated about 1,700 m.y. ago, and late in this orogenic cycle the gneissic granodiorite was emplaced about 1,670 m.y. ago. Although no age was obtained from the metagabbro, its degree of metamorphism and i:ts tectonic setting suggest that it too wrus emplaced in the 1,650-1,700 m.y. interval.
The next major event was intrusion of the Vernal Mesa Quartz Monzonite 1,480 m.y. ago. This was apparently followed fairly closely by intrusion of biotitemuscovite granite, probably in the 1,400-1,450-m.y. interval-the last major Precambrian event which has been recognized in this area.
A correlation of this history together with that of other areas in Colorado is summarized in table 3. The metamorphic rocks from the Uncompahgre PlUJteau appear to be slightly younger than those from nearby areas, but the relatively large uncertainties of the ages
TABLE 3.-Provisi(Jifl.al o01Telatioo ohart tor some major Precambrian 'ltnits of Colorado
[The position of the geologic name on the chart approximates the radiometric age except where modified by known geologic relationships. A question mark above or below the name indicates that the precise position on the chart is not known. Numbers in parentheses refer to sources of dnta as follows: (1) Peterman and others (1968); (2) Hutchinson and Hedge (1967); (3) Hedge (1967); (4) T. W. Stern (in U.S. Geological Survey, 1964, p. A95) ; (:5) Hedge and others (1967) ; (6) Pearson and others (1966) ; (7) B. R. Doe (oral commun., 1968); (8) Wetherill and Bickford (1965); (9) Hansen and Peterman (1968); (10) Bickford and others (1967); and (11) Silver and Barker (1967)]
AGE (m.y.) FRONT RANGE SAWATCH RANGE BLACK CANYON UNCOMPAHGRE UPLIFT NEEDLE MOUNTAINS
1,400 - --------------- _________ __: _____ -------------- --------------- --------------
1.450
Silver Plume and Sherman Granites (1,2,3)
1 St. Kevin Granite (6,7) Pegmatites (8)
Curecanti Quartz Monzonite (9)
Vernal Mesa Quartz Monzonite (9)
1,500 - --------------- --------------- -------'-------
1,550
? Biotite-muscovite granite
Vernal Mesa Quartz Eolus Granite, gabbro of
Electra Lake, granitic Monzonite dikes (10,11)
-----------------------------
? Uncompahgre" Formation (11)
?
1,600 - --------------- --------------- -------------:--- --------------- _______ :..._ _____ _
1,650 Granite to granodiorite (8)
1,700 ---Boulder Creek Granite-- -Augen gneiss of Trout Creek- ---Metamorphism (9)---(1,2,3.4) (Mosquito Range) (2) Pitts Meadow Granodiorite (9)
Black Canyon Schist (9)
1.750 Metamorphism (5) ?
Gneissic granodiorite Porphyroblastic gneiss
__ F..:_I~s~!!_~c~~e~=._ ____ --------------
Posttectonic granites (10,11)
Metamorphism (11) Twilight Granite (11)
Idaho Springs Formation (5) Irving Greenstone (11)
1,800 - _______ ::.._ _______ ---------------·--------------- --------------- -~~e~~~~~~~~~~~
1 B. R. D()e reports a U-Pb zlrc:m age of 1,420 m.y. for the St. Kevin Granite, compared with a whole-rock isochron age of 1,470 m.y. reported by Pearson and others ( 1966).
C96 GEOCHRONOLOGY
from this area make it possible that the metamorphism is exactly correla~tive. Muehlberger and others (1966) reported three ages from the buried basement to the north and west of this area. These indicate that the two periods of igneous and metamorphic rocks activity approxim31tely 1,400-1,450 m.y. and 1,700-1,750 m.y. ago affected rocks for an as-yet-undetermined distance north and west of the U ncompwligre Plateau.
REFER.ENCES
Aldrich, L. T., Tilton, G. R., Davis, G. L., Nicolaysen, L. 0., and Patterson, 0. C., 1955, Comparison of U-Pb, Pb-Pb, and Rb-Sr ages of Precambrian minerals, in Derry, D. R., Symposium on Precambrian correlation and dating: Geol. Assoc. Canada Proc.1955, v. 7, pt. 2, p. 7-13.
Aldrich, L. T., Wetherill, G. W., Davis, G. L., and Tilton, G. R., 1958, Radioactive ages of micas from granitic rocks by Rb-Sr and K-Ar methods: Am. Geophys. Union Trans., v. 39, no. 6, p. 1124-1134.
Bickford, M. E., Barker, Fred, Wetherill, G. W., and Lee-Hu, Chin-Nan, 1967, Precambrian chronology in the Needle Mountains, southwestern Colorado [abs.]: Geol. Soc. America 1967 Ann. Mtg., Program, p.14.
Case, J. E., 1966, Geophysical anomalies over Precambrian rocks, northwestern Uncompahgre Plateau, Utah and Colorado : Am. Assoc. Petroleum Geologists Bull., v. 50, no. 7, p. 1423--1443.
Hansen, W. R., and Peterman, Z. E., 1968, Basement-rock geochronology of the Black Canyon of the Gunnison, Colorado, in Geological Survey Research 1968: U.S. Geol. Survey Prof. Pa-per 660-C, p. C80-C90.
Hedge, C. E., 1967, Precambrian geochronology of the c.entral Front Range, Colorado [abs.] :. Geol.. Soc. America, Rocky Mountain Sec., 20th Ann. Mtg., Program, p. 39.
Hedge, C. E., Peterman, Z. E., and Braddock, W. A., 1967, Age of the major Precambrian regional metamorphism in the northern Front Range, Colorado: Geol. Soc. America Bull., v.78,no.4,p.551-558.
Hutchinson, R. M., and Hedge, C. E., 1967, Depth-zone emplacement and geochronology of Precambrian plutons, central Colorado Front Range [abs.]: Geol. Soc. America, Rocky Mountain Sec., 20th Ann. Mtg., Program, p. 40-41.
Muehlberger, ·w. R., Hedge, C. E., Denison, R. E., and Marvin, R. F., 1966, Geochronology of the midcontinent region, United States, pt. 3, Southern area: Jour. Geophys. Research,v.71,no.22,p. 5409-5426.
Pearson, R. C., Hedge, C. E., Thomas, H. H., and Stern, T. W., 1966, Geochronology of the St. Kevin granite and neighboring Precambrian rocks, Northern Sawatch Range, Colorado: Geo.I. Soc. America Bull., v. 77, no. 10, p. 1109-1120.
Peterman, Z. E., Doe, B. R., and Bartel, Ardith, 1967, Data on the rock GSP-1 (granodiorite) and the isotope-dilution method of analysis for Rb and Sr ; in Geological Survey Research 1967: U.S. Geol. Survey Prof. Paper 575-B, p. B181-B186.
Peterman, Z. E., Hedge, C. E., and Braddock, W. A., (1968), Age of Precambrian events in the northeastern Front Range, Colorado: Jour. Geophys. Research, v. 73, no. 6, rp, 2277-2296.
Shoemaker, E. M., 1956, Precambrian rocks of the north-central Colorado Plateau, in Intermountadn Assoc. Petroleum Geologists Guidebook 7th Ann. Field Conf., Geology and-economic deposits of east central Utah, 1956: p. 54-57.
Silver, L. T., and Barker, Fred, 1967, Geochronology of Precambrian rocks in the Needle Mountains, southwestern Colorado, pt. 1, U-Pb zircon results [abs.] : Geol. Soc. America, 1967 Ann. Mtg., Program, p. 204.
U.S. Geological Survey, 1964, Geological Survey Research 1964: U.S. Geol. Survey Prof. Paper 501-A, 367 rp.
Wetherill, G. W., and Bickford, M. E., 1965, Primary and metamorphic Rb-Sr chronology in central Colorado: Jour. Geophys. Research, v. 70, no. 18, p. 4669--4686.
..i
...
GEOLOGICAL SURVEY RESEARCH 1968
ORGANIC GEOCHE'MISTRY OF RECENT SEDIMENTS IN THE
CHOCTAWHATCHEE BAY AREA, FLORIDA-A PRELIMINARY REPORT
By JAMES G. PALACAS, VERNON E. SWANSON, and ALONZA H. LOVE, Denver, Colo.
A.bstract.-Sediments of Choctawhatchee Bay, an estuary on the northeast shore of the Gulf of Mexico, range from relatively clean quartz sand in shallower near-shore areas to silty clay in deeper areas. The upper 10-16 em of bottom muds (silty clays) contain an average of 6.7 percent organic matter, whereas the relatively clean sands contain generally less than 0.5 percent organic matter. Average bitumen content of bottom muds is about 225 ppm of the dried sediment and ac~unts for about 0.4 percent of the organic matter. Alkaline-soluble humic substances constitute the largest organic fraction extracted from these Recent sediments and generally amount to 10-50 percent of the organic matter. Early diagenetic transformations of the organic matter with shallow depth of burial are indicated by the decrease in the ratio of soluble humic substances to total organic content, the marked decrease of free sulfur, and the increase of carbon/nitrogen ratios.
This report presents the preliminary results of field and laboratory analyses of organic matter in bottom sediments of Choctawhatchee Bay. In addition to the bay, five contiguous depositional environments were ~ampled for purposes of comparison-bayou, barrier Island, marsh, river, and lake. The study is part of a broader program of organic geochemical investigf.l,tions to determine the composition and quantity of organic matter and its source in modern sediments, with particular emphasis on early diagenetic transformations. This knowledge will be applied toward de-Ciphering the history of organic matter in ancient sediments, especially the role that organ~c matter plays in the formation of petroleum, :natural gas, oil shale, and metalliferous sedimentary deposits.
Most of the field study was done in the latter half of April1964, when 14 sediment cores were collected· several additional core samples were collected in the ~estern part of Choctawhatchee Bay in the fall of 1966. Sediment cores were taken with a piston corer, and the core samples were kept frozen to prevent bacterial decomposition until they were prepared for laboratory analysis.
The following environmental parameters were measured at each core station : ( 1) depth of water; ( 2) specific conductance, salinity, temperature, pH and Eh of •surface water and of water a few centimeters above the sediment; and ( 3) pH and Eh of the upper few centimeters of sediment. A subsequent report will discuss these n1easurements in terms of their significance to the geochemical environment.
The use of a 12-foot skiff, outboard motor, and other facilities from the Special Service Branch, Small Boat Section, Eglin Air Force Base, Fla., is gratefully acknowledged. Sincere thanks are· due to Kelly Boat Service, Destin, Fla., for freezer storage of core samples.
DESCRIPTION OF SEDIMENTARY ENVIRONMENTS AND SAMPLE LOCATIONS
Bay.-Choctawhatchee Bay, the prime target of this study, is an estuarine bodyof water located in the panhandle of northwest Florida (fig. 1). The bay is about 28 miles long and 2--5 miles wide, with its long axis parallel to the Gulf of Mexico coastline. The maximum water depth is 10 feet ( 3.0 meters) in the eastern part of the bay and 43 feet (13.1m) in the western part. Though water salinity differs greatly depending on the movement of tidal currents and time of year, the bottom salinity is generally less than 20 parts per thousand in the eastern part of the bay, east of the causeway (fig. 2A), and generally rnore than 20 parts per thousand throughout the rest of the bay. The marked changes in salinity can be illustrated thus: During the field season of April1964, after a period of heavy rainfall, a bottom-water salinity of less than 1 part per thousand was measured in the bay east of the causeway, whereas during May 1967, after a period of drought, a salinity of 15 parts per thousand was measured.
Core samples were collected at six stations in the bay, and one grab sample was collected at an additional sta-
:097 U.S. GEOL. SURVEY PROF. PAPER 600-C, PAGES C97-C106
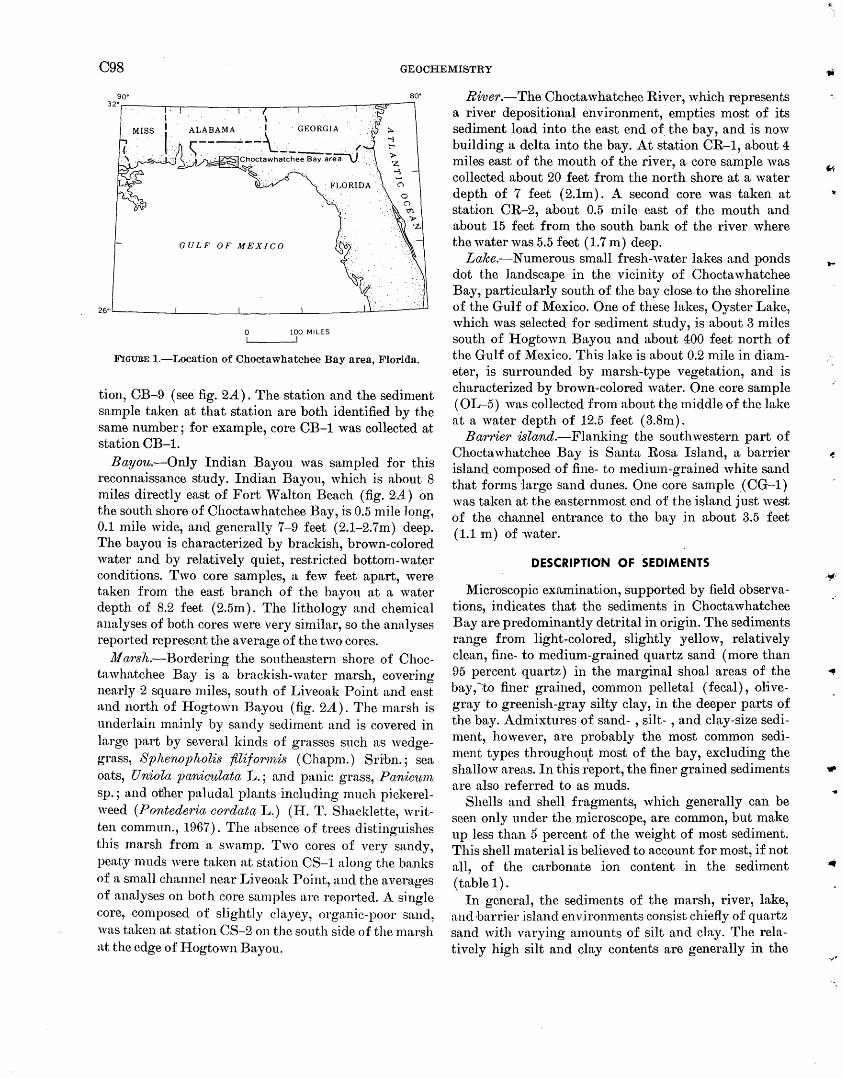
C98 GEOCHEMISTRY
go· so· 32° r.-:---:-----,r--.--------,-~---,-----:-r~~.--,
.. MISS
GULF OF MEXICO
0 100 MILES
FIGURE 1.-Location of Choctawhatchee Bay area, Florida.
tion, CB-9 (see fig. 2A) . The station and the sediment sample taken at that station are both identified by the same number; for example, core CB-1 was collected at station CB-1.
Bayou.-Only Indian Bayou was sampled for this reconnaissance study. Indian Bayou, which is about 8 miles directly east of Fort Walton Beach (fig. 2A) on the south shore of Choctawhatchee Bay, is 0.5 mile long, 0.1 mile wide, and generally 7-9 feet (2.1-2.7m) deep. The bayou is characterized by brackish, brown-colored water and by relatively quiet, restricted bottom-water conditions. Two core samples, a few feet apart, were taken from the east branch of the bayou at a water depth of 8.2 feet (2.5m). The lithology and chemical analyses of both cores were very similar, so the analyses reported represent the average of the two cores.
Marsh.-Bordering the southeastern shore of Choctawhatchee Bay is a brackish-water marsh, covering nearly 2 square miles, south of Liveoak Point and east and north of Hogtown Bayou (fig. 2A). The marsh is underlain mainly by sandy sediment and is covered in large part by several kinds of grasses such as wedgegrass, SphenozJholis filiformis ( Ohapm.) Srihn.; sea oats, Uniola paniculata L.; and panic grass, Paniaun1 sp.; and other paludal plants including much pickerelweed (Pontederia aordat(~ L.) (H. T. Shacklette, written commun., 1967). The absence of trees distinguishes this marsh from a swamp. Two cores of very sandy, peaty muds were taken at station CS-1 along the banks of a small channel near Liveoak Point, and the averages of analyses on both core samples are reported. A single core, composed of slightly clayey, organic-poor sand, was taken at station CS-2 on the south side of the marsh at the edge of Hogtown Bayou.
River.-The Choctawhatchee River, which represents a river depositional environment, empties most of its sediment load into the east end of the bay, and is now building a delta into the bay. At station CR-1, about 4 miles east of the mouth of the river, a core sample was collected about 20 feet from the north shore at a water depth of 7 feet ( 2.1m) . A second core was taken at station CR-2, about 0.5 mile east of the mouth and about 15 feet from the south bank of the river where the water was 5.5 feet (1.7 m) deep.
Lake.-Numerous small fresh-water lakes and ponds dot the landscape in the vicinity of Choctawhatchee Bay, particularly south of the bay close to the shoreline of the Gulf of Mexico. One of these lakes, Oyster Lake., which was selected for sediment study, is about 3 miles south of Hogtown Bayou and about 400 feet north of the Gulf of Mexico. This htke is about 0.2 mile in diameter, is surrounded by marsh-type vegetation, and is characterized by brown-colored water. One core sample ( OL-5) was collected from about the middle of the lake at a water depth of 12.5 feet (3.8m).
Barrier island.-Flanking the southwestern part of Choctawhatchee Bay is Santa Rosa Island, a barrier island composed of fine- to medimn-grained white sand that forms Iarge sand dunes. One core sample .( CG-1) was taken at the easternmost end of the island just west of the channel entrance to the bay in about 3.5 feet (1.1 m) of water.
DESCRIPTION OF SEDIMENTS
Microscopic examination, supported by field observations, indicates that the sediments in Choctawhatchee Bay are predominantly detrital in origin. The sediments range from light-colored, slightly yellow, relatively clean, fine- to medium-grained quartz sand (more than 95 percent quartz) in the marginal shoal areas of the bay, ~to finer grained, com·mon pelletal (fecal), olivegray to greenish-gray silty clay, in the deeper parts of the bay. Admixtures of sand- , silt- , and clay-size sediment, however, are probably the most common sediment types throughou
1t most of the bay, excluding the
shallow areas. In this repo'rt, the finer grained sediments are also referred to as muds.
Shells and shell fragments, which generally can be seen only under the microscope, are common, but make up less than 5 percent of the weight of most sediment. This shell material is believed to account for most, if not all, of the carbonate ion content in the sediment (table 1).
In general, the sediments of the marsh, river, lake, and barrier island environn1ents consist chiefly of quartz sand with varying amounts of silt and clay. The relatively high silt and clay contents are generally in the
...
..
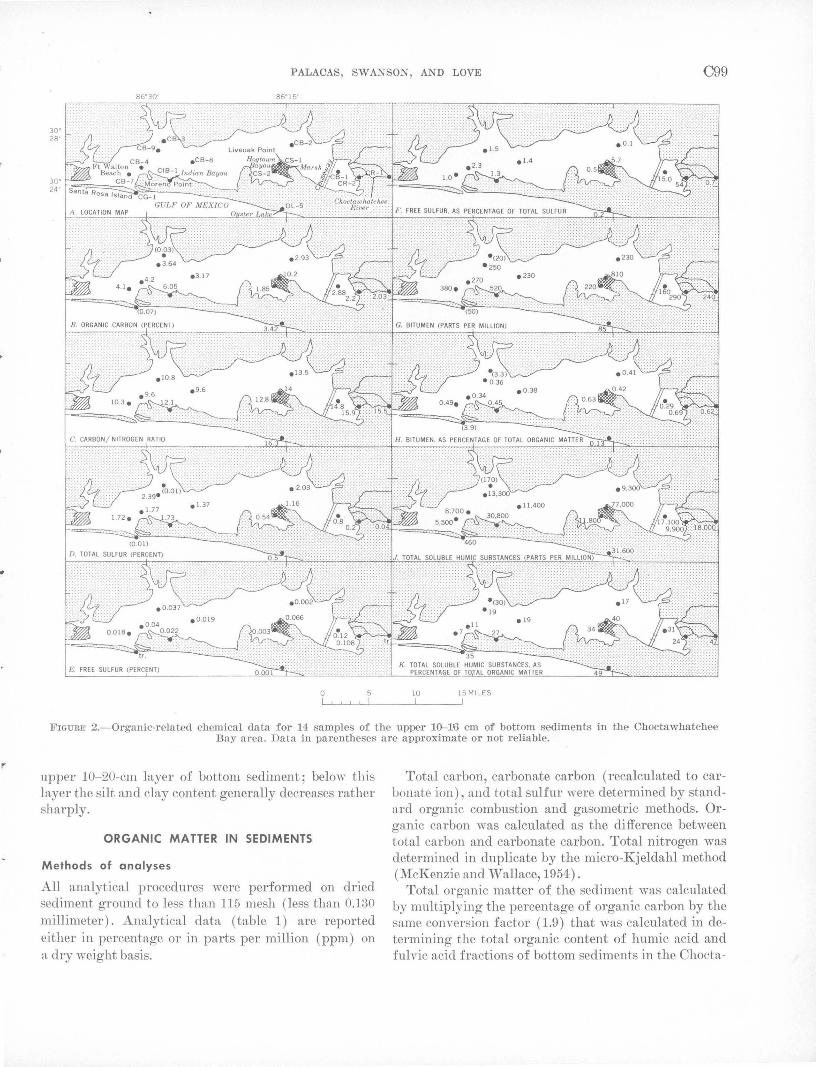
r
PALACAS, SWANSON, AND LOVE C99
0 10 15 MILES
FIGURE 2.- 0rganic-related chemical data for 14 samples of the upper 10-16 em of bottom sediments in the Ohoctawhatchee Bay area. Data in parentheses are approximate or not reliable.
upper 10-~20-cm layer of bottom sediment; below this layer the silt and clay content generally decreases rather sharply.
ORGANIC MATTER IN SEDIMENTS
Methods of analyses
All analytical procedures were performed on dried sediment ground to less than 115 mesh (less than 0.130 millimeter). Analytical data (table 1) are reported either in percentage or in parts per million (ppm) on a dry weight basis.
Total carbon, carbonate carbon (recalculated to carbonate ion), and total sulfur were determined by standard organic combustion and gasometric methods. Or ganic carbon was calculated as the difference between total carbon and carbonate carbon. Total nitrogen was determined in duplicate by the micro-Kjeldahl method (McKenzie and Wallace, 1954) .
Total organic matter of the sediment was calculated by multiplying the percentage of organic carbon by the same conversion factor (1.9) that was calculated in determining the total organic content of humic acid and fulvic acid fractions of bottom sediments in the Chocta-
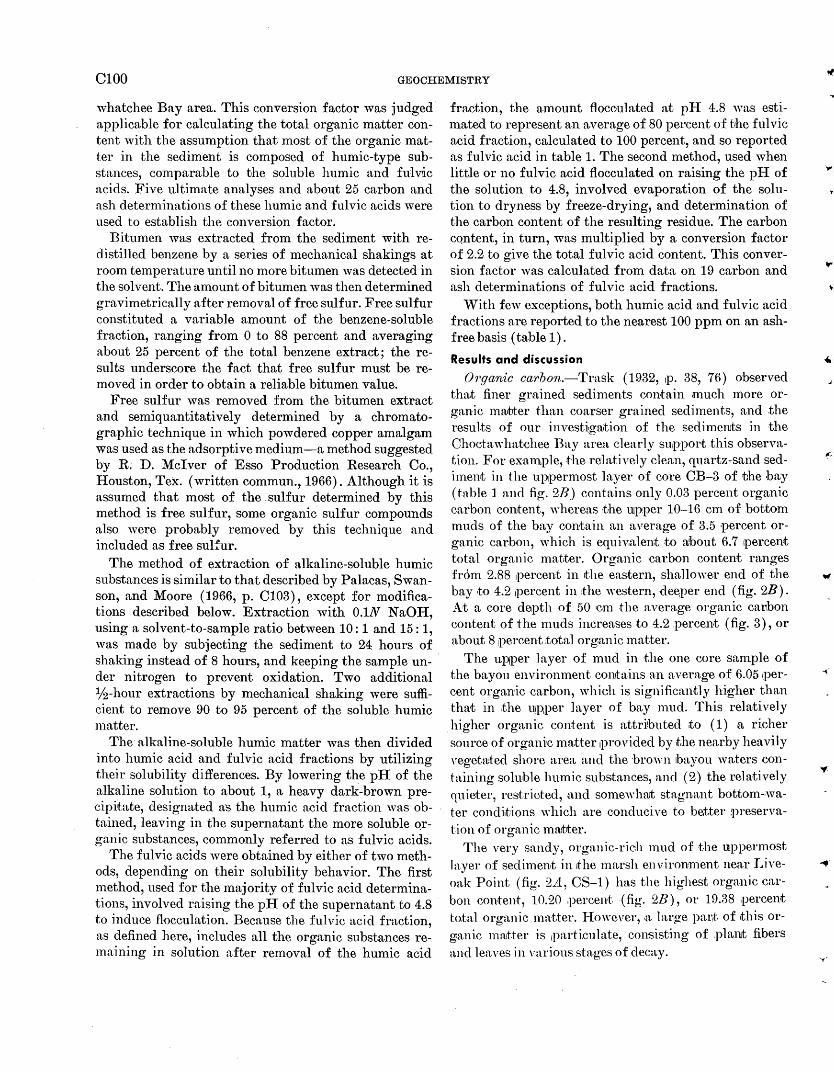
ClOO GEOCHEMISTRY
whatchee Bay area. This conversion factor was judged applicable for calculating the total organic matter content with the assumption that most of the organic matter in the sediment is composed of humic-type substances, comparable to the soluble humic and fulvic acids. Five ultimate analyses and about 25 carbon and ash determinations of these humic and fulvic acids were used to establish the conversion factor.
Bitumen was extracted from the sediment with redistilled benzene by a series of mechanical shakings at room temperature until no more bitumen was detected in the solvent. The amount of bitumen was then determined gravimetrically after removal of free sulfur. Free sulfur constituted a variable amount of the benzene-soluble fraction, ranging from 0 to 88 percent and averaging about 25 percent of the total benzene extract; the results underscore the fact that free sulfur must be removed in order to obtain a reliable bitumen value.
Free sulfur was removed from the bitumen extract and semiquantitatively determined by a chromatographic technique in which powdered copper amalgam was used as the adsorptive medium-a method suggested by R. D. Mciver of Esso Production Research Co., Houston, Tex. (written commun., 1966) . Although it is assumed that most of the sulfur determined by this method is free sulfur, some organic sulfur compounds also were probably removed by this technique and included as free sulfur.
The method of extraction of alkaline-soluble humic substances is similar to that described by Palacas, Swanson, and Moore (1966, p. C103), except for modifications described below. Extraction with 0.1N N aOH, using a solvent-to-sample ratio between 10: 1 and 15: 1, was made by subjecting the sediment to 24 hours of shaking instead of 8 hours, and keeping the sample un- · der nitrogen to prevent oxidation. Two additional lf2-hour extractions by mechanical shaking were sufficient to remove 90 to 95 percent of the soluble humic matter.
The alkaline-soluble humic matter was then divided into humic acid and fulvic acid fractions by utilizing their solubility differences. By lowering the pH of the alkaline solution to about 1, a heavy dark-brown precipi'tate, designated as the humic acid fraction was obtained, leaving in the supernatant the more soluble Qrganic substances, commonly referred to as fulvic acids.
The fulvic acids were obtained by either of two methods, depending on their solubility behavior. The first method, used for the majority of fulvic acid determinations, involved raising the pH of the supernatant to 4.8 to induce flocculation. Because the fulvic acid fraction, as defined here, includes all the organic substances remaining in solution after removal of the humic acid
fraction, the amount flocculated at pH 4.8 was estimated to represent an average of 80 percent of the fulvic acid fraction, calculated to 100 percent, and so reported as fulvic acid in table 1. The second method, used when little or no fulvic acid flocculated on raising the pH of the solution to 4.8, involved evaporation of the solution to dryness by freeze-drying, and determination of the carbon content of the resulting residue. The carbon cQntent, in turn, was multiplied by a conversion factor of 2.2 to give the total fulvic acid content. This conversion factor was calculated from data on 19 carbon and ash determinations of ful vic acid fractions.
. With few exceptions, both humic acid and fulvic acid fractions are reported to the nearest 100 ppm on an ashfree basis (table 1) .
Results and discussion
Organic carbon.-Trask ( 1932, IP· 38, 76) observed tha.t finer grained sediments contain .much more organic mrutrter ;than coarser grained sediments, and .the results of our investigrution of the sedimenrt:s in the Choctawhatchee Bay area clearly support this observation. For example, the relatively clean, quartz-sand sediment ·in the Ul~permost layer of core CB-3 of the bay (table 1 and fig: 2B) contains only 0.03 percent organic carbon content, whereas the UJpper 10-16 em of bottom muds of the bay contain an average of 3.5 ·percent organic carbon, which is equiv,alen:t to a!bout 6.7 percent total organic matter. Organic carbon content ranges fr6m 2.'88 percent in rthe eastern, shallower end of the bay to 4.2 1percent in the western, de~per end (fig. 2B). At a core depth of 50 om the average organic caribon content of the muds increases to 4.2 ,percent (fig. 3), or about 8 1percent total org;anic .matter.
The upfper layer of mud in the one core sample of the bayou environment contains an average of 6.05 ipercent organic carbon, which is significantly higher than that in the tllp;per layer of bay n1ud. This relatively higher organic content is attributed to ( 1) ,a richer source of organi'c matter 1provided by the nearby heavily vegetwted shore area and the brown 1bayou waters containing soluble humic substances, and (2) the relatively quieter, restricted, .and some,duut stagnant bottom-.water concHt:ions which are conducive to better preservation of organic ma:trter.
The very sandy, organic-rich mud of the uppermost layer of sediment in1the marsh environment near Liveoak Point (fig. 2A, CS-1) has the highest organic carbon content, 10.20 .percent (fig. 2B), or 19.38 ,percent total organic matter. However, .a, large par,t of ,this organic mnJtter is 1parti.culate, consisting of plant fibers and leaves in various stages of decay.
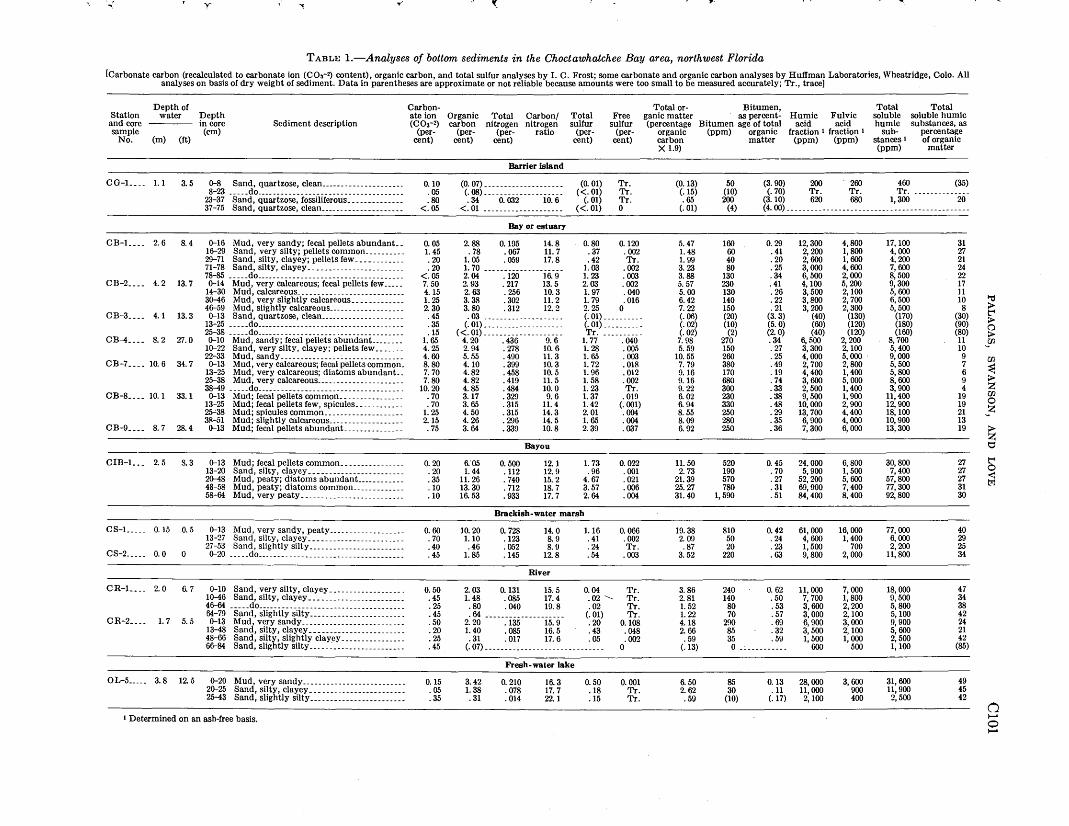
y T' ~ ). ~ ~
TABLE I.-Analyses of bottom sediments in the Choctawhatchee Bay area, northwest Florida
[Carbonate carbon (recalculated to carbonate ion (C0~-2) content), organic carbon, and total sulfur analyses by I. C. Frost; some carbonate and organic carbon analyses by Huffman Laboratories, Wheatridge, Colo. All analyses on basis of dry weight of sediment. Data in parentheses are approximate or not reliable because amounts were too small to be measured accurately; Tr., trace]
Depth of Carbon- Total or- Bitumen, Total Total Station water Depth ate ion Organic Total Carbon/ Total Free ganic matter as percent- Humic Fulvic soluble soluble humic and core in core Sediment description (C03-2) carbon nitrogen nitrogen sulfur sulfur (percentage Bitumen age of total acid acid humic substances, as sample (em) (per- (per- (per- ratio (per- (per- organic (ppm) organic fraction 1 fraction I sub- percentage
No. (m) (ft) cent) cent) cent) cent) cent) carbon matter (ppm) (ppm) stances 1 of organic X 1.9) (ppm) matter
Barrier island
CG-L ___ 1.1 3. 5 o-8 Sand, quartzose, clean _____________________ 0.10 (0. 07) ____________________ (0. 01) Tr. (0.13) 50 (3. 90) 200 260 460 (35) 8-23 ___ .. do _____________________________________ .05 (. 08) -------------------- (<.01) Tr. (.15) (10) (. 70) Tr. Tr. Tr. --------------
23-37 Sand, quartzose, fossiliferous ______________ .80 .34 0. 032 10.6 (. 01) Tr. .65 200 (3.10) 620 680 1,300 20 37-75 Sand, quartzose, clean _____________________ <.05 <. 01 -------------------- (<. 01) 0 (. 01) (4) (4. 00) ----------------------------------------------
Bay or estuary
CB-L ___ 2. 6 8. 4 Q-16 Mud, very sandy; fecal pellets abundant._ 0. 05 2. 88 0.195 14.8 0. 80 0.120 5. 47 160 0. 29 12,300 4,800 17, 100 31 1~29 Sand, very silty; pellets common ___________ 1.45 . 78 . 067 11.7 .37 . 002 1.48 60 . 41 2, 200 1,800 4, 000 27 29-71 Sand, silty, clayey; pellets few ____________ . 20 1. 05 . 059 17.8 . 42 Tr . 1.99 40 . 20 2,600 1, 600 4,200 21 71-78 Sand, silty, clayey ___ -------------- _______ . 20 1. 70 -------------------- 1.03 . 002 3. 23 80 .25 3,000 4,600 7, 600 24 78-85 _____ do _____________________________________ <.05 2.04 .120 16.9 1.23 . 003 3. 88 130 .34 6, 500 2,000 8,500 22
CB-2 ____ 4. 2 13.7 Q-14 Mud, very calcareous; fecal pellets few _____ 7. 50 2. 93 . 217 13.5 2.03 . 002 5. 57 230 . 41 4,100 5, 200 9,300 17 14-30 Mud, calcareous ___________ ---------------_ 4.15 2. 63 . 256 10.3 1. 97 .040 5. 00 130 . 26 3,500 2,100 5, 600 11 3o-46 Mud, very slightly calcareous _____________ 1.25 3.38 .302 11.2 1. 79 . 016 6.42 140 . 22 3,800 2, 700 6,500 10 ""d 4~59 Mud, slightly calcareous ___________________ 2. 30 3. 80 . 312 12.2 2. 25 0 7. 22 150 . 21 3,200 2,300 5,500 8 >
CB-3 ____ 4.1 13.3 Q-13 Sand, quartzose, clean _____________________ .45 . 03 -------------------- (. 01) ---------- (. 06) (20) (3.3) (40) (130) (170) (30) t"1 > 13-25 _____ do _____________________________________ .35 (. 01) -------------------- (. 01) __________ (.02) (10) (5.0) (60) (120) (180) (90) 0 25-38 _____ do ____________________ ·--------- _______ .15 (<.01) _____________ ·------ Tr. ---------- (. 02) (2) (2. 0) (40) (120) (160) (80) > CB-4 ____ 8. 2 27.0 o-10 Mud, sandy; fecal pellets abundant_ _______ 1.65 4. 20 .436 9. 6 1. 77 . 040 7.£18 270 .34 6,500 2, 200 8, 700 11 U2
1Q-22 Sand, very silty, clayey; pellets few _______ 4. 25 2. 94 .278 10.6 1.28 . 005 5. 59 150 . 27 3,300 2,100 5,400 10 ~
22-33 Mud, sandy ______________ -~ _______________ 4. 60 5.55 .490 11.3 1.65 . 003 10.55 260 . 25 4,000 5,000 . 9,000 9 U2 CB-7 ____ 10.6 34.7 Q-13 Mud, very calcareous; fecal pellets common. 8.80 4.10 .399 10.3 1. 72 .018 7. 79 380 .19 2, 700 2,800 5,500 7 ~ 13-25 Mud, very calcareous; diatoms abundant._ 7. 70 4.82 . 458 10.5 1. 96 .012 9.16 170 .19 4,400 1,400 5,800 6
25-38 Mud, very calcareous ______________________ 7.80 4.82 . 419 11.5 1. 58 .002 9.16 680 . 74 3,600 5,000 8,600 9 > 38-49 _____ do ____________________________________ .. 10.20 4.85 .484 10.0 1.23 Tr. 9. 22 300 .33 2,500 1,400 3,900 4 z
CB-8 ____ 10.1 33.1 Q-13 Mud; fecal pellets common ________________ . 70 3.17 .329 9. 6 1.37 . 019 6. 02 230 .as 9,500 1, 900 11,400 19 U2 13-25 Mud; fecal pellets few, spicules ___________ . . 70 3. 65 . 315 11.4 1.42 (.001) 6. 94 330 .48 10,000 2,900 12,900 19 0 ~38 Mud; spicules common ____________________ 1.25 4.50 . 315 14.3 2.01 .004 8.55 250 .29 13,700 4,400 18,100 21 ~z 3R-51 Mud; slightly calcareous ___________________ 2.15 4. 26 .296 14.5 1.65 .004 8.09 280 . 35 6, 900 4,000 10,900 13
CB-9 ____ 8. 7 28.4 Q-13 Mud; fecal pellets abundant_ ______________ . 75 3. 64 .339 10.8 2.39 .037 6. 92 250 .36 7,300 6, 000 13,300 19 ~
Bayou ~
CIB-L __ 2. 5 8.3 Q-13 Mud; fecal pellets common ________________ 0. 20 6."05 0.500 12.1 1. 73 0. 022 11.50 520 0. 45 24,000 6,800 30,800 27 t"1 13-20 Sand, silty, clayey ________________________ . 20 1.44 .112 12.9 . 96 . 001 2. 73 190 . 70 5, 900 1, 500 7,400 27 0
<! 2o-48 Mud, peaty; diatoms abundant_ ___________ .35 11.26 . 740 15.2 4. 67 . 021 21.39 570 .27 52,200 5, 600 57,800 27 t:rl 48-58 Mud, peaty; diatoms common _____________ .10 13.30 .712 18.7 3.57 .006 25.27 780 . 31 69,900 7,400 77,300 31 58-64 Mud, very peaty __________________________ .10 16.53 . 933 17.7 2. 64 . 004 31.40 1, 590 . 51 84,400 8,400 92,800 30
Brackish-water marsh
CS-L ___ 0.15 0.5 Q-13 Mud, very sandy, peaty ___________________ 0. 60 10.20 0. 728 14.0 1.16 0.066 19.38 810 0. 42 61,000 16,000 77,000 40 13-27 Sand, silty, clayey ________________________ . 70 1.10 .123 8. 9 . 41 .002 2.09 50 . 24 4, 600 1,400 6,000 29 27-53 Sand, slightly silty ________________________ .40 .46 . 052 8.9 .24 Tr. .87 20 .23 1, 500 700 2,200 25
CS-L ___ 0. 0 0 o-20 ____ .do ________ ----------------------------_ . 45 1.85 .145 12.8 .54 . 003 3.52 220 .63 9,800 2, 000 11,800 34
River
CR-L ___ 2. 0 6. 7 o-10 Sand, very silty, clayey __________________ . 0. 50 2.03 0.131 15.5 0.04 Tr. 3.86 240 0. 62 11,000 7,000 18,000 47 1o-46 Sand, silty, clayey ________________________ .45 1. 48 . 085 17.4 .02 ---- Tr. 2. 81 140 . 50 7, 700 1,800 9,500 34 4~ _____ do _____________________________________ . 25 .80 .040 19.8 .02 Tr . 1.52 80 . 53 3,600 2,200 5,800 38 64-79 Sand, slightly silty ________________________ . 45 . 64 -------------------- (. 01) Tr. 1.22 70 . 57 3,000 2,100 5,100 42
CR-2 ____ 1.7 5. 5 Q-13 Mud, very sandy __________________________ . 50 2. 20 .135 15.9 . 20 0.108 4.18 290 . 69 6, 900 3,000 9, 900 24 13-48 Sand, silty, clayey ________________________ . 20 1.40 . 085 16.5 .43 . 048 2. 66 85 .32 3, 500 2,100 5,600 21 48-66 Sand, silty, slightly clayey ________________ .25 . 31 .017 17.6 .05 . 002 .59 35 .59 1, 500 1, 000 2,500 42 6~84 Sand, slightly silty _____ ~-- ________________ . 45 (.07) ______________________________ 0 (.13) 0 ------------ 600 500 1,100 (85)
Fresh-water lake
OL-L ___ 3.8 12.5 o-20 Mud, very sandy __________________________ 0.15 3.42 0. 210 16.3 0.50 0. 001 6.50 85 0.13 28,000 3, 600 31,600 49 2Q-25 Sand, silty, clayey ___ -------------- _______ . 05 1.38 . 078 17.7 .18 Tr. 2. 62 30 .11 11,000 900 11,900 45 25-43 Sand, slightly silty ________________________ .35 . 31 . 014 22.1 .15 Tr. . 59 (10) (.17) 2.100 400 2,500 42
(') • Determined on an ash-free basis. ........
0 ........
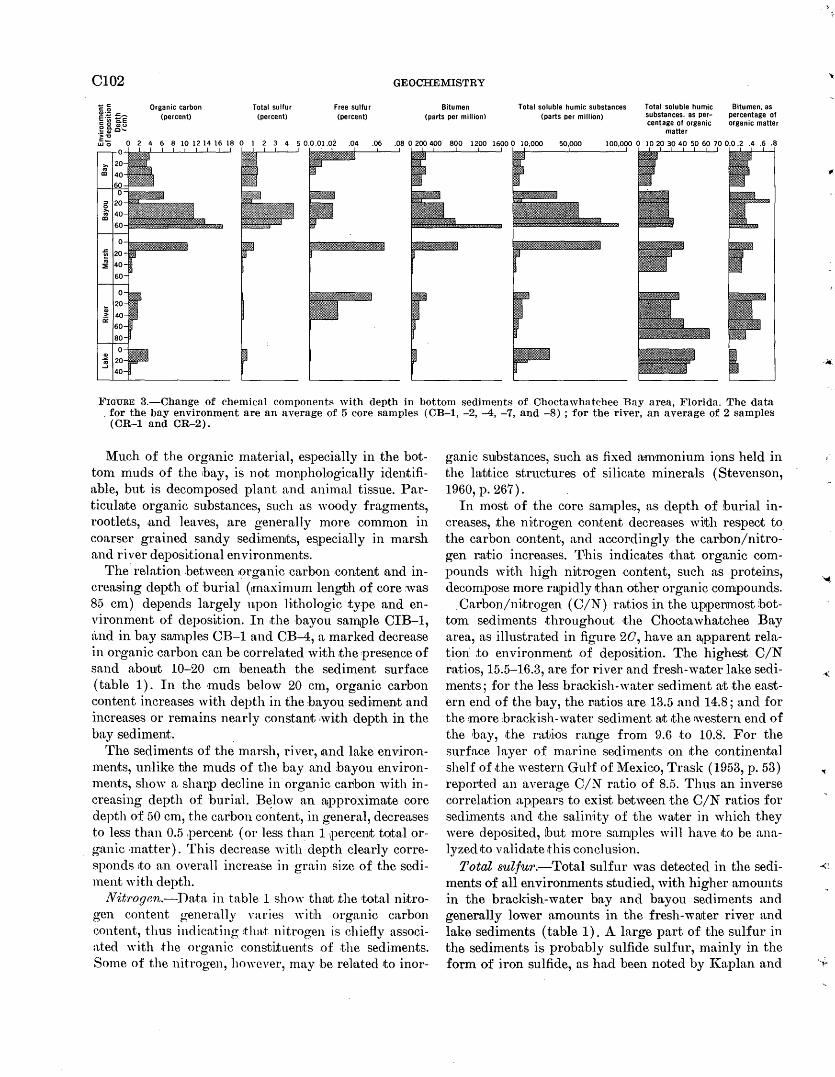
C102 GEOCHEMISTRY
c 0 -..::..r:::::_ ·;;;'liE
Organic carbon (percent)
Total sulfur (percent)
Free sulfur (percent)
Bitumen (parts per million)
Total soluble humic substances (parts per million)
Total soluble humic substances, as percentage of organic
Bitumen, as percentage of organic matter
!~·~ matter
'0 o 2 4 6 8 10 12 14 16 18 o 1 2 3 4 5 o.om.o2 .04 .06
FIGURE 3.-Change of chemical components with depth in bottom sediments of Choctawhatchee Bay area, ]'lorida. The data . for the bay environment are an average of 5 core samples (CB-1, -2, -4, -7, and -8) ; for the river, an average of 2 samples
(CR-1 and CR-2).
Much of the organic material, especially in the bottom muds of the hay, is not moliphol:ogically identifiable, but is decomposed plant and animal tissue. Particulrute organic substances, such as woody fragments, rootlets, and leaves, ,are generally more common in coarser grained sandy sedi.mel1Jts, eBipecially in marsh and river d~positional environments.
The relation between organic •carbon .content ,and increasing depth of burial (,maximum lengbh of core was 85 em) d~pends largely upon li1thologic type and environment of deposition. In ,the bayou sam,ple CIB-1, and in bay sa;mples CB-1 and CB-4, a marked decrease in organic carbon can be ·Correlated with the presence of sand about 10-20 em beneath the sedimeDJt surface (table 1). In the ·muds below 20 em, organic carbon content increases with depth in the hayou sedi,ment and increases or remains nearly constant ·with depth in the bay sediment.·
The sediments of the marsh, river, 1andlake environmeDJts, unlike t:he muds of the bay and bayou environmml!ts, show a shar,p decline in organic caribou with increasing depth of burial. B~low an 31pproxima;te core depth of 50 em, the carbon content, in general, decreases to less than 0.5 .percent (or less than 1 1percent total organic ·matter). This decrease with depth clearly corresponds 1to an overall increase in gra·in size of the sediment with depth.
Nitrogen.-Data in table 1 show thrut the total nitrogen content generally varies with organic carbon content, thus indic:vting 1tha.t nitrogen is chiefly associated \Yith .the organic constituelllts of the sediments. Some of the nitrogen, however, may be rel,ated to inor-
ganic SUJbstances, such as fixed a'lnmonium ions held in the lruttice structures of silicate minerals (Stevenson, 1960, p. 267).
In most of the core samples, as depth of burial increases, the nitrogen content decreases with respeot to the carbon content, and accordingly the carbon/nitrogen r:atio increases. 'I'his indicates 1that organic compounds with high nitrogen content, such as proteins, decompose more rU[>idly than other organic compounds. Carbon/ni~trogen ( C/N) ratios in the U.P)pemnost bot
tom sediments throughout rthe Chootawhatchee Bay area, as illustrated in figure 20, have an .~pparent relntimi to environment of deposition. The highest C/N vatios, 15.5-16.3, are for river and fresh-water lake sediments; for ~the less brackish-wa;ter sediment at the eastern end of the bay, the natios are 13.5 .and14.8; and for the :more brackish-water sediment at ~the 'western end of the bay, the ratios range from 9.6 to 10.8. For the surface layer of marine sediments on 1the continental shelf of,the western Gulf of l\1exico, Trask (1953, p. 53) reported an average C/N ratio of 8.5. Thus an inverse correlation appears to exist between the C/N ratios for sediunents and the salinity of the water in which they were deposited, ibut ·more samples will have 1to be analyzed rto validate .this conclusion.
Total sulfur.-Total sulfur was detected in the sediments of all environments studied, with higher amounts in the brackish-water bay and bayou sediments and generally lower amounts in the fresh-wruter river and lake sediments (table 1) . A la.rge part of the sulfur in the sediments is probably sulfide sulfur, mainly in the form of iron sulfide, as had been noted by l(aplan and
PALACAS, SWANSON, AND LOVE Cl03
others (1963) for the sediments in the basins off southern California.
Total sulfur ranges from 1.37 to 2.39 percent and averages 1.84 percent in 1the uppermost bottom muds of the brackish-water bayou and bay environn1ents, exclusive of the sediment at CB-1 which is near the mouth of the Choctawha-tchee River (fig. 2D). Lower sulfur concentrations were found in the more ftesh-water or continental-type deposits. For example, a sulfur content of 0.8 percent characterizes the less brackish-water bay sediment at CB-1; 0.5 percent, the fresh-water lake sediment ( OL-5) ; 0.2 percent, the sediment near the mouth of Chootawhatchee River (CR-2); and 0.04 percent, the river sediment at station CR-1. This distribution of sulfur content strongly suggests that sulfur compounds are formed in place, probably by reduction of sulfate ions that are availa;ble in the pore water.
With few exceptions, the vertical distribution of total sulfur corresponds very closely to the depth distribution of organic carbon (fig. 3), thus indicating that total sulfur content is closely related to organic-matter content.
Free sulfur.-The amount of free sulfur in ~the uppermost bottom sediments of the six depositional environments studied is generally less than 0.06 percent of the dried weight of sediment (table 1). 'Vith the exception of the CB-1 sediment, the free-sulfur content in the brackish-water bay and bayou muds ranges from 0.002 to 0.04 percent (fig. 2E), averages 0.02 percent, and generally accounts for less than 2 percent of the total sulfur in the sediment (fig. 2F).
The highest free-sulfur content is in the less brackishwater sediment ( CB-1) of the bay near the mouth of the Choctawhatchee River, and in the river sediment (CR-2) near the mouth of the river. The samples from each of these environments contain 0.12 and 0.108 percent free sulfur, respectively, which accounts for the anomalously high amounts of 15 a.nd 54 percent, respectively, of rthe total sulfur content, -as indicated in figure 2F. The explanation for such relatively high free sulfur contents is not fully known, although there is the possibility that some, if not much, of the free sulfur may have been produced by oxidation of unstable iron sulfides, such as hydrotroilite, during the drying of the sediment samples under atmospheric conditions.
Free sulfur diminishes markedly with depth of burial in all environments of deposition (table 1 and fig. 3), and consequently seems to be one of the clearest indicators of early diagenesis. The decrease of free sulfur with depth probably tesults from -its reduction and combination with metals after burial to form, for example, the more stable pyrite. That the decrease of free sulfur with depth does not necessarily 'Correspond to
?hanges in total sulfur content is shown, for example, m cores CB-1, CB-2, and CB--8, where total sulfur generally increases while free sulfur decreases with depth.
Bitumen.-The bitumen content can be regarded as an approximate measure of the hydrocarbon content of the sediment, though no attempt was made for this study to separate the bitumen into its hydrocarbon and asphaltic fractions.
The amount of bitumen in the upper 10-16 em of mud in the bay ranges from 160 to 380 ppm (fig. 2G) and averages about 250 ppm; the average amount decreases to about 190 ppm at an approximate core depth of 50 em (table 1 and fig. 3). The average bitumen content for all the bay muds is 225 ppm which accounts for 0.37 percent of the total organic matter. The content in the upper 10-13 em of sediment in the two river samples is comparable to that of the bay muds, 240 and 290 ppm, but the average content in muds of the bayou is '520 ppm-slightly more than twice as much as in the hay muds.
The highest quantity of bitumen, 810 ppm, determined for .any of the sediment in the uppermost layer is in the very sandy, peaty muds of the marsh environment. However, a higher value of 1,590 ppm was determined for the peaty muds of the ba.you environment at a depth of 58-64 ern beneath the sediment surface (table 1) . These high yields of bitumen in both the marsh and bayou environments, however, are commensurate with their relatively high organic carbon contents of 10.20 and 16.53 percent, respectively. Of all the uppermost bottom sediments that were analyzed, d1e sediment from Oyster Lake (based on a single analysis) showed the lowest yield of bitumen as pePcentage of organic matter, namely 0.13 percent (fig. 2H). This low figure is generally one-third that of the average surface muds of the bay and from one-third to as low as onethirtieth (see data for core CG-1) that of the surface sediments in the other environments. Thus, the browncolored fresh-water lake environment appears to be the least favorable for the accumulation of bi·tumen.
Although the relatively clean quartz sands of the bay ( CB-3) and of the barrier island ( CG-1) environments yielded relatively small amounts of bitumen, average of 10 and 65 ppm, respectively, nevertheless their bitumen contents accounted for the anomalously high average values of 3.4 and 2.9 perecnt of the total organic content (table 1). Before any significance can be attached to this relation of bitumen content to total organic matter, however, many more samples should be analyzed.
In general, no pronounced uniform changes occur in the distribution of bitumen content with depth of burial in bottom sediments of the Choctawhatchee Bay
C104 GEOCHEMISTRY
area (table 1 and fig. 3). With few exceptions, however, a positive correlation (as illustrated in fig. 3) exists between amount of bitumen and organic carbon, both stratigraphically and laterally. Some minor consistent changes in the ratio of bitumen to total organic matter (table 1), which may be an index of diagenesis of organic matter, do occur with depth in two bay samples, CB-2 and CB-4, and in the one marsh core, sample CS-1; in these three samples higher values in the surface layer gradually decrease to lower values below. Conclusions concerning diagenesis of bitumen, however, must await analyses of more samples and of longer cores.
Alkaline-soluble hwmic substances.-The alkalinesoluble humic matter constitutes the largest organic fraction extracted from the bottom sediments. Generally, 10-50 percent of the total organic matter is released from the sediments under mild chemical treatment as soluble humic materials, with most of . the remaining nonparticulate organic material believed to be present as insoluble humic compounds. The soluble humic substances are a heterogeneous mixture of complex organic molecules that can be separated into two fractions, referred to as humic acids and fulvic acids.
The distribution of soluble humic substances in the uppermost sediments in the bay area is illustrated in figure 2J. In the bay environment the soluble humic content of the uppermost muds ranges from 5,500 to 17,100 ppm, and averages about 10,900 ppm; it constitutes approximately 16 percent of the average total organic matter in these muds. Surface muds of the bayou environment contain a significantly higher amount of humic extract, 30,800 pp;m, which represents 27 percent of the total organic content. The overlying brown waters in this bayou environment may, in part, be the source of this larger proportion of soluble humic matter.
In the marsh, river, and lake environments, the total soluble humic matter in the uppermost sediments varies extensively, from 9,900 ppm in one of the river deposits to 77,000 ppm in a marsh sediment (fig. 2J). This wide range in soluble humic content generally reflects the correspondingly wide range in organic matter content. Interestingly, however, the soluble humic matter in these sediments represents on the average nearly 40 percent of the total organic matter, in contrast to the 16 percent for the muds of the bay.
A glance at figure 3 shows that the depth distribution of total soluble humic substances is, almost without exception, directly related to the vertical distribution of organic carbon. However, there is an indication, particularly in the muds of the bay environment, that the ratio of soluble humic matter to total 9rganic
matter sho,vs a net decrease with depth. This decrease is especially evident in the samples from CB-2 (table 1), where the percentage of soluble humic matter of the total organic matter regularly decreases from 17 percent at the surface to 8 percent at depth, thus indicating that the soluble humic compounds gradually become either physically bound to the inorganic constituents, or chemically altered to a more insoluble state, with increasing age and depth. This relation may be extrapolated into the geologic past to those organic-rich substances such as coal-forming materials in which the amount of soluble humic matter decreases with increasin.g rank of coal, and carbonaceous shales in which little or no humic matter can be extracted by dilute alkaline solutions.
Characteristics of humic acid and fulvic acid fractions.-The humic acid fraction of the bottom sediments in the studied areas generally makes up 50-80 percent of the total soluble humic extract, and the fulvic acid fraction accounts for the remaining 20-50 percent. With increasing depth of burial, however, in many of the core samples, the ratio of humic acid content to total soluble humic content decreases while the ratio of fulvic acid to total humic content increases (see table 1), thereby suggesting that the humic acids, which are the more complex, higher molecular-weight compounds, possibly become more tightly bound to the inorganic materials than the more soluble, lower molecularweight fulvic acid compounds.
Comparis<;>n of the elemental composition between the humic acid and fulvic acid fractions in table 2 shows some of the differences of these fractions. If the carbon/hydrogen (C/H) ratio is a measure of the degree of condensation, as suggested by Bordovskiy (1965, p. 56), then the humic acid fraction, which has a C/H ratio of 9.6, possesses a more condensed structure than the fulvic acid fraction, which has a C/H ratio of only 8 (table 2).
TABLE 2.-Average chemical composition of humic acid and fulvic acid fractions in bottom sediments of Choctawhatchee Bay 1
(Column A: C, H, and N based on 10 sample analyses, 0 and Son 2 an3;lyses. Col!Jmn B: c. H, and N based on 9 an~lyses, S on 2 analyses, and 0 _determmed by difference· most of the analysss by Huffman Laboratories, Wheatndge, Colo., and some by r: c. Frost, u.s. Geol. Survey. Column C: humic acid fraction of ~umatecemented sands, Florida (Swanson and Palacas, 1965) included for companson. All data in percent, on ash-free basis]
Carbon _________________ _ IIydrogen _______________ _ Oxygen _________________ _ N~rogen _______________ _ Sulfur __________________ _ C/II ratio _______________ _
A B C
Humic acid Fulvic acid Humic acid !rae-fraction fraction tion of humate
55. 6 5. 8
33. 6 3. 7 1.3 9. 6
45. 5 5. 7
43. 6 2. 7 2. 5 8. 0
55. 0 4. 4
38. 5 1.4 .7
12. 5
1 Includes 4 samples of a ~re from hayou environment.
r
PALACAS, SWANSON, AND LOVE C105
Differences in hydrogen, oxygen, nitrogen, and sulfur contents between the humic acid fraction of bottom sediments of C~octawhatchee Bay and of humate-cemented coastal sands of northwest Florida (Swanson and Pal acas, 1965, tables 2 and 4) suggest that the sources of the organic 1natter are different. Humic acids in the bay sediments are probably derived partly from land types of organic material that form the humate and partly frmn plant and animal organisms that grew within the bay itself. The C/H ratio (9.6) of the humic acids from the bay sediments is significantly lower than the ratio ( 12.5) of the humic acids fron1 humate-cemented sands, and appears to be more closely related to the C;'H ratio of humic acids from marine sediments. For example, Bordovskiy ( 1965, p. 56) has shown that the C/H ratio of the combined humic and fulvic acids of the Bering Sea sediments varies between 6.8 aud 8.8 which is comparable to the combined C/I-I ratio (8.8) of the humic and fulvic acids from the bottom sediments in the Choctawhatchee Bay area. The C/H ratio (12.5) of humic acids in humate deposits, on the other hand, is more akin to the C/I-I ratio of humic acids in soils, which ranges from 12 to 21.4 ( Bordovskiy, 1965, p. 56).
In the uppermost bottom muds of the bay, the extractable hun1ic acid content also appears to be inversely related to the carbonate content, ·which probably consists chiefly of shell material. The humic acid fraction, as percentage of the total organic content, decreases from 22 to 3 percent, while the carbonate ion content increases from 0.05 to 8.8 percent (table 3). Although the limited number of data indicate an inverse relationshi,p, the results may be purely fortuitous. Consequently, 1nore samples must be analyzed before any definite conclusions can be drawn.
TABLl~ 3.-Relation of humic acid content to carbonate ion content in 1tpper 10-16 em of bottom-m1td sediment samples from Choctawhatchee Bay
CB-1 CB-8 CB-9 CB-4 CB-2 CB-7
Humic ncid, as per-centage of total organic matter ____ 22 16 11 8 7 3
Carbonate ion con-tent (in percent) ___ 0. 05 0. 7 0. 75 1. 65 7. 50 8. 80
SUMMARY
The principal findings of this preliminary study of sediments in an estuarine bay, bayou, marsh, river, lake, and barrier island are:
(1) Organic matter content in the upper 10-16 em of bottom 1nud of Choctawatchee Bay averages about 6.7 percent but increases to about 8 percent at an aver-
age depth of 50 em. The coarser grained quartzose sand in the shallow near-shore areas of the bay contains generally less than 0.5 percent organic matter.
( 2) In general, the organic matter content in the upper sediment of the marsh, river, and lake environments varies from 3.5 percent to nearly 20 percent, but usually decreases to less than 1 percent below a core depth of 50 em.
(3) Carbon/nitrogen ratios in sediments indicate the salinity of water in which they were deposited; lower ratios, averaging 10.1, characterize the more brackishwater bay deposits, and higher ratios, averaging 15.9, the fresh-water d~posits. C/N ratios generally increase with depth of burial of sediment, indicating that nitrogen-bearing compounds such as proteins decompose more rapidly than other organic compounds.
( 4) Total sulfur content averages 1.84 percent in the upper layer of muds of the bay, and free sulfur generally accounts for less than 2 percent of the total sulfur. Unexplained anomalous free sulfur values, however, of 15 and 54 percent of the total sulfur content were found in one sediment sample of the bay and in one sediment sample of the river environment near the mouth of the Choctawhatchee River.
(5) A marked decrease in free sulfur with depth of burial of sediment is one of the c1earest indicators of
· early diagenesis. ( 6) The bitumen content averages 250 ppm in the
up,per 10-16 em of mud in the bay but decreases to about 190 ppm at a core depth of 50 em. Higher amounts of bitumen, 520 and 810 ppm, were determined for the uppermost bottom sediment in the bayou and marsh environments, respectively. In quartz sands of the barrier island and bay environments, the average bitumen contents amount to 2.9 and 3.4 percent, respectively, of the total organic matter. In contrast, the average bitumen content of the muds of the bay is only 0.37 percent of the total organic content.
(7) Alkaline-soluble humic material generally makes up 10-50 percent of the organic matter in the sediment, and is the largest organic fraction extracted from these Recent sediments. This soluble humic matter, divided into humic acid and fulvic acid fractions, ranges from 5,500 to 17,100 ppm in the upper 10-16 em of mud in the bay, but higher concentrations of 30,800, 31,600, and 77,000 p,pm were found in the upper sediments of the bayou, lake, and marsh environments, ·respectively.
(8) The ratio of soluble humic substances to total organic matter in the bay muds generally decreases with shallow depth of burial, thus indicating that fixation and chemical alteration of soluble humic substances begins during the early stages of diagenesis.
C106 GEOCHEMISTRY
REFERENCES
Bordovskiy, K., 1965, Accumulation and transformation of organic substances in marine sediments : Marine Geology, v. 3, no. 1-2, p. 3-114.
Kaplan, I. R., Emery, K. 0., and Rittenberg, S. C., 1963, The distribution and ·isotopic abundance of sulphur in recent marine sediments off southern California : Geochim. et Cosmochim. Acta, v. 27, p. 297-331.
McKenzie, H. A., and Wallace, H. S., 1954, The Kjeldahl determination of nitrogen; A critical study of digestion conditions--..:temperature, catalyst, and oxidizing agent: Australian Jour. Chemistry, v. 7, no. 1, p. 55-70.
Palacas, J. G., Swanson, V. E., and Moore, G. W., 1966, Organic geochemistry of three North Pacific deep-sea sediment
samples, in Geological Survey Research 1966: U.S. Geol. Survey Prof. Paper 550-C, p. 010~C107.
Stevenson, F. J., 1960, Some aspects of the distribution of biochemicals in geologic environments: Geochim. et Cosmochim. Acta, v. 19, p. 261-271.
Swanson, V. E., and Palacas, J. G., 1965, Humate in coastal sands of northwest Florida: U.S. Geol. Survey Bull. 1214-B, 29p.
Trask, P. D., 1932, Origin and environment of source sediments of petroleum : Am. Petroleum Inst., Gulf Publishing Co., Houston, Texas, 323 p.
---1953, Chemical studies of sediments of the western Gulf of Mexico, pt. 2 of The sediments of the western Gulf of Mexico: Papers in Physics of Oceanography and Meteorology, Massachusetts Inst. Technology and Woods Hole Oceanog. I.nst., v. 12, no. 4, p. 49-120.
,L
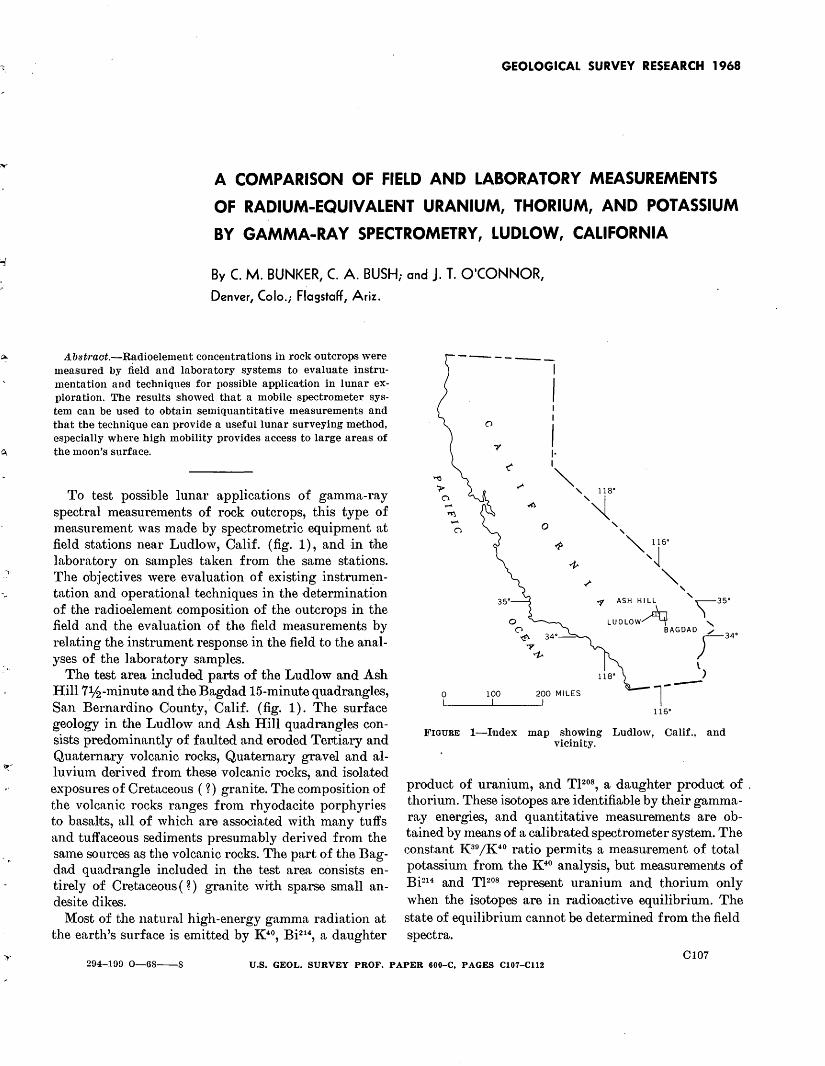
..
GEOLOGICAL SURVEY RESEARCH 1968
A COMPARISON OF FIELD AND LABORATORY MEASUREMENTS
OF RADIUM-EQUIVALENT URANIUM, THORIUM, AND POTASSIUM
BY GAMMA-RAY SPECTROMETRY, LUDLOW, CALIFORNIA
By C. M. BUNKER, C. A. BUSH; and j. T. O'CONNOR,
Denver, Colo.; Flagstaff, Ariz.
Abstmot.-Radioelement concentrations in rock outcrops were measured by field and laboratory systems to evaluate instrumentation and techniques for possible application in lunar exploration. The results showed that a mobile spectrometer system can be used to obtain semiquantitative measurements and that the technique can provide a useful lunar surveying method, especially where high mobility provides access to large areas of the moon's surface.
To test possible lunar applications of gamma-ray spectral measurements of rock outcrops, this type of measurement was made by spectrometric equipment at field stations near Ludlow, Calif. (fig. 1), and in the laboratory on samples taken from the same stations. The objectives were evaluation of existing instrumentation and operational techniques in the determinati.on of the radioelement composition of the outcrops in the field and the evaluation of the field measurements by relating the instrument response in the field to the analyses of the laboratory samples.
The test area included parts of the Ludlow and Ash Hill 17lh-minute and the Bagdad 15-minute quadrangles, San Bernardino County," Calif. (fig. 1). The surface geology in the Ludlow and Ash Hill quadrangles consists predominantly of faulted and eroded Tertiary and Quaternary volcanic rocks, Quaternary gravel and alluvimn derived from these volcanic rocks, and isolated exposures of Cretaceous ( ~) granite. The composition of the volcanic rocks ranges from rhyodacite porphyries to basal,ts, all of which are associated with many tuffs and tuffaceous sediments presumably derived from the same sources as the volcanic rocks. The part of the Bagdad quadrangle included in the test area. c.Onsists entirely of Cretaceous ( ~) granite with sparse small andesite dikes.
Most of the natural high-energy gamma radiation at the earth's surface is emitted by K 40
, Bi21\ a daughter
-------
FIGURE 1-lndex map showing Ludlow, Calif., and vicinity.
product of uranium, and TJ2°8 , a daughter product of . thorium. These isotopes are identifiable by their gammaray energies, and quantitative measurements are obtained by means of a calibrated spectrometer system. The constant K39/K40 ratio permits a measurement of total potassium from the K40 analysis, but measuremelllts of Bi214 and Tl208 represent uranium and thorium only when the isotopes are in radioactive equilibrium. The state of equilibrium cannot be determined from the field spectra.
0107 294-199 0--68----8 U.S. GEOL. SURVEY PROF. PAPER 600-C, PAGES C107-Cll2
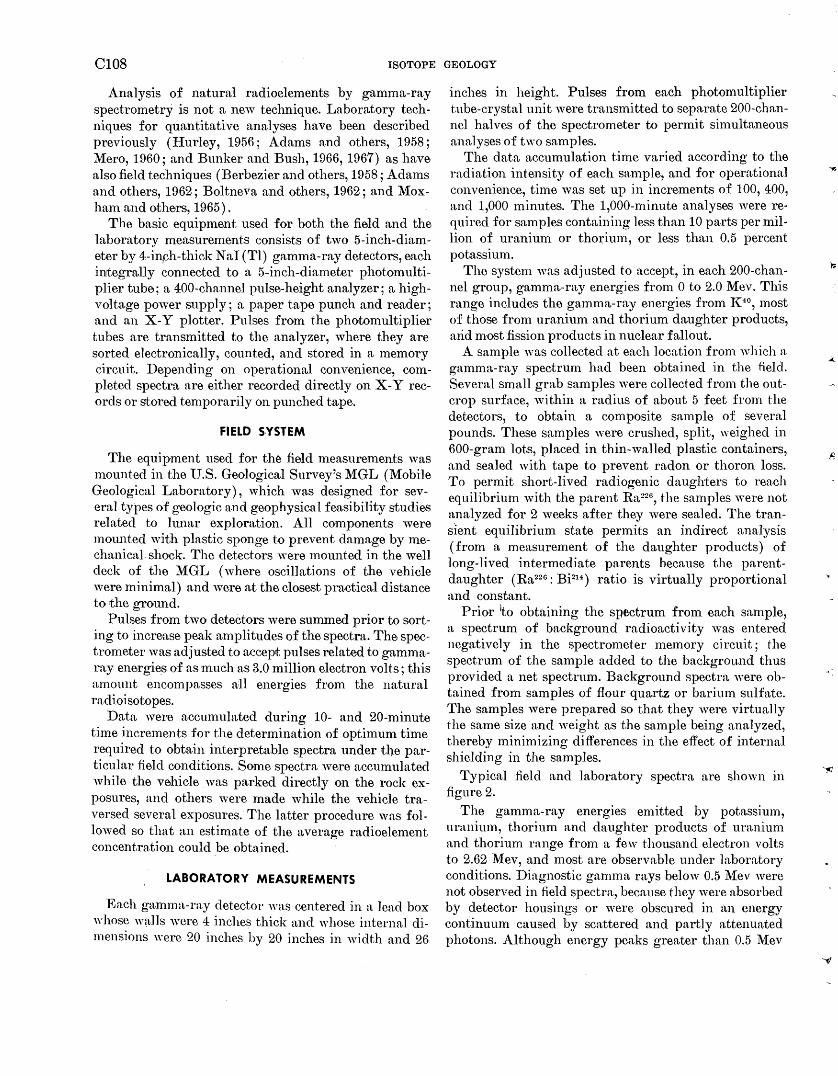
C108 ISOTOPE GEOLOGY
Analysis of natural radioelements by gamma-ray spectrometry is not a new technique. Laboratory techniques for quantitative analyses have been described previously (Hurley, 1956; Adams and others, 1958; Mero, 1960; and Bunker and Bush, 1966, 1967) as have also field techniques (Berbezier and others, 1958; Adams and others, 1962; Boltneva and others, 1962; and Moxham and others, 1965) .
The basic equipment used for both the field and the laboratory measurements consists of two 5-inch-diameter by 4-inph-thick Nai(Tl) gamma-ray detectors, each integrally connected to a 5-inch-diameter photomultiplier tube; a 400-cha.nnel pulse-height analyzer; a highvoltage power supply; a paper tape punch and reader; and an X-Y plotter. Pulses from the photomultiplier tubes are transmitted to the analyzer, where they are sorted electronically, counted, and stored in a memory circuit. Depending on operational convenience, completed spectra are either recorded directly on X-Y records or stored temporarily on punched tape.
FIELD S·YSTEM
The equipment used for th~ field measurements was mounted in the U.S. Geological Survey's MGL (Mobile Geological Laboratory), which was designed for several types of geologic and geophysical feasibility studies related to hu1ar exploration. All components were mom1ted wirt:h plastic sponge to prevent da.mage by mechanical. shock. The detectors were mounted in the well deck of the MGL (where oscillations of the vehicle were minimal) and were at the closest practical distance to the grotmd.
Pulses from two detectors were summed prior to sorting to increase peak a.mplitudes of the spectra. The spectrometer was adjusted to accept pulses related to gammaray energies of as much as 3.0 million electron volts; this amount encompasses ail energies from the natural radioisotopes.
Data were accumulated during 10- and 20-minute time increments for the determination of optimum time required to obtain interpretable spectra under the particular field conditions. Some spectra were accumulated while the vehicle was parked directly on the rock exposures, and others were made while the vehicle traversed several exposures. The latter proce.dure was followed so that an estimate of the average radioelement concentration could be obtained.
LABORATORY MEASUREMENTS
Each gamma-ray detector was centered in a lead box whose walls were 4 inches thick and whose internal dimensions were 20 inches by 20 inches in width and 26
inches in height. Pulses from each photomultiplier tube-crystal unit ·were transmitted to separate 200-channel halves of the spectrometer to permit simultaneous analyses of two samples.
The data accumulation time varied according to the radiation intensity of each sample, and for operational convenience, time was set up in inerements of 100, 400, and 1,000 minutes. The 1,000-minute analyses were re· quired for samples containing less than 10 parts per million of uranium or thorium, or less than 0.5 percent potassium.
The system was adjusted to accept, in each 200-channel group, gamma-ray energies from 0 to 2.0 Mev. This range inelucles the gamma-ray energies from 1{40
, most of those from uranium and thorium daughter products, ~uid most fission products in nuclear fallout.
A sample was eollect~d at each location from which a gamma-ray spectrum had been obtained in the field. Several small grab samples were collected from the outcrop surface, within a radius of about 5 feet from the detectors, to obtain a composite sample of several pounds. These samples were crushed, split, weighed in 600-gram lots, placed in thin-walled plastic containers, and sealed with tape to prevent radon or thoron loss. To permit short-lived radiogenic daughters to reach equilibrium with the parent Ra226
, the samples were not analyzed for 2 weeks after they were sealed. The transient equilibrium state permits an indirect analysis (from a measurement of the daughter products) of long-lived intermediate parents because the parentdaughter (Ra226
: Bi214) ratio is virtually proportional
and constant. Prior ito obtaining the spectrum from each sample,
a spectrum of background radioactivity was entered negatively in the spectrometer memory circuit; the spectrum of the sample added to the background thus provided a net spectrum. Background spectra were obtained from samples of flour quartz or barium sulfate. The samples were prepared so that they were virtually the same size and ·weight as the sample being analyzed, thereby minimizing differences in the effect of internal shielding in the samples.
Typical field and laboratory spectra are shown in figure 2.
The gamma-ray energies emitted by potassium, uranium, thorium and daughter products of uranium and thorimn range from a few thousand electron volts to 2.62 Mev, and most are observable under laboratory conditions. Diagnostic gamma rays below 0.5 Mev were not observed in field spectra, because they were absorbed by detector housings or ·were obscured in an energy continuum caused by scattered and partly attenuated photons. Although energy peaks greater than 0.5 Mev
.. ·
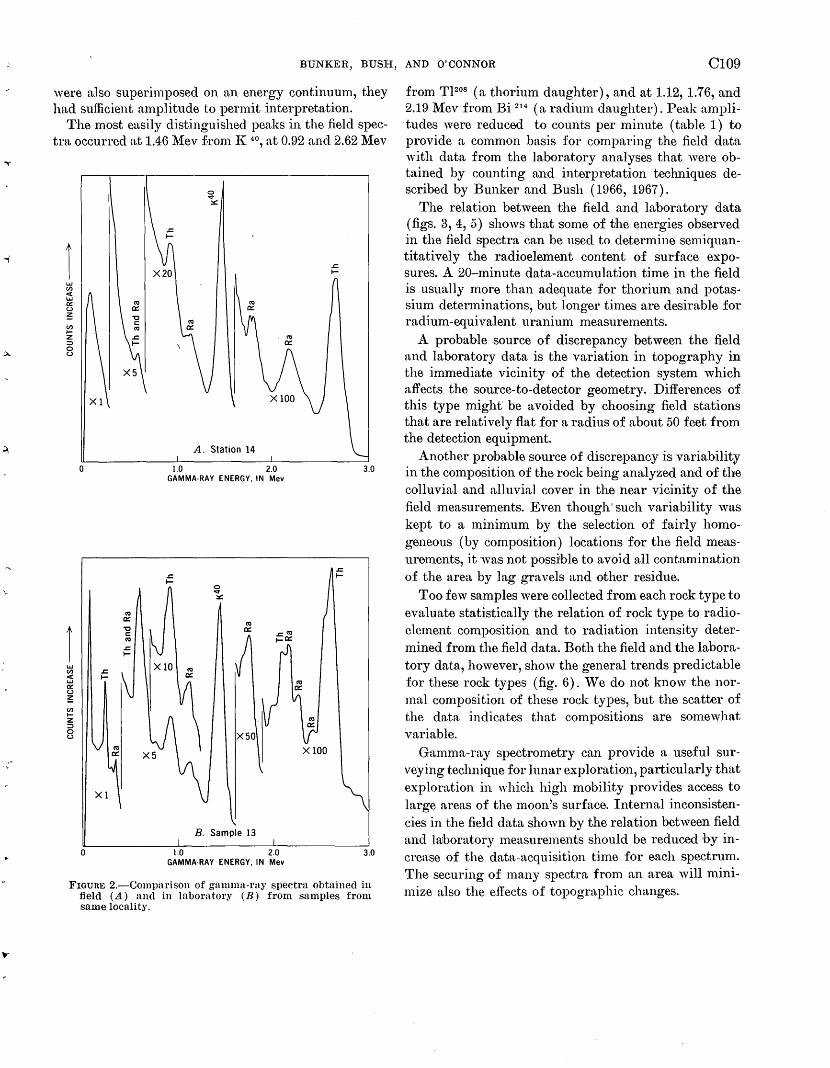
...,·
~.
---;.
-
BUNKER, BUSH, AND O'CONNOR CI09
were also superimposed on an energy continuum, they had sufficient amplitude to permit interpretation.
The most easily distinguished peaks in the field spectra occurred at 1.46 ~1ev f.rom IC 40 , at 0.92 and 2.62 Mev
1 .I: I-
A. Station 14
0 1~ ~0 3.0 GAMMA-RAY ENERGY, IN Mev
.I: I-
0 ..,. ::.:::
~ 0:::
~
1 "t:l 0:::
.I:~ c: ~ 1-0::: .I: I-
LJ.I X 10 ~ (/) ct 0::: UJ 0:: (.)
~ (/) 1-z :J 0 (.)
B. Sample 13
0 1.0 2.0 3.0 GAMMA·RAY ENERGY, IN Mev
FIGURE 2.-Compnrison of gnnuna-ruy spectra obtained in field (A) and in laboratory (B) from samples from same locality.
from Tl208 (a thorium daughter), and at 1.12, 1.76, and 2.19 Mev from Bi 214 (a radium daughter). Peak amplitudes were reduced to counts per minute (table 1) to provide a common basis for comparing the field data with data from the laboratory analyses that were obtained by counting and interpretation techniques described by Bunker and Bush (1966, 1967).
The relation between the field and laboratory data (figs. 3, 4, 5) shows that some of the energies observed in the field spectra can be used to determine semiquantitatively the radioelement content of surface exposures. A 20-minute data-accumulation time in the field is usually more than adequate for thorium ·and potassium determinations, but longer times are desirable for radium-equivalent uranium measurmnents.
A probable source of discrepancy between the field and laboratory data is the variation in topography in the immediate vicinity of the detection system which affects the source-to-detector geometry. Differences of this type might be avoided by choosing field stations that are relatively flat for a radius of about 50 feet from the detection equipment.
Another probable source of discrepancy is variability in the composition of the rock being analyzed and of the colluvial and alluvial cover in the near vicinity of the field ·measurements. Even though' such variability was kept to a minimum by the selection of fairly homogeneous (by composition) locations for the field measurements, it was not possible to avoid all contamination of the area by lag gravels and other residue .
Too few samples were collected from each rock type to evaluate statistically the relation of rock type to radioelement composition and to radiation intensity determined from the field data. Both the field and the laboratory data, however, show the general trends predictable for these rock types (fig. 6). We do not know the normal composition of these rock types, but the scatter of the data indicates that compositions are somewhat variable.
Gamma-ray spectrometry can provide a useful surveying technique for lunar exploration, particularly that exploration in which high mobility provides access to large areas of the moon's surface. Internal inconsistencies in the field data shown by the relation between field and laboratory measurements should be reduced by increase of the data-acquisition time for each spectrum. The securing of many spectra fron1 an area will minimize also the effects of topographic changes.
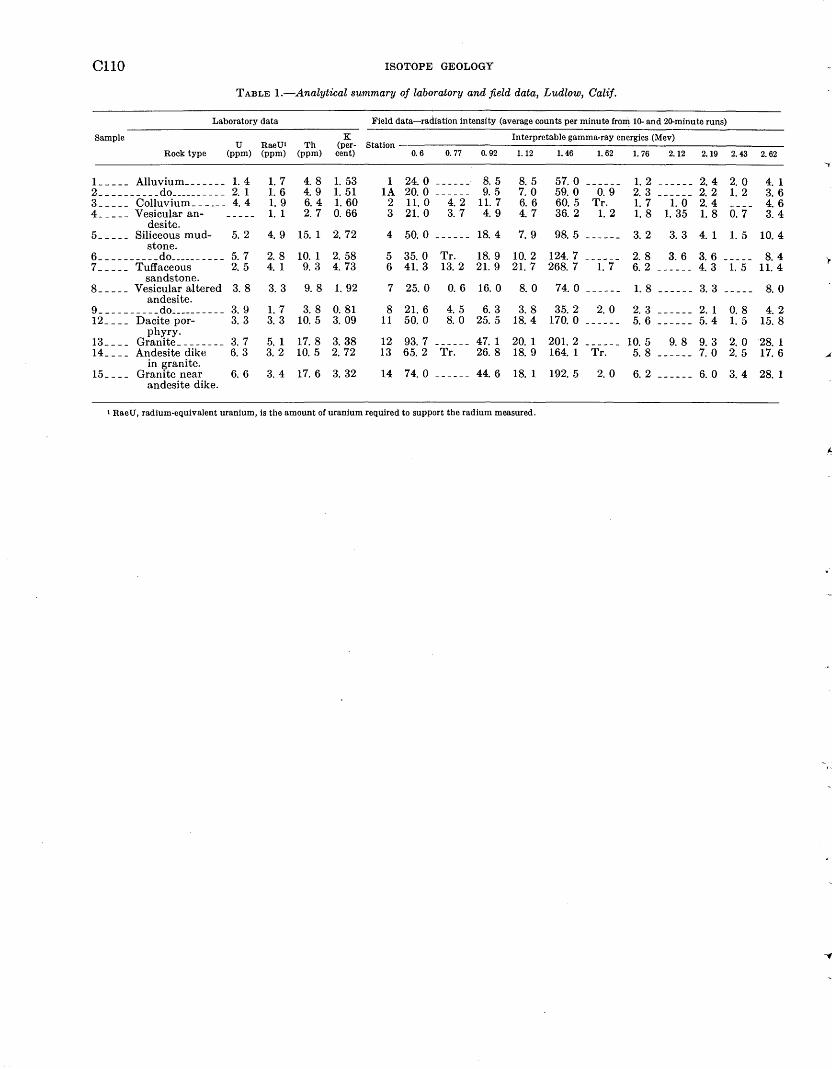
CliO ISOTOPE GEOLOGY
TABLE I.-Analytical summary of laboratory and field data, Ludlow, Calif.
Laboratory data Field data-radiation intensity (average counts per minute from 10- and 20-minute runs)
Sample K Interpretable gamma-ray energies (Mev) u RaeUI Th (per- Station
Rock type (ppm) (ppm) (ppm) cent) 0. 6 0. 77 0.92 1. 12 1. 46 1. 62 1. 76 2.12 2.19 2. 43 2. 62 -.,
l_ ____ Alluvium _______ 1.4 1.7 4. 8 1. 53 1 24. 0 8. 5 8. 5 57. 0 1.2 2. 4 2. 0 4. 1 2 __________ do __________ 2. 1 1.6 4. 9 1. 51 lA 20. 0 9. 5 7. 0 59.0 0. 9 2. 3 2. 2 1.2 3. 6 3 _____ Colluvium ______ 4. 4 1.9 6. 4 1. 60 2 11. 0 4. 2 11. 7 6. 6 60. 5 Tr. 1.7 1.0 2. 4 4. 6 4 _ _ _ _ _ Vesicular an- 1. 1 2. 7 0. 66 3 21. 0 3. 7 4. 9 4. 7 36. 2 1.2 1.8 1. 35 1.8 0. 7 3. 4
desite. 5 _____ Siliceous mud- 5. 2 4. 9 15. 1 2. 72 4 50. 0 18. 4 7. 9 98.5 3. 2 3. 3 4. 1 1.5 10.4
stone. 6 __________ do _______ --- 5. 7 2. 8 10. 1 2. 58 5 35. 0 Tr. 18. 9 10. 2 124. 7 2. 8 3. 6 3. 6 8. 4 7 _____ Tuffaceous 2. 5 4. 1 9. 3 4. 73 6 41. 3 13. 2 21. 9 21. 7 268. 7 1.7 6. 2 4. 3 1.5 11. 4
sandstone. 8 _ _ _ _ _ Vesicular altered 3. 8 3. 3 9. 8 1. 92 7 25. 0 0. 6 16. 0 8. 0 74. 0 1.8 3. 3 8. 0
andesite. 9 __________ do __________ 3. 9 1.7 3. 8 0. 81 8 21. 6 4. 5 6. 3 3. 8 35. 2 2. 0 2. 3 2. 1 0. 8 4. 2 12 ____ Dacite por- 3. 3 3. 3 10. 5 3. 09 11 50. 0 8. 0 25. 5 18.4 170. 0 5. 6 5.4 1.5 15. 8
phyry. 13_--- Granite ________ 3. 7 5. 1 17. 8 3. 38 12 93.7 47. 1 20. 1 201. 2 10. 5 9. 8 9. 3 2. 0 28. 1 14 ____ Andesite dike 6. 3 3. 2 10. 5 2. 72 13 65. 2 Tr. 26. 8 18. 9 164. 1 Tr. 5. 8 7. 0 2. 5 17. 6
15 ____ in granite.
Granite near 6. 6 3. 4 17. 6 3. 32 14 74. 0 44. 6 18. 1 192. 5 2. 0 6. 2 6. 0 3. 4 28. 1 andesite dike.
1 RaeU, radium-equivalent uranium, is the amount of uranium required to support the radium measured.
.~
. '
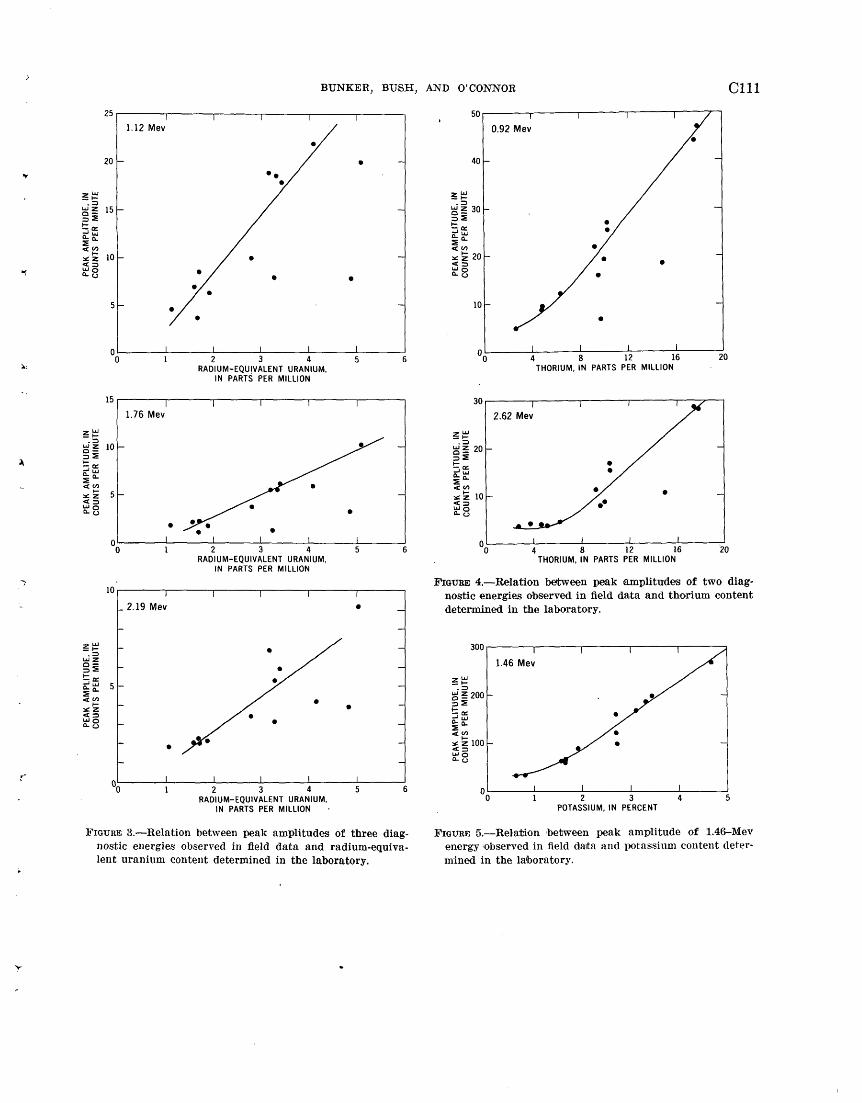
.,.
"''
25
1.12 Mev
20
zl.l.l _._. .:::)
LLJZ 15 o-::;,::!!: !::o:: ...JI.IJ ~0.. CZ:(I)
1-~z <::;, LIJO o..u
1.76 Mev
2.19 Mev
•
BUNKER,
2 3 4 RADIUM-EQUIVALENT URANIUM.
IN PARTS PER MILLION
2 3 4 RADIUM-EQUIVALENT URANIUM,
IN PARTS PER MILLION
2 3 4 RADIUM-EQUIVALENT URANIUM,
IN PARTS PER MILLION
•
•
•
5
BUSH,
6
6
6
]j...,JGURE it-Relation between peak amplitudes of three diagnostic energies observed in :field data and radium-equivalent uranium content determined in the laboratory.
AND O'CONNOR
50
40
zl.l.l _._. .:::)
~~ 30 ::;,::!!: 1--o:: ...JI.IJ ~0.. CZ:(I) ~~ 20 <::;, LLJo o..u
zl.l.l _._. . :::) ~~ 20 ::;,::!!: !::o:: ...JI.IJ ~0.. CZ:(I)
~~ 10 <::;, I.IJO o..u
Clll
20
•
4 8 12 16 THORIUM, IN PARTS PER MILLION
FIGURE 4.-Relation between peak amplitudes of two diagnostic energies observed in field data and thorium content determined in the laboratory.
zl.l.l _ ..... . :::)
~~ 200 :::::>::!!: !::o:: ...Jw ~0.. CZ:(I)
:0:: ~ 100 <::;, LIJO o..u
0o~----~------~2-------3L-----~4~----~
POTASSIUM, IN PERCENT
FIGURE 5.-Rela:tion tbetJween peak amplitude of 1.46-Mev energy observed in field d!wta and potassium content determined in the la1boratory.
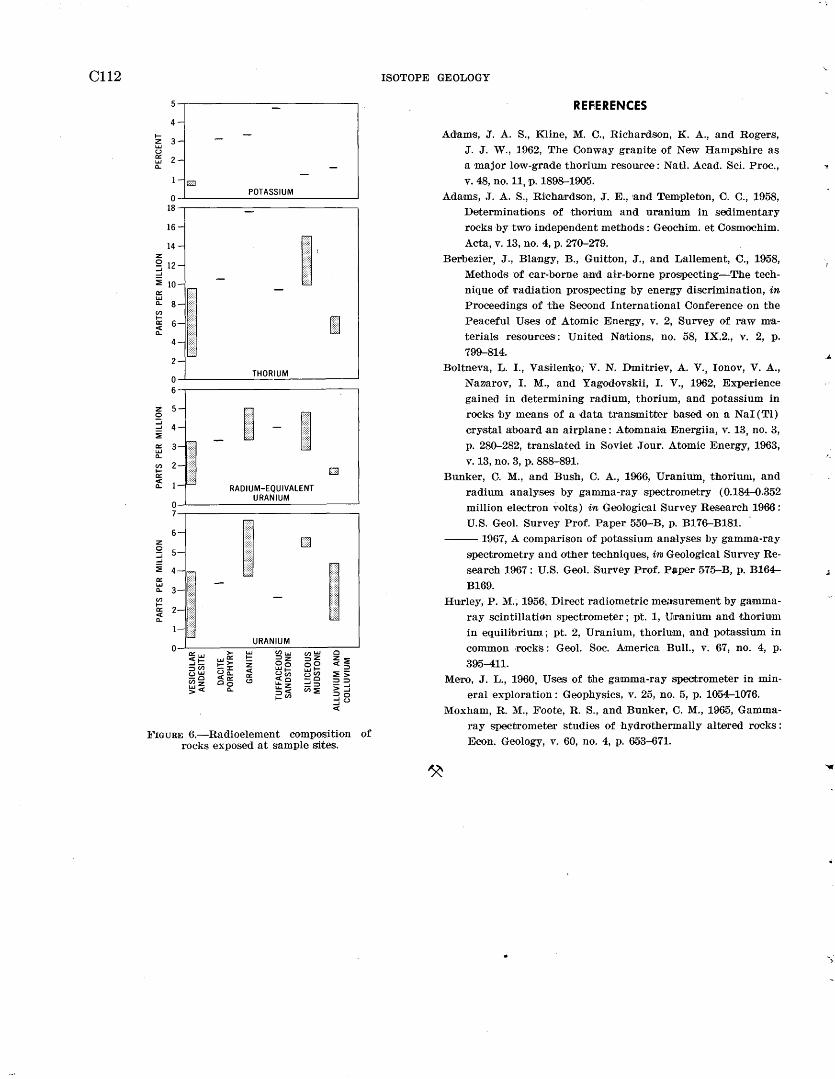
C112
4-
1-z 3-LIJ u c:: 2-LIJ 0..
1-
0 18
16-
14-z 2 12-:::j
D
i
(:=1: ~ 6-0.. .
4-
2-
POTASSIUM
~ i
:
.
O-L __________ T_H~O_R __ IU~M __________ ~
z 0 ::i ...J
i c:: LIJ 0..
(I) 1-
6-.--------------------------,
[8 [] I . . . .
RADIUM-EQUIVALENT URANIUM
0-L--------------------------~
7-.--------------------~----~
6-
.
.
~ 2- I : .
0..
1-
URANIUM 0 >- LIJ CllLLJ (I)LIJ 0 c::LIJ
<t- LIJC:: !::: ::lz ::JZ z~ ...J- t->- z oo oo c(::l ::JCil -:I: c( LI.Jt- LLJI-uLLJ Uo.. c:: U(l) uCil ~> -o <c:: «:!) <o -o ::l::l Cllz oo L&..z ::::!::J -...J ~<( 0.. ~~ (I)~ >...J
::Jo :::ju c(
FIGURE 6.-Radioelement compO'Sition of rocks exposed at sample sites.
ISOTOPE GEOLOGY
REF,ERENCES
Adams, J. A. S., Kline, M. C., Richardson, K. A., and RogeTs, J. J. W., 1962, The Conway granite of New Hampshire as a major low-grade thorium resource: Natl. Acad. Sci. Proc.,
v.48,no.11,p. 1898-1905. Adams, J. A. S., Richrurdson, J. E., 'and Templeton, C. C., 1958,
Determinations of thorium and uranium in sedimenta:ry rocks by two independent methods: Geochim. et Cosmochim. Acta,v.13,no.4,p.270-279.
Berlbezier, J., Blangy, B., Guitton, J., and Lallement, C., 1958, Methods of car-borne and air-borne prospecting-The technique of ll'adiation prospecting by energy di,scrimination, in
Proceedings of the Seoond International Conference on the Peaceful Uses of Atomic Energy, v. 2, Survey o·f raw materials resources: United Nations, no. 58, IX.2., v. 2, p.
799--814. Boltneva, L. I., Vasi'leuko; V. N. Dmitriev, A. V., Ionov, V. A.,
Naz;arov, I. M., and Yagodovskii, I. V., 1962, Experience gained in determining radium, thorium, and potassium in
rocks 'by means of a data transmitter based on a Nai (Tl) cry·stal ruboard an airplane: Atomnai'a Energiia, v. 13, no. 3, p. 280-282, translated in Soviet Jour. Atomic Energy, 1963,
v.13,no.3,p.888-891. Bunker, C. M., and Bush, C. A., 1966, Uraniuin, thorium, and
radium analyses by gamma-ray spectrometry (0.184--().352
million electron volts) in Geological Survey Research 1966: U.S. Geol. Survey Prof. Paper 550-B, p. B176-B181.
----- 1967, A comparison of potassium ana·lyses by gamma-ray
spectrometry and other techniques, iw Geological Survey Research 1967 : U.S. Geol. Survey Prof. Paper 575-B, p. B164-
B169 . Hurley, P.M., 1956, Direct radiometric me;•surement by gamma
ray scintillation spectrometer; pt. 1, Uranium and thorium in equilibrium; pt. 2, Uranium, thorium, ·and pota,ssium in
common .rocks: Geol. Soc. America Bull., v. 67, no. 4, p.
395-411. Mero, J. L., 1960, Uses of the gamma-ray spectrometer in min
eral exploration: Geophysics, v. 25, no. 5, p. 1054-1076.
Moxham, R. M., Foote, R. S., and Bunker, C. M., 1965, Gammaray speCtrometer studies of hydrothermally altered rocks : Econ. Geology, v. 60, no. 4, p. 653--671.
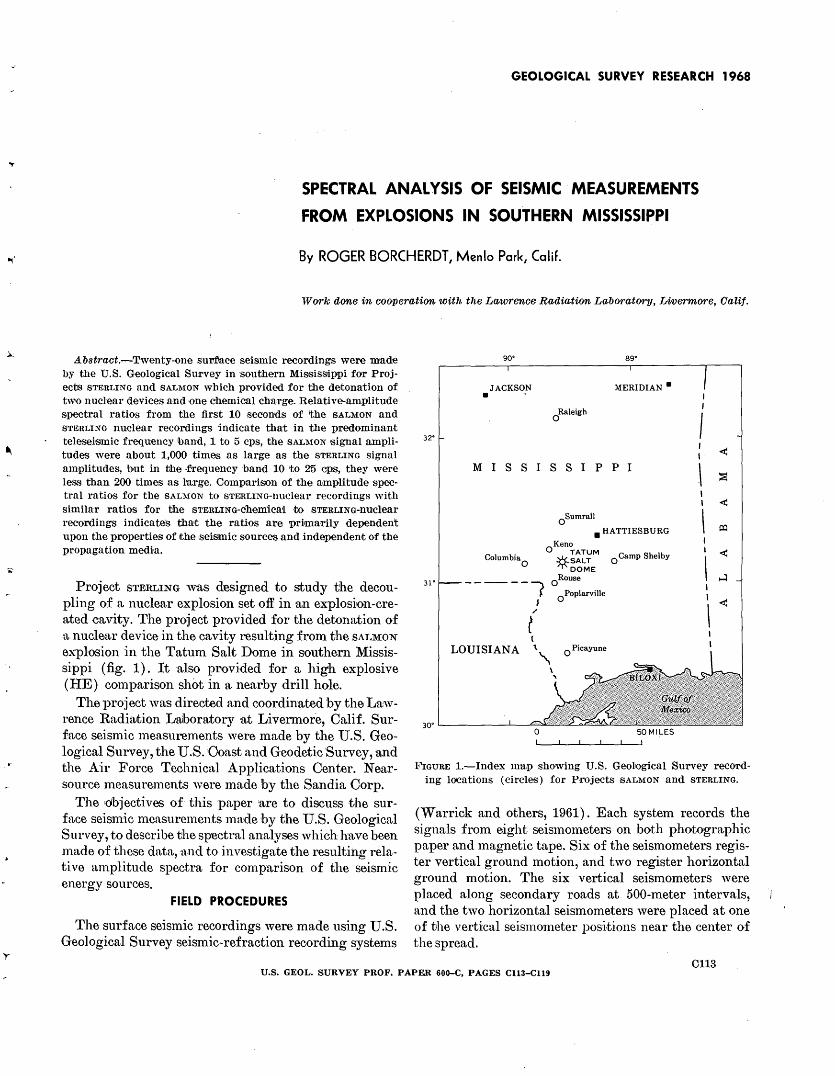
.,.
GEOLOGICAL SURVEY RESEARCH 1968
SPECTRAL ANALYSIS OF SEISMIC MEASUREMENTS
FROM EXPLOSIONS IN SOUTHERN MISSISSIPPI
By ROGER BORCHERDT, Menlo Park, Calif.
Work done in cooperation with the Lawrence Radiation Laboratory, Livermore, OaZif.
A.bstract.-Twenty-one ·suct)ace sei·smic recordings were made by the U.S. Goological Survey in southern Missis:sippi fO'r Projects STEHLING and SALMON which provided for tihe detonation of two nuclear devices and one chemical cha,rge. Relative-amplitude spectral ratios from the first 10 seconds of 'the SALMON and STEHLING nuclear recordings indicate that in the predominant teleseismic frequency !band, 1 to 5 cps, the SALMON •signal amplitudes were about 1,000 times as large as the STERLING signal amplitudes, but in the -frequency 'band 10 to 25 cps, they were less than 200 times as lnxge. Gompadson of the amplitude spectral ratios for the SALMON to STERLING-nuclear recordings with similar ratios for the STERLING-cbemica•l to STERLING-nuclear recordings indicat~s that the ratios are primarily dependent upon the pr'Operties of the se~smic sources and independent of the propagation medi•a.
Project STERLING was designed ~to study the decoupling of a nuclear explosion set off in ,an explosion-created cavity. The project provided for the detonation of tt nuclear device in the cavity resulting from the SALMON
e:\.--plosion in the Tatum Salt Dome in southern Mississippi (fig. 1). It also pvovided for a high explosive (HE) comparison shot in a nearby drill hole.
The project was directed and coordinated by the Lruwrence Radirution Laboratory ·at Livermore, Calif. Surface seismic measurements were made by the U.S. Geological Survey, the U.S. Ooast and Geodetic Survey, and the Air Force Technical Applications Center. Nearsource measurements were made by the Sandia Corp.
The ~dbjectives of this paper ·are to discuss the surfctce seism:ic n1easurements made by the U.S. Geological Survey, to describe the spectral analyses which have been 1nade of these data, and to investigate the resulting relative amplitude spectra for comparison of the seismic energy sources.
FIELD PROCEDURES
The surface seismic recordings were made using U.S. Geological Survey seismic-refraction recording systems
32°
31"
go•
JACKSON . .
0Raleigh
sg·
MERIDIAN •
MISSISSIPPI
Columbia0
-----( I
/
t ( \
0Sumrall
• HATTIESBURG
OKen~ATUM *SALT O Camp Shelby
DOME 0
Rouse
0Poplarville
LOUISIANA '\ 0
Picayune
0 50 MILES
I I
I I I
\ I I
\
I
I <
\
l!'IGURE 1.-lndex map sho'\ving U.S. Geol1ogical Survey recoTding l()ICa tions (circles) for Projects SALMON and STERLING.
(Warrick and others, 1961) . Each system records the signals from eight seis1nmneters on both photographic paper and magnetic tape. Six of the seismometers register vertical ground motion, and two register horizontal ground motion. The six vertical seismometers were placed along secondary roads at 500-meter intervals, and the two horizontal seismometers were placed at one of the vertical seismometer positions near the center of the spread.
0113 U.S. GEOL. SURVEY PROF. PAPER 600-C, PAGES C113-Cl19
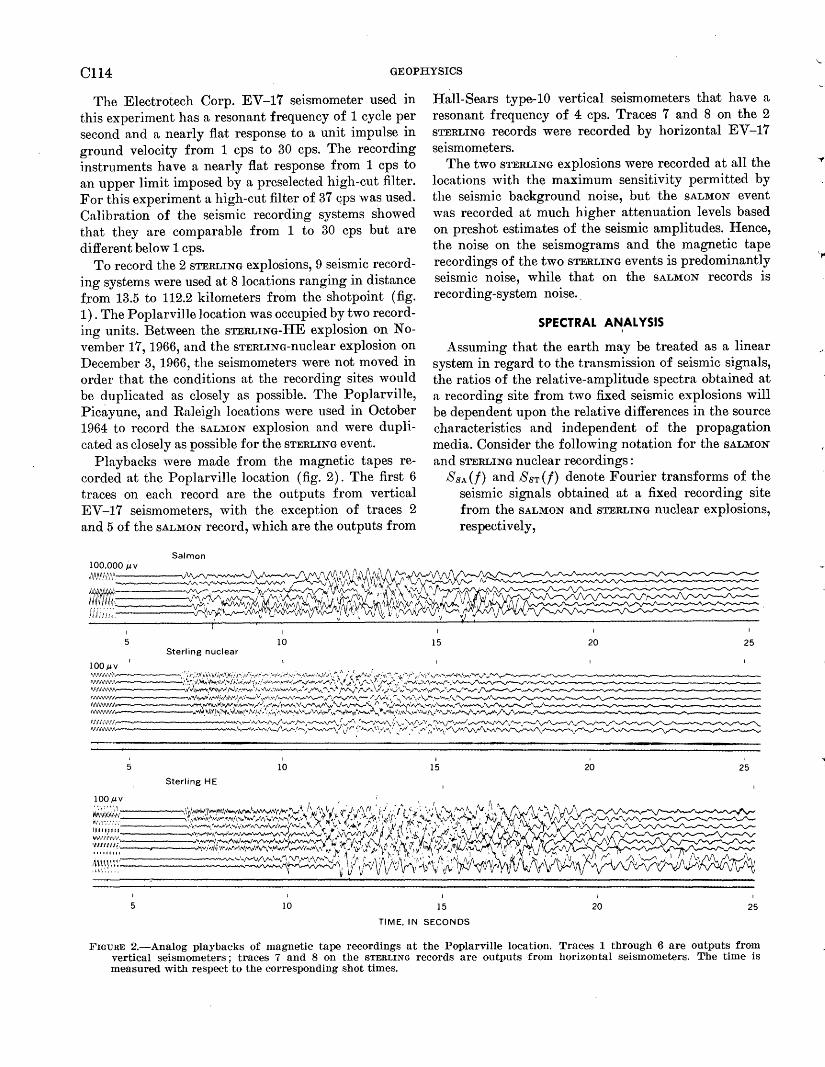
C114 GEOPHYSICS
The Electrotech Corp. EV -17 seismometer used in this experiment has a resonant frequency of 1 cycle per second and a nearly flat response to a unit impulse in ground velocity from 1 cps to 30 cps. The recording instruments have a nearly flat response from 1 cps to an upper limit imposed by a preselected high-cut filter. For this experiment a high-cut filter of 37 Gps was used. Calibration of the seismic recording systems showed that they are comparable from 1 to 30 cps but are different below 1 cps.
To record the 2 STERLING explosions, 9 seismic recording systems were used at 8 locations ranging in distance f,rom 13.5 to 112.2 kilometers from the shotpoint (fig. 1). The Poplarville location was occupied by two recording units. Between the STERLING-HE explosion on November 17, 1966, and the STERLING-nuclear explosion on December 3, 1966, the seismometers were not moved in order that the conditions at the recording sites would be duplicated as closely as possible. The Poplarville, Picayune, and Raleigh locations were used in October 1964 to record the SALMON explosion and were duplicated as closely as possible for the STERLING event.
Playbacks were made from the magnetic tapes recorded at the Poplarville location (fig. 2). The first 6 traces on each record are the outputs from vertical EV-17 seismometers, with the exception of traces 2 and 5 of the sALMON record, which are the outputs from
Salmon
5 10 Sterling nuclear
' 5 10
Hall-Sears type-10 vertical seismometers that have a resonant frequency of 4 cps. Traces 7 and 8 on the 2 STERLING records were recorded by horizontal EV -17 seismometers.
The two STERLING explosions were recorded at all the locations with the maximum sensitivity permitted by the seismic background noise, but the SALMON event was recorded at much higher attenuation levels based on preshot estimates of the seismic amplitudes. Hence, the noise on the seismograms and the magnetic tape recordings of the two STERLING events is predominantly seismic noise, while that on the SALMON records is recording-system noise ..
SPECTRAL ANALYSIS '
Assuming that the earth may be treated as a linear system in regard to the transmission of seismic signals, the ratios of the relative-amplitude spectra obtained at a recording site from two fixed seismic explosions will be dependent upon the relative differences in the source characteristics and independent of the propagation media. Consider the following notation for the SALMON and STERLING nuclear recordings:
15
I
15
SsA(/) and SsT(/) denote Fourier transforms of the seismic signals obtained at a fixed recording site from the SALMON and STERLING nuclear explosions, respectively,
20
20
25
I
25
5 10 15
TIME, IN SECONDS
20 25
l!"'IGURE 2.-Analog playbacks of magnetic tape recordings at the Poplarville location. Traces 1 through 6 are outputs from vertical seismometers; traces 7 and 8 on the STERLING records are outputs from horizontal seismometers. The time is measured with respect to the corresponding shot times.
,,,.
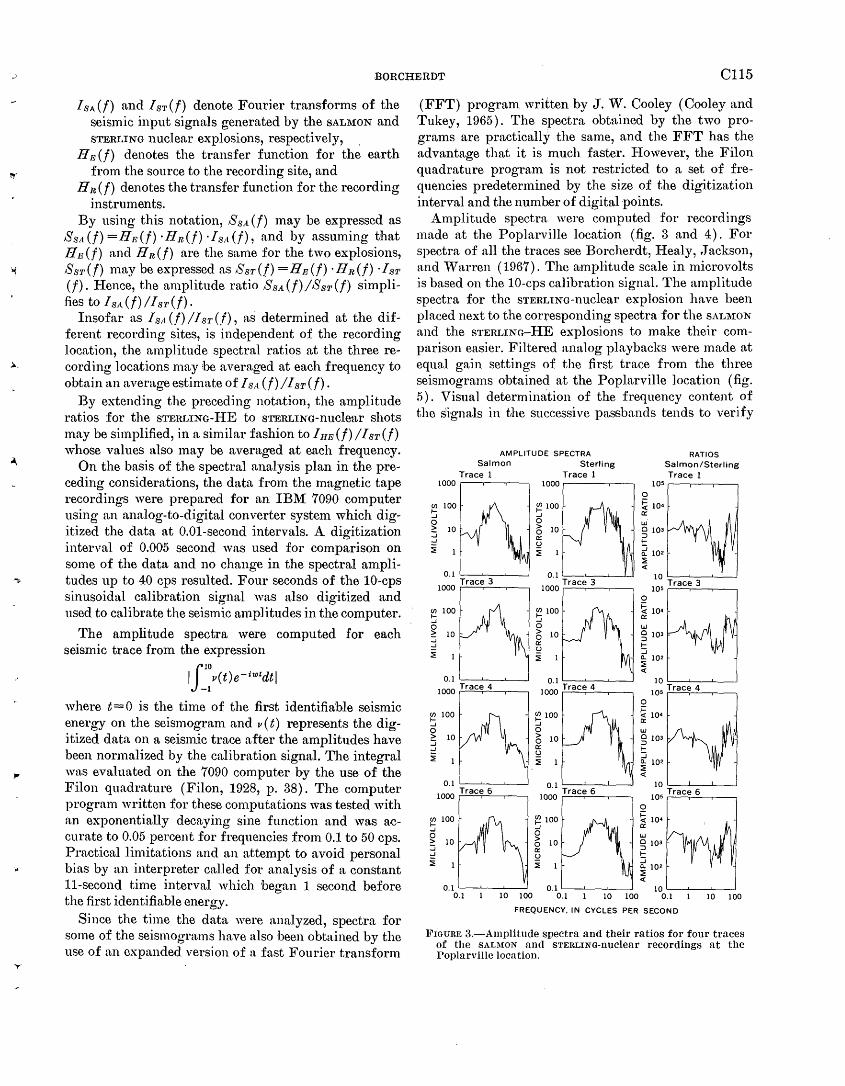
·'
~·
.BORCHERDT CI15
IsA(f) and IsT(f) denote Fourier transforms of the seismic input signals generated by the sALl\ION and STERLING nuclear explosions, respectively, .
JIB (f) denotes the transfer function for the earth from the source to the recording site, and
Hn(f) denotes the transfer function for the recording instruments.
By using this notation, S 8 ,t (f) may be expressed as Ss:t(f) =IIB(f) ·FIR(!) ·I8,t(f), and by assuming that HB (f) and II n (f) are the same for the two explosions, Ss'P(f) may be expressed as SsT(/) =HE(f) ·FIR(f) ·IsT (f). l-Ienee, the amplitude ratio SsA (f)!SsT(f) simplifies to I sA (f) I I sT (f) .
Insofar as I s .. t (f) I IsT (f)' as determined at the different recording sites, is independent of the recording location, the amplitude spectral ratios at the three recording locations may he averaged at each frequency to obtain an average estimate of I s.-t (f)/ I sT(f).
By extending the preceding notation, the amplitude ratios for the STERLING-HE to STERLING-nuclear shots 1nay be simplified, in a similar fashion to I HE (f) I I sT (f) whose values also may be averaged at each frequency.
On the basis of the spectral analysis plan in the preceding considerations, the data from the magnetic tape recordings were prepared for an IBM 7090 computer using an analog-to-digital converter system which digitized the data at 0.01-second intervals. A digitization interval of 0.005 second was used for comparison on some of the data and no change in the spectral amplitudes up to 40 cps resulted. Four seconds of the 10-cps sinusoidal calibration signal was also digitized and used to calibrate the seismic amplitudes in the computer.
The amplitude spectra were computed for each seismic trace from the expression
if~:v(t)e-iwtdtl
where t= 0 is the time of the first identifiable seismic energy on the seismogran1 and v ( t) represents the digitized data on a seis1nic trace after the amplitudes have been normalized by the calibration signal. The integral was evaluated on the 7090 computer by the use of the Filon quadrature (Filon, 1928, p. 38). The computer program written for these computations was tested with an exponentially decaying sine function and was a-ccurate to 0.05 percent for frequencies from 0.1 to 50 cps. Practical limitations and an attempt to avoid personal bias by an interpreter called for analysis of a constant 11-second time interval which began 1 second before the first identifiable energy.
Since the time the data were analyzed, spectra for some of the seismograms have also ·been obtained by the use of an expanded version of a fast Fourier transform
(FFT) program written by J. W. Cooley (Cooley and Tukey, 1965). The spectra obtained by the two programs are practically the same, and the FFT has the advantage that it is much faster. However, the Filon quadrature program is not restricted to a set of frequencies predetermined by the size of the digitization interval and the number of digital·points.
Amplitude spectra were computed for recordings made at the Poplarville location (fig. 3 and 4). For spectra of all the traces see Borcherdt, Healy, Jackson, and Warren (1967). The amplitude scale in microvolts is based on the 10-cps calibration signal. The amplitude spectra for the STERLING-nuclear explosion have been placed next to the corresponding spectra for the SALl\ION and the STERLING-HE explosions to make their comparison easier. Filtered analog playbacks were made at equal gain settings of the first trace from the three seismograms obtained at the Poplarville location (fig. 5). Visual determination of the frequency content of the signals in the successive passbands tends to verify
AMPLITUDE SPECTRA Salmon
Trace 1 1000 r---r--r--;
(/) 100 1-...J 0 > 10 :J ...J
~
(/) 100 1-...J 0 > 10 :J ...J
~
0.1 ::------'--'----l
1000 Trace 4
~ 100 ...J 0 > 10 :J ...J
~
0.1 , _ __.__.____J
1000 Trace 6
(/) 100 1-...J 0 > 10 :J ...J
~
Sterling Trace 1
1000 ..----.--....------.
~ 100 ...J 0 ~ 10 a: u ~
~ 100 ...J 0
~ 10 a: ~ ::!!:
~ 100 ...J 0 ~ 10 a: ~ ::!!: 1
0.1 L.____.J...._...J_____J
1000 Trace 6
~ 100 ...J 0 ~ 10 a: ~ ::!!: 1
RATIOS Salmon/Sterling Trace 1
105 .------,---,---;
0
~ 104 a: w Cl 103 ::J 1-
12 102 ::!!: <
10 '----'---''---__J
105 Trace 3
0
~ 104 a: w § 103 1-::::i c.. 102 ::!!: <
0
1 0 '-----'-----'-__]
105 Trace 4
~ 104 a: w § 103 1-::::i c.. 102 ::!!: <
0
10 L..__-l_~l___J
105 Trace 6
~ 104
a: w § 103 1-::::i c.. 102 ::!!: <
0.1 '----'---'-____J 10 '----'----'---l 10 100 0.1 10 100 0.1 10 100
FREQUENCY, IN CYCLES PER SECOND
I!"I(:mRE 3.-Amplitude spectra and their ratios for four traces of the SALMON and STERLING-nuclear recordings at the Poplarville location.
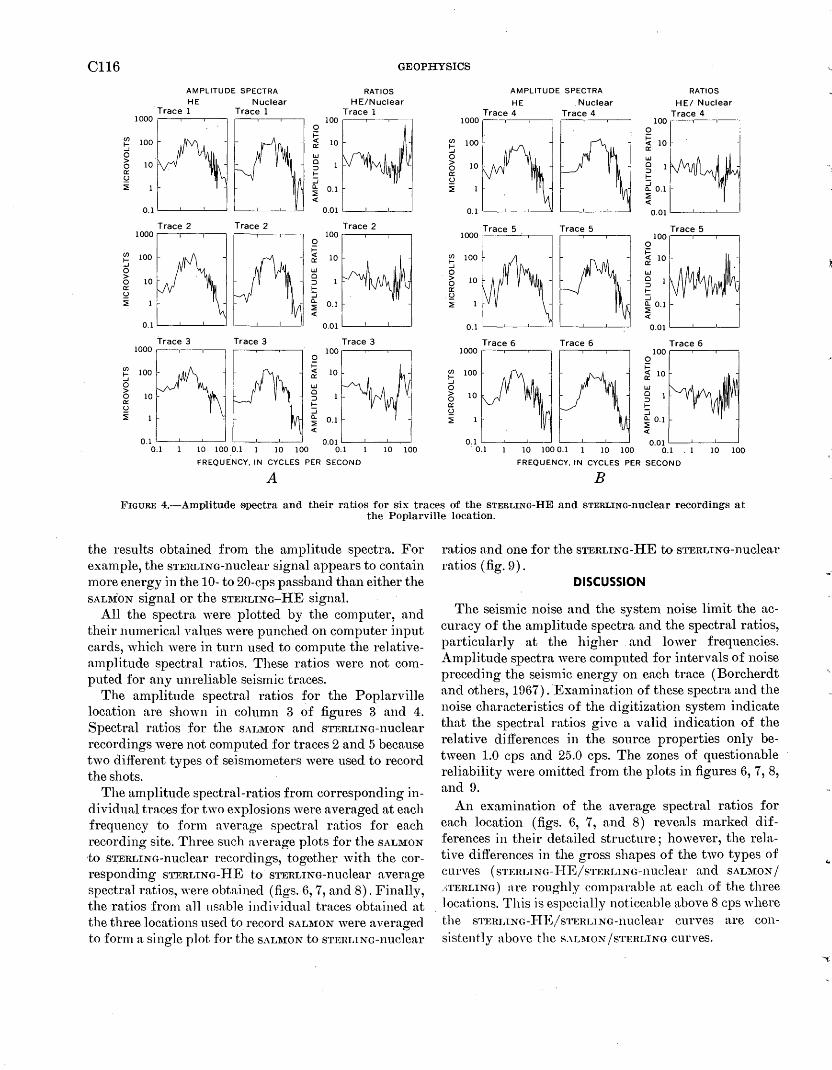
C116 GEOPHYSICS
AMPLITUDE SPECTRA
HE Nuclear Trace 1 Trace 1
1000 r--.---,-----,
~ 100 ...J 0 1:; 10 a:: ~ :2
Trace 2 Trace 2 1000 ,---,----,---, ,----,----,---,
~ 100
0 > 0 10 a:: ~ :2
Trace 3 Trace 3 1000 ,----,----,----,
~ 100 ...J 0 > 0 10 a:: ~ :2
0
~ a:: 10
w 0 :::l 1-::i ~ 0.1 <(
RATIOS HE/Nuclear
Trace 1
Trace 2 100,--,----,----,
0
~ a:: 10 w 0 :::l 1-::i ~ 0.1 <(
Trace 3 100 ,-__,...~--,---.
0 i= ~ 10
w 0 :::l 1-::i ~ 0.1 <(
0.01 <-----L---'-~ 10 100 0.1 1 10 100 0.1 10 100
FREQUENCY, IN CYCLES PER SECOND
A
AMPLITUDE SPECTRA
HE Nuclear
~~:~i ~ T•ace 4
0.1
~ 100 ...J 0 > 0 a:: ~ :2
Trace 6 1000
(/) 100 ~ 0 > 0 a:: ~ :2
10
Trace 5
Trace 6
10 100 0.1 10 100
RATIOS
HE/ Nuclear Trace 4
f=H[ ~ g 1
j I a.. 0.11-
~0.01 ' ' .
Trace 5 100 ,---,-----,---,
0 i= ~ 10-
w g 1 1-::i ~ 0.1 <(
0.01 '-----'---'-_j
Trace 6 100 ,--,----,-------,
0 i= ~ 10
w g 1 1-::i ~ 0.1 <(
0.01 '-----'----'---' 0.1 . 1 10 100
FREQUENCY, IN CYCLES PER SECOND
B
IT'IGURE 4.-Amplitude spectra and their ratios for six traces of the STERLING-HE and STERLING-nuclear recordings at the Poplarville location.
the results obtained from the amplitude spectra. For example, the STERLING-nuclear signal appears to contain more energy in the 10- to 20-cps passband than either the SALMON signal or the STERLING-HE signal.
All the spectra were plotted by the computer, and their numerical values were punched on computer input cards, which were in turn used to compute the relativeamplitude spectral ratios. These ratios were not computed for any unreliable seismic traces.
The amplitude spectral ratios for the Poplarville location are shown in column 3 of figures 3 and 4. Spectral ratios for the SALMON and STERLING-nuclear recordings were not computed for traces 2 and 5 because two different types of seismometers were used to record the shots.
The amplitude spectral-ratios from corresponding individual traces for two explosions were averaged at each frequency to form average spectral ratios for each recording site. Three such average plots for the sALMON 'to STERLING-nuclear recordings, together with the corresponding STERLING-I-IE to STERLING-nuclear average spectral ratios, were obtained (figs. 6, 7, and 8). Finally, the ratios from all nsable individual traces obtained at the three locations used to record SALMON were averao-ed b
to form a single plot for the SAI,l\'ION to STERLING-nuclear
ratios and one for the STERLING-HE to STERLING-nuclear ratios (fig. 9).
DISCUSSION
The seismic noise and the system noise limit the accuracy of the amplitude spectra and the spectral ratios, particularly at the higher and lower frequencies. Amplitude spectra were computed for intervals of noise preceding the seismic energy on each trace ( Borcherdt and others, 1967). Examination of these spectra and the noise characteristics of the digitization system indicate that the spectral ratios give a valid indication of the relative differences in the source properties only between 1.0 cps and 25.0 cps. The zones of questionable reliability "·ere omitted from the plots in figures 6, 7, 8, and 9.
An examination of the average spectral ratios for each location (figs. 6, 7, and 8) reveals marked differences in their detailed structure; however, the relative differences in the gross shapes of the two types of curves (sTimr,ING-1-IE/sTI'~RLING-nuclear and SAL::\:lON I .·jTERLING) are roughly comparable at each of the three
. locations. This is especially noticeable above 8 cps where the STlmLING-I-IE,/sTERLTNG-nuclear curves are consistently above the S.\Ll\:lON /STERLING curves.
~;
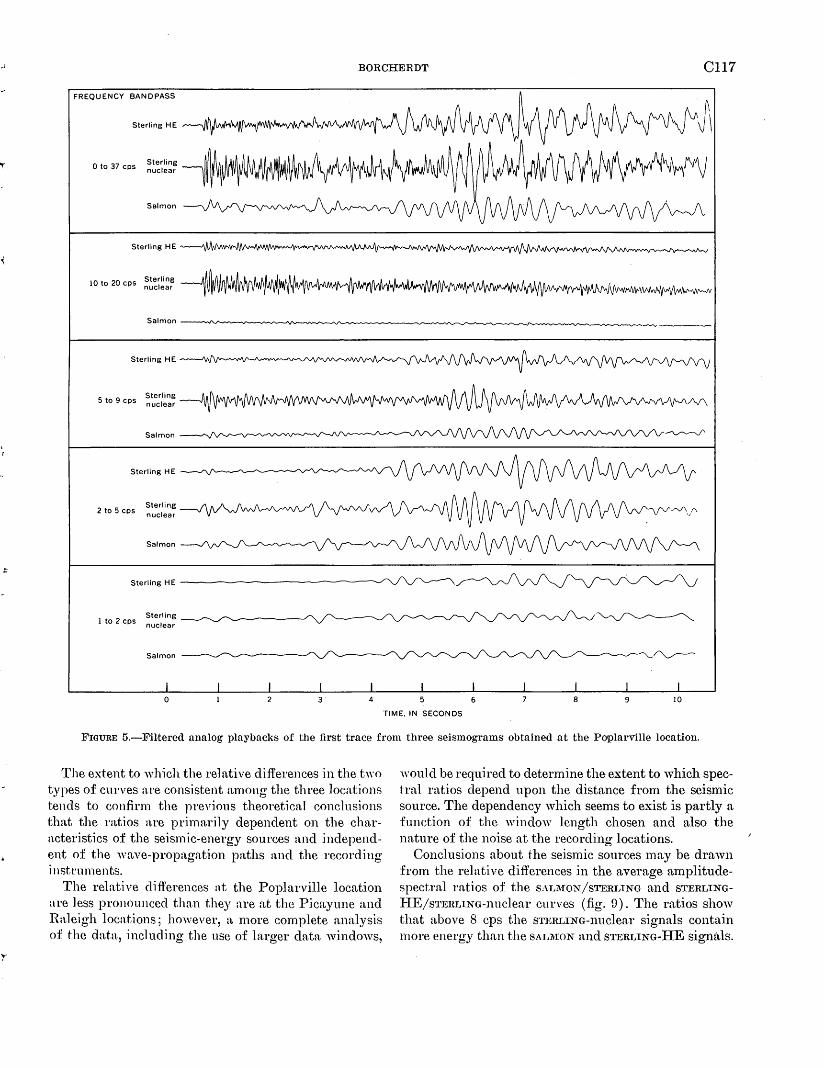
.) BORCHERDT C117
FREQUENCY BANDPASS
0 to 37 cps
5 to 9 cps
2 to 5 cps
Salmon
Sterling nuclear
Sterling nuclear
Salmon
Sterling HE------------~---..../
1 to 2 cps Sterling nuclear
Salmon ----~~ .....__.........__ ___ ___,
0 3 4 6 8 9 10
TIME, IN SECONDS
FIGURE 5.-FHtered analog playbacks of the first trace from three seismograms obtained at the Poplarville location.
The extent to which the relative differences in the two types of curves are consistent among the three locations tends to confirm the previous theoretical conclusions that the rn.tios are primarily dependent on the characteristics of the seismic-energy sources and independent of the wave-propn.gation paths and the recording i nstt·uments.
The relative differences at the Poplarville location are less pronounced than they are at the Picayune and Haleigh locations; however, a more complete analysis of the data, including the use of larger data windows,
would be required to determine the extent to which spectral ratios depend upon the distance from the seismic source. The dependency which seems to exist is partly a function of the window length chosen and also the nature of the noise at the recording locations.
Conclusions about the seismic sources may be drawn from the relative differences in the average amplitudespectral ratios of the SALl\ION /STERLING and STERLINGl-IE/STERLING-nuclear curves (fig. 9). The ratios show that above 8 cps the STJ<:RLING-nuclear signals contain more energy than the SALl\ION and STERLING-HE signals.
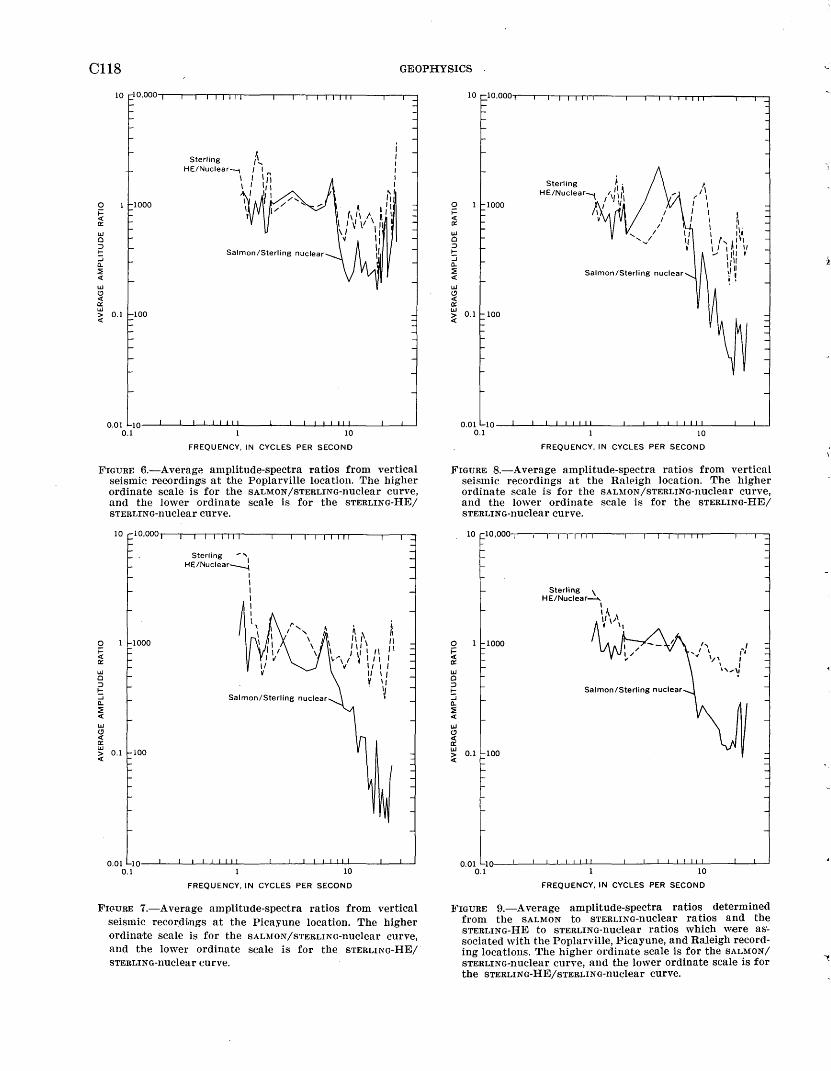
C118 GEOPHYSICS
0 i= <1: a: w Q ;:) I:; 0.. ::E <1: w (.!) <1: a: w
Sterling H E/Nuclear---1
I I
Salmon/Sterling nuclear
> 0.1 100 <1:
0.01 10---L--~~~~~~----~~L-~~-LLLL---~---L~
0.1 10
FREQUENCY, IN CYCLES PER SECOND
FIGURE 6.--Average amplitude-spectra ratios from vertical seismic reoordin~s at the Poplarville location. The higher ordinate scale is for the SALMON /STERLING-nuclear curve, and the lower ordinate scale is for the STERLING-HE/ STERLING-nuclear curve.
0 i= <1: a: w Q ;:) 1-:::; 0.. ::E <1: w (.!) <1: a: w > <1:
1000
0.1 100
Sterling '" HE/Nuclear----1
I I I I I I l
' I I
Salmon/Sterling nuclear
11 II ,, I
I I I I ,, ~
0.01 1 O---L--~~--L..._l_I~~---..L__.Jt__-'-.L...J~J....LL-------1---L--l 0.1 10
FREQUENCY, IN CYCLES PER SECOND
FI(l-URE 7.-Average amplitude-spectra ratios from vertical seismic recordings at the Picayune location. The higher ordinate scale is for the SALMON/STERLING-nuclear curve, and the lower ordinate scale is for the STERLING-HE/ STERLING-nuclear curve.
0 i= <1: a: w Q ;:) I:; 0.. ::E <1:
w (.!) <1: a: w ~ 0.1 100
Sterling HE/Nuclear--;
Salmon/Sterling nuclear
10
FREQUENCY, IN CYCLES PER SECOND
FIGURE 8.-Average amplitude-spectra ratios from vertical seismic recordings at the Raleigh location. The higher ordinate scale is for the SALMON/STERLING-nuclear curve, and the lower ordinate scale is for the STERLING-HE/ STERLING-nuclear curve.
0 i= <1: a: w Q :J 1-:::; 0.. ::E <1:
w (.!) <1: a: w
0.1 ~
Sterling \ HE/Nuclear___._
I I~ \I 1'\ t ,,
Salmon/Sterling nuclear
10
FREQUENCY, IN CYCLES PER SECOND
FIGURE 9.-A verage amplitude-spectra ratios determined from the SALMON to STERLING-nuclear ratios and the STERLING-HE to STERLING-nuclear ratios which w.ere associated with the Poplarville, Picayune, and Raleigh recording locations. The higher ordinate scale is for the SALMON/ STERLING-nuclear curve, and the lower ordinate scale is for the STERLING-HE/STERLING-nuclear curve.
_, ;BORCHERDT C119
This agrees with visual examination of the filtered analog playbacks and the amplitude spectra. In the frequency range _(1 to 5 cps) which predominates in teleseismic signals, the STERLING-nuclear explosion produced, on the average, about the same seismic amplitudes as the STERLING-HE explosion, but at frequencies between 8 and 25 cps it produced seismic amplitudes about 1.4 times g-reater than the STERLING-HE explosion. The SALl\:lON nuclear explosion, on the other hand, generated seismic amplitudes in the 1- to 5-cps band about 1,000 times as large as the STERLING nuclear, and in the 10- to 25-cps band the SAI....l\fON amplitudes were less than 200 times as large.
The consistency of the relative differences in the overall structure of the 2 types of amplitude spectral ratios obtained from 10 seconds of the seismic signals at the 3 recording locations tends to confirm the theoretical conclusions that spectral ratios determined from the entire seismogram are· dependent on only the relative differences in the seismic-source properties and not on the
propagation path or the recording instn1ments. The relative differences in the seismic-source properties as determined from the average spectral ratios for the SAI....l\fON and STERLING nuclear recordings vary more than a factor of 5 in the frequency band 1 to 25 cps, with the STF..RI....ING-nuclear recordings being richer in the 10- to 25-cps frequencies.
REFERENCES
Borcherdt, R. D., Healy, J. H., Jackson, W. H., and Warren, D. H., 1967, Seismic measurements of explosions in the Tatum Salt Dome, Mississippi: U.S. Geol. Survey open-file rept. Oct. 17, 1967, 64 p.
Cooley, J. ,V., and Tul{ey, .J. W., 1965, An algorithm for the machine calculation of complex Fourier series: Mathematics of Computation, v. 19, p. 297-301.
Filon, I ... N. G., 1928, On a quadrature formula for tr-igonometric integrals: Royal Soc. Edinburgh Proc., v. 49, p. 38-47.
Warrick, R. E., Hoover, D. B., .Jackson, W. H., Pakiser, L. C., Jr., and Roller, J. C., 1961, The specification and testing of a seismic-refraction syste.m for crustal studies : Geophysics, v. 26, no. 6, p. 820-824.
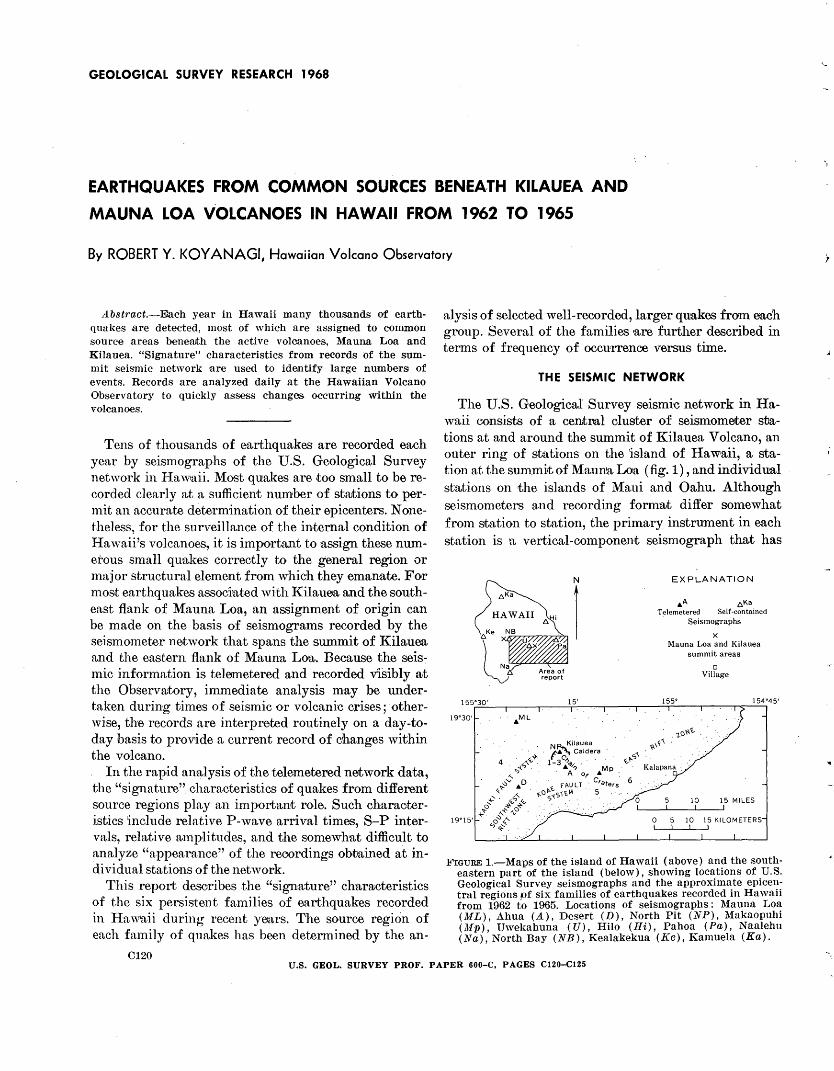
GEOLOGICAL SURVEY RESEARCH 1968
EARTHQUAKE'S FROM COMMON SOURCES BENEATH KILAUEA AND
MAUNA LOA VOLCANOES IN HAWAII FROM 1962 TO 1965
By ROBERT Y. KOYANAGI, Hawaiian Volcano Observatory
Ab.ytract.-Each year in Hawaii many thousands of earthquakes .are detected, most of which are assigned to common source areas benea1th the active volcanoes, Mauna Loa and Kilauea. "Signature" characteristics from records of the summit seismic network ·are used to identify large numbers of events. Records are analyzed daily at the Hawaiian Volcano Observatory to quickly assess changes occurring within the volcanoes.
Tens of thousands of earthquakes are recorded each year by seismographs of the U.S. Geological Survey network in Hawaii. Most quakes are too small to be recorded clearly at a sufficient number of strutions to permit an accurate determination of their epicenters. Nonetheless, for the surveillance of the internal condition of Hawaii's volcanoes, it is important to assign these numerous small quakes correctly to the general region or major structural element from which they emanate. For most earthquakes assocJi:ated with l{ilauea and the southeast flank of Mauna Loa, an assignment of origin can be made on the basis of seismograms recorded by the seismometer network that spans the summit of Kilauea and the eastern flank of Mauna Loa. Because the seis-:mic information is telem.etered and recorded visibly 31t the Observatory, immediate analysis may be undertaken during times of seismic or volcanic crises; otherwise, the records are interpreted routinely on a day-today basis to provide a current record of changes within the volcano.
In the rapid analysis of the telemetered network data, the "signature" characteristics of quakes from different source regions play an importJant role. Such characteristics include relative P-wave arrival times, S-P intervals, relative amplitudes, and the somewhat difficult to analyze "appearance" of the recordings obtained at individual stations of the networ.k.
This report describes the "signature" chara;cteristics of the six persistent families of earthquakes recorded in Ha,vaii during recent years. The source region of each :family of qua.kes has been determined by the an-
0120
alysis of selected well-recorded, larger quakes from eaeh group. Several of the families 'are further described in terms of frequency of occurrence versus time.
THE SEISMIC NETWORK
The U.S. Geological Survey seismic network in Hawaii consists of a centflal cluster of seismometer stations at and around the summit of Kilauea Volcano, an outer ring of stations on the island of Hawaii, a station at the summit of M,auna Loa (fig. 1), and individual stations on the islands of Maui and Oahu. Although seis1nometers and recording :form·a..t differ somewhat from station to station, the primary instrument in each station is 1a vertical-component seismograph that has
155°30'
19°30'
EXPLANATION
,.A 6 Ka Telemetered Self-contained
. Seismographs
X Mauna Loa and Kilauea
summit areas
0 Village
.I!'IGURE 1.-Maps of the island of Hawaii (above) and the southeastern part of the island (below), showing locations of U.S. Geological Survey seis!llographs and the approximate epicentral regions pf six families of earthquakes recorded in Hawaii from 1962 to 1965. Locations of seismographs: Mauna Loa (ML), Alma (A), Desert (D), North Pit (NP), Makaopuhi (Mp), Uwekahuna (U), Hilo (Hi), Pahoa (Pa), Naalehu (Na), North Bay (NB), Kealakekua (Ke), Kamuela (Ka).
U.S. GEOL. SURVEY PROF. PAPER 600-C, PAGES C120-CI25
·-
,.
.r
KOYANAGI Cl21
a peak magnification of 20,000 to 40,000 at a period of 0.2 second. Signals from the central net are telemetered to the observUJtory, where they are recorded visibly on smoked-paper drums. Timing for the central net is· provided by the master clock in the conventional station (Uwekahuna) nt the observatory. Other stations of the network are self-contained and record locally, each having its own master clock and VVlVV 1 radio receiver. Stn,ndard short-period horizontal-component torsion seismometers ( 'iV ood-Anderson type) , having n, free period of 0.8 sec, slightly less than critical damping, 'n.nd static magnification of 2,800, provide northsouth 'and en,st-west component records at Hilo n.nd I-:Ialeakala (M~aui). Intermediate magnification shortperiod seism:ographs (vertical and east-west com.ponoot series DH Sprengnethers, having a peak magnification of about 1,500 at a period of about 1 sec), and a 3-component long-period Press-Ewing seismograph (15-sec pendulums and 90-sec galvanometers) are also operated at U wekahuna.
Seasonal and sporadic variations in background noise level occur, and the changes in seismometer sensitivity, which are introduced to minimize the effect of these variations on seismogram legibility, lead to moderate variations in the threshold of earthquake detection at some stations, especially those near the coast.
DISTRIBUTION OF EARTHQUAKES
From ,January 1962 to September 1965, 133,000 local earthquakes were detected by seismographs of the U.S. Geologicnl Survey network in Hawaii. Nearly 99 percent of these occurred beneath the active volcanoes, ~{a una Loa and 1Gl>auea, at the southeastern end of the I-Iawaiian Ridge. More than 2,200 of these quakes were of magnitude 2.0 or greater and were recorded by a sufficient nmnber of stations to permit determination of their epicenters (U.S. Geological Survey, 1962-1965). Threequarters of these "located" earthquakes occurred beneath ~fauna Loa and 1Glauea. The concentration of sensitive seismographs in active regions on Mauna Loa and 1Cilauea and the dependence of radius of detection on earthquate magnitude, lead to the apparent discrepancy in the fractions of "detected'~ and "located" earthquakes that lie beneath the two active volcanoes.
COMMON SOURCES OF EARTHQUAKES BENEATH KILAUEA AND MAUNA LOA
During recent years, most of the earthquakes recorded by the 1-Iawaii network have been associated with major
1 National Bureau of Standards time-signal broadcasts on WWV network fl'equencies.
structures at or near the summit of Kilauea Volcano. In the geologically complex region around the summit of 1\:ilauea, several structural features intersect and overlap; thus, it is difficult to separate the quakes into distinct classes. The active 1\:oae fault system (1\:inoshita, 1967), a northeast-trending fault system several kilometers south of 1Glauea Caldera, presents such a problem. The western end of the system intersects the south west rift zone, and the eastern end intersects the east rift zone. In this report, earthq~1akes along the eastern and western parts of the 1\:oae fault system were combined with those along the upper east rift zone, and the 1\:aoiki fault and southwest rif.t zone, respectively. After some consideration, the principal "families" of earthquakes were grouped ~according to their region of origin as follows (fig. 1) :
Kilauea summit earthquakes 1. Shallow caldera earthquakes (foci beneath or near
Kilauea Caldera at depths from "surface" to several kilometers) .
2. Intermediate-depth caldera earthquakes (foci beneath 1Cilauea Caldera at depths of about 5 km).
3. 30-km earthquakes (foci beneath the summit of 1Cilauea at depths of 25 to slightly more than 30km).
4. 1\:aoiki and southwest rift earthquakes Foci at shallow to moderate depths ( 0 to about 10
km) beneath the 1\:aoiki fault system west of 1\:ilauea Caldera and the eontiguous part of the southwest rift zone of 1Glauea.
5. Upper east rift earthquakes Foci at shallow to moderate depths (0 to 10 km)
beneath the eastern half of the Chain of Craters and the adjacent zone of conspicuous faults toward the south and southwest.
6. 1\:alapana Trail earthquakes Foci at shallow depths beneath the part of the easL
rift zone southeast of the Chain of Craters. Seismograms from each of these regions, recorded at
five stations of the summit cluster, are illustrated in figure 2. Differences in the ,predominant frequency of the recorded waves, in the clarity and sharpness of onset of the P phases and S phases, and in relative amplitudes among the five stations are readily apparent. Some of the characteristics that are most useful in identifying the source of these quakes are shown in sketches of key records (fig. 3).
About 50 earthquakes from each source region were located and analyzed in detail to determine the average focal coordinates of each region (table 1). Comparison of these regions with quarterly maps of epicenters of
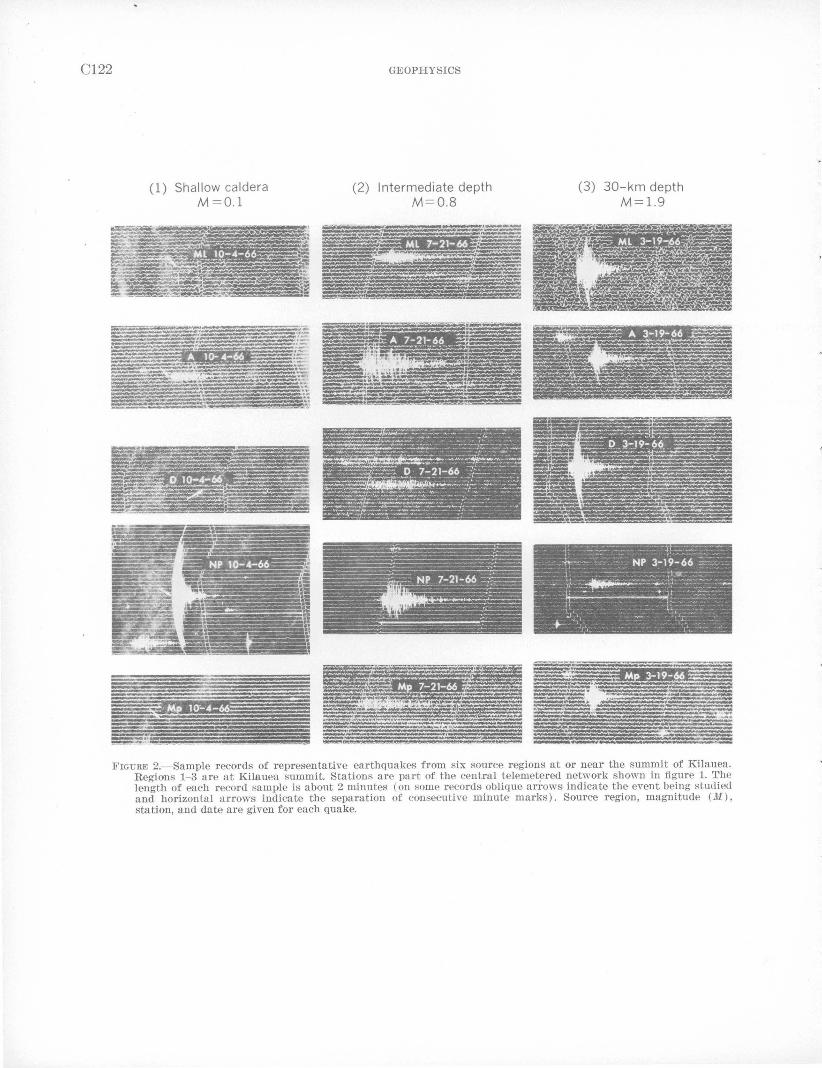
C122
( 1) Shallow caldera M=O.l
GEOPHYSICS
(2) Intermediate depth M=0.8
(3) 30-km depth M=l.9
FIGURE 2.-Sample records of representative earthquakes fr()IIIl six source regions at or near the summit of Kilauea. Regions 1-3 are at Kilauea summit. Stations are part of the central t.elemetered network shown in figure 1. The length of each recorcl sample is about 2 minutes (on some records oblique ari:ows indicate the event being studied and horizontal arrows indicate the separation of consecutive minute marks). Source region, magnitude (M), station, and date are given for each quake.
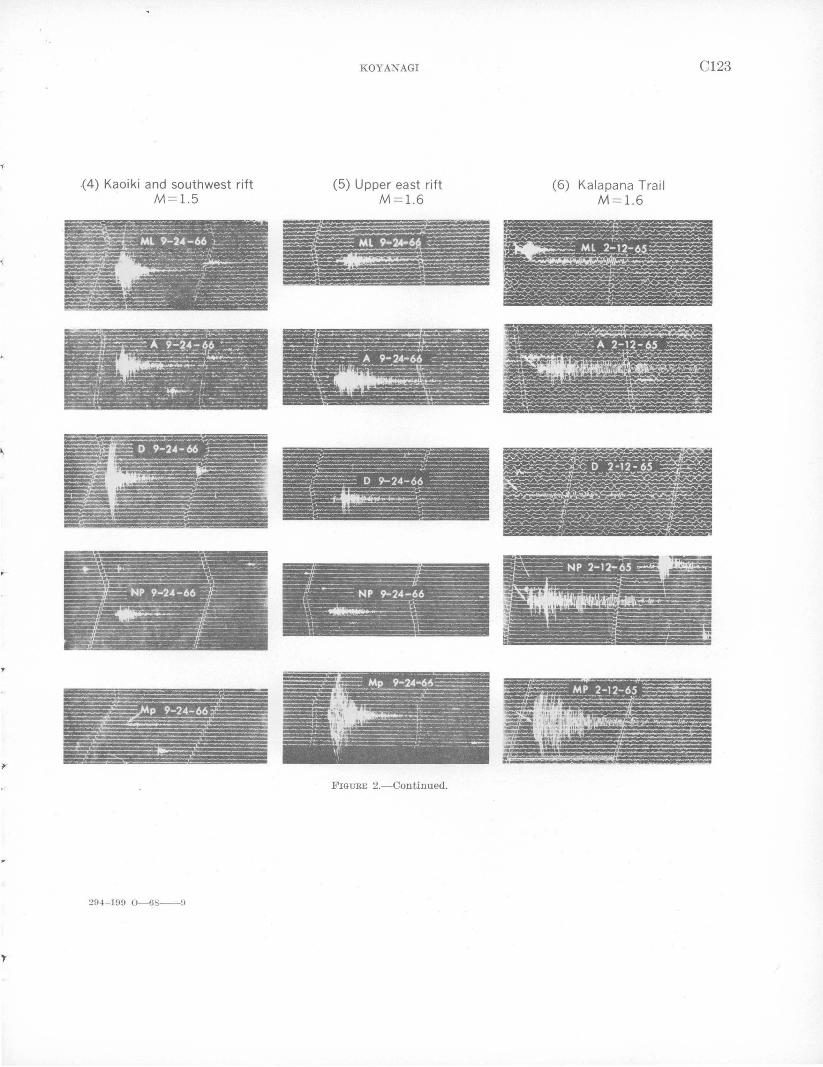
-(4) Kaoiki and southwest rift M=l.5
204- 109 0-68--0
KOYANAGI
(5) Upper east rift M=l.6
~~:=b-~~~-':~~if:::- -~:~~~-~ :,__~:_l'k- ·.:· ·-:-::.. A 9-24-66 = ·;.;;~;_:__
--~--------_.,___ --- ~---.. --... --- -- - ~ -~--~-~ .......... ___. ----. - "';:;. --
- ·- _J.l.::.... -I-- ---- -==--::::::.-...._ ~ ~ ' - ~- ~ - ~ - ~ ~ _..,._
- - ~ -- - -- ~--~-_ .. ------ -------~ ---- --- -
- ( . C - NP ~;.~-:: ~;-
FIGURE 2.-Continued.
(6) Kalapana Trail M=1.6
C123
~-.
---
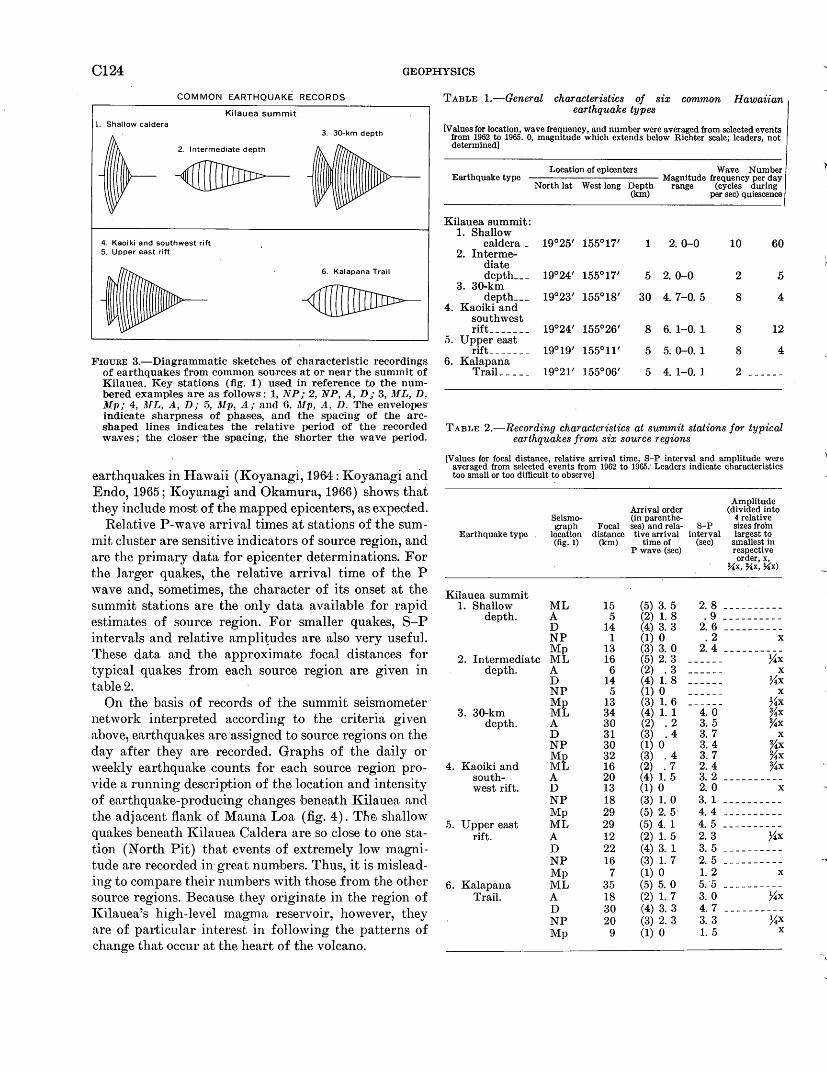
C124 GEOPHYSICS
COMMON EARTHQUAKE RECORDS
Kilauea summit 1. Shallow caldera
3. 30-km depth
2. Intermediate depth
4. Kaoiki and southwest rift 5. Upper east rift
6. Kalapana Trail
FIGURE 3.-Diagrammatic sketches of characteristic recordings of earthquakes from common sources at or near the summit of Kilauea. Key stations (fig. 1) used in reference to the numbered examples are as follows: 1, NP; 2, NP, A, D; 3, JJfL, D, JJfp; 4, liiL, A, D; 5, JJfp, A; and 6. JJfp, A., D. The envelopes indicate sharpness of phases, and the spacing of the arcshaped lines indicates the relative period of the recorded waves; the closer the spacing, the shorter the wave period.
earthquakes in Hawaii (Koyanagi, 1964: l{oyanagi and Endo, 1965; Koyanagi and Okamura, 1966) shows that they include most of the mapped epicenters, as expect8d.
Relative P-wave arrival times at stations of the summit cluster are sensitive indicators of source region, and are the primary data for epicenter determinations. For the larger quakes, the relative arrival time of the P wave and, sometimes, the character of its onset at the summit stations are the only data available for rapid estimates of source region. For smaller quakes, S-P intervals and relative amplitudes are also very useful. These data and the approximate focal distances for typical quakes from eacl1 source region are given in table 2.
On the basis of records of the summit seismometer network interpreted according to the criteria given above, earthquakes are assigned to source regions on the day after they are recorded. Graphs of the daily or weekly earthquake counts for each source region provide a running description of the location and intensity of earthquake-producing changes beneath Kilauea and the adjacent flank of Mauna Loa (fig. 4). Th~ shallow quakes beneath l(ilauea Caldera are so close to one station (North Pit) that events of extremely low magnitude are recorded in· great numbers. Thus, it is misleading to. compare their numbers with those from the other source regions. Because they originate in the region of IGlauea's high-level magma reservoir, however, they are of particular interest in following the patterns of change that occur at the heart of the volcano.
TABLE 1.-General characteristics of six common Hawaiian earthquake types
[Values for location, wave frequency, and number were averaged from selected events from 1962 to 1965. 0, magnitude which extends below Richter scale; leaders, not determined)
Location of epicenters Wave Number Earthquake type Magnitude frequency per day
North lat West long Depth range (cycles during (km) per sec) quiescence
Kilauea summit: 1. Shallow
caldera_ 19°25' 155°17' 1 2. o-o 10 60 2. Interme-
diate depth ___ 19°24' 155°17' 5 2. 0-0 2 5
3. 30-km depth ___ 19°23' 155°18' 30 4. 7-0. 5 8 4
4. Kaoiki and southwest rift_ ______ 19°24' 155°26' 8 6. 1-0. 1 8 12
5. Upper east rift _______ 19°19' 155°11' 5 5. 0-0. 1 8 4
6. Kala pan a TraiL ____ 19°21' 155°06' 5 4. 1-0. 1 2
TABLE 2.-Recording characteristics at summit stations for typical earthquakes from six source regions
[Values for focal distance, relative arrival time, 8-P interval and amplitude were averaged from selected events from 1962 to 1965.' Leaders indicate characteristics too small or too difficult to observe)
Amplitude Arrival order (divided into
8eismo- (in parenthe- 4 relative graph Focal ses) .and rela- 8-P sizes from
Earthquake type location distance tive arrival interval largest to (fig. 1) (km) time of (sec) smallest in
P wave (sec) respective order, x,
~x, %x, ~x)
Kilauea summit 1. Shallow ML 15 (5) 3. 5 2. 8 - - - - - - - - - -
depth. A 5 (2) 1. 8 . 9 ------~---D 14 (4) 3. 3 2. 6 ----------NP 1 (1) 0 .2 X
Mp 13 (3) 3. 0 2. 4 - - - - - - - - - -2. Intermediate ML 16 (5) 2. 3 %x
depth. A 6 (2) .3 X
D 14 (4) 1. 8 %x NP 5 (1) 0 X
Mp 13 (3) 1. 6 ?~x 3. 30-km ML 34 (4) 1. 1 4. 0 %x
depth. A 30 (2) .2 3. 5 %x D 31 (3) .4 3. 7 X
NP 30 (1) 0 3. 4 %x Mp 32 (3) .4 3. 7 %x
4. Kaoiki and ML 16 (2) .7 2. 4 %x south- A 20 (4) 1. 5 3. 2 ----------west rift. D 13 (1) 0 2. 0 X
NP 18 (3) 1. 0 3. 1 ----------Mp 29 (5) 2. 5- 4. 4 ----------
5. Upper east ML 29 (5) 4. 1 4. 5 ----------rift. A 12 (2) 1. 5 2. 3 ?~x
D 22 (4) 3. 1 3. 5 ----------NP 16 (3) 1. 7 2. 5 ----------Mp 7 (1) 0 1.2 X
6. Kalapana ML 35 (5) 5. 0 5. 5 ----------Trail. A 18 (2) 1. 7 3. 0 %x
D 30 (4) 3. 3 4. 7 ----------NP 20 (3) 2. 3 3. 3 }~X
Mp 9 (1) 0 1.5 X
-·
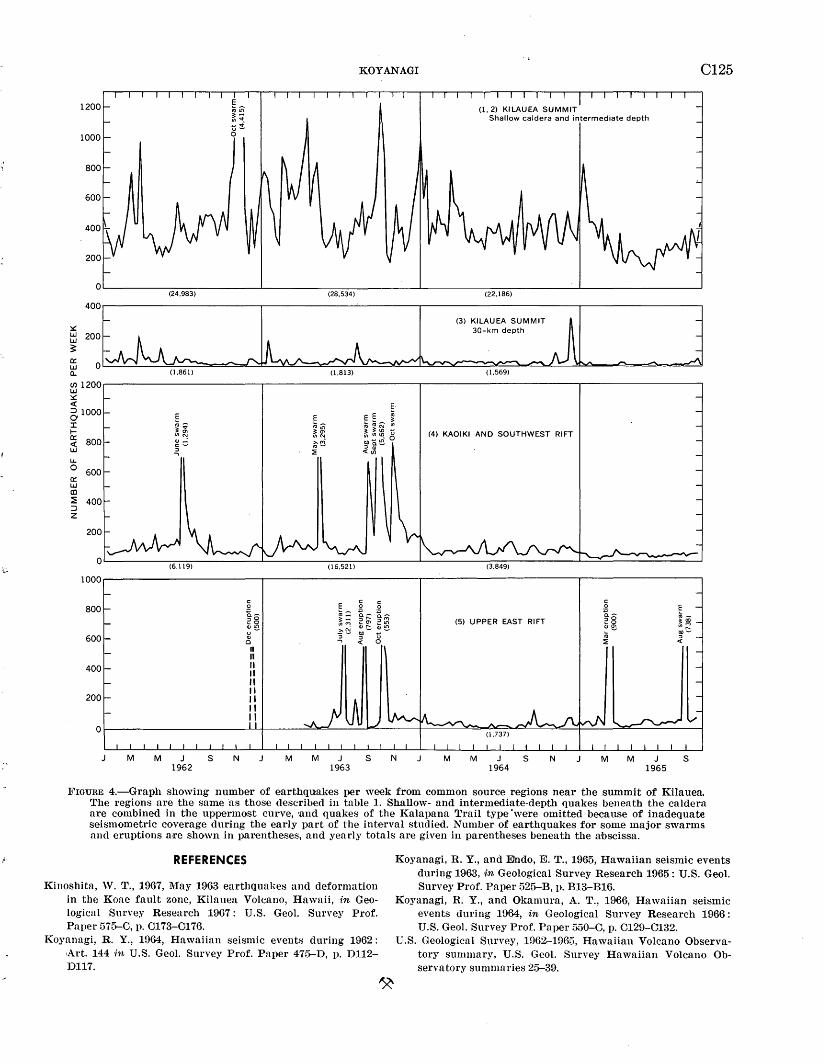
--
KOYANAGI C125
OL-----------------------~-----------------------L----------~~--------~----------------~ (24.983) (28,534) (22,186)
400
. (3) KILA.UEA SUMMIT ::!1:: 30-km depth t:1 200 ] 3: a: ~ 0
(1.861) (1,813) (1,569)
(/) 1200 IJ.J ::!1:: <(
51000 :c to: ~ 1.1.. 0 a: IJ.J co ~ ::J z
1000
800
600
400
200
0
M M J s N 1962
c: 0
~-:JO ~o
"'!!?. u Q)
0 II II II II II II II II II
M
(4) KAOIKI AND SOUTHWEST RIFT
c: E~ .Q
~= (5) UPPER EAST RIFT "'"" ri u 0
M J S N M M J S N 1963 1964
c: 0 :g__ :JO ~o
~e; ::E
J M M J 1965
~~ ;:oo VI~ g,o~
~
s
Il'IGURE 4.-Graph showing number of earthquakes per week from common source regions near the summit of Kilauea. The regions are the same ·as those described in table 1. Shallow- and intermediate-depth quakes beneath the caldera are combined in the uppermost curve, ·and quakes of the Kalapana Trail type 'were omitted because of inadequate seismometric coverage during the early part of the interval studied. Number of earthquakes for some major swarms and eruptions M'e shown in parentheses, and yearly totals are given in parentheses beneath the aobscissa.
REFERENCES
Kiuoshita, W. T., 1967, May 1963 earthquakes and deformation in the Koae fault zone, Kilauea Volcano, Hawaii, in Geological Survey Research 1967: U.S. Geol. Survey Prof. Paver 575-C, p. 0173-0176.
Koyanngi, R. Y., 11)64, Hawaiian seismic events during 1962: ,Art. 144 ·in U.S. Geol. Survey Prof. Paper 475-D, p. Dll2-D117.
Koyanagi, R. Y., and IDndo, E. T., 1965, Hawaiian seismic events during 1963, in Geological Survey Research 1965: U.S. Geol. Survey Prof. Paper 525-B, p. B13-B16.
Koyanagi, R. Y., and Okamura, A. T., 1966, Hawaiian seismic events during 1964, in Geological Suney Research 1966 : U.S. Geol. Survey Prof. Paper 550-0, p. 0129-0132.
U.S. Geological Survey, 11)62-1965, Hawaiian Volcano Observatory summary, U.S. Geol. Survey Hawaiian Volcano Observatory summaries 25--39.
GEOLOGICAL SURVEY RESEARCH 1968
RECENT VOLCANIC ACTIVITY ON AUGUSTINE ISLAND, ALASKA
By ROBERT L. DETTERMAN, Menlo Park, Calif.
Abstract.-Augustine Volcano erupted October 11, 1963, ending a 28-year quiet period. The initial eruption from the summit dome was of a nuee ardente type laterally directed to the southeast, where it blew out a 3,200-foot section of crater wall. The mass of debris ( 120 X 10 6 cu yd) formed by the eruption covers about 3 square miles and is locally as much as 375 feet thick. Mudflows ~onsisting of reactivated rubble (20 X 10 6 cu yd) cover an additional area of about 2 square miles.
Augustine Volcano is on Augustine Island, 175 miles southwest of Anchorage, Alaska, and 7 miles from the nearest point on the west side of Cook Inlet. Augustine is near the north end of the volcanic arc that forms the Aleutian Islands and Alaska Peninsula and is about 200 miles northwest of the Aleutian Trenoh. It is about mid,vay between Trident and Redoubt Vol'Canoes, which also have been active since 1963. Augustine has been active intermittently during historic times (Coats, 1950, table 2). Before the 1963 activity, 'the most recent eruptions were in 1902 and 1935.
The vol'cano is a symmetrical composite ·cone about 4,025 feet high formed by andesitic a.nd dacitic lava, rubble and breccia flows, volcani'c mud, cinders and pumice lapilli, with a summit crater and plug dome. The slope of the upper 2,000 feet of the volcano is near the 40° angle of repose for volcaniclastic rocks.
On October 11, 1963, Augustine Volcano had the first of a series of continued eruptions that occurred over a period of about 10 months. Major eruptions took place on November 17,1963, July 5,1964, and August 19,1964. Undoubtedly m-any others went unnoti'Ced, as 'the island is uninhabited and the nearest town is 60 miles east on the l(enai Peninsula. Smoke and steam issued from the cone continuously during 1965 and 1966. In 1967,_members of the U.S. Geological Survey revisited the island. By this time the activity had declined to a moderate flow of steam with an OC'Casional puff of smoke from s~verai vents on the sides and top of the cone. The 1967 visit to the isla~d was made pri~arily to ~ssess the amount, type, and distributJion of material erupted from the volcano, and secondarily, to check for a poss~ble change
0126
in elevation of the peak as well a:s evidence of uplift or subsidence of the island as a result of the March 27, 1964, earthquake. The earthquake was known to have caused subsiden% of 4.2 to 5.7 feet at Homer on the east side of Cook Inlet (Waller, 1966), and uplift of about 18 inches at Ili3Jmna ·and Tuxedni Bays on the west side of Cook Inlet (Plafker, 1965).
The exact nature and sequence of events surrounding the eruption of Augustine Volcano are imperfectly known becaus~ of remoteness of the area and consequent lack of eyewitnesses. Some of the more important events can be determined, however, from a study of the deposits formed by the eruption and from aerial photographs taken at intervals during the time that the volcano was active.
TYPE OF ERUPTION
The initial major eruption was of a nuee ardente type, directed laterally toward the southeast; it apparently came from low on the side of the summit dome \ ( tholoid) and blew out a section of crater wall about 3,200 feet long, 500 feet high, and as much as 700 feet thick. This mass of debris from the crater wall ( approxi~ mately 30 X 106 cubic yards) was incorporated as parts of flows I and II, as shown on figure 1.
This eruption of Augustine was similar in some aspects, and dissimilar in others, to the classic nuee ardente eruption of Mount Pelee in the West Indies in 1902, described by Lacroix (1904) and MacGregor ( 1952 and 1955). The explosion at Mount Pelee broke through the side of a newly formed summit tholoid, and the debris flowed through a previously formed breach in the crater wall; the ejected rock was hot, semiconsolidated, and gas rich, and rapid expansion of compressed gases allowed the debris to flow great distances with little regard for topography. At Augustine the flank eruption was from a previously formed summit tholoid (the date of ·formation: is unknown, but field evidence indicated that at least two previous eruptions were also flank eruptions on this dome). The consolidated vesicular rocks were colder with less volatile gas
U.S. GEOL. SURVEY PROF. PAPER 600-C, PAGES C126-Cl29
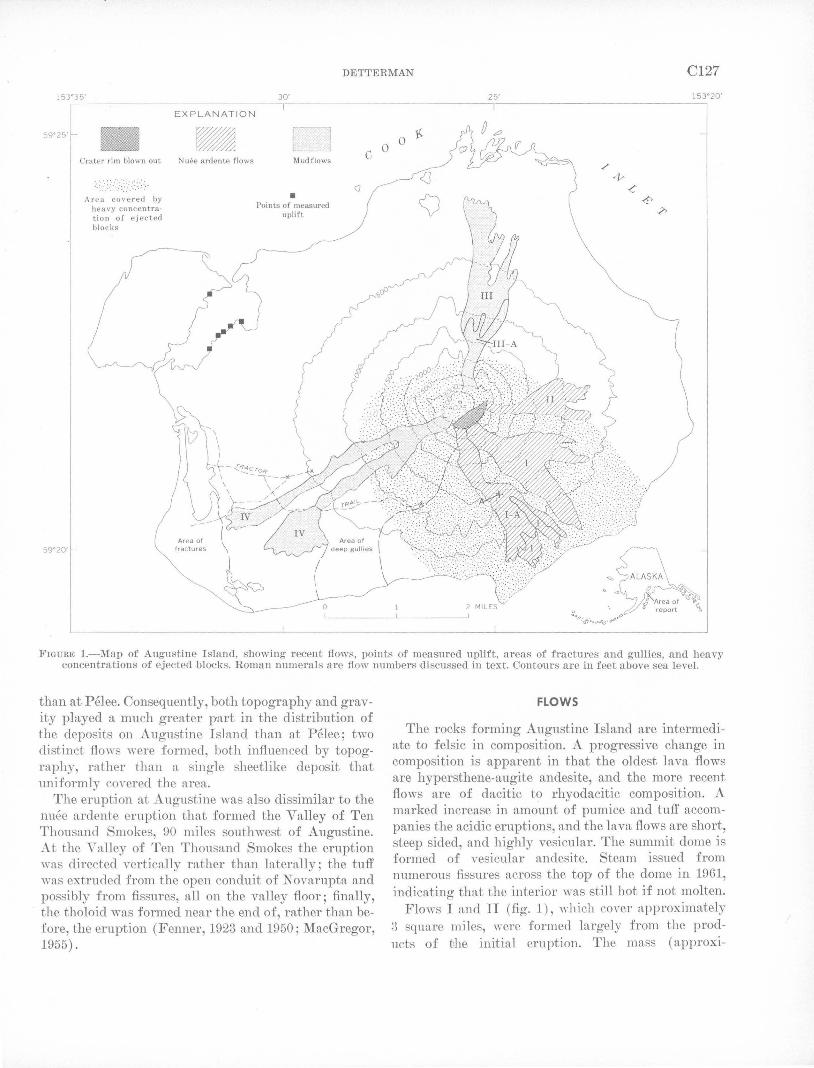
DETTERMAN C127
153"35' 30' 25' 153"20'
EXPLANATION
59"25' • Crater rim blown out N uee arden te flows
D Mudflows
0 1<c 0
59"20'
Area covered by heavy concentration of ejected blocks
<J • Points of measured
uplift
FIGURE 1.-~·ap of Au~ustine I sland, showing recent flows, points of measured uplift, areas of fractures and gullies, and heavy concentratwns of eJected blocks. Roman numerals are flow numbers discussed in text. Contours are in feet above sea level.
than at Pelee. Consequently, both topography and o-rav-. 0
1ty played a much greater part in the distribution of the deposits on Augustine Island than at Pelee; two distinct flows were formed, both influenced by topography, rather than a single sheetlike deposit that uniformly covered the area.
The eruption at Augustine was also dissimilar to the nuee ardente eruption that formed the Valley of Ten Thousand Smokes, 90 miles southwest of Augustine. At the Valley of Ten Thousand Smokes the eruption was directed vertically rather than laterally; the tuff was extruded from the open conduit of Novarupta and possibly from fissures, all on the valley floor; finally, the tholoid was formed near the end of, rather than before, the eruption (Fenner, 1923 and1950; MacGregor, 1955).
FLOWS
The rocks forming Augustine Island are intermediate to felsic in composition. A progressive change in composition is apparent in that the oldest lava flows are hypersthene-augite andesite, and the more recent flows are of dacitic to rhyodacitic composition. A marked increase in amount of pumice and tuff accompanies the acidic eruptions, and the lava flows are short, steep sided, and highly vesicular. The summit dome is formed of vesicular andesite. Steam issued from numerous fissures across the top of the dome in 1961, indicating that the interior was still hot if not molten.
Flo"-s I and II (fig. 1), which cover approximately 3 square miles, ''"ere formed largely from the products of the initial eruption. The mass ( approxi-
Cl28 VOLCANOLOGY
mately 120 X 106 cu yd) is virtually unsorted, and fragments range in size from coarse ash ( 4 to 0.5 mm) to house-size blocks of vesicular lava that were probably part of the crater wall. The debris, mainly pumice la pilli, was directed southeastward by the explosion; most of the material flowed into a canyon, where it overrode the west wall and continued down the side of an intervening spur. At point A (fig. 1) the flow in the canyon is at least 375 feet thick. A second flow (flow I-A, fig. 1) which came down the same canyon is darker and is made up mainly of cinders and small blocks.
The distal ends of flows I and II are crudely lobate and partially digitated with a distal rim and convex cross section. Abundant roughly parallel longitudinal grooves cover the lower parts of the flows. In many respects the flows are similar to the air-cushioned Sherman landslide (Shreve, 1966). The longitudinal grooves were not inspe.cted at close range but are undoubtedly similar to those in some of the old flows. Their :formation is believed to be similar to a lava tube or a natural volcanic levee in which the outside cools first and the hotter interior continues to move :forward. In cross .section the grooves are sharply concave to U-shaped with rims commonly 10 to 20 feet higher than the center; the rims are firmly welded breccia or vesicular la:va. A "pile-up" of debris is noted at the terminal end of these grooves, in most places near the margin of the flow. Although the grooves are locally as long as 1 mile, most are less than hal:f a mile long and 50 to 200 :feet wide.
That the debris :forming flows I and II traveled at high speed and probably on a cushion of rapidly expanding gas and compressed air is evident in that little of the material came to rest closer to ·the dome than 4,000 :feet and that it was able to override a 375-:foothigh canyon wall. About one-quarter of the total mass (30 X 106 cu yd) came :from the crater wall and consequently would contain no hot compressed gas; it probably trapped a partial cushion of compressed air in its :fall, but most of the forward momentum must have been provided by hot· expanding gases released by a nuee ardente eruption similar to the flows at Mount Pelee and the Valley of Ten Thousand Smokes. There are no trees near the flows, but low alder brush along the margin are charred. Fumarolic action reported by crews :from fishing boats could be expected :from the more deeply buried parts of these flows. None was noted during our visit to the island in 1967; however, this was also during a period of high wind that stirred up dust clouds that would have obscured any fumaroles.
Flows III and IV (fig. 1) are composed mainly of mud and pumiceous sand with a mixture of coarse rubble in ·the upper parts. The flows (approximately 20 X
106 cu yd) are spread thinly over an area of about 2
square mriles, showing that they were quite fluid. They range in tJhick.ness from a few inches at the distal ends to rubout 10 to 15 feet in the upper parts and cover two old pumiee flows (Detterman and Reed, 1964). They are believed to have been formed mainly by melt water from the extensive snowfield in the crater which reactivated unstable unconsolidated material within the crater and on the upper slopes of the volcano. These flows actually may have been formed just prior to the initial eruption, as they have their origin at former breaks in the crater wall. The mud was apparently hot at the time of the flow, as partly buried clumps of alder brush show signs of scalding.
Flow III-A is dark pumiceous sand and cinders with some small blocks similar to flow I-A; it may be from the same eruption. ~fost of the debris is concentrated within 1 mile of the dome, however, and there is little evidence to suggest a nuee ardente flow.
Between flows I and IV is an -area, adj'acent to flow IV, in whi~h the surface was severely gullied by melt water during the eruptions. The gullies are closely spaced, being 30 to 200 feet apart, and are 25 to 100 feet deep and 1j2 mile to 2 miles l:ong. Most eut into poorly consolidated to unconsolidated pumice and rubble. Because the gradient is steep, most of the material was washed directly into Cook Inlet. There was little or no unconsolidated de!hris lying on the surface between the herud of the gullies ·and the cone; consequently, there was no material to form mudflows, and the water concentrated within depressions, where it quickly eroded gullies.
Angular blocks of ejected lava cover the upper part of ·the oone and are scattered a.cross the surfruce of the old flows, the greatest concentration forming a roughly elliptical area ·a;bout 3 miles wide t'hat trends about S. 40° E. (fig. 1). The long axis of the ellipse coincides with the direction of the nuee -ardente explosion.
Photographs taken from the same location as photographs obtained in 1961, ·as well ·as posteruption vertical color air photographs taken by ·the U.S. Coast and Geodetic Survey, indicate there has been little or no change in the height of Augustine Volcano as a result of the recent eruptions.
EARTHQUAKE-RELATED FEATURES
An uplift of 12 to 13 inches indicated for Augustine Island is probably a result of the M-arch 27, 1964, earthquake rather than the volcanic eruption. The uplift was measured in the manner discussed by Plafker (1965). Measurements were made at six localities in the protected lagoon at the north west side of the island (marked by the symbol for "points of measured uplift"
DETTERMAN C129
on fig. 1), where dead barnacles of the species Balanus balanoides (Linnaeus) were found aJbove living barnacles of the same species. On the exposed beaches 'around the island, formed mostly of pumiceous sand and gravel; dead barnacles were not seen.
.A!btmdant evidence of past uplift is found along the west and north sides of Augustine Island, where elevated beach ridges and wave-cut sea cliffs are now inland from present-day beaches. The small island off the northwest side of Augustine Island also shows evidence of periodic uplift ·over a considerable length of time by well-defined horizontal vegetational zones between the nonvegetated mudflats elevated by the 1964 earthquake and the brush-covered hilltops at about 100 feet. T-his 100-foot line corresponds to the tops of the highest beach ridges on Augustine Island.
The beach ridges 'On the southwest side of Augustine Island are broken by numerous small, subparallel fissures whose main sets were 10 to 25 feet apart, ·approxilnately a quarter of a mile in length, and roughly parallel to the coastline. The east sides of the fissures were cormnonly raised one-quarter to three-quarters of an inch; small cracks without vertical movement intersect the main fissures. The fissures probably resulted from slumping of the inhomogeneous unconsolidated materials as a result of the uplift.
REFERENCES
Coats, R. R., 1950, Volcanic activity in the Aleutian Arc: U.S. Geol. Survey Bull. 974-B, p. 35-49.
Detterman, R. L., and Reed, B. L., 1964, Preliminary map of the geology of the Iliamna quadrangle, Alaska: U.S. Geol. Survey Misc. Geol. Inv. Map I-407, scale 1 :250,000 .
Fenner, C. N., 1923, The origin and mode of empl·acement of the great tuff deposit of the Valley of Ten Thousand Smokes: Natl. Geog. Soc. [America], Contributed Tech. Papers, Katmai ser., no. 1, 74 p.
--1950, The chemical kinetics of the K.atmai eruption, pts. 1 and 2: Am. Jour. Sci., v. 248, no. 9, p. 593-627; no. 10, p. 697-725.
LaCroix, Alfred, 1904, La Montagne Pelee et ses eruptions : Paris, Masson et Cie, 662 p.
MacGregor, A. G., 1952, Eruptive mechanisms-Mt. Pelee, the Soufriere of St. Vincent ['Vest Indies] and the Valley of Ten Thousand Smokes [Alaska] : Bull. volcanologique, ser. 2, v. 12, p. 49-74.
--1955, Classifications of nuee ardente eruptions: Bull. volcanologique, ser. 2, v. 16, p. 7-10.
Plafker, George, 1965, Tectonic deformation associated with the 1964 Alaska earthquake: Science, v. 148, no. 3678, p. 1675-1687.
Shreve, R. L., 1966, Sherman landslide, Alaska : Science, v. 154, no.3757,p.1639-1643.
Waller, R. M., 1966, Effects of the earthquake of March 27, 1964, in the Homer, area, Alaska with a section on Beach changes on Homer Spit, by Kirk M. Stanley: U.S. Geol. Survey Prof. Paper 542-D, p. 13-14.
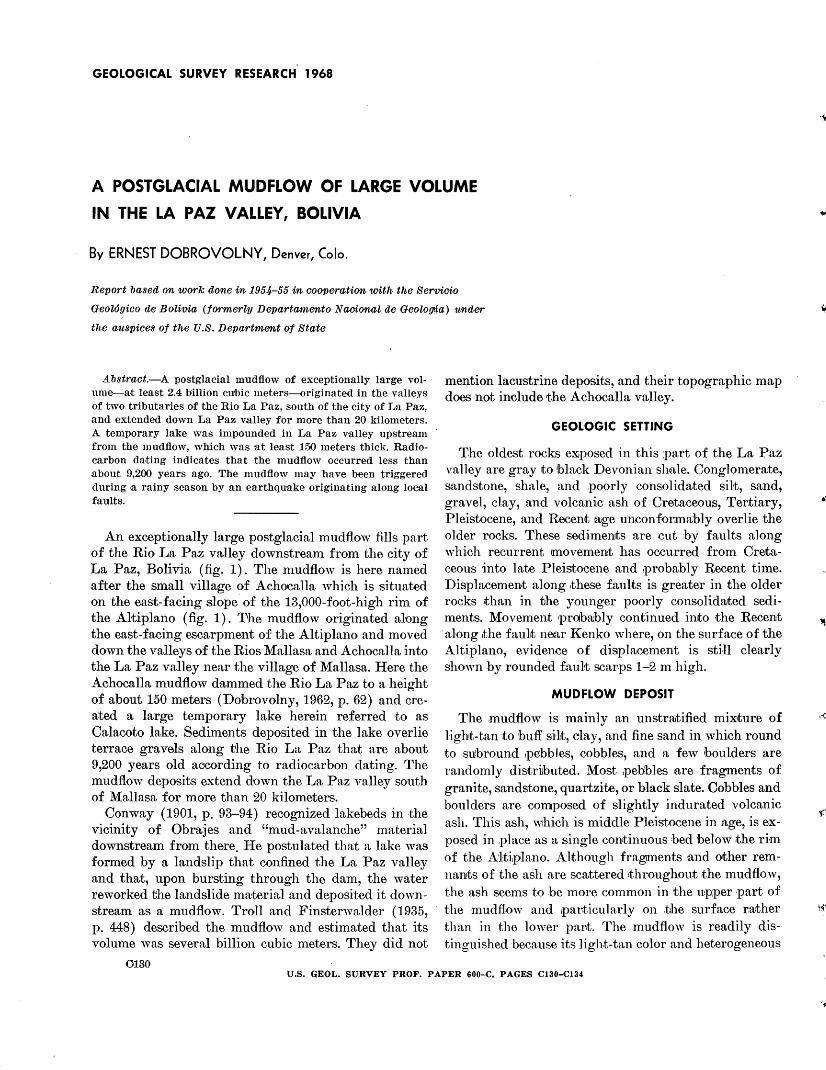
GEOLOGICAL SURVEY RESEARCH 1968
A POSTGLACIAL MUDFLOW OF LARGE VOLUME
IN THE LA PAZ VALLEY, BOLIVIA
By ERNEST DOBROVOLNY, Denver, Colo.
Report based on work done in 1954-55 in cooperation with the Servicio
GeolOgico de Bolivia (formerly Departamento Naoional de Geolo{flia) under
the auspices of the U.S. Department of State
Abstract.-A postglacial mudflow of exceptionally large volmue---at least 2.4 blillion cubic meters-originated in the valleys of two tributaries of the Rio La Paz, south of the city of La Paz, and extended down La Paz valley for more than 20 kilometers. A temporary lake was impounded in La Paz valley upstream from the mudflow, which was at least 150 meters thick. Radiocarbon da·ting indicates that the mudflow occurred less than .about 9,200 years ago. The mudflow may have been triggered during a rainy season by an earthquake originating along local faults.
An exceptionally large postglacial mudflow fills part of the Rio La Paz valley downstream from the city of La Paz, Bolivia (fig. 1) . The mudflow is here named after the small villa;ge of Achocalla which is situated on the east-facing slope of the 13,000-foot-high rim of the Altiplano (fig. 1). The mudflow originated along the east-facing escarpment of the Altiplano and moved down the valleys of the Rios Mallasa and Achocalla into the La Paz valley nea,r the village of Mallasa. Here the Achocalla mudflow dammed the Rio La Paz to a height of about 150 meters (Dobrovolny, 1962, p. 62) and created a large temporary lake herein referred ·to as Calacoto lake. Sediments deposited in the lake over lie terrace gravels along the Rio La Paz that are about 9,200 years old according to radiocarbon dating. The mudflow deposits extend down the La Paz valley south of Mallasa for more than 20 kilometers.
Conway (1901, p. 93-94) recognized lakebeds in the vicinity of Obrajes and "mud-avalanche" material downstream from there. He postulated that a lake was formed by a landslip that confined the La Paz valley and that, upon bursting through the dam, the water reworked the landslide ma-terial and deposited it downstream as a mudflow. Troll and Finsterwalder ( 1935, p. 448) described the mudflow and estimated that its volume was several billion cubic meters. They did not
0130
mention lacustrine deposits, and their topographic map does not include the Achocalla valley.
GEOLOGIC SETTING
The oldest rocks eX!posed in this :part of the La Paz valley are gray to !black Devonian shale. Conglomerate, sandstone, shale, and .poorly consolida;ted silt, sand, gravel, clay, and volcanic ash of Cretaceous, Tertiary, Pleistocene, and Recent 1a;ge unconfolillla;bly over lie the older rocks. These sedimell!ts are cut by faults along which recurrent movement has occurred from Cretaceous into late Pleistocene and .probably Recent time. Displ3!Cement along ,these faults is greater in the older rocks than in the younger poorly consolidated sediments. Movement 'PrOibrubly continued ill!to the Recent along ~the fault near Kenko where, on the surface of the Altiplano, evidence of displ3icement is still clearly shown by rounded fault scar.ps 1-2m high.
MUDFLOW DEPOSIT
The .mudflow is mainly an unstra;tified mix,ture of light-tan to huff si,lt, clay, and fine sand in which round to su!bround 1pebbles, cobbles, and a few boulders are randomly distrilbuted. Most ,pebbles 1are fragments of granite, sandstone, quartzite, or black slate. Cobbles and boulders are composed of slightly indurated volcanic ash. This ash, w1hich is middle Pleistocene in :age, is exposed in .place as a single continuous bed below the rim of the .A'l!tiplano. Although fragments and other remnants of the ash are sca;ttered ~throughout the mudflow, the ash seems to :be more common in the up~)er ·part of the mudflow and particularly on t:he surface rather than in the lower paDt. The mudflow is readily distinguished because its light-tan color and heterogeneous
U.S. GEOL. SURVEY PROF. PAPER 600-C, PAGES C130-C134
.•.
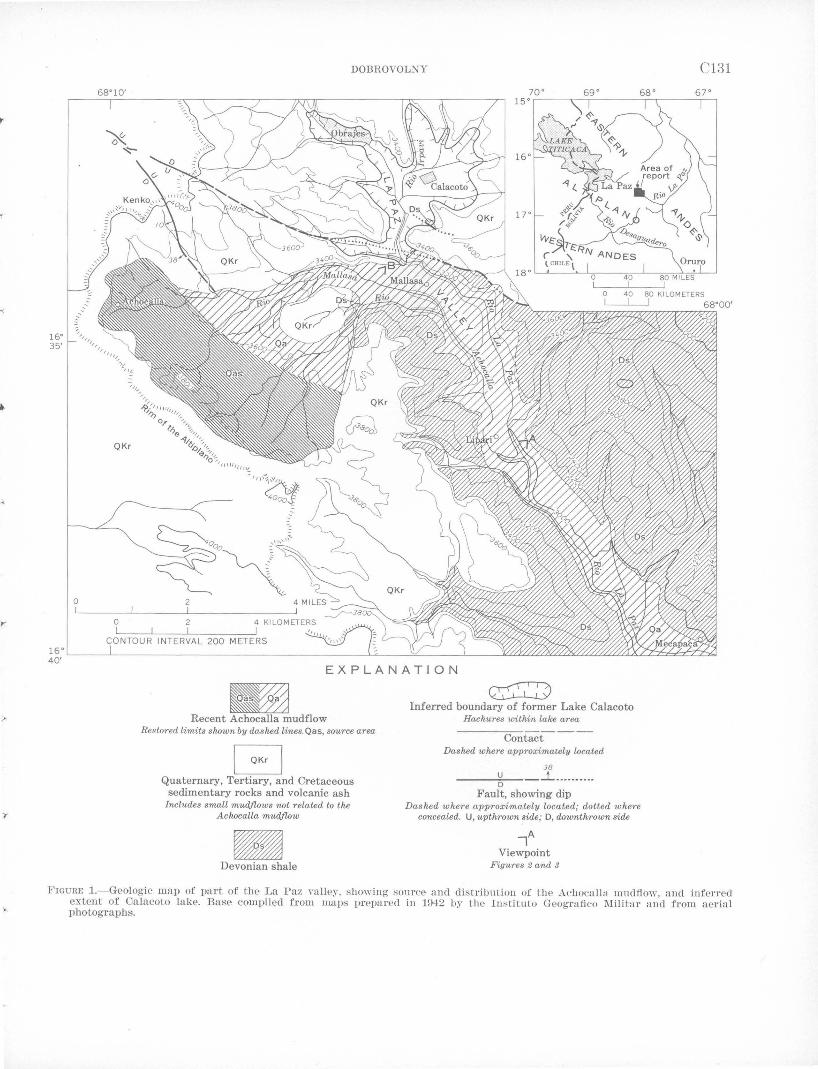
DOBROVOLNY
EXPLANATION .,;a Recent Achocalla mudflow
Restored limits shown by dashed lines. Qas, source area
G Quaternary, Tertiary, and Cretaceous
sedimentary rocks and volcanic ash Includes small mudflows not related to the
Achocalla mudjlow
• Devonian shale
~ Inferred boundary of former Lake Calacoto
Hachures within lake area
Contact-Dashed where approximately located
38 __ ____,uf-- ...L ......... .
D Fault, showing dip
Dashed where approximately located; dotted where concealed. U, upthrown side; D, downthrown side
lA Viewpoint
F'igu·res 2 and 9
Cl31
l!~IGURE I.-Geologic map of part of the La Paz valley, showing source ancl distribution of the Achocalla mudflo·w, ancl inferred extent of Calacoto lake. Base compiled from maps prepared in 1942 by the In:tituto Geograflco l\lilitar ancl from aerial photographs.
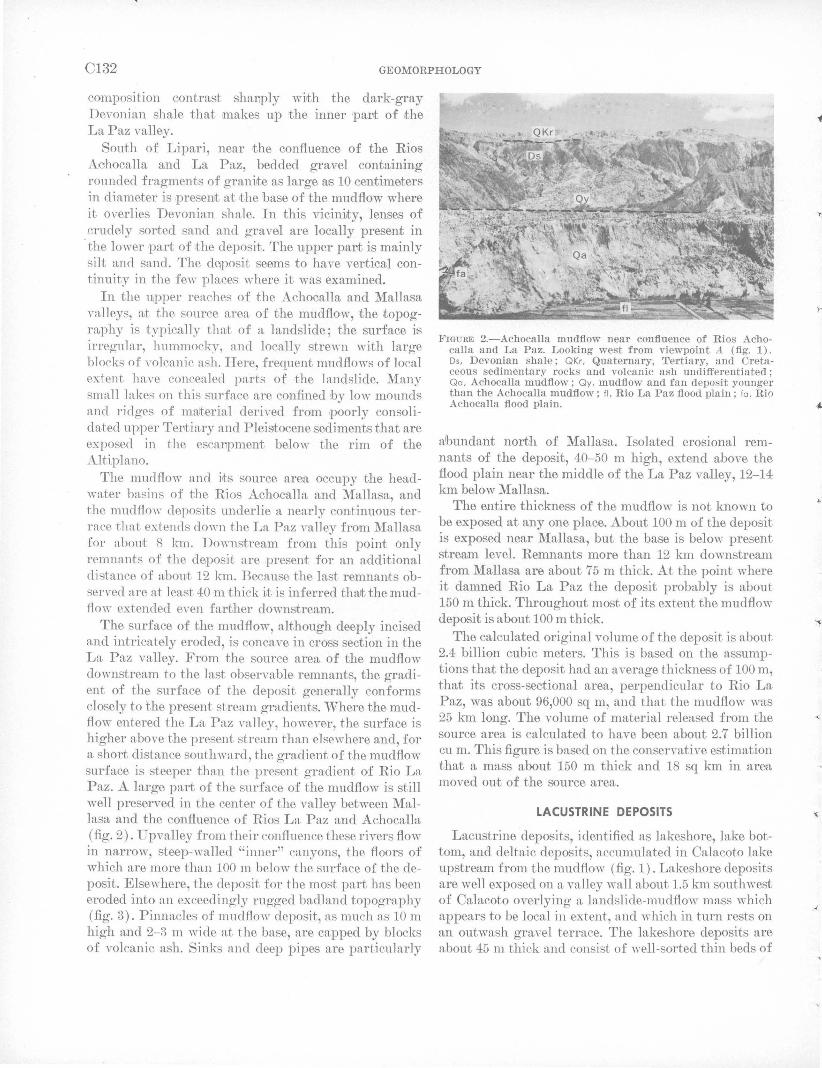
C132 GEOMORPHOLOGY
composition contrast sha11ply with the dark-gray Devonian shale that makes UJP the inner 'part of the La Paz valley.
South of Lipari, near the confluence of the Rios Achocalla and La Paz, bedded gravel containing rounded fragments of granite as large as 10 centimeters in diameter is present at the base of the mudflow where it overlies Devonian shale. In this vicini,ty, lenses of erudely sorted sand and gravel are locally present in the lower part of the deposit. The Uipper part is mainly silt and sand. The d~pos~t seems to have ventical continuity in the few places where it was examined.
In the 111pper reaches of the Achocalla and Mallasa ,-alleys, a,t the source area of t;he mudflow, the topography is typicaJly tlu11t of a landslide; the surface is irregular, hummocky, and locally strewn with large blocks of volcanic ash. Here, frequent mudflows of local ex,tent have concealed parts of the landslide. Many small lakes on this surface are confined by low mounds and ridges of material derived fro:m ,poorly consolidated upper Tevtiary and Pleisrtocenesedimentsthat are exposed in the escanpment below the rim of the Altiplano.
The mudflow and its source area occUJpy the headwater basins of the Rios Achocalla and Mallasa and
' the mudflow deposits underlie a nearly continuous ter-race that extends dom1 the La Paz valley from Mallasa for about 8 km. Do,vnsrtream from this point only remnants of the deposi,t are .present for an additional distance of about 12 km. Because the last remnants observed are at least 40 m thick it is inferred thalt the mudflow extended even farrther downstream.
The surface of the mudflow, although deeply incised and intricately eroded, is concave in cross section in the La Paz valley. From the source area of the mudflo\Y downstream to the last observable remnants the Q'Tadi-
' b
ent of the surface of the deposit generally conforms closely to the present stream gradients. Where the mudflow entered the La Paz valley, however, the surface is higher above the present stream than elsewhere and, for a short distance southward, the gradient of the mudflow surface is steeper than the present gradient of Rio La, Paz. A large part of the surface of the mudflow is still well preserved in the center of the valley between Mallasa and the confluence of Rios La Paz and Achocalla (fig. 2). Upvalley from their confluence these rivers flow in narrow, steep-walled "inner" canyons, the floors of which are more than 100m below the surface of the deposit. Elsewhere, the deposit for the most part has been eroded into an exceedingly rugged badland topography (fig. 3). Pinnacles of mudflow deposit, as much as 10m high and 2-3 m wide at the base, are capped by blocks of volcanic ash. Sinks and deep i)ipes are pn,rticuln,rly
FIGURE 2.-Achocalla mudflow near confluence of Rios Achecalla and La Paz. Looking west from viewpoint A (fig. 1). Ds, Devonian shale; QKr, Quaternary, Tertiary, and Cretaceous sedimentary rocks and volcanic ash undifferentiated; Qa, Achocalla mudflow; Qy, mudflow and fan deposit younger than the Achocalla mudflow; fl, Rio La Paz flood plain; fa, Ri(l Achocalla flood plain.
a!bundant north of Mallasa. Isolated erosional remnants of the deposit, 40-50 m high, extend above the flood plain near the middle of the La Paz valley, 12-14 km below Mallasa.
The entire thickness of the mudflow is not known to be exposed at any one place. About 100m of the deposit is exposed near Mallasa, but the base is below present stream level. Remnants more than 12 km downstream from Mallasa are about 75 m thick. At the point where .it damned Rio La Paz the deposit probably is about 150 m thick. Throughout most of its extent the mudflow deposit is about 100m thick.
The calculated original volume of the deposit is about 2.4 billion cubic meters. This is based on the assumptions that the deposit had an average thiclmess of 100m, that its cross-sectional area, perpendicular to Rio La Paz, was about 96,000 sq m, and that the mudflow was 25 lrm long. The volume of material released from the source area is calculated to have been about 2.7 billion cu m. This figure is based on the conservative estimation that a mass about 150 m thick and 18 sq km in area moved out of the source area.
LACUSTRINE DEPOSITS
Lacustrine deposits, identified as lakeshore, lake bottom, and deltaic deposits, accumulated in Calacoto lake upstream from the mudflow (fig. 1). Lakeshore deposits are well exposed on a valley wall about 1.5 km southwest of Calacoto overlying a landslide-mudflow mass which appears to be locn.l in extent, and >>hich in turn rests on an outwash gravel terrace. The lakeshore deposits are about 45 m thick and consist of well-sorted thin beds of
t
y
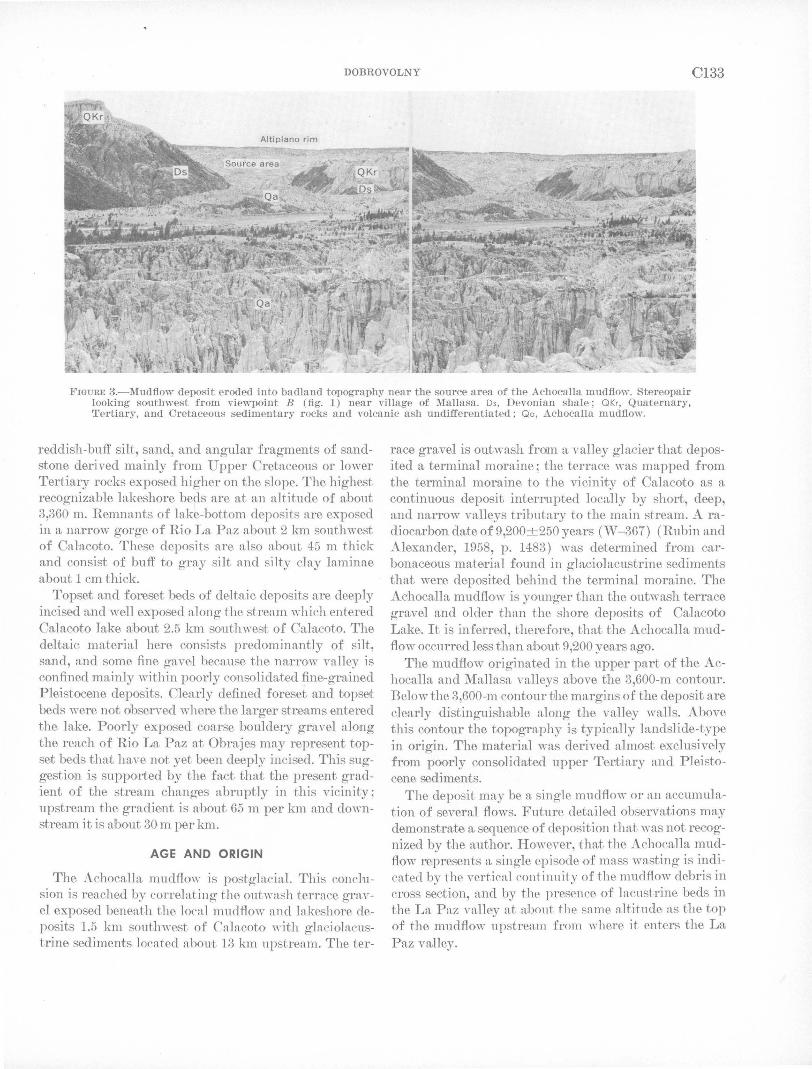
DOBROVOLNY C133
FIGURE 3.-Mudfiow deposit eroded into badland topography near the source area of the Achocalla mudfiow. Stereopair looking southwest from viewpoint B (fig. 1) near village of Mallasa. Ds, Devonian shale; QKr, Quaternary, Tertiary, and Cretaceous sedimentary rocks and volcanic ash undifferentiated ; Qa, Achocalla mudfiow.
reddish-buff silt, sand, and angular fragments of sandstone derived mainly from Upper Cretaceous or lower Tertiary rocks exposed higher on the slope. The highest recognizable lakeshore beds are at an altitude of about 3,360 m. Remnants of lake-bottom deposits are exposed in a narrow gorge of Rio La Paz about 2 lrm southwest of Calacoto. These deposits are also about 45 m thick and consist of buff to gray silt and silty clay laminae about 1 em thick.
Topset and foreset beds of deltaic deposits are deeply incised and well exposed along the stream which entered Calacoto lake a;bout 2.5 km southwest of Calacoto. The deltaic material here consists predominantly of silt, sand, and some fine gavel beC<"Luse the narTow valley is confined mainly within poorly consolidated fine-grained Pleistocene deposits. Cl~"Lrly defined foreset and topset beds were not observed where the larger streams entered the lake. Poorly exposed coarse bouldery gravel along the reach of Rio La Paz at Obrajes may represent topset beds that have not yet been deeply incised. This suggestion is suppo1ted by the fact that the present gradient of the stream changes abruptly in this vicinity ; upstre.:'Lffi the gradient is about 65 m per km and clownstream. it is aJbout 30m per km.
AGE AND ORIGIN
The Achocalla mudflo"· is postglacial. This conclusion is reached by correlating the out"-ash terrace gravel exposed beneat.h the loca,l muclflow and lakeshore deposits 1.5 km southwest of C'abcoto "·ith glaciolacustrine sediments located about 13 lrm upstream. The ter-
race gravel is outwash fr01m a valley glacier that deposited a terminal moraine; the terrace was mapped f.rom the terminal moraine to the vicinity of Calacoto as a continuous deposit interrupted locally by short, deep, and narTow valleys tributary to the main stream. A radiocarbon date of 9,200+250 years (W -367) (Rubin and Alexander, 1958, p. 1483) was determined from ca,rbonaceous ma,terial fow1d in glaciolacustrine sediments that were deposited behind the terminal moraine. The Achocalla mud flow is yotmger than the outwash terrace gravel and older than the shore deposits of Calacoto Lake. It is inferTed, therefore, that the Achocalla mudflow occurred less than xbout 9,200 years ago.
The mudflow originated in the upper part of the Achocalla and Ma,llasa valleys a'bove the 3,600-m contour. Below the 3,600-m contour tJhe margins of the deposit are clearly distinguishruble a.Jong the va.lley walls. Above this contour the topography is typically landslide-type in origin. The material was derived almost exclusively from poorly consolidated upper Tertiary and Pleistocene sediments.
The deposit ma,y be a single mudflo'" or an accumulation of several flows. Future detailed observations may demonstrate a sequence of deposition that was not recognized by the author. However, that the Achocalla mudflow represents a single episode of mass wasting is indicated by the vertical continuity of the mudflow debris in cross section, and by the presence of lacustrine beds in the La Paz vall ey nt abont. the same altitude as tl1e top of t.he mudflow upstream from where it enters the La Paz valley.
C134 GEOMORPHOLOGY
Although small mudflows and landslides occur during every rainy season along the La Paz valley, the Achocalla mudflow soomingly demands som.e mechanism by which tremendous masses of material could have been set in motion simultaneously. Such a mechanism proibably was an earthquake or series of earthquakes eaused by movement along local fa.ults, perhaps those near J(enko. The mudflow may have been triggered in this way during a time of unusually heavy precipitation, when incompetent materials in the escarpment below the Altiplano were highly saturated.
REFERENCES
Conway, W. l\f., 1901, The Bolivian Andes-A record of climbing and exploration in the Cordillera Real in the years 1898--1900: New York and London, Harper and Bros., 402 p.
Dobrovolny, Ernest, 1962, Geologia del Valle de La Paz: Dept. Nac. de Geologia, La Paz, Bolivia, Bol. 3, 153 p.
Troll, Carl, and Finsterwalder, Richard, 1935, Die Karten der Cordillera Real und des Talkessels von La Paz ( Boli vi en) und die Diluvialgeschichte der zentralen A.nden: Hannover, Petermanns Geog. Mitt., v. 81, p. 393-455.
Rubin, Meyer, and Alexander, Corrinne, 1958, U.S. Geological Survey radiocarbon dates IV: Science. v. 127, p. 1476-1487.
•.
~-
v.
...
GEOLOGICAL SURVEY RESEARCH 1968
THE TROY VALLEY OF SOUTHEASTERN WISCONSIN
By J. H. GREEN, Madison, Wis.
Work done in cooveration with the Geological and Natural History Sm·vey,
University Extension, The University of Wisconsin
A.bst1·aot.-Since 1915 the term "Troy Valley" has been used to describe a buried bedrock valley that was thought to extend southwestward across 'Valworth County, '\Vis., into Illinois, although its actual extent and configuration were not clearly defined. Becnuse such a valley might contain productive waterbenring glacial deposits, more accurate information about its size and shape could ue helpful in the development of groundwnter supplies. Information gathered in 1964 and 1965 incHcates that the 'l'roy Valley is not continuous across 'Valworth County, 'Vis.; instead, two distinct valleys that trend in nearly opposite directions are separated uy a preglacial bedrock drainage divide near Elkhorn, 'Vis. One of the valleys trends southwestward from near Delavan and Lake Geneva, Wis., into Illinois. The other valley trends northeastward from the Troy area in Wisconsin, and apparently drained eastward toward Lnke Michigan.
Troy Valley is the name given to a buried preglacial valley thought (Alden, 1904) to extend continuously from southeastern Milwaukee County or northeastern Racine County, vVis., into Lee County, Ill. Early evidence for the valley was a number of widely spaced and somewhat nJined water wells that penetrated thicker glacial drift and that reached bedrock at lower altitudes than did other nearby wells. As envisionr.d, the valley headed about 5 miles from Lake Michigan and extended west and south as part of the Mississippi River drainage system.
Ground water in southeastern vVisconsin generally is available from two sources-a deep sandstone aquifer, and a shallower sand and gravel aquifer. Because of their lesser depth, the sand and gravel, where thick or extensive, may offer the more economical source of ground water. In water-resources planning and development, a deep bedrock valley that is filled with saturated sand and gravel may be regarded as a possible source of municipal and industrial water supply. Because the Troy Va1ley may contain permeable glacial water-bearing deposits, an understanding of its actual extent and configuration is important to geologists, hydrologists,
planners, well drillers, and possibly others in the southeastern vVisconsin area.
So that the Troy Valley may be understood more fully, this report was prepared with the following objectives: (1) to review briefly the background that led to the definition and continued use of the term "Troy Valley," and (2) to discuss subsurface infonnation from recent studies in Wisconsin that shows that the Troy Valley is actually two valleys; both valleys head in central Walworth County, Wis., and trend in opposite directions.
BACKGROUND
Troy Valley was first named and described by Alden (1904, p. 16); he wrote, "Since the position of the preGlacial valley is now most plainly marked by the low area within and adjacent to the towns of Troy and East Troy, in northeastern Walworth County, it may be conveniently referred to as Troy Valley." Alden's reference was to a topographic low overlying part of a bedrock valley. The presence of a relatively deep bedrock valley· was confirmed by the logs of two wells near East Troy and a third in Williams Bay (fig. 1).
Figure ~ is a later map by Alden ( 1918, pl. 2) that shows his original assumed alinement of the Troy Valley. Thus, from this evidence in northern and southern Walworth County, Alden assumed that a deep preglacial valley cut entirely across the county from northeast to southwest, although he did acknowledge that the
·Troy Valley was mostly an inferred valley. Following Alden the next Wisconsin reference to
the Troy Valley was by Foley, Walton, and Drescher in 1953 ( p. 22 and pl. 1). Most of the evidence given in that report seemed to indicate an eastward drainage for the entire area; yet the idea of a southwestward-draining Troy Valley was so well established that the authors did not seriously question it.
0135 U.S. GEOL. SURVEY PROF. PAPER 600-C, PAGES C135-C139
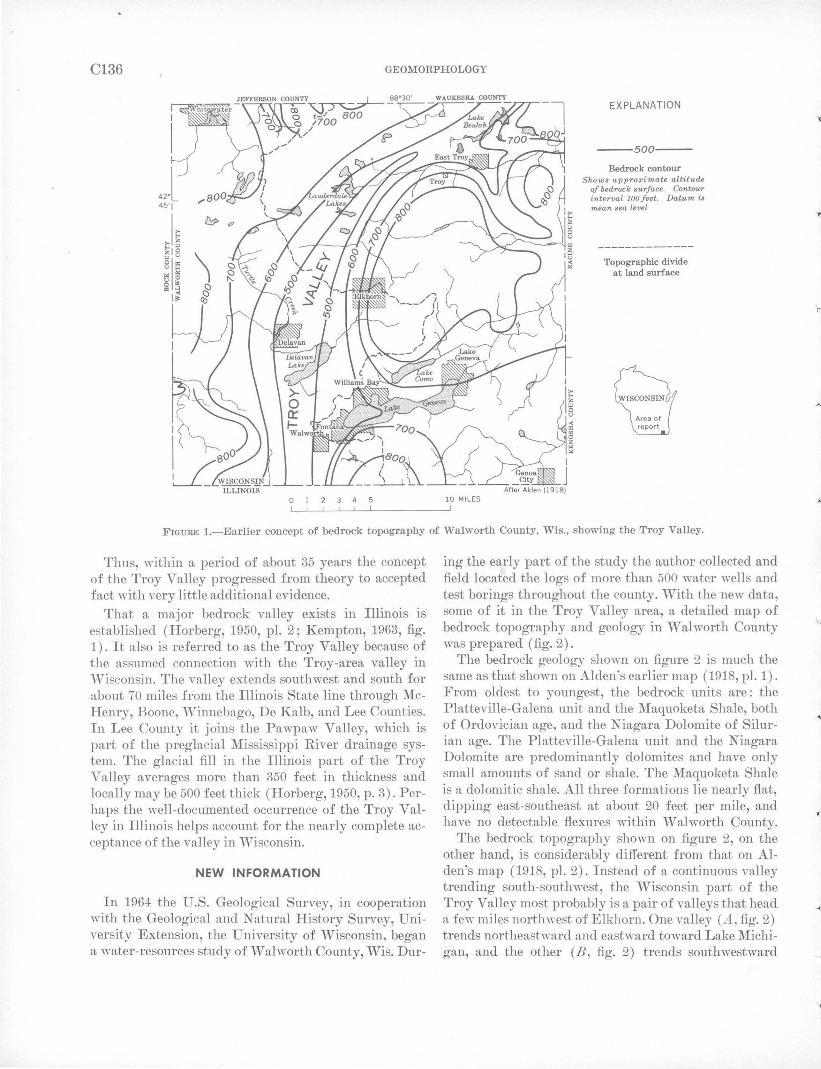
C136 GEOMORPHOLOGY
I
I
42.l 45'J
I~ JO
li I~
012345 10 MILES
EXPLANATION
- - 5 00-- -
Bedrock contour Shows approximate altitude
of bedrock surface. Contour interval 100 feet . Datum is mean sea level
Topographic divide at land surface
FIGURE I.-Earlier concept of bedrock topography of Walworth County, Wis., showing the Troy Valley.
Thus, within a period of UJbout 35 years the concept of the Troy Valley progressed from theory to accepted fact with very little additional evidence.
That a major bedrock valley exists in Illinois is established (Horberg, 1950, pl. 2; Kempton, 1963, fig. 1). It also is referred to as the Troy Valley because of the assumed connection with the Troy-area valley in vVisconsin. The valley extends southwest and south for about 70 miles from the Illinois State line through McHenry,. Boone, .,Ninnebago, De Kalb, and Lee Counties. In Lee County it joins the Pawpaw Valley, which is part of the preglacial Mississippi River drainage system. The glacial fill in the Illinois part of the Troy Valley averages more than 350 feet in thickness and locally may be 500 feet thick (Horberg, 1950, p. 3). Perhaps the well-documented occurrence of the Troy Valley in Illinois helps account for the nearly complete acceptance of the valley in Wisconsin.
NEW INFORMATION
In 1964 the U.S. Geological Survey, in cooperation with the Geological and Natural History Survey, University Extension, the University of Wisconsin , began a water-resources study of \V" al worth County, Wis. Dur-
ing the early part of the study the author collected and field located the logs of more than 500 water wells and test borings throughout the county. With the new data, some of it in the Troy Valley area, a detailed map of bedrock topography and geology in Walworth County was prepared (fig. 2).
The bedrock geology shown on figure 2 is much the same as that shown on Alden's earlier map (1918, pl. 1). From oldest to youngest, the bedrock units are : the Platteville-Galena unit and the Maquoketa Shale, both of Ordovician age, and the Niagara Dolomite of Silurian age. The Platteville-Galena unit and the Niagara Dolomite are predominantly dolomites and have only small amounts of sand or shale. The Maquoketa Shale is a dolomitic shale. All three formations lie nearly flat, dipping east-southeast at about 20 feet per mile, and have no detectable flexures within Walworth County.
The bedrock topography shown on figure 2, on the other hand, is considerably different from that on Alden's map (1918, pl. 2) . Instead of a continuous valley trending south-southwest, the Wisconsin part of the Troy Valley most probably is a pair of valleys that head a few miles nortlmest of Elkhorn . One valley (.A, fig. 2) trends northeastward and eastward toward Lake Michigan, and the other (B, fig. 2) trends southwestward
..
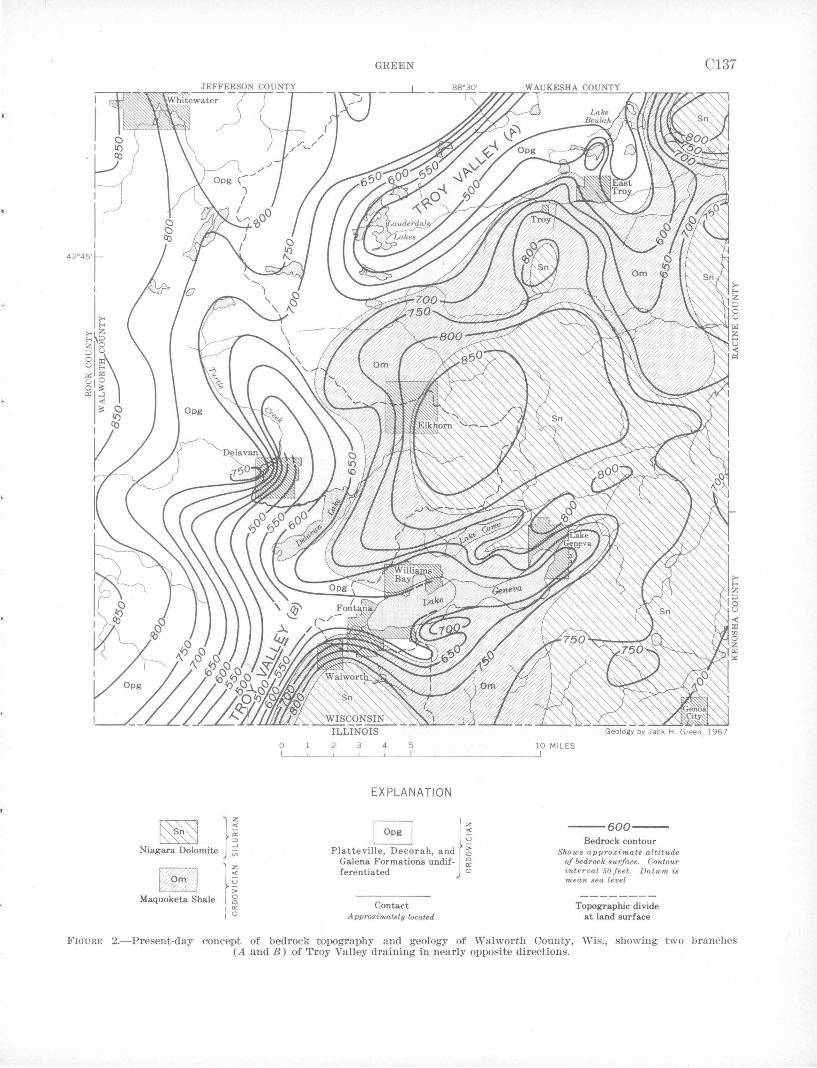
0
~ 1~ Niagara Dolomite j ~
Maquoketa Shale
GREEN
2 3 4 5
EXPLANATION
~ l z L::_j I ~
Platteville, Decorah, andj ;'; Galena F~rmations undif- ~ ferentiated o
Contact Approxirrwtely located
10 MILES
--600-Bedrock contour
Shows approximate altitude of bedrock surface. Contour interval 50 feet . Datum is mean sea level
Topographic divide at land surface
C137
FIGURE 2.-Present-day concept of bedrock topography and geology of Walworth County, Wis., showing two branches (A and B) of Troy Valley draining in nearly opposite directions.
C138 GEOMORPHOLOGY
into the Troy Valley system of Illinois. Although the axis of the northeast-trending Troy Valley is nearly the same as Alden proposed in 1904 and 1918, newer information shows that the valley is not only slightly deeper but also shows that it slopes from southwest to northeast instead of in the reverse direction as indicated earlier by Alden. The principal divide is between Delavan and the Lauderdale Lakes, where Alden lacked subsurface Q.ata. New information in the divide area shows that the Maquoketa Shale is at an altitude of 668 feet in a well just 4 ·miles northwest of the center of Elkhorn and along the approximate centerline of Alden's valley.
· Other wells in this area support the presence of a bed~ock divide.
In the area south of Elkhorn (fig. 2) the southwesttrending Troy Valley has two branches, one heading near the city of Lake Geneva and the other heading north of Delavan. These separate branches join a short d.istance west of Fontana and trend southwestward into Illinois. The east branch occupies the low areas of Lakes Geneva and Como; the west qranch coincides with the low, marshy areas· around Turtle Creek and southeast of Delavan. West of Fontana and north of the Illinois State line the valley lies below ~nother topographically low area, formerly part of a small marsh.
The bedrock divide near Elkhorn simplifies the inf~rred preglacial drainage pattern of southeastern Wisconsin. The newer two-: valley interpretation of drainage allows the northeast-trending Troy Valley to trend · eastward through Walworth, Waukesha, and Milwau~ kee Counties in Wisconsin-parallel to the other preglacial drainage of the ar~a .. With. the divide near Elkhorn the drainage area of the southwest-trending Troy Valley is considerably less than supposed for the .
·Troy Valley as mapped by . Alden; also, the area draining to Lake Michigan is greater ..
The following evidence, although partly inferred, also supports the two-~alley interpretation:
1. In· relatively uneroded glacial ground moraines, bedrock valleys and bedrock highs commonly are· reflected by low and high counterparts in land-surface topography above them. The two separate valleys lie beneath areas of low topography, and the subsurface divide nearly coincides with the present topographic divide (fig. 2).
2. Bedrock dips east-southeast at about 20 feet per mile. A preglacial stream traversing the area probably would have migrated downdip and eroded away· the softer shale between the dolomites. This migration would have eroded away tJhe broad shale area northwest
of Elkhorn and left Elkhorn at the edge of a Niagara Dolomite escarpment. Instead, the shale occupies at least a large part of the area of the divide. The separate valleys evidently formed by headward erosion, in the dolomite, from opposite directions.
3. Known bedrock altitudes are lower near Lake Michigan than in the Troy area of Walworth County; this indicates probruble eastward drainage of the northeast-trending Troy Valley.
4. Tributaries normally join their main streams at acute angles. The preglacial drainage in northern W alworth County suggests that the flow of water was northeastward in the main stream (fig. 2). The tributary streams would have entered the main stream in the Troy Valley at about 60° rather than 120° if flow had been southwestward.
5. Further support for the conclusion that the northern part of the Troy Valley drained eastward comes from recent unpublished work by Hutchinson. His work (written commun., 1967) in Racine and Kenosha Counties (contiguous to the eastern border of Walworth County) shows that all preglacial drainage generally was eastward. Thus, the major drainage divide probably was west of Racine and Kenosha Counties, probably in Walworth County. (See figure 2.)
CONCLUSIONS
As originally conceived by Alden, the Troy Valley was tho:ught to extend southwestward across Walworth County. It was logically inferred from limited data, but subsurface information in a critical part of the county was lacking. New data, particularly in the critical part of Walworth County, indicate that a continuous bedrock· valley does not extend across the county. Instead, ·a bedrock .high near the center of the county separated the pregla~ial drainage so that the southwestern part of the county drained toward Illinois, and the northeastern ·part drained toward Lake Michigan.
·Either of the bedrock valleys may contain a significant amount of water in glacial fill. The northeasttrending Troy Valley lies below a line of marshes and lakes, and the glacial fill is saturated to, or nearly to, land suface. The southwest-trending Troy Valley lies below more complex surface terrain, and water levels are deeper over much of its extent. Worthy of special notice is the divide area west and northwest of Elkhorn; here the absence of valley fill and the low-permeability bedrock decrease the possibility of shallow, high-yield :wells.
-"
GREEN C139
REFERENCES
Alden, ,V. C., 1904, The Delavan lobe of the Lake Michigan glacier of the "risconsiu stage of glaciation and associated phenomena: U.S. Geol. Survey Prof. Paper 34, 99 p.
--- 1918, The Quaternary geology of southeastern Wisconsin, with a chapter on the older rock formations: U.S. Geol. Survey Prof. Paper 106, 347 p.
294-HW 0-GS--1 0
Foley, F. C., Walton, W. C., and Drescher, W. J., 1953, Groundwater conditions in the Milwaukee-Waukesha area, Wisconsin: U.S. Geol. Survey Water-Supply Paper 1229, 92 p.
Horberg, L. H., 1950, Bedrock topography of Illinois: Illinois State Geol. Survey Bull. 73, 111 p., 23 fig., 2 pl., 9 tables.
Kempton, J. P., 1963, Subsurface stratigraphy of the Pleistocene deposits of central northern Illinois: Illinois State Geol. Survey Circ. 356, 43 p., 17 fig., 2 tables.
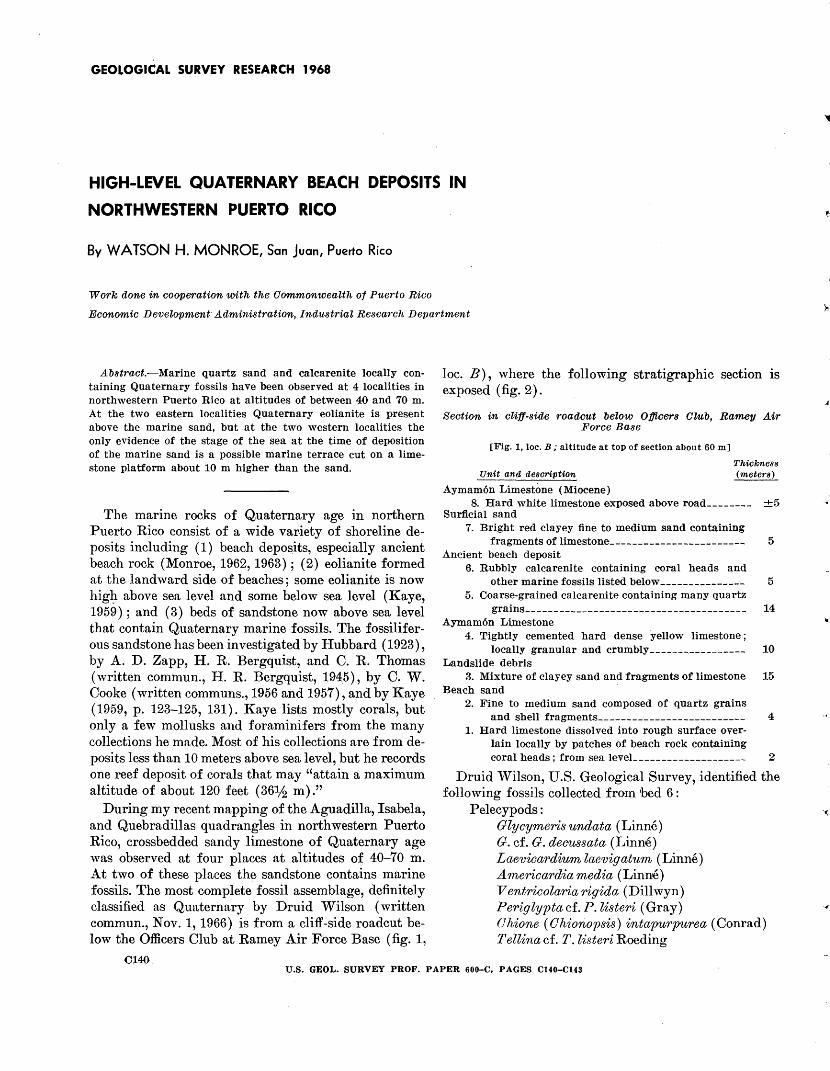
GEOLOGICAL SURVEY RESEARCH 1968
HIGH-LEVEL QUATERNARY BEACH DEPOSITS IN
NORTHWESTERN PUERTO RICO
By WATSON H. MONROE, San juan, Puerto Rico
Work done in cooperation with the Commonwealth of Puerto Rico
Economic Development· Administration, Industrial Research Department
Abstract.-Marine quartz sand and calcarenite locally containing Quaternary fossils have been observed at 4 localities in northwestern Puerto Rico at altitudes of between 40 and 70 m. At the two eastern localities Quaternary eolianite is present above the marine sand, but at the two western localities the only evidence of the stage of the sea at the time of deposition of the marine sand is a possible marine terrace cut on a limestone platform about 10 m higher than the sand.
The marine rocks of Quaternary age in northern Puerto Rico consist of a wide variety of shoreline deposits including (1) beach deposits, especially ancient beach rock (Monroe, 1962, 1963); (2) eolianite formed at the landward side of beaches; some eolianite is now higJ:t above sea level and some below sea level (Kaye, 1959); and (3) beds of sandstone now above sea level that contain Quaternary marine fossils. The fossiliferous sandstone has been investigated by Hubbard (1923), by A. D. Zapp, H. R. Bergquist, and C. R. Thomas (written commun., H. R. Bergquist, 1945), by C. W. Cooke (written communs., 1956 and 1957), and by Kaye ( 1959, p. 123-125, 131). Kaye lists mostly corals, but only a few mollusks and foraminifers from the many collections he made. Most of his collections are from deposits less than 10 meters above sea level, but he records one reef deposit of corals that may "attain a maximum altitude of about 120 feet (36lh m) ."
During my recent mapping of the Aguadilla, Isabela, and Quebradillas quadrangles in northwestern Puerto Rico, crossbedded sandy limestone of Quaternary age was observed at four places at altitudes of 40-70 m. At two of these places the sandstone contains marine fossils. The most complete fossil assemblage, definitely classified as Quaternary by Druid Wilson (written commun., Nov. 1, 1966) is from a cliff-side roadcut below the Officers Club at Ramey Air Force Base (fig. 1,
C140
loc. B), where the following stratigraphic section Is exposed (fig. 2).
Section in cliff-side roadcut below Officers Club, Ramey Air Force Base
[Fig. 1, loc. B; altitude at top of section about 60 m]
Unit and description
Aymam6n Limestone (Miocene)
Thickness (meters)
8. Hard white limestone exposed above road________ ±5 Surficial sand
7. Bright red clayey fine to medium sand containing fragments of limestone________________________ 5
Ancient beach deposit 6. Rubbly calcarenite containing coral heads and
other marine fossils listed below_______________ 5 5. Coarse-grained calcarenite containing many quartz
grains_______________________________________ 14 Aymam6n Limestone
4. Tightly cemented hard dense yellow limestone ; locally granular and crumbly----------------- 10
Landslide debris 3. Mixture of clayey sand and fragments of limestone 15
Beach sand 2. Fine to medium sand composed of quartz grains
and shell fragments__________________________ 4 1. Hard limestone dissolved into rough surface over-
lain locally by patches of beach rock containing coral heads; from sea leveL___________________ 2
Druid 'Vilson, U.S. Geological Survey, identified the following fossils collected from bed 6 :
Pelecypods: Glycymeris undata (Linne) G. cf. G. decussata (Linne) Laevicardiwm laevigatum (Linne) Americard·ia media (Linne) V entricolaria rig ida (Dillwyn) Periglyptacf. P.listeri (Gray) 0 hione ( 0 hionopsis) intapurpurea (Conrad) Tellina cf. T.listeri Roeding
U.S. GEOL. SURVEY PROF. PAPER 600-C, PAGES C140-Cl43
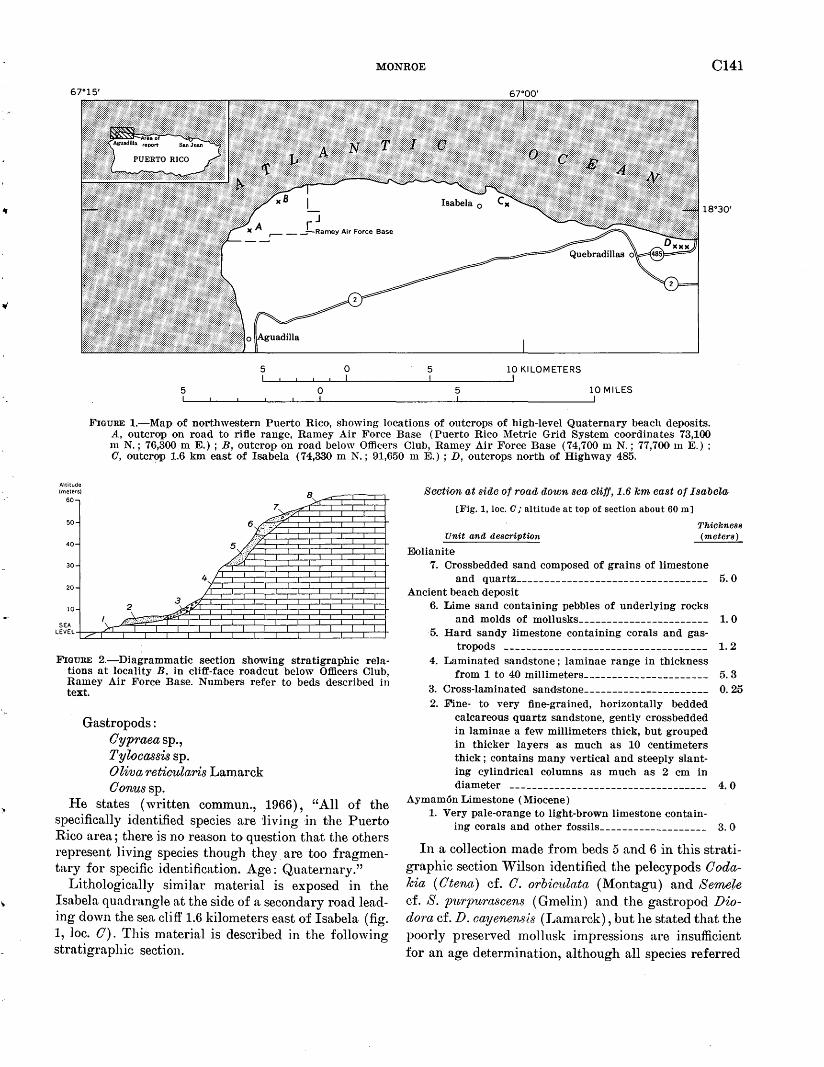
MONROE C141
67"00'
18°30'
rJ ,..-- _ ~-Ramey Air Force Base
5 0 5 10 Kl LOM ETERS
5 0 5 10 MILES
FIGURE 1.-Map of northwestern Puerto Rico, showing locations of outcrops of high-level Quaternary beach deposits. A, outcrop on road to rifle range, Ramey Air Force Base (Puerto Rico Metric Grid System coordinates 73,100 m N.; 76,300 mE.); B, outcrop on road below Officers Club, Ramey Air Force Base (74,700 m N.; 77,700 mE.): 0, outcrop 1.6 km east of Isabela (74,330 m N.; 91,650 m E.) ; D, outcrops north of Highway 485.
Altitude (meters)
60-
50
40-
30-
20
8
4
3
FIGURE 2.-Diagrammatic section showing stratigraphic relations at locality B, in cliff-face roadcut below Officers Club, Ramey Air Force Base. Numbers refer to beds described in text.
Gastropods : Oypraea sp., Tylocassis sp. 0 liva reticularis Lamarck Oonussp.
He states (written commun., 1966), "All of the specifically identified species are 'living in the Puerto Rico area; there is no reason to question that the others represent living species though they are too fragmentary for specific identification. Age: Quaternary."
Lithologically similar material is exposed in the Isabela quadrangle at the side of a secondary road leading down the sea cliff 1.6 kilometers east of Isabel a (fig. 1, loc. 0). This material is described in the following stratigraphic section.
Section at side of road down sea cliff, 1.6 km east of Isabela
[Fig. 1, loc. 0 ,·altitude at top of section about 60 m]
Unit and description Thickness (meters)
Eolianite 7. Crossbedded sand composed of grains of limestone
and quartz__________________________________ 5. 0 Ancient beach deposit
6. Lime sand containing pebbles of underlying rocks and molds of mollusks_______________________ 1. 0
5. Hard sandy limestone containing corals and gas
tropods ------------------------------------ 1.2 4. Laminated sandstone ; laminae range in thickness
from 1 to 40 millimeters______________________ 5. 3 3. Cross-laminated sandstone______________________ 0. 25 2. Fine- to very fine-grained, horizontally bedded
calcareous quartz sandstone, gently crossbedded in laminae a few millimeters thick, but grouped in thicker layers as much as 10 centimeters thick; contains many vertical and steeply slant-ing cylindrical columns as much as 2 em in
diameter ----------------------------------- 4.0 Aymam6n Limestone (Miocene)
1. Very pale-orange to light-brown limestone eontain-ing corals and other fossils___________________ 3. 0
In a collection made from beds 5 and 6 in this stratigraphic section Wilson identified the pelecypods Oodakia ( Otena) cf. 0. orbiC1_tlata (Montagu) and Se7Mle cf. S. JYurpurascens ( Gmelin) and the gastropod Diodora cf. D. cayenensis (Lamarck), but he stated that the poorly preserved mollusk impressions are insufficient for an age determination, although all species referred
C142 GEOMORPHOLOGY
to above are living in the Puerto Rico area. The present writer on the basis of similar stratigraphic relations, comparable altitude, and lithologic resemblance of the matrix correlates the bed with that below the Ramey Officers Club, and considers the bed Quaternary, probably Pleistocene, even though no species are identical in the collections from the two localities.
Similar sandstone crops out at two other places in northwestern Puerto Rico. In Ramey Air Force Base, at the top of the hill on the road leading to the rifle range (fig. 1, loc. A), several meters of crossbedded C<'tlcareous quartz sandstone and calcarenite is poorly exposed at several places at altitudes between 40 and 60 m above sea 'level. At altitudes between 30 and 40 m on this road, soft yellow chalk of the upper member of the Aymam6n Limestone is exposed and, at the top of the hill, 3 m of hard white limestone of the Aymam6n crops out. The deposit of sandstone, therefore, seems to be plastered on the side of the hill.
Farther east in the Quebradillas quadrangle (Monroe, 1967), calcareous quartz sandstone containing many flat pebbles as much as 2 em in diameter is exposed at several places between altitudes of 50 and 70 m for about a kilometer on the hillside north of Highway 485 (fig. 1, loc. D). The highway runs east from Quebradillas for 2.6 km and thence north-northeast 1 km to the top of the sea cliff on the coast. The sandstone rests at some places on Aymam6n Limestone and at other places on pink chalk of the Camuy Formation, also of Miocene age. Exposures in the area are poor because ~f a thick mantle of sandy colluvium that has washed down the hills from weathered eolianite of probable Quaternary age, which in turn is well exposed on the higher slopes. No fossils were seen in the pebbly sandstone; however it was mapped as an ancient beach deposit because the pebbles differentiate the calcareous sandstone from the fairly homogeneous crossbedded and fine to medium quartz sand eolianite. The pebbly sandstone-slightly higher than all the deposits at Ramey Air Force Base, and the highest ( 6) of the ancient beach deposits at Isabel a-is probably of Quaternary age, for it is (1) apparently of marine origin, ('2) rests unconformably on rocks of ~Eocene age, and ( 3) is overlain by eolianite of probable Quaternary age.
The level of the sea at the time the sandstone was deposited is difficult to ascertain. The quartz grains probalbly we.re eroded from the widely distributed "blanket sands" (Briggs,., 1966), and the water was probably fairly shallow, judging from the crossbedding. The topographic map of the Aguadilla quadrangle shows an escarpment on Ramey Air Force Base that might be the
remnant of a sea cliff at about 65 m. This escarpment, however, rises just south of a deposit of blanket sand, under which there has been subsoil solution of the Aymam6n Limestone. Thus the escarpment, which is composed of Aymam6n Limestone, may merely mark the edge of an area of solution.
Perhaps more significant is the body of eolianite at Isabela. This sandstone of wind/blown origin accumulated at the landward side of a beach and necessarily was deposited above sea level. The basal contact of the eolianite at Isabela has actually been seen on its seaward side only at the place described in the section 1.6 km east of Isabela, for at most places it is covered by colluvium washed down the hill from the upper part of the oolianite. At the roadside locaJity the b:!,se of the eolianite is at an altitude of about 55 m. At the northern edge of the town of Isabela, about 11 m of travertine., resting in part on eolianite, extends down the slope to an altitude of about 50 m where it is underlain by Aymam6n Limestone. Thus the evidence at Isa;bela suggests that the shoreline at the time of deposition of the eolianite was at a'bout 55 ·m, that is, if the fossiliferous beach sand and the eolianite were hoth deposited at the same stand of sea level, some 10m lower than the postulated altitude at Ramey Air Force Base. There is no certainty, however, that the eolianite was deposited at the same time as the fossiliferous sandstone; it may have been deposited at some later time when sea level may have been lower.
Whether the four deposits of high-level beach sand were all deposited at the same stage of the sea or at different stages cannot be determined with certainty at this time. The present altitudes of the deposits may be due to tectonic uplift of the island of Puerto Rico or to lowering of sea level since deposition. On the basis of correlation of marine terraces at widely different places, Lobeck ( 1922, p. 367-369) and Meyerhoff ( 1933, p. 179-180) both presented evidence that Puerto Rico had been tilted during the Quaternary. More· recent studies by !{aye (1959, p. 1~0, 121) indicate that Puerto Rico has been tectonically stable at least throughout late Pleistocene and Recent time. My own studies suggest stability throughout most of Pleistocene time. Thus the present altitude of the four deposits of fossiliferous marine standstone is probably due to lowering of sea level since deposition. The sandstones were deposited during one or more interglacial stages when sea level was generally higher than it is today in most parts of the world. The altitudes of the deposits in Puerto Rico are comparable with those of the Sunderland, Coharie, and Hazelhurst terraces of the continental United States (Cooke, 1966).
.~·
..,.
)..
MONROE C143
REFERENCES changes, Puerto Rico: U.S. Geol. Survey Prof. Paper 317-B, p. 49-140.
Briggs, R. P., 1966, The blanket sands of northern Puerto Rico: Caribbean Geol. Conf., 3d, Kingston, Jamaica, 1962, Trans., p. 60-69.
Cool{e, C. W., 1966, Emerged Quaternary .shore lines in the Mississippi Embayment: Smithsonian Misc. Colin., v. 149, no. 10,41 p.
Hubbard, Bela, 1923, The geology of the Lares district, Porto Rico: New York Aca.d. Sci., Scientific Survey of Porto Rico and the Virgin Islands, v. 2, pt. 1, p. 1-115.
Kaye, C. A., 1959, Shoreline fea,tures and Quaternary shoreline
Lobeck, A. K., 1922, The physiography of Porto Rico: New York Acad. Sci., Scientific Survey of Porto Rico and the Virgin Islands, v. 1, pt. 4, p. 301-384.
Meyerhoff, H. A., 1933, Geology of Puerto Rico: Puerto Rico Univ. Mon., ser. B, no. 1, 306 p.
Monroe, \V. H., 1962, Geology of the Manati quadrangle, Puerto Rico: U.S. Geol. Survey Misc. Geol. Inv. Map I-334.
--- 1963, Geology of the Vega Alta quadrangle, Puerto Rico : U.S. Geol. Survey Geol. Quad. Map GQ-191.
--- 1967, Geologic map of the Quebradillas quadrangle, Puerto Rico: U.S. Geol. Survey Misc. Geol. Inv. Map I-498.
(}
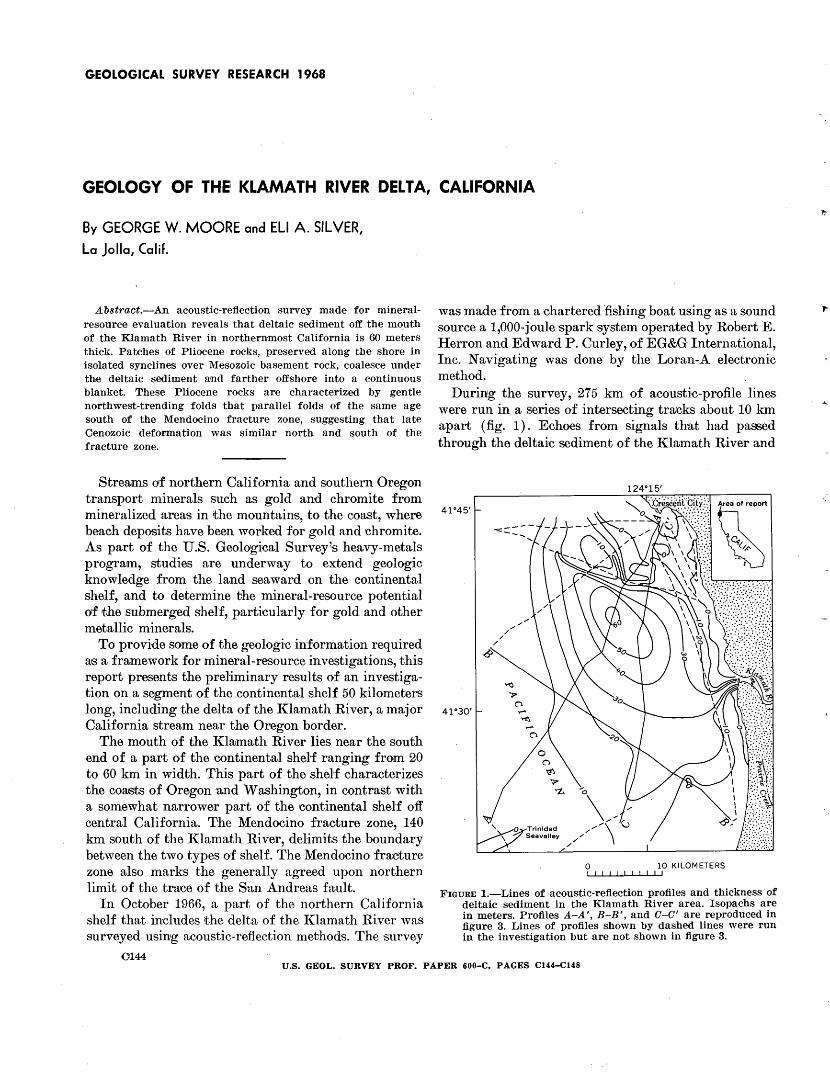
GEOLOGICAL SURVEY RESEARCH 1968
GEOLOGY OF THE KLAMATH RIVER DELTA, CALIFORNIA
By GEORGE W. MOORE and Ell A. SILVER,
La Jolla, Calif.
Abstract.-An acoustic-reflection survey made for mineralresource evaluation reveals that deltaic sediment off the mouth of the Klamath River in northernmost California is 60 meters thick. Patches of Pliocene rocks, preserved along the shore in isolated synclines over Mesozoic basement rock, coalesce under the deltaic sediment and farther offshore into a continuous blanket. These Pliocene rocks are characterized by gentle northwest-trending folds that parallel folds of the same age south of the Mendocino fracture zone, suggesting that late Cenozoic deformation was similar north and south of the fracture zone.
Streams af northern California and southern Oregon transport minerals such as gold and chromite from mineralized areas in the mountains, to the coast, where beach deposits have been worked for gold and chromite. As part of the U.S. Geological Survey's heavy-metals progrrum, studies are underway to extend geologic knowledge from the land seaward on the continental shelf, and to determine the mineral-resource potential of the submerged shelf, particularly for gold and other metallic minerals.
To provide some of the geologic information required rus a framework for mineral-resource investigations, this report presents the preliminary results of an investigation on a segment of the continental shelf 50 kilometers long, including the delta of the Klamath River, a major California stream near the Oregon border.
The mouth of the KlUJmath River lies near the south end of a part of the continental shelf ranging from 20 to 60 km in width. This part of the shelf characterizes the coasts of Oregon ·and Washington, in contrast with a somewhat narrower part of the continental shelf off central California. The Mendocino fracture zone, 140 km south of the Klamath River, delimits the boundary between the two types of shelf. The Mendocino fracture zone also marks the generally agreed upon northern limit of the trace of the San Andreas fruult.
In October 1966, a part of the northern California shelf that includes the delta of the IGamath River was surveyed using acoustic-reflection methods. The survey
0144
was made from a chartered ·fishing boat using as a sound source a 1,000-joule spark system operated by Robert E. Herron and Edward P. Curley, of EG&G International, Inc. Navigating was done by the Loran-A eleC'tronic method.
During the survey, 275 km of acoustic-profile lines were run in a series of intersecting tracks about 10 km apart (fig. 1). Echoes from signals that had passed through the deltaic sediment of the Klamath River and
41 °45'
41"30'
0 10 KILOMETERS I I I I II II I I I
FIGURE 1.-Lines of acoustic-reflection profiles and thickness of deltaic sediment in the Klamath River area. Isopachs are in meters. Profiles A-A', B-B', and 0-0' are reproduced in figure 3. Lines of profiles shown by dashed lines were run in the investigation but are not shown in figure 3.
U.S. GEOL. SURVEY PROF. PAPER 600-C, PAGES Cl44-Cl48
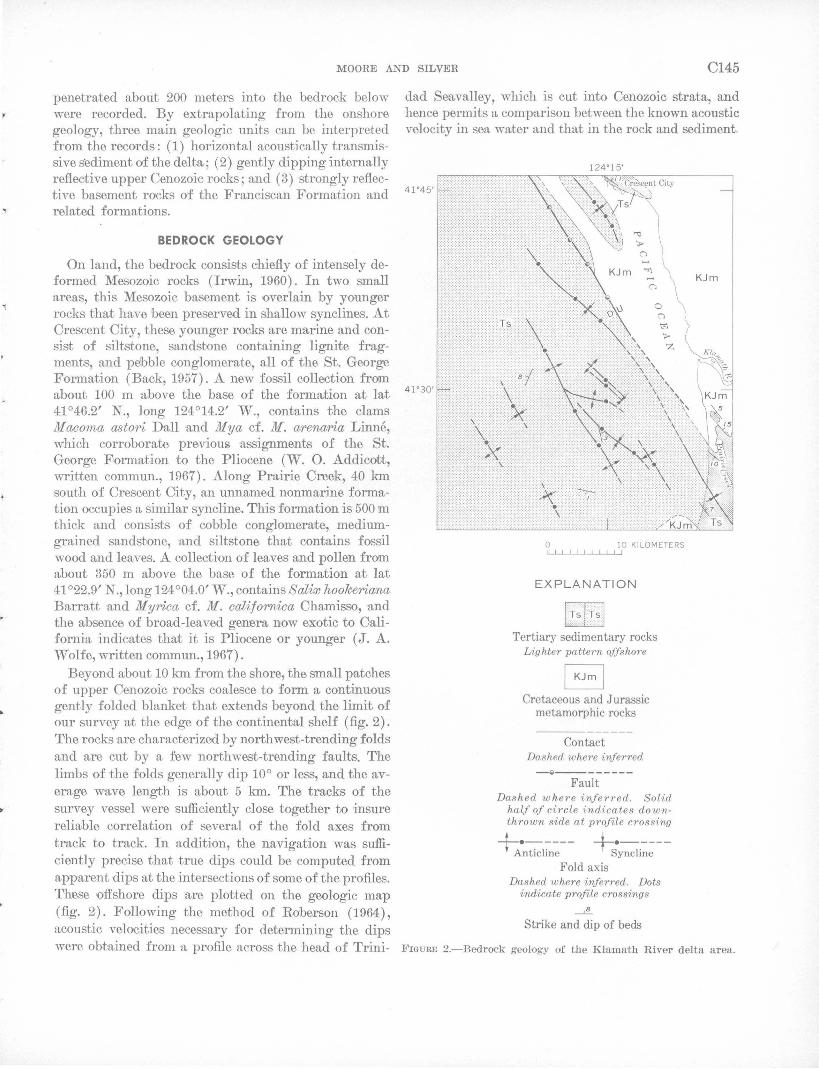
MOORE AND SILVER C145
penetrated about 200 meters into the bedrock below were recorded. By extrapolating from the onshore geology, three main geologic units can be interpreted from the records: ( 1) horizontal acoustically transmissive sediment of the delta; (2) gently dipping internally reflective upper Cenozoic rocks; and (3) strongly reflective basement rocks of the Franciscan Formation and
, related formations.
y
BEDROCK GEOLOGY
On land, the bedrock consists chiefly of intensely deformed Mesozoic rocks (Irwin, 1960). In two small areas, this Mesozoic basement is overlain by younger rocks that have 'been preserved in shallow synclines. At Crescent City, these younger rocks are marine and consist of siltstone, sandstone containing lignite fragments, and pebble conglomerate, all of the St. George Formation (Back, 1957). A new fossil collection frO'lll abourt 100 m above the base of the formation at lat 41 °46.2' N., long 124°14.2' W., contains the clams Macoma astori Dall and Mya c£. M. arenaria Linne, which corroborate previous assignments of the St. George Formation to the Pliocene (W. 0. Addicott, written commun., 1967). Along Prairie Creek, 40 km south of Crescent City, an unnamed nonmarine formation occupies a similar syncline. This formation is 500 m thick and consists of cobble conglomerate, mediumgrained sandstone, and siltstone that contains fossil wood and leaves. A collecti:on of leaves and pollen frO'lll about 350 m above the base of the formation at lat 41 °22.9' N., long 124°04.0' W., containsSaliw hookeriana Barratt and Myrica c£. M. californica Chamisso, and the absence of broad-leaved genera now exotic to California indicates that it is Pli•ocene or younger ( J. A. Wolfe, written commun., 1967).
Beyond about 10 km from the shore, the small patches of upper CenoZ'oic rocks coalesce to form a continuous gently folded blanket that extends beyond the limit of our survey ·rut the edge of the continental shelf (fig. 2). The rocks are characterized by northwest-trending folds and are cut by a :fuw northwest-trending faults. The limbs of the folds generally dip 10° or less, and the average wave length is about 5 km. The tracks of the survey vessel were sufficiently close together to insure reliaJble correlation of several of the fold axes from track to track. In addition, the navigation was sufficiently precise that true dips could be computed from apparent dips at the intersections of some of the profiles. These offshore dips are plotted on the geologic map (fig. 2). Following the method of Roberson ( 1964), acoustic velocities necessary for determining the dips were obtained from a profile across the head of Trini-
dad Seavalley, which is cut into Cenozoic strata, and hence permits a comparison between the known acoustic velocity in sea water and that in the rock and sediment.
124"15'
0 10 KILOMETERS ! I I I l I I I I I I
EXPLANATION
IIrtr~l Tertiary sedimentary rocks
Lighter pattern offshore
8 Cretaceous and Jurassic
metamorphic rocks
Contact Dashed where inferred _., _______ _
Fault Dashed where inferred. Solid
half of circle indicates downthrown side at profile crossing
-G.•nticl:n:-- +;yncli~~--Fold axis
Dashed where inferred. Dots indicate profile crossings
~
Strike and dip of beds
FIGURE 2.-Bedrock geology af the Klllllllath River delta area.
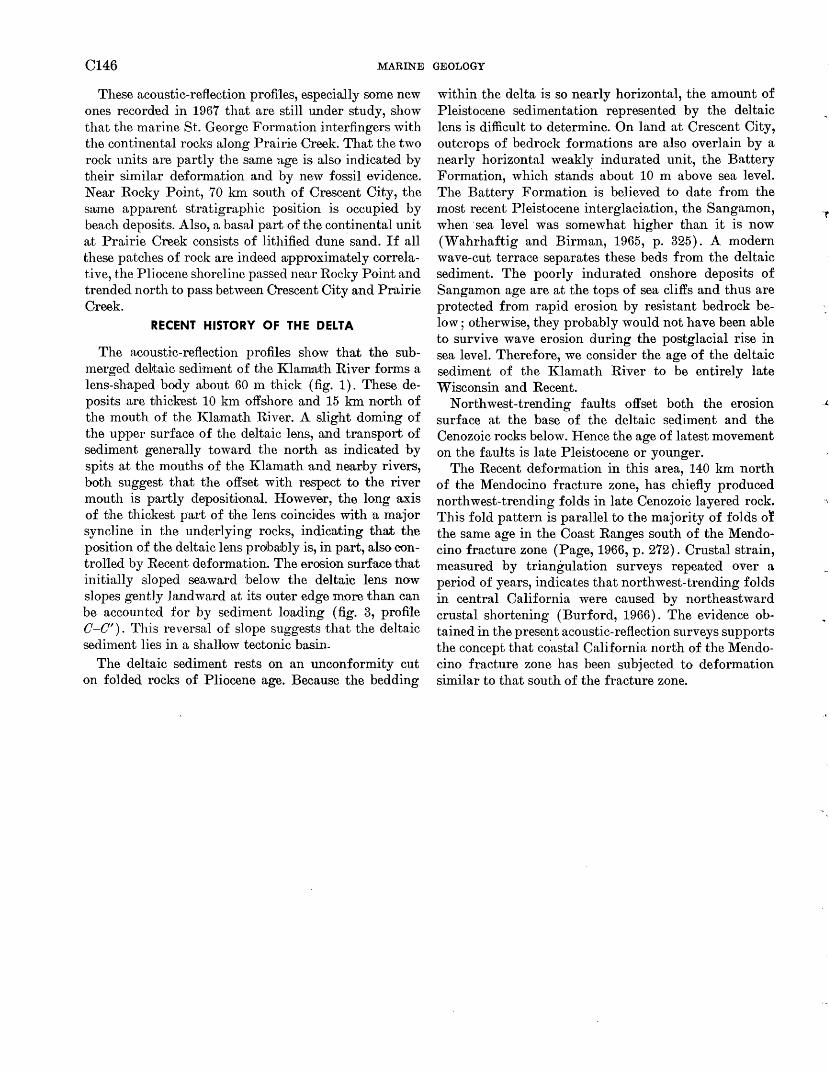
C146 MARINE GEOLOGY
These acoustic-reflection profiles, especially some new ones recorded in 1967 that are still under study, show that the marine St. George Formation interfingers with the continental rocks along Prairie Creek. That the two rock units are partly the same ·age is also indicated by their similar deformation and by new fossil evidence. Near Rocky Point, 70 km south of Crescent City, the same apparent stratigraphic position is occupied by be:ach deposits. Also, a basal part rof the continental unit at Prairie Creek consists of lithified dune sand. If all these patches of rock are indeed rupproximately correlative, the Pliocene shoreline passed near Rocky Point and trended north to pass between Crescent City and Prairie Creek.
RECENT HISTORY OF THE DELTA
The acoustic-reflection profiles show that the submerged deltaic sediment of the Klamath River :£orms a lens-shaped body about 60 m thick (fig. 1). These deposits are thickest 10 km offshore and 15 km north of the mouth of the l{]amath River. A slight doming of the upper surface of the deltaic lens, and transport of sediment generally toward the north as indicated by spits at the mouths of the Klamath and nearby rivers, both suggest that the offset with respect to the river mouth is partly depositional. However, the long axis of the thickest part of the lens coincides with a major syncline in the underlying rocks, indicating that the position of the deltaic lens probably is, in part, also controlled by Recent deformation. The erosion surf.ace that initially sloped seaward below the deltaic lens now slopes gently landward at its outer edge more than can be accounted for by sediment loading (fig. 3, profile 0-0'). This reversal of slope suggests that the deltaic sediment lies in a shallow tectonic basin.
The deltaic sediment rests on an unconformity cut on folded rocks of Pliocene age. Because the bedding
within the delta is so nearly horizontal, the amount of Pleistocene sedimentation represented by the deltaic lens is difficult to determine. On land at Crescent City, outcrops of bedrock formations are also overlain by a nearly horizontal weakly indurated unit, the Battery Formation, which stands about 10 m above sea level. The Battery Formation is believed to date from the most recent Pleistocene interglaciation, the Sangamon, when ·sea level was somewhat higher than it is now (Wahrhaftig and Birman, 1965, p. 325). A modern wave-cut terrace separates these beds from the deltaic sediment. The poorly indurated onshore deposits of Sangamon age are at the tops of sea cliffs and thus are protected from rapid erosion by resistant bedrock below; otherwise, they probably would not have been able to survive wave erosion during the postglacial rise in sea level. Therefore, we consider the age of the deltaic sediment of the Klamath River to be entirely late Wisconsin and Recent.
Northwest-trending faults offset both the erosion surface at the base of the deltaic sediment and the Cenozoic rocks below. Hence the age of latest movement on the faults is late Pleistocene or younger.
The Recent deformation in this area, 140 km north of the Mendocino fracture zone, has chiefly produced northwest-trending folds in late Cenozoic layered rock. This fold pattern is parallel to the majority of folds o~ the same age in the Coast Ranges south of the Mendocino fracture zone (Page, 1966, p. 272). Crustal strain, measured by triangulation surveys repeated over a period of years, indicates that northwest-trending folds in central California were caused by northeastward crustal shortening (Burford, 1966). The evidence obtained in the present acoustic-reflection surveys supports the concept that co.astal California north of the Mendocino fracture zone has been subjected to deformation similar to that south of the fracture zone.
.J..
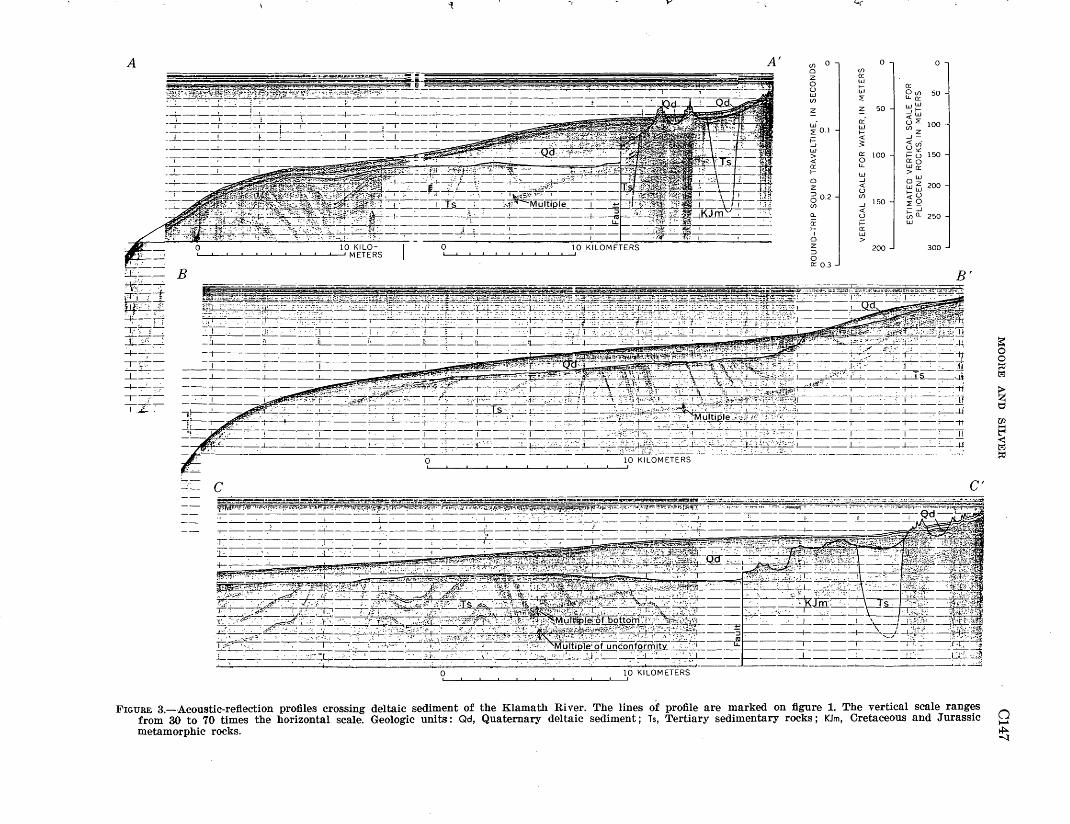
"l. y <.i.j
A A' (f) 0 0 0 0 (f)
--y---~-~.-T_:~~_:_-~---L----!------_;_ _____ _:_ __ _
~I ==-r · .. 1 =t- ! ==-,= !~=== I==___.:_==-, _ _I_ __ _L __ _l__i._ __ . _ _L _ ___:_L ___ ___:_ __
z 0::
0 w u 1-
w w (f) ~
z ~
w· o::'
~ 0.1 w 1-
1- <l: ...J 3: w > 0:: <l: 0 0:: lL. 1- w 0 ...J
z <l:
g 0.2 u (f)
(f) ...J
a.. <l: u
0:: 50 0(f)
LL.o:: ww
~~ 100. <flz ...J-<l:(f)·
g G 15o o::o Wo:: >
w 8 ~ 200 1-u <l:o ~--_J
~a.. 250
50
100
150
0:: f= w
---1----.-::::-;: ..:...;__~~------ 1- 0:: I w
0 > z :::> 300 200
0 0:: 0.3
~:? B
...LL,...-· +--';--~ .-~
_~_....:......:__
-+-~-:-:---.---::'-'--l..i .,--- ~:~ ··~ ··. ··.· ·: , ·· t=''. f;cZ.~·2:· .. ~rgJ.;::}i~~:;~~f,:tj·'t~Zk'" ·~ · · ; •·•··. ·~
~--·-· _._ J___. ,_=sE= . :- =-=E=E=~ __ i_ ~ ... : .':·'- E,~~~~3E~~;. :,:·'--·: ',~;:;::.=~~:_,--~- ______ : ~-------~--~-----~~ 0 1,0 KILOMETERS
c C'
·.. .· ~ ... . -:-~3 :·~,~. i~ ____ _L_ ____ _j__ ___ __L:_· ___ LL:._ .. :~
0 10 KILOMETERS
FIGURE 3.--Acoustic-reflection profiles crossing deltaic sediment of the Klamath River. The lines of profile are marked on figure 1. The vertical scale ranges from 30 to 70 times the horizontal scale. Geologic units: Qd, Quaternary deltaic sediment; Ts, Tertiary sedimentary rocks; KJm, Cretaceous and Jurassic metamorphic rocks.
~ 0 0 ~ t_:rj
> z '=' Ul ~
t"l ...::: t_:rj
~
0 ,_. ~ ---1
C148 MARINE GEOLOGY
REFERENCES
Back, William, 1957, Geology and ground-water features of the Smith River plain, Del Norte County, California: U.S. Geol. Survey Water-Supply Paper 1254, 76 p.
Burford, R. 0., 1966, Strain analysis across the San Andreas fault and Coast Ranges of California: Acad. Sci. Fennicas Annales, ser. A., pt. 3, Geologica-Geographica No. 90, p. 99-110.
Irwin, W. P., 1960, Geologic reconnaissance of the northern Coast Ranges and Klamath Mountains, California, with a summary of the mineral resources: California Div. Mines Bull. 179, 80 p.
Page, B. M., 1966, Geology of the Coast Ranges of California, in Bailey, E. H., ed., Geology of northern California : Calif.ornia Div. Mines and Geology Bull. 190, p. 255-276.
Roberson, M. I., 1964, Continuous seismic profiler survey of Oceanographer, Gilbert, and Lydonia submarine canyons, Georges Bank: Jour. Geophys. Research, v. 69, no. 22, p. 4779-4789.
Wahrhaftig, Clyde, and Birman, J. H., 1965, The Quaternary of the Pacific mountain system in California, in Wright, H. E., Jr., and Frey, D. G., eds., The Quaternary of the United States: Princeton, N.J., Princeton Univ. Press, p. 299-340.
GEOLOGICAL SURVEY RESEARCH 1968
A TRANSCURRENT STRUCTURE IN FA VETTE
AND GREENE COUNTIES, PENNSYLVANIA
By jOHN B. ROEN, Beltsville, Md.
Work done in cooperation 1vitn tne Pennsylvania Geological Survey
Abstmct.-Study of a peridotite intrusion zone in southwest Pennsylvania indicates that the peridotite intruded a preexisting stril{e-slip fault of minimal left-lateral nmvement. Along the strike of this northwest-trending fault zone, northeast-trending folds terminate, fold amplitudes change, and axial trends vary; the net effect produces a noticeable northwest-trending transcurrent structural lineament at least 7 miles long. This lineament is considered to be the reflection of differential movement along the margin of a subsurface decollement.
J. F. ICemp, at the 1905 Ottawa meeting of the Geological Society of America, first described the peridotite dike system that intrudes rocks of Pennsylvanian and Permian age in Fayette and Greene Counties, Pa. (fig. 1) (ICemp and Ross, 1907). Later, ICemp and Ross (1907) published a generalized map and petrologic description of the dikes. In 1912 L. B. Smith gave a more detailed description of the field relations. The most recent description was by Hickok and Moyer (1940), based on fieldwork in Fayette County during the 1930's.
None of these workers mentioned anything specific concerning the zone of weakness that allowed the peridotite magma to ascend; they stated simply that the magma invaded a northwest-trending, vertical to near vertical, joint or fracture system. The only previous speculation on the origin of the fractures was made by R. R. Rice (Smith, 1912, p. 150) in an editorial note introducing Smith's paper. Rice at first conjectured that "cross folding" produced the rupture, but he thought that evidence of vertical movement was insufficient to explain such a i·upture by this method. He then concluded that the rocks broke under stress without vertical movement, in a direction transverse to the regional structure. Rice's conclusion was not based on a detailed study and is therefore considered general and speculative. l-Ienee, the purpose of the present investigation is to gain a better and more detailed understanding of the tectonic significance of this fracture zone.
All previously reported outcrops of the intrusive zone were visited. Except to note certain structural features, detailed descriptions of all these exposures would be repetitive; therefore, only one locality, selected for its accessibility and good exposure, will be described herein.
The map of the dike and fault system (fig. 2) is based on both surface and subsurface data; however, because exposures are generally poor, owing to deep weathering and extensive soil cover, the extent and pattern of the system are based largely on data from coal mines.
FIELD RELATIONS
The surface and near-surface rocks cut by the dike and fault system are nearly flat-lying beds of sandstone, shale, limestone, and coal. These rocks are assigned to the Pittsburgh and Uniontown Formations of Late Pennsylvanian age and the Waynesburg Formation of Late Pennsylvanian and Early Permian age. The strata have been gently warped into low-amplitude folds trending N. 35° E. The peridotite intrusion zone strikes N. 51° W., almost normal to the axial trend of the folds.
The most accessible well-exposed outcrop of the intrusion zone is in the creek bottom and north bank of Middle Run (fig. 2, loc. A). Here, peridotite dikes cut coal, limestone, and clastic rocks in the Uniontown Formation and in the lower member of the Waynesburg Formation. The main dike is 300 feet downstream from the fourth main road bridge upstream from the confluence of Middle Run and the Monongahela River. At this point, about 20 feet above creek level on the north bank, the dike is 3 feet wide. About 45 feet above creek level, the dike ·narrows to 2 feet where it cuts ·a limestone bed. A thin clay parting in the limestone has been squeezed and dragged upward between the dike and the limestone. Exposures of the peridotite-limestone contact are poor, but the limestone does not seem to be significantly altered. Only small calcite veinlets, one
0149 U.S. GEOL. SURVEY PROF. PAPER 600-C, PAGES Cl49-C152
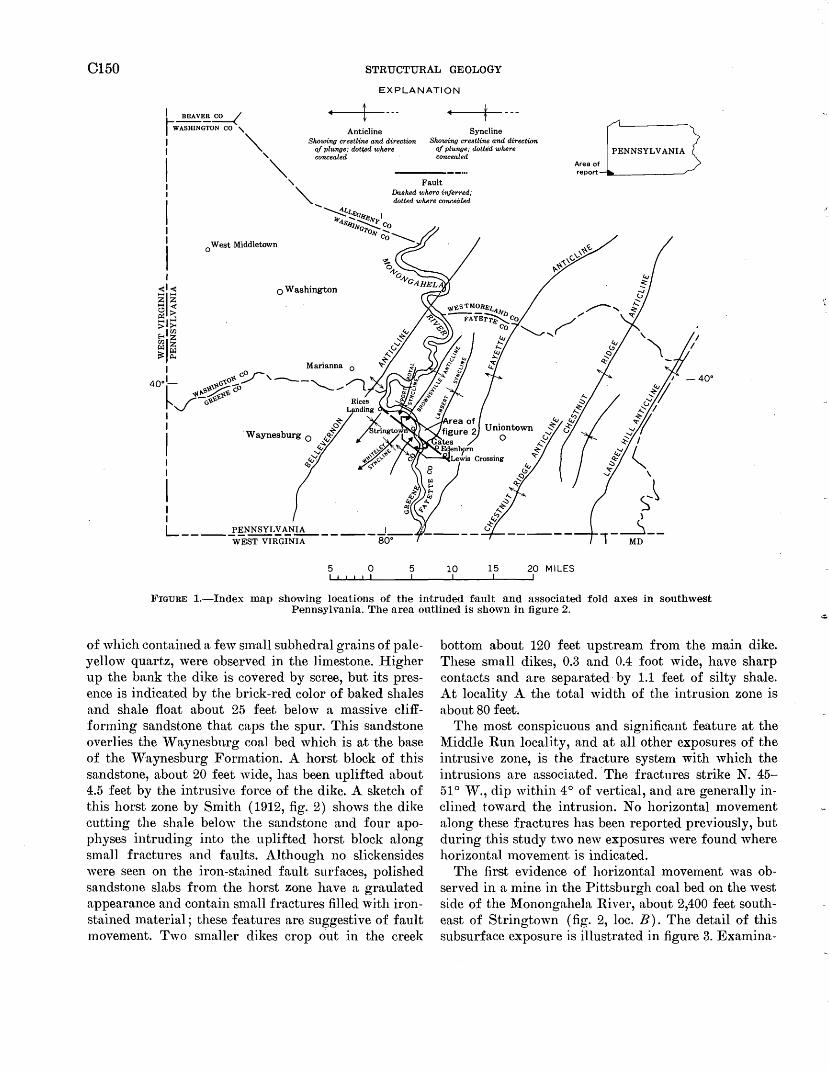
C150 STRUCTURAL GEOLOGY
EXPLANATION
t I BEAVER~ ~-~~ON CO' I ' Anticline Syncline I ""' Showing crestline and direction Showing crestline and direction 1 ' ~:::fe~; dot(ed where ~~:af'e~; dotted where
! ""' Fault
PENNSYLVANIA
Area of report
1 "'- Dashed where in.{erred;
I "-_ dotted where concealed
I I
0 West Middletown
~c.e IJ' -Gifli:Jv I <i.SifJ~Co
IVG'J'o!v -co--._
o Washington
·Waynesburg 0
L ____ _!~N~.Y~.!L_ ______ I __ WEST VIRGINIA so•
5 0 5 10 15 20 MILES
FIGURE 1.-Index map showing locations of the intruded f.ault and associated fold axes in southwest Pennsylvania. The area outlined is shown in figure 2.
of which contained a few s1nall subhedral grains of paleyellow quartz, were observed in the limestone. Higher up the bank the dike is covered by scree, but its presence is indicated by the brick-red color of baked shales and shale float about 25 feet below a massive cliffforming sandstone that caps the spur. This sandstone overlies the Waynesburg coal bed which is at the base of the Waynesburg Formation. A horst block of this sandstone, about 20 feet wide, has been uplifted about 4.5 feet by the intrusive force of the dike. A sketch of this horst zone by Smith ( 1912, fig. 2) shows the dike cutting the shale below the sandstone and four apophyses intruding into the uplifted horst block along small fractures and faults. Although no slickensides were seen on the iron-stained fault surfaces, polished sandstone slabs from the horst zone have a graulated appearance and contain small fractures filled with ironstained material; these features are suggestive of fault movement. Two smaller dikes crop out in the creek
bottom about 120 feet upstream from the main dike. These small dikes, 0.3 and 0.4 foot wide, have sharp contacts and are separated· by 1.1 feet of silty shale. At locality A the total width of the intrusion zone is about 80 feet.
The most conspicuous and significant feature at the Middle Run locality, and at all other exposures of the intrusive zone, is the fracture system with which the intrusions are associated. The fractures strike N. 45-51° ,V., dip within 4° of vertical, and are generally inclined toward the intrusion. No horizontal movement along these fractures has been reported previously, but during this study two new exposures were found where horizontal movement is indicated.
The first evidence of horizontal movement was observed in a mine in the Pittsburgh coal bed on the west side of the Monongahela River, about 2,400 feet southeast of Stririgtown (fig. 2, loc. B). The detail of this subsurface exposure is illustrated in figure 3. Examina-
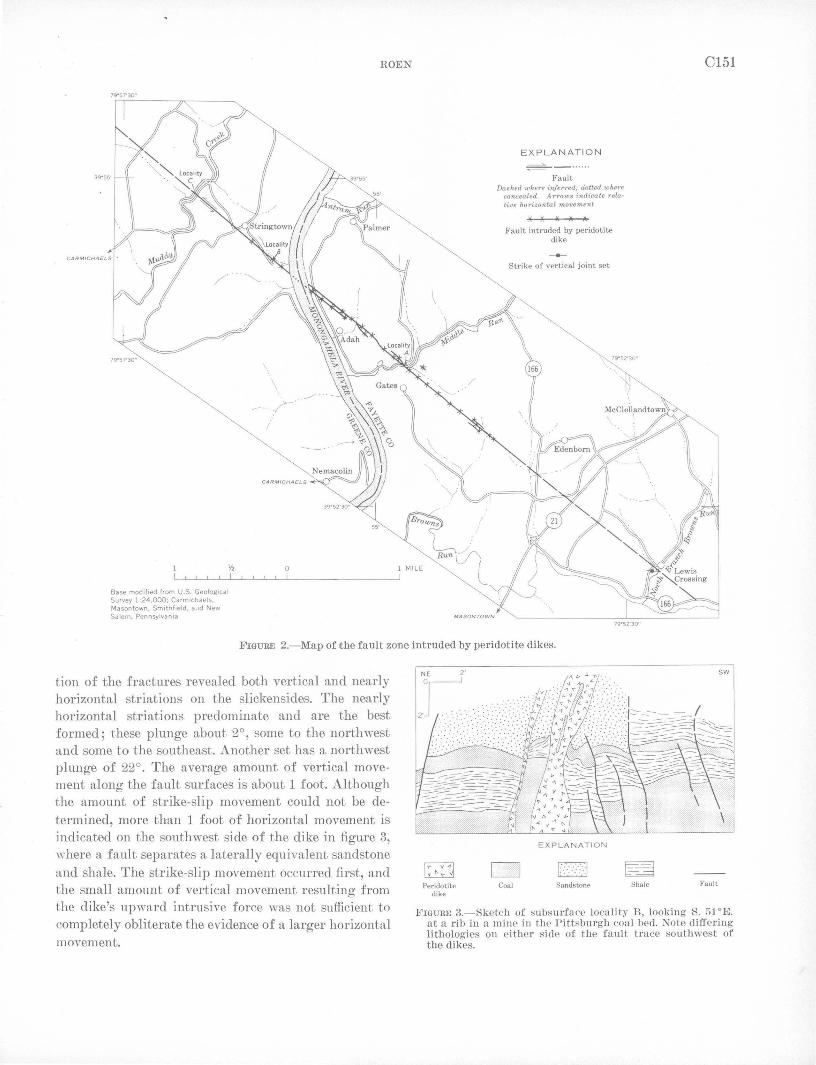
Base modified from U.S. Geolog•cal Survey 1 :24 ,000; CarmiChaels, Masontown, Smith field . a.1d New Sctlem, Pennsylvan•a
\
I
CARMICHAELS
0
ROEN
EXPLANATION
Fault Dashed where i?l/erred; dotted where
concealed. Arrows indicate relative horizontal movement
N X X ~ X
Fault intruded by peridotite dike
Strike of vertical joint set
C151
FmuRE 2.- Map of rthe fault zone intruded by peridotite dikes.
tion of the fractures revealed both vertical and nearly horizontal striations on the slickensides. The nearly horizontal striations. predominate and are the best formed; these plunge about 2°, some to the northwest and some to the southeast. Another set has a northwest plunge of 22° . The average amount of vertical movement along the fault surfaces is about 1 foot. Although the amount of strike-slip movement could not be determined, more than 1 foot of horizontal movement is indicated on the southwest side of the dike in figure 3, where a fault separates a laterally equivalent sandstone and shale. The strike-slip movement occurred first, and the small amount of vertical movement resulting from the dike's upward intrusive force was not sufficient to completely obliterate the evidence of a larger horizontal movement.
r;-v:il ~ Peridotite
dike
D Coal
EXPLANATI O N
~ ~ Sandstone Shale Fault
l!'IGURE 3.- Sketch of ::;ubsurface locality B, looking S. i:il 0 E . at a rib in a mine in the Pittsburgh coal bed. Note diffe ring lithologies on either side of the fault trace southwest of the dikes.
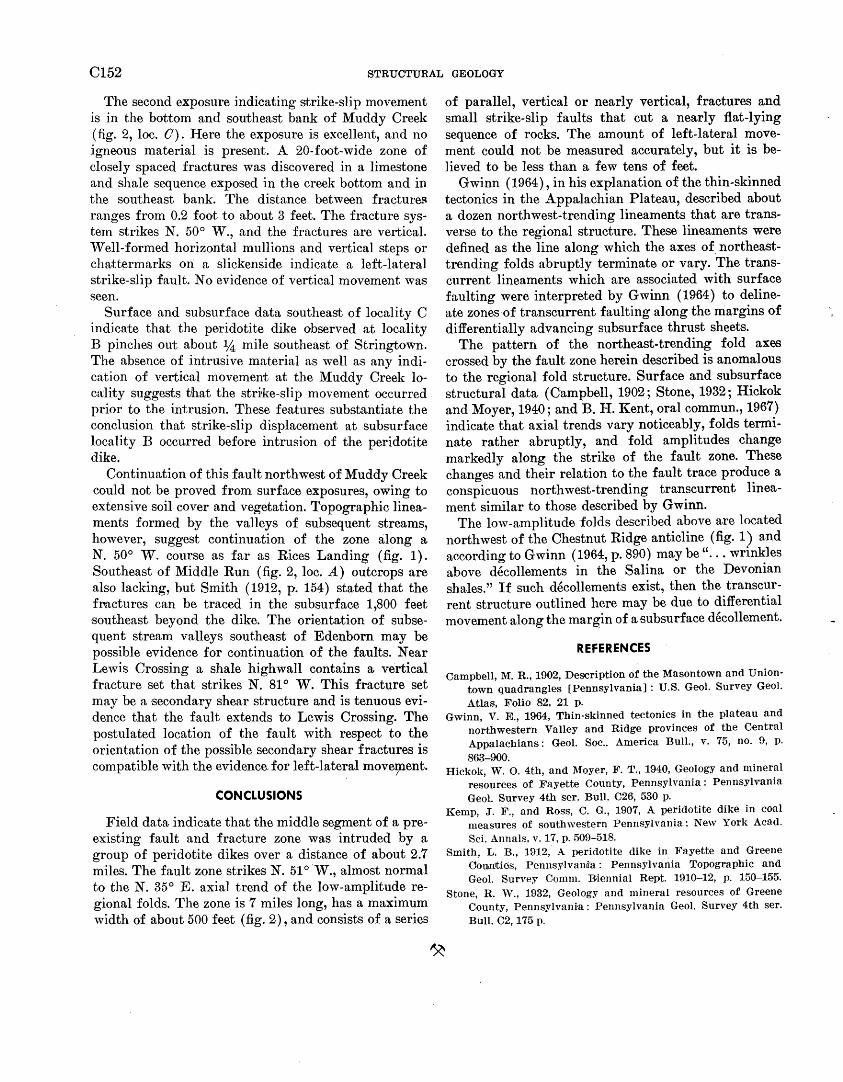
Cl52 STRUCTURAL GEOLOGY
The second exposure indicating strike-slip movement is in the bottom and southeast bank of Muddy Creek (fig. 2, loc. 0). Here the exposure is excellent, and no igneous material is present. A 20-foot-wide zone of closely spaced fractures was discovered in a limestone and shale sequence exposed in the creek bottom and in the southeast bank. The distance between fractures ranges from 0.2 foot to about 3 feet. The fracture system strikes N. 50° W., and the fractures are vertical. Well-formed horizontal mullions and vertical steps or chattermarks on a slickenside indicate a left-lateral strike-slip fault. No evidence of vertical movement was seen.
Surface and subsurface data southeast of locality C indicate that the peridotite dike observed at locality B pinches out about 14. mile southeast of Stringtown. The absence of intrusive material as well as any indication of vertical movement at the Muddy Creek locality suggests tihat the stri'ke-slip movement occurred prior to the intrusion. These features substantiate the conclusion that strike-slip displacement at subsurface locality B occurred before intrusion of the peridotite dike.
Continuation of this fault northwest of Muddy Creek could not be proved from surface exposures, owing to extensive soil cover and vegetation. Topographic lineaments formed by the valleys of subsequent streams, however, suggest continuation of the zone along a N. 50° W. course as far as Rices Landing (fig. 1). Southeast of Middle Run (fig. 2, loc. A) outcrops are also lacking, but Smith ( 1912, p. 154) stated that the fl"actures can be traced in the subsurface 1,800 feet southeast beyond the dike. The orientation of subsequent stream valleys southeast of Edenborn may be possible evidence for continuation of the faults. Near Lewis Crossing a shale highwall contains a vertical fracture set that strikes N. 81° W. This fracture set may be a secondary shear structure and is tenuous evidence that the fault extends to Lewis Crossing. The postulated location of the fault with respect to the orientation of the possible secondary shear fractures is compatible with the evidence. for left-late~al move91ent.
CONCLUSIONS
Field data indicate that the middle segment of a preexisting fault and fracture zone was intruded by a group of peridotite dikes over a distance of about 2.7 miles. The fault zone strikes N. 51 o ·w., almost normal to the N. 35° E. axial trend of the low-amplitude regional folds. The zone is 7 miles long, has a maximum width of about 500 feet (fig. 2), and consists of a series
of parallel, vertical or nearly vertical, fractures and small strike-slip faults that cut a nearly flat-lying sequence of rocks. The amount of left-lateral movement could not be measured accurately, but it is believed to be less than a few tens of feet.
Gwinn ( 1964), in his explanation of the thin-skinned tectonics in the Appalachian Plateau, described about a dozen northwest-trending lineaments that are transverse to the regional structure. These lineaments were defined as the line along which the axes of northeasttrending folds abruptly terminate or vary. The transcurrent lineaments which are associated with surface faulting were interpreted by Gwinn (1964) to delineate zones of transcurrent faulting along the margins of differentially advancing subsurface thrust sheets.
The pattern of the northeast-trending fold axes crossed by the fault zone herein described is anomalous to the regional fold structure. Surface and subsurface structural data (Campbell, 1902; Stone, 1932; Hickok and Moyer, 1940; and B. H. Kent, oral commun., 1967) indicate that axial trends vary noticeably, folds terminate rather abruptly, and fold amplitudes change markedly along the strike of the fault zone. These changes and their relation to the fault trace produce a conspicuous northwest-trending transcurrent lineament similar to those described by Gwinn.
The low-amplitude ·folds described above are located northwest of the Chestnut Ridge anticline (fig. 1) and according to Gwinn (1964, p. 890) may be" ... wrinkles above decollements in the Salina or the Devonian shales." If such decollements exist, then the transcurrent structure outlined here may be due to differential movement along the margin of a subsurface decollement.
REFERENCES
Campbell, 1\I. R., 1902, Description of the Masontown and Uniontown quadrangles [Pennsylvania] : U.S. Geol. Survey Geol. Atlas, Folio 82, 21 p.
Gwinn, V. E., 1964, Thin-skinned tectonics in the plateau and northwestern Valley and Ridge provinces of the Central Appalachians: Geol. Soc .. America Bull.,. v. 75, no. 9, p.
863-900. Hickok, W. 0. 4th, and Moyer, F. T., 1940, Geology and mineral
resources of Fayette County, Pennsylvania: PennsylV'ania Geol. Survey 4th ser. Bull. C26, 530 p.
Kemp, J. F., and Ross, C. G., 1907, A peridotite dike in coal measures of southwestern Pennsylvania: New York Acad. Sci. Annals, v. 17, p. 509-518.
Smith, L. B., 1912,· A peridotite dike in Fayette and Greene Ooun!ties, Penn:sylvani'a : Pennsylvania Topographic and Geol. Survey Comm. Biennial Rept. 1910-12, p. 150-155.
Stone, R. ,V., 1932, Geology and mineral resources of Greene County, Pennsylvania: Pennsylvania Geol. Survey 4th ser. Bull. 02, 175 p.
...
GEOLOGICAL SURVEY RESEARCH 1968
STRUCTURAL CONTROLS ON STREAMFLOW IN THE
NORTH FORK RIVER AND BRYANT CREEK BASINS, MISSOURI
By JOHN SKELTON and E. j. HARVEY, Rolla, Mo.
Work done in cooperation with the Missouri Division of Geological Survey
and Water Resources
Abstract.-North Fork River and Bcyant Creek, which drain adjacent basins in southern Missouri, have practically the same size drainage areas and similar basin shape, climate, and surface geology. However, the ground-water runoff of North Fork River basin, where kal'st topography is much better developed, is twice that of Bryant Creek. Structure is the major factor influencing ground-water outflow. Jointing and perhaps faulting with N'V-SE and NE-SW trends have pronounced effect on the alinement of sinkholes and orientation of ridges and valleys~ Large springs occur where these trends intersect, and the flow from these springs accounts for most of the difference in groundwater runoff between the two basins.
North Fork River and Bryant Creek, w+hich drain adjacent basins in Douglas and Ozark Counties, about 50 miles southeast of Springfield in southern Missouri, have practically the same size drainage areas ( 561 sq mi and 570 sq mi, respectively), and similar basin shape, climate, and surface geology. Since 1945, records from two continuous-record streamflow stations in the lower reaches of the streams have indicated that the groundwater runoff of North Fork River is twice that of Bryant Creek. Ground-water runoff is that part of the runoff that has passed into the ground; become ground water, and then has been discharged into a stream channel a.s spring or seepage water.
In the fall of 1964, a hydrologic reconnaissance was made in the two basins to determine, if possible, where the differences in ground-water runoff originate. Figure 1 shows the drainfl!ge network, 'locations of lbhe measuring sites, and resu1ts of discharge measurements Jnade during the reconnaissance.
An exa;mination of the da:ta revealed the following faots: 1. .AJbout t.wo ... thirds of :the ground-water runoff is
derived from the lower one-,third of the basins, pri,m.arily because of the contribution of large springs.
2. The discharge from the Nor,th Fork Springs-Double Spring system accounts for most of the difference in ground-water runoff between Bry,ant Creek and Nor.th Fork River.
3. Major ground-water contributions are by springs on the ,main stems of NoDth Fork River and Bryant Creek.
4. Bryanrt Creek is an interrupted stream in the up,per reaches, whereas NoDth Fork River is perennial from head waters to mouth.
The reconna:issance survey showed rthat a closer look at the relation between tQpog;raphy, geology, and streamflow was needed to gain 1more understanding of the hydrology of the basins. Since 1964 other data have been collected and observ.rutions have been made of physiography, geology, and variations in stream and spring flow at selected points in rthe basins. This article discusses the results of these observations and suggests some conclusions about the functioning of the hydrologic system in the .area.
PHYSIOGRAPHY
The land sur£ace in the divide areas is rolling, whereas near ~the strea:ms i't is moderately rugged. Valley floors rise from 600 feet a!bove mean sea level to about 1,200 feet in rthe hea;chvruters, and divides rise from 800 feet a;bove mean sea level to 1,600 feet at the northern end of ,the basin. The ·,maximum relief is about 1,000 feet. Al,though the land is generally ;maturely dissected, some variation in the scu~pture of rthe terrain is present. Smoothness of the contours indicates rounding of .the hiHs in the Bryant Creek 1basin as contrasted with very ste~p slopes, fia;t divides, and more intricate dissootion in the lower end of the N or.th Fork River ba.sin. Also, numerous .sinkholes are present in the terI~ain of the North Fork basin, which suggests that collapse was an important agent in its development.
0153 U.S. GEOL. SURVEY PROF. PAPER 600-C, PAGES C153-C157
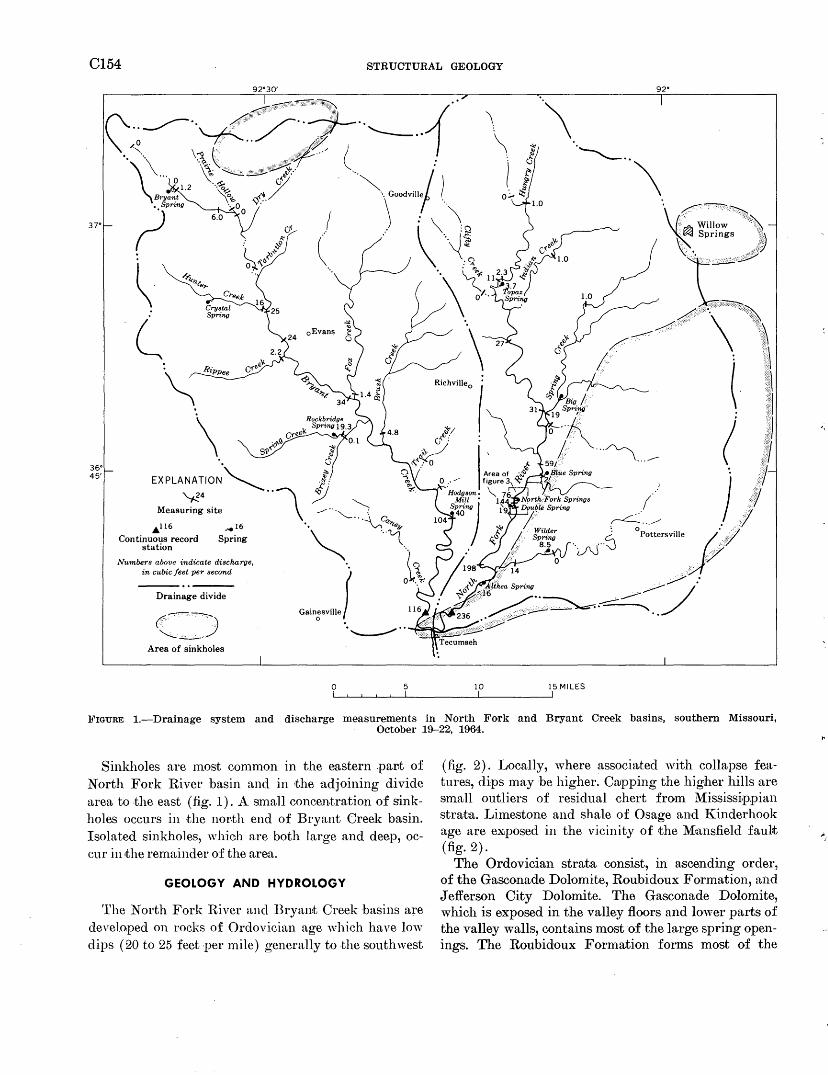
C154 STRUCTURAL GEOLOGY
37"
36° 45'
Drainage divide
Area of sinkholes
92°30'
0
92°
·~ ..
\
5 10 15 MILES
]'IGURE 1.-Drainage system and discharge measurements in North Fork and Bryant Creek basins, southern Missouri, October 19-22, 1964.
Sinkholes are 1nost common in the eastern .pal'lt of North Fork River basin and in ~the adjoining divide area to the east (fig. 1). A small concentration of sinkholes occurs in the nor.th end of Bryant Creek basin. Isolated sinkholes, which are both large and deep, occur in the remainder of the area.
GEOLOGY AND HYDROLOGY
The North Fork River and Bryant Creek basins are cle,reloped on rocks of Ordovician age which have low dips (20 to 25 feet per mile) generally to the southwest
(fig. 2). Locally, where associated with collapse features, dips may be higher. Crupping the higher hills are small outliers of residual chert from Mississippian strata. Limestone and shale of Osage and Kinderhook age are eXJposed in the vicinity of the M~ansfield fault (fig. 2).
The Ordovician strata consist, in ascending order, of the Gasconade Dolomite, Roubidoux Formation, and J e:fferson City Dolomite. The Gasconade Dolomite, which is exposed in the valley floors and lower parts of the valley walls, contains most of the large spring openings. The Roubidoux Formation forms most of the
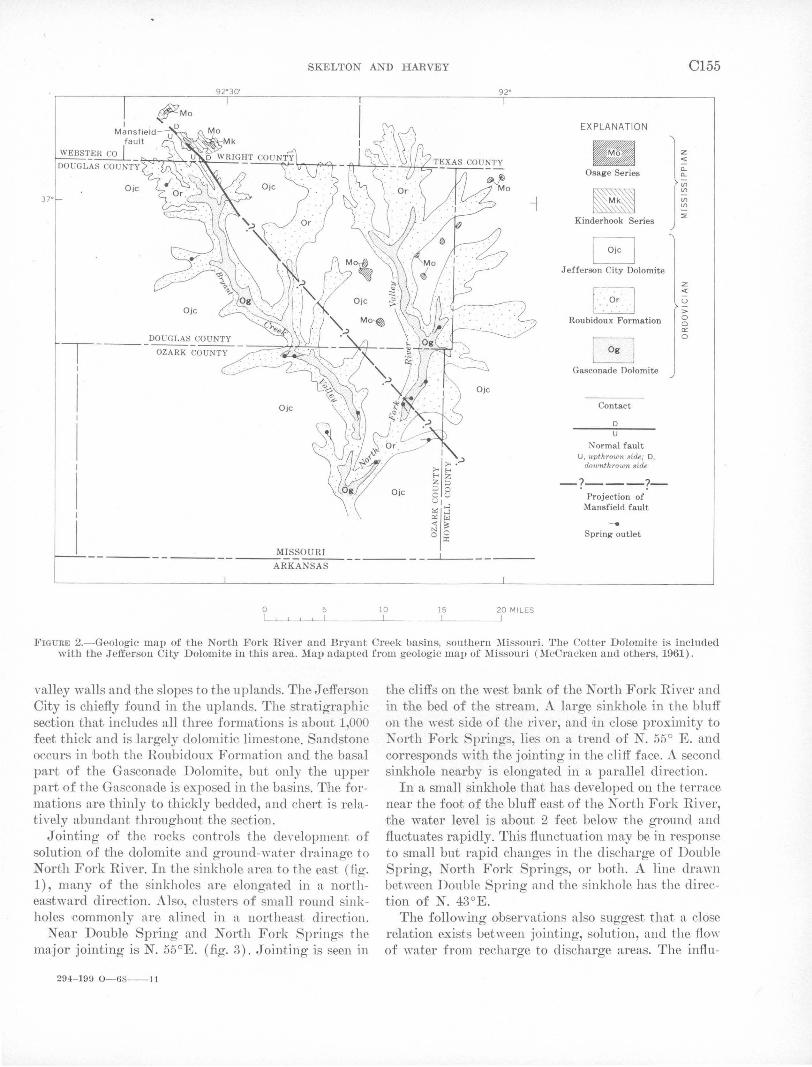
SKELTON AND HARVEY C155
Ojc
Ojc
92"30'
Ojc
__ ___:.MISSOURI
ARKANSAS
0 5
92"
10 15 20MILES
EXPLANATION
Osage Series
Kinderhook Series
G Jefferson City Dolomite
Roubidoux Formation
Gasconade Dolomite
Contact
D u
Normal fault U , upthrown side; D,
downthrown side
-?---?-Projection of
Mansfield fault
..... Spring outlet
z <(
""(f) (f)
(f) (f)
::E
z <(
u > 0 0
"' 0
FIGURE 2.- Geologic map of the North Fork River and Bryant Creek basins, southern Missouri. 'l'be Cotter Dolomite is included with the Jefferson City Dolomite in this area. Map adapted from geologic map of Missouri (McCracken and others, 1961).
valley walls and the slopes to the uplands. The Jefferson City is chiefly found in the uplands. The stratigraphic section that includes all three formations is about 1,000 feet thick and is largely dolomitic limestone. Sandstone occurs in 'both the Roubidoux Formation and the basal part of the Gasconade Dolomite, but only the upper part of the Gasconade is exposed in the basins. 'Dhe formations are thinly to thickly bedded, and chert is relatively abundant throughout the section.
Jointing of the rocks controls the development of solution of the dolomite and ground-water drainage to North Fork River. In the sinkhole area to the east (fig. 1), many of the sinkholes are elongated in a northeastward direction. Also, clusters of small round sinkholes commonly are alined in ~• northeast direction.
Near Double Spring and North Fork Springs the major jointing is N. 55°E. (fig. 3) . Jointing is seen in
294-199 0-68--11
the cliffs on the west bank of theN orth Fork River and in the bed of the stream. A large sinkhole in the bluff on the west side of the river, and ri.n close proximity to ~orth Fork Springs, lies on a trend of N. 55° E. and corresponds with the jointing in the cliff face. A second sinkhole nearby is elongated in a parallel direction.
In a small sinkhole that has developed on the terrace near the foot of the bluff east of the North Fork River, the water level is about 2 feet below the ground and fluctuates rapidly. This ftunctuation may be in response to small but rapid changes in the discharge of Double Spring, North Fork Springs, or both. A line draml bet"·een Double Spring and tJhe sinkhole has the direction of N. 43°E.
The following observations also suggest that ~• close relation exists between jointing, solution, and the flow of water from recharge to discharge areas. The inftu-
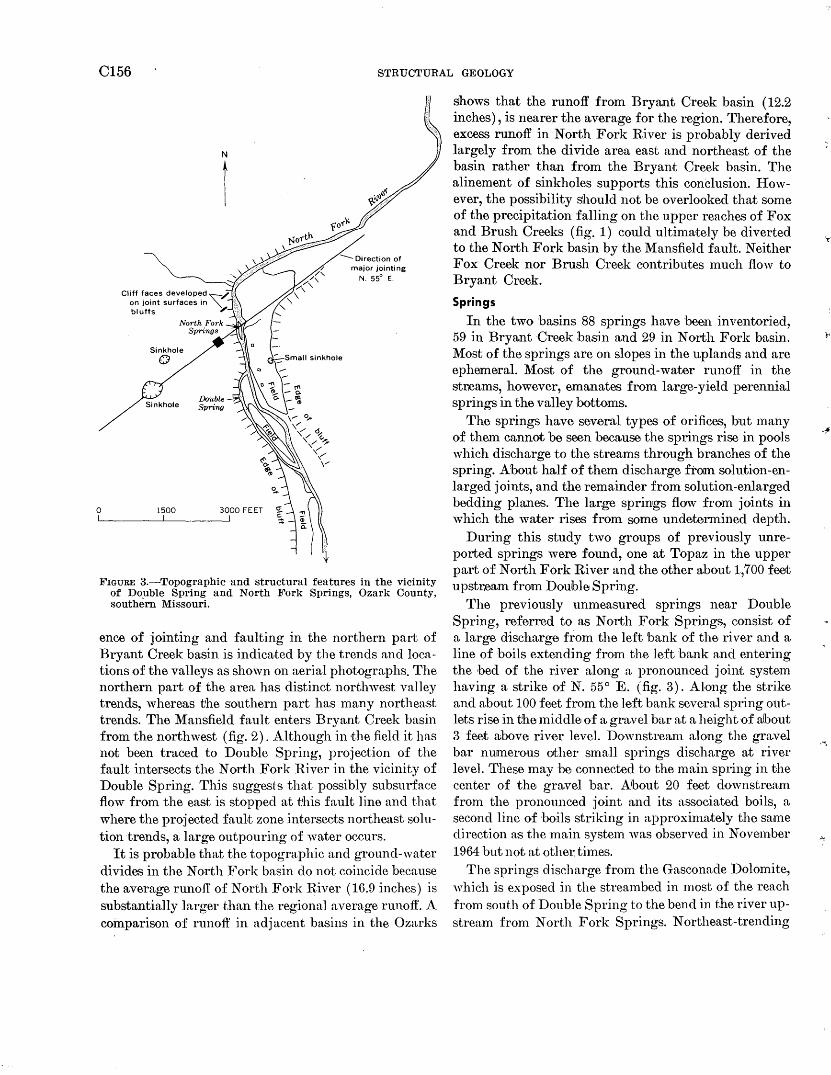
C156 STRUCTURAL GEOLOGY
0 1500
N
I
3000 FEET
major jointing
N. 55° E.
FIGURE 3.-Topographic and structural features in the vicinity of Do_uble Spring and North Fork Springs, Ozark County, southern Missouri.
ence of jointing and faulting in the northern part of Bryant Creek basin is indicated by the trends and locations of the valleys as shown on aerial photographs. The northern part of the area has distinct northwest valley trends, whereas the southen1 part has many northeast trends. The Mansfield fault enters Bryant Creek basin from the northwest (fig. 2). Although in the field it has not been traced to Double Spring, projection of the fault intersects the North Fork River in the vicinity of Double Spring. This suggests that possibly subsurface flow from the east is stopped at this fault line and that where the projected fault zone intersects northeast solution trends, a large outpouring of water occurs.
It is probable that the topographic and ground-water divides in the North Fork basin do not coincide because the avera.ge runoff of North Fork River (16.9 inches) is substantially larger than the regional average runoff. A comparison of runoff in adjacent basins in the Ozarks
shows that the runoff from Bryant Creek basin (12.2 inches), is nearer the avera.ge for the region. Therefore, excess runoff in North Fork River is probably derived largely from the divide area east and northeast of the basin rather than from the Bryant Creek basin. The alinement of sinkholes supports this conClusion. However, the possibility f5hould not be overlooked that some of the precipitation falling on the upper reaches of Fox and Brush Creeks (fig. 1) could ultimately be diverted to the North Fork basin by the Mansfield fault. Neither Fox Creek nor Brush Creek contributes much flow to Bryant Creek.
Springs
In the two basins 88 springs have boon inventoried, 59 in Bryant Greek basin and 29 in North Fork basin. Most of the springs are on slopes in the uplands and are ephecrneral. Most of the ground-water runoff in the streams, however, emanates from large-yield perennial springs in the valley bottoms.
The springs have several types of orifices, but many of them cannot be seen because the springs rise in pools which discharge to the streams through branches of the spring. About half of them discharge frO!J1l solution-enlarged joints, and the remainder from solution-enlarged bedding planes. The lar.ge springs flow from joints in which the water rises from some undetermined depth.
During this study two groups of previously unreported springs were found, one at Topaz in the upper part of North Fork River and the other about 1,700 feet upstr.ea.m from Douible Spring.
The previously unmeasured springs near Double Spring, referred to as North Fork Springs, consist of a large discharge from the left 'bank of the river and a line of boils extending from the left bank and entering the bed of the river along a pronounced joint syste.m having a strike of N. 55° E. (fig. 3). Along the strike and about 100 feet from the left bank several spring otltlets rise in the middle of a gra.vel bar at a height of albout 3 feet a;bove river level. Downstrerun a.long the gra.vel bar nUJmerous other small springs discharge at river level. These may be connected to the main spring in the center of the gravel bar. About 20 feet downstrea.m from the pronounced joint and its associated boils, a second line of boils striking in ~tpproxin1ately the saane eli recti on as the main system was observed in November 1964 but not a.t other: times.
The springs discharge from the Gasconade Dolomite, which is exposed in the streambed in most of the reach fron1 south of Double Spring to the bend in the river upstream from North Fork Springs. Northeast-trending
.... ,
SKELTON AND HARVEY C157
joints are most conspicuous in the vicinity of Double Spring and at North F'ork Springs. Between Double and North Fork Springs, however, north-south jointing (N. 5°-10° W.) is more conspicious. The directions of the two reaches of the river shown in figure 3 correspond closely with the principal joint trends.
Relation of streamflow to spring discharge
The outlets of Double Spring and North Fork Springs are only 1,700 feet apart, and we suggest that there is a hydraulic connection between the two, despite a large difference in the characteristics of their discharges. The majority of Ozark springs, including Double Spring, are responsive to precipitation, but, as shown in table 1, the flow of North Fork Springs is uniform at about 70 cubic feet per second. The flow from the multiple openings of North Fork Springs is controlled by an orifice that is restricted to a maximum discharge of about 70 cfs, and the head of water on the system remains high enough to insure a relatively constant flow. The Double Spring orifice, on the other hand, is capable of discharging excess flows; therefore the underground reservoir or feeder system supplying Double Spring is depleted more rapidly, which accounts for the variability of its discharge. The general source area of the two springs is probably the large sinkhole and karst area to the northeast (fig. 1).
The large difference in base flow between Bryant Creek and North Fork River results frmn an increase of about 150 percent in the discharge of North Fork River owing to additions from the Double Spring-North Fork Springs system. These additions occur in the 1,700-foot reach of the stream between the two spring areas.
TABLE 1.-Discharge measurements of Double Spring and North Fork Springs
Date
4- 4-64 8- 3-64 9- 9-64
11-16-64 4- 7-65 4- 8-66 7- 6-66
10- 6-66 3-23-67
11-20-67 1-24-68
Double Spring North Fork Springs (cfs) (cfs)
202 76 56 47
232 180 150 132 154 157 164
68
66 75 74 76 67 71
General geohydrologic conditions suggest that Double, Blue, North Fork, Big, Wilder, and Althea Springs are all being fed through a system of condu~ts originating in the sinkhole area in the eastern part of the North Fork River basin.
SUMMARY AND CONCLUSIONS
1. Ground-water runoff in the North Fork River is about twice that of Bryant Creek, although their drainage basins are similar in size, shape, climate, and surface geology.
2. Trends of many of the valleys in the North Fork River and Bryant Creek basins are either joint or fault controlled. Major jointing in the vicinity of the Double Spring system trends N. 55° E., parallel to the long dimension or alinement of many of the sinkholes in the catchment area.
3. l{arst topography is much more developed in the North Fork River basin than in Bryant Creek basin. This indicates that the underground drainage system is better developed in North Fork River basin, resulting in larger spring discharges.
4. The main source of the water that makes the difference between the base flows of the two streams is believed to be the extensive sinkhole area on the east side of the North Fork basin.
5. It is suspected that the Mansfield fault zone extends southeastward to the vicinity of Double Spring, where subsurface flow from the east is intercepted and reaches the surface in Double Spring and North Fork Springs.
6. The Double Spring-North Fork Springs system increases the base flow or ground-water runoff of North Fork River about 150 percent in a 1,700-foot reach of the stream. Thus, the discharge of the springs accounts for most of the difference in base flow between Bryant Creek and North Fork River.
7. North Fork Springs have a uniform flow, whereas the flow of Double Spring is variable. Flow from the multiple openings of North Fork Springs is probably controlled by an orifice that is restricted to a discharge of about 70 cfs.
REFERENCE
~\'IcOrackeu, M. H. and others, 1961, compilers, Geologic map of l\fissouri: Missouri Div. Geol. Survey and Water Resources, sca,Ie 1 : 500,000.
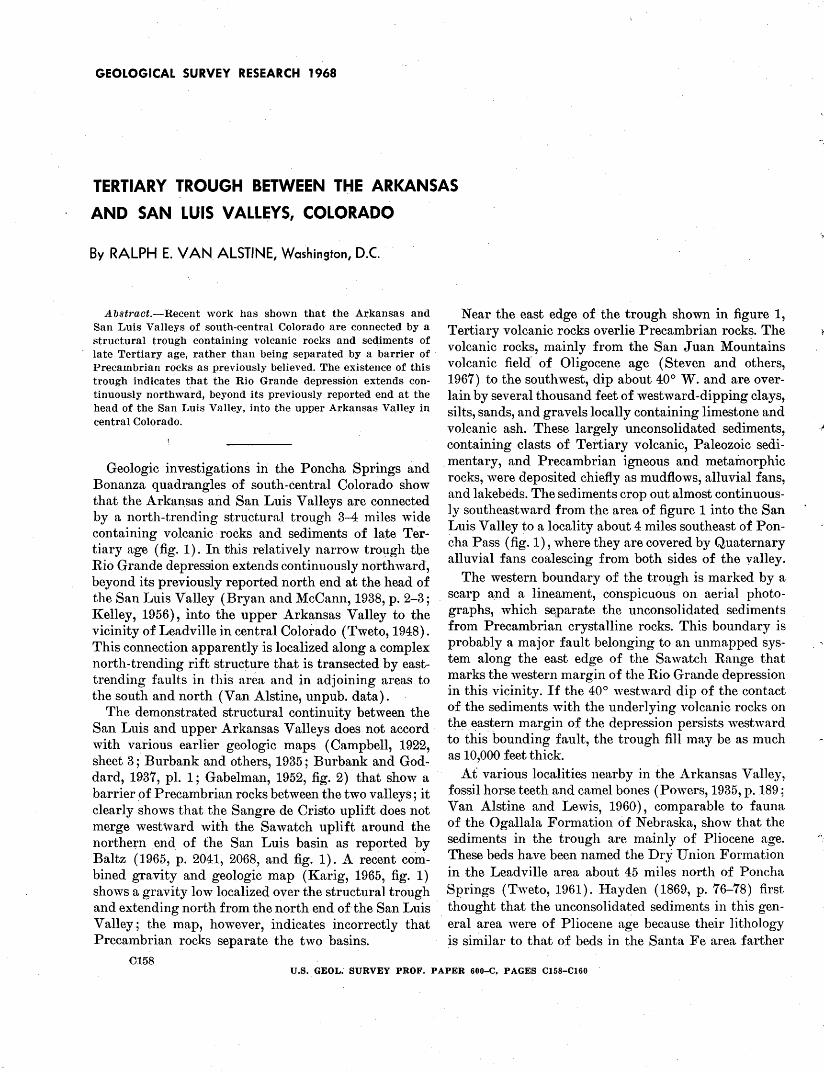
GEOLOGICAL SURVEY RESEARCH 1968
TERTIARY TROUGH BETWEEN THE ARKANSAS
AND SAN LUIS VALLEYS, COLORADO
By RALPH E. VAN ALSTINE, Washington, D.C.
Abstract.-Recent work has shown that the Arkansas and San Luis Valleys of south-central Colorado are connected by a structural trough containing volcanic rocks and sediments of late Tertiary age, rather than being separated by a barrier of Precambrian rocks as previously believed. The existence of this trough indicates that the Rio Grande depression extends continuously northward, beyond its previously reported end at the head of the San Luis Valley, into the upper Arkansas Valley in central Colorado.
Geologic investigations in the Poncha Springs arid Bonanza quadrangles of south-central Colorado show that the Arka~sas and San Luis Valleys are connected by a north-trending structural trough 3-4 miles wide containing volcanic rocks and sediments of late Tertiary age (fig. 1) . In this r~lati vely narrow trough the Rio Grande depression extends continuously northward, beyond its previously reported north end at the head of the San Luis Valley (Bryan and McCann, 1938, p. 2-3; l(elley, 1956), into the upper Arkansas Valley to the vicinity of Leadville in central Colorado (Tweto, 1948). This connection apparently is localized along a complex north-trending rift structure that is transected by easttrending faults in this area and in adjoining areas to the south and north (Van Alstine, unpub. data). .
The demonstrated structural continuity between the San Luis and upper Arkansas Valleys does not accord · with various earlier geologic maps (Campbell, 1922, sheet 3; Burbank and others, 1935; Burbank and Goddard, 1937, pl. 1 ; Gabelman, 1952, fig. 2) that show a barrier of Precambrian rocks between the two valleys; it clearly shows that the Sangre de Cristo uplift does not merge west\vard with the Sawatch uplift around the northern . end. of the San Luis basin as reported by Baltz (1965, p. 2041, 2068, and fig. 1). A recent combined gravity and geologic map (Karig, 1965, fig. 1) shows a gravity low localized over the structural trough and extending north from the north end of the San Luis Valley; the map, however, indicates incorrectly that Precambrian rocks separate the two basins.
0158
Near the east edge of the trough shown in figure 1, Tertiary volcanic rocks overlie Precambrian rocks. The volcanic rocks, mainly from the San Juan Mountains volcanic field' of Oligocene age (Steven and others, 1967) to the southwest, dip about 40° W. and are overl~in by several thousand feet of westward-dipping clays, silts, sands, and gravels locally containing limestone and volcanic ash. These largely unconsolidated sediments . . . ' containing clasts of Tertiary volcanic, Paleozoic sedi-
. mentary, and Precambrian igneous and metamorphic rocks, were deposited chiefly as mudflows, alluvial fans, and lakebeds. The sediments crop out almost continuously southeastward from the area of figure 1 into the San Luis Valley to a locality about 4 miles southeast of Poncha Pass (fig. 1), where they are covered by Quaternary alluvial fans coalescing from both sides of the valley.
The western boundary of the trough is marked by a scarp and a lineament, conspicuous on aerial photographs, which se,parate the unconsolidated sediments from Precambrian crystalline rocks. This boundary is probably a major fault belonging to an unmapped system along the east edge of the Sawatch Range that marks the western margin of the Rio Grande depression in this vicinity. If the 40° westward dip of the contact of the sediments with the underlying volcanic rocks on the. eastern margin of the depression persists westward to this bounding fault, the trough fill may be as much as 10,000 feet thick.
At various localities nearby in the Arkansas Valley, fossil horse teeth and camel bones (Powers, 1935, p. 189; Van Alstine and Lewis, 1960), comparable to fauna of the Ogallala Formation of Nebraska, show that the sediments in the trough are mainly of Pliocene age. These beds have been named the Dry Union Formation in the Leadville area about 45 miles north of Poncha Springs (Tweto, 1961). Hayden (1869, p. 76-78) first thought that the unconsolidated sediments in this O'en-
. . 6
eral ~rea were of Pliocene age because their lithology is similar to that of beds in the Santa Fe area farther
U.S. GEOL~ SURVEY PROF. PAPER 600-C, PAGES Cl58-Cl60
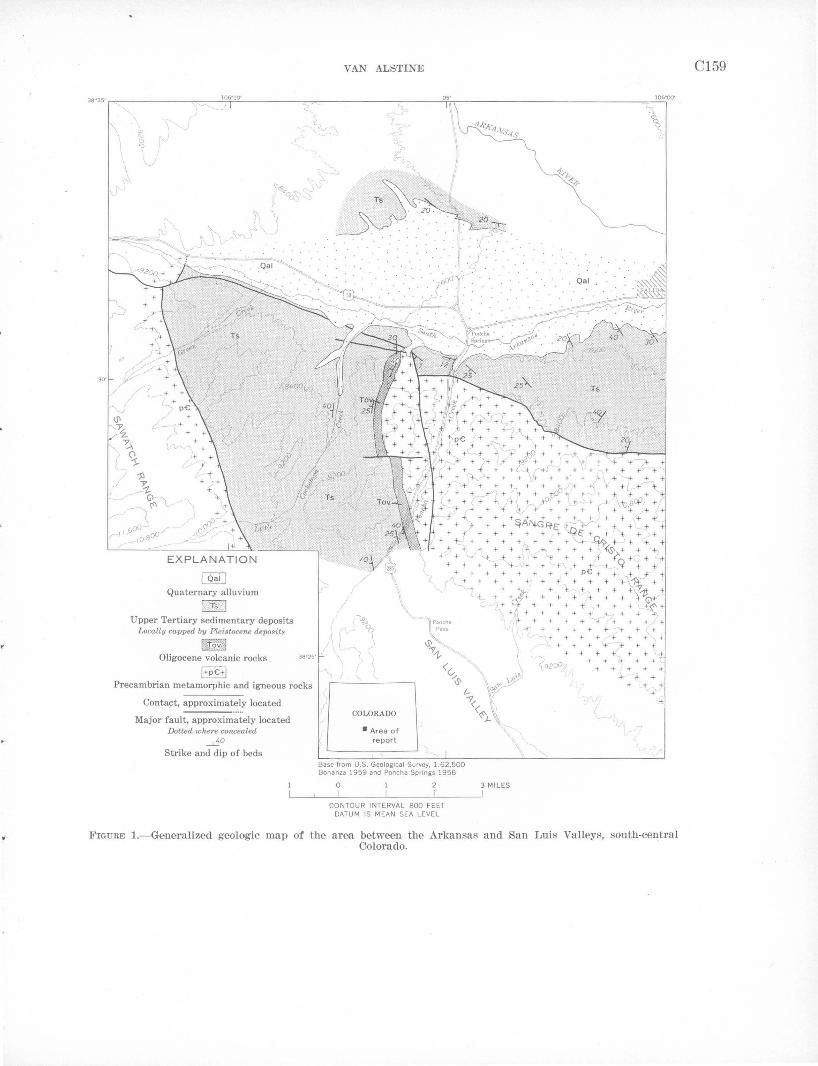
--)
(
106"10'
Quaternary alluvium
I 'T~ I Upper Tertiary sedimentary deposits
Locally capped by Pleistocene deposits
lst~t;JJ
VAN ALSTINE
J
/ / ~
'b ;l ) I,
05'
\
Oligocene volcanic rocks
l+p£+1
J \(~" ( 38"25' \ "?
---._, r ) Precambrian metamorphic and igneous rocks
Contact, approximately located
Major fault, approximately located Dotted where concealed
__tiO
Strike and dip of beds
/
J "
COLORADO
• Area of report
Base from U.S. Geological Survey, 1:62,500 Bonanza 1959 and Poncha Springs 1956
0
CONTOUR INTERVAL 800 f EET DATU M IS MEAN SEA LEVEL
3 MILES I
+
1rv,
(
+ + 4-
+
') l_,.l
+ + + +
i:_r;,_f +
(
'"
:F'IGURE I.-Generalized geologic map of the area between the Arkansas and San Luis Valleys, south-central Colorado.
C159
0160 STRUCTURAL GEOLOGY
south along the same depression; later he and others regarded them as Pleistocene (Hayden, 1876, p. 52; Crawford, 1913, p. 29, 33; Campbell, 1922, sheet 3 and p. 162; Powell, 1958, p. 20).
REFERENCES
Baltz, E. H., 1965, Stratigraphy and history of Raton Basin and notes on San Luis Basin, Colorado-New Mexico: Am. Assoc. Petrolewn Geologists Bull., v. 49, no. 11, p. 2041-2075.
Bryan, Kirk, and McCaru1, F. T., 1937-38, The Ceja del Rio Puerco, a border feature of the Basin and Range province in New Mexico: Jour. Geology, v. 45, no. 8, p. 801-828; v. 46, no. 1, p. 1-16.
Burbank, ,V. S., and Goddard, E. N., 1937, Thrusting in Huer:flano Park, Colorado, and related problems of 01rogeny in 'the Sangre de Cristo Mountains: Geol. Soc. America Bull., v.48,no.7,p.931-976.
Burbank, ,V. S., Lovering, T. S., Goddard, E. N., and Eckel, E. B., 1935, Geologic map of Colorado: U.S. Geol. Survey, scale 1:500,000.
Campbell, M. R., 1922, Guidebook of the western Unit~ States, pt. E, The Denver & Rio Grande 'Vestern Route: U.S. Geol. Survey Bull. 707, 266 p.
Crawford, R. D., 1913, Geology and ore deposits of the Mona:rch and Tomichi districts, Colorado: Colorado Geol. Survey Bull. 4, 317 p.
Gabelman, .J. ,V., 1952, Structure and origin of northern Sangre de Cristo Range, Colorado: Am. Assoc. Petrolewn Geologists Bull., v. 36, no. 8, p. 1574-1612.
Hayden, F. V., 1869, Preliminary field report [third annual] of the United States Geological and Geographical Survey of the
Territories, Colorado and New Mexico: Washington, U.S. Govt. Printing Office, 155 p.
--- 1876, [Eighth] Annual report of the United States Geological and Geographical Survey of the Territories, embracing Colorado and parts of adjacent Territories, being a report of progress of the exploration for the yea·r 1874: 'Vashington, U.S. Govt. Printing Office, 515 p.
Karig, D. E., 1965, Geophysical evidence of a caldera at Bonanza, Colorado, 'in Geological Survey research 1965: U.S. Geol. Survey Prof. Paper 525-B, p. B9--B12.
Kelley, V. 0., 1956, The Rio Grande depression from Taos to Santa Fe, in New Mexico Geol. Soc. Guidebook of southeastern Sangre de Cristo Mountains, New Mexico, 7th field conference, October 19--21, 1956: p. 109-114.
Powell, ,V. J., 1958, Ground-water resources of the San Luis Valley, Colorado: U:S. Geol. Survey 'Vater-Supply Paper 1379, 284 p.
Powers, ,V. E., 1935, Physiographic history of the upper Arkansas River valley and the Royal Gorge, Colorado: Jour. Geology, v. 43, no. 2, p. 184-199.
Steven, T. A., Mehnert, H. H., and Obradovich, J. D., 1967, Age of volcanic activity in the San Juan Mountains, Colorado, 'in Geological Survey research 1967: U.S. Geol. Survey Prof. Paper 575-D, p. D47-D55.
Tweto, Ogden, 1948, Generalized geologic section from the Sawatch to the Mosquito J;tange, through Leadville: Colorado School Mines Quart., v. 43, no. 2, pl. 7.
--- 1961, Late Cenozoic events of the Leadville district and upper Arkansas Valley, Colorado: Art. 56 in U.S. Geol. Survey Prof. Paper 424-B, p. B133--B135.
Van Alstine, R. E., and Lewis, G. E., 1960, Pliocene sediments near Salida, Chaffee County, Colorado: Art. 111 in U.S. Geol. Survey Prof. Paper 400-B, p. B245.
~.,.
GEOLOGICAL SURVEY RESEARCH 1968
DETERMINATION OF GOLD, PLATINUM, AND PALLADIUM
BY A COMBINED FIRE-ASSAY, ION-EXCHANGE,
AND SPECTROCHEMICAL TECHNIQUE
By PAUL R. BARNETT, DWIGHT L. SKINNER, and CLAUDE HUFFMAN, JR., Denver, Colo.
Abst1·act.-The techniques of fire assay, ion exchange, and spectr()lscopy are combined to determine gold, platinum, and paHadium in ores. After silica is added to the resin containing these metals, the mixture is ignited and analyzed spectrochemically. 'l""hese techniques were used on copper and dunite-chromite ores; they produced lhnJts of detootion orf at least 0.03 ppm for Au and Pt and 0.01 ppm for Pd.
Gold, platinum, and palladium are efficiently collected in the lead button of the fire-~assay teclmique. In forming the silver bead by cupellation the losses are not significant (Frazer and Beamish, ·1954; Hoffman and Be~unish, 1956; Bean1igh, 1966). Therefore, accurate analysis of the silver beJad should give exact determinations of these elements in ores or slags. Although wet chemical methods are available for analyzing the bead for these three metals, the procedures are relatively time consuming -and are not completely reliable at low concentrations.
.As a substitute for wet CJhemical methods, direct spectrographic analysis of the bead was attempted but proved unsatisfactory because of lack of precision and accuracy. An ion-exchange concentration technique based on the work of Kraus and Nelson ( 1955), however, was successfully developed. Their data suggest the possibiHty of quantitrut::ively absorbing gold, platinum, and palladiun1 on an anion-exchange resin (Dowex 1, 50-100 1nesh, ch.loride form) column from 2M HCl in order to concentrate the elements to levels that can be estimated by a, speotographic method. Brooks and others (1960), in all'aJyzing silicrute rocks, used an anion-exchange technique to concentrate Ag, Ph, Sn, Bi, Cd, Zn, Tl, Mo, and In prior to their determination by a spectrochemical method. The i'Oll-exCJhange technique described in this report differs in one major respect from previ-
ously described techniques (Sen Gupta .and Beamish, 1963) ; no attempt is made to elute the elements from the resin. Instead, the resin is ignited in a muffle furnace after the addition of silica sand. The silica sand-resin residue is then mixed thOToughly and analyzed spectrographically fur gold, platinum, and palladium. The method has a detection limit of 0.001 ounoo per ton or 0.03 part per million for gold and platinum, and 0.0003 oz per ton or 0.01 ppm for palladium. However, these detection limits may be lowered by making fireassay fusions on several sample aliquots. The silver beads thus obtained are then combined, dissolved and absorbed on a single resin column.
EXPERIMENTAL PROCEDURE
Fire-assay technique
Two ores, VCF 239-61, a platinum-bearing copper ore from Montana, and AM P-1, a dunite-chromite ore from the Acoje mines, Philippines, are used in the fireassay technique described in this paper. These two samples were selected because preliminary assays indicated that both contain gold, platinum, and palladium. Of several different flux compositions tried, the two outlined below O'ive the most consistent results in the final
b .
spectrographic analysis of the resin ash. The composi-tion of the two fluxes is as follows:
1. For sample VOF '239-61: 100 grams of litharge, 35 g of sodium carbonate, 7 g of silica, and 3 g of flour (Bugbee, 1941).
2. For sample AM P-1: 60 g of litharge, 40 g of sodium carbonate, 15 g of silica, 20 g of borax glass, and 3 g of flour (Lodge, 1910).
The amount of sample normally taken for an assay of ores of these types is 1 assay ton (29.166 g). The gold concentrated from this size sample of these particular
C161 U.S. GEOL. SURVEY PROF. PAPER 600-C, PAGES C161-C163
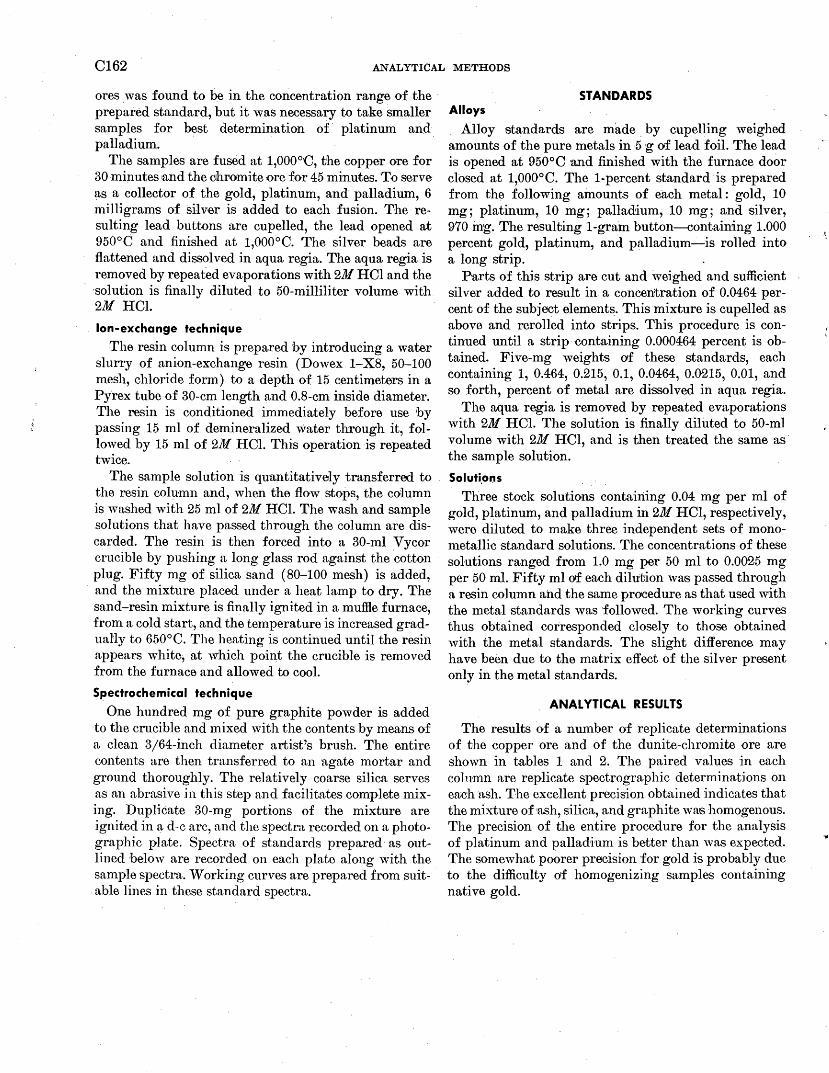
C162 ANALYTICAL METHODS
ores _was found to be in the concentration range of the prepared standard, but it was necessary to take smaller
· samples for best determination of· platinum and palladium.
The samples are fused at 1,000°C, the copper ore for 30 ·minutes 'and the c;hromite ore for 45 minutes. To serve as a collector of the gold, platinum, and· palladium, 6 milligrams of sil v·er is added to each fusion. The resulting lead buttons are cupelled, the lead opened at 950°C and finished at 1,000°0. The silver beads are flattened and dissolved in aqua regia. The aqua regia is removed by repeat.ed evaporations with 2M HCl and the ·solution is finally diluted to 50-milliliter volume with 2M HCI.
lon-exchange technique
The resin column is prepared by introducing a water slurry of anion-exchange resin (Dowex 1-X8, 50-100 mesh, chloride form) to a depth of 15 centimeters in a Py'rex tube of 30-cm length and 0.8-cm inside diameter. The resin is conditioned immediately before use by passing 15 ml of demineralized "'ater through it, followed by 15 ml of 2M HCI. This operation is repeated twice.
The sample solution is quantitatively transferred to the resin column and, when the flow stops, the column is washed with 25 ml of 2M HCI. The wash and sample solutions that have passed through the column are discarded. The resin is then forced into a 30-ml Vycor crucible by pushing a long glass rod against the cotton plug. Fifty mg of silica sand (80-100 mesh) is added, and the mixture placed under a heat lamp to dry. The sand-resin mixture is finally ignited in a muffle furnace, from a cold start, and the temperature is increased gradually to 650°C. The heating is continued until the resin appears white, at which point the crucible is removed from the furnace and allowed to cool.
Spectrochemical technique
One hundred mg of pure graphite powder is added to the crucible and mixed with the contents by means of a clean 3/64-inch diameter artist's brush. The entire contents are then transferred to an agate mortar and ground thoroughly. The relatively coarse silica serves as an abrasive in this step and facilitates complete mixing. Duplicate 30-mg portions of the mixture are ignited in a d-e arc, and the spectra recorded on a photographic plate. Spectra of standards prepared· as outlined below are recorded on each plate along with the sample spectra. Working curves are prepared from suit-. able lines in these standard spectra.
STAN·DARDS Alloys
Alloy standards are made. by cupelling weighed amounts of the pure metals in 5 g of lead foil. The lead is opened at 950°C ·and finished with the furnace door closed at 1,000°0. The 1-percent standard is prepared from the following amounts of each metal: gold, 10 mg; platinum, 10 mg; palladium, 10 mg; and silver, 970 ing. The resulting 1-gram button-containing 1.000 percent gold, platinum, and palladium-is rolled into a long strip.
Parts of this strip are cut and weighed and sufficient silver added to result in a concentration of 0.0464 percent of the subjoot elements. This ·mixture is cupelled ~s above and rerolled into strips. This procedure is continued until a strip containing 0.000464 percent is obtained. Five-mg weights of these standards, each containing 1, 0.464, 0.215, 0.1, 0.0464, 0.0215, 0.01, and so forth, percent of metal are dissolved in aqua regia.
The aqua regia is removed by repeated evaporations with 2M HCI. The solution is finally diluted to 50-ml volume with 2M HCl, and is then treated the same as· the sample solution.
Soluti.ons
Three stock solutions containing 0.04 mg per ml of gold, platinum, and palladium in 2M HCl, respectively, were diluted to make three independent sets of monometallic standard solutions. The concentrations of these solutions ranged from 1.0 mg per 50 ml to 0.0025 mg per 50 ml. Fifty ml of each dilution was passed through a resin column and the same procedure as that used with the metal standards was ·followed. The working curves thus obtained corresponded closely to those obtained with the metal standards. The slight difference may have been due to the matrix effect of the silver present only in the metal standards.
ANALYTICAL RESULTS
The results of a number of replicate determinations of the copper ore and of the dunite-chromite ore are shown in tables 1 and 2. The paired values jn each co]nmn are replicate spectrographic determinations on eruch ash. The excellent precision obtained indicates that the mixture of 'ash, silica, and graphite wrus homogenous. The precision of the entire procedure for the analysis of platinum and palladium is better than was expected. The somewhat poorer precision ·for gold is probably due to the difficulty of homogenizing samples containing native gold .
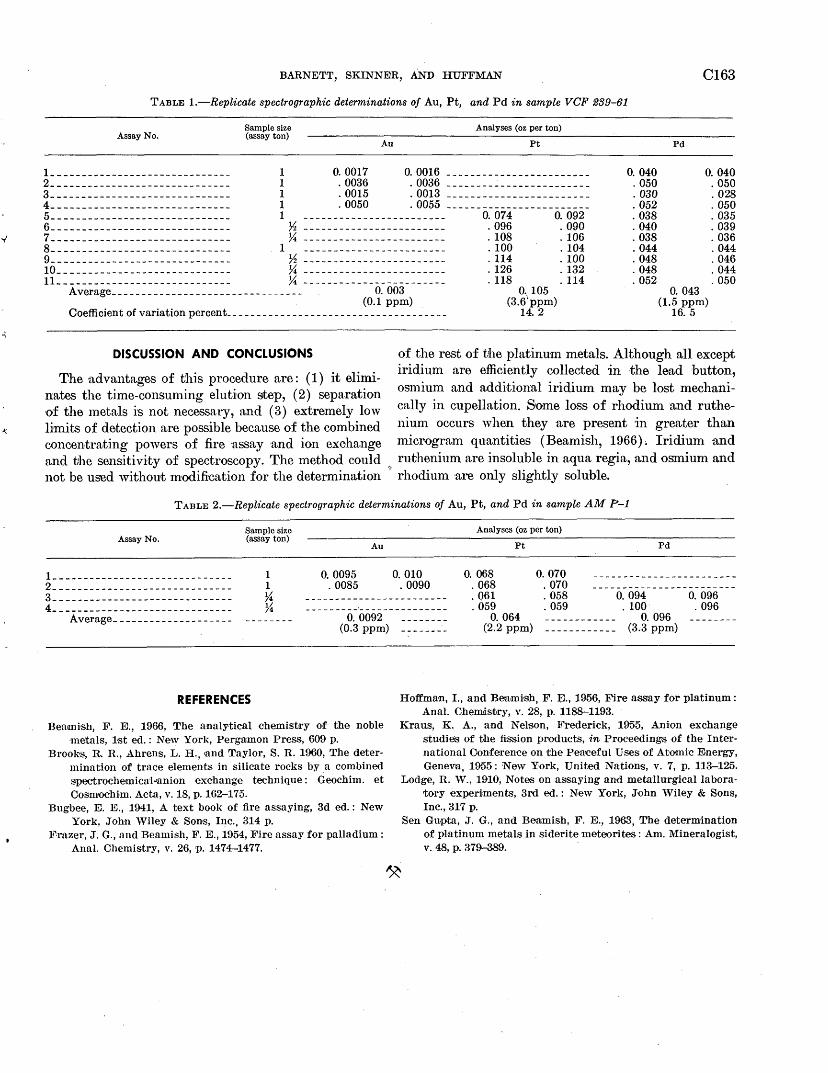
BARNETT, SKINNER, AND HUFFMAN CI63
TABLE !.-Replicate spectrographic determinations of Au, Pt, and Pd in sample VCF 239-61
Analyses (oz per ton) Assay No.
Sample size (assay ton)
Au Pt Pd
1------------------------------ 1 2------------------------------ 1 3------------------------------ 1 4------------------------------ 1 5------------------------------ 1 6------------------------------ % 1------------------------------ ~ 8------------------------------ 1 9------------------------------ ~ 10_____________________________ 7~
0. 0017 . 0036 . 0015 . 0050
0. 0016 . 0036 . 0013 . 0055
11----------------------------- 7~ ------------------------
0. 074 . 096 . 108 . 100 . 114 . 126 . 118
0. 092 . 090 . 106 . 104 . 100 . 132 . 114
0. 040 . 050 . 030 . 052 . 038 . 040 . 038 . 044 . 048 . 048 . 052
0. 040 . 050 . 028 . 050 . 035 . 039 . 036 . 044 . 046 . 044 . 050 Average _______________________________ _ 0. 003
(0.1 ppm) 0. 105
(3.6'ppm) 14. 2
0. 043 (1.5 ppm)
16. 5 Coefficient of variation percent ____________________________________ _
DISCUSSION AND CONCLUSIONS
The ·advantages of this procedure are: (1) it eliminates the time-consun1ing elution step, (2) separation of the metals is not necessary, and ( 3) extremely low limits of detection are possible because of the combined concentrating powers of fire ·assay ·and ion exchange and the sensitivity of spectroscopy. The method could not be used without modification for the determination
of the rest of the platinum metals. Although all except iridium are efficiently collected in the lead button, osmium and additional iridium may be lost mechanically in cupellation. Some loss of rhodium and ruthenium occurs when they are present in greater than microgram quantities (Beamish, 1966). Iridium and ruthenium are insoluble in aqua regia, and osmium and
~ rhodium ·are only slightly soluble.
TABLE 2.-Replicate spectrographic determinations of Au, Pt, and Pd in sample AM P-1
Assay No.
1------------------------------2 _____________________________ _
3------------------------------4 _____________________________ _
Sample size (assay ton)
1 1 ~ 7~
0. 0095 . 0085
Au
0. 010 . 0090
Analyses (oz per ton)
0. 068 . 068 . 061 . 059
Pt Pd
0. 070 ------------------------. 070 ------------------------. 058 0. 094 0. 096 . 059 . 100 . 096
Average ___________________ _ 0. 0092 -------- 0. 064 (2.2 ppm)
------------ Q 096 --------(0.3 ppm) ~------- -- _ _ _ _ _ _ _ _ _ _ (3.3 ppm)
REFERENCES
Beamish, F. E., 1966, The analytical chemistry o;f the noble metals, 1st ed.: New York, Pergamon Press, 609 p.
Brooks, R. R., Ahrens, L. H., m1d 1.'aylor, S. R. 1960, The determination of trace elements in silicate rocks by a combined spectrochemica'l .. anion exchange technique: Geochim. et Cosmochim. Acta, v. 18, p. 162-175.
Bugbee, E. E., 1941, A text book of fire assaying, 3d ed.: New York, John '.Yiley & Sons, Inc., 314 p.
:E'·razer, J. G., and Beamish, F. E., 1954, Fire assay for palladium: Anal. Chemistry, v. 26, p. 1474-1477.
Hoffman, I., and Beami·sh, F. E., 1956, Fire ass:ay for platinum: Anal. Che:mJ.stry, v. 28, p. 1188-1193.
Kraus, K. A., 'and Nelson, Frederick, 1955, Anion exchange studies of the fission pvoducts, in Proceedings of the International Oonfe:rence on the Peaceful Uses of Atomic Energy, Genevn, 1955: New York, United Nations, v. 7, p. 113-125.
Lodge, R. ,.Y., 1910, Notes on assaying and metallurgical laboratory experiments, 3rd ed.: New York, John Wiley & Sons, Inc., 317 p.
Sen Gupt.:'l, J. G., and Beamish, F. E., 1963, The determination of platinum metals in siderite meteorites: Anl. Mineralogist, v. 48, p. 379-389.
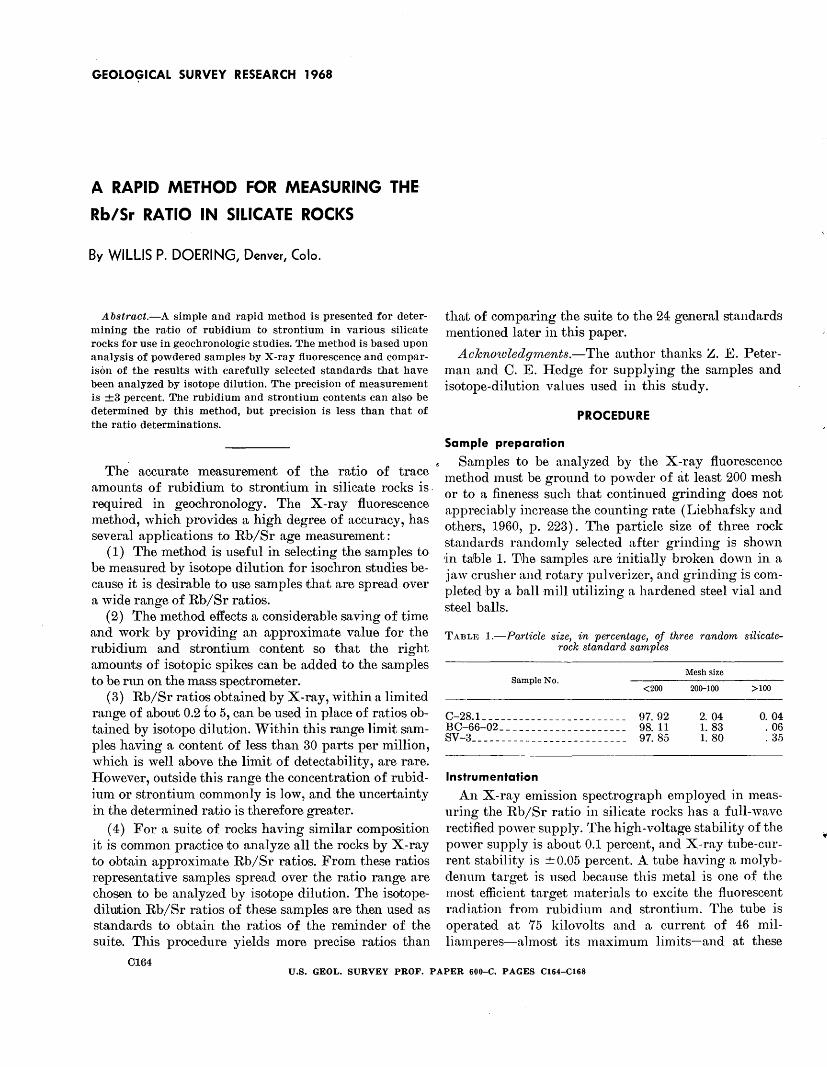
GEOLO~ICAL SURVEY RESEARCH 1968
A RAPID METHOD FOR MEASURING THE
Rb/Sr RATIO IN SILICATE ROCKS
By WILLIS P. DOERING, Denver, Colo.
Abstract.-A simple and rapid method is presented for determining the ra.tio of rubidium to strontium in various silicate rocks for use in geochronologic studies. The method is based upon analysis of powdered samples by X-ray fluorescence and comparison of the results with carefully selected standards that have been analyzed by isotope dilution. The precision of measurement is ±3 percent. The rubidium and strontium contents can also be determined by this method, but precision is less than that of the ratio determinations.
The accurate measurement of the ratio of trace amounts of rubidium to strontium in silicate rocks is. required in geochronology. The X-ray fluorescence 1nethod, which provides a high degree of accuracy, has several applications to Rb/Sr age measurement :
(1) The method is useful in selecting the samples to be measured by isotope dilution for isochron studies because it is desirable to use samples that are spread over a wide range of Rb/Sr ratios.
(2) The method effects a considerable saving of time and work by providing an approximate value for the rubidium and strontium content so that the right amounts of isotopic spikes can be added to the samples to be rtm on the mass spectrometer.
(3) Rb/Sr ratios obtained by X-ray, within a limited range of about 0.2 to 5, can be used in place of ratios obtained by isotope dilution. Within this ra.nge limit sa.mples having a content of less than 30 parts per million, which is well above the limit of detectability, are rare. However, outside this range the concentration of rubidium or strontium commonly is low, and the uncertainty in the determined ratio is therefore greater.
( 4) For a suite of rocks having similar composition it is common practice to analyze all the rocks by X-ray to obtain approximate Rb/Sr ratios. From these ratios representative samples spread over the ratio range are chosen to be analyzed by isotope dilution. The isotopediluJtion Rb/Sr ratios of these samples are then used as standards to obtain the ratios of the reminder of the suite. This procedure yields more precise ratios than
0164
tha;t of comparing the suite to the 24 general standards mentioned later in this paper.
Acknowledgnwnts.-The author thanks h. E. Peterman and C. E. Hedge for supplying the samples and isotope-dilution values used in this study.
PROCEDURE
Sample preparation
Samples to be analyzed by the X-ray fluorescence method must be ground to powder of at least 200 mesh or to a fineness such that continued grinding does not appreciably increase the counting rate (Liebhafsky and others, 1960, p. 223) . The particle size of three rock standards randomly selected after grinding is shown in table 1. The samples are initially broken down in a jaw crusher and rotary ·pulverizer, and grinding is completed by a hall mill utilizing a hardened steel vial and steel balls.
TABLE 1.-Particle size, in percentage, of three random silicaterock standard samples
Sample No. <200
C-28. L _ _ _ _ _ _ _ _ _ _ _ _ _ _ _ _ _ _ _ _ _ _ _ 97. 92 BC-66-02 _____________________ 98.11 SV-3__ _ __ _ _ _ _ _ _ __ _ _ _ _ _ _ _ _ _ _ _ _ _ 97. 85
Instrumentation
Mesh size
20Q-100
2. 04 1. 83 1. 80
>100
0. 04 . 06 . 35
An X-ray emission spectrograph employed in measuring the Rb/Sr ratio in silicate rocks has a full-wave rectified power supply. The high-voltage stability of the power supply is about 0.1 percent, and X-ray tube-current stability is ± 0.05 percent. A tube having a molybdenum target is used because this metal is one of the most efficient target materials to excite the fluorescent radiation from rubidium and strontium. The tube is operated at 75 kilovolts and a current of 46 milliamperes-almost its maximum limits-and at these
U.S. GEOL. SURVEY PROF. PAPER 600-C, PAGES C164-C168
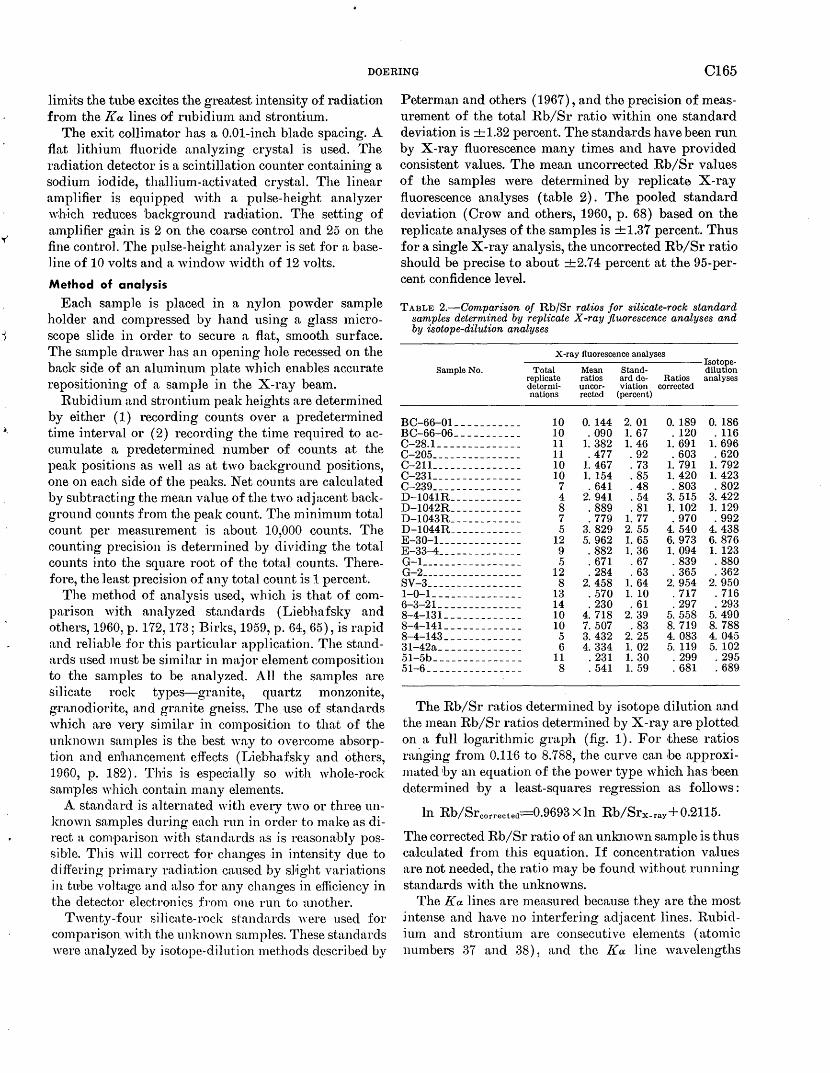
DOERING C165
limits the tube excites the greatest intensity of radiation from the l{a lines of rubidiun1 and strontium.
The exit collimator has a 0.01-inch blade spacing. A flat lithium fluoride analyzing crystal is used. The radiation detector is a scintillation counter containing a sodium iodide, thallium-activated crystal. The linear amplifier is equipped with a pulse-height analyzer which reduces background radiation. The setting of a.mplifier gain is 2 on the coarse control and 25 on the fine control. The pulse-height analyzer is set for a baseline of 10 volts and a window width of 12 volts.
Method of analysis
Each sample is placed in a nylon powder sample holder and compressed by hand using a glass microscope slide in order to secure a flat, smooth surface. The sample drawer has an opening hole recessed on the back side of an aluminum plate which enables accurate repositioning of a sample in the X-ray beam.
Rubidium and strontium peak heights are determined by either (1) recording counts over a predetermined time interval or (2) recording the time required to accumulate a predetel'lnined number of counts at the peak positions as well as at two background positions, one on each side of the peaks. Net counts are calculated by subtracting the mean value of the two adjacent background counts from the peak count. The minimum total count per measurement is about 10,000 counts. The counting precision is determined by dividing the total counts into the square root of the total counts. TherAfore, the least precision of any total count is 1 percent.
The method of analysis used, which is that of comparison with analyzed standards (Liebhafsky and others, 1960, p. 172, 173; Birks, 1959, p. 64, 65), is rapid and reliable for this particular application. The standards used must be similar in major element composition to the samples to be analyzed. All the samples are silicate rock types-granite, quartz monzonite, granodiorite, and granite gneiss. The use of standards which are very similar in composition to that of the unknown samples is the best way to overcome absorption and enhancement effects (Liebhafsky and others, 19'60, p. 182). This is especially so with whole-rock samples which contain many elements.
A standard is alternated with every two or three unknown samples during each run in order to make as direct a comparison with standards as is reasonably possible. This will correct ·for changes .in intensity due to differing primary radiation caused by sHght variations in tube voltage and also for any changes in efficiency in the detector electronics from one run to another.
Twenty-four silicate-rock standards were used for comparison with the unknown samples. These standards were analyzed by isotope-dilution methods described by
Peterman and others (1967), and the precision of measurement of the total Rb/Sr ratio within one standard deviation is +1.32 percent. The standards have been run by X-ray fluorescence many times and have provided consistent values. The mean uncorrected Rb/Sr values of the samples were determined by replicate X-ray fluorescence analyses (table 2). The pooled standard deviation (Crow and others, 1960, p. 68) based on the replicate analyses of the samples is +1.37 percent. Thus for a single X-ray analysis, the uncorrected Rb/Sr ratio should be precise to about +2.74 percent at the 95-percent confidence level.
TABLE 2.-Comparison of Rb/Sr ratios for silicate-rock standard samples determined by replicate X-ray fluorescence analyses and by isotope-dilution analyses
X-ray fluorescence analyses Isotope-
Sample No. Total Mean Stand- dilution replicate ratios ard de- Ratios analyses determi- uncor- viation corrected nations rected (percent)
BC-66-0L __________ 10 0. 144 2. 01 0. 189 0. 186 B C-66-06 ___________ 10 . 090 1. 67 . 120 . 116 C-28.1 ______________ 11 1. 382 1. 46 1. 691 1. 696 C-205 _______________ 11 . 477 . 92 . 603 . 620 C-211 _______________ 10 1. 467 . 73 1. 791 1. 792 C-231 _______________ 10 1. 154 . 85 1. 420 1. 423 C-239 _______________ 7 . 641 . 48 . 803 . 802 I>-1041R ____________ 4 2. 941 . 54 3. 515 3.422 I>-1042R ____________ 8 . 889 . 81 1. 102 1. 129 I>-1043R ____________ 7 . 779 1. 77 . 970 . 992 I>-1044R ____________ 5 3. 829 2. 55 4. 540 4.438 E-30-1 ______________ 12 5. 962 1. 65 6. 973 6. 876 E-33-4 ______________ 9 . 882 1. 36 1. 094 1. 123 G-1 _________________ 5 . 671 . 67 . 839 . 880 G-2 _________________ 12 . 284 . 63 . 365 . 362 SV-3 ________________ 8 2. 458 1. 64 2. 954 2. 950 1-0-1 _______________ 13 . 570 1. 10 . 717 . 716 6-3-21 ______________ 14 . 230 . 61 . 297 . 293 8-4-131 _____________ 10 4. 718 2. 39 5. 558 5. 490 8-4-141 _____________ 10 7. 507 . 83 8. 719 8. 788 8-4-143 _____________ 5 3. 432 2. 25 4. 083 4. 045 31-42a ______________ 6 4. 334 1. 02 5. 119 5. 102 51-5b _______________ 11 . 231 1. 30 . 299 . 295 51-6 ________________ 8 . 541 1. 59 . 681 . 689
The Rb/Sr ratios determined by isotope dilution and the mean Rb/Sr ratios determined by X-ray are plotted on a full logarithmic graph (fig. 1). For ·these ratios rruiging from 0.116 to 8.788, the curve can be approximated by an equation of the power type which has been determined by a least-squares regression as follows :
ln Rb/Sr corrected=0.9693 X ln Rb/Srx-ray + 0.2115.
The corrected Rb/Sr ratio of an unla10wn sample is thus calculated from this equation. If concentration values are not needed, the ratio may be found without running standards with the unknowns.
The K a lines are measured because they are the most intense and have no interfering adjacent lines. Rubidium and strontium are consecutive elements ( n.tomic numbers 37 and 38) , and the K a line wavelengths
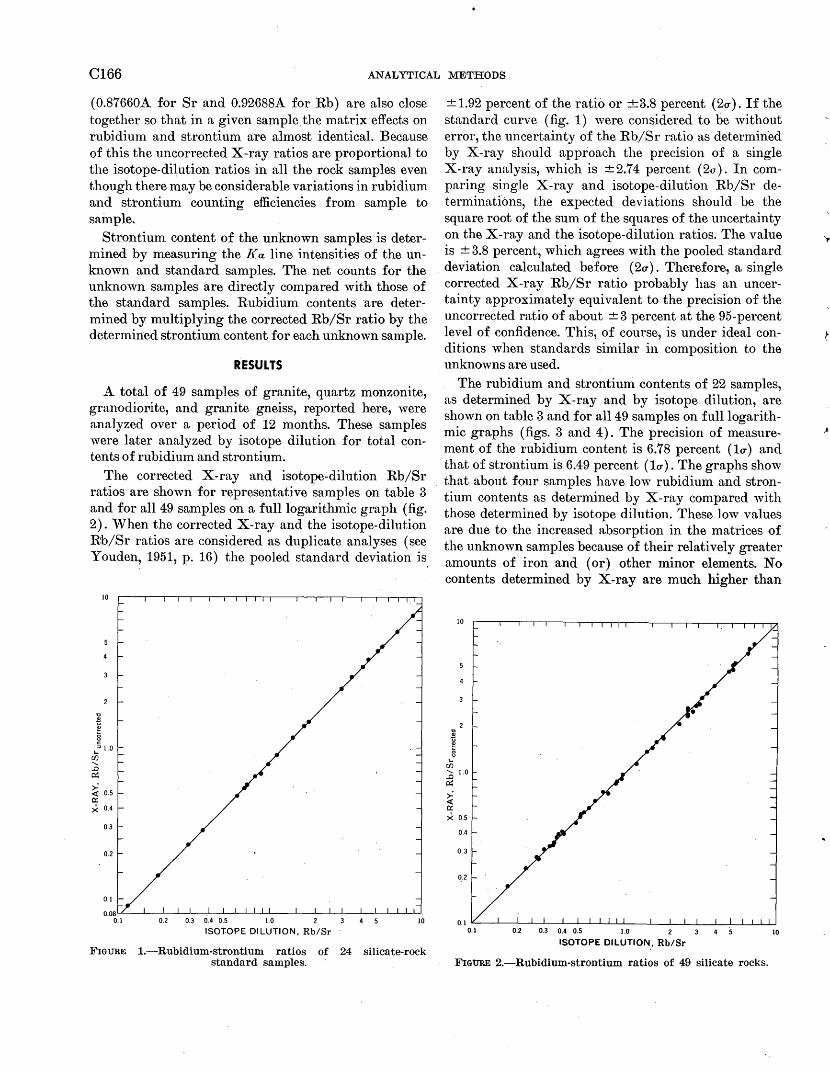
C166 ANALYTICAL METHODS
( 0.87660A for Sr and 0.92688A for Rb) are also close together so that in a given samplethe matrix effects on rubidium and strontium are almost identical. Because of this the uncorrected X-ray ratios are proportional to the isotope-dilution ratios in all the rock samples even though there may be considerable variations in rubidium and strontium counting efficiencies from sample to sample.
Strontium content of the unknown samples is determined by measuring the /{a line intensities of the unknown and standard samples. The net counts for the unknown samples are directly compared with those of the standard samples. Rubidium contents are determined by multiplying the corrected Rb/Sr ratio by the determined strontium content for each unknown sample.
RESULTS
A total of 49 samples of granite, quartz monzonite, granodiol'lite, and granite gneiss, reported here, were analyzed over a period of i2 months. These samples were later analyzed by isotope dilution for total contents of rubidium and strontium.
The corrected X-ray and isotope~dilution Rb/Sr ratios are shown for representative samples on table 3 and for all49 samples on a full logarithmic gra.ph (fig. 2). When the corrected X-ray and the isotope-dilution Rb/Sr ratios are considered as duplicate analyses (see Youden, 1951, p. 16) the pooled standard deviation is.
"0
Q)
0
r::
10
::1 1.0
'"' rfJ ...... ..c ~
~ 0.5 0:: x o.4
0.3
0.2
0.1
FIGURE
0.2 0.3 0.4 0.5 1.0 2
ISOTOPE 01 LUTION, Rb/Sr
1.-Rubidium-strontium ratios of 24 standard samples.
4 5 10
silicate-rock
± 1.92 percent of the ratio or +3.8 percent (2u). If the standard curve (fig. 1) were considered to be without error, the uncertainty of the RQ/Sr ratio as determin-ed by X-ray should approach the precision of a single X-ray analysis, which is ±2.74 percent (2a). In comparing single X-ray and isotope-dilution Rb/Sr determinations, the expected deviations should be the square root of the sum of the squares of the uncertainty on the X-ray and the isotope-dilution ratios. The value is ± 3.8 percent, which agrees with the pooled standard deviation calculated before (2u). Therefore, a single corrected X-ray Rb/Sr ratio probably has an uncertainty approximately equivalent to the precision of the uncorrected ratio of about ± 3 percent at the 95-percent level of confidence. This; of course, is under ideal conditions when standards similar in composition to the unknowns are used.
The rubidium and strontium contents of 22 samples, as determined by X-ray and by isotope dilution, are shown on table 3 and for all49 samples on full logarithmic graphs (figs. 3 and 4). The precision of measurement of the rubidium content is 6.78 percent ( lu) and that of strontium is 6.49 percent ( 1u). The graphs show that about four samples have low rubidium and strontium contents as determined by X-ray compared with those determined by isotope dilution. These low values are due to the increased absorption in the matrices of the unknown samples because of their relatively greater amounts of iron and (or) other minor elements. No contents determined by X-ray are much higher than
"0 Q)
~ 8
'"' rfJ
10
...... 1.0 ..c ~
> <( 0:: x o.5
0.4
0.3
0.2
0.2 0.3 0.4 0.5 1.0 2 4 5 ISOTOPE DILUTION, Rb/Sr
FIGURE 2.-Rubidium-strontium ratios of 49 silicate rocks.
10
).
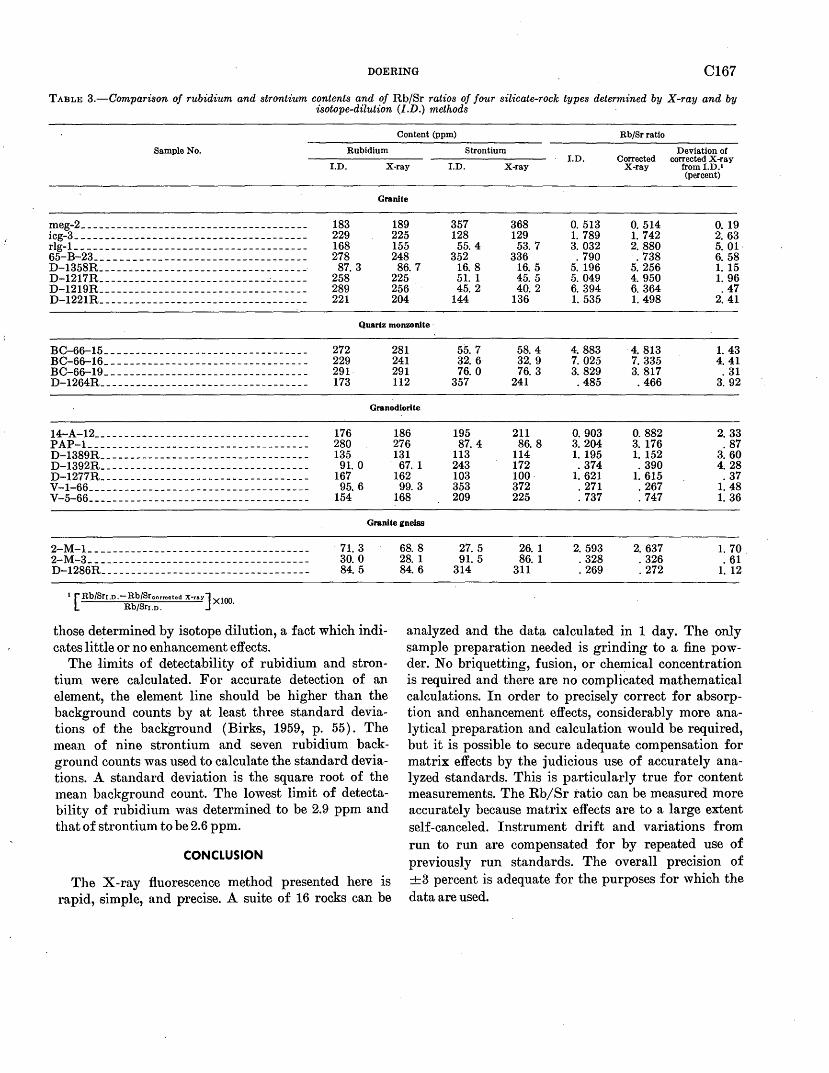
DOERING C167
TABLE 3.-Comparison of rubidium and strontium contents and of Rb/Sr ratios of four silicate-rock types determined by X-ray and by isotope-dilution (J.D.) methods
Content (ppm) Rb/Sr ratio
Rubidium Strontium Deviation of J.D. Corrected corrected X-ray
Sample No.
I. D. X-ray J.D. X-ray X-ray from J.D.' (percent)
Granite
~:~i~====================================== rlg-1---------------------------------------65-B-23 __________________________________ _
I>-1358R-----------------------------------I>-1217R----------------------------~------I>-1219R----------------------------------I>-1221R---------------------------~-------
183 229 168 278 87. 3
258 289 221
189 357 225 128 155 55. 4 248 352 86. 7 16. 8
225 51. 1 256 45. 2 204 144
368 0. 513 0. 514 0. 19 129 1. 789 1. 742 2. 63 53.7 3. 032 2. 880 5. 01·
336 . 790 .. 738 6. 58 16. 5 5. 196 5. 256 1. 15 45.5 5. 049 4. 950 1. 96 40. 2 6. 394 6. 364 . 47
136 1. 535 1. 498 2. 41
Quartz monzonite
BC-66-15---------------------------------- 272 281 55.7 58. 4 4. 883 4. 813 1. 43 BC-66-16 _________________________________ _ 229 241 32.6 32.9 7. 025 7. 335 4.41 BC-66-19---------------------------------- 291 291 76. 0 76.3 3. 829 3. 817 . 31 I>-1264R----------------------------------- 173 112 357 241 . 485 . 466 3. 92
Granodiorite
14-A-12------------------------------------p AP-1 ____ - - - _ - - - - - - - - - - - - - - - - - - - - - - - - - - - - -I>-1389R-----------------------------------I>-1392R __________________________________ _
I>-1277R-----------------------------------V-1-66------------------------------------V-5-66-------------------------------------
176 280 135
91. 0 167 95.6
154
186 195 276 87. 4 131 113 67. 1 243
162 103 99. 3 353
168 209
211 0. 903 0. 882 2. 33 86. 8 3. 204 3. 176 . 87
114 1. 195 1. 152 3. 60 172 . 374 . 390 4. 28 100. 1. 621 1. 615 . 37 372 . 271 . 267 1. 48 225 . 737 . 747 1. 36
Granite gneiss
2-~-1 ____________________________________ _ . 71. 3 2-~-3------------------------------------- 30. 0 I>-1286R----------------------------------- 84. 5
I [Rb/Srr.o.-Rb/Srenrreeted X-ray] XlOO. Rb/Srr.o.
those determined by isotope dilution, a fact which indicates little or no enhancement effects.
The limits of detectability of rubidium and strontium were calculated. For accurate detection of an element, the element line should be higher than the background counts by at least three standard deviations of the background (Birks, 1959, p. 55). The mean of nine strontium and seven rubidium background counts was used to calculate the standard deviations. A standard deviation is the square root of the mean background count. The lowest limit of detectability of rubidium was determined to be 2.9 ppm and that of strontium to be 2.6 ppm.
CONCLUSION
The X-ray fluorescence method presented here is rapid, simple, and precise. A suite of 16 rocks can be
68. 8 27.5 26. 1 2. 593 2. 637 1. 70 28. 1 91. 5 86. 1 . 328 . 326 . 61 84.6 314 311 . 269 . 272 1. 12
analyzed and the data calculated in 1 day. The only sample preparation needed is grinding to a fine powder. No briquetting, fusion, or chemical concentration is required and there are no complicated mathematical calculations. In order to precisely correct for absorption and enhancement effects, considerably more analytical preparation and calculation would be required, but it is possible to secure adequate compensation for matrix effects by the judicious use of accurately analyzed standards. This is particularly true for content measurements. The Rb/Sr ratio can be measured more accurately because matrix effects are to a large extent self -canceled. Instrument drift and variations from run to run are compensated for by repeated use of previously run standards. The overall precision of +3 percent is adequate for the purposes for which the data are used.
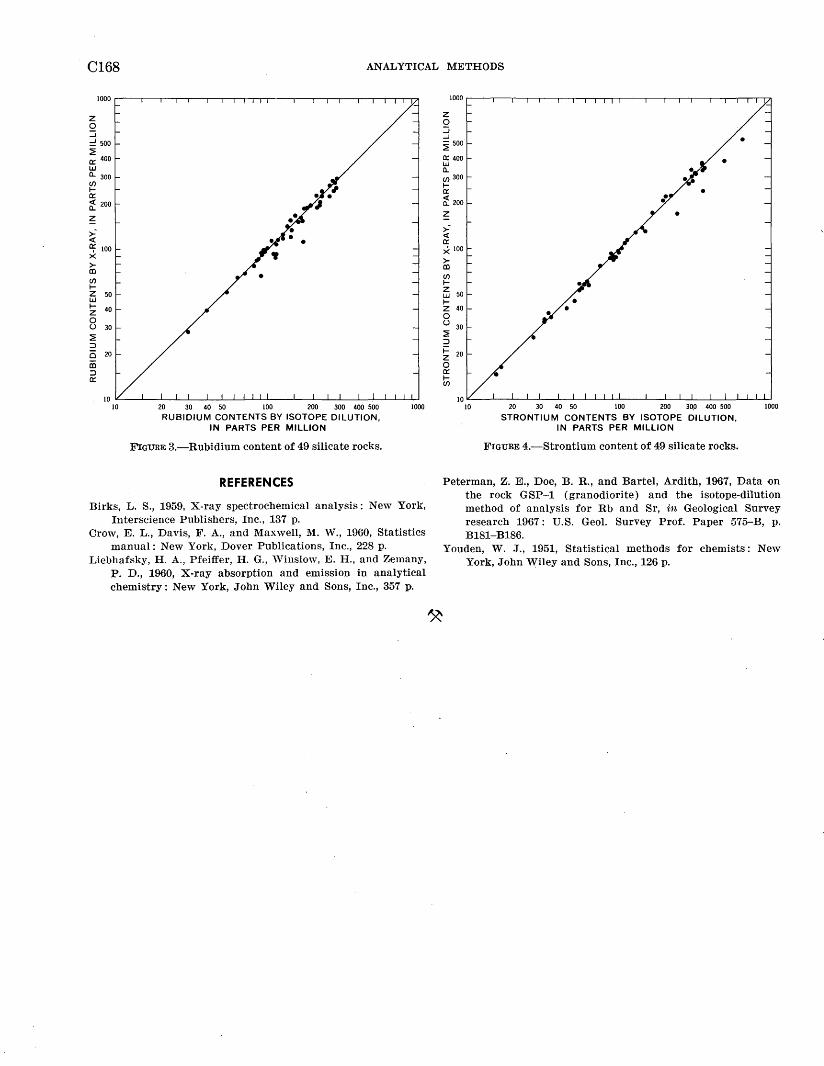
C168
1000
z 0 :::::i = 500 :2 a:: 400 UJ
a.. 300 en 1-a:: ~ 200
z
>=" <(
o;: 100 X >-co en 1-z UJ 1-z 0 u :2 :::> 0 iii :::> a::
ANALYTICAL
20 30 40 50 100 200 300 400 500
RUBIDIUM CONTENTS BY ISOTOPE DILUTION, IN PARTS PER MILLION
FIGURE 3.-Rubidium content of 49 silicate rocks.
REFERENCES
1000
Birks, L. S., 1959, X-ray spectrochemical analysis: New York, Interscience Publishers, Inc., 137 p.
Crow, E. L., Davis, F. A., and Maxwell, M. ,V., 1960, Statistics manual: New York, Dover Publications, Inc., 228 p.
Liebhafsky, H. A., Pfeiffer, H. G., "rinslow, E. H., and Zemany, P. D., 1960, X-ray absorption and emission in analytical chemistry: New York, John Wiley and Sons, Inc., 357 p.
METHODS
1000
z 0 :::::i ...J ~ 500
a:: 400 UJ a.. en 3oo 1-a:: ~ 200
~ >-" <( a:: x 1oo
>-co en 1-z UJ 50 1-z 40 0 u
30 :2 :::> i= z 20
0 a:: 1-en
20 30 40 50 100 200 30,0 400 500
STRONTIUM CONTENTS BY ISOTOPE DILUTION, IN PARTS PER MILLION
FIGURE 4.-Strontium content of 49 silicate rocks.
1000
Peterman, Z. E., Doe, B. R., and Bartel, Ardith, 1967, Data on the rock GSP-1 (granodiorite) and the isotope-dilution method of analysis for Rb and Sr, in Geological Survey research 1967: U.S. Geol. Survey Prof. Paper 575-B, p. B181-B186.
Youden, W. J., 1951, Statistical methods for chemists: New York, John Wiley and Sons, Inc., 126 p.
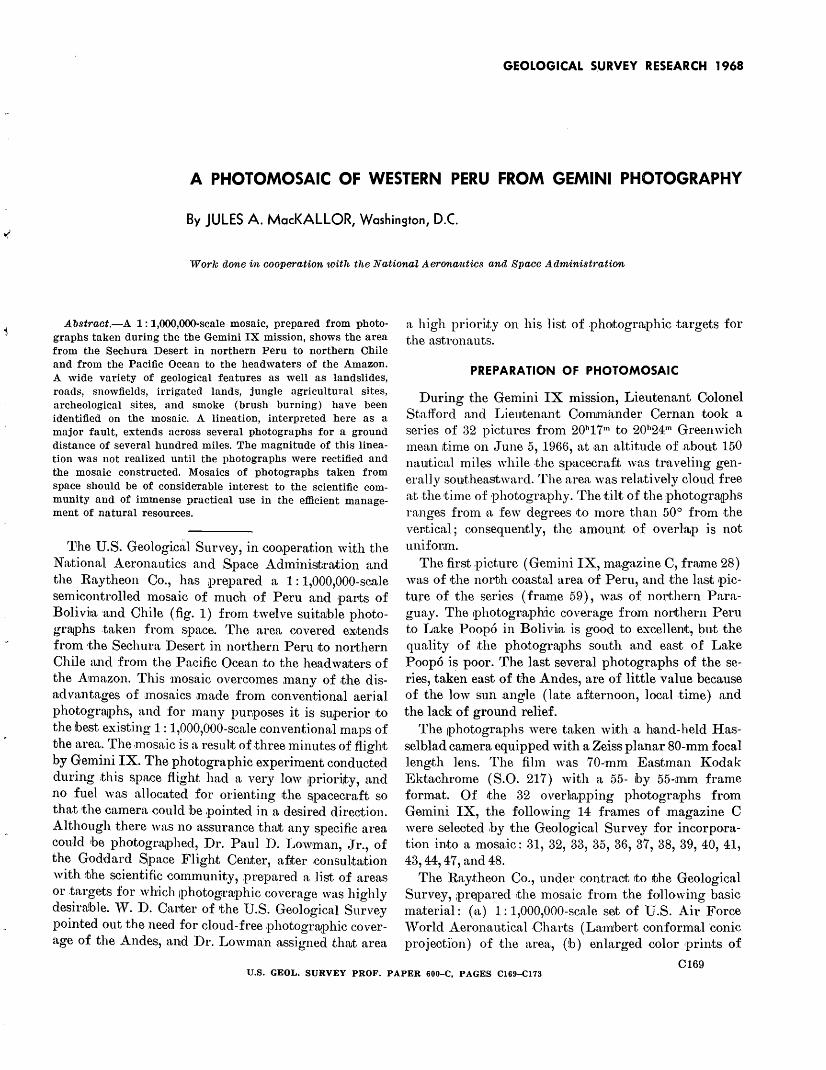
GEOLOGICAL S.URVEY RESEARCH 1968
A PHOTOMOSAIC OF WESTERN PERU FROM GEMINI PHOTOGRAPHY
By JULES A. MacKALLOR, Washington, D.C.
Work done in cooperation with the National Aeronautics and Space Administration
Abstract.-A 1: 1,000,()()()-scale mosaic, prepared from photographs taken during the the Gemini IX mission, shows the area from the Sechura Desert in northern Peru to northern Chile and from the Pacific Ocean to the headwaters of the Amazon. A wide variety of geological features as well as landslides, roads, snowfields, irrigated lands, jungle agricultural sites, archeological sites, and smoke (brush burning) have been identified on the mosaic. A lineation, interpreted here as a major fault, extends across several photographs for a ground distance of several hundred miles. The magnitude of this lineation was not realized until the photographs were rectified and the mosaic constructed. Mosaics of photographs taken from space should be of considerable interest to the scientific community and of immense practical use in the efficient management of natural resources.
The U.S. Geological Survey, in cooperation with the N~ttional Aeronautics and Space Administration and the Raytheon Co., has ;prepared a 1 : 1,000,000-scale semicontrolled mosaic of much of Peru and parts of Bolivi1a and Chile (fig. 1) from twelve sui1truble pho.togr~phs .taken from space. The area covered extends from -the Sechura Desert in northern Peru to northern Chile and from the Pacific Ocean to the head waters of the .A..1mazon. This ·mosaic overcomes .many of .the disad vantages of :mosaics made from conventional aerial photogrUiphs, and for many ptmposes it is superior to the 1best existing 1 : 1,000,000-scale conventional maps of the area. The .mosaic is a result of three minutes of flight by Gemini IX. The photographic experiment conducted during this space flight had a very low tprior~ty, .and no fuel was allocated for orienting the Slpacecraft so that the camera could :be .pointed in .a desired direction. Although there was no assurance thaJt any specific area could be photognljphed, Dr. Paul D. Lowman, Jr., of the Goddard Space Flight Center, .after constll.tation with t1he scientific community, .prepared a list of areas or targets for which 1photogrruphic coverage was highly desira!ble. '""· D. Carter of the U.S. Geological Survey pointed out the need for cloud-free .photogr~phic coverage of the Andes, and Dr. Lowman .assigned .thrut area
a high priority on his list of .photogrruphic .targets for the astronauts.
PREPARATION OF PHOTOMOSAIC
During the Gemini IX mission, Lieutenant Oolonel Stafford and LieUitenant Comm~lnder Cernan took a series of 32 pietures from 20h17m to 201124m Greenwich mean itime on June 5, 1966, at .an altitude of .about 150 naUJtical miles w·hile .the spacecraft was tvaveling generally southeastward. The area was reln,tively cloud free at the time of ·photography. The tilt of the ;photogra1l_)hs ranges from ,a few degrees ~to more than 50° from the ver.tical; consequellJtly, the amount of overlap is not uniform.
The first .picture (Gemini IX, magazine C, frrume 28) was of the north coastal area of Peru, and .the last picture of the series ( frUJme 59), w.as of northern Paraguay. The 1photogr.aphic coverage from northern Peru to Lake Poop6 in Boliv~a is good to excellent, but the quality of ,the photogrruphs south and east of Lake Poop6 is poor. The last several photographs of the series, taken east of the Andes, are of little value because of the low sun .angle (late afternoon, looal .time) and the lack of ground relief.
The !Photographs were taken wi!th .a hand-held Hasselblad camera equipped with a Zeiss planar 80-mm focal leng:th lens. The film was 70-·mm Eastman l{odak Ektachrome ( S.O. 217) with a 55- iby 55-anrn frame format. Of ~the 32 overlapping photogra·phs from Gemini IX, the following 14 fvames of magazine C were selooted by the Geological Survey for incorporation into a mosaic: 31, 32, 33, 35, 36, 37, 38, 39, 40, 41, 43, 44, 47, and 48.
The Raytheon Co., under contract to !the Geological Survey, ;prt>jpared the mosaic from the following basic material: (,a,) 1: 1,000,000-scale set of U.S. Air Force 'Vorld Aeronautical Charts (Lam:bert conformal ·conic projection) of the area, (!b) enlarged color ~prints of
0169 U.S. GEOL. SURVEY PROF. PAPER 600-C, PAGES Cl69-Cl73
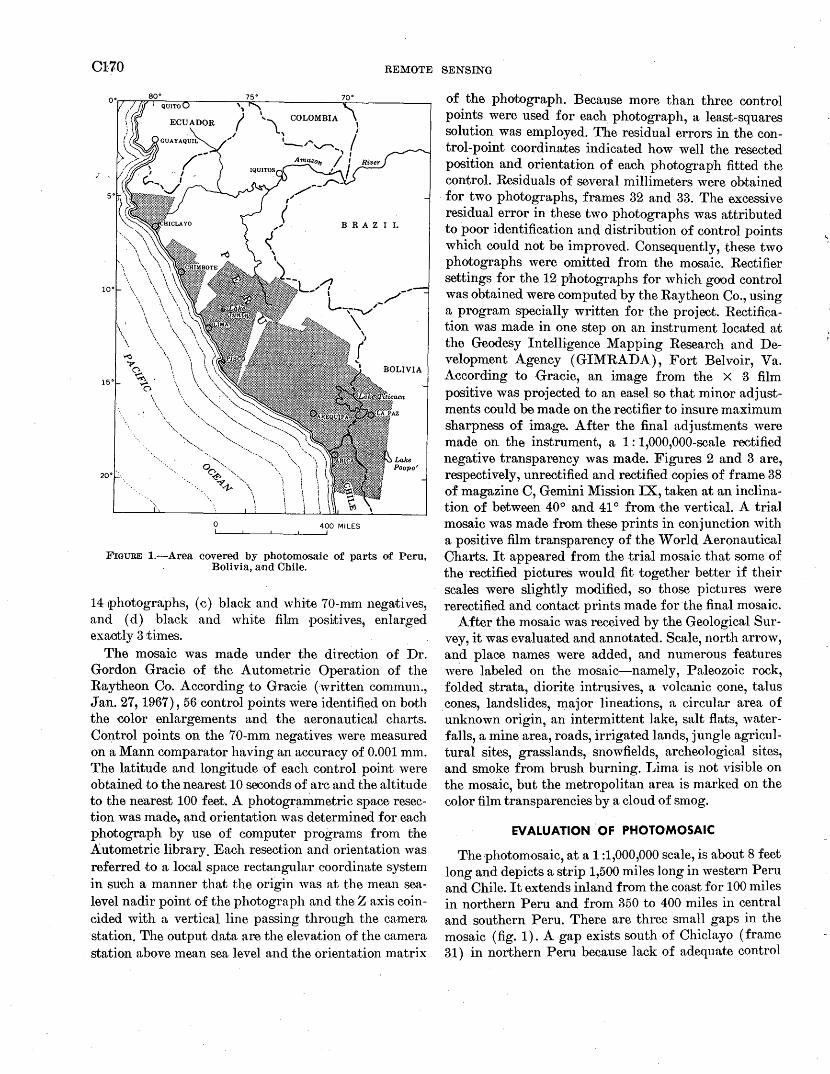
C170 REMOTE SENSING
0 400 MILES
FIGURE 1.-Area covered by photomOSiaic of parts of Peru, Bolivia, and Chile.
14 1photographs, (c) black and white 70-mm negatives, and (d) black and white film positives, enlarged exacltly 3 times.
The mosaic was made under the direction of Dr. Gordon Gracie of the Autometric Operation of the Raytheon Co. According to Gracie (written commun., Jan. 27, 1967), 56 control points were identified on both the ·color enlargements and the aeronautical charts. Control points on the 70-mm negatives were measured on a Mann comparator having an accuracy of 0.001 mm. The latitude ·and longitude of each control point were obtained to the nearest 10 seconds of arc and the altitude to the nearest 100 feet. A photogrammetric space resection was made, and orientation was determined for each photograph by use of computer programs from the Autometric library. Each resection and orientation was referred .to a local space rectangular coordinate system in such a manner that the origin was at the. mean sealevel nadir point of the photograph and the Z axis coincided with a vertical line passing through the camera station. The output data are the elevUJtion of the camera station above mean sea level and the orientation matrix
of the photograph. Because more than three control points were used for each photograph, a least-squares solution was employed. The residual errors in the control-point coordinates indicated how well the resected position and orientation of each photograph fitted the control. Residuals of several millimeters were obtained for two photographs, frames 32 and 33. The excessive residual error in these two photographs was attributed to poor identification and distribution of control points which could not be improved. Consequently, these two photographs were omitted from the mosaic. Rectifier settings for the 12 photographs for which good control was obtained were computed by the Raytheon Co., using a program specially written for the projoot. Rectification was made in one step on an instrument located at the Geodesy Intelligence Mapping Research and Development Agency (GIMRADA), Fort Belvoir, Va. According to ·Gracie, an image from the X ·3 film positive was projected to an easel so that minor adjustments could be made on the rectifier to insure maximum sharpness of image. After the final adjustments were made on the instrument, a 1 : 1,000,000-scale rectified negative transparency was made. Figures 2 and 3 are, respectively, unrootified and rectified copies of frame 38 of magazine C, Gemini Mission IX, taken at an inclination of between 40° and 41° from the vertical. A trial mosaic was made from these prints in conjunction with a positive film transparency of the World Aeronautical Charts. It appeared from the trial mosaic that some of the rectified pictureS would fit together better if their scales were slightly modified, so those pictures were rerectified and contact prints made for the final mosaic.
After the mosaic was received by the Geological Survey, it was evaluated and annotated. Scale, north arrow, and place names were added, and numerous features were labeled on the mosaic-namely, Paleozoic rock, folded strata, diorite intrusives, a volcanic cone, talus . cones, landslides, major lineations, a circular area of unknown origin, an intermittent lake,· salt flats, waterfalls, a mine area, roads, irrigated lands, jungle agricultural sites, grasslands, snowfields, archeological sites, and smoke from brush burning. Lima is not visible on the mosaic, but the metropolitan area is marked on the color film transparencies by a cloud of smog.
EVALUATION OF PHOTOMOSAIC
The photomosaic, at a 1 :1,000,000 scale, is about 8 feet long and depicts a strip 1,500 miles long in western Peru and Chile. It extends inland from the coast for 100 miles in northern Peru and from 350 to 400 miles in central and southern Peru. There are three small gaps in the mosaic (fig. 1). A gap exists south of Chiclayo (frame 31) in northern Peru because lack of adequate control
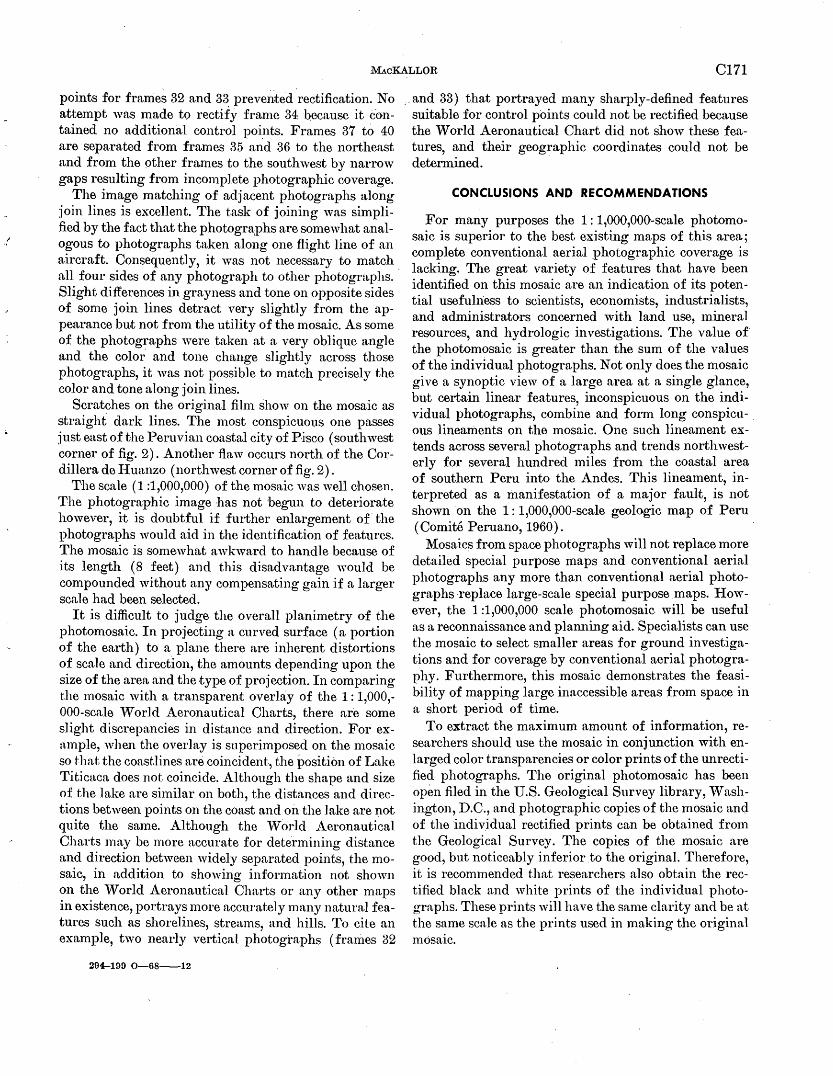
MAcKALLOR CI71
points for frames 32 and 33 preve1~ted rectification. No attempt was made to rectify frame 34 because it c'ontained no additional control points. Frames 37 to 40 are separated from frames 35 m~d 36 to the northeast and from the other frames to the southwest by narrow gaps resulting from incomplete photographic coverage.
The image matching of adjacent photographs along join lines is excellent. The task of joining was simplified by the fact that the photogra,phs are somewhat analogous to photographs taken along one flight line of an aircraft. Consequently, it was not necessary to match all four sides of any photograph to other photographs. · Slight differences in grayness and tone on opposite sides of some join lines detract very slightly from the appearance but not from the utility of the mosaic. As some of the photographs were taken at a very oblique angle and the color and tone change slightly across those photographs, it was not possible to match precisely the color and tone along join lines.
Scratches on the original fihn show on the mosaic as straight dark lines. The n1ost conspicuous one passes just east of the Peruvian coastal city of P.isco (southwest corner of fig. 2). Another flaw occurs north of the Cordillera de Huanzo (northwest corner of fig. 2).
The scale ( 1 :1,000,000) of the mosaic was well 0hosen. The photographic image has not 'begun to deteriorate however, it is doubtful if further enlargement of the photographs would aid in the identification of features. The mosaic is somewhat awkward to handle because of its length (8 feet) and this disadvantage would be compounded without any compensating gain if a larger scale had been selected.
It is difficult to judge the overall planimetry of the photomosaic. In projecting a curved surface (a portion of the earth) to a plane there are inherent distortions of scale and direction, the amounts depending upon the size of the area and the type of projection. In comparing the mosaic with a transparent overlay of the 1 : 1,000,-000-scale 'Vorld Aeronautical Charts, there are some slight discrepancies in distance and direction. For exn.mple, when the overlay is superimposed on the mosaic so that the coastlines are coincident, the position of Lake Titicaca does not coincide. Although the shape and size of the lake are similar on both, the distances and directions between points on the coast and on the lake are not quite the smne. Although the World Aeronautical Charts may be more accurate for dete-rmining distance and direction between widely separated points, the mosaic, in addition to showing information not shown on the World Aeronautical Charts or any other maps in existence, portrays more accurately many natural features such as shorelines, streams, and hills. To cite an example, two nearly vertical photographs ( fran1es 32
294-199 0--68----12
.·and 33) that portrayed many sharply-defined features suitable for control points could not be rectified because the World Aeronautical Chart did not show these features, and their geographic coordinates could not be determined.
CONCLUSIONS AND RECOMMENDATIONS
For many purposes the 1 : 1,000,000-scale photomosaic is superior to the best existing maps of this area; complete conventional aerial ,photographic coverage is lacking. The great variety of features that have been identified on this mosaic are an indication of its potential usefulness to scientists, economists, industrialists, and administrators concerned with land use, mineral resources, and hydrologic investigations. The value of the photomosaic is greater than the sum of the values of the individual photographs. Not only does the mosaic give a synoptic view of a large area at a single glance, but certain linear features, inconspicuous on the individual photographs, combine and form long conspicu-. ous lineaments on the mosaic. One such lineament extends across several photographs and trends northwesterly for several hundred miles from the coastal area of southern Peru into the Andes. This lineament, interpreted as a manifestation of a major fault, is not shown on the 1: 1,000,000-scale geologic map of Peru (Co mite Peruano, 1960).
Mosaics from space photographs will not replace more detailed special purpose maps and conventional aerial photographs any more than conventional aerial photographs -replace large-scale special purpose maps. However, the 1:1,000,000 scale photomosaic. will be useful as a reconnaissance and planning aid. Specialists can use the mosaic to select smaller areas for ground investigations and for coverage by conventional aerial photography. Furthermore, this mosaic demonstrates the feasibility of mapping large inaccessible areas from space in a short period of time.
To extract the maximum amount of information, researc.hers should use the mosaic in conjunction with enlarged color transparencies or color prints of the unrectified photographs. The original photomosaic has been open filed in the U.S. Geological Survey library, Washington, D.C., and photographic copies of the mosaic and of the individual rectified prints can be obtained from the Geological Survey. The copies of the mosaic are good, but noticeably inferior to the original. Therefore, it is recommended that researchers also obtain the rectified black and white prints of the individual photographs. These prints will have the same clarity and be at the same scale as the prints used in making the original mosaic.
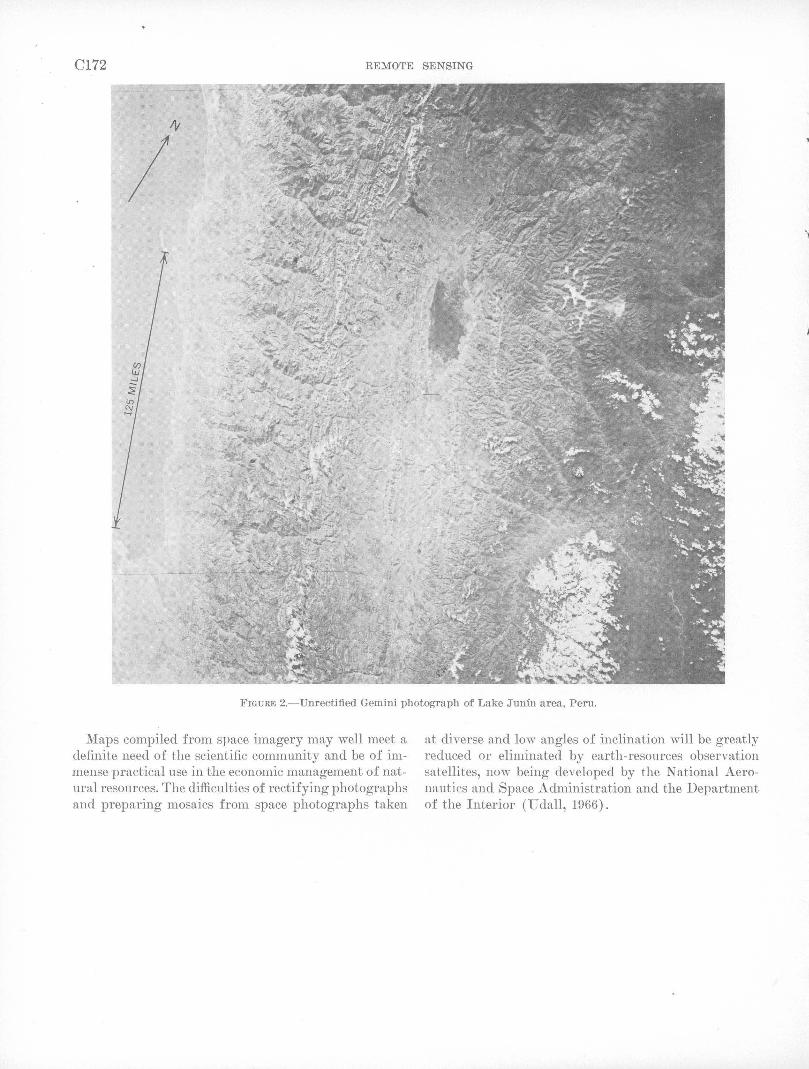
C172 REMOTE SENSING
IV
I
FIGURE 2.-Unrectified Gemini photograph of Lake Junfn area, Peru.
Maps compiled from space imagery may well meet a definite need of the scientific community and be of immense practical use in the economic management of natural resources. The difficulties of rectifying photographs and preparing mosaics from space photographs taken
at diverse and low angles of inclination will be greatly reduced or eliminated by earth-resources observation satellites, no\\· being developed by the National Aeronautics and Space Administration and the Department of the Interior (Udall, 1966).
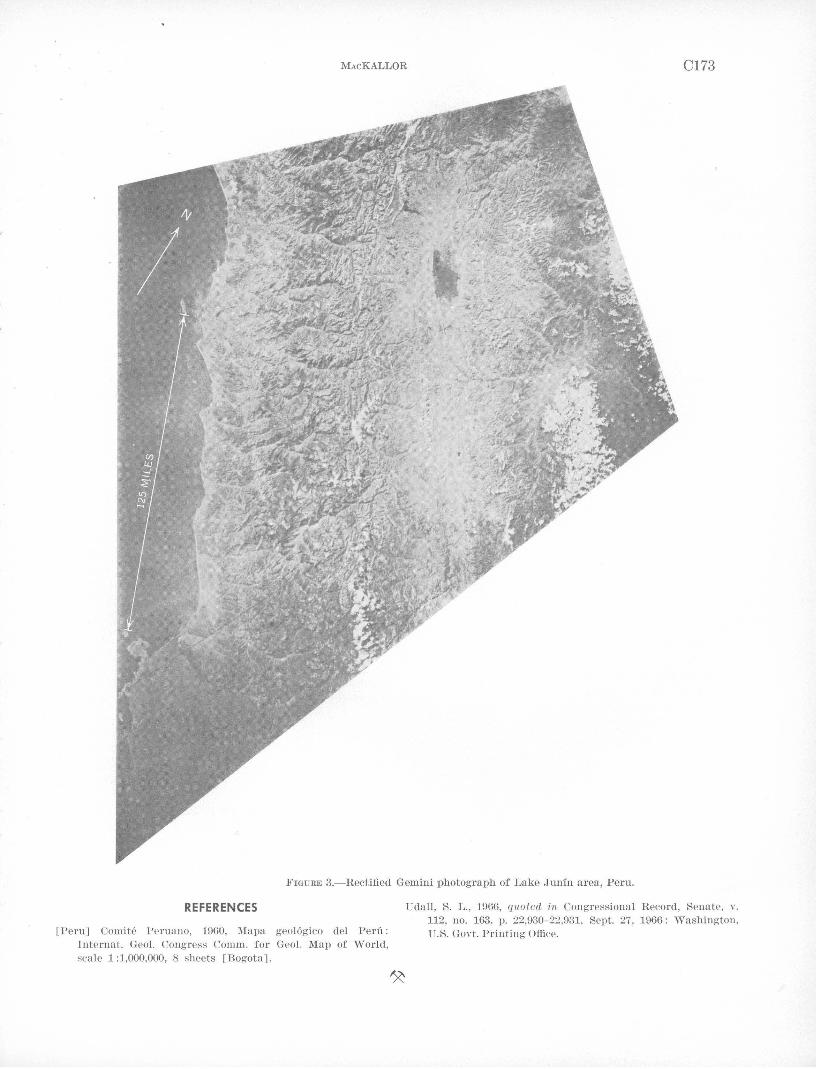
MAcKALLOR C173
FIGURE 3.-Rectified Gemini photograph of Lake Jun:in area, Peru.
REFERENCES
[Peru] Comite l'eruano, 1960, Mapa geologico del l'erf1: Internat. Geol. Congress Comm. for Geol. Map of World, scale 1 :1,000,000, 8 sheets [Bogota].
Udall , S. L., 1966, quoted in Congressional Record, Senate, v. 112, no. 163, p. 22,930-22,931. Sept. 27, 1966: Washington, U.S. Govt. Printing Office.
GEOLOGICAL SURVEY RESEARCH 1968
DETERMINATION OF RECTANGULAR COORDINATES
FOR MAP PROJE'CTIONS-MODIFICATION OF BASIC FORMULAS
AND APPLICATION TO COMPUTER PLOTTING
By DONALD PLOUFF, Menlo Park, Calif.
A.bstract.-The automa'tic plotting of geographic looa.tious 1by me.:'ln!s ·of a comrputer-plotter combination iis considera;bly faster, costs leSJS, and is less subject to error than hand methods. The basic map formulas used with the polyconic, the universal transve·rse Mercator, the Lambert conformal conic, 13.nd the Albe·rs equal-area projections, the four principal map projections used in the United States, a1re revised to forms applicable to both hand and computer methods.
Modern computers 'and associated automatic plotting machines make possible the calculation and plotting of <Yeographic locations at rates far exceeding the pro-
o . . ductivity of hand methods. The use of automatic pmnt plotting on stable-base material provides -an accuracy comparable to that of hand methods but with less chance for human error.
In hand methods, geographic coordinates are converted to rectangular -coordinates :by using desk calculator operations on numbers obta.ined from tabulated v·alues such as sines, cosines, logarithms, ·and geodetic distances. 'Jlhe formulas used are modifications of the original map projection formulas compatible with the desk calculator and tabulation approach. The speed of calculation can be increased with consequent loss in accuracy by carrying fewer significant figures ·and by omitting certain small corrective terms in the formulas.
In computer methods the original map-projection formulas may be used. The speed of calculation can be increased~and the cost reduced--hy using approximation formulas consistent with the precision needed in the final map. If the limiting ·accuracy needed on a map is, for example, the distance corresponding to the width of the finest line on the mU~p, all terms tha.t contribute values less than this distance can he dropped. For a line width of 0.002 inch, the corresponding map distance is 3.2 meters a.t a map scale of 1 : 62,500.
The advantage of the computer is not so much in the
accuracy of the result as it is in the speed and cost of the result. The cost of plotting on an automUJtic plotting machine often exceeds that of the computer calculations. But the computer can be used not only to provide the format needed for communication with the automatic plotter but ~also to n1inimize time on the plotter by sorting the random points to be plotted into an arrangement that minimizes the total pen movement among the· points to be plotted. Card punching, which .is an additional stage in comparison with the number of stages required by hand methods, does not occur in most applications, inasmuch as cards related to data collect~d at the point to be plotted generally are already a vallable for another computational purpose:
Maps based on four types of projection are most commonly used in the United Strutes. The polyconic projection· is commonly used for quadrangle maps at scales of 1 : 24,000 to 1 : 125,000 that cover map widths of 7~ to 30 minutes. The transverse Mercator projection is used for a number of State maps and for a series of 1° by 2° maps at a sooJe of 1: 250,000 that covers the COI~terminous United States. The Lambert conformal conic projection is used for oa number of 8tate m•aps usually at scales of 1:500,000 or 1:1,000,000. A commonly used map of Russia at a scale of l: 8,000,000 also uses the conform1a.l conic projection. The Albers equal:-area projection is used for the most oommon map of the conterminous United States at scales of 1:2,500,000 or less.
a ________ _
b~--------
DEFINITION OF SYMBOLS USED
radius of earth at equator (6,378,206.4 m for Clarke spheroid of 1866 and 6,377,-397.2 m for Bessel spheroid of 1841)
radius of earth at pole (6,356,583.8 m for Clarke spheroid and 6,356,079.0 m. for Bessel spheroid)
C174 U.S. GEOL. SURVEY PROF. PAPER 600-C,_ PAGES C174-C176_
PLOUFF C175
e2 _______ _
c/>, x_------
flcp _______ _
flX _______ _ Q ________ _ s ________ _ Cc--------Sc----- - - - -M _______ _
Q ________ _ x ________ _
Y---------
square of the earth's eccentricity (0.006768658 for Clarke spheroid and 0.0066743'(2 for the Bessel spheroid)
latitude and longitude of point to be plotted
latitude and longitude of arbitrary point related to map to be plotted
cp- <Pc, in radians (llc/>0 expressed in degrees)
Xc- X, in radians cos cp sin cp COS c/>c sin cl>c length, in meters, of a degree of the
meridian at a latitude c/>m =~ (<P+<Pc). The value of M = 111,132.09-566.05 COS (2 c/>m)+1.20 COS (4cJ>m) =111,-699.34-1,141.70 cos2 <Pm+9.60 cos4
cl>m (U.S. Coast and Geodetic Survey, 1935)
scale of map east-west coordinate, in meters, of point
to be plotted; value increases to east; location usually relative to arbitrary map point (c/>c, Ac)
north-south coordinate of point, in meters; value increases to north.
DERIVATION OF FORMULAS
Polyconic proiecfi.on
From U.S. Coast and GeodeticSurvey (1935), x=QL sine, and
where
aO L 'and
S.J1-e2S 2
e=S(llX). For an accuracy of 0.4 m on a 30-minute map,
X=Qa(llX)[Cc-Sc(llcp) + ~e2Sc2 0c], and y= Q[(flcp0
) (111,699.34-1,141. 700c2 +9.600c4)
+ 72a(llX) 2Sc0c] . . For a given map, all terms except llX, tlcp, and ~cp0 are constant.
Transverse Mercator· proiection
Formulas for the transverse Mercator projection are given by Thomas (1952, p. 2). After modifying the original formulas,
x=0.9996 QG(llX)O [1 + 1/602(llX)2(1-T2+ E02)
+ 1 ~0 04(~X) 4(5-18T2+ T4 + 14E02-58ES2) ]' and
y=O. 9996Q{ M(llc/>0 )+ G(llX)20S[1/2+ 1/24(llX)20 2(5-T2
+9E02+4E20 4)+ 1/72004(llX)4(61-58T2+ T 4
+.270E02-33ES2)]},
where
T=S/0, e2
E=-1
- 2=0.006814784 for the ·Clarke spheroid, and -e
For an accuracy of 13.6 m on a map with a north-south dimension less than 1.6°,
x=0.9996QG(llX) [Oc-Sc(llcp)], and
y 0.9996Q{ (llc/>0) [111,699.34+(1141.70
-9. 600c 2)( S cOc{tlcp)- Oc 2) ]+ 1/2G( flX )28 cOc } ,
where
Conformal conic proiection
From Adams (1918), the projection using two standard parallels cp8 and <Pn is given by
where
· x= QR sin (LllX), and y= -QR cos (LllX),
C176 CARTOGRAPHIC TECHNIQUES
Ss=sin ¢ 8 ,
Gs=COS ¢s,
Sn=sin ¢n, and Gn=cos ¢n·
The Clarke spheroid is used in the United States. Standard la.titudes are 33° and 45° (Adan1s, 1918). The quantity L~0.6305. Standard parallels for the map of Russia (Bessel spheroid of 1841) are 46° and 63°. The value L=0.81719369 is calculated.
Albers equal-area projection
From Adams ( 1927) the projection using two standard parallels is given by
x=Qp sin (Nd'A), and
y=-Qp cos (N d'A),
where
p=a~ Jv{ N(l ~·;'8,') + 2[1-e'][ 8,-8 +2/3e2( 8,' -8')
+3/5e'(8,'-8')] }• and
Os2 Gn2
N 1-e2S 82 1-e2Sn2
2[1-e2][Sn-Ss+ 2/3e2(Sn3-S83)+3/5e4(Sn5-S8
5))
Standard parallels commonly used for the United States map are 29.5° and 45.5°. The value N =0.6029035 is calculated.
REFERENCES
Adams, 0. S., 1918, Lambert projection tables for the United States: U.S. Coast and Geod. Survey Spec. Pub. 52, 243 p.
--1927, Tables for Albers projection: U.S. Coaslt and ·Geod. Survey Spec. Pub. 130, 24 p.
'l'homas, P. D., 1952, Conformal projections in geodesy and cartography: U.S. Coast and Geod. Survey Spec. Pub. 251, 142p.
United Sta.tes Coast and Geodetic Survey, 1935, Tables: for a polyconic projection of maps and lengths of terrestrial arcs of meridian and parallels: U.S. Coast and Geod. Survey Spec. Pub. 5, 6th ed., 189 p.
GEOLOGICAL SURVEY RESEARCH 1968
"CUT -AND-TRY" METHOD FOR LOCATING
DISTANT GEOLOGIC FEATURES ON TOPOGRAPHIC MAPS
By R. L. SUTTON, Flagstaff, Ariz.
Abstract.-ln areas of sloping terrain, the "cut-and-try" method enables rapid and accurate location of distant points by one person using planetnule and telescopic alidade. Sight rays through the points are drawn on a topographic map mounted on an accm\'ltely positioned pla.neta.ble. The dis.t:ances to the po·ints are determined by use of ( 1) the measured vertical angles of the lines of sight to the points, and (2) the differences, on the map, of elevations IJetween the points and' the alidade. These quantities applied as tangent functions provide actual and scalar distances of the points from the alidade. Accuracy within a quarter of the contour interval can be attained by a careful operato·r.
The ability to determine the position and elevation of a distant point on a topographic map is useful in geologic mapping. The principle of remote location from a single known point was described by .Varnes and others (1959). The graphic method and the mathematical solution by trial and error have been used by some geologists, but the "cut-and-try" planetable method has not, to the author's knowledge, been described in detail in the literature.
Briefly, the object is to determine and plot the point at which a line of sight from a known point intersects the ground surface portrayed by topographic contour lines. The method is especially convenient for locating features on steep or hard-to-reach hillsides. The procedure is rapid and accurate and can be performed without the assistance of a rodman.
A map distance between the planetable and distant point must be selected so that the contour elevation on the map matcl1es the oomput.ed elevation at that distance along the line of sight. The proper map distance can be selected by a graphic method or by trigonometric computation. The trigonometric computation, which has been ca11ed "cut-and-try," is simple: the tangent of the vertical angle of the sight ray defines the slope of the ray, or the change in elevation along the sight ray with horizontal distance. Thus, the point at which the sight ray intersects the ground is the point of agreement between elevation on the -ray and the contour elevation
indicated on the map. This is an advantage because geologic contacts are generally refered to topographic elevations, even where the position of topographic contour lines is slightly inaccurate. Topographic accuracy is discussed further on in this paper.
The solution by computation is more accurate than the graphic method described by Varnes, Finnell, and Post, and it enables in1mediate evaluation of the results. In the discussion which follows, all directional sightings and vertical angles are assumed to be made by telescopic alidade. Other sighting instruments can he used depending upon precision requirements.
METHOD
The procedure for using the cut-and-try method is as follows: 1. Mount the topographic map on the planetruble. If
available, use a map printed on scale-stable material. Choice of map scale is not significant, although distances are most easily measured if the scale of the straightedge matches that of the map.
2. Set up, locate, and orient the planetable, preferably at a reliable map control point and known elevation. If this is not feasible, location, orientation, and elevation can be determined by resection.
3. With the map oriented, make a foresight to the distant feature of interest (for example, a fot~ma
tional contact exposed on a hillside). ·Draw the sight ray on the map. It should be long enough to pass through the approximate location of the feature. Commonly, several geologic features may be located along the same ray.
4. Carefully determine the vertical angle between the alidade and the distant feature. Find the tangent of the angle. A void using angles larger than about 5o, if possible, even if this necessitates moving the planetable in order to shoot longer distances.
C177 U.S. GEOL. SURVEY PROF. PAPER 600-C, PAGES Cl77-C181
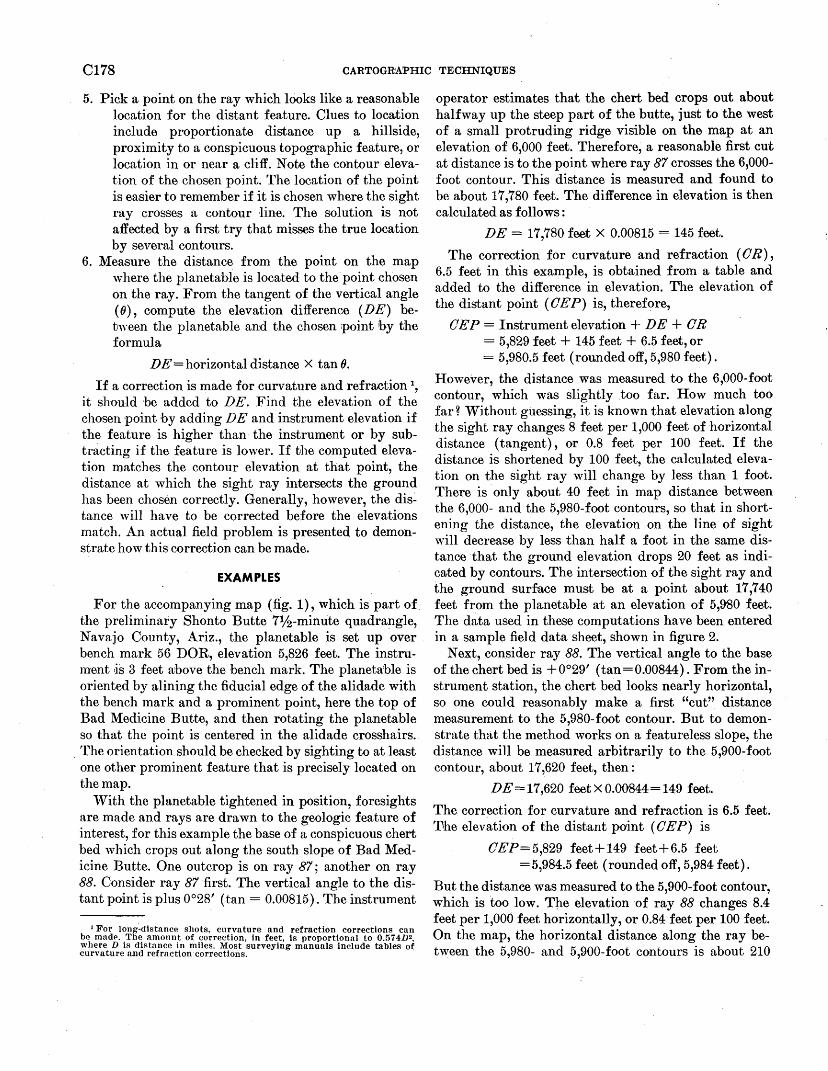
C178 CARTOGR'APHIC TECHNIQUES
5. Pick a point on the ray which looks like a reasonable location for the distant feature. Clues to location include proportionate distance up a hillside, proximity to a conspicuous topographic feature, or location in or near a cliff. Note the contour elevation of the chosen point. The location of the point is easier to remember if it is chosen where the sight ray crosses a contour Iine. The solution is not affected by a first try that misses the true location by several contours.
6. Measure the distance from the point on the map where the planetahle is located to the point chosen on the ray. From the tangent of the vertical angle ( 8), compute the elevation difference (DE) betnveen the planetable and the chosen point lby the formula
DE=horizontal distance X tan 8.
If a correction is made for curvature and refraction \ it should be added to DE. Find the elevation of the chosen 'Point by adding DE and instrument elevation if the feature is higher than· the instrument or by subtracting if the feature is lower. If the computed elevation matches the contour elevation at that point, the distance at which the sight ray intersects the ground has been chosen correctly. Generally, however, the dis~ tance will have to be corrected before the elevations match. An actual field problem is presented to. demonstrate how this correction can be made.
EXAMPLES
For the accompanying map (fig. 1), which is part of. the preliminary Shonto Butte 7lj2-minU:te quadrangle, Navajo County, Ariz., the planetable is set up over bench mark 56 DOR, elevation 5,826 feet. The instruInent :is 3 feet ahove the bench mark. The planetahle is oriented by alining the fiducial edge of the alidade with the bench mark and a prominent point, here the top of Bad Medicine Butte, and then rotating the planetable so that the point is centered in the alidade crosshairs.
. The orientation should be checked by sighting to at least one other prominent feature that is precisely located on the map.
With the planetable tightened in position, foresights are made and rays are drawn to the geologic feature of interest, for this example the base of a conspicuous chert bed which crops out along the south slope of Bad Medicine Butte. One outcrop is on ray 87; another on ray 88. Consider ray 87 first. The vertical angle to the distant point is plus 0°28' (tan = 0.00815 ). The instrument
1 For long;-distance shots, curvature and refraction corrections can be madP. The amount of correction, in feet, is proportional to 0.574D2 where D is distance in miles. Most surveying manuals include tables of curvature and refraction corrections.
operator estimates that the chert bed crops out about halfway up the steep part of the butte, just to the west of a small protruding ridge visible on the map at an elevation of 6,000 feet. Therefore, a reasonable first cut at distance is to the point where ray 87 crosses the 6,000-foot contour. This distance is measured and found to be about 17,780 feet. The difference in elevation is then calculated as follows :
DE= 17,780 feet X 0.00815 = 145 feet.
The correction for curvature and refraction ( 0 R), 6.5 feet in this example, is obtained from a table and added to the difference in elevation. The elevation of the distant point ( 0 E P) is, therefore,
0 E P = Instrument elevation + DE + 0 R = 5,829 feet + 145 feet + 6.5 feet, or = 5,980.5 feet (rounded off, 5,980 feet) .
However, the distance was measured to the 6,000-foot contour, which was slightly too far. How much too far~ Without guessing, it is known that elevation along the sight ray changes 8 feet per 1,000 feet of horizontal distance (tangent), or 0.8 feet per 100 feet. If the distance is shortened by 100 feet, the calculated elevation on the sight ray will change by less than 1 foot. There is only about 40 feet in map distance between the 6,000- and the 5,980-foot contours, so that in shortening the distance, the elevation on the line of sight ·will decrease by less than half a foot in the same distance that the ground elevation drops 20 feet as indicated by contours. The intersection of the sight ray and the ground surface must be at a point about 17,7 40 feet from the planetable at an elevation of 5,980 feet. The data used in these computations have been entered in a sample field data sheet, shown in figure 2.
Next, consider ray 88. The vertical angle to the base of the chert bed is +0°29' (tan=0.00844). From the instrument station, the chert bed looks nearly horizontal, so one could reasonably make a first "cut" distance measurement to the 5,980-foot contour. But to demonstrate that the method works on a featureless slope, the distance will be measured arbitrarily to the 5,900-foot contour, about 17,620 feet, then:
DE=17,620 feet X 0.00844=149 feet.
The correction for curvature and refraction is 6.5 feet. 'Dhe elevation of the distant point ( OEP) is
OEP=5,829 feet+149 feet+6.5 feet = 5,984.5 feet (rounded off, 5,984 feet).
But the distance was measured to the 5,900-foot contour, which is too low. TP.e elevation of ray 88 changes 8.4 feet per 1,000 feet horizontally, or 0.84 feet per 100 feet. On the map, the horizontal distance along the ray between the 5,980- and 5,900-foot contours is about 210
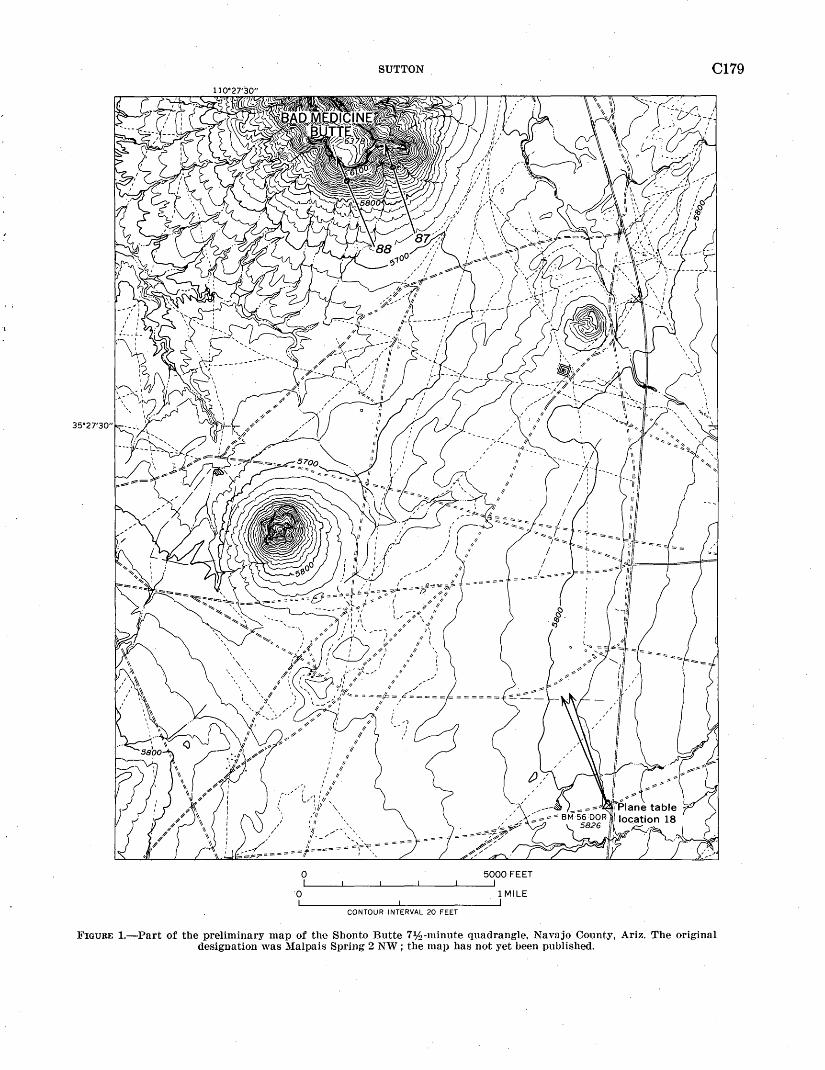
SUTTON
35"27'30"
II It
I 1/ ,' It
I 1/
,.,#,"' : ,l /Itt; \.J \i:' '\
/II \ 1/f ',
~~~ .. _/ ........... ','','
/== == = =i= =:== ·= = ~':~~'~ = ="'
0
0
CONTOUR INTERVAL 20 FEET
5000 FEET
1 MILE
C179
1!-,IOURE 1.-Part of the preliminary map of the Shonto Butte 7%-minute quadrangle, Navajo County, Ariz. The original designation was Malpais Spring 2 NW; the map has not yet ueen puulished.
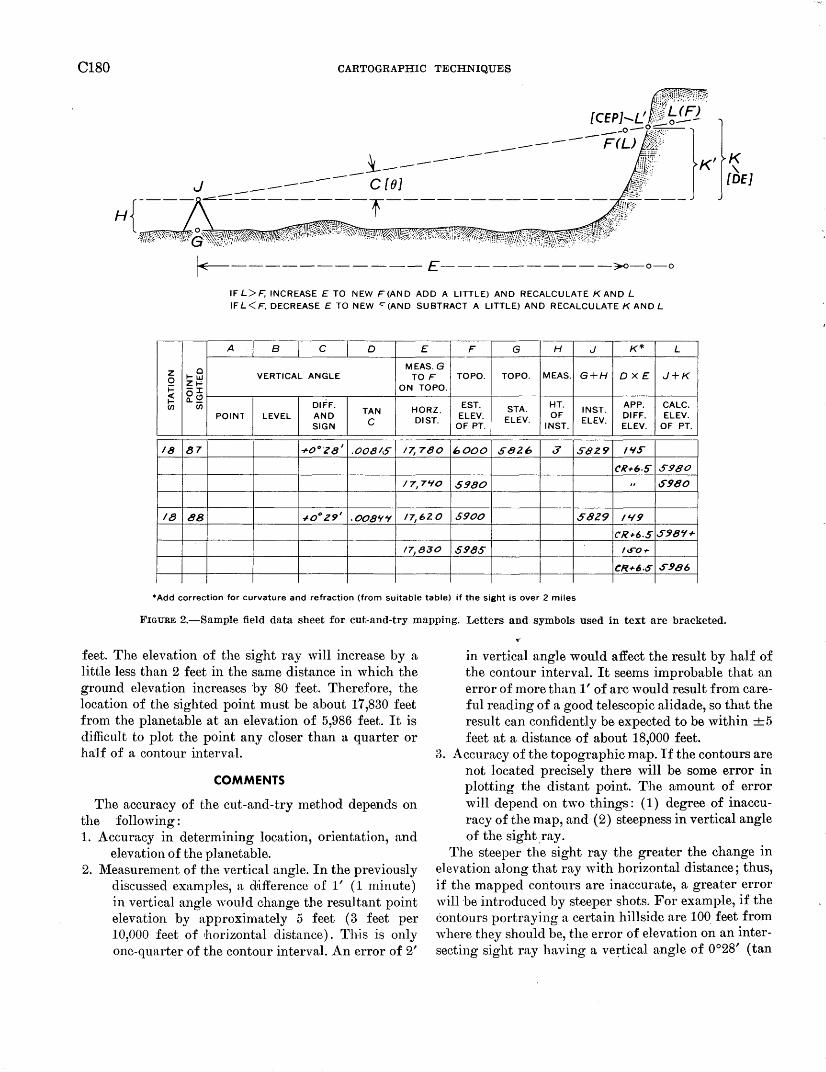
C180 CARTOGRA'PHIC TECHNIQUES
~----------- £----------:;.<>-o-o
IF L>F, INCREASE E TO NEW F(AND ADD A LITTLE) AND RECALCULATE K AND L IFL<F. DECREASE E TO NEW '="(AND SUBTRACT A LITTLE) AND RECALCULATE K AND L
A B c D E F G H J K* L
0 MEAS. G z VERTICAL ANGLE TO F TOPO. TOPO. MEAS. G+H OX£ J+K 0 1-LI..I
Zl-'-f= -:r ON TOPO.
0(!) <( ..... a.._
DIFF. EST. HT. APP. CALC. rn rn HORZ. STA. IN ST. POINl LEVEL AND TAN ELEV. OF DIFF. ELEV.
SIGN c DIST. OF PT.
ELEV. IN ST.
ELEV. ELEV. OF PT.
18 137 +0°.Z8' .00816" 17, 780 /:,000 SB26 .3' 58Z9 !'IS"
CR+6·5" S980
I 7, 7Lf0 .5980 " 6980
18 88 ~oo zg' -008'1'"1 17,62 0 5900 5829 1'-19
CR+6.S .5!78'1+
17,830 5985 I<S"O+
CR+6.$ S"!J86
*Add correction for curvature and refraction (from suitable table) if the sight is over 2 miles
FIGURE 2.-Sample field data sheet for cut-and-try mapping. Letters and symbols used in text are bracketed.
feet. The elevation of the sight ray will increase by a little less than 2 feet in the same distance in which the ground elevation increases by 80 feet. Therefore, the location of the sighted point must be about 17,830 feet from the planetable at an elevation of 5,986 feet. It is difficult to plot the point any closer than a quarter or ha'lf of a contour interval.
COMMENTS
The accuracy of the cut-and-try method depends on the following: 1. Accuracy in determining location, orientation, and
elevation of the planetable. 2. Measurement of the vertical angle. In the previously
discussed examples, a difference of 1' (1 minute) in vertical angle wou] d change the resultant point elevation by approximately 5 feet (3 feet per 10,000 feet of ~horizontal distance). This is only one-quarter of the contour interval. An error of 2'
in vertical angle would affect the result by half of the contour interval. It seems improbable that an error of more than 1' of arc would result from careful reading of a good telescopic ali dade, so that the result can confidently be expected to be within +5 feet at a distance of about 18,000 feet.
3. Accuracy of the topographic map. If the contours are not located precisely there will be some error in plotting the distant point. The amount of error will depend on two things: (1) degree of inaccuracy of the map, and (2) steepness in vertical angle of the sight_ray.
The steeper the sight ray the greater the change in elevation along that ray with horizontal distance; thus, if the mapped contours are inaccurate, a greater error will be introduced by steeper shots. For example, if the contours portraying a certain hillside are 100 feet from \vhere they should be, the error of elevation on an intersecting sight ray having a ve~tical angle of 0°28' (tan
SUTTON C181
0.00815) will be only 0.8 foot; however, if the sight ray has a vertical angle of 4°0' (tan 0.06976), the error in elevation will be 7 feet. 4. Angle at which a sight ray intersects the contours.
(a) The direction of the sight ray should be as nearly normal to the direction of the contours as feasible in the vicinity of the distant point. The more obliquely the sight ray and contours intersect, the less accurate the results. (b) A distant point can be located most rapidly and accurately from a verti.cal cliff because the distance can be measured precisely on the first try and the sight ray is nearly perpendicular to the cliff face. Accuracy decreases as the slope of the ground
at the distant point more nearly matches the slope of the sight ray.
An advantage· of the trigonometric solution is that it affords a good basis for judgment of accuracy with each cut-and-try. After readying the planetable, a practiced mapper can perform the entire operation in 3 or 4 minutes per shot. Because of its high degree of accuracy, this is a good method for obtaining control points for structure contouring and geologic mapping.
REFERENCE
Varnes, D. J., Finnell, T. L., and Post, E. V., 1959, Graphic-locator method in geologic mapping: U.S. Geol. S'urvey Bull. 1081-A, 10 p.
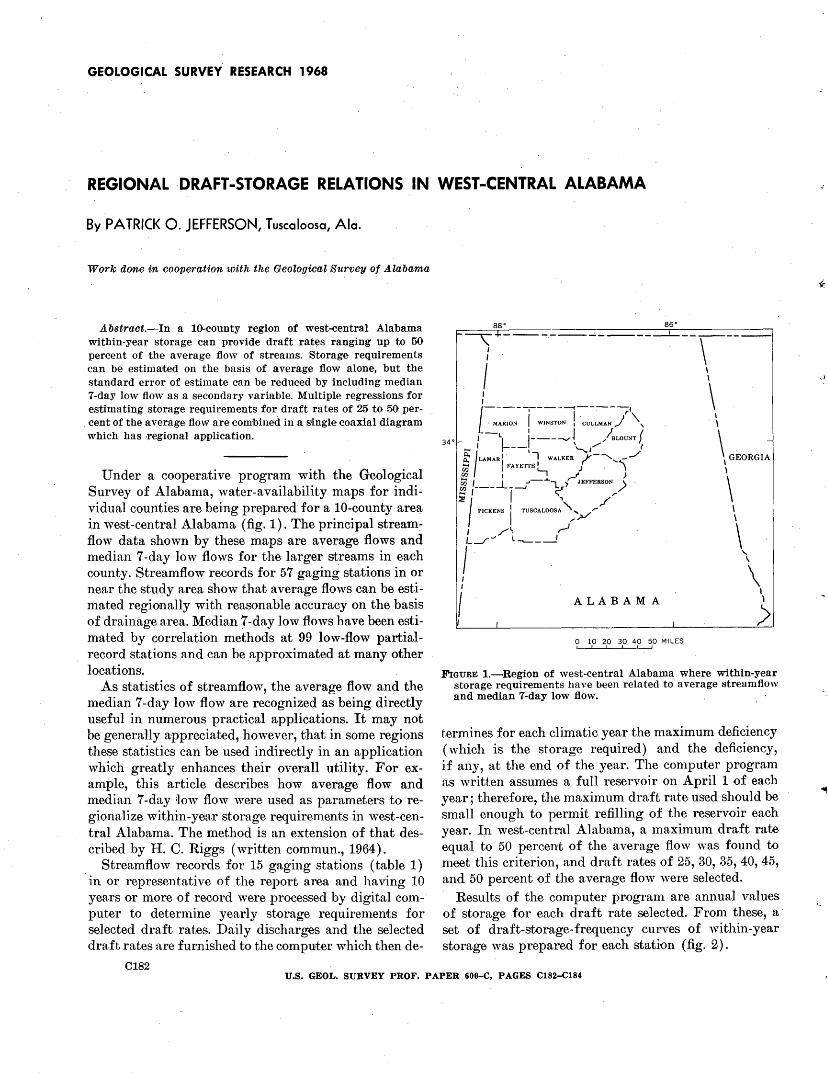
GEOLOGICAL SURVEY RESEARCH 1968
REGIONAL -DRAFT-STORAGE RELATIONS IN WEST-CENTRAL ALABAMA
By PATRICK 0. JEFFERSON, Tuscaloosa, Ala.
Work done in cooperation with the Geological Survey of Alabama
Abstract.-In a 10-county region of west-central Alabama within-year storage can provide draft rates ranging up to 50 percent of the average flow of streams. Storage requirements can be estimruted on the basis -of average flow alone, but the standard error of estimate can be reduced by including median 7-day low flow as a secondary variable. Multiple regressions for estimating storage requirements for draft rates of 25 to 50 per-
. cent of the average flow are combined in a S'ingle coaxial diagram which has ·regional application.
Under a cooperative program with the Geological Survey of Alabama, water-availability maps for individual counties are being prepared for a 10-county area in west-central Alabama (fig.1). The principal stream:flow data shown by these maps are. average flows and median 7 -day low flows for the larger streams in each county. Streamflow records for 57 gaging stations in or near the study area show that average flows can be estimated regionally with reasonable accuracy on the basis of drainage area. Median 7-day low flows have been estimated by correlation methods at 99 low-flow partialrecord stations and can be .approximated at many other locations.
As statistics of streamflow, the average flow and the median 7 ~day low flow are recognized as being directly useful in numerous practical applications. It may not be generally appreciated, however, that in some regions these statistics can be used indirectly in an application which greatly enhances their overall utility. For example, this article describes how average flow and median 7 -day ;}ow flow were used as parameters to regionalize within-yea.r storage requirements in west-central Alabama. The method is an extension of that described by H. C. Riggs (written commun., 1964).
. Streamflow records for 15 gaging stations (table 1) in or representative of the report area and having 10 yea.rs or more of record were processed by digital computer to determine yearly storage requirements for selected draft rates. Daily discharges and the selected draft rates are furnished to the computer which then de-
0182
aa· a6· ~~+-,---.-----------.1. ________ _
: . . \ I \ .
'-
'-----,. ---~--,-----,\ \ -~ARION I WINSTON 1 . CULLMAN ) ' \
34·1- I L' 1-------{ ,../BLOUNT r \
..... I 1---L '-,J'".... I -
~ /LAMAR II l WALKER /'- -..... .... -._./ I GEORGIA ri2 FAYETTE L, J . \ 1 ~ I ..._ ,--" ) \ r/) I _j_ _,- ..... ... JEFFERSON )
~ ,--- T-' ?"' ,.
"'I ""'" i '""·~·:"-';.// 1 :.... ___r _, / ~ .....___- ___j,.-1 \
I \ I \ I I
I I ALABAMA' > 0 10 20 30 40 50 MILES
FIGURE 1.-Region of west-central Alabama where within-year storage requirements have been related to average streamflow and median 7 -day low flow.
termines for each climatic year the maximum deficiency (which is the storage required) and the deficiency, if any, at the end of the year. The computer program as written assumes a full reservoir on April 1 of each year; therefore, the maximum draft rate used should be small enough to permit refilling of the reservoir each year. In west-central Alabama, a maximum draft rate equal to 50 percent of the average flow was found to meet this criterion, and draft rates of 25, 30, 35, 40, 45, and 50 percent of the average flow were selected.
Results of the computer progrmn are annual values of storage for each draft rate selected. From these, a set of draft-storage-frequency curves of within-year storage was prepared for each station (fig. 2).
U.S. GEOL. SURVEY PROF. PAPER 600-C, PAGES C182-Cl84
,J
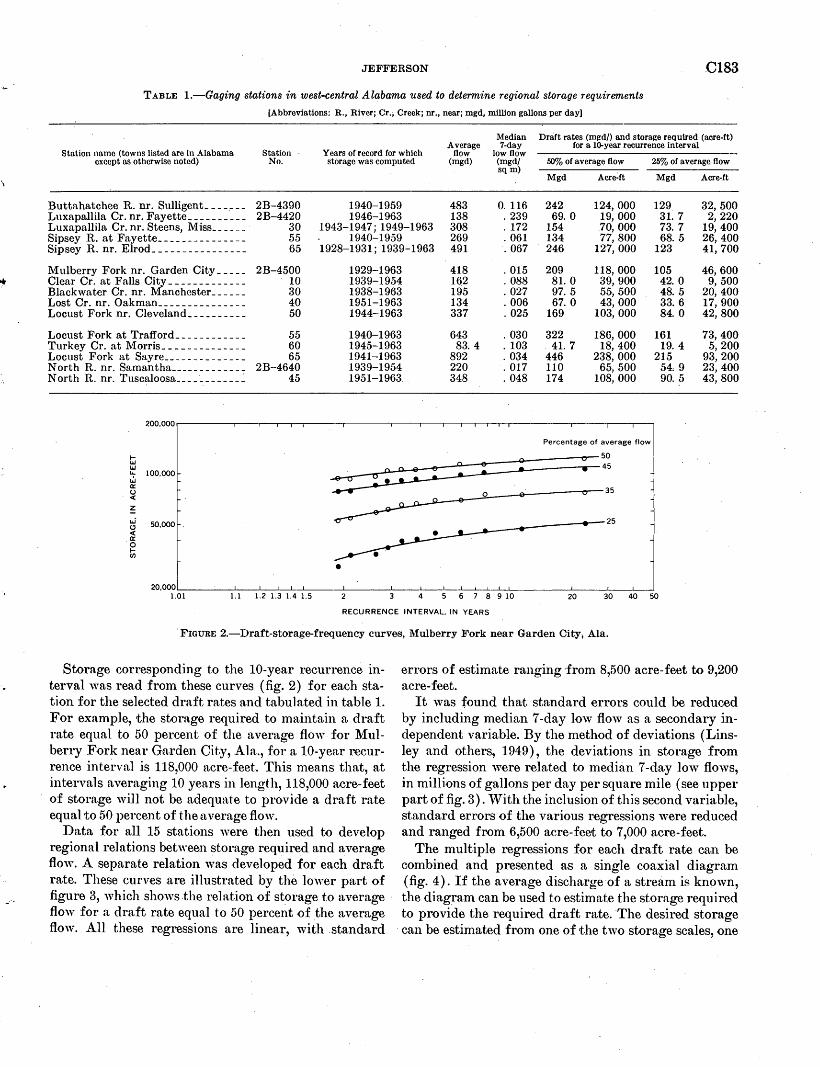
+
JEFFERSON C183
TABLE 1.-Gaging stations in west-central Alabama used to determine regional storage requirements
[Abbreviations: R., River; Cr.; Creek; nr., near; mgd, million gallons per day]
Median Draft rates (mgd/) and storage required (acre-ft) Average 7-day for a 10-year recurrence interval
Station name (towns listed are in Alabama Station Years of record for which flow low flow except as otherwise noted) No. storage was computed (mgd) (mgd/ 50% of average flow 25% of average flow
sqm) Acre~ft Mgd Mgd Acre-ft
Buttahatchee R. nr. Sulligent _______ 2B-4390 1940-1959 483 0. 116 242 124,000 129 32,500 Luxapallila Cr. nr. Fayette __________ 2B-4420 1946-1963 138 . 239 69. 0 19, 000 31. 7 2,220 Luxapallila Cr. nr. Steens, Miss ______ 30 1943-1947; 1949-1963 308 . 172 154 .70, 000 73. 7 19,400 Sipsey R. at Fayette _______________ 55 1940-1959 269 . 061 134 77, 800 68. 5 26,400 Sipsey R. nr. Elrod ________________ 65 1928-1931; 1939-1963 491 . 067 246 127, 000 123 41, 700
Mulberry Fork nr. Garden City _____ 2B-4500 1929-1963 418 . 015 209 118,000 105 46,600 Clear Cr. at Falls City _____________ 10 1939-1954 162 . 088 81. 0 39,900 42. 0 9, 500 Blackwater Cr. nr. Manchester ______ 30 1938-1963 195 . 027 97. 5 55,500 48. 5 20,400 Lost Cr. nr. Oakman _______________ 40 1951-1963 134 . 006 67.0 43,000 33. 6 17,900 Locust Fork nr. Cleveland __________ 50 1944-1963 337 . 025 169 103, 000 84. 0 42, 800
Locust Fork at Trafford ____________ 55 1940-1963 643 . 030 322 186, 000 161 73,400 Turkey Cr. at Morris ______________ 60 1945-1963 83. 4 . 103 41. 7 18,400 19. 4 5, 200 Locust Fork at Sayre ______________ 65 1941-1963 892 . 034 446 238, 000 215 93,200 North R. nr. Samantha _____________ 2B-4640 1939-1954 220 . 017 110 65, 500 54, 9 23,400 North H.. nr. Tuscaloosa ____ ·-------~ 45 1951-1963 348 . 048 174 108, 000 90. 5 43,800
200,000
Percentage of average flow
1-UJ UJ 1.1.. 100,000 ~ a: u
o....~~,..--~-:-==!===~o;= 50 ___.; _ _..J:...__--..... ·:- 45
~--0 --~-----t:~-r--35 < ~ u.i 50.000 (.?
< a: 0 1-en
• 20,000L....... ___ J___L___J__..L_.L.._ __ L_ __ _!_ __ .t___l _ _.J__j__j__L_J_ ___ ___L __ _J_ _ _L___J
1.01 L 1 1.2 1.3 1.4 1.5 3 4 5 6 7 8 9 10 20 30 40 50
RECURRENCE INTERVAL, IN YEARS
·FIGURE 2.-Draft-storage-frequency curves, Mulberry Fork near Garden City, Ala.
Storage corresponding to the 10-year recurrence interval was read from these curves (fig. 2) for each station for the selected draft rates and tabulated in table 1. For examp],e, the storage required to maintain a draft rate equal to 50 percent of the average flow for Mulberry Fork near Ga.rden City, Ala., for a 10-year recurrence interval is 118,000 acre-feet. This means that, at intervals averaging 10 years in length, 118,000 acre-feet of storage wiU not be adequate to provide a draft rate equal to 50 percent of the .average flow.
Data for all 15 stations were then used to develop regional relations between storage required and average flow. A separate relation was developed for each draft rate. These curves are illustrated by the lower part of figure 3, which shows the relation of storage to average flow for a draft rate equal to 50 percent of the average flow. All these regressions are linear, with .standard
errors of estimate ranging -from 8,500 acre-feet to 9,200 acre-feet.
It was found that standard errors could be reduced by including median 7-day low flow as a secondary independent variable. By the method of deviations (Linsley and others, 1949), the deviations in storage from the regression were related to median 7-day low flows, in millions of gallons per day per square mile (see upper part of fig. 3). With the inclusion of this second variable, standard errors of the various regressions were reduced and ranged from 6,500 acre-feet to 7,000 acre-feet.
The multiple regressions for each draft rate can be combined and presented as a single coaxial diagram (fig. 4). If the average discharge of a stream is known, the diagram can be used to estimate the storage required to provide the required draft rate. The desired storage
· can be estimated from one of the two storage scales, one
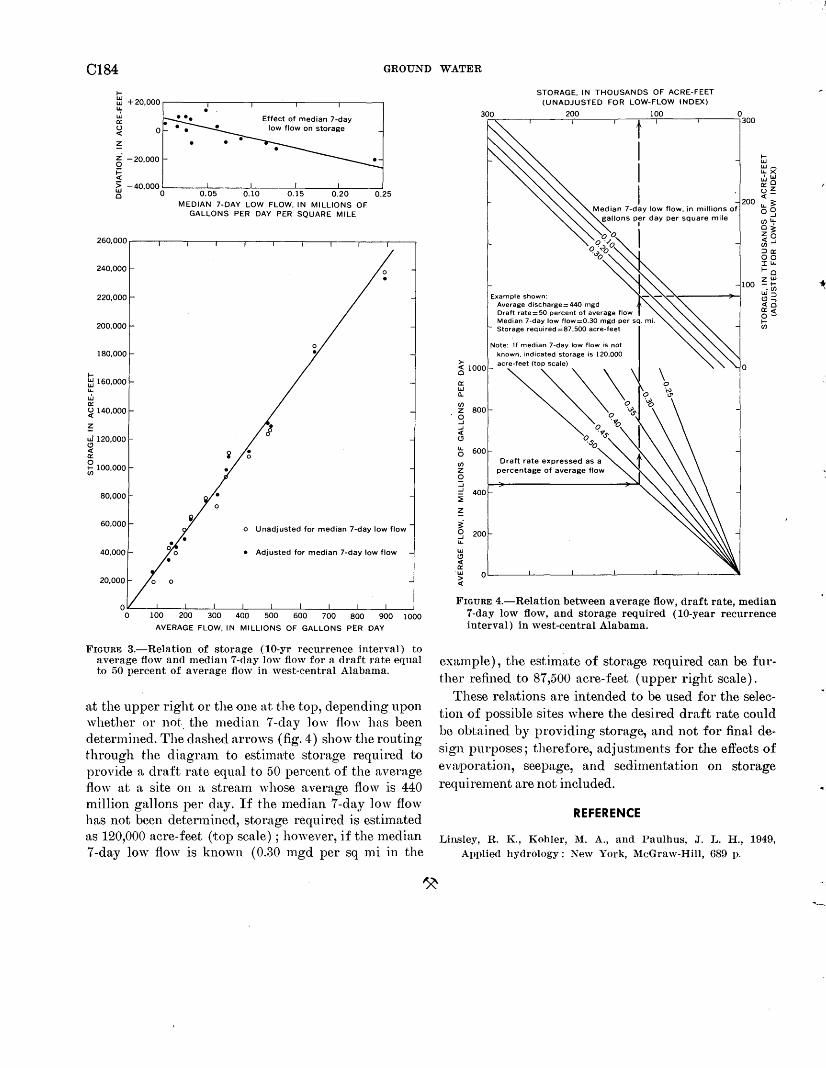
C184 GROUND WATER
1-t!l + 20,000 .--------,------.---'----.-------,------, u.. w 0:: u <(
~
0
~ -20,000
i= <(
Effect o.f median 7-day low flow on storage
~ -40,000 :----::-'-:-=-----'-=:------::--'c-::----,-L---...l 0 0 0.25
lt!J160,000 u.. w 0: ~ 140,000
z u.i 120,000 (!) <( 0::
~ 100,000 (/)
80,000
20,000
MEDIAN 7-DAY LOW FLOW, IN MILLIONS OF GALLONS PER DAY PER SQUARE MILE
o Unadjusted for median 7-day low flow
• Adjusted for median 7-day low flow
o~--~--~----L---~---L--~L_--~ __ _L __ ~--~ 0 300 400 500 600 700 800 900 1000
AVERAGE FLOW, IN MILLIONS OF GALLONS PI::R DAY
FIGURE 3.-Relation of storage (10-yr recurrence interval) to average flow and median 7-clay lo\v flow for a draft rate equal to 50 percent of average flow in west-central Alabama.
at the upper right or the one at the top, depending upon whether or not .. the median 7 -day ]ow flow has been determined. The dashed arrows (fig. 4) show the routing through the diagnun to estimate storage required to provide a draft rate equal to 50 percent of the average flow at a, site on a stream whose average flow is 440 1nillion gallons per day. If the median 7-day ]ow flow has not been determined, stor~age required is estimated as 120,000 acre-feet (·top scale) ; however, if the median 7 -day low flow is known ( 0.30 mgd per sq mi in the
0:: w 0..
(/)
z 0 ..J ..J <( (!)
~ 600 (/)
z 0 ::i ..J 400 :::!:
~
~ g 200 u.. w (!) <( 0:
STORAGE, IN THOUSANDS OF ACRE-FEET (UNADJUSTED FOR LOW-FLOW INDEX)
~---.---2o,o ___ ,__,-_1o,o~--.---~o300 t I I I
Median 7-day low flow, in millions of gallons per day per square mile
I
I
Example shown: Average discharge=440 mgd Draft rate= 50 percent of average flow Median 7-day low flow=0.30 mgd per sq. mi. Storage required=87.500 acre-feet
Note: If median 7-day low flow is not
known. indicated storage is 120.000 acre-feet (top scale)
~~~~I Draft rate expressed as a
percentage of average flow
~ 0~---L---L---~---L----L--~ <(
t;j w~ u..x 'W wo
o::z ~-u..3: oo
..J (J)U..
~3 <Co (/)..J
:>a:: 00 IU..
1-o zw -1-
.(/) W:J (!)-, <Co 0::<( o~
.... (/)
FIGURE 4.-Relation between average flow, draft rate, median 7-day low flow, and storage required (10-year recurrence interval) in west-central Alabama.
example), the estim~1.te of storage required can be further refined to 87,500 acre-feet (upper right scale).
These relations are intended to be used for the seJection of possible sites where the desired draft rate could be obtained by providing storage, and not for final design purposes; therefore, adjustments for the effects of evaporation, seepage, and sedimentation on storage requirement are not included.
REFERENCE
Linsley, R. K., Kohler, l\1. A., and Paulhus, J. L. H., 1949, Applied hydrology: New York, McGraw-Hill, 689 p.
GEOLOGICAL SURVEY RESEARCH 1968
NOTES ON THE GEOHYDROLOGY OF THE DAKOTA SANDSTONE,
EASTERN .NORTH DAKOTA
By T. E. KELLY, Grand Forks, N. Dak.
Work done in cooperation with the North Dakota State Water Commission
and the North Dakota Geo·logical Survey
A.bstmct.-In eastern North Dakota the Dakota Sandstone consists primarily of unconsolidated fine sand. Transmissibilities are less than 50,000 gallons per day per foot, and the coefficient of storage is about 0.0004. Total dissolved solids and fluoride content differ considerably from place to place; the silica concentration is lower than in water from the glacial drift.
The Dakota Sandstone of Cretaceous age, or its stratigraphic equivalent, underlies much of the Grea-t Plains and is present throughout North Dakota, with the exception of a narrow band along the eastern border of the State (fig. 1). The aquifers within this formation have been an important source of ground water for many yea.rs. Numerous loca.l studies of the hydrologic characteristics of the Dakota Sandstone in North Dakota have been made in the past, but regional studies have not been made since 1\1einzer and Hard's study in 1925. Data are now ava-ilable which make it possible to evaluate the geohydrology of the formation throughout the part of eastern North Dakota shown on figure 1.
Sufficient subsurface data are available to permit subdivision of the Dakota sequence into five formations in western North Dakota ( Ca,rlson and Anderson, 1965, fig. 3) ; however, subsurface correlation in the eastern part of the State is somewhat more difficult. Consequently, for the purpose of this report, the Dakota Sandstone will be considered as one stratigraphic unit.
LITHOLOGY AND WATER-BEARING CHARACTERISTICS
Very fine to medium, subrounded, quartzose sand is the principnJ water-bearing lithologic type of the Dakota. The lower sand units commonly are coarser than the upper, and locally consist of very coarse.sand and fine gravel. The basa,l unit of the Dakota Sandstone in eastern North Dakota consists of gray to variegated
clay. A1though cores from the formation in western North Dakota display thick sequences of laminated sandstone and siltstone, this facies has not been reported in the eastern part of the State.
According to Hansen (19'55, fig. 10), sand is present in the Dakota everywhere in the State, although it is not restricted to any particular strrutigraphic horizon. Early workers believe that the Dakota Sandstone consisted of three distinct and widespread layers of sand separated by shale (Hard, 1929, p. 49; Simpson, 19·29, p. 41). However, recent test drilling indicates that numerous facies changes in the formation preclude correlation of an individual stratum for more than a few miles. vVater-well drillers report that the sand may he present in a single stratum or in as many as seven strata.
In eastern North Dakota the basal shale unit of the formation is separted from the underlying Red River Formation of Ordovician .3.oo-e by an a.ngular unconformity. A shale of Late Cretaceous age conformahly overlies the Dakota except along the eastern edge where the sandstone is mantled by glacial drift.
The upper surface of the Dakota sequence has a general westward slope that averages approximately 8 feet per mile (fig. 1) The regional slope reflects tJhe structure of the vVilliston basin that is centered in western North Dakota. Inasmuch as the general slope of the topography is toward the east, the depth to the top of the Dakota increases rapidly towa,rd the west. Along the subcrop in Grand Forks and Traill Counties the top of the Dakota is slightly more 1than 100 feet below the land surface, whereas a:bout 60 miles to the west the top of the Dakota is at a depth of more than 1,500 feet.
According to Wenzel and Sand (1942, p. 1), the first well in North Dakota t!hat produced water from the Dakota Sandstone was drilled in 188£ in Dickey County.
0185 U.S. GEOL. SURVEY PROF. PAPER 600-C, PAGES C185-C191
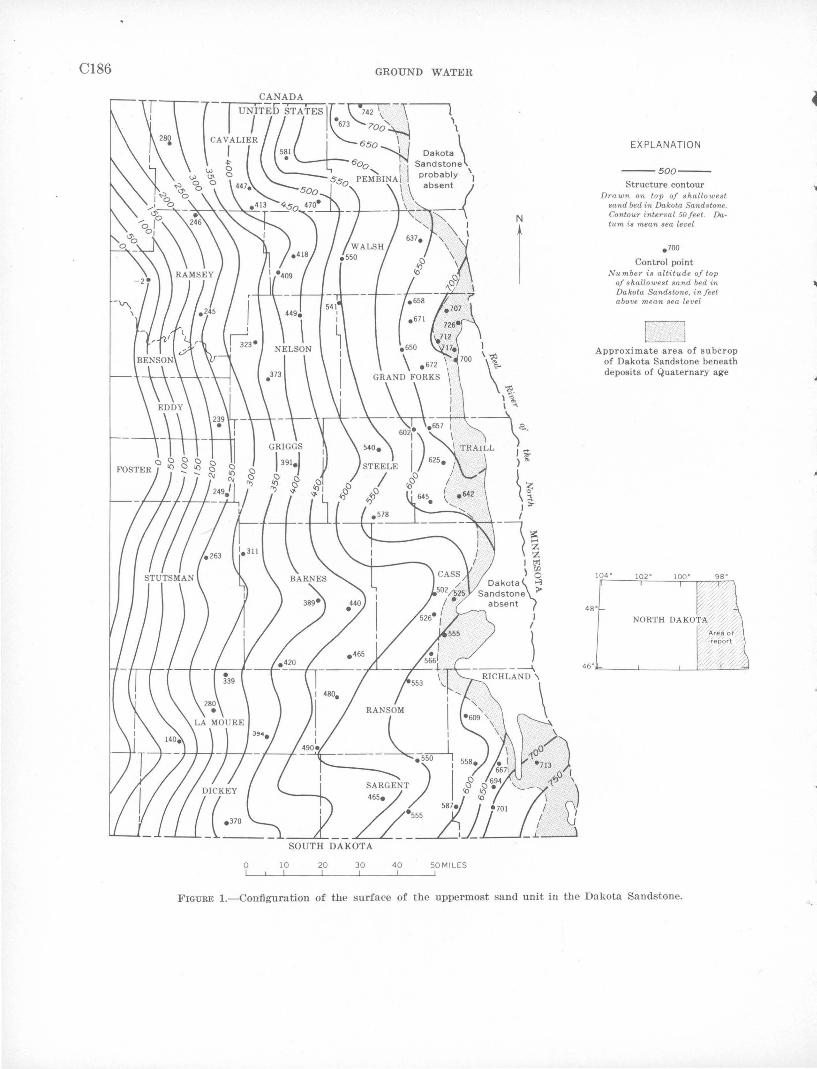
C186
SOUTH DAKOTA
0 10 20 30
GROUND WATER
N
1
l
\t \~.
~ ~ I...,
--le., 'fRAJL \
40 50 MILES
EXPLANATION
---500--
Structure contour Drawn on top of s hallowest
sand bed in Dakota Sandstone. Contour interval 50 feet. Datum is mean sea level
. 700
Control point N umber is altitude of top
of shallowest sand bed in Da kota Sands tone1 in f eet a bove mean sea level
D Appro xi mate area of subc rop
of Dakota Sandstone beneath deposits of Quaternary age
FIGURE 1.-Conrfiguration of the surface of the uppermost sand unit in the Dakota Sandstone.
l
..
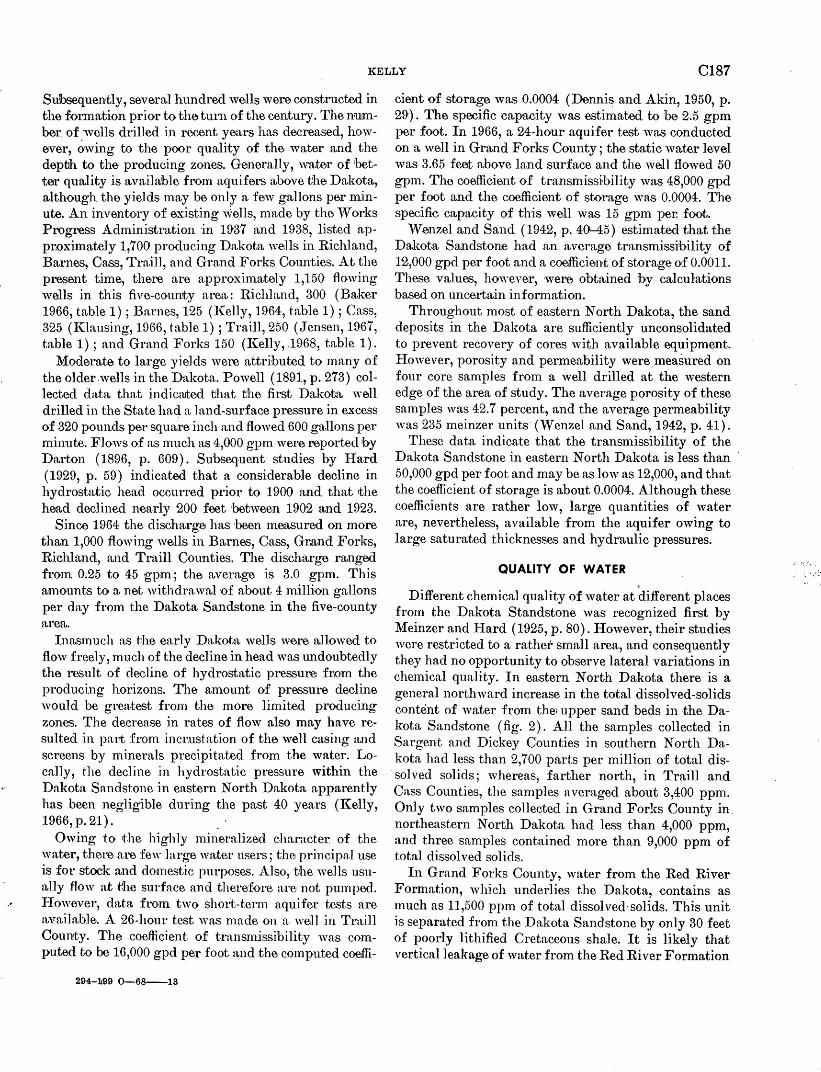
KELLY C187
Swbsequenltly, several hundred wells were constructed in the formation prior to the turn of the century. The nUil11-ber of wells drilled in recent years has decreased, however, awing to the poor quality of the water a.nd the depth to the producing zones. Generally, water of 'better quality is availruble from aquifers above the Dakota, although the yields may be only a few gallons per minute. An inventory of existing '~ells, made by theW orks Progress Adn1inistration in 1937 and 1938, listed appr.oximately 1,700 producing Dakota wells in Richland, Barnes, Cass, Tra.ill, and Grand Forks Com1ties. At the present time, there are a.pproximately 1,150 flowing wells in this five-county area.: Richland, 300 (Baker 1966, table 1); Barnes, 125 (J(elly, 1964, table 1); Cass, 325 (lOa using, 1966, table 1) ; Traill, 250 (Jensen, 1967, table 1) ; and Grand Forks 150 (J(elly, .1968, table 1).
Moderate to large yi~kls were attributed to many of the older.wells in the Dakota. Powell (1891, p. 273) collected data that indicarted that the first Dakota weB drilled in the State had a land-surface pressure in excess of 320 pounds per square inch and flowed 600 ga.llons per minute. Flows of as much as 4,000 gpm were reported by Darton (1896, p. 609). Subsequent studies by Hard (1929, p. 59) indicated that a considerable decline in hydrostatic head occurred prior to 1900 and that the head declined nearly ·200 feet between 1902 and 1923.
Since 1964 the disclutrge has been measured on more than 1,000 flowing wells in Barnes, Cass, Gr.and Forks, Richland, and Traill Counties. The discharge r&nged from 0.25 to 45 gp:m; the average is 3.0 gpm. This U~mounts to a net withdra.wal of about 4 1nillion gallons per day from the Dakota Sandstone in the five-county area.
Inasmueh ·as t:he early Dakota wells were allowed to flow freely, much of the decline in head was tmdoubtedly the result of dedine of hydrostatic pressure from the producing horizons. The an1ount of pressure decline would be greatest frorm the more limited producing zones. The decrease in rates of flow also may have resulted in parrt from iner~usta.tion of the wen casing and screens by minerals precipitated from the water. Locally, the decline in hydrostatic pressure within the Dakota Sandstone in eastern North Dakota apparently has been negligible during the past 40 years (Kelly, 1966,p.21). .
Owing to ~the highly mineralized chara.cte·r of the water, there.a.re few large water users; the principal use is for stock and domestic. purposes. Also, the wells usun.l.ly flow at the surface and therefore a.re not pumped. flowever, chtta from two shod:.-term aquifer tests are :waila.ble. A 26-hour test was made on a. well in Tra.ill County. The coefficient of transmissi'bility w.as computed to be 16,000 gpd per foot and the computed coeffi-
294-~99 0--68----13
cient of storage was 0.0004 (Dennis and Akin, 1950, p. 29') . The specific capacity was estimated to be 2.5 gpm per foot. In 1966, a 24-hour aquifer test was conducted on a well in Grand Forks County; the static water level was 3.65 feet above land surface and the well flowed 50 gpm. The coefficient of transmissibility was 48,000 gpd per foot and the coefficient of storage was 0.0004. The specific capacity of this well was 15 gpm per. foot.
W.enzel and Sand ( 1942, p. 40-45) estimated that tihe Dakota Sandstone had an average transmissibility of 1'2,000 gpd per foot and a coefficient of storage of 0.0011. These values, however, were obtained by calcul·a.tions based on uncertain inforn1ation.
Throughout most of eastern North Dakota, the sand deposits in the Dakota are sufficiently unconsolidated to prevent recovery of cores with available equipment. However, porosity and permeability were_measured on four core samples from a well drilled at the western edge of the area of study. The average porosity of these samples was 42.7 percent, and the average permeability was 235 meinzer units· (Wenzel and Sand, 1942, p. 41).
These data indicate that the transmissibility of the Dakota Sandstone in eastern North Dakota is less than 50,000 gpd per foot and may be as low as 12,000, and that the coefficient of storage is about 0.0004. Although these coefficients are rather low, large quantities of water are, nevertheless, available from the aquifer owing to large saturated thicknesses and hydraulic pressures.
QUALITY OF WATER
Different chemical quality of water at different places from the Dakota Standstone was recognized first by Meinzer and Hard ( 1925, p. 80). However, their studies were restricted to a rather small area, and consequently they had no opportunity to observe lateral variations in chemical quality. In eastern North Dakota there is a general northward increase in the total dissolved-solids content of water from the• upper sand beds in ·the Dakota Sandstone (fig. 2). All the samples collected in Sargent a~1d Dickey Counties in southern North Dakota had less than 2,700 parts per million of total dis-solved solids; whereas, farther north, in Traill and Cass Counties, the samples averaged about 3,400 ppm. Only two samples collected in Grand Forks County in. northeastern North Dakota had less than 4,000 ppm, and three samples contained more than 9,000 ppm of total dissolved solids.
In Grand Forks County, water from the Red River Formation, which underlies the Dakota, contains as much as 11,500 ppm of total dissolved· solids. This unit is separated from the Dakota Sandstone by only 30 feet of poorly lithified Cretaceous shale. It is likely that vertical leakage of water from the Red River Formation
.... .':/.·:.
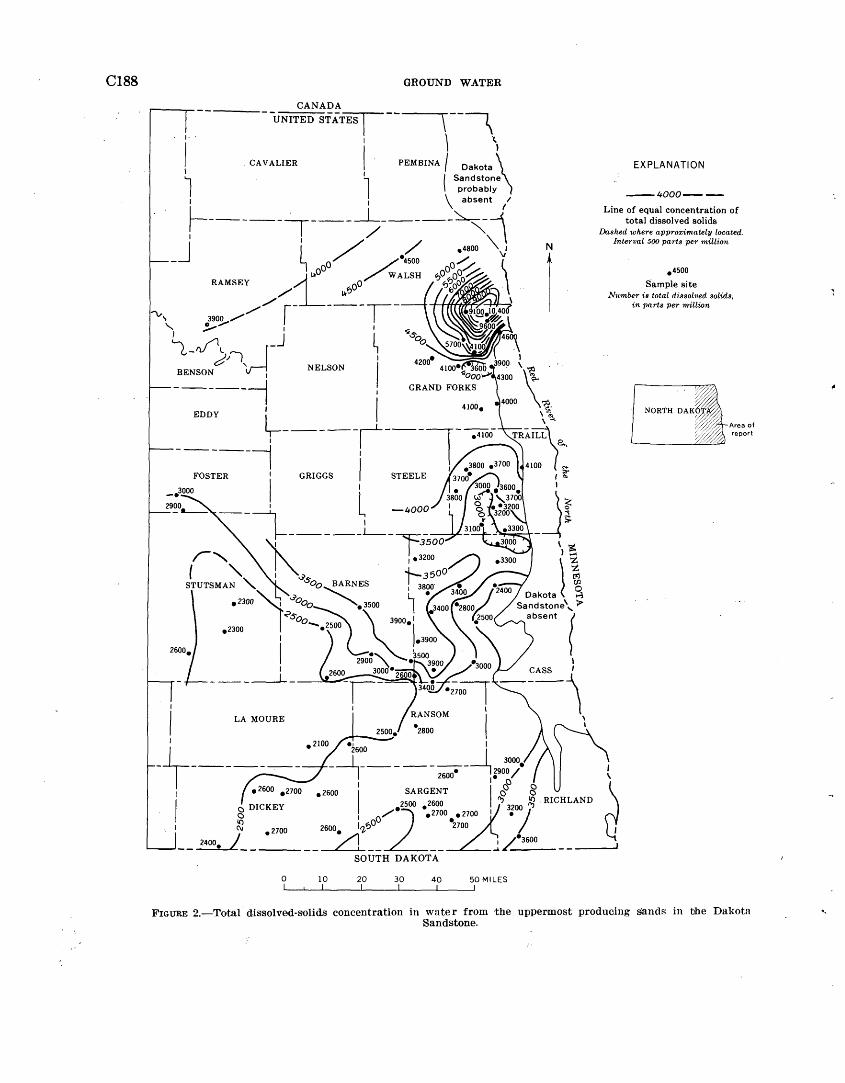
Cl88 GROUND WATER
CANADA
--UNITED STAT~-- \ --,
I \ ·c.,
I PEMBINA / Dakota \
l1
( Sandstone probably
1 \ absent /
~-----, ___ _j_ _____ ~--\ I 1 / '\ \
_j v N
1
I·
I I
l I
CAVALIER
RAMSEY
I
I LA MOURE
I -t------- e 2100 •2600 I
-~------- -26_0_0.--__l, 290~0/• I 1• 0
1 • 2600 e2700
I g DICKEY I SARGENT I ~
•2500 •2600 1\j 3200
!q · RICHLAND
I oz·2700 .. 2700 I • ·vI e2600
~ 2400. I_ - • 2700
0
26oo. '1-~o 21oo 1 /! -- -- ..! /_.3600
SOUTH DAKOTA
10 20 30 40 50 MILES
EXPLANATION
--4000---
Line of equal concentration of total dissolved solids
Dashed where approximately located. Interval 500 parts per million
.4500
Sample site Number is total dissolved solids,
in parts per million
I \
d
Area of report
FIGURE 2.-Total dissolved-solids concentration in water from the uppermost producing sandR in bhe Dalwtn Sandstone.
..
....
KELLY 0189
into the overlying sands in the Dakota may account for the high concentration of dissolved solids in the Dakota water in Grand Forks County. The absence of similar dissolved-solids content in the Dakota south of Grand Forks County is the result of a more effective seal formed by the southward thickening of the shale layers in the Dakota (Hansen, 1955, pl. 2).
Meinzer and Hard ( 1925, p. 79) reported that the water from the upper sand beds in the Dakota in the southeastern part of the State was "relatively soft" and high in sodium chloride, and that the lower beds contained water that was "extremely hard" and high in sodium sulfate. This is not true throughout the area of study. All the samples shown on figure 2 are reported to be from the shallmYest sand beds, but there is no apparent relationship between stratigraphic position and chemical quality of the water. In Grand Forks County the shallow Dakota wells yield sodium sulfate 'vater, but the deeper wells produce sodium chloride water, the reverse of that reported by l\1einzer and Hard. The fact that sodium chloride is the principal salt in water from the Red River Formation and that, in places, the lower part of the Dakota contains large concentrations of sodium chloride, supports the premise that upward leakage occurs from the Red River Formation into the Dakota. Vertical leakage of 'Yater from underlying carbonate rocks is reported to be an important source of.
,1,.'
recharge to the sandstone in South Dakota (Swenson, 1968, p. 174).
Two of the most noteworthy chemical characteristics of water from the Dakota Sandstone are the fluoride and silica content. In general, the fluoride content of water from the Dakota is greater thanl.O ppm, whereas that of water from the glacial drift is less than 1.0 ppm. Commonly the fluoride content of Dakota water is at least three to four times greater than that in water from overlying deposits.
In general, the fluoride concentration in eastern North Dakota decreases toward the north (fig. 3) ; this characteristic was first recognized by Abbott ( 1937, p. 8-9). One sample collected in Sargent County contained 9.2 ppm of fluoride, and eight samples from Sargent and Richland Counties contained more than 5.0 ppm. Although Grand Forks County samples contained from 0.6 to 2.8 ppm, the average concentration was only 1.8 ppm fluoride. This areal change in flouride concentration is not explainable with the available data.
The silica concentration in samples from the Dakota Sandstone usually is less than 10 pp1n, whereas water from the overlying glacial drift usually has more than 20 ppm of silica. There is no obvious lateral variation in the silica concentration as there is for fluoride, nor is there an apparent relationship between the silica content and other dissolved constituents in Dakota samples.
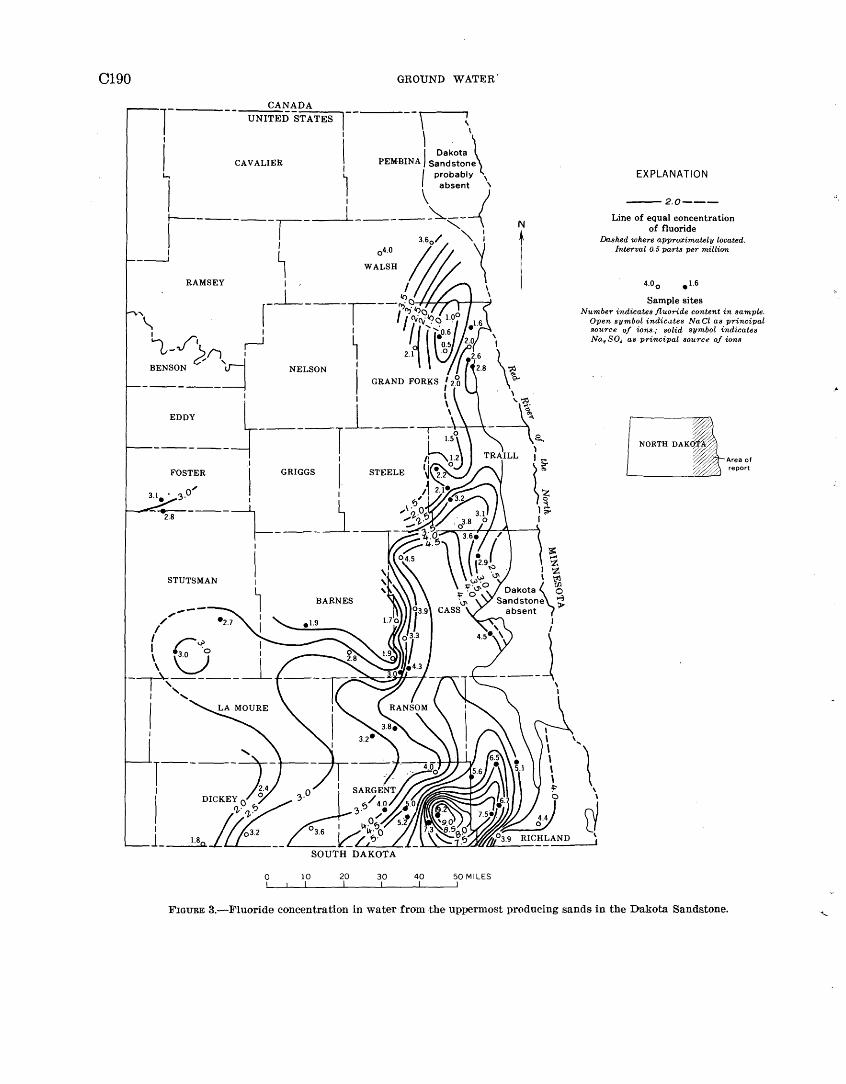
Cl90
--~CA;.;;,;NAD___;A __ ...., UNITED STATES I
i I
CAVALIER
I I
I
RAMSEY
STUTSMAN
,.-------/
I
' cl.i> I 30 ·o
\V -~~---
'
0 10 20
0 4.0
WALSH
30
GROUND WATER'
40 50 MILES
EXPLANATION
---2.0---
Line of equal concentration of fluoride
Dashed where approximaU!ly locawd. Inwrval 0.5 parts per million
Sample sites Number indicates fluoride content in sample.
Open symbol indicates NaCl as principal source of ions.; solid symbol indicates Na, S04 as principal source of ions
NORTH
Area of report
FIGURE 3.-Fluoride concentration in water from the uppermost producing sands in the Dakota Sandstone.
•.
KELLY Cl91
REFERENCES
Abbott, G. A., 1937, 'l"'he fluoride content of North Dakota ground water as related to the occurrence and distribution of mottled enamel: N or:th Dakota Geol. Survey Bull. 9, 15 p.
Baker, C. H., Jr., 1966, Geology and ground water resources o.f Richland County, North Dakota; p. II, Basic data: North Dalwta Geol. Survey Bull. 46 and North Dakota State Water Comm. County Ground Water Studies no. 7, 170 p.
Oarlson, C. G., and Anderson, S. B., 1965, Williston Basin: Am. Assoc. Petroleum Geologists Bull., v. 49, p. 1833-1846.
Darton, N. H., 1896, Preliminary report on artesian waters of a portion of the Dakotas: U.S. Geol. Survey 17th Ann. Rept., pt. 2-g, p. ~603-694.
Dennis, P. E., and Akin, P. D., 1950, Ground water in the Portland area, Traill County, North Dakota: North Dakota State Water Comm. Ground 'Yater· Studies, no. 15, 50 p.
Hansen, D. E., 1955, Subsurface correlations of the Cretaceous G·reeillwrn-Lalwta interval in Nor.th Dakota: North Dakota Geol. Survey Bull. 29, 46 p.
Hard, H. A., 1929, Geology and water resources of the Edgeley and La Moure quadrangles, North Dakota: U.S. Geol. Survey Bull. 801, 90 p.
Jensen, H. M., 1967, Geology and ground water resources of Traill County, North Dakota; p. II, Ground water basic data: North Dakota Geol. Survey Bull. 49 and North Dakota State "·ater Comm. County Ground 'Vater Studies, no. 10, 105 p.
Kelly, T. E., 1964, Geology and ground water resources of Barnes County, North Dakota; p. II, Ground water basic data: North Dakota Geol. Survey Bull. 43 and North Dakota State "Tater Comm. County Ground "Tater Studies, no. 4, 156 p.
Kelly, T. E., 1966, Geology and g.round water resources of Barnes County, North Dakota; p. III, Ground water resources: North Dakota Geol. Survey Bull. 43 and North Dakota State "Tater Comm. County Ground "Tater Studies, no. 4, 67 p.
---1968, Geology and ground water resources of Grand Forks County, North Dakota ; p. II, Ground water basic data: North Dakota Geol. Survey Bull. 53 and North Dakota State Water Comm. County Ground 'Vater Studies, no. 13, 117 p.
Klausing, R. L., 1966, Geology and ground water resources of Cass County, North Dakota; p. II, Ground water basic data: North DaJwta Geol. Survey Bull. 47 and North Dakota State "Tater Corum. County Ground 'Vater Studies, no. 8, 158 p.
Meinzer, 0. E., and Hard, H. A., 1925, The artesian water supply of the Dakota Sandstone in North Dakota, with special reference to the Edgeley quadrangle, in Contribution to the hydrology of the United States, 1923-24; U.S.· Geol. Survey Water-Supply Paper 520-E, p. 73-95.
Powell, J. "r., 1891, Artesian irrigation on the Great Plains : U.S. Geol. Survey 11th Ann. Rept., pt. 2, p.· 272-275.
Simpson, H. E., 1929,. Geology and ground-water resources of North Dakota: U.S. Geol. Survey "rater-Supply Paper 598, 312 p.
Swenson, F. A., 1968, Ne\v theory of recharge to the artesian basin of the Dakotas: Geol. Soc. America Bull., v. 79, p. 163-182.
'Venzel, L. K., and Sand, H. H., 1942, 'Vater supply of the Dakota Sandstone in the Ellendale-Jamestown area, North Dakota, with reference to changes between 1923 and 1938: U.S. Geol. Survey Water-Supply Paper 889-A, 81 p.
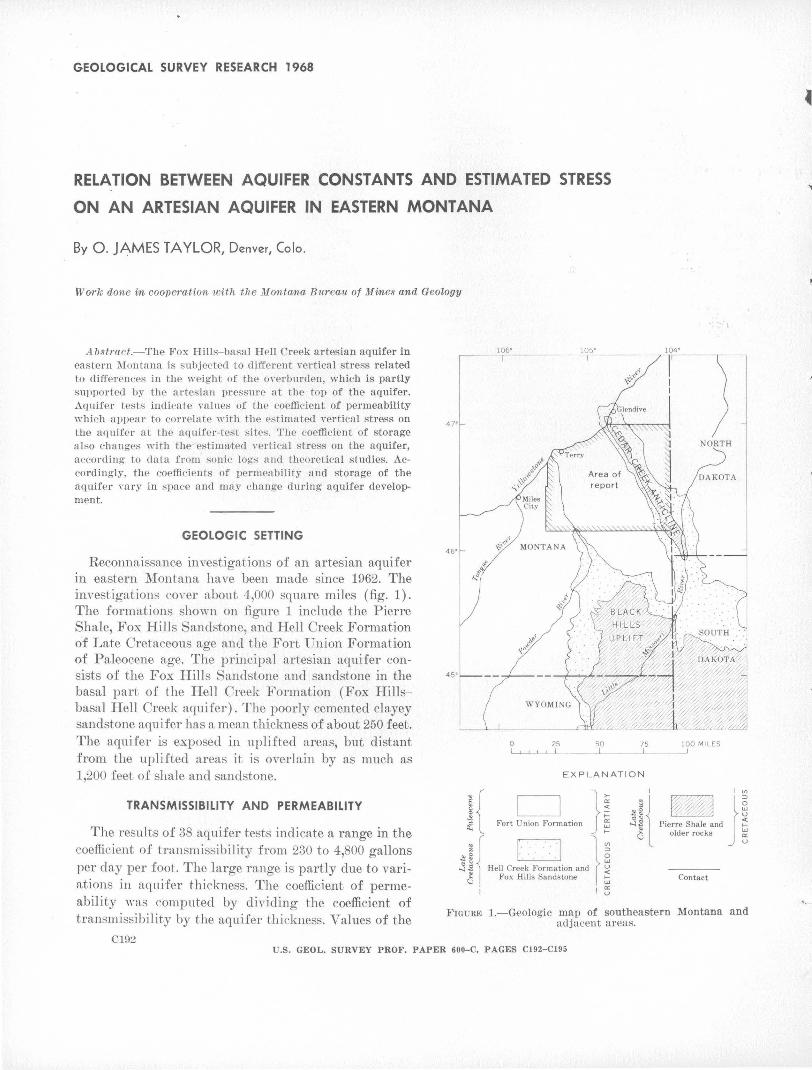
GEOLOGICAL SURVEY RESEARCH 1968
RELATION BETWEEN AQUIFER CONSTANTS AND ESTIMATED STRESS
ON AN ARTESIAN AQUIFER IN EASTERN MONTANA
By 0. JAMES TAYLOR, Denver, Colo .
Worlc done in cooperat·ion with the Montana Bttreiiiu of Milnes and Geology
Abstract.-The Fox Hills-basal Hell Creek artesian aquifer in eastern Montana is subjected to different vertical stress related to differences in the weight of the oYerburden, which is partly supported by the artesian pressure at the top of the aquifer. Aquifer tests indicate values of the coefficient of permeability which appear to correlate with the estimated vertical stress on the aquifer at the aquifer-test sites. The coefficient of storage al~o changes with the estima•ted vertical stress on the aquifer, according to data from- sonic Jogs and theoretical studies. Accordingly, the coefficients of permeability and storage of the aquifer Yary in space and may change during aquifer development.
GEOLOGIC SETTING
Reconnaissance investigations of an artesian aquifer in eastern Montana have been made since 1962. The investigations cover about 4,000 square miles (fig. 1). The formations shown on figure 1 include the Pierre Shale, Fox Hills Sandstone, and Hell Creek Formation of Late Cretaceous age and the Fort Union Formation of Paleocene age. The principal artesian aquifer consists of the Fox Hills Sandstone and sandstone in the basal part of the Hell Creek Formation (Fox Hillsbasal Hell Creek aquifer). The poorly cemented clayey sandstone aquifer li.as a mean thickness of about 250 feet. The aquifer is exposed in uplifted areas, but distant from the uplifted areas it is overlain by as much as 1,200 feet of shale and sandstone.
TRANSMISSIBILITY AND PERMEABILITY
106' 105"
0 25 50 75
E X PLANATION
i{ I I } ~ ~ Fort Union Formation ~
;!{ ~ 1~ 0 ~ 0
~ ~ Hell Cre~k ~o~m~tion and ~ l Fox Hills Sandstone t;;
I I 5
. , ~ I
100 MILES
Contact
The results of 38 aquifer tests indicate a range in the coefficient of transmissibility from 230 to 4,800 gallons per day per foot. The large range is partly due to variations in aquifer thickness. The coefficient of permeability \Yas computed by dividing the coefficient of transmissibility by the aquifer thickness. Values of the
FIGURE 1.-Geologic map of southeastern Montana and adjacent areas.
Cl92 U.S. GEOL. SURVEY PROF. PAPER 600-C, PAGES C192-C195
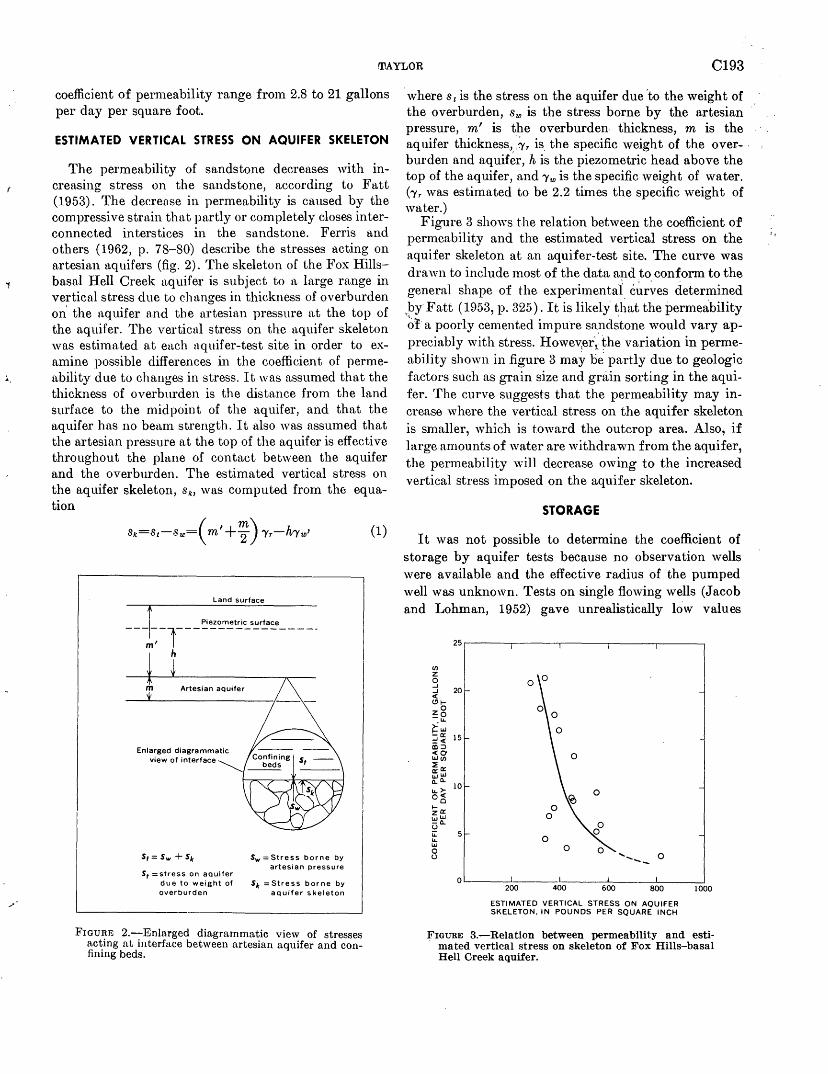
...
-~·
rnAYLOR C193
coefficient of permeability range from 2.8 to 21 gallons per day per square foot.
ESTIMATED VERTICAL STRESS ON AQUIFER SKELETON
The permeability of sandstone decreases with incrensing stress on the sandstone, according to Fatt (1953). The decrease in permeability is caused by the compressive strn.in that partly or completely closes interconnected interstices in the sandstone. Ferris and others (1962, p. 78-80) describe the stresses acting on artesian ttquifers (fig. 2). The skeleton of the Fox Hillsbasal Hell Creek aquifer is subject to a large range in vertical stress due to ehanges in thickness of overburden on. the aquifer ttnd the artesian pressure at the top of the aquifer. The vertical stress on the aquifer skeleton was estimated at each nq uifer-test site in order to examine possible differences in the coefficient of permeability due to changes in stress. It was assumed that the thickness of overburden is the dista.nce from the land surface to the midpoint of the aquifer, and that the aquifer has no bean1 strength. It also was assumed that the artesian pressure at the top of the aquifer is effective throughout the plane of contact between the aquifer and the overburden. The estimated vertical stress on the aquifer skeleton, sk, was computed from the equation
land surface
s, :::stress on aquifer due to weight of overburden
Sw =Stress borne by artesian pressure
S1c =Stress borne by aquifer skeleton
FIGURE 2.-Enlarged diagrammatic view of stresses acting at interface between artesian aquifer and confining beds.
(1)
where s 1 is the stress on the aquifer due 'to the weight of the overburden, Sw is the stress borne by the artesian pressure, m' is the overburden thickness, m is the aquifer thickness, :~r is the specific weight of the over- . burden and aquifer, his the piezometric head above the top of the aquifer, and 'Yw is the specific weight of water. ('Yr was estimated to be 2.2 times the specific weight of water.)
Figure 3 shows the relation between the coefficient of permeability and the estimated vertical stress on the aquifer skeleton at an aquifer-test site. The curve was drawn to include 1nost of the data and to conform to the general shape of the experimentai_ c{lr~es determined by· Fatt (1953, p. 325). It is likely that the permeability '~l a poorly cemented impure sa.nd~tone would vary appreciably with stress. Howev~er~: the variation in permeability shown in figure 3 may be. partly due to geologic factors such as grain size and grain sorting in the aquifer. The curve suggests that the permeability may increase where the vertical stress on the aquifer skeleton is smaller, which is toward the outcrop area. Also, if large amounts of water are withdrawn from the aquifer, the permeability will decrease owing to the increased vertical stress imposed on the aquifer skeleton.
STORAGE
It was not possible to determine the coefficient of storage by aquifer tests because no observation wells were available and the effective radius of the pumped well was unknown. Tests on single flowing wells (Jacob and Lohman, 1952) gave unrealistically low values
(/)
z 0 ...J ...J 20 <( <!H-zo -e ~UJ -0:: 15 ::!< a!:> <O UJC/) ~0:: o::UJ ~D. LJ..>-o<
Cl 1-zo:: UJUJ uo.. L;: LJ.. UJ 0 u
0
...... --- 0
200 400 600 800
ESTIMATED VERTICAL STRESS ON AQUIFER SKELETON. IN POUNDS PER SQUARE INCH
1000
FIGURE 3.-Relation between permeability and esti. mated vertical stress on skeleton of Fox Hills-basal
Hell Creek aquifer.
,,
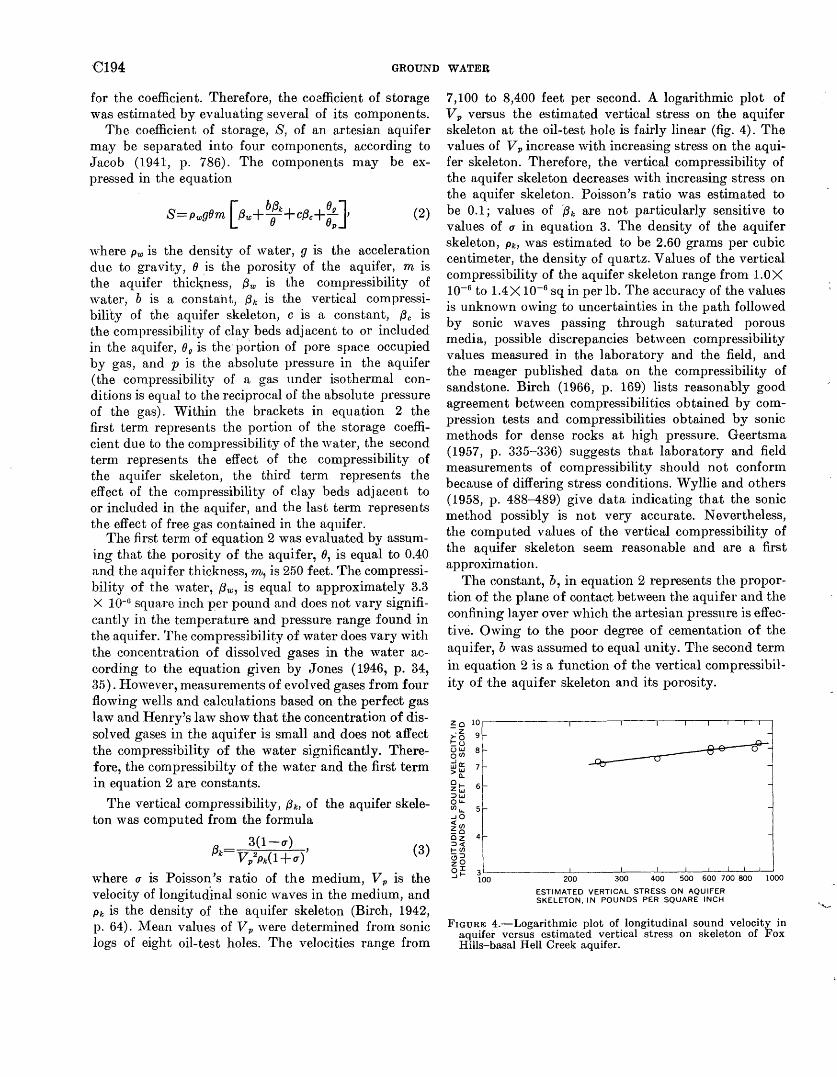
C194 GROUND WATER
for the coefficient. Therefore, the coefficient of storage was estimated by evaluating several of its components.
The coefficient of storage, S, of an artesian aquifer may be separated into four components, according to Jacob (1941, p. 786). The components may be expressed in the equation
(2)
where Pw is the density of water, g is the acceleration due to gravity, (} is the porosity of the aquifer, m is the aquifer thic~pess, f3w is the compressibility of water, b is a constant, {3k is the vertical compressibility of the aquifer skeleton, c is a constant, f3c is the compressibility of clay beds adjacent to or included in the aquifer, Ou is the·portion of pore space occupied by gas, and p is the absolute pressure in the aquifer (the compressibility of a gas under isothermal conditions is equal to the reciprocal of the absolute pressure of the gas). Within the brackets in equation 2 the first term represents the portion of the storage coefficient due to the compressibility of the water, the second term represents the effect of the compressibility of the aquifer skeleton, the third term represents the effect of the compressibility of clay beds adjacent to or included in the aquifer, and the last term represents the effect of free gas contained in the aquifer.
The first term of equation 2 was evaluated by assum-ing that the porosity of the aquifer, 0, is equal to 0.40 and the aquifer thickness, m, is 250 feet. The compressibility of the water, f3w, is equal to approximately 3.3 X 10⁻⁶ ~qua·re inch per pound and does not vary significantly In the temperature and pressure range found in the aquifer. The compressibility of water does vary with the concentration of dissolved gases in the water according to the equation given by Jones (1946, p. 34, 35). !fowever, measurements of evolved gases from four flowing wells and calculations based on the perfect gas law and Henry's law show that the concentration of dissolved gases in the aquifer is small and does not affect the compressibility of the water significantly. Therefore, the compressibilty of the water and the first term in equation 2 are constants.
The vertical compressibility, {3k, of the aquifer skeleton was computed from the formula
3(1-u) V/Pi1+u)'
(3)
where u is Poisson's ratio of the medium V is the • • ' p
velocity of longitudinal sonic waves in the medium and Pk is the density of the aquifer skeleton (Birch, i942, p. 64). Mean values of V v were determined from sonic logs of eight oil-test holes. The velocities range from
7,100 to 8,400 feet per second. A logarithmic plot of Vv versus the estimated vertical stress on the aquifer skeleton at the oil-test hole is fairly linear (fig. 4). The values of V v increase with increasing stress on the aquifer skel~ton. Therefore, the vertical compressibility of the aquifer skeleton decreases with increasing stress on the aquifer skeleton. Poisson's ratio was estimated to be 0.1; values of /h are not particularly sensitive to values of u in equation 3. The density of the aquifer skeleton, Pk, was estimated to be 2.60 grams per cubic centimeter, the density of quartz. Values of the vertical compressibility of the aquifer skeleton range from LOX 10-6 to 1.4X 10⁻⁶ sq in per lb. The accuracy of the values is unknown owing to uncertainties in the path followed by sonic waves passing through saturated porous media, possible discrepancies between compressibility values measured in the laboratory and the field, and the meager published data on the compressibility of sandstone. Birch (1966, p. 169) lists reasonably good agreement between compressibilities obtained by compression tests and compressibilities obtained by sonic methods for dense rocks at high pressure. Geertsma (1957, p. 335-336) suggests that laboratory and field measurements of compressibility should not conform because of differing stress conditions. Wyllie and others (1958, p. 488-489) give data indicating that the sonic method possibly is not very accurate. Nevertheless, the computed values of the vertical compressibility of the aquifer skeleton seem reasonable and are a first approximation.
The constant, b, in equation 2 represents the proportion of the plane of oontaet between the aquifer and the confining layer over which the artesian pressure is effective. Owing to the poor degree of cementation of the aquifer, b was assumed to equal unity. The second term in equation 2 is a function of the vertical compressibility of the aquifer skeleton and its porosity.
FIGURE 4.-Logarithmic plot of longitudinal sound velocity in aquifer versus estimated vertical stress on skeleton of Fox Hills-basal Hell Creek aquifer.
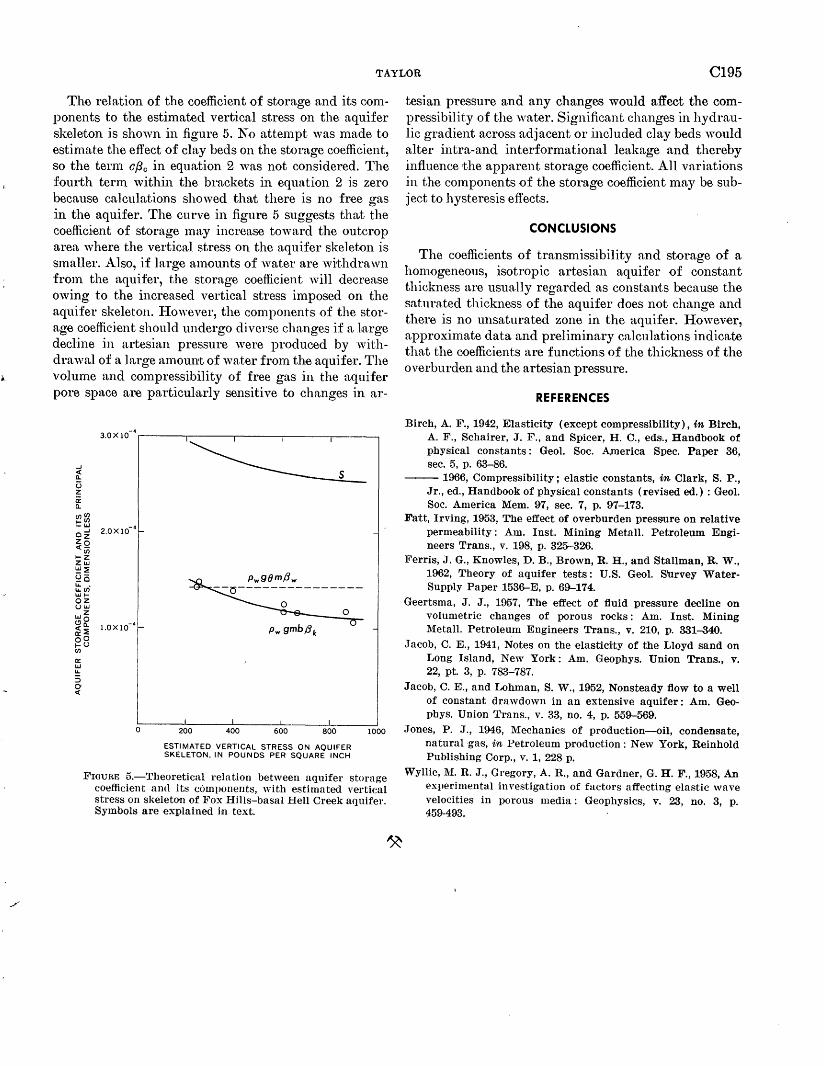
TAYLOR C195
The relation of the coefficient of storage and its components to the estimated vertical stress on the aquifer skele'ton is shown in figure 5. No attempt was made to esti1nate the effect of clay beds on the storage coefficient, so the term cf3c in equation 2 was not considered. The fourth tenn within the brackets in equation 2 is zero because calculations showed that there is no free gas in the aquifer. The curve in figure 5 suggests that the coefficient of storage may increase toward the outcrop area where the vertical stress on the aquifer skeleton is smaller. Also, if large amounts of water are wi,thdrawn frmn the aquifer, the storage coefficient will decrease owing to the increased vertical stress imposed on the aquifer skeleton. IIowever, the components of the storage coefficient should undergo diverse changes if a large decline in artesian pressure were produced by withdrawal of a large amount of water from the aquifer. The volume and compressibility of free gas in the aquifer pore space are particuhtrly sensitive to changes in ar-
..J <( a.. u z ~ a..
~~ 0 ~ 2.0X10-
4
zo <u; t-Z zw UJ~
Qo Ll. • Ll.fn WtOZ UUJ
~~ ('i ~ l.OX 10-
4
~8 en a: UJ Ll.
3 0 <(
0 200 400 600 800
ESTIMATED VERTICAL STRESS ON AQUIFER SKELETON, IN POUNDS PER SQUARE INCH
1000
FIGURE 5.-Theoretical relation between aquifer storage coefficient and its comvonents, with estimated vertical stress on sl\:eleton of Fox Hills-basal Hell Creek aquifer. Symbols are explained in text.
tesian pressure and any changes would affect the compressibility of the water. Significant changes in hydraulic gradient across adjacent or included clay beds would alter intra-and interformational leakage and thereby influence the apparent storage coefficient. All variations in the components of the storage coefficient may be subject to hysteresis effects.
CONCLUSIONS
The coefficients of transmissibility and storage of a hom,ogeneous, isotropic artesian aquifer of constant thickness are usua-lly regarded as constants because the saturated thickness of the aquifer does not change and there is no unsaturated zone in the aquifer. However, approximate data and preliminary calculations indicate that the coefficients are functions of the thickness of the overburden and the artesian pressure.
REFERENCES
Birch, A. F., 1942, Elasticity (except compressibility), in Birch, A. F., Schairer, J. F., and Spicer, H. C., eds., Handbook of physical constants : Geol. Soc. A,merica Spec. Paper 36, sec. 5, p. 63-86 .
--- 1966, Compressibility; elastic constants, in Clark, S. P., Jr., ed., Handbook of physical constants (revised ed.): Geol. Soc. America Mem. 97, sec. 7, p. 97-173.
Fatt, Irving, 1953, The effect of overburden pressure on relative permeability : Am. Inst. Mining Metall. Petroleum Engineers Trans., v. 198, p. 325-326.
Ferris, J. G., Knowles, D. B., Brown, R. H., and Stallman, R. W., 1962, Theory of aquifer tests: U.S. Geol. Survey WaterSupply Paper 153~E. p. 69-174.
Geertsma, J. J., 1957, The effect of fluid pressure decline on volumetric changes of porous rocks : Am. Inst. Mining Metall. Petroleum Engineers Trans., v. 210, p. 331-340.
Jacob, C. E., 1941, Notes on the elasticity of the Lloyd sand on Long Island, New York: Am. Geophys. Union Trans., v. 22, pt. 3, p. 783-787.
Jacob, C. E., and Lohman, S. W., 1952, Nonsteady flow to a well of constant drawdown in an extensive aquifer: Am. Geophys. Union Trans., v. 33, no. 4, p. 559-569.
Jones, P. J., 1946, Mechanics of production--oil, condensate, natural ga,s, in Petroleum production: New York, Reinhold Publishing Corp., v. 1, 228 p.
Wyllie, M. R. J., Gregory, A. R., and Gardner, G. H. F., 1958, An experimental investigation of factors affecting elastic wave velocities in porous media : Geophysics, v. 23, no. 3, p. 459-493.
·GEOLOGICAL SURVEY RESEARCH 1968
PRELIMINARY ESTIMATES OF LOW-FLOW FREQUENCY
'INTERRELATIONS FOR UPSTATE NEW YORK STREAMS
By ROBERT M. BEALL, Albany, N.Y.
Work done in cooperation with the New York State Department of Health
Abstraot.-Reasonably accurate values of mean annual dis· charge and of the annual low flow having a recurrence interYal of 2 years usua.lly eau be obtained from shor.t~term secondary or partial-reeord station data by correlation with longterm station data. At 125 sites in or near upstate New York where more than 20 yea.rs of daily discharge data have been collected, thes1e flow characteriSities have been related to annual low flows with recurrence in.te.rYals of 10, 20, and 50 years. 'rhe relation is Slhown as a family of curves from which longterm return period discharge may be estimated within accuracy limits of about 1 percent of the mean annual flow.
Low-flow frequency data provide a means of a.ppraising the yield of streams under low-flow conditions and are useful in certain engineering and hydrologic studies. The slope of frequency curves of .annual low flows, particularly those for a small number of consecutive da .. ys, reflects geologic and hydrologic characteristics of drainage basins, but the slope is defined with confidence only after a long period of data collection. Procedures for extending a limited amount of site data in time :and space are increasingly necessary.
Except for two studies, there has been no investigation inN ew York of the variation in annual low flows for different recurrence intervals. Hardison and Martin ( 1963, p. 15 and table 6) listed ratios of lowest mean flow for 7 consecutive da.ys at the 20-year recurrence interval to those at the 2-year recurrence interval for streams in the Delaware River basin and southern New .T ersey " * * * for possible use in hydrologic studies." Ratios were computed on the basis of frequency analyses of observed data and were also adjusted for the effect of difference in unit yield. Adjusted ratios ranged from 0.26 to 0.63 hut were not analyzed further.
A recent study by the lJ.S. Geological Survey (R. C. IIeath, written commun., 1966) concerned the relation between annual 7 -day low flmvs at the 10- and 50-
0196
year recurrence intervals levels in New York State. A curve of relation was defined, but it had an average error of estimrute of about 20 percent. In view of the error inherent in defining the 10-year figure from limited data, its usefulness in defining the 50-year figure is limited.
A recent analysis of all long-term data for streams in upstate New York now permits defining relations between mean annual flow, median annual 7 -day low flow, and the 7 -day annual low flow at longer recurrence intervals.
The median annual minimum 7-day low flow (7-day, 2-year) is one of several statistics called a low-flow index and is defined as the lowest mean flow for 7 consecutive days, occurring as an annual low with an average frequency of 1 year out of 2-a 50-percent prob:tbility of occurrence in any particul:a.r year. This lowflow index can be computed for all regular gaging stations, at a level of reliability which 'increases with the term of operation, assuming no significant manipulation of low flows by storage or diversion ~activity. In addition, reliable estimates of the 7 -day, 2-year low flow can usually be made for partial-record sites. These estiInates are based on regressions of simultaneous dise<harges at long-term continuous-record stations with those at the short-term partial-record stations. Discharge records at the latter, as a mininmm, consist of a few discharge measurements made under base-flow conditions. The estimates will have a wide range of accuracy, depending on the number of concurrent discharge items correlated, distance between stations, a .. nd other factors.
The low-flow statistic n1.ost frequently sought for waste dilution and other nonstorage studies is not the annual low flow with a. 2-year recurrence interval but rather the annual low flow to be expeoted during 1 year
U.S. GEOL. SURVEY PROF. PAPER 600-C, PAGES Cl96-Cl98
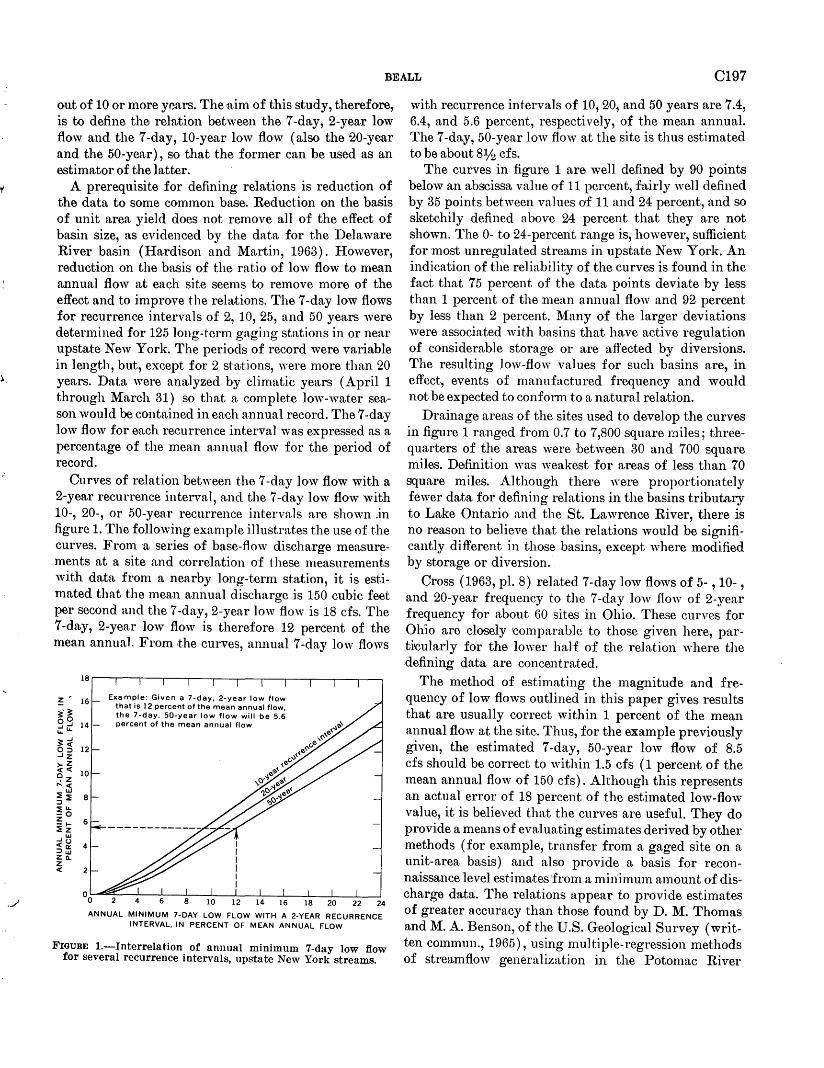
./
BEALL C197
out of 10 or more years. The ·aim of this study, therefore, is to define the relation between the 7-day, 2-year low flow and the 7-day, 10-year low flow (also the 20-year and the 50-year), so that the former can be used as an estimator of the latter.
A prerequisite for defining relations is reduction of the data to some common base. Reduction on the basis of unit area yield does not remove all of the effect of basin size, as evidenced by the data for the Del a ware River basin (Hardison and Martin, 1963). However, reduction on the basis of the ratio of low flow to mean annual flow at each site seems to remove more of the effect and to improve the relations. The 7-day low flows for recurrence intervals of 2, 10, 25, and 50 years were determined for 125long-term gaging stations in or near upstate New York. The periods of record were variable in length, but, except for 2 stations, were more than 20 years. Data were analyzed by climatic yea.rs (April 1 through March 31) so that a complete low-water season would be contained in each a.nnual record. The 7 -day low flow for each recurrence interval was expressed as a percentage of the mean annual flow for the period of record.
Curves of relation between the 7 -day low flow with a 2-year recurrence interval, and the 7 -day low flow with 10-, 20-, or 50-year recurrence intervals a.re shown .in figure 1. The following example illustrates the use of the curves. From a series of base-flow discharge measurements at a site and correlation of these measurements with data from a nearby long-term station, it is estimated that the mean annual discharge is 150 cubic feet per second and the 7-day, 2-year low flow is 18 cfs. The 7-day, 2-year low flow is therefore 12 percent of the mean annual. From the curves, annual 7 -day low flows
Example: Given a 7-day, 2-year low flow that is 12 percent of the mean annual flow, the 7-day, 50-year low flow will be 5.6 percent of the mean annual flow
12 16 18 20 22 24
ANNUAL MINIMUM 7-DAY LOW FLOW WITH A 2-YEAR RECURRENCE INTERVAL, IN PERCENT OF MEAN ANNUAL FLOW
FIGURE !.-Interrelation of annual minimum 7-day low fiow for several recurrence intervals, upstate New York streams.
with recurrence intervals of 10, 20, and 50 years are 7.4, 6.4, and 5.6 percent, respectively, of the mean annual. The 7-day, 50-year low flow at the site is thus estimated to be about 8¥2 cfs.
The curves in figure 1 are well defined by 90 points below an abscissa value of 11 percent, fairly well defined by 35 points between values of 11 and 24 percent, and so sketchily defined above 24 percent that they a.re not shown. The 0- to 24-percent range is, however, sufficient for ·most unregulated streams in upstate New York. An indication of the reliability of the curves is found in the fact that 75 percent of the data points deviate by less than 1 percent of the n1ean annual flow and 92 percent by less than 2 percent. ~1any of the larger deviations were associated with basins that have active regulation of considerable storage or are affected by diversions. The resulting low-flow values for such basins are, in effect, events of manufactured frequency and would not be expected to confonn to a natural relation.
Drainage areas of the sites used to develop the curves in figure 1 ranged from 0.7 to 7,800 square rniles; threequa;rters of the areas \vere between 30 and 700 square miles. Definition was weakest for areas of less than 70 square miles. Although there were proportionately fewer data for defining relations in the basins tributary to Lake Ontario and the St. Lawrence River, there is no reason to believe that the relations would be significantly different in those basins, except where modified by storage or diversion.·
Cross ( 1963, pl. 8) related 7 -day low flows of 5- , 10- , and 20-year frequency to the 7-day low flow of 2-year frequency for about 60 ·sites in Ohio. These curves for Oh'io are closely ~omparable to those given here, partircularly for the lower half of the relation where the .defining data are concentrated.
The method of estimating the magnitude and frequency of low flows outlined in this paper gives results that are usually correct within 1 percent of the mean annual flow at the site .. Thus, for the example previously given, the estimated 7-day, 50-year low flow of 8.5 cfs should be correct to within 1.5 cfs ( 1 percent of the mean annual flow of 150 cfs). Although this represents an actual error of 18 percent of the estimated low-flow value, it is believed that the curves are useful. They do provide a means of evaluating estimates derived by other methods (for example, transfer from a gaged site on a unit-area basis) and also provide a basis for reconnaissance level est:imates 'from a min'immn amount of discharge data. The relations appear to provide estimates of greater accuracy than those found by D. M. Thomas and M. A. Benson, of the U.S. Geological Survey (written commun., 1965), using multiple-regression methods of streamflow generalization in the Potomac River
C198 SURFACE WATE.R
basin. They found a prediction error of 60 percent for the 7-day, 2-year low flow when that characteristic was determined from an equation incorporating a number of topographic and climatic variables.
Data reported by Busch and Shaw (1966) for 52 sites in Pennsylvania have been used to test the 20-year recurrence interval curve. Results were similar to those for New York streams, in that three-quarters of the data points deviated from the relation by less than 1 percent of the mean annual flmv.
The overriding constraint in the use of the curves presented in this paper is the adequacy of definition of the mean annual flow and of the 7-day, 2-year low flow. Reasonably accurate esti·mates for both of these param-
eters should be attainable by partial-record station operation and have been defined for about 600 sites in New York State.
REFERENCES
Busch, W. F., and Shaw, L. C., 1966, Pennsylvania streamflow characteristics, low-flow frequency and flow duration : Pennsylvania Dept. of Forests and Waters Bull. 1, 289 p.
Cross, ,V. P., 1963, Low-flow frequencies and storage requirements for selected Ohio streams : Ohio Dept. Nat. Resources, Div. of Water Bull. 37, 66 p.
Hardison, C. H., and Martin, R. 0. R., 1963, Water-supply characteristics of streams in the Delaware River basin and in southern New .Jersey: U.S. Geol. Survey Water-Supply Paper 1669-N, 45 p.
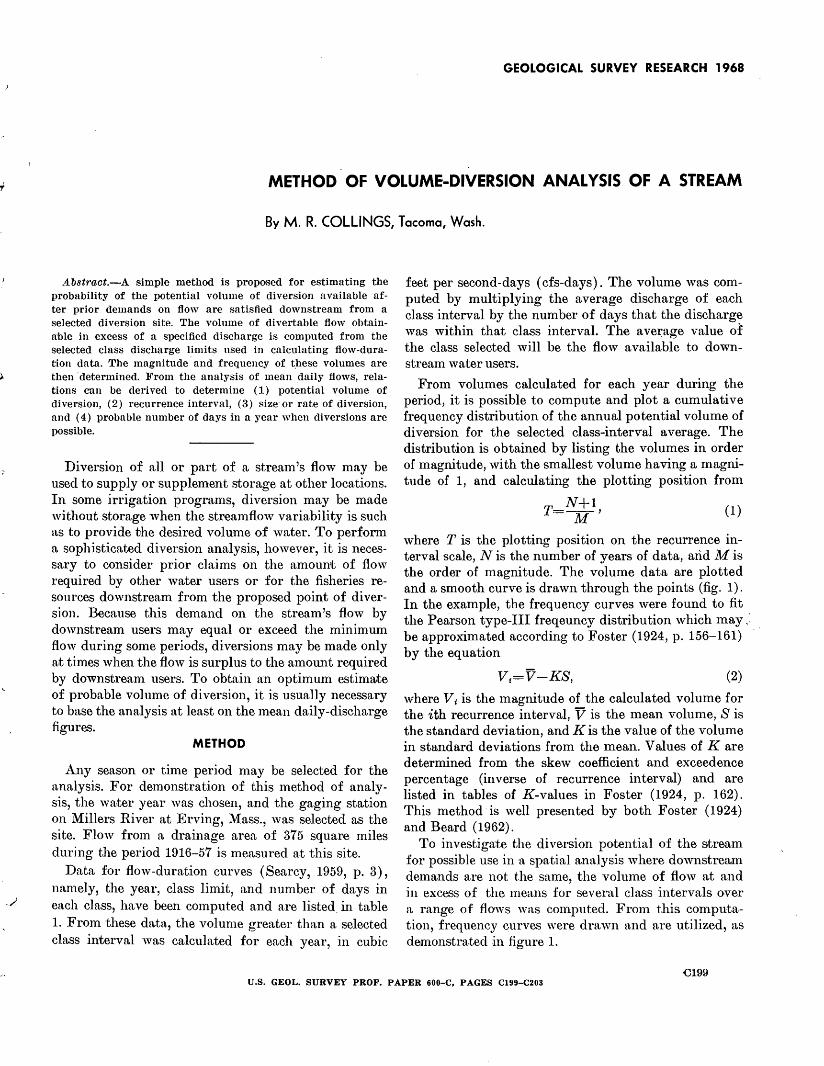
./
GEOLOGICAL SURVEY RESEARCH 1968
METHOD OF VOLUME·-DIVERSION ANALYSIS OF A STREAM
By M. R. COLLINGS, Tacoma, Wash.
A.bstract.-A simple method is proposed for estimating the probability of the potential volume of diversion available after prior demands on flow are satisfied downstream from a selected diversion site. The volume of divertable flow obtainable in excess of a specified discharge is computed from the selected class discharge limits used in calculating flow-duration data. The magnitude· and frequency of t.hese volumes are then ·determined. From the analysis of mean daily flows, relations can be derived to determine (1) potential volume of diversion, (2) recurrence interval, (3) size or rate of diversion, and ( 4) probaiJle number of days in a year when diversions are possible.
Diversion of all or part of a stream's flow may be used to supply or supplement storage at other locations. In some irrigation programs, diversion may be made without storage when the streamflow variability is such as to provide the desired volume of water. To perform a sophisticated diversion analysis, however, it is necessary to consider prior claims on the amount of flow required by other water users or for the fisheries resources downstream from the proposed point of diversion. Because this demand on the stream's flow by downstream users may equal or exceed the minimum flow during some periods, diversions may be made only at times when the flow is surplus to the amount required by downstream users. To obtain an optimum estimate of probable volume of diversion, it is usually necessary to base the analysis at least on the mean daily-discharge figures.
METHOD
Any season or time period may be selected for the analysis. For demonstration of this method of analysis, the water year was chosen, and the gaging station on Millers River at Erving, Mass., was selected as the site. Flow from a drainage area of 375 square miles dur.ing the period 1916-57 is measured at this site.
Data for flow-duration curves (Searcy, 1959, p. 3), namely, the year, class limit, and number of days in each class, have been computed and are listed in table 1. Frmn these data, the volume greater than a selected class interval was calculated for each year, in cubic
feet per second-days ( cfs-days). The volume was computed by multiplying the average discharge of each class interval by the number of days that the discharge was within that class interval. The a ve~age value of the class selected will be the flow available to downstream water users.
From volumes calculated for each year during the period, it is possible to compute and plot a cumulative frequency distribution of the annual potential volume of diversion for the selected class-interval average. The distribution is obtained by listing the volumes in order of magnitude, with the smallest volume having a magnitude of 1, and calculating the plotting position from
(1)
where T is the plotting position on the recurrence interval scale, N is the number of years of data, arid M is the order of magnitude. The volume data are plotted and a smooth curve is drawn through the points (fig. 1). In the example, the frequency curves were found to fit the Pearson type-III freqeuncy distribution which may;: . be approximated according to Foster (1924, p. 156-161) · by the equation
(2)
where Vt is the magnitude of the calculated volume for the ith recurrence interval, V is the mean volume, S is the standard deviation, and K is the value of the volume in standard deviations from the mean. Values of K are determined from the skew coefficient and exceedence percentage (inverse of recurrence interval) and are listed in tables of K-values in Foster (1924, p. 162). This method is well presented by both Foster (1924) and Beard (1962).
To investiga;te the diversion potential of the stream for possible use in a spatial analysis where downstream demands are not the same, the volume of flow at and in excess of the means for several class intervals over a range of flows was computed. From this computation, frequency curves were drawn and are utilized, as demonstrated in figure 1.
0199 U.S. GEOL. SURVEY PROF. PAPER 600-C. PAGES Cl99-C203
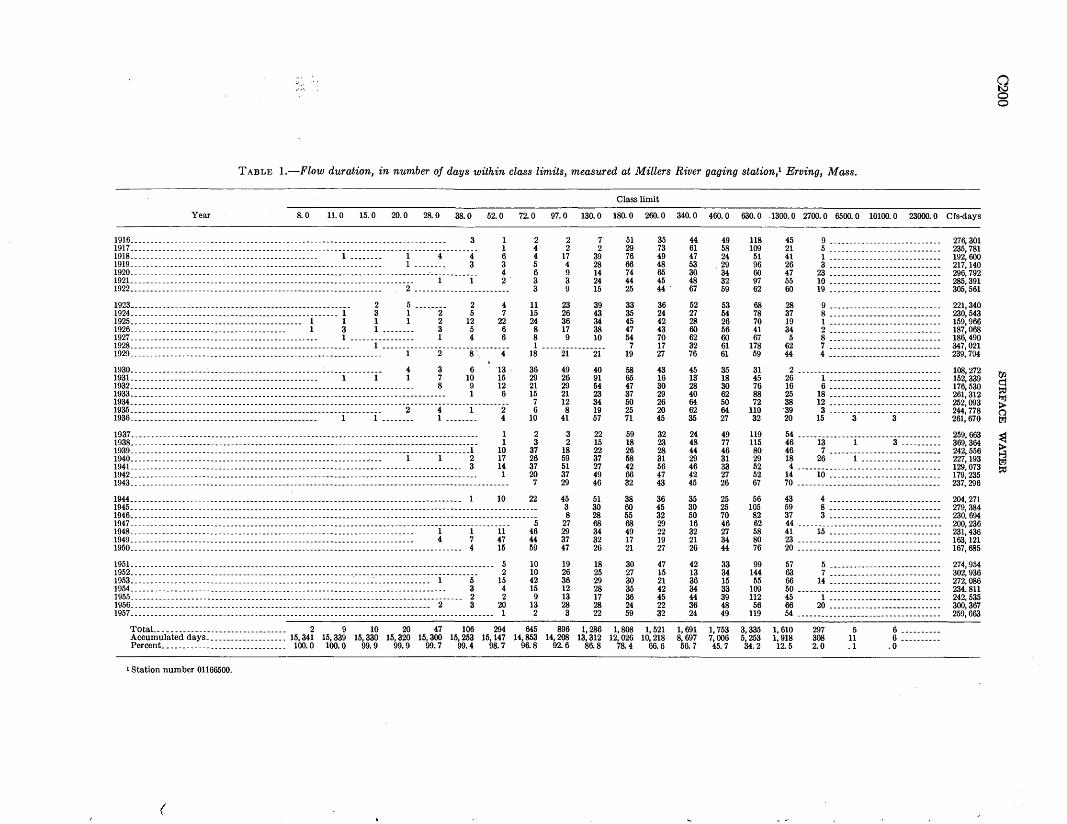
TABLE 1.-Flow duration, in number of days within class limits, measured at Millers River gaging station,1 Erving, Mass.
Class limit
Year 8. 0 11. 0 15. 0 20. 0 28. 0 38. 0 52. 0 72. 0 97. 0 130. 0 180. 0 260. 0 340. 0 460. 0 630. 0 .1300. 0 2700. 0 6500. 0 10100. 0 23000. 0 Cfs-days
1916 __ ---- ------------------------------------------------------------------------- 3 1917---------------------------------------------------------------------------------------1918 __ --- ------------------------------------------ 1 -------- 1 4 4 1919 __ -- ----------------------------------------------------------- 1 -------- 3 1920 ___________________________________________________________________________ . ___________ _
1921__ --------------------------------------------------------------------- 1 1 1922 __ ---------------- _·_------ ------------------------------------- 2 -----------------
1 1 6 3 4 2
2 4 4 5 6 3 3
2 2
17 4 9 3 9
7. 2
39 28 14 24 15
1923 __ ----------------------------------------------------- 2 5 ----.---- 2 5
12 5 4
4 7
22 6 6
11 23 39 1924_---- ----------------------------------------------- 1 3 1 2 15 26 43 1925 ___________________________________________ 1 1 1 1 2
~ 36 34 1926_______________________________________ 1 3 1 -------- 3 8 17 38 1927----------------------------------------------- 1 ---------------- 1 8 9 10 1928 __ ----------------------------------------------------- 1 -------------------------------- 1 ----------------1929 __ ------------------------------------------------------------- 1 2 8 --. 4 18 21 21
1930_--- ------------ ___ ._ ----------------------------:-------------- 4 3 6 13 . 1931_______________________________________________ 1 1 1 7 10 15 1932_- --------------------------------------------------------------------- 8 9 12 1933 __ ----------------------------------------------------------------------------- 1 6 1934 __ ------------------------------------------------------------------------------------------- ~-1935 ____ -- --------------------------------------------------------- 2 4 1 2 1936_______________________________________________ 1 1 -------- 1 -------- 4
1937--------------------------------------------------------------------------------------- 1 1938 __ ------------------------------------------------------------------------------------- 1 1939_------------------------------------------- ---------------------------------------- _l 10 1940 __ -------------------------------------------------------------- 1 1 2 17 1941__ --------------------------------------------------------------------------------- 3 14 1942 ___ - ----------------------------------------------------------------------------------- 1 1943 ______________________________________________________________________________________________ _
36 29 21 15 7 6
10
2 3
37 26 37 20 7
1944 __ --------------------------------------------------------------------------------- 1 10 ~ 1945 __ -- --------------------------------------------------------------------------------------------------1946_--- --------------------------------------------------------------------------------------------------1947----------------------------------------------------------------------------------------------- 5 1948 __ ------ --------------------------------------------------------------- 1 1 11 46 1949 __ --------------------------------------------------------------------- 4 7 47 44 1950 ____ ------------------------------------------------------------------------------- 4 15 59
1951_- ----------------------------------------------------------------------------------------- 5 10 1952 __ ------------------------------------------------------------------------------------- 2 10 1953 __ ----------------------------------------------------- _· __ - __ · __ - ----------- 1 5 15 42 1954 __ ----------------------------------------------------------------------------- 3 4 15 1955_- --------------------------------------------------------------------------------- 2 2 9 1956_- ------------------------------------------------------------------------- 2 3 20 13 1957------------------------------------------------------------------------------------------- 1 2
G ~ ~ w 29 M ~ 23 ~ 34 8 w
M " 3 ~ 2 M
u ~ w ~ M ~ ~ G 29 ~
% M 3 ~ 8 28 ~ ~ 29 34 ~ ~ fl ~
w u ~ 25 ~ 29 ~ 28 u u 28 28 3 ~
51 M 29 n w G 00 ~ H 65 « ~ 25 «·
~ ~ M ~ ~ G fl ~ M m
7 u w ~
~ ~ 65 u fl ~ ~ 29 w ~ 25 w 71 ~
w ~ u 23 ~ 28 ~ u G w 00 fl ~ ~
38 ~ 60 ~ M ~ ~ 29 G ~ u w ~ ~
~ fl ~ M ~ ~ ~ G ~ % ~ ~ w ~
TotaL------------------------------- 2 9 10 20 47 106 294 645 896 1,286 1,808 1,521 Accumulated days ____________________ 15, 341 15, 339 15, 330 15, 320 15, 300 15, 253 15, 147 14, 853 14, 208 13, 312 12, 026 10, 218 Percent_ ______________________________ 100.0 100.0 99.9 99.9 99.7 99.4 98.7 96.8 92.6 86.8 78.4 66.6
I Station number 01166500.
(
44 49 118 45 9 ---------------------------- 276,301 61 58 109 21 5 ---------------------------- 235,781 47 24 51 41 1 ---------------------------- 192,600 53 29 96 26 3 ---------------------------- 217, 140 30 34 60 47 23 ---------------------------- 296,792 48 32 97 55 10 ---------------------------- 285,391 67 59 62 60 19 ---------------------------- 305,561
52 53 68 28 9 ---------------------------- 221,340 ~ 54 78 37 8 ---------------------------- 230,M3 28 26 70 19 1 ---------------------------- 159,966 60 56 41 34 2 ---------------------------- 187,068 62 60 67 5 8 ---------------------------- 186,490 32 61 178 62 7 ---------------------------- 347,021 76 61 59 « 4 ---------------------------- 239,794
45 ~ 31 2 -----------------------·------------- 108,272 13 18 45 26 1 ---------------------------- 152,~9 28 30 76 16 6 ---------------------------- 176,530 40 62 88 25 18 ---------------------------- 261,312 64 50 72 38 12 ---------------------------- 252,093 62 64 110 39 3 ---------------------------- 2«, 778 M 27 32 20 15 3 3 261,670
24 49 119 M------------------------------------ 259,663 48 77 115 46 13 1 3 ---------- 369,364 44 46 80 46 7 ---------------------------- 242,556 29 31 29 18 26 1 -------------------- 227,193 46 33 52 4 - ----------------------------------- 129,073 42 27 52 14 10 ---------------------------- 179,235 45 26 67 70 -------------------------~---------- 237,296
35 25 56 43 4 ---------------------------- 204,271 30 25 105 59 8 --------------------~------- 279,384 50 70 82 37 3 ---------------------------- 230,694 16 46 62 44 ------------------------------------ 200,236 32 27 58 41 15 ---------------------------- 231,436 21 34 80 23 ------------------------------------ 163, 121 26 44 76 20 ------------------------------------ 167,685
42 33 99 57 5 ---------------------------- 274, 9M 13 34 144 63 7 ---------------------------- 302,936 36 15 55 66 14 --------- ------------------- 272,086 34 33 109 50 ------------------------------------ 234.811 44 39 112 45 1 ---------------------------- 242,535 36 48 56 66 20 ---------------------------- 300,367 24 49 119 M ------------------------------------ 259,663
1, 691 1, 753 3,335 1, 610 297 5 6 ----------8,697 7,006 5, 253 1, 918 308 11 6 ----------56.7 45.7 34.2 12.5 2.0 .1 .0
g 0 0
f/2 c:l =:tl ~ > c trl
~ ~ trl =:tl
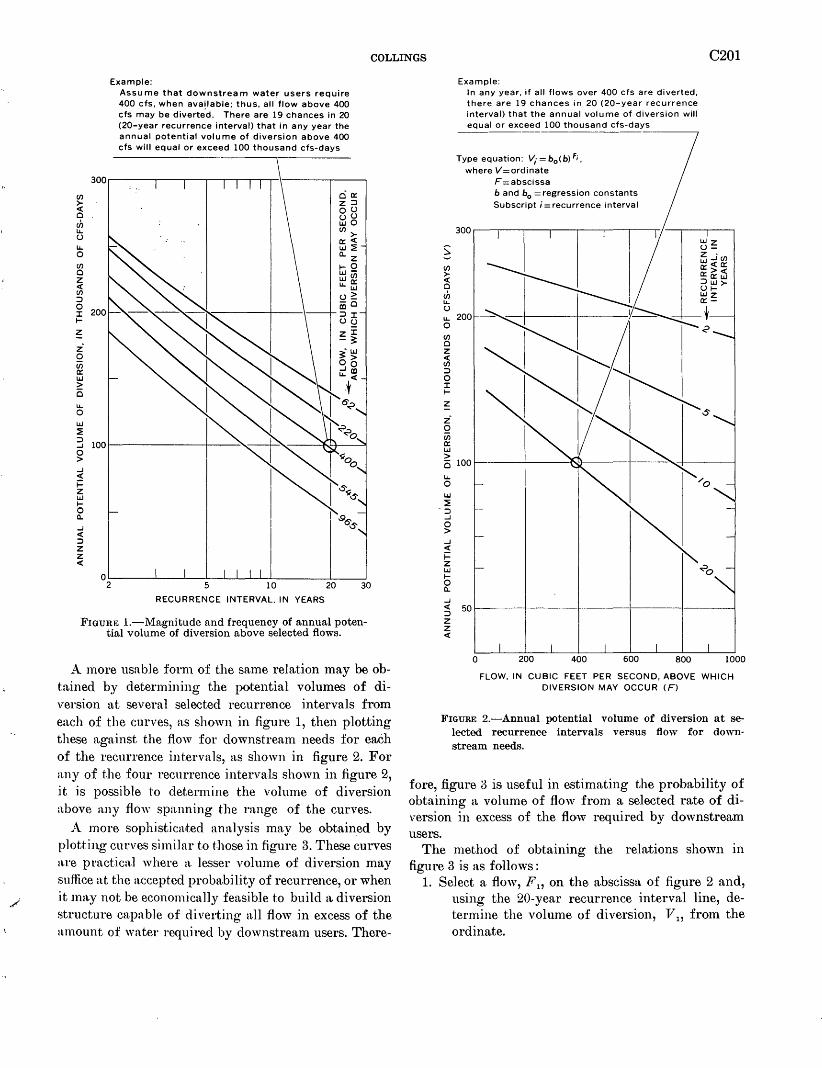
.•. /
COLLINGS C201
(/)
>c( 0 rh u... u u... 0 (/)
0 z c( (/)
::> 0 J: t-
z
z 0 en a:: LJ.J > 0 u... 0 LJ.J ~ ::> ...J 0 > ...J c(
f= z LJ.J to a.. ...J c( ::> z z c(
Example: Assume that downstream water users require 400 cfs, when available; thus, all flow above 400 cfs may be diverte.d. There are 19 chances in 20 (20-year recurrence interval) that in any year the annual potential volume of diversion above 400 cfs will equal or exceed 100 thousand cfs-days
RECURRENCE INTERVAL. IN YEARS
FIGURE !.-Magnitude and frequency of annual potential volume of diversion above selected flows.
A more usable fo11n of the same relation may be obtn.ined by determining the potential volumes of diversion at several selected recurrence intervals from each of the curves, ·as shown in figure 1, then plotting these against the flow for downstream needs for eaeh of the recurrence intervals, as shown in figure 2. For any of t.he four recurrence intervals shown in figure 2, .it is possible to dete11nine the volume of diversion above any flow spanning the range of the curves.
A more sophist.icMed analysis may be obtained by plotting curves similar to t.hose in figure 3. These curves are practical where a. lesser volume of diversion may suffice at the accepted probability of recurrence, or when it 1nn.y not be economically feasible to build a diversion structure capable of diverting all flow in excess of the amount of water required by downstream users. There-
s: (/)
>-c( 0 rh u... u u... 0 (/) 0 z c( (/)
::> 0 J: t-
~ z· 0 en a:: LJ.J > 0 u... 0 LJ.J ~ .. ::> ...J 0 > ...J c(
f= z LJ.J t-0 a.. ...J c( ::> z z c(
Example: In any year, if all flows over 400 cfs are diverted, there are 19 chances in 20 (20-year recurrence interval) that the annual volume of diversion will equal or exceed 100 thousand cfs-days
Type equation: V; = b0 (b) F;,
where V=ordinate
300
200
100
50
0
F =abscissa band b0 =regression constants Subscript i =recurrence interval
400
---....,
800 1000
FLOW, IN CUBIC FEET PER SECOND, ABOVE WHICH DIVERSION MAY OCCUR (F)
FIGURE 2.-Annual potential volume of diversion at selected recurrence intervals versus flow for downstream needs.
fore, figure 3 is useful in estimating the probability of obtaining a volume of flow from a selected rate of diversion in excess of the flow required by downstream users.
The method of obtaining the relations shown in figure 3 is as follows :
1. Select a flow, Fu on the abscissa of figure 2 and, using the 20-year recurrence interval line, determine the volume of diversion, V 1 , from the ordinate.
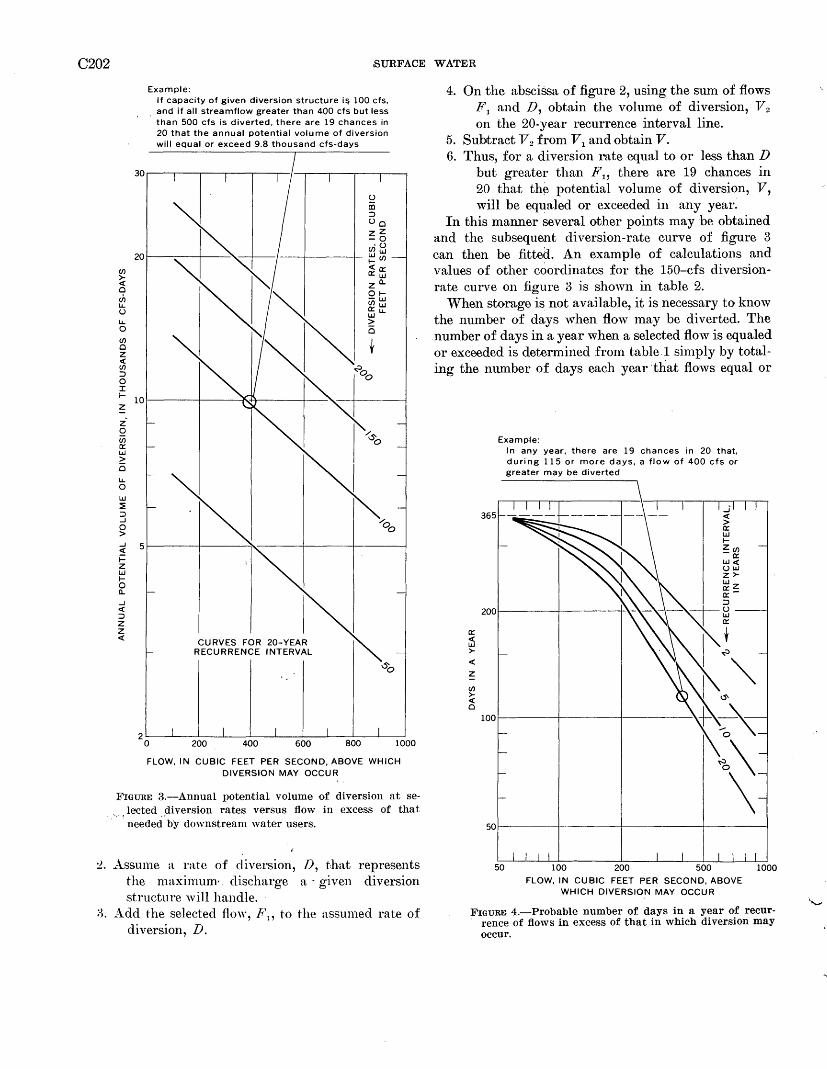
C202 SURFACE WATER
C/)
><( 0 ch LL. u LL. 0 C/) 0 z <( C/)
::::> 0 I
Example: If capacity of given diversion structure i~ 100 cfs,
. and if all streamflow greater than 400 cfs but less than 500 cfs is diverted, there are 19 chances in 20 that the annual potential volume of diversion will equal or exceed 9.8 thousand cfs-days
I- 10~------~----~~------+-~~ z z 0 u; 0::: IJ.J > 0 LL. 0 IJ.J ~ ::::> ...J 0 > ...J <(
f= z IJ.J 1--0 a.. ...J <( ::::> z z <(
CURVES FOR 20-YEAR RECURRENCE INTERVAL
FLOW, IN CUBIC FEET PER SECOND, ABOVE WHICH DIVERSION MAY OCCUR
FIGURE 3.-Annual potential volume of diversion at selected diversion rates versus flow in excess of that needed by downstream water users.
:L Assume a rate of diversion, D, that represents the maximum·. discharge a - giVen diversion structure will handle.
a. Add the selected flow, F\, to the assumed rate of diversion, D.
4. On the absciSsa of figure 2, using the sum of flows F 1 and D, obtain the volume of diversion, Tfz
on the 20-year recurrence interval line. 5. Subtract Tfz from T11 and obtain V. 6. Thus, for a diversion rate equal to or less than D
but greater than Fu there are 19 chances in 20 that th~ potential volume of diveTsion, V, will be equaled or exceeded in any year.
In this manner several other points may be obtained and the subsequent diversion-rate curve of figure 3 can then be fitted. An example of calculations and values of other coordinates for the 150-cfs diversionrate curve on figure 3 is shown in table 2.
When storage is not available, it is necessary to know the numbe.r of clays when flow may be diverted. The .number of days in a year when a selected flow is equaled or exceeded is determined from table.1 simply by totaling the number of days each year that flows equal or
0:::
~ ><(
~ C/)
><( 0
Example: In any year, there are 19 chances in 20 that, during 115 or more days, a flow of 400 cfs or greater may be diverted
FLOW, IN CUBIC FEET PER SECOND, ABOVE WHICH DIVERSION MAY OCCUR
1000
FIGURE 4.-Probable number of days in a year of recur. renee of flows in excess of that in which diversion may
occur.
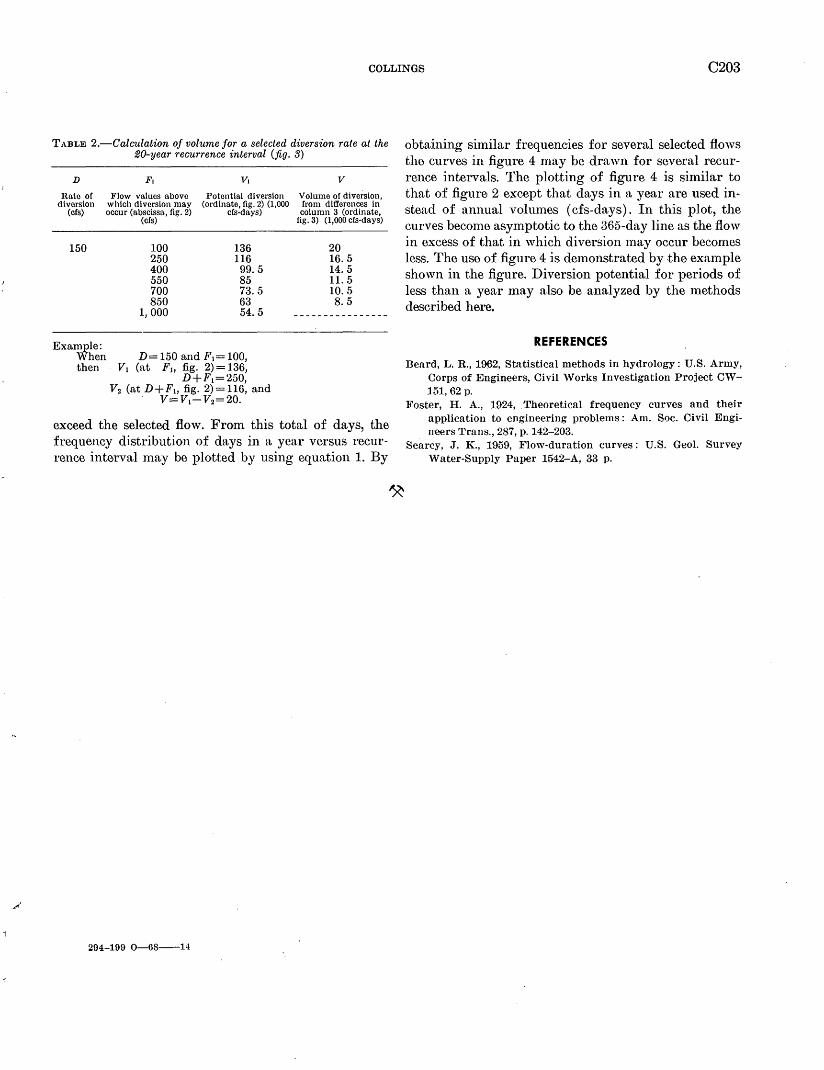
COLLINGS C203
TABLE 2.-Calculation of volume for a selected diversion rate at the 20-year recurrence interval (fig. 3)
D F. v. Rate of Flow values above Potential diversion
diversion which diversion may (ordinate, fig. 2) (1,000 (cfs) occur (abscissa, fig. 2) cfs-days)
150
Example: When then
(cfs)
100 136 250 116 400 99.5 550 85 700 73.5 850 63
1,000 54.5
D= 150 and F1= 100, V1 (at Fh fig. 2) = 136,
D+F~=250, V2 (at D+Fh fig. 2)=116, and
V= V1-V2=20.
v Volume of diversion, from differences in column 3 (ordinate,
fig. 3) (1,000 cfs-days)
20 16.5 14.5 11.5 10.5 8.5
----------------
exceed the selected flow. From this total of days, the frequency distribution of days in a year versus recurrence interval may be plotted by using equation 1. By
294-199 0-68--14
obtaining similar frequencies for several selected flows the curves in figure 4 may be drawn for several recurrence intervals. The plotting of figure 4 is similar to that of figure 2 except that days in a year are used instead of annual volumes ( cfs-days). In this plot, the curves become asymptotic to the 365-day line as the flow in excess of that in which diversion may occur becomes less. The use of figure 4 is demonstrated by the example shown in the figure. Diversion potential for periods of less than a year n1ay also be analyzed by the methods described here.
REFERENCES
Beard, L. R., 1962, Statistical methods in hydrology: U.S. Army, Corps of Engineers, Civil Works Investigation Project CW-151, 62 p.
1!-,oster, H. A., 1924, . Theoretical frequency curves and their application to engineering problems: Am. Soc. Civil Engineers Trans., 287, p. 142-203.
Searcy, J. K., 1959, Flow-duration curves: U.S. Geol. Survey Water-Supply Paper 1542-A, .33 p.
GEOLOGICAL SURVEY RESEARCH 1968
THE BOUNDARY CONDITIONS IN THE IMPLICIT SOLUTION
OF RIVER TRANSIENTS
By CHINTU LAI, Washington, D.C.
Abstract.-Transient riverflow in a given reach at a particular time can be defined by partial differential equations and appropriate boundary conditions. Consideration of physical properties of the riverfiow gives four different sets of boundary conditions. In solving these equations using the implicit method al.l unknowns at the advanced time line have to be found simultaneously; therefore, different combinations of known boundary data leave different sets of unknowns to be solved implicitly. Computer programs have been written to handle different boundary-value problems separately. Test runs have indicated that transient flows with all four boundary conditions can be treated adequately, and have shown that good agreement exists between. computed and observed values.
Many unsteady flows in rivers and the propagations of tides in estuaries of the well-mixed type can be described by the partial differential equations for onedimensional flow shown in a number of books and papers (Stoker, 1957; Dronkers, 1964; Lai, 1965a, 1965b; Baltzer and Lai, in press). In order to determine the solution for these partial differential equations, boundary conditions defining the flow in a particular reach for a particular period of time should be added. By combining these boundary conditions together with the basic partial differential equations, a boundary-value problem defining that particular unsteady flow can be set up, and the flow may be uniquely determined by a numerical solution using ra high-speed digital computer.
In open-channel unsteady flows, the physical consideration of flow conditions generally leads to four different sets of boundary conditions (Baltzer and Lai, in press), namely, (1) stage values are known at both the upstream and the downstream ends (either given directly or defined by equations); (2) stage at the upstream end and velocity or discharge at the downstre.:'lm end are known; (3) velocity or discharge .at the upstream end and stage at the downstream end are known; and ( 4) velocities or discharges are known at both ends of the reach.
In a broad sense, the governing differential equations together with spacewise boundary conditions and timewise initial conditions constitute the boundary-value
C204
problem (Churchill, 1941). However, in the present paper the term "boundary conditions" is used in a narrower sense and refers only to conditions at space boundaries.
In the solution of transient flows by the method of characteristics using specified time intervals (Lai, 1965,a), four boundary equations, two at each end of the reach, can be derived, and each of four unknowns can be solved explicitly from one of the four equations using known boundary values. These four dependent variables are, for example, velocity and stage at the upstream end and at the downstream end, denoted as u0 , Zo, Un, and z,l• The combination of two such boundary equations, one at each end, constitutes ·four different sets of boundary conditions. Which two equations should be used depends on which types of houndaiy-value data rare obtainable. However, a different choice of boundaryequation set does not affect the computation of the intermediate points between the two ends of the reach. In other words, with adequate handling of boundary conditions at each end of the reach, the same computer program using the method of characteristics can be applied to all four boundary-value problems.
In the solution by the implicit method, however, these four boundary-value problems pose a different issue. As previously shown (Lai, 1965b), for a given type of boundary values (say, water-surfrace elevations, Z, are known at both ends) in a single-reach problem, the unknowns (discharges, Q, at both ends in this case) are to be solved simultaneously by using an iteration technique. Unlike the case treated with the above-mentioned method of charac-teristics, in which all unknown boundary values are solved separately and explicitly, in the solution hy the implicit method, for a particular set of known boundary values there remains a corresponding set of unknowns that are to be solved simultaneously at the ~advanced time level. In principle, all four sets can be solved by the similar technique of the implicit method, but in actuality, separate solution schemes must be established for different combinations of boundary
U.S. GEOL. SURVEY PROF. PAPER 600-C, PAGES C204-C210
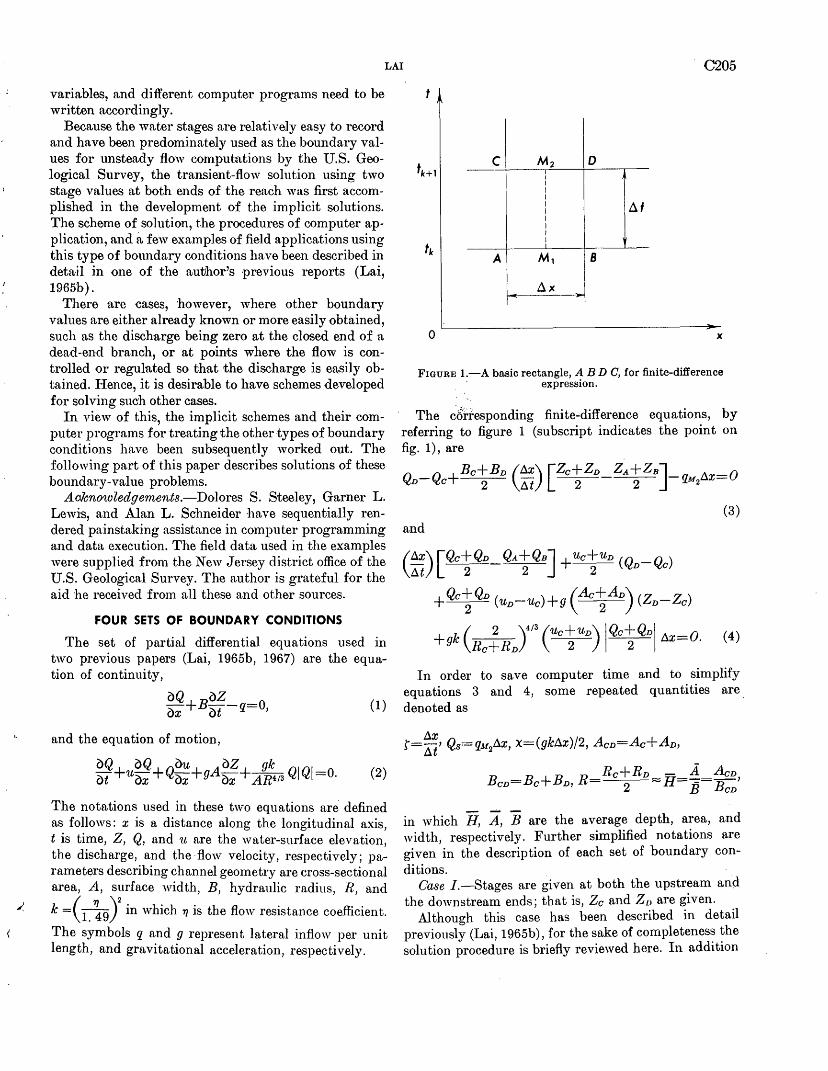
LAI C205
variables, and different computer programs need to be written accordingly.
Because the water stages are relatively easy to record and have been predominately used as the boundary values for unsteady flow computations by the U.S. Geological Survey, the transient-flow solution using two stage values at both ends of the reach was first accomplished in the development of the implicit solutions. The scheme of solution, the procedures of computer application, and a few examples of field applications using this type of boundary conditions have been described in detail in one of the author's previous reports (Lai, 1965b).
There are cases, however, where other boundary values are either already known or more easily obtained, such as the discharge being zero at the closed end of a dead -end branch, or at points where the flow is controlled or regulated so that the discharge is ea,.sily obtaiiled. Hence, it is desirable to have schemes developed for solving such other cases.
In view of this, the implicit schemes and their computer programs for treating the other types of boundary conditions have been subsequently worked out. The following part of this paper describes solutions of these boundary-value problems.
Acknmoledgements.-Dolores S. Steeley, Garner L. Lewis, and Alan L. Schneider have sequentially rendered painstaking assistance in computer programming and data execution. The field data used in the examples were supplied from the New Jersey district office of the U.S. Geological Survey. The author is grateful for the aid he received from all these and other sources.
FOUR SETS OF BOUNDARY CONDITIONS
The set of partial differential equations used in two previous papers (Lai, 1965b, 1967) are the equation of continuity,
oQ oz -+B--q=O ox ot ' (1)
and the equation of motion,
(2)
The notations used in these two equations are defined as follows: x is a distance along the longitudinal axis, t is time, Z, Q, and 'l.l are the water-surface elevation, the discharge, and the ·flow velocity, respectively; parameters describing channel geometry are cross-sectional area, A, surface width, B, hydraulic radius, R, and
k =(1. ~9)2
in which rJ is the flow resistance coefficient.
The symbols q and g represent lateral inflow per unit length, and gravitational acceleration, respectively.
c M2 D
D.t
A Mt
J D.x
0 X
FIGURE 1.-A basic rectangle, A B DC, for finite-difference expression.
The cbrtesponding finite-difference equations, by referring to figure 1 (subscript indicates the point on fig. 1), are
QD-Qc+Bc~BD (~~) [Zc~ZD ZA~ZB]-qM/~x=O
(3) and
(~~) [Qc~QD QA~QB J + UctUD (QD-Qc)
+ Qc~QD (uD-Uc)+g ( Ac~AD) (ZD-Zc)
+gk (Rc!RD)4/3 (Uc~UD) IQctQDI flx=O. (4)
In order to save computer time and to simplify equations 3 and 4, some repeated quantities are. denoted as
t=~~' Qs==q!o!2AX, X=(gkllx)/2, AcD=Ac+AD,
Rc+RD - A AcD BcD=Bc+BD, R= 2 H= B= BeD'
in which H, A, B are the average depth, area, and width, respectively. Further simplified notations are given in the description of each set of boundary conditions.
Case I.-Stages are given at both the upstream and the downstream ends; that is, Zc and ZD are given.
Although this case has been described in detail previously (Lai, 1965b), for the sake of completeness the solution procedure is briefly reviewed here. In addition
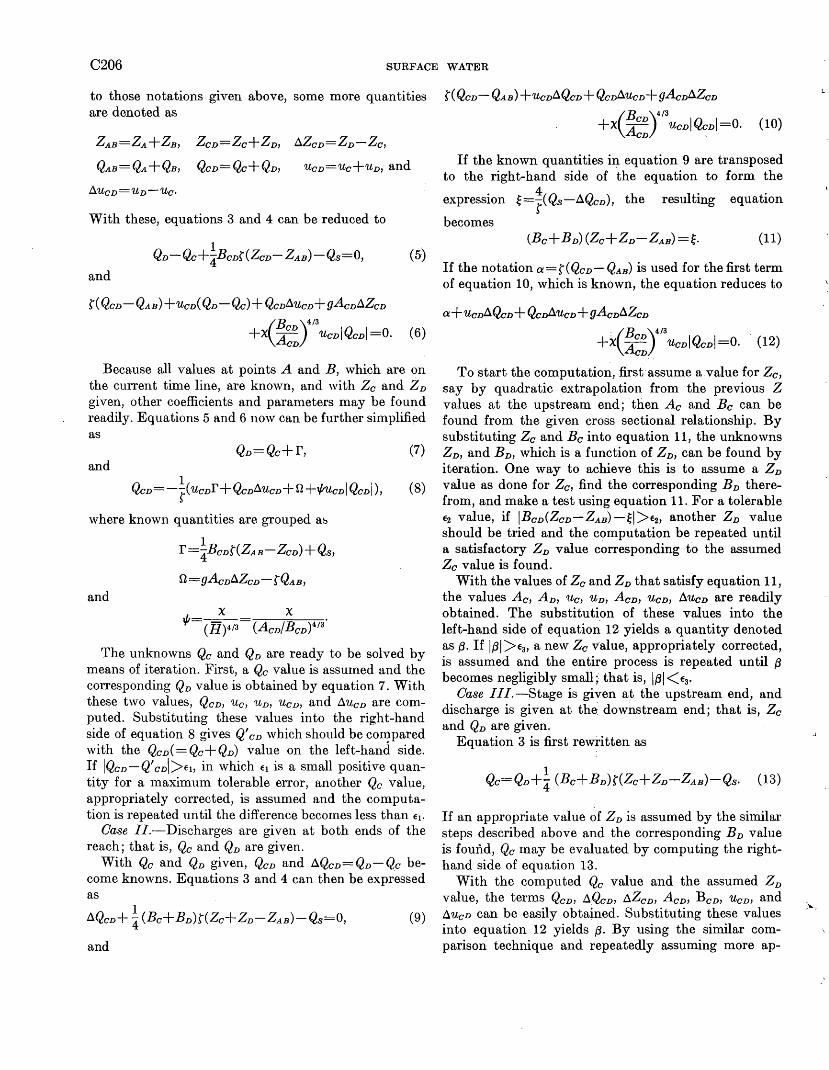
C206 SURFACE WATER
to those notations given above, some more quantities are denoted as
~Ucv='Uv-Uc.
With these, equations 3 and 4 can be reduced to
(5)
and
(B )4;3 +x A:: UcniQcni=O. (6)
Because all values at points A and B, which are on the current time line, are known, and with Zc and Zn given, other coefficients and parameters may be found readily. Equations 5 and 6 now can be further simplified as
(7) and
Qcn= -~( Ucnr + Qcn~Ucn + Q +1/lucnl Qcnl), ( 8)
where known quantities are grouped al::>
1 r=4Bcnf'(ZAB-Zcn)+Qs,
Q=gAcnAZcn-f'QAB, and
X X 1/1 (H) 413 (Acn/Bcn) 413 •
The unknowns Qc and Q0 are ready to be solved by means of iteration. First, a Qc value is assumed and the corresponding Qn value is obtained by equation 7. With these two values, Qcn, u0 , Un, Ucn, and ~Ucn are computed. Substituting these values into the right-hand side of equation 8 gives Q' en which should be compared with the Qcn( = Qc+ Qn) value on the left-hand side. If IQcn-Q' cvl>e1, in which e1 is a small positive quantity for a maximum tolerable error, another Qc value, appropriately corrected, is assumed and the computation is repeated until the difference becomes less than e1•
Case fl.-Discharges are given at both ends of the reach; that is, Qc and Qn are given.
With Qc and Qn given, Qcn and ~Qcn= Qn- Qc become knowns. Equations 3 and 4 can then be expressed as
~Qcn+ ~(Be+ Bn)f'(Zc+Zn-ZAB)-Qs=O, (9)
and
(10)
If the known quantities in equation 9 are transposed to the right-hand side of the equation to form the
4 expression ~=r( Q8 -ilQ0 n), the resulting equation
becomes
If the notation a=f'(Qcn-QAB) is used for the first term of equation 10, which is known, the equation reduces to
a+ucnil'lcn+'lcnilUcn+gAcn~Zcn
+~(~:)413
UcniQcni=O .. (12)
To start the computation, first· assume a.value for Z0 ,
say by quadratic extrapolation from the previous Z values at the upstream end; then Ac and Be can be found from the given cross sectional relationship. By substituting Zc and Be into equation 11, the unknowns Zn, and Bn, which is a function of Zn, can be found by iteration. One way to achieve this is to assume a Zn value as done for Z0 , find the corresponding Bn therefrom, and make a test using equation 11. For a tolerable E2 value, if IBcn(Zcn-ZAB)-~i>e2 , another Zn value should be tried and the computation be repeated until a satisfactory Zn value corresponding to the assumed Zc value is found.
With the values of Zc and Zn that satisfy equation 11, the values Ac, An, Uc, Un, Acn, Ucn, AUcn are readily obtained. The substitution of these values into the left-hand side of equation 12 yields a quantity denoted as (3. If lf31 >e3, a new Zc value, appropriately corrected, is assumed and the entire process is repeated until {3
becomes negligibly small; that is, lf31 < e3•
Case JJJ.-Stage is given at the upstream end, and discharge is given at the: downstream end; that is, Zc and Qn are given.
Equation 3 is first rewritten as
If an appropriate value of Zv is assumed by the similar steps described above and the corresponding B n value is found, Qc may be evaluated by computing the righthand side of equation 13.
With the computed Q0 value and the assumed Zn value, the terms Q0 n, ~Q0n, ~Zcn 1 A 0 n, B 0 n, Ucn, and ~u0v can be easily obtained. Substituting these values into equation 12 yields (3. By using the similar comparison technique and repeatedly assuming more ap-
: ....
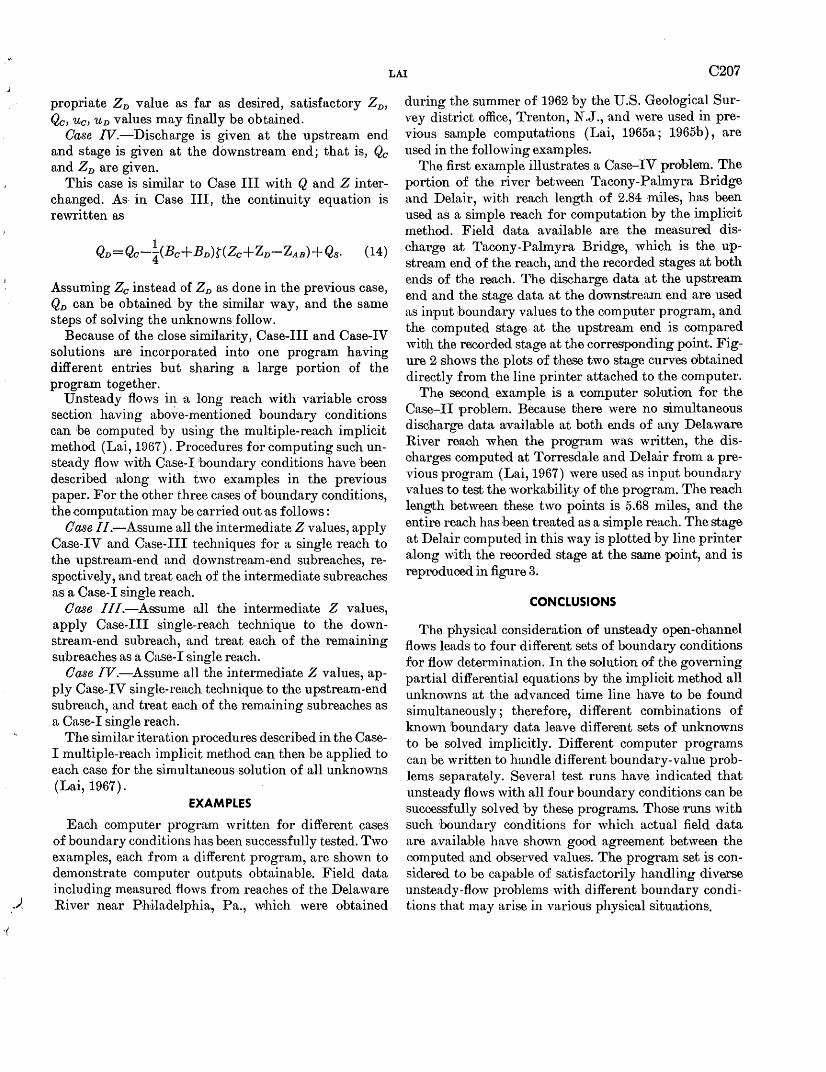
LA! C207
propriate ZD value as far as desired, satisfactory ZD, Qc, uc, uD values may finally be obtained.
Case IV.-Discharge is given at the upstream end and stage is given at the downstream end; that is, Qc and ZD are given.
This case is similar to Case III with Q and Zinterchanged. As· in Case III, the continuity equation is rewritten as
1 QD=Qc-4(Bc+BD)t(Zc+ZD-ZAB)+Q8 • (14)
Assuming Zc instead of ZD as done in the previous case, QD can be obtained by the similar way, and the same steps of solving the unknownsfollow.
Because of the close similarity, Case-III and Case-IV solutions are incorporated into one program having different entries but sharing a large portion of the program together.
Unsteady flows in a long reach with variable cross section having above-mentioned boundary conditions can be computed by using the multiple-reach implicit method (Lai, 1967). Procedures for computing su~h unsteady flow with Case-I 'boundary conditions have been described along with two examples in the previous paper. For the other three cases of boundary conditions, the ·computation may be carried out as follows:
Oase //.-Assume all the intermediate Z values, apply Case-IV and Case-III techniques for a single reach to the upstream-end and downstream-end subreaches, respectively, and treat ea~h of the intermediate sub reaches as a Case-I single reach.
Oase 1/I.-kssume all the intermediate Z values, apply Case-III single-reach technique to the downstreain-end subreach, and treat each of the remaining sub reaches as a Case-I single reach.
Oase /V.-Assume all the intermediate Z values, apply Case-IV single-reach technique to the upstream-end subreach, and treat each of the remaining subreaches as a Case-I single reach.
The similar iteration procedures described in the CaseI multiple-reach implicit method can then be applied to each case for the simultaneous solution of all unknowns (Lai, 1967).
EXAMPLES
Each computer progra:m written for different cases of boundary conditions has been successfully tested. Two examples, each from a different program, are shown to demonstrate computer outputs obtainable. Field data including measured flows from reaches of the Delaware River near Philadelphia, Pa., which were obtained
during the summer of 1962 by the U.S. Geological Survey district office, Trenton, N.J., and were used in previous sample computations (Lai, 1965a; 1965b), are used in the following examples.
The first example illustrates a Case-IV problem. The portion of the river between Tacony-Palmyra Bridge and Delair, with reach length of 2.84 ·miles, has been used as a simple reach for computation by the implicit method. Field data available are the measured discharge at Tacony-Palmyra Bridge, which is the upstream end of the reach, a:nd the recorded stages at both ends of the reach. The discharge data at the upstream end and the stage data at the downstream end are used as input boundary va1ues to the computer program, and the computed stage at the upstream end is oompared witJh the recorded stage at the corresponding point. Figure 2 shows the plots of these two stage curves dbtained directly from the line printer attached to the computer.
The second example is a computer soluJtion for the Case-II problem. Because there were no simultaneous disclharge data a:vaila:ble at both ends of any Delaware River reach when the program was written, the discharges com-puted at Torresdale and Delruir from a previous program (Lai, 1967) were used as input boundary values to test the workability of the program. The reach length between these two points is 5.68 miles, and the entire reach has been treated as a simple reach. The stage at Delair computed in this way is plotted by line printer along with the recorded stage at the same point, and is reproduced in figure 3.
CONCLUSIONS
The physical consideration of unsteady open-channel flows leads to four different sets of boundary conditions for flow determination. In the solution of the governing partial differential equations by the implicit method all unknowns at the advanced time line have to be found simultaneously; therefore, different combinations of known boundary data leave different sets of unknowns to be solved implicitly. Different computer programs can be written to handle different boundary-value problems separately. Several test runs have indicated that unsteady flows with all four boundary conditions can be successfully solved by these programs. Those runs with such boundary conditions for which actual field data are available have shown good agreement between the computed and observed values. The program set is considered to be capable of satisfactorily handling diverse unsteady-flow problems with different boundary conditions that may arise in various physical situations.
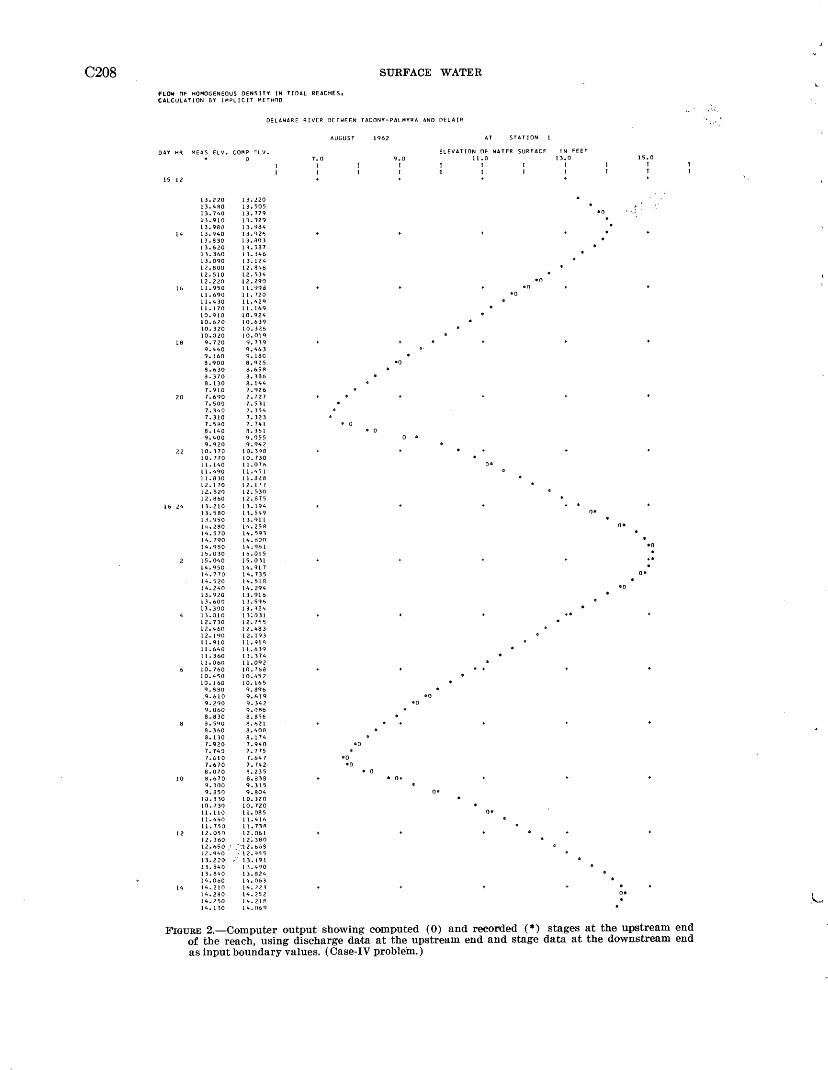
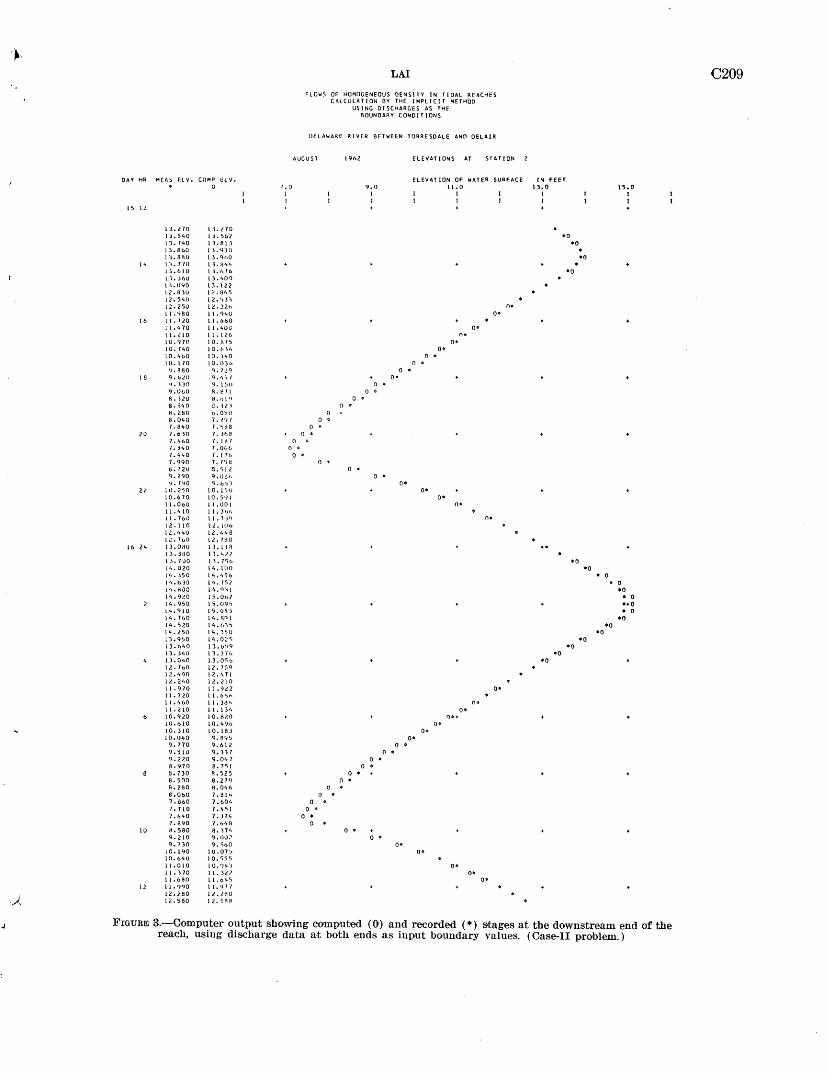
:~.
LAI C209 FLOWS OF HOMOGENEOUS DENSITY IN TIDAL REACHES
ChLCULATIDN BY THE IMPLICJr METHOD USING DISCHARGES AS THE
BOUNDARY CONDITIONS
llE LAW ARE RIVER BFTWEEN TORRESDALE AND DELAIR
AUGUST 1962 fLEVATIONS AT STAT ION 2
DAY HR M[A~ f.L v. COMP EL V. ELEVATION OF WATER SURFACE IN FEET 0 1.0 9. 0 11.0 13.0 15.0
I I I I I I I I I I
15 12
13.l70 13.l"/0 1 J. 540 1 J. 56Z •o 13. 740 I 3. A 13 •o I :J. 860 I L 93H . 13. 8HO 1 3.9h0 •o
14 1'<. 770 1 3. !J44 13.610 1 j. b 16 •o 13. Jou 1 3. 40<) 1 I. 0~0 13. 121 12. H )0 l?. 8'· 5 12.540 l 2. 1l .l ·; 12. 25\l 12. 2?.h n• II. 'ISO 11. '140 o•
16 II. 720 11. i>60 11.470 II. 400 o• 11.<10 I I. 121> n• IO.HO I 0. 615 o• 10. /40 IO.t-1'• o• I 0. 460 10. HO (1 . I 0. 170 l Q. O'jb 0 . 'J. R80 9. 1.!q 0 .
I 8 9. 1.20 9,.,,,, I o• '1. I ~10 9. l ~· ll 0 . 9 .u&o 8. 8/ I 0 . A. 12U H .. I) 1 q 0 . s. ''•0 :J. ll J 0 . s. 280 6 .. 0~) 0 0 ~
8. 040 7. /'II 0 . 7. 840 1 .. ~08 0 .
lU 7.o:Jo 1. Joe () . 7. 460 7. I d 7 0 * .,. J40 7. Q(,(, 0 * 7. 41t0 7.1"10 0 . 7. 9'10 7. l'i H 0 . t\. 72U S. ~I 2 0 . 'l. %'10 9. ()~I· 0 . •J. 790 '1. o>'J o•
2? 10. 2~0 I O. 1 '>0 0* I 0.670 10. 5'1 I o• 11.060 11.00 I o• ll.'o10 ll.)ltt, II. 760 11.7J<) n• 12. 110 12. lllb L!.4 1t0 ll. '•4 8 1 t!. 7o0 12. 780
lb 24 13.ono I 3. 118 13. 3HO 11. '·2 2 I .l. 7UO 1 3. 7'lh •o 14.020 14. 100 •o I'• • .!50 l4.'tS6 . 0 1 '••6 "30 14. ,~, 7 • 0 I '•. ~00 14. 9'1 1 •o 14.91.0 15.062 • 0 14.950 15.09'> ••o l'•·'llO 15. 0'> 3 . 0 1 4. 71,0 14. W>1 •o 14. ~20 l4. hl':> •o 14 .l50 14. 1')0 •o I 3.'1>0 14. 02~ •o 13.640 13. b'l'l •o 13.340 13.311> •o l.l. 040 13. O'io •o 12. 7oO 12. 7~; 9 12.490 12. '• 71 1l. ?.40 12. 7.10 11.970 11.'1<2 o• 11. 7 20 11. bl,h
11 • 1ob0 1 l. )ll'• n• 11.210 11.13'· o• 10.920 1 o. 8?.0 1)0+
10. b 10 lO. 496 o• I O. 310 10. 18J o• 10.1!40 9. 89, o• 9. 770 'l. 612 0 . 9. s io 9.317 0 • '1. 220 9. 04 7 0 . 8.970 e. 7~ 1 0 . a. no R. 52 5 0 . + s. 500 8.2'/'1 0 . 8. 2t!O 9. 0 1o6 0 . d .UbU 7. 814 0 . 1. 860 7. 604 0 . 7.110 1. 451 0 . 7 .&40 7. 174 0 . 1. 890 7 .o48 0 .
10 8. 580 e. H4 0 . 9. 210 9. OU? 0 • 9. 730 9.%0 o•
10. 190 1 0.07, o• 10.640 1 o. '>55 11.010 1 o. '14) o• 11.170 11.30 o• 11.680 11. o'•'> o•
12 11. 'l'IO 11.'17'/
)_ 12.£80 )l.2tHl I?.. 580 1 2. 5R8
.J FIGURE 3.-Computer output showing computed (0) and recorded (*) stages at the downstream end of the reach, using discharge data at both ends as inp.ut boundary values. (Case-II problem.)
C210 SURFACE WATER
REFERENCES
Baltzer, R. A., and Lai, Chintu, in press, Computer simulation of unsteady flows in waterways : Am. Soc. Civil Engineers Hyd·raulics Div. Jour., Paper 5742.
Churchill, R. ID., 1941, Fourier series and boundary value problems: New York-London, McGraw-Hill Book Co., 206 p.
Dronkers, J. J., 1964, Tidal computations in rivers and coastal waters: Amsterdam, North-Holland Publishing Co.; 518 p.
Lai, Ohintu, 1965a, Flows of homogeneous density in tidal
reaches, solution by the method of characteristics: U.S. Geol. Survey open-file report, 58 p.
---1965b, Flows of homogeneous density in tidal reaches, solution by the implicit method: U.S. Geol. Survey open-file report, 43 p.
---1967, Computation of transient flows in rivers and estuaries by the multiple-reach implicit method, in Geological Survey Research 1967: U.S. Geol. Survey Prof. Paper 575-B, p. B228-B232.
Stoker, J. J., 1957, Water waves: New York-London, Interscience Publishers, 567 p.
J.
-j
·,,
GEOLOGICAL SURVEY RESEARCH 1968
FREEZE-DRYING OF ORGANIC MATTER, CLAYS,
AND OTHER EARTH MATE,RIALS
By R. L. MALCOLM, Denver, Colo.
Abstract.-Freeze-drying (or lyophilization) is a mild and efficient method of drying organic matter and clays. Several samples ranging in weight from 1 milligram to several grams can be dried in 1 to 5 hours, respectively. Quantitative recovery of dried material can be achieved for all samples. Freeze-dried c'lays have a fluffy, powderlike consistency so that crushing is not required to obtain fine particles, they can readily be resuspended a~ colloidal clay particles, and they have advantages over air-dried clay for differential thermal analysis, X-ray diffraction analysis, and infrared studies. Freeze-drying of organic matter minimizes microbial degradation and physicochemical changes which may occur during air-drying or ovendrying. The technique also has promise in preventing physical and chemical changes in drill cores, stream sediments, and soil samp1es.
Freeze-drying (or lyophilization) techniques show great promise in tJhe obtaining and preserving of organic matter, clays, and other naturally occurring organic and inorganic substances. Freeze-drying has been used extensively in the biological sciences but much less in t:he earth sciences. The purposes of this paper are ( 1) to point out the usefulness of the techniques to geologists, geochemists, mineralogists, and soil scientists and (2) to describe in detail a useful freeze-drying technique.
Lyophilization is defined as the process of drying frozen matter under high vacuum so that the solidified solvent or suspending medium sublimes, and a residue, usually a solid, remains. Although the material most commonly sublimed is ice, other materials of higher vapor pressures may be sublimed. Freeze-drying and lyophilization are frequently used as synonomous terms and are so treated in this paper, but they are not exactly synonomous because freeze-drying can occur without vacuum, whereas lyophilization cannot.
Although the basic principles of freeze-drying were applied to histological fixation by Altman in 1890 (Smith, 1958), the method was seldom used until World War II when it was employed with much success to preserve blood plasma. Since the war, freeze-drying equipment has been used largely in hospital clinics and biochemical research centers to preserve heat-sensitive
and labile substances such as tissue, vaccine, enzymes, and organic extracts. The applications of freeze-drying to biological and pathological research are numerous (Ahn and others, 1964; Greiff and others, 1964; Harris, 1964; Hwang and others, 1964; and Rey, 1964).
CLAY COLLOIDS·
The application of freeze-drying techniques to inorganic earth materials has been limited principally to clays. When most clays a,re air dried from aqueous suspension, hard flakes or cakes are for~ed which are difficult to crush into a fine powder. Th~inajor advantages of freeze-dried clays are related to their fluffy, powderlike consistency. Such clay preparations have obvious advantages in differential thermal analysis and X-ray diffraction analysis, and they can be uniformly mixed with I\::Br for infrared analysis. Figure 1 illustrates the fluffy nature and relative volume of freezedried montmorillonite as compared with an identical weight of air-dried montmorillonite.
The volume of material that remains after freezedrying varies, depending upon the type of clay mineral. Freeze-dried montmorillonite obtained from suspensions of moderate concentrations ( 5-25 percent weight/weight) occupy virtually the same volume as the original suspension. For this reason bulk densities vary with concentration of the original suspension, but commonly range from 0.02 to 0.20 gram per cubic centimeter. Freeze-dried vermiculite is very similar to montmorillonite in physical appearance, but kaolinite and illite, although fine and powdery, are much less fluffy than montmorillonite or vermiculite.
Freeze-drying of clays is a mild method of drying. Ahlrichs and White ( 1962) and Brydon and others (1963) stated that X-ray diffraction patterns of untreated and glycerol-treated clays were the same whether clays were air-dt1ied or freeze-dried. Although X-ray diffraction analyses are not suitable for detection of minute changes in mineralogy, these data indicate that no major deformation or change in clay
·0211 U.S. GEOL. SURVEY PROF. PAPER 600-c, PAGES C211-c216
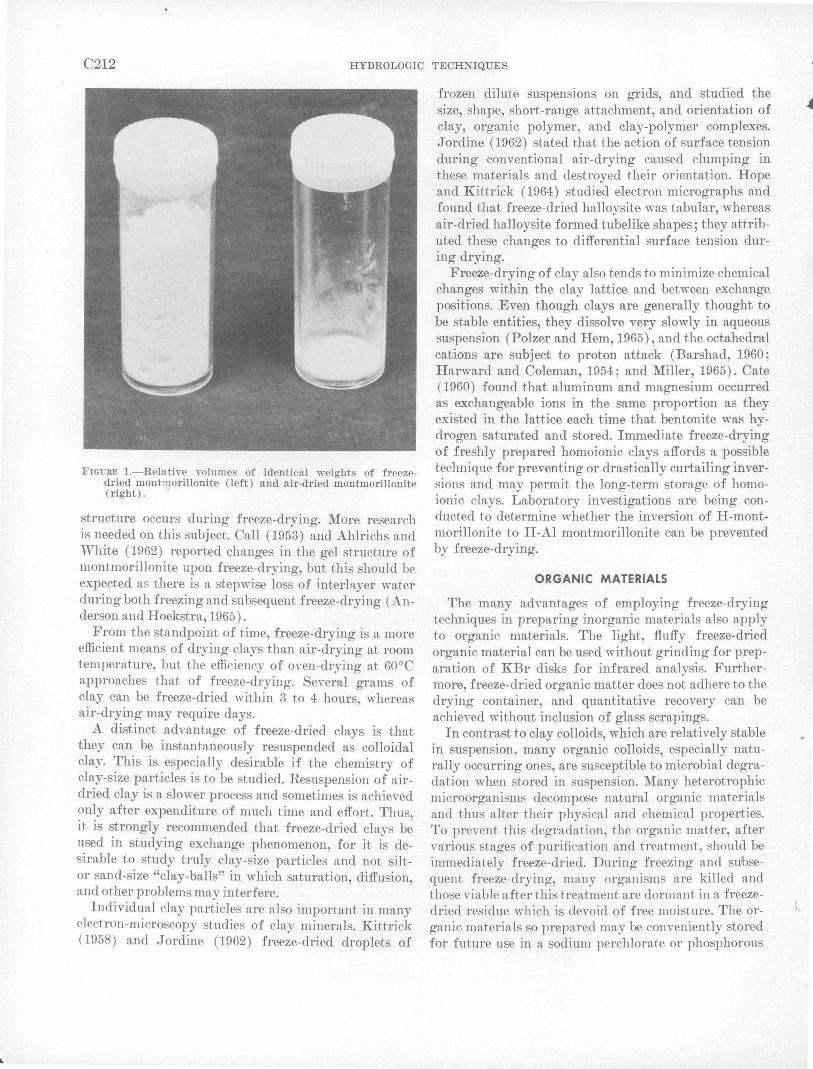
C212 HYDROLOGIC TIDCHNIQUES
FIGURE I.-Relative volumes of identical weights of freezedried montmorillonite (left) and air-dried montmorillonite (right).
structure occurs during freeze-drying. More research is needed on this subject. Call (1953) and Ahlrichs and White (1962) reported changes in the gel structure of montmorillonite upon freeze-drying, but this should be expected as there is a stepwise loss of interlnyer water during both freezing and subsequent freeze-drying (Anderson and Hoekstra, 1965).
From the standpoint of time, freeze-drying is a more efficient means of drying clays than air-drying at room temperature, but the efficiency of oven-drying at 60°C approaches that of freeze-drying. Several grams of clay can be freeze-dried within 3 to 4 hours, whereas air-drying may require days.
A distinct advantage of freeze-dried clays is that they can be instantaneously resuspended as colloidal clay. This is especially desirable if the chemistry of clay-size particles is to be studied. Resuspension of airdried clay is a slower process and sometimes is achieved only after expenditure of much time and effort. Thus, it is strongly recommended that freeze-dried clays be used in studying exchange phenomenon, for it is desirable to study truly clay-size particles and not siltor sand-size "clay-balls" in which saturation, diffusion, and other problems may interfere.
Individual clay particles are also important in many electron-microscopy studies of clay minerals. Kittrick (1958) and Jordine (1962) freeze-dried droplets of
frozen dilute suspensions on grids, and studied the size, shape, short-range attachment, and orientation of clay, organic polymer, and clay-polymer complexes. Jordine (1962) stated that the action of surface tension during conventional air-drying caused clumping in these materials and destroyed their orientation. Hope and Kittrick (1964) studied electron micrographs and found that freeze-dried halloysite was tabular, whereas air-dried halloysite formed tubelike shapes; they attributed these changes to differential surface tension during drying.
Freeze-drying of clay also tends to minimize chemical changes within the clay lattice and between exchange positions. Even though clays are generally thought to . be stable entities, they dissolve very slowly in aqueous suspension (Polzer and Hem, 1965), and the octahedral cations are subject to proton attack (Barshad, 1960; Harward and Coleman, 1954; and Miller, 1965). Cate (1960) found that aluminum and magnesium occurred as exchangeable ions in the same proportion as they existed in the lattice each time that bentonite was hydrogen saturated and stored. Immediate freeze-drying of freshly prepared homoionic clays affords a possible teclmique for preventing or drastically curtailing inversions and may permit the long-term storage of homoionic clays. Laboratory investigations are being conducted to determine whether the inversion of H-montmorillonite to H-Al montmorillonite can be prevented by freeze-drying.
ORGANIC MATERIALS
The many advantages of employing freeze-drying techniques in preparing inorganic materials also apply to organic materials. The light, fluffy freeze-dried organic material can be used without grinding for preparation of KBr disks for infrared analysis. Furthermore, freeze-dried organic matter does not adhere to the drying container, and quantitative recovery can be achieved without inclusion of glass scrapings.
In contrast to clay colloids, which are relatively stable in suspension, many organic colloids, especially naturally occurring ones, are susceptible to microbial degradation when stored in suspension. Many heterotrophic microorganisms decompose natural organic materials and thus alter their physical and chemical properties. To prevent this degradation, the organic matter, after various stages of purification and treatment, should be immediately freeze-dried. During freezing and subsequent freeze-drying, many organisms are killed and those viable after this treatment are dormant in a freezedried residue which is devoid of free moisture. The organic materials so prepared may be conveniently stored for future use in a sodium perchlorate or phosphorous
)
MALCOLM C213
pentoxide desiccator without the danger of microbial degradation or physicochemical changes.
When organic matter is air-dried with or without vacuum at room or elevated temperature, both microbial degradation and physicochemical changes are likely to occur during the time lapse, especially if the temperature is elevated. That lyophilization minimizes these changes is suggested by the fact that many hydrogensaturated humic acids are soluble in distilled water after f.reeze-drying, but are insoluble after either air-drying or oven-drying. ·
Organic colloids should be quick. frozen prior to freeze-drying to prevent freeze-concentration, especially when they are in suspensions having medium to high salt concentrations. The higher concentrations of organic matter produced by freeze-concentration may cause precipitation and (or) chmnica.I changes in the organic material. An example of the resolubility of freeze-dried albumen from salt suspensions has been given by Harris (1954). He states that if the albumen is quick frozen it is readily soluble, but if frozen slowly, it is denatured and difficult to dissolve.
OTHE~ MATERIALS
The application of freeze-drying to studies in earth sciences has been limited primarily to organic matter and clay colloids. The author has concentrated the dissolved solids of natural waters by vacuum concentrations and subsequent freeze-drying for spectrographic analysis. The technique is very useful in facilitating the measurement of trace elements which are below detectable limits in the unconcentrated sample.
Freeze-drying could be effectively applied to drill cores, stream sediments, and bulk soil samples because they are often obtained from reducing environments and may contain pyrite or other sulfides, which are readily oxidizable during air-drying or prolonged exposure to atmospheric conditions. Obvious interpretive errors tnight result from chemical and mineralogical studies of air-dried samples, whereas chemical changes and resultant interpretive errors would be minimized by immediate freeze-drying and storage und~r nitrogen gas.
Strea1n-sediment samples collected for study of mineralogy, cation-exchange capacity, and exchangeableion determinations are frequently shipped and stored for weeks in the moist state before analysis. The partial dec01nposit.ion of organic matter during this period may cause changes in both El1 and pH that greatly alter the chemical parameters of the system. Sesquioxide minerals and amorphous coatings on sediment particles may dissolve and thus cause changes in mineralogy and alteration of exchangeable-ion populations. Analy-
sis of such samples for exchange capacity and exchangeable ions is questionable and perhaps meaningless. However, freeze-drying of the sediment samples upon collection (after filtering the excess water) would prevent
. these changes and help provide accurate exchange data. The study of changes in mineralogy and particle
orientation with depth in samples of soil and consolidated sediment could be improved by freeze-drying, cementation with resin under vacuum, and thin-section analysis. Thaine (1962), for example, found a similar technique useful in studying the structural arrangement of plant tissues. The a.pplication of this technique to soils and sediments has greatest promise for those samples well cemented with organic matter and (or) sesquioxides because such samples would be less susceptible to collapse during resin impregnation.
EQUIPMENT AND PROCEDURE
The following outline of eql.1ipment and procedure includes innovations and refinements that the author found useful in overcoming several difficulties in the initial freeze-drying technique. The procedure is described in considerable detail so that others interested in using the technique may do so with a minimum of expense and time. The equipment used is shown in figures 2 and 3. Steps in the usage of the equipment are as follows:
I. Close all ports on the freeze-drier and lubricate the ring of the inner drum with silicone high-vacuum grease.
2. Connect in sequence (using flexible %-inch inside diameter high-vacuum tubing) the freeze-drier, stainless steel trap, McLeod gage, and high-vacuum pump (see figs. 2 and 3) .
3. Evacuate the system to 10 microns pressure or less, isolate the pump from the system by clamping the hose with a screw clamp, and check for leaks with the McLeod gage. Poor vacuum' leads to slow drying and even to thawing of suspensions with loss of freeze-dried properties of the residue.
4. Cool the suspension or solution to be freeze-dried to approximately 1 °C in an ice-water bath.
5. Add denatured ethanol to dry ice-alcohol baths of the freeze-drier and trap until they are about half full, and carefully add small pieces of dry ice. During the initial cooling of the ethanol, extreme frothing occurs which may cause loss of ethanol. Continue adding small pieces of dry ice until the baths are approximately three-fourths filled. Further filling prohibits the additional use of the freeze-drier bath for cooling the freezedry flasks during shell freezing of the suspension.
6. Chill the lower part of the freeze-dry flask in the dry ice-alcohol bath for approximately one minute and
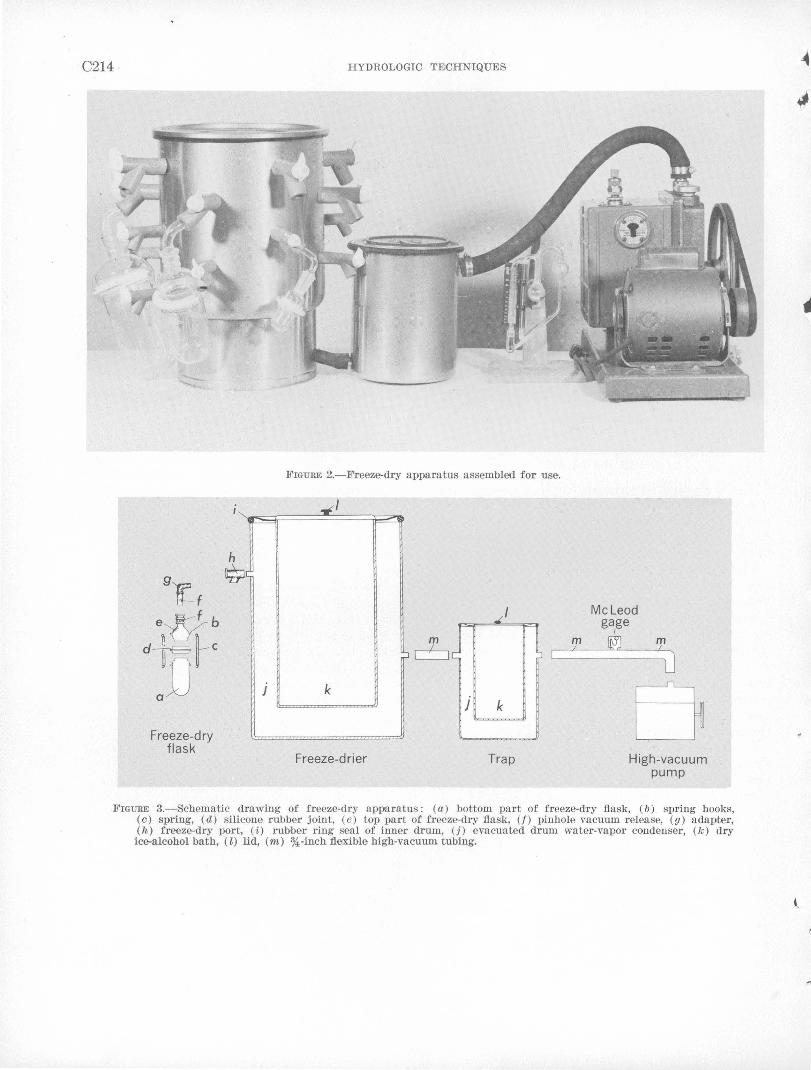
C214
Freeze-dry flask
1
HYDROLOGIC TIDCHNIQUES
FIGURE 2.-Freeze.-dry apparatus assembled for use.
_.,
-LI
m ~
k 1 k
F reeze-d ri er Trap
Mcleod gage
I
'!' 10 m
'------~\]
B High-vacuum
pump
FIGURE 3.-Schematic drawing of freeze-dry apparatus : (a) bottom part of freeze-dry flask, (b) spring hooks, (c) spring, (d) silicone rubber joint, (c ) top part of freeze-dry flask, (f) pinhole vacuum release, (g) adapter, (h) freeze-dry port, ( i ) rubber ring seal of inner drum, (j) evacuated drum water-vapor condenser, (lc) dry ice-alcohol bath, (l) lid, (m) %,-inch flexible high-vacuum tubing.
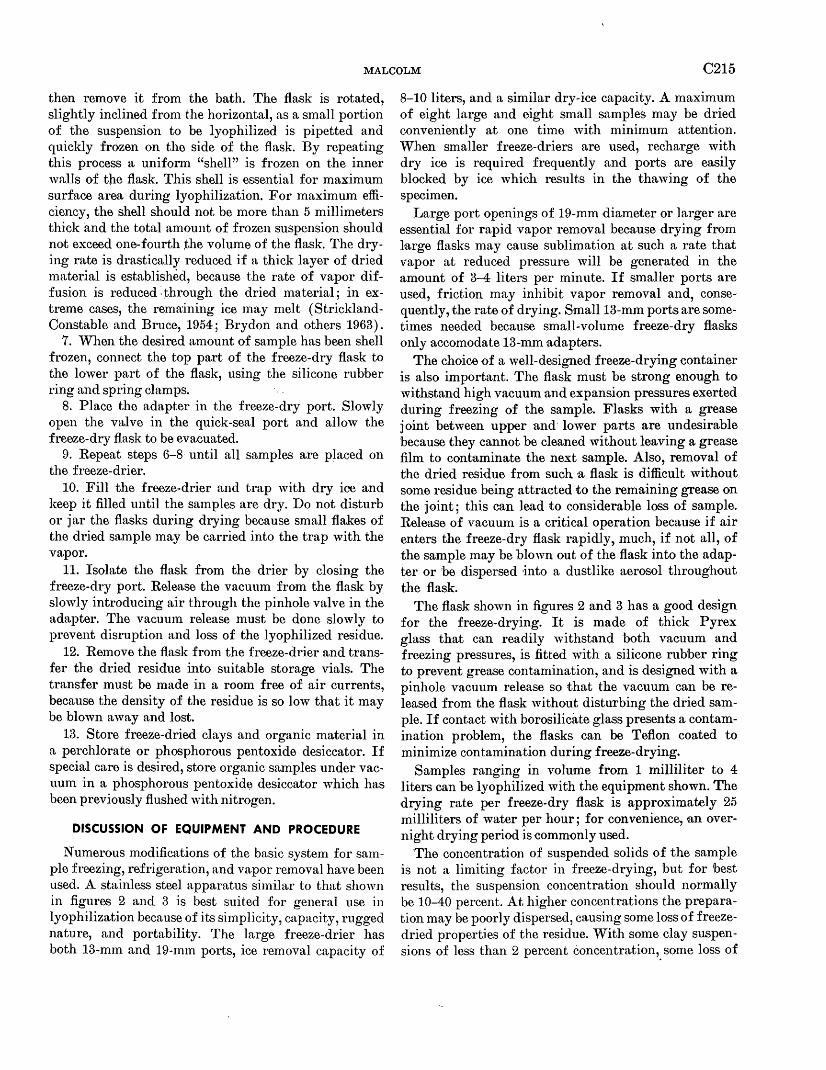
MALCOLM C215
then remove it from the bath. The flask is rotated, slightly inclined from the horizontal, as a small portion of the suspension to be lyophilized is pipetted and quickly frozen on the side of the flask. By repeating this process a uniform "shell" is frozen on the inner walls of the flask. This shell is essential for maximum surface area during lyophilization. For maximum efficiency, the shell should not be more than 5 millimeters thick and the total amount of frozen suspension should not exceed one-fourth the volume of the flask. The drying rate is drastically reduced if a thick layer of dried material is established, because the rate of vapor diffusion is reduced -through the dried material; in extreme cases, the remaining ice may melt (StricklandConstable and Bruce, 1954; Brydon and others 1963) .
7. When the desired amount of sample has been shell frozen, connect the top part of the freeze-dry flask to the lower part of the flask, using the silicone rubber ring and spring clamps.
8. Place the adapter in the freeze-dry port. Slowly open the valve in the quick-seal port and allow the freeze-dry flask to be evacuated.
9. Repeat steps 6-8 until all samples are placed on the freeze-drier.
10. Fill the freeze-drier and trap with dry ice and h::eep it filled until the samples are dry. Do not disturb or jar the flasks during drying because small flakes of the dried sample may be carried into the trap with the vapor.
11. Isolate the flask from the drier by closing the freeze-dry port. Release the vacuum from the flask by slowly introducing air through the pinhole valve in the adapter. The vacuum release must be done slowly to prevent disruption and loss of the lyophilized residue.
12. Remove the flask from the freeze-drier and transfer the dried residue into suitable storage vials. The transfer must be made in a room free of air currents, because the density of the residue is so low that it may be blown a way and lost.
13. Store freeze-dried clays and organic material in a perchlorate or phosphorous pentoxide desiccator. If special mire is desired, store organic samples under vacuum in a phosphorous pentoxid~ desiccator which has been previously flushed with nitrogen.
DISCUSSION OF EQUIPMENT AND PROCEDURE
Numerous m.odifications of the basic system for sample freezing, refrigeration, and vapor removal have been used. A stainless steel apparatus simila,r to that shown :in figures 2 and 3 is best suited for general use in lyophilization because of :its simplicity, capacity, rugged nature, and portability. The large freeze-drier has both 13-mm and 19-mm ports, ice removal capacity of
8-10 liters, and a similar dry-ice capacity. A maximum of eight large and eight small samples may be dried conveniently at one time with minimum attention. When smaller freeze-driers are used, recharge with dry ice is required frequently and ports are easily blocked by ice which results in the thawing of the specimen.
Large port openings of 19-mm diameter or larger are essential for rapid vapor removal because drying from large flasks may cause sublimation at such a rate that vapor at reduced pressure will be generated in the amount of 3-4 liters per minute. If smaller ports are used, friction m-ay inhibit vapor removal and, conse-· quently, the rate of drying. Small13-mm ports are sometimes needed because small-volume freeze-dry fl-asks only accomodate 13-·mm adapters.
The choice of a well-designed freeze-drying container is also important. The flask must be strong enough to withstand high vacuum and expansion pressures exerted during freezing of the sample. Flasks with a grease joint between upper and· lower p-arts are undesirable because they cannot be cleaned without leaving a grease film to contaminate the next sample. Also, removal of the dried residue from such ·a flask is difficult without some residue being attracted to the rem-aining grease on the joint; this can lead to considerable loss of sample. Release of vacuum is a critical operation because if air enters the freeze-dry flask rapidly, much, if not all, of the sample may be blown out of the flask into the adapter or be dispersed into a dustlike aerosol throughout the flask.
The flask shown in figures 2 and 3 has a good design for the freeze-drying. It is made of thick Pyrex glass that can readily withstand both vacuum and freezing pressures, is fitted with a silicone rubber ring to prevent grease contamination, and is designed with a pinhole vacuum release so that the vacuum can be released from the flask without disturbing the dried sample. If contact with borosilicate glass presents a contamination problem, the flasks can be Teflon coated to minimize contamination during freeze-drying.
Samples ranging in volume from 1 milliliter to 4 liters can be lyophilized with the equipment shown. The drying rate per freeze-dry flask is approximately 25 milliliters of water per hour; for convenience, ,an overnight drying period is commonly used.
The concentration of suspended solids of the sample is not a limiting factor in freeze-drying, but for best results, the suspension concentration should normally be 10-40 percent. At higher concentrations the preparation may be poorly dispersed, causing some loss of freezedried properties of the residue. With some clay suspensions of less than 2 percent concentration,. some loss of
C216 HYDROLOGIC TBCHNIQUES
dried clay into the evacuated inner drum was observed. Brydon and others ( 1963) noted that this loss was due to the low interparticle forces of the dry clay, which enables it to escape in the flow of water vapor.
R'EFERENCES
Ahlrichs, J. L., and W·hite, J. L., 1962, Freezing and lyophilizing aUers the structure of bentonite gels: Science, v. 136, p. 1116-1118.
Nhn, T. H., Nishihara, H., Carpenter, C. M., and Taplin, G. V., 1964, Viability and metabolism of staphylococcus aureus af.ter freezing, lyophilization, and irradiation: Jour. Bacteriology, v. 88, p. 545-552.
Anderson, D. M., and Hoekstra, Pieter, 1965, Migration of interlamellar water dur.ing freezing and thawing of Wyoming bentonite: ·Soil Sci. Soc. America Proc., v. 29, p. 498-504.
Barshad, J.saac, 1960, Significance of the presence of exchangeable magnesium ions in acidified clays: Science, v. 131, p. 989-990.
Brydon, J. E., Rice, H. M., and ScotJt, G. C., 1963, Note on the recovery of clays from suspension by freeze--drying: Cana· dian Jour. Soil Sci., v. 43, p. 404--405.
CaU, F., 1953, Preparation of dry clay-gels by freeze-drying: Nature [London], v. 172, p. 126.
Cate, R. B., 1960, Can petroleum be of pedogenic origin?: Am. Assoc. Petroleum Geologists Bull. 44, p. 423-432.
Greiff, Donald, Rightsel, W. A., and Sch\ller, E. E., 1964, Effects of freezing, stJorage at low temper~tures, and drying by
sublimation in vacuo on the activities' of measles vi·rus: Nature [London], v. 202, p. 624-625.
Harris, F. J. C., 1954, Biological applications of freezing and drying: New York, Academic Press.
Ha·rward, M. E., and Coleman, N. T., 1954, Some properties of H· and Al-clays and exchange resins: Soil Sci., v. 78, 181-188.
Hope, ID. W., and Kittrick, J. A., 1964, Surface tension and the morphology of halloysitJe: Am. Mineralogist, v. 49, p. 859-866.
Hwang, Shuh-Wic, Davis, E. E., and Alexander, M. T., 1964, Freezing and viability of tetrahymena pyriformis in dimethylsulfoxide : Science, v. 144, p. 64-65.
Jordirie, E. A., 1962, Electron microscopy of clay minerals: California Univ., unpub. Master's thesis, 49 p.
Kittrick, J. A., 1958, Electron microscope observations on several freeze-dried macromolecular systems: Jour. Polymer, v. 28, p. 247-250.
Miller, R. J., 1965, Mechanisms for hydrogen to aluminum transformations in clays: Soil Sci. Soc. America Proc., v. 29, p. 36-39.
Polzer, W. L., and Hem, J.D., 1965, The dissolution of kaolinite: Jour. Geophys. Research, v. 70, p. 6233-6240.
Rey, L. R., 1964, Fundamentals of sublimation drying: Prumysl Potravin [Prague], v. 15, p. 61-66.
Smith, A. U., 1958, Freezing and drying biological materials: Nature [London], v. 181, p. 1694-1696.
Strickland-Constable, R. F., and Bruce, E. W., 1954, Freeze drying of clay and vacuum drying of wet clay ; pt. 5 of The mechanism of drying of solids : Inst. Chern. Engineers [London] Trans., v. 32, p. 199-203.
Thaine, R. C., 1962, Freeze-drying of plant tissue: Nature [London], v. 195, p. 1014-1016.
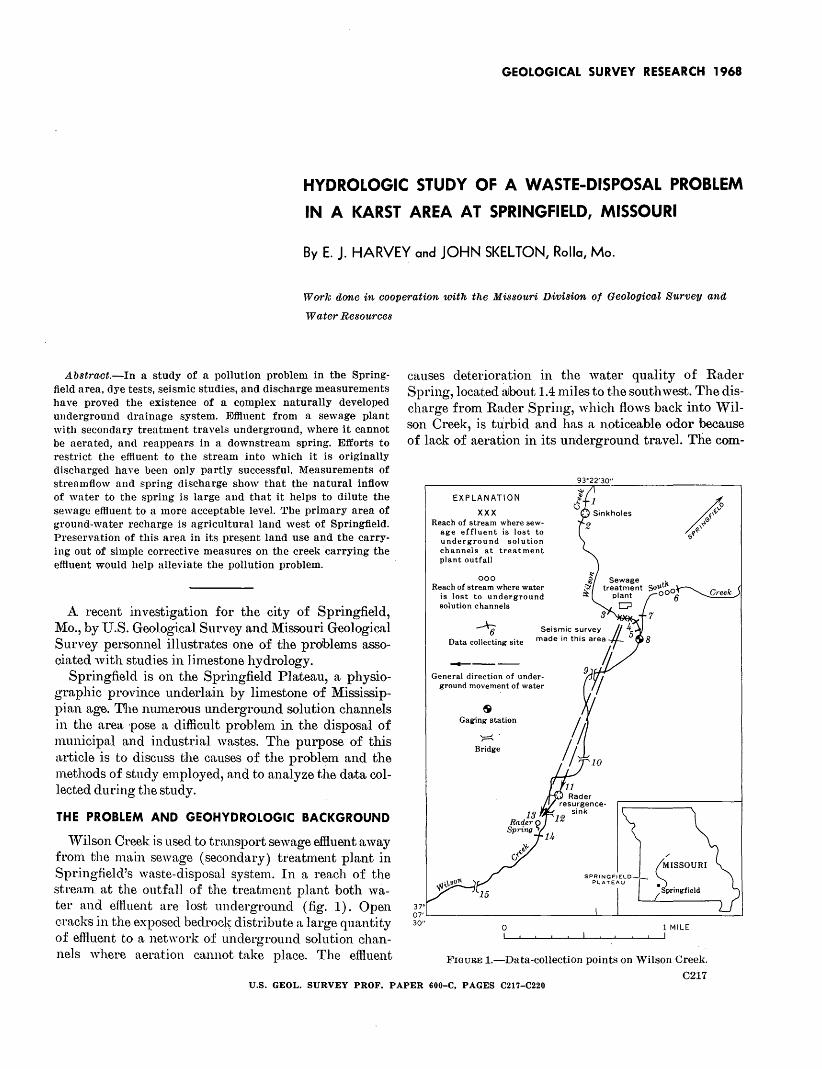
GEOLOGICAL SURVEY RESEARCH 1968
HYDROLOGIC STUDY OF A WASTE-DISPOSAL PROBLEM
IN A KARST AREA AT SPRINGFIELD, MISSOURI
By E. j. HARVEY and JOHN SKELTON, Rolla, Mo.
Work dcme in cooperation with the Missouri Divisicm of GeoZogicaZ Survey and
Water Resources
Abstract.-In a study of a pollution problem in the Springfield area, dye tests, seismic studies, and discharge measurements have proved the existence of a complex naturally developed underground drainage system. Effluent from a sewage plant with secondary treatment travels underground, where it cannot be aerated, and reappears in a downstream spring. Efforts to restrict the effluent to the stream into which it is originally discharged have been only partly successful. Measurements of streamflow and spring discharge show that the natural inflow of water to the spring is large and that it helps to dilute the sewage effluent to a more acceptable level. The primary area of ground-water recharge is agricultural land west of Springfield. Preservation of this area in its present land use and the carrying out of simple corrective measures on the creek carrying the effluent would help alleviate the pollution problem.
A recent investigation for the city of Springfield, Mo., by U.S. Geological Survey and Missouri Geologica,! Survey personnel illustrates one of the problems associated with studies in limestone hydrology.
Springfield is on the Springfield Plateau, a physiographic province underlain by limestone of Mississippian age. The nmnerous nnderground solution cha1mels in the area pose a difficult problem in the disposal of municipal and industrial wastes. The purpose of this article is to discuss the causes of the problen1 and the methods of study employed, and to analyze the data collected during the study.
THE PROBLEM AND GEOHYDRO.LOGIC BACKGR:OUND
'V'ilson Creek is used to transport sewage efHuent away from the n1ain sewage (secondary) tl'eatment plant in Springfield's waste-disposal system. In a reach of the stren:m at the outfall of the treatment plant both water and eftiuent are lost underground (fig. 1). Open oracks in the exposed bedrocl~ distribute a large quantity of effluent to a network of underground solution channels where aeration cannot take place. The effluent
causes deterioration in the water quality of Rader Spring, located aJbout 1.4 miles to the southwest. The discharge from Rader Spring, which flows back into Wilson Creek, is turbid and has a noticeable odor because of lack of aeration in its underground travel. The com-
37'
EXPLANATION
XXX Reach of stream where sew
age effluent is lost to underground solution channels at treatment plant outfall
000 Reach of stream where water
is lost to underground solution channels
General direction of underground movement of water
s Gaging station
~· r---
Bridge
07'~------------------------L---~----------------~ 30"
0 1 MILE
FIGURE 1.-Data-collection points on Wilson Creek. 0217
U.S. GEOL. SURVEY PROF. PAPER 600-C, PAGES C217-C220
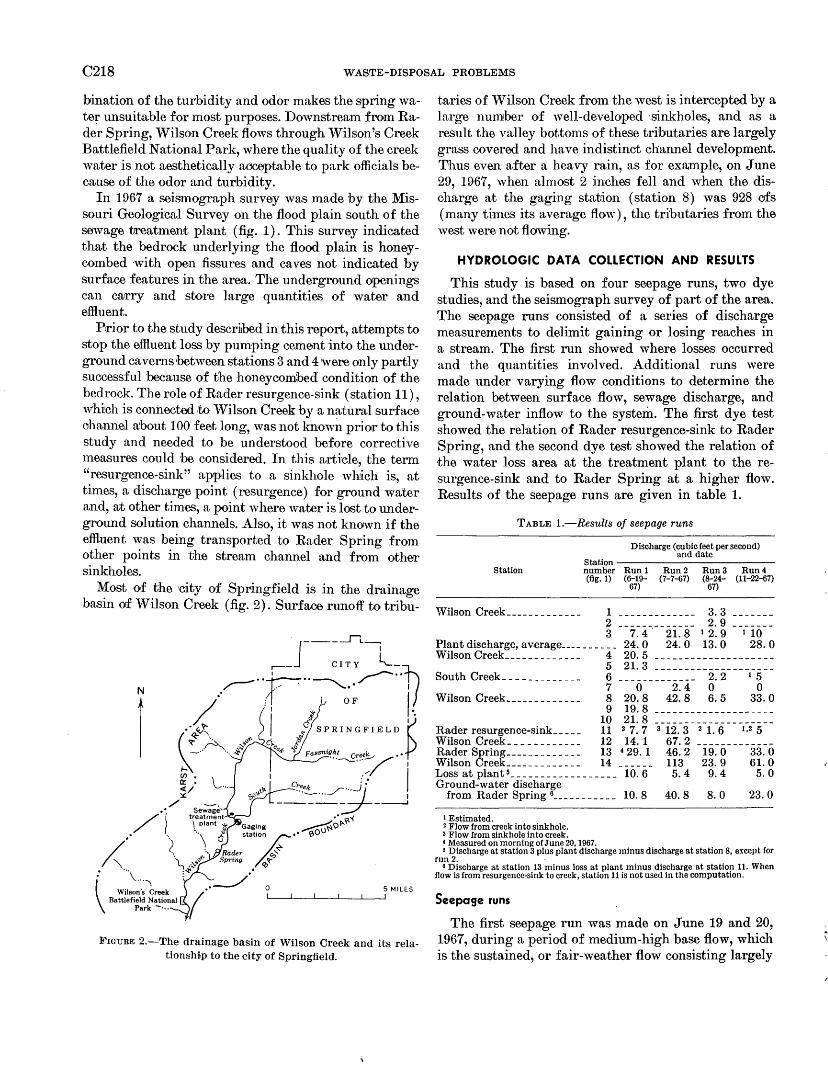
C218 WASTE-DISPOSAL PROBLEMS
bination of the turbidity and odor makes the spring water unsuitable for most purposes. Downstream from Rader Spring, Wilson Creek flows through Wilson's Creek Battlefield National Park, where the quality of the creek water is not aesthetically acceptable to park officials because of the odor and turbidity.
In 1967 a seismograph survey was made by the Missouri Geologi~al Survey on the flood plain south of the sewage treatment plant (fig. 1). This survey indicated that the bedrock underlying the flood plain is honeycombed with open fissures and caves not indicated by surface features in the area. The underground openings can crurry and store large quantities of water and effluent.
P1rior to the study descr]bed in this report, attempts to stop the effluent loss by pumping cement into the underground cavernshetween stations 3 and 4were only partly successful because of the honeycombed condition of the bedrock. The role of Rader resurgence-sink (station 11), whrch is connected to Wilson Creek by a natural surface
·oliannel a:bout 100 feet long, was not know~ prior to this study and needed to be understood before corrective measures could be considered. In this article, the term "resurgence-sink" applies to a sinkhole which is, at times, a discharge point (resurgence) for ground water and, at other times, a point where water is lost to underground solution channels. Also, it was not known if the effluent was being transported to Rader Spring from other points in the stream channel and from other sinkholes.
Most of the city of Springfield is in the drainage basin of Wilson Creek (fig. 2). Surfaoe runoff to tribu-
N
l
FIGURE 2.-The drainage basin of Wilson Creek and its relationsbi.p to the city of Springfield.
taries of Wilson Creek from the west is intercepted by a large number of well-developed ·sinkholes, and as a result the valley bottoms of these tributaries are largely grass covered and have indistinct channel development. Thus even after a heavy rain, as for example, on June 29, 1967, when almost 2 inches fell and when the discharge at the ga.ging station (station 8) was 928 CJfs (many times its average flow), the tributaries from the west were not flowing.
HYDROLOGIC DATA COLLECTION AND RESULTS
This study is based on four seepage runs, two dye studies, and the seismograph survey of part of the area. The seepage runs consisted of a series of discharge measurements to delimit gaining or losing reaches in a stream. The first run showed where losses occurred and the quantities involved. Additional runs were made under varying flow conditions to determine the relation between surface flow, sewage discharge, and ground-water inflow to the system. The first dye test showed the relation of Rader resurgence-sink to Rader Spring, and the second dye test showed the relation of the water loss area at the treatment plant to the resurgence-sink and to Rader Spring at a higher flow. Results of the seepage runs are given in table 1.
TABLE 1.-Results of seepage runs
Station
Discharge (cubic feet per second) and date
Station-----------number Run 1 Run 2 (fig. 1) (6-19- (7-7-67)
67)
Run3 Run4 (8-24- (11-22-67)
67)
Wilson Creek_____________ 1 ------------- 3.3 2 ------------- 2.9 3 7. 4. 21. 8 1 2. 9 1 10
Plant discharge, average__________ 24. 0 24. 0 13. 0 28. 0 Wilson Creek_____________ 4 20.5 --------------------
5 21.3 --------------------South Creek_____________ 6 ------------- 2. 2 1 5
7 0 2.4 0 0 Wilson Creek_____________ 8 20.8 42.8 6.5 33.0
9 19.8 --------------------10 21.8 --------------------
Rader resurgence-sink_____ 11 2 7. 7 a 12. 3 2 1. 6 I,2 5 Wilson Creek____________ 12 14.1 67.2 -------------Rader Spring _____________ 13 4 29.1 46.2 19.0 33.0 Wilson Creek_____________ 14 ______ 113 23.9 61.0 Loss at plants __________________ 10.6 5. 4 9. 4 5. 0 Ground-water discharge
from Rader Spring 6 ___________ 10.8 40.8 8. 0 23.0
1 Estimated. 2 Flow from creek into sinkhole. 3 Flow from sinkhole into creek. 4 Measured on morning of June 20, 1967. s Discharge at station 3 plus plant discharge minus discharge at station 8, except Cor
run 2. · 6 Discharge at station 13 minus loss at plant minus discharge at station 11. When
flow is from resurgence-sink to creek, station 11 is not used in the computation.
Seepage runs
The first seepage run was made on June 19 and 20, 1967, during a period of medium-high base flow, which is the sustained, or £air-weather flow consisting largely
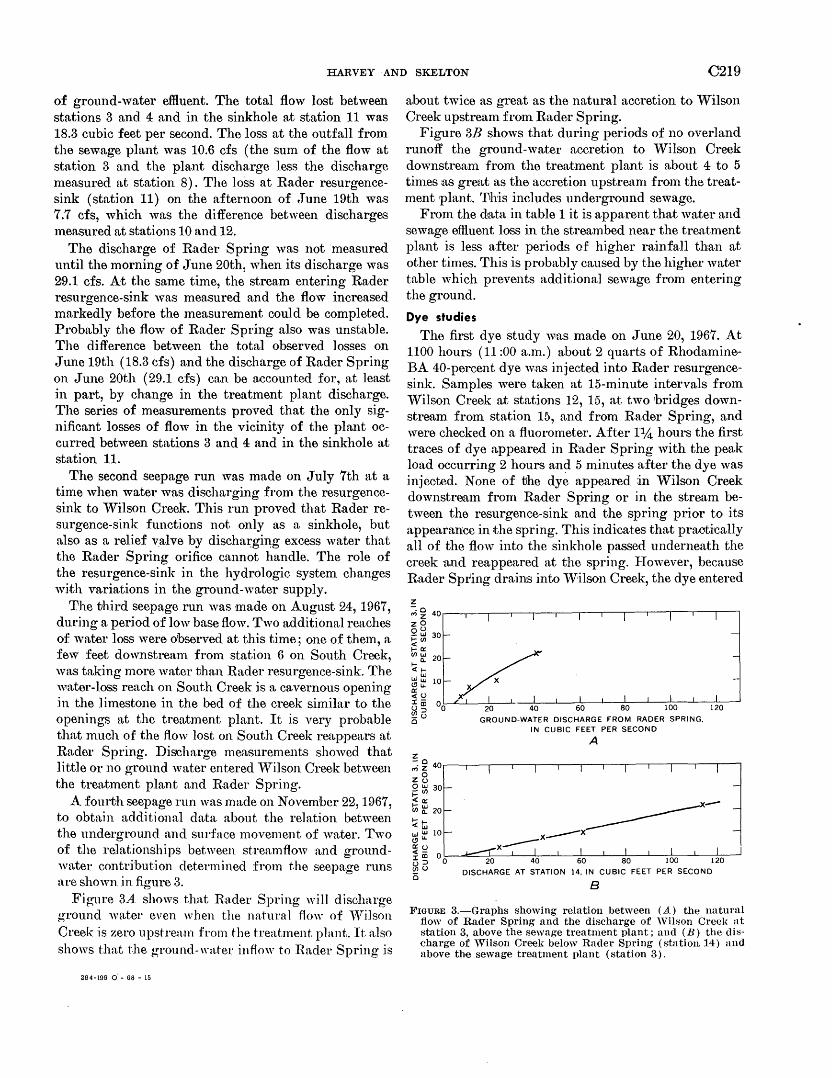
HARVEY AND SKELTON C219
of ground-water effluent. The total flow lost between stations 3 and 4 and in the sinkhole at station 11 was 18.3 cubic feet per second. The loss at the outfall from the sewage plant was 10.6 cfs (the sum of the flow at station 3 and the plant discharge less the discharge measured at station 8). The loss at Rader resurgencesink (station 11) on the afternoon of June 19th was 7.7 cfs, which was the difference between discharges 1neasured at stations 10 and 12.
The discharge of Rader Spring was not measured until the morning of June 20th, when its discharge was 29.1 cfs. At the same time, the stream entering Rader resurgence-sink was measured and the flow increased markedly before the measurement could be completed. Probably the flow of Rader Spring also was unstable. The difference between the total observed losses on ,June 19th ( 18.3 cfs) and the discharge of Rader Spring on June 20th (29.1 cfs) can be accounted for, at least in part, by change in the treatment plant discharge. The series of measurements proved that the only significant losses of flow in the vicinity of the plant occurred between stations 3 and 4 and in the sinkhole at station 11.
The second seepage run was made on July 7th at a time when water was discharging from the resurgencesink to Wilson Creek. This run proved that Rader resurgence-sink functions not only as a sinkhole, but also as a relief valve by discha~gi~g excess water that the Rader Spring orifice cannot handle. The role of the resurgence-sink in the hydrologic system changes with variations in the ground-water supply.
The third seepage run was ·made on August 24, 1967, during a period of low· base flow. Two additional reaches of water loss were observed at this time; one of them, a few feet downstream from station 6 on South Creek, was taking more water than Rader resurgence-sink. The water-loss reach on South Creek is a cavernous opening in the limestone in the bed of the creek similar to the openings at the treatment plant. It is very probable that 1nuch of the flow lost on South Creek reappears at Rn.der Spring. Discharge measurements showed that little or no ground water entered "\Vilson Creek between the trea.tm.ent plant and Rader Spring.
A fourth seepage run was made on November 22,1967, to obta.in additional data about the relation between the underground and surface movement of w:ater. Two of the relationships between streamflow ·and groundwater contribution determined from t.he seepage runs are shown in figure 3.
Figure 3A shows that Rader Spring will discharge ground water even when the natural flow of "Tilson Creek is zero upstream from the treatment plant. It a.lso shows that t.he ground-wa.tet· inflow to Rader Spring is
294-199 o·- 68 - 1s
about twice as great as the natural accretion to Wilson Creek upstream from Rader Spring.
Figure 3B shows that during periods of no overland runoff the ground-water accretion to Wilson Creek downstream from the treatment plant is about 4 to 5 times :as great as the accretion upstream from the treatment plant. This includes underground sewage.
From the data in table 1 it is apparent that water and sewage effluent loss in the streambed near the treatment plant is less after periods of higher rainfall than at other times. This is probably caused by the higher water table which prevents additional sewage from entering the ground.
Dye studies
The first dye study was made on June 20, 1967. At 1100 hours (11 :00 a.m.) about 2 quarts of RhodamineBA 40-percent dye w:as injected into Rader resurgencesink. Samples were taken at 15-minute intervals from Wilson Creek at stations 12, 15, at two bridges downstream from station 15, and from Rader Spring, ·and were checked on a fluorometer. After 114 hours the first traces of dye appeared in Rader Spring with the peak load occurring 2 hours and 5 minutes after the dye was injected. None of tJhe dye appeared in Wilson Creek downstream from Rader Spring or in the stream between the resurgence-sink and the spring prior to its appearan~e in the spring. This indicates that practically all of the flow into the sinkhole passed underneath the creek ·and reappeared at the spring. However, because Rn.der Spring drains into "\V.ilson Creek, the dye entered
GROUND-WATER DISCHARGE FROM RADER SPRING. IN CUBIC FEET PER SECOND
A
DISCHARGE AT STATION 14, IN CUBIC FEET PER SECOND
B
FIGURE 3.-Graphs showing relation between (A) the natural flow of Rader Spring and the discharge of \Vilson Creek at station 3, above the sewage treatment plant; and (B) the dis·charge of \Vilson Creek below Rader Spring (station 14) and above the sewage treatment plant (station 3).
C220 WASTE-DISPOSAL PROBLEMS
the stream at that point. Undoubtedly it would have been found in the stream had sampling continued. The rate af underground movement of the water, assuming it traveled in a straight line between Rader resurgencesink :and Rader Spring, was approximately 0.3 foot per second.
The second dye test was conducted during the period of high base flow on July 7, 1967. At this time, Rader resurgence-sink was discharging 12.3 cfs into Wilson Creek. The only known loss was 5.4 cfs between stations 3 and 4.
In order to determine the relationship of Rader resurgence-sink to the system during periods of high base flow, Rhodamine-BA dye was injected at 0720 hours (7:20a.m.) on July 7, 1967 at staJtion 3 a few hundred feet upstream from the water-loss reach at the treatment plant. Part of the dye remained in Wilson Creek and part entered the solution channels between stations 3 -and 4. Samples were taken from Wilson Creek at station 12, at Rader Spring, and from Rader resurgencesink. The dye appeared at the sampling points in the order shown in ta;ble 2.
Again assuming straight-line travel of the water between the injection point and the sinkhole and spring, the rate of underground movement of the water was about 0.4 foot per second. The rate of movement in Wilson Creek averaged 1.3 feet per second.
TABLE 2.-Results of dye study on Wilson Creek near Springfield, Mo., July 7, 1967
Station Station No.
(fig. 1)
Wilson Creek _______ 12 Rader resurgence-~nk _____________ 11
Rader Spring ______ 13
I Dye injected at 0720 hours. 2 Measured along streambed.
Distance 'from injec- Arrival time, tion point leading edge 1
(miles)
2 1. 70 0915 hours
3 1. 25 1150 3 1. 35 1255
3 Measured in a straight line, as underground flow is assumed.
Arrival time, peak concentra-
tion
1000 hours
1300 1400
SUMMARY AND CONCLUSIONS FROM ANALYSIS OF DATA
The following conclusions are based on an analysis of the data:
1. Seismic records indicate that bedrock underlying the flood plain of Wilson Creek is honeycombed and has many more pinnacles, open fissures, and caves than is indicated by the surface features in the area.
2. A direct underground physical connection exists between the reach of effluent loss at the plant, Rader resurgence-sink, and Rader Spring. The effluent from the treatment plant is the source of pollution of Rader Spring.
3. At low stages Rader resurgence-sink takes flow from Wilson Creek, whereas at high stages the flow is reversed. The sinkhole functions as a relief valve operating when the ground-water supply is greater than the capacity of the solution channels leadings to Rader Spring. '
4. No significant amount of ground water flows into Wilson Creek between the sewage treatment plant and Rader Spring during periods of low creek stages and low ground-water levels ..
5. If the water travels in a straight line between injection points and Rader Spring, the rate of travel is approximately 0.3 foot per second through the underground voids and fissures of the Mississippian limestone.
6. The loss of water into the cracks in the streambed at the sewage treatment plant is smaller after periods of precipitation.
7. The graphs (fig. 3) show the importance of the karst area west of Wilson Creek in supplying water to the creek through Rader Spring. The values for discharge below Rader Spring used in figure 3B include all the sewage effluent. Subtracting the effluent would move the curve to the left but would not materially change the slope of the curve. This indicates that the ground-water contribution from the agricultural land area to R,ader Spring is much greater than the upstream contribution. The karst area is mainly agricultural land. In its present state of use the area will continue to supply water to Wilson Creek. Should the land use change through urbanization, the ground-water discharge will decrease and the dilution capability of the area will be reduced.
SUBJECT INDEX
[For major headings such as "I~conomic geology," "Geophysics," "Paleontology," see under State names or refer to table of contents]
A Achocalla mudflow, Bolivia ____ _ Age determinations, basement
rock, Colorado _____ _ blueschist, California _____ _ gneiss, granodiorite, and
monzonite, Utah and Colorado __________ _
intrusions, Washington ____ _ postglacial mudflow, Bolivia_
Alabama, surface water, west-central part ________ _
Alaska, volcanic activity, Augus-tine Island ________ _
Albite, in blueschist, California_ Analyses. See various types of
analyses: Electron-microprobe, Fluorescence, Gamma-ray, Isotope-dilution, X-ray.
Apatite, in ultramafic chlorite rock, Maryland ____ _
Aquifers, artesian, relation between aquifer constants and estimated stress _____________ _
Augustine Volcano, Alaska, re-cent activity _______ _
B
Barstow Formation, California, paleontology _______ _
Basalt, identification, from refractive index of sil-ica _______________ _
Beach deposits, high-level, Puer-to Rico ___________ _
Belden Formation, Colorado, stratigraphy _______ _
Black Canyon Schist, Colorado, radiometric age ____ _
Bolivia, postglacial mudflow, La Paz Valley ________ _
Boundary conditions, consideration in implicit method of flow determination_----------
Buried valleys, Wisconsin and Illinois ____________ _
Page
130
80 13
91 45
130
182
126 13
38
192
126
75
27
140
53
80
130
204
135
c California, gamma-ray spectrom
etry, southern part __ marine geology, Klamath
River delta ________ _ paleontology, San Berna-
dino County _______ _ petrology, north-central part __ Red Mountain-Del Puerto
area ______________ _
Carbon-14 age, postglacial mud-flow, Bolivia ______ _
Cephalopods, relation to particu-lar lithology _______ _
Chlorite, in ultramafic rock, Maryland _________ _
Choctawhatchee Bay area, Florida, organic matter in sediments _________ _
Clay, flint-type, West Virginia __ Clay minerals, freeze-drying tech-
nique _____________ _
Clayton Formation, Tennessee, micropaleontology __ _
Clinopyroxenite, in ultramafic rocks, California ___ _
Colorado, geochronology, Black Canyon of the Gun-nison _____________ _
geochronology, U ncompah-gre Plateau ________ _
paleontology, San Miguel County ___________ ,_
stratigraphy, Elk Moun-tains ______________ _
structural geology, south-central part ________ _
Computer pl~·tting, basic formula m~dificatio.ns for map projection~- _______ _
Computers, use i'n determination of. transient flqw ____ _
Cretaceous, Col~rado, paleontologY---------~------
Montana, ground water ___ _ North Dakota, geohydrol-
ogy ________ 7 ______ _
Saudi Arabia, phosphorite __ Curecanti . Quartz Monzonite,
Colorado, radiometric age _______________ _
Page
107
144
75 13
18
130
66
38
97 1
211
69
18
80
91
66
53
158
174
204
66 192
185 4
80
Dakota D
Sandstone, North Dakota, geohydrol-ogy _______________ _
Delta deposits, California, marine geology ____ _
Draft-storage relations, west-central Alabama ___ _
Dunite, in ultramafic rocks, California _________ _
E
Eagle Valley Formation, Colo-rado, stratigraphy __ _
Earthquakes, Hawaii_ ________ _
possible cause for post-glacial mudflow ____ _
Electron-microprobe analysis, problems in analyzing small particles __
Elk Mountains, Colo., stratig-raphy _____________ _
Eocene, Saudi Arabia, phos-phorite ___ ~ ________ _
Equipment. See Instruments and equipment.
Estuaries, sediment, geochem-istry ______________ _
F
Faulting, effect on streamflow, Missouri __________ _
strike-slip, Pennsylvania __ _
Fire assay, for determination of gold, platinum, and palladium _____ _
Flint clay, occurrence, West Virginia __ ~ ________ _
Florida, organic geochemistry, Choctawhatchee Bay area ______________ _
Fluorescence analysis, rapid method for Rb/Sr ratio determinations_
C221
Page
185
144
182
18
53 120
130
31
53
4
97
153 149
161
97
164
C222 Page
Fluorhydroxylapatites, mineral-ogy________________ 38
Foraminifera, Paleocene, Ten-nessee ______________ 69
Fox Hills-basal Hell Creek aquifer, Montana, aquifer mechanics___ 192
Freeze-drying, organic matter and earth materials__ 211
G
Gamma-ray spectrometry, in measurements of uranium, thorium, and potassium______ 107
Gemini IX, photomosaic from photographs, Peru___ 169
Geochronology. See Age determinations.
Geologic mapping, distance determination by cut-and-try method_____ 177
Glaucophane, in blueschist, Cal-ifornia_____________ 13
Gold, determination by com-bined techniques____ 161
Gothic Formation, Colorado, stratigraphy________ 53
Granite, age determination, Washington ________ 45
H
Harzburgite, in ultramafic rocks, California._________ 18
Hawaii, earthquakes___________ 120 Horses, fossil, California________ 75
Illinois, buried valleys, north-eastern part_ _ _ _ _ _ _ _ 135
Instruments and equipment, freeze-drier for earth-materials___________ 211
Intrusion zones, peridotite, along : faults------~------- 149
Ion exchange, for determination of gold, platinum, and palladium __________ 161
Isotope-dilution analysis, of standards for Rb/Sr ratio determination__ 164
J
Jointing, effect on streamflow, Missouri_ _ _ _ _ _ _ _ _ _ _ 153
K
Karst regions, sewage disposal problems___________ 2.17
SUBJE.CT INDEX
Page
Kilauea Volcano, Hawaii, earth-quakes_____________ 120
Klamath River, Calif., geology of delta____________ 144
M
Magnetic studies. See Paleomagnetic studies.
Magnetite, in ultramafic chlo-rite rock, Maryland_ 38
Mancos Shale, Colorado, paleon-tology_____________ 66
Maps, formulas revised for com-puter plotting of pro-jections ____________ 174
topographic, use in plane-table distance deter-mination _______ -___ 177
Maroon Formation, Colorado, stratigraphy________ 53
Maryland, mineralogy, Harford County____________ 38
Massachusetts, streamflow-diver-sion analysis, Erving_ 199
Mauna Loa, Hawaii, earth-quakes_____________ 120
Methods and techniques, determination of gold, plat-inum, and palladium 161
determination of streamflow-diversion volumes.__ 199
distance determination in planetable surveys___ 177
estimation of low-flow fre-quency relations_____ 196
freeze-drying of earth mate-rials.______________ 211
implicit method of transient-flow determina-tion_ _ _ _ _ _ _ _ _ _ _ _ _ _ _ 204
modification of formulas for computer plotting map projections____ 174
rapid method for RbjSr ratio determination_ 164
small-particle analysis with electron microprobe_ 31
Micropaleontology, foraminifers, Tennessee._________ 69
Minturn Formation, Colorado, stratigraphy________ 53
Miocene, California, paleontology 75 Mississippi, seismic studies,
southern part.______ 113 Missouri, sewage disposal prob-
lei11S, Springfield____ 217 surface water, southern
part_______________ 153
Montana, aquifer mechanics, eastern part________ 192
Mudflow, Bolivia, postglaciaL__ 130
N Nevada, paleomagnetic studies,
southern part ______ _ New York, low-flow frequency
estimates, upstate. __ North Dakota, geohydrology,
eastern part _______ _ Nuclear explosions, Mississippi,
seismic studies. ____ _
0
Olivine, composition in ultramafic rocks, Cali-
Page
61
196
185
113
fornia______________ 18 Orthopyroxene, composition in
ultramafic rocks, Cal-ifornia_____________ 18
p
Paleocene, Montana, ground water ________ ----__ 192
Tennessee, micropaleontol-ogy________________ 69
Paleomagnetic studies, ash-flow sheets, Nevada______ 61
Paleozoic. See Pennsylvanian, Permian.
Palladium, determination by combined techniques. 161
Pelecypods, relation to particular lithology_ _ _ _ _ _ _ _ _ _ _ 66
Pennsylvania, structural geology, southwestern part___ 149
Pennsylvanian, Colorado, stratig-raphy______________ 53
West Virginia, refractory clays _______________ 1
Peridotite intrusions, along strike-slip faults__________ 149
Permian, Colorado, stratigraphy_ 53 Peru, photomosaic from Gemini
photography________ 169 Phosphorite, occurrence in Saudi
Ara;bia·:. _ _ _ _ _ _ _ _ _ _ _ _ 4 Photomosaic, from spacecraft
photography, Peru.. 169 Pitts Meadow Granodiorite,
Colorado, radiomet-ric age_____________ 80
Planetable surveying, distance determination by cut-and-try method_____ 177
Platinum, determination by combined techniques. 161
Potassium, measurement by gamma-ray spectrom-etry_______________ 107
Potassium-argon age, blueschist, California._________ 13
intrusions, Washington_____ 45 Precambrian, Colorado, geo-
chronology_ _ _ _ _ _ _ _ _ 80, 91 Utah, geochronology_______ 91
Puerto Rico, beach deposits, northwestern part __ _
Pyroxene, in blueschist, Cali-fornia ___________ - __
Q
Quartz diorite, age determina-tion, Washington ___ _
Quaternary, Puerto Rico, beach deposits ___________ _
R
Radiocarbon age. See Carbon-14 age.
Recent, Florida, organic mat-ter in sediments ____ _
Red Mountain-Del Puerto area, California, petrology_
Refractive index, silica, in identification of basalt_ __
Rio Grande depression, northward extension in Colorado __________ _
Rivers, computation of tran-sient flow in _______ _
determination of streamflow-diversion volumes __ _
Rubidium-strontium age, basement rock, Colo-rado ______________ _
gneiss, granodiorite, and monzonite, Utah and Colorado __________ _
Rubidium-strontium ratio, determination in silicate rocks _____________ _
Rutile, in ultramafic chlorite rock, Maryland ____ _
s
Saudi Arabia,_ phosphorite, north-ern part. __________ _
Schist, albite-pyroxene-glaucophane type, Califor-nia _______________ _
Sediment, estuarine, geochemis-try _______________ _
Seismic studies, HawaiL ______ _ Mississippi, southern part __ See also Earthquakes.
Page
140
13
45
140
97
18
27
158
204
199
80
91
164
38
4
13
97 120 113
,SUBJECT INDEX
Serpentinization, in ultramafic rocks, California ___ _
Sewage disposal, problems in karst regions _______ _
Silicate rocks, determination of of Rb/Sr ratio _____ _
South America. See Bolivia, Peru.
Spacecraft photography, photo-mosaic of Peru _____ _
Spectral analysis, seismic measurements of nuclear explosions _________ _
Spectrochemical technique, for determination of gold, platinum, and palla-dium _____________ _
Spectrometric analysis, gammaray, in measurement of uranium, thorium, and potassium _____ _
small particles, problems __ _ Spinel, composition in ultramaf
ic rocks; California_ Springs, in karst area, effect on
streamflow ________ _
Storage, surface water, estimate from average flow and low flow ___________ _
Streamflow, estimates of lowflow frequency relations, upstate New York _____________ _
relation to geologic struc-ture ______________ _
transient-type, determina-~on ______________ _
volume-diversion analysis._
T
Tennessee, micropaleontology, Hardeman County __
Tertiary, California, marine ge-ology _____________ _
Colorado, structural ge-ology _____________ _
Washington, petrology of basalt _____________ _
See also Paleocene, Eocene, Miocene.
Thorium, measurement by gamma-ray spectrom-etry ______________ _
Page
18
217
164
169
113
161
107 31
18
153
182
196
153
204 199
69
144
158
27
107
C223
Troy Valley, Wisconsin-Illinois, buried bedrock valley_
Tuff, paleomagnetic studies, Nevada ___________ _
u
Ultramafic rock, mineralogy, Maryland _________ _
petrology, California ______ _ Uncompahgre Plateau, Utah and
Colorado, geochronol-ogy _______________ _
Uranium, measurement by gamma-ray spectrom-etry ______________ _
Utah, geochronology, Uncom-pahgre Plateau _____ _
v Vernal Mesa Quartz Monzonite,
Colorado,' radiomet-ric age ____________ _
Vertebrate fossils, Miocene, California _________ _
Volcanic rocks, Nevada, paleo-magnetic studies ___ _
Volcanoes, recent activity, Alaska ____________ _
w Washington, petrology, Pasay-
ten River area _____ _
petrology, southwestern part ______________ _
Waste disposal, municipal, in karst region _______ _
West Virginia, refractory clay, Randolph County __ _
Wisconsin, buried valleys, south-eastern part _______ _
X
X-ray analysis, apatites, Mary-land ______________ _
preparation of clay sample for, by freeze-drying_
silicate rocks, Rb/Sr ratio determination ______ _
small particles, problems __ _
Page
135
61
38 18
91
107
91
80
75
61
126
45
27
217
1
135
38
211
164 31

B Barnett, P. R ________________ _ Bartleson, B. L ______________ _ Bath, G. D __________________ _ Beall, R. M _________________ _ Borcherdt, Roger _____________ _ Bryant, Bruce _______________ _ Bunker, C. M ________________ _ Bush, C. A __________________ _
c Calk, L. c ___________________ _ Carr, M. H __________________ _ Case, J. E ___________________ _ Cathcart, J. B _______________ _ Christiansen, R. L ____________ _ Coleman, R. G----------------Collings, M. R _______________ _
D
Detterman, R. L _____________ _ Dobrovolny, Ernest_ _________ _ Doering, W. P _______________ _
E
Engels, J. C _________________ _ Englund, K. J_ ______________ _
G
Goett, H. J __________________ _ Green, J. H __________________ _
Page
161 53 61
196 113 53
107 107
31 31 91
4 61
13, 18 199
126 130 164
45 1
1 135
AUTHOR INDEX
H Page Hansen, W. R_________________ 80 Harvey, E. J_ ______________ 153,217 Hedge, C. E__________________ 91 Herrick, S. M_________________ 69 Himmelberg, G. R____ _ _ _ _ _ _ _ _ _ 18 Huffman, Claude, Jr___________ 161
J
Jefferson, P. 0________________ 182
K
Keith, T. E. C _______________ _ Kelly, T. E ____ --------------Koyanagi, R. y ______________ _
L
Lai, Chintu __________________ _ Lewis, G. E _________________ _ Love, A. H __________________ _
M
MacKallor, J. A ______________ _ McKee, E. H ________________ _ Malcolm, R. L _______________ _ Monroe, W. H _______________ _ Moore, G. W ________________ _ Mutschler, F. E ______________ _
N
Noble, D. C _________________ _
13 185 120
204 75 97
169 27
211 140 144 53
61
0 Page Obradovich J. D_ _ _ _ _ _ _ _ _ _ _ _ _ _ 91 O'Connor, J. T________________ 107 Orkild, P. P__________________ 61
p
Page, N. J _ _ _ _ _ _ _ _ _ _ _ _ _ _ _ _ _ _ _ _ 31 Palacas, J. G _ _ _ _ _ _ _ _ _ _ _ _ _ _ _ _ _ 97 Peterman, Z. E _______________ 80,91 Plouff, Donald________________ 174
R
Rima, D. R------------------ 69 Roen, J. B___________________ 149
s Shawe, D. R------------------ 66 Silver, E. A___________________ 144 Skelton, John _______________ 153, 217 Skinner, D. L_________________ 161 Southwick, D. L______________ 38 Staatz, M. H_________________ 45 Sutton, R. L__________________ 177 Swanson, V. E________________ 97
T
Tabor, R. W__________________ 45 Taylor, 0. J__________________ 192
v Van Alstine, R. E ____________ _ 158
C225
U.S. GOVERNMENT PRINTING OFFICE: 1968 Q-294-199