Embed Size (px)
Citation preview

Soil Horizons p. 1 of 12
Comparison of Surficial Geology Maps Based on Soil Survey and In Depth Geological SurveyBradley A. Miller* and C. Lee Burras
Previous studies have suggested researchers should use Soil Survey maps to create surficial geology maps where more spatial detail about surficial geology is needed than is available from maps already produced by geologists. Despite the widespread availability of relatively detailed soil maps in the United States, few areas have a surficial geology map published at similar map scales. This apparent gap between disciplines calls to question the accuracy of soil maps to represent the spatial distribution of surficial geologic materials. Therefore, the purpose of this research is to test the agreement between maps from these two sources. To accomplish this, published surficial geology maps are compared to those derived from Soil Survey maps in an area where geologists have a close relationship with soil scientists, but the coverage of detailed surficial geology maps is limited. This study compares seventeen 1:100,000 and ten 1:24,000 surficial geology maps recently produced by the Iowa Geologic Survey with Soil Survey maps that have been categorized to represent the surficial geology of the same areas. Depending on the state of understanding the geologic history for an area when the map was produced and the acceptance of differences due to cartographic scale, most of the maps were in agreement at 67 to 99% of the examined sites. Lower agreement percentages were in areas with more complicated geologic histories, such as areas described as loamy sediments or where a thin loess cover could be obscured bioturbation.
PeerReviewed
Papers
The creation of surficial geology maps and soil maps are genetically intertwined. Both may use the other as a refer-
ence data set. Hence, the building of information in both of the respective maps for a given area is cyclical. However, the pur-poses of the respective maps are different. Surficial geology maps are generally intended to communicate geologic mate-rials and general landform regions (Bernknopf et al., 1996). In contrast, Soil Survey maps focus on soil properties for the purpose of informing land use and management decisions at a finer scale (Soil Survey Staff, 1993). The dependence of soil properties on the materials in which the soil forms make Soil Survey maps a potentially useful surficial geology map where more detailed geology maps are not available. The close relationship between the information included in both maps suggests that soil maps with high resolution could provide a useful alternative map for surficial geology (Lindholm, 1993, 1994a; Evans, 2002; Miller et al., 2008; Oehlke and Dolliver, 2011; Juilleret et al., 2012). Indeed, data from soil maps have been
used successfully as aids to research on surficial geology (e.g., Brevik and Fenton, 1999; Lindholm, 1994b; Luehmann et al., 2013; Muhs and Bettis, 2000; Schaetzl and Attig, 2013; Schaetzl and Weisenborn, 2004; Schaetzl et al., 2000; Vader et al., 2012).
The level of detail included in either a geologic map or a soil map is dependent on the complexity of the terrain, ease of access, amount of resources available, and the style of the mapper. Map-ping a higher level of detail for the same area requires more data collection and more time to delineate the additional boundaries (Simonson, 1952). Of the geologic maps available from the USGS, 94% are at a scale of 1:24,000 or smaller (USGS, 2014). The USDA-NRCS Soil Survey mostly produces maps at scales between 1:24,000 and 1:12,000 (Soil Survey Staff, 1993). The greater cov-erage and higher level of detail usually included in Soil Survey maps is due to the intended use of the maps for agriculture and land valuation, combined with a higher level of investment.
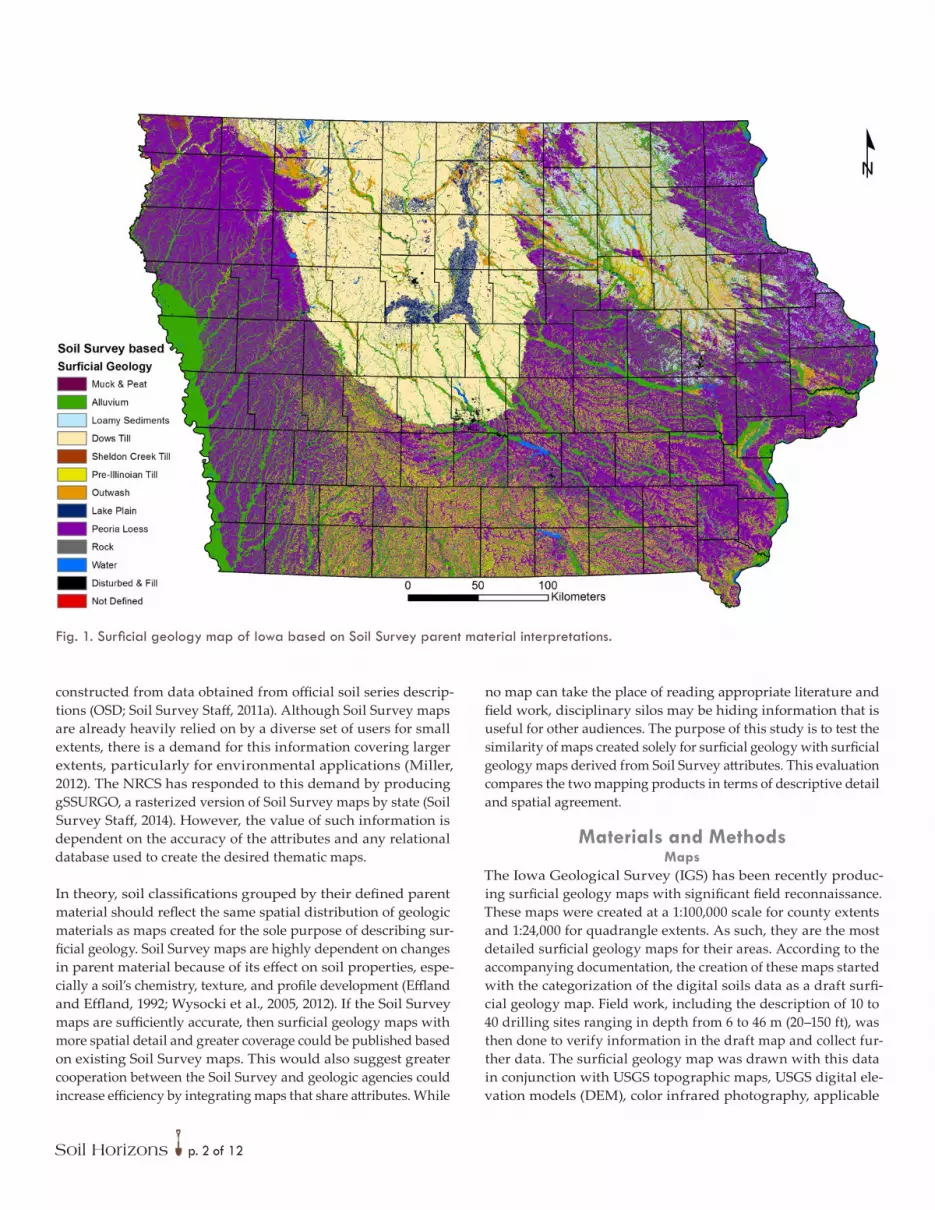
Because soil maps have been produced for the majority of the United States, surficial geology maps based on soil map attri-butes can be constructed relatively quickly for large extents through the use of a relational attribute database (Miller et al., 2008). For example, a surficial geology map for the state of Iowa was created for this study from a 30-m resolution grid of map unit keys (mukey) based on Soil Survey maps and a relational database of surficial geology attributes interpreted from the map units’ parent materials (Fig. 1). The relational database was
B.A. Miller, Project Coordinator, Leibniz Centre for Agricultural Landscape Research (ZALF) e.V., Institute of Soil Landscape Research, Eberswalder Straße 84, 15374 Müncheberg, Germany; C.L. Burras, Professor, Dep. of Agronomy, Iowa State Univ., Ames, Iowa 50011. *Corresponding author ([email protected]).
doi:10.2136/sh14-05-0005A peer-reviewed contribution published in Soil Horizons (2015).Received 23 May 2014.Accepted 12 Nov. 2014.
© Soil Science Society of America 5585 Guilford Rd., Madison, WI 53711 USA.
All rights reserved. No part of this periodical may be reproduced or transmitted in any form or by any means, electronic or mechanical, including photocopying, recording, or any information storage and retrieval system, without permission in writing from the publisher.
Abbreviations: DEM, digital elevation model; IGS, Iowa Geological Survey; OSD, official soil series description.
Published January 7, 2015
Soil Horizons p. 2 of 12
constructed from data obtained from official soil series descrip-tions (OSD; Soil Survey Staff, 2011a). Although Soil Survey maps are already heavily relied on by a diverse set of users for small extents, there is a demand for this information covering larger extents, particularly for environmental applications (Miller, 2012). The NRCS has responded to this demand by producing gSSURGO, a rasterized version of Soil Survey maps by state (Soil Survey Staff, 2014). However, the value of such information is dependent on the accuracy of the attributes and any relational database used to create the desired thematic maps.
In theory, soil classifications grouped by their defined parent material should reflect the same spatial distribution of geologic materials as maps created for the sole purpose of describing sur-ficial geology. Soil Survey maps are highly dependent on changes in parent material because of its effect on soil properties, espe-cially a soil’s chemistry, texture, and profile development (Effland and Effland, 1992; Wysocki et al., 2005, 2012). If the Soil Survey maps are sufficiently accurate, then surficial geology maps with more spatial detail and greater coverage could be published based on existing Soil Survey maps. This would also suggest greater cooperation between the Soil Survey and geologic agencies could increase efficiency by integrating maps that share attributes. While
no map can take the place of reading appropriate literature and field work, disciplinary silos may be hiding information that is useful for other audiences. The purpose of this study is to test the similarity of maps created solely for surficial geology with surficial geology maps derived from Soil Survey attributes. This evaluation compares the two mapping products in terms of descriptive detail and spatial agreement.
Materials and MethodsMaps
The Iowa Geological Survey (IGS) has been recently produc-ing surficial geology maps with significant field reconnaissance. These maps were created at a 1:100,000 scale for county extents and 1:24,000 for quadrangle extents. As such, they are the most detailed surficial geology maps for their areas. According to the accompanying documentation, the creation of these maps started with the categorization of the digital soils data as a draft surfi-cial geology map. Field work, including the description of 10 to 40 drilling sites ranging in depth from 6 to 46 m (20–150 ft), was then done to verify information in the draft map and collect fur-ther data. The surficial geology map was drawn with this data in conjunction with USGS topographic maps, USGS digital ele-vation models (DEM), color infrared photography, applicable
Fig. 1. Surficial geology map of Iowa based on Soil Survey parent material interpretations.

Soil Horizons p. 3 of 12
graduate thesis, various other publications, and boring log data from other sources. The final product was designed to reflect the surficial geology of the upper 5 m of the landscape. To represent a complex landscape, a landform sediment assemblage approach was used (Quade et al., 2005a, 2002). This approach enabled a generalization of landforms by recognizing the genetic rela-tionships between landforms and their underlying sediments (Sugden and John, 1976; Eyles and Menzies, 1983).
Current Soil Survey maps in the same areas as the surficial geology maps described above were created at 1:15,840. At this cartographic scale, the Soil Survey considers 1 ha to be the minimum delineation size (Schoeneberger et al., 2012). The USDA-NRCS Soil Survey Manual describes the standardized procedures for creating these maps (Soil Survey Staff, 1993). In preparation for creating these maps, all available resources were gathered, which can include older soil maps, aerial photogra-phy, USGS topographic maps, geology maps from the USGS and respective state agencies such as IGS, vegetation maps, climate maps, and applicable graduate theses. These resources were used to construct mapping aids, such as a genetic key that defines soils by parent material, vegetation, local climate, and landscape
position (Bromley and Miller, 2015). The first draft of the map was sketched on stereoscopic aerial photographs or on a DEM. From these rough sketches and in consideration of potential obstacles, routes of traverse were planned for field verification. The density of traverses varied depending on the complexity of the soil pattern. For example, a fairly detailed survey would be expected to pass within 200 to 400 m of every point in the survey area, which was believed to enable detection of small areas of dif-fering soil properties. As the soil scientist proceeded across these traverses, the models predicting the kinds of soils in an area and the respective boundaries were tested. The tests ranged from a quick search for key properties identifying a soil delineation to a soil core or pit dug to 1.5 m (60 in) deep. After a series of samples had been taken, the soil mapper looked back over the landscape to reflect on any adjustments that might need to be made (Soil Survey Staff, 1993).
The study areas for this research consisted of 17 counties from across the state of Iowa that have been mapped for surficial geol-ogy at a scale of 1:100,000 and 10 quadrangles in northeastern Iowa that have been mapped for surficial geology at 1:24,000 (Fig. 2). The county maps individually covered areas of 1034 to 2522
Fig. 2. County study areas are highlighted by white borders and are labeled by name. Quad study areas are highlighted in bold, black borders and are labeled by number: (1) Bluffton, (2) Burr Oak, (3) Highlandville, (4) Decorah, (5) Freeport, (6) Bremer, (7) Stanwood, (8) Cedar Bluff, (9) Rochester, and (10) Bennett.

Soil Horizons p. 4 of 12
km2, and the quadrangle maps each covered areas of 140 to 145 km2. The 10 quadrangles were the largest cartographic scale—most highly detailed—surficial geology maps provided by the IGS. The additional analysis of the 17 1:100,000 surficial geology maps provided a comparison of the surficial geology maps on different landform regions than the landform regions in which the 1:24,000 maps were located.
The 1:24,000 maps described areas of the Iowan Erosion Sur-face, the Southern Iowa Drift Plain, and the Paleozoic Plateau landform regions (Liu et al., 2007; McKay et al., 2007a,b; Tassier-Surine et al., 2007a,b,c,d,e,f,g). The Southern Iowa Drift Plain and the Iowan Erosion Surface were landscapes that have been gla-ciated many times in the past 2.2 million to 500,000 yr, but now have a well-developed drainage network. The Southern Iowa Drift Plain differed from the Iowan Erosion Surface in that Peoria loess covers most of the Pre-Illinoian till on the Southern Iowa Drift Plain instead of only in small patches. The Southern Iowa Drift Plain also had greater relief. The Iowan Erosion Surface had large areas of unnamed loamy sediments overlying the Pre-Illinoian till. The Paleozoic Plateau was a region dominated by limestone and dolomite. The area has been deeply incised over the past 500,000 yr and contains karst topography. The bedrock was sometimes mantled by thin deposits of Peoria loess. All of the landscapes had Holocene alluvial landforms.
The majority of the 1:100,000 maps were within the Des Moines Lobe landform region, which was dominated by landscapes of late Wisconsin till and included outwash with Holocene allu-vium on floodplains and terraces (Prior, 1991; Quade et al., 2001, 2002). The counties of Clay and Osceola extended across the western border of the Des Moines Lobe to include an area called the Northwest Iowa Plain. The Northwest Iowa Plain landscape was older than the Des Moines Lobe and consisted of an earlier Wisconsin till covered by Peoria loess or loamy sediments, except on steep side slopes (Ruhe, 1969; Quade et al., 2005a). This land-scape also had outwash and Holocene alluvium on floodplains and terraces (Quade et al., 2005a). Three of the surficial geology maps at 1:100,000 were not on the Des Moines Lobe. The Bremer County map covered an area within the Iowan Erosion Surface described above and overlapped the Bremer quadrangle. Maps of Johnson and Cedar counties covered areas of the Southern Iowa Drift Plain, also described above. Cedar County overlapped with the Stanwood, Cedar Bluff, Rochester, and Bennett quadrangles. (Quade, 2005a,b,c,d,e,f,g,h,i,j; Quade, 2011; Quade et al., 2005b,c; Quade and Giglierano, 2006; Quade et al., 2011; Tassier-Surine et al., 2011a,b)
Shapefiles of the IGS’s surficial geology maps were obtained from the Iowa Department of Natural Resources’ Geographic Information Systems Library website (https://programs.iowadnr.gov/nrgislibx/, accessed 17 Dec. 2014). Soil Survey derived surfi-cial geology maps were produced from a rasterized version of the NRCS SSURGO soil maps for the state of Iowa (Soil Survey
Staff, 2011b) and the method described in Miller et al. (2008) for assigning surficial geology attributes. The relational database pri-marily relied on the parent material description in the geographic setting section of the OSD to determine the surface geologic mate-rial associated with each soil map unit. To create a legend that was appropriately simple for a statewide surface geology map, the relational database focused on the geologic material at the surface. However, within a GIS framework, it would have been possible to include deeper layers as a second attribute.
Comparison MethodsThese two sets of maps were first visually compared for general boundary agreement. This comparison was made by super-imposing the boundary lines of the smaller cartographic scale maps over a color coded display of the larger scale map. Then location agreement was tested for 100 random points generated for each study area with a minimum distance of 1 m apart. The surficial geology attribute at each of those points was extracted from the respective maps and assessed for agreement. Agree-ment was characterized by a predetermined equivalency chart (Table 1). In constructing the equivalencies we recognized that the Soil Survey does not describe geologic landforms to the same level of detail as the IGS maps. Most notably, the attributes of IGS surficial geology maps included the geologic time period associ-ated with map units. For example, the IGS surficial geology maps differentiated alluvial deposits by terrace level, while the Soil Survey information only described some alluvial map units as occurring on terraces in general.
Differences in focus and scale presented challenges for assess-ing agreement. Therefore, three levels of agreement criteria were used. The first level was a strict agreement criterion, which only accepted the maps as agreeing if the attributes matched exactly. The second criteria set allowed for the matching of attributes that did not contradict each other (i.e., not in disagreement). The third criteria set also accepted disagreements that were likely caused by inclusions of features due to differences in cartographic scale (i.e., acceptance of scale).
The “not in disagreement” criteria accepted all of the agree-ments from the first strict criteria and then also accepted differences in attributes that could both be true for the given point. For example, the IGS named map units by the mate-rial dominant in the 5-m profile. The Soil Survey information focused on the top layer and sometimes included a second if it was shallow enough. In the case of Sheldon Creek till being thinly mantled by Peoria loess, the IGS attribute focused on the Sheldon Creek till, while noting that it could be mantled by Peoria loess. The Miller et al. (2008) method placed the Peoria loess as the primary attribute and could have included the Shel-don Creek till as a secondary attribute.
Other map attributes that were considered “not in disagree-ment” were those associated with similar processes. For example,

Soil Horizons p. 5 of 12
Table 1. Attribute equivalency table. This table merges the separate geologic map attributes of all study areas.Geological Survey Soil Survey
Dc—Bedrock Exposures (Devonian Cedar Valley Group) RockDcv—Limestone and Dolomite (Coralville Formation) Limestone or DolomiteDlc—Dolomite and Limestone (Little Cedar Formation) Limestone or DolomiteDlgc—Dolomite, Limestone, and Shale (Lithograph City Formation) Limestone, Dolomite, or ShaleDu-Su—Devonian-Silurian (undifferentiated) RockDw—Dolomite (Wapsipinicon Group) DolomiteMu—Bedrock RockMuck Muck and PeatOd—Limestone (Dunleith Formation) LimestoneOdpg—Shale, Limestone, and Dolomite (Decorah, and underlying Platteville and Glenwood Formations) Shale, Limestone, or DolostoneOdwd—Limestone (Dubuque, Wise Lake, Dunleith Formations) LimestoneOm—Shale, Limestone, and Dolostone (Maquoketa Formation) Shale, Limestone, or DolostoneOo—Dolomite (Oneota Formation) DolomiteOs—Dolomite and Sandstone (Shakopee Formation) Dolomite or SandstoneOsp—Sandstone (St. Peter Sandstone Formation) SandstoneOwd—Limestone and Minor Shale Limestone or ShalePu—Pennsylvanian Bedrock Exposures (Cherokee, Marmaton and Bronson Groups) Shale, Limestone, or SandstoneQaf—Alluvial fan (Corrington Member) AlluviumQal1—Alluvium (DeForest Formation) AlluviumQal2—Thick Alluvium (DeForest Formation) AlluviumQalb—Alluvium/rock (DeForest Formation) Alluvium or RockQalht—High Terrace (DeForest Formation-Gunder Member/Corrington Member) AlluviumQali-ht—Intermediate-High Terrace (DeForest Formation-Roberts Creek Member and Gunder Member) AlluviumQalit—Intermediate Terrace (DeForest Formation-Camp Creek Member, Roberts Member, and Gunder Member) AlluviumQallt—Low Terrace/Modern Channel Belt (DeForest-Camp Creek Member and Roberts Creek Member) AlluviumQe—Eolian Sand (Peoria Formation) Eolian SandQe—Sand Dunes and Sand Sheets (Peoria Formation) Eolian SandQf—Fill or Fill Areas FillQgfp—Complex Glaciofluvial Plain (Noah Creek Formation) OutwashQglhc—Collapsed Lake Sediments (Dows Formation-Lake Mills Member/Morgan Member) Lake PlainQglp(ls)—Lake Plain (Dows Formation-Lake Mills Member) Lake PlainQglp(ss)—Lake Sediment Small-scale Landforms (Dows Formation-Lake Mills Member) Lake PlainQglp—Lake Plain (Dows Formation-Lake Mills Member) Lake PlainQlglp—Lake Plain, broad-scale landform features with aligned ridge forms (Dows Formation-Lake Mills
Member)/Morgan Member)Lake Plain
Qnw2—Sand and Gravel (Noah Creek Formation) OutwashQnw—Sand and Gravel (Noah Creek Formation) OutwashQoch(s)—Slackwater/outwash (Noah Creek Formation) OutwashQochb—Outwash/rock (Noah Creek Formation) Outwash or RockQoch—Outwash (Noah Creek Formation) OutwashQoch—Valley Train Outwash (Noah Creek Formation) OutwashQo—Depressions (DeForest Formation-Woden Member) Dows Till or Dows Till AlluviumQo—Muck and Peat (DeForest Formation-Woden Member) Muck and PeatQof—Outwash Fan (Noah Creek Formation) OutwashQpq—Pits and Quarries PitsQps1b—Thick Loess and Intercalated Eolian Sand (Peoria Formation-Silt Facies) Peoria LoessQps1—Loess and Intercalated Eolian Sand (Peoria Formation-Silt Facies) Peoria LoessQps2—Eolian Sand and Intercalated Silt (Peoria Formation-Silt Facies) Peoria LoessQps5—Loess and Intercalated Eolian Sand (Peoria Formation-Silt Facies) Peoria LoessQps—Loess (Peoria Formation-Silt Facies) Peoria LoessQpsr—Loess over Bedrock (Peoria Formation-Silt Facies) Peoria LoessQptep—Early Phase High Terrace (Peoria Formation-Silt Facies) Peoria LoessQpt—High Terrace (Peoria Formation-Silt or Sand Facies) Peoria LoessQptlp—Late Phase High Terrace (Peoria Formation) AlluviumQrc—Rock Core Meanders/Structural Benches RockQsc2—Loamy Sediments Shallow to Glacial Till (Sheldon Creek Formation) Loamy SedimentsQsc—Glacial Till (Sheldon Creek Formation) Sheldon Creek TillQsgclp—Supraglacial Complex with Lineated Ridge Forms (Dows Formation-Pilot Knob Member/Morgan Member) Dows Till or Dows Till AlluviumQsgc—Supraglacial Complex (Dows Formation-Pilot Knob Member/Morgan Member) Dows Till or Dows Till AlluviumQte—Till Escarpment (Dows Formation-Morgan Member) Dows Till or Dows Till Alluvium
Table continued.

Soil Horizons p. 6 of 12
both alluvium and outwash were fluvial deposits. Outwash was associated with glacial meltwater, which would have tended to make the material coarser due to higher flow velocities and pre-Holocene due to the end of the ice age. However, fine fluvial sediments on terraces could have dated back to a glacial period, in which case, describing the material as alluvium or outwash was not necessarily contradictory. Loamy sediments were also identified as a potentially nondisagreeing attribute for similar reasons. The term loamy sediments alone would only indicate that the material had a loam texture class, with no specified definition of landform or depositional process. However, the IGS associated loamy sediments in these map areas with the downslope deposi-tion of materials from a variety of processes. Because both loamy sediments and local alluvium could have resulted from surface wash and rill erosion, these two descriptions were not consid-ered contradictory for this less strict analysis.
The most liberal criteria, “acceptance of scale,” added the accep-tance of agreement for differences that were most likely due to the cartographic scale at which the maps were created. For exam-ple, the 1:15,840 scale of the Soil Survey derived map included small ponds that were too small to be included in smaller scale maps. The smaller cartographic scale maps sometimes did not delineate streams either. Also, because streams meander across their floodplains, maps created at different times could posi-tion the water differently while still being correct for their time. Therefore, the most liberal criteria accepted differences associ-ated with water. Disturbed areas such as fills, pits, and quarries were also accepted in this last agreement criteria level because of the decreased likelihood of being delineated at smaller carto-graphic scales. The difference in cartographic scale also caused issues in the other direction. Smaller scale maps often had
boundaries drawn around areas dominated by a certain attribute, but enveloped several inclusions in the process. Therefore, areas like muck and peat, which were likely to be spatially intermittent within areas delineated at smaller cartographic scales, were also accepted by this last agreement criteria as long as the larger scale map still identified a reasonable surficial geology.
ResultsStarting with an evaluation of the attribute equivalency tables, some of the differences between the two map types were appar-ent (Table 1). The quantity of map units for the 1:15,840 scale map was increased by its level of spatial detail. For example, it was spatially detailed enough to include delineations of local alluvium found in swales between till ridges. In contrast, the quantity of map units for the 1:100,000 and 1:24,000 IGS maps was increased by a finer attribute resolution. Those maps described material by geologic formation and member, which provided information about both the lithology as well as timing. In total, these differences resulted in many more map units for the IGS maps. The lack of additional interpretation about geologic attri-butes was certainly a limitation for the Soil Survey map. The map based on the Soil Survey did not distinguish between terrace levels nor between different formations of bedrock.
Visual review of each study area showed general agreement in boundary lines. Of course the more detailed 1:15,840 map had additional lines, but lines from the smaller cartographic scale maps usually aligned with boundaries also shown on the 1:15,840 map. Examples of these general boundary agreements are shown in Fig. 3 through 7, which also demonstrate differences. An exam-ple of boundary differences was where clusters of lake plain sediments individually delineated by the 1:15,840 scale map
Geological Survey Soil SurveyQtpl1—Till Plain with Aligned-elongated Ridge Forms (Dows Formation-Pilot Knob Member) Dows Till or Dows Till AlluviumQtpld4–3—Till Plain with Linked Depressions and Aligned-elongated Ridge Forms (Dows Formation-Morgan
Member/Lake Mills Member)Dows Till or Dows Till Alluvium
Qtpld4—Till Plain with Linked Depressions and Elongated Ridge Forms (Dows Formation-Morgan Member/Lake Mills Member)
Dows Till or Dows Till Alluvium
Qtpl—Till Plain with Elongated Ridge Forms (Dows Formation-Morgan Member) Dows Till or Dows Till AlluviumQtp—Till Plain (Dows Formation-Morgan Member) Dows Till or Dows Till AlluviumQtr_bamc—Till Ridge (Dows Formation-Morgan Member) Dows Till or Dows Till AlluviumQtr_bm—Till Ridge (Dows Formation-Morgan Member) Dows Till or Dows Till AlluviumQtr—Till Ridge (Dows Formation-Morgan Member) Dows Till or Dows Till AlluviumQwa1—Sand and Gravel Shallow to Till (Unnamed Erosion Surface Sediment) Loamy SedimentsQwa2—Loamy and Sandy Sediment Shallow to Glacial Till (Sediment Associated with Erosion Surface) Loamy SedimentsQwa3—Till (Wolf Creek or Alburnett formations) Pre-Illinoian tillQwa5—Loamy and Sandy Sediment Shallow to Rock Loamy SedimentsSg—Silurian Gower Formation DolomiteShb—Dolomite with Chert (Hopkinton and Blanding Formations) Dolomite or ChertSh—Dolomite (Hopkinton and Blanding Formations) DolomiteSs—Dolomite (Scotch Grove Formation) DolomiteSu—Bedrock Exposures (Silurian Gower and Scotch Grove Formations) RockUpland Anything not alluviumW—Water or Water Features Water
Table 1. Continued.

Soil Horizons p. 7 of 12
tended to be one delineation for the cluster area on the smaller cartographic scale maps (Fig. 4). Also in several study areas, the IGS surficial geology maps tended to delineate the extent of allu-vium further upstream (Fig. 5). This trend was reversed in Cedar County (Fig. 6). The study areas on the Iowan Erosion Surface (primarily the Bremer quadrangle) showed a similar pattern, except the Soil Survey based map, which described some areas of outwash sediments coinciding with and extending further upstream from the IGS delineations of alluvium (Fig. 7).
The agreement assessment of 100 random points in each study area created a percentage based measurement of how much the Soil Survey based surficial geology maps agreed with the IGS maps (Table 2). With the exception of the Stanwood quad-rangle, the strict agreement criteria of the quadrangle areas had agreements of 67 to 92%. The Stanwood quadrangle only had 45% agreement by strict standards, but had an 84% agreement when attributes that were not in disagreement were allowed. The primary reason for the low agreement rate for the Stanwood quadrangle under the strict agreement criteria was due to the IGS labeling areas as loamy sediments that the Soil Survey had
characterized as Peoria loess. The Cedar Bluff and Bremer quad-rangles had the same issue, but for smaller extents. Accepting loamy sediments as not in disagreement increased the Bremer quadrangle agreement from 71 to 84% and the Cedar Bluff quad-rangle agreement from 73 to 88%. The second lowest percentage for strict agreement was the Highland quadrangle with 67%. Here, the IGS map delineated more areas of bedrock than the Soil Survey indicated was at the surface.
Using the same method for comparison, the seventeen coun-ties had levels of agreement similar to the quadrangle study areas (Table 3). Except for the counties of Osceola and Clay, the strict agreement criteria ranged between 63 and 94%. In Osceola County, the IGS recognized large areas of Sheldon Creek till that the Soil Survey had described as either covered by Peoria loess or exposures of Pre-Illinoian till. In similar landscape positions of the adjacent Clay County, the IGS map included an additional subunit attribute indicating loess over Sheldon Creek till that was not used in the Osceola County map. Since the IGS surficial geology map of Osceola County provided no indication of loess over the Sheldon Creek till, even the Peoria loess areas of the
Fig. 3. Example area from Story County, Iowa. In all figures the Soil Survey based surficial geology map is represented by the colors and the IGS surficial geology maps are represent by the black outlines (see Table 1 for symbol definitions). Note the general agreement in line placement for major/large map entities, but with additional delineations in the larger cartographic scale map. The additional delineations in the Soil Survey based map are primarily identifying depressions of the DeForest Formation-Woden Member (Qo) that are often too small to be delineated at smaller cartographic scales.
Fig. 4. Example area from Wright County, Iowa. Boundary lines generally agree for areas of alluvium, outwash, and Dows till plain. In the southwest quarter of this example area, the 1:15,840 map delineates scattered areas of glacial lacustrine sediments (Lake Plain) clustered in an area delineated as collapsed lake sediments by the 1:100,000 map. (See Table 1 for symbol legend.)

Soil Horizons p. 8 of 12
Soil Survey based map needed to be considered a true disagree-ment. Therefore, the percent agreement for Osceola County did not increase with more liberal agreement criteria. The primary issue for Clay County was the same as the Stanwood quadrangle with the interpretation of loamy sediments versus Peoria loess. Accepting loamy sediments as not disagreeing raised the Clay County percent agreement to 90%. Cedar and Bremer counties also had many areas described by the IGS as loamy sediments. Allowing for nonconflicting attribute comparisons brought the agreement percentage up to 89% for Cedar County and up to 94% for Bremer County. As was expected, the difference in car-tographic scale was more of an issue for comparing the 1:100,000 IGS maps with the Soil Survey based 1:15,840 maps. With the exception of Osceola County—for the reason described above—a full allowance for disagreement due to non-contradictory attri-butes and cartographic scale characterized the maps as agreeing 76 to 99% of the time.
DiscussionGiven the differences in cartographic scale, purpose, as well as the natural differences between one mapper and the next, some disagreement between these maps should be expected. Maps cre-ated at different cartographic scales and with different purposes will have strengths and weaknesses that make them more appro-priate for certain uses. Smaller cartographic scale maps provide generalizations that help communicate broad phenomena across large areas (Robinson et al., 1995). In contrast, the Soil Survey’s high quantity of surficial sampling enabled the creation of larger cartographic scale maps that delineate individual landscape features and leave the determination of feature patterns to the viewer. The respective focuses of the IGS and Soil Survey maps also differed in the profile depth considered, with the Soil Survey focusing on the upper 1.5 m and the IGS considering the upper 5 m. Finally, different human perspectives on thresholds for suffi-cient evidence to make classifications and on how to amalgamate
Fig. 5. Example area from Clay County, Iowa. Note that on the eastern side of this example area the Iowa Geological Survey (IGS) delineated alluvium further upstream than indicated by the Soil Survey based surficial geology map. Also, the divide between Clay County (surveyed in 2002) and O’Brien County (surveyed in 1981) demonstrate the impact of evolving understanding of local geology. In Clay County, both the Soil Survey based surficial geology map and the IGS surficial geology map delineate matching extents of Sheldon Creek till on the sides of the river valley. In O’Brien County, the Soil Survey based surficial geology map delineates Dows till in similar landscape positions. Although an IGS surficial geology map is not available for O’Brien county, it is likely that it as well as an updated Soil Survey map would describe these areas as Sheldon Creek till. (See Table 1 for symbol legend.)
Fig. 6. Example area from Cedar County, Iowa. Note the Soil Survey based surficial geology map extends the delineation of alluvium further headward on waterways. The two map units of Peoria Loess delineated by the Iowa Geological Survey (IGS) here differentiate where the loess overlies Pre-Illinoian till (Qps1) from where it overlies erosion surface sediment (Qps5). (a) IGS’s 1:100,000 surficial geology map delineations (see Table 1 for symbol legend) overlaid on the Soil Survey based surficial geology map. (b) The IGS’s1:100,000 surficial geology map delineations overlaid on an infrared orthophoto (Iowa Department of Natural Resources, 2002).

Soil Horizons p. 9 of 12
complex landscapes were likely to cause differences between the products of every mapper of a physical landscape.
The alignment of delineations was anticipated as the Soil Survey maps often serve as a draft map for the IGS’s process of creating surficial geology maps. In Iowa, soil scientists and geologists collaborated well with each other, which led to a sharing of knowledge and better use of the others respective mapping products. Map agreement may not be as high in areas where there was less collaboration between disciplines. Many of the unaligned boundaries found by visual compar-ison in this study were due to the level of detail associated with the respective map scales. As these disagreements were more the result from differences in cartographic scale than differences in interpretation of geologic material, we did not consider these types of differences to be a flaw for either map.
The largest cause for disagreement between the two maps was because the Soil Survey identified additional areas of loess cover in areas dominated by loamy sediments. In the maps used for this study, the description of loamy sediments was always associated with erosion surface materials and were found on old till plains that were likely covered by Peoria loess at one time. Due to bioturbation, thin remnants of the loess sheet would be more difficult to recognize (Luehm-ann et al., 2013). These kinds of discrepancies between the two maps draw attention to opportunities for additional research.
A similar description conflict that was common and never considered to be in agreement was the occurrence of high terraces covered in Peoria loess as identified by the IGS maps, but described as alluvium or outwash by the Soil Survey. In this case, the IGS identified a loess cover where the Soil Survey did not. The IGS description of Peoria loess on these high terraces included fine to medium sand intercalated
Fig. 7. Example area from the Bluffton, Iowa quadrangle. The southeast corner includes an example of the Soil Survey indicating outwash coinciding with and extending beyond an area delineated as alluvium by the Iowa Geological Survey (IGS) map. Also, note the 1:24,000 scale, IGS surficial geology map’s additional delineations of shale, limestone, and dolostone on the sides of stream valleys. (a) IGS’s 1:24,000 surficial geology map delineations (see Table 1 for symbol legend) overlaid on the color coded Soil Survey based, 1:15,840 surficial geology map. (b) IGS’s 1:24,000 surficial geology map delineations overlaid on infrared orthophoto (Iowa Department of Natural Resources, 2002).
Table 2. Percentages of agreement for 100 random points in each quadrangle study area by three levels of agreement criteria.
Bennet Bluffton Bremer Burr OakCedar Bluff Decorah Freeport Highland Rochester Stanwood
Strict Agreement 92% 75% 71% 77% 73% 79% 70% 67% 86% 45%Not in Disagreement 92% 79% 84% 79% 88% 80% 72% 67% 88% 84%Acceptance of Scale 92% 80% 85% 79% 88% 80% 72% 67% 88% 87%
Table 3. Percentages of agreement for 100 random points in each county study area by three levels of agreement criteria.Boone Bremer Cedar Clay Dallas Hamilton Hancock Hardin Humboldt
Strict Agreement 90% 63% 69% 40% 94% 78% 68% 77% 86%Not in Disagreement 90% 94% 89% 90% 96% 78% 70% 82% 86%Acceptance of Scale 96% 96% 90% 92% 99% 87% 76% 94% 94%
Johnson Kossuth Osceola Polk Story Webster Winnebago WrightStrict Agreement 82% 74% 39% 88% 91% 86% 72% 72%Not in Disagreement 89% 75% 39% 90% 91% 86% 73% 74%Acceptance of Scale 90% 90% 39% 95% 93% 89% 84% 83%

Soil Horizons p. 10 of 12
with the loess grading downward to sand, loam, or silt loam alluvium. This description indicated zones of sand in close association with loess that could not be separately delineated in the map. Although areas smaller than the minimum legible mapping area may have provided some explanation, this effect would be more likely to reduce the amount of information in the IGS map due to the smaller cartographic scale. A better explanation would be the centrally managed map units for the Soil Survey, which may not have had a soil series that describes loess in these landscape positions.
Another common difference between the maps was the delinea-tion of alluvium further upstream on first order streams by the IGS. Although this could have been a disagreement between the maps, it also could have been reflecting the headward erosion of stream channels. However, our investigation of aerial photo-graphs taken sometime in the 1960s compared with those taken in 2002 did not show a clear progression in these areas. Instead, the images demonstrated an understandable difference in inter-pretation (Fig. 6 and 7). The channels gradually narrowed as gullies transitioned to rills. The mappers needed to make a deci-sion for where to place the boundary line for a feature that was not discrete and gradually decreasing below the minimum leg-ible size for the map. On a map with a smaller cartographic scale, it would be a sensible and common approach to slightly exag-gerate the size of small features when they are important to the purpose of the map.
The IGS 1:24,000 maps of northeastern Iowa commonly delin-eated bedrock in transitional areas between uplands and lowlands that are often not shown in the Soil Survey information (Fig. 7). While in our analysis these were regarded as disagree-ments, it is possible that these areas are loess-covered, in which case our conversion of the OSD to a single, surficial attribute would reflect only the loess. The interest of the IGS maps in the deeper profile could explain the additional delineations of shale, limestone, and/or dolomite, especially where they are only thinly mantled by loess.
The boundary between Clay County and O’Brien County dem-onstrated the evolution of understanding geologic history. Although an IGS surficial geology map was not available for O’Brien County, an important issue with the age of maps was illustrated by the two county Soil Survey maps. In Clay County, where the soil map was updated in 2002, the Moneta soil series was delineated on the side slopes of a river valley. There was a clear mapping discontinuity, as this valley crosses into O’Brien County where the side slopes were mapped as the Storden soil series (Fig. 7). The O’Brien County soil map was last updated in 1981. The identification of the two soils was an important distinc-tion for a surficial geology map because the OSD associated the Moneta soil with Sheldon Creek till (early Wisconsin) and the Storden soil with Dows till (Late Wisconsin). The description of a soil formed in Sheldon Creek till in Clay County reflected
the newer soil map and the more recent developments in under-standing the glacial history of this area. If these side slopes were investigated today, it is probable that they would be described as exposures of Sheldon Creek Till. For the user of a surficial geology map derived from the O’Brien County soil map, the description would still correctly identify a till of similar clay mineralogy (Quade et al., 2005b), but other properties such as the shale content and the timing of when the material was deposited during the Wisconsin glacial period would be different.
The surficial geology map based on the Soil Survey provides useful information where surficial geology maps are not avail-able or when additional spatial resolution is needed. This study cannot verify the additional information provided by the higher level of spatial detail included in the USDA-NRCS Soil Survey maps. While the two types of maps showed generally good agreement for the spatial distribution of surficial geologic mate-rials, the smaller cartographic scale maps cannot validate the additional details presented in the Soil Survey map. However, the Soil Survey maps were produced by a well-documented, systematic process, lending a certain degree of credibility to its spatial delineations. An example of additional detail available in the 1:15,840 Soil Survey map was the delineation between Dows till and alluvium derived from Dows till. This distinc-tion enabled the visualization of landform features on the Des Moines Lobe till plain by separating convex and concave parts of the landscape. When this level of detail was not wanted, the Dows till alluvium could be grouped with the Dows till for a simpler till plain map unit (compare Fig. 1 with Fig. 3 and 4).
Because the Soil Survey maps were not created with the direct intention of providing geologic information, some caution should be used when using them in a geologic context. When the Soil Survey based surficial geology map is used for additional resolution in an area that also has a surficial geology map avail-able at a smaller cartographic scale, the maps should be used in combination. Comparison of the two maps would provide an indication of where the confidence in the correct interpretation of the geologic material was either high or low. Using a Soil Survey based surficial geology map in an area where there is no other surficial geology map available could provide valuable infor-mation, but the user should be cognizant of the potential issues identified in this study. However, this problem could be negated by increased cooperation between the two map sources to pro-duce a more integrated system of maps.
It should also be remembered that derived maps carry the same limitations as their source maps. Users of 1:100,000 geologic maps, 1:24,000 geologic maps, and 1:15,840 Soil Survey maps are all cau-tioned by the respective publishers to avoid using these relatively small, cartographic scale maps when site specific detail is needed. While a surficial geology map derived from the Soil Survey can be an additional tool to understanding the landscape, it does not replace the need for more site specific investigation.

Soil Horizons p. 11 of 12
ConclusionsThe surficial geology maps derived from NRCS Soil Survey maps had generally good agreement with surficial geology maps pro-duced by the IGS. Accepting for non-contradictory descriptions, the 1:24,000 surficial geology maps agreed with the Soil Survey derived surficial geology maps, in total, 81% of the time. The 1:100,000 surficial geology maps required more acceptance of dif-ferences in cartographic scale for comparison with Soil Survey derived surficial geology maps. Accepting for non-contradic-tory descriptions and issues of scale, in total the two types of maps agreed 87% of the time. These high levels of agreement confirmed the assessments of earlier studies in different land-scapes that Soil Survey maps include information consistent with existing surficial geology maps, but at a higher spatial reso-lution (Evans, 2002; Lindholm, 1994a; Oehlke and Dolliver, 2011). However, caveats about differences in attribute resolution, partic-ularly for the soil maps not differentiating stratigraphic units of rock formations was also reaffirmed (Lindholm, 1994b).
For the landscapes examined in this study, the majority of the area was covered by transported regolith. This condition reduced the impact of the soil map’s limited differentiation of rock for-mations. Nonetheless, some landform regions had many more differences in geologic material descriptions than others. These differences were mostly related to locations that may or may not have a loess cover. Often the IGS map described a geologic mate-rial that the Soil Survey indicated was not at the surface, but buried by loess instead. Such differences could be explained by the IGS surficial geology maps focusing on the top 5 m and the Soil Survey focusing on the top 1.5 m or bioturbation obscuring the presence of the loess.
Given the general agreement of Soil Survey derived surficial geology maps with the available surficial geology maps, it is rea-sonable to use Soil Survey maps as preliminary surficial geology maps. Due to the large investment made by the Soil Survey to map the majority of the United States at large cartographic scales, the Soil Survey maps can provide valuable spatial detail about surficial geology. However, certain limitations should be kept in mind. Specifically the Soil Survey data is only reporting on the upper 1.5 m of material and does not investigate the geochronol-ogy or underlying rock type. Nonetheless, even though maps at different scales will still be needed, the similarities between the two maps suggest that soil mapping and surficial geology map-ping should no longer be considered separate endeavors.
ReferencesBernknopf, R.L., D.S. Brookshire, D.R. Soller, M.J. McKee, J.F. Sutter, J.C. Matti, and
R.H. Campbell. 1996. Societal value of geologic maps. USGS Circular 1111. USGS, Washington, DC.
Brevik, E.C., and T.E. Fenton. 1999. Improved mapping of the lake Agassiz Herman strandline by integrating geological and soil maps. J. Paleolimnol. 22:253–257. doi:10.1023/A:1008050510681
Bromley, M., and B.A. Miller. 2015. Soil mapping and maps. International Ency-clopedia of Geography. Association of American Geographers. Wiley, New York (In press.)
Effland, A.B.W., and W.R. Effland. 1992. Soil geomorphology studies in the U.S. soil survey program. Agric. Hist. 66:189–212.
Evans, R. 2002. The potential of soil survey data in a quantitative evaluation of surficial geology mapping in northern Maine. M.A. thesis. West Virginia Univ., Morgantown.
Eyles, N., and J. Menzies. 1983. The subglacial landsystem. In: N. Eyles, editor, Glacial geology—An introduction for engineers and earth scientists. Pergamon Press, Oxford. p. 19–70.
Iowa Department of Natural Resources. 2002. Color infrared digital orthophoto quads. http://ortho.gis.iastate.edu (accessed 3 Oct. 2011).
Juilleret, J., J.F. Iffly, L. Hoffmann, and C. Hissler. 2012. The potential of soil survey as a tool for surface geological mapping: A case study in a hydrological experimental catchment (Huewelerbach, Grand-Duchy of Luxembourg). Geo-logica Belgica 15(1–2):36–41.
Lindholm, R.C. 1993. Soil maps as an aid to making geologic maps with an exam-ple from the Culpeper basin, Virginia. J. Geol. Educ. 41(4):352–357.
Lindholm, R.C. 1994a. The value of soil maps to geologists: An acknowledgment. Soil Surv. Horiz. 35:40–48.
Lindholm, R.C. 1994b. Information derived from soil maps: Areal distribution of bedrock landslide distribution and slope steepness. Environ. Geol. 23:271–275.
Liu, H., R. McKay, J. Young, and S. Tassier-Surine. 2007. Surficial geology of the Burr Oak 7.5’ Quadrangle in Iowa. Iowa DNR, Geological Survey, Iowa City, IA. ftp://ftp.igsb.uiowa.edu/gis_library/projects/geology_statemap/quads/burr_oak/surficial_geology_burr_oak_quad.zip (accessed 2 Oct. 2011).
Luehmann, M.D., R.J. Schaetzl, B.A. Miller, and M.E. Bigsby. 2013. Thin, pedotur-bated, and locally sourced loess in the western Upper Peninsula of Michigan. Aeolian Res. 8:85–100. doi:10.1016/j.aeolia.2012.11.003
McKay, R., H.P. Liu, J. Young, and S. Tassier-Surine. 2007a. Surficial geology of the Freeport 7.5’ Quadrangle in Iowa. Iowa DNR, Geological Survey, Iowa City, IA. ftp://ftp.igsb.uiowa.edu/gis_library/projects/geology_statemap/quads/freeport/surficial_geology_freeport_quad.zip (Accessed 2 October 2011).
McKay, R., H. Liu, J. Young, and S. Tassier-Surine. 2007b. Surficial geology of the Highlandville 7.5’ Quadrangle in Iowa. Iowa DNR, Geological Survey. Iowa City, IA. ftp://ftp.igsb.uiowa.edu/gis_library/projects/geology_statemap/quads/highlandville/surficial_geology_highlandville_quad.zip (Accessed 2 October 2011).
Miller, B.A., C.L. Burras, and W.G. Crumpton. 2008. Using soil surveys to map Qua-ternary parent materials and landforms across the Des Moines Lobe of Iowa and Minnesota. Soil Surv. Horiz. 49(4):91–95.
Miller, B.A. 2012. The need to continue improving soil survey maps. Soil Horiz. 53(3). doi:10.2136/sh12-02-0005.
Muhs, D.R., and E.A. Bettis, III. 2000. Geochemical variations in Peoria Loess of western Iowa indicate paleowinds of midcontinental North America during last glaciation. Quat. Res. 53:49–61. doi:10.1006/qres.1999.2090
Oehlke, B.M., and H.A.S. Dolliver. 2011. Quaternary Glacial Mapping in Western Wisconsin Using Soil Survey Information. J. Nat. Resour. Life Sci. Educ. 40:73–77. doi:10.4195/jnrlse.2011.0002se
Prior, J.C. 1991. Landforms of Iowa. University of Iowa Press, Iowa City, IA.Quade, D.J. 2005a. Surficial geology of Boone County, Iowa. Iowa DNR, Geo-
logical Survey, Iowa City, IA. ftp://ftp.igsb.uiowa.edu/gis_library/counties/boone/surficial_geology_08.zip (accessed 2 Oct. 2011).
Quade, D.J. 2005b. Surficial geology of Dallas County, Iowa. Iowa DNR, Geo-logical Survey, Iowa City, IA. ftp://ftp.igsb.uiowa.edu/gis_library/counties/dallas/surficial_geology_25.zip (accessed 2 Oct. 2011).
Quade, D.J. 2005c. Surficial geology of Hamilton County, Iowa. Iowa DNR, Geo-logical Survey, Iowa City, IA. ftp://ftp.igsb.uiowa.edu/gis_library/counties/hamilton/surficial_geology_40.zip (accessed 2 Oct. 2011).
Quade, D.J. 2005d. Surficial geology of Hancock County, Iowa. Iowa DNR, Geo-logical Survey, Iowa City, IA. ftp://ftp.igsb.uiowa.edu/GIS_Library/Counties/hancock/surficial_geology_41.zip (accessed 2 Oct. 2011).
Quade, D.J. 2005e. Surficial geology of Humboldt County, Iowa. Iowa DNR, Geo-logical Survey, Iowa City, IA. ftp://ftp.igsb.uiowa.edu/gis_library/counties/humboldt/surficial_geology_46.zip (accessed 2 Oct. 2011).

Soil Horizons p. 12 of 12
Quade, D.J. 2005f. Surficial geology of Kossuth County, Iowa. Iowa DNR, Geo-logical Survey, Iowa City, IA. ftp://ftp.igsb.uiowa.edu/gis_library/counties/kossuth/surficial_geology_55.zip (accessed 2 Oct. 2011).
Quade, D.J. 2005g. Surficial geology of Story County, Iowa. Iowa DNR, Geologi-cal Survey, Iowa City, IA. ftp://ftp.igsb.uiowa.edu/gis_library/counties/story/surficial_geology_85.zip (accessed 2 Oct. 2011).
Quade, D.J. 2005h. Surficial geology of Webster County, Iowa. Iowa DNR, Geo-logical Survey, Iowa City, IA. ftp://ftp.igsb.uiowa.edu/gis_library/counties/webster/surficial_geology_94.zip (accessed 2 Oct. 2011).
Quade, D.J. 2005i. Surficial geology of Winnebago County, Iowa. Iowa DNR, Geological Survey, Iowa City, IA. ftp://ftp.igsb.uiowa.edu/gis_library/coun-ties/winnebago/surficial_geology_95.zip (accessed 2 Oct. 2011).
Quade, D.J. 2005j. Surficial geology of Wright County, Iowa. Iowa DNR, Geo-logical Survey, Iowa City, IA. ftp://ftp.igsb.uiowa.edu/gis_library/counties/wright/surficial_geology_99.zip (accessed 2 Oct. 2011).
Quade, D.J. 2011. Surficial geology of Polk County, Iowa. Iowa DNR, Geological Survey, Iowa City, IA. ftp://ftp.igsb.uiowa.edu/gis_library/counties/polk/sur-ficial_geology_77.zip (accessed 2 October 2011).
Quade, D.J., and J.D. Giglierano. 2006. Surficial geology of Hardin County, Iowa. Iowa DNR, Geological Survey, Iowa City, IA. ftp://ftp.igsb.uiowa.edu/gis_library/counties/hardin/surficial_geology_42.zip (Accessed 2 Oct. 2011)
Quade, D.J., J.D. Giglierano, E.A. Bettis, III, and R.J. Wisner. 2005a. Surficial geo-logic map of the Des Moines Lobe of Iowa, Phase 7: Clay and Osceola Coun-ties. Iowa DNR, Geological Survey, Iowa City, IA. ftp://ftp.igsb.uiowa.edu/igspubs/pdf/ofm-2005-2_txt.pdf (accessed 2 Oct. 2011).
Quade, D.J., J.D. Giglierano, and E.A. Bettis, III. 2005b. Surficial geology of Clay County, Iowa. Iowa DNR, Geological Survey, Iowa City, IA. ftp://ftp.igsb.uiowa.edu/gis_library/counties/clay/surficial_geology_21.zip (accessed 2 Oct. 2011).
Quade, D.J., J.D. Giglierano, and E.A. Bettis, III. 2005c. Surficial geology of Osceola County, Iowa. Iowa DNR, Geological Survey, Iowa City, IA. ftp://ftp.igsb.uiowa.edu/gis_library/counties/osceola/surficial_geology_72.zip (accessed 2 Oct. 2011).
Quade, D.J., J.D. Giglierano, E.A. Bettis, III, and R.J. Wisner. 2001. Overview of the surficial geologic map of the Des Moines Lobe of Iowa, Phase 3: Boone and Story counties, scale 1:100,000. Iowa DNR, Geological Survey, Iowa City, IA. ftp://ftp.igsb.uiowa.edu/igspubs/pdf/ofm-2001-1.pdf (accessed 2 Oct. 2011).
Quade, D.J., J.D. Giglierano, E.A. Bettis, III, and R.J. Wisner. 2002. Surficial geo-logic map of the Des Moines Lobe of Iowa, Phase 4: Humboldt County. Iowa DNR, Geological Survey, Iowa City, IA. ftp://ftp.igsb.uiowa.edu/igspubs/pdf/ofm-2002-3_txt.pdf (accessed 2 Oct. 2011).
Quade, D.J., S. Tassier-Surine, J.D. Giglierano, and E.A. Bettis, III. 2011. Surficial geology of Cedar County, Iowa. Iowa DNR, Geological Survey, Iowa City, IA. ftp://ftp.igsb.uiowa.edu/gis_library/counties/cedar/surficial_geology_16.zip (accessed 2 Oct. 2011).
Robinson, A.H., J.L. Morrison, P.C. Muehrcke, A.J. Kimerling, and S.C. Guptill. 1995. Elements of cartography. 6th ed. John Wiley & Sons, New York.
Ruhe, R.V. 1969. Quaternary landscapes in Iowa. Iowa State Univ. Press, Ames, Iowa.
Schaetzl, R.J., and J.W. Attig. 2013. The loess cover of northeastern Wisconsin. Quat. Res. 79:199–214. doi:10.1016/j.yqres.2012.12.004
Schaetzl, R.J., and B.N. Weisenborn. 2004. The Grayling Fingers region of Michi-gan: Soils, sedimentology, stratigraphy and geomorphic development. Geo-morphology 61:251–274. doi:10.1016/j.geomorph.2004.01.002
Schaetzl, R.J., F.J. Krist, Jr., P.R. Rindfleisch, J. Liebens, and T.E. Williams. 2000. Postglacial landscape evolution of northeastern lower Michigan, inter-preted from soils and sediments. Ann. Assoc. Am. Geogr. 90(3):443–466. doi:10.1111/0004-5608.00204
Schoeneberger, P.J., D.A. Wysocki, and E.C. Benham, and Soil Survey Staff. 2012. Field book for describing and sampling soils. Version 3.0. USDA-NRCS, Lincoln, NE.
Simonson, R.W. 1952. Lessons from the first half century of soil survey: II. mapping of soils. Soil Sci. 74:323–330. doi:10.1097/00010694-195210000-00009
Soil Survey Staff. 1993. Soil survey manual. Soil Conservation Service. US Dep. Agric. Handb. 18. US Gov. Print. Office, Washington, DC.
Soil Survey Staff. 2011a. Official Soil Series Descriptions (OSD). USDA-NRCS. http://soils.usda.gov/technical/classification/osd/ (accessed May 2011).
Soil Survey Staff. 2011b. Soil Survey Geographic (SSURGO). USDA-NRCS. http://soildatamart.nrcs.usda.gov (accessed 28 Apr. 2011).
Soil Survey Staff. 2014. Gridded Soil Survey Geographic (gSSURGO). USDA-NRCS. http://datagateway.nrcs.usda.gov (accessed 28 Aug. 2014).
Sugden, D.E., and B.S. John. 1976. Glaciers and landscape: A geomorphological approach. John Wiley & Sons, New York.
Tassier-Surine, S., D.J. Quade, J.D. Giglierano, and E.A. Bettis, III. 2007a. Surfi-cial geology of the Bremer 7.5’ Quadrangle in Iowa. Iowa DNR, Geological Survey. Iowa City, IA. ftp://ftp.igsb.uiowa.edu/gis_library/projects/geol-ogy_statemap/quads/bremer/surficial_geology_bremer_quad.zip (accessed 2 Oct. 2011).
Tassier-Surine, S., D.J. Quade, R. McKay, and P. Liu. 2007b. Surficial geology of the Bennett 7.5’ Quadrangle in Iowa. Iowa DNR, Geological Survey, Iowa City, IA. ftp://ftp.igsb.uiowa.edu/gis_library/projects/geology_statemap/quads/bennett/surficial_geology_bennett_quad.zip (accessed 2 Oct. 2011).
Tassier-Surine, S., R. McKay, H.P. Liu, J. Young, and J. Giglierano. 2007c. Surfi-cial geology of the Bluffton 7.5’ Quadrangle in Iowa. Iowa DNR, Geological Survey, Iowa City, IA. ftp://ftp.igsb.uiowa.edu/gis_library/projects/geology_statemap/quads/bluffton/surficial_geology_bluffton_quad.zip (accessed 2 Oct. 2011).
Tassier-Surine, S., D.J. Quade, J.D. Giglierano, and E.A. Bettis, III. 2007d. Surficial geology of the Cedar Bluff 7.5’ Quadrangle in Iowa. Iowa DNR, Geologi-cal Survey, Iowa City, IA. ftp://ftp.igsb.uiowa.edu/gis_library/projects/geol-ogy_statemap/quads/cedar_bluff/surficial_geology_cedar_bluff_quad.zip (accessed 2 Oct. 2011).
Tassier-Surine, S., G. Ludvigson, B. Witzke, J. Young, R. Anderson, R. McKay, P. Liu, B. Bunker, and D. Pals. 2007e. Geologic mapping of the Upper Iowa River Water-shed: Phase 1: Decorah 7.5’ Quadrangle. Iowa DNR, Geological Survey, Iowa City, IA. ftp://ftp.igsb.uiowa.edu/gis_library/projects/geology_statemap/quads/decorah/surficial_geology_decorah_quad.zip (accessed 2 Oct. 2011).
Tassier-Surine, S., D.J. Quade, R. McKay, and P. Liu. 2007f. Surficial geology of the Rochester 7.5’ Quadrangle in Iowa. Iowa DNR, Geological Survey, Iowa City, Iowa. ftp://ftp.igsb.uiowa.edu/gis_library/projects/geology_statemap/quads/rochester/surficial_geology_rochester_quad.zip (accessed 2 Oct. 2011).
Tassier-Surine, S., D.J. Quade, J.D. Giglierano, and E.A. Bettis, III. 2007g. Surficial geology of the Stanwood 7.5’ Quadrangle in Iowa, Iowa DNR, Geological Survey, Iowa City, IA. ftp://ftp.igsb.uiowa.edu/gis_library/projects/geology_statemap/quads/stanwood/surficial_geology_stanwood_quad.zip (accessed 2 Oct. 2011).
Tassier-Surine, S., D. Quade, H. Liu, R. McKay, and J. Giglierano. 2011a. Surficial geology of Bremer County, Iowa. Iowa DNR, Geological Survey, Iowa City, Iowa. ftp://ftp.igsb.uiowa.edu/gis_library/counties/bremer/surficial_geol-ogy_09.zip (accessed 2 Oct. 2011).
Tassier-Surine, S.A., J.J. Krieg, D.J. Quade, E.A. Bettis, III, J.A. Artz, and J.D. Gigli-erano. 2011b. Surficial geology of Johnson County Iowa. Iowa Geological and Water Survey, DNR, Iowa City, IA. ftp://ftp.igsb.uiowa.edu/gis_library/coun-ties/johnson/surficial_geology_52.zip (accessed 2 Oct. 2011).
USGS. 2014. National geologic map database. http://ngmdb.usgs.gov/ngmdb/ngm_quicksearch.html (accessed 6 May 2014).
Vader, M.J., B.K. Zeman, R.J. Schaetzl, K.L. Anderson, R.W. Walquist, K.M. Frei-berger, J.A. Emmendorfer, and H. Wang. 2012. Proxy evidence for easterly winds in glacial Lake Algonquin, from the Black River delta in northern Lower Michigan. Phys. Geogr. 33(3):252–268. doi:10.2747/0272-3646.33.3.252
Wysocki, D.A., P.J. Schoeneberger, D.R. Hirmas, and H.E. LaGarry. 2012. Geo-morphology of soil landscapes. In: P.M. Huang, Y. Li, and M.E. Sumner, editors, Handbook of soil science. 2nd ed. CRC Press, New York. p. 29-1–29-26.
Wysocki, D.A., P.J. Schoeneberger, and H.E. LaGarry. 2005. Soil surveys: A window to the subsurface. Geoderma 126:167–180. doi:10.1016/j.geoderma.2004.11.012


