Embed Size (px)
Citation preview
Journal of Constructional Steel Research 62 (2006) 168–177
www.elsevier.com/locate/jcsr
of theirof extensiveinet analysesalingatisticallyh theheoreticall fatigue
Fatigue life of girders with undulating webs
J. Machacek∗, M. Tuma
Czech Technical University in Prague, Faculty of Civil Engineering, Thakurova 7, Prague, Czech Republic
Received 13 December 2004; accepted 13 April 2005
Abstract
Steel girders with sinusoidally predeformed webs, commonly used in Central Europe and elsewhere, are described. A reviewstatic and fatigue resistance, based on tests and theoretical analyses performed at CTU in Prague, is presented. First, resultsstatic tests with local patch loading are given. The tests were statistically evaluated in accordance with Annex Z of Eurocode 3, to determcharacteristic and design resistance values. The results were verified using geometrically and materially non-linear finite elemenaccounting for imperfections, and supplemented with parametrical studies. The main part of the paper reports on a vast number of tests dewith the fatigue of undulating webs under cyclic shear and cyclic steady local patch loading. The results are summarised and stevaluated into fatigue curves in compliance with Eurocode 3. Finally, tests simulating moving local crane loads are described, for whiccyclic and moving strain patterns in the undulating web were achieved through a special testing rig. Evaluation of these tests and tanalysis of local yielding were performed using ANSYS software. Finally, some recommendations are presented for the practicadesign of girders with undulating webs.© 2005 Elsevier Ltd. All rights reserved.
Keywords: Cyclic loading; Fatigue; Local loading; Moving loading; Shear loading; Statistical evaluation; Undulating web
e
duetictheorthellyanders.inn,
nde
466.
.
le
ingdartersedame–600aveserses
e-
1. Introduction
Girders with predeformed web plates enable the usof extremely thin webs (with slendernesshw/tw up to600) without a significant reduction of shear resistanceto buckling, resulting in economical and usually aestheelements in modern steel structures. The shape ofweb folding may be trapezoidal, rectangular, triangularundulating, with the waves running in the transverse orlongitudinal direction. In Sweden, girders with trapezoidaprofiled webs have been used since the mid-sixties,gradually became common especially as roof girdLight girders with longitudinal waves were developedFrance during the eighties. While effective for productioconnections to flanges via angles and also stiffeners ulocal loading were necessary [1]. In Central Europe, theWT (Wellstegträger) girders developed by Zeman+ Co
∗ Corresponding author. Tel.: +420 224 354 916; fax: +420 233 337E-mail address: [email protected] (J. Machacek).
0143-974X/$ - see front matter © 2005 Elsevier Ltd. All rights reserveddoi:10.1016/j.jcsr.2005.04.018
r
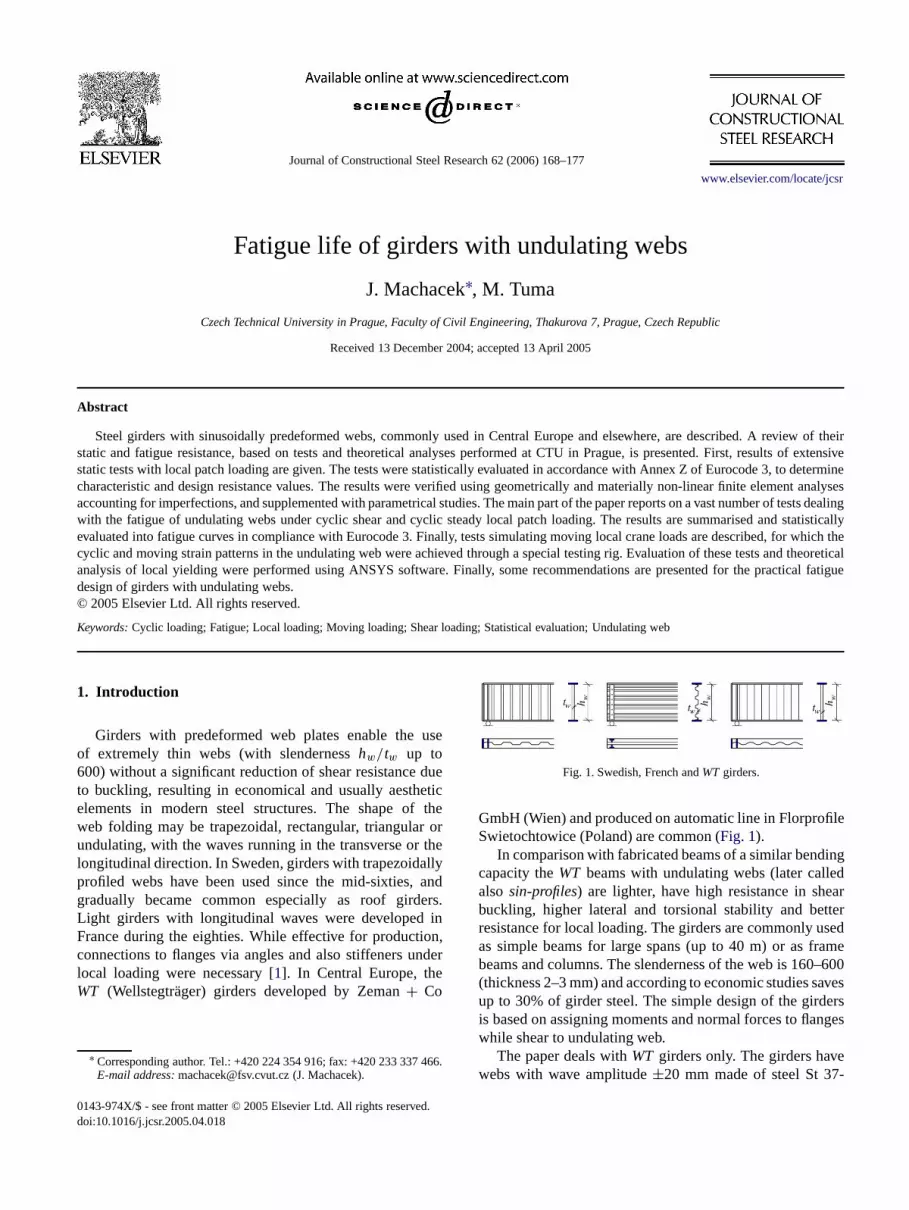
Fig. 1. Swedish, French andWT girders.
GmbH (Wien) and produced on automatic line in FlorprofiSwietochtowice (Poland) are common (Fig. 1).
In comparison with fabricated beams of a similar bendcapacity theWT beams with undulating webs (later callealso sin-profiles) are lighter, have high resistance in shebuckling, higher lateral and torsional stability and betresistance for local loading. The girders are commonly uas simple beams for large spans (up to 40 m) or as frbeams and columns. The slenderness of the web is 160(thickness 2–3 mm) and according to economic studies sup to 30% of girder steel. The simple design of the girdis based on assigning moments and normal forces to flangwhile shear to undulating web.
The paper deals withWT girders only. The girders havwebs with wave amplitude±20 mm made of steel St 37

J. Machacek, M. Tuma / Journal of Constructional Steel Research 62 (2006) 168–177 169
fssu
thece
an
by
wo
untaueibe
tos)ak
inasofvebes,on-ranleeebeslged
e
Fig. 2.WT girders.
Fig. 3. Experimental investigation ofWT girders under local loading.
2G ( fy = 215 N/mm2), single-sided fillet welds that are ogood quality and taking into account small web thickne(2–3 mm) they may be considered as butt welds withowelded root. Three series ofWT girders are produced:WTAwith web thicknesstw = 2 mm,WTB with tw = 2.5 mm,and WTC with tw = 3 mm. The depth ofthe girdersis hw = 500–1500 mm,Fig. 2. The moment and shearresistance of the girders under static loading is given indesign manual [2], based on full web plastic shear resistanfor all producedWT girders without any reduction due toshear buckling as resulted from research by PasternakBranka [3].
Considering a good transverse support of a flangethe web an idea to use thesegirders as crane runwaybeams for light overhead travelling cranes emerged. Tproblems were envisaged for such use, i.e. elastic and plasticdesign resistance of webs under local loading and fatigresistance of the girders. The corresponding experimeand theoretical investigation performed at CTU in Pragin recent years and the most important results are descrbelow.
2. Resistance of undulating webs under steady local orpatch loading
Local resistance under patch loading correspondingplastic crippling of the web was experimentally (27 testand theoretically investigated in the late nineties by Novand Machacek [4], Figs. 3and4.
t
d
el
d
Fig. 4. Theoretical analysis ofWT girders under local loading.
Fig. 5. Influence of support on local resistance ofWT girders.
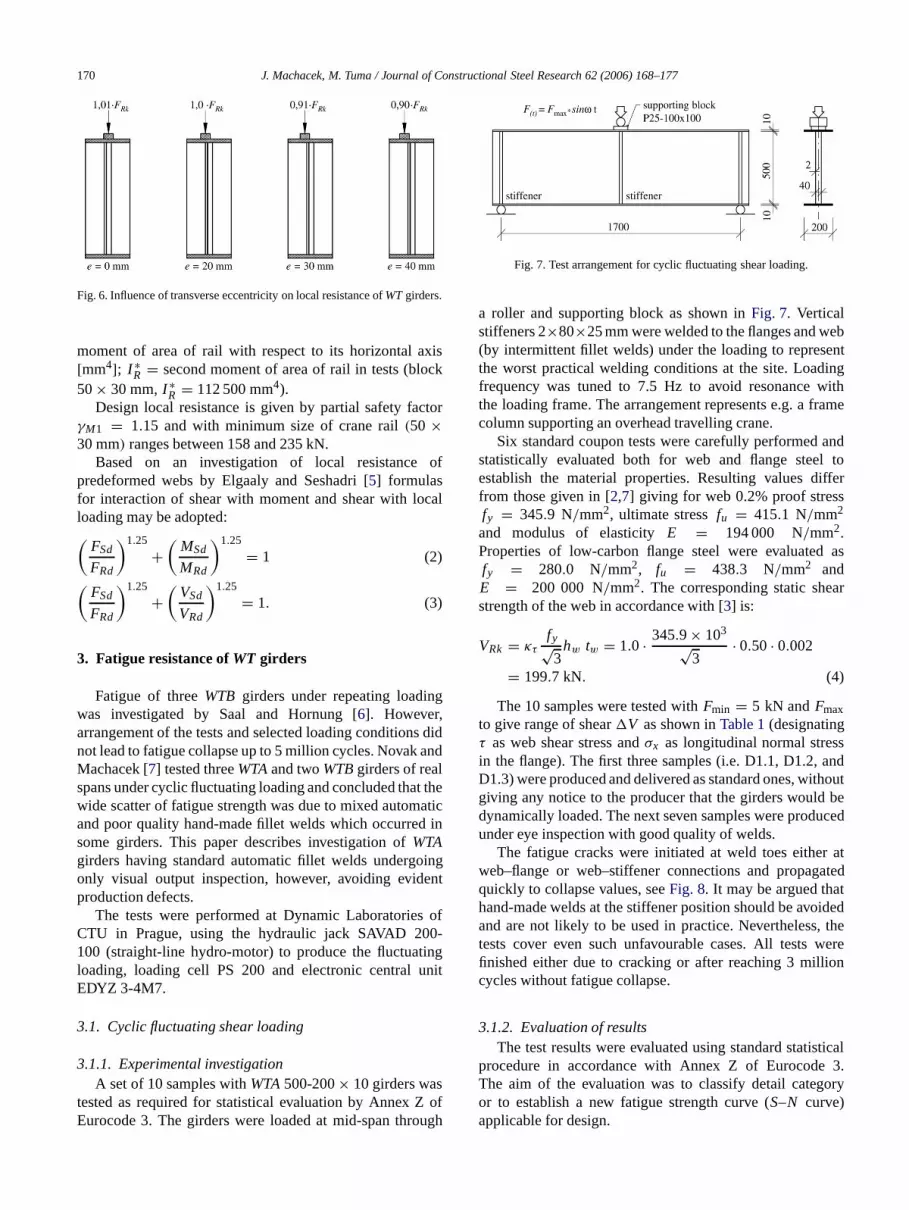
The experimental results were statistically evaluatedaccordance with Annex Z of Eurocode 3. Loading wrealized as “knife loading” via an unfastened crane railheight 30 mm with transverse eccentricity within web waamplitude, i.e.±20 mm. Therefore, characteristic local weresistance was derived as 5% fractile of experimental valudepending on thickness of web and flange. Numerical nlinear GMNIA (geometrically and materially non-lineaanalysis with imperfections) FEM analysis enabledadditional check of the proposed formulas for the whoproduced range ofWT girders. The influence of transverseccentricity and direct support on the other edge of the wwas investigated in a parametrical study, resulting in valupresented inFigs. 5and6. Both theoretical and experimentaresults confirmed that local resistance remains unchanwith eccentricity of the loadingkeeping within the web waveamplitude, i.e.e ≤ 20 mm. The resistance in [kN] finallyreads:
FRk = (78.9 tw + 3.2 t f − 14.7) · 3
√I f + IR
I f + I ∗R
≤ 270· 3
√I f + IR
I f + I ∗R
. (1)
wheretw = web thickness (2–3) [mm];t f = flange thickness(12–30) [mm];I f = second moment of area of loaded flangwith respect to its horizontal axis[mm4]; IR = second
170 J. Machacek, M. Tuma / Journal of Constructional Steel Research 62 (2006) 168–177
ck
tor
f
l
g
s dind
theicin
ingnt
of-
ingit
fugh
ebentingith
e
ndoiffer
as
ar
s
houtbe
uced
r atted
tidedthe
wereon
tical3.
ory
Fig. 6. Influence of transverse eccentricity on local resistance ofWT girders.
moment of area of rail withrespect toits horizontal axis[mm4]; I ∗
R = second moment of area of rail in tests (blo50× 30 mm,I ∗
R = 112 500 mm4).Design local resistance is given by partial safety fac
γM1 = 1.15 and with minimum size of crane rail (50 ×30 mm) ranges between 158 and 235 kN.
Based on an investigation of local resistance opredeformed webs by Elgaaly and Seshadri [5] formulasfor interaction of shear withmoment and shear with localoading may be adopted:(
FSd
FRd
)1.25
+(
MSd
MRd
)1.25
= 1 (2)
(FSd
FRd
)1.25
+(
VSd
VRd
)1.25
= 1. (3)
3. Fatigue resistance of WT girders
Fatigue of threeWTB girders under repeating loadinwas investigated by Saal and Hornung [6]. However,arrangement of the tests and selected loading conditionnotlead to fatigue collapse up to 5 million cycles. Novak aMachacek [7] tested threeWTA and twoWTB girders of realspans under cyclic fluctuating loading and concluded thatwide scatter of fatigue strength was due to mixed automatand poor quality hand-made fillet welds which occurredsome girders. This paper describes investigation ofWTAgirders having standard automatic fillet welds undergoonly visual output inspection, however, avoiding evideproduction defects.
The tests were performed at Dynamic LaboratoriesCTU in Prague, using the hydraulic jack SAVAD 200100 (straight-line hydro-motor) to produce the fluctuatloading, loading cell PS 200and electronic central unEDYZ 3-4M7.
3.1. Cyclic fluctuating shear loading
3.1.1. Experimental investigationA set of10 samples withWTA 500-200× 10 girders was
tested as required for statistical evaluation by Annex Z oEurocode 3. The girders were loaded at mid-span thro
d
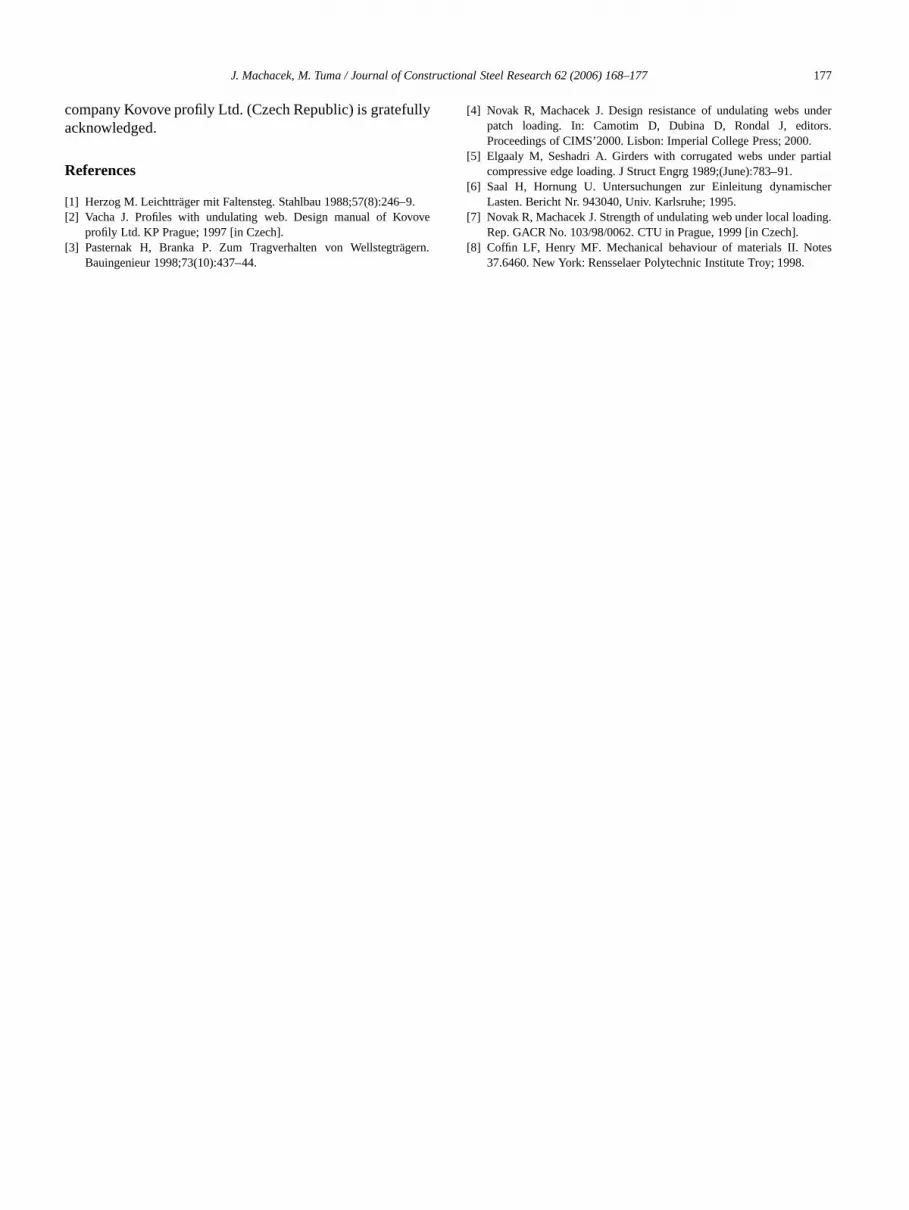
Fig. 7. Test arrangement for cyclic fluctuating shear loading.
a roller and supporting block as shown inFig. 7. Verticalstiffeners 2×80×25 mm were welded to the flanges and w(by intermittent fillet welds) under the loading to represthe worst practical welding conditions at the site. Loadfrequency was tuned to 7.5 Hz to avoid resonance wthe loading frame. The arrangementrepresents e.g. a framcolumn supporting an overhead travelling crane.
Six standard coupon tests were carefully performed astatistically evaluatedboth for web and flange steel testablish the material properties. Resulting values dfrom those given in [2,7] giving for web 0.2% proofstressfy = 345.9 N/mm2, ultimate stressfu = 415.1 N/mm2
and modulus of elasticityE = 194 000 N/mm2.Properties of low-carbon flange steel were evaluatedfy = 280.0 N/mm2, fu = 438.3 N/mm2 andE = 200 000 N/mm2. The corresponding static shestrength of the web in accordance with [3] is:
VRk = κτ
fy√3
hw tw = 1.0 · 345.9× 103
√3
· 0.50 · 0.002
= 199.7 kN. (4)
The 10 samples were tested withFmin = 5 kN andFmaxto give range of shear�V as shown inTable 1(designatingτ as web shear stress andσx as longitudinal normal stresin the flange). The first three samples (i.e. D1.1, D1.2, andD1.3) were produced and delivered as standard ones, witgiving any notice to the producer that the girders woulddynamically loaded. The next seven samples were produnder eye inspection with good quality of welds.
The fatigue cracks were initiated at weld toes eitheweb–flange or web–stiffener connections and propagaquickly to collapse values, seeFig. 8. It may be argued thahand-made welds at the stiffener position should be avoand are not likely to be used in practice. Nevertheless,tests cover even such unfavourable cases. All testsfinished either due to cracking or after reaching 3 millicycles without fatigue collapse.
3.1.2. Evaluation of resultsThe test results were evaluated using standard statis
procedure in accordance with Annex Z of EurocodeThe aim of the evaluation was to classify detail categor to establish a new fatigue strength curve (S–N curve)applicable for design.

J. Machacek, M. Tuma / Journal of Constructional Steel Research 62 (2006) 168–177 171
Table 1Fatigue under shear loading
Test V (kN) �τ (MPa) N (cycles) σmaxx (MPa) Position of cracks
D1.1 50 50 2110 790 44.1 Upper flange–web weld toeD1.2 50 50 1419 150 44.1 Bottom flange–web weld toeD1.3 50 50 774 000 44.1 Upper flange–web weld toeD1.4 50 50 3072 300 44.1 Without any cracksD2.1 30 30 3033 820 26.5 Without any cracksD3.1 40 40 3069 930 35.3 Without any cracksD4.1 45 45 3022 900 39.7 Without any cracksD5.1 60 60 980 000 52.9 Stiffener–web weld toeD5.2 60 60 1473 690 52.9 Stiffener–web weld toeD5.3 60 60 2715 610 52.9 Stiffener–web weld toe
filed
hgueof
in
hehe
ntts
e
al
r
gues
tallyithate,
Fig. 8. Fatigue cracks under cyclic shear loading.
The design function of fatigue shear range�τ was takenin accordance with recommendations of Eurocode 3:
rt = �τ = m
√a
N. (5)
The tests ofTable 1 were evaluated with the help oregression analysis, taking the stress range of non-fasamples D2.1 and D3.1 the same as for D4.1, i.e. �τ =45 N/mm2 (as thecut-off limit). Resulting values are:
a = 2.71× 10²², slope constantm = 9.45. (6)
The detail category designating the respective strengtcurve corresponds to the reference value of the fatistrength at 2× 10⁶ cycles. The experimental mean valuethis strength is:
�τC =(
2 × 10⁶
a
)− 1m
= 51.03 N/mm2. (7)
In accordance with the procedure given minutelyAnnex Z of Eurocode 3 the following Eqs. (8)–(12) leadto the characteristic detail category (corresponding to t5% fractile of experimental results). The mean value of tcorrection factor isb = 1.005 and for the error termsδi , themean value of∆i = ln δi and standard deviation follows:
δi = rei
brt i, ∆ = 1, sδ = 0.109. (8)
Coefficient of variationVδ is given by
Vδ =√
es2δ − 1 = 0.109. (9)
Fig. 9. Experimental and recommended shear fatigue curves log�τ– logN .
Variation coefficient of number of cyclesVrt = 0,thereforeVr = Vδ. The standard deviation of the logarithmof functionr is given by
Q = σln(r) =√
ln(V 2r + 1) = Qδ = σln(δ)
=√
ln(V 2δ + 1) = 0.109. (10)
Af ter taking the limited number of tests into accou(i = 10) the weighting factors and 5% fractile coefficien(with level of confidence of 0.75) are
αrt = 0, αδ = 1, uk,n = 1.92. (11)
The coefficientc of the characteristic strength valuconcerning the detail category follows eventually from:
c = e−1.64αrt Qrt −uk,nαδ Qδ−0.5Q2 = 0.807. (12)
The resulting detail category DC from the statisticevaluation is therefore DC = c�τC = 0.807× 51.03 =41.2. Therefore, for design ofWT girders under shealoading the non-standard fatigue curve 40 (with slopem =9.445) may be recommended. The corresponding faticurves are shown inFig. 9 (extrapolation of the curveabove 3× 10⁶ cycles and cut-off limit at 108 cycles followsEurocode 3 recommendation and was not experimenvalidated). The design curve may be compared wEurocode recommendation for a one-side welded pl

172 J. Machacek, M. Tuma / Journal of Constructional Steel Research 62 (2006) 168–177
Table 2Fatigue under local loading
Test �F (kN) Position of loading N (cycles) σmaxx (MPa) Position of cracks
E1 120 W 31 550 26.0 At weld toeE2 60 A 3054 980 13.5 No cracksE3 80 W 3059 670 17.7 No cracksE4 100 A 512 420 21.9 7 mm beneath weld toeE5 90 W 939 570 19.8 At weld toeE10 90 A 1123 860 19.8 3 mm beneath weld toeE11 100 W 3028 840 21.9 No cracksE12 110 A 238 190 24.0 3 mm beneath weld toeE13 70 W 3047 970 15.6 No cracksE14 100 A 165 810 21.9 5 mm beneath weld toe
rs,
uching
gth
ty.earderll
dilyeir
n of
ofing
ueresed.iveainseir
entsleeact
e,s
00
Fig. 10. Test arrangement for local loading.
where standard category 100 for web without stiffenecategory 80 for vertical stiffeners and category 36∗ for weldsare prescribed.
3.2. Cyclic fluctuating local loading
3.2.1. Experimental investigationIn this case the knife type loading via a roller was applied
through a fastened rail block of 50× 30 mm, where 30 mmheight represented an extremely worn-out crane rail,Fig. 10.The position of the loading was, however, stable and as sdid not fully represent a moving crane wheel with changlocal shear stresses. The loading frequency for local loadingwas tuned to 8.5 Hz. The corresponding static local strenin accordance with Eq. (1) wasFRk = 175.1 kN.
Ten samples were tested withFmin = 5 kN and Fmaxto give range of loading�F as shown inTable 2. Fatiguecracks were initiated either at the weld toe or in its viciniIn contrast to steady propagation of cracks under shloading leading to quick fatigue collapse the cracks unlocal fixed cyclic loading were not so catastrophic. Apropagated in a horizontal direction, some of them steain one direction and another in both directions, stopping thpropagation after enlargingits original length approximately50%, seeFig. 11.
The tests were terminated after reasonable evolutiothe cracking or after reaching 3 million cycles withoutfatigue failure. Thenumber of cycles inTable 2corresponds
Fig. 11. Fatigue cracks under local loading and their propagation.
to first visible emergence of the cracks. The third columnthe table shows the longitudinal position of the knife load(A—at amplitude of the web wave, W—within the wave, inboth cases with eccentricity 20 mm, seeFig. 10).
3.2.2. Theoretical analysisGMNIA FEM analysis similar to the one described
in Section 2 was needed to evaluate elastic and fatigbehaviour under the local loading. The ANSYS softwapackage and Newton–Raphson iteration method were uThe aim of the analysis was to find the elastic effectlength of the web under local loading and stresses and strat “hot spots”, i.e. at points along the weld toe, where thvaluesσz , εpl in the vertical direction are maximal.
One half of the WT girder was analysed withrespect to overall symmetry as shown in Fig. 12. Weband flanges were modelled using isoparametric elemSHELL 43 (elastic–plastic large-deflection elements), whirail elementsSOLID 45 (with the same capabilities) werconnected with the upper flange via non-linear contelementsCONTAC 52. Initial imperfections of the webswere introduced according to linear critical buckling modwith amplitude of deflection 1 mm. The model wacalibrated by Novak and Machacek [4] against experimentalresults with excellent agreement. In total approx. 17elements were employed and “knife loading” was introducedat the upper rail element central nodes.
Trilinear stress–strain curves for web (E = 194 000N/mm2, Et1 = 0.02E = 3900 N/mm2, Et2 =100 N/mm2) and bilinear one (E = 200 000 N/mm2,

J. Machacek, M. Tuma / Journal of Constructional Steel Research 62 (2006) 168–177 173
Fig. 12. FEM modelling. Vertical stress forF = 90 kN (arrangement accord.Fig. 10).
al
d
cal
sessA”er.5
ailstediveingrea
h
,
out
st ofg
sses
rering.the
ionsne
lic
fortic
lsog
Fig. 13. Stress–strain curves from coupon tests and those for theoreticanalysis.
Et = 100 N/mm2) for other parts were used with yield anultimate values( fy, fu) as given inSection 3.1, seeFig. 13.
To determine the effective length of the web under loloading the girders were analysed with variouslongitudinalpositions of local “knife” loading keeping the transvereccentricitye = 20 mm. The one giving the maximum strewas found at the amplitude of the web wave (position “in Table 2). Extensive parametrical study of girders undsuch loading for all produced thicknesses of web (2, 2and 3 mm) and flange (10–35 mm) and six types of r(varying their height between 30 and 70 mm) was evaluaby regression analysis, leading to a formula for effectlength of the web loaded through a crane rail, substitutthe real stress distribution for the maximum one over atw × leff:
leff.2 = −32.5+ 1.1953√
IR + 6.45t f [mm] (13)
leff = leff.2e−0.1865(tw−2) [mm]. (14)
Eq. (13) represents the value of effective length for web wittw = 2 mm and Eq. (14) the correction for thicknesstw =2.5 or 3 mm. Correlation indexes of the formulas withinthe range of all producedWT girders are 0.985 and 0.997respectively (with the greatest difference fortw = 2 mm,reaching 7% on the safe side). In the case of a girder with
Fig. 14. Vertical stressσz for girderWTA 500-200× 25 with rail 50× 30.
rail (IR = 0) the formula is perfectly correct fort f ≥20 mm, otherwise rather conservative (e.g. fort f = 10 mmthe correct numerical value isleff.2 = 50.0 mm).
Noteworthy is the distribution of vertical stressσz alongthe flange–web weld root,Fig. 14. The eccentric loading ilocated directly above the web (shown in the upper parthe picture). Compression stresses develop at the loadinposition and adjacent vertexes of waves while tensile streat the averted ones.
Fatigue cracks described inTable 2grew in parts undethe loading, which were nominally in compression, howevin the area affected by residual stresses due to weldThe above presented theoretical analysis (not takingresidual stresses into account) proved plasticity regunder loading. The values of total and plastic mid-plastrains (in vertical directionz) at the top of the web aregiven inTable 3for both the first reach ofFmax (i.e. after halfcycle of loading) and during the second loading cycle (cycrange),Fig. 15. It is obvious that cyclic plastic strains werelow.
Considering vertical stress and strain as basic valuesevaluation of fatigue under local loading, the fictitious elasstress ranges�σel corresponding to the value of�F andcalculated by LA (linear elastic) FEM analysis are apresented inTable 3, together with other values resultinfrom Eq. (15) employing effective length given by Eq. (14)

174 J. Machacek, M. Tuma / Journal of Constructional Steel Research 62 (2006) 168–177
Table 3Fatigue under local loading—theoretical values
Test Range forN = 1/2 Cyclic range Stress (MPa)�εtot �εpl �εtot �εpl �σel �σ �S
E1 0.0147 0.0135 0.00344 8.96× 10−04 438a 669 667E2 0.0047 0.0036 0.00167 0 311 335 324E3 0.0043 0.0032 0.00167b 0 292a 445 324b
E4 0.0170 0.0158 0.00265 1.03× 10−04 519 558 514E5 0.0065 0.0054 0.00242 1.28× 10−05 328a 502 469E10 0.0072 0.0061 0.00236 6.00× 10−07 467 502 458E11 0.0038 0.0026 0.00267 1.38× 10−04 365a 558 518E12 0.0120 0.0109 0.00296 4.14× 10−04 571 613 574E13 0.0027 0.0016 0.00167b 0 255a 390 324b
E14 0.0095 0.0084 0.00265 1.03× 10−04 519 558 514
a Note, that the load is at position W.b Values replaced by those valid for E2 (corresponding to position A and giving the highest values).
12.
e
onanlas’sc
d
ofo-
ves
e
e
he
Fig. 15. Theoretical stress–strain curve for the first two cycles of test E
(due to very thin flanges theleff is rather conservative, seabove):
�σ = �F
lefftw. (15)
Instead of using Coffin–Manson’s approach basedplastic strain range and to ease practical fatigue designattempt to use the stress range was investigated. Thecolumn of Table 3 presents double the value of Langerpseudo-stressS corresponding to half of the fictitious elastistress range (see [8]) and calculated from cyclic strain valuesby the formula:
�S = 2S = E�εtot. (16)
From comparison of�σel, �σ and�S values may beconcluded a safe use of�σ based on effective length insteaof pseudo-stress�S.
3.2.3. Evaluation of resultsThe statistical evaluation again follows the procedure
Annex Z of Eurocode 3, here for design function of pseudstress�S:
rt = �S = m
√a
N. (17)
t
Fig. 16. Experimental and recommended local fatigue curlog�S– log N .
Regression analysis forn = 10 tests givesm = 7.403anda = 6.395× 1025. The experimental mean value of thdetail category corresponding to 2 million cycles is:
�SC =(
2 × 10⁶
a
)− 1m
= 431.74 [N/mm2]. (18)
The following values were determined:
b = 1.01, ∆ = 1, sδ = 0.157,
Vδ =√
es2δ − 1 = 0.156,
Q = σln(r) =√
ln(V 2r + 1) = 0.156= Qδ, αrt = 0,
αδ = 1, uk,n = 1.92. (19)
The coefficient c of characteristic strength valuconcerning the detail category:
c = e−1.64αrt Qrt −uk,nαδ Qδ−0.5Q2 = 0.733. (20)
Therefore, the resulting detail category DC from tstatistical evaluation of pseudo-stress leads to DC=c�SC = 0.733× 431.7 = 316, seeFig. 16(extrapolation of

J. Machacek, M. Tuma / Journal of Constructional Steel Research 62 (2006) 168–177 175
Fig. 17. Set-up of the test with moving local loading.
Fig. 18. Test with moving local loading.
nd
sin
towas
izels
r
ngt. Soth
ackwayereent
.sd,b
he000
000stcaltedon)
m
the fatigue strength curve above 3× 10⁶ cycles and cut-offlimit at 108 cycles follows Eurocode 3 recommendation ais not experimentally validated). As follows fromTable 3thereasonable pseudo-stress values are easily available uEq. (11).
3.3. Cyclic moving local loading
To accomplish the experimental model with respectreal stress state under moving loading a special test rigdeveloped, seeFig. 17. Two girdersWTA 500-200× 10 weretested under loading as in Tests E5 and E10 via real-scrane wheel(F = 90 kN) and supported by the same wheeat span length of 1 m. Girder movement of±70 mm inlongitudinal direction was imposed by movement generato(straightforward saw mechanism, seeFig. 18). The force inmoving bar was changing in range of±2 kN. The rails of50 × 30 mm cross section were heavily worn away durithe tests and had to be replaced by new ones at each tesheavy-duty plastic wheels supplied the side support of bflanges (four at the top and two at the bottom flange).
g
ix
3.3.1. Test K1The cracking originated at the weld toe as a surface cr
after 286 000 cycles, being affected by excessive wear aof the rail reaching about 1 mm in depth, leading to sevloading conditions. The rail had to be replaced. Subsequloading had no deteriorating effect up to 515 000 cyclesWhile the crack widened about 1 mm only in both directionthe rail was destroyed again and the test was terminateFig. 19. The cracking was visible on one side of the weonly.
3.3.2. Test K2A new girder specimen of the same parameters as for t
K1 test was used. The rail had to be replaced at 182cycles together with replacement of the crane wheel for asurface quenched one, and again at 282 000 and 648cycles (finally substituted by another material). The fircracking originated at 1353 000 cycles as a 4 mm verticrack at the weld toe of web vertex. The test was terminaat 1506 000 cycles from economic (energy consumptireasons with cracking through the web thickness of 18 mlength,Fig. 20.

176 J. Machacek, M. Tuma / Journal of Constructional Steel Research 62 (2006) 168–177
heIAgof
s
ezed
asstre
ressof
ting
ringstic
oftoetlesg.
edna
hen of
d
of
stshe
ay
bsectrs
ing.d to
local
r
withd
in
theng
rythe
Fig. 19. Test K1—cracking on one web surface at upper weld toe.
3.3.3. Numerical investigation of moving loadingA full length girder was analysed numerically using t
above described elastic GNIA and elastic–plastic GMNFEM. In total 57 loading cases representing two full movincycles were analysed (with sequential 10 mm changethe load position). In each loading case five loading step(90/5 = 18 kN) were introduced. Loading history wasincluded by respecting theprevious stress–strain state as thinitial one. The results of the analysis may be summarias follows:
(i) Due to rather short path of theloading (±70 mm) themaximal numerical range of elastic vertical stress w321.0 N/mm2 (instead of 501.7 N/mm2 as correspondto Eq. (15)), being reached 140 mm away from cenof loading.
(ii) The maximum reached numerical range of shear stwas 45.7 N/mm2, exceeding the expected valueF/(2twhw) = 90/(2 × 2 × 625) = 36.0 N/mm2
and covering total and local shear stresses in undulaweb.
(iii) Loading produced plasticzones in the top of the girdeweb at mid-span, with maximum vertical plastic straεp.z = 0.0042 emerging within the first three loadincases, remaining further unchanged (zero cyclic plastrain).
The limited experimental and numerical investigationcyclic moving local loading provided deeper insight infatigue behaviour of the girders under real conditions. Thcollapse was in both tests with moving loading genbut in the first one with rather lower value of cycleleading to fatigue in comparison with the fluctuating loadinNo radical conclusion can be deduced from these limitresults, but the numerical analysis revealed additioimportant factors (lower vertical normal stress range and thigher shear one) which are influencing the comparisoresults.
l
Fig. 20. Test K2—cracking through web thickness starting from upper weltoe.
4. Conclusions
Design recommendations for fatigue behaviour ofWTgirders follow the statistical and theoretical evaluationsthe test results performed on girders with 500× 2 mm weband 200× 10 mm flanges. Fatigue behaviour ofWT girderswith other web thickness (2.5 or 3 mm) or slenderneswasnot experimentally investigated and therefore the resulneed careful appraisal before using in a design. Trecommendation follows the Eurocode methodology.
Undulating webs loaded prevailingly in cyclic shear mbe designed as fatigue detail category 40 (with slopem =9.45) covering both web and web–flange butt weld. Weunder local loading are subject to both local vertical dirstress and shear stresses. The investigation covers girdehaving crane rail (with minimum cross section 50× 30 mm)and shear corresponding to half value of the local loadThe fatigue curve for the pseudo-stress range provecorrespond to fatigue detail category 308 (with slopem =7.40). The pseudo-stress may easily be calculated asdirect stress using formula (15). For otherload combinationssuitable interaction formulas have to be used.
Two tests with moving local loading provided furtheinsight into the fatigue behaviour of theWT girders buthave not affected the conclusions determined from testsfluctuating type of loading. It can be noted that a workeexample performed in accordance with Eurocode 3 for anoverhead crane girder (span 12 m, crane 8 t) resultedsuccessfuldesign ofWTC 1000× 3-250× 12 [mm] profile.The design proved that using the above given resultsinteraction of moment and local loading was the limitiproof while fatigue was not decisive.
Acknowledgements
Financial support of a grant by the Czech Ministof Education MSM 6840770001 and sponsorship of
J. Machacek, M. Tuma / Journal of Constructional Steel Research 62 (2006) 168–177 177
lly
.
nderrs.
al
r
ing.
s
company Kovove profily Ltd. (Czech Republic) is gratefuacknowledged.
References
[1] Herzog M. Leichtträger mit Faltensteg. Stahlbau 1988;57(8):246–9.[2] Vacha J. Profiles with undulating web. Design manual of Kovove
profily Ltd. KP Prague; 1997 [in Czech].[3] Pasternak H, Branka P. Zum Tragverhalten von Wellstegträgern
Bauingenieur 1998;73(10):437–44.
[4] Novak R, Machacek J. Design resistance of undulating webs upatch loading. In: Camotim D, Dubina D, Rondal J, editoProceedings of CIMS’2000. Lisbon: Imperial College Press; 2000.
[5] Elgaaly M, Seshadri A. Girderswith corrugated webs under particompressive edge loading. J Struct Engrg 1989;(June):783–91.
[6] Saal H, Hornung U. Untersuchungen zur Einleitung dynamischeLasten. Bericht Nr. 943040, Univ. Karlsruhe; 1995.
[7] Novak R, Machacek J. Strength of undulating web under local loadRep. GACR No. 103/98/0062. CTU in Prague, 1999 [in Czech].
[8] Coffin LF, Henry MF. Mechanical behaviour of materials II. Note37.6460. New York: Rensselaer Polytechnic Institute Troy; 1998.


