Embed Size (px)
Citation preview

AD
EARTHQUAKE ENGINEERING SUPPORT PHASE 5
Final Technical Report
by
R S Steedman
August 2002
United States Army
EUROPEAN OFFICE OF THE U.S. ARMY
London England
CONTRACT NUMBER: N68171-01-M-5037
PRINCIPAL INVESTIGATOR: DR R S STEEDMAN
Approved for Public Release; distribution unlimited
20020912 113

Report RSS/J0101R04 Rev 0
SUMMARY
This report summarizes the findings of an experimental study supported by the U.S. Army Centrifuge Research Center and Engineer Earthquake Engineering Research Program (EQEN) into the behavior of saturated sands under high initial effective confining stresses subjected to strong ground shaking. The research was conducted using the Army Centrifuge at the U.S. Army Engineering Research and Development Center (ERDC), located in Vicksburg, MS. A large dataset of the response of saturated sand to dynamic shaking under 'level ground' conditions has been compiled and a series of verification models have been conducted. Several techniques were used to investigate the response of deep soil sites (in excess of 70m) including surcharges, lowered water table and higher acceleration (gravities). The most effective approach was to test specimens at higher gravity, as the interpretation of data from specimens tested using a heavy surcharge on the ground surface, or a deep water table has proved difficult. Many deep samples showed a limit to the excess pore pressure generated during shaking at a level much less than 100% of the initial vertical effective stress. A range of explanations has been proposed, including container effects, saturation, compression of the soil, redistribution of pore pressure and dynamic response of the surcharge. The verification tests eliminated container effects, and parallel research by others has shown that there are several reasons for pore pressure generation at depth to be limited. However, as postulated in earlier stages of this research, there is no absolute limit: in a fully saturated specimen of broadly uniform permeability, liquefaction was observed within a few cycles of strong shaking throughout (to an equivalent field depth of around 65m). A second key finding indicates that dense layers overlying loose layers may still be readily liquefied as a consequence of the high excess pore pressures generated below. These findings are highly significant for designers.

Report RSS/J0101R04 Rev 0
LIST OF KEYWORDS
liquefaction centrifuge earthquake model experiment sand dam safety
u

Report RSS/J0101R04 Rev 0
TABLE OF CONTENTS
Summary l
List of Keywords » Table of Contents in
1 Background 1
2 Introduction 1
3 The ERDC centrifuge facility 3
4 Research Program 4
5 Results 7
6 Determination of shear stress-strain histories 12
7 Conclusions 16
8 References and bibliography 16
Appendix A Earthquake dataset A-l
Appendix B Summary of data B-l
in

Report RSS/J0101R04 Rev 0
1.0 BACKGROUND
This research contract addressed a further phase in the completion of an experimental and analytical research programme in support of the Earthquake Engineering Research Program under the direction of the USAE ERDC (formerly the Waterways Experiment Station), Vicksburg, Mississippi. The phase was entitled Earthquake Induced Liquefaction in Deep Sand Deposits. This study was a continuation of earlier research under Contract Nos. N68171-98-C-9014, N68171- 97-M-5710, N68171-97-C-9012, N68171-99-C-9021 and N68171-00-M-5505. The research involved further interpretation of the early experimental data, design of verification experiments, interpretation and analysis of new experimental data and preparation of technical papers for publication. The work was completed in September 2001.
2.0 INTRODUCTION
The current state-of-practice for the evaluation of liquefaction potential and for remediation design and analysis depends on empirical correlations of in-situ measurements of strength versus field experience of liquefaction at shallow depth and laboratory data of the behavior of confined elements under cyclic loading. (Liquefaction is defined here to mean the development of pore pressure equal to 100% of the initial vertical effective stress.) This approach is known as the "simplified procedure". Opinions vary as to the maximum depth in the field at which liquefaction has been observed, but there is no established field evidence from historic earthquakes of liquefaction at depths greater than a few tens of meters. The NCEER Workshop in 1996 on the Evaluation of Liquefaction Resistance of Soils noted that the simplified procedure was developed from evaluations of field observations and field and laboratory test data, Youd and Idriss (1997). The report notes, "These data were collected mostly from sites ... at shallow depths (less than 15m). The original procedure was verified for and is applicable only to these site conditions".
Hence, in design practice the assessment of liquefaction under high initial effective confining stress, such as might relate to the foundations of large earth dams, is based on the extrapolation of observed behavior and correlations at shallow depths. In practice, the behavior of saturated soil under these conditions is not well understood. Based on the results of laboratory tests, researchers have postulated that there is a reduction in the liquefaction resistance of such soil compared to shallow depths. This reduction is accounted for in standard approaches by a ratio known as Ko, a "correction factor" developed by Seed (1983) in the simplified procedure. This strength ratio is postulated to reduce with increasing initial effective confining stress, which has a large impact potentially on the extent and method (hence cost) of remedial construction required to assure adequate seismic performance of large dams. For example, it may reduce the cyclic shear stress ratio predicted to cause liquefaction in a soil layer under a typical large dam (of the order of 30m high) to about 50% of its value in the absence of the dam. The predicted deformations and resistance and the remedial strength required are a direct function of the reduced shear strength. The Ko strength reduction therefore
1

Report RSS/J0101R04 Rev 0
has a strong influence on the decision to remediate a large dam and on the costs of that remediation.
The factor K^ quantifies the curvature in the cyclic shear strength envelope (cyclic shear stress required to cause liquefaction versus confining stress) for a soil as observed in laboratory tests on discrete specimens. Although some curvature may be expected, such large reductions in cyclic shear strength ratios are counter- intuitive. It is generally accepted that increased confining stress should broadly improve the capacity of a soil to resist applied loads, not reduce it. Clearly the volume of soil that requires to be treated and the difficulty and expense ofthat treatment are highly dependent on an accurate assessment of the potential for and consequences of liquefaction.
There is therefore strong motivation for owners of large dams to investigate the behavior of saturated sands subject to strong ground shaking under high initial effective confining stresses. In the absence of field data, the use of a centrifuge was considered to be the only practical option to realistically represent a deep soil deposit subjected to earthquake shaking. The experiments reported herein relate exclusively to level ground initial stress conditions in a single layer (loose) or two- layer (dense over loose) deposit of clean, fine sand.
Liquefaction of a level sand bed has previously been the subject of research by many others. Experiments using Nevada sand were conducted at many centrifuge centers under the VELACS project, Arulanandan and Scott (1994). The objective of the ERDC study is to investigate the onset of liquefaction under much higher initial effective overburden stresses than used in the VELACS experiments. Nevada sand, which was used in the VELACS research and has been extensively studied in the laboratory, was adopted for the series of experiments under the ERDC centrifuge test program.
3.0 THE ERDC CENTRIFUGE FACILITY
The design specification for the ERDC centrifuge followed a review of the Army's research needs and a study of the available academic facilities, Ledbetter (1991). Many of the field problems with which the U.S. Army Corps of Engineers is concerned are physically large, such as earth dams, locks and river control structures, environmental problems and military research. It was determined that a new facility with a high payload capacity and high g capability was required to meet future Army needs. A large beam centrifuge was commissioned, Figure 1, termed the Acutronic 684, based on the French designed Acutronic 661, 665 and 680 series of geotechnical centrifuges, Ledbetter et al. (1994a). The capacity of the ERDC centrifuge is a payload of 8 tonnes at up to 143 g, reducing to 2 tonnes at 350 g, with a platform area of 1.3m square. This high capacity enables field problems of the order of up to 300m in breadth, 300m in depth, and 1000m in length to be simulated under a wide variety of loading conditions. The facility is equipped with a large range of equipment and appurtenances.

Report RSS/J0101R04 Rev 0
Figure 1. The WES centrifuge
The research approach for this high confining stress liquefaction study uses the large capacity of the WES centrifuge to investigate the generation of excess pore pressure and liquefaction under conditions that much more closely resemble those at depth in the field, Ledbetter et al. (1999). To do this required the design and construction of a large dynamic actuator. The history, design and characteristics of the actuator and specimen container have been discussed in a previous Technical Report, Steedman (2000) and are not repeated here.
4.0 RESEARCH PROGRAM
Table 1 summarises the experiments conducted during 1998 and 2001. The models are grouped in series, where each series corresponds to a different target range of vertical effective overburden stress in the loose layer.
Model Models in series Effective
overburden stress near bottom
Equivalent field depth (approx)
Depth of specimen
Notes (all specimens constructed from Nevada Sand, tested at SOg unless specified)
a, b, c, d, e, f
a, b, c, d, e, f
a, b, c, d
e, f, g, h, i, j
k
a, b, c, d, e
h
llOKPa(ltsf)
210 KPa (2 tsf)
320-540KPa (3 - 5 tsf)
420-1040 KPa (3.9-9.7 tsf)
200-510 KPa (1.9-4.8 tsf)
750-1070 Kpa (7-10 tsf)
740 KPa (6.9 tsf)
610 KPa (5.7 tsf)
730 KPa (6.8 tsf)
15m
26 m
300 mm
525 mm
26-40m 525 mm
30-60m 525 mm
25 - 39 m 525 mm
54-63 m 525 mm
41 m 525 mm
41m 525 mm
41m 460 mm
Fully submerged
Fully submerged (3f at 100g)
Lowered phreatic surface or surcharge (weights)
Surcharge (weights) and fully submerged, tested up to 125g
No surcharge, fully submerged, tested up to 125g
Surcharge (weights), fully submerged
Surcharge (weights), fully submerged (5g reused Model 3e)
No surcharge, fully submerged, tested up to 125g
No surcharge, lowered phreatic surface, tested at 125g
Table 1. Outline summary of centrifuge model test program

Report RSS/J0101R04 Rev 0
Model Overall Code depth (mm)
Relative Density (Dr)* a»' near base of specimen (tsf)
OCR Number of Comments (all models constructed from Nevada earthquakes Sand and tested at 50g unless specified)
2a 300 44% loose, 83% dense 1 1 3
2b 300 50% loose, 75% dense 1 1 2
2c 300 49% loose, 74% dense 1 1 5
2d 300 50% loose, 75% dense 1 1 4
2e 300 49% loose, 73% dense 1 2.5 4
2f 300 50% loose, 75% dense 1 2.5 4
3a 525 34% loose, 73% dense 2 1 2
3b 525 49% loose, 77% dense 2 1 3
3c 525 49% loose, 79% dense 2 1 3
3d 525 54% loose, 80% dense 2 2.5 4
3e 525 50% loose, 75% dense 2 1 1
3f 262 50% loose, 75% dense 2 1 1
4a 525 49% loose, 80% dense 3 1 4
4b 525 56% loose, 74% dense 3 2.5 4
4c 525 50% loose, 75% dense 4.7 1 4
4d 525 50% loose, 68% dense 4.7 2.5 4
4e 525 47% uniform 3.9-7.8 1 2,1,1
4f 525 55% uniform 3.9-9.7 1 1,1,2,1
4g 525 50% uniform 3.9-9.7 1 1,1,1,2
4h 525 50% uniform 3.9-9.7 1 1,1,1,1
4i 525 50% uniform 3.9-9.7 1 1,1,1,1
4j 525 50% uniform 3.9-9.7 1 1,1, 1,2
4k 525 50% uniform 1.9-4.8 1 1,1,1,2
41 525 Densities uncertain 4.8 1 1
5a 525 51% loose, 72% dense 7.4 1 4
5b 525 49% loose, 76% dense 7.4 2.5 4
5c 525 52% loose, 75% dense 9.2 1 3
5d 525 57% loose, 80% dense 9.2 1 1
5e 525 50% uniform 8.4 1 7
5f 525 50% loose, 75% dense 6.9 1 1
5g 525 50% loose, 75% dense 6.9 1 1
5h 525 49% loose, 74% dense 5.7 1 1
460 50% loose, 75% dense 6.8
Fully submerged
Fully submerged
Fully submerged
Fully submerged
Fully submerged
Fully submerged
Fully submerged
Fully submerged
Fully submerged
Fully submerged
Fully submerged
182 mm dense layer overlying 80 mm loose layer, fully submerged, no surcharge, 100g
Saturated to top of loose layer only.
Saturated to top of loose layer only.
Fully submerged, surcharge (weights)
Fully submerged, surcharge (weights)
Fully submerged, surcharge (weights), Shaking at 50,80,100g
Fully submerged, surcharge (weights), Shaking at 50, 80,100,125g
Fully submerged, surcharge (weights), Shaking at 50,80,100,125g
Fully submerged, surcharge (weights), Shaking at 50,80,100,125g
Fully submerged, surcharge (weights), Shaking at 50,80,100,125g
Fully submerged, surcharge (weights), Shaking at 50,80,100,125g.
Fully submerged, no surcharge, Shaking at 50, 80,100,125g.
Fully submerged, surcharge (weights)
Fully submerged, surcharge (weights)
Fully submerged, surcharge (weights)
Fully submerged, surcharge (weights)
Fully submerged, surcharge (weights)
Fully submerged, surcharge (weights)
Fully submerged, surcharge (weights)
Fully submerged, surcharge (same model as 3e with surcharge added)
Fully submerged, no surcharge, 125g
396 mm dense layer, saturated to depth of 250mm only, overlying 64 mm loose layer, no surcharge, 125g
»Relative density of the portion of the model termed 'loose', generally refers to a 160 mm thick layer placed at the bottom of the model. For the 'model of the model' experiments, this loose layer was reduced in depth. Relative density of the portion of the model termed 'dense', refers to that portion of the model above the 'loose' layer (ranged in thickness from 140 to 365 mm). Model 41 was understood to have been built to the standard specification, i.e. 75% dense over 50% loose.
Table 2. Summary description of centrifuge model test program

Report RSS/J0101R04 Rev 0
Generally, specimens were up to 525mm deep with the bottom 160mm placed at around 50% Relative Density (RD) and the upper portion at around 75% RD. The 'early' models were shaken at 50g; later models were shaken at up to 125g. During the verification phase modelling of models was carried out at 100g and 125g. Some models were overconsolidated by a factor of 2.5 prior to shaking (achieved by running the centrifuge up to 125g and then dropping back to 50g). The size of the dataset and number of repetitions provided the opportunity to characterise the data on the basis of the quality of the output. This is seen in Appendix A, where the summary data for each transducer and each earthquake analysed is presented. A quality rating of low/medium/high and * was assigned to each time history based on the consistency and reliability of the data and the quality of the experiment itself. For example, higher 'quality ratings' would be assigned to transducers which showed internal consistency in terms of static pore pressures, physical location in the model, response during shaking etc.
The Nevada sand used in the models was characterized by standard laboratory tests to determine parameters such as dry density and gradation. Table 3 presents key material parameters for this sand.
Specific gravity 2.64 Maximum void ratio 0.757 (density 93.8 pcf) Minimum void ratio 0.516 (density 108.7 pcf) D5o 0.18 mm (approx) D10 0.11 mm (approx)
Table 3. Nevada Sand (parameters as measured)
The pore fluid comprised a mixture of glycerine and water, 80% by weight for experiments conducted at 50g. Measurements of the viscosity of glycerine-water mixes at a range of temperatures and proportions show that the viscosity is sensitive to both parameters.
The density of a glycerine-water mix was calculated from:
pm = pg(mg + mw)/( mg + pg mw)
where pm is the density of the mix, pg is the density of glycerine, nig is the mass of glycerine, and mw is the mass of water. Table 4. summarizes the properties of the glycerine-water solution used as the pore fluid.
Density 1200 kg/m3
Viscosity 50 cs Specific Gravity 1.26 Composition 80% glycerine-water mix (by weight)
Table 4. Parameters for pore fluid (as measured)

Report RSS/J0101R04 Rev 0
The models were poured dry from a hopper and saturated under vacuum or slowly under gravity. Instrumentation was placed in the model as it was being constructed.
The typical arrangement of the model specimens for the different test series is shown in Figure 2. Instrumentation was positioned through the depth of the models, and comprised pore pressure transducers and accelerometers. The location of the instrumentation for Model 5b is shown in Figure 3.
■796
? water table at soil medium dense sand layer, ' surface
RD = 75%
loose sand layer, RD = 50%
Typical cross section through Model series 1 and 2
"796"
medium dense sand layer, RD = 75% water table at
around 300 nun depth
loose sand layer, RD = 50%
140
160
15
365
160
15
796"
? water table at soil surface
medium dense sand layer, RD = 75%
loose sand layer, RD = 50%
Typical cross section through Model series 3
"796 \ lead surcharge
water table at soil surface
medium dense sand layer, RD = 75%
loose sand layer, RD = 50%
base layer, coarse sand
365
160
15
365
160
15
Typical cross section through Models 4a, 4b Typical cross section through Models 4c, 4d and 5
Figure 2. Cross sections through the different model configurations

Report RSS/J0101R04 Rev 0
-300-
snrchargec<Tfnpri«ngleads6ips, totalling 586 lb (11.6 KP»)
V
7 ACC5754
ACC 7771, PPT15
ACC 12608, PPT8
ACC 12801. PPT11
phreatic surface at soil surface
dense sand layer, HD = 76%
ACC 7709
ACC 12768, PPT31
ACC 12814, PPT10
ACC 12815, PPT13
ACC 12804, PPT46
ACC 12817, PPT«
PPT 38, ACC 12807
loose sand layer,
ACC 12806, PPT47
ACC 12821, PPTS0
PPT 51, ACC 12811
365
_|160
70 I -MO
slotted sheet and porous plates
Cross-section through Model 5b
/ ACC 7314 was mounted
horizontally on the bottom ring.
Figure 3. Instrumentation for Model 5b
5.0 RESULTS
Earlier reports, Steedman (1999), (2000) have presented analysis of the data using a range of approaches. In this report, the data from the verification models is summarized alongside the earlier experimental results, and in the same format.
Appendix A presents the dataset of limiting excess pore pressures, by model and by transducer. Comments are added concerning the quality of each record, and the experiment in general.
From this set a number of time histories were selected as of particularly high quality for possible future interpretation. This selection was made in part based on the internal consistency of the experimental results, and in part using subjective judgment based on past experience. These data are presented in Figures 4a and 4b, and 5a and 5b, below. In each case, the model reference number and earthquake is given, which can be checked against the commentary in Appendix A. Figures 4a and 5a present the pore pressure records; Figures 4b and 5b present the (matching) base input acceleration time history from the same model test.
A summary of selected data and recommendations for future centrifuge testing of level ground conditions under high effective confining stress has been prepared, Sharp and Steedman (2002).

Report RSS/J0101R04 Rev 0
IS- 120%
I. 100% I 80% -
£ 40%
§■ 20% +
§ 0% UJ -20% A
PPT30
iW« ''
A/ Al'ii i
fY hAi-
2b,eql
Time (seconds)
0.2 0.4 0.6 0.8 1.2 1.4
140% T
2 120%
^ 100%
3 80% - (0
£ 60%
I 40% g 20%
8 0% UJ A
-20% <"
-a- 120% CD
* 100%
§ 80%
I 60% g 40% -
§. 20% CO
g 0% UJ -20% <&
120% T
: 100%
| 80%
| 60%
I" 40%
>■ 20%
PPT 10
|WW
i, t/ 1 ! Ö.2
2b,eql
Time (seconds)
0.4 0.6 0.8 1.2
PPT3
1.4
2d,eql
^^l^Mfp^^rf^ r*»*-t-
Time (seconds)
0.2 0.4 0.6 0.8
PPT30
1.2 1.4
3c, eql
Time (seconds)
; o% 1 -20%
_ 120%
£ 100%
| 80% - u | 60%
g 40% ■-
| 20% + w o
0.1 0.2 0.3 0.4 0.5 0.6 0.7 0.8 0.9
0%
-20%
PPT31
Tims (seconds) 3c, eq 1
0.1 0.2 0.3 0.4 0.5 0.6 0.7 0.8 0.9 1
120%
a 100%
~£ 80%
jj> 60% -
£ 40%
i. a 20%
0%
-20%
PPT10
f Tme (seconds)
■Qjfiiyipil.tftfitowft
3c, eq 1
0.1 0.2 0.3 0.4 0.5 0.6 0.7 0.8
Figure 4a. Selected pore pressure time histories (I)
0.9

Report RSS/J0101R04 Rev 0
15
10
5 + ^ 10-- ACC7314
g 0 o
§ -5
< -10
-15
15
10
£ 5
« 0
| -4 -10
-15 i
20 T
l.»fl|Mi*«|W»l»lil»HTV.|i'V,
0.2
ACC7314
A ftivwvmwwwv"'»^!/1/^ Time (seconds)
i»ry'>HflVi«W- mfmm i ^v 4T
"Time (seconds)
ACC12815
c o
Time (seconds)
15 T
10
5
a 0
I 'S0 <
-10
-15
15
10
r 5
ACC7314
#ill^
g 0
§ -5 <
-10
-15
0.1
ACC7314
Time (seconds)
kAMAAAAAAAAA WtWWVWWVWWVW^ 0.1
Time (seconds)
ACC7314
Time (seconds)
Figure 4b. Matching acceleration (base input) time histories (I)

Report RSS/J0101R04 Rev 0
120%
100%
80%
60%
40%
20%
0%
-20% Q*4
PPT35
k§
'M^M^§$^ 3e, eql Time (seconds)
0.8 1.2 1.4 1.6 1.8
120%
100%--
80%--
60% -•
40%
20%
0%
PPT39
mmm -20%
„ 150% T
Q.
u 100% -■ U> (ß Q)
a. 50%
(I 'I
iff'
S 0%
-50%
PPT35
Time (seconds)
0.4 0.6 0.8 1.2 1.4
hW^ 3f,eql
Time (seconds)
0.8 1.2 1.4 1.6 1.1
_ 140% j
| 120% --
sT 100% | 80% o fc. 60%
| 40%
a 20%
0%
PPT53
A,
1 -20% I»
„ 120%
£ 100%
| 80% -■
!8 60% -■
g 40%
S- 20%
-20%
JfnW
PPT38
0.2
4g, eql
.^l^^W.^k^^
0.4 0.6 0.8
m
g 0% -,r.\-..'-'..+ j.t.yi
Tims (seconds)
1.2 1.4
'U
^/HHfVA~>~>~w~V-
4f,eql
0.2 0.4 0.6 0.8 1 Time (seconds) ^ 4
140%
cü 120%
"jjT 100% -■
8 80% a> fc. 60% - o> ä & 20%
40%
0%
-20% 1
PPT13
Jld,' v f
ypV»tT' ■Hrn*
Time (seconds) 4k, eql
0.2 0.4 0.6 0.8 1.2 1.4
Figure 5a. Selected pore pressure time histories (II)
10

Report RSS/J0101R04 Rev 0
60 j 40-1- MEAN 20 Ulli
IllllllllUlf ii IM M l!l{|ll||Jjlljl||i^.Hfl:'l,ddJ/|l — ;: I ■ - ■ I
Ui.it
-200f4
-40
-60
-80
1 Kl I i
II I Hit ■|llll!!tfl|l|ll!imiillilii]-»
Time (seconds)
80
40
20
• MEAN
lill III pi I1 lrtllMilil!lliU!|||
«■ m 1.4
Tinne (seconds)
c o
Time (seconds)
50 T
40
30
20 --
10
MEAN
".^WJfl
MEAN
il I ! ^^■Wv^Kj^-^fw^i^^
-10 !'
-20 ■■ -30
30
20
10 -■
Iff I »t 1.4
Time (seconds)
.S 0
-10 if
-20
-30 •■
-40
30
20
10 4-
Wm I Mi I W\wm 1.4
Time (seconds)
MEAN
Hi I Ill\/W 1-
-10
-20
-30
If 1 [
III! 1.4
Time (seconds)
Figure 5b. Matching acceleration (base input) time histories (II)
11

Report RSS/J0101R04 Rev 0
6.0 DETERMINATION OF SHEAR STRESS-STRAIN HISTORIES
All of the experiments undertaken in this study addressed level ground conditions, with no initial static shear stress. The only shear stress and subsequent shear strain was that imposed by the loading. Level ground liquefaction is therefore a special case of the cyclic mobility phenomenon that occurs when the static shear stress is less than the shear strength of the liquefied soil. Level ground liquefaction failures are caused by the upward flow of water that occurs when seismically induced excess pore pressures dissipate. Depending on the length of time required to reach hydraulic equilibrium, level ground liquefaction failure may occur well after ground shaking has ceased and this was seen in a number of the experiments. References in Appendix A to transducers 'still climbing at the end of shaking' are evidence of pore pressure redistribution affecting the pore pressure generation caused by shaking.
A critical aspect in the assessment of these model experiments was to compute the stress strain time histories for comparison with laboratory element and field experience. This was done in collaboration with researchers at WES and RPI.
The method adopted to compute the stress and strain time histories was known as System Identification or SI. The method is described in a paper by Zeghal et. al. (1995), where the authors proposed that accelerometer and pore pressure time histories could offer a direct and effective means of evaluating seismic soil properties, in particular, a second order accurate estimation of shear stress and shear strain. This SI technique was utilized for analysis of the earthquake data.
Stress strain figures are shown here for Models 4k (Figure 6) and 5b (Figure 7), windowed during similar stages of shaking, Steedman and Sharp (2001).
The left column of plots are the traditional stress-strain loops computed for the early time data, as the excess pore pressures are developing strongly. This may be seen by comparison with the time history of vertical effective stress below the stress strain figures. For Model 4k this shows the largest amount of straining near the surface at nearly 1%, decreasing to a strain of 0.6% at a depth of 24 m. The remaining columns of figures show how the stress strain loops are altered by the development of excess pore pressure. In the case of Model 4k, the specimen reaches close to 100% excess pore pressure, and the upper layers become isolated from the straining at the base. In the case of Model 5b, the excess pore pressure is limited and the response of the soil column becomes nearly linear. The marked contrast in response between the two specimens confirm the observation that the stabilization of the excess pore pressure development in the deeper specimens is a genuine phenomenon associated with a stable cycling of applied load at a level significantly below 100% excess pore pressure, and with the soil retaining considerable reserves of strength and stiffness.
One explanation for the limiting level of excess pore pressure may be associated with upward drainage of the excess pore pressures. Appendix B presents isochrones of stress and strain levels from each experiment, based on this method.
12

Report RSS/J0101R04 Rev 0
3.6m depth
8.4m depth
11-13m depth
18-20m depth
22-24m depth
vertjcEdE«ecihesirB5se24m Vertical effective
stress at base of model
50 time (sees) 60
Figure 6. Stress strain time histories, Model 4k
13

Report RSS/J0101R04 Rev 0
31.5m depth
40- 150 i shear 45 100
50 ri^ai
-1.0% /, 1.0»
31.5m \i depth
>>/(oo
-150
shear strain
42.7m depth
45.9m depth -10*
50.2m depth
52.1m depth
900 i (KPa)
700
500 20 40 60 80 100
Figure 7. Stress strain time histories, Model 5b
120 time(s) 140
A very large dataset of the behavior of Nevada sand subject to shaking under level ground conditions has been accumulated as a result of this work. Review of the stress-strain data alongside the time histories of excess pore pressure provided considerable additional insight into the explanation of the pore pressure response in many cases. The verification models that were tested during 2000-2001 were successful in validating the performance of the specimen chamber and shaker in many respects. The verification models showed that the use of surcharges may indeed be having an effect on the response of the soil column, although exactly how the surcharge affects the soil column has not yet been conclusively
14

Report RSS/J0101R04 Rev 0
determined; many other factors, including soil density, compression and saturation may also be influencing the 'true' response under cyclic loading at high effective confining stress. It is clear that the most effective method of investigating the influence of very high effective confining stress is to use the centrifuge at high g, with or without dry sand surcharging, as for example was achieved with the final experiments in the series, Models 5h and 5i.
120% T
~ 100% r 80%
£ 40% Q. £ 20% + S. 0%
-20%0l6
PPT35 Equivalent field depth = 62m
/
'■^ ■A.M./Vv,v~"''f J^
Mt ^r^Mn ̂ -Y^^\^oa^^vAA^^^'^-^A"Yw^lVlL'
0.65 0.7 0.75 0.8 0.85
Time (seconds)
0.9 0.95
Mean of raw data of base input motion
-0.3 -L Shear stress ratio using mean of input data with one smoothing Time (seconds)
Figure 8. Liquefaction at 62m equivalent depth, Model 5h
Figure 8 presents data from PPT35, Model 5h, which shows 100% excess pore pressure reached after a few cycles of strong shaking in a fully saturated deep specimen without surcharge, at 125g. The shear stress ratio time history shown here was calculated using the simplified method, Steedman (2000) and may be compared to the isochrones of stress ratio calculated using the SI method, Appendix B. Appendix B also shows the long term response after the end of shaking, where consolidation effects and pore pressure redistribution last for a very long period after the end of the earthquake.
15

Report RSS/J0101R04 Rev 0
7.0 CONCLUSIONS
1. A large data-set of the behavior of loose saturated sands under high initial effective confining stresses and subject to earthquake-like shaking has been collected during an extensive experimental program on the ERDC Centrifuge, Vicksburg MS.
2. Early findings from the centrifuge experiments showed that under high effective confining stress, the potential to generate excess pore pressures was limited, and this may be of considerable importance if verified.
3. Detailed investigation into the early findings has provided a range of explanations for the limiting values, including experimental problems such as specimen saturation, chamber effects or the distorting effects of large surcharges on the soil surface. Of these possible effects, detailed investigation of the response of the chamber effectively eliminated movement, or distortion of the ESB container as an explanation.
4. The effect of surcharging was investigated by comparison with changing g level and using different methods of surcharging, or no surcharges at all. The use of dry sand appeared preferable to lead or steel weights; this method was used in early experiments as well as in later models.
5. In the final experiments, which were carried out at high g without the use of surcharges, liquefaction occurred throughout the entire depth within a few cycles. This experiment confirmed that with sufficient input shaking, large excess pore pressures are generated in a saturated soil column of broadly uniform permeability.
6. A key finding of the study has been to recognise the importance of pore pressure redistribution in deep soil columns, which can cause an 'up- welling' of excess pore pressure from lower layers leading to liquefaction of upper layers some time after shaking has ceased. This is an effect not widely considered in standard design methods.
7.0 REFERENCES AND BIBLIOGRAPHY
This research work has made use of a wide range of references; these are presented below for completeness:
Arulanandan, A. and Scott, R.F. (1994) editors, Proc. Int. Conf. on Verification of Numerical Procedures for the Analysis of Soil Liquefaction Problems, at U.C. Davis; Volumes 1 & 2; Balkema.
Arulmoli, K., Muraleetharan, K.K., Hossain, M.M., and Fruth, L.S., (1992). "VELACS Verification of Liquefaction Analyses by Centrifuge Studies Laboratory Testing Program Soil Data Report." National Science Foundation Report.
16

Report RSS/J0101R04 Rev 0
Butler, G.D. (2000). A dynamic analysis of the stored energy angular momentum actuator used with the equivalent shear beam container, PhD thesis, Engineering Department, Cambridge University.
Elgamal, A-W, Zeghal, M., Tang, H.T., and Stepp, J.C., (1995). "Lotung Downhole Array. I: Evaluation of Site Dynamic Properties", Journal of Geotechnical Engineering, Vol, 121, No. 4, pp. 350-362.
Finn, W.D.L. and Yogendrakumar, M., Yoshida, N. and Yoshida, H., (1986), "TARA-3: A Program to Compute the Response of 2-D Embankments and Soil- Structure Interaction Systems to Seismic Loadings", Department of Civil Engineering University of British Columbia, Canada.
Finn, W.D.L., Ledbetter, R.H., and Marcuson, W.F. Ill (1995). "Seismic Deformations in Embankments and Slopes", Symposium on Developments in Geotechnical Engineering - From Harvard to New Delhi, 1936-1994, Bangkok, Thailand, A.A. Balkema, Rotterdam.
Finn, W.D.L. and Yogendrakumar, M., (1989) "TARA-3FL; Program for Analysis of Liquefaction Induced Flow Deformations", Department of Civil Engineering, University of British Columbia, Vancouver, Canada.
Gonzals, L., Abdoun, T., and Sharp, M.K., (2002). "Modeling of Seismically Induced Liquefaction Under High Confining Stress", submitted International Journal of Physical Modeling and Geotechnics.
Harder, L.F., (1988). "Use of Penetration Tests to determine the Cyclic loading Resistance of Gravelly Soils during Earthquake Shaking", PhD Dissertation, University of California at Berkeley.
Hynes, M.E. and Olsen, R., (1998). "Influence of Confining Stress on Liquefaction Resistance." Proceedings of the International Symposium on the Physics and Mechanics of Liquefaction, John Hopkins University, Baltimore, MD, 10-11 September 1998.
Hynes, M.E., (1988). A Pore pressure characterization of gravels under undrained cyclic loading, PhD Dissertation, University of California at Berkeley.
Ledbetter, R.H. (ed) (1991) Large centrifuge: a critical Army capability for the future, Misc. Paper GL-91-12, Dept. of the Army, Waterways Experiment Station, Vicksburg, MS, May.
Ledbetter, RH., and Finn, W.D.L. (1993). "Development and Evaluation of Remediation Strategies by Deformation Analysis", ASCE Specialty Conference on Geotechnical Practice In Dam Rehabilitation, Raleigh, North Carolina, April, pp 386-401.
17

Report RSS/J0101R04 Rev 0
Steedman, R.S. and Habibian A. (1987) Modelling the failure of coastal dykes during earthquakes. 9th European Conf. Soil Mech. Found. Eng. Vol 2, pp 633- 636, Dublin, 31 Aug - 3 Sept.
Steedman, R.S. (1998) Initial earthquake centrifuge model experiments for the study of liquefaction, Final Technical Report, Contract No. N68171-97-M-5710, European Office of the U.S. Army, London, March.
Steedman, R.S. (1999) Earthquake engineering support, Phase 2, Final Technical Report, Contract No. N68171-98-C-9014, European Office of the U.S. Army, London, January.
Steedman, R.S. (1999) Earthquake engineering support, Phase 3, Final Technical Report, Contract No. N68171-99-C-9021, European Office of the U.S. Army, London, November.
Steedman, R.S. (2000) Earthquake Engineering Support Phase 4, Final Technical Report, USAE WES, Contract No. N68171-00-M-5505, European Office of the US Army, London, September.
Steedman, R.S., Ledbetter, R.H., and Hynes, M.E. (2000). "The influence of high confining stress on the cyclic behavior of saturated sand", ASCE Geotechnical Special Publication No. 107, Soil Dynamics and Liquefaction 2000, Eds. Ronald Y.S. Pak and Jerry Yamamura,pp. 35-57.
Steedman, R.S. and Sharp, M. (2001) Liquefaction of deep saturated sands under high effective confining stress, Proc 4th Int Conf Recent Advances in Geotech Earthquake Engineering and Soil Dynamics, San Diego, California, March 26-31, Univ Missouri-Rolla.
Taboada, V. and Dobry, R. (1998), "Centrifuge Modeling of Earthquake-Induced Lateral Spreading in Sand", Jour, of Geotech. andGeoenv. Eng., ASCE, Vol. 120, No. 12, pp. 1195-1206.
Vaid, Y. P. and Thomas, J., (1995). "Liquefaction and post liquefaction behavior of sand." Journal of Geotechnical Engineering, ASCE, Vol. 121, No. 2, February, pg 163-173.
Vaid, Y.P., Chern, J.C. and Tumi, H., (1985). "Confining pressure, grain angularity, and liquefaction." Journal of Geotechnical Engineering, ASCE, October, Vol. Ill,No. 10,pg 1229-1235.
Youd, L. and Idriss, I., Eds (1997) Workshop on Evaluation of Liquefaction Resistance of Soils, Proceedings, Salt Lake City, Technical Report NCEER-97- 0022, sponsored by FHWA, NSF and WES, published by NCEER.
Youd, T.L., Idriss, I.M., Andrus, R.D., Arango, I., Castro, G, Christian, J.T., Dobry, R, Finn, W.D.L., Harder, L.F., Hynes, M.E., Ishihara, K., Koester, J.P., Liao, S.C., Marcuson, W.F., Martin, G.R., Mitchell, J.K., Moriwaki, Y., Power,
19

Report RSS/J0101R04 Rev 0
M.S., Robertson, P.K., Seed, R.B., Stokoe, K.H. (2001), "Liquefaction Resistance of Soils: Summary Report from the 1996 NCEER and 1998 NCEER/NSF Workshops on Evaluation of Liquefaction Resistance of Soils, Jour. OfGeotech AndGeoenv. Eng., ASCE, Vol. 127, No. 10, pp. 817-833.
Zeghal, M., Elgamal, A.-W., Tang, H.T., and Steep, J.C., (1995). Lotung downhole array. II: Evaluation of Soil Nonlinear Properties, J. Geotech. Engrg., ASCE, 121(4), 363-378.
20

Report RSS/J0101R04 Rev 0
APPENDIX A
EARTHQUAKE DATASET
Data of limiting pore pressures, Models and cycles (1998-2001)
A-l

■o a >> c ■o
" o
c ■ «o 5 x i" 3 CB ^
co -o s
H
H Q
© S
CO JE o
eg a a •a o
M
£ Q. O
E E o u
= e O JS
».SB 55 S
to o o ü CÜ >* ±= "SI a. o «> 2
ü. 3 = C
Is o B «1 f a>
n fl Ti * f * n * S fl
H o V P v y
£ r* ? y s» s» c * * t» * * i X fe 0} CO CO CO
PI O CD
CO o CD
oil u u: co m » o a> £ t Jc *T" V
o o i: ^
^ 09
E S
s (0
s s
r- i- r- N <M N
T- T- T- <N CN CM
CO CO CD CO CO CD
"ID "5 "3> "5 "ö tu TJ T3 T3 "D TJ ti o o o o o o S 5 2 5 S S
2 e s o o o
es c
S a si • «•
f 1 S
u } J ö o > a T- o
* S
o o m o o in io io t*- m in r»
CO T- CM T- © o x- ao o» CM i- tn
« Ö ör^wNo o o o o
i- «- N m i-
00 ■* i-
*- 00 0> 00 T-
CM CN s m ID
■* o a o o =3 t/3 öS c o o.
8 £
1 I S
I * «I S u
o
£ ja
o c eS to
? ? i 1 o o
i •* XI XI
? 9 ?
S B
rF 10 «ft
a (0 s
a i
- s * p P CO CC in UJ tu o> t*- CM CD
I F s ?
x: x: J=
F a i*
in V t- O c
m S
* i £ 9 9 9 C C £
r # § * i
HI I ! 1
> > co or tu K
* E ? ^ •I • « ™ w
■ " « si ? ? 9 I a 1 1 I | |
S 5 ~
I???i
9 9 1 1
9 I I | Hit
K co co co ic iu a.
a a
i i _. _. .-.._._. 0>r^<NO>CD^-CDr-CMO><DT-' ^rTT eo'^-rttr'V^'co^to*or,v^-<o,*co'<r'er
O) n u) ■*- «o m co oo Is-- CD CD ^ O O U) o o o
O O CD *-
v CM CO ö <2 ^
t>~ ■*-
t- CM
o> o r-
io co co
o> o> ^
CO CO T- CO 0> O CD CM CM -C CO CO CM CM J2 CM CM
r- r- t- (N N CM
CO T-
t-r-r-NNNNNNtonnnnn'r^'Vvv^ioin
T- CM CO «- T- t- N N N t-^-T- ^ri-NN«(M(MNnnnionn'<r^,^^,^^min
<0 CD CD CD CD CO TJ TJ TJ "O O T3 o o o o o o
(DOOOttOOOOOOOOO CDCDCDOCDCDCDCD TJ O O 0,OT)0"OTJO'0-OXI1OT)TJTJ1OTJTJ"0"01OTJ'OTJ
5 S S S S S 5 ooooooooooooooooooooooo
S S 5 5 S 5 SSSSSSSS

a. a
S. EL
£ £ a a
§ 3 i 2 O) S (M O) V « V «
D-S2
*f °5 1 £ co •
S3
o 'S 2- o 1 £■ o I
£•
s S (A «1 CD C |
•9
3 S
o e £• ft?
3 a ?
5 a-
£ a>
0 £
co
id
1 ? «? 5 £ t i «
CD 1 | i I!- Z | ll
« = s »
o
f a* a c (0 3
2
«0
| 3 CD
05 O « 3
2 | f o s CO
CO CO
O O 1 l CD 3 s
O 8 C
o 0) o
« £ S ■e
3 Z tr a •
e
|* 2 U
•> o o
f
• a A-
i
• i o
« 3 a >• s y
• o ? IS «
3 s r
ED a>
P
£ CO
■o
1 8.
o
co
A-
i «
• g
S (D
*
| a >• M S CT
CD • o ? a>
5 ?
a 3
t: co ■
1 s o a
e »
2- A-
«0 (0
CO M O
s i 3
i CO CD
o ? a S
u
i CD 3
CO ■
« i i o CO
e £ S ■c "O
o 1 c | 3 13 £
to • t 3
1 £ i I o o •£"
o S«U c V 5 3 C ft CO o a s Ä o O CD i a □ Q a CO O (E CO o o CO CO O CO CO CO
CO *- CD f» f- i- CO to T- CD r». r- ■«- 00 CO ▼- CD .N- JT T- CD CO JT CO t*- jr
i e
I i S 1
CO 'V ^ U)
o o o o o o o
CD 'V r>- «O tN CO CD CO O)
*- to m to 00 o r- (MN r CN ■«- T- *- CM ■*-
tN •>• CO CN tn to V CM in V
CO CM CM ■«- *-
o o o o o
00 CD CM ,^' O 'CT ^ O
O CO ^~
-- £ «
CM eo *
* 1
o cc o o i/3 C/3 Oi r o
2 =
E c r EJZXT^E^SX:
co o> o> tOC0O>0)C0t0O>O)tOtOO>O>C0
r-*-tO (ONP)(NCOW(Din(DVCONCO ^ -: c» otoooio^rotno'^'ocno
Ö Ö ÖÖÖÖÖÖÖÖÖÖÖÖÖ
tOi-COtNCOtOtOtOfOCNtOtntO CD^-U5^riOT-CO,ertDCMCO'V-~ T-(Mt-T~T-;CNi-;i-r-iN^-;^
ÖÖÖ ÖÖÖÖÖÖÖÖÖÖÖÖÖ
CO CM ^
, <
CO CM CO o r^ o> o> o> CD CO CO S CO CD
o w to CO CD CO CO CM f- CM CM t- CM W
CD CO CO O i-~ co to in
co to r- ^ o ^ co o T- CM io CD T- CM tO *- •«- CM
■*- 1^ ^ I-:
tD tO CO to o> O *- T-
in io ID m
to IO IO IO
CD CD CD V T3 TJ T3 T) O O O O 5 5 5 S
CMCMCMtMCMCMCMCOCOeOtOfOtOCO ^ ^- •*■ ^ ■»
CMCMCMtMCMCMCMCOtOtOtOtOCOtO
T3 *0 TJ TJ TJ t3 TJ'DTJTJTJ'D'D'DTJB'DTJTJ'OTJ'D'O'DTJ CMCM CM CM CMCMCMCMCMCMCMCMCMCMCMCMCMCMCMCMCMCMCMCMCMCMCMCM
■OT3 T3T3 T3T3TJTJTJ^T3TJTJT3TJT3T3TJT3-0*OTJXJ"0'0'0"0"0
5 S E
oooooooooooooooooooooooo
o co r i m IN ■: T cn u)
T- CD U) CM CM IO T- CM
o *- o> O IO o o (J) N tO S CO S N N CD CO O) CO
V N *
CM O CO CO N N r- CM CO
CONC00)(OSCI)O>C0<»f'r ^lOiDOitrforioN^
N ro CM CO 2 Z CM "~ ^~ ^- CO ^~
0)0>»— 0>0>0>T-0>0>0>'^0>
t-fMtoSi-CMtO?^CMtO
T-T-1- i-tMNCMCMfOCOtOn^t^^
^.^.^ T-CMCMCMCMtOtOCOCO^-'^-'4-'<r
CD CD CD CO t) O O O d> O" CD O CD (9 CO V (M CN CM CMCMCMCMCMCMtMCMCMtMCMCMCM
CD CD CD CD CO CD t] TJ TJ TJ"O"OT3T3"OT3T)T3TJ"D"0"O ooo ooooooooooooo ESS SSSSSSSSSSSSS

I 1 f S
* 1
IS 2 f- 9 e
T> o
r ■F F s « u as
9 o o
HI Ul Ü ,— in ,^- CO in *-
1 § £ 2 O _;
s *
Is: ST s 8
E lit
1 1 s ° » o o a
H?
« 1_ w « « „.■.■_
• S £ « E f 11 i 1 - •
i I I I UJ O
S S £ 2 o o to CD a a
(D(D'-U)i-'-N«D<0»- ■*rt^,,»ninr'vn^'i«nw
o o <o m x- in T-
si £ • ? s
L o »
j m CO O
o t» o
x: x: x:
t NO t- (O U) ID O) ■<- CM CM T-
ÖÖÖÖ ÖÖÖÖÖÖÖÖÖÖÖÖÖ
N W N CO 0 010)0) CM CO CO CM ÖÖÖÖ ÖÖÖOOOOO o o o o
o o o o in in _ m m m m h- r*~ in
CO TT O) CD ■*- to o> O) m r o) o o) o> *- CM CM T- CO CM T- Ö Ö Ö Ö Ö Ö Ö
ID O) N i- n U)
o o o o
CO N W f S CM if CM T- ^ <D
*- CO
N -«r N <M n CM o> o en co
T- m CO CD CM CM T- CO to
lOOCMWCDCMCMtMOCO t0£D0000C00>0)0)O0)
«T T- *t V> 00(D^(MNT-nCOS
r^ in *- <-
(D CM S CO CD « CM ^ CM £
to s co n N en to CM m to CO CD ID O) Vf (O t
i- CO O (O P) V N t T- CM CM
CM CO 'V O
^o>(Dno)iniD^ ^^^o<°co£^ ^ t tD ^ O ^t
0> O O) IO t»- T O) ^ J <° CO lO ^ r ■*t o n f ^
o ^ N CM r^h-^rococM CM o o h- (o N m N T- T- CO •«-■«- ■*- CO T- N (O i- T-
h- <n r- ^r o co CM O) S ^t O CO (M co h- m CM i- *- CO -r CM (O T- T-
E o « 2
5*8 n o A Ü O Ü CD CM -r-
s S i f s i ■ § » g T O O O 3 ■»- <0 CM T- *-
o > a: «3- O
o © in ai
i a.
Ä # *
c » * o © S "£ •"
S * i «
1 e" 2 *
1 "E
£ I S 5 5 j 3 a: o o
ov-tomincMi-OT-o iu ui O T- _ . _ _ CO CO *- V- r- t~ CO CO T-
x:x:x:x:x:x:x:x:-a ODIOIOOtOIDICSB 8> O) O) O) CD CJ> OJ Ol
Errr E x: x: oioicncnoooooootnmminininooo V"»ttU)WU)IOIOI010NNNNNN«WII)
x: x: £ £ x: x: x:
CM «-■*-■«- Ö Ö Ö Ö
T- CD CD CO CO U) CM CM CM
CM CM CD CD
CM CD CO
T- CM CO "«T
r*- CM N co
m m in w
CO CO N — -- oooooooo ÖÖÖÖÖÖÖÖ
oooooooo
O CO co m CO CM CD co 2 °^ f^ ^ r^ in S ID V ID N f
tO r- *- -r *- *-
OOCMOinOCDO 0)0)tocncoo)(DO)
cooto^rof^o,«r
^vmco-*,»»oco
oooooooo
CD CO t- -r- ■ co m m CM CM co co . , ._- IO O) O O) * t CO
ÖÖÖÖÖÖÖÖÖÖÖÖ
0(DNCOCOniO<D(0<-0) CMCM^-'VCD^,
r;!:<,'T"W
CM CM CM CM CM CM Ö Ö Ö Ö Ö Ö
CO CM CM CM CM Ö Ö Ö Ö Ö
^^OIOCO
CM •*- i- T- O CO t in en co o
*- *- CM
o o m r- o o ■* O O O CO O) O ~~
OCMCMCMOlCMi-Or-. 'T^^CM^T^CMV^
^■tocMomoinTO^'cooj O) CXt CM CO CM CD -,; U> O O) O» CM
wiONnroT-T-Nww
OOOOOOOOOOOO toinminmuiinininmininininminmininm
r-T-T-T- T-CM(M{MCMCMCMCMCOCOCOCOCOCOCO'rVir*<,V^ ^- •«- CM CM CMtMCMCMtOCOtOtO ^T-T-^t-T-T-t-t-CMCMCM
,_,_,_,_ T-CMCMCMCMCMeMCMCOCOCOCOCOCOCO^-^-^-'*^'^'^-
(M CM CM CM CMCMCMCMCMCMCMCMCMCMCMCNCMCMCMCMCMCMCMCMCMCM
*- CM
n to co co
«DO« OOCOOVttOO CD CD O CO 4) O CD CD W Q O T3-OT3T5 TJTJtJtJ-OTJTJtJTJTJTJTITJTJ-DB'D-O'tJB'O'D OOOO OOOOOOOOOOOOOOOOOOOOOO S 5 I I S S S S 2 S S 5 S S 2 2 S 2 2 S S 2 S S S 5 2 2 2
CMCMCMCMCOCOtOCO
J3 J3 XI xT xT xf x» xf COCOCOCOCOCOCOCO
TJTJTJTJtJtJTJT) OOOOOOOO 22222222
o'o'ouooouoooo COCOCOCOCOCOCOCOCOCOCOCO
"5"5>'I5^CD"5"CD"CD'CD^ O W a> TJ'D'DTJ'OtJTJ'DTJTJTI'D OOOOOOOOOOOO 222222222222

g 8 *
* S „ s * 1 ° a ° * -s s !^ £? 1 - Z x> %
g g S
5 ■ » a t a to DC o (O U] ID
.£ -S 2 M
? ?
? g 1 1
g *. ^ 's » ~ o o w
S £ £ 'S
I 8 g S £ - - * *f i?
O O tt > O T- (O (O W CM i-
x: £ x: x: TJ x: x: x: 5 5 o» a» o> o> o> _g» a» $ S .c» _g> j
x: x: E ° o « x: x: x: x: ID U) U) ID U) Ul r-- r^ r- r- h- h*
oooooooooo o o o
0)CDmO)m©NO>O)N(D(0tflO) (ONIOCMOCOOOfflNVNSM CMQCNOCOCNCNCNI-CNCMCNCMQ Ö Ö ÖÖÖÖÖÖÖÖÖ
a>ou)niococoo)(0 (OCOWODCDr-OooJ co *~ "*T ^-* to oi T- i- a) i- •<- ^- 00 O) N ^ r-
0> CD CD CN
11 g g 3 5 s «
g
O s s S £ g g g O s S 3 ■o n m a C £ £ J=
g g
e Et g ?
o £ £ a o o
* s ?
s- g D C
g g
g g
UJ co co a K to co
f I ill f I ffii OTJ-O™"«™ *> w J= £ _oo — — _—ooS2 coOOcocococoFFUU
Mnooovsuxoo
<? <?
BNIOOOVNWBIOB»*.--. -:— =i :=..=.== _a. ■q-cocO'*fO'*co(0,^',*o,»roiO'*'*co^cocO'^i,<rf*J'V
-o x:
* Ex:* ■*t ■* ■* ^r U) ID ID ID
O) lO N CM 0 0)0)0)
N. h- o> T- ^r *«r ■v ^r
Ö Ö Ö Ö
CO *- ID U)
cooocon^T-t-(Drtcoo)Ncoo r^cD^^CN^eot^io-^iDfsi-vco (O CO CM CN CO CO »- ^ ^ CM CM CN
O OJ O ID ^,
■«-.«-,-CM^^-T-S
COOCMiDCONNCOM-(DONtf)CO OJCMCOT-CNIOIDCDCNOTCMCOT-CN MCOCOr-i-CMt^lDCNCOCOi-i-
oooooooooooooo ioiomu)iDioiDU)iomu)U)iDin
CNCMCMNNCMCOCOOncOCOCOCOCO
CMCNWCMCMCMCOCOCOCOCOCOCOCOCO o" o" o o" tS o" o" o" o" o" O U U Ü cocococococococoncocococon öoövövöslÖlDvvöi CD ■O'OTJ'ÖTJTJXJ'O'DTITJTJTJTJ'O ooooooooooooooo
x: x: x: x: 0)010)0
"«■ 1- ^ ■*■ ID ID ID ID
CO CM i- CM
*~. Ö T T o o o
o o o o
co *- ^ r-- O) ^ CO s CM 0> G> CO O) 1- ID ID
N N CD CD
S^ O m
N 9 5 9 Ä
7 £ -
u co £ o s a E „ c Q «3 J* .ffl O 2 B B o a
„ O) CO CO CD N co co v ^ in <o
CO ID CO CO CM ■» V CM CM CM CM CM
■* Ul CN f CO CM CO T- CM CO CM CM "f Ul U) V ID ID
CO CO co r» CM CM
CO CM CM CM ID ID
CD CM ■*- O) CO N CD Ul CM CM CM CM
CO CO N N CO S U) U) CM CM CM CM
CO CM ID CD O CM CO CO ID ID ^T ^T
ID ID ID ID ID ID CM CM CM CM CM CM
N«WNN«onnonnv*<r^^^
»-T-T-T-T-i-wNNNNwnwwnnnttfl^T^ T3 "O TJ TJ T3 T>" T3 TJ TJ~ TJ~ TJ" TJ" TJ~ "O Tj" TJ" TJ* TJ~ TJ TJ~ TJ~ Tj" TJ~ TJ~
•>Ud}a>a}4}a>oo4>o4>a>0iD4>i> O V flJ 4J 0 O wT)T)TIT3ÜOTJT)T)T)T)t]BTJTJT)B13TniTIT3t) oooooooooooooooooooooooo SSS2SS2SES22SSS22SSESS
w £: "> « — r^
,_- TJ
9 E ~ E
_ o o4 m
O
©
o ^s
(*> CO
c o a.
1 * »Si
« & >. M
U co co O
CM CD ^ CO CM -«-
CM t- N CO «-
ID CO CM CO CM
4> CD « « CO CO CO CO CO CO CO
"5 "5 "5 » "CD « T) Tl TI TJ T> TJ o o o o o o S 2 S 2 5
T- CD *- C7)
i- ^ CD Ul r^ o» ^- r^- H1 CO CO CO
CO CO CO CO
"5 "5 «> « TJ TJ TJ TJ o o o o

& g g
■E E
ill
g g — s a i=
o ? c
I
3 3 3
S. fi. 8. e e e - - - 3 =■ = £ £ £ •> "> •>
a a a | | | n w « a a a
o o u a a a a Jl £ S I C C 3= tS
Ü 09 (O C IT 5 5 5 5 HH Nnu)U)M(OIOIANn m^^com-v^-coio^'
* I- s £ * m eg CD r IO IO
s. a. a. goo
aal
o> o ■*
§ I s s ^ IO ^ CM CM CM O O CM IO tO CM
o > u
os rr O a: o o
!/3 OS
c o D.
1 ?
II
? a 2 2
gggggggggggggg 22222222" — ~~~~ 2 2 2 a 2
3 3=]
e e €>
o o o o o o o I??????????????? c • © « SCO««
? g 11
S 8 11
8 8 1 1
ggggggggg
111111111
& M & ■> • • _ _
a a a a a a
g g g g g u u u
O O co co CO CO CD CO <0
ir v w ^ u) <o ir
co *r CO co m m
T-T-^-tNCNCMCMCOCOCOCO^-^--*** T-ft-NN(Nnnn**tr ^l(M{M(MtM(Mnp)nnp)rt^'^,^■^■^,^'
T-T-T-N«(MNnnnn^*'»^ niCOCSCOCDtOtO(Q(O(Q<QCDC0C0<n
©^^©"5"cD"cD"i£'cD^'ä>©fl5"5^ •OT3XJT3-0-OT3TJ'DXJTJTIXJt3TJ OOOOOOOOOOOOOOO
T-T-T-NNNnnn^v^
TJTJT>T3T)"0"OTJT>Bt) _ oooooooooooo
" o o u o" o" o" o" o" o" o" a
TJTJTJTJ'ü'DTJTJ'D'D'DTJTJTJtJTJ'aTJTJTJ'D'D'D'O oooooooooooooooooooooooo SSSSSSSSSS S22S2S2S2

■O m 3
10 in CM
? g
? ?
s a 5 S ? 5? naSS
£ £ 1 S ■c t: " ™ a a o o
* " S ? o o £ £
£ c a a
. 2 ? ??: ? ?
E S i ? ? 2 2 a a E 2
OSS
S 5 S I?! Ill lii « 33 33 U CO CO
_ - . _ _ _ tO O T-
I ? 1 1 s s ? II ° °s?l ■£ £ 5 £ o o ■£ O O CO « o o o
N(D O r (Or-N
«I g' ^ • g O o "C * — —
E E s s I I • 2 ° ° is -g
- £ » 5 2 s I I ? g s s I 1 i i I I a. CL ü o < <
c E i £
* * I o © ° « a» E
* ? I 111 o o 2
CO w Ü O CO CO UJ Ü WKW
CD CO
(0 O r ^ Ifl t
o» CO
CO to
o to to io -^
o» to CO CN *- o>
O CD o o CM CM
*- o> *- o CM CM
CO CO
to LO
to CO
CD £
to CO
LO LO
tO CO
CO CD
CO CO
LO CO
LO CN
LO LO
G „p — tt» U> eP *- CM O y- O u) « M in
co # ■=
e o 2 o *- ■£. ex ._ 5? :
2 « « » « S
T* ;= X)
XJ -O X3 x>
K — -S B * *
■* o *-
CO CO en T-
CO CD f"- h-
NNCMOiNNntonnnn^^f^v1*
T3 T) TI TJ TJ T3 ■<r *T -v ^ ^- ■*
CMCMCMtNCMCMtOCOtOCOCOCO
XJ* XJ~ XJ~ XJ~ XJ" T3 TJ" XJ XJ~ XJ XI XJ
*r ^r ^r T ■V ^-
XJ *0~ TJ" TJ" Xj" XJ ^ ^- ^- -^ -^ -* üövvsööv OSOVOOOOtlOVVOIDl). — — - - -
XJXJXJTJXJXJXJXJXJXJXJTJTJXJXJXJXJXJXJTJXJXJXJXJ oooooooooooooooooooooooo SSSSSSSSSSSSSS 5 S S 2 5
CM tO i-
o u) s n o to
CD CD LO CD o (Ö ^ O 09 (O S (D IO U) ^<
o o o o o o LO LO LO LO LO LO
CM a. c J=
Q CM »O <
3 «2
^ « 8 3 HI O 3
CO CD *- CO CO T-
jg> 5 D)
CO CM CD T- ,- <T- CJ> T- ■r- -r- O i- t-
■«- CD ^ CD CM ▼- •*-
| I o g J # = ^ CM O O IO io to Hi
75 TJ
•> £ <D « «J
^ o o o
o o o c a is £ a
u <a XJ •o T* a» ■D ■o •» u
o o o O o o til O e> o O DC O (!) z to Ü
to CO o to CO LO ■* CO CO ^> ■V LO ■* ■* LO
ir x: JC x: O» O) 0> 0> : !c !c x= !c J
o o o o o LO LO LO LO LO
o o o o o
CO CO CO T- TT
o o o o
LO CO o o to rr s o m IM
o> I*. T- to CM CN
o >
0£
o o
E
CO CO CD *- *- CM
O V fi Q V C ^ ^- ^ -^ ^- ^-
XJ T» XJ XJ XJ XJ o o o o o o 5 S 5 5 2 5
r— o-»-LOtoo>T-^-r-i
CNCMCOlO'^rtO'^COcN
(OonincoN'-^ws
oooooooooo lOLOLOLOLOLOLOLOLOLO
T ^ ^ "* •V ^ ■v OOVIDAOOOVO XJXJXJXJXJXJXJTJTJXJ OOOOOOOOOO SS2SSS22S2
CM CO LO CD CO T CO to to o eO to to to ^*
O CD i- t*~ CM tO OJ ■* CM CO CM CM
CNOCDi-CDLOOO .. (DNOWtOiOP) (DintDIONNIO^n
ooooooooo LOlOlOLOLOLOLOtOlO
XJXJXJ----- ooooooooo

-5 § o 3 £ £
■o >* = to *o — ® 5J J=
- 5 * o 5 o *■ 01 «
3 3 .£ 3 «J O O
CO O CD O O
in co «- CM co -^r -sr -q-
JC X: O) OI
JC C
■o sz xj -a v o) to m E x: E E
m E
CO T- •^ in
i- O CO t- in ^r •* to m
o o o o o
o o o o o
CD CO CO CO CO N o> O) n m
CO CO
^ ID (D N N
tOtOtOCM^-^CMCO
i- CM r-- O) t- •*- CM . N(OOT-r(MNO)
oooooooo mwiommioiom
x:x:x:x:x:x:x:x:
"55 "© "Q "5> "55 T5 "© _ ■OTI'ODTJ'DTJTJ OOOOOOOO 22222222
o E E in
c 3 o"
CD # still
- p * c o E .a a o o E — ^ co 5 N ^ o o co to CM to w
S = = = s ° « S x, r r - = E <t> 5 co to a» >, =
203ÜÜÜ>Z 3
(0(DCOO>^COT-N^- * n n in co T-
£ x: x: "o o> o> o> tu Z Z Z E o o o o m «o to w
o o o o
*- co to in m CM O O O O) 0" CM CM CM T-
Ö Ö Ö Ö
r». -^ CM *- r- ^ r-. CM CM *-
H 22 2 Z. Z. S*
___oooj=Ej=fc _iZi_iZ22waco_i
co co co o co
toomor-^-toco _
CMO>i-<D-^-CMOO
ooooooooo lotommmmmintn
TS'tpTiiTS'ÖJ^i'cD^i'tD TJ'O'OTJTJTJTJ'O-a ooooooooo 22222222
to co fe MM0» •c -c o
o o o ja £i
£1 XI £= =§ ■■- a>"
I- «0 - *
• & s
-I S E
o "3 © fc E E _j _j
T CO CO CO i*. in CM m -^ ■* co co ■*
010)01
o o o
*- CO CM io n ^ CM CM CM
CM T- *-
£ £ £ f £ 0)01010)0
o o o o o u) ui io in in
o o o o o
*■— CO ^" o> CO CO CO ■*— CO ^" CM CM CM CM CM Ö Ö Ö Ö Ö
O) N N m V CO ■«*■ *- O t- CO CO <-
NIDOtOOWi-S
COCNCOCMCMCO^-CMCOCO
coincoocoocococT) cn-^-i-cocor-cococo inirmnntDNNiou)
oooooooooo mmmmininwmmm
ÜÖÖOOVÖivÖÖÖttÖÖBib CD 4) (D ■0"OTDTJT>TJTJT3-OTJ,OT3T3T3-OT3-0"OTJ OOOOOOOOO 0|0 OOOOOOOO
,3 W ~ C O a: -O « £ O E JJ "£ *■_
O p -j 3 O
§ « I * " — CM O O O in Z m m
£ & S s
° O CM -^
s s « to
co o > O CO CM
o» a> c x: 00 o
x: x: x: x: c O) O) O) oi o» x: * x: x: x: x: o o oo co oo ao in m ■*- *tr ^r T
io co co to co in (O T- N r N S T- CM CM CM CO CM Ö Ö Ö Ö Ö Ö
tT CO CM CM i- CO 00 CM T CO CO CM CM co -: co in T
_ier en o> o> ^r CD o CD N 0)f"- oo^-^-^r
to O) O) i- IO o (M N o n i- w
-r- CM 1- T- T-
T- m to to oo CM IO *- Oi to T- lO -^ CO CM
ooooooooo loinininminioioio
S E 2 2 2 2 2 2 2 2
£ CO O "O o- x: c a to p 3 «
or TJ ^ „ 3 p M <o a>
S E £> "5 1? C! io m £ m m CM o> ® > ■*- m CM D <
xt xi -c XI
>, >» o> >.
cocDr-tooO'T-Oio lo-veo^-'j^-coco
co o> m to t~ co co n T- ^ co T co co in T xr ■*
O^COCOtMCMCMCO •r—OlT-^COfDCO*— inncocsmN"
OOOOOOOO loiniommmmm
"5 'S 'S "v 'S ~5 'S T3T3TJT3T3UTJTJ OOOOOOOO 22222222
c? ® a a> "" -O 3 M
_ M O
S I S - § io <o # H CM CO ■*- N «I ID IO
o a:
C/3
r o a
M
a a
■■ o f ?!
ft si; 3 3«? SSI s i -
i fs t fi
8 ? S 2 ill?
S S S B S to to » to to
IO U> IO IO
to to to to CO CO CO CO o o o o Ö Ö Ö Ö
o o o o ö ö d ö
m m t- I--
*r ■«■ CM -v
to i- o ■*
co m r** r*. CM CM en O) 03 CO N N
t- in o co o o -«r to T- ^- o o
o o o o in m in in
in m io io m io m
"to • "5 "to « "to » ■O -O Ü T> T3 -O T) O O O O o o o

g g ■a S
g £ M W •>
o o o o «
g g CD (B
2 O © 3Z 2 S ? ? s
gig
_ _ C • • £ ? E ? ?
O «0
« 3
1 1
||s sffl 2 2 e « 2 3Z _ s. & s s I £
www
c? ?
at a CD
11111111 _ H> — V — M
SSI s » s s s (0 CO (0 CO CO CO CO
S (D f ID T- l-T-^^ll)(0^inT-T-
° ° 8. 8. „ „
««ggOfflOOffl« g?..gg»£gg
IIIIIIIIII 3= 33 CD « 3= Ä JE £ 35 — Q}CO>><0t»<<COCO
scD'-OT-on'-NaJ
£ £ TJ T) O) O) CD CD
in in to to
CO CO CD CD to w n n o o o o Ö Ö Ö Ö
to to co m in m in m o o o o ö ö ö ö
•<t m <D to <o f- «^ cri r- -- *- o CO CN G> CN to CO t-
tr m o> in CN CM CD O CO 00 N CO
n ro ^ *- ▼- -V -- -- O
CD 1*»
m
K <i> ^ to E
E
to o o .£=
fti m "V ^
* 8
g g ? g ? «? 2 32 2 2 2 _ to co m m to a ■>= ■*= ■= -= -S -E « v « « •> « o o o o o o
???!]] « CD « CD « •
a a a a a a
=5 S « S T= -£
£figgggg?gg g g g g
£ M M 2 2 2 2
OOOOOOOOM
«••«coco««-
— * • 2 CO CD CD
£ £ s. _ 9 8 B- _. n
• S E • • a & & I &
--???????? 1 I I I I i 1
t = lt.ii?88?? ä(E;>?ir5äo:n:o:o:a:^^'~,~'" T-(OS(DOi-rOS0Drr-OIMDOt-i-OMCO*-
i i I E i 1 1 »n^-wco^-^-w^r
T-««NWMWN«nno»nnnn^*st^^*^
T-«N«NNN(N««noe)nnnnv^^^^fl«»
cgwwwMNnnrtnnn^^^^v^
WN«N««nnn»Bn^'r9tt^T-T- ü ji n n ü
S E
O
© =3 c/j on a: c o o. 0)
S £
a a
i i
ON
<
OOOOOOOOIVI) CD CD CD CD _____ _ _ _ ___ _ _ _ _ ooocoootio T3TJTI"OT3"0'DT3"OTJT3t3"0'OT3-OT3"OT3"0"D"OT3'DTJ OOOOOOOOOOOOOOOOOOOOOOOOO
<DCDCDCD(D<D(DCD4>4) CD CD CD (D 'OTJTJ'DTJfl'OTJTJtITJTJTJXJTITJTI'OT)
O0t)O(DCDtt(D TJ T3 ü "D
2 S 2 S 2 5 2222222222222 oooooooooooooooooooooooo 5 2 5 5 2 22222222 2 5 2 2 2 2

r». m in
8 g
_ = « CO ■* ■* ■*
g g
£ £ £ -fi o o • © ■a -a £ 2 c e vi 01
* 5 1 I t E g g
ST ST ST E" ^ ^
EBCDailBainGiei-C €>»««„ „C©(fl
oooo " " o o o
? ? « <n CD
i I
g S 2 & 8. SI
5 5 2 0 2 Ü
hq
ua
hq
ua
Hno
,
Ö g 5 3»
g g a ca w u « g g g
111 u u u u u
g g g 111 o o T- © N
I 1
g g _ _ I 1 U U Ö u »- O CO T-
io ^ t ^ in (O io
05 O) O O
CM i- ■«- T- CM CM a> a> CM CM CM CM
OOOO in in in m
•r-T-T-*-CMCMCMCMCMCMCOCOCOCOCOCO
T-T--<-I-CMCMCMCMCMCMCOCOCOCOCOCO
o" o o" o" o" o" o" o" o o" o" o" o o" o" o" mminmmmmmmintnminmmm
TJTJTJTJTJTJTJTJTJTJTJTJTJTJTJTJ OOOOOOOOOOOOOOOO
2 5 2 2 2 2 5 2
TJ 3 «0
N N S K
1 f
i e o o o u u u S £ £ c c c o o o
0)0 0)
o in v
o o o
r^- r-- CM
co co m
r-: «
oo in r- N co n 0> O) o
(ONO
o o o in m m
o o CD a) "O TJ TJ -a oooo
O CM O O »- m s m
* 5 * — ff CD *?« £ a * CM i g
2 e # ED Ö «
I li |i i So*
CJ> 0> 0) CO
m o ■*- o
oooo in m in m
oooo in in in in oooo
T3 TJ T) T3 OOOO
Is- in in # ao CM o> o o
n to « n id
in CD co I*- oi n ^ v w n
O N N (D 03
o o o o o in m m m m
m m m m
TJ TJ TJ TJ TJ O O O O O 2 2 2 5 5
ii m in TJ sP do H CM a> c oo o •» B M1 Ot * U)
1 g n w «
8 a » t 1 CD CO
f o M £ xs m
f
« c CO
1 ■a
3
I I c
2 O
C
it o
S
c
CB "5 s 1
s 1 CD
CD t: «
1 8 8 • V) 8
CB
a
* £ « >» s c i i 3= g 1
?■ f ■a f .*• a s s s 5 (0 K s s o o» ro a> N. in N- CD en o> CO ■v ■*■ U) in <o m ■*r m CO
E CO CO
in co CM CM
CM m
T- o o o co CM N n IO (O O 00 N GO N (O
o o o o o o in m in m m m
CD o o « o o TJ TJ TJ TJ TJ TJ O O O O O O 2 2 2 2 2 2
m Z ■» i-
r-- -» ■*■ r-- co
m p) t t . co co m m •«- N S O) U) «-
OOOO- TJ TJ TJ TJ TJ O O O O O 2 2 2 2 2
E c
^ 5 « - &N Ö <ö •
S ° o t Z tf)
I 1 F O
■& s
o S -o ■= c S S. i_ (n t> o 5 ° S I 5 8! g
o
o
on
•a ? CO
s. o
■c S • & » • £ a 1 i
o fl « o g 2
n CM (0 in on m r«-
r-. r~ r*. in m CO CO CO CO CO o o o o o
TJ .C .C t) O) OI E H 'E o o o
r— i*- r—
O
i <
*~ o r^ m o o> in co -rr co -^ o co co in f- t <o co co co
S K CO W CO t- f O) CO N O) O CO (O ui s t to a co oi
in m in in m m m Ö Ö Ö Ö Ö tt Ö TJ TJ TJ TJ TJ TJ TJ O O O O O O O 2 2 2 2 2 2 2

Report RSS/J0101R04 Rev 0
APPENDIX B
SUMMARY OF DATA
Time histories of acceleration, excess pore pressure and model configurations Stress and strain histories
B-l

Report RSS/J0101R04 Rev 0
0.25 0.20 0.15 0.10 0.05 0.00
-0.05 -0.10 -0.15
0 10 20 30 40 50 60 70 80
T
No recorded PPT Data
0 10 20 30 40 50 60 70 80
0 10 20 30 40 50 60 70 80 100
-ACC 575AZ J. ACC 3457
■ ACC6835-_- . • . • . • . • _. . . . . .**. W ACC 7709 dense sand layer, RD = 83% • •
'ACC7319'-'-' Y„= 105.9 IWF •' ACC 7706-• ' . . . . w.—:—;—:—:—:—:—:—:—:—:*£...'.
ACC 7771,; PPT 10' loose sand layer,
RD = 44% y4 = 99.8 lb/ff
I ■ ;ACC 7828, . ::PPT9
• ACC7318-&-:•.-.■.•.■.■.■.■.■:■ &: Accrm
■ ~T 55
1 70
+ 66 160
19
T* Cross-section through Model 2a 50 G ACC 7314(1
Model 2a
B-l

Report RSS/J0101R04 Rev 0
Model 2a-eql
Cyclic Stress Ratio
0.00 0.05 0.10 0.15 0.20 0.25 0.30 0C
Q
Model 2a-eql
Cyclic Shear Strain, %
0.5 1.0 1.5 2.0 2.5
Model 2a-eql
Cyclic Shear Stress, kPa
10 15 20 25 30 35
Model 2a Stress and strain isochrones
B-2

Report RSS/J0101R04 Rev 0
40 60
Time, sec
ACC 5754 ■S '■'•'■'•'•'•' ■'i- '■'••&' ■ ACC 7706 ~
"ip'r-ini "-P " denser sand layer, • ■ •« -ACC 7771 ACC7828-. ,-_ ^, = 75./. .". . .".
rd-io"«*' ■:-:-^:-;Cc7726 TT.■.■. i . ■ . i
ACC 12613.
ACC12611,:;:-:; loose sand layer, ;:;'.; :;-. ;ACC 12612, ppTio:*f:: RD=5O%
:::::#:
:PPT3O
:.;.;.;.;'■:'■;'■: Td=ioo.7ih«p ::■:::•:•::::::::
:::: > ^ACC 126O8 0: •: ■ i •: •: • I •: • I • I ■ i :fe.Acc 12610' ! 11 ■ 111 ■ 111111 ■ ■ 11111 ■ 111 ■ ■ ■ I ■ 111 ■ 111 ■ ■ ■ ■ ■ 1 ■ ■ 11 r-t-T-fri
+ 74160
-4 13
Cross- section through Model 2b 50G
Model 2b
B-3

Model 2b-eql
Excess Pore Pressure, kPa 60 80 100 120 140
MOsec
t=15sec o T t=20sec
v t=25soc
• t=30sec
D t=40sac
♦- — t=10Osoc
Initial VES, Meas
Initial VES, Calc
a u Q
_l L_ _J L_
Report RSS/J0101R04 Rev 0
Cyclic Stress Ratio
0.00 0.05 0.10 0.15 0.20 0.25 0.30 0.35 0
2 -
E 6- -4-* o. 3 *
10
12
14
i i
-
- 1 !\ i i\ o m
- / //
; // ■, //
- \ \\ / / • o
t=5seo t=10sec
i vV 64 i i i i
v
1 1
t=20sec t=30sec t=50sec
i
oo 0.15 f=0.6Hz amax = 0.08g
0.0
20 40 60 80 100
Time, sec
Model 2b-eql
Cyclic Shear Strain, %
0.5 1.0 1.5 2.0
Model 2b-eql
Cyclic Shear Stress, kPa
5 10 15 20 01 L, i I I
• \>^
2 -
4
AJ -
e 6 \ T ) ..'.:0
X! -4-J
8 - 1/ Us^ t=5sec Q o t=l0sec T t=20sec
10 - -fv\ V t=30sec • m — t=50seo
12 i "o VV
25
Model 2b Stress and strain isochrones
B-4

0.10 0.08 0.06 0.04 - 0.02 b 0.00
-0.02 -0.04 -0.06 -O.08
Report RSS/J0101R04 Rev 0
< 0.02 - 0.00
-0.02 -0.04 -0.06 -0.08
0.08 0.06 0.04 0.02 0.00
-0.021- -0.04 -0.06 -0.08
0.08 0.06 0.04 0.02 0.00
-0.02 -0.04 -0.06 -0.08
Depth=llm _i i i 1
30 40 50 60 20 30 40 50
Time, sec 796
60
•P\\ •.-.•.•.•. I ■ ACC 7319, PPT 37 fe © . ACC 7726, PPT 42 •.•_• dense sand layer, RD= 74% ' .• ' ".■.".".".■.'. . . »,-] 04.4 IMP ".". ACC 12610". ■.*. .'.ACC 12817 ...
. ACC 12609, PPT 41 V:-:m-:m-:-:-r-:':':':-:m ACC 12815, PPT 49.
•: •: loose sand layer, RD=49% :•:•:■:•:•:•:■ •^: yd= 100.5 IMP :^-'Acci26M ■?■ ■.-■-■-■-■■■-■■ ■-■-■•^
Cross-nctton through Modd 2c SOG ACC7314-B
Time, sec
Model 2c
B-5

Mxiel2oeql
Excess Pore Pressure, kPa
10 60 80
Report RSS/J0101R04 Rev 0
100
t=50sec t=55sec o
T t=60*sc V H70MC m — t=SOsec D t=90jec • WOOsec
Initial VES,Meas Initial VES,Calc
120
f = 0.6 Hz a = 0.06 g max «•«« 6
10 20 30 40
Time, sec
0
2
4
6 S
f 8 <0
Q 10
12
14
16
0.0
Model 2c-eql
Cyclic Shear Strain, %
0.1 0.2 0.3 0.4 0.5 0.6 V^ ' I i
\ '^•"•»«i»
- V ""^ t=10sec _ t=30sec •-0-
\ 1 —T- t=45sec -
y? y?
yy yy
yy
°€ - NN - NX
N\ -
I i i i i
Cyclic Stress Ratio
0.00 0.02 0.04 0.06 0.08 0.10 0. 0
4
6
8
10
12
14
16
12 0.14 0.16 i 1—
0«
2
4
6
f 8 B
a <u Q
10
12
14
16
■■.0
-O t=5see t=10sec t=30seo t=45seo
nz
Model 2c-eql
Cyclic Shear Stress, kPa
12 3 4 5 6 IV-.i ' 1 r i I
A
- 'S " "-0 O t=10seo " ▼ t=30seo
V- V t=45sec
K\6 - \ V;.
\ X \N.
V. \ <
\ \
\ \
< k > T 1 1 1 1 1 1
Model 2c Stress and strain isochrones
B-6

Report RSS/J0101R04 Rev 0
Depth = 14.5 m i i
40 60
Time, sec
40 60
Time, sec
ACC 12806 S • ' ■B- ACC 12816 •
ACC 12801, • .fe •. «taue sand layer, PPT2-'- •' RD = 75%
Acc 12609,•:•:•: ^««IMP
PPT3 '&'.'.'.'.'.'.'.'
.©•■ACC 12821, ■ -PPT7
. . ACC 12824, -^^ PPT 41
ACC 12610,: PPT31 •
loose sand layer, RD = 50%
yt = 100.7 lb/ft1 ■■&:■
ACC 12814, PPT8. :•:•:■:■:■: -«.ACC 12815, PPT 46.
liiiiiiiiini mm illinium nun Cross-section through Model 2d 50 G ACC 7314-1
+ 40
i 140
75
"160 lio
Model 2d
B-7

Mxlel2d-eql
Excess Pore Pressure, kPa 40 60 80 100 120 140
t=15seo t=20sec o
-T t=25sec v t=30sec m- — t=35sec □ t=40sec
♦- — t=60sec 0 t=100sec
Initial VES,Msas Initial VES, Calc
Report RSS/J0101R04 Rev 0
Cyclic Stress Ratio
0.00 0.05 0.10 0.15 0.20 0.25 0.30 0.35 0D>==^—-i 1 1 1 1 1
(X
16 _i i i i i i_
f = 0.6 Hz amax = 0-13g
Model 2d-eql
Cyclic Shear Strain, %
0.0 0.2 0.4 0.6 0.8 1.0 1.2 1.4 1.6 OCk^
t=10sec
o t=15sec T t=20seo v t=30seo
m — t=40sec
D t^50 sec
J3 a Q
6
8
10
12
14
16
Jfe-.^J 1 1 1 1
■\
.•■' \
\ ***
tfr/ Vb N
-
i i i i i i i
Model 2d-eql
Cyclic Shear Stress, kPa
10 20 30
Q
40
Model 2d Stress and strain isochrones B-8

0.3 0.2 0.1 h 0.0
-0.1 -0.2 -0.3
~i 1 1 r
0 20
umm Surface
j i i '
Report RSS/J0101R04 Rev 0
40 60 100
nil "in inn 11111111111111111 I^T i 3
Cross-section through Model2e SOG ACC7314**
Model 2e B-9

Model 2e-eql
Excess Pore Pressure, kPa
20 40 60 80 100 120 140 160 180 200
Report RSS/J0101R04 Rev 0
Cyclic Stress Ratio
0.00 0.05 0.10 0.15 0.20 0.25 0.30 0.35 Ot
40 60
Time, sec
Model 2e-eql
Cyclic Shear Strain, %
O- "f- V
t=10sec t=15seo
t=30sec t=50seo
0.0 0.2 0.4 0.8 1.0 1.2 1.4
E
Q
Model 2e-eql
Cyclic Shear Stress, kPa
10 20 30 40
Model 2e Stress and strain isochrones B-10

Report RSS/J0101R04 Rev 0
öD
c
2 <a
*ö> o u <
dense sand layer, RD = 75% ACCI2806, ■.-.■ L-104.51W . . Accl2821>
PPT 15 6- ' »• PPT 31 I I I I I I I I llllllllllll—t—■—I II I I
ACC 12609, PPT 47 |£.:.:.;.;.;.:.;.;.;.;. w ACC 12808, PPT 50 . ■:■:•:•:•:•:■:•:• i-ioosesandiaya, RD=5O% :•:•:■:■:•:■:•:■:•: j:;:;-.;:;:;:;:;:;:; i,-100.7 IMP :::-:-:::":-:":-:': : Acc 12811, PPT41 :•;.:■:•:•:•::::: o >: • ^j Acc 12815, PPT46
iiniimmiiiiiimiiiiiiiim iiiiiiiiiiiniii^» Cross-section through Model2f SOG ACC73140
Model 2f
B-ll

Nfodel2f-eql
Excess Pore Pressure, kPa 40 60 80 100 120 140 160
«5 sec t=40sec o
T t=45sec v t=50seo B — t=55sec D t=60sec
♦- — t=80sec ——0— t=120sec A M50sec
Initial VES,Meas Initial VES,Calc
0
2
4
6 e a. Q
10
12
14
16
0.0
Report RSS/J0101R04 Rev 0
Cyclic Stress Ratio
0.1 0.2 0.3 0.4 JF-——-^^—'
- w\ Y\° \\\
1 (
TT9 \ l 1 1
- w v ▼ b •
i ■ '
f=0.6Hz amax = 0.2g
40 60
Time, sec
Model 2f-eql
Cyclic Shear Strain, %
O t=10sec t=20sec
f t=30sec
V t=50sec
0
2
4
6
8
10
12
14
16
0 1 2 3 4 5
" -;;0
"if /" -
"it \ \ N
-£ \ X •o v > :
■ ' 1 •
Model 2f-eql
Cyclic Shear Stress, kPa
10 15 20 25 30 35
X!
% Q
a.
Model 2f Stress and strain isochrones B-12

Report RSS/J0101R04 Rev 0
20
Sä o
Z3U i i i i
200 /—- 150 100 - / 50 0
' / Depth = 22.5m " ' rill-
20
40 60 80
Time, see
40 60
Time, sec
80 100
Cross-section through Model 3a 50 G
B-13
ACC7314
Model 3 a

Model 3a-eql
Excess Pore Pressure, kPa
100 150 200 250
25
t=10sec 1=15 sec o
T tr=20sec <j t=25sec > — 1=30 sec D t=40sec
♦ t=60sec
0 1=100 sec A t=150sec
Initial VES, Mess Initial VES, Calc
Note: PPT at 15m appearsto have stopped responding at 15 seconds, or 10 seconds into shake
0.00 0
Report RSS/J0101R04 Rev 0
Cyclic Stress Ratio
0.05 0.10 0.15 0.20 0.25 0.30 0.35
10
20
25
30
J~- ^ l~~ 1 1 T " 1 i
^^^^r~\ . / / : \ / \
11 o > \ •■ \ -
\ \ ; \
K \ ? t / / i
< v «»■ \ \> v Vo #
i i i J 1 1
BO 0.3
Depth = 26m
f = 0.6 Hz
40 60 Time, sec
80 100
Model 3a-eql
Cyclic Shear Strain, %
O- t=10sec t=20seo
▼ t=40sec
V t=60sec
0.0 0.2 0.4 0.6 0.8 1.0 1.2 1.4 1.6
Model 3a-eql
Cyclic Shear Stress, kPa
20 40 60
10
f 15 e f Q
20
25
30
Y>»-^^~" i i i i i i
'•^^"^-^ 'Q'F^f :• / 1
' ss / <? /
- \ •• / ~
v: / - /! /-, - Vv^-*^0-..
^v^. J^?*'-'0 -""""T"
^*^***^ "^ i or ^v 1
i i i i i i i
Model 3a Stress and strain isochrones
80
B-14

Report RSS/J0101R04 Rev 0
Model 3b
:::::::::::....ACC:™8:;T::::::::::::: -= 100.6 IMP •:■:•:•:•: PPT H,ACC7319-1I.:-:-:-:-:-
50 G Arn 7ii. %
Cross-section through Model 3b
B-15

Model 3b-eq2
Excess Pore Pressure, kPa
100 150
Report RSS/J0101R04 Rev 0
Cyclic Stress Ratio
0.25
Model 3b-eql
Cyclic Shear Strain, %
0.0 0.2 0.4 0.6 0.8 1.0 1.2 1.4 1.6 1.8 00—
—• t=10seo ■••O t=20sec —▼ t=40seo -V t=60see
Model 3b-eql
Cyclic Shear Stress, kPa
10 20 30 40
30 _i i i i_ _i i i_
50
Model 3b Stress and strain isochrones B-16

0.06 0.04 0.02 0.00
-0.02 -0.04
öD -0.06
g 0.06 •2 0.04 g 0.02 ü 0.00 g -0.02 o -0.04 < -0.06
0.12 0.08 0.04 0.00
-0.04 -0.08 -0.12 -0.16
Report RSS/J0101R04 Rev 0
60
40
20
0 T WP I
^tii»^HWf*(S^MVM
Depth=5.3 m j i i i
•„r«in»»n>i«iwq«Mw'
40 60
Time, see
Model 3c
ACC 3457, PPT 6,- ACC7709. ■
dense sand layer,
ACC 12613, ACC 7706,. -^.. ' Jtk.' .' .' RD " 78°/o
PPT2, PPT5. ■. ■. • y. ■ . ■ . ■ Y4- 105.1 lb-fP
PPT1,ACC12612
.».• ACC 12611, PPT 11, PPT 16
PPT 15, ACC 12608 ■
ACC 12610, PPT30,: ■ PPT31-:
• loose sand layer, ■; '■ RD = 49% I yd= 100.6 IMP
•:■:•:■:■: PPT IO4ACC 12609©.:•:•:■:■:■:■:■:•:■:•:•:■ :üio
4-T
Cross-section through Model 3c ACC 7314 .
B-17

30
^0.12 g 0.08 h •|0.04 g 0.00 «•0.04- 8-0.08 w-0.12
a,
Q
Model 3c-eql
Excess Pare Pressure, kPa
100 150 200 250
t=3sec t=10sec o
v t=15sec V-— t-20sec m — t=25sec o t=30sec
■——• 1=40 sec ——0 t=603ec 4 t=100sec
Initial VES,Meas
Initial VE$ Calc
Report RSS/J0101R04 Rev 0
Cyclic Stress Ratio
0.00 0.02 0.04 0.06 0.08 0.10 0<
f=0.6Hz ^» = 0.07 8
20 40 60 80 100
lime, sec
Model 3o-eql
Cyclic Shear Strain, %
1 2 3
O t=10sec t=20sec
▼ t=40sec V t=60sec
Model 3c-eql
Cyclic Shear Stress, kPa
10 15 20
Q
25
Model 3c Stress and strain isochrones B-18

Report RSS/J0101R04 Rev 0
Model 3d
Cross-section through Model 3d
B-19

50
Model 3d-eql
Excess Pore Pressure, kPa 100 150 200 250
Report RSS/J0101R04 Rev 0
Cyclic Stress Ratio
0.4
oo 0.3 C 0.2
■% 0.1 -
6 < L ■g -oi ■ 3 -0.2 < -0.3 J L 1_
= 26m
f=0.6Hz a^-O.Wg
20 40 60 80 100
Time, sec
Model 3d-eql
Cyclic Shear Strain, %
■-0
t=10seo t=20sec
▼ t=40sec V t=60seo
Model 3d-eql
Cyclic Shear Stress, kPa
0 10 20 30 40 50 60 70
30
0
5 -
10 -
B +-»
u Q
■B 15
20 -
25
30
it- r i i i i i
^\ - V-X -
W 'o x - \\ \ \
-
VQ \x '•• \
r > \ U o V \\
"■^ Ö »
i i i 1 1 1
Model 3d Stress and strain isochrones B-20

Report RSS/J0101R04 Rev 0
ÖD
§ 1 u u o u <
0.3 0.2 0.1
0.0 -0.1 -0.2
0.20 0.15 0.10 0.05 0.00
-0.05 -0.10 -0.15 -0.20
0.20 0.15 0.10 0.05 0.00
-0.05 -0.10 -0.15 -0.20
0.3 0.2 0.1 0.0
-0.1 -0.2
Depth = 5.4m L ueptn = 70 60 h 50 40 30 20 10 h
-10 ^
_j I p
Depth = 5.4 m _i i i i i i
T 1 1 r
i Depth = 11.2 m
_i i i i_
n r
120 100 80 60 40 20 0
-20
~i 1 1 1 1 r nnmiini|iiinii minUM»*«»!*»!
Depth= 11.2m _i i i i i i
_J I I L = 14.6 m &
1 ' n
l Depth =
HPBP _i E i i i
I 250 = 18.2mJ * 200 -
8 150 a loo h
(3 50
- <a
Depth = 18.2 m
300 250 h 200 150 100 50 oW
-50
Depth = 25.6 m
LVDTstub
40 60
Time, see
100 120
Model 3e
0 100 200 300 400 500 600 700
Time, see
-796-
denser sand layer, RD = 75% .•.•.■.'
.' .Vaccl&lO. (.•.'.•.•. •«*.H|*.13JHPPTi«.
■HBCC12B0KPPT-39-
; I loose sand layer, RD = 50%
;ta:Häoc326>XfFra8:
:fejiaceiiaw;per:35:
B-21 Model 3e Test at 50 G
11 J
I 69
4 71
4- 80
4
AccBonleft Acc 12816 on right '

Model 3e (Archtest 2a, no weight)
Excess Pore Pressure, kPa 100 150
Report RSS/J0101R04 Rev 0
Cyclic Stress Ratio
0.1 0.2 0.3
80 100 120
Time, sec
Model 3e-eql
Cyclic Shear Strain, %
• t=10seo O t=^20sec ▼ t=*tt)sec
V t=60sec ■> t=70sec
c ) i 2 3 4 Ul
\
5
1
n 10
& -
£ _
CX d> Q %x
20 - n\ ul*. W=~~» 25
i
Model 3e-eql
Cyclic Shear Stress, kPa
20 30 40 50 60 70
Model 3e Stress and strain isochrones B-22

Report RSS/J0101R04 Rev 0
ÖD
C o
1 13 Ü u <
182.5
0 200 400 600 800 1000 1200 1400 1600
Time, see
Model 3f 50 100 150 200 250 300
Time, see
B-23

Model 3f (Half Scale 100g)
Excess Bare Rosine, kft
100 150
Report RSS/J0101R04 Rev 0
Cyclic Stress Ratio
0.05 0.10 0.15 0.20 0.25
100 150 200
Time, sec
Model 3f-eql
Cyclic Shear Strain, %
0.5 1.0 1.5 2.0 2.5
-O t=25sec t=50sec
—▼ t=100seo •-V t=150sec
Model 3f-eql
Cyclic Shear Stress, kPa
3.0
a.
Model 3f Stress and strain isochrones B-24

Report RSS/J0101R04 Rev 0
-796"
ACC 12823 .ö." .".' .".".".".'.".'. ^ ACC 12824 .
ACC 12608 -I ACC 12826
denser sand layer, RD-80%
yd= 105.4 lb/fi5
ACC 12611
ACC 12804 s*
ACC 12806, PPT38 '.".'.'. "Phnaliesmftce .'.■.■ .Acc 12807, PFT51.
ACC12609,PPT43^;;:;
ACC'l281l",PPT35
I loose sand layer, : '■ ^ ACC 12801, PPT 52
rd= 100.5 lb/fP •/.■
T!
115
70
"I 70
,85
W' : 70
Cross-KCtloa through ModtMa 50 G Saturated loose layer, dense layer not saturated
40 60
Time, sec
40 60 80
Time, sec
Model 4a
B-25

100
Model 4a-eql
Excess Pore Pressure, kPa
200 300
S
f I' cu
Q
^-— ■ 1 1
9 * K^^w^
i
0 t=15soc
f t=20sec
V t=30sec
>— t=40see
0 t^50sec
— —♦ t=€Osec
0 t=70sec A t=S0soc
A t=100sec
-, \V ao 0.1S
f=0.6Hz amax = 0.09g
y -0.10 <
80 100
0.0
Model 4a-eql
Cyclic Shear Strain, %
0.2 0.4 0.6
•O- t=10seo t=20sec
Y t=40sec V t=60sec
0.8
10
1 15 (a
20
25
30
-
-
p$ ' *>v*-».«s^
1 1 1
Report RSS/J0101R04 Rev 0
Cyclic Stress Ratio
0.05 0.10 0.15 0.20 0.25
Model 4a-eql
Cyclic Shear Stress, kPa
10 20 30 40 50 60 70
Model 4a Stress and strain isochrones B-26

Report RSS/J0101R04 Rev 0
100 120 140 160
Model 4b
40 60 80 100 120 140 160
Time, sec B-27

Model 4b-eql
Excess Fbre Ftesure. kft 100 200 300
S
u Q
t=10sec t=20sec o
T t=30sec \^ V t=409ec
» — t-50sec D t=«soc
Il£Z MO sec t=®90C
" A WO sec A t=100sec • MIO sec 0- — M20sec
- , t=140soc Iritid VEB, Mt» Iritial VHS, Calc
0.00
a Q
oo 0.3 f=0.6Hz amax = 0.16 g
20 40 60 80 100 120 140 160
Time, sec
Model 4b-eql
Cyclic Shear Strain, %
0.4 0.6
O t=40sec t=60sec
▼ t=80sec
V t=100sec
Report RSS/J0101R04 Rev 0
Cyclic Stress Ratio
0.05 0.10 0.15 0.20 0.25 1 f*—— .._~T~ """ ' ">" " 1 1
i7 ^^T—* s \ \
\ \ \ \
V » P 10 / /
/ /
\ << 15 \ \ t t X
/ \ 20^ # * "
\ \ \ \
25t • * -
->r\ i i i i
Model 4b-eql
Cyclic Shear Stress, kPa
20 40 60 80
Model 4b Stress and strain isochrones
100
B-28

HHHIIIHWWWff»«»
0.15 0.10 0.05 I- 0.00
-0.05 -0.10 -0.15 0.15 0.10 0.05 0.00 Imwwmi*«»
-0.05 - -0.10 -0.15
iyalent Depth = 16.1 m-
iMMmMIMfM
Soil,Dep1fa=l,.8m
T 1 1 1 1 uValent Depth = 20.1 m-
Soil Depth = 5.8 m
iyalent Depth = 25.8 m-
Soil Depth = 11.5m i i * i i
0.04 h 0.02 0.00
» z8:8i cf -0.06 o -0.08
-0.10
alent Depth = 2^.3 m
Soil Depfh= 15 m-
0.00 -0.05 -0.10 0.15 0.10 0.05 0.00
-0.05 -0.10 -0.15 0.15 0.10 0.05 0.00
ivalent Depth = 36.8 m
Soil Depth = 22.5 m"
ivaient Depth'= 40.6 m
Depth = 42.3 m-
Spil Input, 28 m
Report RSS/J0101R04 Rev 0
|-10
£ 70 2 60
<£ 50 « 40 - 8 I» - o 20 - w 0
Equivalent Depth = 32.6 m
-10 180 150 (Equivalent Depth = 36.81 120 90 60 h 30
0 -30 400
300
200
100 0
-100
Soil Depth = 18.3 m i i i i
Soil Depth = 22.5 m
Equivalent Depth = 40.6 m" Soil Depth = 26.3 nv
-j i i i
0 20 40 60 80 100 120 140 160
Cross-Mctk» through Model 4c Lead surcharge (1 weight) on top, 292 lb
0 20 40 60 80 100 120 140 160
Time, sec
Model 4c
-796-
_ACC 5754' , T*. .ACC.77Q9 . •
ACC 7771, PPT 15i
ACC126p8,_PPT6-
ACC 12801, PPT 5'
.'.'.'.'.'.'.'.'?": Afc. 12.76?> P.PT.16. denser sand layer, .'.'.'.'.'.'.".'.'.
RD = 75% ya = 104.6 lb/ft' . • •». ACC 12.814. P.FT.10. !?
ACC 12815, PPT 13
ACC 12804, PPT 46., ; AQC 128P6..PPT 4.7'.
ft
135,
365
•4° fr
'& _ 35
B-29 50G ACC 7314 <

Model 4c-eql
Excess Pore Pressure, kPa
200 300 400 500 600
a ■S
i
• t=40sec O t=50sec T trtOsec V t=70sec m— t=80sec D t=90xc ♦- — WOOsoc 0— t=110sec A 1?=1203ec A t=130sec « t=140sec O — t=150sec Initial VES, Mess Initial VES> Calc
T"
NOTE: Lead weight surcharge of 292 lbs wer 347 in Surcharge at 50g 290 kfo, added 14.5 mof eqiiralent sou
OO0.15 a o.io
■B 0.05 § 0.00
"3-0.05 - O-0.10 ^-0.15
lllgll Input, 28 m
0 20 40 60 80 100 120 140 160 Time, sec
Model 4c-eql
Cyclic Shear Strain, %
0.2 0.4 0.6
Report RSS/J0101R04 Rev 0
Cyclic Stress Ratio
0.00 0.02 0.04 0.06 0.08 0.10 0.12 0.14 0.16 0.18 01
f=0.6Hz amax = 0.08g
t=50seo
o t=60sec T HTOsec
v t=80sec
m — t=90sec
Model 4c-eql
Cyclic Shear Stress, kPa
20 40 60
10
■g 20 a>
30
40
II 1 i
\% ' ^>v
^ \ '■■
\ ■•.
- ^
Vo. \ ■■
-
■
^ V
1
1
'Q
b
Model 4c Stress and strain isochrones
B-30

Report RSS/J0101R04 Rev 0
Model 4d
SOG ACC 7314
B-31

10
20
E
30
50
MxJel4d-eql
Excess Pore Pressing. kPa
0 100 200 300 400 500 600
• 1==10sec
O (=15KK
T t=20sec
V (=409ec
•— t=60sec 0 1?=80sec
« WOsec 0—— t=140sec A 1pl50sec Initial VES,Meas Initial VES,Calc
Report RSS/J0101R04 Rev 0
Cyclic Stress Ratio
0.00 0.02 0.04 0.06 0.08 0.10 0.12 0.14 0.16 01
NOTE Lead wag* sudmge of 294 lbs ewer 347 in Sucharge at 50g 290 kft, added 14.6m equivalent soil
50
Equivalent Inpil. 42 m
f=0.6Hz
a -02 < 0 20 40 60 80 100 120
Time, sec
Model 4d-eql
Cyclic Shear Strain, %
0.2 0.4 0.6
O t=10sec t=20sec
f t=40sec V t=60sec ■- t=80 sec
0.8
Model 4d-eql
Cyclic Shear Stress, kPa
40 60
Model 4d Stress and strain isochrones
B-32

Report RSS/J0101R04 Rev 0
0.3 0.2 0.1 0.0
-0.1 -0.2 0.4 0.3 0.2 0.1 0.0
-0.1
c o
-1.0
100 80 60 40 20 0
-20 -i 1 1 1
Equivalent Depth=25.1 m
Soil Depth = 14.8 m
—i 1 1
Equivalent Depth=28.6 m
MMMMMM*
Soil Depth = 18.3 m j i 1—
en
' PL,
Equivalent Depth=32.6 ml
Soil Depth=22.3 m-
o PL, 05
u
350 300 250 200 150 100 50 0
-50
400 300 200 100
0 -100
l 1
Depth = 36.6 m;
Soil Depth = 26.3 m"
i 1
Input, 38.3 m
il Input, 28 m
40 60 80 Time, sec
100
Model 4e
Equivalent Depth=21.6 m Soil Depth = 11.3 m
Equivalent Depth=25.1 m-
Soil Depth =14.8 ml
f-* I»IIM »II »*« I
Equivalent Depth=28.6 m Soil Depth = 18.3 m:
Equivalent Depth=32.6 m Soil Depth = 22.3 m
_i i i i
Equivalent Depth = 36.6 m Soil Depth = 26.3 m
J I
20 40 60
Time, sec 100
-796-
iSi;:;iii!i::iii:i loose sand model,
RD = 44% yd = 98.6 lb/ft3
; I; I; ACC 12824, PPT 6 ;
PPT 50, PPT 54
ACC 13284
ACC 12825, PPT 46 !•
•/.•/.■/.■/.■/.•::'.■_:■/.■/.■:_PPTE,PPTJS. : 'ACC)2804| \ '.&:::::::: :•::::: •::: '*. '■
ACC 12815, PPT 39 >
4l 160
Cross-section through Model 4e 50 G
Lead surcharge (3 strips) on top, 211.00 lb
ACC 12807 left, ACC 12821 right, ACC 12611
on center lead weight
B-33

Report RSS/J0101R04 Rev 0 Model 4e-eql
Excess Pore Pressure, kPs
0 0 100 200 300 400 500
t=5sec t=10sec
\^ o T t=15sec
4 x 7 t=20sec m — t=30sec
10 a t=40sec
m \ «— t=50sec
\1 \ 0 t=60sec
■Al \ * C
t=709ec t=S0seo
Mi -\ • t=85sec
n 20 lnttalVES,Meas l
i
l
5 lOTAfe. \ Initial VES, Calc
1 30
l , 0 ^T T»0» A
40
NOTE Leadwdght smtage of 211 lbs over 347 in2
SocteRe at 5Ce 209 kPa, added 10.3 m equivalent soil ! ° ° , 1 1 1
0.0
10 -
0.1
Cyclic Stress Ratio
0.2 0.3 0.4
5 20 o, 3
30 -
40
f- 1 1 1
?• \ \\- \
-%. \ -
% \
% \
" ^ \ ~
m. > Y V 0 < \ \ ••.
V. V'b. < > ■
i i i
>
60 0.8 f=1.5Hz
Model 4e-eql
Cyclic Shear Strain, %
0.5 1.0 1.5
•-0-
20 2.5
t=10sec t=20sec t=40sec t=60sec
Model 4e Stress and strain isochrones
Model 4e-eql
Cyclic Shear Stress, kPa
40 60 80 100 120 140 160
B-34

60
a o
1 u u o
0.08 0.06 0.04 0.02 0.00
-0.02 -0.04 -0.06 -0.08
.Depth = 11.6 m
Soil Depth = 13m
ent Depth = 16.1m-
Soil Depth = 5.8 m
T 1
Depth = 21.6rr]
Soil Depth = 11.3m
Depth = 25.1m
MM******
oil Depth = 14.8 m-
valent Depth = 28.6 nr
Soil Depth = 18.3 m i - i
Equivalent Depth = 32.6 m-
Soil Depth = 22.3 m
Depth = 36.3 ml
Soil Depth = 26 m
'' ' :'Depth ='38.3m-
50 40 30 20 10 0
-10
Report RSS/J0101R04 Rev 0
Equivalent Depth = 11.6 m Soil Depth = 1.3 m
__j i i
Equivalent Depth = 16.1 m Soil Depth = 5.8 m
Equivalent Depth = 28.6 m Soil Depth = 18.3 m
Equivalent Depth = 32.6 m Soil Depth = 22.3 m
Equivalent Depth = 36.3 m
Soil Depth = 26 m i i
0 20
Cro»-Kcnon through Model 4f
60 80 100
Lead surcharge (3 strips) on top, 211 lb
Model 4f
40 60 80 100 Time, sec
B-35
•ACC 126W PPT 8 f- 9
ACC 12608,. ACC 12814'
, ACC. 12.82?'.'.
PPT 1, PPT 48
•ACC 12826, PPT 41 ■ . dense sand RD= 75%
PPT.14,PPT39 .
r ACC 12824, PPT.10.-
.PPJ 1.6, PPT 54
■ 9P
I- Jj60
50 G ACC 12816 on left, ACC 12807 on rig

Mx3el4f-€ql Excess Pore Pressure, kPa
200 300 400 500
i»
30
NOTE Lead weght sushage of 211 Vtx era 347 in2
Sa^tase at 5Cfe20pkPa, added 10.3mequiydert sop
Report RSS/J0101R04 Rev 0
Cyclic Stress Ratio
0.20 0.25 0.30
f=1.2Hz amax = 0-06g
-0.08 20 40 60 80 100
Time, sec
Model 4f-eql
Cyclic Shear Strain, %
O t=10seo t=20sec
—T t=40sec
—V t=60seo
0.0 0.2 0.4 0.6 0.8 1.0 1.2 1.4 1.6 0t? 1 1 1 1 1 r
40
'-■0
_J I I L_
—jr~-v
Model 4f Stress and strain isochrones
20
10
'S 20
Q
Model 4f-eql
Cyclic Shear Stress, kPa
40 60 80 100 120
30 -
40
^ 1 1 1— 1 1
V - V\ NfrV vN-SX "\\
Tt M H i \ Ho V
i ' i i —i—i—
B-36

0.25 0.20 0.15 0.10 0.05 0.00
-0.05 -0.10 -0.15
0.20 0.15 0.10 0.05 0.00
-0.05 -0.10 -0.15
0.20 0.15 0.10 0.05 0.00
-0.05 -0.10
oo -0.15
§ 1 B 13 o u <
-I 1 1 1
Equivalent Depth = 11.8 m
Soil Depth = 1.5 m
1 1 1
Equivalent Depth = 21.6 m
oil Depth = 11.3 m j L
Equivalent Depth = 25.1m
Soil Depth = 14.8 m
Equivalent Depth = 28.6 m"
Soil Depth = 18.3 m
Depth = 32.8 m
Depth = 22.5 m
1 1
valent Depth = 36.3 m
oil Depth = 26 m
ivalent Depth = 38.3 m
Spil Input,, 28 m
Report RSS/J0101R04 Rev 0
ea
a i en
PL,
o PH
u
w
-50
500 400 300 200 100 0
#yn****ft**d -
Equivalent Depth = 11.8 m Soil Depth = 1.5 m
Equivalent Depth = 28.6 m Soil Depth = 18.3 m
Equivalent Depth = 32.8 m Soil Depth = 22.5 m
Equivalent Depth = 36.3 m
Soil Depth = 26 m
0 20 40 Cross-section through Model 4g
60 80 100 l^dsurchaige (3 strips) on top, 211 lb
40 60 Time, sec
80 100
Model 4g B-37
; ACC. 7706, PPT 13 \
• AQC 5751, PPT. 46. .
loose sand model, RD = 49%
y4 = 99.4 lb/ft'
■ACC7709,PPT50:
;.-.■.-.■.■.•.•.•.;.;.;.;.• PPT42,PPT6 ACC 12788 *:-:-:-:-:*-:-:-:-:-»;
•ACC 13284, PPT 43-
.ACC.1261Q .PET 53. PPT 37 ■:-:-f-:-^:
ft
M5
5
50G ACC 12821 on left & ACC 12611 on right, ACC 12807 on center lead weight ■

Model 4g-eql
Excess Pore Pressure, kPa 100 200 300
Q
Report RSS/J0101R04 Rev 0
Cyclic Stress Ratio
0.2 0.3 0.4 0.5
BO 0.6
Model 4g-eql
Cyclic Shear Strain, %
f= 1.15 Hz
amax = 0-3g
t=10seo
o t=20seo T t=30sec
v t=40 sec
—-» — t=60sec
Model 4g Stress and strain isochrones
Model 4g-eql
Cyclic Shear Stress, kPa
50 100 150 200 250
B-38

Report RSS/J0101R04 Rev 0
o
o o
3
Model 4h
B-39 50 G ACC 12611 on left, & ACC 12821 on right ACC 12807 on crater lead weight

Nfodel4h-eql
Excess Pore Pressure, kPa 200 300
E
& a
500
MOsec O t?=15sec
~f tp20sec
-V tr=30aec
Hi— tp40sec
t^SOsec
t=60sec 1?=70!
A t-SOsec -A t=90sec
Initial VES,MKB
Initial VES,Calc
6 > NOTE: Lead vwi^tsurcbaige of 211 lbs over 347 in2
Sucharge at 50g 209 kPa, added 10.3 m equivalent soil
Report RSS/J0101R04 Rev 0
Cyclic Stress Ratio
0.00 0.05 0.10 0.15 0.20 0.25 0.30 0.35 0C
10
£ ■*-»
OH
Q
-B 20 OH 5T
30
40
jt- 1 1— 1 1 1 1
\ ^\ ■ \ c\ V Q > \ ■■■•
V Q. * 1
< ° ^ ? \
>9 \ - i 6 \
i i i i i i
00 0.4
f=l.lHz «W = 0.25g
•O-
20 40 60 80 100
Time, sec
Model 4h-eql
Cyclic Shear Strain, %
0.0 0.2 0.4 0.6 0.8 1.0 1.2 1.4 1.6 1.8 2.0 0Q 1 1 1 1 1 p 1 1 1—
t=10sec t=20sec
▼ t=40sec
V t=60seo
"-v
40' L- ' ' i '
0
10
"5 20 OH
30
40
Model 4h-eql
Cyclic Shear Stress, kPa
0 20 40 60 80 100 120 140 IK ' ' ' 1 i i
Vv\ " \ v\ -
V o\ \ '■••.
T °\ -
k O \ V ^
0
V. 1 1 1
h
Model 4h Stress and strain isochrones B-40

u u o <
Report RSS/J0101R04 Rev 0
0.03 0.02 0.01 h 0.00
-0.01 (- -0.02 -0.03 0.15 0.10 0.05 0.00
-0.05 -0.10
0.3 0.2 0.1 0.0
-0.1 60 -0.2 e o
S 0.10 0.05
Equivalent Depth = 15.8 m
Soil Depth = 5.5 m"
Equivalent Depth = 21.6 m-
Soil Depth = 11.3m
Equivalent Depth = 25.1 m-
Soil Depth = 14.8 m
[uivalent Depth = 28.6 m
Soil Depth = 18.3 m
: Depth = 32.6 m
>th = 22.3nr
Depth = 36.3 nv
d Depth = 26 m:
ent Depth = 38.3 m
oil Input, 28 m
-21 350 300 250 200 150 100 50 0
-50
Equivalent Depth = 12.1 m Soil Depth = 1.8 m
Equivalent Depth = 15.8 m Soil Depth = 5.5 m
Equivalent Depth = 21.6 m Soil Depth = 11.3m
Equivalent Depth = 28.6 m
Soil Depth = 18.3 m
illl/*1'*********^**!/!
Equivalent Depth = 32.6 m
Soil Depth = 22.3 m
Equivalent Depth = 36.3 m Soil Depth = 26 m
20
Cross, section through Model 41
40 60 80 100
20 40 60 Time, sec
80 100
Model 4i B-41
796 Lead surcharge (3 strips) on top, 211 lb
riH ;. ACC 7726, PPT 6
'•'. ACC 7828, PPT 1
:|ACC6835,PPT14
ACC 7771 j"pi :•:■:•:
:::ACCJ28151PPT54:
1282J '. j»::::::::
'ACC"I2817,PPT37:
?m. ;■;■ loose sand model, ;'■;'. RD = 50% ;:;! ya-99.6rblfl?
PPT 8, PPT 38
PPT 39, PPT 46
65 I . ,415
I-
50 G ACC 12823 on left, & ACC 12821 on right ACC 12807 on center lead weight

Model 4i-eql
Excess Pore Riessure, kPa 100 200 300
Report RSS/J0101R04 Rev 0
Cyclic Stress Ratio
0.05 0.10 0.15 0.20
20 40 60 80 100
Model 4i-eql
Cyclic Shear Strain, %
• t=10sec O t=20sec ^ t=40sec V t=60sec
0.0 0.5 1.0 1.5 2.0 2.5 3.0 3.5 0©—
Model 4i-eql
Cyclic Shear Stress, kPa
20 40 60
40
V L_
100
Model 4i Stress and strain isochrones B-42

Report RSS/J0101R04 Rev 0
Model 4j
50 G ACC 12823 on left, & ACC 12821 on right ACC 12807 on center lead weight H
B-43

Report RSS/J0101R04 Rev 0
40
Model 4j-eql
Excess Fore Pressure, kPa
NOTE LradmraghtsudHigeaf211 lbs over 347 in Sudmge at 50g 209 kPa, added 10.3 m equhralert soil
Model 4j Stress and strain isochrones
B-44

Report RSS/J0101R04 Rev 0
o u <
0.1 - jyf^^lMmy^ljll^iyyyiUlUll, 00 i——-—■ppBiliiBHF —■—* -0.2 - T Depth= 18.3m- -0.3 I ' ' ' ' '
*^d«v» »MdMri^ HMJ h ».j
Depth = 5.5m I
Depth = 11.3 m -
OS k*mii,Miw*<Wiw*mW
Depth = 15 m
W 250 200 miiMiHWi"i«»»*MOHli>W»li*|WlMi«»i>»>MW>;
Depth = 22.3 m
■^w^mi»^M^iiWii^iiw>M>"WH)>miii'<ii> *
Depth = 26m
40 80 120 160 200
40 60 Time, sec
Model 4k
PPT 4«
ACC 12824, PPT 16
ACC 12864 ':&:::::::
ACC 12815, PPT 1
W
PPT 8,
loose sand model, RD = 49%
fd = 99.4 lb/ft3
PPT 53
PPT 13 *•
365
4' 75 I
B-45 Crou-section through Model 4k SOG ACC 12823 on left, & ACC 12821 on right 1

Model 4k-eql
Excess R>refte8sure,kPa
S
Report RSS/J0101R04 Rev 0
Cyclic Stress Ratio
0.00 0.05 0.10 0.15 0.20 0.25 0.30 0.35 Of.
Q 15
f=l.lHz
amax = 0-38
Model 4k-eql
Cyclic Shear Strain, %
0.0 0.1 0.2 0.3 0.4 0.5 0.6 u:
t=10sec
o t=20sec T- t=30sec
v t=40seo g. t=50sec
t=60sec
0 u./ U
25
•DSI^V ""o
J I I L.
Q
Model 4k-eql
Cyclic Shear Stress, kPa
10 20 30 40 50 60
Model 4k Stress and strain isochrones
B-46

ÖD
C o +-»
Ö jB *ö> u u <
0.3 0.2 0.1 0.0
-0.1 -0.2 -0.3 -0.4 0.6 0.4 0.2 0.0
-0.2 -0.4 -0.6 -0.8
Equivalent Depth = 15.75 m.
Soil Depth = 1.55 m j ; L
Equivalent Depth=25.45 m -
Soil Depth = 11.25m
l 1 1 Equivalent Depth=32.2 m
Equivalent Depth = 36.4 m
Soil Depth= 18m
Soil Depth=22.2 m i - i
Equivalent Depth = 40.4 m \
Soi} Depth=26.2m
1 1 valent Input, 42.2 m
Soil Input, 28 m
100 80 60 40 20
0 -20
VI
8 400 300 200 100
0 -100
400 300 200 100
0 -100
l-
-I A12611
A12823
m 40 60 Time, sees
80 100
Model 41
Al 2804
A12821
A12817
A12801
A12814
A13284
Report RSS/J0101R04 Rev 0
Equivalent Depth=25.2 m
SoilDspth = llm -
MM Equivalent Depth=28.95 m
Sou Depth = 14.75m
Equivalent Depth = 32.2 m Soil Depth = 18m
' fr^T Equiv
wwmttoß Equivalent Depth=36.4 m
Soil Depth=22.2m
1 1
Equivalent Depth = 40.4 m_
Soil Depth = 26.2m
50 100 150 200
-796- Lead surcharge on top, 295 lb
phreatic surface above soil sur&ce
,•■«■« 6835
' -1-PFT46-'
, denser sand layer, RD = 75%
'vfili'.' pHacc.7828 .'.
loose sand layer,
PPF39_ '■:'■:'■: w:0?*?5**: :PPTM:
70
Cross-section through Model 41 Laser LVDT in center of box to 50G ACC12826 measure expansion on table
B-47
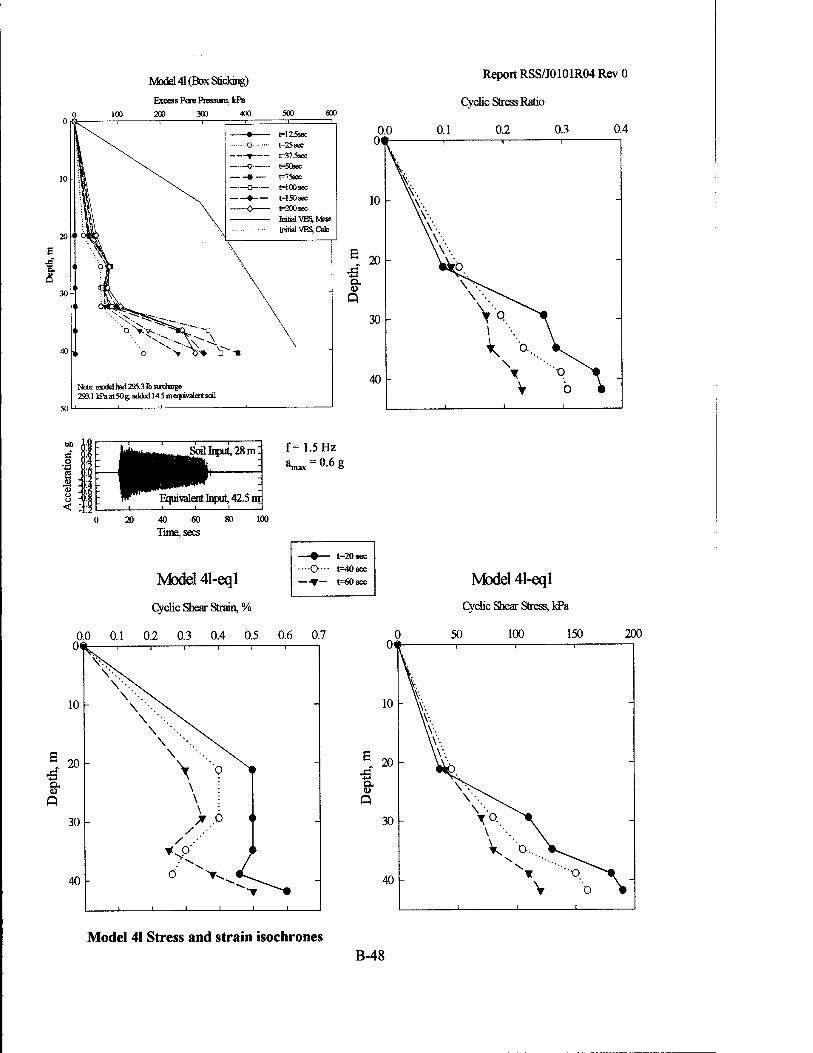
Model 41 (Box Sticking) Excess Pore Pressure. kPa
200 300 400 500 eoo
t=125sec t=25sec t?=37.5sec F50sec t=75aec t=10O9OC M50sec t=200sec Initial VESMeas Initial VES,Calc
Note: model had 295.3 lb surchmge 293.1 Id?aat50g>adaedl4.5meqiiivalentsoil
0.0
Report RSS/J0101R04 Rev 0
Cyclic Stress Ratio
0.1 0.2 0.3 0.4 01 t ! , 1
10 V-
S 20 \\\ .
■B •qjö
4> \^\ Q
30
40 T v" ^^ V
1 1
b •
Soil Input, 28 ml
Equivalent Input, 42.5 m
20 40 60 Time, sees
80 100
f=1.5Hz
amax = 0-68
Model 41-eql
Cyclic Shear Strain, %
0.0 0.1 0.2 0.3 0.4 0.5 0.6 0.7
-•— t=20seo
••(>•■• t=40sec
-■▼— fc=60sec
0
10
„ 20
ST
30 -
40 -
Ifc- 1 1 1 1 1 1
\\ \ '\ \ X.
\ . \ ~ \ \ \ '••• \ \ \ \ . \
> '•? \ \
< > / .
/
1 1 1 1 1 I
Model 41 Stress and strain isochrones
Model 41-eql
Cyclic Shear Stress, kPa
50 100 150 200
B-48

Report RSS/J0101R04 Rev 0
0.15 0.10 0.05 0.00
-0.05 -0.10 -0.15 0.15 0.10
M 0.05 ö- 0.00 § -0.05 •a -o.io 2 -0.15 Ö -0.20 u 0.15
0.10 0.05 0.00
-0.05 -0.10 -0.15 -0.20
Spü Depth = 1.3m
Soil Depth = 11.2 m «AfWM
dent Depth = 39m
il Depth = 22.3 m iWiffi'niMim'nti
r 1 1 r alent Input, 56 m
MmMMUfilAM
Soil Input, 26.3 m-
60 80 100 120
Time, sec
Model 5a
cd
52
3
0)
O OH
u
Soil Depth = 25.3 m ; Equivalent Depth = 53 m i i i
0 20 40 60 80 100 120 140
Lead surcharge (2 weights) on top, 585.72 Ibi
• .■ ACC 5754 im. ■ . ACC 7771, PPT 15 , ■ ACC 7828, PPT 31 ■
denser sand layer, .■.■.■.■.■.'.■.■.■.'.■. RD=72% ■.■.'.■.■.■.'.*.■. .■ ACC 12608, PPT 8 ■«*.-.-. Y> 104.0 IMP '.•* ACC 12814, PPT 10,
ACC 12801, PPT 11 •• ■»ACC 12815, PPT 13-
.ACC 12804, PPT 46. ■ ACC 12806, PPT 47'
:ACC 12817, PPT 41 !
::ÄCC 1*280*7, PPT 38)
loose sand layer, ' • RD = 51% ;I
rd = 100.8 IMP ;: [ACC 12821, PPT 50
»ACC 1281 i,PPT5l'
Cross-section through Model 5a 50 G
70
1 65
-H- 1160
60
4 ACC 7314
B-49

20
E
f a ■S 30
40
50
60
MxteI5a-eql
Excess Pore Pressure, kPa 400 600 800 1000
tp30sec tHOsec t=50sec t?=60aec
l?=80sec t=100sec ir=120sec t=140sec t=150s« Initial VES,Msas Initial YES, Calc
NOTE: Model had a lead Michaige of 586 U» rarer 347 in or sucharge at 50 g of 581 kPa, added 27.8 m equivalent soil
Report RSS/J0101R04 Rev 0
Cyclic Stress Ratio
0.000 0.005 0.010 0.015 0.020 0.025 0.030 0.035
i 5
01 r i i i
\
i i i
10
20
\'•• \ 30 - W\ 40
V4-... ^» 50 * '"I T
o\
T i i i i i i
"<U5 g 0.10
•S 0.05 g 0.00 « -0.05 « -o.io o .0.15 < 0 20 40 60 80 100 120 140
Time, sec
f=0.6Hz amax = 0.09g
Model 5a-eql
Cyclic Shear Strain, %
0.0 0.2 0.4 0.6 0.8 1.0 1.2 1.4 1.6 09 1 1 1 1 1 1 r-
—9— M0 sec ••(>••■ t=30sec
—▼— t=50seo
60
10
20
-B 30
£ •♦-» (X
Q
Model 5a-eql
Cyclic Shear Stress, kPa
10 15 20 25
40 -
50
60
30 II 1 1 r i I
\\ v\ v\ v--\ \ ■ \ " \'.\ \'-.\
M> > ' X Ö *. -
k>-....^^ ^ ■•..
> "\ ^~~~"~\ *^ o...
1 1
■o ^"^-#
1 1 1
Model 5a Stress and strain isochrones
B-50

0.15 Report RSS/J0101R04 Rev 0
0.15 0.10 0.05 0.00
-0.05 -0.10 -0.15 -0.20
60 80 100 120
Time, sec
Model 5b
10 8 6 4 2 0
-2 -4
1 i 1 1 1 1 r
: Soil Depth = 6ml Equivalent Depth = 34m
^^«■»^'»^^»(„tiM^i^^'miiJn'♦»■■■win»"« _l 1 I L_
"" Soil Depth = 11.5 m jivalent Denth= 39m
T 1 1 r
Soil Depth = 18.3 m Equivalent Depth = 46m
■ Soil Depth=22.5 m ^Equivalent Depth = 50.
Soil Depth = 26.3 m Equivalent Depth = 54p
0 20 40 60 80 100 120 140
Lead surchaige (2 weights) on top, 586 lb
ACC5754 :■:■:■:■:$■
ACC 7709 .•.'.■
. ACC7771,PPT15 «j. Ö ACC 12768, PPT 31
denser sand layer, .■.■.'.■.".■.■.■.■.*. RD = 76% ■.".■.■.■.'.■.■.'.■ . ACC 12608, PPT 8 .fe-. •. ^ = 104.7 lb/ft' ". '& ACC 12814, PPT 10'
■ACC 12801, PPT 11 -e .•.•.■.•.■.■.".■.■." A ACC 12815, PPT 13.
ACC 12804, PPT 46 • ACC 12806, PPT 47-
■:•;•;•;• '. ■;■;■;•;•'. •' loose sand layer, :ACC 12817,PPT4i 4^::>: RD=4«% :::::::::::::::::::::: Tj=100.5 IMP
I ACC 12807, PPT 38 J
L ACC 12821, PPT 50
::^-AC.C;28JI,.PPJ-5.I.
T
no
+
Cross-section through Model Sb 50 G ACC7314
B-51

20
s S, to a
•4 30
200
Model 5b-eql
Excess Pore Pressure, kPa 400 600 800 1000
O t=40sec T t=50sec «7 t=60sec » — t=80sec p MOOsec — —♦-— t=120sec —0 t=140sec
A t=150sec Initial VES,Meas Initial VES, ale
t=35seo
60
NOTE hfaddtedaleadsuriHigecf 586 lbs over 347 itf or sucharge at 50g rf 581 kPa, added 27.7 m equivalent soil
Report RSS/J0101R04 Rev 0
Cyclic Stress Ratio
0.00 0.02 0.04 0.06 0.08 0.10 0.12 0.14 01
"? 0.15 a 0.10 .2 0.05 S 0.00 2 -0.05 £ -0.10 8 -0.15 o -020 <
Soil Input, 28 nr
1 ■
lent Input, 56,111
0 20 40 60 80 100 120 140
Time, sec
Model 5b-eql
Cyclic Shear Strain, %
0.2 0.4 0.6
f=0.6Hz
amax = 0-12g
O t=10sec
t=20sec
^ t=30sec
V t=40sec
m- t^50sec
0.8
Model 5b-eql
Cyclic Shear Stress, kPa
40 60 80 100
Model 5b Stress and strain isochrones
120
B-52

Report RSS/J0101R04 Rev 0
WESref. #19 Nevada Sand 11 Lead surcharge (2 weights & 4 strips) on top, 585.72 lb
796
This test generated no useable data, Eql and 2 were particularly poor, Eq3 have produced some information.
Model 5c
may
porous and slotted plates 50 G
Cross-section through Model 5c
ACC 7314 was mounted 1 horizontally on the base plate
B-53

Soil Depth = 1.7m
4c 0.4 ^ 0.2
0.0 -0.2 -0.4 -0.6 -0.8 0.6
; f*Pf? E
Soil Dqpth= 18.3 m J H
Equivalent Depth = 55m. _l I L
0.4 h 0.2 0.0
-0.2 h -0.4 -0.6
-awl«» i 1 1 1 1 r
Soil Depth = 22.5 m
Equivalent Depth = 59m
i 1 1 1 1 1 1— Soil Depth = 26.3 m 1 ■ ■ ■
Equivalent Depth = 63m; J I l—L I I I 1—
1 1 1 1 1 1 r Equivalent Input 65m
Soil Input, 28 m
0 20 40 60 80 100 120 140
Time, sec
Model 5d
o OH
U
Report RSS/J0101R04 Rev 0
Soil Depth =6 m Equivalent Depfo = 43m ■
1 1 1 1 1 1 r
Soil Depth = 11.5m Eqiy valen^ Depth, = 48m
Soil Depth = 26.3 m Equivalent Depth = 63m
20 40 60 80 100 120 140
Lead surcharge on top, 775 lb
■ ACC 3457. .■.•.'.■ .'.' ,'C ■' ■' ■ • ACC5754 '
, ACC 7706, PPT 47 ■ ACC 6835, PPT 50 .
• ACC 7726, PPT 41
denser sand layer, RD = 80% .•.■.■.■.■.".■.■.■
y„ = 105.3 lb/fl1 . -^ ACC 7771, PPT 46 "
ACC 12609, PPT 10 i
. ACC 7709, PPT 13 ,
y ACC 12804, PPT 16.
ACC 12613, PPT 49.
; 1ACC 12608, PPT 31
:ÄCC 12806, PPT 39
loose sand layer, ;.;.;.;.;.;.;.;.;. RD = 57% I :«i ACC 12814, PPT«"
y,,= 101.81b/ftJ -^r ------ -
15
365
:_fi6o
Cross-section through Model Sd 50 G ACC 7828
B-54

Model 5d-eql
Excess Pore ftessure, kPa 0 200 400 60O 800 1000 1200
\ O t=30sec T t=30sec .7 t=40sec >— t=30sec 0 t=60sec
20 - »- — t=«0sec ——0 tplOOsec A t=120sec A t=140sec 0 t=150sec
40 \ 1 \
I ' '\
60
NOTE Mxfcl lad a lead Mdmge of 775 lbs wer 347 in* or archaige at 50g of 769 kPa, added 37 meqimalat soil
Report RSS/J0101R04 Rev 0
Cyclic Stress Ratio
0.05 0.10 0.15 0.20 0.25
>il Input, 28 nr
Equivalent Input, 65 m
f= 1.6 Hz
80
Model 5d-eql
Cyclic Shear Strain, %
1 2 3
100
t=5sec
o t=10sec
T t=20sec
v t=30seo
m- — t=40seo □ t=50sec
A t=60sec W
Model 5d-eql
Cyclic Shear Stress, kPa
50 100 150 200 250
Model 5d Stress and strain isochrones B-55

0.2 0.1 0.0
-0.1 -0.2 -0.3
2.0 1.5 1.0 0.5 0.0
-0.5 -1.0 -1.5
2 1 0
-1 - -2 - -3
0.8 0.4 0.0
-0.4 -0.8 -1.2
0 20
'Soil Depth = 1.5m.
Equivalent Depth = 36m"
T 1
Soil Depth = 5.8 m;
Equivalent Depth = 41n>
i 1 1
Sou Depth = 14.8 m
Sou Depth = 18.3 m.
Equivalent Depth = 53m'
Report RSS/J0101R04 Rev 0
60 50 40 30 20 10 0
-10 40 30 20 10 0
-10
i^*«**^ SoÜ Depth = 15 m "
tffcw Equivalent Depth = 36m-
Soil Depth = 5.8 m" LtUlM wwp
a 50 Equivalent Depth = 50m-j w Q
I -50 © 600 g 500
« 300 £ 200 8 100 x 0
W -100 800 600 400 200
0 -200
800 600 400 200
0 -200
il Depth=25.8 m
valent Depth = 61m- j i 1
i f Soil Input, 28 m-
Equivalent Input 63m
0
Equivalent Depth=41m'
Sou Depth = 14.8 m; Equivalent Depth = 50m ■
Soil Depth = 18.3 m Equivalent Depth = 53m -
Soil Depth = 22.3 m Equivalent Depth = 57m
—i 1—
Soil Depth = 25.8 m Equivalent Depth = 61m
20 40 60 100
Lead surcharge an top, 708 lb
40 60
Time, sec 100
Model 5e Cross-section through Model 5e SOG ACC 12821 left, ACC 12807 right
B-56

Model 5e-eql Excess Pore Pressure, kPa
400 600
Report RSS/J0101R04
Cyclic Stress Ratio
RevO
NOTE MxfelhriakadsiidBrgeof708 lbs over 347 in or surcbaige at 50 g of 703 kPa, added 35 m equivalei* soil
0.00 0.05 0.10 0.15 0.20 0.25 0.30 0.35 01 f 1 1 1 1
■\
\-\
I \ V- \
!—■■ 1
20 -!'■ \
E V ' •B \ '•• \
V^7 """■■° ^~ V\ </ 7 <
60 /"^V v^- t «6 ■ v
i i _i 1—
*
"? 0.8 i 1 1——i 1 r——r g 0.4 - A .ItA.LLti. .Sffll Input, 28 m
_i i i_ Equivalent Input 63 m'
Ö -0.4 "«3 -0.8 8-1* < 0 10 2030405060 70 80
Time, sec
Model 5e-eql
Cyclic Shear Strain, %
1 2 3
f= 1.6 Hz
amax = 0-5g
• t=10sec
O t=20sec «f t=30seo
V t=M0sec ft t=60seo
Model 5e-eql
Cyclic Shear Stress, kPa
50 100 150 200 250 300
20
s
o. 40
60
'k 1
\\
\\\\
- V\N -
V \ \ V \ v- Vv \ x
//.'' .--•
y^-K <&.^ "'..•'.•.o
<TKtC '^.^▼a».. .
i ' 1 _1 I I L_
Model 5e Stress and strain isochrones B-57

8:! m -0.4
m
Soil Depth = 5.7m
Equivalent Depth = 30 m
il Depth = 11.2 m-
Eqirivalent Depth=35 m
Soil Depth = 14.5 m-
8 6 4 2 0
-2 -4 -6
Equivalent Depth = 38 m
Soil Depth = 17.9 in-
Equivalent Depth = 42 m
<a 250 i-
Soil Depth = 22.2 m
Equiyalent Depth = 46 m
Report RSS/J0101R04 Rev 0
Soil Depth = 11.2m , Equivalent Depth = 35 m
Soil Depth = 14.5 m Equivalent Depth=38 m
' ' i_
Soil Deptii= 17.9 m Equivalent Depth = 42 m
i i i i i i_
l 1 1 1
Soil Depth = 25.7 m
Equivalent Depth = 49 m
i—XTT; 1 1 1 r
Soil Input, 28 m
Equivalent Input 52 m j i i
0 100 200 300 400 500 600 700 800
Cross Section of Model 5f 50G Lead surcharge on top, 585.72 lb
0 20 40 60 80 100 120 140
Time, sec
Model 5f
Hacc 12823 LVDT3598 I
Hacc 12807 I
ftl LVDT3599
Hacc 12815
r 599 |
&1
Vacc12611 $■
. Vacc 12610 '$'
Hacc 12826
denser sand layer, RD = 75%
'Hacc 12824,PPT43 . » '-Hacc 12613, PPT 48* •
."Hacc 12817, PPT 39
: Vacc 12814 fc '■ I •'. •'. •'. •'. •' *' ■'. • Iloose sand layer,; ■ : |^Hacc"l3284", PPT 37 '; l RD = 50%
I 110
-r- 67
68
X.
B-58 ACC 12816 on left, ACC 12804 on right

MDdel 5f (Arch 1)
Exoess Pore Pressure, kPa 400 600 1000
Report RSS/J0101R04 Rev 0
Cyclic Stress Ratio
0.02 0.04 0.06 0.08 0.10 0.12
6 ■4-» ex 5T
e 0.6 'S Ö.2 2 0.6 £ -0-2 u -0.4 H -06 3 -0.8 < -1.0
Mail Input, 2!
— entftiput^ yalentftiput^Slm
20 40 60 80 100 120 140
Timft ser.
Model 5f-eql
Cyclic Shear Strain, %
f=1.6Hz
—• t=10sec —O tr=20sec —f t=40sec •-V t^lOsec Model 5f-eql
Cyclic Shear Stress, kPa
0.0 0.5 1.0 1.5 2.0 2.5
10
20
'S 30 ex 5T
40
50 -
60
\ i i
,\
A -
s\ A -
i \ ■\ \
-
\ - *
i
^vo "—•
1 1 1
Model 5f Stress and strain isochrones
ex o Q
0 0©
10
20
30
40
50
60
20 40 60 100 7 1 1
\ -r i
"'1 \
'""•■0s»
B-59

c o
2 *«3 u u
0.3 0.2 0.1 0.0
-0.1 -0.2 -0.3
0.3 0.2 0.1 0.0
-0.1 -0.2
0.3 0.2 0.1 0.0
-0.1 -0.2 -0.3 0.4 0.3 0.2 0.1 0.0
-0.1 -0.2 -0.3 -0.4
n 1 1 1 1 r Soil Depth = 5.4 m
Report RSS/J0101R04 Rev 0
Equivalent Depth = 29m j i i i i i_
-i 1 1 1 1 r
Soil Depth = 11.2m
Equivalent Depth = 35m _i : i i i i L
-i 1 1 r
Soil Depth = 14.6 m
Equivalent Depth = 38m
1 1 1 1 r Soil Depth = 18.2 m
Equivalent Depth = 42m - J I I I L
160 140 120 100 80 60 40 20 0
-20
ea
S3 Cfl
0>
§ 5°° PH 400
Soil Depth = 5.4m
Equivalent Depth = 29m
Soil Depth = 11.2m .
Equivalent Depth = 35m.
Soil Depth = 18.2 m Equivalent Depth = 42m
20
Soil Depth = 25.6 m
Equivalent Depth = 49m; J I I L.
T 1 1 r
Soil Input, 28 m
[uivalent Depth = 52m
700 600 500 400 300 200 100 0
-100
1 1
Soil Depth = 25.6 m
Equivalent Depth = 49m _i i i i
0 200 400
Model Sg 50G
600 800 1000
Lead surcharge 494 lbs
40 60 a Time, sec
100 120 LVDTS74
Model 5g
B-60 ACC 13 on left, ACC 12816 on right

Report RSS/J0101R04 Rev 0
Model 5g (Archtest 2b, with weight)
Excess Pore Pressure, kPa 200 400 000
20
•ä 30
40 -
60
800 ZZ1
t=25sec (=37.5 sec tpSOsec
t=100sec t=200 sec t=400sec t=60Osec t=S00sec
WOOOsec Initial VES, Mas Initial VES, Gale
Note Mxiel had 495 lb surcharge 491.5 Hfe at 50 g, added 25 m equivalent soil
0.00 0
10
Cyclic Stress Ratio
0.02 0.04 0.06 0.08 0.10
20
Q 30-
40
50
f 1 _, ... ,, ,, ,
A w i\
'%- \ % \
- % \ •A- N
#>. "*■
>*),.. \ V
1 i i i
on 0.6 ef 0.4
•2 0.2 § o.o H -0.2
< -0.6
I ^^ Soil hrouL 28 m ■I . Equivalent Inpqt, 53 m alept Input, 53 m~
f=1.2Hz amax = 0.4g
0 20 40 60 80 100 120
Model 5g-eql
Cyclic Shear Strain, %
0.2 0.4 0.6
O t=10seo t=20seo
▼ t=40sec
V tr=60sec
0.8 10
Model 5g-eql
Cyclic Shear Stress, kPa
20 30 40 50 60
g
Hi
10
20
Q 30
40
50
r i i 1 1 1
A A A " *\ 1 \ - % \ '•\- \
■*>. »
'*. >*,.
^ \\ ■'••••^>\
1 1 1 1 1
Model 5g Stress and strain isochrones B-61

Report RSS/J0101R04 Rev 0
ÖD
e _o
2 J2 "öS o o <:
0 200 400 600 800 1000 1200 1400 1600
Time, see
Model 5h 50 100 150 200
Time, see B-62

Model 5h (No Weight 125g)
Excess Pore Pressure. kPa
200 300 400 500 600
Report RSS/J0101R04 Rev 0
Cyclic Stress Ratio
0.00 0.05 0.10 0.15 0.20 0.25 0.30 0.35 0<
Model 5h-eql
Cyclic Shear Strain, %
0.0 0.1 0.2 0.3 0.4 0.5 0.6 0.7
Model 5h-eql
Cyclic Shear Stress, kPa
0 20 40 60 80 100 120 140 160 180 0Q r
Model 5h Stress and strain isochrones B-63

Report RSS/J0101R04 Rev 0
«JO
e o
0)
8 o
denser sand layer, RD = 75%dry
ACC12815 '
ACC13285
, ACC12801,PPT10376,*>.-
denser sand layer,' RD = 75%
l i i i l -i—i—l—l—l—*J 1 '. loose sand layer,
RD = 50%
Cross-Mcti« tkTMgh Model 51 125 G
phreattc surface planned to be at 250mm, actual 390mmdeplh
ACC13269, PPT10374 m r ACC13283,PPT10378'
ACC13284,PPT10375.
ACC13282,PPTl6379 t i i r i
ACC12610,PPT56; ACC12826, PPT57
146
ACC mounted horizontally H
on the base plate
T 1 1 1 1 1
Soil Depth = 55 mi
0 200 400 600 800100012001400160018002000
Time, sec
Model 5i 100 150 200 250 300
Time, sec B-64

Report RSS/J0101R04 Rev 0
Model 5i (Dry Surcharge 125g)
Excess Pore Pressure, kPa
200 «0 600 =]_
- tMOKC
■ t=5ösec
- t=eOBec
•- t=75sec
m— t=90«K
D MOOBOC
— —♦ M25sec 0 t=20Oaec
* I?=300sec
A t=4O0sec • tpSOOaec
O — t=120CBec
—•— t=ieooBoc
Initial VESjCak
0.0
Cyclic Stress Ratio
0.1 0.2 0.3
20 -
60
0.4 Ifcr— 1 1 1
X\';:^r---^ \^^^-^_
V> ^V^^ - / / / / / "
/ / / / /
n fU I y i i I
. ■ V V o i
i i i
«KM cQ3 §02
2oo Ü-Q1 »■02 8-03 < 0
20
& «
illlllHIIIIIIImi« fcpl=ffim
lipimn
KB 150 2D 2D 3D
Model 5i-eql
Cyclic Shear Strain, %
2 3 4 5
60
f = 0.43 Hz a = 0.22 g "max «•*■*■ 6
—• t=25seo
— O t=50sec
—f t=100sec
—V t=150sec
■ -» t=200sec
II i i i i i
i il
-
-
-
i i i
Model 5i Stress and strain isochrones
Model 5i-eql
Cyclic Shear Stress, kPa
50 100 150 200
20 -
o. 40
60
250 lb- 1 1 r i
\X^\ VvV>
-1 \ \\\ - 1 \ v\\ 1 v- \ ■•. \ T r v \ \
} * \ "Q T»
■ v V 0 •
i
B-65


