Embed Size (px)
Citation preview
Drying of yam with solar adsorption system
Emmanuel Yaw Adu Amankwah
Thesis committee
Promotor
Prof.Dr K.J. Keesman
Personal chair Biobased Chemistry and Technology
Wageningen University & Research
Co-promotors
Dr A.J.B. van Boxtel
Associate professor Biobased Chemistry and Technology
Wageningen University & Research
Prof. Dr K.A. Dzisi
Associate professor Food and Post-Harvest Engineering
KNUST, Kumasi, Ghana
Prof.Dr G. van Straten
Emeritus professor Systems and Control
Wageningen University & Research
Other members
Prof.Dr P.C. Struik, Wageningen University & Research
Prof.Dr J. Müller, Hohenheim University, Germany
Dr M.A.I. Schutyser, Wageningen University & Research
Dr M.A. Boon, Wageningen University & Research
This research was conducted under the auspices of the Graduate School VLAG (Advance
studies in Food Technology, Agrobiotechnology, Nutrition and Health Sciences)
Drying of yam with solar adsorption system
Emmanuel Yaw Adu Amankwah
Thesis
submitted in fulfilment of the requirements for the degree of doctor
at Wageningen University
by the authority of the Reactor Magnificus
Prof. Dr A.P.J. Mol,
in the presence of the
Thesis Committee appointed by the Academic Board
to be defended in public
on Thursday 9 May 2019
at 11 a.m. in the Aula.
E.Y.A. Amankwah
Drying of yam with solar adsorption system
138 Pages
PhD thesis, Wageningen University, Wageningen, the Netherlands (2019)
With references, with summaries in English and Twi.
ISBN: 978-94-6343-439-3 DOI 10.18174/471677
i
Table of Contents Chapter 1 .................................................................................................................................... 1
Drying of yam with solar adsorption system, ............................................................................ 1
Introduction ................................................................................................................................ 1
1.1 Background ................................................................................................................. 3
1.2 Yam ............................................................................................................................. 3
1.3 Solar drying ................................................................................................................. 4
1.4 Solar Adsorption Drying (SAD) ................................................................................. 6
1.5 Modeling of moisture content and sorption ................................................................ 7
1.6 Problem Formulation................................................................................................... 8
1.7 Outline of thesis .......................................................................................................... 9
Chapter 2 .................................................................................................................................. 11
Modeling the equilibrium moisture content of desorption and adsorption of yam (Dente) . 11
2.1 Introduction ............................................................................................................... 13
2.2 Materials and methods .............................................................................................. 14
2.2.1 Source and preparation of material ................................................................... 14
2.2.2 Procedure and measuring equipment ................................................................ 14
2.2.3 Observed curves ................................................................................................. 15
2.2.4 Models ................................................................................................................ 15
2.2.5 Statistical analysis of data ................................................................................. 17
2.2.6 Approximate confidence bound.......................................................................... 18
2.3 Results and discussion ............................................................................................... 18
2.3.1 Desorption and adsorption isotherms measurements ........................................ 18
2.3.2 Modeling the isotherms ...................................................................................... 20
2.4 Conclusion ................................................................................................................. 26
Chapter 3 .................................................................................................................................. 27
Moisture dependent diffusion and shrinkage in yam during drying .................................... 27
3.1 Introduction ............................................................................................................... 29
3.2 Materials and Methods .............................................................................................. 30
3.2.1 Yam species and sample preparation ................................................................ 30
3.2.2 Shrinkage and moisture measurements ............................................................. 30
3.2.3 CFD- calculations .............................................................................................. 31
3.2.4 Drying procedure and equipment ..................................................................... 31
3.2.5 Statistical analysis of data ................................................................................ 32
ii
3.3 Results and discussion ............................................................................................... 33
3.3.1 Shrinkage ........................................................................................................... 33
3.3.2 Drying and drying rate curves ........................................................................... 36
3.3.3 CFD-results........................................................................................................ 37
3.3.4 Fitting drying curves to data.............................................................................. 39
3.3.5 Discussion .......................................................................................................... 42
3.4 Conclusion ................................................................................................................. 46
Chapter 4 .................................................................................................................................. 49
Distributed mathematical model supporting design and construction of solar collectors for drying ................................................................................................................................... 49
4.1 Introduction ............................................................................................................... 51
4.2 Solar collector modeling ........................................................................................... 53
4.3 Results and discussion ............................................................................................... 59
4.3.1 Model-based solar collector design and analysis .............................................. 59
4.3.2 Effect of absorber surface on performance ....................................................... 61
4.3.3 Effect of collector length on temperature .......................................................... 61
4.3.4 Construction of Collector Equipment ................................................................ 63
4.3.5 Effect of design decisions ................................................................................... 63
4.3.6 Collector performance ....................................................................................... 64
4.3.7 Effect of air speed on collector performance ..................................................... 65
4.4 Experimental verification and validation .................................................................. 67
4.4.1 Description of the experiments .......................................................................... 67
4.4.2 Model verification and parameter adjustment ................................................... 67
4.4.3 Validation ........................................................................................................... 68
4.5 Discussion ................................................................................................................. 69
4.6 Conclusions ............................................................................................................... 70
Chapter 5 .................................................................................................................................. 73
Experimental verification of yam drying with Solar Adsorption Drying ............................ 73
5.1 Introduction ............................................................................................................... 75
5.2 Materials and methods .............................................................................................. 77
5.2.1 Description of dryer systems .............................................................................. 77
5.2.2 Temperature, air velocity and weight measurements ........................................ 78
5.2.3 Chemical Analysis .............................................................................................. 79
5.2.4 Vitamin C content .............................................................................................. 79
5.2.5 Instrumental determination of color .................................................................. 79
iii
5.4 Results and discussion ............................................................................................... 81
5.4.1 Performance of SAD drying ............................................................................... 81
5.5 Drying different yam cultivars .................................................................................. 85
5.5.1 Operational conditions ...................................................................................... 85
5.5.2 Vitamin C and color of dried yam...................................................................... 88
5.6 Regeneration of silica gel adsorbent ......................................................................... 90
5.7 Conclusion ................................................................................................................. 93
Chapter 6 .................................................................................................................................. 95
Perspectives, reflections and conclusion .............................................................................. 95
6.1 Introduction ............................................................................................................... 97
6.2 Sorption isotherms..................................................................................................... 98
6.3 Drying kinetics of shrinking yam cubicles .............................................................. 100
6.4 Solar collector ......................................................................................................... 101
6.5 Experimental verification and proof-of-principle ................................................... 104
6.6 Perspectives of SADS (in Africa and elsewhere).................................................... 106
6.7 Conclusions ............................................................................................................. 107
7.0 References ................................................................................................................... 109
Summaries.............................................................................................................................. 123
Summary ................................................................................................................................ 125
Twi tɔfa bɔ ............................................................................................................................. 128
Acknowledgement ................................................................................................................. 131
About the author .................................................................................................................... 133
List of publications ................................................................................................................ 135
Completed training activities ................................................................................................. 137

iv
1
Chapter 1
Drying of yam with solar adsorption system,
Introduction

2
3
1.1 Background
Drying is a common but one of the most challenging unit operations in food processing. It
concerns removing moisture in food to yield a solid product (Chemkhi et al., 2005; Vega-
Mercado et al., 2001). The aims of drying vary from weight reduction to enhancing aesthetic
and sensory effects of food (Brennan, 2006). However, the main goal is to reduce moisture
content to levels that halt or slow the growth of spoilage organisms and incident of chemical
reactions (2010; Vega-Mercado et al., 2001) in order to extent the shelf life of food (Doymaz,
2004, 2005; Oduro et al., 2007). One of the concerns of the consumer is to have a sample that
closely represents the original sample. Also the dried product should potentially lead to the
same variety of processed foods compared to products from the raw sample. In case of heat
treatment, undesirable changes in the quality of the dried product may occur, and it is a
challenge to preserve the original qualities as much as possible (Akpinar et al., 2003b).
1.2 Yam
Yam (see Figure 1.1) is an important food crop for many people in the yam zone of West
Africa. It forms about 10% of the total roots and tubers produced in the world (FAO, 2005). It
has been estimated that the world yam production would increase by 27% between 2003 and
2020. In Ghana yam production increased by 10% in 2004 (Kenyon et al., 2006). Yam is second
to cassava as the most important tropical root crop, but is nutritionally better than cassava on
account of their vitamin C (0.040 - 0.120mg/g edible portion) and crude protein (0.040 -
0.140g/kg dry matter) content (Opara, 1999). In addition to their high carbohydrate content,
Eka (1985) reported that most yams are rich in phosphorus and vitamins such as thiamine,
riboflavin and niacin. Yam has a moisture content of about 70% (wb) when harvested (Fioreze
and Morini, 2000). Its high moisture content makes it susceptible to rot, thus, making it highly
perishable (Osunde, 2008). Presently, Ghana is the leading exporter of raw yam in West Africa
to the international market, Nigeria being the leading producer in the world. Studies have
shown that post-harvest losses are estimated within the range of 40-50% in the tropics, and that
between the field and final consumer, high amounts are rejected for consumption (Salunkhe et
al., 1991: Kadar et al., 1985). An overall solution to prevent postharvest losses is by drying.
Therefore it is essential to develop effective methods that prolong the shelf life of yam (tubers
and slices) while maintaining the nutritional and healthy components. Yam is consumed fresh
when boiled, roasted or fried. The shelf life of yam ranges between 1-6 months depending on
the variety (Opara, 1999) with post-harvest losses between 10-50% (Alhassan, 1994). It is
consumed when cooked or fried. The fried yam is taken with sauce, stew fried or fresh pepper.
The processing of yam into other finished product varies with people of different cultural
backgrounds. Much has not been done in the area of enhancing new product development such
as dried yam powders incorporated in soups, making composite mixtures in bread dough or
weaning foods.
4
Figure 1.1 Display of yam.
The concentration of nutrients in food products, expressed per kg wet product, increases due
to moisture loss during drying. Substantial amount of nutrients, however, can be lost due to
both nutrient in evaporated water and temperature effect (Zanoni et al. 1999). Vitamin C, for
example, is temperature sensitive and degrades during drying. Thus low and moderate
temperatures are necessary for drying. However, the combination of temperature and length of
exposure of air to the product is yet to be investigated. Vitamin C degradation during drying of
tomato pulp at higher temperatures have been reported by several researchers (Amankwah et
al., 2006, Giovanelli et al., 2002, Toor and Savage, 2004). Agunbiade et al. (2006) measured
some physicochemical properties of dried plantain and banana and reported that some
proximate composition reduced after dehydration. Effect of drying on protein is expressed in
terms of decrease in digestibility and biological value and are denatured at high temperature
(Rubens and Heremans, 2000). Heat does not affect total dietary fiber content, but the insoluble
dietary fiber content is rather increased due to complexing of its components with protein and
amino acids. As a requirement to maintain quality it important that food is dried at low
temperature as possible, and at short exposure as possible.
1.3 Solar drying
Drying is an energy intensive operation. Conventional and fossil fuel heating are expensive
and less efficient for drying and result in unwanted CO2-exhaust. Biomass heating is not a good
option since it leads to desertification and erosion. Expensive sources of energy such as
electricity or a combination of solar energy and some other form of energy is normally used in
drying. An inexpensive option in terms of capital and operational costs is harnessing solar
energy technology for heating agricultural products. Ghana is endowed with daily hour by hour
mean radiation between 0-920 W/m2 (Akuffo et al., 1991, 2003). The annual sunshine duration
is between 1800-3000 hours (Edjekumhene and Atakora, 2001). This resource has not been
harnessed effectively, especially for drying purposes. Solar drying, in open air is the most
widely practiced agricultural operation in the world. It is simple, inexpensive and represent a
low cost technique for drying agricultural products. During open air drying however, the food
is at the mercy of the weather (re-wetting) and subject to microbial contamination, pest,
rodents, dust and fumes from vehicles. Consumers demand processed foods that maintains its
5
original characteristics, while bacterial and fungal contamination must be prevented from a
food hygiene and food safety point of view (Özcan et al., 2005).
The use of solar dryers in drying to minimize or prevent the shortcomings of the open sun
drying has been well researched and has proven to be a better alternative to the open sun drying
in efficiency and quality of dried products. According to Oguntola et al. (2010), solar dried
foods are quality products that can be stored for extended periods, easily transported at less
cost while still providing excellent nutritive values. Food samples that are usually dried by
direct exposure to the sun in Ghana include cocoa beans, cereals, legumes, leafy vegetables,
cassava, yam, cocoyam, plantain and shrimps. Therefore any means by which samples could
be dried effectively, quickly and hygienically at a lower cost to make them available during the
lean season and to increase its variety of uses without compromising on quality would be very
much appreciated. Improvement of design and orientations of the collector to enable it to
absorb maximum radiation from the sun during the day would lead to a better performance of
the dryer by reducing drying time and increasing the efficiency of the dryer (Karim and
Hawlader, 2004). Many developing countries enjoy a superfluous supply of solar energy and
as a result still practice the open sun method of drying as reported by Gutti et al. (2012). Solar
dryers are generally classified according to the manner in which solar heat is applied and used
during the drying process. Generally, dryers are categorized into two broad groups; active solar
dryers (forced circulation) and passive dryers (natural circulation) (Sreekumar et al., 2008).
Active dryers are systems which induce forced air circulation, while passive dryers only make
use of the natural convection principle which generates movement of the heated air. The
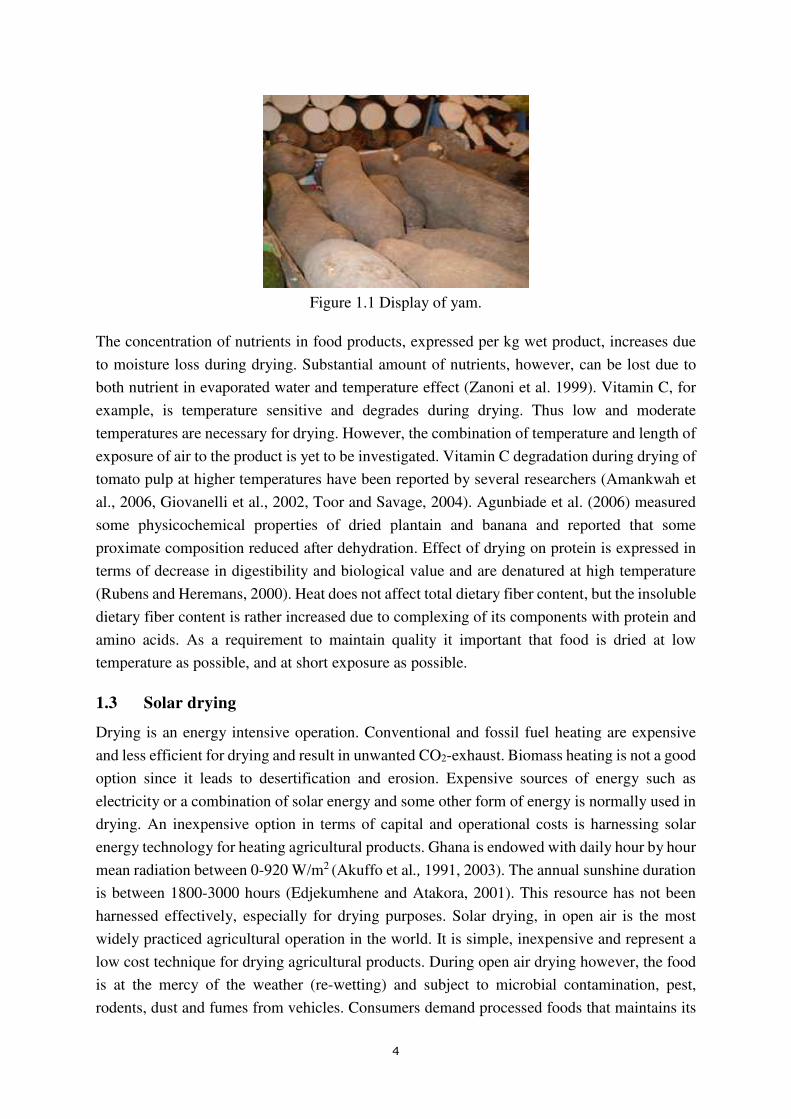
passive ones have various designs but the most common is as shown in Figure 1.2A and a
tunnel one in Figure 1.2C. Figures 1.2B and D are indirect active solar dryers with fans
positioned at chimney and inlet respectively.
Figure 1.2 Various types of solar dryers: direct passive (A), indirect active (B), indirect passive
solar dryer (C) and indirect active solar dryers (D).
Drying has a positive impact on shelf life (Esper and Muhlbauer, 1996). However, the quality
of dried products can be compromised after a long exposure to the drying temperatures with
adverse effect on some physical properties and nutrient content (Fellow 2000, Hofsetz et al.,
2008).
A C D B
6
1.4 Solar Adsorption Drying (SAD)
Ghana is exposed to between 6-8 hours of sunshine each day, therefore it would be logical to
harvest solar energy with solar collectors for drying during the day time. As mentioned by
Arata and Sharma (1991), solar dryers are superior over open sun dryers, whereas it is also true
that the solar radiation is not available always. It is important in drying that majority of the free
water is removed within the shortest possible time to retard, prevent or halt microbial growth.
Adsorption drying has the potential of continuing the drying process especially when the sun
is no more. Adsorption drying has been considered lately. Djaeni et al. (2007) developed an
integrated process for food drying with air dehumidified by zeolites for adsorption drying,
whereby air passes over adsorbent for dehumidification. At the same time the temperature of
the air is increased by the release of adsorption heat by converting water vapor to liquid. With
this technology, the drying capacity of air is enhanced and drying during the night becomes a
reality. Adsorption drying of flowers and herbs, giving excellent quality colour and texture, has
been studied by Chua and Chou (2003). Hodali and Bougrand (2001) reduced the drying time
of apricot by 8 hours after integrating adsorption into a drying system. Therefore, by combining
the best of solar energy systems and adsorption drying, agricultural products can be dried
continuously at temperatures with low effect on product quality and color while increasing the
through-put.
Although energy is required to regenerate the adsorbent after the adsorption drying process,
adsorption drying is much more energy efficient than conventional drying systems (Atuonwu
et al., 2010). The challenge is to generate enough energy with the solar collector for
regeneration and by so doing, cut down on input energy. Information on the effect of integrated
solar and adsorption drying on the drying kinetics and quality of yam is not available.
Silica gel as adsorbent is inert and can be regenerated at low temperatures. Though some
researchers have regenerated with compound parabolic concentrator (Pramuang and Exell,
2007), integrated desiccant /collector by (Saito, 1993) and Techajunta et al. (1999) the cost of
producing and maintaining a solar concentrator is much higher than for a flat-plate one.
Moreover, for flat plate collector the technical expertise, such as maintenance, replacement of
parts, monitoring air temperature, can be met by the local farmer. The large surface to volume
ratio of silica and the smaller pore spaces impedes on the air flow. This affects the drying and
regeneration rate. However, one difficulty is the switch between night adsorbent drying and
day regeneration of adsorbent.
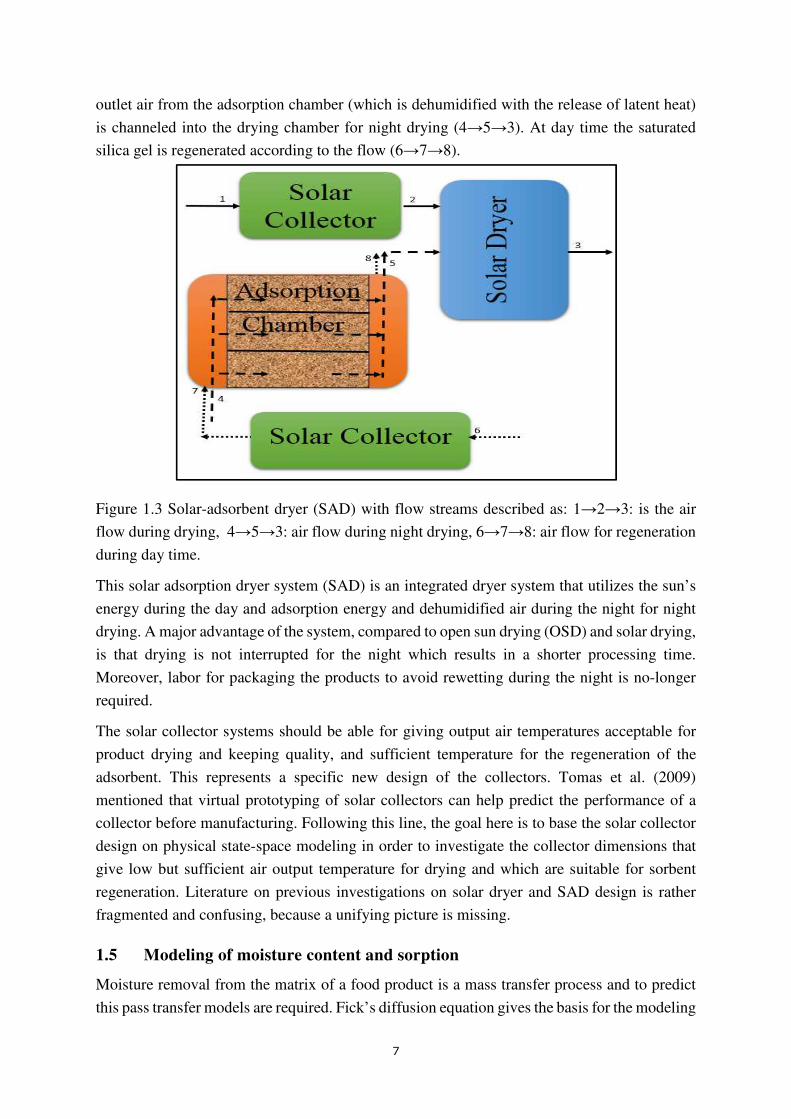
A scheme of the SAD concept is shown in Figure 1.3. In this figure, ambient air flows through
the collector with the aid of fan over black coated aluminum absorber plate and glass cover
plate. The air heats up along the length of the collector. The heated outlet air is channeled into
the drying chamber for dying during the day when the sun is available (1→2→3). At night,
humid ambient air with the aid of axial fan (blower) is blown through an adsorption chamber
(silica gel as adsorbent) with compartments arranged in parallel relative to the air flow. The
7
outlet air from the adsorption chamber (which is dehumidified with the release of latent heat)
is channeled into the drying chamber for night drying (4→5→3). At day time the saturated
silica gel is regenerated according to the flow (6→7→8).
Figure 1.3 Solar-adsorbent dryer (SAD) with flow streams described as: 1→2→3: is the air
flow during drying, 4→5→3: air flow during night drying, 6→7→8: air flow for regeneration
during day time.
This solar adsorption dryer system (SAD) is an integrated dryer system that utilizes the sun’s
energy during the day and adsorption energy and dehumidified air during the night for night
drying. A major advantage of the system, compared to open sun drying (OSD) and solar drying,
is that drying is not interrupted for the night which results in a shorter processing time.
Moreover, labor for packaging the products to avoid rewetting during the night is no-longer
required.
The solar collector systems should be able for giving output air temperatures acceptable for
product drying and keeping quality, and sufficient temperature for the regeneration of the
adsorbent. This represents a specific new design of the collectors. Tomas et al. (2009)
mentioned that virtual prototyping of solar collectors can help predict the performance of a
collector before manufacturing. Following this line, the goal here is to base the solar collector
design on physical state-space modeling in order to investigate the collector dimensions that
give low but sufficient air output temperature for drying and which are suitable for sorbent
regeneration. Literature on previous investigations on solar dryer and SAD design is rather
fragmented and confusing, because a unifying picture is missing.
1.5 Modeling of moisture content and sorption
Moisture removal from the matrix of a food product is a mass transfer process and to predict
this pass transfer models are required. Fick’s diffusion equation gives the basis for the modeling
8
of moisture content of products of a specified standard shape. Crank (1975) provides analytical
solutions of the diffusion equation. The validity of this analytical solution for an average
moisture content in an infinite sized slab holds only for uniform initial moisture concentration,
negligible external resistance and time invariant diffusion coefficient. The Page equation
(Saeed et al., 2006) does not reflect the diffusion behavior that occurs in many food products.
It has been observed by some researchers (Sjöholm and Gekas, 1995) that a linear relationship
between moisture and both shrinkage moisture diffusivity exists. Thus, a systematic deviation
between an experimental data and model outputs based on the Crank equation, may exist. For
a diffusion limited moisture transport system, deviations can be a result of the fact that
geometry of sample cubicles may not satisfy the conditions for a homogenous flow through
infinite sized slabs or moisture transport may be affected by shrinkage or the effective diffusion
coefficient may not be constant. Therefore, in this thesis, fractal and non-fractal shrinkage as
linear function of moisture content and diffusion coefficient were systematically investigated.
Sorption isotherms at various temperatures helps to predict the water activity which is
indicative of the susceptibility of food product to spoilage by microorganisms. Much attention
has been restricted to crops such as potato, carrots, green pepper, onions and dates (Samaniego-
Esquerra et al., 1991; Kiranoudis et al., 1993; Myhara et al., 1998a,b). A recent work on
desorption isotherms of two cultivars of yam (D. rotundata) was published by Montes et al.
(2009). Models used to describe sorption isotherms of foods include: Guggenheim-Anderson-
de Boer (GAB), Henderson, Halsey, Oswin, Smith, Brunauer-Emmett-Teller (BET) and Peleg.
Most studies are either restricted to desorption or adsorption (Andrade et al., 2011; Montes et
al., 2009 and Saad et al., 2014). The method of assessing the parameters have differed from
one researcher to the other, whereas limited attention has been given to the uncertainty in the
parameters. Additionally, there is generally no methodological attention, with respect to the
choice of the most appropriate model.
1.6 Problem Formulation
Apart from being a high intensity energy unit operation, drying degrades the quality of the
product when subjected to high temperatures. Solar drying of agricultural products can be a
solution especially when the output air temperature from the collector is designed not to exceed
a certain limit. The problem then is what particular dimension of collector the system gives an
output air condition in combination with an adsorption system that is most appropriate for
relatively low temperature drying and is appropriate for the regeneration of adsorbent after its
saturation due to night drying. What is mostly missing is the link between collector modeling
and dryers (Matuska et al, 2009; Simate, 2010; Njomo, 2000; Njomo, D. and Daguenet, M.,
2006; Ong and Law, 2009; Jorge and Armando, 2004). Majority of these works is based on
building the solar collector to see what happens in the solar dryer. On the other hand,
experimental work and the principle of proof of SAD is missing. In this thesis, the solar
collector systems is studied based on systematic mass and energy balances, while the principle
of proof of performance SAD is verified experimentally. Solar drying is limited to the day,
9
therefore to avoid rewetting, adsorption drying at night is a possible solution. However, the
adsorbent has to be regenerated after saturation. The solar collector system needs to be designed
such that air temperatures are high enough to regenerate the adsorbent.
Therefore, the corresponding research questions are:
• What model (GAB, Henderson, Halsey, Oswin, Smith, BET and Peleg) best describes
the equilibrium moisture isotherms for yam at 25°C and 50°C, both for sorption and
desorption.
• What is the effect of shrinkage and moisture diffusivity on the deviation between the
experimental drying data and the Crank equation.
• What collector dimension gives an output temperature suitable for drying agricultural
products and regeneration of adsorbent using spatially distributed modeling.
• What is the principle of proof of the SAD (pilot) plant and how does the operation affect
the quality of dried yam.
1.7 Outline of thesis
In chapter 2 the equilibrium moisture content of the adsorption and desorption isotherm of
yam at different temperatures is modeled, while in chapter 3, moisture dependent diffusion
and shrinkage in yam during drying is modeled using Crank’s solution of Fick’s equation. A
step-wise analysis to understand the observed deviations between the data and model outputs
based on the two term analytical solution by Crank (1975), was performed. The role of
shrinkage is investigated by using the concepts of volume reduction and the effect of fractal
change of thickness. Chapter 4 of this thesis discusses the design of the solar collector system.
The design which is based on an alternative numerical approach of the modeling work of Duffie
and Beckman (1980) as their work is limited to the use of analytical expressions and
approximations. The applied approach in this work eliminates the difficulty to determine the
spatial mean temperature of the absorber plate which is required to obtain an overall heat loss
coefficient.
In chapter 5, the performance of the solar adsorption dryer system is verified experimentally
using yam as the food product. The drying performance was evaluated, while the gain in
processing time due to night drying was estimated. The quality with respect to some nutrient,
vitamin C and color were also assessed, together with the regeneration performance was also
tested.
In chapter 6 new established facts and achievements in retrospective view are reflected.
Further recommendations emanating from this work and conclusions are duly made. The
potential of application of the solar adsorption drying method in Ghana has been discussed.
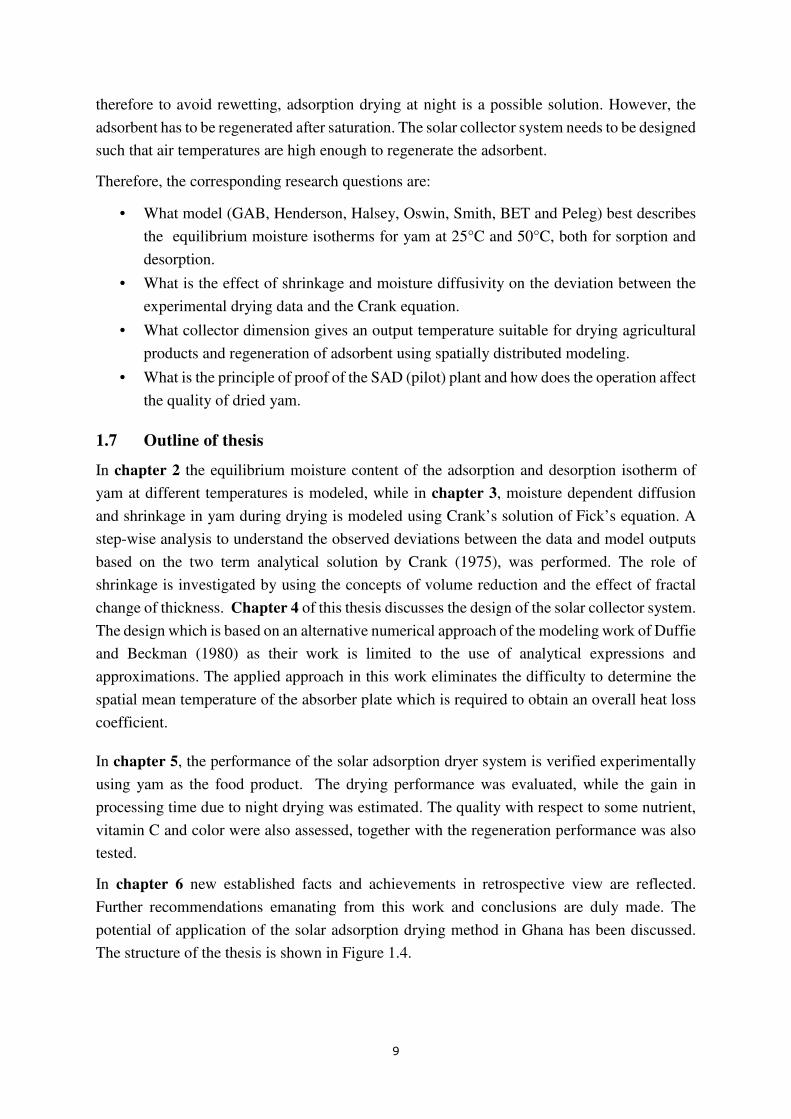
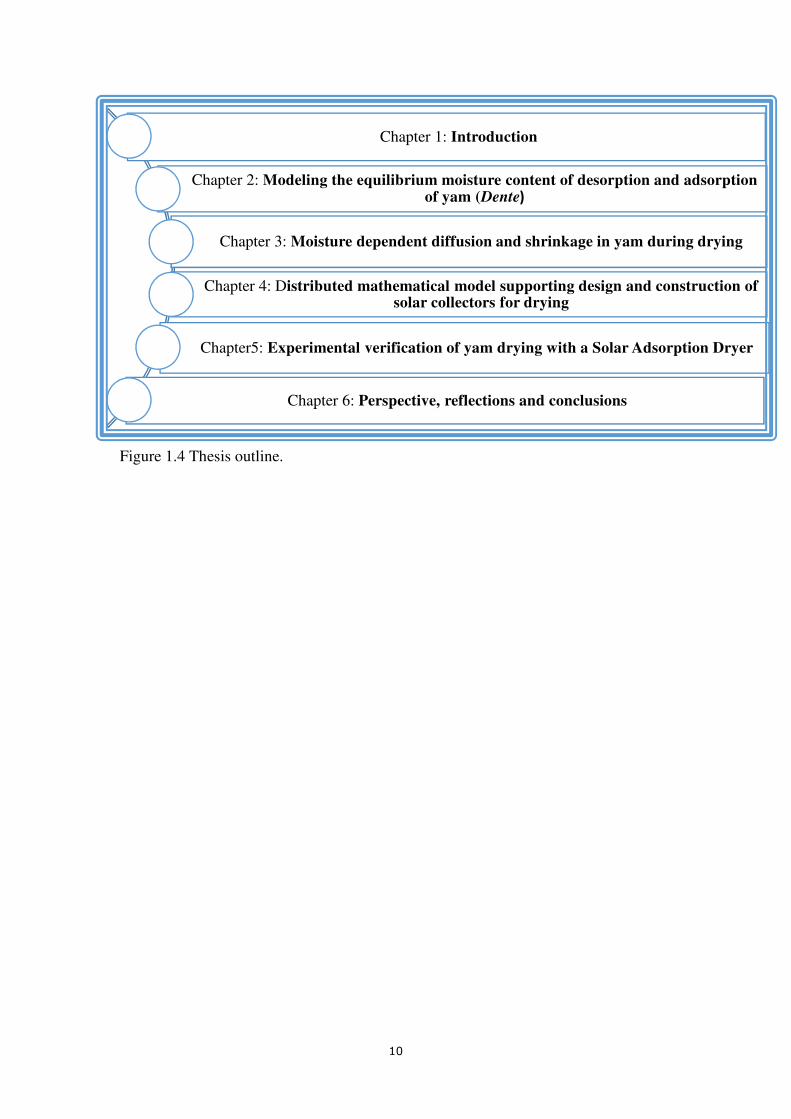
The structure of the thesis is shown in Figure 1.4.
10
Figure 1.4 Thesis outline.
Chapter 1: Introduction
Chapter 2: Modeling the equilibrium moisture content of desorption and adsorption of yam (Dente)
Chapter 3: Moisture dependent diffusion and shrinkage in yam during drying
Chapter 4: Distributed mathematical model supporting design and construction of solar collectors for drying
Chapter5: Experimental verification of yam drying with a Solar Adsorption Dryer
Chapter 6: Perspective, reflections and conclusions
11
Chapter 2
Modeling the equilibrium moisture content of desorption and
adsorption of yam (Dente)
This chapter is published as:
Amankwah, E. A., K. A. Dsizi, G. van Straten, and A. J. B. van Boxtel. 2018. Modeling the equilibrium moisture content of desorption and adsorption of yam (Dente). Agricultural Engineering International: CIGR Journal, 20(1): 184–192
12
Abstract
The experimental equilibrium moisture content of yam (Dioscorea rotundata; cultivar: Dente)
at temperatures of 25°C and 50°C were determined at relative humidity from 0% to 95%
employing the dynamic vapor sorption analyzer. Wet yam samples with about 68% initial
moisture content were used, first for desorption and subsequently for sorption. Water activity
decreased with increased temperature at constant equilibrium moisture content. The desorption
and adsorption isotherms were fitted by the Guggenheim-Anderson-de Boer (GAB),
Henderson, Halsey, Oswin, Smith, Brunauer-Emmett-Teller (BET) and Peleg models. On the
basis of the fit the Peleg, GAB and Oswin models were most suitable for describing the
observed data. When the focus is on drying, the GAB (3 parameters) and empirical Peleg
model (4 parameters) performed best. Of these, GAB is preferable because it has fewer
parameters, which, moreover, have a physical meaning.
.
13
2.1 Introduction
Yam is an important food crop for many people in the yam zone of West Africa. It forms about
10% of the total roots and tubers produced in the world. It has been estimated that the world
yam production would increase by 27% between the years 2003-2020. In past decades, yam
production in Ghana increased by 10% per year (Kenyon et al., 2006). It is second to cassava
as the most important tropical root crop but is nutritionally better than cassava on account of
their vitamin C (40-120 mg g-1 edible portion) and crude protein (40-140 g kg-1 dry matter)
content (Opara, 1999). Yam has a moisture content of about 70% when harvested (Fioreze and
Morini, 2000), making it highly perishable. Therefore it is essential to develop effective
methods that prolong the shelf life of yam without compromising on its nutritional and healthy
components. With this purpose in mind, it is imperative to obtain more information on some
properties of yam that can help to reduce post-harvest losses.
Sorption isotherms give an indication of the equilibrium conditions of a food product under
varying conditions of relative humidity and temperature. Information about the sorption
isotherms is necessary for the optimization and design of drying equipment, predictions of
quality parameters, shelf-life study, milling, mixing, packaging and storage investigations.
Sorption data helps to predict the water activity which is indicative of the susceptibility of food
product to spoilage microorganisms. One of the ways by which yam can be preserved to extend
its shelf life is by drying, but not much is known about the parameters related to drying
characteristics of yam, especially regarding desorption and sorption isotherms. Sorption
isotherms of food materials have been reported by amongst others Gálvez et al. (2006), Montes
(2009) and Saad et al. (2014). The majority of the work pertains to constant temperatures in
the range of 15°C – 60°C on samples from a variety of crops such as potato, carrots, green
pepper, onions and dates (Samaniego-Esquerra et al., 1991; Kiranoudis et al., 1993; Myhara et
al., 1998a,b). However, not much attention has been given to yam. A recent work on the
desorption isotherms of two varieties of D. rotundata was studied by Montes et al. (2009). It
was shown that, according the general accepted view, the equilibrium moisture content (EMC)
increases with water activity of the air (aw) and decreases with temperature. A similar result
was found by Igathinathane et al. (2005). There is also some recent work on water yam flour,
which, however, is a derived product (Owo et al., 2017). Empirical and semi-empirical
equations have been proposed to fit the EMC to relative humidity (RH) of food samples.
Models that have been used to describe the sorption isotherms of foods include: Guggenheim-
Anderson-de Boer (GAB), Henderson, Halsey, Oswin, Smith, Brunauer-Emmett-Teller (BET),
Peleg. These models do not all apply over the full moisture content range. The GAB equation
has been applied successfully to various foods up to 0.9 water activity (Maroulis et al., 1988;
Samaniego-Esquerra et al., 1991; Andrade et al., 2011) but is not suitable beyond 0.93 water
activity (Andrade et al., 2011). That of Halsey is effective between 0.1 – 0.8 (Rizvi, 1995).
While others have reported a decrease in EMC for increased temperature at the same water
activity, Montes et al. (2009) showed no temperature effect on the desorption isotherms of yam
14
(Dioscorea rotundata) at temperatures 45°C and 55°C. Moreover, some works were restricted
to desorption or adsorption alone as reported in the work of Andrade et al. (2011), Montes et
al. (2009) and Saad et al. (2014). The reported investigations also differ in the method of
assessing the parameters, whereas limited attention has been given to the uncertainty in the
parameters (a noteworthy exception is e.g. Quirijns (2005)). In addition, there is generally no
methodological attention to the choice of the most appropriate model. The object of this
research is to obtain experimental equilibrium moisture isotherms for yam at 25°C and 50°C,
both for sorption and desorption, to estimate the parameters and their uncertainty range for
each of the models (GAB, Henderson, Halsey, Oswin, Smith, BET and Peleg), and then to use
objective criteria to select the model that best describes the experimental desorption and
adsorption isotherms over the relevant range of moisture contents.
2.2 Materials and methods
2.2.1 Source and preparation of material
The yam tubers of the variety, D. rotundata and cultivar (Dente) were purchased from a
commercial farmer at Ejura, in the Sekyere Odumasi district of the Ashanti region of Ghana.
The yam tubers were send to Wageningen, the Netherlands for the sorption measurements. For
each experiment, a tuber of the yam was washed and cut into two halves. An amount of 13.36
and 31.39 mg of fresh samples at initial moisture contents 69.87% and 65.25% w.b. for 25°C
and 50°C constant temperature experiments, respectively, was scooped from the middle part
of one surface of the cut yam. The sample was carefully placed in the sample pan.
2.2.2 Procedure and measuring equipment
The experimental technique of the dynamic method was used to determine the desorption
isotherms of the fresh yam. The dynamic vapor sorption (DVS) analyzer (Surface Measurement
System DVS Advantage (ET), UK) was used for the measurement. The DVS analyzer uses a
microbalance to measure the weight changes of samples. Two air mass flow controllers (wet
and dry) mix air in such a way that the RH of the air flow is set and controlled in the range of
95% to 0% (desorption) with an optical vapor concentration RH detector. At equilibrium
between sample and air RH/100 corresponds to the water activity ��. RH and temperature in
the DVS are computer controlled and followed by a chosen procedure. The RH starts at 95%
and goes down by steps of 10% to 15% and then to 0% RH. At each step the sample mass was
measured every minute and equilibrium was reached when the standard deviation between
three successive measurements was less than 3 × 10⁻⁴ g (i.e. in terms of EMC 1.5 × 10⁻⁵ g water.
g-1 dry weight). The adsorption behavior was measured by the reverse procedure by stepping
up from 0% through 15% to 95% RH. This process was repeated for temperatures 25°C and
50°C.
15
2.2.3 Observed curves
The observed data were determined for D. rotundata varieties (cultivar Dente) at 25°C and
50°C at relative humidity from 95% to 0% for desorption and 0%-95% for adsorption. During
the RH ramp the micro balance (0.0001g accuracy) continuously measures the mass of the
sample at intervals of 1 minute. Based on the mass of the sample as function of the RH, the
EMC was calculated in dry basis (kg water.kg-1 dry weight). The equilibrium moisture content
was then plotted against the water activity (RH/100) of the air, to obtain equilibrium moisture
curves.
2.2.4 Models
The most common equations for describing sorption isotherms of food products are the BET
model, Oswin model, Smith model, Halsey model, Henderson model, GAB model, and Peleg
model (Sahin and Sumnu, 2006). In order to make sure that parameters are dimensionally
consistent across models, the models of Halsey, Henderson, Smith and Peleg were
reformulated, such that the parameter �� in all models has the same units as ��, and all other
parameters are dimensionless (Table 2.1).
The Henderson model is often used in describing food sorption isotherms. It was originally
formulated as �− ��� ����# ��/. The form in the table arises by redefining �� = � ���#���
, which
has the same units as ��, and avoids a parameter with fractional units. The Halsey model is
suitable for describing the sorption behavior of starchy foods. It expresses the condensation of
multilayers at large distance from the surface of the drying product with the assumption that
energy potential of a molecule varies as the inverse of the nth power of the distance from the
surface. It describes well the sorption isotherm of types I, II and III (Levine and Slade, 1991).
The form in the table arises from the original form �� = ����#� ���/, by redefining �� = ���#���.
The Oswin equation is an empirical model that satisfies sigmoidal shaped curves (Labuza et
al., 1972). The Smith model, originally formulated as �� = �� + ��#ln�1 − ��� is an empirical
model that describes the final curved portion of water sorption isotherm of high molecular
weight biopolymers. The model is based on two fractions of water that are adsorbed onto a dry
surface. The first fraction represents the quantity of water in the first sorbed fraction, while the
second specifies the quantity of water in the multilayer moisture fraction. In the reformulated
equation in table 1, �� is a dimensionless parameter defined by ��#/��. The model is suitable
for various foods products of water activity
16
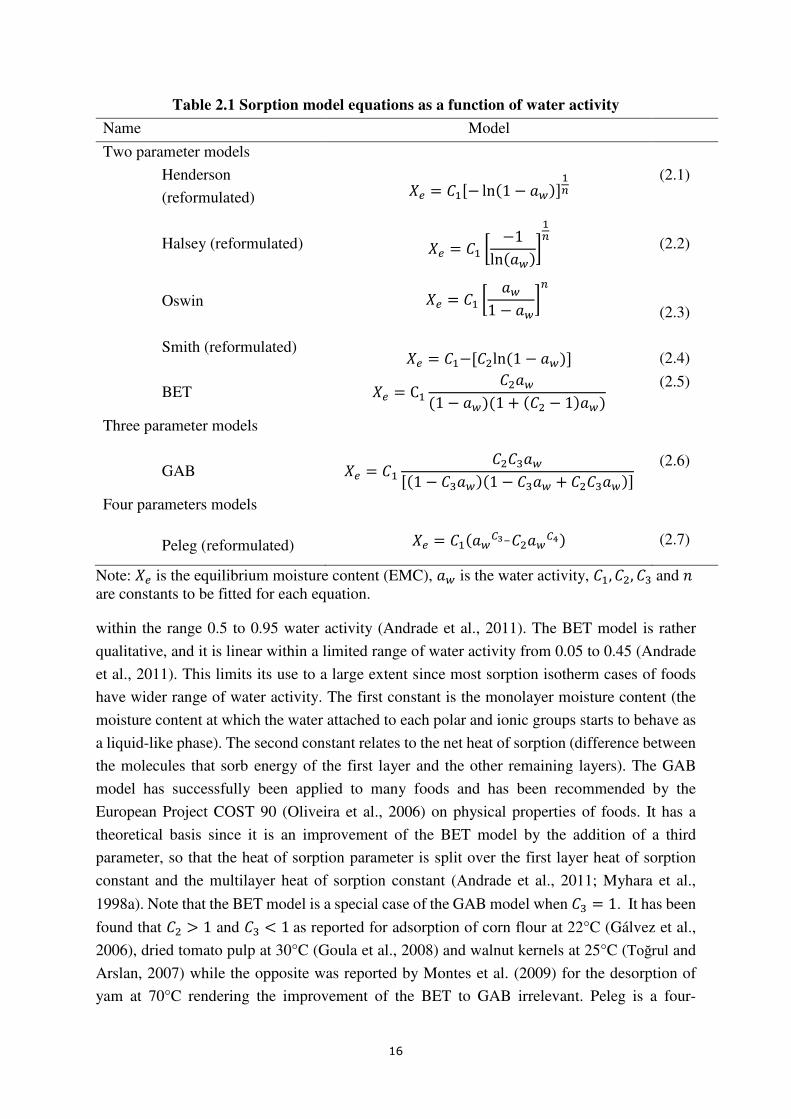
Table 2.1 Sorption model equations as a function of water activity
Name Model
Two parameter models
Henderson
(reformulated) �� = ���− ln�1 − ����� (2.1)
Halsey (reformulated) �� = �� � −1ln���� �
(2.2)
Oswin �� = �� � ��1 − ��
(2.3)
Smith (reformulated) �� = ��−���ln�1 − ����
(2.4)
BET �� = C� �����1 − ����1 + ��� − 1���� (2.5)
Three parameter models
GAB �� = �� ���"����1 − �"����1 − �"�� + ���"���� (2.6)
Four parameters models
Peleg (reformulated) �� = ������#$�����%� (2.7)
Note: �� is the equilibrium moisture content (EMC), �� is the water activity, ��, ��, �" and ' are constants to be fitted for each equation.
within the range 0.5 to 0.95 water activity (Andrade et al., 2011). The BET model is rather
qualitative, and it is linear within a limited range of water activity from 0.05 to 0.45 (Andrade
et al., 2011). This limits its use to a large extent since most sorption isotherm cases of foods
have wider range of water activity. The first constant is the monolayer moisture content (the
moisture content at which the water attached to each polar and ionic groups starts to behave as
a liquid-like phase). The second constant relates to the net heat of sorption (difference between
the molecules that sorb energy of the first layer and the other remaining layers). The GAB
model has successfully been applied to many foods and has been recommended by the
European Project COST 90 (Oliveira et al., 2006) on physical properties of foods. It has a
theoretical basis since it is an improvement of the BET model by the addition of a third
parameter, so that the heat of sorption parameter is split over the first layer heat of sorption
constant and the multilayer heat of sorption constant (Andrade et al., 2011; Myhara et al.,
1998a). Note that the BET model is a special case of the GAB model when �" = 1. It has been
found that �� > 1 and �" < 1as reported for adsorption of corn flour at 22°C (Gálvez et al.,
2006), dried tomato pulp at 30°C (Goula et al., 2008) and walnut kernels at 25°C (Toğrul and
Arslan, 2007) while the opposite was reported by Montes et al. (2009) for the desorption of
yam at 70°C rendering the improvement of the BET to GAB irrelevant. Peleg is a four-
17
parameter model, originally given by �� = �����# − ��#���% , which is a purely empirical
equation without a theoretical background. Andrade et al. (2011) mentioned that generally
C3<1 while C4 >1, but Montes et al. (2009) suggest the opposite which makes these parameter
values inconsistent. Note that the two-parameter models deteriorate at �� = 1, as lim �→� �� =∞. Hence, there is an upper limit for �� beyond which these models must lose their validity.
It is expected in all models that lim �→. �� = 0.
2.2.5 Statistical analysis of data
The nonlinear regression method in Matlab was used for the parameter estimation of the
models, by minimizing the sum of squared differences between experimental and model results
of desorption and adsorption. The goodness of fit was determined with three statistical tools,
that is:
the standard error (SE) 01 = 2∑ �456789�:6��;<=>� ?� − ?@
(2.8)
the percent average relative deviation (PRD)
A4B�%� = 100?� DE|456789�:6|1G�� H;<=>�
(2.9)
and the coefficient of performance (R2)
4� = 1 − ∑ �456789�:6��;<=>�∑ �1G�IIIIII� − 1G�J��;<=>�
(2.10)
Here, 1G�J is the modeled value of equilibrium moisture content, 1G�� is the experimental
equilibrium moisture content value, ?@ is the number of parameters of a particular model, ?�
is the number of experimental data points, 1G�IIIIII� is the arithmetic mean of the experimental
equilibrium moisture contents, and the residuals are defined by 1G�� − 1G�J. All data were
processed and evaluated using the Matlab software. In general, more parameters lead to a better
fit, but the predictive power may be worse, unless the improvement is worthwhile. Akaike’s
Information Criterion (AIC) is especially suitable for comparing models with a different
number of parameters (Ljung, 1987). The criterion is reformulated here as: KL� = 2?@ + ?�ln�N�OP�� (2.11)
The model with the lowest AIC is preferred. Here N�QP� is the sum of squared errors for the
estimated parameter vector QP i.e. N�QP� = ∑ �G�J�R, QP� − G���R�;S>� ��. Since the number of
data points is small, it is better to use the small sample corrected variant (Hu, 2007), which is:
KL�T = KL� + 2?@U?@ + 1V?� − ?@ − 1 (2.12)
18
2.2.6 Approximate confidence bound
The least squares method with the water activity ��as independent variable does not suffer
from the so-called errors-in-variables problem which would occur if both the dependent and
independent variable would have errors. Hence, the uncertainty of the parameter estimates can
be evaluated by calculating the 2σ confidence interval based on the Jacobian matrix. The
Jacobian matrix specifies the sensitivity of each point to each of the parameters. The
relationships in Table 2.1 are linear in the parameter ��, meaning that the 2σ bound corresponds
to the 95% confidence interval, i.e. there is 5% chance that the true value is outside this range.
For the other parameters, the 95% bound is only approximate. For convenience, in the tables
below, the uncertainty is reported as the 1σ coefficient of variation, i.e. as 100WX�� , where X is the parameter estimate.
2.3 Results and discussion
2.3.1 Desorption and adsorption isotherms measurements
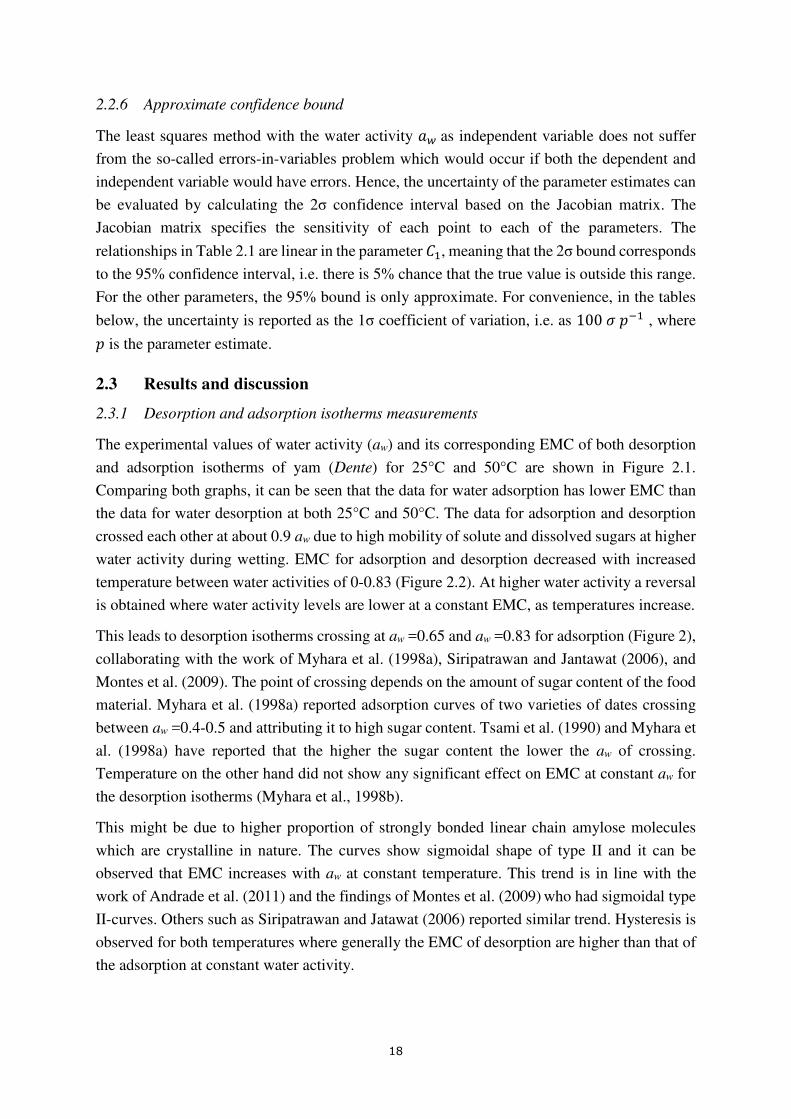
The experimental values of water activity (aw) and its corresponding EMC of both desorption
and adsorption isotherms of yam (Dente) for 25°C and 50°C are shown in Figure 2.1.
Comparing both graphs, it can be seen that the data for water adsorption has lower EMC than
the data for water desorption at both 25°C and 50°C. The data for adsorption and desorption
crossed each other at about 0.9 aw due to high mobility of solute and dissolved sugars at higher
water activity during wetting. EMC for adsorption and desorption decreased with increased
temperature between water activities of 0-0.83 (Figure 2.2). At higher water activity a reversal
is obtained where water activity levels are lower at a constant EMC, as temperatures increase.
This leads to desorption isotherms crossing at aw =0.65 and aw =0.83 for adsorption (Figure 2),
collaborating with the work of Myhara et al. (1998a), Siripatrawan and Jantawat (2006), and
Montes et al. (2009). The point of crossing depends on the amount of sugar content of the food
material. Myhara et al. (1998a) reported adsorption curves of two varieties of dates crossing
between aw =0.4-0.5 and attributing it to high sugar content. Tsami et al. (1990) and Myhara et
al. (1998a) have reported that the higher the sugar content the lower the aw of crossing.
Temperature on the other hand did not show any significant effect on EMC at constant aw for
the desorption isotherms (Myhara et al., 1998b).
This might be due to higher proportion of strongly bonded linear chain amylose molecules
which are crystalline in nature. The curves show sigmoidal shape of type II and it can be
observed that EMC increases with aw at constant temperature. This trend is in line with the
work of Andrade et al. (2011) and the findings of Montes et al. (2009) who had sigmoidal type
II-curves. Others such as Siripatrawan and Jatawat (2006) reported similar trend. Hysteresis is
observed for both temperatures where generally the EMC of desorption are higher than that of
the adsorption at constant water activity.
19
Figure 2.1 Experimental data of equilibrium moisture content (EMC) against water activity ���) at 25°C (a) and 50°C (b) for water desorption and adsorption.
One reason for differences in EMC between the desorption and adsorption at constant
temperature and water activity is that, during desorption, solutes may supersaturate below their
crystallization water activity and therefore can hold more water, especially for products with
high sugar content (Aguilera and Stanley, 1999). The other common explanation is that when
dried biological material is subjected to a wetting environment, the moisture first adheres to
the surface of the cells, primarily in a unimolecular layer. After a high amount of molecules
adhered to the surface, the diffusional forces exceed the binding forces and allow moisture to
move inside the cell. When, subsequently, the vapor pressure of the environment of the cell
surface is reduced again, absorbed moisture from the cell moves out of the cells due to
0 0.1 0.2 0.3 0.4 0.5 0.6 0.7 0.8 0.9 10
0.1
0.2
0.3
0.4
0.5
0.6
aw
(-)
EM
C (
kg[w
ate
r]/k
g[d
ry m
att
er]
)
drying obs. (25 °C)
wetting obs. (25 °C)
0 0.1 0.2 0.3 0.4 0.5 0.6 0.7 0.8 0.9 10
0.05
0.1
0.15
0.2
0.25
0.3
0.35
aw
(-)
EM
C (
kg[w
ate
r]/k
g[d
ry m
att
er]
)
drying obs. (50 °C)
wetting obs. (50 °C)
a)
b)
EM
C (
kg
wa
ter. k
g-1
dry
we
igh
t)
��
��
EM
C (
kg w
ate
r. kg
-1d
ry w
eig
ht)
20
diffusional forces caused by concentration gradient leading to the hysteresis (Young and
Nelson, 1967).
2.3.2 Modeling the isotherms
In fitting the models the data point at water activity 0.95 was ignored since according to the
literature beyond aw 0.9, most models are not able to explain well the experimental data
(Samaniego-Esguerra et al., 1991). One reason could be that, according to the differences
between wetting and drying behavior at high water activity, it is hard to obtain a reliable
measurement point since reaching the equilibrium may require a long equilibration time. Tables
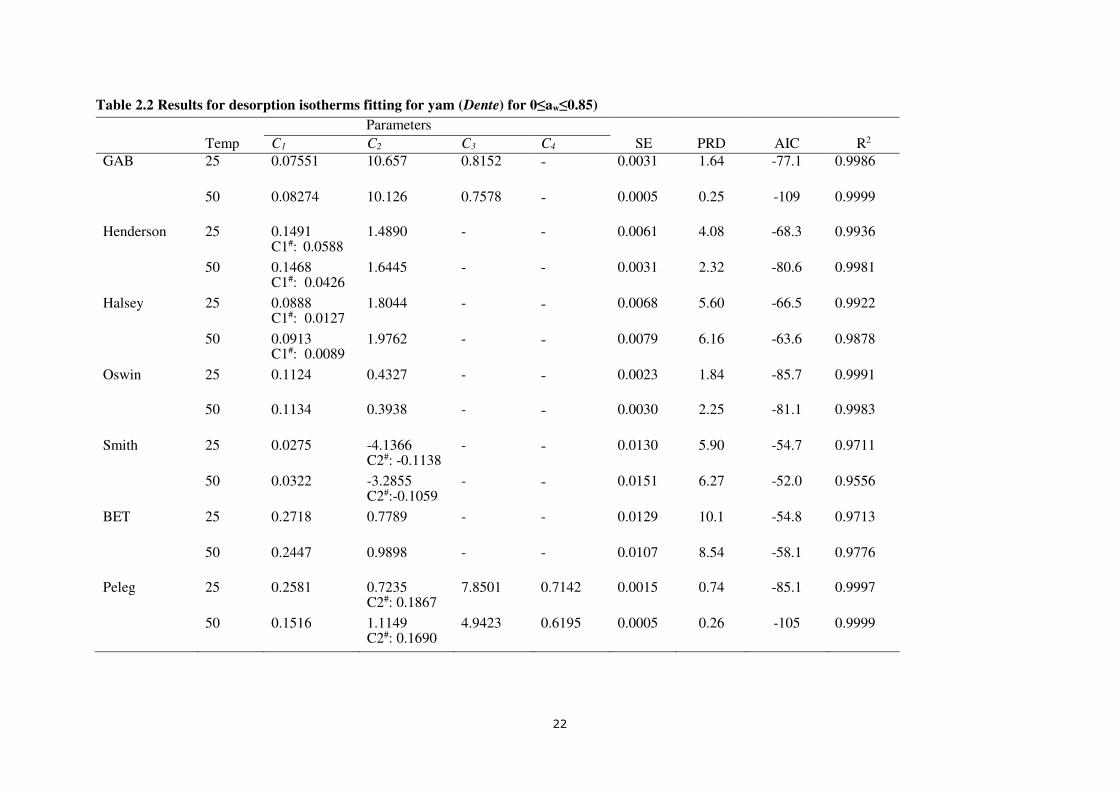
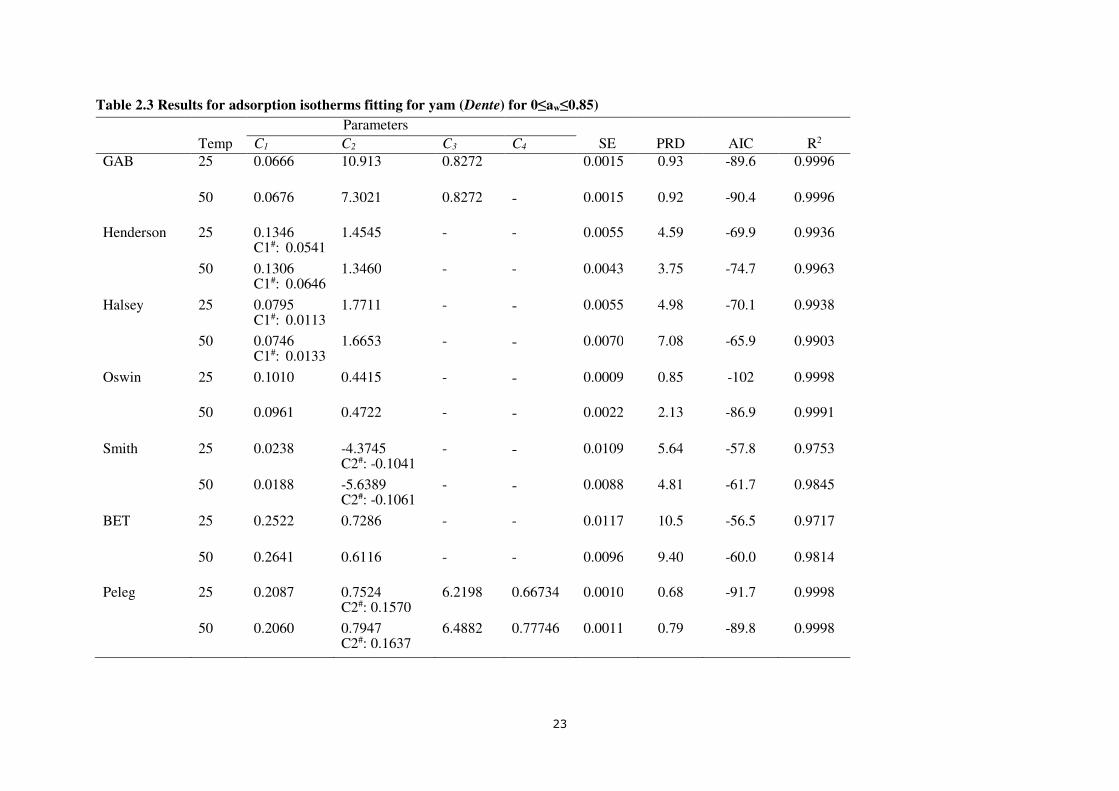
2.2 and 2.3 show the outcome of the nonlinear regression analysis of desorption and adsorption
isotherms respectively, of yam (Dente) for 0≤aw≤0.85 at 25°C and 50°C. The parameters of
the seven models, that is, GAB, Henderson, Halsey, Oswin, Smith, BET and Peleg, fitted to
the desorption and adsorption data along with SE, PRD, AIC and R2, for the temperatures 25°C
and 50°C. Peleg is purely empirical (it has the best combination of sores for SE, PRD, AIC of
all), but the GAB and BET have a physiological background. This makes them stronger
candidates. It turns out that the SE, PRD, AIC of GAB were equally low, and with fewer
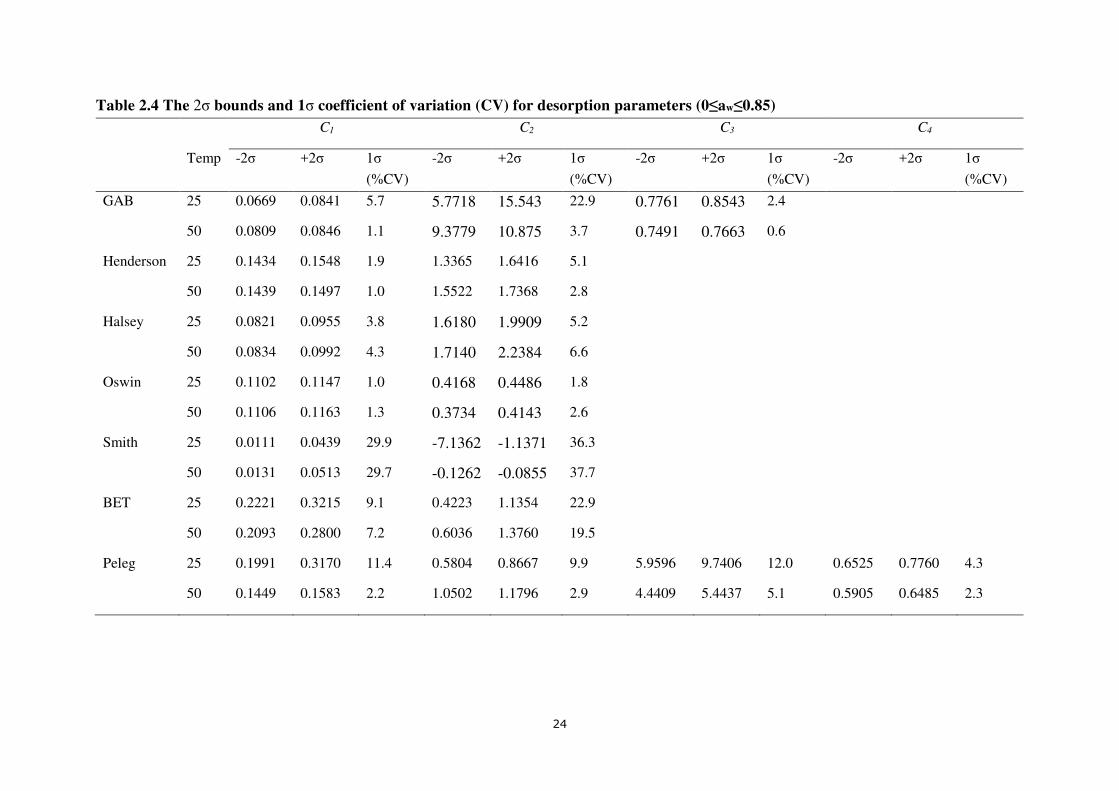
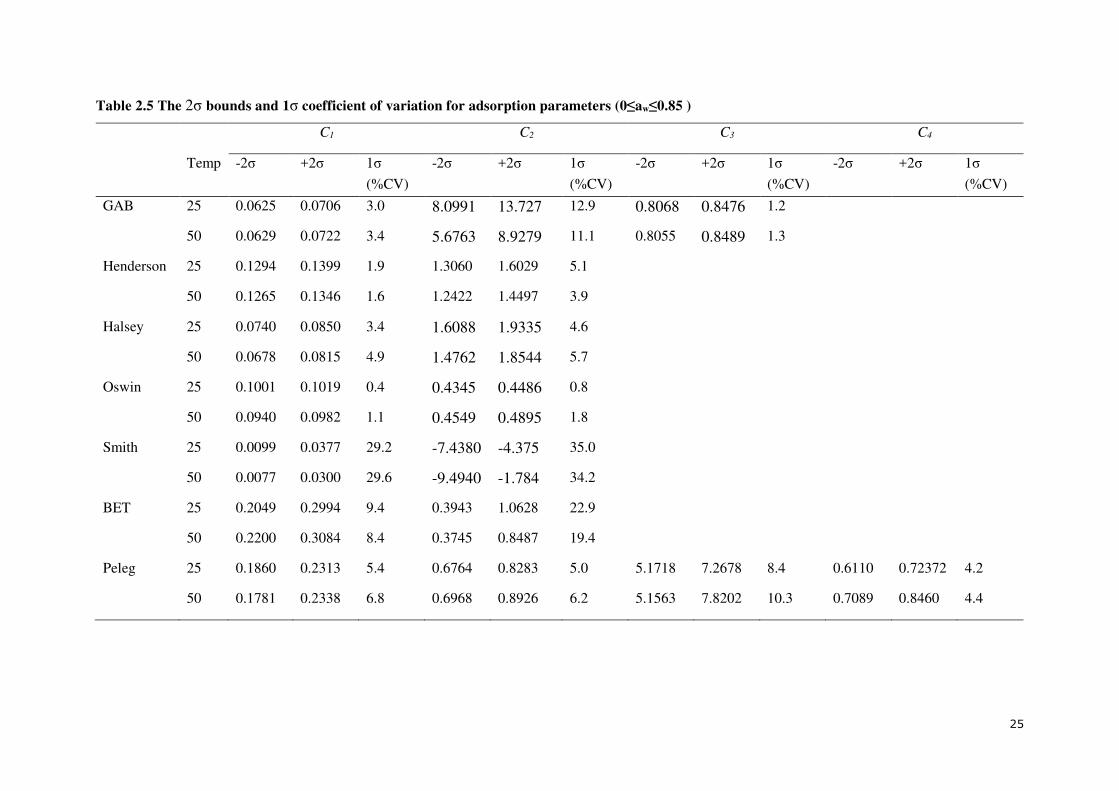
parameters than Peleg. On the other hand, with respect to the confidence interval of the
parameters using the 2-σ bound, and in particular on the first parameter, C1 which has the same
unit as that of Xe, the GAB and Oswin recorded the least percentage coefficient of variation (1-
σ, %CV) for all the phenomena at different temperatures (Tables 2.4 and 2.5). The GAB model
is subsequently considered for describing the desorption and adsorption data at temperatures
25°C and 50°C. Montes et al. (2009) mentioned that the Peleg model was best for describing
the desorption isotherm of two varieties of yam (D. rotundata), while Peleg and Oswin models
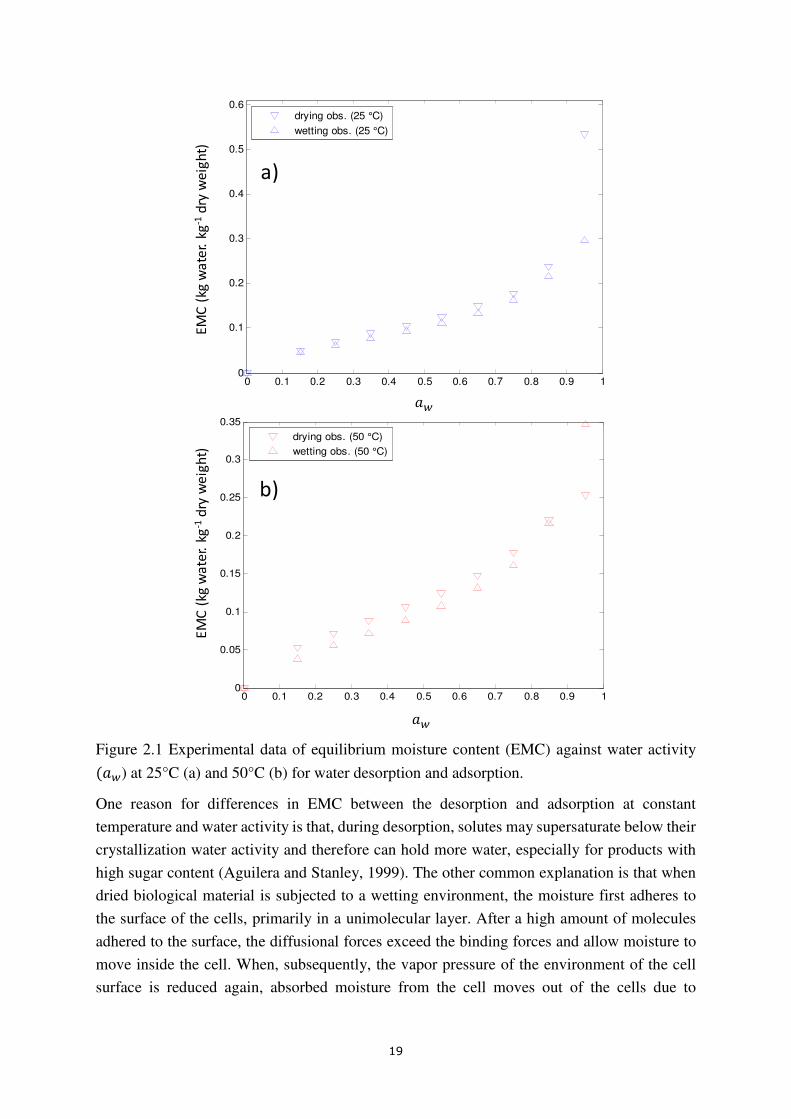
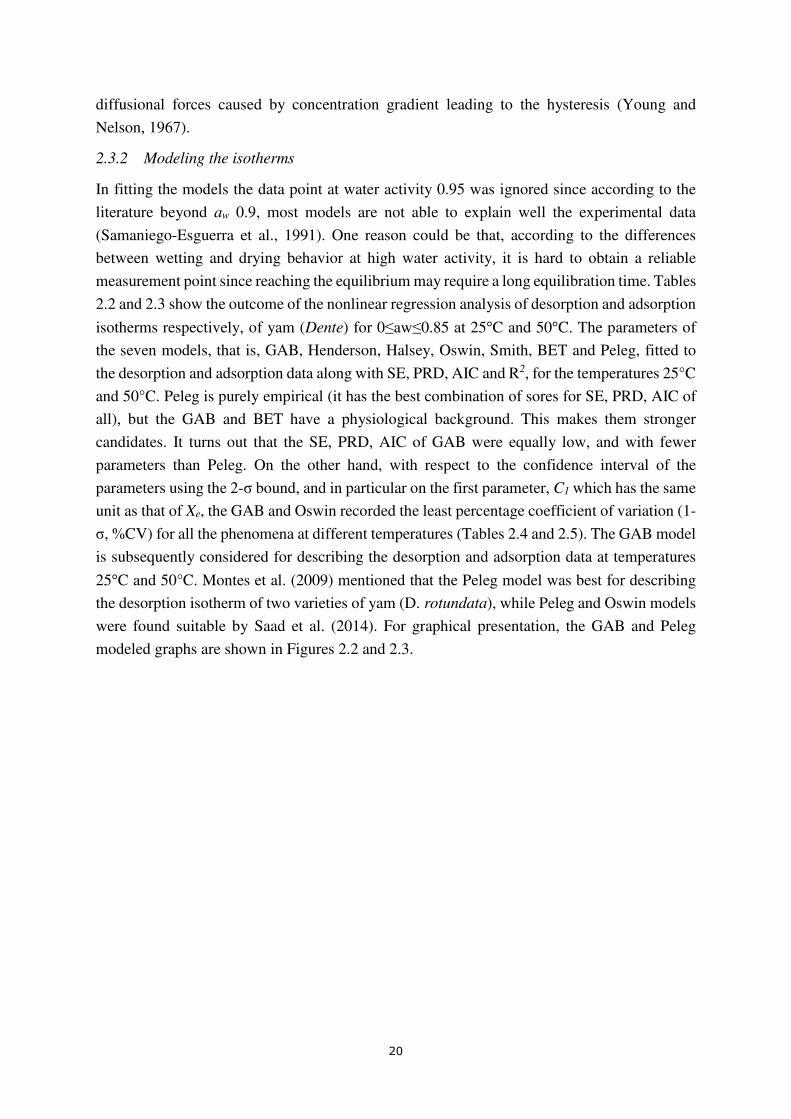
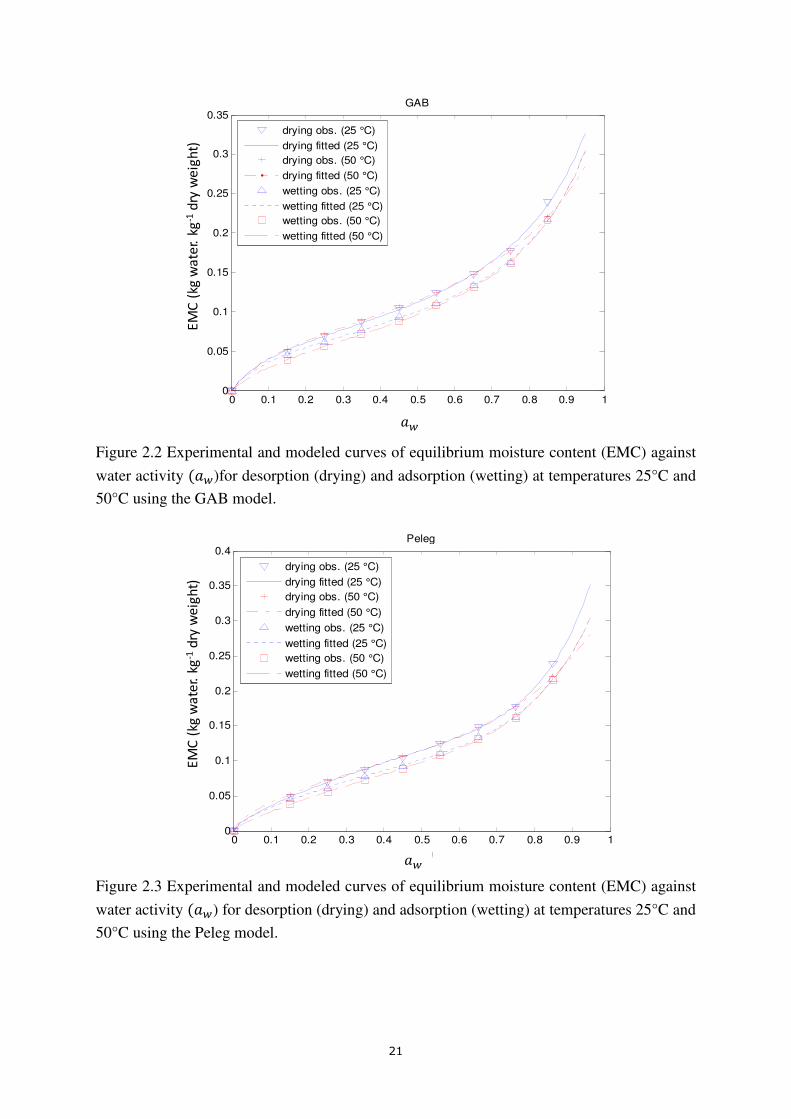
were found suitable by Saad et al. (2014). For graphical presentation, the GAB and Peleg
modeled graphs are shown in Figures 2.2 and 2.3.
21
Figure 2.2 Experimental and modeled curves of equilibrium moisture content (EMC) against
water activity ���)for desorption (drying) and adsorption (wetting) at temperatures 25°C and
50°C using the GAB model.
Figure 2.3 Experimental and modeled curves of equilibrium moisture content (EMC) against
water activity ���) for desorption (drying) and adsorption (wetting) at temperatures 25°C and
50°C using the Peleg model.
0 0.1 0.2 0.3 0.4 0.5 0.6 0.7 0.8 0.9 10
0.05
0.1
0.15
0.2
0.25
0.3
0.35
aw
(-)
EM
C (
kg[w
ate
r]/k
g[d
ry m
att
er]
)
GAB
drying obs. (25 °C)
drying fitted (25 °C)
drying obs. (50 °C)
drying fitted (50 °C)
wetting obs. (25 °C)
wetting fitted (25 °C)
wetting obs. (50 °C)
wetting fitted (50 °C)
��
EM
C (
kg
wa
ter. k
g-1
dry
we
igh
t)
0 0.1 0.2 0.3 0.4 0.5 0.6 0.7 0.8 0.9 10
0.05
0.1
0.15
0.2
0.25
0.3
0.35
0.4
aw
(-)
EM
C (
kg[w
ate
r]/k
g[d
ry m
att
er]
)
Peleg
drying obs. (25 °C)
drying fitted (25 °C)
drying obs. (50 °C)
drying fitted (50 °C)
wetting obs. (25 °C)
wetting fitted (25 °C)
wetting obs. (50 °C)
wetting fitted (50 °C)
��
EM
C (
kg
wa
ter. k
g-1
dry
we
igh
t)
22
Table 2.2 Results for desorption isotherms fitting for yam (Dente) for 0≤aw≤0.85)
Parameters Temp C1 C2 C3 C4 SE PRD AIC R2 GAB 25 0.07551 10.657 0.8152 - 0.0031 1.64 -77.1 0.9986
50 0.08274 10.126 0.7578 - 0.0005 0.25 -109 0.9999
Henderson 25 0.1491 C1#: 0.0588
1.4890 - - 0.0061 4.08 -68.3 0.9936
50 0.1468 C1#: 0.0426
1.6445 - - 0.0031 2.32 -80.6 0.9981
Halsey 25 0.0888 C1#: 0.0127
1.8044 - - 0.0068 5.60 -66.5 0.9922
50 0.0913 C1#: 0.0089
1.9762 - - 0.0079 6.16 -63.6 0.9878
Oswin 25 0.1124 0.4327 - - 0.0023 1.84 -85.7 0.9991
50 0.1134 0.3938 - - 0.0030 2.25 -81.1 0.9983
Smith 25 0.0275 -4.1366 C2#: -0.1138
- - 0.0130 5.90 -54.7 0.9711
50 0.0322 -3.2855 C2#:-0.1059
- - 0.0151 6.27 -52.0 0.9556
BET 25 0.2718 0.7789 - - 0.0129 10.1 -54.8 0.9713
50 0.2447 0.9898 - - 0.0107 8.54 -58.1 0.9776
Peleg 25 0.2581 0.7235 C2#: 0.1867
7.8501 0.7142 0.0015 0.74 -85.1 0.9997
50 0.1516 1.1149 C2#: 0.1690
4.9423 0.6195 0.0005 0.26 -105 0.9999
23
Table 2.3 Results for adsorption isotherms fitting for yam (Dente) for 0≤aw≤0.85)
Parameters Temp C1 C2 C3 C4 SE PRD AIC R2 GAB 25 0.0666 10.913 0.8272 0.0015 0.93 -89.6 0.9996
50 0.0676 7.3021 0.8272 - 0.0015 0.92 -90.4 0.9996
Henderson 25 0.1346 C1#: 0.0541
1.4545 - - 0.0055 4.59 -69.9 0.9936
50 0.1306 C1#: 0.0646
1.3460 - - 0.0043 3.75 -74.7 0.9963
Halsey 25 0.0795 C1#: 0.0113
1.7711 - - 0.0055 4.98 -70.1 0.9938
50 0.0746 C1#: 0.0133
1.6653 - - 0.0070 7.08 -65.9 0.9903
Oswin 25 0.1010 0.4415 - - 0.0009 0.85 -102 0.9998
50 0.0961 0.4722 - - 0.0022 2.13 -86.9 0.9991
Smith 25 0.0238 -4.3745 C2#: -0.1041
- - 0.0109 5.64 -57.8 0.9753
50 0.0188 -5.6389 C2#: -0.1061
- - 0.0088 4.81 -61.7 0.9845
BET 25 0.2522 0.7286 - - 0.0117 10.5 -56.5 0.9717
50 0.2641 0.6116 - - 0.0096 9.40 -60.0 0.9814
Peleg 25 0.2087 0.7524 C2#: 0.1570
6.2198 0.66734 0.0010 0.68 -91.7 0.9998
50 0.2060 0.7947 C2#: 0.1637
6.4882 0.77746 0.0011 0.79 -89.8 0.9998
24
Table 2.4 The 2σ bounds and 1σ coefficient of variation (CV) for desorption parameters (0≤aw≤0.85)
C1 C2 C3 C4
Temp -2σ +2σ 1σ
(%CV)
-2σ +2σ 1σ
(%CV)
-2σ +2σ 1σ
(%CV)
-2σ +2σ 1σ
(%CV)
GAB 25 0.0669 0.0841 5.7 5.7718 15.543 22.9 0.7761 0.8543 2.4
50 0.0809 0.0846 1.1 9.3779 10.875 3.7 0.7491 0.7663 0.6
Henderson 25 0.1434 0.1548 1.9 1.3365 1.6416 5.1
50 0.1439 0.1497 1.0 1.5522 1.7368 2.8
Halsey 25 0.0821 0.0955 3.8 1.6180 1.9909 5.2
50 0.0834 0.0992 4.3 1.7140 2.2384 6.6
Oswin 25 0.1102 0.1147 1.0 0.4168 0.4486 1.8
50 0.1106 0.1163 1.3 0.3734 0.4143 2.6
Smith 25 0.0111 0.0439 29.9 -7.1362 -1.1371 36.3
50 0.0131 0.0513 29.7 -0.1262 -0.0855 37.7
BET 25 0.2221 0.3215 9.1 0.4223 1.1354 22.9
50 0.2093 0.2800 7.2 0.6036 1.3760 19.5
Peleg 25 0.1991 0.3170 11.4 0.5804 0.8667 9.9 5.9596 9.7406 12.0 0.6525 0.7760 4.3
50 0.1449 0.1583 2.2 1.0502 1.1796 2.9 4.4409 5.4437 5.1 0.5905 0.6485 2.3
25
Table 2.5 The 2σ bounds and 1σ coefficient of variation for adsorption parameters (0≤aw≤0.85 )
C1 C2 C3 C4
Temp -2σ +2σ 1σ
(%CV)
-2σ +2σ 1σ
(%CV)
-2σ +2σ 1σ
(%CV)
-2σ +2σ 1σ
(%CV)
GAB 25 0.0625 0.0706 3.0 8.0991 13.727 12.9 0.8068 0.8476 1.2
50 0.0629 0.0722 3.4 5.6763 8.9279 11.1 0.8055 0.8489 1.3
Henderson 25 0.1294 0.1399 1.9 1.3060 1.6029 5.1
50 0.1265 0.1346 1.6 1.2422 1.4497 3.9
Halsey 25 0.0740 0.0850 3.4 1.6088 1.9335 4.6
50 0.0678 0.0815 4.9 1.4762 1.8544 5.7
Oswin 25 0.1001 0.1019 0.4 0.4345 0.4486 0.8
50 0.0940 0.0982 1.1 0.4549 0.4895 1.8
Smith 25 0.0099 0.0377 29.2 -7.4380 -4.375 35.0
50 0.0077 0.0300 29.6 -9.4940 -1.784 34.2
BET 25 0.2049 0.2994 9.4 0.3943 1.0628 22.9
50 0.2200 0.3084 8.4 0.3745 0.8487 19.4
Peleg 25 0.1860 0.2313 5.4 0.6764 0.8283 5.0 5.1718 7.2678 8.4 0.6110 0.72372 4.2
50 0.1781 0.2338 6.8 0.6968 0.8926 6.2 5.1563 7.8202 10.3 0.7089 0.8460 4.4
26
2.4 Conclusion
Important thermodynamic characteristics for predicting the interactions between water and
food components are moisture desorption and adsorption isotherms. The moisture desorption
and adsorption isotherms for yam (the Dente cultivar of D. Rotundata) have been determined
at 25 oC and 50°C by the dynamic method using the DVS analyzer between 0% to 0.95% water
activity. The isotherms showed a sigmoidal shape. The equilibrium moisture contents were
found to increase with increasing water activity at constant temperature. While at constant
EMC the water activity is higher at higher temperature under adsorption, there is no significant
difference in the case of desorption. Crossing of the adsorption isotherms of 25°C and 50oC,
and of the adsorption and desorption isotherms at 50°C took place at higher water activity,
which is most probable result of the low sugar content in yam compared to other products, as
discussed before. Within the range 0≤aw≤0.85 all seven models tested can provide a reasonable
fit, although the BET and Smith models are inferior for yam. All models require two different
parameter sets to describe the hysteresis between adsorption and desorption, which is a
common flaw of these equations. Based on the standard error of prediction, the Peleg, Oswin
and GAB models were found as most suitable to describe the experimental equilibrium
moisture contents of yam (Dente) of both desorption and adsorption. The parameter uncertainty
of the Oswin model is low. In general, a low parameter uncertainty means that the parameters
can be estimated well from experimental data. At 50°C the absolute error is larger for the Oswin
model than for Peleg and GAB. The Oswin model has the lowest AIC for sorption, which may
make it the best model when it is needed to describe wetting of a product. For drying, however,
the larger number of parameters in the Peleg and GAB models is justified, as shown by the
lowest AIC values at desorption. Of these two, the GAB is preferred since it has a physiological
basis, and fewer parameters that can be estimated quite well from experimental data.
27
Chapter 3
Moisture dependent diffusion and shrinkage in yam during
drying
This chapter is published as:
Amankwah, Emmanuel A.; Dzisi, Komla Agbeko; Straten, Gerrit van; Boxtel, Anton J.B. van
2018. Moisture dependent diffusion and shrinkage in yam during drying, International Journal
of Food Engineering, 14(7-8), ISSN 2194-5764 - 15 p.
28
Abstract
Crank’s analytical approximations for Fick’s diffusion equation were used to investigate the
effect of moisture dependent sample thickness and diffusivity on the drying behavior of yam
(Dioscoreaceae rotundata) cubicles. Drying and shrinkage experiments were separately
conducted at temperatures of 30, 40 and 50oC in a cabinet drier. The comparative study of
moisture dependent shrinkage and moisture dependent diffusivity justifies the interdependence
of diffusivity and shrinkage due to water loss during drying. The behavior for yam is best
explained by a combination of fractal moisture dependent shrinkage and moisture dependent
diffusion, describing both the drying and rate curves better with good prediction of the high
moisture regions. This assertion was reached as a result of low mean square error, standard
error, percentage relative deviation, Akaike’s Information Criterion and high coefficient of
determination. The results may indicate a varying mobility of water in food matrix of different
moisture content in the multilayer and monolayer regimes.
29
3.1 Introduction
Yam, a delicacy and a major source of food supply for many African, Asian and Latin
American countries, has a moisture content of about 70% when harvested, which make yam
perishable (Fioreze et al., 2000). This can be prevented by drying into powders and storage
under appropriate conditions. The powders are incorporated into soups, baby foods or
processed into a thick viscous diet called Amala in Nigeria or Fufu in Ghana. Yam powder is
obtained from yam cubicles which are dried in a traditional way like open sun drying or by
using industrial or solar dryers. During drying, shrinkage occurs. To advance drying
technology, it is essential to quantify and analyze the drying characteristics of yam cubicles,
not neglecting the shrinkage factor.
Torres et al. (2011) report about the drying characteristics of two yam species (Dioscoreaceae
alata) by using a classical model approach. The use of the Page equation is a semi-empirical
approach and does not reflect the diffusion behavior that occurs in many food products as
formulated by Yadollahinia, and Jahangiri (2009), Al-Muhtaseb et al. (2004) and Hassini et al.
(2007) who have shown a linear relationship between moisture and shrinkage. Sjöholm and
Gekas (1995) have shown a linear relationship between B�ZZ and moisture content during apple
drying as a consequence of volume change with moisture content. The change of moisture
content in these products is given by Fick’s second law: 8��[, \�8[ = 88\ B 8��[, \�8\ (3.1)
with ��[, \� the moisture content (kg water/kg solids) as a function of time ([) and position (\)
in the product compared to the center. B is the effective diffusion coefficient (]�/6).
Crank (1975) provided analytical solutions of the diffusion equation for standard shaped
products. For a product with an uniform initial moisture concentration (�.�, negligible external
resistance and time invariant diffusion coefficient the analytical solutions for the average
moisture content in an infinite sized slab is given as:
G4�[� = ��[� − ���^ − �� = 8̀� D 1�2' + 1�� 5\X E− �2' + 1��`�Ba� [Hb>. (3.2)
With G4�[� the moisture ratio, ��[� the actual averaged moisture content, �. the initial
moisture content, �� the equilibrium moisture content at the end of drying, all in kg water/kg
solids and a�]� the thickness of the slab.
Equation 3.2 represents a series of terms and writing the first 3 terms out (' = 0,1and2) gives
G4�[� = 8̀� 5\X E−`�Ba� [H + 89`� 5\X E−9`�Ba� [H+ 825`� 5\X E−25`�Ba� [H+.. (3.3)
30
The time scales of the successive terms differ strongly, i.e. the time scale of the third term is
very short, for the second term, longer but still fast and the expression is dominated by the time
scale of the first term. Together with a decreasing pre-exponential factor for each term, in
practice just one or two terms suffice �' = 0�'81), leading to Equation 3.4 as a suitable basis
for the interpretation of drying curves �' = 0�'81�.
G4�[� = 8̀� 5\X E−`�Ba� [H + 89`� 5\X E−9`�Ba� [H (3.4)
Often only one term is used as reported by Ah-Hen et al. (2013), Ben Haj Said et al. (2015),
Chayjan et al. (2012), Asiah et al. (2017) and Hassini et al. (2007). In our experiments on
drying of yam cubicles with a limited size, we observed systematic deviations between the data
and fitted curves based on Equation 3.4. Assuming that moisture transport for yam is diffusion
limited, these deviations can be a result of the following issues: (i) the geometry of the cubicles
does not satisfy the conditions for infinite sized slabs, (ii) moisture transport is affected by
shrinkage Mulet (1994), or (iii) the effective diffusion coefficient is not constant (Ruiz-Lopez
and Garcia-Alvarado (2007). In this work we perform a step-wise analysis to understand the
observed deviations between the data and fits for Equation 3.4. To check the role of the
geometry and size of the particles, an analysis with computational fluid dynamics is performed.
The role of shrinkage is investigated by using the concepts of volume reduction (Sjöholm and
Gekas, 1995) and the effect of fractal change of thickness (Gekas and Lamberg, 1991). Ruiz-
Lopez and Garcia-Alvarado (2007) related the diffusivity of water in the product matrix to
moisture content. In line with their observations a moisture dependent diffusion coefficient is
evaluated in this work.
3.2 Materials and Methods
3.2.1 Yam species and sample preparation
Yam tubers, Dioscoreaceae rotundata cultivar Dente, were precisely cut into discs of 10 mm
thickness and subsequently the discs were further cut into square dimensions of 30 mm by 30
mm. The dimensions of the samples were measured using digital calipers (model: 01407A,
NEIKO, USA) of 0.02 mm accuracy.
3.2.2 Shrinkage and moisture measurements
In separate experiments on shrinkage, ten fresh yam cuts (3x3x1cm) were placed in the drying
chamber and dried at 30, 40 and 50oC. Before and after drying for 2, 4, 6, and 15 hours for all
temperatures, plus 19, 42 and 72 hours for 50, 40 and 30oC, respectively and, 5 samples
(replicates) were randomly selected from the drying chamber. For each sample cubicle, the side
thickness (0f) and side lengths �0g) were determined with the digital calipers at the four sides
of the sample, while the center thickness (�f) was measured three times within the
neighborhood of the center of the sample. The average values each of the 0f , SiandSl ere
calculated. After the size measurements the corresponding moisture content of the samples were
determined.
31
According to Gekas and Lamberg (1991) the relative sample thickness and sample volume are
related to each other by an exponential relation with fractal dimensional exponent (m) as shown
in Equation 3.5: a=a. = �N=N. �/n
(3.5)
With N. and a. respectively the initial sample volume (mm3) and thickness (mm), N=and a= the volume and thickness of the sample at the sampling moments during drying. The thickness
of the sample is the average value from the four measured side thicknesses (0f� and the center
thickness (�f�: a= = �40f + �f5 (3.6)
The circular deformation from the sides to the center at the top and bottom surface of the
sample is considered as a parabolic form. With symmetrical surfaces, the actual volume of
the product is then the volume of a square product Npqr minus the volume of the parabolic
indentions N@ r: N= = Npqr − 2N@ r = 0g�0f − 2�0.5πt�ℎ� (3.7)
With t = vw� the radius of parabola basis and ℎ = vx��x� the height of the parabola.
3.2.3 CFD- calculations
In COMSOL two geometries of product cubicles (3×3×1 cm) were defined and Ficks diffusion
equation was applied to these geometries. Simulations were performed with a diffusion
coefficient of 2.5×10⁻¹⁰ m2/s. The initial condition for water content throughout the geometry
was set to 1.0 kg/m3 and at the boundaries of the geometry at 0.0 kg/m3. Drying in the first
geometry corresponds to an infinite slab by blocking water transport through the side surfaces
which results in water transport through only the top and bottom surface. The second geometry
concerned the actual drying behavior by moisture transport through all surfaces. The results
were evaluated by fitting Equation 3.4 to the simulated moisture content as a function of time.
3.2.4 Drying procedure and equipment
The dryer system was made up of a fan, heating element and drying chamber. Ambient air at a
speed of 2.6 m/s reaches the heating element by a fan (accuracy ±0.05 m/s) through a controlled
valve. The temperatures of the heated air and in the chamber were measured with K-type
thermocouples (accuracy ±0.1°C). The relative humidity of the inlet air to the dryer was
determined by a relative humidity sensor of accuracy ±0.2%RH. The inlet air enters the dryer
at the bottom side and leaves at the top side (See Figure 3.1).
32
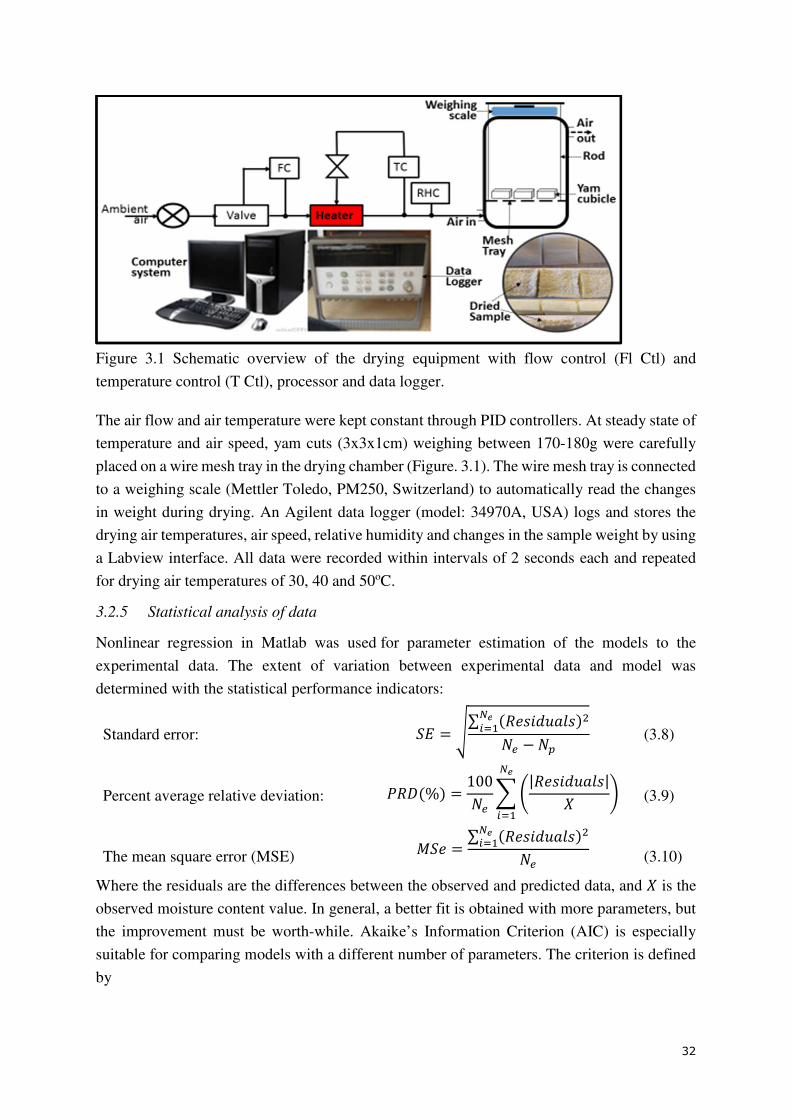
Figure 3.1 Schematic overview of the drying equipment with flow control (Fl Ctl) and
temperature control (T Ctl), processor and data logger.
The air flow and air temperature were kept constant through PID controllers. At steady state of
temperature and air speed, yam cuts (3x3x1cm) weighing between 170-180g were carefully
placed on a wire mesh tray in the drying chamber (Figure. 3.1). The wire mesh tray is connected
to a weighing scale (Mettler Toledo, PM250, Switzerland) to automatically read the changes
in weight during drying. An Agilent data logger (model: 34970A, USA) logs and stores the
drying air temperatures, air speed, relative humidity and changes in the sample weight by using
a Labview interface. All data were recorded within intervals of 2 seconds each and repeated
for drying air temperatures of 30, 40 and 50oC.
3.2.5 Statistical analysis of data
Nonlinear regression in Matlab was used for parameter estimation of the models to the
experimental data. The extent of variation between experimental data and model was
determined with the statistical performance indicators:
Standard error: 01 = 2∑ �456789�:6��;<=>� ?� − ?@
(3.8)
Percent average relative deviation: A4B�%� = 100?� DE|456789�:6|� H;<=>�
(3.9)
The mean square error (MSE) G05 = ∑ �456789�:6��;<=>� ?�
(3.10)
Where the residuals are the differences between the observed and predicted data, and � is the
observed moisture content value. In general, a better fit is obtained with more parameters, but
the improvement must be worth-while. Akaike’s Information Criterion (AIC) is especially
suitable for comparing models with a different number of parameters. The criterion is defined
by
33
KL� = 2?@ + ?�ln�N�OP�� (3.11)
based on the likelihood function, but ignoring the constant term −?� ln�?�� − ?� ln�2`� −?�. The model with the lowest AIC is preferred. Here N�QP� is the sum of squares errors, ?@ is
the number of parameters of a particular model, and ?� is the number of experimental data
points. All data were processed and evaluated using the Matlab software.
3.3 Results and discussion
3.3.1 Shrinkage
Table 3.1 shows the mean dimensions of the yam cubicles and its corresponding moisture
content in time. Shrinkage is highest in the center of the cubicle and is temperature dependent.
The percentage shrinkage is between 44-64% in the center with highest shrinkage recorded at
50oC From the data in Table 3.1 first the thickness and volume were calculated according
Equations 3.6 and 3.7 and next the results were transformed to the relative thickness (aT =a=/a.) and relative volume (NT = N=/N.) by dividing with the initial values at start of the
experiment. These results are given in Table 3.2.
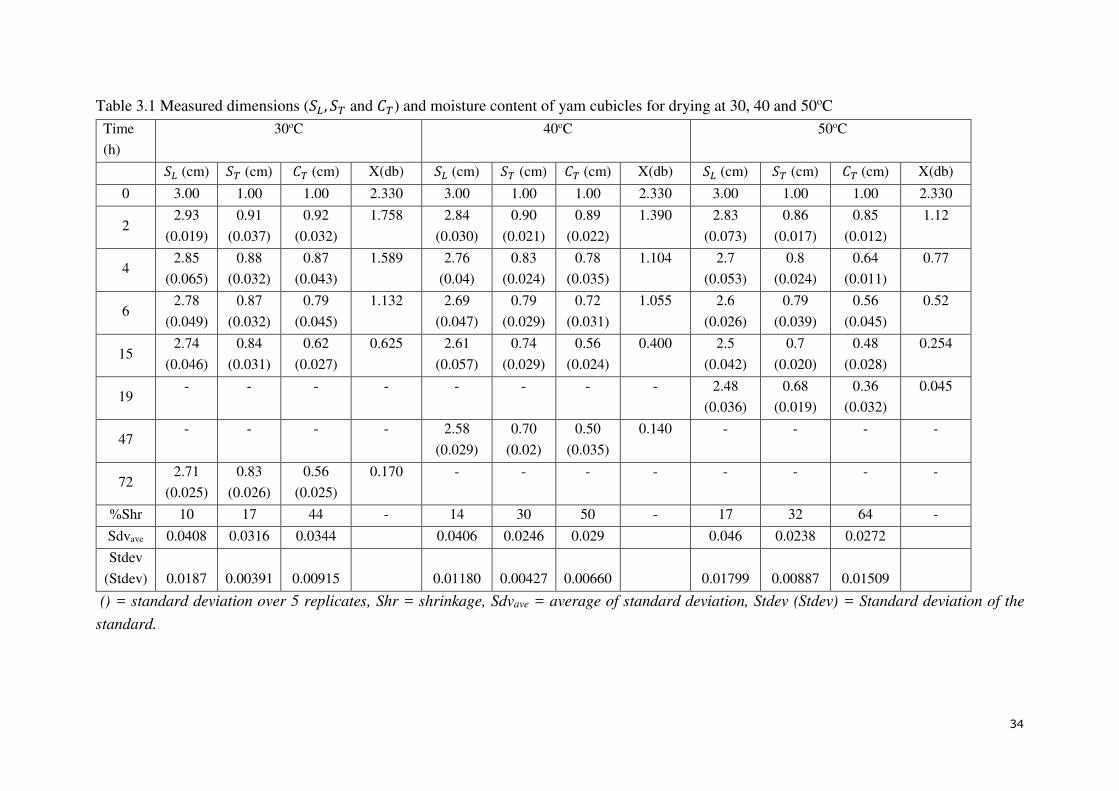
34
Table 3.1 Measured dimensions (0g, 0f and �f) and moisture content of yam cubicles for drying at 30, 40 and 50oC
Time
(h)
30oC
40oC
50oC
0g (cm) 0f (cm) �f(cm) X(db) 0g (cm) 0f (cm) �f(cm) X(db) 0g (cm) 0f (cm) �f(cm) X(db)
0 3.00 1.00 1.00 2.330 3.00 1.00 1.00 2.330 3.00 1.00 1.00 2.330
2 2.93
(0.019)
0.91
(0.037)
0.92
(0.032)
1.758 2.84
(0.030)
0.90
(0.021)
0.89
(0.022)
1.390 2.83
(0.073)
0.86
(0.017)
0.85
(0.012)
1.12
4 2.85
(0.065)
0.88
(0.032)
0.87
(0.043)
1.589 2.76
(0.04)
0.83
(0.024)
0.78
(0.035)
1.104 2.7
(0.053)
0.8
(0.024)
0.64
(0.011)
0.77
6 2.78
(0.049)
0.87
(0.032)
0.79
(0.045)
1.132 2.69
(0.047)
0.79
(0.029)
0.72
(0.031)
1.055 2.6
(0.026)
0.79
(0.039)
0.56
(0.045)
0.52
15 2.74
(0.046)
0.84
(0.031)
0.62
(0.027)
0.625 2.61
(0.057)
0.74
(0.029)
0.56
(0.024)
0.400 2.5
(0.042)
0.7
(0.020)
0.48
(0.028)
0.254
19 - - - - - - - - 2.48
(0.036)
0.68
(0.019)
0.36
(0.032)
0.045
47 - - - - 2.58
(0.029)
0.70
(0.02)
0.50
(0.035)
0.140 - - - -
72 2.71
(0.025)
0.83
(0.026)
0.56
(0.025)
0.170 - - - - - - - -
%Shr 10 17 44 - 14 30 50 - 17 32 64 -
Sdvave 0.0408 0.0316 0.0344 0.0406 0.0246 0.029 0.046 0.0238 0.0272
Stdev
(Stdev) 0.0187 0.00391 0.00915 0.01180 0.00427 0.00660 0.01799 0.00887 0.01509
() = standard deviation over 5 replicates, Shr = shrinkage, Sdvave = average of standard deviation, Stdev (Stdev) = Standard deviation of the
standard.
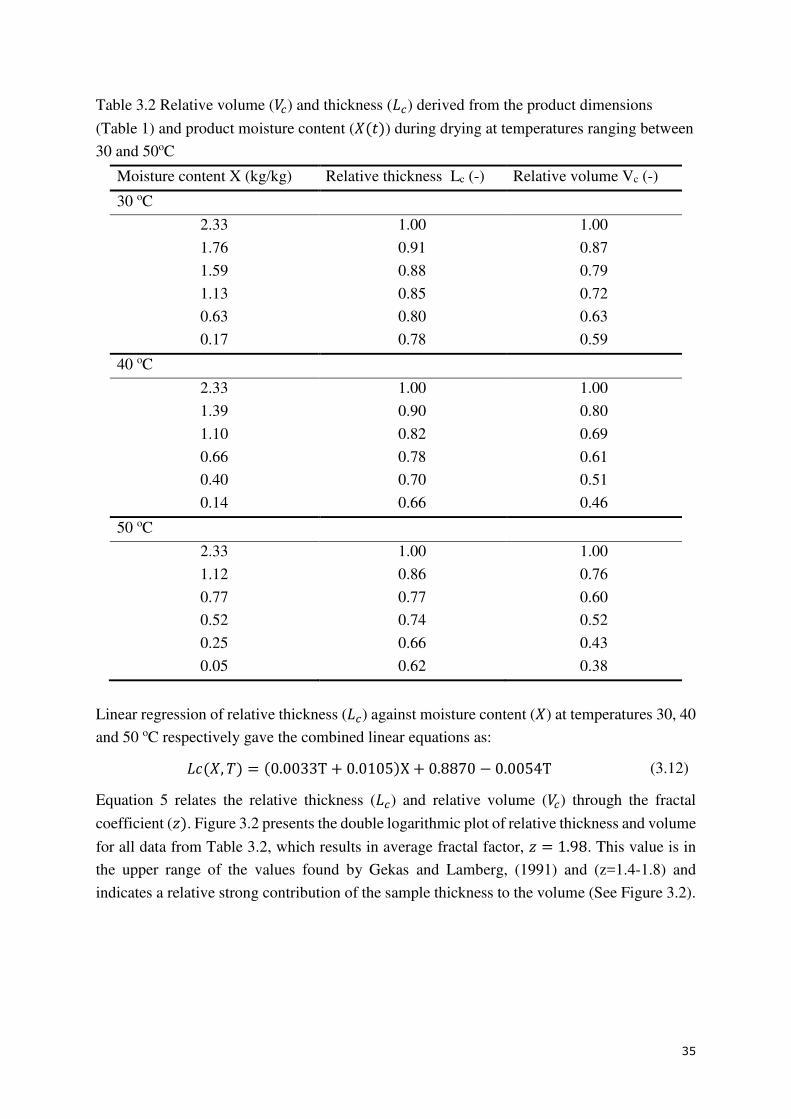
35
Table 3.2 Relative volume (NT) and thickness (aT) derived from the product dimensions
(Table 1) and product moisture content (��[�) during drying at temperatures ranging between
30 and 50oC
Moisture content X (kg/kg) Relative thickness Lc (-) Relative volume Vc (-)
30 oC
2.33 1.00 1.00
1.76 0.91 0.87
1.59 0.88 0.79
1.13 0.85 0.72
0.63 0.80 0.63
0.17 0.78 0.59
40 oC
2.33 1.00 1.00
1.39 0.90 0.80
1.10 0.82 0.69
0.66 0.78 0.61
0.40 0.70 0.51
0.14 0.66 0.46
50 oC
2.33 1.00 1.00
1.12 0.86 0.76
0.77 0.77 0.60
0.52 0.74 0.52
0.25 0.66 0.43
0.05 0.62 0.38
Linear regression of relative thickness (aT) against moisture content (�) at temperatures 30, 40
and 50 oC respectively gave the combined linear equations as: ay��, z� = �0.0033T + 0.0105�X + 0.8870 − 0.0054T (3.12)
Equation 5 relates the relative thickness (aT) and relative volume (NT) through the fractal
coefficient (m�. Figure 3.2 presents the double logarithmic plot of relative thickness and volume
for all data from Table 3.2, which results in average fractal factor, m = 1.98. This value is in
the upper range of the values found by Gekas and Lamberg, (1991) and (z=1.4-1.8) and
indicates a relative strong contribution of the sample thickness to the volume (See Figure 3.2).
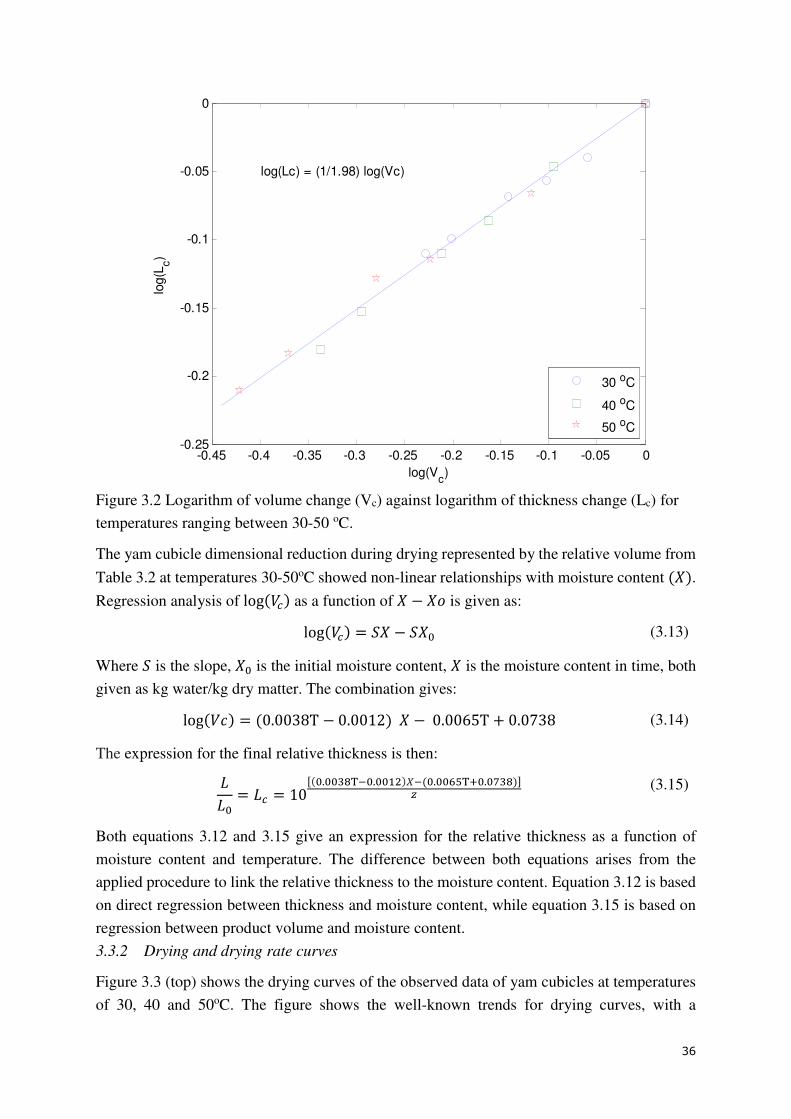
36
Figure 3.2 Logarithm of volume change (Vc) against logarithm of thickness change (Lc) for
temperatures ranging between 30-50 oC.
The yam cubicle dimensional reduction during drying represented by the relative volume from
Table 3.2 at temperatures 30-50oC showed non-linear relationships with moisture content ���.
Regression analysis of log�NT� as a function of � − �� is given as: log�NT� = 0� − 0�. (3.13)
Where 0 is the slope, �. is the initial moisture content, � is the moisture content in time, both
given as kg water/kg dry matter. The combination gives: log�Ny� = �0.0038T − 0.0012�� − 0.0065T + 0.0738 (3.14)
The expression for the final relative thickness is then: aa. = aT = 10��...."�l�....������....��l�...�"���n (3.15)
Both equations 3.12 and 3.15 give an expression for the relative thickness as a function of
moisture content and temperature. The difference between both equations arises from the
applied procedure to link the relative thickness to the moisture content. Equation 3.12 is based
on direct regression between thickness and moisture content, while equation 3.15 is based on
regression between product volume and moisture content.
3.3.2 Drying and drying rate curves
Figure 3.3 (top) shows the drying curves of the observed data of yam cubicles at temperatures
of 30, 40 and 50oC. The figure shows the well-known trends for drying curves, with a
-0.45 -0.4 -0.35 -0.3 -0.25 -0.2 -0.15 -0.1 -0.05 0-0.25
-0.2
-0.15
-0.1
-0.05
0
log(Vc)
log(L
c)
log(Lc) = (1/1.98) log(Vc)
30 oC
40 oC
50 oC
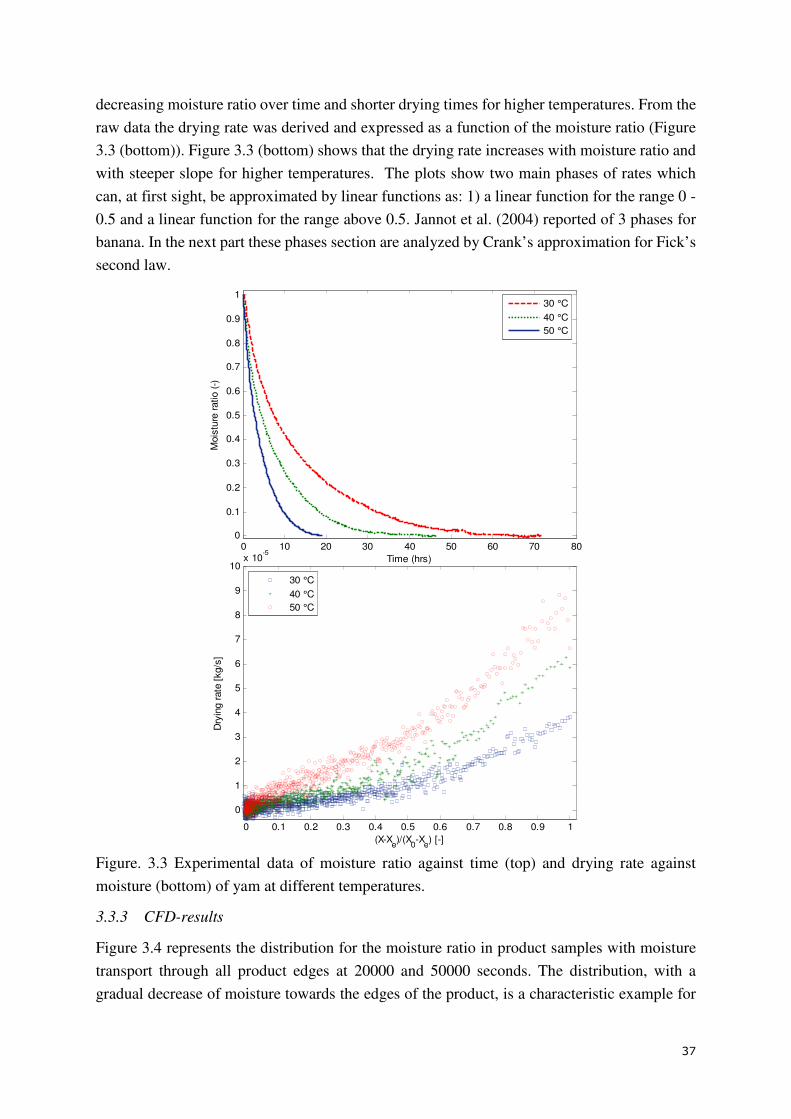
37
decreasing moisture ratio over time and shorter drying times for higher temperatures. From the
raw data the drying rate was derived and expressed as a function of the moisture ratio (Figure
3.3 (bottom)). Figure 3.3 (bottom) shows that the drying rate increases with moisture ratio and
with steeper slope for higher temperatures. The plots show two main phases of rates which
can, at first sight, be approximated by linear functions as: 1) a linear function for the range 0 -
0.5 and a linear function for the range above 0.5. Jannot et al. (2004) reported of 3 phases for
banana. In the next part these phases section are analyzed by Crank’s approximation for Fick’s
second law.
Figure. 3.3 Experimental data of moisture ratio against time (top) and drying rate against
moisture (bottom) of yam at different temperatures.
3.3.3 CFD-results
Figure 3.4 represents the distribution for the moisture ratio in product samples with moisture
transport through all product edges at 20000 and 50000 seconds. The distribution, with a
gradual decrease of moisture towards the edges of the product, is a characteristic example for
0 0.1 0.2 0.3 0.4 0.5 0.6 0.7 0.8 0.9 1
0
1
2
3
4
5
6
7
8
9
10x 10
-5
(X-Xe)/(X
0-X
e) [-]
Dry
ing r
ate
[kg/s
]
30 °C
40 °C
50 °C
0 10 20 30 40 50 60 70 800
0.1
0.2
0.3
0.4
0.5
0.6
0.7
0.8
0.9
1
Time (hrs)
Mois
ture
ratio (
-)
30 °C
40 °C
50 °C
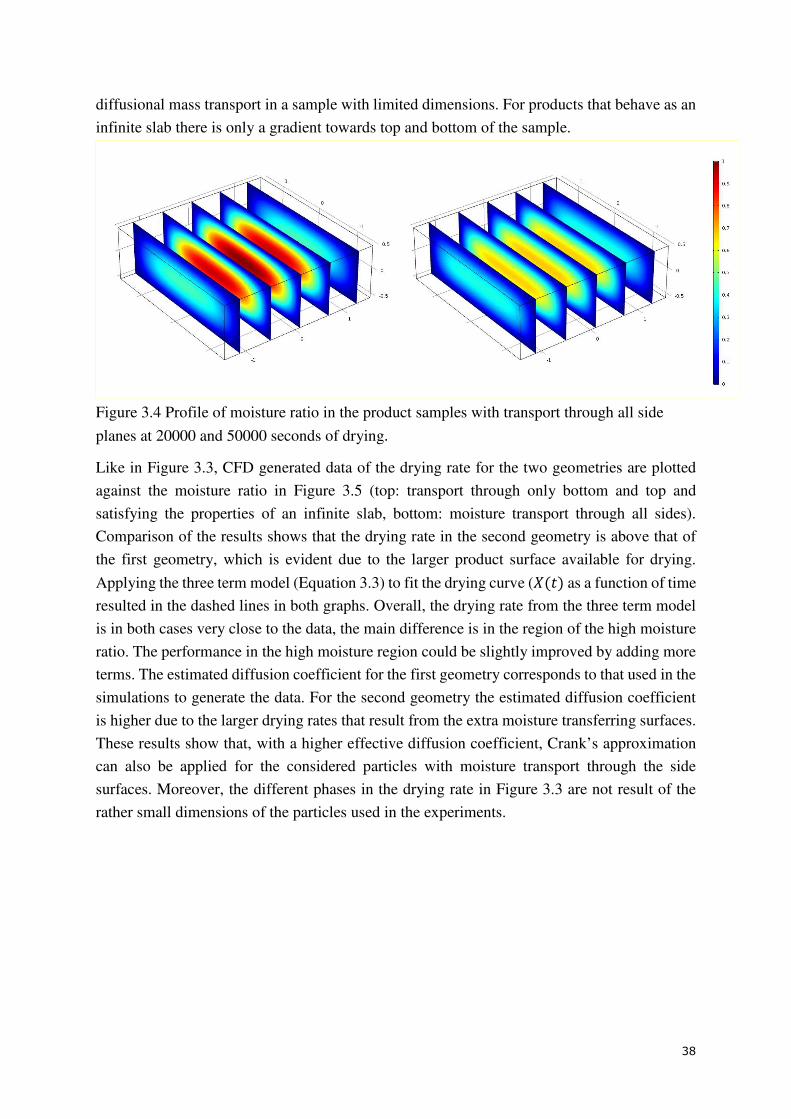
38
diffusional mass transport in a sample with limited dimensions. For products that behave as an
infinite slab there is only a gradient towards top and bottom of the sample.
Figure 3.4 Profile of moisture ratio in the product samples with transport through all side
planes at 20000 and 50000 seconds of drying.
Like in Figure 3.3, CFD generated data of the drying rate for the two geometries are plotted
against the moisture ratio in Figure 3.5 (top: transport through only bottom and top and
satisfying the properties of an infinite slab, bottom: moisture transport through all sides).
Comparison of the results shows that the drying rate in the second geometry is above that of
the first geometry, which is evident due to the larger product surface available for drying.
Applying the three term model (Equation 3.3) to fit the drying curve (��[� as a function of time
resulted in the dashed lines in both graphs. Overall, the drying rate from the three term model
is in both cases very close to the data, the main difference is in the region of the high moisture
ratio. The performance in the high moisture region could be slightly improved by adding more
terms. The estimated diffusion coefficient for the first geometry corresponds to that used in the
simulations to generate the data. For the second geometry the estimated diffusion coefficient
is higher due to the larger drying rates that result from the extra moisture transferring surfaces.
These results show that, with a higher effective diffusion coefficient, Crank’s approximation
can also be applied for the considered particles with moisture transport through the side
surfaces. Moreover, the different phases in the drying rate in Figure 3.3 are not result of the
rather small dimensions of the particles used in the experiments.
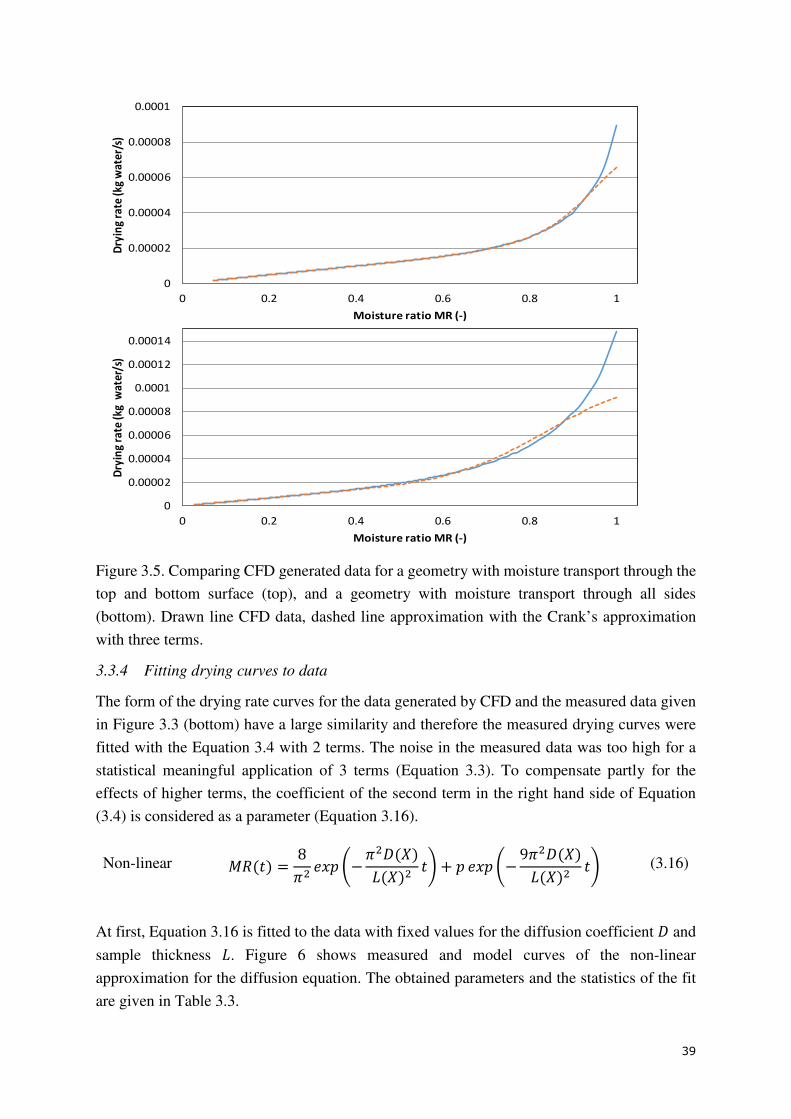
39
Figure 3.5. Comparing CFD generated data for a geometry with moisture transport through the
top and bottom surface (top), and a geometry with moisture transport through all sides
(bottom). Drawn line CFD data, dashed line approximation with the Crank’s approximation
with three terms.
3.3.4 Fitting drying curves to data
The form of the drying rate curves for the data generated by CFD and the measured data given
in Figure 3.3 (bottom) have a large similarity and therefore the measured drying curves were
fitted with the Equation 3.4 with 2 terms. The noise in the measured data was too high for a
statistical meaningful application of 3 terms (Equation 3.3). To compensate partly for the
effects of higher terms, the coefficient of the second term in the right hand side of Equation
(3.4) is considered as a parameter (Equation 3.16).
Non-linear G4�[� = 8̀� 5\X E−`�B���a���� [H + X 5\X E−9`�B���a���� [H (3.16)
At first, Equation 3.16 is fitted to the data with fixed values for the diffusion coefficient B and
sample thickness a. Figure 6 shows measured and model curves of the non-linear
approximation for the diffusion equation. The obtained parameters and the statistics of the fit
are given in Table 3.3.
0
0.00002
0.00004
0.00006
0.00008
0.0001
0.00012
0.00014
0 0.2 0.4 0.6 0.8 1
Dry
ing
rate
(kg
wat
er/s
)
Moisture ratio MR (-)
0
0.00002
0.00004
0.00006
0.00008
0.0001
0 0.2 0.4 0.6 0.8 1
Dry
ing
rate
(kg
wat
er/
s)
Moisture ratio MR (-)
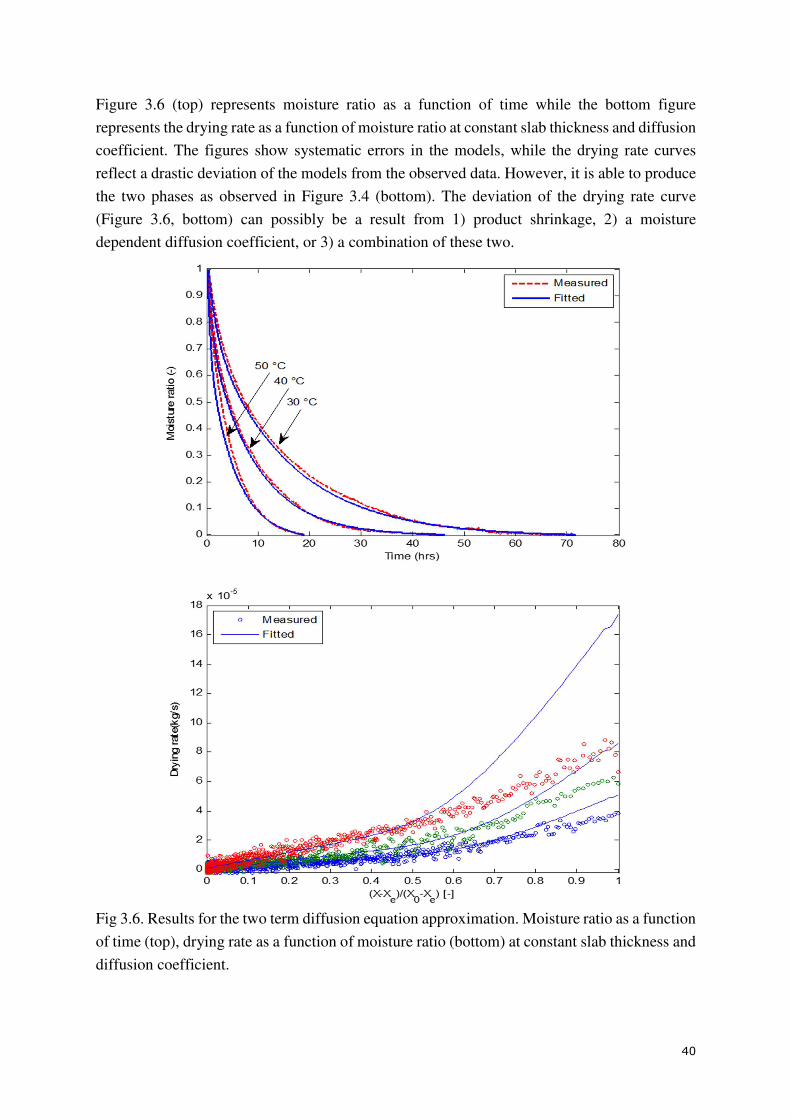
40
Figure 3.6 (top) represents moisture ratio as a function of time while the bottom figure
represents the drying rate as a function of moisture ratio at constant slab thickness and diffusion
coefficient. The figures show systematic errors in the models, while the drying rate curves
reflect a drastic deviation of the models from the observed data. However, it is able to produce
the two phases as observed in Figure 3.4 (bottom). The deviation of the drying rate curve
(Figure 3.6, bottom) can possibly be a result from 1) product shrinkage, 2) a moisture
dependent diffusion coefficient, or 3) a combination of these two.
Fig 3.6. Results for the two term diffusion equation approximation. Moisture ratio as a function
of time (top), drying rate as a function of moisture ratio (bottom) at constant slab thickness and
diffusion coefficient.
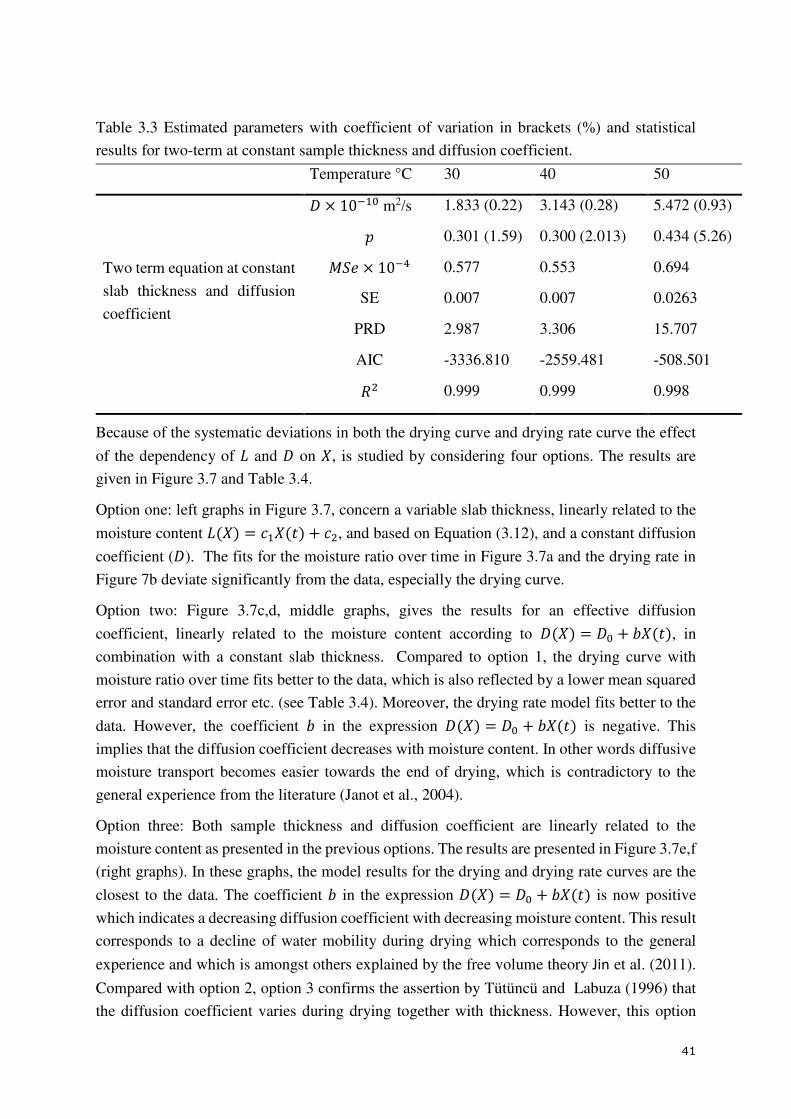
41
Table 3.3 Estimated parameters with coefficient of variation in brackets (%) and statistical
results for two-term at constant sample thickness and diffusion coefficient.
Temperature °C 30 40 50
Two term equation at constant
slab thickness and diffusion
coefficient
B × 10��. m2/s 1.833 (0.22) 3.143 (0.28) 5.472 (0.93) X 0.301 (1.59) 0.300 (2.013) 0.434 (5.26) G05 × 10�� 0.577 0.553 0.694
SE 0.007 0.007 0.0263
PRD 2.987 3.306 15.707
AIC -3336.810 -2559.481 -508.501 4� 0.999 0.999 0.998
Because of the systematic deviations in both the drying curve and drying rate curve the effect
of the dependency of a and B on �, is studied by considering four options. The results are
given in Figure 3.7 and Table 3.4.
Option one: left graphs in Figure 3.7, concern a variable slab thickness, linearly related to the
moisture content a��� = y���[� + y�, and based on Equation (3.12), and a constant diffusion
coefficient (B). The fits for the moisture ratio over time in Figure 3.7a and the drying rate in
Figure 7b deviate significantly from the data, especially the drying curve.
Option two: Figure 3.7c,d, middle graphs, gives the results for an effective diffusion
coefficient, linearly related to the moisture content according to B��� = B. + ���[�, in
combination with a constant slab thickness. Compared to option 1, the drying curve with
moisture ratio over time fits better to the data, which is also reflected by a lower mean squared
error and standard error etc. (see Table 3.4). Moreover, the drying rate model fits better to the
data. However, the coefficient � in the expression B��� = B. + ���[� is negative. This
implies that the diffusion coefficient decreases with moisture content. In other words diffusive
moisture transport becomes easier towards the end of drying, which is contradictory to the
general experience from the literature (Janot et al., 2004).
Option three: Both sample thickness and diffusion coefficient are linearly related to the
moisture content as presented in the previous options. The results are presented in Figure 3.7e,f
(right graphs). In these graphs, the model results for the drying and drying rate curves are the
closest to the data. The coefficient � in the expression B��� = B. + ���[� is now positive
which indicates a decreasing diffusion coefficient with decreasing moisture content. This result
corresponds to a decline of water mobility during drying which corresponds to the general
experience and which is amongst others explained by the free volume theory Jin et al. (2011).
Compared with option 2, option 3 confirms the assertion by Tütüncü and Labuza (1996) that
the diffusion coefficient varies during drying together with thickness. However, this option
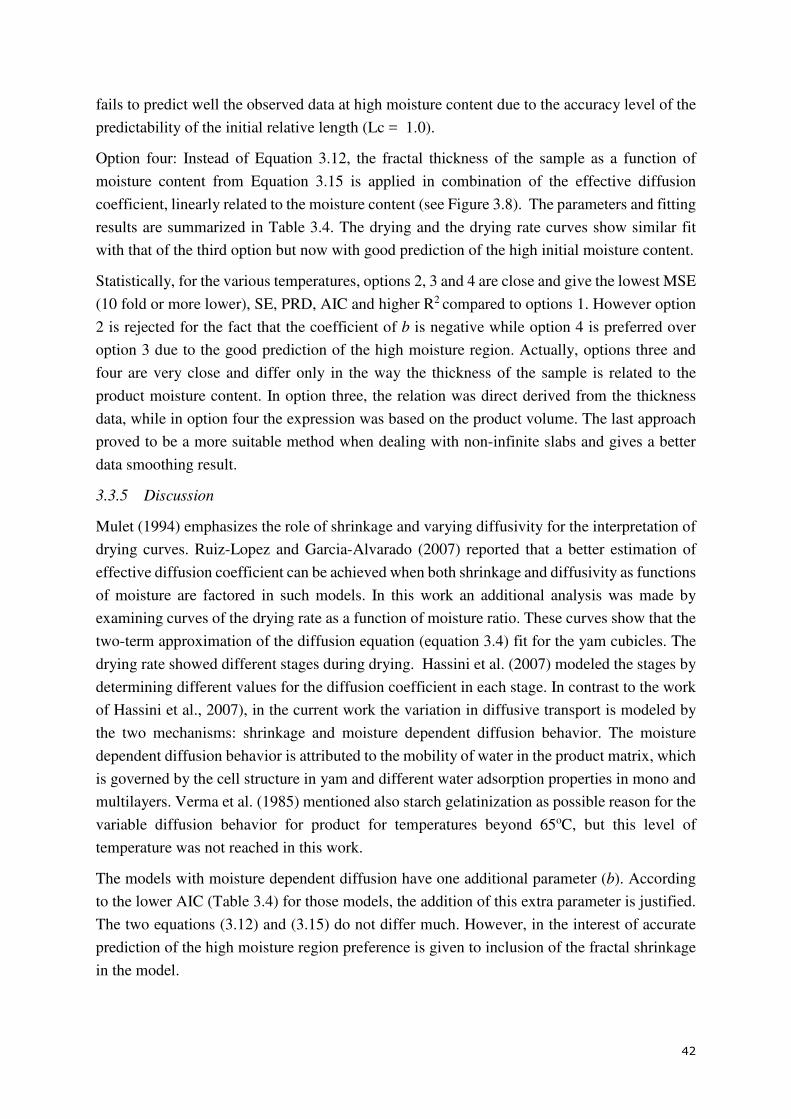
42
fails to predict well the observed data at high moisture content due to the accuracy level of the
predictability of the initial relative length (Lc = 1.0).
Option four: Instead of Equation 3.12, the fractal thickness of the sample as a function of
moisture content from Equation 3.15 is applied in combination of the effective diffusion
coefficient, linearly related to the moisture content (see Figure 3.8). The parameters and fitting
results are summarized in Table 3.4. The drying and the drying rate curves show similar fit
with that of the third option but now with good prediction of the high initial moisture content.
Statistically, for the various temperatures, options 2, 3 and 4 are close and give the lowest MSE
(10 fold or more lower), SE, PRD, AIC and higher R2 compared to options 1. However option
2 is rejected for the fact that the coefficient of b is negative while option 4 is preferred over
option 3 due to the good prediction of the high moisture region. Actually, options three and
four are very close and differ only in the way the thickness of the sample is related to the
product moisture content. In option three, the relation was direct derived from the thickness
data, while in option four the expression was based on the product volume. The last approach
proved to be a more suitable method when dealing with non-infinite slabs and gives a better
data smoothing result.
3.3.5 Discussion
Mulet (1994) emphasizes the role of shrinkage and varying diffusivity for the interpretation of
drying curves. Ruiz-Lopez and Garcia-Alvarado (2007) reported that a better estimation of
effective diffusion coefficient can be achieved when both shrinkage and diffusivity as functions
of moisture are factored in such models. In this work an additional analysis was made by
examining curves of the drying rate as a function of moisture ratio. These curves show that the
two-term approximation of the diffusion equation (equation 3.4) fit for the yam cubicles. The
drying rate showed different stages during drying. Hassini et al. (2007) modeled the stages by
determining different values for the diffusion coefficient in each stage. In contrast to the work
of Hassini et al., 2007), in the current work the variation in diffusive transport is modeled by
the two mechanisms: shrinkage and moisture dependent diffusion behavior. The moisture
dependent diffusion behavior is attributed to the mobility of water in the product matrix, which
is governed by the cell structure in yam and different water adsorption properties in mono and
multilayers. Verma et al. (1985) mentioned also starch gelatinization as possible reason for the
variable diffusion behavior for product for temperatures beyond 65oC, but this level of
temperature was not reached in this work.
The models with moisture dependent diffusion have one additional parameter (b). According
to the lower AIC (Table 3.4) for those models, the addition of this extra parameter is justified.
The two equations (3.12) and (3.15) do not differ much. However, in the interest of accurate
prediction of the high moisture region preference is given to inclusion of the fractal shrinkage
in the model.
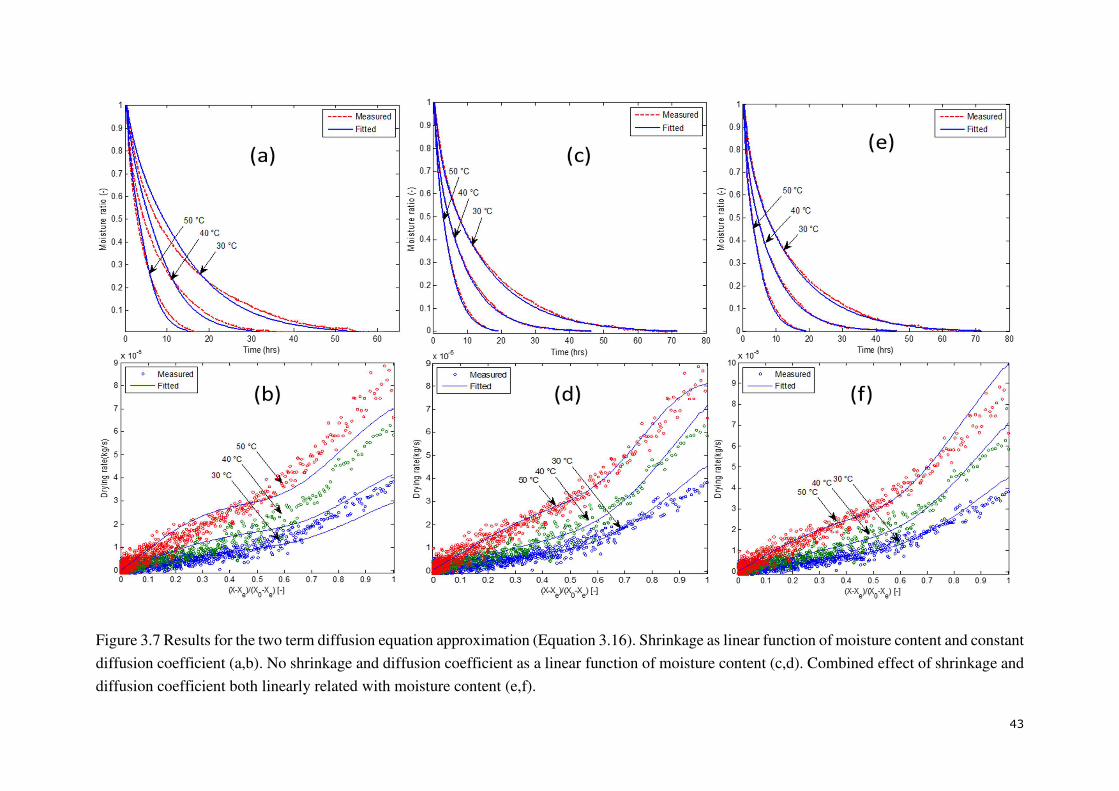
43
Figure 3.7 Results for the two term diffusion equation approximation (Equation 3.16). Shrinkage as linear function of moisture content and constant
diffusion coefficient (a,b). No shrinkage and diffusion coefficient as a linear function of moisture content (c,d). Combined effect of shrinkage and
diffusion coefficient both linearly related with moisture content (e,f).
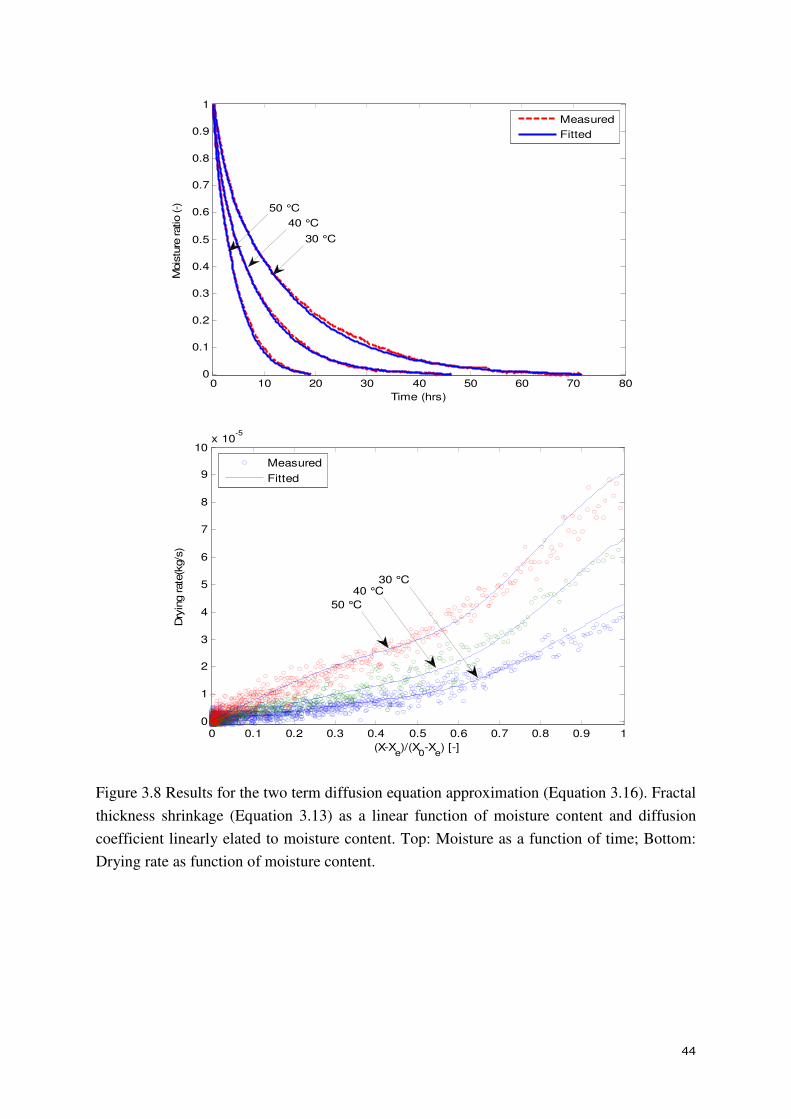
44
Figure 3.8 Results for the two term diffusion equation approximation (Equation 3.16). Fractal
thickness shrinkage (Equation 3.13) as a linear function of moisture content and diffusion
coefficient linearly elated to moisture content. Top: Moisture as a function of time; Bottom:
Drying rate as function of moisture content.
0 10 20 30 40 50 60 70 800
0.1
0.2
0.3
0.4
0.5
0.6
0.7
0.8
0.9
1
Time (hrs)
Mois
ture
ratio (-)
Measured
Fitted
50 °C
40 °C
30 °C
0 0.1 0.2 0.3 0.4 0.5 0.6 0.7 0.8 0.9 10
1
2
3
4
5
6
7
8
9
10x 10
-5
(X-Xe)/(X
0-X
e) [-]
Dry
ing rate
(kg/s
)
Measured
Fitted
50 °C
30 °C40 °C
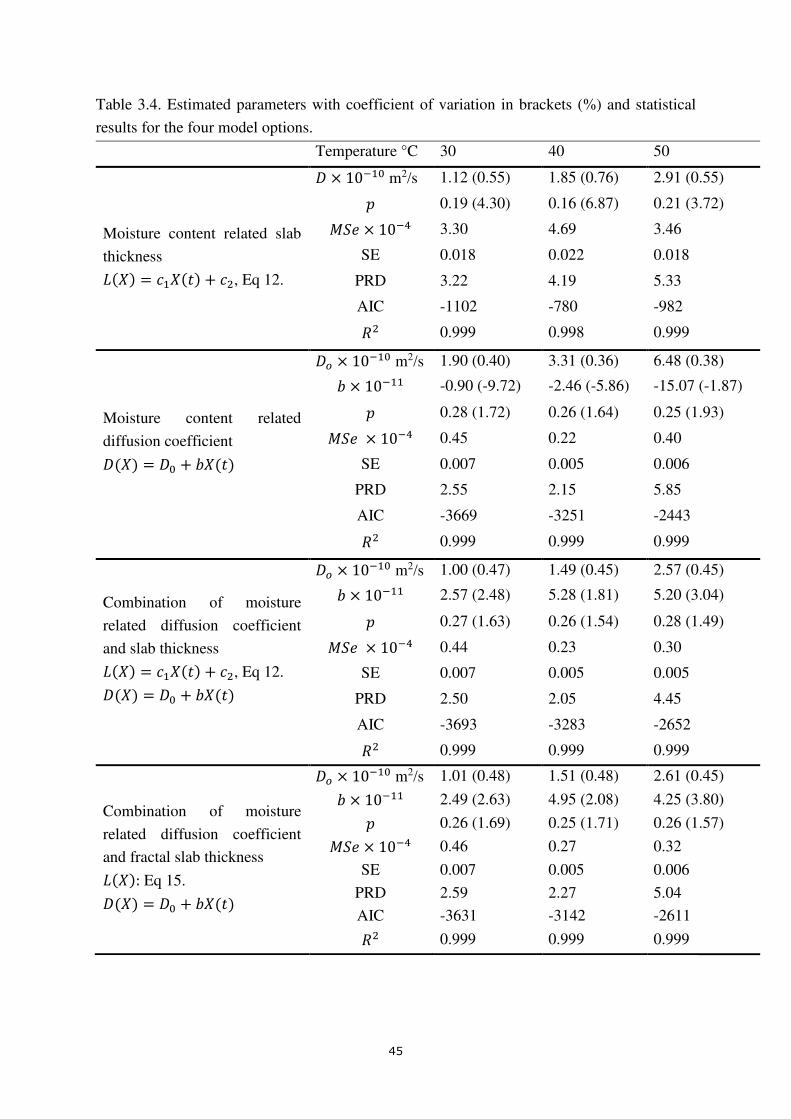
45
Table 3.4. Estimated parameters with coefficient of variation in brackets (%) and statistical
results for the four model options.
Temperature °C 30 40 50
Moisture content related slab
thickness a��� = y���[� + y�, Eq 12.
B × 10��. m2/s 1.12 (0.55) 1.85 (0.76) 2.91 (0.55) X 0.19 (4.30) 0.16 (6.87) 0.21 (3.72) G05 × 10�� 3.30 4.69 3.46
SE 0.018 0.022 0.018
PRD 3.22 4.19 5.33
AIC -1102 -780 -982 4� 0.999 0.998 0.999
Moisture content related
diffusion coefficient B��� = B. + ���[�
B^ × 10��. m2/s 1.90 (0.40) 3.31 (0.36) 6.48 (0.38) � × 10��� -0.90 (-9.72) -2.46 (-5.86) -15.07 (-1.87) X 0.28 (1.72) 0.26 (1.64) 0.25 (1.93) G05 × 10�� 0.45 0.22 0.40
SE 0.007 0.005 0.006
PRD 2.55 2.15 5.85
AIC -3669 -3251 -2443 4� 0.999 0.999 0.999
Combination of moisture
related diffusion coefficient
and slab thickness a��� = y���[� + y�, Eq 12. B��� = B. + ���[�
B^ × 10��. m2/s 1.00 (0.47) 1.49 (0.45) 2.57 (0.45) � × 10��� 2.57 (2.48) 5.28 (1.81) 5.20 (3.04) X 0.27 (1.63) 0.26 (1.54) 0.28 (1.49) G05 × 10�� 0.44 0.23 0.30
SE 0.007 0.005 0.005
PRD 2.50 2.05 4.45
AIC -3693 -3283 -2652 4� 0.999 0.999 0.999
Combination of moisture
related diffusion coefficient
and fractal slab thickness a���: Eq 15. B��� = B. + ���[�
B^ × 10��. m2/s 1.01 (0.48) 1.51 (0.48) 2.61 (0.45) � × 10��� 2.49 (2.63) 4.95 (2.08) 4.25 (3.80) X 0.26 (1.69) 0.25 (1.71) 0.26 (1.57) G05 × 10�� 0.46 0.27 0.32
SE 0.007 0.005 0.006
PRD 2.59 2.27 5.04
AIC -3631 -3142 -2611
4� 0.999 0.999 0.999
46
The analytical expression for the diffusion in a slab as given by Crank explains the two apparent
stages in the drying rate as a function of moisture ratio. These stages appear in a similar way
for large infinite slabs as the smaller cubicles. The trend in these phases is strongly supported
by the introduction of a sample moisture dependent thickness and diffusion coefficient in the
model.
The mathematical form of the two-term approximation for Fick’s diffusion equation as given
in Equation 3.16 corresponds to models used in semi-empirical expressions for the drying rate
(Verma et al., 1985, Henderson, 1994, Sharaf-Eldeen et al., 1980). In those models the
exponential terms are only estimated parameters. It is common practice to reject or to modify
the mentioned models if the model does not adequately fit to the data. Examples of
modifications are discussed in the review of Erbay and Icier (2010). Instead of modifying or
seeking for another model, in this work the parameters were linked to moisture dependent
diffusion behavior and shrinkage, which leads more to the fundamentals of moisture transport.
This work was focused on the mass transport by diffusion. From the dynamics for heat transfer
a time constant around 30 seconds was derived. Therefore, the role of variations in temperature
on the very slow mechanism of moisture transport can be neglected. The product samples
remained close to the dryer inlet air temperature. Product quality degradation, like vitamin C
and color were not the focus of this work. Vitamin C degradation which can already occur at
the applied drying temperatures in the high moisture content region needs attention in further
investigation.
3.4 Conclusion
Crank’s analytical solution of Fick’s diffusion equation for slabs has been used to describe the
drying behavior of yam (Dioscoreaceae rotundata cultivar Dente) in terms of moisture
dependency of shrinkage and diffusivity. The analytical expression for the diffusion in a slab
is also valid for the smaller cubicles, but results in a higher effective diffusion coefficient, and
shows two stages in the drying rate as a function of moisture ratio. The comparative study of
moisture dependent shrinkage and moisture dependent diffusivity justifies the interdependence
of diffusivity and shrinkage due to water loss during drying. This study shows that this behavior
for yam is best explained by a combination of fractal moisture dependent shrinkage and
moisture dependent diffusion. The moisture dependent diffusion behavior can be attributed to
mobility of water from the food matrix due to different moisture content in the multilayer and
monolayer regimes. The results from this study challenges to investigate the drying behavior
of other food products.
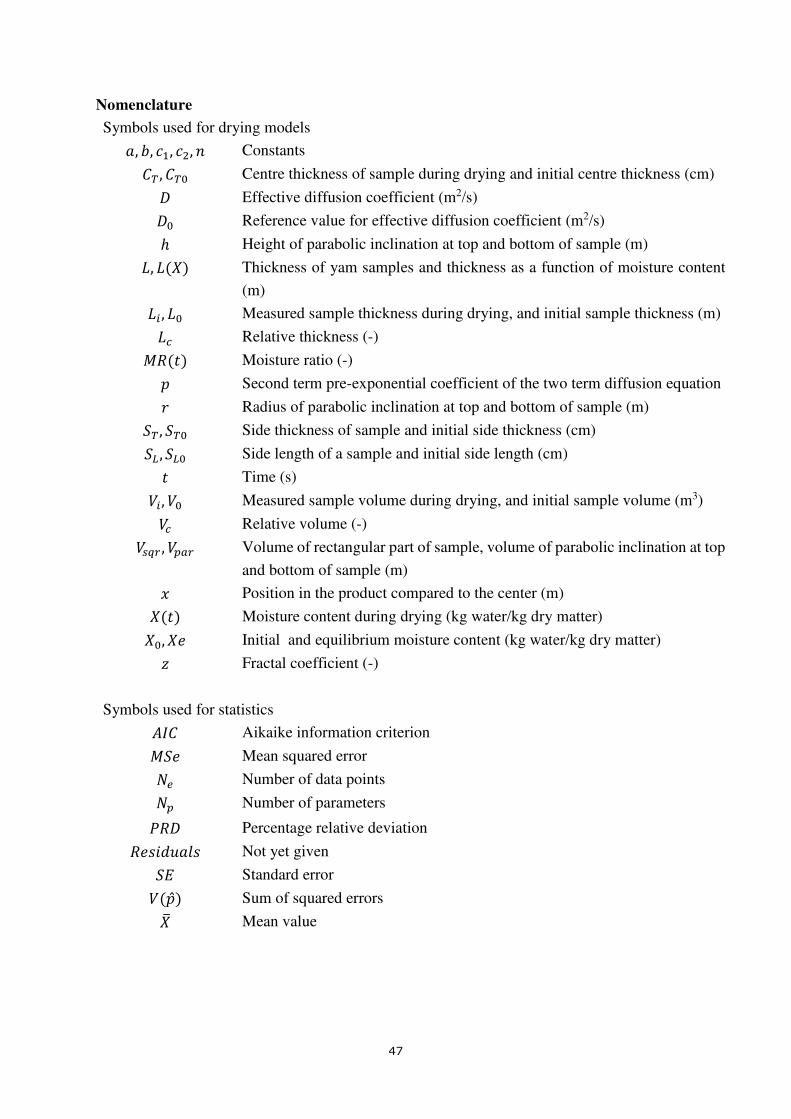
47
Nomenclature
Symbols used for drying models �, �, y�, y�, ' Constants �f , �f. Centre thickness of sample during drying and initial centre thickness (cm) B Effective diffusion coefficient (m2/s) B. Reference value for effective diffusion coefficient (m2/s) ℎ Height of parabolic inclination at top and bottom of sample (m) a, a��� Thickness of yam samples and thickness as a function of moisture content
(m) a= , a. Measured sample thickness during drying, and initial sample thickness (m) aT Relative thickness (-) G4�[� Moisture ratio (-) X Second term pre-exponential coefficient of the two term diffusion equation t Radius of parabolic inclination at top and bottom of sample (m) 0f , 0f. Side thickness of sample and initial side thickness (cm) 0g , 0g. Side length of a sample and initial side length (cm) [ Time (s) N= , N. Measured sample volume during drying, and initial sample volume (m3) NT Relative volume (-) Npqr , N@ r Volume of rectangular part of sample, volume of parabolic inclination at top
and bottom of sample (m) \ Position in the product compared to the center (m) ��[� Moisture content during drying (kg water/kg dry matter) �., �5 Initial and equilibrium moisture content (kg water/kg dry matter) m Fractal coefficient (-)
Symbols used for statistics KL� Aikaike information criterion G05 Mean squared error ?� Number of data points ?@ Number of parameters A4B Percentage relative deviation 456789�:6 Not yet given 01 Standard error N�X̂� Sum of squared errors �I Mean value

48
49
Chapter 4
Distributed mathematical model supporting design and
construction of solar collectors for drying
This part of thesis was published as:
E. A. Y. Amankwah, K. A. Dzisi, G. van Straten, L. G. van Willigenburg & A. J. B. van Boxtel (2017) Distributed mathematical model supporting design and construction of solar collectors for drying, Drying Technology, 35:14, 1675-1687, DOI: 10.1080/07373937.2016.1269806
50
Abstract
Coupled partial differential equations were developed to investigate which collector lengths
are appropriate for drying and adsorbent regeneration under prevailing Ghanaian weather.
Unlike approaches based on empirical data, the numerical model is more flexible. Effects of
operational and design variables on outlet temperature and performance were systematically
studied. Collector length and air speed affects performance indicators. Operational overall heat
loss coefficient, an important characteristic of the collector, is not constant but varies during
the day. With plausible physical parameters the model describes the experimental data well.
Collector lengths of 1.5 m and 4.5 m suited drying and regeneration, respectively.
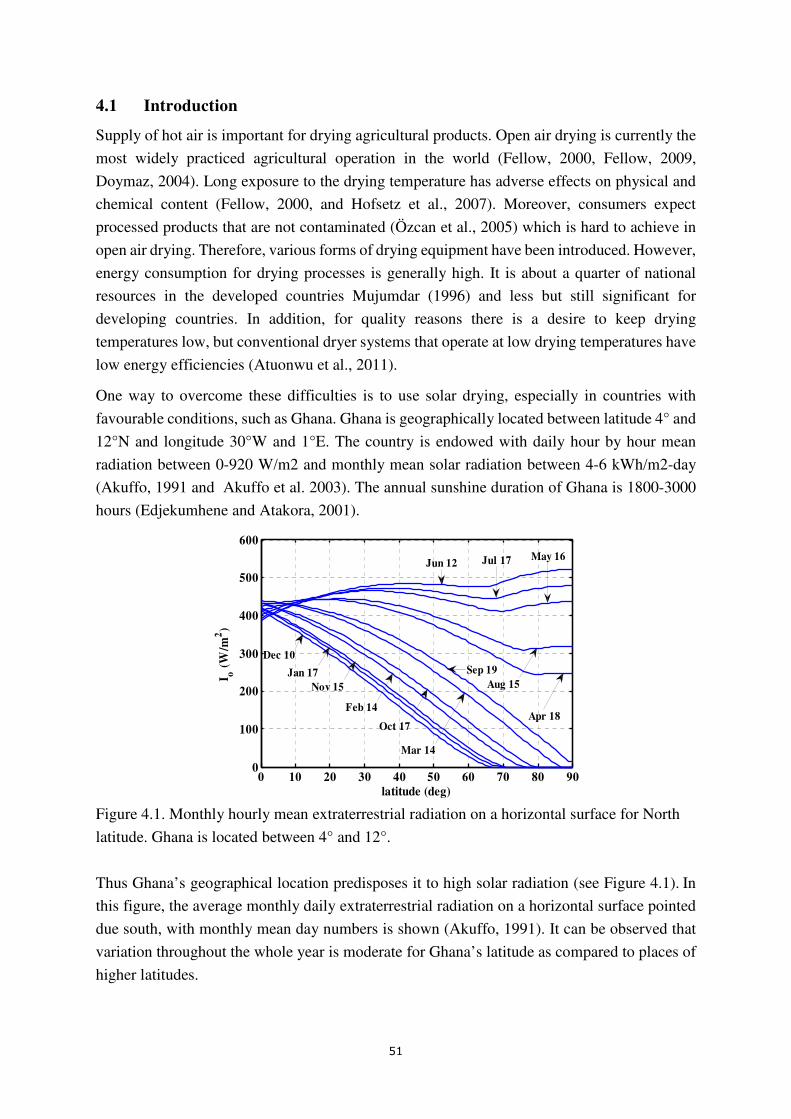
51
4.1 Introduction
Supply of hot air is important for drying agricultural products. Open air drying is currently the
most widely practiced agricultural operation in the world (Fellow, 2000, Fellow, 2009,
Doymaz, 2004). Long exposure to the drying temperature has adverse effects on physical and
chemical content (Fellow, 2000, and Hofsetz et al., 2007). Moreover, consumers expect
processed products that are not contaminated (Özcan et al., 2005) which is hard to achieve in
open air drying. Therefore, various forms of drying equipment have been introduced. However,
energy consumption for drying processes is generally high. It is about a quarter of national
resources in the developed countries Mujumdar (1996) and less but still significant for
developing countries. In addition, for quality reasons there is a desire to keep drying
temperatures low, but conventional dryer systems that operate at low drying temperatures have
low energy efficiencies (Atuonwu et al., 2011).
One way to overcome these difficulties is to use solar drying, especially in countries with
favourable conditions, such as Ghana. Ghana is geographically located between latitude 4° and
12°N and longitude 30°W and 1°E. The country is endowed with daily hour by hour mean
radiation between 0-920 W/m2 and monthly mean solar radiation between 4-6 kWh/m2-day
(Akuffo, 1991 and Akuffo et al. 2003). The annual sunshine duration of Ghana is 1800-3000
hours (Edjekumhene and Atakora, 2001).
Figure 4.1. Monthly hourly mean extraterrestrial radiation on a horizontal surface for North
latitude. Ghana is located between 4° and 12°.
Thus Ghana’s geographical location predisposes it to high solar radiation (see Figure 4.1). In
this figure, the average monthly daily extraterrestrial radiation on a horizontal surface pointed
due south, with monthly mean day numbers is shown (Akuffo, 1991). It can be observed that
variation throughout the whole year is moderate for Ghana’s latitude as compared to places of
higher latitudes.
0 10 20 30 40 50 60 70 80 900
100
200
300
400
500
600
latitude (deg)
I o (
W/m
2)
Jan 17
Apr 18
Aug 15
Jul 17 May 16
Sep 19
Mar 14
Oct 17
Feb 14
Dec 10
Nov 15
Jun 12
52
This resource has not been harnessed effectively, especially for drying due to the fact that
output collector air temperature is not known before construction. Food products that are
usually dried in Ghana include cocoa beans, cereals, legumes, leafy vegetables, cassava, yam,
cocoyam, plantain, fish, snail and shrimps etc. However, currently these are mostly dried in the
open sun exposing them to contaminants.
Therefore any means by which these products could be dried effectively, quickly and
hygienically to make them available during the lean season and to increase its variability of
uses in product formulation without compromising on quality would be appropriate. Low
temperatures are known to have minimal effect on heat sensitive components of a food product.
However, improper design of collector systems may lead to over-heating or under-heating.
Hence in designing a solar collector for drying purposes with the intention of maintaining
nutrition value, parameters such as flow of heating medium, collector dimensions, absorber
and cover plates material and surface type have to be considered.
Continuous drying at night can be possible by introducing an adsorbent (with for example silica
gel) in the process. A solar adsorption dryer system (SADS) is an integrated dryer system that
utilizes the sun’s energy for drying and regeneration during the day and drying with
dehumidified and slightly heated air drying during the night. This represents a new technology.
Starting from this new technology a first essential step is a model-based design of flat plate
solar collectors and investigating its suitability for drying and regeneration at varying collector
length. Tomas et al. (2009) mentioned that virtual prototyping of solar collectors helps to
predict the performance of a collector before manufacturing. Following this line, the goal here
is to base the solar collector design on physical state-space modeling in order to investigate the
collector dimensions that give low air output temperature which may lead to minimal
deleterious effect on heat sensitive nutrients during drying during day time and, in addition, to
investigate a collector system of dimension suitable for sorbent regeneration. Investigation of
design and operational parameters on performance is also considered.
The design of solar collectors for drying find their basis in the model based work of Duffie and
Beckman (1980). There are, however, several aspects of novelty in the model based approach
of the current study. The earlier literature on solar collectors, such as the seminal work of Duffie
and Beckman (1980) (and thus most of the subsequent work) was at the time necessarily limited
to the use of analytical expressions and approximations. With numerical models the limitations
of this approach can be alleviated. For instance, Duffie and Beckman (1980) mention that it is
difficult to determine the spatial mean temperature of the absorber plate, which is required to
obtain an overall heat loss coefficient. In the spatially distributed model as presented here this
is not a problem at all. Moreover, solar collectors are often characterized by the heat removal
factor that must be determined experimentally. This is obviously not of much use when the
collector still has to be designed. In more recent papers on solar collector modeling, the focus
is on heat gain from solar radiation and heat removal factor (Koyuncu, 2006) but surprisingly
not enough on the temperature at the outlet. However, the temperature at the outlet is essential
53
for drying sensitive agricultural products (40 – 50oC), and for regeneration of adsorbents in an
adsorption dryer system (50-80oC). Kicsiny (2016) modeled the outlet temperatures for an
existing solar collector based on experimental data for the environmental conditions, but this
approach does not help to design the dimensions of the solar collector, especially solar
collectors being operated under different conditions. The current work does include the
collector outlet temperature, and evaluates the effect of operational factors, such as air speed,
and design factors, such as collector length. In addition, the dynamics during the day can be
evaluated, in contrast to several steady state analyses in the literature. Heat transfer coefficients
are not constant, and change during the day and may be affected by collector length, which is
another motivation for the development of a dynamic model. The heat transfer coefficients in
the work of some researchers were not investigated as function of time, space and air velocity.
Some researchers have reported them as parameters to be estimated (Kicsiny, 2016, Gao et al.,
2007, Alvarez et al., 2010). In the dynamic model of Buzás et al. (1998) spatial distribution is
not considered as the collector is considered as a mixed tank. Spatially distributed works that
come close to this work are PV/water systems (Chow et al., 2006, Ji et al., 2009, Tiwari and
Sodha, 2007), solar tunnel dryer Talbot et al. (2016), and solar water heater (Tiwari and Sodha,
2007). This work sought to use a model-based approach to design and construct solar collectors
for low and high outlet temperatures in a solar adsorption drying system for drying agricultural
products and for regeneration of the adsorbent used for night drying. The models are validated
with experimental data from the constructed collector systems.
4.2 Solar collector modeling
On a solar collector, the incident solar energy is partially absorbed by an absorber plate and
subsequently transferred to a flowing medium in an enclosure. One design uses an absorber
plate and a glass cover with flowing air in between (Figure 4.2). The regime of air flow, whether
laminar or turbulent, has an influence on the dynamic behavior of the system. In the present
model, the rate of change of air temperature between plates is a function of absorber plate and
cover temperatures, air gap, collector length and air flow rate. On the other hand the rate of
change of absorber (plate) temperature is a function of the external input solar flux, plate
temperature and glass temperature while the rate of change of cover plate (glass) temperature
is a function of the glass, ambient and sky temperatures.
The glass cover, air stream and the absorber plate (aluminum coated black) are modeled using
the following assumptions:
• Solar absorption is mainly by the absorber plate
• Air flow is in longitudinal direction only (one dimensional)
• The temperature equilibration in the directions perpendicular to the flow direction is so
fast that there are no temperature gradients in these directions
• Transversal temperature gradients within the glass cover are ignored
54
• Losses through the front end, back end and the convective term of the top cover are to
ambient temperature while the irradiation term of the top cover is to the sky
• Longitudinal dispersion of heat is negligible
• Dust and dirt on the collector are negligible
• Shading of the absorber plate is negligible
• Convective transfer coefficients between absorber plate and air and between air and
cover plate (glass) are the same
The schematic sketch (not to scale) of the solar collector system showing the incident radiation,
air flow between glass and absorber plates and the heat transfer coefficients is shown in Figure
4.2 (Top), and the whole system including air boxes at the inlet and outlet end beyond the
collector in Figure 4.2 (Bottom). The inlet box is to ensure an even distribution of air over the
width of the collector, the outlet box collects the air for further use.
The inputs are ambient air temperature z (°C), incident radiation L (W/m2) while the states
are glass temperature z�(°C), air temperature zZ�°C� and plate temperature z@�°C�
respectively.
Accumulation of heat in the absorber plate is a function of radiation received by absorber plate
minus radiation heat lost to the atmosphere through the glass, minus heat transferred to the
fluid, minus heat transferred to the back and edge wall as represented in 8z@�\, [�8[ = �L�t�α�τ� − ℎr@� �z@�\, [� − z��\, [�� − ℎT@Z �z@�\, [� − zZ�\, [��− �SUz@�\, [� − z V − ��p 2�@� Uz@�\, [� − z V 1�@�@�X@
(4.1)
The one but last term between the square brackets at the right hand side stems from the loss
through the back of the plate, and the last term from the heat loss at the edges of the plate
(���� = ���∆����^p= � r� ^Z@ ����∆��T^�T�^r r� � �. As only the back plate is insulated, the heat loss
coefficient through insulation materials wool (ins) and wood (constr) is:
�S = ��=p¡=p + ��^p�r¡�^p�r ��
(4.2)
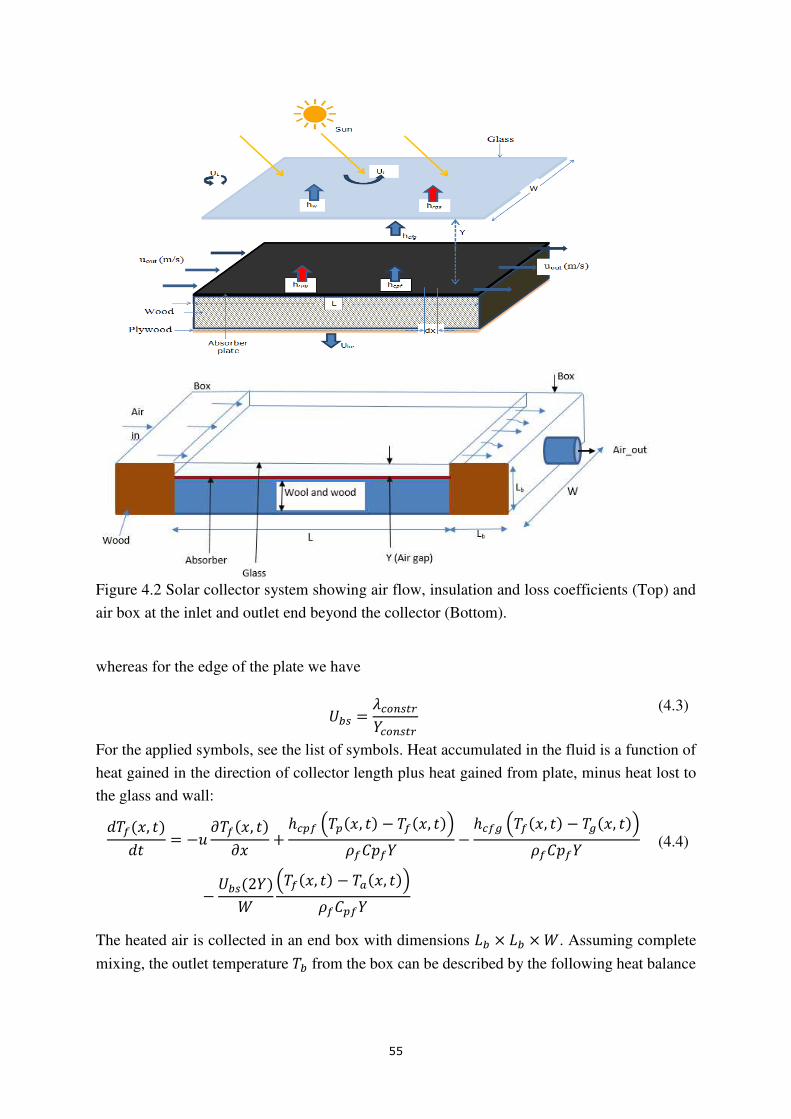
55
Figure 4.2 Solar collector system showing air flow, insulation and loss coefficients (Top) and
air box at the inlet and outlet end beyond the collector (Bottom).
whereas for the edge of the plate we have
For the applied symbols, see the list of symbols. Heat accumulated in the fluid is a function of
heat gained in the direction of collector length plus heat gained from plate, minus heat lost to
the glass and wall: 8zZ�\, [�8[ = −9 ¢zZ�\, [�¢\ + ℎT@Z �z@�\, [� − zZ�\, [���Z�XZ� − ℎTZ� �zZ�\, [� − z��\, [���Z�XZ�− ��p�2��� �zZ�\, [� − z �\, [���Z�@Z�
(4.4)
The heated air is collected in an end box with dimensions a� × a� × �. Assuming complete
mixing, the outlet temperature z� from the box can be described by the following heat balance
��p = ¡T^p�r�T^p�r (4.3)
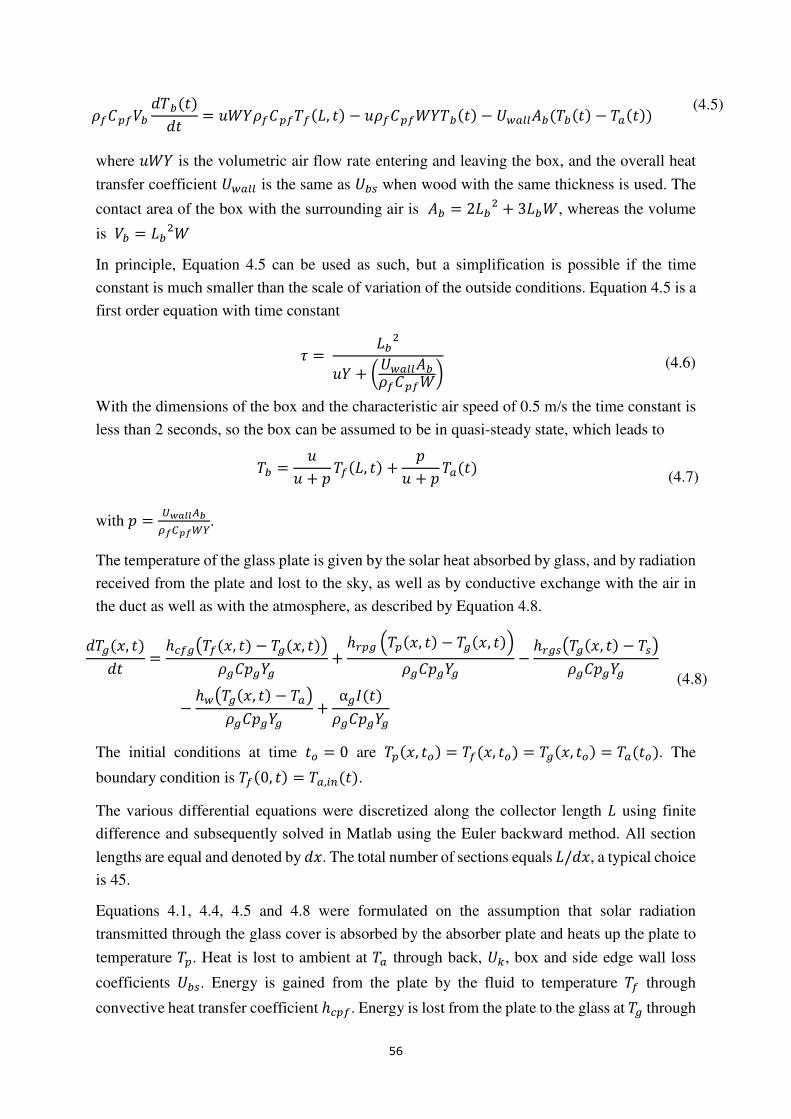
56
�Z�@ZN� 8z��[�8[ = 9���Z�@ZzZ�a, [� − 9�Z�@Z��z��[� − �� K��z��[� − z �[�� (4.5)
where 9�� is the volumetric air flow rate entering and leaving the box, and the overall heat
transfer coefficient �� is the same as ��p when wood with the same thickness is used. The
contact area of the box with the surrounding air is K� = 2a�� + 3a��, whereas the volume
is N� = a���
In principle, Equation 4.5 can be used as such, but a simplification is possible if the time
constant is much smaller than the scale of variation of the outside conditions. Equation 4.5 is a
first order equation with time constant
£ = a��9� + ¤�� K��Z�@Z�¥ (4.6)
With the dimensions of the box and the characteristic air speed of 0.5 m/s the time constant is
less than 2 seconds, so the box can be assumed to be in quasi-steady state, which leads to
z� = 99 + X zZ�a, [� + X9 + Xz �[� (4.7)
with X = ¦�§¨¨©ª«¬��¬��.
The temperature of the glass plate is given by the solar heat absorbed by glass, and by radiation
received from the plate and lost to the sky, as well as by conductive exchange with the air in
the duct as well as with the atmosphere, as described by Equation 4.8.
8z��\, [�8[ = ℎTZ�UzZ�\, [� − z��\, [�V���X��� + ℎr@� �z@�\, [� − z��\, [�����X��� − ℎr�pUz��\, [� − zpV���X���− ℎ�Uz��\, [� − z V���X��� + α�L�[����X���
(4.8)
The initial conditions at time [^ = 0 are z@�\, [^� = zZ�\, [^� = z��\, [^� = z �[^�. The
boundary condition is zZ�0, [� = z ,=�[�.
The various differential equations were discretized along the collector length a using finite
difference and subsequently solved in Matlab using the Euler backward method. All section
lengths are equal and denoted by 8\. The total number of sections equals a/8\, a typical choice
is 45.
Equations 4.1, 4.4, 4.5 and 4.8 were formulated on the assumption that solar radiation
transmitted through the glass cover is absorbed by the absorber plate and heats up the plate to
temperature z@. Heat is lost to ambient at z through back, �S, box and side edge wall loss
coefficients ��p. Energy is gained from the plate by the fluid to temperature zZ through
convective heat transfer coefficient ℎT@Z. Energy is lost from the plate to the glass at z� through
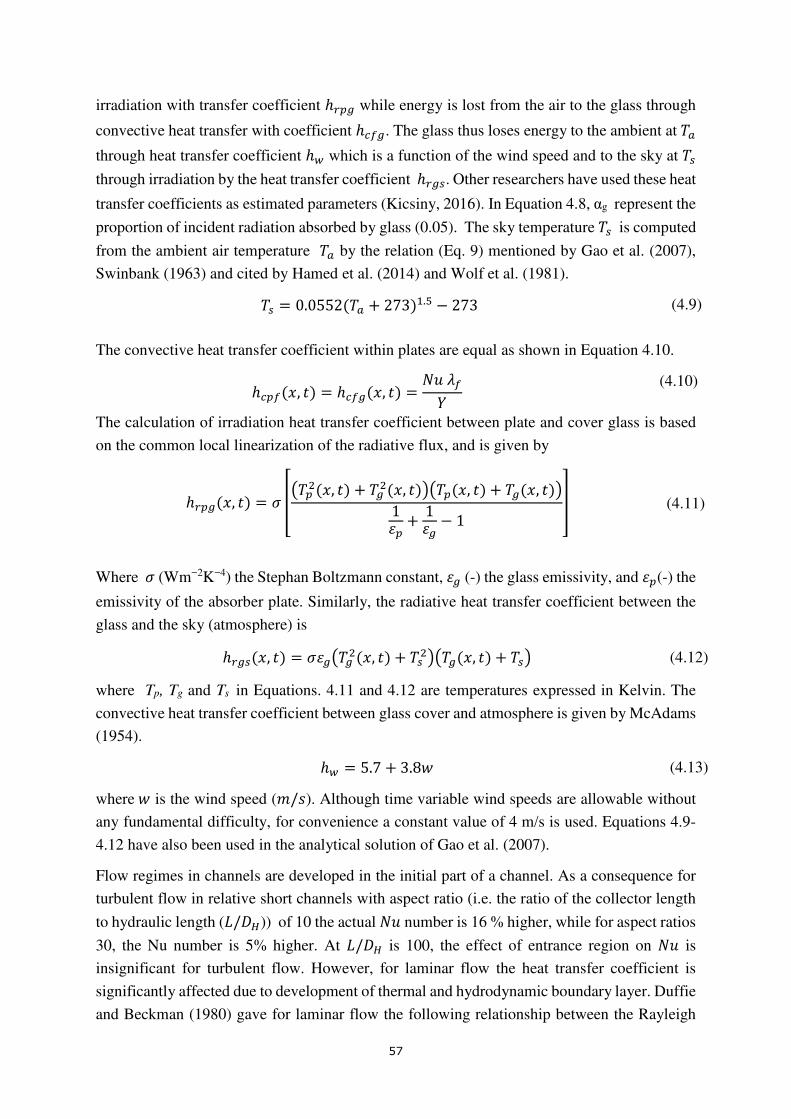
57
irradiation with transfer coefficient ℎr@� while energy is lost from the air to the glass through
convective heat transfer with coefficient ℎTZ�. The glass thus loses energy to the ambient at z
through heat transfer coefficient ℎ� which is a function of the wind speed and to the sky at zp
through irradiation by the heat transfer coefficient ℎr�p. Other researchers have used these heat
transfer coefficients as estimated parameters (Kicsiny, 2016). In Equation 4.8, αg represent the
proportion of incident radiation absorbed by glass (0.05). The sky temperature zp is computed
from the ambient air temperature z by the relation (Eq. 9) mentioned by Gao et al. (2007),
Swinbank (1963) and cited by Hamed et al. (2014) and Wolf et al. (1981). zp = 0.0552�z + 273��.� − 273
(4.9)
The convective heat transfer coefficient within plates are equal as shown in Equation 4.10.
ℎT@Z�\, [� = ℎTZ��\, [� = ?9¡Z� (4.10)
The calculation of irradiation heat transfer coefficient between plate and cover glass is based
on the common local linearization of the radiative flux, and is given by
ℎr@��\, [� = W Uz@��\, [� + z���\, [�VUz@�\, [� + z��\, [�V1®@ + 1®� − 1 ¯ (4.11)
Where W (Wm−2K−4) the Stephan Boltzmann constant, ®� (-) the glass emissivity, and ®@(-) the
emissivity of the absorber plate. Similarly, the radiative heat transfer coefficient between the
glass and the sky (atmosphere) is ℎr�p�\, [� = W®�Uz���\, [� + zp�VUz��\, [� + zpV (4.12)
where Tp, Tg and Ts in Equations. 4.11 and 4.12 are temperatures expressed in Kelvin. The
convective heat transfer coefficient between glass cover and atmosphere is given by McAdams
(1954). ℎ� = 5.7 + 3.8° (4.13)
where° is the wind speed (]/6). Although time variable wind speeds are allowable without
any fundamental difficulty, for convenience a constant value of 4 m/s is used. Equations 4.9-
4.12 have also been used in the analytical solution of Gao et al. (2007).
Flow regimes in channels are developed in the initial part of a channel. As a consequence for
turbulent flow in relative short channels with aspect ratio (i.e. the ratio of the collector length
to hydraulic length (a/B±)) of 10 the actual ?9 number is 16 % higher, while for aspect ratios
30, the Nu number is 5% higher. At a/B± is 100, the effect of entrance region on ?9 is
insignificant for turbulent flow. However, for laminar flow the heat transfer coefficient is
significantly affected due to development of thermal and hydrodynamic boundary layer. Duffie
and Beckman (1980) gave for laminar flow the following relationship between the Rayleigh
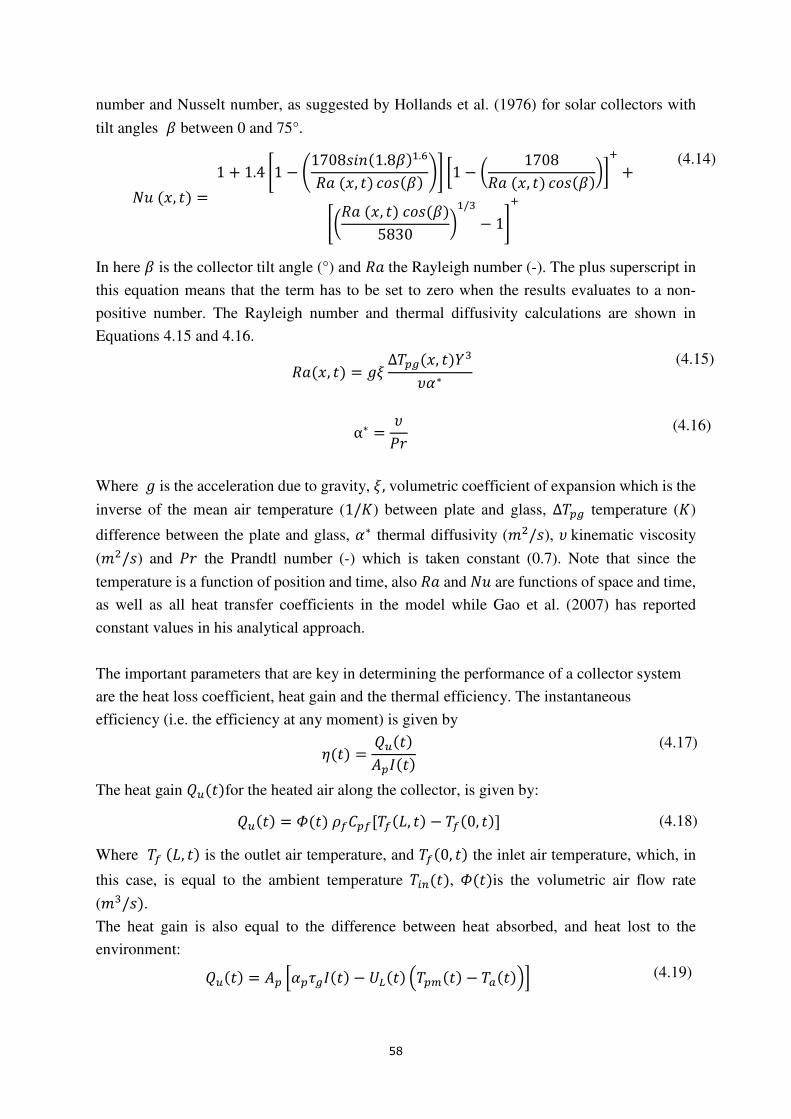
58
number and Nusselt number, as suggested by Hollands et al. (1976) for solar collectors with
tilt angles ² between 0 and 75°.
?9�\, [� = 1 + 1.4 ³1 − E170867'�1.8²��.�4��\, [� y�6�²� H´ �1 − ¤ 17084��\, [� y�6�²�¥ � +³¤4��\, [�y�6�²�5830 ¥�/" − 1´�
(4.14)
In here ² is the collector tilt angle (°) and 4�the Rayleigh number (-). The plus superscript in
this equation means that the term has to be set to zero when the results evaluates to a non-
positive number. The Rayleigh number and thermal diffusivity calculations are shown in
Equations 4.15 and 4.16.
4��\, [� = µ¶ ∆z@��\, [��"·¸∗ (4.15)
α∗ = ·At (4.16)
Where µ is the acceleration due to gravity, ¶, volumetric coefficient of expansion which is the
inverse of the mean air temperature (1/º) between plate and glass, ∆z@� temperature (º)
difference between the plate and glass, ¸∗ thermal diffusivity (]�/6), ·kinematic viscosity
(]�/6) and At the Prandtl number (-) which is taken constant (0.7). Note that since the
temperature is a function of position and time, also 4� and ?9 are functions of space and time,
as well as all heat transfer coefficients in the model while Gao et al. (2007) has reported
constant values in his analytical approach.
The important parameters that are key in determining the performance of a collector system
are the heat loss coefficient, heat gain and the thermal efficiency. The instantaneous
efficiency (i.e. the efficiency at any moment) is given by
»�[� = ¼½�[�K@L�[� (4.17)
The heat gain ¼½�[�for the heated air along the collector, is given by: ¼½�[� = ¾�[��Z�@Z�zZ�a, [� − zZ�0, [�� (4.18)
Where zZ �a, [� is the outlet air temperature, and zZ�0, [� the inlet air temperature, which, in
this case, is equal to the ambient temperature z=�[�, ¾�[�is the volumetric air flow rate
(]"/6�.
The heat gain is also equal to the difference between heat absorbed, and heat lost to the
environment: ¼½�[� = K@ �¸@£�L�[� − �g�[� �z@J�[� − z �[��� (4.19)
59
Where ¸@£� is the combination of the solar absorption-coefficient of the plate and
transmittance of the glass, L�[� the solar radiation intensity as measured on a horizontal plane,
and z@J�[� the mean plate temperature over the length of the collector, i.e.
z@J�[� = 1a¿ z�\, [�8\g.
(4.20)
The term �g�[� is the instantaneous overall heat loss coefficient, and is an important
characteristic of the solar air heater. In fact, under the assumption that the rate of heat storage
in the material of the collector is small as compared to the other terms, the two heat gains
(Equations 4.18 and 4.19) should be equal, which provides an operational definition of the
actual overall heat loss coefficient as Equation 4.21.
�g�[� = KT¸@£�L�[� − ¾�[��Z�@ZÀzZ�a, [� − zZ�0, [�ÁK@ �z@J�[� − z �[�� (4.21)
The overall heat loss coefficient could be a useful characteristic to compare various designs,
on the basis of measurements after the units have been built. Prior to construction, when no
data is available on the temperatures, the overall heat loss coefficient has little value as a design
parameter.
4.3 Results and discussion
4.3.1 Model-based solar collector design and analysis
Design and analysis calculations have been performed with the default nominal parameters as
given in Table 4.1 (The Engineering Toolbox), and using representative inputs and operational
conditions. To solve the partial differential equations, the solar collector was discretized in 45
sections of equal length and for each section Equations 4.1, 4.4, 4.5 and 4.8 were solved in
time. The calculations were performed with the differential equation solver “ode45” of Matlab.
Table 4.1. Parameter values
Symbol Name Value
Cpf Heat capacity of air (J kg-1K-1) 1009
Cpp Heat capacity of plate (J kg-1K-1) 910
Cpg Heat capacity of glass (J kg-1K-1) 840
g Acceleration due to gravity (m s-2) 9.81
Lb Edge of box (m) 0.15
Pr Prandtl number 0.7
u Air speed (m s-1) 0.5
W Width of plate (m) 1.00
w Wind speed, nominal value (m s-1) 4
Yp Thickness of plate (m) 0.002
Yg Thickness of glass (m) 0.005
Ywool Thickness of wool (m) 0.07
60
Ywood Thickness of wood (m) 0.03
αg Glass absorption coefficient 0.05
αp Plate absorption coefficient 0.95 (0.88 after
adjustment, see
text)
β Collector tilt angle (degrees), nominal value
(degree)
25
εg Emittance of glass 0.84
εp Emittance of plate 0.90
λa Thermal conductivity of air (W m-1K-1) 0.029
λins =λwool Thermal conductivity of wool (W m-1K-1) 0.029
λconstr=λwood Thermal conductivity of wood (W m-1K-1) 0.15
λp Thermal conductivity of aluminum plate (W m-1K-1) 205
λg Thermal conductivity of glass (W m-1K-1) 0.13
ρa Density of air (kg m-3) 1.14
ρp Density of aluminum plate (kg m-3) 2700
ρs Density of silica gel (kg m-3) 600
ρg Density of glass (kg m-3) 2600
σ Stefan Boltzmann constant (W m-2K-4) 5.7x 10⁻⁸
τg Glass transmittance 0.88
υ Kinematic viscosity (m2s-1) 2.029x10⁻⁵
The varying input conditions to the model are the ambient temperature z ,=�[� and the
radiation L�[�. Figure 4.3 gives an example of the variation of these inputs over the simulation
time. This figure starts with the use of the system at 8.00h in the morning. The simulation is
stopped at around 17.00h. The linear air flow velocity was 0.5 m/s and after evaluation of
different air gaps, the value was set to 0.025m. The collector width was set to 1.0m.
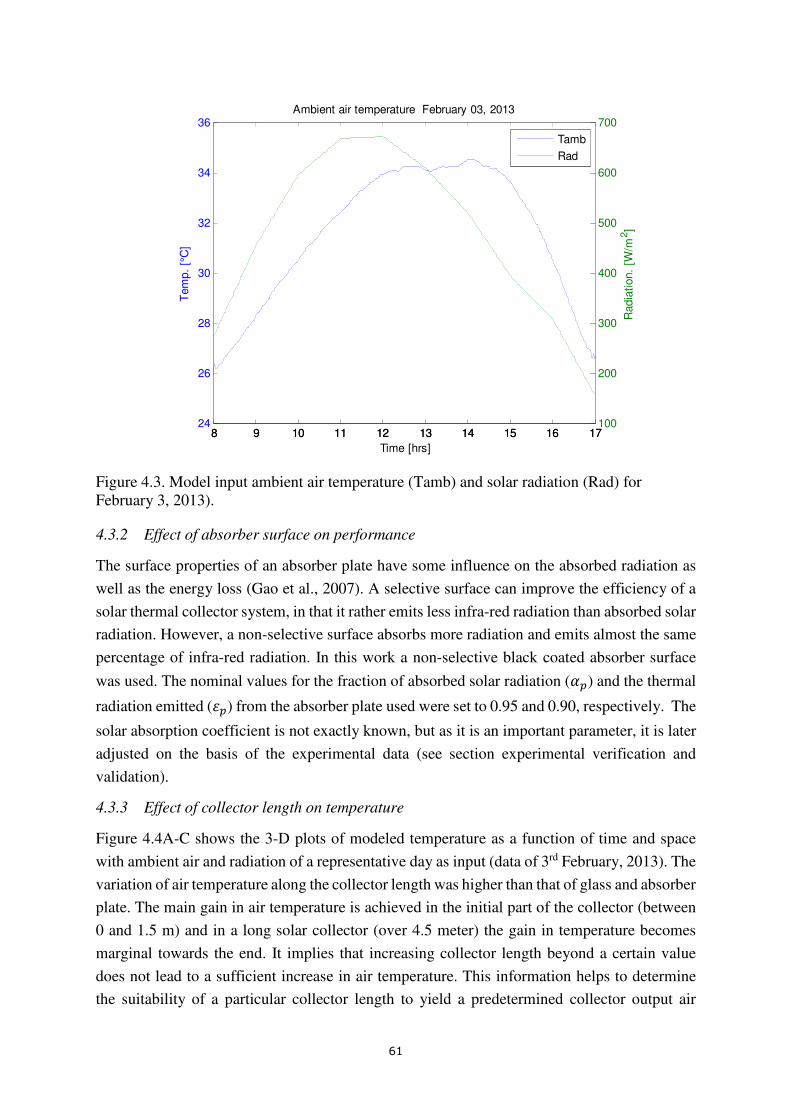
61
Figure 4.3. Model input ambient air temperature (Tamb) and solar radiation (Rad) for February 3, 2013).
4.3.2 Effect of absorber surface on performance
The surface properties of an absorber plate have some influence on the absorbed radiation as
well as the energy loss (Gao et al., 2007). A selective surface can improve the efficiency of a
solar thermal collector system, in that it rather emits less infra-red radiation than absorbed solar
radiation. However, a non-selective surface absorbs more radiation and emits almost the same
percentage of infra-red radiation. In this work a non-selective black coated absorber surface
was used. The nominal values for the fraction of absorbed solar radiation (¸@) and the thermal
radiation emitted (®@) from the absorber plate used were set to 0.95 and 0.90, respectively. The
solar absorption coefficient is not exactly known, but as it is an important parameter, it is later
adjusted on the basis of the experimental data (see section experimental verification and
validation).
4.3.3 Effect of collector length on temperature
Figure 4.4A-C shows the 3-D plots of modeled temperature as a function of time and space
with ambient air and radiation of a representative day as input (data of 3rd February, 2013). The
variation of air temperature along the collector length was higher than that of glass and absorber
plate. The main gain in air temperature is achieved in the initial part of the collector (between
0 and 1.5 m) and in a long solar collector (over 4.5 meter) the gain in temperature becomes
marginal towards the end. It implies that increasing collector length beyond a certain value
does not lead to a sufficient increase in air temperature. This information helps to determine
the suitability of a particular collector length to yield a predetermined collector output air
8 9 10 11 12 13 14 15 16 1724
26
28
30
32
34
36Ambient air temperature February 03, 2013
Time [hrs]
Tem
p.
[°C
]
Tamb
Rad
8 9 10 11 12 13 14 15 16 17100
200
300
400
500
600
700
Radia
tion.
[W/m
2]
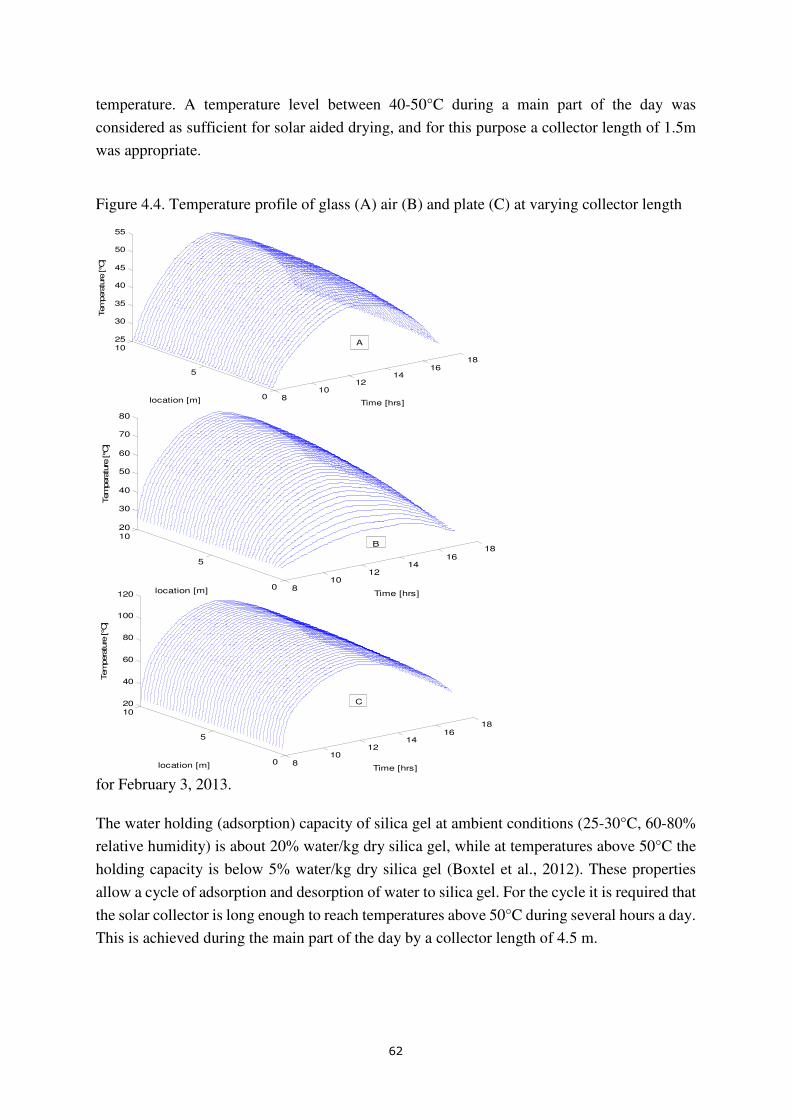
62
temperature. A temperature level between 40-50°C during a main part of the day was
considered as sufficient for solar aided drying, and for this purpose a collector length of 1.5m
was appropriate.
Figure 4.4. Temperature profile of glass (A) air (B) and plate (C) at varying collector length
for February 3, 2013.
The water holding (adsorption) capacity of silica gel at ambient conditions (25-30°C, 60-80%
relative humidity) is about 20% water/kg dry silica gel, while at temperatures above 50°C the
holding capacity is below 5% water/kg dry silica gel (Boxtel et al., 2012). These properties
allow a cycle of adsorption and desorption of water to silica gel. For the cycle it is required that
the solar collector is long enough to reach temperatures above 50°C during several hours a day.
This is achieved during the main part of the day by a collector length of 4.5 m.
810
1214
1618
0
5
1020
40
60
80
100
120
Time [hrs]location [m]
Tem
pera
ture
[°C
]
C
810
1214
1618
0
5
1020
30
40
50
60
70
80
Time [hrs]location [m]
Tem
pera
ture
[°C
]
B
810
1214
1618
0
5
1025
30
35
40
45
50
55
Time [hrs]location [m]
Tem
pera
ture
[°C
]
A
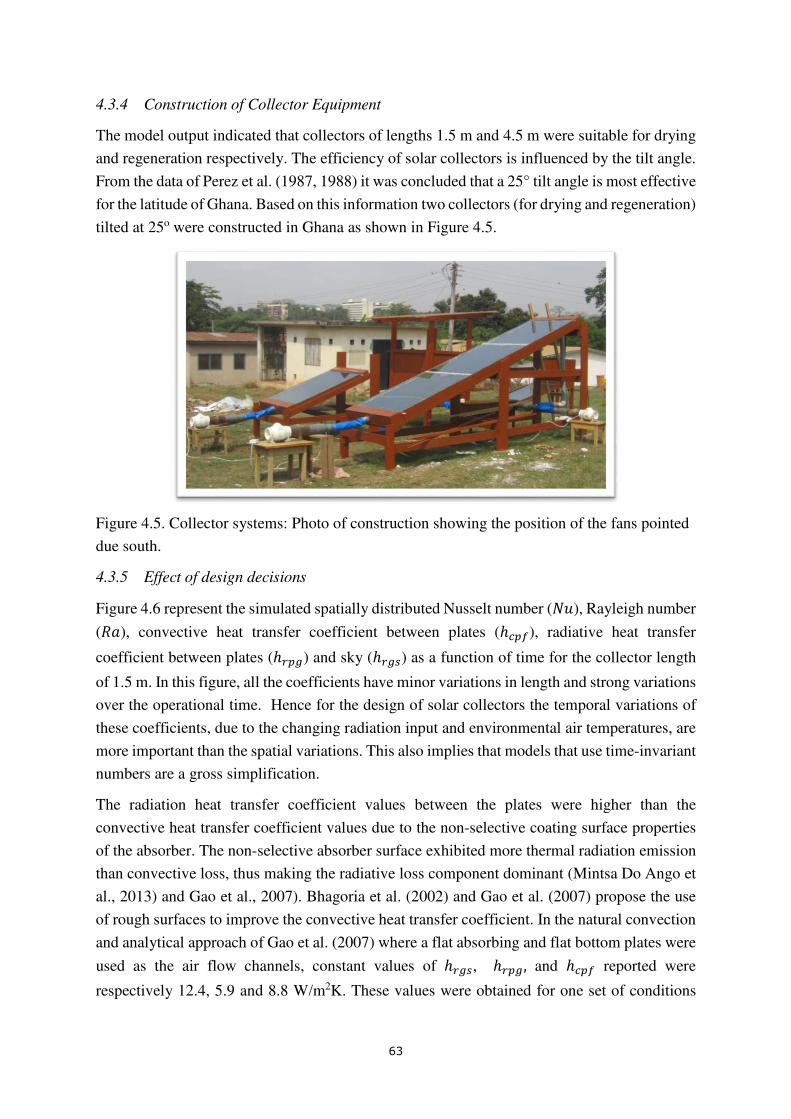
63
4.3.4 Construction of Collector Equipment
The model output indicated that collectors of lengths 1.5 m and 4.5 m were suitable for drying
and regeneration respectively. The efficiency of solar collectors is influenced by the tilt angle.
From the data of Perez et al. (1987, 1988) it was concluded that a 25° tilt angle is most effective
for the latitude of Ghana. Based on this information two collectors (for drying and regeneration)
tilted at 25o were constructed in Ghana as shown in Figure 4.5.
Figure 4.5. Collector systems: Photo of construction showing the position of the fans pointed
due south.
4.3.5 Effect of design decisions
Figure 4.6 represent the simulated spatially distributed Nusselt number (?9), Rayleigh number
(4�), convective heat transfer coefficient between plates (ℎT@Z), radiative heat transfer
coefficient between plates (ℎr@�) and sky (ℎr�p) as a function of time for the collector length
of 1.5 m. In this figure, all the coefficients have minor variations in length and strong variations
over the operational time. Hence for the design of solar collectors the temporal variations of
these coefficients, due to the changing radiation input and environmental air temperatures, are
more important than the spatial variations. This also implies that models that use time-invariant
numbers are a gross simplification.
The radiation heat transfer coefficient values between the plates were higher than the
convective heat transfer coefficient values due to the non-selective coating surface properties
of the absorber. The non-selective absorber surface exhibited more thermal radiation emission
than convective loss, thus making the radiative loss component dominant (Mintsa Do Ango et
al., 2013) and Gao et al., 2007). Bhagoria et al. (2002) and Gao et al. (2007) propose the use
of rough surfaces to improve the convective heat transfer coefficient. In the natural convection
and analytical approach of Gao et al. (2007) where a flat absorbing and flat bottom plates were
used as the air flow channels, constant values of ℎr�p, ℎr@�, and ℎT@Z reported were
respectively 12.4, 5.9 and 8.8 W/m2K. These values were obtained for one set of conditions
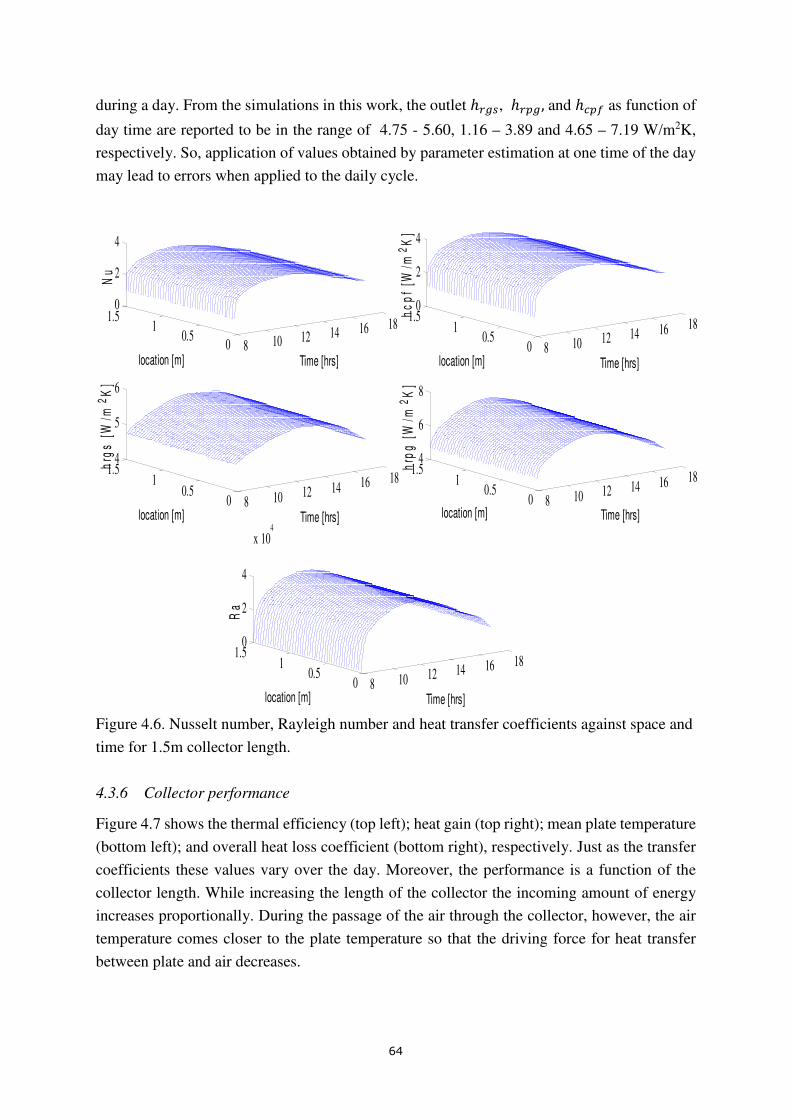
64
during a day. From the simulations in this work, the outlet ℎr�p, ℎr@�, and ℎT@Z as function of
day time are reported to be in the range of 4.75 - 5.60, 1.16 – 3.89 and 4.65 – 7.19 W/m2K,
respectively. So, application of values obtained by parameter estimation at one time of the day
may lead to errors when applied to the daily cycle.
Figure 4.6. Nusselt number, Rayleigh number and heat transfer coefficients against space and
time for 1.5m collector length.
4.3.6 Collector performance
Figure 4.7 shows the thermal efficiency (top left); heat gain (top right); mean plate temperature
(bottom left); and overall heat loss coefficient (bottom right), respectively. Just as the transfer
coefficients these values vary over the day. Moreover, the performance is a function of the
collector length. While increasing the length of the collector the incoming amount of energy
increases proportionally. During the passage of the air through the collector, however, the air
temperature comes closer to the plate temperature so that the driving force for heat transfer
between plate and air decreases.
8 10 12 14 16 18
00.5
11.5
0
2
4
Time [hrs]location [m]
Nu
8 10 12 14 16 18
00.5
11.5
0
2
4
Time [hrs]location [m]
hc
pf
[W/m
2K
]
8 10 12 14 16 18
00.5
11.5
4
5
6
Time [hrs]location [m]
hrg
s [
W/m
2K
]
8 10 12 14 16 18
00.5
11.5
4
6
8
Time [hrs]location [m]
hrp
g [
W/m
2K
]
8 10 12 14 16 18
00.5
11.5
0
2
4
x 104
Time [hrs]location [m]
Ra
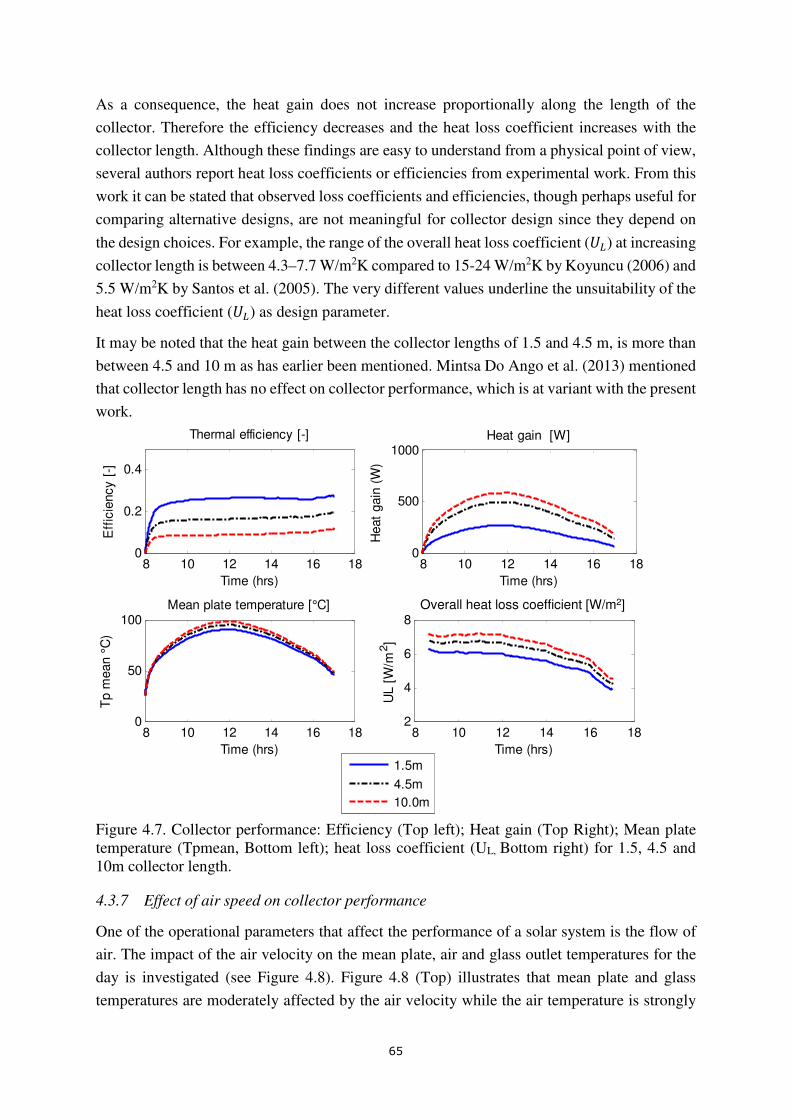
65
As a consequence, the heat gain does not increase proportionally along the length of the
collector. Therefore the efficiency decreases and the heat loss coefficient increases with the
collector length. Although these findings are easy to understand from a physical point of view,
several authors report heat loss coefficients or efficiencies from experimental work. From this
work it can be stated that observed loss coefficients and efficiencies, though perhaps useful for
comparing alternative designs, are not meaningful for collector design since they depend on
the design choices. For example, the range of the overall heat loss coefficient (�g) at increasing
collector length is between 4.3–7.7 W/m2K compared to 15-24 W/m2K by Koyuncu (2006) and
5.5 W/m2K by Santos et al. (2005). The very different values underline the unsuitability of the
heat loss coefficient (�g) as design parameter.
It may be noted that the heat gain between the collector lengths of 1.5 and 4.5 m, is more than
between 4.5 and 10 m as has earlier been mentioned. Mintsa Do Ango et al. (2013) mentioned
that collector length has no effect on collector performance, which is at variant with the present
work.
Figure 4.7. Collector performance: Efficiency (Top left); Heat gain (Top Right); Mean plate temperature (Tpmean, Bottom left); heat loss coefficient (UL, Bottom right) for 1.5, 4.5 and 10m collector length.
4.3.7 Effect of air speed on collector performance
One of the operational parameters that affect the performance of a solar system is the flow of
air. The impact of the air velocity on the mean plate, air and glass outlet temperatures for the
day is investigated (see Figure 4.8). Figure 4.8 (Top) illustrates that mean plate and glass
temperatures are moderately affected by the air velocity while the air temperature is strongly
8 10 12 14 16 180
0.2
0.4
Time (hrs)
Eff
icie
ncy [
-]
Thermal efficiency [-]
8 10 12 14 16 180
500
1000
Time (hrs)
Heat
gain
(W
)
Heat gain [W]
8 10 12 14 16 180
50
100
Time (hrs)
Tp m
ean °
C)
Mean plate temperature [°C]
8 10 12 14 16 182
4
6
8
Time (hrs)
UL [
W/m
2]
Overall heat transfer coefficient [W/m2]
1.5m
4.5m
10.0m
Overall heat loss coefficient [W/m2]
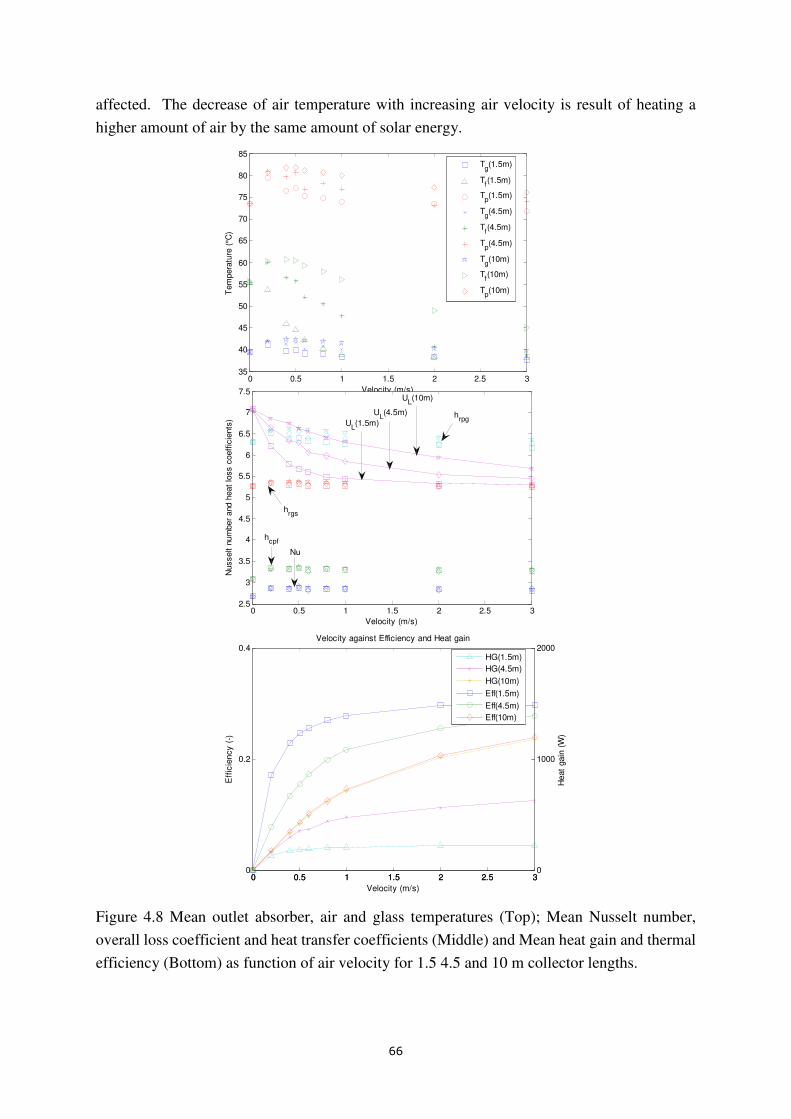
66
affected. The decrease of air temperature with increasing air velocity is result of heating a
higher amount of air by the same amount of solar energy.
Figure 4.8 Mean outlet absorber, air and glass temperatures (Top); Mean Nusselt number,
overall loss coefficient and heat transfer coefficients (Middle) and Mean heat gain and thermal
efficiency (Bottom) as function of air velocity for 1.5 4.5 and 10 m collector lengths.
0 0.5 1 1.5 2 2.5 335
40
45
50
55
60
65
70
75
80
85
Velocity (m/s)
Tem
pera
ture
(°C
)
Tg(1.5m)
Tf(1.5m)
Tp(1.5m)
Tg(4.5m)
Tf(4.5m)
Tp(4.5m)
Tg(10m)
Tf(10m)
Tp(10m)
0 0.5 1 1.5 2 2.5 32.5
3
3.5
4
4.5
5
5.5
6
6.5
7
7.5
Velocity (m/s)
Nusselt n
um
ber
and h
eat
loss c
oeff
icie
nts
)
hcpf
Nu
hrgs
UL(1.5m)
UL(10m)
UL(4.5m) h
rpg
0 0.5 1 1.5 2 2.5 30
0.2
0.4
Eff
icie
ncy (
-)
0 0.5 1 1.5 2 2.5 30
1000
2000
Heat
gain
(W
)
Velocity against Efficiency and Heat gain
Velocity (m/s)
HG(1.5m)
HG(4.5m)
HG(10m)
Eff(1.5m)
Eff(4.5m)
Eff(10m)
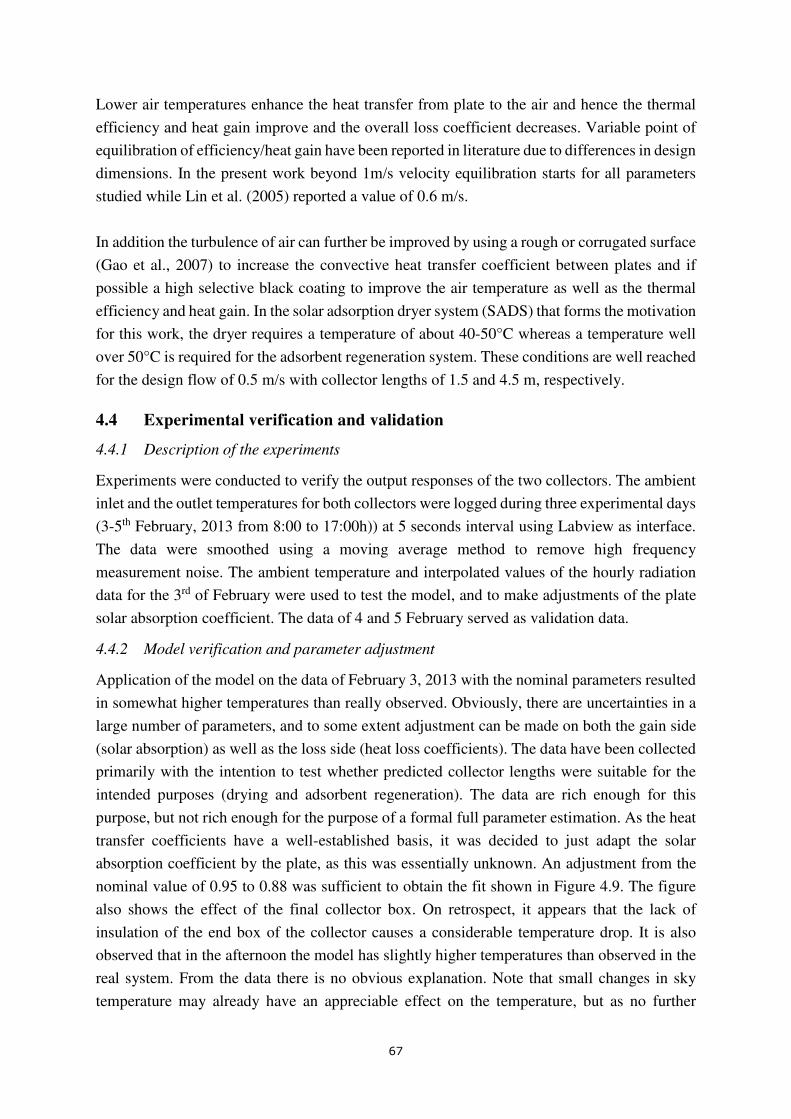
67
Lower air temperatures enhance the heat transfer from plate to the air and hence the thermal
efficiency and heat gain improve and the overall loss coefficient decreases. Variable point of
equilibration of efficiency/heat gain have been reported in literature due to differences in design
dimensions. In the present work beyond 1m/s velocity equilibration starts for all parameters
studied while Lin et al. (2005) reported a value of 0.6 m/s.
In addition the turbulence of air can further be improved by using a rough or corrugated surface
(Gao et al., 2007) to increase the convective heat transfer coefficient between plates and if
possible a high selective black coating to improve the air temperature as well as the thermal
efficiency and heat gain. In the solar adsorption dryer system (SADS) that forms the motivation
for this work, the dryer requires a temperature of about 40-50°C whereas a temperature well
over 50°C is required for the adsorbent regeneration system. These conditions are well reached
for the design flow of 0.5 m/s with collector lengths of 1.5 and 4.5 m, respectively.
4.4 Experimental verification and validation
4.4.1 Description of the experiments
Experiments were conducted to verify the output responses of the two collectors. The ambient
inlet and the outlet temperatures for both collectors were logged during three experimental days
(3-5th February, 2013 from 8:00 to 17:00h)) at 5 seconds interval using Labview as interface.
The data were smoothed using a moving average method to remove high frequency
measurement noise. The ambient temperature and interpolated values of the hourly radiation
data for the 3rd of February were used to test the model, and to make adjustments of the plate
solar absorption coefficient. The data of 4 and 5 February served as validation data.
4.4.2 Model verification and parameter adjustment
Application of the model on the data of February 3, 2013 with the nominal parameters resulted
in somewhat higher temperatures than really observed. Obviously, there are uncertainties in a
large number of parameters, and to some extent adjustment can be made on both the gain side
(solar absorption) as well as the loss side (heat loss coefficients). The data have been collected
primarily with the intention to test whether predicted collector lengths were suitable for the
intended purposes (drying and adsorbent regeneration). The data are rich enough for this
purpose, but not rich enough for the purpose of a formal full parameter estimation. As the heat
transfer coefficients have a well-established basis, it was decided to just adapt the solar
absorption coefficient by the plate, as this was essentially unknown. An adjustment from the
nominal value of 0.95 to 0.88 was sufficient to obtain the fit shown in Figure 4.9. The figure
also shows the effect of the final collector box. On retrospect, it appears that the lack of
insulation of the end box of the collector causes a considerable temperature drop. It is also
observed that in the afternoon the model has slightly higher temperatures than observed in the
real system. From the data there is no obvious explanation. Note that small changes in sky
temperature may already have an appreciable effect on the temperature, but as no further
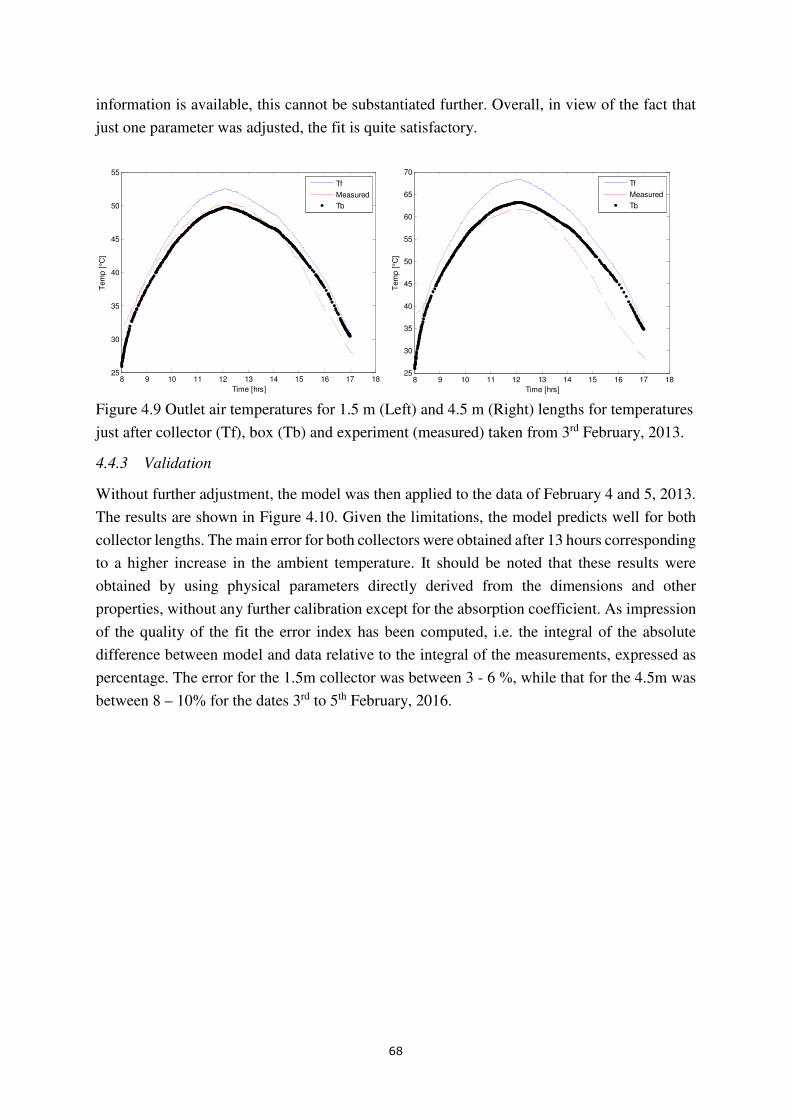
68
information is available, this cannot be substantiated further. Overall, in view of the fact that
just one parameter was adjusted, the fit is quite satisfactory.
Figure 4.9 Outlet air temperatures for 1.5 m (Left) and 4.5 m (Right) lengths for temperatures
just after collector (Tf), box (Tb) and experiment (measured) taken from 3rd February, 2013.
4.4.3 Validation
Without further adjustment, the model was then applied to the data of February 4 and 5, 2013.
The results are shown in Figure 4.10. Given the limitations, the model predicts well for both
collector lengths. The main error for both collectors were obtained after 13 hours corresponding
to a higher increase in the ambient temperature. It should be noted that these results were
obtained by using physical parameters directly derived from the dimensions and other
properties, without any further calibration except for the absorption coefficient. As impression
of the quality of the fit the error index has been computed, i.e. the integral of the absolute
difference between model and data relative to the integral of the measurements, expressed as
percentage. The error for the 1.5m collector was between 3 - 6 %, while that for the 4.5m was
between 8 – 10% for the dates 3rd to 5th February, 2016.
8 9 10 11 12 13 14 15 16 17 1825
30
35
40
45
50
55
Time [hrs]
Tem
p [
°C]
Tf
Measured
Tb
8 9 10 11 12 13 14 15 16 17 1825
30
35
40
45
50
55
60
65
70
Time [hrs]T
em
p [
°C]
Tf
Measured
Tb
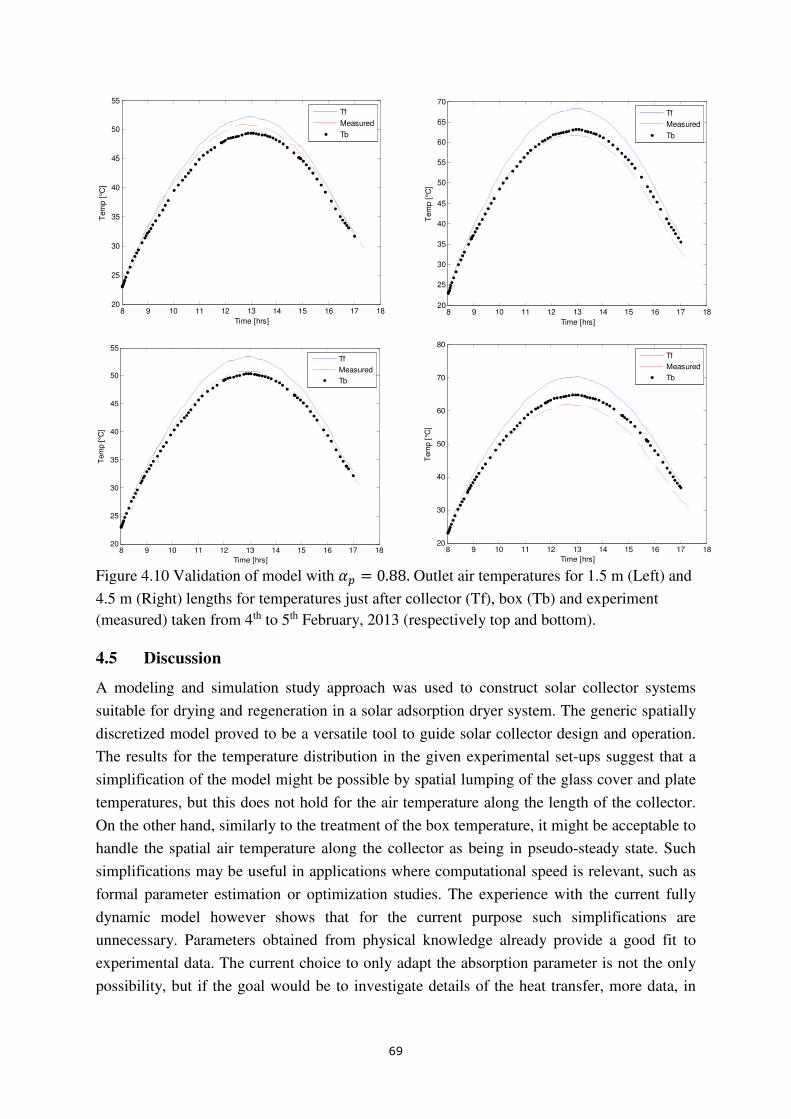
69
Figure 4.10 Validation of model with ¸@ = 0.88. Outlet air temperatures for 1.5 m (Left) and
4.5 m (Right) lengths for temperatures just after collector (Tf), box (Tb) and experiment
(measured) taken from 4th to 5th February, 2013 (respectively top and bottom).
4.5 Discussion
A modeling and simulation study approach was used to construct solar collector systems
suitable for drying and regeneration in a solar adsorption dryer system. The generic spatially
discretized model proved to be a versatile tool to guide solar collector design and operation.
The results for the temperature distribution in the given experimental set-ups suggest that a
simplification of the model might be possible by spatial lumping of the glass cover and plate
temperatures, but this does not hold for the air temperature along the length of the collector.
On the other hand, similarly to the treatment of the box temperature, it might be acceptable to
handle the spatial air temperature along the collector as being in pseudo-steady state. Such
simplifications may be useful in applications where computational speed is relevant, such as
formal parameter estimation or optimization studies. The experience with the current fully
dynamic model however shows that for the current purpose such simplifications are
unnecessary. Parameters obtained from physical knowledge already provide a good fit to
experimental data. The current choice to only adapt the absorption parameter is not the only
possibility, but if the goal would be to investigate details of the heat transfer, more data, in
8 9 10 11 12 13 14 15 16 17 1820
25
30
35
40
45
50
55
Time [hrs]
Tem
p [
°C]
Tf
Measured
Tb
8 9 10 11 12 13 14 15 16 17 1820
25
30
35
40
45
50
55
60
65
70
Time [hrs]
Tem
p [
°C]
Tf
Measured
Tb
8 9 10 11 12 13 14 15 16 17 1820
25
30
35
40
45
50
55
Time [hrs]
Tem
p [
°C]
Tf
Measured
Tb
8 9 10 11 12 13 14 15 16 17 1820
30
40
50
60
70
80
Time [hrs]
Tem
p [
°C]
Tf
Measured
Tb
70
particular air temperatures along the collector, and distance measurements of the plate
temperature, should be recommended to allow for a more formal parameter estimation.
4.6 Conclusions
Experiments conducted on collectors with air path lengths of 1.5 or 4.5 m indicated a good
comparison between the model and observed data, just on the basis of physical parameters
without further calibration, except for the solar absorption coefficient of the collector plate.
The modeling exercise makes it clear that increasing the collector length beyond a certain limit
makes it inefficient due to decreasing driving force for heat transfer between plate and air.
The findings of this work indicate that plate and glass temperatures as well as heat transfer
coefficients are practically independent of the length and are weak functions of air velocity. In
contrast, the overall heat loss coefficient, heat gain and efficiency are highly dependent on the
operational air velocity. In addition, it was shown that heat transfer coefficients and the overall
heat loss coefficient vary considerably during the day. Therefore designing a solar collector
based on a general number of the heat loss coefficient is not feasible, and fixed heat loss
coefficients as reported in literature have little to offer for the design of a new collector.
Empirical approaches based on constant values are gross simplifications. The study shows that
these limitations can be overcome by using a physical model. Finally, the primary goal, namely
to know which collector lengths would be needed for drying and adsorbent regeneration, was
reached. The model indicated that under conditions prevailing at the latitude of Ghana a
collector length of 1.5 m gives drying temperatures suitable for drying of heat sensitive
agricultural products at air speed of 0.5 m/s, and this was confirmed by the experiments.
Likewise a collector of 4.5 m length at an operational air speed between 0.2 – 0.5 ms-1 is
suitable for adsorbent (silica gel) regeneration.
71
NOMENCLATURE
Physical symbols
Ac Area of collector (m2)
Cp Specific heat capacity (kg-1K-1)
DH Hydraulic diameter (m)
dx Discretized plate length (m)
g Acceleration due to gravity (m-2)
h Heat transfer coefficient (W m-2K-1)
I Irradiance (Wm-2)
L Total plate length (m)
Lb Edge dimension of the receiving box (m)
Nu Nusselt number
p Combined parameter ÂÃÄÅÅÆÇÈÉÊËÉÌÍ.
Pr Prandtl number
Qu Useful heat gain (W)
Ra Rayleigh number
Re Reynolds number
T Temperature (K)
∆T Temperature difference (K)
u Velocity (ms-1)
Uk Back loss coefficient (Wm-2K-1)
UL Overall loss coefficient (W m-2K-1)
Uwall=Ubs Box or Side wall loss coefficient (Wm-2K-1)
W Width of plate (m)
Y Air gap between plate and glass cover (m)
Yp Thickness of plate(m)
Yg Thickness of glass (m)
Subscripts
a Ambient
b Receiving air box
c Convective
col Collector
constr Construction material (wood)
e Side wall
f Flowing medium, i.e. air
g Glass cover
in Input
ins Insulation (wool)
72
k Absorber insulation
m Mean
p Plate
r Radiative
s Sky
w Wind
Greek letters
α Absorbance of radiation(-)
α* Thermal diffusivity (m2s-1)
β Slope of plate(o)
ε Emissivity (-)
ŋ Collector efficiency (-)
λ Thermal conductivity (Wm-1K-1)
ξ Volumetric coefficient of
expansion (K��)
ρ Density (kgm-3)
σ Stephan Boltzmann
constant(Wm-2K-4)
τ Transmittance (-)
υ Kinematic viscosity (m2s-1)
Φ Volumetric flow rate (m3/s)
73
Chapter 5
Experimental verification of yam drying with Solar Adsorption
Drying
This chapter is being prepared for submission as:
E.A. Amankwah, G. Kyere, H. Kyeremateng, K.A. Dzisi, A.J.B. Boxtel. Experimental verification of yam drying with a Solar Adsorption Drying.
74
Abstract
This work evaluates the yam drying performance of solar adsorption drying (SAD) compared
to solar drying (SD) and open sun drying (OSD). The evaluation concerns the drying cycle for
batches of yam, the effect on vitamin C, color and composition. As SAD can be applied during
the night, by using air dehumidified by passing through a bed of silica gel, the cycle time for
drying batches of yam can be reduced over 20-25% compared to SD and halved compared to
OSD. SAD is thereby most effective during the first nights of drying when the driving force is
the highest. Composition was not affected by drying methods but did affect vitamin C content.
Vitamin C retention for SD and SAD is close to each other with a preference for SD. For three
yam cultivars (Pona, Lilii and Dente), Lilii dried fastest and Dente drying slowest. SAD
maintained the whitish color of yam better than the other drying methods. Seasonal variations
affected drying conditions and drying time. Regeneration of silica gel is realized over three
successive days with air heated in a solar collector. The regeneration rate was the highest on
the first day of regeneration. The highest day temperature and a good adsorbent bed loading
are crucial for efficient regeneration, whereas more work on regeneration is needed for a
complete systems design.
75
5.1 Introduction
Alternate energy sources which are less costly, abundant and safe will not only help to meet
the energy needs of the farmer but will also help to remove potential roadblocks for processing
agricultural products. Energy from the sun has been used in the drying and preservation of
agricultural products for a long time. According to Berinyuy et al. (2012), most agricultural
surpluses are preserved using energy from the sun. Arinze et al. (1990) reported that in
developing countries over 90% of agricultural products are sun dried. Although open sun
drying requires little capital and work force, it is associated with many problems and short-
comings. Beside longer drying periods and the possibility of contact with contaminants such
as stones and dirt, the crops dried along roadsides stand the risk of contamination with exhaust
gasses from traffic or moving vehicles, hence denaturing their nutritional value (Basuinia,
2001). El-Beltagy et al. (2007) reported that vitamin C has a high sensitivity to light and
therefore the exposure to solar radiation increased the vitamin C loss during drying. In order to
minimize or prevent the shortcomings of open air drying, the use of dryer equipment driven by
solar energy has been investigated and proven to be a better alternative.
Reliable supply of energy is one of the important prerequisites for the growth of Africa's
agricultural industry. Access to fossil fuels such as coal and petroleum or electricity for farm
operations or crop processing is expensive and mostly unreliable, while that of fuel wood is
not sustainable. Solar energy is an alternative source of energy which has an advantage over
other alternative sources of energy such as wind and shale because of its abundant,
inexhaustible, renewable and non-polluting nature. The method of drying affects the rate of
drying and the quality of the product. Air drying in general enhances the drying rate, while
direct exposure to the sun can have a deleterious effect on the quality of the dried product.
Changes of vitamin C content during drying have been affected by drying time, drying air
temperature as well as moisture content (Erenturk et al., 2005 and Davey et al., 2000). Yam in
particular, contains vitamin C as a bioactive compound which has a strong antioxidant activity.
It plays an important role in human nutrition due to free radical scavenging activities (Skrede
et al., 2000 and Giovanelli et al., 2009). Vitamin C is degraded by irreversible oxidative
reactions during air drying (Vega-Gálvez et al., 2009). Santos and Silva (2008) mentioned that
a high oxygen concentration around the drying environment may lead to increase in vitamin C
degradation in the dried product. It has been reported that drying methods effects final moisture
content, but not on other components of yam flours (Hsu et al., 2003). Maintaining the original
colour of food samples is a priority of the processor and the demand of the consumer. Yam
contains phenolic compounds which are associated with oxidative browning by enzymes and
oxidative browning (Okaka and Okaka., 2001). Thus any processing method that is consumer
acceptability driven by maintaining either the whitish or creamer color of yam meets a great
demand.
Solar drying systems, where either the product is directly dried in a glass covered chamber or
indirectly by channeling hot air into a drying chamber by first heating ambient air through a
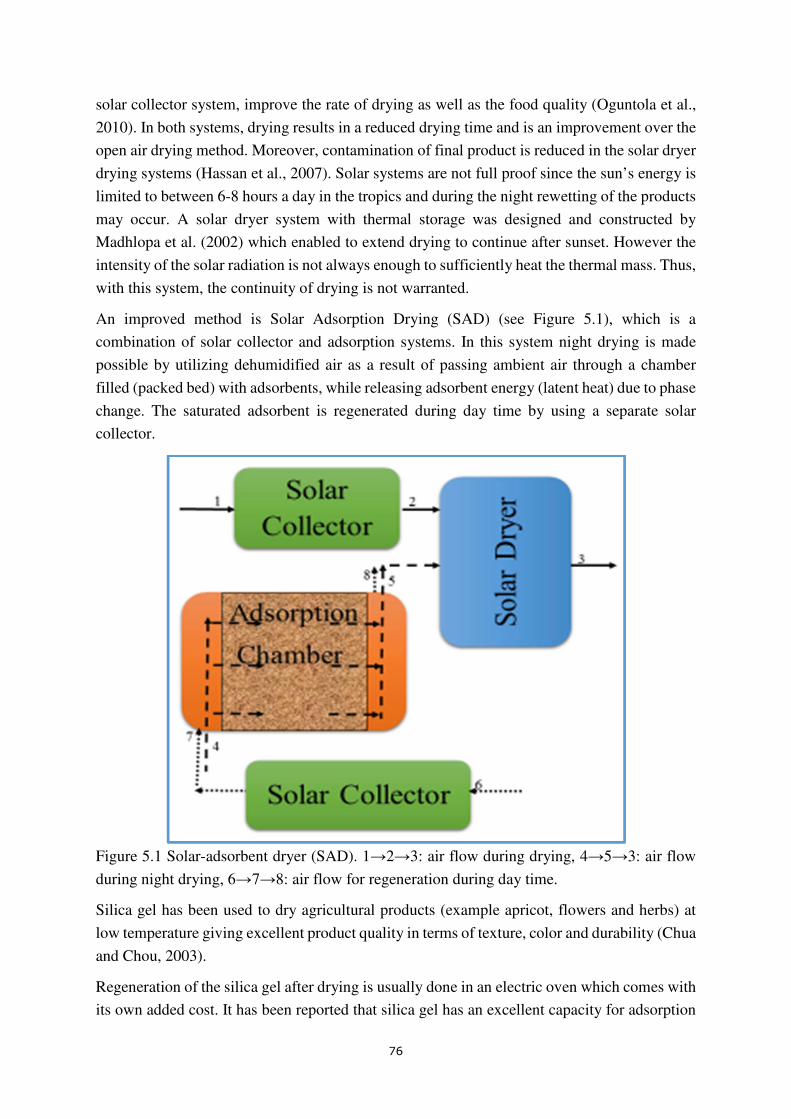
76
solar collector system, improve the rate of drying as well as the food quality (Oguntola et al.,
2010). In both systems, drying results in a reduced drying time and is an improvement over the
open air drying method. Moreover, contamination of final product is reduced in the solar dryer
drying systems (Hassan et al., 2007). Solar systems are not full proof since the sun’s energy is
limited to between 6-8 hours a day in the tropics and during the night rewetting of the products
may occur. A solar dryer system with thermal storage was designed and constructed by
Madhlopa et al. (2002) which enabled to extend drying to continue after sunset. However the
intensity of the solar radiation is not always enough to sufficiently heat the thermal mass. Thus,
with this system, the continuity of drying is not warranted.
An improved method is Solar Adsorption Drying (SAD) (see Figure 5.1), which is a
combination of solar collector and adsorption systems. In this system night drying is made
possible by utilizing dehumidified air as a result of passing ambient air through a chamber
filled (packed bed) with adsorbents, while releasing adsorbent energy (latent heat) due to phase
change. The saturated adsorbent is regenerated during day time by using a separate solar
collector.
Figure 5.1 Solar-adsorbent dryer (SAD). 1→2→3: air flow during drying, 4→5→3: air flow
during night drying, 6→7→8: air flow for regeneration during day time.
Silica gel has been used to dry agricultural products (example apricot, flowers and herbs) at
low temperature giving excellent product quality in terms of texture, color and durability (Chua
and Chou, 2003).
Regeneration of the silica gel after drying is usually done in an electric oven which comes with
its own added cost. It has been reported that silica gel has an excellent capacity for adsorption
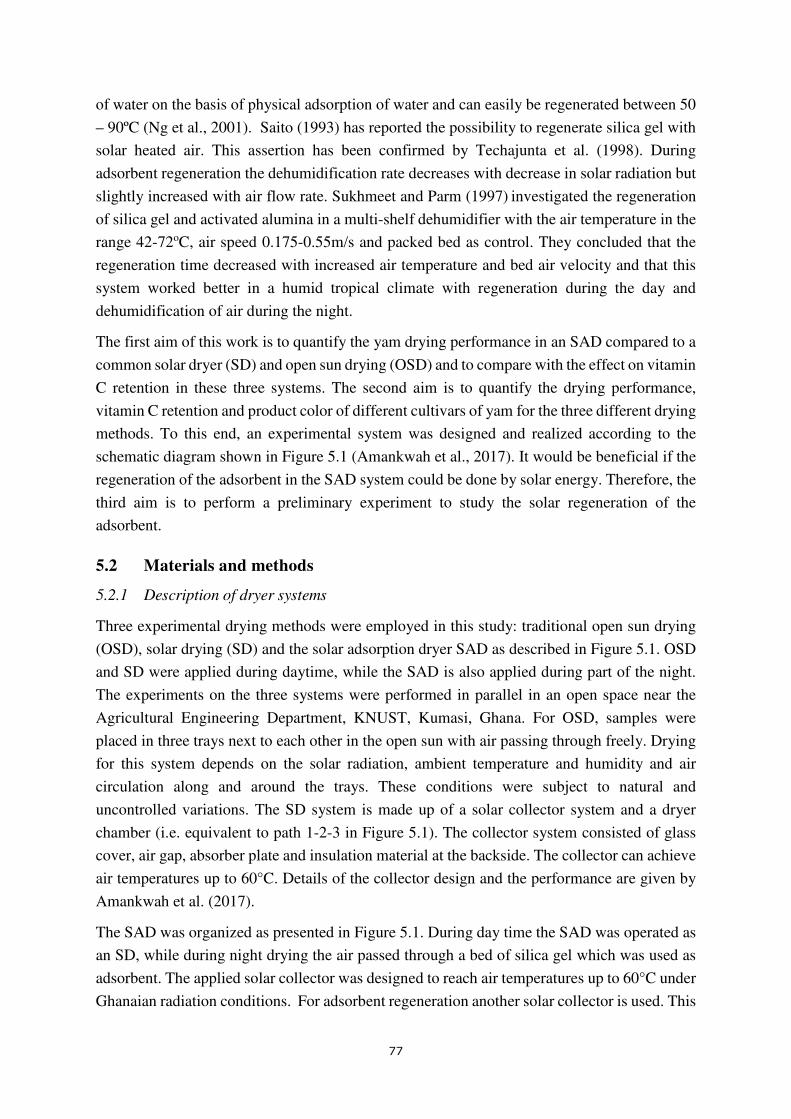
77
of water on the basis of physical adsorption of water and can easily be regenerated between 50
– 90ºC (Ng et al., 2001). Saito (1993) has reported the possibility to regenerate silica gel with
solar heated air. This assertion has been confirmed by Techajunta et al. (1998). During
adsorbent regeneration the dehumidification rate decreases with decrease in solar radiation but
slightly increased with air flow rate. Sukhmeet and Parm (1997) investigated the regeneration
of silica gel and activated alumina in a multi-shelf dehumidifier with the air temperature in the
range 42-72oC, air speed 0.175-0.55m/s and packed bed as control. They concluded that the
regeneration time decreased with increased air temperature and bed air velocity and that this
system worked better in a humid tropical climate with regeneration during the day and
dehumidification of air during the night.
The first aim of this work is to quantify the yam drying performance in an SAD compared to a
common solar dryer (SD) and open sun drying (OSD) and to compare with the effect on vitamin
C retention in these three systems. The second aim is to quantify the drying performance,
vitamin C retention and product color of different cultivars of yam for the three different drying
methods. To this end, an experimental system was designed and realized according to the
schematic diagram shown in Figure 5.1 (Amankwah et al., 2017). It would be beneficial if the
regeneration of the adsorbent in the SAD system could be done by solar energy. Therefore, the
third aim is to perform a preliminary experiment to study the solar regeneration of the
adsorbent.
5.2 Materials and methods
5.2.1 Description of dryer systems
Three experimental drying methods were employed in this study: traditional open sun drying
(OSD), solar drying (SD) and the solar adsorption dryer SAD as described in Figure 5.1. OSD
and SD were applied during daytime, while the SAD is also applied during part of the night.
The experiments on the three systems were performed in parallel in an open space near the
Agricultural Engineering Department, KNUST, Kumasi, Ghana. For OSD, samples were
placed in three trays next to each other in the open sun with air passing through freely. Drying
for this system depends on the solar radiation, ambient temperature and humidity and air
circulation along and around the trays. These conditions were subject to natural and
uncontrolled variations. The SD system is made up of a solar collector system and a dryer
chamber (i.e. equivalent to path 1-2-3 in Figure 5.1). The collector system consisted of glass
cover, air gap, absorber plate and insulation material at the backside. The collector can achieve
air temperatures up to 60°C. Details of the collector design and the performance are given by
Amankwah et al. (2017).
The SAD was organized as presented in Figure 5.1. During day time the SAD was operated as
an SD, while during night drying the air passed through a bed of silica gel which was used as
adsorbent. The applied solar collector was designed to reach air temperatures up to 60°C under
Ghanaian radiation conditions. For adsorbent regeneration another solar collector is used. This
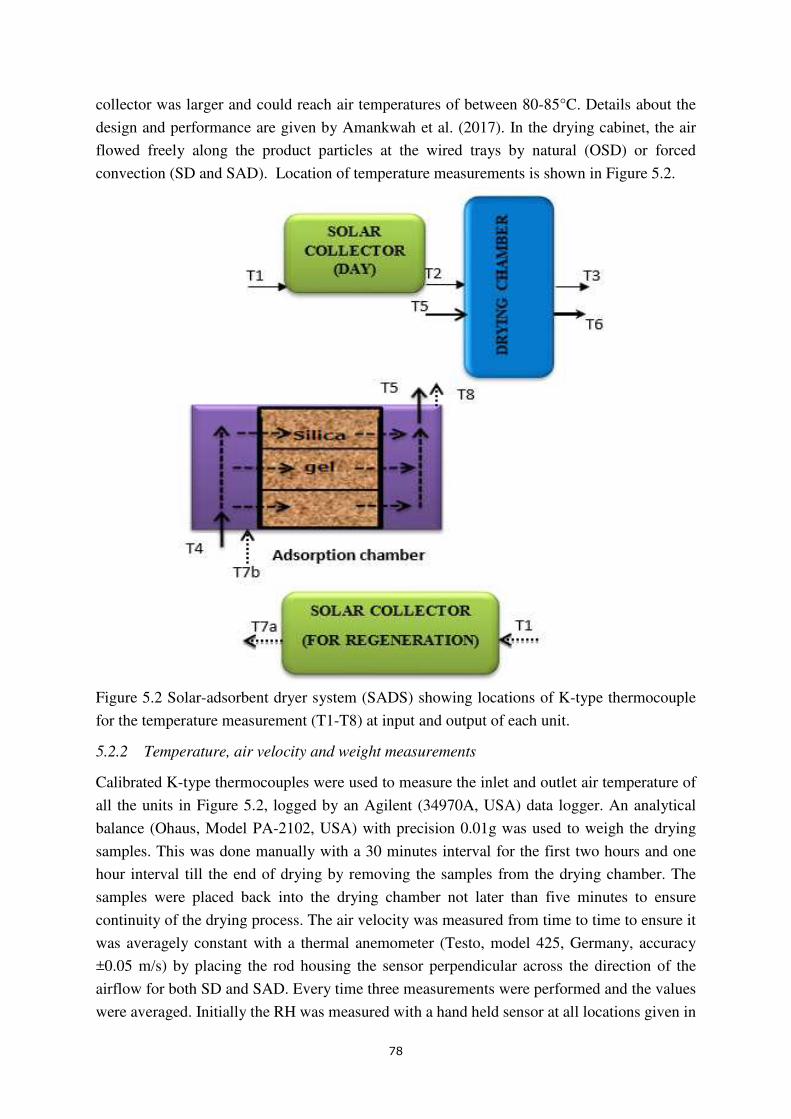
78
collector was larger and could reach air temperatures of between 80-85°C. Details about the
design and performance are given by Amankwah et al. (2017). In the drying cabinet, the air
flowed freely along the product particles at the wired trays by natural (OSD) or forced
convection (SD and SAD). Location of temperature measurements is shown in Figure 5.2.
Figure 5.2 Solar-adsorbent dryer system (SADS) showing locations of K-type thermocouple
for the temperature measurement (T1-T8) at input and output of each unit.
5.2.2 Temperature, air velocity and weight measurements
Calibrated K-type thermocouples were used to measure the inlet and outlet air temperature of
all the units in Figure 5.2, logged by an Agilent (34970A, USA) data logger. An analytical
balance (Ohaus, Model PA-2102, USA) with precision 0.01g was used to weigh the drying
samples. This was done manually with a 30 minutes interval for the first two hours and one
hour interval till the end of drying by removing the samples from the drying chamber. The
samples were placed back into the drying chamber not later than five minutes to ensure
continuity of the drying process. The air velocity was measured from time to time to ensure it
was averagely constant with a thermal anemometer (Testo, model 425, Germany, accuracy
±0.05 m/s) by placing the rod housing the sensor perpendicular across the direction of the
airflow for both SD and SAD. Every time three measurements were performed and the values
were averaged. Initially the RH was measured with a hand held sensor at all locations given in
79
Figure 2. However, in the low RH range the repeatability of the measurements with the hand
held sensor was not satisfactory for interpretation and therefore these measurements were no
longer used.
5.2.3 Chemical Analysis
The AOAC protocol (1990) was followed for the determination of crude fat and fiber. Nitrogen
was determined by the Kjeldahl digestion and fat by the Soxhlet method (AOAC, 1990). Crude
protein content was calculated using a factor of 6.25. Moisture and ash content were determined
gravimetrically in accordance with AACC methods 44-17 (AACC, 2000). Crude fiber content
was determined by the digestion method (AACC, 2000). Total percentage carbohydrate was
determined by the difference method. This method involves adding the total value of moisture,
ash, crude protein, crude fiber component of sample and subtracting it from 100. The values
determined were converted to dry basis (kg/kg dry matter).
5.2.4 Vitamin C content
The vitamin C was determined by visual titration of ascorbic acid with 2,6
dichlorophenolindophenol as indicator in a pH range of 1 -. 3.5 (Ojukwu and Nwobi, 2017,
Kumar et al., 2013). The values were reported in dry basis (mg/g dry matter).
5.2.5 Instrumental determination of color
The colour of fresh and dried yam slices was determined in terms of the tristimulus color values
L*, a* and b* using Minolta Chromameter, CR-300 (Minolta Co., Japan). Where, L* indicates
lightness or darkness of the material; L* = 0 is completely black and L* = 100 is completely
bright. The a*is the color coordinate in red-green axis; positive a* value for redness and
negative for greenness. b* is the color coordinate in yellow-blue axis; positive for yellowness
and negative blueness. The color of the yam slices was measured after calibrating the
instrument with a white tile (L* 93.3; a* 0.32 and b* 0.33). Yam slices were put into a
transparent petri dish and the measuring head of the meter was carefully placed on three
different locations on the petri dish. The measurements were determined in triplicates and mean
determined.
5.3 Experimental procedure
Two collector systems of the same dimension were separately used for the SAD and SD drying
processes. The first experiment, hereafter called ‘Performance of SAD drying’, concerns the
comparison of the required drying times and vitamin C retention of SAD relative to SD and
OSD. For this experiment OSD and SD were carried out during the day time between 9am –
5pm when enough solar radiation was available. The SAD was applied for five additional hours
in the evening until 10pm, with the adsorption system in use. Full night experiments were not
feasible in view of safety regulations. Before each experiment the SD and SAD were allowed
to run for 30 minutes to reach steady state before loading the trays that contain the yam cubicles
to be dried each day.
80
About 200 grams of yam (Dente) cut (3x3x1cm) with initial moisture content between 1.63-
2.13 kg water/kg dry matter was placed on each of the three successive trays stacked in the
same chamber of external and internal dimensions 70×45×50cm and 60×45×40cm
respectively. The air flow was in the upward direction from the bottom part of the drying
chamber beneath the trays made of wire mesh. At the end of each day, the yam samples were
cooled and placed in zip-lock polyethylene bags and stored at room temperature. Next day, the
samples were unpacked and placed at the trays to continue drying. This process was repeated
on the subsequent days until the product was sufficiently dried. At low moisture contents the
benefit of air dehumidification at night becomes minor. Hence, in one experiment, after two
day-night cycles, the drying was continued by the solar system only. The vitamin C content
was measured for the dried samples.
The next experiment, herein after called ‘Drying different yam cultivars’, concerned the drying
behavior of different cultivars and the effect of different drying methods on the composition,
color and again vitamin C. The procedure is similar as described for the first experiment. One
hundred grams (100g) each of yam cultivar cut (3x3x1cm) with initial moisture content
between 1.55-2.06 kg water/kg dry matter depending on the variety were all loaded on one tray
and same loaded on tray stacked below it as replicate. Yam samples from tree cultivars (Pona,
Lilii and Dente) of D. Rotundata were bought from a yam farm.
The last part of this work, herein after called ‘Regeneration of silica gel’, concerns the
regeneration of the silica gel. The regeneration commenced for saturated adsorbent after the 3
nights of drying of D. Rotundata (Dente). The adsorbent chamber (three holder compartments
in series), that had gained weight as a result of the adsorption drying, was connected to the
solar collector system designed for regeneration (Amankwah et al., 2017). The regeneration
was applied during the full day, during which heated air from the collector passed through the
silica gel. The silica gel was weighed before and after each day of regeneration to determine
the amount of moisture removed. This process was continued for 3 days until equilibrium was
reached. The day averaged regeneration rates of the silica gel were calculated from the amount
of water removed over the period of regeneration and expressed as kg water/hour (Mehla et al.,
2014). The main characteristics of the various categories of experiments are shown in Table
5.1.
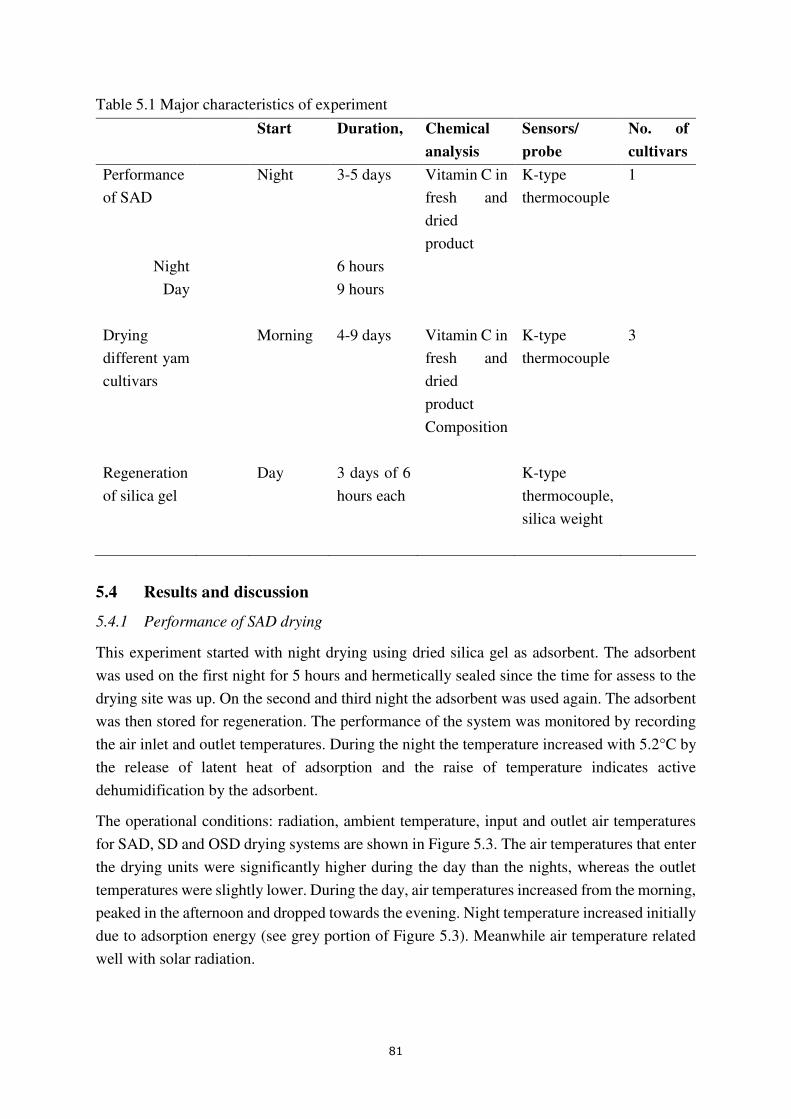
81
Table 5.1 Major characteristics of experiment
Start Duration, Chemical
analysis
Sensors/
probe
No. of
cultivars
Performance
of SAD
Night 3-5 days Vitamin C in
fresh and
dried
product
K-type
thermocouple
1
Night 6 hours
Day 9 hours
Drying
different yam
cultivars
Morning 4-9 days Vitamin C in
fresh and
dried
product
Composition
K-type
thermocouple
3
Regeneration
of silica gel
Day 3 days of 6
hours each
K-type
thermocouple,
silica weight
5.4 Results and discussion
5.4.1 Performance of SAD drying
This experiment started with night drying using dried silica gel as adsorbent. The adsorbent
was used on the first night for 5 hours and hermetically sealed since the time for assess to the
drying site was up. On the second and third night the adsorbent was used again. The adsorbent
was then stored for regeneration. The performance of the system was monitored by recording
the air inlet and outlet temperatures. During the night the temperature increased with 5.2°C by
the release of latent heat of adsorption and the raise of temperature indicates active
dehumidification by the adsorbent.
The operational conditions: radiation, ambient temperature, input and outlet air temperatures
for SAD, SD and OSD drying systems are shown in Figure 5.3. The air temperatures that enter
the drying units were significantly higher during the day than the nights, whereas the outlet
temperatures were slightly lower. During the day, air temperatures increased from the morning,
peaked in the afternoon and dropped towards the evening. Night temperature increased initially
due to adsorption energy (see grey portion of Figure 5.3). Meanwhile air temperature related
well with solar radiation.
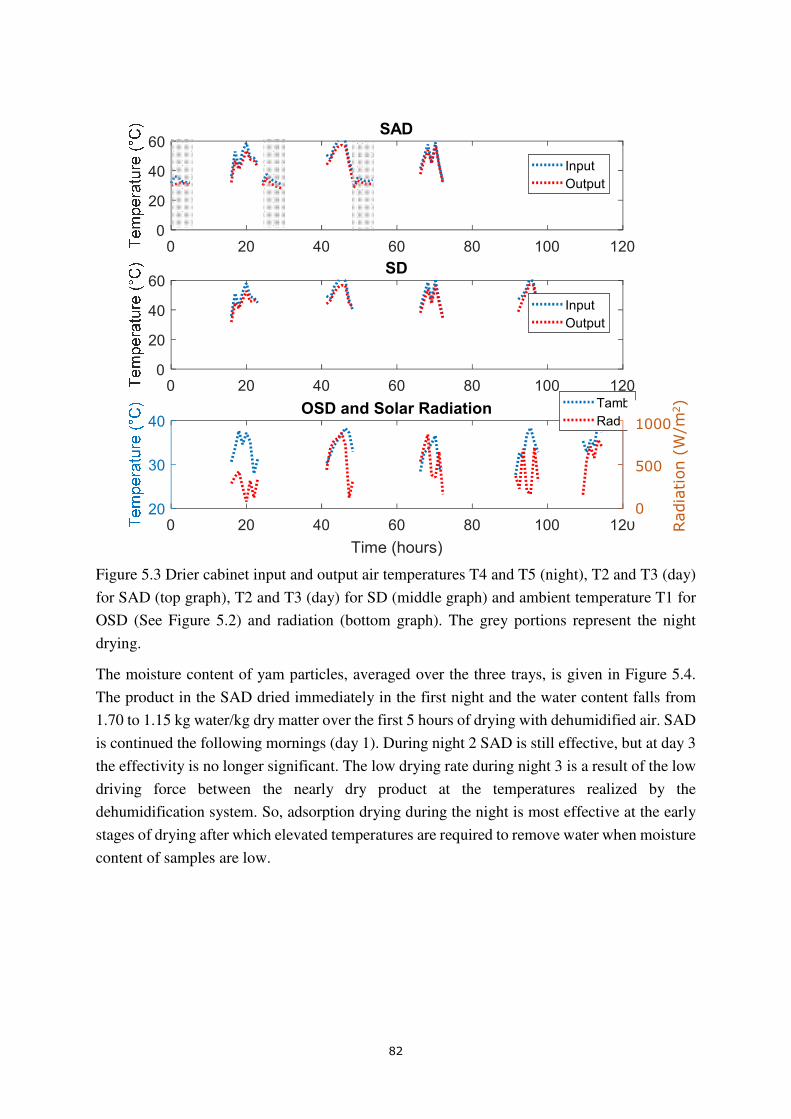
82
Figure 5.3 Drier cabinet input and output air temperatures T4 and T5 (night), T2 and T3 (day)
for SAD (top graph), T2 and T3 (day) for SD (middle graph) and ambient temperature T1 for
OSD (See Figure 5.2) and radiation (bottom graph). The grey portions represent the night
drying.
The moisture content of yam particles, averaged over the three trays, is given in Figure 5.4.
The product in the SAD dried immediately in the first night and the water content falls from
1.70 to 1.15 kg water/kg dry matter over the first 5 hours of drying with dehumidified air. SAD
is continued the following mornings (day 1). During night 2 SAD is still effective, but at day 3
the effectivity is no longer significant. The low drying rate during night 3 is a result of the low
driving force between the nearly dry product at the temperatures realized by the
dehumidification system. So, adsorption drying during the night is most effective at the early
stages of drying after which elevated temperatures are required to remove water when moisture
content of samples are low.
0 20 40 60 80 100 1200
20
40
60SAD
Input
Output
0 20 40 60 80 100 1200
20
40
60SD
Input
Output
0 20 40 60 80 100 120
Time (hours)
20
30
40OSD and Solar Radiation
Tamb
Rad
0
500
10001000
500
0
Radia
tion (
W/m
2)
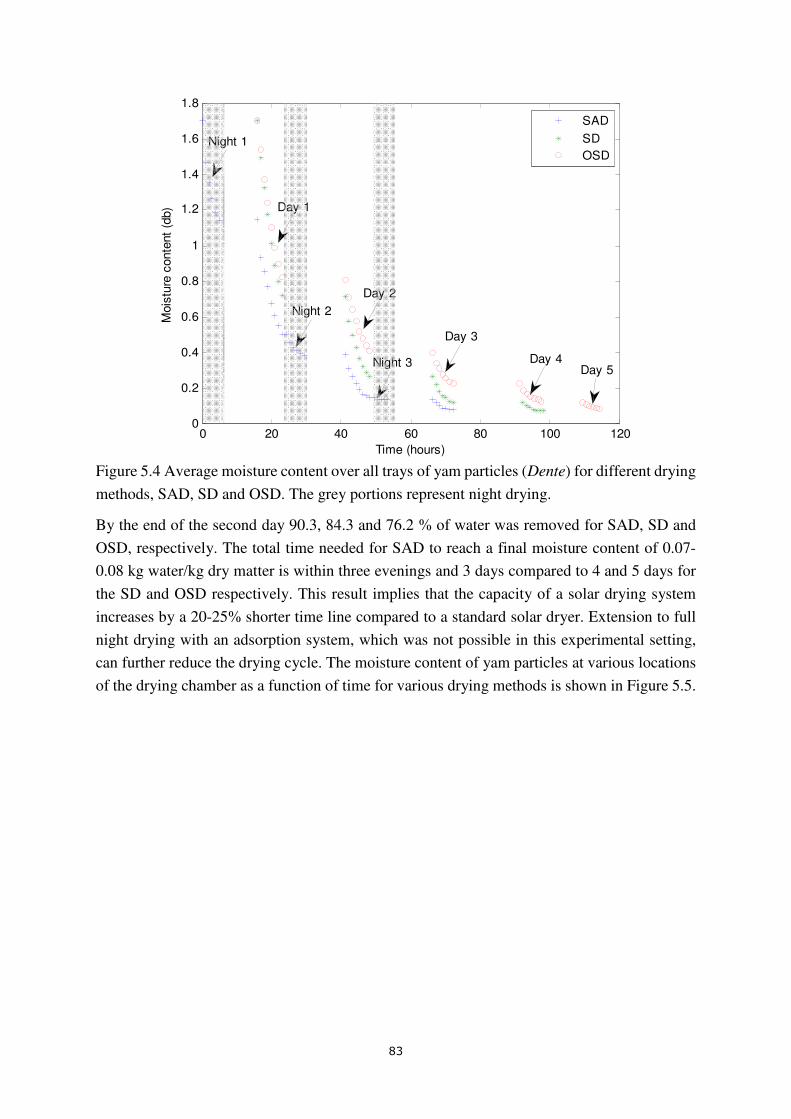
83
Figure 5.4 Average moisture content over all trays of yam particles (Dente) for different drying
methods, SAD, SD and OSD. The grey portions represent night drying.
By the end of the second day 90.3, 84.3 and 76.2 % of water was removed for SAD, SD and
OSD, respectively. The total time needed for SAD to reach a final moisture content of 0.07-
0.08 kg water/kg dry matter is within three evenings and 3 days compared to 4 and 5 days for
the SD and OSD respectively. This result implies that the capacity of a solar drying system
increases by a 20-25% shorter time line compared to a standard solar dryer. Extension to full
night drying with an adsorption system, which was not possible in this experimental setting,
can further reduce the drying cycle. The moisture content of yam particles at various locations
of the drying chamber as a function of time for various drying methods is shown in Figure 5.5.
0 20 40 60 80 100 1200
0.2
0.4
0.6
0.8
1
1.2
1.4
1.6
1.8
Time (hours)
Mois
ture
conte
nt
(db)
SAD
SD
OSD
Day 4
Day 1
Day 2
Day 3
Day 5
Night 1
Night 2
Night 3
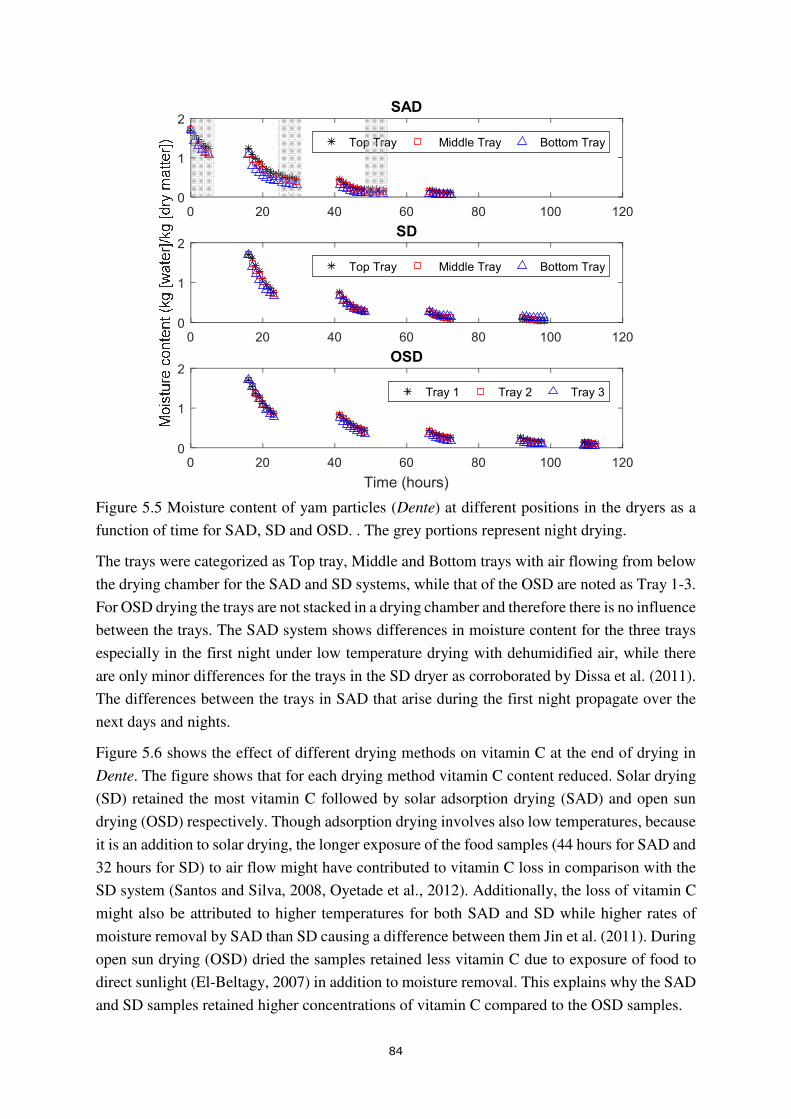
84
Figure 5.5 Moisture content of yam particles (Dente) at different positions in the dryers as a
function of time for SAD, SD and OSD. . The grey portions represent night drying.
The trays were categorized as Top tray, Middle and Bottom trays with air flowing from below
the drying chamber for the SAD and SD systems, while that of the OSD are noted as Tray 1-3.
For OSD drying the trays are not stacked in a drying chamber and therefore there is no influence
between the trays. The SAD system shows differences in moisture content for the three trays
especially in the first night under low temperature drying with dehumidified air, while there
are only minor differences for the trays in the SD dryer as corroborated by Dissa et al. (2011).
The differences between the trays in SAD that arise during the first night propagate over the
next days and nights.
Figure 5.6 shows the effect of different drying methods on vitamin C at the end of drying in
Dente. The figure shows that for each drying method vitamin C content reduced. Solar drying
(SD) retained the most vitamin C followed by solar adsorption drying (SAD) and open sun
drying (OSD) respectively. Though adsorption drying involves also low temperatures, because
it is an addition to solar drying, the longer exposure of the food samples (44 hours for SAD and
32 hours for SD) to air flow might have contributed to vitamin C loss in comparison with the
SD system (Santos and Silva, 2008, Oyetade et al., 2012). Additionally, the loss of vitamin C
might also be attributed to higher temperatures for both SAD and SD while higher rates of
moisture removal by SAD than SD causing a difference between them Jin et al. (2011). During
open sun drying (OSD) dried the samples retained less vitamin C due to exposure of food to
direct sunlight (El-Beltagy, 2007) in addition to moisture removal. This explains why the SAD
and SD samples retained higher concentrations of vitamin C compared to the OSD samples.
0 20 40 60 80 100 1200
1
2SAD
Top Tray Middle Tray Bottom Tray
0 20 40 60 80 100 1200
1
2SD
Top Tray Middle Tray Bottom Tray
0 20 40 60 80 100 120
Time (hours)
0
1
2OSD
Tray 1 Tray 2 Tray 3
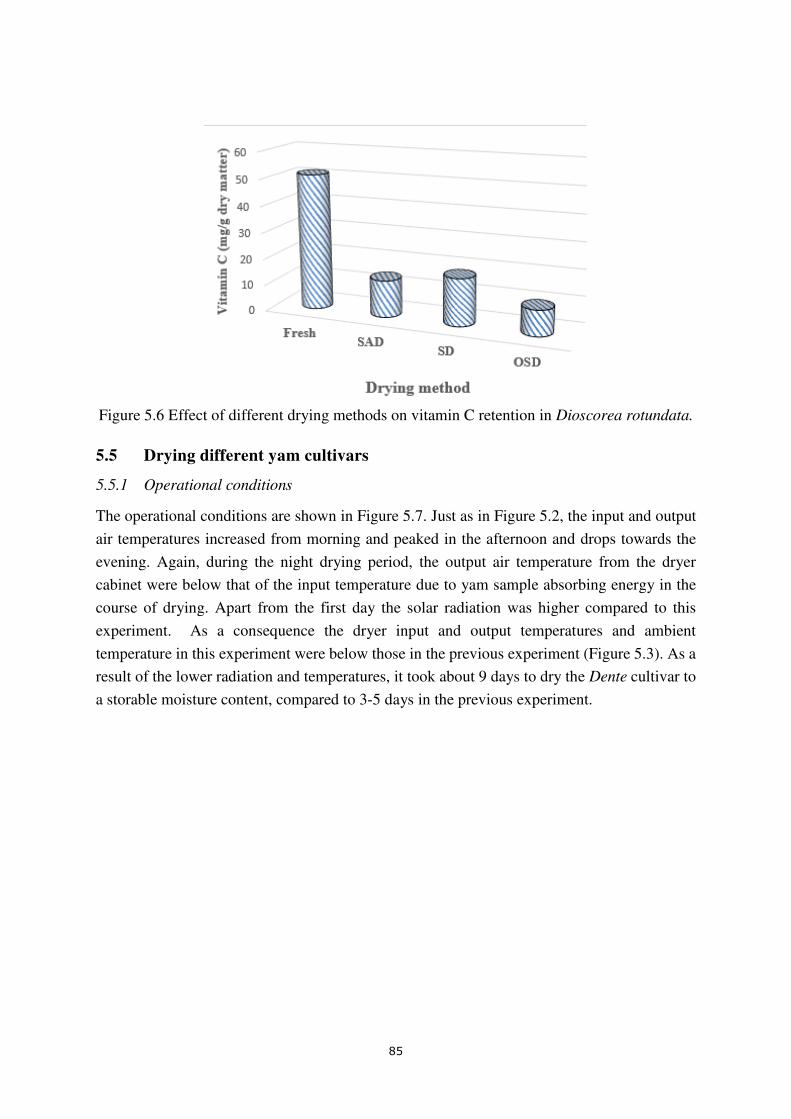
85
Figure 5.6 Effect of different drying methods on vitamin C retention in Dioscorea rotundata.
5.5 Drying different yam cultivars
5.5.1 Operational conditions
The operational conditions are shown in Figure 5.7. Just as in Figure 5.2, the input and output
air temperatures increased from morning and peaked in the afternoon and drops towards the
evening. Again, during the night drying period, the output air temperature from the dryer
cabinet were below that of the input temperature due to yam sample absorbing energy in the
course of drying. Apart from the first day the solar radiation was higher compared to this
experiment. As a consequence the dryer input and output temperatures and ambient
temperature in this experiment were below those in the previous experiment (Figure 5.3). As a
result of the lower radiation and temperatures, it took about 9 days to dry the Dente cultivar to
a storable moisture content, compared to 3-5 days in the previous experiment.
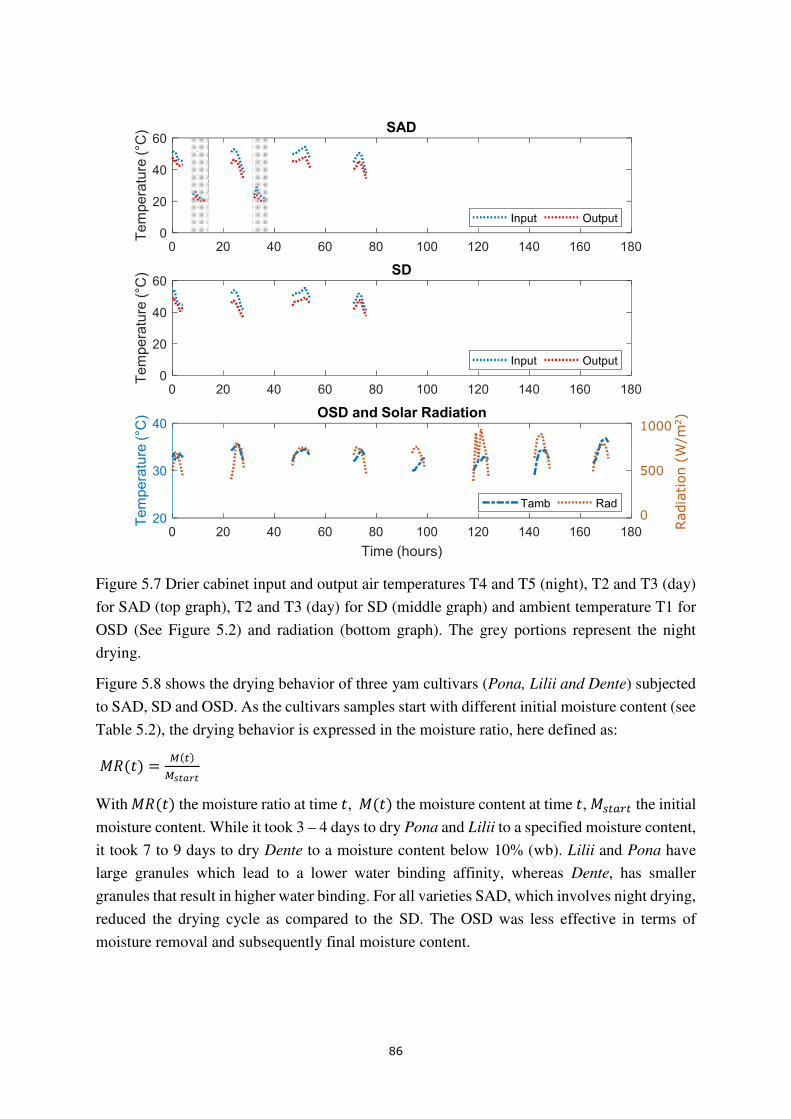
86
Figure 5.7 Drier cabinet input and output air temperatures T4 and T5 (night), T2 and T3 (day)
for SAD (top graph), T2 and T3 (day) for SD (middle graph) and ambient temperature T1 for
OSD (See Figure 5.2) and radiation (bottom graph). The grey portions represent the night
drying.
Figure 5.8 shows the drying behavior of three yam cultivars (Pona, Lilii and Dente) subjected
to SAD, SD and OSD. As the cultivars samples start with different initial moisture content (see
Table 5.2), the drying behavior is expressed in the moisture ratio, here defined as:
G4�[� = Ï���ÏÐѧÒÑ With G4�[� the moisture ratio at time [, G�[� the moisture content at time [, Gp� r� the initial
moisture content. While it took 3 – 4 days to dry Pona and Lilii to a specified moisture content,
it took 7 to 9 days to dry Dente to a moisture content below 10% (wb). Lilii and Pona have
large granules which lead to a lower water binding affinity, whereas Dente, has smaller
granules that result in higher water binding. For all varieties SAD, which involves night drying,
reduced the drying cycle as compared to the SD. The OSD was less effective in terms of
moisture removal and subsequently final moisture content.
0 20 40 60 80 100 120 140 160 1800
20
40
60T
em
pera
ture
(°C
) SAD
Input Output
0 20 40 60 80 100 120 140 160 1800
20
40
60
Tem
pera
ture
(°C
) SD
Input Output
0 20 40 60 80 100 120 140 160 180
Time (hours)
20
30
40
Tem
pera
ture
(°C
) OSD and Solar Radiation
0
500
1000
Radia
tion (
W/m
2)
Tamb Rad
1000
500
0
Radia
tion (
W/m
2)
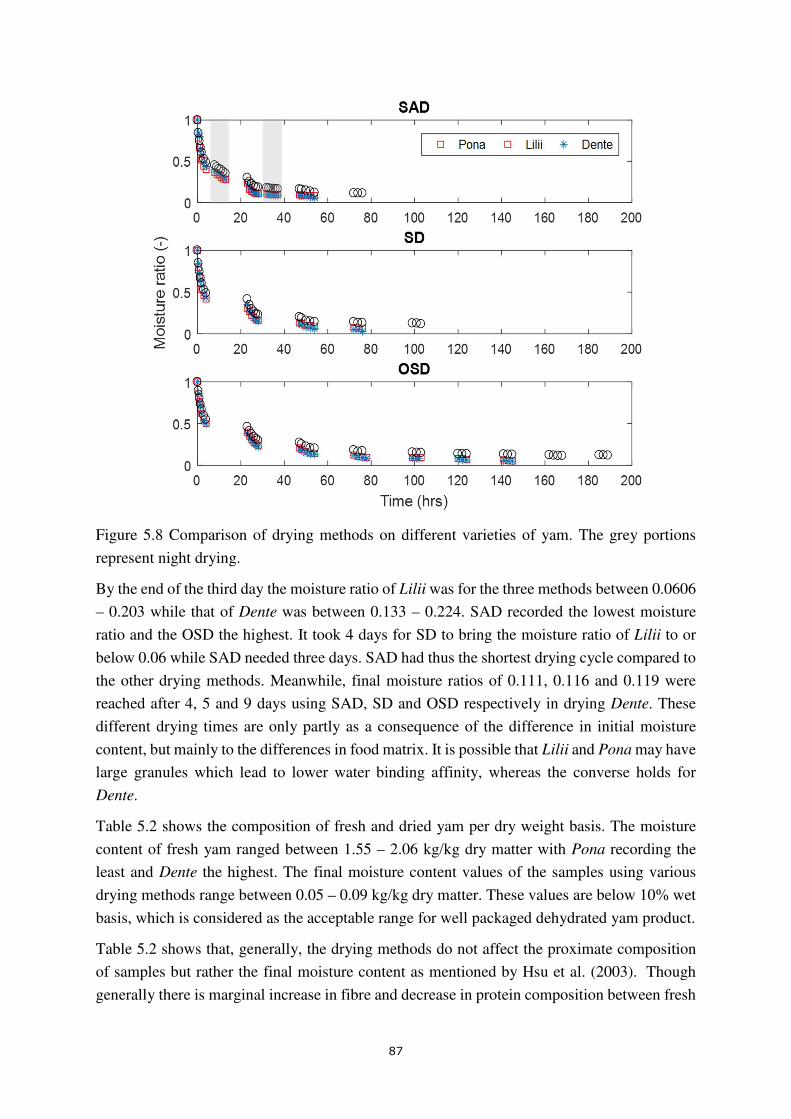
87
Figure 5.8 Comparison of drying methods on different varieties of yam. The grey portions
represent night drying.
By the end of the third day the moisture ratio of Lilii was for the three methods between 0.0606
– 0.203 while that of Dente was between 0.133 – 0.224. SAD recorded the lowest moisture
ratio and the OSD the highest. It took 4 days for SD to bring the moisture ratio of Lilii to or
below 0.06 while SAD needed three days. SAD had thus the shortest drying cycle compared to
the other drying methods. Meanwhile, final moisture ratios of 0.111, 0.116 and 0.119 were
reached after 4, 5 and 9 days using SAD, SD and OSD respectively in drying Dente. These
different drying times are only partly as a consequence of the difference in initial moisture
content, but mainly to the differences in food matrix. It is possible that Lilii and Pona may have
large granules which lead to lower water binding affinity, whereas the converse holds for
Dente.
Table 5.2 shows the composition of fresh and dried yam per dry weight basis. The moisture
content of fresh yam ranged between 1.55 – 2.06 kg/kg dry matter with Pona recording the
least and Dente the highest. The final moisture content values of the samples using various
drying methods range between 0.05 – 0.09 kg/kg dry matter. These values are below 10% wet
basis, which is considered as the acceptable range for well packaged dehydrated yam product.
Table 5.2 shows that, generally, the drying methods do not affect the proximate composition
of samples but rather the final moisture content as mentioned by Hsu et al. (2003). Though
generally there is marginal increase in fibre and decrease in protein composition between fresh
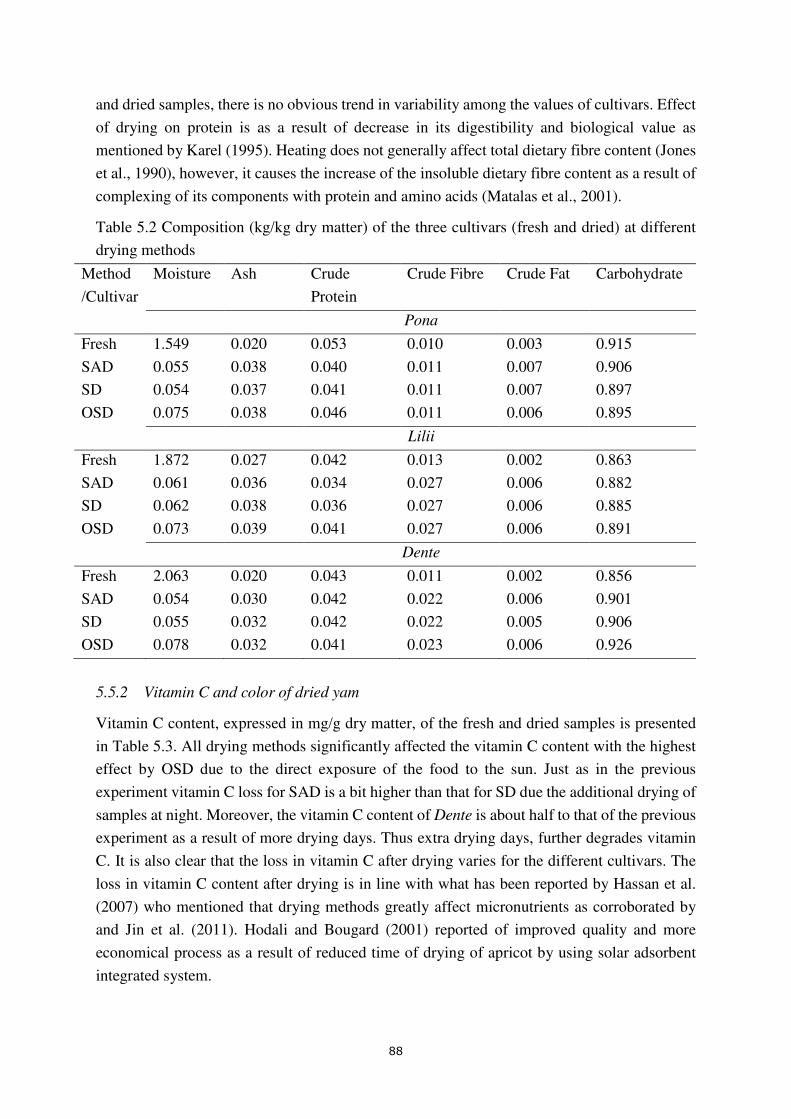
88
and dried samples, there is no obvious trend in variability among the values of cultivars. Effect
of drying on protein is as a result of decrease in its digestibility and biological value as
mentioned by Karel (1995). Heating does not generally affect total dietary fibre content (Jones
et al., 1990), however, it causes the increase of the insoluble dietary fibre content as a result of
complexing of its components with protein and amino acids (Matalas et al., 2001).
Table 5.2 Composition (kg/kg dry matter) of the three cultivars (fresh and dried) at different
drying methods
Method
/Cultivar
Moisture Ash Crude
Protein
Crude Fibre Crude Fat Carbohydrate
Pona
Fresh 1.549 0.020 0.053 0.010 0.003 0.915
SAD 0.055 0.038 0.040 0.011 0.007 0.906
SD 0.054 0.037 0.041 0.011 0.007 0.897
OSD 0.075 0.038 0.046 0.011 0.006 0.895
Lilii
Fresh 1.872 0.027 0.042 0.013 0.002 0.863
SAD 0.061 0.036 0.034 0.027 0.006 0.882
SD 0.062 0.038 0.036 0.027 0.006 0.885
OSD 0.073 0.039 0.041 0.027 0.006 0.891
Dente
Fresh 2.063 0.020 0.043 0.011 0.002 0.856
SAD 0.054 0.030 0.042 0.022 0.006 0.901
SD 0.055 0.032 0.042 0.022 0.005 0.906
OSD 0.078 0.032 0.041 0.023 0.006 0.926
5.5.2 Vitamin C and color of dried yam
Vitamin C content, expressed in mg/g dry matter, of the fresh and dried samples is presented
in Table 5.3. All drying methods significantly affected the vitamin C content with the highest
effect by OSD due to the direct exposure of the food to the sun. Just as in the previous
experiment vitamin C loss for SAD is a bit higher than that for SD due the additional drying of
samples at night. Moreover, the vitamin C content of Dente is about half to that of the previous
experiment as a result of more drying days. Thus extra drying days, further degrades vitamin
C. It is also clear that the loss in vitamin C after drying varies for the different cultivars. The
loss in vitamin C content after drying is in line with what has been reported by Hassan et al.
(2007) who mentioned that drying methods greatly affect micronutrients as corroborated by
and Jin et al. (2011). Hodali and Bougard (2001) reported of improved quality and more
economical process as a result of reduced time of drying of apricot by using solar adsorbent
integrated system.
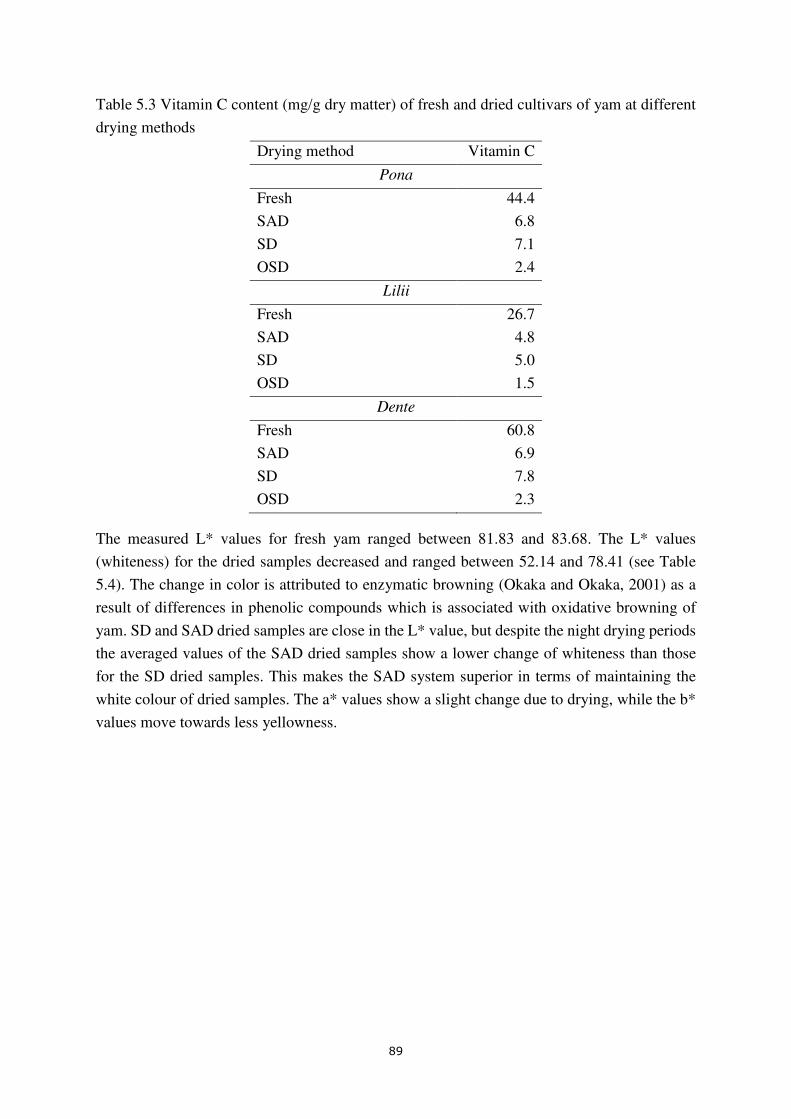
89
Table 5.3 Vitamin C content (mg/g dry matter) of fresh and dried cultivars of yam at different
drying methods
Drying method Vitamin C
Pona
Fresh 44.4
SAD 6.8
SD 7.1
OSD 2.4
Lilii
Fresh 26.7
SAD 4.8
SD 5.0
OSD 1.5
Dente
Fresh 60.8
SAD 6.9
SD 7.8
OSD 2.3
The measured L* values for fresh yam ranged between 81.83 and 83.68. The L* values
(whiteness) for the dried samples decreased and ranged between 52.14 and 78.41 (see Table
5.4). The change in color is attributed to enzymatic browning (Okaka and Okaka, 2001) as a
result of differences in phenolic compounds which is associated with oxidative browning of
yam. SD and SAD dried samples are close in the L* value, but despite the night drying periods
the averaged values of the SAD dried samples show a lower change of whiteness than those
for the SD dried samples. This makes the SAD system superior in terms of maintaining the
white colour of dried samples. The a* values show a slight change due to drying, while the b*
values move towards less yellowness.
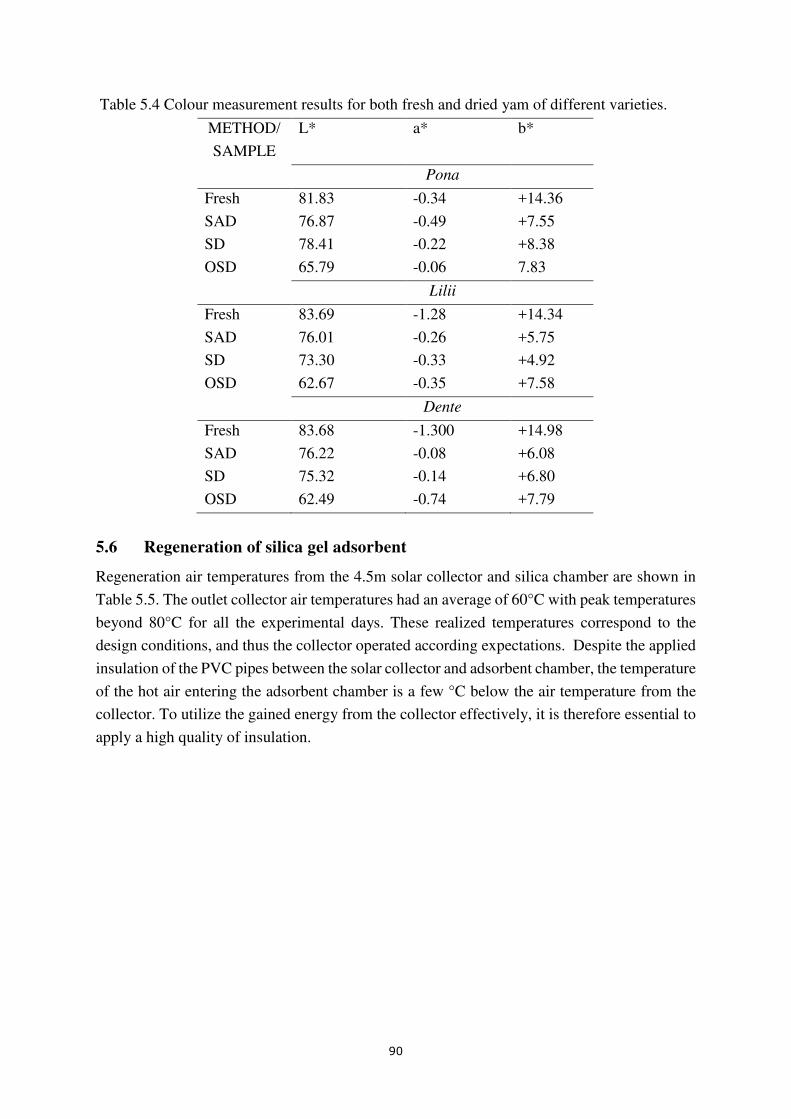
90
Table 5.4 Colour measurement results for both fresh and dried yam of different varieties.
5.6 Regeneration of silica gel adsorbent
Regeneration air temperatures from the 4.5m solar collector and silica chamber are shown in
Table 5.5. The outlet collector air temperatures had an average of 60°C with peak temperatures
beyond 80°C for all the experimental days. These realized temperatures correspond to the
design conditions, and thus the collector operated according expectations. Despite the applied
insulation of the PVC pipes between the solar collector and adsorbent chamber, the temperature
of the hot air entering the adsorbent chamber is a few °C below the air temperature from the
collector. To utilize the gained energy from the collector effectively, it is therefore essential to
apply a high quality of insulation.
METHOD/
SAMPLE
L* a* b*
Pona
Fresh 81.83 -0.34 +14.36
SAD 76.87 -0.49 +7.55
SD 78.41 -0.22 +8.38
OSD 65.79 -0.06 7.83
Lilii
Fresh 83.69 -1.28 +14.34
SAD 76.01 -0.26 +5.75
SD 73.30 -0.33 +4.92
OSD 62.67 -0.35 +7.58
Dente
Fresh 83.68 -1.300 +14.98
SAD 76.22 -0.08 +6.08
SD 75.32 -0.14 +6.80
OSD 62.49 -0.74 +7.79
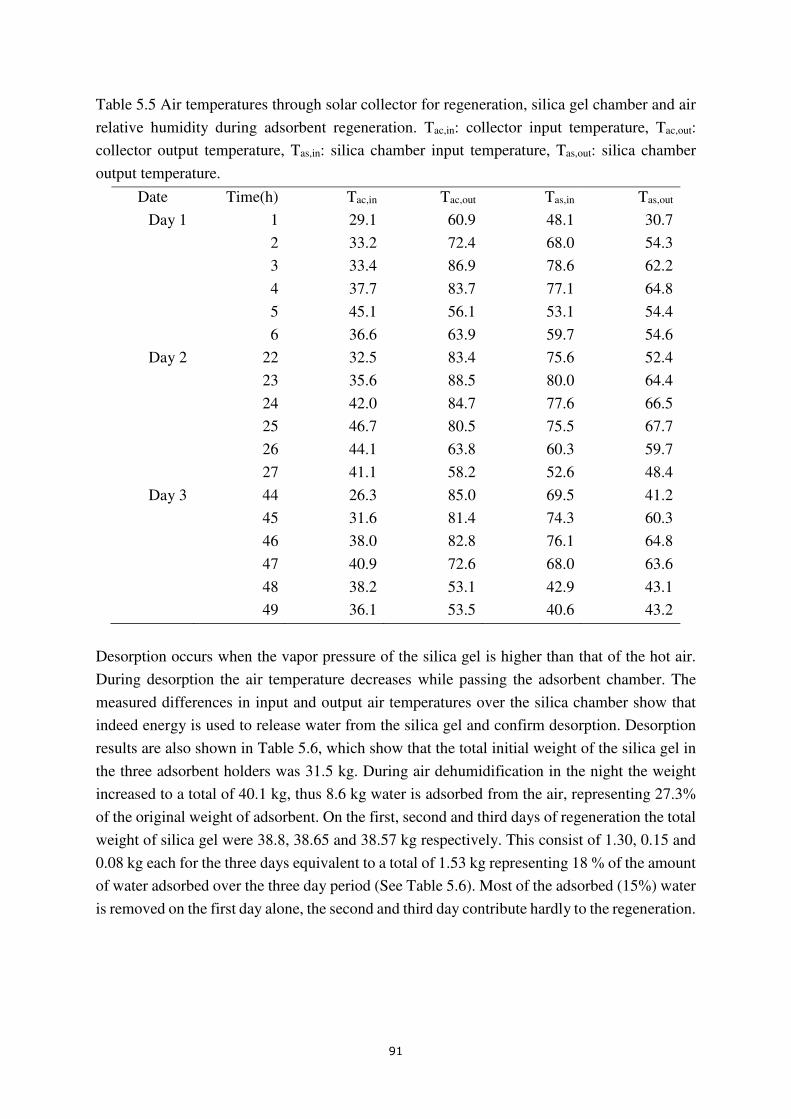
91
Table 5.5 Air temperatures through solar collector for regeneration, silica gel chamber and air
relative humidity during adsorbent regeneration. Tac,in: collector input temperature, Tac,out:
collector output temperature, Tas,in: silica chamber input temperature, Tas,out: silica chamber
output temperature.
Date Time(h) Tac,in Tac,out Tas,in Tas,out
Day 1 1 29.1 60.9 48.1 30.7
2 33.2 72.4 68.0 54.3
3 33.4 86.9 78.6 62.2
4 37.7 83.7 77.1 64.8
5 45.1 56.1 53.1 54.4
6 36.6 63.9 59.7 54.6
Day 2 22 32.5 83.4 75.6 52.4
23 35.6 88.5 80.0 64.4
24 42.0 84.7 77.6 66.5
25 46.7 80.5 75.5 67.7
26 44.1 63.8 60.3 59.7
27 41.1 58.2 52.6 48.4
Day 3 44 26.3 85.0 69.5 41.2
45 31.6 81.4 74.3 60.3
46 38.0 82.8 76.1 64.8
47 40.9 72.6 68.0 63.6
48 38.2 53.1 42.9 43.1
49 36.1 53.5 40.6 43.2
Desorption occurs when the vapor pressure of the silica gel is higher than that of the hot air.
During desorption the air temperature decreases while passing the adsorbent chamber. The
measured differences in input and output air temperatures over the silica chamber show that
indeed energy is used to release water from the silica gel and confirm desorption. Desorption
results are also shown in Table 5.6, which show that the total initial weight of the silica gel in
the three adsorbent holders was 31.5 kg. During air dehumidification in the night the weight
increased to a total of 40.1 kg, thus 8.6 kg water is adsorbed from the air, representing 27.3%
of the original weight of adsorbent. On the first, second and third days of regeneration the total
weight of silica gel were 38.8, 38.65 and 38.57 kg respectively. This consist of 1.30, 0.15 and
0.08 kg each for the three days equivalent to a total of 1.53 kg representing 18 % of the amount
of water adsorbed over the three day period (See Table 5.6). Most of the adsorbed (15%) water
is removed on the first day alone, the second and third day contribute hardly to the regeneration.
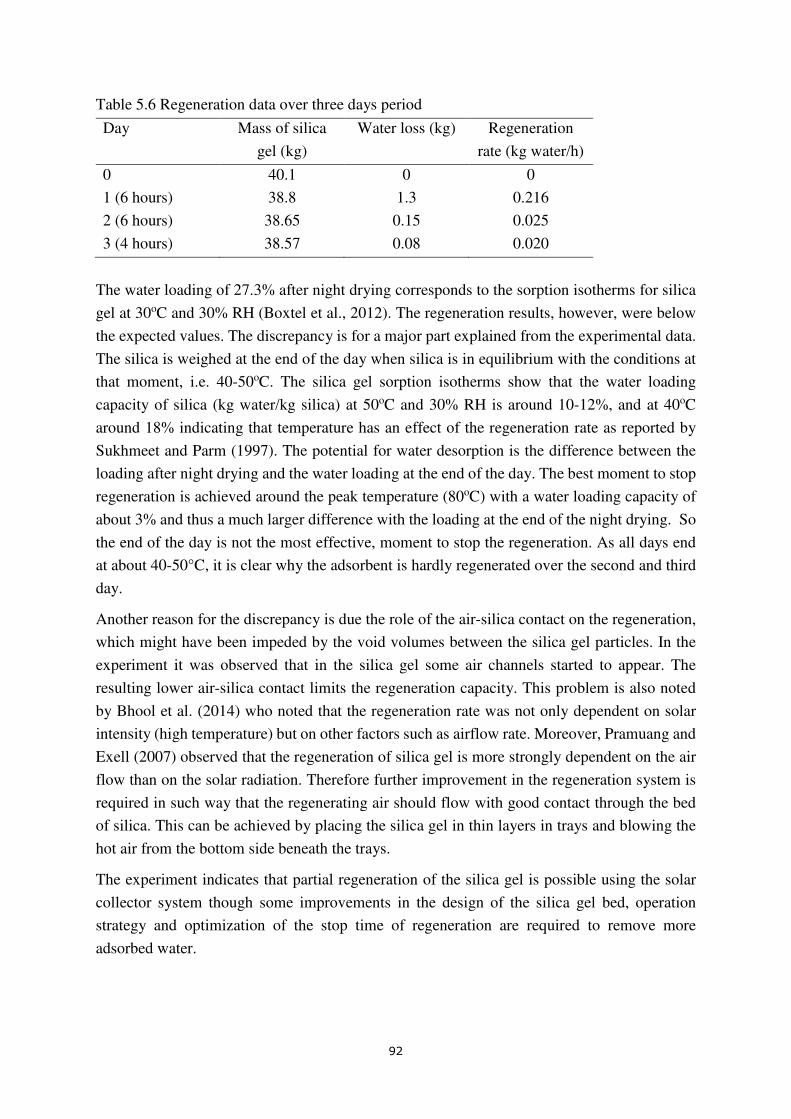
92
Table 5.6 Regeneration data over three days period
Day Mass of silica
gel (kg)
Water loss (kg) Regeneration
rate (kg water/h)
0 40.1 0 0
1 (6 hours) 38.8 1.3 0.216
2 (6 hours) 38.65 0.15 0.025
3 (4 hours) 38.57 0.08 0.020
The water loading of 27.3% after night drying corresponds to the sorption isotherms for silica
gel at 30oC and 30% RH (Boxtel et al., 2012). The regeneration results, however, were below
the expected values. The discrepancy is for a major part explained from the experimental data.
The silica is weighed at the end of the day when silica is in equilibrium with the conditions at
that moment, i.e. 40-50oC. The silica gel sorption isotherms show that the water loading
capacity of silica (kg water/kg silica) at 50oC and 30% RH is around 10-12%, and at 40oC
around 18% indicating that temperature has an effect of the regeneration rate as reported by
Sukhmeet and Parm (1997). The potential for water desorption is the difference between the
loading after night drying and the water loading at the end of the day. The best moment to stop
regeneration is achieved around the peak temperature (80oC) with a water loading capacity of
about 3% and thus a much larger difference with the loading at the end of the night drying. So
the end of the day is not the most effective, moment to stop the regeneration. As all days end
at about 40-50°C, it is clear why the adsorbent is hardly regenerated over the second and third
day.
Another reason for the discrepancy is due the role of the air-silica contact on the regeneration,
which might have been impeded by the void volumes between the silica gel particles. In the
experiment it was observed that in the silica gel some air channels started to appear. The
resulting lower air-silica contact limits the regeneration capacity. This problem is also noted
by Bhool et al. (2014) who noted that the regeneration rate was not only dependent on solar
intensity (high temperature) but on other factors such as airflow rate. Moreover, Pramuang and
Exell (2007) observed that the regeneration of silica gel is more strongly dependent on the air
flow than on the solar radiation. Therefore further improvement in the regeneration system is
required in such way that the regenerating air should flow with good contact through the bed
of silica. This can be achieved by placing the silica gel in thin layers in trays and blowing the
hot air from the bottom side beneath the trays.
The experiment indicates that partial regeneration of the silica gel is possible using the solar
collector system though some improvements in the design of the silica gel bed, operation
strategy and optimization of the stop time of regeneration are required to remove more
adsorbed water.
93
5.7 Conclusion
This work sought to quantify the yam drying performance in a solar adsorption dryer (SAD)
compared to a solar dryer (SD) and open sun drying (OSD) and to validate the effect on vitamin
C and composition retention in these three systems. The dryer performance, vitamin C retention
and product color of different cultivars as well as the ability of the system to regenerate the
adsorbent were conducted.
The SAD drying works the best in the initial period of drying. In this period the night
contributes to drying and reduces the total drying cycle in terms of days due to the application
of night drying. At the end of drying, the benefit of night drying is minor due to the low driving
force for water transfer. At this stage, dehumidification of the air hardly helps the drying at
night. In this period an elevated temperature is more effective. The drying time in the SAD is
affected by seasonal variations and weather conditions.
For three cultivars, Lilii dried faster than Pona and Dente with Dente drying slowest, which
results from the differences in granule shape and sizes of these cultivars. SAD helped in
maintaining the original whitish color of yam better than the other drying methods. Long
exposure of yam to drying conditions had more influence on the deterioration of vitamin C, but
did not affect the composition. The deterioration of vitamin C is the strongest for OSD, and is
close for SD and SAD drying with a preference for SD.
The applied solar collector provides a sufficient high temperature for regeneration. However,
the temperature at which regeneration is stopped has to be optimized towards the highest
temperature at a day to remove more water from the adsorbent. Moreover, a good and equal
flow pattern of air through the adsorbent bed is required for the air-adsorbent contact.

94
95
Chapter 6
Perspectives, reflections and conclusion

96
97
6.1 Introduction
Yam is an important food crop in Ghana which has many uses. Due to the high moisture content
when harvested it is susceptible to spoilage and a limited shelf life. Drying is therefore required
to increase the shelf life but affects some quality parameters such as vitamin C and color. To
preserve the nutritional components, low drying temperatures and short exposure are desirable.
The solar adsorption dryer system (SAD) can be used to dry yam cubicles day and night. After
drying the yam is milled into powders and incorporated into other food products such as soups,
weaning foods and bread. For drying and storage purposes the sorption isotherms of yam, in
addition to the drying characteristics need to be studied with a focus on moisture dependent
shrinkage and moisture diffusivity.
Drying requires high amounts of energy for its operation. Electricity and fossil fuel heating are
cost intensive and result in unwanted CO2 exhaust. Fuel wood could be an option but leads to
desertification and erosion, and this option must be rejected. The sun’s energy is free and its
application in terms of solar energy technology for heating agricultural products is inexpensive.
Open sun drying is mostly practiced in Ghana, though solar drying in a confined chamber has
no contamination from the environment and can be performed under controlled conditions and
is therefore preferred for good food quality. Solar drying (SD) at night is not possible and
typically leads to rewetting unless hermetically packaged. Solar adsorption drying (SAD) is a
new system that can continue with night drying with humidifier air, by lowering the moisture
content and boosting the temperature of the drying air by passing it over an absorber prior to
entering the dryer, thus preventing rewetting and reducing the drying cycle. However, night
drying requires the adsorbent to be regenerated.
A 3-dimensional drawing of the solar adsorption drying system is shown in Figure 6.1. In this
thesis the principle and performance of the solar adsorption system was experimentally
explored and analyzed in order to assess the feasibility of SADS for drying of yam.
Investigations were centered on: the sorption properties of yam; drying kinetics of yam; design
of the solar collector system; proof of principle of solar adsorption drying and comparing with
solar drying and open sun drying; and the effects of solar adsorption drying on product quality.
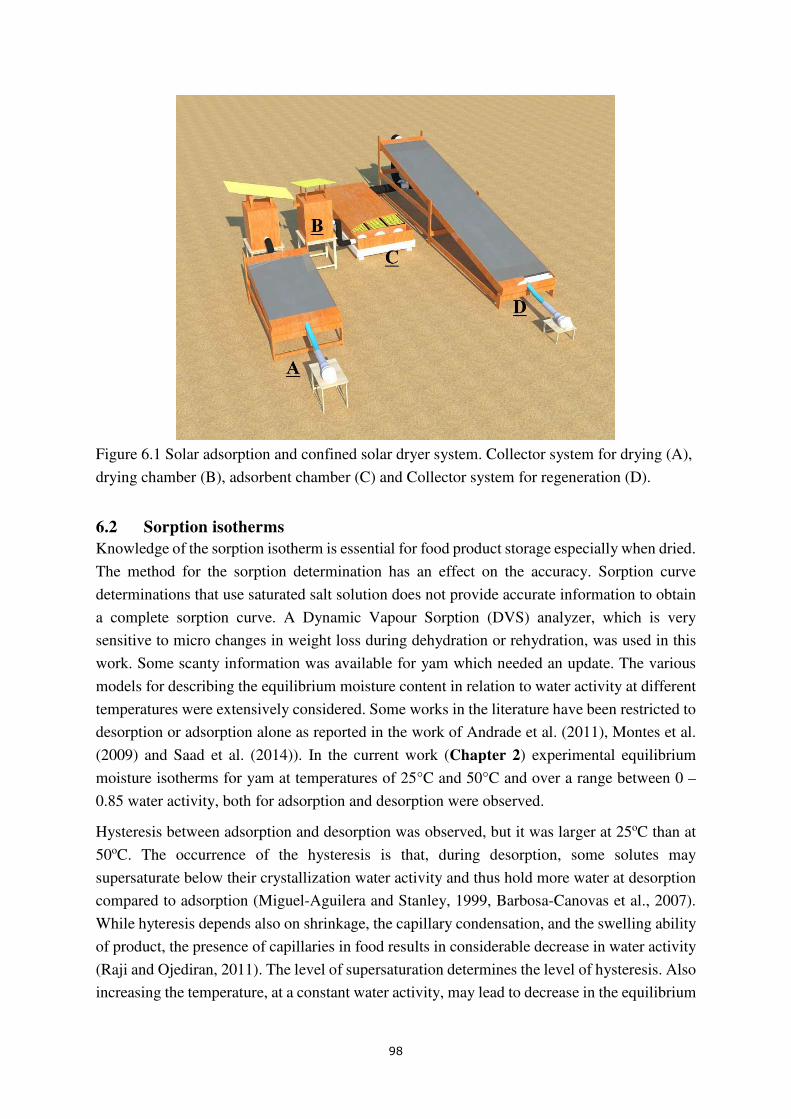
98
Figure 6.1 Solar adsorption and confined solar dryer system. Collector system for drying (A),
drying chamber (B), adsorbent chamber (C) and Collector system for regeneration (D).
6.2 Sorption isotherms
Knowledge of the sorption isotherm is essential for food product storage especially when dried.
The method for the sorption determination has an effect on the accuracy. Sorption curve
determinations that use saturated salt solution does not provide accurate information to obtain
a complete sorption curve. A Dynamic Vapour Sorption (DVS) analyzer, which is very
sensitive to micro changes in weight loss during dehydration or rehydration, was used in this
work. Some scanty information was available for yam which needed an update. The various
models for describing the equilibrium moisture content in relation to water activity at different
temperatures were extensively considered. Some works in the literature have been restricted to
desorption or adsorption alone as reported in the work of Andrade et al. (2011), Montes et al.
(2009) and Saad et al. (2014)). In the current work (Chapter 2) experimental equilibrium
moisture isotherms for yam at temperatures of 25°C and 50°C and over a range between 0 –
0.85 water activity, both for adsorption and desorption were observed.
Hysteresis between adsorption and desorption was observed, but it was larger at 25oC than at
50oC. The occurrence of the hysteresis is that, during desorption, some solutes may
supersaturate below their crystallization water activity and thus hold more water at desorption
compared to adsorption (Miguel-Aguilera and Stanley, 1999, Barbosa-Canovas et al., 2007).
While hyteresis depends also on shrinkage, the capillary condensation, and the swelling ability
of product, the presence of capillaries in food results in considerable decrease in water activity
(Raji and Ojediran, 2011). The level of supersaturation determines the level of hysteresis. Also
increasing the temperature, at a constant water activity, may lead to decrease in the equilibrium
99
moisture content (EMC) which is in contrast to the findings of this work where temperature
did not affect EMC during desorption. The no temperature effect on EMC at constant water
activity may be due to minimal change in solubility of solute, low dissociation of water and
minimal enthalpy of water binding at the temperatures of 25oC and 50 oC for yam. Recent
findings by Montes et al. (2009) on yam (Dioscorea rotundata) between temperatures of 45°C
and 55°C supports this assertion.
A decrease in equilibrium moisture content for increased temperature at the same water activity
(water content that does or does not support the growth of microorganisms) has been reported
(Saad et 2014, Kiranoudis et al., 1993). Ronald et al. (2005) reported an insignificant difference
in EMC for temperatures of 30 and 40 oC between water activity range of 0 - 0.4 during
desorption of Ziziphus spinachristi leaves. In the present work a change in water activity of
0.15 – 0.65 results in 0.093 (kg water/kg dry matter) increase in moisture content. Therefore
yam powders must be properly sealed during storage to avoid rewetting.
The parameters and their uncertainty range for each of the models (GuggenheimAnderson-de
Boer (GAB), Henderson, Halsey, Oswin, Smith, Brunauer-Emmett-Teller (BET) and Peleg
were estimated, where objective criteria were used to select the model that best describes the
experimental desorption and adsorption isotherms over the relevant range of moisture contents.
The Peleg, Oswin and GAB models were found to be most suitable for describing the
experimental equilibrium moisture contents of yam (Dente) of both desorption and adsorption
based on the standard error of prediction. The lowest Akaike Information Criterion (AIC) for
sorption makes the Oswin model the most appropriate when it is needed to describe wetting of
a product. Though the Peleg and GAB models had the larger number of parameters, the low
AIC values at desorption make them good candidates for drying. The GAB having
physiological background and fewer parameters than that of Peleg makes it preferable. On the
other hand the GAB is not usually utilized beyond water activity of 0.93 (Andrade, 2011). It
thus underestimates the moisture content values at high water activity (��) levels (�� > 0.93).
The GAB model is made up of mono-molecular layer and multilayer adsorption layer, whereas
that of the Peleg model, does not have a monolayer component. The Peleg model is deficient
in explaining structural water (H-bonded water) and water which is sorbed by the hydrophilic
and polar groups (polysaccharides, proteins, etc.) in foods (Mujumdar, 1980).
The present study did not consider intermediate temperatures between 25-50oC, nor did it
consider temperatures beyond 50oC, to ascertain the temperature effect on equilibrium moisture
content at constant water activity. For example, in this study the monolayer moisture constant
C1 and the adsorption constants C2 and C3 which are related to the energies of interaction
between the first and the further sorbed molecules at the individual sorption sites at 25oC and
50oC respectively gave values that are not temperature dependent. A vast difference exists
between the parameters of the present study and that of Montes et al. (2009) for yam at 70oC
(see Table 6.1). Since C2 and C3 are related to the enthalpies of interaction between the
multilayers of sorbed molecules, it would have been appropriate to establish the relationship
100
between these constants and temperature using the Arrhenius equation. However, the limitation
is as a result of using only two temperatures for the work. A linear curve using the Arrheneus
equation, could not be established with two points. The measurements at two temperatures,
however, do satisfy for drying purposes where drying occurs at temperatures in the midrange
40 - 60oC.
The sorption isotherm model of yam is a tool for designing drying equipment, and for studies
on shelf-life, packaging and storage. In packaging, water activity range at a particular
temperature range helps to predict the equilibrium moisture content that is suitable for long
storage life. Yam floor producers and the yam floor packagers will now know at what range of
relative humidity to store their products in order to expect a good equilibrium moisture content
that will inhibit the growth of microorganisms.
Table 6.1 Parameters of the present work by applying the GAB model at different temperatures
compared to that of Montes et al. (2009) for Yam (Deouscorea rotundata)
Parameter
Temperature (oC) C1 C2 C3 Reference
25 0.0755 10.657 0.8152
Amankwah et al. (2017) 50 0.0827 10.126 0.7578
70 0.136 0.448 2.111 Montes et al. (2009)
6.3 Drying kinetics of shrinking yam cubicles
Cranks approximation of diffusion (Crank, 1975) helps to understand the drying behavior of
food particles. The equation concerns a series expansion of Fick’s diffusion equation for
products with a uniform moisture distribution at the start of drying. The equation is often
applied in semi-empirical drying models by using one term of the series expansion. Moreover,
the use of the Cranks equation is limited to infinite and non-shrinking slabs. These conditions
do not exist in practice since most food particles are limited in their dimension and are
accompanied with shrinkage during drying. A CFD investigation in this thesis conducted on
the error made by assuming finite yam cuts resulted in a higher value of effective coefficient
of moisture diffusivity. Also incorporation of shrinkage with the fractal approach helped to
solve this problem. The drying curves were fit, and the results were graphically evaluated by
the curve of drying rate as a function of moisture ratio which is not very common. The present
work is thus a significant contribution in view of literature.
Chapter 3 clearly indicates that there exist moisture content dependent shrinkage and
diffusivity. It therefore suggests that empirical and semi-empirical models are a gross
simplification for explaining the moisture removal of food particle during drying as practiced
by other researchers (Saeed et al., 2006), Doymaz, 2005b, Yaldiz and Eterkin, 2001). This work
indicates that using the drying curve alone to understand the drying behavior of food products
is not only deceptive but also inaccurate. It is therefore concluded that observing both the
drying curve and the drying rate curves result in a better interpretation and of the drying
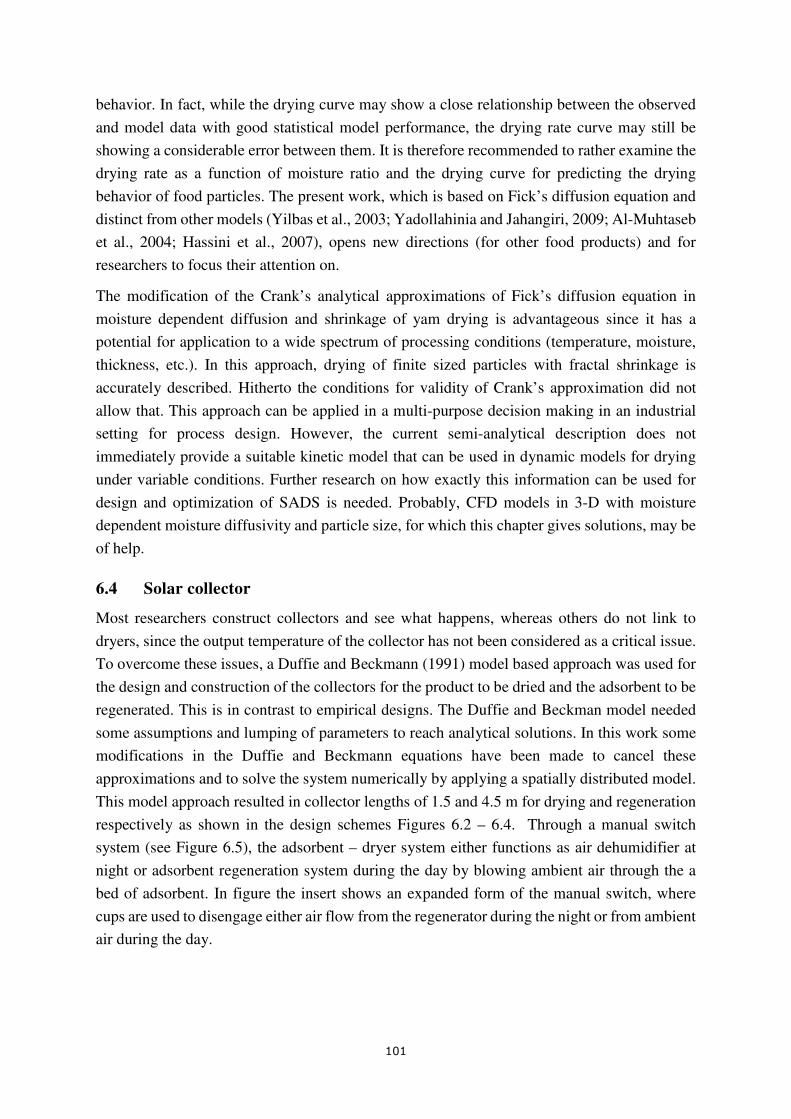
101
behavior. In fact, while the drying curve may show a close relationship between the observed
and model data with good statistical model performance, the drying rate curve may still be
showing a considerable error between them. It is therefore recommended to rather examine the
drying rate as a function of moisture ratio and the drying curve for predicting the drying
behavior of food particles. The present work, which is based on Fick’s diffusion equation and
distinct from other models (Yilbas et al., 2003; Yadollahinia and Jahangiri, 2009; Al-Muhtaseb
et al., 2004; Hassini et al., 2007), opens new directions (for other food products) and for
researchers to focus their attention on.
The modification of the Crank’s analytical approximations of Fick’s diffusion equation in
moisture dependent diffusion and shrinkage of yam drying is advantageous since it has a
potential for application to a wide spectrum of processing conditions (temperature, moisture,
thickness, etc.). In this approach, drying of finite sized particles with fractal shrinkage is
accurately described. Hitherto the conditions for validity of Crank’s approximation did not
allow that. This approach can be applied in a multi-purpose decision making in an industrial
setting for process design. However, the current semi-analytical description does not
immediately provide a suitable kinetic model that can be used in dynamic models for drying
under variable conditions. Further research on how exactly this information can be used for
design and optimization of SADS is needed. Probably, CFD models in 3-D with moisture
dependent moisture diffusivity and particle size, for which this chapter gives solutions, may be
of help.
6.4 Solar collector
Most researchers construct collectors and see what happens, whereas others do not link to
dryers, since the output temperature of the collector has not been considered as a critical issue.
To overcome these issues, a Duffie and Beckmann (1991) model based approach was used for
the design and construction of the collectors for the product to be dried and the adsorbent to be
regenerated. This is in contrast to empirical designs. The Duffie and Beckman model needed
some assumptions and lumping of parameters to reach analytical solutions. In this work some
modifications in the Duffie and Beckmann equations have been made to cancel these
approximations and to solve the system numerically by applying a spatially distributed model.
This model approach resulted in collector lengths of 1.5 and 4.5 m for drying and regeneration
respectively as shown in the design schemes Figures 6.2 – 6.4. Through a manual switch
system (see Figure 6.5), the adsorbent – dryer system either functions as air dehumidifier at
night or adsorbent regeneration system during the day by blowing ambient air through the a
bed of adsorbent. In figure the insert shows an expanded form of the manual switch, where
cups are used to disengage either air flow from the regenerator during the night or from ambient
air during the day.
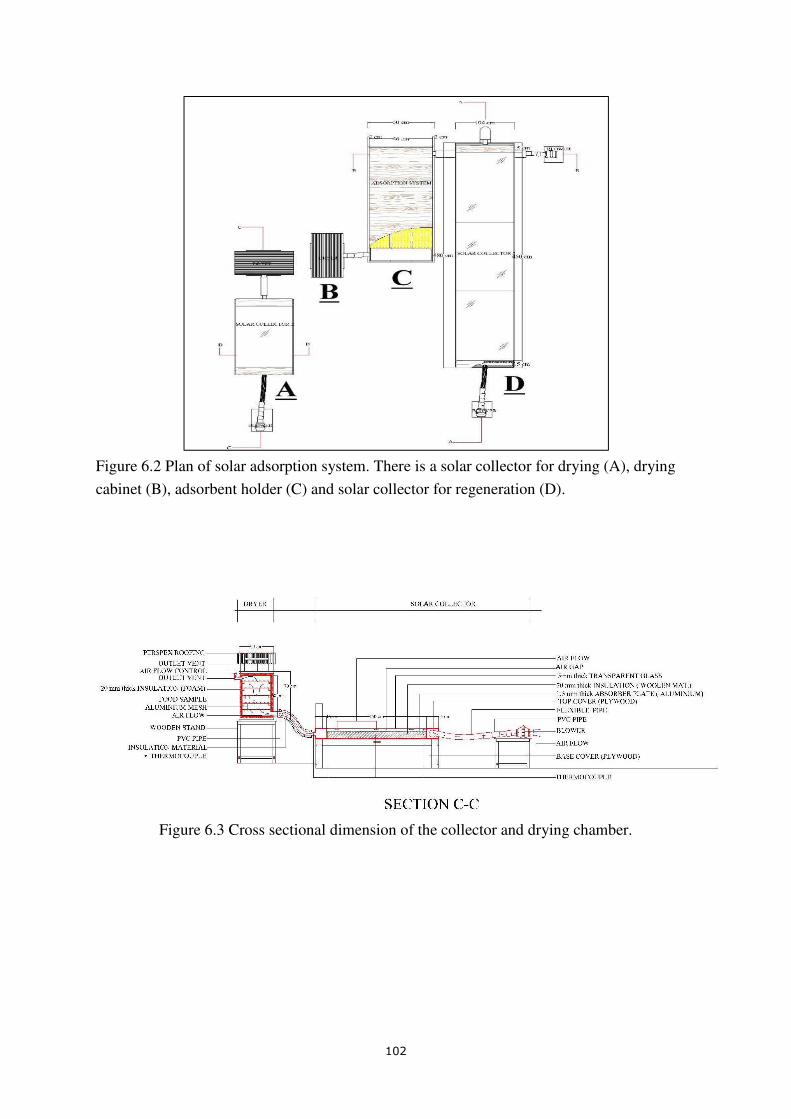
102
Figure 6.2 Plan of solar adsorption system. There is a solar collector for drying (A), drying
cabinet (B), adsorbent holder (C) and solar collector for regeneration (D).
Figure 6.3 Cross sectional dimension of the collector and drying chamber.
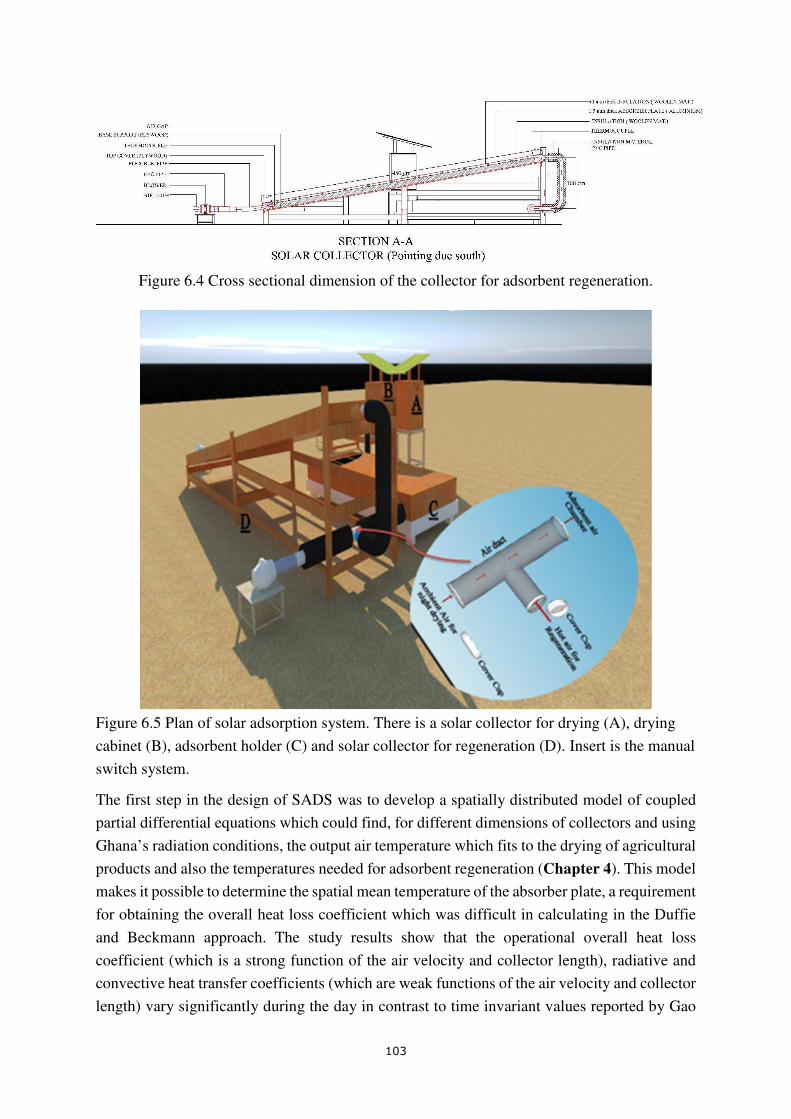
103
Figure 6.4 Cross sectional dimension of the collector for adsorbent regeneration.
Figure 6.5 Plan of solar adsorption system. There is a solar collector for drying (A), drying
cabinet (B), adsorbent holder (C) and solar collector for regeneration (D). Insert is the manual
switch system.
The first step in the design of SADS was to develop a spatially distributed model of coupled
partial differential equations which could find, for different dimensions of collectors and using
Ghana’s radiation conditions, the output air temperature which fits to the drying of agricultural
products and also the temperatures needed for adsorbent regeneration (Chapter 4). This model
makes it possible to determine the spatial mean temperature of the absorber plate, a requirement
for obtaining the overall heat loss coefficient which was difficult in calculating in the Duffie
and Beckmann approach. The study results show that the operational overall heat loss
coefficient (which is a strong function of the air velocity and collector length), radiative and
convective heat transfer coefficients (which are weak functions of the air velocity and collector
length) vary significantly during the day in contrast to time invariant values reported by Gao
104
et al. (2007). The collector performance is a function of the collector length. Though increased
collector length leads to input energy, the passage of air through the collector, bring closer the
air and plate temperatures decreasing the driving force of heat transfer between them. As a
result, the heat gain increases disproportionately with collector length, in comparison with
decreased thermal efficiency and increased overall heat loss coefficient. On the other hand the
plate and glass cover temperatures vary significantly during the day but are weak functions of
the collector length. It is thus recommended, that solar collectors must not be designed based
on a general number of the heat loss coefficient and that constant values are gross
simplifications.
There are some limitations that may need attention. Uniform air distribution on the absorber
plate is difficult to ascertain, even though a T-joint pipe with perforations receives and passes
the inlet air over the plate. To solve the issue of uniform airflow, the perforations could be
tapered from the ends towards the middle (joint). More air will then reach the outer section
over the absorber plate.
Since the collector parts are made of wood and especially the 4.5m collector which is supported
on an angle iron frame to prevent it from sagging, the structure of the collector system is heavy,
thus exerting so much pressure on the supporting stands. This sometimes leads to total collapse
of the setup and damage of the glass cover. Light materials such as aluminum moldings which
is affordable and available, could be used for the main structure and frame. The weight of the
structure will then drastically be reduced. More jobs will be created by diversifying the use of
aluminum sheets.
The mathematical model tool is suitable for design optimization. The model also provides the
required collector length for Ghana’s radiation conditions, given the temperatures allowed for
the product and the temperatures needed for regeneration. Specifically, a collector length of
1.5m gives drying temperatures suitable for drying agricultural products at air speed of 0.5m/s.
Likewise a collector of 4.5m length at an operational air speed between 0.2 – 0.5m/s is suitable
for adsorbent (silica gel) regeneration. The model output is close to the experimental data in
predicting the output air temperature for both 1.5 and 4.5m collector lengths. Further study
about heat losses and possible changes in the design is needed to reduce heat losses. All parts
that are in contact with heated air must be insulated.
6.5 Experimental verification and proof-of-principle
Chapter 5 concerned the proof of principle of solar adsorption drying (SAD) in comparison to
solar drying (SD) and open sun drying (OSD). The proof of principle concerned the duration
of drying cycles, vitamin C retention, composition and colour and drying of three yam different
cultivars. Moreover, the regeneration ability of the solar collector system was evaluated. Three
type of experiments were performed:
105
1) Proof of principle of SAD and its benefits compared to SD and OSD
A dryer that gives a specific final moisture content at the shortest possible time would be a
better option. The findings indicate that SAD gives the shortest drying cycle but due to night
drying the product is longer exposed to drying conditions whereas the OSD dried slowest and
had the highest final moisture content within the allotted time. Adsorption drying is effective
at the early stages of drying after which elevated temperatures which cannot be achieved during
the night or longer duration of drying are required to remove water when the moisture content
of the samples get gradually lower. The SAD system is thus a better option in terms time cycle.
It can therefore be said that, a system that needs a longer time to reach not even the target
moisture content, is inferior from the point of view of throughput.
2) Effect of SADS on quality of different yam cultivars
As a result of the longer exposure to drying conditions in SAD, vitamin C degraded slightly
(not much) more compared to SD. SAD preserved the whitish color of yam better than the other
methods whereas OSD gave the worst performance on vitamin C and color, though all the
drying methods significantly affected vitamin C content. In this work between 80-90% vitamin
C reduction occurred.
With regard to the cultivars (Pona, Lilii and Dente), Lilii dried fastest and Dente slowest across
all methods which may be due to differences in the molecular structure of the different yam
matrix. Generally the drying method do not affect the proximate composition (Hsu et al., 2003)
though there is marginal increase in fiber and decrease in protein composition between fresh
and dried samples due to an increase in insoluble dietary fiber content by complexing with
protein and amino acids (Matalas et al., 2001). No obvious trend in variability among the values
of cultivars is found. The two seasonal variations in weather and pre-history of yam cultivar
affected the drying rate especially of Dente cultivar which dried slowest.
3) Regeneration of silica gel.
The solar collector performance was according to the design and is satisfactory for regeneration
of the silica gel, but further work is needed to understand the recovery rate, and to optimize the
system. Silica gel requires between 50-150oC for regeneration. In this work the target
temperature was between 70-80oC. In the adsorption drying experiment (rehydration of
adsorbent), over three days, the sorbent adsorbed up to 27.3 w% of moisture per the original
weight of the adsorbent. The regeneration experiment removed (desorbed) up to 18 w% of
water adsorbed during the adsorption drying process, in three days, of which 15 w% occurred
on the first day. On the second and third day, hardly was water removed. It is expected that
more water was regenerated at the peak temperatures, but at that moment, no measurement was
taken. For a typical silica gel sorption isotherm at 50oC and 30% RH the loading capacity is
between 10-12%. However, at 80oC the water loading capacity reduces roughly to about 3 %.
In view of this difference, and assuming that equilibrium is reached fast in the adsorber, it may
perhaps be best to stop the regeneration at the highest temperature of the day. Bhool et al.
(2014) and Pramuang and Exell (2007) reported that the regeneration rate is not entirely
106
dependent on solar radiation but also the air flow. In the present design, the air is impeded by
the small interspace between the bed of particles of silica gel making it difficult for air flow to
pass and to transfer heat to adjacent particles by conduction. Redesign of the regeneration
system is paramount to expose the hot air to thin layer of adsorbent.
6.6 Perspectives of SADS (in Africa and elsewhere)
For the farmer’s use, a scale-up is necessary. The farmers who are categorized as families,
groups and small and medium scale enterprises (SME) in order of financial strength, dry for
home consumption, for the local market or for export, respectively. Women groups who dry
unsold products of dry fruits and vegetables can take advantage of this confined solar dryer
system, which produces hygienic and wholesome products - a prerequisite for the Food and
Drugs Authority giving approval for samples to be consumed or exported. Also SMEs can
explore this system to hygienically dry and package their produce such as processed tubers,
cereals, mangoes, pineapples, bananas, ripe and unripe plantain, coconut fruit, and etcetera for
the international market. The SMEs often obtain technical and financial support from
government and/or non-governmental organizations and have the purchasing power even
beyond $4000 per dryer for SAD inclusive of a solar dryer house of 2.5x4x2.5m size. With
little financial and technical support, this dryer system can be maintained between 7-10 years
without any major renovation. When production is to be increased several copies of same dryer
system may be needed. Also a combination of direct and indirect solar dryer house system is
proposed as shown below to dry cocoa, ginger, cassava, yam etc., as against the traditional
method for drying in the open sun. For a direct solar dryer, the solar radiation is directly
incident on the food material, whereas hot air is blown from a solar collector duct and
channeled into a drying chamber for the indirect dryer system. Thus, with a combination of
redesigned adsorption system, the benefit of reducing the drying cycle is achieved. The
integrated approach of combined direct and indirect solar adsorption dryer system cost within
the neighborhood of $5000 – $10000 depending on the size between 60m3 and 125m3 and 2 -
4 tons capacity of the integrated system for a drying period of 3 to 5 days.
Thus, with some modification in the adsorption system, as mentioned above the solar
adsorption dryer system can be built and operated in many agricultural farms and close to silos
and warehouses in Ghana. Meanwhile, further detailed economical study would be worth-
while.
After the investigations of the sorption properties of yam, drying kinetics of yam, design of the
solar collector system, proof of principle of solar adsorption drying and the effects of solar
adsorption drying on product quality, some limitations have been adduced above: To this end
the following are further research that need to be considered.
107
- The universal application of the modified Crank equation into a moisture dependent
fractal shrinkage and moisture diffusivity model for drying kinetics of other food
materials.
- Use of cheaper sorbent such as clay can be investigated.
- A model-based optimization of the design, at different geographical solar conditions to
simplify the equation.
- Model-based optimization of the operation of the system in an attempt to reduce the
error between the model data and observed data.
- Thorough investigation to handle and to incorporate differences characteristic attributes
between yam cultivars in drying equation.
6.7 Conclusions
The sorption isotherm model of yam is a tool for designing drying equipment, shelf-life studies,
and packaging and storage investigations. From this work, the equilibrium moisture content
can be predicted while monitoring storage life. This means that the close environment of stored
packages can be controlled to maintain moisture content that will not support microbial growth.
For the desorption isotherm, temperature had no effect on equilibrium moisture content at
constant water activity which is contrary to what has been reported in literature. Yam powders
must be stored well since a change in water activity between 0.15 to 0.65 leads to a significant
change in equilibrium moisture content. The Peleg, Oswin and GAB models were found to best
describe both desorption and adsorption processes, whereas using the Akaike Information
Criterion (AIC) which takes into account, the number of parameters, makes the Oswin model
the most suitable for wetting of yam. In the same way, for drying, the Peleg and GAB models
were the best. They had the larger number of parameters, the lowest AIC values. In the end the
GAB was preferable since it had physiological meaning and fewer parameters than that of the
Peleg.
The modification of the Crank’s analytical approximations of Fick’s diffusion equation with
moisture dependent diffusion and shrinkage has potential for application to a wide spectrum of
processing conditions. Real life situational drying practices could be achieved in practice, since
moisture dependent fractal shrinkage and diffusivity is factored in the modified model. Drying
rate as a function of moisture ratio, establishes a better relationship between observed and
modeled data. Here, a finite sized particle with fractal shrinkage is a possibility. Hitherto the
conditions of Crank did not allow that. In process design in an industrial setting, a multi-
purpose decision can be made using this spatially distributed model.
A spatially distributed model for the solar collector is available and can be used to design and
construct solar collectors for drying of agricultural products in Ghana and regeneration of
adsorbent. The model can foretell the collector length that is needed to achieve the required
output temperature of the collector. In combination with adsorbent system, drying is extended
108
to the night preventing rewetting. In this work the mean plate temperature was estimated, a
prerequisite for the determination of the overall heat loss coefficient. It has been shown in this
work that outlet air temperature increases with collector length but limited to some extent. The
difficulty in calculating the overall heat loss coefficient as alluded to by Duffie and Beckmann
is not a problem in this model, whereas the heat removal factor, collector efficiency and heat
gain could be predicted with this spatially distributed model. Hitherto experimental work was
requite. Meanwhile, assuming a constant value of the overall heat transfer coefficient is over
simplification and leads to inaccurate predictions. It is indicative that the plate temperature,
glass temperature and radiative and convective heat loss coefficients can be lumped together
as constants along the collector length. The operational air velocity affects the overall heat loss
coefficient, heat gain and efficiency.
A quick removal of water especially on the first days is indeed a sure bet to maintain the original
color of food product. The extent of water removed from adsorbent depends on the regeneration
temperature. SAD systems helped to reduce the drying cycle compared to the SD and OSD
systems. Product dried with SAD maintained the white color of the yam better than the other
methods whereas its dried samples had a little lower vitamin C content than that of the SD. The
OSD was worse in terms of maintaining original color and vitamin C content. This research
showed that different cultivars of yam from the same variety (D. rotundata) dried at different
rate, Dente drying at the slowest rate while Lilii dried at the fastest rate. The solar collector for
the regeneration operated according to the design but the measured rate of regeneration was
low as a result of low temperature at end of dehydration. Therefore regeneration must end at
the highest temperature of the day assuming that equilibrium is reached fast in the sorbent.
With some modification in the adsorption system the solar adsorption dryer system as
investigated in this thesis can be built and operated in many agricultural farms in Ghana. The
SAD hold promise to boost high throughput.
109
7.0 References
110
AACC (2000). Approved Methods of the AACC, 10th edn. Methods 44-17, St. Paul, MN:
American Association of Cereal Chemists.
AOAC International Official methods of analysis. (1990). Gaithersburg, MD. (17) Method,
985.14.
Aguilera, J.M., and D.W. Stanley. 1999. Microstructural Principles of Food Processing and
Engineering. Aspen Publishers INC. Gaithersburg Maryland.
Agunbiade, S.O., Olranlokun, J.O. and Olaofe, O.A. (2006). Quality of chips produced from
rehydrated, dehydrated plantain and banana chips. Pakistan Journal of Nutrition, 5 (5): 471-
473.
Ah-Hen, K.,Zambra, C.E.,Aguëro, J.E.,Vega-Gálvez, A.,Lemus-Mondaca,R. (2013) Moisture
diffusivity coefficient and convective drying modeling of murta (Ugni molinae Turcz):
Influence of temperature and vacuum on drying kinetics. Food and Bioprocess Technology
6(4): 919-930.
Akpinar, E.K., Midilli, A., Bicer, Y. (2003b). Experimental Investigation of Drying Behaviour
and Conditions of Pumpkin Slices Via A Cyclone-Type Dryer. Journal of the Science of Food
and Agriculture, 83: 1480-1489.
Akuffo, F.O. (1991). Climatic data for solar and wind energy application in Ghana, Ministry of
Energy, Ghana, 2, 1-22.
Akuffo, F.O., Brew-Hammond, F.O., Antonio, A., Forson, J., Edwin, F., Sunnu, I.A.,
Akwensivie, A., Agbeko, F., Ofori, K.E., Appiah, F.K. (2003). Solar and Wind Energy
Resource Assessment (SWERA), Energy Commission, Ghana. 1-44.
Alhassan A.Y. (1994). Post-harvest aspects of yam and cassava in Ghana. Consultancy Report,
MOFA/GTZ, Ghana.
Al-Muhtaseb, A.H., McMinn, W.A.M., Magee, T.R.A. (2004). Shrinkage, density and porosity
variations during the convective drying of potato starch gel. In: 14th International Drying
Symposium (IDS), São Paulo, Brazil, vol. C, 1604–1611. Eds. M.A. Silva, Campinas State
University, Brazil.
Alvarez, A., Cebaza, O., Muñiz, M.C., Varela, L.M. (2010). Experimental and numerical
investigation of a _at-plate solar collector, Energy, 35, 3707-3716.
Amankwah, E.A.Y. Dzisi, K.A. van Straten, G. van Willigenburg L.G. and van Boxtel, A.J.B.
Distributed mathematical model supporting design and construction of solar collectors for
drying, Drying Technology, 2017, 35(14), 1675-1687.
Amankwah E.A., Ellis W.O., Oldham J.H. (2006). Manufacture of tomato ketchup using the
gravity method of concentration. Journal of Ghana Science Association, 8: 63-64.
111
Andrade, P.R.D., Lemus, M.R. and Pérez., C.C.E. (2011). Models of sorption isotherms for
food: uses and limitations. Vitae, Revista of the Facultad of Química Farmacéutica, 18(3): 325-
334.
Arata, A. and Sharma, V. (1991) Performance evaluation of solar assisted dryers for low drying
temperature applications-Plant description, Renewable energy, 1(5and 6): 729-736.
Arinze, E.A., Adefila, S.S., and Eke, B.A. (1990). Experimental evaluation of various designs
of free-convection solar crop dryer with and without thermal storage. Proceeding of National
Conference of Nigerian Society of Agricultural Engineers, 15-19.
Asiah, N., Djaeni, M., Hii, C.L. (2017). Moisture transport mechanism and drying kinetic of
fresh harvested red onions bulbs under dehumidified air. International Journal of Food
Engineering, DOI:10.1515/ijfe-2016-0401.
Atuonwu, J.C., van Straten, G., van Deventer, H.C., van Boxtel, A.J.B. (2011). Improving
adsorption drying energy efficiency by simultaneous optimization and heat integration. Drying
Technology, 29, 1459-1471.
Atuonwu, J.C., van Straten, G., van Deventer, H.C., van Boxtel, A.J.B. (2010). Modeling and
energy efficiency optimization of a low temperature adsorption based food dryer, Proceedings-
17thInternational Drying Symposium, Magdeburg, Germany, 423-431.
Ayensu, A., (1997) Dehydration of food Crops Using a Solar Dryer with Convective Heat
Flow.
Solar Energy, 59, 121-126.
Bala, B.K., Morshed, M., and Rahman, M.F. (2009). Solar drying of mushroom using solar
tunnel dryer, International Solar Food Processing Conference, Department of Farm Power and
Machinery Bangladesh Agricultural University, Mymensingh 2202, Bangladesh, 1-11.
Barbosa-Canovas, G.V. Fontana, A.J., Schmidt, S. J. and Labuza, T.P., (2007). Water activity
in foods, Blackwell Publishing Company, Ames, Iowa, USA.
Basuinia, M.A. and Abe, T. (2001). Design and construction of simple three shelf solar rough
rice dryer. Journal of Agricultural Mechanization in Asia, Africa and Latin America, 32(3): pp.
54-55.
Ben Haj Said, L., Najjaa, H., Farhat, A., Neffati, M. and Bellagha, S. (2015). Thin layer
convective air drying of wild edible plant (Allium roseum) leaves: experimental kinetics,
modeling and quality. Journal of Food Science and Technology, 52(6): 3739–3749.
Berinyuy, J.E., Tangka, J.K., and Fotso, G.M. (2012). Enhancing natural convection solar
drying of high moisture vegetables with heat storage. Agricultural Engineering International:
CIGR Journal, 14(1): 141-148.
112
Bhagoria, J.L., Saini, J.S., Solanki, S.C. Heat transfer coefficient and friction factor correlations
for rectangular solar air heater duct having transverse wedge shaped rib roughness on the
absorber plate. Renewable Energy, 2002, 25(3), 341–369.
Bhool, R., Kumar, P., and Mehla, A. (2014). Performance evaluation and regeneration of
activated charcoal by solar parabolic dish collector. International Journal of Science
Engineering and Technology Research, 3(5): pp. 1507-1513.
Boxtel, van A.J.B, Boon, M.A., Deventer H.C. van, Bussmann P.J.Th. (2012). Zeolites for
reducing drying energy usage. In Modern Drying Technology, Vol. 4, Energy Savings, Edited
E. Tsotsas, A.S. Mujumdar. Wiley-VCH Verlag, Weinheim, Germany.
Brennan, J.G. (2006). Evaporation and drying. In: Handbook of Food Processing, Brennan, J.G
(Ed) Wiley-VCH, Weinheim, Germany.
Buzás, J. Farkas, I. Biró, A. Németh, R. (1998). Modeling and simulation of a solar thermal
system, Mathematics and Computers in Simulation, 48, 33-46.
Chayjan, R.A., Salari K, Barikloo (2012). H. Modeling moisture diffusivity, activation energy
and specific energy consumption of squash seeds in a semi fluidized and fluidized bed drying
Acta Sci Pol Technol Aliment., 11(2):131-48.
Chemkhi, S., Zagrouba F., and Bellagi, A. (2005). Modeling and simulation of drying
phenomena with rheological behaviour. Brazilian Journal of Chem. Engineering 22 (2): 153-
163.
Chow, T.T., He, W., Ji, J. (2006). Hybrid photovoltaic-thermosyphon water heating system for
residential application, Solar Energy, 80, 298–306.
Chua, K.J. and Chou, S.K. (2003) Low-cost drying methods for developing countries, Trends
in Food Science & Technology, Review, 14, 519–528.
Crank, J. The Mathematics of Diffusion. 1975. Oxford University Press. Oxford.
Davey, M.W., Montagu, M., Inze, D., Sanmartin, M., and Benzie, J.J. Plant L-ascorbic acid:
Chemistry, function, metabolism, bioavailability and effects of processing. Journal of Science
Food and Agriculture, 2000, 80: 825-860.
Dissa, A.O., Desmoreux, H. Bathiebo, J. and Koulidiatti, J. (2011). A comparative study of
direct and indirect solar drying of mango, Global Journal of Pure and Applied Sciences, 17(2):
273-294.
Djaeni, M., Bartels, P., Sanders, L., van Straten, J. and van Boxtel, A.J.B. (2007). Process
Integration for Food Drying with Air Dehumidified by Zeolites, Drying Technology, 25. 225-
239.
Doymaz I. (2004), Drying Kinetics of White Mulberry, Journal of Food Engineering, 61, 341-
346.
113
Doymaz, I. (2005). Sun drying of figs: an experimental study. Journal of Food Engineering,
71: 403-407.
Duffie, J.A., Beckman, W.A. (1991). Solar engineering of thermal processes, John Wiley and
Sons Inc. 23-41, 73-74, 95-101.
Duffie, J.A., Beckman, W.A. (1980). Solar Engineering of Thermal Processes, ed 2, John
Wiley and Sons, Inc., 23, 73-74, 95-101.
Edjekumhene, I. and Atakora, S.B. (2001). Implementation of renewable energy resources –
opportunities and barriers, Ghana Country Study, 48.
Eka, O. U. (1985). The chemical composition of yam tubers in Advances in Yam Research.
The Biochemistry and Technology of Yam tubers, Vo. 1 ed. Osuji, G. O, published by
Biochemical Society of Nigeria in collaboration with ASUTECH, Enugu, pp. 51-75.
El-Beltagy, A., Gamea, G.R., and Essa, A.H.A. (2007). Solar drying characteristics of
strawberry. Journal of Food Engineering. 78: 456-464.
Erbay, Z., Icier, F.A review of thin layer drying of foods: Theory, modeling, and experimental
results. Critical Reviews in Food Science and Nutrition. 2010, 50:5,441-464.
Erenturk, S., Gulaboglu M.S, Gultekin S. (2005). The effects of cutting and drying medium
on the vitamin C content of rosehip during drying, Journal of Food Engineering, 68, 513–518.
Esper, A, and Mühlbauer, W. (1996). Solar tunnel dryer for fruits, Plant Res Development, 44: 61-80. Exell, RHB, Kornsakoo, S. A low-cost solar rice dryer. Appropriate Technology 1978; 5: 23-24.
Ezekoye, B.A. and Enebe O.M. (2006). Development and Performance Evaluation of Modified
Integrated Passive Solar Grain Dryer. The Pacific Journal of Science and Technology
Department of Physics and Astronomy, University of Nigeria, Nsukka. 7(2): Enugu State,
Nigeria, 185-190.
FAO, (2005). Production Year book, Vol. 55. Collection FAO statistics no. 170. FAO, Rome
Italy.
Fagunwa, A.O., Koya O.A. and Faborode M.O. (2009). Development of an Intermittent Solar
Dryer for Cocoa Beans, Obafemi Awolowo University, Ile-Ife, Nigeria.
Fellow, P. (2000). Food Processing Technology-Principles and Practice, Second Edition,
Wood Head Publishing Limited, Cambridge England, 330.
Fellow, P. (2009). Food Processing Technology: Principles and Practice, Wood Head
Publishing Limited, Cambridge, England. 481.
Fioreze, R., and B. Morini. (2000). Yam (Dioscorea sp) drying with different cuts and
temperatures: experimental and simulated results. Food Science and Technology (Ciencia e
Tecnologia de Alimentos), 20(2): 262–266.
Gálvez, A.V., Aravena, E.L. and Mondaca, R.L. (2006). Isotermas de adsorción en harina de
114
maíz (Zea mays L.). Food Science and Technology (Ciencia e Tecnologia de Alimentos), 26(4):
821-827.
Gao, W., Lin, W., Liu, T., Xia, C. (2007). Analytical and experimental studies on the thermal
performance of cross-corrugated and flat plate solar air heaters. Applied Energy, 84( 4): 425-
441.
Gekas, V.; Lamberg, I. (1991). Determination of Diffusion Coefficients in Volume-Changing
Systems – Application in the Case of Potato, Drying Journal of Food Engineering, 14, 317-
326.
Giovanelli, G., and Buratti, S. (2009). Comparison of polyphenolic composition and
antioxidant activity of wild Italian blueberries and some cultivated varieties. Food Chemistry,
112(4): 903–908.
Giovanelli, G., Zanoni, B., Lavelli, V. and Nani, R. (2002). Water sorption, drying and
antioxidant properties of dried tomato products, Journal of Food Engineering, 52, 135–141.
Goula, A.M., Karapantsios, T.D. Achilias, D.S. and KAdamopoulos, G. (2008). Water sorption
isotherms and glass transition temperature of spray dried tomato pulp. Journal of Food
Engineering. 85(1): 73-83.
Gutti, B.,Kiman, S., and Mustafa, B.G. (2012). Design and construction of forced and natural
convection solar vegetable dryer with heat storage. Journal of Engineering and Applied
Science, 7(10): 1213-1218.
Hamed, M., Fellah, A., Brahim, A.B. (2014). Parametric sensivity studies on the performance
of a flat plate solar collector in transient behaviour. Energy Conservation and Management,
78, 938-947.
Hassan, S. W., Umar, R. A., Maishanu, H.N., Matuza, I.K., Faruk, U.Z. and Sani, A.A. (2007)
The effect of drying method on nutrients and non-nutrients composition of leaves of
Gynandropsis gynandra (Capparaceae), Asian Journal of Biochemistry. 2007, 2:349-353.
Hassini, L., Azzouz, S. Peczalski, R. Belghith, A. (2007). Estimation of potato moisture
diffusivity from convective drying kinetics with correction for shrinkage, Journal of Food
Engineering, 79, 47–56.
Henderson, S.M. Progress in developing the thin layer drying equation. (1974). Transactions
of the ASAE, 17, 1167-1172.
Hodali, R. and Bougard, J. (2001). Integration of a desiccant unit in crops solar drying
installation: optimization by numerical simulation, Energy Conversion and Management, 42,
1543–1558.
Hollands, K.G.T., Unny, T.E., Raithby, G.D., Konicek, L. (1976). Free convective heat transfer
across inclined air layers. Journal of Heat Transfer, 98, 189-192.
115
Hofsetz K. Lopes C.C., Hubinger M.D., Mayor L., Sereno A.M. (2007), Changes in the
Physical Properties of Bananas on Applying HTST Pulse During Air Drying, Journal of Food
Engineering, 83, 531-540.
Hsu, C.L., Chen, W., Weng, Y.M., Tseng, C.Y., Chin-Lin, H., Wenlung, C. (2003). Chemical
composition, physical properties, and antioxidant activities of yam flours as affected by
different drying methods, Food Chemistry, 83, 85–92.
Hu, S. (2007). Akaike Information Criterion. Available at: http://www4.ncsu.edu/~shu3
/Presentation/ AIC.pdf. Accessed 4 June 2018.
Igathinathane, C., Womac, A.R. Sokhansanj, S. and Pordesimo, L.O. 2005. Sorption
equilibrium moisture characteristics of selected corn stover components. Transaction of the
ASAE, 48(4): 1449-1460.
Jannot, Y., Talla, A., Nganhou, J., Puiggali, J.R. (2004). Modeling of banana convective drying
characteristic curve (DCC) method. Drying Technology, 22, 1949-1968.
Ji, J., He, H., Chow, T., Pei, G., He, W., Liu, K. (2009). Distributed dynamic modeling and
experimental study of PV evaporator in a PV/T solar-assisted heat pump, International Journal
of Heat and Mass Transfer, 52, 1365–1373.
Jin X., Sman, R.G.M.van der, Boxtel A.J.B. van. (2011). Evaluation of the Free Volume
Theory to predict moisture transport and quality changes during broccoli drying. Drying
Technology, 29(16): 1963-1971.
Jones, G.P., Biggs, D.R., Wahlqvist, M.L., Flente. L.M. and Shiell, B.J. (1990). Dietary fibre
content of Australian foods, Fruits and fruits products. Food Australia, 42(3): 143-145.
Jorge, F., Armando, C.O., (2004) Analysis of a Plate Heat Pipe Solar Collector International
Conference on Sustainable Energy Technologies. Nottingham, UK, 277-283.
Kadar, A., Kashmire, R.F., Mitchel, F.G., Reid, M.S., Sommer, N.P. and Thompson, J.F.
(1985). Postharvest Technology of Horticultural Crops Special Publication No. 3311. Division
of Agriculuture and Natural Resources. University of Natural Resources. University of
California. Davis, CA.
Karel, M. (1985). Control of lipid oxidation in dried food. In: the concentration and drying of
foods, Richardson, J. and Finley, J. W. (Eds). Springer Technology and industrial arts,
California, 495-512.
Karim, M.A. and Hawlader, M.N.A (2004). Mathematical modeling and experimental
investigation of tropical fruits drying, International journal of heat and mass transfer, 48, 4915-
4925.
Kenyon L., Anandajayasekeram, P. and Ochieng, C. (2006). A Synthesis/Lesson-Learning
Study of the Research Carried Out on Root and Tuber Crops Commissioned through the DFID-
RNRRS Research Programmes between 1995 and 2005. Available at:
116
http://www.envirobase.info/PDF/Root_Tuber_research_synthesis_P1.pdf. Accessed 4 June
2018.
Kicsiny, R. (2016). Improved multiple linear regression based models for solar collectors,
Renewable Energy, 91, 224-232.
Kiranoudis, C. T., Z. B. Maroulis, E. Tsami and D. Marinos-Kouris. 1993. Equilibrium
moisture content and heat of desorption of some vegetables. Journal of Food Engineering,
20(1): 55-74.
Koyuncu, T. (2006). Performance of various design of solar air heaters for crop drying
applications. Renewable Energy, 31, 1073-1088.
Krokida M.K., Marinos-Kouris D. (2003). Rehydration Kinetics of Dehydrated Products,
Journal of Food Engineering, 57, 1-7.
Kumar, G. Vasanth, Ajay Kumar, K., Raghu Patel, G.R. and Manjappa, S. (2013).
Determination of vitamin C in some fruits and vegetables in Davanagere city, (Karanataka) –
India, International Journal of Pharmacy & Life Sciences, 4(3): 2489-2491.
Labuza T.P., Mizrahi, S. and Karel, M. (1972). Mathematical models for optimization of
flexible film packaging of foods for storage. Transactions of the American Society of
Agricultural Engineers, 15(1): 150-155.
Levine, H., and Slade, L. (1991). Water Relations in Foods. New York, United States: Plenum
Press.
Lin, W., Gao W., Liu T. (2005). A parametric study on the thermal performance of cross
corrugated solar air collectors. Applied Thermal Engineering, 26(10): 1043-1053.
Ljung, L. 1987. System Identification – Theory for the User. Englewood Cliffs, New Jersey:
Prentice-Hall.
Madhlopa, A., Jones, S.A., Kalenga Saka, D.J. (2002). A solar air heater with composite–
absorber systems for food dehydration, Renewable Energy, 27(1): 27-37.
Matalas, A.L., Zampelas, A. and Stavrinos, J. (2001). The Mediterranean Diet, CRC Press ICC.
Matuska T, Zmrhal V and Metzger J (2009) Detailed modeling of flat plate collectors with
design tools 2.2, (2009) Eleventh international IBPSA conference, Glasgow, Scotland, 2289-
2295.
McAdams, W.H. (1954). Heat transmission. New York, McGraw-Hill.
Mehla A., Kumar, P., Bhool R., Kumar P. (2014). Regeneration of Solid Desiccant by Solar
Parabolic Dish Collector in India: An Experimental Analysis, International Journal of
Scientific Engineering and Technology Research, 3(5): 743-723.
Miguel Aguilera, J. and Stanley, D.W. 1999, Microstructural principles of food processing and
engineering, Aspen.
117
Mintsa Do Ango A.C. Medale, M. Abi, C. Optimization of the design of a polymer flat plate
solar collector, Solar Energy, 2013, 87, 64-67.
Montes, E., R. Torres, R. Andrade, O. Perez, J. Marimon, and I. Meza. 2009. Models of
desorption isotherms of yam (Dioscorea rotundata). Dyna, 76(157): 145-152.
Maroulis, Z.B., Tsami, E., Marinos-Kouris, D. and Saravacos, G.D. (1988). Application of the
GAB model to the moisture sorption isotherms for dried fruits. Journal of Food Engineering,
7(1): 63–78.
Mulet, A. Drying modeling and water diffusivity in carrots and potatoes. Journal of Food
Engineering, 1994, 22, 329–348.
Myhara, R.M., Taylor, MS. Slominski, B.A. and Al-Bulush, I. (1998a.) Moisture sorption
isotherms and chemical composition of Omani dates. Journal of Food Engineering, 37(4): 471-
479.
Myhara, R. M., Sablani, S. S. Al-Alawi, S. M. and Taylor, M. S. (1998b). Water sorption
isotherms of dates: modeling using GAB equation and artificial neural network approaches.
LWT-Food Science and Technology, 31(7-8): 699-706.
Maroulis, Z.B., Tsami, E. Marinos-Kouris, D. and Saravacos, G.D. (1988). Application of the
GAB model to the moisture sorption isotherms for dried fruits. Journal of Food Engineering,
7(1): 63–78.
Mujumdar, A.S. (1996). Innovation in drying. Drying Technology – An International Journal,
14, 1459-1475.
Mujumdar, A.S. 1980 Drying theories: Their bases and limitations as applied to foods and
grains, (Ed.). Advances in Drying, Fortes M, Okos MR. 1: Washington, USA: Hemisphere
Publishing Corporation; 301.
Ng, K.C., Chua, H.T., Chumg, C.Y., Loke, C.H., Kashiwagi, T., Akisawa, A., and Saha, B.B.
(2001). Experimental investigation of the silica gel water adsorption isotherms. Applied
Thermal Engineering, 21(16): 1631-1642.
Njomo D. (2000). Unglazed selective absorber solar air collector: Heat exchanger analysis, Journal of Heat and Mass Transfer, 36: 313-317.
Njomo, D. and Daguenet, M. (2006) Sensitivity analysis of thermal performances of flat plate
Solar air heaters, Heat and mass transfer, 42.
Oduro, I. Ellis, W., Sulemana A., Oti-Boateng P. (2007). Breakfast meal from breadfruit and
Soybean composite, Discovery and Innovation, 19(3), 238-242.
Oguntola, J.A, Collins, N.N.; Olayinka, A. (2010). Design and construction of a domestic
passive solar food dryer, Leonardo Journal of Sciences. 16, 71-82.
Ojukwu U.P. and Nwobi S.C. (2017). Determination of ascorbic acid content of some local
fruits in Nigeria. Analytical Chemistry: An Indian Journal. 17 (1): 1-5.
118
Okaka, J.C. and Okaka, A.N.C. (2001). Food: Composition, Spoilage, Shelf-life Extension.
OCJANKO Academic Publishers, Enugu.
Oliveira, M.M., Campos, A.R.N. Dantas, J.P. Gomes, J.P. and Silva, F.L.H.D. (2006).
Desorption isotherms of passion fruit peel (Passiflora edulis Sims): experimental determination
and mathematical model evaluation. Cienc Rural, 36(5): 1624-1629.
Opara L. (1999), YAMS: Post Harvest Operation, Massey University, New Zealand.
Osunde, Z. D. (2008). Minimizing postharvest losses in Yam (Dioscora sp.). Treatments and techniques. International Journal of Food Science and Technology; 12: 2-14.
Owo, H.O., Adebowale, A.A. Sobukola, O.P. Obadina, A.O. Kajihausa, O.E. Adegunwa, M.O.
Sanni, L.O. and Tomlins, K. (2017). Adsorption isotherms and thermodynamics properties of
water yam flour. Quality Assurance and Safety of Crops & Foods, 9(2): 221-227.
Oyetade, O.A., Oyeleke, G.O., Adegoke, B.M., and Akintunde, A.O. (2012). Stability studies
on Ascorbic acid (Vitamin C) from different sources. Journal of Applied Chemistry. 2(4): 20-
24.
Özcan M, Arslan D and Ünver A (2005) Effect of drying methods on the mineral content of
basil (Ocimum basilicum L.). Journal of Food Engineering, 69, 375–379.
Pramuang, S., and Exell, R.H.B. (2007). The regeneration of silica gel desiccant by air from
solar heater with a compound parabolic concentrator. Renewable Energy, (32): 173-182.
Perez, R., Seals, R., Ineichen, P., Stewart, R. Menicucci, D. (1987). A new simplified version
of the Perez diffuse irradiance model for tilted surfaces, Solar Energy, 39: 221.
Perez, R., Stewart, R., (1988). The Development and Verification of the Perez diffuse radiation
model, Sandia National Laboratories Contractors Report (SAND88-7030).Postharvest
Technology of Horticultural Crops Special Publication No. 3311. Division of Agriculture and
Natural Resources. University of Natural Resources. University of California. Davis, CA.
Pramuanga, S. and Exella, R.H.B. (2007). The regeneration of silica gel desiccant by air from
a solar heater with a compound parabolic concentrator, Renewable Energy, 32, 173–182.
Quirijns, E.J., van Boxtel, A.J., van Loon, W.K. and van Straten, G. (2005). Sorption isotherms,
GAB parameters and isosteric heat of sorption. Journal of the Science of the Food and Agriculture,
85(11): 1805-1814.
Raji, A.O. and Ojediran, J.O. (2011). Moisture sorption isotherms of two varieties of millet.
Food Bioproduct Processing. Jul; 89 (3): 178-184.
Rizvi, S.S.H. 1995. Thermodynamic properties of foods in dehydration. In Engineering
Properties of Foods, 2nd ed., eds. M. A. Rao and S.S.H. Rizvi, 223-309. New York: M. Dekker
Inc.
119
Ronald, E.W. Eric, A.D. Steven, J.S. and Peter, S. (2005). Handbook of food analytical
chemistry, water, proteins, enzymes, lipids, and carbohydrates, John Wiley and Sons,
Hoboken, NJ, USA.
Rubens, P. and Heremans, K. (2000). Stability diagram of rice starch as determined with FTIR,
High Pressure Research, 19, 161-166.
Ruiz-Lopez. I.I., Garcia-Alvarado M.A. (2007). Analytical solution for food-drying kinetics
considering shrinkage and variable diffusivity. Journal of Food Engineering, 79: 208- 216.
Saad, A., Touati, B., Draoui, B., Tabti, B., Abdenebi A., and Benaceur. S. (2014). Mathematical
modeling of moisture sorption isotherms and determination of isosteric heats of sorption of
Ziziphus leaves. Modeling and Simulation in Engineering, 2014: article No. 16.
Saeed, I. E., Sopian, K. and Zainol Abidin, Z. (2006). Drying kinetics of Roselle (Hibiscus
sabdariffa L.): dried in constant temperature and humidity chamber. Proc. SPS 2006. Edited by
Muchtar. 29th-30th August. Permata, Bangi, S.D.E., Malaysia: 143-148.
Saito, Y. (1993). Regeneration characteristics of adsorbent in the integrate desiccant/collector.
Journal of Solar Engineering, 115: 169-75.
Sahin, S., and Sumnu, S.G. (2006). Physical Properties of Foods. New York, United States:
Springer.
Eltief, S.A., Ruslan, M.H., Yatim B. (2007). Drying chamber performance of V-groove forced
convective solar dryer. Desalination 209(1-3) 151–155.
Salunkhe, d.K., Bolin, H.r. and Reddy, N.R. (1991). Storage, Processing and Nutritional
Quality of Fruits and Vegetables, 2 ed. CRC Press. Boca Roton. FL.
Samaniego-Esquerra, C. M., I. F. Boag and G. L. Robertson. (1991). Comparison of regression
methods for fitting the GAB model to the moisture isotherms of some dried fruits and
vegetables. Journal of Food Engineering, 13(2): 115-133.
Santos, B.M., Queiroz, M.R., Borges, T.P.F. (2005). A solar collector design procedure for
crop drying. Brazilian Journal of Chemical Engineering, 22(02), 277-284.
Santos, P.H.S., and Silva, M.A. (2008). Retention of vitamin C in drying process of fruits and
Vegetables - A review, Drying Technology, 26 (12): 1421-1437.
Sharaf-Eldeen, Y.I., Blaisdell, P.N., Hamdy , M.Y. A model for corn drying. Transactions of
the ASAE 1980, 23, 1261-1271.
Simate, I.N. (2010) Simulation of the mixed-mode natural convection solar drying of on maize,
Drying Technology. Dekker, Online publication, 1136-1154.
Siripatrawan, U., and Jantawat, P. (2006). Determination of moisture sorption isotherms of jasmine
rice crackers using BET and GAB models. Food Science and Technology International, 12(6):
459–465.
120
Sjöholm, I. and Gekas, V. Apple, (1995). Shrinkage upon Drying, Journal of Food
Engineering. 25, 123-130.
Skrede, G., Wrolstad, R.E. and Durst, R.W. (2000). Changes in Anthocyanins and
polyphenolics during juice processing of highbush blueberries (Vaccinium corymbosum L.).
Journal of Food Science, Sensory and Nutritive Qualities of Food, 2000, 65(2), 357–364.
Sreekumar, A., Manikantan, P.E. and Vijayakumar, K.P. (2008). Performance of indirect solar cabinet dryer, Energy Conversion and Management, 49, 1388–1395.
Sukhmeet, S. and Parm, P.S. (1997). Regeneration of silica gel in multi-shelf regenerator,
Renewable Energy, 13(1): 105-119.
Swinbank; W.C. (1963). Long wave radiation from clear skies, Quart. J. Royal Meteorol. Soc.,
89. 339-348.
Talbot, P., Lhote, M., Heilporn, C., Schubert, A., Willaert F.-X., Haut B. (2016). Ventilated
tunnel solar dryers for small-scale farmers communities: Theoretical and practical aspects,
Drying Technology, 1-46.
Techajunta S., Chirarattananon S. and Exell R.H.B. (1999) Experiments in a solar simulator on
solid desiccant regeneration and air dehumidification for air conditioning in a tropical humid
climate. Renewable Energy, 17:549–68.
Tiwari, A., Sodha, M.S. (2007). Parametric study of various configurations of hybrid
PV/thermal air collectors: Experimental validation of theoretical model. Solar Energy
Materials and Solar Cells, 91, 17-28.
Toğrul H., Arslan, N. (2007). Moisture sorption isotherms and thermodynamic properties of
walnut kernels. Journal of Stored Products Research, 43: 252–264.
Tomas, M.; Vladimir, Z.; Juliane, M. (2009). Detailed modeling of solar flat-plate collectors
with design tool kolektor 2.2, Building Simulation. Eleventh International IBPSA Conference
Glasgow, Scotland, 2289-2296.
Toor, R.K. and G.P. Savage (2004). Effect of semi-drying on the antioxidant components of
tomatoes, Food Chemistry, 94, 90-97.
Torres, R., Montes, E.J., Andrade, R.D., Perez, O.A., Toscano, H. (2011). Drying kinetics of
two yam (Dioscoreaceae alata) varieties. Dyna., 79(171), 175-182.
Tsami, E., Marinos-Kouris, D. and Maroulis, Z.B. (1990). Water sorption isotherms of raisins,
currants, figs, prunes and apricots. Journal of Food Science, 55(6): 1594-1597.
Tütüncü, M.A., Labuza, T.P. (1996).Effect of Geometry on the Effective Moisture Transfer
Diffusion Coefficient, Journal of Food Engineering, 30, 433-447.
Vega-Gálvez, A., Lemus-Mondaca, R., Tello-Ireland, C., Miranda, M., and Yagnam, F.
(2009).)
121
Kinetic study of convective drying of blueberry variety O’Neil (Vaccinium corymbosum).
Chilean Journal of Agricultural Research, 2009, 69(2): 171–178.
Vega-Mercado, H., Gongora-Nieto, M.M and Barbosa-Canovas, G. (2001). Advances in
dehydration of food. Journal of Food Engineering, 49, 271-289.
Verma L.R., Bucklin R.A., Endan J.B., Wratten F.T. (1985). Effect of drying air parameters on
rice drying models. Transaction of the ASAE, 28(1): 296-301.
Wolf, D., Kudish, A.I., Sembira A.N. Dynamic simulation and parametric sensitivity studies
on a flat-plate solar collector. (1981). Energy. 6, 333-349.
Yadollahinia, A. Jahangiri, M. (2009). Shrinkage of potato slice during drying, Journal of Food
Engineering, 94, 52–58.
Yaldiz, O. and Ertekin, C. (2001). Thin layer solar drying of some vegetables. Drying
Technology, 19(3/4): 583-597.
Yilbas, B.S., Hussain, M.N. and Dincer, I. (2003). Heat and moisture diffusion in slab products
to convective boundary. Heat and Mass Transfer, 39:471-476.
Young, J.H., and Nelson, G.L. (1967). Theory of hysteresis between sorption and desorption
isotherms in biological material. Transaction of the ASAE, 10(2): 260-263.
Zanoni, B., Peri, C., Nani, V. and Lavelli (1999). Oxidative heat damage of tomato halves as
affected by drying, Food Research International, 31, 395-401.

122

123
Summaries

124
125
Summary Yam is an important food crop in Ghana. It is a delicacy that is eaten after cooking or frying
the fresh sample when cut into slices. The powders of the dried yam can be incorporated into
soups, baby food and bread as composite flours. However, the high moisture content of yam
when harvested (about 70%wb) makes it susceptible to spoilage leading to reduced shelf life
and onward rejection by the consumer. This adds to the waste basket. Drying is a worldwide
postharvest method for extending the shelf life of agricultural food products such as yam. An
energy source that is cheap and clean has always been from the sun. The open sun method has
been utilized severally and for many years, but this is subject to various contaminants and thus
reducing its quality. A confined solar drying method is a better option but the energy source is
limited to the day’s solar energy. Solar adsorption drying is an opportunity to dry day and night
in an efficient and product conserving manner with a reduced drying cycle. Prior to this thesis
work, several aspects were insufficiently known to really judge the potential. The thesis tackles
some of the bottlenecks and problems: lack of knowledge about the drying properties of yam;
how to design appropriate solar collectors for drying and regeneration and to share experiences
with the actual implementation of the system to see its possibilities an opportunities. In this
thesis the sorption properties of yam which gives an indication of the equilibrium moisture
content in relation to water activity at constant temperature, but has been given less attention
in literature, is studied. The analytical Crank solution to the Fick’s second law has been utilized
in the prediction of drying curves of many food products. However the Crank solution puts
limitations on the extent to which the equation could be utilized. The limitation is that the
particle of food sample to be dried must be infinite, shrinkage should not exist, while moisture
diffusion coefficient must be constant. In practice, these limitations are not realistic since most
biological food products go through shrinkage together with variable moisture diffusion.
Meanwhile the source of energy for drying has largely come from the sun and has led the use
of the so-called open sun drying (OSD) method especially in tropical countries, for so many
years. This method exposes the food to weather conditions and contaminants reducing the
quality of the dried product. Recent research has shown that a confined drying system is most
appropriate in terms of reduced drying time and quality of the final product. The shortcoming
of the solar drying (SD) method is that, drying is limited to a time interval of 6-9 hours of the
day after which the sun’s energy can no more be explored. Solar adsorption drying (SAD), as
an alternative drying to solar drying, is an integrated drying method that helps in drying day
and night in a continuous manner. Research in solar adsorption drying systems is limited in
literature, therefore its performance is yet to be explored. Solar collectors are an integral part
of solar and solar adsorption dryers. However, most researchers construct collectors to see what
happens or use heuristic rules, whereas others do not link to dryers. The output air temperature
has an effect on the quality of the dried food product, therefore much attention must be given
to the output temperature of the air that enters the dryer. On the other hand after adsorption
126
drying, the adsorbent needs to be regenerated. The easiest way to regenerate the adsorbent
(silica gel), which requires temperatures over 70°C is by conventional ovens, which is costly.
In this thesis, the condition and requirements for solar adsorption drying of yam (Dioscorea
rotundata) is investigated. The approach is first to investigate the sorption properties of yam,
then the drying characteristics of yam by modifying the Crank solution of the Fick’s diffusion
equation, subsequently the model based design and construction of solar collectors for drying
and regeneration purposes, and then finally, the proof of principle of solar - adsorption for both
drying and regeneration.
The first part of this thesis concerns investigating the equilibrium moisture isotherms for yam
at 25°C and 50°C, both for sorption and desorption, experimentally using the gravimetric
method (Chapter 2). The strength of this work is that a Dynamic Vapour Sorption (DVS)
analyzer, which is very sensitive to micro changes in weight loss during dehydration or
rehydration, was used. A graphical presentation of equilibrium moisture content, as a function
of water activity from the outcome of nonlinear regression analyses of desorption and
adsorption isotherms respectively, is shown. The findings contradict most of the findings in
literature. The parameters and their uncertainty range for each of the models (GAB, Henderson,
Halsey, Oswin, Smith, BET and Peleg) are estimated. The strength of the statistical analysis is
that an objective criteria is used to select the model that best describes the experimental
desorption and adsorption isotherms over the relevant range of moisture contents. This has
been presented in a table form where statiscally, the standard error (SE), the percent average
relative deviation (PRD), Akaike Information Criterion (AIC), coefficient of performance (R2),
and most importantly, the 2-σ bound confidence interval of the parameters, in particular those
that bear the same unit as the equilibrium moisture content (Xe), have been taken into
consideration. The GAB model was selected to describe both the desorption and adsorption
isotherms, because it allows a physical interpretation.
In Chapter 3, the Crank’s analytical approximation to Fick’s diffusion equation is used to
investigate the effect of moisture dependent sample thickness and diffusivity on the drying
behavior of yam (Dioscoreaceae rotundata) cubicles. Separate experiments of drying and
shrinkage at constant temperatures of 30, 40 and 50oC were conducted in a cabinet dryer. The
comparative study shows an interdependence between diffusivity and shrinkage due to water
loss during drying. The analytical expression for the diffusion in a slab results in non-Fickian
behavior for smaller cubicles and consequently, results in a higher effective diffusion
coefficient. The drying rate trajectory shows two stages as a function of moisture ratio. The
drying behavior of yam is better described by observing both drying and drying rate curves
concurrently. This gives good agreement between observed and model data by a combination
of fractal moisture dependent shrinkage and moisture dependent diffusion. The advantage of
this modified Crank’s approximation is that the moisture trajectory of finite food cubicles can
be predicted appropriately.
127
In Chapter 4, coupled partial differential equations are developed to investigate which
collector lengths are appropriate for drying and for adsorbent regeneration. The output air
temperature of the model was validated with an experiment. The spatially distributed model is
a powerful tool to aid in multi-purpose collector design leading to solar dryer and regeneration
system construction. The advantage of this model is that, the spatial mean temperature of the
absorber plate, a requirement for the determination of the overall heat loss coefficient, which
hitherto is absent in the approach of Duffie and Beckmann, is no more a problem. The result
shows a spatially distribution of temperature in air, absorber plate, and glass cover as functions
of collector length and time (day) at constant air velocity and presented in a graphical from.
While the temperature of absorber plate, glass cover and air are functions of time (day), the air
temperature additionally varies directly with collector length. The study shows the operational
overall heat loss coefficient, radiative and convective heat gain and efficiency as functions of
the operational air velocity. There was a good agreement between the observed and the model
air output temperature.
The proof of principle of solar adsorption drying (SAD) and its benefits, compared to solar
drying (SD) and open sun drying (OSD) and the effects of these drying methods on the quality
of different yam cultivars and regeneration of silica gel is considered in Chapter 5. The drying
methods SAD, SD and OSD are compared in terms of drying cycles. The SAD had, the shortest
drying cycle while maintaining the whitish colour of yam, followed by SD and OSD. However,
due to the night drying, the SAD dried product is longer exposed to the drying medium (air),
leading to slightly lower vitamin C content of dried sample compared to SD dried samples.
OSD had the worst effect on vitamin C. The study shows that the different cultivars of yam
dried at different rates. Drying has no effect on composition. Regeneration was possible with
solar energy but more work must be done to obtain the information needed for improved
designs and operation strategies for the desorption. Chapter 6 gives the perspective, impact
and reflection of the whole work. The potential application of the study has also been discussed.
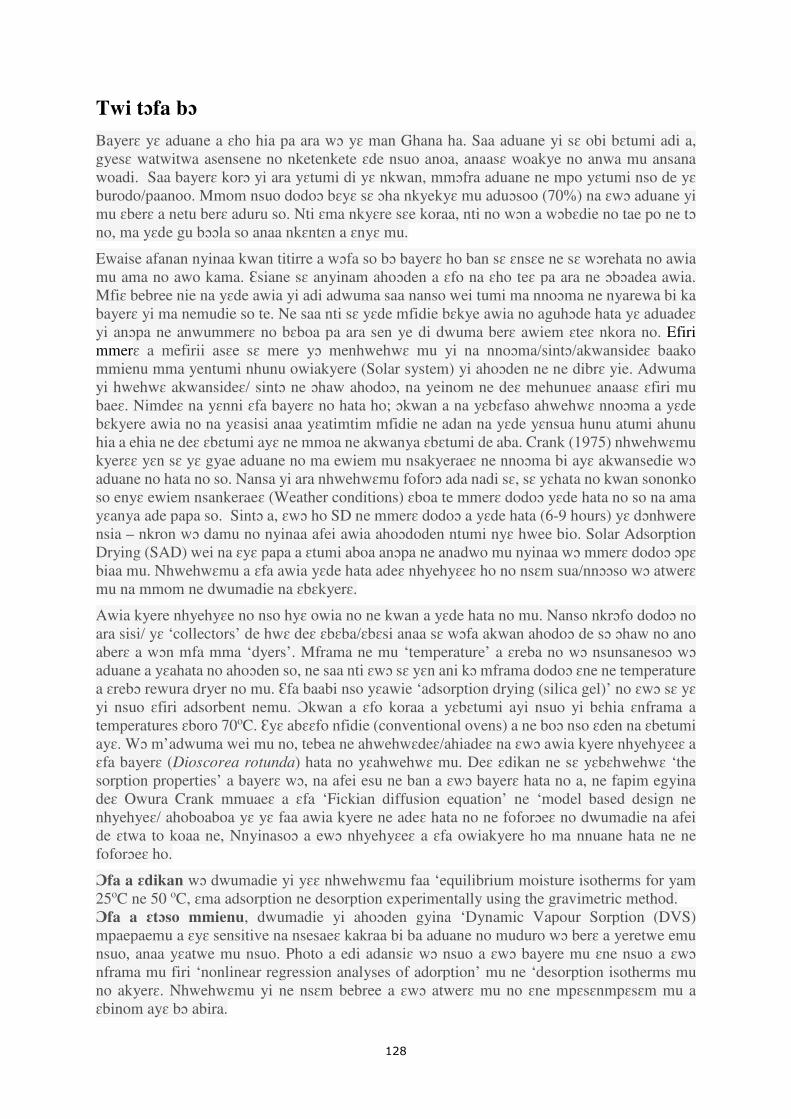
128
Twi tɔfa bɔ
Bayerɛ yɛ aduane a ɛho hia pa ara wɔ yɛ man Ghana ha. Saa aduane yi sɛ obi bɛtumi adi a, gyesɛ watwitwa asensene no nketenkete ɛde nsuo anoa, anaasɛ woakye no anwa mu ansana woadi. Saa bayerɛ korɔ yi ara yɛtumi di yɛ nkwan, mmɔfra aduane ne mpo yɛtumi nso de yɛ burodo/paanoo. Mmom nsuo dodoɔ bɛyɛ sɛ ɔha nkyekyɛ mu aduɔsoo (70%) na ɛwɔ aduane yi mu ɛberɛ a netu berɛ aduru so. Nti ɛma nkyɛre sɛe koraa, nti no wɔn a wɔbɛdie no tae po ne tɔ no, ma yɛde gu bɔɔla so anaa nkɛntɛn a ɛnyɛ mu.
Ewaise afanan nyinaa kwan titirre a wɔfa so bɔ bayerɛ ho ban sɛ ɛnsɛe ne sɛ wɔrehata no awia mu ama no awo kama. Ɛsiane sɛ anyinam ahoɔden a ɛfo na ɛho teɛ pa ara ne ɔbɔadea awia. Mfiɛ bebree nie na yɛde awia yi adi adwuma saa nanso wei tumi ma nnoɔma ne nyarewa bi ka bayerɛ yi ma nemudie so te. Ne saa nti sɛ yɛde mfidie bɛkye awia no aguhɔde hata yɛ aduadeɛ yi anɔpa ne anwummerɛ no bɛboa pa ara sen ye di dwuma berɛ awiem ɛteɛ nkora no. Efiri mmerɛ a mefirii asɛe sɛ mere yɔ menhwehwɛ mu yi na nnoɔma/sintɔ/akwansideɛ baako mmienu mma yentumi nhunu owiakyere (Solar system) yi ahoɔden ne ne dibrɛ yie. Adwuma yi hwehwɛ akwansideɛ/ sintɔ ne ɔhaw ahodoɔ, na yeinom ne deɛ mehunueɛ anaasɛ ɛfiri mu baeɛ. Nimdeɛ na yɛnni ɛfa bayerɛ no hata ho; ɔkwan a na yɛbɛfaso ahwehwɛ nnoɔma a yɛde bɛkyere awia no na yɛasisi anaa yɛatimtim mfidie ne adan na yɛde yɛnsua hunu atumi ahunu hia a ehia ne deɛ ɛbɛtumi ayɛ ne mmoa ne akwanya ɛbɛtumi de aba. Crank (1975) nhwehwɛmu kyerɛɛ yɛn sɛ yɛ gyae aduane no ma ewiem mu nsakyeraeɛ ne nnoɔma bi ayɛ akwansedie wɔ aduane no hata no so. Nansa yi ara nhwehwɛmu foforɔ ada nadi sɛ, sɛ yɛhata no kwan sononko so enyɛ ewiem nsankeraeɛ (Weather conditions) ɛboa te mmerɛ dodoɔ yɛde hata no so na ama yɛanya ade papa so. Sintɔ a, ɛwɔ ho SD ne mmerɛ dodoɔ a yɛde hata (6-9 hours) yɛ dɔnhwere nsia – nkron wɔ damu no nyinaa afei awia ahoɔdoden ntumi nyɛ hwee bio. Solar Adsorption Drying (SAD) wei na ɛyɛ papa a ɛtumi aboa anɔpa ne anadwo mu nyinaa wɔ mmerɛ dodoɔ ɔpɛ biaa mu. Nhwehwɛmu a ɛfa awia yɛde hata adeɛ nhyehyɛeɛ ho no nsɛm sua/nnɔɔso wɔ atwerɛ mu na mmom ne dwumadie na ɛbɛkyerɛ.
Awia kyere nhyehyɛe no nso hyɛ owia no ne kwan a yɛde hata no mu. Nanso nkrɔfo dodoɔ no ara sisi/ yɛ ‘collectors’ de hwɛ deɛ ɛbɛba/ɛbɛsi anaa sɛ wɔfa akwan ahodoɔ de sɔ ɔhaw no ano aberɛ a wɔn mfa mma ‘dyers’. Mframa ne mu ‘temperature’ a ɛreba no wɔ nsunsanesoɔ wɔ aduane a yɛahata no ahoɔden so, ne saa nti ɛwɔ sɛ yɛn ani kɔ mframa dodoɔ ɛne ne temperature a ɛrebɔ rewura dryer no mu. Ɛfa baabi nso yɛawie ‘adsorption drying (silica gel)’ no ɛwɔ sɛ yɛ yi nsuo ɛfiri adsorbent nemu. Ɔkwan a ɛfo koraa a yɛbɛtumi ayi nsuo yi bɛhia ɛnframa a temperatures ɛboro 70oC. Ɛyɛ abɛɛfo nfidie (conventional ovens) a ne boɔ nso ɛden na ɛbetumi ayɛ. Wɔ m’adwuma wei mu no, tebea ne ahwehwɛdeɛ/ahiadeɛ na ɛwɔ awia kyere nhyehyɛeɛ a ɛfa bayerɛ (Dioscorea rotunda) hata no yɛahwehwɛ mu. Deɛ ɛdikan ne sɛ yɛbɛhwehwɛ ‘the sorption properties’ a bayerɛ wɔ, na afei esu ne ban a ɛwɔ bayerɛ hata no a, ne fapim egyina deɛ Owura Crank mmuaeɛ a ɛfa ‘Fickian diffusion equation’ ne ‘model based design ne nhyehyeɛ/ ahoboaboa yɛ yɛ faa awia kyere ne adeɛ hata no ne foforɔeɛ no dwumadie na afei de ɛtwa to koaa ne, Nnyinasoɔ a ewɔ nhyehyɛeɛ a ɛfa owiakyere ho ma nnuane hata ne ne foforɔeɛ ho.
Ɔfa a ɛdikan wɔ dwumadie yi yɛɛ nhwehwɛmu faa ‘equilibrium moisture isotherms for yam 25oC ne 50 oC, ɛma adsorption ne desorption experimentally using the gravimetric method. Ɔfa a ɛtɔso mmienu, dwumadie yi ahoɔden gyina ‘Dynamic Vapour Sorption (DVS) mpaepaemu a ɛyɛ sensitive na nsesaeɛ kakraa bi ba aduane no muduro wɔ berɛ a yeretwe emu nsuo, anaa yɛatwe mu nsuo. Photo a edi adansiɛ wɔ nsuo a ɛwɔ bayere mu ɛne nsuo a ɛwɔ nframa mu firi ‘nonlinear regression analyses of adorption’ mu ne ‘desorption isotherms mu no akyerɛ. Nhwehwɛmu yi ne nsɛm bebree a ɛwɔ atwerɛ mu no ɛne mpɛsɛnmpɛsɛm mu a ɛbinom ayɛ bɔ abira.
129
Adwene mu kesenee ntanta ne nteaseɛ/akyinniyegyeɛ bi a na ɛwɔ wɔn mu no sesɛ kakra. The parameters ɛne uncertainty range ɛwɔ models (GAB, Henderson, Halsey, Oswin, Smith, BET and Peleg) ɛnhwewh mu kɔɔso. Ahoɔden na ɛwɔ akonta buo nhwehwɛmu no kyerɛ sɛ wɔ gyina nokwasɛm ne nsusueɛ bi a ɛyɛ na ɛbɛ boa so na wɔde kyerɛɛ wɔ nsɛm no mu yie. Yɛahyehyɛ wei wɔ kama wɔ ɛpono so a akontabuo ne nnoɔma nyinaa deda n’akwan mu kama. Yɛnwhewhɛmu no kyeresɛ GAB model no na ɛtumi kyerɛ sɛ nia bayerɛ ɛhata ne sɛnia ɛnsuo firi emu ba ɛne sɛnia ɛkyi nsuo. Yɛsii saa gyinaɛ wei esansɛ GAB no wɔ physical interpretation.
Ɔfa a ɛtɔso mmiɛnsa, Crank mpɛnsɛnpensɛnmu a efa ‘Fick diffusion equation’ no na ɔde hwehwɛɛ nsunsunaeɛ nsuo dodoɔ ɛne sɛ nea bayerɛ fɔn sɛ nea nsuo pue firi mu ba, afei yɛ hata nso a sedeɛ ɛyɛ. Nsɔhwɛ ahodo mmienu bi nso ɛfa yɛre hata/yɛɛma no awoɔ ne ɛremoa/ɛtwom a na egyina temperatures ahoroɔ 30, 40 ne 50 0C nso kɔɔ so wɔ kabenet draya mu. Adesua/suahunu a ɛfiri mu baeɛ ne sɛ nteaseɛ ne ahotɔsoɔ bi wɔ sɛ ɛremoa ne nsuo a efiri mu ɛnam nsuo dodoɔ ɛhwere berɛ a yɛre hata no.
Ɔfa ɛtɔso nan yɛkeka nnoɔma ahodoɔ bebree na yɛde yɛ nhwehwɛmu hunu adekodeɛ ne mmerɛ dodoɔ a ɛyɛ ma ne woɔ/hata ne ‘for adsorbent’ ɛfoforɔeɛ. Yɛde coupled partial differential equations ɛna ɛyɛɛ nhwehwɛmu sɛ collector tintin bɛn na yɛtumi de hata bayerɛ ɛne deɛ yɛde hata silica gel. Model yi yɛ soronko ɛsansɛ yɛtumi de design solar dryers ɛna and regenerators. Ɛbio, spatial mean temperature ɛma absorber plate a yɛde whewhɛ overall heat loss coefficient ɛnyɛ ɛhao koraa, efisɛ overall heat loss coefficient, Duffie and Beckmann, kaasɛ ɛyɛ ohao paa. The result shows a spatially distribution of temperature ɛwɔ mframa mu, absorber plate, ɛne glass cover as functions of collector ne tintin ɛne ɛmmirɛ (day) at constant air velocity akyerɛ ɛwɔ photo mu. Biibiaa di adansiɛ sɛ yɛ model yi ɛne deɛ esi wɔ bayirɛ hata mu ɛkɔ paa.
Ɛnsonsuanso pa ɛne ɛnsonsuanso bɔne a ɛda solar adsorption drying (SAD), solar drying (SD)
ɛne open sun drying (OSD) mu akyerɛ ɛwɔ krata fa a ɛtɔso enum mu. Ɛmmirɛ a SAD no de
hata bayerɛ ɛwo ntɛm kyɛn SD ɛne OSD. Afei nso SAD ɛtumi maa bayerɛ no colour fitaa no
ansesa kɛse koraa. Nanso vitamin C no deɛ na SD deɛ no wɔ ɛsoro kakra ɛkyɛn SAD deɛ no.
Enam sɛ ɛmmirɛ kakra ɛbɛ tɔɔ SAD deɛ no so. OSD ɛnsonsuanso wɔ vitamin C so no na ano
ɛden kyɛn SAD ɛne SD deɛ no so. Cultivars no anya ɛnsonsuanso ɛwɔ enuanenuro a ɛwɔ bayerɛ
mu. Yɛtumi de awia no ɛhataa silica gel no nanso adwuma kakra wɔ hɔ a ɛwɔ sɛ yɛ na ɛwie pɛ
yɛ. Krata fa a ɛtɔ so nsia bɔ adwuma no nyinaa tofa ɛne sɛ nea yɛ bɛ tumi de ayɛ adwuma
afa.

130
131
Acknowledgement I am most grateful to my supervisors for the wonderful support, encouragement and the various
inputs made to the success of this research. Zimmerman once said “opportunity is not, it
becomes”. In this sense I will say “Titles are not, they become”. You have proven beyond all
reasonable doubt that your output justifies your titles. To Emeritus Professor Gerrit van Straten,
I will say thank you so much for your meticulous scrutiny and objective comments. In fact you
have always expected excellence throughout the supervision of this research. I remember you
once told me that failure of one method of solution only brings a closure to that path of solution.
My sincere gratitude goes to Associate professor Ton van Boxtel, who has been very
instrumental to the successful end of this research. Ton the laptop you gave me is still alive and
kicking. Your caring behavior is unimaginable. Professor Karel Keesman taught me physical
modeling. That was the first time I was introduced to Matlab. The level of understanding of
Matlab and the contributions made by my supervisors cannot be over emphasized. The
contributions of Karel to the research lately, has been stunning. Dr. Rachel Ooteghem was an
assistant lecturer to Karel during my Physical modeling classes. In fact she always gave an
alternative solution to any challenge I was faced with. With regards to technical challenges,
Kees Asselt was instrumental. In fact his technical knowledge is excellent be it new equipment,
electrical gadgets, software for running control systems. My warm regards to you Kees. My
regards also go to Marja for the infectious you always put on your face. It was always a delight
to work with you as the secretary to the group. I thank Bitter Harry for his good and generous
leadership style. I am indebted to you. This is because your intervention came in on time when
I missed my flight to Las Vegas, USA, for a conference. You instructed the secretary Gerda
Bos to repay for my ticket though I had lost the opportunity for the first time. I will forever
remember this kind gesture you offered to me. Bitter the song we sung for you during your
early days as the new chair is still fresh in my mind. In fact the composers of the song were
apt. These, the cakes at coffee times and many others are the unique memories that will always
linger in my mind for a long time. One person that I cannot forget is the person who initiated
the discussion on my PhD with Ton, Peter Twumasi, a professor in Biochemistry, KNUST.
Probably this new knowledge from these noble men of rich scientific background in
Wageningen University wouldn’t have materialized if you had not initiated talk on this research
work with Ton. Peter I am grateful to you. My sincere thanks goes to Jos, who allowed me in
his lab in performing the sorption experiment on yam. My regards to Prof Johan Sanders and
Prof. Mrs. Elinor Scott for the wonderful experience we shared together especially on the
chlorogenic acid (from cocoa husk) proposal we attempted soliciting for funds to undertake.
Of course there have been various contributions and concerns from people in my host country
and University. First I will like to Acknowledge Professor Ibok Oduro and Professor W.O.
Ellis (The former Vice Chancellor) for their support for bringing this work to a successful end.
To my co-supervisor in Ghana, Prof. K.A. Dzisi, I am grateful to you for your objective
132
comments and pieces of advice. Senior lecturers who have taken keen interest in my research
work and want this Sandwich PhD work come to its logical terminating point are: Mrs F.O.
Mensah, Prof. V.P. Dzogbefia (all of Biochemistry Department, KNUST) Prof J.H. Oldham,
Mr. J. Barimah (all of Food Science and Technology Department, KNUST). I am most grateful
to you, Mrs. F.O. Mensah, for it was you who wrote and signed the Department (KNUST)
support letter for me. You are indeed a woman of genuinely good heart. I am most grateful to
the MSc students, whom I supervised their thesis while using the solar adsorption dryer system
(SADS) I constructed for their experimental work during this thesis work. They include:
Gladys Kyere, Ama Adutwumwaa, Herbert Kyeremateng (yam drying) and Esther (Banana
drying). In fact we shared so much experiences together and it was nice working with you all.
Out of this sandwich PhD experience, a new direct and indirect solar house dryer has been
constructed. I have already supervised two MSc students (Clifford Yeboah-Manson and
Gabriel Annobil Bisiw) who have dried cocoa seeds with better quality characteristics
compared to those dried in the open sun. I am currently supervising one MSc student (Fidaus
Abdul Rahman) using the solar house dryer, in drying and extraction of Oleoresin from ginger
These various experiments justifies the scientific basis for my research work. There have been
numerous BSc students whom I also supervised while using various food products ranging
from pepper, mangoes, coconut fruit, cassava, etc just to mention a few in the SADS.
I am most grateful to my colleague PhD students, Ellen, Xin, Jimmy, James, Nural, Sanne and
Piet. It was wonderful working with you as researchers. Ellen, Sanne, Xin etc, when are you
visiting Ghana? Ellen what about the mind mapping agenda?
My sincere thanks go to Henrietta Brew (Mrs,) for helping me with the architechtural drawings
and Evelyn Ewuraa Ama Ennu for translation the English version of the summary to Twi (An
Akan language spoken by many Ghanaians in Ghana). My profound gratitude goes to the
professional carpenter, Kwaku Adu Boahen, Alias Kooko (RIP), who did all the carpentry work
for this project. I thank him so much.
My family has been there for me throughout this research work since as part of the work I have
to be in Netherlands for some months while the experiment is conducted in Ghana. My family
has been supportive. My sincere thanks goes to my parents (James Adu Amankwah and
Comfort Owusu Afriyie (Diseased)) and especially my wife Mrs. Bertha Amankwah and my
children Adubofour Amankwah, Nana Adwoa Amankwah, Kufour Amankwah and Naomi
Amankwah. Bertha, I appreciate your objective criticisms and financial support.
Finally, this project was funded by the Wageningen University and Research Centre (WUR),
The Netherlands, and Kwame Nkrumah University of Science and Technology (KNUST),
Kumasi, Ghana. The authors are grateful for this financial and in kind contribution.
133
About the author
Emmanuel Yaw Adu Amankwah was born in May 13, 1968.
He attended Adisadel College (both Ordinary and Advance
level), Cape Coast in Ghana for his secondary education
between 1981 and 1988. He received his BSc degree in
Agricultural Engineering in the year 1996 and M.Sc. in Food
Science & Technology (2000) all at the Kwame Nkrumah
University of Science and Technology, Kumasi, Ghana. The
energy consumption (bio-fuel and agricultural input) and its
efficient use on one of the largest maize farms in West Africa
was studied during his B.Sc. programme. Just after the B.Sc.
programme an offer to serve in the Agricultural Engineering Department as a teaching assistant
was given. At the MSc. level, he worked on food product development/ sensory analysis and
evaluation of some varieties of tomatoes in Ghana as a potential use as tomato ketchup, using the
gravity method as a means of concentration. After the MSc. level an offer was also given to work
as an Assistant lecturer (2001) which was upgraded to a lecturer position in 2002. As a lecturer
both the BSc. and MSc. students were supervised in areas ranging from preparation of weaning
foods using local materials (maize, soy bean, rice etc.), heat treatment effect of food nutrients,
microbiological studies, composite fruit drinks (e.g. moringa-fruit beverages), improving
efficiencies of local drying and its effect on agricultural materials, establishing the sensory and
chemical stability of Wagashie (a Ghanaian local cheese), drying characteristics and
physicochemical properties of two varieties of plantain, etc. Emmanuel’s main areas of recent
research has been in model based design and manufacture of Solar – Adsorption Drying Systems
(SADS). In 2005-2006 he was the Principal Investigator in a World Bank funded project titled
“Design and Manufacture of Solar and Oven Driers Using local materials to Improve Drying
Operations at the Biochemistry, Biotechnology and Food Science Departments.” This World Bank
project was funded through Ghana Ministry of Education, Youth and Sports (MEYS), Ghana
National Council for Tertiary Education (NCTE), and Ghana Education Sector Project (EDSEP).
He has supervised over 30 MSc/MPhil students and numerous number of BSc students in their
theses. His sandwich PhD research in Wageningen University Research center was begun in
September 2010. It involved some few months in the Netherlands for completion of proposal, take
some courses as part of the award of the degree, research conferences both within and abroad and
to conduct most of the experimental work in the researcher’s home country. The title of the PhD
research work is “Drying of yam with solar adsorption system”. Six MSc/MPhil students have
been supervised the candidate in using the solar adsorption dryer equipment for their experimental
work.

134
135
List of publications
• Amankwah, E. A., K. A. Dsizi, G. van Straten, and A. J. B. van Boxtel. 2018. Modeling
the equilibrium moisture content of desorption and adsorption of yam (Dente).
Agricultural Engineering International: CIGR Journal, 20(1): 184–192.
• Amankwah, Emmanuel A.; Dzisi, Komla Agbeko; Straten, Gerrit van; Boxtel, Anton J.B.
van 2018. Moisture dependent diffusion and shrinkage in yam during drying, International
Journal of Food Engineering, 14(7-8), ISSN 2194-5764 - 15 p.
• E. A. Y. Amankwah, K. A. Dzisi, G. van Straten, L. G. van Willigenburg & A. J. B. van
Boxtel (2017) Distributed mathematical model supporting design and construction of
solar collectors for drying, Drying Technology, 35:14, 1675-1687.
Conference proceedings (peer reviewed) • Amankwah, E.A. Dzisi, K.A. van Straten, G. and van Boxtel, A.J.B. (2014) Modeling the
drying and sorption behavior of Yam (Dioscoreaceae rotundata), 3rd International
Conference and Exhibition on Food Processing and Technology, July 21-23, 2014,
Hampton inn, Las Vegas, USA.
• Amankwah, E.A., K.A. Dzisi, G. van Straten, A.J.B. van Boxtel, Modeling the solar
collector for drying agricultural products, 18th International Drying Symposium
November 11th - 15th, 2012, Vol B, Swiss International Hotel, Xiamen, China.
• Ooteghem R.J.C. van, Amankwah E.A., Boxtel, A.J.B. Recursive identification of time-
variant model parameters from drying curves. IDS2016. Gifu Japan.

136
137
Completed training activities Discipline specific activities
Reaction kinetics in food science, VLAG, 2013
Physical modeling, SENSE, 2010
3rd International Conference and Exhibition on Food Processing and Technology, July 21-23,
2014, Hampton inn, Las Vegas, USA.
General courses
VLAG student week, Venlo, VLAG, 2010
Sustainability analysis in food and biobased production, VLAG, 2014
Scientific writing, Centa, 2012
Presentation skills, Centa, 2012
End note X4, Library, 2012
Lecturing, EDS, 2010
Conversation skills in One to one guidance, EDS, 2010
Food Structuring and rheology, WU
Optional
Writing/updating project proposal, SCO, 2010
Control engineering, SCO, 2011

138
This work was performed at Wageningen University within the chair group Biobased Chemistry and Technology. The research has been financially supported by the Wageningen University Fund and Kwame Nkrumah University of Science and Technology.
Cover design: Emmanuel Peprah, Perpx Print Solutions