Embed Size (px)
Citation preview

CXCR4/IgG-expressing plasma cells are associated withhuman gastrointestinal tissue inflammation
Clarisa M. Buckner, PhD,a* Susan Moir, PhD,a* Lela Kardava, PhD,a Jason Ho, PhD,a Brian H. Santich, BA,a
Leo Jin Young Kim, BA,a Emily K. Funk, BA,a Amy K. Nelson, BSN,a Britanny Winckler, BA,b Cheryl L. Chairez, BSN,a
Narda L. Theobald-Whiting, BS,b Sandra Anaya-O’Brien, MSN,b Meghna Alimchandani, MD,c Martha M. Quezado, MD,c
Michael D. Yao, MD,b Joseph A. Kovacs, MD,d Tae-Wook Chun, PhD,a Anthony S. Fauci, MD,a Harry L. Malech, MD,b and
Suk See De Ravin, MD, PhDb Bethesda, Md
Background: We previously reported abnormalities incirculating B cells in patients with chronic granulomatousdisease (CGD) and those with HIV infection. Gastrointestinalcomplications are common to both diseases and likely involveperturbation of immune cells, including plasma cells (PCs). IgAis the most abundant immunoglobulin in the human body, withroles in protection and maintenance of intestinal homeostasis.IgA is produced primarily by PCs residing in mucosal tissuesthat are also thought to circulate in the blood.Objective: We sought to characterize and compare PCs inpatients with infectious (HIV) and noninfectious (CGD andCrohn disease) diseases that have been associated with intestinalinflammation.Methods: Phenotypic and transcriptional analyses wereperformed on cells isolated from the blood and colon.Results: IgA-secreting CCR10-expressing PCs predominated inthe guts of healthy subjects, whereas in patients with HIV, CGD,and Crohn disease, there was a significant increase in theproportion of IgG-secreting PCs. Where intestinal inflammationwas present, IgG-secreting PCs expressed reduced levels ofCCR10 and increased levels of CXCR4. The intensity of CXCR4expression correlated with the frequency of IgG-expressing PCsand the frequency of CXCR41/IgG1 PCs was associated withthe severity of intestinal inflammatory disease yet distinct fromPCs and plasmablasts circulating in the blood.Conclusions: These findings suggest that regardless of theunderlying disease, the presence of CXCR41/IgG1 PCs in thegut is a strong yet localized indicator of intestinal inflammation.Furthermore, our findings suggest that CXCR41/IgG1 PCsmight play a role in immune cell homeostasis duringinflammatory processes of the gut. (J Allergy Clin Immunol2013;nnn:nnn-nnn.)
From the Laboratories of aImmunoregulation and bHost Defenses, National Institute of
Allergy and Infectious Diseases; cthe Laboratory of Pathology, National Cancer Insti-
tute; and dCritical Care Medicine, National Institutes of Health Clinical Center.
*These authors equally contributed to this work.
Supported by the Intramural Research Program of the National Institute of Allergy and
Infectious Diseases, National Institutes of Health.
Disclosure of potential conflict of interest: The authors declare that they have no relevant
conflicts of interest.
Received for publication June 28, 2013; revised September 16, 2013; accepted for pub-
lication October 14, 2013.
Corresponding author: SusanMoir, PhD, Laboratory of Immunoregulation, NIAID, NIH,
10 Center Dr, 6A02, Bethesda, MD 20892. E-mail: [email protected]. Or: Suk See
De Ravin, MD, PhD, Laboratory of Host Defenses, NIAID, NIH, 10 Center Dr,
5W-3816, Bethesda, MD 20892. E-mail: [email protected].
0091-6749
http://dx.doi.org/10.1016/j.jaci.2013.10.050
Key words: Plasma cells, primary and infectious immunodefi-ciencies, gastrointestinal inflammation, inflammatory bowel disease,homing receptors
Chronic inflammation of the gut occurs in a wide array ofdisease settings, including infectious diseases, such as HIV, andnoninfectious diseases, such as inflammatory bowel disease(IBD) and the primary immunodeficiency chronic granulomatousdisease (CGD).1-4 In patients with HIV infection, high levels ofviral replication and cellular apoptosis decimate gut-associatedlymphoid tissue CD41 T cells. This process occurs particularlyduring the acute phase of infection and is continued to a somewhatlesser degree during the chronic phase characterized by variablelevels of persistent viremia. The end results are mucosal perturba-tions that cause loss of intestinal integrity and leakage of inflam-matory microbial products that contribute to immune activation.1
In patients with IBD, chronic inflammation is thought to involvedisturbances in the interactions between immune cells andcommensal bacteria of the gut, resulting in an increased proin-flammatory response and damage to the mucosal and submucosalcomponents of the gut.2 Crohn disease (CD) is a form of IBDinvolving granuloma formation in subjects who are thought tohave a genetic predisposition to CD but who otherwise are im-mune competent.4 In contrast, CGD is a primary host defensedeficiency characterized by a neutrophil disorder involving muta-tions in the NADPH oxidase pathway that cause defects in micro-bial killing and lead to increased susceptibility to life-threateningbacterial infections.5 Inflammatory granuloma formation isfrequent in patients with CGD, although colitis, with manifesta-tions similar to colitis in IBD, is observed in approximately30% of patients with CGD.3
Intestinal homeostasis is maintained by several interconnected,although not fully delineated, factors that include interactionsbetween microbes, physical barriers, and the host immunesystem.6,7 Among the many soluble factors involved in this deli-cate balance is secretory IgA, which provides a mucosal environ-ment with protection against invading pathogens and helps tomaintain a healthy diversified microbiota.8 The induction ofIgA-secreting PCs, occurring primarily in the gut-associatedlymphoid tissue but also in the lamina propria, is itself controlledby complex interactions involving various immune competentcells and soluble factors that favor immunoglobulin class-switching to IgA.9 IgA is traditionally referred to as a noninflam-matory antibody for empiric reasons, but this might be related tothe inability of IgA to activate complement and other proinflam-matory factors,6 the ability of IgA to restrict colonization of proin-flammatory bacteria,8 and the dendritic cell and T-cell pathwaysthat suppress proinflammatory effector responses in part through
1

J ALLERGY CLIN IMMUNOL
nnn 2013
2 BUCKNER ET AL
Abbreviations used
APC: A
llophycocyaninCD: C
rohn diseaseCGD: C
hronic granulomatous diseaseDAPI: 4
9-6-Diamidino-2-phenylindole dihydrochlorideHD: H
ealthy donorIBD: I
nflammatory bowel diseaseMFI: M
ean fluorescence intensityPC: P
lasma cellPE: P
hycoerythrinUC: U
lcerative colitissecretion of cytokines, such as TGF-b and IL-10, that favor IgAproduction.7 Furthermore, IgA deficiencies in mouse models, aswell as in the setting of human diseases, have been associatedwith gastrointestinal inflammation.10,11
One of the outcomes of gastrointestinal inflammation, whethergenetic or acquired or infectious or noninfectious, is the skewingof gut B cells toward production of IgG.6,12 Recent studies havealso shown that intestinal inflammation caused by CD and ulcer-ative colitis (UC) is associated with alterations in chemokinereceptor profiles of PCs in the gut and peripheral blood.13,14 Inthe present study we investigated IgA-expressing and IgG-expressing PCs and chemokine receptor expression in the colonsof healthy subjects, as well as patients with diseases associatedwith intestinal perturbations. Our findings reveal a spectrum ofprofiles unique to the gut environment, with CCR10 expressionon IgA1 and dual IgA1/IgG1 PCs predominating in the guts ofhealthy subjects with no evidence of inflammation, to increasingfrequencies of CXCR4-expressing high-intensity IgG1 PCs in theguts of subjects with diseases manifested by intestinal inflamma-tion. Collectively, these findings identify an immune cell–basedmarker of intestinal inflammation that is observed in a broad spec-trum of infectious and noninfectious disease settings.
METHODS
Participants and proceduresDemographics and clinical data for participants are detailed in Table I.
Colonoscopies were performed after informed consent in accordance with
the Institutional Review Board of the National Institute of Allergy and Infec-
tious Diseases. A gastrointestinal symptom score based on the Harvey-
Bradshaw Index, a validated CD clinical activity index, was created to assess
the severity of symptoms in participants. Participants without any gastrointes-
tinal symptoms were given a gastrointestinal symptom score of 1. The scores
of patients with CDwere assessed at the time of the initial visit. The score was
applied retrospectively to the CGD colitis group based on information from
clinical charts.15 The histopathologic evaluation was done in a blinded fashion
and given scores of 1 to 4, as detailed in Table I and theMethods section in this
article’s Online Repository at www.jacionline.org. Healthy donors (HDs)
were selected based on age, sex, and absence of gastrointestinal symptoms.
Cell isolation from colonoscopic biopsy specimensApproximately 30 tissue samples were obtained from each subject. The
tissue samples were incubated with 0.5 mg/mL collagenase (Type IV; Sigma-
Aldrich, St Louis, Mo) and 25 U/mL Benzonase (Novagen, Madison, Wis) in
RPMI containing 20% FBS, HEPES, and penicillin/streptomycin at 378Cwith
shaking for 30 minutes. After further dissociation by means of frequent
pipetting, cells were washed, enumerated, and stored on ice for use in
phenotypic analysis.
Flow cytometryMulticolor flow cytometric analyses were performed on gut-derived single
cells. The following conjugated mAbs were used for cell staining: allophy-
cocyanin (APC)–H7-CD20, V450-CD3, phycoerythrin (PE)–CD32, PE-Igk,
V450-Igl, and APC-IgG (BD Biosciences, San Jose, Calif); PerCP-
Cy5.5-CD19, PE-CD138, and PE-Cy7-CD27 (eBioscience, SanDiego, Calif);
PE-CCR10 and PE-CXCR4 (R&D Systems, Minneapolis, Minn); APC-IgM
(BioLegend, San Diego, Calif); and fluorescein isothiocyanate–IgA (Dako,
Carpinteria, Calif). Unless otherwise indicated, cells were permeabilized
(Permeabilizing solution 2, BD Biosciences) before addition of anti-
immunoglobulin antibodies. Samples were acquired on a FACSCanto II (BD
Biosciences) and analyzed with FlowJo software (TreeStar, Ashland, Ore).
Fluorescence microscopyGut-derived single cellswere stainedwith antibodies againstCD3, IgG (Alexa
Fluor 594), IgA (Alexa Fluor 488), CD20, CD27, and CD19. Cells were sorted
into 3 fractions by using a FACSAria (BD Biosciences): a CD31CD202CD192
negative control fraction, IgG1CD191CD2711CD202CD32 PCs, and the re-
maining CD191CD2711CD202CD32 PCs. Cells collected from each fraction
were cytospun, fixed with 49-6-diamidino-2-phenylindole dihydrochloride
(DAPI)–containing antifade reagent (Invitrogen Life Technologies, Carlsbad,
Calif), and visualized by using a fluorescence microscope (Evos; Advance
Microscopy Group, Bothell, WV).
Immunoglobulin transcriptional analysisTotal RNA was extracted from sorted cells by using the RNeasy Micro kit
(Qiagen, Valencia, Calif) and reverse transcribed with qScript cDNA SuperMix
(Quanta, Gaithersburg, Md). The variable regions of recombined IGH genes
were amplified, as described previously, by using the 59VH3 leader primer
(AAGGTGTCCAGTGTGARGTGCAG) with either the 39Cg CH1 primer
(GGAAGGTGTGCACGCCGCTGGTC) for IGG or the 39CaCH1 primer
(TGGGAAGTTTCTGGCGGTCACG) for IGA.16,17 The RNA moiety (H1
RNA) of human RNase P was amplified by using TaqMan RNase P Control
probes (Applied Biosystems Life Technologies, Carlsbad, Calif). Semiquantita-
tive analysis was performed with ImageJ software (http://imagej.nih.gov/ij/).
Statistical methodsMedian values were compared by using Mann-Whitney or Wilcoxon
matched-pairs signed-rank tests, where appropriate, with Prism software
(GraphPad Software, La Jolla, Calif). Three-way analyses were compared
simultaneously by using either Kruskal-Wallis or Friedman tests, and signif-
icant results prompted appropriate pairwise comparisons. The Spearman rank
method was used to test for correlation, and the Fisher exact test was used to
test for differences in sex. A P value of .05 or less was considered significant.
RESULTS
Description of study groupsColon biopsies were performed on 39 subjects divided into 4
groups based on their specific disease diagnosis (Table I). Therewere no significant differences in age and sex among the groups,whereas mutation and treatment profiles were varied for CGDparticipants (see Table E1 in this article’s Online Repository atwww.jacionline.org). For the HIV group, all participants were an-tiretroviral therapy naive; the median CD41 T-cell count was 591cells/mL, and the geometric mean plasma viremia was 7258 HIVRNA copies/mL (see Table E1). Two measures of gut disease andinflammation were reported, one based on histopathology (read asdeidentified samples by a gastroenterology pathologist) and theother based on gastrointestinal symptoms, as described in theMethods section. All HDs, HIV-infected patients, and patientswith nonsymptomatic CGD had absence of gastrointestinal

TABLE I. Participant profiles and clinical observations
Participant Age (y) Sex Pathology score GI symptom score Combined score Other pathologic findings
1-HD 34 M 2 1 3
2-HD 50 F 1 1 2 Reactive lymphoid aggregate; hyperplastic polyp
3-HD 43 M 1 1 2
4-HD 40 M 1 1 2 Reactive lymphoid aggregate
5-HD 36 M 1 1 2
6-HD 24 M 1 1 2
7-HD 43 M 1 1 2 Tubular adenoma
8-HD 22 F 1 1 2
9-HD 28 M 1 1 2 Tubular adenoma
10-HD 30 M 1 1 2 Reactive lymphoid aggregate
11-HD 27 M 1 1 2 Lymphoid aggregate
1-HIV 21 M 1 1 2 Reactive lymphoid aggregates; tubulovillous adenoma
2-HIV 55 M 1 1 2
3-HIV 36 M 1 1 2 Spirochetosis without inflammatory changes
4-HIV 30 M 1 1 2 Reactive lymphoid aggregate; pigmented macrophages
5-HIV 45 M 1 1 2
6-HIV 48 M 1 1 2
7-HIV 30 M 1 1 2 Reactive lymphoid aggregate
8-HIV 39 M 1 1 2 Lymphoid aggregate
9-HIV 52 M 1 1 2 Reactive lymphoid aggregate
10-HIV-A 23 M 2 1 3 Reactive lymphoid aggregate; poorly formed granuloma
1-CGD 29 M 4 3 7
2-CGD 43 M 1 3 4 Pigmented macrophages; granulomas
3-CGD 37 F 4 4 8
4-CGD 24 M 4 3 7 Pigmented macrophages; granulomas
5-CGD 22 M 4 3 7
6-CGD 23 M 4 3 7
7-CGD 20 M 4 3 7 Inflammatory pseudopolyp
8-CGD-N 19 M 1 1 2 Pigmented macrophages
9-CGD-N 29 M 1 1 2 Reactive lymphoid aggregate; pigmented macrophages
10-CGD-N 41 M 1 1 2 Tubular adenomas
11-CGD-N-A 28 M 1 1 2
1-CD 25 F 4 3 7
2-CD 47 M 4 3 7 Inflammatory pseudopolyp
3-CD 22 F 3 1 4 Granulomas
4-CD 23 F 3 1 4 Prominent eosinophilia
5-CD 25 M 4 2 6 Reactive lymphoid aggregate
6-CD 55 M 4 4 8 Reactive lymphoid aggregate
7-CD 30 M 1 1 2
Pathology score: 15 normal colon with no increase in inflammatory infiltrates; 25 mild inflammation with mild increase in density of inflammatory cells and patchy involvement
up to 25% of tissue; 3 5 moderate inflammation with moderate increase in density of inflammatory cells and involvement of greater than 25% to 50% of tissue; and 4 5 severe
inflammation with marked increase in density of inflammatory cells and involvement of greater than 50% of tissue. Gastrointestinal symptom score based on the Harvey-Bradshaw
Index (HBI): 1 5 no symptoms/remission (HBI score, <5); 2 5 mild disease (HBI score, 5-7); 3 5 moderate disease (HBI score, 8-16); and 4 5 severe disease (HBI score, >16).
-A, IgA deficient; GI, gastrointestinal; -N, asymptomatic.
J ALLERGY CLIN IMMUNOL
VOLUME nnn, NUMBER nn
BUCKNER ET AL 3
symptoms (score5 1, Table I). In the HD and HIV groups and theCGD with no gastrointestinal symptoms subgroup, all had anormal pathology score, with the exception of 1 participant ineach of the HD and HIV groups, both of whom had mild acuteinflammation. Patients with CGDwith colitis had gastrointestinalsymptom scores of 3 to 4, and 6 of the 7 patients had pathologyscores of 4 (Table I), all of which were mixed (acute and chronic)inflammation. Six of 7 patients with CD had pathology scores of 3or 4, all of which were mixed inflammation, and variable gastro-intestinal symptom scores.
Analysis of gut PCsSingle-cell preparations were obtained by means of enzymatic
digestion and limited mechanical manipulation of the gut tissue
samples. The PCs were identified within the lymphocyte gate asCD191 cells that expressed high levels of CD27 in the absence ofCD20 and CD3 (Fig 1, A). Similar results were obtained with analternative strategy based on CD138 expression,18 although thisstrategy was more difficult to apply to all samples becauseCD138 was not uniformly expressed on PCs nor was its expres-sion restricted to PCs (data not shown), which is consistent withobservations from previous studies on gut samples from HIV-infected patients.19 Another plasma cell (PC) marker, CD38,also presents difficulties both in the gut20 and in certain diseasesettings.21 Furthermore, the gating strategy was verified bydetermining the immunoglobulin isotype distribution among thePCs. As shown in Fig 1, B, for a representative of the HD group,the sum of IgA-, IgG-, and IgM/IgD-secreting cells was close to100% (IgE is rare in the gut), with a predominance of IgA.

B
A
FIG 1. Identification of gut-derived PCs by using flow cytometry. A, PCs of a representative HDwere defined
as CD191CD32CD202CD2711within the lymphocyte gate. Each plot title identifies the gated cell population,
and numbers indicate cell percentages in each quadrant or gate. FSC, Forward scatter; SSC, side scatter.
B, The immunoglobulin isotype profile was determined with 2 separate stains: one for IgA and IgG and
the other for IgM and IgD.
FIG 2. Characterization of dual IgA/IgG-expressing PCs in the gut. A, Microscopy of sorted PCs stained for
IgA (Alexa Fluor 488, green) and IgG (Alexa Fluor 594, red). Arrows show dual positivity. B, Expression of
immunoglobulin light chains for single IgG- or IgA-expressing and dual IgG/IgA-expressing PCs. Numbersindicate cell percentages in each quadrant. The dotted box identifies cells sorted for transcriptional analysis
(see Fig E1).
J ALLERGY CLIN IMMUNOL
nnn 2013
4 BUCKNER ET AL
In addition to IgA, there were minor fractions presentcomprised of PCs expressing only IgG and IgM/IgD-expressingPCs. Unexpectedly, we also observed a population of PCs thatexpressed both IgA and IgG. These dual IgA/IgG-expressing PCswere not observed among the other B-cell populations in the gutand did not appear to be doublets (data not shown), prompting usto further investigate the nature of these PCs using microscopy,flow cytometry, and transcriptional analysis (Fig 2 and see Fig E1in this article’s Online Repository at www.jacionline.org).
A detailed description of the strategies used is presented in theResults section in this article’s Online Repository at www.jacionline.org. As shown in Fig 2, A, sorted PCs expressingonly IgG were characterized by strong single-color fluorescencein the cytoplasm, whereas the remaining PCs not expressingIgG only were composed of both single IgA-fluorescing and dou-ble IgA/IgG-fluorescing cells. The observation that both IgA andIgGwere expressed on or in the same cell was confirmed by usingimmunoglobulin light chain distribution, as shown in Fig 2, B.

J ALLERGY CLIN IMMUNOL
VOLUME nnn, NUMBER nn
BUCKNER ET AL 5
Whereas the patterns of expression for single IgG- and IgA-expressing PCs were mutually exclusive, as expected, dualexpression of the Igl and Igk light chains was observed amongthe dual IgA/IgG-expressing PCs. The most likely explanationfor B cells that are positive for 2 different immunoglobulin heavyand light chains (excluding IgD and IgM) is that one is producedby the cells whereas the other is in soluble form bound to areceptor expressed on the cell surface. On the basis of analysespresented in the Results section in this article’s OnlineRepository, the most likely, although not conclusive, explanationis that the dual IgA/IgG-expressing PCs are primarily secretingIgG and binding IgA.
Increased frequency of IgG-expressing PCs in
the guts of patients with symptomatic CGD and
HIV-infected patientsNext we characterized the gut-derived PCs of subjects in
Table I. As shown by the pie charts in Fig 3, A, and group analysesin Fig 3, B, PCs expressed predominantly IgA (alone) across allgroups, although frequencies were highest for the HD group.For PCs expressing only IgG, the highest frequency was 34%for the CGD group (46% excluding nonsymptomatic patients),although frequencies were also significantly higher between the2 other disease groups and the HD group (Fig 3, B). The patternfor IgM-expressing PCs was similar to that of PCs expressingIgG only, whereas for dual IgA/IgG-expressing PCs, frequencieswere significantly lower for the CGD group when compared withthe 3 other groups (Fig 3, B). Of note, when the 3 patients withCGDwithout colitis were excluded from the analyses, differencesfor IgA- and IgG-expressing PCs became significant when theCGD group was compared with the 2 other patient groups (seeFig E2, A, in this article’s Online Repository at www.jacionline.org). Previous findings have suggested a link between PCs inthe gut and terminally differentiated B cells (either PCs or plas-mablasts) circulating in the peripheral blood.14,22 Accordingly,we determined the immunoglobulin isotype distribution ofPCs/plasmablasts of subjects in Table I. In contrast to theprofiles in the gut, the only increased frequencies of circulatingIgG1 PCs/plasmablasts were those of the HIV-infected patients(Fig 3, C [pie charts] andD [group analyses]), which is consistentwith previous findings.23 Taken together, these data indicate thatthe increased frequency of PCs expressing only IgG in the gutwas highest in patients with symptomatic CGD and restrictedto this compartment, whereas in HIV-infected patients andpatients with CD, numbers of PCs expressing IgG only weremore modestly increased in the gut compared with those see inHDs, and in the case of patients with HIV, such an increase wasalso reflected in the peripheral blood.
Distinct expression of homing receptors on IgG-,
IgA-, and dual IgA/IgG-expressing PCsGiven the association of intestinal PCs expressing IgG only
with colitis/inflammation and distinctions between PCs express-ing only IgG and dual IgG/IgA-expressing PCs, we sought tofurther characterize the phenotype of gut PCs. CCR10 is theprincipal homing receptor expressed on IgA-expressing PCs inthe colons of healthy subjects, whereas CCR9 is more restrictedto the small bowel.24 Consistent with this pattern and recentfindings,13 CCR10 was expressed at high levels on both types
of IgA-expressing PCs in the colons of HDs (Fig 4, A and B).Similar profiles were observed for the patient groups (Fig 4, Aand B), although the mean fluorescence intensity (MFI) ofCCR10 on both IgA-expressing PCs of patients with CGD wassignificantly lower compared with that of the HD and HIV groups(Fig 4, B and C). Of note, significant differences in Fig 4, C, werestronger when patients with nonsymptomatic CGDwere excludedfrom the CGD group. Finally, levels of CCR10 expression on PCsexpressing only IgG were approximately 10-fold lower than onIgA-expressing PCs, and there was no significant difference inthe MFI between the groups (Fig 4, C).
Increased CXCR4 expression has been associated with intes-tinal inflammation25 and, in particular, on gut IgG-expressing PCsof patients with CD and UC.13 Accordingly, we investigated theexpression of CXCR4 on gut PCs. CXCR4 was expressed at rela-tively low levels on PCs expressing only IgA and dual IgA/IgG-expressing PCs, although levels were significantly higher forthe CGD group when compared with all other groups (Fig 5, Aand B, for representative profiles and Fig 5, C, for group compar-isons). In contrast, PCs expressing only IgG of patients with CGDand those with CD expressed levels of CXCR4 that were rela-tively high and significantly higher when compared with the other2 groups (Fig 5). Of note, differences were even higher whenpatients with nonsymptomatic CGD were excluded from theCGD group and significantly higher when compared with theCD group (see Fig E2, B). Furthermore, we studied 2 IgA-deficient subjects with absent or mild gastrointestinal symptoms(Table I); CXCR4 levels were not increased on their PCs (Fig 5,C), which were primarily of the IgG isotype (data not shown).
We then considered differences in the expression of eachhoming receptor among the 3 PC populations. For CCR10with allgroups combined, the MFI was significantly higher on PCsexpressing only IgA than on both dual IgA/IgG-expressing PCsand PCs expressing only IgG and, in turn, significantly higher ondual IgA/IgG-expressing PCs than on PCs expressing only IgG(see Fig E3, A, in this article’s Online Repository at www.jacionline.org). The differences remained significant whengroups were analyzed separately. Conversely, for CXCR4, withall groups combined, the MFI was significantly higher on PCs ex-pressing only IgG than on both dual IgA/IgG-expressing PCs andPCs expressing only IgA and, in turn, significantly higher on dualIgA/IgG-expressing PCs than on PCs expressing only IgA (seeFig E3, B). Collectively, these data show that CCR10 is stronglyassociated with IgA expression, whereas CXCR4 is associatedwith increased IgG expression, and dual IgA/IgG-expressingPCs have intermediate homing receptor expression profiles.
Finally, we assessed the association between CXCR4-expressing PCs expressing only IgG in the gut and variousparameters for all groups combined. Therewas a direct and highlysignificant correlation between the fraction of gut PCs expressingonly IgG and the MFI of CXCR4 on these cells (Fig 6, A). Thegroups also clustered together, with patients with symptomaticCGD at one end of the spectrum, HDs at the other end, and thenonsymptomatic CGD, CD, and HIV groups in between. Therewas also a strong association between the combined scoresfrom the pathology and gastrointestinal indices and the frequencyof CXCR41 PCs expressing only IgG among all gut-derived PCs(Fig 6, B). Taken together, these data suggest that the analysis ofimmunoglobulin isotype distribution and CXCR4 expression arestrong indicators of active colonic inflammation, irrespective ofthe underlying disease.

B
A
D
C
J ALLERGY CLIN IMMUNOL
nnn 2013
6 BUCKNER ET AL

A
C
B
FIG 4. Expression of CCR10 on gut-derived PCs.A, Representative plots of CCR10 expression by IgA and IgG
are shown by group.Numbers indicate cell percentages in each quadrant. B and C,Histograms from plots in
Fig 4, A (Fig 4, B), and group comparisons of CCR10 expression (Fig 4, C) were obtained by gating on single
IgG- or IgA-expressing and dual IgG/IgA-expressing PCs. Horizontal bars represent medians and asterisksand light gray triangles identify IgA-deficient subjects and patients with CGD with no gastrointestinal symp-
toms from Table I, respectively. NS, Not significant.
=
J ALLERGY CLIN IMMUNOL
VOLUME nnn, NUMBER nn
BUCKNER ET AL 7
DISCUSSIONIn this study we investigated gut PCs across a spectrum of
diseases involving varying degrees of inflammation and clinicalintestinal manifestations. First, and in agreement with anextensive literature,6,9,11,26 PCs expressing only IgAwere the pre-dominant population in the gut of HDs. Second, although notwidely reported or appreciated, a substantial fraction of PCs inhealthy gut tissue were dual IgA/IgG-expressing PCs. Both PCsexpressing only IgA and dual IgA/IgG-expressing PCs expressedhigh levels of CCR10 and thus are likely to have followed similarpathways from inductive to effector sites. Third, PCs expressingonly IgG constituted a very small fraction of PCs in the guts ofHDs; however, this fraction increased significantly withincreasing inflammation and was accompanied by increasedexpression of CXCR4 in patients with colitis. The highest
FIG 3. Immunoglobulin isotype distribution among g
A and B, Immunoglobulin isotype mean distribution (Fi
(Fig 3, B) from the groups described in Table I. Light grtinal symptoms. C andD,Analyses were performed on p
in Table I. Horizontal bars represent medians. NS, Not
frequencies of CXCR41 PCs expressing only IgG in the gutwere observed in patients with active/chronic colitis (CGD andCD), with disease scores that were increased for both clinicaland tissue pathology. Interestingly, in patients with nonsympto-matic CGD, PC profiles were very similar to those observed inHDs. In HIV-infected patients, in whom tissue examination andclinical evaluation revealed little evidence of active inflammatorygut disease, cellular profiles showed increased frequencies of PCsexpressing only IgG without an increased intensity of CXCR4.These data are consistent with previous findings in gut cells ofHIV-viremic patients,12,27-29 although the effect of viremia perse and stage of disease on CXCR4-expressing and/or IgG-expressing PCs remains to be determined. Finally, patients withCD had an intermediate, although somewhat heterogeneous,profile both with regard to clinical and tissue manifestations of
ut-derived and peripheral blood PCs/plasmablasts.
g 3, A) and median comparisons of gut-derived PCs
ay triangles, Patients with CGD with no gastrointes-
eripheral blood PCs/plasmablasts from participants
significant.

A
C
B
FIG 5. Expression of CXCR4 on gut-derived PCs. Analyses for CXCR4 were identical to those presented for
CCR10 in Fig 4.
J ALLERGY CLIN IMMUNOL
nnn 2013
8 BUCKNER ET AL
inflammatory disease and PC phenotypes. Collectively, thesefindings suggest that CCR10-expressing PCs expressing onlyIgA and dual IgA/IgG-expressing PCs reflect a healthy gutenvironment, whereas CXCR4-expressing PCs expressing onlyIgG are associated with both inflamed tissues and clinically activeintestinal disease, which is consistent with recent findings inpatients with UC.13,14 One notable caveat to the current study isthe paucity of female subjects investigated.
The importance of IgA and IgA-producing cells in maintainingintestinal homeostasis is widely reported, although its non-inflammatory properties are not as widely accepted or under-stood.6,9,11,26 In human subjects IgA deficiencies have beenassociated with intestinal inflammatory conditions, althoughthis is not an inevitable finding, and there appears to be a widespectrum of manifestations.30 Of note, there were 2 participantswithout active intestinal disease (1 patient with CGD and 1HIV-infected subject, Table I) who were found to have an IgAdeficiency based on serum analyses. Both had high frequenciesof IgG-expressing PCs in their guts; however, neither hadCXCR4 expression on their IgG-expressing PCs that was greaterthan levels observed for HDs, whereas CCR10 expression waseither at or above average for their respective groups. Althoughmore IgA-deficient subjects need to be investigated, theseobservations help solidify the notion that it is not the mere
presence of IgG-expressing PCs in the gut that is associatedwith inflammatory conditions but rather those PCs expressingonly IgG that also express CXCR4.
The gut PCs expressing only IgA and dual IgA/IgG-expressinggut PCs had phenotypes that were clearly distinct from those ofthe PCs expressing only IgG. Several factors in mucosal tissues,including both T cell–dependent and T cell–independent factors,have been shown to favor B-cell immunoglobulin class-switchingto IgA.9 However, few studies have addressed class-switching toIgG in the healthy intestinal mucosa. It is tempting to speculatethat PCs expressing only IgA and dual IgA/IgG-expressing PCsare signatures of a healthy intestinal mucosa. In this regard IgAis the predominant isotype of PCs/plasmablasts that circulate,possibly from mucosal tissues,22 in the blood of healthy subjects,and one recent study demonstrated increased frequencies of IgG/CXCR4/CXCR3-expressing PCs in the blood of patients withUC that mirrored changes in the gut.14 However, alterations ofplasmablasts/PCs in the blood did not extend to CD,14 which isconsistent with our findings; no clear associations were foundfor the 3 diseases studied between PCs in the gut and plasma-blasts/PCs circulating in the blood.
In summary, we have described 3 distinct populations of PCs inhealthy and diseased intestinal tissues. In healthy subjectsapproximately 75% of PCs in the gut express only IgA, and

A B
FIG 6. Correlation and association between CXCR4, IgG, and combined scores. Comparisons were
performed between fraction of gut-derived PCs expressing only IgG and the intensity (MFI) of CXCR4
expression on PCs expressing only IgG (A) and the percentage of CXCR41 PCs expressing only IgG and the
combined pathology and gastrointestinal symptom scores described in Table I (B).
J ALLERGY CLIN IMMUNOL
VOLUME nnn, NUMBER nn
BUCKNER ET AL 9
another 18% express both IgA and IgG, the majority of which arelikely producing IgG and binding IgA. In disease settings inwhich gastrointestinal perturbations are subclinical, such as inHIV-infected patients, there is an increase in frequencies of PCsexpressing only IgG in the gut, but these cells do not expressincreased levels of CXCR4. Finally, in disease settings in whichthere is both tissue inflammation and symptomatic disease, suchas in a subgroup of patients with CGD and patients with CD, thereis an increase in frequencies of PCs expressing only IgG that isaccompanied by increased expression of CXCR4. These findingssuggest that IgG and CXCR4 expression by PCs in the gut canserve as an indicator of intestinal inflammation across a broadspectrum of diseases that cause intestinal disturbances.
We thank the patients and healthy donors for their willingness to participate
in this study. We thank Linda Ellison-Dejewski and Emily Spurlin for
assistance in participant recruitment and care.We are also very grateful for the
helpful discussions with Drs Warren Strober and Ivan Fuss.
Key messages
d There are at least 3 distinct populations of IgA- and IgG-expressing PCs in the guts of healthy subjects that arealtered in patients with diseases associated with varyingdegrees of intestinal perturbations.
d The presence of CXCR4/IgG-expressing PCs is associatedwith gastrointestinal disease and tissue inflammation, andthese PCs are observed in several disease settings.
d PCs in the gut are distinct from those circulating in theperipheral blood, at least in certain disease settings.
REFERENCES
1. Brenchley JM, Douek DC. HIV infection and the gastrointestinal immune system.
Mucosal Immunol 2008;1:23-30.
2. DuPont AW, DuPont HL. The intestinal microbiota and chronic disorders of the
gut. Nat Rev Gastroenterol Hepatol 2011;8:523-31.
3. Marciano BE, Rosenzweig SD, Kleiner DE, Anderson VL, Darnell DN, Anaya-
O’Brien S, et al. Gastrointestinal involvement in chronic granulomatous disease.
Pediatrics 2004;114:462-8.
4. Soucy G, Wang HH, Farraye FA, Schmidt JF, Farris AB, Lauwers GY, et al. Clin-
ical and pathological analysis of colonic Crohn’s disease, including a subgroup
with ulcerative colitis-like features. Mod Pathol 2012;25:295-307.
5. Kang EM, Marciano BE, DeRavin S, Zarember KA, Holland SM, Malech HL.
Chronic granulomatous disease: overview and hematopoietic stem cell transplanta-
tion. J Allergy Clin Immunol 2011;127:1319-26.
6. Brandtzaeg P. Update on mucosal immunoglobulin A in gastrointestinal disease.
Curr Opin Gastroenterol 2010;26:554-63.
7. Maloy KJ, Powrie F. Intestinal homeostasis and its breakdown in inflammatory
bowel disease. Nature 2011;474:298-306.
8. Fritz JH, Rojas OL, Simard N, McCarthy DD, Hapfelmeier S, Rubino S, et al.
Acquisition of a multifunctional IgA1 plasma cell phenotype in the gut. Nature
2012;481:199-203.
9. Cerutti A, Chen K, Chorny A. Immunoglobulin responses at the mucosal interface.
Annu Rev Immunol 2011;29:273-93.
10. Cerutti A, Cols M, Gentile M, Cassis L, Barra CM, He B, et al. Regulation of
mucosal IgA responses: lessons from primary immunodeficiencies. Ann N Y
Acad Sci 2011;1238:132-44.
11. Mora JR, von Andrian UH. Differentiation and homing of IgA-secreting cells.
Mucosal Immunol 2008;1:96-109.
12. Scamurra RW, Nelson DB, Lin XM, Miller DJ, Silverman GJ, Kappel T, et al.
Mucosal plasma cell repertoire during HIV-1 infection. J Immunol 2002;169:
4008-16.
13. Uo M, Hisamatsu T, Miyoshi J, Kaito D, Yoneno K, Kitazume MT, et al. Mucosal
CXCR41 IgG plasma cells contribute to the pathogenesis of human ulcerative co-
litis through FcgammaR-mediated CD14 macrophage activation. Gut 2013;62:
1734-44.
14. Hosomi S, Oshitani N, Kamata N, Sogawa M, Okazaki H, Tanigawa T, et al.
Increased numbers of immature plasma cells in peripheral blood specifically over-
express chemokine receptor CXCR3 and CXCR4 in patients with ulcerative colitis.
Clin Exp Immunol 2011;163:215-24.
15. Harvey RF, Bradshaw JM. A simple index of Crohn’s-disease activity. Lancet
1980;1:514.
16. Tiller T, Meffre E, Yurasov S, Tsuiji M, Nussenzweig MC, Wardemann H. Effi-
cient generation of monoclonal antibodies from single human B cells by
single cell RT-PCR and expression vector cloning. J Immunol Methods 2008;
329:112-24.

J ALLERGY CLIN IMMUNOL
nnn 2013
10 BUCKNER ET AL
17. Benckert J, Schmolka N, Kreschel C, Zoller MJ, Sturm A, Wiedenmann B, et al.
The majority of intestinal IgA1 and IgG1 plasmablasts in the human gut are an-
tigen-specific. J Clin Invest 2011;121:1946-55.
18. Di Niro R, Mesin L, Raki M, Zheng NY, Lund-Johansen F, Lundin KE, et al. Rapid
generation of rotavirus-specific human monoclonal antibodies from small-
intestinal mucosa. J Immunol 2010;185:5377-83.
19. Smith AJ, Schacker TW, Reilly CS, Haase AT. A role for syndecan-1 and claudin-2
in microbial translocation during HIV-1 infection. J Acquir Immune Defic Syndr
2010;55:306-15.
20. Guilliano MJ, Foxx-Orenstein AE, Lebman DA. The microenvironment of human
Peyer’s patches inhibits the increase in CD38 expression associated with the
germinal center reaction. J Immunol 2001;166:2179-85.
21. Yukl SA, Gianella S, Sinclair E, Epling L, Li Q, Duan L, et al. Differences in HIV
burden and immune activation within the gut of HIV-positive patients receiving
suppressive antiretroviral therapy. J Infect Dis 2010;202:1553-61.
22. Mei HE, Yoshida T, Sime W, Hiepe F, Thiele K, Manz RA, et al. Blood-borne
human plasma cells in steady state are derived from mucosal immune responses.
Blood 2009;113:2461-9.
23. Buckner CM, Moir S, Ho J, Wang W, Posada JG, Kardava L, et al. Characterization
of plasmablasts in the blood of HIV-infected viremic individuals: evidence for
nonspecific immune activation. J Virol 2013;87:5800-11.
24. Kunkel EJ, Kim CH, Lazarus NH, Vierra MA, Soler D, Bowman EP, et al. CCR10
expression is a common feature of circulating and mucosal epithelial tissue IgA
Ab-secreting cells. J Clin Invest 2003;111:1001-10.
25. Hart AL, Ng SC, Mann E, Al-Hassi HO, Bernardo D, Knight SC. Homing of im-
mune cells: role in homeostasis and intestinal inflammation. Inflamm Bowel Dis
2010;16:1969-77.
26. Bakema JE, van Egmond M. The human immunoglobulin A Fc receptor Fcal-
phaRI: a multifaceted regulator of mucosal immunity. Mucosal Immunol 2011;4:
612-24.
27. Olsson J, Poles M, Spetz AL, Elliott J, Hultin L, Giorgi J, et al. Human immunode-
ficiency virus type 1 infection is associated with significant mucosal inflammation
characterized by increased expression of CCR5, CXCR4, and beta-chemokines.
J Infect Dis 2000;182:1625-35.
28. Schneider T, Zippel T, Schmidt W, Pauli G, Wahnschaffe U, Chakravarti S, et al.
Increased immunoglobulin G production by short term cultured duodenal biopsy
samples from HIV infected patients. Gut 1998;42:357-61.
29. Nilssen DE, Oktedalen O, Brandtzaeg P. Intestinal B cell hyperactivity
in AIDS is controlled by highly active antiretroviral therapy. Gut 2004;53:
487-93.
30. Latiff AH, Kerr MA. The clinical significance of immunoglobulin A deficiency.
Ann Clin Biochem 2007;44:131-9.
REFERENCES
E1. Woof JM, Mestecky J. Mucosal immunoglobulins. Immunol Rev 2005;206:
64-82.
E2. Lebreton C, Menard S, Abed J, Moura IC, Coppo R, Dugave C, et al. Interactions
among secretory immunoglobulin A, CD71, and transglutaminase-2 affect
permeability of intestinal epithelial cells to gliadin peptides. Gastroenterology
2012;143:698-707, e1-4.
J ALLERGY CLIN IMMUNOL
VOLUME nnn, NUMBER nn
BUCKNER ET AL 10.e1
METHODS
Criteria used to establish pathology scores in
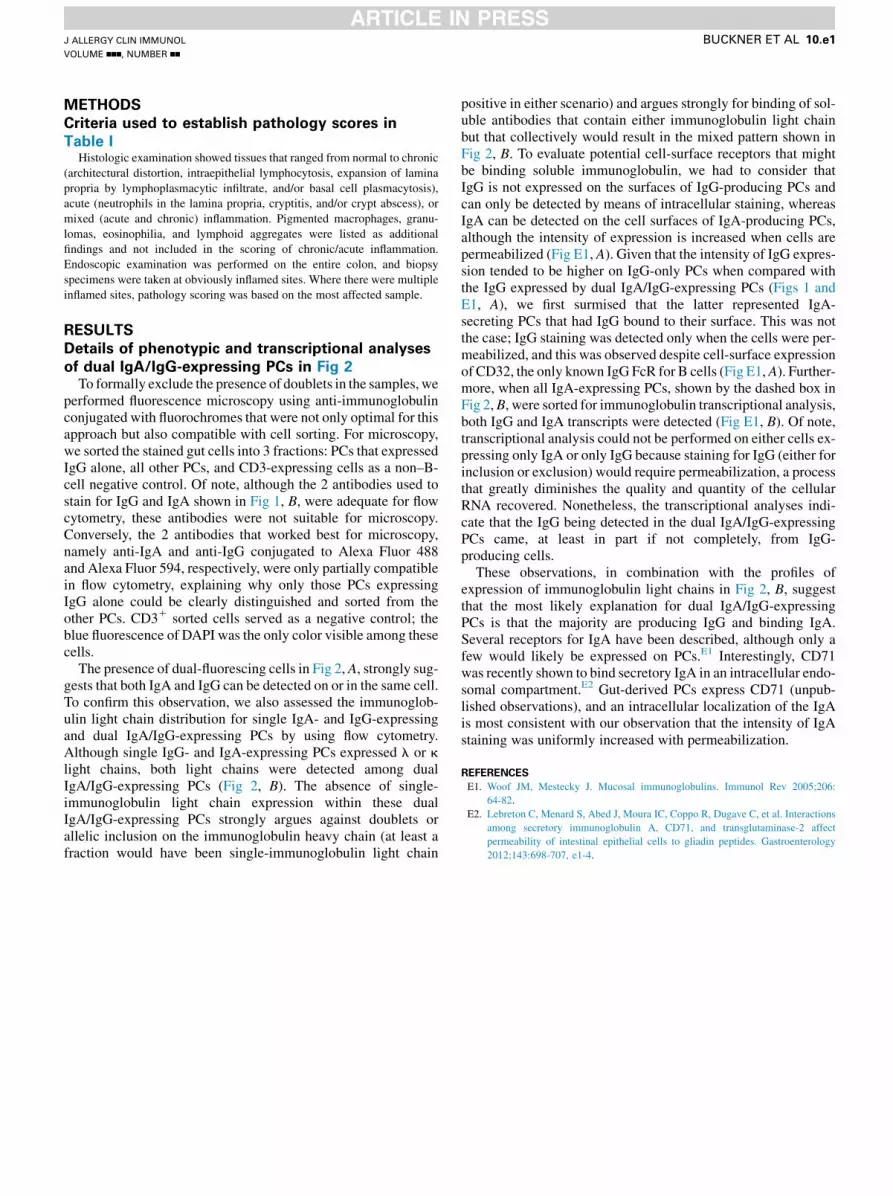
Table IHistologic examination showed tissues that ranged from normal to chronic
(architectural distortion, intraepithelial lymphocytosis, expansion of lamina
propria by lymphoplasmacytic infiltrate, and/or basal cell plasmacytosis),
acute (neutrophils in the lamina propria, cryptitis, and/or crypt abscess), or
mixed (acute and chronic) inflammation. Pigmented macrophages, granu-
lomas, eosinophilia, and lymphoid aggregates were listed as additional
findings and not included in the scoring of chronic/acute inflammation.
Endoscopic examination was performed on the entire colon, and biopsy
specimens were taken at obviously inflamed sites. Where there were multiple
inflamed sites, pathology scoring was based on the most affected sample.
RESULTS
Details of phenotypic and transcriptional analyses
of dual IgA/IgG-expressing PCs in Fig 2To formally exclude the presence of doublets in the samples, we
performed fluorescence microscopy using anti-immunoglobulinconjugated with fluorochromes that were not only optimal for thisapproach but also compatible with cell sorting. For microscopy,we sorted the stained gut cells into 3 fractions: PCs that expressedIgG alone, all other PCs, and CD3-expressing cells as a non–B-cell negative control. Of note, although the 2 antibodies used tostain for IgG and IgA shown in Fig 1, B, were adequate for flowcytometry, these antibodies were not suitable for microscopy.Conversely, the 2 antibodies that worked best for microscopy,namely anti-IgA and anti-IgG conjugated to Alexa Fluor 488and Alexa Fluor 594, respectively, were only partially compatiblein flow cytometry, explaining why only those PCs expressingIgG alone could be clearly distinguished and sorted from theother PCs. CD31 sorted cells served as a negative control; theblue fluorescence of DAPI was the only color visible among thesecells.
The presence of dual-fluorescing cells in Fig 2, A, strongly sug-gests that both IgA and IgG can be detected on or in the same cell.To confirm this observation, we also assessed the immunoglob-ulin light chain distribution for single IgA- and IgG-expressingand dual IgA/IgG-expressing PCs by using flow cytometry.Although single IgG- and IgA-expressing PCs expressed l or klight chains, both light chains were detected among dualIgA/IgG-expressing PCs (Fig 2, B). The absence of single-immunoglobulin light chain expression within these dualIgA/IgG-expressing PCs strongly argues against doublets orallelic inclusion on the immunoglobulin heavy chain (at least afraction would have been single-immunoglobulin light chain
positive in either scenario) and argues strongly for binding of sol-uble antibodies that contain either immunoglobulin light chainbut that collectively would result in the mixed pattern shown inFig 2, B. To evaluate potential cell-surface receptors that mightbe binding soluble immunoglobulin, we had to consider thatIgG is not expressed on the surfaces of IgG-producing PCs andcan only be detected by means of intracellular staining, whereasIgA can be detected on the cell surfaces of IgA-producing PCs,although the intensity of expression is increased when cells arepermeabilized (Fig E1, A). Given that the intensity of IgG expres-sion tended to be higher on IgG-only PCs when compared withthe IgG expressed by dual IgA/IgG-expressing PCs (Figs 1 andE1, A), we first surmised that the latter represented IgA-secreting PCs that had IgG bound to their surface. This was notthe case; IgG staining was detected only when the cells were per-meabilized, and this was observed despite cell-surface expressionof CD32, the only known IgG FcR for B cells (Fig E1,A). Further-more, when all IgA-expressing PCs, shown by the dashed box inFig 2,B, were sorted for immunoglobulin transcriptional analysis,both IgG and IgA transcripts were detected (Fig E1, B). Of note,transcriptional analysis could not be performed on either cells ex-pressing only IgA or only IgG because staining for IgG (either forinclusion or exclusion) would require permeabilization, a processthat greatly diminishes the quality and quantity of the cellularRNA recovered. Nonetheless, the transcriptional analyses indi-cate that the IgG being detected in the dual IgA/IgG-expressingPCs came, at least in part if not completely, from IgG-producing cells.
These observations, in combination with the profiles ofexpression of immunoglobulin light chains in Fig 2, B, suggestthat the most likely explanation for dual IgA/IgG-expressingPCs is that the majority are producing IgG and binding IgA.Several receptors for IgA have been described, although only afew would likely be expressed on PCs.E1 Interestingly, CD71was recently shown to bind secretory IgA in an intracellular endo-somal compartment.E2 Gut-derived PCs express CD71 (unpub-lished observations), and an intracellular localization of the IgAis most consistent with our observation that the intensity of IgAstaining was uniformly increased with permeabilization.

A B
FIG E1. Properties of surface IgA1/IgG2 gut-derived PCs. A, Flow cytometry with and without permeabiliza-
tion of cells was performed to evaluate the expression of CD32, IgG, and IgA on (Surface) and within (Intra-cellular) gut-derived PCs. B, RT-PCR was performed to evaluate the expression of IgG and IgA in gut-derived
PCs that were sorted by IgA. CD191 B cells from the peripheral blood and sorted by IgA1/IgG2 were used as
positive controls, and amplification of RNaseP was included as a housekeeping gene.
J ALLERGY CLIN IMMUNOL
nnn 2013
10.e2 BUCKNER ET AL

A
B
FIG E2. A, Graphs are identical to those of Fig 3, B, with the exception that the CGD group does not include
patients without colitis. Only those P values that changed are shown. B, Graphs are identical to those of
Fig 5, B, with the exception that the CGD group does not include patients without colitis. Only P values
that changed are shown. NS, Not significant.
J ALLERGY CLIN IMMUNOL
VOLUME nnn, NUMBER nn
BUCKNER ET AL 10.e3

A B
FIG E3. Comparison of homing receptor expression on gut-derived PCs by immunoglobulin isotype. Data
are from Figs 4, B, and 5, B, with all groups combined. Intensities of CCR10 (A) and CXCR4 (B) were
compared between PCs expressing only IgA, dual IgA/G-expressing PCs, and PCs expressing only IgG.
Horizontal bars represent medians.
J ALLERGY CLIN IMMUNOL
nnn 2013
10.e4 BUCKNER ET AL

TABLE E1. Additional participant profiles and clinical observations
Participant Mutated gene Immune-modulating medication CD41 T cells (count/mL) HIV RNA (copies/mL)
1-HIV 337 2,901
2-HIV 459 12,592
3-HIV 599 5,114
4-HIV 615 10,089
5-HIV 583 40,702
6-HIV 483 9,722
7-HIV 1003 6,258
8-HIV 663 445
9-HIV 690 15,410
10-HIV-A 502 12,679
1-CGD gp91phox Adalimumab (Humira)
2-CGD p47phox3-CGD p47phox Prednisone, 10 mg/d; adalimumab (Humira)
4-CGD gp91phox Adalimumab (Humira)
5-CGD p47phox IFN-g 33/wk; adalimumab (Humira)
6-CGD gp91phox Prednisone, 10 mg/d
7-CGD gp91phox Adalimumab (Humira)
8-CGD-N p47phox IFN-g 33/wk
9-CGD-N gp91phox IFN-g 33/wk
10-CGD-N gp91phox
11-CGD-N-A p47phox
1-CD Infliximab every 6 wk
2-CD Hydrocortisone foam (Cortifoam)
3-CD Certolizumab
4-CD Adalimumab (Humira)
5-CD
6-CD
7-CD
-A, IgA deficiency; CGD-N, CGD with no gastrointestinal symptoms.
J ALLERGY CLIN IMMUNOL
VOLUME nnn, NUMBER nn
BUCKNER ET AL 10.e5