Embed Size (px)
Citation preview

RESEARCH ARTICLE
CONSTRICTOR: Constraint ModificationProvides Insight into Design ofBiochemical NetworksKeesha E. Erickson1, Ryan T. Gill1, Anushree Chatterjee1,2*
1. Department of Chemical and Biological Engineering, University of Colorado, Boulder, Colorado, UnitedStates of America, 2. BioFrontiers Institute, University of Colorado, Boulder, Colorado, United States ofAmerica
Abstract
Advances in computational methods that allow for exploration of the combinatorial
mutation space are needed to realize the potential of synthetic biology based strain
engineering efforts. Here, we present Constrictor, a computational framework that
uses flux balance analysis (FBA) to analyze inhibitory effects of genetic mutations
on the performance of biochemical networks. Constrictor identifies engineering
interventions by classifying the reactions in the metabolic model depending on the
extent to which their flux must be decreased to achieve the overproduction target.
The optimal inhibition of various reaction pathways is determined by restricting the
flux through targeted reactions below the steady state levels of a baseline strain.
Constrictor generates unique in silico strains, each representing an ‘‘expression
state’’, or a combination of gene expression levels required to achieve the
overproduction target. The Constrictor framework is demonstrated by studying
overproduction of ethylene in Escherichia coli network models iAF1260 and
iJO1366 through the addition of the heterologous ethylene-forming enzyme from
Pseudomonas syringae. Targeting individual reactions as well as combinations of
reactions reveals in silicomutants that are predicted to have as high as 25% greater
theoretical ethylene yields than the baseline strain during simulated exponential
growth. Altering the degree of restriction reveals a large distribution of ethylene
yields, while analysis of the expression states that return lower yields provides
insight into system bottlenecks. Finally, we demonstrate the ability of Constrictor to
scan networks and provide targets for a range of possible products. Constrictor is
an adaptable technique that can be used to generate and analyze disparate
populations of in silico mutants, select gene expression levels and provide non-
intuitive strategies for metabolic engineering.
OPEN ACCESS
Citation: Erickson KE, Gill RT, ChatterjeeA (2014) CONSTRICTOR: Constraint ModificationProvides Insight into Design of BiochemicalNetworks. PLoS ONE 9(11): e113820. doi:10.1371/journal.pone.0113820
Editor: Patrick C. Cirino, University of Houston,United States of America
Received: June 26, 2014
Accepted: October 30, 2014
Published: November 25, 2014
Copyright: � 2014 Erickson et al. This is anopen-access article distributed under the terms ofthe Creative Commons Attribution License, whichpermits unrestricted use, distribution, and repro-duction in any medium, provided the original authorand source are credited.
Data Availability: The authors confirm that all dataunderlying the findings are fully available withoutrestriction. All relevant data are within the paperand its Supporting Information files.
Funding: This work is supported by the Universityof Colorado start-up funds and US Department ofEnergy grant (DE-SCOOO8812). KE was partiallysupported by NIH Pharmaceutical Biotechnologytraining grant 5T32GM008732. The funders had norole in study design, data collection and analysis,decision to publish, or preparation of themanuscript.
Competing Interests: The authors have declaredthat no competing interests exist.
PLOS ONE | DOI:10.1371/journal.pone.0113820 November 25, 2014 1 / 24

Introduction
Developing better predictive models of metabolic network behavior is essential for
exploiting microbial cell factories for biochemical production. Though microbial
cell factories have been successfully engineered for the overproduction of a
number of products including ethanol [1, 2], isobutanol [3, 4], alkanes [5, 6], and
thermoplastics [7, 8], continued advancement in strain engineering requires
increased understanding of the impacts of combinatorial mutations on overall
physiology [9–12]. Recent high-throughput genome engineering strategies such as
trackable recursive multiplex recombineering (TRMR) [13] and multiplex
automated genome engineering (MAGE) [14] have allowed for rapid genome-
wide search and combinatorial manipulation of microbial chromosomes [15].
Computational design tools that allow for exploration of the combinatorial
mutation space are thus valuable tools to guide such genome-wide experimental
techniques, providing an avenue for analyzing the system-wide effects of genetic
manipulations.
Biological networks have been described using kinetic models for decades [16–
21]; however, these require kinetic parameters and are computationally more
complex. Steady state models based on stoichiometric and flux constraints
provide a comparatively straightforward platform for analysis of complex systems
where kinetic parameters are not required. Among such steady state modeling
techniques, FBA is one of the most prevalent for modeling cellular metabolism.
FBA has been applied to central metabolism-focused networks containing a few
hundred reactions [22, 23] as well as genome-scale reconstructions containing
thousands of reactions, and has been demonstrated to successfully predict growth
[24, 25], estimate theoretical yields from heterologous pathways [26], locate
engineering targets to maximize product yield [27], and design antibiotics [28].
While typical FBA is limited in that kinetics, thermodynamics, and gene-
regulation are often neglected, FBA has remained in favor because it provides a
straightforward platform for analysis of complex systems.
A number of studies have been published that use the FBA framework to reveal
non-obvious network characteristics. Optknock was developed for designing in
silico knockout strains that redirect flux from biomass to biochemical production
[29]. OptReg and OptForce expanded upon the Optknock framework by
exploring combinations of gene up-regulation, down-regulation, and deletion to
find metabolic engineering targets [30, 31]. Because combinatorial analysis of gene
targets with FBA scales exponentially, alternate algorithms have been applied to
efficiently study metabolic networks. Genetic algorithms [32], successive linear
programming [33], and local search [34] have succeeded in rapidly locating target
modifications with order of magnitude reductions in computational time. These
approaches can incorporate mixed integer linear programming problems, such
that simulated constraints generated via OptKnock or others can be solved with
efficient algorithms; examples include the use of OptKnock and OptGene [35]
and OptReg*LS [33]. The current FBA-inspired methods allow optimization
of fluxes and identification of gene targets for deletion, up-regulation, and
Constricting Flux through Biochemical Networks Reveals New Insights
PLOS ONE | DOI:10.1371/journal.pone.0113820 November 25, 2014 2 / 24

down-regulation; however, there continues to be a need for alternate approaches
that allow for comparison between subtle variations in gene expression and
metabolic network behavior.
In this report, we introduce Constrictor, an FBA strategy to analyze the impact
of various degrees of inhibitory effects of genetic mutations observed during
genome engineering experiments on the performance of biochemical networks.
This is achieved by restricting flux bounds by ‘‘Minor’’ and ‘‘Major’’ levels below
the steady state level in order to simulate different extents of inhibition caused by
mutations. Constrictor generates unique in silico strains, each representing an
‘‘expression state’’, or a combination of gene expression levels (Fig. 1A-B). Sets of
expression states are based on percentage reductions in flux, such that the impact
of finely tuned gene repression can be studied rationally. Constrictor is employed
to investigate heterologous ethylene production. Ethylene is an important
intermediate compound that can be converted into a multitude of products,
including plastics like polyethylene, polyethylene terephthalate, and polyvi-
nylchloride, as well as fuels like gasoline, diesel, and ethanol [36]. Biological
synthesis of ethylene is a promising avenue to reduce fossil fuel requirements and
industrial emissions associated with chemical manufacturing.
Ethylene biosynthesis utilizing the ethylene forming enzyme (EFE) from
Pseudomonas syringae has been studied in a number of organisms, including
Figure 1. Overview of the Constrictor framework. (A) Constrictor explores the impact of various ‘‘expression states’’ corresponding to different levels ofexpression of metabolic enzymes in the reaction network to obtain in silico mutants with diverse properties. When multiple reactions are targetedsimultaneously, each combination of expression states is optimized, such that the total number of expression states becomes equal to 22k+h, where k and hare the number of reversible and irreversible reactions respectively that are targeted by Constrictor. (B) Constrictor algorithm: Constrictor uses FBA tocombinatorially explore the impact of modifying lower and upper bounds of enzyme associated reaction fluxes in a metabolic pathway. FBA is first run withlower (LB) and upper bounds (UB) set to -vmax and vmax to obtain a baseline flux solution. The baseline solution for a single reaction to be targeted byConstrictor is shown in the uppermost arrow, labeled vb(ti). Constrictor is used to generate expression states based on percentage reductions of the fluxbounds from the baseline flux. When considering two possible adjustments: a ‘‘Minor’’ restriction and a ‘‘Major’’ restriction, modified bounds (LBmod andUBmod) are calculated as shown. For a reversible reaction four expression states exist which correspond to the degree to which the lower and upper boundsare restricted (‘‘Minor-Minor’’, ‘‘Minor-major’’, ‘‘Major-minor’’ and ‘‘Major-major’’). For irreversible reactions, two expression states exist (‘‘Major’’ and‘‘Minor’’).
doi:10.1371/journal.pone.0113820.g001
Constricting Flux through Biochemical Networks Reveals New Insights
PLOS ONE | DOI:10.1371/journal.pone.0113820 November 25, 2014 3 / 24

Saccharomyces cerevisiae [37], Synechococcus elongatus [38], Synechocystis [36, 39],
Pseudomonas putida [40], and E. coli [39, 41, 42]. The ethylene forming enzyme
from P. syringae catalyzes a reaction between L-arginine, 2-oxoglutarate, and
oxygen to form ethylene, carbon dioxide, succinate, guanidine, and (S)-1-pyrroline-
5-carboxylate (P5C) [43]. In yeast, the highest ethylene yield is reported to be
0.01 mol ethylene/mol glucose, which is approximately 1% of the theoretical
maximum yield, reported as ranging between 0.73 and 0.87 mol ethylene/mol
glucose [26]. Engineered P. putida strains have been shown to produce 0.14 mol
ethylene/mol glucose at a production rate of 2.86 mmol/gdcw/hr, which is the
highest reported yield and production rate for ethylene in any microbial host
[40, 44]. In E. coli, the maximum reported ethylene production rate is 0.008 mmol/
gdcw/hr, which is less than 1% of the production rate in P. putida [45]. We choose
Escherichia coli as the ethylene production host for the model, as E. coli represents a
common bacterial production strain with a simple metabolic network, and low
ethylene production in E. coli indicates the potential for optimization. Here,
modifications to E. coli metabolism are combinatorially analyzed using Constrictor,
with the goal of revealing gene repressions that can inform experimental efforts and
improve bioethylene yields as well as yields of alternate products.
Methods
Metabolic models for ethylene production
To study ethylene production in E. coli, the E. coli core model iAF1260 was
modified to build a focused metabolic network for heterologous ethylene
production. The core model contains 95 reactions and 72 metabolite species,
derived from the iAF1260 genome scale reconstruction (http://gcrg.ucsd.edu/
Downloads/EcoliCore) [46]. Ethylene production was modeled according to the
Ps. syringae EFE reaction [43]. The BIGG (http://bigg.ucsd.edu/), KEGG (http://
www.genome.jp/kegg/), and Ecocyc databases (http://ecocyc.org/) were used to
locate the additional reactions and metabolites needed to complete the model
[47–49]. Complete lists of the 114 reactions and 89 metabolites in the core
ethylene producing model are available in the Supplement (Tables S2-S3 in File S1
and Fig. S1). Out of the 114 reactions in the core metabolic model, 66 reactions
are reversible, and 48 reactions are irreversible. Unless otherwise stated, presented
results are derived from the ethylene core model. For genome scale studies, the
EFE reaction was added to the E. coli iAF1260 and the iJO1366 models [46, 50].
Modifications and constraints applied to the core and genome scale models are
described in the following sections and summarized in Supplementary
Information (Table S1 in File S1). MATLAB (The Mathworks, Inc., Natick, MA)
was used with the Gurobi Optimizer (Gurobi Optimization, http://www.gurobi.
com) to execute each FBA linear programming problem. All models were
modified and solved using the COBRA toolbox [51]. Constrictor software and
SBML models created for this report are provided at http://www.colorado.edu/
UCB/chatterjeelab/.
Constricting Flux through Biochemical Networks Reveals New Insights
PLOS ONE | DOI:10.1371/journal.pone.0113820 November 25, 2014 4 / 24

Conditions and parameters for ethylene production models
Aerobic conditions are considered for all studies by setting a maximum glucose
uptake of 10.5 mmol per gram dry cell weight per hour (mmol/gdcw/hr) and a
maximum oxygen uptake of 15 mmol/gdcw/hr [25] (Equation 1). The lower
bound on the ATP maintenance reaction is held at a constant value of 3.15 mmol/
gdcw/hr [50]. Exponential growth is simulated by enforcing a minimum bound
on the biomass reaction [29, 33]. The required growth rate for this study is 0.3 hr-
1, defined according to experimental observations for E. coli MG1655 in minimal
media (Fig. S2). Results for other minimum growth rates are summarized in Fig.
S3. Ethylene yield is defined as the absolute value of the ratio of flux through the
ethylene demand reaction and the glucose uptake reaction (mol ethylene/mol
glucose). Ethylene production rate is defined as the flux value through the
ethylene demand reaction (mmol/gdcw/hr).
Constrictor framework: Exploring impact of constraints on lower
and upper bounds for all fluxes in a network
Constrictor explores the system response for combinations of ‘‘inhibitory’’ rate
adjustments (Fig. 1A-B). First, the FBA linear programming problem is solved to
obtain the maximum theoretical ethylene yield (Equation 1):Maximize vb,Eth{dem
such that:
S|vb~0
LBƒvbƒUB
LBATPM~3:15mmol=gdcw=hr
LBEx glc(e)~{10:5mmol=gdcw=hr
LBEx o2(e)~{15:0mmol=gdcw=hr
LBbiomass~0:3hr{1
ð1Þ
Where the vector vb represents the baseline flux through each of r reactions and S
is the stoichiometric matrix for the reaction network. For the majority of results
presented, we maximize ethylene production in order to study maximum
theoretical ethylene yield, while enforcing a minimum growth rate in order to
simulate metabolically relevant flux distributions. To demonstrate that alternate
objectives are supported, we also describe a study that maximizes growth (via
biomass reactions). The LB and UB vectors contain the lower and upper bounds
of the flux for each reaction, respectively, and limits are placed on ATP
maintenance, glucose uptake, and oxygen uptake (Equation 1). Other reactions
are allowed to vary between -vmax to vmax mmol/gdcw/hr for reversible reactions,
and 0 to vmax mmol/gdcw/hr for irreversible reactions. We set vmax to 1000 mmol/
gdcw/hr indicating unlimited flux through each reaction of the metabolic
(1)
Constricting Flux through Biochemical Networks Reveals New Insights
PLOS ONE | DOI:10.1371/journal.pone.0113820 November 25, 2014 5 / 24

network. Steady state conditions are assumed, such that the rate of metabolite
change in the system is equal to zero.
A representative solution (vb, of length r) to this linear programming problem is
determined for the baseline strain without any genetic modifications. Though
alternate optimal solutions exist with equivalent maximized ethylene production
[52], in this case as in others it is not necessary to determine the range of flux
variability [23, 26, 33, 53], here because the intention is to generate derivative flux
distributions corresponding to modifications of target reactions. Thus, we select one
representative ‘‘baseline’’ solution as the starting point on which the Constrictor
algorithm is subsequently applied. Constrictor targets metabolic reactions by
constricting the lower and upper bounds of flux through the targeted reaction(s) at
‘‘Minor’’ and ‘‘Major’’ levels (Fig. 1B). Scalar ‘‘restriction factors’’ fMinor and fMajor
are coefficients that are used to modulate the upper and lower bounds of the
targeted metabolic reaction(s) at Minor and Major levels (Equation 2). The
restriction factors are user defined, range between 0 and 1, and represent percentage
reductions in flux. Unless otherwise specified, the restriction factors fMinor and fMajor
are set to 0.8 and 0.2, respectively. For a set of ‘n’ metabolic reactions targeted by
Constrictor (input into the vector t), all possible combinations of sMinor and sMajor
are generated (Equation 2). Each targeted reaction is multiplied by the baseline flux
value to define specific expression values (sMinor,i, sMajor,i), where i51 through n.
sMinor,i~fMinor| vb tið Þj jsMajor,i~fMajor| vb tið Þj j
ð2Þ
The modified lower and upper bounds of the flux (LBmod and UBmod) for each
reaction respectively are obtained by replacing the original lower and upper
bounds used in the baseline solution by the specific expression values (Equation
3). By using this approach, reaction flux in either direction of reversible reactions
is constrained according to major and minor reductions of the magnitude of
baseline (Fig. 1B). This allows flux to switch directions if subsequent FBA runs
find this to be optimal. As a result for a reversible reaction, there exist 22 possible
combinations of adjusted flux bounds (‘‘Minor-Minor’’, ‘‘Minor-Major’’,
‘‘Major-Minor’’ and ‘‘Major-Major’’) (Equation 3). Similarly, for an irreversible
reaction there exist 21 possible combinations (‘‘Major’’ and ‘‘Minor’’).
Reversible reaction :
LBmod,i
UBmod,i
" #~
{sMinor,i
sMinor,i
" #,
{sMajor,i
sMajor,i
" #,
{sMinor,i
sMinor,i
" #,
{sMajor,i
sMajor,i
" #( )
Irreversible reaction :
LBmod,i
UBmod,i
" #~
0
sMinor,i
" #,
0
sMajor,i
" #( )ð3Þ
Constricting Flux through Biochemical Networks Reveals New Insights
PLOS ONE | DOI:10.1371/journal.pone.0113820 November 25, 2014 6 / 24
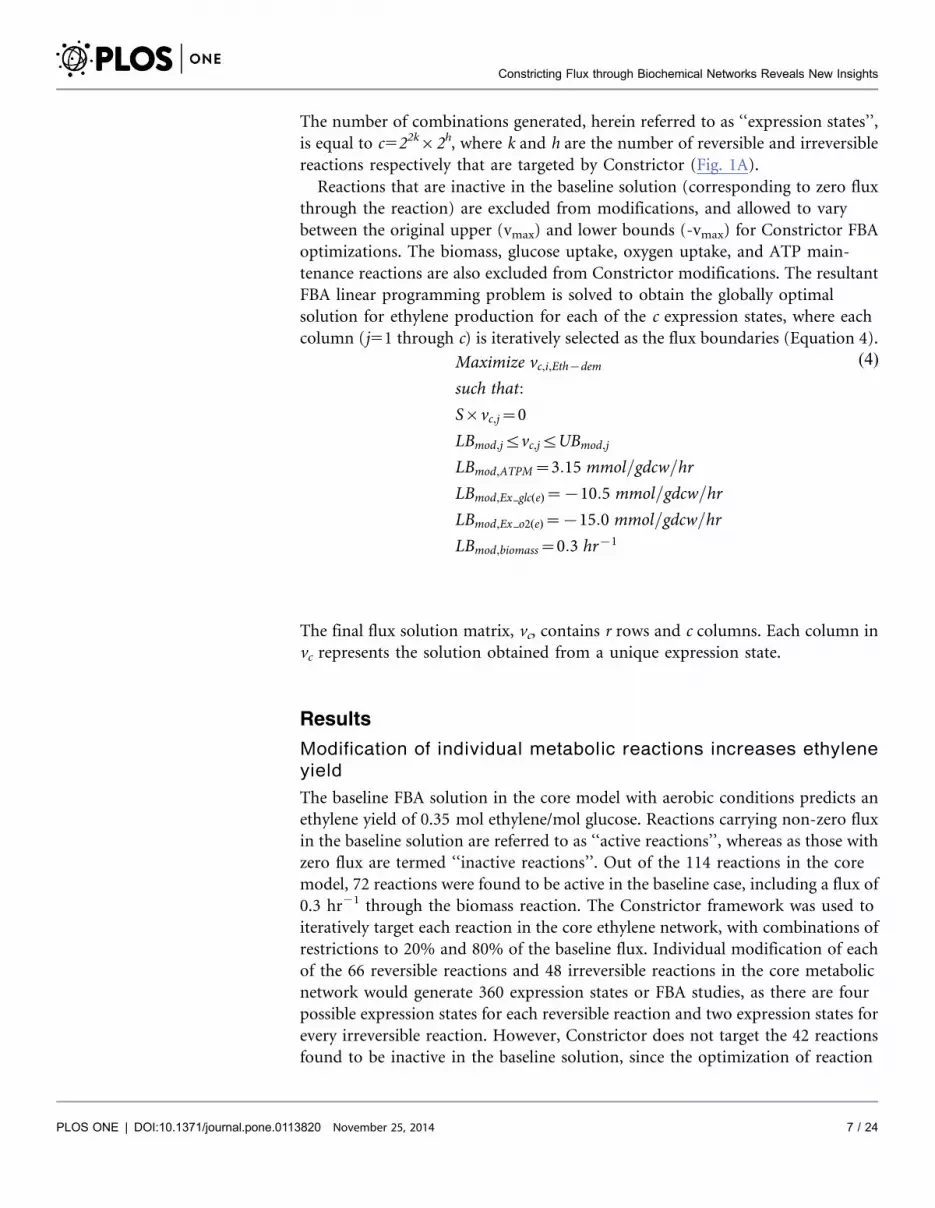
The number of combinations generated, herein referred to as ‘‘expression states’’,
is equal to c522k62h, where k and h are the number of reversible and irreversible
reactions respectively that are targeted by Constrictor (Fig. 1A).
Reactions that are inactive in the baseline solution (corresponding to zero flux
through the reaction) are excluded from modifications, and allowed to vary
between the original upper (vmax) and lower bounds (-vmax) for Constrictor FBA
optimizations. The biomass, glucose uptake, oxygen uptake, and ATP main-
tenance reactions are also excluded from Constrictor modifications. The resultant
FBA linear programming problem is solved to obtain the globally optimal
solution for ethylene production for each of the c expression states, where each
column (j51 through c) is iteratively selected as the flux boundaries (Equation 4).
Maximize vc,i,Eth{dem
such that:
S|vc,j~0
LBmod,jƒvc,jƒUBmod,j
LBmod,ATPM~3:15 mmol=gdcw=hr
LBmod,Ex glc(e)~{10:5 mmol=gdcw=hr
LBmod,Ex o2(e)~{15:0 mmol=gdcw=hr
LBmod,biomass~0:3 hr{1
ð4Þ
The final flux solution matrix, vc, contains r rows and c columns. Each column in
vc represents the solution obtained from a unique expression state.
Results
Modification of individual metabolic reactions increases ethylene
yield
The baseline FBA solution in the core model with aerobic conditions predicts an
ethylene yield of 0.35 mol ethylene/mol glucose. Reactions carrying non-zero flux
in the baseline solution are referred to as ‘‘active reactions’’, whereas as those with
zero flux are termed ‘‘inactive reactions’’. Out of the 114 reactions in the core
model, 72 reactions were found to be active in the baseline case, including a flux of
0.3 hr21 through the biomass reaction. The Constrictor framework was used to
iteratively target each reaction in the core ethylene network, with combinations of
restrictions to 20% and 80% of the baseline flux. Individual modification of each
of the 66 reversible reactions and 48 irreversible reactions in the core metabolic
network would generate 360 expression states or FBA studies, as there are four
possible expression states for each reversible reaction and two expression states for
every irreversible reaction. However, Constrictor does not target the 42 reactions
found to be inactive in the baseline solution, since the optimization of reaction
(4)
Constricting Flux through Biochemical Networks Reveals New Insights
PLOS ONE | DOI:10.1371/journal.pone.0113820 November 25, 2014 7 / 24

network with modifications to inactive reactions results in solutions identical to
the baseline case. Applying Constrictor to the remaining 72 active reactions gives
rise to 222 expression states. While 12 of these expression states converge to the
baseline solution and another 196 expression states decrease ethylene yield, 14
expression states positively impact the ethylene yield with respect to the baseline
solution (Fig. 2A-B). The expression states reveal a range (4–9%) of elevated
ethylene yields when compared to baseline case (Fig. 2A). For majority of
Constrictor modifications, restrictions to target reactions result in a proportional
reduction in flux throughout the network, as demonstrated by the linear
relationship between yield and production for the majority of expression states
(Fig. 2B). However, certain expression states impact the network in a nonlinear
fashion, causing disproportionate shifts in flux that can increase yield. These ‘‘off-
diagonal’’ solutions highlight imbalances in the network, as described below for
two high yield solutions.
The maximum yield of 0.38 mol ethylene/mol glucose, a 9% increase over the
baseline yield is found for in silico mutant A when glucose transport (GLCpts) is
held to 80% of the baseline value. In mutant B, yield increases by 6% (0.37 mol
ethylene/mol glucose) with respect to baseline when either glyceraldehyde-3-
phosphate dehydrogenase (GAPD) or phosphoglycerate kinase (PGK) is restricted
to 80% of baseline (Table 1). The differences between the baseline and the mutant
flux distributions are displayed in Fig. 2C (Table S4 in File S1). We observe that
in the baseline case ethanol is produced, which indicates the presence of anaerobic
limitations, despite the aerobic constraints simulated. In mutant A, the ethanol
production pathway (ACALD, ALCD2x, ETOHt2r, and EX_etoh(e)) is completely
off, while pyruvate dehydrogenase (PDH) activity increases. PDH reduces NAD+
to NADH, while ACALD and ALCD2x in the baseline solution regenerate NAD+
supply. The shifts in these reactions indicate that the ethanol production pathway
is active in the baseline solution in order to balance NAD+/NADH. Constrictor
targeting of GLCpts reduces flux through glycolysis, which reduces the amount of
NAD+ converted to NADH via GAPD. Up-regulation of PDH flux (by 2 mmol/
gdcw/hr with respect to baseline) is insufficient to compensate for the decrease in
GAPD activity (by 4.2 mmol/gdcw/hr with respect to basline), so the ethanol
production pathway shuts off and we observe increased flux through NADH
dehydrogenase (NADH16). The decrease in ethanol production when the flux
requirement for NAD+/NADH balance is reduced gives rise to improved ethylene
yield in mutant A.
Similarly, mutant B also has a lower ethanol yield than the baseline (albeit the
decrease is only 2.5%), again due to reduced NADH production by GAPD. In
mutant B, as opposed to mutant A, we note that limiting GAPD or PGK causes a
portion of the upstream flux to divert through the pentose phosphate pathway
(G6PDH2r, PGL, GND, RPE, RPI, TKT1, TALA, and TKT2). By this mechanism,
some carbon dioxide is released via phosphogluconate dehydrogenase (GND),
which reduces the amount of carbon that passes through GAPD or PGK and
allows the Constrictor constraint to be satisfied. Additionally, the pentose
phosphate pathway produces NADPH, which is used by glutamate dehydrogenase
Constricting Flux through Biochemical Networks Reveals New Insights
PLOS ONE | DOI:10.1371/journal.pone.0113820 November 25, 2014 8 / 24

Constricting Flux through Biochemical Networks Reveals New Insights
PLOS ONE | DOI:10.1371/journal.pone.0113820 November 25, 2014 9 / 24

(GLUDy) and N-acetylglutamylphosphate reductase (AGPR) to synthesize
precursors of L-arginine. We note that flux decreases through the NAD(P)
transhydrogenase (THD2), presumably because the NADPH produced by
G6PDHyr and GND is sufficient to meet the NADPH requirement of the L-
arginine biosynthesis pathway. Increases in ATP synthase (ATPS4r), cytochrome
oxidase (CYTBD), and NADH16 flux for both mutants A and B show that
additional cofactors also influence ethylene production in a non-intuitive manner,
likely related to oxygen deficiency. Certain expression states are not able to be
solved, pointing to bottlenecks in the network. For instance, neither a 20% or 80%
reduction in phosphate uptake or ribose-5-phosphate isomerase (RPI) activity is
tolerated, nor is an 80% reduction in nitrogen or glucose uptake (Table 1).
Since decreasing glucose uptake improved yield in mutants A and B, we next
examined the impact of fixing glucose uptake to 10.5 mmol/gdcw/hr during
Constrictor analysis. Under this constraint none of the expression states lead to
increased yield, though increased growth rates are noted when reactions in
glycolysis are targeted (mutant C and D, Table 1 and Table S4 in File S1).
Restricting glycolysis forces flux to divert through the pentose phosphate pathway,
increasing production of biomass precursors. Again, restricting certain reactions
including those in glycolysis as well as nitrogen, phosphate, and glucose transport
(Table 1) is not viable due to stoichiometric violations. When we plot yield versus
Figure 2. Constrictor Study on Individual Reactions. (A) The ethylene yields for each expression state (relative to baseline) are shown on the verticalaxis, and the corresponding number of the expression states is shown on the horizontal axis. Expression states are indicated in the legend. ‘‘Major’’ and‘‘Minor’’ represent modifications to the upper bound of irreversible reactions. Other expression states (e.g. ‘‘Major-Major’’) describe the modifications to lowerand upper bounds of reversible reactions, respectively. (B) The solutions obtained from targeting each active reaction are plotted according to their yield andproduction rate. Horizontal and vertical lines indicate baseline yield and baseline production rate, respectively. (C) Metabolic pathway map comparing flux ofmetabolic reactions (mmol/gdcw/hr) between the baseline case and mutants A and B (baseline/mutant A/mutant B). Red, green and black text indicates thatthe magnitude of flux in the mutant is lower, higher, and equal to the baseline flux, respectively. Purple text indicates that the direction of the reaction isopposite to the baseline case.
doi:10.1371/journal.pone.0113820.g002
Table 1. Mutants identified through Constrictor modifications in the ethylene core network (fminor50.8, fmajor50.2).
Strain Reactions Modified (Individually) Expression State Ethylene Yield% DYield (withrespect to baseline)
Growth Rate(hr-1)
Baseline - - 0.35 - 0.3
Upper limit on glu-cose uptake
Mutant A GLCpts Minor (80% of baseline) 0.38 +9% 0.3
Mutant B GAPD, PGK Minor (80% of baseline) 0.37 +6% 0.3
Not viable Ex_nh4(e){, NH4t{, GLCpts{, RPI*,Ex_pi(e)*, PIt2r*
{Major (20% of baseline)*Either Major or Minor
0 2100% 0
Fixed glucoseuptake
Mutant C GAPD, PGK Minor 0.18 248% 0.45
Mutant D ENO, PGM Minor 0.20 243% 0.43
Not viable ENO{, GAPD{, PFK{, PGK{, FBA{, PGM{,TPI{, Ex_nh4(e) {, NH4t{, RPI*, Ex_pi(e)*,PIt2r*, GLCpts*
{Major *Either Major orMinor
0 2100% 0
doi:10.1371/journal.pone.0113820.t001
Constricting Flux through Biochemical Networks Reveals New Insights
PLOS ONE | DOI:10.1371/journal.pone.0113820 November 25, 2014 10 / 24

production rate for the solutions obtained with fixed glucose, no off-diagonal
solutions are observed (data not shown). Thus, in order to further explore
possible ethylene yields, we continue to allow for flexibility in substrate uptake,
and enforce only maximum uptake rates and a minimum growth rate.
Constrictor allows for expression state tuning to locate higher
yields
We analyzed the impact on ethylene yield when individual reactions were modified
by a range of restriction factors, from complete knockout (f50) to slight reduction
(f50.9). We maintained a minimum growth rate of 0.3 hr21 and maximized
ethylene demand. In the core model, numerous off-diagonal solutions are observed,
many with yield increases (Fig. 3A). The highest yields in this study are obtained
when baseline flux values are restricted by 50% (mutants E and F, Table 2). When
enolase (ENO) or phosphoglycerate mutase (PGM) are targeted in mutant F,
ethylene yield increases by 25% whereas when fructose-bisphosphate aldolase (FBA),
phosphofructokinase (PFK), or triose-phosphate isomerase (TPI) are targeted in
mutant F, yield increases by 23%. The mechanism for yield increase is similar to that
for mutant A, wherein, ethanol production shuts off entirely when the flux
requirement for NAD+/NADH balance decreases (solutions in Table S4 in File S1).
The analysis was repeated using two genome scale models: iAF1260 (Fig. 3B),
from which the core model was derived, and iJO1366 (Fig. 3C), the most current
E. coli genome scale model. The baseline solution for each is obtained via the
maximization of ethylene demand with constraints as described in Methods
section. The baseline yield and production rate are found to be identical for the
core and iAF1260 models (Table 2), though there are 437 reactions active in the
iAF1260 baseline solution (Table S5 in File S1) versus the 72 active in the core
baseline. The baseline solution in the iJO1366 model predicts a yield that is higher
than that of the iAF1260 based models, at 0.43 mol ethylene/mol glucose, and
includes 569 active reactions (Table S6 in File S1). When Constrictor is used to
apply restrictions from 0 to 90% of the iAF1260 or iJO1366 baseline flux, higher
yield and off-diagonal solutions are obtained. Neither the amount of flux
restriction nor the targeted reactions that lead to the highest yield are completely
consistent across models, though all top-performing targets impact glycolysis. The
highest yield found in the iAF1260 model (18% increase over baseline, mutant G)
is obtained when glucose transport is restricted to 70% of the baseline value, while
the second highest yield (12% increase over baseline, mutant H) is obtained when
GAPD or PGK are held at 40% of their baseline flux. As in mutant B and mutant
H, the highest yielding solutions mutants I and J associated with the iJO1366
model are obtained by targeting GAPD or PGK. In mutant I, these reactions are
constricted to 30% of baseline to provide an 18% increase in yield, and in mutant
J, held at 20% of baseline for a 5% yield increase. For each of these mutants,
ethanol production decreases by 100% with respect to baseline, indicating that
oxygen limitation plays a role in suppressing the baseline yield. The complete flux
solutions for each mutant are available in Tables S5 and S6 in File S1.
Constricting Flux through Biochemical Networks Reveals New Insights
PLOS ONE | DOI:10.1371/journal.pone.0113820 November 25, 2014 11 / 24

Constricting functional classes of reactions reveals expression
states that positively and negatively impact ethylene yield
One challenge facing all combinatorial approaches to study metabolic network
behavior is the sheer size of the space that can be explored. In the core network,
simulating every combination of major and minor restriction across every
reaction would result in 1053 scenarios, many of which would be redundant. To
Figure 3. Tuning expression of individual reactions in the core model (A), the genome scale modelsiAF1260 (B) and iJO1366 (C). Constrictor was used to reduce each reaction individually by each of therestriction factors indicated in the legend, where each factor is a fraction of the baseline flux. Each pointrepresents the ethylene yield and production rate of one Constrictor solution.
doi:10.1371/journal.pone.0113820.g003
Constricting Flux through Biochemical Networks Reveals New Insights
PLOS ONE | DOI:10.1371/journal.pone.0113820 November 25, 2014 12 / 24
reduce the combinatorial space when simultaneously modifying multiple
reactions, we applied the Constrictor framework to restrict sets of metabolic
reactions in various functional classes. The metabolic network is divided into
fourteen functional classes, including glycolysis, the TCA cycle, pyruvate
metabolism, anaplerotic reactions, oxidative phosphorylation, and ethylene
production, among others (refer to Table S2 in File S1 for complete listing of
reactions in each class). Sets of four to nine reactions were modified
simultaneously in the core and genome scale networks, resulting in hundreds to
thousands of expression states per study. The results of this assessment (using
major and minor modifications of 20% and 80% baseline, respectively) in several
functional classes are shown in Table 3. As found through individual reaction
modification, a set of the expression states targeting glycolysis increase ethylene
yield in the core model and in the model iJO1366, while restrictions to other
subsystems decrease yield or create unsolvable bottlenecks. For most subsystems,
the results were found to be consistent across models (e.g. for L-arginine
biosynthesis, Exchange, TCA cycle), except for oxidative phosphorylation, in
which case the core model was more heavily impacted (86% decrease in yields for
some expression states) than either of the genome scale models. In iAF1260, none
of the subsystems predicted yield increases for 20% and 80% restrictions, which is
consistent with the results in Fig. 3, where the highest yielding solutions were
obtained by directly restricting glucose exchange (GLCtex) to 70% or 80% of
baseline.
Restricting these subsystems does not reveal any expression states with yields
higher than those found through individual reaction modification, but
simultaneously modifying multiple reactions can provide a descriptive profile of
the network. Targeting nine reactions in glycolysis (Table 3) gives rise to 65,536
expression states, which generate eight unique flux vectors in the core model
(Fig. 4). By arranging the unique solutions in the form of a heatmap, key network
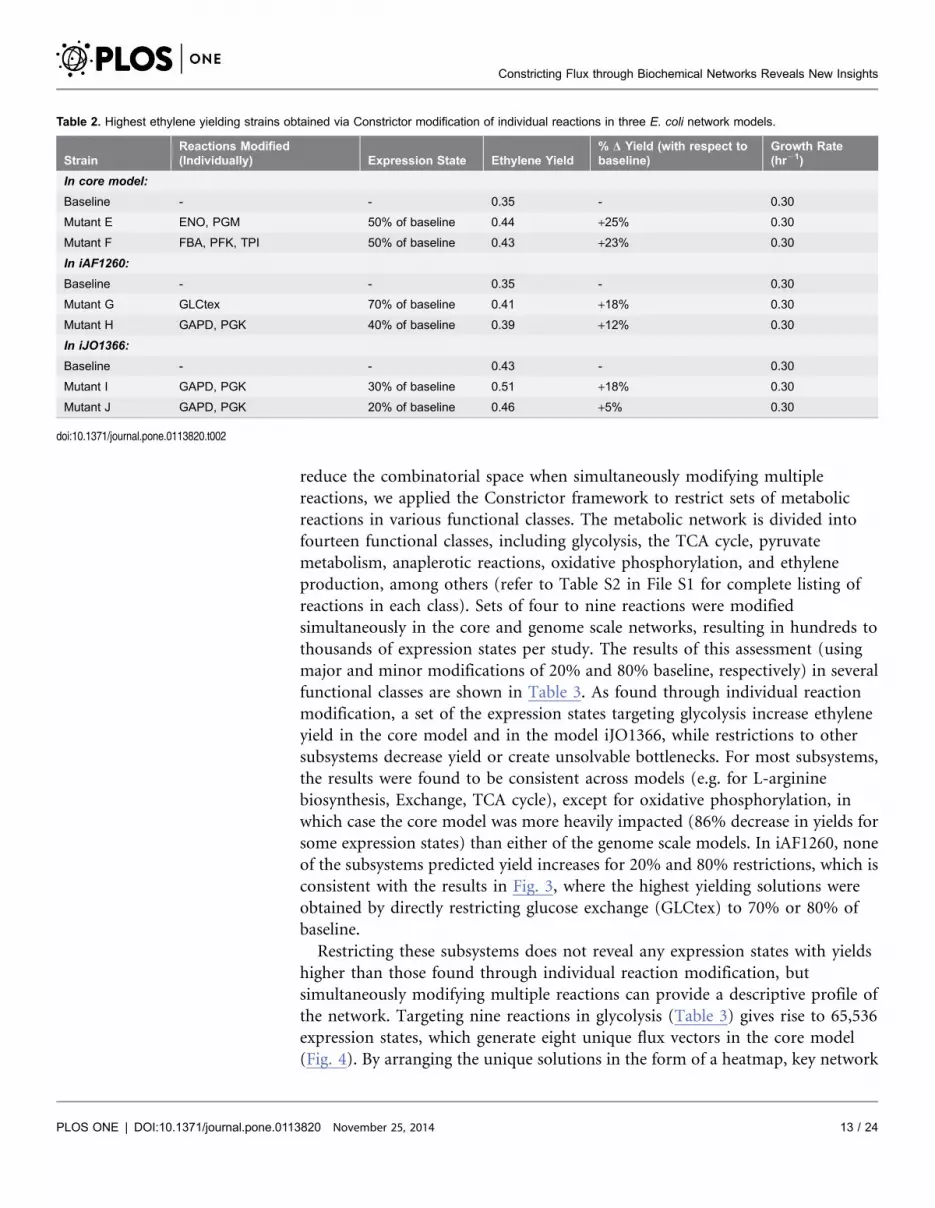
Table 2. Highest ethylene yielding strains obtained via Constrictor modification of individual reactions in three E. coli network models.
StrainReactions Modified(Individually) Expression State Ethylene Yield
% D Yield (with respect tobaseline)
Growth Rate(hr21)
In core model:
Baseline - - 0.35 - 0.30
Mutant E ENO, PGM 50% of baseline 0.44 +25% 0.30
Mutant F FBA, PFK, TPI 50% of baseline 0.43 +23% 0.30
In iAF1260:
Baseline - - 0.35 - 0.30
Mutant G GLCtex 70% of baseline 0.41 +18% 0.30
Mutant H GAPD, PGK 40% of baseline 0.39 +12% 0.30
In iJO1366:
Baseline - - 0.43 - 0.30
Mutant I GAPD, PGK 30% of baseline 0.51 +18% 0.30
Mutant J GAPD, PGK 20% of baseline 0.46 +5% 0.30
doi:10.1371/journal.pone.0113820.t002
Constricting Flux through Biochemical Networks Reveals New Insights
PLOS ONE | DOI:10.1371/journal.pone.0113820 November 25, 2014 13 / 24

characteristics are highlighted. We observe that, as yield decreases (top to bottom
rows) the percent change in flux tends to decrease for most reactions. However, as
the reactions that are not specifically targeted are allowed to vary between the
original unlimited bounds, certain reactions experience increases in flux in
response to Constrictor modifications. Reactions for which flux increases include
G6PDH2r, GND, RPI, and PGL in the pentose phosphate pathway, which increase
by a similar percentage for all expression states, suggesting that flux will divert
through the pentose phosphate pathway for any restriction in glycolysis. The
Table 3. Maximum and minimum ethylene yield changes resulting from Constrictor modification of functional classes (fminor50.8, fmajor50.2).
Core Model iAF1260 iJO1366
Functional ClassReactions Modified(Simultaneously)
Max %DYield
Min %DYield Max % DYield
Min %DYield Max % DYield
Min %DYield
Amino acid + GlutamateMetabolism + Anapleroticreactions
ASPTA, P5CD, GLNS,GLUDy, PPC
226% 283% Not viable Not viable Not viable Not viable
L-arginine biosynthesis ACGK, ACGS, ACODA,ACOTA, AGPR, ARGSL,ARGSS, CBPS, OCBT
220% 280% 221% 284% 221% 283%
Exchange EX_ac(e), EX_co2(e),EX_for(e), EX_etoh(e),EX_h2o(e)
225% 299% 225% 262% 227% 295%
Glycolysis ENO, FBA, GAPD, PFK, PGI,PGK, PGM, PYK, TPI
+6% 292% 23% 245% +5% 226%
Oxidative Phosphorylation ADK1, ATPS4r, CYBD, PPKr,SUCDi, THD2, FRD7,NADH16
221% 286% 20% 22% 21% 26%
Pentose Phosphate Pathway RPE, TALA, TKT1, TKT2 0% 20.1% 20.1% 21% 0% 20.2%
Pyruvate Metabolism ACALD, ACKr, ALCD2x,PFL, PTAr
22% 28% 21% 24% 22% 28%
TCA Cycle ACONTa, ACONTb, CS,FUM, ICDHyr, MDH
221% 285% 221% 283% 221% 284%
doi:10.1371/journal.pone.0113820.t003
Figure 4. In silico modifications predicted by Constrictor targeting glycolysis. Eight unique flux vectors were obtained within the 65,536 expressionstates generated by simultaneously targeting ENO, FBA, GAPD, PFK, PGI, PGK, PGM, PYK, and TPI. These flux vectors are arranged (top to bottom rows)from highest to lowest percent change in ethylene yield relative to baseline yield. Reactions active in at least one expression state are arranged across thehorizontal axis. Colors in the heat map depict the magnitude of the percent change in flux through each reaction (relative to baseline). Reactions that havezero flux for all combinations are not shown.
doi:10.1371/journal.pone.0113820.g004
Constricting Flux through Biochemical Networks Reveals New Insights
PLOS ONE | DOI:10.1371/journal.pone.0113820 November 25, 2014 14 / 24

reactions that differ significantly between high and low yields are of particular
interest. Flux through ATPS4r increases by a lower percentage in the solutions
with improved yield than it does for the solutions with decreased yield: the lower
yield solutions produce more ATP. This observation, combined with the fact that
acetate exchange (EX_ac(e)) and acetate kinase (ACKr) also decrease more in the
lower yield solutions, points to the importance of ATP/ADP balance. In this
network, PFK, ACKr, and ATPS4r produce ATP, while the arginine biosynthesis
pathway consumes ATP. When glycolysis is restricted, less carbon is available for
processing by pyruvate metabolism, and acetate production decreases. This
further limits ATP production, causing ATP synthase to balance the ADP
produced by the arginine biosynthesis pathway. Thus, ATPS4r flux increases
slightly with minor restrictions in glycolysis and continues to increase with major
restrictions.
Maximizing growth and applying Constrictor leads to export of
ethylene and other products
All previous studies maximized ethylene production under simulated constraints.
However, Constrictor is able to function on any baseline state. To demonstrate
this potential, we maximized growth (via the biomass reaction) in the core,
iAF1260, and iJO1366 models, then applied Constrictor with 20% and 80%
restrictions on individual reactions to search for modifications that increase
ethylene yield. None of the baseline solutions produce ethylene when growth is
the objective (Table 4), which is not unexpected, as there is no native motivation
for E. coli to divert resources towards ethylene biosynthesis. The baseline core
achieves a maximum growth rate of 0.79 hr21, while the genome scale models
iAF160 and iJO1366 grow faster (0.85 hr21 and 0.92 hr21 respectively), likely due
to differences in metabolites involved in the biomass reaction. When Constrictor
is applied to the core model, no solutions result in ethylene production; however,
expression states that produce ethylene are found when Constrictor is applied to
iAF1260 and iJO1366 genome scale models. In either of the genome scale models,
restricting L-glutamate 5-semialdehyde dehydratase reaction (G5SADs) results in
Table 4. Strains producing ethylene when growth is the objective.
StrainReactions Modified(Individually) Expression State Ethylene Yield
Ethylene ProductionRate
Growth Rate(hr21)
In core model:
Baseline - - 0 0 0.79
In iAF1260:
Baseline - - 0 0 0.85
Mutant K G5SADs Major (20% of baseline) 0.03 0.29 0.82
In iJO1366:
Baseline - - 0 0 0.92
Mutant L G5SADs Major 0.03 0.30 0.89
doi:10.1371/journal.pone.0113820.t004
Constricting Flux through Biochemical Networks Reveals New Insights
PLOS ONE | DOI:10.1371/journal.pone.0113820 November 25, 2014 15 / 24

ethylene production. Ethylene production is higher when G5SADs is modified by
the major restriction factor (mutants K and L in Table 4) than when modified by
the minor factor, though ethylene production is seen for either degree of
restriction. G5SADs is a spontaneous reaction that is part of the proline
biosynthesis pathway, which converts L-glutamate to L-proline. Limiting flux
through this pathway increases flux through the L-arginine biosynthesis pathway
(see ARGSL in mutant K in Table S5 in File S1 and mutant L in Table S6 in File
S1). As L-arginine is a reactant in the EFE reaction, restrictions in G5SADs allow
ethylene to be produced when biomass is the objective. Interestingly, targeting the
two upstream reactions in L-proline biosynthesis (GLU5k and G5SD) or the
downstream reaction (P5CR) does not cause ethylene to be produced. Restricting
the other reactions in the pathway actually leads to decreases in flux through L-
arginine synthesis. The differences between restricting the spontaneous G5SADs
and the enzymatic reactions GLU5k, G5SDs, and P5CR may be due to the cofactor
requirements of the enzymatic reactions. GLU5k is ATP/ADP dependent, while
G5SDs and P5CR are NADP+/NADPH dependent. As described in previous
sections, cofactor balances are crucial for achieving maximum ethylene yields.
We also maximize growth to demonstrate an alternate application of
Constrictor; rather than looking for modifications that improve yield of a specific
product, it also possible to scan a network to search de novo for desirable
phenotypes. We applied Constrictor with fminor50.8, and fmajor50.2 to individual
reactions in the core and genome scale model to locate modifications that increase
production rate and yield of alternate metabolites. A summary of the targeted
reactions in the core model that lead to increased production of ethanol, formate,
acetate, or acetaldehyde is depicted in Fig. 5. In the core baseline state obtained
from maximizing growth (Table 4), neither acetaldehyde, ethanol, nor formate is
produced. Scanning with Constrictor reveals expression states that generate
0.41 mol ethanol/mol glucose, approximately 20% of the maximum theoretical
yield on glucose [54]. The highest ethanol yields are obtained when either
NADH16 or CYBD are restricted to 20% of the baseline value, which forces
decreases in oxygen uptake and, as expected, shifts the metabolic network to
utilize fermentation pathways. Similar increases in ethanol production are
observed when oxygen transport is targeted in either the core network or genome
scale networks, with the highest ethanol yield of 1.3 mol/mol glucose (65% of
maximum theoretical yield) located in iAF1260. Select ethanol-producing
solutions are included in Tables S4-S6 in File S1. Targeting oxygen uptake is
expected to shift the network towards fermentation, but constricting many
reactions within central metabolism can also increase fermentation product yield.
In the TCA cycle for instance, targeting isocitrate dehydrogenase (ICDHyr) leads
to increased acetate yield in the core model (Fig. 5) as well as in both genome
scale models (Tables S5-S6 in File S1). As the genome scale models contain
hundreds of exchange reactions (299 in iAF1260 and 312 in iJO1366), a number
of potential products can be targeted. Several expression states in the Constrictor
scan produce trace amounts of metabolites, such as D-lactate in iJO1366 when
ICDHyr is targeted, and in iAF1260 with restrictions in Lipid A disaccaride
Constricting Flux through Biochemical Networks Reveals New Insights
PLOS ONE | DOI:10.1371/journal.pone.0113820 November 25, 2014 16 / 24
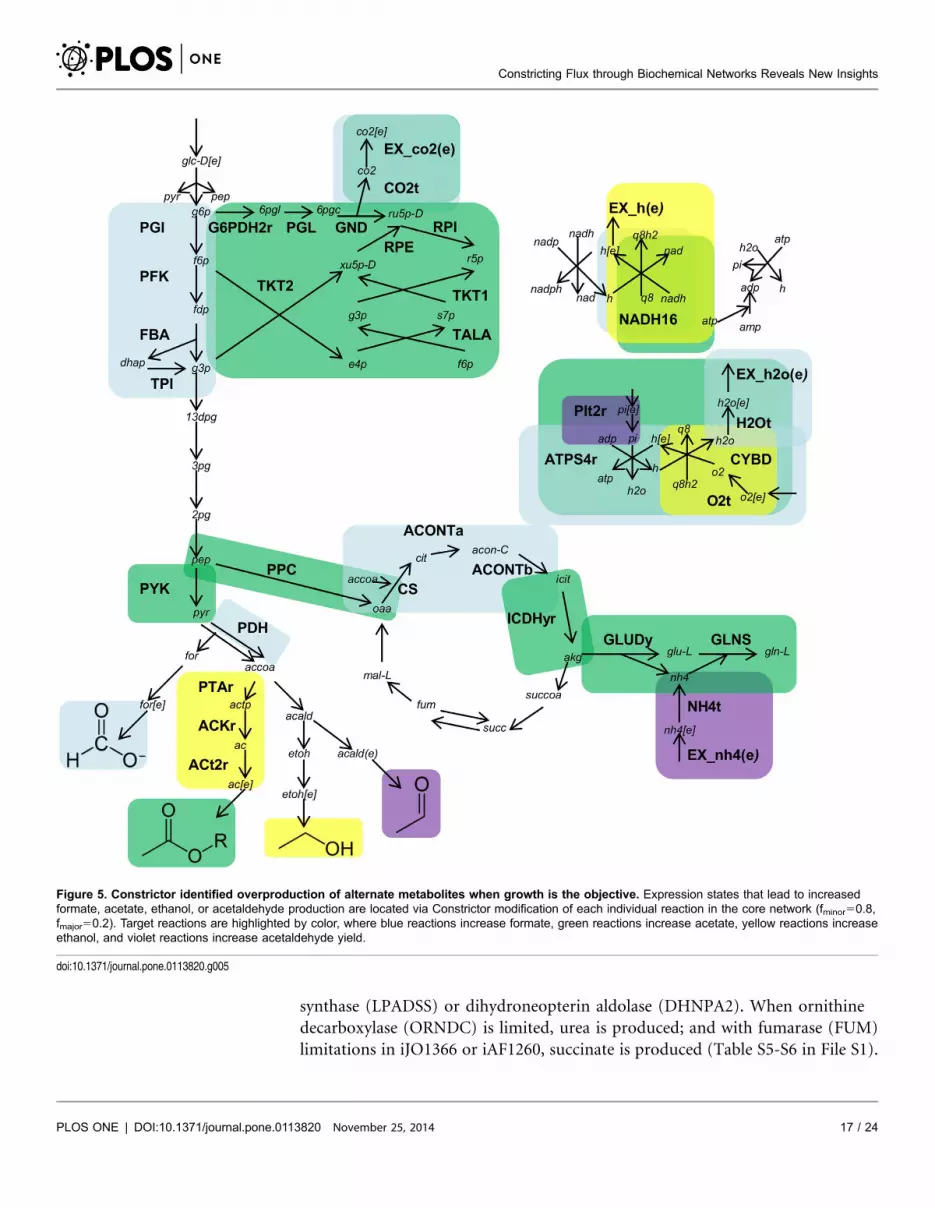
synthase (LPADSS) or dihydroneopterin aldolase (DHNPA2). When ornithine
decarboxylase (ORNDC) is limited, urea is produced; and with fumarase (FUM)
limitations in iJO1366 or iAF1260, succinate is produced (Table S5-S6 in File S1).
Figure 5. Constrictor identified overproduction of alternate metabolites when growth is the objective. Expression states that lead to increasedformate, acetate, ethanol, or acetaldehyde production are located via Constrictor modification of each individual reaction in the core network (fminor50.8,fmajor50.2). Target reactions are highlighted by color, where blue reactions increase formate, green reactions increase acetate, yellow reactions increaseethanol, and violet reactions increase acetaldehyde yield.
doi:10.1371/journal.pone.0113820.g005
Constricting Flux through Biochemical Networks Reveals New Insights
PLOS ONE | DOI:10.1371/journal.pone.0113820 November 25, 2014 17 / 24

Discussion
Here, we present an FBA based optimization framework called Constrictor that
predicts metabolic interventions by identifying unique ‘‘expression states’’ that
give rise to overproduction of the biochemical target. We show that enforcing
various levels of inhibition of flux constraints in metabolic network pathways can
provide valuable engineering intervention strategies to achieve the overproduction
target. We investigate heterologous ethylene production in E. coli, and
demonstrate the capability of Constrictor to generate unique in silico mutants that
are predicted to produce high ethylene yields. By restricting single enzymatic
reactions or combinations of reactions, thousands of possible network states are
revealed. In both reduced and genome scale models of E. coli metabolism,
alternate expression states predict improvements in ethylene yield. By limiting
individual reactions, disproportionate shifts in the network are forced, which
reveal alternate solutions that highlight network characteristics. Constricting
many reactions simultaneously provides a means to scan a larger portion of the
solution space, which can be used to infer reactions or metabolites that have large
impact on ethylene yield. In this analysis of ethylene production, we conclude that
glucose and oxygen cannot be balanced at their maximum allowable values to
achieve the highest ethylene yield. Thus anaerobic limitations result in ethanol
production in the baseline networks. Constrictor suggests that the imbalance in
the network can be remedied by reducing flux through glycolysis. Depending on
the model, the highest ethylene yields are obtained for different target reactions
and different restriction factor values, which emphasizes the importance of using a
high throughput experimental approach, such as MAGE [14], to test a range of
expression states in several potential target genes simultaneously. We also
demonstrate the ability of Constrictor to search a network for targets that improve
production of other metabolites. With biomass as the objective, we scanned and
located major and minor expression states that increase export of formate,
ethanol, acetate, or acetaldehyde. In genome scale models, additional products
were detected in trace amounts by applying Constrictor to restrict individual
reactions.
So far, improvements in ethylene production by selectively repressing metabolic
activity have not yet been reported. Experimental attempts to engineer ethylene-
producing microorganisms have included increasing media concentration,
increasing gene copy number, inserting codon-optimized efe sequences, testing
different promoters to drive efe expression, and reducing homologous
recombination between efe promoter and chromosome [38, 40, 45, 55]. Flux
balance analysis has not yet been applied to optimize ethylene production in E.
coli. In the ethylene-producing networks described here, we focused on modifying
only flux through the metabolic reactions initially present in the network, and did
not attempt to substitute enzymes with different cofactors or force alternate
substrates as has been suggested via computational analysis to optimize ethylene
production in other organisms [26, 37]. Therefore, the mutants presented here
Constricting Flux through Biochemical Networks Reveals New Insights
PLOS ONE | DOI:10.1371/journal.pone.0113820 November 25, 2014 18 / 24

could provide novel strategies to modify E. coli metabolism for ethylene
production.
To achieve the overarching goal of creating robust platforms for predictive
strain engineering, it is necessary to apply lessons learned from a multitude of FBA
frameworks into experimental strain design strategies, including those that focus
on improving computational efficiency [33, 34, 56], introducing novel and non-
native pathways [57–59], defining biologically relevant objectives [60–62],
incorporating experimental gene expression data [63, 64], and exploring gene
addition [57], deletion, and over- or under-expression [29, 31, 57]. Unlike other
FBA based optimization techniques, Constrictor provides a framework that
samples an unexplored solution space by combinatorially analyzing various
degrees of inhibitory effects of genetic mutations on the performance of
biochemical networks. We demonstrate that by subtly or dramatically reducing
flux through specific pathways, a distribution of solutions can be obtained that
reveal novel metabolic engineering targets. Constrictor is a generally applicable
technique for computationally generating and analyzing mutant strains, and can
be incorporated into any metabolic flux analysis method that uses linear
programming methodology, including regulated [64, 65], dynamic [24], and
thermodynamic models [66, 67]. Because Constrictor operates independently of
objective function, it has the potential to be used in conjunction with
minimization of metabolic adjustment [60], regulatory on/off minimization [61],
or with multi-objective optimization algorithms [68, 69].
Recent high-throughput recombineering techniques demonstrate that combi-
natorial exploration of the genomic space can reveal optimal mutants, while
computational techniques prove to be well suited to analyze these combinations.
Modifications suggested by Constrictor can be translated into in vivo modifica-
tions via a wealth of available strain engineering tools. Recently, characterization
of promoter and upstream element sequences have enabled specific ranges of gene
expression to be realized [70–72]. Similarly, emerging techniques that use small
regulatory RNAs to target specific genes appear to be especially well-suited for
implementing Constrictor predictions. The CRISPR interference system, which
uses a catalytically inactive Cas9 protein to inhibit transcription of genes
homologous to a guide RNA sequence, has been demonstrated to be tunable
according to the location of the DNA target [73]. Implementing riboregulators is
another strategy for achieving modular expression from selected genes [74]. In
light of these and other advances in synthetic biology and genome engineering, it
is becoming increasingly possible to achieve precise performance from biological
parts, which allows for enhanced integration of strain engineering efforts and in
silico predictions.
Supporting Information
Figure S1. Map of the core metabolic network for ethylene production. The
core metabolic network comprises of central metabolism, including glycolysis, the
Constricting Flux through Biochemical Networks Reveals New Insights
PLOS ONE | DOI:10.1371/journal.pone.0113820 November 25, 2014 19 / 24

TCA cycle, and co-factor balancing equations (in grey box at top), as well as the
arginine biosynthesis pathway. Ethylene production is carried out by the ethylene
forming enzyme (EFE). Reaction abbreviations are in bold uppercase, and
metabolite names are in lower case italics. Arrows indicate directionality of each
reaction as allowed by the model. Refer to Table S2 in File S1 for the complete
reactions used in the model, including the biomass reaction and list of all
cofactors not illustrated in this figure.
doi:10.1371/journal.pone.0113820.s001 (TIFF)
Figure S2. Experimental growth rate of E. coli K12 MG1655. E. coli (ATCC
700926) was grown at 37 C in M9 minimal media with 0.4% glucose. Optical
density (OD562) was recorded every 20 minutes with a Tecan GENios plate reader
(Tecan Group Ltd.) with Magellan software version 7.2. Normalized OD is
presented (OD at time t divided by OD at t50). Error bars are standard deviation
of n59 biological replicates. Growth rate (m) was calculated with an exponential
fit to the exponential growth portion of the curve (shadowed region in plot).
doi:10.1371/journal.pone.0113820.s002 (TIFF)
Figure S3. Trade-off between growth rate and ethylene yield with and without
Constrictor. The maximum theoretical ethylene yield was recorded for a range of
minimum growth rates, with (fminor50.8, fmajor50.2) and without Constrictor. In
each of the three models (labeled in panels), a similar trend is noted, with
Constrictor yields approaching baseline yields as growth rate is increased.
doi:10.1371/journal.pone.0113820.s003 (TIFF)
File S1. Supplementary Tables. Table S1: Reactions and Parameters. Table S2:
Reactions in the core model for ethylene production from EFE. Table S3: List of
metabolites in the core model. Table S4: Selected solutions from Constrictor in
ethylene core model. Table S5: Selected solutions from Constrictor in genome
scale model iAF1260. Table S6: Selected solutions from Constrictor in genome
scale model iJO1366.
doi:10.1371/journal.pone.0113820.s004 (XLSX)
Author Contributions
Conceived and designed the experiments: AC KE. Performed the experiments: KE.
Analyzed the data: AC KE. Contributed reagents/materials/analysis tools: AC KE
RTG. Wrote the paper: AC KE.
References
1. Ingram LO, Conway T, Clark DP, Sewell GW, Preston JF (1987) Genetic Engineering of EthanolProduction in Escherichia coli. Appl Envir Microbiol 53: 2420–2425.
2. Woodruff LBA, May BL, Warner JR, Gill RT (2013) Towards a metabolic engineering strain‘‘commons’’: an Escherichia coli platform strain for ethanol production. Biotechnol Bioeng 110: 1520–1526.
3. Atsumi S, Hanai T, Liao JC (2008) Non-fermentative pathways for synthesis of branched-chain higheralcohols as biofuels. Nature 451: 86–89.
Constricting Flux through Biochemical Networks Reveals New Insights
PLOS ONE | DOI:10.1371/journal.pone.0113820 November 25, 2014 20 / 24

4. Trinh CT, Li J, Blanch HW, Clark DS (2011) Redesigning Escherichia coli metabolism for anaerobicproduction of isobutanol. Appl Environ Microbiol 77: 4894–4904.
5. Schirmer A, Rude MA, Li X, Popova E, del Cardayre SB (2010) Microbial biosynthesis of alkanes.Science 329: 559–562.
6. Howard TP, Middelhaufe S, Moore K, Edner C, Kolak DM, et al. (2013) Synthesis of customizedpetroleum-replica fuel molecules by targeted modification of free fatty acid pools in Escherichia coli. ProcNatl Acad Sci U S A 110: 7636–7641.
7. Lutke-Eversloh T, Fischer A, Remminghorst U, Kawada J, Marchessault RH, et al. (2002)Biosynthesis of novel thermoplastic polythioesters by engineered Escherichia coli. Nat Mater 1: 236–240.
8. Aldor IS, Kim S, Prather KLJ, Keasling JD (2002) Metabolic Engineering of a Novel Propionate-Independent Pathway for the Production of Poly (3-Hydroxybutyrate- co -3-Hydroxyvalerate) inRecombinant Salmonella enterica Serovar Typhimurium. Appl Environ Microbiol 68: 3848–3854.
9. Yadav VG, De Mey M, Giaw Lim C, Kumaran Ajikumar P, Stephanopoulos G (2012) The future ofmetabolic engineering and synthetic biology: Towards a systematic practice. Metab Eng 14: 233–241.
10. Du J, Yuan Y, Si T, Lian J, Zhao H (2012) Customized optimization of metabolic pathways bycombinatorial transcriptional engineering. Nucleic Acids Res 40: e142.
11. Esvelt KM, Wang HH (2013) Genome-scale engineering for systems and synthetic biology. Mol SystBiol 9: 641.
12. Boyle NR, Gill RT (2012) Tools for genome-wide strain design and construction. Curr Opin Biotechnol23: 666–671.
13. Warner JR, Reeder PJ, Karimpour-Fard A, Woodruff LB, Gill RT (2010) Rapid profiling of a microbialgenome using mixtures of barcoded oligonucleotides. Nat Biotechnol 28: 856–862.
14. Wang HH, Isaacs FJ, Carr PA, Sun ZZ, Xu G, et al. (2009) Programming cells by multiplex genomeengineering and accelerated evolution. Nature 460: 894–898.
15. Sandoval NR, Kim JYH, Glebes TY, Reeder PJ, Aucoin HR, et al. (2012) Strategy for directingcombinatorial genome engineering in Escherichia coli. Proc Natl Acad Sci 109: 10540–10545.
16. Chatterjee A, Cook LCC, Shu C-C, Chen Y, Manias D, et al. (2013) Antagonistic self-sensing andmate-sensing signaling controls antibiotic-resistance transfer. Proc Natl Acad Sci U S A 110: 7086–7090.
17. Chatterjee A, Johnson CM, Shu C-C, Kaznessis YN, Ramkrishna D, et al. (2011) Convergenttranscription confers a bistable switch in Enterococcus faecalis conjugation. Proc Natl Acad Sci U S A108: 9721–9726.
18. Elowitz MB, Leibler S (2000) A synthetic oscillatory network of transcriptional regulators. Nature 403:335–338.
19. Gardner TS, Cantor CR, Collins JJ (2000) Construction of a genetic toggle switch in Escherichia coli.Nature 403: 339–342.
20. Shu C-C, Chatterjee A, Dunny G, Hu W-S, Ramkrishna D (2011) Bistability versus BimodalDistributions in Gene Regulatory Processes from Population Balance. Plos Comput Biol. 7
21. Savageau MA (1969) Biochemical Systems Analysis I. Some Mathematical Properties of the Rate Lawfor the Component Enzymatic Reactions. J Theor Biol 25: 365–369.
22. Raman K, Rajagopalan P, Chandra N (2005) Flux balance analysis of mycolic acid pathway: targets foranti-tubercular drugs. PLoS Comput Biol 1: e46.
23. Boyle NR, Morgan J (2009) Flux balance analysis of primary metabolism in Chlamydomonas reinhardtii.BMC Syst Biol 3: 4.
24. Mahadevan R, Edwards JS, Doyle FJ (2002) Dynamic flux balance analysis of diauxic growth inEscherichia coli. Biophys J 83: 1331.
25. Varma A, Palsson BO (1994) Stoichiometric flux balance models quantitatively predict growth andmetabolic by-product secretion in wild-type Escherichia coli W3110. Appl Environ Microbiol 60: 3724–3731.
Constricting Flux through Biochemical Networks Reveals New Insights
PLOS ONE | DOI:10.1371/journal.pone.0113820 November 25, 2014 21 / 24
26. Larsson C, Snoep JL, Norbeck J, Albers E (2011) Flux balance analysis for ethylene formation ingenetically engineered Saccharomyces cerevisiae. IET Syst Biol 5: 245–251.
27. Singh A, Cher Soh K, Hatzimanikatis V, Gill RT (2011) Manipulating redox and ATP balancing forimproved production of succinate in E. coli. Metab Eng 13: 76–81.
28. Brynildsen MP, Winkler J, Spina CS, MacDonald IC, Collins JJ (2013) Potentiating antibacterialactivity by predictably enhancing endogenous microbial ROS production. Nat Biotechnol 31: 160–165.
29. Burgard AP, Pharkya P, Maranas CD (2003) Optknock: a bilevel programming framework for identifyinggene knockout strategies for microbial strain optimization. Biotechnol Bioeng 84: 647–657.
30. Pharkya P, Maranas CD (2006) An optimization framework for identifying reaction activation/inhibition orelimination candidates for overproduction in microbial systems. Metab Eng 8: 1–13.
31. Ranganathan S, Suthers PF, Maranas CD (2010) OptForce: An optimization procedure for identifyingall genetic manipulations leading to targeted overproductions. PLoS Comput Biol 6: e1000744.
32. Patil KR, Rocha I, Forster J, Nielsen J (2005) Evolutionary programming as a platform for in silicometabolic engineering. BMC Bioinformatics 6: 308.
33. Yang L, Cluett WR, Mahadevan R (2011) EMILiO: a fast algorithm for genome-scale strain design.Metab Eng 13: 272–281.
34. Lun DS, Rockwell G, Guido NJ, Baym M, Kelner J, et al. (2009) Large-scale identification of geneticdesign strategies using local search. Mol Syst Biol 5: 296.
35. Feist AM, Zielinski DC, Orth JD, Schellenberger J, Herrgard MJ, et al. (2010) Model-drivenevaluation of the production potential for growth-coupled products of Escherichia coli. Metab Eng 12:173–186.
36. Ungerer J, Tao L, Davis M, Ghirardi M, Maness P-C, et al. (2012) Sustained photosyntheticconversion of CO2 to ethylene in recombinant cyanobacterium Synechocystis 6803. Energy Environ Sci5: 8998.
37. Pirkov I, Albers E, Norbeck J, Larsson C (2008) Ethylene production by metabolic engineering of theyeast Saccharomyces cerevisiae. Metab Eng 10: 276–280.
38. Takahama K, Matsuoka M, Nagahama K, Ogawa T (2003) Construction and analysis of a recombinantcyanobacterium expressing a chromosomally inserted gene for an ethylene-forming enzyme at thepsbAI locus. J Biosci Bioeng 95: 302–305.
39. Guerrero F, Carbonell V, Cossu M, Correddu D, Jones PR (2012) Ethylene Synthesis and RegulatedExpression of Recombinant Protein in Synechocystis sp. PCC 6803. PLoS One 7: e50470.
40. Wang J-P, Wu L-X, Xu F, Lv J, Jin H-J, et al. (2010) Metabolic engineering for ethylene production byinserting the ethylene-forming enzyme gene (efe) at the 16S rDNA sites of Pseudomonas putidaKT2440. Bioresour Technol 101: 6404–6409.
41. Ishihara K, Matsuoka M, Inoue Y, Tanase S, Ogawa T, et al. (1995) Overexpression and in vitroreconstitution of the ethylene-forming enzyme from Pseudomonas syringae. J Ferment Bioeng 79: 205–211.
42. Dong HJ, Wu LX, Chen SF (2007) Molecular cloning and expression of ethylene-forming enzyme (EFE)gene from Pseudomonas syringae pv. glycinea ICMP2189. J Agric Biotechnol 15: 698–701.
43. Fukuda H, Ogawa T, Tazaki M, Nagahama K, Fujiil T, et al. (1992) Two reactions are simultaneouslycatalyzed by a single enzyme: the arginine-dependent simultaneous formation of two products, ethyleneand succinate, from 2-oxoglutarate by an enzyme from Pseudomonas syringae. Biochem Biophys ResCommun 188: 483–489.
44. Eckert C, Xu W, Xiong W, Lynch S, Ungerer J, et al. (2014) Ethylene-forming enzyme and bioethyleneproduction. Biotechnol Biofuels 7: 33.
45. Guerrero F, Carbonell V, Cossu M, Correddu D, Jones PR (2012) Ethylene Synthesis and RegulatedExpression of Recombinant Protein in Synechocystis sp. PCC 6803. PLoS One 7: e50470.
46. Feist AM, Henry CS, Reed JL, Krummenacker M, Joyce AR, et al. (2007) A genome-scale metabolicreconstruction for Escherichia coli K-12 MG1655 that accounts for 1260 ORFs and thermodynamicinformation. Mol Syst Biol 3: 121.
Constricting Flux through Biochemical Networks Reveals New Insights
PLOS ONE | DOI:10.1371/journal.pone.0113820 November 25, 2014 22 / 24

47. Kanehisa M, Goto S (2000) KEGG: Kyoto encyclopedia of genes and genomes. Nucleic Acids Res 28:27–30.
48. Keseler IM, Collado-Vides J, Santos-Zavaleta A, Peralta-Gil M, Gama-Castro S, et al. (2011)EcoCyc: a comprehensive database of Escherichia coli biology. Nucleic Acids Res 39: D583–D590.
49. Schellenberger J, Park JO, Conrad TM, Palsson BØ (2010) BiGG: a Biochemical Genetic andGenomic knowledgebase of large scale metabolic reconstructions Database. BMC Bioinformatics 11:213.
50. Orth JD, Conrad TM, Na J, Lerman J, Nam H, et al. (2011) A comprehensive genome-scalereconstruction of Escherichia coli metabolism—2011. Mol Syst Biol 7: 535.
51. Schellenberger J, Que R, Fleming RMT, Thiele I, Orth JD, et al. (2011) Quantitative prediction ofcellular metabolism with constraint-based models: the COBRA Toolbox v2.0. Nat Protoc 6: 1290–1307.
52. Mahadevan R, Schilling CH (2003) The effects of alternate optimal solutions in constraint-basedgenome-scale metabolic models. Metab Eng 5: 264–276.
53. Alper H, Jin Y-S, Moxley JF, Stephanopoulos G (2005) Identifying gene targets for the metabolicengineering of lycopene biosynthesis in Escherichia coli. Metab Eng 7: 155–164.
54. Alterthum F, Ingram LO (1989) Efficient ethanol production from glucose, lactose, and xylose byrecombinant Escherichia coli. Appl Environ Microbiol 55: 1943–1948.
55. Ungerer J, Tao L, Davis M, Ghirardi M, Maness P-C, et al. (2012) Sustained photosyntheticconversion of CO2 to ethylene in recombinant cyanobacterium Synechocystis 6803. Energy Environ Sci5: 8998–9006.
56. Patil KR, Rocha I, Forster J, Nielsen J (2005) Evolutionary programming as a platform for in silicometabolic engineering. BMC Bioinformatics 6: 308.
57. Pharkya P, Burgard AP, Maranas CD (2004) OptStrain: A computational framework for redesign ofmicrobial production systems. Genome Res: 2367–2376.
58. Kim J, Reed JL, Maravelias CT (2011) Large-scale bi-level strain design approaches and mixed-integerprogramming solution techniques. PLoS One 6: e24162.
59. Hatzimanikatis V, Li C, Ionita J, Henry CS, Jankowski MD, et al. (2005) Exploring the diversity ofcomplex metabolic networks. Bioinformatics 21: 1603–1609.
60. Segre D, Vitkup D, Church GM (2002) Analysis of optimality in natural and perturbed metabolicnetworks. Proc Natl Acad Sci 99: 15112–15117.
61. Shlomi T, Berkman O, Ruppin E (2005) Regulatory on/off minimization of metabolic flux changes aftergenetic perturbations. Proc Natl Acad Sci 102: 7695–7700.
62. Rockwell G, Guido NJ, Church GM (2013) Redirector: Designing Cell Factories by Reconstructing theMetabolic Objective. PLoS Comput Biol 9: e1002882.
63. Colijn C, Brandes A, Zucker J, Lun DS, Weiner B, et al. (2009) Interpreting expression data withmetabolic flux models: Predicting Mycobacterium tuberculosis mycolic acid production. PLoS ComputBiol 5: e1000489.
64. Chandrasekaran S, Price ND (2010) Probabilistic integrative modeling of genome-scale metabolic andregulatory networks in Escherichia coli and Mycobacterium tuberculosis. Proc Natl Acad Sci U S A 107:17845–17850.
65. Covert MW, Palsson BØ (2002) Transcriptional regulation in constraints-based metabolic models ofEscherichia coli. J Biol Chem 277: 28058–28064.
66. Beard D, Liang S, Qian H (2002) Energy balance for analysis of complex metabolic networks.Biophys J 83: 79–86.
67. Henry CS, Broadbelt LJ, Hatzimanikatis V (2007) Thermodynamics-based metabolic flux analysis.Biophys J 92: 1792–1805.
68. Xu M, Bhat S, Smith R, Stephens G, Sadhukhan J (2009) Multi-objective optimisation of metabolicproductivity and thermodynamic performance. Comput Chem Eng 33: 1438–1450.
69. Deb K, Sundar J, Udaya Bhaskara RN, Chaudhuri S (2006) Reference Point Based Multi-ObjectiveOptimization Using Evolutionary Algorithms. Int J Comput Intell Res 2: 273–286.
Constricting Flux through Biochemical Networks Reveals New Insights
PLOS ONE | DOI:10.1371/journal.pone.0113820 November 25, 2014 23 / 24

70. Rhodius V, Mutalik VK (2010) Predicting strength and function for promoters of the Escherichia colialternative sigma factor, sigmaE. Proc Natl Acad Sci U S A 107: 2854–2859.
71. Rhodius VA, Mutalik VK, Gross CA (2012) Predicting the strength of UP-elements and full-length E.coli sE promoters. Nucleic Acids Res 40: 2907–2924.
72. Alper H, Fischer C, Nevoigt E, Stephanopoulos G (2005) Tuning genetic control through promoterengineering. Proc Natl Acad Sci U S A 102: 12678–12683.
73. Qi LS, Larson MH, Gilbert LA, Doudna JA, Weissman JS, et al. (2013) Repurposing CRISPR as anRNA-guided platform for sequence-specific control of gene expression. Cell 152: 1173–1183.
74. Isaacs FJ, Dwyer DJ, Ding C, Pervouchine DD, Cantor CR, et al. (2004) Engineered riboregulatorsenable post-transcriptional control of gene expression. Nat Biotechnol 22: 841–847.
Constricting Flux through Biochemical Networks Reveals New Insights
PLOS ONE | DOI:10.1371/journal.pone.0113820 November 25, 2014 24 / 24