Embed Size (px)
Citation preview

Analysis of the Phlebiopsis gigantea Genome,Transcriptome and Secretome Provides Insight into ItsPioneer Colonization Strategies of WoodChiaki Hori1, Takuya Ishida1, Kiyohiko Igarashi1, Masahiro Samejima1, Hitoshi Suzuki2, Emma Master2,
Patricia Ferreira3, Francisco J. Ruiz-Duenas4, Benjamin Held5, Paulo Canessa6, Luis F. Larrondo6,
Monika Schmoll7, Irina S. Druzhinina8, Christian P. Kubicek8, Jill A. Gaskell9, Phil Kersten9,
Franz St. John9, Jeremy Glasner10, Grzegorz Sabat10, Sandra Splinter BonDurant10,
Khajamohiddin Syed11, Jagjit Yadav11, Anthony C. Mgbeahuruike12, Andriy Kovalchuk12,
Fred O. Asiegbu12, Gerald Lackner13, Dirk Hoffmeister13, Jorge Rencoret14, Ana Gutierrez14, Hui Sun15,
Erika Lindquist15, Kerrie Barry15, Robert Riley15, Igor V. Grigoriev15, Bernard Henrissat16, Ursula Kues17,
Randy M. Berka18, Angel T. Martınez4, Sarah F. Covert19, Robert A. Blanchette5, Daniel Cullen9*
1 Department of Biomaterials Sciences, University of Tokyo, Tokyo, Japan, 2 Department of Chemical Engineering, University of Toronto, Toronto, Ontario, Canada,
3 Department of Biochemistry and Molecular and Cellular Biology and Institute of Biocomputation and Physics of Complex Systems, University of Zaragoza, Zaragoza,
Spain, 4 Centro de Investigaciones Biologicas, Consejo Superior de Investigaciones Cientificas, Madrid, Spain, 5 Department of Plant Pathology, University of Minnesota, St.
Paul, Minnesota, United States of America, 6 Millennium Nucleus for Fungal Integrative and Synthetic Biology and Departamento de Genetica Molecular y Microbiologıa,
Facultad de Ciencias Biologicas, Pontificia Universidad Catolica de Chile, Santiago, Chile, 7 Health and Environment Department, Austrian Institute of Technology GmbH,
Tulin, Austria, 8 Austrian Center of Industrial Biotechnology and Institute of Chemical Engineering, Vienna University of Technology, Vienna, Austria, 9 USDA, Forest
Products Laboratory, Madison, Wisconsin, United States of America, 10 University of Wisconsin Biotechnology Center, Madison, Wisconsin, United States of America,
11 Department of Environmental Health, University of Cincinnati, Cincinnati, Ohio, United States of America, 12 Department of Forest Sciences, University of Helsinki,
Helsinki, Finland, 13 Department of Pharmaceutical Biology at the Hans-Knoll-Institute, Friedrich-Schiller-University, Jena, Germany, 14 Instituto de Recursos Naturales y
Agrobiologia de Sevilla, CSIC, Seville, Spain, 15 US Department of Energy Joint Genome Institute, Walnut Creek, California, United States of America, 16 Architecture et
Fonction des Macromolecules Biologiques, Unite Mixte de Recherche 7257, Aix-Marseille Universite, Centre National de la Recherche Scientifique, Marseille, France,
17 Molecular Wood Biotechnology and Technical Mycology, Busgen-Institute, Georg-August University Gottingen, Gottingen, Germany, 18 Novozymes, Inc., Davis,
California, United States of America, 19 Warnell School of Forestry and Natural Resources, University of Georgia, Athens, Georgia, United States of America
Abstract
Collectively classified as white-rot fungi, certain basidiomycetes efficiently degrade the major structural polymers of woodcell walls. A small subset of these Agaricomycetes, exemplified by Phlebiopsis gigantea, is capable of colonizing freshlyexposed conifer sapwood despite its high content of extractives, which retards the establishment of other fungal species.The mechanism(s) by which P. gigantea tolerates and metabolizes resinous compounds have not been explored. Here, wereport the annotated P. gigantea genome and compare profiles of its transcriptome and secretome when cultured on fresh-cut versus solvent-extracted loblolly pine wood. The P. gigantea genome contains a conventional repertoire of hydrolasegenes involved in cellulose/hemicellulose degradation, whose patterns of expression were relatively unperturbed by theabsence of extractives. The expression of genes typically ascribed to lignin degradation was also largely unaffected. Incontrast, genes likely involved in the transformation and detoxification of wood extractives were highly induced in itspresence. Their products included an ABC transporter, lipases, cytochrome P450s, glutathione S-transferase and aldehydedehydrogenase. Other regulated genes of unknown function and several constitutively expressed genes are also likelyinvolved in P. gigantea’s extractives metabolism. These results contribute to our fundamental understanding of pioneercolonization of conifer wood and provide insight into the diverse chemistries employed by fungi in carbon cyclingprocesses.
Citation: Hori C, Ishida T, Igarashi K, Samejima M, Suzuki H, et al. (2014) Analysis of the Phlebiopsis gigantea Genome, Transcriptome and Secretome ProvidesInsight into Its Pioneer Colonization Strategies of Wood. PLoS Genet 10(12): e1004759. doi:10.1371/journal.pgen.1004759
Editor: Gregory P. Copenhaver, The University of North Carolina at Chapel Hill, United States of America
Received April 15, 2014; Accepted September 16, 2014; Published December 4, 2014
This is an open-access article, free of all copyright, and may be freely reproduced, distributed, transmitted, modified, built upon, or otherwise used by anyone forany lawful purpose. The work is made available under the Creative Commons CC0 public domain dedication.
Funding: The major portions of this work were performed under US Department of Agriculture Cooperative State, Research, Education, and Extension ServiceGrant 2007-35504-18257 (to DC and RAB). The US Department of Energy Joint Genome Institute is supported by the Office of Science of the US Department ofEnergy under Contract DE-AC02-05CH11231. This work was also supported by the HIPOP (BIO2011-26694) project of the Spanish Ministry of Economy andCompetitiveness (MINECO) (to FJRD), the PEROXICATS (KBBE-2010-4-265397) and INDOX (KBBE-2013-.3.3-04-613549) European projects (to ATM), and the ChileanNational Fund for Scientific and Technological Development Grant 1131030 (to LFL). The funders had no role in study design, data collection and analysis,decision to publish, or preparation of the manuscript.
Competing Interests: The authors have declared that no competing interests exist.
* Email: [email protected]
PLOS Genetics | www.plosgenetics.org 1 December 2014 | Volume 10 | Issue 12 | e1004759

Introduction
The most abundant source of terrestrial carbon is plant biomass,
composed primarily of cellulose, hemicellulose, and lignin.
Numerous microbes utilize cellulose and hemicellulose, but a
much smaller group of filamentous fungi has the capacity to
degrade lignin, the most recalcitrant component of plant cell walls.
Uniquely, such ‘white-rot’ fungi efficiently depolymerize lignin to
access cell wall carbohydrates for carbon and energy sources. As
such, white-rot fungi play a key role in the carbon cycle.
White-rot basidiomycetes may differ in their substrate prefer-
ence and morphological patterns of decay (for review see [1,2]).
The majority of lignin-degrading fungi, including Phanerochaetechrysosporium and Ceriporiopsis subvermispora, are unable to
colonize freshly cut wood unless inhibitory compounds (extrac-
tives) are removed or transformed [2–5]. A few basidiomycetes,
including Phlebiopsis gigantea, are pioneer colonizers of softwood
because they tolerate and utilize resinous extractives (e.g., resin
acids, triglycerides, long chain fatty acids, see Figure 1) which
cause pitch deposits in paper pulp manufacturing [6]. It is this
unusual capability that also led to the development of P. giganteaas a biocontrol agent against subsequent colonization of cut
stumps by the root rot pathogen Heterobasidium annosum sensu
lato (now considered several species) [7,8] and of harvested wood
by blue stain fungi [9,10]. It seems likely that when applied to
freshly cut wood, P. gigantea is able to rapidly metabolize
accessible extractives and hemicellulose. As the hyphae continue to
invade tracheids and ray parenchyma cells, the more recalcitrant
cell wall polymers (cellulose, lignin; Figure 1) are eroded. Little is
known of how some white-rot fungi degrade conifer extractives
[11,12] or interact with other fungi such as H. annosum [13].
White-rot fungi degrade major cell wall polymers through
concerted action of hydrolytic and oxidative enzymes (reviewed in
[14,15]). Cellulose is attacked by a combination of exo-
cellobiohydrolases and endoglucanases assigned to glycoside
hydrolase families GH5, GH6, GH7 and possibly GH9, GH12,
GH44 and GH45 [16,17]. In addition to these hydrolases, recent
evidence strongly supports the involvement of lytic polysaccharide
monooxygenases (LPMOs) in cellulose degradation [18–20].
Lignin degradation is catalyzed by an array of oxidative enzymes,
especially lignin peroxidase (LiP), manganese peroxidase (MnP)
and versatile peroxidase (VP) belonging to class II of the plant-
fungal-prokaryotic peroxidase superfamily. Recent genome inves-
tigations reveal that all efficient lignin degraders possess some
combination of these class II ligninolytic peroxidases [21,22]. In P.gigantea, four MnP sequences were previously identified [23].
In addition to peroxidases, laccases have been implicated in
lignin degradation [24–26]. To date, multiple laccase isozymes
and/or the corresponding genes have been characterized from
most white-rot fungi except P. chrysosporium, an efficient
lignocellulose degrader that lacks such enzymes [27–29]. The
mechanism(s) by which laccases might degrade lignin remain
unclear as the enzyme lacks sufficient oxidation potential to cleave
non-phenolic linkages within the polymer. Interestingly, laccase
activity has not been reported in P. gigantea.
Additional ‘auxiliary activities’ [30] commonly ascribed to
ligninolytic systems include extracellular enzymes capable of
generating H2O2. These enzymes may be physiologically coupled
to peroxidases. Among them, aryl-alcohol oxidase (AAO),
methanol oxidase (MOX), pyranose 2-oxidase (P2O), and copper
radical oxidases (such as glyoxal oxidase, GLX) have been
extensively studied. With the exception of P2O [31], none of
these activities have been reported in P. gigantea cultures. In
short, the repertoire of extracellular enzymes produced by P.gigantea is largely unknown, and its mechanism(s) for cell wall
degradation remain unexplored.
Beyond extracellular systems, the complete degradation of
lignin requires many intracellular enzymes for the complete
mineralization of monomers to CO2 and H2O. Examples of
enzymes that have been characterized from P. chrysosporiuminclude cytochromes P450 (CYPs) [32–34], glutathione transfer-
ases [35], and aryl alcohol dehydrogenase (AAD) [36]. The role of
such enzymes in P. gigantea, if any, is unknown.
Herein, we report analysis of the P. gigantea draft genome.
Gene annotation, transcriptome analyses and secretome profiles
identified numerous genes involved in lignocellulose degradation
and in the metabolism of conifer extractives.
Results
Genome assembly and annotationFollowing an assessment of wood decay properties (Figure 2), P.
gigantea single basidiospore strain 5–6 was selected for sequencing
using Illumina reads assembled with AllPathsLG. Genome size
was estimated to be approximately 30 Mbp (Text S1), somewhat
lower than closely related members of the ‘Phlebia clade’ [23,37]
such as C. subvermispora (39 Mbp) and P. chrysosporium(35 Mbp) [22,27]. Aided by 17,915 mapped EST clusters, the
JGI annotation pipeline predicted 11,891 genes. Proteins were
assigned to 6412, 5615, 6932 and 2253 KOG categories, GO
terms, pfam domains and EC numbers, respectively. Significant
synteny with P. chrysosporium was observed (Figure S1). Detailed
information on the assembly and annotations is available via the
JGI portal MycoCosm [38].
Gene familiesPrincipal component analysis (PCA), based on 73 and 12
families of carbohydrate active enzymes (CAZys, [16]) and
auxiliary activities (AAs), [30]), respectively, clustered P. giganteawith other efficient lignin degraders ([39], Figures 3A and S2).
Gene numbers were extracted from 21 fungal genomes and
excluded genes encoding putative GMC oxidases such as
methanol oxidase, alcohol oxidase and glucose oxidase (Dataset
S1). Highest contribution of PC1 (50% of variance separating
white-rot and brown-rot fungi) and PC2 (13.0% of variance))
values were those genes associated with degradation of plant cell
wall polysaccharides and lignin, respectively (Text S1). Hierarchi-
cal clustering analysis with this dataset also categorized P. giganteainto a clade of white-rot fungi that included the polypore P.chrysosporium. The precise number and distribution of P. gigantea
Author Summary
The wood decay fungus Phlebiopsis gigantea degrades allcomponents of plant cell walls and is uniquely able torapidly colonize freshly exposed conifer sapwood. Howev-er, mechanisms underlying its conversion of lignocelluloseand resinous extractives have not been explored. Wereport here analyses of the genetic repertoire, transcrip-tome and secretome of P. gigantea. Numerous highlyexpressed hydrolases, together with lytic polysaccharidemonooxygenases were implicated in P. gigantea’s attackon cellulose, and an array of ligninolytic peroxidases andauxiliary enzymes were also identified. Comparisons ofwoody substrates with and without extractives revealeddifferentially expressed genes predicted to be involved inthe transformation of resin. These expression patterns arelikely key to the pioneer colonization of conifers by P.gigantea.
Phlebiopsis gigantea Colonization of Conifers
PLOS Genetics | www.plosgenetics.org 2 December 2014 | Volume 10 | Issue 12 | e1004759

genes likely involved in lignocellulose degradation were similar,
but not identical, to other polypores such as P. chrysosporium and
C. subvermispora (Figure 4). Like P. chrysosporium and Phaner-ochaete flavido-alba, P. gigantea had no laccase sensu strictogenes. Interestingly, while both P. gigantea and the white-rot
Russulales H. annosum are adapted to colonization of conifers,
significant numbers of laccase sensu stricto genes were only
observed in H. annosum (Figure 4). This important conifer
pathogen also lacked GLX, LiP and representatives of GH5
subfamiles 15 and 31.
With regard to hemicellulose degradation, the genomes of
conifer-adapted P. gigantea and H. annosum revealed increased
numbers of genes involved in pectin degradation such as GH28
polygalacturonase, CE8 pectin methylesterase and CE12 rham-
nogalacturonan acetylesterase (Figure 4). The major hemicellulose
of conifer is galactoglucomannan ([40], Figure 1) but, in the case
of mannan degradation, no significant increase in genes encoding
GH2 b-mannosidase, GH5_7 endo-mannanase and GH27 a-
galactosidase was observed relative to other wood decay fungi
(Figure 4). Similarly, no significant differences in the number of
genes involved in arabinoglucuronoxylan hydrolysis were identi-
fied, except for two transcriptionally convergent GH11 genes
present in P. gigantea (Text S1). Encoding putative endo-1,4-b-
xylanases, wood decay fungi typically harbor one or no GH11
genes. Auricularia delicata is another exception with three of these
endoxylanases. Also unusual among white-rot fungi, none of the P.gigantea protein models were assigned to GH95 (Dataset S1). This
family includes 1,2-a-fucosidases that hydrolyze the a-Fuc-1,2-Gal
linkages in plant xyloglucans.
The P. gigantea genome includes representatives for all the
peroxidase families reported in basidiomycetes, including LiP,
MnP, heme-thiolate peroxidases, and dye-decolorizing type
peroxidases (DyP), with the only exception of VP (Text S1;
Figures S8–S13). MnP gene expansion is similar to that found in
the C. subvermispora and H. annosum genomes. Beyond class II
peroxidases and multicopper oxidases (MCOs), genes encoding
auxiliary enzymes involved in ligninolysis were also found such as
GMC oxidoreductases (Figures S14–S19; Table S5) and copper
radical oxidases (CRO, Figure 4; Table S4). Among the latter
group, GLX is coupled to P. chrysosporium LiPs via extracellular
H2O2 generation [41]. Consistent with this physiological connec-
tion, the P. gigantea genome features both GLX- and LiP-
encoding genes. GMC genes encoding putative AAO, MOX and
glucose oxidase (GOX) may also be involved in H2O2 production
by oxidation of low molecular weight aliphatic and aromatic
alcohols. The P2O gene (protein model Phlgi1_130349) lies
immediately adjacent to a putative pyranosone dehydratase
(Phlgi1_16096) gene. This arrangement is conserved in several
wood decay fungi and, in addition to peroxide generation, suggests
a route for conversion of glucose to the pyrone antibiotic,
cortalcerone [42,43]. Genes encoding AAD, members of the
zinc-type alcohol dehydrogenase superfamily [44], are also
abundant in P. gigantea. Relatively few genes were predicted to
encode CYPs which are generally considered important in the
Figure 1. Schematic representations of lignocellulose components in cell walls of pine wood. Panel A: The extractives (long chain fattyacids, triglycerides, resin acids and terpenes) are found primarily in the resin ducts, but damage to pine wood causes the release of these compoundsacross wounded areas. Panel B: In tracheid cell walls, the amorphous, phenylpropanoid polymer lignin (brown) form a matrix around the morestructured carbohydrate polymers, hemicellulose (yellow and green) and cellulose (blue).doi:10.1371/journal.pgen.1004759.g001
Phlebiopsis gigantea Colonization of Conifers
PLOS Genetics | www.plosgenetics.org 3 December 2014 | Volume 10 | Issue 12 | e1004759

intracellular metabolism of lignin derivatives and related aromatic
compounds (Figure S19; Dataset S2).
The repertoire of P. gigantea genes contrasts sharply with that
of brown-rot polypores, such as Postia placenta [45], which lack
ligninolytic class II peroxidases, cellobiohydrolases (GH6, GH7),
and endoglucanases fused to cellulose binding modules [21,46]
(Figure 4). Unlike P. gigantea and other white-rot fungi, brown-
rot fungi often lack genes encoding cellobiose dehydrogenase
(CDH) and have relatively few lytic polysaccharide monooxygen-
ase genes (LPMOs). Formerly classified as GH61 ‘hydrolases’, the
LPMOs are now known to be copper-dependent monooxygenases
[18–20] capable of enhancing cellulose attack by CDH and
cellobiohydrolase (CBH) [47,48]. With the exception of Gloeo-phyllum trabeum, genes encoding GH74 enzymes have not been
found in brown-rot fungi. Two such xyloglucanase genes were
identified in P. gigantea (Text S1).
In contrast to analysis of genes involved in lignocellulose
degradation (Figure 3A), white-rot and brown-rot fungi were not
clearly separated by principal component analysis of 14 enzymes
involved in lipid metabolism (Figures 3B and S3). However, P.gigantea was grouped near B. adusta and P. carnosa. These
associations seem in line with the preferential colonization of
softwood substrates by P. carnosa [49] and with the efficient
degradation of conifer extractives by B. adusta culture superna-
tants [50].The highest contribution to PC1 (26.0% variance) and
PC2 (6.8% variance) were aldehyde dehydrogenase and long chain
fatty acid CoA ligase, respectively (Figures 3A and S3, Text S1).
Also potentially involved in intracellular lipid metabolism, CYP52
and CYP505 clans of cytochrome P450s are associated with
degradation of fatty acids and alkanes. Relative to other white-rot
fungi, P. gigantea had a slightly greater number of CYP52-
encoding genes whereas CYP505 gene numbers were similar
(Figure 4; Dataset S1; Figures S31, S32; Tables S13–S15).
P. gigantea also diverges from other Agaricomycetes with
respect to genes encoding proteins that are more distantly
connected to lignocellulose degradation, including hydrophobins
(Figures S33 and S34; Tables S17–S19), transporters (Table S20)
and non laccase MCOs (Figure S20). Detailed analyses are
provided for CAZys (Tables S7–S10; Figures S22–S30; Dataset
S1), peroxidases (Figures S8–S13), auxiliary proteins, cytochrome
P450s (Figures S31–S32; Table S13–S15), potential regulatory
genes (Figures S4–S7; Tables S3, S11–S12) and genes involved in
secondary metabolite synthesis (Table S16).
Differential gene expression of P. gigantea in response tosubstrate
Transcript levels were determined in cultures in which the sole
carbon source was glucose (Glc), freshly harvested loblolly pine
wood (Pinus taeda; LP) extracted with acetone (ELP), or freshly
harvested but not extracted loblolly pine wood (NELP) (Text S1).
GC-MS analysis [51] identified the major extract components as
resin acids (46%), triglycerides (13%) and fatty acids (11%) (Text
S1; Figure S35; Table S21).
Excluding genes with relatively low transcript levels (RPKM
values ,10) in LP-containing media, transcripts of 187 genes were
increased.2-fold (p,0.05) in NELP or ELP relative to Glc. Of
Figure 2. Wood decay characteristics. Comparative weight loss of parental strain 11061 and single basidiospore derivatives on colonized loblollypine wood (Pinus taeda) wood wafers were determined after 4, 8 and 12 weeks incubation (bottom left panel) as described in Methods. Singlebasidiospore strain 5–6 also aggressively decayed birch and spruce (Text S1) and was selected for sequencing. Upper panels show scanning electronmicroscopy [68] of radial (left) and transverse (right) sections of pine wood tracheids that were substantially eroded or completely degraded by P.gigantea strain 5–6 by week twelve. Transverse section of sound wood (bottom photo) provides comparison. (Bar = 40 mm).doi:10.1371/journal.pgen.1004759.g002
Phlebiopsis gigantea Colonization of Conifers
PLOS Genetics | www.plosgenetics.org 4 December 2014 | Volume 10 | Issue 12 | e1004759

those Glc-derived transcripts with RPKM values.10, 146 genes
had higher transcripts in Glc relative to NELP or ELP (Figure 5;
Dataset S2).
Mass spectrometry (nanoLC-MS/MS) identified extracellular
peptides corresponding to a total of 319 gene products in NELP
and ELP cultures (Dataset S2). Most proteins were observed in
both NELP and ELP culture filtrates, which contained 294 and
268 proteins, respectively. Approximate protein abundance,
expressed as the exponentially modified protein abundance index
(emPAI) [52], varied substantially within samples. As expected,
gene products with predicted secretion signals and high transcript
levels were often detected. Other detected proteins (e.g. MOX
model Phlgi1_120749; [53]) may be loosely associated with cell
walls and/or secreted via ‘non-classical’ mechanisms ([54]; www.
cbs.dtu.dk/services/SecretomeP). Still other peptides correspond
to true intracellular proteins released by cell lysis, e.g. ribosomal
proteins (Dataset S2).
Glycoside hydrolase gene expression was heavily influenced by
media composition with transcripts corresponding to 76 genes
increasing.2-fold in NELP- or ELP-containing media relative to
glucose medium (Figure 6). Some of these genes were highly
expressed with RPKM values well over 100. For example,
transcript and peptide levels matching GH7 cellobiohydrolase
(CBH1; model Phlgi1_34136) were among the ten most highly
expressed genes (Table 1). Indicative of a complete cellulolytic
system, this CBH1 was accompanied by upregulated transcripts
Figure 3. Comparative analysis of gene repertoires associated with degradation of plant cell wall polymers and extractives in 21fungal genomes. (A) Principal component analysis (PCA) of 21 fungi using 73 CAZy and 12 AA families (Dataset S1). GMC oxidoreductases methanoloxidase, glucose oxidase and aryl alcohol oxidase were excluded because confident functional assignments could not be made and/or their inclusiondid not contribute to separation of white- and brown-rot species. (B) PCA of 21 fungi using genes encoding 14 enzymes involved in lipid metabolism(KEGG reference pathway 00071, Dataset S1). There is no significant segregation of white-rot and brown-rot fungi although P. gigantea waspositioned in the third quadrant with B. adusta and P. carnosa. Symbols for white rot and brown rot fungi appear in blue and red, respectively.Tremella mesenterica is a mycoparasite. For raw data and contributions of the top 20 families see Dataset S1, Text S1 and Figures S2 and S3.doi:10.1371/journal.pgen.1004759.g003
Phlebiopsis gigantea Colonization of Conifers
PLOS Genetics | www.plosgenetics.org 5 December 2014 | Volume 10 | Issue 12 | e1004759

and extracellular proteins corresponding to another CBH1
(Phlgi1_13298), a GH6 family member CBH2 (Phlgi1_17701)
and GH5_5 b-1,4 endoglucanases (EGs; Phlgi1_86144,
Phlgi1_84111), all of which feature a family 1 carbohydrate
binding module (CBM1). Also highly expressed were putative b-
glucosidases (Phlgi1_127564, Phlgi1_18210) and a GH12
(Phlgi1_34479). Other glycoside hydrolases likely involved in
degradation of cell wall hemicelluloses include GH5_7 endoman-
nanases (Phlgi1_97727, Phlgi1_110296), a GH74 xyloglucanase
(Phlgi1_98770), a GH27 a-galactosidase (Phlgi1_72848) and a
GH10 endoxylanase (Phlgi1_85016).
Expression of oxidative enzymes implicated in lignocellulose
degradation was also influenced by growth on LP-media (NELP or
ELP) relative to Glc-containing media. Transcripts corresponding
to five LPMO-encoding genes showed significant regulation (P,
0.01) in LP-medium, and three LPMO proteins were detected
(Phlgi1_227588, Phlgi1_227560, Phlgi1_37310). An AAD-like
oxidoreductase (Phlgi1_30343), possibly involved in the transfor-
mation of lignin metabolites, was also upregulated. However, we
did not observe high expression of class II peroxidases under the
conditions tested (Dataset S2). On the other hand, a DyP
(Phlgi1_85295) was significantly upregulated in certain LP-
containing media (Table 1). The importance of these peroxidases
is further supported by the high protein levels of another DyP,
Phlgi1_122124. Specifically, the latter protein showed emPAI
values.17 after 5 days growth on LP media and, relative to Glc
medium, its transcript ratios were.5-fold higher (p,0.04)
(Dataset S2). High DyP gene expression has been observed in
white-rot fungi Trametes versicolor and Dichomitus squalens [21],
but no genes for these proteins are present in P. chrysosporiumand C. subvermispora (Figure 4). The P. gigantea DyP
(Phlgi1_122124) was also abundant in media containing micro-
crystalline cellulose (Avicel) as the sole carbon source (Dataset S2).
To identify enzymes involved in tolerance to and/or degrada-
tion of extractives, comparisons were made of gene expression in
ground loblolly pine wood that had been extensively extracted
with acetone (ELP) versus non-extracted loblolly pine wood
(NELP) (Figure 7A). In general, this treatment had little impact on
Figure 4. Number of genes identified in white rot fungi P. gigantea (Phlgi), P. chrysosporium (Phach)[27], C. subvermispora (Cersu)[22],and H. annosum (Hetan)[75], and the brown rot fungus P. placenta (Pospl)[45]. CROs were distinguished as previously described [76]. Lyticpolysaccharide monooxygenases were formerly classified as GH61 within the CAZy system (http://www.cazy.org/; [16]). Glycoside hydrolase familyGH5 was subdivided as described [77] (Figure S22).doi:10.1371/journal.pgen.1004759.g004
Phlebiopsis gigantea Colonization of Conifers
PLOS Genetics | www.plosgenetics.org 6 December 2014 | Volume 10 | Issue 12 | e1004759

gene expression. For example, glycoside hydrolase transcript and
protein patterns showed only minor differences (Figure 8).
Nevertheless, transcripts corresponding to 22 genes showed
significantly increased levels (.4-fold; p,0.01) in NELP relative
to ELP (Figure 7B; Table 2). Of particular interest were genes
potentially involved in metabolism of resin acids (e.g. CYPs; [55]),
in altering the accessibility of cell wall components (e.g., an
endoxylanase), and in regulating gene expression (e.g. proteins
containing putative Zn finger domains or HMG-Box transcription
factors). Integration of transcript profiles of genes involved in
intracellular lipid and oxalate metabolism, together with TCA and
glyoxylate cycles, strongly supports a central role for b-oxidation in
triglyceride and terpenoid transformation by P. gigantea (Fig-
ure 9).
Relaxing the transcript fold-change threshold (.2-fold; p,0.01)
and focusing on mass spectrometry-identified proteins revealed 14
additional genes potentially involved in metabolism and/or
tolerance to loblolly pine wood extractives (Table 3).Among these
Figure 5. P. gigantea transcriptome. Scatterplots show the distribution of RNA-seq RPKM values (log2) for 11,376 P. gigantea genes when grownon basal salts containing A, acetone-extracted loblolly pine wood (ELP) or B, non-extracted loblolly pine wood (NELP) relative to glucose (Glc). Plotlines define 2-fold borders and best fit regression. Darkened points represent 164 (A) and 145 (B) transcripts accumulating.4-fold at p,0.01. Venndiagram (C) illustrates genes with RPKM signals.10 and upregulated.4-fold in NELP or ELP relative to Glc.doi:10.1371/journal.pgen.1004759.g005
Figure 6. Number and expression of genes likely involved in lignocellulose degradation. The number of genes encoding massspectrometry-identified proteins was limited to those matching$2 unique peptides after 5–9 days growth in media containing NELP or ELP. RPKMvalues.100 for RNA derived from these cultures were arbitrarily selected as the threshold for high transcript levels. Genes designated as ‘regulated’showed significant accumulation (p,0.05;.2-fold) in NELP or ELP relative to glucose containing media. Methods and complete data are presented inText S1 and Dataset S2.doi:10.1371/journal.pgen.1004759.g006
Phlebiopsis gigantea Colonization of Conifers
PLOS Genetics | www.plosgenetics.org 7 December 2014 | Volume 10 | Issue 12 | e1004759

Ta
ble
1.
Dif
fere
nti
ally
reg
ula
ted
ge
ne
sin
me
dia
con
tain
ing
no
n-e
xtra
cte
dlo
blo
llyp
ine
wo
od
(NEL
P),
solv
en
te
xtra
cte
dlo
blo
llyp
ine
wo
od
(ELP
),o
rg
luco
se(G
lc)
asso
leca
rbo
nso
urc
e.
em
PA
Iv
alu
eo
ffi
ltra
tes
fro
mp
ine
cult
ure
sR
NA
-se
q5
Da
yT
ran
scri
pt
rati
os
(R)
&p
rob
ab
ilit
ies
(P)
NE
LP
EL
PR
PK
Mv
alu
eN
EL
P/G
lcN
EL
P/E
LP
EL
P/G
lc
PR
Oid
Pu
tati
ve
fun
ctio
n5
Da
y7
Da
y9
Da
y5
Da
y7
Da
y9
Da
yN
EL
PE
LP
Glc
Pro
bR
Pro
bR
Pro
bR
Fift
ee
nh
igh
lye
xpre
sse
d(.
10
0R
PK
M)
ge
ne
se
xhib
itin
gsi
gn
ific
ant
tran
scri
pt
accu
mu
lati
on
(p,
0.0
1;.
4-f
old
)in
NEL
Pm
ed
ium
rela
tive
toG
lcm
ed
ium
:
79
15
0G
H6
1LP
MO
11
45
12
,0
.01
58
.60
.28
62
.20
.02
12
6.2
74
62
3C
aro
ten
oid
est
er
lipas
e0
.00
0.3
90
.18
0.3
60
.00
0.0
03
13
15
98
,0
.01
40
.50
.04
62
.00
.01
32
0.7
12
81
20
GH
15
Glu
coam
ylas
e3
.06
1.4
50
.53
2.3
54
.76
4.7
51
70
47
5,
0.0
13
2.2
0.0
10
3.6
0.0
23
8.9
20
51
4C
yto
chro
me
P4
50
*3
68
30
14
,0
.01
27
.2,
0.0
11
2.3
0.0
37
2.2
88
42
5G
H5
5b
-1
,3g
luca
nas
e0
.76
1.4
80
.68
0.5
50
.81
0.7
41
49
49
6,
0.0
12
6.3
0.1
20
3.0
0.0
57
8.7
10
98
78
SDH
51
01
00
02
0,
0.0
12
6.0
0.4
74
0.5
0.0
25
51
.0
88
50
7G
H1
8C
hit
inas
e*
40
98
81
9,
0.0
12
1.6
,0
.01
4.7
0.0
46
4.6
12
38
37
Zn
fin
ge
rd
om
ain
*8
22
31
74
54
36
,0
.01
18
.9,
0.0
14
.70
.05
74
.0
36
21
8H
ypo
the
tica
l2
.48
0.5
70
.19
0.8
50
.00
0.0
03
99
22
33
42
27
,0
.01
17
.60
.20
91
.70
.01
41
0.3
12
32
73
Epo
xid
eh
ydro
lase
13
91
12
10
,0
.01
13
.80
.76
71
.20
.04
41
1.2
12
52
13
GH
61
(LP
MO
)*1
29
13
06
10
9,
0.0
11
1.8
,0
.01
4.2
0.0
58
2.8
30
34
3A
AD
-lik
eO
R1
30
81
68
34
,0
.01
9.2
0.3
64
1.8
0.0
83
5.0
36
29
3H
ypo
the
tica
l3
71
35
24
6,
0.0
18
.10
.88
51
.10
.01
27
.7
10
50
51
Pe
pti
das
eM
17
65
12
4,
0.0
17
.3,
0.0
13
.40
.06
52
.1
10
72
68
Hyp
oth
eti
cal
11
06
91
5,
0.0
17
.30
.03
51
.60
.01
34
.6
Th
irty
hig
hly
exp
ress
ed
ge
ne
s(R
PK
M.
10
0)
exh
ibit
ing
sig
nif
ican
ttr
ansc
rip
tac
cum
ula
tio
n(p
,0
.01
;.4
-fo
ld)
inN
ELP
and
ELP
me
diu
mre
lati
veto
Glc
me
diu
m:
34
13
6G
H7
Ce
llob
ioh
ydro
lase
16
.85
5.7
72
.91
35
.76
0.8
22
.91
39
27
29
31
40
,0
.01
97
.70
.21
81
.3,
0.0
17
2.9
98
43
0H
exo
setr
ansp
ort
er
0.0
80
.06
0.0
60
.37
0.0
00
.00
22
13
17
94
63
,0
.01
35
.40
.32
31
.2,
0.0
12
8.7
19
02
8Li
pas
e*
6.8
61
.20
0.7
61
.79
1.9
21
.34
19
03
27
42
2,
0.0
18
7.7
,0
.01
7.0
,0
.01
12
.6
11
02
96
GH
5-7
Man
nan
ase
5.2
92
4.9
21
9.2
32
.12
0.6
80
.87
14
48
12
43
15
,0
.01
97
.00
.59
71
.2,
0.0
18
3.3
10
16
70
Pe
pti
das
eM
35
1.3
90
.54
0.2
80
.80
0.0
00
.00
12
32
58
32
2,
0.0
15
6.8
0.1
46
2.1
,0
.01
26
.9
69
03
0A
qu
apo
rin
10
80
51
81
8,
0.0
15
8.7
0.0
11
2.1
,0
.01
28
.2
17
70
1G
H6
Ce
llob
ioh
ydro
lase
3.6
82
.17
1.0
62
.92
0.2
10
.19
69
94
36
9,
0.0
17
9.9
0.2
44
1.6
,0
.01
49
.8
99
87
6C
DH
5.3
11
.37
0.6
35
.63
0.1
20
.23
60
23
27
12
,0
.01
50
.40
.06
51
.8,
0.0
12
7.4
97
72
7G
H5
-7M
ann
anas
e1
.16
0.6
00
.24
0.8
90
.00
0.0
05
38
72
11
6,
0.0
13
4.5
0.1
30
0.7
,0
.01
46
.2
13
29
8G
H7
Ce
llob
ioh
ydro
lase
1.0
01
.05
0.5
90
.64
0.0
00
.17
41
82
96
9,
0.0
14
5.3
0.2
15
1.4
,0
.01
32
.1
98
77
0G
H7
4X
ylo
glu
can
ase
3.5
31
.82
0.7
64
.36
0.2
30
.69
37
34
46
9,
0.0
14
3.4
0.3
07
0.8
,0
.01
51
.9
22
75
88
GH
61
(LP
MO
)20
.61
0.4
40
.09
0.1
90
.00
0.0
03
67
59
21
1,
0.0
13
4.5
0.2
76
0.6
,0
.01
55
.7
18
26
4G
H6
1(L
PM
O)
34
41
50
4,
0.0
19
2.2
0.2
09
2.3
,0
.01
40
.2
12
75
64
GH
3b
-glu
cosi
das
e5
.02
5.8
94
.87
4.8
40
.48
0.3
32
79
19
18
,0
.01
35
.60
.13
41
.5,
0.0
12
4.4
72
84
8G
H2
7a
-gal
acto
sid
ase
0.7
01
.25
0.5
30
.74
0.0
00
.00
24
42
32
28
,0
.01
8.8
0.8
50
1.0
,0
.01
8.4
Phlebiopsis gigantea Colonization of Conifers
PLOS Genetics | www.plosgenetics.org 8 December 2014 | Volume 10 | Issue 12 | e1004759

Ta
ble
1.
Co
nt.
em
PA
Iv
alu
eo
ffi
ltra
tes
fro
mp
ine
cult
ure
sR
NA
-se
q5
Da
yT
ran
scri
pt
rati
os
(R)
&p
rob
ab
ilit
ies
(P)
NE
LP
EL
PR
PK
Mv
alu
eN
EL
P/G
lcN
EL
P/E
LP
EL
P/G
lc
PR
Oid
Pu
tati
ve
fun
ctio
n5
Da
y7
Da
y9
Da
y5
Da
y7
Da
y9
Da
yN
EL
PE
LP
Glc
Pro
bR
Pro
bR
Pro
bR
86
14
4G
H5
-5En
do
glu
can
ase
5.8
91
.29
0.6
12
.69
0.0
00
.00
23
82
23
4,
0.0
16
2.2
0.9
01
1.1
,0
.01
58
.4
23
52
3H
ypo
the
tica
l2
16
28
55
0,
0.0
14
.30
.16
90
.8,
0.0
15
.7
34
47
9G
H1
2En
do
glu
can
ase
19
71
14
2,
0.0
18
7.0
0.2
10
1.7
,0
.01
50
.4
85
01
6G
H1
0En
do
xyla
nas
e3
4.6
41
9.6
34
.82
18
.22
0.7
52
.62
17
51
73
3,
0.0
16
8.0
0.9
77
1.0
,0
.01
67
.0
33
91
0T
ran
spo
rte
r1
66
28
41
0,
0.0
11
6.9
0.0
57
0.6
,0
.01
28
.8
18
21
0G
H1b
-glu
cosi
das
e1
64
20
71
0,
0.0
11
7.2
0.3
42
0.8
,0
.01
21
.7
77
28
1H
ypo
the
tica
l1
58
33
95
,0
.01
34
.10
.04
30
.5,
0.0
17
3.5
44
97
0H
ypo
the
tica
l1
57
14
11
5,
0.0
11
0.6
0.7
09
1.1
,0
.01
9.5
84
11
1G
H5
-5En
do
glu
can
ase
25
.88
12
.32
3.5
02
7.4
61
.40
1.9
61
49
14
69
,0
.01
15
.80
.97
11
.0,
0.0
11
5.4
27
73
4H
ypo
the
tica
l1
42
20
01
0,
0.0
11
3.7
0.0
45
0.7
,0
.01
19
.3
Nin
eh
igh
lye
xpre
sse
dg
en
es
(.1
00
RP
KM
)e
xhib
itin
gsi
gn
ific
ant
tran
scri
pt
accu
mu
lati
on
(p,
0.0
1;.
4-f
old
)in
ELP
me
diu
mre
lati
veto
Glc
me
diu
m:
42
45
49
Hyp
oth
eti
cal
65
11
53
0.0
14
24
.70
.06
00
.6,
0.0
14
4.1
37
10
8H
ypo
the
tica
l7
81
35
50
.01
51
6.6
0.2
58
0.6
,0
.01
28
.5
12
45
22
Hyp
oth
eti
cal
88
16
41
20
.01
47
.20
.11
30
.5,
0.0
11
3.6
85
29
5H
ero
xid
ase
DyP
39
14
51
10
.05
03
.40
.01
50
.3,
0.0
11
2.8
10
08
74
Hyp
oth
eti
cal
29
54
15
63
0.0
18
4.7
0.0
72
0.7
,0
.01
6.6
12
53
16
Hyp
oth
eti
cal
14
02
01
35
0.0
09
3.9
0.0
60
0.7
,0
.01
5.7
12
87
52
His
tid
ine
kin
ase
13
52
25
44
0.0
31
3.1
0.0
60
0.6
,0
.01
5.1
63
33
8P
IPki
nIII
71
13
72
90
.03
62
.40
.01
60
.5,
0.0
14
.7
22
17
3H
ypo
the
tica
l6
81
11
27
0.0
24
2.5
0.0
21
0.6
,0
.01
4.0
Ab
bre
viat
ion
s:SD
H,
sho
rtch
ain
de
hyd
rog
en
ase
;LP
MO
,ly
tic
po
lysa
cch
arid
em
on
oo
xyg
en
ase
;A
AD
,ar
ylal
coh
ol
de
hyd
rog
en
ase
;C
DH
,ce
llob
iose
de
hyd
rog
en
ase
;O
R,
oxi
do
red
uct
ase
;D
yP,
dye
de
colo
rizi
ng
pe
roxi
das
e;
PIP
kin
-III,
ph
osp
hat
idyl
ino
sito
l-3
-ph
osp
hat
e5
-kin
ase
.1O
xid
ore
du
ctas
eis
53
%id
en
tica
lto
S.p
om
be
AA
D(Q
9P
7U
2).
2G
H6
1LP
MO
mo
de
lP
hlg
i1_
22
75
88
is3
9-tr
un
cate
d.
*Pro
tein
mo
de
lscr
oss
liste
dw
ith
Tab
les
2an
d3
.d
oi:1
0.1
37
1/j
ou
rnal
.pg
en
.10
04
75
9.t
00
1
Phlebiopsis gigantea Colonization of Conifers
PLOS Genetics | www.plosgenetics.org 9 December 2014 | Volume 10 | Issue 12 | e1004759

extract-induced genes, lipases Phlgi1_19028 and Phlgi1_36659
likely hydrolyze the significant levels of triglycerides. The substrate
specificity of aldehyde dehydrogenases such as Phlgi1_115040 is
difficult to assess based on sequence, although several have been
implicated in the degradation of pine wood resins by bacteria [56].
Secretome patterns in media containing microcrystalline cellulose
(Avicel) as sole carbon source generally supported the importance
of the same proteins in the metabolism of pine wood extractives
(Table 3, Dataset S2). Specifically, lipases Phlgi1_19028 and
Phlgi1_36659 and aldehyde dehydrogenase Phlg1_115040 were
more abundant in loblolly pine wood and in Avicel media relative
to the same media without extractives. The role of peroxiredoxin
(Phlgi1_95619) and glutathione S-transferase (Phlgi1_113065) are
less clear, but transformations involving H2O2 reduction and
glutathione conjugation are possible. A single MCO
(Phlgi1_129839) and its corresponding transcripts, were observed
to be upregulated in ELP relative to NELP. Although lacking the
L2 signature common to laccases [57], the MCO4 protein may
have iron oxidase activity provided that an imperfectly aligned Glu
residue serves in catalysis (Text S1; Figures S20 and S21; Table
S6).
Discussion
The distinctive repertoire and regulation of P. gigantea genes
underlie a unique and efficient system for degrading all
components of conifer sapwood. Transcriptome and proteome
analyses demonstrate an active system of hydrolases and LPMOs
involved in the complete deconstruction of cellulose and hemicel-
lulose. The overall enzymatic strategy is therefore similar to most
cellulolytic microbes, but unlike closely related brown-rot decay
Agaricomycetes such as P. placenta.
With regard to ligninolysis, key genes were identified including
LiPs, MnPs, CROs and GMC oxidoreductases. As in P.chrysosporium, the presence of both LiP- and GLX-encoding
genes is consistent with a close physiological connection involving
peroxide generation [41]. We also annotated non-class II
peroxidases HTPs and DyPs some of which have been implicated
in metabolism of lignin derivatives [58,59]. The distribution and
expression of DyP-encoding genes are notable; with no genes
present in P. chrysosporium and C. subvermispora but several
highly expressed genes in T. versicolor, D. squalens [21] and P.gigantea (Table 2). Physiological roles of DyP are likely diverse,
but oxidation of lignin-related aromatic compounds has been
demonstrated [59].
In addition to lignin, oxidative mechanisms likely play a central
role in P. gigantea cellulose attack. Of 15 LPMO-encoding genes,
transcripts of six genes were regulated (.2-fold; p,0.01) and
peptides corresponding to three were unambiguously identified in
NELP- or ELP-containing media. Our inability to detect any
LPMO proteins in Avicel media (Dataset S2) suggests induction by
substrates other than cellulose [60]. Beyond this, the CDH gene
was highly expressed (transcripts and protein) in LP media. The
observed coordinate expression of CDH and LPMO may reflect
oxidative ‘boosting’ as recently demonstrated [19,20,47,61].
However, we did not detect elevated transcripts or peptides
corresponding to the two P. gigantea aldose 1-epimerase genes
even though these were previously observed in culture filtrates of
various white-rot fungi [21,62], including Bjerkandera adusta,Ganoderma sp, and Phlebia brevispora [17]. Thus, it seems
unlikely that enzymatic conversion of oligosaccharides to their b-
anomers is necessary for efficient CDH catalysis.
Softwood hemicellulose composition typically includes 15-20% ga-
lactoglucomannan while hardwoods contain 15–30% glucuronoxylan
[40]. Consistent with an adaption to conifer hemicellulose, GH5_7 b-
mannanases were highly expressed in both NELP and ELP cultures,
together with a GH27 a-galactosidase (Table 1). GH11 endoxylanase
and CE carbohydrate esterase peptides were also detected in the pine
wood-containing media, but not in Avicel cultures (Dataset S2). In
aggregate, these results demonstrate P. gigantea adaptation to conifer
hemicellulose degradation.
Figure 7. P. gigantea transcriptome. Scatterplot (A) shows thedistribution of RNA-seq RPKM values (log2) for 11,376 P. gigantea geneswhen grown on basal salts containing acetone-extracted loblolly pinewood (ELP) or non-extracted loblolly pine wood (NELP). Lines define 2-fold borders and best fit regression. Darkened points represent 44transcripts accumulating.4-fold at p,0.01. Venn diagram (B) illustratesgenes with RPKM signals.10 and upregulated.4-fold in NELP relativeto ELP. Twenty-two genes showed significant transcript accumulation inNELP relative to ELP suggesting potential response to resin and pitchcontent. Under these stringent thresholds (p,0.01;.4-fold), only onegene, a MCO model Phlgi1_129839, showed significant transcriptaccumulation in ELP relative to NELP. Additional detail appears inTables 1-3. Detailed methods and complete data are presented in TextS1 and Dataset S2.doi:10.1371/journal.pgen.1004759.g007
Phlebiopsis gigantea Colonization of Conifers
PLOS Genetics | www.plosgenetics.org 10 December 2014 | Volume 10 | Issue 12 | e1004759

P. gigantea’s gene expression patterns reveal multiple strategies
for overcoming the challenging composition of resinous sapwood.
Tolerance to monoterpenes may be mediated in part by a putative
ABC efflux transporter (Phlbi1_130987, Figure 9). Of the 51 ABC
proteins of P. gigantea, this protein is most closely related to the
GcABC-G1 gene of the ascomycete Grosmannia clavigera, a
pathogen of Pinus contorta [63]. The GcABC-G1 gene is
upregulated in response to various terpenes and appears to be a
key element against the host defenses. Consistent with a similar
function, our analysis showed the P. gigantea homolog to be
upregulated.4.9-fold (p = 0.02) in NELP relative to ELP media
(Dataset S2). Other transcripts accumulating in NELP-derived
mycelia included three CYPs (Table 2) potentially involved in the
hydroxylation of diterpenoids and related resin acids [55].
Differential regulation also implicates glutathione S-transferase,
aldehyde dehydrogenase and peroxiredoxin in the transformation
and detoxification of extractives (Table 2). Three putative
transcription regulators were similarly regulated (Table 3). Alde-
hyde dehydrogenase- and AAD-encoding genes, some of which
are upregulated in P. gigantea LP cultures relative to Glc cultures
(Tables 1), are induced by aromatic compounds in P. chrysospor-ium [64,65].
Predicted to degrade triglycerides, a total of nine lipase-
encoding genes were identified in the P. gigantea genome and
four of these were upregulated.2-fold (p,0.01) in LP media
compared to Glc medium (Dataset S2). Two lipases displayed
similar patterns of transcript and protein upregulation on NELP
relative to ELP (Table 3), and the pine wood extractive also
induced accumulation of these lipases in Avicel media (Table 3).
Further metabolism of triglycerides is uncertain, although a
putative glycerol uptake facilitator (Phlbi1_99331) was highly
expressed (RPKM value of 2532) and significantly (p,0.02)
upregulated (2.1-fold) in NELP compared to ELP (Dataset S2).
Fatty acids activation and b-oxidation can be inferred by the
expression of fatty acid CoA ligase (Phlgi1_107548,
Phlgi1_126556, Phlgi1_89325), b-ketothiolase (Phlgi1_27649,
Phlgi1_130767), and fatty acid desaturase (Phlgi1_100083,
Phlgi1_115799). Upregulation of a mitochondrial malate dehy-
drogenase (Phlgi1_22176, Table 3), together with relatively high
transcript levels of other TCA cycle components (citrate synthases
Figure 8. Glycoside hydrolase encoding genes show similar patterns of expression in media containing freshly ground and non-extracted loblolly pine wood (NELP) relative to the same substrate but extracted with acetone (ELP) to remove pitch and resins.Proteins (upper panel) and transcripts (lower panel) were identified by LC-MS/MS and RNA-seq, respectively. Protein identification was limited tothose with.2 unique peptides after five days incubation. Transcript upregulation was limited to significant accumulation (p,0.05;.2-fold) on NELPor ELP relative to glucose-containing medium. Secretome and transcriptome experimental details and complete data are presented in Text S1 andDataset S2.doi:10.1371/journal.pgen.1004759.g008
Phlebiopsis gigantea Colonization of Conifers
PLOS Genetics | www.plosgenetics.org 11 December 2014 | Volume 10 | Issue 12 | e1004759

Phlgi1_126205, Phlgi1_100215; 2-oxoglutarate dehydrogenase,
Phlgi1_126652) may complete fatty acid oxidation. In this
connection, we also observed high expression of isocitrate
lyase (Phlgi1_21482, Phlgi1_93159) and malate synthase
(Phlgi1_27815), which partially explain oxalate accumulation
[66] and strongly support an active glyoxylate shunt [45,67]
(Figure 9). Upregulation of glycoside hydrolases, transcription
factors, cyclophilins, ATP synthase and ribonuclease may also
reflect broad shifts in metabolism or reduced accessibility of the
unextracted substrate (Tables 2 and 3).
Beyond genetic regulation, certain constitutively expressed
genes are also likely involved in the degradation of all plant cell
wall components, including complex resins and triglycerides. For
example MOX (Phlgi1_120749) is among the most abundant
transcripts in both NELP and ELP (Dataset S2), suggesting an
important role in H2O2 production associated with lignin
demethylation [53]. Extracellular peroxide generation is key to
peroxidase activity, and MOX fulfills this role along with CRO,
AAO, and P2O. Along these lines, we also observed high
extracellular protein levels of DyP (Phlgi1_122124) under all
culture conditions.
Most problematic, many P. gigantea genes and proteins
exhibited little or no homology to NCBI NR or Swiss-Prot entries.
Some of these ‘hypothetical’ or ‘uncharacterized’ proteins are
undoubtedly important, particularly those that are highly
expressed, regulated and/or secreted. For example, of 92 genes
upregulated (.2-fold; p,0.01) in NELP relative to ELP, 51 were
designated as hypothetical (Table 2; Dataset S2). Three of these
featured predicted secretion signals and peptides were detected in
one case. In the absence of biochemical characterization and/or
genetic evidence, assigning function to these genes represents a
major undertaking. Nevertheless, high throughput transcript and
secretome profiling substantially filtered the number of potential
targets from a genome-wide estimate of 4744 ‘hypothetical’ genes
to the more manageable numbers reported here. More broadly,
the results advance understanding of the early and exclusive
colonization of coniferous wood by P. gigantea and also provide a
framework for developing effective wood protection strategies,
improving biocontrol agents and identifying useful enzymes
[6,9,10].
Methods
Wood colonization assaysWood wafers (1 cm by 1 cm by 2 mm) were cut from the
sapwood of aspen (Populus tremuloides), pine (P. taeda) and spruce
(Picea glauca) and sterilized by autoclaving. Following inoculation
by contact with mycelium growing on malt extract agar (15 g malt
extract [Difco, Detroit, MI] and 15 g agar per liter of water) in
Petri dishes, colonized wafers were harvested 30, 60 and 90 days.
Noninoculated wood wafers placed on the same media in Petri
dishes served as controls. Wafers were removed 30, 60 or 90 days
later, weighed and percent weight loss was determined. Additional
wafers were removed at the same time period, immediately frozen
Table 2. Transcripts accumulating.4-fold in non-extracted loblolly pine wood (NELP) relative to extracted loblolly pine wood(ELP).1
RPKM Ratio
PRO ID3 Putative function Comments NELP ELP NELP/ELP Probability
385265 Hypothetical 174.01 10.84 16.058 0.001
20514* Hytochrome P450 CYP512B 368.06 29.90 12.310 ,0.001
118355 Hypothetical 72 aa; IVS 132.48 10.98 12.068 ,0.001
21241 GH11 endo-b-1,4-xylanase 133.85 12.68 10.559 0.006
118300 Hypothetical 84 aa 210.69 28.40 7.419 ,0.001
119094 Cytochrome P450 CYP5148A 180.08 31.01 5.808 0.008
128107 Hypothetical 53.61 10.25 5.229 0.001
35298 Hypothetical 204.88 40.46 5.064 ,0.001
75047 Hypothetical 178.94 35.38 5.057 ,0.001
116265 Hypothetical 61.31 12.38 4.954 0.002
99997 Hypothetical 162.61 33.31 4.882 0.008
19184 Cytochrome P450 CYP5136A 99.22 20.33 4.880 0.002
19877 Hypothetical 57.37 11.83 4.849 0.007
123837* Zn finger domain protein 8222.76 1745.42 4.711 0.002
340250 HMG-Box transcription factor 295.72 63.02 4.693 ,0.001
88507* GH18 Chitinase CBM5 409.32 87.55 4.675 0.002
122504 Hypothetical 245.20 55.28 4.436 0.006
125213* GH61 LPMO2 1290.80 305.62 4.223 ,0.001
36458 HMG-Box transcription factor 256.76 61.38 4.183 0.001
1Listing limited to genes with RPKM values.10 and high confidence differential expression (p,0.01). Complete listings for 11,892 genes provided in Dataset S2.Abbreviations: aa, amino acids; CYP, cytochrome P450; IVS, long intervening sequence in gene model; CBM, carbohydrate binding module;2Truncated gene model predicts incomplete protein (117aa).3Nineteen of 22 accumulating in NELP relative to ELP as illustrated in Figure 4B. Three additional upregulated genes were associated with LC-MS/MS-detected proteinsand listed in Table 3. Proteins with asterisks are also listed in Table 2.doi:10.1371/journal.pgen.1004759.t002
Phlebiopsis gigantea Colonization of Conifers
PLOS Genetics | www.plosgenetics.org 12 December 2014 | Volume 10 | Issue 12 | e1004759
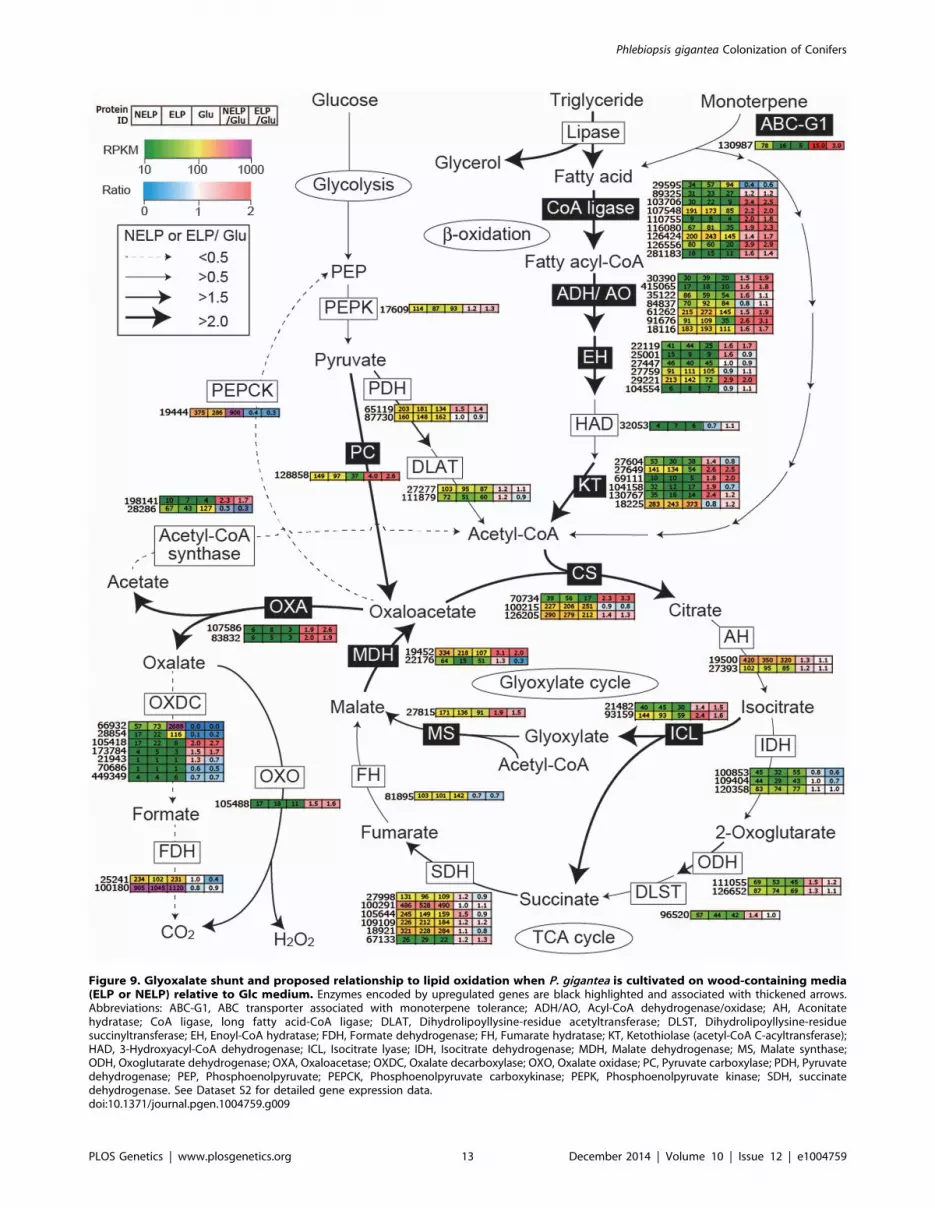
Figure 9. Glyoxalate shunt and proposed relationship to lipid oxidation when P. gigantea is cultivated on wood-containing media(ELP or NELP) relative to Glc medium. Enzymes encoded by upregulated genes are black highlighted and associated with thickened arrows.Abbreviations: ABC-G1, ABC transporter associated with monoterpene tolerance; ADH/AO, Acyl-CoA dehydrogenase/oxidase; AH, Aconitatehydratase; CoA ligase, long fatty acid-CoA ligase; DLAT, Dihydrolipoyllysine-residue acetyltransferase; DLST, Dihydrolipoyllysine-residuesuccinyltransferase; EH, Enoyl-CoA hydratase; FDH, Formate dehydrogenase; FH, Fumarate hydratase; KT, Ketothiolase (acetyl-CoA C-acyltransferase);HAD, 3-Hydroxyacyl-CoA dehydrogenase; ICL, Isocitrate lyase; IDH, Isocitrate dehydrogenase; MDH, Malate dehydrogenase; MS, Malate synthase;ODH, Oxoglutarate dehydrogenase; OXA, Oxaloacetase; OXDC, Oxalate decarboxylase; OXO, Oxalate oxidase; PC, Pyruvate carboxylase; PDH, Pyruvatedehydrogenase; PEP, Phosphoenolpyruvate; PEPCK, Phosphoenolpyruvate carboxykinase; PEPK, Phosphoenolpyruvate kinase; SDH, succinatedehydrogenase. See Dataset S2 for detailed gene expression data.doi:10.1371/journal.pgen.1004759.g009
Phlebiopsis gigantea Colonization of Conifers
PLOS Genetics | www.plosgenetics.org 13 December 2014 | Volume 10 | Issue 12 | e1004759

Ta
ble
3.
Ge
ne
se
nco
din
gLC
-MS/
MS
de
tect
ed
pro
tein
san
de
xhib
itin
g.
2-f
old
reg
ula
tio
nin
com
par
iso
ns
of
NEL
Pan
dEL
Pcu
ltu
res.
1
Pin
ee
mP
AI
va
lue
sR
NA
-se
q5
da
ys
Tra
nsc
rip
tra
tio
(R)
&P
rob
ab
ilit
ies
(Pro
b)
em
PA
Iv
alu
es
Da
ys
inN
EL
PD
ay
sin
EL
PR
PK
MN
EL
P/G
lcN
EL
P/E
LP
EL
P/G
lc5
da
yA
vic
el
PR
Oid
Pu
tati
ve
fun
ctio
n5
79
57
9N
EL
PE
LP
Glc
Pro
bR
Pro
bR
Pro
bR
+e
xtr
-e
xtr
19
02
8Li
pas
e6
.86
1.2
00
.76
1.7
91
.92
1.3
41
90
32
74
22
0.0
01
87
.70
.00
07
.00
.00
71
2.6
2.2
40
.80
12
60
44
Cyc
lop
hili
n6
.77
0.7
00
.34
3.6
30
.58
0.5
42
72
56
19
50
.63
71
.40
.00
74
.90
.12
40
.35
.89
8.7
8
22
17
6M
alat
ed
eh
ydro
ge
nas
e0
.44
0.0
00
.07
0.1
41
.34
0.2
76
41
55
10
.70
51
.30
.00
34
.20
.09
20
.33
.70
7.1
2
26
60
2G
H1
7b
-(1
-6)
en
do
hyd
rola
se0
.00
0.0
90
.09
0.0
00
.00
0.0
04
78
12
43
00
.11
91
5.9
0.0
03
3.8
0.3
31
4.1
0.0
00
.00
95
61
9P
ero
xire
do
xin
0.2
60
.19
0.2
30
.00
0.0
00
.00
98
26
10
80
.77
30
.90
.00
13
.80
.02
30
.21
.35
1.3
5
11
30
65
Glu
tath
ion
eS-
tran
sfe
rase
0.9
70
.69
0.0
50
.00
0.0
00
.00
52
14
45
0.5
69
1.2
0.0
00
3.6
0.0
23
0.3
0.0
00
.00
36
65
9Li
pas
e0
.93
0.0
00
.12
0.0
00
.00
0.0
02
85
86
17
80
.47
31
.60
.00
53
.30
.29
20
.50
.66
0.2
2
33
45
4G
H1
3-C
BM
20a
-am
ylas
e1
.23
1.4
40
.67
0.7
81
.34
2.1
65
01
18
61
68
0.4
05
3.0
0.0
05
2.7
0.9
41
1.1
0.6
80
.77
11
50
40
Ald
eh
yde
de
hyd
rog
en
ase
0.6
00
.00
0.0
20
.00
0.0
00
.00
10
13
81
40
.01
27
.40
.00
12
.70
.05
72
.81
.89
0.5
1
64
36
5R
ibo
nu
cle
ase
T2
0.6
40
.25
0.1
50
.38
1.0
60
.98
80
32
18
0.0
15
4.5
0.0
09
2.5
0.1
07
1.8
0.6
92
.31
70
52
5A
TP
syn
thas
e0
.54
0.1
20
.04
0.0
00
.00
0.0
02
21
02
90
.24
60
.80
.00
42
.20
.02
00
.30
.91
1.3
7
36
22
0G
lyco
pro
tein
0.1
70
.17
0.0
40
.12
0.3
80
.23
10
64
83
65
0.2
04
0.3
0.0
09
2.2
0.0
71
0.1
0.0
00
.00
19
59
6U
nch
arac
teri
zed
pro
tein
0.9
70
.69
0.4
00
.45
0.0
00
.00
19
37
90
02
05
60
.80
70
.90
.00
22
.20
.03
50
.40
.00
0.0
0
12
98
39
Mu
ltic
op
pe
ro
xid
ase
(MC
O4
)1
.45
1.0
30
.25
2.6
18
.79
6.1
04
02
09
18
00
.09
10
.20
.01
00
.20
.85
21
.20
.50
1.0
2
1Li
stin
glim
ite
dto
ge
ne
sw
ith
RP
KM
valu
es.
10
and
,in
com
par
iso
ns
of
NEL
Pan
dEL
Pcu
ltu
res,
wit
hh
igh
con
fid
en
ceo
fd
iffe
ren
tial
exp
ress
ion
(p,
0.0
1).
Tra
nsc
rip
tva
lue
sfo
rcu
ltu
res
gro
wn
on
mic
rocr
ysta
llin
ece
llulo
se(A
vice
l)as
sole
carb
on
sou
rce
un
avai
lab
le.
Th
eco
mp
osi
tio
no
flo
blo
llyp
ine
wo
od
ext
ract
(ext
r)is
liste
din
Te
xtS1
.C
om
ple
telis
tin
gs
for
11
,89
2g
en
es
pro
vid
ed
inD
atas
et
S2.
do
i:10
.13
71
/jo
urn
al.p
ge
n.1
00
47
59
.t0
03
Phlebiopsis gigantea Colonization of Conifers
PLOS Genetics | www.plosgenetics.org 14 December 2014 | Volume 10 | Issue 12 | e1004759

to 220uC and prepared for scanning electron microscopy as
previously described [68].
Sequencing and annotationThe genome was sequenced using Illumina and annotated using
the JGI Annotation Pipeline [69]. Assembly and annotations are
available from JGI portal MycoCosm [38] and deposited to
DDBJ/EMBL/GenBank under accession AZAG00000000. The
version described in this paper is version AZAG01000000. The
completeness of the P. gigantea genome was assessed by finding
99.1% of CEGMA proteins conserved across sequenced genomes
of eukaryotes [70](Text S1; Tables S1, S2).
RNA-seqMycelium was derived from triplicate cultures of 250 ml basal
salts containing: i. 1.25 g freshly-harvested, ground (1mm mesh)
loblolly pine wood that had been ‘spiked’ with acetone and
thoroughly dried (NELP); or ii. the same material following
extended acetone extraction in a Soxhlet apparatus and drying
(ELP). The composition of the extract (Text S1) was determined
by GC-MS [51]. Duplicate cultures of basal salts medium with
glucose as sole carbon source served as a reference. After 5 days
incubation, total RNA was purified from frozen mycelium as
described [22,71]. Multiplexed libraries were constructed and
sequenced on an Illumina HiSeq2000. DNAStar Inc (Madison,
WI) modules SeqNGen and Qseq were used for mapping reads
and statistical analysis. Transcriptome data was deposited to the
NCBI Gene Expression Omnibus (GEO) database and assigned
accession GSE53112 (Reviewer access via http://www.ncbi.
nlm.nih.gov/geo/query/acc.cgi?token=ilovmswixtajjez&acc=GSE
53112). Experimental details are provided in Text S1 and all
transcriptome analyses are summarized in Dataset S2.
Secretome analysisWith minor modification, NanoLC-MS/MS analysis identified
extracellular proteins in culture filtrates as described [22,72]. For
each of the two woody substrates (e.g NELP and ELP), cultures
were harvested after 5, 7 and 9 days. Mass spectrometric protein
identifications were accepted if they could be established at
greater than 95.0% probability within 0.9% False Discovery Rate
and contained at least two identified peptides. Protein probabil-
ities were assigned by the Protein Prophet algorithm [73]. To
verify the effects of pine wood extractives in a well-defined
substrate, media containing microcrystalline cellulose (Avicel)
were also employed [22,45,74]. Filtrates from these cultures, with
or without addition of loblolly pine wood acetone extract, were
collected after 5 days and analyzed. Approximate protein
abundance in each of the cultures was expressed as the number
of unique peptide and the exponentially modified protein
abundance index (emPAI) value [52] (See Text S1 for detailed
methods).
Supporting Information
Figure S1 Vista dot plot illustrating syntenic relationship
between 12 longest scaffolds of P. gigantea and P. chrysosporium.
(EPS)
Figure S2 Top 20 families of contributing to PC1 and PC2
values in Figure 3A. The x-axis designates each enzyme family
and y-axis indicates the squared rotation values for PC1 and PC2.
As shown in Figure 2, the PC2 value mainly separated the white-
and brown-rot fungi.
(EPS)
Figure S3 Ten genes encoding enzymes potentially involved in
lipid metabolism contributing to PC1 and PC2 values in
Figure 3B. The x-axis designates each enzyme family and y-axis
indicates the squared rotation values for PC1 and PC2.
(EPS)
Figure S4 Phylogenetic analysis of opsin genes from P. gigantea(Phlgi), C. subvermispora (Cersu), P. placenta (Pospl), A. nidulans(AN), Sordaria macrospora (SM) and Neurospora crassa (NCU).
The evolutionary history was inferred using the Minimum
Evolution method [78]. The bootstrap consensus tree inferred
from 500 replicates (MEGA4) is taken to represent the
evolutionary history of the taxa analyzed (MEGA4). Branches
corresponding to partitions reproduced in less than 50% bootstrap
replicates are collapsed. The percentage of replicate trees in which
the associated taxa clustered together in the bootstrap test (500
replicates) are shown next to the branches (MEGA4). The tree is
drawn to scale, with branch lengths in the same units as those of
the evolutionary distances used to infer the phylogenetic tree. The
evolutionary distances were computed using the Poisson correction
method [79] and are in the units of the number of amino acid
substitutions per site. The ME tree was searched using the Close-
Neighbor-Interchange (CNI) algorithm [4] at a search level of 1.
The Neighbor-joining algorithm [80] was used to generate the
initial tree. All positions containing gaps and missing data were
eliminated from the dataset (Complete deletion option). There
were a total of 183 positions in the final dataset. Phylogenetic
analyses were conducted in MEGA4 [81].
(EPS)
Figure S5 Phylogenetic analysis of putative photoreceptors of
Ceriporiopsis subvermispora (Cersu), Phlebiopsis gigantea (Phlgi),
Postia placenta (Pospl), Cryptococcus neoformans (CN), Laccariabicolor (LB), Phycomyces blakesleeanus (PB), Neurospora crassa(NCU), Aspergillus nidulans (ANIDU) and Trichoderma reesei(TR). Along with the species, the name is given of the respective
protein (if known) and the GenBank accession number or protein
ID in JGI genome databases.
(EPS)
Figure S6 Alignment of the homologous region comprising the
PAS/LOV domain (NCRFLQ) in photoreceptor orthologues.
LOV signatures are highlighted.
(EPS)
Figure S7 Genomic locus comprising the cluster of response
regulator genes.
(EPS)
Figure S8 Homology models for the molecular structures of
class II heme peroxidases from the P. gigantea genome.
Ligninolytic peroxidases, including LiP models - A) 150531
peroxidase, B) 121662 peroxidase and C) 30372 peroxidase -
harboring an exposed tryptophan potentially involved in oxidation
of high redox-potential substrates, and MnP models - D) 75566
peroxidase, E) 75572 peroxidase, F) 115591 peroxidase, G)
115592 peroxidase and H) 117668 peroxidase - harboring a
putative Mn2+ oxidation site (formed by two glutamates and one
aspartate); and I) manually curated GP (32509). Note that an
alanine and an asparagine residues in the LiP models occupy the
position of the catalytic glutamate and aspartate involved in Mn2+
oxidation by MnP, and a serine residue in the MnP models
occupies the position of the putative catalytic tryptophan
characterizing LiP. The amino acid numbering refers to putative
mature sequences, after manual processing of their peptide
sequences.
(EPS)
Phlebiopsis gigantea Colonization of Conifers
PLOS Genetics | www.plosgenetics.org 15 December 2014 | Volume 10 | Issue 12 | e1004759

Figure S9 Dendrogram showing evolutionary relationships
among 478 basidiomycete heme peroxidases, including structur-
al-functional classification based on Ruiz-Duenas et al. (2)
(GeneBank and JGI references in parentheses and P. giganteagenome references on yellow background). Amino-acid sequence
comparisons as Poisson distances and clustering based on
UPGMA and "pairwise deletion" option of MEGA5 [81].
Compressed sub-trees are shown to facilitate the P. giganteaperoxidases analysis. Numbers on branches represent bootstrap
values (based on 1000 replications) supporting that branch; only
the values $50% are presented. Fungal abbreviations:AGABI, Agaricus bisporus; AURDE, Auricularia delicata;
BJEAD, Bjerkandera adusta; CERSU, Ceriporiopsis subvermis-pora-B; COPCI, Coprinopsis cinerea; DACSP, Dacryopinax sp.;
DICSQ, Dichomitus squalens v1.0; FOMME, Fomitiporia medi-terranea v1.0; FOMPI, Fomitopsis pinicola SS1 v1.0; IZU,
basidiomycete IZU-154; LACBI, Laccaria bicolor v2.0; LENED,
Lentinula edodes; PHACH, Phanerochaete chrysosporium;
PHASO, Phanerochaete sordida; PHLBR, Phlebia brevisporaHHB-7030 SS6 v1.0; PHLGI, Phlebiopsis gigantea; POSPL,
Postia placenta; PUNST, Punctularia strigosozonata v1.0;
SERLA, Serpula lacrymans; SPOSP, Spongipellis sp.; STEHI,
Stereum hirsutum FP-91666 SS1 v1.0; TRACE, Trametopsiscervina; TREME, Tremella mesenterica; USTMA, Ustilagomaydis. Most of the sequences included in the dendrogram were
obtained from the analysis of fungal genome sequences. The
genome version from which the peroxidase sequence was obtained
is in some cases indicated as v1.0 and v2.0. Peroxidaseabbreviations: i) GP, generic peroxidase; ii) MnP-short, MnP-
long and MnP-extralong, three different mangenese peroxidase
(MnP) subfamilies including a typical Mn(II)-oxidation site, formed
by two glutamates and one aspartate residues, and differing in the
length of their C-terminal tails; iii) LiP, lignin peroxidase
harboring an exposed tryptophan residue located at the same
position described for the catalytic Trp171 of P. chrysosporiumLiP; iv) VP, versatile peroxidase including a Mn(II)-oxidation site
like in MnP, and a catalytic tryptophan like in LiP; v) VP-LiP
intermediate states, two Ceriporiopsis subvermispora peroxidases
occupying an intermediate position between typical LiPs and VPs
according to their structural and catalytic properties [22]; and vi)
MnP-atypical and VP-atypical, MnP and VP lacking one of the
three acid residues forming the typical Mn(II)-oxidation site
present in MnP and VP (Glu35/36, Glu39/40 and Asp179/175 in
P. chrysosporiun MnP/P.eryngii VP).
(PDF)
Figure S10 Homology models for the molecular structures of
heme-thiolate peroxidases (HTPs) from the P. gigantea genome.
A) Phlgi1_131735 peroxidase, B) Phlgi1_18201 peroxidase, C)
Phlgi1_19534 peroxidase and D) Phlgi1_104428 peroxidase,
including proximal cysteine residue acting as the fifth heme iron
ligand and a few more amino acid residues of the active center.
(EPS)
Figure S11 Homology models for the molecular structures of
DyP peroxidases from the P. gigantea genome. A) Phlgi1_122124
peroxidase (old Phlgi1_78526 peroxidase), B) Phlgi1_71660
peroxidase, C) Phlgi1_85295 peroxidase and D) Phlgi1_125681
peroxidase, including amino acid residues located at the proximal
and distal sides of the heme active site involved in catalysis.
(EPS)
Figure S12 Dendrogram focused on class II heme peroxidases (a
total of 219) showing evolutionary relationships and structural-
functional classification. A) Short, long and extralong MnPs have a
Mn2+-oxidation site formed by two glutamic and one aspartic
residues, and differ in the length of the C-terminal tail; B) LiPs
contain a catalytic tryptophan, with the only exception of TRACE-
LiP being the ‘‘unique’’ ligninolytic peroxidase with a catalytic
tyrosine (3); C) VPs harbor the catalytic sites described above for
both MnPs and LiPs; D) GPs do not contain any of the above two
catalytic sites; and E) atypical MnPs and VPs lack one of the three
acidic residues forming the Mn2+-oxidation site. The analysis is
described in Figure S9. Fungal abbreviations: AGABI,
Agaricus bisporus; AURDE, Auricularia delicata; BJEAD, Bjer-kandera adusta; BJESP, Bjerkandera sp; CERRI, Ceriporiopsisrivulosa; CERSU, Ceriporiopsis subvermispora-B; CERUN, Cer-rena unicolor; COPCI, Coprinopsis cinerea; COPDI, Coprinellusdisseminatus; DICSQ, Dichomitus squalens v1.0; FOMME,
Fomitiporia mediterranea v1.0; FOMPI, Fomitopsis pinicola SS1
v1.0; GANAP, Ganoderma applanatum; GANAU, Ganodermaaustrale; GANFO, Ganoderma formosanum; GANLU, Ganodermalucidum; GANSP, Ganoderma sp.; HETAN, Heterobasidionannosum v2.0; IZU, basidiomycete IZU-154; LACBI, Laccariabicolor v2.0; LENED, Lentinula edodes; PHACH, Phanerochaetechrysosporium; PHASO, Phanerochaete sordida; PHLBR, Phlebiabrevispora HHB-7030 SS6 v1.0; PHLGI, Phlebiopsis gigantea;
PHLRA, Phlebia radiata; PLEER, Pleurotus eryngii; PLEOS,
Pleurotus ostreatus; PLEPU, Pleurotus pulmonarius; PLESA,
Pleurotus sapidus; POSPL, Postia placenta; PUNST, Punctulariastrigosozonata v1.0; SPOSP, Spongipellis sp.; STEHI, Stereumhirsutum FP-91666 SS1 v1.0; TAICA, Taiwanofungus camphor-atus; TRACE, Trametopsis cervina; TRAVE, Trametes versicolor;WOLCO, Wolfiporia cocos MD-104 SS10 v1.0. GeneBank and
JGI references are shown in parentheses and P. gigantea genome
references on yellow background.
(PDF)
Figure S13 Dendrogram focused on DyP peroxidases (a total of
64) showing evolutionary relationships. The analysis is described in
Figure S7. Fungal abbreviations: AURAU, Auricularia auricula-judae; AURDE, Auricularia delicata; BJEAD, Bjerkandera adusta;
COPCI, Coprinopsis cinerea; DICSQ, Dichomitus squalens v1.0;
FOMME, Fomitiporia mediterranea v1.0; GANLU, Ganodermalucidum; GANSP, Ganoderma sp.; HETAN, Heterobasidion annosumv2.0; LACBI, Laccaria bicolor v2.0; MARSC, Marasmius scorodo-nius; MELLA, Melampsora laricis-populina v1.0; PHLBR, Phlebiabrevispora HHB-7030 SS6 v1.0; PHLGI, Phlebiopsis gigantea;
PLEOS, Pleurotus ostreatus; POSPL, Postia placenta; PUNST,
Punctularia strigosozonata v1.0; STEHI, Stereum hirsutum FP-91666
SS1 v1.0; TERAL, Termitomyces albuminosus; TRAVE, Trametesversicolor. GenBank and JGI references are shown in parentheses and
P. gigantea genome references on yellow background.
(PDF)
Figure S14 Multiple alignments of aryl alcohol oxidases (AAO)
sequences from P. gigantea (Phlgi128071, Phlgi121514) and P.eryngii (AAOpe) [82]. Highly conserved histidine active site
residues [83] are in red. Bottom lines show conserved motifs in
GMC family [84]. Obtained using Clustal W [85].The
Phlgi128071 and Phlgi121514 models conserve the substrate-
binding pocket reported for AAO from P. eryngii and the motifs in
GMC family.
(EPS)
Figure S15 Multiple alignments of methanol oxidase (MOX)
sequences from P. gigantea (Phlgi120749, Phlgi108516
and Phlgi72751) and G. trabeum (ABI14440.1)[53]. Highly conserved
Phlebiopsis gigantea Colonization of Conifers
PLOS Genetics | www.plosgenetics.org 16 December 2014 | Volume 10 | Issue 12 | e1004759

histidine/asparagine active site residues [84] are in red. Bottom lines
show conserved motifs in GMC family [84]. Obtained using Clustal W
[85]. The MOX models conserve motifs in GMC family.
(EPS)
Figure S16 Multiple alignments of cellobiose dehydrogenase (CDH)
sequence from P. gigantea (model Phlgi99876) and Gelatoporiasubvermispora (ACF60617). Highly conserved active site residues are in
red [86]. Obtained using Clustal W [85].
(EPS)
Figure S17 Multiple alignments of pyranose oxidse (POX)
sequences from P. gigantea (Phlgi130349), Peniphora sp.(AAO13382.1) and Trametes ochracea (AAP40332.1). Obtained using
Clustal W [85].
(EPS)
Figure S18 Multiple alignments of glucose oxidase (GOX)
sequences from P. gigantea (Phlgi128108), B. fuckeliana(CDA88590.1) and C. immitis (EAS27606) and A. niger(AAF59929.2) [1]. Highly conserved histidine active site residues
[84] are in red. Bottom lines show conserved motifs in GMC
family [84]. Obtained using Clustal W [85].
(EPS)
Figure S19 Multiple alignments of eight putative aryl alcohol
dehydrogenase (AAD) sequences from P. gigantea (Phlgi1) and P.chrysosporium (AAA61931.1)[36]. Obtained using Clustal W [85].
(EPS)
Figure S20 Phylogenetic tree of multicopper oxidases from
Acremonium sp. (Acr), Aspergillus nidulans (Ani), Cryptococcusneoformans (Cne), Coprinopsis cinerea (Cci), Pleurotus ostreatus (Pos),
Phanerochaete carnosa (Pca), Phanerochaete chrysosporium (Pch),
Phanerochaete flavido-alba (Pfa), Phlebiopsis gigantea (Pgi), Postiaplacenta (Ppl), Saccharomyces cerevisiae (Sce), Schizophyllum commune(Sco), Serpula lacrymans (Sla), Sporobolomyces roseus (Sro), Tremellamesenterica (Tme), and Ustilago maydis (Uma). Alignments were
produced in program ClustalW, manually adjusted in Genedoc and
computed in MEGA4.0 for phylogenetic tree production (neighbour-
joining, bootstrap values 500). ID numbers refer to protein models in
the JGI MycoCosm (http://genome.jgi-psf.org/programs/fungi/
index.jsf), other accession numbers to the NCBI database (http://
www.ncbi.nlm.nih.gov/), specific names to proteins specified with
accession numbers in Hoegger et al. [29] and Lettera et al. [87]. Blue
coloring marks enzymes with laccase activity experimentally shown,
light brown enzymes with proven ferroxidase activity, purple enzymes
with ascorbate activity, olive enzymes acting in fungal pigment
synthesis, and two colors dual enzymatic activities with the left color
marking the respective major performance ([88,89] and references in
the review of Kues and Ruhl 2011 [90]). Proteins from P. gigantea are
highlighted in red.
(EPS)
Figure S21 Sequence alignment for four regions of S. cerevisiaeferroxidase Fet3 with corresponding regions of enzymes of P.gigantea and Phanerochaete species. Marked in yellow are residues
that in Fet3 of S. cerevisiae are critical for Fe2+ binding and the
electron-transfer pathway (for references see [90]). Three groups of
enzymes become obvious: i) the Fet3-type ferroxidases; ii) within the
cluster of ferroxidases/laccases one subgroup that is more similar to
the Fet3-type ferroxidases to which the ferroxidase Mco1 of P.chrysosporium belongs to; and iii) one more distinct subgroup that
misses three amino acids in the second region of importance for
binding pocket formation and to which P. favido-alba bona fidelaccase PfaL belongs.
(EPS)
Figure S22 Phylogenetic analysis and subfamily assignments of
GH5 protein models of P. gigantea (Phlgi), H. annosum (Hetan)
and Stereum hirsutum (stehi).
(EPS)
Figure S23 Phylogenetic analysis of LPMO proteins of P.gigantea, C. subvermispora, and P. Chrysosporium.(EPS)
Figure S24 Phylogeny and differential expression of carbohy-
drate esterase family 1 (CE1) genes. CDS sequences were obtained
from each genome database according to assigned protein IDs.
Incomplete CDS sequences (partial fragments) were eliminated
from the analysis. For each CE family, a multiple alignment was
performed using MegAlign version 10 software. The phylogenetic
tree was then constructed from the multiple alignment using
Clustal W [85]. Numbers at the nodes represent bootstrap values,
based on 1000 replications. Species: Aurde, Auricularia delicataSS-5; Conpu, Coniophora puteana; CC1G, Coprinopsis cinerea;
Dicsq, Dichomitus squalens; Fomme, Fomitiporia mediterranea;
Fompi, Fomitopsis pinicola FP-58527 SS1; Glotr, Gloeophyllumtrabeum; Hetan, Heterobasidion annosum; Lacbi, Laccaria bicolor;
Phaca, Phanerochaete carnosa HHB-10118; Phach, Phanerochaetechrysosporium RP78; Phlgi, Phlebiopsis gigantea; Punst, Punctu-laria strigosozonata; Schco, Schizophyllum commune; Serla,
Serpula lacrymans S7.3; Stehi, Stereum hirsutum FP-91666 SS1;
Trave, Trametes versicolor; Wolco, Wolfiporia cocos MD-104
SS10. Ecology: W, white rot; B, brown rot; M, mycorrhiza; S,
non-wood decay saprotroph. Location of comprised CBM1 was
indicated as N or C-terminal. Differential regulation of Phlgi CE
transcripts between the cultivations tested in this study were also
indicated as up- (U) or down- (D) regulated. Asterisk was
accompanied if the p value was ,0.05. Possible CE1 gene
Phlgi_121418 was excluded as the model was severely truncated
(91 amino acid residues).
(PDF)
Figure S25 Phylogeny and differential expression of CE4 genes.
Analysis and abbreviations as in Figure S24.
(PDF)
Figure S26 Phylogeny and differential expression of CE8 genes.
Analysis and abbreviations as in Figure S24. Possible CE8 gene
Phlgi_132681 was excluded as the model was severely truncated
(79 residues).
(PDF)
Figure S27 Phylogeny and differential expression of CE9 genes.
Analysis and abbreviations as in Figure S24.
(PDF)
Figure S28 Phylogeny and differential expression of CE12
genes. Analysis and abbreviations as in Figure S24.
(PDF)
Figure S29 Phylogeny and differential expression of CE15
genes. Analysis and abbreviations as in Figure S24.
(PDF)
Figure S30 Phylogeny and differential expression of CE16
genes. Analysis and abbreviations as in Figure S24. Possible CE16
gene Phlgi_73119 was excluded as the model was severely
truncated (95 residues).
(PDF)
Figure S31 Phylogenetic tree of the cytochrome P450 proteins
(P450ome) in P. gigantea. Tree was constructed using 124 P450
sequences (which were full-length or near full-length) and
evolutionary history was inferred using bootstrap Neighbor-
Phlebiopsis gigantea Colonization of Conifers
PLOS Genetics | www.plosgenetics.org 17 December 2014 | Volume 10 | Issue 12 | e1004759

Joining method. Phylogenetic analyses were conducted using
MEGA4 [81]. The P450 listing in the tree is based on the
corresponding protein ID with the CYP name in parenthesis.
P450s that belong to a new subfamily are indicated with the
abbreviation NS.
(EPS)
Figure S32 Comparative evolutionary analysis of the P450omes
of P. gigantea and Phanerochaete species (P. chrysosporium and P.carnosa). Clan level comparison was made for this analysis.
(EPS)
Figure S33 Multiple alignment of representative protein sequences
of P. gigantea hydrophobins. Sequences were aligned using MUSCLE
alignment tool implemented in Molecular Evolutionary Genetic
Analysis software (MEGA 5.0). MUSCLE was chosen because it is
computationally more suitable for multiple sequence alignments and
gives a better accuracy than the conventional CLUSTAL alignment
[91]. The aligned protein sequences were viewed with the Biological
sequence alignment editor (Bioedit), windows 95/98/NT/2K/XP.
Identical amino acid residues are marked in black, conserved cysteine
residues are marked with asterisks.
(EPS)
Figure S34 The evolutionary history of P. gigantea hydro-
phobins with a selected set of closely related basidiomycetes and
Acremonium alcalophilum, an ascomycete. Evolutionary related-
ness was inferred using the Neighbor-Joining method [80]. The
percentage of replicate trees in which the associated taxa clustered
together in the bootstrap test (500 replicates) are shown next to the
branches. Branches with blue colour represent hydrophobin
sequences from P. gigantea and branches without support values
are less than 50%. The tree is drawn to scale, with branch lengths
in the same units as those of the evolutionary distances used to
infer the phylogenetic tree. The evolutionary distances were
computed using the Poisson correction method [79], and are in
the units of the number of amino acid substitutions per site. The
analysis involved 174 amino acid sequences. All ambiguous
positions were removed for each sequence pair. There were a
total of 155 positions in the final dataset. Evolutionary analyses
were conducted in MEGA5 [92]. Fungal species IDs: |Cersu|
(Ceriporiopsis subvermispora), |Phlgi| (Phlebiopsis gigantea),
|Phchr|(Phanerochaete chrysosporium), |Gansp| (Ganodermasp.), |Phlbr| (Phlebia brevispora), |Serla_varsha|(Serpula lacry-mans), |Wolco| (Wolfiporia cocos), |Hetan| (Heterobasidionannosum), |Schco| (Schizophyllum commune), |Copci| (Copri-nopsis cinerea), |Lacbi| (Laccaria bicolor), |Ustma| (Ustilagomaydis), |Acral| (Acremonium alcalophilum). The tree is rooted at
Acremonium alcalophilum, representing class II of hydrophobins.
(EPS)
Figure S35 Chromatogram of loblolly pine wood acetone
extract.
(EPS)
Table S1 Genome assembly.
(DOCX)
Table S2 Annotation.
(DOCX)
Table S3 Transcript profiles of response regulator genes
clustered on scaffold.
(DOCX)
Table S4 Copper radical oxidases (CROs) of P. Gigantea.(DOCX)
Table S5 Expression of P. gigantea GMC oxidoreductases in
solvent extracted lodgepole pine wood (ELP) and non-extracted
lodgepole pine wood (NELP).
(DOCX)
Table S6 Multicopper oxidases of P. gigantea.(DOCX)
Table S7 Glycoside hydrolase comparisons of brown-rot (BR)
and white-rot (WR) fungi.
(DOCX)
Table S8 Carbohydrate esterase comparisons of brown-rot (BR)
and white-rot (WR) fungi.
(DOCX)
Table S9 Polysaccharide lyase comparisons of brown-rot (BR)
and white-rot (WR) fungi.
(DOCX)
Table S10 Protein features and regulation of lytic polysaccha-
ride monooxygenases (LPMO) in P. gigantea.(DOCX)
Table S11 Properties of the transcription factors for which
binding sites have been detected in CAZymes that are significantly
regulated during growth on ground pine wood.
(DOCX)
Table S12 Transcript levels of potential regulators in P.gigantea cultures.
(DOCX)
Table S13 Overview of the P. gigantea P450ome and
comparison with P. chrysosporium and P. carnosa.(DOCX)
Table S14 Clan-, family-, and subfamily- level classification of
the P450ome of P. gigantea and comparison with P. chrysospor-ium and P. carnosa.(DOCX)
Table S15 Expression profile of P. gigantea P450ome.
(DOCX)
Table S16 Products of annotated putative secondary metabolite
genes in the P. gigantea genome.
(DOCX)
Table S17 P. gigantea hydrophobin models.
(DOCX)
Table S18 Fungal species and hydrophobin gene number used
for phylogenomics analysis.
(DOCX)
Table S19 RNAseq analysis of P. gigantea hydrophobins.
(DOCX)
Table S20 P. gigantea ABC models.
(DOCX)
Table S21 Chemical composition of lipids from Loblolly pine
wood (Pinus taeda).
(DOCX)
Text S1 Detailed description of methods and annotated gene
families.
(DOCX)
Dataset S1 Number and distribution of genes used for PCA.
(XLSX)
Phlebiopsis gigantea Colonization of Conifers
PLOS Genetics | www.plosgenetics.org 18 December 2014 | Volume 10 | Issue 12 | e1004759

Dataset S2 Complete listing of P. gigantea protein models and
expression data.
(XLSX)
Author Contributions
Conceived and designed the experiments: ATM SFC RAB DC. Performed
the experiments: CH JAG GS SSB EL JR AG SFC RAB DC. Analyzed
the data: CH TI KI MSa HSuz EM PF FJRD BHel PC LFL MSc ISD
CPK JAG PK FSJ JG KS JY ACM AK FOA GL DH HSun JR AG EL
KB RR IVG BHen UK RMB ATM SFC RAB DC. Wrote the paper: CH
KI MSa HSuz EM PF FJRD PC LFL MSc ISD CPK PK FSJ KS JY AK
FOA GL DH RR IVG BHen UK RMB ATM SFC RAB DC.
References
1. Blanchette R (1991) Delignification by wood-decay fungi. Ann Rev Phytopath
29: 381–398.
2. Eriksson K-EL, Blanchette RA, Ander P (1990) Microbial and enzymatic
degradation of wood and wood components; Timell TE, editor. Berlin:
Springer-Verlag.
3. Rayner ADM, Boddy L (1988) Fungal decomposition of wood: its biology and
ecology. Chichester: John Wiley and Sons.
4. Kaarik AA (1974) Decomposition of wood. In: Dickinson CH, Pugh GJF,
editors.Biology of plant litter composition.New York: Academic Press. pp.129–
174.
5. Shigo AL (1967) Succession of organisms in discoloration and decay wood. Int
Rev For Res 2: 237–299.
6. Gutierrez A, Del Rio JC, Martinez AT (2009) Microbial and enzymatic control
of pitch in the pulp and paper industry. Appl Microbiol Biotechnol 82: 1005–
1018.
7. Garbelotto M, Guglielmo F, Mascheretti S, Croucher PJ, Gonthier P (2013)
Population genetic analyses provide insights on the introduction pathway and
spread patterns of the North American forest pathogen Heterobasidionirregulare in Italy. Mol Ecol 10.1111/mec.12452.
8. Rishbeth J (1963) Stump protection against Fomes annosus. Annals of Applied
Biology 52: 63–77.
9. Behrendt CJ, Blanchette RA (1997) Biological Processing of Pine Logs for Pulp
and Paper Production with Phlebiopsis gigantea. Appl Environ Microbiol 63:
1995–2000.
10. Behrendt CJ, Blanchette RA (2001) Biological control of blue stain in pulpwood:
mechanisms of control used by Phlebiopsis gigantea. Holzforschung 55: 238–
245.
11. Fischer K, Akhtar M, Blanchette RA, Burnes TA, Messner K, et al. (1994)
Reduction in resin content in wood chips during experimental biological pulping
processes. Holzforschung 48: 285–290.
12. Martinez-Inigo MJ, Immerzeel P, Gutierrez A, del Rio JC, Sierra-Alvarez R
(1999) Biodegradability of extractives in sapwood and heartwood from Scots
Pine by sapstain and white rot fungi. Holzforschung 53: 247–252.
13. Adomas A, Eklund M, Johansson M, Asiegbu FO (2006) Identification and
analysis of differentially expressed cDNAs during nonself-competitive interaction
between Phlebiopsis gigantea and Heterobasidion parviporum. FEMS Microbiol
Ecol 57: 26–39.
14. Kersten P, Cullen D (2013) Recent advances on the genomics of litter- and soil-
inhabiting Agaricomycetes. Genomics of Soil- and Plant-Associated Fungi:
Springer. pp. 311–332.
15. Baldrian P, Valaskova V (2008) Degradation of cellulose by basidiomycetous
fungi. FEMS Microbiol Rev 32: 501–521.
16. Cantarel BL, Coutinho PM, Rancurel C, Bernard T, Lombard V, et al. (2009)
The Carbohydrate-Active EnZymes database (CAZy): an expert resource for
Glycogenomics. Nucleic Acids Res 37: D233–238.
17. Hori C, Gaskell J, Igarashi K, Samejima M, Hibbett D, et al. (2013) Genome-
wide analysis of polysaccharide degrading enzymes in eleven white- and brown-
rot polyporales provides insight into mechanisms of wood decay. Mycologia 105:
1412–1427.
18. Bey M, Zhou S, Poidevin L, Henrissat B, Coutinho PM, et al. (2013) Cello-
oligosaccharide oxidation reveals differences between two lytic polysaccharide
monooxygenases (family GH61) from Podospora anserina. Appl Environ
Microbiol 79: 488–496.
19. Quinlan RJ, Sweeney MD, Lo Leggio L, Otten H, Poulsen JC, et al. (2011)
Insights into the oxidative degradation of cellulose by a copper metalloenzyme
that exploits biomass components. Proc Natl Acad Sci U S A 108: 15079–
15084.
20. Westereng B, Ishida T, Vaaje-Kolstad G, Wu M, Eijsink VG, et al. (2011) The
putative endoglucanase PcGH61D from Phanerochaete chrysosporium is a metal-
dependent oxidative enzyme that cleaves cellulose. PLoS ONE 6: e27807.
21. Floudas D, Binder M, Riley R, Barry K, Blanchette RA, et al. (2012) The
Paleozoic origin of enzymatic lignin decomposition reconstructed from 31 fungal
genomes. Science 336: 1715–1719.
22. Fernandez-Fueyo E, Ruiz-Duenas FJ, Ferreira P, Floudas D, Hibbett DS, et al.
(2012) Comparative genomics of Ceriporiopsis subvermispora and Phanerochaetechrysosporium provide insight into selective ligninolysis. Proc Natl Acad
Sci U S A 109: 5458–5463.
23. Morgenstern I, Klopman S, Hibbett DS (2008) Molecular evolution and
diversity of lignin degrading heme peroxidases in the Agaricomycetes. J Mol
Evol 66: 243–257.
24. Kawai S, Asukai M, Ohya N, Okita K, Ito T, et al. (1999) Degradation of non-
phenolic beta-O-4 susbstructure and of polymeric lignin model compounds by
laccase of Coriolus versicolor in the presence of 1-hydroxybenzotriazole. FEMS
Microbiol Lett 170: 51–57.
25. Bourbonnais R, Paice MG, Freiermuth B, Bodie E, Borneman S (1997)
Reactivities of various mediators and laccases with kraft pulp and lignin model
compounds. Appl Environ Microbiol 63: 4627–4632.
26. Eggert C, Temp U, Eriksson K (1997) Laccase is essential for lignin degradation
by the white-rot fungus Pycnoporus cinnabarinus. FEBS Lett 407: 89–92.
27. Martinez D, Larrondo LF, Putnam N, Sollewijn Gelpke MD, Huang K, et al.
(2004) Genome sequence of the lignocellulose degrading fungus Phanerochaetechrysosporium strain RP78. Nat Biotechnol 22: 695–700.
28. Larrondo L, Salas L, Melo F, Vicuna R, Cullen D (2003) A novel extracellular
multicopper oxidase from Phanerochaete chrysosporium with ferroxidase activity.
Appl Environ Microbiol 69: 6257–6263.
29. Hoegger PJ, Kilaru S, James TY, Thacker JR, Kues U (2006) Phylogenetic
comparison and classification of laccase and related multicopper oxidase protein
sequences. FEBS J 273: 2308–2326.
30. Levasseur A, Drula E, Lombard V, Coutinho PM, Henrissat B (2013) Expansion
of the enzymatic repertoire of the CAZy database to integrate auxiliary redox
enzymes. Biotechnol Biofuels 6: 41.
31. Bastian S, Rekowski MJ, Witte K, Heckmann-Pohl DM, Giffhorn F (2005)
Engineering of pyranose 2-oxidase from Peniophora gigantea towards improved
thermostability and catalytic efficiency. Appl Microbiol Biotechnol 67: 654–663.
32. Yadav JS, Soellner MB, Loper JC, Mishra PK (2003) Tandem cytochrome P450
monooxygenase genes and splice variants in the white rot fungus Phanerochaetechrysosporium: cloning, sequence analysis, and regulation of differential
expression. Fungal Genet Biol 38: 10–21.
33. Syed K, Porollo A, Lam YW, Grimmett PE, Yadav JS (2013) CYP63A2, a
catalytically versatile fungal P450 monooxygenase capable of oxidizing higher-
molecular-weight polycyclic aromatic hydrocarbons, alkylphenols, and alkanes.
Appl Environ Microbiol 79: 2692–2702.
34. Syed K, Yadav JS (2012) P450 monooxygenases (P450ome) of the model white
rot fungus Phanerochaete chrysosporium. Crit Rev Microbiol 38: 339–363.
35. Dowd CA, Buckley CM, Sheehan D (1997) Glutathione S-transferases from
the white-rot fungus, Phanerochaete chrysosporium. Biochem J 324 (Pt 1):
243–248.
36. Reiser J, Muheim A, Hardegger M, Frank G, Fiechter A (1994) Aryl-alcohol
dehydrogenase from the white-rot fungus Phanerochaete chrysosporium: gene
cloning, sequence analysis, expression and purification of recombinant protein.
J Biol Chem 269: 28152–28159.
37. Hibbett DS, Donoghue MJ (2001) Analysis of character correlations among
wood decay mechanisms, mating systems, and substrate ranges in homobasi-
diomycetes. Syst Biol 50: 215–242.
38. Grigoriev IV, Nordberg H, Shabalov I, Aerts A, Cantor M, et al. (2012) The
genome portal of the Department of Energy Joint Genome Institute. Nucleic
Acids Res 40: D26–32.
39. Riley R, Salamov AA, Brown DW, Nagy LG, Floudas D, et al. (2014) Extensive
sampling of basidiomycete genomes demonstrates inadequacy of the white-rot/
brown-rot paradigm for wood decay fungi. Proc Natl Acad Sci U S A 111:
9923–9928.
40. Sjostrom E (1993) Wood Chemistry. Fundamentals and Applications. San
Diego: Academic Press. 293 p.
41. Kersten PJ (1990) Glyoxal oxidase of Phanerochaete chrysosporium: Its
characterization and activation by lignin peroxidase. Proc Natl Acad Sci USA
87: 2936–2940.
42. de Koker TH, Mozuch MD, Cullen D, Gaskell J, Kersten PJ (2004) Pyranose 2-
oxidase from Phanerochaete chrysosporium: isolation from solid substrate,
protein purification, and characterization of gene structure and regulation.
Appl Environ Microbiol 70: 5794–5800.
43. Giffhorn F (2000) Fungal pyranose oxidases: occurrence, properties and
biotechnical applications in carbohydrate chemistry. Appl Microbiol Biotechnol
54: 727–740.
44. Sun HW, Plapp BV (1992) Progressive sequence alignment and molecular
evolution of the Zn-containing alcohol dehydrogenase family. J Mol Evol 34:
522–535.
45. Martinez D, Challacombe J, Morgenstern I, Hibbett D, Schmoll M, et al. (2009)
Genome, transcriptome, and secretome analysis of wood decay fungus Postiaplacenta supports unique mechanisms of lignocellulose conversion. Proc Natl
Acad Sci U S A 106: 1954–1959.
Phlebiopsis gigantea Colonization of Conifers
PLOS Genetics | www.plosgenetics.org 19 December 2014 | Volume 10 | Issue 12 | e1004759

46. Eastwood DC, Floudas D, Binder M, Majcherczyk A, Schneider P, et al. (2011)
The plant cell wall-decomposing machinery underlies the functional diversity offorest fungi. Science 333: 762–765.
47. Langston JA, Shaghasi T, Abbate E, Xu F, Vlasenko E, et al. (2011)
Oxidoreductive cellulose depolymerization by the enzymes cellobiose dehydro-genase and glycoside hydrolase 61. Appl Environ Microbiol 77: 7007–7015.
48. Phillips CM, Beeson WT, Cate JH, Marletta MA (2011) Cellobiosedehydrogenase and a copper-dependent polysaccharide monooxygenase
potentiate cellulose degradation by Neurospora crassa. ACS Chem Biol 6:
1399–1406.49. Macdonald J, Doering M, Canam T, Gong Y, Guttman DS, et al. (2011)
Transcriptomic responses of the softwood-degrading white-rot fungus Phaner-ochaete carnosa during growth on coniferous and deciduous wood. Appl Environ
Microbiol 77: 3211–3218.50. Dorado J, Claassen FW, van Beek TA, Lenon G, Wijnberg JB, et al. (2000)
Elimination and detoxification of softwood extractives by white-rot fungi.
J Biotechnol 80: 231–240.51. Gutierrez A, del Rio JC, Gonzalez-Vila FJ, Martin F (1998) Analysis of lipophilic
extractives from wood and pitch deposits by solid-phase extraction and gaschromatography. J Chromatogr 823: 449–455.
52. Ishihama Y, Oda Y, Tabata T, Sato T, Nagasu T, et al. (2005) Exponentially
modified protein abundance index (emPAI) for estimation of absolute proteinamount in proteomics by the number of sequenced peptides per protein. Mol
Cell Proteomics 4: 1265–1272.53. Daniel G, Volc J, Filonova L, Plihal O, Kubatova E, et al. (2007) Characteristics
of Gloeophyllum trabeum alcohol oxidase, an extracellular source of H2O2 inbrown rot decay of wood. Appl Environ Microbiol 73: 6241–6253.
54. Bendtsen JD, Jensen LJ, Blom N, Von Heijne G, Brunak S (2004) Feature-based
prediction of non-classical and leaderless protein secretion. Protein engineering,design & selection: PEDS 17: 349–356.
55. van Beek TA, Claassen FW, Dorado J, Godejohann M, Sierra-Alvarez R, et al.(2007) Fungal biotransformation products of dehydroabietic acid. J Nat Prod 70:
154–159.
56. Adams AS, Aylward FO, Adams SM, Erbilgin N, Aukema BH, et al. (2013)Mountain pine beetles colonizing historical and naive host trees are associated
with a bacterial community highly enriched in genes contributing to terpenemetabolism. Appl Environ Microbiol 79: 3468–3475.
57. Kumar SV, Phale PS, Durani S, Wangikar PP (2003) Combined sequence andstructure analysis of the fungal laccase family. Biotechnol Bioeng 83: 386–394.
58. Hofrichter M, Ullrich R, Pecyna MJ, Liers C, Lundell T (2010) New and classic
families of secreted fungal heme peroxidases. Appl Microbiol Biotechnol 87:871–897.
59. Liers C, Pecyna MJ, Kellner H, Worrich A, Zorn H, et al. (2013) Substrateoxidation by dye-decolorizing peroxidases (DyPs) from wood- and litter-
degrading agaricomycetes compared to other fungal and plant heme-
peroxidases. Appl Microbiol Biotechnol 97: 5839–5849.60. Agger JW, Isaksen T, Varnai A, Vidal-Melgosa S, Willats WG, et al. (2014)
Discovery of LPMO activity on hemicelluloses shows the importance ofoxidative processes in plant cell wall degradation. Proc Natl Acad
Sci U S A 10.1073/pnas.1323629111.61. Vaaje-Kolstad G, Westereng B, Horn SJ, Liu Z, Zhai H, et al. (2010) An
oxidative enzyme boosting the enzymatic conversion of recalcitrant polysaccha-
rides. Science 330: 219–222.62. Vanden Wymelenberg A, Minges P, Sabat G, Martinez D, Aerts A, et al. (2006)
Computational analysis of the Phanerochaete chrysosporium v2.0 genomedatabase and mass spectrometry identification of peptides in ligninolytic cultures
reveals complex mixtures of secreted proteins. Fungal Genet Biol 43: 343–356.
63. Wang Y, Lim L, DiGuistini S, Robertson G, Bohlmann J, et al. (2013) Aspecialized ABC efflux transporter GcABC-G1 confers monoterpene resistance
to Grosmannia clavigera, a bark beetle-associated fungal pathogen of pine trees.New Phytol 197: 886–898.
64. Matsuzaki F, Shimizu M, Wariishi H (2008) Proteomic and metabolomic
analyses of the white-rot fungus Phanerochaete chrysosporium exposed toexogenous benzoic acid. J Proteome Res 7: 2342–2350.
65. Shimizu M, Yuda N, Nakamura T, Tanaka H, Wariishi H (2005) Metabolicregulation at the tricarboxylic acid and glyoxylate cycles of the lignin-degrading
basidiomycete Phanerochaete chrysosporium against exogenous addition ofvanillin. Proteomics 5: 3919–3931.
66. Annesi T, Curcio G, D’Amico L, Motta E (2005) Biological control of
Heterobasidion annosum on Pinus pinea by Phlebiopsis gigantea. ForestPathology 35: 127–134.
67. Munir E, Yoon JJ, Tokimatsu T, Hattori T, Shimada M (2001) A physiologicalrole for oxalic acid biosynthesis in the wood-rotting basidiomycete Fomitopsispalustris. Proc Natl Acad Sci USA 98: 11126–11130.
68. Blanchette RA, Held BW, Arenz BE, Jurgens JA, Baltes NJ, et al. (2010) An
Antarctic hot spot for fungi at Shackleton’s historic hut on Cape Royds. MicrobEcol 60: 29–38.
69. Grigoriev IV, Martinez DA, Salamov AA (2006) Fungal genomic annotation. In:Arora DK, Berka RA, Singh GB, editors.Applied Mycology and Biotechnolo-
gy.Amsterdam: Elsevier. pp. 123–142.
70. Parra G, Bradnam K, Korf I (2007) CEGMA: a pipeline to accurately annotate
core genes in eukaryotic genomes. Bioinformatics 23: 1061–1067.
71. Vanden Wymelenberg A, Gaskell J, Mozuch MD, Sabat G, Ralph J, et al. (2010)
Comparative transcriptome and secretome analysis of wood decay fungi Postiaplacenta and Phanerochaete chrysosporium. Appl Environ Microbiol 76: 3599–
3610.
72. Ryu JS, Shary S, Houtman CJ, Panisko EA, Korripally P, et al. (2011) Proteomic
and functional analysis of the cellulase system expressed by Postia placentaduring brown rot of solid wood. Appl Environ Microbiol 77: 7933–7941.
73. Nesvizhskii AI, Keller A, Kolker E, Aebersold R (2003) A statistical model foridentifying proteins by tandem mass spectrometry. Anal Chem 75: 4646–4658.
74. Vanden Wymelenberg A, Gaskell J, Mozuch MD, Kersten P, Sabat G, et al.
(2009) Transcriptome and secretome analysis of Phanerochaete chrysosporiumreveal complex patterns of gene expression. Appl Environ Microbiol 75: 4058–4068.
75. Olson A, Aerts A, Asiegbu F, Belbahri L, Bouzid O, et al. (2012) Insight intotrade-off between wood decay and parasitism from the genome of a fungal forest
pathogen. New Phytol 194: 1001–1013.
76. Vanden Wymelenberg A, Sabat G, Mozuch MD, Kersten P, Cullen D, et al.
(2006) Structure, organization, and transcriptional regulation of a family ofcopper radical oxidase genes in the lignin-degrading basidiomycete Phaner-ochaete chrysosporium. Appl Environ Microbiol 72: 4871–4877.
77. Aspeborg H, Coutinho PM, Wang Y, Brumer H, 3rd, Henrissat B (2012)
Evolution, substrate specificity and subfamily classification of glycoside hydrolasefamily 5 (GH5). BMC Evol Biol 12: 186.
78. Rzhetsky A, Nei M (1992) Statistical properties of the ordinary least-squares,generalized least-squares, and minimum-evolution methods of phylogenetic
inference. J Mol Evol 35: 367–375.
79. Zuckerkandl J, Pauling L (1965) Evolutionary divergence and convergence in
proteins. In: Bryson V, Vogel HJ, editors.Evolving genes and proteins. NewYork: Academic Press.
80. Saitou N, Nei M (1987) The neighbor-joining method: a new method forreconstructing phylogenetic trees. Mol Biol Evol 4: 406–425.
81. Tamura K, Dudley J, Nei M, Kumar S (2007) MEGA4: Molecular Evolutionary
Genetics Analysis (MEGA) software version 4.0. Mol Biol Evol 24: 1596–1599.
82. Guillen F, Evans CS (1994) Anisaldehyde and veratraldehyde acting as redox
cycling agents for H2O2 production by Pleurotus eryngii. Appl EnvironMicrobiol 60: 2811–2817.
83. Ferreira P, Ruiz-Duenas FJ, Martinez MJ, van Berkel WJ, Martinez AT (2006)Site-directed mutagenesis of selected residues at the active site of aryl-alcohol
oxidase, an H2O2-producing ligninolytic enzyme. FEBS J 273: 4878–4888.
84. Cavener DR (1992) GMC oxidoreductases. A newly defined family of
homologous proteins with diverse catalytic activities. J Mol Biol 223: 811–814.
85. Thompson JD, Higgins DG, Gibson TJ (1994) ClustalW improving the
sensitivity of progressive multiple sequence alignment through sequenceweighting, position-specific gap penalties and weight matrix choice. Nucleic
Acids Res 22: 2552–2556.
86. Hallberg BM, Henriksson G, Pettersson G, Vasella A, Divne C (2003)
Mechanism of the reductive half-reaction in cellobiose dehydrogenase. J BiolChem 278: 7160–7166.
87. Lettera V, Piscitelli A, Leo G, Birolo L, Pezzella C, et al. (2010) Identification ofa new member of Pleurotus ostreatus laccase family from mature fruiting body.
Fungal Biol 114: 724–730.
88. Kilaru S, Hoegger PJ, Kues U (2006) The laccase multi-gene family in
Coprinopsis cinerea has seventeen different members that divide into two distinctsubfamilies. Curr Genet 50: 45–60.
89. Ruhl M, Majcherczyk A, Kues U (2013) Lcc1 and Lcc5 are the main laccasessecreted in liquid cultures of Coprinopsis cinerea strains. Antonie van
Leeuwenhoek 103: 1029–1039.
90. Kues U, Ruhl M (2011) Multiple multi-copper oxidase gene families in
basidiomycetes - what for? Curr Genomics 12: 72–94.
91. Altschul SF, Madden TL, Schaffer AA, Zhang J, Zhang Z, et al. (1997) Gapped
BLAST and PSI-BLAST: a new generation of protein database searchprograms. Nucleic Acids Res 25: 3389–3402.
92. Tamura K, Peterson D, Peterson N, Stecher G, Nei M, et al. (2011) MEGA5:molecular evolutionary genetics analysis using maximum likelihood, evolution-
ary distance, and maximum parsimony methods. Mol Biol Evol 28: 2731–2739.
Phlebiopsis gigantea Colonization of Conifers
PLOS Genetics | www.plosgenetics.org 20 December 2014 | Volume 10 | Issue 12 | e1004759


![[ Team LiB ] Active Directory, 2nd Edition, provides system and](https://img.dokumen.tips/doc/110x75/6323236e117b4414ec0c3138/-team-lib-active-directory-2nd-edition-provides-system-and-.jpg)