Embed Size (px)
Citation preview

BAGY2 Retrotransposon Analyses in Barley CalliCultures and Regenerated Plantlets
Sibel Yilmaz • Sevgi Marakli • Nermin Gozukirmizi
Received: 28 February 2013 / Accepted: 25 October 2013
� Springer Science+Business Media New York 2014
Abstract The stability of aging barley calli and regenerated plantlets from those
calli was investigated by the BAGY2 retrotransposon-specific IRAP technique.
Mature embryos of barley (Hordeum vulgare cv. Golden Promise) were cultured in
Murashige and Skoog medium supplemented with 4 mg/L dicamba and maintained
on the same medium for 45 and 90 days. Two IRAP-based primers were used, and
the levels of variation of DNA isolated from 45- and 90-day-old calli and regen-
erated plantlets were found to be increased 0–21%, depending on the mature
embryo material and the age of the callus. It has been observed that culture con-
ditions cause genetic variations and evident BAGY2 retrotransposon alterations.
Internal domains of BAGY2 were also analyzed by qPCR, and copy numbers were
found to be increased. These findings are expected to contribute to understanding of
how retrotransposons affect features like tissue culture (especially callus tissue)
formation and genetic engineering studies.
Keywords Hordeum vulgare � Somaclonal variation � BAGY2 �Polymorphism � Copy number variations
Introduction
Somaclonal variation is defined as a genetic and phenotypic variation among clonally
propagated plants of a single donor clone (Larkin and Scowcoft 1981). During tissue
S. Yilmaz (&) � S. Marakli � N. Gozukirmizi
Department of Molecular Biology and Genetics, Istanbul University, Vezneciler, 34134 Istanbul,
Turkey
e-mail: [email protected]
S. Marakli
e-mail: [email protected]
N. Gozukirmizi
e-mail: [email protected]
123
Biochem Genet
DOI 10.1007/s10528-014-9643-z

culture some genetic and epigenetic changes (such as cytogenetic abnormalities, sequence
changes, DNA methylation variations, and transposon movements) can occur in calli,
regenerated plants, and their progeny (Kaeppler et al. 2000; Evrensel et al. 2011).
Retrotransposons are ubiquitous components of DNA and play a major role for genome
evolution (Kumar and Bennetzen 1999). Long terminal repeat (LTR) retrotransposons
constitute a subclass of transposons. They transpose in a replicative manner using an RNA
intermediate mechanism (Grzebelus 2006). The highest percentage of retrotransposons
encodes proteins needed for their life cycle. They have a coding region containing gag and
pol (protease, reverse transcriptase, RNaseH, integrase) genes flanked by long terminal
repeats (Sabot and Schulman 2006). They resemble retroviruses because of their physical
structure. Some retrotransposons also have an envelope (ENV) domain needed for
retrovirus infection. Due to their copy-and-paste mechanism, genomes diversify through
the insertion of new retrotransposon copies. Their abundance in the genome is generally
correlated with genome size (Schulman and Kalendar 2005). Cereal genomes especially
contain retrotransposons up to 95%. In barley, BARE1 is the most active retrotransposon:
BARE1[BAGY2 = Sukkula[ Nikita[Sabrina (Leigh et al. 2003). BAGY2 is a
gypsy-like retrotransposon, containing the ENV domain, and has 47% similarity with
BAGY1 (Shirasu et al. 2000; Leigh et al. 2003).
The mobility of a retrotransposon can be easily detected by retrotransposon-based
markers. One such marker technique is inter-retrotransposon amplified polymorphism
(IRAP). It relies on the amplification of the genomic regions flanked by two LTR
retrotransposons or solo LTRs (Kalendar et al. 1999). In this method, the polymorphism
is detected by the presence or absence of the PCR product, and lack of amplification
indicates the absence of the retrotransposon at the particular locus. IRAP has been used
to investigate genetic relationships between varieties and related species (Guo et al.
2006), gene mapping (Manninen et al. 2000), characterization of somaclonal variation
(Campbell et al. 2011; Evrensel et al. 2011; Bayram et al. 2012), and somatic genome
variations (Muhammad and Othman 2005). It also has been adapted to human
endogenous virus screening studies (Guliyev et al. 2013).
In the current study, we investigated BAGY2 retrotransposon insertion patterns of
45- and 90-day-old calli in barley and their regenerated shoots. In addition, both
sequence analyses were conducted and copy number alterations of BAGY2 internal
domains (GAG, PR, RT, RH, INT, and ENV) were investigated. This is the first
report on BAGY2 movements and copy number variations of the internal domains in
cultured barley materials.
Materials and Methods
Plant Material and DNA Isolation
Barley (Hordeum vulgare cv. Golden Promise) seeds were surface-sterilized with
commercial bleach for 20 min and rinsed three times with sterile dH2O for 10 min.
After sterilization, mature embryos were removed from seeds and dipped into absolute
ethanol for 30 s. Ethanol was removed and embryos were rinsed three times with sterile
dH2O for 1 min and dried on sterile filter papers. Each embryo was given a number and
Biochem Genet
123

cultured on MS medium (Murashige and Skoog 1962) of 3% sucrose and 0.9% agar (pH
5.7), supplemented with 4 mg/L dicamba, and was maintained on the same medium for
45 days. At the end of 45 days of cultivation time, each callus was cut into three pieces
and each piece was numbered with the starting embryo’s number. One of the callus
pieces was used for genomic DNA isolation, the second for shoot regeneration in MS
medium supplemented with 0.5 mg/L zeatin, and the third was subcultured under the
same callus culture conditions for another 45 days. At the end of the second 45 days,
each callus was cut into two pieces and numbered. One of the pieces was used for shoot
regeneration and the other for DNA isolation. At the end of the tissue culture, we
obtained four experimental plant materials (45- and 90-day-old calli and their
regenerated shoots) from one embryo; these were considered a single group. IRAP was
performed with three different groups. Genomic DNA was isolated from those three
groups and three control groups using Tri Reagent (Sigma T9424) according to the
manufacturer’s instructions. The control groups consisted of noncultured mature
embryos that were kept in water for 16 h (first control), the leaf of a seedling germinated
between filter papers (second control), and the leaf of a seedling germinated in MS0
medium (third control).
IRAP
IRAP was performed with forward and reverse primers designed for LTR sequences
of BAGY2 retrotransposon (Table 1, Primers 1 and 2). Amplification was carried out
in a 20 lL reaction volume containing 3.5 lL nuclease-free dH2O, 0.5 lL dNTP
mixture (10 mM), 2 lL of each primer (10 nmol/lL), 2 lL template genomic DNA
(10 ng/lL), and 10 lL 29 Sapphire enzyme mix. PCR conditions were an initial
denaturation step at 94�C for 3 min; followed by 30 cycles at 94�C for 20 s, 52�C
for 20 s, and 72�C for 2 min; and a final extension step at 72�C for 10 min.
Evaluation of PCR Products
A 10 lL aliquot of IRAP PCR product was separated on 8% nondenaturing
polyacrylamide (29:1 Ac:Bis) gel at 200 V for 4 h in 19 TBE buffer. A molecular
weight marker (Fermentas, SM0321) was also loaded to determine the size of
amplicons. Gel was stained in 39 GelRed solution (Biotium, 41003) for 30 min.
Well-resolved bands were evaluated as present (1) or absent (0). The binary matrix
(1/0) was used to calculate the similarity by Jaccard’s coefficient (Jaccard 1908)
among samples (controls, 45- and 90-day-old calli, and their regenerated shoots).
Sequence Analysis of BAGY2 Domains
BAGY2 internal domains for GAG, protease (PR), reverse transcriptase (RT),
RNaseH (RH), integrase (INT), and envelope (ENV) were amplified using specific
primers for each domain. The reference sequence was obtained from NCBI
(accession no. AF254799.1). Primers were designed by IDT PrimerQuest (Table 1,
Primers 3–14). BAGY2 internal domains were amplified from genomic DNA of
embryos by Phusion High-Fidelity DNA Polymerase (Thermo, F-530S). PCR was
Biochem Genet
123

performed in a total volume of 20 lL, containing 11.3 lL nuclease-free dH2O, 4 lL
59 buffer (with 7.5 mM MgCl2), 0.5 lL dNTP mixture (10 mM), 1 lL of each
primer (10 nmol/lL), 2 lL template genomic DNA (10 ng/lL), and 0.2 lL Phusion
DNA polymerase. PCR conditions were initial denaturation at 98�C for 30 s;
followed by 30 cycles of denaturation at 98�C for 10 s, annealing at 53�C for 20 s,
and extension at 72�C for 20 s; and completion with an additional extension at 72�C
for 5 min. PCR products were resolved on 1% agarose gel in 19 TAE buffer at
70 V for 40 min. Expected bands were purified from agarose gel with a DNA
extraction kit (Roche, 11696505001). Extracted fragments were ligated into
pJET1.2/blunt cloning vector (Fermentas, K1231) and transformed to JM-107
Escherichia coli cell line according to the manufacturer’s instructions. Then, colony
PCR was performed to detect recombinant colonies. Recombinant colonies for each
domain were cultured in LB broth (containing 100 lg/mL ampicillin) at 37�C for
Table 1 Primer sequences used in this study
No Name Direction Sequence (50?30) Expected
band size
Purpose
1a BAGY2/
E0521
Forward TCGAAAGGTCTATGATTGATCCC Variable IRAP
2a BAGY2/
E0520
Reverse CATGAAAGCATGATGCAAAATGG
3 GAG-F Forward GGATCATCACATCCAGACTTGCATC 925 bp Sequence
analysis4 GAG-R Reverse TAACATGCCCGTCTATGTCTTCGG
5b PR-F Forward GTGATATGGGTGCTAGTGTTAGTGC 261 bp Sequence
analysis6 PR-R Reverse TGACAGTGTTGAGAAAGGGTCTGC
7 RT-F Forward GGAAGCAGGAATCATTTATCCTGTTGCTCA 702 bp Sequence
analysis8 RT-R Reverse AGAAACCAGCATGACCTAGGAAAC
9 RH-F Forward TGCGGCGCTAGTGATTATGCTGTT 322 bp Sequence
analysis10 RH-R Reverse GGTTATCAGCACCCTTTCGGTCAA
11 INT-F Forward AAGCCTACAGAGGACACCATGCTA 960 bp Sequence
analysis12 INT-R Reverse CACCGGAACGATATACTTCCTCGACA
13a ENV-F Forward CCAAGGTCTATGGGACTTGGAACC 385 bp Sequence
analysis14a ENV-R Reverse CAAGGGGATTGCCCATACCAATGC
15 GAG2F Forward TCGGCTTTCTCATGAAGATCGTACC 100 bp qPCR
analysis16 GAG2R Reverse GATTCTTTCCAATAAATTCCACTTGTGGTC
17 PR-2R Reverse GCGTAATAGTGACATCAATGGGTTC 105 bp qPCR
analysis
18 RT-2F Forward CCGTTTACGGTTCTTCCTTTGACG 102 bp qPCR
analysis19 RT-2R Reverse AGTGGCACTTCTCCCAGTTCAGGA
20 RH-2F Forward GAAACTATGCCACTACGGAGAAGG 109 bp qPCR
analysis21 RH-2R Reverse GCAGCATGATCAGAGTGAATAATGACC
22 INT-2F Forward TGGCGGTTCACACTTCATTCATGG 108 bp qPCR
analysis23 INT-2R Reverse TCCACTTGACCACTAGACTGAGGA
a Primer sequence obtained from Vicient et al. (2001)b Primer used in sequence and qPCR analyses
Biochem Genet
123

18 h. Plasmids were isolated using a Qiagen Plasmid Mini Kit (Qiagen, 12125). The
plasmids were digested by BglII restriction enzyme (Fermentas, FD0083) and
sequenced. The sequences were compared with both nucleotide (Blastn) and amino
acid (tBlastn) sequences of BAGY2 domains at the NCBI web page by Blast. Amino
acid sequences of domains were obtained from GyDB (Gypsy DataBase).
Copy Number Analysis of BAGY2 Domains by qPCR
We employed qPCR to determine the copy number alterations of BAGY2 internal
domains during tissue culture. To form a standard curve, a plasmid series with copy
number from 105 to 109/lL was used. An additional qPCR with actin primers was
performed for confirmation of the equivalence of all DNA sample concentrations. The
qPCR was performed using Bio Rad CFX96. We designed qPCR primers using IDT
PrimerQuest (Table 1, Primers 5 and 15–23). The qPCR was performed in a total
volume of 10 lL containing 2.2 lL nuclease-free dH2O, 5 lL 29 EvaGreen Enzyme
Mix (Bio-Rad, 730001462), 0.4 lL of each primer (10 nmol/lL), and 2 lL template
genomic DNA (10 ng/lL). The qPCR conditions were an initial denaturation at 98�C
for 3 min; followed by 40 cycles of denaturation at 98�C for 5 s, annealing and
extension at 55�C for 5 s; and a melt curve step (from 65�C, gradually increasing
0.5�C/s, to 95�C, with acquisition data every 1 s).
To determine the statistical significance of copy number alterations, we classified
the tissue culture samples into seven groups (45-day-old calli, 90-day-old calli,
45-day-old shoots, 90-day-old shoots, and controls 1, 2, and 3) according to their
ages and types. Starting-quantity values of qPCR were evaluated using a one-way
ANOVA test to find out whether the copy number of each domain had a statistically
significant (p \ 0.05) alteration in different samples. Multiple comparison tests for
equal (Tukey) or unequal (Games Howell) variances were used to determine which
groups have significant copy number alterations.
Results and Discussion
IRAP Results
In the current study, BAGY2 retrotransposon movements were investigated in 45-
and 90-day-old calli and their regenerants. All four plant materials originating from
the same embryo were grouped. IRAP-PCR was performed with three groups to
determine whether there are any different polymorphisms between samples
originating from different embryos. Furthermore, we used three control groups
(four individuals of each) to compare polymorphism rates between calli and shoots.
After IRAP analysis of the first control group, we observed 41 bands under
1,000 bp, and all of these bands were monomorphic in the group (Fig. 1). This
result may indicate that there are not any natural polymorphisms between individual
embryos regarding BAGY2 transposition. Despite their mutagenic feature, it might
be said that retrotransposons have an excellent mechanism for conservation of their
transposition between individuals of the same species. The band patterns of the
Biochem Genet
123

second and third control groups were also monomorphic, but they differed from the
first control group in that we observed two novel bands and one missing band
(Fig. 1). The polymorphism rate was calculated at 7% between control groups by
Jaccard’s coefficient.
IRAP band patterns of each callus and regenerated shoot were different from both
control groups and other calli and shoots (Fig. 2). We calculated the polymorphism
rate by comparing each sample with other samples and controls and found it to be
0–21% (Table 2). These polymorphism rates between control groups and tissue
culture samples (calli and shoots) clearly show that culturing conditions and time
have an effect on BAGY2 movements. Further, different polymorphism percentages
between all samples indicated that tissue culture might not have the same effect on
the samples even if they originated from the same embryo. For example, the calli in
Fig. 2 cultured for 45 (lane 2) and 90 (lane 4) days have 12% polymorphism,
although they originated from the same embryo.
Leigh et al. (2003) reported that BARE1 is the most active and BAGY2 the second
most active retrotransposon in barley. In our previous studies, we also observed
polymorphisms of BARE1 and Nikita retrotransposons during tissue culture of
barley (Evrensel et al. 2011; Bayram et al. 2012; Temel and Gozukirmizi 2013), and
the polymorphism rates for BARE1 were calculated as 14–25% (Evrensel et al.
2011). In this study, the polymorphism percentages for BAGY2 were lower than for
Fig. 1 IRAP results for control groups. Lanes 1–4 (first control group) mature embryo, lanes 5–8 (secondcontrol group) leaf of seedlings germinated between filter papers, lanes 9–12 (third control group) leaf ofseedlings germinated on MS medium, NC PCR negative control. Arrow a novel bands in second and thirdcontrols, arrow b unique band in first control, arrow c novel bands in second and third controls
Biochem Genet
123

BARE1. These results are consistent with the barley retrotransposon activation
order.
Previously, some retrotransposons were shown to be activated by biotic and
abiotic stress (Grandbastien 1998; Hamad-Mecbur et al. 2014). Tissue culture
conditions can also be accepted as a stress factor. Copy number alterations of
tobacco Tto1 (Hirochika 1993) and rice Tos17 (Hirochika et al. 1996) elements were
shown during the tissue culture process. Somaclonal variations induced by
retrotransposons have been studied for the last few years (Evrensel et al. 2011;
Bayram et al. 2012). Campbell et al. (2011) used the IRAP technique to detect
somaclonal variation in barley tissue cultures; they stated that retrotransposon-based
marker systems, such as IRAP, are valuable tools for the characterization of
mutations that arise during tissue culture. Tissue culture conditions, however, did
not show the same effect in every individual, leading to variable polymorphism
rates. Therefore, determination of general aspects of retrotransposon-induced
somaclonal variations and the prediction of average polymorphism rates are
challenging. Hence, these results show that differences in both tissue culture
conditions and culturing time alter retrotransposon movements.
Fig. 2 IRAP results for callus and shoot tissue culture materials. Lane 1 first control. In lanes 2–5 (group1), lanes 6–9 (group 2), and lanes 10–13 (group 3), even-numbered lanes are barley callus and odd-numbered lanes are regenerated shoot. Tissues in lanes 2, 3, 6, 7, 10, and 11 were cultured 45 days.Tissues in lanes 4, 5, 8, 9, 12, and 13 were cultured 90 days. Arrowheads indicate polymorphic bands
Biochem Genet
123

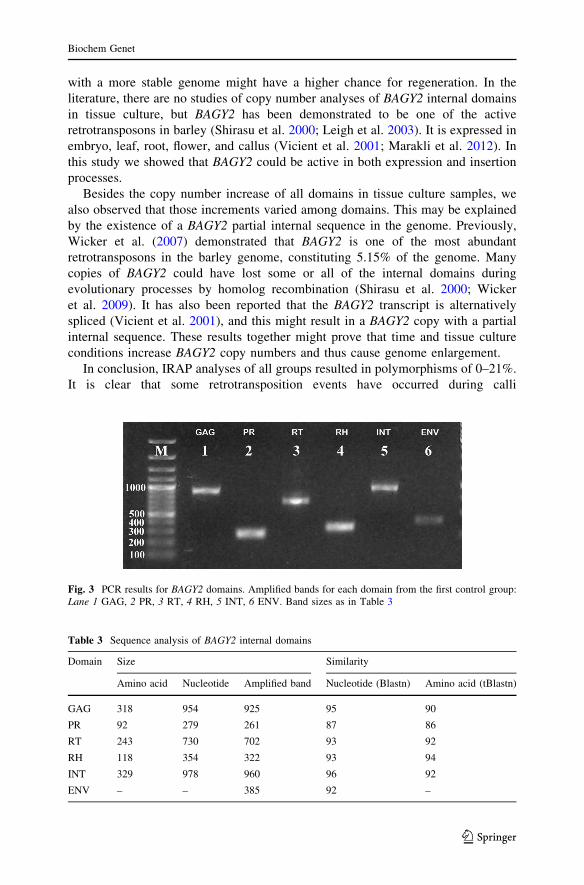
Sequence Analysis of BAGY2 Domains
In addition to the IRAP analyses, we also amplified the internal domains of BAGY2
from both control groups and tissue culture samples. We designed specific primers
for the GAG, PR, RT, RH, and INT domains of the BAGY2 sequence (NCBI
accession no. AF254799.1). Primer sequences for the ENV domain were obtained
from Vicient et al. (2001). All the internal domains were amplified from both
control and tissue culture samples (Fig. 3). Further, we cloned and sequenced all the
domains from the first control sample (mature embryo). The comparisons with Blast
sequences (Table 3) show high degrees of nucleotide (87–95%) and amino acid
(86–94%) sequence similarity.
Copy Number Analysis of BAGY2 Domains by qPCR
In order to determine copy number alterations of the BAGY2 internal domains we
performed qPCR with specific primers (Table 1, Primers 5 and 15–23). The qPCR
results of actin primers showed that all reactions have nearly the same starting
quantities, and the ANOVA test (p [ 0.05) indicated that all DNA samples have
equal concentrations. The starting-quantity values of the BAGY2 internal domains
were variable, however, some samples had statistically significant copy number
increments and others did not (Table 4). Especially in calli samples, copy numbers
of all domains were found to be dramatically increased. This might be caused by the
unstable nature of the cell genome in calli culture. On the other hand, in shoots, the
copy numbers of domains were found to be lower than in calli, indicating that cells
Table 2 Polymorphism percentage of calli and regenerated shoots
Group Group 1 Group 2 Group 3
Culture 45 days 90 days 45 days 90 days 45 days 90 days
Tissue BC RS BC RS BC RS BC RS BC RS BC RS
First control 5 5 14 5 14 10 12 2 7 7 7 10
1 45 BC – 0 12 13 10 7 7 5 5 7 5 7
RS – 12 15 8 8 0 0 3 0 0 3
90 BC – 18 8 11 17 13 15 15 15 15
RS – 21 15 15 20 17 15 9 12
2 45 BC – 6 19 20 14 9 6 15
RS – 12 17 14 12 9 12
90 BC – 0 5 0 0 16
RS – 3 0 0 5
3 45 BC – 3 3 13
RS – 0 8
90 BC – 8
BC barley callus, RS regenerated shoot from the callus
Biochem Genet
123
with a more stable genome might have a higher chance for regeneration. In the
literature, there are no studies of copy number analyses of BAGY2 internal domains
in tissue culture, but BAGY2 has been demonstrated to be one of the active
retrotransposons in barley (Shirasu et al. 2000; Leigh et al. 2003). It is expressed in
embryo, leaf, root, flower, and callus (Vicient et al. 2001; Marakli et al. 2012). In
this study we showed that BAGY2 could be active in both expression and insertion
processes.
Besides the copy number increase of all domains in tissue culture samples, we
also observed that those increments varied among domains. This may be explained
by the existence of a BAGY2 partial internal sequence in the genome. Previously,
Wicker et al. (2007) demonstrated that BAGY2 is one of the most abundant
retrotransposons in the barley genome, constituting 5.15% of the genome. Many
copies of BAGY2 could have lost some or all of the internal domains during
evolutionary processes by homolog recombination (Shirasu et al. 2000; Wicker
et al. 2009). It has also been reported that the BAGY2 transcript is alternatively
spliced (Vicient et al. 2001), and this might result in a BAGY2 copy with a partial
internal sequence. These results together might prove that time and tissue culture
conditions increase BAGY2 copy numbers and thus cause genome enlargement.
In conclusion, IRAP analyses of all groups resulted in polymorphisms of 0–21%.
It is clear that some retrotransposition events have occurred during calli
Fig. 3 PCR results for BAGY2 domains. Amplified bands for each domain from the first control group:Lane 1 GAG, 2 PR, 3 RT, 4 RH, 5 INT, 6 ENV. Band sizes as in Table 3
Table 3 Sequence analysis of BAGY2 internal domains
Domain Size Similarity
Amino acid Nucleotide Amplified band Nucleotide (Blastn) Amino acid (tBlastn)
GAG 318 954 925 95 90
PR 92 279 261 87 86
RT 243 730 702 93 92
RH 118 354 322 93 94
INT 329 978 960 96 92
ENV – – 385 92 –
Biochem Genet
123

Ta
ble
4M
ult
iple
com
par
iso
nte
sts
(Tu
key
and
Gam
esH
ow
ell)
Cal
lus
90
day
sS
hoo
t4
5d
ays
Sh
oo
t9
0d
ays
GA
GP
RR
TR
HIN
TG
AG
PR
RT
RH
INT
GA
GP
RR
TR
HIN
T
Cal
lus
45
day
s0
.847
*0
.468
*0
.777
*0
.64
8*
0.8
60
*0
.001
0.0
25
0.0
79
*0
.995
*0
.001
0.0
01
0.0
90
*0
.046
0.5
62
*0
.00
1
Cal
lus
90
day
s0
.001
0.2
68
*0
.730
*0
.308
*0
.001
0.0
01
0.9
00
*0
.769
*0
.038
0.0
01
Sh
oo
t4
5d
ays
0.9
22
*0
.27
9*
0.9
99
*0
.889
*0
.91
8*
Con
tro
l1
Con
tro
l2
Con
tro
l3
GA
GP
RR
TR
HIN
TG
AG
PR
RT
RH
INT
GA
GP
RR
TR
HIN
T
Cal
lus
45
day
s0
.00
10
.03
20
.134
*0
.00
10
.001
0.0
01
0.0
19
0.0
13
0.0
01
0.0
01
0.0
01
0.0
28
0.1
04
*0
.001
0.0
01
Cal
lus
90
day
s0
.00
10
.14
2*
0.9
61
*0
.00
10
.001
0.0
01
0.0
68
*0
.123
*0
.001
0.0
01
0.0
01
0.1
47
*0
.91
2*
0.0
01
0.0
01
Sh
oo
t4
5d
ays
0.0
01
0.1
69
*0
.700
*0
.00
10
.022
0.0
01
0.0
30
0.0
92
*0
.001
0.0
16
0.0
01
0.1
88
*0
.83
8*
0.0
01
0.0
21
Sh
oo
t9
0d
ays
0.0
01
0.1
01
*0
.498
*0
.00
10
.137
*0
.00
10
.039
0.0
14
0.0
01
0.0
96
*0
.00
10
.100
*0
.75
3*
0.0
01
0.1
43
*
Con
tro
l1
0.0
01
0.0
01
0.0
01
0.0
01
0.0
01
0.9
97
*0
.923
*0
.58
2*
0.9
73
*0
.62
8*
Con
tro
l2
0.0
01
0.0
01
0.0
01
0.0
01
0.0
01
*p
[0.0
5(n
ot
stat
isti
call
ysi
gnifi
cant)
Biochem Genet
123

development and shoot regeneration. In addition, qPCR analyses proved that copy
numbers of BAGY2 internal domains increase during tissue culture. Our results are
the first data on BAGY2 movement alterations in cultured material and qPCR
analyses of internal domains.
Acknowledgments This study was supported by the Research Fund of Istanbul University (Project Nos.
17704 and 5501).
References
Bayram E, Yilmaz S, Hamad-Mecbur H, Kartal G, Gozukirmizi N (2012) Nikita retrotransposon
movements in barley (Hordeum vulgare L.) callus culture. Plant Omics 5:211–215
Campbell BC, LeMare S, Piperidis G, Godwin ID (2011) IRAP, a retrotransposon-based marker system
for the detection of somaclonal variation in barley. Mol Breed 27:193–206
Evrensel C, Yılmaz S, Temel A, Gozukirmizi N (2011) Variations in BARE-1 insertion patterns in barley
callus cultures. Genet Molec Res 10:980–987
Grandbastien ML (1998) Activation of plant retrotransposons under stress conditions. Trends Plant Sci
3:181–187
Grzebelus D (2006) Transposon insertion polymorphism as a new source of molecular markers. J Fruit
Ornam Plant Res 14:21–29
Guliyev M, Yilmaz S, Sahin K, Marakli S, Gozukirmizi N (2013) Human endogenous retrovirus H
insertion screening. Mol Med Rep 7(4):1305–1309
Guo D, Zhang H, Luo Z (2006) Genetic relationships of Diospyros kaki Thunb. and related species
revealed by IRAP and REMAP analysis. Plant Sci 170:528–533
Hamad-Mecbur H, Yilmaz S, Temel A, Sahin K, Gozukirmizi N (2014) Effects of epirubicin on barley
seedlings. Toxicol Ind Health 30:52–59
Hirochika H (1993) Activation of tobacco retrotransposons during tissue culture. EMBO J 12:2521–2528
Hirochika H, Sugimoto K, Otsuki Y, Tsugawa H, Kanda M (1996) Retrotransposons of rice involved in
mutations induced by tissue culture. Proc Natl Acad Sci USA 93:7783–7788
Jaccard P (1908) Nouvelles recherches sur la distribution florale. Bul Soc Vaudoise Sci Nat 44:223–270
Kaeppler SM, Kaeppler HF, Rhee Y (2000) Epigenetic aspects of somaclonal variation in plants. Plant
Mol Biol 43:179–188
Kalendar R, Grob T, Regina M, Suoniemi A, Schulman A (1999) IRAP and REMAP: two new
retrotransposon-based DNA fingerprinting techniques. Theor Appl Genet 98:704–711
Kumar A, Bennetzen JL (1999) Plant retrotransposons. Annu Rev Genet 33:479–532
Larkin PJ, Scowcroft WR (1981) Somaclonal variation: a novel source of variability from cell cultures for
plant improvement. Theor Appl Genet 6:197–214
Leigh F, Kalendar R, Lea V, Lee D, Donini P, Schulman AH (2003) Comparison of the utility of barley
retrotransposon families for genetic analysis by molecular marker techniques. Mol Gen Genomics
269:464–474
Manninen O, Kalendar R, Robinson J, Schulman AH (2000) Application of BARE-1 retrotransposon
markers to the mapping of a major resistance gene for net blotch in barley. Mol Gen Genet
264:325–334
Marakli S, Yilmaz S, Gozukirmizi N (2012) BARE1 and BAGY2 retrotransposon movements and
expression analyses in developing barley seedlings. Biotech Biotechnol Equip 26(6):3451–3456
Muhammad AJ, Othman RY (2005) Characterization of fusarium wilt-resistant and fusarium wilt-
susceptible somaclones of banana cultivar Rastali (Musa AAB) by random amplified polymorphic
DNA and retrotransposon markers. Plant Mol Biol Rep 23:241–249
Murashige T, Skoog F (1962) A revised medium for rapid growth and bioassays with tobacco tissue
cultures. Physiol Plant 15:473–479
Sabot F, Schulman AH (2006) Parasitism and the retrotransposon life cycle in plants: a hitchhiker’s guide
to the genome. Heredity 97:381–388
Schulman AH, Kalendar R (2005) A movable feast: diverse retrotransposons and their contribution to
barley genome dynamics. Cytogenet Genome Res 110:598–605
Biochem Genet
123

Shirasu K, Schulman AH, Lahaye T, Schulze-Lefert P (2000) A contiguous 66 kb barley DNA sequence
provides evidence for reversible genome expansion. Genome Res 10:908–915
Temel A, Gozukirmizi N (2013) Analysis of retrotransposition and DNA methylation in barley callus
culture. Acta Biol Hung 64:86–95
Vicient CM, Kalendar R, Schulman AH (2001) Envelope-class retrovirus-like elements are widespread,
transcribed and spliced, and insertionally polymorphic in plants. Genome Res 11:2041–2049
Wicker T, Sabot F, Hua-Van A, Bennetzen JL, Capy P, Chalhoub B, Flavell A, Leroy P, Morgante M,
Panaund O, Paux E, Sanmiguel P, Schulman AH (2007) A unified classified classification system for
eukaryotic transposable elements. Nature Rev Genet 8:973–982
Wicker T, Taudien S, Houben A, Keller B, Graner A, Platzer M, Stein N (2009) A whole-genome
snapshot of 454 sequences exposes the composition of the barley genome and provides evidence for
parallel evolution of genome size in wheat and barley. Plant J 59:712–722
Biochem Genet
123


