Embed Size (px)
Citation preview
Introduction
The analysis of genetic diversity and relatednessamong different individuals, species or popula-tions is the central topic in genetics. Marker tech-nology, based on polymorphism, started fromanalysis of seed storage proteins and isozymes.These markers have been superseded byDNA-based methods that generate fingerprints,i.e. distinctive patterns of DNA fragments(Weissing et al. 2005). In addition to estimationof the genetic uniqueness of each accession, rela-tive to others, the redundant germplasm is re-moved in order to increase the efficiency ofresource management. Passport data are often notfully reliable, so traditional morphological or bio-chemical characterizations are restricted due tolimited variation and influence of the environ-ment. Even though not currently implemented andlegally recognized by UPOV (The International
Union for the Protection of New Varietiesof Plants), molecular markers are being used assupplementary descriptors (UPOV 2002).
Since in a majority of cultivated crops no orvery limited genome sequence information isavailable, the RAPD (randomly amplified poly-morphic DNA) method introduced by Williamset al. (1990) has become widely used and popular.Nowadays, microsatellites (tandem repeats ofshort DNA motifs) are frequently used. The ini-tially used ISSR (inter-simple sequence repeatspolymorphism, Zietkiewicz et al. 1994) a broadlyapplicable but error-prone technique was gradu-ally substituted by locus-specific, robust andco-dominant SSR (simple sequence repeats,Morgante and Olivieri 1993). Both RAPD andISSR techniques were applied to pea, but lowpolymorphism was obtained (Samec et al. 1998;Simioniuc et al. 2002). In 1995, a universal AFLP(amplified length fragment polymorphism) tech-nique was invented and since then it has been
J Appl Genetic 47(3), 2006, pp. 221–230
Development of an efficient retrotransposon-based fingerprinting
method for rapid pea variety identification
Petr Smýkal
AGRITEC Plant Research Ltd., Plant Biotechnology Department, Šumperk, Czech Republic
Abstract. Fast and efficient DNA fingerprinting of crop cultivars and individuals is frequently used in both theo-retical population genetics and in practical breeding. Numerous DNA marker technologies exist and the ratioof speed, cost and accuracy are of importance. Therefore even in species where highly accurate and polymorphicmarker systems are available, such as microsatellite SSR (simple sequence repeats), also alternative methods maybe of interest. Thanks to their high abundance and ubiquity, temporary mobile retrotransposable elements comeinto recent focus. Their properties, such as genome wide distribution and well-defined origin of individual inser-tions by descent, predetermine them for use as molecular markers. In this study, several Ty3-gypsy typeretrotransposons have been developed and adopted for the inter-retrotransposon amplified polymorphism (IRAP)method, which is suitable for fast and efficient pea cultivar fingerprinting. The method can easily distinguish evenbetween genetically closely related pea cultivars and provide high polymorphic information content (PIC)in a single PCR analysis.
Key words: fingerprinting, IRAP, pea, polymorphism, retrotransposon.
Received: April 7, 2006. Accepted: June 20, 2006.Correspondence: P. Smýkal, AGRITEC Plant Research Ltd., Plant Biotechnology Department, Zemìdìlská 2520/16,CZ-787 01 Šumperk, Czech Republic; e-mail: [email protected]
widely used (Vos et al. 1995). This method workson any organism without any knowledgeof genomic sequences, but it is prone to contami-nation sensitivity and is labour intensive. Majordrawbacks of AFLP, RAPD and ISSR are due tounspecific primers, producing multilocus bandingpatterns of dominantly inherited markers. Subse-quently, abundant repeat motives formingmicrosatellites were isolated with flankinggenomic DNA regions, leading to design of lo-cus-specific and robust SSR (simple sequence re-peats) markers, also for pea (Burstin et al. 2001;Ford et al. 2002; Loridon et al. 2005). Integrationof several available marker systems for peagermplasm evaluation was used by Baranger et al.(2004) and Tar´an et al. (2004). The great advan-tage of microsatellite analysis is the accuracy, highpolymorphism, multiallelism, genome coverage,and co-dominance (Becher et al. 2000).Microsatellites are commonly used for genomemapping, estimation of genetic diversity, genetagging, and marker-assisted selection (McCouchet al. 1997). Therefore, the working group on bio-chemical and molecular techniques of UPOV hasidentified SSR markers as the most widely usedmarker system for plant variety characterization(UPOV, 2002).
Yet another marker system has emerged duringthe last few years, when it become evident that an-other class of highly abundant sequences domi-nate in genomes. Retrotransposons (RTNs),together with transposons, represent a ubiquitousclass of repetitive elements in all eukaryoticgenomes. They can constitute a majority of the ge-nome, e.g. in grasses making up to 60–90%(Kumar and Bennetzen 1999). Both their ubiqui-tous nature and activity in creating genomic diver-sity (Kazazian 2004) by integrating stable DNAfragments into dispersed chromosomal loci makethese elements ideal for use as molecular markers(Kumar and Hirochika 2001). Unlike transposons,the retrotransposons do not excise, but are tran-scribed and by reverse transcription inserted intoDNA as copies of the mother element.Retrotransposons are divided into 2 separategroups (Kumar and Bennetzen 1999): those con-taining long terminal repeats (LTRs) and thoselacking LTRs. Retrotransposons share many simi-larities with the retroviruses, both in their organi-zation and the encoded gene products. LTRelements are further divided into 2 major groups:Ty1-copia and Ty3-gypsy types, on the basis of or-ganisation of their coding domains. Any given ele-ment insertion site, which was shared between
accessions, was likely to occur in a common an-cestor, which retrotransposon markers currentlythe most informative for phylogenetic and pedi-gree studies (Batzer and Deininger 2002;Shedlock and Okada 2000). The developedretrotransposon-based marker methods rely on theprinciple that a joint between retrotransposon andgenomic DNA is formed during the integrationprocess. These joints can be detected by PCR am-plification between a primer corresponding to theretrotransposon and a primer matching a nearbymotif in the genome (Schulman et al. 2004).The SSAP (sequence-specific amplified polymor-phism) method derives from AFLP (Waugh et al.1997). In IRAP (inter-retrotransposon amplifiedpolymorphism), segments between 2 nearby ele-ments are amplified (Kalendar et al. 1999).Retrotransposon-based insertional polymorphism(RBIP) provides a locus-specific co-dominantmarker system, suitable for high-throughput anal-ysis (Flavell et al. 1998, 2003; Jing et al. 2005).The SSAP is now used in numerous species whereterminal LTR sequences can be effectively cloned(Pierce et al. 1998; Schulman et al. 2004). How-ever, proper use of the SSAP technique requireseither radioactivity or fluorescent labellingof primers and product detection. Both these draw-backs could be overcome by the IRAP method.
In garden pea (Pisum sativum L.), a large bodyof information on various retrotransposons exists.Special attention was paid to the PDR-1 element,a representative of the Ty1-copia class (Ellis et al.1998). This low-copy element was successfullyused in numerous studies of pea phylogeny (Elliset al. 1998; Pearce et al. 2000; ). Lately, PDR-1 in-dividual insertion loci were sequence- character-ized, some positionally mapped and convertedinto high-throughput RBIP markers ready ina DNA chip format (Flavell et al. 2003; Jing et al.2005). However, these applications require manyPCR analyses to gain sufficient information con-tent.
The objective of the present study was to dem-onstrate the development and usefulness of a rela-tively simple IRAP protocol for efficient DNAfingerprinting in pea. The study focused on an-other group of retrotransposons, Ty3-gypsy types,which are far more abundant, being represented bythousands of copies and making up to 10–30%of the pea genome (Neumann et al. 2001). Our re-search team has so far investigated Ogre
(Neumann et al. 2003), Cyclop (Chavanne et al.1998), Pigy (Neumann et al. 2003), PisTR-A
(Neumann et al. 2001) and a miniature in-
222 P. Sm�kal
verted-repeat transposable element, i.e. MITE(Macas et al. 2005) for use in IRAP format suit-able for fast and efficient pea genotype finger-printing.
Materials and methods
Plant material and DNA isolation
Leaves from 33 currently grown commercial peacultivars registered in the Czech Republic (Ta-ble 1) were taken from greenhouse-grown plants.Genomic DNA was isolated according to a modi-fied CTAB protocol (Doyle and Doyle 1987). Ap-proximately 100 mg of leaves were manuallyhomogenised with a pestle in 500 �L of CTAB ex-traction buffer (100 mM Tris-HCl pH 8.0, 1.4MNaCl, 20 mM EDTA, 2% CTAB, 1% PVP MW360 000, 0.4% mercaptoethanol added prior touse) with addition of quartz sand, incubated at65oC for at least 60 min with occasional mixing.Subsequently 500 �L of chloroform was added,vigorously vortexed and centrifuged for 15 minat 13 000 g. Upper aqueous phase was transferredinto a new tube, supplemented with 0.5 × volume
of 5M NaCl and 1× volume of iso-propanoland left at –20oC for at least 60 min. Then the sam-ple was centrifuged for 30 min at 13 000 g, the pel-let was washed with 75% ethanol and left to dry.Finally the pellet was resuspended in 400 �L ofTE buffer containing 2 �L RNaseA (10 mg mL–1)(Sigma, USA), left for at least 30 min at room tem-perature, extracted with chloroform, precipitated,and stored at 4oC for a short time or at –20oC. Op-tionally, genomic DNA was isolated by thesalt-acidic protocol (Guillemaut and Marechal-Drouard 1992) or commercially available kits,such as DNeasy Plant Mini Kit (Qiagen, Ger-many) and Invisorb Spin Plant Mini Kit (Invitek,Germany), according to manufacturers’ protocols.
IRAP analysis
Reverse (R) and forward (F) primers were de-signed to match close to the 5’ and 3’ termini ofLTR sequences of the following retrotransposons:for Ogre (Y299398), R 5´-GTG GGC TGG GCTTTA GTG AGA TGC TTT CC-3’ and F 5’-TCGCGA GAC CAT GTC TTT TCC CAG GTTTAC-3’; for Cyclop (J000640), R 5’-GCAAGGAAACGGAGTGAAAGATGC-3´ and F 5’-CGA
Inter-retrotransposon amplified polymorphism (IRAP) in pea cultivar fingerprinting 223
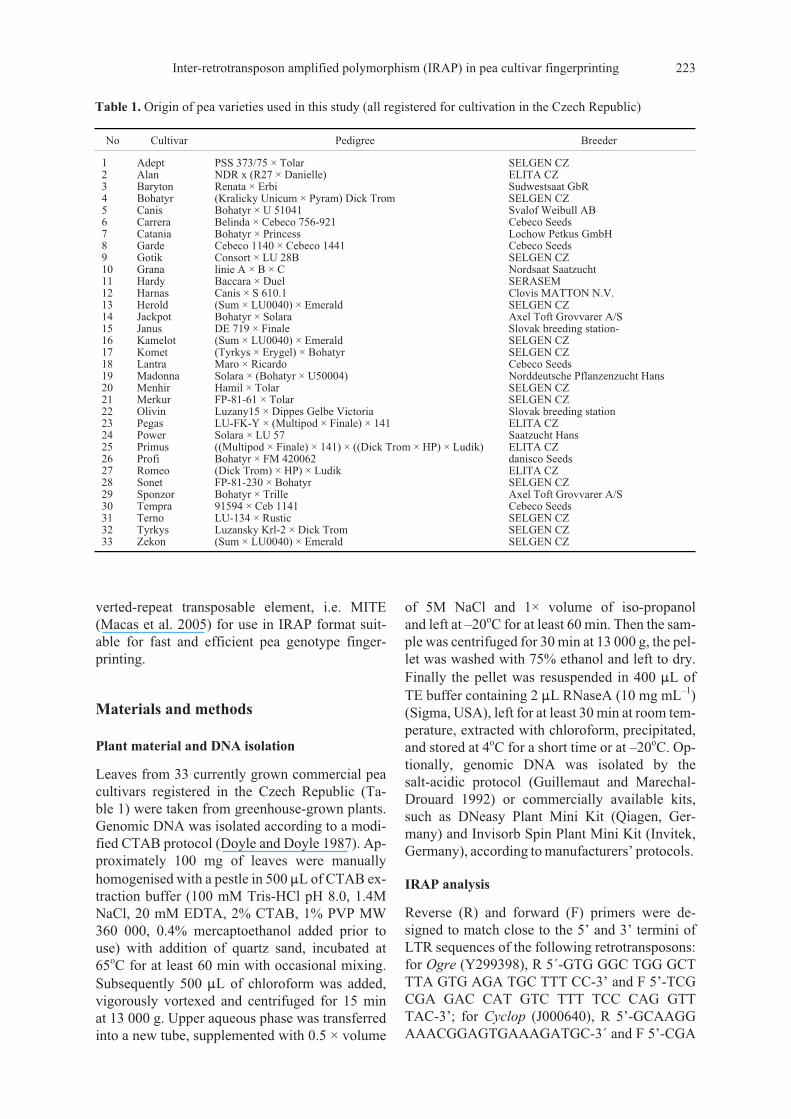
Table 1. Origin of pea varieties used in this study (all registered for cultivation in the Czech Republic)
No Cultivar Pedigree Breeder
123456789101112131415161718192021222324252627282930313233
AdeptAlanBarytonBohatyrCanisCarreraCataniaGardeGotikGranaHardyHarnasHeroldJackpotJanusKamelotKometLantraMadonnaMenhirMerkurOlivinPegasPowerPrimusProfiRomeoSonetSponzorTempraTernoTyrkysZekon
PSS 373/75 × TolarNDR x (R27 × Danielle)Renata × Erbi(Kralicky Unicum × Pyram) Dick TromBohatyr × U 51041Belinda × Cebeco 756-921Bohatyr × PrincessCebeco 1140 × Cebeco 1441Consort × LU 28Blinie A × B × CBaccara × DuelCanis × S 610.1(Sum × LU0040) × EmeraldBohatyr × SolaraDE 719 × Finale(Sum × LU0040) × Emerald(Tyrkys × Erygel) × BohatyrMaro × RicardoSolara × (Bohatyr × U50004)Hamil × TolarFP-81-61 × TolarLuzany15 × Dippes Gelbe VictoriaLU-FK-Y × (Multipod × Finale) × 141Solara × LU 57((Multipod × Finale) × 141) × ((Dick Trom × HP) × Ludik)Bohatyr × FM 420062(Dick Trom) × HP) × LudikFP-81-230 × BohatyrBohatyr × Trille91594 × Ceb 1141LU-134 × RusticLuzansky Krl-2 × Dick Trom(Sum × LU0040) × Emerald
SELGEN CZELITA CZSudwestsaat GbRSELGEN CZSvalof Weibull ABCebeco SeedsLochow Petkus GmbHCebeco SeedsSELGEN CZNordsaat SaatzuchtSERASEMClovis MATTON N.V.SELGEN CZAxel Toft Grovvarer A/SSlovak breeding station-SELGEN CZSELGEN CZCebeco SeedsNorddeutsche Pflanzenzucht HansSELGEN CZSELGEN CZSlovak breeding stationELITA CZSaatzucht HansELITA CZdanisco SeedsELITA CZSELGEN CZAxel Toft Grovvarer A/SCebeco SeedsSELGEN CZSELGEN CZSELGEN CZ
TAT CTC ACA ATC CCT GTG GAG AC-3’; forPigy (AY299398), R 5’-ATC ATC AAA GTATCA TCC GCC TTA GC-3’ and F 5’-ACG CTCGTC ACA TGC CCG TGG CGG TC-3’; forPisTR-A (AF300839), R 5’-ACA TCC TGA AGAGAG CGA AGG-3’ and F 5’-GTT ATG GATAAT CTT CCA TGC GAG G-3’; and for Stow-
away-MITE (AY833549), 5’-CTG TGA ATTTTT CCT TGC CTC CCT C-3’.
The IRAP protocol was developed by adapta-tion of an original method of Kalendar et al.(1999). PCR amplification was performed ina 20-�L reaction mixture containing: 20–50 ng ofDNA, 1 × PCR buffer (75 mM Tris-HCl, pH 9.0,50mM KCl, 20 mM (NH4)2SO4), 2.5 mM MgCl2,4 pmol of each primer, 100 �M dNTP, and 1 U ofTaq polymerase (BioTools, Spain). Amplificationwas performed in a Mastercycler (Eppendorf, Ger-many) in 0.2-mL tubes (TreffLab, Switzerland).After 4 min of initial denaturation at 94oC, ampli-fication was carried out in 35 cycles at 94oC for30 sec, 60oC for 30 sec and 72oC for 2.5 min, withfinal extension at 72oC for 10 min. Products wereresolved on 8% non-denaturing Tris-BoricAcid-EDTA polyacrylamide electrophoresis(TBE-PAGE) on Protean II gel electrophoresisunit (Bio-Rad, Germany) according to productsizes (from 100 bp to 1000 bp) at 30 mA per 25 cmProtean II gel for 2–3 h. Gels were subsequentlystained with ethidium bromide and visualized withUV. Alternatively, the products were resolved onhorizontal 1.5% agarose gel (Serva, Germany).
Band scoring and data evaluation
IRAP data were recorded from the PAGE gel byusing CrossChecker 2.91 software (Buntjer 1999)and visual inspection upon band size classificationand scoring in the binary code. Monomorphicbands were removed from the raw scored data sets.The sets that contained missing values were alsoexcluded at that stage. All DNA marker data wereprocessed by NTSYS-pc 2.1 software (Rohlf2000) by using a SIMQUAL module withthe Nei-Li 1979 coefficient, also known asthe Dice coefficient of similarity, S = 2nab/(na + nb),where na and nb represent the number of bands presentin lines a and b, and nab represents the number of sharedbands. Polymorphic information content (PIC) wascalculated for each marker by using a calculator(http://www.agri.huji.ac.il/~weller/Hayim/parent/PIC)based on the following formula:
PIC P P Pi i j� � � ���1 2 2 ,where Pi is the frequency of an individual geno-type.
Results and discussion
Selection of pea retrotransposons suitable
for the IRAP technique
IRAP principally relies on amplification of DNAfragments between retrotransposons that are suffi-ciently close to be amplified by Taq polymerase(Kalendar et al. 1999). Terminal LTRs unique toeach element are arranged as inverted repeats on
224 P. Sm�kal
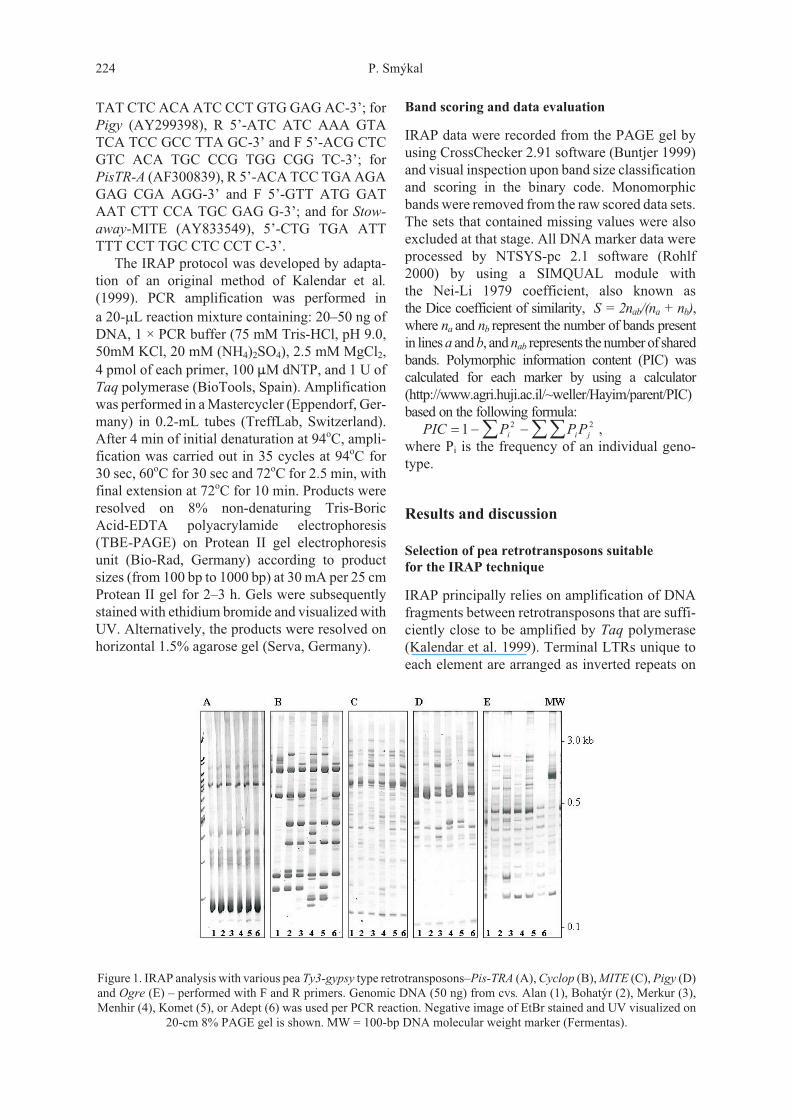
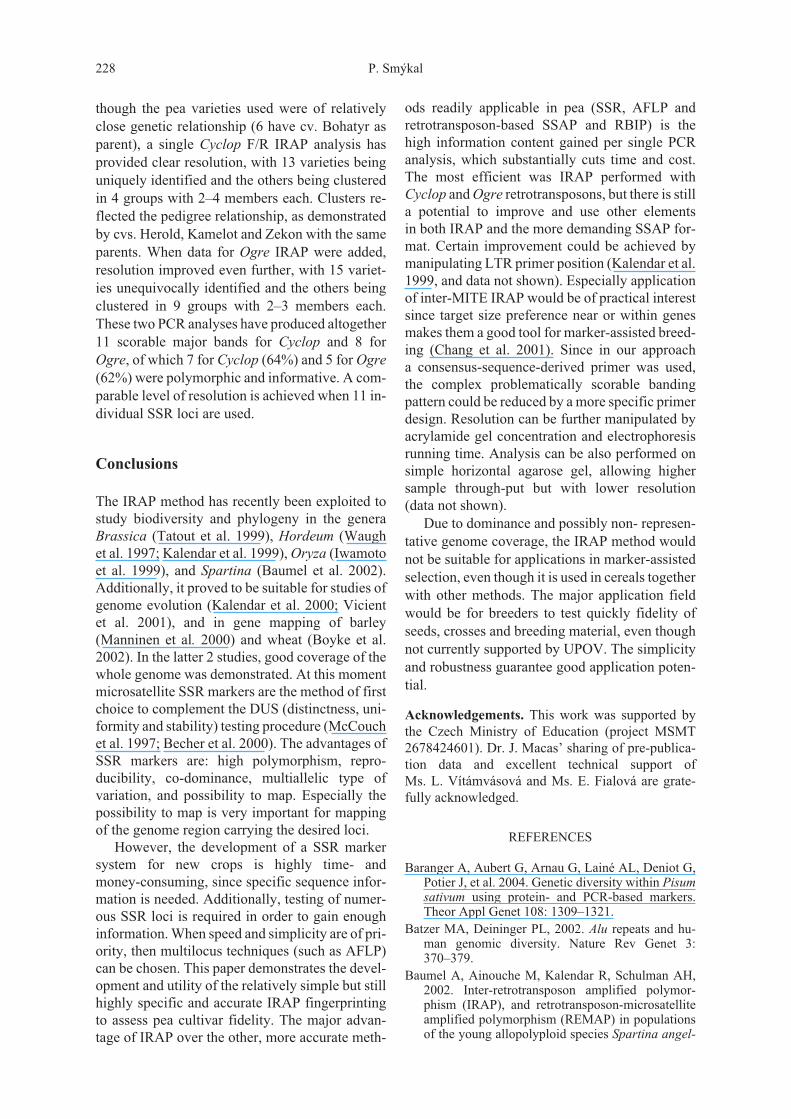
Figure 1. IRAP analysis with various pea Ty3-gypsy type retrotransposons–Pis-TRA (A), Cyclop (B), MITE (C), Pigy (D)and Ogre (E) – performed with F and R primers. Genomic DNA (50 ng) from cvs. Alan (1), Bohatýr (2), Merkur (3),Menhir (4), Komet (5), or Adept (6) was used per PCR reaction. Negative image of EtBr stained and UV visualized on
20-cm 8% PAGE gel is shown. MW = 100-bp DNA molecular weight marker (Fermentas).
both ends of a given element (Kumar andBennetzen 1999). Therefore, 2 outward-facingprimers can be designed. Theoretically, annealingof even a single outward-facing primer suffi-ciently close to an LTR end can be used. The IRAPmethod works due to frequent nested element in-sertions and a tendency of retrotransposons tocluster together. Five representatives of Ty3-gypsy
type retrotransposons and one MITE have been se-lected to design primers sufficiently close to bothends of unique LTR regions (within 50–150 bp)and next applied in F/R combinations on peagenomic DNA of 6 varieties. The primer anneal-ing temperature was set up sufficiently high(58oC) in all cases to minimize unspecific amplifi-cation. Analyses of Cyclop and Ogre elementsperformed with both F and R primers have pro-duced consistently the largest number of clearlyseparated DNA fragments (Figure 1). Dependingon pea accession tested, band number varied from10 to 21, of which a high number proved to bepolymorphic (average PIC from our set of 33 ac-cessions was 0.299 for Cyclop and 0.236 forOgre). Most information is gained when both Fand R primers are used, but additional DNA frag-ments can be amplified with single primers. Com-bination of Ogre and Cyclop primers (Ogre-FCyclop-F etc., 12 combinations in total) gavea pattern that was not simply additive (data notshown). Other elements (PisTR-A, Pigy) gave ei-ther only a small number (15) and/or poorly re-solved smearing bands (MITE, PisTR-A)(Figure 1). The low number of fragments indicatesthat there are fewer elements of the respectiveretrotransposon in the pea genome, and/or thatthey are too distantly spaced for efficient IRAP.Conversely, too numerous bands suggest the op-posite situation.
Optimization of the IRAP method
DNA concentration and isolation
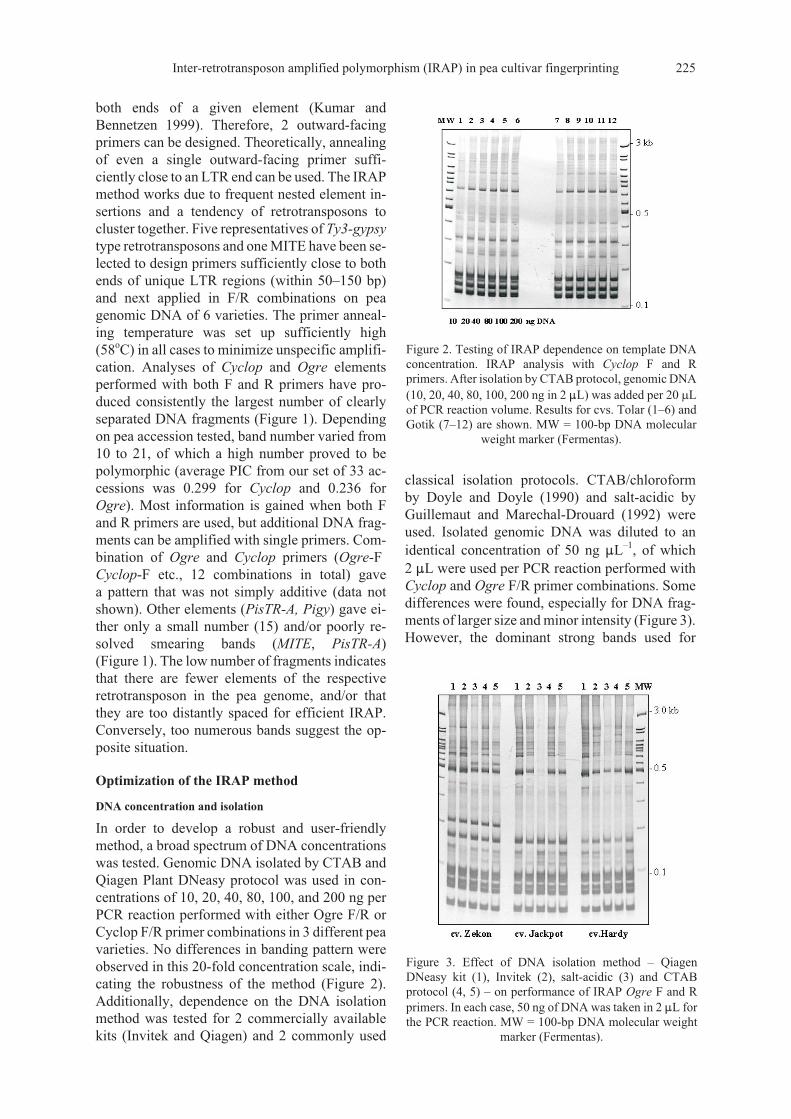
In order to develop a robust and user-friendlymethod, a broad spectrum of DNA concentrationswas tested. Genomic DNA isolated by CTAB andQiagen Plant DNeasy protocol was used in con-centrations of 10, 20, 40, 80, 100, and 200 ng perPCR reaction performed with either Ogre F/R orCyclop F/R primer combinations in 3 different peavarieties. No differences in banding pattern wereobserved in this 20-fold concentration scale, indi-cating the robustness of the method (Figure 2).Additionally, dependence on the DNA isolationmethod was tested for 2 commercially availablekits (Invitek and Qiagen) and 2 commonly used
classical isolation protocols. CTAB/chloroformby Doyle and Doyle (1990) and salt-acidic byGuillemaut and Marechal-Drouard (1992) wereused. Isolated genomic DNA was diluted to anidentical concentration of 50 ng �L–1, of which2 �L were used per PCR reaction performed withCyclop and Ogre F/R primer combinations. Somedifferences were found, especially for DNA frag-ments of larger size and minor intensity (Figure 3).However, the dominant strong bands used for
Inter-retrotransposon amplified polymorphism (IRAP) in pea cultivar fingerprinting 225
Figure 2. Testing of IRAP dependence on template DNAconcentration. IRAP analysis with Cyclop F and Rprimers. After isolation by CTAB protocol, genomic DNA(10, 20, 40, 80, 100, 200 ng in 2 �L) was added per 20 �Lof PCR reaction volume. Results for cvs. Tolar (1–6) andGotik (7–12) are shown. MW = 100-bp DNA molecular
weight marker (Fermentas).
Figure 3. Effect of DNA isolation method – QiagenDNeasy kit (1), Invitek (2), salt-acidic (3) and CTABprotocol (4, 5) – on performance of IRAP Ogre F and Rprimers. In each case, 50 ng of DNA was taken in 2 �L forthe PCR reaction. MW = 100-bp DNA molecular weight
marker (Fermentas).
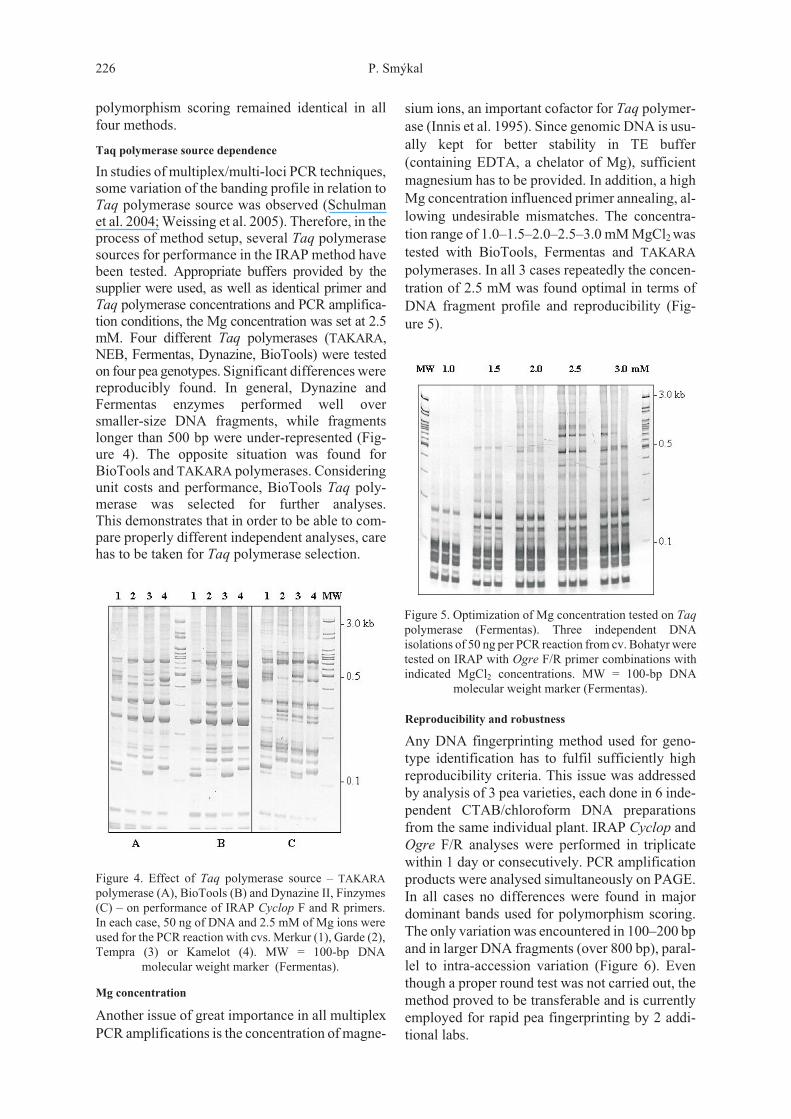
polymorphism scoring remained identical in allfour methods.
Taq polymerase source dependence
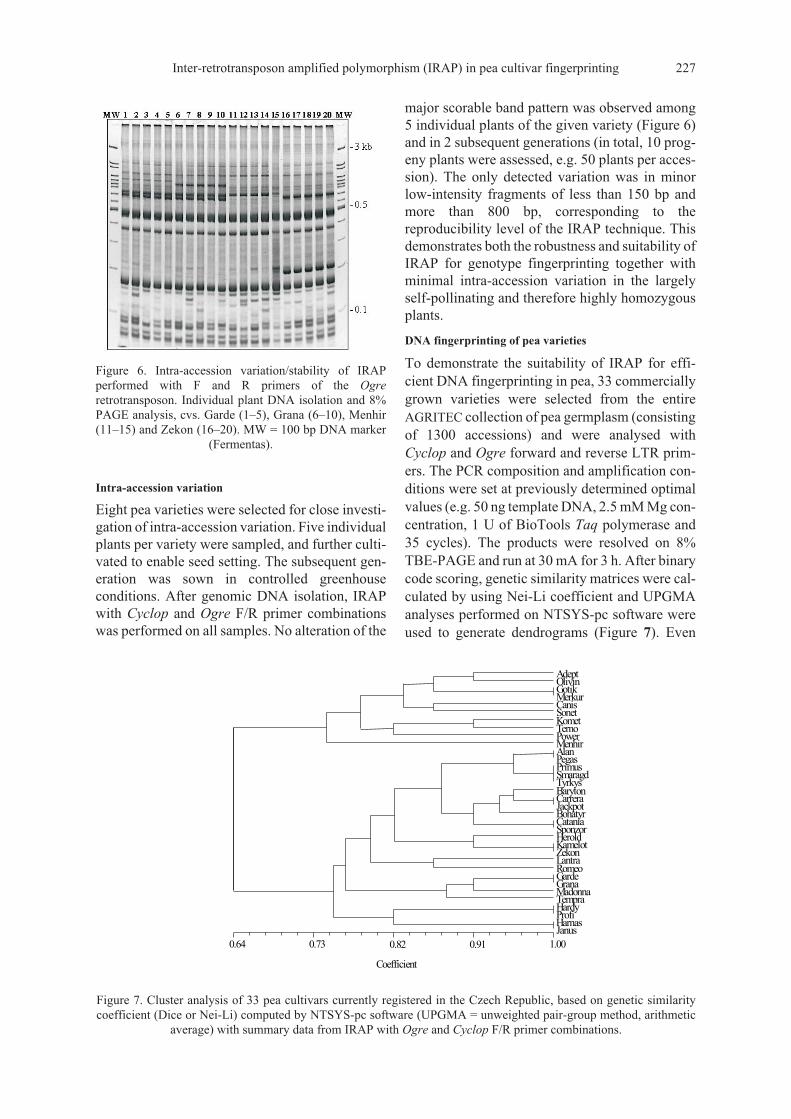
In studies of multiplex/multi-loci PCR techniques,some variation of the banding profile in relation toTaq polymerase source was observed (Schulmanet al. 2004; Weissing et al. 2005). Therefore, in theprocess of method setup, several Taq polymerasesources for performance in the IRAP method havebeen tested. Appropriate buffers provided by thesupplier were used, as well as identical primer andTaq polymerase concentrations and PCR amplifica-tion conditions, the Mg concentration was set at 2.5mM. Four different Taq polymerases (TAKARA,NEB, Fermentas, Dynazine, BioTools) were testedon four pea genotypes. Significant differences werereproducibly found. In general, Dynazine andFermentas enzymes performed well oversmaller-size DNA fragments, while fragmentslonger than 500 bp were under-represented (Fig-ure 4). The opposite situation was found forBioTools and TAKARA polymerases. Consideringunit costs and performance, BioTools Taq poly-merase was selected for further analyses.This demonstrates that in order to be able to com-pare properly different independent analyses, carehas to be taken for Taq polymerase selection.
Mg concentration
Another issue of great importance in all multiplexPCR amplifications is the concentration of magne-
sium ions, an important cofactor for Taq polymer-ase (Innis et al. 1995). Since genomic DNA is usu-ally kept for better stability in TE buffer(containing EDTA, a chelator of Mg), sufficientmagnesium has to be provided. In addition, a highMg concentration influenced primer annealing, al-lowing undesirable mismatches. The concentra-tion range of 1.0–1.5–2.0–2.5–3.0 mM MgCl2 wastested with BioTools, Fermentas and TAKARApolymerases. In all 3 cases repeatedly the concen-tration of 2.5 mM was found optimal in terms ofDNA fragment profile and reproducibility (Fig-ure 5).
Reproducibility and robustness
Any DNA fingerprinting method used for geno-type identification has to fulfil sufficiently highreproducibility criteria. This issue was addressedby analysis of 3 pea varieties, each done in 6 inde-pendent CTAB/chloroform DNA preparationsfrom the same individual plant. IRAP Cyclop andOgre F/R analyses were performed in triplicatewithin 1 day or consecutively. PCR amplificationproducts were analysed simultaneously on PAGE.In all cases no differences were found in majordominant bands used for polymorphism scoring.The only variation was encountered in 100–200 bpand in larger DNA fragments (over 800 bp), paral-lel to intra-accession variation (Figure 6). Eventhough a proper round test was not carried out, themethod proved to be transferable and is currentlyemployed for rapid pea fingerprinting by 2 addi-tional labs.
226 P. Sm�kal
Figure 4. Effect of Taq polymerase source – TAKARApolymerase (A), BioTools (B) and Dynazine II, Finzymes(C) – on performance of IRAP Cyclop F and R primers.In each case, 50 ng of DNA and 2.5 mM of Mg ions wereused for the PCR reaction with cvs. Merkur (1), Garde (2),Tempra (3) or Kamelot (4). MW = 100-bp DNA
molecular weight marker (Fermentas).
Figure 5. Optimization of Mg concentration tested on Taq
polymerase (Fermentas). Three independent DNAisolations of 50 ng per PCR reaction from cv. Bohatyr weretested on IRAP with Ogre F/R primer combinations withindicated MgCl2 concentrations. MW = 100-bp DNA
molecular weight marker (Fermentas).
Intra-accession variation
Eight pea varieties were selected for close investi-gation of intra-accession variation. Five individualplants per variety were sampled, and further culti-vated to enable seed setting. The subsequent gen-eration was sown in controlled greenhouseconditions. After genomic DNA isolation, IRAPwith Cyclop and Ogre F/R primer combinationswas performed on all samples. No alteration of the
major scorable band pattern was observed among5 individual plants of the given variety (Figure 6)and in 2 subsequent generations (in total, 10 prog-eny plants were assessed, e.g. 50 plants per acces-sion). The only detected variation was in minorlow-intensity fragments of less than 150 bp andmore than 800 bp, corresponding to thereproducibility level of the IRAP technique. Thisdemonstrates both the robustness and suitability ofIRAP for genotype fingerprinting together withminimal intra-accession variation in the largelyself-pollinating and therefore highly homozygousplants.
DNA fingerprinting of pea varieties
To demonstrate the suitability of IRAP for effi-cient DNA fingerprinting in pea, 33 commerciallygrown varieties were selected from the entireAGRITEC collection of pea germplasm (consistingof 1300 accessions) and were analysed withCyclop and Ogre forward and reverse LTR prim-ers. The PCR composition and amplification con-ditions were set at previously determined optimalvalues (e.g. 50 ng template DNA, 2.5 mM Mg con-centration, 1 U of BioTools Taq polymerase and35 cycles). The products were resolved on 8%TBE-PAGE and run at 30 mA for 3 h. After binarycode scoring, genetic similarity matrices were cal-culated by using Nei-Li coefficient and UPGMAanalyses performed on NTSYS-pc software wereused to generate dendrograms (Figure 7). Even
Inter-retrotransposon amplified polymorphism (IRAP) in pea cultivar fingerprinting 227
Figure 6. Intra-accession variation/stability of IRAPperformed with F and R primers of the Ogre
retrotransposon. Individual plant DNA isolation and 8%PAGE analysis, cvs. Garde (1–5), Grana (6–10), Menhir(11–15) and Zekon (16–20). MW = 100 bp DNA marker
(Fermentas).
Figure 7. Cluster analysis of 33 pea cultivars currently registered in the Czech Republic, based on genetic similaritycoefficient (Dice or Nei-Li) computed by NTSYS-pc software (UPGMA = unweighted pair-group method, arithmetic
average) with summary data from IRAP with Ogre and Cyclop F/R primer combinations.
Coefficient
0.64 0.73 0.82 0.91 1.00
BarytonMW
AdeptOlivinGotikMerkurCanisSonetKometTernoPowerMenhirAlanPegasPrimusSmaragdTyrkysBarytonCarreraJackpotBohatyrCataniaSponzorHeroldKamelotZekonLantraRomeoGardeGranaMadonnaTempraHardyProfiHarnasJanus
though the pea varieties used were of relativelyclose genetic relationship (6 have cv. Bohatyr asparent), a single Cyclop F/R IRAP analysis hasprovided clear resolution, with 13 varieties beinguniquely identified and the others being clusteredin 4 groups with 2–4 members each. Clusters re-flected the pedigree relationship, as demonstratedby cvs. Herold, Kamelot and Zekon with the sameparents. When data for Ogre IRAP were added,resolution improved even further, with 15 variet-ies unequivocally identified and the others beingclustered in 9 groups with 2–3 members each.These two PCR analyses have produced altogether11 scorable major bands for Cyclop and 8 forOgre, of which 7 for Cyclop (64%) and 5 for Ogre
(62%) were polymorphic and informative. A com-parable level of resolution is achieved when 11 in-dividual SSR loci are used.
Conclusions
The IRAP method has recently been exploited tostudy biodiversity and phylogeny in the generaBrassica (Tatout et al. 1999), Hordeum (Waughet al. 1997; Kalendar et al. 1999), Oryza (Iwamotoet al. 1999), and Spartina (Baumel et al. 2002).Additionally, it proved to be suitable for studies ofgenome evolution (Kalendar et al. 2000; Vicientet al. 2001), and in gene mapping of barley(Manninen et al. 2000) and wheat (Boyke et al.2002). In the latter 2 studies, good coverage of thewhole genome was demonstrated. At this momentmicrosatellite SSR markers are the method of firstchoice to complement the DUS (distinctness, uni-formity and stability) testing procedure (McCouchet al. 1997; Becher et al. 2000). The advantages ofSSR markers are: high polymorphism, repro-ducibility, co-dominance, multiallelic type ofvariation, and possibility to map. Especially thepossibility to map is very important for mappingof the genome region carrying the desired loci.
However, the development of a SSR markersystem for new crops is highly time- andmoney-consuming, since specific sequence infor-mation is needed. Additionally, testing of numer-ous SSR loci is required in order to gain enoughinformation. When speed and simplicity are of pri-ority, then multilocus techniques (such as AFLP)can be chosen. This paper demonstrates the devel-opment and utility of the relatively simple but stillhighly specific and accurate IRAP fingerprintingto assess pea cultivar fidelity. The major advan-tage of IRAP over the other, more accurate meth-
ods readily applicable in pea (SSR, AFLP andretrotransposon-based SSAP and RBIP) is thehigh information content gained per single PCRanalysis, which substantially cuts time and cost.The most efficient was IRAP performed withCyclop and Ogre retrotransposons, but there is stilla potential to improve and use other elementsin both IRAP and the more demanding SSAP for-mat. Certain improvement could be achieved bymanipulating LTR primer position (Kalendar et al.1999, and data not shown). Especially applicationof inter-MITE IRAP would be of practical interestsince target size preference near or within genesmakes them a good tool for marker-assisted breed-ing (Chang et al. 2001). Since in our approacha consensus-sequence-derived primer was used,the complex problematically scorable bandingpattern could be reduced by a more specific primerdesign. Resolution can be further manipulated byacrylamide gel concentration and electrophoresisrunning time. Analysis can be also performed onsimple horizontal agarose gel, allowing highersample through-put but with lower resolution(data not shown).
Due to dominance and possibly non- represen-tative genome coverage, the IRAP method wouldnot be suitable for applications in marker-assistedselection, even though it is used in cereals togetherwith other methods. The major application fieldwould be for breeders to test quickly fidelity ofseeds, crosses and breeding material, even thoughnot currently supported by UPOV. The simplicityand robustness guarantee good application poten-tial.
Acknowledgements. This work was supported bythe Czech Ministry of Education (project MSMT2678424601). Dr. J. Macas’ sharing of pre-publica-tion data and excellent technical support ofMs. L. Vítámvásová and Ms. E. Fialová are grate-fully acknowledged.
REFERENCES
Baranger A, Aubert G, Arnau G, Lainé AL, Deniot G,Potier J, et al. 2004. Genetic diversity within Pisumsativum using protein- and PCR-based markers.Theor Appl Genet 108: 1309–1321.
Batzer MA, Deininger PL, 2002. Alu repeats and hu-man genomic diversity. Nature Rev Genet 3:370–379.
Baumel A, Ainouche M, Kalendar R, Schulman AH,2002. Inter-retrotransposon amplified polymor-phism (IRAP), and retrotransposon-microsatelliteamplified polymorphism (REMAP) in populationsof the young allopolyploid species Spartina angel-
228 P. Sm�kal
ica Hubbard (Poaceae). Mol Biol Evol 19:1218–1227.
Becher SA, Steinmetz K, Weising K, Boury S,Peltier D, 2000. Microsatellites for cultivar identifi-cation in Pelargonium. Theor Appl Genet 101:643–651.
Boyko E, Kalendar R, Korzun V, Gill B, Schulman AH,2002. Combined mapping of Aegilops tauschii byretrotransposon, microsatellite, and gene markers.Plant Mol Biol 48: 767–790.
Burstin J, Deniot G, Potier J, Weinachter C, Aubert G,Baranger A, 2001. Microsatellite polymorphism inPisum sativum. Plant Breeding 120: 311–317.
Cooke RJ, 1999. Modern methods for cultivar verifica-tion and the transgenic plant challenge. Seed Sciand Technol 27: 669–680.
Doyle JJ, Doyle JL, 1987. A rapid DNA isolation pro-cedure for small quantities of fresh leaf tissue.Phytochem Bull 19: 11–15.
Ellis THN, Poyser SJ, Knox MR, Vershinin AV,Ambrose MJ, 1998. Polymorphism of insertionsites of Ty1-copia class retrotransposons and its usefor linkage and diversity analysis in pea. Mol GenGenet 260: 9–19.
Flavell AJ, Bolshakov VN, Booth A, Jing R, Russell J,Ellis THN, Isaac P, 2003. A microarray-based highthroughput molecular marker genotyping method:the tagged microarray marker (TAM) approach.Nucleic Acids Res 31: e115.
Flavell AJ, Knox MR, Pearce SR, Ellis THN, 1998.Retrotransposon-based insertion polymorphisms(RBIP) for high throughput marker analysis.The Plant J 16: 643–650.
Ford R, Le Roux K, Itman C, Brouwer JB, Taylor PWJ,2002. Diversity analysis and genotyping in Pisumwith sequence tagged microsatellite site (STMS)primers. Euphytica 124: 397–405.
Guillemaut P, Marechal-Drouard L, 1992. Isolation ofplant DNA: A fast, inexpensive and reliablemethod. Plant Mol Biol Rep 10: 60–65.
Chang RY, O´Donoughue LS, Bureau TE, 2001.Inter-MITE polymorphism (IMP): a high through-put transposon-based genome mapping and finger-printing approach. Theor Appl Genet 102:773–781.
Chavanne F, Zhang DX, Liaud MF, Cerff R, 1998.Structure and evolution of Cyclops: a novel giantretrotransposon of the Ty3/Gypsy family highly am-plified in pea and other legume species. Plant MolBiol 37: 363–375.
Innis MA, Gelfand DH, Sninsky JJ, 1995. PCR Strat-egies. Academic Press.
Iwamoto M, Nagashima H, Nagamine T, Higo T,Higo K, 1999. p-SINE-like intron of the CatAcatalase homologs and phylogenetic relationshipsamong Aagenome, Oryza and related species. TheorAppl Genet 98: 853–861.
JingRC,KnoxMR,LeeJM,VershininAV,AmbroseM,Ellis THN, Flavell AJ, 2005. Insertional polymor-phism and antiquity of PDR1 retrotransposon inser-tions in Pisum species. Genetics 171: 741–752.
Kalendar R, Grob T, Regina M, Suoniemi A,Schulam A, 1999. IRAP and REMAP: two newretrotransposon-based DNA fingerprinting tech-niques. Theor Appl Genet 98: 704–711.
Kalendar R, Tanskanen J, Immonen S, Nevo E,Schulman AH, 2000. Genome evolution of wildbarley (Hordeum spontaneum) by BARE-1retrotransposon dynamics in response to sharpmicroclimatic divergence. Proc Natl Acad Sci USA97: 6603–6607.
Kazazian HH, 2004. Mobile elements: drivers of ge-nome evolution. Science 303: 1626–1632.
Kumar A, Bennetzen JL, 1999. Plant retrotransposons.Annu Rev Genet 33: 479–532.
Loridon K, McPhee K, Morin J, Dubreuil P,Pilet-Nayel ML, Aubert G, et al. 2005. Microsatellitemarker polymorphism and mapping in pea (Pisumsativum L.). Theor Appl Genet 111: 1022–1031.
Macas J, Koblizkova A, Neumann P, 2005. Character-ization of Stowaway MITEs in pea (Pisumsativum L.) and identification of their potential mas-ter elements. Genome 48: 831–839.
Manninen O, Kalendar R, Robinson J, Schulman AH,2000. Application of BAR/M retrotransposonmarkers to the mapping of a major resistance genefor net blotch in barley. Mol Gen Genet 264:325–334.
McCouch SR, Chen X, Panaud O, Temnykh S, Xu Y,Cho YG, 1997. Microsatellite marker development,mapping and application in rice genetics and breed-ing. Plant Mol Biol 35: 89–99.
Morgante M, Olivieri AM, 1993. PCR-amplifiedmicrosatellites as markers in plant genetics.The Plant J 3: 175–182.
Nei M, Li WH, 1979. Mathematical model for studinggenetic variation in terms of restrictionendonucleases. Proc Natl Acad Sci USA 76:5269–5273.
Neumann P, Nouzova M, Macas J, 2001. Molecularand cytogenetic analysis of repetitive DNA in pea(Pisum sativum L.). Genome 44: 716–728.
Neumann P, Pozarkova D, Koblizkova A, Macas J,2005. PIGY, a new plant envelope-class LTRretrotransposon. Mol Genet Genomics 273: 43–53.
Neumann P, Pozarkova D, Macas J, 2003. Highly abun-dant pea LTR retrotransposon Ogre is constitutivelytranscribed and partially spliced. Plant Mol Biol 53:399–410.
Pearce SR, Knox M, Ellis THN, Flavell AJ, Kumar A,2000. Pea Ty1-copia group retrotransposons:transpositional activity and use as markers to studygenetic diversity in Pisum. Mol Gen Genet 263:898–907.
Rohlf M, 2000. NTSYS-pc: Numerical taxonomy andmultivariate analysis system. Version 2.1, Depart-ment of Ecology and Evolution, State Universityof New York, USA.
Samec P, Posvec J, Stejskal V, Nasinec V, Griga M,1998. Cultivar identification and relationships inPisum sativum L. based on RAPD and isozymes.Biol Plant 41: 39–48.
Inter-retrotransposon amplified polymorphism (IRAP) in pea cultivar fingerprinting 229
Shedlock AM, Okada N, 2000. SINE insertions: pow-erful tools for molecular systematics. BioEssays 22:148–160.
Schulman AH, Flavell AJ, Ellis THN, 2004. The appli-cation of LTR retrotransposons as molecular mark-ers in plants. In: Method in Molecular Biology 260:145–175.
Simioniuc D, Uptmoor R, Friedt W, Ordon F, 2002.Genetic diversity and relationships among peacultivars revealed by RAPDs and AFLPs. PlantBreeding 121: 429–435.
Tar´an B, Zhang C, Warkentin T, Tullu A,Vandenberg A, 2005. Genetic diversity among va-rieties and wild species accessions of pea (Pisumsativum L.) based on molecular markers, and mor-phological and physiological characters. Genome48: 257–272.
Tatout C, Warwick S, Lenoir A, Deragon JM, 1999.SINE insertions as clade markers for wild cruciferspecies. Mol Biol Evol 16: 1614–1621.
UPOV-BMT: BMT/36/10. 2002. Progress report of the36th session of the technical committee, the techni-cal working parties and working group on biochem-ical and molecular techniques and DNA-profilingin particular. Geneva.
Vos P, Hogers R, Bleeker M, Reijans M, van de Lee T,Hornes M, et al. 1995. AFLP: a new technique forDNA fingerprinting. Nucleic Acids Res 23:4407–4414.
Waugh R, McLean K, Flavell AJ, Pearce SR, Kumar A,Thomas WT, Powell W, 1997. Genetic distributionof Bare-1 like retrotransposable elements in the bar-ley genome revealed by sequence-specific amplifi-cation polymorphism (S-SAP). Mol Gen Genet253: 687–694.
Weising K, Nybom H, Wolf K, Kahl G, eds. 2005.DNA fingerprinting in plants: Principles, methodsand applications 2nd edn. CRC Press Taylor andFrancis Group, Boca Raton, USA.
Williams JGK, Kubelik AR, Livak KJ, Rafalski JA,Tingey SV, 1990. DNA polymorphism amplifiedby arbitrary primers are useful as genetic markers.Nucleic Acids Res 18: 6531–6535.
Zietkiewitz E, Rafalski A, Labuda D, 1989. Genomefingerprinting by simple sequence repeat (SSR) an-chored polymerase chain reaction amplification.Genomics 20: 176–173.
230 P. Sm�kal