Embed Size (px)
Citation preview
Attenuation of Petroleum Hydrocarbons by Weathering: A Case Study
by Leo C. Osuji*, Inimfon A. Udoetok, and Regina E. Ogali
Department of Industrial and Pure Chemistry, University of Port Harcourt, PMB 5323, Choba,Port Harcourt, Nigeria (e-mail: [email protected])
Possible alterations in the distribution and composition of total petroleum hydrocarbon (TPH),polycyclic aromatic hydrocarbons (PAHs), and benzene, toluene, ethyl benzene, and xylene isomers(BTEX) in the released oil at Idu-Ekpeye in Niger Delta (Nigeria) were studied within two seasonalvariations of two months and six months, with a view to assessing the level of attenuation of thesehydrocarbons in impacted soils. Although there were significant contaminations in the kerosene range(n-C10–n-C14) two months after, especially of the n-C12 and n-C13 fractions, the complete disappearanceof the n-C8 to n-C23 hydrocarbons, including the acyclic isoprenoids (pristane and phytane), and thereduced amounts of PAHs, and BTEX, six months after, provided substantial evidence of attenuation asindicated in the reduction in total hydrocarbon content (THC) from 61.17 to 42.86%. Soilphysicochemical properties such as pH, moisture content, heavy metal, TOC, and TOM, all providedcorroborative evidence of hydrocarbon attenuation. The pristane/phytane ratio of the spill samplessuggests that the spilled oil was genetically oxic.
Introduction. – Petroleum, in common parlance, refers to the three major forms ofhydrocarbons, namely crude oil, natural gas, and condensates. Crude oil, the liquid formof petroleum, is a complex mixture of hydrocarbons or substituted hydrocarbons inwhich thousands of compounds of the two major elements, carbon and hydrogen,combine with those of three minor elements, nitrogen, sulfur, and oxygen (NSOcompounds), as well as trace metals like nickel, vanadium, and cadmium. Structurally,the predominant constituents of crude oils include its total petroleum hydrocarbon(TPH) content, the polycyclic aromatic hydrocarbons (PAH), and the volatilearomatics, i.e., benzene, toluene, ethylbenzene, xylene (BTEX). Thus, a molecule ofcrude oil contains the paraffins, naphthenes, aromatics, and asphaltics. The composi-tional variation in crude oils comes from the geohistory of the particular crude oilsource and confers on it marked peculiarity in chemical and physical characteristics [1].When crude oil spills, it releases hydrocarbons onto the environment, and one of the
problems usually associated with profiling such hydrocarbons at contaminated sites isthe phenomenon known as @weatheringA. Weathering is the change in composition ofhydrocarbons with time, through the action of volatilization, leaching, chemicalreaction, and biotransformation [2]; such alterations might attenuate the hydrocarboncontent of the affected site. Thus, substantial evidence of hydrocarbon attenuation canbe obtained by the direct monitoring of the disappearance of hydrocarbon fractionsfrom the affected area. Such monitoring programmes usually involve repetitiveobservations, measurements, and evaluation of site and hydrocarbon content accordingto pre-arranged schedules.
CHEMISTRY & BIODIVERSITY – Vol. 3 (2006)422
G 2006 Verlag Helvetica Chimica Acta AG, ZJrich

As levels of attenuation are somewhat synonymous with the degree of alteration(s)exhibited by the petroleum hydrocarbons, the severity of the processes should dependon factors such as the physico-chemical properties of the substrate. Oxygen, forinstance, is an obligate requirement for the biotransformation of hydrocarbons via ageneral mechanism that involves the oxidation of hydrocarbons to alcohols, ketones,and acids. Again, photo-oxidation may increase the solubility of oils due to theformation of polar compounds such as carboxylic acids [3] [4]. Therefore, the fates thatbefall the hydrocarbon molecule in soil modify the observed composition of thehydrocarbon.The present study takes a look at the preferential consumption of these hydro-
carbons vis-a-vis some bulk indices of attenuation within two seasonal variations (twomonths and six months) of recorded incidence of oil spillage. The study site wasselected from the petroliferous Niger Delta of southern Nigeria, following reconnais-sance surveys of oil impacted areas in the region. Our interest was focused on thevarious inputs to the overall hydrocarbon contamination situation at the site (within thesaid seasonal fluctuations) which should be taken into account in the site-recoverymanagement scheme.
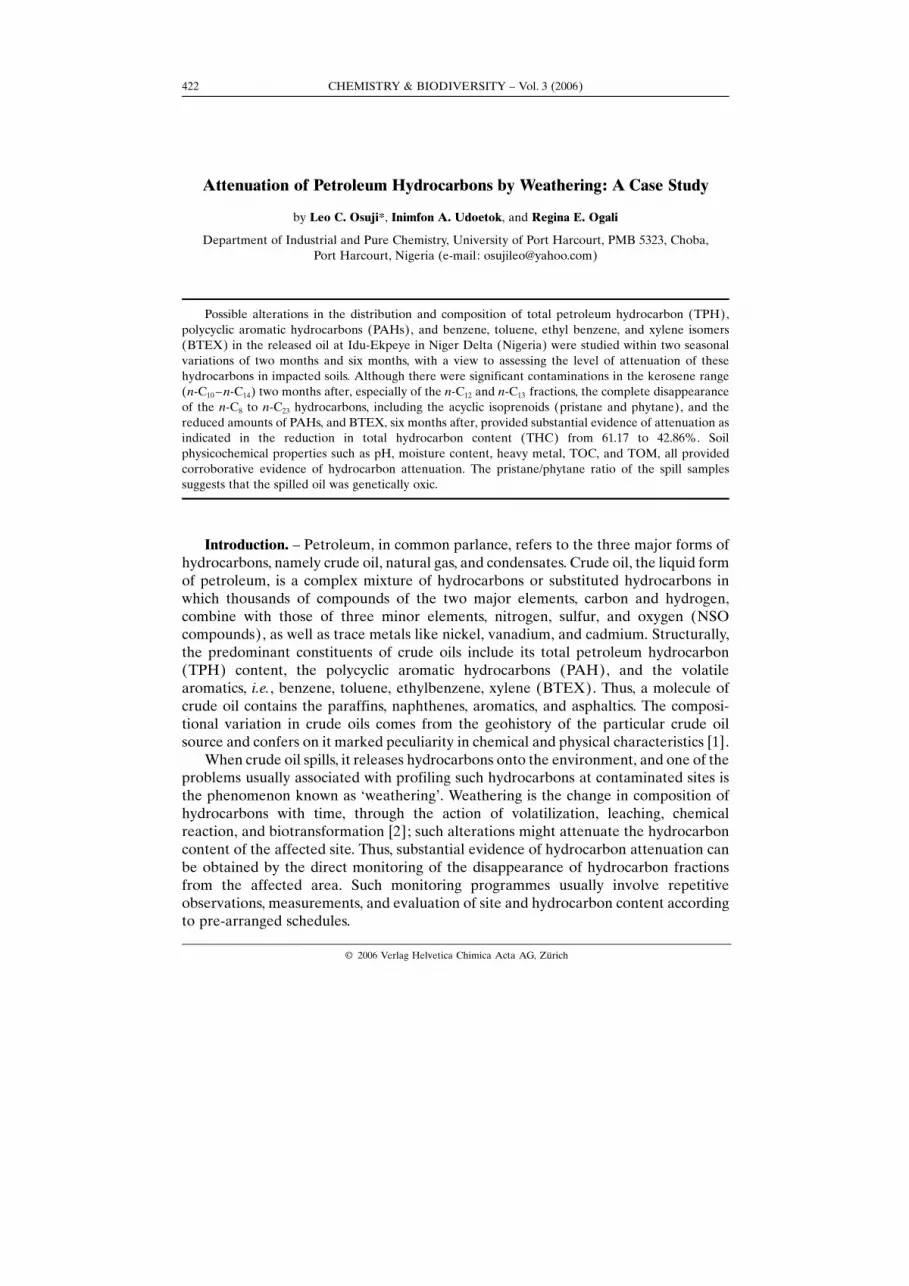
Results and Discussion. – TPH, PAH, and BTEX. Results of the total petroleumhydrocarbon (TPH) content of the oil-impacted soils are presented in Tables 1–3. Thechromatograms (cf. Fig. 1) are representations of the adsorptions and desorptions ofthe hydrocarbons and their resultant separations by molecular sizes. The gas-chromatographic (GC) analyses conducted on the first set of samples collected twomonths after the incidence of oil spillage showed fuller chromatograms of n-C8–n-C23as depicted in Fig. 1; it also showed a substantial concentration of polyaromatichydrocarbons (PAHs; Table 2). The benzene, toluene, ethylbenzene, and xylene(BTEX) contents (Table 3) of the first samples (collected two months after oil spill)were also substantial, though volatile and easily degraded under aerobic conditions. Incompromise, the results show that the spilled oil was still fresh on site, by the time of thefirst sampling (two months after) with significant hydrocarbon contamination in the thekerosene range (n-C10–n-C14), especially of the n-C12 and n-C13 fractions. However, sixmonths later, the results showed complete disappearance of the n-C8–n-C23 hydro-carbon fractions including the isoprenoids (pristane and phytane), leaving the n-C13, n-C14, n-C19, and n-C30 hydrocarbons (Fig. 1). The results obtained for the polyaromatichydrocarbons showed that naphthalene, acenaphthalene, benz[a]anthracene, benzo[k]-fluoranthrene, and indeno[1,2,3-cd]pyrene were likely most prone PAHs to biode-gradation and the other forms of attenuation as observed in the marked reduction inthe concentration of the fractions (Table 2). Similarly, a mass reduction of the BTEXfractions was observed in each of the spill samples analyzed, which corroborates thesignificant alteration adduced from the other parameters. Thus, the hydrocarbondistributions have provided evidence of attenuation.Complete disappearance of the acyclic isoprenoids (pristane and phytane) provides
similar evidence of hydrocarbon attenuation. Prince et al. [5] reported that pristane andphytane, which were originally thought to be resistant to biodegradation, can only beused to monitor the earliest stages of biodegradation. Also the amounts of hydrocarbonfractions expressed as ratios such as the pristane/phytane, n-C17/pristane and n-C18/
CHEMISTRY & BIODIVERSITY – Vol. 3 (2006) 423
CHEMISTRY & BIODIVERSITY – Vol. 3 (2006)424
Fig. 1. A chromatogram of one of the spill samples from Idu-Ekpeye oil-polluted site in Niger Delta,Nigeria, showing n-C8 to n-C23 hydrocarbon fractions of the released oil
Table 1. Seasonal Variation of Total Petroleum Hydrocarbon (TPH) Content of Soils Two Months andSix Months after Oil Spill
Total Petroleum Hydrocarbon (TPH [mg/kg])�S.E.a)Hydrocarbon Fraction 1st Sampling (two months after) 2nd Sampling (six months after)
Amount [mg/kg]�103 Amount [mg/kg]�103
C8 1.10�0.07 –C9 0.43�0.02 –C10 0.22�0.02 –C11 0.04�0.00 –C12 1.07�0.04 –C13 5.34�0.01 0.13�0.01C14 0.48�0.00 0.03�0.01C15 0.84�0.01 –C16 0.14�0.00 –C17 1.65�0.00 –Pristaneb) 0.48�0.05 –C18 0.27�0.00 –Phytanec) 0.02�0.01 –C19 0.02�0.01 0.27�0.00C20 0.07�0.01 –C21 0.03�0.01 –C22 0.09�0.01 –C23 0.03�0.00 –
a) S.E. is standard error at 95% confidence limit. b) 2,6,10,14-Tetramethylpentadecane. c) 2,6,10,14-Tetramethylhexadecane.
phytane suggests increasing attenuation of hydrocarbons as observed from thedecreasing ratios. The pristane/phytane ratio decreased from 21.41 to almost zero,the n-C17/pristane and n-C18/phytane ratio also decreased from 3.45 and 12.14,respectively, to almost zero. These ratios may also serve useful purposes in locating thesource of the contaminant. The fingerprints, n-alkanes, and the acyclic isoprenoids(pristane and phytane) are diagnostic and have far reaching implications on correlationstudies [6]. The quantitative expression of the fingerprints shows that pristane wasmuch more abundant than phytane. This, therefore, implies a very high pristane/
CHEMISTRY & BIODIVERSITY – Vol. 3 (2006) 425
Table 2. Seasonal Variation in Polycyclic Aromatic Hydrocarbon (PAH) Content of Soil Samples2 Months and 6 Months after Oil Spill
Hydrocarbon Fraction 1st Sampling (two months after) 2nd Sampling (six months after)Amount [mg/kg] Amount [mg/kg]
Naphthalene 7.7�1.2 BDLa)Acenaphthylene 70.9�5.7 BDLAcenaphthene 98.3�10.0 0.3�0.1Fluorene 135�16.8 2.9�1.4Phenanthrene 137�8.0 BDLAnthracene 134�24.5 39.1�0.5Fluoranthene 97�7.8 18.6�6.2Pyrene 135�8.0 21.8�12.4Benz[a]anthracene 221�26.4 BDLChrysene 138�2.4 27.4�8.0Benzo[b]fluoranthene 231�10.2 22.4�2.1Benzo[k]fluoranthene 79.6�9.6 BDLBenzo[a]pyrene 318�13 80.8�0.8Indeno[1,2,3-cd]pyrene 246�48 BDLDibenz[a,b]anthracene 131�12 16.1�4.4Benzo[ghi]perylene 103�6.4 69.1�7.0
a) BDL¼Below Detectable Limit (where detectable limit is 1�10�6 mg/kg)
Table 3. Seasonal Variation of Benzene, Toluene, Ethylbenzene, and Xylene (BTEX) Contents of Soils2 Months and 6 Months after Oil Spill
Hydrocarbon Fraction 1st Sampling (two months after) 2nd Sampling (six months after)Amount [mg/kg] Amount [mg/kg]a)
Benzene 48.2�12.5 BDLChlorobenzene 32.3�4.6 BDL1,2-Dichlorobenzene 20.6�4.8 BDL1,3-Dichlorobenzene 412.8�66.5 BDL1,4-Dichlorobenzene 4.5�2.1 BDLEthylbenzene 11.7�1.9 BDLToluene 18.1�6.6 BDLm,p-Xylene 22.1�12.2 BDLo-Xylene 3.8�1.6 BDL
a) BDL¼Below Detectable Limit (where detectable limit is 1�10�6 mg/kg).
phytane ratio, which is far greater than unity (>1) (pristane/phytane 21.41), and thusgives a clue on the spilled-oilAs depositional environment. Pristane represents a productof decarboxylation, therefore, the pristane/phytane ratio tends to be high in moreoxidizing environments such as peat swamps and low in strongly reducing environ-ments [7] [8]. Hence, the pristane/phytane ratio of 21.41 for the spilled oil might wellsuggest an oxic depositional environment and a phytoplankton input.
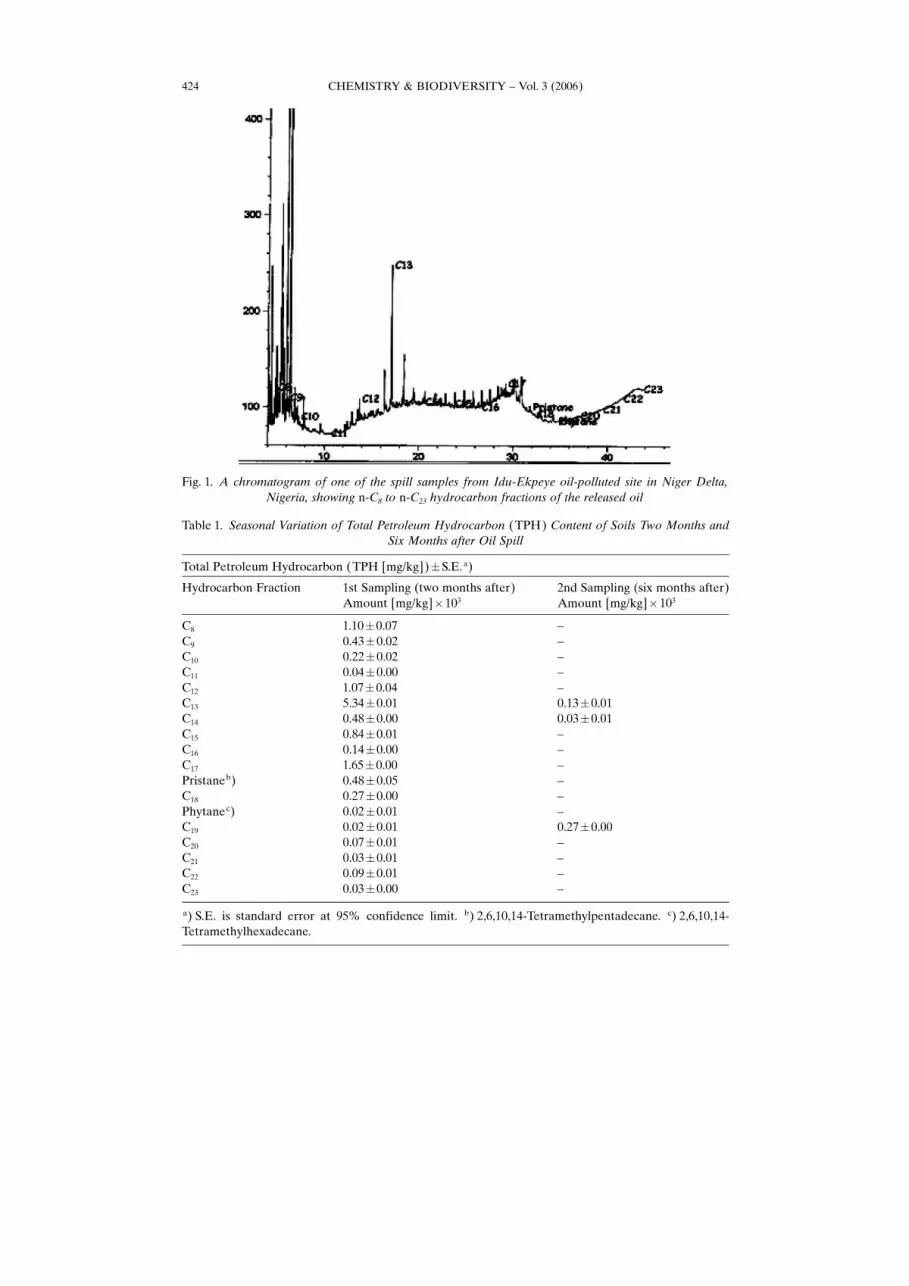
Total Extractable Hydrocarbon Content. The total hydrocarbon content (THC) ofsoils is frequently used to assess and ascertain the extent of hydrocarbon contaminationat an oil-spill-polluted site. Results obtained show that the samples collected twomonths after the oil spill had higher hydrocarbon content than the control. Althoughthe concentration of hydrocarbons at the time of spillage, barely two months prior tosampling, was not known, the paucity of the data obtained for the THCs at surface andsubsurface depths (Fig. 2) presuppose that there was a high level of hydrocarboncontamination on site, at least an amount far exceeding the compliamce limit of 50parts per million set for petroleum industries in Nigeria [9].
The decrease in THC of 61.17 and 42.86% (Fig. 2) obtained between first andsecond sample collection may be attributable to the increase in the number ofhydrocarbon degraders in the soil, and their adaptation to hydrocarbons. The severityof hydrocarbon depletion is observed in the disappearance of the isoprenoids (pristaneand phytane), which were previously thought to be resistant to degradation. Thedecrease in the hydrocarbon concentration at the site might also be attributed to the
Fig. 2. Seasonal variation in the total hydrocarbon content of soils two months and six months after the oilspill at Idu-Ekpeye in Niger Delta, Nigeria
CHEMISTRY & BIODIVERSITY – Vol. 3 (2006)426

tilling of the soil and the construction of secondary windows, which might haveenhanced microbial activities on the petroleum hydrocarbons due to aeration of the soiland physical abrasion of the spilled oil. Aeration enhances the oxidation of thesubstrate by oxygenases, which might have led to the formation of alcohols, ketones,and acids [10]. This was probably why soil-pH decreased on second sampling asobserved from the physico-chemical collected six months after the spillage (Fig. 3).
Though there is evidence of extensive petroleum hydrocarbon attenuation at thesite, the level of hydrocarbon contamination of the soil as indicated in this study is stillsignificantly high compared to the control site. Usually, the presence of highconcentration of petroleum hydrocarbons in soils is detrimental to the growth andproductivity of plants and animals. This calls for more stringent depollution measurestowards facilitating the removal of these hydrocarbons from the affected site.
Soil Physicochemical Properties. The moisture content of soils from the oil-pollutedand control areas are represented by Fig. 4. The result shows higher moisture in the oil-impacted samples (on first and second sampling, resp.). This may be attributed toinsufficient soil aeration due to the displacement of air arising from water logging andreduced rate of evaporation. The higher moisture content may also be as a result of thehydrophobic nature of the soil. The higher moisture content at subsurface depth can beexplained by the evaporation that took place at the surface depth due to its exposure tosunlight. The results from the control site (Fig. 4) corroborate this as the subsurfacecontrol soils had higher moisture content. Moisture content of soils in % six monthsafter the oil spill indicated an increase of 11.8 and 25.0% for surface and subsurface
Fig. 3. Seasonal variation in soil-pH two months and six months after the oil spill at Idu-Ekpeye in NigerDelta, Nigeria
CHEMISTRY & BIODIVERSITY – Vol. 3 (2006) 427

soils, respectively (when compared with results obtained two months after), thedifference being statistically significant (P<0.05). This indicates that, six months afterthe oil spill, the moisture content of the polluted soil increased. This could be ascribedto water droplets which initially adhered to the oil-in-water emulsion being released tothe soil, resulting in the wetting of the inner parts of soil aggregates [11]. The highermoisture content of the subsurface depth of the affected soil on second samplingconfirms this.Increased moisture content of the polluted soil six months after the spill might also
be attributed to the rainfall that was predominant at the region prior to the secondsampling. Moisture content of soils usually affects soil formation, erosion, andaggregate stability. It is essential for photosynthesis and nutrient mobility. Highmoisture content, for instance, may result in the leaching of organic nutrients. This,therefore, means that high moisture content may prevent the full use of all organicnutrients by the organisms involved in organic matter decomposition and thushydrocarbon attenuation.The pH of the affected soils (Fig. 3) generally fell within the acidic range of the pH
scale, implying that the soils are acidic; however, soil samples collected six months afterthe spill were more acidic with % decrease in pH of 15.22 and 14.37 for surface andsubsurface soils, respectively. This higher pH of the first samples and a reduction in thesoil-pH (increased soil acidity) of the second samples may be ascribed to theintroduction of petroleum hydrocarbons to the study site as a result of the oil spillage,and subsequent degradation which might have led to the removal of these hydro-carbons as corroborated by qualitative and quantitative results of the GC analysesearlier discussed. These attenuation processes result in increased activity of hydro-carbon utilizers whose hydrocarbon-oxidizing potentials might have already been
CHEMISTRY & BIODIVERSITY – Vol. 3 (2006)428
Fig. 4. Moisture content, total organic carbon (TOC) and total organic matter (TOM) of soil samplesfrom Idu-Ekpeye oil polluted site in Niger Delta, Nigeria
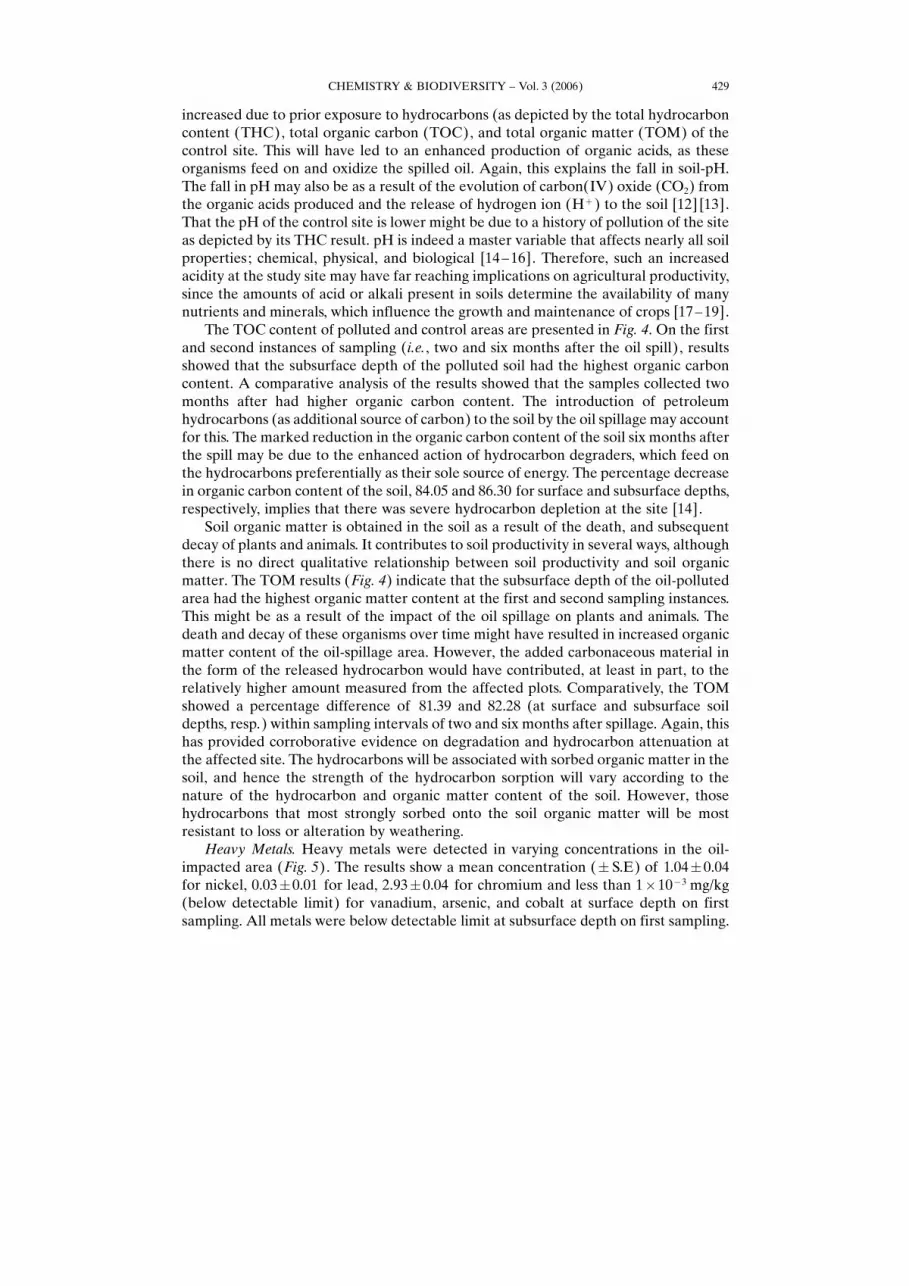
increased due to prior exposure to hydrocarbons (as depicted by the total hydrocarboncontent (THC), total organic carbon (TOC), and total organic matter (TOM) of thecontrol site. This will have led to an enhanced production of organic acids, as theseorganisms feed on and oxidize the spilled oil. Again, this explains the fall in soil-pH.The fall in pH may also be as a result of the evolution of carbon(IV) oxide (CO2) fromthe organic acids produced and the release of hydrogen ion (Hþ ) to the soil [12] [13].That the pH of the control site is lower might be due to a history of pollution of the siteas depicted by its THC result. pH is indeed a master variable that affects nearly all soilproperties; chemical, physical, and biological [14–16]. Therefore, such an increasedacidity at the study site may have far reaching implications on agricultural productivity,since the amounts of acid or alkali present in soils determine the availability of manynutrients and minerals, which influence the growth and maintenance of crops [17–19].The TOC content of polluted and control areas are presented in Fig. 4. On the first
and second instances of sampling (i.e., two and six months after the oil spill), resultsshowed that the subsurface depth of the polluted soil had the highest organic carboncontent. A comparative analysis of the results showed that the samples collected twomonths after had higher organic carbon content. The introduction of petroleumhydrocarbons (as additional source of carbon) to the soil by the oil spillage may accountfor this. The marked reduction in the organic carbon content of the soil six months afterthe spill may be due to the enhanced action of hydrocarbon degraders, which feed onthe hydrocarbons preferentially as their sole source of energy. The percentage decreasein organic carbon content of the soil, 84.05 and 86.30 for surface and subsurface depths,respectively, implies that there was severe hydrocarbon depletion at the site [14].Soil organic matter is obtained in the soil as a result of the death, and subsequent
decay of plants and animals. It contributes to soil productivity in several ways, althoughthere is no direct qualitative relationship between soil productivity and soil organicmatter. The TOM results (Fig. 4) indicate that the subsurface depth of the oil-pollutedarea had the highest organic matter content at the first and second sampling instances.This might be as a result of the impact of the oil spillage on plants and animals. Thedeath and decay of these organisms over time might have resulted in increased organicmatter content of the oil-spillage area. However, the added carbonaceous material inthe form of the released hydrocarbon would have contributed, at least in part, to therelatively higher amount measured from the affected plots. Comparatively, the TOMshowed a percentage difference of 81.39 and 82.28 (at surface and subsurface soildepths, resp.) within sampling intervals of two and six months after spillage. Again, thishas provided corroborative evidence on degradation and hydrocarbon attenuation atthe affected site. The hydrocarbons will be associated with sorbed organic matter in thesoil, and hence the strength of the hydrocarbon sorption will vary according to thenature of the hydrocarbon and organic matter content of the soil. However, thosehydrocarbons that most strongly sorbed onto the soil organic matter will be mostresistant to loss or alteration by weathering.
Heavy Metals. Heavy metals were detected in varying concentrations in the oil-impacted area (Fig. 5). The results show a mean concentration (� S.E) of 1.04�0.04for nickel, 0.03�0.01 for lead, 2.93�0.04 for chromium and less than 1�10�3 mg/kg(below detectable limit) for vanadium, arsenic, and cobalt at surface depth on firstsampling. All metals were below detectable limit at subsurface depth on first sampling.
CHEMISTRY & BIODIVERSITY – Vol. 3 (2006) 429

The results for the second samples collected six months after the oil spill indicate amean concentration of 0.49�0.44 for nickel, 1.79�0.28 for chromium, and belowdetectable limit (<1�10�3 mg/kg) for vanadium, lead, arsenic, and cobalt at surfacedepth. At subsurface depth, nickel had a concentration of 0.56�0.20, chromium had1.70�0.55, and vanadium, lead, arsenic, and cobalt were still below detectable limit.These results show significantly higher concentration of nickel and chromium at surfacedepth for the first samples, thus implying a difference of 52.28% for nickel and 38.90%for chromium at this depth between the first and second samples. The heavy-metalconcentration at subsurface depth was <1�10�3 mg/kg for the first samples but wasabove this for the second samples. This may be a result of the tilling of the soil andconstruction of secondary windrows, which might have led to the mixing of the top andsubsoils, thereby enhancing the penetration of these heavy metals [15].
Conclusions. – The composition and distribution of petroleum hydrocarbons at theIdu-Ekpeye oil-spillage site in Niger Delta, Nigeria, showed that the spilled oil was stillfresh on site, by the time of the first sampling (two months after) with significanthydrocarbon contamination in the kerosene range (n-C10–n-C14), especially of the n-C12 and n-C13 fractions. However, six months later, the results showed completedisappearance of the n-C8–n-C23 hydrocarbon fractions including the isoprenoids(pristane and phytane), leaving the n-C13, n-C14, n-C19, and n-C30 hydrocarbons. These
Fig. 5. Seasonal variation in the heavy-metal concentration of soils two months and six months after oilspill at from Idu-Ekpeye in Niger Delta, Nigeria
CHEMISTRY & BIODIVERSITY – Vol. 3 (2006)430
provide substantial evidence of attenuation of hydrocarbons at the affected site. Theincrease in moisture content, decrease in THC, TOC, TOM, and the fall in the soil-pHof the affected area six months later were also positive indicators to the on-goingattenuation at the site. The pristane/phytane ratio of the spill samples suggested an oxicdepositional environment of a probable non-waxy, marine-derived organic matter. Thatpristane hydrocarbon was more highly abundant than phytane affirmed that the spilledoil was genetically oxic.
The authors thank the management of Shell Petroleum Development Company of Nigeria (SPDC) ,Port Harcourt, for allowing the use of their Preparatory Chemistry Laboratory and facilities for chemicalanalysis.
Experimental Part
Site Description and Sample Collection. The study site is located in Idu-Ekpeye, Ahoda West LocalGovernment Area of Rivers State, Nigeria. Sampling was carried out within intervals of two months andsix months after spill; first sampling exercise was on April 04, 2004. Sample area and technique wereadopted after Osuji and Adesiyan [14].
Oil Extraction and Chromatographic Analysis. Homogenized samples (5 g) were accurately weighedinto clean, dry beakers. The weighed samples were extracted with 10 ml of hexane, resp., and passedthrough a filter paper. The extract (the hydrocarbon/hexane mix), now ready for GC, was injected into aVarian model 3400 gas chromatograph with the following operational conditions: flow rate (H2: 30 ml/min, air: 300 ml/min and N2: 30 ml/min); injection temp.: 508, detector temp.: 3208 ; recordersA voltage(ImV); and chart speed: 1 cm/min. For interpretation of results, the GC recorder was interfaced to aHewlett Packard (hp) Computer (6207AA Software, Kayak XA PIT/350 W/48 megabytes CD-ROM).The chromatograms were quantified with respect to the internal standards.
Estimation of Hydrocarbon Content, Moisture Content, pH, Electrical Conductivity, and SoilNutrients. Total Extractable Hydrocarbon Content. Total extractable hydrocarbon content (THC) wasestimated by the method of Osuji and Adesiyan [14]. Each soil sample (5 g) was weighed out andtransferred into a 500-ml volumetric flask. Into this was added 50 ml of xylene. The xylene/soil mixturewas shaken vigorously for 5 min and filtered into 400-ml cylinder. The volumetric flask and solidmaterials were rinsed properly with 500 ml of xylene and filtered again into the cylinder. The xylene/oilextract was thereafter placed in cuvette wells, and its absorbance was determined with a Hack DR/2010particle data logging spectophotometer. A calibration curve was obtained by measuring the absorbanceof dilute standard solns. of lease oil (Bonny Light/BonnyMedium crude oils), prepared by diluting 2.5,5.0, 10.0, 20.0, 25.0, and 30.0 ml of the lease oil with 50 ml of xylene soln. THCwas calculated after readingthe absorbance of the extract from the spectrophotometer, extrapolating from the calibration curve andmultiplying by an appropriate dilution.
Soil-pH and Electrical Conductivity. To 5.0 g of each soil sample (in a sample cell) was added 50 ml ofdist. H2O. The lump of the soil was stirred to form homogenous slurry, then the pH-meter probe (Jenway3015 model) was immersed into the sample and allowed to stabilize at 258, and pH of sample wasrecorded. Conductivity was measured with the conductivitymeter (Jenway 4010 model) as described byOsuji and Onojake [15].
Determination of Moisture Content. A constant weight of watch glass was obtained, and, thereafter,20 g of sample was weighed into the watch glass, and transferred into the oven for 1 h at 1108. The sampleswere cooled inside a desiccator for 30 min before a constant weight of the sample and watch glass afterheating and cooling was recorded. Moisture content was estimated as:
CHEMISTRY & BIODIVERSITY – Vol. 3 (2006) 431

% Moisture Content¼ [W1� (W3�W2) ]�100 /W1
where
W1¼weight of sample,W2¼constant weight of watch glass, andW3¼weight of sampleþwatch glass after heating and cooling.
Total Organic Carbon (TOC) and Total Organic Matter (TOM). TOC and TOM were measured bythe modifiedWalkey–Black wet oxidation method [20] as follows: 1 g of soil sample was weighed into a500-ml flask, and 10 ml of K2Cr2O7 and 20 ml of conc. H2SO4 were added. To the mixture were furtheradded 200 ml of dist. H2O, 10 ml of H3PO4, and five drops of diphenylamine indicator before titratingwith 0.5n (NH4)2SO4Fe. A blank titration (without 1 g of soil) was thereafter carried out, and percentTOC was calculated as:
%TOC¼Blank Titer�Sample Titer�0.003�100 / Sample Weight%TOM¼TOC [%]�1.724where: 1.724¼conversion factor;(i.e. %TOM¼%TOC�100 / 58; since TOC is 58% of TOM).
Statistical Analysis. Standard Error (� SE) was given as: SE¼SD / N1/2 where SD is standarddeviation and N is the number of replicates. SE was estimated at 95% Confidence Limit (CL) bymultiplying by 1.96
REFERENCES
[1] @Advances in Organic GeochemistryA, Eds. A. G. Douglas, J. R. Maxwell, Pergamon Press, Oxford,1979.
[2] @Proceedings of the Fifth National Workshop on the Assessment of Site ContaminationA, Eds. A.Langsley, M. Gilgey, B. Kennedy, NEPC Service Corporation, 2003.
[3] J. Connan, A. Restle, P. Albrecht, in @Advances in Organic GeochemistryA, Eds. A. Douglass, J. R.Maxwell, Oxford Pergamon Press, 1979, pp. 1–17.
[4] R. M. Atlas, J. Chem. Tech. Biotechnol. 1991, 52, 149.[5] R. C. Prince, D. L. Emendorf, J. R. Lute, C. S. Hsu, C. E. Haith, J. D. Senius, G. J. Dechert, G. S.
Douglas, E. L. Butler, Environ. Sci. Technol. 1994, 28, 142.[6] W. John, P. E. Wigger, E. T. Bruce, @Petroleum Hydrocarbon Fingerprinting – Numerical
Interpretation DevelopmentsA, Environmental Liability Management Inc., Tulsa, Owahoma, 1997.[7] J. Connan, in @Advances in Petroleum GeochemistryA, Eds. J. Brooks, D. Welte, London Academic
Press, 1984, pp. 229–335.[8] R. L. Kaufman, A. S. Ahmed, R. J. Elsinger, in @Proceedings of the 9th Annual Research Conference
of the Society of Economic Paleontologists and MineralogistsA, Eds. D. Schumaker, B. F. Perkins,New Orleans, 1990, pp. 263–282.
[9] HSE-ENV, @Accompanying Guidelines for SPDC EIA Process – Data CollectionA. Vol. III.HSE-ENV, SPDC 2004 – 0002712, 2004, pp. 12–17.
[10] J. K. Volkman, R. Alexander, R. I. Kagi, S. J. Rowland, P. N. Sheppard,Org. Geochem. 1984, 6, 619.[11] M. J. Rowell, in @The Reclamation of Agricultural Soils After Oil Spills Part 1A, Ed. J. A. Toogood,
Edmonton, Canada, 1977, pp. 1–33.[12] Z.-Y. Hseu, Z.-S. Chen, Proc. Natl. Sci. Counc. ROC(B) 2000, 24, 143.[13] L. G. Whyte, B. Goalen, J. Hanari, C. W. Greer, D. Labbe, M. Nahir, Cold Regions Sci. Tech. 2001,
32, 121.[14] L. C. Osuji, S. O. Adesiyan, Chem. Biodiv. 2005, 2, 1079.[15] L. C. Osuji, C. M. Onojake, Chem. Biodiv. 2004, 1, 1708.[16] E. Riser-Roberts, @Remediation of Petroleum Contaminated Soils: Biological, Physical, and
Chemical ProcessesA, Lewis Publishers/CRC Press, Boca Raton, FL., 1998.
CHEMISTRY & BIODIVERSITY – Vol. 3 (2006)432

[17] L. C. Osuji, S. O. Adesiyan, G. C. Obute, Chem. Biodiv. 2004, 1, 1569.[18] S. L. Tisdale, W. L. Nelson, @Soil Fertility and Fertilizers, 3rd Edn.A Macmillan Publishing Co., New
York, 1975.[19] L. C. Osuji, E. J. G. Egbuson, C. M. Ojinnaka, Chem. Ecol. 2005, 21, 1.[20] D. W. Nelson, L. E. Sommers, in @Methods of Soil Analysis, Part 2. Chemical and Microbiological
PropertiesA, Eds. A. L. Page, D. R. Keeny, D. E. Baker, R. H. Miller, R. Ellis Jr., J. D. Rhoades,American Society of Agronomy, Madison, WI., USA, 1982, pp. 539–577.
Received December 28, 2005
CHEMISTRY & BIODIVERSITY – Vol. 3 (2006) 433