Embed Size (px)
Citation preview
_____________________________________________________________________________________________________ *Corresponding author: Email: [email protected];
Asian Journal of Applied Chemistry Research
9(4): 31-40, 2021; Article no.AJACR.75469 ISSN: 2582-0273
Assessment of Total Petroleum Hydrocarbons and Polycyclic Aromatic Hydrocarbons in Wastewater
from Selected Flow Stations in Agbada II, Rivers State
Akpan Esther Emmanuel1, Obi Chidi2* and Kinigoma Boma3
1Department of Industrial Chemistry/ Petrochemical Technology, School of Science and Laboratory
Technology, University of Port Harcourt, Nigeria. 2Department of Pure and Industrial Chemistry, Faculty of Science, University of Port Harcourt,
Nigeria. 3Department of Petroleum Engineering, Faculty of Engineering, University of Port Harcourt, Nigeria.
Authors’ contributions
This work was carried out in collaboration among all authors. Authors OC and KB designed the study. Author AEE managed the analyses of the study and the literature searches while author OC wrote the
manuscript of this work. All authors read and approved the final manuscript.
Article Information
DOI: 10.9734/AJACR/2021/v9i430221 Editor(s):
(1) Prof. Angélica Machi Lazarin, State University of Maringá, Brazil. Reviewers:
(1) Igiebor Francis Aibuedefe, Wellspring University, Nigeria. (2) Theerawut Phusantisampan, King Mongkut’s University of Technology North Bangkok, Thailand.
Complete Peer review History: https://www.sdiarticle4.com/review-history/75469
Received 09 August 2021 Accepted 19 October 2021 Published 27 October 2021
ABSTRACT
Aims: This study evaluates total petroleum hydrocarbon (TPH) and polycyclic hydrocarbons (PAHs) concentrations in wastewaters from three locations of the oil-producing flow station in Rivers State. Study Design: By experiment and the results obtained by analytical means. Place and Duration of Study: This work was conducted at the Department of Industrial Chemistry/Petrochemical Technology, School of Science and Laboratory Technology, University of Port Harcourt, Choba, Rivers State, Nigeria between February and August, 2021. Methodology: The evaluation was done using gas chromatography-Flame Ionization Detector (GC-FID), and Gas Chromatography-Mass Spectrometer Detector (GC-MSD). Results: Results obtained showed low levels of total petroleum hydrocarbons ranging from 0.051,
Original Research Article
Emmanuel et al.; AJACR, 9(4): 31-40, 2021; Article no.AJACR.75469
32
0.119, and 0.07 mg/l and 0.01, 0.06, and < 0.01 mg/l for polycyclic aromatic hydrocarbons for the three locations, respectively. The results also revealed that the concentrations of the total petroleum hydrocarbons of the samples from the three locations were highest at carbon atom 17 suggesting a biogenic contribution of organic matter. The chromatographs obtained gave evidence that the nature of the contamination was minimally crude oil, because crude oil normally distributes in broad range, as observed in the locations samples as against the narrower carbon range of C8 to C40 characteristics of refined products. The pristane/phytane ratios, which were 0.925, 0.891 and 0.372 for the three samples, depicted an oxygenated environment. The C17/pristane ratios (39.53, 38.93, and 31.48) for all three locations revealed that the wastewaters were slightly weathered. The low concentrations as well as absence of high molecular weight polycyclic aromatic hydrocarbons and higher concentrations of low molecular weight polycyclic aromatic hydrocarbons support the petrogenity of the wastewaters. The phenanthrene/anthracene ratios (1.26, 0, and 0) for the three samples confirm the nature of the wastewaters. In addition, the absence of benzo(a)anthracene to chrysene ratio for all three samples point to proper treatment of the wastewaters. Conclusion: From this study, the level of total petroleum hydrocarbons (TPH) and polycyclic hydrocarbons (PAHs) obtained from all the samples were lower than the maximum recommended levels by the Department of Petroleum Resources (DPR). This study recommends constant monitoring in the total petroleum hydrocarbons and polycyclic hydrocarbons concentrations because even at its low concentrations can be injurious to health of the people residing within the facility and beyond.
Keywords: Hydrocarbons; wastewaters; gas chromatography Spectrometer; crude oil; assessment.
1. INTRODUCTION The development of science and technology through human participation has caused severe damage to the fragile ecosystem. Industrial chemicals such as petroleum hydrocarbons (PHs) used extensively in different spheres have caused significant damage to the environment [1].
The intentional or erroneous discharge of hydrocarbons such as polycyclic and total hydrocarbons into the environment have led to serious soil, water, and air pollution issues [2,3,4,5].
The realization that the ability of the environment to handle pollutants may after all be limited and the pollution is not restricted to the particular environment where it has happened because of the interconnectivity of the ecological system, the better for us to minimize or eliminate completely this ecosystem destroyer [6,7]. Nigeria, for example, produces crude oil as its highest means of export commodity. However, the extraction of crude oil from its reservoirs is usually associated with diverse environmental challenges; a development that led to massive oil pollution of land and water bodies [8]. The amount of natural crude oil seepage was estimated to be 600,000 metric tons per year
with a range of uncertainty of 200,000 metric tons per year [2]. A closer look at the areas of greater crude oil generation in Nigeria, the Niger Delta region, is an area of great environmental importance even from the earliest historical times.
The Niger Delta is enriched with large rivers, extensive flat areas, and rich alluvial soils that support dense agriculture populations [9]. However, the area has suffered many disadvantages arising from the production of crude oil.
The effects of oil pollution have rendered the vast aquatic environment unfertile and the diseases associated have resulted in adverse health effects to the people within the region. It also has a destructive effect on living resources, altering marine activities, impairing the quality of water as well as distorting the balance in the ecosystem, which may be irreversible [10].
According to the United States Environmental Protection Agency (USEPA) [11], total petroleum hydrocarbon (TPH) and polycyclic hydrocarbons (PAHs) released into the environment threaten public health and safety by contaminating drinking water, causing fire and explosion hazards, diminishing air and water quality, compromising agriculture, destroying recreational areas, destroying habitats and food, and wasting non-renewable resources [12].
Emmanuel et al.; AJACR, 9(4): 31-40, 2021; Article no.AJACR.75469
33
Because of the detrimental effects of oil pollution on the aquatic environment around the communities surrounding the flow stations, the need to monitor total petroleum hydrocarbon and polycyclic hydrocarbon levels in the wastewater becomes imperative. Therefore, this study aims at determining the total petroleum hydrocarbon and polycyclic hydrocarbon concentrations in wastewater from selected flow stations in Agbada II, Rivers State.
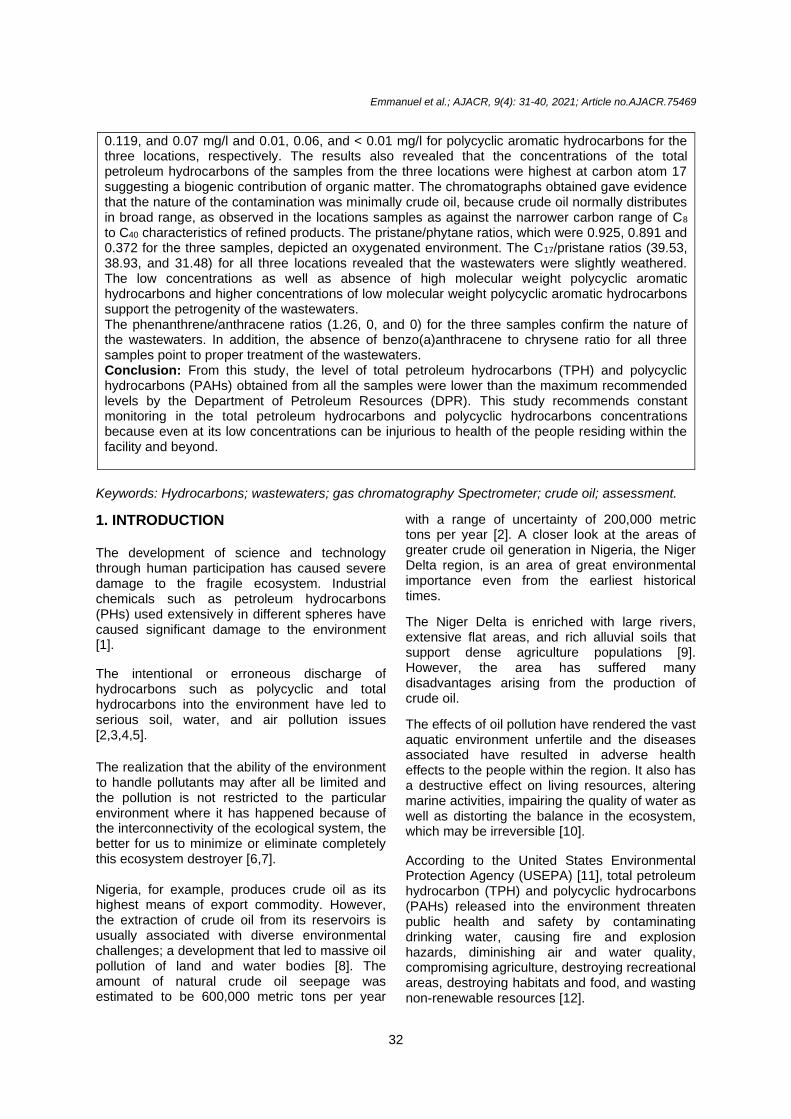
2. MATERIALS AND METHODS 2.1 The Study Area The area of the study was the Agbada II flow station belonging to SPDC Nigeria limited and located between Eneka and Igwuruta communities in Ikwerre Local Government Area of Rivers State. The geography location of the facility lies on longitude 7° 0’ – 70 10’E and latitude 40 31’ – 40 40’N in Rivers State of Nigeria [13]. The facility has three different flare points consisting of two vertical and one horizontal flare point. Accessibility to the site was
through a tarred road from the Eneka axis or Igwuruta Airport road.
2.2 Sample Collection
Wastewater samples were collected from Agbada II flow station saver pits using the grab sampling technique at three different locations labeled 1, 2, and 3. A 2 ml concentrated sulphuric acid was added to each 250 ml wastewater sample as a preservative.
2.3 Reagent Preparation
The following analytical grade reagents and chemicals; 95% n-hexane (Riedel de Haen Germany), dichloromethane (BDH, Poole England), 99% sodium sulfate anhydrous, AR (Guangdong Guanghua Sci-Tech Co., Ltd.) were used. Working solutions of 25, 50, and 250 mg/L concentrations were prepared from a TPH stock solution of 500 mg/L in hexane. This was done by transferring an aliquot volume of 0.05, 0.10, and 0.50 ml respectively, into sample vials. Each volume was made up to the 1.0 ml mark using a 500 micro syringe. PAH standards were also prepared.
Fig. 1. Map of Ikwerre Local Government Area of Rivers State, showing the study area [14]
Emmanuel et al.; AJACR, 9(4): 31-40, 2021; Article no.AJACR.75469
34
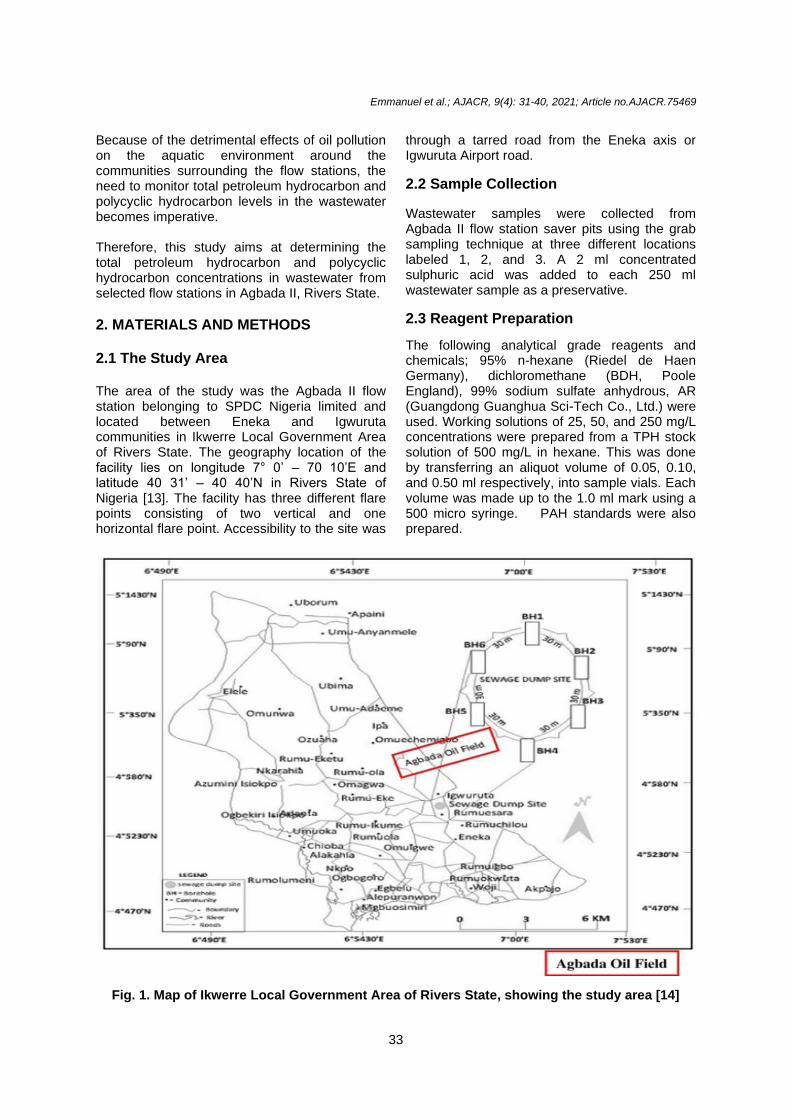
Plate 1. A photograph of location 1 of the Agbada II flow station
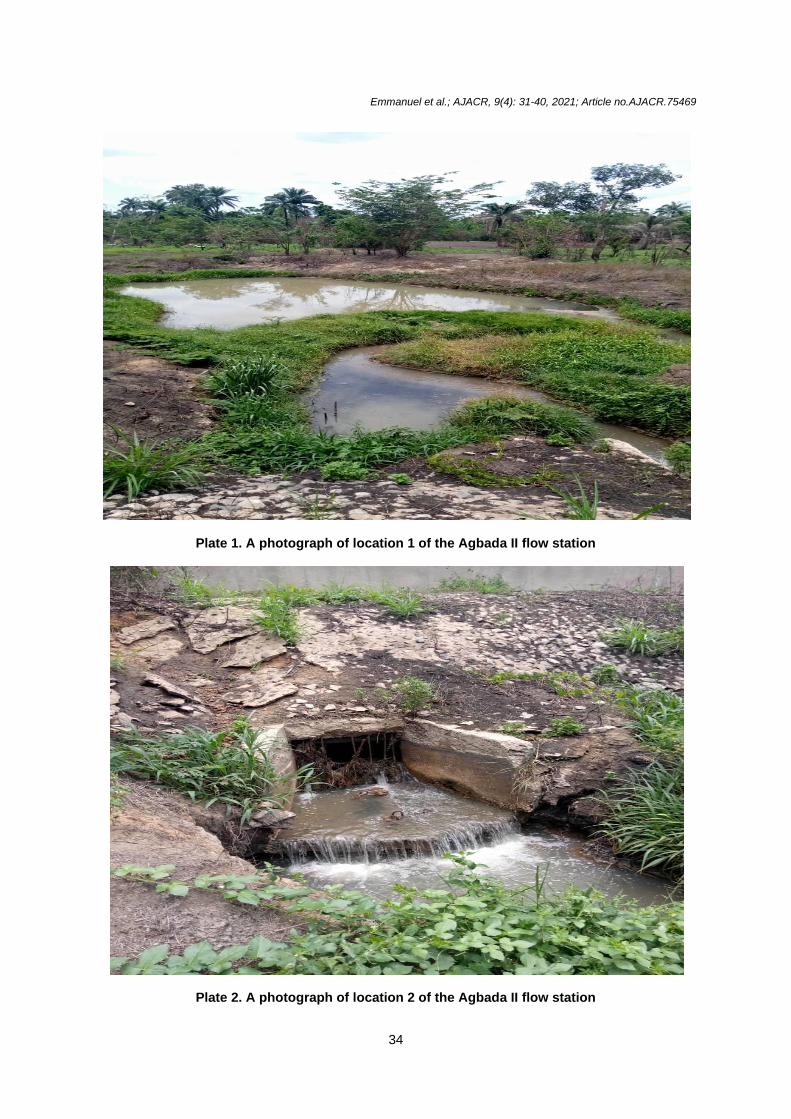
Plate 2. A photograph of location 2 of the Agbada II flow station
Emmanuel et al.; AJACR, 9(4): 31-40, 2021; Article no.AJACR.75469
35
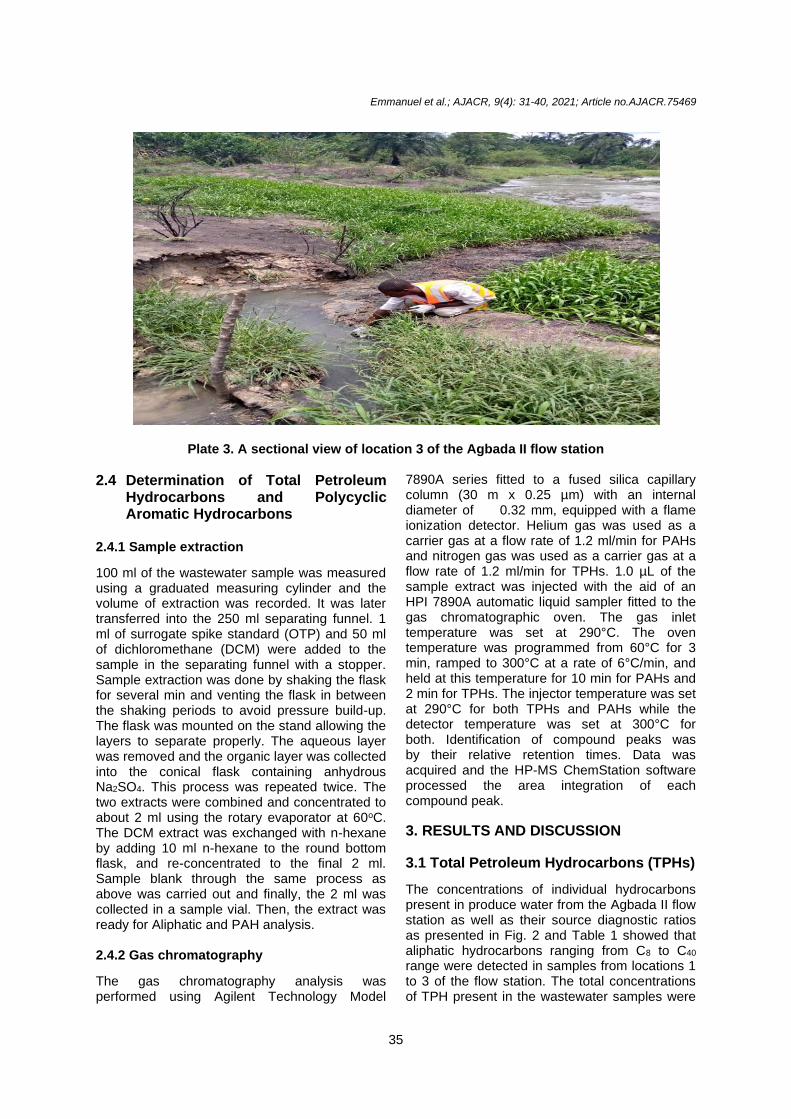
Plate 3. A sectional view of location 3 of the Agbada II flow station
2.4 Determination of Total Petroleum Hydrocarbons and Polycyclic Aromatic Hydrocarbons
2.4.1 Sample extraction
100 ml of the wastewater sample was measured using a graduated measuring cylinder and the volume of extraction was recorded. It was later transferred into the 250 ml separating funnel. 1 ml of surrogate spike standard (OTP) and 50 ml of dichloromethane (DCM) were added to the sample in the separating funnel with a stopper. Sample extraction was done by shaking the flask for several min and venting the flask in between the shaking periods to avoid pressure build-up. The flask was mounted on the stand allowing the layers to separate properly. The aqueous layer was removed and the organic layer was collected into the conical flask containing anhydrous Na2SO4. This process was repeated twice. The two extracts were combined and concentrated to about 2 ml using the rotary evaporator at 60oC. The DCM extract was exchanged with n-hexane by adding 10 ml n-hexane to the round bottom flask, and re-concentrated to the final 2 ml. Sample blank through the same process as above was carried out and finally, the 2 ml was collected in a sample vial. Then, the extract was ready for Aliphatic and PAH analysis. 2.4.2 Gas chromatography
The gas chromatography analysis was performed using Agilent Technology Model
7890A series fitted to a fused silica capillary column (30 m x 0.25 µm) with an internal diameter of 0.32 mm, equipped with a flame ionization detector. Helium gas was used as a carrier gas at a flow rate of 1.2 ml/min for PAHs and nitrogen gas was used as a carrier gas at a flow rate of 1.2 ml/min for TPHs. 1.0 µL of the sample extract was injected with the aid of an HPI 7890A automatic liquid sampler fitted to the gas chromatographic oven. The gas inlet temperature was set at 290°C. The oven temperature was programmed from 60°C for 3 min, ramped to 300°C at a rate of 6°C/min, and held at this temperature for 10 min for PAHs and 2 min for TPHs. The injector temperature was set at 290°C for both TPHs and PAHs while the detector temperature was set at 300°C for both. Identification of compound peaks was by their relative retention times. Data was acquired and the HP-MS ChemStation software processed the area integration of each compound peak.
3. RESULTS AND DISCUSSION
3.1 Total Petroleum Hydrocarbons (TPHs)
The concentrations of individual hydrocarbons present in produce water from the Agbada II flow station as well as their source diagnostic ratios as presented in Fig. 2 and Table 1 showed that aliphatic hydrocarbons ranging from C8 to C40
range were detected in samples from locations 1 to 3 of the flow station. The total concentrations of TPH present in the wastewater samples were
Emmanuel et al.; AJACR, 9(4): 31-40, 2021; Article no.AJACR.75469
36
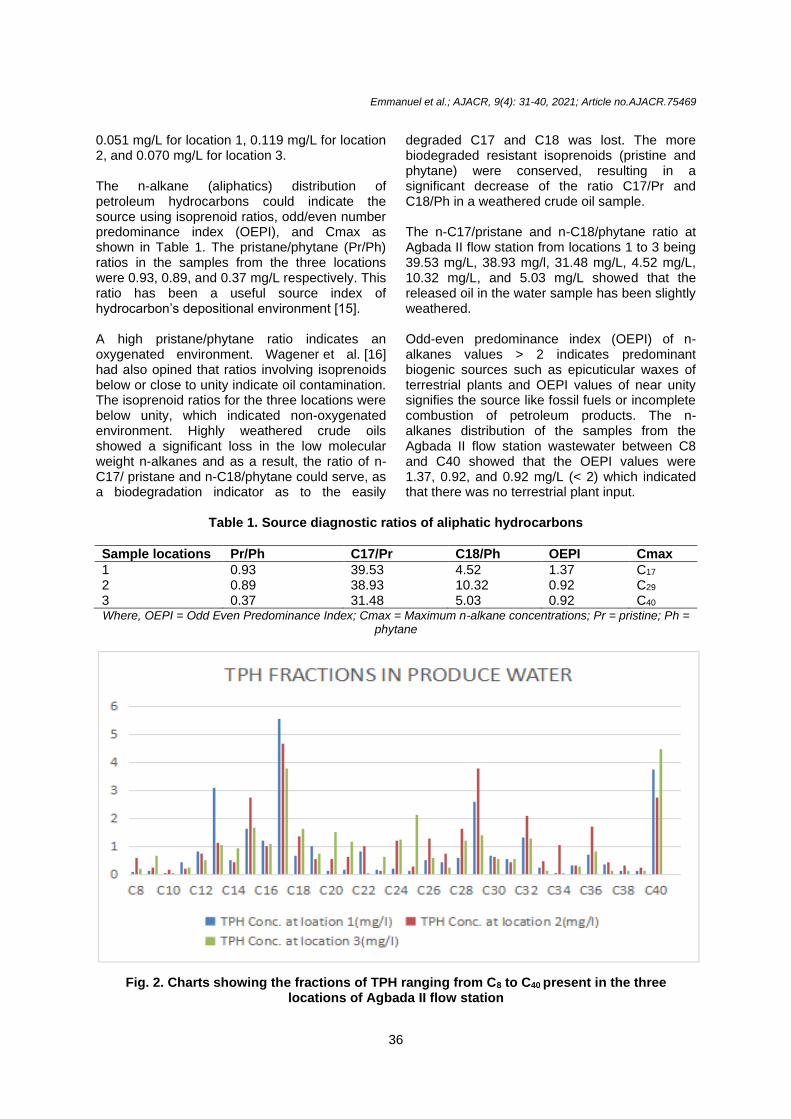
0.051 mg/L for location 1, 0.119 mg/L for location 2, and 0.070 mg/L for location 3. The n-alkane (aliphatics) distribution of petroleum hydrocarbons could indicate the source using isoprenoid ratios, odd/even number predominance index (OEPI), and Cmax as shown in Table 1. The pristane/phytane (Pr/Ph) ratios in the samples from the three locations were 0.93, 0.89, and 0.37 mg/L respectively. This ratio has been a useful source index of hydrocarbon’s depositional environment [15]. A high pristane/phytane ratio indicates an oxygenated environment. Wagener et al. [16] had also opined that ratios involving isoprenoids below or close to unity indicate oil contamination. The isoprenoid ratios for the three locations were below unity, which indicated non-oxygenated environment. Highly weathered crude oils showed a significant loss in the low molecular weight n-alkanes and as a result, the ratio of n-C17/ pristane and n-C18/phytane could serve, as a biodegradation indicator as to the easily
degraded C17 and C18 was lost. The more biodegraded resistant isoprenoids (pristine and phytane) were conserved, resulting in a significant decrease of the ratio C17/Pr and C18/Ph in a weathered crude oil sample. The n-C17/pristane and n-C18/phytane ratio at Agbada II flow station from locations 1 to 3 being 39.53 mg/L, 38.93 mg/l, 31.48 mg/L, 4.52 mg/L, 10.32 mg/L, and 5.03 mg/L showed that the released oil in the water sample has been slightly weathered. Odd-even predominance index (OEPI) of n-alkanes values > 2 indicates predominant biogenic sources such as epicuticular waxes of terrestrial plants and OEPI values of near unity signifies the source like fossil fuels or incomplete combustion of petroleum products. The n-alkanes distribution of the samples from the Agbada II flow station wastewater between C8 and C40 showed that the OEPI values were 1.37, 0.92, and 0.92 mg/L (< 2) which indicated that there was no terrestrial plant input.
Table 1. Source diagnostic ratios of aliphatic hydrocarbons
Sample locations Pr/Ph C17/Pr C18/Ph OEPI Cmax
1 0.93 39.53 4.52 1.37 C17 2 0.89 38.93 10.32 0.92 C29 3 0.37 31.48 5.03 0.92 C40 Where, OEPI = Odd Even Predominance Index; Cmax = Maximum n-alkane concentrations; Pr = pristine; Ph =
phytane
Fig. 2. Charts showing the fractions of TPH ranging from C8 to C40 present in the three locations of Agbada II flow station

Emmanuel et al.; AJACR, 9(4): 31-40, 2021; Article no.AJACR.75469
37
Table 2. Total Petroleum Hydrocarbon Fractions from three locations and DPR limit
TPH Location 1 (mg/L)
Location 2 (mg/L) Location 3 (mg/L) DPR limit (mg/L)
C8 0.12 0.63 0.21 C9 0.16 0.27 0.70 C10 0.07 0.17 0.06 C11 0.45 0.24 0.26 C12 0.85 0.78 0.53 C13 3.10 1.14 1.06 C14 0.53 0.47 0.96 C15 1.66 2.75 1.70 C16 1.22 1.03 1.10 C17 5.59 4.69 3.82 Pristane 0.14 0.12 0.12 C18 0.69 1.39 1.64 Phytane 0.15 0.14 0.33 C19 1.05 0.58 0.78 C20 0.15 0.56 1.52 C21 0.17 0.65 1.19 C22 0.84 1.02 0.03 C23 0.19 0.16 0.63 C24 0.23 1.23 1.26 C25 0.14 0.32 2.14 C26 0.53 1.33 0.62 C27 0.46 0.76 0.26 C28 0.63 1.65 1.23 C29 2.61 3.81 1.41 C30 0.69 0.66 0.59 C31 0.57 0.47 0.57 C32 1.35 2.11 1.29 C33 0.25 0.50 0.16 C34 0.07 1.07 0.09 C35 0.36 0.35 0.32 C36 0.75 1.75 0.85 C37 0.36 0.46 0.16 C38 0.16 0.35 0.16 C39 0.17 0.27 0.15 C40 3.78 2.77 4.48 Total 0.05 0.12 0.07 10.00
The results from the three locations showed that C17 had the highest percentages of total petroleum hydrocarbons. The concentration of TPH at C17 in location 1 was 5.591 mg/L, while that of locations 2 and 3 were 4.69, and 3.82 mg/L respectively. There was also a high concentration of TPH at C40 at location 3 having 4.48 mg/L. The concentrations of phytane in the three locations were 0.15 mg/L for location 1, 0.1351 mg/L for location 2, and 0.33 mg/L for location 3. The lowest percentages of hydrocarbons were observed at C34 for location 1 at 0.06 mg/L, and 0.08 mg/L. The value of C10 was also observed at 0.06 mg/L and 0.05 mg/L for locations 1, and 3
respectively. The total petroleum hydrocarbons obtained at the three locations in this study also were below the Department of Petroleum Resources (DPR) limit of 10.00 mg/L as shown in Table 2.
3.2 Polycyclic Aromatic Hydrocarbons (PAHs)
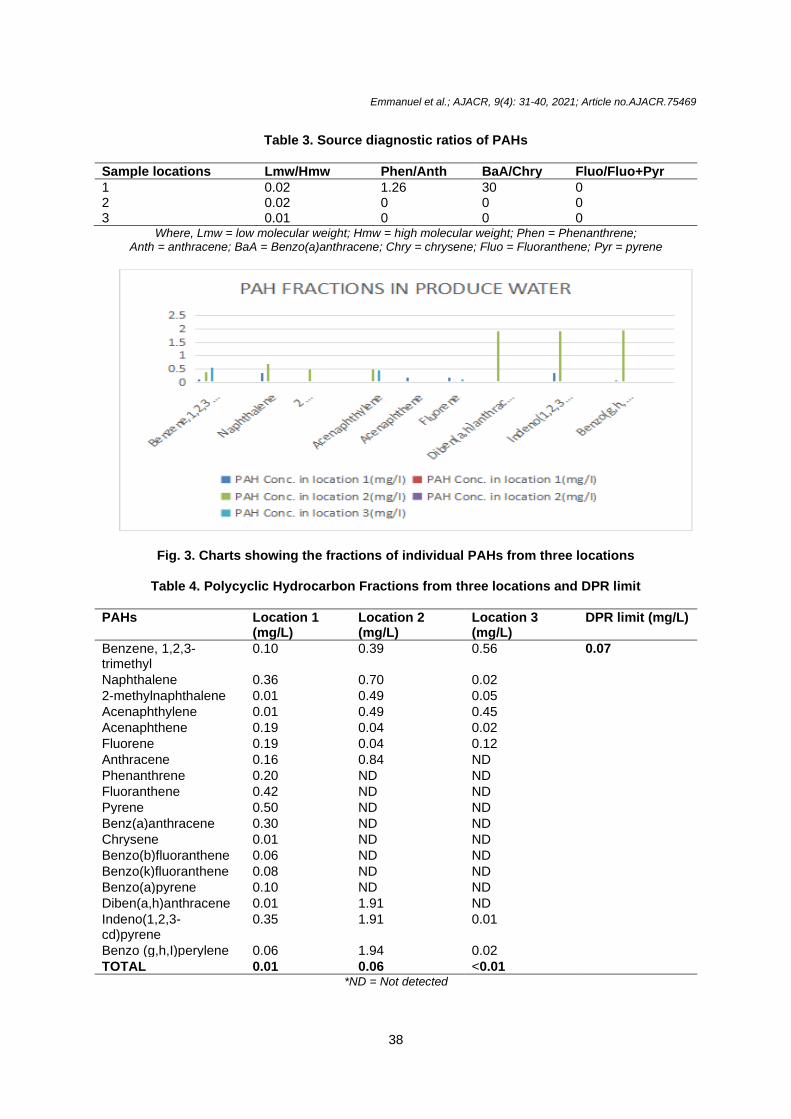
The concentrations of each polycyclic aromatic hydrocarbon and their source diagnostic ratios in the three locations as presented in Table 3 and Fig. 3 showed that the total concentrations of PAHs from the three locations were 0.01 mg/L for location 1, 0.06 mg/L for location 2, and < 0.01 mg/L for location 3, respectively.
Emmanuel et al.; AJACR, 9(4): 31-40, 2021; Article no.AJACR.75469
38
Table 3. Source diagnostic ratios of PAHs
Sample locations Lmw/Hmw Phen/Anth BaA/Chry Fluo/Fluo+Pyr
1 0.02 1.26 30 0 2 0.02 0 0 0 3 0.01 0 0 0
Where, Lmw = low molecular weight; Hmw = high molecular weight; Phen = Phenanthrene; Anth = anthracene; BaA = Benzo(a)anthracene; Chry = chrysene; Fluo = Fluoranthene; Pyr = pyrene
Fig. 3. Charts showing the fractions of individual PAHs from three locations
Table 4. Polycyclic Hydrocarbon Fractions from three locations and DPR limit
PAHs Location 1 (mg/L)
Location 2 (mg/L)
Location 3 (mg/L)
DPR limit (mg/L)
Benzene, 1,2,3- trimethyl
0.10 0.39 0.56 0.07
Naphthalene 0.36 0.70 0.02
2-methylnaphthalene 0.01 0.49 0.05
Acenaphthylene 0.01 0.49 0.45
Acenaphthene 0.19 0.04 0.02
Fluorene 0.19 0.04 0.12
Anthracene 0.16 0.84 ND
Phenanthrene 0.20 ND ND
Fluoranthene 0.42 ND ND
Pyrene 0.50 ND ND
Benz(a)anthracene 0.30 ND ND
Chrysene 0.01 ND ND
Benzo(b)fluoranthene 0.06 ND ND
Benzo(k)fluoranthene 0.08 ND ND
Benzo(a)pyrene 0.10 ND ND
Diben(a,h)anthracene 0.01 1.91 ND
Indeno(1,2,3-cd)pyrene
0.35 1.91 0.01
Benzo (g,h,I)perylene 0.06 1.94 0.02
TOTAL 0.01 0.06 <0.01 *ND = Not detected

Emmanuel et al.; AJACR, 9(4): 31-40, 2021; Article no.AJACR.75469
39
Low molecular weight PAHs showed predominance in all three locations, suggesting that petrogenic origin may be the most significant source of PAHs in the wastewater [17]. Diagnostic ratios have been used to determine the source of PAHs in the environment. Some of these PAHs isomer pairs were calculated to infer the probable sources of PAHs from the sample locations. Pyrogenic sources were suspected when the values of the Phe/Anth ratio were less than 1.00 (unity). The values obtained for this ratio as shown in Fig. 3 for all three locations were 1.26, 0, and 0, respectively. This result revealed petrogenic sources as the major source of PAHs in these locations. The value of Fluo/Fluo+py for these samples from the three locations showed no dominance of combustion since Fluo/Fluo+pyr 0.4 indicates petroleum spillage; ratio > 0.4 was for combustion sources [18]. The ratio from all three locations indicated petrogenic sources as seen in Table 3 and values for PAHs obtained were also below the DPR permissible limit as shown in Table 4. The ratio of BaA/Chry from all three locations was zero except at location 1, which confirmed the petrogenic origin of the oil [15]. The results from all the three locations showed that the concentrations of low molecular weight PAHs were much higher than the percentages of the high molecular weight PAHs. Phenanthrene and anthracene had the highest percentages in location 1 with 0.20 mg/L, and 0.84 mg/L at location 2, respectively. The percentage of high molecular weight polycyclic aromatic hydrocarbons from locations was zero because of prior treatment of the wastewater.
4. CONCLUSION
The results obtained from correlating the pollution of the wastewater from the different locations of the Agbada II flow station showed that the contaminations arose from a petrogenic source. The concentrations of the total petroleum hydrocarbons of the samples from the three locations were highest at carbon atom 17 and this suggests the biogenic contribution of organic matter. The chromatographs obtained gave evidence that the nature of the contamination was minimally crude oil. This study reveals that the level of total petroleum hydrocarbons (TPH) and polycyclic hydrocarbons (PAHs) obtained from all the samples were lower than the maximum recommended levels by the Department of Petroleum Resources (DPR). This
study recommends that the level of polycyclic hydrocarbons and total petroleum hydrocarbons should be consistent or even lower than these values because the presence of these contaminants even at lower concentrations can be injurious to health of people around the facility and beyond.
DISCLAIMER The products used for this research are commonly and predominantly use products in our area of research and country. There is absolutely no conflict of interest between the authors and producers of the products because we do not intend to use these products as an avenue for any litigation but for the advancement of knowledge. Also, the research was not funded by the producing company rather it was funded by personal efforts of the authors.
COMPETING INTERESTS Authors have declared that no competing interests exist.
REFERENCES
1. Megharaj M, Singleton I, McClure N, Naidu, R. Influence of petroleum hydrocarbon contamination on microalgae and microbial activities in a long-term contaminated soil. Arch. Environ. Cont. Toxicol. 2016;38:439-445.
2. Kumari N, Vashishtha A, Saini P, Menghani E. Isolation, identification and characterization of oil degrading bacteria isolated from the contaminated sites of Barmer, Rajasthan. Inter. J. Biotechnol. Bioeng. Res. 2013;4:429-436.
3. Alvarez P, Vogel T. Substrate interactions of benzene, toluene and para-xylene during microbial degradation by pure cultures and mixed cultures aquifer slurries. Appl. Environ. Micro. 1991; 57: 2981-2985.
4. Bardi L, Mattei A, Steffan S, Marzona M. Hydrocarbon degradation by a soil microbial population with β-cyclodextrin as surfactant to enhance bioavailability. Enzy. Microb. Technol. 2014;27:709-713
5. Egbe RE, Thompson D. Environmental challenges of oil spillage for families in oil producing communities of the Niger Delta region. J. Health Environ. Res. 2016; 13: 24-34.

Emmanuel et al.; AJACR, 9(4): 31-40, 2021; Article no.AJACR.75469
40
6. Ekanem AN, Osabor VN, Ekpo BO. Polycyclic aromatic hydrocarbons (PAHs) contamination of soils and water around automobile repair workshops in Eket metropolis, Akwa Ibom State, Nigeria. Springer Nat. Appl. Sci. 2019;1(447). https://doi.org/10.1007/s42452-019-0397-4.
7. Vanloocke R, De Borger R, Voets JP, Verstraete W. Soil and groundwater contamination by oil spills; problems and remedies. Inter. J. Environ. Stud. 1975; 8(1-4): 99-111.
8. Michael W, Anna Z. Consistently unreliable: Oil spill data and transparency discourse. Extr. Ind. Soc. 2020; 7(3): 790-795.
9. Horsfall (Jr) M, Spiff A. Principles of Environmental Pollution, Metroprints Limited Nigeria; 2011.
10. Kuppusamy S, Maddela NR, Megharaj M, Venkateswarlu K. An overview of total petroleum hydrocarbons. In: Total petroleum hydrocarbons. Springer, Cham. 2020; https://doi.org/10.1007/978-3-030-24035-6_1.
11. US Environmental Protection Agency. Provisional Guidance for Quantitative Risk Assessment of Polycyclic Aromatic Hydrocarbons; EPA/600/R/089; Office of Research and Development, US Environmental Protection Agency: Washington, DC, USA; 2003.
12. Ogeleka DF, Tudararo-Aherobo LE, Okieimen FE. Ecological effects of oil spill
on water and sediment from two riverine communities in Warri, Nigeria. Inter. J. Biol. Chem Sci. 2017;11(1): 453-461.
13. Gobo AE, Richard G, Ubong IU. Health Impact of Gas Flares on Igwuruta/Umuechem Communities in Rivers State. J. Appl. Sci. Environ. Manage. 2016; 13: 27-33.
14. Ned O, Victor-Oji C, Iwuoha G. Chemical fingerprinting and diagnostic ratios of Agbada 1 oil spill impacted sites in Niger Delta, Nigeria. Egypt. J. Pet. 2015; 25(4): 465-471.
15. Udoetok I, Osuji L. Gas chromatographic fingerprinting of crude oil from Idu-Ekpeye oil spillage site in Niger Delta, Nigeria. Environ. Monitor. Assess. 2018; 141: 359-364.
16. Wagener A, Hamacher C, Farias C, Marcus G, Scofield A. Evaluation of tools to identify hydrocarbon sources in recent and historical sediments of a tropical bay. Marine Chem. 2012; 121: 67-79.
17. Yang C, Wang Z, Yang Z, Hollebone B, Brown C, Landriault M, Fieldhouse B. Chemical fingerprints of Alberta oil sands and related petroleum products. Environ. Foren. 2011; 12: 173-188.
18. Jiaxing G, Jia F, Jingjing C. Characteristics of petroleum contaminants and their distribution in lake Taihu, China University of Petroleum, Beijing. Chem. Cent. J. 2012;6(92): 1-10.
© 2021 Emmanuel et al.; This is an Open Access article distributed under the terms of the Creative Commons Attribution License (http://creativecommons.org/licenses/by/4.0), which permits unrestricted use, distribution, and reproduction in any medium, provided the original work is properly cited.
Peer-review history: The peer review history for this paper can be accessed here:
https://www.sdiarticle4.com/review-history/75469