Embed Size (px)
Citation preview
TECHNICAL REPORTS
642
Mass balances on 10 polycyclic aromatic hydrocarbons (PAHs) in the New York–New Jersey Harbor (hereafter “the Harbor”) were constructed using monitoring data from the water column, sediment, and atmosphere. Inputs considered included tributaries, atmospheric deposition, wastewater treatment plant discharges, combined sewer overfl ows (CSOs), and stormwater runoff . Removal processes examined included tidal exchange between the Harbor and the coastal Bight and Long Island Sound, volatilization, and accumulation or burial of sediment-bound PAHs in the Harbor. Th e PAHs investigated were fl uorene, phenanthrene, fl uoranthene, pyrene, benz[a]anthracene, benzo[a]pyrene, perylene, benzo[ghi]perylene, indeno[1,2,3-cd]pyrene, and dibenz[a,h]anthracene. Th e results show inputs and outputs are fairly well balanced for most compounds, a fi nding that suggests aerobic biodegradation may not be a key loss process in this Harbor, as has been assumed in other systems. Th e main pathway for inputs of all PAHs is stormwater runoff . Atmospheric deposition is an important conveyor of PAHs with molecular weights ≤202 g mol−1. A principal objective of this report is to expose key data gaps, which include the need for comprehensive monitoring of both fl ow and PAH concentrations in stormwater and CSOs. An improved understanding of the key transmission routes of nonpoint source pollutants is essential for sustainable management of urban water resources.
Mass Balances on Selected Polycyclic Aromatic Hydrocarbons
in the New York–New Jersey Harbor
Lisa A. Rodenburg* Rutgers University
Sandra N. Valle, Marta A. Panero, and Gabriela R. Muñoz New York Academy of Sciences
Leslie M. Shor University of Connecticut
Polycyclic aromatic hydrocarbons (PAHs) are ubiqui-
tous organic compounds containing two to eight fused aro-
matic rings. Polycyclic aromatic hydrocarbon compounds can
be produced naturally via volcanoes and forest fi res; however,
PAHs in the urban environment are dominated by those aris-
ing from anthropogenic sources, which include various combus-
tion processes (burning of wood, coal, gasoline, diesel, natural
gas, municipal waste, etc.). In most cases, humans are exposed
to PAHs mainly by breathing contaminated ambient air, eating
grilled meat, and inhaling tobacco smoke. Th e U.S. Department
of Health and Human Services has determined that some PAHs
may reasonably be expected to be carcinogens. Some PAHs,
most notably benzo[a]pyrene, are known as probable human
carcinogens (Agency for Toxic Substances and Disease Registry,
1995). Benzo[a]pyrene is on the U.S. Environmental Protection
Agency (USEPA) list of 12 priority Persistent, Bioaccumulative,
and Toxic (PBT) chemicals currently being addressed under its
PBT initiative (http://www.epa.gov/pbt/ [verifi ed 13 Jan. 2010]).
Furthermore, PAHs are part of a group of 31 priority chemicals
that the USEPA has identifi ed for source reduction under the
National Partnership for Environmental Priorities.
Due to their ubiquitous presence and potential to cause
adverse human health eff ects, PAHs are a concern in all urban
watersheds. Historical contamination can have ongoing eff ects to
biota in urban watersheds (Cooper et al., 2009). Th e complex-
ity of such watersheds, however, makes the construction of eco-
system mass balances challenging. Most urban watersheds have
not been subjected to the kind of intense data-gathering eff orts
required to adequately characterize sources. Th e New York–New
Jersey Harbor (hereafter “the Harbor”) is likely an exception. Th e
Abbreviations: CARP, Contamination Assessment and Reduction Project; CSOs,
combined sewer overfl ows; IEC, Interstate Environmental Commission; MW, molecular
weight; NJADN, New Jersey Atmospheric Deposition Network; NJDEP, New Jersey
Department of Environmental Protection; NYSDEC, New York State Department of
Environmental Conservation; PAHs, polycyclic aromatic hydrocarbons; POC, particulate
organic carbon; REMAP, Regional Environmental Monitoring and Assessment Program.
L.A. Rodenburg, Dep. of Environmental Sciences, Rutgers Univ., 14 College Farm Rd.,
New Brunswick, NJ 08901; S.N. Valle, M.A. Panero, and G.R. Muñoz, New York Academy
of Sciences, 7 World Trade Center, 250 Greenwich St., 40th Floor, New York, NY 10007-
2157; M.A. Panero, current address: Robert F. Wagner Graduate School of Public Policy,
New York Univ., 295 Lafayette St., Ste. 2317, New York, NY 10012; G.R. Muñoz, current
address: New York-New Jersey Harbor Estuary Program, New England Interstate
Water Pollution Control Commission, 290 Broadway, 24th Floor, New York, NY 10007;
L.M. Shor, Dep. of Chemical, Materials and Biomolecular Engineering and Center for
Environmental Science and Engineering, Univ. of Connecticut, Storrs, CT 06269-3222.
Assigned to Associate Editor Steven Siciliano.
Copyright © 2010 by the American Society of Agronomy, Crop Science
Society of America, and Soil Science Society of America. All rights
reserved. No part of this periodical may be reproduced or transmitted
in any form or by any means, electronic or mechanical, including pho-
tocopying, recording, or any information storage and retrieval system,
without permission in writing from the publisher.
Published in J. Environ. Qual. 39:642–653 (2010).
doi:10.2134/jeq2009.0264
Published online 29 Jan. 2010.
Received 10 July 2009.
*Corresponding author, formerly Lisa A. Totten
© ASA, CSSA, SSSA
677 S. Segoe Rd., Madison, WI 53711 USA
TECHNICAL REPORTS: SURFACE WATER QUALITY
Rodenburg et al.: Mass Balances on 10 PAHs in the New York–New Jersey Harbor 643
Contamination Assessment and Reduction Project (CARP)
(Contamination Assessment and Reduction Project, 2007a
and 2007b) and other extensive monitoring eff orts have made
it possible to assess loadings and losses for this system. Such an
analysis can help scientists and policymakers establish targeted
programs to prevent primary emission or secondary transmis-
sion of contaminants—including PAHs—in urban water-
sheds. Previous attempts to assess PAH contamination in the
Harbor have been hampered by a lack of data on regional PAH
concentrations due to both a limited number of studies and
diffi culties associated with measuring PAHs in environmental
media. For example, Farley et al. (1999) used PAH concentra-
tion data from the Great Lakes region to estimate atmospheric
deposition to the Harbor.
Th e goal of this work has been to estimate loads and losses
of 10 PAH compounds from various transmission routes to
the Harbor to identify the key loading pathways and thereby
to inform policies designed to stem or lessen these loadings.
Th e focus of this investigation is on loads because they are
better characterized and can be calculated with less uncertainty
than losses. Rough estimates of losses are also presented. To
the extent that the Harbor is typical of urban watersheds in
the United States, the results should increase our understand-
ing of the types of processes that are important for the cycling
of PAHs in urbanized estuaries. To our knowledge, this report
represents the fi rst attempt to construct a mass balance on
PAHs in the Harbor based entirely on data collected in the
Harbor region.
Materials and Methods
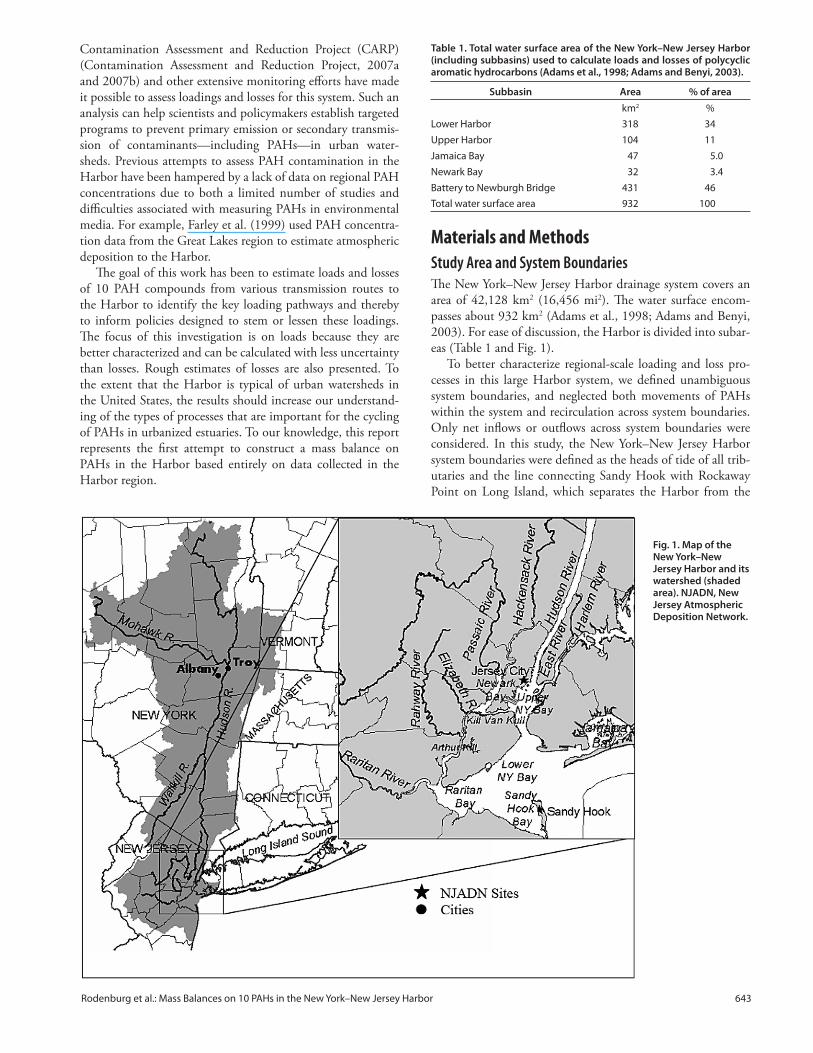
Study Area and System BoundariesTh e New York–New Jersey Harbor drainage system covers an
area of 42,128 km2 (16,456 mi2). Th e water surface encom-
passes about 932 km2 (Adams et al., 1998; Adams and Benyi,
2003). For ease of discussion, the Harbor is divided into subar-
eas (Table 1 and Fig. 1).
To better characterize regional-scale loading and loss pro-
cesses in this large Harbor system, we defi ned unambiguous
system boundaries, and neglected both movements of PAHs
within the system and recirculation across system boundaries.
Only net infl ows or outfl ows across system boundaries were
considered. In this study, the New York–New Jersey Harbor
system boundaries were defi ned as the heads of tide of all trib-
utaries and the line connecting Sandy Hook with Rockaway
Point on Long Island, which separates the Harbor from the
Table 1. Total water surface area of the New York–New Jersey Harbor (including subbasins) used to calculate loads and losses of polycyclic aromatic hydrocarbons (Adams et al., 1998; Adams and Benyi, 2003).
Subbasin Area % of area
km2 %
Lower Harbor 318 34
Upper Harbor 104 11
Jamaica Bay 47 5.0
Newark Bay 32 3.4
Battery to Newburgh Bridge 431 46
Total water surface area 932 100
Fig. 1. Map of the New York–New Jersey Harbor and its watershed (shaded area). NJADN, New Jersey Atmospheric Deposition Network.
644 Journal of Environmental Quality • Volume 39 • March–April 2010
New York Bight (Fig. 1). Th e East River, which is not a true
river but a channel connecting Long Island Sound to the
Upper Harbor, is another boundary. Although there is sub-
stantial dynamic recycling between bottom sediment and sus-
pended sediment in a typical estuary, net sediment movement
is governed by nontidal gravitational forces (Grabemann and
Krause, 1989). Th erefore, to unambiguously identify key input
and output sources to the Harbor, we focused our mass bal-
ance on the Harbor water column itself, and defi ned the inter-
face between the water column and the sediment as another
system boundary. As a result, bottom sediments are external
to this Harbor system, and loss processes occurring in bottom
sediment such as PAH biodegradation and dredging were not
considered. Although accumulation of sediment-bound PAHs
in the bottom sediments of the Harbor removes them from
the water column, it does not remove them from the Harbor
ecosystem itself and therefore is not truly a loss process.
Polycyclic Aromatic Hydrocarbons Loading
and Loss PathwaysPathways of PAHs to the Harbor considered in this paper
include tributaries, atmospheric deposition via wet and dry
particle deposition and gross gas absorption, wastewater treat-
ment plant discharges, CSOs, and stormwater runoff . Th e
tributaries considered are the Hudson, Wallkill, and Mohawk
rivers in New York, and the Hackensack, Passaic, Raritan,
Elizabeth, and Rahway rivers in New Jersey.
Direct petrogenic-related inputs, including oil spills and
creosote, have been identifi ed as important sources of PAHs in
other studies, especially in localized regions directly adjacent
to sites of major oil spills or wood treatment facilities (Iannuzi
et al., 1995; Katz, 1998; Brenner et al., 2002; Walker et al.,
2005). Reported oil spills directly in the Harbor were deter-
mined not to be a major source of PAHs, and we know of no
currently operating wood treatment facilities in the immediate
vicinity of the Harbor. Ongoing emissions from individual oil
spills and leaching from creosote-treated wood pilings in the
Harbor area were considered in a previously published report
related to this study (Valle et al., 2007). Leaching of PAHs from
creosote-treated wood may be an important individual emis-
sion source of PAHs in the watershed as a whole. However, it is
diffi cult to estimate the magnitude of this input due to the lack
of long-term leaching studies and the diffi culty in determin-
ing the number of marine pilings in the Harbor. Nevertheless,
emission estimates of creosote to the Harbor directly (i.e., via
creosote-treated marine pilings) were estimated and are likely to
be minor for most PAHs relative to other input sources (Valle
et al., 2007). Other processes, such as groundwater discharges
to the Harbor from leaking underground storage tanks, erosion
of PAH-laden soils within the Harbor area (for example, super-
fund sites associated with creosote production, wood-treatment,
or manufactured gas production), or unidentifi ed point sources
could represent important loadings of PAHs to the Harbor, but
the data necessary to evaluate their importance are unavailable.
Losses considered include tidal exchange with the Bight and
Long Island Sound and volatilization. Sedimentation (accu-
mulation or storage in sediments) is also calculated, although
as noted above this is not a true loss process. Aerobic degra-
dation of PAHs in the water column is a potential loss pro-
cess that is not included because the parameters necessary to
accurately estimate it are lacking. Th ere is no clear consensus
in the literature on the importance of biodegradation in estu-
aries. Th e water quality model for the Harbor developed by
HydroQual does not consider degradation of PAHs at all due
to the absence of strong evidence indicating that such degrada-
tion is occurring (HydroQual, 2007).
Modeling Loads and LossesFlows of PAHs in surface water, including inputs from the
New York tributaries, wastewater treatment plants, CSOs,
stormwater, and outfl ows from tidal exchange, were quantifi ed
as mass fl ow rates:
aq diss part( )M C C Q= + [1]
where Maq
is the mass fl ow rate (in or out) via the aqueous
phase (kg yr−1), Cdiss
is the PAH concentration in the dissolved
phase (kg m−3), Cpart
is the PAH concentration in the particle
phase, and Q is the annual volumetric fl ow rate (m3 yr−1).
Loadings of PAHs from the New Jersey tributaries were
not computed according to Eq. [1] because the concentration
information available at the head of tide of the New Jersey
tributaries was not background-corrected. Instead, loads were
generated by the U.S. Geological Survey (USGS) and are
described in detail elsewhere (Bonin and Wilson, 2007). In
brief, particle-phase PAH concentrations were normalized to
particulate organic carbon (POC), and these concentrations
were multiplied by the POC loads. Th e POC loads were con-
structed using rating curves that describe the concentration of
POC as a function of river fl ow. Th ese loads do not include an
estimate of uncertainty.
Input pathways of atmospheric PAHs include gas absorp-
tion of gaseous PAHs and wet and dry deposition of particle-
associated PAHs. Loadings to the Harbor from the atmosphere
from these processes combined, Matm-in
(kg yr−1) were com-
puted as follows
gatm-in g p p r r
H
( )K
CM v C v C v A= + + [2]
where Cg and C
p are the concentrations of PAHs in the atmo-
sphere in the gaseous phase and associated with atmospheric
particles, respectively (kg m−3), and Cr is the concentration of
PAHs in rain (kg m−3). Th ese concentrations were multiplied
by deposition velocity vg, v
p, or v
r (m yr−1), for the gaseous,
particle-associated, and rain phases, respectively. Th e PAH
concentrations in the gas phase were converted to aqueous con-
centrations using KH, the temperature-corrected Henry’s Law
constant, as described elsewhere (Gigliotti et al., 2002). Th e
resulting fl uxes were converted to a mass fl ow rate by multiply-
ing by the Harbor area, A (m2).
Th e loss of PAHs from the Harbor due to volatilization
(Matm-out
) was calculated by
atm-out diss gM C v A= [3]
where Cdiss
is dissolved concentration of PAHs (kg m−3).
Rodenburg et al.: Mass Balances on 10 PAHs in the New York–New Jersey Harbor 645
Mass outfl ows of PAHs via net sediment settling were com-
puted by
s sM C SA= [4]
where Cs is the concentration of PAHs in sediment (kg m−3),
and S is the net sedimentation rate (m of sediment yr−1).
Estimating UncertaintyAlthough more complete than any previous mass balance study
for PAHs in the Harbor, our study is limited by a lack of detailed
environmental monitoring data. For example, particle-phase
PAH concentrations in each tributary were measured by the
CARP in just eight to 14 grab samples from 1998 to 2001. Th e
paucity of data made it challenging to characterize uncertainty
in loading and losses estimates. Furthermore, although it is
well known that in most river systems the majority of sediment
load (and associated PAHs) moves during a few extreme events,
limitations in the available data made it impossible to recon-
struct hydrographs for all tributaries and integrate loads from
paired fl ow and concentration data, as has been recommended
(Webb et al., 2000). In fact, for the CARP data set, there was
no signifi cant correlation between particle-phase PAH concen-
trations and tributary fl ow rate or POC concentrations for the
New York tributaries. Although sediment total organic carbon
(TOC) content and PAH concentration are widely known to
be highly correlated, Ouyang et al. (2006) similarly found no
correlation either in space or time in two Florida rivers because
major TOC and PAH inputs to the systems were widely segre-
gated. Th ese researchers stress the importance of better charac-
terization of pollutant input sources to understand eff ects on
sediment systems (Ouyang et al., 2006).
Our approach for estimating infl ows and outfl ows and
characterizing their uncertainty was to multiply each available
concentration by each available annual volumetric fl ow rate or
average transport velocity (i.e., deposition velocity, or settling
velocity) and to report the 25th, 50th, and 75th percentile loads
of the resulting matrix along with its mean. For water-based
input and output pathways, where PAH concentrations were
available separately for aqueous and particle-bound phases, the
mean, median, 25th, and 75th percentile loads were calculated
separately for each phase and then summed. Our approach is
to rely directly on the full scope of all available data to char-
acterize variability in loadings estimates. Th e major drawback
of our unweighted full factorial approach may be a tendency
to skew loads low because uncommon extreme events are less
likely to have been sampled, yet may comprise a dispropor-
tionately large proportion of total infl ows. For similar reasons,
our approach may also tend to underestimate variability. Our
approach was also not able to account for autocorrelation in
parameters, for example between PAH aqueous concentrations
and tributary volumetric fl ow rate.
Uncertainty could not be propagated and calculated ana-
lytically. Concentration data are often distributed log normally,
while volumetric fl ow rates tend to be distributed normally.
Th ere is no accepted analytical procedure for propagating error
for the product of a log-normally distributed parameter with
a normally distributed parameter, even assuming enough data
were available to identify the parameter distributions accurately.
Other authors have used a numerical Monte Carlo
approach to compute loads and estimate uncertainty (Venier
and Hites, 2008; Schenker et al., 2009). In Monte Carlo simu-
lations, individual data sets are fi t to distributions, then the
distributions are sampled repeatedly in evaluating the loading
model, and summary statistics for thousands of computations
are reported directly. Th is approach was not warranted in the
present work because of the diffi culty of uniquely identifying
parameter distributions from sparse data sets.
Th e uncertainty in all input and output pathways could not
be estimated using the metrics of the full factorial matrix. Since
the publicly available New Jersey CARP surface water PAH
concentration data did not include information on blanks nec-
essary to perform background correction, we judged it was pref-
erable to use the results from a separate USGS analysis, wherein
USGS used the CARP data to calculate tributary loads (Bonin
and Wilson, 2007). In calculating these loads, USGS used a
diff erent procedure in which particle-phase PAH concentra-
tions were normalized to POC. Th e USGS did not include an
estimate of uncertainty in these loads. Also, volumetric fl ow
rate information for several input and output pathways were
so sparse that a single best estimate value was used instead and
multiplied by an average concentration, as described below.
Pathways where a single best estimate of annual volumetric
fl ow rate was used include infl ows from CSOs and outfl ows
from tidal exchange and sedimentation. Because uncertainly
on losses was so poorly characterized in general, loss estimates
should be considered as rough estimates only, and are provided
here primarily for comparison purposes.
Polycyclic Aromatic Hydrocarbons ConsideredMass balances were constructed for fl uorene, phenanthrene, fl u-
oranthene, pyrene, benz[a]anthracene, benzo[a]pyrene, perylene,
benzo[ghi]perylene, indeno[1,2,3-cd]pyrene, and dibenz[a,h]
anthracene. Th ese compounds were chosen because they repre-
sent a wide range of molecular weights, which are closely related
to the physical properties of the compounds. In addition, these
PAHs were measured in all three of the key data sets (i.e., CARP,
New Jersey Atmospheric Deposition Network [NJADN], and
Regional Environmental Monitoring and Assessment Program
[REMAP]). Furthermore, these compounds (except for per-
ylene) are included in the 16 priority PAHs designated by the
USEPA. Compounds with molecular weight (MW) <202 g
mol−1, including fl uorene, phenanthrene, fl uoranthene, and
pyrene, are referred to here as low-MW PAHs, while the remain-
ing compounds are grouped into the high-MW PAH category.
Data Sources—Polycyclic Aromatic
Hydrocarbon ConcentrationsConcentration information for 22 PAHs in surface waters, sewer
overfl ows, wastewater treatment plant effl uent, and stormwater is
available from the CARP. Information on regional atmospheric
concentrations of 27 PAHs is available from the NJADN. Finally,
Harbor sediment concentrations for 17 PAHs are available from
the REMAP. Th is project is made possible by the availability of
high-quality monitoring data for a wide range of PAHs in the
water, air, and sediment of the Harbor region.
646 Journal of Environmental Quality • Volume 39 • March–April 2010
Th e CARP is a collaborative eff ort among several federal,
state, and nongovernmental partners that involved environ-
mental data collection by the New York State Department
of Environmental Conservation (NYSDEC), the New Jersey
Department of Environmental Protection (NJDEP), and the
USGS. Th e NYSDEC CARP samples were collected during
1998 to 2001 and the NJDEP CARP data were collected
during 2000 to 2002. Th e CARP measured PAHs by isotope
dilution gas chromatography with high-resolution mass spec-
trometry. Details of the methodology are available in a vari-
ety of reports through two Web sites: http://www.state.nj.us/
dep/dsr/njtrwp/ (verifi ed 13 Jan. 2010) and http://www.dec.
ny.gov/chemical/23839.html (verifi ed 13 Jan. 2010), and the
raw CARP data are available by request (http://www.carpweb.
org [verifi ed 14 Jan. 2010]).
Th e CARP data were used to construct PAH loads from
tributaries, wastewater treatment plants, CSOs, and storm-
water outfl ows, and to calculate losses from the Harbor due
to volatilization and tidal exchange. Th e CARP generally pro-
vided PAH concentration data as both aqueous and particle-
bound phases, except for tributary samples.
Information on blank concentrations was not available for
the NJDEP CARP data, so the NYSDEC CARP data were
used where possible. Th e sole exception was data from storm-
water outfalls. New Jersey CARP data from stormwater outfalls
were used in the mass balance because PAH concentrations in
the stormwater samples were generally high enough that blank
correction was not necessary.
Th e PAH inputs from New York tributaries were calculated
using particle-phase concentrations at the head of tide (i.e., the
farthest point upstream where a river is aff ected by tidal fl uctua-
tions). Dissolved-phase PAHs were not measured in these tribu-
taries. Th e dissolved-phase load was therefore estimated using
all dissolved-phase measurements from CARP samples collected
from other areas of the Harbor. About 90 of these were available,
but many PAHs were below detection limit in the majority of
these samples. One-half the detection limit was therefore used as
the concentration in these samples. Th is represents a reasonable
compromise between discarding below-detection-limit data,
which would result in a load estimate that is biased high, and
substituting zero for below-detection-limit data, which would
result in a load estimate that is biased low. Because the dissolved-
phase load is estimated using data collected in other areas of the
Harbor, it is less accurate than the particle-phase load and may
be biased high, because other areas of the Harbor tend to be
more contaminated that the northern tributaries, which lie well
outside the New York City metropolitan area.
Volatilization losses were based on dissolved PAH concen-
trations from the locations within the Harbor that represent
the largest portion of the total surface area: the Hudson River,
Jamaica Bay, and the Lower Bay. Tidal exchange terms were
calculated using PAH concentrations measured in Raritan Bay,
New York Bight, Long Island Sound, and Hudson River below
the Harlem River in both dissolved and particle-bound forms.
Th e NJADN measured atmospheric concentrations of 27
PAHs at several sites in New Jersey every 12th day for a period of
4 yr starting in 1997 (Gigliotti et al., 2005). Polycyclic aromatic
hydrocarbons in the gaseous, particle-associated, and aqueous
(precipitation) phases were measured by isotope dilution gas
chromatography with low-resolution mass spectrometry via
methods detailed elsewhere (Gigliotti et al., 2005). Th e NJADN
included two sites within the Harbor watershed at Sandy Hook
and Jersey City. In general, atmospheric concentrations of
PAHs are higher by about a factor of 4 at Jersey City than at the
more remote Sandy Hook (Gigliotti et al., 2005). Yan (2003)
reports PAH concentrations in the atmosphere at a location
in the middle of Raritan Bay that were generally higher than
those measured at Sandy Hook and lower than those measured
at Jersey City. Th us, the PAH concentrations measured at Jersey
City and Sandy Hook are assumed to be representative of con-
centrations throughout the Harbor, and both data sets were used
to characterize atmospheric PAH concentrations for this study.
Sedimentation losses were estimated using data from
REMAP, which includes measurements of 17 PAHs in sedi-
ment samples collected during 1993–1994 and 1998 at 28
locations in each of four subbasins of the Harbor (Adams et al.,
1998; Adams and Benyi, 2003). Th e four subbasins included in
the REMAP were the Upper Harbor, Lower Harbor, Newark
Bay, and Jamaica Bay. REMAP data from the Upper Harbor
were used for the Battery to Newburgh Bridge area. Th e 1998
REMAP data set (Adams and Benyi, 2003) is the most recent
available and was used for all but dibenz[a,h]anthracene.
Th is PAH was not included in the 1998 REMAP study, so
the 1993–1994 sediment concentrations were used instead
(Adams et al., 1998).
Although data for all 10 PAHs were available in all data
sets, CARP and REMAP measured dibenz[a,h]anthracene,
while NJADN measured dibenz[a,h+a,c]anthracene. Use of
the combined compound data from NJADN may overestimate
loadings from atmospheric processes to the Harbor; however,
atmospheric inputs for dibenz[a,h]anthracene are small com-
pared with overall loadings so this issue is unlikely to impact
the overall mass balance for this compound.
Data Sources—Volumetric Flow Rates: TributariesAverage annual volumetric fl ow rates for the New York trib-
utaries for the years 1980 to 2007 were taken from USGS
reports and are available online (http://wdr.water.usgs.gov/
[verifi ed 13 Jan. 2010]). New Jersey tributary fl ow information
was not needed because loads of PAHs from the New Jersey
tributaries were taken directly from Bonin and Wilson (Bonin
and Wilson, 2007).
Data Sources—Volumetric Flow Rates:
Wastewater Treatment PlantsTh e Harbor receives about 94 m3 s−1 in effl uent from about 70
wastewater treatment plants according to annual reports published
by the Interstate Environmental Commission (IEC) (http://www.
iec-nynjct.org/publications.htm [verifi ed 21 Jan. 2010]). In com-
parison, fl ow of the Hudson River past Manhattan is about 430
m3 s−1 for most of the year (Farley et al., 1999). For the CARP, the
NYSDEC sampled 18 wastewater treatment plants in New York.
Th ese 18 plants discharge about 85% of the total wastewater fl ow
to the Harbor. Total volumetric fl ow rates through all plants in
the area are reported annually and are available online for 2000 to
2007 (http://www.iec-nynjct.org/publications.htm [verifi ed 21
Jan. 2010]). Th ese IEC reports include fl ow data for between 68
Rodenburg et al.: Mass Balances on 10 PAHs in the New York–New Jersey Harbor 647
and 75 plants (depending on the year). Th e total fl ows for each
year through all plants were multiplied by the effl uent concentra-
tions from the CARP data set.
Data Sources—Volumetric Flow Rates:
Combined Sewer Overfl owsCalculating CSO loads was challenging due to lack of informa-
tion on CSO fl ows. Th e most comprehensive monitoring of
CSOs performed in the area occurred during the 1980s as part
of a CSO facilities planning study. Th e results of this monitor-
ing resulted in a reported fl ow of about 12 m3 s−1 for the 1987–
1988 water-year (HydroQual, 1991). Th is reported fl ow did not
include an estimate of uncertainty. Since this time, there has not
been a comprehensive program to monitor CSO fl ows in the
Harbor region, although some cities and collection systems have
performed intermittent monitoring of CSO fl ows. Th erefore,
current CSO fl ow rates were calculated in two ways. Th e fi rst
used data from the Jamaica Bay Watershed Protection Plan. Th is
plan lists a CSO fl ow to Jamaica Bay of 2355 million gallons
yr−1 (0.28 m3 s−1), which represents 2.6% of the total wastewater
treatment plant effl uent fl ow into Jamaica Bay. Assuming that
this percentage is representative of the Harbor as a whole, the
total CSO fl ow into the Harbor would be 2.6 m3 s−1, or about
22% of the 1987–1988 fl ow. Th is seems reasonable because there
have been extensive eff orts to increase CSO capture and therefore
decrease CSO fl ows since the 1980s (http://www.iec-nynjct.org/
publications.htm [verifi ed 21 Jan. 2010]). Th e second approach
to estimating CSO fl ow is based on fl ow statistics reported by the
IEC. Th e IEC reports that 12% of total wastewater treatment
plant fl ow is in the form of CSOs, and that New York City’s cur-
rent capture rate for CSOs is 69%. Multiplying these percent-
ages suggests that 3.7% of the total wastewater treatment plant
effl uent fl ow is untreated CSO inputs into the Harbor. Th is is in
fairly good agreement with the 2.6% estimate given above. Both
of these estimates of fl ow are obviously highly uncertain. We have
used the higher 3.7% number, coincidentally corresponding to
3.7 m3 s−1, to estimate CSO loads. Th e New York CARP data
set contains four to fi ve CSO samples, so both the fl ow and the
concentration are highly uncertain. Because of the high degree
of uncertainty, we have elected to present the best estimate CSO
loads without error bars.
Data Sources—Volumetric Flow Rates: StormwaterEstimates of stormwater fl ows to the Harbor for six water-years
were kindly provided by Robin Miller of HydroQual (personal
communication, 2004). Th e HydroQual estimates are based
on the detailed hydrodynamic model of the Hudson River and
its estuary, developed over the last 25 yr. Th e area of the estuary
in the HydroQual model is essentially the same as the Harbor
in the present study except that in the HydroQual model, the
estuary begins at Piermont Marsh (Piermont, NY) as opposed
to Troy, NY. Stormwater fl ows were calculated based on the rain
that actually fell and the ground cover type in the drainage area
on an hourly basis for October to September in six water-years:
1988–1989, 1994–1995, 1998–1999, 1999–2000, 2000–
2001, and 2001–2002. Th e estimated stormwater fl ows range
from 462 to 1062 million m3 yr−1 and average 710 million m3
yr−1. For comparison, the fl ow of stormwater into the Harbor
has been estimated by the USEPA (TAMS Consultants, Inc.
and Gradient Corporation, 1995) to be about 900 million m3
yr−1 (converted from approximately 1000 ft3 s−1).
Data Sources—Volumetric Flow Rates: Tidal ExchangeVolumetric fl ow rates reported by Rosenthal and Perron-
Cashman (2002) were used to estimate mass fl ows from tidal
exchange into and out of Raritan Bay and the New York–New
Jersey Bight. Th ese authors report the fl ow of water from the
Harbor to the Bight to be 1971 m3 s−1, and the fl ow of ocean
water into the Harbor to be 726 m3 s−1. Caplow (2004) reports
tidal exchange fl ows in the East River which are 630 m3 s−1
from the Long Island Sound to the Harbor, and 430 m3 s−1
from the Harbor to the Sound. Although the net fl ow is into
the Harbor, the higher contaminant concentration in the
Harbor results in net export for most contaminants, including
all PAHs investigated here.
Data Sources—Air–Water Exchange Mass
Transfer Coeffi cientsTh e air–water exchange mass transfer coeffi cient, v
g (also
referred to as the gaseous deposition velocity or the volatiliza-
tion velocity) is typically based on tracer studies for exchange
of tracer gasses such as SF6 and CO
2 as a function of wind
speed. Th e resulting vg is a function of wind speed as well as
the physicochemical properties of the compound. Using this
methodology, described in detail by Gigliotti et al. (2002), this
study used 100 values of vg calculated for PAHs using 100 wind
speed values designed to replicate the typical wind speed distri-
bution observed in the region at Newark Liberty International
Airport in Newark, NJ.
Dry deposition velocities (vp) were taken from the literature.
Here, we use all available values of vp included in fi ve published
papers (Sheu et al., 1996; Franz et al., 1998; Odabasi et al.,
1999; Vardar et al., 2002; Shannigrahi et al., 2005). Th ese 81
values were log-normally distributed and ranged from 0.006 to
2.04 cm s−1 with a geometric mean of 0.3 cm s−1. For comput-
ing wet deposition loads, the total annual rain depths for the
region (vr) for all years between 1980 and 2007 were used. Th ese
depths averaged 1.24 m yr−1 and are available online from the
New Jersey state climatologist (http://climate.rutgers.edu/state-
clim_v1/norms/monthly/precip.html [verifi ed 13 Jan. 2010]).
Data Sources—Sedimentation RateHere we assume a net sediment accumulation rate of 2.5 mm
yr−1, based on the study of Woodruff et al. (2001). As a net
accumulation rate, this parameter accounts for the combined
eff ects of deposition and resuspension. Multiplying this accu-
mulation rate by the Harbor sediment surface area of 932 km2
(equal to the water surface area), and a solids concentration of
500 g L−1 (Farley et al., 1999), the net amount of solids settled
each year is 1.2 × 10⁹ kg yr−1.
Results
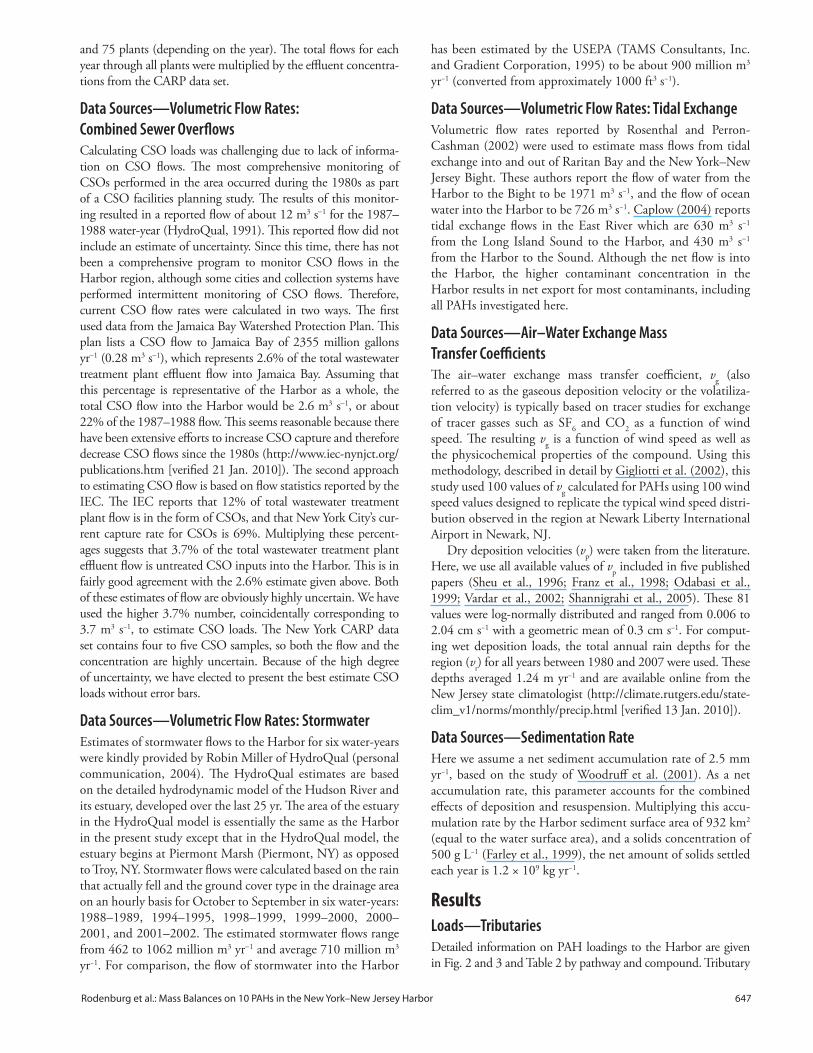
Loads—TributariesDetailed information on PAH loadings to the Harbor are given
in Fig. 2 and 3 and Table 2 by pathway and compound. Tributary
648 Journal of Environmental Quality • Volume 39 • March–April 2010
inputs are presented individually for particle-bound PAHs for
each of the three New York tributaries, and as combined inputs
in the dissolved phase from the Hudson, Wallkill, and Mohawk
rivers. Inputs of PAHs from all the New Jersey tributaries are given
as a composite estimate for particle-bound plus dissolved PAHs.
In general, the tributaries contribute about 10 to 15% to
total PAH loadings to the Harbor. Th e New York tributaries
contribute between 7 and 25% of all PAH inputs by compound,
while inputs from the New Jersey tributaries contribute between
0.5 and 16%. No trends by compound are apparent. In general,
the Mohawk River contributed the greatest fraction to total par-
ticle-bound PAH loads among the New York tributaries with the
Hudson River at Troy contributing second most and the Wallkill
River the least. For example, the median load of particle-bound
benzo[a]pyrene from tributary infl ows was 27, 18, and 10 kg
yr−1 via Mohawk, Hudson, and Wallkill rivers, respectively. Th is
is somewhat at odds with their total average discharge: 7 × 10¹²
L yr−1 for the Hudson, 5 × 10¹² L yr−1 for the Mohawk, and 1 ×
1012 L yr−1 for the Wallkill.
It was not possible to assess the uncertainty of the loadings via
the New Jersey tributaries, as previously explained. However, for
particle-bound PAHs from the three New York tributaries, the
Fig. 2. Calculated loads of polycyclic aromatic hydrocarbons to the New York–New Jersey Harbor. Top of box, midline of box, and bottom of box repre-sent the 25th, 50th, and 75th percentile calculated loads. Circles represent mean and/or best estimate loads. Atm Dep, atmo-spheric deposition; CSOs, combined sewer overfl ows; MW, molecular weight; tribs, tributaries.
Rodenburg et al.: Mass Balances on 10 PAHs in the New York–New Jersey Harbor 649
25th percentile of inputs is about 25% of the median, and the
75th percentile load is about three times the median.
Loads—Wastewater Effl uentsLoads from wastewater treatment plant effl uents were typically
<5% of total loads for most PAHs. Th ere is no clear trend by
compound, with the three-ring PAH fl uorene and the fi ve-ring
PAH dibenz[a,h]anthracene having the largest fraction of load-
ings from wastewater (7.6 and 18.5% of the median loading
value, respectively), and benzo[a]pyrene with the smallest frac-
tion of loadings from wastewater (1.4%).
Loads—Combined Sewer Overfl owsCombined sewer overfl ows contribute about 5% of total
Harbor PAH loadings. However, these estimates are very
uncertain because there is such limited information on CSO
fl ow rates in the region.
Loads—StormwaterFor many of the PAHs investigated, stormwater runoff is the
most important input pathway to the Harbor. Stormwater runoff
contributes between 17 and 46% of total loads for diff erent PAH
compounds, with the higher MW PAHs contributing a slightly
greater proportion to total inputs to the Harbor. Recovery of par-
ticulate matter from urban pavement runoff is high, in one study
exceeding 90% per event (Sansalone and Kim, 2008), so it is not
surprising that the high-MW PAHs, which tend to be particle
bound, are prevalent in stormwater. However, the magnitude of
the stormwater load is highly uncertain. Th e fl ow of runoff into
the Harbor is expected to exhibit signifi cant temporal variabil-
ity, as changes in precipitation rate and ground permeability will
change the amount of rainfall that percolates through the soil or
evaporates vs. the amount that runs off into the Harbor. Although
the annual average stormwater fl ow rate has been characterized
fairly well, the concentration of PAHs in stormwater runoff is not
well understood. Th e stormwater load-
ings described here are based on just
two measurements of PAHs in storm-
water outfl ows in New York, and 16
measurements in New Jersey.
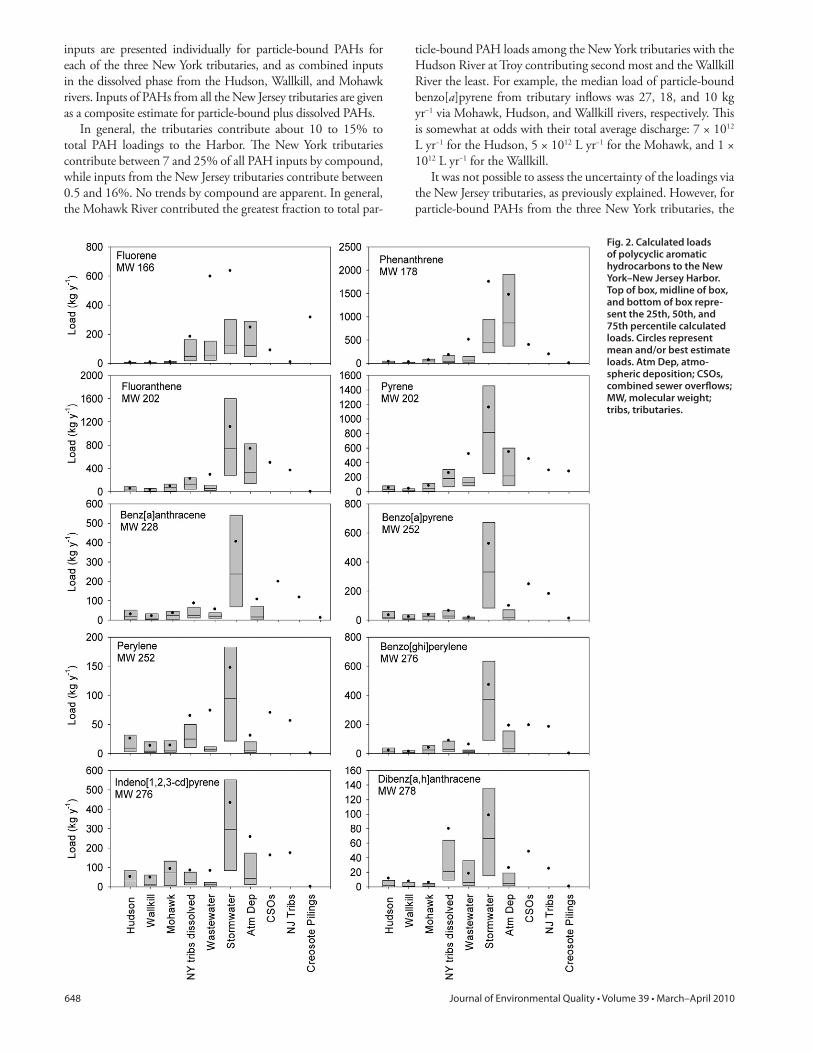
Loads—Atmospheric DepositionAtmospheric deposition seems to be
an important route for the delivery of
low-MW PAHs to the Harbor. For
example, atmospheric inputs contrib-
ute 44% of total loads for the three-ring
compound phenanthrene, but only
about 2% of inputs of perylene, benzo[a]
pyrene, and dibenz[a,h]anthracene.
Losses
Tidal Exchange
Tidal exchange is responsible for
about 30% of PAH outfl ows from the
Harbor. About two-thirds of the tidal
exchange losses occur to the New York
Bight, with the remainder occurring to
the Long Island Sound. Tidal exchange
is slightly more important as a loss process for the heaviest PAHs,
including dibenz[a,h]anthracene and indeno[1,2,3-cd]pyrene,
but this process’s contribution to losses of low-MW PAHs such
as phenanthrene and fl uoranthene is less signifi cant. However,
the magnitude of tidal exchange is highly uncertain because the
average annual tidal exchange fl ow rates are so poorly character-
ized for the Harbor.
Volatilization
Not surprisingly, volatilization is a strong function of molecular
weight. Evaporative losses from the surface of the Harbor back
to the atmosphere contribute only about 10% or less to total
losses of the high-MW PAHs, but this loss pathway contrib-
utes about 30% or more for the low-MW PAHs. Volatilization
losses are fairly well characterized because there are high-qual-
ity monitoring data of aqueous-phase PAH concentrations in
the Harbor, as well as reasonable estimates of the water–air
exchange velocity based on tracer studies.
Sedimentation
Losses of high-MW PAHs from the Harbor are dominated
by sedimentation, which may account for about half of total
losses. However, sedimentation rates are not very well under-
stood. Th is study uses a single annual net settling velocity to
characterize loss due to sedimentation. Clearly, sedimentation
in a large estuary is an extremely complex process, with sedi-
mentation rates varying widely across the Harbor, and biotur-
bation, scour, and storm events contributing a great deal of
temporal variability to sedimentation processes as well.
Discussion
Polycyclic Aromatic Hydrocarbon Annual BudgetTables 2 and 3 present the annual budget for PAHs in the
Harbor. Figure 4 presents a comparison of loads and losses.
Fig. 3. Calculated loads of polycyclic aromatic hydrocarbons (PAHs) to the New York–New Jersey Harbor by PAH (in order of increasing molecular weight) and loading pathway. Loads presented are 50th percentile loads (where available) and best estimate (mean) loads for combined sewer over-fl ows (CSOs) and New Jersey tributaries (Tribs). Abbreviations for PAHs are given in Table 2. Atm Dep, atmospheric deposition; WPCP, water pollution control plant.
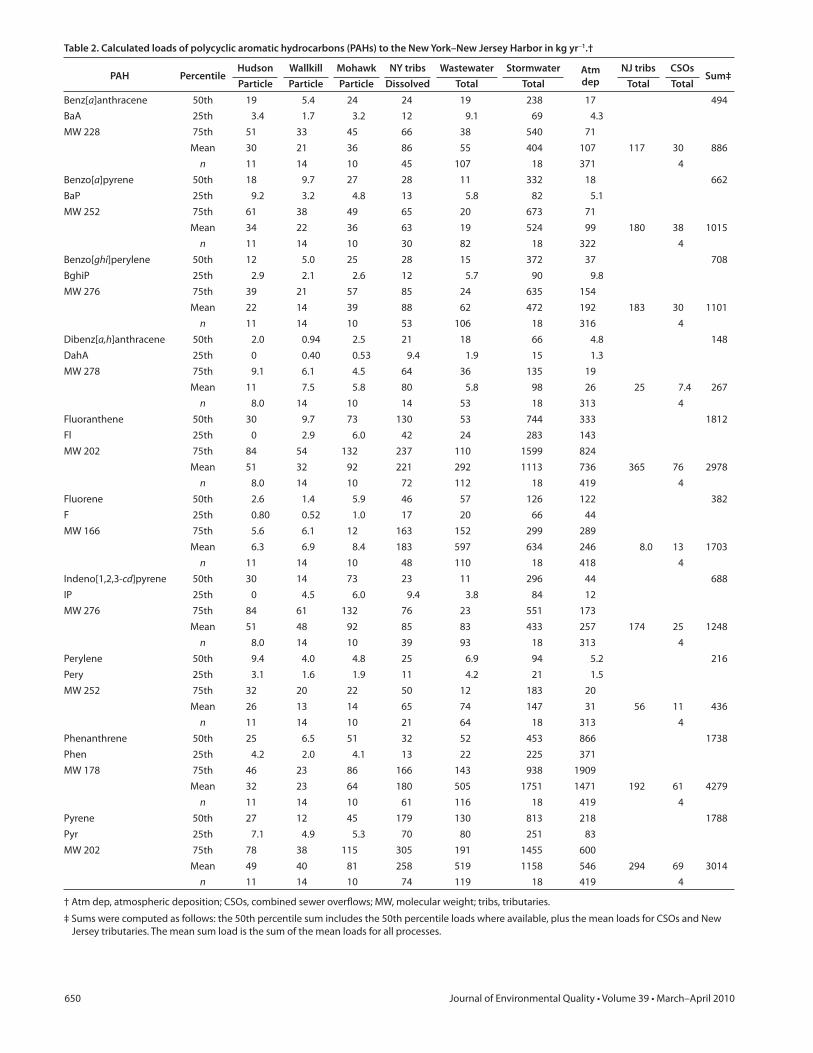
650 Journal of Environmental Quality • Volume 39 • March–April 2010
Table 2. Calculated loads of polycyclic aromatic hydrocarbons (PAHs) to the New York–New Jersey Harbor in kg yr−1.†
PAH PercentileHudson Wallkill Mohawk NY tribs Wastewater Stormwater Atm
dep
NJ tribs CSOsSum‡
Particle Particle Particle Dissolved Total Total Total Total
Benz[a]anthracene 50th 19 5.4 24 24 19 238 17 494
BaA 25th 3.4 1.7 3.2 12 9.1 69 4.3
MW 228 75th 51 33 45 66 38 540 71
Mean 30 21 36 86 55 404 107 117 30 886
n 11 14 10 45 107 18 371 4
Benzo[a]pyrene 50th 18 9.7 27 28 11 332 18 662
BaP 25th 9.2 3.2 4.8 13 5.8 82 5.1
MW 252 75th 61 38 49 65 20 673 71
Mean 34 22 36 63 19 524 99 180 38 1015
n 11 14 10 30 82 18 322 4
Benzo[ghi]perylene 50th 12 5.0 25 28 15 372 37 708
BghiP 25th 2.9 2.1 2.6 12 5.7 90 9.8
MW 276 75th 39 21 57 85 24 635 154
Mean 22 14 39 88 62 472 192 183 30 1101
n 11 14 10 53 106 18 316 4
Dibenz[a,h]anthracene 50th 2.0 0.94 2.5 21 18 66 4.8 148
DahA 25th 0 0.40 0.53 9.4 1.9 15 1.3
MW 278 75th 9.1 6.1 4.5 64 36 135 19
Mean 11 7.5 5.8 80 5.8 98 26 25 7.4 267
n 8.0 14 10 14 53 18 313 4
Fluoranthene 50th 30 9.7 73 130 53 744 333 1812
Fl 25th 0 2.9 6.0 42 24 283 143
MW 202 75th 84 54 132 237 110 1599 824
Mean 51 32 92 221 292 1113 736 365 76 2978
n 8.0 14 10 72 112 18 419 4
Fluorene 50th 2.6 1.4 5.9 46 57 126 122 382
F 25th 0.80 0.52 1.0 17 20 66 44
MW 166 75th 5.6 6.1 12 163 152 299 289
Mean 6.3 6.9 8.4 183 597 634 246 8.0 13 1703
n 11 14 10 48 110 18 418 4
Indeno[1,2,3-cd]pyrene 50th 30 14 73 23 11 296 44 688
IP 25th 0 4.5 6.0 9.4 3.8 84 12
MW 276 75th 84 61 132 76 23 551 173
Mean 51 48 92 85 83 433 257 174 25 1248
n 8.0 14 10 39 93 18 313 4
Perylene 50th 9.4 4.0 4.8 25 6.9 94 5.2 216
Pery 25th 3.1 1.6 1.9 11 4.2 21 1.5
MW 252 75th 32 20 22 50 12 183 20
Mean 26 13 14 65 74 147 31 56 11 436
n 11 14 10 21 64 18 313 4
Phenanthrene 50th 25 6.5 51 32 52 453 866 1738
Phen 25th 4.2 2.0 4.1 13 22 225 371
MW 178 75th 46 23 86 166 143 938 1909
Mean 32 23 64 180 505 1751 1471 192 61 4279
n 11 14 10 61 116 18 419 4
Pyrene 50th 27 12 45 179 130 813 218 1788
Pyr 25th 7.1 4.9 5.3 70 80 251 83
MW 202 75th 78 38 115 305 191 1455 600
Mean 49 40 81 258 519 1158 546 294 69 3014
n 11 14 10 74 119 18 419 4
† Atm dep, atmospheric deposition; CSOs, combined sewer overfl ows; MW, molecular weight; tribs, tributaries.
‡ Sums were computed as follows: the 50th percentile sum includes the 50th percentile loads where available, plus the mean loads for CSOs and New
Jersey tributaries. The mean sum load is the sum of the mean loads for all processes.
Rodenburg et al.: Mass Balances on 10 PAHs in the New York–New Jersey Harbor 651
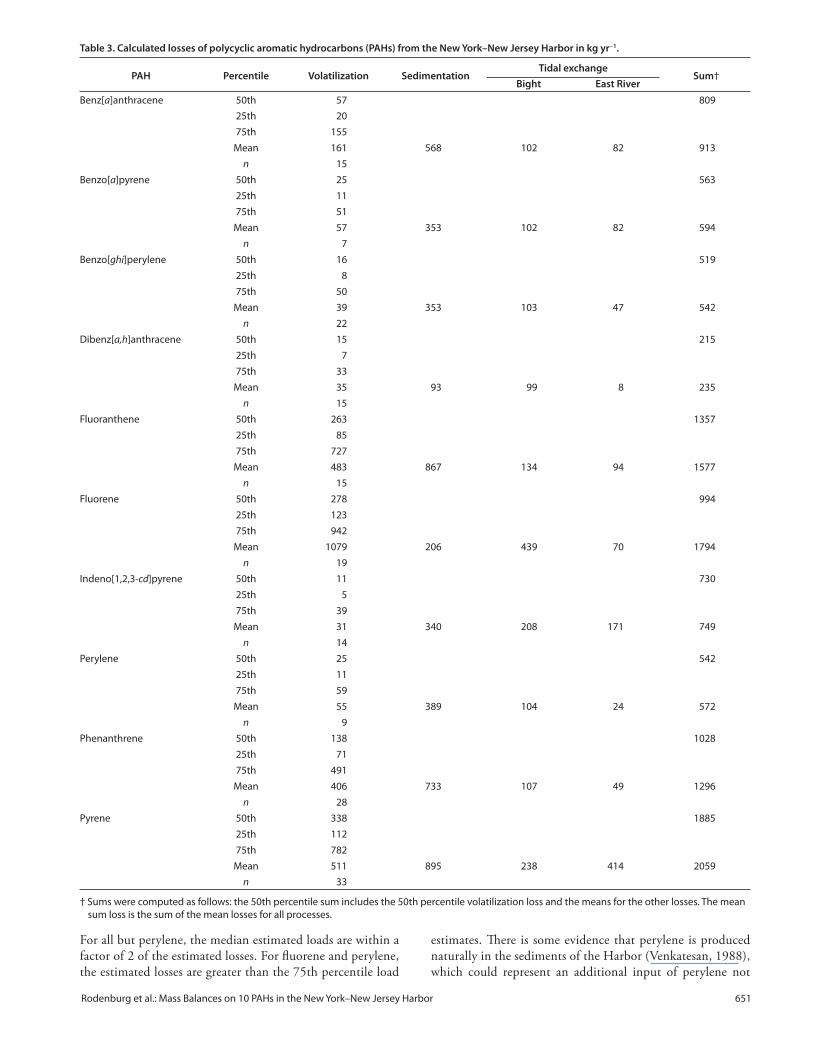
For all but perylene, the median estimated loads are within a
factor of 2 of the estimated losses. For fl uorene and perylene,
the estimated losses are greater than the 75th percentile load
estimates. Th ere is some evidence that perylene is produced
naturally in the sediments of the Harbor (Venkatesan, 1988),
which could represent an additional input of perylene not
Table 3. Calculated losses of polycyclic aromatic hydrocarbons (PAHs) from the New York–New Jersey Harbor in kg yr−1.
PAH Percentile Volatilization SedimentationTidal exchange
Sum†Bight East River
Benz[a]anthracene 50th 57 809
25th 20
75th 155
Mean 161 568 102 82 913
n 15
Benzo[a]pyrene 50th 25 563
25th 11
75th 51
Mean 57 353 102 82 594
n 7
Benzo[ghi]perylene 50th 16 519
25th 8
75th 50
Mean 39 353 103 47 542
n 22
Dibenz[a,h]anthracene 50th 15 215
25th 7
75th 33
Mean 35 93 99 8 235
n 15
Fluoranthene 50th 263 1357
25th 85
75th 727
Mean 483 867 134 94 1577
n 15
Fluorene 50th 278 994
25th 123
75th 942
Mean 1079 206 439 70 1794
n 19
Indeno[1,2,3-cd]pyrene 50th 11 730
25th 5
75th 39
Mean 31 340 208 171 749
n 14
Perylene 50th 25 542
25th 11
75th 59
Mean 55 389 104 24 572
n 9
Phenanthrene 50th 138 1028
25th 71
75th 491
Mean 406 733 107 49 1296
n 28
Pyrene 50th 338 1885
25th 112
75th 782
Mean 511 895 238 414 2059
n 33
† Sums were computed as follows: the 50th percentile sum includes the 50th percentile volatilization loss and the means for the other losses. The mean
sum loss is the sum of the mean losses for all processes.
652 Journal of Environmental Quality • Volume 39 • March–April 2010
included in the mass balance. Th is could
therefore lead to losses exceeding inputs to
the system for this compound.
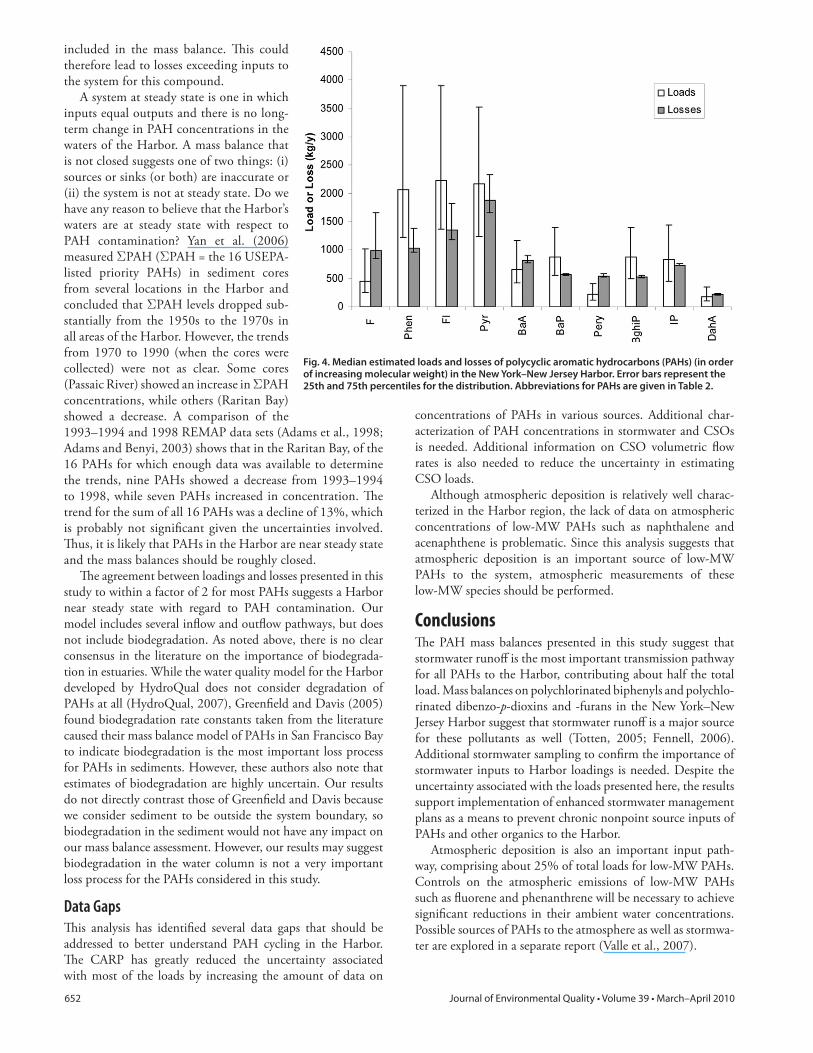
A system at steady state is one in which
inputs equal outputs and there is no long-
term change in PAH concentrations in the
waters of the Harbor. A mass balance that
is not closed suggests one of two things: (i)
sources or sinks (or both) are inaccurate or
(ii) the system is not at steady state. Do we
have any reason to believe that the Harbor’s
waters are at steady state with respect to
PAH contamination? Yan et al. (2006)
measured ΣPAH (ΣPAH = the 16 USEPA-
listed priority PAHs) in sediment cores
from several locations in the Harbor and
concluded that ΣPAH levels dropped sub-
stantially from the 1950s to the 1970s in
all areas of the Harbor. However, the trends
from 1970 to 1990 (when the cores were
collected) were not as clear. Some cores
(Passaic River) showed an increase in ΣPAH
concentrations, while others (Raritan Bay)
showed a decrease. A comparison of the
1993–1994 and 1998 REMAP data sets (Adams et al., 1998;
Adams and Benyi, 2003) shows that in the Raritan Bay, of the
16 PAHs for which enough data was available to determine
the trends, nine PAHs showed a decrease from 1993–1994
to 1998, while seven PAHs increased in concentration. Th e
trend for the sum of all 16 PAHs was a decline of 13%, which
is probably not signifi cant given the uncertainties involved.
Th us, it is likely that PAHs in the Harbor are near steady state
and the mass balances should be roughly closed.
Th e agreement between loadings and losses presented in this
study to within a factor of 2 for most PAHs suggests a Harbor
near steady state with regard to PAH contamination. Our
model includes several infl ow and outfl ow pathways, but does
not include biodegradation. As noted above, there is no clear
consensus in the literature on the importance of biodegrada-
tion in estuaries. While the water quality model for the Harbor
developed by HydroQual does not consider degradation of
PAHs at all (HydroQual, 2007), Greenfi eld and Davis (2005)
found biodegradation rate constants taken from the literature
caused their mass balance model of PAHs in San Francisco Bay
to indicate biodegradation is the most important loss process
for PAHs in sediments. However, these authors also note that
estimates of biodegradation are highly uncertain. Our results
do not directly contrast those of Greenfi eld and Davis because
we consider sediment to be outside the system boundary, so
biodegradation in the sediment would not have any impact on
our mass balance assessment. However, our results may suggest
biodegradation in the water column is not a very important
loss process for the PAHs considered in this study.
Data GapsTh is analysis has identifi ed several data gaps that should be
addressed to better understand PAH cycling in the Harbor.
Th e CARP has greatly reduced the uncertainty associated
with most of the loads by increasing the amount of data on
concentrations of PAHs in various sources. Additional char-
acterization of PAH concentrations in stormwater and CSOs
is needed. Additional information on CSO volumetric fl ow
rates is also needed to reduce the uncertainty in estimating
CSO loads.
Although atmospheric deposition is relatively well charac-
terized in the Harbor region, the lack of data on atmospheric
concentrations of low-MW PAHs such as naphthalene and
acenaphthene is problematic. Since this analysis suggests that
atmospheric deposition is an important source of low-MW
PAHs to the system, atmospheric measurements of these
low-MW species should be performed.
ConclusionsTh e PAH mass balances presented in this study suggest that
stormwater runoff is the most important transmission pathway
for all PAHs to the Harbor, contributing about half the total
load. Mass balances on polychlorinated biphenyls and polychlo-
rinated dibenzo-p-dioxins and -furans in the New York–New
Jersey Harbor suggest that stormwater runoff is a major source
for these pollutants as well (Totten, 2005; Fennell, 2006).
Additional stormwater sampling to confi rm the importance of
stormwater inputs to Harbor loadings is needed. Despite the
uncertainty associated with the loads presented here, the results
support implementation of enhanced stormwater management
plans as a means to prevent chronic nonpoint source inputs of
PAHs and other organics to the Harbor.
Atmospheric deposition is also an important input path-
way, comprising about 25% of total loads for low-MW PAHs.
Controls on the atmospheric emissions of low-MW PAHs
such as fl uorene and phenanthrene will be necessary to achieve
signifi cant reductions in their ambient water concentrations.
Possible sources of PAHs to the atmosphere as well as stormwa-
ter are explored in a separate report (Valle et al., 2007).
Fig. 4. Median estimated loads and losses of polycyclic aromatic hydrocarbons (PAHs) (in order of increasing molecular weight) in the New York–New Jersey Harbor. Error bars represent the 25th and 75th percentiles for the distribution. Abbreviations for PAHs are given in Table 2.
Rodenburg et al.: Mass Balances on 10 PAHs in the New York–New Jersey Harbor 653
AcknowledgmentsTh anks to the New York Academy of Sciences for their support of this
work. Th anks also to Simon Litten of New York State Department of
Environmental Conservation (NYCDEC) and Joel Pecchioli from the
New Jersey Department of Environmental Protection (NJDEP) for
providing data and discussions.
ReferencesAdams, D., and S. Benyi. 2003. Sediment quality of the NY/NJ Harbor
system: A 5-year revisit: 1993/4–1998. An investigation under the Re-gional Environmental Monitoring and Assessment Program. Final Rep. EPA/902-R-03-002. USEPA Region 2, New York.
Adams, D.A., J.S. O’Connor, and S.B. Weisberg. 1998. Sediment quality of the NY/NJ Harbor system: An investigation under the Regional Envi-ronmental Monitoring and Assessment Program (R-EMAP). Final Rep. EPA/902-R-98-001. USEPA Region 2, New York.
Agency for Toxic Substances and Disease Registry. 1995. Toxicological profi le for polycyclic aromatic hydrocarbons (PAHs). Available at http://www.atsdr.cdc.gov/toxprofi les/tp69.html (verifi ed 12 Jan. 2010). ATSDR Dep. of Health and Human Services, Atlanta, GA.
Bonin, J.L., and T.P. Wilson. 2007. Concentrations and loads of organic com-pounds and trace elements in tributaries to Newark and Raritan Bays, New Jersey. Sci. Investigations Rep. 2007-5059. Available at http://www.state.nj.us/dep/dsr/njtrwp/ (verifi ed 12 Jan. 2010). USGS, Reston, VA.
Brenner, R.C., V.S. Magar, J.A. Ickes, J.E. Abbott, S.A. Stout, E.A. Crecelius, and L.S. Bingler. 2002. Characterization and fate of PAH-contaminated sediments at the Wyckoff /Eagle Harbor Superfund Site. Environ. Sci. Technol. 36:2605–2613.
Caplow, T. 2004. New insights on the transport of solutes in a large estuary revealed with SF6 tracer. Ph.D. diss. Columbia Univ., New York.
Contamination Assessment and Reduction Project. 2007a. Data archive: Wa-ter, sediment and biota data collected from 1999–2003 [CD-ROM]. Hudson River Foundation, New York.
Contamination Assessment and Reduction Project. 2007b. A model for the evaluation and management of contaminants of concern in water, sedi-ment, and biota in the NY/NJ Harbor Estuary: Contaminant fate & transport & bioaccumulation sub-models. Hudson River Foundation, New York.
Cooper, M.J., R.R. Rediske, D.G. Uzarski, and T.M. Burton. 2009. Sediment contamination and faunal communities in two subwatersheds of Mona Lake, Michigan. J. Environ. Qual. 38:1255–1265.
Farley, K.J., R.V. Th omann, T.F.I. Cooney, D.R. Damiani, and J.R. Wands. 1999. An integrated model of organic chemical fate and bioaccumula-tion in the Hudson River Estuary. Rep. to Th e Hudson River Founda-tion, Riverdale, NY.
Fennell, D.E. 2006. A mass balance on dioxins and dioxin-like compounds in the NY-NJ Harbor Estuary. In G.R. Munoz and M.A. Panero. Pollution prevention and management strategies for dioxins in the New York/New Jersey Harbor, New York. New York Acad. of Sci., New York.
Franz, T.P., S.J. Eisenreich, and T.M. Holsen. 1998. Dry deposition of particu-late polychlorinated biphenyls and polycyclic aromatic hydrocarbons to Lake Michigan. Environ. Sci. Technol. 32:3681–3688.
Gigliotti, C.L., P.A. Brunciak, J. Dachs, T.R. Glenn IV, E.D. Nelson, L.A. Totten, and S.J. Eisenreich. 2002. Air - water exchange of polycyclic aro-matic hydrocarbons in the New York-New Jersey, USA, Harbor Estuary. Environ. Toxicol. Chem. 21:235–244.
Gigliotti, C.L., L.A. Totten, J.H. Off enberg, J. Dachs, J.R. Reinfelder, E.D. Nelson, T.R. Glenn, and S.J. Eisenreich. 2005. Atmospheric concentra-tions and deposition of PAHs to the Hudson River Estuary. Environ. Sci. Technol. 39:5550–5559.
Grabemann, I., and G. Krause. 1989. Transport processes of suspended matter derived from time series in a tidal estuary. J. Geophys. Res. 94(C10):14373–14380.
Greenfi eld, B., and J.A. Davis. 2005. A PAH fate model for San Francisco Bay. Chemosphere 60:515–530.
HydroQual. 1991. Assessment of pollutant loadings to the New York-New Jersey Harbor. Rep. to USEPA Marine and Wetlands Protection Branch Region 2. Job no. WOCL0302. Hydroqual, Inc., Mahwah, NJ.
HydroQual. 2007. A model for the evaluation and management of contami-nants of concern in water, sediment, and biota in the NY/NJ Harbor Estuary. Contaminant fate, transport, and bioaccumulation sub-models. Available at http://www.carpweb.org (verifi ed 14 Jan. 2010). Rep. pre-pared for the Hudson River Foundation on behalf of the Contamination Assessment and Reduction Project (CARP), New York.
Iannuzi, T.J., S.L. Huntley, N.L. Bonnevie, B.L. Finley, and R.J. Wenning. 1995. Distribution and possible sources of polychlorinated biphenyls in dated sediments from the Newark Bay estuary, New Jersey. Arch. Envi-ron. Contam. Toxicol. 28:108–117.
Katz, C.N. 1998. Seawater polynuclear aromatic hydrocarbons and copper in San Diego Bay. Tech. Rep. 1768. Space and Naval Warfare Systems Ctr., San Diego, CA.
Odabasi, M., A. Sofuoglu, N. Vardar, Y. Tasdemir, and T.M. Holsen. 1999. Measurement of dry deposition and air-water exchange of polycyclic aromatic hydrocarbons with the water surface sampler. Environ. Sci. Technol. 33:426–434.
Ouyang, Y., J.E. Zhang, and L.-T. Ou. 2006. Temporal and spatial distribu-tions of sediment total organic carbon in an estuary river. J. Environ. Qual. 35:93–100.
Rosenthal, Y., and S. Perron-Cashman. 2002. Cadmium cycling in the Hud-son/Raritan River Basin. New York Acad. of Sci., New York.
Sansalone, J.J., and J.-Y. Kim. 2008. Transport of particulate matter frac-tions in urban source area pavement surface runoff . J. Environ. Qual. 37:1883–1893.
Schenker, U., M. Scheringer, M.D. Sohn, R.L. Maddalena, T.E. McKone, and K. Hungerbuhler. 2009. Using information on uncertainty to improve environmental fate modeling: A case study on DDT. Environ. Sci. Tech-nol. 43:128–134.
Shannigrahi, A.S., T. Fukushima, and N. Ozaki. 2005. Comparison of diff er-ent methods for measuring dry deposition fl uxes of particulate matter and polycyclic aromatic hydrocarbons (PAHs) in the ambient air. Atmos. Environ. 39:653–662.
Sheu, H.L., W.-J. Lee, C.-C. Su, H.-R. Chao, and Y.-C. Fan. 1996. Dry de-position of polycyclic aromatic hydrocarbons in ambient air. J. Environ. Eng. 122:1101–1109.
TAMS Consultants, Inc. and Gradient Corporation. 1995. Further site char-acterization and analysis database report. Phase 2 Rep. Rep. to USEPA Region 2. EPA Work Assignment no. 013-2N84. TAMS Consultants, Inc. and Gradient Corporation, New York.
Totten, L.A. 2005. Present-day sources and sinks for polychlorinated biphenyls (PCBs) in the Lower Hudson River Estuary. In M. Panero et al. Pollution prevention and management strategies for polychlorinated biphenyls in the New York/New Jersey Harbor. New York Acad. of Sci., New York.
Valle, S., M.A. Panero, and L. Shor. 2007. Pollution prevention and manage-ment strategies for polycyclic aromatic hydrocarbons in the New York/New Jersey Harbor. New York Acad. of Sci., New York.
Vardar, N., M. Odabasi, and T.M. Holsen. 2002. Particulate dry deposition and overall deposition velocities of polycyclic aromatic hydrocarbons. J. Environ. Eng. 128:269–274.
Venier, M., and R.A. Hites. 2008. Atmospheric deposition of PBDEs to the Great Lakes featuring a Monte Carlo analysis of error. Environ. Sci. Technol. 42:9058–9064.
Venkatesan, M.L. 1988. Occurrence and possible sources of perylene in ma-rine sediments—A review. Mar. Chem. 25:1–27.
Walker, S.E., R.M. Dickhut, C. Chisholm-Brause, S. Sylva, and C.M. Reddy. 2005. Molecular and isotopic identifi cation of PAH sources in a highly industrialized urban estuary. Org. Geochem. 36:619–632.
Webb, B.W., J.M. Phillips, and D.E. Walling. 2000. A new approach to deriv-ing ‘best-estimate’ chemical fl uxes for rivers draining the LOIS study area. Sci. Total Environ. 251–252:45–54.
Woodruff , J.D., R.W. Geyer, C.K. Sommerfi eld, and N.W. Driscoll. 2001. Seasonal variation of sediment deposition in the Hudson River estuary. Mar. Geol. 179:105–119.
Yan, B., T.A. Abrajano, R.F. Bopp, D.A. Chaky, L.A. Benedict, and S.N. Chill-rud. 2006. Combined application of δ13C and molecular ratios in sedi-ment cores for PAH source apportionment in the New York/New Jersey harbor complex. Org. Geochem. 37:674–687.
Yan, S. 2003. Air-water exchange controls phytoplankton concentrations of polychlorinated biphenyls in the Hudson River Estuary. M.S. thesis. Rutgers Univ., New Brunswick, NJ.


