Embed Size (px)
Citation preview
National Research Center, Inc. • 2955 Valmont Rd., Suite 300 • Boulder, CO 80301 • 303‐444‐7863 • www.n‐r‐c.com
September 2014 Pearl Harbor-Airport-Lagoon Drive
Resident Survey
City and County of Honolulu
Department of Planning & Permitting
Prepared by
CityandCountyofHonolulu Airport/SaltLake/MapunapunaResidentSurvey
ReportofResults
Contents
ExecutiveSummary................................................................................................................................................................ 1
SurveyBackground................................................................................................................................................................. 3
CommunityAmenities ........................................................................................................................................................... 5
NeighborhoodMobility .......................................................................................................................................................23
DevelopmentOpportunities .............................................................................................................................................35
AppendixA:SurveyResults ..............................................................................................................................................39
AppendixB:SurveyResultsbyTenure ........................................................................................................................60
AppendixC:SurveyResultsbyGender ........................................................................................................................70
AppendixD:SurveyResultsbyStation ........................................................................................................................80
AppendixE:ResponsestoOpenEndedQuestions ..................................................................................................93
AppendixF:Methodology ............................................................................................................................................... 106
AppendixG:SurveyInstrument ................................................................................................................................... 109
CityandCountyofHonolulu Airport/SaltLake/MapunapunaResidentSurvey
1 ReportofResults
Executive Summary
TheAirport/SaltLake/MapunapunaCommunitySurveywasmailedtoasampleofhouseholdswithintwomilesofthestationsplannedforthePearlHarborNavalBase(1,979),theHonoluluInternationalAirport(565),andLagoonDrive(1,506)duringJulyandAugust,2014.Nineteenpercentofdeliveredsurveyswerecompletedandreturned.Thesurveyelicitedresidentperspectivesonavarietyofcommunityplanningissuesrelatedtotransit‐orienteddevelopment(TOD):communityamenities,civicconnection,neighborhoodmobilityanddevelopmentopportunities.Thisreportsummarizestheresultsofthissurvey;itoutlinesfindingsacrossallrespondentsandhighlightsdifferencesbygender,tenure(whethertheresidentownsorrentstheirhome)andresidents’closestrailstation.
CommunityAmenities
Airport/Salt Lake/Mapunapuna residents enjoyed the location of their neighborhood. Whenaskedwhattheylikedmostaboutlivingintheirneighborhood,mostresidentscitedtheirproximitytoshopping,jobsandbusstops.Rentersweremorelikelythanhomeownerstomentionhousingbeingingoodconditionamongthethreethingstheylikedmostabouttheirneighborhood.About4in10residentssaidtheylikedthattheirneighborhoodwasquiet.Fewresidentssaidtheirneighborhoodhadastrongsenseofcommunityorwasalivelycommunitywithalotgoingon.
Residents appreciated local businesses, with the highest ratings awarded to grocery stores and drug stores. Residentsdescribedtheirneighborhoodsascommunitieswithavarietyofbusinessesandresources.Aboutthree‐quartersofresidentsawardedratingsofexcellentorgoodtolocalbusinessesincludingdrugstores,conveniencestores,coffeeshopsandgrocerystores.Abouttwo‐thirdsgavefavorableratingstofamilyentertainment,laundriesanddrycleaners,beautysalonsandrestaurants.Residentsalsolaudedthequalityofcommunityresourcessuchaslibraries,childdaycare,schools,medicalclinicsanddentists,youthcentersandcommunitycenters.Fewerresidentswereawareofbars/nightclubsandaffordableandseniorhousingintheircommunityandtheseamenitiesweregivenlowerratings.
Few visited neighborhood parks, though most felt safe. Airport/SaltLake/Mapunapunaresidentsvisitedtheirneighborhoodparksinfrequently,andevenfewerusedtheKeehiLagoonBeachPark.Ofthosewhodidvisitlocalparks,mostfeltsafeinparksduringthedaybutnotafterdarkorwhenhomelesspeoplewerepresent.Justoverhalfofresidentsgavefavorableratingstothequalityofparksforplayingsports,whilealmosttwo‐thirdsgavenegativeratingstothequalityofparksforpicnickingorhangingout.
Residents wished to see more affordable housing and improved parking. Whenaskedwhattheylikedleastabouttheirneighborhood,Airport/SaltLake/Mapunapunaresidentsmostoftenrespondedthathousingwasexpensive,theydidn’tknowmanyneighborsandthattheneighborhoodwastoonoisy.Someresidentsalsomentionedthattheirneighborhoodwasfarfromrecreationareas,crimewastoohighandhousesandpropertiesweresmall.Themostlycommonlydesiredimprovementwasmorecarparking;overhalfofsurveyrespondentschosethisimprovementfromalistanditwasalsothemostcommonlywritten‐inresponsewhenaskedtopickonlyoneimprovement.Homeownersweremorelikelythanrenterstocitemorecarparkingasaneededimprovement.
CityandCountyofHonolulu Airport/SaltLake/MapunapunaResidentSurvey
2 ReportofResults
NeighborhoodMobility
Walking was viewed as the easiest way to navigate Airport/Salt Lake/Mapunapuna neighborhoods. MostAirport/SaltLake/MapunapunaresidentssaidtheycouldgenerallygetaroundHonoluluwithafairamountofease,andwalkingwasratedastheeasiestwaytogetaroundtheneighborhoods(7in10residentsratingtheoveralleaseofwalkingasexcellentorgood).Mostgavehighmarkstothepresenceofsidewalks.Slightlyfewergavehighmarkstothenumberofcross‐walksandcrossing‐lights,safetywhilewalkingandtheconditionofsidewalks;howevereachofthesereceivedapositiveratingfromatleast62%ofresidents.
Residents saw opportunities to improve travel by bike. BikingwasthoughttobethemostdifficultwayofgettingaroundinAirport/SaltLake/Mapunapuna,with7in10respondentsgivingfairorpoorratingstotheoveralleaseofbikingintheirneighborhood.About6in10respondentsgavenegativeratingstotheavailabilityofbikeracksandbikestorage,andonly3in10feltsafewhilebiking.
Most Airport/Salt Lake/Mapunapuna residents drove alone to commute to work or school. AthirdofresidentsindicatedworkingintheAirport/PearlHarborareaandabout17%saidtheyworkeddowntownorinMoanalua/SaltLake.In2014,65%ofresidentsintheAirport/SaltLake/Mapunapunaneighborhoodssaidtheydroveavehiclealoneeverydayoftheircommutetoworkortoschool.Oneinfourresidentsusedalternatemodesoftransportationatleastonedayaweek;mostofthesecarpooledortookthebus.
Many were eager to use the new rail transit line for shopping and to go to restaurants, bars or nightclubs. About40%to51%ofresidentsthoughttheywouldusethenewrailtransitlineforavarietyoftriptypesonceitwasbuilt.Themostlikelyuseoftheraillinewasfortripstogoshoppingandtogotorestaurants,barsornightclubs;withalmosthalfindicatingtheywouldbeveryorsomewhatlikelytouseitforsuchtrips.
DevelopmentOpportunities
Residents supported a variety of potential amenities near the new rail stations. Whenresidentswereaskedwhichofalistofamenitiestheywouldsupportbeingbuiltneartheirclosestplannedrailstation,mostsupportedeveryamenitylisted.Improvedlandscaping,placestosit,restroomsandbicycleparkinggarneredthemostsupport.Newaffordable/subsidizedhousingnearthestationsreceivedtheleastsupport.
Residents supported the development of a variety of amenities near the new rail stations. Whenresidentswereaskedwhichofalistofamenitiestheywouldsupportbeingbuiltneartheirclosestplannedrailstation,parks,parkingstructuresandretailstores/servicesgarneredthemostsupportwithatleastthree‐fourthsindicatingsupport.Newhotels,officetowersandresidentialtowersnearthestationsreceivedtheleastsupportwithlessthanone‐thirdindicatingsupport.
Most proposed improvements to major streets received strong support. Residentswelcomedallstreetimprovementssuggestedandmoststronglysupportedimprovingsidewalks,addingstreetlighting,addingtrashbinsandaddingcrosswalks.Aboutone‐thirdofresidentsagreedthatSaltLakeBoulevardwasmostinneedofthesetypesofimprovements.
CityandCountyofHonolulu Airport/SaltLake/MapunapunaResidentSurvey
3 ReportofResults
Survey Background
SurveyPurposeStaffoftheCityandCountyofHonoluluDepartmentofPlanningandPermittingsoughttocapturetheperspectivesofresidentsintheAirport/SaltLake/MapunapunaneighborhoodaroundtheplannedPearlHarborNavalBase,HonoluluInternationalAirportandLagoonDriverailtransitstations.NationalResearchCenter,Inc.(NRC)wascontractedtoconductasurveytoassessresident’sperceptionsabouttheirneighborhoodandopinionsaboutpotentialtransit‐orienteddevelopmentintheseareas.
Resultsofthesurveywillhelpstaffguidefuturepublicinvestmentanddevelopmentaroundtherailstations.
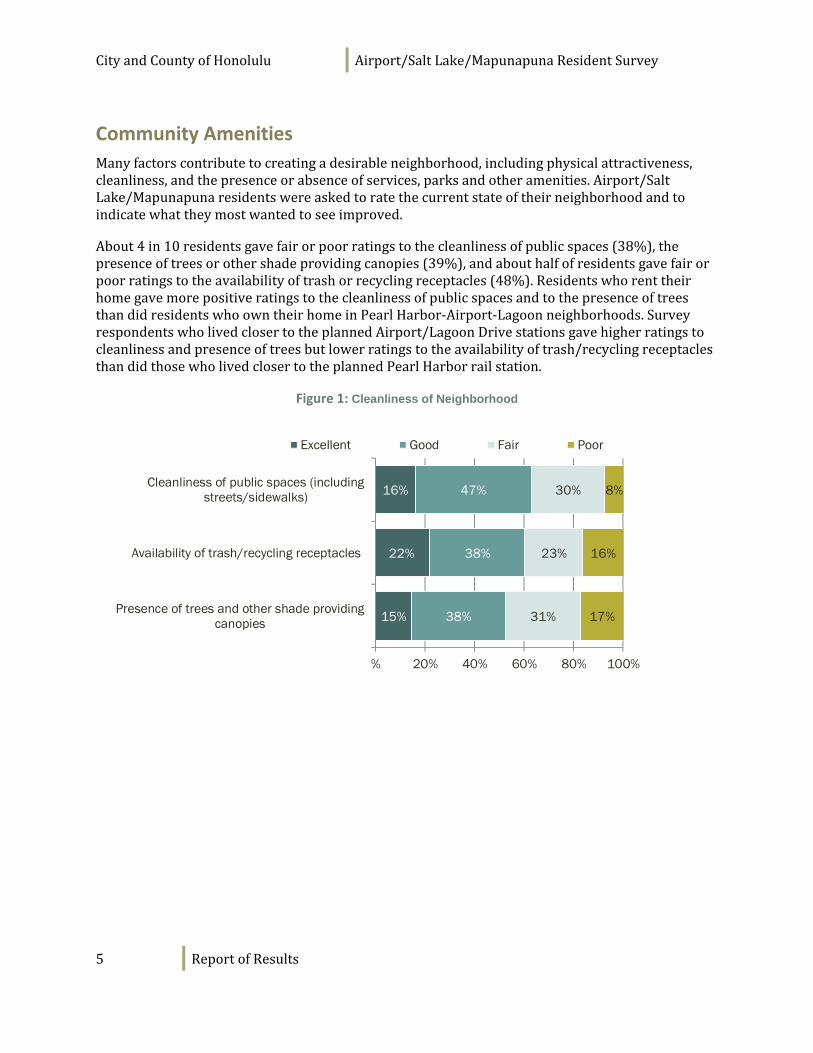
SurveyMethodsThesamplingplanforthisseriesofcommunitysurveys(ofwhichtheAirport/SaltLake/Mapunapunaisthe6th),wastomailsurveysto1,350householdswithinahalfmileofeachoftheplannedstationsineachcommunity.However,theAirport/SaltLake/Mapunapunacommunityhasalargebusinesses/industrialarea,andmostnearbyhouseholdsweremorethanahalfmileawayfromeachofthethreestations.Toensurethatthehouseholdsclosesttothesestationswereadequatelyrepresented,theminimumdistancetothestationwasincreasedtotwomiles.Additionally,mosthouseholdsthatwerewithintwomilesoftheHonoluluInternationalAirportstationwereclosertoeitherthePearlHarbororLagoonDrivestations.Thefinalsamplingplan,shownbelow,wascreatedtoaccommodatetheseuniqueneighborhoodfeatures.
ClosestStationPearlHarbor
Station
HonoluluInternationalAirportStation
LagoonDriveStation
Numberthatareclosesttostation 1,979 565 1,506Minimumdistancetocloseststation 0.32miles 0.48miles 0.53milesMaximumdistancetocloseststation 1.45miles 1.98miles 1.36miles
Ofthe4,050mailedsurveys,3,746weredeliveredtooccupiedhouseholds.Atotalof719completedsurveyswerereturned,foraresponserateof19%;thisisatypicalresponseratecomparedtothosethatNRCseesforsurveysinlargecities.Ofthe719respondents,58wereclosesttotheHonoluluInternationalAirportstation,239wereclosesttotheLagoonDrivestationand421wereclosesttothePearlHarborstation.GiventhelownumberofrespondentswhowereclosesttotheAirportstation,whenresultsarereported“bystation,”theAirportandLagoonDrivestationareasarecombined(Airport/Lagoon).
Surveyresultswereweightedsothatrespondentage,gender,ethnicityandhousingtenure(rentorown)wererepresentedintheproportionsreflectiveoftheentireadultpopulationlivinginCensusblockscoveredbythesurvey(asreportedfromthe2010U.S.Censusandthe2005‐2009AmericanCommunitySurvey).Themarginoferrorisplusorminusfourpercentagepointsaroundanygivenpercentforaquestionansweredbyallrespondents.
MoreinformationaboutthesurveymethodologycanbefoundinAppendixF:Methodology.
CityandCountyofHonolulu Airport/SaltLake/MapunapunaResidentSurvey
4 ReportofResults
UnderstandingtheResults
How the Results Are Reported ResultsforallrespondentsareshowninthebodyofthereportandinAppendixA:SurveyResults.Resultswerealsocomparedbyselectedsubgroups:therespondent’sgender,whethertherespondentownedorrentedtheirhome,andwhichplannedstationtheylivedclosestto.ThesecomparisonscanbefoundinAppendicesB,C,andDandarementionedinthebodyofthereportwhentherearesignificantdifferences.
Precision of Estimates Itiscustomarytodescribetheprecisionofestimatesmadefromsurveyswitha“levelofconfidence”(ormarginoferror).The95percentconfidencelevelforthissurveyisgenerallynogreaterthanplusorminusfourpercentagepointsaroundanygivenpercentreportedforallrespondents(719).Whereestimatesaregivenforsubgroups,theyarelessprecise.Foreachsubgroupfromthesurvey,themarginoferrorrisestoasmuchasplusorminus5%forasamplesizeof421(PearlHarbor)toplusorminus6%for298(Airport/Lagoon)completedsurveys.
“Don’t Know” Responses and Rounding Onmanyofthequestionsinthesurvey,respondentswereabletoanswer“don’tknow.”However,theseresponseshavebeenremovedfromtheanalysespresentedinthebodyofthereport.Inotherwords,themajorityofthetablesandgraphsinthebodyofthereportdisplaytheresponsesofrespondentswhohadanopinionaboutaspecificitem.Theproportionofrespondentsgivingaresponseof“don’tknow”isshowninthefullsetofresponsesincludedinAppendixA:SurveyResultsandismentionedinthebodyofthisreportifitis20%orgreater.
Forsomequestions,respondentswerepermittedtoselectmorethanoneoption(i.e.,amultipleresponsequestion).Whenthetotalexceeds100%inatableforamultipleresponsequestion,itisbecausesomerespondentswerecountedinmorethanonecategory.Whenatableforaquestionthatonlypermittedasingleresponsedoesnottotaltoexactly100%,itisduetothecustomarypracticeofroundingpercentagestothenearestwholenumber.
CityandCountyofHonolulu Airport/SaltLake/MapunapunaResidentSurvey
5 ReportofResults
Community Amenities
Manyfactorscontributetocreatingadesirableneighborhood,includingphysicalattractiveness,cleanliness,andthepresenceorabsenceofservices,parksandotheramenities.Airport/SaltLake/Mapunapunaresidentswereaskedtoratethecurrentstateoftheirneighborhoodandtoindicatewhattheymostwantedtoseeimproved.
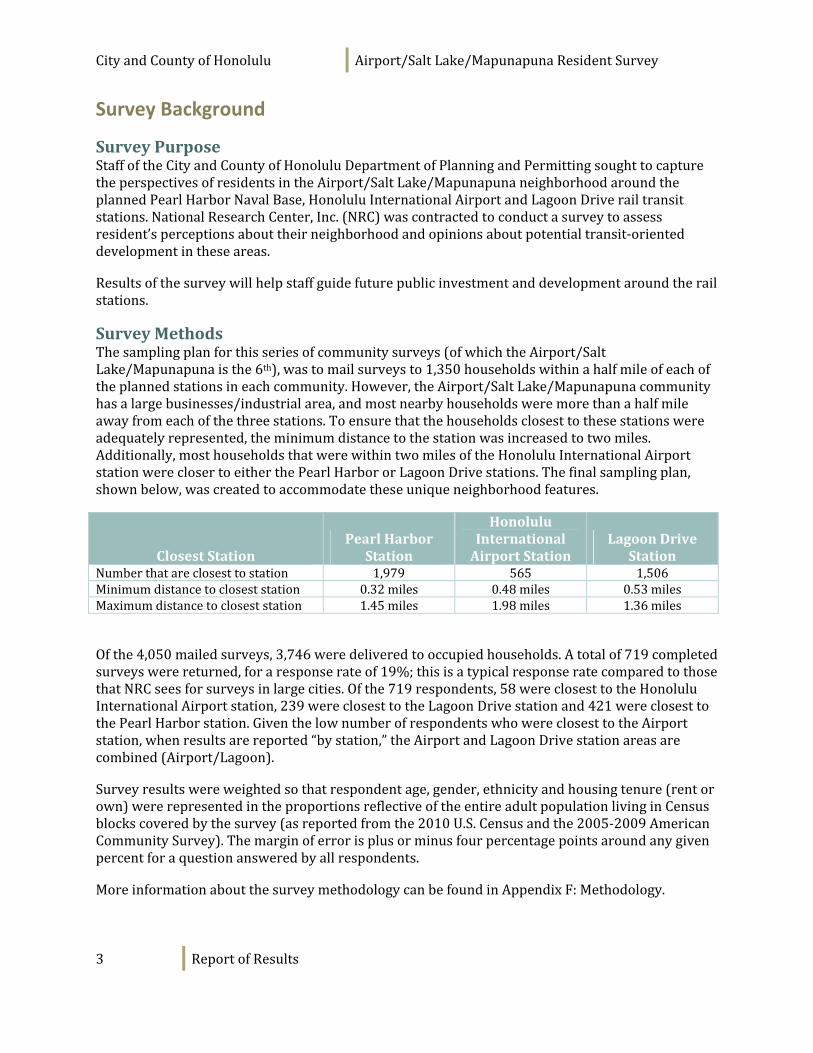
About4in10residentsgavefairorpoorratingstothecleanlinessofpublicspaces(38%),thepresenceoftreesorothershadeprovidingcanopies(39%),andabouthalfofresidentsgavefairorpoorratingstotheavailabilityoftrashorrecyclingreceptacles(48%).ResidentswhorenttheirhomegavemorepositiveratingstothecleanlinessofpublicspacesandtothepresenceoftreesthandidresidentswhoowntheirhomeinPearlHarbor‐Airport‐Lagoonneighborhoods.SurveyrespondentswholivedclosertotheplannedAirport/LagoonDrivestationsgavehigherratingstocleanlinessandpresenceoftreesbutlowerratingstotheavailabilityoftrash/recyclingreceptaclesthandidthosewholivedclosertotheplannedPearlHarborrailstation.
Figure 1: Cleanliness of Neighborhood
15%
22%
16%
38%
38%
47%
31%
23%
30%
17%
16%
8%
% 20% 40% 60% 80% 100%
Presence of trees and other shade providingcanopies
Availability of trash/recycling receptacles
Cleanliness of public spaces (includingstreets/sidewalks)
Excellent Good Fair Poor
CityandCountyofHonolulu Airport/SaltLake/MapunapunaResidentSurvey
6 ReportofResults
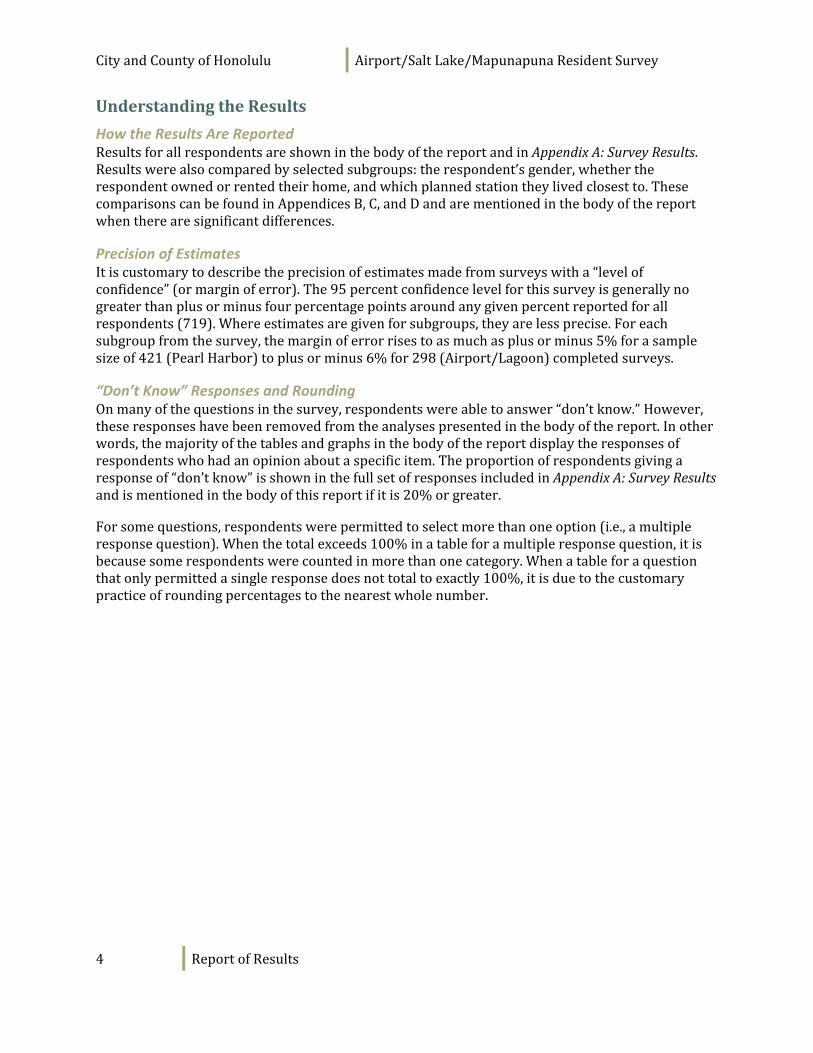
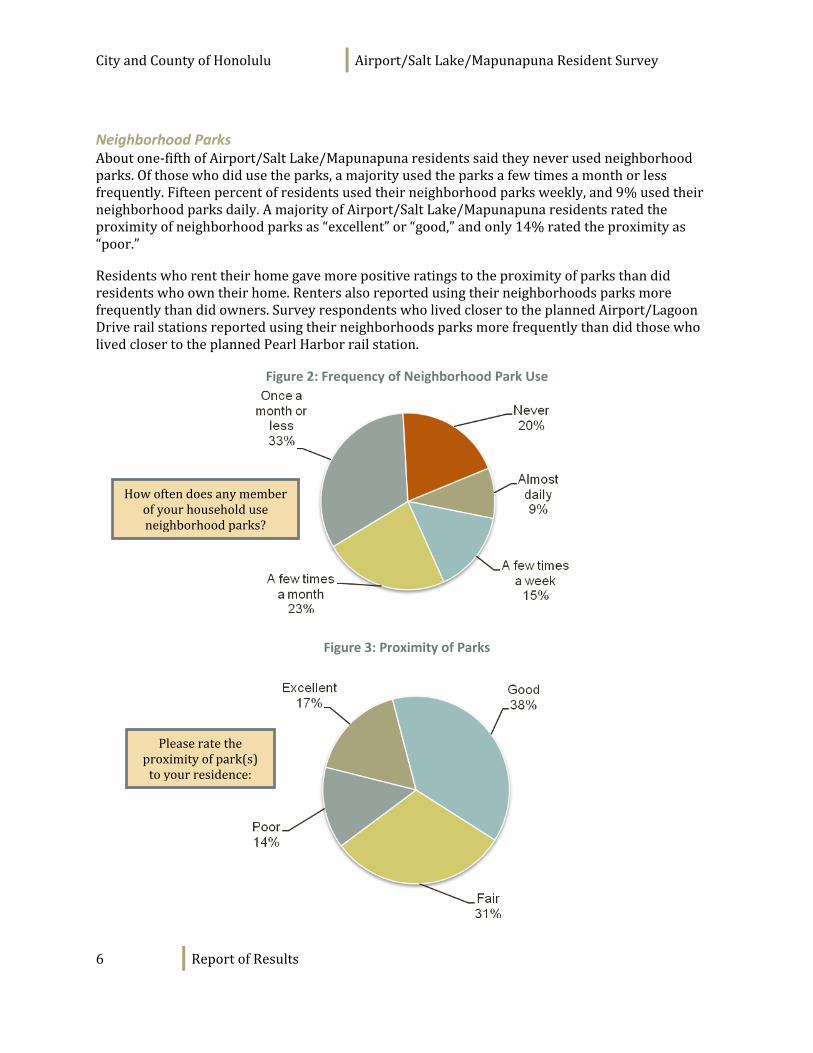
Neighborhood Parks Aboutone‐fifthofAirport/SaltLake/Mapunapunaresidentssaidtheyneverusedneighborhoodparks.Ofthosewhodidusetheparks,amajorityusedtheparksafewtimesamonthorlessfrequently.Fifteenpercentofresidentsusedtheirneighborhoodparksweekly,and9%usedtheirneighborhoodparksdaily.AmajorityofAirport/SaltLake/Mapunapunaresidentsratedtheproximityofneighborhoodparksas“excellent”or“good,”andonly14%ratedtheproximityas“poor.”
Residentswhorenttheirhomegavemorepositiveratingstotheproximityofparksthandidresidentswhoowntheirhome.Rentersalsoreportedusingtheirneighborhoodsparksmorefrequentlythandidowners.SurveyrespondentswholivedclosertotheplannedAirport/LagoonDriverailstationsreportedusingtheirneighborhoodsparksmorefrequentlythandidthosewholivedclosertotheplannedPearlHarborrailstation.
Figure 2: Frequency of Neighborhood Park Use
Figure 3: Proximity of Parks
Howoftendoesanymemberofyourhouseholduseneighborhoodparks?
Pleaseratetheproximityofpark(s)toyourresidence:
CityandCountyofHonolulu Airport/SaltLake/MapunapunaResidentSurvey
7 ReportofResults
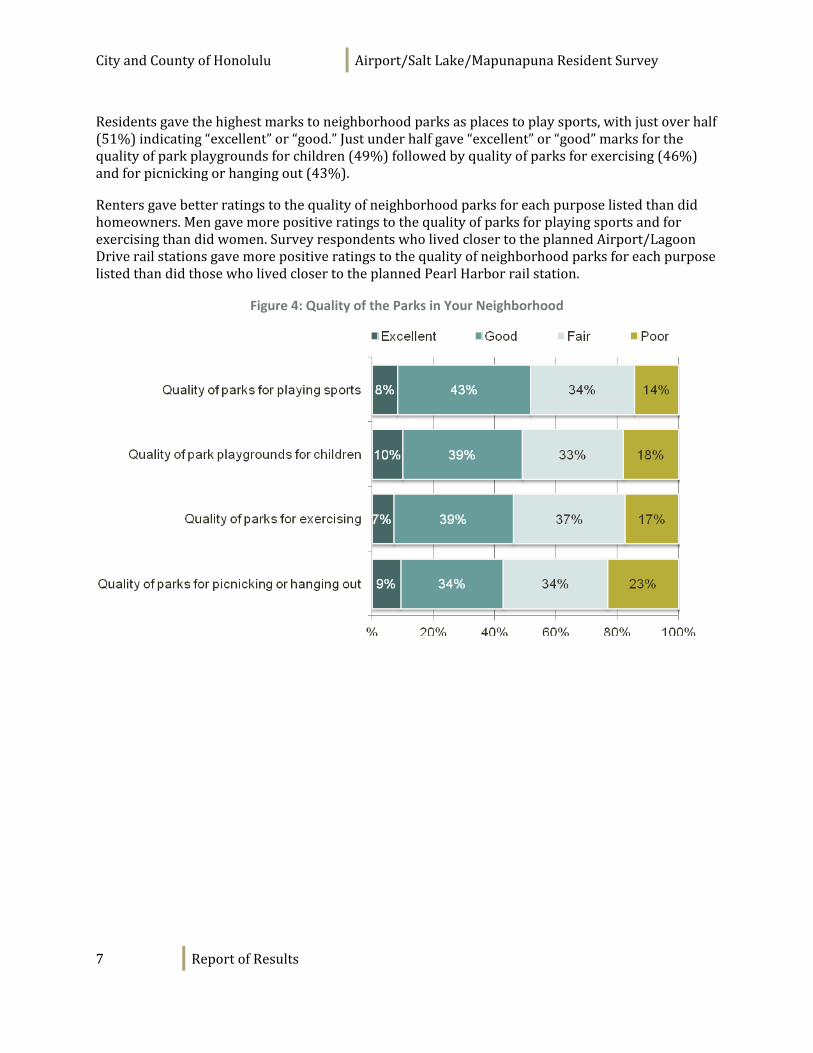
Residentsgavethehighestmarkstoneighborhoodparksasplacestoplaysports,withjustoverhalf(51%)indicating“excellent”or“good.”Justunderhalfgave“excellent”or“good”marksforthequalityofparkplaygroundsforchildren(49%)followedbyqualityofparksforexercising(46%)andforpicnickingorhangingout(43%).
Rentersgavebetterratingstothequalityofneighborhoodparksforeachpurposelistedthandidhomeowners.Mengavemorepositiveratingstothequalityofparksforplayingsportsandforexercisingthandidwomen.SurveyrespondentswholivedclosertotheplannedAirport/LagoonDriverailstationsgavemorepositiveratingstothequalityofneighborhoodparksforeachpurposelistedthandidthosewholivedclosertotheplannedPearlHarborrailstation.
Figure 4: Quality of the Parks in Your Neighborhood
CityandCountyofHonolulu Airport/SaltLake/MapunapunaResidentSurvey
8 ReportofResults
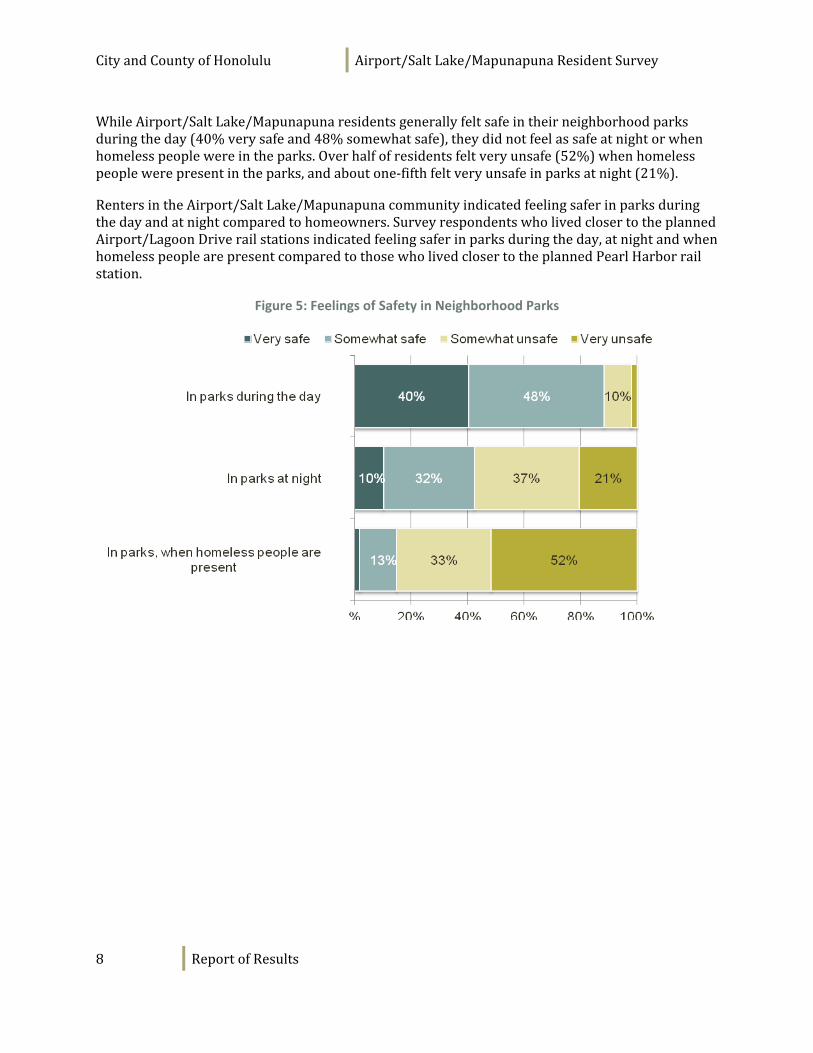
WhileAirport/SaltLake/Mapunapunaresidentsgenerallyfeltsafeintheirneighborhoodparksduringtheday(40%verysafeand48%somewhatsafe),theydidnotfeelassafeatnightorwhenhomelesspeoplewereintheparks.Overhalfofresidentsfeltveryunsafe(52%)whenhomelesspeoplewerepresentintheparks,andaboutone‐fifthfeltveryunsafeinparksatnight(21%).
RentersintheAirport/SaltLake/Mapunapunacommunityindicatedfeelingsaferinparksduringthedayandatnightcomparedtohomeowners.SurveyrespondentswholivedclosertotheplannedAirport/LagoonDriverailstationsindicatedfeelingsaferinparksduringtheday,atnightandwhenhomelesspeoplearepresentcomparedtothosewholivedclosertotheplannedPearlHarborrailstation.
Figure 5: Feelings of Safety in Neighborhood Parks
CityandCountyofHonolulu Airport/SaltLake/MapunapunaResidentSurvey
9 ReportofResults
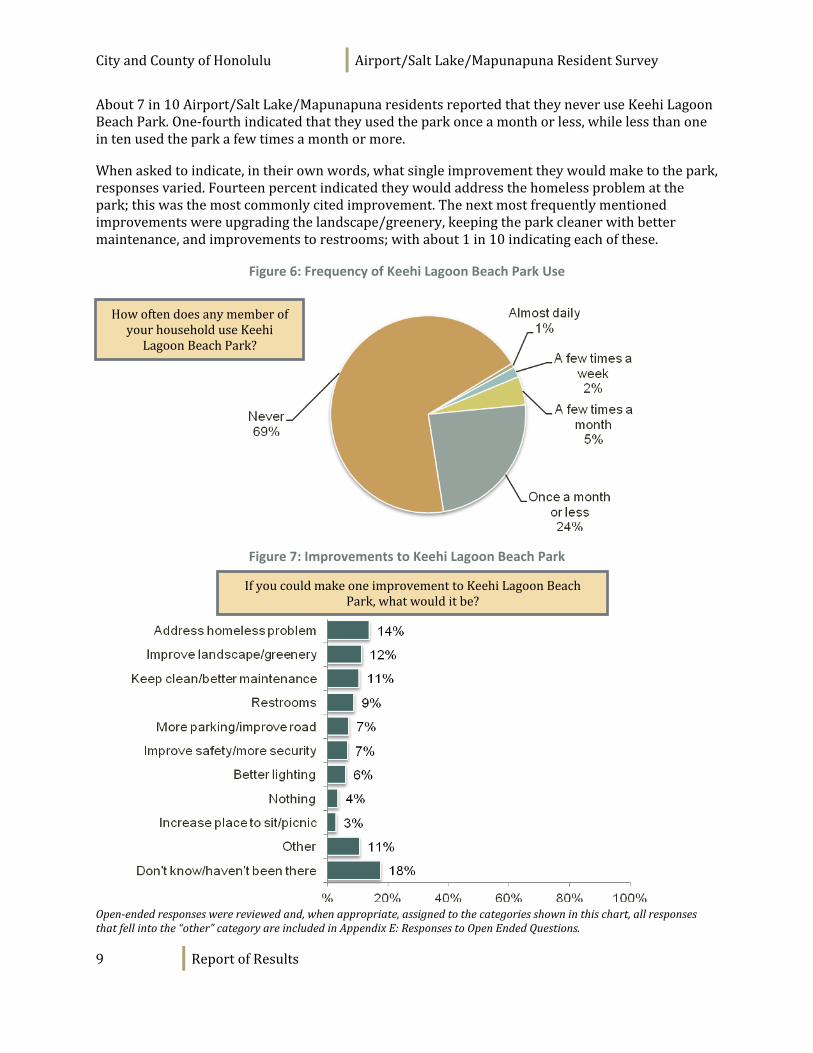
About7in10Airport/SaltLake/MapunapunaresidentsreportedthattheyneveruseKeehiLagoonBeachPark.One‐fourthindicatedthattheyusedtheparkonceamonthorless,whilelessthanoneintenusedtheparkafewtimesamonthormore.
Whenaskedtoindicate,intheirownwords,whatsingleimprovementtheywouldmaketothepark,responsesvaried.Fourteenpercentindicatedtheywouldaddressthehomelessproblematthepark;thiswasthemostcommonlycitedimprovement.Thenextmostfrequentlymentionedimprovementswereupgradingthelandscape/greenery,keepingtheparkcleanerwithbettermaintenance,andimprovementstorestrooms;withabout1in10indicatingeachofthese.
Figure 6: Frequency of Keehi Lagoon Beach Park Use
Figure 7: Improvements to Keehi Lagoon Beach Park
Open‐endedresponseswerereviewedand,whenappropriate,assignedtothecategoriesshowninthischart,allresponsesthatfellintothe“other”categoryareincludedinAppendixE:ResponsestoOpenEndedQuestions.
HowoftendoesanymemberofyourhouseholduseKeehiLagoonBeachPark?
IfyoucouldmakeoneimprovementtoKeehiLagoonBeachPark,whatwoulditbe?
CityandCountyofHonolulu Airport/SaltLake/MapunapunaResidentSurvey
10 ReportofResults
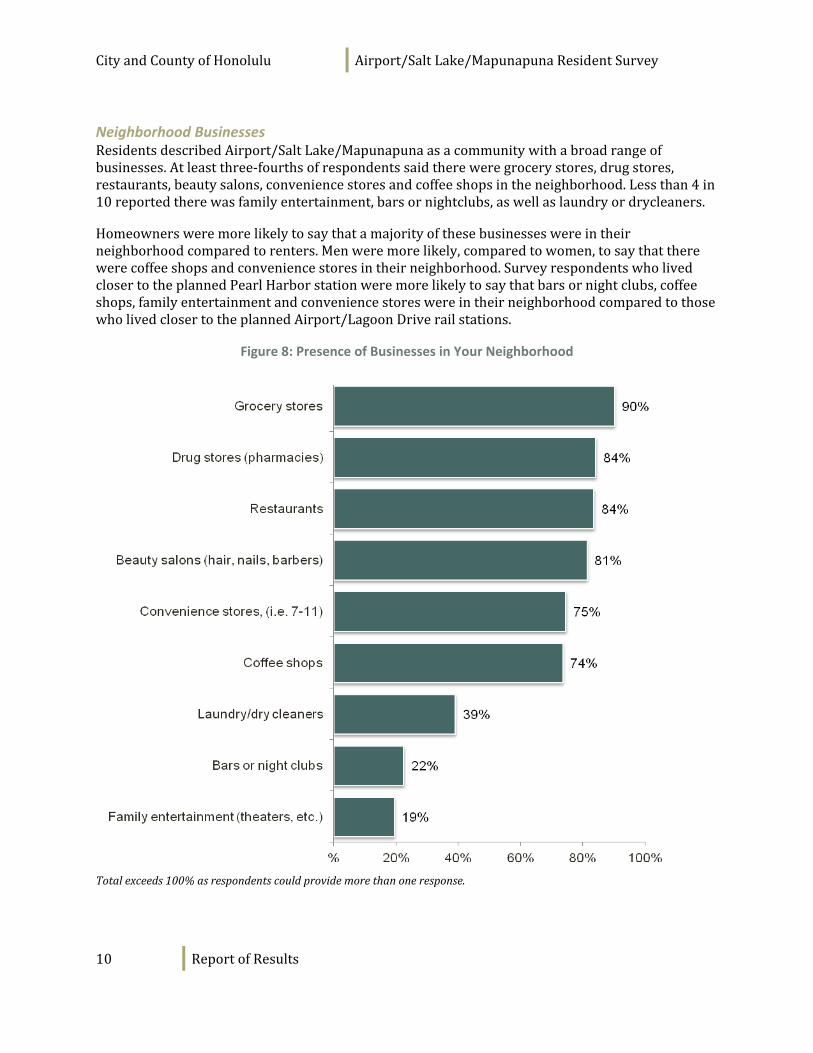
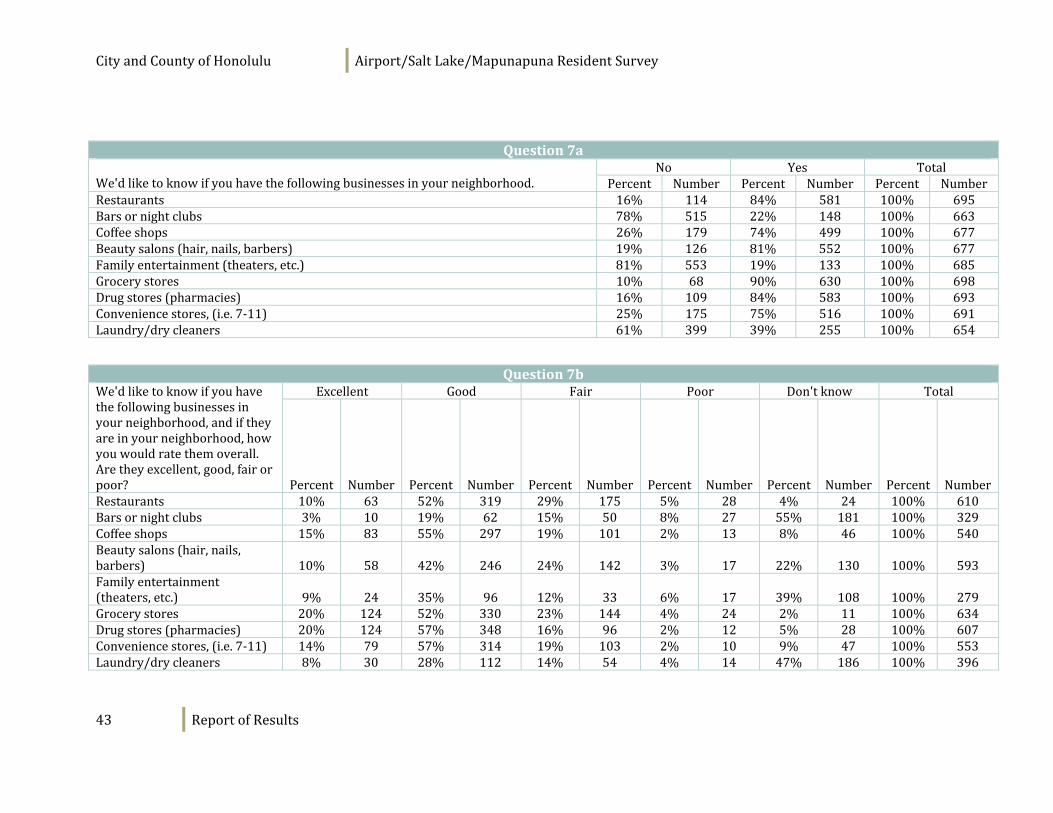
Neighborhood Businesses ResidentsdescribedAirport/SaltLake/Mapunapunaasacommunitywithabroadrangeofbusinesses.Atleastthree‐fourthsofrespondentssaidthereweregrocerystores,drugstores,restaurants,beautysalons,conveniencestoresandcoffeeshopsintheneighborhood.Lessthan4in10reportedtherewasfamilyentertainment,barsornightclubs,aswellaslaundryordrycleaners.
Homeownersweremorelikelytosaythatamajorityofthesebusinesseswereintheirneighborhoodcomparedtorenters.Menweremorelikely,comparedtowomen,tosaythattherewerecoffeeshopsandconveniencestoresintheirneighborhood.SurveyrespondentswholivedclosertotheplannedPearlHarborstationweremorelikelytosaythatbarsornightclubs,coffeeshops,familyentertainmentandconveniencestoreswereintheirneighborhoodcomparedtothosewholivedclosertotheplannedAirport/LagoonDriverailstations.
Figure 8: Presence of Businesses in Your Neighborhood
Totalexceeds100%asrespondentscouldprovidemorethanoneresponse.
CityandCountyofHonolulu Airport/SaltLake/MapunapunaResidentSurvey
11 ReportofResults
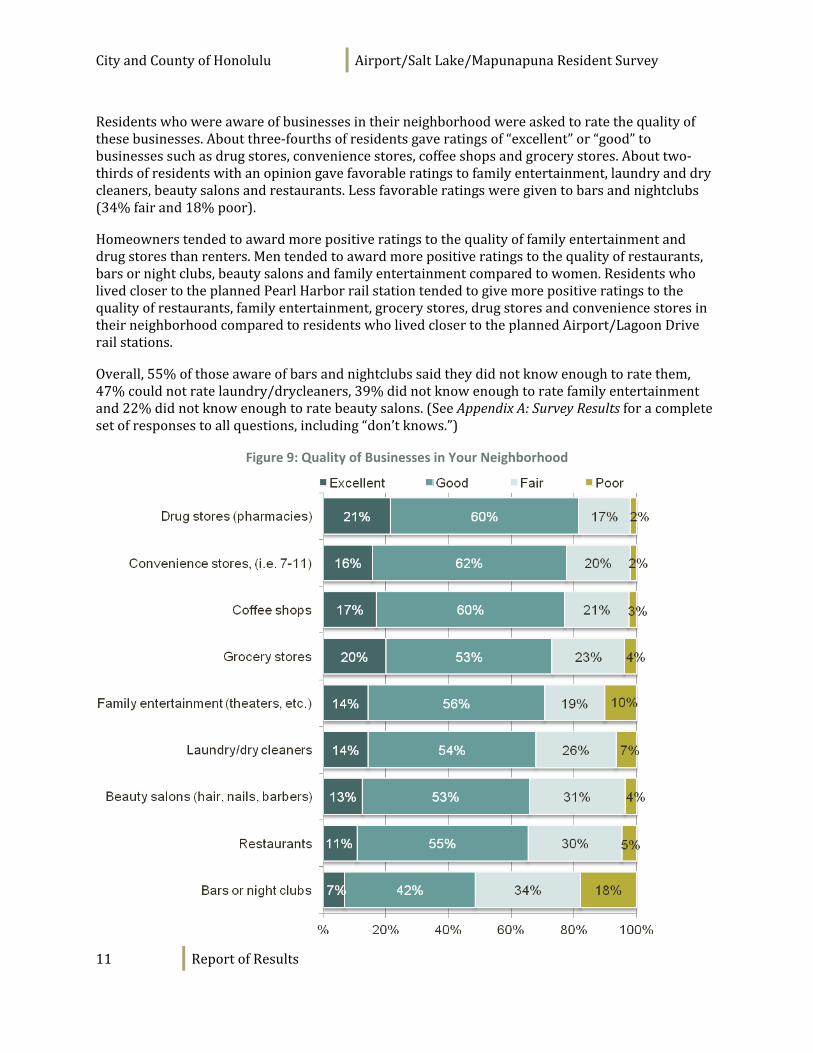
Residentswhowereawareofbusinessesintheirneighborhoodwereaskedtoratethequalityofthesebusinesses.Aboutthree‐fourthsofresidentsgaveratingsof“excellent”or“good”tobusinessessuchasdrugstores,conveniencestores,coffeeshopsandgrocerystores.Abouttwo‐thirdsofresidentswithanopiniongavefavorableratingstofamilyentertainment,laundryanddrycleaners,beautysalonsandrestaurants.Lessfavorableratingsweregiventobarsandnightclubs(34%fairand18%poor).
Homeownerstendedtoawardmorepositiveratingstothequalityoffamilyentertainmentanddrugstoresthanrenters.Mentendedtoawardmorepositiveratingstothequalityofrestaurants,barsornightclubs,beautysalonsandfamilyentertainmentcomparedtowomen.ResidentswholivedclosertotheplannedPearlHarborrailstationtendedtogivemorepositiveratingstothequalityofrestaurants,familyentertainment,grocerystores,drugstoresandconveniencestoresintheirneighborhoodcomparedtoresidentswholivedclosertotheplannedAirport/LagoonDriverailstations.
Overall,55%ofthoseawareofbarsandnightclubssaidtheydidnotknowenoughtoratethem,47%couldnotratelaundry/drycleaners,39%didnotknowenoughtoratefamilyentertainmentand22%didnotknowenoughtoratebeautysalons.(SeeAppendixA:SurveyResultsforacompletesetofresponsestoallquestions,including“don’tknows.”)
Figure 9: Quality of Businesses in Your Neighborhood
CityandCountyofHonolulu Airport/SaltLake/MapunapunaResidentSurvey
12 ReportofResults
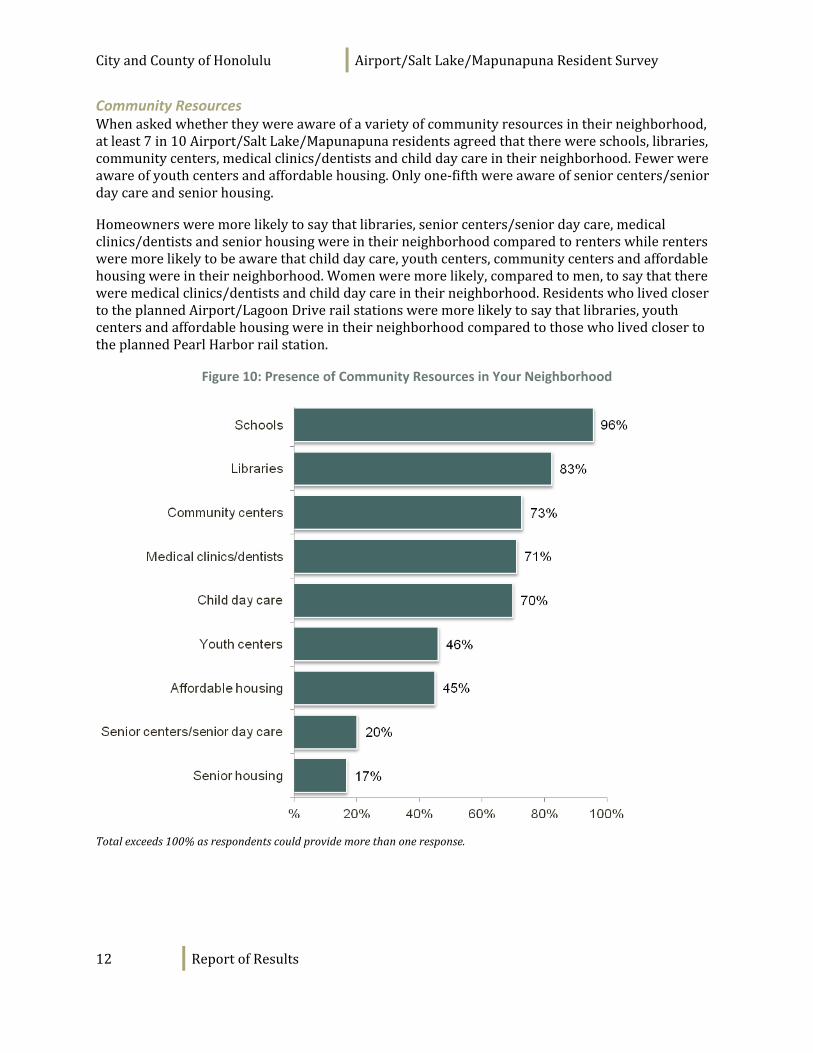
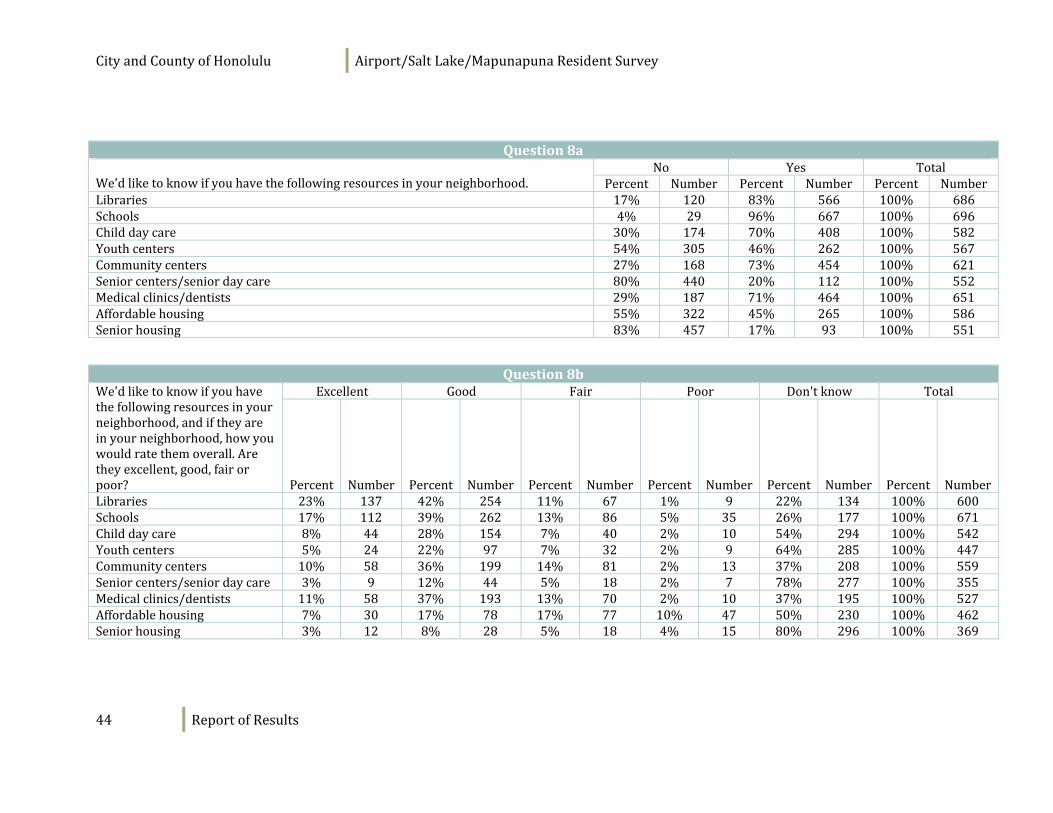
Community Resources Whenaskedwhethertheywereawareofavarietyofcommunityresourcesintheirneighborhood,atleast7in10Airport/SaltLake/Mapunapunaresidentsagreedthattherewereschools,libraries,communitycenters,medicalclinics/dentistsandchilddaycareintheirneighborhood.Fewerwereawareofyouthcentersandaffordablehousing.Onlyone‐fifthwereawareofseniorcenters/seniordaycareandseniorhousing.
Homeownersweremorelikelytosaythatlibraries,seniorcenters/seniordaycare,medicalclinics/dentistsandseniorhousingwereintheirneighborhoodcomparedtorenterswhilerentersweremorelikelytobeawarethatchilddaycare,youthcenters,communitycentersandaffordablehousingwereintheirneighborhood.Womenweremorelikely,comparedtomen,tosaythatthereweremedicalclinics/dentistsandchilddaycareintheirneighborhood.ResidentswholivedclosertotheplannedAirport/LagoonDriverailstationsweremorelikelytosaythatlibraries,youthcentersandaffordablehousingwereintheirneighborhoodcomparedtothosewholivedclosertotheplannedPearlHarborrailstation.
Figure 10: Presence of Community Resources in Your Neighborhood
Totalexceeds100%asrespondentscouldprovidemorethanoneresponse.
CityandCountyofHonolulu Airport/SaltLake/MapunapunaResidentSurvey
13 ReportofResults
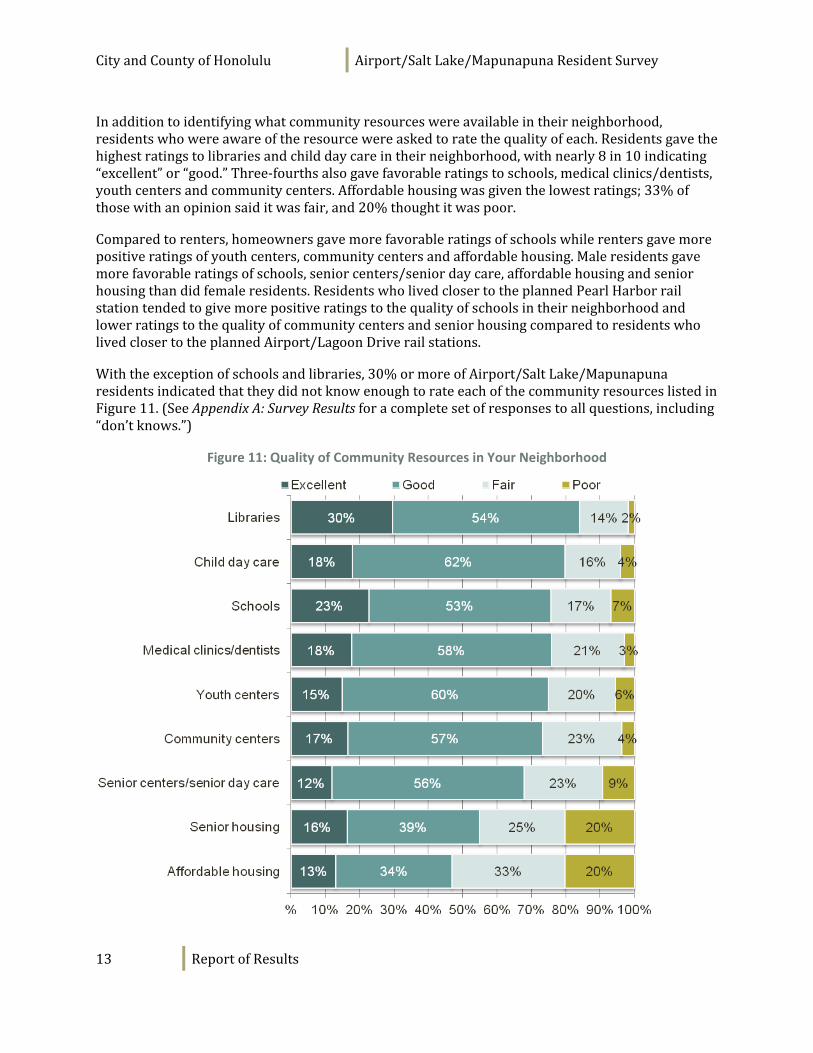
Inadditiontoidentifyingwhatcommunityresourceswereavailableintheirneighborhood,residentswhowereawareoftheresourcewereaskedtoratethequalityofeach.Residentsgavethehighestratingstolibrariesandchilddaycareintheirneighborhood,withnearly8in10indicating“excellent”or“good.”Three‐fourthsalsogavefavorableratingstoschools,medicalclinics/dentists,youthcentersandcommunitycenters.Affordablehousingwasgiventhelowestratings;33%ofthosewithanopinionsaiditwasfair,and20%thoughtitwaspoor.
Comparedtorenters,homeownersgavemorefavorableratingsofschoolswhilerentersgavemorepositiveratingsofyouthcenters,communitycentersandaffordablehousing.Maleresidentsgavemorefavorableratingsofschools,seniorcenters/seniordaycare,affordablehousingandseniorhousingthandidfemaleresidents.ResidentswholivedclosertotheplannedPearlHarborrailstationtendedtogivemorepositiveratingstothequalityofschoolsintheirneighborhoodandlowerratingstothequalityofcommunitycentersandseniorhousingcomparedtoresidentswholivedclosertotheplannedAirport/LagoonDriverailstations.
Withtheexceptionofschoolsandlibraries,30%ormoreofAirport/SaltLake/MapunapunaresidentsindicatedthattheydidnotknowenoughtorateeachofthecommunityresourceslistedinFigure11.(SeeAppendixA:SurveyResultsforacompletesetofresponsestoallquestions,including“don’tknows.”)
Figure 11: Quality of Community Resources in Your Neighborhood
CityandCountyofHonolulu Airport/SaltLake/MapunapunaResidentSurvey
14 ReportofResults
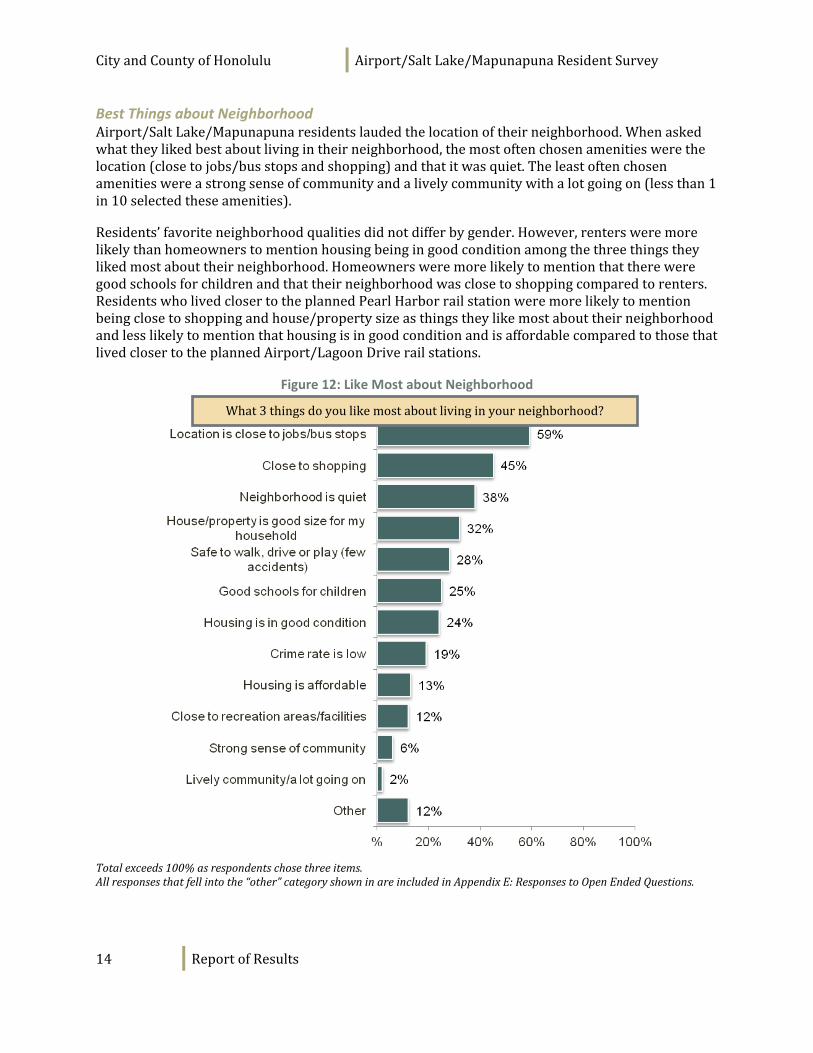
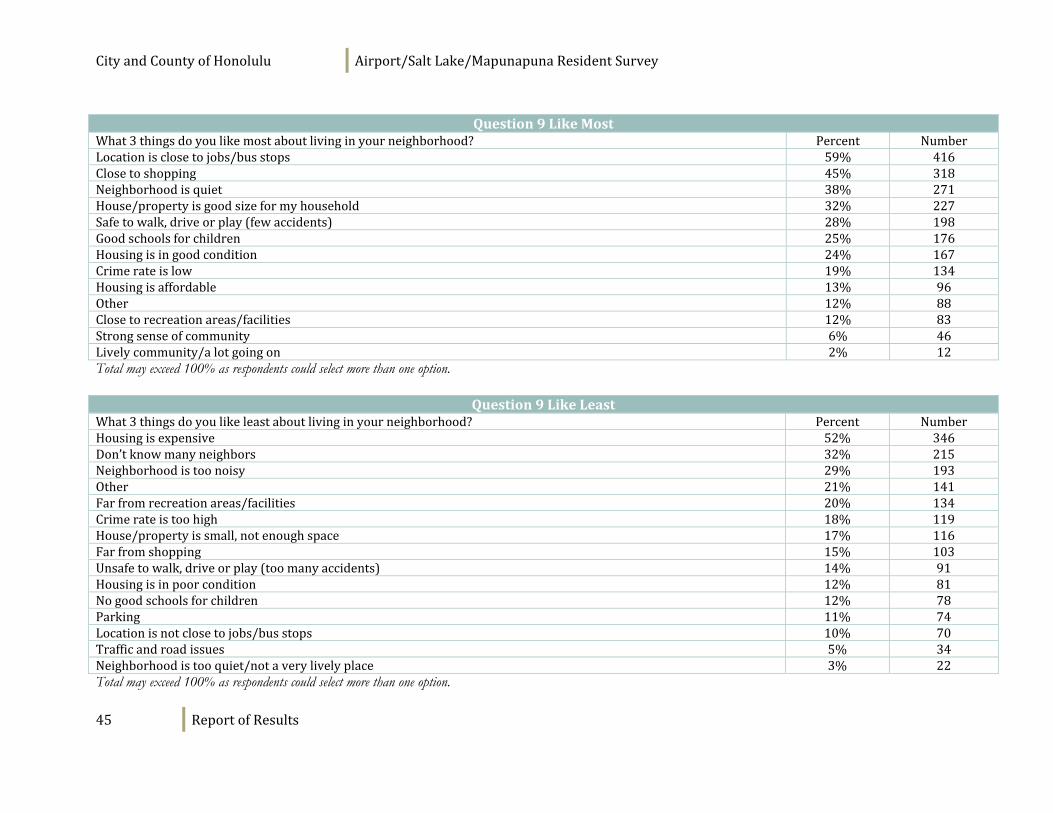
Best Things about Neighborhood Airport/SaltLake/Mapunapunaresidentslaudedthelocationoftheirneighborhood.Whenaskedwhattheylikedbestaboutlivingintheirneighborhood,themostoftenchosenamenitieswerethelocation(closetojobs/busstopsandshopping)andthatitwasquiet.Theleastoftenchosenamenitieswereastrongsenseofcommunityandalivelycommunitywithalotgoingon(lessthan1in10selectedtheseamenities).
Residents’favoriteneighborhoodqualitiesdidnotdifferbygender.However,rentersweremorelikelythanhomeownerstomentionhousingbeingingoodconditionamongthethreethingstheylikedmostabouttheirneighborhood.Homeownersweremorelikelytomentionthatthereweregoodschoolsforchildrenandthattheirneighborhoodwasclosetoshoppingcomparedtorenters.ResidentswholivedclosertotheplannedPearlHarborrailstationweremorelikelytomentionbeingclosetoshoppingandhouse/propertysizeasthingstheylikemostabouttheirneighborhoodandlesslikelytomentionthathousingisingoodconditionandisaffordablecomparedtothosethatlivedclosertotheplannedAirport/LagoonDriverailstations.
Figure 12: Like Most about Neighborhood
Totalexceeds100%asrespondentschosethreeitems.Allresponsesthatfellintothe“other”categoryshowninareincludedinAppendixE:ResponsestoOpenEndedQuestions.
What3thingsdoyoulikemostaboutlivinginyourneighborhood?
CityandCountyofHonolulu Airport/SaltLake/MapunapunaResidentSurvey
15 ReportofResults
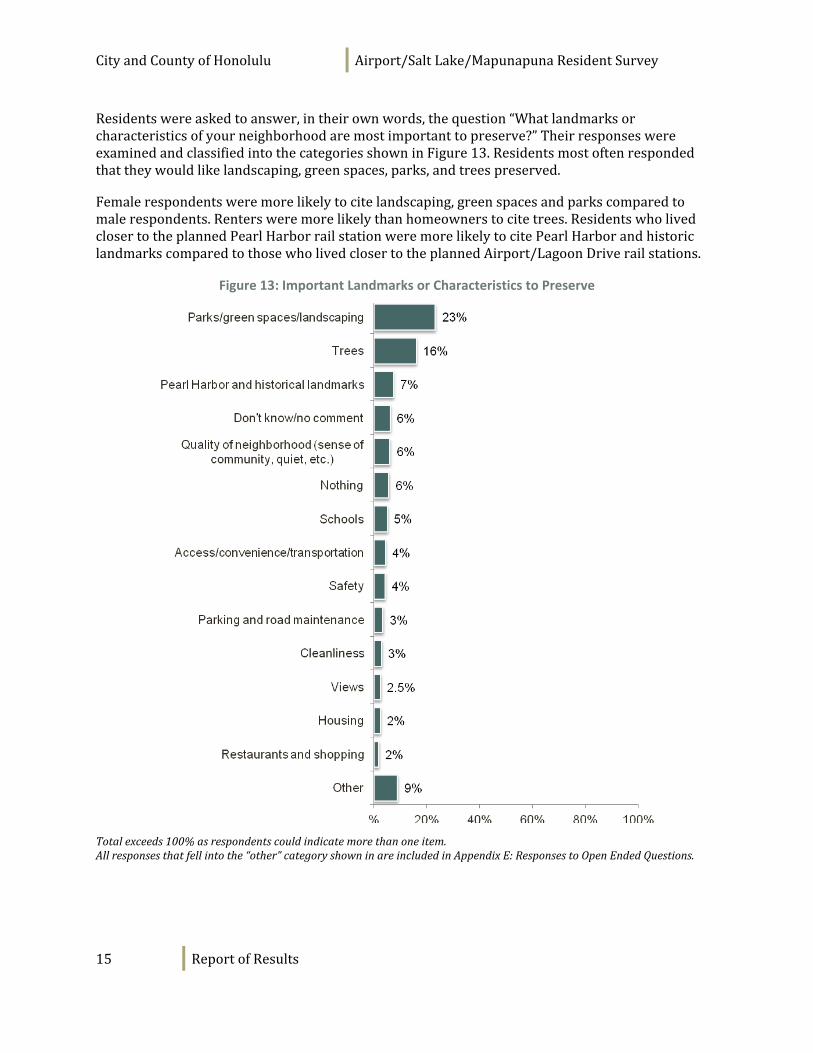
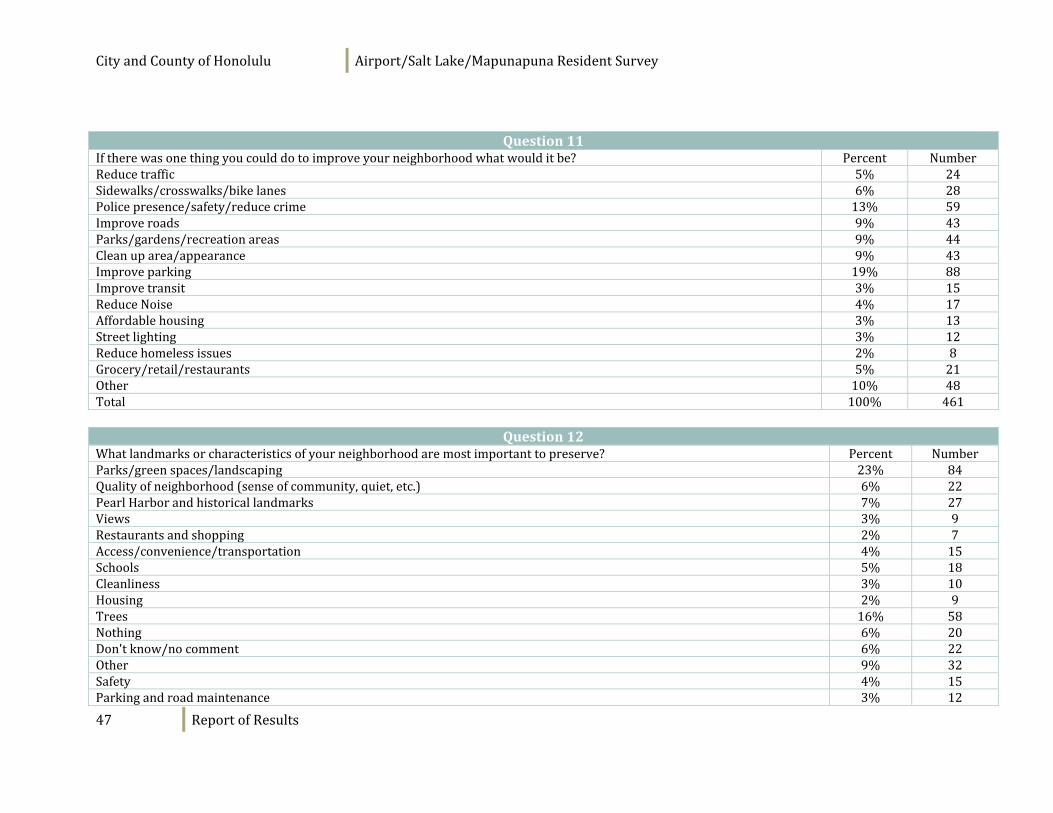
Residentswereaskedtoanswer,intheirownwords,thequestion“Whatlandmarksorcharacteristicsofyourneighborhoodaremostimportanttopreserve?”TheirresponseswereexaminedandclassifiedintothecategoriesshowninFigure13.Residentsmostoftenrespondedthattheywouldlikelandscaping,greenspaces,parks,andtreespreserved.
Femalerespondentsweremorelikelytocitelandscaping,greenspacesandparkscomparedtomalerespondents.Rentersweremorelikelythanhomeownerstocitetrees.ResidentswholivedclosertotheplannedPearlHarborrailstationweremorelikelytocitePearlHarborandhistoriclandmarkscomparedtothosewholivedclosertotheplannedAirport/LagoonDriverailstations.
Figure 13: Important Landmarks or Characteristics to Preserve
Totalexceeds100%asrespondentscouldindicatemorethanoneitem.Allresponsesthatfellintothe“other”categoryshowninareincludedinAppendixE:ResponsestoOpenEndedQuestions.
CityandCountyofHonolulu Airport/SaltLake/MapunapunaResidentSurvey
16 ReportofResults
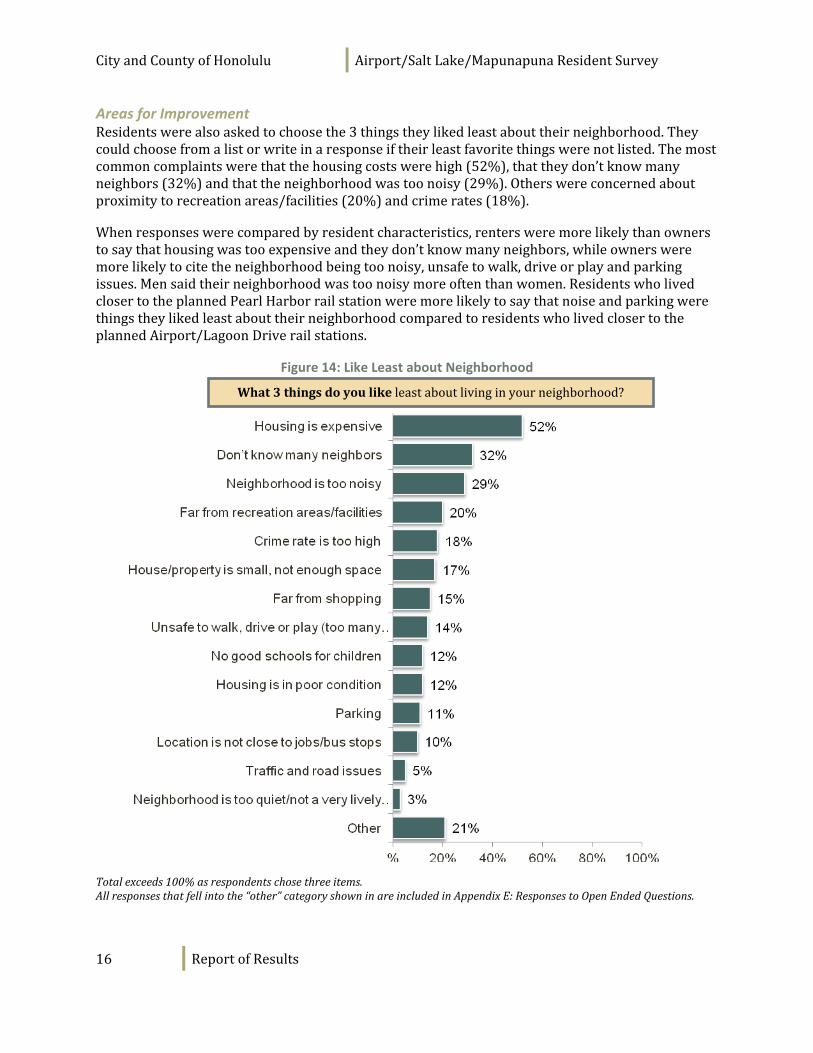
Areas for Improvement Residentswerealsoaskedtochoosethe3thingstheylikedleastabouttheirneighborhood.Theycouldchoosefromalistorwriteinaresponseiftheirleastfavoritethingswerenotlisted.Themostcommoncomplaintswerethatthehousingcostswerehigh(52%),thattheydon’tknowmanyneighbors(32%)andthattheneighborhoodwastoonoisy(29%).Otherswereconcernedaboutproximitytorecreationareas/facilities(20%)andcrimerates(18%).
Whenresponseswerecomparedbyresidentcharacteristics,rentersweremorelikelythanownerstosaythathousingwastooexpensiveandtheydon’tknowmanyneighbors,whileownersweremorelikelytocitetheneighborhoodbeingtoonoisy,unsafetowalk,driveorplayandparkingissues.Mensaidtheirneighborhoodwastoonoisymoreoftenthanwomen.ResidentswholivedclosertotheplannedPearlHarborrailstationweremorelikelytosaythatnoiseandparkingwerethingstheylikedleastabouttheirneighborhoodcomparedtoresidentswholivedclosertotheplannedAirport/LagoonDriverailstations.
Figure 14: Like Least about Neighborhood
Totalexceeds100%asrespondentschosethreeitems.Allresponsesthatfellintothe“other”categoryshowninareincludedinAppendixE:ResponsestoOpenEndedQuestions.
What3thingsdoyoulikeleast aboutlivinginyourneighborhood?
CityandCountyofHonolulu Airport/SaltLake/MapunapunaResidentSurvey
17 ReportofResults
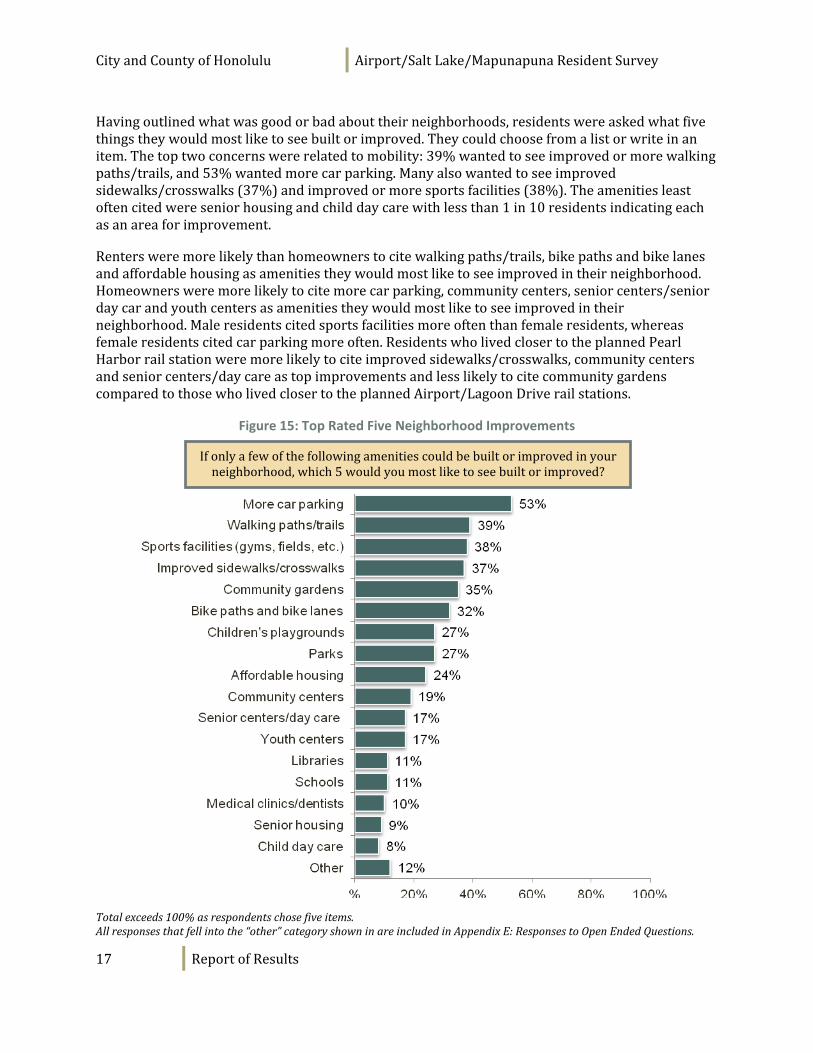
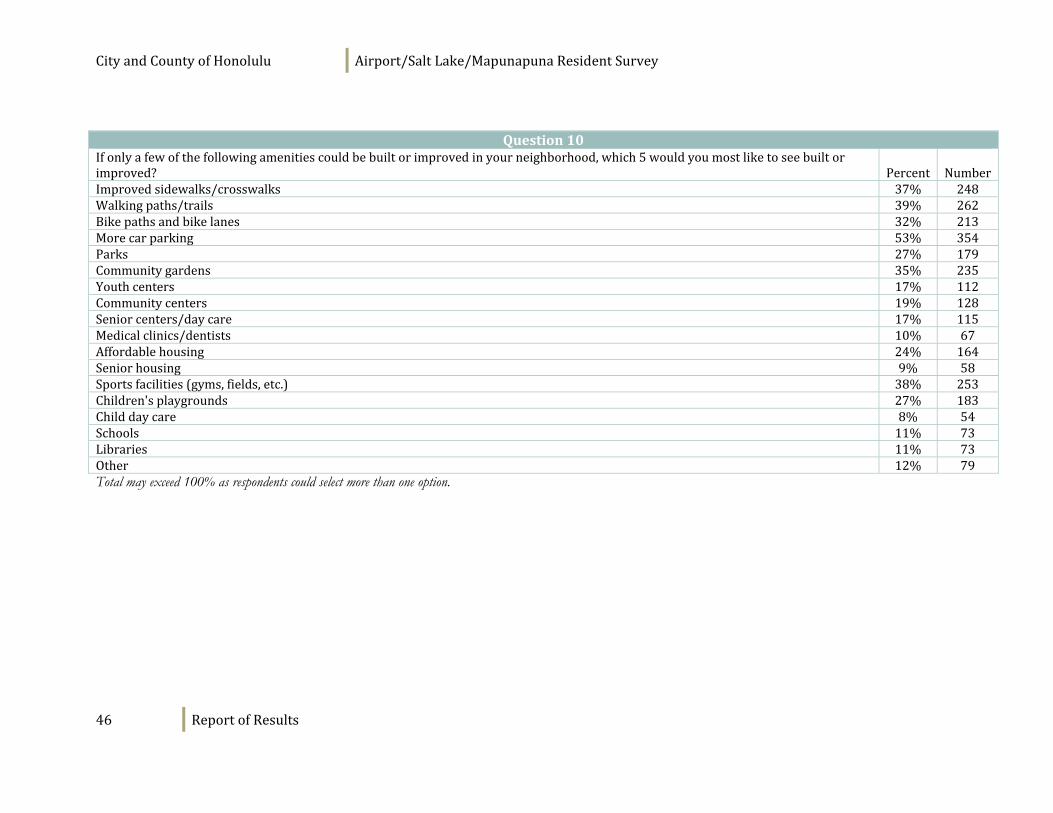
Havingoutlinedwhatwasgoodorbadabouttheirneighborhoods,residentswereaskedwhatfivethingstheywouldmostliketoseebuiltorimproved.Theycouldchoosefromalistorwriteinanitem.Thetoptwoconcernswererelatedtomobility:39%wantedtoseeimprovedormorewalkingpaths/trails,and53%wantedmorecarparking.Manyalsowantedtoseeimprovedsidewalks/crosswalks(37%)andimprovedormoresportsfacilities(38%).Theamenitiesleastoftencitedwereseniorhousingandchilddaycarewithlessthan1in10residentsindicatingeachasanareaforimprovement.
Rentersweremorelikelythanhomeownerstocitewalkingpaths/trails,bikepathsandbikelanesandaffordablehousingasamenitiestheywouldmostliketoseeimprovedintheirneighborhood.Homeownersweremorelikelytocitemorecarparking,communitycenters,seniorcenters/seniordaycarandyouthcentersasamenitiestheywouldmostliketoseeimprovedintheirneighborhood.Maleresidentscitedsportsfacilitiesmoreoftenthanfemaleresidents,whereasfemaleresidentscitedcarparkingmoreoften.ResidentswholivedclosertotheplannedPearlHarborrailstationweremorelikelytociteimprovedsidewalks/crosswalks,communitycentersandseniorcenters/daycareastopimprovementsandlesslikelytocitecommunitygardenscomparedtothosewholivedclosertotheplannedAirport/LagoonDriverailstations.
Figure 15: Top Rated Five Neighborhood Improvements
Totalexceeds100%asrespondentschosefiveitems.Allresponsesthatfellintothe“other”categoryshowninareincludedinAppendixE:ResponsestoOpenEndedQuestions.
Ifonlyafewofthefollowingamenitiescouldbebuiltorimprovedinyourneighborhood,which5wouldyoumostliketoseebuiltorimproved?
CityandCountyofHonolulu Airport/SaltLake/MapunapunaResidentSurvey
18 ReportofResults
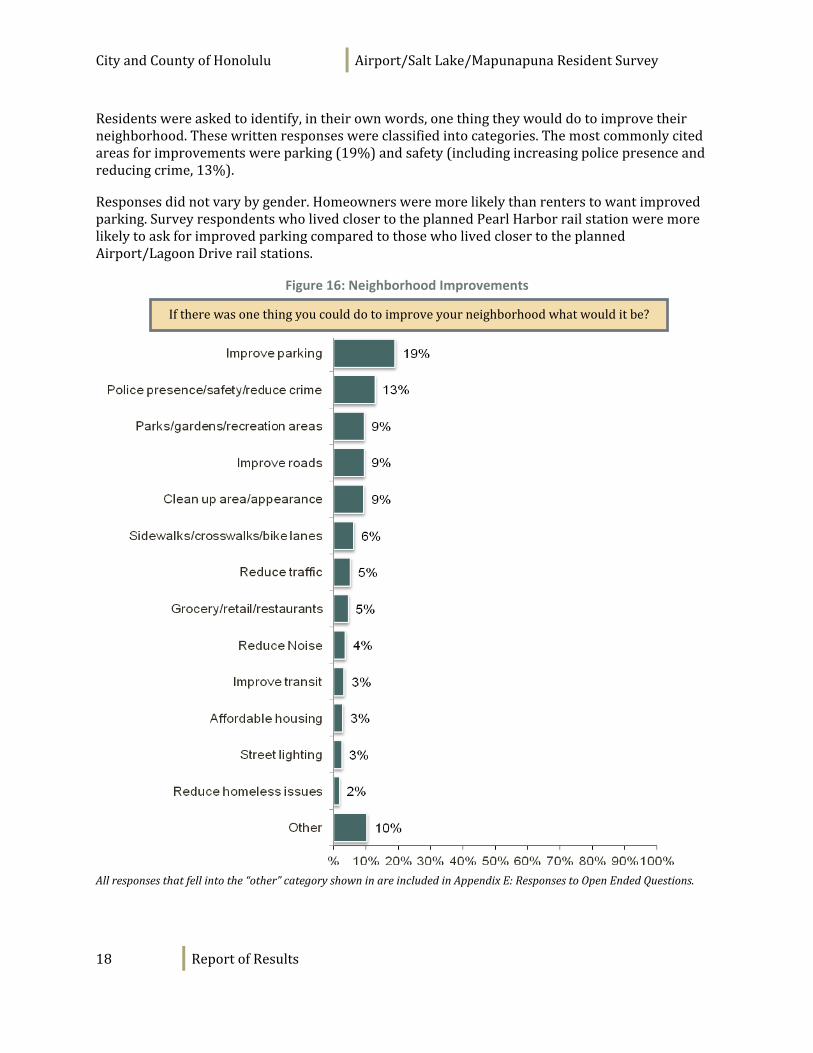
Residentswereaskedtoidentify,intheirownwords,onethingtheywoulddotoimprovetheirneighborhood.Thesewrittenresponseswereclassifiedintocategories.Themostcommonlycitedareasforimprovementswereparking(19%)andsafety(includingincreasingpolicepresenceandreducingcrime,13%).
Responsesdidnotvarybygender.Homeownersweremorelikelythanrenterstowantimprovedparking.SurveyrespondentswholivedclosertotheplannedPearlHarborrailstationweremorelikelytoaskforimprovedparkingcomparedtothosewholivedclosertotheplannedAirport/LagoonDriverailstations.
Figure 16: Neighborhood Improvements
Allresponsesthatfellintothe“other”categoryshowninareincludedinAppendixE:ResponsestoOpenEndedQuestions.
Iftherewasonethingyoucoulddotoimproveyourneighborhoodwhatwoulditbe?
CityandCountyofHonolulu Airport/SaltLake/MapunapunaResidentSurvey
19 ReportofResults
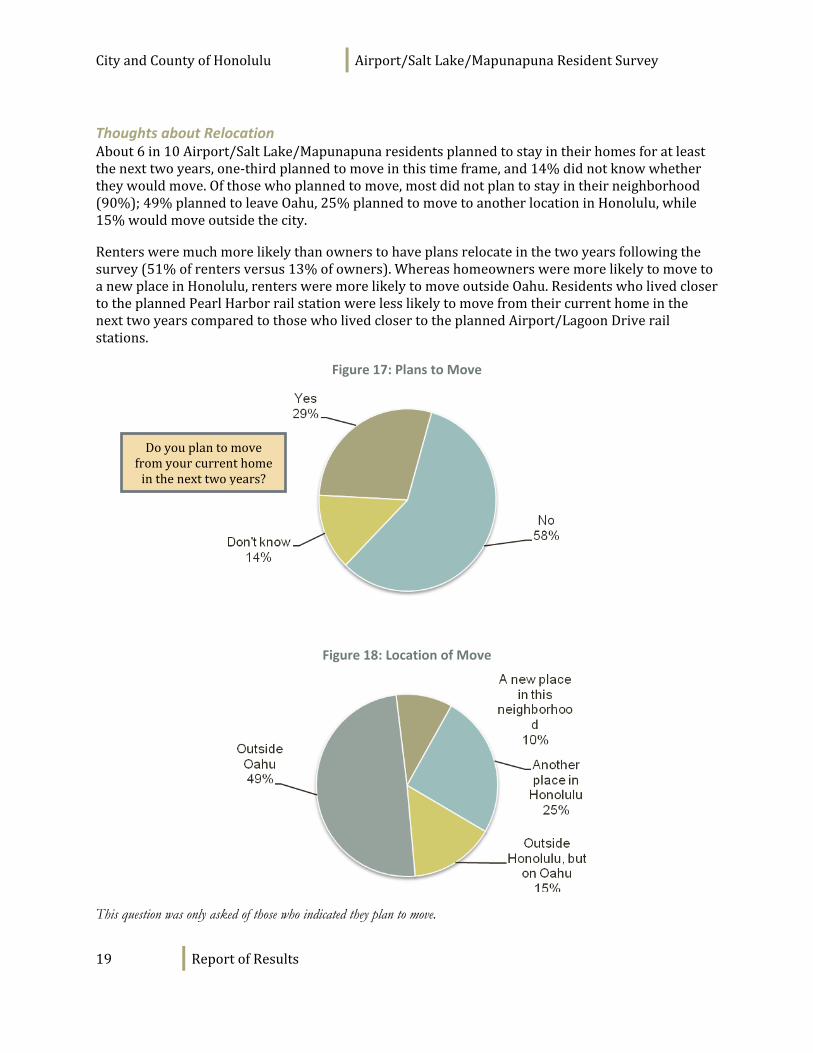
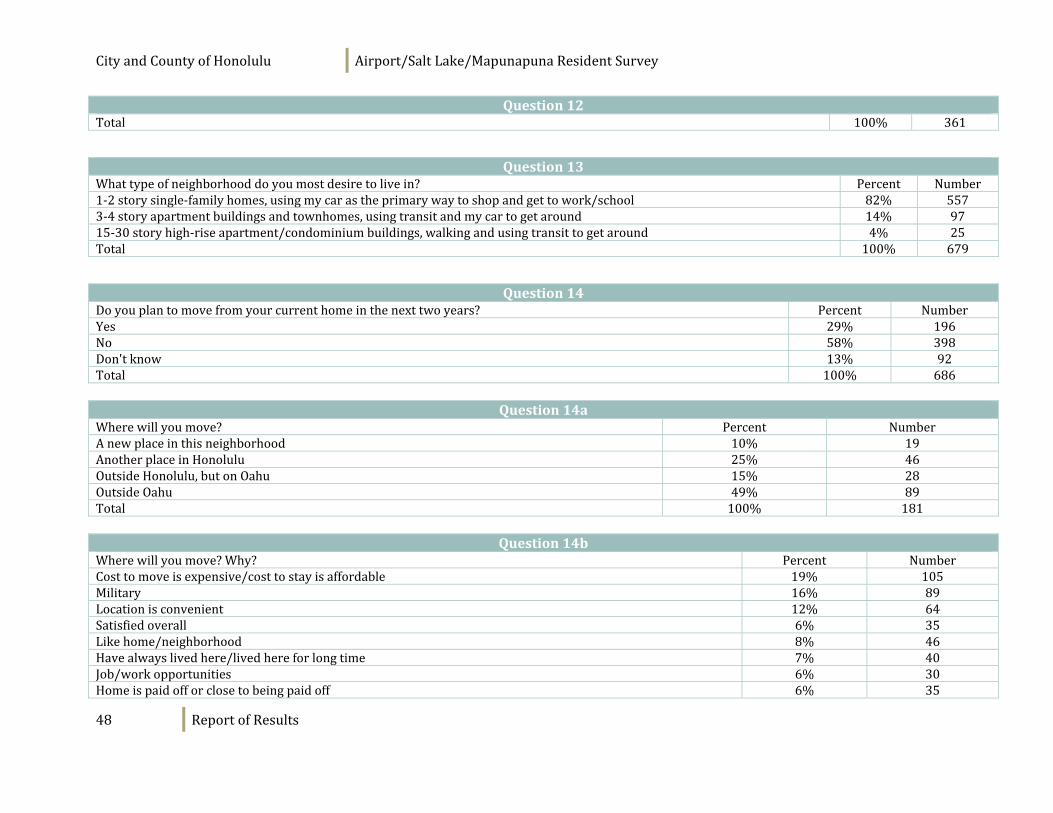
Thoughts about Relocation About6in10Airport/SaltLake/Mapunapunaresidentsplannedtostayintheirhomesforatleastthenexttwoyears,one‐thirdplannedtomoveinthistimeframe,and14%didnotknowwhethertheywouldmove.Ofthosewhoplannedtomove,mostdidnotplantostayintheirneighborhood(90%);49%plannedtoleaveOahu,25%plannedtomovetoanotherlocationinHonolulu,while15%wouldmoveoutsidethecity.
Rentersweremuchmorelikelythanownerstohaveplansrelocateinthetwoyearsfollowingthesurvey(51%ofrentersversus13%ofowners).WhereashomeownersweremorelikelytomovetoanewplaceinHonolulu,rentersweremorelikelytomoveoutsideOahu.ResidentswholivedclosertotheplannedPearlHarborrailstationwerelesslikelytomovefromtheircurrenthomeinthenexttwoyearscomparedtothosewholivedclosertotheplannedAirport/LagoonDriverailstations.
Figure 17: Plans to Move
Figure 18: Location of Move
This question was only asked of those who indicated they plan to move.
Doyouplantomovefromyourcurrenthomeinthenexttwoyears?
CityandCountyofHonolulu Airport/SaltLake/MapunapunaResidentSurvey
20 ReportofResults
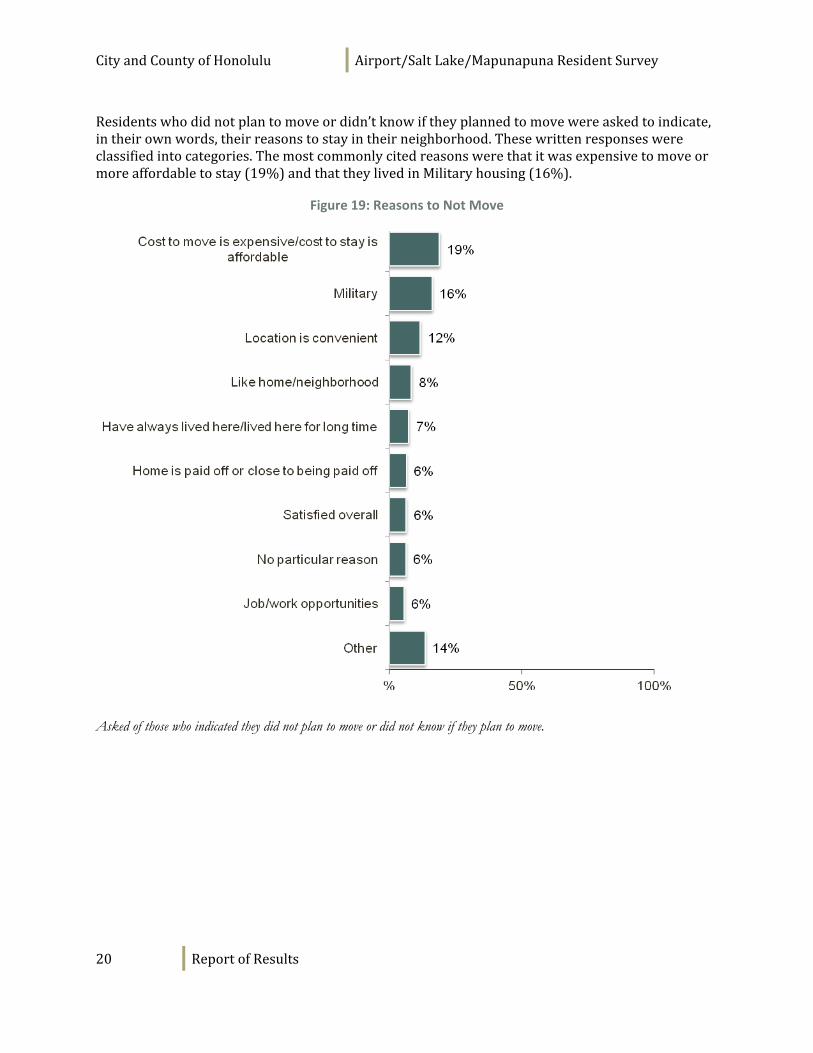
Residentswhodidnotplantomoveordidn’tknowiftheyplannedtomovewereaskedtoindicate,intheirownwords,theirreasonstostayintheirneighborhood.Thesewrittenresponseswereclassifiedintocategories.Themostcommonlycitedreasonswerethatitwasexpensivetomoveormoreaffordabletostay(19%)andthattheylivedinMilitaryhousing(16%).
Figure 19: Reasons to Not Move
Asked of those who indicated they did not plan to move or did not know if they plan to move.
CityandCountyofHonolulu Airport/SaltLake/MapunapunaResidentSurvey
21 ReportofResults
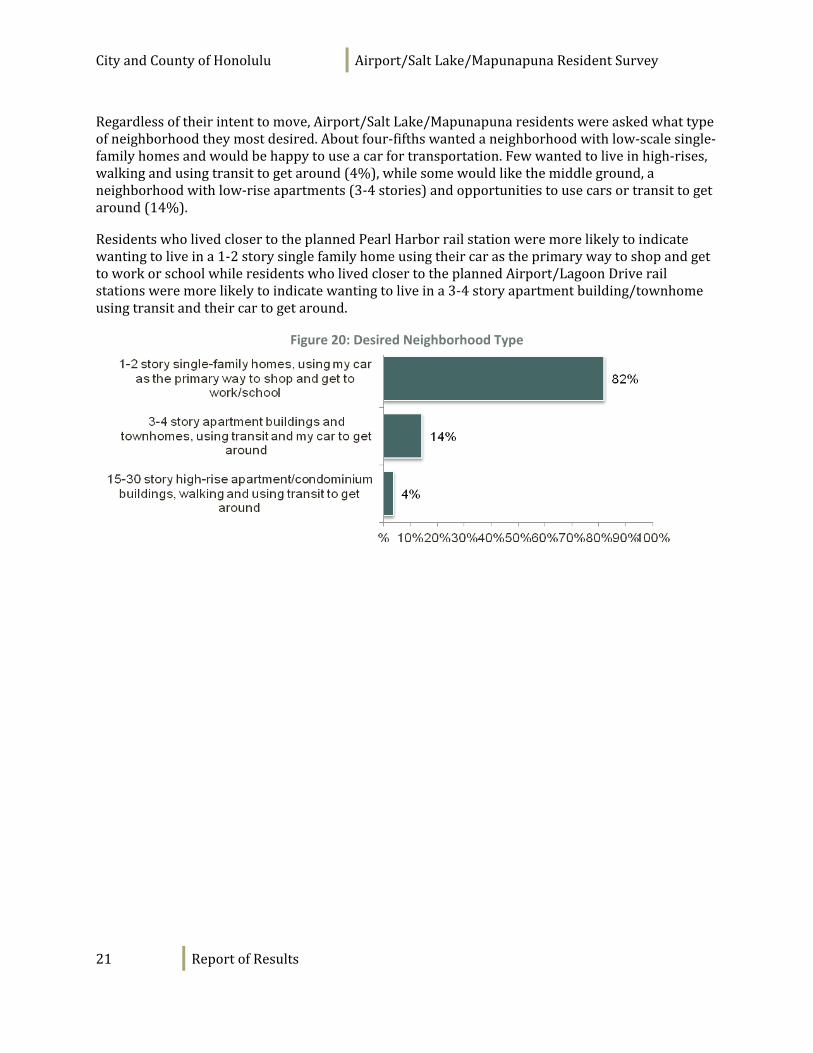
Regardlessoftheirintenttomove,Airport/SaltLake/Mapunapunaresidentswereaskedwhattypeofneighborhoodtheymostdesired.Aboutfour‐fifthswantedaneighborhoodwithlow‐scalesingle‐familyhomesandwouldbehappytouseacarfortransportation.Fewwantedtoliveinhigh‐rises,walkingandusingtransittogetaround(4%),whilesomewouldlikethemiddleground,aneighborhoodwithlow‐riseapartments(3‐4stories)andopportunitiestousecarsortransittogetaround(14%).
ResidentswholivedclosertotheplannedPearlHarborrailstationweremorelikelytoindicatewantingtoliveina1‐2storysinglefamilyhomeusingtheircarastheprimarywaytoshopandgettoworkorschoolwhileresidentswholivedclosertotheplannedAirport/LagoonDriverailstationsweremorelikelytoindicatewantingtoliveina3‐4storyapartmentbuilding/townhomeusingtransitandtheircartogetaround.
Figure 20: Desired Neighborhood Type
CityandCountyofHonolulu Airport/SaltLake/MapunapunaResidentSurvey
22 ReportofResults
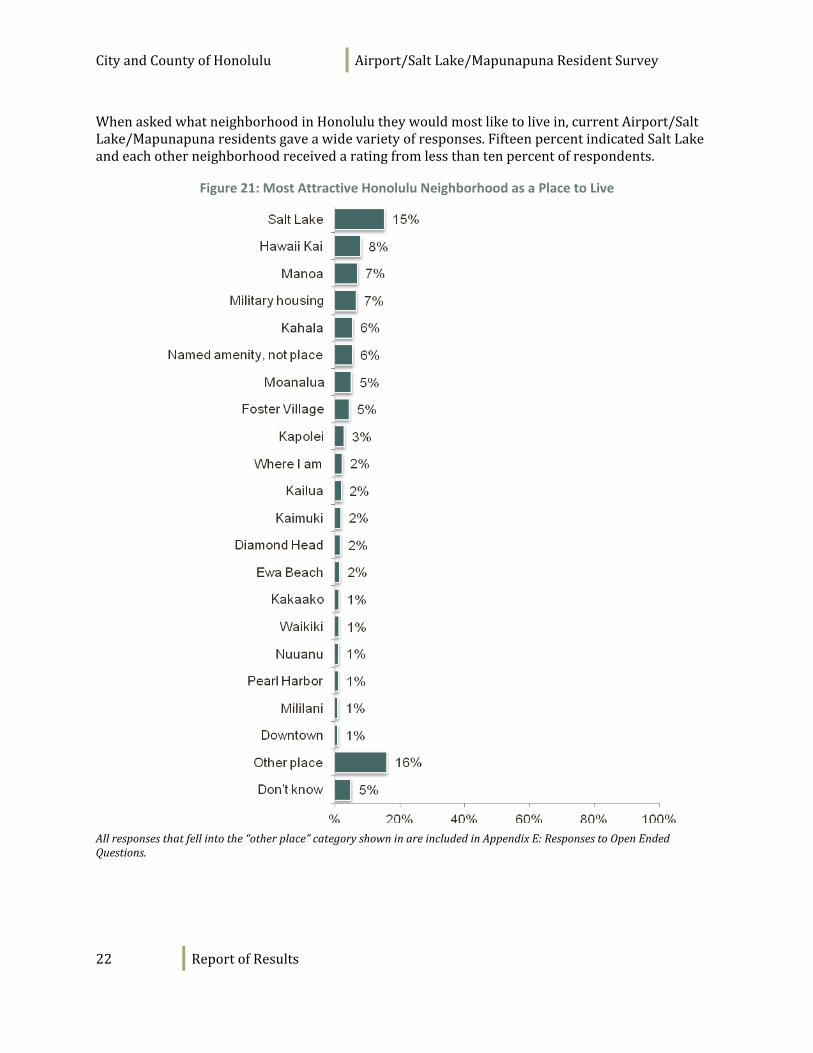
WhenaskedwhatneighborhoodinHonolulutheywouldmostliketolivein,currentAirport/SaltLake/Mapunapunaresidentsgaveawidevarietyofresponses.FifteenpercentindicatedSaltLakeandeachotherneighborhoodreceivedaratingfromlessthantenpercentofrespondents.
Figure 21: Most Attractive Honolulu Neighborhood as a Place to Live
Allresponsesthatfellintothe“otherplace”categoryshowninareincludedinAppendixE:ResponsestoOpenEndedQuestions.
CityandCountyofHonolulu Airport/SaltLake/MapunapunaResidentSurvey
23 ReportofResults
Neighborhood Mobility
Respondentswereaskedhoweasyitwastogetaroundtheirneighborhoodbycar,bike,walkingandtransit;theywerealsoaskedtorateaspectsoftheinfrastructurethatsupportthesetravelmodes.
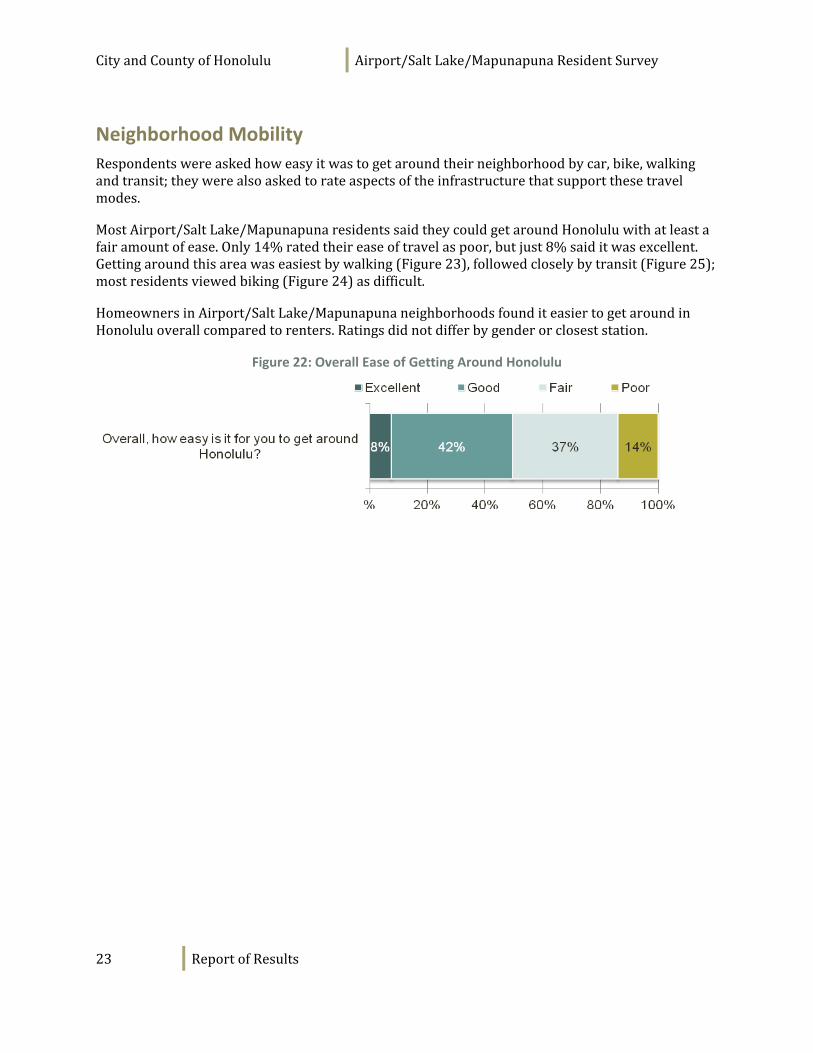
MostAirport/SaltLake/MapunapunaresidentssaidtheycouldgetaroundHonoluluwithatleastafairamountofease.Only14%ratedtheireaseoftravelaspoor,butjust8%saiditwasexcellent.Gettingaroundthisareawaseasiestbywalking(Figure23),followedcloselybytransit(Figure25);mostresidentsviewedbiking(Figure24)asdifficult.
HomeownersinAirport/SaltLake/MapunapunaneighborhoodsfounditeasiertogetaroundinHonoluluoverallcomparedtorenters.Ratingsdidnotdifferbygenderorcloseststation.
Figure 22: Overall Ease of Getting Around Honolulu
CityandCountyofHonolulu Airport/SaltLake/MapunapunaResidentSurvey
24 ReportofResults
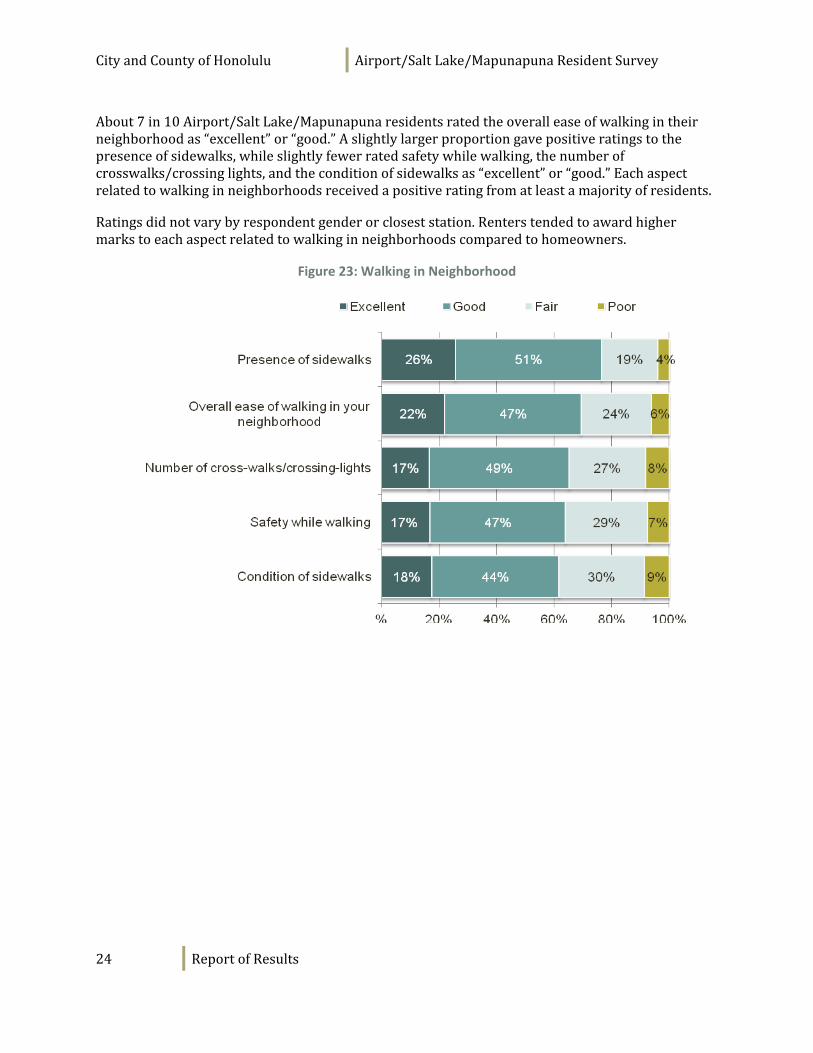
About7in10Airport/SaltLake/Mapunapunaresidentsratedtheoveralleaseofwalkingintheirneighborhoodas“excellent”or“good.”Aslightlylargerproportiongavepositiveratingstothepresenceofsidewalks,whileslightlyfewerratedsafetywhilewalking,thenumberofcrosswalks/crossinglights,andtheconditionofsidewalksas“excellent”or“good.”Eachaspectrelatedtowalkinginneighborhoodsreceivedapositiveratingfromatleastamajorityofresidents.
Ratingsdidnotvarybyrespondentgenderorcloseststation.Renterstendedtoawardhighermarkstoeachaspectrelatedtowalkinginneighborhoodscomparedtohomeowners.
Figure 23: Walking in Neighborhood
CityandCountyofHonolulu Airport/SaltLake/MapunapunaResidentSurvey
25 ReportofResults
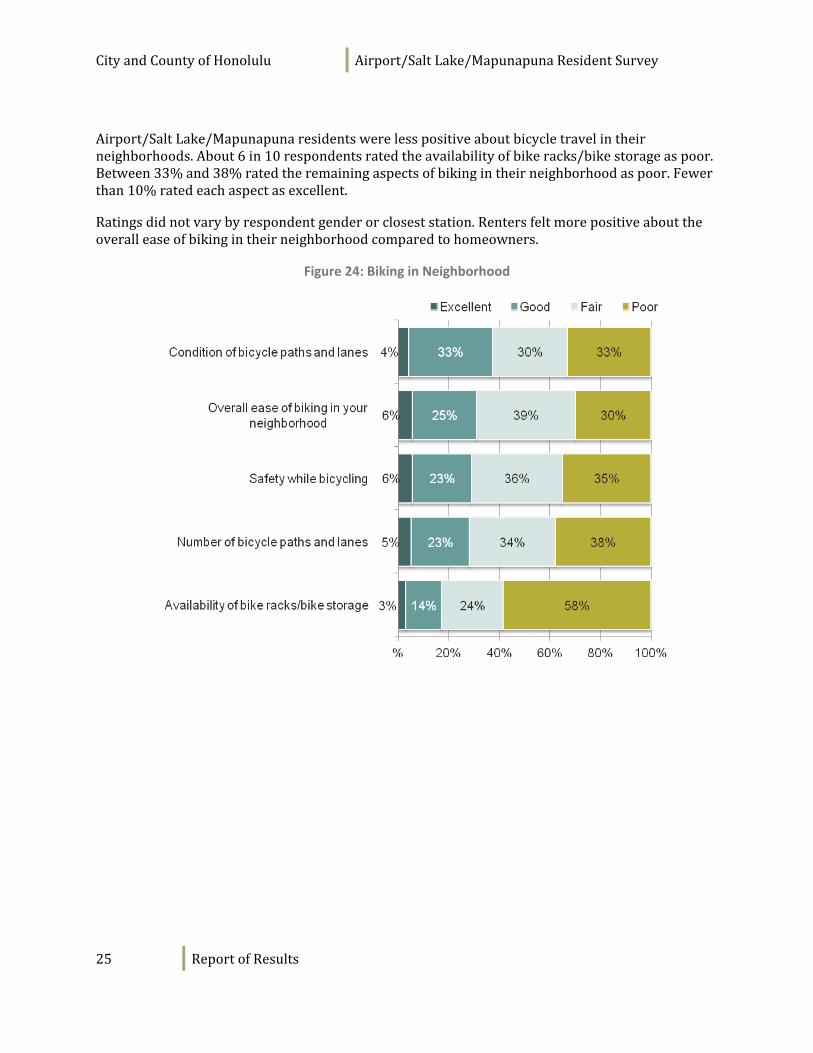
Airport/SaltLake/Mapunapunaresidentswerelesspositiveaboutbicycletravelintheirneighborhoods.About6in10respondentsratedtheavailabilityofbikeracks/bikestorageaspoor.Between33%and38%ratedtheremainingaspectsofbikingintheirneighborhoodaspoor.Fewerthan10%ratedeachaspectasexcellent.
Ratingsdidnotvarybyrespondentgenderorcloseststation.Rentersfeltmorepositiveabouttheoveralleaseofbikingintheirneighborhoodcomparedtohomeowners.
Figure 24: Biking in Neighborhood
CityandCountyofHonolulu Airport/SaltLake/MapunapunaResidentSurvey
26 ReportofResults
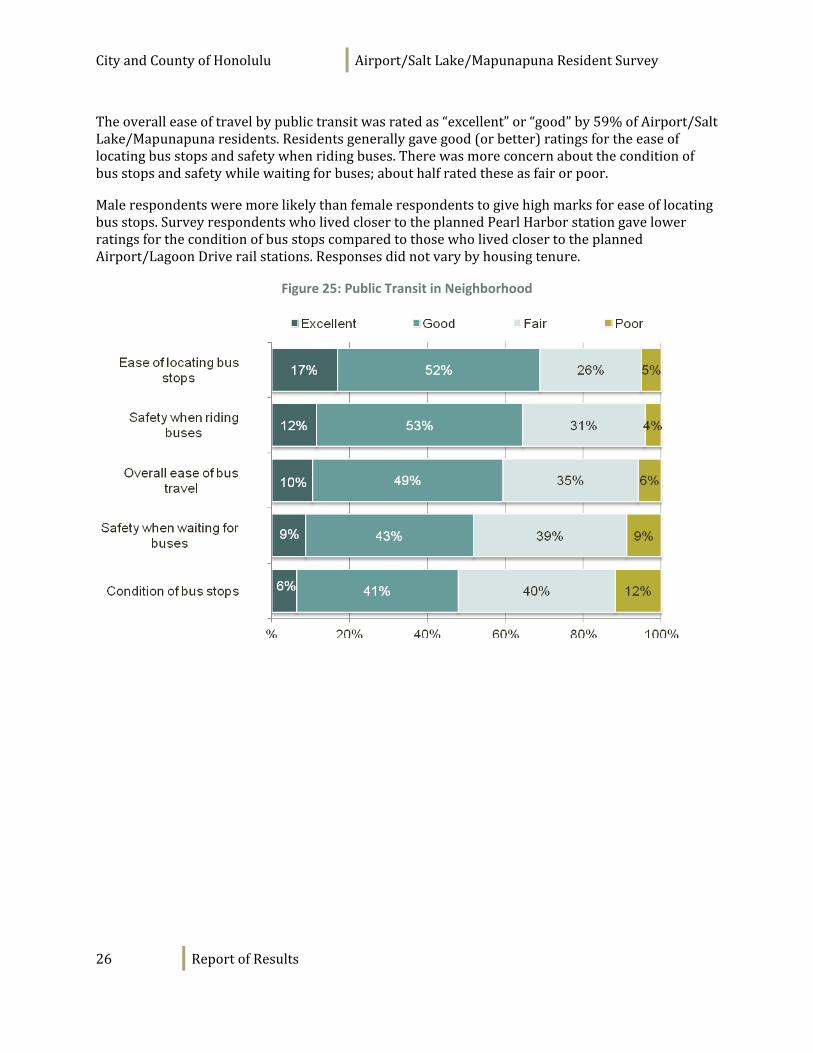
Theoveralleaseoftravelbypublictransitwasratedas“excellent”or“good”by59%ofAirport/SaltLake/Mapunapunaresidents.Residentsgenerallygavegood(orbetter)ratingsfortheeaseoflocatingbusstopsandsafetywhenridingbuses.Therewasmoreconcernabouttheconditionofbusstopsandsafetywhilewaitingforbuses;abouthalfratedtheseasfairorpoor.
Malerespondentsweremorelikelythanfemalerespondentstogivehighmarksforeaseoflocatingbusstops.SurveyrespondentswholivedclosertotheplannedPearlHarborstationgavelowerratingsfortheconditionofbusstopscomparedtothosewholivedclosertotheplannedAirport/LagoonDriverailstations.Responsesdidnotvarybyhousingtenure.
Figure 25: Public Transit in Neighborhood
CityandCountyofHonolulu Airport/SaltLake/MapunapunaResidentSurvey
27 ReportofResults
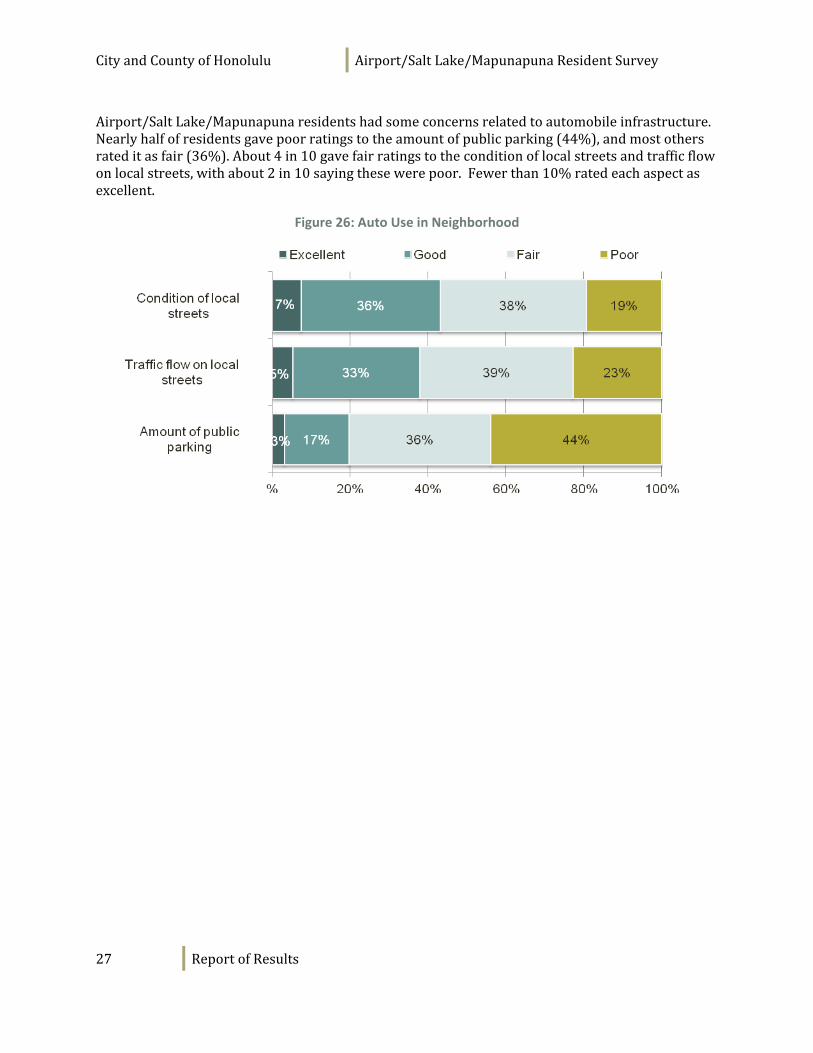
Airport/SaltLake/Mapunapunaresidentshadsomeconcernsrelatedtoautomobileinfrastructure.Nearlyhalfofresidentsgavepoorratingstotheamountofpublicparking(44%),andmostothersrateditasfair(36%).About4in10gavefairratingstotheconditionoflocalstreetsandtrafficflowonlocalstreets,withabout2in10sayingthesewerepoor.Fewerthan10%ratedeachaspectasexcellent.
Figure 26: Auto Use in Neighborhood
CityandCountyofHonolulu Airport/SaltLake/MapunapunaResidentSurvey
28 ReportofResults
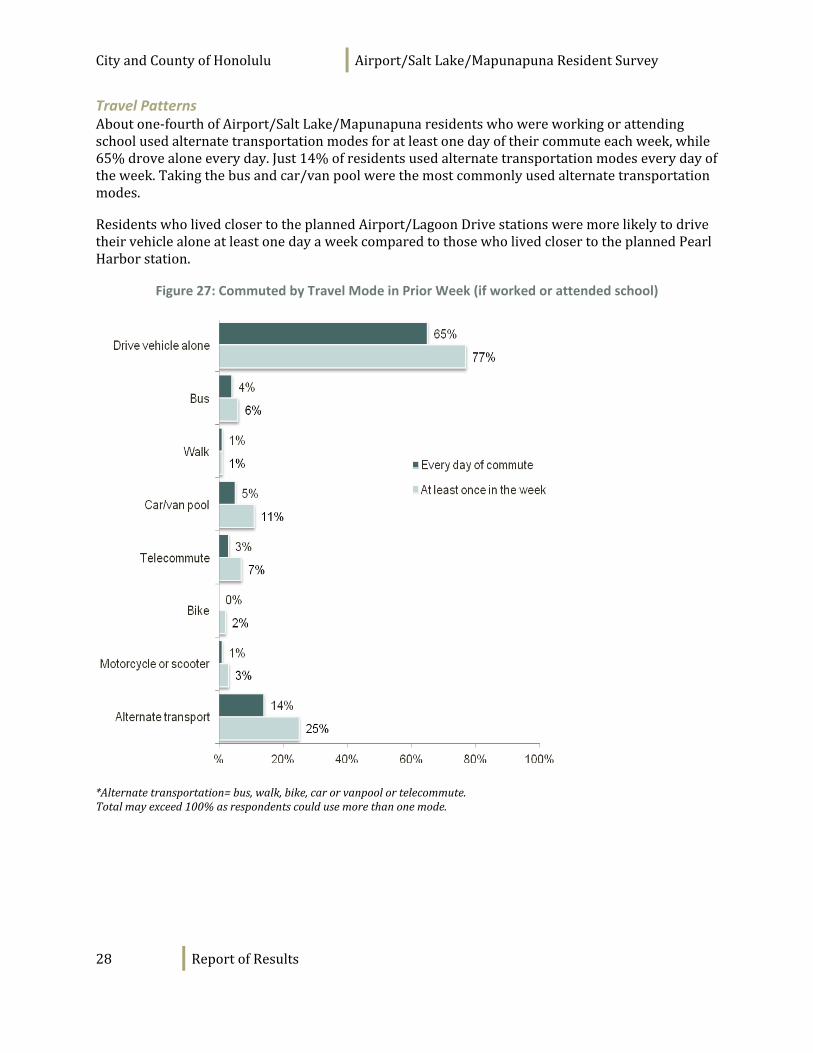
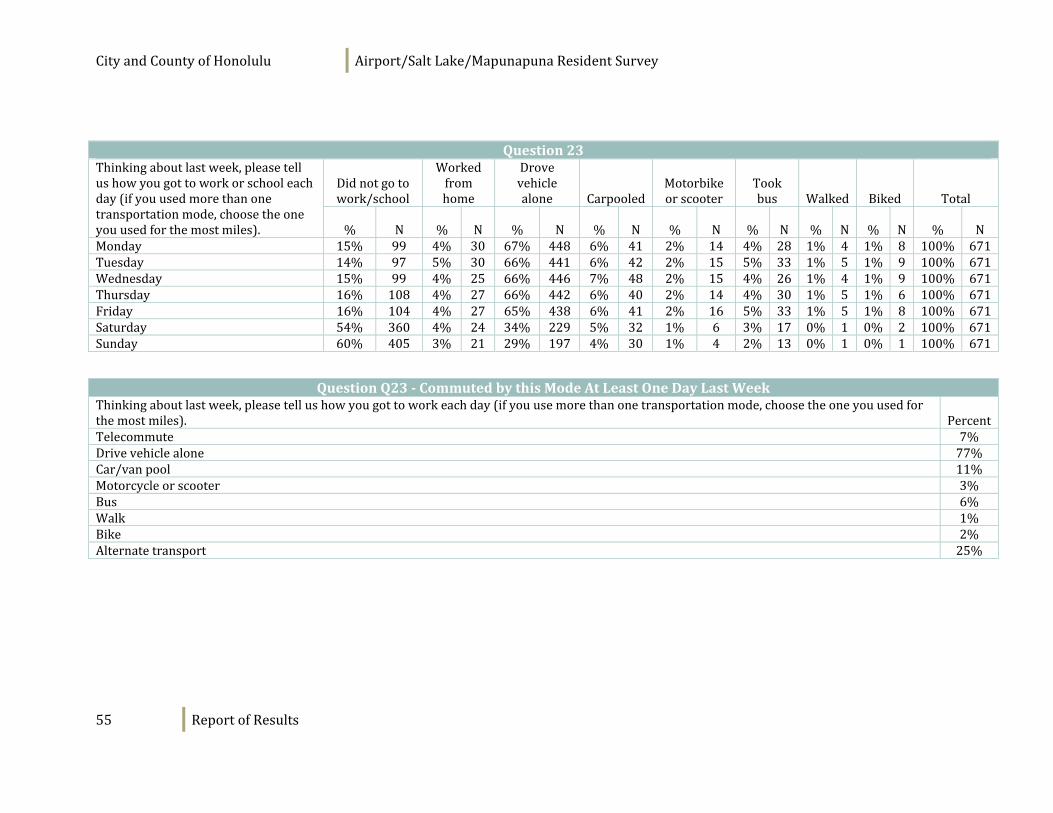
Travel Patterns Aboutone‐fourthofAirport/SaltLake/Mapunapunaresidentswhowereworkingorattendingschoolusedalternatetransportationmodesforatleastonedayoftheircommuteeachweek,while65%drovealoneeveryday.Just14%ofresidentsusedalternatetransportationmodeseverydayoftheweek.Takingthebusandcar/vanpoolwerethemostcommonlyusedalternatetransportationmodes.
ResidentswholivedclosertotheplannedAirport/LagoonDrivestationsweremorelikelytodrivetheirvehiclealoneatleastonedayaweekcomparedtothosewholivedclosertotheplannedPearlHarborstation.
Figure 27: Commuted by Travel Mode in Prior Week (if worked or attended school)
*Alternatetransportation=bus,walk,bike,carorvanpoolortelecommute.Totalmayexceed100%asrespondentscouldusemorethanonemode.
CityandCountyofHonolulu Airport/SaltLake/MapunapunaResidentSurvey
29 ReportofResults
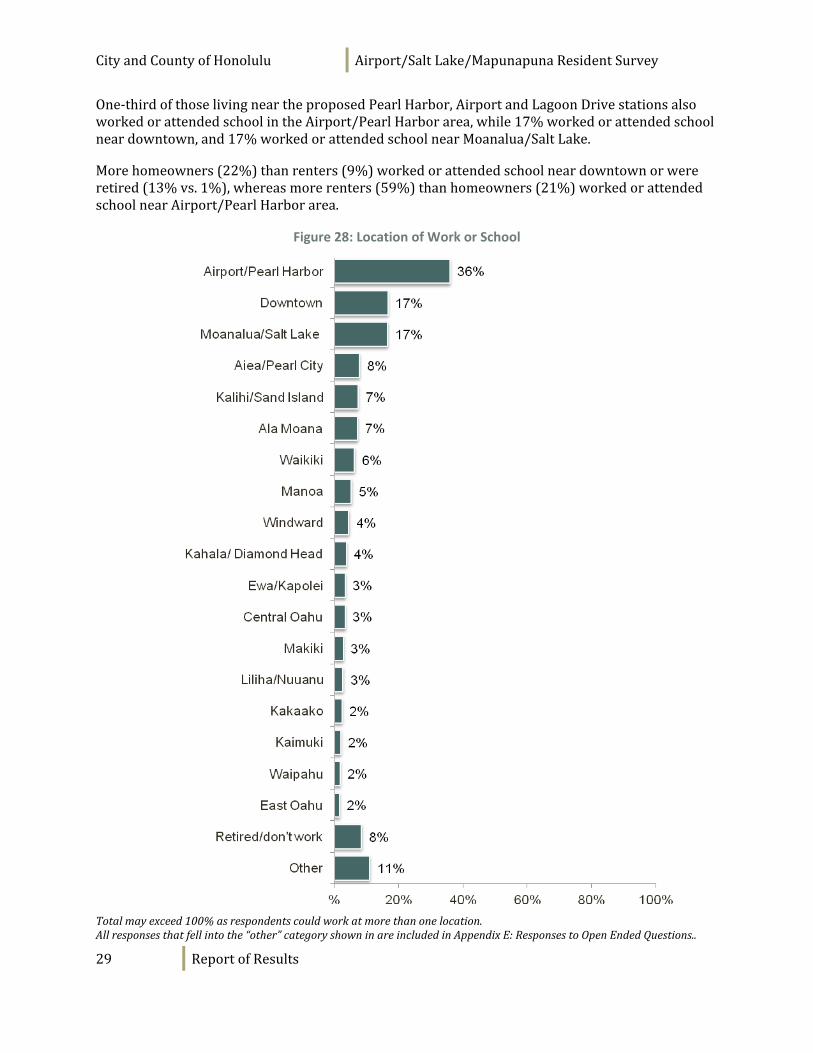
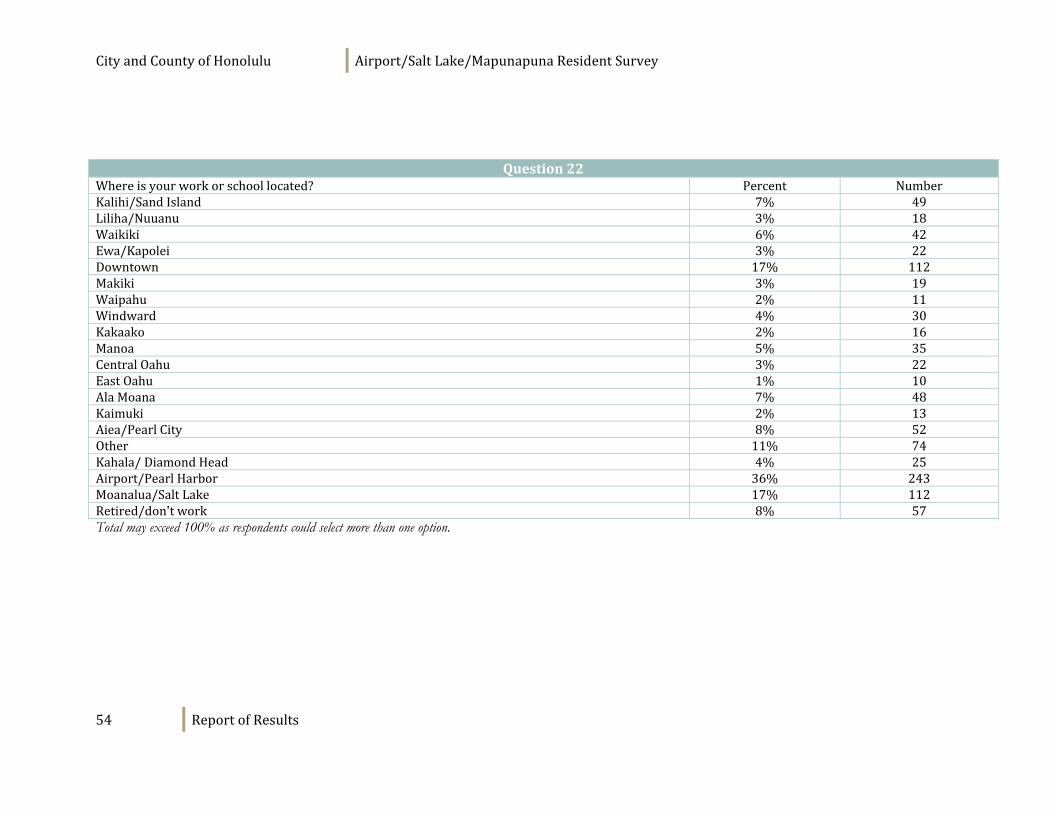
One‐thirdofthoselivingneartheproposedPearlHarbor,AirportandLagoonDrivestationsalsoworkedorattendedschoolintheAirport/PearlHarborarea,while17%workedorattendedschoolneardowntown,and17%workedorattendedschoolnearMoanalua/SaltLake.
Morehomeowners(22%)thanrenters(9%)workedorattendedschoolneardowntownorwereretired(13%vs.1%),whereasmorerenters(59%)thanhomeowners(21%)workedorattendedschoolnearAirport/PearlHarborarea.
Figure 28: Location of Work or School
Totalmayexceed100%asrespondentscouldworkatmorethanonelocation. Allresponsesthatfellintothe“other”categoryshowninareincludedinAppendixE:ResponsestoOpenEndedQuestions..
CityandCountyofHonolulu Airport/SaltLake/MapunapunaResidentSurvey
30 ReportofResults
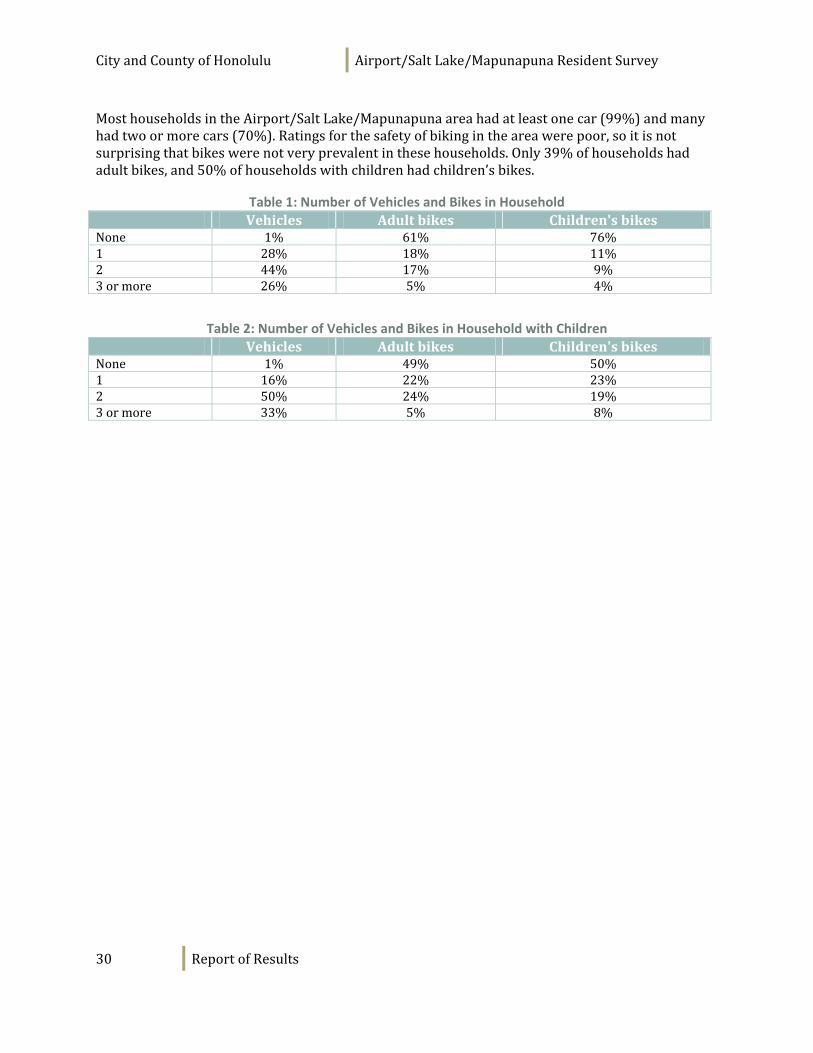
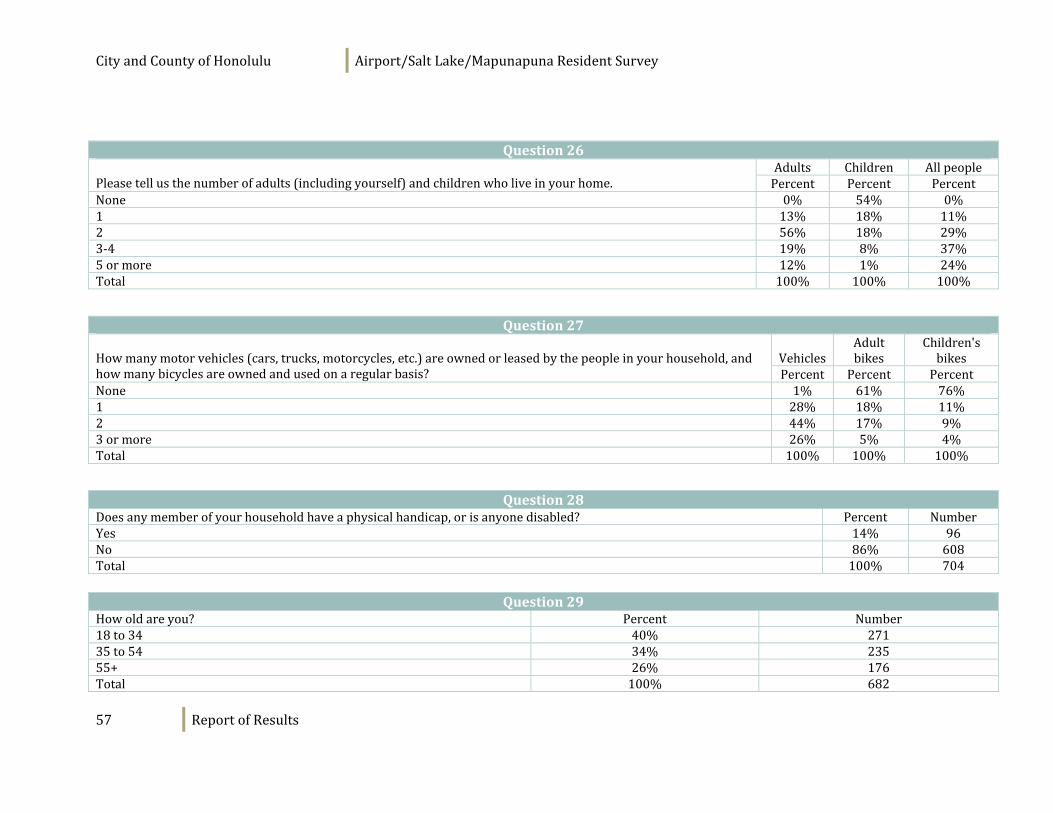
MosthouseholdsintheAirport/SaltLake/Mapunapunaareahadatleastonecar(99%)andmanyhadtwoormorecars(70%).Ratingsforthesafetyofbikingintheareawerepoor,soitisnotsurprisingthatbikeswerenotveryprevalentinthesehouseholds.Only39%ofhouseholdshadadultbikes,and50%ofhouseholdswithchildrenhadchildren’sbikes.
Table 1: Number of Vehicles and Bikes in Household
Vehicles Adultbikes Children'sbikesNone 1% 61% 76%1 28% 18% 11%2 44% 17% 9%3ormore 26% 5% 4%
Table 2: Number of Vehicles and Bikes in Household with Children
Vehicles Adultbikes Children'sbikesNone 1% 49% 50%1 16% 22% 23%2 50% 24% 19%3ormore 33% 5% 8%
CityandCountyofHonolulu Airport/SaltLake/MapunapunaResidentSurvey
31 ReportofResults
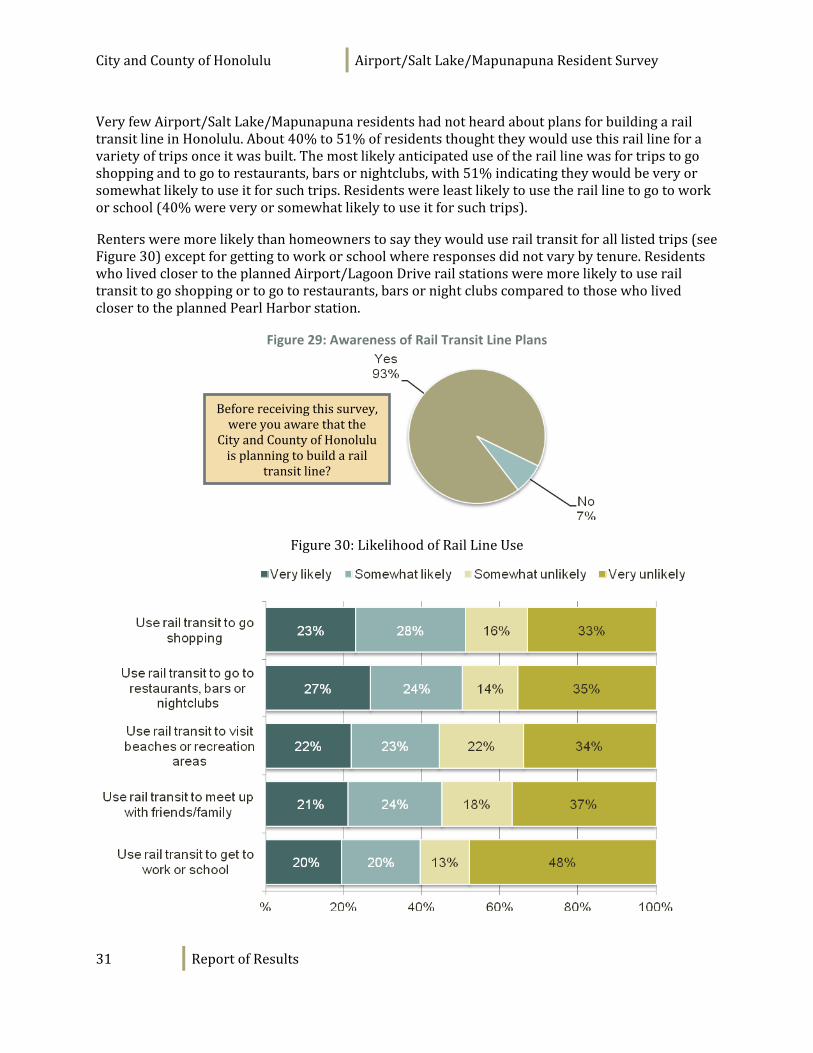
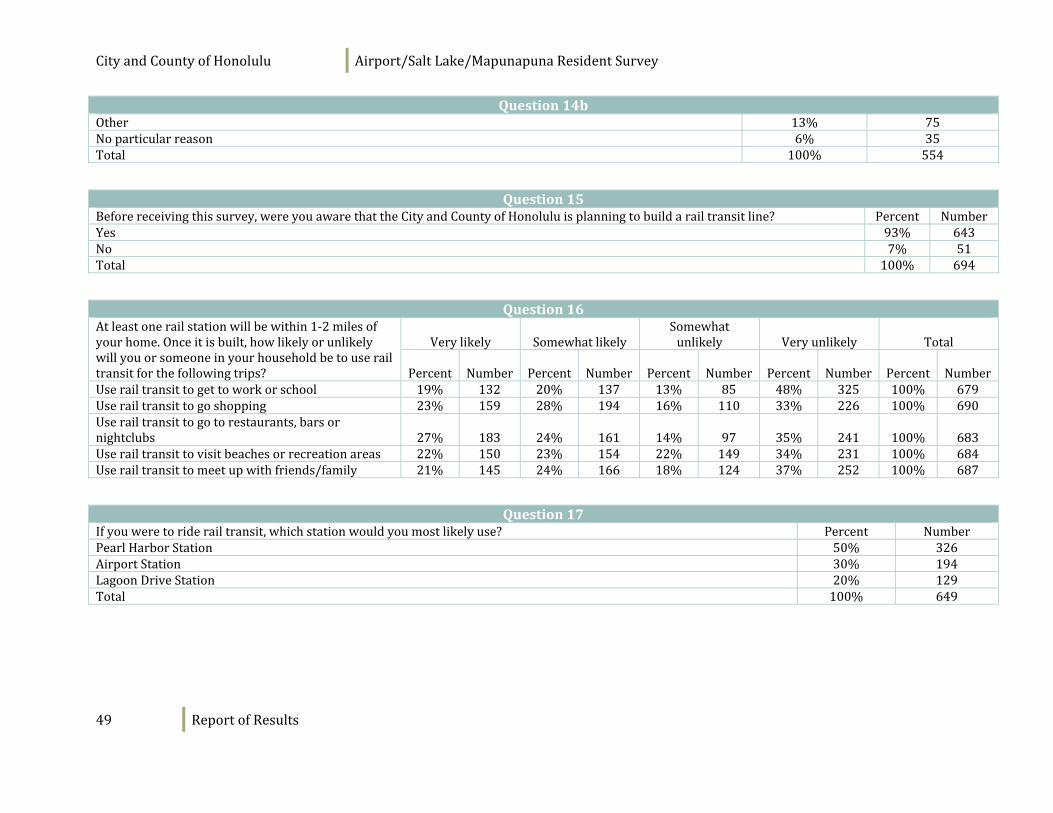
VeryfewAirport/SaltLake/MapunapunaresidentshadnotheardaboutplansforbuildingarailtransitlineinHonolulu.About40%to51%ofresidentsthoughttheywouldusethisraillineforavarietyoftripsonceitwasbuilt.Themostlikelyanticipateduseoftheraillinewasfortripstogoshoppingandtogotorestaurants,barsornightclubs,with51%indicatingtheywouldbeveryorsomewhatlikelytouseitforsuchtrips.Residentswereleastlikelytousetheraillinetogotoworkorschool(40%wereveryorsomewhatlikelytouseitforsuchtrips).
Rentersweremorelikelythanhomeownerstosaytheywoulduserailtransitforalllistedtrips(seeFigure30)exceptforgettingtoworkorschoolwhereresponsesdidnotvarybytenure.ResidentswholivedclosertotheplannedAirport/LagoonDriverailstationsweremorelikelytouserailtransittogoshoppingortogotorestaurants,barsornightclubscomparedtothosewholivedclosertotheplannedPearlHarborstation.
Figure 29: Awareness of Rail Transit Line Plans
Figure30:LikelihoodofRailLineUse
Beforereceivingthissurvey,wereyouawarethatthe
CityandCountyofHonoluluisplanningtobuildarail
transitline?
CityandCountyofHonolulu Airport/SaltLake/MapunapunaResidentSurvey
32 ReportofResults
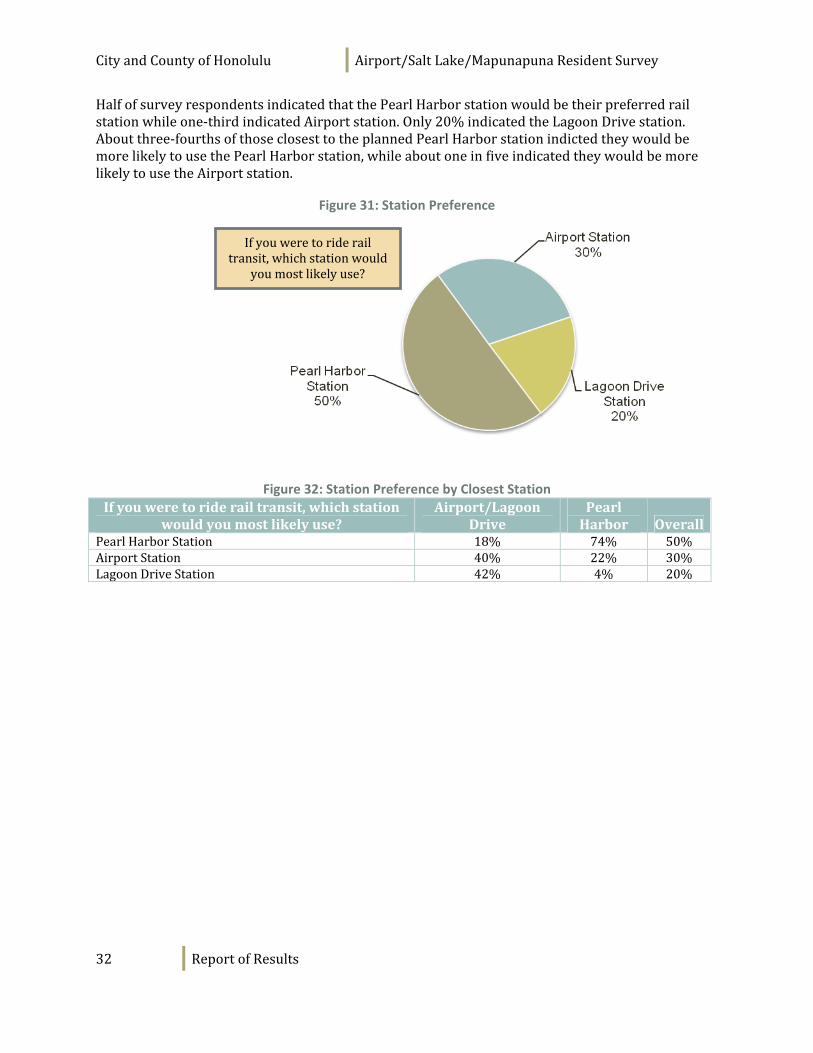
HalfofsurveyrespondentsindicatedthatthePearlHarborstationwouldbetheirpreferredrailstationwhileone‐thirdindicatedAirportstation.Only20%indicatedtheLagoonDrivestation.Aboutthree‐fourthsofthoseclosesttotheplannedPearlHarborstationindictedtheywouldbemorelikelytousethePearlHarborstation,whileaboutoneinfiveindicatedtheywouldbemorelikelytousetheAirportstation.
Figure 31: Station Preference
Figure 32: Station Preference by Closest Station
Ifyouweretoriderailtransit,whichstationwouldyoumostlikelyuse?
Airport/LagoonDrive
PearlHarbor Overall
PearlHarborStation 18% 74% 50%AirportStation 40% 22% 30%LagoonDriveStation 42% 4% 20%
Ifyouweretoriderailtransit,whichstationwould
youmostlikelyuse?
CityandCountyofHonolulu Airport/SaltLake/MapunapunaResidentSurvey
33 ReportofResults
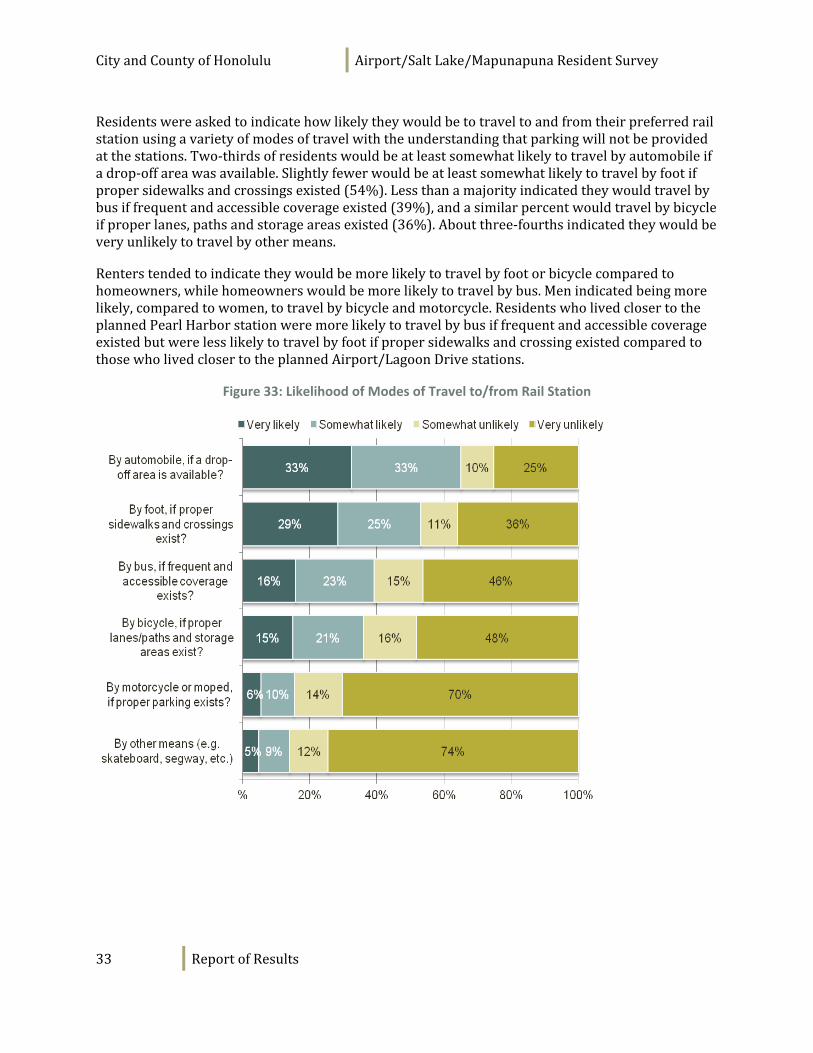
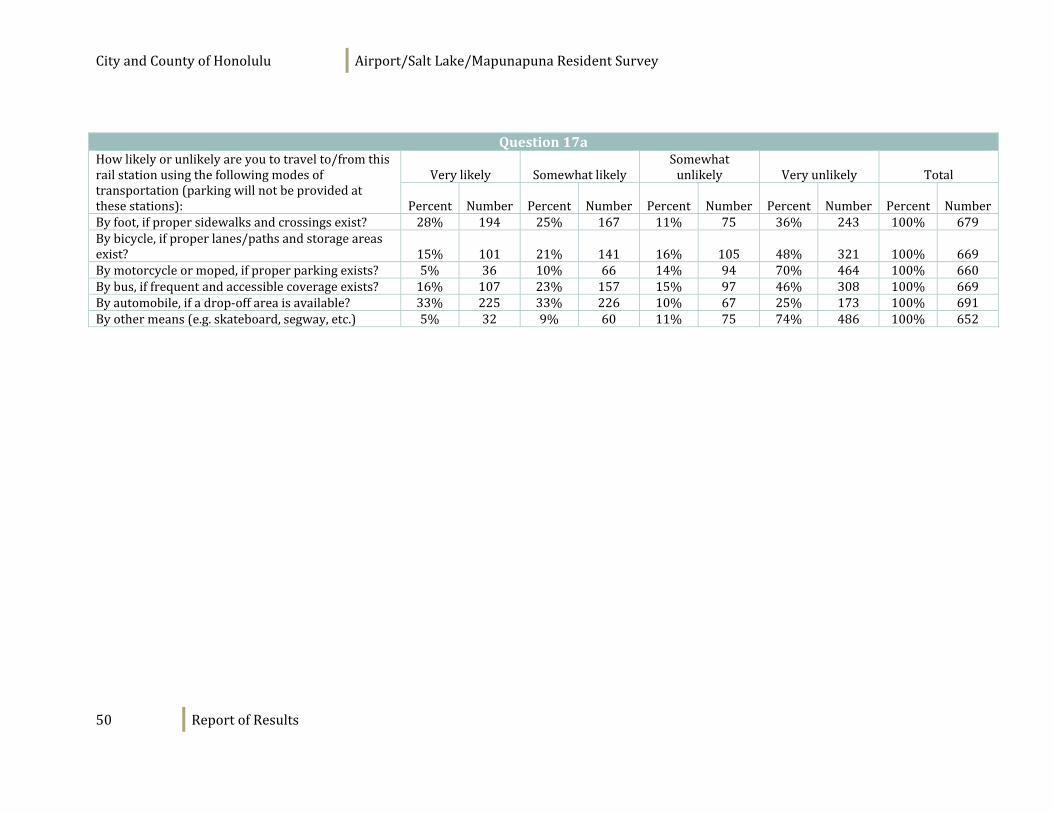
Residentswereaskedtoindicatehowlikelytheywouldbetotraveltoandfromtheirpreferredrailstationusingavarietyofmodesoftravelwiththeunderstandingthatparkingwillnotbeprovidedatthestations.Two‐thirdsofresidentswouldbeatleastsomewhatlikelytotravelbyautomobileifadrop‐offareawasavailable.Slightlyfewerwouldbeatleastsomewhatlikelytotravelbyfootifpropersidewalksandcrossingsexisted(54%).Lessthanamajorityindicatedtheywouldtravelbybusiffrequentandaccessiblecoverageexisted(39%),andasimilarpercentwouldtravelbybicycleifproperlanes,pathsandstorageareasexisted(36%).Aboutthree‐fourthsindicatedtheywouldbeveryunlikelytotravelbyothermeans.
Renterstendedtoindicatetheywouldbemorelikelytotravelbyfootorbicyclecomparedtohomeowners,whilehomeownerswouldbemorelikelytotravelbybus.Menindicatedbeingmorelikely,comparedtowomen,totravelbybicycleandmotorcycle.ResidentswholivedclosertotheplannedPearlHarborstationweremorelikelytotravelbybusiffrequentandaccessiblecoverageexistedbutwerelesslikelytotravelbyfootifpropersidewalksandcrossingexistedcomparedtothosewholivedclosertotheplannedAirport/LagoonDrivestations.
Figure 33: Likelihood of Modes of Travel to/from Rail Station
CityandCountyofHonolulu Airport/SaltLake/MapunapunaResidentSurvey
34 ReportofResults
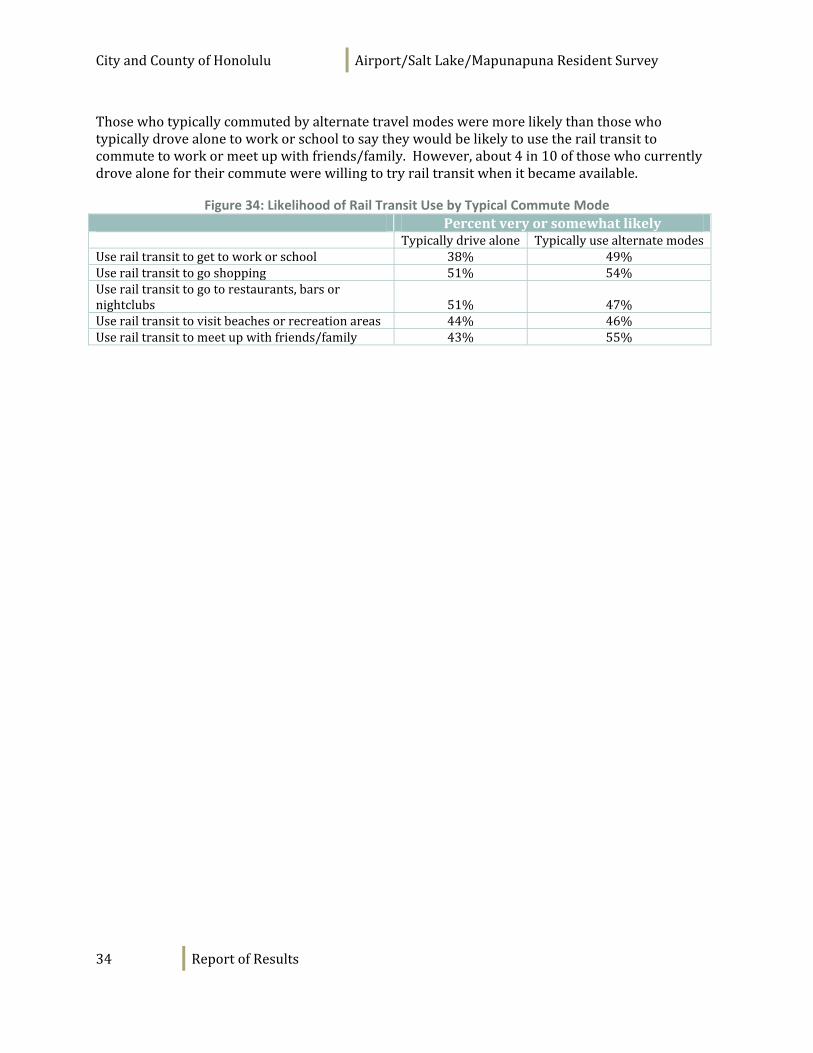
Thosewhotypicallycommutedbyalternatetravelmodesweremorelikelythanthosewhotypicallydrovealonetoworkorschooltosaytheywouldbelikelytousetherailtransittocommutetoworkormeetupwithfriends/family.However,about4in10ofthosewhocurrentlydrovealonefortheircommutewerewillingtotryrailtransitwhenitbecameavailable.
Figure 34: Likelihood of Rail Transit Use by Typical Commute Mode
Percentveryorsomewhatlikely Typicallydrivealone TypicallyusealternatemodesUserailtransittogettoworkorschool 38% 49%Userailtransittogoshopping 51% 54%Userailtransittogotorestaurants,barsornightclubs 51% 47%Userailtransittovisitbeachesorrecreationareas 44% 46%Userailtransittomeetupwithfriends/family 43% 55%
CityandCountyofHonolulu Airport/SaltLake/MapunapunaResidentSurvey
35 ReportofResults
Development Opportunities
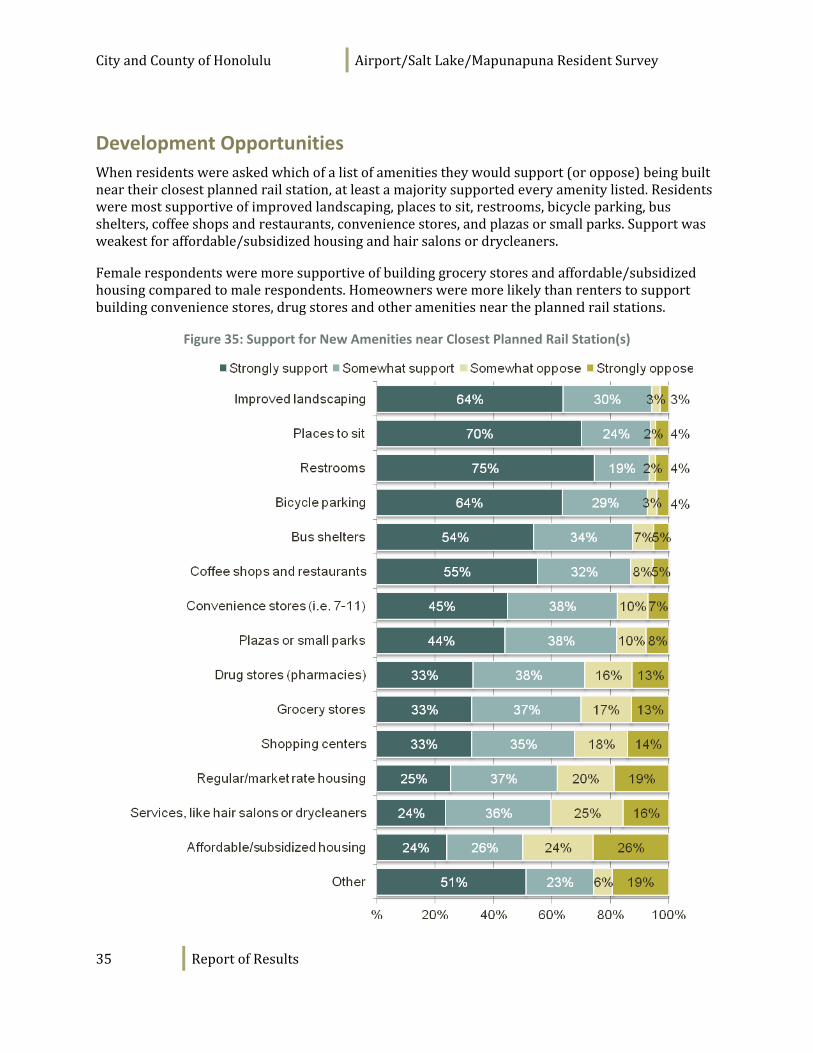
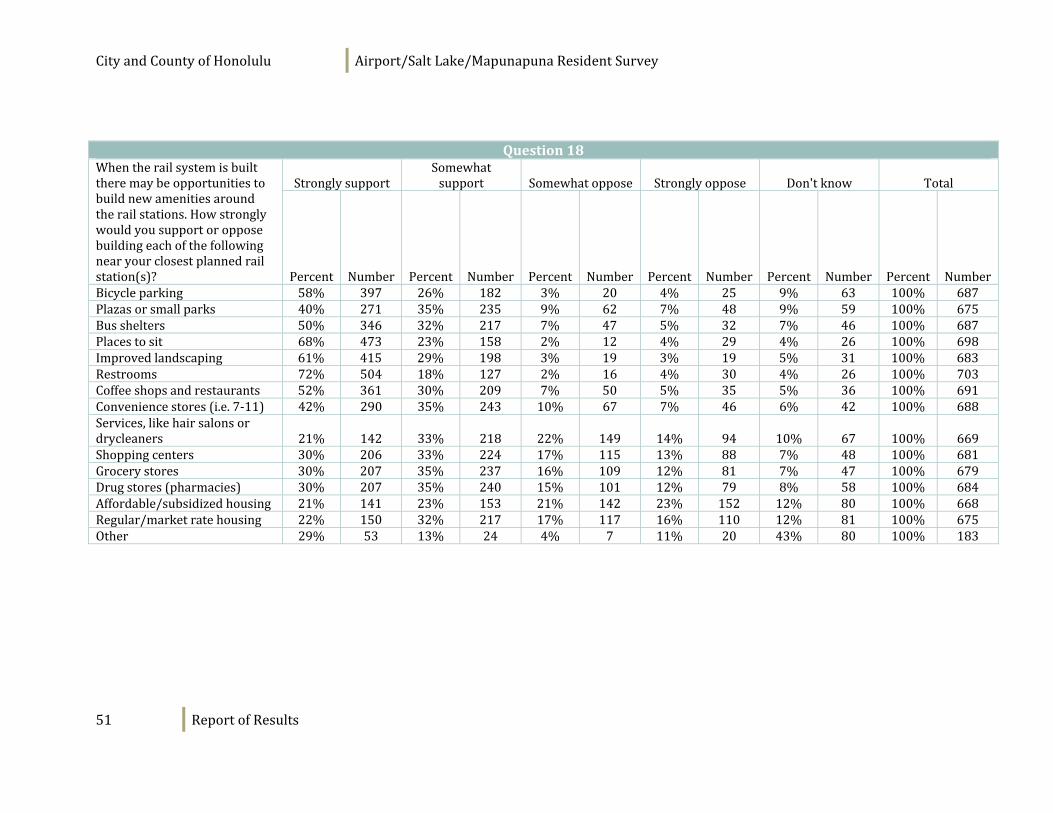
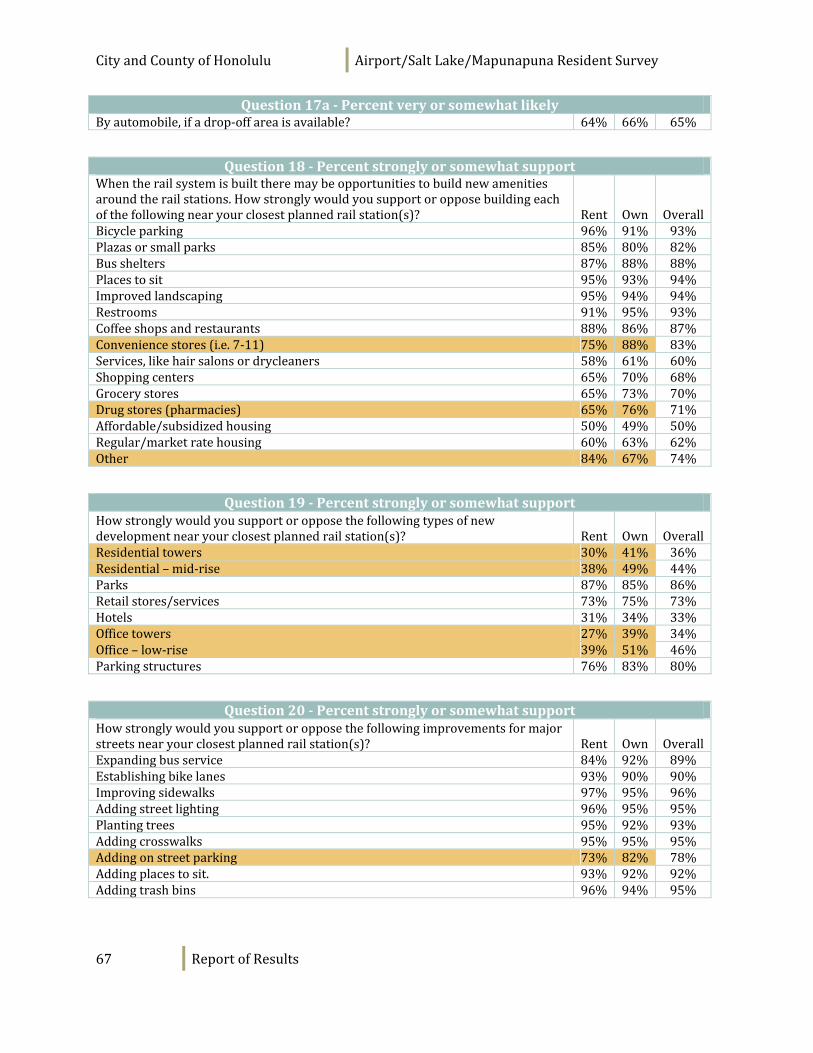
Whenresidentswereaskedwhichofalistofamenitiestheywouldsupport(oroppose)beingbuiltneartheirclosestplannedrailstation,atleastamajoritysupportedeveryamenitylisted.Residentsweremostsupportiveofimprovedlandscaping,placestosit,restrooms,bicycleparking,busshelters,coffeeshopsandrestaurants,conveniencestores,andplazasorsmallparks.Supportwasweakestforaffordable/subsidizedhousingandhairsalonsordrycleaners.
Femalerespondentsweremoresupportiveofbuildinggrocerystoresandaffordable/subsidizedhousingcomparedtomalerespondents.Homeownersweremorelikelythanrenterstosupportbuildingconveniencestores,drugstoresandotheramenitiesneartheplannedrailstations.
Figure 35: Support for New Amenities near Closest Planned Rail Station(s)
CityandCountyofHonolulu Airport/SaltLake/MapunapunaResidentSurvey
36 ReportofResults
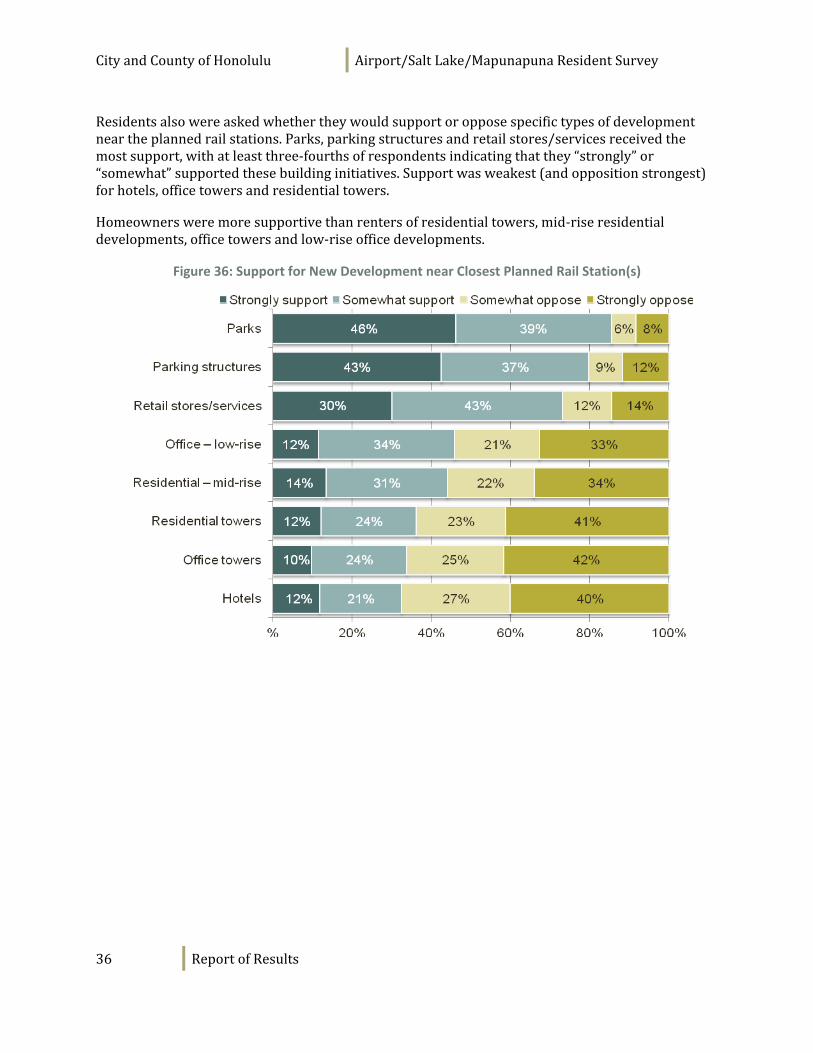
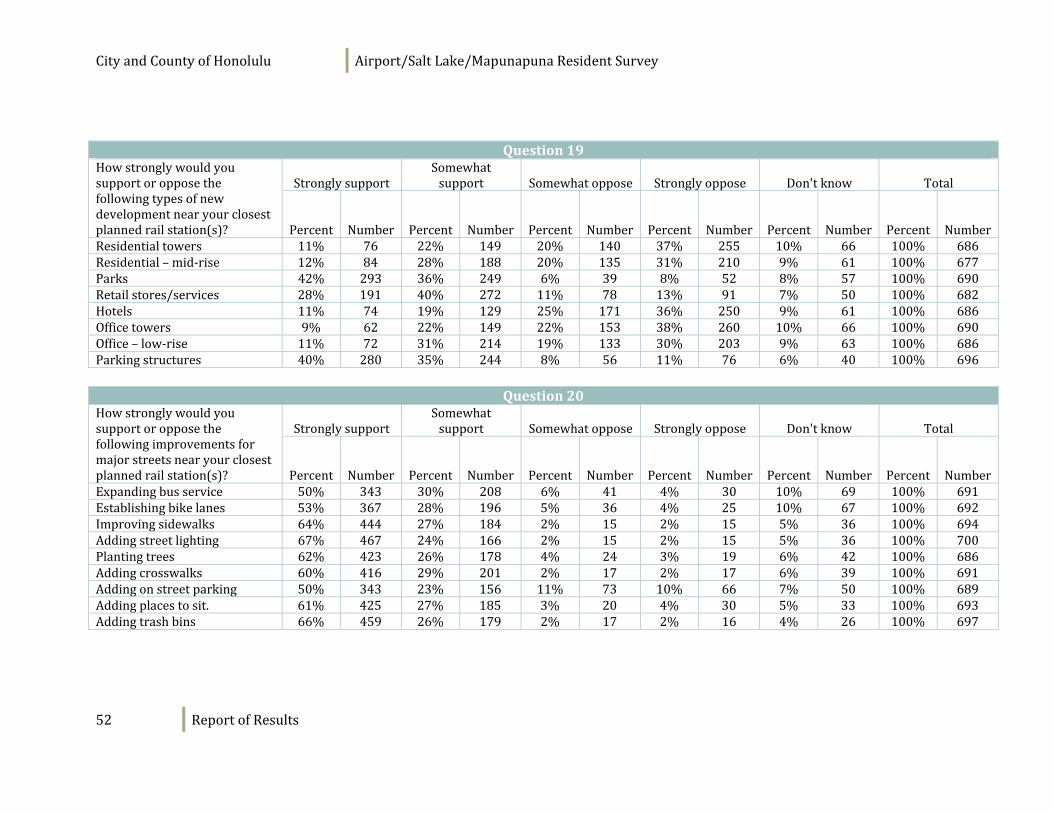
Residentsalsowereaskedwhethertheywouldsupportoropposespecifictypesofdevelopmentneartheplannedrailstations.Parks,parkingstructuresandretailstores/servicesreceivedthemostsupport,withatleastthree‐fourthsofrespondentsindicatingthatthey“strongly”or“somewhat”supportedthesebuildinginitiatives.Supportwasweakest(andoppositionstrongest)forhotels,officetowersandresidentialtowers.
Homeownersweremoresupportivethanrentersofresidentialtowers,mid‐riseresidentialdevelopments,officetowersandlow‐riseofficedevelopments.
Figure 36: Support for New Development near Closest Planned Rail Station(s)
CityandCountyofHonolulu Airport/SaltLake/MapunapunaResidentSurvey
37 ReportofResults
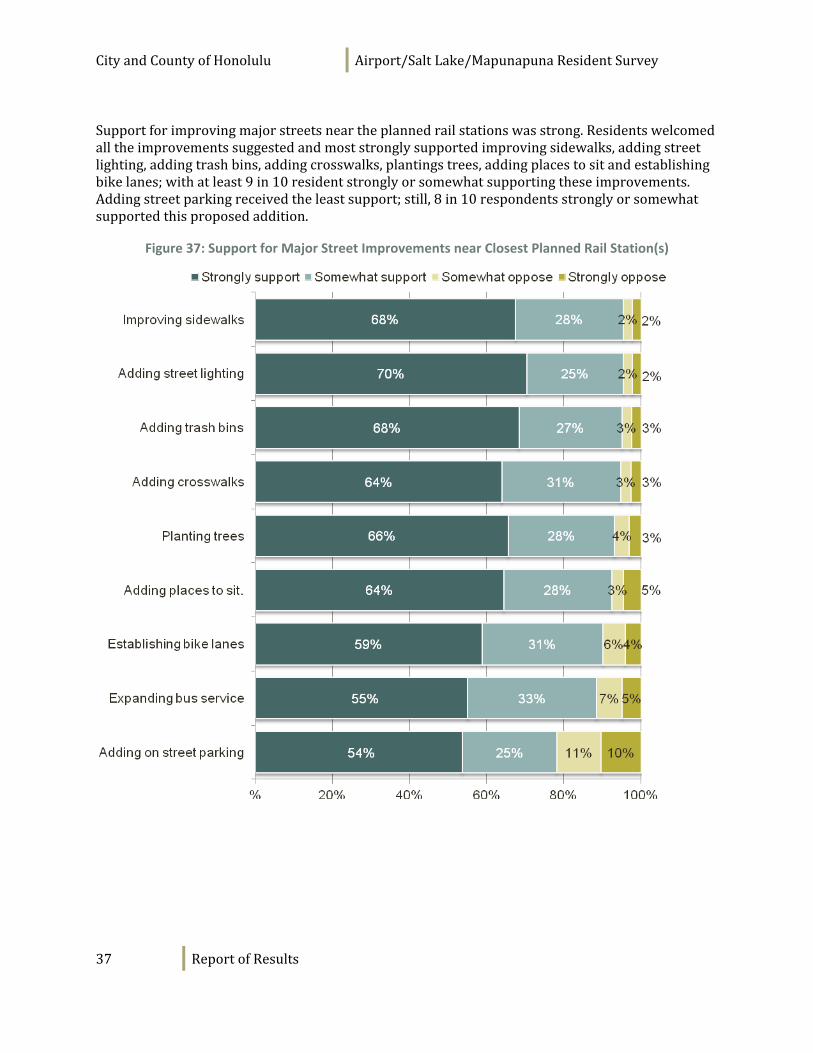
Supportforimprovingmajorstreetsneartheplannedrailstationswasstrong.Residentswelcomedalltheimprovementssuggestedandmoststronglysupportedimprovingsidewalks,addingstreetlighting,addingtrashbins,addingcrosswalks,plantingstrees,addingplacestositandestablishingbikelanes;withatleast9in10residentstronglyorsomewhatsupportingtheseimprovements.Addingstreetparkingreceivedtheleastsupport;still,8in10respondentsstronglyorsomewhatsupportedthisproposedaddition.
Figure 37: Support for Major Street Improvements near Closest Planned Rail Station(s)
CityandCountyofHonolulu Airport/SaltLake/MapunapunaResidentSurvey
38 ReportofResults
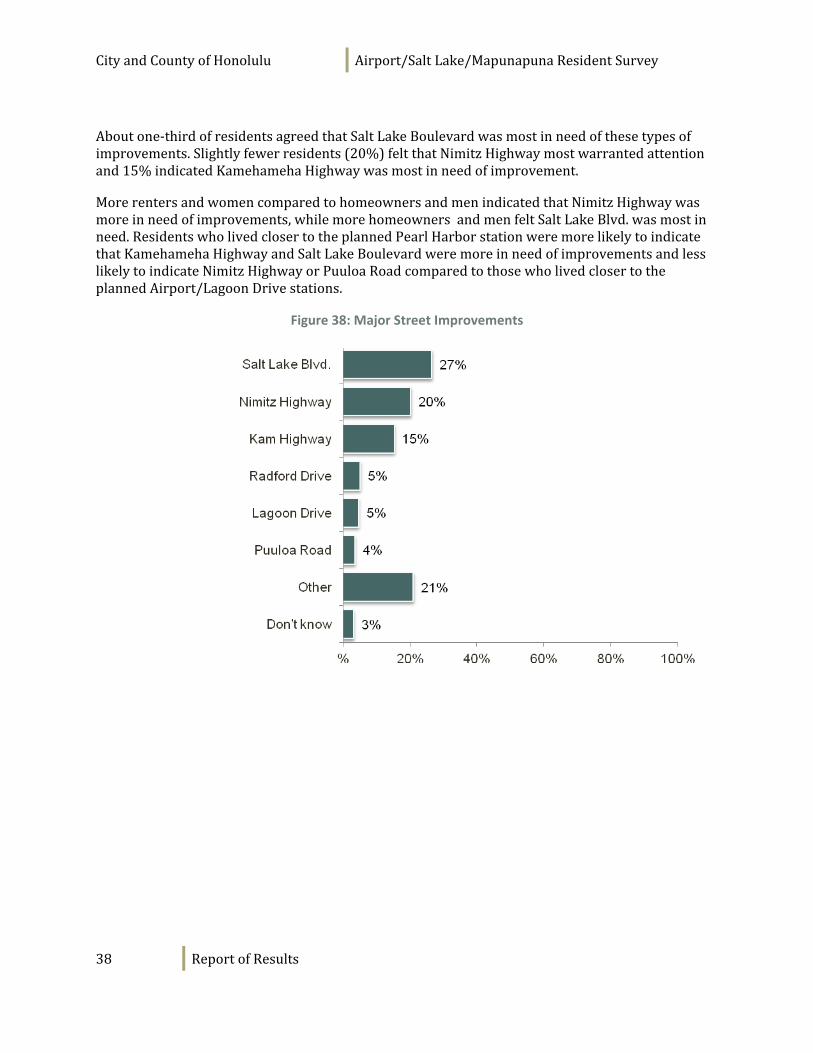
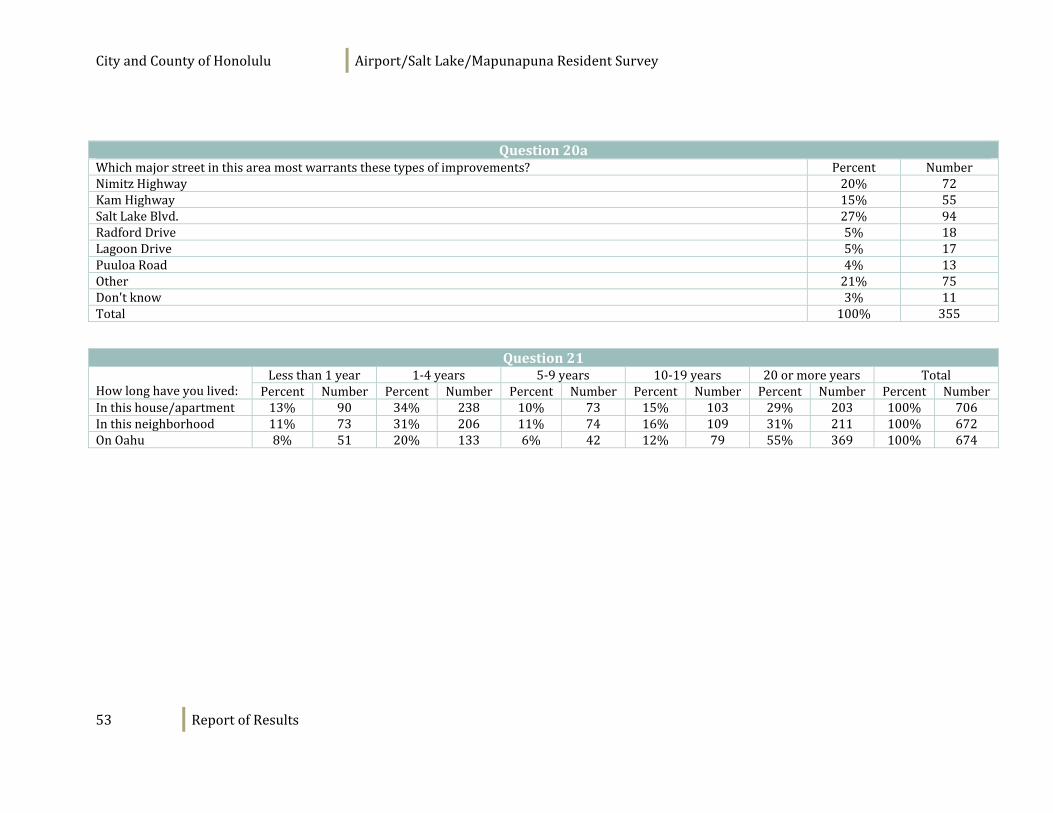
Aboutone‐thirdofresidentsagreedthatSaltLakeBoulevardwasmostinneedofthesetypesofimprovements.Slightlyfewerresidents(20%)feltthatNimitzHighwaymostwarrantedattentionand15%indicatedKamehamehaHighwaywasmostinneedofimprovement.
MorerentersandwomencomparedtohomeownersandmenindicatedthatNimitzHighwaywasmoreinneedofimprovements,whilemorehomeownersandmenfeltSaltLakeBlvd.wasmostinneed.ResidentswholivedclosertotheplannedPearlHarborstationweremorelikelytoindicatethatKamehamehaHighwayandSaltLakeBoulevardweremoreinneedofimprovementsandlesslikelytoindicateNimitzHighwayorPuuloaRoadcomparedtothosewholivedclosertotheplannedAirport/LagoonDrivestations.
Figure 38: Major Street Improvements
CityandCountyofHonolulu Airport/SaltLake/MapunapunaResidentSurvey
39 ReportofResults
Appendix A: Survey Results
The95percentconfidencelevelforthesurveyisgenerallynogreaterthanplusorminusfourpercentagepointsaroundanygivenpercentreportedforalltherespondents(719).Ifthereisaquestionwherenotallrespondentswererequiredtorespond,theresultsforthatquestionwillhaveawiderconfidenceinterval(Forexample,inquestions7and8whereonlythosewhosaidanamenityorbusinessexistedintheirneighborhoodwereaskedtorateit).Therefore,whereestimatesaregivenforsubgroups,theyarelessprecise.
CityandCountyofHonolulu Airport/SaltLake/MapunapunaResidentSurvey
40 ReportofResults
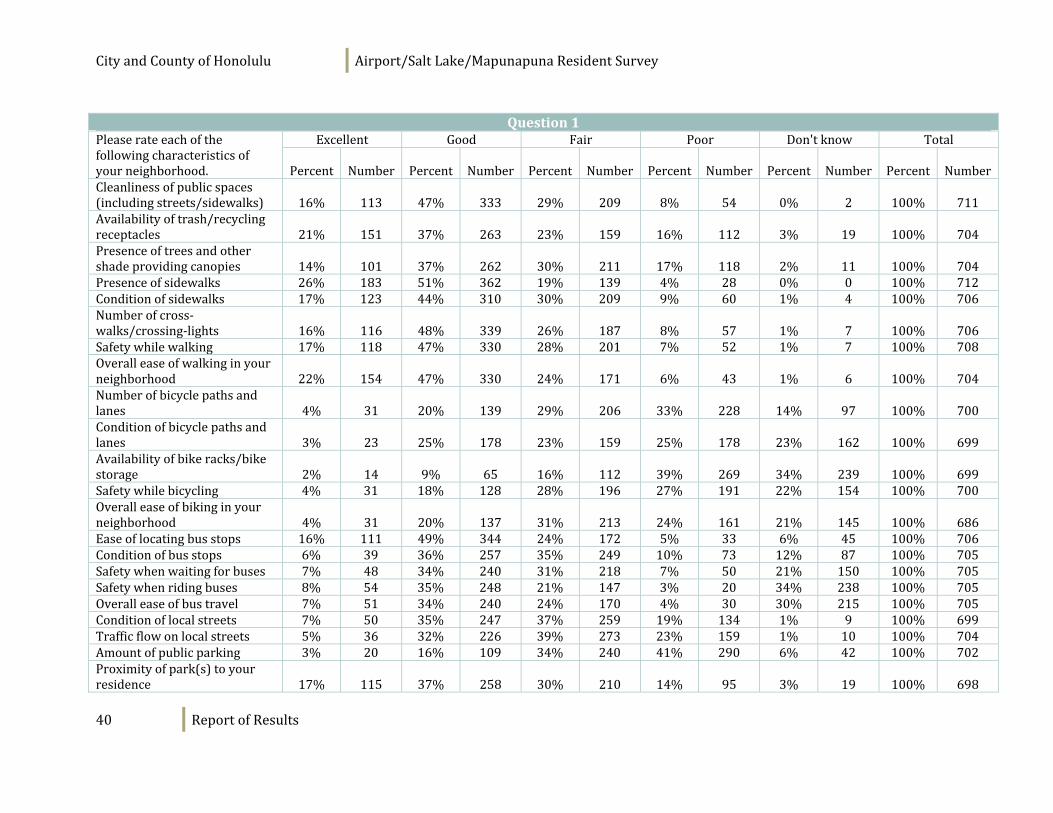
Question1
Excellent Good Fair Poor Don'tknow TotalPleaserateeachofthefollowingcharacteristicsofyourneighborhood. Percent Number Percent Number Percent Number Percent Number Percent Number Percent NumberCleanlinessofpublicspaces(includingstreets/sidewalks) 16% 113 47% 333 29% 209 8% 54 0% 2 100% 711Availabilityoftrash/recyclingreceptacles 21% 151 37% 263 23% 159 16% 112 3% 19 100% 704Presenceoftreesandothershadeprovidingcanopies 14% 101 37% 262 30% 211 17% 118 2% 11 100% 704Presenceofsidewalks 26% 183 51% 362 19% 139 4% 28 0% 0 100% 712Conditionofsidewalks 17% 123 44% 310 30% 209 9% 60 1% 4 100% 706Numberofcross‐walks/crossing‐lights 16% 116 48% 339 26% 187 8% 57 1% 7 100% 706Safetywhilewalking 17% 118 47% 330 28% 201 7% 52 1% 7 100% 708Overalleaseofwalkinginyourneighborhood 22% 154 47% 330 24% 171 6% 43 1% 6 100% 704Numberofbicyclepathsandlanes 4% 31 20% 139 29% 206 33% 228 14% 97 100% 700Conditionofbicyclepathsandlanes 3% 23 25% 178 23% 159 25% 178 23% 162 100% 699Availabilityofbikeracks/bikestorage 2% 14 9% 65 16% 112 39% 269 34% 239 100% 699Safetywhilebicycling 4% 31 18% 128 28% 196 27% 191 22% 154 100% 700Overalleaseofbikinginyourneighborhood 4% 31 20% 137 31% 213 24% 161 21% 145 100% 686Easeoflocatingbusstops 16% 111 49% 344 24% 172 5% 33 6% 45 100% 706Conditionofbusstops 6% 39 36% 257 35% 249 10% 73 12% 87 100% 705Safetywhenwaitingforbuses 7% 48 34% 240 31% 218 7% 50 21% 150 100% 705Safetywhenridingbuses 8% 54 35% 248 21% 147 3% 20 34% 238 100% 705Overalleaseofbustravel 7% 51 34% 240 24% 170 4% 30 30% 215 100% 705Conditionoflocalstreets 7% 50 35% 247 37% 259 19% 134 1% 9 100% 699Trafficflowonlocalstreets 5% 36 32% 226 39% 273 23% 159 1% 10 100% 704Amountofpublicparking 3% 20 16% 109 34% 240 41% 290 6% 42 100% 702Proximityofpark(s)toyourresidence 17% 115 37% 258 30% 210 14% 95 3% 19 100% 698
CityandCountyofHonolulu Airport/SaltLake/MapunapunaResidentSurvey
41 ReportofResults
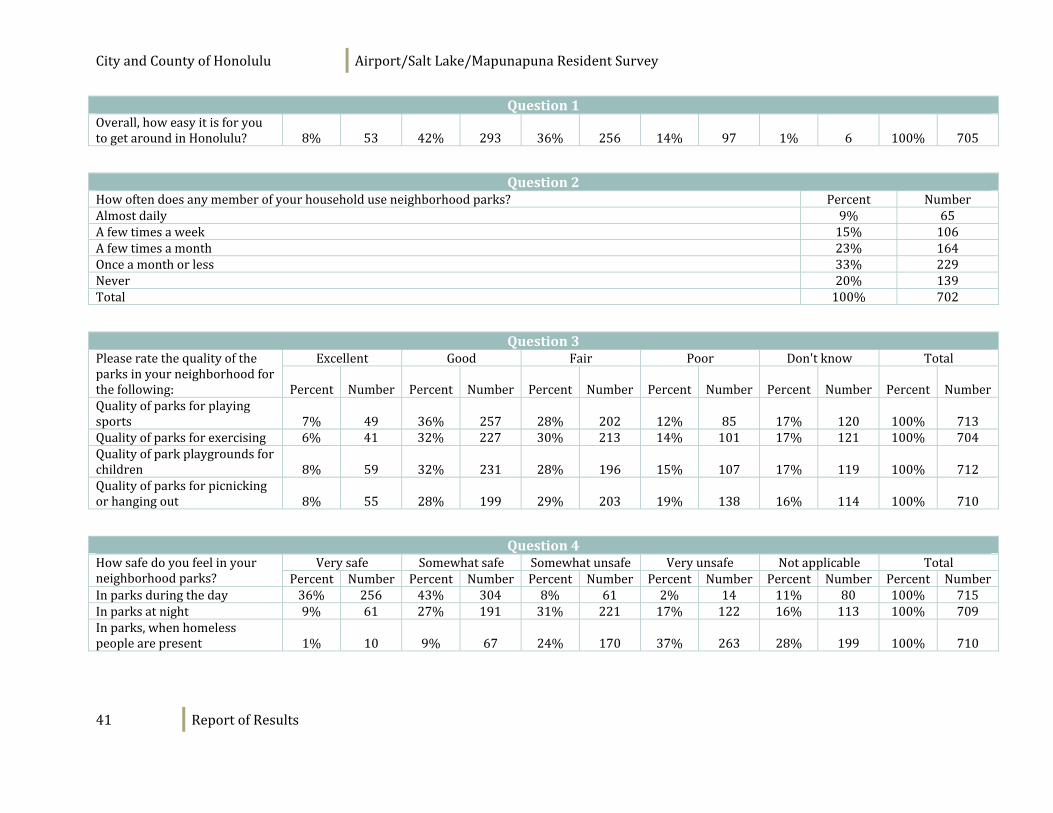
Question1Overall,howeasyitisforyoutogetaroundinHonolulu? 8% 53 42% 293 36% 256 14% 97 1% 6 100% 705
Question2
Howoftendoesanymemberofyourhouseholduseneighborhoodparks? Percent NumberAlmostdaily 9% 65Afewtimesaweek 15% 106Afewtimesamonth 23% 164Onceamonthorless 33% 229Never 20% 139Total 100% 702
Question3
Excellent Good Fair Poor Don'tknow TotalPleaseratethequalityoftheparksinyourneighborhoodforthefollowing: Percent Number Percent Number Percent Number Percent Number Percent Number Percent NumberQualityofparksforplayingsports 7% 49 36% 257 28% 202 12% 85 17% 120 100% 713Qualityofparksforexercising 6% 41 32% 227 30% 213 14% 101 17% 121 100% 704Qualityofparkplaygroundsforchildren 8% 59 32% 231 28% 196 15% 107 17% 119 100% 712Qualityofparksforpicnickingorhangingout 8% 55 28% 199 29% 203 19% 138 16% 114 100% 710
Question4
Verysafe Somewhatsafe Somewhatunsafe Veryunsafe Notapplicable TotalHowsafedoyoufeelinyourneighborhoodparks? Percent Number Percent Number Percent Number Percent Number Percent Number Percent NumberInparksduringtheday 36% 256 43% 304 8% 61 2% 14 11% 80 100% 715Inparksatnight 9% 61 27% 191 31% 221 17% 122 16% 113 100% 709Inparks,whenhomelesspeoplearepresent 1% 10 9% 67 24% 170 37% 263 28% 199 100% 710
CityandCountyofHonolulu Airport/SaltLake/MapunapunaResidentSurvey
42 ReportofResults
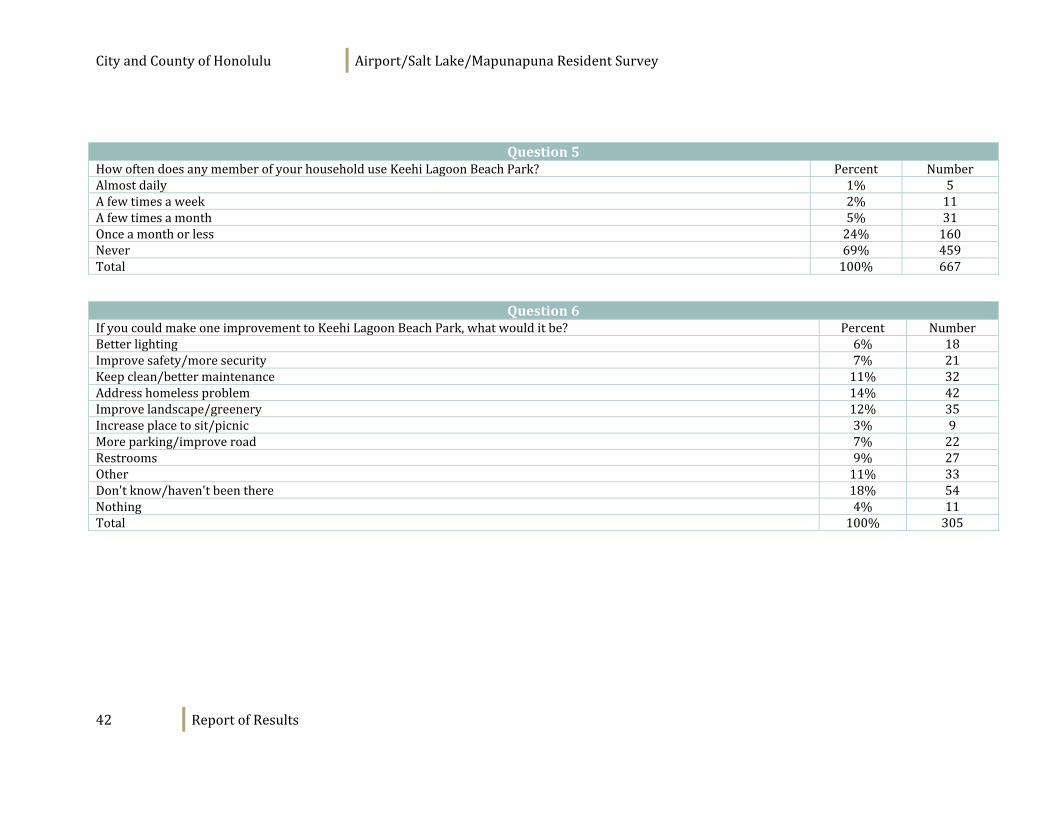
Question5
HowoftendoesanymemberofyourhouseholduseKeehiLagoonBeachPark? Percent NumberAlmostdaily 1% 5Afewtimesaweek 2% 11Afewtimesamonth 5% 31Onceamonthorless 24% 160Never 69% 459Total 100% 667
Question6
IfyoucouldmakeoneimprovementtoKeehiLagoonBeachPark,whatwoulditbe? Percent NumberBetterlighting 6% 18Improvesafety/moresecurity 7% 21Keepclean/bettermaintenance 11% 32Addresshomelessproblem 14% 42Improvelandscape/greenery 12% 35Increaseplacetosit/picnic 3% 9Moreparking/improveroad 7% 22Restrooms 9% 27Other 11% 33Don'tknow/haven'tbeenthere 18% 54Nothing 4% 11Total 100% 305
CityandCountyofHonolulu Airport/SaltLake/MapunapunaResidentSurvey
43 ReportofResults
Question7a
No Yes TotalWe'dliketoknowifyouhavethefollowingbusinessesinyourneighborhood. Percent Number Percent Number Percent NumberRestaurants 16% 114 84% 581 100% 695Barsornightclubs 78% 515 22% 148 100% 663Coffeeshops 26% 179 74% 499 100% 677Beautysalons(hair,nails,barbers) 19% 126 81% 552 100% 677Familyentertainment(theaters,etc.) 81% 553 19% 133 100% 685Grocerystores 10% 68 90% 630 100% 698Drugstores(pharmacies) 16% 109 84% 583 100% 693Conveniencestores,(i.e.7‐11) 25% 175 75% 516 100% 691Laundry/drycleaners 61% 399 39% 255 100% 654
Question7b
Excellent Good Fair Poor Don'tknow TotalWe'dliketoknowifyouhavethefollowingbusinessesinyourneighborhood,andiftheyareinyourneighborhood,howyouwouldratethemoverall.Aretheyexcellent,good,fairorpoor? Percent Number Percent Number Percent Number Percent Number Percent Number Percent NumberRestaurants 10% 63 52% 319 29% 175 5% 28 4% 24 100% 610Barsornightclubs 3% 10 19% 62 15% 50 8% 27 55% 181 100% 329Coffeeshops 15% 83 55% 297 19% 101 2% 13 8% 46 100% 540Beautysalons(hair,nails,barbers) 10% 58 42% 246 24% 142 3% 17 22% 130 100% 593Familyentertainment(theaters,etc.) 9% 24 35% 96 12% 33 6% 17 39% 108 100% 279Grocerystores 20% 124 52% 330 23% 144 4% 24 2% 11 100% 634Drugstores(pharmacies) 20% 124 57% 348 16% 96 2% 12 5% 28 100% 607Conveniencestores,(i.e.7‐11) 14% 79 57% 314 19% 103 2% 10 9% 47 100% 553Laundry/drycleaners 8% 30 28% 112 14% 54 4% 14 47% 186 100% 396
CityandCountyofHonolulu Airport/SaltLake/MapunapunaResidentSurvey
44 ReportofResults
Question8a
No Yes TotalWe'dliketoknowifyouhavethefollowingresourcesinyourneighborhood. Percent Number Percent Number Percent NumberLibraries 17% 120 83% 566 100% 686Schools 4% 29 96% 667 100% 696Childdaycare 30% 174 70% 408 100% 582Youthcenters 54% 305 46% 262 100% 567Communitycenters 27% 168 73% 454 100% 621Seniorcenters/seniordaycare 80% 440 20% 112 100% 552Medicalclinics/dentists 29% 187 71% 464 100% 651Affordablehousing 55% 322 45% 265 100% 586Seniorhousing 83% 457 17% 93 100% 551
Question8b
Excellent Good Fair Poor Don'tknow TotalWe'dliketoknowifyouhavethefollowingresourcesinyourneighborhood,andiftheyareinyourneighborhood,howyouwouldratethemoverall.Aretheyexcellent,good,fairorpoor? Percent Number Percent Number Percent Number Percent Number Percent Number Percent NumberLibraries 23% 137 42% 254 11% 67 1% 9 22% 134 100% 600Schools 17% 112 39% 262 13% 86 5% 35 26% 177 100% 671Childdaycare 8% 44 28% 154 7% 40 2% 10 54% 294 100% 542Youthcenters 5% 24 22% 97 7% 32 2% 9 64% 285 100% 447Communitycenters 10% 58 36% 199 14% 81 2% 13 37% 208 100% 559Seniorcenters/seniordaycare 3% 9 12% 44 5% 18 2% 7 78% 277 100% 355Medicalclinics/dentists 11% 58 37% 193 13% 70 2% 10 37% 195 100% 527Affordablehousing 7% 30 17% 78 17% 77 10% 47 50% 230 100% 462Seniorhousing 3% 12 8% 28 5% 18 4% 15 80% 296 100% 369
CityandCountyofHonolulu Airport/SaltLake/MapunapunaResidentSurvey
45 ReportofResults
Question9LikeMost
What3thingsdoyoulikemostaboutlivinginyourneighborhood? Percent NumberLocationisclosetojobs/busstops 59% 416Closetoshopping 45% 318Neighborhoodisquiet 38% 271House/propertyisgoodsizeformyhousehold 32% 227Safetowalk,driveorplay(fewaccidents) 28% 198Goodschoolsforchildren 25% 176Housingisingoodcondition 24% 167Crimerateislow 19% 134Housingisaffordable 13% 96Other 12% 88Closetorecreationareas/facilities 12% 83Strongsenseofcommunity 6% 46Livelycommunity/alotgoingon 2% 12Total may exceed 100% as respondents could select more than one option.
Question9LikeLeastWhat3thingsdoyoulikeleastaboutlivinginyourneighborhood? Percent NumberHousingisexpensive 52% 346Don’tknowmanyneighbors 32% 215Neighborhoodistoonoisy 29% 193Other 21% 141Farfromrecreationareas/facilities 20% 134Crimerateistoohigh 18% 119House/propertyissmall,notenoughspace 17% 116Farfromshopping 15% 103Unsafetowalk,driveorplay(toomanyaccidents) 14% 91Housingisinpoorcondition 12% 81Nogoodschoolsforchildren 12% 78Parking 11% 74Locationisnotclosetojobs/busstops 10% 70Trafficandroadissues 5% 34Neighborhoodistooquiet/notaverylivelyplace 3% 22Total may exceed 100% as respondents could select more than one option.
CityandCountyofHonolulu Airport/SaltLake/MapunapunaResidentSurvey
46 ReportofResults
Question10Ifonlyafewofthefollowingamenitiescouldbebuiltorimprovedinyourneighborhood,which5wouldyoumostliketoseebuiltorimproved? Percent NumberImprovedsidewalks/crosswalks 37% 248Walkingpaths/trails 39% 262Bikepathsandbikelanes 32% 213Morecarparking 53% 354Parks 27% 179Communitygardens 35% 235Youthcenters 17% 112Communitycenters 19% 128Seniorcenters/daycare 17% 115Medicalclinics/dentists 10% 67Affordablehousing 24% 164Seniorhousing 9% 58Sportsfacilities(gyms,fields,etc.) 38% 253Children'splaygrounds 27% 183Childdaycare 8% 54Schools 11% 73Libraries 11% 73Other 12% 79Total may exceed 100% as respondents could select more than one option.
CityandCountyofHonolulu Airport/SaltLake/MapunapunaResidentSurvey
47 ReportofResults
Question11Iftherewasonethingyoucoulddotoimproveyourneighborhoodwhatwoulditbe? Percent NumberReducetraffic 5% 24Sidewalks/crosswalks/bikelanes 6% 28Policepresence/safety/reducecrime 13% 59Improveroads 9% 43Parks/gardens/recreationareas 9% 44Cleanuparea/appearance 9% 43Improveparking 19% 88Improvetransit 3% 15ReduceNoise 4% 17Affordablehousing 3% 13Streetlighting 3% 12Reducehomelessissues 2% 8Grocery/retail/restaurants 5% 21Other 10% 48Total 100% 461
Question12Whatlandmarksorcharacteristicsofyourneighborhoodaremostimportanttopreserve? Percent NumberParks/greenspaces/landscaping 23% 84Qualityofneighborhood(senseofcommunity,quiet,etc.) 6% 22PearlHarborandhistoricallandmarks 7% 27Views 3% 9Restaurantsandshopping 2% 7Access/convenience/transportation 4% 15Schools 5% 18Cleanliness 3% 10Housing 2% 9Trees 16% 58Nothing 6% 20Don'tknow/nocomment 6% 22Other 9% 32Safety 4% 15Parkingandroadmaintenance 3% 12
CityandCountyofHonolulu Airport/SaltLake/MapunapunaResidentSurvey
48 ReportofResults
Question12Total 100% 361
Question13
Whattypeofneighborhooddoyoumostdesiretolivein? Percent Number1‐2storysingle‐familyhomes,usingmycarastheprimarywaytoshopandgettowork/school 82% 5573‐4storyapartmentbuildingsandtownhomes,usingtransitandmycartogetaround 14% 9715‐30storyhigh‐riseapartment/condominiumbuildings,walkingandusingtransittogetaround 4% 25Total 100% 679
Question14
Doyouplantomovefromyourcurrenthomeinthenexttwoyears? Percent NumberYes 29% 196No 58% 398Don'tknow 13% 92Total 100% 686
Question14aWherewillyoumove? Percent NumberAnewplaceinthisneighborhood 10% 19AnotherplaceinHonolulu 25% 46OutsideHonolulu,butonOahu 15% 28OutsideOahu 49% 89Total 100% 181
Question14bWherewillyoumove?Why? Percent NumberCosttomoveisexpensive/costtostayisaffordable 19% 105Military 16% 89Locationisconvenient 12% 64Satisfiedoverall 6% 35Likehome/neighborhood 8% 46Havealwayslivedhere/livedhereforlongtime 7% 40Job/workopportunities 6% 30Homeispaidofforclosetobeingpaidoff 6% 35
CityandCountyofHonolulu Airport/SaltLake/MapunapunaResidentSurvey
49 ReportofResults
Question14bOther 13% 75Noparticularreason 6% 35Total 100% 554
Question15
Beforereceivingthissurvey,wereyouawarethattheCityandCountyofHonoluluisplanningtobuildarailtransitline? Percent NumberYes 93% 643No 7% 51Total 100% 694
Question16
Verylikely SomewhatlikelySomewhatunlikely Veryunlikely Total
Atleastonerailstationwillbewithin1‐2milesofyourhome.Onceitisbuilt,howlikelyorunlikelywillyouorsomeoneinyourhouseholdbetouserailtransitforthefollowingtrips? Percent Number Percent Number Percent Number Percent Number Percent NumberUserailtransittogettoworkorschool 19% 132 20% 137 13% 85 48% 325 100% 679Userailtransittogoshopping 23% 159 28% 194 16% 110 33% 226 100% 690Userailtransittogotorestaurants,barsornightclubs 27% 183 24% 161 14% 97 35% 241 100% 683Userailtransittovisitbeachesorrecreationareas 22% 150 23% 154 22% 149 34% 231 100% 684Userailtransittomeetupwithfriends/family 21% 145 24% 166 18% 124 37% 252 100% 687
Question17
Ifyouweretoriderailtransit,whichstationwouldyoumostlikelyuse? Percent NumberPearlHarborStation 50% 326AirportStation 30% 194LagoonDriveStation 20% 129Total 100% 649
CityandCountyofHonolulu Airport/SaltLake/MapunapunaResidentSurvey
50 ReportofResults
Question17a
Verylikely SomewhatlikelySomewhatunlikely Veryunlikely Total
Howlikelyorunlikelyareyoutotravelto/fromthisrailstationusingthefollowingmodesoftransportation(parkingwillnotbeprovidedatthesestations): Percent Number Percent Number Percent Number Percent Number Percent NumberByfoot,ifpropersidewalksandcrossingsexist? 28% 194 25% 167 11% 75 36% 243 100% 679Bybicycle,ifproperlanes/pathsandstorageareasexist? 15% 101 21% 141 16% 105 48% 321 100% 669Bymotorcycleormoped,ifproperparkingexists? 5% 36 10% 66 14% 94 70% 464 100% 660Bybus,iffrequentandaccessiblecoverageexists? 16% 107 23% 157 15% 97 46% 308 100% 669Byautomobile,ifadrop‐offareaisavailable? 33% 225 33% 226 10% 67 25% 173 100% 691Byothermeans(e.g.skateboard,segway,etc.) 5% 32 9% 60 11% 75 74% 486 100% 652
CityandCountyofHonolulu Airport/SaltLake/MapunapunaResidentSurvey
51 ReportofResults
Question18
StronglysupportSomewhatsupport Somewhatoppose Stronglyoppose Don'tknow Total
Whentherailsystemisbuilttheremaybeopportunitiestobuildnewamenitiesaroundtherailstations.Howstronglywouldyousupportoropposebuildingeachofthefollowingnearyourclosestplannedrailstation(s)? Percent Number Percent Number Percent Number Percent Number Percent Number Percent NumberBicycleparking 58% 397 26% 182 3% 20 4% 25 9% 63 100% 687Plazasorsmallparks 40% 271 35% 235 9% 62 7% 48 9% 59 100% 675Busshelters 50% 346 32% 217 7% 47 5% 32 7% 46 100% 687Placestosit 68% 473 23% 158 2% 12 4% 29 4% 26 100% 698Improvedlandscaping 61% 415 29% 198 3% 19 3% 19 5% 31 100% 683Restrooms 72% 504 18% 127 2% 16 4% 30 4% 26 100% 703Coffeeshopsandrestaurants 52% 361 30% 209 7% 50 5% 35 5% 36 100% 691Conveniencestores(i.e.7‐11) 42% 290 35% 243 10% 67 7% 46 6% 42 100% 688Services,likehairsalonsordrycleaners 21% 142 33% 218 22% 149 14% 94 10% 67 100% 669Shoppingcenters 30% 206 33% 224 17% 115 13% 88 7% 48 100% 681Grocerystores 30% 207 35% 237 16% 109 12% 81 7% 47 100% 679Drugstores(pharmacies) 30% 207 35% 240 15% 101 12% 79 8% 58 100% 684Affordable/subsidizedhousing 21% 141 23% 153 21% 142 23% 152 12% 80 100% 668Regular/marketratehousing 22% 150 32% 217 17% 117 16% 110 12% 81 100% 675Other 29% 53 13% 24 4% 7 11% 20 43% 80 100% 183
CityandCountyofHonolulu Airport/SaltLake/MapunapunaResidentSurvey
52 ReportofResults
Question19
StronglysupportSomewhatsupport Somewhatoppose Stronglyoppose Don'tknow Total
Howstronglywouldyousupportoropposethefollowingtypesofnewdevelopmentnearyourclosestplannedrailstation(s)? Percent Number Percent Number Percent Number Percent Number Percent Number Percent NumberResidentialtowers 11% 76 22% 149 20% 140 37% 255 10% 66 100% 686Residential–mid‐rise 12% 84 28% 188 20% 135 31% 210 9% 61 100% 677Parks 42% 293 36% 249 6% 39 8% 52 8% 57 100% 690Retailstores/services 28% 191 40% 272 11% 78 13% 91 7% 50 100% 682Hotels 11% 74 19% 129 25% 171 36% 250 9% 61 100% 686Officetowers 9% 62 22% 149 22% 153 38% 260 10% 66 100% 690Office–low‐rise 11% 72 31% 214 19% 133 30% 203 9% 63 100% 686Parkingstructures 40% 280 35% 244 8% 56 11% 76 6% 40 100% 696
Question20
StronglysupportSomewhatsupport Somewhatoppose Stronglyoppose Don'tknow Total
Howstronglywouldyousupportoropposethefollowingimprovementsformajorstreetsnearyourclosestplannedrailstation(s)? Percent Number Percent Number Percent Number Percent Number Percent Number Percent NumberExpandingbusservice 50% 343 30% 208 6% 41 4% 30 10% 69 100% 691Establishingbikelanes 53% 367 28% 196 5% 36 4% 25 10% 67 100% 692Improvingsidewalks 64% 444 27% 184 2% 15 2% 15 5% 36 100% 694Addingstreetlighting 67% 467 24% 166 2% 15 2% 15 5% 36 100% 700Plantingtrees 62% 423 26% 178 4% 24 3% 19 6% 42 100% 686Addingcrosswalks 60% 416 29% 201 2% 17 2% 17 6% 39 100% 691Addingonstreetparking 50% 343 23% 156 11% 73 10% 66 7% 50 100% 689Addingplacestosit. 61% 425 27% 185 3% 20 4% 30 5% 33 100% 693Addingtrashbins 66% 459 26% 179 2% 17 2% 16 4% 26 100% 697
CityandCountyofHonolulu Airport/SaltLake/MapunapunaResidentSurvey
53 ReportofResults
Question20a
Whichmajorstreetinthisareamostwarrantsthesetypesofimprovements? Percent NumberNimitzHighway 20% 72KamHighway 15% 55SaltLakeBlvd. 27% 94RadfordDrive 5% 18LagoonDrive 5% 17PuuloaRoad 4% 13Other 21% 75Don'tknow 3% 11Total 100% 355
Question21
Lessthan1year 1‐4years 5‐9years 10‐19years 20ormoreyears TotalHowlonghaveyoulived: Percent Number Percent Number Percent Number Percent Number Percent Number Percent NumberInthishouse/apartment 13% 90 34% 238 10% 73 15% 103 29% 203 100% 706Inthisneighborhood 11% 73 31% 206 11% 74 16% 109 31% 211 100% 672OnOahu 8% 51 20% 133 6% 42 12% 79 55% 369 100% 674
CityandCountyofHonolulu Airport/SaltLake/MapunapunaResidentSurvey
54 ReportofResults
Question22Whereisyourworkorschoollocated? Percent NumberKalihi/SandIsland 7% 49Liliha/Nuuanu 3% 18Waikiki 6% 42Ewa/Kapolei 3% 22Downtown 17% 112Makiki 3% 19Waipahu 2% 11Windward 4% 30Kakaako 2% 16Manoa 5% 35CentralOahu 3% 22EastOahu 1% 10AlaMoana 7% 48Kaimuki 2% 13Aiea/PearlCity 8% 52Other 11% 74Kahala/DiamondHead 4% 25Airport/PearlHarbor 36% 243Moanalua/SaltLake 17% 112Retired/don'twork 8% 57Total may exceed 100% as respondents could select more than one option.
CityandCountyofHonolulu Airport/SaltLake/MapunapunaResidentSurvey
55 ReportofResults
Question23
Didnotgotowork/school
Workedfromhome
Drovevehiclealone Carpooled
Motorbikeorscooter
Tookbus Walked Biked Total
Thinkingaboutlastweek,pleasetellushowyougottoworkorschooleachday(ifyouusedmorethanonetransportationmode,choosetheoneyouusedforthemostmiles). % N % N % N % N % N % N % N % N % NMonday 15% 99 4% 30 67% 448 6% 41 2% 14 4% 28 1% 4 1% 8 100% 671Tuesday 14% 97 5% 30 66% 441 6% 42 2% 15 5% 33 1% 5 1% 9 100% 671Wednesday 15% 99 4% 25 66% 446 7% 48 2% 15 4% 26 1% 4 1% 9 100% 671Thursday 16% 108 4% 27 66% 442 6% 40 2% 14 4% 30 1% 5 1% 6 100% 671Friday 16% 104 4% 27 65% 438 6% 41 2% 16 5% 33 1% 5 1% 8 100% 671Saturday 54% 360 4% 24 34% 229 5% 32 1% 6 3% 17 0% 1 0% 2 100% 671Sunday 60% 405 3% 21 29% 197 4% 30 1% 4 2% 13 0% 1 0% 1 100% 671
QuestionQ23‐CommutedbythisModeAtLeastOneDayLastWeek
Thinkingaboutlastweek,pleasetellushowyougottoworkeachday(ifyouusemorethanonetransportationmode,choosetheoneyouusedforthemostmiles). PercentTelecommute 7%Drivevehiclealone 77%Car/vanpool 11%Motorcycleorscooter 3%Bus 6%Walk 1%Bike 2%Alternatetransport 25%
CityandCountyofHonolulu Airport/SaltLake/MapunapunaResidentSurvey
56 ReportofResults
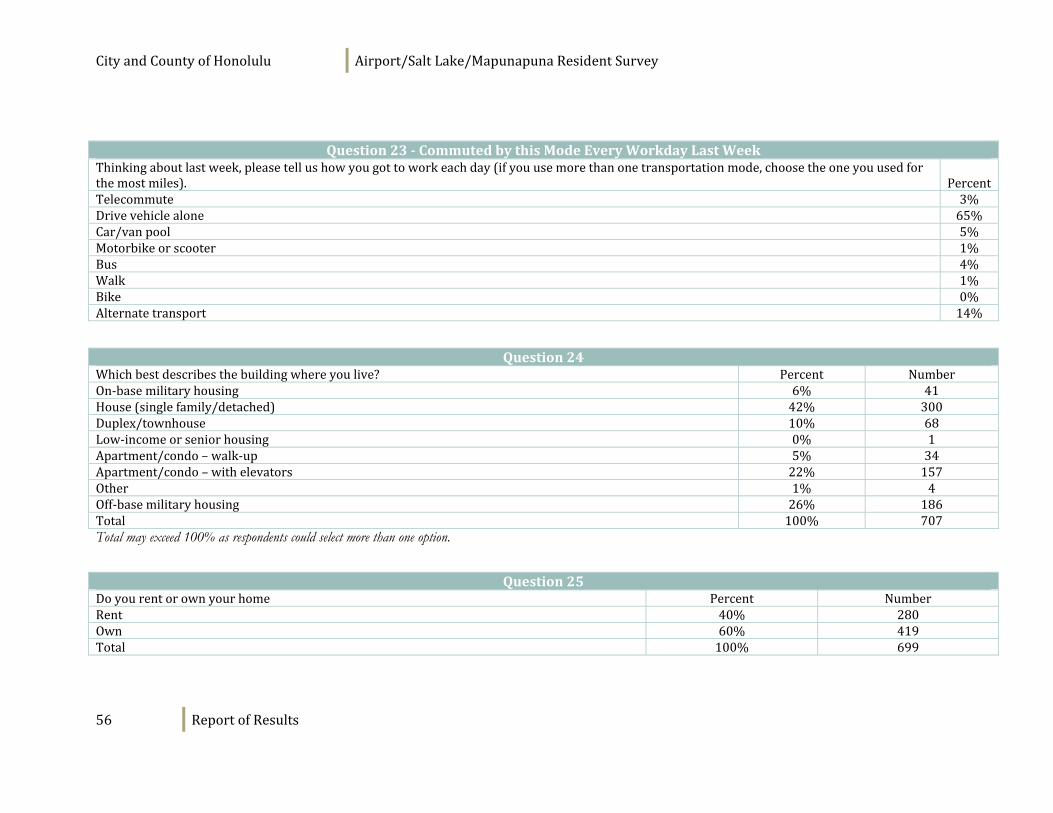
Question23‐CommutedbythisModeEveryWorkdayLastWeek
Thinkingaboutlastweek,pleasetellushowyougottoworkeachday(ifyouusemorethanonetransportationmode,choosetheoneyouusedforthemostmiles). PercentTelecommute 3%Drivevehiclealone 65%Car/vanpool 5%Motorbikeorscooter 1%Bus 4%Walk 1%Bike 0%Alternatetransport 14%
Question24
Whichbestdescribesthebuildingwhereyoulive? Percent NumberOn‐basemilitaryhousing 6% 41House(singlefamily/detached) 42% 300Duplex/townhouse 10% 68Low‐incomeorseniorhousing 0% 1Apartment/condo–walk‐up 5% 34Apartment/condo–withelevators 22% 157Other 1% 4Off‐basemilitaryhousing 26% 186Total 100% 707Total may exceed 100% as respondents could select more than one option.
Question25
Doyourentorownyourhome Percent NumberRent 40% 280Own 60% 419Total 100% 699
CityandCountyofHonolulu Airport/SaltLake/MapunapunaResidentSurvey
57 ReportofResults
Question26
Adults Children AllpeoplePleasetellusthenumberofadults(includingyourself)andchildrenwholiveinyourhome. Percent Percent PercentNone 0% 54% 0%1 13% 18% 11%2 56% 18% 29%3‐4 19% 8% 37%5ormore 12% 1% 24%Total 100% 100% 100%
Question27
VehiclesAdultbikes
Children'sbikesHowmanymotorvehicles(cars,trucks,motorcycles,etc.)areownedorleasedbythepeopleinyourhousehold,and
howmanybicyclesareownedandusedonaregularbasis? Percent Percent PercentNone 1% 61% 76%1 28% 18% 11%2 44% 17% 9%3ormore 26% 5% 4%Total 100% 100% 100%
Question28
Doesanymemberofyourhouseholdhaveaphysicalhandicap,orisanyonedisabled? Percent NumberYes 14% 96No 86% 608Total 100% 704
Question29Howoldareyou? Percent Number18to34 40% 27135to54 34% 23555+ 26% 176Total 100% 682
CityandCountyofHonolulu Airport/SaltLake/MapunapunaResidentSurvey
58 ReportofResults
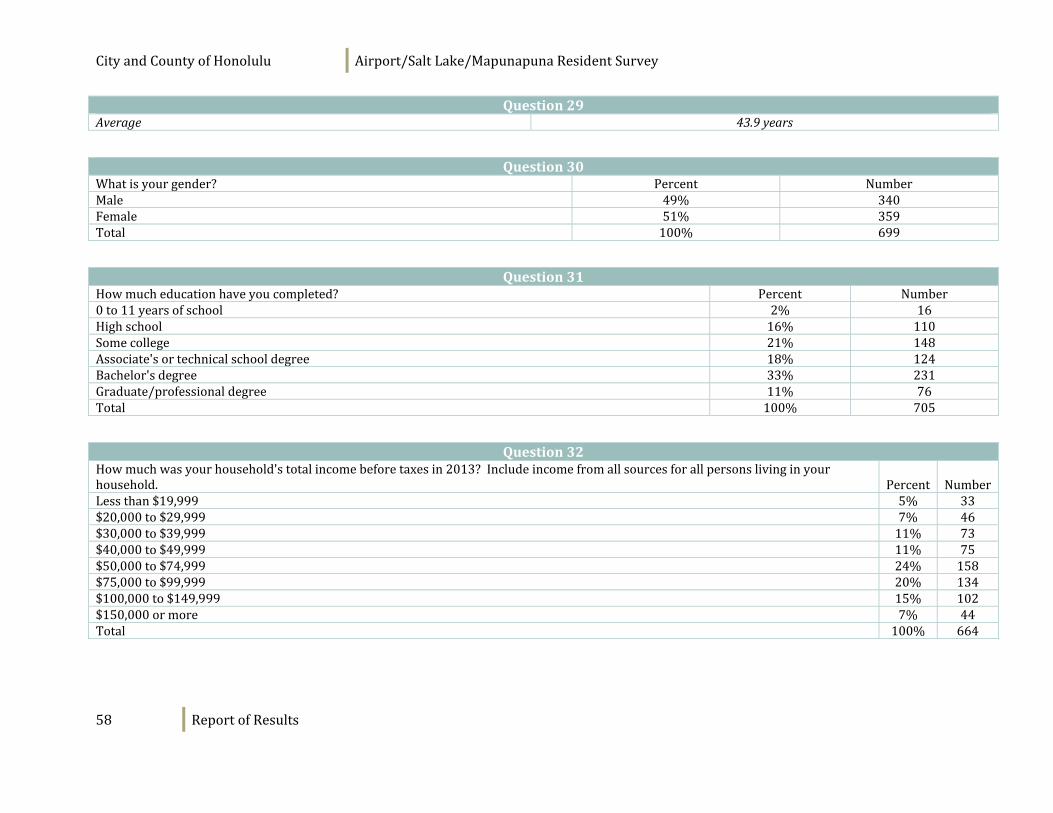
Question29Average 43.9years
Question30
Whatisyourgender? Percent NumberMale 49% 340Female 51% 359Total 100% 699
Question31
Howmucheducationhaveyoucompleted? Percent Number0to11yearsofschool 2% 16Highschool 16% 110Somecollege 21% 148Associate'sortechnicalschooldegree 18% 124Bachelor'sdegree 33% 231Graduate/professionaldegree 11% 76Total 100% 705
Question32
Howmuchwasyourhousehold'stotalincomebeforetaxesin2013?Includeincomefromallsourcesforallpersonslivinginyourhousehold. Percent NumberLessthan$19,999 5% 33$20,000to$29,999 7% 46$30,000to$39,999 11% 73$40,000to$49,999 11% 75$50,000to$74,999 24% 158$75,000to$99,999 20% 134$100,000to$149,999 15% 102$150,000ormore 7% 44Total 100% 664
CityandCountyofHonolulu Airport/SaltLake/MapunapunaResidentSurvey
59 ReportofResults
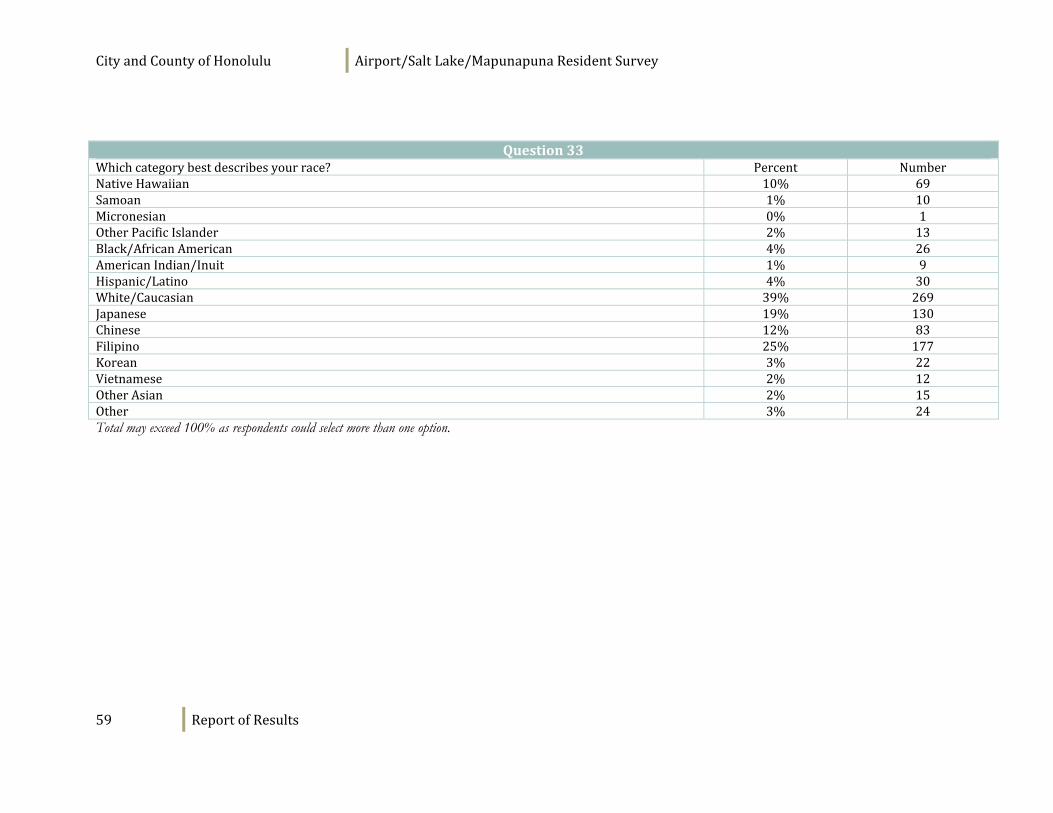
Question33
Whichcategorybestdescribesyourrace? Percent NumberNativeHawaiian 10% 69Samoan 1% 10Micronesian 0% 1OtherPacificIslander 2% 13Black/AfricanAmerican 4% 26AmericanIndian/Inuit 1% 9Hispanic/Latino 4% 30White/Caucasian 39% 269Japanese 19% 130Chinese 12% 83Filipino 25% 177Korean 3% 22Vietnamese 2% 12OtherAsian 2% 15Other 3% 24Total may exceed 100% as respondents could select more than one option.
CityandCountyofHonolulu Airport/SaltLake/MapunapunaResidentSurvey
60 ReportofResults
Appendix B: Survey Results by Tenure
Whencomparingresultsbetweensubgroups,themarginoferror(orconfidenceinterval)variesbywhichgroupsarecomparedandhowmanyrespondentsareineachsubgroup.Ofallthesurveyrespondents,419ownedtheirhomesand280rented.Themarginoferrorforcomparisonbetweenthesetwogroupsis±8%.
Differencesinresponsesbetweenanytwogroupsmustbegreaterthanthemarginoferrorinordertobeconsideredastatisticallysignificantdifferenceatthe.95confidencelevel.Forexample,sincethemarginoferrorbetweenthetwogroupsis±8%,if54%ofownersand62%ofrenterssaidtheyfeltsafeinthecity,thiswouldnotbestatisticallydifferent.Howeverif54%ofownersand63%ofrenterssaidtheyfeltsafeinthecity,thiswouldbeconsideredstatisticallydifferent.Statisticallysignificantdifferencesareindicatedwithshading.
CityandCountyofHonolulu Airport/SaltLake/MapunapunaResidentSurvey
61 ReportofResults
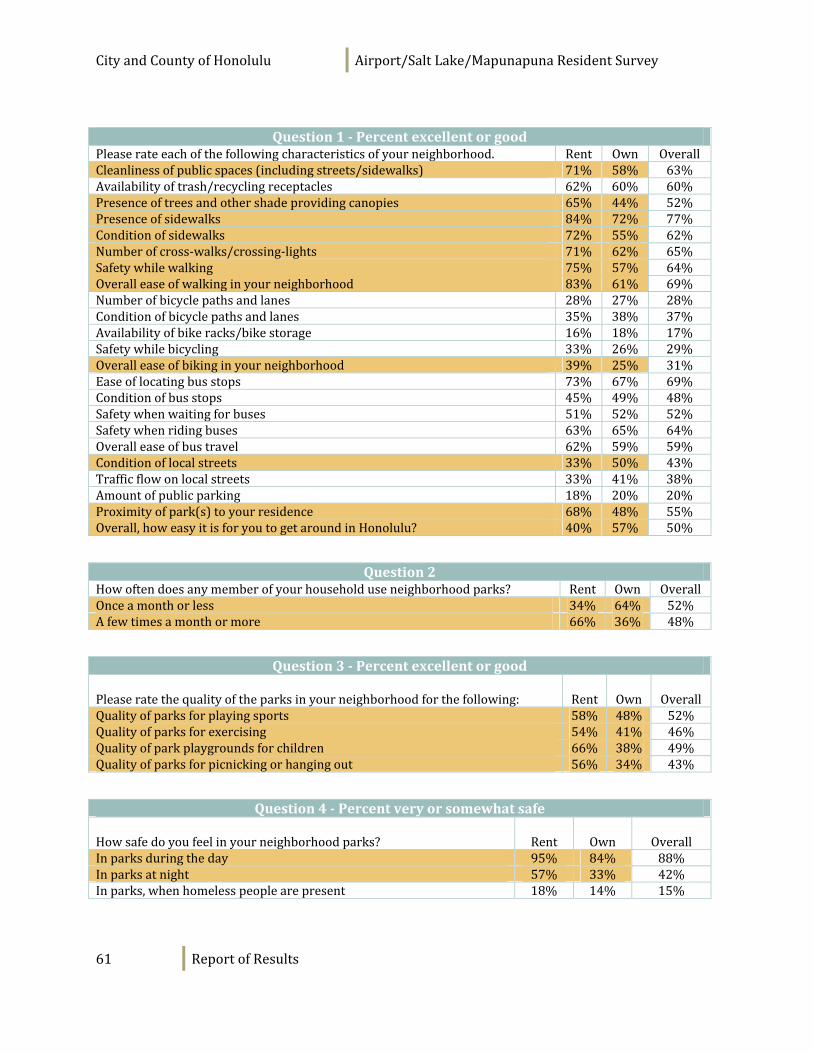
Question1‐PercentexcellentorgoodPleaserateeachofthefollowingcharacteristicsofyourneighborhood. Rent Own OverallCleanlinessofpublicspaces(includingstreets/sidewalks) 71% 58% 63%Availabilityoftrash/recyclingreceptacles 62% 60% 60%Presenceoftreesandothershadeprovidingcanopies 65% 44% 52%Presenceofsidewalks 84% 72% 77%Conditionofsidewalks 72% 55% 62%Numberofcross‐walks/crossing‐lights 71% 62% 65%Safetywhilewalking 75% 57% 64%Overalleaseofwalkinginyourneighborhood 83% 61% 69%Numberofbicyclepathsandlanes 28% 27% 28%Conditionofbicyclepathsandlanes 35% 38% 37%Availabilityofbikeracks/bikestorage 16% 18% 17%Safetywhilebicycling 33% 26% 29%Overalleaseofbikinginyourneighborhood 39% 25% 31%Easeoflocatingbusstops 73% 67% 69%Conditionofbusstops 45% 49% 48%Safetywhenwaitingforbuses 51% 52% 52%Safetywhenridingbuses 63% 65% 64%Overalleaseofbustravel 62% 59% 59%Conditionoflocalstreets 33% 50% 43%Trafficflowonlocalstreets 33% 41% 38%Amountofpublicparking 18% 20% 20%Proximityofpark(s)toyourresidence 68% 48% 55%Overall,howeasyitisforyoutogetaroundinHonolulu? 40% 57% 50%
Question2
Howoftendoesanymemberofyourhouseholduseneighborhoodparks? Rent Own OverallOnceamonthorless 34% 64% 52%Afewtimesamonthormore 66% 36% 48%
Question3‐Percentexcellentorgood
Pleaseratethequalityoftheparksinyourneighborhoodforthefollowing: Rent Own OverallQualityofparksforplayingsports 58% 48% 52%Qualityofparksforexercising 54% 41% 46%Qualityofparkplaygroundsforchildren 66% 38% 49%Qualityofparksforpicnickingorhangingout 56% 34% 43%
Question4‐Percentveryorsomewhatsafe
Howsafedoyoufeelinyourneighborhoodparks? Rent Own OverallInparksduringtheday 95% 84% 88%Inparksatnight 57% 33% 42%Inparks,whenhomelesspeoplearepresent 18% 14% 15%
CityandCountyofHonolulu Airport/SaltLake/MapunapunaResidentSurvey
62 ReportofResults
Question5
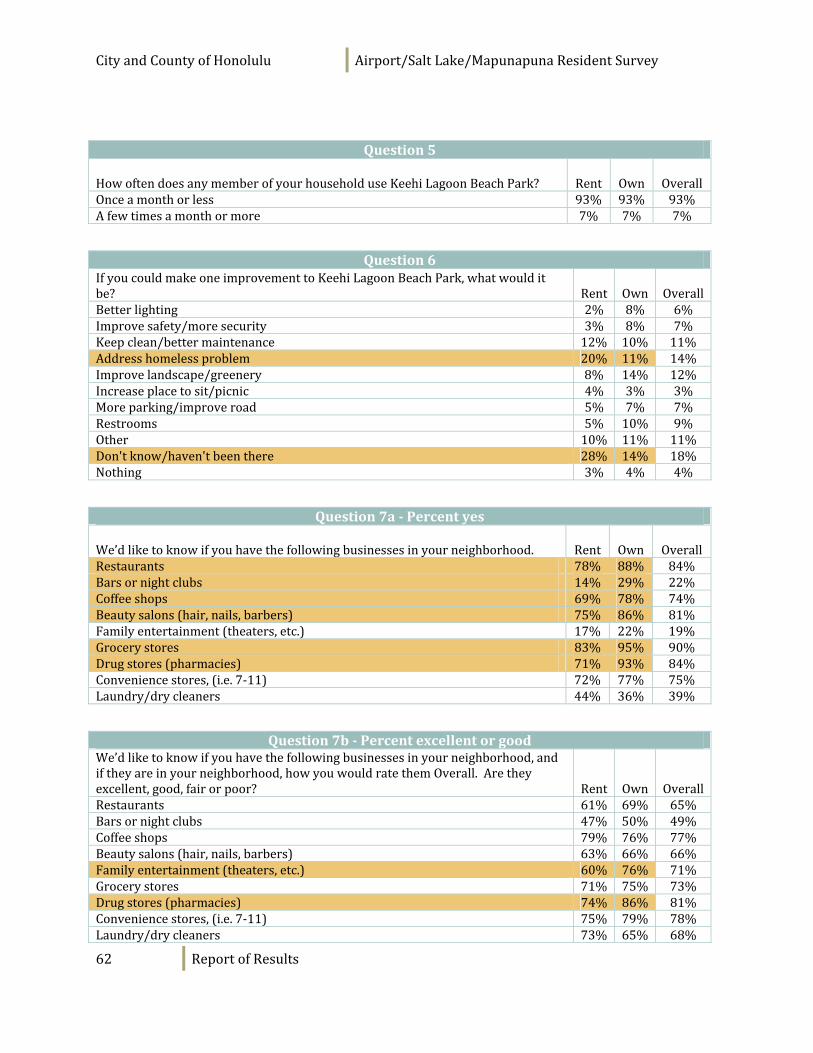
HowoftendoesanymemberofyourhouseholduseKeehiLagoonBeachPark? Rent Own OverallOnceamonthorless 93% 93% 93%Afewtimesamonthormore 7% 7% 7%
Question6
IfyoucouldmakeoneimprovementtoKeehiLagoonBeachPark,whatwoulditbe? Rent Own OverallBetterlighting 2% 8% 6%Improvesafety/moresecurity 3% 8% 7%Keepclean/bettermaintenance 12% 10% 11%Addresshomelessproblem 20% 11% 14%Improvelandscape/greenery 8% 14% 12%Increaseplacetosit/picnic 4% 3% 3%Moreparking/improveroad 5% 7% 7%Restrooms 5% 10% 9%Other 10% 11% 11%Don'tknow/haven'tbeenthere 28% 14% 18%Nothing 3% 4% 4%
Question7a‐Percentyes
We’dliketoknowifyouhavethefollowingbusinessesinyourneighborhood. Rent Own OverallRestaurants 78% 88% 84%Barsornightclubs 14% 29% 22%Coffeeshops 69% 78% 74%Beautysalons(hair,nails,barbers) 75% 86% 81%Familyentertainment(theaters,etc.) 17% 22% 19%Grocerystores 83% 95% 90%Drugstores(pharmacies) 71% 93% 84%Conveniencestores,(i.e.7‐11) 72% 77% 75%Laundry/drycleaners 44% 36% 39%
Question7b‐Percentexcellentorgood
We’dliketoknowifyouhavethefollowingbusinessesinyourneighborhood,andiftheyareinyourneighborhood,howyouwouldratethemOverall.Aretheyexcellent,good,fairorpoor? Rent Own OverallRestaurants 61% 69% 65%Barsornightclubs 47% 50% 49%Coffeeshops 79% 76% 77%Beautysalons(hair,nails,barbers) 63% 66% 66%Familyentertainment(theaters,etc.) 60% 76% 71%Grocerystores 71% 75% 73%Drugstores(pharmacies) 74% 86% 81%Conveniencestores,(i.e.7‐11) 75% 79% 78%Laundry/drycleaners 73% 65% 68%
CityandCountyofHonolulu Airport/SaltLake/MapunapunaResidentSurvey
63 ReportofResults
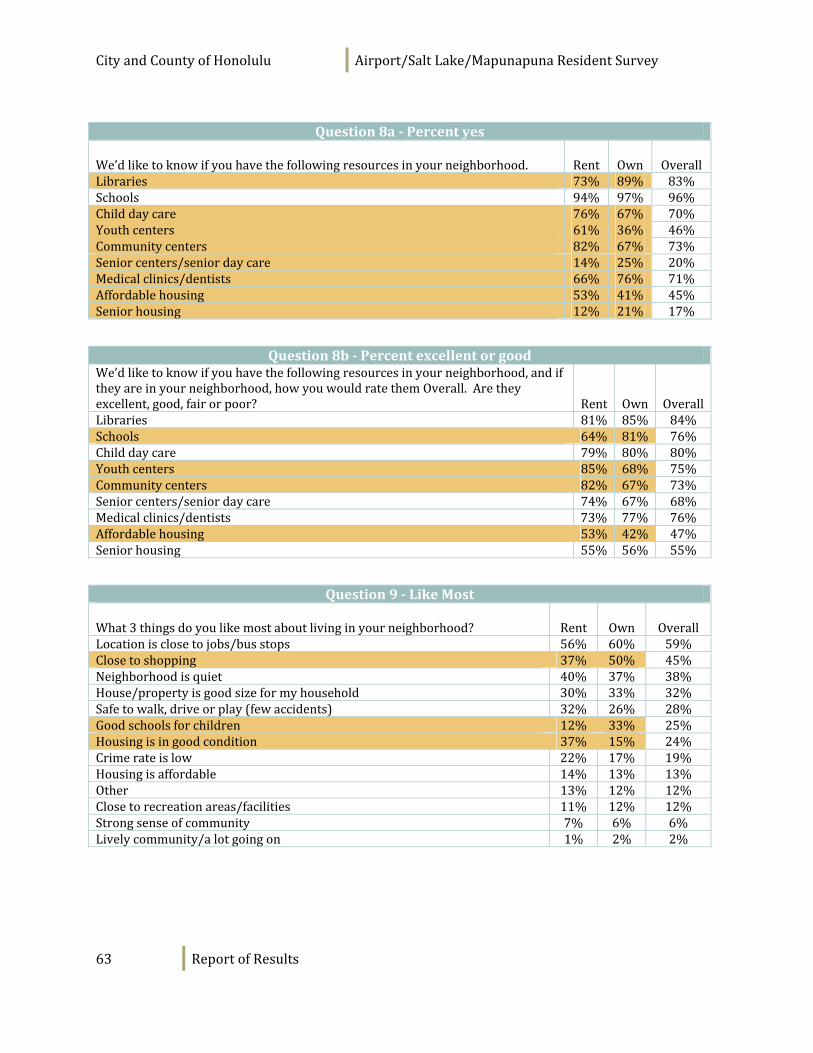
Question8a‐Percentyes
We’dliketoknowifyouhavethefollowingresourcesinyourneighborhood. Rent Own OverallLibraries 73% 89% 83%Schools 94% 97% 96%Childdaycare 76% 67% 70%Youthcenters 61% 36% 46%Communitycenters 82% 67% 73%Seniorcenters/seniordaycare 14% 25% 20%Medicalclinics/dentists 66% 76% 71%Affordablehousing 53% 41% 45%Seniorhousing 12% 21% 17%
Question8b‐Percentexcellentorgood
We’dliketoknowifyouhavethefollowingresourcesinyourneighborhood,andiftheyareinyourneighborhood,howyouwouldratethemOverall.Aretheyexcellent,good,fairorpoor? Rent Own OverallLibraries 81% 85% 84%Schools 64% 81% 76%Childdaycare 79% 80% 80%Youthcenters 85% 68% 75%Communitycenters 82% 67% 73%Seniorcenters/seniordaycare 74% 67% 68%Medicalclinics/dentists 73% 77% 76%Affordablehousing 53% 42% 47%Seniorhousing 55% 56% 55%
Question9‐LikeMost
What3thingsdoyoulikemostaboutlivinginyourneighborhood? Rent Own OverallLocationisclosetojobs/busstops 56% 60% 59%Closetoshopping 37% 50% 45%Neighborhoodisquiet 40% 37% 38%House/propertyisgoodsizeformyhousehold 30% 33% 32%Safetowalk,driveorplay(fewaccidents) 32% 26% 28%Goodschoolsforchildren 12% 33% 25%Housingisingoodcondition 37% 15% 24%Crimerateislow 22% 17% 19%Housingisaffordable 14% 13% 13%Other 13% 12% 12%Closetorecreationareas/facilities 11% 12% 12%Strongsenseofcommunity 7% 6% 6%Livelycommunity/alotgoingon 1% 2% 2%
CityandCountyofHonolulu Airport/SaltLake/MapunapunaResidentSurvey
64 ReportofResults
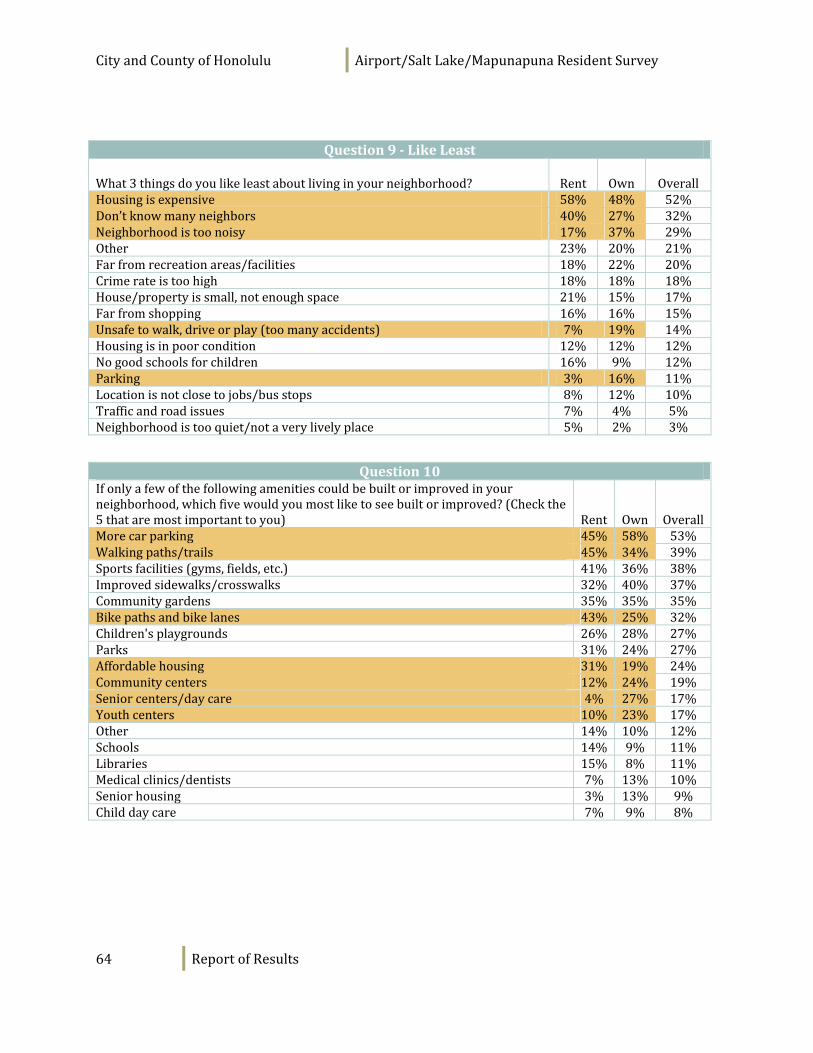
Question9‐LikeLeast
What3thingsdoyoulikeleastaboutlivinginyourneighborhood? Rent Own OverallHousingisexpensive 58% 48% 52%Don’tknowmanyneighbors 40% 27% 32%Neighborhoodistoonoisy 17% 37% 29%Other 23% 20% 21%Farfromrecreationareas/facilities 18% 22% 20%Crimerateistoohigh 18% 18% 18%House/propertyissmall,notenoughspace 21% 15% 17%Farfromshopping 16% 16% 15%Unsafetowalk,driveorplay(toomanyaccidents) 7% 19% 14%Housingisinpoorcondition 12% 12% 12%Nogoodschoolsforchildren 16% 9% 12%Parking 3% 16% 11%Locationisnotclosetojobs/busstops 8% 12% 10%Trafficandroadissues 7% 4% 5%Neighborhoodistooquiet/notaverylivelyplace 5% 2% 3%
Question10
Ifonlyafewofthefollowingamenitiescouldbebuiltorimprovedinyourneighborhood,whichfivewouldyoumostliketoseebuiltorimproved?(Checkthe5thataremostimportanttoyou) Rent Own OverallMorecarparking 45% 58% 53%Walkingpaths/trails 45% 34% 39%Sportsfacilities(gyms,fields,etc.) 41% 36% 38%Improvedsidewalks/crosswalks 32% 40% 37%Communitygardens 35% 35% 35%Bikepathsandbikelanes 43% 25% 32%Children'splaygrounds 26% 28% 27%Parks 31% 24% 27%Affordablehousing 31% 19% 24%Communitycenters 12% 24% 19%Seniorcenters/daycare 4% 27% 17%Youthcenters 10% 23% 17%Other 14% 10% 12%Schools 14% 9% 11%Libraries 15% 8% 11%Medicalclinics/dentists 7% 13% 10%Seniorhousing 3% 13% 9%Childdaycare 7% 9% 8%
CityandCountyofHonolulu Airport/SaltLake/MapunapunaResidentSurvey
65 ReportofResults
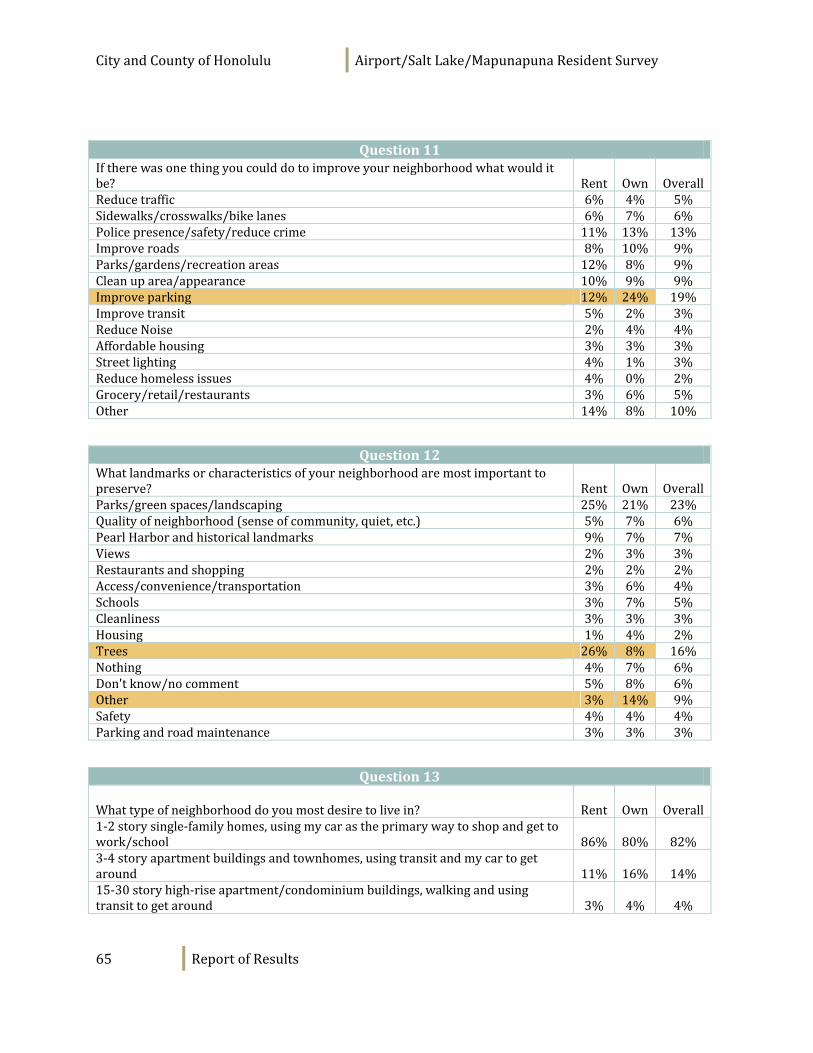
Question11
Iftherewasonethingyoucoulddotoimproveyourneighborhoodwhatwoulditbe? Rent Own OverallReducetraffic 6% 4% 5%Sidewalks/crosswalks/bikelanes 6% 7% 6%Policepresence/safety/reducecrime 11% 13% 13%Improveroads 8% 10% 9%Parks/gardens/recreationareas 12% 8% 9%Cleanuparea/appearance 10% 9% 9%Improveparking 12% 24% 19%Improvetransit 5% 2% 3%ReduceNoise 2% 4% 4%Affordablehousing 3% 3% 3%Streetlighting 4% 1% 3%Reducehomelessissues 4% 0% 2%Grocery/retail/restaurants 3% 6% 5%Other 14% 8% 10%
Question12
Whatlandmarksorcharacteristicsofyourneighborhoodaremostimportanttopreserve? Rent Own OverallParks/greenspaces/landscaping 25% 21% 23%Qualityofneighborhood(senseofcommunity,quiet,etc.) 5% 7% 6%PearlHarborandhistoricallandmarks 9% 7% 7%Views 2% 3% 3%Restaurantsandshopping 2% 2% 2%Access/convenience/transportation 3% 6% 4%Schools 3% 7% 5%Cleanliness 3% 3% 3%Housing 1% 4% 2%Trees 26% 8% 16%Nothing 4% 7% 6%Don'tknow/nocomment 5% 8% 6%Other 3% 14% 9%Safety 4% 4% 4%Parkingandroadmaintenance 3% 3% 3%
Question13
Whattypeofneighborhooddoyoumostdesiretolivein? Rent Own Overall1‐2storysingle‐familyhomes,usingmycarastheprimarywaytoshopandgettowork/school 86% 80% 82%3‐4storyapartmentbuildingsandtownhomes,usingtransitandmycartogetaround 11% 16% 14%15‐30storyhigh‐riseapartment/condominiumbuildings,walkingandusingtransittogetaround 3% 4% 4%
CityandCountyofHonolulu Airport/SaltLake/MapunapunaResidentSurvey
66 ReportofResults
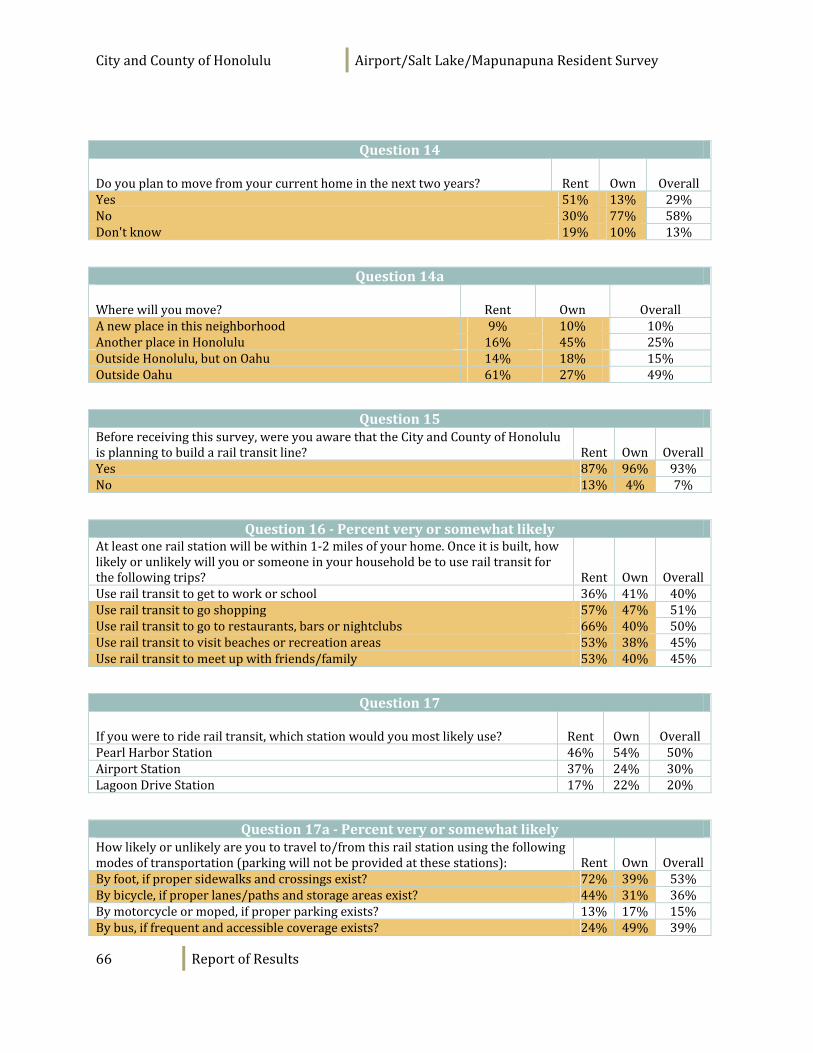
Question14
Doyouplantomovefromyourcurrenthomeinthenexttwoyears? Rent Own OverallYes 51% 13% 29%No 30% 77% 58%Don'tknow 19% 10% 13%
Question14a
Wherewillyoumove? Rent Own OverallAnewplaceinthisneighborhood 9% 10% 10%AnotherplaceinHonolulu 16% 45% 25%OutsideHonolulu,butonOahu 14% 18% 15%OutsideOahu 61% 27% 49%
Question15
Beforereceivingthissurvey,wereyouawarethattheCityandCountyofHonoluluisplanningtobuildarailtransitline? Rent Own OverallYes 87% 96% 93%No 13% 4% 7%
Question16‐Percentveryorsomewhatlikely
Atleastonerailstationwillbewithin1‐2milesofyourhome.Onceitisbuilt,howlikelyorunlikelywillyouorsomeoneinyourhouseholdbetouserailtransitforthefollowingtrips? Rent Own OverallUserailtransittogettoworkorschool 36% 41% 40%Userailtransittogoshopping 57% 47% 51%Userailtransittogotorestaurants,barsornightclubs 66% 40% 50%Userailtransittovisitbeachesorrecreationareas 53% 38% 45%Userailtransittomeetupwithfriends/family 53% 40% 45%
Question17
Ifyouweretoriderailtransit,whichstationwouldyoumostlikelyuse? Rent Own OverallPearlHarborStation 46% 54% 50%AirportStation 37% 24% 30%LagoonDriveStation 17% 22% 20%
Question17a‐Percentveryorsomewhatlikely
Howlikelyorunlikelyareyoutotravelto/fromthisrailstationusingthefollowingmodesoftransportation(parkingwillnotbeprovidedatthesestations): Rent Own OverallByfoot,ifpropersidewalksandcrossingsexist? 72% 39% 53%Bybicycle,ifproperlanes/pathsandstorageareasexist? 44% 31% 36%Bymotorcycleormoped,ifproperparkingexists? 13% 17% 15%Bybus,iffrequentandaccessiblecoverageexists? 24% 49% 39%
CityandCountyofHonolulu Airport/SaltLake/MapunapunaResidentSurvey
67 ReportofResults
Question17a‐PercentveryorsomewhatlikelyByautomobile,ifadrop‐offareaisavailable? 64% 66% 65%
Question18‐Percentstronglyorsomewhatsupport
Whentherailsystemisbuilttheremaybeopportunitiestobuildnewamenitiesaroundtherailstations.Howstronglywouldyousupportoropposebuildingeachofthefollowingnearyourclosestplannedrailstation(s)? Rent Own OverallBicycleparking 96% 91% 93%Plazasorsmallparks 85% 80% 82%Busshelters 87% 88% 88%Placestosit 95% 93% 94%Improvedlandscaping 95% 94% 94%Restrooms 91% 95% 93%Coffeeshopsandrestaurants 88% 86% 87%Conveniencestores(i.e.7‐11) 75% 88% 83%Services,likehairsalonsordrycleaners 58% 61% 60%Shoppingcenters 65% 70% 68%Grocerystores 65% 73% 70%Drugstores(pharmacies) 65% 76% 71%Affordable/subsidizedhousing 50% 49% 50%Regular/marketratehousing 60% 63% 62%Other 84% 67% 74%
Question19‐Percentstronglyorsomewhatsupport
Howstronglywouldyousupportoropposethefollowingtypesofnewdevelopmentnearyourclosestplannedrailstation(s)? Rent Own OverallResidentialtowers 30% 41% 36%Residential–mid‐rise 38% 49% 44%Parks 87% 85% 86%Retailstores/services 73% 75% 73%Hotels 31% 34% 33%Officetowers 27% 39% 34%Office–low‐rise 39% 51% 46%Parkingstructures 76% 83% 80%
Question20‐Percentstronglyorsomewhatsupport
Howstronglywouldyousupportoropposethefollowingimprovementsformajorstreetsnearyourclosestplannedrailstation(s)? Rent Own OverallExpandingbusservice 84% 92% 89%Establishingbikelanes 93% 90% 90%Improvingsidewalks 97% 95% 96%Addingstreetlighting 96% 95% 95%Plantingtrees 95% 92% 93%Addingcrosswalks 95% 95% 95%Addingonstreetparking 73% 82% 78%Addingplacestosit. 93% 92% 92%Addingtrashbins 96% 94% 95%
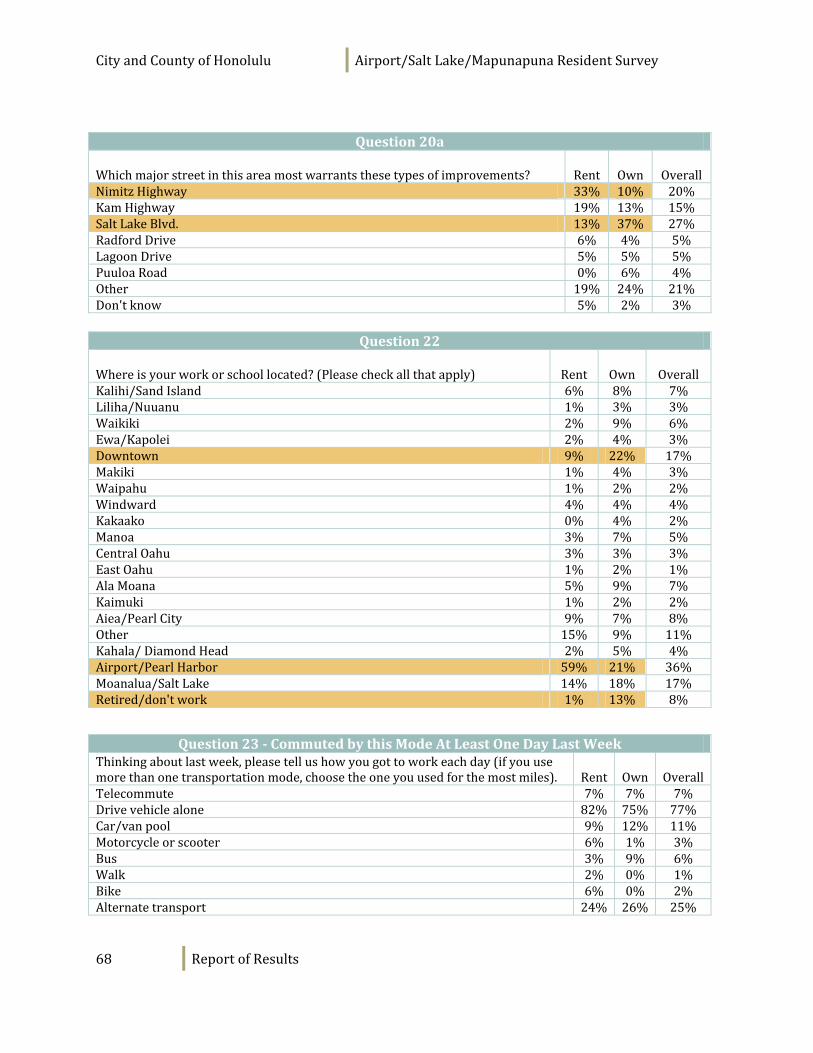
CityandCountyofHonolulu Airport/SaltLake/MapunapunaResidentSurvey
68 ReportofResults
Question20a
Whichmajorstreetinthisareamostwarrantsthesetypesofimprovements? Rent Own OverallNimitzHighway 33% 10% 20%KamHighway 19% 13% 15%SaltLakeBlvd. 13% 37% 27%RadfordDrive 6% 4% 5%LagoonDrive 5% 5% 5%PuuloaRoad 0% 6% 4%Other 19% 24% 21%Don'tknow 5% 2% 3%
Question22
Whereisyourworkorschoollocated?(Pleasecheckallthatapply) Rent Own OverallKalihi/SandIsland 6% 8% 7%Liliha/Nuuanu 1% 3% 3%Waikiki 2% 9% 6%Ewa/Kapolei 2% 4% 3%Downtown 9% 22% 17%Makiki 1% 4% 3%Waipahu 1% 2% 2%Windward 4% 4% 4%Kakaako 0% 4% 2%Manoa 3% 7% 5%CentralOahu 3% 3% 3%EastOahu 1% 2% 1%AlaMoana 5% 9% 7%Kaimuki 1% 2% 2%Aiea/PearlCity 9% 7% 8%Other 15% 9% 11%Kahala/DiamondHead 2% 5% 4%Airport/PearlHarbor 59% 21% 36%Moanalua/SaltLake 14% 18% 17%Retired/don'twork 1% 13% 8%
Question23‐CommutedbythisModeAtLeastOneDayLastWeek
Thinkingaboutlastweek,pleasetellushowyougottoworkeachday(ifyouusemorethanonetransportationmode,choosetheoneyouusedforthemostmiles). Rent Own OverallTelecommute 7% 7% 7%Drivevehiclealone 82% 75% 77%Car/vanpool 9% 12% 11%Motorcycleorscooter 6% 1% 3%Bus 3% 9% 6%Walk 2% 0% 1%Bike 6% 0% 2%Alternatetransport 24% 26% 25%
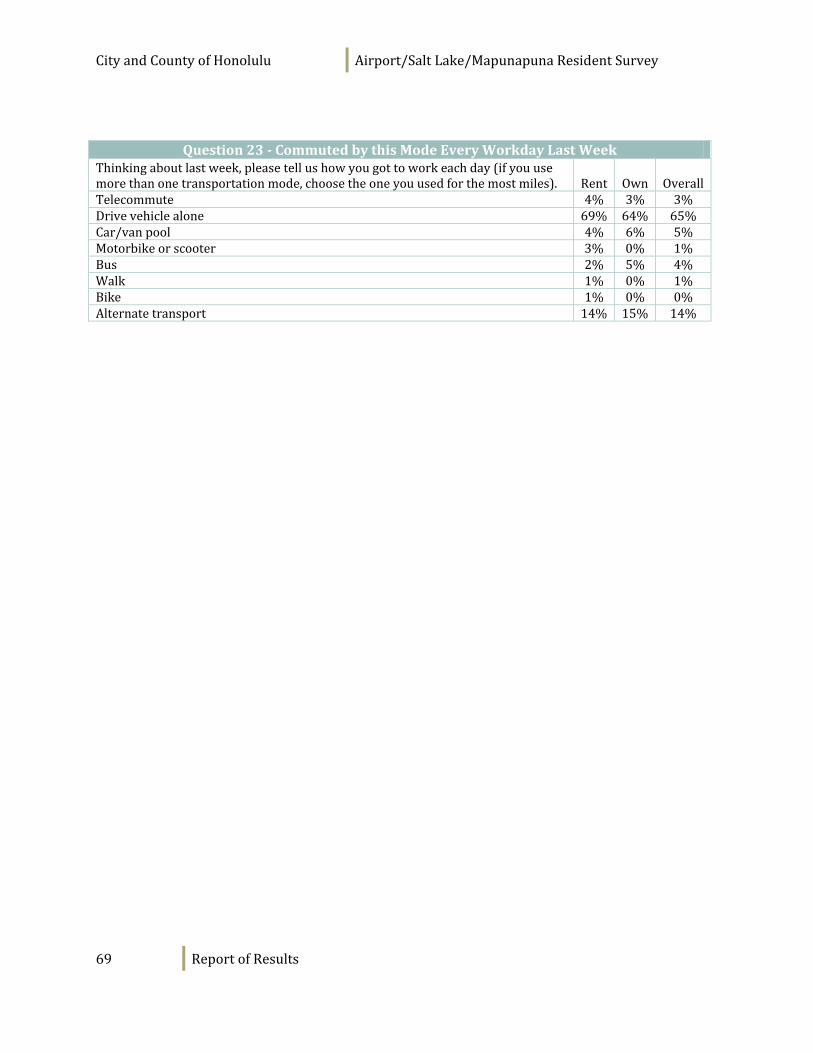
CityandCountyofHonolulu Airport/SaltLake/MapunapunaResidentSurvey
69 ReportofResults
Question23‐CommutedbythisModeEveryWorkdayLastWeek
Thinkingaboutlastweek,pleasetellushowyougottoworkeachday(ifyouusemorethanonetransportationmode,choosetheoneyouusedforthemostmiles). Rent Own OverallTelecommute 4% 3% 3%Drivevehiclealone 69% 64% 65%Car/vanpool 4% 6% 5%Motorbikeorscooter 3% 0% 1%Bus 2% 5% 4%Walk 1% 0% 1%Bike 1% 0% 0%Alternatetransport 14% 15% 14%
CityandCountyofHonolulu Airport/SaltLake/MapunapunaResidentSurvey
70 ReportofResults
Appendix C: Survey Results by Gender
Whencomparingresultsbetweensubgroups,themarginoferror(orconfidenceinterval)variesbywhichgroupsarecomparedandhowmanyrespondentsareineachsubgroup.Ofallthesurveyrespondents,340weremenand359werewomen.Themarginoferrorforcomparisonbetweenthesetwogroupsis±7%.
Differencesinresponsesbetweenanytwogroupsmustbegreaterthanthemarginoferrorinordertobeconsideredastatisticallysignificantdifferenceatthe.95confidencelevel.Forexample,sincethemarginoferrorbetweenthetwogroupsis±7%,if54%ofwomenand60%ofmensaidtheyfeltsafeinthecity,thiswouldnotbestatisticallydifferent.Howeverif54%ofwomenand62%ofmensaidtheyfeltsafeinthecity,thiswouldbeconsideredstatisticallydifferent.Statisticallysignificantdifferencesareindicatedwithshading.
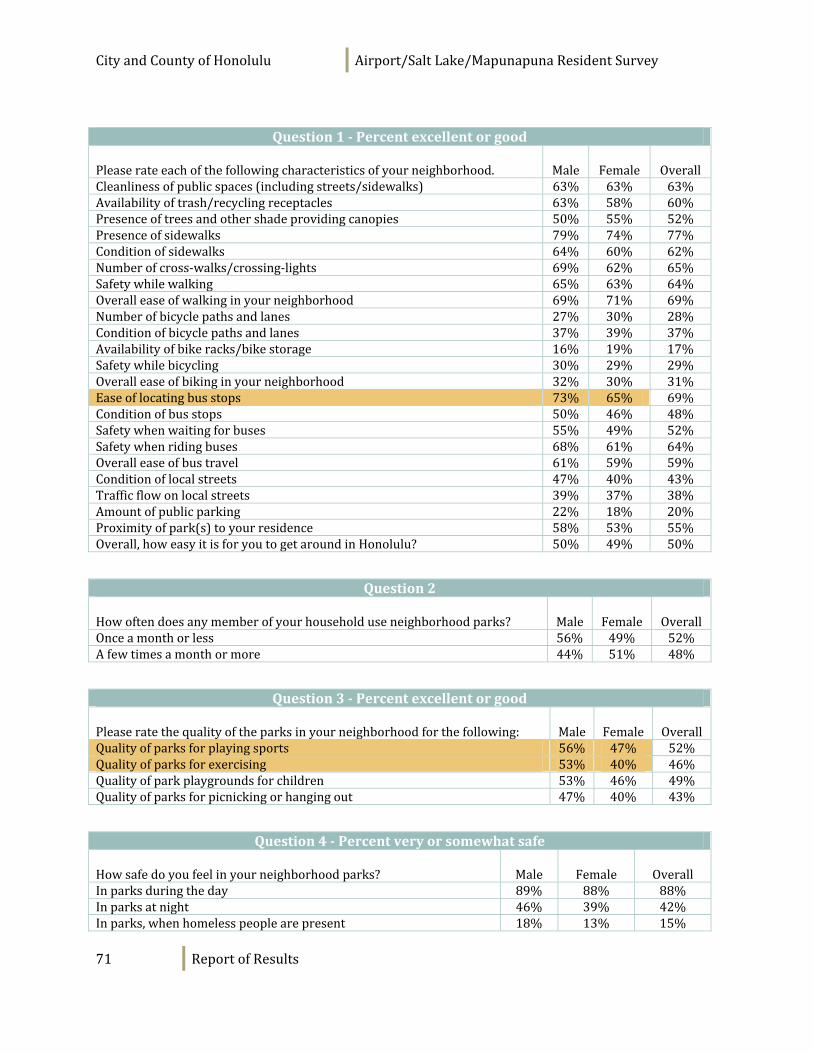
CityandCountyofHonolulu Airport/SaltLake/MapunapunaResidentSurvey
71 ReportofResults
Question1‐Percentexcellentorgood
Pleaserateeachofthefollowingcharacteristicsofyourneighborhood. Male Female OverallCleanlinessofpublicspaces(includingstreets/sidewalks) 63% 63% 63%Availabilityoftrash/recyclingreceptacles 63% 58% 60%Presenceoftreesandothershadeprovidingcanopies 50% 55% 52%Presenceofsidewalks 79% 74% 77%Conditionofsidewalks 64% 60% 62%Numberofcross‐walks/crossing‐lights 69% 62% 65%Safetywhilewalking 65% 63% 64%Overalleaseofwalkinginyourneighborhood 69% 71% 69%Numberofbicyclepathsandlanes 27% 30% 28%Conditionofbicyclepathsandlanes 37% 39% 37%Availabilityofbikeracks/bikestorage 16% 19% 17%Safetywhilebicycling 30% 29% 29%Overalleaseofbikinginyourneighborhood 32% 30% 31%Easeoflocatingbusstops 73% 65% 69%Conditionofbusstops 50% 46% 48%Safetywhenwaitingforbuses 55% 49% 52%Safetywhenridingbuses 68% 61% 64%Overalleaseofbustravel 61% 59% 59%Conditionoflocalstreets 47% 40% 43%Trafficflowonlocalstreets 39% 37% 38%Amountofpublicparking 22% 18% 20%Proximityofpark(s)toyourresidence 58% 53% 55%Overall,howeasyitisforyoutogetaroundinHonolulu? 50% 49% 50%
Question2
Howoftendoesanymemberofyourhouseholduseneighborhoodparks? Male Female OverallOnceamonthorless 56% 49% 52%Afewtimesamonthormore 44% 51% 48%
Question3‐Percentexcellentorgood
Pleaseratethequalityoftheparksinyourneighborhoodforthefollowing: Male Female OverallQualityofparksforplayingsports 56% 47% 52%Qualityofparksforexercising 53% 40% 46%Qualityofparkplaygroundsforchildren 53% 46% 49%Qualityofparksforpicnickingorhangingout 47% 40% 43%
Question4‐Percentveryorsomewhatsafe
Howsafedoyoufeelinyourneighborhoodparks? Male Female OverallInparksduringtheday 89% 88% 88%Inparksatnight 46% 39% 42%Inparks,whenhomelesspeoplearepresent 18% 13% 15%
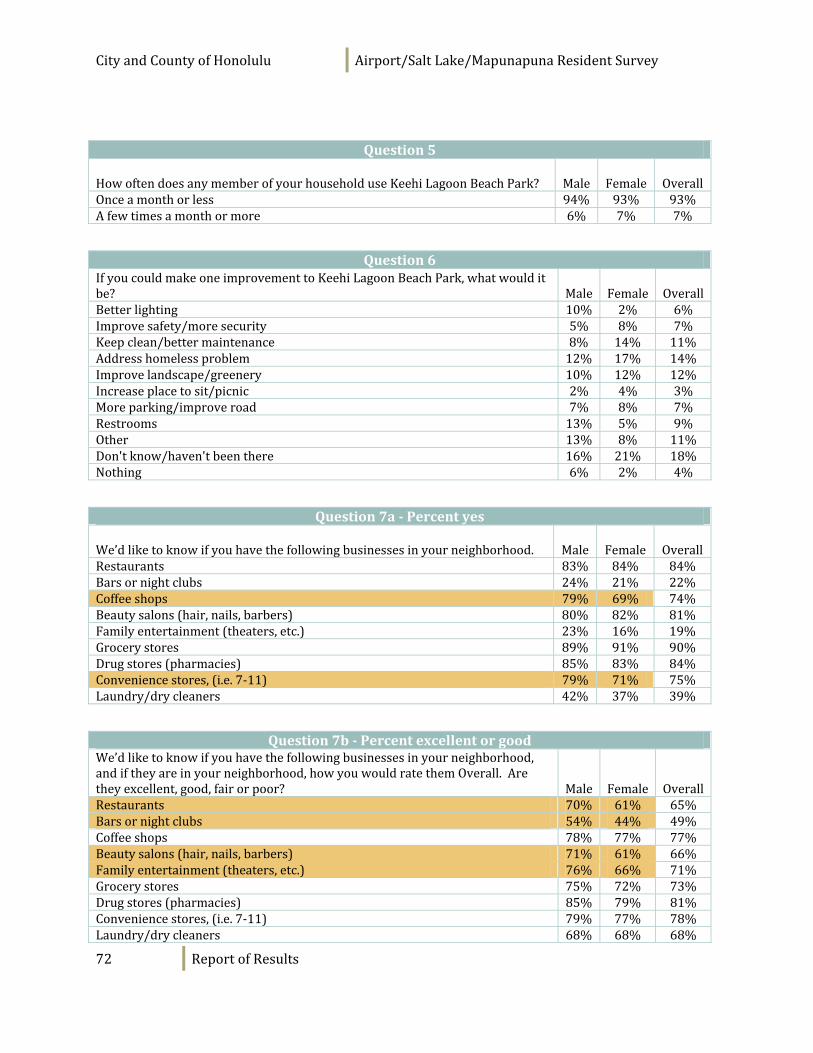
CityandCountyofHonolulu Airport/SaltLake/MapunapunaResidentSurvey
72 ReportofResults
Question5
HowoftendoesanymemberofyourhouseholduseKeehiLagoonBeachPark? Male Female OverallOnceamonthorless 94% 93% 93%Afewtimesamonthormore 6% 7% 7%
Question6
IfyoucouldmakeoneimprovementtoKeehiLagoonBeachPark,whatwoulditbe? Male Female OverallBetterlighting 10% 2% 6%Improvesafety/moresecurity 5% 8% 7%Keepclean/bettermaintenance 8% 14% 11%Addresshomelessproblem 12% 17% 14%Improvelandscape/greenery 10% 12% 12%Increaseplacetosit/picnic 2% 4% 3%Moreparking/improveroad 7% 8% 7%Restrooms 13% 5% 9%Other 13% 8% 11%Don'tknow/haven'tbeenthere 16% 21% 18%Nothing 6% 2% 4%
Question7a‐Percentyes
We’dliketoknowifyouhavethefollowingbusinessesinyourneighborhood. Male Female OverallRestaurants 83% 84% 84%Barsornightclubs 24% 21% 22%Coffeeshops 79% 69% 74%Beautysalons(hair,nails,barbers) 80% 82% 81%Familyentertainment(theaters,etc.) 23% 16% 19%Grocerystores 89% 91% 90%Drugstores(pharmacies) 85% 83% 84%Conveniencestores,(i.e.7‐11) 79% 71% 75%Laundry/drycleaners 42% 37% 39%
Question7b‐Percentexcellentorgood
We’dliketoknowifyouhavethefollowingbusinessesinyourneighborhood,andiftheyareinyourneighborhood,howyouwouldratethemOverall.Aretheyexcellent,good,fairorpoor? Male Female OverallRestaurants 70% 61% 65%Barsornightclubs 54% 44% 49%Coffeeshops 78% 77% 77%Beautysalons(hair,nails,barbers) 71% 61% 66%Familyentertainment(theaters,etc.) 76% 66% 71%Grocerystores 75% 72% 73%Drugstores(pharmacies) 85% 79% 81%Conveniencestores,(i.e.7‐11) 79% 77% 78%Laundry/drycleaners 68% 68% 68%
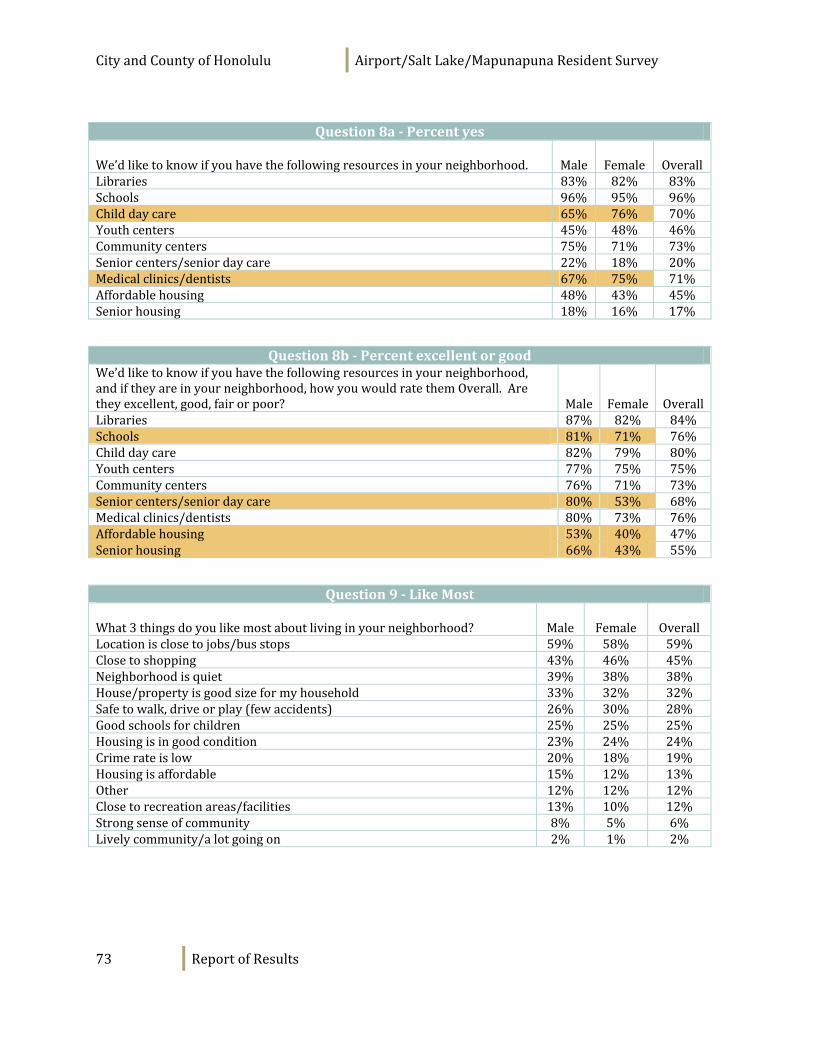
CityandCountyofHonolulu Airport/SaltLake/MapunapunaResidentSurvey
73 ReportofResults
Question8a‐Percentyes
We’dliketoknowifyouhavethefollowingresourcesinyourneighborhood. Male Female OverallLibraries 83% 82% 83%Schools 96% 95% 96%Childdaycare 65% 76% 70%Youthcenters 45% 48% 46%Communitycenters 75% 71% 73%Seniorcenters/seniordaycare 22% 18% 20%Medicalclinics/dentists 67% 75% 71%Affordablehousing 48% 43% 45%Seniorhousing 18% 16% 17%
Question8b‐Percentexcellentorgood
We’dliketoknowifyouhavethefollowingresourcesinyourneighborhood,andiftheyareinyourneighborhood,howyouwouldratethemOverall.Aretheyexcellent,good,fairorpoor? Male Female OverallLibraries 87% 82% 84%Schools 81% 71% 76%Childdaycare 82% 79% 80%Youthcenters 77% 75% 75%Communitycenters 76% 71% 73%Seniorcenters/seniordaycare 80% 53% 68%Medicalclinics/dentists 80% 73% 76%Affordablehousing 53% 40% 47%Seniorhousing 66% 43% 55%
Question9‐LikeMost
What3thingsdoyoulikemostaboutlivinginyourneighborhood? Male Female OverallLocationisclosetojobs/busstops 59% 58% 59%Closetoshopping 43% 46% 45%Neighborhoodisquiet 39% 38% 38%House/propertyisgoodsizeformyhousehold 33% 32% 32%Safetowalk,driveorplay(fewaccidents) 26% 30% 28%Goodschoolsforchildren 25% 25% 25%Housingisingoodcondition 23% 24% 24%Crimerateislow 20% 18% 19%Housingisaffordable 15% 12% 13%Other 12% 12% 12%Closetorecreationareas/facilities 13% 10% 12%Strongsenseofcommunity 8% 5% 6%Livelycommunity/alotgoingon 2% 1% 2%
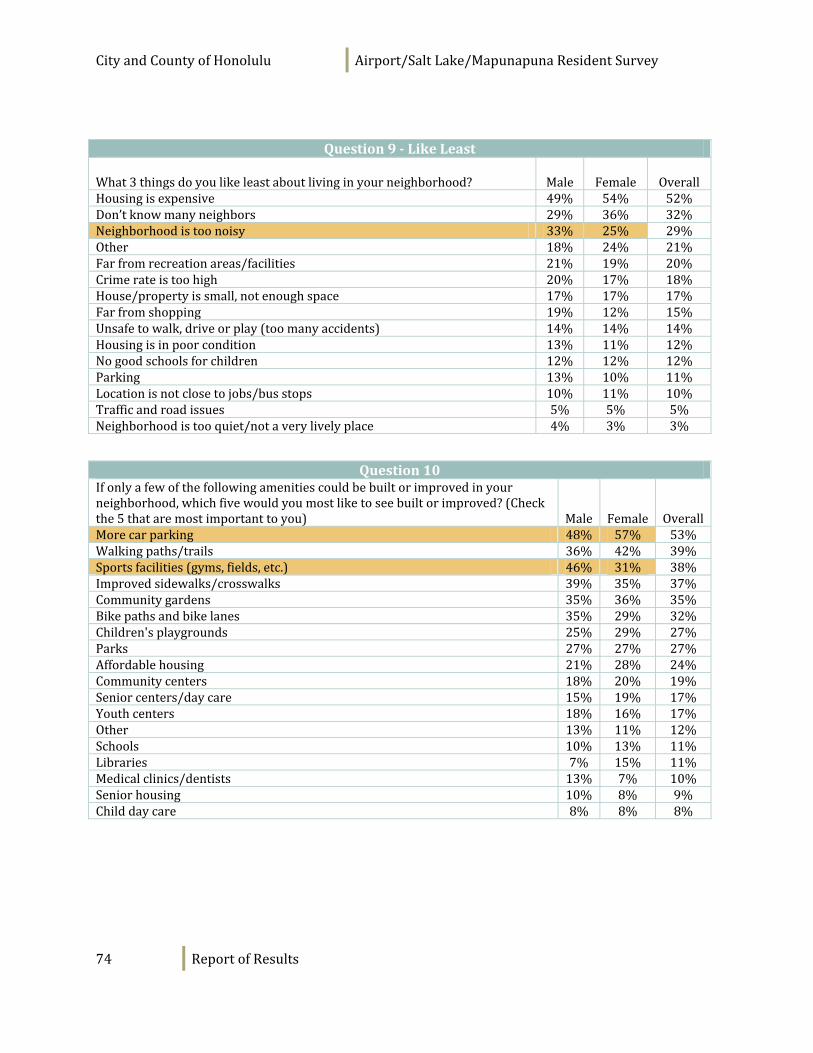
CityandCountyofHonolulu Airport/SaltLake/MapunapunaResidentSurvey
74 ReportofResults
Question9‐LikeLeast
What3thingsdoyoulikeleastaboutlivinginyourneighborhood? Male Female OverallHousingisexpensive 49% 54% 52%Don’tknowmanyneighbors 29% 36% 32%Neighborhoodistoonoisy 33% 25% 29%Other 18% 24% 21%Farfromrecreationareas/facilities 21% 19% 20%Crimerateistoohigh 20% 17% 18%House/propertyissmall,notenoughspace 17% 17% 17%Farfromshopping 19% 12% 15%Unsafetowalk,driveorplay(toomanyaccidents) 14% 14% 14%Housingisinpoorcondition 13% 11% 12%Nogoodschoolsforchildren 12% 12% 12%Parking 13% 10% 11%Locationisnotclosetojobs/busstops 10% 11% 10%Trafficandroadissues 5% 5% 5%Neighborhoodistooquiet/notaverylivelyplace 4% 3% 3%
Question10
Ifonlyafewofthefollowingamenitiescouldbebuiltorimprovedinyourneighborhood,whichfivewouldyoumostliketoseebuiltorimproved?(Checkthe5thataremostimportanttoyou) Male Female OverallMorecarparking 48% 57% 53%Walkingpaths/trails 36% 42% 39%Sportsfacilities(gyms,fields,etc.) 46% 31% 38%Improvedsidewalks/crosswalks 39% 35% 37%Communitygardens 35% 36% 35%Bikepathsandbikelanes 35% 29% 32%Children'splaygrounds 25% 29% 27%Parks 27% 27% 27%Affordablehousing 21% 28% 24%Communitycenters 18% 20% 19%Seniorcenters/daycare 15% 19% 17%Youthcenters 18% 16% 17%Other 13% 11% 12%Schools 10% 13% 11%Libraries 7% 15% 11%Medicalclinics/dentists 13% 7% 10%Seniorhousing 10% 8% 9%Childdaycare 8% 8% 8%
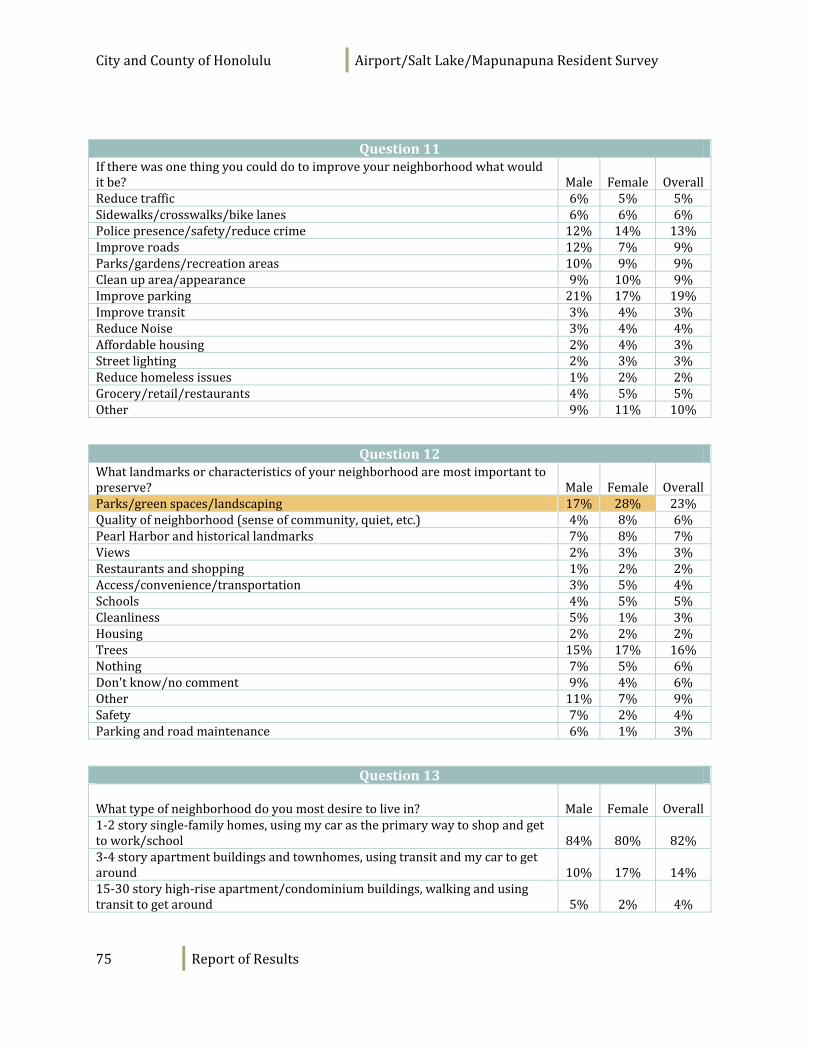
CityandCountyofHonolulu Airport/SaltLake/MapunapunaResidentSurvey
75 ReportofResults
Question11
Iftherewasonethingyoucoulddotoimproveyourneighborhoodwhatwoulditbe? Male Female OverallReducetraffic 6% 5% 5%Sidewalks/crosswalks/bikelanes 6% 6% 6%Policepresence/safety/reducecrime 12% 14% 13%Improveroads 12% 7% 9%Parks/gardens/recreationareas 10% 9% 9%Cleanuparea/appearance 9% 10% 9%Improveparking 21% 17% 19%Improvetransit 3% 4% 3%ReduceNoise 3% 4% 4%Affordablehousing 2% 4% 3%Streetlighting 2% 3% 3%Reducehomelessissues 1% 2% 2%Grocery/retail/restaurants 4% 5% 5%Other 9% 11% 10%
Question12
Whatlandmarksorcharacteristicsofyourneighborhoodaremostimportanttopreserve? Male Female OverallParks/greenspaces/landscaping 17% 28% 23%Qualityofneighborhood(senseofcommunity,quiet,etc.) 4% 8% 6%PearlHarborandhistoricallandmarks 7% 8% 7%Views 2% 3% 3%Restaurantsandshopping 1% 2% 2%Access/convenience/transportation 3% 5% 4%Schools 4% 5% 5%Cleanliness 5% 1% 3%Housing 2% 2% 2%Trees 15% 17% 16%Nothing 7% 5% 6%Don'tknow/nocomment 9% 4% 6%Other 11% 7% 9%Safety 7% 2% 4%Parkingandroadmaintenance 6% 1% 3%
Question13
Whattypeofneighborhooddoyoumostdesiretolivein? Male Female Overall1‐2storysingle‐familyhomes,usingmycarastheprimarywaytoshopandgettowork/school 84% 80% 82%3‐4storyapartmentbuildingsandtownhomes,usingtransitandmycartogetaround 10% 17% 14%15‐30storyhigh‐riseapartment/condominiumbuildings,walkingandusingtransittogetaround 5% 2% 4%
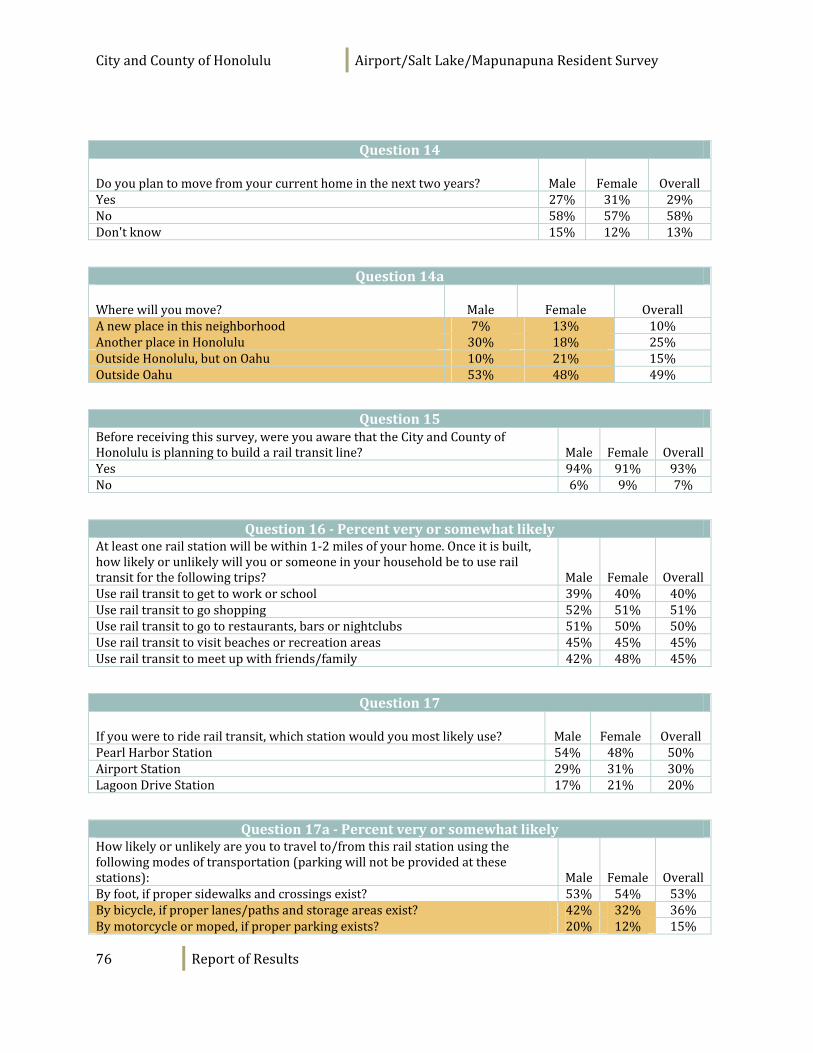
CityandCountyofHonolulu Airport/SaltLake/MapunapunaResidentSurvey
76 ReportofResults
Question14
Doyouplantomovefromyourcurrenthomeinthenexttwoyears? Male Female OverallYes 27% 31% 29%No 58% 57% 58%Don'tknow 15% 12% 13%
Question14a
Wherewillyoumove? Male Female OverallAnewplaceinthisneighborhood 7% 13% 10%AnotherplaceinHonolulu 30% 18% 25%OutsideHonolulu,butonOahu 10% 21% 15%OutsideOahu 53% 48% 49%
Question15
Beforereceivingthissurvey,wereyouawarethattheCityandCountyofHonoluluisplanningtobuildarailtransitline? Male Female OverallYes 94% 91% 93%No 6% 9% 7%
Question16‐Percentveryorsomewhatlikely
Atleastonerailstationwillbewithin1‐2milesofyourhome.Onceitisbuilt,howlikelyorunlikelywillyouorsomeoneinyourhouseholdbetouserailtransitforthefollowingtrips? Male Female OverallUserailtransittogettoworkorschool 39% 40% 40%Userailtransittogoshopping 52% 51% 51%Userailtransittogotorestaurants,barsornightclubs 51% 50% 50%Userailtransittovisitbeachesorrecreationareas 45% 45% 45%Userailtransittomeetupwithfriends/family 42% 48% 45%
Question17
Ifyouweretoriderailtransit,whichstationwouldyoumostlikelyuse? Male Female OverallPearlHarborStation 54% 48% 50%AirportStation 29% 31% 30%LagoonDriveStation 17% 21% 20%
Question17a‐Percentveryorsomewhatlikely
Howlikelyorunlikelyareyoutotravelto/fromthisrailstationusingthefollowingmodesoftransportation(parkingwillnotbeprovidedatthesestations): Male Female OverallByfoot,ifpropersidewalksandcrossingsexist? 53% 54% 53%Bybicycle,ifproperlanes/pathsandstorageareasexist? 42% 32% 36%Bymotorcycleormoped,ifproperparkingexists? 20% 12% 15%
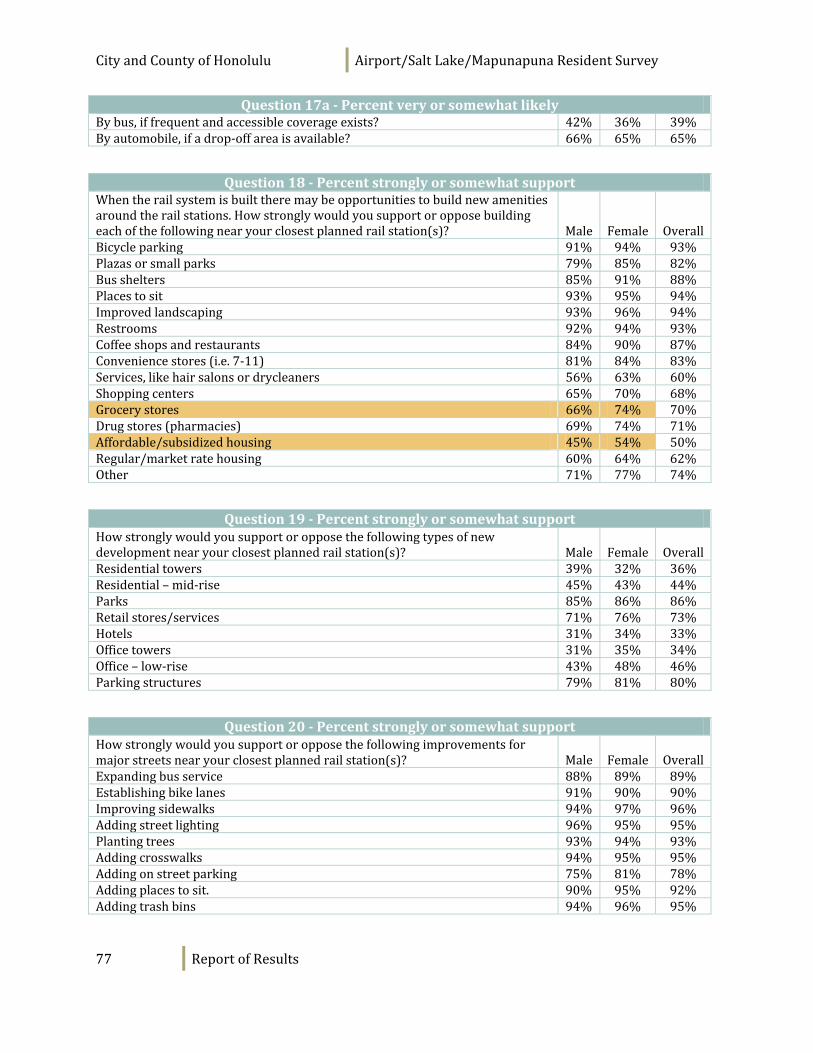
CityandCountyofHonolulu Airport/SaltLake/MapunapunaResidentSurvey
77 ReportofResults
Question17a‐PercentveryorsomewhatlikelyBybus,iffrequentandaccessiblecoverageexists? 42% 36% 39%Byautomobile,ifadrop‐offareaisavailable? 66% 65% 65%
Question18‐Percentstronglyorsomewhatsupport
Whentherailsystemisbuilttheremaybeopportunitiestobuildnewamenitiesaroundtherailstations.Howstronglywouldyousupportoropposebuildingeachofthefollowingnearyourclosestplannedrailstation(s)? Male Female OverallBicycleparking 91% 94% 93%Plazasorsmallparks 79% 85% 82%Busshelters 85% 91% 88%Placestosit 93% 95% 94%Improvedlandscaping 93% 96% 94%Restrooms 92% 94% 93%Coffeeshopsandrestaurants 84% 90% 87%Conveniencestores(i.e.7‐11) 81% 84% 83%Services,likehairsalonsordrycleaners 56% 63% 60%Shoppingcenters 65% 70% 68%Grocerystores 66% 74% 70%Drugstores(pharmacies) 69% 74% 71%Affordable/subsidizedhousing 45% 54% 50%Regular/marketratehousing 60% 64% 62%Other 71% 77% 74%
Question19‐Percentstronglyorsomewhatsupport
Howstronglywouldyousupportoropposethefollowingtypesofnewdevelopmentnearyourclosestplannedrailstation(s)? Male Female OverallResidentialtowers 39% 32% 36%Residential–mid‐rise 45% 43% 44%Parks 85% 86% 86%Retailstores/services 71% 76% 73%Hotels 31% 34% 33%Officetowers 31% 35% 34%Office–low‐rise 43% 48% 46%Parkingstructures 79% 81% 80%
Question20‐Percentstronglyorsomewhatsupport
Howstronglywouldyousupportoropposethefollowingimprovementsformajorstreetsnearyourclosestplannedrailstation(s)? Male Female OverallExpandingbusservice 88% 89% 89%Establishingbikelanes 91% 90% 90%Improvingsidewalks 94% 97% 96%Addingstreetlighting 96% 95% 95%Plantingtrees 93% 94% 93%Addingcrosswalks 94% 95% 95%Addingonstreetparking 75% 81% 78%Addingplacestosit. 90% 95% 92%Addingtrashbins 94% 96% 95%
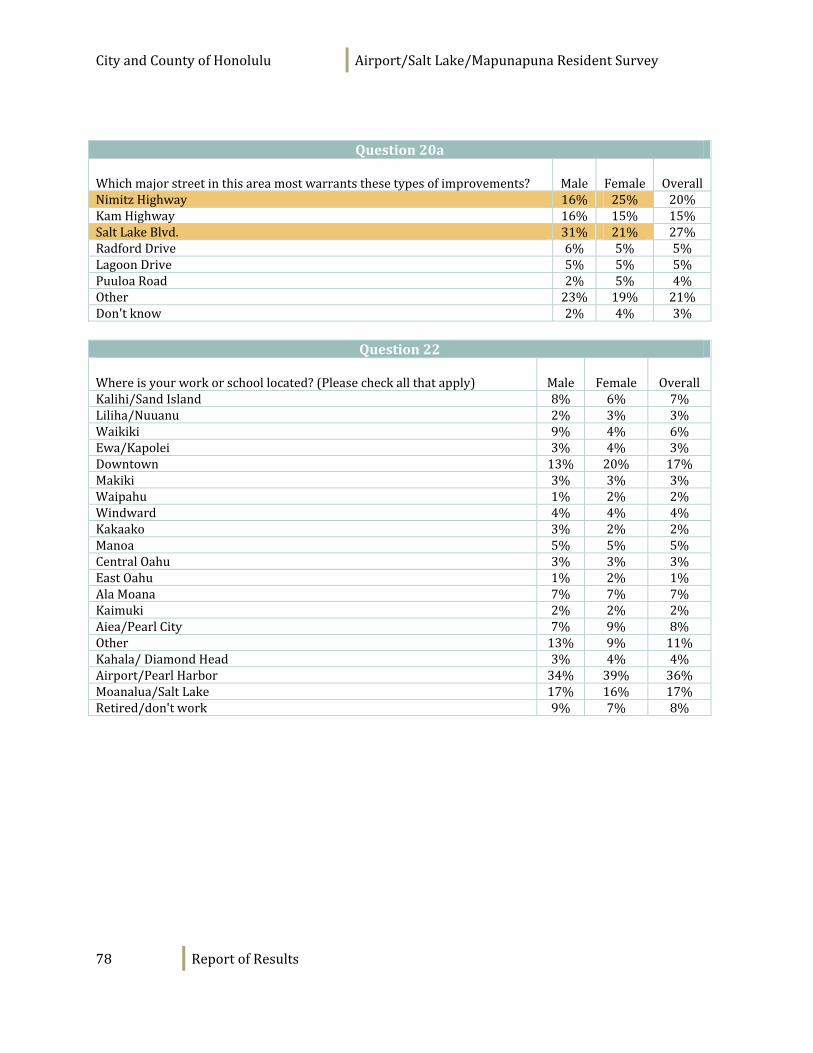
CityandCountyofHonolulu Airport/SaltLake/MapunapunaResidentSurvey
78 ReportofResults
Question20a
Whichmajorstreetinthisareamostwarrantsthesetypesofimprovements? Male Female OverallNimitzHighway 16% 25% 20%KamHighway 16% 15% 15%SaltLakeBlvd. 31% 21% 27%RadfordDrive 6% 5% 5%LagoonDrive 5% 5% 5%PuuloaRoad 2% 5% 4%Other 23% 19% 21%Don'tknow 2% 4% 3%
Question22
Whereisyourworkorschoollocated?(Pleasecheckallthatapply) Male Female OverallKalihi/SandIsland 8% 6% 7%Liliha/Nuuanu 2% 3% 3%Waikiki 9% 4% 6%Ewa/Kapolei 3% 4% 3%Downtown 13% 20% 17%Makiki 3% 3% 3%Waipahu 1% 2% 2%Windward 4% 4% 4%Kakaako 3% 2% 2%Manoa 5% 5% 5%CentralOahu 3% 3% 3%EastOahu 1% 2% 1%AlaMoana 7% 7% 7%Kaimuki 2% 2% 2%Aiea/PearlCity 7% 9% 8%Other 13% 9% 11%Kahala/DiamondHead 3% 4% 4%Airport/PearlHarbor 34% 39% 36%Moanalua/SaltLake 17% 16% 17%Retired/don'twork 9% 7% 8%
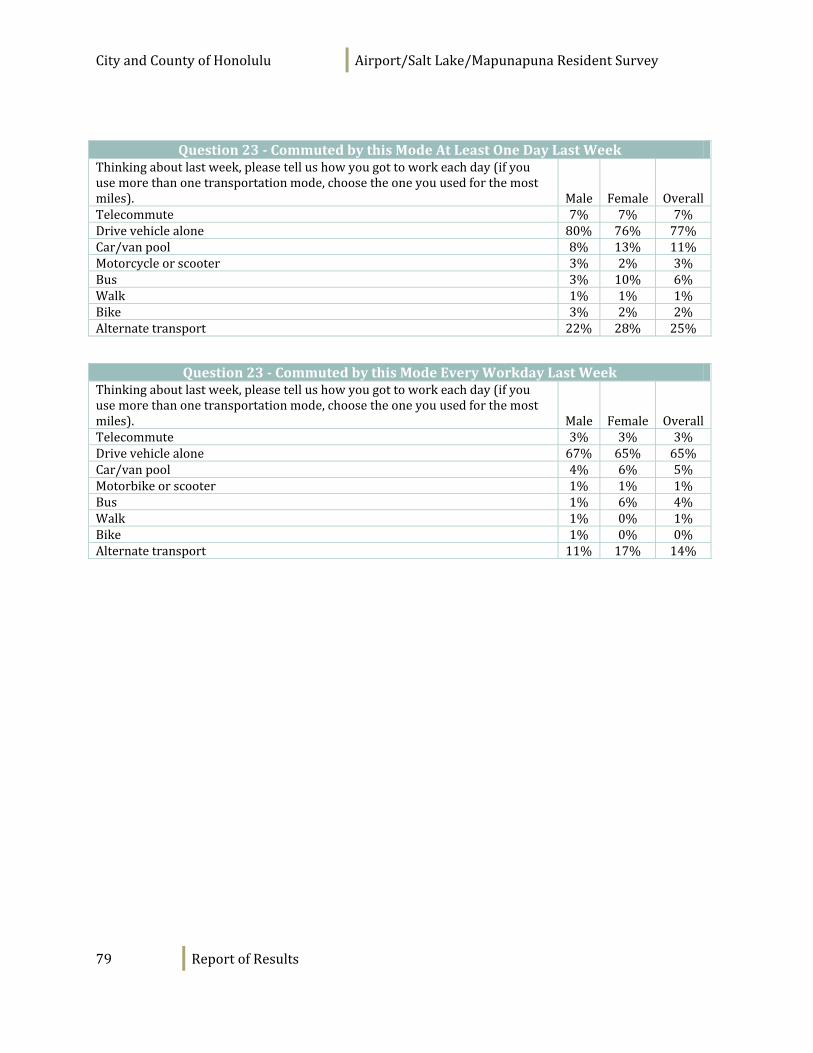
CityandCountyofHonolulu Airport/SaltLake/MapunapunaResidentSurvey
79 ReportofResults
Question23‐CommutedbythisModeAtLeastOneDayLastWeek
Thinkingaboutlastweek,pleasetellushowyougottoworkeachday(ifyouusemorethanonetransportationmode,choosetheoneyouusedforthemostmiles). Male Female OverallTelecommute 7% 7% 7%Drivevehiclealone 80% 76% 77%Car/vanpool 8% 13% 11%Motorcycleorscooter 3% 2% 3%Bus 3% 10% 6%Walk 1% 1% 1%Bike 3% 2% 2%Alternatetransport 22% 28% 25%
Question23‐CommutedbythisModeEveryWorkdayLastWeek
Thinkingaboutlastweek,pleasetellushowyougottoworkeachday(ifyouusemorethanonetransportationmode,choosetheoneyouusedforthemostmiles). Male Female OverallTelecommute 3% 3% 3%Drivevehiclealone 67% 65% 65%Car/vanpool 4% 6% 5%Motorbikeorscooter 1% 1% 1%Bus 1% 6% 4%Walk 1% 0% 1%Bike 1% 0% 0%Alternatetransport 11% 17% 14%
CityandCountyofHonolulu Airport/SaltLake/MapunapunaResidentSurvey
80 ReportofResults
Appendix D: Survey Results by Station
Whencomparingresultsbetweensubgroups,themarginoferror(orconfidenceinterval)variesbywhichgroupsarecomparedandhowmanyrespondentsareineachsubgroup.Ofallthesurveyrespondents,421livedclosesttotheplannedPearlHarborNavalBaserailstation,239livedclosesttotheplannedLagoonDriverailstationand58livedclosertotheplannedHonoluluInternationalAirportrailstation.TheHonoluluInternationalAirportandLagoonDriveareaswerecombinedforthepurposeofthiscomparison;297surveyrespondentslivedclosesttotheplannedAirport/LagoonDriverailstations.Themarginoferrorforcomparisonbetweenthesetwogroupsis±7%.
Differencesinresponsesbetweenanytwogroupsmustbegreaterthanthemarginoferrorinordertobeconsideredastatisticallysignificantdifferenceatthe.95confidencelevel.Forexample,sincethemarginoferrorbetweenthetwogroupsis±7%,if54%ofthoseclosesttotheplannedPearlHarborNavalBaserailstationand60%ofthoseclosesttotheplannedAirport/LagoonDrivestationssaidtheyfeltsafeinthecity,thiswouldnotbestatisticallydifferent.Howeverif54%ofthoseclosesttothePearlHarborNavalBasestationand62%ofthoseclosesttotheAirport/LagoonDrivestationssaidtheyfeltsafeinthecity,thiswouldbeconsideredstatisticallydifferent.Statisticallysignificantdifferencesareindicatedwithshading.
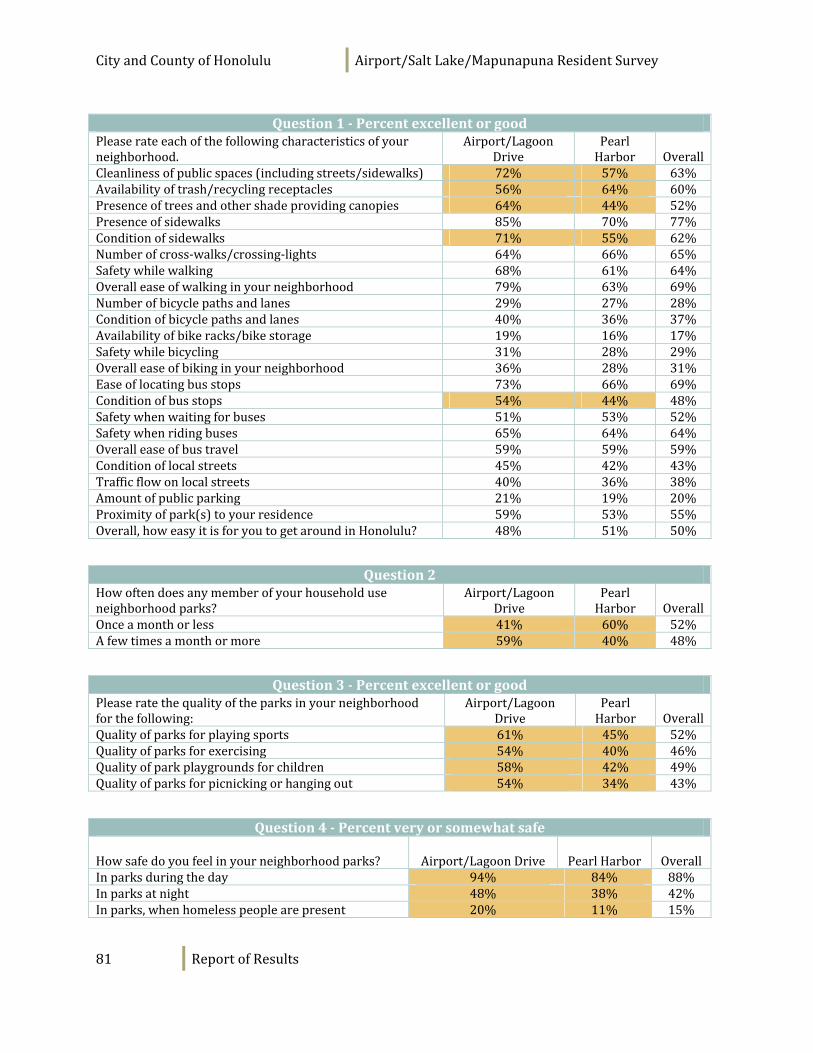
CityandCountyofHonolulu Airport/SaltLake/MapunapunaResidentSurvey
81 ReportofResults
Question1‐Percentexcellentorgood
Pleaserateeachofthefollowingcharacteristicsofyourneighborhood.
Airport/LagoonDrive
PearlHarbor Overall
Cleanlinessofpublicspaces(includingstreets/sidewalks) 72% 57% 63%Availabilityoftrash/recyclingreceptacles 56% 64% 60%Presenceoftreesandothershadeprovidingcanopies 64% 44% 52%Presenceofsidewalks 85% 70% 77%Conditionofsidewalks 71% 55% 62%Numberofcross‐walks/crossing‐lights 64% 66% 65%Safetywhilewalking 68% 61% 64%Overalleaseofwalkinginyourneighborhood 79% 63% 69%Numberofbicyclepathsandlanes 29% 27% 28%Conditionofbicyclepathsandlanes 40% 36% 37%Availabilityofbikeracks/bikestorage 19% 16% 17%Safetywhilebicycling 31% 28% 29%Overalleaseofbikinginyourneighborhood 36% 28% 31%Easeoflocatingbusstops 73% 66% 69%Conditionofbusstops 54% 44% 48%Safetywhenwaitingforbuses 51% 53% 52%Safetywhenridingbuses 65% 64% 64%Overalleaseofbustravel 59% 59% 59%Conditionoflocalstreets 45% 42% 43%Trafficflowonlocalstreets 40% 36% 38%Amountofpublicparking 21% 19% 20%Proximityofpark(s)toyourresidence 59% 53% 55%Overall,howeasyitisforyoutogetaroundinHonolulu? 48% 51% 50%
Question2
Howoftendoesanymemberofyourhouseholduseneighborhoodparks?
Airport/LagoonDrive
PearlHarbor Overall
Onceamonthorless 41% 60% 52%Afewtimesamonthormore 59% 40% 48%
Question3‐Percentexcellentorgood
Pleaseratethequalityoftheparksinyourneighborhoodforthefollowing:
Airport/LagoonDrive
PearlHarbor Overall
Qualityofparksforplayingsports 61% 45% 52%Qualityofparksforexercising 54% 40% 46%Qualityofparkplaygroundsforchildren 58% 42% 49%Qualityofparksforpicnickingorhangingout 54% 34% 43%
Question4‐Percentveryorsomewhatsafe
Howsafedoyoufeelinyourneighborhoodparks? Airport/LagoonDrive PearlHarbor OverallInparksduringtheday 94% 84% 88%Inparksatnight 48% 38% 42%Inparks,whenhomelesspeoplearepresent 20% 11% 15%
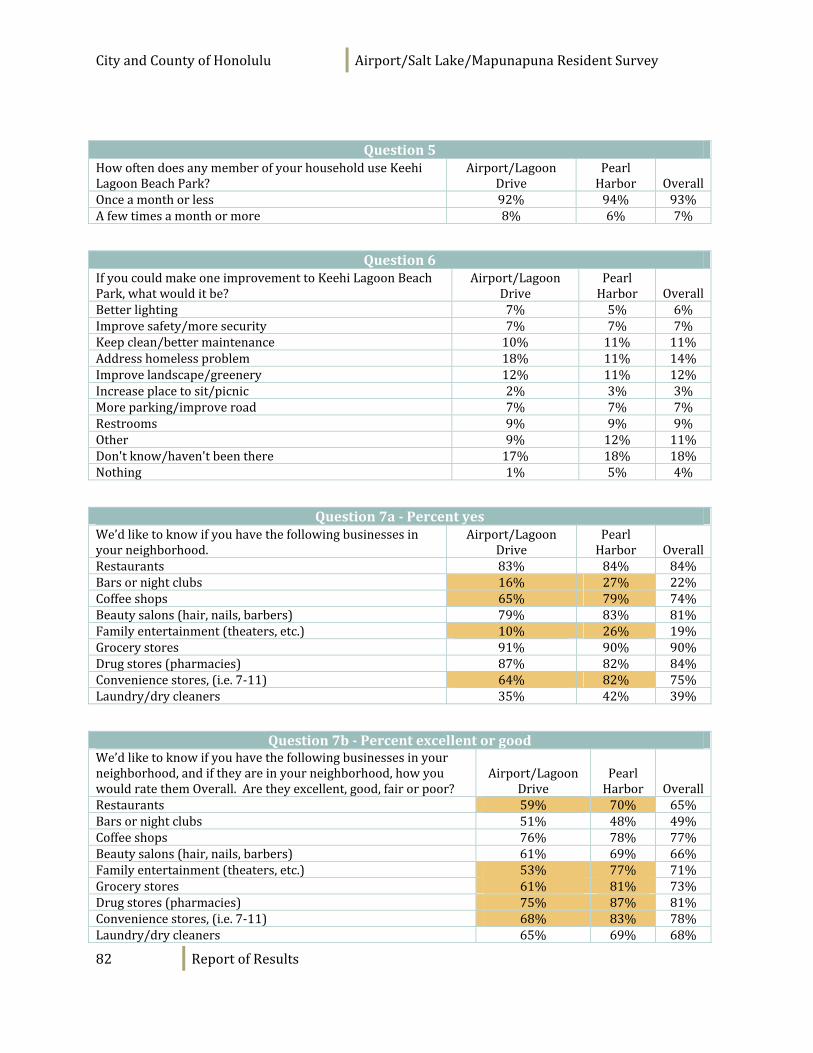
CityandCountyofHonolulu Airport/SaltLake/MapunapunaResidentSurvey
82 ReportofResults
Question5
HowoftendoesanymemberofyourhouseholduseKeehiLagoonBeachPark?
Airport/LagoonDrive
PearlHarbor Overall
Onceamonthorless 92% 94% 93%Afewtimesamonthormore 8% 6% 7%
Question6
IfyoucouldmakeoneimprovementtoKeehiLagoonBeachPark,whatwoulditbe?
Airport/LagoonDrive
PearlHarbor Overall
Betterlighting 7% 5% 6%Improvesafety/moresecurity 7% 7% 7%Keepclean/bettermaintenance 10% 11% 11%Addresshomelessproblem 18% 11% 14%Improvelandscape/greenery 12% 11% 12%Increaseplacetosit/picnic 2% 3% 3%Moreparking/improveroad 7% 7% 7%Restrooms 9% 9% 9%Other 9% 12% 11%Don'tknow/haven'tbeenthere 17% 18% 18%Nothing 1% 5% 4%
Question7a‐Percentyes
We’dliketoknowifyouhavethefollowingbusinessesinyourneighborhood.
Airport/LagoonDrive
PearlHarbor Overall
Restaurants 83% 84% 84%Barsornightclubs 16% 27% 22%Coffeeshops 65% 79% 74%Beautysalons(hair,nails,barbers) 79% 83% 81%Familyentertainment(theaters,etc.) 10% 26% 19%Grocerystores 91% 90% 90%Drugstores(pharmacies) 87% 82% 84%Conveniencestores,(i.e.7‐11) 64% 82% 75%Laundry/drycleaners 35% 42% 39%
Question7b‐Percentexcellentorgood
We’dliketoknowifyouhavethefollowingbusinessesinyourneighborhood,andiftheyareinyourneighborhood,howyouwouldratethemOverall.Aretheyexcellent,good,fairorpoor?
Airport/LagoonDrive
PearlHarbor Overall
Restaurants 59% 70% 65%Barsornightclubs 51% 48% 49%Coffeeshops 76% 78% 77%Beautysalons(hair,nails,barbers) 61% 69% 66%Familyentertainment(theaters,etc.) 53% 77% 71%Grocerystores 61% 81% 73%Drugstores(pharmacies) 75% 87% 81%Conveniencestores,(i.e.7‐11) 68% 83% 78%Laundry/drycleaners 65% 69% 68%
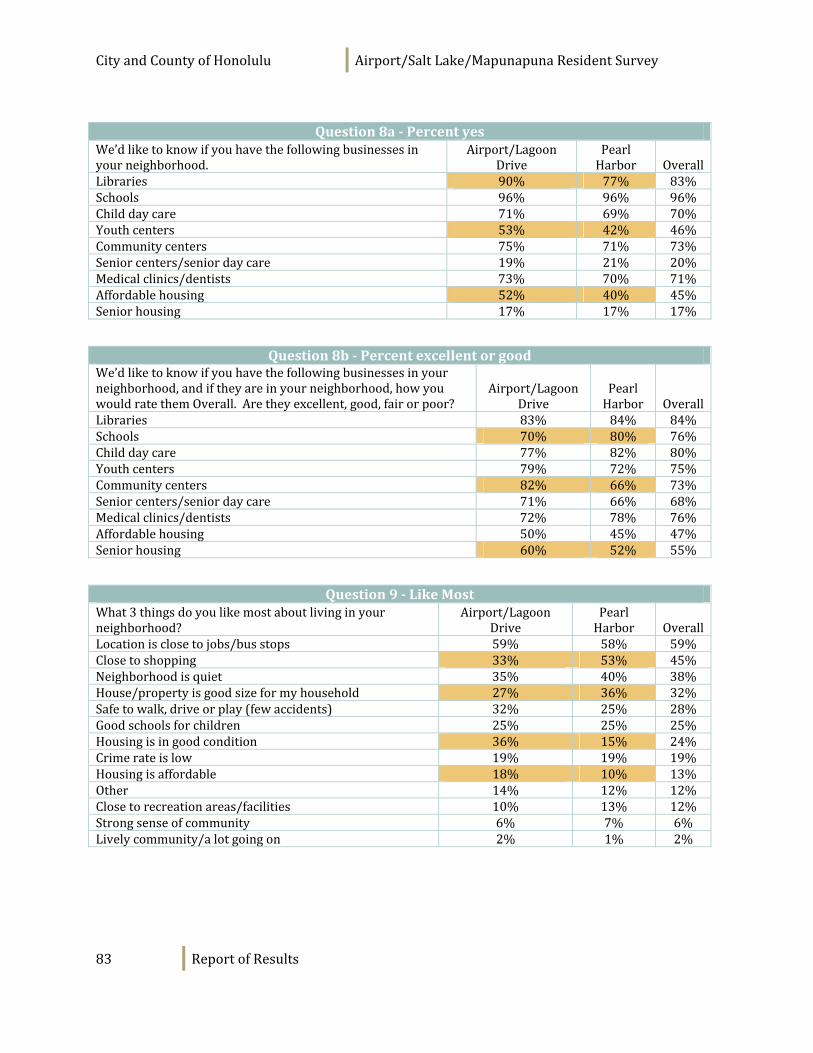
CityandCountyofHonolulu Airport/SaltLake/MapunapunaResidentSurvey
83 ReportofResults
Question8a‐Percentyes
We’dliketoknowifyouhavethefollowingbusinessesinyourneighborhood.
Airport/LagoonDrive
PearlHarbor Overall
Libraries 90% 77% 83%Schools 96% 96% 96%Childdaycare 71% 69% 70%Youthcenters 53% 42% 46%Communitycenters 75% 71% 73%Seniorcenters/seniordaycare 19% 21% 20%Medicalclinics/dentists 73% 70% 71%Affordablehousing 52% 40% 45%Seniorhousing 17% 17% 17%
Question8b‐Percentexcellentorgood
We’dliketoknowifyouhavethefollowingbusinessesinyourneighborhood,andiftheyareinyourneighborhood,howyouwouldratethemOverall.Aretheyexcellent,good,fairorpoor?
Airport/LagoonDrive
PearlHarbor Overall
Libraries 83% 84% 84%Schools 70% 80% 76%Childdaycare 77% 82% 80%Youthcenters 79% 72% 75%Communitycenters 82% 66% 73%Seniorcenters/seniordaycare 71% 66% 68%Medicalclinics/dentists 72% 78% 76%Affordablehousing 50% 45% 47%Seniorhousing 60% 52% 55%
Question9‐LikeMost
What3thingsdoyoulikemostaboutlivinginyourneighborhood?
Airport/LagoonDrive
PearlHarbor Overall
Locationisclosetojobs/busstops 59% 58% 59%Closetoshopping 33% 53% 45%Neighborhoodisquiet 35% 40% 38%House/propertyisgoodsizeformyhousehold 27% 36% 32%Safetowalk,driveorplay(fewaccidents) 32% 25% 28%Goodschoolsforchildren 25% 25% 25%Housingisingoodcondition 36% 15% 24%Crimerateislow 19% 19% 19%Housingisaffordable 18% 10% 13%Other 14% 12% 12%Closetorecreationareas/facilities 10% 13% 12%Strongsenseofcommunity 6% 7% 6%Livelycommunity/alotgoingon 2% 1% 2%
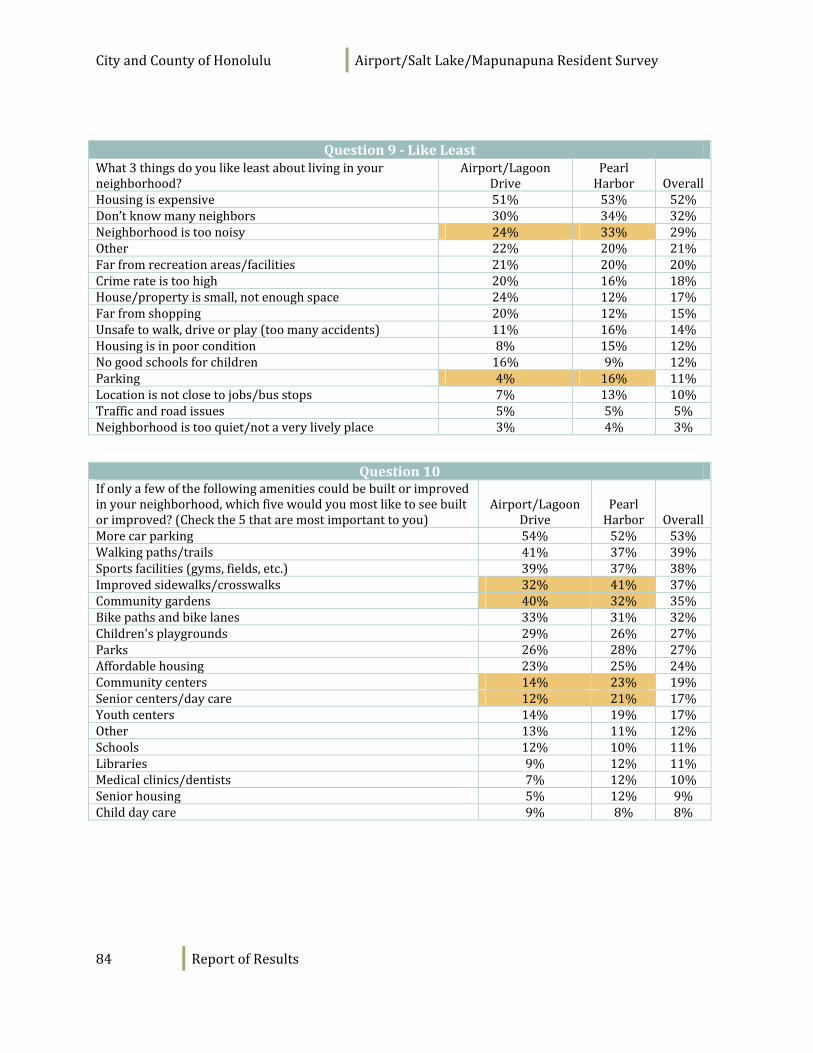
CityandCountyofHonolulu Airport/SaltLake/MapunapunaResidentSurvey
84 ReportofResults
Question9‐LikeLeast
What3thingsdoyoulikeleastaboutlivinginyourneighborhood?
Airport/LagoonDrive
PearlHarbor Overall
Housingisexpensive 51% 53% 52%Don’tknowmanyneighbors 30% 34% 32%Neighborhoodistoonoisy 24% 33% 29%Other 22% 20% 21%Farfromrecreationareas/facilities 21% 20% 20%Crimerateistoohigh 20% 16% 18%House/propertyissmall,notenoughspace 24% 12% 17%Farfromshopping 20% 12% 15%Unsafetowalk,driveorplay(toomanyaccidents) 11% 16% 14%Housingisinpoorcondition 8% 15% 12%Nogoodschoolsforchildren 16% 9% 12%Parking 4% 16% 11%Locationisnotclosetojobs/busstops 7% 13% 10%Trafficandroadissues 5% 5% 5%Neighborhoodistooquiet/notaverylivelyplace 3% 4% 3%
Question10
Ifonlyafewofthefollowingamenitiescouldbebuiltorimprovedinyourneighborhood,whichfivewouldyoumostliketoseebuiltorimproved?(Checkthe5thataremostimportanttoyou)
Airport/LagoonDrive
PearlHarbor Overall
Morecarparking 54% 52% 53%Walkingpaths/trails 41% 37% 39%Sportsfacilities(gyms,fields,etc.) 39% 37% 38%Improvedsidewalks/crosswalks 32% 41% 37%Communitygardens 40% 32% 35%Bikepathsandbikelanes 33% 31% 32%Children'splaygrounds 29% 26% 27%Parks 26% 28% 27%Affordablehousing 23% 25% 24%Communitycenters 14% 23% 19%Seniorcenters/daycare 12% 21% 17%Youthcenters 14% 19% 17%Other 13% 11% 12%Schools 12% 10% 11%Libraries 9% 12% 11%Medicalclinics/dentists 7% 12% 10%Seniorhousing 5% 12% 9%Childdaycare 9% 8% 8%
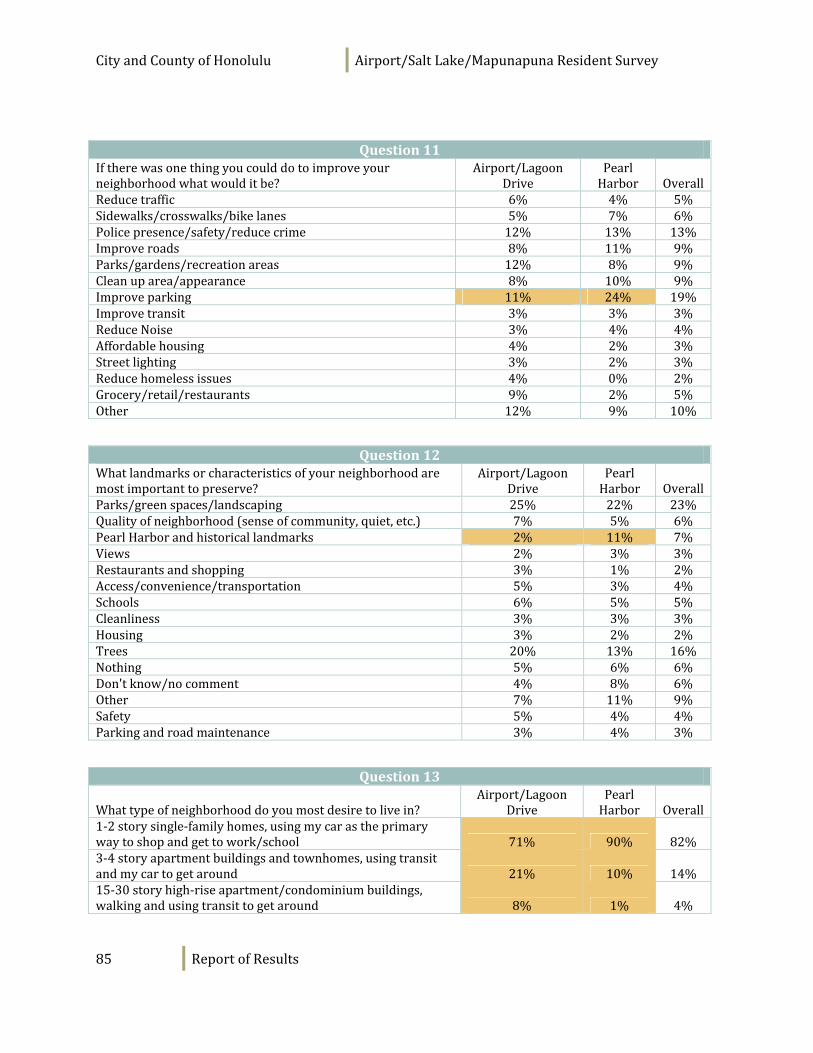
CityandCountyofHonolulu Airport/SaltLake/MapunapunaResidentSurvey
85 ReportofResults
Question11
Iftherewasonethingyoucoulddotoimproveyourneighborhoodwhatwoulditbe?
Airport/LagoonDrive
PearlHarbor Overall
Reducetraffic 6% 4% 5%Sidewalks/crosswalks/bikelanes 5% 7% 6%Policepresence/safety/reducecrime 12% 13% 13%Improveroads 8% 11% 9%Parks/gardens/recreationareas 12% 8% 9%Cleanuparea/appearance 8% 10% 9%Improveparking 11% 24% 19%Improvetransit 3% 3% 3%ReduceNoise 3% 4% 4%Affordablehousing 4% 2% 3%Streetlighting 3% 2% 3%Reducehomelessissues 4% 0% 2%Grocery/retail/restaurants 9% 2% 5%Other 12% 9% 10%
Question12
Whatlandmarksorcharacteristicsofyourneighborhoodaremostimportanttopreserve?
Airport/LagoonDrive
PearlHarbor Overall
Parks/greenspaces/landscaping 25% 22% 23%Qualityofneighborhood(senseofcommunity,quiet,etc.) 7% 5% 6%PearlHarborandhistoricallandmarks 2% 11% 7%Views 2% 3% 3%Restaurantsandshopping 3% 1% 2%Access/convenience/transportation 5% 3% 4%Schools 6% 5% 5%Cleanliness 3% 3% 3%Housing 3% 2% 2%Trees 20% 13% 16%Nothing 5% 6% 6%Don'tknow/nocomment 4% 8% 6%Other 7% 11% 9%Safety 5% 4% 4%Parkingandroadmaintenance 3% 4% 3%
Question13
Whattypeofneighborhooddoyoumostdesiretolivein?Airport/Lagoon
DrivePearlHarbor Overall
1‐2storysingle‐familyhomes,usingmycarastheprimarywaytoshopandgettowork/school 71% 90% 82%3‐4storyapartmentbuildingsandtownhomes,usingtransitandmycartogetaround 21% 10% 14%15‐30storyhigh‐riseapartment/condominiumbuildings,walkingandusingtransittogetaround 8% 1% 4%
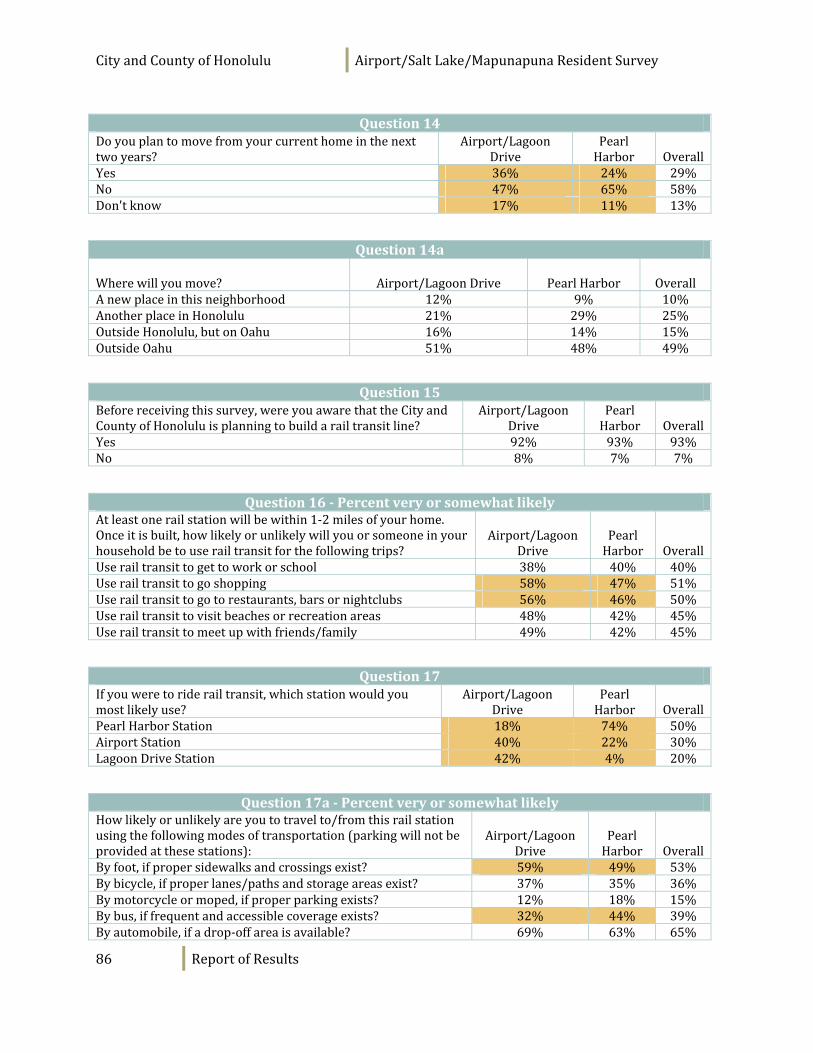
CityandCountyofHonolulu Airport/SaltLake/MapunapunaResidentSurvey
86 ReportofResults
Question14
Doyouplantomovefromyourcurrenthomeinthenexttwoyears?
Airport/LagoonDrive
PearlHarbor Overall
Yes 36% 24% 29%No 47% 65% 58%Don'tknow 17% 11% 13%
Question14a
Wherewillyoumove? Airport/LagoonDrive PearlHarbor OverallAnewplaceinthisneighborhood 12% 9% 10%AnotherplaceinHonolulu 21% 29% 25%OutsideHonolulu,butonOahu 16% 14% 15%OutsideOahu 51% 48% 49%
Question15
Beforereceivingthissurvey,wereyouawarethattheCityandCountyofHonoluluisplanningtobuildarailtransitline?
Airport/LagoonDrive
PearlHarbor Overall
Yes 92% 93% 93%No 8% 7% 7%
Question16‐Percentveryorsomewhatlikely
Atleastonerailstationwillbewithin1‐2milesofyourhome.Onceitisbuilt,howlikelyorunlikelywillyouorsomeoneinyourhouseholdbetouserailtransitforthefollowingtrips?
Airport/LagoonDrive
PearlHarbor Overall
Userailtransittogettoworkorschool 38% 40% 40%Userailtransittogoshopping 58% 47% 51%Userailtransittogotorestaurants,barsornightclubs 56% 46% 50%Userailtransittovisitbeachesorrecreationareas 48% 42% 45%Userailtransittomeetupwithfriends/family 49% 42% 45%
Question17
Ifyouweretoriderailtransit,whichstationwouldyoumostlikelyuse?
Airport/LagoonDrive
PearlHarbor Overall
PearlHarborStation 18% 74% 50%AirportStation 40% 22% 30%LagoonDriveStation 42% 4% 20%
Question17a‐Percentveryorsomewhatlikely
Howlikelyorunlikelyareyoutotravelto/fromthisrailstationusingthefollowingmodesoftransportation(parkingwillnotbeprovidedatthesestations):
Airport/LagoonDrive
PearlHarbor Overall
Byfoot,ifpropersidewalksandcrossingsexist? 59% 49% 53%Bybicycle,ifproperlanes/pathsandstorageareasexist? 37% 35% 36%Bymotorcycleormoped,ifproperparkingexists? 12% 18% 15%Bybus,iffrequentandaccessiblecoverageexists? 32% 44% 39%Byautomobile,ifadrop‐offareaisavailable? 69% 63% 65%
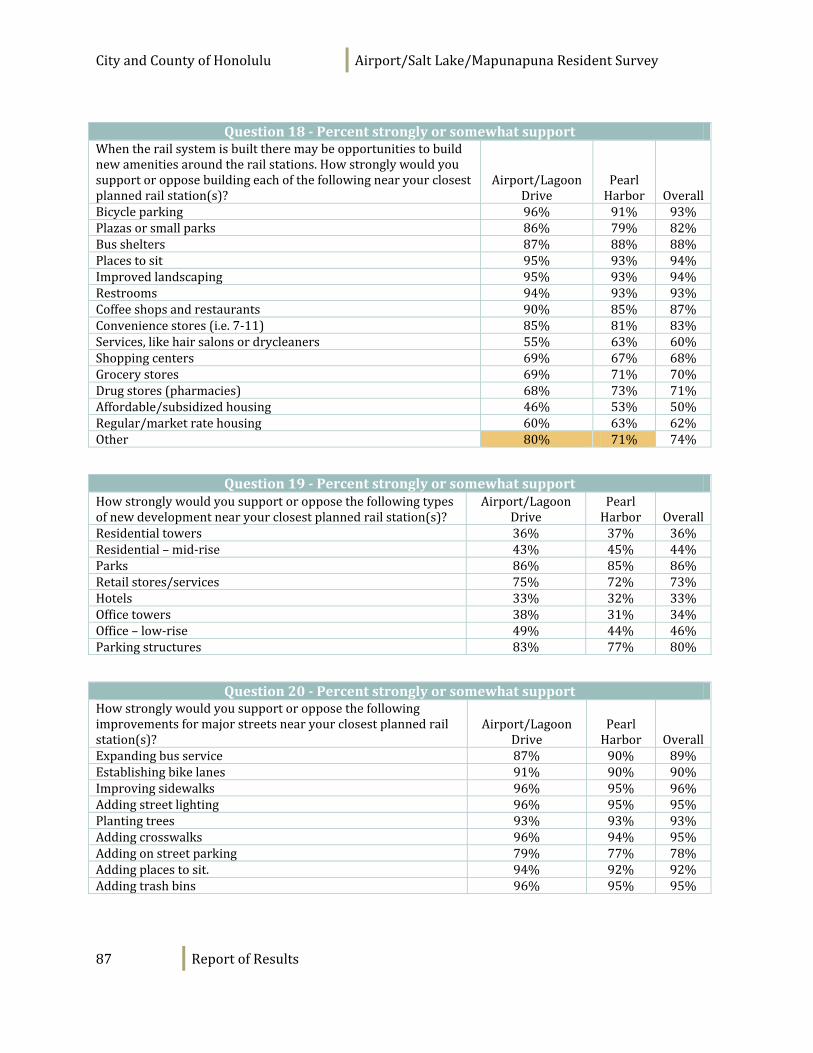
CityandCountyofHonolulu Airport/SaltLake/MapunapunaResidentSurvey
87 ReportofResults
Question18‐Percentstronglyorsomewhatsupport
Whentherailsystemisbuilttheremaybeopportunitiestobuildnewamenitiesaroundtherailstations.Howstronglywouldyousupportoropposebuildingeachofthefollowingnearyourclosestplannedrailstation(s)?
Airport/LagoonDrive
PearlHarbor Overall
Bicycleparking 96% 91% 93%Plazasorsmallparks 86% 79% 82%Busshelters 87% 88% 88%Placestosit 95% 93% 94%Improvedlandscaping 95% 93% 94%Restrooms 94% 93% 93%Coffeeshopsandrestaurants 90% 85% 87%Conveniencestores(i.e.7‐11) 85% 81% 83%Services,likehairsalonsordrycleaners 55% 63% 60%Shoppingcenters 69% 67% 68%Grocerystores 69% 71% 70%Drugstores(pharmacies) 68% 73% 71%Affordable/subsidizedhousing 46% 53% 50%Regular/marketratehousing 60% 63% 62%Other 80% 71% 74%
Question19‐Percentstronglyorsomewhatsupport
Howstronglywouldyousupportoropposethefollowingtypesofnewdevelopmentnearyourclosestplannedrailstation(s)?
Airport/LagoonDrive
PearlHarbor Overall
Residentialtowers 36% 37% 36%Residential–mid‐rise 43% 45% 44%Parks 86% 85% 86%Retailstores/services 75% 72% 73%Hotels 33% 32% 33%Officetowers 38% 31% 34%Office–low‐rise 49% 44% 46%Parkingstructures 83% 77% 80%
Question20‐Percentstronglyorsomewhatsupport
Howstronglywouldyousupportoropposethefollowingimprovementsformajorstreetsnearyourclosestplannedrailstation(s)?
Airport/LagoonDrive
PearlHarbor Overall
Expandingbusservice 87% 90% 89%Establishingbikelanes 91% 90% 90%Improvingsidewalks 96% 95% 96%Addingstreetlighting 96% 95% 95%Plantingtrees 93% 93% 93%Addingcrosswalks 96% 94% 95%Addingonstreetparking 79% 77% 78%Addingplacestosit. 94% 92% 92%Addingtrashbins 96% 95% 95%
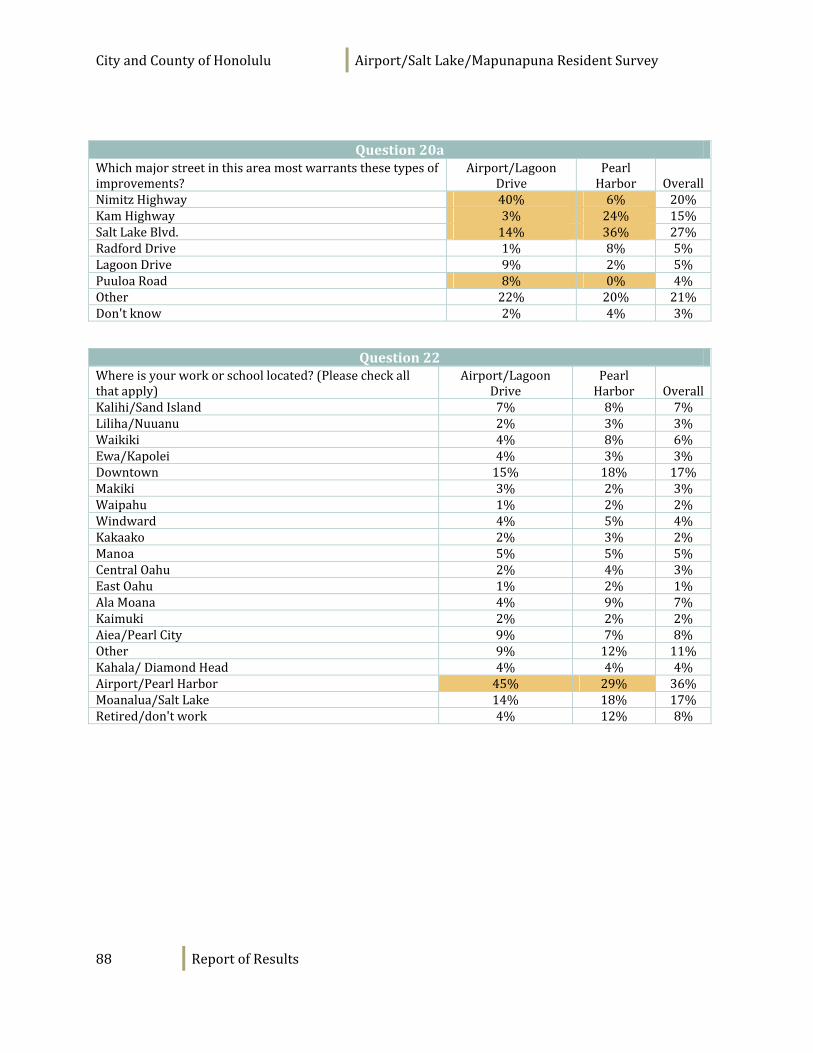
CityandCountyofHonolulu Airport/SaltLake/MapunapunaResidentSurvey
88 ReportofResults
Question20a
Whichmajorstreetinthisareamostwarrantsthesetypesofimprovements?
Airport/LagoonDrive
PearlHarbor Overall
NimitzHighway 40% 6% 20%KamHighway 3% 24% 15%SaltLakeBlvd. 14% 36% 27%RadfordDrive 1% 8% 5%LagoonDrive 9% 2% 5%PuuloaRoad 8% 0% 4%Other 22% 20% 21%Don'tknow 2% 4% 3%
Question22
Whereisyourworkorschoollocated?(Pleasecheckallthatapply)
Airport/LagoonDrive
PearlHarbor Overall
Kalihi/SandIsland 7% 8% 7%Liliha/Nuuanu 2% 3% 3%Waikiki 4% 8% 6%Ewa/Kapolei 4% 3% 3%Downtown 15% 18% 17%Makiki 3% 2% 3%Waipahu 1% 2% 2%Windward 4% 5% 4%Kakaako 2% 3% 2%Manoa 5% 5% 5%CentralOahu 2% 4% 3%EastOahu 1% 2% 1%AlaMoana 4% 9% 7%Kaimuki 2% 2% 2%Aiea/PearlCity 9% 7% 8%Other 9% 12% 11%Kahala/DiamondHead 4% 4% 4%Airport/PearlHarbor 45% 29% 36%Moanalua/SaltLake 14% 18% 17%Retired/don'twork 4% 12% 8%
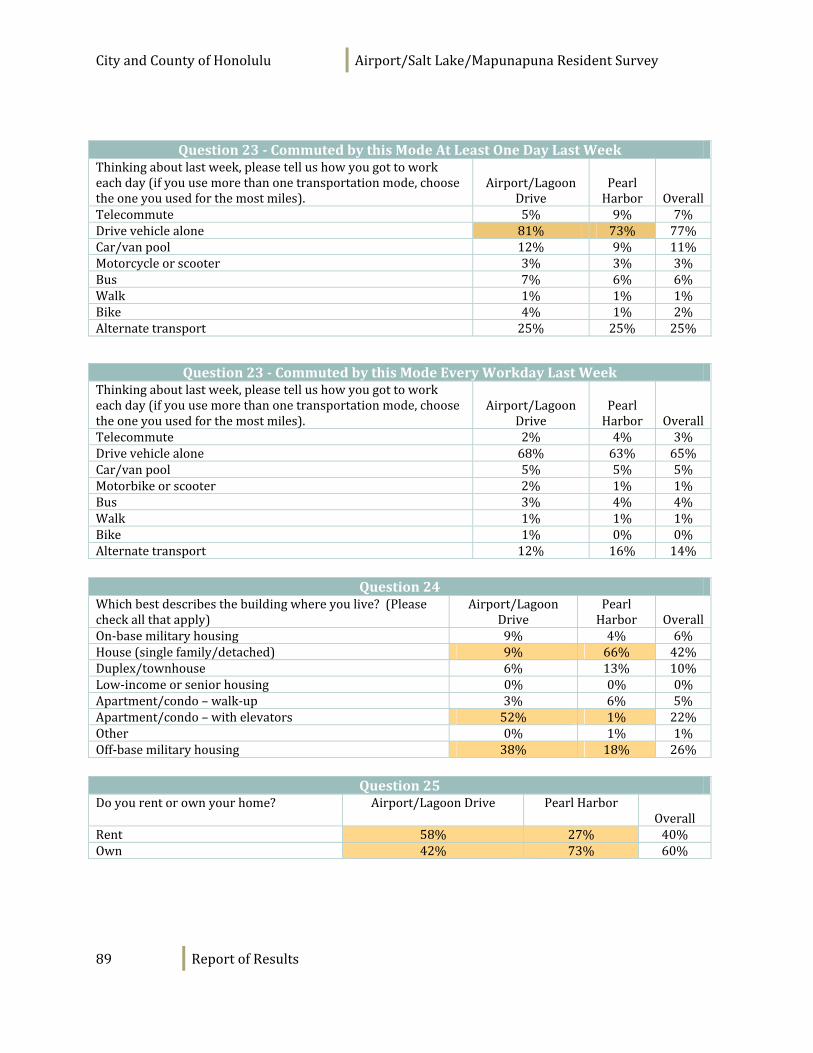
CityandCountyofHonolulu Airport/SaltLake/MapunapunaResidentSurvey
89 ReportofResults
Question23‐CommutedbythisModeAtLeastOneDayLastWeek
Thinkingaboutlastweek,pleasetellushowyougottoworkeachday(ifyouusemorethanonetransportationmode,choosetheoneyouusedforthemostmiles).
Airport/LagoonDrive
PearlHarbor Overall
Telecommute 5% 9% 7%Drivevehiclealone 81% 73% 77%Car/vanpool 12% 9% 11%Motorcycleorscooter 3% 3% 3%Bus 7% 6% 6%Walk 1% 1% 1%Bike 4% 1% 2%Alternatetransport 25% 25% 25%
Question23‐CommutedbythisModeEveryWorkdayLastWeek
Thinkingaboutlastweek,pleasetellushowyougottoworkeachday(ifyouusemorethanonetransportationmode,choosetheoneyouusedforthemostmiles).
Airport/LagoonDrive
PearlHarbor Overall
Telecommute 2% 4% 3%Drivevehiclealone 68% 63% 65%Car/vanpool 5% 5% 5%Motorbikeorscooter 2% 1% 1%Bus 3% 4% 4%Walk 1% 1% 1%Bike 1% 0% 0%Alternatetransport 12% 16% 14%
Question24Whichbestdescribesthebuildingwhereyoulive?(Pleasecheckallthatapply)
Airport/LagoonDrive
PearlHarbor
Overall
On‐basemilitaryhousing 9% 4% 6%House(singlefamily/detached) 9% 66% 42%Duplex/townhouse 6% 13% 10%Low‐incomeorseniorhousing 0% 0% 0%Apartment/condo–walk‐up 3% 6% 5%Apartment/condo–withelevators 52% 1% 22%Other 0% 1% 1%Off‐basemilitaryhousing 38% 18% 26%
Question25Doyourentorownyourhome? Airport/LagoonDrive PearlHarbor
OverallRent 58% 27% 40%Own 42% 73% 60%
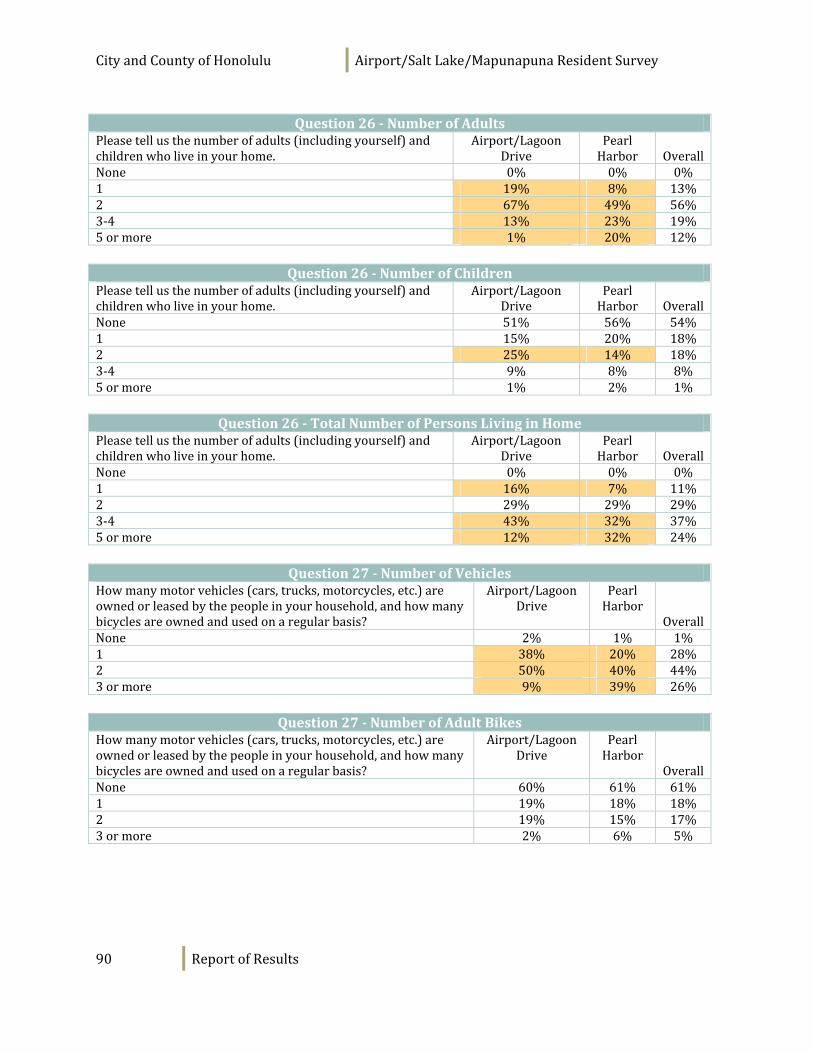
CityandCountyofHonolulu Airport/SaltLake/MapunapunaResidentSurvey
90 ReportofResults
Question26‐NumberofAdults
Pleasetellusthenumberofadults(includingyourself)andchildrenwholiveinyourhome.
Airport/LagoonDrive
PearlHarbor
Overall
None 0% 0% 0%1 19% 8% 13%2 67% 49% 56%3‐4 13% 23% 19%5ormore 1% 20% 12%
Question26‐NumberofChildrenPleasetellusthenumberofadults(includingyourself)andchildrenwholiveinyourhome.
Airport/LagoonDrive
PearlHarbor
Overall
None 51% 56% 54%1 15% 20% 18%2 25% 14% 18%3‐4 9% 8% 8%5ormore 1% 2% 1%
Question26‐TotalNumberofPersonsLivinginHomePleasetellusthenumberofadults(includingyourself)andchildrenwholiveinyourhome.
Airport/LagoonDrive
PearlHarbor
Overall
None 0% 0% 0%1 16% 7% 11%2 29% 29% 29%3‐4 43% 32% 37%5ormore 12% 32% 24%
Question27‐NumberofVehiclesHowmanymotorvehicles(cars,trucks,motorcycles,etc.)areownedorleasedbythepeopleinyourhousehold,andhowmanybicyclesareownedandusedonaregularbasis?
Airport/LagoonDrive
PearlHarbor
OverallNone 2% 1% 1%1 38% 20% 28%2 50% 40% 44%3ormore 9% 39% 26%
Question27‐NumberofAdultBikesHowmanymotorvehicles(cars,trucks,motorcycles,etc.)areownedorleasedbythepeopleinyourhousehold,andhowmanybicyclesareownedandusedonaregularbasis?
Airport/LagoonDrive
PearlHarbor
OverallNone 60% 61% 61%1 19% 18% 18%2 19% 15% 17%3ormore 2% 6% 5%
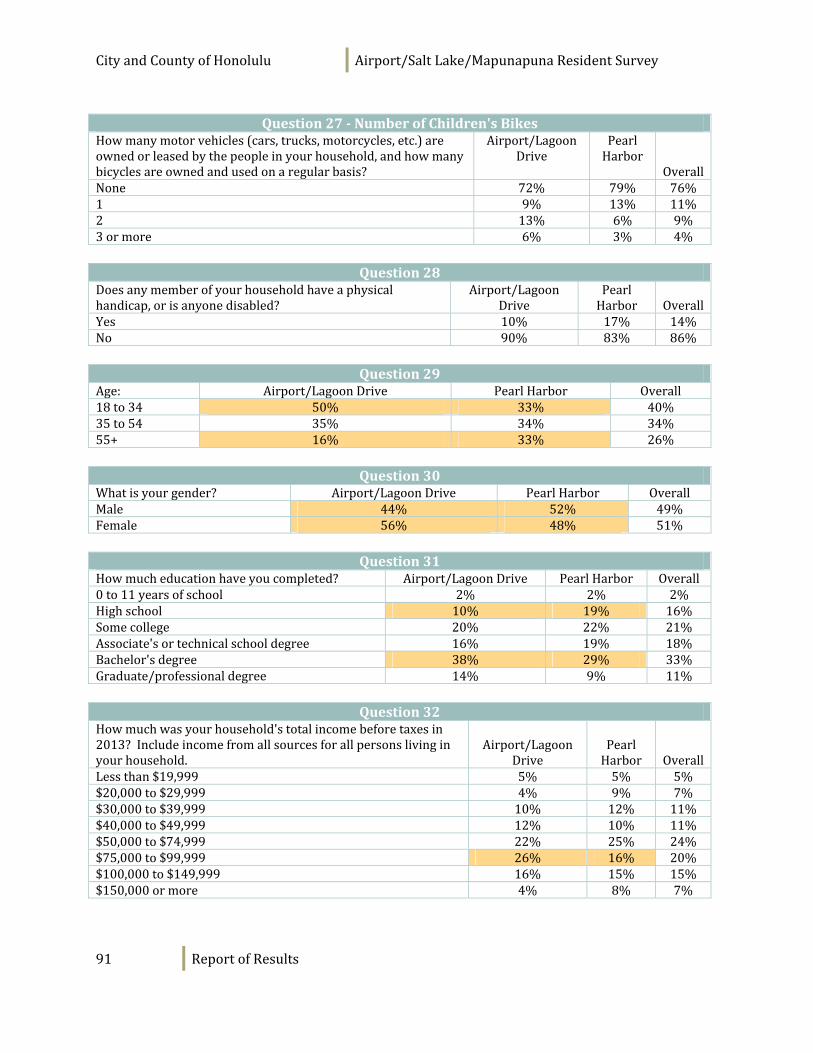
CityandCountyofHonolulu Airport/SaltLake/MapunapunaResidentSurvey
91 ReportofResults
Question27‐NumberofChildren'sBikes
Howmanymotorvehicles(cars,trucks,motorcycles,etc.)areownedorleasedbythepeopleinyourhousehold,andhowmanybicyclesareownedandusedonaregularbasis?
Airport/LagoonDrive
PearlHarbor
OverallNone 72% 79% 76%1 9% 13% 11%2 13% 6% 9%3ormore 6% 3% 4%
Question28Doesanymemberofyourhouseholdhaveaphysicalhandicap,orisanyonedisabled?
Airport/LagoonDrive
PearlHarbor
Overall
Yes 10% 17% 14%No 90% 83% 86%
Question29Age: Airport/LagoonDrive PearlHarbor Overall18to34 50% 33% 40%35to54 35% 34% 34%55+ 16% 33% 26%
Question30Whatisyourgender? Airport/LagoonDrive PearlHarbor OverallMale 44% 52% 49%Female 56% 48% 51%
Question31Howmucheducationhaveyoucompleted? Airport/LagoonDrive PearlHarbor Overall0to11yearsofschool 2% 2% 2%Highschool 10% 19% 16%Somecollege 20% 22% 21%Associate'sortechnicalschooldegree 16% 19% 18%Bachelor'sdegree 38% 29% 33%Graduate/professionaldegree 14% 9% 11%
Question32Howmuchwasyourhousehold'stotalincomebeforetaxesin2013?Includeincomefromallsourcesforallpersonslivinginyourhousehold.
Airport/Lagoon
Drive
PearlHarbor
OverallLessthan$19,999 5% 5% 5%$20,000to$29,999 4% 9% 7%$30,000to$39,999 10% 12% 11%$40,000to$49,999 12% 10% 11%$50,000to$74,999 22% 25% 24%$75,000to$99,999 26% 16% 20%$100,000to$149,999 16% 15% 15%$150,000ormore 4% 8% 7%
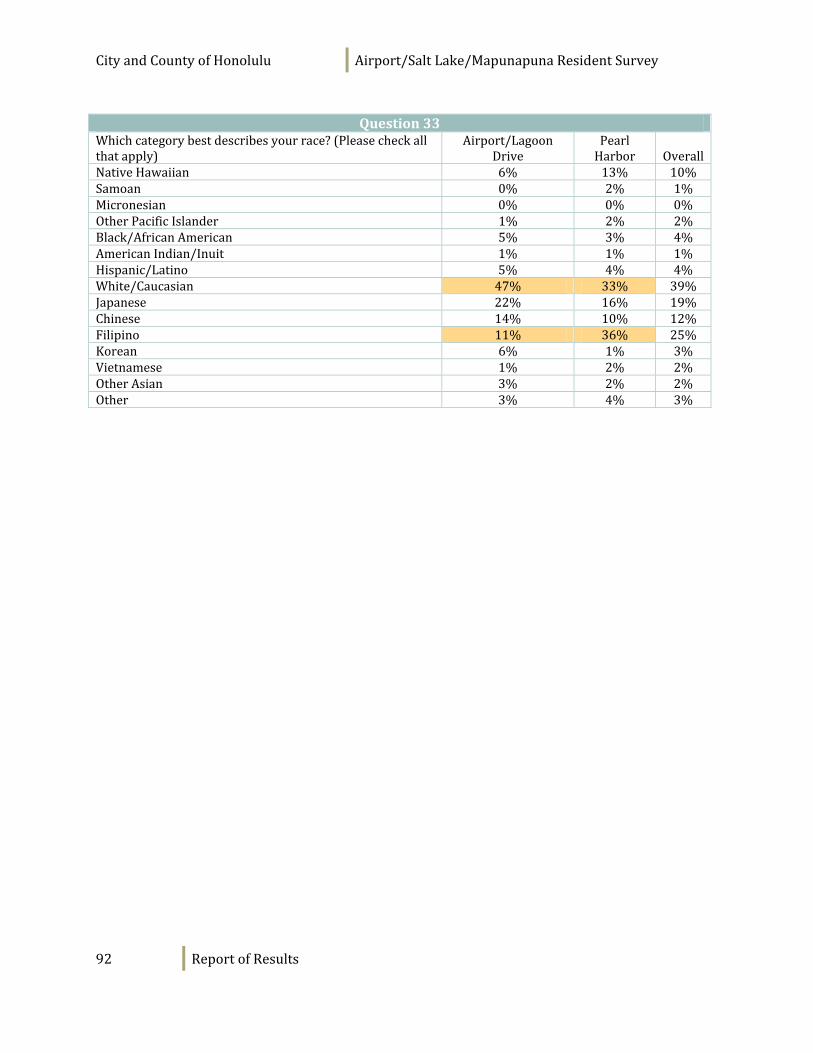
CityandCountyofHonolulu Airport/SaltLake/MapunapunaResidentSurvey
92 ReportofResults
Question33
Whichcategorybestdescribesyourrace?(Pleasecheckallthatapply)
Airport/LagoonDrive
PearlHarbor
Overall
NativeHawaiian 6% 13% 10%Samoan 0% 2% 1%Micronesian 0% 0% 0%OtherPacificIslander 1% 2% 2%Black/AfricanAmerican 5% 3% 4%AmericanIndian/Inuit 1% 1% 1%Hispanic/Latino 5% 4% 4%White/Caucasian 47% 33% 39%Japanese 22% 16% 19%Chinese 14% 10% 12%Filipino 11% 36% 25%Korean 6% 1% 3%Vietnamese 1% 2% 2%OtherAsian 3% 2% 2%Other 3% 4% 3%
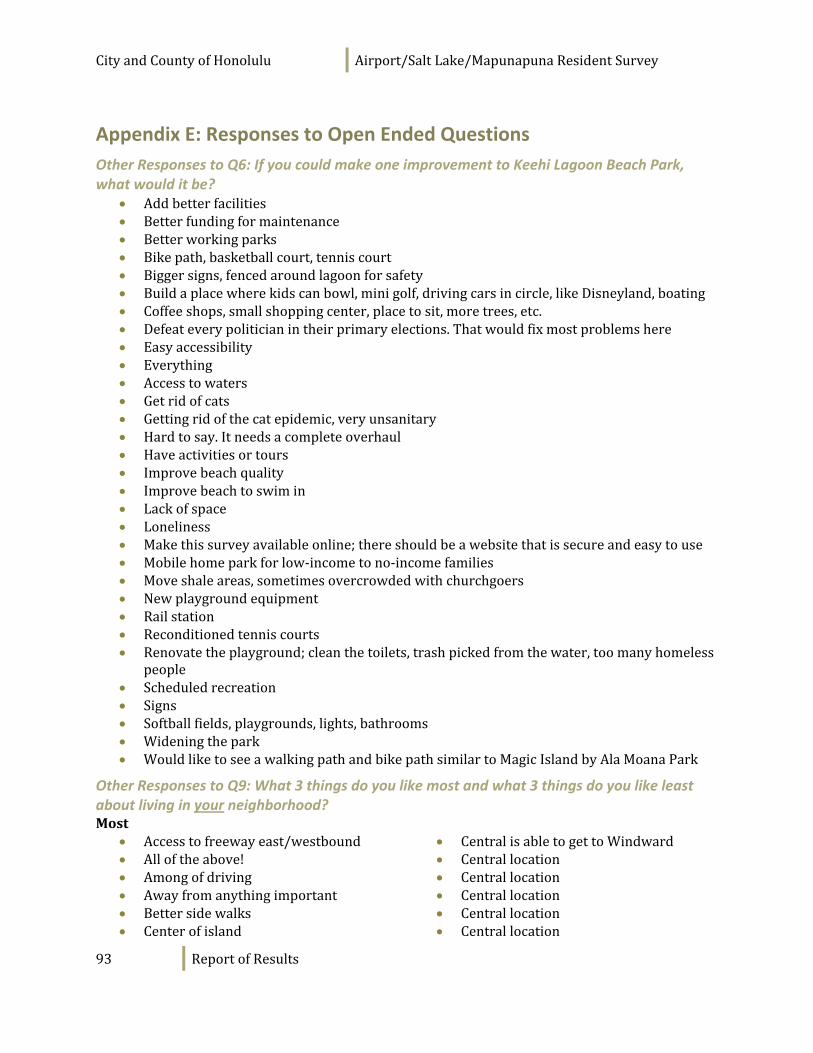
CityandCountyofHonolulu Airport/SaltLake/MapunapunaResidentSurvey
93 ReportofResults
Appendix E: Responses to Open Ended Questions
Other Responses to Q6: If you could make one improvement to Keehi Lagoon Beach Park, what would it be?
Addbetterfacilities Betterfundingformaintenance Betterworkingparks Bikepath,basketballcourt,tenniscourt Biggersigns,fencedaroundlagoonforsafety Buildaplacewherekidscanbowl,minigolf,drivingcarsincircle,likeDisneyland,boating Coffeeshops,smallshoppingcenter,placetosit,moretrees,etc. Defeateverypoliticianintheirprimaryelections.Thatwouldfixmostproblemshere Easyaccessibility Everything Accesstowaters Getridofcats Gettingridofthecatepidemic,veryunsanitary Hardtosay.Itneedsacompleteoverhaul Haveactivitiesortours Improvebeachquality Improvebeachtoswimin Lackofspace Loneliness Makethissurveyavailableonline;thereshouldbeawebsitethatissecureandeasytouse Mobilehomeparkforlow‐incometono‐incomefamilies Moveshaleareas,sometimesovercrowdedwithchurchgoers Newplaygroundequipment Railstation Reconditionedtenniscourts Renovatetheplayground;cleanthetoilets,trashpickedfromthewater,toomanyhomeless
people Scheduledrecreation Signs Softballfields,playgrounds,lights,bathrooms Wideningthepark WouldliketoseeawalkingpathandbikepathsimilartoMagicIslandbyAlaMoanaPark
Other Responses to Q9: What 3 things do you like most and what 3 things do you like least about living in your neighborhood? Most
Accesstofreewayeast/westbound Alloftheabove! Amongofdriving Awayfromanythingimportant Bettersidewalks Centerofisland
CentralisabletogettoWindward Centrallocation Centrallocation Centrallocation Centrallocation Centrallocation
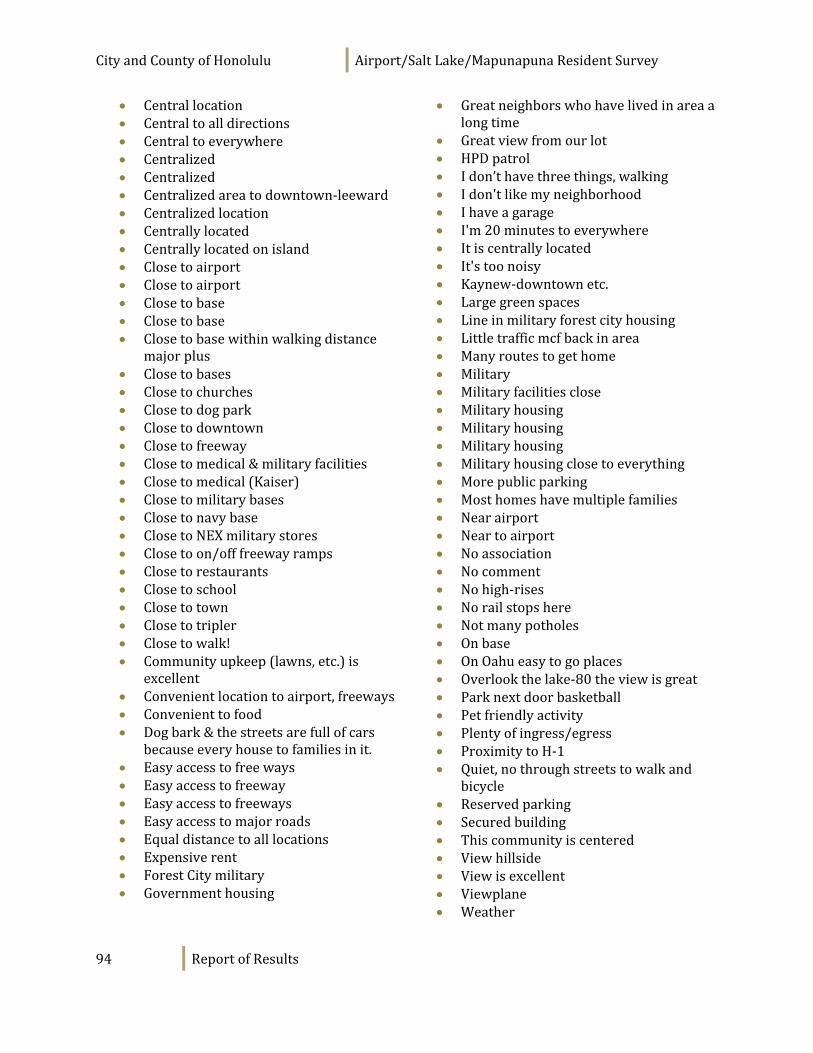
CityandCountyofHonolulu Airport/SaltLake/MapunapunaResidentSurvey
94 ReportofResults
Centrallocation Centraltoalldirections Centraltoeverywhere Centralized Centralized Centralizedareatodowntown‐leeward Centralizedlocation Centrallylocated Centrallylocatedonisland Closetoairport Closetoairport Closetobase Closetobase Closetobasewithinwalkingdistance
majorplus Closetobases Closetochurches Closetodogpark Closetodowntown Closetofreeway Closetomedical&militaryfacilities Closetomedical(Kaiser) Closetomilitarybases Closetonavybase ClosetoNEXmilitarystores Closetoon/offfreewayramps Closetorestaurants Closetoschool Closetotown Closetotripler Closetowalk! Communityupkeep(lawns,etc.)is
excellent Convenientlocationtoairport,freeways Convenienttofood Dogbark&thestreetsarefullofcars
becauseeveryhousetofamiliesinit. Easyaccesstofreeways Easyaccesstofreeway Easyaccesstofreeways Easyaccesstomajorroads Equaldistancetoalllocations Expensiverent ForestCitymilitary Governmenthousing
Greatneighborswhohavelivedinareaalongtime
Greatviewfromourlot HPDpatrol Idon’thavethreethings,walking Idon'tlikemyneighborhood Ihaveagarage I'm20minutestoeverywhere Itiscentrallylocated It'stoonoisy Kaynew‐downtownetc. Largegreenspaces Lineinmilitaryforestcityhousing Littletrafficmcfbackinarea Manyroutestogethome Military Militaryfacilitiesclose Militaryhousing Militaryhousing Militaryhousing Militaryhousingclosetoeverything Morepublicparking Mosthomeshavemultiplefamilies Nearairport Neartoairport Noassociation Nocomment Nohigh‐rises Norailstopshere Notmanypotholes Onbase OnOahueasytogoplaces Overlookthelake‐80theviewisgreat Parknextdoorbasketball Petfriendlyactivity Plentyofingress/egress ProximitytoH‐1 Quiet,nothroughstreetstowalkand
bicycle Reservedparking Securedbuilding Thiscommunityiscentered Viewhillside Viewisexcellent Viewplane Weather
CityandCountyofHonolulu Airport/SaltLake/MapunapunaResidentSurvey
95 ReportofResults
Least
I’dpreferatrain Alotofblackstreetdirtcomesinto
myz Aircraftnoise Allofthesearefine Areaisdirty,dirty,dirty AttheirhomesIdon'tmindthis Awesome! Badmaintenance/slow
response/work Barsandsocialplaces Basehousingalllooksthesame Becomingovercrowded‐‐toomany
renters Bums/homelesseverywhere Buscomesnotoftenenough Busrouteisonourtightstreet. Busstopcrossthestreet. Busstophasnoshade Chickens(crowingroosters)tooearly Closetofreeway/rathernoisytrucks
&ambulances. Crimehappensalotbutitisn'thigh Crimeinmilitaryhousingbylocals Disrespectfultenantsoutsidemy
window. Dodrugsnearwatertank Doesn'thavelocallaroorlaterestrain
asoptionsorplacetogettoeasily Dogs&chickenseverywhere Dogsoffleashfrequently Dragracingisdangerousstopracers
ongateroad! Drugsdealerswearwatertrailtraffic Drugs‐seeabove Duringthelineslubdrunkand
obnoxiousmaketheneighborhoodveryunpleasant!
Earlydumpingofbulkyitemsonsidewalks
Emergencyvehiclesconstantlyheadingto/fromAMC
Eveningsdon'tfeelsafetowalkforexercise,duetohighdensitypopulation
Farfromgoodbeaches
Farfromnicebeaches Farfromthebeach Feralpigeonsonelectricwireand
parkground.Notenoughpublicparking
Folksinonehouse Gasprices Goodshippingandeating Governmenthousing Grassalldeadbecausesprinklers
don'twork HardtocrossAlaIlimacrosswalk Highcostofutilitiesandfuel HomelessalongNimitzHighway Homelessintheunderpasses Homelessnearby HomelesspeopleinNimitz Homelesspeople Homeless/poorpeoplesquattingon
sidewalks,parkinglot Hotinsummer Housestooclose Housingdevelopmentnotsecure Housingmanagement Icouldhardlyseeoncomingcarsboth
whenhappenIdriveoutfrommygarage
Justtoobadit'smilitaryhousing LackofHPD Landneighborstoomanydump Lateatnightgangsdrivefast Libraryhoursarelimited LikeThirdWorldnation Lotsofbreak‐ins Lotsofhighrates Lotsofhomeless Manyholipsmeindiscorairorlotsof
trutsly Membersinonehome Militaryhousingseemstobethebest
choiceonOahu Militarylimitsaccesstosuchofmuch
ofneighborhood. Minorsallowedtosmokebymy
apartment
CityandCountyofHonolulu Airport/SaltLake/MapunapunaResidentSurvey
96 ReportofResults
Moderatepettycrime Mopedusageconstant More Multifamilyhomes Needbrighterstreetlights Needcoveredsittingatbusstopson
Allaneahowst Needgrowswildly Neededmorecitybuses Neighbordon'ttakecareofproperty Nextdoorneighboronourrightside Nobarinarea Nocoffeeshopnearby Noconveniencestores;coffeeshops Nodogpark Nodoggiestationsfortrashandpoop
bags Nofamilyentered/dimeos. Noformal(organized)neighborhood
watch. Nogoodbeaches. Nogoodeatingplaces Nogoodfoodcloseby Nogoodrestaurants Noplaceforteenstohangout Nopolicepresence Norestaurantsnearus Nosafenon‐militaryhousingoptions Nosenseofcommunity Noyard Noyouthactivitycenterclose Noisybusstopnowsituatedinfront
ofmyapartment.Thebusesoftenblockourdrivewayandwecantgetoutontothestreet.Thedriversdroppassengersontoourdriveway.
Noisymopheads Noneoftheabove Notanynightlifeclose Notchainstoresorfastfood Notclosetomanyrestaurants Notenoughshade,trees Notenoughgasstations Notenoughrestaurant/baroptions Notenoughroom. Notenoughsecurityformilitary
Notenoughsidewalkorbikelane.onSaltLake.
Notenoughstreetlights Notenoughwholesomethingtodo Notmanybusroutesavailable Notmuchofanythingwithinwalking
distance Notnearabeach Notverypretty NothingliveinCatlinPark Onfriendlydrivers‐inconsiderate Only1concernnear! OtherthanthatRadfordispretty OthersOK! OutsideNavyhousingnotpleasant Peoplenottakingcareofsidewalks Pettytheftcarstolentwice Pickupbulkyitemsonsidewalks. Poorestheticstohomes‐toocluttered
infrontofhomes‐havinglivechickensonsite
Poorqualityrestaurants Potholesonhighway Publictransportationwfideal Qualityofgrocerystores. Racingonsaltlakeblvd., Randomdumpingareas Randompeoplewalkthru
neighborhood Re:cashdwelling Safetyconcernsb/cofmanyhomeless
inthearea Safeway/McDonaldareaismyrun
down. Saltlakenotbad! Saltlakesurroundedbyindustrial
areas Sidewalkcan’twalk Sidewalks.Can’twalkon Sidewalks.Theyareblockedw/trash
too!Likinistreet Sidewalks Sketchypeoplewalkingaround. Smallyardw/brokenfence. Sometimesneighborsholdgateways. Speedaroundonmoped,stealing
frompeople'sgaragewhileweare
CityandCountyofHonolulu Airport/SaltLake/MapunapunaResidentSurvey
97 ReportofResults
sleeping.I'mKanakamackiflagtodetergangs.
Speedlimitisnotenforced Statevacantlandnotmaintained Storiesofbreak‐ins Strangersfoundinbackyardtrashing
itupwithbagsetc. Streetstonarrow Taxesonproperty Thefewlow‐incomepropertiesmake
theareaghetto Thereareviatraces Thingsdon’tgetfixedquickly Timeofmaintenance/construction TooclosetohomelessonNimitz. Toomanybigdogs Toomanybunkcaronproperty Toomanyloudmufflers&mopeds Toomuchjunkoakproperty Tooclosetomajorhighways Toocongestedw/condosnearby Toofar/toomuchtrafficto/from
downtown Toomanybuildings/concrete Toomanycarehomes
Toomanyfamily Toomanyhills Toomanyhomesconvertedfor
rentals.Multi‐units Toomanyidleteenagersinpark Toomanypeopleinhouses Toomanyself‐employedindividuals
withnursinghomes.Takesuppublicparkingspaces.
Toomanystrangerswalkingaround(shipyardworkers&homeless)
Toomuchgraffiti ToomuchSerena Toooverlypopulated Transientneighborhood Trashleftouttoolazytotaketo UnderHighway92waydarkatnight
feelsupside Wantthetreebehindourhouse
trimmedalot Weareveryhappyinour
neighborhood Welovethisarea
Other Responses to Q10: If only a few of the following amenities could be built or improved in your neighborhood, which five would you most like to see built or improved? (Check the 5 that are most important to you)
Adulteducation‐computers/free Alltrafficlights AlohaStadium Bar Beaches Better&nicermalls,largechainretailers Betterbenchaccess. Betterlightingforcrosswalks BetterlightingonHighway92&getridofhomelesson92 Betteropenfarmermarket Bowlingalleyinstadiumarea. Busstationnesik Coffeeshop CompleteSaltLakeBlvdwideningproject Differentshops Don'tputarailstophere Enforceparkedcarsblockingsidewalks
CityandCountyofHonolulu Airport/SaltLake/MapunapunaResidentSurvey
98 ReportofResults
FirestationbasedinAMCandemergency Getridofmopedsridingonsidewalks Hire®ularlymonitorteachersforskillscontinuousimprovementincludingprincipals Improveroads Improvedroads Improvedsafeatnight,solutionfortheterribletrafficduringrushhour Improvedstreets/roadways Lessstreetparking Lesstraffic/congestion MorefrequentbusestooutinSaltlake. Morelights Moreroadspace Moretrees Neighborhoodwatch NimitzHighwayrepave Nomoreconstruction! Outlinestreetparkingspacesforspacesaving&continuity Plantmoretrees Policedoingtheirjobs Policestation Policestation Potholes! Rail Removalofhomeless Removethatdangerousbusstop.Whentryingtogetoutofourdrivewayandontotothe
street,theserudebusdriverswilldriveinfrontofus,blockingourdrivewaytogetpassengersoffthebus.Thenthepassengerswilllookatuslikeweareinthewayandatfault.
Removewildpigeonsonoverheadwires&parkgrounds Re‐paint"noparkingzones"curbs Restaurants Restaurants Restaurants Restaurants Roadconditions Roadconditions Satisfiedwithcurrentamenities Securitypolice Seebelow Speeding Starbucks/Jambajuice Stopalltheshoppingcartsfrombeing1stallareovertheSaltlakeapartmentareas. Streetbumpforcrazydrivers Streetfixed Streetlights(workingandadded) Stripmall Theater,plays
CityandCountyofHonolulu Airport/SaltLake/MapunapunaResidentSurvey
99 ReportofResults
Theaters Trashcans! Trees,drplants Welikequietw/notraffic&noise
Other Responses to Q11: If there was one thing you could do to improve your neighborhood what would it be?
Activitiestoencourageresponsiblecitizenship Adulteducationisaffordableorfree Behavior Beingabletocleararoundmyhome(area)dangerous Beinggoodneighbors Betterbeaches Betterpublicschools Betterschools Betterschools Blockparties Can'tthinkofany Communitymeeting Conserveenergy DomorefamilyactivitiessoIcouldmeetmyneighbors. Don'tknow Estimatebuyuseatshameeneparksbathroom! Getridofchickens‐toomanymlikini Getridofthesprinklers(leavewaterspotsonfans) Havethelibraryopen8am.‐9pm.7daysaweek Idon'tknow Ihavelinedeast,westcoastagreatneighborhoodhereinHawaii Ilikemyneighborhood I'minmilitaryhousing Improvequalityofpublicschools Improvesenseofcommunity Lessdomesticanimals Mailinfoonactivitiesortovolunteeratelseshortsbikesalesatallclosebycenters Minetheatre Moreentertainmentoptions Move! Nocomment Noimprovementneeded Nomoredoor‐to‐doorsaleit'sannoying Noresponse Noroosters! None Noneatthistime Notsure Nothing Nothing
CityandCountyofHonolulu Airport/SaltLake/MapunapunaResidentSurvey
100 ReportofResults
Nothing‐ForestCitykeepsitupamazingly Promoteneighborcommunication Recentlymoved Reducemulti‐family/ohanaunitsallowedperlandlot Satisfied Seeabove Senseofcommunity Singlefamilyhomesshouldnotrenttheirhomesorroomstootherpeople Solarandwindpowerforpoorandlow‐incomerentersmandatory Sprinklers Thecity&countyshouldlowerrealpropertytax Utilitymanagement‐highcostofenergy Volunteerincommunitycenterstohelpseniors&children
Other Responses to Q12: What landmarks or characteristics of your neighborhood are most important to preserve?
AlohaStadium AlohaStadium Self‐reliantatmosphere Olivewatertower Ourrailstop‐freecommunityissomethingItreasuregreatly Churches Liboreg Notthecellphonetowersforsure! VAcenter‐wonderfulforourfreedomkeepingvets! Thestadium,keepit TheNimitzhwypylonsfullofgraffiti Thestadium,swapmeet. SaltlakeLibrary Theclass6 AlohaStadium(leaveitwhereitis) AlohaStadium Airport Someonechurch! IcePalaceandAlohaStadium Stadium Wellyoualreadytoredownourgoodcommunitycentertomakeacrappyparkinglotthatis
notused Unkmouwa Considerationforother'sconvenience Hokolunisign AlohaStadium
Other Response to Q13a: What neighborhood in Honolulu would you most like to live in? Aiea Aiea Aiea Aiea
AieaHeights AieaHeights AinaHaina AlaHapuustreet,Milkini,EwaGentry
CityandCountyofHonolulu Airport/SaltLake/MapunapunaResidentSurvey
101 ReportofResults
AlaMoana AlaMoana Aiea AieaHights/mountains Aliamanu(affordableconvenient) Aliamanu Alizmager Amr Dasehonsing DorisMillerLP DowsettHighlands EastHonolulu Everything FordIsland FordIslandhistorichousing Hakulani Halemomu Haleiwa HawaiiLoaRidge HawaiiLoaaRidge HawaiiKai Hokalani Honolulu Honolulu96818 Hawaiikai Hulamoka Inmanuali Iok Kailua Kailua Kaimuki Kaimuki Kalaheo Kaneohearea Kapahuluarea Lanikai
Lanikai Makakilo MililaniTownImissit.Buttoomuch
traffictowork&home Mililani Miue Mochalasvalley Newtown Newtown Newtown Newtown NiuValley Northshore Ola PacificPalasades/MomiLani Pali Pauoa PearlCity Pearlcity PearlCity Portlock Portlock Punahou Radford RadfordTerrace RadfordTerrace RadfordTerrace RadfordTerrace(forestcity) RoyalSummit RoyalSummit Southshore Tantalus WaialaeIki Waipio Waipahu
Other Responses to Q14b: If you do not plan to move, why? Aliamanuistoonoisy,toocrowded,run‐down,noparking,noparks Allmyrelationsinthemainland OtherfamilymembersarecomingfromthePhilippines Avoidunsightlyrailonhorizon Becausethisinaquietplaceforus Becauseitisdirty,busyandhighcrime BecauseitsghettoonSaltLakeBoulevard Betterhome Biggerhousedesired
CityandCountyofHonolulu Airport/SaltLake/MapunapunaResidentSurvey
102 ReportofResults
Changingweekconditions Confidential Congestion&rail‐‐don'twanttoseeit! Dependingonschoolsandhomeavailability Dependsonifgetpregnant,thenyes,willneedmorespace DonotlivinginOahu,Hawaii Don'tlikemoving Don'tneedto Foralargerplace Getofftheisland,experiencemore,schooling Goodschools Haveelderparentstocarefor! Havingbabymayneedmorespace Idon'tknowwhatisaheadforthenexttwoyears Iplanonpursuingmymaster'sdegreeatH.P.U.withmyG.I.Bill Ipraywegobacktothemainland.Oahuisovercrowded! Iwillfindorbuildeco‐friendlygreenhomesomewhereinManoaareamadewithsuitable Iwillhaveto Ifourfamilygrows,maybe I'llbetransferringaroundthen Justgothere MaybemovetoKahaluuintwoyears.Idon'tlikethestreetdistinmyapartment Morespace Movingin3‐4years Movingjusttoattendschoolingmainlandfordegree MovingtoOregononDec.31,2016 Mychildstartedhighschoolandwouldn'twanttochangeschools Needachange‐quieterplace Needmorespace Needtolivetoclosetoelderlylivingparents Newplaceandnottoomuchvandalism Nightmovetoabiggerhouseorstaycurrentresidentforawhile Nonewconstructionhousinginthearea Noparkingspace Noplanstomove Nosenseofcommunitypridehere Notrafficcontrol,population Nowhereelsetogo Noisefromtraffic,distancetotownandbeach Oahuistoocrowdedandoverdeveloped Ontothemainlandtofinishcollege Parkingtwocrowded Populationdensity PossiblymoveinwithmydaughterinMakaha SaltLakeisghetto Somethingbetter Toomuchdescriptiontorautens.
CityandCountyofHonolulu Airport/SaltLake/MapunapunaResidentSurvey
103 ReportofResults
Tooexclusive Tooindustrial,terriblemiddleschool,Aliamanuadministrationwaveofschool Toomanyparkedcarsandriff‐raffslivinginarea. Trafficishorrible,educationsystemsucks Wantbigger,updatedhome Wanthousew/yardparking WemayormaynotretireheretoHawaii,ifwedowewillstayonOahu WillbeleavingHawaiiwithinthenextyears Wouldliketohaveaccessiblesidewalkswithoutcarsblockingsidewalks Youarenotpayingforit,sonotworryaboutit
Other Responses to Q18: When the rail system is built there may be opportunities to build new amenities around the rail stations. How strongly would you support or oppose building each of the following near your closest planned rail station(s)?
Adultlounge/club/bar Allthings Art Athleticgymi.e.24‐HourFitness Bookstore Bookstore Carparking Carparking Carparking Chargingstations Chick‐Fil‐A Coffeeshops Dogparks Education/locationsites Enoughparkingaffordable Farmersmarket Freeshuttletorallstations Fruit/vegetablestands! Gardens Informationkiosks(automated)for
tourists Let'snotoverdevelop!!! Locallyawardbusiness Moresecurity
Needparkingatthestation Nohomelesspeople Norail None Parking Parking Parkingforcars Parkingfordropoffcar Parkinggarages Parkinglot Parkingspacesforcommuters Parking Policestation Policestations Policesubstationhomelessshelters,
becausethehomelesswillmostlikelysquatneartheserailstations.
Publicpool Securitystations/HPDstations Station Vehicleparking Venderpark(fleamarking)
Other Responses to Q20a: Which major street in this area most warrants these types of improvements?
AiaIlima. AlaIlima,AlaNapunani AlaIlimaStreet AlaMooinaWay AlaNapunaniStreetorPedlonroad AlaNapunaniStreet
AlaNapunaniStreet AlaNapunani,Likini Alatlingarstreet AlaNapunani AlaNapunaniStreet All
CityandCountyofHonolulu Airport/SaltLake/MapunapunaResidentSurvey
104 ReportofResults
All Allmystreetaregood! Allofthem Allstreets Allstreets Allthestreetsthathavesketchybike
lanes.Prettymuchallthebikelanescouldbeimproved.Likeonthewholeisland
All‐inthearea All‐withoutrail Anyapplicable AnystreetInDowntownarea AoleleandValena Aroundrailstations AlaIlima BehindmyhouseHolakuist. Bougainville Bouqainville Busline CampCatlin CampCatlinNimitzHighway CenterDrive CenterDrive CentralDrive&Kamehameha
Highway Chinatownarea Chinatown Closesttoresidences ElliottStreet H‐1west/east HaloaDrive Innerbusroutes(houses)
Joeour Likini LikiniStreet LikiniStreet LikiniStreet LikiniStreet/PakiniStreet LikiniStreet Moanalua,Alailing Morestreetlights Mostareas Nearschoolsfor None‐tinyHawaii Oahudoesn'tneedtocramevenmore
onthistinyIsland OnallmajorstreetsonOahu PaieaStreet,OhohiaStreet Paieatorailstation PakiniStreet PearlHarborside Peltier Pukoloastreet Roads That'suptocityplanner ThereisaareanearNavybasethat
basenosidewalkonbaseskipofstreet/Butitmaytakeawayfromtrafficlanes
Trashbins Ukinist ValkenburghDrive Wahiawaa Waipahu Wanakaft
Other Responses to Q22: Where is your work or school located? (Please check all that apply) PearlHarbor/Hickam Aliamanu AllOahu Army‐FortShafter BarbersPint CampsSith CampSith Chinatown Don'thaveone Everywhere Everywhere(travel) FordIsland FortShafter
H‐2Kamehameha HickamAFB Halawa‐work Hawaiikai Hickam Hickam HickamAFB HickamAFB HickamAFB HickamAFB HickamAFB Home Home
CityandCountyofHonolulu Airport/SaltLake/MapunapunaResidentSurvey
105 ReportofResults
Home HomeorMoanaluawhichishome Home‐childcare Itraveltheislandformywork Iworkallovertheisland Islandwide JointBasePearlHarbor‐Hickam JointBasePearlHarbor‐Hickam Kailua Kailua Kaneohe Kapolei KaneoheBay KaneoheBay(soon) Leeward Leeward Lessthanminutesaway Mapunapuna MarneCorpsBaseHawaii‐Kaneohe
Bay Mililani Mililani‐Waiwai Nimitzhwy Ontheroad PearlHarbor PearlHarbor PearlHarbor PearlHarborbase PearlHarbornavy
PearlHarbor/Kunia HonoluluCommunityCollege Realtor,all Saltlake Sandisland SchofieldBarracks SchofieldBarracks Selfemployed(adultcarehome) Self‐employedathome Shafter Thewholeisland Tripler Tripler Truentloround Wahiawa Wahiawa Wahiawa Wahiawa Wahiawa Wahiawa Waianae Waianae Waianaecoast Wahiawa Waikele Waikele,PearlHarbor Wahiawa Windward
Other Responses to Q24: Which best describes the building where you live? (Please check all that apply)
24‐hoursecurity 71/2hourshouse Homeown Homework Lowrisefour‐story Own Ownhome Two‐storyhouse
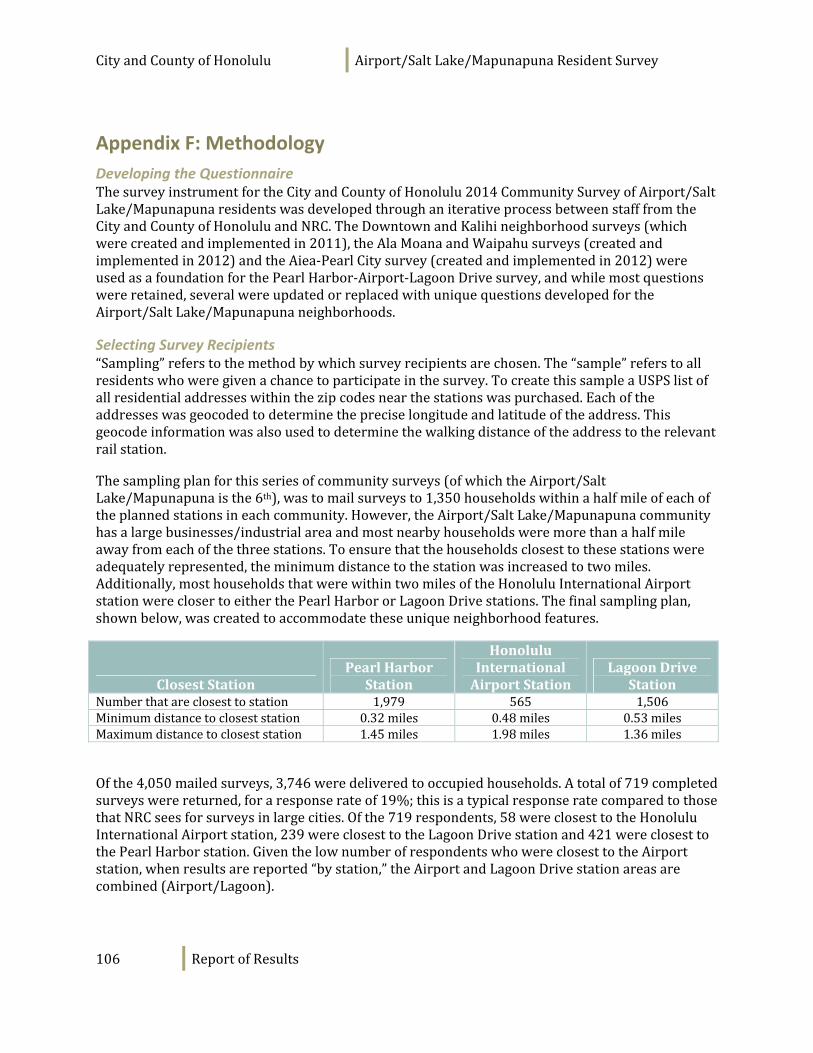
CityandCountyofHonolulu Airport/SaltLake/MapunapunaResidentSurvey
106 ReportofResults
Appendix F: Methodology
Developing the Questionnaire ThesurveyinstrumentfortheCityandCountyofHonolulu2014CommunitySurveyofAirport/SaltLake/MapunapunaresidentswasdevelopedthroughaniterativeprocessbetweenstafffromtheCityandCountyofHonoluluandNRC.TheDowntownandKalihineighborhoodsurveys(whichwerecreatedandimplementedin2011),theAlaMoanaandWaipahusurveys(createdandimplementedin2012)andtheAiea‐PearlCitysurvey(createdandimplementedin2012)wereusedasafoundationforthePearlHarbor‐Airport‐LagoonDrivesurvey,andwhilemostquestionswereretained,severalwereupdatedorreplacedwithuniquequestionsdevelopedfortheAirport/SaltLake/Mapunapunaneighborhoods.
Selecting Survey Recipients “Sampling”referstothemethodbywhichsurveyrecipientsarechosen.The“sample”referstoallresidentswhoweregivenachancetoparticipateinthesurvey.TocreatethissampleaUSPSlistofallresidentialaddresseswithinthezipcodesnearthestationswaspurchased.Eachoftheaddresseswasgeocodedtodeterminethepreciselongitudeandlatitudeoftheaddress.Thisgeocodeinformationwasalsousedtodeterminethewalkingdistanceoftheaddresstotherelevantrailstation.
Thesamplingplanforthisseriesofcommunitysurveys(ofwhichtheAirport/SaltLake/Mapunapunaisthe6th),wastomailsurveysto1,350householdswithinahalfmileofeachoftheplannedstationsineachcommunity.However,theAirport/SaltLake/Mapunapunacommunityhasalargebusinesses/industrialareaandmostnearbyhouseholdsweremorethanahalfmileawayfromeachofthethreestations.Toensurethatthehouseholdsclosesttothesestationswereadequatelyrepresented,theminimumdistancetothestationwasincreasedtotwomiles.Additionally,mosthouseholdsthatwerewithintwomilesoftheHonoluluInternationalAirportstationwereclosertoeitherthePearlHarbororLagoonDrivestations.Thefinalsamplingplan,shownbelow,wascreatedtoaccommodatetheseuniqueneighborhoodfeatures.
ClosestStationPearlHarbor
Station
HonoluluInternationalAirportStation
LagoonDriveStation
Numberthatareclosesttostation 1,979 565 1,506Minimumdistancetocloseststation 0.32miles 0.48miles 0.53milesMaximumdistancetocloseststation 1.45miles 1.98miles 1.36miles
Ofthe4,050mailedsurveys,3,746weredeliveredtooccupiedhouseholds.Atotalof719completedsurveyswerereturned,foraresponserateof19%;thisisatypicalresponseratecomparedtothosethatNRCseesforsurveysinlargecities.Ofthe719respondents,58wereclosesttotheHonoluluInternationalAirportstation,239wereclosesttotheLagoonDrivestationand421wereclosesttothePearlHarborstation.GiventhelownumberofrespondentswhowereclosesttotheAirportstation,whenresultsarereported“bystation,”theAirportandLagoonDrivestationareasarecombined(Airport/Lagoon).
CityandCountyofHonolulu Airport/SaltLake/MapunapunaResidentSurvey
107 ReportofResults
Survey Administration and Response Eachselectedhouseholdwascontactedfourtimes.First,aprenotificationannouncementwassenttotheselectedhouseholdinformingthemthattheyhadbeenselectedtoparticipateinthesurvey.Approximatelyoneweekaftermailingtheprenotification,eachhouseholdwasmailedasurveycontainingacoverlettersignedbytheDirectoroftheDepartmentofPlanningandPermittingenlistingparticipation.Thepacketalsocontainedapostage‐paidreturnenvelopeinwhichthesurveyrecipientscouldreturnthecompletedquestionnairetoNRC.Eachsurveyhadauniquefive‐digitcodeink‐jettedonthetopofthecoverpagesothatthereturnedsurveycouldbelinkedtothedataabouthowfarthehouseholdwasfromaplannedrailstation.
Areminderletterandsurveywasmailedtoarriveoneweekafterthefirstsurvey.Thesecondcoverletteraskedthosewhohadnotcompletedthesurveytodosoandthosewhohadalreadydonesotorefrainfromturninginanothersurvey.Aweekaftertheremindersurvey,afollow‐uppostcardwasmailed.Thepostcardaskednon‐responderstofindandcompletethesurveyandprovidedaphonenumbertocalliftheyhadlostthesurvey.
ThemailingsweresentinJulyandAugustof2014,andcompletedsurveyswerecollectedoverthefollowingsixweeks.About8%ofthe4,050surveysmailedwerereturnedbecausethehousingunitwasvacantorthepostalservicewasunabletodeliverthesurveyasaddressed.Oftheremaining3,746whoreceivedasurvey,719completedthesurvey,providingaresponserateof19%.Thisisatypicalresponserate;averageresponseratesforamailedresidentsurveytypicallyrangefrom15%to25%forlargerurbanpopulations.
Confidence Intervals The95%confidenceinterval(or“marginoferror”)quantifiesthe“samplingerror”orprecisionoftheestimatesmadefromthesurveyresults.A95%confidenceintervalcanbecalculatedforanysamplesizeandindicatesthatin95of100surveysconductedlikethisone,foraparticularitem,aresultwouldbefoundthatiswithinplusorminusfourpercentagepointsoftheresultthatwouldbefoundifeveryoneinthepopulationofinterestwassurveyed.Thepracticaldifficultiesofconductinganyresidentsurveymayintroduceothersourcesoferrorinadditiontosamplingerror.Despitebesteffortstoboostparticipationandensurepotentialinclusionofallhouseholds,someselectedhouseholdswilldeclineparticipationinthesurvey(potentiallyintroducingnon‐responseerror)andsomeeligiblehouseholdsmaybeunintentionallyexcludedfromthelistedsourcesforthesample(referredtoascoverageerror).
Whilethe95percentconfidencelevelforthesurveyisgenerallynogreaterthanplusorminusfourpercentagepointsaroundanygivenpercentreportedforaquestionansweredbyalltherespondents(719),resultsforsubgroupswillhavewiderconfidenceintervals.Whereestimatesaregivenforsubgroups,theyarelessprecise.Foreachsubgroupfromthesurvey,themarginoferrorrisestoasmuchasplusorminus14%for50completedsurveys,toplusorminus7%for200completedsurveys.
Survey Processing (Data Entry) Mailedsurveysweresubmittedviapostage‐paidbusinessreplyenvelopes.Eachsurveywasreviewedand“cleaned”asnecessary.Forexample,aquestionmayhaveaskedarespondenttopicktwoitemsoutofalistoffive,buttherespondentcheckedthree;staffwouldchooserandomlytwoofthethreeselecteditemstobecodedinthedataset.
Onceallsurveyswereassignedauniqueidentificationnumber,theywereenteredintoanelectronicdataset.Thisdatasetwassubjecttoadataentryprotocolof“keyandverify,”inwhich
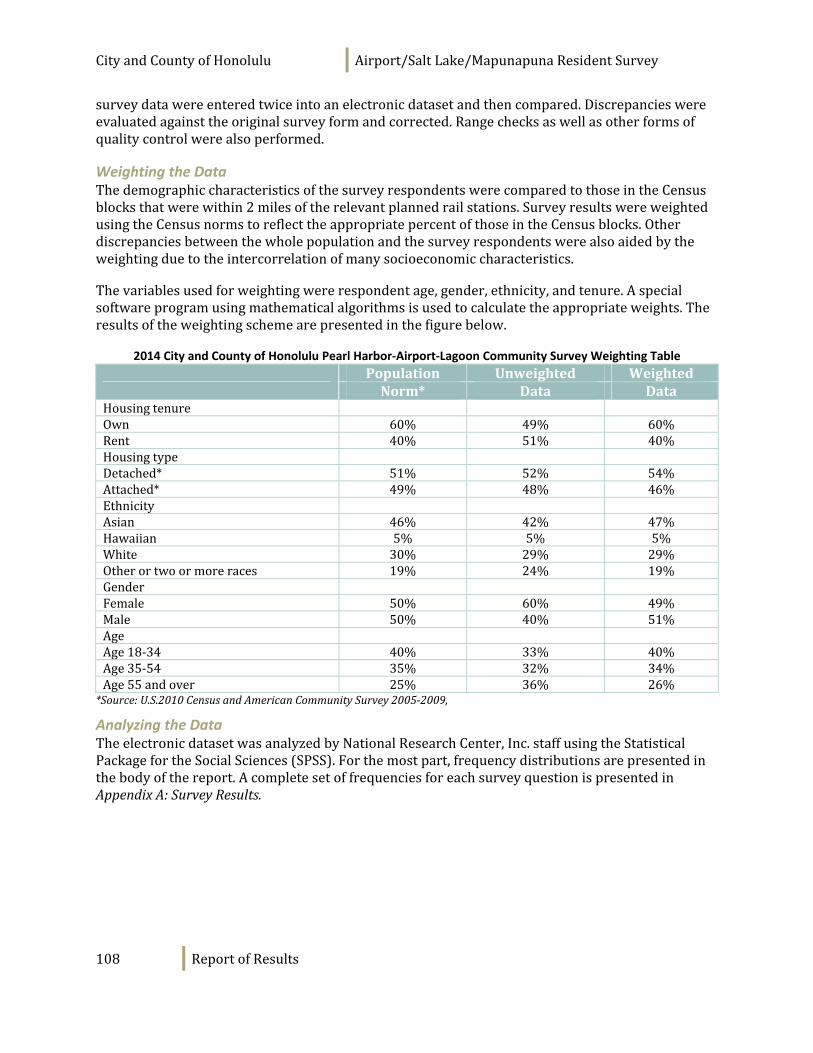
CityandCountyofHonolulu Airport/SaltLake/MapunapunaResidentSurvey
108 ReportofResults
surveydatawereenteredtwiceintoanelectronicdatasetandthencompared.Discrepancieswereevaluatedagainsttheoriginalsurveyformandcorrected.Rangechecksaswellasotherformsofqualitycontrolwerealsoperformed.
Weighting the Data ThedemographiccharacteristicsofthesurveyrespondentswerecomparedtothoseintheCensusblocksthatwerewithin2milesoftherelevantplannedrailstations.SurveyresultswereweightedusingtheCensusnormstoreflecttheappropriatepercentofthoseintheCensusblocks.Otherdiscrepanciesbetweenthewholepopulationandthesurveyrespondentswerealsoaidedbytheweightingduetotheintercorrelationofmanysocioeconomiccharacteristics.
Thevariablesusedforweightingwererespondentage,gender,ethnicity,andtenure.Aspecialsoftwareprogramusingmathematicalalgorithmsisusedtocalculatetheappropriateweights.Theresultsoftheweightingschemearepresentedinthefigurebelow.
2014 City and County of Honolulu Pearl Harbor‐Airport‐Lagoon Community Survey Weighting Table
Population Unweighted Weighted Norm* Data Data
Housingtenure Own 60% 49% 60%Rent 40% 51% 40%Housingtype Detached* 51% 52% 54%Attached* 49% 48% 46%Ethnicity Asian 46% 42% 47%Hawaiian 5% 5% 5%White 30% 29% 29%Otherortwoormoreraces 19% 24% 19%Gender Female 50% 60% 49%Male 50% 40% 51%Age Age18‐34 40% 33% 40%Age35‐54 35% 32% 34%Age55andover 25% 36% 26%*Source:U.S.2010CensusandAmericanCommunitySurvey2005‐2009,
Analyzing the Data TheelectronicdatasetwasanalyzedbyNationalResearchCenter,Inc.staffusingtheStatisticalPackagefortheSocialSciences(SPSS).Forthemostpart,frequencydistributionsarepresentedinthebodyofthereport.AcompletesetoffrequenciesforeachsurveyquestionispresentedinAppendixA:SurveyResults.

CityandCountyofHonolulu Airport/SaltLake/MapunapunaResidentSurvey
109 ReportofResults
Appendix G: Survey Instrument
Thisappendixcontainsthe2014Airport/SaltLake/MapunapunaCommunitySurvey.
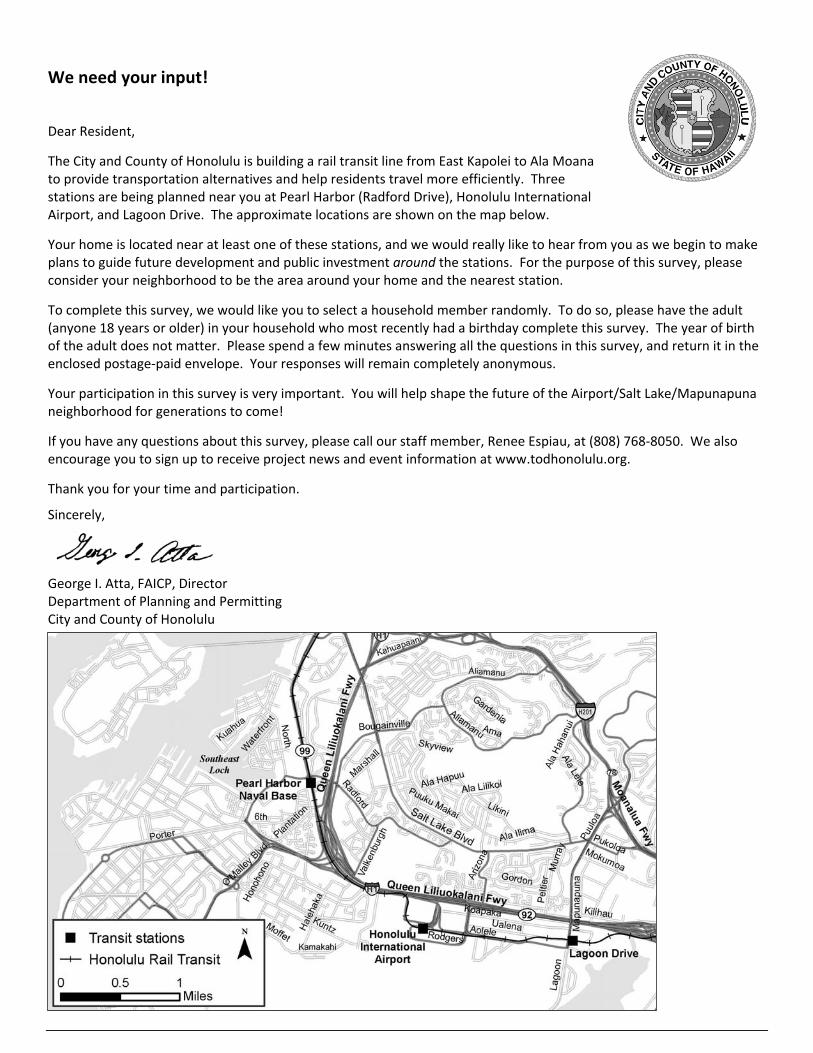
We need your input!
Dear Resident,
The City and County of Honolulu is building a rail transit line from East Kapolei to Ala Moana to provide transportation alternatives and help residents travel more efficiently. Three stations are being planned near you at Pearl Harbor (Radford Drive), Honolulu International Airport, and Lagoon Drive. The approximate locations are shown on the map below.
Your home is located near at least one of these stations, and we would really like to hear from you as we begin to make plans to guide future development and public investment around the stations. For the purpose of this survey, please consider your neighborhood to be the area around your home and the nearest station.
To complete this survey, we would like you to select a household member randomly. To do so, please have the adult (anyone 18 years or older) in your household who most recently had a birthday complete this survey. The year of birth of the adult does not matter. Please spend a few minutes answering all the questions in this survey, and return it in the enclosed postage‐paid envelope. Your responses will remain completely anonymous.
Your participation in this survey is very important. You will help shape the future of the Airport/Salt Lake/Mapunapuna neighborhood for generations to come!
If you have any questions about this survey, please call our staff member, Renee Espiau, at (808) 768‐8050. We also encourage you to sign up to receive project news and event information at www.todhonolulu.org.
Thank you for your time and participation.
Sincerely,
George I. Atta, FAICP, Director Department of Planning and Permitting City and County of Honolulu
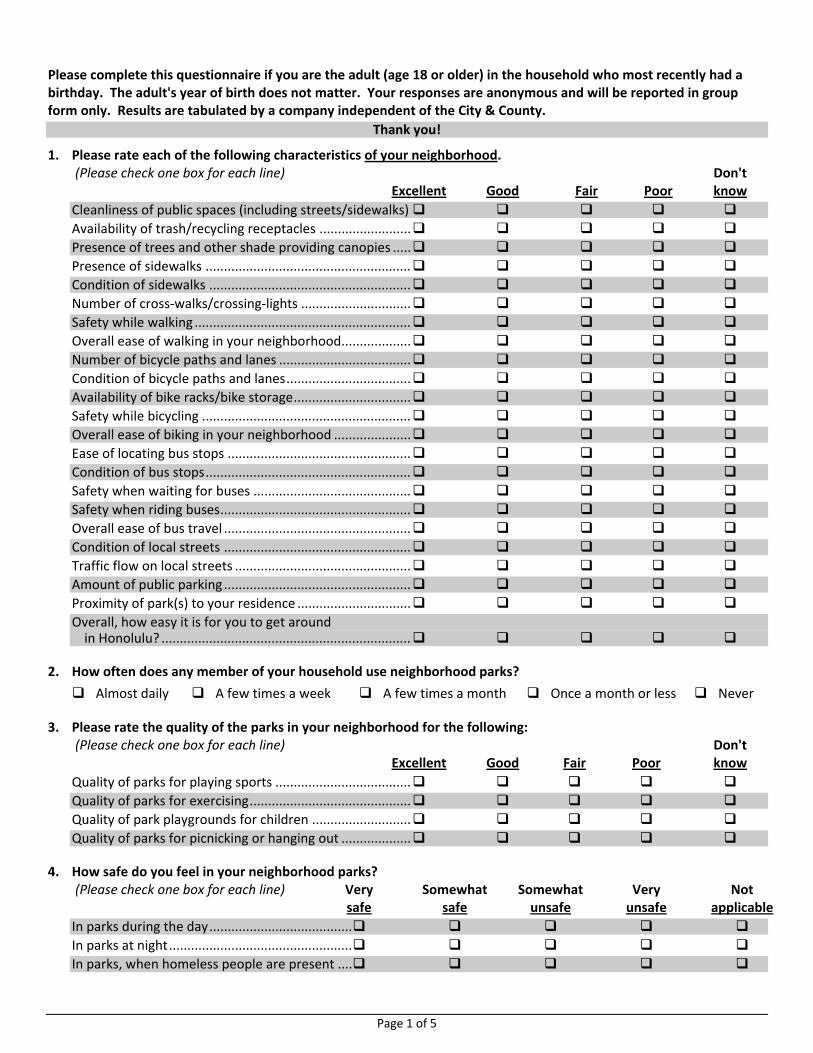
Page 1 of 5
Please complete this questionnaire if you are the adult (age 18 or older) in the household who most recently had a birthday. The adult's year of birth does not matter. Your responses are anonymous and will be reported in group form only. Results are tabulated by a company independent of the City & County.
Thank you!
1. Please rate each of the following characteristics of your neighborhood. (Please check one box for each line) Don't Excellent Good Fair Poor know
Cleanliness of public spaces (including streets/sidewalks)
Availability of trash/recycling receptacles .........................
Presence of trees and other shade providing canopies .....
Presence of sidewalks ........................................................
Condition of sidewalks .......................................................
Number of cross‐walks/crossing‐lights ..............................
Safety while walking ...........................................................
Overall ease of walking in your neighborhood...................
Number of bicycle paths and lanes ....................................
Condition of bicycle paths and lanes..................................
Availability of bike racks/bike storage................................
Safety while bicycling .........................................................
Overall ease of biking in your neighborhood .....................
Ease of locating bus stops ..................................................
Condition of bus stops........................................................
Safety when waiting for buses ...........................................
Safety when riding buses....................................................
Overall ease of bus travel ...................................................
Condition of local streets ...................................................
Traffic flow on local streets ................................................
Amount of public parking ...................................................
Proximity of park(s) to your residence ...............................
Overall, how easy it is for you to get around in Honolulu? ....................................................................
2. How often does any member of your household use neighborhood parks?
Almost daily A few times a week A few times a month Once a month or less Never
3. Please rate the quality of the parks in your neighborhood for the following: (Please check one box for each line) Don't Excellent Good Fair Poor know
Quality of parks for playing sports .....................................
Quality of parks for exercising............................................
Quality of park playgrounds for children ...........................
Quality of parks for picnicking or hanging out ...................
4. How safe do you feel in your neighborhood parks? (Please check one box for each line) Very Somewhat Somewhat Very Not safe safe unsafe unsafe applicable
In parks during the day.......................................
In parks at night..................................................
In parks, when homeless people are present ....
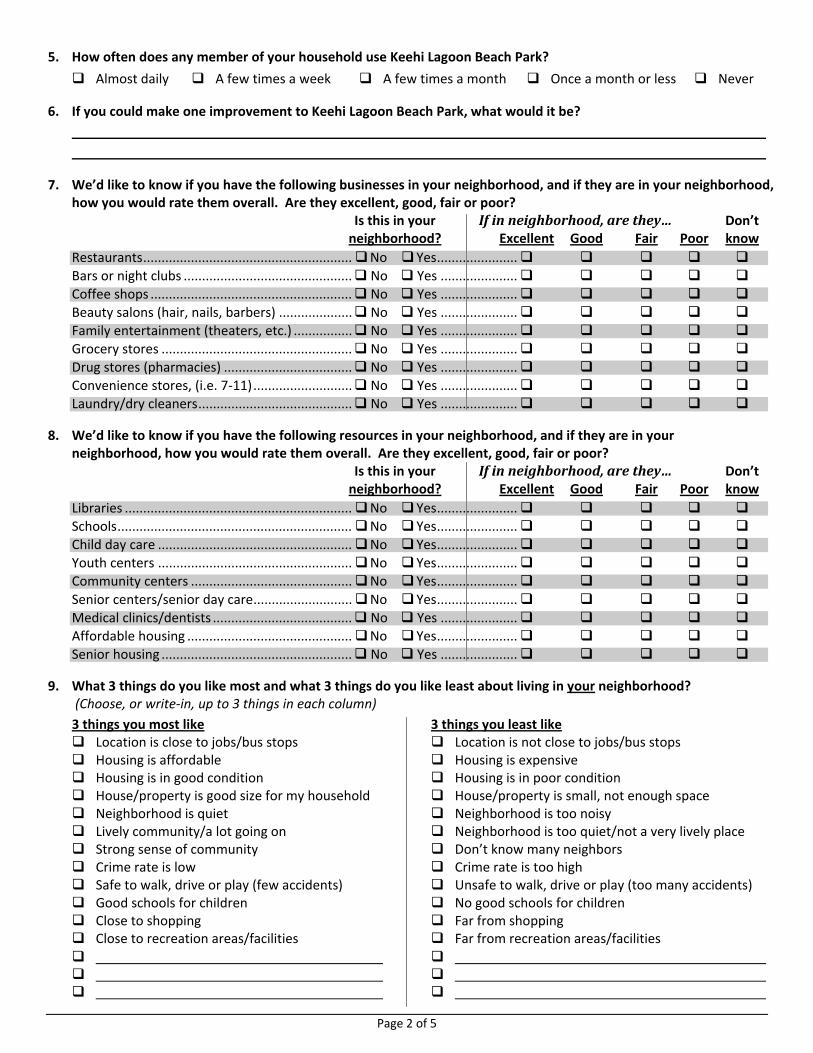
Page 2 of 5
5. How often does any member of your household use Keehi Lagoon Beach Park?
Almost daily A few times a week A few times a month Once a month or less Never
6. If you could make one improvement to Keehi Lagoon Beach Park, what would it be?
7. We’d like to know if you have the following businesses in your neighborhood, and if they are in your neighborhood, how you would rate them overall. Are they excellent, good, fair or poor?
Is this in your Ifinneighborhood,arethey… Don’t neighborhood? Excellent Good Fair Poor know
Restaurants......................................................... No Yes......................
Bars or night clubs .............................................. No Yes .....................
Coffee shops ....................................................... No Yes .....................
Beauty salons (hair, nails, barbers) .................... No Yes .....................
Family entertainment (theaters, etc.) ................ No Yes .....................
Grocery stores .................................................... No Yes .....................
Drug stores (pharmacies) ................................... No Yes .....................
Convenience stores, (i.e. 7‐11)........................... No Yes .....................
Laundry/dry cleaners.......................................... No Yes .....................
8. We’d like to know if you have the following resources in your neighborhood, and if they are in your neighborhood, how you would rate them overall. Are they excellent, good, fair or poor? Is this in your Ifinneighborhood,arethey… Don’t neighborhood? Excellent Good Fair Poor know
Libraries .............................................................. No Yes......................
Schools................................................................ No Yes......................
Child day care ..................................................... No Yes......................
Youth centers ..................................................... No Yes......................
Community centers ............................................ No Yes......................
Senior centers/senior day care........................... No Yes......................
Medical clinics/dentists ...................................... No Yes .....................
Affordable housing ............................................. No Yes......................
Senior housing .................................................... No Yes .....................
9. What 3 things do you like most and what 3 things do you like least about living in your neighborhood? (Choose, or write‐in, up to 3 things in each column)
3 things you most like 3 things you least like Location is close to jobs/bus stops Location is not close to jobs/bus stops Housing is affordable Housing is expensive Housing is in good condition Housing is in poor condition House/property is good size for my household House/property is small, not enough space Neighborhood is quiet Neighborhood is too noisy Lively community/a lot going on Neighborhood is too quiet/not a very lively place Strong sense of community Don’t know many neighbors Crime rate is low Crime rate is too high Safe to walk, drive or play (few accidents) Unsafe to walk, drive or play (too many accidents) Good schools for children No good schools for children Close to shopping Far from shopping Close to recreation areas/facilities Far from recreation areas/facilities
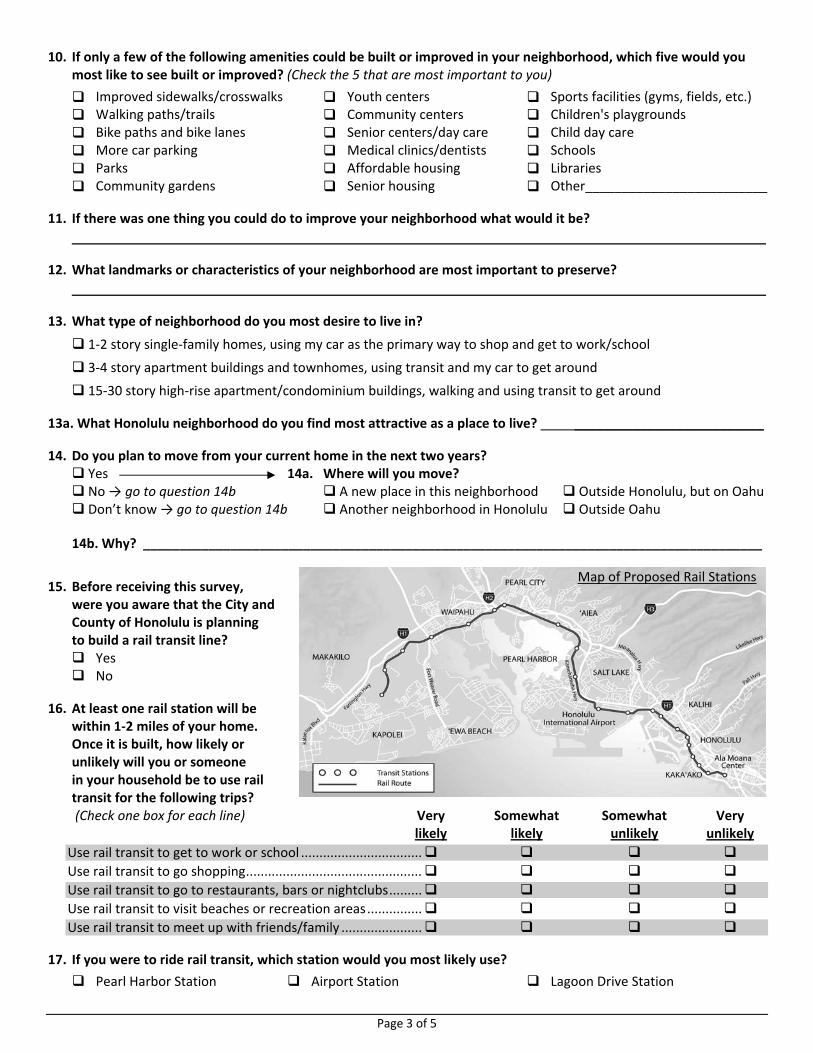
Page 3 of 5
10. If only a few of the following amenities could be built or improved in your neighborhood, which five would you most like to see built or improved? (Check the 5 that are most important to you)
Improved sidewalks/crosswalks Youth centers Sports facilities (gyms, fields, etc.)
Walking paths/trails Community centers Children's playgrounds
Bike paths and bike lanes Senior centers/day care Child day care
More car parking Medical clinics/dentists Schools
Parks Affordable housing Libraries
Community gardens Senior housing Other_________________________
11. If there was one thing you could do to improve your neighborhood what would it be?
12. What landmarks or characteristics of your neighborhood are most important to preserve?
13. What type of neighborhood do you most desire to live in?
1‐2 story single‐family homes, using my car as the primary way to shop and get to work/school
3‐4 story apartment buildings and townhomes, using transit and my car to get around
15‐30 story high‐rise apartment/condominium buildings, walking and using transit to get around
13a. What Honolulu neighborhood do you find most attractive as a place to live? __________________________
14. Do you plan to move from your current home in the next two years? Yes 14a. Where will you move? No → go to question 14b A new place in this neighborhood Outside Honolulu, but on Oahu Don’t know → go to question 14b Another neighborhood in Honolulu Outside Oahu
14b. Why? _____________________________________________________________________________________
15. Before receiving this survey,
were you aware that the City and County of Honolulu is planning to build a rail transit line? Yes No
16. At least one rail station will be within 1‐2 miles of your home. Once it is built, how likely or unlikely will you or someone in your household be to use rail transit for the following trips?
(Check one box for each line) Very Somewhat Somewhat Very likely likely unlikely unlikely
Use rail transit to get to work or school .................................
Use rail transit to go shopping................................................
Use rail transit to go to restaurants, bars or nightclubs.........
Use rail transit to visit beaches or recreation areas...............
Use rail transit to meet up with friends/family ......................
17. If you were to ride rail transit, which station would you most likely use?
Pearl Harbor Station Airport Station Lagoon Drive Station
Map of Proposed Rail Stations
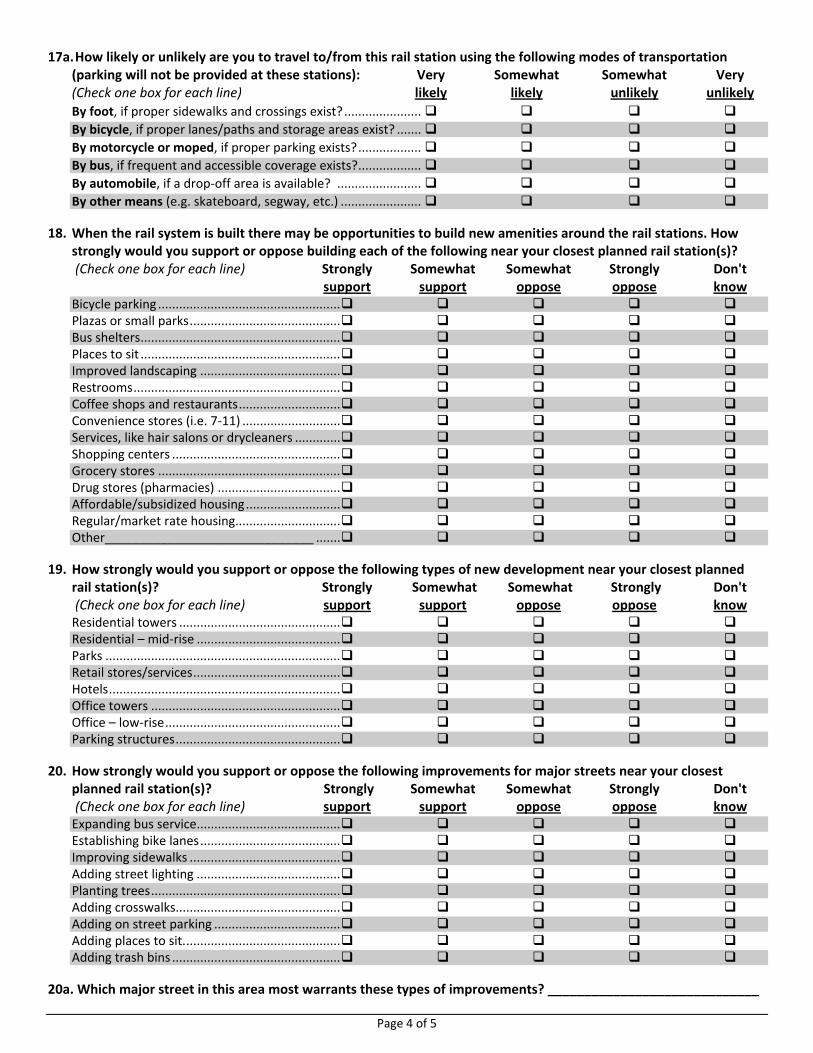
Page 4 of 5
17a. How likely or unlikely are you to travel to/from this rail station using the following modes of transportation (parking will not be provided at these stations): Very Somewhat Somewhat Very (Check one box for each line) likely likely unlikely unlikely
By foot, if proper sidewalks and crossings exist?......................
By bicycle, if proper lanes/paths and storage areas exist? .......
By motorcycle or moped, if proper parking exists?..................
By bus, if frequent and accessible coverage exists?..................
By automobile, if a drop‐off area is available? ........................
By other means (e.g. skateboard, segway, etc.) .......................
18. When the rail system is built there may be opportunities to build new amenities around the rail stations. How strongly would you support or oppose building each of the following near your closest planned rail station(s)? (Check one box for each line) Strongly Somewhat Somewhat Strongly Don't
support support oppose oppose know Bicycle parking .................................................... Plazas or small parks........................................... Bus shelters......................................................... Places to sit ......................................................... Improved landscaping ........................................ Restrooms........................................................... Coffee shops and restaurants............................. Convenience stores (i.e. 7‐11) ............................ Services, like hair salons or drycleaners ............. Shopping centers ................................................ Grocery stores .................................................... Drug stores (pharmacies) ................................... Affordable/subsidized housing........................... Regular/market rate housing.............................. Other______________________________ .......
19. How strongly would you support or oppose the following types of new development near your closest planned rail station(s)? Strongly Somewhat Somewhat Strongly Don't
(Check one box for each line) support support oppose oppose know Residential towers .............................................. Residential – mid‐rise ......................................... Parks ................................................................... Retail stores/services.......................................... Hotels.................................................................. Office towers ...................................................... Office – low‐rise.................................................. Parking structures...............................................
20. How strongly would you support or oppose the following improvements for major streets near your closest planned rail station(s)? Strongly Somewhat Somewhat Strongly Don't
(Check one box for each line) support support oppose oppose know Expanding bus service......................................... Establishing bike lanes........................................ Improving sidewalks ........................................... Adding street lighting ......................................... Planting trees...................................................... Adding crosswalks............................................... Adding on street parking .................................... Adding places to sit............................................. Adding trash bins ................................................
20a. Which major street in this area most warrants these types of improvements? _____________________________
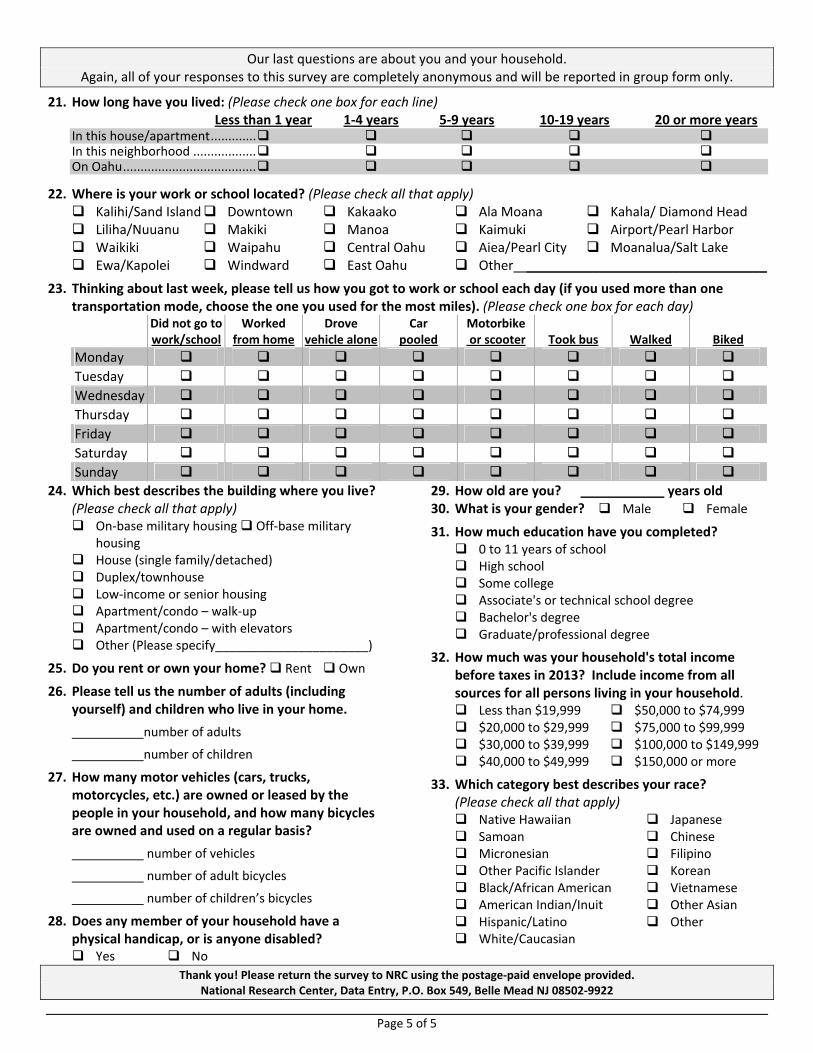
Page 5 of 5
Our last questions are about you and your household. Again, all of your responses to this survey are completely anonymous and will be reported in group form only.
21. How long have you lived: (Please check one box for each line) Less than 1 year 1‐4 years 5‐9 years 10‐19 years 20 or more years
In this house/apartment............. In this neighborhood .................. On Oahu......................................
22. Where is your work or school located? (Please check all that apply) Kalihi/Sand Island Downtown Kakaako Ala Moana Kahala/ Diamond Head Liliha/Nuuanu Makiki Manoa Kaimuki Airport/Pearl Harbor Waikiki Waipahu Central Oahu Aiea/Pearl City Moanalua/Salt Lake Ewa/Kapolei Windward East Oahu Other _________________________________
23. Thinking about last week, please tell us how you got to work or school each day (if you used more than one transportation mode, choose the one you used for the most miles). (Please check one box for each day) Did not go to
work/school Worked
from home Drove
vehicle alone Car
pooled Motorbike or scooter Took bus Walked Biked
Monday
Tuesday
Wednesday
Thursday
Friday
Saturday
Sunday
24. Which best describes the building where you live? (Please check all that apply) On‐base military housing Off‐base military
housing House (single family/detached) Duplex/townhouse Low‐income or senior housing Apartment/condo – walk‐up Apartment/condo – with elevators Other (Please specify______________________)
25. Do you rent or own your home? Rent Own
26. Please tell us the number of adults (including yourself) and children who live in your home.
number of adults
number of children
27. How many motor vehicles (cars, trucks, motorcycles, etc.) are owned or leased by the people in your household, and how many bicycles are owned and used on a regular basis?
number of vehicles
number of adult bicycles
number of children’s bicycles
28. Does any member of your household have a physical handicap, or is anyone disabled? Yes No
29. How old are you? years old 30. What is your gender? Male Female
31. How much education have you completed? 0 to 11 years of school High school Some college Associate's or technical school degree Bachelor's degree Graduate/professional degree
32. How much was your household's total income before taxes in 2013? Include income from all sources for all persons living in your household. Less than $19,999 $50,000 to $74,999 $20,000 to $29,999 $75,000 to $99,999 $30,000 to $39,999 $100,000 to $149,999 $40,000 to $49,999 $150,000 or more
33. Which category best describes your race? (Please check all that apply) Native Hawaiian Japanese Samoan Chinese Micronesian Filipino Other Pacific Islander Korean Black/African American Vietnamese American Indian/Inuit Other Asian Hispanic/Latino Other White/Caucasian
Thank you! Please return the survey to NRC using the postage‐paid envelope provided.
National Research Center, Data Entry, P.O. Box 549, Belle Mead NJ 08502‐9922


