Embed Size (px)
Citation preview

~,~ 1, .. t
/
1971 - 81-
FINAL REPORTALL INDIA CO-ORDINATED . RESEARCH PROJECT
ON ECOLOGY AND FISHERIESOF FRESHWATER RESERVOIRS
,•
BHA Yn~Ni's~e~~~6chInformation Series 1
\ May, 1981,·lto I

FINAL REPORT1971-1981
ALL INDIA COORDINATED RESEARCH PROJECT ON ECOLOGY ANDFISHERIES OF FRESHWATER RESERVOIRS
BHAVANISAGAR SUBCENTRE
Shri S.D. Tripathi(1.1.1980 - continuing)
Project Coordinator Dr. A.V. Natarajan(8.4.1971-30.6.1979)
Associates Shri C'h, GopalakrishnayyaOfficer-in-Charge(11.5.1971-29.3.1976)
Smt. S. Sivakami(26.9.1977 - till date)
Dr. Mathew AbrahamOfficer-in-Charge(27.7.1972- till date)
Dr. B.P. Gupta(21.4.1972-10.7.1977)
Dr. K. ...Ugaraja(5.5.1971-26.9.1974)
Other participants Shri C. Selvaraj(22.5.1971-6.7.1972)

FOREWORD
Detailed investigations on ecology and fisheriesof Bhavanisagar reservoir waS taken up in the year 1971as part of the progran~e under the All India CoordinatedResearch Project on Ecology and Fisheries of FreshwaterReservoirs. The studies covering a period of nearly adecade have resulted in a wealth of information on thephysico-chemical parameters of reservoir, nutrient statusof,basin soil, biotic communities including plankton,benthos and periphyton, fish dispersal in time ~d space,stock responses to changes in fishing effort, vulnerabi-lity of fish species to specific mesh sizes and a hostof other data vital for management of reservoir fishe-ries on scientific basis. The reservoir which provideda production of 19 kg/ha/year in 1970 surged ahead inyield to the level of 80 kg/ha/year in a space of6 years following adoption of scientific managementmeaSures. The studies also revealed the inbuilt recruit-ment variations in stocks and the need for stocking toeven out fluctuations in fish yield. It is sincerelyhoped that suitable development meaSures will be takenby the State in terms of recommendations contained inthis report" to ensure sustained optimum production offishes from this reservoir.
I like to place on record my deep appreciationof the excellent'supervision and imaginative leadershipprovided by the Officers-in-Charge" Shri Ch.Gopala-krishnayya, Dr. rJIathewAbz-ab am and Hrs. S. Sivakamiand vigorous pursuit of research programmes by asSO-c La+e e ,
It gives me equal pleasure to place on recordthe excellent cooperation extended by Directors ofFisheries, Government of Tamil Nadu and the staff ofFisheries Directorate at Bhavanisagar.
Barrackpore,4 May, 1981 luV• ''Na ta:t1aJ r: ..;;;.
Director 't : S=, IJ ~

FOREWORD
Detailed investigations on ecology and fisheriesof Bhavanisagar reservoir waS taken up in the year 1971as part of the programme under the All India CoordinatedResearch Project on Ecology and Fisheries of FreshwaterReservoirs. The studies covering a period of nearly adecade have resulted in a wealth of information on thephysico-chemical parameters of reservoir, nutrient statusof basin soil, biotic communities including plankton,benthos and periphyton, fish dispersal in time ~d space,stock responses to changes in fishing effort, vulnerabi-lity of fish species to specific mesh sizes and a hostof other data vital for management of reservoir fishe-ries on scientific basis. The reservoir which provideda production of 19 kg/ha/year in 1970 surged ahead inyield to the level of 80 kg/ha/year in a space of6 years following adoption of scientific managementmeaSures. The studies also revealed the inbuilt recruit-ment variations in stocks and the need for stocking toeven out fluctuations in fish yield. It is sincerelyhoped that suitable development meaSures will be takenby the State in terms of recommendations contained inthis report" to ensure sustained optimum production offishes from this reservoir.
I like to place on record my deep appreciationof the excellent'supervision and imaginative leadershipprovided by the Officers-in-Charge, Shri Ch.Gopala-kri shnayya, Dr. rJIathewAbraham and JVIrs.S. Sivakamiand vigorous pursuit of research programmes by asso-ciates.
It gives me equal pleasure to place on recordthe excellent cooperation extended by Directors ofFisheries, Government of Tamil Nadu and the staff ofFisheries Directorate at Bhavanisagar.
Barrackpore,4 JVIay,1983 A.3T. Waa:11aJr:
Director 't

9
101 1
CONTENTS
12
INTRODUCTIONPHYSIC AL Al'JDI"IQRPHOrvIETRICFE ATURBS OFBHAVANISAGAR RESERVOIRSAlWLING ~rnTHODOLOGYMETEOROLOGICAL OBSERVATIONSWATER LEVEL P..ND INFLOW Al.'JDOUTFLOVlCHEMICAL CHARACTERISTICS OF SOILPHYSICO-CHEr,nCAJ.JFEATURES OF SURFACEWATER OF THE RESERVOIR
34
56
7
7.1 Ph;vsical features of differentsectors
7.2 Chemical features of differentsectors
7.2.1 Lentic sector7.2.2 Intermediate sector7.2.3 Lotic sector7.2.4 Moyar sector
Page
1
2
2
4
4
5
6
6
6
6
9
9
9
7.3 ~utrient features of different 9sectors'7.3.1 Lentic sector 97.3.2 Intermediate sector 97.3.3 Lotic sector 97.3.4 IVIo;)Tarsector 10
7.4 Impact of viscose industry on waterqunlity of different sectors 10
8 VERTICAL DISTRIBUTION OF PHYSICO-CHEHICALCHARACTERISTICSDIURNAL VARIATION IN. CHEMICAL PARAMETERSPRIMARY PRODUCTIVITYFISH FOOD RESOURCES OF THE RESERVOIR
101215
15

Page
11 .1 Plankton 15
11.1.1 Phytoplankton 1911.1.2 Zooplankton 22
11 .2 Bottom biota 22
11.2.1 Lentic sector 22
11.2.2 Intermediate sector 24
11.2.3 Lotic sector 24
11.2.4 Moyar sector 24
11 .3 Aquatic plants 24
12 FISH FAUNA 25
'13 UTILISATION OF FOOD RESOURCESBY THE FISHES 26
14 BREEDING BIOLOGY OF FISHES 27
14.1 !!.. calbasu 27
14.2 C. mrigeJ..? 29
14.3 g.• catla 29
14.4 ;r.. dub ius 29
14.5 ..11. ~ 29
14.6 lie ~ 29
14.7 Q. bimaculatus 30
14.8 !?. dorsalis 30
15 RECRUITr.1ENT 3116 LENGTH-'WEIGHT RELATIONSHIP OF
ECONOMIC FISHES 32
17 FISH CATCH iiliDCATCH ,STRUCTURE 33 -!'r
17.1 Trends' in individual fishery 33
17.1.1 !!.. calbasu 3317.1.2 C. mrigala 3517.1.3 Q. catla 35
17.1.4 !!.. rohita 3517.1.5 ~. dub ius 35
17.1.6 !!.. fimbriatus 35

r
18
",
19
20
21
17 .•1.7 ~.bata17.1.8 !i. ~17.1 .•9 Yl.. ~
17.2 Fishing ef'f'ort,catch per unitef'f'ortand yield17.2.1 ~.calbasu17$2.2 9.,. mrigala17.2.3 9.,. catla17.2.4 r· dubius17.2.5 N. ~17.2.6 'ji. ~
IMl?1l.CTOF STOCKING ON YIELD18.1 C • catla18.2 9.,. mrigala18.3 ~.rohita18.4 L. f'imbriatus18.5 Q.. carpio
TAGGING AND CLIPPING
EXPBRIlVIENT.ALFISHING20.1 Fish distribution in space and time20.2 Yield composition sector-wise
species-wiseFish size - Mesh size relationshipEf'f'ective mesh size f'or dif'ferentspeciesPercentage species composition inexpe:r<imental nets and commercial:fishing
FISHERY POTENTIl~ OF BHAVANISAGAR VIS-A-VIS PRESENT YIELD
Page
353636
36363737383838393939393941414141
4245
45
45
53

iv
Page
22 PEN CULTURE 5423 ACKNOv>ILEDGEMENTS 5424 REFERENCES 5525 SU:r.1MAR.Y 5726 PUBLICATIONS 6127 REC 0I\1I>'IENDATIONS 6328 SUGGESTIONS FOR FUTURE WORK 66

1 INTRJDUCTION
According to the National Commission on Agriculturethere are about 50 large and 475 medium and small reservoirsin India covering approximately a surface water area of 3million hectares (Government of India 1976). These waterbodies are important sources of fish production, but thepresent yield from these reservoirs averaging 6-7 kg/ha(Jhingran and Tripathi 1969), with the existing managementpractices, are only a fraction of their potential. Thereasons for such low yields among others are inadequateunderstanding of eco-system, scanty stocking, wrong selec-tion of the species and irrational exploitation arising fromlack of expertise in basic principles of stock dynamicsvis-a-vis fishing effort, mesh size parameters and princi-ples of stock manipulation. With a view to finding solu-tions to the problems of reservoir fisheries and develop-ing principles for their scientific management, an AllIndia Coordinated Research Project on Ecology and Fisheriesof Freshwater Reservoirs waS launched in 1971 with centresin different eco-climatic zones. One such centre waslocated at Bhavanisagar (District Periyar) in Tamil Nadu.
Earlier studies on Bhavanisagar were confined topreimpoundment survey (Chacko and Dinamani, 1949); limnologyand primary productivity (Dorai Raj and Pankajam, 1956;Men ori and'Chari, 1959; Sreenivasan, 1962, 1964, 1970;Franklin, 1969; Sreenivasan et al., 1969); biology ofcommercial fishes like P. dubiu~-(Ranganathan et al., 1962),M. ~ (Ranganathan and-Radha, 1966), 1. c8lba~ -tNatarajan, 1971) and O. marulius {Devaraj, 1973); and,experimental fishing (Renganatha~ and Venkataswarny, 1967).The investigations under the All India Coordinated ResearchProject were aimed at more detailed studies on soilcharacter, water quality, productivity indices which formthe guidelines for determining the productive potentialof the reservoir, fish food resources and their extentof utilization, stocking and its impact on yield, stockdynamics vis-a-vis fishing effort, catch per unit effortand yield and mesh selectivity for different species.

2
2 PHYSICAL AND l\lORPHOlV1ETRIC:F'EATURES OF BHAV ANISAGlill
The reservoir was constructed near Pungar village(Periyar district) below the confluence of the rivers Bhavaniand Moyar in 1953 and is located at latitude 110.28' N withthe twi~ objectives of meeting the irrigation demands andcontrolling the floods. The morphometric data on the reservoiris given below :
River bed level (msl)FRL (msl)MRL (msl)Area at FRLArea at MRL
242.9 m
278.9 m280.4 m7,265 ha7,877 ha
Average area(FRL + DSL)
23,695 ha
Capacity at FRLAverage annual waterlevel fluctuationsMeari depthShore line length at FRL
81, 411 ha- m
14.24 m
11.18 m
125.5 kmThe following parameters were derived from thebaeLo data :Sho.re development at FRLVolume development at FRL
4.010.94
3 SAMPLING METHODOLOGY
The reservoir was divided into four sectors forpurpose of sampling - Lentic (deep water area having lacustrineconditions)~ Lotic (the riverine portion of the reservoirhaving fluviatile conditions) and the Intermediate (the areain between the Lotic and the Lentic sectors) and Moyar inter-mediate (Fig.1).

3
Soil samples were collected by using an Bkman's dredgefrom every 5 Sq km area in the initial years of investigationsbut later from every 13 Sq km area.
[,Vatersampling waS done during 1973-74 from areascorresponding to littoral, sub-littoral and profundal zonesin all the four sectors. From 1974-75 onwards depth profilesamples were taken at every 3 m depth in the profundal regionsof all the sectors. But each sector waS covered once inthree months. Thus Lentic sector w a.esampled in April, J-uly~October and January; Intermediate sector in Hay, August, No-vember and February;. Lotic and IVloyarsectors in June, Se:"..Gsm-ber, December and March. From 1974, studies on diurnal vari'a-tions were also initiated in the Lentic sector in everyquarter.
Primary productivity studies usingBottle technique were conducted from 1972.years the studies 'were confined to surfacethe entire euphotic zone was covered.
Dark and LightIn the initial
but from 1974-75
Plankton samples ",leretaken in the initialyearsfrom the littoral zone of the Lentic sector only. From 1974onwards, all the sectors were covered. Samples were t~cenfrom the littoral, sub-littoral and profundal zones of eachsector, Vertical hauls were taken from each zone using a plank-ton net of nylobolt (m.25) having a length of 1 m and 30 cmdiameter at mouth.
Bottom biota samples were taken at every 2m depthup to 10 m and then at a depth of every 5 m. Each sector waScovered once in three months during 1974-76. Three sampleswere taken from each depth with a 23 cq cq Ekman's dredge andthe samples ",;oresieved through a 40 mesh sieve (256 meshes/sq cm) •
Data on biologic al parameters was· collected at thefish assembly centre while the catch statistics were notedfrom the records of the State Fisheries Department.
To study the recruitment, standard shooting netswere operated to collect the spawn in the 'upper reaches ofthe river Bhavani during the south-west monsoon. Sar.lplesof'eggs were reared in earthen hundies and cement cisterns toidentifiable size. Drag nets of 1.6 mm mesh were also plie~in the littoral areaS to collect the fry.

4
Experimental fishing waS conducted during 1978-79and 1979-80. Multi-meshed surface gill nets from 40 to 300 mmmesh sizes were used. Nets were plied for four days in eachsector during a month with the smaller meshes towards theshore. The fishing stations are shown in Fig.1. The nets werehauled after 24 hours. A total of 32 pieces of nets eachhaving 35 m of hung length were used. Thus, the total hunglength of the nets was 1,120 m with a hanging co-efficient of0.5. The nets had a hung depth of 5.1 m with a hanging co-efficient of 0.85. During the second year 40 and 50 mm meshsize nets were not operated.
5 WATER LEVEL AND INFLOW AND OUTFLOW
4 METEOROLOGICAL OBSERVATIONSThe air temperature and wind speed at Bhavani-
sagar are presented in Table I, Maximum air temperature wasrecorded in April/May but the minimum air temperature did notfollow a set pattern. Maximum wind speed generally occ!rredduring June-August touching 40 km/hr in June 1979. November-January generally showed minimum wind speed. The data onrainfall is presented in Fig.2. The catchment of the reser-voir is subjected to both south-west and north-east monsoons,the effect of the latter being usually more than that of theformer.
Data on the inflow-outflow, water levels, co-rresponding areas and capacities during the period of studyare shown in Figs. 2-5 respectively. The area capacity curveof the reservoir is shown in Fig. 6.
The water levels during the period fluctuatedfrom 256.64 m (1974-75) to 280.42 m (1978-79). The averagewater level was maximum in 1978-79 (279.71 m) and minimum in1976-77 (265~14 ~). The water level fluctuations were maximumin 1977-78 (22.06 m) and minimum in 1979-80 (5.46 m). Maximumwater levels were generally during December/January and minimumduring April/May.
The area and capacity fluctuated in the rangeof 745 to 7,877 ha and from 2,501 to 92,889 ha-m. The inflowwas maximum in 1979-80 (42,007 m3/sec) and minimum in 1976-7'7(14,731 m3/sec). The outflow also showed maximum and minimumvalues (42,413 and 16,378 m3/sec) during the same years asinflow. The reservoir generally received maximum inflow duringnorth-east monsoon (November/December). It is mainly regula-ted by the discharge from the Pillur Dam - a hydel damsituated in the upper reaches of the Bhavan~ river.

- 5 -
DA']>\ ON I"IETEOROLOGICALOBSBRVATIONS IN BHAVANISAGlillDURING 1971~72 TO 19~Q-8j
Air tempera- Wind speed Average windY-U'iJT ture (oC) (km/hr) speed (km/hr)
Max. IvIin. Max Min Max fJIin
1971-72 38.34 18.49 18 .•98 0.08(May) (Nov) (June) (Dee)
1972-73 40.00 16.67 37c21 0.03 15.54 1.24(rJiay) 1-- ) (July) (Jan) (July) (Nov)\"";'€,e
1973-74 40000 16.7 30.34 0.29 6.27 0.96(Apr-May) (Jan) (July) (Nov) (July) (Jan)
1974-75 45.43 21 .3 30.32 0.10 9.32 0.75(Hay) (Jan) (J."ug) (Nov) (June) (Dee)
1975-76 45.43 21 ..3 23.94 0.23 8.45 1 .17(May) (Feb) (June) (Oet) (June) (Dee)
1976-77 41 .11 23.33 ~23.39 0.06 11 .48 0 e58(May) (Apr) (July) (Jan) (July) (J a..YJ.)
1977-78 38.6 12.2 24.00 0.68 10.60 2.01(f •.pr) (July) (Aug) .(Apr) (July) (Apr)
1978-79 39·5 18&0 22.0 2.0 10 ..4 4.0(Apr) (Dee) (May-Sep) (Jan) (Aug) (Dee-Feb)
1979-80 39.0 17.0 40.0 2.0 11 .08 2.0·(Apr-May) (Jan) (.June) (Nov-J an) (l~ug ) (Nov-~an)
1980··81 39.0 18.0 1600 2.0(Apr-May) (Feb. ) (June) (Apr.-OetotDee. & Jan.)

6
6 CHEMICAL CHARAC~ERISTICS,OF SOIL
The reservoir productivity is very much influ-enced by the quality of the soil of the reservoir basin aswell as that of the catchment. Studies made during 1973-76in'different sectors of the reservoir revealed that thebasin soil contains fairly high values of organic carbon(1.83 to 2.68%) and available nitrogen (31.6 to 50.8 mg/100 g)but the available phosphorus (1.0 to 3.58 mg/100 g) waS poor.Soil waS always acidic in nature with pH ranging from 5.2 to6.4. Lower values of soil pH were due to the presence offree carbondioxide in the bottom water layers of the reser-voir. Studies during the premonsoon and post-monsoon seaSonsindicated that the values of all the parameters were, higherin the premonsoon season than post-monsoon. Moyar and Loticsectors of the reservoir were richer in organic carbon, totalnitrogen and available nitrogen than the other sectors.C:N ratio (10 : 1 to 18 : 1) for this reservoir basin waSideal. By going through the data given in Table II, Bhavani-sagar .can be placed under the group of average productivereservoirs.
7 PHYSICO-CHElI'lIC,ALFEATURES OF SURFACE Wld'ER OF THERESERVOIR
7.1 Physical features of different sectors
Sectorwise water temperature fluctuated between23°.1C(January)to 29°.0 C(April) in the Lentic sector, 240.9 C(November) to 280.2 C (May) in Intermed'iate sector, 240.6 C(December) to 280.8 C (March) in Lotic sector and 250.0 C(December) to 280.2 C (March) in the Moyar sector. Sector-wisewater transparency (Fig. 7) varied from 23-135 cm, 21-133 cm,18.5-117 cm and 37.0-78.8 cm in the Lentic, Intermediate,Lotic and Moyar sectors respectively.
7.2 Chemical features of different sectors
Chemical feature of surface water in diffe~ent sectorsand seasons have been presented in Table Ill.
7.2.1 Lentic sectorThis sector showed a high value of pH (7.9)
and fairly high v a'Lize a of alkalinity (40.9 ppm) but organicmatter (2.8 ppm) , calcium (15.1 ppm) and specific conducti-vity (257.4 jUmhos) were lower than the other sectors.

- 7 ...
TABLE 11
SECTOR-WISE SOIL CHARACTERISTICS OF BHAVANISAGARDURING 1973-76
Soil PRE -r.lONSOON SEASON POST-MONSOON SEASONcharacte- Bhavani Inter- Lentic Moyar Bhavani Inter-, Len- Mo-ristics Lotic mediate Lotic mediate tic ,yar
pH 6.4 6.0 6.1 5.9 5.7 5.2 5.3 5.6
Organic 2.42 2.07 1.83 2.68 2.51 1 .98 2.05 2.57carbon(%)
Totalnitrogen(%) 0.22 0.20 0.18 0.26 0.14 0.18 0.18 0.21
C:N ratio 11: 1 10:1 10: 1 10: 1 18: 1 11:1 11: 1 12:1
Available 50.8 45.3 40.4 45.4 35.6 31 .6 33.0 36.9nitrogen(mg/100 g)
Available 1.60 2.41 3.03 3.58 1.25 1 .24 1 .00 1.03phosphorus(mg/100 g)

- 8 -TABLE III
CHEMICAL FEATURES OF SURFACE WATER IN DIFFERENT SECTORS OF BHAVANISAGAR
Sector Months Diss- Organic pH Free Total Calcium Magne- S-peci£icolved matter carbon alka- (ppm) sium conducti-oxygen (J'pm) dioxide linity (ppm) vity(ppm) (ppm) (ppm) (Micro-mhos)
Lentic A-pril 9.0 2.2 8.1 0.3 46;4 15 ~0 3;7 249.7July 9 ..1 2~4 7;7 2;9 35;4 16; 6 2;9 244~5October 9 ~1 3~9 7.8 1 .1 36;7 13 ~6 2;1 216;3January 8.0 2.9 7.9 1 .5 45.3 15.2 3.9 273.4Average 8.8 2.8 7.9 1 .4 40.9 15.1 3.2 254.4
Inter- May 8~5 4; 1 8;0 0;5 44~7 17 ~6 3;2 290;0mediate August 10; 7 4;8 7.5 3;9 30;0 12 ~5 2;6 162; 2
November 9;1 3;7 7~8 1 .6 38~3 12 ~7 2;3 266;5February 8.7 3.5 8.0 0.5 53.3 19.3 3.9 335.0Average 9.2 4.0 7.8 1 .6 41 .6 15.5 3.0 263.4
Lentic June 7~3 3~2 7;2 5;7 34;0 13;6 3;6 255;3September 8.8 4~2 7~3 3~0 32~0 12;1 2;4 183 ~5December 8~3 3.9 7~3 4~6 38;3 12;3 2;8 257~8Ma.r-ch 7.9 3.5 7.9 2.0 48.1 15.9 3.3 340.2Average 8.1 3.7 7.4 3.8 38.1 13.5 3.0 259.2
Moyar June 8~8 2~7 7~6 1 ~1 42;7 15;0 4~2 300~8September 8;3 4.3 7 ;4 1 ;7 30;7 11 ;2 2;8 180;2December 9;3 2;8 8; 1 1 ~3 42;6 11 ;6 2;5 248; 1March 8.7 3.2 7.9 1 .3 40.0 18.3 3.3 306.5Average 8.8 3.2 7.8 1 .4 39.0 15.5 3.2" 258~9

9
Dissolved oxygen, organic matter and pH did not showany regular seasonal pattern. Free carbondioxide waS maximum
(2.9 ppm) whereas alkalinity and specific conductivity wereminimum during the monsoons.
7.2.2 Intermediate sector
This sector showed high values of organic matter(4.0 ppm) , alkalinity (41.6 ppm), calcium (15.5 ppm) andspecific conductivity (263.4~mhos). pH, alkalini y, calciumand specific conductivity showed the lowest valued duringmonsoons. The values of all these parameters showed anincreasing trend from November onwards.
7.2.3 Lotic sector
This sector showed comparatively low values ofpH (7.4), alkalinity (38.1 ppm), calcium (13.5 ppm) andspecific conductivity (259.2~mhos). The values of theseconstituents were minimum during monsoons.
7.2.4 Moyar sector
This sector waS fairly rich in pH (7.8),alkalinity (39.0 pprri)and calcium (15.5 ppm) while specificconductivity showed a slightly lower value (258~9~mhos).
7.3 Nutrient features of different sectors7.3.1 Lentic sectorPhosphate waS very low and it varied from traces
to 0.016 ppm. Nitrate nitrogen varied between traces to0.34 ppm. Silica concentration varied between 2.0 to 15.2ppm.- Iron (ferric) waS in the range of nil to 0.26 ppm.
7.3.2 Intermediate sectorPhosphate contents of water varied between
traces to 0.015 ppm. Nitrate nitrogen ranged from traces to0.24 ppm and its value' w ao high in August. The values ofsilica were higher than the Lentic sector, ranging between2.2 to 18.0 ppm. The concentration of iron (ferric) inthis sector was about the Same as in the Lentic sector.
7.3.3 Lotic sectorPhosphate concentration in this sector waS
very poor and varied between traces to 0.018 ppm. Nitratenitrogen ranged between traces to 0.04 ppm and was lowerthan the Lentic and Intermediate sectors. Silica rangedbetwoen 1.6 to 13.6 ppm and its value waS lower than in theLentic and Intermediate sectors. Iron (ferric) rangedbetween nil to 1.5 ppm.

10
7.3.4 Moyar sector
The values of phosphate ranged between tracesto 0.06 ppm. Nitrate-nitrogen varied between traces to0.04 ppm. Silica ranged between 2.0 to 14.0 ppm. Iron(ferric) varied between nil to 0.46 ppm. No markedseasonal differences were noticed in the nutrient featuresof the reservoir.
7.4 Impact of viscose industry on water gualttyof different sectors
The effluents of the South India ViscoseFactory at Sirumughai are discharged at a point which isabout 3 km downstream of the Moolathurai spawn collectioncentre. Comparative studies on water quality in differentsectors of the reservoir are presented in Table IV. Itis apparent from the table that the water quality in respectof different chemical parameters like pH, D.0.,C02, HC03,Ca++, Mg++ etc. shows a sudden change in Sirumugha~stretch. However, the impact of effluents on water qualityremains confined to a certain stretch below Sirumughai only.Further the adverse effect is noticed mainly when the inflowis very low. During the course of investigation only onceon 30th March 1974, .when water inflow was extremely low, pHof water was recorded below 4.0, dissolved oxygen 1.0 ppmwith saturation percentage 14.0 at Sirumughai. Dead planktonand fishes were observed on the surface of water. The dis-charge of acidic effluents and subsequent depletion of pHand oxygen were the cause of mortality of plankton and fishes.Similar oxygen depletion (1.5 ppm), decrease in pH (5.0 ppm)and accumulation of carbondioxide (126.0 ppm) were noted inJune 1976 also when the inflow in the reservoir waS of alow order.
8 VERTICAL DISTRIBUTION OF PHYSICO-CHEMICALCHARACTERISTICS
Bhavanisagar did not show any thermal stratification.The maximum difference between surface and bottom watertemperature waS 2 to 30C. This is clear from the narrowrange of seasonal variation in water temperature. On theother hand a strong oxycline and klinograde distribution ofoxygen (decline of 3 to 6 ppm from surface to bottom) hasbeen noted in this reservoir (Fig. 8). In tropical impound-ments, high temperatures prevailing in the bottom zoneaccelerate the rate of chemical reactions and hence theiroxygen demand is higher than temperate waters. It has been

- 11 -
I ABLE IV
EFFECT OF THE EFFLUENTS OF VISCOSE INDUSTRY ON THEWATER QUALITY (AVERAGE Vi\LUES)OF BHAVANISAGAR DURING
1973-77
Characteris- S E C T 0 R Stics of sur-face w a t e r Moola- Sirumu- Lotic Int er- Lentic Moyar
thurai ghai mediate
\Cjater tempera- 28 ••1 28.0 26.8 2602 26.2 26.2ture (cC)pH 7.5 6.4 7.3 707 7.9 7.8Dissolved 8 ..6 6.1 7.5 9 •1 8.8 8.8oxygen (p prn )
Free CO2 (p pm ) 1 .5 2706 3 08 200 2.2 1 09Bicarbonate --)3500 4466 38 e 1 3900 36,,6 35,,0
(ppm)Calcium (ppm) 19 ..5 9 05 1 3 03 1 5.1 1 5 .1 1 5.5Magnesium (ppm) 5.8 3 .9 3,,5 3 .0 3 •1 3.2Organic matter 2.5 509 3.4 4 •1 208 3.2( p pm)

found that reservoirs with rich biota reflect sharper oxygendecline causing its klinograde distribution and hence oxygencurve is an important parameter for·evaluating the productivityof reservoirs. The klinograde oxygen curve obtained inBhavanisagar clearly indicates its productive nature (Fig.8).Many productive reservoirs like Amaravati, Stanley, Nagarju-nasagar and Govindsagar also show similar oxygen decline butthe low productive reservoirs like Tilaiya, Konar and Rihandin spite of the presence of strong thermal stratification'have near uniform distribution of oxygen from surface tobottom.
In Bhavanisagar, the oxygen decline from surface tobottom was always associated with accumulation of carbondioxideand decrease of pH in the bottom layers (Fig. 8 and Table V).The release and accumulation of carbondioxide by the decompo-sition of bottom organic sediments and subsequent increase inhydrogen-ion-concentration causes a fall in the pHe Bottomaccumulation of carbondioxide which reflects the amount ofoxidisable organic matter and decline of pH are also suggestiveof Bhavan~sagar being a productive reservoir.
The reservoir also showed stratification of bicarbonatealkalinity that is low value on the surface and high values atthe bottom (Fig. 8). Carbondioxide accumulated in the bottomdissolves· carbonate deposits thereby increasing the .bicarbonateconcentration and specific conductivity.
The strong chemical stratification is broken eitherby wind or by influx of flood water. Table V shows that during1974, the stratification continued upto October but during 1975it was broken in July by heavy inflow. It again got stabilisedin October. During 1976, a very strong stratification was notedin April (Fig. 8), but due to heavy wind it was broken in Mayitself and then the 0ntire water column waS homogeneous uptoOctober. All these observations point that Bhavanisagargets stratified chemically, whenever there is less disturbanceeither by wind or by influx of water. This indicates thatboth photosynthetic and tropholytic activities are very highin this reservoir.
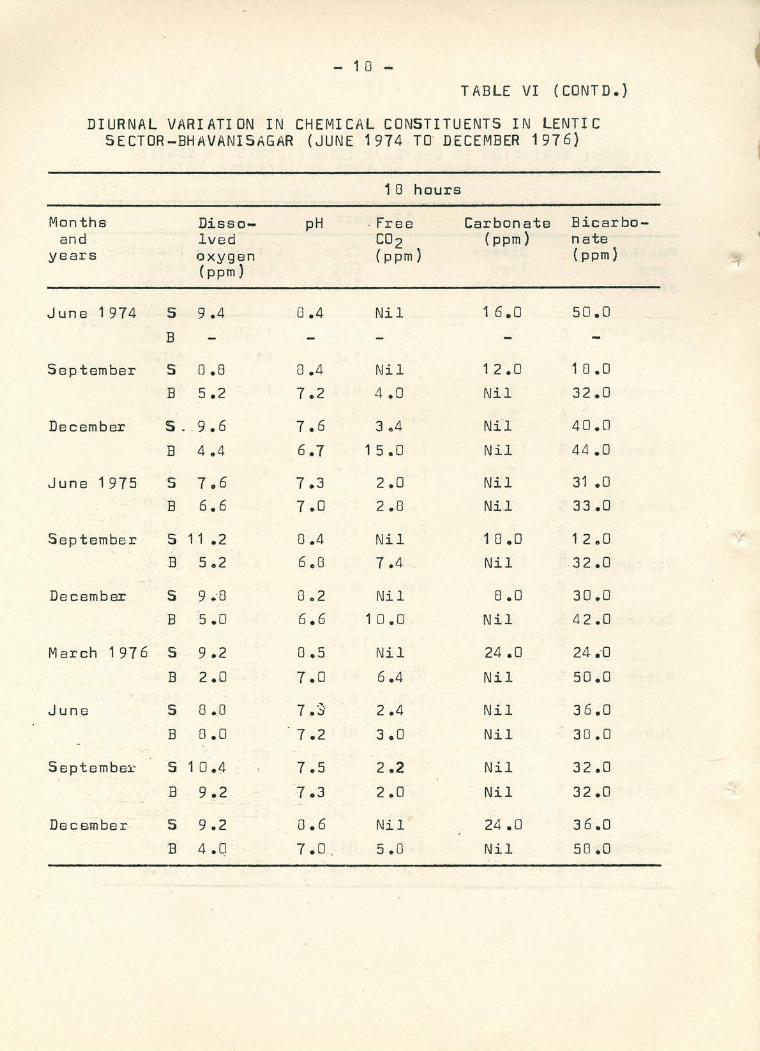
9 DIURNAL VARIATION IN CHEMICAL PlUUJfillTERS
Diurnal changes in chemical parameters during thedifferent years of study have been represented in Table VI.It is apparent that all the parameters like dissolved oxygen,pH, free carbondioxide, carbonate and bicarbonate show consi-derable change from morning 6 hrs to evening 6 hrs. Dissolved

13TABLE V
PHYSICO-CHEMICAL FEATURES OF SURFACE AND BOTTOMWATERS OF BHAVANISAGAR FROIYlJUNE 1974 TO FEBRUARY
1917
Year/ Temp. Diss- Free Bicar- SpecificMonth (OC) olved pH carbon ..bonate conducti- .
oxy- dioxide (ppm) vity(micro-p-Gn (ppm) mhos)(ppm)
1 2 3 4 5 6 7LENTIC PROFUNDA.,L
1.2.ll .-June Sur£aoe 26,,5 8.8 801 0.4 48.0' 337.0
Bottom 2589 8.0 7.7 2.1 56.0 353.0July Surface 25.6 8.0 8.4 Nil 34.0 257.6
Bottom 23.6 3.6 6.8 8.0 44.0 294.1Octo- Surrace 26.8 8.8 8.2 Nil 30.0 178'.0ber Bottom 25&5 4.0 7.0 geO 40.0 194.0121.2January Surface 24.5 8.8 8g0 1.2 42.0 267.0
Bottom 23.5 5.2 7.1 14.0 46.0 281..0April Surface 29.0 10.4 7.5 1.0 37.0 262.9
Bottom 28.5 5.6 6.9 6.2 42.0 286.7May Surface 28.0 9.2 8.4 Nil 32.0 276.0
Bottom 26.9 5..2 7,,3 6.0 52.0 286.0June Surface 24.9 7.6 7.3 2.4 40_0 220.3
Bottom 23.5 5.2 7.1 4.6 44.0 223.3July Surface 25.0 8eO 7.ij 1.6 28.0 183.1
Bottom 24.0 7.2 7.3 3.0 30.0 185.4Octo- Surface 26 ..9 10.0 7.6 1 .4 30.0 167.0ber Bottom 24.7 4.8 607 4.6 40.0 170.71976January Surface 23~3 708 7~5 3.2 38.0 205 .•4
Bottom 22.8 6.1 7.2 10.0 48~0 220 •.3April Surface 28.9 7.8 8.4 Nil 34.0 266.6
Bottom 26.6 1.2 6.8 9.0 56.0 316.6May Surface 27.2 8.4 705 1.6 40.0 286.7
Bottom 27.0 7.8 7.4 1 .8 42.0 298.0

14TABLE V (0ontd.)
1 2 3 4 5 6 7June Surf'ace 26.6 6.4 7.4 2.0 34.0 271.4
Bottom 26.2 6.0 703 2.4- :3600 276.3July Buz-fac e 25.5 11 .2 7.3 7.0 34.0 292.8
Bottom 25.5 9.6 7.3 8.0 34.0 304.0Octo- Surf'ace 26.8 8.4 7.7 1 .8 .44.0 304.0ber Bottom 25.8 7.6 7.2 2.8 49.0 337.712]7January Surface 23.1 7.5 8.3 Nil 44.0 347.8
Bottom 22.6 4.•4 7.1 6.0 62.0 389.7INTERVillDIATE PROFUNDAL.1.2.llAugust Surf'ace 25.6 8.4 8.0 1 .2 30.0 304.0
Bottom 23.1 5.4 7.1 4.0 34.0 316.0Novem- Surf'ace 26.3 10.0 8.4 Nil 30.0 304.0ber Bottom 24.7 400 7.2 9.5 46.0 316.01212May Surf'ace 2702 8.0 7.2 3.0 50.0. 302.0
Bottom 2702 6.4 7 e 1 5.2 56.0 361 .0August Surf'ace 25.9 10.8 7.2 2.0 30.0 152.0
Bottom 23.0 800 6.8 2 .•6 32.0 152.0Novem- Surf'ace 25.5 7.6 7.4 4.0 30.0 178.8ber Bottom 24.9 6.8 703 4.4 34.0 200.01976Febr-' Surf'ace 2504 10.8 8.2 Nil 34.0 257.6uary Bot-1:)m 24.4 6.8 6. ' 14.0 50.0 292.3May Surf'ace 27.3 7.6 7.3 2.2 40.0 292.3
Bottom 27.1 7.3 7.2 2.4 40.0 292.3August Surf'ace 26 Q 1 13 ~O '7 7 8.4 30.0 168.8I ~./
Bottom 25.2 10.0 6.8 13.0 31 .0 178.8Novem- Surf'ace 24.9 9.6 7.5 0.8 45.0 316.6ber Bottom 24.5 8.4 7.3 2.0 48.0 344.61917.Febr- Surf'ace 25.5 7.6 8.2 Nil 56.0 380.0uary Bottom 25.0 4.0 7.2 3.4 72.0 389.7

oxygen, pH and carbonate increased Irom mor~ing to noon(12 hrs) ar.d, in general, ahov ad a decreasing trend whereasIree carbondioxide (iI present) and bicarbonate decreasedIrom morning to noon and then showed an increasing trend.Diurnal variations in water quality were very well markedduring September 1975 when dissolved oxygen increased Irom12 to 14 ppm; pH Irom 7.6 to 8.4, Carbonate Irom nil to18.0 ppm and bicarbonate decreased Irom 30.0 to 12.0 ppmwith the progress OI the day Irom morning to evening. InMarch 1976, the values OI DO increased Irom 8.2 to 9.4,pH Irom 8.4 to 8.8, carbonate Irom 16 to 26 ppm while thatOI bicarbonate decreased Irom 28.0 to 20.0 ppm. Duringother seaSons also the diurnal trend waS similar but themagnitude OI variation was OI a low ordero Studies madeIrom surIace to bottom at 6 hrs, 12 hrs and 18 hrs indicatedconsiderable changes in the entire water column (Table .VI).
Sharp changes in the chemic al parameters with theprogress OI the day, noted in Bhavanisagar, clearlyindicate that the photosynthetic activities are quite highin the reservoir.
·10 PRIMARY PRODUCTIVITY
The measurement OI the rate OI conversion OIincident solar energy to chemical energy and its Iixationby primary producers gives an important meaSure Ior evalua-ting the productivity OI a reservoir.
Both gross and net production were the highestin the Moy~r sector Iollowed by the Intermediate sectorthe minimum being in the LotiG sectorL The production L(Fig.9).rate "vasminimum during monsoon months. The average grossand net production Ior 1973~77 were 830.79 mgC 1m2 I day and458035 mgC/m2/day respectively. The rate OI respiration togross production was 44083%. As 3068 calories OI energy isrequired to liberate one mg OI oxygen through algal photo-synthesis, the energy Iixed by the primary producers in thisreservoir amounts to 8158035 cal/m2/day showing the photo-synthetic eIIiciency to be 00412%0
1 1 FISH FOOD RESOURCES OF THE RESERVOIR11 01 PJ-anktoU
The plankton abundance through months is given inFig.10. In 1974, it exhibited bimodal production with twopulses, the primary occurring in April-May (summer) andthe secondary peak during October-November (post-monsoon)(Fig.10).

- 1 6 -T AB,LE VI
DIURNAL VARIATION IN CHEMI CAL CONSTITUENTS IN LENTI CSECTOR-BHAVANISAGAR (JUN E'1974 TO DECEMBER1976)
06 hours ~ - . _.-.
Months Disso- pH free Carbonate Bicarbo-and lved CO2 (ppm) n ate
years oxygen (ppm) (ppm)(ppm)
June 1974 5 8.8 8 •1 0.4 Nil 48.0B 8.0 7.7 2 •1 Nil 56.0
September 5 8.4 8.2 Nil 8.0 22.0B 5.6 7 .1 6.0 Nil 32.0
December 5 8.0 7.4 5.0 Ni:l ,42.0B 3.6 6.9 10.0 Nil 48.0
June 1975 5 8.8 7 .1 3.0 Nil 31 .0B 7.2 6.9 3.2 Nil 32.0
September 5 12.0 7.6 1 .4 Nil 30.0B 6.0 6.7 9.0 Nil '36.0
December 5 8.4 7.3 6.0 Nil 38.0B 5.2 6.7 1 6.0 Nil 46.0
March - 5 8.2 8.4 Nil 1 6.0 28.01 976 B 3.2 6.8 9.0 Nil 50.0.June 5 8.4 7.4 2.0 Nil 34.0
B 7.6 7102 2.8 Nil '6.'0
September 5 11 .2 1.3 2.2 Nil 26.0B 8.8 7.3 2.4 Nil 26.0
December 5 7.6 7.9 0.8 Nil 56.0B 4.0 7.0 5.0 Nil 60.0

- 17 -TABLE VI (CONTD.)
DIURNAL VARIATION IN CHEMICAL CONSTITUENTS IN LENTI CSECTOR-BHAVANISAGAR (JUNE 19.74 TO DECEMBER 1976)
1 2 .h o u r s
Months Disso- pH Free. Carbonate Bicarbo-.r- and lved CO2 (ppm) nate
years oxygen (ppm) (ppm)(ppm) ,
June 1974 5 9 •.2 0.4 Nil 14 ;'0 42.0
B 7 n 0.1 t40 Nil 50.0.'-'
September 5 9.2 0.5 Nil 1 6.0 16.0
B 5.6 7.3 2.0 Nil 36.0
December S 1 0 .0 7.6 3.0 Nil 44.0
B 6.0 7.0 17.0 Nil 4B.O
June 1975 S 9.2 7.3 1 .6 Nil 30.0
B B.O 7.2 2.0 Nil 32.0
September S 14.0 B.4 Nil 1 2.0 1B.0
B 1 0 .0 6.B 0.4 Nil 32.0
December 5 9.6 7.9 0 ••4 Nil 36.0
B 5.6 6.7 13.4 Nil 46.0
March 1976 5 9.4 G .8 Nil 26.0 20.0
B 2.4 7.0 6.6 Nil 48.0
June 5 14 .0 8.4 Nil 1 2.0 30.0
B 1 0.4 7 .4 2.4 Nil 40.0
September S 12.4 7.6 2.0 Nil 24.0
B 10.4 7.4 2.0 Nil 26.0
December 5 9.6 8.4 Nil 10 .•0 50.0
B 3.6 7·.0 6a4 Nil 62 ••0
- 1 0 ...TABLE VI (CONT D.)
DIURNAL VARIATION IN CHEMICAL CONSTITUENTS IN LENTIC5ECTOR-BHAVANISAGAR (JUNE 1974 TO' DECEMBER 1976)
1 0 hoursMonths Disso ..•. pH .Free Carbonate Bicarbo-
and lved CO2 (ppm) nateyears oxygen (ppm) (ppm)
(ppmJ
June 1974 5 9.4 0.4 Nil 1 6.0 50.0B
September 5 0.8 8.4 Nil 12.0 1 0 .0B 5.2 7.2 4.0 Nil 32.0
December 5. 9.6 7.6 3 e 4 Nil 40.0B 4 .•4 6.7 1 5 .0 Nil 44.0
June 1975 5 706 7 .3 2.0 Nil 31 .0B 6.6 7.0 2.0 Nil 33.0
September 5 11 .2 0.4 Nil 1 0.0 12,,0B 5 ..2 6.,0 7.4 Nil 32.0
December 5 9.:8 002 Nil B.O 30.0B 5.0 6.6 10.0 Nil 42.0
March 1976 S 9.2 B .5 Nil 24.0 24 •.0B 2.0 7.0 6.4 Nil 50.0
June 5 e .0 7 .~, 2.4 Nil 36.0,.~'B 0.0 7.2 3.0 Nil 30.0
Septembei: 5 1 0.4 7.5 2.2 Nil 32.0B 9.2 7.3 2.0 Nil 32.0
Dece.mber 5 9.2 0.6 Nil 24.0 36.0B 4 •Cl 7.0, 5.0 Nil 50.0

19
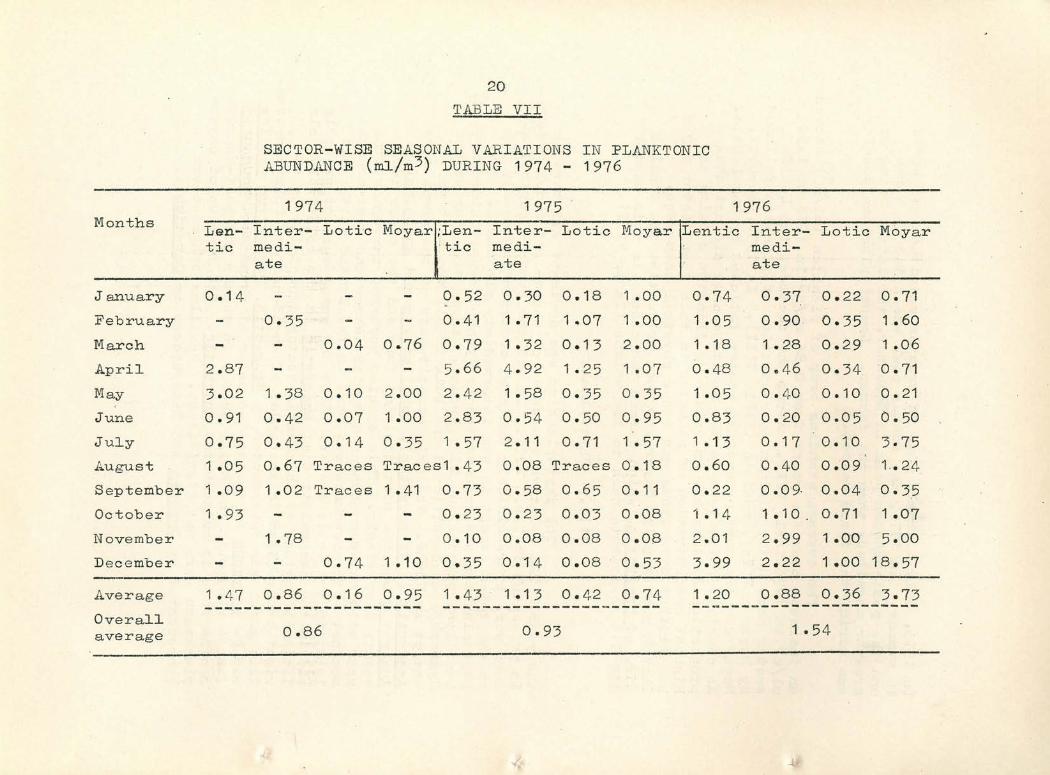
In 1975, only a single peak of greater magnitude waS notedin summer. In 1976, the summer peak waS noted in Marchand the post-monsoon peak in December, the latter being ofgreater magnitude than the former. Lowest plankton densitywaS during the flood season.
The average standing crop of plankton (ml/m3) showedan increase over the years from 0.86 ml/m3 in 1974 to 1.54ml/m3 in 1976'Tablo VII). Among"the sectors, the Lenticsector showed the maximum concentration of plankton followedby Moyar and Intermediate (Table VIII)v In 1976, however,Moyar was the most productive sector followed by the Lentic.As chemical parameters in the Lentic sector did not show aproportionate increase in values as plankton density thehighest concentration of plankton in this deep sector maybe attributed to winds and other physical phenomena.Though numerically Moyar waS most productive the smallersize of Mougeotia, which formed the blooms in this sectordid not contribute much to the volume (Table VIII) •
11.1.1 Phytoplankt on
The phytoplankton waS dominant all throughthe year. The relative abundanoe of phyto- and zooplanktersis presented in Table VIII. In all the sectors phytopl&~k-ters"were overwhelmingly dominant contributing nearly 90%to the total except in the Intermediate profundal. Thephytoplankton was represented by Cyanophyceao, Chlorophyceae,Bacillariophyceae and Dinophyceae. Among the four groupsCyanophyceao constituted the bulk in all the sectors"exoopt in Moyar. The main constituents of the group were~~acystis (=,Microcystis), Oscillatoria and Anabaena.Anacystis was the most dominant form and the other twooccurred sparingly. This species occurred throughout theyeax with maximum abundance during summer and post-monsoonmonths. Its abundance was more in the Lentic sector andleast in the Lotic sector. Winds and water current probablyaid in tho accumulation of Anacystis in the relatively calmlittoral regions of the Lentic sector especially on theright bank. Next in the order of abunda co was C'h.Loz-o phy cee.e,This group waS represented by Moageotia, Pediastrum simplexand ;E" boryanum in the stated order of abundonce. Mougootiaformed blooms in the Moyar sector in summer and post-monsoonmonths when it outnumbered Anacystis. Other group of phyto-plankters were not significant. Bacillariophyceae waSrepresented by Synedra and Dinophyceae by Coratium.
20TABLE VII
SECTOR-WISE SEASONAL VARIATIONS IN PLANKTONICABUNDANCE (ml/m3) DURING 1974 - 1976
1974 1975 . 1976Months Len- Inter- Lotic l\1oyar;Len- Inter- Lotic Moyar Lentic Inter- Lotic Moyar
tic medi- .tic medi- medi-ate ate ate
January 0.14 0.52 0.30 0.18 1 .00 0.74 0.37 0.22 0.71February 0.35 0.41 1 .71 1 .07 1 .00 1.05 0.90 0.35 1 .60March 0.04 0.76 0.79 1 .32 0.13 2.00 1 .18 1 .28 0.29 1 .06April 2.87 5.66 4.92 1 .25 1 .07 0.48 Oe46 0.34 0.71May 3.02 1 .38 0.10 2.00 2.42 1.58 0.35 0.35 1 .05 0.40 0.10 0.21June 0.91 0.42 0.07 1.00 2.83 0.54 0.50 0.95 0.83 0.20 0.05 0.50July 0.75 0.43 0.14 0.35 1 .57 2.11 0.71 1 .57 1 .13 0.17 0.10 3.75August 1 .05 0.67 Traces Traces1 .43 0;08 Traces 0.18 0.60 0.40 0.09 1.24September 1 .09 1 .02 Traces 1 .41 0.73 0.58 0.65 0.11 0.22 0.09· 0.04 0.35October 1 .93 0.23 0.23 0.03 0.08 1 .14 1 .10 . 0.71 1.07November 1.78 0.10 0.08 0.08 0.08 2.01 2.99 1.00 '5.00December 0.74 1 .10 0.35 0.14 0.08 0.53 3.99 2.22 1.00 18.57
Average 1 .47 0.86 0.16 0.95 1 .43 ' 1 .13 0.42 0.74 1 .20 0.88 0.36 3.73-----------~---------- ---------------------- -----------------------Overall 1 .54average 0.86 0.93

21
1;.ABLLV I 11
SECTORAL .ABUNDl-l.NCE OF PHYTO-!!.ND ZOOPLANKTON (UNITS/M3)DURING 1 97 ~'~76 (FIGURES IN P f..RENTHE'5:53 SHOW PERCENTAGES)
Sectors_, ,__~_~~ __ ~_EN_'_TI_C ' [ INTERMEDIATE + LOTIC =r MOYAR
Li ttoral Sub~ Pro- lLi-.tt- Sub"':'l'i_t_-_p_r_o_f_u_-_..I...L__i_t_t_o_r_a_lj,.Littora~~_it-toral fundal ora::!... toral ndal--- ,,~. _'.' -----.
Phytoplankton 1 (;;;tD9'! 2 343261 322608 (~95635 403138 >297097 291167 1471332(94018) (89.13) (90 ~56) (93c21) (90 e 72) (74072) (89.38) (97.56)
Zoopla.nkton (;ti!1-33 41858 33674 50656 41255 100514 34594 36749(5<82) (i0057) ( 9044) (6. '79) (9028) (2:: e 28) (10 •.62) (2044)
._-- .•._-- ... -""-""'---_ . .-Total plankton 1'1 583fr5 335119 356282 746291 444393 397611 324761 1508081
Volume (ml/m3) 1 .872 10042 1 6192 10245 0.869 0.767 0'0311 1.806.._----

11.1.2 Zooplankton
Zooplankton did not contribute significantlyto the plankton (Table VIII). Its -abundance was more inthe Intermediate sector. The main groups represented wereCopepoda, Protozoa, Rotifera and Cladocera. None of thegroups showed significant seasonal abundance. Protozoawas represented by Arcella and Actinosphaerium; Copepodaby Cyclops, Diaptomus and nauplii; Rotifera by Keratella,Filinia, Polyarthra, Brachionus and Cladocera by Daphnia.
The plankton of the reservoir waS characterisedby the dominance of a eingle species of Anacystis. in themain reservoir and Mougeotia in the Moyar sector. In theearly years of impoundment successive dominance of Melosira,Microcystis, Synedra, Navicula and Ceratium was observed inthe course of a year (Menon and Chari, 1959) whereas Anacystis(= Microcystis) dominated throughout the year during thepresent period of study.
11.2 Bottom biota
The qualitative and quantitative abundanceof bottom macro-fauna in different sectors is presented inTable IX.
11.2.1 Lentic sector
The average standing crop (units/m2) ofbottom macro-fauna in this sector was estimated to be-1 .848 g. ,(119 units). The abundance of biota steadily in-'creased with depth with maximam at 1'5m (324 units arid7.605 g/m2). Thereafter it decreased in the profundal.Oligochaetes, C~ironomus and Chaoborus larvae and mayflynymphs were rep~sented in the Oiota.
There is no clear v.ariation in the qualitativeabundance wi~h depth. Oligochaetes and Chironomus larvaewere present at all depths. Chaoborus larvae were alsopre~ent throughout- the' bottom exce.pt at..q2 m and 15 mdepths. MayUy nymphs" however, were pre'sent only at 8 ID
depth.

~,
23TABLE IX
BATHYr<'lETRICDISTRIBUTION OF BOTTON IvlACRO-FAUNA (UNIT Mm V/EIGHT/M2) OF BHAV l'..NISAGARDURING 1974-1976
Depth LENTIC INTERMEDIATE LOTIC MOYAR(m) .- Vleight Weight vleight \,yeijhtSpecies Unit (g) Species Unit (g) Species Uni-t (g) Species Unit (g
<: 2 Oligochaetes 1 Chironomus· 1 0.010 Oligochaetes 264 1 .670 Oligochaetes 6 0.040C.hirono~ 1 ChirQ~~ 14 0.154 Q,hironomus 10 0:040
2 Oligochaetes 3 0.007 Oligochaetes 3 0.013 Oligochaetes 692' 5.957 Oligochaetes 6 0.070Chironomus 3 0.050 Chironomus 5 0.090 Chironomus 48 0.302 Chi£onomus 14 0.200Chaoborus 2 Chaoborus 1 Chaobor:!l§ 3 Chaoborus 3 -
. ( :" ; \M ay fly nymph f 0.030
.: \~. (. \ -. ,.'- .
4 Oligochaetes 6 0.054 Oligochaetes 4 0.020 Oligochaetes 681 5.532 Oligochaetes 11 0.050Qhirono,mu.§. 2 Chi z-oriornu a 4 0.080 Chironomus.. 87 0.820 Q.hironomus 27 0.090Cha.212.E~ 6 0.010 Chaoborus 9 0.007 Chaobo~ 20 0.020
Mayfl;y n~mJ2h 11 1 .430Damselfly 1 0.120
nymph6 Oligochaetes 15 0.050 Oligoc-haetes 1 0.010 Oligochaetes 130 0.835 Chironomus 14 0.060
Chiroll2~ 21 0.275 Chironomus 8 0.030 Chironom:!l§ 12 0.046 Chaoborus 3Chaoborus 36 0.046 Chaoboru.§. 28 0.030 r.1ayflynymph 3 0.420
8 Oligochaetes 7 0.134 Oligochaetes 22 0.170 .Q.hironomus 7 0.020Chirq,nomus 88 2.064- Chironomus 11 0.120 Chaobrous 2ChaobQ..=£:!l§ 72 0.056 Chaoborus 58 0.071 IJIayflynymph 6 0.810Mayfly nymph 1 0.011
10 Oli~:c.:::haetes 3 0.034 Oligochaetes 67 0.830Qhironomus i 188 2.889 Chironomus 289 5~080Chaoborus 82 0.217 Chaoborus 77 0.094
15 Oligochaetes 10 0~075 Oligochaetes 1Qhironomus 314 7.530 Qhironomus ,29 1 .030
Chaoborus 20 0.017'20 Oligochaetes 25 0.800 Chironomus 2
Chironomus 17 0.462 Chaoborus :1Chaobor~ 53' 0.023
--- 483 29 Oob80Average 11 9 1.848 80 0.963 3.829--

11.2.2 Intermediate sector
The standing crop o£ bottom biota in thissector waS estimated to be 0.963 g' (80 units). The bathy-metric distribution waS similar to the Lentic sector withan increase in biota with depth, the maximum being at10 ra , The composi tiono:f biota waS also similar to thato£ the Lentic sector e4cept £or the absence o£may£lynYmphs.
11.2.3 Lotic sector
This sector was by £arstanding crop o£ 3.829 g (483 units) •waS constituted by oligochaetes. Theat 2 and 4 m depths and least at 6 m.
the richest with aThe bulk o£ the £auna
biota was maximum
11.2.4 Moyar sector
The standing crop was least in this sectorwith 0.68 g (29 units). The constituents were sioilar tothat o£ the Lentic. In addition, daosel-£ly nYmphs werealso encountered. The maximum abundance was noted at 4 m.Chironomids were present at all depths while oligochaoteswere present upto 4 m, Chaoborus and may£ly nymphs £rom2m onwards and damsel-£ly nymphs at 4 o.
The basin in the littoral zones o£ the Lentic andIntermediate sectors is composed o£ red soil with stones&~d pebbles while the rest o£ the reservoir basin has aso£t muddy bottom. The £luctuations in water level £re-quently expose the littoral zones o£ the reservoir inhibitingdevelopment o£ bottom £a,una. However," the high concentrationo£ oligochaetes in the Lotic sector can be attributed to themuddy soil with a high organic content. The burrowing habitso£ oligochaetes help. them to survive exposed condition insome seasons.
Gastropod 'shells observed in the Lentic sectorwore not taken into 'account as no live ones were observed
'in the sample though the empty shells were observed in thesamples qnd 'in the shore areas.
,11.•.3 Aquatic plants
No ;Large aquatic plants were. availabl-e in~he reservoir.

12 :F.ISH FAUNA
In all, 50 species OI Iish belonging to 11 Iamilieswere encountered in the reservoir end are listed below :
ClassSub-class:OrderSub-order:Family
OrderDivision:Sub-order:Farr!ilySub-Iamily:
Sub-Iarnily:
Sub-Iamily:
Family
TeleostomiActinopterygiiClupeiIorwosNotopteroidaoNotoptoridaeNotopterus ndtoptorus (Pallas)
CypriniIQrmeSCypriniCyprinoideiCyprinidaeAbraoidinaeChela atp~ (Hamilton), Q. laubuca (Hamilton),Q. argentea (Day)RasborinaoBarilius ~Dtehsis (Valenciennes) Danio malabaricusTJerdon), Esomus danrica (Hamilton)CyprinidaeTor khudroe (Sykos), Acrossochoilus hoxagonolopis(NcClolland), Catla catla (Hamilton), Cirrhinus
, mrigala (Hamilton), Q. cirrhosa (Bloch), .Q. reba (Hamilton), Laboo rohita (Hamilton);L.' calbasu (Hamilton), L. bata (Ha~ilton),L. kontius (Jordon), L.-li~atus (Bloch),Puntius dubius (Day),-P. carnaticus (Jerdon),~. Sarana (Hamilton), ~. sophoro (Hamilton),~. puckelii (Day), ~' dorsalis (Jordon),P. mahicola (Valenciennes), P. molano~TJerdon), P. ticto (Hamilton), P. Iilamentosus(Valoncien~es), ~. micropogon (Cuv. & Val.),Osteochilus thomassi (Day), Schizraatorhynchus(Nukta) nukta (Sykes), Osteobrama cotio(Hamilton), O. vigorsii (Sykes). Garra~erdoni (Day), CYJ?rinus carpio .\Tar.cor:mlUnis,Linn.).
CobitidaeLepidocephalichthys thermalis (Cuv. & Va~Noemachilus beavani (Gunther)

Division :Sub-order:Super family:
Family ..
Family
Order :Sub-order:Family
OrderSub-order :Family
OrderFamily
OrderSub-order:Family
Sub-order:FamilySub-family:
OrderFamily
13
SiluriSiluroi-deiSiluroidae
S:,tluridae(mpok bimaculatus (Bloch),Wallago attu
Schneider)BagridaoMystus ~ (Hamilton), ~. cavasius (Hamilton),M. tongra (Hamilton), M. punctatus (Jerdon).
.Anguilliformos
.AnguilloideiAnguillidaeA..'1.guillabongalensis (Gray and Hardw.)BeloniformesScomberosocoideiBelonidaeXenentodon cancila (Hamilton)OphiocophnliformesOphiocophalidae (Channidae)Channa marulius (Harnilton) l'
PerciformosPercoideiCichlidaeEtroplussuratensis (Bloch), Tilapia mossambica(Peters)GobioideiGobiidaeGobiinaeGlossogobius giuris (Hamilton)Mastocemboli£ormosNastocembelidaoMastocombolus armatus (Lacepede),
21. pancalus (Hamilton) 1
UTILISATION OF FOOD RESOURCES BY THE FISHESDetritus w~s the chief food for the fish population
in the -reservoir. It occurred predominantly in the guts ofL. calbasu (95%), Q. mrigala (8705%), ~. dubius (94.9%),

27
C. catla (55%), M. aor (64.9%) and lie ~ (59.3%) along with~arious quantiti;s ~zoo- and phytoplankton in the case ofcarps and fishes in the case of ~. ~ (27.7%) and~. attu(40.7%). Cannibalism waS also observed in~. ~ and~. ~.Bottom macrofauna formed a part of the diet in ~. dubius,~. calbasu and ~e~. Aquatic insects and insect larvaeformed the main food of Q. bimaculatus ann insects,crustaceans and algae in ~. dorsalis.
A study of the food hebits of the fishes of Bhavani-sagar yeveals that all the available food resources of thereservoir are utilised by the existing £ish populations exceptAnacystis and gastropods. Though Anacystis is not beingutilized directly it might be forming one of the main cons-tituents of the detritus on which the fishes mainly subsist.
14 BREEDING BIOLOGY OF FISHES
14. 1 ~ • c alb aSu
v.J"itha view to find out the extent of spawning perio-dicity in different age groups within the species, studieson the breeding biology of ~. calbasu were conducted fromDece~ber 1977 to November 1979. Specimens collected for thestudy were divided into four size groups viz., Si;e group I(301-400 mm), Size group 11 (401-500 mQ), Size group III(501-600 mm) and size group IV (601 mm and above).
Size group I (301-400 mm) A total of 84 specimenswere studied in this size group. Sex ratio between males ~~dfemales waS found in the ratio of 1 1.2. During most ofthe months of the year, gonads, both testes and'ovaries,were in the immature stages thereby showing that f:.. calbasuin this reservoir does not enter life as a breeder unless itattains a growth in length of 400 mm at least. However, somespecimens during the month of April/May possessed ovaries inmaturing stage. Gonado-somatic index however waS the maximuQduring May both in 1977-78 and 1978-79, 'being 3.84 and 5.83respectively.
Size group 11 (401-500 mm) : About 194 specimenswere studied in this group. Sex ratio between males and fe-Qales waS in the order of 1 1.06. Males with immatureand Qaturing gonads were available during November toFebruary, with mature gonads during April to June and withspawning and spent gonads during Jul~,rto September. Femaleshad their gonads in the imQature and maturing conditions, _during the peried from October to I\~arch,in the maturecondition during January to June and the spawning or spent
28
condition during July to September. Maximum gonado-somatic index obtainod was 6.5 and 7.5 during l\'Iayin1977-78 and June in 1978-79 respectively.
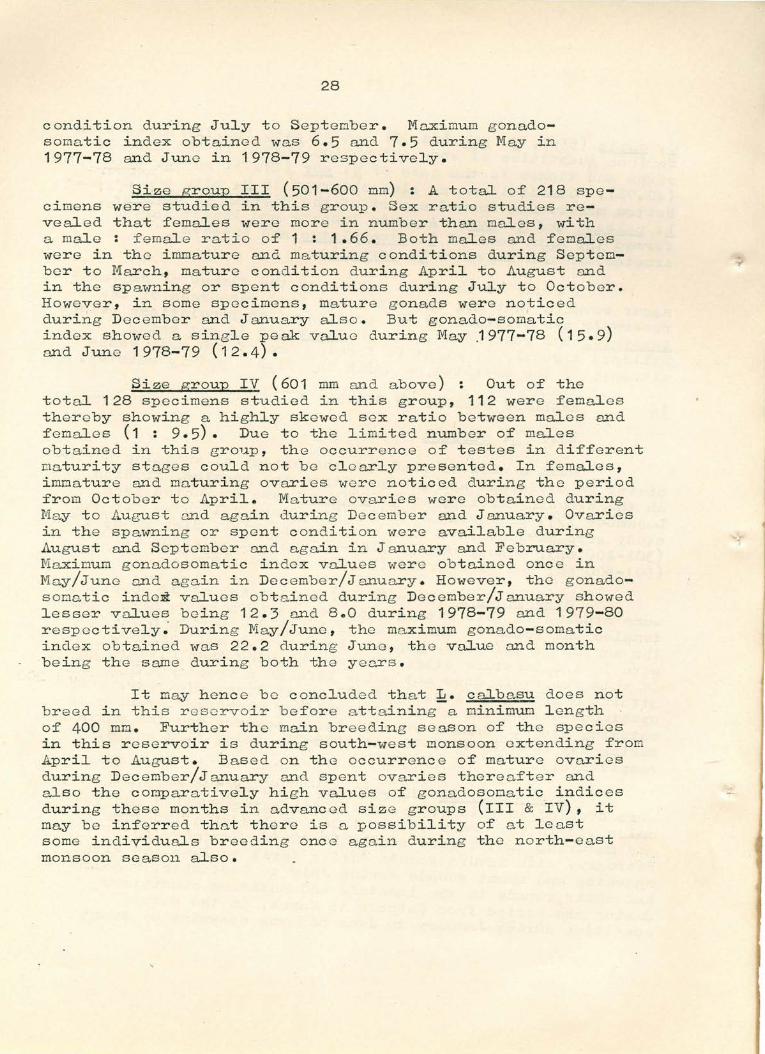
Size group III (501-600 mm) : A total of 218 spe-cimens were studied in this group. Sex ratio studies re-vealed that females were more in number than males, witha male female ratio of 1 1.66. Both males and femaleswere in the immature and maturing conditions during Septem-ber to March, mature condition during April to August andin the spawning or spent conditions during July to October.However, in some specimens, mai;;uregonads were noticed. . (during December and January also. But gonado-somaticindex showed a single pe ak value during May .1977-78 (15.9)and June 1978-79 (12.4).
Size group IV (601 mm and above) : Out of thetotal 128 specimens studied in this group, 112 were femalesthereby showing a highly skewed sex ratio between males andfemales (1 9.5). Due to the limited number of malesobtained in this group, the occurrence of testes in differentmaturity stages could not be clearly presented. In females,immature and maturing ovaries were noticed during the periodfrom October to April. Mature ovaries were obtained duringMay to August and again during December and January. Ovariesin the spawning or spent condition were available duringAugust and September and again in January and February.Maximum gonadosomatic index vnlues were obtained once inMay/June and again in December/January. However, the gonado-somatic indeN values obtained during December/January showedlesser vnlues being 12.3 and 8.0 during 1978-79 and 1979-80respectively: During May/June, the maximum gonado-somaticindex obtained was 22.2 during June, the value and monthbeing the same during both the years.
It may hence be concluded that ~. calbasu does notbreed in this reservoir before attaining a minimun lengthof 400 mm. Further the main breeding seaSon of the speciesin this reservoir is during south-west monsoon extending fromApril to August. Based on the occurrence of mature ovariesduring December/January and spent ovaries thereafter andalso the comparatively high values of gonadosomatic indicesduring these months in advanced size groups (Ill & IV), itmay be inferred that there is 0. possibility of at leastsome individuals breeding once again during the north-eastmonsoon season also.

29
14.2 Q. mrigala
This fish in 'che range of 246-963 mm (m~mber-sexamined, 207) had a sex ratio of males to females, 1 : 1.4.Mature gonads were noticed during Apr£l-September and spentfish from October. Gonado-somatic index showed a singlepeak indicating a single breeding 'season during south-westmOnsoon. Fecundity range was 1,17,468 (530 mm71600 g) .•..2,77,129 (963 mm/12,100 g) 0
14.3 Q. catla
This fish in the size range of 804-1,082 mID.
(numbers exaoined, 74) had a male: female ratio of 1 : 2.Mature gonads were observed during April-May and November.The main breeding season appears to be during south-westmonsoon. Fecundity waS in the range of-89,902 (807 mm/11,500 g)to 46,29,570 (1,075 mm/29,000 g).
14.4 !:. dubius
Fishes in the size range of 412-610 om werestudied ~ Sex ratio of males to females was 1 : 1.90 Matu-refishes were observed during February-June and August-Nov.ember.The fish breeds during both the monsoon seasons. Fecundityrenge was 5,544 (435 mm/850 g) - 25,440 (610 mm/3,OOO g).
The specimens-in the size range of 546-830 mm(numbers examined, 261) showed a sex ratio of1 : 2 (male:female). Fishes with matur~ gonads were observed during mostof the months. Breeding appears to be round the year.Fecundity ra...1'l.[Se"TaS 2-2,061 (590 mm/1,100 g) - ~n,240 (830 mm/4,200g) •
Sex ratio of male to female of the fish inthe size range of 411 -- 1,335 mm (numbers e~amined, 163)was 1 : 3. r<laturegonads were observed during July,September, December, February and March indicating roundthe year breeding. Fecundity ranged between 9,944 (610 mm/1,000 g)-5,33,,950 (1,335 mm/15,500 g).

30
14.7 o. bimaculatus
A total of 324 spe9ioens of O. bimaculatus~ranging in length from 140 mm to 398 mm (25 to 198 g) werestudied. Sex ratio between male and female waS found tobe 1 : 1.1. r·1aleswith immature gonads 'were encounteredduring the period from January to August and again duringDecember_ Males with maturing gonads were also obtained,during the same period from February to August, while thosein the mature condition were ~oticed during February, July,September'and October. Males with spawning and spentgonads were encountered almost throughout the year with ahigher percentage during September to November. Femalesin different stages of ma~urity were also found to followalmost a similar sequence as that of the males, with theincidence of spawning or spent ovaries occurring in a higherpercentage during the period from September to November.It was thus apparent that 0'.bimaculatus in the reservoirbreeds mainly during the North-East monsoon seaSon withstray individuals breeding during the other months also.This can be further supported by the three peaks shown bythe gonadosomatic indices during Feqruary, May and Septem-ber in maLes.and during February, July and October infemales, with the third peruc during September/October showinghighest values in both the sexes.
It is interesting to note that mature individualsof most of the fishes were available during a greaterpart of the year. This seems to be related to the twomonsoon seaSons that the reservoir, is subjected to and the,absence of winter with extreme fluctuations in temperatuxe.
14.8 P. dorsalis: 230 spocimens ranging in length from110 to 192 mm (20 to 100 g) were studied. Sex ratio betweenmales and females was 1 : 75.6 probably due to the small'size of the 'males enabling their escapement from the gearused. Emma+uz-e ovaries were noticed during January, Marchand May, while maturing ovaries were obtained during April,Nay, August and September. Mature and ripe ovaries werenoticed throughout the year, while a fully spent ovary waSseldom obtained. This and the trinodal peaks of gonado-somatic indices indicate an intermittent breeding habit 0:::the species in the reservoir.

31
15 RECRUITMENT
Spawn survey work was conducted at Moolathurai,about 33 km upstreamoI the dam site on Bhavani river, duringmid-June to mid-September in 1975, 1976 and 1977. Dominantspawn spurts in the form of eggs were observed in the lastweeks of July during all the three years. The composition ofthe spawn on rearing in 1975 was made of ~. bata 60.7%, ~.c81basu 3.1%, ~. fimbriatus 4.1%, ~. mri~R1a 0.1%, ~.cqnaticus 10.1%, and niscellaneous. 21 .90. During 1976,the reared spawn showed a composition of ~. ~ 90%,~. reba 4.37%, ~. catla 0.54%, ~. iimbriatus 0.65%,~. rohita 0.12%, ~. Calbasu 0.82%, L. kontius 1.55% andmiscellaneous 0.98%. ' In 1977, the· composition waS ~. bata83.0%, ~. calbasu 15.0%, ~. reba 0.6%, ~. fimbriatus 0.~6%,!!.. kontius 0 •.19%, ~. catla 0.04% and miscellaneous 1.0170.The spawn index waS not reflected proportionately in thecommercial catches of ~. calbasu and ~. bata. The strayoccurrence of spawn of Q.. catla. I!.. rohita and Q.. mrigg,1.aand their limited abundance in the catches indicated thatthere waS no large scale breeding and recruitment of thesefishes in the reservoir. Hence intensive sustained stockingof these species is necessary to improve their fishery.
Shore collections were made to obtain fry usingdrag nets of 1.6 mm mesh during 1973 to 1977. However, nofry of'commercially .important fishes could be 'obtained exceptduring the first week of 1'Ilay1977 when fry of ~. calbasuoeasuring 13-21 mm were obtained, indicating that spawningof calbasu occurred in late April'.
The floods generally experienced in the Bhavaniriver are mainly the result of the discharge of water fromthe Pillur dam - a hydro-electric project about 20 kmabove Moolathurai. The available breeding g~ounds cove~ astretch of about 5 km between Moolathurai and Nellithurai,tho river bed above Nellithurai being steep. Shortage ofsufficient migratory space for large size carps like catla,rohu and mrigala may be a roaSon for their unsuccessfulbreeding on a large scale. Even the restricted availablebreeding grounds seeo to have been monopolised by mediuoand small sized fishes like ~. ~' C. ~' etc.

32
16 LENGTH-WEIGHT RELATIONSHIP OF ECONOMIC FISHES
The length-weight relationship of economic fishesbased on the study upto 1976 are as·~~der
Fish species Length-weight relationship CorrelationCo-efficient (r)
Q. catla V/= 10-6 x 2035'11L3.2995 0.703
Q.. mrigala vl= 10-6 x 1.6978 L3.2864 0.9658.
~. calbasu w= 10-5 x 1.2809 L2.9885 0.9237
!:la ~ vl= 10-6 x 3.0207 L3.0977 0.9334
V,f • attu ~v= 10-7 X 7~5875 L3.2846 0.8206
Further studies on the above species and ~.rohitaand ~. ~ gave the following relationships.
-6 0.98Q,. catla \"1= 3.37 x 10 L3.2561 r =
Q,. mrigala itT= 2.08 x 10⁻⁶ L3.2642 r = 0.74
,-li,. rohita 1tT= 2.36 x 10-0 L3.2565 r = 0.97
L. calbasu Vl= 1.84 x 10⁻⁶ L3.3006 r = 0.98
li· ~ w= 7.75 x 10⁻⁶ L2.8420 r = 0.94
It waSdifferent from
found that the values were not significantly3 in all the above cases.
-3w= 4.36 x 10 L2.0219
On testing the exponent against the value 3 it wasobserved that t1h = 2.86 waS highly significant showing depar-ture of the rela~ionship from cube law.

33
The length frequency analysis following Petersen' smethod showed that .Q.. mrigala re&~hes a size of 540 mm in2nd year, 640 mm in 3rd year, 740 mm in 4th year and 820 mmin 5th year. The fish reaches asymptotic length (la:;).)at1243 mm.
L. calbasu reaches a size of 320 mm in 22/3 years,420 mm i~ 3273 years, 500 mm in 42/3 years, 560 mm in 52/years and 630 mm in 62/3 years. The fish reaches asympto~iclength (100.) at 869 mm.
~. dubius reaches a length of 397 mm at 13/4 years,457 mm at 23/4 years and 517 mm in 33/4 years.
M. ~ reaches the size of 470 mm in 2nd year,590 mm at 3rd year, 710 mm in 4th year and 790 mm at 5th year.The fish reaches asymptotic length (loO,) at 1230 mm.
W. attu reaches a size 'Of 500 mm in 13/4 years,675 mm i~ 2~years, 801 mm in 33/4 years and 900 mm in 43/4-years.
17 FISH CATCH Mm CATCH STRUCTURE
Tho fish yield from the reservoir during the period1971-72 to 1979-80 (Fig .11) ah owe d a steady -increase from 94.462to 294.12 t in 1976-77. Thereafter it declined to 215.69 tin 1977-78, 196,;63 t in 1978-79 and again increased to 210.42 L
The important species encountered in the catchwere J:!.. calbasu, C. mrigala, .Q.. catla,h rohita, 1:. dubiusand 1. fimbriatus among carps and·!:1.~ and J!.. ~ amorrgcat fisheD.
17.1 Trends in individual fishery
The contribution of different species to thetotal fishery is given in Table X.
17.1.1 L. calbasu1. calbasu was the most dominant species
throughout the period and its contribution varied-between27.05% (1979-80) to 47.28% (1971-72). The yield of thisspecies was maximum in 1976-77 with 123.14 t and minimumin 1971-72 with '44.66 t.
L and 251.33 t during 1979-80 and 1980-81 respeatively.

TABLE x 54
ANNUAL YIELD (TONNES) AND YIELD STRUCTURE BHAVANISAGAR (1971-72 TO 1989-81)
Years 'I 1~71 -:72 1972-73 1973-74 1974-75 1975-76 1976-77 1977-78 1978-79 1979- 1980-81Species 80 ...~.calbasu 44~663 46;353 59.029 79 ~771 71 ~293 123~137 85~280 84~017 56.93779.956
(47.28%) ( 38.11%) (41 .08%) (38.92%) ( 38.11 %) (41 .86%) (39.53%)(42.73%)(27.05%)(31.8%)Q.mrigala 6~193 12;822 18; 121 24; 141 24;737 35;519 24;382 9;233 7;793 10.148
(6.56% ) (10.54% ) (1 2.60%) ( 11 .78%) (13.29% ) ( 12~07%) (11.51%) (4.68% ) ( 3.70%) (4.0%)Q.catla 8;753 12; 099 7;793 5;162 6;589 19;902 8 ~111 1 ;999 3;058 2.821
(9.26% ) (9.95%) (5.40% ) (2.5~70) (3.52%) (6.77% ) (3.76%) (1 •02%)" (1. 45%) (1 .1 %)!!.rohitn 1 i406 1 ;013 1 ; 7~4 4;009 ~2;660 25;600 6 ;613 8;392 16.212
~ ( 1 .1 6%) (1.30%) ( 0.87%) ( 2.57%) (7.68% ) (11 .86%) (3.36% ) (4.00% ) (6.4%)!:.dubius 6;640 9;040 6;045 7~438 9;435 15; 280 6;038 5;568 7 ;092 9.979
( 7.03%) (7.43% ) (4.21%) (3.63% ) ( 5.04%) ( 5.19%) ( 2.79%) ( 2.83%') ( 3.37%) ( 4.0%)I:!,.fimbriatus 1 ~545 3 ;941 2;960 2;680 1 ; 31 2 3;789 13 ~160 8.208
( 1 .98%) ( 1 .92/.0 (1 .58%) (0.91%) (0.60%) (1 .93%) (6.25%) (3.2%)1!..~ 6 ~710 1 ;335 2;484 5;064 3;273 4;096 1 ;709 10.114
\ ..,. ..,. ( 4.67%) ( 0.65%) (1 .33%) (1 .72$) (1.51%) (2.08% ) (0.81%) (4.0%)r:1.~ 14; 582 22;489 24; 119 58;28$ 36; 096 39;432 25;868 41;290 43;923 64.687
(15.44% ) (18.49% ) (16.81%) (28.44% ) (19.30% ) (13.41%) (11 .90%)( 21 .00%)( 20.81%) (25.7%)
li.~ 11 ; 235 13;370 10;332 13;684 22;598 23;957 29; 198 20; 135 26;660 25.598(11 .89%) (10.99% ) (10.33% ) ( Q • ~G%)/ ( 12 .08%) (8.14% ) (13.53%)(10.24%)(12.67%) (10.2%)
\Miscellaneous* 2;396 4;064 8; 152 9 ;419 6.055 6~484 6;624 19;889 41 ;699 tg:~%f( 2.54%) (3.34%) (6.40% ) ( 3.95%) (3.42% ) (2.20%) ( 3 •04%) ( 10 .1.1% ) ( 19 .02%).210~423 248.537Total 94.462 121 .643 143.659 204.973 187.055 . 294.115 215.686 196.679
*Miscellaneous : I.C.A.R. (Experimental fishing)catch, spoiled & ~~±veQ fish

35
17.1.? Q. mrigaln
The species contributed only 6.19 t in1971-72. Its catch increased steadily to a maximum of35.52 t in 1976-77 and declined thereafter. Its percentagecontribution varied between 3.70 and 13.29.
17.1.3 Q. catla
The landings of c. catla were maximum in1976-77 with 19.90 t and minimum in 1978-79 with 1.99 t.The fluctuations in the catches wore erratic and its per-centage contribution varied between 1.02 to 9.95.
17.1.4 ~. rohita
This species contributed meagrely in theinitial years of investigation. From a mere 1-.4t in1972-73 it increased to 25.60 t in 1977-78 but declined-in the subsequent years. The perce~tage contributionwaS in the range of 0.87 to 11.86.
17.•1 .5 ;E. dubius
The catch of P. dubius r81'lgedbetwee:n '5.57tin 1978-79 and 15.28 t in 1976-77. The trends in thecatches were irregular and the percentage compositionvaried in the range of 2.79 to 7.43.
17.1.6 ~. fimbriatus
This species ,TaS almost negligible' in theearly years. Upto 1978-79 its contribution varied from1.31 t in 1977-78 to 3.94 t in 1974-75. In 1979-80 thefishery of this species remarkably improved to 13.16 tforming 6.25% of catch.
The catches of this species were' mGa~re -throughout the period. The catch waS significant '~.71 t)in 1973-74 when it formed 4.67% of the total yield. Thehighest landings (10.1 t) were recorded during 1980-81 butit constituted only 4*0% to the total catches. -

36
17.1.8 M. ~The species was next to ~. calbasu in the
total yield. It contributed a maximum of ~.lS9 t :in1980-S"f and a minimum of 14.58't in 19'71-72. The percentagecontribution waS in the range of 11.90 to 28.44.
J!.. ~ was the second important catfish yi·eld-ing from a minimum of 10.33 t in 1973-74 to a marimum of29.20 t in 1977-78. Its percontage contribution rangedbetween 6.68 and 13e53.
'17.2 Fishing effort, catch per unit effort and'yielu
Fishing effort waS increased.in a phased mannerduring the period 1971-72 to 1979-80 (Fig. 12). The effectivefishing effort (in terms of 50 m hung length of the gill net)was of th~' order of 30 x 103 units in 1971-72, 34 x 103 unitsin 1972:-'73,71 x 10³ units in 1973-74, 103 x 103 units in1974-'1'5, 112 x 103 units in 1975-76 and 1976~77, 107 x 103J..W.i.tsin 1977-78, 164 x 103 units 'in 1978-79,: 202 x 103
Land __~units in 1979-801 Taking 1971-72 as the base ye~ the fishing244.~ effort was increased by 13% in 1972-73, 136% in 1973-74,units 243% in 1974-75, 273% in 1975-76 and 1976-77, 257% in 1977-78,in BO- 447%:in 1978-79,~- 573% in 1979-80~ Corresponding to the81. increase in the fishing effort the fish yield incre~sed by
29% in 1972-73, 53% in 1973-74, 117% in 1974-75, 98% in 1975-76,211% in 1976-77, 128% in 1977-78, 108% in 1978-79,:..:-.,~123.% in1979-80l The low yield in 1978-79 and 1979-80 inspite of theincreas~d effort is probably due to the high water levelsmaintained during these years (average water level. 279.71and 278.16 m respectively).
iJ. and713% in
1980-81.
#and128% in1980-81 • The overall catch/unit effort after increasing to
3.58 kg in 1972-73 from 3.15 kg .Ln 1971-72 declined till1975-76 (Fig. 12). But it increased again in 1976-77 anddwindled subsequently till 1979-80.It.was 1.t3kg in 1980-81.
17 .2 •1 ~. calb asu
The species contributed 44.66 t :in 1971-72wi th EU1 increase in fishing effort as mentioned above. Theannual. yield of !!.. caJ.basu increased by 14% in 1972-73, 32%in 1973-74, 71% in 1974-75, 60% in 1975-76, 176% in 1976-77,90% in 1977-78 and 1978-79 and 27% in 1979-80. The catch(kg)/unit effort (50 m length unit) was 1.477, 1.363, 0.827,0..774, 0.637, 1.099, 0.790, 0.510 and 0.822 during 1971-72

37
to 1979-80 respectively. The increase in fishing effortthus positively contributed in increasing its yield. Thefluctuations in c·atch/unit may be attributed' to normalyearly recruitment variations. This is also reflectedby the fact that for identical effort density in 1975-76and 1976-77 the cat~h/unit fluctuated as much as 0.637kg and 1.099 kg res~ectively. The steep decline in 1979-80m ay probably be attributed to the rise in the catch o:f ..'-/I;. fimbriatus. The annual moan length of the fish variedin the range 465 - 530 mm in the size range of 309-790 mm •.
17.2.2 c. mriRala tonnesThe annual yield w a.aonly 6.1~in 1971-72.
With an increase in effort the·yield increased to 107% in 1972-73,193% in 1973-74, 290% in 1974-75, 299% in 1975-76, 477% in1976-77, 293% in 1977-78, 49% in 1978-79 and 26% in 1979-80.The catch/unit indices in the above years were. 0.205, 0.377,0.254,0.234,0.2.21,0.317,0.227,0.056 and 0·.039 kgrespectively. This is a clear case where increased fishingeffort coupled with stocking increased the producti vi ty,.Low productivity in 1978-79 and 1979-80 is probably due tohigh water levels and poor stocking. The fish occurred inthe size range of 380-980 mm and the annual mean length variedbetween 623-807 mm.
17 •2 •3 Q. • catla
The yield of Q.. catla was 8.753 t in 1971-72~With an increase in fishing effort its catch registeredan increase of 28% in 1972-73, a decrease of 11% in1973 -74, 41% in 1974-75, 25% in 1975-76' and again anincrease of 127% in 1976-77, 7.87% inc~ease in 1977-78, .a decrease of 77% in 1978-79 and 65% in·1979~80. The catch/unit indices for the above years were 0.289, 0.356, 0.109, 0.050,0.063, 0.177, 0.076, 0.012 and 0.015 kg respectively. Thocatch/unit index clearly points to the fact that the stock ..is subjected to extreme annual recruitment variations andon that score alone needs intensive stocking over theyears till its establishBent. The stock density variationsare not governed by the fishing effort as the catch/unitindex varied from 0.060 kg in 1975-76 to 0.177 kg in 1976-77even when the effort was the same in both the years. Thefish occurred in the size range of 396-1390 mm with theannual mean length varying from 606~913 mm.
The catch was 11 .235 t in 1971-72.Consequent to the increase in the fishing effort thecatch registered an increase of 19% in 1972-73, a declineof 8% in 1973-74, an increase of 22~ in 1974-75, anincrease of 101% in 1975-76, 113% in 1976 77, 160% in1977-78, 79% in 1978-79 and 130% in 1979-So.Lo.133,0.202, 0.203, 0.272, 0.113, and 0.132 kg respectively.The higher catch/unit indices in 1971-72 and 1972-73 maybe due to the lower fishing effort. The fish occurred inthe size range of 412-1725 mm with annual mean lengthvarying from 743-831 mm.
f
38
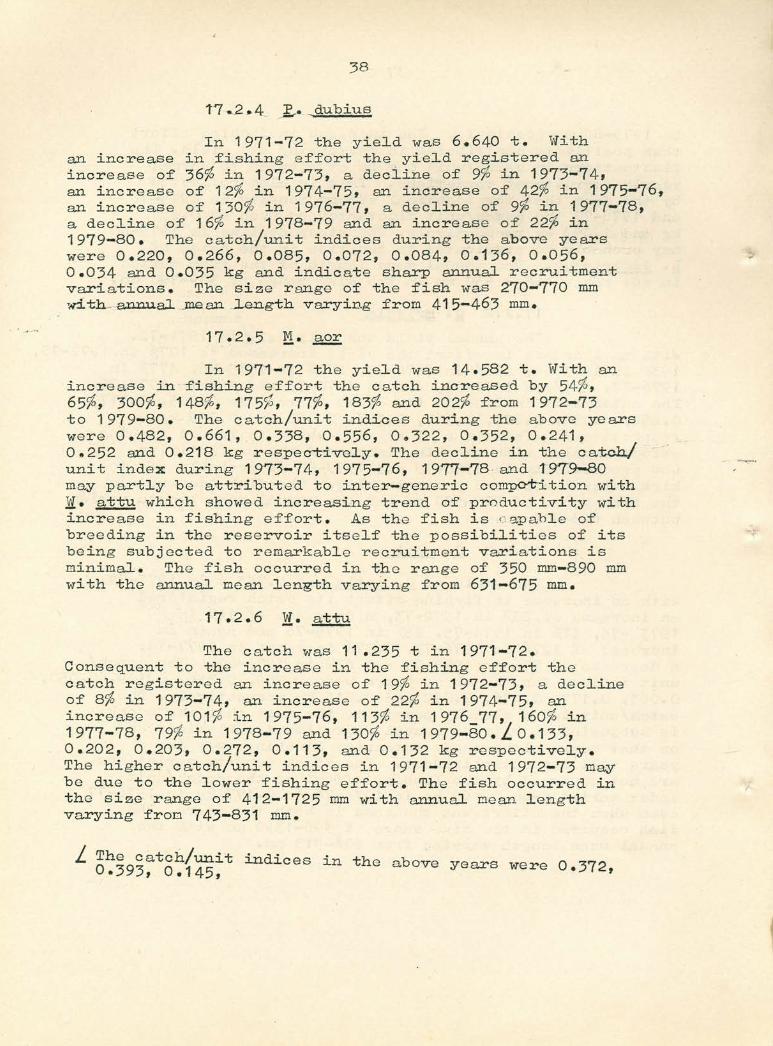
11.2~4~ .L•. dub ius
In 1971-72 the yield waS 6.640 t. Withan increase in f~shing effort the yield registered anincrease of 36% in 1972-73, a deciine of 9% in 1973-74,an increase of 12% in 1974-75, an increase of 42% in 1975-76,an increase of 130% in 1976-77, a decline of 9% in 1977-78,a decline of 16% in 1978-79 and an increase of 22% in1979-80. The catch/unit indices during the above yearswere 0.220, 0.266, 0.085, 0.072, 0.084, 0.136, 0.056,0.034 and 0.035 kg and indicate sharp annual recruitmentvariations. The size range of the fish waS 270-770 mmw:i th.-...annuaJ. .me an J..ength varying from 415-463 mm.
In 1971-72 the yield was 14.582 t. vii th anincrease in~ishing effort the catch increased by 54%,65%, 300%, 148%, 175%, 77%, 183% and 202% from 1972-73to 1979-80. The catch/unit indices during the above yearswere 0.482, 0.661,0.338, 0.556, 00322, 0.352, 0.241,0.252 and 0.218 kg respectively. The decline in the ca~unit index during 1973-74, 1975-76, 19T7-78·and 1979-80may partly be attributed to inter-generic com:p<Yt-itionwith~. ~ which showed increasing trend of ,productivity withincrease in fishing effort. As the fish is C apab Le ofbreeding in the reservoir itself the possibilities of itsbeing subjected to remarkable recruitment variations isminimal. The fish occurred in the range of 350 mm-890 mmwith the annual mean length vary'ing from 631-675 mm.
L The catch/unit indices' th bO 39 ~n e a ove years were 0.372,• 3, 0.145,

39
18 I¥~ACT OF STOCKING ON YIELD
Details of stocking during 1971-1980 are presentedin Table XI. Both C. catla and P. dubius showed markedchanges in recruitm;nt as reflected by catch/unit indices.These fishes require intensive sustained stocking.
18.1 Q. catla
The average stocking rate for this fish during1970-71 to 1974-75 waS 3,125 fingerlings/year (less than1/ha/annum). The stockin~ was continued -again from 1977-78with 12,000 fingerlings ~3/ha), 25,330 (71ha) in 1978-79and only 100 in 1979-80. The impact of stocking in 1977-78and 1978-79 is yet to be felt.
18.2 Q. mrigala
It waS stocked at the rate of 2,49,070 finger-lings/year (67/ha) .during 1970-74. The size range of mrigal~in Bhavanisagar was 300-980 mm wi~h the mean length varyingin the range of 623-759 mm. The age of this mean size can-be attributed to 3+ and 4Te Thus the fingerlings stocked in1971-72 probably resulted in the catch of 24.1 t in 1974-75.And the hca~J stocking in 1972-73 yielded a catch of 24.7 tin 1975-76 and 35.5 t in 1976-77. The results of thestocking in 1974-75 (47/ha) has ,resulted in 24'~4 "bin1977-78. Low stocking in 1975-76 and 1976-77 has resultedin a poor fishery in 1978-79 ~d 1979-80. The results ofstocking in 1977-78 and 1978-79 are yet to be reflected inthe fishery. Hence stocking of this species is to becontinued to improve the ;yield.
18.3 ~.rohita
T~e average stocking rate for ~. rohita from1972-73 to 1975-76 was 77893 fingerlings/year (21'/ha/year).This appeared tu have improved the fishery from 1.4 t in1972-73 to 22.66 t in 1976-77 and 25.6 t in 1977-78. After1975-76 the stocking rat~of fingerlings wero only 2/ha in1976-77 and 5/ha in 1977--78, with the result that the ,oatchesdeclined to 6.66 t in 1978-79 and 8.4 t in 1979-80. Thisspecies also needs stocking support.
18.4 ~. fimbriatus
The stocking of this fish waS 1,52,386 finger-lings/annun from 1972-73 to 1976-77 (41/ha/year). The

40T,ll.BLE XI
DATA ON STOCKING OF FISH SEED IN BHAV,A.NIS1~GAR
_ •....•
1970-71 1971-72 .1972-73 1973-74'1974-75 1975-76 i1976-77 1977-78 1978-79 1979-80 J~~)-t9aO-81--------------------------------,------------------------------------------------------------~.--------Q..catla 283 1,975 3,695 5 9,669 25,330 100 l , i ; 1,700
!!.rohita 96,752 27,000 32,810 1,54,630 7,000 20,000 49,170 1, 89,729 i,!
Q..mrigala 1,31,235 71,940 7,65,108 28,000 1,72,447 90, 562 18,000 98,400 1,25,350 29,484 1?1;'l1i~770
J.!,o.fi!1}- 2, L'ir6 , 177 3,45,725 16;>L~08 94,118 59~500 71,520b:ri,.g.t.£§
.Q. c ££:1'..12.:1-9- 1.,7505,11,870 1,71,8'15 30,499 11v8OO 25,590
!!.cal~~ 2,4\)4 1,19,730 19,000 21,254 1,26,957
30,000 2,074 1,197----_ .._----------..,..---
1,42,561 2~23,645 11,13,482 9,31,600 4,26,477 4,97,963 96,350 1,30~400 2,96,960 2,19,013 1,16,470
(* 3,000 silver carp (32-66 nll,) wer('~ also stocked during 1980-81)

41
stocking did not have the desired effect and the catchesfluctuated at lower levels between 1.3 t in 1977-78 and3.9 t in 1974':'75. Persistent stocking, however, does notseem to have improved the catch ·to 13.2 t in 1979-80. Asthe catch of ~. calbasu decli:.lCdto 56.9 t in 1979-80, itneeds to be seen whether the increase in stocks of 1:~imbriatus have affected the fishery or ~. calbasu •
18.5 Q. •• carpio
It was stocked continuously from 1972-73to 1976-77 at 1,45,547/annum (39/ha/annum) but the yieldhas been rather poor. It contributed only 1.2 t in 1979-80.The reaSons for its failure could be possible heavy morta-lity of the seed which was stocked in an advanced fry stage,overlapping of its food habits with the established stocksof ~. calbasu and its sluggish nature falling an easy preyto the catfishes.
19 TAGGING AND CLIPPING
About 42,477 fingerlings of L. fimbriatus of averagesize 34 - 67 mm (0.5 - 2.5 g) in 1972-73 and 13,480 finger-lings of 58-65 mm (2.2-2.4 g) in 1973-74 were clipped andreleased. The recoveries after a free life ranging from 455-764 days revealed that the fish grows to a size of 257 mmand 391 mm at the ond of first an~ second years respectively.This CODpares with the sizes attained in Nagarjunasagar of260 and 370 mm for the identical periods.
Tagging experiments on ~. calbasu, ~. fimbriatus,~a dubius, C. mriRala and ~. ~ were however suspended astho tagged fishes wero caught within a few hour!3 of theirtagging.
20 EXPERIMENTAL FISHING20.1 Fish distribution in space ~~d time
Fig. 13(A) depicts the catches/50 m net from tho foursectors of the reservoir during the years 1978-79 and1979-80. During both the years tho Lotic sector yielded themaximum catches of 2.70 kg and 2.31 kg/50 m net respectivelyoDuring 1978-79, the Intermediate sector closely followedthe Lotic yielding 1 .49 kg while the Moyar sector followed theIntermediate with 1.30 kg. During both the years, the -Lentic sector yielded the lowest catches of 0088 kg and0~78 kgo Taking the Lentic sector as base the catches during

42
1978-79 and 1979~80 from the Intermediate sector were 210%and 160%, from/the Moyar,sector 167% and 210% and from theLotic sector 306% and 296% respectively. The averagecatches from the reservoir during -1978-79 and 1979-80 were1.85 and 1.46 kg/50 m :t:l<!'t.A similar decrease in thecatch/unit wa'snoticed'Vin the commercial catches alsoduring the period.
Fig. 13(b) shows the quantitative abundance per50 m net during vari0us months in the two years (datanot shown relates to months when fishing could not beconducted). During 1978-79 November, when only Moyar sectorwaS covered, maximum catch of 2.46 kg was obtained. However,in December, when all the four sectors were covered, amaximum batch of 2.19 kg was noticed. In 1979-80, themaximum catch of 2.7 kg was observed during August. It isinteresting to note that the maximum catches were duringthe north-east monsoon in 1978-79 and during south-westmonsoon in 1979-80.
Table XII presents the details of the speciescomposit~on in the four sectors during both the years.In general, all the species were represented in all thesectors during both the years. At the same time the foursectors showed clear variations in the abundance ofcommercially important fishes. Thus £. catla waS abundantin both the years in the Lotic sector f'oL'l.owe d by Moyar.£. mrigala during the first year showed the same pattern ofaistribution but during the second year it waS more abundantin the Intermediate sector than flloyar. During both theyears, ~. rohita waS more- common in Intermediate sector •L. calbasu which forms the most important fishery of the;eservoir showed an equal abundance in the Lotic a~dIntermediate sectors during the first year whereas in thesecond year it waS maximum in the Lotic sector followed byMoyar sector. ~e~, which constitutGd a major portionof the experimental fishing catches but not properly ex-ploited by the commercial nets, show8d a high concentra-tion in the Lotic sector and waS fairly abundant in theIntermediate sector also during both the years. ~. dubiuswas more abundant in the Intermediate sector followed bythe Lotic sector during first year and during the sec::>ndyearit waS more abundant in the r.10yarsector followed by theLotic sector. During both the years; ~. sarana waS maximumin the Moyar sector. M. ~ did not show any clear
r
20.2 Yield composition - sector-wise endspecies-wise

43TlffiLEXII
SECTOR-WISE TOTAL CATCH (KG) OF VL.RIOUS SPECIES IN EXPERI-MENT~~ FISHING DURING 1978-79 AND 1979-80
Sectors r·Ioyo.r Lcntic1978-79
I Intermedi~'t-.:a·'1979-801978-79 1979-80 1978-79 1979-80
Qocatla 47.050Qomrigala 46.655b.rohita 19.950~. calbasu 172.7851.~ 127.8651.kontius 1 .680~.£imbriatus 19.210~.dubius 53.675~.carnaticus 11.170~ e sarana 137.490~.~ 234.670i[<>~ 79.635Qobimacula~ 124.645£.~ 46.365Puntius sp., 43.380Mystus sp., 4.405!.mossambica 4.385~.armatus 5.305Miscellaneous 0.135
44.250439400
266.070800505
7.49019u490
1440585111900
122.755183~255
73.22510 ••415
0.2700.5204.5302.705
22.40000470
13.65043.675
104.180
5300201 .36011,,,400
31 .0952q085
46.275204~620
32.81080.82545,,80026 ..725
8.3850.8603.8203 c010
8.00041 .90537.00062.47539.670
3.100
20.79553.565
1.75069.350
210.03026.390
7.1850~8800.910
1 .1 208.5451 .7350.470
\5.700\3·2.490
35 .•125,480.475365·.045,
3 ~\7509.865
138.9753.285
1160455242.075
69.00096.59545.19040.60512.980
1 .47010.945
2.535
12.45053.49049.150
104.505195 •.040
0.710
4.30059.••505
'.1,~930
31 ~\055.120.\000
\24.4·05-,
4.800,'1.0300.7651 .0552.9855.0750.050
(Contd. next page)
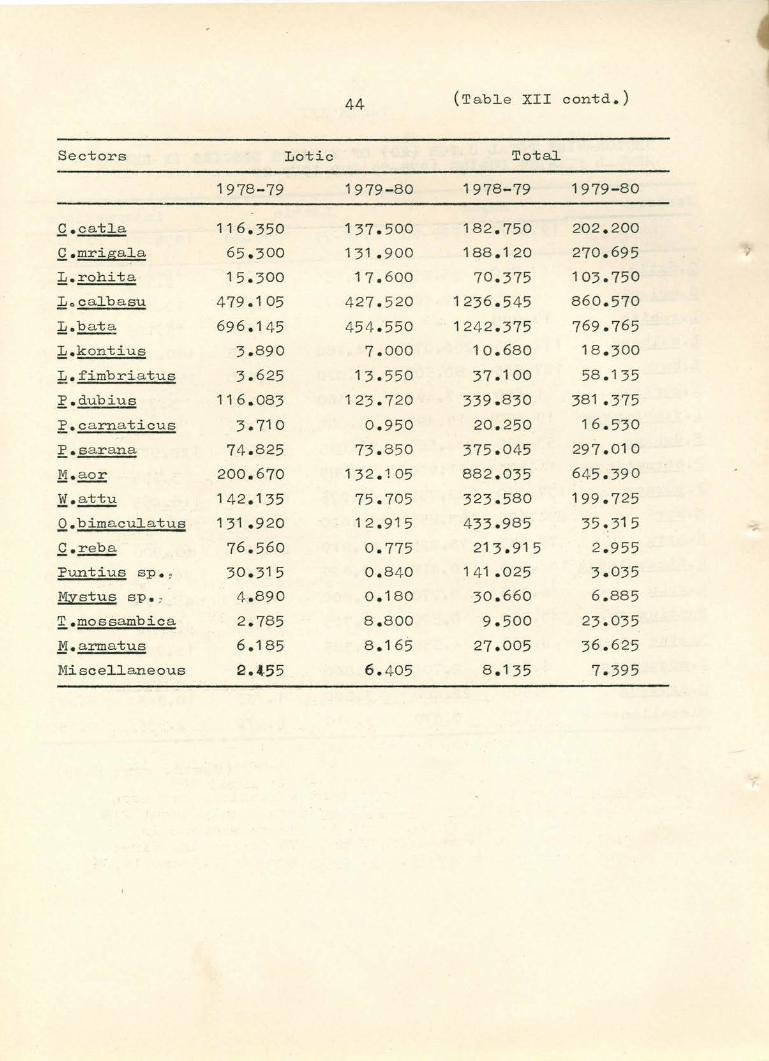
44 (Table XII c orrt d , )
Sectors Lotic Total
1978-79 1979-80 1978-79 1979-80
Q.catla 116.350 137.500 182.750 202.200Q.mrigala 65.300 131.900 188.1 20 270.695J::.rohita 15.300 17.600 70.375 103.750J::ocalbasu 479.105 427.520 1236.545 860.570J::.~ 696.145 454.550 .1242.375 769.765J::.kontius 3.890 7.000 10.680 18.300!:. fimbriatus 3.625 13.550 37.100 58.135R·dubius 116.083 123.720 339.830 381 .375R.carnaticus 3.710 0.950 20.250 16.530l:,. sarana 74.825 73.850 375.045 297.010~.~ 200.670 132.105 882.035 645.390li·~ 142.135 75.705 323.580 199.725Q.bimaculatus 131.920 12.91 5 433.985 35.,315Q.~ 76.560 0.775 213.915 2.955Punt ius sp. ~ 30.315 0.840 141.025 3.035Mystus sp.: 4.890 0.180 30.660 6.885l·mossambica 2.785 8.800 9.500 23.035k!.armatus 6.185 8.165 27.005 36.625Miscellaneous 2.455 6.405 8.135 7.395
1

45
sectoral variation during both the years. }i~ ~ was morecommon in -the -Lotic sector f'oLLotee d by ]\ioyarduring boththe years. O. bimaculatus showed 0. slight abundance in theLotic and Moyar sectors whereas Q. ~ was more common inthe Lot ic sector.
20.3 Fish size - mesh bar size relationship
The relationship between length/weight/girthat dorsal fin of fish with mesh bar for the cQmmerciallyimportant species is given in Table XIII.
20.4 Effective mesh size for different specie§.
Data on mesh-wise catch of various speciesduring 1978-79 unO. 1979-80 are given in Tables XIV andXV respectively.. vIThenexnmined in ~relation vdth theaverage total length of individual species obtained invarious meshes it is observed that the effective mesh barranges from 130-150 mm for C. catla (750-842 mm) in Bhava-nisag6.r.. The effective mesh bar for Q. mrigala (605-757--mm)and ~. rohit..£(548-929 mm) ranges'from 60-85 mm; forl!" ~(362-385 mm) from 38~50 mm; for~. calbasu (541~608 mm)from 60-80 rr®; for E. dubius (337~377 on) and Eo sarana(247-360'mm) from 35-50 mm; f'orM. aor (511-644 l11lll) from,50-70 mm. For 'smaller fishes like O:-bimaculatus. C; rebaand Puntius ep ,~ the effective mesh -bam are 20-30 m;. -
The vulnerability of various species of fish in rein-tion to their weight in nets of-different 'mesh bars has beenworked out statistically and is given in Table XVI to enablea fisherman to catch fish of 'desired weight by operating ..nets of ~ppropriate mesh bar.
2005 Percentage S1)ec:'.8scomposition in .experimentalnets and commercial fishing
..:
Percentage species composition of experimentaland commercial fishing during 1978-79 and 1979-80 is givenin Table XVII. Though much difference.: is 'not noticed inthe composition of major carps except in Q. cat!£ andQ. mrigal~ in second year, significant variations are seen
in ~. calbasu and ~.~. I:.. calbasu formed only about 21%in experimental fishing during both the years whereas incommercial fishing it formed 42.7% and 27% during'the firstand second years respectively. ~. ~ formed 21.5 and 19 ••5%

46TABLE XIII
RELATIONSHIP BETWEEN LENGTH/WEIGHT/GIRTH AT DORSAL OF FISH WITHMESH BAR CF COMMBRCIALLY IMPORTANT FISHES OF BHAVANISAGAR
Species Regression between Regression between Girth and mesh barlength & mesh bar weight & mesh bar
L=295.584 + 1.774 M W=51 .006 M - 4541 .952 G=Oe4192 M + 528.7586L=239.379 + 2.867 M ~f=45 .635 M - 2606.084 G=2.1418 M + 73.1759IJ=283.978 + 1 .851 M W=20.749 M - 778.514L=249.383 + 2.382 r-i W=49.362 M - 4041 .391 G=2.5966 :fI1 - 3.6698L=198.710 + 1 .095 M W=10.355 M - 222.461L=204.851 + 1.894 M 1'[=1 2.348 M - 365.275L=1 02.351 + 2 •.682 M W=11 .796 M - 403.980L=284.107 + 0.988 M W= 6.771 M - 11 .249L=180.562 + 1 .000 rlI W= 4.995 M - 109.509L= 89.005 + 2.518 M vv= 3.789 M - 89.782L=176.376 + 1 .675 M 1'1= 2.555 M - 35.449L=350.359 + 1 .809 M W=15.001 :fI1 - 418.384 G=1.7641 M + 74.3156
L== Length of £"1,sh in mmM= Mesh bar in mmW= 1.'leightof fish in gmG= Girth of fish at dorsal fin in mm
Q.catlaQ.mrigalaI!.calbasuI!.rohitaI!,.fimbriatus1:.dub ius1:•carna tic usI!,.~1:.saranaQo~Q.bimaculatusl:1.§:.2£

47TABLE XIV
MESH-WISE CATCH (kg) OF VARIOUS SPECIES IN BHAVANISAGAR DURING(1978-79)
Species Mesh-bar (in mm)20 25 30 35 37 45 50 60
Q..catlaQ..mrigala 0.820 5.090 4.045 7.465 10.750 34.050~.rohita 1 .150 0.900 3.045 11 .780I!..calbasu 2.500 ,1.650 5.655 13.985 36.730 47.960 85.875 191 _660L.~ 3.900 23.920 149.045 211.540 .320.360 306.285 202.685 23.840~.kontius 0.930 0.915 1.390 1.655 3.940 1.850~. f'd.mbz-La+u e 0.075 0.140 2.630 3.390 8.090 5.575 5.600P .dubius 2.710 15.765 49.870 51.970 59.025 39,.990 44.130 26 "195~ •carnaticus 0.195 0.065 1 .635 1 .700 3.380 5.550 2.825 3.800~.sarana 1.175. 7.845 39.970 68.745 108.465 87.270 56.695 3.230M.la9.£ 12.595 14.450 38.645 38.?15 65.645 74.885 83.690 92.010~.~ 12.785 17.175 11 .145 17.495 19.1 50 13.555 8.655 44.490O.bimaculatus 85.380 239.105 94.740 11 .505 2.650 0.415 0.190C.~ 127.390 74.645 10.865 0.390 0.625~untius spu 70.050 60.130 9.190 1 .445 0.210Mystus sp. 9.940 11 .895 7.07C 1.755I·mossambica 0.280 1.395 1 .655 1 .845 2.970 1.355!'i.armatus 4.690 7.650 8.980 5.685Miscellaneous 3.310 0.515 05290 1 .195 0.980 0.-845 1 .000Total 336.620 481 .165 430.385 435.915 629,040 597.835 509.410 439.505Percentage 5.03 8.33 7.45 7.55 10~89 10.35 8.82 7.61
--'-

48 TABLE XIV (CONTD.)fv'lE SH -wr SE CATCH (kg) OF VARIOUS SPECIES IN BHAVANISAGlI.R DURING
(1970-79)
Species Mesh-bar (in mm)65 7() 75 00, 85' 130 ~ 135 150 Toto.l
Q.ocatla - , 4,,7OJO f)-.15 - 89015· 48.25 32.50 102 .•7509.·mrigala 31.450 20.650 '22c,10 22.70 13030 15.70 1~ ••12iJ;g.rohita 80450 12.100 12045 20.50 70.375;g.calbasu 272.440 199.430 146.76 133080 92 ••10 1236.545~.bata Oe800 1242.375;g.kontius 10 ..680l.of'imbriai!:l§. 6.500 4.000 1 .10 370100£:odubiu§. 13.100 15.475 16075 3.35 1 .50 339.830I 0 carnaticu§. 1 0100 20 e250E,.sarana o ~750 0.550 0035 375.045!:!.~ 103_,095 121 .345 100.72 68.69 62.20 4.85 1 .•00 882.035~.~ 22",000 32.040 5.74 30.60 15.85 42.25 13.65 27.00 323.580Q • bimaculatus 433.985Q..reba 213.915Puntius sp. 141.025M;y:stusep , 30.660!.mossambica, 9.500!'i • az-ma tu s ~ 27.005Miscellaneous 8.135Total 459,,685 400 • .290 301.32 271.59 205 ••00 151.95 61.90 60.50 5772.910Percentage 7.96 6 ..93 5.21 4.70 3.56 2.63 1 .07 1.04

TABLE xv 49rvn~sH-wISECATCH (kg) OF VARIOUS SPECIES IN BHAVANISAGAR DURING 1979-80
Mesh-bar (in mm)Species
30 35 37· . 45 50 60 65 70.Q..catla 1.000 4.700Q. .mrigaJ.a 0.290 4.8~5 2.600 5.450 13.950 25.300 37.150~.rohita 2.400 5.300 14.800~.calbasu 6.120 16.945 16.870 13.945 38.790 146.750 127.300 154.100
L.~ 55.855 1~5.750 199.610 189.170 168.955 28.425 2.CCO~.kontius 3.830 2.240 5.410 2.615 3.855 0.350 -Jd.. fimbriatus 10350 2.850 3.020 3.795 7.830 8.970 12.050 15.720~.dubius 35 ..280 54.385 69-.080 68.370 67.000 48.640 17.080 16.550P .carnaticus 0.125 0.580 0.935 5.870 3.120 2.150 2.650 1 .100
~.sarana 48.085 80.265 71.885 50.360 34.355 5.390!':1.~ 29.380 58.790 52.130 49.585 71 .515 98.910 74.800 98.180J!..~ 15.595 14.220 8.120 5.230 15.025 31 .150 22.950 8.185Q .bimaculatus 29.540 5.275 0.325 0.075 0.100Q..~ 2.835 0.120Pu rrt Lue ep , 2.845 0.190Mystus sp ~ 3.765 0.470 2.6501,.mossamb:i.ca 3.670 5.250 6.500 4.205 2.265 4.145!':1.armatus 23.845 11.780 1.000M:i.scellarteous0.940 1.555 4.900Total 263.060 380.955 445.740 395.820 423.310 385.830 288.430 357.385Percentage 6.67 9.67 11 .31 . 10.05 10.74 9.'79 7.32 9.07

50 TABLE XV (CONTD. )
MESH-WISE CATCH (kg) OF VARIOUS SPECIES IN BHAV1\NISAGARDURING 1979-80
Mesh-bar (in mm)Species
75 80 85 ~ 130 135 150 Total
Q,.catla 3.200 9.400 84.850 76.550 22.,500 .202.200"
Q.mrigala 41 .350 70.150 69.600 . 270.695..J:!,.rohita 12.750 24.500 }8.590 25.500 103.750L .calbasu 145.500 96.30Q 97.950 .- 860.570I:!.. bata " 7,69.•765J:!,.kontius 1~~300J:!,.£imbriatus 1 .450 1 .100 58.1:3 51: .dubius . 1 .510 3.480 381.575;g,.c arnat:1.cus - 16'.530
.~esarana 0.670 297.010!1.~ 41.25Q 30.000 30.900 8.700.' 1(.250 645.390~.~ 13.300 8.200 30.000 18.400 4.600 4.750 199.725Q.bimaculatus ~ 35.315C.~ 2.955Puntius sp. , .•. 3·035
Mystus sp. 6.885!.rnossambica - 23.035!1.armatus 36.625Miscellaneous 7.395
Total 260.980 243.130 246.950 1370.450 82.400 27e250 3930.690
Percentage 6062 6.17 'J ~ 026 "3048 2.09 0.69
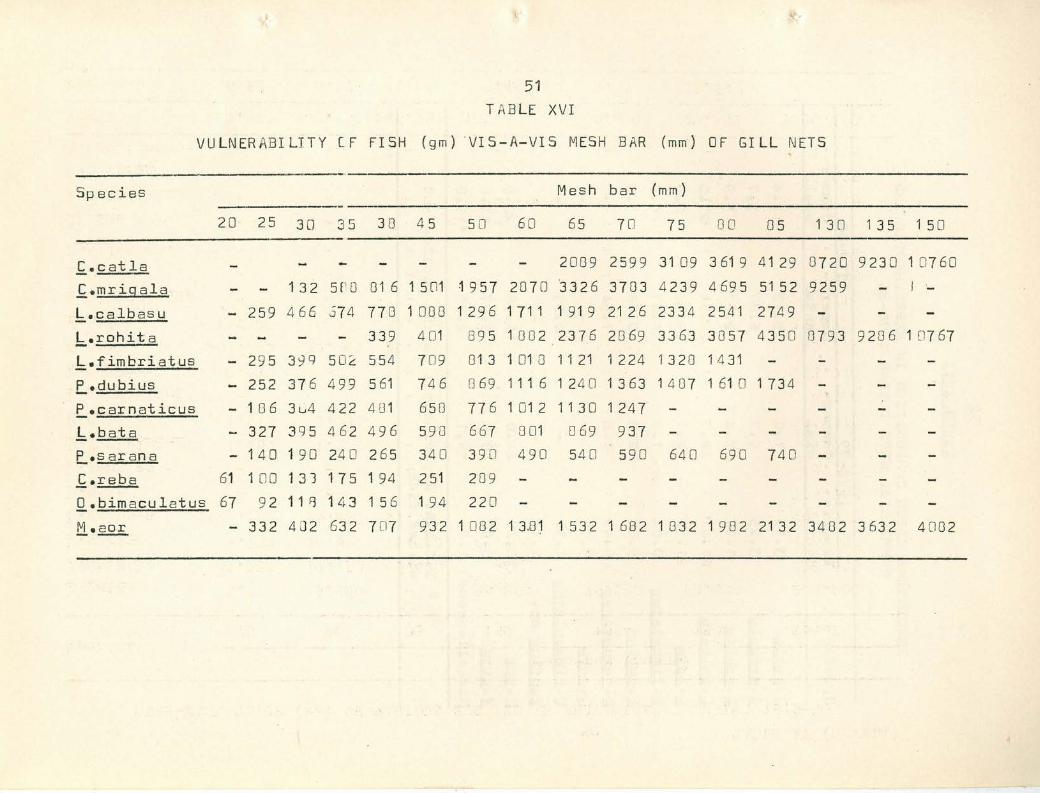
51T /i BLE XVI
VULNERABI LITY (F FISH (gm) VIS-A-VIS MESH BAR (mm) OF GI LL NETS
Species Mesh bar (mm)
20 25 30 35 30 45 50 60 65 70 75 00 05 1 30 1 35 1 50
£.catla 2009 2599 31 09 361 9 41 29 0720 9230 1 0760
C.mrigala 132 5 f' 0 01 6 1 581 1957 2070 '3326 3703 4239 4695 51 52 9259 I '-l-.calbasu - 259 466 .574 770 1 000 1 296 1 71 1 1 91 9 2126 2334 2541 2749
L.rohita 339 401 895 1 002 2376 2069 3363 3057 4358 0793 9206 1 8767
L.fimbriatus - 295 399 50~ 554 709 01 3 1 01 0 11 21 1 224 1320 1431
E...dubius - 252 376 499 561 746 069_1116 1 240 1 363 1407 1 61 0 1 734
E...carnaticus - 106 3~4 422 401 650 776 1 01 2 11 30 1 247L.bata - 327 395 462 496 590 667 001 069 937E..sarana - 140 1 90 240 265 340 390 490 540 590 640 690 740
C.reba 61 1 00 1 3] 175 1 94 251 209Q.. bim acu lat us 67 92 11 8 143 1 56 1 94 220
M.£!2£. - 332 4Q2 632 7 Cl7 932 1 002 1 3.81 1 532 1 602 1 032 1 902 21 32 3402 3632 4 [102

52TlillLEXVII
PERCENTAGE CATCH COMPOSITION IN EXPERIMENTAL ANDCOMMERCIAL NETS DURING 1978-80
1278-79 1979-80Species Experi- Commer-
ment3,l cialExperi- Commer-mental cial
Q..catla 3.16 1 .0 5.13 1.4Q..mrigala 3.25 4.7 6.87 3.7!t.rohita 1 .21 3.4 2.63 3.9!!.• calb asu 21 .41 42.7 21 .84 27.0L. bata 21.52 2.1 19.54 0.8!!.. fimbriatus 0.64 1 .9 1.47 6.2I·dubius 5.88 2.8 9.68 3.4~.carnaticus 6.49 0.8 7.54Q..~ 3.70.Q. bimaculatus 7.51 0.89Puntius SPa - 2.44!!l.~ 15.27 21 .0 16.38 20.8W.attu 5.60 10.2 5.07 12.6--Miscellaneous 1.92 *9.1 2.96 *19.8
* l.C.A.R. Experimental catch, spoiled andseized fish

53
during the two years respectively in the experLmentalcatches but it formed ,ou+y 2.1" and 0,,8%duriri,g the twoyears respectively in comme r-cioJ..:fishing. Simil,p.rlyP. dubius formed 5.9 and 9.7% in' experimental. :fishing~d 2.8 and 2.•4% in commercia1. :fishingdurirlgthe twoyears respectively. ;g,. carnaticus formed 6.5 and 7.5% inexperimental fishj.:ngwhile it was meagre o'r absent incommercial fishing. The higher catches of cat-:fishe$ incommercial fishing can be attributed to occasional use .of hooks and lines. Smaller :fishes like O. bimaculatus,~. ~ and Puntius spp. were not at all ;epresented in thecommercial catches. Thus, it is evident that populationsof !t.. ~, ;g,. carnaticus, Puntiusspp. and Q •. bimaculatus-are not properly explo~ted.
21 FISHERY POTENTIAL OF BHAVANISAGAR RESERVOIR VIS-A-VISPRESENT YIELD
It has been :found from pri~ary productivity studiesthat the energy fixed by producers is very high in th~reservoir, 29,794 x 103 Kcal/ha/yr (average va.Lue :from April1973 to March 1977). The net ener~ assimilated by produ- 'cers is of the order of 16,387 x 105 Kcal/ha/yr which showsthat only 55%,o:f the energy :fixed is stored by the primary" ,producers and is available f'or-consumers. The'-net productinnstudies have shown that the reservoir has a fishery poten-tial of 155 kg/ha. Taking the average area as 3,695 ha, thereservoir has a fish potential o:f 572.7to~~annum. Theactual per hectare yield :from the reservoir was ·26 kg in1971-72, 33 kg in 1972-73, 40 kg in 1973-74, 55 kg i~ 1,974~7~,51 kg in 1975-76, 80 kg in 1976-77,'·58 kg in ,1977-78, 53 kgin 1978-79 , 57 k~ in 1979-30L(Fig.11). Th~ average ,yieldfrom the reservoir \1973-74 to 1976-77) works ,out-to 207.9tonnr.s.Hence it is clea~ that only 31.1% of the potentialyield is being harvested and there is enough scope of increa-sing the yi~ld. The above calculation of fish potentialis based,on'the assumption that all the energy availablefor the consumers comes from sun through conversion of lightenergy to chemical energy by primary producers. However,the reservoir receives a good amount of energy :from alloch-thomous source and taking this source also into account thereservoir can sustain more fish than shown above. Comparisonof energy output :from the reservoir (55.34 x 10³ Kcal/ha/yr)with energy :fixed by producers reveals that 0.2% of theenergy at producer level is harvested as :fish.
L and 68 kg in 1980-81

54
22 PJiN CULTURE
Acute shortage of rearing space for raising fingerlingsfor stocking the reservoirs is a great constraint. Tocircumvent this problem, experiments on pen culture wereundertaken on rearing hatchlings to fingerlings stage.The pen waS managed following the pond culture principles.In 1979, five days' old Q. mrigala hatchlings (7 mm)numbering 65,000 and 3 d'ays' old hatchlings of L. fimbriatus(5 mm) numbering- 50,000 were stocked in a 0.02S-ha peninstalled in Poongar swamp at Bhavanisagar. The area waSenclosed using bamboo frames and nylon netting (0.78 and1.56 mm mesh). The hatchlings were artificially fed ongroundnut oil cake and rice bran (1 : 1). Partial harvestingof 12,210 advanced fry of L. fimbriatus (28 mm) and 7,875advanced fry of C. mrigala-( 38 mm) waS made after a month'srearing. Final harvest yielded 1,550 fingerlings of~.
imbriatus (75 mm) and 10,851 fingerlings of Q. mrigala88 mm after a further rearing of two months. The production
rate thus waS 7.83 lakhs of a.dvanoed fry and 4.96 lakhs offingerlings/ha. The over~l survival rate of hatchlingsto advanced fry and fingerlings waS 27.8%. The input-outputratio worked out to 2.58.
During 1980, the pen waS stocked with~1,40,000 hatch-lings of C. mri~ala at 5 million/ha. While a com~oundedfeed compr-LeLrrg ground nut oil coke, rice bran, fish meal,soyabean,vi tamin B12 and mineral mix was used as feed duringthe first month, ground nut oil cake and rice bran (1:1)alone w'ereused during the second and third months. Atotal of 300 kg of feed was used. The pen waS har~estedafter 90 days' of rearing and a total of 14,022 fingerlings(96.5 mm/9.5 gm) obtaine,d, the yield working out to 0.5million/ha or 4,750 kg/ha. The carrying capacity of the penthus seems to "be about·O. 5 million/ha and in this context,the stocking density could be reduced and a higher survivalobtained.~3 ACKNOWLEDGEMENTS
The Project Coord~ator, AICRP on Ecology and Fisheriesof Freshwater Reservoirs wishes to record his deep sense ofgratitude to the -Department of Fisheries, Government of TamilN ad'ufor the kind help and cooperation extended to the ResearchSub-cent~e at Bhavanisagar throughout the course of presentstudies. Thanks are also due to the Public Works Departmentand Agricultural Research Station, Bh a'vand.eagaz''for supplyingthe data on reservoir morphometry and meteorology respec-tively.
-r

55
24 REFERENCES
Chacko, P.I. and P. Dinamani (1949). Preliminary reporton the fishery resources of the Bhavani river inrelation to the Lower Bhavani Pz-o ] ec'~~, Indian Sci.Congr., ~(3) : 166
Devaraj, M. (1973). Biology of the large snake-head,Ophicevhalus marulius (Ham) in Bhavanisagar waters.Indian Je Fish., 20(2) : 280-307=
Dorai Raj, K.H. and No Pankaj alii (1956). Linmology ofBhavanisagar (Reservoir). Fish.Sta. Reporto 1954-55,Department of Fisheries, Madras, 323-345.
Franklin, T. (1969).Mp Q,r.;';e;: J. Fish.
Phytoplankton of Bhavanisagar Reservoir.2: 112-118 •.
Government of India (1976).. Report of the National Commi-ssion on Agriculture. Part VIII Fisheries$ Ministryof Agriculture and Irrigation. New belhi
Menon, MeD. and S.T. Chari (1959). Annual report of theFreshwater Biological Station, Bhavanisagar for theyear 1955-56. Government of fvladras, Fisheries StationReports and Year Book. 20-44 '
Nataraj an, V. (1971). Biology and fishery of k.c'albasu(Hamilton) in Bhavanisagar reservoir. Mad. J. Fish.,~ ; 14-56.
Ranganathan, V. and Radha, N.V0 (1966). Biology and fisheriesof.' Mystus (Q.§teobagrU~l) ..Q&;!: (Sykes) L1. the Brrav ani.e agaz- ,reservoir. £!o.dxn.sJ• .E.i§h., ~ : 11-14
and E.R. Venkataswamy (1967). On theeffi6iencY,o:fthe "Mettur Rangoon" nets in the Bhavanisagarreservoir. Ibid, '3 : 46-60
Ranganathan, V., V. Ramachandramenon and N.V. Radha :(1962) 0
Biology and fisheries of ~. dubius (Day) in ',theBhavaniso.gar reservoir.MoiJ:rnpJ. Fish., 1 : ,1-24.
=
Sreenivasan, A. (1962). A note on the hy~rology of Bhavani-sagar reservoir for the years 1956-61. Madras J. Fish.,1 : 70-71=

56
Sreenivason, A. (1964). A hydrobiological study of atropical impoundment, Bhavanisagar reservoir,Madras State, India for the year 1956 to 1961.Hydrobiologia, ~ (4) : 514-539.
Sreenivason, A. (1970). Lir.mology of Tropical impoundoents :a cooparative study of the major reservoirs in MadrasState (India). Hydrobiologia, 22 (3 & 4) : 443-469
Sreenivasan,' A., R. Sundararaj and Felicy Antony (1969).Limnological studies of tropical impoundments.11. Hydrological features and plankton of BhavonisagarReservoir (Madras State) for 1961-62. Proe. IndianAcnd. Sci., ~ : 53-70.

57
25 SUMMARY
1 Bhavanisagar, constructed. in 1953 on Bhavani riverin Periyar district of Tamil Nadu with the twin objectivesof meeting the irrigation needs and flood control, has anaverage water area of 3,695 ha.
2 The reservoir has a shore-line length of 125.5 km,shore development of 4.01 and volume development of 0.94at Full Reservoir Level (FRL).
3 The water levels in the reservoir fluctuated be1:;,.;een256.64 to 280.42 rn, the area and capacity of the reservoirbetween 745 to 7,877 ha and 2,501 to 92,889 ha-m respectively.
4 The inflow and outflow were the maximum during1979-80, being 42,007 and 42,413'cusecs respectively, and,minimum during 1976-77, being 14p731 and 16,378 cusecsrespectively. Though the reservoir is subject to both themonsoons, the maximum inflow is generally received duringNovember-December (North-east monsoon). The inflow is alsolargely governed by the discharge from the Pillur Dam.
5 The basin soil of the reservoir is acidic (pH,5.2-6.4) in nature and rich in organic carbon (1.83-2.68%)and available nitrogen (31.6-50.8 mg/100 g) but poor inavailable phosphorus (1.00-3.58 mg/100 gm). .
6 Total alkalinity (41.6 ppm), calcium (15.5 ppm),or-ganic matterLand specific conductivity (263.4 pmbos) were L4 ppmhigh in the Intermediate sector in surface water.
7 Nitrate-nitrogen in the reservoir varied from tracesto 0.34 ppm while phosphates from traces to 0.06 ppm. 'Ferriciron ranged from nil to 1.5 ppm and silica from 1.6 to 18.0ppm. Seasonal variations in nutrient features of the reser-voir were not marked.
8 The effluents of the Viacose Rayon Factory atSirumughai affect both the plankton and fish resulting inkills especially when the inflow of water in the river ispoor. The effluents adversely affect the water quality,though in a limited stretch, reducing the pH and oxygenlevels to 4.0 and 1.0 ppm respectively and increasing thecarbon dioxide concentration to 126 ppm.

58
9 No. thermal stratificatian waS abserved in thereservair, maximum difference between surface and bottamwaters being 3aC. Hawever, a strang o~Jcline and klinagradedistributian of axygen was nated.
10 A strang chemical stratificatian resulting in thedecline in pH fram surface to.battom and an increase incarbandiaxide~ bicarbanate, and specific canductivityindicating high phatasynthetic and trophalytic activitiespoint to.tho productivo naturo of the reservair. The stra-tification is braken either by heavy monsaan inflaw or heaVywind.
11 Marked diurnal variatians in carbonate and bicar-banate were nated in September 1975 and March 1976 but themagnitude af variatian was otherwise af a law order.
12 The average grass and net praductian during 1973-77were 830.79 and 458.35 mg C/m2/day resPJ;}ctive'ly,bath grassand net primary praductian being the highest in the Mayarsector. The photosy~thetic efficiency in the reservairwarks aut to.0.412%.
13 Phytaplanktan damin~ted throughaut the year cantri-buting abaut 90% to the tatal planktan praductian in thereservair and was mainly ropresented by Anacystiso Itsmaximum abundance waS recarded in the Lentic sectar.
14 Lo~ic secto~ was'by far the richest (3.83 gm/483units/m2) in abundance of bottam biota, aligachaetes beingthe 'main constituents.
15 No. largo aquatic plants are available in thereservair.
16 The fish fauna of tho resGrvair comprised 50 speciesbelonging to.11 familios.
17 Detritus, however, formed the chief foad af thefish papulation in the reservair occurring to.the extent af87.5 to.95.0% in the guts af L. calbasu, Q. mrigala andP. dubius. Even Q. catla (55%T, ~. ~ (q5%) and lie ~T59%) were faund to.subsist an detritus. Anacystis, thaughnat utilized by any fish directly, is prabably taken asdetritus.

5918 vvhile the Gangetic carps breed mainly during theSouth-west monsoon, ~. calbasu seems to spawn during North~east monsoon.- also e
19 S-tudies on recruitmel·~thave indicated that ~. ~spawns heavily in Bhavani ri"'oTeroWhile Ji. calbasu formed asizeable percentage of the eggs collected at Moolathurai,occurrence of Q~ catla, ~' rohita and Q. mrigal~ was veryscarce indicating thoir pooJ.:':::·;;:)cl~uitment in the reservoir 0
20 Certain aspects of the biology of ~c ~bas1l'C. mti-galE)"Q •• ~+a, ;Eo £,Qrsalis, ;E. gubius, Q. bimaculatu§"~. ~ and lie ~tE have bee~ studiedo
21 Fish yield from the reservoir increased as a resultof increased fishing effort from 94 t in 1971~72 to anaverage of 233 t during the 5~year period from 1976-77 to1980-81, the maximum 1veing 294 t during 1976-770 Jd. e- calbasuwaS the most dominant species in the catch forming 27.05-47.28%. The catch/ha during 1980-81 was 68 kg.
22 The high catch/unit ef.fort index f'or-~. calbasuindicates abundance of its stocks with normal variations inyearly recruitment. The .Low cnd fluctuating catch/uniteffort ind:ice3for:2" ~!i1..§: . c;w::;.d2.0 E.."siliJ..:t£: show their poorabundance in the reservoir and extreme fluctuations inrecruitment. Even the present increased donsity of fishingeffort does not seem to affect the fishery of 11- ~ asindicated by high catch/unit-effort. There appearedto besome intergeneric competition betvleen ~. ~ and li· ~ butan increased fishing effort showed increased productivityor''!!i.. ~ as l'l'ellas tha-i~o:f r.~" .9£;: .•
23 Tbe stocking rates of Q.., catlQ: and !C'" rohita havebeen rather poor being 1-7 Gud 2-21 fingerlings/ha/yrrespectivel~: but they always had some effect on the fishery.Stocking of Jio fimbriatus (41 fingerlings/ha/yr) and .Q. carpio (39 fingerlings/ha/yr) have however, had no effecton their fisheries.
24 Experiments on clipping of ~' fimbriatus ino~catedthat the species attains a size of 257 and 391 mm after afree life of 455 and 764 days in the reservoir.25 Expe;rimental fishing has indicated that ~ •.~'~. calbasu, Q. ~atla, £0 mrigal~ and W. attu form heavycatches in the Lotic sector followed by Intermediate/Moyar sectors. The catch/unit effort is also the maximum
in the Lotic sector.

60
26 Relationships between fish-mesh bar sizes have beenestablished. Effective mesh bar for Catla fishing in thereservoir has been found to range from 130.-150 mm, for1. rohita and Q. mrigala 60-85 mm and for ~. ~ 38-50 mm.Vulnerability of various sizes of fish in relation to meshbar has been worked out statistically.
27 A comparison of the catches of eXperimental andcommercial fishing has indicated that while ~. ~~ and1- bata are equally abundant in the reservoir, the popula-tion of 1. ~ remains commercially unexploited.
28 Based on productivity studies, the fish productionpotential of the resorvoir has been estimated to be 155 kg/haor 573 t/year. This does not include the energy enteringthe reservoir from allochthonous sources. A comparison ofthe energy output from the reservoir with energy fixed bythe producers shows that only 0.2% of the energy atproducer level is harvested as fish.
29 Experiments on pen culture in Poongar swamp,located in the fish farm adjoining the reservoir, have shownthe possibi:litiies of rearing about 0.5 million fingerlings/ha.

61
26 PUBLICATIONSPublished
1 • rJlathewAbrnham (1979). Studies on the bottom macro-faunaof 3havanisagar reservcir (T.N.). J. Inland Fish. Soc.India, 1~(2) : 41-48
2. (1979). Seasonal distribution and quantitativedistribution of plankton of a medium sized reservoir,Bhavanisagar~ 19 Proceedings of Summer Institute 2£Capture and Culture Fisheries of the Man-made Lakes inIndia, Central Inland Fisheries Research Institute,Barrackpore. 7 July - 6 August 1979.
3. and S. Sivakami (1979). Stock distributionin timo and space in Bhavanisagar as reflected from theexperimental fishing during the year 1978-7ge 1£i£.
4. Ch. Gopalakrishnayya and I'1athewAbraham, 1979. The extentof utilization of fish food organisms by economicfishes of Bhavanisagar reservoir. Ibid.
5. Ch. Gopalakrishnayya, 1979. Role of tagging/clipping inevaluation of age and growth in fishes - A case studyin respect of ~. fimbriatus in Bhavnnisagar. IbiQ.
6. 1979. Impact of stocking on yield trendsin Bhavanisagar with particular reference to ~. rohitaarids- mrigala. ~.
70 1979. Fish production trend in relation tophased increase in fishing effort in BhavlJXlisagarreservoir. Ibid.
8. Age and growth rate of commercially,;"important fishes of Bhavanisagar. Ibid.
9. Gupta, B.P. 1979. Soil characteristics of Bhavanisagarreservoir. Ibid.
10. 1979. Impact of effluents of viscoseindustry on water quality and fish productivity. lhi£.
11. 1979. Hydrological features of Bhavanisagarreservoir. ~.

62
Under publication
12. Mathew Abrahom. Preliminary observations on rearing of'hatchlings-to f'ingerlings in pens. (MS).
13. • Breeding of' carps in Bhavanisagar (T.N.)with special ref'erence to the ef'f'ectof'Pillur Dam (MS).
and S. Sivakami. Fisheries of'Bhavanisagarreservoir (TN) as ref'lected by commercial f'ishing andexperimental f'ishing with special ref'erence toL. bata (Ham). (MS).- -
16. • Mesh seloctivity of' important f'ishes of'Bhavanisagar reservoir (TN), 1",ithspecial ref'erence totheir vulnerability to gill nets. (MS)
18.,_____ ~ __ • Biology of'Puntius dorsalis f'rom
Bhavanisagar. (MS)
17. s. Sivakami and Mathew Abraham. Studies on the f'ry of'1. calbasu f'rom Bhavanisagar reservoir. (MS)
19. _" • Biology of' Ompok bimaculatus with specialref'erence to its abundance in Bhavanisagar. (MS)
20. S. Sivakar:J.i. Studies on the induced breeding and larvaldevelopment of'Rasboradoniconius. (MS)
21. Gupta, B.P.. A limnologicol study of' chemical stratif'ica-tion in Bhavanisagar reservoir (T.N.). (lYIS)
22. . • Studie s on primary produc tivi ty in Bhava-nisagar reservoir (T.N.). (MS).

63
27 RECOMMENDATIONS ON CONSERVATION .ANDDEVELOPr.'IENTOF TmJ_ FISH:E;RLJSOF"BH.:.i..VANISAGAR'
1 There arc clear indications of extended breedingof economic carps covering south-west and north-east mon-soons. Fishing intensity may be reduced to half thepresent level if not totally prohibited during the period.
2 The natural recruitment of the Gangetic major carpsother than ~. calbasu, is of rather low order as evidencedby an almost negligible percentage of their young onos inspawn collections made at "l"1oolathuraifrom 1975-77. Howe-ver, the three Gangetic c~rps viz. catla, rohu and mrigalhave formed a good fishery in certain years depending onthoir stocking. Hence it is recommended that regular andintensive stocking of three major carps may be taken up ona priority basis with a view not only to augment the totalyield but also help improve their. recruitment and sub-sequent ~stablishment.
3 The stocking rates of catla, rohu and mrigal workout to 1.8, 19.5 and 41.4 fingerlings/ha during the 9-yearperiod from 1971-80. Even this rate of stocking has resultedin average yields of 8.2, 8.1 and 18.03 t/annum respectively.It is therefore recommended that stocking may be done at50 fingerlings (150 mm)/ha in the proportion of 3 catla ;3 rohu : 2 mrigal : 1~. cnrnaticusand 1 t. dubius.
4 The reservoir water is quite rich in calcium andwould favour development of molluscan ~a. Suitablespecies of molluscs adapted to lacustrine conditions betransplar~ted from N agarjunasagar. In the long run thismay facilitate development of Pangasius fishery likeN agarjunasagar.
5 The dominant pla~kton of the reservoir beingMicrocystis, it is suggested that Q. catla with medium-sizedpectoral fin (PM) from Rihand reservoir, which is known toconsume Microcystis may be transplanted for better utili-zation of this abundant food resource.
6 Bhavanisagar ecotope also favours introduction ofcatla x rohu hybrid which is as much detritophagic as itis phytoplanktophagic.

64
7 Stocking .9.f~.fimbriatus has not improved fishyield of this specios. Hence stocking of this spec~esmay be discontinued.
8 About 2,953,169 advanced fry of common carp havebeen stocked be·tween 1972-73 and 1976-77 but the specieshas failed to establish its fishery.
9 Experiments on pen culture in a swamp adjoiningBhavanisagar have shown the possibilities of raisingfingerlings on a large scale in a limited area. Adoptionof this technology would help in raising the fingerlingsfor stocking the reservoir 0 The production could be ashigh as 0.5 million fingerlings/ha.
10 The reservoir has a production potential of155 kg/ha i.e. 573 tonnes for the reservoir. As against thisthe present level of yield is 63 kg/ha or 233 t (1976-77to 1980-81). To realise the potential yield the reservoirmust be stocked with catla, rohu and mrigal. In addition:;ej,s-Mngffi'$ybo, res-t::d:oted-t~:_::· ., half the normal fishingintensity during south~west (June and July) and north-east(October and November) monsoon.
11 The existing fish farm may be suitably improvedso tha-tit serves the seed requirement of Bhavanisagar.
12 Cage culture experiments may be att'empted withsilver carp.
13 The results of experimental fishing indicate that theLotic sector haS' the maximum stock abundance and as such~hecatches are the heaviest in this sector. It is recommendedthat fishing may be intensified in the Lotic sector andmulti-meshed gill nets (mesh bar, 40-150 mm) operated toeffectively exploit the different-fish populations. Moyar8...1'1(1 Intermediate sec-tors are the next bost fishing areaswhich need intensive exploitation.
14 A comparison of the catches of experimental (20%)and commercial (1.5%) fishing haS revealed that the abundantpopulation of ~. ~ in the reservoir remains almost un-exploited. It is therefore suggested that nets with 38-50 mmmesh bar may be used for effective exploitation of ~. batain the size range of 362-385 mm/600 g. L. ~ is especiallyabundant in the Lotic sector.
65
15 The present fishing effort in the reservoir,which is of the orderL200,000 units*(each unit comprising Lo£ .50 m hung length), may not be increased any further till aboutsuitable stocking measures to build up the stock strengthsof various species are undertaken. Any increase infishing effort is likely to result in a reduced catch/unit-effort thereby rendering it uneconomic to the commercialfishermen.16 Nets with the following sizes of mesh bar arerecommended for effective exploitation of commerciallyimportant species in the reservoir
SpeciesQ.. c atlaL. rohitaQ.. ~igalaIt.. c8.lbasu!!.. ~1:. dubiusP. Sarana~.~O. bimaculatus
Mesh bar (mm)130-150
60-8560-8560-8530-5030-6035-5037-8520-30
17 1. bata, which is a choice fish and fetches agood market price, constitutes about 80% of the spawncollections at Mulathurai.' The centre could be regularlyexplvited and the collections thus made utilized for culture.
18 Pollution caused by Rayon Viscose factoryeffluents at Sirumughai may be monitored periodically tokeep the pollutional effects under control.
* Equivalent to an average of 40 fishing units/day asrecognised by the State Department. It will, however,be advantageous if the present level of fishing ef:fortis scaled down to an average o:f 30 fishing units/dayuntil the reservoir is suitably developed by stocking
, as recommended.

66
28 SUGGESTIONS FOR FUTURE vlORK
It is suggested that -'chefollowinginvestigations may be continued/or taken up afresh
(i) Collection of data on total and species-wise catchof all commercially-importan-t; species and catch/unit effort.
(ii) Length frequency of all commercially_important species
(iii) Assessment of index of spawn quality and quantityat Hulathurai during both the north~east and south-westmonsoons.
(iv) Induced breeding of major carps during north-eastmonSoon to augment the seed resource.

TEXT FIGURES
PLATES
1 - 13
: Fig. 1 - 18

..••. ..••. ..••.
SAMPLING STATIONS
• sue-LITTORAL..••.•.••• 0 PROFUNDAL...•..
•..•.•A LITTORAL
IRlJM9ARAI ..•••
• VISCOSE FACTO'
ILLlJPPANATHAM
Fig. 1 Bhavanisagar reservoir showing sectoraldemarcation and sampling centres

.L. , I I ,•• ... ., •• .., •... eo ••• 0•...
'I •... ": t;' r- •... •...eo
0 I I 0 0 .;.•• ..• ., on .., •... eo•... •... •... •... •... r- •... •... •...••• ••• .•. ... !: ~ ~ ~ !:
yEARS
r--.V
'"III-:1::>u 40 0---- -0 OUTFLOW0
•.....•..1300 Z<t -----.. INFLOWIII~ ::>
~ 0~ 0---0 RAINFALL"'-" 0...J 1100 3: 30...J 0<tu, ...J
•...Z I-
~ ::>er 0
900 0..J Z-e ~•...
3: 200•... 0.J
700u.
~...J
~I-0I-
500 10 r--r'" '" '" '<t '" •... .., 0•... •... •... •... r- •... •... a-0 I , r- •... <XI,;, , , , ,;::: •... ~ ... .~'" r- eo '"•... •... •... •... •... •... •...a- 0> o- e- 0, a- ~ a- a- 0>
.~:..Y [ A" S
Fig.2 Total rainfall and inflow-outflow-Bhavanisagar( 1971-72 to 1979-80)
VI'"°1
::; 1/ /'uJ
2701I ' /'\> / \
0 I './ \ID r//«/:
..J
'">UJ.J
260a:'"~<4.3:
;---;:::- MAX 'MUMI •..
I •...AVERAGE
II MINIMUMII
.I'I ," I\ r:\ I
\/
Fig. 3 Maximum, minimum and average water levels ofBhavanisagar (1971-72 to 1979-80)

80
oZ-e
'"::>o:r
i> ....I ""AVERA(iEII
/\ : MINIMUM
I \ "I '
/' \ / /,. ,/ I", \ ;
,OV\V~\/O~' f , I i
'",..o
'"t-O'
60
_--- MAX ,MuM
40
~wa:<I
no
"o'""
.,,..o...
t-Oo
, 1 I I•.. Cl •.. 0t- •.. r-, Cl0 0 00o r- '""- .•.
" " "e- •.. ~ ~YEAI-I:>
Fig.4 Maximum, mmimum and average areaof Bhavanisagar ( 1971-72 to 1979-80 )
~, J .oolMAXIMi.'M
'-''" 110uICl:..'"::l
0
'" 60ex<{ MINIMUM..u•••J:
Z 40
>..V<I 20a,<Iv
0 I .1n '" '0 '" .0
•.. .•. 0r- •... ~ 'i' ':
,.. ... IDI 0 0 0 ,
n .., ..,'" .0 Cl .•.
" ... ... ... •.. •.. ... ...e- .•. ••• .•. ~ .•. ••• !
YEARS
Fig. 5 Maximum, minimum and average capacityof Bhavanisagar ( 1971-72 to 1979-80)

j"I
/I
I/
/'-:
-:»>:
!~I~J~!__-,__~__~__~ .-__~__.-__~
wa:....w~wex«>-uwI
z
>->-u«o.«u
9
8
7
6
5
4
3
2
o 75 6 82 3 4
AREA IN THOUSAND HECTARE
Fig. 6 Area-capacity curve of Bhavanisagar-;
"

r-- 60Eu
<;»
>-o:zILla:etCl.If) 140zeta:I-
140
100
60
20
o140
100
20
LENTIC SECTOR~ a
INTERMEDIATE SECTORo ~ ~b
~ eoILlI-et3:
40
o140
100
60
20
LOTIC SECTOR c
MOYAR SECTORo
O+-rT'-rT~••-rTO-r~rr~rT'-••~~-rTO-. ••-r~rT.-r--AMJJASONDJFMAMJJASONDJ~MAMJJASONDJ~MA
1974 1975 1976 1977
Fig. 7 Water transparency in Bhavanisagar reservoir

2
DI550L'JED OXYGEN (pprn):3 4 5 6 7 8
3
5,......E
:I 7I-a.wa
9
11
j 3
15
5
I 7f-a.wa
9
11
13
15
oFREE CARBON DIOXIDE (ppm)
123456789 30BICARBONATE (ppm)
40 50 60
6I
7 ,9
sP CONDUCT1VITY (mic:rom"o~)250 275 300 325
f
Fig, 8 Vertical distribution of physico-chemical characteristics

9000
8000 ~- GROSS
c=:J- NET,.-.... 7000
:;T\«)~-NE
6000--;0~Z0 5000;:~~,...,.. 4000Cler:'"z'"lA.0 3000•••~-eet:
Fig. 9 Primary productivity in BhavanisagarLENTIC INTERMEDIATE LOTIC MOYAR
zoI-
"2«..Je,
12
0'8
,I
II
I
~,... 'i~I t ,
, " \i , \I: \I I \i I .;: ~
I.1,II
•.•-- .••1975
_--_. 1976
J FMAMJ JA SOND
MONTHS
Fig. 10 Abundance of net plankton in Bhavanisagarduring 1974-76

260
In..•ZZ0
z 80 co.I
Z -----U
,.-.,.... O'l... '"u 60 '--'":I:
-I U... ...... ...0 u...
40
100
80 20
TOTAL CATCH - ~
.. •.. .. '" ~ e-, GO '" 0,.. ": ": c,•... ,. •... ID
'" ... .. '" '",
'"•.. •... •... •... r-; •... :::: ~ •...••• ~ ~ ~ - ~ ~ '" '" •••
"--~ E A ~ s
Fig, 11 Total catch and catch/ha from Bhavanisagarduring 1971-72 to 1979-80
-',
210
~40
FISHING EFFORT
on c/u E---
0 ~ ~z z... 170 :0oil:>-0 :r:I: 3-0 •..... o
Z
=130
w.J
~ ~z 2-0 0:0 on
:I: 90 '"... '"e wzw 1-0 ~.J -~ u
0 $00on
30 0
'" ... e- IDr;- ";- r;- r;- r- r;- ~;::. ... 'oot on .. ~ ••• 0-r- r- r- r- ... ;~ ~ ~ ~ ~ ~ ~
Fig. 12 Fishing effort and catch/unit effortduring 19.71-72to 1979-80

I-W 2 5Z
e 20o
~ I 5~.><-- 1"0:I:UI- 05<l:U
~ 1976-79
D 1979-80
)"0
LENT.C INTER, LOllC MOYAP. WHOLE RESE RV/,)'"
Fig, 13 (a) Yearly average catch per 50 m experimentalfishing net in different sectors during 1978-79 and 1979-80
(h))'0
I-WZ 2"5
E0 Z 0
~,.-- , ~en-"'-':I: I QUt-<t 0'5U
0A M
~ 1978-79
o 1979-80
J A SON 0
MONTHS
Fig. 13 (b) Monthly average catch in 50 m experimentalfishing net during 1978-79 and 1979-80 in Bhavanisagar

FJg. 1 An inner view of the dam
Fig. 2 The reservoir showing Bhavani and Moyar rivers

Fig. 3 Transporting the catches to Fish Stall
Fig. 4 A day's catch at the Fish Stall

Fig. 5 Fish Sale at the Stall
Fig. 6 Transportir g the fis'iing units to T ntermediate and Lotic sectors

."'"i:"
1
~~.-~-'.-----.,
Fig. 7 Commercial fishing
s-
Fig. 8 Collecting plankton samples

Fig. 9 Sampling for bottom biota
Fig. 10 Making shore collections for fiogerliog availability

Fig. 11. Sub-surface water sampling
{,

Fig. 13 Laying the gill nets for experimental fishing
Fig. 14 Hauling the experimental fishing nets and recording data

f,
Fig. 15 Prospecting .investigations atMoolathurai for recruitment studies'_ _" _ ~ _ ••. _ . ~ ~. _ _ _ . __ 1
I. I
Fig. 16 A 'pen' in Poongar swamp

Fig. 17 A haul of fingerlings raised in the pen
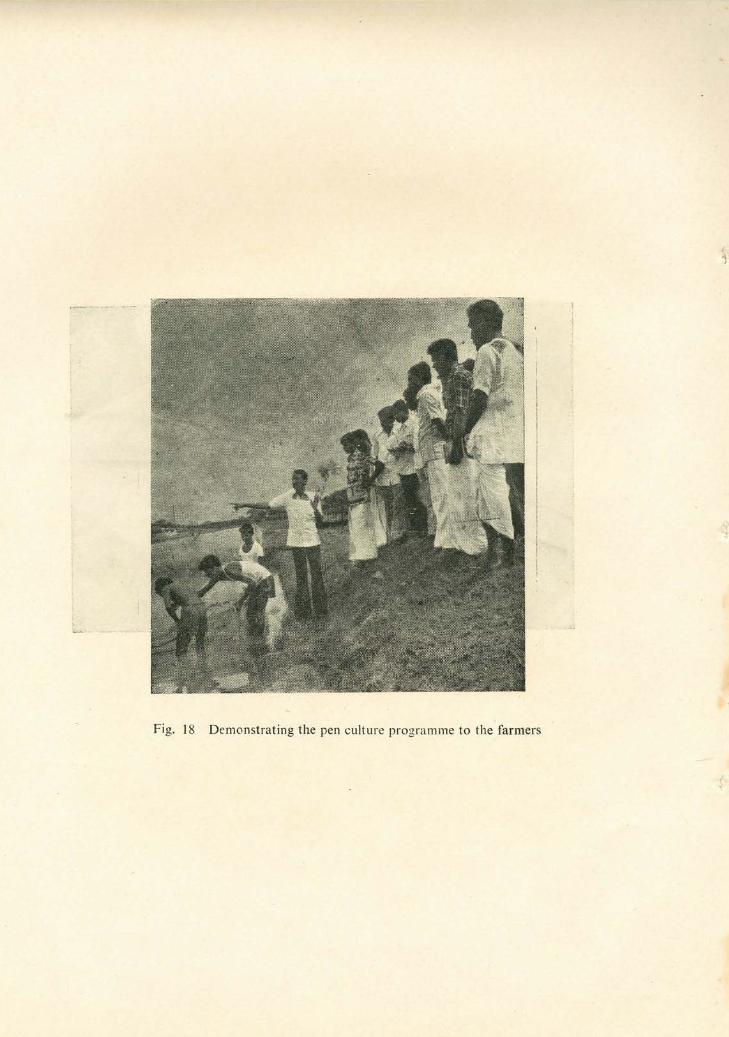
(
•
Fig. 18 Demonstrating the pen culture programme to the farmers


