Embed Size (px)
Citation preview

No Increased Storm Intensity
Review of Weather Event
Statement in Insurance Bureau of Canada’s
“Telling the Weather Story” prepared by
Institute for Catastrophic Loss Reduction
Robert Muir, P.Eng.

Content • Overview
• Telling the Weather Story Statement on Increased Frequency of Storms and Weather Events
• Contrary Analysis and Data
– Environment Canada Report
– Environment Canada Data
– Local Rain Intensity Trends
• Telling the Weather Story Data Review
– Frequency Shift Theory and Error
– Frequency Shift Data and Source Review
– Comparison to Actual Data
• Telling the Weather Story Theory as Fact
– Economic Reports / Strategies
– Policy (Chamber of Commerce, Energy Policy, Local Civic Policy)
– Insurance (Premium Costs/ Endorsement Advertising)
• Summary
July 5, 2015 Telling the Weather Story Review 2

Overview • Telling the Weather Story makes a statement on the increased
frequency of storms and weather events, indicating that in parts of Canada, events that occurred every 40 years are occurring every 6 years, due to climate change.
• The statement on increased frequency is unfounded as it is based on a theoretical shift in temperature frequency from a global climate change report, and is contrary to Environment Canada’s actual analysis and data on local rainfall intensity trends.
• The Telling the Weather Story statement, based on temperature theory has been i) embraced as rainfall facts and research by many organizations, ii) embellished to apply to extreme rainfall, and iii) considered in policy and economic reports.
• The unfounded association of increased flood damages to increased rainfall frequency can misdirect mitigation policies and efforts from the root causes of increased flood damages (e.g., away from infrastructure rehabilitation and comprehensive risk management policies and pricing, and instead toward emissions reduction to address climate change and erroneous storm frequency shifts).
July 5, 2015 Telling the Weather Story Review 3

Weather Story Statement on Increased Storms • Institute for Catastrophic Loss Reduction (ICLR) report for Insurance Bureau of
Canada (IBC) states there is an increasing frequency of weather events, including storms, due to climate change (page 15).
• A shift in event “return period” from 40 years to 6 years is noted (a rare storm event with a previous 2.5% chance per year (1/40), now has a 17% chance per year (1/6))
• The general type of data used by Environment Canada to characterize storm severity is noted in the reference (page 64), but no actual analysis is provided.
July 5, 2015 Telling the Weather Story Review 4

Contrary Analysis & Data - Environment Canada Report
• Environment Canada’s Adaptation and Impacts Research Climate Research Division reviewed Canadian and Ontario rainfall analysis and found only non-significant trends in intensity, and reported both increases and decreases in storm severity, contrary to the Telling the Weather Story statement.
• The Environment Canada report Methodologies to Improve Rainfall, Intensity-Duration-Frequency (IDF) Estimates, A Southern Ontario Pilot Study (December 2011) describes Canadian and Southern Ontario data in Chapter 6 -IDF Information in a Changing Climate : – Canada (page 75): “The majority of trends in daily, multi-day (i.e. 3-, 5-, 10-
day) and sub-daily rainfall have been determined to be non-significant, varying with duration of precipitation and regional location, and including decreases as well as increases.”
– Ontario (page 78) “… within Ontario, a number of studies have conducted a trend analysis of Environment Canada’s short-duration rainfall intensity data (Adamowski and Bougadis, 2003; Adamowski et al., 2010; Bruce et al., 2007; Klaassen and Seifert, 2006; Zhang and Burn, 2009; Hogg and Hogg, 2010). The majority of the trends were determined to be non-significant with no simple patterns or uniform rates of change evident in the short duration rainfall.”
July 5, 2015 Telling the Weather Story Review 5

Contrary Analysis & Data - Environment Canada Data
• Environment Canada’s publishes rainfall intensity and frequency data and analysis for weather stations across Canada through its “Engineering Climate Datasets”
• Data are readily available for 563 locations across Canada from this site: http://climate.weather.gc.ca/prods_servs/engineering_e.html
• Example rainfall data and statistics for the Toronto Bloor Street weather station are shown below.
July 5, 2015 Telling the Weather Story Review 6
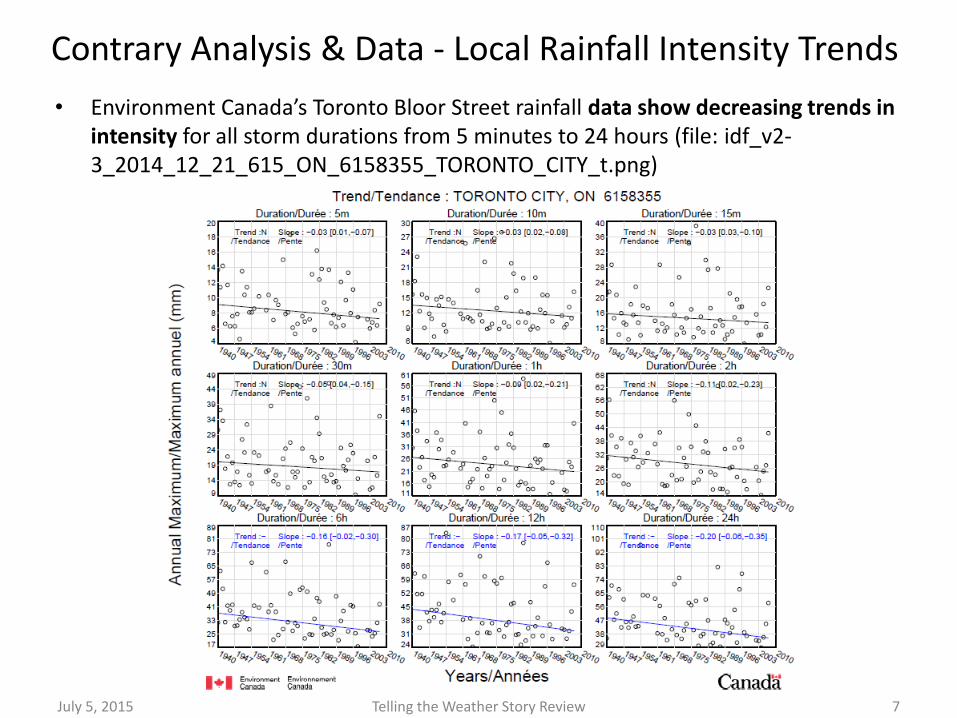
Contrary Analysis & Data - Local Rainfall Intensity Trends
• Environment Canada’s Toronto Bloor Street rainfall data show decreasing trends in intensity for all storm durations from 5 minutes to 24 hours (file: idf_v2-3_2014_12_21_615_ON_6158355_TORONTO_CITY_t.png)
July 5, 2015 Telling the Weather Story Review 7

Weather Story Review – Frequency Shift Theory • The Telling the Weather Story presentation describes shifts in average and extreme
climate data using a theoretical “bell curve” with no actual climate data.
• A whole standard deviation shift in the average is shown to make extremes more frequent (40 year event becomes a 6 year event in a standardized bell curve).
July 5, 2015 Telling the Weather Story Review 8

Weather Story Review – Frequency Shift Error • After presenting data on observed temperature shifts of many degrees, an error is
made associating “rainfall rate of so many millimetres per hour” with a 40 year to 6 year frequency shift if “you just shift the mean by one degree’.
• The association of rainfall event frequency is inconsistent with IPCC discussion on temperature frequency, and the stated shift of ‘one degree’ is inconsistent with a one standard deviation shift in bell curve average required for a 40 to 6 year shift.
July 5, 2015 Telling the Weather Story Review 9

Weather Story Review – Frequency Shift Data • A 40 year to 6 year return period shift is based on a one standard deviation shift in
the mean of a standard normal distribution, or bell curve. Cumulative probability tables show this theoretical shift from z = 1.96 to z = 0.96 (i.e., mean shift of 1.0).
Exceedance probability of P = 17 % with
z= 1.96 - 1.00 = 0.96 Return period of
1/P = 6 years
Exceedance probability of P = 2.5 % with
z= 1.96 Return period of
1/P = 40 years
July 5, 2015 Telling the Weather Story Review 10

Weather Story Review – IPCC Source Review • The Telling the Weather Story release presentation references an Intergovernmental
Panel on Climate Change (IPCC) report that discusses general aspects of climate data variations (shifts in statistical average, variability and skew), but does not analyze actual data and references only temperature, and not rainfall.
July 5, 2015 Telling the Weather Story Review 11
Weather Story Review – Comparison to Actual Data
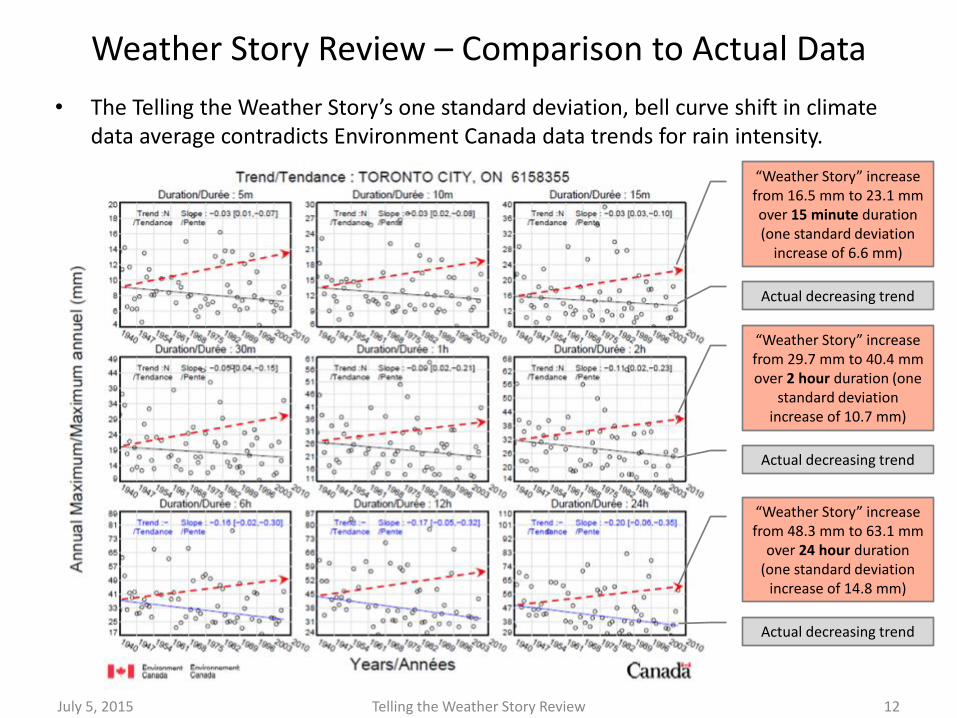
• The Telling the Weather Story’s one standard deviation, bell curve shift in climate data average contradicts Environment Canada data trends for rain intensity.
“Weather Story” increase from 16.5 mm to 23.1 mm over 15 minute duration (one standard deviation
increase of 6.6 mm)
Actual decreasing trend
“Weather Story” increase from 29.7 mm to 40.4 mm over 2 hour duration (one
standard deviation increase of 10.7 mm)
Actual decreasing trend
“Weather Story” increase from 48.3 mm to 63.1 mm
over 24 hour duration (one standard deviation
increase of 14.8 mm)
Actual decreasing trend
July 5, 2015 Telling the Weather Story Review 12

Weather Story Theory as Fact - Economics • The Telling the Weather Story’s statement “weather events that used to happen
every 40 years are now happening once every 6 years in some regions of the country” appears to be based on theoretical bell curve shift in weather that is contrary to Environment Canada data and analysis.
• However economists repeat the theoretical statement as fact in their analysis.
• “severe weather” has been substituted for
Weather Story’s theoretical statement on
“weather events”.
July 5, 2015 Telling the Weather Story Review 13

Weather Story Theory as Fact - Economics • Media reports substitute ‘storms’ for ‘weather events’ and associates storm
frequency to ‘damaging events’.
July 5, 2015 Telling the Weather Story Review 14

Weather Story Theory as Fact - Economics • Media reports substitute ‘storms’ for ‘weather events’, although the IPCC reference
on frequency changes relates to temperature, and the IBC presentation did not reference actual data and suggested
shifts of ‘one degree’.
July 5, 2015 Telling the Weather Story Review 15
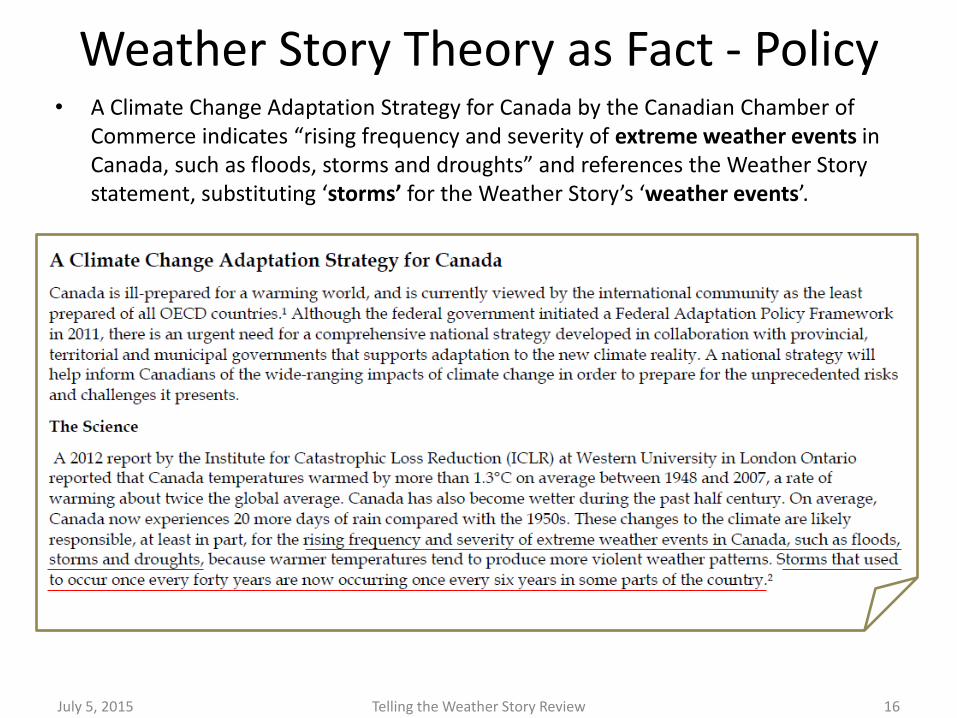
Weather Story Theory as Fact - Policy • A Climate Change Adaptation Strategy for Canada by the Canadian Chamber of
Commerce indicates “rising frequency and severity of extreme weather events in Canada, such as floods, storms and droughts” and references the Weather Story statement, substituting ‘storms’ for the Weather Story’s ‘weather events’.
July 5, 2015 Telling the Weather Story Review 16

Weather Story Theory as Fact – Policy • Economists have have repeated the theory of frequency shifts as fact, e.g., “The
reality is that the frequency of weather events has increased.” in the context of disaster mitigation policy.
July 5, 2015 Telling the Weather Story Review 17

Weather Story Theory as Fact - Policy • Policy organizations repeat the statement from economic analysis, substituting
‘storms’ for the Weather Story’s ‘weather events’ and citing ‘research’ on storms.
July 5, 2015 Telling the Weather Story Review 18

Weather Story Theory as Fact - Policy • More policy organizations repeat the statement cited from the Toronto Star,
substituting ‘storms’ for the Weather Story’s ‘weather events’ , adding the statement relates to ‘extreme’ weather events, and that “Ontario is experiencing significant changes”, contrary to Environment Canada’s Ontario analysis.
July 5, 2015 Telling the Weather Story Review 19
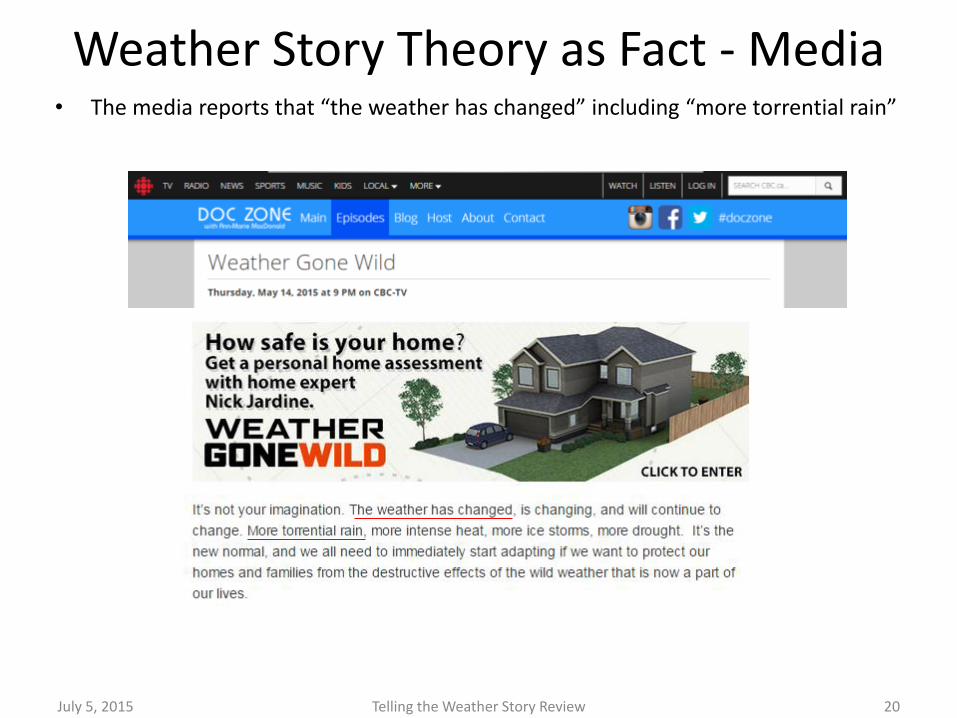
Weather Story Theory as Fact - Media • The media reports that “the weather has changed” including “more torrential rain”
July 5, 2015 Telling the Weather Story Review 20

Weather Story Theory as Fact - Insurance • Media have related the Weather Story statement on ‘weather events’ to ‘heavy
rainfall’ events, and have stated “severe weather is on the rise” :
July 5, 2015 Telling the Weather Story Review 21

Weather Story Theory as Fact - Insurance • IBC substitutes ‘extreme weather events’ for ‘weather events’, describes trends in
storm regularity, and links this to insurance premium increases.
July 5, 2015 Telling the Weather Story Review 22
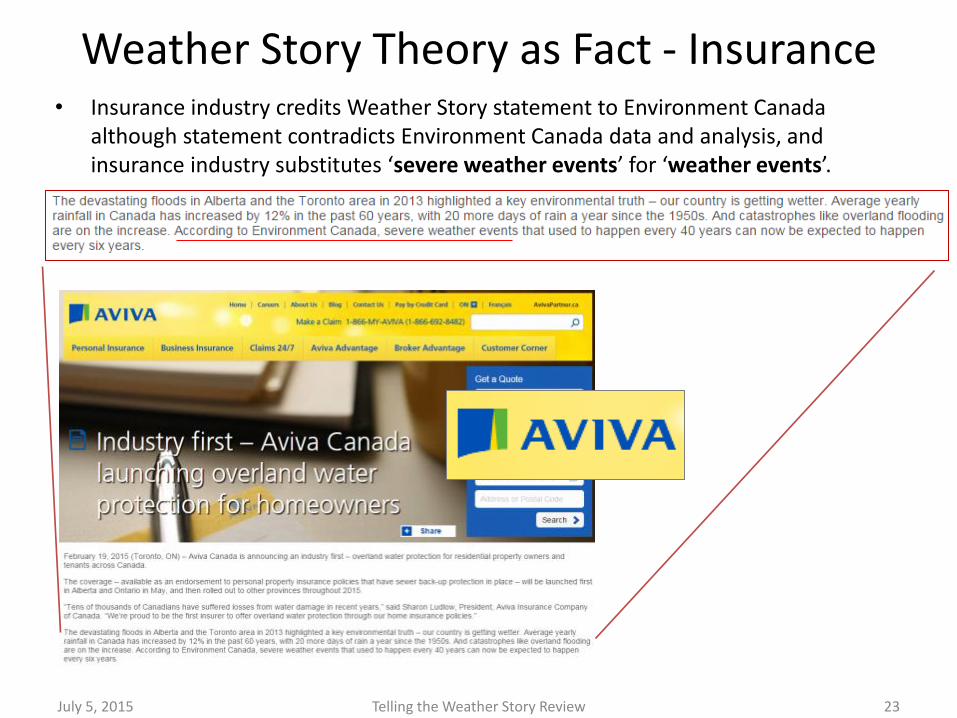
Weather Story Theory as Fact - Insurance • Insurance industry credits Weather Story statement to Environment Canada
although statement contradicts Environment Canada data and analysis, and insurance industry substitutes ‘severe weather events’ for ‘weather events’.
July 5, 2015 Telling the Weather Story Review 23
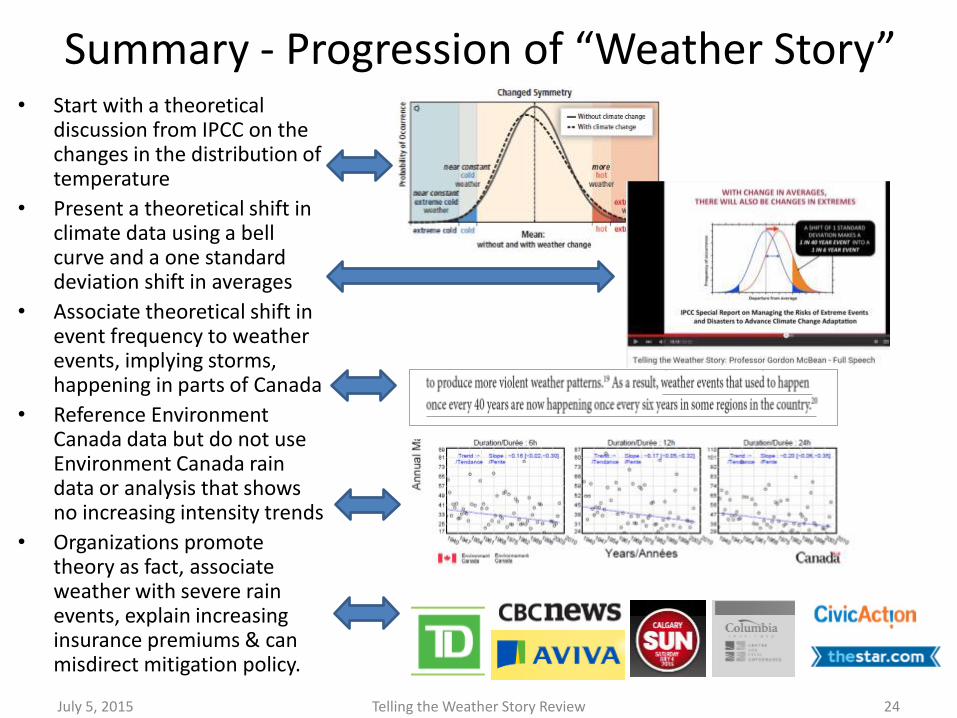
Summary - Progression of “Weather Story” • Start with a theoretical
discussion from IPCC on the changes in the distribution of temperature
• Present a theoretical shift in climate data using a bell curve and a one standard deviation shift in averages
• Associate theoretical shift in event frequency to weather events, implying storms, happening in parts of Canada
• Reference Environment Canada data but do not use Environment Canada rain data or analysis that shows no increasing intensity trends
• Organizations promote theory as fact, associate weather with severe rain events, explain increasing insurance premiums & can misdirect mitigation policy.
July 5, 2015 Telling the Weather Story Review 24

Summary – No Increased Storm Intensity • A theoretical discussion from the IPCC on the changes in the distribution of temperature has
been convoluted into: 1) A statement on theoretical probability shifts for a standard normal bell curve
(Telling the Weather Story presentation transcript)
2) A statement on the frequency of actual weather events (once every 40 year events occurring now every 6 years) caused by climate change
(Telling the Weather Story publication)
• The Telling the Weather Story statement is contrary to Environment Canada rain data and analysis that shows no increasing rain intensity trends in Canada or Ontario.
• The Telling the Weather Story statement on weather events, originating from average temperature changes discussions, has been misinterpreted by many to apply to:
1) Severe Weather Events,
2) Extreme Weather Events,
3) Storms,
4) Torrential Rain.
• Many organizations promote the Weather Story statement as fact, describe a this statement based on theory as ‘reality’ based on ‘research’, credit the statement to Environment Canada as the source, and use it support economic and other policies.
• Due to the Weather Story statement, policies and efforts toward mitigating increasing urban flood damages may be misdirected to climate change mitigation, as opposed to more effective risk identification/management efforts, urban planning/stormwater management policies and infrastructure remediation/capital investment efforts that address the root causes of increased damages, not related to theoretical storm frequency shifts.
July 5, 2015 Telling the Weather Story Review 25