Embed Size (px)
Citation preview


Forecast: storm Warnings
Preparing for More Severe Hurricanes Due
to Global Warming
By Dr. Kit Batten, Jane Bullock, Benjamin goldstein, george Haddow, Bracken Hendricks,
Kari manlove, and Daniel J. WeissCenter fo r Amer i can Progress
August 2007

w w w . a m e r i c a n p r o g r e s s . o r g
�
Center for American Progress
Their names are seared into the minds of those who lived through them. Andrew. Charley. Hugo. Ivan. Rita. And, of course, Katrina.
These and other major hurricanes ripped through United States coastal areas around the Gulf of Mexico and Atlantic shoreline with 100-plus mile-per-hour winds and stinging sideways rain. These storms left devastation in their path, ripping roofs off houses, flat-tening whole buildings, tossing around cars as if they were toys, and taking lives.
The recipients of their wrath number in the tens of thousands, the damages in the bil-lions of dollars. Recovery often takes years. Two years after Hurricane Katrina struck land on August 29, 2005, thousands of Mississippi and Louisiana residents have yet to restore their homes, businesses and lives. And some may never do so. Hurricanes gather and release nature’s fury, and the consequences are deadly.
And now the actions of humans since the dawn of the industrial age will only propel future hurricanes’ power. There is an overwhelming scientific consensus that carbon di-oxide in the atmosphere released by burning coal, oil, and other fossil fuels has begun to warm the planet. The surface temperature of the eastern Atlantic Ocean has increased by nearly one degree Celsius in the last century, and the temperature will likely increase in the future.1 Scientists have determined that warmer water can boost hurricanes’ fe-rocity, and may even increase their frequency.
In short, the global warming forecast is for severe storm warnings ahead.
Even if the United States and other nations were to severely slash their emissions today, the Earth will continue to warm in the coming years due to the pollution already in the atmosphere. It is imperative that we immediately adopt global warming pollution reductions to slow and eventually halt the warming that is underway.
In the meantime, coastal communities facing the greatest hurricane threat must take steps to increase their resilience to damage from these future, fiercer storms. Commu-nity- based mitigation efforts, supported by federal policies and resources, can dramati-cally reduce the effects of a future Andrew or Katrina. The urgency of this work grows every day as thousands of Americans return to their homes and communities to try to rebuild their shattered lives and others go about their daily lives a potential target for the next storm.
Introduction

w w w . a m e r i c a n p r o g r e s s . o r g A U G U S T 2 0 0 7
2
This report begins by detailing scientists’ cur-rent understanding of the effects of global warming on the severity and frequency of hurricanes and the need for more scientific research on the relationship between these phenomena. After all, as our globe warms, our understanding of long-term environmen-tal consequences requires more than the anal-ysis of annual weather patterns. Evidence is growing that future storms will be more severe and unpredictable. Future storms will also continue to be more costly as more Americans settle in coastal communities that are more vulnerable to natural disasters.
Just as importantly, though, this report also includes recommendations for proven steps that communities can undertake to signifi-cantly reduce the devastation that hurricanes can suddenly deliver to those in the paths of these storms. We also outline essential steps that the federal government must take to as-sist cities and towns on the frontline of global warming. With the best science, the best local preparation, and dedicated federal support, we can minimize the likelihood that future storms join the tragic roster of the deadliest hurricanes.

w w w . a m e r i c a n p r o g r e s s . o r g A U G U S T 2 0 0 7
�
Forecast: Storm Warnings
Hurricane Intensity
This year’s Fourth United Nations Assessment Report by the Intergovernmental Panel on Climate Change, or IPCC—the world’s largest scientific body ever assembled—re-confirmed that human-generated greenhouse gas emissions are responsible for global warming, this time with over 90 percent certainty. While scientific research about the link between climate change and hurricanes continues to mature, Hurricane Katrina’s landfall clarified the consequences of this connection, as well as the need to improve our understanding of global warming’s effect on future storms.
In recent years, scientists have found that global warming results in an increase in hurri-cane intensity and may also lead to a greater frequency of hurricanes—effects that will continue for years to come. Scientific debate continues over exactly how global warm-ing affects hurricane patterns, but there is an emerging scientific consensus that global warming heats our oceans and their surfaces and that warmer sea-surface temperatures lead to more intense hurricanes.
Based on these lines of evidence, most scientists expect hurricanes to become more severe under warmer global climate conditions. Dr. Michael Mann, a well-known and widely published paleo-climatologist at Pennsylvania State University, and Dr. Kerry Emanuel of the Massachusetts Institute of Technology, one of our nation’s leading hurricane specialists, found that global warming increases sea-surface temperatures.2 In fact, mere weeks before Katrina’s landfall, Emanuel published one of the first studies to demonstrate that hurricane intensity doubled over the past 30 years, and that there is a link to rising sea-surface temperature.3
Other studies reached the same conclusion while also showing a correlation between sea-surface temperatures and hurricane intensity across the world’s oceans.4,5,6,7A 2006 study published in Science found that sea-surface temperature is directly linked to the increased numbers of category 4 and category 5 hurricanes for the period 1970–2004, and the au-thors dismissed the influence of other variables, such as wind shear or humidity.
The implication of [our] results is that the strong increasing trend in NCAT45 [number of category 4 and 5 hurricanes] for the period 1970–2004 is directly linked to the trend in tropical SST [sea surface temperatures], and that other aspects of the tropical environment, although they influence

w w w . a m e r i c a n p r o g r e s s . o r g A U G U S T 2 0 0 7
�
shorter-term variations in hurricane intensity, do not contribute significantly to the global trend of increasing hurricane intensity.8
The fourth IPCC report also supports these conclusions, finding evidence for a correla-tion between tropical cyclone activity in the North Atlantic and sea-surface temperature since 1970. The report also ascribes the recent rise in sea-surface temperature to hu-man-caused global warming.
The IPCC reports are extraordinarily valuable for informing policy, yet in fact they reflect the cautious consensus of over 2,000 scientists. The reports are then edited by government officials from around the world, including those who oppose efforts to slow global warm-ing. Thus the IPCC’s careful assessment that global warming will increase hurricane inten-sity and sea surface temperatures is even more alarming and must be paid heed.
Hurricane Frequency
Scientists, however, are less certain about the link between hurricane frequency and global warming, partly due to differences in the method of hurricane data collection and record-keeping over the last century. An ini-tial study to examine this relationship—pub-lished in Science in 20059—found a significant increase in the number of tropical storms and hurricanes in the North Atlantic since 1995, which the authors of the report corre-lated with increased sea-surface temperature. However, the study did not find the same relationship in any of the other ocean basins studied, including the North Pacific, Indian, and South Pacific Oceans. Still, the authors confirmed an increase in hurricane intensity in all of these ocean basins since 1995 and correlated this phenomenon with warmer sea-surface temperatures.
FIGURE 1: EVOLUTION OF SEA SURFACE TEMPERATURE ANOMOLIESSummer Sea Surface Temperature by Ocean Basin
Source: Curry, J.A. P.J. Webster, G.J. Holland, 2006: Mixing politics and science in testing the hypothesis thatgreenhouse warming is causing a global increase in hurricane intensity. Bull. Amer. Meteorol. Soc., 87, 1025-1037.
Sea
Surf
ace
Tem
pera
ture
Ano
mal
ies
(˚C)
1970 1980 1990 2005
North Atlantic OceanNorthwest Pacific OceanEastern Pacific OceanSouth Indian OceanSouthwest Pacific OceanNorthern Indian Ocean
0.4
0.2
0
–0.2
–0.41975 1985 1995 2000
The IPCC’s careful assess-
ment that global warming will
increase hur-ricane intensity and sea surface
temperatures is even more
alarming and must be paid
heed.

w w w . a m e r i c a n p r o g r e s s . o r g A U G U S T 2 0 0 7
�
The Science report did not consider years prior to 1995 because of the lack of satellite data. However, in a July 2007 peer-reviewed study, expert climate scientists Dr. Greg Holland and Dr. Peter Webster, at the Na-tional Center for Atmospheric Research and Georgia Institute of Technology, respectively, examined a more comprehensive data set and found that global warming influences the number of tropical cyclones and hurri-canes in the Atlantic Ocean.10 Holland and Webster adjusted their analysis to account for the different types of historical records and lack of satellite data availability in the early 1900s and found that about twice as many hurricanes form each year in the Atlantic now as compared with a century ago. They conclude this increase is likely due to warmer sea-surface temperatures and altered wind patterns associated with global warming. Holland and Webster drew the fol-lowing conclusion from the data:
Given the strong relationship between east At-lantic SST [sea surface temperature] anomalies and tropical cyclone variability...we are led to the confident conclusion that the recent upsurge in tropical cyclone frequency is due in part to greenhouse warming and this is most likely the dominant effect.11
Critics of the finding that more frequent hur-ricanes are the result of global warming be-lieve that there are other causes for hurricane frequency. The scientific debate over the relationship between hurricane frequency and warmer sea-surface temperature is still young. Nonetheless, Holland and Webster’s recent research makes a compelling case: If the United States receives not only fiercer, but also a greater number of intense storms, our coastlines will experience an even greater beating in the years to come. And regardless of the ultimate findings on storm frequency, the trend toward more severe storms is rea-
FIGURE 2: NUMBER OF TOTAL NAMED STORMS IN THE NORTH ATLANTIC AND THE AVERAGE SEA SURFACE TEMPERATURE IN THE MAIN DEVELOPMENT REGION
Source: Data are obtained from http://www.aoml.noaa.gov/hrd/hurdat/. Figure courtesy of M. Jelinek.
Num
ber
of S
torm
s
1850 1870 1910 1950 2010
Tropical CyclonesSea Surface Temperatures
16
14
12
10
8
6
4
27.8
27.6
27.4
27.2
27.0
26.81890 1930 1970 1990
Sea Surface Temperature (˚C)

w w w . a m e r i c a n p r o g r e s s . o r g A U G U S T 2 0 0 7
�
son enough to begin a program to prepare for and reduce the harm of future storms.
Consider recent history. Both 2004 and 2005 were very active hurricane years (see Table 1), with the latter a record-breaking year of 15 hurricanes and 28 named storms in the Atlantic. The 2006 hurricane season, however, was relatively quiet in comparison, in part because of an “El Nino” effect—an oscillation of the ocean-atmosphere system in the tropical Pacific which has important consequences for weather around the globe and almost always reduces the frequency that tropical storms develop into hurricanes.12 None of the 2006 hurricanes made landfall in the United States. Yet even with only five hurricanes and four other named storms, Holland believes that 2006 was still a more active season compared to a typical year from a century ago.13
So what does the 2007 hurricane season hold for us? The National Oceanic and Atmospheric Administration predicts the 2007 season will be an active one, with up to 17 named storms, including as many as five major hurricanes (see Table 1). In late Au-gust, Hurricane Dean, the first major storm of the season, missed Texas and the still fragile Gulf Coast, but the Category 5 hur-ricane pounded the Caribbean and Mexico. Casualties and economic damages are still uncalculated at this writing. Although annual storm predictions have an inherent degree of uncertainty, the question remains: As global warming continues, will future hurricane seasons approach or exceed the number and intensity of storms in 2005?
This question cuts to the heart of the de-bate about the effects of global warming on hurricanes.
FIGURE 3: FREQUENCY OF ATLANTIC STORMS
The source of this material is the University Corporation for Atmospheric Research (UCAR). © 2002 University Corporation for Atmospheric Research. All Rights Reserved. Illustration by Steve Deyo.
The National Oceanic and Atmospheric
Administration predicts the
2007 season will be an active
one, with up to 17 named
storms.

w w w . a m e r i c a n p r o g r e s s . o r g A U G U S T 2 0 0 7
7
Regardless of the frequency of hurricanes, future severe storms pose a greater threat due to prevailing demographic trends. Over half of the U.S. population lives near our Atlantic and Gulf coasts, with a large por-tion living in the North Atlantic’s “hurri-cane alley.”19 According to the Census Bu-reau, 12 percent of the U.S. population, or 34.9 million people, lived along the Atlantic and Gulf coasts in July 2006, an increase of 244 percent since 1950.20 And, a number of states prone to hurricanes—Florida, Geor-gia, North Carolina, South Carolina, Texas, and Virginia—all have recent growth rates that exceed the national aver-age21 (see Table 2).
More troubling, a recent poll of people living within 20 miles of the coast in eight southeastern states found that nearly one-third would not evacuate even if given warning in advance of a hurricane.22 Most believe that their homes are strong enough to withstand these storms, and they believe that evacuation routes would be too crowded. Even worse, four in 10 respondents admit-ted that they do not know the loca-tion of the nearest evacuation shelter. Clearly, communities must become better prepared to manage hurri-canes and other natural disasters.
Given that seven of the 10 costliest hurricanes in terms of insured losses have occurred in the past three years,
this suggests that the United States is inad-equately prepared to respond to the growing risk of high intensity storms (see Table 3 and Table 4).
The Consequences of Extreme Hurricanes
The most recent, devastating hurricanes caused tragic loss of life and displace-ment of thousands of people. Hurricane Katrina is the third-deadliest hurricane to
Table 1: Frequency and SeveriTy oF hurricaneS
NamEd STormS HurrICaNESmajor HurrICaNES:
CaTEgory � or HIgHEr
2007 Season: NOAA Prediction14 13–17 7–10 3–5
200615 9 5 2
200516 27 15 7
200417 15 9 6
1950–2005 Average18 10.3 6.2 2.7
Table 2: huGe PoPulaTion GrowTh raTeS oF hurricane Prone coaSTal STaTeS 2000–2006
PErCENT CHaNgE 2000–200�
Georgia 14.4%
Florida 13.2
Texas 12.7
North Carolina 10.1
Delaware 8.9
Virginia 8.0
South Carolina 7.7
New Hampshire 6.4
Maryland 6.0
New Jersey 3.7
Maine 3.7
Alabama 3.4
Mississippi 2.3
Rhode Island 1.8
New York 1.7
District of Columbia 1.7
Massachusetts 1.4
Louisiana -4.1
National Average 6.4
Source: US Census, http://www.census.gov/popest/states/NST-pop-chg.html
The most recent, devastating
hurricanes caused tragic loss of life
and displacement of thousands of people.
w w w . a m e r i c a n p r o g r e s s . o r g A U G U S T 2 0 0 7
�
More Global Warming Research Needed
Despite the importance of having the best science to understand and prepare for the threats posed by global warming, federal
research has fallen markedly under the Bush Administration. In 2005, the National Aeronautics and Space Administration had 18 Earth obser-vation satellites carrying 64 research sensors. In 2007 this capacity is a quarter lower, at just 14 satellites. By 2010, only a few satellites will continue to deliver data. There are also fewer federal funds available for federal scientific research.
Worse still, President Bush requested a 7 percent budget cut for NOAA for fiscal year 2008, which could hinder its administration of our nation’s system of dedicated Earth and climate-monitoring satellites. Unlike NASA’s satellite program, which also focuses heavily on space research, NOAA’s satellites concentrate exclusively on Earth-based observations—including research on climate, oceans, and weather that is vital to understanding global warming. On August 21, 2007, CNN reported that NOAA’s Quick-Scat satellite, used by the National Hurri-cane Center to monitor hurricane activity, is 3–5 years past its designed lifespan, and working with a backup data transmitter. A replacement is not expected until 2013.
Funding for NASA and NOAA research is part of the Commerce-Jus-tice-Science appropriations bill now pending in Congress, which so far has withstood Bush’s proposed cuts.23 Instead, the House-passed version included $6 million for a two-year global warming study by the National Academy of Sciences and $23 million to restore climate sen-sors cut or downgraded from the National Polar-orbiting Operational Environmental Satellite System last year.24
The House Commerce-Justice-Science bill would increase climate change research at NOAA, NASA, and other federal agencies to $1.9 billion, which is $171 million, or 9.9 percent, more than the White House request.25 This represents the first time in five years that the House has passed a NOAA appropriations measure that exceeds the White House request. Unfortunately, President Bush is threatening to veto this bill, thus obstructing the first major federal efforts to address these issues during his administration. A presidential veto would con-stitute a major setback for enhanced scientific understanding of global warming, as well as our capacity to adapt and prepare for the effects of global warming borne by hurricanes.
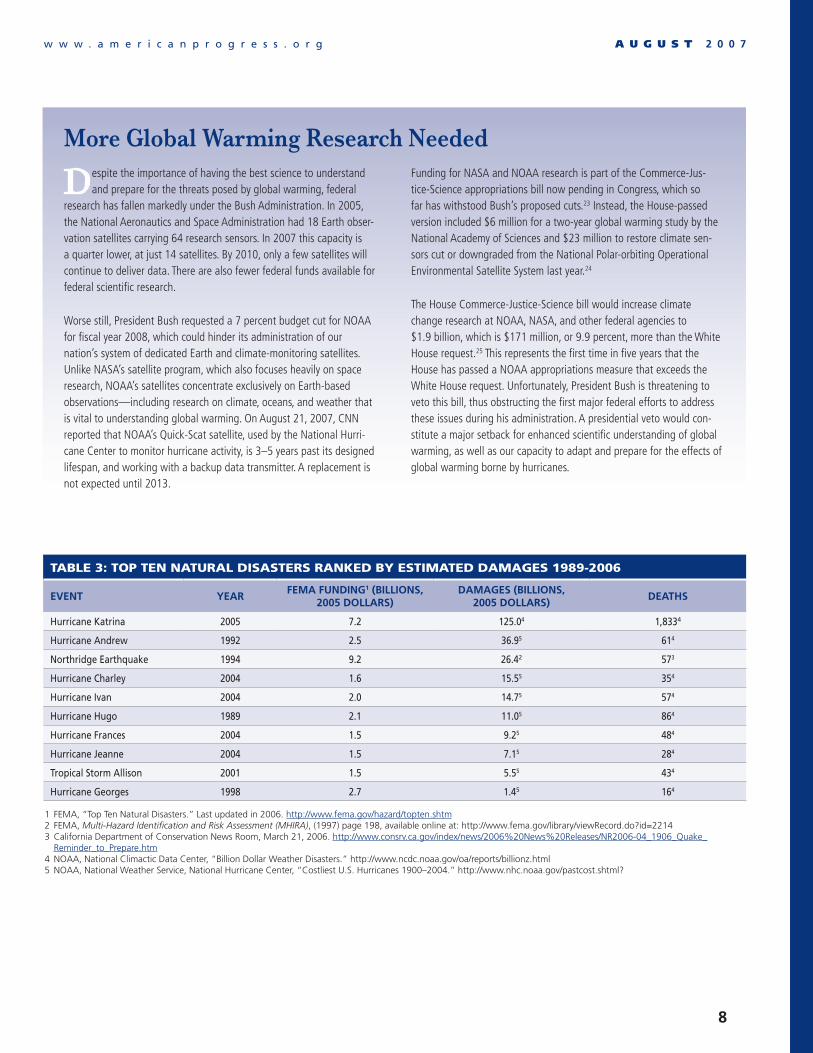
Table 3: ToP Ten naTural diSaSTerS ranked by eSTimaTed damaGeS 1989-2006
EvENT yEarFEma FuNdINg� (BIllIoNS,
200� dollarS)damagES (BIllIoNS,
200� dollarS)dEaTHS
Hurricane Katrina 2005 7.2 125.04 1,8334
Hurricane Andrew 1992 2.5 36.95 614
Northridge Earthquake 1994 9.2 26.42 573
Hurricane Charley 2004 1.6 15.55 354
Hurricane Ivan 2004 2.0 14.75 574
Hurricane Hugo 1989 2.1 11.05 864
Hurricane Frances 2004 1.5 9.25 484
Hurricane Jeanne 2004 1.5 7.15 284
Tropical Storm Allison 2001 1.5 5.55 434
Hurricane Georges 1998 2.7 1.45 164
1 FEMA, “Top Ten Natural Disasters.” Last updated in 2006. http://www.fema.gov/hazard/topten.shtm 2 FEMA, Multi-Hazard Identification and Risk Assessment (MHIRA), (1997) page 198, available online at: http://www.fema.gov/library/viewRecord.do?id=2214 3 California Department of Conservation News Room, March 21, 2006. http://www.consrv.ca.gov/index/news/2006%20News%20Releases/NR2006-04_1906_Quake_
Reminder_to_Prepare.htm 4 NOAA, National Climactic Data Center, “Billion Dollar Weather Disasters.” http://www.ncdc.noaa.gov/oa/reports/billionz.html 5 NOAA, National Weather Service, National Hurricane Center, “Costliest U.S. Hurricanes 1900–2004.” http://www.nhc.noaa.gov/pastcost.shtml?

w w w . a m e r i c a n p r o g r e s s . o r g A U G U S T 2 0 0 7
�
Time to Study Hurricanes in Earnest
In February 2007, a number of respected scientists wrote to Sen. Daniel Inouye (D-HI), chairman of the Senate Committee on Com-
merce, Science, and Transportation and to Rep. Bart Gordon (D-TN), chairman of the House Committee on Science and Technology, to urge that the Federal government “undertake prompt action to institute a comprehensive interagency research program aimed at reducing the impacts of hurricanes for the U.S.A. and our neighbors.”26 These recom-mendations build on those of the National Science Board, NOAA Sci-ence Advisory Board, American Geophysical Union, and other hurricane experts. They recommend the following measures to provide better protection from hurricanes:
• Improvements in zero-to-five day hurricane forecasts. New hurricane forecasting tools are necessary for better predictions of hurricane
intensity, including wind speed and the extent of damaging winds and rainfall.
• Better long range projections of hurricane activity from weeks to decades. Scientists need the next generation of regional climate models to better predict long-term variations and trends in hurricane intensity and location as global warming intensifies.
• Better projections of hurricane costs and consequences. Multidisci-plinary collaborations among scientists, engineers, and community leaders would increase understanding of how hurricanes damage communities and natural landscapes, from high winds, waves, coastal storm surge, rainfall, flooding, land slippage, and deteriora-tion of ecosystems.
strike the United States since 1900.27 More than 1,800 people lost their lives.28 More than 1.2 million people were evacuated and 700,000 individuals displaced from their homes. The deadly 2004 hurricane season saw four major hurricanes land in Florida, causing over $42 billion dollars in damages (2005 $). Of these four, Hurricane Charley caused approximately $15.5 billion (2005 $) in damages.
In addition to the human toll, these recent storms caused billions of dollars of damage and losses due to storm-related effects on critical infrastructure, housing, unemploy-ment, and disease. In 1992, Hurricane An-drew cost $36.9 billion (2005 $), which is less than a third of the cost of Hurricane Katrina in 2005,29 which has already exceeded $125 billion. Additionally, the insurance industry estimates that insured losses from Katrina will exceed $40 billion.30 The National Flood Insurance Program has paid out over $18 bil-lion in flood insurance claims alone.
The economic effect of more severe storms is clear. The financial costs of hurricanes
striking the United States have risen dramati-cally in recent years. The insurance industry reports that the average insured losses from hurricanes rose to $57.2 billion in 2005, from $2.7 billion in 1999 (2005 $).31 Similarly, the average personal claims rose to $12,396 in 2005 from $2,078 in 1999, and the aver-age commercial claim rose to $82,667 from $12,624 in 1999.32 Nine of the top 10 natu-ral disasters since 1989, ranked by estimated damage costs, have been hurricanes and tropical storms.
As more people migrate to coastal areas, the damage-related costs from future, more severe hurricanes will only increase. Since 1980, 40 percent of all weather-insured loss claims have been associated with major hurricanes.33 A March 2007 Government Accountability Office report on the financial risk of climate change to private insurers spells out just how damaging even a few strong hurricanes can be. The GAO’s analysis shows that in the 1980s, 17 hurricanes caused $16.9 billion (2005 $) in losses while in the 1990s, 19 hur-ricanes cost $44.6 billion (2005 $). Since 2000, just 14 hurricanes caused $97 billion (2005 $)

w w w . a m e r i c a n p r o g r e s s . o r g A U G U S T 2 0 0 7
�0
in losses to insurance companies.34 These costs will only rise as global warming leads to more severe storms while more Americans live along our coasts.
In addition to loss of life and displacement of thousands of people, Katrina and Rita inflicted severe damage to the energy infra-structure in the Gulf of Mexico. The storms damaged production and distribution facili-ties that were still recovering from Ivan the year before. Oil rigs were shut down and/or damaged. Of the nearly 4,000 offshore rigs in operation in the Gulf, roughly 190 were destroyed or harmed.35 In all, damages in the energy sector accounted for about 8 percent of the total cost of the hurricane damages.36
A number of oil refineries were also dam-aged or closed due to the storm. These dis-abled facilities led to a drop in oil production
and gasoline refining. The Federal Trade Commission found that Hurricane Katrina
“caused the immediate loss of 27 percent of the nation’s crude oil production and 13 per-cent of national refining capacity.”37 The supply disruption, combined with oil compa-ny price gouging, led to a spike in gas prices, with the typical gallon of gasoline nearly 17 percent more expensive in September 2005 than in August that year.38
In addition to higher gas prices, Katrina and Rita knocked out electricity for four million people in the region.39 The restoration of the electricity infrastructure caused a $2 hike for every 1,000 kilowatts used in New Orleans, which translates into about a $2 increase on electric bills each month. This price increase is slated to last for 10 years.40 Prevention of infrastructure damage is both smart public policy and sound fiscal management.
6.2
17.7
96.1
133.1
FIGURE 4: ECONOMIC DAMAGES BY HURRICANE CATEGORY FOR U.S.HURRICANES MAKING LANDFALL, 1900–2005
Source: GAO adaption of Pielke et al. data.Note: value of each bar compares the median economic damage associated with hurricanes of that Saffir-Simpson category
with the medianeconomic damage of Category One storms. Of the 158 hurricanes reviewed, only three were Category Five.
Econ
omic
Dam
age
in R
elat
ion
to C
ateg
ory
1 H
urri
cane
1 3 5
150
125
100
75
50
25
02 4
Damage from Category Four storm is nearly 100 times greater than Category One storm
Saffir-Simpson Hurricane Scale

w w w . a m e r i c a n p r o g r e s s . o r g A U G U S T 2 0 0 7
��
In addition to the human toll, costs for dam-ages, and debilitated infrastructure, there are also serious environmental and public health consequences associated with hurricanes. Se-vere storms, for example, frequently transmit invasive agricultural and human diseases. Scientists believe that Asian soybean rust, a disease that can completely devastate an entire crop, was introduced to the southeast-ern United States from the Caribbean via hurricanes. Soybean rust was first spotted in 2004, and initial estimates projected poten-tial annual crop losses between $240 million and $2 billion, depending on the scope and severity of outbreaks.42
By 2007, this disease attacked soybeans in 15 states, harming the second most valuable U.S. crop. The U.S. Department of Agricul-ture mounted a massive campaign against soybean rust and estimates that this program saved farmers $300 million during the 2005 growing season.43 Similar monitoring, quar-antine, and eradication policies must be put in place in order to detect and stop the spread of other such crop diseases that may be intro-duced to the United States via hurricanes.
The conditions after Hurricane Katrina also demonstrated the potential for the swift spread of communicable human diseases in the wake of intense storms. Population displacement creates conditions prone to epidemic diseases and poor health.44 Unsani-tary conditions are caused or exacerbated by reduced access to health care, limited access to clean water and sanitation, and exposure to water-borne diseases.
In the United States, our standard of living often spares us this reality. Yet following Ka-trina and the associated flooding, when some 10,000 people found refuge in the Louisiana Superdome, there were recorded outbreaks of diseases such as cholera, dysentery, and typhoid fever.45 Without better preparation,
the tragic reality of overcrowding at the Superdome could become the norm in the aftermath of intensifying hurricanes.
Massive evacuations and restoration of order must promptly occur after severe storms. This will become more difficult in the wake of more intense storms because they will cause additional damage to communications infra-structure and decrease the ability to swiftly mobilize. In addition, the National Guard is already stretched thin due to homeland de-fense and overseas commitments. In particular, the operational strain of ongoing deployments in Iraq has left the National Guard danger-ously low on equipment and diminishes our security at home.46 Tornadoes and unusually severe flooding in Kansas recently demon-strated the point; the National Guard was un-able to promptly and effectively respond.47
Hazard risk mitigation
Reversing climate change due to global warming will take decades even if we begin immediately. In the meantime, though, it is possible to protect our communities, our economy, and our environment from thor-oughly predictable natural disasters through community-based mitigation efforts. Sus-tained action to reduce or eliminate risk to people and property from hazards and their harms is effective and well within our grasp as a nation.
Unlike other preparedness activities, which are designed to enhance an individual, com-munity, or government’s readiness to respond to and recover from a disaster, mitigation actions are designed to anticipate and reduce the consequences of a future disaster. Ap-plying film to home windows, for example, reduces the potential for wind-blown debris to penetrate windows and expose the interior to wind and water damage. Trimming tree
Analysts from the Department of
Energy’s Energy Information
Administration estimate that the
upcoming 2007 hurricane sea-
son will shut-in 13.2 million barrels
of crude oil and 86.5 billion cubic
feet of natural gas.41

w w w . a m e r i c a n p r o g r e s s . o r g A U G U S T 2 0 0 7
�2
limbs near power lines reduces the likelihood of power outages due to downed lines from a wind or ice storm.
Effective community-wide mitigation re-quires the participation of a broad spectrum of people and organizations, including busi-nesses, professional associations, non-profits, community-based organizations, universities, faith-based groups, and the media. Effective mitigation requires leadership and political will. If done well, these mitigation measures can contribute substantially to the creation of economic and social sustainability within a community.
Unilateral approaches, such as the Bush Administration’s recent revision of the Na-tional Response Plan for disasters, have been widely criticized for being ineffective and for being developed without adequate consulta-tion with state and local officials.48 During Katrina, the National Response Plan was ineffective because it was developed through a top-down planning process driven by the Department of Homeland Security; failed to clearly delineate agency responsibilities; was overly focused on terrorism; and was untest-ed. Its latest version is overly simplistic and was developed without significant input from states and at risk communities.
In contrast, after an unprecedented number of natural disasters in the early 1990’s, the
Federal Emergency Management Agency de-termined that local programs are the most ef-fective means to reduce the effects of future extreme hurricanes. FEMA created “Proj-ect Impact,” which focused on hazard risk mitigation actions at the community level with strong support from the federal govern-ment. It helped establish community-based hazard risk mitigation programs in over 250 communities nationwide. The charge was to design and implement mitigation proj-ects with appropriate financial and technical support from federal and state emergency management officials. For the first time ever, Project Impact sought the involvement of the business community and leveraged mil-lions of dollars of direct and in-kind support from national corporations and local busi-nesses. (See page 21 for examples of Project Impact’s success.)
Independent reviews conducted in 2000 by the Disaster Research Center at the Univer-sity of Delaware and in 2005 by the National Institute of Building Sciences determined that Project Impact was a significant success. The NIBS study, which examined the costs and benefits of mitigation, found that:
The total national benefits of FEMA hazard mitigation grants between mid-1993 and mid-2003 are $14.0 billion compared with $3.5 bil-lion in costs. This yielded an overall benefit cost ratio of 4.0. This means that the benefits of
Defining Mitigation
Many public officials and advocates seek to “mitigate” global warming via a reduction in carbon pollution. Global warming mitigation refers to altering energy production and use to reduce emissions, as well as the
removal and sequestration of greenhouse gases from power plants and other industrial sources.
Similarly, those dedicated to the reduction of damage from natural disasters such as hurricanes commonly refer to their efforts to reduce or eliminate risk to people and property from these events as “mitigation.” Mitigation in this context is unrelated to reductions of carbon emissions that cause global warming. In this report, mitigation refers to reduction of risk from hurricanes, and not reduction of global warming pollution.

w w w . a m e r i c a n p r o g r e s s . o r g A U G U S T 2 0 0 7
��
these grants to the nation significantly exceeded their costs. In addition, the savings to the federal treasury were estimated. Federal expenditures on hazard mitigation were juxtaposed against poten-tial savings in federal post disaster recovery costs and recouped federal taxes. The results were that every dollar of hazard mitigation expenditures potentially saves the federal treasury $3.46 of future discounted expenditures or lost taxes. Thus, in addition to providing broad based benefits to society, hazard mitigation grants programs more than pay for themselves.49
Yet despite its enormous success, President George W. Bush cancelled Project Impact in 2001, asserting that it was not cost effective.50,51
Clearly, bold, innovative action by a partner-ship of federal, state, and local governments, private sector and nonprofit community-based organizations, and individuals can protect the social and economic sustainability of commu-nities that are vulnerable to increasingly severe hurricanes as a result of global warming.
Community partnerships directly benefit the local community and also provide collat-eral value to federal and state governments. These benefits include lower disaster costs, stability of the tax base, protection for the natural environment, continued economic development and an overall increase in the health and safety of citizens.
In that context, both federal and state gov-ernments should play major roles in the promotion, design, initiation and investment in programs and policies that will enhance community-based partnerships for hurricane risk mitigation. A number of steps are neces-sary to successfully implement community-based hurricane preparedness measures:
Create a community partnership that includes participation from all community sectors.
ß
Identify community and neighborhood vulnerabilities to hurricane storm surge, flooding or wind damage, with an empha-sis on special needs populations, emer-gency operations centers, local businesses, and schools.
Identify and prioritize both structural and nonstructural actions that can reduce damage from future hurricanes:
–clear streams of debris
–restore and protect wetlands and create open spaces in the community to ab-sorb rain and flood waters
–buy out properties in the floodplain
–construct or improve all existing struc-tural mitigation entities such as levees, drainage and water diversion channels, and flood protection gates.
Communicate global warming-driven storm risks and the mitigation plan to the community and neighborhoods. Generate the political, financial and public support necessary to implement the plan. Local media involvement at the beginning can help accomplish this objective.
Establish Community Emergency Com-munications Networks designed to com-municate mitigation and preparedness messages to residents and to collect and provide information from residents to government, business and non-profit sector decision-makers. As part of this effort, conduct a community-integrated demographic mapping project to identify mitigation needs within the community, establish the points of contact within Community Emergency Communications Networks, and ensure participation among special needs groups such as seniors, the disabled, and non-English speakers.
ß
ß
ß
ß
Every $1 of Federal funds
spent on mitigation
saves society an average of $4.

w w w . a m e r i c a n p r o g r e s s . o r g A U G U S T 2 0 0 7
��
Generate local funds to match federal, state, and private resources for mitiga-tion projects. For instance, voters in Napa, California, approved a half-cent sales tax increase to support their 20-year flood reduction plan. Tulsa, Oklahoma used a storm water drainage fee approved by the voters to help fund critical flood mitigation actions over the last two decades. In these and other communities across the country, locally generated funds have been used to match funding from federal and state gov-ernments, the business community, and the non-profit and foundation sectors to fund mitigation actions.
Establish an ongoing monitoring and evaluation process that truly measures the benefits of the mitigation actions to the community. Establish metrics in each community to measure the reduction in disaster relief costs realized by the mitiga-tion action, the economic benefits to the community of becoming more disaster resilient, and the multiple benefits realized from a healthy natural environment.
resume Federal Support for Community-Based Hazard mitigation
The late 1980s and early 1990s saw a rapid escalation in federal government costs due to disasters. From 1983–88, FEMA obligated $1.7 billion (calculated in 2005 $) in federal relief finds in 151 disasters.52 Starting in 1989 with Hurricanes Hugo and Iniki and the Loma Prieta earthquake, and into the early 1990s with Hurricane Andrew, federal costs rose dramatically. From 1989–94, FEMA obligated $8.6 billion (2005 $) in relief funds in 246 disasters.53 Most of the federal costs for these disasters were paid for by supplemental congressional appropriations outside the nor-mal appropriations process.
ß
ß
In the aftermath of the devastating 1993 Midwest floods that harmed 500 counties in eight Midwest states, the Clinton administra-tion, through FEMA, worked with Congress to meaningfully increase the amount of resources available to communities to imple-ment post-disaster mitigation actions. The direct funding (a percentage of the overall cost of the disaster) was increased and the match requirement was reduced as an incen-tive to undertake mitigation. This led to the largest-ever voluntary buyout and relocation effort for residential properties. Thousands of flood-prone homes and businesses were removed from the floodplain. This effort also created thousands of acres of open space that could help buffer future flood waters.
The success of this mitigation program was quickly realized when a repeat of the 1993 flood occurred in 1995. Fewer communi-ties and individuals suffered flood damage, and federal, state, and local disaster relief costs were reduced by over a third. This led FEMA to reform its approach to disasters by allowing funds for pre-disaster mitigation and by initiating Project Impact.
Despite this experience, the Bush administra-tion and conservatives in Congress dramati-cally cut the dollars available for all mitiga-tion programs. Post-disaster mitigation funds from FEMA’s Hazard Mitigation Grant Program were slashed from 15 percent to 20 percent of total federal disaster assistance costs to 7.5 percent—a reduction of 50 per-cent or more in funding for the mitigation actions that provided highly valuable and cost-effective protection to communities.
Once FEMA transferred into the new De-partment of Homeland Security, further ero-sion in mitigation funds occurred. Resources that should have gone for flood-plain man-agement as well as earthquake and hurricane preparedness and mitigation were regularly

w w w . a m e r i c a n p r o g r e s s . o r g A U G U S T 2 0 0 7
��
used to cover other budget shortfalls. After the elimination of Project Impact, the suc-cessful community-based pre-disaster miti-gation program became a confusing, com-petitive grant program with awards often determined by politics rather than need.
Federal spending on disasters rose due to disinvestment in mitigation and more in-tensive storms fueled by global warming hitting denser coastal population centers. To respond, the federal government must reinvigorate a comprehensive hazard mitiga-tion strategy as one of its primary means for minimizing the immediate impacts of hur-ricanes linked to global warming.
A new federal entity focused solely on disas-ter mitigation and long-term recovery, with a focus on global warming-related extreme weather, could ensure adequate support for community-based mitigation. Currently, the limited federal mitigation efforts are housed in the Mitigation Division within FEMA. While FEMA’s missions include prepared-ness, response, recovery, and mitigation, the latter two responsibilities consistently fall victim to the urgency of responding to the next disaster. And while a federal recovery czar was appointed after Katrina, the lack of clout within the administration and federal bureaucracy yielded unacceptable delays in New Orleans and along the Gulf Coast.
One option is to sufficiently expand FEMA’s full-time staffing so that it can adequately support all of its programs. Another possi-bility could be the creation of a new federal entity with mitigation and recovery as its pri-mary mission. This new entity would need sufficient resources, including steady grant funding and the ability to attract private investment, without adding a needless layer of bureaucracy. One model could be the Ap-palachian Regional Commission, an organi-zation with a limited mission and designed to address a specific need.
This new mitigation entity organization could undertake the following efforts.
Administer a national fund to promote and finance pre-disaster mitigation ac-tivities to reduce the impacts of global warming-related storms and post-disaster recovery actions.
Provide technical assistance to communi-ties’ innovative strategies and best prac-tices in mitigation to build more disaster-resilient communities.
Develop partnerships with universities and businesses to support research to identify new strategies and technologies to re-duce the impact of hurricanes and other emerging hazards linked to global warm-ing, such as drought and wildfires.
Provide incentives to the private sector to incorporate mitigation into economic de-velopment projects, infrastructure devel-opment, and business contingency plans.
Collect and publicize data on disaster-re-lated fatalities, injuries, displacement of people from their homes, and damage costs. There is no central entity that cur-rently collects this vital information.
A crucial element in hurricane mitigation is the construction of more storm-resistant buildings as part of post-storm reconstruc-tion or new developments. Congress should revise existing federal disaster legislation and policies to require disaster-resistant construc-tion in new or reconstructed public buildings, facilities, and infrastructure.
In addition, Congress and the administration need to review and revise federal capital and infrastructure funding programs to incorpo-rate mitigation in the design and construc-tion of projects. A good model exists in the Intermodal Surface Transportation Efficien-
ß
ß
ß
ß
ß
A new federal entity focused
solely on disaster mitigation
and long-term recovery, with a focus on global
warming-related extreme weather,
could ensure adequate support
for community-based mitigation.

w w w . a m e r i c a n p r o g r e s s . o r g A U G U S T 2 0 0 7
��
cy Act, enacted in 1991, which called for all federally funded projects to assess the earth-quake threat and incorporate earthquake resistant construction. As we face fiercer, and possibly more, hurricanes a similar assess-ment should occur. Federal facilities should adhere to state or local building code provi-sions. The federal government should be the leader in mitigation and disaster-resistant construction, not the exception.
Equally important is the need to revise federal mapping programs to incorporate our knowledge of global warming and the potential for more intense hurricanes. This is particularly critical for the National Flood Insurance Program community maps. The map revision cycle, however, can be as frequent as five years or as long as 20 years depending on funds and other circumstances, including political pressure. That’s why other federal mapping programs, such as the U.S. Geological Survey, should be examined to determine whether further data such as soils stability and liquefaction would be beneficial for disaster-resistant construction.
The federal government must also reinvigo-rate its commitment to assess the diverse range of regional hazards resulting from global warming with more support for projects such as the interagency U.S. Global Change Research Program. It conducts assessments of the potential regional conse-quences of climate variability and change. This action-oriented research should be a top priority because it would provide use-ful data for regional and community-based hazard mitigation efforts. This program be-gan in the 1990s to assist regions and states in understanding and anticipating weather changes and threats, but it has languished under the current administration.
On the financial front, the federal govern-ment needs to step in to help state-backed
hazard catastrophe funds. As the costs of hurricanes and other disasters escalate, pri-vate insurance markets may not provide suf-ficient coverage to meet the needs of states or regions. Insurance is less available even as many storm-prone states experience popu-lation growth rates well above the national average. In return for federal reinsurance, state catastrophe funds would be required to dedicate specific levels of funding for com-munity-based hazard reduction efforts.
To prevent complete collapse of the electric-ity infrastructure when disaster strikes, state and federal governments should initiate a program to support the deployment of smart micro grids that use advanced technology to distribute electricity at the neighborhood level. Micro grids would improve both emergency response and energy security. Strategically de-ployed distributed energy generation methods such as solar photovoltaic cells can generate electricity close to the point of use. They also avoid reliance on a large central generating plant that can be knocked out in a natural disaster and take a long time to restart.
In the wake of Hurricane Katrina, the toll of both human and economic damage was greatly increased because of power failures that crippled pumping stations and ham-pered the effectiveness of first responders. A smart micro grid can ensure that power for essential services such as streetlamps and wastewater treatment is brought back on line quickly in the event of disaster. It can also help keep the electronic communications infrastructure (including cell phones and computers) charged and operable.
Rather than spending more to recover from disasters after the fact, the federal govern-ment must do more now to minimize the cost of disasters we know are coming. Annual funds for risk reduction in the United States must be substantially increased. There is, of

w w w . a m e r i c a n p r o g r e s s . o r g A U G U S T 2 0 0 7
�7
course, intense competition for resources for other pressing needs such as education, health care, social security, national security, and other priorities. But there are several op-tions that separately or in combination can provide resources to assist communities with their resources needs.
Provide a percentage of disaster funds for response and recovery, which would yield a reliable revenue stream for mitiga-tion efforts.
Dedicate a percentage of revenue from the future auction of carbon credits under a cap-and-trade carbon emissions control program to pay for disaster risk reduction.
Create a Global Warming Disaster Mitiga-tion Trust Fund from fees collected from building permits for future construction or major upgrades, storm water discharges, an assessment on federally funded con-struction projects, or a “risk cost” on fed-erally backed mortgages in at-risk places. This would provide a significant incentive for communities to develop formal mitiga-tion programs. Such communities could reinvest this money into projects that both reduce weather-related risk and reduce greenhouse gas emissions as well.
Dedicate a percentage of resources from state all-hazard catastrophe insurance funds to mitigation. State and local mitiga-tion efforts could receive matching federal grants from the mitigation trust fund.
Establish mitigation programs within existing community redevelopment ef-forts. Work with related industries such as mortgage bankers, the building and con-struction industries, insurance companies, utility companies, and others to create a Mitigation Investment Bank. Investors might receive favorable tax treatment as
ß
ß
ß
ß
ß
an incentive. In turn, the bank can provide important capital to back projects that in-corporate significant disaster and environ-mental mitigation into building design.
other Key Support for Community-Based Hazard risk mitigation
A successful community-based initiative should combine effective government leader-ship and provide important incentives that at-tract robust business involvement and harness the energy of interest and nonprofit groups. States can offer incentives to encourage com-munities and businesses to adapt. Such incen-tives are cost-effective, as statistics indicate that between 40 percent and 60 percent of small businesses harmed by a disaster never recover. States can also educate businesses and provide technical assistance regarding the post-disaster economic benefits of mitigation to help pro-vide greater job security for workers and more rapid recovery times for impacted communi-ties in the event of a disaster.
The active involvement of major businesses in hurricane mitigation is vital. The business community plays an increasingly impor-tant role in response to catastrophic disaster events. According to the U. S. Chamber of Commerce, the business community provid-ed over $1.2 billion in assistance to victims of Hurricanes Katrina and Rita.
Recovery depends on retention or restora-tion of the community’s economic base. As-sistance to local businesses so that they can protect themselves from future hurricanes makes good economic sense. Local Cham-bers of Commerce were big supporters of Project Impact, which leveraged millions of dollars in funding and in-kind support from major corporations and local businesses.
Community mitigation of
hurricane risk is an economic
imperative. Between 40%
and 60% of small businesses
harmed by a disaster never
recover.

w w w . a m e r i c a n p r o g r e s s . o r g A U G U S T 2 0 0 7
��
The voluntary agencies active in disasters have also long played a major role in hur-ricane response. The groups provide imme-diate food, shelter, and clothing to people harmed by hurricanes. They help commu-nities rebuild after these events. In recent years, these efforts were joined by a growing number of non-governmental organizations that provide financial resources, staff support, and partnerships to help individuals and communities recover. Corporate, family, and community foundations have also become more involved in response and recovery ef-forts to major disasters.
A comprehensive and integrated approach to local or regional hazard reduction includes important roles for state and local govern-ment, businesses, and nonprofit organiza-tions. Each entity should undertake some or all of the following initiatives to ensure the success of hurricane mitigation efforts.
State and Local Government
Incorporate mitigation elements in all state and local government buildings and infra-structure construction projects and require a percentage of this construction to be
“green” construction that reduces energy use and greenhouse gas emissions. This will produce safer buildings as well as promote distributed renewable energy generation and reduce state disaster costs in the after-math of a hurricane. This is an important consideration as many states are self-in-sured and a large disaster can represent significant budget problems even for a state that is eligible for federal assistance.
Provide state tax incentives to businesses to incorporate mitigation in their facilities and capital improvement programs. States can create tax and economic incentives to support and promote better construction
ß
ß
and development practices. Incentives to protect green spaces and public areas would also mitigate hurricanes’ impact since they can buffer storm surges and absorb flood waters.
Revise state building codes to require cost-effective mitigation in all new construction and in any level of remodeling or recon-struction that affects 25 percent or more of the building. Inclusion of mitigation measures as part of new construction is the most cost-effective approach to reduc-ing damages. Most states require upgrades to current code based on a 50 percent or greater impact on the building. If this threshold was lowered to 25 percent, then it would affect almost all major renova-tions and achieve a much higher level of risk reduction.
Build a skilled workforce for hazard mitiga-tion. Establish formal programs to address hazard mitigation with state workforce boards and training programs, union and industry apprenticeship programs, com-munity colleges and vocational training institutions. State training and workforce incentives can address the growing need for new construction and management practices. In addition, states should create a safety net to assist small businesses and employees temporarily dislocated in the event of natural disaster to ensure that lo-cal economies rapidly regain their footing.
Business
Promote local planning that identifies crit-ical cross-dependencies and supply chains necessary for swift economic recovery.
Provide financial, material (products and services), and technical support to com-munity mitigation efforts.
ß
ß
ß
ß

w w w . a m e r i c a n p r o g r e s s . o r g A U G U S T 2 0 0 7
��
Encourage skilled employees to assist com-munity partnerships and to help imple-ment mitigation actions.
Complete a business impact analysis for all facilities and operations and assist ven-dors and suppliers with this task.
Provide grants and low-interest loans to employees to finance low-cost mitigation actions to protect their homes. Other em-ployee assistance would also speed recov-ery efforts. The General Electric Power Plant in Wilmington, North Carolina, for example, provided employees with genera-tors to provide electricity to their homes in the aftermath of a hurricane.
Include mitigation, energy conservation, and environmentally friendly techniques in the location, design, and construction of new facilities and retrofitting of exist-ing facilities.
Support federal and state policies to create incentives to achieve adequate participa-tion of the business community in mitiga-tion activities.
Nonprofit Organizations
Provide trained and experienced staff to help organize community partnerships, design community mitigation actions plans, and implement them.
Provide financial and technical support and staff for community partnerships. Foundations can provide the financial resources and community-based organiza-tions and programs can provide the exper-
ß
ß
ß
ß
ß
ß
ß
tise to develop and conduct training and mentoring programs for community lead-ers nationwide. Areas of emphasis might include reduction of disasters’ harm to children, low-income families and com-munities, and the elderly.
Provide financial and technical support for a monitoring and evaluation program. Nonprofit groups have extensive experi-ence with the design and implementa-tion of such programs. Non-government organizations, for example, could measure progress in community mitigation ef-forts, economic benefits realized through mitigation, and the savings realized by reduced losses from future hurricanes.
Incorporate mitigation planning and ac-tions into their existing community devel-opment programs. As nonprofits become more involved in disaster response and recovery, it is critical that their operations, services, and facilities remain functional after a disaster. An audit of the ability of these operations and facilities to withstand disasters will ensure that they can assist the community when they are needed.
Nonprofit groups that protect and en-hance the natural environment should provide technical, organizational, and financial support for community mitiga-tion efforts. A healthy and vibrant natural environment is a great buffer for hur-ricanes, particularly wetlands that can absorb rains and flood waters. Prior to Katrina, Louisiana lost thousands of wetlands due to commercial activity. This wetlands destruction created open water that strengthened, rather than weakened, Hurricane Katrina.
ß
ß
ß

w w w . a m e r i c a n p r o g r e s s . o r g A U G U S T 2 0 0 7
20
There is a scientific consensus that global warming is real, and its effects on cli-mate are already underway. Much of the debate on climate change to date has focused on the method and legal system to reduce the carbon emissions to pre-
vent the worst economic, social, and environmental harm from global warming. These reductions must become our first line of defense in the fight to slow the harms from a changing climate.
In the face of Bush administration opposition to reductions in global warming pollution, other countries and many states have taken the lead. They adopted programs to re-duce global warming pollution from coal-fired power plants, motor vehicles, and other sources. The U.S. federal government must join them in these efforts by embracing an 80 percent reduction in greenhouse gas pollution by 2050, requirements for significantly more efficient cars and cleaner fuels, renewable electricity standard, energy efficient buildings and appliances, and investments in clean alternative energy sources such as wind and solar power.
All of these steps are vital to slow—and eventually halt—the growth of pollution and global warming and dampen the very real damages to our global environment and soci-eties across the planet. One of those clears sources of danger, warn many scientists who study global warming and tropical storms, are more severe and possibly more frequent hurricanes arising in the North Atlantic. That’s why we must also face the implications of climate change on our communities today.
These circumstances demand a serious program to mitigate the threat of more severe hurricanes by building more disaster-resilient communities. Our strategy will promote citizen preparation, enhance infrastructure, save money, and, most importantly, save lives. A community-based mitigation strategy—supported by federal and state resources and policies—can help communities that are on the receiving end of these brutal storms.
Finally, we must provide scientists with the resources and tools to enhance their knowl-edge of hurricanes and global warming and better predict their occurrence and strength. This would also assist communities with reduction in damages from these fierce storms. If we launch all of these efforts now, we can build a safer world for our children, grandchildren, and generations to come.
Conclusion

w w w . a m e r i c a n p r o g r e s s . o r g A U G U S T 2 0 0 7
2�
Community-Based Mitigation at Work
Freeport, new York
The Village of Freeport is located on the southern shore of Long Island in Nassau County, New York, approximately 13 miles east of John F. Kennedy Airport. Freeport relied on its waterfront location; it is a major recreational boating center on Long Island. Development in Freeport led to frequent flooding, especially in the commercial district known as the Nautical Mile in South Freeport.
In 1983, Freeport began to routinely elevate streets in South Freeport. Because of the cost, the time to complete the elevation of all streets at risk from floods was estimated to be decades. The majority of funds for this effort—between $1 million and $2 million annually—came from the issuance of general obligation bonds. Periodically, Freeport also received financial assistance from both the state and federal Depart-ments of Transportation.
By the mid-1990s, many streets had been elevated, including Woodcleft Avenue, which is now a fishing and tourist attraction as well as the most significant commercial business district in Freeport. The Village of Freeport and private citizens raised $10 million to redevelop the Nautical Mile, a project that included the installation of new bulkheads, replacement of overhead electric wires with underground wiring, and construction of new upscale restaurants.
Freeport used funding from six FEMA hazard-mitigation grants to elevate roads and 23 individual residences. Freeport also received funds from FEMA’s Project Impact to fund public awareness activities, replace and repair bulkheads, conduct a roadway grade raise and drainage improvement project, remove trees that threatened overhead power lines, and install hurricane-resistant windows and doors in the Village’s emergency operations center.
When several major storms caused major flooding on parts of Long Island earlier this summer, it caused negligible harm in the mitigated areas.
Source: National Institute of Building Sciences, “Natural Hazard Mitigation Saves: An Inde-pendent Study to Assess the Future Savings from Mitigation Activities” (2005), available at http://www.nibs.org/MMC/MitigationSavingsReport/natural_hazard_mitigation_saves.htm.
Deerfield Beach, Florida
Deerfield Beach, a coastal community of over 66,000 people, was the first Project Impact community to partner with FEMA. Deerfield Beach is well-acquainted with damages from a natural disaster; over a span of 75 years it has been hit by seven major hurricanes. Residents knew more hur-ricanes were likely. The community became determined to decrease dam-ages sustained from future hurricanes after a particularly bad blow from Hurricane Andrew in 1992 and the near-misses of Erin and Opal in 1995.
With guidance from FEMA, Deerfield Beach identified and prioritized mitigation projects that would most benefit the community. One of the first efforts undertaken was retrofitting the Deerfield Beach High School, which also serves as a community shelter during emergencies. Hurricane tie-down straps that mitigate the loss of roofs were added to the cafeteria and auditorium and wind shutters were placed on all the school’s windows. Additional projects included shuttering and disaster-resistant improvements to critical facilities, shuttering for single family residences for senior citizens and low income households, and a variety of public awareness activities.
Deerfield Beach worked very closely with a variety of business partners. The local Home Depot maintained a “Project Impact Aisle,” offering products and informational materials on making buildings more disas-ter-resistant. During the initial two years of the program, the store also designated a senior manager as a Project Impact advocate, allowing him to spend 80 percent of his time in support of Project Impact activities.
Solutia, Inc., a window manufacturer, donated hurricane-resistant glass to retrofit the Deerfield Beach Chamber of Commerce. Deerfield Build-ers Supply, a corporate sponsor of the annual Hurricane Awareness Week and member of the Local Mitigation Strategy working group, do-nated labor to install windows and doors in the Chamber of Commerce. Marina One Yacht Club built the first hurricane-resistant marine storage facility, designed to withstand 125 mph winds, and offered 2.6 million cubic feet of storage.
Source: FEMA, “Emergency and Risk Management Case Studies Textbook” (2004), avail-able at http://training.fema.gov/EMIWeb/edu/emoutline.asp.
Several hurricane-prone states took mitigation actions in recent years to reduce the harm from future hurricanes. Below are brief case studies of efforts in Freeport, New York, Wilmington, North Carolina, and Deerfield Beach, Florida. All three communities participated in FEMA’s Project Impact: Building
Disaster-Resistant Communities initiative.
Both Wilmington and Deerfield Beach experienced minor damage during the series of hurricanes that made landfall in 2004 but were spared any major storm activity. Freeport has been spared any hurricanes, but major flooding occurred throughout Long Island, where Freeport is located, earlier this year. The mitigated areas were essentially unharmed.

w w w . a m e r i c a n p r o g r e s s . o r g A U G U S T 2 0 0 7
22
Community-Based Mitigation at Work (continued)Wilmington, north carolina
Wilmington is a coastal community in North Carolina that was harmed by six hurricanes between 1996 and 1999. Wilmington is one of the original seven Project Impact communities and the Port of Wilming-ton, the center of the community’s economy, was an active partner in Project Impact.
As part of its commitment to reduce damage from future hurricanes, the Port of Wilmington invested in a planning and mitigation efforts that brought together federal, state, local, and business organizations. A risk analysis and four mitigation measures were implemented to eliminate or minimize hurricane losses and ensure business continuity. These measures included securing gantry cranes and mobile cranes to ensure they do not topple over; taking non-structural measures to secure sensitive equipment; structurally reinforcing buildings, including wind-resistant roofing; and structural reinforcement of electric power and telecommunications systems.
A study of the benefits of Project Impact to the Wilmington’s labor market concluded:
The findings of this article are consistent with Project Impact’s having a beneficial impact on the labor market of Wilmington. After the initiative, the equilibrium unemployment rate in Wilmington is significantly lower than before the policy intervention, controlling for the effects of other business cycle factors and trends. Additionally, the policy intervention is associated with a significant reduction in the long-run variance of the unemployment rate. The evidence is also consistent with the claim that the disturbance created by a hurricane is less after Project Impact was initiated than before. Taken together, these findings suggest that the activities and coordination efforts associated with Project Impact coin-cide with improvements in the Wilmington labor market characterized by a lower natural unemployment rate and a reduction of labor market risk. On one hand, these findings may be taken as evidence that Project Impact can improve the performance of a local economy. The results suggest that, at the very least, increased interaction between public and private sectors may be associated with improved labor market conditions.
Sources: North Carolina Division of Emergency Management, “Mitigation in North Caro-lina: Measuring Success” (2000), Chapter 4, available at www.nccrimecontrol.org/Index2.cfm?a=000003,000010,001623,000177,000834,001604; Bradley T. Ewing and Jamie Brown Kruse, “The Impact of Project Impact on the Wilmington, North Carolina, Labor Market,” Public Finance Review 30 (2002):296, available at http://pfr.sagepub.com/cgi/con-tent/abstract/30/4/296.
Table 4: The Ten u.S. hurricaneS wiTh hiGheST inSured loSSeS ($ billionS)
ESTImaTEd INSurEd loSS*
raNK daTE loCaTIoN HurrICaNEdollarS WHEN
oCCurrEdIN 200� dollarS**
1 aug. 25–29, 2005 aL, FL, ga, La, ms, tn Katrina $40.6 $41.9
2 aug. 23–24, 25–26, 1992 FL, La, ms andrew 15.5 22.3
3 oct. 24, 2005 FL Wilma 10.3 10.6
4 aug. 13–15, 2004 FL, nc, sc charley 7.5 8.0
5 sep. 16–21, 2004aL, FL, ga, oH, Pa, nY, nc, 8 other states
ivan 7.1 7.6
6 sep. 17–18, 21–22, 1989U.s. Virgin islands, Pr, ga, sc, nc, Va
Hugo 4.2 6.8
7 sep. 20-26, 2005 aL, ar, FL, La, ms, tn, tX rita 5.6 5.8
8 sep. 5, 2004 FL, ga, sc, nc, nY Frances 4.6 4.9
9 sep. 15–25, 2004 Pr, FL, Pa, ga, sc, nY Jeanne 3.4 3.7
10 sep. 21–28, 1998Pr, U.s. Virgin islands, aL, FL, La, ms
georges 2.9 3.6
* Property coverage only.** Adjusted to 2006 dollars by the Insurance Information Institute.Source: ISO; Insurance Information Institute. http://www.iii.org/media/facts/statsbyissue/catastrophes/?table_sort_748341=6.

w w w . a m e r i c a n p r o g r e s s . o r g A U G U S T 2 0 0 7
2�
1 Greg J. Holland and Peter J. Webster, “Heightened Tropical Cyclone Activity in the North Atlantic: Natural Variability or Climate Trend?” Philosophical Transactions of the Royal Society of London (2007): 22, available at www.mmm.ucar.edu/people/holland/files/NaturalVariabilityOrClimateTrend.pdf.
2 M.E. Mann and K.A. Emanuel, “Atlantic Hurricane Trends Linked to Climate Change,” EOS 87 (24) (2006): 233-244.
3 K. Emanuel, “Increasing Destructiveness of Tropical Cyclones over the Past 30 Years,” Nature 436 (2005): 686-688.
4 Ibid.
5 Kevin E. Trenberth and Dennis J. Shea, “Atlantic Hurricanes and Natural Variability in 2005,” Geophysical Research Letters 33 (2006).
6 P.J. Webster, G.J. Holland, J.A. Curry , and H-R Chang, “Changes in Tropical Cyclone Number, Duration, and Intensity in a Warming Environment,” Science 309 (2005): 1844-1846.
7 J.A. Curry, P.J. Webster, and G.J. Holland, “Mixing Politics and Science in Testing the Hypothesis that Greenhouse Warming is Causing a Global Increase in Hurricane Intensity,” Bull. Amer. Meteorol. Soc., 87 (2006): 1025-1037.
8 C.D. Hoyos, P.A. Agudelo, P.J. Webster, and J.A. Curry, “Deconvolution of the Factors Contributing to the Increase in Hur-ricane Intensity,” Science 312 (2006).
9 Webster, Holland, Curry, and Chang, “Changes in Tropical Cyclone Number.”
10 Holland and Webster, “Heightened Tropical Cyclone Activity in the Northern Atlantic.”
11 Ibid, p. 23.
12 El Nino produces an increased wind shear in areas of the tropical North Atlantic where hurricanes develop. The increased wind shear breaks many of the developing storms apart before they can mature.
13 “Frequency of Atlantic Hurricanes Doubled Over Last Century; Climate Change Suspected,” available at www.ucar.edu/news/releases/2007/hurricanefrequency.shtml#mediaterms.
14 “NOAA Predicts Above Normal 2007 Atlantic Hurricane Season,” available at www.noaanews.noaa.gov/stories2007/s2864.htm.
15 “Climate of 2006, Atlantic Hurricane Season,” available at www.ncdc.noaa.gov/oa/climate/research/2006/hurricanes06.html.
16 “Climate of 2005, Atlantic Hurricane Season,” available at www.ncdc.noaa.gov/oa/climate/research/2005/hurricanes05.html.
17 “Climate of 2004, Atlantic Hurricane Season,” available at www.ncdc.noaa.gov/oa/climate/research/2004/hurricanes04.html.
18 “Background Information: The North Atlantic Hurricane Season,” available at www.cpc.ncep.noaa.gov/products/outlooks/background_information.shtml.
19 “Population Trends Along the Coastal United States: 1980-2008,” available at www.oceanservice.noaa.gov/programs/mb/pdfs/coastal_pop_trends_complete.pdf.
20 “Facts for Features: 2007 Hurricane Season Begins,” available at www.census.gov/Press-Release/www/2007/cb07-ffse-03.pdf.
21 U.S. Census Bureau, “Cumulative Estimates of Population Change for the United States, Regions, States and Puerto Rico and Region and State Rankings: April 1, 2000 to July 1, 2006” (2006), available at www.census.gov/popest/states/NST-pop-chg.html.
22 “Survey of Hurricane Preparedness Finds One-Third on High Risk Coast Will Refuse Evacuation Order,” available at www.hsph.harvard.edu/news/press-releases/2007-releases/press07242007.html.
23 As of Aug. 27, 2007, the Commerce-Justice-Science appropriations bill passed the full House and passed the Senate Ap-propriations Committee. The full Senate will debate the bill sometime after the August recess ends on Sept. 4.
24 See www.eenews.net/EEDaily/2007/07/13/archive/5?terms=appropriations.
25 See http://www.eenews.net/EEDaily/budget_2008/2007/07/13/5.
26 Judith A. Curry, “Statement to the Select Committee on Energy Independence and Global Warming of the United States House of Representatives” (2007), available at http://globalwarming.house.gov/pdf/curry%20testimony26April2007.pdf.
27 NOAA, Atlantic Oceanographic and Meteorological Laboratory, Hurricane Research Division. http://www.aoml.noaa.gov/hrd/tcfaq/E12.html.
Endnotes

w w w . a m e r i c a n p r o g r e s s . o r g A U G U S T 2 0 0 7
2�
28 U.S. Senate, “Hurricane Katrina: A Nation Still Unprepared, Special Report of the Committee on Homeland Security and Governmental Affairs,” S. Rept. 109-322 (Washington: Government Printing Office, 2006).
29 NOAA, National Weather Service, National Hurricane Center, “Costliest U.S. Hurricanes 1900--2004.” http://www.nhc.noaa.gov/past-cost.shtml?
30 Opening Statement of Chairman Melvin Watt at the Hearing before the Subcommittee on Oversight and Investigations of the Com-mittee on Financial Services. “Insurance Claims Payment Processes in the Gulf Coast after the 2005 Hurricanes.” February 28, 2007. http://www.house.gov/apps/list/hearing/financialsvcs_dem/katrina_watt_opening_statement.pdf
31 Insurance Information Institute, “Catastrophic Hurricane Claims and Losses in the United States, 199-2006” (2006), available at www.iii.org/disaster2/facts/wrapup/.
32 Ibid.
33 Government Accountability Office, “Climate Change: Financial Risks to Federal and Private Insurers in Coming Decades are Potentially Significant” (2007), available at www.gao.gov/new.items/d07285.pdf.
34 Ibid.
35 Don Stowers, “Special Report: Hurricane Preparedness - Oil and Gas Interests Warned of Active 2007 Hurricane Season,” Oil and Gas Financial Journal 4(6) (2007), available at www.ogfj.com/articles/article_display.cfm?Section=ARTCL&ARTICLE_ID=295489&page=4.
36 Bill Evans’ statement is available at www.net.org/warming/hurricane_transcript.vtml
37 Federal Trade Commission, “Investigation of Gasoline Price Manipulation and Post-Katrina Gas Price Increases” (2006), p. 62-63, avail-able at: http://www.ftc.gov/reports/060518PublicGasolinePricesInvestigationReportFinal.pdf
38 Ibid.
39 U.S. Department of Energy, “The Department of Energy’s Response to Hurricanes Katrina and Rita” (2005), p. 2, available at www.dhs.gov/xoig/assets/katovrsght/OIG_DOE_111405.pdf.
40 “Energy Customers to Pay for Hurricane Expenses,” Greenwire, Aug. 2, 2007, available at http://blog.nola.com/tpmoney/2007/08/en-tergy_rates_to_increase_2_a.html.
41 EIA, “Short-term Energy Outlook Supplement: The 2007 Outlook for Hurricane Impacts on Gulf of Mexico Crude Oil and Natural Gas Production” (2007), available at www.eia.doe.gov/emeu/steo/pub/pdf/2007_hurricanes.pdf.
42 Mike Livingston, et al., “Economic and Policy Implications of Wind-Borne Entry of Asian Soybean Rust into the United States” (Wash-ington: United States Department of Agriculture, 2004).
43 “USDA Acts Fast to Fight Soybean Rust Infection,” GCN, July 10, 2006, available at www.gcn.com/print/25_19/41251-1.html.
44 John T. Watson, Michelle Gayer, and Maire A. Connolly, “Epidemics After Natural Disasters,” Perspective 13(1) (2007), available at www.cdc.gov/ncidod/eid/13/1/1.htm.
45 Sidney Spiesel, “Sick City: The Diseases that Katrina Unleashed,” Slate, available at www.slate.com/id/2125757/. See also “Infectious Disease and Dermatologic Conditions in Evacuees and Rescue Workers After Hurricane Katrina,” available at www.cdc.gov/mmwr/pre-view/mmwrhtml/mm54d926a1.htm.
46 Lawrence J. Korb and Sean Duggan, “Caught Off Guard: The Link Between Our National Security and Our National Guard” (Washing-ton: Center for American Progress, 2007), available at www.americanprogress.org/issues/2007/05/national_guard.html.
47 “Iraq War Hampers Kansas Cleanup,” Associated Press, May 6, 2007, available at www.kcbs.com/pages/424076.php?contentType=4&contentId=472199.
48 Spencer S. Hsu, “States Feel Left Out of Disaster Planning,” The Washington Post, Aug. 8, 2007, available at www.washingtonpost.com/wp-dyn/content/article/2007/08/07/AR2007080702115.html.
49 National Institute of Building Sciences “Natural Hazard Mitigation Saves: An Independent Study to Assess the Future Savings from Mitigation Activities, National Institute of Building Sciences” (2005): Vol. 2, p. 123.
50 Ironically, the Bush administration after 9/11 supported the establishment of a modified Project Impact strategy when it launched its Citizen Corps effort. Citizen Corps is a preparedness effort that relies substantially on the many of the strategic tenets of Project Impact. However, the Bush administration’s support of Citizen Corps has been half-hearted at best.
51 National Institute of Building Sciences, “Natural Hazard Mitigation Saves.”
52 General Accounting Office, “Disaster Assistance: Improvements Needed in Determining Eligibility for Public Assistance” (1996), avail-able at www.gao.gov/archive/1996/rc96113.pdf.
53 Ibid.